acc ii isor - california air resources board - ca.gov
TRANSCRIPT
Staff Report: Initial Statement of Reasons
Date of Release: April 12, 2022 Date of Hearing: June 9, 2022
California Air Resources Board
Public Hearing to Consider the Proposed Advanced Clean Cars II Regulations
Staff Report: Initial Statement of Reasons
Date of Release: April 12, 2022 Scheduled for Consideration:
Board Hearing Date – June 9, 2022
This report has been reviewed by the staff of the California Air Resources Board and approved for publication. Approval does not signify that the contents necessarily reflect the views and policies of the California Air Resources Board, nor does mention of trade names or commercial products constitute endorsement or recommendation for use.
Staff Report: Initial Statement of Reasons
Date of Release: April 12, 2022 Date of Hearing: June 9, 2022
Table of Contents Executive Summary ................................................................................................................... 4
I. Introduction and Background ................................................................................................. 0
A. Regulatory History .......................................................................................................... 1
II. The Problem the Proposal is Intended to Address ............................................................... 3
A. Need for Emission Reductions ....................................................................................... 5
B. Advancing Environmental Justice ................................................................................... 9
C. California has unique authority under federal law to regulate vehicle emissions ......... 10
D. California has broad authority under California law to regulate vehicle emissions ...... 11
III. Summary of Staff’s ZEV Regulation Proposal ..................................................................... 12
A. Background .................................................................................................................. 12
1. ZEV Technologies ......................................................................................................... 12
2. ZEV Technology is Rapidly Improving .......................................................................... 13
3. Expansion of the ZEV Market ....................................................................................... 18
4. Importance of the Used Vehicle Market ...................................................................... 21
5. Consumer Challenges Exist and Must be Addressed .................................................. 21
6. Complementary Policies: Equitably Building a Successful ZEV Market ....................... 24
B. Need for Proposed ZEV Regulations ............................................................................ 35
C. Proposed Requirements and Feasibility ....................................................................... 36
1. ZEV Stringency: Annual ZEV Percentage Requirements ............................................ 36
2. Proposed ZEV Requirement Structure and Compliance Rules .................................. 42
3. Minimum Technical Requirements for ZEVs ............................................................... 46
4. PHEV Allowance and Minimum Technical Requirements ........................................... 56
5. Environmental Justice Allowances ............................................................................. 60
6. Early Compliance Values ............................................................................................ 66
7. SVM treatment ........................................................................................................... 67
8. Summary of ZEV Regulation Proposals ...................................................................... 67
D. ZEV Assurance Measures .............................................................................................. 69
1. On-Vehicle Data Standardization ................................................................................. 71
2. Durability ...................................................................................................................... 72
3. Warranty ....................................................................................................................... 77
4. Service Information ...................................................................................................... 83
5. Battery Labeling ........................................................................................................... 84
6. Summary of ZEV Assurance Measure Proposals .......................................................... 88
IV. Summary of Staff’s LEV Proposals ...................................................................................... 89
A. Background .................................................................................................................. 90
1. Certification Requirements for Light-Duty Vehicles .................................................. 90
2. Emission Bins and Fleet-Average Standards ................................................................ 90
3. Cold-Start Emissions .................................................................................................... 91
4. High-Powered Starts for PHEVs ................................................................................... 91
5. PM Standards for Aggressive Driving Conditions ........................................................ 92
6. Medium-Duty Vehicles ................................................................................................. 92
7. Conforming amendments to related regulations ......................................................... 93
B. Need for LEV Proposals ................................................................................................ 94
1. Need to Prevent Backsliding of ICEVs as ZEVs Significantly Increase in the New VehicleFleet ................................................................................................................................. 94
2. Need to Reduce High-Powered Cold-Start Emissions from PHEVs ............................. 95
3. Need to Address Cold-Start Emissions Under Real-World Driving Conditions ........... 96
4. Need for More Stringent PM Standards for Aggressive Driving Cycle ...................... 100
5. Need for In-Use Standards for Medium-Duty Vehicles .............................................. 100
6. Need for More Stringent Standards for Medium-Duty Vehicles ................................ 102
7. Need to amend the OBD regulations ........................................................................ 103
C. LEV Proposals and Feasibility ..................................................................................... 104
1. Proposal: Fleet Average Standard without ZEVs ....................................................... 104
2. Proposal: Stand-Alone Standards for Aggressive Driving .......................................... 105
3. Proposal: PM Standard for Aggressive Driving .......................................................... 109
4. Proposal: Cold-Start Emission Control ....................................................................... 110
5. Proposal: PHEV High-Power Cold-Start Emission Standard ...................................... 116
6. Proposal: Lower Running Loss Standard .................................................................... 120
7. Proposal: PEMS In-use Standards for MDVs greater than 14,000 GCWR ................. 121
8. Proposal: Lower Emission Standards for MDV ........................................................... 124
9. Proposal: Standalone Standards for MDV for Aggressive Driving Cycles .................. 128
10. Summary of OBD Proposal ...................................................................................... 131
D. Other Test Procedure Modifications .......................................................................... 132
1. Proposed Split of California’s Light- and Medium-Duty Vehicle Test Procedure ...... 132
2. Proposed Split of California’s Evaporative Emissions Test Procedure ....................... 132
3. Proposed Amendments to California’s Non-Methane Organic Gas Test Procedure 133
4. Proposed Amendments to California’s Test Procedures for Evaluating Substitute Fuelsand New Clean Fuels ..................................................................................................... 133
V. The Specific Purpose and Rationale of Each Adoption, Amendment, or Repeal ............. 133
VI. Benefits Anticipated from the Regulatory Action, Including the Benefits or Goals Providedin the Authorizing Statute ..................................................................................................... 134
A. Summary of Emission Benefits .................................................................................... 134
B. Summary of Health Benefits ....................................................................................... 135
1. Incidence-Per-Ton Methodology ............................................................................... 135
2. Reduction in Adverse Health Impacts ........................................................................ 136
3. Uncertainties Associated with the Mortality and Illness Analysis ............................... 138
4. Monetization of Health Impacts ................................................................................. 138
C. Greenhouse Gas Reduction Benefits - Social Cost of Carbon .................................... 141
D. Benefits to Manufacturers Making ZEVs ..................................................................... 143
E. Benefits to Individuals – Total Cost of Ownership...................................................... 143
VII. Air Quality – Emission Benefits........................................................................................ 145
F. Baseline Assumptions ................................................................................................. 145
G. Total Emission Benefits ............................................................................................... 146
VIII. Environmental Analysis ................................................................................................... 148
IX. Environmental Justice ...................................................................................................... 150
X. Standardized Regulatory Impact Analysis ......................................................................... 155
A. Changes since the release of the SRIA ....................................................................... 156
1. Updated Technology Package Cost ........................................................................... 156
2. Updated Baseline Assumptions ................................................................................. 163
3. Updated Minor Assumptions for Fleet Modeling ...................................................... 165
4. Changes to ZEV Sales Requirements ......................................................................... 167
5. Total Costs to the Manufacturer ................................................................................ 167
B. The creation or elimination of jobs within the State of California. ............................. 168
C. The creation of new business or the elimination of existing businesses within the Stateof California. ...................................................................................................................... 170
D. The expansion of businesses currently doing business within the State of California. 171
E. Significant Statewide Adverse Economic Impact Directly Affecting Business, IncludingAbility to Compete ............................................................................................................ 172
F. The competitive advantages or disadvantages for businesses currently doing businesswithin the state .................................................................................................................. 172
G. The increase or decrease of investment in the state .................................................. 172
H. The incentives for innovation in products, materials, or processes ............................ 173
I. The benefits of the regulation to the health and welfare of California residents, workersafety, and the state’s environment. .................................................................................. 173
XI. Evaluation of Regulatory Alternatives .............................................................................. 173
A. Alternative Considered with Different Sales Percentage Requirements Than theProposal ............................................................................................................................. 174
1. Description of Alternatives ......................................................................................... 174
2. Total Manufacturer Costs for Alternatives ................................................................. 175
3. Emission Benefits for the Alternatives ........................................................................ 176
4. Health Benefits ........................................................................................................... 177
5. Monetized Health Benefits for Alternatives and Social Cost of Carbon for Alternatives ....................................................................................................................................... 177
6. Reason for Rejection for Alternatives ......................................................................... 180
B. Small Business Alternative .......................................................................................... 180
C. Performance Standards in Place of Prescriptive Standards ........................................ 180
D. Health and Safety Code section 57005 Major Regulation Alternatives...................... 181
XII. Justification for Adoption of Regulations Different from Federal Regulations Contained inthe Code of Federal Regulations .......................................................................................... 181
XIII. Public Process for Development of the Proposed Action .............................................. 183
XIV. Next Steps ..................................................................................................................... 185
XV. References ...................................................................................................................... 186
4
Executive Summary
The Advanced Clean Cars II (ACC II) regulatory proposal will drive the sales of zero emission vehicles (ZEV) to 100-percent ZEVs in California by the 2035 model year, including battery electric vehicles (BEV) and hydrogen fuel cell electric vehicles (FCEV) and the cleanest-possible plug-in hybrid-electric vehicles (PHEV), while reducing smog-forming emissions from new internal combustion engine vehicles (ICEVs). Additionally, the proposed charging and ZEV assurance measures, which include proposals to set minimum warranty and durability requirements, increase serviceability, and facilitate battery labeling, will help ensure consumers can successfully replace their ICEVs within California households with new or used ZEVs and PHEVs that meet their needs for transportation and protect the emission benefits of the program. These standards will also reduce the total cost of ownership for passenger cars and light trucks, saving drivers money in the long term and further promoting consumer adoption.
ACC II is critical to meeting California’s public health and climate goals and meeting State and federal air quality standards. Mobile sources are the greatest contributor to emissions of criteria pollutants1 and greenhouse gases (GHG) in California, accounting for about 80-percent of ozone precursor emissions and approximately 50-percent of statewide GHG emissions, when accounting for transportation fuel production and delivery.2 The National Ambient Air Quality Standards (NAAQS) for two of these criteria pollutants—ozone (sometimes referred to as smog) and fine particulate matter (PM2.5, sometimes referred to as soot)—are particularly relevant in California. California suffers some of the worst air pollution in the nation. The South Coast and San Joaquin Valley air basins are the only two regions in the country classified as ‘Extreme’—the worst category—for nonattainment of the federal ozone standard of 70 parts per billion (ppb). These areas also suffer some of the worst levels of PM2.5 pollution. This proposal is an integral part of California’s strategy to address these pressing public health needs, in compliance with state and federal law.
Emissions from motor vehicle engines hurt public health, welfare, the environment, and the climate in multiple interrelated ways. Reducing emissions of one kind supports reducing emissions of others and contributes to decreasing the severity of their impacts, as discussed below.3 In particular, as the climate warms, ozone becomes harder to control and more particulate matter is released from wildfires. Reducing the emissions that cause climate change will lead to greater reductions in ozone from the efforts to reduce the pollutants that cause it, which are primarily oxides of nitrogen (NOx) and hydrocarbons (HC) from fuel combustion. These emission reductions will help stabilize the climate and reduce the risk of severe drought and wildfire and its consequent fine particulate matter pollution.
1 The federal Clean Air Act, 42 U.S.C. §7401, et seq., requires the United States Environmental Protection Agency (U.S. EPA) to set National Ambient Air Quality Standards (NAAQS) for six “criteria” pollutants. The Clean Air Act also requires states to develop and enforce implementation plans for “nonattainment” areas, i.e., areas of the State that do not meet the NAAQS or contribute to a nearby area that does not meet the NAAQS. Nonattainment areas have air pollution surpassing levels the federal government has deemed requisite to protect public health and the environment 2 CARB 2021a. 2020 Mobile Source Strategy. Released September 2021. (https://ww2.arb.ca.gov/sites/default/files/2021-09/Proposed_2020_Mobile_Source_Strategy.pdf, accessed January 31, 2022) 3 Infra, Chapter II.A.
5
The emission reductions from the ACC II proposal are critical to achieving carbon neutrality by 2045, an essential target established by the Governor’s Executive Order B-55-184, and being evaluated in the draft 2022 Scoping Plan Update, which is set to be heard by the Board in June 2022. The 2022 State Strategy for the State Implementation Plan (SIP) Strategy also relies on reducing emissions of oxides of nitrogen (NOx) from passenger vehicles to attain the latest federal ambient ozone standards by 2037 in the South Coast5 (as has been further emphasized in previously adopted SIPs). Moreover, communities burdened by transportation pollution throughout the state, including near-roadway communities, will benefit from declines in pollution at the local level.
California’s Long History of Emission Regulations
The proposal builds upon the California Air Resources Board’s (CARB or the Board) long history of controlling emissions from mobile sources. Over 30 years ago, the Board established the Low-Emission Vehicle (LEV) regulation, which contained aggressive exhaust emission regulations for light-duty passenger cars and trucks and the first requirement for manufacturers to build ZEVs. In 2004, following the adoption of Assembly Bill (AB) 1493, (Pavley, Chapter 200, Statutes of 2002), CARB approved a landmark greenhouse gas (GHG) exhaust standard, more commonly known as “the Pavley regulation” for the statute’s author, to require automakers to control GHG emissions from new passenger vehicles beginning with the 2009 model year. These were the first regulations in the nation to control greenhouse gas emissions from motor vehicles, one of the largest contributors to climate change emissions in the state.
Continuing its leadership role in developing innovative and groundbreaking emission control programs and advancing ZEV technologies, California developed the Advanced Clean Cars (ACC) program, which the Board finalized in 2012. The ACC program incorporated three elements that combined the control of smog-causing pollutants and GHG emissions into a single coordinated package of requirements for model years 2015 through 2025, assuring the development of environmentally superior vehicles that will continue to deliver the performance, utility, and safety vehicle owners have come to expect. These three elements included the LEV III regulations to reduce criteria pollutants and GHG emissions and another phase of ZEV requirements.6
When the Board adopted ACC in 2012, it committed to conducting a comprehensive midterm review (MTR) of three elements within the ACC program. At completion of the MTR, the Board concluded the following, among other things, at its March 2017 hearing:
• California’s GHG tailpipe standards remain appropriate and achievable for the 2022 through 2025 model years;
• California’s ZEV requirements as adopted in 2012 are appropriate and will remain in place to develop the market;
4 GO 2018. Governor Jerry Brown. Executive Order B-55-18. https://www.ca.gov/archive/gov39/wp-content/uploads/2018/09/9.10.18-Executive-Order.pdf September 2018. Accessed March 7, 2022. 5 CARB 2022a. California Air Resources Board. 2022. “Draft 2022 State Strategy for the State Implementation Plan.” Released January 31, 2022. Accessed February 1, 2022. https://ww2.arb.ca.gov/sites/default/files/2022-01/Draft_2022_State_SIP_Strategy.pdf. 6 Although the Clean Fuels Outlet regulation update was adopted by the Board as part of the ACC package, it was not finalized in response to Assembly Bill 8 (AB 8, stats. 2013, ch. 401), which included dedicated funding for hydrogen fueling infrastructure to support the market launch of FCEVs.
6
• Complementary policies are needed and should be expanded to help support an expanding ZEV market;
• California’s particulate matter (PM) standard is feasible but further action is needed to ensure robust control; and
• Staff are directed to immediately begin rule development for more stringent standards for the 2026 and subsequent model years.7
Following the Board’s direction in 2017, staff developed these proposed ACC II regulations. The proposals go beyond the existing State and federal GHG emission standards, which have been adopted by CARB and the U.S. Environmental Protection Agency (EPA), respectively, and which will remain in effect8. Staff’s proposal aims to further curb criteria, toxic, and GHG emissions by increasing stringency of emission standards for ICEVs, ensuring emissions are reduced under real-world operating conditions, and accelerating the transition to ZEVs beginning with the 2026 model year through both increased stringency of ZEV sales requirements and associated requirements to support wide-scale adoption and use.
Considering Equity in Advanced Clean Cars
Improving access to clean transportation and mobility options for low-income households and communities most impacted by pollution supports equity and environmental justice and is key in achieving emission reductions.9 CARB’s statewide strategy to address these goals, known as the Community Air Protection Program Blueprint, identifies ACC II in helping to reduce exposure to criteria pollution and toxic air contaminants in burdened communities. The significant pollution reductions from the proposal as a whole, when accounting for cleaner ICEVs as well as ZEVs, will reduce exposure to vehicle pollution in communities throughout California, including in low-income and disadvantaged communities that are often disproportionately exposed to vehicular pollution.10 Further, the proposed ZEV assurance measures, discussed in Chapter III.D., will ensure these emissions benefits are realized and long-lasting, while supporting more reliable ZEVs in the used vehicle market, where the cost of ZEVs become more affordable to lower-income households. Staff have also proposed provisions, discussed in Chapter IX, to encourage manufacturers to take actions that improve access to ZEVs for disadvantaged, low-income, and other frontline communities, including by investing in community car share programs, producing affordable ZEVs, and keeping used vehicles in California to support CARB’s complementary equity incentive programs.
A Growing ZEV Market
At the time of ACC adoption in 2012, there were less than 5 ZEV and PHEV models available for sale in California. By the end of 2021, California had 60 ZEV and PHEV models in the
7 CARB 2017a, Advanced Clean Cars, Midterm Review, Reso. 17-3, May 24, 2017, Advanced Clean Cars Midterm Review - Resolution 17-3. 8 CARB will continue to work closely with its federal agency partners as it considers whether to revise its GHG exhaust emission standards in a future proposal 9 Infra., Chapter II.B. 10 Infra., Chapter IX; see also Apte 2019. Apte, Joshua S, Sarah E Chambliss, Christopher W Tessum, and Julian D Marshall. 2019. A Method to Prioritize Sources for Reducing High PM2.5 Exposures in Environmental Justice Communities in California. CARB Contract Number 17RD006. Accessed February 25, 2022. https://ww2.arb.ca.gov/sites/default/files/classic/research/apr/past/17rd006.pdf.
7
market and had surpassed 1 million cumulative ZEVs and PHEVs sold, leading the United States (US) in ZEV sales. Over this time, many factors helped in transforming the transportation sector to cleaner technologies. Legal requirements in California, primarily CARB’s ACC program, and international regulations, have required manufacturers to invest in developing zero-emission technology. Those investments have improved ZEV technology to meet a broader array of driver needs and complementary programs, and the associated expansion of public infrastructure, that has driven consumer demand.
The industry has rapidly responded to evolving market pressures, consumer demands, and regulatory requirements in California, across the United States, and around the globe. Overall, these improvements have reduced costs for batteries, the main driver of BEV and PHEV costs, as well as for non-battery components. This has enabled manufacturers to accelerate plans to bring to market more long-range ZEVs in more market segments and highly capable PHEVs. Today, every manufacturer has a public commitment to significant if not full electrification in the next 20 years. Based on public announcements, it is expected that nearly 120 ZEV and PHEV models will be available to consumers before the 2026 model year.
In California, 74-percent of drivers report having at least some interest in the electric vehicle market, and 40-percent considering going electric for their “next vehicle.”11 This interest is turning into growing sales, with new vehicle market share of electric drive vehicles in 2021 jumping to 12.4-percent from 7.8-percent just the year prior in California. Further, satisfaction is high among electric vehicle owners and is likely to lead to subsequent purchases of electric vehicle technology.
Over the long term, a transition to technology that does not rely on petroleum fuels will also reduce costs in addition to mitigating adverse impacts on public health, the environment, and the climate. US household expenditures on energy consumption have ranged between 4% and 8% of their disposable income, and it has been shown historically that consumers spend higher shares of their income on energy expenditures when energy prices are higher.12 The impact of higher energy prices can be more significant for low-income households, as they spend larger magnitudes of their disposable income on energy expenditures. Less dependency on conventional sources of energy, and thus reduced demand for petroleum fuels, lessens exposure to the global energy market and lowers impacts from volatile gasoline and diesel prices. It will also reduce attendant costs due to risks to national and global stability and security from dependency on oil.13
The ACC II regulation will not achieve success on its own but is one tool that works in concert with many other complementary programs and policies that California is undertaking to support the transition to zero-emission transportation. Sustained California policy signals and
11 Consumer Reports 2021. Consumer Reports. “Consumer Attitudes Towards Electric Vehicles and Fuel Efficiency in California: 2020 Survey Results”, Published March 2021. 12 EIA 2014. U.S. Energy Information Administration. 2014. “Today in Energy: Consumer Energy Expenditures are Roughly 5% of Disposable Income, Below Long-Term Average.” October 21, 2014. Accessed March 18, 2022. https://www.eia.gov/todayinenergy/detail.php?id=18471. 13 For example, U.S. EPA has cited estimates that the U.S. military spends $81 billion per year protecting global energy supplies. EPA 2021a. U.S. Environmental Protection Agency, Revised 2023 and Later Model Year Light Duty Vehicle GHG Emissions Standards: Regulatory Impact Analysis, EPA-420-R-21-028, December 2021, p. 3-24, https://nepis.epa.gov/Exe/ZyPDF.cgi?Dockey=P1013ORN.pdf.
8
regulations, backed by significant financial investment in a suite of complementary policies have been critical to accelerating demand. Since the adoption of ACC, network planning for better placement of charging and hydrogen infrastructure has developed, along with increased funding for these fueling stations. Public investment and regulations are working to address barriers in support of this proposed vehicle regulation.
The Evolution of Advanced Clean Cars II
Consistent with the Board’s long-standing practice, staff have engaged in an extensive public process in developing the Proposed Regulation, holding four public workshops in 2020 and 2021, culminating in a pre-draft regulatory proposal released in December 2021. As discussed in Chapter XIII, the proposal reflects extensive feedback received throughout this process.
The proposed regulations are also founded on significant positive developments in the market. Every light-duty vehicle manufacturer has made commitments to electrify their product line in a significant way.14 Confidential manufacturer projections received mid-2021 confirmed these announcements, building confidence in a strong near-term market for ZEVs and PHEVs. Furthermore, subsequent to CARB’s public workshops on its initial proposals in 2021, U.S. EPA finalized its rulemaking for 2023 through 2026 model year light-duty vehicle greenhouse gas emission standards.15 Its rulemaking analysis showed a minimum compliance path that would result in 17-percent of new vehicle sales being ZEVs and PHEVs by the 2026 model year nationally.
These factors, in combination with adjustments to ZEV and PHEV costs since the release of the Draft Standardized Regulatory Impact Analysis (SRIA), meant that staff was able to strengthen its proposal for the early years of the regulation relative to earlier regulatory concepts. Specifically, staff was able to leverage more recent analysis from the Argonne National Laboratory (ANL), and U.S. EPA teardown reports, and additionally added further detail on delete costs for mechanical all-wheel drive (AWD) components. The net of these changes has lowered BEV incremental costs throughout all the model years covered by the proposed rule. The results show that for BEVs, operational savings will offset any incremental costs over the 10-year period evaluated. For example, a passenger car BEV with a 300-mile range will have initial annual savings occur in the first year for the 2026 model year technology. For the 2035 model year technology, the initial savings are nearly immediate and cumulative savings over ten years exceed $7,500. For a more detailed discuss of these costs and analyses, see Chapter X and Appendices G (ACC II ZEV Technology Assessment), and H, (ACC II LEV Technology Appendix).
Additionally, staff further bolstered the proposal since the SRIA in the area of equity and environmental justice (EJ), already a multi-faceted effort in ACC II, and one that sits within a larger set of actions – from incentive programs to other regulatory measures – intended to protect priority populations. Following continued input from external stakeholders and internal equity partners, staff are proposing to add a third category to increase affordable access to ZEVs and PHEVs by providing an incentive for manufacturers to offer lower priced
14 A list of all manufacturer announcements can be found in Appendix G. 15 EPA 2021b. U.S. Environmental Protection Agency, “Revised 2023 and Later Model Year Light-Duty Vehicle GHG Emissions Standards.” Federal Register 86, no. 248 (December 30, 2021): 74434. https://www.govinfo.gov/content/pkg/FR-2021-12-30/pdf/2021-27854.pdf.
9
vehicles. This is especially important in the earlier years of the proposed ACC II program when battery costs are higher. The EJ vehicle values are aimed at providing manufacturers with incentive for targeted actions that would help achieve more equitable outcomes.
Summary of ZEV Regulation Proposal
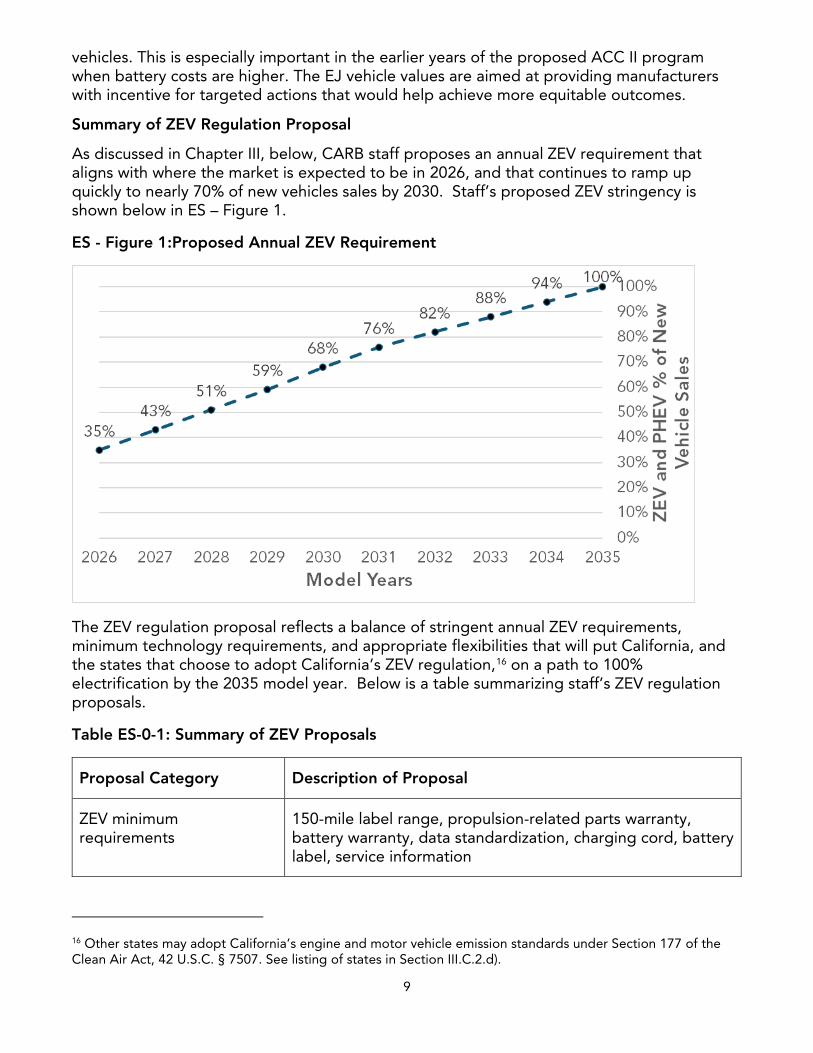
As discussed in Chapter III, below, CARB staff proposes an annual ZEV requirement that aligns with where the market is expected to be in 2026, and that continues to ramp up quickly to nearly 70% of new vehicles sales by 2030. Staff’s proposed ZEV stringency is shown below in ES – Figure 1.
ES - Figure 1:Proposed Annual ZEV Requirement
The ZEV regulation proposal reflects a balance of stringent annual ZEV requirements, minimum technology requirements, and appropriate flexibilities that will put California, and the states that choose to adopt California’s ZEV regulation,16 on a path to 100% electrification by the 2035 model year. Below is a table summarizing staff’s ZEV regulation proposals.
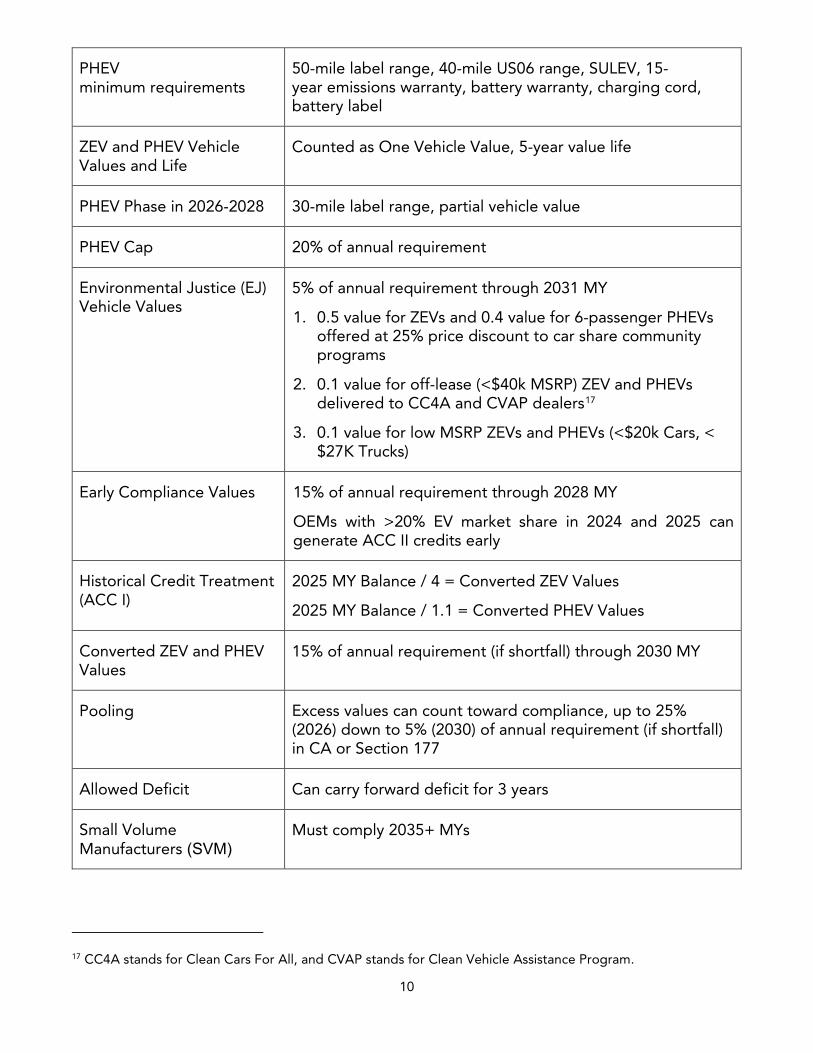
Table ES-0-1: Summary of ZEV Proposals
Proposal Category Description of Proposal
ZEV minimum requirements
150-mile label range, propulsion-related parts warranty, battery warranty, data standardization, charging cord, battery label, service information
16 Other states may adopt California’s engine and motor vehicle emission standards under Section 177 of the Clean Air Act, 42 U.S.C. § 7507. See listing of states in Section III.C.2.d).
10
PHEV minimum requirements
50-mile label range, 40-mile US06 range, SULEV, 15- year emissions warranty, battery warranty, charging cord, battery label
ZEV and PHEV Vehicle Values and Life
Counted as One Vehicle Value, 5-year value life
PHEV Phase in 2026-2028 30-mile label range, partial vehicle value
PHEV Cap 20% of annual requirement
Environmental Justice (EJ) Vehicle Values
5% of annual requirement through 2031 MY
1. 0.5 value for ZEVs and 0.4 value for 6-passenger PHEVs offered at 25% price discount to car share community programs
2. 0.1 value for off-lease (<$40k MSRP) ZEV and PHEVs delivered to CC4A and CVAP dealers17
3. 0.1 value for low MSRP ZEVs and PHEVs (<$20k Cars, < $27K Trucks)
Early Compliance Values 15% of annual requirement through 2028 MY
OEMs with >20% EV market share in 2024 and 2025 can generate ACC II credits early
Historical Credit Treatment (ACC I)
2025 MY Balance / 4 = Converted ZEV Values
2025 MY Balance / 1.1 = Converted PHEV Values
Converted ZEV and PHEV Values
15% of annual requirement (if shortfall) through 2030 MY
Pooling Excess values can count toward compliance, up to 25% (2026) down to 5% (2030) of annual requirement (if shortfall) in CA or Section 177
Allowed Deficit Can carry forward deficit for 3 years
Small Volume Manufacturers (SVM)
Must comply 2035+ MYs
17 CC4A stands for Clean Cars For All, and CVAP stands for Clean Vehicle Assistance Program.
11
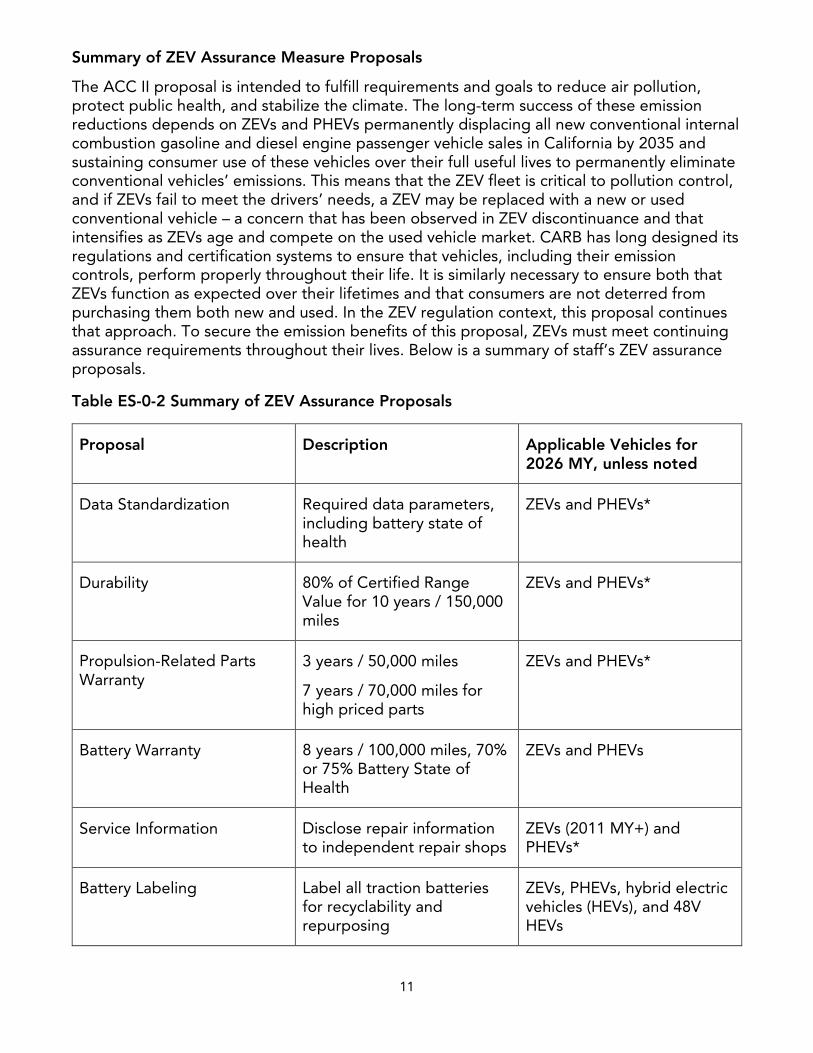
Summary of ZEV Assurance Measure Proposals
The ACC II proposal is intended to fulfill requirements and goals to reduce air pollution, protect public health, and stabilize the climate. The long-term success of these emission reductions depends on ZEVs and PHEVs permanently displacing all new conventional internal combustion gasoline and diesel engine passenger vehicle sales in California by 2035 and sustaining consumer use of these vehicles over their full useful lives to permanently eliminate conventional vehicles’ emissions. This means that the ZEV fleet is critical to pollution control, and if ZEVs fail to meet the drivers’ needs, a ZEV may be replaced with a new or used conventional vehicle – a concern that has been observed in ZEV discontinuance and that intensifies as ZEVs age and compete on the used vehicle market. CARB has long designed its regulations and certification systems to ensure that vehicles, including their emission controls, perform properly throughout their life. It is similarly necessary to ensure both that ZEVs function as expected over their lifetimes and that consumers are not deterred from purchasing them both new and used. In the ZEV regulation context, this proposal continues that approach. To secure the emission benefits of this proposal, ZEVs must meet continuing assurance requirements throughout their lives. Below is a summary of staff’s ZEV assurance proposals.
Table ES-0-2 Summary of ZEV Assurance Proposals
Proposal Description Applicable Vehicles for 2026 MY, unless noted
Data Standardization Required data parameters, including battery state of health
ZEVs and PHEVs*
Durability 80% of Certified Range Value for 10 years / 150,000 miles
ZEVs and PHEVs*
Propulsion-Related Parts Warranty
3 years / 50,000 miles
7 years / 70,000 miles for high priced parts
ZEVs and PHEVs*
Battery Warranty 8 years / 100,000 miles, 70% or 75% Battery State of Health
ZEVs and PHEVs
Service Information Disclose repair information to independent repair shops
ZEVs (2011 MY+) and PHEVs*
Battery Labeling Label all traction batteries for recyclability and repurposing
ZEVs, PHEVs, hybrid electric vehicles (HEVs), and 48V HEVs
12
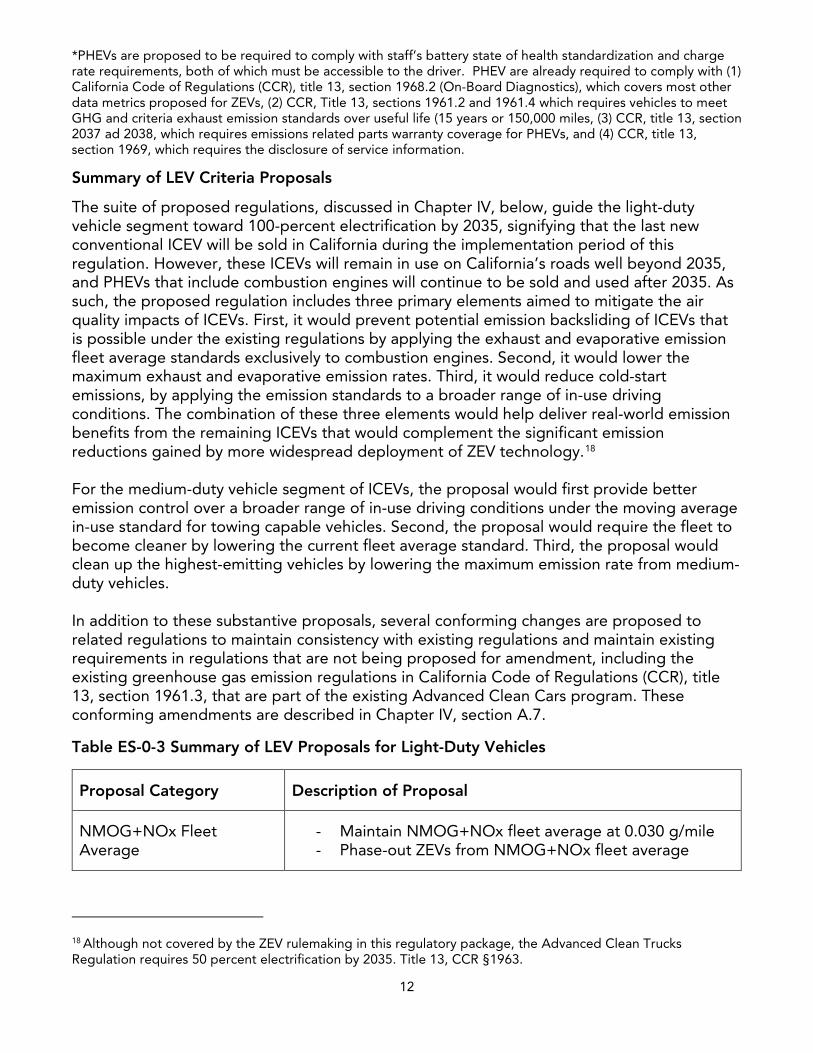
*PHEVs are proposed to be required to comply with staff’s battery state of health standardization and charge rate requirements, both of which must be accessible to the driver. PHEV are already required to comply with (1) California Code of Regulations (CCR), title 13, section 1968.2 (On-Board Diagnostics), which covers most other data metrics proposed for ZEVs, (2) CCR, Title 13, sections 1961.2 and 1961.4 which requires vehicles to meet GHG and criteria exhaust emission standards over useful life (15 years or 150,000 miles, (3) CCR, title 13, section 2037 ad 2038, which requires emissions related parts warranty coverage for PHEVs, and (4) CCR, title 13, section 1969, which requires the disclosure of service information.
Summary of LEV Criteria Proposals
The suite of proposed regulations, discussed in Chapter IV, below, guide the light-duty vehicle segment toward 100-percent electrification by 2035, signifying that the last new conventional ICEV will be sold in California during the implementation period of this regulation. However, these ICEVs will remain in use on California’s roads well beyond 2035, and PHEVs that include combustion engines will continue to be sold and used after 2035. As such, the proposed regulation includes three primary elements aimed to mitigate the air quality impacts of ICEVs. First, it would prevent potential emission backsliding of ICEVs that is possible under the existing regulations by applying the exhaust and evaporative emission fleet average standards exclusively to combustion engines. Second, it would lower the maximum exhaust and evaporative emission rates. Third, it would reduce cold-start emissions, by applying the emission standards to a broader range of in-use driving conditions. The combination of these three elements would help deliver real-world emission benefits from the remaining ICEVs that would complement the significant emission reductions gained by more widespread deployment of ZEV technology.18 For the medium-duty vehicle segment of ICEVs, the proposal would first provide better emission control over a broader range of in-use driving conditions under the moving average in-use standard for towing capable vehicles. Second, the proposal would require the fleet to become cleaner by lowering the current fleet average standard. Third, the proposal would clean up the highest-emitting vehicles by lowering the maximum emission rate from medium-duty vehicles. In addition to these substantive proposals, several conforming changes are proposed to related regulations to maintain consistency with existing regulations and maintain existing requirements in regulations that are not being proposed for amendment, including the existing greenhouse gas emission regulations in California Code of Regulations (CCR), title 13, section 1961.3, that are part of the existing Advanced Clean Cars program. These conforming amendments are described in Chapter IV, section A.7.
Table ES-0-3 Summary of LEV Proposals for Light-Duty Vehicles
Proposal Category Description of Proposal
NMOG+NOx Fleet Average
- Maintain NMOG+NOx fleet average at 0.030 g/mile - Phase-out ZEVs from NMOG+NOx fleet average
18 Although not covered by the ZEV rulemaking in this regulatory package, the Advanced Clean Trucks Regulation requires 50 percent electrification by 2035. Title 13, CCR §1963.
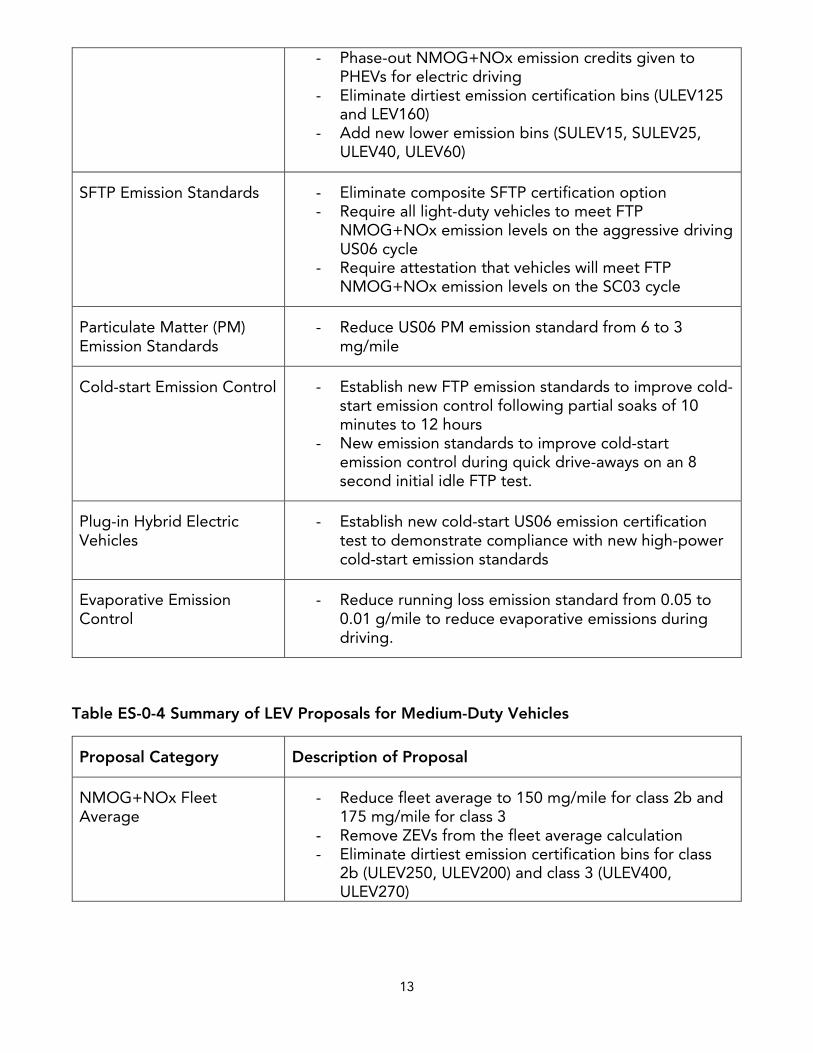
13
- Phase-out NMOG+NOx emission credits given to PHEVs for electric driving
- Eliminate dirtiest emission certification bins (ULEV125 and LEV160)
- Add new lower emission bins (SULEV15, SULEV25, ULEV40, ULEV60)
SFTP Emission Standards - Eliminate composite SFTP certification option - Require all light-duty vehicles to meet FTP
NMOG+NOx emission levels on the aggressive driving US06 cycle
- Require attestation that vehicles will meet FTP NMOG+NOx emission levels on the SC03 cycle
Particulate Matter (PM) Emission Standards
- Reduce US06 PM emission standard from 6 to 3 mg/mile
Cold-start Emission Control - Establish new FTP emission standards to improve cold-start emission control following partial soaks of 10 minutes to 12 hours
- New emission standards to improve cold-start emission control during quick drive-aways on an 8 second initial idle FTP test.
Plug-in Hybrid Electric Vehicles
- Establish new cold-start US06 emission certification test to demonstrate compliance with new high-power cold-start emission standards
Evaporative Emission Control
- Reduce running loss emission standard from 0.05 to 0.01 g/mile to reduce evaporative emissions during driving.
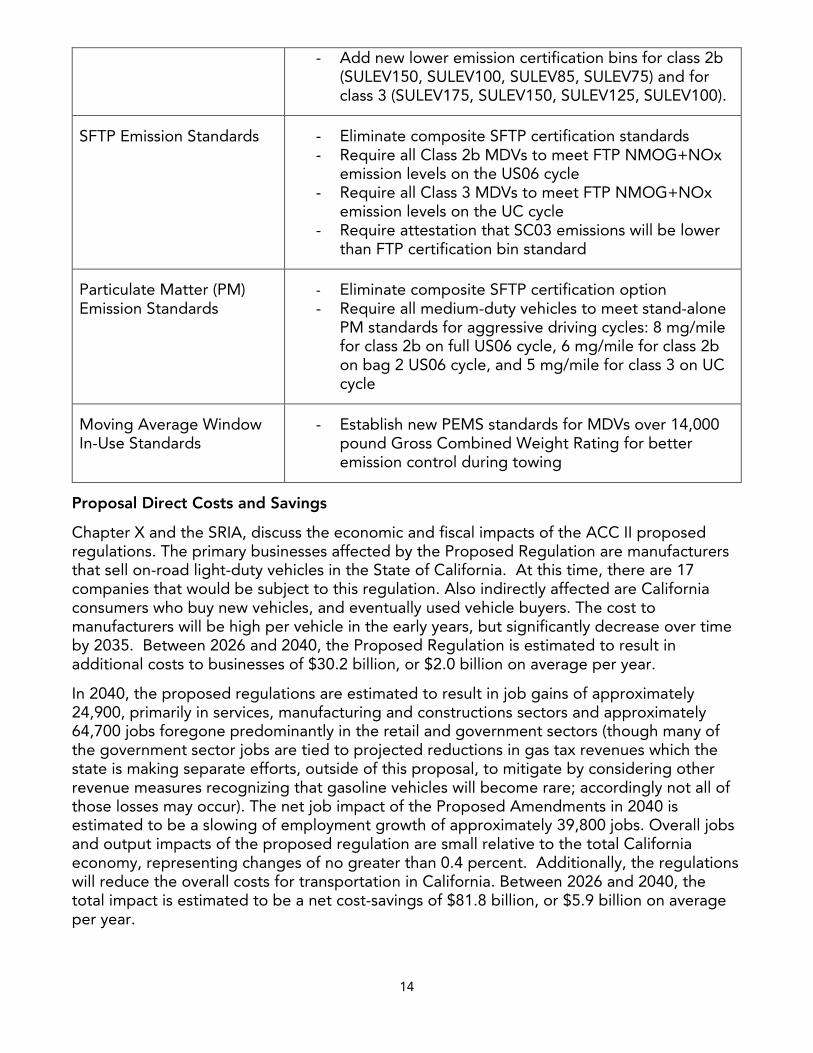
Table ES-0-4 Summary of LEV Proposals for Medium-Duty Vehicles
Proposal Category Description of Proposal
NMOG+NOx Fleet Average
- Reduce fleet average to 150 mg/mile for class 2b and 175 mg/mile for class 3
- Remove ZEVs from the fleet average calculation - Eliminate dirtiest emission certification bins for class
2b (ULEV250, ULEV200) and class 3 (ULEV400, ULEV270)
14
- Add new lower emission certification bins for class 2b (SULEV150, SULEV100, SULEV85, SULEV75) and for class 3 (SULEV175, SULEV150, SULEV125, SULEV100).
SFTP Emission Standards - Eliminate composite SFTP certification standards - Require all Class 2b MDVs to meet FTP NMOG+NOx
emission levels on the US06 cycle - Require all Class 3 MDVs to meet FTP NMOG+NOx
emission levels on the UC cycle - Require attestation that SC03 emissions will be lower
than FTP certification bin standard
Particulate Matter (PM) Emission Standards
- Eliminate composite SFTP certification option - Require all medium-duty vehicles to meet stand-alone
PM standards for aggressive driving cycles: 8 mg/mile for class 2b on full US06 cycle, 6 mg/mile for class 2b on bag 2 US06 cycle, and 5 mg/mile for class 3 on UC cycle
Moving Average Window In-Use Standards
- Establish new PEMS standards for MDVs over 14,000 pound Gross Combined Weight Rating for better emission control during towing
Proposal Direct Costs and Savings
Chapter X and the SRIA, discuss the economic and fiscal impacts of the ACC II proposed regulations. The primary businesses affected by the Proposed Regulation are manufacturers that sell on-road light-duty vehicles in the State of California. At this time, there are 17 companies that would be subject to this regulation. Also indirectly affected are California consumers who buy new vehicles, and eventually used vehicle buyers. The cost to manufacturers will be high per vehicle in the early years, but significantly decrease over time by 2035. Between 2026 and 2040, the Proposed Regulation is estimated to result in additional costs to businesses of $30.2 billion, or $2.0 billion on average per year.
In 2040, the proposed regulations are estimated to result in job gains of approximately 24,900, primarily in services, manufacturing and constructions sectors and approximately 64,700 jobs foregone predominantly in the retail and government sectors (though many of the government sector jobs are tied to projected reductions in gas tax revenues which the state is making separate efforts, outside of this proposal, to mitigate by considering other revenue measures recognizing that gasoline vehicles will become rare; accordingly not all of those losses may occur). The net job impact of the Proposed Amendments in 2040 is estimated to be a slowing of employment growth of approximately 39,800 jobs. Overall jobs and output impacts of the proposed regulation are small relative to the total California economy, representing changes of no greater than 0.4 percent. Additionally, the regulations will reduce the overall costs for transportation in California. Between 2026 and 2040, the total impact is estimated to be a net cost-savings of $81.8 billion, or $5.9 billion on average per year.
15
Individual vehicle consumers, for most ZEVs in the program, will see cost-savings when considering the total cost of ownership (TCO). The results show that for BEVs, operational savings will offset any incremental costs over the 10-year period evaluated. For example, a passenger car BEV with a 300-mile range will have initial annual savings occur in the first year for the 2026 model year technology. For the 2035 model year technology, the initial savings are nearly immediate and cumulative savings over ten years exceed $7,500. These TCO savings are even more favorable for a BEV owner who has access to a home charger.
Proposal Net Benefits
As discussed in Chapter XI and Appendix D, Emissions Inventory Methods and Results for the Proposed Amendments, the ACC II program would increase new vehicle sales of BEVs, FCEVs, and PHEVs and reduce emissions from the remaining new ICEVs sold. Increased use of ZEVs penetrating the California fleet will reduce vehicle as well as upstream fuel production emissions of GHGs, criteria pollutants (especially hydrocarbons or HC, oxides of nitrogen or NOx, and fine particulate matter, or PM2.5), and toxics. Through the proposed regulation, California will see a reduction in 2040 of 30.1 tons per day of NOX, 2.0 tons per day of PM2.5, and 57.4 MMT/yr of CO2 emissions (well-to-wheels emissions accounting for fuel production) in 2040. The proposal will lead to an estimated 1,272 fewer cardiopulmonary deaths; 208 fewer hospital admissions for cardiovascular illness; 249 fewer hospital admissions for respiratory illness; and 639 fewer emergency room visits for asthma.
The proposed regulation is expected to significantly reduce GHG emission by replacing ICEVs with ZEV technologies. The benefit of these GHG emission reductions can be estimated using the social cost of carbon (SC-CO2), which provides a dollar valuation of the damages caused by one ton of carbon pollution and represents the monetary benefit today of reducing carbon emissions in the future. The avoided SC-CO2 from 2026 to 2040 is the sum of the annual well-to-tank (WTT)19 and tank-to-wheel (TTW) GHG emissions reductions multiplied by the SC-CO2 in each year. The cumulative well-to-wheel (WTW) GHG emissions reductions along with the estimated benefits range from about $10.9 billion to $46.0 billion through 2040, depending on the chosen discount rate. The net result of these analyses shows the proposed regulation delivers a cumulative net benefit to California of $80.7 billion and has a benefit-cost ratio of 1.38, meaning benefits are more than costs between 2026 and 2040.
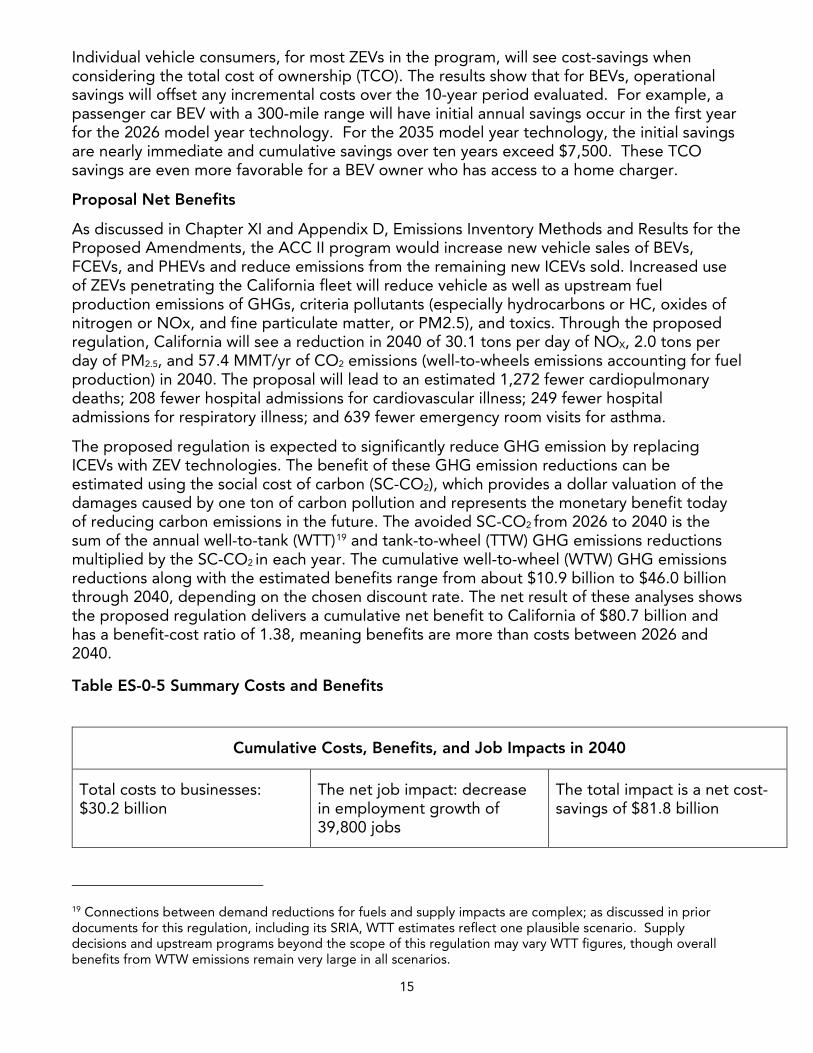
Table ES-0-5 Summary Costs and Benefits
Cumulative Costs, Benefits, and Job Impacts in 2040
Total costs to businesses: $30.2 billion
The net job impact: decrease in employment growth of 39,800 jobs
The total impact is a net cost-savings of $81.8 billion
19 Connections between demand reductions for fuels and supply impacts are complex; as discussed in prior documents for this regulation, including its SRIA, WTT estimates reflect one plausible scenario. Supply decisions and upstream programs beyond the scope of this regulation may vary WTT figures, though overall benefits from WTW emissions remain very large in all scenarios.
16
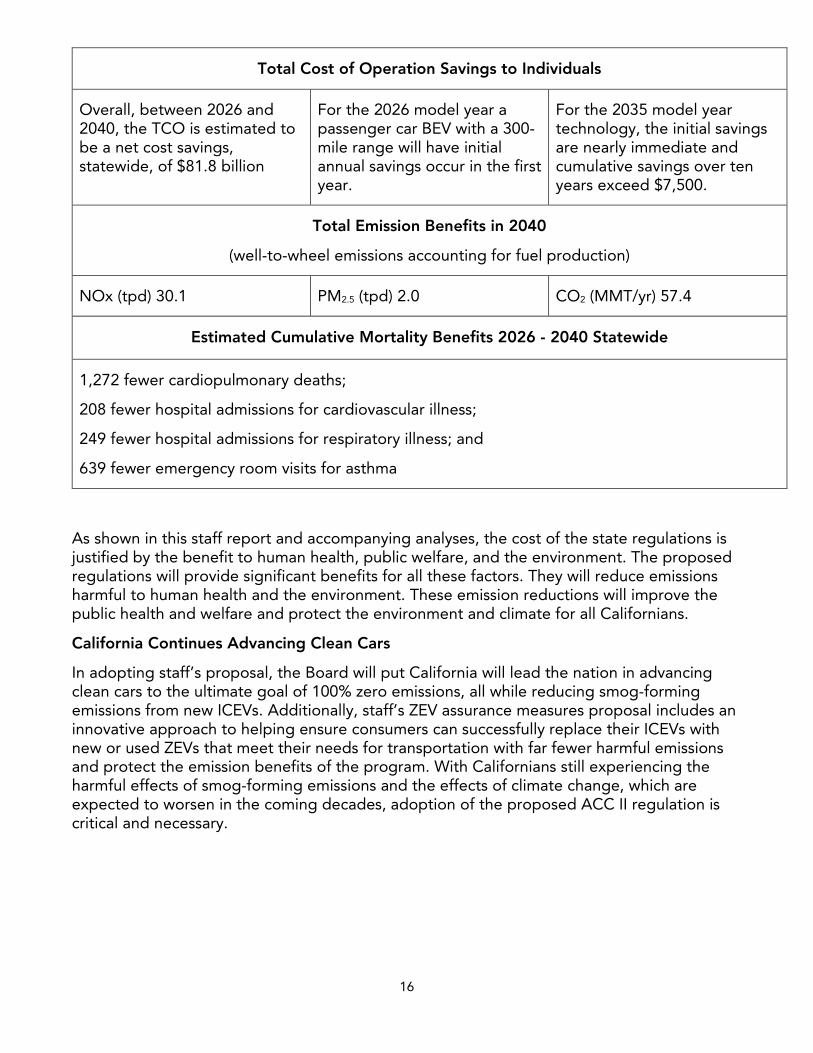
Total Cost of Operation Savings to Individuals
Overall, between 2026 and 2040, the TCO is estimated to be a net cost savings, statewide, of $81.8 billion
For the 2026 model year a passenger car BEV with a 300-mile range will have initial annual savings occur in the first year.
For the 2035 model year technology, the initial savings are nearly immediate and cumulative savings over ten years exceed $7,500.
Total Emission Benefits in 2040
(well-to-wheel emissions accounting for fuel production)
NOx (tpd) 30.1 PM2.5 (tpd) 2.0 CO2 (MMT/yr) 57.4
Estimated Cumulative Mortality Benefits 2026 - 2040 Statewide
1,272 fewer cardiopulmonary deaths;
208 fewer hospital admissions for cardiovascular illness;
249 fewer hospital admissions for respiratory illness; and
639 fewer emergency room visits for asthma
As shown in this staff report and accompanying analyses, the cost of the state regulations is justified by the benefit to human health, public welfare, and the environment. The proposed regulations will provide significant benefits for all these factors. They will reduce emissions harmful to human health and the environment. These emission reductions will improve the public health and welfare and protect the environment and climate for all Californians.
California Continues Advancing Clean Cars
In adopting staff’s proposal, the Board will put California will lead the nation in advancing clean cars to the ultimate goal of 100% zero emissions, all while reducing smog-forming emissions from new ICEVs. Additionally, staff’s ZEV assurance measures proposal includes an innovative approach to helping ensure consumers can successfully replace their ICEVs with new or used ZEVs that meet their needs for transportation with far fewer harmful emissions and protect the emission benefits of the program. With Californians still experiencing the harmful effects of smog-forming emissions and the effects of climate change, which are expected to worsen in the coming decades, adoption of the proposed ACC II regulation is critical and necessary.

Staff Report: Initial Statement of Reasons
Date of Release: April 12, 2022 Date of Hearing: June 9, 2022
I. Introduction and Background
California has a long history of regulating tailpipe emissions from passenger cars and trucks, dating to the 1960s. Among the many high watermarks of these programs, in 1990 CARB adopted an ambitious program to significantly reduce the environmental impact of light-duty vehicles through the introduction of the Low-Emission Vehicle (LEV) regulations. The regulations, referred to as the “LEV I” regulations, included three primary elements — (1) tiers of exhaust emission standards for increasingly more stringent categories of low-emission vehicles, (2) a mechanism requiring each manufacturer to phase in a progressively cleaner mix of vehicles from year to year with the option of credit trading, and (3) a requirement that a specified percentage of passenger cars and light-duty trucks be zero-emission vehicles (ZEV), vehicles with no exhaust emissions. In 2012, CARB combined LEV regulations for controlling smog-causing pollutants and greenhouse gas (GHG) emissions with ZEV regulations requiring the manufacture of ZEVs into what is now referred to as the Advanced Clean Cars (ACC) program for model years 2015 and beyond. CARB will continue the success of this approach with this proposal, Advanced Clean Cars II.
The Advanced Clean Cars II (ACC II) regulatory proposal expands the existing requirements to transition to ZEVs for almost all new car and light truck sales in California while cleaning up any internal combustion-powered passenger vehicles that will continue to be offered for sale. Doing so is critical to meeting California’s public health and climate goals and meeting State and federal air quality standards. Mobile sources are the greatest contributor to emissions of criteria pollutants and GHGs in California, accounting for about 80 percent of ozone precursor emissions and approximately 50 percent of statewide GHG emissions, when accounting for transportation fuel production and delivery.20 The emission reductions from the ACC II proposal will be critical to achieving carbon neutrality by 2045 a goal which CARB continues to define via the draft 2022 Scoping Plan Update, which is set to be heard for the first time by the Board in June 2022. The draft 2022 State Strategy for the State Implementation Plan (SIP) Strategy also relies on reducing emissions of oxides of nitrogen (NOx) from passenger vehicles to attain the latest federal ambient ozone standards by 2037 in the South Coast,21 and reductions from these vehicles are critical to attaining or maintaining compliance with federal standards as a general matter.
Internal combustion engine vehicles (ICEV), the majority of which are fueled by petroleum-based fuels, are the dominant type of passenger car and trucks sold in California today, and will continue to be through the first years of Advanced Clean Cars II. ZEVs, most commonly battery electric vehicles (BEV) and hydrogen fuel cell electric vehicles (FCEV), have no exhaust (or tailpipe) emissions and therefore are a clear solution to several public health and environmental threats. ZEVs reduce mobile source emissions that contribute to unhealthy
20 CARB 2021a. 2020 Mobile Source Strategy. Released September 2021. (https://ww2.arb.ca.gov/sites/default/files/2021-09/Proposed_2020_Mobile_Source_Strategy.pdf, accessed January 31, 2022) 21 CARB 2022a. “Draft 2022 State Strategy for the State Implementation Plan”
1
regional ozone and particulate matter levels and reduce local exposure to toxics. ZEVs also reduce demand for petroleum production, delivery, and combustion that is destabilizing the climate and directly impacting public health. While ZEVs do still have upstream emissions that are associated with the production of the electricity and hydrogen used to fuel them (which are accounted for in the analysis of this proposal), the criteria pollutants and carbon intensity of transportation electricity and hydrogen are already cleaner than gasoline in California and are aggressively becoming even cleaner under state laws mandating renewable sources of fuel and energy production along with CARB’s upstream regulatory programs.
The proposed regulation will drive the sales of ZEVs and the cleanest-possible plug-in hybrid-electric vehicles (PHEV) to 100-percent in California by the 2035 model year, all while reducing smog-forming emissions from new ICEVs. Additionally, the proposed charging and ZEV assurance measures, which include proposals to set minimum warranty requirements, durability requirements, increase serviceability, and streamline battery labeling, will help ensure consumers can successfully replace their ICEVs within California households with new or used vehicles that meet their needs for transportation with far fewer harmful emissions and protect the emission benefits of the program.
A. Regulatory History
Staff’s proposal builds upon many decades of CARB regulations seeking to reduce emissions from light-duty passenger cars and trucks. Each of those regulations ultimately yielded significant public benefits.
In 1990, CARB established the LEV regulation which contained aggressive exhaust emission regulations for light-duty passenger cars and trucks and the first requirement for manufacturers to build ZEVs. Building upon the success of the LEV regulation, CARB adopted the second phase of the regulations. These amendments, known as LEV II, set more stringent fleet average non-methane organic gas (NMOG) requirements for model years 2004 through 2010 for passenger cars and light-duty trucks. Separately, in 2004 following the adoption of a new state law (Assembly Bill (AB) 1493, statutes of 2002, chapter 200, Pavley), CARB approved a landmark greenhouse gas (GHG) tailpipe standard, more commonly known as “the Pavley regulation” for the statute’s author, to require automakers to control GHG emissions from new passenger vehicles beginning with the 2009 model year. These were the first regulations in the nation to control greenhouse gas emissions from motor vehicles, one of the largest contributors to climate change emissions in the state.
The ZEV regulation has been adjusted numerous times since its 1990 inception to account for changes in market response and technology development. Through this time, manufacturers continued to develop technology and test pilot vehicles in limited use applications. In 2009, staff concluded that even widespread market adoption of advanced conventional technologies, like non-plug-in hybrid-electric vehicles (HEV), would be inadequate to meet California’s then-current 2050 GHG targets22 of reducing emissions by 80-percent below 1990 levels. Staff determined that ZEVs would need to comprise nearly 100-percent of new vehicle sales between 2040 and 2050, and broad commercial markets for ZEVs would need
22 CARB, 2009a. “White Paper: Summary of Staff’s Preliminary Assessment of the Need for Revisions to the Zero Emission Vehicle Regulation”. (PDF)
2
to launch in the 2015 to 2020 timeframe. The Board heard staff’s findings at its December 2009 hearing and adopted Resolution 09-66,23 reaffirming its commitment to meeting California’s long-term air quality and climate change reduction goals through commercialization of ZEV technologies.
Continuing its leadership role in the development of innovative and groundbreaking emission control programs and advancing ZEV technologies, California developed the ACC program, which was finalized with Board action in 2012. The ACC program incorporated three elements that combined the control of smog-causing pollutants and GHG emissions into a single coordinated package of requirements for model years 2015 through 2025, assuring the development of environmentally superior vehicles that will continue to deliver the performance, utility, and safety vehicle owners have come to expect. These three elements included the LEV III regulations to reduce criteria pollutants and GHG emissions and another phase of ZEV requirements.24
When the Board adopted ACC in 2012, it committed to conducting a comprehensive midterm review (MTR) of three elements within the ACC program: 1) the ZEV regulation, 2) the 1 milligram per mile particulate matter (PM) standard, and 3) the light-duty vehicle GHG standards for 2022 and later model years. Staff’s ACC review was conducted at the same time as staff also participated in a related midterm evaluation by the United States Environmental Protection Agency (U.S. EPA) of the federal light-duty vehicle greenhouse gas standards for the 2022 through 2025 model years. Following completion of the MTR, the Board concluded the following, among other things, at its March 2017 hearing:
• California’s GHG tailpipe standards remained appropriate and achievable for the 2022 through 2025 model years
• California’s ZEV requirements as adopted in 2012 are appropriate and will remain in place to develop the market
• Complementary policies are needed and should be expanded to help support an expanding ZEV market
• California’s PM standard is feasible but further action is needed to ensure robust control
• Staff are directed to immediately begin rule development for more stringent standards for the 2026 and subsequent model years
The federal program was subsequently significantly modified under successive federal administrations, with the latest standards becoming effective on February 28, 2022.25 CARB’s work, however, continued in response to the findings of the 2017 MTR. Following the Board’s direction in 2017, staff developed the proposed ACC II regulations. CARBs efforts have been accelerated by the growing magnitude of the climate and air quality crisis, and by
23 CARB 2009b. Resolution 09-66. December 9, 2009. (https://www.arb.ca.gov/board/res/2009/res09-66.pdf, accessed on January 31, 2022) 24 Although the Clean Fuels Outlet regulation update was adopted by the Board as part of the ACC package, it was not finalized in response to Assembly Bill 8 (AB 8, stats. 2013, ch. 401), which included dedicated funding for hydrogen fueling infrastructure to support the market launch of FCEVs. 25 U.S. EPA, Revised 2023 and Later Model Year Greenhouse Gas Emission Standards, 86 Fed. Reg. 74,434, Dec. 30, 2021. The federal government also took actions intended to prevent enforcement of certain model years of CARB’s ACC program under the federal Clean Air Act and other law; those actions have since been reconsidered and do not bear directly upon ACC II or limit CARB’s ability to propose these regulations.
3
resulting direction from the Governor. Governor Newsom signed Executive Order N-79-2026 establishing a goal that 100 percent of California sales of new passenger car and trucks be ZEVs by 2035. Staff’s proposal aims to further curb criteria, toxic, and GHG emission reductions through increased LEV program stringency, requirements to ensure emissions are reduced under real-world operating conditions, and by accelerating the transition to ZEVs through both increased stringency of ZEV requirements and associated actions to support wide-scale adoption and use beginning with the 2026 model year. The proposals go beyond the existing state and federal GHG emission standards, which have been adopted by CARB and U.S. EPA, respectively, and which will remain in effect pending any further revision.27
The success of emission controls and electrification within the light-duty sector, along with growing private and public sector support for electrification across the board, has enabled similar regulations to be adopted in the medium- and heavy-duty sectors. Some medium-duty vehicles have the option to certify using the light duty regulations or heavy-duty regulations; therefore, it is important to know the regulatory landscape for this category. CARB has finalized a comprehensive update to the California emission standards and other emission-related requirements for heavy-duty engines and vehicles, referred to as the “Heavy-Duty Omnibus Regulation.”28 The Heavy-Duty Omnibus Regulation is aimed at ensuring real-world emissions performance on the road, not just in the laboratory. In addition to more stringent criteria pollutant standards for heavy-duty engines, CARB also adopted the Advanced Clean Trucks (ACT) regulation. The ACT Regulation29 will accelerate the market for zero-emission medium- and heavy-duty vehicles in applications that are well suited for their use. Medium- and heavy-duty vehicle manufacturers will be required to start producing and selling a modest number of ZEVs beginning with the 2024 model year with ZEV sales increasing through the 2030 model year. CARB is also in the process of proposing an Advanced Clean Fleets (ACF) regulation which will accelerate adoption of ZEV vehicles in important uses, and which proposes phasing out new combustion vehicles amongst the vehicle classes it would cover by 2040.
II. The Problem the Proposal is Intended to Address
The California Legislature has directed CARB to “systematically attack the serious problem caused by motor vehicles [as] the major source of air pollution in many areas of the state.”30
26 GO 2020. Governor Gavin Newsom. Executive Order N-79-20. Released September 23, 2020. https://www.gov.ca.gov/wp-content/uploads/2020/09/9.23.20-EO-N-79-20-Climate.pdf, accessed January 31, 2022 27 CARB will continue to work closely with its federal agency partners as it considers whether to revise its GHG exhaust emission standards in a future proposal 28 CARB 2020a. Initial Statement of Reasons: Proposed Amendments to the Exhaust Emissions Standards and Test Procedures for 2024 and Subsequent Model Year Heavy-Duty Engines and Vehicles, Heavy-Duty On-Board Diagnostic System Requirements, Heavy-Duty In-Use Testing Program, Emissions Warranty Period and Useful Life Requirements, Emissions Warranty Information and Reporting Requirements, and Corrective Action Procedures, In-Use Emissions Data Reporting Requirements, and Phase 2 Heavy-Duty Greenhouse Gas Regulations, and Powertrain Test Procedures. Released June 23, 2020. (https://ww2.arb.ca.gov/sites/default/files/barcu/regact/2020/hdomnibuslownox/isor.pdf, accessed January 31, 2022) 29 CARB 2019a. Initial Statement of Reasons: Advanced Clean Trucks Regulation. Released October 22, 2019. (https://ww2.arb.ca.gov/sites/default/files/barcu/regact/2019/act2019/isor.pdf, accessed January 31, 2022.) 30 Health and Saf. Code, § 39003.
4
Air pollution presents multiple threats to public health and welfare, and CARB is mandated to meet those threats in many ways. CARB is responsible for controlling emissions from vehicles31, for preparing the state implementation plan required by the federal Clean Air Act32, and regulating sources of the greenhouse gases that are causing global warming.33
California must significantly reduce emissions of ozone and particulate matter on schedules that are developed to ensure the air we all breath meets National Ambient Air Quality Standards (NAAQS), set by U.S. EPA, and the California Ambient Air Quality Standards, set by CARB, that limit pollution to levels necessary to protect public health. The most recent federal ozone NAAQS standard is a level of 70 parts per billion (ppb), with a required attainment date in the South Coast Air Basin by 2037. The federal PM requirements also require action in California for attainment, with a deadline of 2024 for the 35 ug/m3 24-hour standard and 2025 for the 12 ug/m3 annual standard. In California, NOx is a critical precursor to ozone and secondary PM formation. Exposure to ozone and fine particulate matter (PM2.5) is associated with increases in premature death, hospitalizations, visits to doctors, use of medication, and emergency room visits due to exacerbation of chronic heart and lung diseases and other adverse health conditions. Accordingly, ZEVs and reduced emissions from conventional vehicles are a leading measure supporting the State SIP Strategy.
To evaluate the kinds of strategies necessary, and the pace of action needed, to address the complex, wide-reaching problem of air pollution from motor vehicles and other mobile sources, CARB developed the 2020 Mobile Source Strategy.34 As with the prior 2016 Mobile Source Strategy, the updated Strategy informs policy decisions for specific measures in the State Implementation Plan (SIP) required by the federal Clean Air Act, the Climate Change Scoping Plan, and Community Emission Reduction Plans to protect vulnerable communities from disparate pollution impacts. Although feasibility assessments and regulatory stringency requirements are established in separate rulemakings, the Mobile Source Strategy provides important context on how to mitigate multiple pollutants when considering all mobile sources in California as a top-down assessment of the magnitude of change needed to be achieved across a portfolio of programs. The need to continue reducing pollution from conventional passenger vehicles while simultaneously scaling up requirements for ZEVs on California’s roads, including within this regulatory proposal along with other efforts, are important outcomes of the Mobile Source Strategy and integral to these proposed regulations.
The State Strategy for the State Implementation Plan provides the framework for meeting the federal and State health-based ambient air quality standards.35
The California Global Warming Solutions Act of 2006, Assembly Bill 32 (Nuñez, Chapter 488, Statutes of 2006, requires CARB “to achieve the maximum technologically feasible and cost-effective greenhouse gas emission reductions”36 Senate Bill 32 requires CARB to ensure that
31 Health and Saf. Code, §§ 39002, 39667 32 Health and Saf. Code, § 39602 33 Health and Saf. Code, § 38510. 34 CARB 2021a. 35 CARB 2017b. CARB Staff Report - Revised Proposed 2016 State Strategy for the State Implementation Plan, March 2017. https://ww3.arb.ca.gov/planning/sip/2016sip/rev2016statesip.pdf Accessed January 20, 2022. 36 HSC 38560; see also 38510.
5
California’s statewide emissions of GHG emissions are reduced to at least 40 percent below the level of statewide GHG emissions in 1990 by 2030.37 In December 2017, CARB adopted the Scoping Plan Update, known as California’s 2017 Climate Change Scoping Plan, to provide the strategy to meet California’s 2030 target for reducing GHG emissions.38 It too includes zero-emission passenger cars and light trucks as a key component of the strategy to meet California’s long-term goals for a sustainable climate and transportation system.
Subsequently, Executive Order B-55-1839 established a statewide goal of achieving carbon neutrality no later than 2045. In support of reducing vehicle emissions, Governor Newsom signed Executive Order N-79-2040 establishing a goal that 100 percent of California sales of new passenger car and trucks be ZEVs by 2035.
CARB also recognizes that the proposed regulations must have multiple approaches to meet the complex, multi-dimensional public health, welfare, and climate problem of motor vehicle pollution. To meet this objective, CARB incorporated numerous market-based flexibilities and mechanisms into the proposal. These include averaging, banking, and trading provisions for meeting the emission and ZEV standards.
A. Need for Emission Reductions
Cars, trucks, and other mobile sources contribute a significant amount of smog-forming NOx (a precursor to ozone formation, sometimes referred to as smog) and the largest portion of GHG emissions in California.41 As shown in the baseline conditions of the updated 2020 Mobile Source Strategy, on-road light-duty vehicles accounted for 13-percent of the total NOx emissions statewide in 2017. In the South Coast Air Basin specifically, light-duty vehicles comprised 18 percent of the 2017 NOx emissions inventory. Also as shown in the 2020 Mobile Source Strategy, light-duty vehicles comprise 28 percent of the GHG emissions in California,42 or about 70-percent of the direct emissions from vehicles and equipment. The indirect or upstream emissions from fuel production (for all transportation modes) are 7-percent for refineries, 4.1-percent for oil and gas extraction, 0.9-percent for pipelines, and 0.7-percent for agriculture activities to produce fuel. When coupled with the direct emissions from all transportation sources, the total GHG emissions from mobile sources and their fuel production represent more than 50-percent of the total statewide GHG inventory. The 2020 Strategy reinforced the conclusions of the 2016 Mobile Source Strategy: transitioning to zero-emission technology for every on- and off-road mobile sector is essential for meeting
37 Pavley, ch. 249, stats. 2016; HSC 38566 38 CARB 2017c. California Air Resources Board. California's 2017 Climate Change Scoping Plan Update. https://ww2.arb.ca.gov/sites/default/files/classic/cc/scopingplan/scoping_plan_2017.pdf November 2017. Accessed January 31, 2022. 39 GO 2018. Governor Jerry Brown. Executive Oder to Achieve Carbon Neutrality, EO B-55-18. Released September 10, 2018. https://www.ca.gov/archive/gov39/wp-content/uploads/2018/09/9.10.18-Executive-Order.pdf, accessed January 31, 2022 40 GO 2020. 41 CARB 2021a. 42 CARB 2021a; this remains consistent with the more recent CARB GHG Emission Inventory Report for 2019 emissions. CARB 2021b. California Greenhouse Gas Emissions for 2000 to 2019. https://ww3.arb.ca.gov/cc/inventory/pubs/reports/2000_2019/ghg_inventory_trends_00-19.pdf
6
near- and long-term emission reduction goals mandated by statute, with regard to both ambient air quality and climate requirements.43
The Draft 2022 State Strategy for the State Implementation Plan44 builds on emission reductions from the proposed regulations, which are critical to meeting air quality standards. If the state cannot demonstrate it can attain these standards via enforceable plans it may face various federal sanctions or regulatory burdens, further heightening this need. It is part of efforts underway to cut emissions from new combustion vehicles while taking all new vehicle sales to 100-percent electrification no later than 2035. It is designed to reduce NOx emissions from today’s light-duty vehicles by up to 90-percent, contributing nearly a third of the emission reductions committed in the SIP for attainment of the previous 75 ppb ozone air quality standards that require attainment in 2031. The proposed regulations adopt new enforceable requirements that will reduce emissions of criteria pollutants. The proposed regulations will be submitted to U.S. EPA as a revision to the California State Implementation Plan (SIP) required by the federal Clean Air Act to attain and maintain the National Ambient Air Quality Standards. Although the regulations will be effective as a matter of state law once final, upon approval by U.S. EPA as a revision to the SIP, the regulations will also be effective for purposes of federal law. The regulations also respond to the gathering climate crisis. The dramatic increase in greenhouse gas emissions from human activity, particularly carbon dioxide (CO2), over the past several decades is having indisputable and significant harmful impacts. Because of this dramatic uptick in CO2 concentrations, the average global surface temperature has increased by around 1.1 degrees Celsius compared with the average in 1850–1900—a level that hasn’t been witnessed since 125,000 years ago, before the most recent ice age.45 This warming trend is particularly pronounced in recent years: the seven warmest years on record are the last seven years (2015-2021), and the 2010-2019 decade is the warmest decade recorded.46 This makes sense on a fundamental level, because the warming effect of greenhouse gases is compounded by further emissions since they can remain in the atmosphere for long periods of time (particularly CO2). As explained in the Fourth National Climate Assessment, “[w]aiting to begin reducing emissions is likely to increase the damages from climate-related extreme events (such as heat waves, droughts, wildfires, flash floods, and stronger storm surges due to higher sea levels and more powerful hurricanes).”47
California is already experiencing the effects of climate change, and it is expected that these effects will worsen in the coming decades, particularly if actions are not taken to mitigate
43 CARB 2016. California Air Resources Board 2016 Mobile Source Strategy, https://ww3.arb.ca.gov/planning/sip/2016sip/2016mobsrc.pdf Released May 2016. Accessed February 8, 2022. 44 CARB 2022a. “Draft 2022 State Strategy for the State Implementation Plan” 45 IPCC 2021. Intergovernmental Panel on Climate Change. 2021. The Physical Science Basis: Summary for Policymakers. IPCC, Switzerland. October 2021. https://www.ipcc.ch/report/ar6/wg1/downloads/report/IPCC_AR6_WGI_SPM_final.pdf. (IPCC uses the reference period 1850–1900 to approximate pre-industrial temperature, as this is the earliest period with near-global observations.). 46 UN 2022. United Nations (UN) News, 2021 joins top 7 warmest years on record: WMO (Jan. 19, 2022), 2021 joins top 7 warmest years on record: WMO | | UN News. 47 USGCRP 2018. U.S. Global Change Research Program. 2018. Impacts, Risks, and Adaptation in the United States: Fourth National Climate Assessment, Volume II. [Reidmiller, D.R., C.W. Avery, D.R. Easterling, K.E. Kunkel, K.L.M. Lewis, T.K. Maycock, and B.C. Stewart (eds.)]. U.S. GCRP, Washington, DC, USA, 1515 pp. doi: 10.7930/NCA4.2018.
7
greenhouse gas emissions. For instance, consistent with global and US observations, California temperatures have risen since records began in 1895, with the rate of increase accelerating since the 1980s.48 Data released in the fall of 2020 by NOAA’s National Centers for Environmental Information49 shows that September 2020 officially ranks as California’s hottest September since record-keeping began in 1880. And the summer of 2021 was California’s hottest summer on record. Tracking with rising temperatures, California’s annual wildfire extent has increased fivefold since the 1970s,50 and California’s 2020 fire season alone shattered records, not only in the total amount of acres burned (at just over 4 million) but also in wildfire size, with 5 of the 6 largest wildfires in California history occurring in 2020.51 52 If greenhouse gas emissions continue to rise, one study found that by 2100 the frequency of extreme wildfires burning 25,000 acres or more would increase by nearly 50 percent and average area burned statewide would increase by 77 percent.53 Indeed, a recent study suggests that smoke from wildfires like these could become one of the deadliest climate impacts within decades.54 55 And with these growing wildfires comes increased costs: California’s wildfire spending has already more than tripled since 2005 because of the climate-change-induced increase in number and severity of wildfires.56 57
Climate change also exacerbates other air pollution problems throughout California. Increasing temperatures generally cause increases in ozone concentrations in California’s
48 OEHHA 2018. Office of Environmental Health Hazard Assessment, California Environmental Protection Agency (2018). Indicators of Climate Change in California. https://oehha.ca.gov/media/downloads/climate-change/report/2018caindicatorsreportmay2018.pdf. 49 NOAA 2020. National Oceanic and Atmospheric Administration. Earth just had its hottest September on record (Oct. 14, 2020), https://www.noaa.gov/news/earth-just-had-its-hottest-september-on-record. 50 Williams 2019. Williams, A. P., Abatzoglou, J. T., Gershunov, A., Guzman‐Morales, J., Bishop, D. A., Balch, J. K., & Lettenmaier, D. P. (2019). Observed impacts of anthropogenic climate change on wildfire in California. Earth's Future, 7, 892–910. https://doi.org/10.1029/2019EF001210 51 LA Times 2021a. John Myers, “California unveils sweeping wildfire prevention plan amid record fire losses and drought,” LA Times, April 8, 2021, https://www.latimes.com/california/story/2021-04-08/california-wildfire-prevention-536-million-newsom-lawmakers. Accessed March 9, 2022. 52 Marshall Burke et al. 2021, The Changing Risk and Burden of Wildfire in the United States, PNAS 118(2) e2011048118, January 12. 2021, https://doi.org/10.1073/pnas.2011048118. Accessed March 9, 2022 53 Id. 54 LA Times 2021b. Tony Barboza, “Wildfire smoke now causes up to half the fine-particle pollution in Western U.S., study finds,” LA Times, Jan. 13, 2021, https://www.latimes.com/california/story/2021-01-13/wildfire-smoke-fine-particle-pollution-western-us-study, Accessed March 9, 2022. (new study blames climate change for worsening air quality and health risks in both urban and rural communities in recent years) 55 Marshall Burke, et al. 2021. 56 AP 2021. Adam Beam, California Oks new spending on drought, wildfire prevention, Associated Press, September 9, 2021, California OKs new spending on drought, wildfire prevention | AP News; see also Legislative Analyst’s Office, State Wildfire Response Costs Estimated to Be Higher Than Budgeted, Fig. 3 (Oct. 19, 2020), State Wildfire Response Costs Estimated to Be Higher Than Budgeted (ca.gov). 57 LAO 2020. Legislative Analyst’s Office, State Wildfire Response Costs Estimated to Be Higher Than Budgeted, Fig. 3, October 19, 2020, https://lao.ca.gov/Publications/Report/4285.
8
polluted regions.58 59 60 And increasing frequency and intensity of wildfires is already having a measurable effect on air quality.61 62 63 In 2020, California came under siege from record-breaking heat waves and smoke from more than 7,000 fires burning simultaneously, and the Bay Area even awoke to an eerie deep-orange sky.64 Similarly, climate change is increasing the frequency of droughts, which will increase wind erosion and ambient dust concentration.65 As soils become increasingly dry during a drought, dust from the ground is more likely to become airborne. Particulate matter suspended in the air from these events or from wildfire smoke can increase the risk for respiratory infections like bronchitis and pneumonia, which will result in greater health costs to the State.66,67
These intense heat waves and widespread wildfire smoke caused Southern California to experience worse air pollution readings and the highest number of health-damaging bad air-days since the mid-1990s. There were 157 bad-air days for ozone pollution across the vast, coast-to-mountains basin spanning Los Angeles, Orange, Riverside and San Bernardino Counties—the most days above the federal health standard since 1997. This ”climate penalty” threatens to degrade the notable air quality improvements California has made, and it makes attaining and maintaining federal and state air quality standards more difficult. California has met its obligations under the federal Clean Air Act to develop state implementation plans to attain the NAAQS. But those plans are increasingly requiring greater emission reductions as a percentage of CARB’s total mobile source contribution to meet the federal ambient air quality standards.
Failing to meet or make adequate progress toward meeting the federal standards requires at minimum further planning and emissions reductions. If the State fails to meet those planning
58 Shupeng et al 2019. Zhu, Shupeng, Jeremy R Horne, Michael Mac Kinnon, G S Samuelsen, and Donald Dabdub. 2019. “Comprehensively Assessing the Drivers of Future Air Quality in California.” Environment International 125: 386–98. https://doi.org/10.1016/j.envint.2019.02.007, Accessed March 9, 2022. 59 KVPR 2021. Kerry Kline, ”As temperatures rise, air quality experts keep an eye on ’ozone climate penalty’,” KVPR, November 16, 2021, https://www.kvpr.org/health/2021-11-16/as-temperatures-rise-air-quality-experts-keep-an-eye-on-ozone-climate-penalty. Accessed March 9, 2022. 60 Lung 2021. The American Lung Association’s State of the Air: 2018 report also found that California’s ozone levels rose significantly in 2016 due to extreme temperatures (page 4), and its State of the Air: 2021 report also notes the continuing role warming temperatures play on air quality (pages 13 & 14, State of the Air 2021 (lung.org)). 61 Kalashnikov 2022. Kalashnikov DA, Schnell JL, Abatzoglou JT, Swain DL, Singh D. “Increasing co-occurrence of fine particulate matter and ground-level ozone extremes in the western United States.” Sci Adv. 2022;8(1):eabi9386. doi:10.1126/sciadv.abi9386 https://www.science.org/doi/pdf/10.1126/sciadv.abi9386 62 McClure 2018. McClure, Crystal D, and Jaffe, D. A. “US particulate matter air quality improves except in wildfire-prone areas.” Proc Natl Acad Sci USA. 2018;115(31):7901-7906. doi:10.1073/pnas.1804353115 63 X. Liu, et al. 2017. “Airborne Measurements of Western U.S. Wildfire Emissions: Comparison with Prescribed Burning and Air Quality Implications,” 122 J. GEOPHYS. RES. ATMOS. 6108-29 (2017), doi:10.1002/2016JD 026315 (showing that wildfires emit fine particulate matter at over three times the level previously estimated) 64 NY Times 2020. Thomas Fuller & Christopher Flavelle, “A Climate Reckoning in Fire-Stricken California,” N.Y. TIMES, Sept. 18, 2020, https://www.nytimes.com/2020/09/10/us/climate-change-california-wildfires.html. Accessed March 9, 2022. 65 Duniway et al 2019. M.C. Duniway, et al., Wind Erosion and Dust from US Drylands: A Review of Causes, Consequences, and Solutions in a Changing World, ECOSPHERE 10(3) (2019). 66 Stanke et al 2013. C. Stanke, et al., Health Effects of Drought: A Systematic Review of the Evidence, PLOS CURRENTS, 5 (2013). 67 Jones er al 2020. See, e.g., C.G. Jones, et al., Out-of-Hospital Cardiac Arrests and Wildfire-Related Particulate Matter During 2015-2017 California Wildfires, J. AM. HEART ASSOC. 9(8) (2020).
9
obligations, it can ultimately trigger extreme consequences. These include, for stationary sources of emissions like factories, increased fees and offset requirements.68 The State can also be blocked from receiving federal highway funds, and U.S. EPA may impose a federal implementation plan to meet the standards.69 Emission reductions – including from vehicles covered by this proposal – are urgently needed to respond to the climate crisis and ensure that California’s air quality progress to date continues forward and is not erased.
B. Advancing Environmental Justice
In addition to meeting health-based air quality standards and climate change goals, emission reductions are particularly necessary in areas most vulnerable to, and that have been disproportionately impacted by, pollution. In many overburdened and underserved communities, the pollution and public health impacts from on-road vehicle emissions are especially significant and greater than in other communities. These impacts are often compounded by the congregation of nearby industrial sources, including upstream, mid-stream, and downstream fuel production sources. Underserved communities are also especially vulnerable to the economic impacts and health burdens associated with climate change, as the most severe harms from climate change fall disproportionately upon these underserved communities who are least able to prepare for and recover from associated impacts.70,71,72,73 Racial and ethnic minority communities are particularly vulnerable to the greatest impacts of climate change, and climate change increasingly impacts places, foods, and lifestyles of Native American Tribes, threatening traditional livelihoods and critical infrastructure. 74, 75, 76
Improving access to clean transportation and mobility options for low-income households and communities most impacted by pollution supports equity and environmental justice and is key in achieving emission reductions. Both state and federal law focus CARB’s attention on eliminating inequitable pollution burdens. Title VI of the U.S. Civil Rights Act of 1964
68 42 U.S.C. § 7511d. 69 42 U.S.C. § 7509. 70 EPA 2021c. United States Environmental Protection Agency. Climate Change and Social Vulnerability in the United States: A Focus on Six Impact Sectors. (EPA 430-R-21-003) https://www.epa.gov/cira/social-vulnerability-report September 2021. Accessed January 31, 2022. 71 Petkova 2016. Elisaveta Petkova. The Disproportionate Consequences of Climate Change. https://ncdp.columbia.edu/ncdp-perspectives/the-disproportionate-consequences-of-climate-change/ February 12, 2016. Accessed January 31, 2022. 72 OEHHA 2010. Indicators of Climate Change in California: Environmental Justice Impacts Report, OEHHA, https://oehha.ca.gov/climate-change/document/indicators-climate-change-california-environmental-justice-impacts-report Released December 31, 2010. Accessed January 31, 2022. 73 IPCC 2021. 74 Patnik 2020. Aneesh Patnaik, Jiahn Son, Alice Feng, Crystal Ade. Racial Disparities and Climate Change. https://psci.princeton.edu/tips/2020/8/15/racial-disparities-and-climate-change Released August 15, 2020. Accessed January 31, 2022. 75 Maldonado 2013. Julie Koppel Maldonado, Christine Shearer, Robin, Bronen, Kristina Peterson, and Health Lazrus. Climate Change (213) 120:601-614. The Impact of Climate Change on Tribal Communities In The US: Displacement, Relocation, and Human Rights. http://wordpress.ei.columbia.edu/climate-adaptation/files/2017/10/Maldonado-et-al-2011-Tribal-resettlement-US_ClimaticChange.pdf Published April 9, 2013. Accessed January 31, 2022. 76 Laduzinsky 2019. Paige Laduzinsky. The Disproportionate Impact of Climate Change on Indigenous Communities. https://www.kcet.org/shows/tending-nature/the-disproportionate-impact-of-climate-change-on-indigenous-communities December 19, 2019. Accessed February 1, 2022.
10
prohibits discrimination on the basis of race, color, or national origin in all agency programs or activities receiving federal funding -- and both state transportation and pollution programs are federally funded, motivating a strong focus on remediating disparate impacts of air pollution. 77,78 CARB’s statewide strategy to address these goals is further informed by specific legal commitments to address disparate pollution exposure, including the pollution generated by the transportation sector. 79 Furthermore, AB 32, the California Global Warming Solutions Act of 2006, directs CARB to “ensure that [its GHG] regulations [and] programs … where applicable and to the extent feasible, direct public and private investment toward the most disadvantaged communities in California.80
Staff’s approach to advancing environmental justice in this proposal is multi-faceted and sits within a larger set of actions – from incentive programs to other regulatory measures – intended to protect priority populations. The significant pollution reductions from the proposal as a whole, when accounting for cleaner ICEVs as well as ZEVs, will reduce exposure to vehicle pollution in communities throughout California, including in low-income and disadvantaged communities that are often disproportionately exposed to vehicular pollution.81
Further, the proposed ZEV assurance measures will ensure these emissions benefits are realized and long-lasting, while supporting more reliable ZEVs in the used vehicle market. Durable and better performing used ZEVs can help increase access to clean vehicle technologies for communities that may not be buying new vehicles, but which do need reliable household mobility options.
As part of this overall portfolio approach to equity and environmental justice, staff have also proposed provisions to encourage manufacturers to take actions that improve access to ZEVs for disadvantaged, low-income, and other frontline communities, including by investing in community car share programs, producing affordable ZEVs, and keeping used vehicles in California to support CARB’s complementary equity incentive programs.
C. California has unique authority under federal law to regulate vehicle emissions
California has long held and implemented its authority under state and federal law to reduce emissions from motor vehicles. The federal Clean Air Act provides California an exemption from federal preemption of state motor vehicle emission standards.82 In recent years, that authority was called into question by several illegal actions by the administration of President Trump.83
77 C. Garcia, Chapter 136, Statutes of 2017 78 California Health and Safety Code sec. 44391.2(b) and (c)(4) 79 CARB 2018a. Community Air Protection Program Blueprint, Appendix D – Statewide Actions https://ww2.arb.ca.gov/sites/default/files/2020-06/final_community_air_protection_blueprint_october_2018_appendix_d_acc.pdf October 2018. Accessed January 31, 2022. 80 California Health and Safety Code sec. 38565 81 Apte 2019. 82 Clean Air Act, § 209(b), 42 U.S.C. §7543(b). 83 In 2019, the U.S. EPA and the U.S. Department of Transportation, through NHTSA, finalized rules and actions to preempt California’s authority for its greenhouse gas emission and ZEV standards in ACC. Specifically,
11
CARB challenged all aspects of those actions.84 While the challenges have remained pending, CARB administered its greenhouse gas emission and ZEV standards on a voluntary basis in anticipation of successfully overturning these illegal federal rules and actions.
On January 20, 2021, President Biden issued his Executive Order on Protecting Public Health and the Environment and Restoring Science to Tackle the Climate Crisis.85 Among other things, the Order directed U.S. EPA and NHTSA to consider revisiting the SAFE Rules. In April 2021, U.S. EPA published its proposal to restore California’s waiver for these regulations.86 On December 21, 2021, NHTSA finalized its action to rescind the preemption regulation.87
U.S. EPA restored California’s waiver for its Advanced Clean Cars greenhouse gas emission and ZEV standards on March 14, 2022.88 The proposed standards are entitled to a waiver of federal preemption under the Clean Air Act and CARB expects to obtain that waiver in due course if the proposed regulations are adopted.
D. California has broad authority under California law to regulate vehicle emissions
CARB has been granted both broad and extensive authority under the Health and Safety Code (HSC) to adopt the Proposed Amendments. The California Legislature has placed the responsibility of controlling vehicular air pollution on CARB and has designated CARB as the state agency that is “charged with coordinating efforts to attain and maintain ambient air quality standards, to conduct research into the causes of and solution to air pollution, and to systematically attack the serious problems caused by motor vehicles, which is the major source of air pollution in many areas of the State.”89 CARB is authorized to adopt standards, rules and regulations needed to properly execute the powers and duties granted to and imposed on CARB by law.90 HSC 43013 and 43018 broadly authorize and require CARB to
NHTSA adopted a regulation stating that the Energy Policy and Conservation Act (EPCA), which sets fuel economy standards, preempts California’s greenhouse gas emission and ZEV standards. U.S. EPA revoked California’s waiver of federal preemption under the Clean Air Act for the same standards. The Safer Affordable Fuel-Efficient (SAFE) Vehicles Rule Part One: One National Program, 84 Fed. Reg. 51,310 (Sept. 27, 2019). 84 CARB challenged the SAFE Part One Rule as well as the related Final Rule that revised federal greenhouse gas emission and fuel economy standards. See California v. Wheeler, et al., Case No. 19-1239, consolidated under No. 19-1230.; 85 Fed. Reg. 24,174 (Apr. 30, 2020) (Final SAFE Vehicles Rule); California v. Wheeler, et al., United States Court of Appeals, District of Columbia Circuit, Case No. 20-1167, consolidated under No. 20-1145, with Nos. 20-1168, 20-1169, 20-1173, 20-1174, 20-1176, and 20-1177 (Challenge to the Final SAFE Vehicles Rule). The challenges are pending and in abeyance in the United States Court of Appeals for the District of Columbia Circuit. 85 Presidential Documents 2021. “Protecting Public Health and the Environment and Restoring Science To Tackle the Climate Crisis.” Federal Register 86, no. 14 (January 25, 2021): 7037. https://www.govinfo.gov/content/pkg/FR-2021-01-25/pdf/2021-01765.pdf 86 EPA 2021d. U.S. Environmental Protection Agency. “California State Motor Vehicle Pollution Control Standards; Advanced Clean Car Program; Reconsideration of a Previous Withdrawal of a Waiver of Preemption; Opportunity for Public Hearing and Public Comment.” Federal Register 86, no. 80 (April 28, 2021): 22421. https://www.govinfo.gov/content/pkg/FR-2021-04-28/pdf/2021-08826.pdf 87 NHTSA 2021. Department of Transportation. “Corporate Average Fuel Economy (CAFE) Preemption.” Federal Register 86, no. 247 (December 29, 2021). 74236. https://www.govinfo.gov/content/pkg/FR-2021-12-29/pdf/2021-28115.pdf 88 87 Fed. Reg. 14,332, March 14, 2022. 89 HSC 39002 and 39003. 90 HSC 39600 and 39601.
12
achieve the maximum feasible and cost-effective emission reductions from motor vehicles. This authority encompasses adopting and implementing vehicle emission and in-use performance standards,91 and requirements to improve emission system durability and performance.92
CARB is further authorized to adopt and implement emission standards for new motor vehicles and new motor vehicle engines that are necessary and technologically feasible93 and to adopt test procedures and any other procedures necessary to determine whether vehicles and engines are in compliance with the emissions standards.94 Indeed, CARB may not certify a new motor vehicle or motor vehicle engine for legal sale in California unless a manufacturer shows, according to the required test procedures, that it meets the emission standards adopted by CARB.95
CARB is also mandated to ”adopt rules and regulations . . . to achieve the maximum technologically feasible and cost-effective greenhouse gas emission reductions from sources or categories of sources”, and to “ensure that statewide greenhouse gas emissions are reduced to at least 40 percent below the statewide greenhouse gas emissions limit no later than December 31, 2030.”96
III. Summary of Staff’s ZEV Regulation Proposal
The following chapter summarizes staff’s proposals related to ZEVs and PHEVs. Overall, staff focused its proposal on what is necessary to achieve 100-percent ZEV or PHEV sales by the 2035 model year in California. The proposal includes increasing annual sales requirements of ZEVs and PHEVs between the 2026 and 2035 model years, minimum technical performance requirements for ZEVs and PHEVs, addressing credits for over compliance accrued under the existing standards while maintaining appropriate flexibilities, and requiring a suite of ZEV assurance measures to ensure ZEVs can serve as full replacements to ICEVs for all drivers in the new and used vehicle markets, thereby ensuring ZEVs permanently displace emissions from ICEVs and preserving the emission benefits of the regulations.
A. Background
1. ZEV Technologies
By definition, ZEVs produce no exhaust emissions under any possible operational mode. BEVs and FCEVs are the most common examples of ZEVs and are the foundation of staff’s proposal.
BEVs utilize batteries with an on-board charger to store energy from the electrical grid to power electric motors. These electric vehicles have instant torque response, low noise, regenerative braking from energy recovered by the motor that greatly reduces brake wear
91 HSC 43013(a). 92 HSC 43018(c)(2). 93 HSC 43101. 94 HSC 43104. 95 HSC 43102. 96 HSC 38560 and 38566.
13
and associated emissions, and generally have a simplified mechanical drivetrain, often without a transmission.97
FCEVs are full electric drive vehicles where the propulsion energy is supplied by hydrogen stored on board and a fuel cell stack that transforms the chemical energy stored in hydrogen into electricity for the drive motor. The electrochemical process for the fuel cell stack is fed by oxygen (retrieved from ambient air) and hydrogen (stored on board in pressurized tanks), with the byproducts being electricity, water, and heat (although it does not combust the hydrogen). The major components of the fuel cell system include the fuel cell stack, necessary associated equipment (e.g., fuel valves, air compressor, coolant fluid sub-system, etc.), and a battery pack. FCEVs are able to travel long distances between refueling events due to the large quantity of energy in the hydrogen stored in the on-board tanks and are able to refill with hydrogen in times similar to gasoline vehicles.98
Although not a ZEV by definition because of its internal combustion engine emissions, PHEVs also use battery packs to power electric motors. In addition to their battery pack with grid-supplied electricity, these vehicles use another fuel, typically gasoline, to power an internal combustion engine. PHEV powertrains can be categorized into two different groups – blended and non-blended. Blended PHEVs do not have an electric drive powertrain that can meet all the motive power requirements of the vehicle on electric power only; they require the combustion engine to meet the higher power demands of the vehicle even when the battery has not been depleted. On the other hand, non-blended PHEVs are capable of driving on electric power for the majority of driving conditions until the battery has been depleted. Non-blended PHEVs require electric motors that can deliver power levels roughly equal to that of the ICE.99
2. ZEV Technology is Rapidly Improving
Much of the market growth of ZEVs is attributed to improvements in ZEV technology. The industry has rapidly responded to evolving market pressures, consumer demands, and regulatory requirements in California, across the U.S., and around the globe. Overall, these improvements have reduced costs for batteries, the main driver of BEV and PHEV costs, as well as for non-battery components. This has enabled manufacturers to accelerate plans to bring to market more long-range ZEVs in more market segments and highly capable PHEVs. Looking to the future of electric drive technologies in the 2026 to 2035 timeframe, it is anticipated there will be even greater efficiency improvements, longer ranges, and comparable vehicle offerings and capabilities across all passenger car and truck categories and comparable costs to ICEVs as summarized further in Appendix G.
a) BEV Technology Improvements
BEV technology has progressed quickly since the market introduction of the Nissan LEAF, the first widely available BEV, in 2010. Lithium-ion batteries (LIB), used in virtually every ZEV application, continue to improve resulting in increased energy capacity and decreased cost.
97 Additional background on how this technology works is summarized by the U.S. Department of Energy (U.S. DOE) here: https://afdc.energy.gov/vehicles/electric_basics_ev.html 98 Additional background from the U.S. DOE: https://afdc.energy.gov/vehicles/fuel_cell.html 99 Additional background from the U.S. DOE: https://afdc.energy.gov/vehicles/electric_basics_phev.html
14
LIBs consist of the following main components: a cathode, an anode, current collectors, a separator, electrolyte, and a case of some kind to contain those components. Lithium-ion technology, evolving through innovative chemistries, provides the best balance of energy density and cost of any rechargeable battery technology available today, allowing manufacturers to store more energy in a battery pack at a lower cost.
All in all, BEVs are becoming highly attractive vehicles with integrated platform designs, leading to increased range and efficiency. Significant improvements in range can be seen in BEV offerings from many manufacturers, such as Ford, General Motors, Nissan, Tesla, and Volkswagen (VW). Range increases have come from several technology advancements, including manufacturers moving to dedicated BEV platforms that have further improved total vehicle efficiency, mass, and available space for larger battery packs to respond to consumer demand.
The median driving range of 2021 model year BEVs has increased to 234 miles, but that still trails the median range of a gasoline vehicle of 403 miles. The increase in electric range is necessary for market development as consumers are looking for EVs that can go 300 to 500 or more miles on a single charge and that cost about the same as their gasoline counterparts.100,101,102 There are already BEV models in the process of certifying for the 2022 model year achieving a maximum range of 520 miles, including the Lucid Air. As more long-range BEVs become available, the discrepancy in range between gasoline-powered vehicles and BEVs is likely to continue to narrow.103
1) Battery Costs Are Falling
Looking ahead, recent findings indicate that battery costs will continue to decline in the long term. Bloomberg New Energy Finance (BNEF), a respected provider of strategic research covering commodity markets and disruptive low-carbon technology, conducted industry surveys indicating that prices of automotive battery packs were $137/kWh by the end of 2020, representing a nearly 90-percent decline from 2010.104 BNEF’s 2021 annual battery price survey found that battery prices have continued to fall through 2021 to $132/kWh. That is a 6-percent drop from their findings for 2020 of $140/kWh but rising raw material prices like lithium or nickel could cause battery prices to rise in 2022 to $135/kWh. BNEF anticipates achieving $100/kWh, but in 2026 as opposed to 2024 due to those near-term raw material
100 Consumer Reports 2020. Consumer Reports, “Consumer Interest and Knowledge of Electric Vehicles: 2020 Survey Results”, Published December 2020. 101 Cox 2021a. Cox Automotive, “2021 Cox Automotive Path to EV Adoption Study”, Conducted June/July 2021. 102 Deloitte 2022, Deloitte “2022 Global Automotive Consumer Study”, Published January 2022. 103 DOE 2022a. US Department of Energy. Fact of the week #1221. “January 17, 2022: Model Year 2021 All-Electric Vehicles Had a Median Driving Range about 60% That of Gasoline Powered Vehicles” https://www.energy.gov/eere/vehicles/articles/fotw-1221-january-17-2022-model-year-2021-all-electric-vehicles-had-median Accessed February 11, 2022. 104 BNEF 2020. Bloomberg New Energy Finance. 2020. “Battery Pack Prices Cited Below $100/kWh for the First Time in 2020, While Market Average Sits at $137/kWh.” December 16, 2020. Accessed March 22, 2022. https://about.bnef.com/blog/battery-pack-prices-cited-below-100-kwh-for-the-first-time-in-2020-while-market-average-sits-at-137-kwh/.
15
price increases and supply constraints.105 The National Academies of Sciences (NAS), a panel of academics, scientists, engineers, and other recognized experts in the field, released an assessment of battery costs expecting automotive battery pack costs to decrease to $90-$115/kWh by 2025 and $65-$80/kWh by 2030.106 Researchers credit falling prices to improved and simplified battery cell and pack designs, lower raw material input costs, introduction of new battery chemistries, adjustments to cathode technologies, new manufacturing techniques, and increasing production volumes.107 108
2) Dedicated Electric Vehicle Platform Design
Another improvement in BEV technology is the use of dedicated vehicle platforms. Earlier in the development of BEVs, manufacturers used both shared and dedicated platforms for their vehicle offerings; however, most manufacturers have shifted to dedicated platforms as they electrify their fleets. Use of a shared platform across ICEV and BEV models allows commonality and facilitates access to international markets for increased volumes, while a dedicated platform allows for a higher level of optimization specifically for the electric vehicle technology. Dedicated BEV platforms avoid provisions for gasoline powertrains, exhaust emissions, evaporative emissions, and fuel systems that would otherwise need to be accommodated on platforms that are shared between BEV, PHEV, HEV, and ICEV models. This dedicated BEV platform approach allows integration of the battery pack entirely within the vehicle floor structure, reduces vehicle weight, reduces manufacturing costs, increases available passenger and cargo volume, and in some cases, has the battery pack integrated as part of the vehicle's crash mitigation structure. Those developments enable even greater vehicle efficiencies by reducing structural material in the chassis and battery pack and increasing battery cell packing efficiency without the battery module specific materials. Most importantly, it decreases costs.
3) Battery Pack Capacity and Energy Efficiency Improvements
Another technology trend improving the functionality of BEVs is an increase in battery pack capacity, which enables more range and overall vehicle capability. Battery packs as large as 200 kWh have now entered the market in larger vehicles like the GMC Hummer EV truck with 329 miles of range.109 Other models like the Tesla Model 3 Long Range have increased battery capacity from 75kWh to 82kWh partway through the 2021 model year. Nissan has
105 BNEF 2021. Bloomberg New Energy Finance. “Battery Pack Prices Fall to an Average of $132/kWh, But Rising Commodity Prices Start to Bite” https://about.bnef.com/blog/battery-pack-prices-fall-to-an-average-of-132-kwh-but-rising-commodity-prices-start-to-bite/ Released November 30, 2021. Accessed February 11, 2022. 106 NAS 2021. National Academies of Sciences, Engineering, and Medicine. 2021. Assessment of Technologies for Improving Light-Duty Vehicle Fuel Economy—2025-2035. Washington, DC: The National Academies Press. https://doi.org/10.17226/26092. March 31, 2021. Accessed January 31, 2022. 107 BNEF 2020. 108 NAS 2021. 109 MotorAuthority 2021. Stephen Edelstein. “2022 GMC Hummer EV Edition 1 to have 329 miles of range, too heavy for official EPA rating” https://www.motorauthority.com/news/1134272_2022-gmc-hummer-ev-edition-1-to-have-329-miles-of-range-too-heavy-for-official-epa-rating November 24, 2021. Accessed January 31, 2022.
16
introduced a 62kWh battery option for the 2021 model year LEAF110 and Chevrolet has increased its Bolt battery packs from 60kWh to 64kWh.
In conjunction with increases in battery pack energy capacity, energy efficiencies of BEVs also are increasing which can increase range and reduce costs. Several vehicle models that have been in the market for more than one or two model years have seen year-over-year energy efficiency increases since they were first introduced. Efficiency in BEVs is expressed as miles-per-gallon equivalent (MPGe) which is a metric based on energy content that can be used to compare across different vehicle technologies and fuels.111 Tesla’s Model 3 Long Range AWD model variants started in 2018 with 116 MPGe and in less than four years are now achieving an efficiency of 131 MPGe.112 The Model S has increased 35-percent from 89 MPGe to 120 MPGe in the ten years since it was first introduced for the 2012 model year. New models like the model year 2022 Lucid Motors Air large sedan are also debuting with impressive efficiencies for the vehicle’s size and power indicating that further gains in efficiency can be had by better reducing mass and better optimizing for efficiency rather than (or sometime in addition to) performance.113 Ford has taken a similar approach, making on the line-improvements to cut costs, reduce weight, and increase efficiency which has resulted in more range. The 2022 Ford Mach-E has achieved a maximum range of 314 miles, up from 305 miles for the 2021 model.114
b) FCEV Technology Improvements
Fuel cell systems utilized in FCEVs have also significantly improved in recent decades helping reduce costs on the vehicle side. The United States Department of Energy (U.S. DOE) reports that fuel cell stack costs have fallen 70-percent since 2008 (at high production volumes). 115 Hyundai reports a similar cost reduction of 98-percent between prototype systems developed in 2003 and their next-generation fuel cell systems set for commercial introduction in the near future.116 Durability of Hyundai fuel cells are also reported to have increased from 3,000 hours/100,000 km (62,000 miles) in their first-generation system to a target 500,000 km (310,000 miles) in their next-generation fuel cell system for commercial applications. The fuel cell systems have also increased total power over time while becoming more compact due to increasing system power density. Toyota has reported similar gains
110 Nissan 2022. Nissan Leaf 2021 Model Year. https://www.nissanusa.com/vehicles/electric-cars/leaf/features/range-charging-battery.html Accessed January 31, 2022 111 DOE 2022b. United States Department of Energy. Learn About the Label. “Electric Vehicle” https://www.fueleconomy.gov/feg/Find.do?action=bt1 Accessed February 21, 2022. 112 DOE 2022c. United States Environmental Protection Agency and United States Department of Energy. n.d. Fueleconomy.gov 2018 Tesla Model 3 Long Range AWD and 2022 Tesla Model 3 Long Range AWD. Accessed January 31, 2021. https://www.fueleconomy.gov/feg/Find.do?action=sbs&id=40385&id=45011. 113 Lucid 2021. PDF. Comment letter submitted to CARB by Lucid on June 11, 2021. 114 Green Car 2022. Edelstein, Stephen. 2022. “CEO: Ford plans to “reengineer” Mustang Mach-E incrementally, won’t save improvements for mid-cycle refresh” By Stephen Edelstein https://www.greencarreports.com/news/1134986_ceo-ford-plans-to-reengineer-mustang-mach-e-incrementally-wont-save-improvements Posted February 2, 2022. Accessed February 15, 2022. 115 Satyapal 2021. “2021 AMR Plenary Session” Satyapal, Sunita. (presentation, 2021 US Department of Energy Hydrogen Technology Office Annual Merit Review, Online, June 7, 2021). 116 Hyundai 2021. “Hyundai Motor Group’s next-generation fuel cell system, a key technology for popularizing hydrogen energy,” Hyundai Motor Group, September 7, 2021. https://tech.hyundaimotorgroup.com/article/hyundai-motor-groups-next-generation-fuel-cell-system-a-keytechnology-for-popularizing-hydrogen-energy/. Accessed February 1, 2022
17
between its first and second generation Mirai. The second-generation fuel cell, released in model year 2021, is 20-percent smaller, 50-percent lighter, and 12-percent more powerful than the fuel cell in the first generation Mirai.117 Despite FCEVs being very early in their commercial development with significant remaining opportunity for future cost reduction, the second-generation Mirai list price was approximately $9,000 less than its predecessor. igure
c) PHEV Technology Improvements
PHEV technology also continues to evolve as manufacturers introduce different architectures and all-electric capabilities, and is discussed further in Appendix G. Toyota more than doubled the equivalent all-electric range of the Prius Plug-in Hybrid in five model years. In addition to more all-electric range, the Prius Prime also had improvements in electric power, enabling it to complete 10 miles on the US06 drive cycle under electric power alone. Four model years later, Toyota introduced the larger 2020 model year RAV4 Prime with a 68-percent range improvement over the Prius Prime.118 The RAV4 Prime also includes all-wheel drive (AWD) and even more all-electric power than the Prius Prime.
Ford has also improved their PHEVs with their second-generation products. The C-MAX and Fusion Energi Plug-in Hybrids both debuted for the 2013 model year with 20 miles of electric range. The larger Ford Escape PHEV debuted for the 2020 model year with 37 miles of electric range119 as did a much larger Lincoln Aviator PHEV with three rows of seating and 21 miles of range. Other manufacturers have also increased range in their PHEV offerings, like Volvo with its T8 variants of the XC60, XC90, V60, S60, and S90 vehicles; Karma with its Revero GT; BMW with its ‘e’ variants of the X5, 3 series, and 7 series; Hyundai with its Ioniq, Santa Fe, and Tucson models; and Kia with its Sorento and Niro. Jaguar Land Rover (JLR) also recently announced the Range Rover P440e with 48 miles of range for the 2023 model year.120
Those improvements stem from some of the same improvements in BEVs. Improved electric motors and power electronics are being utilized to further enhance all-electric operation efficiency to extend range. Heat pumps have been integrated into PHEV designs to increase all-electric efficiency in inclement weather. Increases in PHEV battery energy capacity can lead to longer zero-emission ranges in future vehicle designs.
117 Toyota 2020. “Toyota Introduces Second-Generation Mirai Fuel Cell Electric Vehicle as Design and Technology Flagship Sedan,” Toyota Newsroom, December 16, 2020. https://pressroom.toyota.com/toyota-introduces-second-generation-mirai-fuel-cell-electric-vehicle-as-design-and-technology-flagship-sedan/ Accessed February 1, 2022 118 DOE 2022d. United States Department of Energy. Compare Side-by-Side: 2012Toyota Prius, 2017 Toyota Prius Prime, and 2021 Toyota Rav-4 Prime https://www.fueleconomy.gov/feg/Find.do?action=sbs&id=32484&id=38531&id=42793 Accessed February 1, 2022 119 DOE 2022e. United States Department of Energy. Compare Side-by-Side: 2013 Ford Energi PHEV, 2013 Ford Energi, and 2020 Ford Escape PHEV https://www.fueleconomy.gov/feg/Find.do?action=sbs&id=33336&id=33398&id=42743 120 Land Rover 2022. “New Range Rover: Orders Open For Flagship SV Model And Extended Range Plug-In Hybrid With 48 Miles Of EV Range” https://media.landrover.com/en-us/news/2022/01/new-range-rover-orders-open-flagship-sv-model-and-extended-range-plug-hybrid-48-miles Published January 27, 2022. Accessed February 11, 2022.
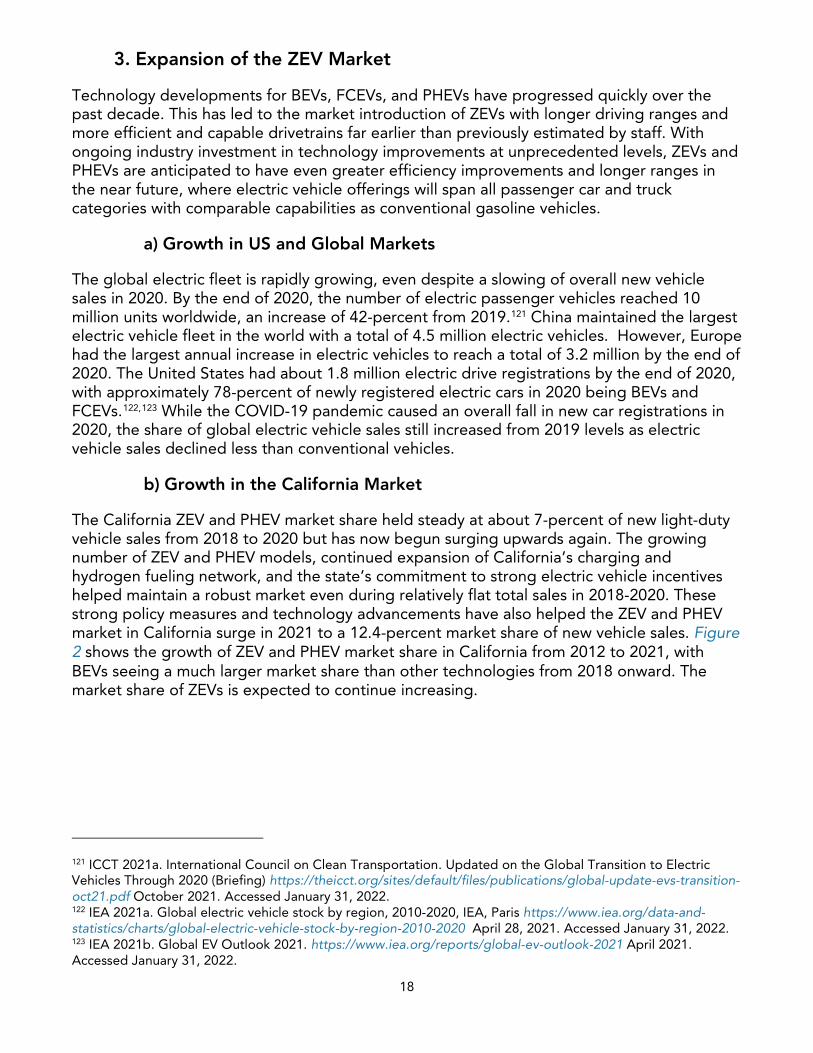
18
3. Expansion of the ZEV Market
Technology developments for BEVs, FCEVs, and PHEVs have progressed quickly over the past decade. This has led to the market introduction of ZEVs with longer driving ranges and more efficient and capable drivetrains far earlier than previously estimated by staff. With ongoing industry investment in technology improvements at unprecedented levels, ZEVs and PHEVs are anticipated to have even greater efficiency improvements and longer ranges in the near future, where electric vehicle offerings will span all passenger car and truck categories with comparable capabilities as conventional gasoline vehicles.
a) Growth in US and Global Markets
The global electric fleet is rapidly growing, even despite a slowing of overall new vehicle sales in 2020. By the end of 2020, the number of electric passenger vehicles reached 10 million units worldwide, an increase of 42-percent from 2019.121 China maintained the largest electric vehicle fleet in the world with a total of 4.5 million electric vehicles. However, Europe had the largest annual increase in electric vehicles to reach a total of 3.2 million by the end of 2020. The United States had about 1.8 million electric drive registrations by the end of 2020, with approximately 78-percent of newly registered electric cars in 2020 being BEVs and FCEVs.122,123 While the COVID-19 pandemic caused an overall fall in new car registrations in 2020, the share of global electric vehicle sales still increased from 2019 levels as electric vehicle sales declined less than conventional vehicles.
b) Growth in the California Market
The California ZEV and PHEV market share held steady at about 7-percent of new light-duty vehicle sales from 2018 to 2020 but has now begun surging upwards again. The growing number of ZEV and PHEV models, continued expansion of California’s charging and hydrogen fueling network, and the state’s commitment to strong electric vehicle incentives helped maintain a robust market even during relatively flat total sales in 2018-2020. These strong policy measures and technology advancements have also helped the ZEV and PHEV market in California surge in 2021 to a 12.4-percent market share of new vehicle sales. Figure 2 shows the growth of ZEV and PHEV market share in California from 2012 to 2021, with BEVs seeing a much larger market share than other technologies from 2018 onward. The market share of ZEVs is expected to continue increasing.
121 ICCT 2021a. International Council on Clean Transportation. Updated on the Global Transition to Electric Vehicles Through 2020 (Briefing) https://theicct.org/sites/default/files/publications/global-update-evs-transition-oct21.pdf October 2021. Accessed January 31, 2022. 122 IEA 2021a. Global electric vehicle stock by region, 2010-2020, IEA, Paris https://www.iea.org/data-and-statistics/charts/global-electric-vehicle-stock-by-region-2010-2020 April 28, 2021. Accessed January 31, 2022. 123 IEA 2021b. Global EV Outlook 2021. https://www.iea.org/reports/global-ev-outlook-2021 April 2021. Accessed January 31, 2022.
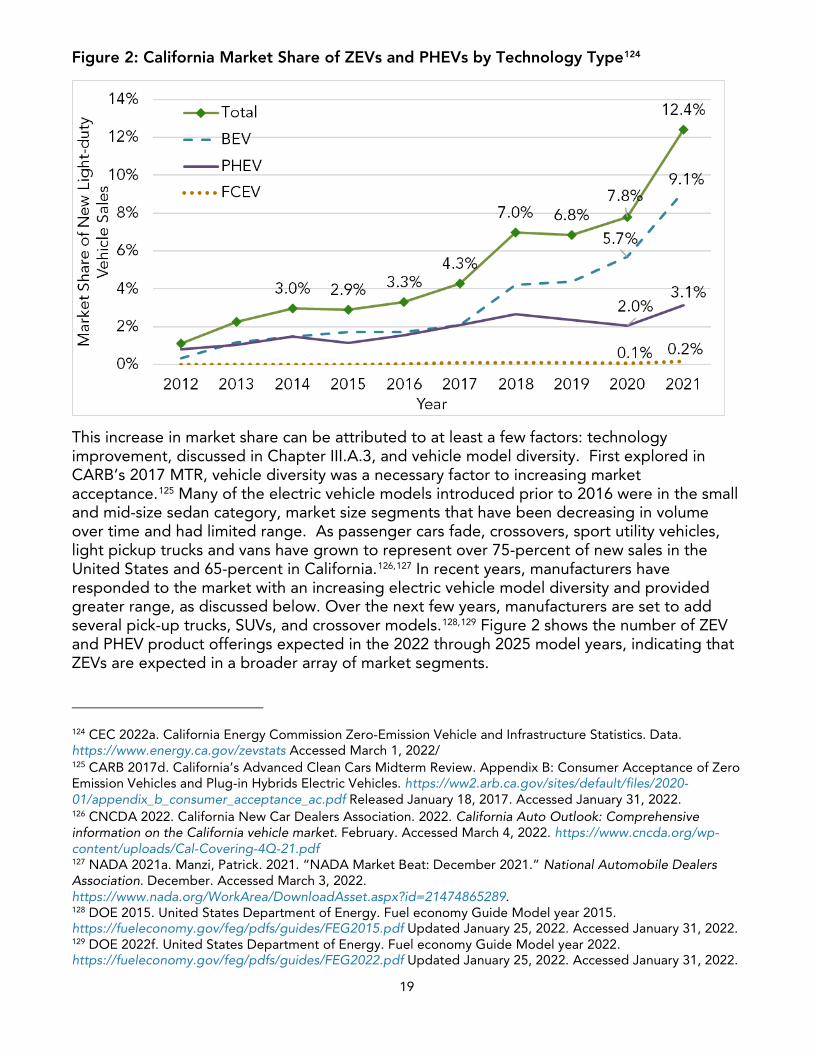
19
Figure 2: California Market Share of ZEVs and PHEVs by Technology Type124
This increase in market share can be attributed to at least a few factors: technology improvement, discussed in Chapter III.A.3, and vehicle model diversity. First explored in CARB’s 2017 MTR, vehicle diversity was a necessary factor to increasing market acceptance.125 Many of the electric vehicle models introduced prior to 2016 were in the small and mid-size sedan category, market size segments that have been decreasing in volume over time and had limited range. As passenger cars fade, crossovers, sport utility vehicles, light pickup trucks and vans have grown to represent over 75-percent of new sales in the United States and 65-percent in California.126,127 In recent years, manufacturers have responded to the market with an increasing electric vehicle model diversity and provided greater range, as discussed below. Over the next few years, manufacturers are set to add several pick-up trucks, SUVs, and crossover models.128,129 Figure 2 shows the number of ZEV and PHEV product offerings expected in the 2022 through 2025 model years, indicating that ZEVs are expected in a broader array of market segments.
124 CEC 2022a. California Energy Commission Zero-Emission Vehicle and Infrastructure Statistics. Data. https://www.energy.ca.gov/zevstats Accessed March 1, 2022/ 125 CARB 2017d. California’s Advanced Clean Cars Midterm Review. Appendix B: Consumer Acceptance of Zero Emission Vehicles and Plug-in Hybrids Electric Vehicles. https://ww2.arb.ca.gov/sites/default/files/2020-01/appendix_b_consumer_acceptance_ac.pdf Released January 18, 2017. Accessed January 31, 2022. 126 CNCDA 2022. California New Car Dealers Association. 2022. California Auto Outlook: Comprehensive information on the California vehicle market. February. Accessed March 4, 2022. https://www.cncda.org/wp-content/uploads/Cal-Covering-4Q-21.pdf 127 NADA 2021a. Manzi, Patrick. 2021. “NADA Market Beat: December 2021.” National Automobile Dealers Association. December. Accessed March 3, 2022. https://www.nada.org/WorkArea/DownloadAsset.aspx?id=21474865289. 128 DOE 2015. United States Department of Energy. Fuel economy Guide Model year 2015. https://fueleconomy.gov/feg/pdfs/guides/FEG2015.pdf Updated January 25, 2022. Accessed January 31, 2022. 129 DOE 2022f. United States Department of Energy. Fuel economy Guide Model year 2022. https://fueleconomy.gov/feg/pdfs/guides/FEG2022.pdf Updated January 25, 2022. Accessed January 31, 2022.
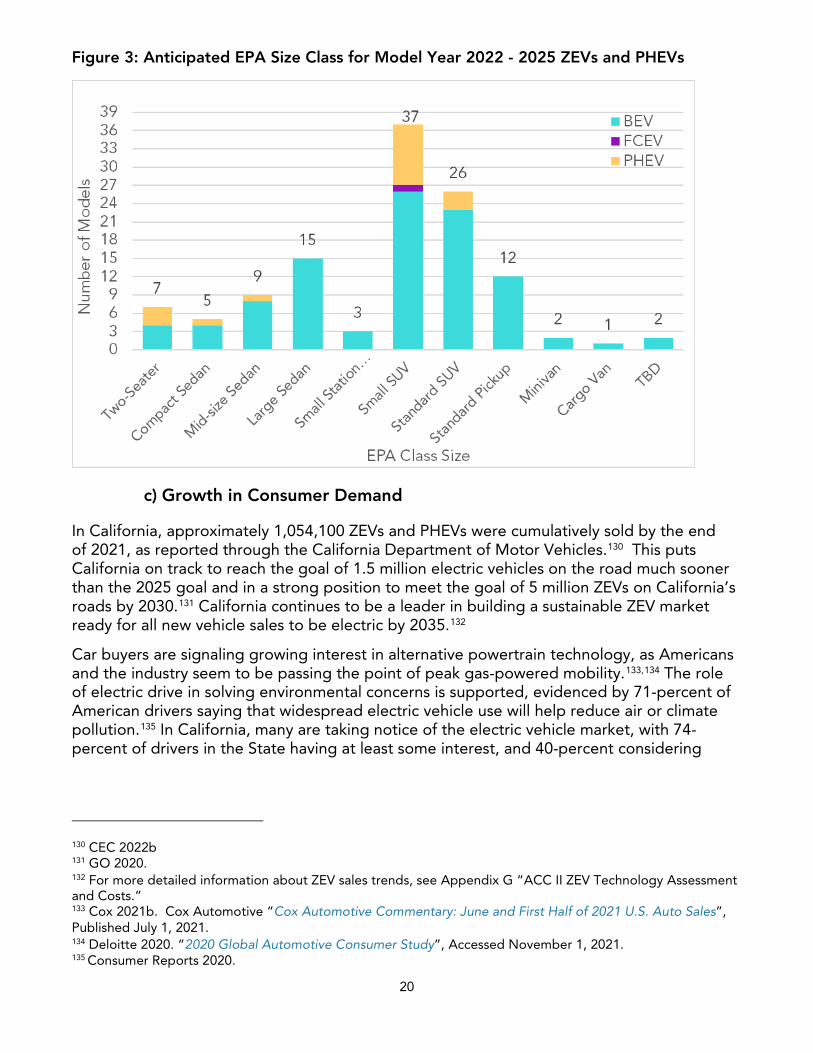
20
Figure 3: Anticipated EPA Size Class for Model Year 2022 - 2025 ZEVs and PHEVs
c) Growth in Consumer Demand
In California, approximately 1,054,100 ZEVs and PHEVs were cumulatively sold by the end of 2021, as reported through the California Department of Motor Vehicles.130 This puts California on track to reach the goal of 1.5 million electric vehicles on the road much sooner than the 2025 goal and in a strong position to meet the goal of 5 million ZEVs on California’s roads by 2030.131 California continues to be a leader in building a sustainable ZEV market ready for all new vehicle sales to be electric by 2035.132
Car buyers are signaling growing interest in alternative powertrain technology, as Americans and the industry seem to be passing the point of peak gas-powered mobility.133,134 The role of electric drive in solving environmental concerns is supported, evidenced by 71-percent of American drivers saying that widespread electric vehicle use will help reduce air or climate pollution.135 In California, many are taking notice of the electric vehicle market, with 74-percent of drivers in the State having at least some interest, and 40-percent considering
130 CEC 2022b 131 GO 2020. 132 For more detailed information about ZEV sales trends, see Appendix G “ACC II ZEV Technology Assessment and Costs.” 133 Cox 2021b. Cox Automotive “Cox Automotive Commentary: June and First Half of 2021 U.S. Auto Sales”, Published July 1, 2021. 134 Deloitte 2020. “2020 Global Automotive Consumer Study”, Accessed November 1, 2021. 135 Consumer Reports 2020.
21
going electric for their “next vehicle.”136 This interest is turning into growing sales as shown in Figure 2 above, with new vehicle market share of electric drive vehicles jumping to 12.4-percent from 7.8-percent just the year prior in California. Further, satisfaction is high among electric vehicle owners and is likely to lead to subsequent purchases of zero-emission technology. Evidence of this is abundant in research, with J.D. Power for example reporting 82-percent of early adopters say they “definitely will” consider purchasing another electric vehicle in the future.137,138,139,140
4. Importance of the Used Vehicle Market
According to a McKinsey analysis “the used car market is more than twice the size of the new car segment and outpacing it in growth.”141 They estimate that as of 2018, “Americans buy 39.4 million used cars each year, versus 17.3 million new ones.”142 More people buy used vehicles because they are less expensive than new vehicles, due to depreciation.
The used car market can be a powerful tool in ensuring ZEV access at all income levels. Already, in disadvantaged communities in California, used electric vehicles are purchased at higher rates than new electric vehicles.143 On average, used electric vehicles cost 43-72-percent less than new ones.144 This makes the used market important in achieving California’s carbon reduction goals, and a critical place to ensure ZEVs are thriving. As the ZEV market expands over time, especially for used vehicles, ZEVs will likely become more attainable for lower-income households.
5. Consumer Challenges Exist and Must be Addressed
Achieving 100 percent ZEV and PHEV sales by 2035 will require mainstream consumers to embrace electric drive technologies in their purchasing. This consumer change will require continued improvements in electric vehicle technology, owner support and conveniences, as well as successful strategies to communicate the benefits to potential buyers.
136 Consumer Reports 2021. Consumer Reports. “Consumer Attitudes Towards Electric Vehicles and Fuel Efficiency in California: 2020 Survey Results”, Published March 2021. 137 J.D. Power 2021a. JD Power “Majority of Electric Vehicle Owners Are Intent on Purchasing Another One in the Future, J.D. Power Finds” (Press release), Published January 21, 2021. 138 Hardman 2021. Scott Hardman and Gil Tal, “Discontinuance Among California’s Electric Vehicle Buyers: Why are Some Consumers Abandoning Electric Vehicles?” (Research Report, University of California, Davis, National Center for Sustainable Transportation), Published April 1, 2021. 139 PIA 2021. Plug in America, “Satisfied Drivers, Optimistic Intenders”, Published February 2021. 140 Consumer Report 2021. 141 Ellencweig et al 2019. Ben Ellencweig, Sam Ezratty, Dan Fleming, and Itai Miller, “Used Cars, New Platforms: Accelerating Sales in a Digitally Disrupted Market”, Mckinsey & Company, Published June 2019. 142 Ellencweig et al 2019. 143 Canepa et al 2019. Canepa, K., Hardman, S., & Tal, G. An early look at plug-in electric vehicle adoption in disadvantaged communities in California. Transport Policy (June 2019), 78, 19–30. https://doi.org/10.1016/j.tranpol.2019.03.009 Accessed January 31, 2022. 144 Edmunds 2018. Ronald Montoya, “The Pros and Cons of Buying a Used EV”, Edmunds, Published 5, March 2018.
22
While California leads the nation in electric vehicle sales145,146, interest levels in the broader U.S. appear to be lower among new vehicle shoppers with about as many people reluctant to buy electric vehicles as there are interested.147,148,149 Even so, the opportunity to convert buyers is great since research shows that 59-percent of new-vehicle shoppers in the U.S. seem to be on the cusp, falling into the “somewhat likely” or “somewhat unlikely” categories of considering an electric vehicle for their next purchase or lease.150 With “lack of information” a known cause of hesitation, better informing shoppers about electric drive vehicles combined with the already rapidly expanding model offerings of long-range electric cars in market segments that consumers care most about is likely to have a substantial effect on interest. Consumer research will continue to be essential in identifying the greatest motivators to adopt clean technologies.
For buyers with little enthusiasm for electric drive, research indicates the following actions will increase interest: increasing access to charging, increasing driving range, reducing cost, broadening the diversity of models to meet more of consumers’ needs, achieving parity in quality with ICEVs, and increasing education about the benefits of electric vehicles. Mainstream consumers may be less forgiving of inconveniences than their earlier electric vehicle adopter counterparts.151
Research indicates that increased education and experience will translate to increased electric vehicle interest, and that “lack of information” is one reason why more people are not considering going electric.152,153,154 Well-funded, sustained strategic campaigns and experiential marketing can go a long way in building intrinsic demand for electric vehicles. Those who buy used vehicles also need more tools and knowledge to move them from the ICEV to ZEV purchase. Used car buyers lag in awareness of ZEVs and incentives, and they are less likely to say they have noticed public charging available to them. They also do much more online research – 40-percent more – than new car buyers,155 and they rely much less on the salesperson, and more on their own research. This means acceptance of electric vehicles in the used market will require serving the information needs of used car buyers.
Aside from consumer knowledge and perception, and vehicle performance, another important area to address is expanding access to at-home charging. Research is clear that most current electric vehicle owners are satisfied and will likely re-purchase a vehicle with
145 Veloz 2022. Veloz, “Electric Vehicle Sales in California and the U.S.” (Quarterly Dashboard from California Energy Commission Data), Accessed February 23, 2022. 146 NREL 2021a. National Renewable Energy Laboratory, “Electric Vehicle Registrations by State”, Published June 2021. 147 Green Car 2020, Green Car Congress. “Continental Mobility Study 2020 Finds People Still Have Doubts About EVs”, Published January 8, 2021. 148 J.D. Power 2021b. JD Power, “Battleground for Electric Vehicle Purchase Consideration is Wide Open, J.D. Power Finds“ (Press Release), Published February 25, 2021. 149 MacInnis 2020. MacInnis, Bo, and Jon A. Krosnick, “Climate Insights 2020: Electric Vehicles”, Washington, DC: Resources for the Future, Accessed January 24, 2022. 150 J.D. Power 2021b. 151 Hardman 2021. 152 Pew 2021. Alison Spencer and Cary Funk, “Electric Vehicles Get Mixed Reception From American Consumers”, Pew Research Center, Published June 3, 2021. 153 J.D. Power 2021a. 154 Consumer Report 2021. 155 Ellencweig et al 2019.
23
clean technology. However, for the approximately 20-percent who returned to traditional gasoline vehicles, the research indicates that charging was the major factor in dissatisfaction with the technology.156 In particular, lack of fast at-home charging (often referred to as “Level 2”)157 remains both a frustration and an overall barrier to electric vehicle uptake. This is especially true for under-resourced car buyers and those living in multi-unit or rental housing as they may be required to rely more on public charging,158,159 which is generally more expensive, less reliable, and tends to be less available in less privileged neighborhoods.160
Vehicle durability and longevity are among the factors integral to instilling consumer confidence in ZEVs in both the new and secondary vehicle markets to ensure that these kinds of vehicles are purchased and operated - and thus displace emissions from conventional vehicles. Many car buyers view electric vehicles as lacking compared to traditional gasoline options, in terms of higher costs (real or perceived), fewer mechanics available and trained to fix issues, and faster depreciation.161 For example,
Nearly one-third (29%) of Americans believe that maintaining EVs is more costly than maintaining gasoline-powered cars, and these individuals may be less open to purchasing an EV then the 13% and 50% of Americans who believe that maintenance of all-electric cars is less costly than or as costly as maintaining gasoline-powered cars, respectively.162
Similarly, almost a third of Americans think that few to almost no mechanics are trained to service and repair electric vehicles.163 To address consumer confidence, consumers should be guaranteed the same protections for electric vehicles to which they are accustomed in gasoline vehicles.
Additionally, the early adopter ZEV market has been mostly made up of higher-income individuals with high levels of education. When counting both new and used vehicle purchases, households earning less than $100,000 per year represent 72-percent of gasoline vehicle purchases, but only 44-percent of electric vehicle purchases.164 Among used vehicle buyers, the median income of electric vehicle buyers in California is $150,000, compared with
156 Hardman 2021. 157 Additional information about Level 2 charging by U.S. DOE here: https://afdc.energy.gov/fuels/electricity_infrastructure.html#level2 158 CEC 2022b. Alexander, Matt. 2022. Home Charging Access in California. California Energy Commission. Publication Number: CEC-600-2022-021. https://www.energy.ca.gov/sites/default/files/2022-01/CEC-600-2022-021.pdf 159 Consumer Reports 2020. 160 NREL 2021b. Yanbo Ge, Christina Simeone, Andrew Duvall and Eric Wood, “There’s No Place Like Home: Residential Parking for the Future of Electric Vehicle Charging Infrastructure”, National Renewable Energy Laboratory, Published October 2021. 161 MacInnis 2020. 162 MacInnis, 2020, p. 7. 163 MacInnis, 2020, p. 8. 164 Muehlegger et al 2018. Muehlegger, E., and Rapson, D. Understanding the Distributional Impacts of Vehicle Policy: Who Buys New and Used Alternative Vehicles? https://escholarship.org/uc/item/0tn4m2tx February 2018. Accessed January 31, 2022.
24
$90,000 for gasoline vehicle buyers.165 Some of the disparity in adoption by income is due to the fact that many ZEV and PHEV models on the market are luxury vehicles. This disparity in buyer income levels will continue to be an important barrier to address for the State to successfully electrify all light-duty vehicles.
6. Complementary Policies: Equitably Building a Successful ZEV Market
Transforming to a zero-emission transportation system equitably requires a coordinated, collaborative, and cross-cutting approach. This involves many different policies and programs from international, national, state and local agencies as well as public-private partnerships and commitments from the private sector. California’s ZEV regulation is one piece of the overarching strategy. Although outside the scope of this rulemaking and impact assessment, a comprehensive set of complementary programs and policies are being implemented by many state agencies to address what is needed for a successful ZEV market. In addition to the ZEV regulation, California agencies are focused on several priorities:
• Development of a robust recharging and refueling network • Implementation of a suite of incentive programs for clean cars, funding for charging,
and fueling options • Partnerships with key organizations for enhanced outreach and education to ensure
consumers know the benefits of electric drive vehicles and how those vehicles will meet their transportation needs
• Implementation of equity-focused programs that increase access to and use of ZEVs • A variety of other efforts to address barriers to large-scale uptake of electric vehicles
As California agencies develop the policies and programs needed to ensure a successful transition to electric transportation it is critical that environmental justice communities benefit equitably from this transition. In addition to the ACC II regulations, statewide actions need to include significant increases in funding for targeted incentives and infrastructure development, as well as more directed equity actions from private industry. Further, it is important that the lens for transportation equity extend beyond cars to embrace policies and tools that reduce the need for personal vehicles and extend to walkability and transit as well. Thus, while regulating manufacturers through rulemakings such as ACC II can do much to ensure ZEVs are available and durable, other policy tools are also important.
Regulations, incentives, and supporting programs work together to accelerate the ZEV market by fostering demand that leads to a growing supply that reduces costs across all phases of ZEV technology commercialization and market development. Incentives that bring down the higher up-front costs of electric vehicles are important and effective at all income
165 Turrentine, et al 2018. Turrentine, T., Tal, G., & Rapson, D. The Dynamics of Plug- in Electric Vehicles in the Secondary Market and Their Implications for Vehicle Demand, Durability, and Emissions. https://ww2.arb.ca.gov/sites/default/files/classic/research/apr/past/14-316.pdf April 2018. Accessed January 31, 2022.
25
levels, while maximizing affordability and access for under-resourced drivers and overburdened communities.166
a) California Complementary Policies
California supports this emerging market in many ways. Twenty-eight state agencies, including the California Energy Commission (CEC), Department of General Services, and Caltrans, have policies and programs that support a zero-emission transportation future. In addition, the Governor’s Office of Business and Economic Development (GO-Biz), in collaboration with other California state government agencies, has developed a ZEV Market Development Strategy167 that outlines how those agencies and stakeholder groups key to our transition can move together with the scale and speed required to reach the state’s ZEV targets.168
To equitably support this transition, as part of the 2022 state budget, Governor Newsom has proposed an additional $6.1 billion in new zero-emission transportation investments over four years to increase access to clean transportation, reduce air pollution, and support disadvantaged and low-income communities, including many tribal communities. This includes $256 million for low-income consumer vehicle purchases incentives, $900 million to expand affordable and convenient ZEV infrastructure access in low-income neighborhoods, and $419 million to support sustainable, community-based transportation equity projects that increase access to zero-emission mobility in disadvantaged and low-income communities. This proposal builds upon the $3.9 billion approved in the 2021 Budget Act to deliver a combined $10 billion investment in the critical window between 2021 and 2026 to accelerate the equitable transition to zero-emission transportation for all Californians.169
Locally, there are many California “ZEV ready” cities that have taken steps and enacted policies to encourage ZEVs in their region. These include installation of public electric vehicle charging infrastructure, streamlined infrastructure permitting processes and provision for local incentives and infrastructure funding.170 In 2021, local actions continued to expand through more than $18 million in ZEV readiness grants by the CEC. There are now 15 ZEV readiness regions across California and several cities with a ZEV Community Blueprint.171 To encourage more counties to streamline their permitting processes for electric vehicle
166 Archsmith et al 2021. James Archsmith, Erich Muehlegger & David S. Rapson, “Future Paths of Electric Vehicle Adoption in the United States: Predictable Determinants, Obstacles and Opportunities”, Published July 6, 2021. 167 GO-BIZ 2021. Governor’s Office of Business and Economic Development. “California Zero-Emission Vehicle Market Development Strategy” https://static.business.ca.gov/wp-content/uploads/2021/02/ZEV_Strategy_Feb2021.pdf Published February 2021. Accessed February 11, 2022. 168 GO-BIZ 2022a. California Governor’s Office of Business and Economic Development. 2022. “Agency ZEV Action Plans.” Accessed March 10, 2022. https://business.ca.gov/industries/zero-emission-vehicles/zev-strategy/agency-zev-action-plans/. 169 GO 2022. 2022-2023 Governor’s State Budget Summary pages 82-83, January 10, 2022. Accessed February 11, 2022. https://www.ebudget.ca.gov/2022-23/pdf/BudgetSummary/FullBudgetSummary.pdf 170 OPR 2022. Governor’s Office of Planning and Research https://opr.ca.gov/planning/transportation/zev.html Accessed February 11, 2022. 171 CEC 2021a. 2021–2023 Investment Plan Update for the Clean Transportation Program, California Energy Commission, December 2021 https://www.energy.ca.gov/publications/2021/2021-2023-investment-plan-update-clean-transportation-program Accessed February 11, 2022.
26
charging stations, GO-Biz launched the Permitting Olympics in 2020 and continues to recognize counties where permitting is streamlined.172
Public-private partnerships are also key to expanding the ZEV market in California. For example, CARB is a founding member of two public-private partnerships working to increase the ZEV market in California: Veloz and the California Fuel Cell Partnership. Veloz works to support consumer awareness and accelerate uptake of ZEVs. Veloz’s “Electric For All” consumer awareness campaign and the associated electric vehicle consumer shopping tool ElectricForAll.org launched in 2018 to inform consumers about ZEVs and has reached millions of consumers to date. The next iteration of the Electric For All campaign will launch in 2022.173,174,175 The California Fuel Cell Partnership is focused on growing the market for FCEVs and hydrogen fuel.176 Automotive manufacturers, energy providers, and government agencies collaborate on ideas and actions that will create a sustainable future for zero-emission cars, heavy-duty trucks, and buses.
1) California Plug-In Electric Vehicle Infrastructure
Battery- and PHEVs drivers charge their vehicles by plugging in and accessing grid energy. Like these electric vehicles, electric vehicle charging infrastructure and electric vehicle supply equipment (EVSE) has quickly evolved and grown in availability to meet demand. Since the adoption of ACC, network planning for better EVSE placement has developed, along with increased funding for charging stations. This section will summarize public and private actions being taken to accelerate ZEV charging infrastructure across California, and how public investment and regulations are working to address barriers in support of this proposed vehicle regulation.
Several broad state planning efforts are in place to guide the State role of supporting the market expansion. This includes the coordination effort by the Governor’s Office of Business and Economic Development, and their multi-agency ZEV Market Development Strategy.177 This effort aims to coordinate state actions to support the market, and to help jump-start new actions that may be necessary. CEC is also developing a focused ZEV Investment Plan (ZIP) to help guide publicly funded infrastructure investment strategies generally.178 In developing this proposed vehicle regulation, CARB staff have consulted with CEC and CPUC for their feedback on energy and fuel infrastructure impacts, but also for the other agencies to understand the ZEV fleet implications in their programs. This coordination ensures the
172 GO-BIZ 2022b. Governor’s Office of Business and Economic Development. Permitting Olympics https://business.ca.gov/industries/zero-emission-vehicles/plug-in-readiness/permitting-olympics/ Accessed February 11, 2022. 173 Veloz 2019. Veloz Opposites Attract Campaign Summary, October 22, 2019, Microsoft Word - 191018_opposites_attract_summary.docx (electricforall.org) Accessed February 11, 2022. 174 Veloz 2020. Veloz Electric For All Kicking Gas Campaign, June 16, 2020 Microsoft Word - Kicking_Gas_Campaign.docx (electricforall.org) Accessed February 11, 2022. 175 Veloz 2021. Veloz 2020-2021 Annual Report, 2020 – 2021 Veloz Annual Report - Veloz Accessed February 11, 2022. 176 CAFCP 2022a. “About Us” California Fuel Cell Partnership Website. https://cafcp.org/about_us Accessed February 7, 2022. 177 GO-BIZ 2021. 178 CEC 2022c. California Energy Commission, (Workshop) ZEV Infrastructure Plan, Accessed February 22, 2022 https://www.energy.ca.gov/event/workshop/2022-01/workshop-zero-emission-vehicle-infrastructure-plan
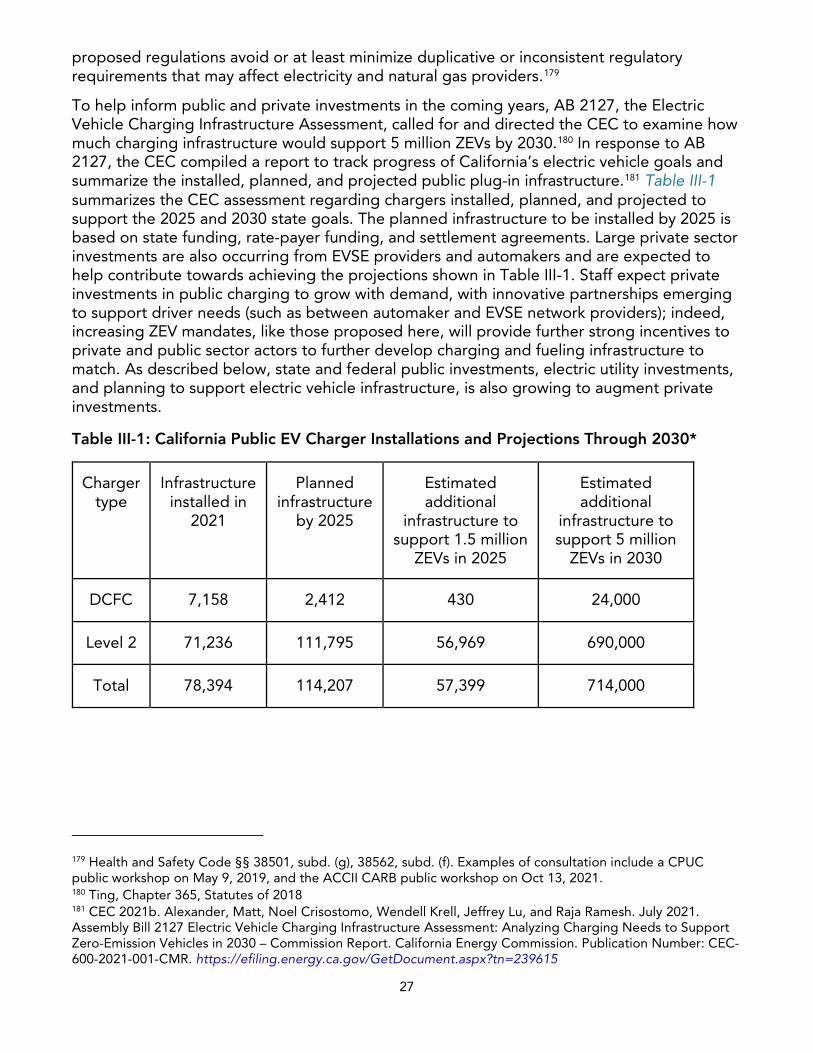
27
proposed regulations avoid or at least minimize duplicative or inconsistent regulatory requirements that may affect electricity and natural gas providers.179
To help inform public and private investments in the coming years, AB 2127, the Electric Vehicle Charging Infrastructure Assessment, called for and directed the CEC to examine how much charging infrastructure would support 5 million ZEVs by 2030.180 In response to AB 2127, the CEC compiled a report to track progress of California’s electric vehicle goals and summarize the installed, planned, and projected public plug-in infrastructure.181 Table III-1 summarizes the CEC assessment regarding chargers installed, planned, and projected to support the 2025 and 2030 state goals. The planned infrastructure to be installed by 2025 is based on state funding, rate-payer funding, and settlement agreements. Large private sector investments are also occurring from EVSE providers and automakers and are expected to help contribute towards achieving the projections shown in Table III-1. Staff expect private investments in public charging to grow with demand, with innovative partnerships emerging to support driver needs (such as between automaker and EVSE network providers); indeed, increasing ZEV mandates, like those proposed here, will provide further strong incentives to private and public sector actors to further develop charging and fueling infrastructure to match. As described below, state and federal public investments, electric utility investments, and planning to support electric vehicle infrastructure, is also growing to augment private investments.
Table III-1: California Public EV Charger Installations and Projections Through 2030*
Charger type
Infrastructure installed in
2021
Planned infrastructure
by 2025
Estimated additional
infrastructure to support 1.5 million
ZEVs in 2025
Estimated additional
infrastructure to support 5 million
ZEVs in 2030
DCFC 7,158 2,412 430 24,000
Level 2 71,236 111,795 56,969 690,000
Total 78,394 114,207 57,399 714,000
179 Health and Safety Code §§ 38501, subd. (g), 38562, subd. (f). Examples of consultation include a CPUC public workshop on May 9, 2019, and the ACCII CARB public workshop on Oct 13, 2021. 180 Ting, Chapter 365, Statutes of 2018 181 CEC 2021b. Alexander, Matt, Noel Crisostomo, Wendell Krell, Jeffrey Lu, and Raja Ramesh. July 2021. Assembly Bill 2127 Electric Vehicle Charging Infrastructure Assessment: Analyzing Charging Needs to Support Zero-Emission Vehicles in 2030 – Commission Report. California Energy Commission. Publication Number: CEC-600-2021-001-CMR. https://efiling.energy.ca.gov/GetDocument.aspx?tn=239615
28
* Installed values from the CEC Dashboard 182; Planned infrastructure values derived using CEC’s AB 2127 report values for planned infrastructure by 2025 minus recent installed chargers; Additional projections from the AB 2127 report values for 2025 and 2030.
The majority of drivers today charge their vehicles at home and supplement their energy needs from public charging. Staff expect this trend to continue but with a growing share of drivers using public charging infrastructure as more and more drivers reside in apartments and rental properties without access to home charging.183 Given home charging is the most convenient and usually the least-cost source of electricity for charging, CARB strives to help increase access to this service. For several years, CARB staff have recommended changes to the state’s building code requirements for new construction of residential buildings. In this advisory capacity, the California Department of Housing and Community Development (HCD) has adopted increased home charging requirements through the CALGreen code.184 Additionally, the proposed requirement of automakers to provide convenience charging cords aims to provide electric vehicle drivers with more options for home charging.
Beyond charging network planning, in 2019, CARB adopted regulations185 required by the Electric Vehicle Charging Stations Open Access Act, which required open access and transparent payment systems for public EVSE.186 The goal of this statute and subsequent regulation is to reduce barriers to electric vehicle drivers by making the electric charging experience more seamless, and available to all California drivers. This includes requirements for multiple forms of payment systems at charging stations and prohibits public charging stations to be restricted to specific memberships. As this regulation is being implemented by CARB, on-going market assessments are occurring to better understand barriers to charging by drivers, with an emerging awareness of station reliability as an issue.187 CARB and CEC staff collaborate on ways the state can help address reliability challenges.
2) California Public Investment in Electric Charging Infrastructure
California’s continued funding has played a key role in advancing the deployment rate of EVSE throughout the state, and it will be increasingly important to support driver fueling needs with this proposed vehicle regulation. Along with private investments made in charging infrastructure development, the State has continued to invest to accelerate the deployment of charging infrastructure throughout California. In recent years, approximately $710 million has been spent to install EVSEs in California with an additional $2.65 billion-$2.69 billion anticipated to be invested through various public investments which are detailed below. Of this amount, $1.284 billion has only recently been committed or proposed in the federal Infrastructure Investment and Jobs Act and Governor Newsom’s proposed
182 CEC 2022d. “California Energy Commission Zero-Emission Vehicle and Infrastructure Statistics.” California Energy Commission. Data last update 01/31/2022. Retrieved 02/08/2022, CEC ZEV Statistics Dashboard. 183 ICCT 2019. Nicholas, Michael, Dale Hall and Nic Lutsey, Quantifying the Electric Vehicle Charging Gap Across U.S. Markets. International Council on Clean Transportation: 2019. ICCT Charging Report 184 CCR, title 24, Part 11. 185 CCR, title 13, sections 2360 through 2360.5 186 Health & Saf. Code, § 44268, et seq.; SB 454, stats. 2013, ch. 418, Corbett. 187 CARB 2022b. California Air Resources Board. 2022. Electric Vehicle Supply Equipment Standards Technology Review. Published February 2022. https://ww2.arb.ca.gov/sites/default/files/2022-02/EVSE%20Standards%20Technology%20Review%204Feb22.pdf Accessed March 1, 2022.
29
2022-23 budget. This additional anticipated funding will help build charging stations that are to be installed by 2025 and help work towards the projections identified in the CEC AB 2127 report, shown in Table III-1. Note that these investment estimates do not include private investment from EVSE providers, like Tesla’s charging network.
The CEC 2021–2023 Investment Plan Update for the Clean Transportation Program (CTP) proposed allocating funds for light-duty charging infrastructure deployment in the amounts of $30.1 million allocated for fiscal years 2021-22 and 2022-23 and $13.8 million for fiscal year 2023-24188. The CEC’s Clean Transportation Program has previously invested in light-duty electric vehicle charging infrastructure for over 13 years for a total investment of $192.6 million189. The CTP has many goals, one of which is to ensure that its investments benefit priority communities including those that are disadvantaged, low-income, and rural. The CTP Advisory Committee was reconstituted to include broader representation of rural communities, tribes, and others. As part of the CTP, the CEC has engaged with priority communities through a workshop on light duty charging infrastructure that can serve residents in rural and multifamily housing.190
The CEC also granted two block grants of up to $250 million each to design and implement light-duty electric vehicle charger incentives for rapid deployment of chargers, to be administered by the Center for Sustainable Energy and CALSTART. Along with these investments, $240 million in general funds were allocated to CEC for fiscal year 2021-2022 from the Budget Act of 2021 for ZEVs and infrastructure, which will fund light-duty electric vehicle charging infrastructure.
Large investments are also occurring through the CPUC’s Transportation Electrification project approvals for utility expenditures as directed by statute, which have authorized $756 million for light-duty charging infrastructure of which $245 million has been spent191. These programs are required to reduce dependence on petroleum, increase the adoption of zero-emission vehicles, help meet air quality standards, and reduce greenhouse gas emissions toward the SB 32 goal of 40% GHG emission reductions by 2030. Through Senate Bill 350, the CPUC and CEC established the Disadvantaged Communities Advisory Group comprising 11 members that advise and review programs and policies to ensure that disadvantaged communities benefit from State investments in transportation electrification.192 The CEC has allocated funds to ensure disadvantaged communities benefit from investments made through the Clean Transportation Program. According to the 2021–2023 Investment Plan Update for the Clean Transportation Program, the CEC will seek to ensure that more than 50 percent of the funds from the Clean Transportation Program will benefit low-income and disadvantaged communities. Approximately 51 percent of awarded project funds from the
188 CEC 2021a 189 CEC 2021a 190 CEC 2021a 191 CPUC 2021. “Approved TE Investments.” California Public Utilities Commission. January 26, 2021, CPUC Transportation Electrification Website. Directing authority from SB 350, statutes of 2015, De Leon. 192 CPUC 2022a. Disadvantaged Communities Advisory Group (ca.gov). https://www.cpuc.ca.gov/industries-and-topics/electrical-energy/infrastructure/disadvantaged-communities/disadvantaged-communities-advisory-group. Accessed February 17, 2022.
30
Clean Transportation Program have been within disadvantaged and/or low-income communities.193
The federal Infrastructure Investment and Jobs Act of 2021 allocated $384 million over five years to support the expansion of the electric vehicle charging network.194 The Governor’s 2022-2023 budget proposed $600 million for ZEV fueling infrastructure grants, and $300 million for equitable at-home charging for light-duty vehicles195.
Finally, Electrify America is investing $800 million over ten years in California as required by Appendix C of the Volkswagen Consent Decree.196 The program is divided into four investment cycles of $200 million each to support increased ZEV technology adoption. To date, Electrify America has allocated $273 million to ZEV infrastructure in Cycles 1197 and 2198, and approximately $127 million additional investment to be spent in Cycle 3199which began in January of 2022 and will conclude in June of 2024. Further, Electrify America, as directed by Senate Bill 92 (Committee on Budgets and Fiscal Review, Chapter 26, Statutes of 2017) and CARB Resolution 17-32, is to strive to ensure that at least 35 percent of their ZEV Investment Plan funds benefit disadvantaged and low-income communities. Electrify America has begun implementing its Cycle 3 ZEV Investment Plan and will strive to ensure that 35% of its investments will be in disadvantaged and low-income communities, as it has done for Cycles 1 and 2.
Taken together, these public and private actions demonstrate commitment to development of charging infrastructure across California. While the projections as shown in Table III-1 are substantial, public and private investment in recent years have accelerated. The State investments and programs currently underway are expected to make strong contributions towards addressing infrastructure growth for ZEV drivers in a manner that complements private investments and works to ensure convenient charging access for all California drivers.
3) California Electric Grid to Support EV Charging Infrastructure
Electric vehicles will rely on the electric grid to provide consistent, on-demand power to charge vehicles. With the light duty market described in this proposal, and the introduction of medium- and heavy-duty electric vehicles, the electric grid will have to expand and adapt rapidly to meet a new and more extensive demand.
Historically, the state’s electric grid has expanded and evolved as consumer demand for electricity services has grown, including with the recent emergence of plug-in electric vehicles. California’s existing grid and approved investments occurring now will allow the state to handle millions of electric vehicles in the near-term, and projections show the
193 CEC 2021a. 194 White House 2021a. White House, United States. 2021. The Infrastructure Investment and Jobs Act will Deliver for California. White House IIJA California Fact Sheet. 195 Gov 2022. Office of Governor Gavin Newsom, Governor’s Budget Summary (2022), 2022 California Governor’s Proposed Budget Summary. 196 CARB 2022c. California Air Resources Board.” Volkswagen Zero-Emission Vehicle (ZEV) Investment Commitment “. https://ww2.arb.ca.gov/our-work/programs/volkswagen-zero-emission-vehicle-zev-investment-commitment 197 VW 2017. Volkswagen Group of America. 2017. California ZEV Investment Plan: Cycle 1. Cycle 1 Plan Report. 198 EA 2018. Electrify America 2018. California ZEV Investment Plan: Cycle 2. Cycle 2 Plan Report. 199 EA 2021. Electrify America 2021. California ZEV Investment Plan: Cycle 3. Cycle 3 Plan Report.
31
broader western grid can handle up to 24 million electric vehicles without requiring any additional power plants.200 However, electrification of California’s entire transportation sector, particularly when combined with increased electrification of the state’s building stock, will require further investments in transmission and local distribution systems and coordinated grid planning efforts.
Longer term, transitioning to 100% passenger vehicle electrification is achievable with a gradual build out of clean energy resources - more gradual than during times of peak electricity sector growth in the past given electric vehicle loads can be distributed over non-peak hourly periods. Several studies have shown no major technical challenges or risks have been identified that would prevent a growing electric vehicle fleet at the generation or transmission level, especially in the near-term.201 202 Additionally, based on historical growth rates, sufficient energy generation and generation capacity is expected to be available to support a growing electric vehicle fleet.203
State agencies and electric utilities have begun proactively planning for electrical distribution upgrades and new load for electric vehicles via statewide energy system planning processes, including the CEC’s Integrated Energy Policy Report (IEPR) forecasting, California Independent System Operator (CAISO) transmission planning, and the CPUC’s Integrated Resource Plan (IRP) proceeding for 10-year grid enhancement strategies. Additionally, recent policy changes allow investor-owned utilities in California to establish rules and tariffs under general rate case proceedings for electrical distribution infrastructure on the utility side of the meter to support transportation electrification charging stations.204
The CPUC has already approved utility investments for upgrading the electric grid along with electricity rate changes to fund those investments.205 The CPUC approved time-of-use (TOU) rates which provides signals to electricity rate changes at different times of the day that would impact the cost to fuel for electric vehicle drivers that charge at home. This decision was made to optimize grid resources, maintain grid reliability, and provide reasonable rates for residential EV charging.206 The CPUC also opened a new proceeding to modernize and prepare the grid in anticipation of multiple distributed energy sources.207 With this new
200 PNNL 2020. Kintner-Meyer, Michael, et al. July 2020. Electric Vehicles at Scale – Phase I Analysis: High EV Adoption Impacts on the Western U.S. Power Grid. Pacific Northwest National Laboratory. https://www.pnnl.gov/sites/default/files/media/file/EV-AT-SCALE_1_IMPACTS_final.pdf 201 US DRIVE 2019. U.S. DRIVE. 2019. Summary Report on EVs at Scale and the U.S. Electric Power System. U.S. Driving Research and Innovation for Vehicle Efficiency and Energy Sustainability (DRIVE). November 2019. Accessed March 10, 2022. https://www.energy.gov/sites/prod/files/2019/12/f69/GITT%20ISATT%20EVs%20at%20Scale%20Grid%20Summary%20Report%20FINAL%20Nov2019.pdf 202 Muratori et al 2021. Matteo Muratori et al 2021 Prog. Energy 3 022002. “The rise of electric vehicles—2020 status and future expectations.” 25 March 2021. https://iopscience.iop.org/article/10.1088/2516-1083/abe0ad/pdf 203 DOE 2019 204 AB 841 (Ting 2020) 205 CPUC 2022b. “Transportation Electrification.” California Public Utilities Commission. January 26, 2022, CPUC’s Transportation Electrification Website. 206 CPUC 2022c. “Electricity Rates and Cost of Fueling.” California Public Utilities Commission. January 26, 2022, CPUC’s Charging Rates Website. 207 CPUC 2022d. California Public Utilities Commission. Proposed Decision: Order Instituting Rulemaking to Modernize the Electric Grid for a High Distributed Energy Resources Future. January 26, 2022. CPUC’s Proposed Rulemaking for Distributed Energy Resources.
32
proceeding, the CPUC aims to evolve grid capabilities to integrate distributed energy sources including electric vehicle charging, EV charging forecasts to improve distribution planning, and community input to optimize infrastructure investments for the grid.208
One of the key goals of this proceeding is to improve distribution planning, including charging infrastructure forecasting to support cost effective and widespread transportation electrification. In parallel, CEC staff is developing the EVSE Deployment and Grid Evaluation (EDGE) tool, which currently uses the IOUs’ Integration Capacity Analysis (ICA) map data to understand existing grid conditions and capacity. EDGE will not only help stakeholders identify suitable locations for charger deployments, but also act as an early warning system for utilities and grid planners to identify locations where grid upgrades may be required to support high charging demand.
In most circumstances, electric vehicles do not draw energy at the same time they are operating, and charging time is usually much shorter than vehicle dwell time. This provides light-duty electric vehicles with the flexibility to charge at times that are less impactful to the grid and at times of abundant renewable generation availability. CEC’s AB 2127 report presented an analysis of electricity consumption due to electric vehicle charging using the Electric Vehicle Infrastructure Projection tool (EVI-Pro 2).209 EVI-Pro 2 is a simulation model used by the CEC to estimate the number, type, and location of chargers needed in California to support light-duty BEV and PHEV drivers, and projects time-of-day charging profiles. Electric vehicles will add power loads to the grid, but if the demand occurs during hours when there is excess electricity supply, less investment is needed from new supply generation.210
Innovative solutions are emerging to help support charging infrastructure and manage loads at the local grid level. Since ZEVs are a unique electric load and are potentially advantageous compared to other types of load, state agencies and utilities are also actively planning for vehicle-to-grid integration (VGI) services. These VGI services range from bi-directional charging (V2X) to one-directional passive load shifting by price signals or rate design. Load shifting is valuable to the state to control peak loads by shifting a large portion of charging loads to hours that are less impactful to the grid. Load shifting strategies are also easy to implement for electric utilities and for public consumers and allow for better integration of renewable energy. Models suggest that electric vehicle charging can reduce renewables curtailment, which is when the output of a renewable energy resource is intentionally reduced below what it could produce,211 anywhere from 25 to 90 percent.212 As VGI services move into bi-directional charging (V2X), where the power can flow to and from the vehicle battery, the benefit to the grid is greater with the potential to offset grid upgrades and further reduce overall strain at peak usage times. Bi-directional services can also provide emergency backup services in the event of grid shutoffs or general power failures. Overall,
208 CPUC 2022e. “CPUC Takes Action to Modernize Electric Grid for High Distributed Energy Resources Future.” California Public Utilities Commission. January 26, 2022, CPUC Summary of Distributed Energy Resource Proceeding. 209 CEC 2021c. Alexander, Charging Infrastructure Assessment, 2021. Chapter 4, Section- EVI-Pro 2 details methodology and additional information regarding analysis to obtain the grid impacts by 2030. 210 CEC 2021c. 211 CalISO 2017. “Impacts of renewable energy on grid operations” Copyright 2017 California ISO. https://www.caiso.com/documents/curtailmentfastfacts.pdf 212 PNNL 2020
33
VGI services create opportunities to reduce system costs and facilitate renewable energy integration, and electric vehicle resource adequacy can be doubled with these managed charging strategies.213 214 215
With the benefits electric vehicles can provide to the grid, state agencies in California have continued to collaborate on policies and programs to enable this integration. The CEC, CAISO, CPUC, CARB, and other stakeholders are working to update the state’s roadmap to integrate electric vehicle charging needs with the needs of the electrical grid. The update will reflect advancements in VGI technology and include actions the state can take to advance California’s transportation electrification goals. Separately, in December 2020, the CPUC adopted a decision on VGI which created metrics and strategies for advancing VGI and authorized almost $40 million for the investor-owned utilities to spend piloting VGI technologies and programs. In November 2021, the CPUC adopted a resolution creating a pathway for alternating current (AC) interconnection for VGI and allowing some electric vehicles to enable bidirectional mode more easily. The CPUC is continuing to consider streamlining procedures for both charging and bidirectional interconnections.
As the electric vehicle market expands, electricity demand will increase to provide the charging needs for these vehicles. To meet this anticipated demand, State agencies and electric utilities have begun planning and putting in place programs for electrical distribution upgrades. Although an increase in electricity demand is anticipated with the widespread adoption of electric vehicles, electric vehicles can aid in managing grid resources and can improve resilience of the grid.
4) California Hydrogen Infrastructure Development and Funding
California has long provided support for the advancement of hydrogen fueling station technology and developing a fueling network. Early efforts like the California Hydrogen Highway and California Blueprint Plan set the stage for today’s hydrogen fueling station designs and operation, network buildout strategies, and public-private collaborative efforts. These efforts enabled the launch of an FCEV market in California. The CEC estimates that 9,647 FCEVs are on the road as of the end of September 2021,216 and industry estimates show 12,187 cumulative sales as of November 2021.217 Recently announced State and federal efforts will further support the development of hydrogen production and fueling infrastructure.218 In January 2022, the Office of Governor Newsom published a proposed budget for fiscal year 2022-2023 and included $6.1 billion for ZEV infrastructure
213 PNNL 2020 214 IRENA (International Renewable Energy Agency) 2019, Innovation Outlook: Smart charging for Electric Vehicles (Abu Dhabi: International Renewable Energy Agency). https://www.irena.org/-/media/Files/IRENA/Agency/Publication/2019/May/IRENA_Innovation_Outlook_EV_smart_charging_2019.pdf 215 Zhang et al 2018a. Zhang J, Jorgenson J, Markel T and Walkowicz K 2019, “Value to the grid from managed charging based on California's high renewables study” IEEE Trans. Power Syst. 34 831–40. 216 CEC 2021d. Baronas, Jean, Belinda Chen, et al. 2021. Joint Agency Staff Report on Assembly Bill 8: 2021 Annual Assessment of Time and Cost Needed to Attain 100 Hydrogen Refueling Stations in California. California Energy Commission and California Air Resources Board. Publication Number: CEC-600-2021-040. 217 CaFCP 2022b. “By The Numbers.” California Fuel Cell Partnership. January 25, 2022, CAFCP By the Numbers Webpage. 218 GO 2022.
34
development, which would include hydrogen fueling infrastructure for light-, medium- and heavy-duty vehicles.
California’s supporting incentive programs and strong policy direction have been primary drivers for network growth. AB 8 provides up to $20 million per year through the end of 2023 to co-fund the development of hydrogen fueling stations through the CEC’s Clean Transportation Program.219 In addition, in 2019, CARB’s Low Carbon Fuel Standard (LCFS) adopted provisions to enhance support for the deployment of hydrogen fueling stations through its Hydrogen Refueling Infrastructure credit pathway.220
Due to these efforts, California has launched the nation’s largest retail hydrogen fueling station network, which began operations in 2015221 and is projected to significantly expand through the end of this decade. There are currently 50222 hydrogen fueling stations considered open-retail (publicly available hydrogen fueling stations that provide retail sales of hydrogen fuel and function similarly to traditional gas stations with no requirement for membership or access agreement to fuel), and approximately 60 additional l stations planned or currently under development through the CEC’s Clean Transportation Program.223,224,225 The recently adopted 2021-23 Clean Transportation Program Investment Plan update commits funds to reach a total of 200 retail hydrogen fueling stations co-funded by the program.226
b) U.S. Support
Beyond California, this transformation is happening with national, state, local and international jurisdictions supporting ZEVs. At the national level, the Infrastructure Investment and Jobs Act allocates $7.5 billion for electric vehicle infrastructure with the goal of placing 500,000 chargers across the country.227 Of the $7.5 billion available, $5 billion will be apportioned to states, territories, and the District of Columbia to install charging stations. The remaining $2.5 billion will be distributed through competitive grants focused on putting
219 AB 8 2013. Assembly Bill No. 8 (Perea, Statutes of 2013, Chapter 401). https://leginfo.legislature.ca.gov/faces/billNavClient.xhtml?bill_id=201320140AB8 220 CARB 2020b.California Air Resources Board. Low Carbon Fuel Standard (Unofficial Electronic Version), January 26, 2022. LCFS Regulation Text. 221 The first station to initiate retail hydrogen fuel sales was the West Sacramento station in 2015. Several other stations previously provided hydrogen fuel to FCEV drivers but were not able to complete retail sale transactions due to their inability to provide sufficiently accurate metered hydrogen dispensing. 222 There are an additional 4 stations that previously achieved Open-Retail status but are temporarily considered Non-Operational. The cause varies by each station, but all are expected to return to retail fuel sales sometime in the future. 223 CEC 2021d 224 CARB 2021c. California Air Resources Board. 2021 Annual Evaluation of Fuel Cell Electric Vehicle Deployment and Hydrogen Fuel Station Network Development, 2021, 2021 Annual Evaluation. 225 CaFCP 2022c. CAFCP Station Map. January 25, 2022. https://cafcp.org/stationmap. Accessed March 10, 2022 226 CEC 2021a 227 White House 2021b. White House, UPDATED FACT SHEET: Bipartisan Infrastructure Investment and Jobs Act, August 2, 2021 https://www.whitehouse.gov/briefing-room/statements-releases/2021/08/02/updated-fact-sheet-bipartisan-infrastructure-investment-and-jobs-act/
35
charging stations in rural areas, improving air quality, and targeting disadvantaged communities.228
Finally, 16 other states have adopted or are in the process of adopting California’s ZEV regulation, which leads to cost reductions and consumer awareness from an expanded market. These states include Colorado, Connecticut, Maine, Maryland, Massachusetts, Minnesota, Nevada, New Jersey, New Mexico, New York, Oregon, Pennsylvania, Rhode Island, Vermont, Virginia, and Washington. In addition to adopting California’s regulations, many states remain committed to further reducing emissions in line with this proposal. For instance, Massachusetts has a goal of 100 percent ZEV sales by 2035.229 On an international level, several countries have set ambitious ZEV targets, including Norway, the United Kingdom, and Canada. Timelines for these targets vary widely. Norway has the most aggressive target of 100 percent electric vehicle sales by 2025, while other countries, such as Costa Rica and Germany, are aiming for these levels by 2050. Such targets send strong policy signals to the market. France and Spain have codified these targets as laws that make these targets legally binding and enforceable.
As seen above, there is a lot of positive activity from government, industry and nongovernmental organizations that is moving California toward a successful transition to an electric transportation future. The ACCII regulation alone will not achieve success on its own but is one tool that works in concert with all the other complementary programs and policies to put California on a path to full electrification.
B. Need for Proposed ZEV Regulations
As described in the 2017 Midterm Review, staff estimated minimum compliance with the existing ZEV regulation to be nearly 8-percent of new vehicle sales as ZEVs and PHEVs by the 2025 model year.230 Manufacturers have thus far over-complied with the regulatory requirements, already selling nearly 12-percent of new vehicles in California as ZEVs and PHEVs in 2021 model year.231 However, as discussed in section VII.A., at current levels, the baseline fleet will not achieve the necessary reductions to achieve California’s long-term criteria pollutant and GHG emission reduction goals. Without future, more stringent regulations, the baseline shows ZEV sales reach over 20-percent in 2026 and subsequent model years. Though this does represent growth from sales levels in 2021, it is insufficient for achieving the deep emission reductions that are needed on the time scale required, especially given the long lifetimes of these vehicles.
228 White House 2021c. White House, FACT SHEET: The Biden- Harris Electric Vehicle Charging Action Plan December 13, 2021. https://www.whitehouse.gov/briefing-room/statements-releases/2021/12/13/fact-sheet-the-biden-harris-electric-vehicle-charging-action-plan/ Accessed February 11, 2022. 229 Choi 2021. Choi, Joseph. Massachusetts to require 100 percent of car sales to be electric by 2035, January 5, 2021. https://thehill.com/policy/energy-environment/532684-massachusetts-to-require-100-percent-of-car-sales-to-be Accessed February 11, 2022. 230 CARB 2017e. Appendix A: Analysis of Zero Emission Vehicle Regulation Compliance Scenarios https://ww2.arb.ca.gov/sites/default/files/2020-01/appendix_a_minimum_zev_regulation_compliance_scenarios_formatted_ac.pdf Released January 18, 2017. Accessed January 28, 2022 231 CEC 2022e. California Energy Commission. 2022. “New ZEV Sales in California: Sales in 2021. ZEV Sales Share.” Accessed March 15, 2022.
36
As discussed in length in Section II.A., mobile sources continue to be significant contributors to smog-forming emissions in California. Transitioning to zero-emission technology for every on- and off-road mobile sector is essential for meeting near- and long-term emission reduction goals mandated by statute, with regard to both ambient air quality and climate requirements.232 This has been affirmed by every planning document released by CARB in the last 10 years. Not only is electrification needed to reduce smog-forming emissions from mobile sources and to protect near-roadway communities, it is also the key strategy for achieving greenhouse gas reductions.
The ZEV regulation, as currently adopted, was never intended to and thus, fails to achieve 100-percent electrification in the timeframe needed to virtually eliminate emissions from light-duty vehicles. As written, manufacturers are already over-complying and amassing significant credits, which do not expire. This reduces the effectiveness of the regulation and does not guarantee a sustained growing number of ZEVs and PHEVs. The ZEV regulation must be updated to continue to push industry and remove barriers to adequately protect public health and the climate. Staff’s full proposal for the 2026 and subsequent model year ZEV regulation is described in Section III.C.
CARB has long designed its regulations and certification systems to ensure that vehicles, including their emission controls, perform properly throughout their life. CARB has not previously applied these measures, which include warranty, durability, and serviceability, to ZEVs. However, to secure the emission benefits of this proposal, it is necessary to ensure both that ZEVs fully function for their expected lifetimes and that consumers are willing and able to purchase them both new and used. Staff therefore propose that ZEVs must meet continuing assurance requirements throughout their lives. Staff’s full proposal of ZEV Assurance Measures are described in Section III.D.
C. Proposed Requirements and Feasibility
1. ZEV Stringency: Annual ZEV Percentage Requirements
Currently, the ZEV regulation requires manufacturers to annually deliver for sale in California an increasing percentage of ZEVs and PHEVs. The current regulation applies to large and intermediate sized manufacturers responsible for approximately 98-percent of new passenger cars and light trucks sold in California each year. In 2012, CARB approved the latest iteration of the ZEV regulation as part of the Advanced Clean Cars rulemaking, which increased the requirements through the 2025 model year and flat line thereafter.
Section III.A.2. and Appendix G details the market expansion of electric vehicles that has been happening in California. However, even with this market expansion, more is needed to meet California’s long term emission reduction goals. As noted in Section II.A and III.B., widespread electrification is necessary to achieve the emission reductions required from the light duty sector. To that end, staff is proposing to require 100-percent electric vehicle sales by 2035 model year.
Manufacturers have made significant improvements in battery technology, which has enabled more vehicle offerings in more segments and increasing capabilities. This was the impetus for
232 CARB 2021a.
37
Staff’s ZEV compliance scenario updated in the 2017 ACC MTR, which showed the effect of advanced ZEV technology and its interaction with the ZEV regulation.233 Additionally, technology costs have fallen significantly, namely battery costs, over the last 10 years and are expected to continue to drop over time. This will make ZEVs cost-competitive with gasoline vehicles in the 2030-2035 timeframe, if not sooner.
Building on 30 years of work to electrify light-duty vehicles in California, the market is clearly poised for massive transformation. Every light duty vehicle manufacturer has made commitments to electrify their product line.234 For instance, in January 2021, General Motors announced plans to become carbon neutral by 2040, including significant investments in battery technology and a goal to shift its light-duty vehicles entirely to zero-emissions by 2035.235 236 In March 2021, Volvo, announced plans to make only electric cars by 2030,237 and Volkswagen announced that it expects half of its U.S. vehicle sales will be all-electric by 2030.238 In April 2021, Honda announced a plan to fully electrify its vehicles by 2040, with 40-percent of its North American vehicle sales expected to be fully electric or fuel cell vehicles by 2030, 80-percent by 2035 and 100-percent by 2040.239 In May 2021, Ford announced that it expects 40-percent of its global light-duty vehicle sales will be all-electric by 2030.240 In June 2021, Fiat announced a move to all-electric vehicles by 2030,241 and in July 2021 its parent corporation, Stellantis, announced an intensified focus on electrification across all its brands.242 Also in July 2021, Mercedes-Benz announced that all its new architectures would be electric-only from 2025, with plans to become ready to go all-electric by 2030 where
233 CARB 2017e. 234 A list of all manufacturer announcements can be found in Appendix G. 235 NY Times 2021. Neal E. Boudette and Coral Davenport. 2021. “G.M. Will Sell Only Zero-Emission Vehicles by 2035.” New York Times. Updated Oct. 1, 2021. Accessed March 10, 2022. https://www.nytimes.com/2021/01/28/business/gm-zero-emission-vehicles.html. 236 Cleantechnica.com 2022. “GM Announces $7 Billion Investment in EVs, Solid-State Battery Supply Chain” CleanTechnica.com, Tina Casey. January 26, 2022. https://cleantechnica.com/2022/01/26/gm-buries-solid-state-ev-battery-supply-chain-lede-under-historic-7-billion-auto-news/ 237 Volvo 2021. Volvo Car Group, “Volvo Cars to be fully electric by 2030,” Press Release, March 2, 2021. https://www.media.volvocars.com/us/en-us/media/pressreleases/277409/volvo-cars-to-be-fully-electric-by-2030 Accessed February 11, 2022. 238 VW 2021. Volkswagen Newsroom, “Strategy update at Volkswagen: The transformation to electromobility was only the beginning,” March 5, 2021. Accessed June 15, 2021 at https://www.volkswagen-newsroom.com/en/stories/strategy-update-at-volkswagen-the-transformation-to-electromobility-was-only-the-beginning-6875 Accessed February 11, 2022. 239 Honda 2021. Honda News Room, “Summary of Honda Global CEO Inaugural Press Conference,” April 23, 2021. Accessed June 15, 2021 at https://global.honda/newsroom/news/2021/c210423eng.html Accessed February 11, 2022. 240 Ford 2021. Ford Motor Company, “Superior Value From EVs, Commercial Business, Connected Services is Strategic Focus of Today’s ‘Delivering Ford+’ Capital Markets Day,” Press Release, May 26, 2021. https://media.ford.com/content/fordmedia/fna/us/en/news/2021/05/26/capital-markets-day.html Accessed February 11, 2022. 241 Stellantis 2021a. Stellantis, “World Environment Day 2021 – Comparing Visions: Olivier Francois and Stefano Boeri, in Conversation to Rewrite the Future of Cities,” Press Release, June 4, 2021 https://www.media.stellantis.com/em-en/fiat/press/world-environment-day-2021-comparing-visions-olivier-franois-and-stefano-boeri-in-conversation-to-rewrite-the-future-of-cities Accessed February 11, 2022. 242 Stellantis 2021b. Stellantis, “Stellantis Intensifies Electrification While Targeting Sustainable Double-Digit Adjusted Operating Income Margins in the Mid-Term,” Press Release, July 8, 2021. https://www.stellantis.com/en/news/press-releases/2021/july/stellantis-intensifies-electrification-while-targeting-sustainable-double-digit-adjusted-operating-income-margins-in-the-mid-term Accessed February 11, 2022.
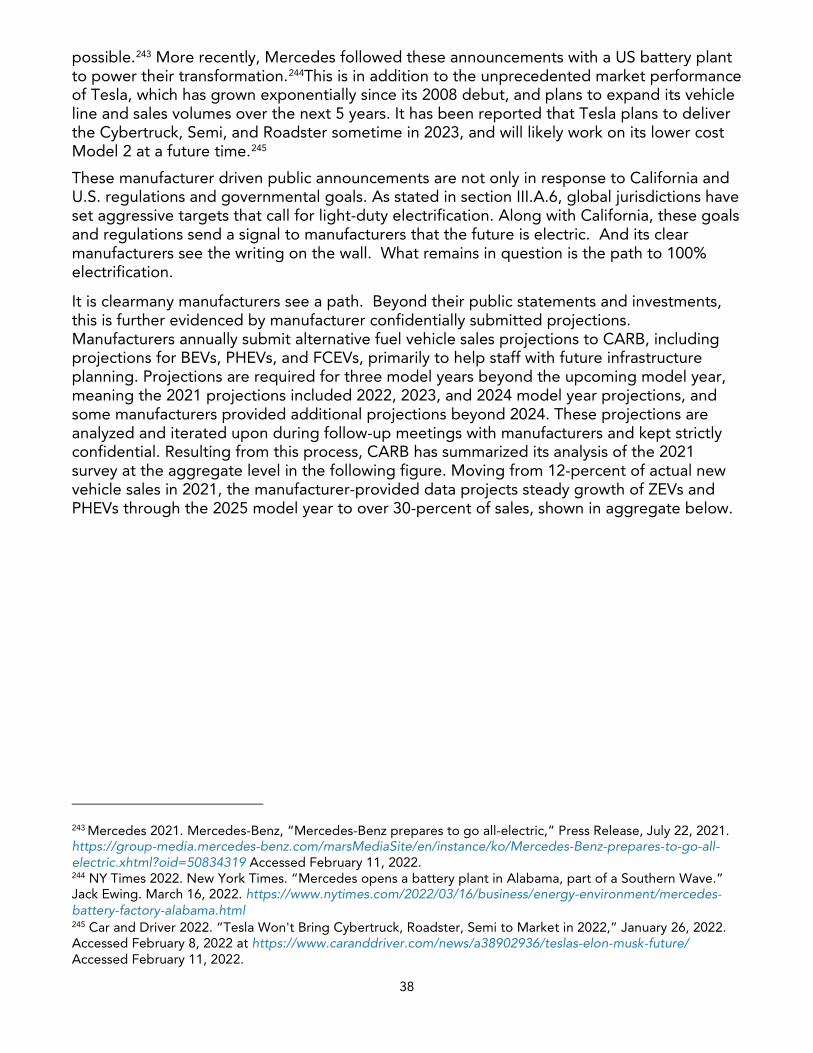
38
possible.243 More recently, Mercedes followed these announcements with a US battery plant to power their transformation.244This is in addition to the unprecedented market performance of Tesla, which has grown exponentially since its 2008 debut, and plans to expand its vehicle line and sales volumes over the next 5 years. It has been reported that Tesla plans to deliver the Cybertruck, Semi, and Roadster sometime in 2023, and will likely work on its lower cost Model 2 at a future time.245
These manufacturer driven public announcements are not only in response to California and U.S. regulations and governmental goals. As stated in section III.A.6, global jurisdictions have set aggressive targets that call for light-duty electrification. Along with California, these goals and regulations send a signal to manufacturers that the future is electric. And its clear manufacturers see the writing on the wall. What remains in question is the path to 100% electrification.
It is clearmany manufacturers see a path. Beyond their public statements and investments, this is further evidenced by manufacturer confidentially submitted projections. Manufacturers annually submit alternative fuel vehicle sales projections to CARB, including projections for BEVs, PHEVs, and FCEVs, primarily to help staff with future infrastructure planning. Projections are required for three model years beyond the upcoming model year, meaning the 2021 projections included 2022, 2023, and 2024 model year projections, and some manufacturers provided additional projections beyond 2024. These projections are analyzed and iterated upon during follow-up meetings with manufacturers and kept strictly confidential. Resulting from this process, CARB has summarized its analysis of the 2021 survey at the aggregate level in the following figure. Moving from 12-percent of actual new vehicle sales in 2021, the manufacturer-provided data projects steady growth of ZEVs and PHEVs through the 2025 model year to over 30-percent of sales, shown in aggregate below.
243 Mercedes 2021. Mercedes-Benz, “Mercedes-Benz prepares to go all-electric,” Press Release, July 22, 2021. https://group-media.mercedes-benz.com/marsMediaSite/en/instance/ko/Mercedes-Benz-prepares-to-go-all-electric.xhtml?oid=50834319 Accessed February 11, 2022. 244 NY Times 2022. New York Times. “Mercedes opens a battery plant in Alabama, part of a Southern Wave.” Jack Ewing. March 16, 2022. https://www.nytimes.com/2022/03/16/business/energy-environment/mercedes-battery-factory-alabama.html 245 Car and Driver 2022. “Tesla Won't Bring Cybertruck, Roadster, Semi to Market in 2022,” January 26, 2022. Accessed February 8, 2022 at https://www.caranddriver.com/news/a38902936/teslas-elon-musk-future/ Accessed February 11, 2022.
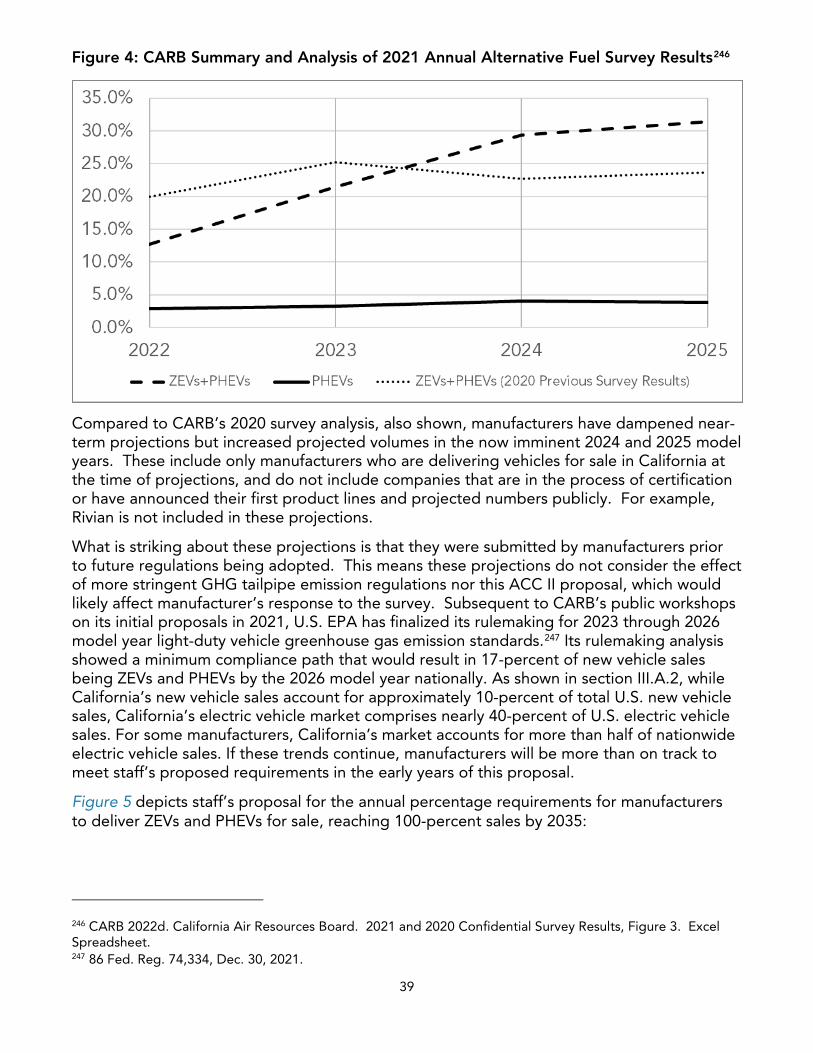
39
Figure 4: CARB Summary and Analysis of 2021 Annual Alternative Fuel Survey Results246
Compared to CARB’s 2020 survey analysis, also shown, manufacturers have dampened near-term projections but increased projected volumes in the now imminent 2024 and 2025 model years. These include only manufacturers who are delivering vehicles for sale in California at the time of projections, and do not include companies that are in the process of certification or have announced their first product lines and projected numbers publicly. For example, Rivian is not included in these projections.
What is striking about these projections is that they were submitted by manufacturers prior to future regulations being adopted. This means these projections do not consider the effect of more stringent GHG tailpipe emission regulations nor this ACC II proposal, which would likely affect manufacturer’s response to the survey. Subsequent to CARB’s public workshops on its initial proposals in 2021, U.S. EPA has finalized its rulemaking for 2023 through 2026 model year light-duty vehicle greenhouse gas emission standards.247 Its rulemaking analysis showed a minimum compliance path that would result in 17-percent of new vehicle sales being ZEVs and PHEVs by the 2026 model year nationally. As shown in section III.A.2, while California’s new vehicle sales account for approximately 10-percent of total U.S. new vehicle sales, California’s electric vehicle market comprises nearly 40-percent of U.S. electric vehicle sales. For some manufacturers, California’s market accounts for more than half of nationwide electric vehicle sales. If these trends continue, manufacturers will be more than on track to meet staff’s proposed requirements in the early years of this proposal.
Figure 5 depicts staff’s proposal for the annual percentage requirements for manufacturers to deliver ZEVs and PHEVs for sale, reaching 100-percent sales by 2035:
246 CARB 2022d. California Air Resources Board. 2021 and 2020 Confidential Survey Results, Figure 3. Excel Spreadsheet. 247 86 Fed. Reg. 74,334, Dec. 30, 2021.
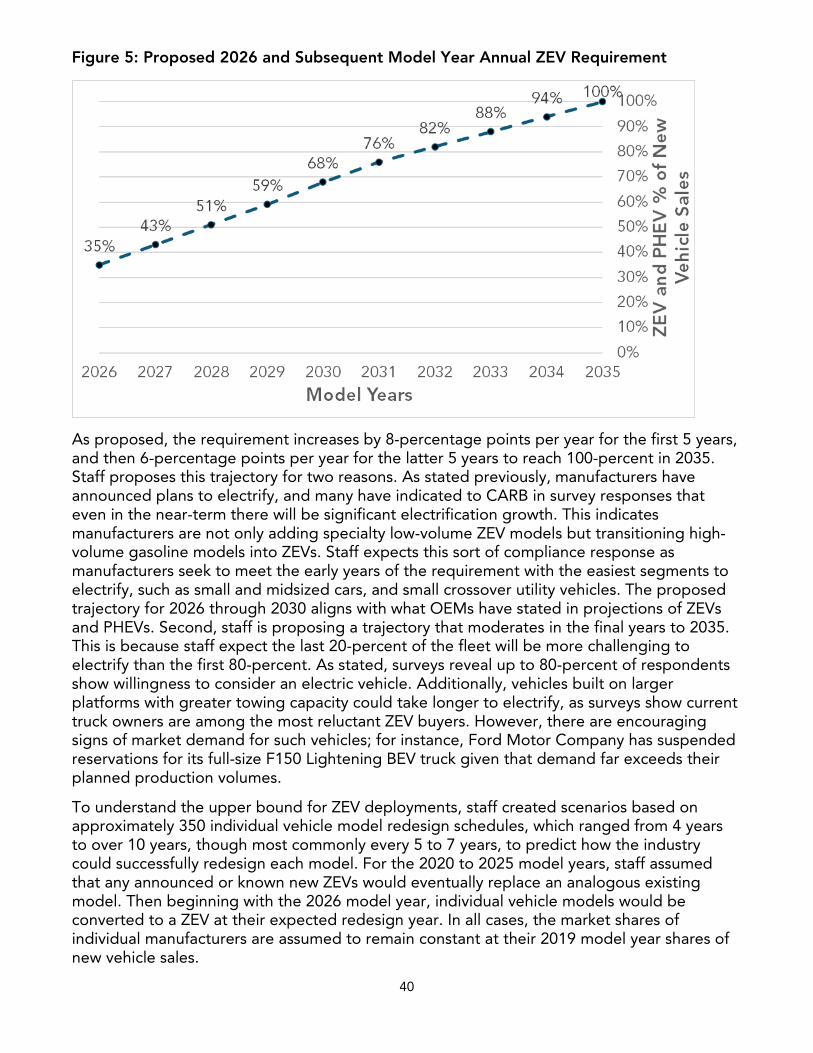
40
Figure 5: Proposed 2026 and Subsequent Model Year Annual ZEV Requirement
As proposed, the requirement increases by 8-percentage points per year for the first 5 years, and then 6-percentage points per year for the latter 5 years to reach 100-percent in 2035. Staff proposes this trajectory for two reasons. As stated previously, manufacturers have announced plans to electrify, and many have indicated to CARB in survey responses that even in the near-term there will be significant electrification growth. This indicates manufacturers are not only adding specialty low-volume ZEV models but transitioning high-volume gasoline models into ZEVs. Staff expects this sort of compliance response as manufacturers seek to meet the early years of the requirement with the easiest segments to electrify, such as small and midsized cars, and small crossover utility vehicles. The proposed trajectory for 2026 through 2030 aligns with what OEMs have stated in projections of ZEVs and PHEVs. Second, staff is proposing a trajectory that moderates in the final years to 2035. This is because staff expect the last 20-percent of the fleet will be more challenging to electrify than the first 80-percent. As stated, surveys reveal up to 80-percent of respondents show willingness to consider an electric vehicle. Additionally, vehicles built on larger platforms with greater towing capacity could take longer to electrify, as surveys show current truck owners are among the most reluctant ZEV buyers. However, there are encouraging signs of market demand for such vehicles; for instance, Ford Motor Company has suspended reservations for its full-size F150 Lightening BEV truck given that demand far exceeds their planned production volumes.
To understand the upper bound for ZEV deployments, staff created scenarios based on approximately 350 individual vehicle model redesign schedules, which ranged from 4 years to over 10 years, though most commonly every 5 to 7 years, to predict how the industry could successfully redesign each model. For the 2020 to 2025 model years, staff assumed that any announced or known new ZEVs would eventually replace an analogous existing model. Then beginning with the 2026 model year, individual vehicle models would be converted to a ZEV at their expected redesign year. In all cases, the market shares of individual manufacturers are assumed to remain constant at their 2019 model year shares of new vehicle sales.
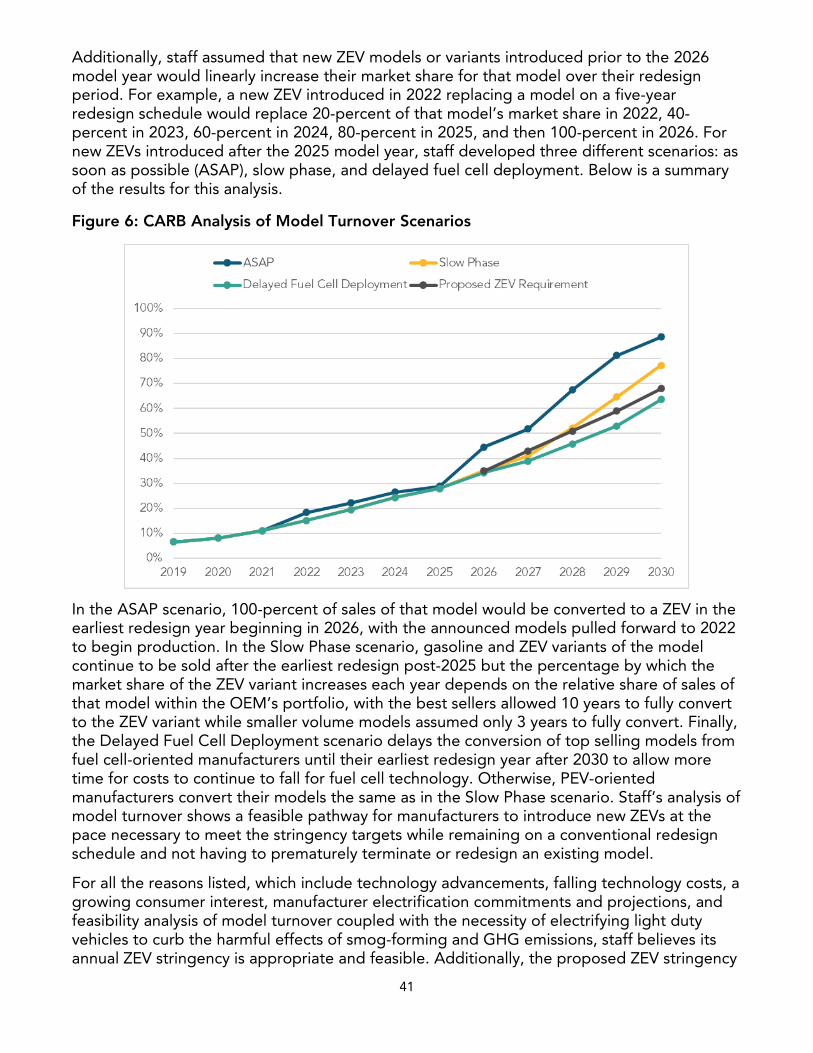
41
Additionally, staff assumed that new ZEV models or variants introduced prior to the 2026 model year would linearly increase their market share for that model over their redesign period. For example, a new ZEV introduced in 2022 replacing a model on a five-year redesign schedule would replace 20-percent of that model’s market share in 2022, 40-percent in 2023, 60-percent in 2024, 80-percent in 2025, and then 100-percent in 2026. For new ZEVs introduced after the 2025 model year, staff developed three different scenarios: as soon as possible (ASAP), slow phase, and delayed fuel cell deployment. Below is a summary of the results for this analysis.
Figure 6: CARB Analysis of Model Turnover Scenarios
In the ASAP scenario, 100-percent of sales of that model would be converted to a ZEV in the earliest redesign year beginning in 2026, with the announced models pulled forward to 2022 to begin production. In the Slow Phase scenario, gasoline and ZEV variants of the model continue to be sold after the earliest redesign post-2025 but the percentage by which the market share of the ZEV variant increases each year depends on the relative share of sales of that model within the OEM’s portfolio, with the best sellers allowed 10 years to fully convert to the ZEV variant while smaller volume models assumed only 3 years to fully convert. Finally, the Delayed Fuel Cell Deployment scenario delays the conversion of top selling models from fuel cell-oriented manufacturers until their earliest redesign year after 2030 to allow more time for costs to continue to fall for fuel cell technology. Otherwise, PEV-oriented manufacturers convert their models the same as in the Slow Phase scenario. Staff’s analysis of model turnover shows a feasible pathway for manufacturers to introduce new ZEVs at the pace necessary to meet the stringency targets while remaining on a conventional redesign schedule and not having to prematurely terminate or redesign an existing model.
For all the reasons listed, which include technology advancements, falling technology costs, a growing consumer interest, manufacturer electrification commitments and projections, and feasibility analysis of model turnover coupled with the necessity of electrifying light duty vehicles to curb the harmful effects of smog-forming and GHG emissions, staff believes its annual ZEV stringency is appropriate and feasible. Additionally, the proposed ZEV stringency
42
results in ZEV and PHEV sales that are in line with the trajectory laid out by the 2020 Mobile Source Strategy. The strategies and scenarios described in the 2020 Mobile Source Strategy do not reflect a market feasibility analysis, and they were developed as exploratory scenarios to show what emission reductions would occur under simple vehicle technology and fuel modeling assumptions. Even with the different in methodology, the similarities between the proposed stringency and the very aggressive and simplistic Mobile Source Strategy indicates staff’s strong approach to ZEV stringency in its proposal. As with all light-duty regulations adopted by the Board, staff understands manufacturers are at different places in terms of technology and market development. The following subsections will describe the structure of the ZEV regulation and various flexibilities that are being proposed in recognition of these differences and still keeping manufacturers on a path to 100% ZEV and PHEV sales by 2035.
2. Proposed ZEV Requirement Structure and Compliance Rules
In the current ZEV regulation, manufacturers must meet an increasing annual requirement for each model year based on a percentage of their average total California sales. Manufacturers fulfill the requirements by producing ZEVs and PHEVs for sale in California. Credits per vehicle vary based on vehicle technology and performance attributes, most notably the vehicle’s all-electric range.248 Additionally, manufacturers may carry forward surplus credits without expiration. Given many longer range 250+ mile BEVs introduced earlier than anticipated, individual vehicles are earning more credits than originally projected. Thus, even at modest sales rates, most manufacturers have readily exceeded the requirements and are carrying forward a significant surplus of credits.
Though overcompliance does represent desired market growth and allows for some degree of compliance flexibility and resilience to unforeseen events, and thus some amount of overcompliance is positive and provides flexibility within a regulatory program, excess overcompliance also brings uncertainty to future ZEV volumes and risks unnecessarily prolonging the elimination of combustion engines and their associated emissions because a manufacturer could use the over-compliance credits in lieu of producing ZEVs in a future year, especially for those manufacturers that have not fully committed to zero-emission platforms. Current rules allow manufacturers to add newly earned ZEV credits into a bank account and then spend unrestricted from that account to meet the requirement. This has made sense in past versions of the ZEV regulation when volumes were low, credits had no expiration, and more flexibility was required of manufacturers developing and introducing their first ZEV products. Below is a graph showing credits amassed by manufacturers through the 2020 model year.
248 See section III.C.3. for more on technical minimum requirements for ZEVs, and section III.C.4 for technical minimum requirements for PHEVs.
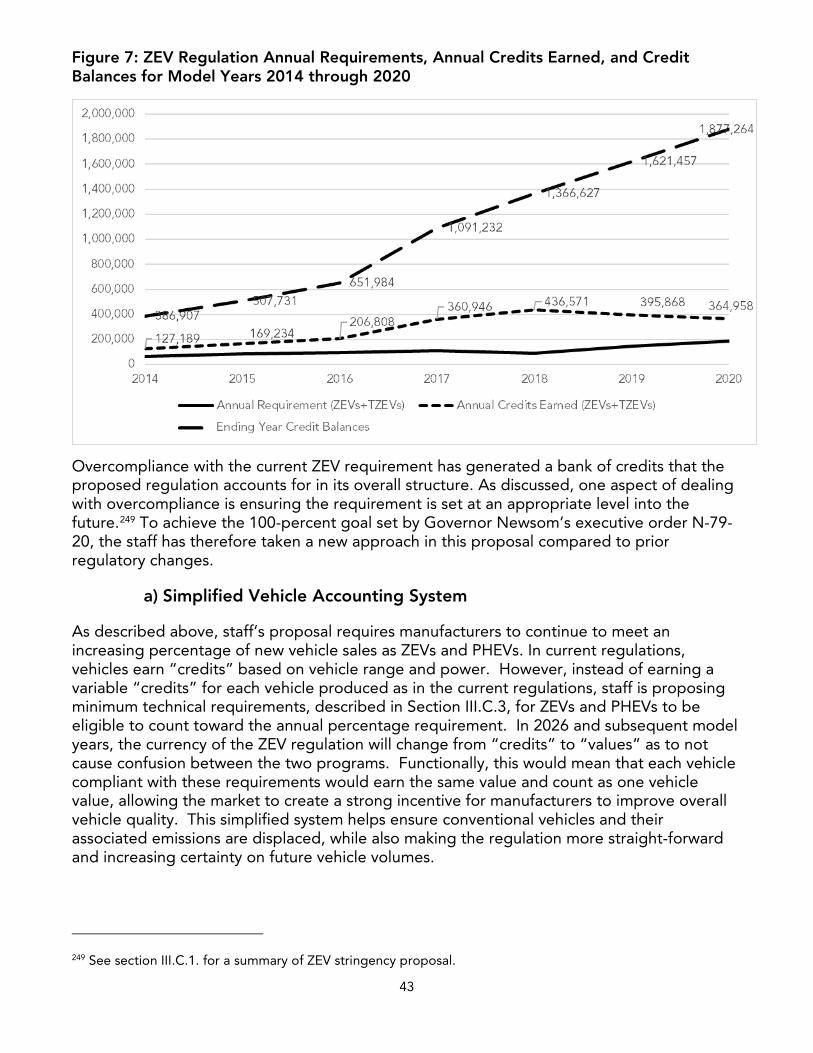
43
Figure 7: ZEV Regulation Annual Requirements, Annual Credits Earned, and Credit Balances for Model Years 2014 through 2020
Overcompliance with the current ZEV requirement has generated a bank of credits that the proposed regulation accounts for in its overall structure. As discussed, one aspect of dealing with overcompliance is ensuring the requirement is set at an appropriate level into the future.249 To achieve the 100-percent goal set by Governor Newsom’s executive order N-79-20, the staff has therefore taken a new approach in this proposal compared to prior regulatory changes.
a) Simplified Vehicle Accounting System
As described above, staff’s proposal requires manufacturers to continue to meet an increasing percentage of new vehicle sales as ZEVs and PHEVs. In current regulations, vehicles earn “credits” based on vehicle range and power. However, instead of earning a variable “credits” for each vehicle produced as in the current regulations, staff is proposing minimum technical requirements, described in Section III.C.3, for ZEVs and PHEVs to be eligible to count toward the annual percentage requirement. In 2026 and subsequent model years, the currency of the ZEV regulation will change from “credits” to “values” as to not cause confusion between the two programs. Functionally, this would mean that each vehicle compliant with these requirements would earn the same value and count as one vehicle value, allowing the market to create a strong incentive for manufacturers to improve overall vehicle quality. This simplified system helps ensure conventional vehicles and their associated emissions are displaced, while also making the regulation more straight-forward and increasing certainty on future vehicle volumes.
249 See section III.C.1. for a summary of ZEV stringency proposal.
44
b) Determining Manufacturer’s Compliance and 5-Year Excess VehicleValue Life
Overall, staff is proposing to continue with a fleet performance standard that allows for banking, trading, and deficits. Allowing for appropriate banking, trading, and fulfillment of deficits appropriately affords manufacturers the flexibility needed to fully transition to electrification and handle year-to-year sales fluctuations and vehicle redesign schedules. In addition to an effective one-to-one vehicle to requirement structure, staff proposes to change the sequence of how annual compliance is performed to align with how it is currently done for both criteria pollutant and GHG fleet average standards. Namely, the manufacturer’s current model year performance (i.e., number of ZEVs and PHEVs produced) is first compared to the annual performance requirement before allowing any usage of credits from trading or banking. In this manner, manufacturers are far more limited in their ability to create stockpiles of credits to stave off future requirements or dip into previously earned reserves while simultaneously banking newly earned surpluses. This will return banking and trading to the intended purpose of managing year to year fluctuations rather than enabling strategies to minimize future compliance or prolong the use of non-ZEVs.
In the case of actual overcompliance with the annual requirement based on ZEVs and PHEVs produced for that model year, the manufacturer will be allowed to bank or trade those surplus values for use any time within the next four model years or to pay off a previous deficit. And in the case of a shortfall with the annual requirement, the manufacturer would be allowed to dip into its bank or make use of other allowances to meet the shortfall or, in the absence of any valid banked values, carry forward a deficit to be made up within the next three model years. But a manufacturer would no longer be able to shuffle credits around such that it was simultaneously banking credits for future use and spending credits earned in past years or otherwise use allowances in any year that it didn’t actually have a shortfall.
c) Converted ZEV and PHEV Values
As discussed previously, manufacturers are expected to over-comply with current ZEV requirements through the 2025 model year. Though this may not be the case for every manufacturer, the industry as a whole, in 2021, was already above what the Midterm Review projected would be necessary for the 2025 model year. Even in the unlikely event that the industry were to flat line at current levels, most manufacturers would be in a position of carrying over significant credits into a future program. And if sales increases continue as projected by the manufacturer survey responses, there will literally be millions of excess ZEV credits and over 100,000 PHEV credits under the existing standards after the 2025 model year.
With regard to the credits earned and expected under the existing standards, staff propose to limit their use in ways that reward past efforts while emphasizing continuing ZEV and PHEV sales. Staff has three proposals related to this flexibility for pre-2026 credits. First, staff proposes to convert pre-2026 banked credits to align with the effective one per vehicle value under the proposed new regulatory structure. Pre-2026 ZEV credit banks would be divided by 4, which represents the maximum number of credits earned by a ZEV under the existing regulation and would be most like a ZEV meeting the proposed minimum range requirement. Pre-2026 PHEV credit banks would be divided by 1.1, which represents the maximum number of credits earned by a PHEV under the existing regulation and most like a PHEV meeting the proposed minimum range requirement.
45
After the credit banks are converted, staff proposes to further limit the use of these credits, first by capping use of these credits to no more than 15-percent of the annual requirement, and second, by expiring these converted credits after the 2030 model year. Allowing for some use of converted ZEV and PHEV values in the 2026 through 2030 model years would continue to help manufacturers manage year-to-year fluctuations in annual vehicle volumes and still allow for full compliance. Limiting the usage and the life of banking within the program would help ensure manufacturers make progress toward future requirements rather than accumulate large compliance banks to stave off increasing deployment of ZEVs.
d) California and Section 177 State Pooling
Section 177 of the federal Clean Air Act allows other States to adopt California’s regulations. At present, 14 states have adopted California’s ZEV regulation (as part of adopting the Advanced Clean Cars program): Colorado, Connecticut, Maine, Maryland, Massachusetts, Minnesota, Nevada, New Jersey, New York, Oregon, Rhode Island, Vermont, Virginia, and Washington. Two others adopted California’s LEV regulation, Delaware and Pennsylvania, and are exploring adopting the ZEV regulation, along with New Mexico and the District of Columbia.250 As other states adopt California’s proposed standards, market demand for ZEVs will increase and costs will tend to decline faster than they otherwise would.251
The concept of pooling is to allow manufacturers to move excess ZEV and PHEV values earned in one state for use in another state where there is a shortfall relative to the requirement. The current ZEV regulation allowed pooling to occur only for those manufacturers that participated in the optional compliance path in the first four years of the regulation (2018 through 2021 model years). However, once in, the current regulation does not limit manufacturers in the amount that they are allowed to pool. Additionally, current pooling only allows this flexibility among individual Section 177 States and does not include California.
Section 177 States are still working toward building electric vehicle markets in their states, though market share is increasing across the board. Depending on when the Section 177 State adopted the ZEV regulation, states are in varying places of ZEV market development. In these years of expansion, ZEVs sold anywhere in a state that has adopted these proposed regulations benefit overall market development, reduce ZEV costs, and increase infrastructure build-out – to the benefit of Californians and residents of any state that chooses to adopt these standards. Over time, however, more focused benefits in particular states become more important. To this end, staff propose to provide flexibility to manufacturers in the 2026 through 2030 model years, by allowing all manufacturers to transfer or “pool” excess ZEVs and PHEVs earned in California or individual Section 177 States to meet a shortfall in any given model year (or a deficit carried forward from a previous model year) elsewhere (e.g., in California or other Section 177 States). Manufacturers could use such pooling to meet up to 25-percent of their annual requirement in 2026 model year, declining thereafter, as shown in the Table III-2. For example, ZEVs
250 CARB 2022e. California Air Resources Board, “States that have Adopted California's Vehicle Standards under Section 177 of the Federal Clean Air Act,” updated March 17, 2022. 251 The decision whether to adopt California’s regulation is solely that of the other states. This analysis, accordingly, only considers the potential costs of the proposed regulation on California individuals and businesses, as required by the Administrative Procedure Act and its implementing requirements.
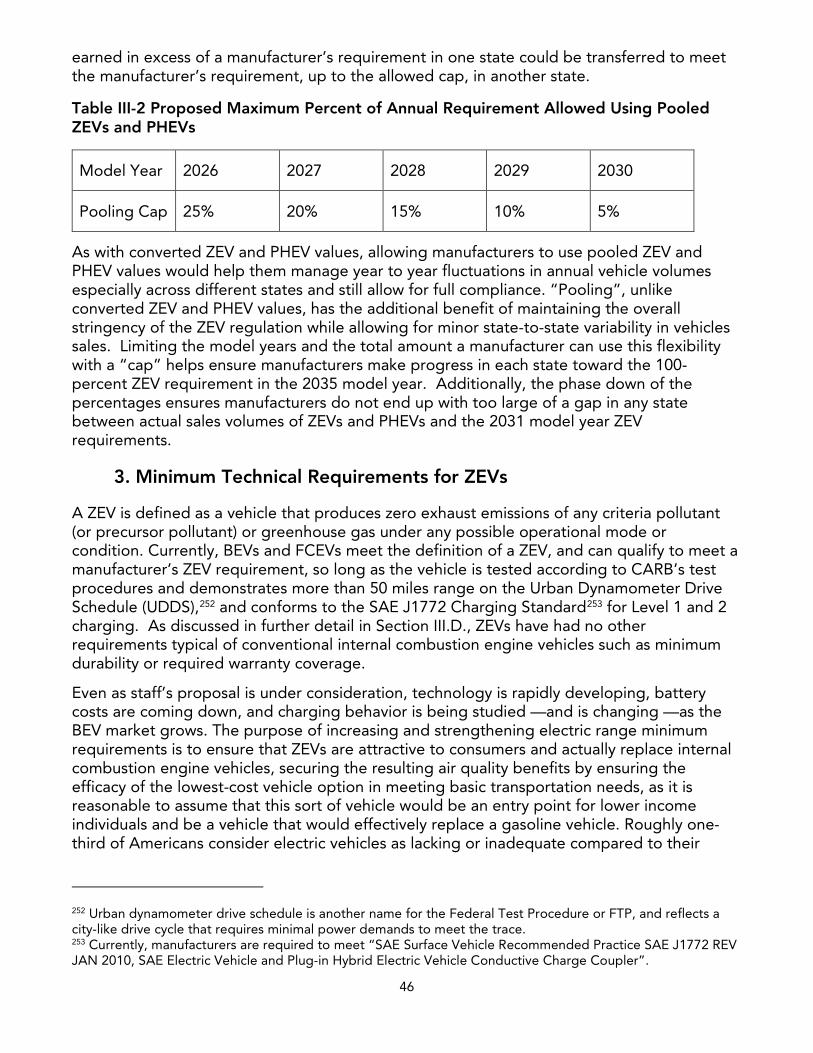
46
earned in excess of a manufacturer’s requirement in one state could be transferred to meet the manufacturer’s requirement, up to the allowed cap, in another state.
Table III-2 Proposed Maximum Percent of Annual Requirement Allowed Using Pooled ZEVs and PHEVs
Model Year 2026 2027 2028 2029 2030
Pooling Cap 25% 20% 15% 10% 5%
As with converted ZEV and PHEV values, allowing manufacturers to use pooled ZEV and PHEV values would help them manage year to year fluctuations in annual vehicle volumes especially across different states and still allow for full compliance. “Pooling”, unlike converted ZEV and PHEV values, has the additional benefit of maintaining the overall stringency of the ZEV regulation while allowing for minor state-to-state variability in vehicles sales. Limiting the model years and the total amount a manufacturer can use this flexibility with a “cap” helps ensure manufacturers make progress in each state toward the 100-percent ZEV requirement in the 2035 model year. Additionally, the phase down of the percentages ensures manufacturers do not end up with too large of a gap in any state between actual sales volumes of ZEVs and PHEVs and the 2031 model year ZEV requirements.
3. Minimum Technical Requirements for ZEVs
A ZEV is defined as a vehicle that produces zero exhaust emissions of any criteria pollutant (or precursor pollutant) or greenhouse gas under any possible operational mode or condition. Currently, BEVs and FCEVs meet the definition of a ZEV, and can qualify to meet a manufacturer’s ZEV requirement, so long as the vehicle is tested according to CARB’s test procedures and demonstrates more than 50 miles range on the Urban Dynamometer Drive Schedule (UDDS),252 and conforms to the SAE J1772 Charging Standard253 for Level 1 and 2 charging. As discussed in further detail in Section III.D., ZEVs have had no other requirements typical of conventional internal combustion engine vehicles such as minimum durability or required warranty coverage.
Even as staff’s proposal is under consideration, technology is rapidly developing, battery costs are coming down, and charging behavior is being studied —and is changing —as the BEV market grows. The purpose of increasing and strengthening electric range minimum requirements is to ensure that ZEVs are attractive to consumers and actually replace internal combustion engine vehicles, securing the resulting air quality benefits by ensuring the efficacy of the lowest-cost vehicle option in meeting basic transportation needs, as it is reasonable to assume that this sort of vehicle would be an entry point for lower income individuals and be a vehicle that would effectively replace a gasoline vehicle. Roughly one-third of Americans consider electric vehicles as lacking or inadequate compared to their
252 Urban dynamometer drive schedule is another name for the Federal Test Procedure or FTP, and reflects a city-like drive cycle that requires minimal power demands to meet the trace. 253 Currently, manufacturers are required to meet “SAE Surface Vehicle Recommended Practice SAE J1772 REV JAN 2010, SAE Electric Vehicle and Plug-in Hybrid Electric Vehicle Conductive Charge Coupler”.
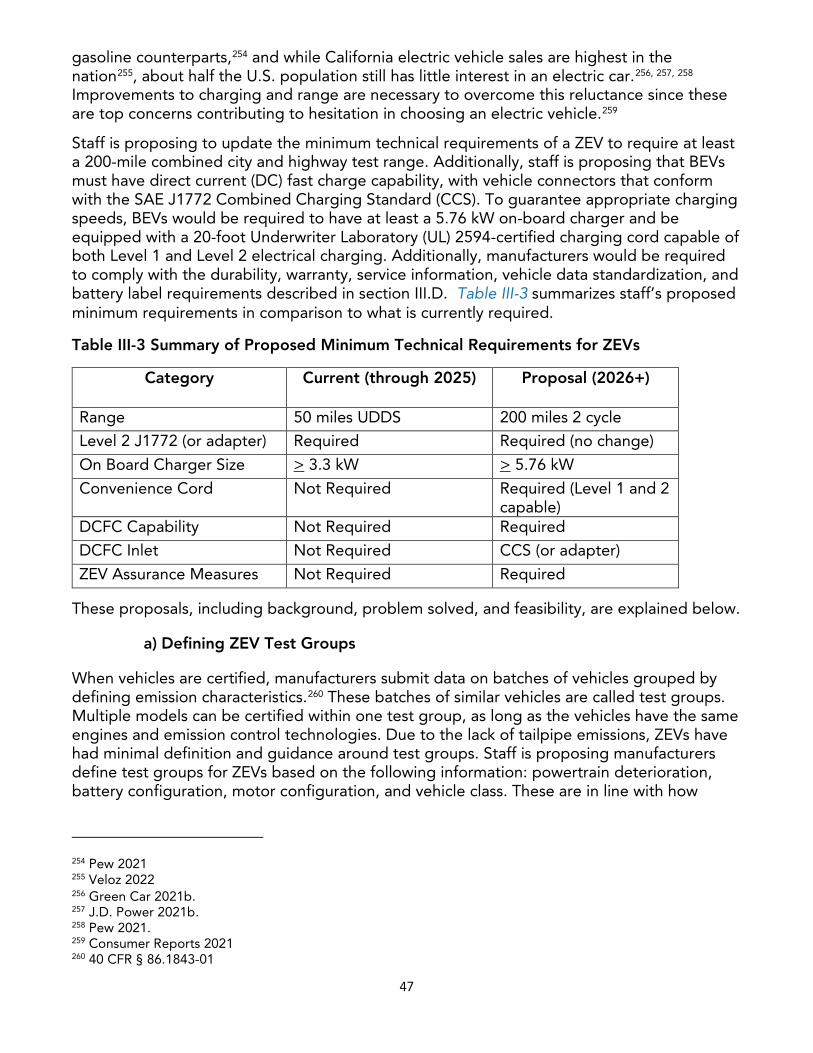
47
gasoline counterparts,254 and while California electric vehicle sales are highest in the nation255, about half the U.S. population still has little interest in an electric car.256, 257, 258 Improvements to charging and range are necessary to overcome this reluctance since these are top concerns contributing to hesitation in choosing an electric vehicle.259
Staff is proposing to update the minimum technical requirements of a ZEV to require at least a 200-mile combined city and highway test range. Additionally, staff is proposing that BEVs must have direct current (DC) fast charge capability, with vehicle connectors that conform with the SAE J1772 Combined Charging Standard (CCS). To guarantee appropriate charging speeds, BEVs would be required to have at least a 5.76 kW on-board charger and be equipped with a 20-foot Underwriter Laboratory (UL) 2594-certified charging cord capable of both Level 1 and Level 2 electrical charging. Additionally, manufacturers would be required to comply with the durability, warranty, service information, vehicle data standardization, and battery label requirements described in section III.D. Table III-3 summarizes staff’s proposed minimum requirements in comparison to what is currently required.
Table III-3 Summary of Proposed Minimum Technical Requirements for ZEVs
Category Current (through 2025) Proposal (2026+)
Range 50 miles UDDS 200 miles 2 cycle
Level 2 J1772 (or adapter) Required Required (no change)
On Board Charger Size > 3.3 kW > 5.76 kW
Convenience Cord Not Required Required (Level 1 and 2 capable)
DCFC Capability Not Required Required
DCFC Inlet Not Required CCS (or adapter)
ZEV Assurance Measures Not Required Required
These proposals, including background, problem solved, and feasibility, are explained below.
a) Defining ZEV Test Groups
When vehicles are certified, manufacturers submit data on batches of vehicles grouped by defining emission characteristics.260 These batches of similar vehicles are called test groups. Multiple models can be certified within one test group, as long as the vehicles have the same engines and emission control technologies. Due to the lack of tailpipe emissions, ZEVs have had minimal definition and guidance around test groups. Staff is proposing manufacturers define test groups for ZEVs based on the following information: powertrain deterioration, battery configuration, motor configuration, and vehicle class. These are in line with how
254 Pew 2021 255 Veloz 2022 256 Green Car 2021b. 257 J.D. Power 2021b. 258 Pew 2021. 259 Consumer Reports 2021 260 40 CFR § 86.1843-01
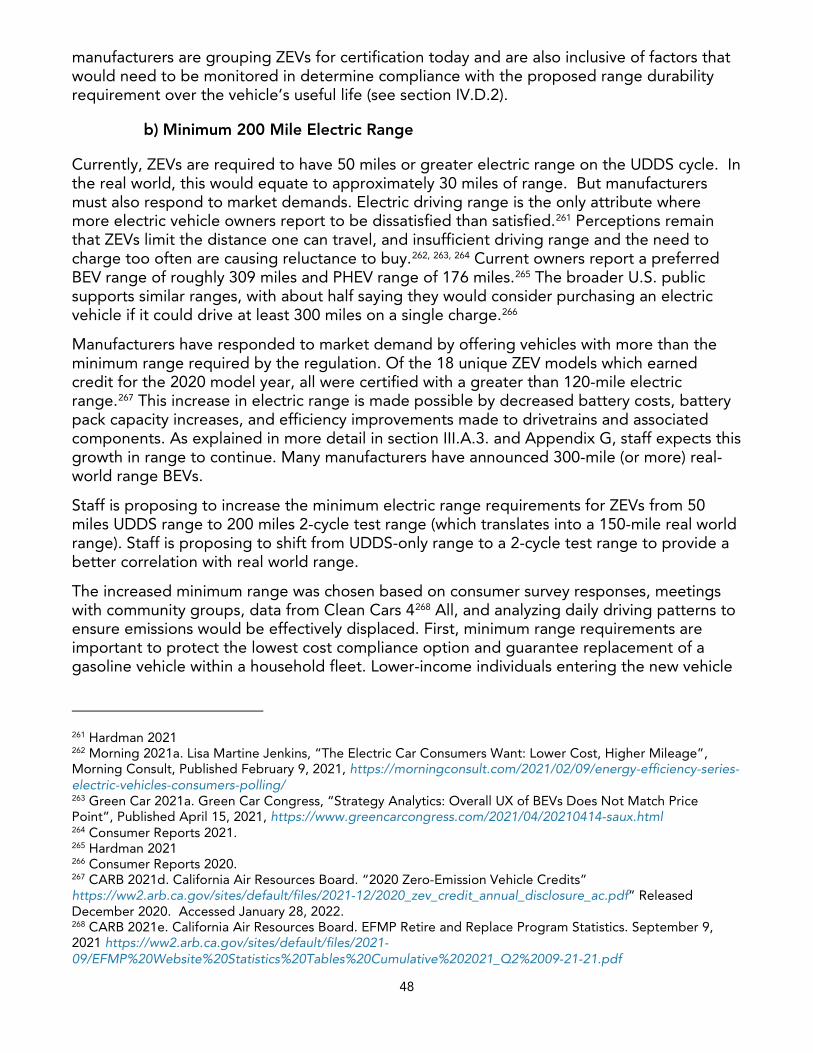
48
manufacturers are grouping ZEVs for certification today and are also inclusive of factors that would need to be monitored in determine compliance with the proposed range durability requirement over the vehicle’s useful life (see section IV.D.2).
b) Minimum 200 Mile Electric Range
Currently, ZEVs are required to have 50 miles or greater electric range on the UDDS cycle. In the real world, this would equate to approximately 30 miles of range. But manufacturers must also respond to market demands. Electric driving range is the only attribute where more electric vehicle owners report to be dissatisfied than satisfied.261 Perceptions remain that ZEVs limit the distance one can travel, and insufficient driving range and the need to charge too often are causing reluctance to buy.262, 263, 264 Current owners report a preferred BEV range of roughly 309 miles and PHEV range of 176 miles.265 The broader U.S. public supports similar ranges, with about half saying they would consider purchasing an electric vehicle if it could drive at least 300 miles on a single charge.266
Manufacturers have responded to market demand by offering vehicles with more than the minimum range required by the regulation. Of the 18 unique ZEV models which earned credit for the 2020 model year, all were certified with a greater than 120-mile electric range.267 This increase in electric range is made possible by decreased battery costs, battery pack capacity increases, and efficiency improvements made to drivetrains and associated components. As explained in more detail in section III.A.3. and Appendix G, staff expects this growth in range to continue. Many manufacturers have announced 300-mile (or more) real-world range BEVs.
Staff is proposing to increase the minimum electric range requirements for ZEVs from 50 miles UDDS range to 200 miles 2-cycle test range (which translates into a 150-mile real world range). Staff is proposing to shift from UDDS-only range to a 2-cycle test range to provide a better correlation with real world range.
The increased minimum range was chosen based on consumer survey responses, meetings with community groups, data from Clean Cars 4268 All, and analyzing daily driving patterns to ensure emissions would be effectively displaced. First, minimum range requirements are important to protect the lowest cost compliance option and guarantee replacement of a gasoline vehicle within a household fleet. Lower-income individuals entering the new vehicle
261 Hardman 2021 262 Morning 2021a. Lisa Martine Jenkins, “The Electric Car Consumers Want: Lower Cost, Higher Mileage”, Morning Consult, Published February 9, 2021, https://morningconsult.com/2021/02/09/energy-efficiency-series-electric-vehicles-consumers-polling/ 263 Green Car 2021a. Green Car Congress, “Strategy Analytics: Overall UX of BEVs Does Not Match Price Point”, Published April 15, 2021, https://www.greencarcongress.com/2021/04/20210414-saux.html 264 Consumer Reports 2021. 265 Hardman 2021 266 Consumer Reports 2020. 267 CARB 2021d. California Air Resources Board. “2020 Zero-Emission Vehicle Credits” https://ww2.arb.ca.gov/sites/default/files/2021-12/2020_zev_credit_annual_disclosure_ac.pdf” Released December 2020. Accessed January 28, 2022. 268 CARB 2021e. California Air Resources Board. EFMP Retire and Replace Program Statistics. September 9, 2021 https://ww2.arb.ca.gov/sites/default/files/2021-09/EFMP%20Website%20Statistics%20Tables%20Cumulative%202021_Q2%2009-21-21.pdf
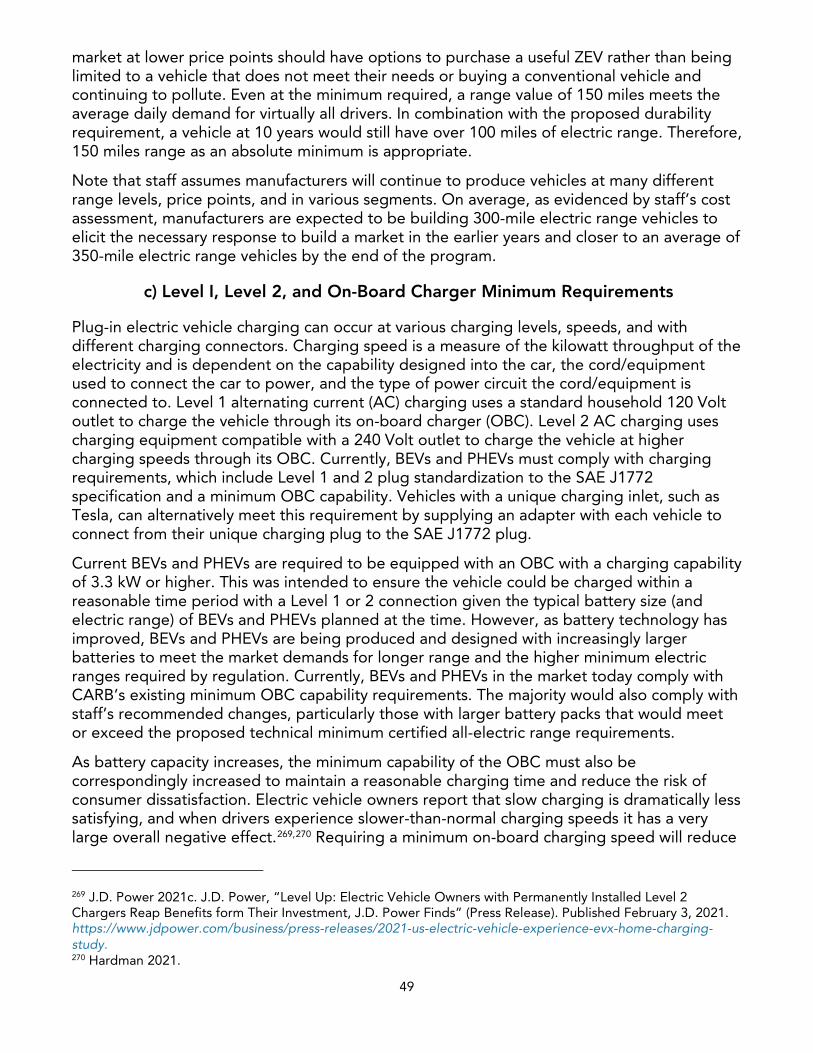
49
market at lower price points should have options to purchase a useful ZEV rather than being limited to a vehicle that does not meet their needs or buying a conventional vehicle and continuing to pollute. Even at the minimum required, a range value of 150 miles meets the average daily demand for virtually all drivers. In combination with the proposed durability requirement, a vehicle at 10 years would still have over 100 miles of electric range. Therefore, 150 miles range as an absolute minimum is appropriate.
Note that staff assumes manufacturers will continue to produce vehicles at many different range levels, price points, and in various segments. On average, as evidenced by staff’s cost assessment, manufacturers are expected to be building 300-mile electric range vehicles to elicit the necessary response to build a market in the earlier years and closer to an average of 350-mile electric range vehicles by the end of the program.
c) Level I, Level 2, and On-Board Charger Minimum Requirements
Plug-in electric vehicle charging can occur at various charging levels, speeds, and with different charging connectors. Charging speed is a measure of the kilowatt throughput of the electricity and is dependent on the capability designed into the car, the cord/equipment used to connect the car to power, and the type of power circuit the cord/equipment is connected to. Level 1 alternating current (AC) charging uses a standard household 120 Volt outlet to charge the vehicle through its on-board charger (OBC). Level 2 AC charging uses charging equipment compatible with a 240 Volt outlet to charge the vehicle at higher charging speeds through its OBC. Currently, BEVs and PHEVs must comply with charging requirements, which include Level 1 and 2 plug standardization to the SAE J1772 specification and a minimum OBC capability. Vehicles with a unique charging inlet, such as Tesla, can alternatively meet this requirement by supplying an adapter with each vehicle to connect from their unique charging plug to the SAE J1772 plug.
Current BEVs and PHEVs are required to be equipped with an OBC with a charging capability of 3.3 kW or higher. This was intended to ensure the vehicle could be charged within a reasonable time period with a Level 1 or 2 connection given the typical battery size (and electric range) of BEVs and PHEVs planned at the time. However, as battery technology has improved, BEVs and PHEVs are being produced and designed with increasingly larger batteries to meet the market demands for longer range and the higher minimum electric ranges required by regulation. Currently, BEVs and PHEVs in the market today comply with CARB’s existing minimum OBC capability requirements. The majority would also comply with staff’s recommended changes, particularly those with larger battery packs that would meet or exceed the proposed technical minimum certified all-electric range requirements.
As battery capacity increases, the minimum capability of the OBC must also be correspondingly increased to maintain a reasonable charging time and reduce the risk of consumer dissatisfaction. Electric vehicle owners report that slow charging is dramatically less satisfying, and when drivers experience slower-than-normal charging speeds it has a very large overall negative effect.269,270 Requiring a minimum on-board charging speed will reduce
269 J.D. Power 2021c. J.D. Power, “Level Up: Electric Vehicle Owners with Permanently Installed Level 2 Chargers Reap Benefits form Their Investment, J.D. Power Finds” (Press Release). Published February 3, 2021. https://www.jdpower.com/business/press-releases/2021-us-electric-vehicle-experience-evx-home-charging-study. 270 Hardman 2021.
50
occurrences and frustrations of “slow charging” and help shift perceptions closer to the convenience car buyers consider reasonable.
Accordingly, staff proposes that all 2026 and subsequent model year BEVs and PHEVs be equipped with an on-board charger with at least an output of 5.76 kilowatts, or capable of providing sufficient power to enable a full charge in less than 4 hours, whichever is lower. Upsizing the OBC also benefits consumers by better ensuring they can take advantage of existing electrical architecture at their residence. The lowest amperage 240 Volt circuit commonly found in residences is a 30 Amp circuit (such as one used for a clothes dryer). By sizing the OBC to at least be able to use 24 Amps (80-percent of the circuit rating as allowed by California Electrical Code) at 240 Volts, the included cord will likely be compatible with any existing 240 Volt circuits in a residence and give the largest number of consumers a reasonably fast maximum charging speed without having to upgrade the cord or the residence wiring. Additionally, in the case of PHEVs, excessive charge times could lead to reduced usage of the electric capacity and increased usage of the gasoline engine undermining the needed air quality and greenhouse gas reductions. Staff expects manufacturers to be able to comply with larger OBCs as they design vehicles that can also meet the proposed technical minimum requirements.
d) Charging Cords
Increasing the ease of home charging is crucial in electric vehicle uptake and retention. Charging is a persistent frustration and barrier to electric vehicle adoption in consumer studies271, 272, 273 and non-residential electric vehicle charging options are generally less convenient and more expensive.274 Additionally, charging dissatisfaction is linked to electric vehicle owners reverting to traditional gasoline vehicles – especially for drivers without Level 2 charging at home.275 As the market expands to lower price point vehicles to appeal to more diverse vehicle owners including used vehicle purchasers, it is important to reduce any barriers, including those rooted in consumer perceptions, that would discourage selection of a BEV or PHEV. If BEVs and PHEVs become the predominant technologies, it is essential those vehicles, in addition to meeting the technical minimum range requirements described above, are able to be charged reasonably quickly which necessarily means at Level 2 speeds in both residential and non-residential settings. Having an appropriate charging cord expands access to charging, easing concerns, and will support market update, thereby ensuring emission reductions from the program.
Current Vehicle Charging Cords. Every BEV and PHEV available on the market today comes with a charging cord: a cord that safely connects an electric vehicle to a standard wall electrical outlet. Though current regulations do not require these cords to be supplied with vehicles, all vehicle manufacturers have provided these cords to the first purchaser of the vehicle to ensure some level of charging capability such as Level 1 charging at a driver’s residence. These included cords have different capabilities across today’s vehicles but
271 Consumer Reports 2021. 272 Consumer Reports 2020. 273 Green Car 2021b. Green Car Congress, “Continental Mobility Study 2020 Finds People Still Have Doubts About EVs”, Published January 8, 2021, https://www.greencarcongress.com/2021/01/20210108-conti.html 274 NREL 2021b 275 Hardman 2021
51
typically provide Level 1 charging capability while the majority of commercially available charging cords and equipment support Level 2 charging to provide owners with faster charging capability. More recently, industry leaders have included dual capability charging cords with their vehicles capable of charging at both Level 1 and Level 2. With such a cord, to take advantage of the faster Level 2 charging speeds, all that is required is for drivers to provide for access to the appropriately sized electrical outlet and circuit at their residence.
Current Vehicle Charging Cord Length. In addition, many included cords are too short in length to be useful to a broad range of consumers with varying access for parking in proximity to an appropriate outlet. A 2012 analysis estimated that approximately half of new car buying households in the United States park vehicles within 25 feet of a 120V outlet.276 While this older research focused on new car buyers, it does illustrate that as the convenience cord lengthens, access to at-home charging expands. Consumers also favor longer charging cords. Tesla was ranked highest overall on the best home charging experience in a recent consumer study with satisfaction scores especially high for their Level 2 permanent charger reliability and cord length,277 which is 24 feet.278 Tesla’s mobile connector is 20 feet long and includes two outlet adapters: one for a standard 120 Volt household outlet and a second adapter for a 240 Volt outlet.279 Rivian trucks and the Ford Mach-e will also come equipped (standard) with a dual capable cord.280,281
Together, the limitations of slower Level 1 charging, need for a dedicated circuit, and shorter cord length only meet the driving (and thus, charging) needs of a small subset of vehicle owners. As a result, many BEV and PHEV drivers have needed to purchase separate Level 2 charging equipment with longer cords either offered by the OEM or by a third-party and many have needed to make electrical modifications to their home or garage to match the needs of the charging equipment. As the market expands to vehicles with larger batteries and a wider range of consumers with higher driving needs and less optimal parking situations, the need for Level 2 capable charging is expanding. Surveys of electric vehicle owners show that most respondents were satisfied with at-home Level 2 charging.282,283 Therefore, a requirement to simplify and expand that access is expected to have a substantial positive effect. While highest satisfaction is associated with using at-home installed Level 2 charging (749 points on a scale of 1,000), using a portable Level 2 charging cord closely follows with satisfaction levels at 741 points according to a JD Power study.284 The lack of Level 2 charging cords as a standard accessory for new BEVs could become a larger barrier
276 NREL 2021b 277 J.D. Power 2021c 278 Tesla 2022a. Tesla, “Wall Connector”, Accessed 1/17/2022, https://shop.tesla.com/product/wall-connector 279 Tesla, 2022b. Tesla, “Mobile Connector”, Accessed 1/17/2022, https://www.tesla.com/support/home-charging-installation/mobile-connector 280 Rivian 2021. Portable Charger Guide https://assets.rivian.com/k534zewngntr/6tSeP1ckHvnfK1Er0P3I3w/0a5ea4d419dcb86019db1e6a3a576b3f/portable-charger-guide.pdf 2021. Accessed February 14, 2022. 281 Ford 2022. Ford Mach-e Specifications. “Charge Capability” and “Ford Mobile Power Cord” https://www.ford.com/suvs/mach-e/?intcmp=charging-bb-vhp-mach-e Accessed February 14, 2022. 282 Hardman 2021 283 J.D. Power 2021c 284 J.D. Power 2021c.
52
to adoption of these vehicles for consumers who are not willing to purchase additional charging equipment.
Dual Voltage Capability. Beyond the length and dual capability, an additional issue with charging cords has emerged. Even with the presence of a compatible 120 Volt or 240 Volt outlet available for charging, there is great variance among households as to the capability of the power circuit and other electrical consumers on the same circuit. For example, an available 120 Volt circuit in a garage might already have other electrical devices such as a spare freezer or garage door opener or a second plug-in vehicle that, when combined with a Level 1 charging cord designed to work at the maximum allowable amperage of a dedicated circuit, could overload the circuit, tripping a breaker and terminating charging. Or a 240 Volt 30 Amp circuit might be readily available in some households, yet a supplied Level 2 charge cord may require a dedicated 50 Amp or larger circuit. In these cases, substantial electrical modifications to the residence are likely necessary even to make use of the supplied charging cord.
Recognizing this need, some manufacturers have already implemented additional features either in vehicle or on the cord itself to allow users to down select and draw power at a lower rate that is compatible with the less capable circuit they are using. For instance, BMW enables users of some PHEVs to reduce the maximum amperage draw during charging through the in-vehicle displays . Additionally, some Hyundai models come with a Level 1 charging cord that has a button on the cord to allow the user to reduce the amperage draw from 12 to 10 or 8 amps. Further, many commercially available Level 2 chargers provide such capability to users that can be selected on the device itself or managed through a connected software program or application. With innovations such as these, a vehicle owner can more readily adapt charging to make use of the supplied cord with existing residence circuits and no additional costs to either modify the home wiring or buy a different charger.
UL Safety Standards. Consistent with UL standards for safety, the user is only allowed to select a lower amperage rate than the cord and plug/outlet configuration is capable of safely handling. As vehicles are already designed to accept varying charge levels at or below the maximum rated charge rate and because precisely controlling the charge rate during charging is a necessary function, vehicles are already designed to accept and control charging at lower amperages. The only feature necessary to meet this capability is providing a method for the consumer to select the amperage either through the charging cord or the vehicle. The addition of such a feature to existing charge management settings is expected to require minimal expense for manufacturers relative to what already exists where a consumer is typically allowed to set preferred days and times for charging to take advantage of favorable electricity rates or ensure a full charge prior to the next planned departure.
Charging Cord Proposal. With these considerations in mind, staff proposes that all 2026 and subsequent model year ZEVs and PHEVs be equipped with convenience cords at the time of vehicle purchase. These cords shall be at least 20 feet in length, which aligns with most commercially available Level 2 chargers and the California Electric Code, section 625.17(C), Part 3, Title 24 of the California Code of Regulations. Cords also must be tested and listed by a nationally recognized testing lab as meeting the UL Standards for Electric Vehicle Supply Equipment (UL2594). These cords must have Level 1 and Level 2 capability, meaning they are able to be used with two or more different plugs that could fit into a standard 110V or 220V outlet. Additionally, staff proposes that a lower charge rate (amperage) can be selectable by the user, either on the cord itself, or through the vehicle user interface. This will help account
53
for unique electrical situations with which a fixed amperage cord would not be compatible, as noted above.
By requiring all vehicles to have an included charging cord that is Level 1 and Level 2 capable, at various amperages, and with a minimum 20-foot length, the cord can meet the charging needs of a much larger portion of vehicle owners. This helps ensure more new and used vehicle buyers will be better situated to choose a ZEV over a conventional vehicle, serving the goal of reducing vehicle emissions. Further, as a basic cord is already included with every BEV and PHEV, the incremental cost to upsize that cord to be more capable in accordance with the proposed requirements is less than the cost a consumer would face to purchase separate Level 2 equipment to meet their needs. And by allowing the consumer to select a lower amperage for charging, the need to modify the home’s electrical circuit to be compatible with the cord is greatly reduced.
e) DC Fast Charging Capability and Inlets
Beyond the Level 1 and Level 2 charging described, direct current fast chargers (DCFC) bypass the vehicle’s OBC to charge the battery directly and more quickly. This allows some vehicles to be charged in just 30 minutes, as opposed to 6 or more hours typically required to charge at Level 1 or Level 2. DCFC capability is not currently required and not available on all vehicles. While many BEVs are equipped with DCFC inlets, some manufacturers have offered some versions of their models without a DCFC inlet or capability.
While the SAE J1772 standard is both required and commonplace for Level 1 and Level 2 charging,285 a singular standard has not been accepted by industry, nor mandated by regulation, for DCFC. Three separate DCFC inlets exist on BEVs deployed in the United States today – CHAdeMO, SAE Combined Charging System (CCS1) Type 1 (SAE J1772), and Tesla’s proprietary connector. While the possibility of one conforming DCFC system has existed for many years, differences in vehicle technologies and business interests have led to continued deployment of the three distinct DCFC connections.
Originally developed by Japanese automakers, CHAdeMO is the longest established, but least deployed, DCFC inlet on current models. Despite its early development, CHAdeMO did not receive support as an SAE standard. In 2011, a consortium of other automakers (BMW, Daimler, Ford, GM, and the VW Group) moved forward in support of the SAE CCS1, which takes the existing Level 1 and Level 2 SAE J1772 plug and adds additional pins for high power DC, eliminating the need for separate low AC and high DC power connections on the vehicle (as needed for CHAdeMO). 286 At around the same time, in 2012, Tesla patented and launched its Supercharger network,287 adding a third fast-charging system with a different
285 CCR, Title 13, section 1962.3 286 Herron, 2016. “EV Fast Charging Standards – CHAdeMO, CCS, SAE Combo, Tesla Supercharger.” Accessed March 26, 2021. https://greentransportation.info/ev-charging/range-confidence/chap8-tech/ev-dc-fast-charging-standards-chademo-ccs-sae-combo-tesla-supercharger-etc.html 287 Tesla 2012. “Tesla Motors Launches Revolutionary Supercharger Enabling Convenient Long Distance Driving.” Accessed March 26, 2021. https://ir.tesla.com/press-release/tesla-motors-launches-revolutionary-supercharger-enabling
54
physical connector.288 Like CCS1, Tesla uses a single receptacle for both AC charging and DC fast charging and initially benefited from having the fastest charge rate.
In addition to the physical differences in connector design, communication methods and protocols also differ among the DCFC systems. To enable DCFC, a connector is plugged into the vehicle whereupon a “handshaking” process is performed. This information exchange between the DCFC equipment and the vehicle is necessary to manage the charging event within the capability of the vehicle and the equipment. While similar, the three DCFC systems do not use identical communication methods for this process – SAE CCS1 uses power line carrier (PLC) communication signals over the J1772 AC pins of the connector, whereas CHAdeMO and Tesla use controller area network (CAN) communications over additional dedicated pins in the connector.289
Though initially targeted primarily for travel corridors to facilitate longer distance traveling and not forecasted to be the main medium for routine charging, DCFC will likely become more prevalent in the future for a few reasons:
1) BEV electric range is growing, as evidenced by the description of technologies found inChapter III.A.3. of this report.
2) As vehicle electric range grows, consumer expectations of the time it takes to charge avehicle are unlikely to change. According to recent surveys, drivers expect to have a similarrefueling experience as gasoline vehicles. This would suggest more drivers may utilize DCFCas a means to recharge longer range BEVs in times closer to that to refuel a conventionalgasoline vehicle.
3) Demographics of ZEV buyers are expanding. The majority of current ZEV buyers areaffluent, single-family homeowners, who tend to have accessible charging at home. A recentsurvey showed roughly one-third of California drivers signal “nowhere to charge at home” isa reason for hesitation in electric vehicle ownership.290 As electric vehicles expand to differentsegments of the population (e.g., wider variety of housing types and geographic locations), itis predicted that the percentage of owners with access to residential charging willdecrease.291,292 As sales increase to meet staff’s proposal for 100-percent electrification by2035, drivers living in rentals and multi-unit dwellings without control over the property toinstall charging systems will become more common. Multi-family dwelling residents andrenters have less residential charging access than drivers living in single-family and ownedhomes.293 These drivers may have limited access to Level 1 or Level 2 charging infrastructure,which can require 8 or more hours to charge a vehicle, and will become more reliant onpublic DCFC to meet routine charging needs. Further, public fast charging is the most
288 Green Car 2011. “Tesla’s 2012 Model S Charging Equipment.” Accessed March 26, 2021. https://www.greencarreports.com/news/1066861_teslas-2012-model-s-charging-equipment-redesign-for-redesigns-sake 289 Yoshida, 2020. “CHAdeMO Charging Standard Future Direction.” Accessed Feb 17, 2020. 290 Consumer Reports 2021 291 NREL 2021b 292 CEC 2022b 293 NREL 2021b
55
common expected charging method among people living in larger apartment buildings (those with more than 12 housing units).294
Without being equipped for DCFC, BEVs will not be able to charge in the shorter times that are more comparable to conventional vehicles, and thus may not be suitable for use by drivers in a way that displaces conventional engines and their associated emissions.
The existence of three different DCFC systems leads to inconsistent and complex charging experiences for consumers. Currently in California, the majority of DCFC connectors are CCS and Tesla, though CHAdeMO has significant availability. This variation complicates expansion of the market for publicly available charging infrastructure at a time when rapid growth is needed for the vehicles that will be produced to meet the proposed ZEV standards. Consumers already can have a hard time with their public charging experience, as evidenced by surveys showing the number one reason for ZEV discontinuance (a term for choosing to buy a non-ZEV after owning a ZEV) is frustration with infrastructure and charging. Measures to simplify charging methods and equipment and increase consistency and availability are essential, especially as the ZEV buying population will continue to evolve to include more drivers dependent on public DCFC.
The CEC projects that in order to meet the Governor’s N-79-20 goals for 2030, 715,000 public and private chargers will need to be deployed, with 24,000 of those being DCFCs.295 If vehicles do not have a standardized DCFC inlet, the deployment of this additional infrastructure will be more complex to protect for the various connectors that vehicles may be equipped with, and consumers will need to take additional steps when planning trips to ensure their vehicle is compatible with the DCFC station they intend to use. If vehicles do not have DCFC capability at all, their ability to be used to replace a gasoline vehicle will be greatly limited to vehicle owners who have very specific and potentially limited travel needs and access to charging. Standardizing to one DCFC inlet will support private and public investment in public DCFC charging equipment and greatly simplify the future charging experience for consumers by ensuring compatibility with their vehicle.
Staff is proposing the SAE J1772 standard for 2026 and subsequent model year BEVs and PHEVs (if they are DCFC charge capable). The majority of manufacturers are already coalescing around the SAE J1772 standard in current vehicle production. For example, in 2020, 13 available BEV models were outfitted with a CCS1 inlet while four BEV models had the Tesla inlet and only two BEV models were outfitted with CHAdeMO. In 2022, 51 vehicle models are expected to have the SAE inlet, six are expected to have the Tesla inlet and two are expected to have the CHAdeMO inlet. Internationally, European Union regulations have standardized DCFC on vehicles and EVSE to the SAE J1772 standard for Europe, commonly referred to as Combined Charging Standard (2) (CCS2), a very similar DCFC charging standard to the standard being proposed here, commonly referred to as CCS1. Choosing the SAE J1772 standard for new vehicles would impact the fewest regulated manufacturers, further standardize charging across the market domestically and internationally, minimize costs, and increase access to charging equipment – all of which leads to greater consumer acceptance and therefore deployment of ZEVs in place of conventional vehicles.
294 Consumer Reports 2020 295 CEC 2021b
56
Additionally, manufacturers with vehicles that do not meet the proposed regulation would have multiple paths to comply and sufficient lead time to comply. Manufacturers could readily design and equip future vehicles with a SAE J1772 compatible inlet since vehicles already have the wire, cooling, necessary processing chips, and inlets for DC charging. This primarily leaves the difference in the communication protocol, and shape and configuration of the connector. Given the lead time in adopting this new proposal, manufacturers have been provided sufficient time to implement such a change during a normally scheduled redesign or refresh interval for the vehicle at little or no additional cost using currently available technology. As an example, Tesla already went through a similar process to switch Model 3 vehicles produced in the U.S. but sold in Europe to be equipped with an SAE J1772-compatible inlet as required by European regulation.296 Further, due to the fewer number of wires and pins required for SAE J1772 versus CHAdeMO, the ability to integrate an SAE J1772 inlet into the same charge door/port on the vehicle as the Level 1 and Level 2 connector, and the higher volume of SAE J1772 connectors expected to be used (leading to increased competition among more suppliers), manufacturers may realize a cost savings by switching to the proposed CCS standard. Alternatively, manufacturers could choose to add the required connector in addition to their alternative connector or provide an adapter to connect between their connector and the required one. This latter method is how Tesla chooses to comply with the current requirements for SAE J1772 compatibility for Level 1 and Level 2 charging.
4. PHEV Allowance and Minimum Technical Requirements
As noted earlier, a PHEV is defined as a vehicle that can draw propulsion power from multiple on-board sources including an internal-combustion engine and a traction battery, with the ability to charge the battery from an off-vehicle power source, such as the electric power grid. Currently, PHEVs are required to have at least 10 miles all-electric range, meet super-ultra-low-emission vehicle (SULEV) emission standards for the engines, and have an extended warranty on emission-related parts. Currently, individual PHEVs earn a variable amount of ZEV credits based on all-electric range and power capability and can be used to meet less than half of a manufacturer’s annual ZEV requirement.
Consumer response to PHEVs has been mixed. As evidenced in the summary of market and technology trends in section III.A.3., PHEV share of the electric vehicle market has declined in recent years, with PHEVs accounting for 30-percent of new electric vehicles sold in the 2021 model year. Manufacturer projections, summarized in section III.C.1., indicate PHEVs will play an even smaller role in the near future.
Staff, through the 2017 ACC Midterm Review, found consumer operation of PHEVs to be highly variable, with a commensurate effect on actual emission reductions and electric vehicle miles traveled. In looking through millions of data points on thousands of ZEVs and PHEVs, staff concluded that electric vehicle miles traveled is highly driver dependent but generally increases with vehicle electric power capability and electric range. Staff have also found the
296 Cleantechnia.com, 2018. “Tesla Model 3 In Europe Will Come With A CCS Charging Port” November 14, 2018. https://cleantechnica.com/2018/11/14/tesla-model-3-in-europe-will-come-with-a-ccs-charging-port/ Accessed January 11, 2022.
57
existence of high-power start emissions from PHEVs.297, 298 According to CARB’s 2017 ACC Midterm Review:
PHEVs could be a significant share of the fleet…and the light-duty vehicle sector would still be on track to meeting its share of emission reductions for the 2030 and 2050 GHG goals. This is due in part to aggressive assumptions in the vehicle sector including PHEVs achieving higher proportions of their miles on electricity, all gasoline vehicles having significant gains in fuel efficiency over time, increases in renewable energy usage, and slower growth in vehicle miles traveled (VMT) from all passenger vehicles. Allowing PHEVs to have a larger role in the future fleet helps to provide additional technology pathways toward meeting California’s long term goals. However…emission benefits from PHEVs are not only affected by vehicle range and architecture but are highly driver dependent, leading to significant uncertainty in future projections.299
Building upon these findings, staff developed its approach to PHEVs for the proposal. Staff believes that PHEVs will still play a role in developing the ZEV market, especially when the goal is 100-percent electrification by 2035. Studies show model diversity and availability are key to driving consumer interest.300,301 PHEVs may also remain a critical choice for low-income drivers as well. According to data from the Clean Cars 4 All program, participants swapped out older vehicles for a plug-in hybrid at four times the rate that they did for a BEV.302 It should be noted, however, that this data represents behavior at a time when very few vehicle models were available to choose from and vehicles had shorter electric range than is expected for the future. Accordingly, the preferences exhibited so far may be a reflection of preferences for other vehicle attributes such as brand, seating or cargo capacity, or vehicle size rather than the powertrain technology itself.
Staff believes that keeping PHEVs as a compliance option within the regulation will better ensure success. However, GHG reduction targets and ambient air quality standards require CARB to balance the risks and emissions from gasoline usage in PHEVs with the need to keep PHEVs as an available option to truly achieve 100-percent of new car sales, expecting some buyers will remain hesitant with fully electric vehicles. As shown in the 2020 Mobile Source Strategy analysis, PHEVs had a limited role but remained in the sales projections and
297 CARB 2017f. California’s Advanced Clean Cars Midterm Review. Appendix G: Plug-in Electric Vehicle In Use and Charging Data Analysis https://ww2.arb.ca.gov/sites/default/files/2020-01/appendix_g_pev_in_use_and_charging_data_analysis_ac.pdf Released January 18, 2017. Accessed January 18, 2017. 298 Staff’s proposal related to changes in testing requirements at the time of certification for PHEVs can be found in section IV.C.5.. 299 CARB 2017g. California’s Advanced Clean Cars Midterm review: Summary Report for the technical Analysis of the Light-Duty Vehicle Standards. Pg. 39-40. https://ww2.arb.ca.gov/sites/default/files/2020-01/ACC%20MTR%20Summary_Ac.pdf Released January 18, 2017. Accessed January 28, 2022. 300Morning 2021b. Lisa Martine Jenkins, “The Coming Electric Vehicle Wave: In 2022, Consumers Get Options”, Morning Consult, Published December 22, 2021. 301 Consumer Reports 2020. 302 CARB 2021e
58
were assumed to have an electric fraction of total vehicle miles traveled (eVMT) of 70-percent or more.303
In addition to proposed changes to testing requirements for PHEVs, staff proposes to impose stringent PHEV technical requirements that functionally emphasize the ZEV capabilities of these vehicles. To that end, staff is proposing updated technical minimum requirements for PHEVs to qualify to be counted toward a manufacturer’s annual ZEV requirement. Staff is proposing a minimum 73 mile 2-cycle all-electric range, (equivalent to 50-mile real world range), and the ability to do at least 40 miles on the US06 drive schedule, an aggressive drive cycle to demonstrate the strength of the vehicle’s electric powertrain capability. This minimum all-electric range requirement is sufficient to cover most driver’s daily driving habits. For means 74-84-percent of new cars and trucks could meet their daily driving needs on all-electric, based on an analysis using CARB’s EMFAC304 model. Even with some degradation, to 87-89-percent of cars and trucks could meet their daily driving needs on all-election operation.
PHEVs with increased ranges are anticipated to replace PHEVs with less range due in part to consumer demand for a more all-electric driving experience. Second generation PHEVs that are now coming to market are offering more range than earlier generation vehicles, and are discussed further in Appendix G.
In addition to minimum range requirements, 2026 and subsequent model year PHEVs need to be certified to super ultra-low (SULEV) emission levels over its useful life305 and have an extended warranty on emission related components for 15 years or 150,000 miles (whichever occurs first), which is in line with the current requirements for PHEVs counting toward a manufacturer’s annual ZEV requirement. As would be required of BEVs, PHEVs would be required at minimum to have a 5.76 kW onboard charger and be equipped with a 20-foot UL certified convenience cord capable of both Level 1 and Level 2 electrical charging, discussed in section III.C.3. Additionally, PHEVs only count toward the manufacturers’ requirements if they comply with the durability, warranty, and battery label requirements described below.
Another conclusion regarding PHEVs from the 2017 ACC Midterm Review was that these vehicles are highly dependent on driver behavior. Staff modeled the effect of high shares of PHEVs with varying eVMT percentages. Staff concluded that though PHEVs can be a significant share of the future fleet, there is a risk of increasing emissions if drivers do not have high eVMT because they do not recharge their vehicles.306 Therefore, staff is proposing regulatory limitations that will help reduce additional risk of emissions associated with PHEVs.
303 CARB 2021a. 304 EMFAC is CARB’s on-road vehicle emission inventory tool. See https://arb.ca.gov/emfac/. It reflects California-specific driving and environmental conditions, passenger vehicle fleet mix, and most importantly the impact of California’s unique mobile source regulations. The current version, EMFAC 2021, is pending U.S. EPA approval to meet transportation conformity and other planning requirements under the federal Clean Air Act. 305 SULEV useful life is defined as 15 years or 150,000 miles, whatever occurs first, per California Code of Regulations, title 13, section 1961.3, and proposed section 1961.4. 306 CARB 2017h. CARB’s Advanced Clean Cars Midterm Review. Appendix F: Scenario Planning: Evaluating impact of varying plug-in hybrid electric vehicle (PHEV) assumptions on emissions. https://ww2.arb.ca.gov/sites/default/files/2020-01/appendix_f_ldf_scenario_planning_ac.pdf Released January 18, 2017. Accessed January 28, 2022.
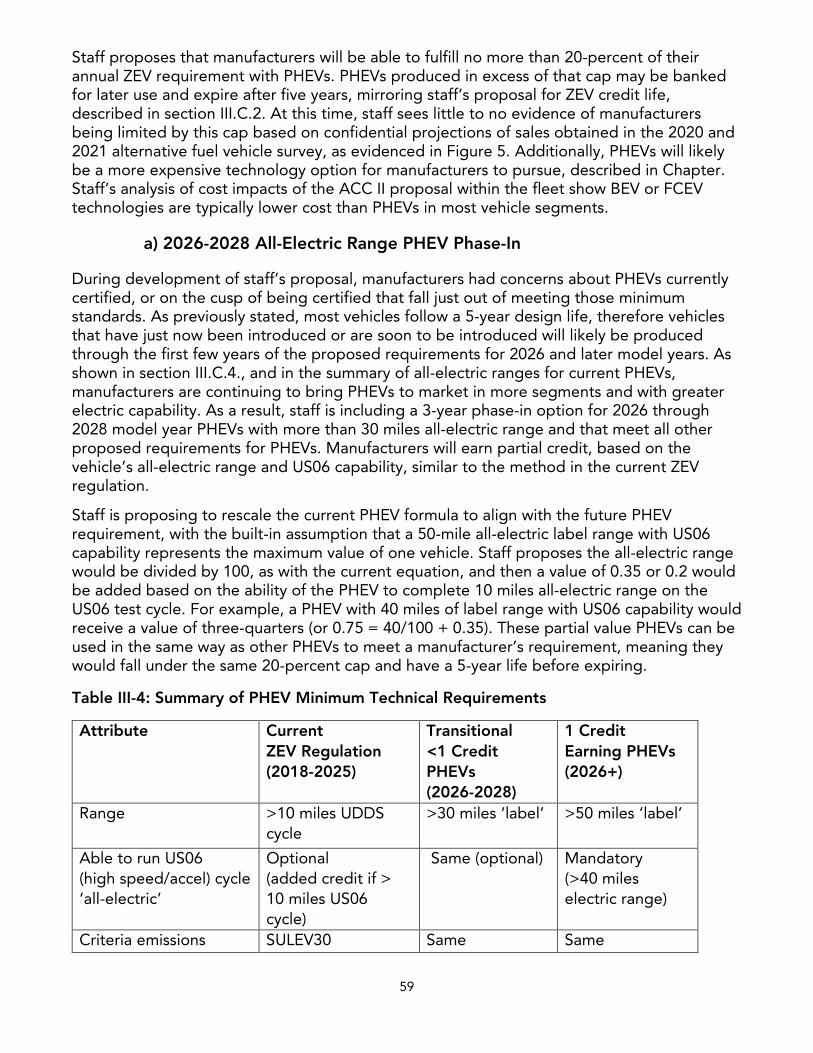
59
Staff proposes that manufacturers will be able to fulfill no more than 20-percent of their annual ZEV requirement with PHEVs. PHEVs produced in excess of that cap may be banked for later use and expire after five years, mirroring staff’s proposal for ZEV credit life, described in section III.C.2. At this time, staff sees little to no evidence of manufacturers being limited by this cap based on confidential projections of sales obtained in the 2020 and 2021 alternative fuel vehicle survey, as evidenced in Figure 5. Additionally, PHEVs will likely be a more expensive technology option for manufacturers to pursue, described in Chapter. Staff’s analysis of cost impacts of the ACC II proposal within the fleet show BEV or FCEV technologies are typically lower cost than PHEVs in most vehicle segments.
a) 2026-2028 All-Electric Range PHEV Phase-In
During development of staff’s proposal, manufacturers had concerns about PHEVs currently certified, or on the cusp of being certified that fall just out of meeting those minimum standards. As previously stated, most vehicles follow a 5-year design life, therefore vehicles that have just now been introduced or are soon to be introduced will likely be produced through the first few years of the proposed requirements for 2026 and later model years. As shown in section III.C.4., and in the summary of all-electric ranges for current PHEVs, manufacturers are continuing to bring PHEVs to market in more segments and with greater electric capability. As a result, staff is including a 3-year phase-in option for 2026 through 2028 model year PHEVs with more than 30 miles all-electric range and that meet all other proposed requirements for PHEVs. Manufacturers will earn partial credit, based on the vehicle’s all-electric range and US06 capability, similar to the method in the current ZEV regulation.
Staff is proposing to rescale the current PHEV formula to align with the future PHEV requirement, with the built-in assumption that a 50-mile all-electric label range with US06 capability represents the maximum value of one vehicle. Staff proposes the all-electric range would be divided by 100, as with the current equation, and then a value of 0.35 or 0.2 would be added based on the ability of the PHEV to complete 10 miles all-electric range on the US06 test cycle. For example, a PHEV with 40 miles of label range with US06 capability would receive a value of three-quarters (or 0.75 = 40/100 + 0.35). These partial value PHEVs can be used in the same way as other PHEVs to meet a manufacturer’s requirement, meaning they would fall under the same 20-percent cap and have a 5-year life before expiring.
Table III-4: Summary of PHEV Minimum Technical Requirements
Attribute Current ZEV Regulation (2018-2025)
Transitional <1 Credit PHEVs (2026-2028)
1 Credit Earning PHEVs (2026+)
Range >10 miles UDDScycle
>30 miles ‘label’ >50 miles ‘label’
Able to run US06 (high speed/accel) cycle ‘all-electric’
Optional (added credit if > 10 miles US06 cycle)
Same (optional) Mandatory (>40 miles electric range)
Criteria emissions SULEV30 Same Same
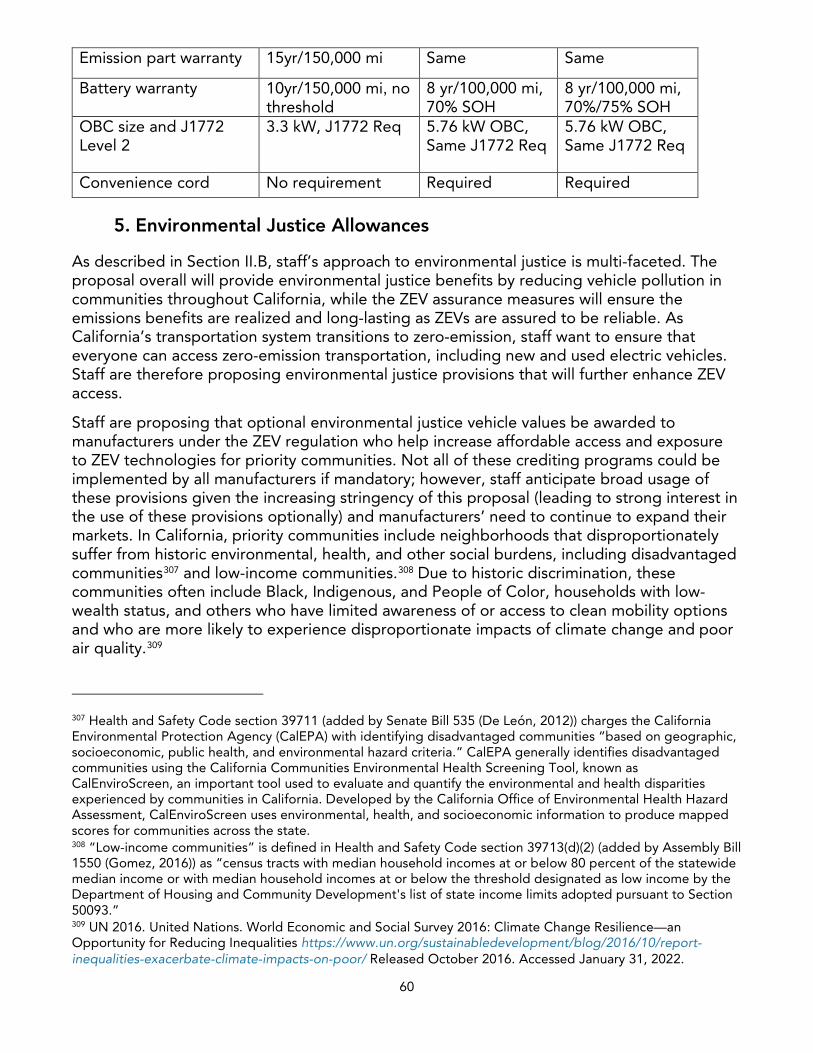
60
Emission part warranty 15yr/150,000 mi Same Same
Battery warranty 10yr/150,000 mi, no threshold
8 yr/100,000 mi, 70% SOH
8 yr/100,000 mi, 70%/75% SOH
OBC size and J1772 Level 2
3.3 kW, J1772 Req 5.76 kW OBC, Same J1772 Req
5.76 kW OBC, Same J1772 Req
Convenience cord No requirement Required Required
5. Environmental Justice Allowances
As described in Section II.B, staff’s approach to environmental justice is multi-faceted. The proposal overall will provide environmental justice benefits by reducing vehicle pollution in communities throughout California, while the ZEV assurance measures will ensure the emissions benefits are realized and long-lasting as ZEVs are assured to be reliable. As California’s transportation system transitions to zero-emission, staff want to ensure that everyone can access zero-emission transportation, including new and used electric vehicles. Staff are therefore proposing environmental justice provisions that will further enhance ZEV access.
Staff are proposing that optional environmental justice vehicle values be awarded to manufacturers under the ZEV regulation who help increase affordable access and exposure to ZEV technologies for priority communities. Not all of these crediting programs could be implemented by all manufacturers if mandatory; however, staff anticipate broad usage of these provisions given the increasing stringency of this proposal (leading to strong interest in the use of these provisions optionally) and manufacturers’ need to continue to expand their markets. In California, priority communities include neighborhoods that disproportionately suffer from historic environmental, health, and other social burdens, including disadvantaged communities307 and low-income communities.308 Due to historic discrimination, these communities often include Black, Indigenous, and People of Color, households with low-wealth status, and others who have limited awareness of or access to clean mobility options and who are more likely to experience disproportionate impacts of climate change and poor air quality.309
307 Health and Safety Code section 39711 (added by Senate Bill 535 (De León, 2012)) charges the California Environmental Protection Agency (CalEPA) with identifying disadvantaged communities “based on geographic, socioeconomic, public health, and environmental hazard criteria.” CalEPA generally identifies disadvantaged communities using the California Communities Environmental Health Screening Tool, known as CalEnviroScreen, an important tool used to evaluate and quantify the environmental and health disparities experienced by communities in California. Developed by the California Office of Environmental Health Hazard Assessment, CalEnviroScreen uses environmental, health, and socioeconomic information to produce mapped scores for communities across the state. 308 “Low-income communities” is defined in Health and Safety Code section 39713(d)(2) (added by Assembly Bill 1550 (Gomez, 2016)) as “census tracts with median household incomes at or below 80 percent of the statewide median income or with median household incomes at or below the threshold designated as low income by the Department of Housing and Community Development's list of state income limits adopted pursuant to Section 50093.” 309 UN 2016. United Nations. World Economic and Social Survey 2016: Climate Change Resilience—an Opportunity for Reducing Inequalities https://www.un.org/sustainabledevelopment/blog/2016/10/report-inequalities-exacerbate-climate-impacts-on-poor/ Released October 2016. Accessed January 31, 2022.
61
The environmental justice vehicle values are aimed at providing manufacturers with incentive for targeted actions that would help achieve more equitable outcomes. The environmental justice vehicle values proposed are allowed to be banked, traded, and used by manufacturers in the 2026 through 2031 model years, further speeding affordable ZEV access in these communities during the critical early years of the program. Staff is also proposing a 5-percent cap on environmental justice vehicle values that could be used in any given year to fulfill a manufacturer’s annual ZEV requirement under the regulation. After the 2031 model year, ZEVs and PHEVs are expected to be the bulk of new vehicle sales, allowing these environmental justice vehicle values to expire. Under the proposal, environmental justice vehicle values can be earned in three ways and are discussed in the following sections.
a) ZEVs and PHEVs sold to a community-based clean mobility program ata discount
The first environmental justice vehicle value option is focused on community programs and intended to increase ZEV mobility and affordable access to clean transportation options for California’s priority communities. Staff is proposing a way for manufacturers to support priority communities’ access to ZEVs through these programs. Staff is proposing to include provisions to allow manufacturers to accrue additional vehicle values for each new 2026 through 2031 model year ZEV or PHEV sold at a discount to qualifying community-based clean mobility programs. Based on feedback from stakeholders, all new vehicles eligible under this community program category must be offered at a minimum 25-percent discount off the base manufacturer’s suggested retail price (MSRP) to earn these additional vehicle values. Credit-able programs would include two programs now in effect in California and could include other similar programs.
The Clean Mobility Options (CMO) Pilot Program, the first of these programs, provides funding for two types of projects, Clean Mobility Projects and Community Transportation Needs Assessments. The goal of the CMO Program is to improve clean transportation access and to increase zero-emission and near zero-emission mobility choices for low-income and disadvantaged communities. To receive CMO funding for clean mobility projects, organizations must conduct a Community Transportation Needs Assessment before applying. Needs Assessments are used to help identify and understand unmet mobility needs of communities and develop solutions in collaboration with residents. Applicants can then apply for up to $1,000,000 to launch and operate a clean mobility project such as ZEV carsharing, ridesharing, ride-on-demand services, and innovative transit services. Mobility projects are meant to bridge transportation gaps and provide connectivity between services and locations. Eligible applicants are public agencies, nonprofit organizations, and tribal governments. For example, using CMO funding and matching funds, the City of Los Angeles Department of Transportation is implementing a carsharing pilot, known as BlueLA powered by Blink Mobility, that includes the construction and installation of 100 carshare stations with 500 charge ports and operation of an electric vehicle carshare program with 300 electric vehicles in disadvantaged communities within the City of Los Angeles.310
310 CARB 2021f. California Air Resources Board. Low Carbon Transportation Investment Project Summaries. https://ww2.arb.ca.gov/sites/default/files/2021-10/fy21-22_fundingplan_appendix_g.pdf Released October 2021. Accessed January 31, 2022.
62
The Sustainable Transportation Equity Project (STEP), the second program, is a new pilot that takes a community-based approach to overcoming barriers to clean transportation in disadvantaged and low-income communities throughout California. STEP provides two types of grants: Planning and Capacity Building Grants and Implementation Grants. STEP aims to address community residents’ transportation needs, increase residents’ access to key destinations (e.g., schools, grocery stores, workplaces, community centers, medical facilities), and reduce greenhouse gas emissions. STEP requires that projects rely on the knowledge and expertise of residents through all phases of project design, implementation, and evaluation and has the flexibility to fund many different types of projects to ensure that STEP funds can help meet the needs of each community within that community’s context. For example, using STEP funding, the Stockton Mobility Collective will help meet the transportation needs of its community by implementing a carsharing project with 30 BEVs.311
With regard to these or similar programs, a manufacturer can earn an additional vehicle value of 0.50 for each ZEV provided at a discount to a qualifying community program and an additional 0.40 value for each PHEV. PHEVs are only eligible for vehicle models with a 6-seat capacity or more. Currently, there are over 20 models of BEVs and FCEVs that provide various options to meet community program needs. Yet, there are not many options for pure ZEVs with more than 5 seats. By allowing PHEVs at this vehicle size, community programs have a few more options, such as today’s Chrysler Pacifica and Mitsubishi Outlander PHEVs.
While CMO and STEP programs would automatically qualify for manufacturers to receive environmental justice vehicle values, staff is also proposing eligibility criteria for other community-based clean mobility programs to qualify. The program must include community-identified mobility options that increase access to clean transportation and zero-emission mobility for communities. Some of these mobility programs may include electric car sharing, ridesharing, vanpools, innovative transit services, or other clean mobility options as identified by the community. To help ensure that the community program meets the needs of the community, the program must be implemented by a community-based organization or Native American Tribe. The community program may also be implemented by a public agency or nonprofit organization that has received a letter of support from a community-based organization or local community group. A manufacturer may request from the Executive Officer (or their counterpart in a state adopting this regulation) a determination that a program qualifies as a community-based clean mobility program by providing applicable information about the program and an attestation from a responsible official of the program implementer.
b) Additional Vehicle Value for ZEVs and PHEVs coming off-lease inCalifornia and delivered to a California dealership for purposes of participating in a low-income used ZEV financial assistance program.
As discussed further in section III.A.6., used vehicles are important for enabling greater access to the cleanest technologies for California’s low-income and disadvantaged communities. Approximately 70-percent of consumers purchase used cars, but the median income of used electric vehicle buyers in California is significantly higher than incomes of
311 CARB 2022f. California Air Resources Board. Sustainable Transportation Equity Project (STEP) Implementation Grant. https://ww2.arb.ca.gov/lcti-stockton-mobility-collective. Accessed January 31, 2022.
63
used gasoline vehicle buyers. 312,313 Used vehicles are often more affordable, both in terms of upfront acquisition cost and ongoing registration and insurance costs. The savings varies among models but, on average, used electric vehicles cost 43 to 72-percent less than new ones.314 With more reliable and durable used ZEVs on the market post-2025 due to the proposed ZEV assurance measures, used ZEVs may help increase access and exposure to the technology.
Leased vehicles are owned by a leasing company, which is typically a financing arm or entity of the vehicle manufacturer. Vehicles enter the used market in various ways, including vehicles coming off of a lease (i.e., returned to the leasing company when the lease term ends). Nationwide, about 1 in 4 new vehicles are leased and not purchased.315 However, CVRP316 statistics of subsidies for drivers to purchase or lease ZEVs show 70-percent of BEVs have been leased.317 This is consistent with other findings that vehicle leasing tends to be higher for newer technologies.318 While the percent of leased ZEVs may decrease over time, newly off-lease vehicles can provide great value in the used vehicle market.
Because leasing companies often are a financing arm of the vehicle manufacturer itself or otherwise have some form of agreement with the manufacturer to be the lease holder, manufacturers typically have some control on where the formerly leased vehicles end up through their off-lease auctioning process. For example, at the end of a lease term, the original lessee (consumer) typically has the right of first refusal to purchase the vehicle. If the lessee declines, then the receiving dealership (where the vehicle was turned in at the conclusion of the lease) is often given the option to purchase the vehicle for resale; otherwise, the vehicle is usually set up for auction to other dealerships.
CARB currently funds two programs that help make clean vehicles accessible and affordable for low-income and disadvantaged communities – Clean Cars 4 All and the Financing Assistance for Lower-Income Consumers Program. Clean Cars 4 All is a program that focuses on providing incentives to lower-income California drivers to scrap their older, high-polluting car and replace it with a zero- or near zero-emission replacement. The Financing Assistance for Lower-Income Consumers Program provides grants and affordable financing to help lower-income consumers purchase or lease a new or used hybrid or electric vehicle. Through 2020, approximately 75-percent of Clean Cars 4 All grants have been awarded for used vehicles, with some regions, such as the San Joaquin Valley, higher than this average with 97-
312 Consumer Reports 2019. New survey shows strong support for electric vehicles across economic spectrum. https://advocacy.consumerreports.org/press_release/evsurvey2019/ July 2019. Accessed January 31, 2022. 313 Turrentine 2018. 314 Edmunds 2018. 315 NADA 2021b. National Automobile Dealers Association. NADA Data 2021: Annual Financial Profile of America’s Franchised New-Car Dealerships. https://www.nada.org/WorkArea/DownloadAsset.aspx?id=21474864928 Accessed January 31, 2022. 316 The Clean Vehicle Rebate Project (CVRP) promotes clean vehicle adoption in California by offering rebates from $1,000 to $7,000 for the purchase or lease of new, eligible ZEVs and PHEVs. (See https://cleanvehiclerebate.org/en/cvrp-info.) It is administered under Health & Saf. Code, § 44258.4. 317 CSE 2022. Center for Sustainable Energy for the California Air Resources Board Clean Vehicle Rebate Project. Rebate Statistics. Data last updated February 2,2022. https://cleanvehiclerebate.org/en/rebate-statistics Retrieved February 2, 2022 318 ICCT 2021b. Tankou, A., Lutsey, N., & Hall, D. The International Council on Climate and Transportation. Understanding and Supporting the Used Zero-Emission Vehicle Market. https://theicct.org/wp-content/uploads/2021/12/ZEVA-used-EVs-white-paper-v2.pdf December 2021. Accessed January 31, 2022.
64
percent of used vehicles in the program. In analyzing data from the Clean Vehicle Assistance Program, staff also found that used vehicles also tend to be purchased at higher rates by our lowest income consumers.319
In CARB’s ACC Midterm Review, staff noted that of the electric vehicles originating in California, a greater share was transferred to other states when compared to gasoline cars, suggesting that there may be a higher demand for (or more limited supply of) used ZEVs in these states and that electric vehicles may be migrating out of the state at faster rates than conventional cars.320 Likewise, for electric vehicles originating in Section 177 ZEV states, historically a sizeable share was transferred to other states and at a greater rate than gasoline-only vehicles are transferred. The re-sorting of used electric vehicles across states often results from the activity of dealerships who purchase the used electric vehicles from previous owners or reclaim ownership after the end of a lease. Rather than selling the car on their own used car lot, dealers will often sell the car to another dealer via an auction clearinghouse.
Staff are proposing that ZEVs and PHEVs originally leased in California with an MSRP of less than or equal to $40,000 when new, adjusted for inflation, can earn an additional 0.10 vehicle value, if the vehicle is subsequently sold to a dealership participating in a financial assistance program for used ZEVs, including Clean Cars 4 All and the Clean Vehicle Assistance Program. The proposal aims to increase the supply of vehicles to dealerships participating in these programs, thereby increasing access to more affordable used ZEVs for consumers. To qualify, these off-lease ZEVs and PHEVs must be 2026 through 2028 model year vehicles. This is important because starting in the 2026 model year and beyond, ZEVs and PHEVs will need to meet more stringent ZEV assurance requirements and technical requirements, which means greater certainty of used ZEVs and PHEVs that will meet drivers’ needs.
As noted, these off-lease ZEVs and PHEVs must have had an MSRP value equal to or lower than $40,000 when they were new.321 This provision captures the intent of increasing access to more affordable ZEVs. Staff’s proposal is that this MSRP value would be determined by the minimum base model price. Most BEVs and PHEVs available would be eligible, while vehicles excluded will largely be higher end luxury class vehicles, such as many of those from BMW, Jaguar, Mercedes Benz, as well as Tesla Models S and X.
This environmental justice vehicle value category would follow the same phase-out in 2031 as the other optional environmental justice allowances. As proposed, vehicle values can only be generated by model year 2026 through 2028 vehicles, which would likely be earned in 2029 through 2031 calendar years as they finish a typical three-year lease term. For example, a model year 2026 BEV leased for three years would be returned in 2029 calendar year. If the BEV was then sold to a California dealership that participates in an eligible financial assistance program, the manufacturer would earn an additional 0.10 environmental justice vehicle value in 2029.
319 CVAP 2022. Clean Vehicle Assistance Program. Program Learnings & Data Transparency. https://cleanvehiclegrants.org/program-data/. Accessed January 31, 2022. 320 CARB 2017d 321 MSRP as defined by US Code, title 15, section 1232(f)(1)
65
c) Low MSRP ZEVs and PHEVs
As previously stated, the early adopter ZEV market has generally excluded priority communities. Adoption of both new and used electric vehicles in disadvantaged communities occurs at very low rates – 5.7-percent and 8.7-percent of electric vehicle sales, respectively.322 Owners of electric vehicles in disadvantaged communities tend to have lower income than electric vehicle owners in non-disadvantaged communities.323 As discussed in section III.B.5, lower income households represent a much larger share of gasoline vehicle purchases compared to electric vehicle purchases.324 Furthermore, when counting both new and used vehicle purchases, Black and Latino car buyers account for 41-percent of gasoline vehicle purchases, but only 12-percent of electric vehicle purchases.325 At the same time, research has shown that savings from ZEVs relative to income are significantly higher for low-income households, Black, Indigenous, and People of Color, and households in areas with higher levels of pollution.326
To help address this electric vehicle adoption disparity, staff is proposing to increase affordable access to ZEVs and PHEVs by providing an incentive for manufacturers to offer lower priced vehicles. This is especially important in the earlier years of the proposed ACC II program when battery costs are higher. Incremental vehicle costs of ZEVs and PHEVs are anticipated to remain above the cost of conventional vehicle technology in the near term and through the first few years of the ACC II program. These higher costs are likely to be passed onto consumers and reflected in part or in whole in the price of new vehicles. Affordability of ZEVs and PHEVs, particularly the upfront vehicle price, is one of the biggest barriers for consumers deciding on whether to purchase an electric vehicle over an ICEV. Cost reductions in new ZEVs could also lead to decreased used ZEV prices and cost parity for low-income households, where the higher rates of depreciation for first owners will lead to larger benefits for second owners.327
Staff is proposing that a 2026 through 2028 model-year ZEV or PHEV delivered for sale with an MSRP less than or equal to $20,275 for passenger cars and less than or equal to $26,670 for light-duty trucks can earn an additional 0.10 vehicle value. Each of these MSRP values will be recalculated to adjust for inflation on an annual basis. Passenger cars include vehicle classes such as sedans, hatchbacks, and station wagons, and light-duty trucks include vehicles such as SUVs, minivans, and pickups.328 To avoid the risk that incentivizing lower priced ZEVs
322 Canepa et al 2019. 323 Canepa et al., 2019 324 Muehlegger et al., 2018. 325 Muehlegger et al., 2018. 326 ICCT 2021b. 327 Busch 2021. Busch, C. Energy Innovation Policy & Technology LLC. Used Electric Vehicles Deliver Consumer Savings Over Gas Cars: Policy Implications and Total Ownership Cost Analysis for Non-Luxury Used Cars Available To California Consumers Today. https://energyinnovation.org/wp-content/uploads/2021/06/Used-Electric-Vehicles-Deliver-Consumer-Savings-Over-Gas-Cars.pdf June 2021. Accessed January 31, 2022. 328 “Light-duty truck” means any 2000 and subsequent model motor vehicle certified to the standards in section 1961(a)(1) or 1961.2 rated at 8,500 pounds gross vehicle weight or less, and any other motor vehicle rated at 6,000 pounds gross vehicle weight or less, which is designed primarily for purposes of transportation of property or is a derivative of such a vehicle or is available with special features enabling off-street or off-highway operation and use.
66
and PHEVs could result in vehicles with inferior electric drive systems, staff is proposing that eligible vehicles be model year 2026 or later to ensure the vehicles meet the proposed minimum technical requirements and ZEV assurance measures.
Under federal statute, every manufacturer of new automobiles distributed in commerce must affix to the windshield or side window a label containing information concerning the vehicle, also known as the Monroney sticker.329 Part of the required information includes the retail price suggested by the manufacturer, the retail delivered price for each accessory or optional equipment, the amount charged for delivery of the vehicle to the dealer, and the total price. MSRP for this proposal means the base retail price of the vehicle suggested by the manufacturer;330 it does not include options or destination charges.
Staff analyzed the MSRP of model-year 2021 passenger cars and light-duty trucks currently registered in California with the Department of Motor Vehicle (DMV) to set the MSRP thresholds. The DMV information does not include MSRP for additional options or upgrades to the base model; however, it is possible to differentiate between the trim levels of a given vehicle model. The MSRP values derived from this analysis were based on the 2021 model year and accordingly, may be inappropriate to achieve the same purpose in the 2026 and subsequent model years. By adjusting the values with a consumer price index (CPI) published by the United States Bureau of Labor Statistics specific to new vehicle prices, the MSRP value should better track the intended target of the lowest 10th percentile for the 2026 through 2028 model years.331
6. Early Compliance Values
Staff’s proposal requires 35% of new vehicles delivered to California to be ZEVs or PHEVs in 2026 model year. The Midterm Review showed manufacturers could deliver 7% in the Section 177 ZEV states, and at 8% in California, of new vehicles as ZEVs and PHEVs and still be in compliance with a significant bank of credits in 2026 model year. Current compliance after 2021 model year shows manufacturers to be on track with those 2017 predictions in the States, and far above that path in California. 332 This proposal is intended for manufacturers to deliver greater volumes of ZEVs and PHEVs as early as possible, to ensure a path toward proposed increased requirements starting in 2026 model year.
One of the bases for staff’s ZEV stringency proposal was the manufacturer generated 2021 projections, summarized in Figure 3, of projected sales in 2023, 2024, and 2025 model year. At an individual level, manufacturers showed varying levels of ZEV and PHEV sales in those years, building on 12% California sales volume in 2021 model year.
However, given the current state of car production and sales worldwide, there could be setbacks that may affect these projections. Additionally, as mentioned in Section III.A.2,
329 Gov Info 2022. 15 U.S.C. 1232 - Label and entry requirements. https://www.govinfo.gov/content/pkg/USCODE-2011-title15/pdf/USCODE-2011-title15-chap28-sec1232.pdf. Accessed January 31, 2022. 330 as defined by US Code, title 15, section 1232(f)(1) 331 BLS 2022. CPI for All Urban Consumers, new vehicles index, new vehicles in U.S. city average, all urban consumers, not seasonally adjusted, U.S. Bureau of Labor Statistics, https://data.bls.gov/timeseries/CUUR0000SETA01 332 CARB 2017e.
67
supply shortages in critical minerals may have an effect in the near term. Staff is proposing a regulatory mechanism that incentivize manufacturers to deliver on those projections prior to the start of the new regulation requirements, and a potential way to bring up sales in the worse-case scenario if setbacks continue.
The proposal rewards progress above current market shares, and thus is calibrated to award value depending on sales averages in states with greater or lesser current market development – thereby rewarding progress in states still coming up to speed, or accelerated progress in more developed markets, while not diluting overall regulatory requirements. Staff proposes to allow manufacturers who deliver for sale more than 20% new vehicle sales on average in in the two model years prior to the new ZEV regulation requirements, in a state that has a total sales average above 7% ZEVs and PHEVs in 2020 through 2022, may optionally bank values associated with those vehicles above 20% sales for use in 2026 through 2028 model year. For those states that have a 2020 through 2022 ZEV and PHEV sales average below 7%, manufacturer who deliver for sale more than 7% new vehicle sales on average in the two model years prior to the new regulation requirements can earn values to use in first three years after the new ZEV regulation requirements commence. These early compliance values may meet up to 15% of a manufacturer’s annual ZEV requirement and are treated as though they were earned in the model year. For example, a manufacturer with an obligation of 100 in 2026 model year could fulfill its obligation with 85 ZEV values from 2026 model year and 15 ZEV values from 2024 and 2025 model years.
7. SVM treatment
Staff propose to treat “small volume manufacturers” – essentially makers of custom and specialty vehicles like some high-end sedans – slightly differently. Because small volume manufacturers often certify only one or two test groups representing less than 3-percent of California’s light-duty vehicle market and have fewer resources for development of new products, staff proposes to require manufacturers who deliver for sale less than 4,500 light-duty vehicles annually in California to submit a compliance plan by the end of 2032 and to meet the requirement no later than the 2035 model year. This would ensure a path for all manufacturers certifying light-duty vehicles in California to be in compliance with 100-percent ZEV or PHEV sales beyond the 2035 model year but provide significant flexibility in recognition of the unique situations of each of these manufacturers and their limited product offerings. Many of these high-end manufacturers have introduced plans for a ZEV model, as shown in the complete list of upcoming models in Appendix G.
8. Summary of ZEV Regulation Proposals
Overall, staff’s ZEV regulation proposal reflects a balance of stringent annual ZEV requirements, minimum technology requirements, and appropriate flexibilities that will put California, and the states that adopt California’s ZEV regulation on a path to 100% electrification by 2035 model year.
Table III-5: Summary of ZEV Regulation Proposals
Proposal Category Description of Proposal
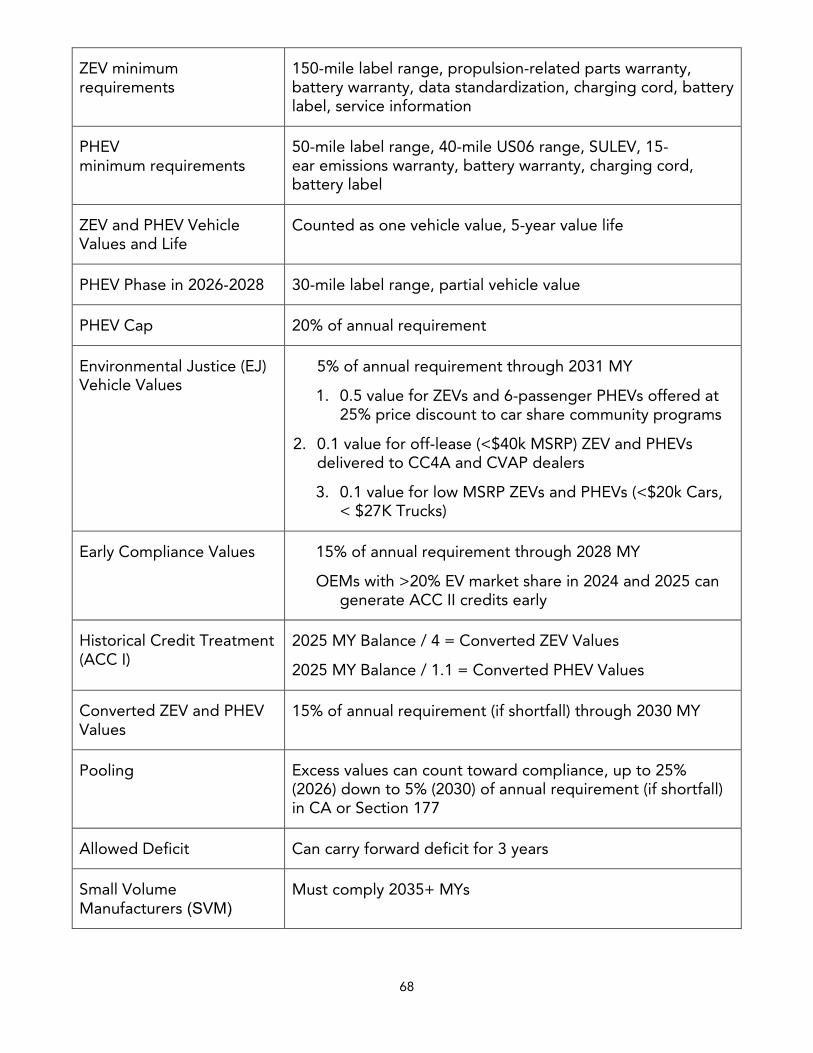
68
ZEV minimum requirements
150-mile label range, propulsion-related parts warranty,battery warranty, data standardization, charging cord, batterylabel, service information
PHEV minimum requirements
50-mile label range, 40-mile US06 range, SULEV, 15-ear emissions warranty, battery warranty, charging cord,battery label
ZEV and PHEV Vehicle Values and Life
Counted as one vehicle value, 5-year value life
PHEV Phase in 2026-2028 30-mile label range, partial vehicle value
PHEV Cap 20% of annual requirement
Environmental Justice (EJ) Vehicle Values
5% of annual requirement through 2031 MY
1. 0.5 value for ZEVs and 6-passenger PHEVs offered at25% price discount to car share community programs
2. 0.1 value for off-lease (<$40k MSRP) ZEV and PHEVsdelivered to CC4A and CVAP dealers
3. 0.1 value for low MSRP ZEVs and PHEVs (<$20k Cars,< $27K Trucks)
Early Compliance Values 15% of annual requirement through 2028 MY
OEMs with >20% EV market share in 2024 and 2025 can generate ACC II credits early
Historical Credit Treatment (ACC I)
2025 MY Balance / 4 = Converted ZEV Values
2025 MY Balance / 1.1 = Converted PHEV Values
Converted ZEV and PHEV Values
15% of annual requirement (if shortfall) through 2030 MY
Pooling Excess values can count toward compliance, up to 25% (2026) down to 5% (2030) of annual requirement (if shortfall) in CA or Section 177
Allowed Deficit Can carry forward deficit for 3 years
Small Volume Manufacturers (SVM)
Must comply 2035+ MYs
69
D. ZEV Assurance Measures
The ACC II proposal is intended to meet multiple requirements and goals to reduce air pollution, protect public health, and stabilize the climate over the long term. Its success over the long term is dependent on ZEVs and PHEVs permanently displacing all new conventional internal combustion gasoline and diesel engine vehicle sales in California by 2035 and sustaining consumer use of such vehicles over their full useful lives to permanently eliminate emissions from conventional vehicles. This means that the ZEV vehicle fleet is critical to pollution control, and if they fail to meet the drivers’ needs, a ZEV may be replaced with a new or used conventional vehicle – a concern that has been observed in ZEV discontinuance and that intensifies as ZEVs age and compete on the used vehicle market. CARB has long designed its regulations and certification systems to ensure that vehicles, including their emission controls, perform properly throughout their life. In the ZEV context, this proposal continues that approach. To secure the emission benefits of this proposal, ZEVs must meet continuing assurance requirements throughout their lives.
As staff worked through its proposal, it became clear that there would need to be targeted measures designed to ensure these ZEVs and PHEVs remain a viable choice for all consumers. These measures focus on the vehicle characteristics needed to ensure that an ordinary new vehicle consumer chooses and retains a ZEV and replaces a gasoline vehicle within their household fleet, and that used vehicle purchasers can make the same choice. To this end, staff is proposing requirements for durability, warranty, battery labeling, and serviceability, which are collectively called the ZEV assurance measures. These measures individually and collectively reduce emissions by ensuring that the vehicles perform as needed to fully and permanently displace ICEVs, providing consumer confidence and reliability so that ZEVs penetrate both the new and used vehicle markets.
Such requirements also have important distributional equity implications, as they can assure the performance of vehicles bought used – when most people buy vehicles – and when vehicles are more affordable for lower-income consumers. Thus, the ZEV assurance measures can support access to reliable ZEVs in communities that may not be buying new vehicles, but which do need reliable, durable, and clean mobility options.
CARB has a long history of ensuring vehicles meet emissions standards over their lifetimes. Currently, ICEVs are required to not only meet criteria pollutant standards, but can be recalled if they do not meet certification standards throughout the vehicle’s defined useful life, which are broadly called durability standards. Manufacturers are also required to provide a minimum warranty on the emission control systems, and vehicles must be equipped with onboard diagnostics (OBD) to track and diagnose emission failures over the defined useful life of the vehicle. Lastly, manufacturers must provide repair information and make available the necessary tooling to non-dealer repair shops. Together these requirements help to control the emissions of the ICEVs over the life of the vehicles and ensure that emission control failures are diagnosed and able to be repaired quickly.
The aforementioned regulatory requirements apply to vehicles with emissions. CARB has not previously applied these requirements to ZEVs. Currently, the only law that provides consumers with some protections in the event of a faulty ZEV is California Civil Code, section
70
1793.2, more commonly known as the “Lemon Law.”333 This applies to vehicles that are defective and cannot be repaired after a “reasonable” number of attempts or length of time. The Lemon Law is limited, as it only applies to new vehicles purchased or leased that are still under a manufacturer’s new vehicle warranty. Though this law serves an important consumer protection function, it does not address how usable a vehicle is over its life. The current legal gap in protections for aspects of ICEVs and ZEVs that implicate emissions could seriously impair ZEV adoption unless corrected, as consumers desire confidence that their vehicles will function properly over the vehicles’ entire lifetime. CARB’s regulatory authorities allow for an important gap-filling set of measures, consistent with CARB's long history of including consumer assurance provisions that protect emissions benefits, in this proposal to ensure consumers’ ZEV uptake that displaces ICEVs.334
The ACC II requirement for ZEV assurance measures is intended to support ZEV displacement of ICEVs by making electric vehicles competitive with the durability, warranty, and serviceability car owners have come to expect with traditional gasoline vehicles. Car buyers currently view electric vehicles as lacking compared to traditional gasoline counterparts, and they have concerns about higher maintenance costs, fewer mechanics to fix issues, and faster depreciation.335 Reservations also persist regarding battery life and the costs associated with battery replacement.336, 337, 338 For new car buyers who anticipate eventual resale on the used market, fear of faster depreciation may generate concern about salability and resale value. Similar uncertainty is further amplified in the used market since used buyers are less likely to consider electric vehicles.339 Used car buyers appear to want to limit their financial risk and are shown to purchase more protection products, like extended warranties, tend to be on tighter budgets, and have lower credit ratings.340
ACC II requirements to guarantee access to service information, assure minimum durability, and provide the protection of minimum warranties will help build confidence that a technology switch to reduce emissions is manageable and safe. The proposed ZEV assurance measures are designed to function both individually and collectively to promote consumer uptake and retention of ZEVs and protect the emissions benefits of ACC II. No single measure could address all technical aspects of ZEV operation and performance to ensure that they effectively displace conventional engines and their emissions, along with all related
333 California Civil Code, section 1793.2 et seq. 334 Statute requires CARB to adopt rules and regulations that are necessary, feasible, and cost-effective and achieve the maximum emissions reductions to meet federal and State ambient air quality and State GHG emission obligations. (E.g., Health & Safety Code, §§ 38560, 39602.5, 43013, 43018, 43018.5, 43101, 43104, 43105.5, 43205, 43210.5.) These mandates are not limited to direct emission standards or controls but also include, for example, data reporting, durability and performance improvements, warranty measures, and compliance procedures. (Ibid; see also Engine Manufacturers Association v. State Air Resources Board (2014) 231 Cal.App.4th 1022, 1036-37.) CARB is further obligated to “adopt standards, rules, and regulations” and “do such acts as may be necessary for the proper execution of the powers and duties granted to, and imposed upon, [it].” (Health & Safety Code, §§ 39600, 39601.) 335 MacInnis 2020. 336 Cox 2021a. 337 MacInnis 2020. 338 Cox 2019. Cox Automotive, “Overcoming Electric Vehicle Misconceptions is Crucial to Converting Consideration to Sales” (Press release), Published August 19, 2019. Accessed February 11, 2022. 339 Hardman 2021. 340 Ellencweig et al., 2019.
71
consumer priorities and concerns. The proposed ZEV assurance measures are necessary to address varied operating characteristics and consumer needs and priorities for household transportation: durability for vehicle longevity and value retention; warranty for vehicle longevity and peace of mind in avoiding costly unexpected repairs; and data availability for transparency to drivers and prospective used vehicle purchasers, reassurance about vehicle component health, and availability and convenience of service options. Combined, these measures help ensure that ZEVs meet consumers’ needs for household transportation so that consumer ZEV adoption will be sufficient to reduce emissions as intended and combustion engines will be displaced. This is key for ZEV technologies to be widely adopted as a trusted choice in both the new and used vehicle markets.
1. On-Vehicle Data Standardization
Access to data has been an important cornerstone of CARB regulations for gasoline vehicles, and it will continue to be important for ZEVs and PHEVs as the market grows. Staff sees this importance throughout the life of the vehicle. First, purchasers of a ZEV have a right to understand the vehicle’s need for repair and warranty qualifications. Prospective drivers, especially in the used vehicle market, should have the ability to evaluate the state of the vehicle and health of the battery (a high-cost component for repair) to encourage them to purchase a ZEV over a conventional vehicle and to be able to appropriately value individual used ZEVs. Repair technicians, particularly independent technicians, need to be able to access vehicle data, diagnostic tools, and manufacturer developed diagnostic and repair information to assess the vehicle’s need for repair and carry out necessary repairs appropriately. Those in the battery repair or reuse industry need key data from the battery management system to better assess the remaining life of the battery and potential second life applications. CARB also has use for vehicle data for a suite of reasons including being able to carry out official tests, to understand in-use operation to ensure official tests are representative of such operation, to better understand impacts on the grid to refine future actions and policies, and to enable future in-use compliance test programs to ensure the regulations achieve their intended outcome of reducing emissions.
One key metric staff is proposing to be implemented on 2026 and subsequent model year BEVs is a “state of health” of the battery. The purpose of this metric is to disclose to the driver, to a repair technician, a prospective buyer, or to a battery rebuilder or re-purposer, the current level of deterioration in the battery relative to when it was new. Staff propose for battery state of health to be correlated to usable battery energy; a specific quantity that is determined by defined testing procedures carried out in a laboratory in accordance with the procedures of SAE J1634. This SAE procedure was developed by industry, agency, and laboratory representatives for the purposes of testing electric vehicles and has been refined over the years. It is also the basis for all electric vehicle testing required by CARB and the U.S. EPA for certification of electric vehicles. With the proposal, the reported battery state of health would be required to report a value normalized from 0 to 100-percent (when the battery is new) and representing a usable battery energy that is no more than 5-percent higher than the actual usable battery energy determined from testing. Lastly, staff proposes that, in addition to this state of health being accessible by a standardized automotive service tool, that it would also be able to be displayed to the driver, in vehicle, without the use of a tool (e.g., through a dashboard display), and that this metric be linked to the minimum battery warranty requirements, further discussed in section III.D.3. The information provided by this parameter would provide consumers (particularly potential used vehicle purchasers)
72
with certainty about the remaining life of the battery or its current capability in a readily understandable format.
Along with state of health of the battery, staff propose additional data parameters and commands that must be standardized and accessed through a common vehicle connector and scan tool. The parameters include data such as vehicle speed and battery voltage and current needed to properly quantify the performance of the vehicle during testing. The data also include a set of historical data to track key parameters such as total energy into the vehicle and average energy usage during driving to verify certification data is representative of in-use operation and to be able to track degradation that may occur over time. Lastly, the standardized commands include the ability for repair technicians to read propulsion-related fault codes when a problem has been detected by the vehicle. This requirement ensures that independent technicians have access to basic information needed to help diagnose and repair vehicles, which further supports consumer confidence in purchasing new and used ZEVs.
To facilitate manufacturers implementation of these standardized data requirements, the proposal includes a two-year phase-in where 40-percent of a manufacturer’s 2026 model year applicable vehicles and 100-percent of the 2027 model year would be required to meet the requirements. As with many phase-ins, an allowance exists for manufacturers to implement an alternative phase-in as long as it achieves an equivalent introduction of vehicles by the 2027 model year. Small volume manufacturers are exempt from the phase-in and provided an extra year to be compliant (no later than the 2028 model year). Further, as the requirements include a multiple data parameters, the proposal includes a deficiency provision whereby, in the 2026 through 2029 model years, manufacturers can still certify a test group as meeting the requirements even if it falls short of fully implementing all of the parameters. This provision, which is similar to provisions for internal combustion engine vehicles in the onboard diagnostic regulations, provides additional flexibility for manufacturers in the first four years of implementation to manage the roll-out across their product line at a time when they are both introducing new ZEV models and refreshing or redesigning existing ZEV models. The deficiencies are only available for shortfalls in the data parameters that and cannot be used to certify vehicles that fail to implement the required connector, communication protocol, or the requirement to display to the driver the battery state of health information and the rate of charging information. These elements are critical pieces to both data standardization and to increasing transparency to vehicle owners to facilitate consumer acceptance of ZEVs.
2. Durability
Today’s gasoline vehicles are required to not only meet criteria pollutant standards when new but throughout the vehicle’s defined useful life.341 This effectively ensures a minimum durability of the vehicle’s emission controls and thus, acceptable emission performance for that period of time and miles. Currently, light-duty vehicles are designed and certified to stay below specific emission levels for a useful life of 15 years or 150,000 miles, whichever occurs first. Manufacturers are also required to test in-use vehicles within each test group as the cars age to verify they are meeting the standard. CARB also carries out such testing and, if a
341 E.g., California Code of Regulations, tit. 13, §§ 1961.2, 1968.2, 1968.5.
73
representative sample of vehicles within a test group indicates the test group as a whole has a problem, CARB can require appropriate remedies to bring that test group into compliance with the standard including recall.
ZEVs have not previously been brought into these types of requirements because volumes have been low, the technology has been evolving, and the resultant air quality consequences of a non-durable ZEV were far less than that of a gasoline vehicle with tailpipe emissions. Knowing the long-term air quality needs for ZEVs required bringing the vehicles to market sooner than they would be developed on their own, staff has prioritized providing time for the technology to mature and manufacturers to gather data crucial to furthering the technology. To support a full transition to clean technology in the new and used light-duty fleet and be successful in dramatically reducing emissions, however, it is necessary to ensure ZEVs have adequate durability to meet consumers’ expectations.342 Failing to do so would unnecessarily risk continued consumer hesitancy to accept the new technology, further delaying or weakening the needed transition to clean vehicles. In addition to increased consumer confidence, creating durability requirements for batteries will lead to reduced battery degradation and therefore less battery replacements. This has a benefit of reducing battery manufacturing impacts of facility emissions and sourcing of raw minerals, as well as slowing down the need for battery recycling and reuse activities.
Accordingly, staff proposes that BEV and FCEV test groups must be designed to maintain 80-percent or more of the original (as new) certified combined city and highway test range (see section III.C.3. for minimum technical requirements for ZEVs) for 10 years or 150,000 miles, whichever occurs first. With this requirement, vehicle owners could have reasonable confidence in the level of degradation in battery capacity, and thus range, that they may see during their term of ownership of the vehicle rather than be faced with uncertainty that might dissuade them from ZEV ownership. Based on discussions with vehicle manufacturers, suppliers, and review of continued development, most manufacturers appear poised to meet this requirement, for an average consumer, on newly introduced products. And with further improvements in battery chemistry, construction, battery management, and thermal management during usage and charging in the lead time provided by this proposal, staff expects all manufacturers will be able to meet this requirement in 2026 and subsequent model years.
Battery state of health data for Nissan Leaf vehicles from the 2013 through 2019 models showed that the later models had reduced battery degradation, due to improved battery management strategies and battery technology. The 2013 model had 3-percent degradation the first year and 8.9-percent degradation by the third year whereas the 2016 model had 2.3-percent degradation the first year and 6.9-percent degradation by the third year. The 2017 model had 2-percent degradation the first year showing even further improvement from previous years. From this same database, an average decline across the 21 vehicle models is 2.3-percent per year which can translate to a 150-mile range vehicle losing 17 miles after 5 years.343 While this reflects a level of degradation that would not meet the proposed
342 E.g., Health and Safety Code, §§ 38560, 39601, 39602.5, 43013, 43018, 43018.5, 43101, 43104, 43106. 343 Geotab, 2020. “What can 6,000 EVs tell us about EV battery health” Originally published on December 13, 2019. Updated July 7, 2020. https://www.geotab.com/blog/ev-battery-health/#:~:text=First%20and%20foremost%2C%20based%20on,usable%20life%20of%20the%20vehicle. Accessed February 11, 2022.
74
requirement, it shows the trend in year over year improvements that are being made to reduce degradation as manufacturers continue to gain knowledge about the operating conditions most harmful to batteries and optimize the control and thermal management systems to minimize or outright eliminate the circumstances that lead to those operating conditions.
Over 1 million Tesla Model S and X vehicles showed less than 15-percent battery degradation, on average, for vehicles that drove between 150,000 and 200,000 miles by 2019,344 and by 2020 these vehicle batteries degraded approximately 10-percent on average after 200,000 miles traveled.345 Tesloop, which is a Tesla rental company in Southern California, operated a Tesla Model X 90D with 350,000 miles on an original battery. The vehicle experienced an estimated 13-percent capacity degradation which was translated to a range reduction from 247 miles to 215 miles at 95-percent charge.346
A Nissan Leaf was used to validate experimental test data for a 24 kWh lithium-manganese-oxide (LMO)-graphite battery for a mid-sized electric vehicle study. The analysis showed that calendar aging contributes more to capacity loss than cycle aging, with an average capacity loss of 31-percent after 10 years, with the majority occurring in earlier years.347 This was also the case when two 2012 Nissan Leaf battery packs rated at 24 kWh were tested for charging impacts on the battery. The packs completed 13 months of cycling which is about 50,000 miles and 780 cycles on a 7,088-second power-based drive cycle. This resulted in the battery pack showing a capacity fade of 23.1-percent and the DCFC charged pack fading 28.1-percent.348 These results, however, represent earlier battery technology and, as a result of the smaller size of the pack (and necessarily, short range of the vehicle), represent a more demanding usage cycle of deeper discharge and charge events to meet a typical driver’s daily needs. With manufacturers now putting forth vehicles with significantly higher battery capacity and thus range, the depth of daily discharge and charge and consequent degradation would be less.
An analysis conducted on Panasonic cells349 revealed minimal capacity loss even at different temperatures. Results revealed that at 10 degrees Celsius, there was 9-percent capacity fade over 15 years and at 25 degrees Celsius there was 16-percent capacity fade over 15 years (Keil et al. (2017)).350 Certain regions in California experience these temperatures, such as San Jose where the average low normal minimum temperature from 1991 to 2020 was 10
344 Tesla 2020. “2019 Tesla Impact Report”. https://www.tesla.com/ns_videos/2019-tesla-impact-report.pdf. Released 2020. Accessed July 14, 2021. 345 Tesla 2021. “2020 Tesla Impact Report”. https://www.tesla.com/ns_videos/2020-tesla-impact-report.pdf. Released 2021. Accessed January 31, 2022. 346 Inside EVs 2019. Tesloop Explains Various Causes For Tesla Battery Degradation. April 22. Accessed March 11, 2022. https://insideevs.com/news/345589/tesloop-reasons-cause-battery-degradation/. 347 Yang 2018. Yang et. al “Considering Battery Degradation in Life Cycle Greenhouse Gas Emission Analysis of Electric Vehicles.” 25th CIRP Life Cycle Engineering (LCE) Conference 505-510. doi:10.1016/j.procir.2017.12.008. 348 Tanim 2018. Tanim, Tanvir R., Matthew G. Shirk, Randy L. Bewley, Eric J. Dufek, and Bor Yann Liaw. 2018. The implications of fast charge in lithium ion battery performance and life: cell vs. pack. Study, Energy Storage and Advanced Vehicles Department, Idaho National Laboratory, Idaho Falls, Idaho: Idaho National Laboratory. 349 Panasonic lithium ion cells: NCR18650PD with an NCA cathode and graphite anode 350 Kiel 2015. Keil, Peter, and Andreas Jossen. 2015. "Aging of Lithium-Ion Batteries in Electric Vehicles: Impact of Regenerative Braking." World Electric Vehicle Journal 7.
75
degrees Celsius and in Burbank where the average high normal maximum temperature from 1991 to 2020 was 25 degrees Celsius.351
The battery industry and researchers are working diligently to further increase battery durability by addressing degradation mechanisms for not only conventional lithium-ion batteries, but also for future batteries. Conventional lithium-ion battery cathode formulations are moving to higher and higher nickel content for energy density which could affect durability. Researchers are finding that doping those cathodes with aluminum helps to improve cycle life.352 Researchers have discovered methods to improve advanced lithium-sulfur based batteries’ cycle life to levels that make them viable for light-duty automotive applications.353 Third party tests of pre-production solid-state cells from QuantumScape have demonstrated their batteries are capable of over 800 cycles with 90-percent energy retention.354 These developments point to continued battery durability improvement in not only conventional lithium-ion systems, but also for advanced battery chemistries.
Manufacturers are also touting further improvements in durability. In a 2021 interview with Car and Driver, Tim Grewe of General Motors made claims that their Ultium battery technology is expected to have no degradation from DC fast charging events and well outlast Bolt EV batteries past 150,000 miles, and beyond the stated 100,000-mile warranty period. This is due to battery chemistry improvements and the addition of aluminum into the cell.355 Toyota also announced its bZ4X, a BEV model soon available in the United States, is expected to retain 90% of its range for nearly 150,000 miles, and maintain battery capacity up to 70% for 10 years, exceeding staff’s proposed requirements.356,357
While the first widely available FCEV was launched in 2015 and 2016, polymer electrolyte membrane (PEM) fuel cell technology at the core of FCEVs has been under development for several decades. In collaboration with automotive manufacturers, research scientists, and others, the U.S. DOE has established goals for performance of PEM fuel cell systems used in
351 Current Results 2022. Average Annual Temperatures for Cities in California. https://www.currentresults.com/Weather/California/average-annual-city-temperatures.php. Accessed March 11, 2022. 352 Zhuo et al 2021. Kai Zhou, Qiang Xie, Baohua Li, and Arumugam Manthiram. An in-depth understanding of the effect of aluminum doping in high-nickel cathodes for lithium-ion batteries, Energy Storage Materials, Volume 34, 2021, Pages 229-240,ISSN 2405-8297, https://doi.org/10.1016/j.ensm.2020.09.015 353 UMich 2022. University of Michigan. 1,000-cycle lithium-sulfur battery could quintuple electric vehicle ranges https://news.umich.edu/1000-cycle-lithium-sulfur-battery-could-quintuple-electric-vehicle-ranges/ Posted January 12, 2022. Accessed February 14, 2022. 354 Mobile Power Solutions 2021. “Q1-1695 Cell Cycle Life Test Report” Prepared by Mobile Power Solutions for Quantum Scope. Spencer Poff. https://www.quantumscape.com/wp-content/uploads/2022/01/FINAL-20211027-Q1-1695-Cell-Cycle-Life.pdf October 21, 2021. Accessed February 14, 2022. 355 Car and Driver 2021. Car and Driver. 2021. “How GM's Ultium Battery Will Help It Commit to an Electric Future by Dave Vanderwerp.” Posted July 21, 2021. Accessed March 11, 2022. https://www.caranddriver.com/features/a36877532/general-motors-ev-ultium-battery-electric-future/. 356 Toyota 2021. Toyota Europe Newsroom. “European premiere of the all-new Toyota bZ4X” https://newsroom.toyota.eu/european-premiere-of-the-all-new-toyota-bz4x/ Posted December 2, 2021. Accessed February 16, 2022. 357 Toyota 2021. Toyota United States Newsroom, “Revealed: The All-New, All-Electric Toyota bZ4X” https://pressroom.toyota.com/revealed-the-all-new-all-electric-toyota-bz4x/ Posted November 17, 2021. Accessed February 16, 2022
76
automobiles.358 Some performance targets have already been achieved or are nearly achieved, including system power density and specific power (output electrical power per unit volume and weight, respectively), cold start capability, and peak efficiency. The U.S. DOE has set an ultimate target of 8,000 hours of operation with no more than 10-percent degradation in system output.359 While this is determined under specific conditions in lab-scale testing, the U.S. DOE has tracked progress in operating fleets of vehicles and reported that maximum and average durability more than doubled between 2007 and 2015.360
Unlike BEVs where battery capacity, and thus, driving range is the expected predominant impact of degradation, the primary durability concern with FCEVs is degradation of the peak power of the FCEV. Over time, the power generated by the fuel cell stack may degrade resulting in a higher consumption of hydrogen fuel to drive the vehicle or a lower maximum power available for propulsion. This impact is expected to first occur at peak powers which, by design, would rarely be encountered in typical customer driving. However, there is still more research to be done on FCEV durability as this technology matures.
In the meantime, staff is proposing that FCEVs meet equivalent driving-range based durability requirements as BEVs to ensure that consumers will be able to rely on equivalent minimum driving range capability throughout the useful life period. It is expected that FCEVs will be able to meet this requirement without any changes to their current designs as today’s FCEVs have not been reported as losing any appreciable range as they age. Further, much like a fuel tank on today’s gasoline vehicles, high pressure hydrogen fuel tanks used to store fuel onboard do not deteriorate or degrade such that they store less fuel over time. As noted above, loss of peak power for the fuel cell itself can directionally increase fuel consumption and thus, decrease range, but the impact at lower operating loads used during routine urban driving on the durability test cycles is expected to be minimal. However, if such a loss of power was severe enough for typical customers to notice, it likely would adversely affect driving-range that is subject to the durability requirement. For the longer term, staff will continue to work with manufacturers as FCEV technology matures to determine if a different durability standard may be necessary for FCEV consumers.
a) Enforcement of Durability Standard
Gasoline manufacturers are required, via U.S. EPA and CARB requirements, to submit laboratory data on a small subset of high mileage in-use vehicles within a test group, based on total sales volumes. Indications of test groups that may be failing their emission standards can trigger additional testing for the manufacturer to conduct. CARB also reviews this data and can do its own additional testing. During this process, if test groups are found to be out
358 DOE 2016. US Department of Energy. Hydrogen and Fuel Cell Technologies Office Multi-Year Research, Development, and Demonstration Plan: Fuel Cells Section, 2016, US DOE Fuel Cells Plan Accessed February 11, 2022. 359 US DOE also notes that this definition of useful life may not be applicable to the definition used by auto manufacturers in the vehicles they make available for sale or lease. The end of useful life metric evaluated by US DOE also does not imply the fuel cell is not usable beyond a 10% voltage degradation. 360 NREL 2019. Kurtz, Jennifer, Sam Sprik, Genevieve Saur, and Shaun Onorato. 2019. Fuel Cell Electric Vehicle Durability and Fuel Cell Performance. Golden, CO: National Renewable Energy Laboratory. NREL/TP-5400-73011. NREL FCEV Durability Report.
77
of compliance with the emission standards within the defined durability time and miles, CARB can require manufacturers to remedy the vehicles including recall if necessary.361
In developing a durability standard for ZEVs, staff modeled its enforcement of the standard after its approach to gasoline vehicles while taking advantage of the capability of on vehicle calculations in lieu of more costly laboratory testing.362 Staff’s proposed battery state of health metric, discussed in section III.D.1, is a good proxy for vehicle range degradation, as degradation of usable battery energy is the main factor expected to cause range degradation. So, in lieu of actually procuring in-use vehicles and subjecting them to multi-day laboratory testing to determine range, the battery state of health data could be procured from a sample of vehicles and likely provide a good indication of the amount of original range the vehicle is still capable of.
To that end, staff proposes that, at the time of certification, manufacturers submit data on the expected degradation of battery state of health over the vehicle’s useful life to confirm the test group has been designed to meet the durability requirement. Further, manufacturers would be required to collect and submit battery state of health data from 30 vehicles per test group at ages 3 and 6 years to provide information to CARB on the battery degradation. CARB would retain the right to conduct official compliance testing on any test group by procuring 10 representative in-use vehicles from the test group and carrying out the official laboratory tests used at the time of certification to determine range and verify the durability requirement was met. If five (50-percent) or more of the vehicles fail the durability test, the manufacturer could be subject to corrective action for vehicles within the test group.
3. Warranty
Durability requirements have the effect of ensuring vehicles in a test group, in the aggregate, are designed to have minimal degradation or deterioration such that they will meet or exceed a performance standard over the useful life period. However, durability requirements do not provide assurance that each and every individual vehicle will be free from defects or other failures. The purpose of warranty requirements, on the other hand, is to provide protection for consumers of individual vehicles that experience failures or defects early in the life of the vehicle. A test group on track to meet the durability standard does not necessarily mean that there will not be individual vehicles that experience failures or defects. Likewise, individual vehicles experiencing a failure or defect does not necessarily mean that the test group as a whole will fail to meet the durability standard. Manufacturers are currently required to provide a minimum warranty on the emission control systems for internal combustion engine vehicles, including PHEVs. Per Health and Safety Code section 43205, manufacturers of light- and medium-duty vehicles must warrant their vehicles and engines are (1) designed, built, and equipped to conform with applicable emission standards, (2) are free from defects in materials and workmanship for 3 years or 50,000 miles, and (3) are free from defects in materials and workmanship in emission related
361 In-use testing and verification procedures can be found in the "California 2015 and Subsequent Model Criteria Pollutant Exhaust Emission Standards and Test Procedures and 2017 and Subsequent Model Greenhouse Gas Exhaust Emission Standards and Test Procedures for Passenger Cars, Light-Duty Trucks, and Medium-Duty Vehicles”. See also California Code of Regulations, tit. 13, §§ 1968.2, 1968.5. 362 E.g., Health and Safety Code, §§ 38560, 39601, 39602.5, 43013, 43018, 43018.5, 43101, 43104, 43106.
78
parts which, at the time of certification by the state board, are estimated by the manufacturer to cost individually more than three hundred dollars (for the 1990 model year and adjusted by the consumer price index for subsequent model years) to replace, for a period of seven years or 70,000 miles, whichever first occurs. Manufacturers are required to track warranty rates (the rates at which vehicles under warranty are repaired) for individual emission controls and progressively submit more information and analysis to CARB if warranty rates exceed specific levels. Upon exceeding a verified warranty rate of 4-percent for a component, the manufacturer can be subject to corrective actions to ensure vehicles in the test group will be below the certified emission standard throughout the useful life. The emission warranty provisions within the California Code of Regulations relating to combustion vehicles reflect CARB’s long-standing use of its broad authority to adopt regulations necessary to achieve healthful air quality and reach the State’s GHG reduction targets.363 This broad authority works in tandem with statutory obligations of manufacturers to warrant that their vehicles will meet the emission standards and other requirements adopted by CARB.364 That authority supports warranty requirements in the zero-emission context as well, as zero-emission vehicles must be durable with substantial warranties to ensure they deliver their emissions reductions benefits. These benefits are critical: As described earlier, the Mobile Source Strategy has confirmed California’s need to fully transform the light-duty vehicle sector to ZEVs and PHEVs to have any chance of meeting the State’s air quality and GHG targets. And for such a full transition to be successful, consumers will need to have equivalent confidence in the performance and durability of ZEVs as they do with the conventional gasoline vehicles they will need to displace. To help support this confidence, the proposal includes minimum warranty requirements for key components related to propulsion (the powertrain) of the vehicle to ensure adequate design specifications are put in place by manufacturers. Staff’s warranty proposal is split into three parts: 1) battery warranty, which would apply to BEVs and PHEVs, 2) propulsion-related parts warranty, which would apply to BEVs and FCEVs, and 3) warranty reporting procedures.
a) Battery Warranty
The most expensive component for making a vehicle move on a BEV and PHEV is the battery pack. Failure or undue degradation of the pack can affect the usefulness and drivability of a BEV and cause individual drivers to stop using the vehicle, revert to gasoline vehicles, or avoid initial or subsequent purchase of the technology for fear of future failure. Today, manufacturers have been somewhat competitive in offering similar sounding battery warranties for BEVs. In recent years, some manufacturers have even begun to define warranties to a specified capacity loss within the warranty period. However, substantial differences between manufacturers still exist as to what level of degradation, if any, is warranted, how such a level will be determined, and to what extent the consumer is aware of
363 E.g., Health & Saf. Code, §§ 39600, 39601, 43205. Legal 2014. Engine Manufacturers Association v. State Air Resources Board (2014) 231 Cal.App.4th 1022. Accessed March 11, 2022. https://www.leagle.com/decision/incaco20141124052; Deukmajian et al 1981. Deukmejian, George and Anthony s. Da Vigo. 1981. “Legal Opinions of the Attorney General.” 64 Ops.Cal.Atty.Gen. 425. May 27,1981. https://oag.ca.gov/system/files/opinions/pdfs/80-718.pdf. 364 Health & Saf. Code, § 43205.
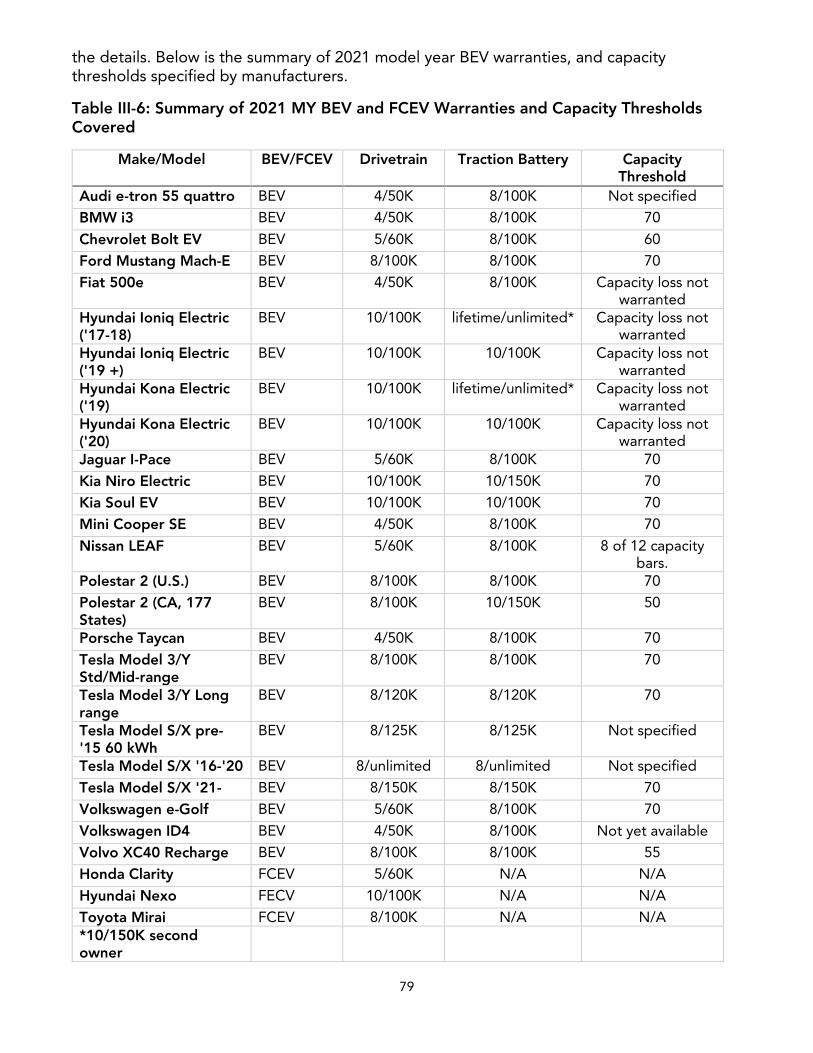
79
the details. Below is the summary of 2021 model year BEV warranties, and capacity thresholds specified by manufacturers.
Table III-6: Summary of 2021 MY BEV and FCEV Warranties and Capacity Thresholds Covered
Make/Model BEV/FCEV Drivetrain Traction Battery Capacity Threshold
Audi e-tron 55 quattro BEV 4/50K 8/100K Not specified
BMW i3 BEV 4/50K 8/100K 70
Chevrolet Bolt EV BEV 5/60K 8/100K 60
Ford Mustang Mach-E BEV 8/100K 8/100K 70
Fiat 500e BEV 4/50K 8/100K Capacity loss not warranted
Hyundai Ioniq Electric ('17-18)
BEV 10/100K lifetime/unlimited* Capacity loss not warranted
Hyundai Ioniq Electric ('19 +)
BEV 10/100K 10/100K Capacity loss not warranted
Hyundai Kona Electric ('19)
BEV 10/100K lifetime/unlimited* Capacity loss not warranted
Hyundai Kona Electric ('20)
BEV 10/100K 10/100K Capacity loss not warranted
Jaguar I-Pace BEV 5/60K 8/100K 70
Kia Niro Electric BEV 10/100K 10/150K 70
Kia Soul EV BEV 10/100K 10/100K 70
Mini Cooper SE BEV 4/50K 8/100K 70
Nissan LEAF BEV 5/60K 8/100K 8 of 12 capacity bars.
Polestar 2 (U.S.) BEV 8/100K 8/100K 70
Polestar 2 (CA, 177 States)
BEV 8/100K 10/150K 50
Porsche Taycan BEV 4/50K 8/100K 70
Tesla Model 3/Y Std/Mid-range
BEV 8/100K 8/100K 70
Tesla Model 3/Y Long range
BEV 8/120K 8/120K 70
Tesla Model S/X pre-'15 60 kWh
BEV 8/125K 8/125K Not specified
Tesla Model S/X '16-'20 BEV 8/unlimited 8/unlimited Not specified
Tesla Model S/X '21- BEV 8/150K 8/150K 70
Volkswagen e-Golf BEV 5/60K 8/100K 70
Volkswagen ID4 BEV 4/50K 8/100K Not yet available
Volvo XC40 Recharge BEV 8/100K 8/100K 55
Honda Clarity FCEV 5/60K N/A N/A
Hyundai Nexo FECV 10/100K N/A N/A
Toyota Mirai FCEV 8/100K N/A N/A *10/150K second owner
80
As evidenced above, manufacturers are typically already offering warranties beyond what is offered for gasoline vehicles with many at 10 years or 100,000 miles, or even more for both powertrain components and batteries. While this may indicate that consumers are indeed hesitant to embrace the newer technologies and manufacturers have needed to offer extended warranty terms to bolster consumer confidence—the very reason staff noted above as to why this proposal includes a minimum warranty—this also indicates that electrical or electro-mechanical components that make up an electric vehicle powertrain are likely inherently more durable than the conventional gasoline engines and components they are displacing. Manufacturers can ill afford to risk substantial costs and consumer backlash from high warranty rates on any vehicle model and ZEVs are no exception. This is evident even in PHEVs, which are already subject to minimum emission warranties and warranty reporting, where the incidence of reported warranty claims for electric drivetrain components is far less than other conventional engine and transmission equipped vehicles.
Manufacturers are currently required to provide battery warranties on PHEVs for 10 years or 150,000 miles, in addition to the emission warranty which covers all of the conventional engine and transmission powertrain components and electric drivetrain components,365 in order for the vehicle to earn ZEV credit. However, while the lengthy warranty term sounds protective, the regulation does not specify the level of degradation or failure that must be warranted and manufacturers are not required to state the level of degradation or failure eligible for warranty replacement of the battery. In practice, this has led to confusion and frustration around PHEV battery warranties as some manufacturers have set criteria for warranty replacement at a significant loss of electric range, others at a complete loss of electric range, or others at a level even beyond complete loss of electric range and at a point where the vehicle is unable to start or drive at all.
In order to make the warranty useful for vehicle owners, it must be tied to a meaningful and transparent metric. Internal combustion engine vehicles today are equipped with complex on-board diagnostic systems with check engine warning lights that provide a clear tell-tale to the owner when a component failure has occurred at a specified level defined by CARB’s on-board diagnostic requirements. Tying battery warranty to a meaningful metric is fundamental to ensuring drivers are aware of early and unexpected battery degradation and can then pursue the necessary repair.
To this end, staff proposes a minimum 8 years or 100,000 miles, whichever occurs first, battery state of health warranty for any battery that falls below 70-percent for 2026 through 2030 model year for BEVs and PHEVs. Staff is proposing to increase the warrant trigger from 70-percent to 75-percent for 2031 and subsequent model year BEVs and PHEVs. For those manufacturers that do explicitly already warrant for battery capacity loss, the vast majority indicate 70-percent is the trigger point and every one of them uses a warranty term at or exceeding the proposed 8 years and 100,000 miles. Staff expects that even those currently offering such a warranty will continue to advance their battery durability (and vehicle control systems to reduce degradation) in the years leading up to 2026 model year to be able to easily meet this requirement even in the face of added transparency to the vehicle owner and
365 On a PHEV, a failure of an electric drivetrain component, including the battery, leads to reduced electric operation and a consequent increase in internal combustion gasoline engine operation which increases tailpipe emissions and is thus, subject to the existing emission control warranty.
81
an anchoring to usable battery energy as opposed to an alternative parameter such as capacity.366
For 2031 and subsequent model years, manufacturers would have more time to develop successive battery technologies with this requirement in mind and make appropriate design decisions to support it. In some cases, this may include choosing a materials or manufacturing solution that sacrifices some cost reduction in order to improve durability. In talking with manufacturers, however, it is clear that battery warranty concerns are not about the typical customer, nominal battery durability, or random manufacturing defect. Rather, the concern is atypical usage, by edge case users, that have a combination of usage behavior, charging behavior, and parking behavior that stack up to a worst-case exposure and operational conditions for the battery. Directionally, higher frequency of deeper discharge and charge cycles, frequent rapid charging while the battery is at high temperature, and extended operation at very low or very high state of charges and at very high ambient temperatures can cause accelerated degradation of the battery. Yet much is still being learned by the manufacturers on control mitigations they can implement to mitigate or avoid the impact of these types of events. Most manufacturers have acknowledged they have resources dedicated to studying clusters of vehicles experiencing greater than expected degradation and identifying they problematic types of operation or combination of factors and systematically attacking them through design and control strategies. Examples of such actions include control strategies that discourage consumers from routinely fully charging the battery except when the extra range is needed, systems that can turn on thermal management while the car is parked if battery temperatures start to get too high, or strategies that moderate fast charging rates or include anticipatory thermal management to minimize high charge rates at high battery temperatures. With continued work in this area, staff expects all manufacturers will narrow the gap between the degradation a median or typical consumer may experience and that which an edge case user will experience which will enable manufacturers to meet the 75-percent threshold on 2031 and subsequent model years with the median behavior still very similar to today’s projected trajectory for degradation.
b) Propulsion Related Parts Warranty
Non-battery propulsion-related components, such as the on-board charger, the electric motors, inverters, and battery management system, are not expected to degrade like batteries on BEVs. However, failure of such components can have detrimental effects on the efficiency, performance, range, or drivability of the ZEV. Currently, as evidenced in Table III-6, manufacturers are offering competitive warranties on electric powertrain-related components.
Staff proposes that manufacturers provide a warranty for ZEVs, meaning BEVs and FCEVs, consistent with what conventional gasoline vehicles are subject to, for a minimum of 3 years
366 While usable battery energy and battery capacity are closely related, there is an important distinction. Usable battery energy is derived from a specified laboratory driving test to quantify the amount of stored energy that can be used to actually drive the vehicle. When the battery energy is insufficient to allow the vehicle to follow the driving trace, the test is terminated. Capacity, however, is a measure of total energy in the battery including energy that is insufficient to drive the vehicle but could still power small devices such as an interior map light or heater fan.
82
or 50,000 miles (or 7 years, 70,000 miles for high-priced parts) for all propulsion-related (powertrain) components, excluding the traction battery. Relative to today’s warranties, every manufacturer currently offers a propulsion-related parts warranty longer than the proposed 3-year, 50,000-mile term. However, for the higher priced components, the industry appears split with most of the more recently developed and released products offering a term that exceeds the proposed 7-year, 70,000-mile term and most of the legacy earlier introduced products offering a shorter term of 4 to 5 years and 50,000 to 60,000 miles. Setting aside the proposed requirements, it is likely that the manufacturers with shorter terms will face mounting competitive pressure to match the terms of their competitor’s offerings in newly launched or redesigned products. Additionally, widespread presence of terms longer than even the 7-year, 70,000-mile proposal suggests that manufacturers have carefully considered their expected warranty failure rates and have confidence the durability and defect rate is far less than is typical on conventional gasoline vehicles despite the long history of building engines and components for gasoline engines. Also in line with minimum requirements for internal combustion engine vehicles, manufacturers must include a standard warranty statement, proposed within the regulatory text for section 1962.8, with every new ZEV delivered for sale, explaining what their warranty covers.
c) Warranty Reporting
In 1988, CARB adopted the Emission Warranty Information Reporting regulations for tracking emission control component defects affecting on-road vehicles. Warranty repairs, and the frequency of them, can provide useful information about the in-use performance and durability of the emission controls early in the life of the vehicle. The regulations require manufacturers to monitor and review warranty claims for each component and submit progressively more information and detailed analysis as the claim rate escalates. At a one-percent warranty rate, initial reporting is required while a four-percent level triggers additional analysis to screen the repairs to determine a true failure rate. Components with warranty rates above four-percent after screening result in further evaluation and can subject the manufacturer to corrective action.
Staff is proposing a similar reporting structure for battery and propulsion-related part warranties on BEVs and FCEVs. Manufacturers would be required to monitor warranty claims and begin reporting quarterly for individual components on test groups where the cumulative number of unscreened warranty claims surpass one-percent (or 25 vehicles, whichever is greater, to address low sales volume test groups where one-percent would reflect too small of a sample). If the warranty claims for a specific component exceed four-percent, the manufacturer would be required to do further reporting and analysis to determine the root cause and actual failure rate (e.g., in cases where it can be determined from analysis of the replaced parts that the component is properly functioning and was mistakenly replaced). If after screening for the actual failure rate, the claims exceed a four-percent level, additional analysis by the manufacturer and review by the Executive Officer is triggered. Depending on the findings of the analysis and review, corrective action could be required to address defects or design flaws that would not be adequately remedied in the existing warranty process.
83
4. Service Information
ZEVs inherently have far fewer propulsion-related parts especially mechanical moving parts as electric motors and power electronics dominate the electric drive propulsion system instead of mechanical internal combustion engines and automatic transmissions comprised of mechanical components like valves, springs, and gears. As a result, it is expected that individual ZEVs will likely need fewer propulsion-related repairs than gasoline vehicles but the sheer number of vehicles in California require a substantial repair network. According to the latest census data, there are over 10,000 independent repair locations in California367, as compared to 1,300 new vehicle dealers368 to serve the needs of the nearly 25 million light-duty vehicles currently in the California fleet. Recognizing the importance of the role of independent repair shops, California has regulations to provide for access to repair information and tooling necessary to carry out emission-related repairs.
In 2001, CARB adopted the Service Information regulation, requiring manufacturers to make available all emission-related information to independent repair shops at a fair and reasonable price. Additionally, the regulation requires manufacturers to offer the same diagnostic tooling (used to communicate with the vehicle and access repair-relevant information) that they sell to dealers to independent repair shops at a similar price. Recognizing that there is also a role for aftermarket service information providers (who often aggregate multiple manufacturer’s information into a common format and package for technicians) and aftermarket tool manufacturers, the regulation also puts forth requirements for manufacturers to work with such entities, commonly through licensing programs. Lastly, the regulation establishes a standardized reprogramming requirement such that emission-related onboard computers that are reprogrammable, are able to be reprogrammed using a standardized interface meeting SAE J2534 specifications.
The U.S. EPA adopted similar requirements subsequent to CARB’s rules but in both cases, the scope of the information and tooling was limited to that needed to carry out emission-related repairs and did not address other components such as safety-related, air conditioning, or infotainment systems. Taking this one step further, Massachusetts adopted multiple rules, commonly known as “Right To Repair”, which required manufacturers to similarly make available service information and tooling for all vehicle components. Faced with different requirements for individual states, manufacturers entered into a voluntary agreement to provide for access to all repair information nationwide.369 Additionally, as originally written, the CARB and U.S. EPA regulations also do not subject ZEVs to the service information rule.
To ensure ZEVs are viable transportation options that will displace emissions from conventional vehicles, service information and tools must similarly be available to the aftermarket repair industry. Vehicle owners have come to rely on the independent service
367 Census 2022. United States Census Bureau. 2022. "81111: Automotive mechanical and electrical repair and maintenance.” Accessed March 21, 2022. https://data.census.gov/cedsci/profile?g=0400000US06&n=81111. 368 CNCDA 2022. California New Car Dealers Association “About Us” https://www.cncda.org/about/ Accessed February 14, 2022. 369 MOU 2014. Right to Repair Memorandum of Understanding. https://wanada.org/wp-content/uploads/2021/01/R2R-MOU-and-Agreement-SIGNED.pdf Released January 15, 2014. Accessed January 30, 2022.
84
providers who in turn rely on access to the training, information, and tooling necessary to carry out the repairs. As of today, many (but not all) manufacturers already make information and tooling available for their ZEVs, due in part to the aforementioned voluntary agreement and the Massachusetts Right-To-Repair rule.
Staff is proposing to amend the existing regulation to require the same access and disclosure of repair information and tooling for 2011 and subsection model year ZEVs as is required by CCR, title 13, section 1969 for conventional light-duty vehicles. For ZEVs, the scope of the required information will be for all propulsion-related parts to ensure that, at a minimum, a vehicle can be repaired to make such that it can continue to be operated as a ZEV. As with gasoline vehicles, manufacturers will also be required to comply with the same tooling standardization requirements to be able to reprogram vehicle electronic control units, which is further explained in Section III.D.1.
5. Battery Labeling
Staff’s proposal requires manufacturers of ZEVs, PHEVs, hybrid electric vehicles (HEV), and 48-Volt HEVs to include a label on the vehicle battery that provides key information about the battery system. The label will include information on the battery chemistry, manufacturer, voltage, and capacity. The physical label will also include a digital identifier used to connect the label to a record in a digital repository of battery information. The digital repository will include the information on the physical label (in case of damage to the physical label rendering it illegible) as well as any hazardous materials or heavy metals, product safety or recall information, and safe disposal information. The digital identifier will also put in place an easy way for manufacturers to disclose (optionally or due to other existing or future requirements) further information linked to the battery such as instructions for deactivation or disassembly or additional safety or tracking information.
Having traction batteries appropriately labeled with information about their chemical and physical makeup, manufacturer, and an identifier linking to a website with safety information serves to boost consumer confidence in ZEVs and to support greater ZEV deployment, ultimately helping secure the emissions reductions needed. With information about the battery readily available, consumers can be assured that any ZEV servicer will have the requisite information whenever needed to service, reuse, recycle, or dispose of the battery, and will be properly informed for servicing. This will assure owners that the battery in their vehicle will perform as intended and will not become a liability at the end of its useful life in a vehicle, thus encouraging consumers to transition from conventional vehicles to BEVs and displacing emissions as intended. Battery labeling can also support greater battery reuse and recycling, helping to promote availability of battery materials, at lower cost and with reduced need for obtaining raw materials, in the quantities needed to displace ICEVs.
The proposed labeling requirement builds on and draws from existing or proposed international standards and guidelines, including SAE J2936, the proposed European Directive, and Peoples Republic of China Restriction of Hazardous Substances (Table III-7), to provide a uniform and consistent approach to promoting availability of requisite battery information and responsible, safe, and efficient battery management.
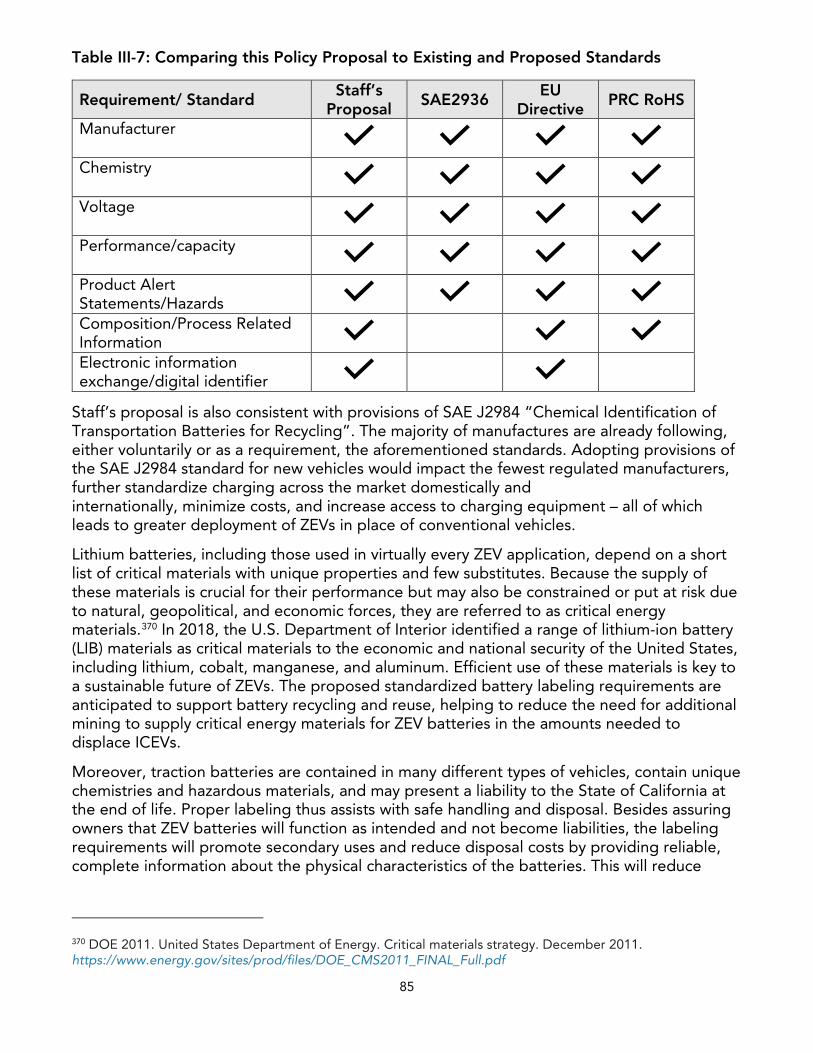
85
Table III-7: Comparing this Policy Proposal to Existing and Proposed Standards
Requirement/ Standard Staff’s
Proposal SAE2936 EU
Directive PRC RoHS
Manufacturer
Chemistry
Voltage
Performance/capacity
Product Alert Statements/Hazards Composition/Process Related Information
Electronic information exchange/digital identifier
Staff’s proposal is also consistent with provisions of SAE J2984 “Chemical Identification of Transportation Batteries for Recycling”. The majority of manufactures are already following, either voluntarily or as a requirement, the aforementioned standards. Adopting provisions of the SAE J2984 standard for new vehicles would impact the fewest regulated manufacturers, further standardize charging across the market domestically and internationally, minimize costs, and increase access to charging equipment – all of which leads to greater deployment of ZEVs in place of conventional vehicles.
Lithium batteries, including those used in virtually every ZEV application, depend on a short list of critical materials with unique properties and few substitutes. Because the supply of these materials is crucial for their performance but may also be constrained or put at risk due to natural, geopolitical, and economic forces, they are referred to as critical energy materials.370 In 2018, the U.S. Department of Interior identified a range of lithium-ion battery (LIB) materials as critical materials to the economic and national security of the United States, including lithium, cobalt, manganese, and aluminum. Efficient use of these materials is key to a sustainable future of ZEVs. The proposed standardized battery labeling requirements are anticipated to support battery recycling and reuse, helping to reduce the need for additional mining to supply critical energy materials for ZEV batteries in the amounts needed to displace ICEVs.
Moreover, traction batteries are contained in many different types of vehicles, contain unique chemistries and hazardous materials, and may present a liability to the State of California at the end of life. Proper labeling thus assists with safe handling and disposal. Besides assuring owners that ZEV batteries will function as intended and not become liabilities, the labeling requirements will promote secondary uses and reduce disposal costs by providing reliable, complete information about the physical characteristics of the batteries. This will reduce
370 DOE 2011. United States Department of Energy. Critical materials strategy. December 2011. https://www.energy.gov/sites/prod/files/DOE_CMS2011_FINAL_Full.pdf
86
lifecycle costs for ZEVs, assuring they are cost effective, and thus making it more likely they will be cost-competitive with conventional vehicles and will reduce emissions as intended.
Electric vehicle batteries are retired from their primary application when the vehicle itself is physically damaged (e.g., in a car accident), when the cost of needed repairs exceeds the perceived value of the vehicle, when the battery itself is repaired or replaced due to a malfunction, or when the range or performance is no longer acceptable to the driver and the pack must be replaced. Retired battery systems are likely to enter a range of applications based on their physical characteristics, state of health, and performance, or would be recycled or disposed if no longer useable.
Some battery modules removed from vehicles with minimal degradation and, absent defects or damage, will likely be refurbished and reused directly as a replacement battery pack for the same model vehicle. Major automakers, including Nissan and Tesla, have offered rebuilt or refurbished battery packs for service or warranty replacement of original battery packs in BEVs.371 Manufacturers such as General Motors have taken steps to allow for repair or replacement of just the portion of the battery pack containing the failure, rather than the entire pack. This has been accomplished by breaking the pack into serviceable and replaceable units.372
After use in a vehicle, lithium battery packs could deliver additional years of service in a stationary application. Examples of stationary energy storage applications include backup power for homes or cellular towers, or, in larger arrays, for large buildings like arenas373 or utility grids. McKinsey reports that second-life batteries may be 30 to 70-percent less expensive than new ones in energy storage applications in 2025. Second-life batteries would also reduce the demand for newly mined materials used in the production of new energy storage batteries.374 McKinsey also reports that, by 2030, the second-life battery supply from the burgeoning BEV and PHEV market could exceed 200 gigawatt-hours per year, which could exceed projected demand by nearly 25-percent.375
While uncertainty exists as to the extent that batteries will be put directly into a second use, eventually the battery will need to be recycled or disposed. To ensure that used batteries can be sustainably and properly managed at their end of life and critical battery materials are recovered efficiently, information on the battery system needs to be provided to end users and entities that receive, acquire, or hold batteries. This will help remove barriers to traction battery reuse and recycling. Providing access to key battery information will facilitate safe
371Green Car 2018. Evartas, Eric. Reports. “Nissan Begins Offering Rebuilt Leaf Battery Packs” https://www.greencarreports.com/news/1116722_nissan-begins-offering-rebuilt-leaf-battery-packs. May 14, 2018. Accessed February 14, 2022. 372 GM 2020. GM Reveals New Ultium Batteries and a Flexible Global Platform to Rapidly Grow its EV Portfolio. https://media.gm.com/media/us/en/gm/home.detail.html/content/Pages/news/us/en/2020/mar/0304-ev.html Posted March 4, 2020. Accessed February 14, 2022. 373 Climate Action 2018. Wentworth, Adam. “Amsterdam Arena Installs Major New Battery Storage” (https://www.climateaction.org/news/amsterdam-arena-installs-major-new-battery-storage) 374 Casals 2018. Lluc Canals Casals et al., Second life batteries lifespan: Rest of useful life and environmental analysis, 2018, p. 7. https://www.sciencedirect.com/science/article/pii/S0301479718313124. 375 McKinsey 2019. McKinsey and Company. “Second-life EV batteries: The newest value pool in energy storage” (https://www.mckinsey.com/industries/automotive-and-assembly/our-insights/second-life-ev-batteries-the-newest-value-pool-in-energy-storage#)
87
and economic collection, transportation, and concentration of materials for recovery.376 Efficient recovery of battery materials will also reduce demand on raw battery mineral mining activities. Modeling shows that, under idealized conditions, material recovered from retired batteries could meet over half of the U.S. demand for battery materials like cobalt, lithium, manganese, and nickel by 2040.377
Recycling is the process of taking packs and reducing them to their base materials. The steps for recycling LIBs can be broken down into three general stages:
• Pre-treatment, which primarily consists of mechanical shredding and sorting plastic, metal-enriched liquid, and metal solids378;
• Secondary treatment, which involves separating, with a chemical solvent, the cathode from the aluminium collector foil; and
• Recovery of the cathode materials through either hydrometallurgy, which relies on chemical leaching, or pyrometallurgy, which relies on high temperatures to enable electrolytic reactions.379
Battery recycling is improving and will continue to improve overtime. Redwood Industries was created to recover the most valuable materials from batteries with the intention of reuse. In 2022, Panasonic announced it would be producing Tesla batteries with copper foil from recovered material, the first closed-loop battery production process–in which batteries are recycled, remanufactured and returned to the same factory. JB Straubel expects recycled materials to be not just cost competitive but less expensive than newly mined materials.380
Consistent labeling of batteries could support more cost-effective end of life management practices and profitable recycling. Recovery of valuable elements from recycling is contributing to the expected decline in costs. Labeling is expected to facilitate recovery of these elements, and by reducing costs may increase recovery of less valuable elements, such as those in lithium iron phosphate batteries. Staff’s labeling proposal would enable more efficient and economic sorting of end-of-life traction batteries and potentially avoid inappropriate disposal pathways. Though not specific to this proposal, the cumulative cost
376 Zhang et al 2018b. Zhang, X., Li, L., Fan, E., Xue, Q., Bian, Y., Wu, F., & Chen, R. (2018). Toward sustainable and systematic recycling of spent rechargeable batteries. Chemical Society Reviews, 47(19), 7239-7302. 377 Dunn 2021. Dunn 2021. Jessica Dunn, Margaret Slattery, Alissa Kendall, Hanjiro Ambrose, and Shuhan Shen. “Circularity of Lithium-Ion Battery Materials in Electric Vehicles.” Environ. Sci. Technol. 2021, 55, 8, 5189–5198. Published March 25, 2021. Accessed March 28, 2022. https://pubs.acs.org/doi/abs/10.1021/acs.est.0c07030. 378 Zhang et al 2018b. 379 See Appendix G for more information on battery recycling processes. 380 Forbes 2022. By Alan Ohnsman. “Panasonic To Make Tesla Battery Cells With Recycled Material From JB Straubel’s Redwood.” Posted January 2, 2022. Accessed March 11, 2022. https://www.forbes.com/sites/alanohnsman/2022/01/04/panasonic-to-make-tesla-battery-cells-with-recycled-material-from-jb-straubels-redwood/?sh=762260956e82.
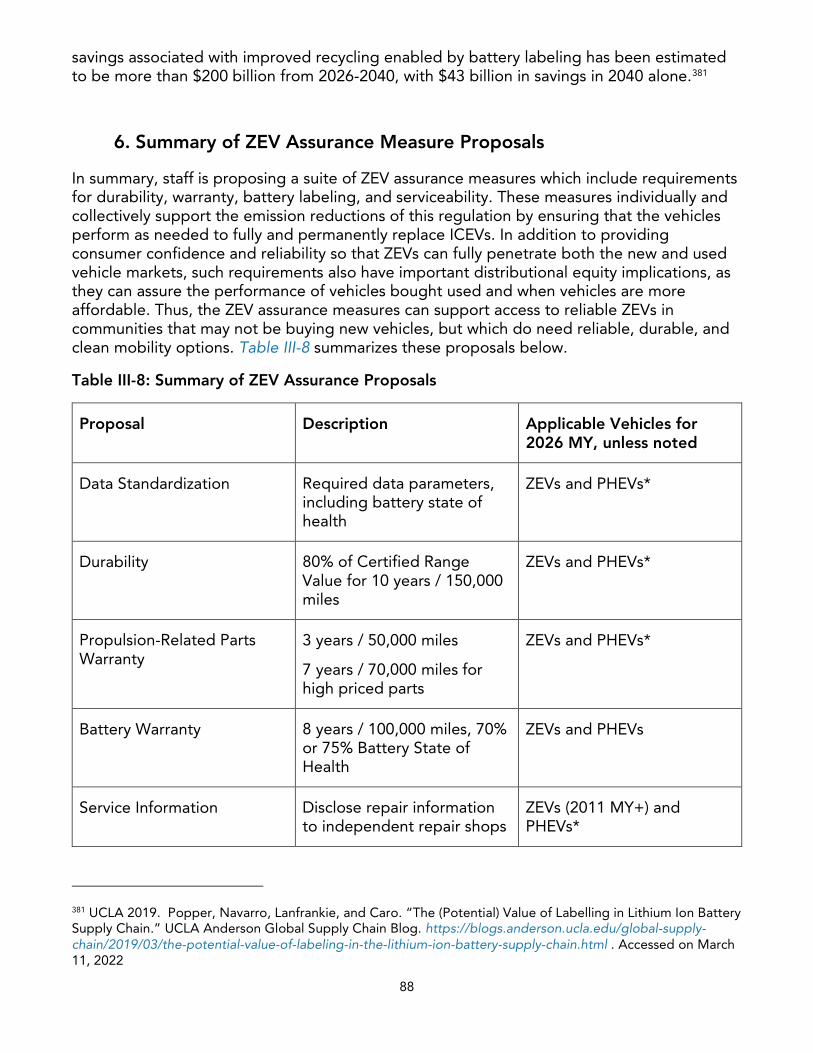
88
savings associated with improved recycling enabled by battery labeling has been estimated to be more than $200 billion from 2026-2040, with $43 billion in savings in 2040 alone.381
6. Summary of ZEV Assurance Measure Proposals
In summary, staff is proposing a suite of ZEV assurance measures which include requirements for durability, warranty, battery labeling, and serviceability. These measures individually and collectively support the emission reductions of this regulation by ensuring that the vehicles perform as needed to fully and permanently replace ICEVs. In addition to providing consumer confidence and reliability so that ZEVs can fully penetrate both the new and used vehicle markets, such requirements also have important distributional equity implications, as they can assure the performance of vehicles bought used and when vehicles are more affordable. Thus, the ZEV assurance measures can support access to reliable ZEVs in communities that may not be buying new vehicles, but which do need reliable, durable, and clean mobility options. Table III-8 summarizes these proposals below.
Table III-8: Summary of ZEV Assurance Proposals
Proposal Description Applicable Vehicles for 2026 MY, unless noted
Data Standardization Required data parameters, including battery state of health
ZEVs and PHEVs*
Durability 80% of Certified Range Value for 10 years / 150,000 miles
ZEVs and PHEVs*
Propulsion-Related Parts Warranty
3 years / 50,000 miles
7 years / 70,000 miles for high priced parts
ZEVs and PHEVs*
Battery Warranty 8 years / 100,000 miles, 70% or 75% Battery State of Health
ZEVs and PHEVs
Service Information Disclose repair information to independent repair shops
ZEVs (2011 MY+) and PHEVs*
381 UCLA 2019. Popper, Navarro, Lanfrankie, and Caro. “The (Potential) Value of Labelling in Lithium Ion Battery Supply Chain.” UCLA Anderson Global Supply Chain Blog. https://blogs.anderson.ucla.edu/global-supply-chain/2019/03/the-potential-value-of-labeling-in-the-lithium-ion-battery-supply-chain.html . Accessed on March 11, 2022
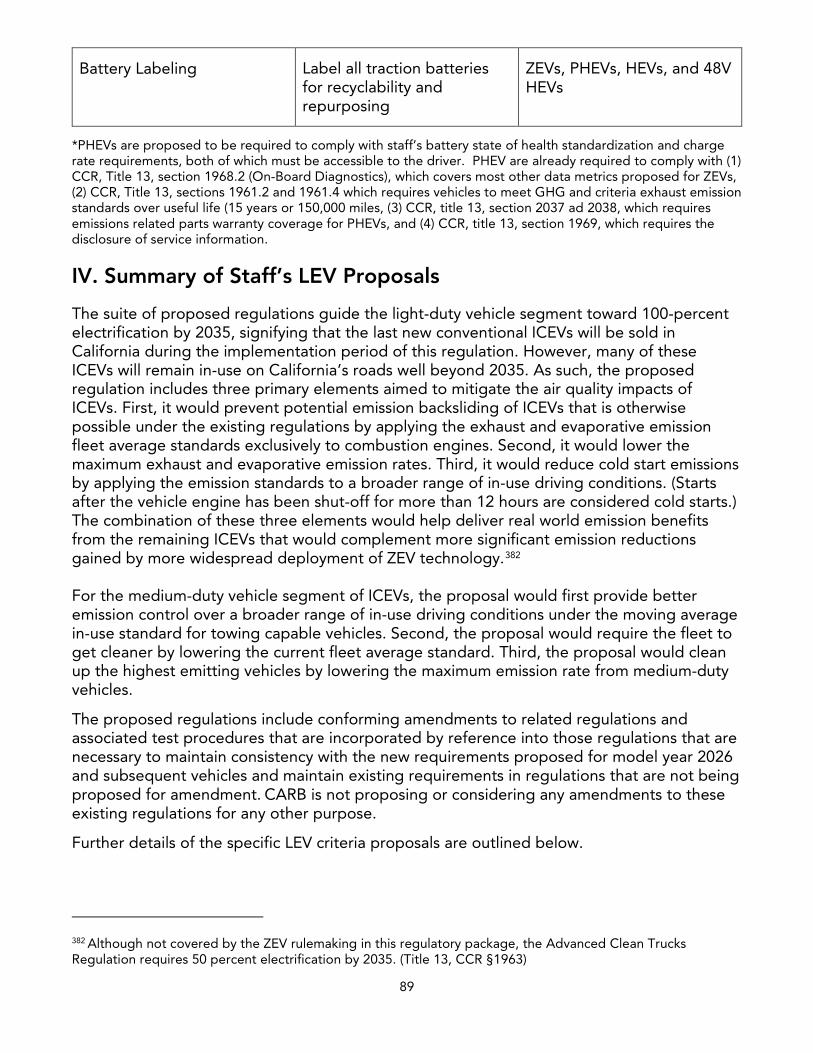
89
Battery Labeling Label all traction batteries for recyclability and repurposing
ZEVs, PHEVs, HEVs, and 48V HEVs
*PHEVs are proposed to be required to comply with staff’s battery state of health standardization and charge rate requirements, both of which must be accessible to the driver. PHEV are already required to comply with (1) CCR, Title 13, section 1968.2 (On-Board Diagnostics), which covers most other data metrics proposed for ZEVs, (2) CCR, Title 13, sections 1961.2 and 1961.4 which requires vehicles to meet GHG and criteria exhaust emission standards over useful life (15 years or 150,000 miles, (3) CCR, title 13, section 2037 ad 2038, which requires emissions related parts warranty coverage for PHEVs, and (4) CCR, title 13, section 1969, which requires the disclosure of service information.
IV. Summary of Staff’s LEV Proposals
The suite of proposed regulations guide the light-duty vehicle segment toward 100-percent electrification by 2035, signifying that the last new conventional ICEVs will be sold in California during the implementation period of this regulation. However, many of these ICEVs will remain in-use on California’s roads well beyond 2035. As such, the proposed regulation includes three primary elements aimed to mitigate the air quality impacts of ICEVs. First, it would prevent potential emission backsliding of ICEVs that is otherwise possible under the existing regulations by applying the exhaust and evaporative emission fleet average standards exclusively to combustion engines. Second, it would lower the maximum exhaust and evaporative emission rates. Third, it would reduce cold start emissions by applying the emission standards to a broader range of in-use driving conditions. (Starts after the vehicle engine has been shut-off for more than 12 hours are considered cold starts.) The combination of these three elements would help deliver real world emission benefits from the remaining ICEVs that would complement more significant emission reductions gained by more widespread deployment of ZEV technology.382 For the medium-duty vehicle segment of ICEVs, the proposal would first provide better emission control over a broader range of in-use driving conditions under the moving average in-use standard for towing capable vehicles. Second, the proposal would require the fleet to get cleaner by lowering the current fleet average standard. Third, the proposal would clean up the highest emitting vehicles by lowering the maximum emission rate from medium-duty vehicles.
The proposed regulations include conforming amendments to related regulations and associated test procedures that are incorporated by reference into those regulations that are necessary to maintain consistency with the new requirements proposed for model year 2026 and subsequent vehicles and maintain existing requirements in regulations that are not being proposed for amendment. CARB is not proposing or considering any amendments to these existing regulations for any other purpose.
Further details of the specific LEV criteria proposals are outlined below.
382 Although not covered by the ZEV rulemaking in this regulatory package, the Advanced Clean Trucks Regulation requires 50 percent electrification by 2035. (Title 13, CCR §1963)
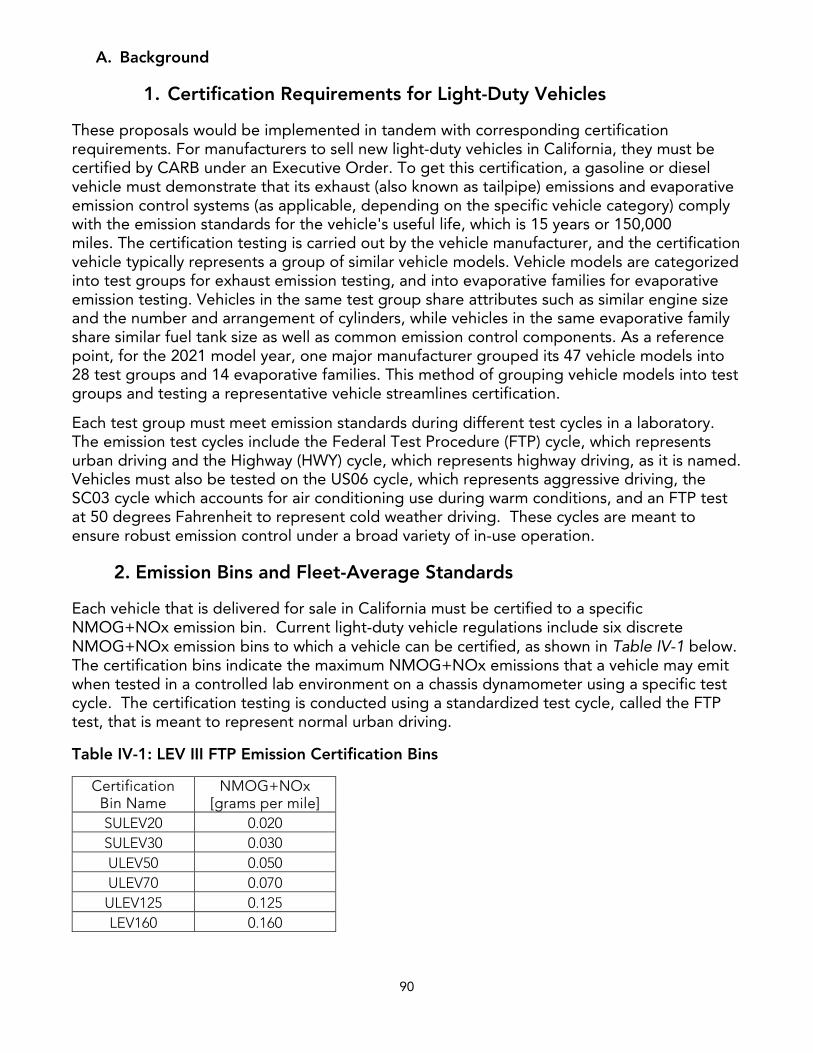
90
A. Background
1. Certification Requirements for Light-Duty Vehicles
These proposals would be implemented in tandem with corresponding certification requirements. For manufacturers to sell new light-duty vehicles in California, they must be certified by CARB under an Executive Order. To get this certification, a gasoline or diesel vehicle must demonstrate that its exhaust (also known as tailpipe) emissions and evaporative emission control systems (as applicable, depending on the specific vehicle category) comply with the emission standards for the vehicle's useful life, which is 15 years or 150,000 miles. The certification testing is carried out by the vehicle manufacturer, and the certification vehicle typically represents a group of similar vehicle models. Vehicle models are categorized into test groups for exhaust emission testing, and into evaporative families for evaporative emission testing. Vehicles in the same test group share attributes such as similar engine size and the number and arrangement of cylinders, while vehicles in the same evaporative family share similar fuel tank size as well as common emission control components. As a reference point, for the 2021 model year, one major manufacturer grouped its 47 vehicle models into 28 test groups and 14 evaporative families. This method of grouping vehicle models into test groups and testing a representative vehicle streamlines certification.
Each test group must meet emission standards during different test cycles in a laboratory. The emission test cycles include the Federal Test Procedure (FTP) cycle, which represents urban driving and the Highway (HWY) cycle, which represents highway driving, as it is named. Vehicles must also be tested on the US06 cycle, which represents aggressive driving, the SC03 cycle which accounts for air conditioning use during warm conditions, and an FTP test at 50 degrees Fahrenheit to represent cold weather driving. These cycles are meant to ensure robust emission control under a broad variety of in-use operation.
2. Emission Bins and Fleet-Average Standards
Each vehicle that is delivered for sale in California must be certified to a specific NMOG+NOx emission bin. Current light-duty vehicle regulations include six discrete NMOG+NOx emission bins to which a vehicle can be certified, as shown in Table IV-1 below. The certification bins indicate the maximum NMOG+NOx emissions that a vehicle may emit when tested in a controlled lab environment on a chassis dynamometer using a specific test cycle. The certification testing is conducted using a standardized test cycle, called the FTP test, that is meant to represent normal urban driving.
Table IV-1: LEV III FTP Emission Certification Bins
Certification Bin Name
NMOG+NOx [grams per mile]
SULEV20 0.020 SULEV30 0.030 ULEV50 0.050 ULEV70 0.070 ULEV125 0.125 LEV160 0.160
91
In addition to each test group being certified to an individual emission standard bin, vehicle manufacturers must also meet a fleet-average standard based on the model year with their full fleet of vehicles. This is calculated by sales weighting of all test groups by the emission bin value for the manufacturer.
3. Cold-Start Emissions
A cold-start occurs when a vehicle is started and all the vehicle components essential for providing the force to move the vehicle and controlling emissions, such as the combustion engine and aftertreatment catalyst, are near ambient air temperature. Cold starts are a common occurrence in real-world driving. Parking a vehicle and leaving it overnight in a garage or driveway will result in a cold-start when the vehicle is turned on in the morning. At the end of a trip, the combustion engine is hot and the aftertreatment catalyst is warm, with temperatures typically measuring several hundred degrees Fahrenheit. After the vehicle is turned off at the end of a trip, both the engine and the catalyst are gradually cooled by the ambient air, and eventually both will reach thermal equilibrium at the ambient air temperature. The cooling down process is commonly referred to as a vehicle soak, since the hot vehicle components are being soaked in the cooler air. Depending on the ambient air temperature, the cool-down process will typically take several hours. For the purposes of emission testing, a full vehicle soak is defined as 12 to 36 hours.
Generally, cold-start conditions will generate the highest emissions during a trip since all the key emission control components are cold and the formation of engine out pollutants, or by-products of combustion, are the highest. To help control cold start emissions, modern vehicles are equipped with complex sensors and computer controls that can optimize measurement and delivery of intake air, delivery of fuel, and spark timing to achieve early complete combustion as fast as possible while also taking action to deliberately accelerate warm-up of key emission controls such as the catalyst and the air fuel sensor(s) used to fine tune fuel injection quantities. Today’s engine and emission controls, when operating properly, are highly effective once operating temperature has been achieved under most driving conditions. However, despite the advances in vehicle technology, the emissions initially released during a cold start continue to represent the bulk of emissions released during a trip, particularly for gasoline vehicles.
4. High-Powered Starts for PHEVs
Looking further into the criteria pollutant emission impacts of PHEVs, during the Midterm Review, staff evaluated the cold start emissions of blended PHEVs representative of typical PHEVs released during 2012-2016 model years. For blended PHEVs, both grid energy stored in the battery and the internal combustion engine (ICE) can be used simultaneously to power the vehicle. Generally, this occurs when the vehicle power demand is higher than what the electric-only propulsion system can provide, and the vehicle must start the engine to combine the electric and ICE power to meet the driver’s demand. In contrast, a non-blended PHEV utilizes a larger electric motor and/or battery so the electric-only propulsion system can fully meet any driver demands without the need to start the engine until the battery is fully depleted. For both non-blended PHEVs and conventional vehicles, the engine is started under more predictable and controllable conditions giving the manufacturer the ability to optimize initial start-up operation to minimize emissions. Blended PHEVs, however, introduce a unique driving condition where the initial engine start of a trip can occur at a time where
92
there is an immediate need for significant power and torque from the engine to help propel the vehicle rather than providing an initial start-up window where emission control can be prioritized. Such starts, referred to here as high-power cold starts, can have different emission characteristics relative to the initial engine start of a conventional vehicle which typically occurs with the vehicle stopped, in park or neutral, and with a very low immediate torque demand. The Midterm Review testing confirmed that cold-start emissions can be significantly higher under high power demand conditions relative to more traditional engine start conditions.383
Staff conducted further testing and had discussions with the vehicle manufacturers to discuss emission control strategies and alternatives that may provide for more robust emission control in these conditions. Through these discussions and further testing, staff was directed by the Board to propose standards to control criteria emission for future, 2026 and beyond model year PHEVs.
5. PM Standards for Aggressive Driving Conditions
PM emissions from light- and medium-duty vehicles are regulated as part of the existing LEV program. Under LEV III, the PM emission standard for passenger cars, light-duty trucks, and medium-duty passenger vehicles was lowered from 10 mg/mi to 3 mg/mi between the 2017 and 2021 model years, then decreasing further to 1 mg/mi between the 2025 and 2028 model years. In the long term, the 1 mg/mi PM standard will be an effective backstop to retain the progress in PM emission reductions achieved by today’s gasoline car fleet in California and further reduce the health impacts associated with exposure to PM emissions. However, testing conducted during the Midterm Review to evaluate manufacturer’s progress in PM control also revealed that some vehicles that exhibit good control of PM emissions on the FTP cycle have notably higher emissions on the US06 cycle, which is representative of high speed and acceleration driving conditions. This was highlighted in testing done by CARB and presented in Appendix J of the MTR. Under the LEV III regulations, the FTP PM emission standard drops to 1 mg/mi in 2025, but the US06 standard remains at 6 mg/mi indefinitely. Based on testing conducted by staff, the current standards could allow for disproportionally higher PM emissions during more aggressive operation instead of protecting for robust PM emission control under the broadest set of in-use driving conditions.
6. Medium-Duty Vehicles
Medium-duty vehicles (MDVs) are a larger class of vehicles rated for a higher payload capacity when compared to light-duty vehicles. The maximum payload capacity for a vehicle is defined as its Gross Vehicle Weight Rating (GVWR). MDVs are separated into two different classes depending on the vehicles’ GVWR and commonly referred to as “class 2b” which are MDVs in the 8,501-10,000 lbs. GVWR and “class 3,” which are MDVs in the 10,001-14,000 lbs. GVWR.
Currently, there is flexibility in certification for class 3 MDVs as they can be certified as whole vehicles using the light-duty chassis dynamometer test procedures or as a standalone engine
383 CARB 2017i. California Air Resources Board. Appendix H: Plug-in Hybrid Electric Vehicle Emissions Testing. Posted January 18, 2017. https://ww2.arb.ca.gov/sites/default/files/2020-01/appendix_h_phev_testing_ac.pdf
93
using the heavy-duty engine dynamometer test procedures. The engine certification process outlined in 13 CCR 1956.8 (used in incomplete Otto-cycle medium-duty vehicles, or incomplete and complete diesel medium-duty vehicles)384 is similar to the chassis-certification process whereby engines, instead of complete vehicles, are tested on engine-specific test cycles and must meet specific standards for those test cycles. One of the many differences between the two certification paths is with the in-use compliance requirements. Chassis-certified vehicles are readily able to be brought into a laboratory, by the manufacturer or CARB, to perform official testing and confirm they meet the standards to which they were certified. Engine-certified vehicles, on the other hand, need to have the engine removed from the vehicle and tested in a specific laboratory designed to directly test engines to verify compliance with the standards. This more complicated path led to the development of an alternative method to verify in-use compliance for engine-certified products by using a Portable Emission Measurement System (PEMS) that can be temporarily installed on a vehicle and tested on-road without having to remove the engine and test it in a laboratory.
The recent heavy-duty Low NOx Omnibus rulemaking adopted amendments to the test procedures and standards for both certification and in-use compliance for engines used in heavy-duty applications as well as engines used in class 3 MDVs. These new amendments included adding an additional engine-certification test cycle for diesel engines to cover the low load engine operation range, which covers a similar area of engine operation as the chassis-certification FTP test cycle. The amendments also established future engine FTP test cycle standards that are much more stringent requiring both gasoline and diesels to meet a 0.02 g/bhp-hr NOx standard. This is a reduction of 80 to 90-percent from the current standards. Additionally, the amendments made changes to the PEMS in-use standards and test procedures for engine-certified vehicles to ensure all areas of engine operation are covered during in-use testing and that the in-use emission threshold was reflective of the new stringent certification standards.
7. Conforming amendments to related regulations
The proposed regulations include amendments to existing regulations to ensure internal consistency and maintain existing requirements. These primarily consist of updates to cross-references and definitions. The affected regulations in this category are the following sections of Title 13 of the California Code of Regulations:
• 1900, Definitions • 1961.2, Exhaust Emission Standards and Test Procedures - 2015 and Subsequent
Model Passenger Cars, Light-Duty Trucks, and Medium-Duty Vehicles • 1961.3, Greenhouse Gas Exhaust Emission Standards and Test Procedures - 2017 and
Subsequent Model Passenger Cars, Light-Duty Trucks, and Medium-Duty Passenger Vehicles.
• 1962.2, Zero-Emission Vehicle Standards for 2018 and Subsequent Model Year Passenger Cars, Light-Duty Trucks, and Medium-Duty Vehicles.
384 As of the 2020 MY, medium-duty engines for use in vehicles from 8,501 to 10,000 pounds GVWR must be chassis certified (13 CCR 1961.2).
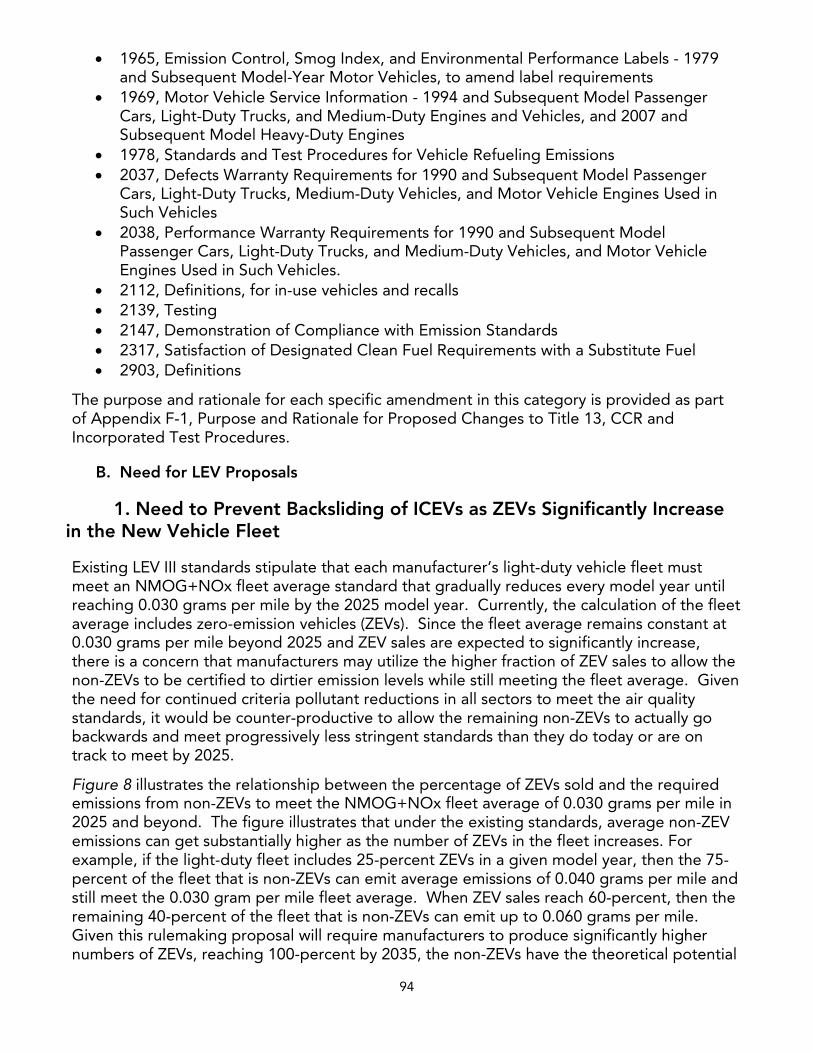
94
• 1965, Emission Control, Smog Index, and Environmental Performance Labels - 1979and Subsequent Model-Year Motor Vehicles, to amend label requirements
• 1969, Motor Vehicle Service Information - 1994 and Subsequent Model PassengerCars, Light-Duty Trucks, and Medium-Duty Engines and Vehicles, and 2007 andSubsequent Model Heavy-Duty Engines
• 1978, Standards and Test Procedures for Vehicle Refueling Emissions• 2037, Defects Warranty Requirements for 1990 and Subsequent Model Passenger
Cars, Light-Duty Trucks, Medium-Duty Vehicles, and Motor Vehicle Engines Used inSuch Vehicles
• 2038, Performance Warranty Requirements for 1990 and Subsequent ModelPassenger Cars, Light-Duty Trucks, and Medium-Duty Vehicles, and Motor VehicleEngines Used in Such Vehicles.
• 2112, Definitions, for in-use vehicles and recalls• 2139, Testing• 2147, Demonstration of Compliance with Emission Standards• 2317, Satisfaction of Designated Clean Fuel Requirements with a Substitute Fuel• 2903, Definitions
The purpose and rationale for each specific amendment in this category is provided as part of Appendix F-1, Purpose and Rationale for Proposed Changes to Title 13, CCR and Incorporated Test Procedures.
B. Need for LEV Proposals
1. Need to Prevent Backsliding of ICEVs as ZEVs Significantly Increasein the New Vehicle Fleet
Existing LEV III standards stipulate that each manufacturer’s light-duty vehicle fleet must meet an NMOG+NOx fleet average standard that gradually reduces every model year until reaching 0.030 grams per mile by the 2025 model year. Currently, the calculation of the fleet average includes zero-emission vehicles (ZEVs). Since the fleet average remains constant at 0.030 grams per mile beyond 2025 and ZEV sales are expected to significantly increase, there is a concern that manufacturers may utilize the higher fraction of ZEV sales to allow the non-ZEVs to be certified to dirtier emission levels while still meeting the fleet average. Given the need for continued criteria pollutant reductions in all sectors to meet the air quality standards, it would be counter-productive to allow the remaining non-ZEVs to actually go backwards and meet progressively less stringent standards than they do today or are on track to meet by 2025.
Figure 8 illustrates the relationship between the percentage of ZEVs sold and the required emissions from non-ZEVs to meet the NMOG+NOx fleet average of 0.030 grams per mile in 2025 and beyond. The figure illustrates that under the existing standards, average non-ZEV emissions can get substantially higher as the number of ZEVs in the fleet increases. For example, if the light-duty fleet includes 25-percent ZEVs in a given model year, then the 75-percent of the fleet that is non-ZEVs can emit average emissions of 0.040 grams per mile and still meet the 0.030 gram per mile fleet average. When ZEV sales reach 60-percent, then the remaining 40-percent of the fleet that is non-ZEVs can emit up to 0.060 grams per mile. Given this rulemaking proposal will require manufacturers to produce significantly higher numbers of ZEVs, reaching 100-percent by 2035, the non-ZEVs have the theoretical potential
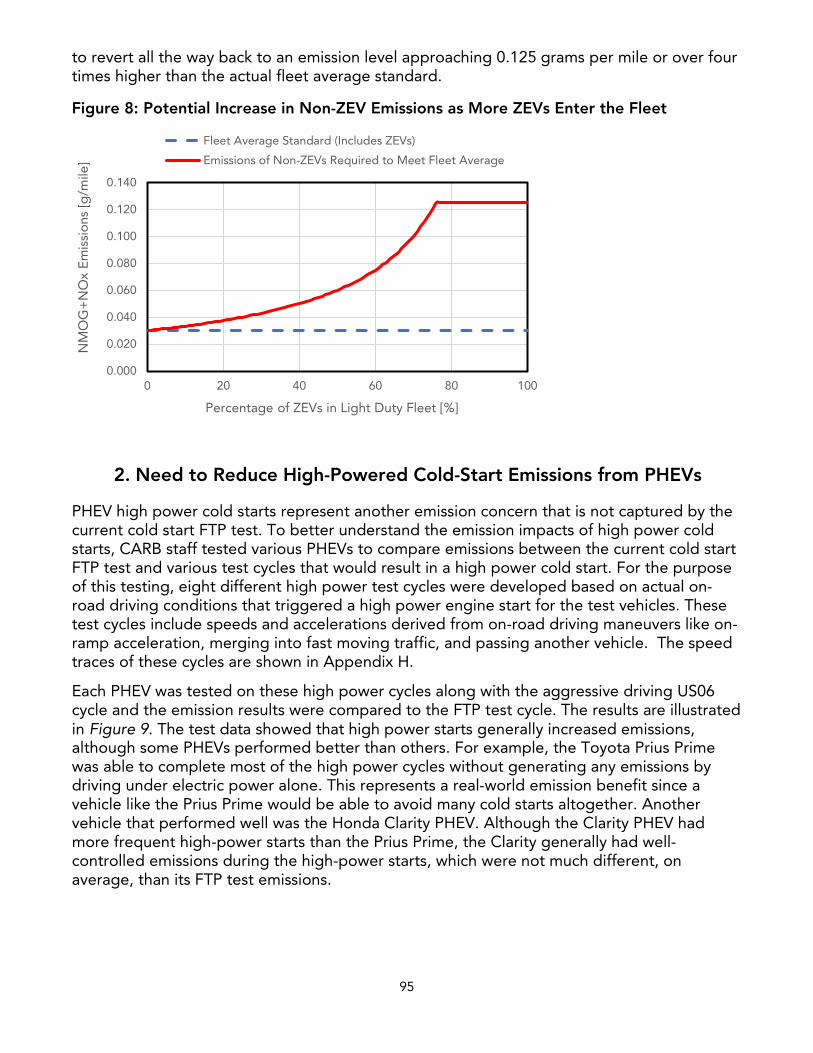
95
to revert all the way back to an emission level approaching 0.125 grams per mile or over four times higher than the actual fleet average standard.
Figure 8: Potential Increase in Non-ZEV Emissions as More ZEVs Enter the Fleet
2. Need to Reduce High-Powered Cold-Start Emissions from PHEVs
PHEV high power cold starts represent another emission concern that is not captured by the current cold start FTP test. To better understand the emission impacts of high power cold starts, CARB staff tested various PHEVs to compare emissions between the current cold start FTP test and various test cycles that would result in a high power cold start. For the purpose of this testing, eight different high power test cycles were developed based on actual on-road driving conditions that triggered a high power engine start for the test vehicles. These test cycles include speeds and accelerations derived from on-road driving maneuvers like on-ramp acceleration, merging into fast moving traffic, and passing another vehicle. The speed traces of these cycles are shown in Appendix H.
Each PHEV was tested on these high power cycles along with the aggressive driving US06 cycle and the emission results were compared to the FTP test cycle. The results are illustrated in Figure 9. The test data showed that high power starts generally increased emissions, although some PHEVs performed better than others. For example, the Toyota Prius Prime was able to complete most of the high power cycles without generating any emissions by driving under electric power alone. This represents a real-world emission benefit since a vehicle like the Prius Prime would be able to avoid many cold starts altogether. Another vehicle that performed well was the Honda Clarity PHEV. Although the Clarity PHEV had more frequent high-power starts than the Prius Prime, the Clarity generally had well-controlled emissions during the high-power starts, which were not much different, on average, than its FTP test emissions.
0.000
0.020
0.040
0.060
0.080
0.100
0.120
0.140
0 20 40 60 80 100
NM
OG
+N
Ox
Emis
sio
ns[g
/mile
]
Percentage of ZEVs in Light Duty Fleet [%]
Fleet Average Standard (Includes ZEVs)
Emissions of Non-ZEVs Required to Meet Fleet Average
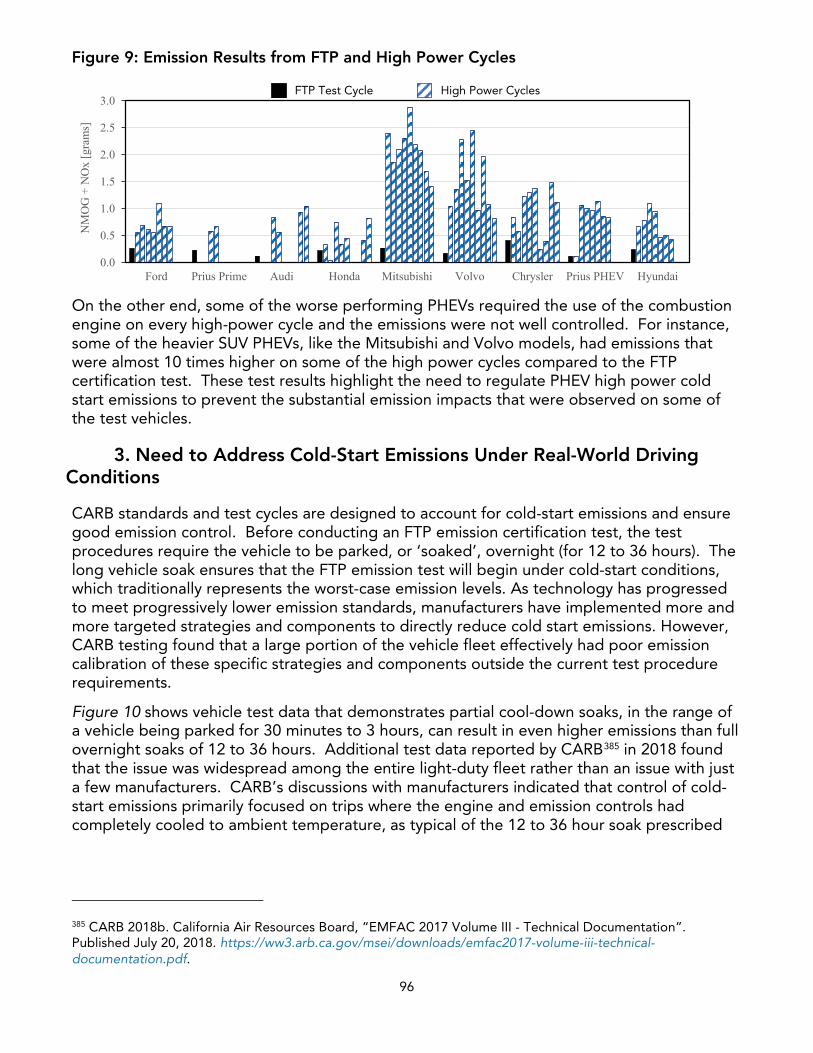
96
Figure 9: Emission Results from FTP and High Power Cycles
On the other end, some of the worse performing PHEVs required the use of the combustion engine on every high-power cycle and the emissions were not well controlled. For instance, some of the heavier SUV PHEVs, like the Mitsubishi and Volvo models, had emissions that were almost 10 times higher on some of the high power cycles compared to the FTP certification test. These test results highlight the need to regulate PHEV high power cold start emissions to prevent the substantial emission impacts that were observed on some of the test vehicles.
3. Need to Address Cold-Start Emissions Under Real-World DrivingConditions
CARB standards and test cycles are designed to account for cold-start emissions and ensure good emission control. Before conducting an FTP emission certification test, the test procedures require the vehicle to be parked, or ‘soaked’, overnight (for 12 to 36 hours). The long vehicle soak ensures that the FTP emission test will begin under cold-start conditions, which traditionally represents the worst-case emission levels. As technology has progressed to meet progressively lower emission standards, manufacturers have implemented more and more targeted strategies and components to directly reduce cold start emissions. However, CARB testing found that a large portion of the vehicle fleet effectively had poor emission calibration of these specific strategies and components outside the current test procedure requirements.
Figure 10 shows vehicle test data that demonstrates partial cool-down soaks, in the range of a vehicle being parked for 30 minutes to 3 hours, can result in even higher emissions than full overnight soaks of 12 to 36 hours. Additional test data reported by CARB385 in 2018 found that the issue was widespread among the entire light-duty fleet rather than an issue with just a few manufacturers. CARB’s discussions with manufacturers indicated that control of cold-start emissions primarily focused on trips where the engine and emission controls had completely cooled to ambient temperature, as typical of the 12 to 36 hour soak prescribed
385 CARB 2018b. California Air Resources Board, “EMFAC 2017 Volume III - Technical Documentation”. Published July 20, 2018. https://ww3.arb.ca.gov/msei/downloads/emfac2017-volume-iii-technical-documentation.pdf.
0.0
0.5
1.0
1.5
2.0
2.5
3.0
Ford Prius Prime Audi Honda Mitsubishi Volvo Chrysler Prius PHEV Hyundai
NM
OG
+ N
Ox
[gra
ms]
FTP Test Cycle High Power Cycles
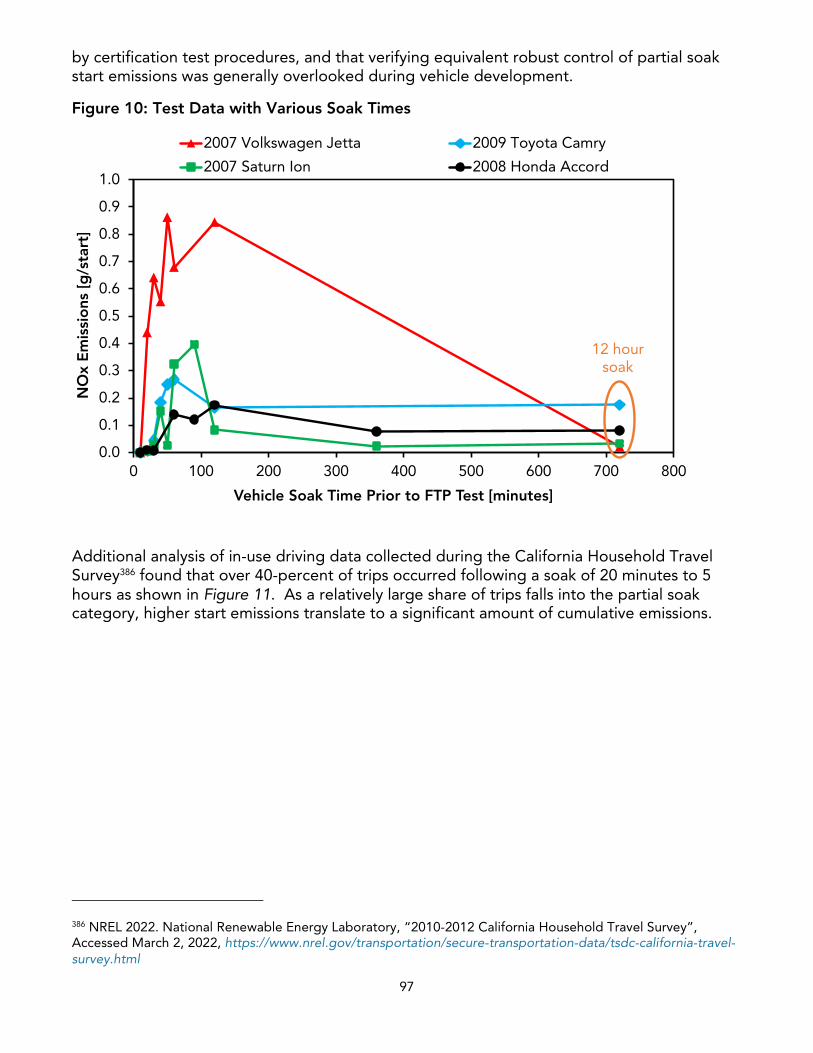
97
by certification test procedures, and that verifying equivalent robust control of partial soak start emissions was generally overlooked during vehicle development.
Figure 10: Test Data with Various Soak Times
Additional analysis of in-use driving data collected during the California Household Travel Survey386 found that over 40-percent of trips occurred following a soak of 20 minutes to 5 hours as shown in Figure 11. As a relatively large share of trips falls into the partial soak category, higher start emissions translate to a significant amount of cumulative emissions.
386 NREL 2022. National Renewable Energy Laboratory, “2010-2012 California Household Travel Survey”, Accessed March 2, 2022, https://www.nrel.gov/transportation/secure-transportation-data/tsdc-california-travel-survey.html
0.0
0.1
0.2
0.3
0.4
0.5
0.6
0.7
0.8
0.9
1.0
0 100 200 300 400 500 600 700 800
NO
x E
mis
sio
ns[g
/sta
rt]
Vehicle Soak Time Prior to FTP Test [minutes]
2007 Volkswagen Jetta 2009 Toyota Camry
2007 Saturn Ion 2008 Honda Accord
12 hoursoak
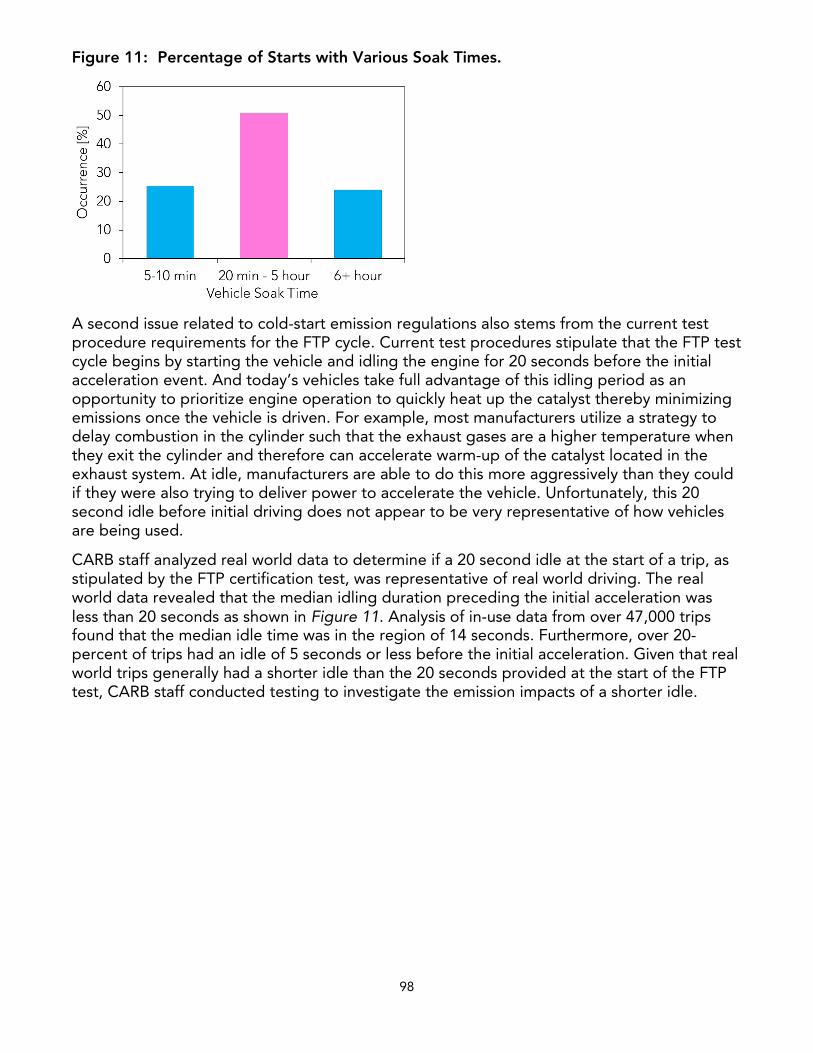
98
Figure 11: Percentage of Starts with Various Soak Times.
A second issue related to cold-start emission regulations also stems from the current test procedure requirements for the FTP cycle. Current test procedures stipulate that the FTP test cycle begins by starting the vehicle and idling the engine for 20 seconds before the initial acceleration event. And today’s vehicles take full advantage of this idling period as an opportunity to prioritize engine operation to quickly heat up the catalyst thereby minimizing emissions once the vehicle is driven. For example, most manufacturers utilize a strategy to delay combustion in the cylinder such that the exhaust gases are a higher temperature when they exit the cylinder and therefore can accelerate warm-up of the catalyst located in the exhaust system. At idle, manufacturers are able to do this more aggressively than they could if they were also trying to deliver power to accelerate the vehicle. Unfortunately, this 20 second idle before initial driving does not appear to be very representative of how vehicles are being used.
CARB staff analyzed real world data to determine if a 20 second idle at the start of a trip, as stipulated by the FTP certification test, was representative of real world driving. The real world data revealed that the median idling duration preceding the initial acceleration was less than 20 seconds as shown in Figure 11. Analysis of in-use data from over 47,000 trips found that the median idle time was in the region of 14 seconds. Furthermore, over 20-percent of trips had an idle of 5 seconds or less before the initial acceleration. Given that real world trips generally had a shorter idle than the 20 seconds provided at the start of the FTP test, CARB staff conducted testing to investigate the emission impacts of a shorter idle.
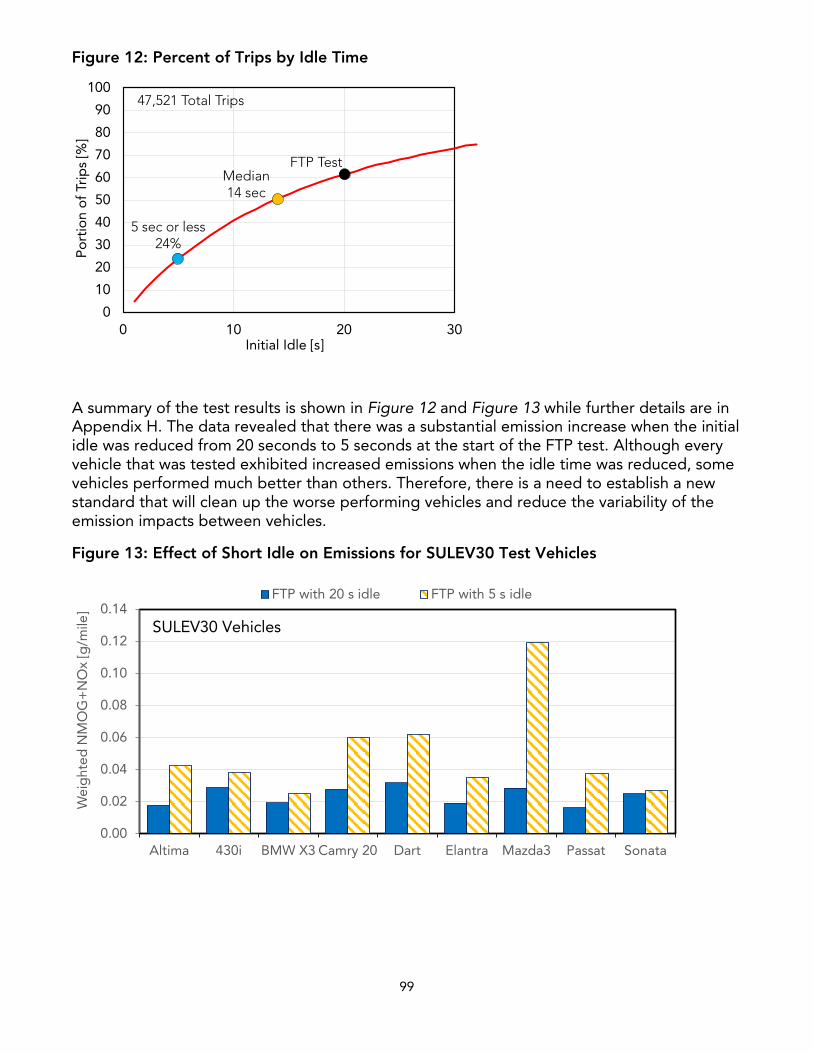
99
Figure 12: Percent of Trips by Idle Time
A summary of the test results is shown in Figure 12 and Figure 13 while further details are in Appendix H. The data revealed that there was a substantial emission increase when the initial idle was reduced from 20 seconds to 5 seconds at the start of the FTP test. Although every vehicle that was tested exhibited increased emissions when the idle time was reduced, some vehicles performed much better than others. Therefore, there is a need to establish a new standard that will clean up the worse performing vehicles and reduce the variability of the emission impacts between vehicles.
Figure 13: Effect of Short Idle on Emissions for SULEV30 Test Vehicles
0
10
20
30
40
50
60
70
80
90
100
0 10 20 30
Po
rtio
n o
f Tr
ips
[%]
Initial Idle [s]
FTP TestMedian14 sec
5 sec or less24%
47,521 Total Trips
0.00
0.02
0.04
0.06
0.08
0.10
0.12
0.14
Altima 430i BMW X3 Camry 20 Dart Elantra Mazda3 Passat Sonata
Wei
ght
ed N
MO
G+
NO
x [g
/mile
]
FTP with 20 s idle FTP with 5 s idle
SULEV30 Vehicles
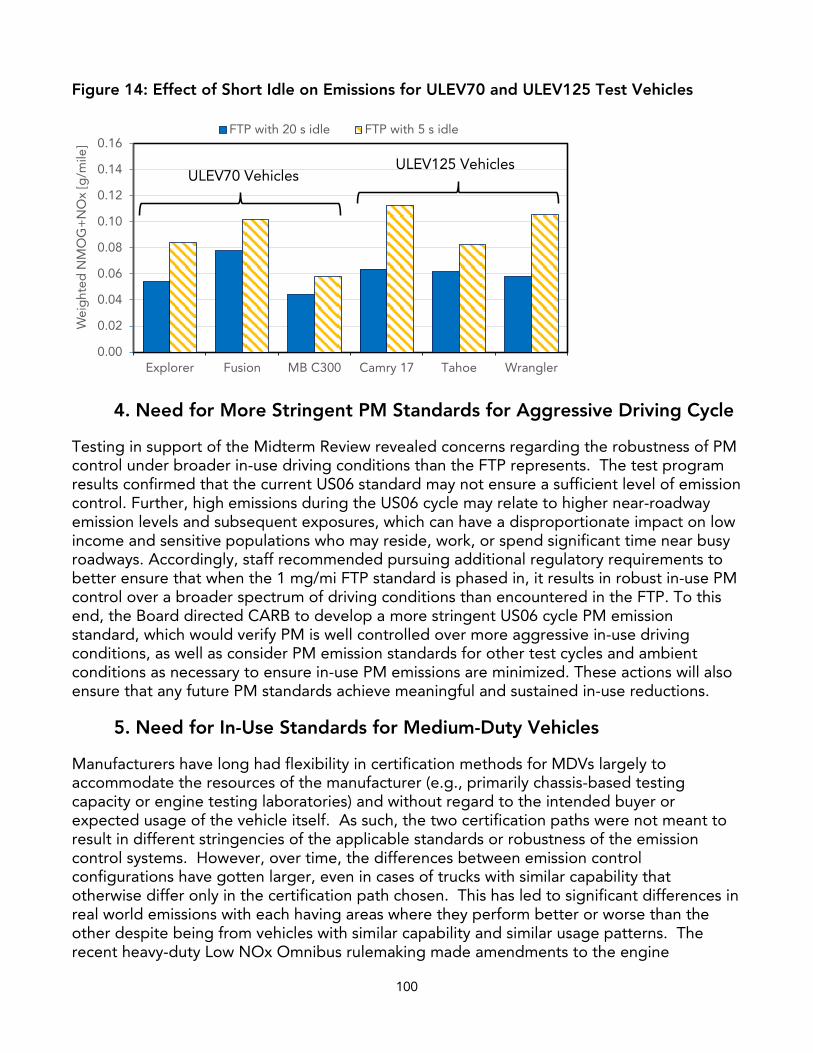
100
Figure 14: Effect of Short Idle on Emissions for ULEV70 and ULEV125 Test Vehicles
4. Need for More Stringent PM Standards for Aggressive Driving Cycle
Testing in support of the Midterm Review revealed concerns regarding the robustness of PM control under broader in-use driving conditions than the FTP represents. The test program results confirmed that the current US06 standard may not ensure a sufficient level of emission control. Further, high emissions during the US06 cycle may relate to higher near-roadway emission levels and subsequent exposures, which can have a disproportionate impact on low income and sensitive populations who may reside, work, or spend significant time near busy roadways. Accordingly, staff recommended pursuing additional regulatory requirements to better ensure that when the 1 mg/mi FTP standard is phased in, it results in robust in-use PM control over a broader spectrum of driving conditions than encountered in the FTP. To this end, the Board directed CARB to develop a more stringent US06 cycle PM emission standard, which would verify PM is well controlled over more aggressive in-use driving conditions, as well as consider PM emission standards for other test cycles and ambient conditions as necessary to ensure in-use PM emissions are minimized. These actions will also ensure that any future PM standards achieve meaningful and sustained in-use reductions.
5. Need for In-Use Standards for Medium-Duty Vehicles
Manufacturers have long had flexibility in certification methods for MDVs largely to accommodate the resources of the manufacturer (e.g., primarily chassis-based testing capacity or engine testing laboratories) and without regard to the intended buyer or expected usage of the vehicle itself. As such, the two certification paths were not meant to result in different stringencies of the applicable standards or robustness of the emission control systems. However, over time, the differences between emission control configurations have gotten larger, even in cases of trucks with similar capability that otherwise differ only in the certification path chosen. This has led to significant differences in real world emissions with each having areas where they perform better or worse than the other despite being from vehicles with similar capability and similar usage patterns. The recent heavy-duty Low NOx Omnibus rulemaking made amendments to the engine
0.00
0.02
0.04
0.06
0.08
0.10
0.12
0.14
0.16
Explorer Fusion MB C300 Camry 17 Tahoe Wrangler
Wei
ght
ed N
MO
G+
NO
x [g
/mile
]
FTP with 20 s idle FTP with 5 s idle
ULEV70 VehiclesULEV125 Vehicles
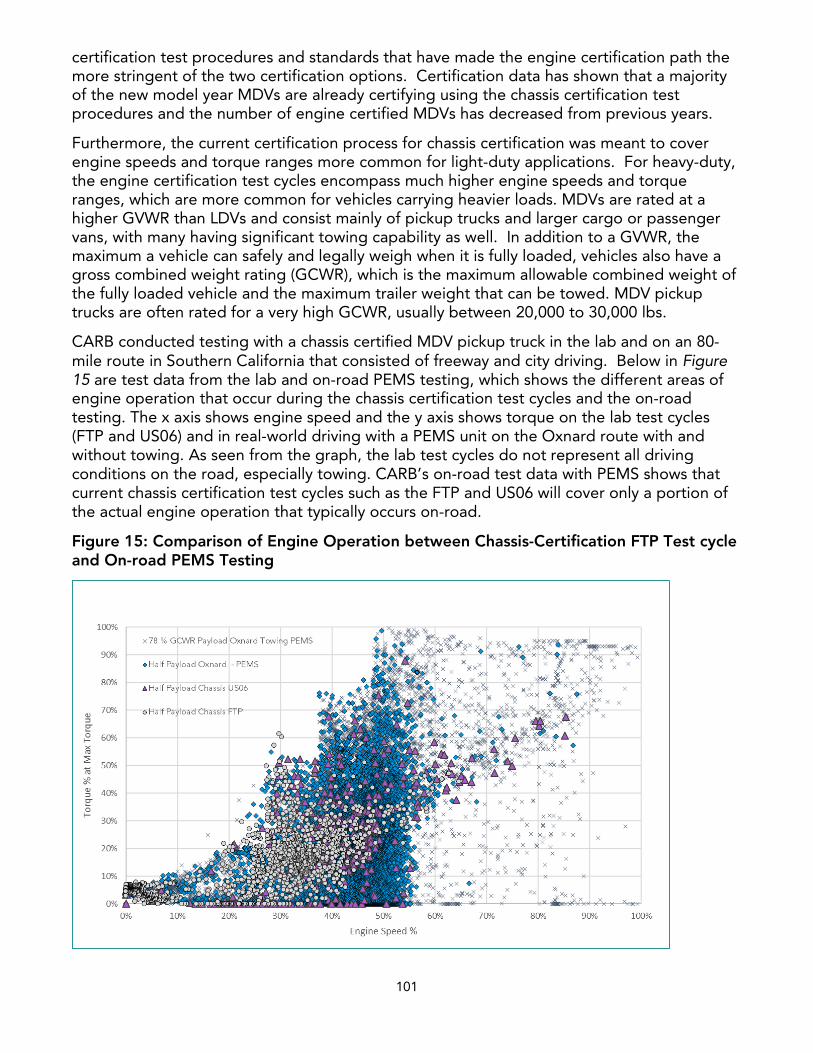
101
certification test procedures and standards that have made the engine certification path the more stringent of the two certification options. Certification data has shown that a majority of the new model year MDVs are already certifying using the chassis certification test procedures and the number of engine certified MDVs has decreased from previous years.
Furthermore, the current certification process for chassis certification was meant to cover engine speeds and torque ranges more common for light-duty applications. For heavy-duty, the engine certification test cycles encompass much higher engine speeds and torque ranges, which are more common for vehicles carrying heavier loads. MDVs are rated at a higher GVWR than LDVs and consist mainly of pickup trucks and larger cargo or passenger vans, with many having significant towing capability as well. In addition to a GVWR, the maximum a vehicle can safely and legally weigh when it is fully loaded, vehicles also have a gross combined weight rating (GCWR), which is the maximum allowable combined weight of the fully loaded vehicle and the maximum trailer weight that can be towed. MDV pickup trucks are often rated for a very high GCWR, usually between 20,000 to 30,000 lbs.
CARB conducted testing with a chassis certified MDV pickup truck in the lab and on an 80-mile route in Southern California that consisted of freeway and city driving. Below in Figure 15 are test data from the lab and on-road PEMS testing, which shows the different areas of engine operation that occur during the chassis certification test cycles and the on-road testing. The x axis shows engine speed and the y axis shows torque on the lab test cycles (FTP and US06) and in real-world driving with a PEMS unit on the Oxnard route with and without towing. As seen from the graph, the lab test cycles do not represent all driving conditions on the road, especially towing. CARB’s on-road test data with PEMS shows that current chassis certification test cycles such as the FTP and US06 will cover only a portion of the actual engine operation that typically occurs on-road.
Figure 15: Comparison of Engine Operation between Chassis-Certification FTP Test cycle and On-road PEMS Testing
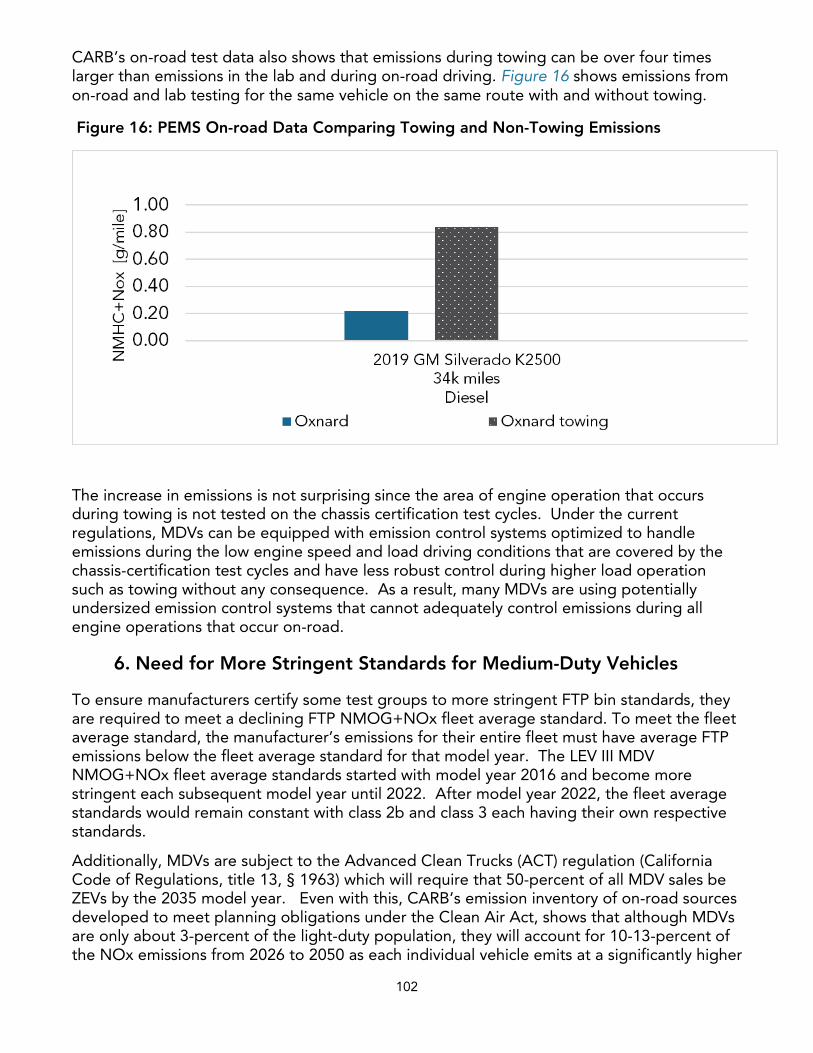
102
CARB’s on-road test data also shows that emissions during towing can be over four times larger than emissions in the lab and during on-road driving. Figure 16 shows emissions from on-road and lab testing for the same vehicle on the same route with and without towing.
Figure 16: PEMS On-road Data Comparing Towing and Non-Towing Emissions
The increase in emissions is not surprising since the area of engine operation that occurs during towing is not tested on the chassis certification test cycles. Under the current regulations, MDVs can be equipped with emission control systems optimized to handle emissions during the low engine speed and load driving conditions that are covered by the chassis-certification test cycles and have less robust control during higher load operation such as towing without any consequence. As a result, many MDVs are using potentially undersized emission control systems that cannot adequately control emissions during all engine operations that occur on-road.
6. Need for More Stringent Standards for Medium-Duty Vehicles
To ensure manufacturers certify some test groups to more stringent FTP bin standards, they are required to meet a declining FTP NMOG+NOx fleet average standard. To meet the fleet average standard, the manufacturer’s emissions for their entire fleet must have average FTP emissions below the fleet average standard for that model year. The LEV III MDV NMOG+NOx fleet average standards started with model year 2016 and become more stringent each subsequent model year until 2022. After model year 2022, the fleet average standards would remain constant with class 2b and class 3 each having their own respective standards.
Additionally, MDVs are subject to the Advanced Clean Trucks (ACT) regulation (California Code of Regulations, title 13, § 1963) which will require that 50-percent of all MDV sales be ZEVs by the 2035 model year. Even with this, CARB’s emission inventory of on-road sources developed to meet planning obligations under the Clean Air Act, shows that although MDVs are only about 3-percent of the light-duty population, they will account for 10-13-percent of the NOx emissions from 2026 to 2050 as each individual vehicle emits at a significantly higher
103
level than light-duty vehicles. If the fleet average standards remain unchanged, then there will be no further improvements to the ICE MDV fleet from the vehicles being certified and built today even though further emission reductions are feasible.
7. Need to amend the OBD regulations
On-board diagnostic (OBD) systems are self-diagnostic systems incorporated into a vehicle’s on-board computer. They are comprised mainly of software designed to detect emission-control system malfunctions as they occur. This is done by monitoring virtually every component and system that can cause increases in emissions, thus maintaining low emissions throughout the vehicle’s life. The OBD system continuously works in the background during vehicle operation to monitor emission-related components and alerts the vehicle operator of detected malfunctions by illuminating the malfunction indicator light (MIL) on the vehicle’s instrument panel. Additionally, the OBD system stores important information, including identification of the faulty component or system and the nature of the fault, which allows for quicker diagnosis and proper repair of the problem by technicians. This helps vehicle owners experience less expensive repairs, and promotes repairs being done correctly the first time.
OBD systems also influence and interact with other CARB emission requirements. For example, the detection of faults during the emission warranty period provides a clear notification to the vehicle operator that a warranty repair is needed. In turn, this provides further motivation to vehicle manufacturers to design durable emission controls to minimize warranty costs and avoid perceptions by the vehicle operator of the need for frequent repairs.
For the most critical emission control components that have the largest influence on tailpipe emissions, the OBD system is required to monitor the components and indicate a fault code when emissions exceed the emission standards by a certain amount. Emission “thresholds” for these faults are typically a multiple of the exhaust emission standard (e.g., 2.0 times the applicable standard).
Under the proposed amendments, new emission bins are being added between and below the existing emission bins to provide manufacturers with additional flexibility in certifying different vehicle models to specific bins such that their overall fleet meets the required fleet average each year. Because the OBD emission thresholds are typically defined as a multiplicative function of the emission bin that the vehicle is certified to and that the multiplicative value varies between different emission bins, each emission bin is listed in the OBD regulation along with the applicable multiplier. However, the newly added emission bins are not in the existing OBD regulation so manufacturers would not know which multiplier to even use with the new bins. Further, because some of the new bins are lower than what was previously the lowest bin available, the appropriateness of which multiplier to use has not yet been assessed. While detection of faults at proportionally lower levels will likely be required in the future as it will be necessary to ensure the maximum benefits of the proposed standards are maintained in-use, the vehicle manufacturers have expressed concern about not knowing with certainty what impact the lower standards will have on their OBD monitoring capability. As such, the vehicle manufacturers have requested interim relief until they have more certainty on what emission thresholds are achievable, and CARB staff concurs that the requested relief is reasonable and needed.
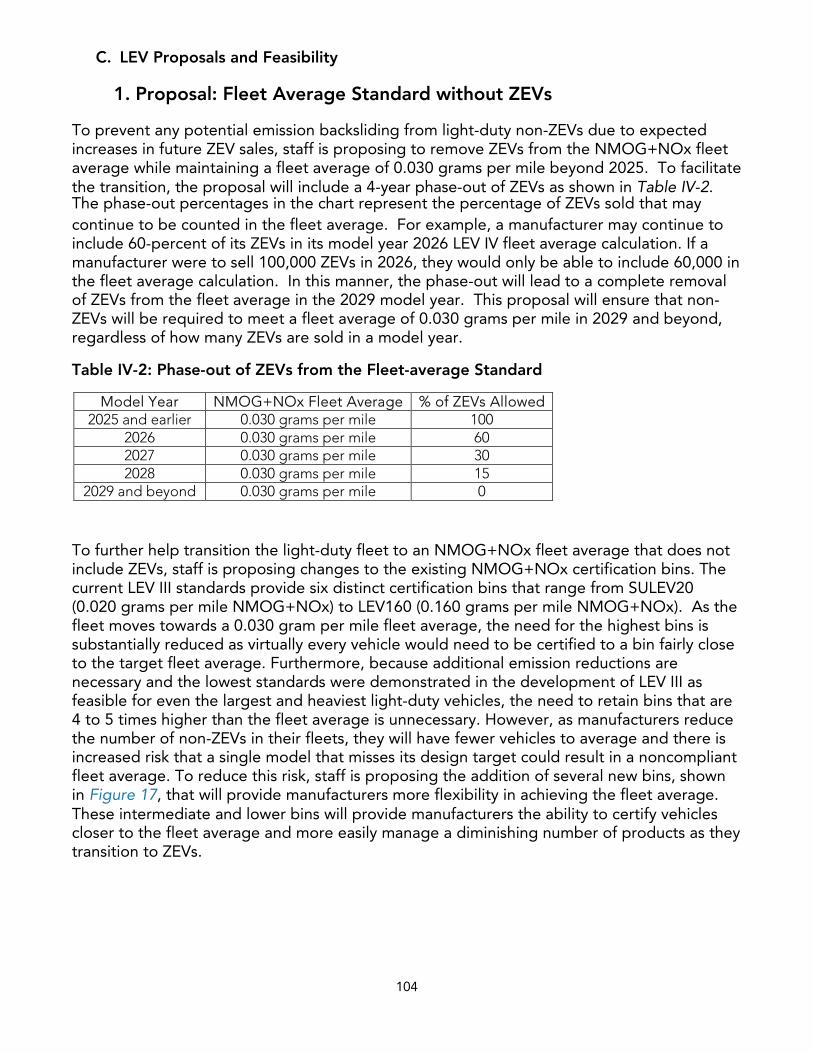
104
C. LEV Proposals and Feasibility
1. Proposal: Fleet Average Standard without ZEVs
To prevent any potential emission backsliding from light-duty non-ZEVs due to expected increases in future ZEV sales, staff is proposing to remove ZEVs from the NMOG+NOx fleet average while maintaining a fleet average of 0.030 grams per mile beyond 2025. To facilitate the transition, the proposal will include a 4-year phase-out of ZEVs as shown in Table IV-2. The phase-out percentages in the chart represent the percentage of ZEVs sold that may continue to be counted in the fleet average. For example, a manufacturer may continue to include 60-percent of its ZEVs in its model year 2026 LEV IV fleet average calculation. If a manufacturer were to sell 100,000 ZEVs in 2026, they would only be able to include 60,000 in the fleet average calculation. In this manner, the phase-out will lead to a complete removal of ZEVs from the fleet average in the 2029 model year. This proposal will ensure that non-ZEVs will be required to meet a fleet average of 0.030 grams per mile in 2029 and beyond, regardless of how many ZEVs are sold in a model year.
Table IV-2: Phase-out of ZEVs from the Fleet-average Standard
Model Year NMOG+NOx Fleet Average % of ZEVs Allowed 2025 and earlier 0.030 grams per mile 100
2026 0.030 grams per mile 60 2027 0.030 grams per mile 30 2028 0.030 grams per mile 15
2029 and beyond 0.030 grams per mile 0
To further help transition the light-duty fleet to an NMOG+NOx fleet average that does not include ZEVs, staff is proposing changes to the existing NMOG+NOx certification bins. The current LEV III standards provide six distinct certification bins that range from SULEV20 (0.020 grams per mile NMOG+NOx) to LEV160 (0.160 grams per mile NMOG+NOx). As the fleet moves towards a 0.030 gram per mile fleet average, the need for the highest bins is substantially reduced as virtually every vehicle would need to be certified to a bin fairly close to the target fleet average. Furthermore, because additional emission reductions are necessary and the lowest standards were demonstrated in the development of LEV III as feasible for even the largest and heaviest light-duty vehicles, the need to retain bins that are 4 to 5 times higher than the fleet average is unnecessary. However, as manufacturers reduce the number of non-ZEVs in their fleets, they will have fewer vehicles to average and there is increased risk that a single model that misses its design target could result in a noncompliant fleet average. To reduce this risk, staff is proposing the addition of several new bins, shown in Figure 17, that will provide manufacturers more flexibility in achieving the fleet average. These intermediate and lower bins will provide manufacturers the ability to certify vehicles closer to the fleet average and more easily manage a diminishing number of products as they transition to ZEVs.
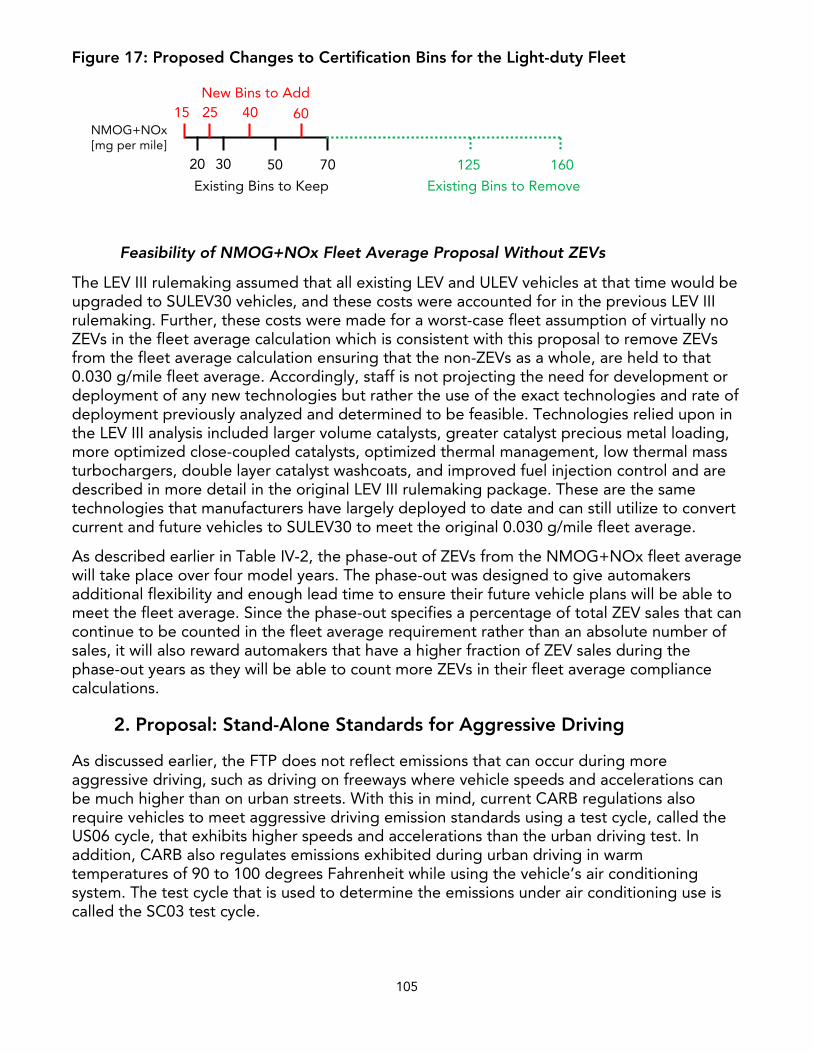
105
Figure 17: Proposed Changes to Certification Bins for the Light-duty Fleet
Feasibility of NMOG+NOx Fleet Average Proposal Without ZEVs
The LEV III rulemaking assumed that all existing LEV and ULEV vehicles at that time would be upgraded to SULEV30 vehicles, and these costs were accounted for in the previous LEV III rulemaking. Further, these costs were made for a worst-case fleet assumption of virtually no ZEVs in the fleet average calculation which is consistent with this proposal to remove ZEVs from the fleet average calculation ensuring that the non-ZEVs as a whole, are held to that 0.030 g/mile fleet average. Accordingly, staff is not projecting the need for development or deployment of any new technologies but rather the use of the exact technologies and rate of deployment previously analyzed and determined to be feasible. Technologies relied upon in the LEV III analysis included larger volume catalysts, greater catalyst precious metal loading, more optimized close-coupled catalysts, optimized thermal management, low thermal mass turbochargers, double layer catalyst washcoats, and improved fuel injection control and are described in more detail in the original LEV III rulemaking package. These are the same technologies that manufacturers have largely deployed to date and can still utilize to convert current and future vehicles to SULEV30 to meet the original 0.030 g/mile fleet average.
As described earlier in Table IV-2, the phase-out of ZEVs from the NMOG+NOx fleet average will take place over four model years. The phase-out was designed to give automakers additional flexibility and enough lead time to ensure their future vehicle plans will be able to meet the fleet average. Since the phase-out specifies a percentage of total ZEV sales that can continue to be counted in the fleet average requirement rather than an absolute number of sales, it will also reward automakers that have a higher fraction of ZEV sales during the phase-out years as they will be able to count more ZEVs in their fleet average compliance calculations.
2. Proposal: Stand-Alone Standards for Aggressive Driving
As discussed earlier, the FTP does not reflect emissions that can occur during more aggressive driving, such as driving on freeways where vehicle speeds and accelerations can be much higher than on urban streets. With this in mind, current CARB regulations also require vehicles to meet aggressive driving emission standards using a test cycle, called the US06 cycle, that exhibits higher speeds and accelerations than the urban driving test. In addition, CARB also regulates emissions exhibited during urban driving in warm temperatures of 90 to 100 degrees Fahrenheit while using the vehicle’s air conditioning system. The test cycle that is used to determine the emissions under air conditioning use is called the SC03 test cycle.
40
30 50
60
7020
15 25New Bins to Add
Existing Bins to Keep
NMOG+NOx[mg per mile]
125 160
Existing Bins to Remove
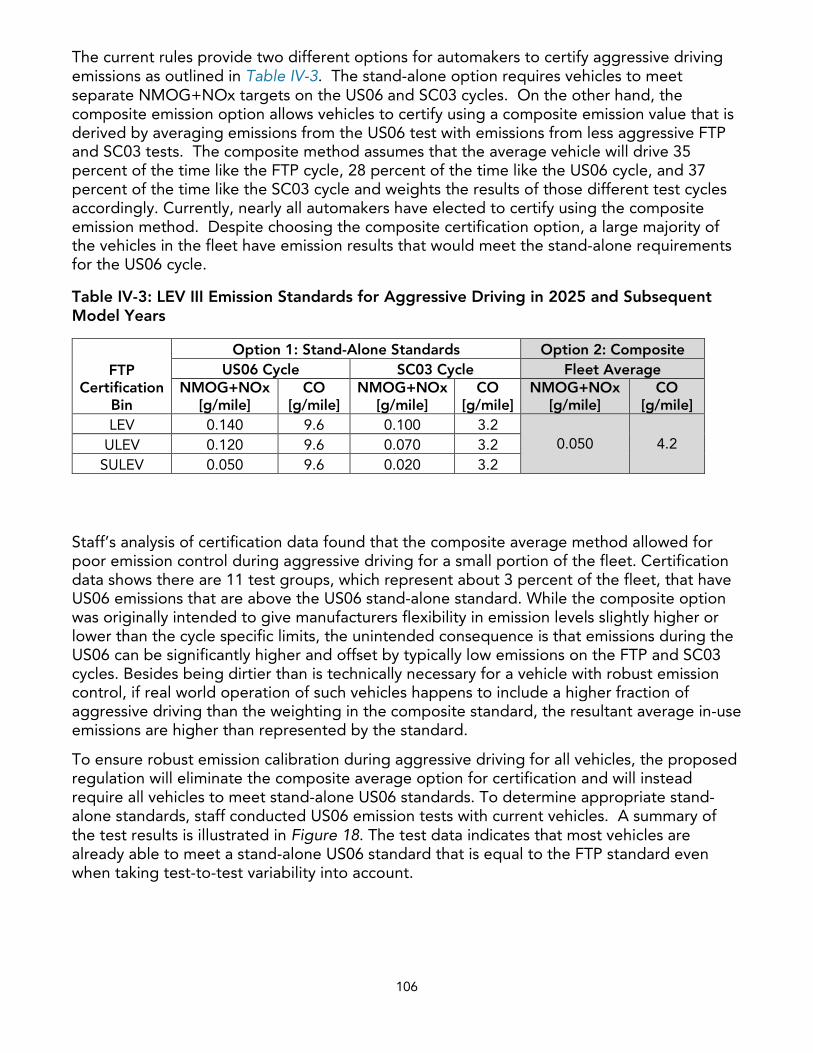
106
The current rules provide two different options for automakers to certify aggressive driving emissions as outlined in Table IV-3. The stand-alone option requires vehicles to meet separate NMOG+NOx targets on the US06 and SC03 cycles. On the other hand, the composite emission option allows vehicles to certify using a composite emission value that is derived by averaging emissions from the US06 test with emissions from less aggressive FTP and SC03 tests. The composite method assumes that the average vehicle will drive 35 percent of the time like the FTP cycle, 28 percent of the time like the US06 cycle, and 37 percent of the time like the SC03 cycle and weights the results of those different test cycles accordingly. Currently, nearly all automakers have elected to certify using the composite emission method. Despite choosing the composite certification option, a large majority of the vehicles in the fleet have emission results that would meet the stand-alone requirements for the US06 cycle.
Table IV-3: LEV III Emission Standards for Aggressive Driving in 2025 and Subsequent Model Years
FTP Certification
Bin
Option 1: Stand-Alone Standards Option 2: Composite US06 Cycle SC03 Cycle Fleet Average
NMOG+NOx [g/mile]
CO [g/mile]
NMOG+NOx [g/mile]
CO [g/mile]
NMOG+NOx [g/mile]
CO [g/mile]
LEV 0.140 9.6 0.100 3.2 0.050 4.2 ULEV 0.120 9.6 0.070 3.2
SULEV 0.050 9.6 0.020 3.2
Staff’s analysis of certification data found that the composite average method allowed for poor emission control during aggressive driving for a small portion of the fleet. Certification data shows there are 11 test groups, which represent about 3 percent of the fleet, that have US06 emissions that are above the US06 stand-alone standard. While the composite option was originally intended to give manufacturers flexibility in emission levels slightly higher or lower than the cycle specific limits, the unintended consequence is that emissions during the US06 can be significantly higher and offset by typically low emissions on the FTP and SC03 cycles. Besides being dirtier than is technically necessary for a vehicle with robust emission control, if real world operation of such vehicles happens to include a higher fraction of aggressive driving than the weighting in the composite standard, the resultant average in-use emissions are higher than represented by the standard.
To ensure robust emission calibration during aggressive driving for all vehicles, the proposed regulation will eliminate the composite average option for certification and will instead require all vehicles to meet stand-alone US06 standards. To determine appropriate stand-alone standards, staff conducted US06 emission tests with current vehicles. A summary of the test results is illustrated in Figure 18. The test data indicates that most vehicles are already able to meet a stand-alone US06 standard that is equal to the FTP standard even when taking test-to-test variability into account.
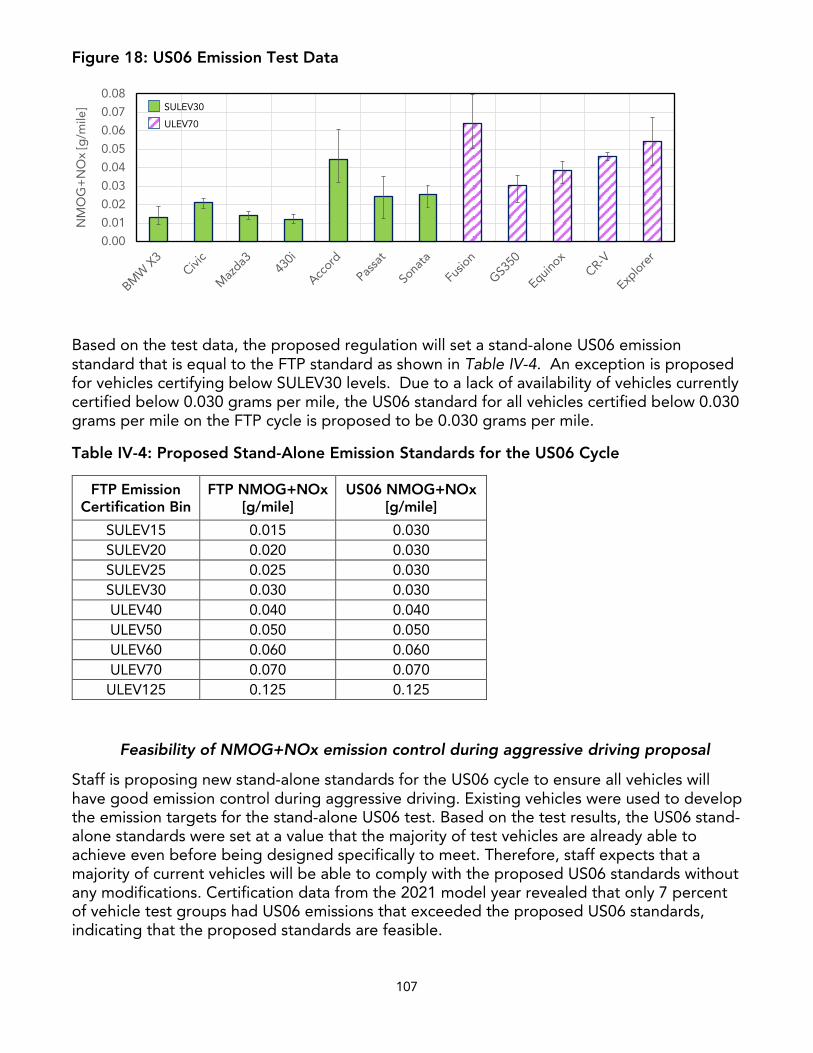
107
Figure 18: US06 Emission Test Data
Based on the test data, the proposed regulation will set a stand-alone US06 emission standard that is equal to the FTP standard as shown in Table IV-4. An exception is proposed for vehicles certifying below SULEV30 levels. Due to a lack of availability of vehicles currently certified below 0.030 grams per mile, the US06 standard for all vehicles certified below 0.030 grams per mile on the FTP cycle is proposed to be 0.030 grams per mile.
Table IV-4: Proposed Stand-Alone Emission Standards for the US06 Cycle
FTP Emission Certification Bin
FTP NMOG+NOx [g/mile]
US06 NMOG+NOx [g/mile]
SULEV15 0.015 0.030 SULEV20 0.020 0.030 SULEV25 0.025 0.030 SULEV30 0.030 0.030 ULEV40 0.040 0.040 ULEV50 0.050 0.050 ULEV60 0.060 0.060 ULEV70 0.070 0.070 ULEV125 0.125 0.125
Feasibility of NMOG+NOx emission control during aggressive driving proposal
Staff is proposing new stand-alone standards for the US06 cycle to ensure all vehicles will have good emission control during aggressive driving. Existing vehicles were used to develop the emission targets for the stand-alone US06 test. Based on the test results, the US06 stand-alone standards were set at a value that the majority of test vehicles are already able to achieve even before being designed specifically to meet. Therefore, staff expects that a majority of current vehicles will be able to comply with the proposed US06 standards without any modifications. Certification data from the 2021 model year revealed that only 7 percent of vehicle test groups had US06 emissions that exceeded the proposed US06 standards, indicating that the proposed standards are feasible.
0.00
0.01
0.02
0.03
0.04
0.05
0.06
0.07
0.08N
MO
G+
NO
x [g
/mile
] SULEV30
ULEV70
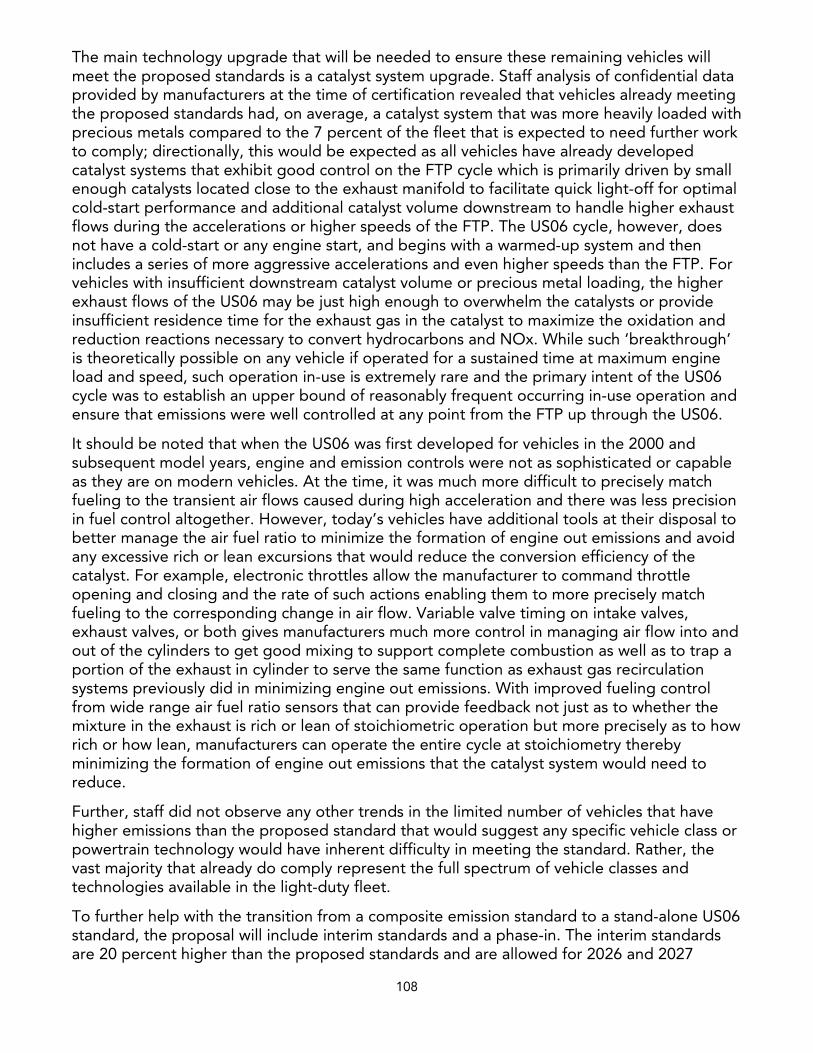
108
The main technology upgrade that will be needed to ensure these remaining vehicles will meet the proposed standards is a catalyst system upgrade. Staff analysis of confidential data provided by manufacturers at the time of certification revealed that vehicles already meeting the proposed standards had, on average, a catalyst system that was more heavily loaded with precious metals compared to the 7 percent of the fleet that is expected to need further work to comply; directionally, this would be expected as all vehicles have already developed catalyst systems that exhibit good control on the FTP cycle which is primarily driven by small enough catalysts located close to the exhaust manifold to facilitate quick light-off for optimal cold-start performance and additional catalyst volume downstream to handle higher exhaust flows during the accelerations or higher speeds of the FTP. The US06 cycle, however, does not have a cold-start or any engine start, and begins with a warmed-up system and then includes a series of more aggressive accelerations and even higher speeds than the FTP. For vehicles with insufficient downstream catalyst volume or precious metal loading, the higher exhaust flows of the US06 may be just high enough to overwhelm the catalysts or provide insufficient residence time for the exhaust gas in the catalyst to maximize the oxidation and reduction reactions necessary to convert hydrocarbons and NOx. While such ‘breakthrough’ is theoretically possible on any vehicle if operated for a sustained time at maximum engine load and speed, such operation in-use is extremely rare and the primary intent of the US06 cycle was to establish an upper bound of reasonably frequent occurring in-use operation and ensure that emissions were well controlled at any point from the FTP up through the US06.
It should be noted that when the US06 was first developed for vehicles in the 2000 and subsequent model years, engine and emission controls were not as sophisticated or capable as they are on modern vehicles. At the time, it was much more difficult to precisely match fueling to the transient air flows caused during high acceleration and there was less precision in fuel control altogether. However, today’s vehicles have additional tools at their disposal to better manage the air fuel ratio to minimize the formation of engine out emissions and avoid any excessive rich or lean excursions that would reduce the conversion efficiency of the catalyst. For example, electronic throttles allow the manufacturer to command throttle opening and closing and the rate of such actions enabling them to more precisely match fueling to the corresponding change in air flow. Variable valve timing on intake valves, exhaust valves, or both gives manufacturers much more control in managing air flow into and out of the cylinders to get good mixing to support complete combustion as well as to trap a portion of the exhaust in cylinder to serve the same function as exhaust gas recirculation systems previously did in minimizing engine out emissions. With improved fueling control from wide range air fuel ratio sensors that can provide feedback not just as to whether the mixture in the exhaust is rich or lean of stoichiometric operation but more precisely as to how rich or how lean, manufacturers can operate the entire cycle at stoichiometry thereby minimizing the formation of engine out emissions that the catalyst system would need to reduce.
Further, staff did not observe any other trends in the limited number of vehicles that have higher emissions than the proposed standard that would suggest any specific vehicle class or powertrain technology would have inherent difficulty in meeting the standard. Rather, the vast majority that already do comply represent the full spectrum of vehicle classes and technologies available in the light-duty fleet.
To further help with the transition from a composite emission standard to a stand-alone US06 standard, the proposal will include interim standards and a phase-in. The interim standards are 20 percent higher than the proposed standards and are allowed for 2026 and 2027
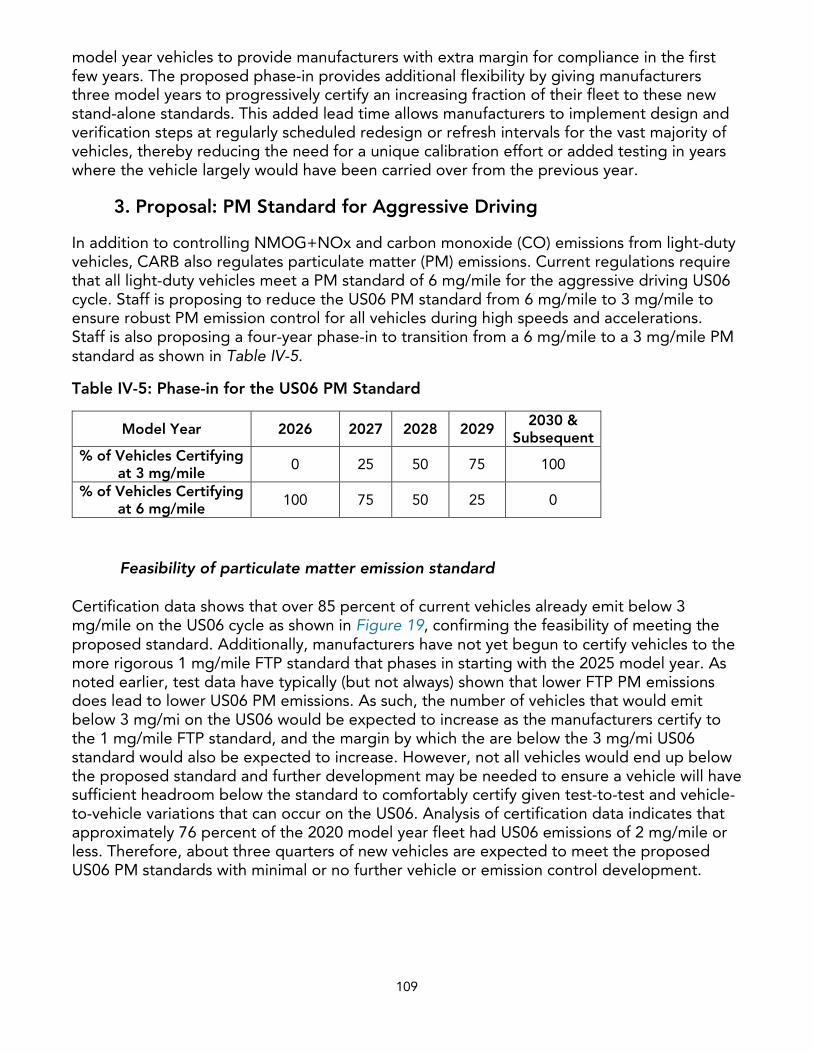
109
model year vehicles to provide manufacturers with extra margin for compliance in the first few years. The proposed phase-in provides additional flexibility by giving manufacturers three model years to progressively certify an increasing fraction of their fleet to these new stand-alone standards. This added lead time allows manufacturers to implement design and verification steps at regularly scheduled redesign or refresh intervals for the vast majority of vehicles, thereby reducing the need for a unique calibration effort or added testing in years where the vehicle largely would have been carried over from the previous year.
3. Proposal: PM Standard for Aggressive Driving
In addition to controlling NMOG+NOx and carbon monoxide (CO) emissions from light-duty vehicles, CARB also regulates particulate matter (PM) emissions. Current regulations require that all light-duty vehicles meet a PM standard of 6 mg/mile for the aggressive driving US06 cycle. Staff is proposing to reduce the US06 PM standard from 6 mg/mile to 3 mg/mile to ensure robust PM emission control for all vehicles during high speeds and accelerations. Staff is also proposing a four-year phase-in to transition from a 6 mg/mile to a 3 mg/mile PM standard as shown in Table IV-5.
Table IV-5: Phase-in for the US06 PM Standard
Model Year 2026 2027 2028 2029 2030 &
Subsequent % of Vehicles Certifying
at 3 mg/mile 0 25 50 75 100
% of Vehicles Certifying at 6 mg/mile
100 75 50 25 0
Feasibility of particulate matter emission standard
Certification data shows that over 85 percent of current vehicles already emit below 3 mg/mile on the US06 cycle as shown in Figure 19, confirming the feasibility of meeting the proposed standard. Additionally, manufacturers have not yet begun to certify vehicles to the more rigorous 1 mg/mile FTP standard that phases in starting with the 2025 model year. As noted earlier, test data have typically (but not always) shown that lower FTP PM emissions does lead to lower US06 PM emissions. As such, the number of vehicles that would emit below 3 mg/mi on the US06 would be expected to increase as the manufacturers certify to the 1 mg/mile FTP standard, and the margin by which the are below the 3 mg/mi US06 standard would also be expected to increase. However, not all vehicles would end up below the proposed standard and further development may be needed to ensure a vehicle will have sufficient headroom below the standard to comfortably certify given test-to-test and vehicle-to-vehicle variations that can occur on the US06. Analysis of certification data indicates that approximately 76 percent of the 2020 model year fleet had US06 emissions of 2 mg/mile or less. Therefore, about three quarters of new vehicles are expected to meet the proposed US06 PM standards with minimal or no further vehicle or emission control development.
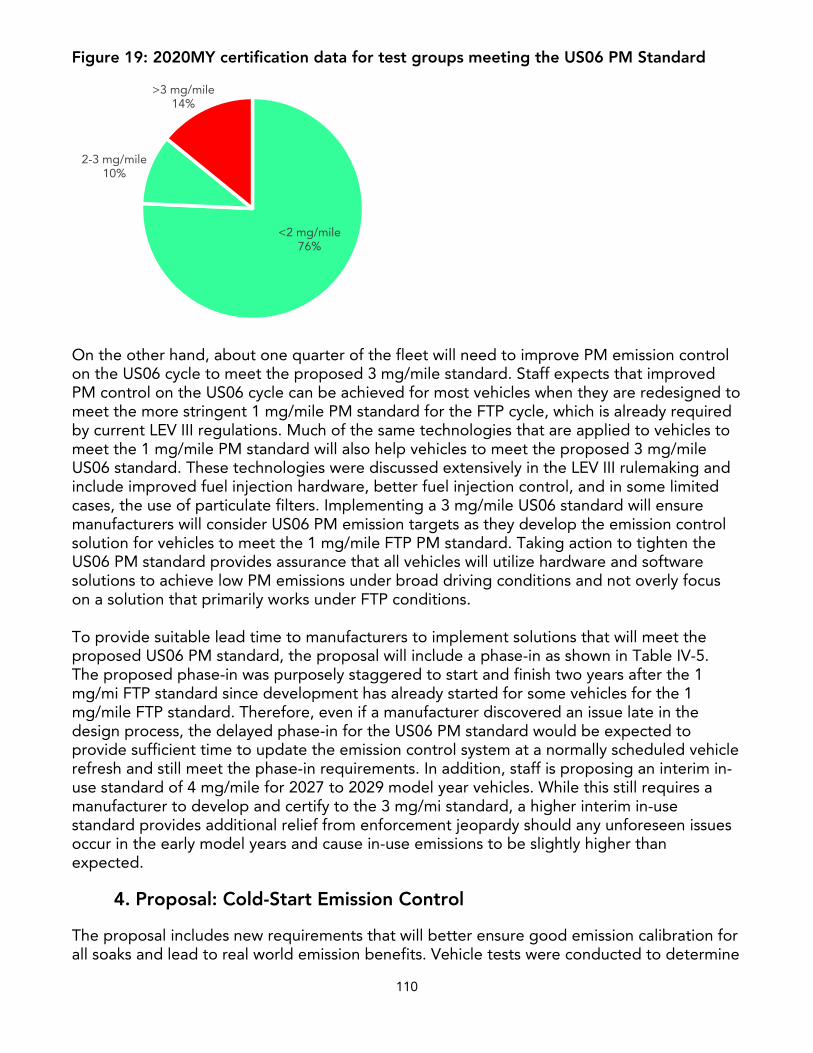
110
Figure 19: 2020MY certification data for test groups meeting the US06 PM Standard
On the other hand, about one quarter of the fleet will need to improve PM emission control on the US06 cycle to meet the proposed 3 mg/mile standard. Staff expects that improved PM control on the US06 cycle can be achieved for most vehicles when they are redesigned to meet the more stringent 1 mg/mile PM standard for the FTP cycle, which is already required by current LEV III regulations. Much of the same technologies that are applied to vehicles to meet the 1 mg/mile PM standard will also help vehicles to meet the proposed 3 mg/mile US06 standard. These technologies were discussed extensively in the LEV III rulemaking and include improved fuel injection hardware, better fuel injection control, and in some limited cases, the use of particulate filters. Implementing a 3 mg/mile US06 standard will ensure manufacturers will consider US06 PM emission targets as they develop the emission control solution for vehicles to meet the 1 mg/mile FTP PM standard. Taking action to tighten the US06 PM standard provides assurance that all vehicles will utilize hardware and software solutions to achieve low PM emissions under broad driving conditions and not overly focus on a solution that primarily works under FTP conditions.
To provide suitable lead time to manufacturers to implement solutions that will meet the proposed US06 PM standard, the proposal will include a phase-in as shown in Table IV-5. The proposed phase-in was purposely staggered to start and finish two years after the 1 mg/mi FTP standard since development has already started for some vehicles for the 1 mg/mile FTP standard. Therefore, even if a manufacturer discovered an issue late in the design process, the delayed phase-in for the US06 PM standard would be expected to provide sufficient time to update the emission control system at a normally scheduled vehicle refresh and still meet the phase-in requirements. In addition, staff is proposing an interim in-use standard of 4 mg/mile for 2027 to 2029 model year vehicles. While this still requires a manufacturer to develop and certify to the 3 mg/mi standard, a higher interim in-use standard provides additional relief from enforcement jeopardy should any unforeseen issues occur in the early model years and cause in-use emissions to be slightly higher than expected.
4. Proposal: Cold-Start Emission Control
The proposal includes new requirements that will better ensure good emission calibration for all soaks and lead to real world emission benefits. Vehicle tests were conducted to determine
<2 mg/mile76%
2-3 mg/mile10%
>3 mg/mile14%
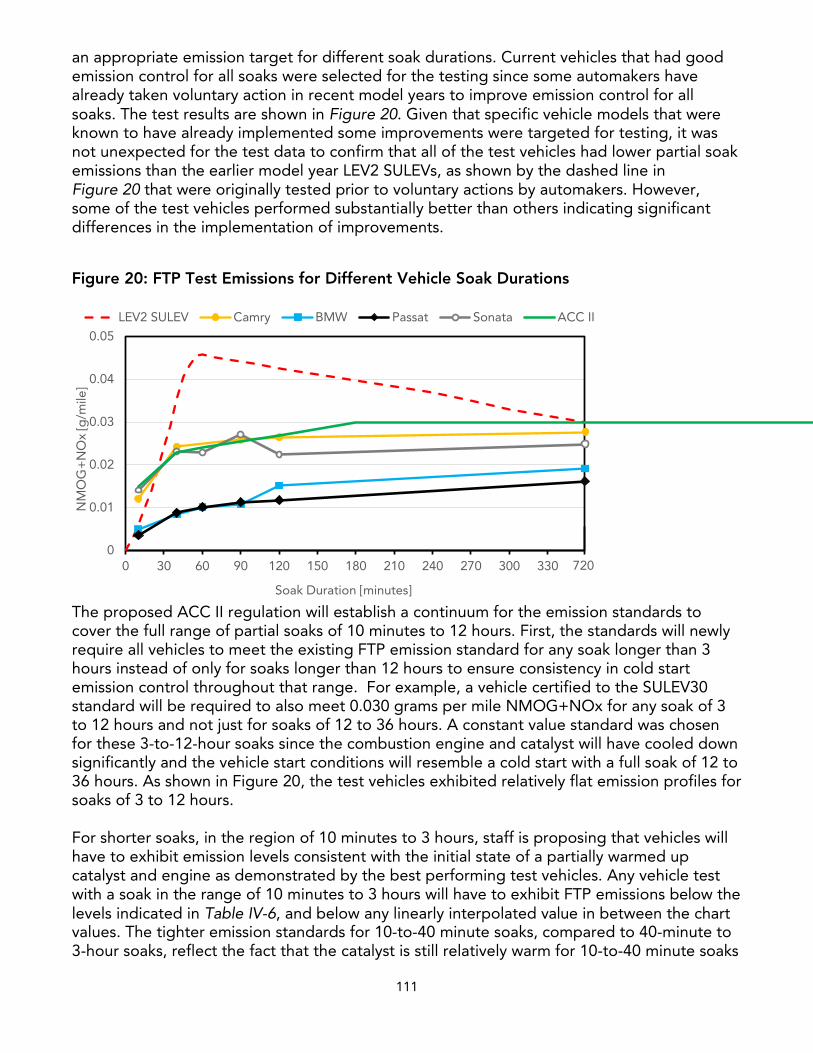
111
an appropriate emission target for different soak durations. Current vehicles that had good emission control for all soaks were selected for the testing since some automakers have already taken voluntary action in recent model years to improve emission control for all soaks. The test results are shown in Figure 20. Given that specific vehicle models that were known to have already implemented some improvements were targeted for testing, it was not unexpected for the test data to confirm that all of the test vehicles had lower partial soak emissions than the earlier model year LEV2 SULEVs, as shown by the dashed line in Figure 20 that were originally tested prior to voluntary actions by automakers. However, some of the test vehicles performed substantially better than others indicating significant differences in the implementation of improvements.
Figure 20: FTP Test Emissions for Different Vehicle Soak Durations
The proposed ACC II regulation will establish a continuum for the emission standards to cover the full range of partial soaks of 10 minutes to 12 hours. First, the standards will newly require all vehicles to meet the existing FTP emission standard for any soak longer than 3 hours instead of only for soaks longer than 12 hours to ensure consistency in cold start emission control throughout that range. For example, a vehicle certified to the SULEV30 standard will be required to also meet 0.030 grams per mile NMOG+NOx for any soak of 3 to 12 hours and not just for soaks of 12 to 36 hours. A constant value standard was chosen for these 3-to-12-hour soaks since the combustion engine and catalyst will have cooled down significantly and the vehicle start conditions will resemble a cold start with a full soak of 12 to 36 hours. As shown in Figure 20, the test vehicles exhibited relatively flat emission profiles for soaks of 3 to 12 hours.
For shorter soaks, in the region of 10 minutes to 3 hours, staff is proposing that vehicles will have to exhibit emission levels consistent with the initial state of a partially warmed up catalyst and engine as demonstrated by the best performing test vehicles. Any vehicle test with a soak in the range of 10 minutes to 3 hours will have to exhibit FTP emissions below the levels indicated in Table IV-6, and below any linearly interpolated value in between the chart values. The tighter emission standards for 10-to-40 minute soaks, compared to 40-minute to 3-hour soaks, reflect the fact that the catalyst is still relatively warm for 10-to-40 minute soaks
0
0.01
0.02
0.03
0.04
0.05
0 30 60 90 120 150 180 210 240 270 300 330
NM
OG
+N
Ox
[g/m
ile]
Soak Duration [minutes]
LEV2 SULEV Camry BMW Passat Sonata ACC II
720
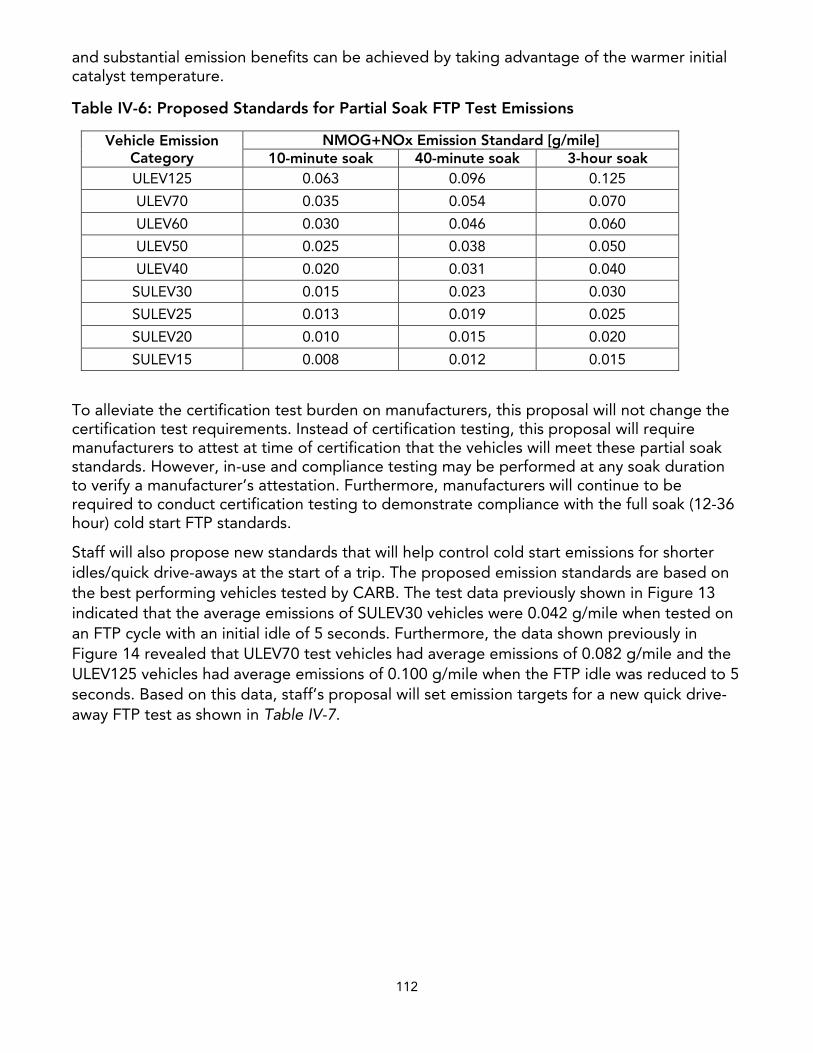
112
and substantial emission benefits can be achieved by taking advantage of the warmer initial catalyst temperature.
Table IV-6: Proposed Standards for Partial Soak FTP Test Emissions
Vehicle Emission Category
NMOG+NOx Emission Standard [g/mile] 10-minute soak 40-minute soak 3-hour soak
ULEV125 0.063 0.096 0.125
ULEV70 0.035 0.054 0.070
ULEV60 0.030 0.046 0.060
ULEV50 0.025 0.038 0.050
ULEV40 0.020 0.031 0.040
SULEV30 0.015 0.023 0.030
SULEV25 0.013 0.019 0.025
SULEV20 0.010 0.015 0.020
SULEV15 0.008 0.012 0.015
To alleviate the certification test burden on manufacturers, this proposal will not change the certification test requirements. Instead of certification testing, this proposal will require manufacturers to attest at time of certification that the vehicles will meet these partial soak standards. However, in-use and compliance testing may be performed at any soak duration to verify a manufacturer’s attestation. Furthermore, manufacturers will continue to be required to conduct certification testing to demonstrate compliance with the full soak (12-36 hour) cold start FTP standards.
Staff will also propose new standards that will help control cold start emissions for shorter idles/quick drive-aways at the start of a trip. The proposed emission standards are based on the best performing vehicles tested by CARB. The test data previously shown in Figure 13 indicated that the average emissions of SULEV30 vehicles were 0.042 g/mile when tested on an FTP cycle with an initial idle of 5 seconds. Furthermore, the data shown previously in Figure 14 revealed that ULEV70 test vehicles had average emissions of 0.082 g/mile and the ULEV125 vehicles had average emissions of 0.100 g/mile when the FTP idle was reduced to 5 seconds. Based on this data, staff’s proposal will set emission targets for a new quick drive-away FTP test as shown in Table IV-7.
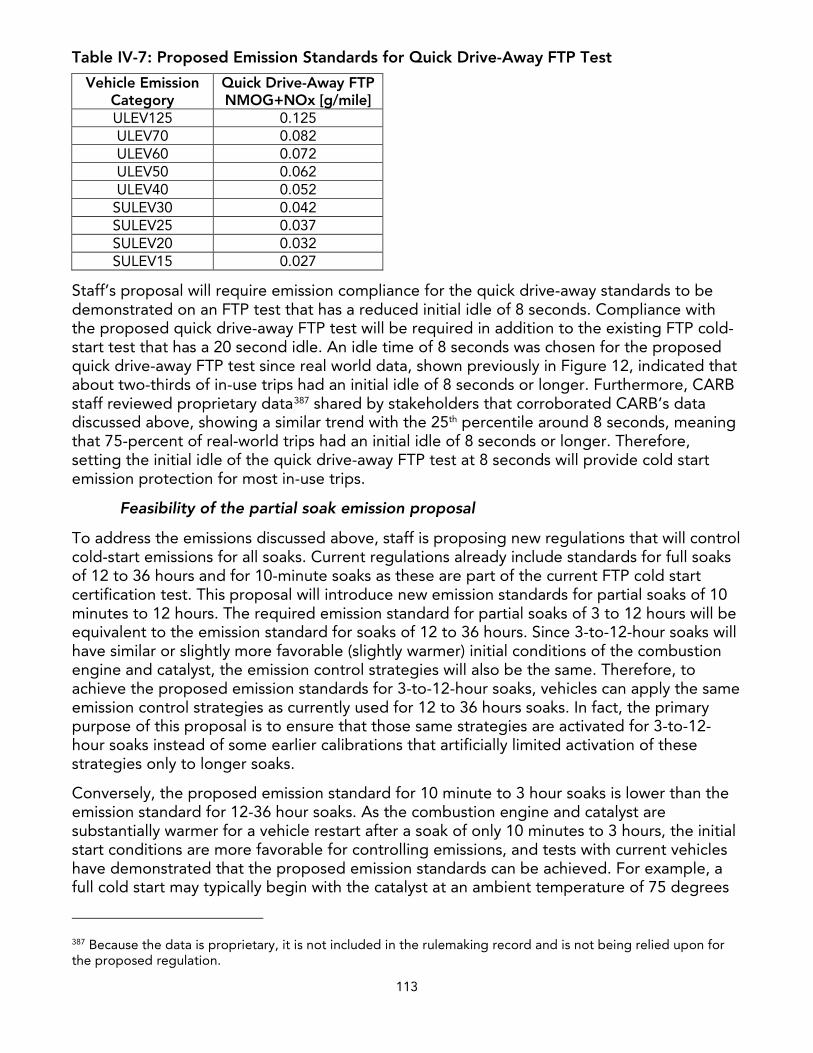
113
Table IV-7: Proposed Emission Standards for Quick Drive-Away FTP Test
Vehicle Emission Category
Quick Drive-Away FTP NMOG+NOx [g/mile]
ULEV125 0.125 ULEV70 0.082 ULEV60 0.072 ULEV50 0.062 ULEV40 0.052 SULEV30 0.042 SULEV25 0.037 SULEV20 0.032 SULEV15 0.027
Staff’s proposal will require emission compliance for the quick drive-away standards to be demonstrated on an FTP test that has a reduced initial idle of 8 seconds. Compliance with the proposed quick drive-away FTP test will be required in addition to the existing FTP cold-start test that has a 20 second idle. An idle time of 8 seconds was chosen for the proposed quick drive-away FTP test since real world data, shown previously in Figure 12, indicated that about two-thirds of in-use trips had an initial idle of 8 seconds or longer. Furthermore, CARB staff reviewed proprietary data387 shared by stakeholders that corroborated CARB’s data discussed above, showing a similar trend with the 25th percentile around 8 seconds, meaning that 75-percent of real-world trips had an initial idle of 8 seconds or longer. Therefore, setting the initial idle of the quick drive-away FTP test at 8 seconds will provide cold start emission protection for most in-use trips.
Feasibility of the partial soak emission proposal
To address the emissions discussed above, staff is proposing new regulations that will control cold-start emissions for all soaks. Current regulations already include standards for full soaks of 12 to 36 hours and for 10-minute soaks as these are part of the current FTP cold start certification test. This proposal will introduce new emission standards for partial soaks of 10 minutes to 12 hours. The required emission standard for partial soaks of 3 to 12 hours will be equivalent to the emission standard for soaks of 12 to 36 hours. Since 3-to-12-hour soaks will have similar or slightly more favorable (slightly warmer) initial conditions of the combustion engine and catalyst, the emission control strategies will also be the same. Therefore, to achieve the proposed emission standards for 3-to-12-hour soaks, vehicles can apply the same emission control strategies as currently used for 12 to 36 hours soaks. In fact, the primary purpose of this proposal is to ensure that those same strategies are activated for 3-to-12-hour soaks instead of some earlier calibrations that artificially limited activation of these strategies only to longer soaks.
Conversely, the proposed emission standard for 10 minute to 3 hour soaks is lower than the emission standard for 12-36 hour soaks. As the combustion engine and catalyst are substantially warmer for a vehicle restart after a soak of only 10 minutes to 3 hours, the initial start conditions are more favorable for controlling emissions, and tests with current vehicles have demonstrated that the proposed emission standards can be achieved. For example, a full cold start may typically begin with the catalyst at an ambient temperature of 75 degrees
387 Because the data is proprietary, it is not included in the rulemaking record and is not being relied upon for the proposed regulation.
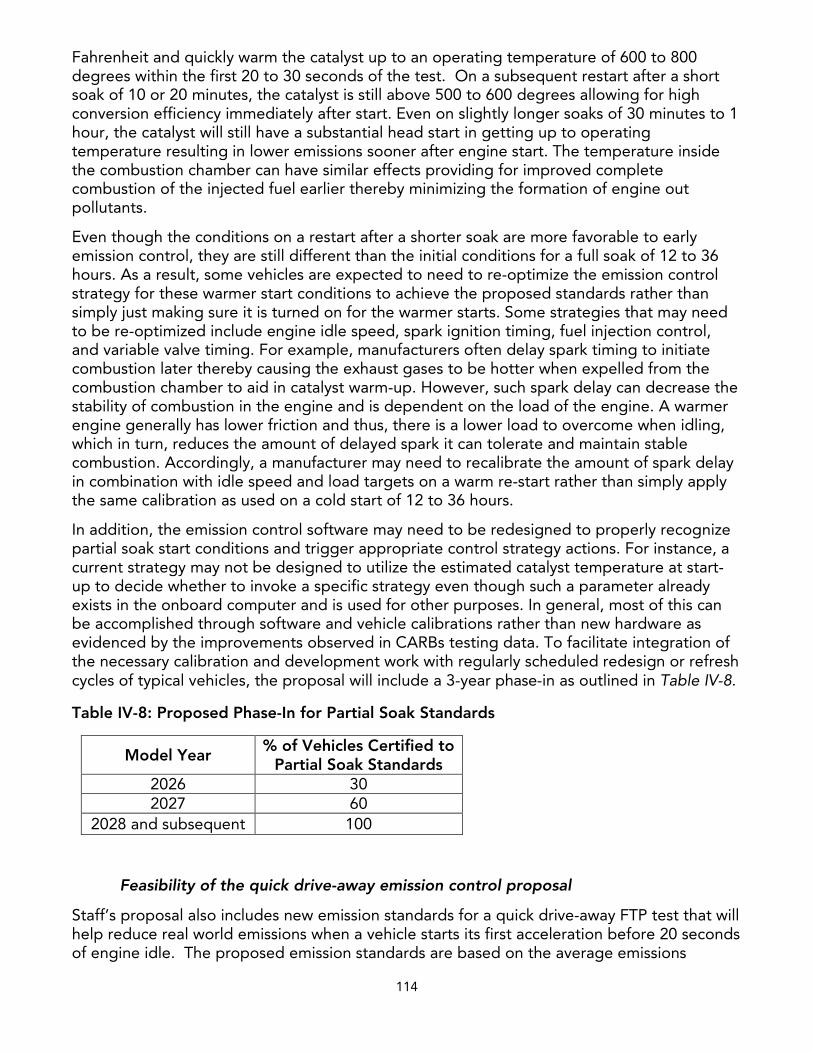
114
Fahrenheit and quickly warm the catalyst up to an operating temperature of 600 to 800 degrees within the first 20 to 30 seconds of the test. On a subsequent restart after a short soak of 10 or 20 minutes, the catalyst is still above 500 to 600 degrees allowing for high conversion efficiency immediately after start. Even on slightly longer soaks of 30 minutes to 1 hour, the catalyst will still have a substantial head start in getting up to operating temperature resulting in lower emissions sooner after engine start. The temperature inside the combustion chamber can have similar effects providing for improved complete combustion of the injected fuel earlier thereby minimizing the formation of engine out pollutants.
Even though the conditions on a restart after a shorter soak are more favorable to early emission control, they are still different than the initial conditions for a full soak of 12 to 36 hours. As a result, some vehicles are expected to need to re-optimize the emission control strategy for these warmer start conditions to achieve the proposed standards rather than simply just making sure it is turned on for the warmer starts. Some strategies that may need to be re-optimized include engine idle speed, spark ignition timing, fuel injection control, and variable valve timing. For example, manufacturers often delay spark timing to initiate combustion later thereby causing the exhaust gases to be hotter when expelled from the combustion chamber to aid in catalyst warm-up. However, such spark delay can decrease the stability of combustion in the engine and is dependent on the load of the engine. A warmer engine generally has lower friction and thus, there is a lower load to overcome when idling, which in turn, reduces the amount of delayed spark it can tolerate and maintain stable combustion. Accordingly, a manufacturer may need to recalibrate the amount of spark delay in combination with idle speed and load targets on a warm re-start rather than simply apply the same calibration as used on a cold start of 12 to 36 hours.
In addition, the emission control software may need to be redesigned to properly recognize partial soak start conditions and trigger appropriate control strategy actions. For instance, a current strategy may not be designed to utilize the estimated catalyst temperature at start-up to decide whether to invoke a specific strategy even though such a parameter already exists in the onboard computer and is used for other purposes. In general, most of this can be accomplished through software and vehicle calibrations rather than new hardware as evidenced by the improvements observed in CARBs testing data. To facilitate integration of the necessary calibration and development work with regularly scheduled redesign or refresh cycles of typical vehicles, the proposal will include a 3-year phase-in as outlined in Table IV-8.
Table IV-8: Proposed Phase-In for Partial Soak Standards
Model Year % of Vehicles Certified to
Partial Soak Standards 2026 30 2027 60
2028 and subsequent 100
Feasibility of the quick drive-away emission control proposal
Staff’s proposal also includes new emission standards for a quick drive-away FTP test that will help reduce real world emissions when a vehicle starts its first acceleration before 20 seconds of engine idle. The proposed emission standards are based on the average emissions
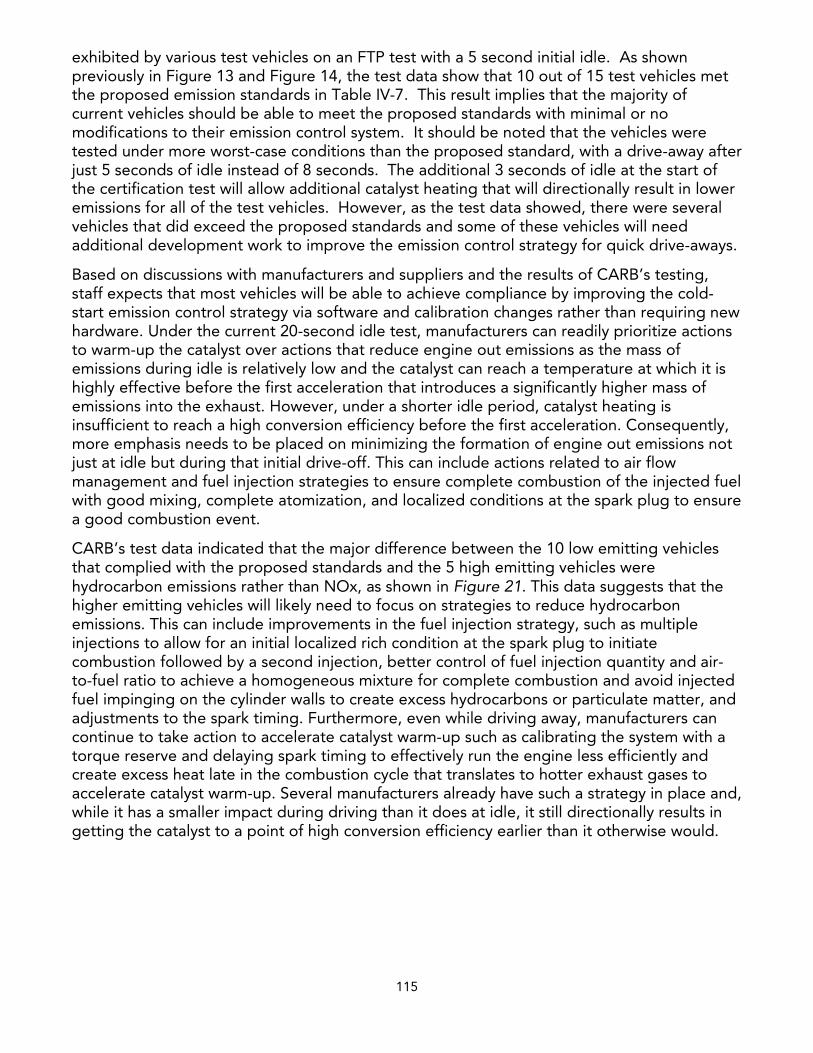
115
exhibited by various test vehicles on an FTP test with a 5 second initial idle. As shown previously in Figure 13 and Figure 14, the test data show that 10 out of 15 test vehicles met the proposed emission standards in Table IV-7. This result implies that the majority of current vehicles should be able to meet the proposed standards with minimal or no modifications to their emission control system. It should be noted that the vehicles were tested under more worst-case conditions than the proposed standard, with a drive-away after just 5 seconds of idle instead of 8 seconds. The additional 3 seconds of idle at the start of the certification test will allow additional catalyst heating that will directionally result in lower emissions for all of the test vehicles. However, as the test data showed, there were several vehicles that did exceed the proposed standards and some of these vehicles will need additional development work to improve the emission control strategy for quick drive-aways.
Based on discussions with manufacturers and suppliers and the results of CARB’s testing, staff expects that most vehicles will be able to achieve compliance by improving the cold-start emission control strategy via software and calibration changes rather than requiring new hardware. Under the current 20-second idle test, manufacturers can readily prioritize actions to warm-up the catalyst over actions that reduce engine out emissions as the mass of emissions during idle is relatively low and the catalyst can reach a temperature at which it is highly effective before the first acceleration that introduces a significantly higher mass of emissions into the exhaust. However, under a shorter idle period, catalyst heating is insufficient to reach a high conversion efficiency before the first acceleration. Consequently, more emphasis needs to be placed on minimizing the formation of engine out emissions not just at idle but during that initial drive-off. This can include actions related to air flow management and fuel injection strategies to ensure complete combustion of the injected fuel with good mixing, complete atomization, and localized conditions at the spark plug to ensure a good combustion event.
CARB’s test data indicated that the major difference between the 10 low emitting vehicles that complied with the proposed standards and the 5 high emitting vehicles were hydrocarbon emissions rather than NOx, as shown in Figure 21. This data suggests that the higher emitting vehicles will likely need to focus on strategies to reduce hydrocarbon emissions. This can include improvements in the fuel injection strategy, such as multiple injections to allow for an initial localized rich condition at the spark plug to initiate combustion followed by a second injection, better control of fuel injection quantity and air-to-fuel ratio to achieve a homogeneous mixture for complete combustion and avoid injected fuel impinging on the cylinder walls to create excess hydrocarbons or particulate matter, and adjustments to the spark timing. Furthermore, even while driving away, manufacturers can continue to take action to accelerate catalyst warm-up such as calibrating the system with a torque reserve and delaying spark timing to effectively run the engine less efficiently and create excess heat late in the combustion cycle that translates to hotter exhaust gases to accelerate catalyst warm-up. Several manufacturers already have such a strategy in place and, while it has a smaller impact during driving than it does at idle, it still directionally results in getting the catalyst to a point of high conversion efficiency earlier than it otherwise would.
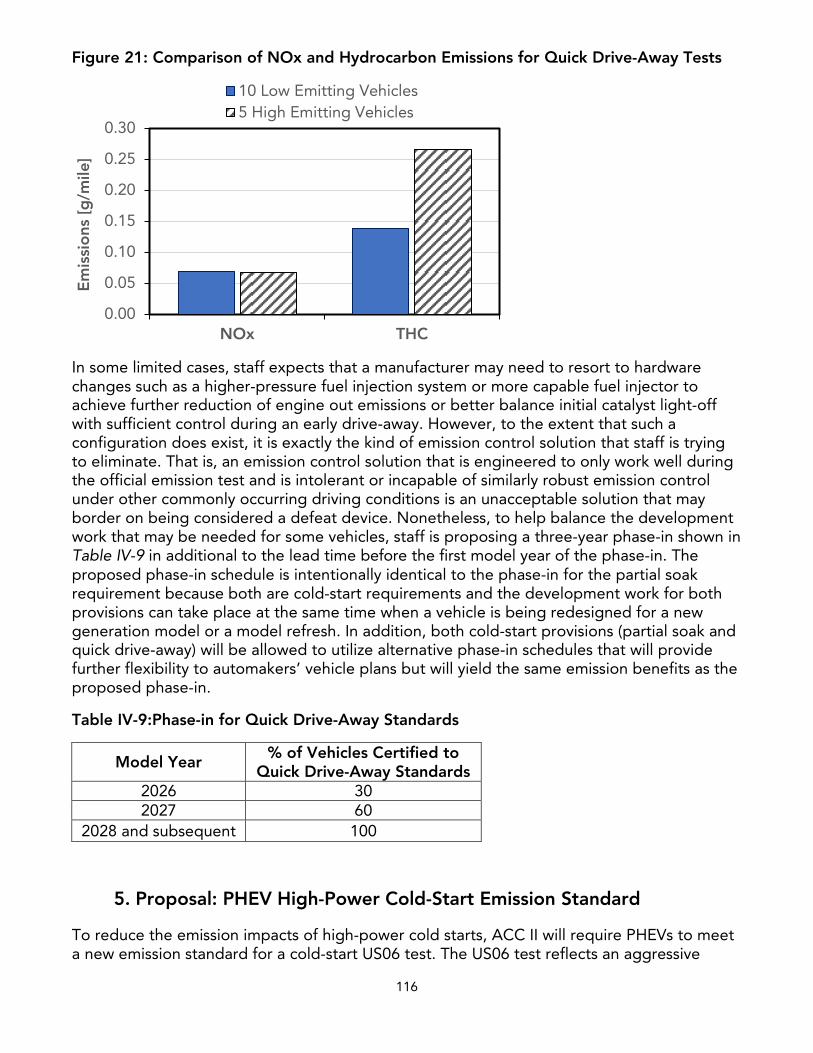
116
Figure 21: Comparison of NOx and Hydrocarbon Emissions for Quick Drive-Away Tests
In some limited cases, staff expects that a manufacturer may need to resort to hardware changes such as a higher-pressure fuel injection system or more capable fuel injector to achieve further reduction of engine out emissions or better balance initial catalyst light-off with sufficient control during an early drive-away. However, to the extent that such a configuration does exist, it is exactly the kind of emission control solution that staff is trying to eliminate. That is, an emission control solution that is engineered to only work well during the official emission test and is intolerant or incapable of similarly robust emission control under other commonly occurring driving conditions is an unacceptable solution that may border on being considered a defeat device. Nonetheless, to help balance the development work that may be needed for some vehicles, staff is proposing a three-year phase-in shown in Table IV-9 in additional to the lead time before the first model year of the phase-in. The proposed phase-in schedule is intentionally identical to the phase-in for the partial soak requirement because both are cold-start requirements and the development work for both provisions can take place at the same time when a vehicle is being redesigned for a new generation model or a model refresh. In addition, both cold-start provisions (partial soak and quick drive-away) will be allowed to utilize alternative phase-in schedules that will provide further flexibility to automakers’ vehicle plans but will yield the same emission benefits as the proposed phase-in.
Table IV-9:Phase-in for Quick Drive-Away Standards
Model Year % of Vehicles Certified to Quick Drive-Away Standards
2026 30 2027 60
2028 and subsequent 100
5. Proposal: PHEV High-Power Cold-Start Emission Standard
To reduce the emission impacts of high-power cold starts, ACC II will require PHEVs to meet a new emission standard for a cold-start US06 test. The US06 test reflects an aggressive
0.00
0.05
0.10
0.15
0.20
0.25
0.30
NOx THC
Em
issi
ons
[g/m
ile]
10 Low Emitting Vehicles5 High Emitting Vehicles
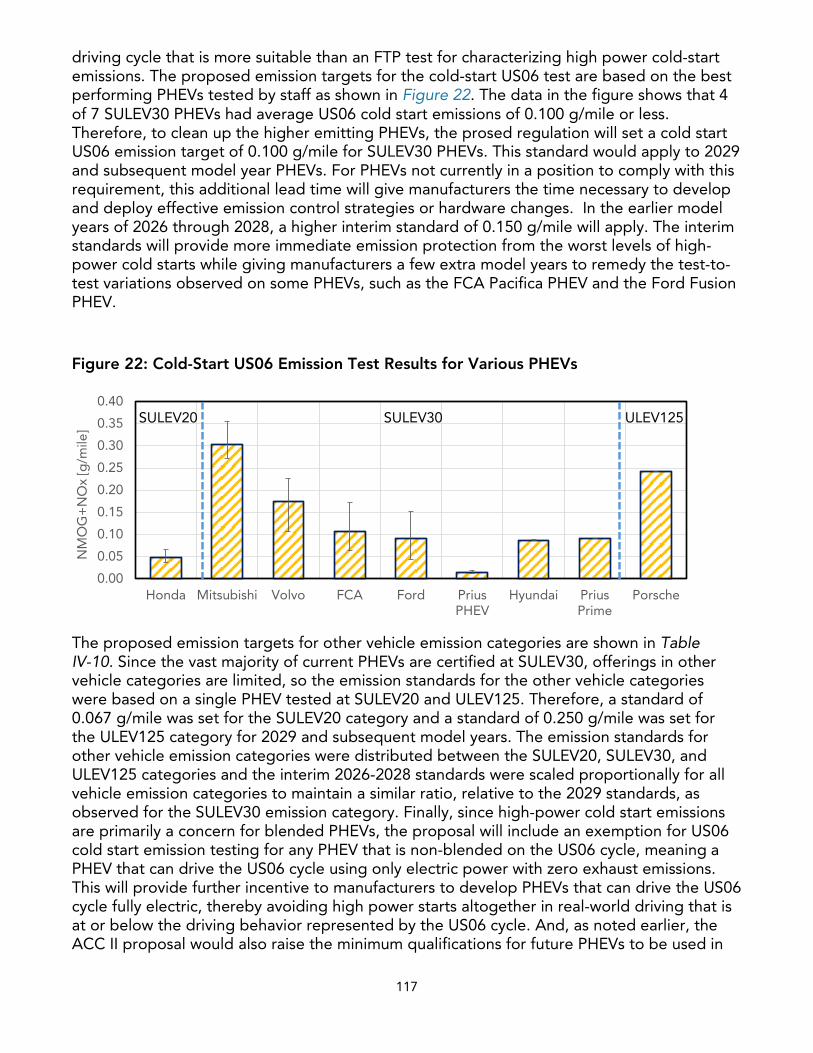
117
driving cycle that is more suitable than an FTP test for characterizing high power cold-start emissions. The proposed emission targets for the cold-start US06 test are based on the best performing PHEVs tested by staff as shown in Figure 22. The data in the figure shows that 4 of 7 SULEV30 PHEVs had average US06 cold start emissions of 0.100 g/mile or less. Therefore, to clean up the higher emitting PHEVs, the prosed regulation will set a cold start US06 emission target of 0.100 g/mile for SULEV30 PHEVs. This standard would apply to 2029 and subsequent model year PHEVs. For PHEVs not currently in a position to comply with this requirement, this additional lead time will give manufacturers the time necessary to develop and deploy effective emission control strategies or hardware changes. In the earlier model years of 2026 through 2028, a higher interim standard of 0.150 g/mile will apply. The interim standards will provide more immediate emission protection from the worst levels of high-power cold starts while giving manufacturers a few extra model years to remedy the test-to-test variations observed on some PHEVs, such as the FCA Pacifica PHEV and the Ford Fusion PHEV.
Figure 22: Cold-Start US06 Emission Test Results for Various PHEVs
The proposed emission targets for other vehicle emission categories are shown in Table IV-10. Since the vast majority of current PHEVs are certified at SULEV30, offerings in other vehicle categories are limited, so the emission standards for the other vehicle categories were based on a single PHEV tested at SULEV20 and ULEV125. Therefore, a standard of 0.067 g/mile was set for the SULEV20 category and a standard of 0.250 g/mile was set for the ULEV125 category for 2029 and subsequent model years. The emission standards for other vehicle emission categories were distributed between the SULEV20, SULEV30, and ULEV125 categories and the interim 2026-2028 standards were scaled proportionally for all vehicle emission categories to maintain a similar ratio, relative to the 2029 standards, as observed for the SULEV30 emission category. Finally, since high-power cold start emissions are primarily a concern for blended PHEVs, the proposal will include an exemption for US06 cold start emission testing for any PHEV that is non-blended on the US06 cycle, meaning a PHEV that can drive the US06 cycle using only electric power with zero exhaust emissions. This will provide further incentive to manufacturers to develop PHEVs that can drive the US06 cycle fully electric, thereby avoiding high power starts altogether in real-world driving that is at or below the driving behavior represented by the US06 cycle. And, as noted earlier, the ACC II proposal would also raise the minimum qualifications for future PHEVs to be used in
0.00
0.05
0.10
0.15
0.20
0.25
0.30
0.35
0.40
Honda Mitsubishi Volvo FCA Ford PriusPHEV
Hyundai PriusPrime
Porsche
NM
OG
+N
Ox
[g/m
ile]
ULEV125SULEV20 SULEV30
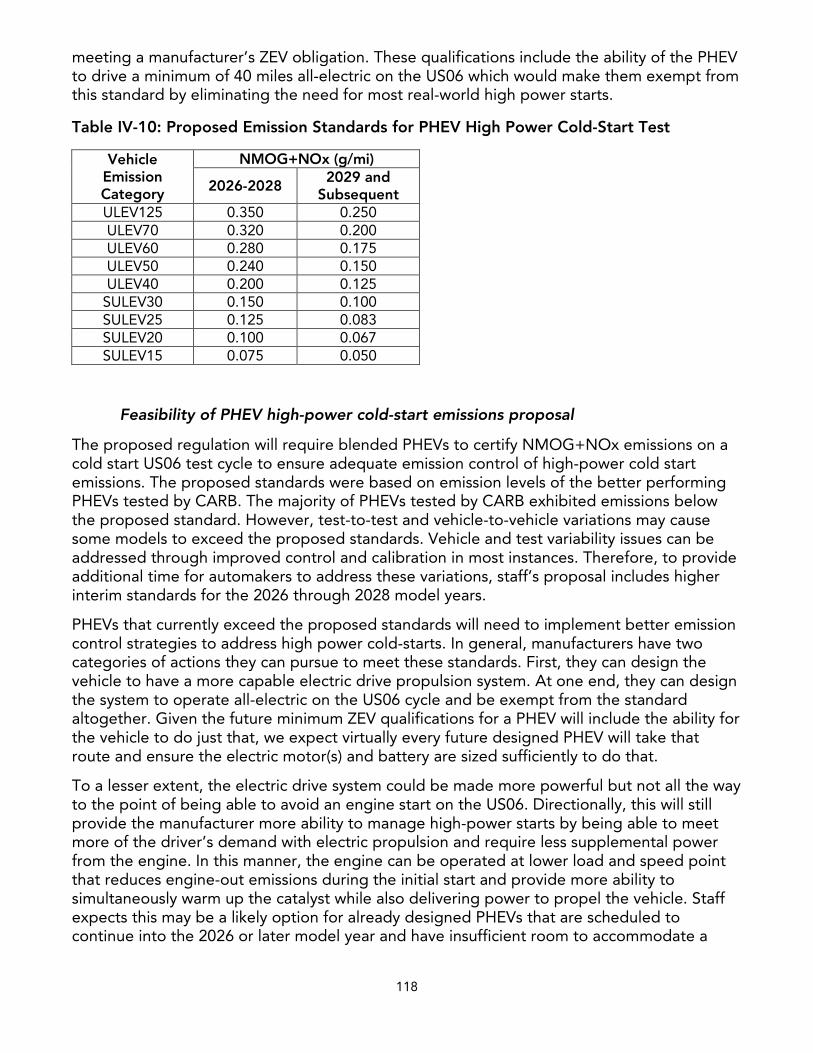
118
meeting a manufacturer’s ZEV obligation. These qualifications include the ability of the PHEV to drive a minimum of 40 miles all-electric on the US06 which would make them exempt from this standard by eliminating the need for most real-world high power starts.
Table IV-10: Proposed Emission Standards for PHEV High Power Cold-Start Test
Vehicle Emission Category
NMOG+NOx (g/mi)
2026-2028 2029 and
Subsequent ULEV125 0.350 0.250 ULEV70 0.320 0.200 ULEV60 0.280 0.175 ULEV50 0.240 0.150 ULEV40 0.200 0.125 SULEV30 0.150 0.100 SULEV25 0.125 0.083 SULEV20 0.100 0.067 SULEV15 0.075 0.050
Feasibility of PHEV high-power cold-start emissions proposal
The proposed regulation will require blended PHEVs to certify NMOG+NOx emissions on a cold start US06 test cycle to ensure adequate emission control of high-power cold start emissions. The proposed standards were based on emission levels of the better performing PHEVs tested by CARB. The majority of PHEVs tested by CARB exhibited emissions below the proposed standard. However, test-to-test and vehicle-to-vehicle variations may cause some models to exceed the proposed standards. Vehicle and test variability issues can be addressed through improved control and calibration in most instances. Therefore, to provide additional time for automakers to address these variations, staff’s proposal includes higher interim standards for the 2026 through 2028 model years.
PHEVs that currently exceed the proposed standards will need to implement better emission control strategies to address high power cold-starts. In general, manufacturers have two categories of actions they can pursue to meet these standards. First, they can design the vehicle to have a more capable electric drive propulsion system. At one end, they can design the system to operate all-electric on the US06 cycle and be exempt from the standard altogether. Given the future minimum ZEV qualifications for a PHEV will include the ability for the vehicle to do just that, we expect virtually every future designed PHEV will take that route and ensure the electric motor(s) and battery are sized sufficiently to do that.
To a lesser extent, the electric drive system could be made more powerful but not all the way to the point of being able to avoid an engine start on the US06. Directionally, this will still provide the manufacturer more ability to manage high-power starts by being able to meet more of the driver’s demand with electric propulsion and require less supplemental power from the engine. In this manner, the engine can be operated at lower load and speed point that reduces engine-out emissions during the initial start and provide more ability to simultaneously warm up the catalyst while also delivering power to propel the vehicle. Staff expects this may be a likely option for already designed PHEVs that are scheduled to continue into the 2026 or later model year and have insufficient room to accommodate a
119
drop-in replacement motor or battery that is sufficiently powerful to avoid engine starts altogether on the US06 cycle.
A third approach that can be used, especially in concert with a stronger electric drive system, is to trigger the initial engine start at a slightly lower power demand than what the electric drive system can actually deliver. With this approach, the initial engine start can be operated in a more controlled manner optimized for low emissions while the electric drive system continues to meet the driver’s demand. The downside of such an approach, however, is that an engine start may be triggered on a trip that could have avoided a start altogether if the driver demand just momentarily exceeded the trigger and then dropped back down. In such cases, the electric drive could have met the driver’s demand fully and not even needed to turn the engine on.
As an alternative to (or in concert with) changes to electric drive capability, manufacturers can improve their emission control systems to further reduce emissions at initial engine start. Some suppliers and manufacturers have been investigating the use of electrically heated catalysts whereby the catalyst can be heated up electrically prior to or at the same time as engine start. Such systems can dramatically reduce cold start emissions and the presence of a high voltage battery on a PHEV means the high electrical power demands of such a system can be more readily handled. However, maximum reductions of such a technology rely on being able to preheat the catalyst before engine start, which then introduces the need for the system to be more predictive in nature in anticipating the upcoming driver demand to be high enough to need the engine to start.
Even less complex emission hardware changes can result in improved emission control. Manufacturers are continually optimizing the location, washcoat, and precious metal content of various catalysts in the exhaust system along with fuel injection system and fast light off air fuel ratio sensors in the exhaust that balance the needs of the various emission standards. However, given that cold-start emissions are such a large portion of the emissions on the FTP test, additional attention is spent on minimizing the formation of the emissions in the combustion chamber and accelerated light-off of the catalyst. As noted earlier, with an increased focus on managing start emissions following partial soaks, as well as during quick drive-away events, manufacturers will need to pay even more attention to this initial burst of emissions at start. Much of that knowledge will be applicable for PHEVs as well, especially the improvements targeted for quick drive-aways where, much like the case of high-power cold-starts on PHEVs, there is a need for the engine to deliver propulsion power while still taking action to minimize the formation of engine-out emissions and warm up the catalyst.
In addition to the measures noted earlier for control of quick drive away conditions, PHEVs have the added capability of using the battery and electric motor to actually spin the engine to a higher engine speed before even initiating fueling. This can provide for more consistent air flow to the cylinders allowing for better air fuel mixing and initial combustion than a conventional engine that may only achieve a few hundred revolutions per minute (rpm) via a starter before fueling must begin. Even after starting the engine, the ability to spin the engine with electrical power provides manufacturers with the capability to run the engine with the spark even more delayed than typically feasible on conventional engines and using the electric power to smooth out the revolutions of the engine from any combustion instability. This allows even more heat to be generated from the combustion event and transferred to the catalyst. While this cannot be as readily done at the same time as significant torque is being requested from the engine due to driver demand, this approach
120
can work in cases above where the engine can be started while the electric drive system is still providing all or most of the driver demand. It can also work in cases where the high driver demand was only a few seconds long and the engine can default back to operating conditions optimized for emission control to complete the warm-up after those first few seconds of providing torque.
Even on some of today’s PHEVs, it seems a variety of these approaches are being used. For example, the Toyota Prius PHEV and the Toyota Prius Prime demonstrated excellent emission control on the US06 cycle, as shown in Figure 22, even though they had less battery energy capacity and lower power electric motors than some of the higher-emitting PHEVs. In the case of the Prius PHEV, it achieved lower US06 emissions by triggering the combustion engine to start at a lower power, which prevented the excessive emissions observed with high power starts. The Honda Clarity PHEV, which had a much higher battery energy capacity and electric power than the Prius PHEV, also appeared to trigger the combustion engine to start at a relatively low power demand. Although the total vehicle power demand was higher than the Prius PHEV, the electric powertrain appeared to provide most of the power during the initial engine start so that the combustion engine operated at relatively low power during its initial start. Therefore, the Clarity PHEV also had cold-start US06 emissions that were well controlled.
In summary, staff projects that the majority of PHEVs will comply with the proposed high power cold-start emission standards by utilizing bigger batteries and more powerful electric powertrains that will allow the PHEV to drive the US06 cycle fully electric and avoid combustion engine starts. These hardware upgrades are expected to be primarily driven by other regulations, such as PHEV ZEV requirements, rather than the US06 cold-start emission standards. However, the excellent emission control of the Toyota Prius PHEV and the Toyota Prius Prime demonstrates that bigger batteries are not necessary to meet the proposed high-power cold-start standards.
6. Proposal: Lower Running Loss Standard
Despite today’s vehicles having very low evaporative emissions, cumulative hydrocarbon evaporative emissions from light duty vehicles exceeds the tailpipe hydrocarbon emissions and is expected to be 75 percent of the emissions by 2040. Evaporative emissions, which result from fuel vapors escaping from the vehicle rather than tailpipe emissions from engine combustion, consist of hydrocarbons that contribute to the formation of ozone. Running loss emissions are a type of evaporative emissions that occur when fuel vapors escape from the vehicle during driving. Manufacturers are required to certify vehicles to the running loss standard by driving a vehicle over a prescribed drive cycle on a dynamometer and measuring the resulting evaporative emissions as captured in a sealed enclosure around the vehicle during testing. The current running loss emission standard of 0.05 grams per mile has not been changed since its introduction in the 1990s. Based on manufacturers’ 2019 model year certification data, the vast majority of the vehicles (87 percent) were certified as emitting at or below 0.01 gram of hydrocarbons per mile. Therefore, staff proposes to reduce the evaporative emission running loss standard from 0.05 grams per mile to 0.01 grams per mile of hydrocarbons. The goal of the proposed amendments is to ensure that vehicles already meeting much more stringent emission levels continue to perform at those levels and to further reduce emissions from the small proportion of vehicles that are currently certifying at higher emission levels.
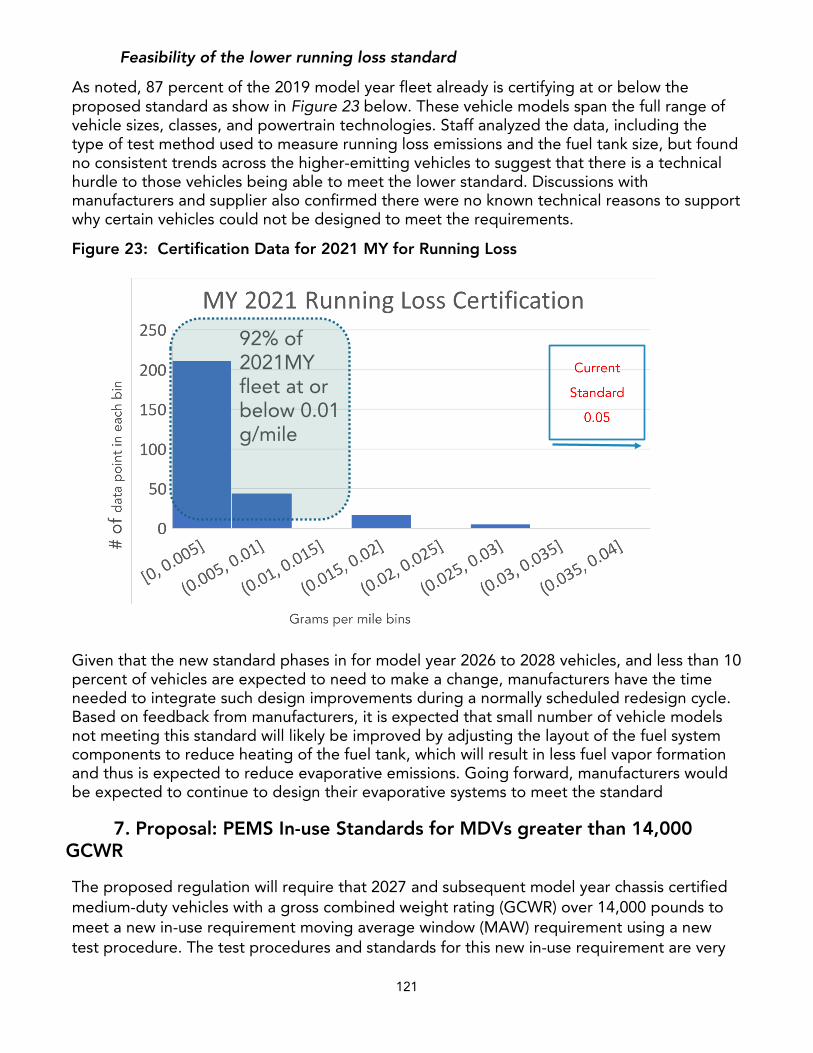
121
Feasibility of the lower running loss standard
As noted, 87 percent of the 2019 model year fleet already is certifying at or below the proposed standard as show in Figure 23 below. These vehicle models span the full range of vehicle sizes, classes, and powertrain technologies. Staff analyzed the data, including the type of test method used to measure running loss emissions and the fuel tank size, but found no consistent trends across the higher-emitting vehicles to suggest that there is a technical hurdle to those vehicles being able to meet the lower standard. Discussions with manufacturers and supplier also confirmed there were no known technical reasons to support why certain vehicles could not be designed to meet the requirements.
Figure 23: Certification Data for 2021 MY for Running Loss
Given that the new standard phases in for model year 2026 to 2028 vehicles, and less than 10 percent of vehicles are expected to need to make a change, manufacturers have the time needed to integrate such design improvements during a normally scheduled redesign cycle. Based on feedback from manufacturers, it is expected that small number of vehicle models not meeting this standard will likely be improved by adjusting the layout of the fuel system components to reduce heating of the fuel tank, which will result in less fuel vapor formation and thus is expected to reduce evaporative emissions. Going forward, manufacturers would be expected to continue to design their evaporative systems to meet the standard
7. Proposal: PEMS In-use Standards for MDVs greater than 14,000GCWR
The proposed regulation will require that 2027 and subsequent model year chassis certified medium-duty vehicles with a gross combined weight rating (GCWR) over 14,000 pounds to meet a new in-use requirement moving average window (MAW) requirement using a new test procedure. The test procedures and standards for this new in-use requirement are very
92% of 2021MY fleet at or below 0.01 g/mile
122
similar to those CARB recently adopted as part of the Heavy-Duty Low NOx Omnibus rulemaking388 at the August 2020 board hearing. Traditionally, medium- and heavy-duty vehicles have been expected to have more similar usage patterns in that they represent heavier, larger, more capable vehicles in terms of carrying capacity and towing capacity that are often used to perform work rather than as personal vehicles. In some cases, the same engine can be used in medium-duty and some of the lighter heavy-duty applications. However, the current options available for certification of MDVs do not ensure consistency in emission control across the various options nor do they adequately ensure emissions are adequately controlled during all engine operations that occur on-road, especially during towing.
The new in-use requirement for chassis certified MDVs will require manufacturers to design the emission controls to meet an in-use emission standard that is measured by a Portable Emissions Measurement System (PEMS) temporarily installed on the vehicle during on-road driving. The PEMS unit is used to measure and record emissions data from the vehicle tailpipe. The method for analyzing the collected data is referred to as the Moving Average Window (MAW) method and was adopted recently for use on 2024 and subsequent model year heavy-duty engines. This method analyzes the PEMS data over continuous five-minute windows that start at every second and will be overlapping. For example, a 10-minute trip can consist of 300 overlapping windows with the first window concluding at 5 minutes into the trip and the second window concluding 1 second later and so on. Each 5-minute window is also analyzed for average engine load and the emission results of each window are then added to one of three bins, as described below, based on the average engine load. Each of these 3 bins has its own corresponding emission standard to which the measured emission results are compared.
For diesel MDVs, each window is sorted into one of three different bins based on the engine percent load which is calculated based on the vehicle’s CO2 emissions. Criteria emissions for each bin are calculated using a defined sum-over-sum (SOS) equation and then compared to the emission standard for that bin. The first bin is the idle bin and consists of windows with an average engine load of less than 6 percent, the second bin is the low load bin and consists of windows with average engine load ranging from 6 to 20 percent, and the last bin is the medium/high bin with windows with average engine load greater than 20 percent. Each bin has its own specific standard. For gasoline MDVs, the primary difference is that there is only one bin that all window results are added to and a single standard for that bin.
The emissions evaluated during in-use PEMS testing will consist of NOx, NMHC, CO, and PM. In addition to meeting the standard, manufacturers will be responsible for conducting self-testing of a number of vehicles each year and reporting for the test groups selected by CARB. As with any standard, CARB can also conduct its own testing of vehicles to determine if a manufacturer’s vehicles are meeting the required standard
Feasibility of meeting the PEMS in-use standard
The feasibility for meeting the proposed MAW in-use standards was demonstrated in the recently adopted Heavy-Duty Low NOx Omnibus rulemaking. Southwest Research Institute
388 For more information regarding the CARB Heavy-Duty Omnibus Regulation, visit https://ww2.arb.ca.gov/rulemaking/2020/hdomnibuslownox
123
(SwRI) researched and performed testing to determine a diesel technology package that could meet the proposed standards. Below in Figure 24 is a diagram of the emission control system for a diesel vehicle that SwRI determined could help with meeting the standards of the MAW during idle, low load, and medium/high load operations. The technology package uses multiple selective catalyst reduction (SCR) catalysts, diesel exhaust fluid dosing, and ammonia slip catalysts (ASC). The light-off SCR is meant to handle cold temperature and low-load emissions, while the larger SCR system would handle the higher emission flow rates during medium and high load operations. The ASC and multiple dosing systems would improve the conversion efficiency of the SCR systems. Another technology demonstrated by SwRI was cylinder deactivation, which can help with controlling low-temperature emissions. Along with these hardware changes, calibration will help ensure robust emission controls during all engine operation.
Staff also tested multiple MDVs to assess their current performance in the laboratory as well as on the road while towing. Currently, these vehicles are only designed to meet the regulatory cycles of the FTP and supplemental FTP (SFTP), which represent urban (FTP) and aggressive (SFTP) driving. The SFTP test cycle is performed with the catalyst at optimal temperatures and the test cycle consist of high speeds and high accelerations. Of particular interest during CARB testing was the 2019 Ram pick-up with the Cummins 6.7L engine that was the subject of an emission recall by CARB. The recall, which consisted of only a software update and no hardware change,389 produced dramatic emission reductions in higher speed and load operating conditions on a truck designed to meet 2019 model year standards nearly an order of magnitude higher than the proposed MAW standards. In comparing pre-and post-recall emission levels for the applicable SFTP cycle, the vehicle achieved a 97 percent reduction in emissions. CARB’s on-road testing of this vehicle after the recall recalibration showed it was one of the best performers for emissions across all operation including towing. When evaluated using the proposed MAW method, it showed much lower emission levels than the other vehicles, and this performance was achieved using a hardware configuration designed for the 2019 model year with no intent to be capable of meeting the future MAW standards. The recalibration makes it close to meet the 2027 standard without any hardware changes. Given the lead time with this proposal and the ongoing work by all manufacturers towards the already adopted heavy-duty standards phasing in before these proposed standards, it would be expected that further hardware changes and software refinements would be developed to reach the levels demonstrated by SwRI.
389 NHTSA 2020. FCA Emissions Recall VB6 Diesel Engine Calibration, February 2020: “The engine control software… must be updated with an upgraded calibration as required by the US Environmental Protection Agency and California Air Resources Board for better emission performance. https://static.nhtsa.gov/odi/tsbs/2020/MC-10173340-9999.pdf
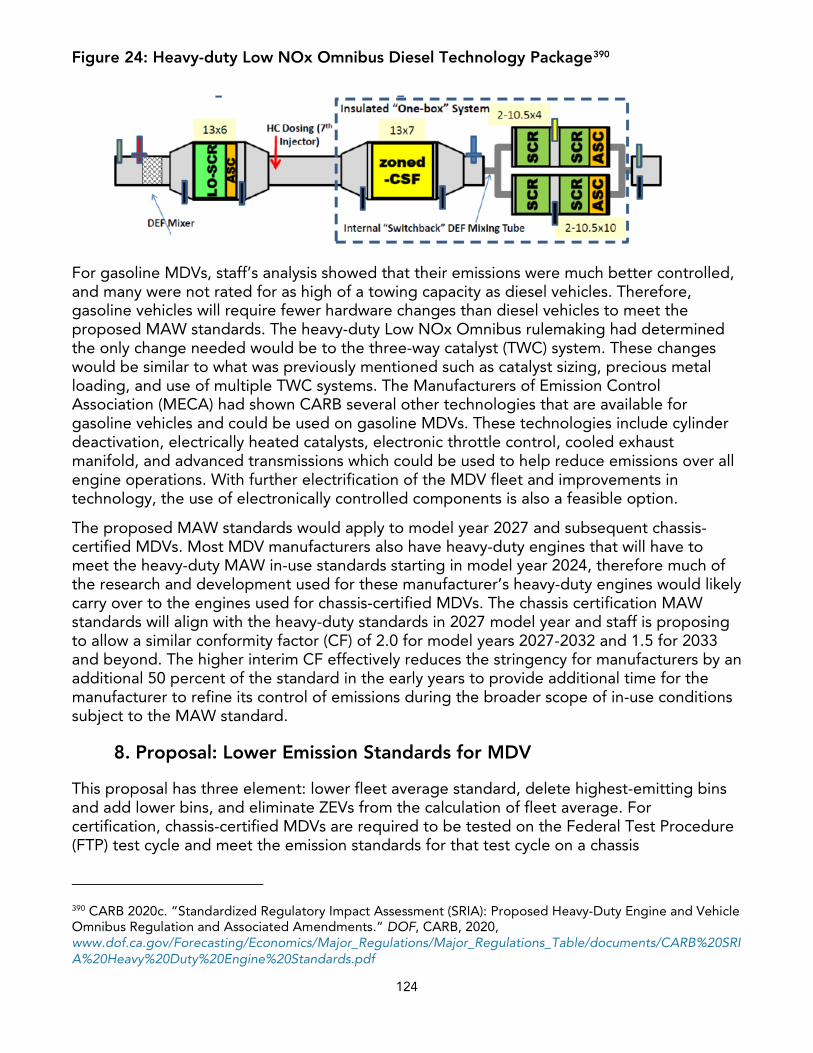
124
Figure 24: Heavy-duty Low NOx Omnibus Diesel Technology Package390
For gasoline MDVs, staff’s analysis showed that their emissions were much better controlled, and many were not rated for as high of a towing capacity as diesel vehicles. Therefore, gasoline vehicles will require fewer hardware changes than diesel vehicles to meet the proposed MAW standards. The heavy-duty Low NOx Omnibus rulemaking had determined the only change needed would be to the three-way catalyst (TWC) system. These changes would be similar to what was previously mentioned such as catalyst sizing, precious metal loading, and use of multiple TWC systems. The Manufacturers of Emission Control Association (MECA) had shown CARB several other technologies that are available for gasoline vehicles and could be used on gasoline MDVs. These technologies include cylinder deactivation, electrically heated catalysts, electronic throttle control, cooled exhaust manifold, and advanced transmissions which could be used to help reduce emissions over all engine operations. With further electrification of the MDV fleet and improvements in technology, the use of electronically controlled components is also a feasible option.
The proposed MAW standards would apply to model year 2027 and subsequent chassis-certified MDVs. Most MDV manufacturers also have heavy-duty engines that will have to meet the heavy-duty MAW in-use standards starting in model year 2024, therefore much of the research and development used for these manufacturer’s heavy-duty engines would likely carry over to the engines used for chassis-certified MDVs. The chassis certification MAW standards will align with the heavy-duty standards in 2027 model year and staff is proposing to allow a similar conformity factor (CF) of 2.0 for model years 2027-2032 and 1.5 for 2033 and beyond. The higher interim CF effectively reduces the stringency for manufacturers by an additional 50 percent of the standard in the early years to provide additional time for the manufacturer to refine its control of emissions during the broader scope of in-use conditions subject to the MAW standard.
8. Proposal: Lower Emission Standards for MDV
This proposal has three element: lower fleet average standard, delete highest-emitting bins and add lower bins, and eliminate ZEVs from the calculation of fleet average. For certification, chassis-certified MDVs are required to be tested on the Federal Test Procedure (FTP) test cycle and meet the emission standards for that test cycle on a chassis
390 CARB 2020c. “Standardized Regulatory Impact Assessment (SRIA): Proposed Heavy-Duty Engine and Vehicle Omnibus Regulation and Associated Amendments.” DOF, CARB, 2020, www.dof.ca.gov/Forecasting/Economics/Major_Regulations/Major_Regulations_Table/documents/CARB%20SRIA%20Heavy%20Duty%20Engine%20Standards.pdf
125
dynamometer. The FTP test cycle measures emissions during the cold start and the drive cycle which is representative of urban driving. Manufacturers can choose from several defined emission bins for certification for each test group. The current regulations allow manufacturers to certify to NMOG+NOx emission bins ranging from 0.150 g/mile up to 0.250 g/mile for Class 2b and 0.200 g/mile to 0.400 g/mile for Class 3.
To ensure manufacturers certify to more stringent FTP bin standards over time, they are required to meet a declining FTP NMOG+NOx fleet average standard. In order to meet the fleet average standard, the manufacturer’s sales-weighted emissions for their entire fleet must have average FTP emissions below the fleet average standard for that model year. The LEV III MDV fleet average standards started with model year 2016 and become more stringent each subsequent model year until 2022. After model year 2022, the fleet average standards remain constant with class 2b and class 3 each having their own respective standards.
In 2022 the fleet average standard is 0.178 g/mile and 0.247 g/mile for Class 2b and 3, respectively. Currently, manufacturers are meeting this fleet average with a mix of vehicles certified to bins above and below this fleet average. Emission control technology has continued to evolve in both the light-duty sector, where manufacturers continue to certify an increasing fraction of their fleet to very low-emission levels to meet the decreasing fleet average, and in the heavy-duty sector where the recent Heavy-Duty Low NOx Omnibus rulemaking established standards representing a 90 percent reduction from today’s heavy-duty standards starting in 2024 model year. MDVs have often shared powertrains with slightly smaller light-duty applications or slightly heavier heavy-duty applications or used powertrains evolved from similar powertrains in those other classes. Accordingly, the ongoing improvements in vehicles both lighter and heavier support the need and capability of the MDVs to also meet more stringent standards than they are meeting today. The proposed regulation will further reduce both fleet average standards to 0.150 g/mile and 0.175 g/mile for class 2b and 3, respectively, starting in the 2026 model year.
In addition, this proposal includes the removal of medium-duty ZEVs from being included in the fleet average in 2026 for both class 2b and class 3. Manufacturers are currently meeting the final LEV III fleet average, which is fixed from 2022 model year on, without any manufacturer having any ZEVs included in that fleet average. However, as the Advanced Clean Trucks (ACT) regulation takes effect beginning in 2024 model year, and consistent with announcements from several manufacturers for ZEV offerings in the MDV sector, ZEVs are expected to gradually increase in volume in the MDV sector. Absent a change in the way the fleet averages can be calculated, this increasing fraction of ZEVs would allow manufacturers to backslide on their gasoline and diesel engines and certify an increasing share of them to dirtier and dirtier emission bins while still meeting the fleet average. By removing the ability to include ZEVs in the fleet average, manufacturers will be required to at least keep the non-ZEVs certified to the lower standards that they have already achieved and then to increase the share of their engines certified to the lower bins to meet the proposed further reductions in the fleet average.
As noted earlier, the current regulations allow manufacturers to certify to bins ranging from 0.150 g/mile up to 0.250 g/mile for Class 2b and 0.200 g/mile to 0.400 g/mile for Class 3. As with staff’s proposal for passenger cars and trucks, staff propose to eliminate the dirtiest
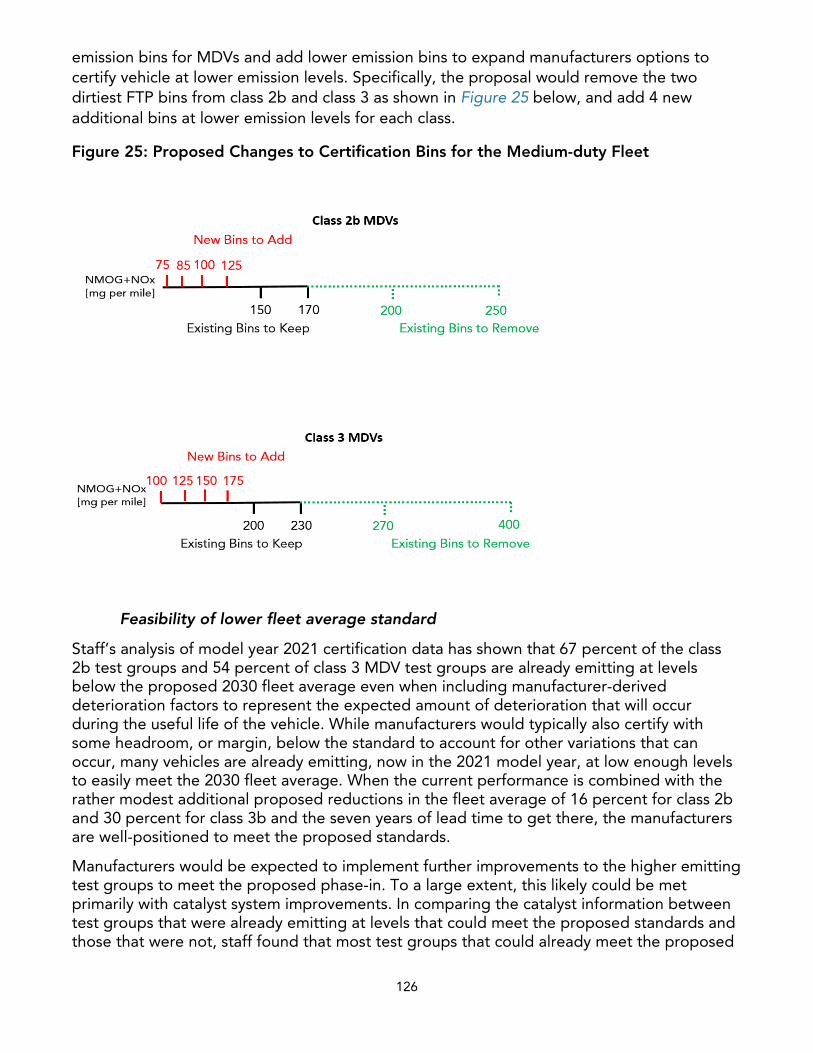
126
emission bins for MDVs and add lower emission bins to expand manufacturers options to certify vehicle at lower emission levels. Specifically, the proposal would remove the two dirtiest FTP bins from class 2b and class 3 as shown in Figure 25 below, and add 4 new additional bins at lower emission levels for each class.
Figure 25: Proposed Changes to Certification Bins for the Medium-duty Fleet
Feasibility of lower fleet average standard
Staff’s analysis of model year 2021 certification data has shown that 67 percent of the class 2b test groups and 54 percent of class 3 MDV test groups are already emitting at levels below the proposed 2030 fleet average even when including manufacturer-derived deterioration factors to represent the expected amount of deterioration that will occur during the useful life of the vehicle. While manufacturers would typically also certify with some headroom, or margin, below the standard to account for other variations that can occur, many vehicles are already emitting, now in the 2021 model year, at low enough levels to easily meet the 2030 fleet average. When the current performance is combined with the rather modest additional proposed reductions in the fleet average of 16 percent for class 2b and 30 percent for class 3b and the seven years of lead time to get there, the manufacturers are well-positioned to meet the proposed standards.
Manufacturers would be expected to implement further improvements to the higher emitting test groups to meet the proposed phase-in. To a large extent, this likely could be met primarily with catalyst system improvements. In comparing the catalyst information between test groups that were already emitting at levels that could meet the proposed standards and those that were not, staff found that most test groups that could already meet the proposed
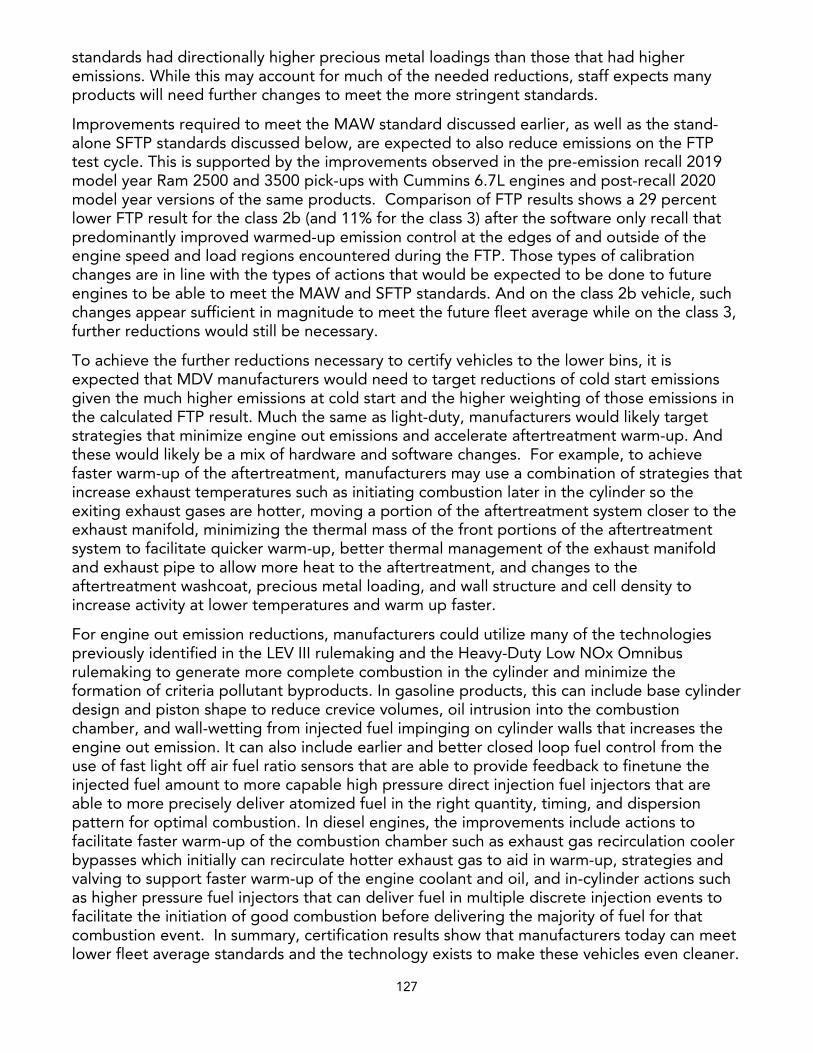
127
standards had directionally higher precious metal loadings than those that had higher emissions. While this may account for much of the needed reductions, staff expects many products will need further changes to meet the more stringent standards.
Improvements required to meet the MAW standard discussed earlier, as well as the stand-alone SFTP standards discussed below, are expected to also reduce emissions on the FTP test cycle. This is supported by the improvements observed in the pre-emission recall 2019 model year Ram 2500 and 3500 pick-ups with Cummins 6.7L engines and post-recall 2020 model year versions of the same products. Comparison of FTP results shows a 29 percent lower FTP result for the class 2b (and 11% for the class 3) after the software only recall that predominantly improved warmed-up emission control at the edges of and outside of the engine speed and load regions encountered during the FTP. Those types of calibration changes are in line with the types of actions that would be expected to be done to future engines to be able to meet the MAW and SFTP standards. And on the class 2b vehicle, such changes appear sufficient in magnitude to meet the future fleet average while on the class 3, further reductions would still be necessary.
To achieve the further reductions necessary to certify vehicles to the lower bins, it is expected that MDV manufacturers would need to target reductions of cold start emissions given the much higher emissions at cold start and the higher weighting of those emissions in the calculated FTP result. Much the same as light-duty, manufacturers would likely target strategies that minimize engine out emissions and accelerate aftertreatment warm-up. And these would likely be a mix of hardware and software changes. For example, to achieve faster warm-up of the aftertreatment, manufacturers may use a combination of strategies that increase exhaust temperatures such as initiating combustion later in the cylinder so the exiting exhaust gases are hotter, moving a portion of the aftertreatment system closer to the exhaust manifold, minimizing the thermal mass of the front portions of the aftertreatment system to facilitate quicker warm-up, better thermal management of the exhaust manifold and exhaust pipe to allow more heat to the aftertreatment, and changes to the aftertreatment washcoat, precious metal loading, and wall structure and cell density to increase activity at lower temperatures and warm up faster.
For engine out emission reductions, manufacturers could utilize many of the technologies previously identified in the LEV III rulemaking and the Heavy-Duty Low NOx Omnibus rulemaking to generate more complete combustion in the cylinder and minimize the formation of criteria pollutant byproducts. In gasoline products, this can include base cylinder design and piston shape to reduce crevice volumes, oil intrusion into the combustion chamber, and wall-wetting from injected fuel impinging on cylinder walls that increases the engine out emission. It can also include earlier and better closed loop fuel control from the use of fast light off air fuel ratio sensors that are able to provide feedback to finetune the injected fuel amount to more capable high pressure direct injection fuel injectors that are able to more precisely deliver atomized fuel in the right quantity, timing, and dispersion pattern for optimal combustion. In diesel engines, the improvements include actions to facilitate faster warm-up of the combustion chamber such as exhaust gas recirculation cooler bypasses which initially can recirculate hotter exhaust gas to aid in warm-up, strategies and valving to support faster warm-up of the engine coolant and oil, and in-cylinder actions such as higher pressure fuel injectors that can deliver fuel in multiple discrete injection events to facilitate the initiation of good combustion before delivering the majority of fuel for that combustion event. In summary, certification results show that manufacturers today can meet lower fleet average standards and the technology exists to make these vehicles even cleaner.
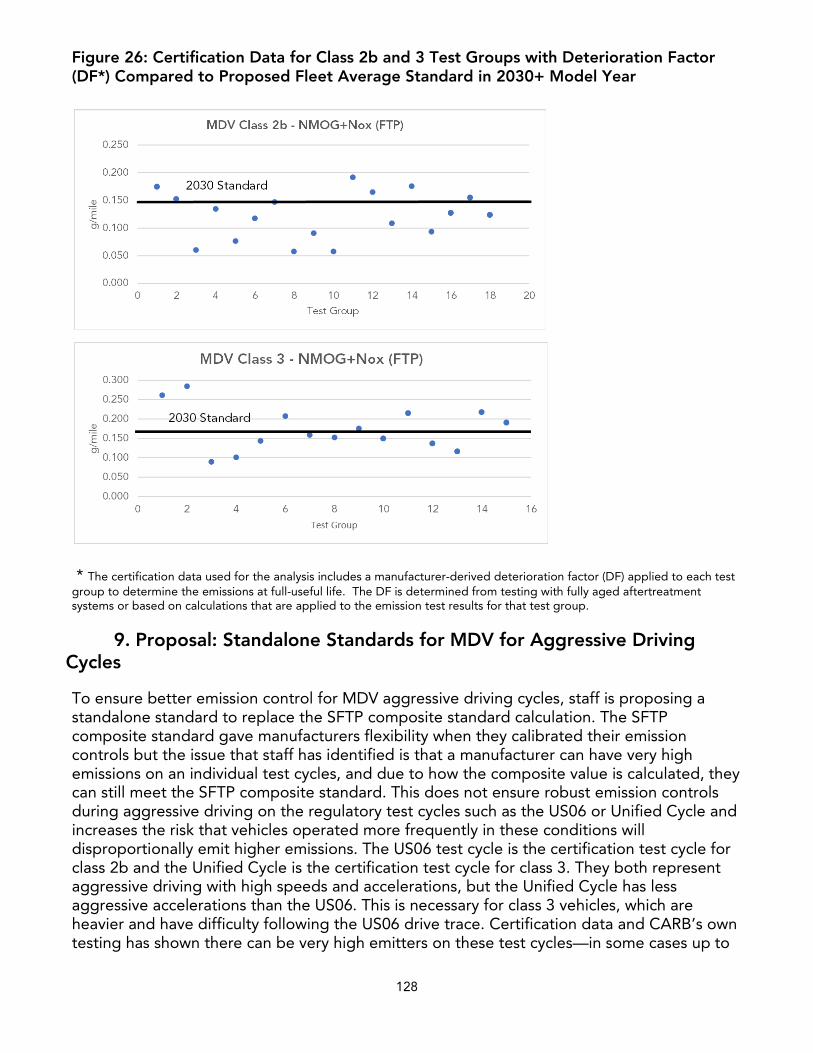
128
Figure 26: Certification Data for Class 2b and 3 Test Groups with Deterioration Factor (DF*) Compared to Proposed Fleet Average Standard in 2030+ Model Year
* The certification data used for the analysis includes a manufacturer-derived deterioration factor (DF) applied to each testgroup to determine the emissions at full-useful life. The DF is determined from testing with fully aged aftertreatmentsystems or based on calculations that are applied to the emission test results for that test group.
9. Proposal: Standalone Standards for MDV for Aggressive DrivingCycles
To ensure better emission control for MDV aggressive driving cycles, staff is proposing a standalone standard to replace the SFTP composite standard calculation. The SFTP composite standard gave manufacturers flexibility when they calibrated their emission controls but the issue that staff has identified is that a manufacturer can have very high emissions on an individual test cycles, and due to how the composite value is calculated, they can still meet the SFTP composite standard. This does not ensure robust emission controls during aggressive driving on the regulatory test cycles such as the US06 or Unified Cycle and increases the risk that vehicles operated more frequently in these conditions will disproportionally emit higher emissions. The US06 test cycle is the certification test cycle for class 2b and the Unified Cycle is the certification test cycle for class 3. They both represent aggressive driving with high speeds and accelerations, but the Unified Cycle has less aggressive accelerations than the US06. This is necessary for class 3 vehicles, which are heavier and have difficulty following the US06 drive trace. Certification data and CARB’s own testing has shown there can be very high emitters on these test cycles—in some cases up to
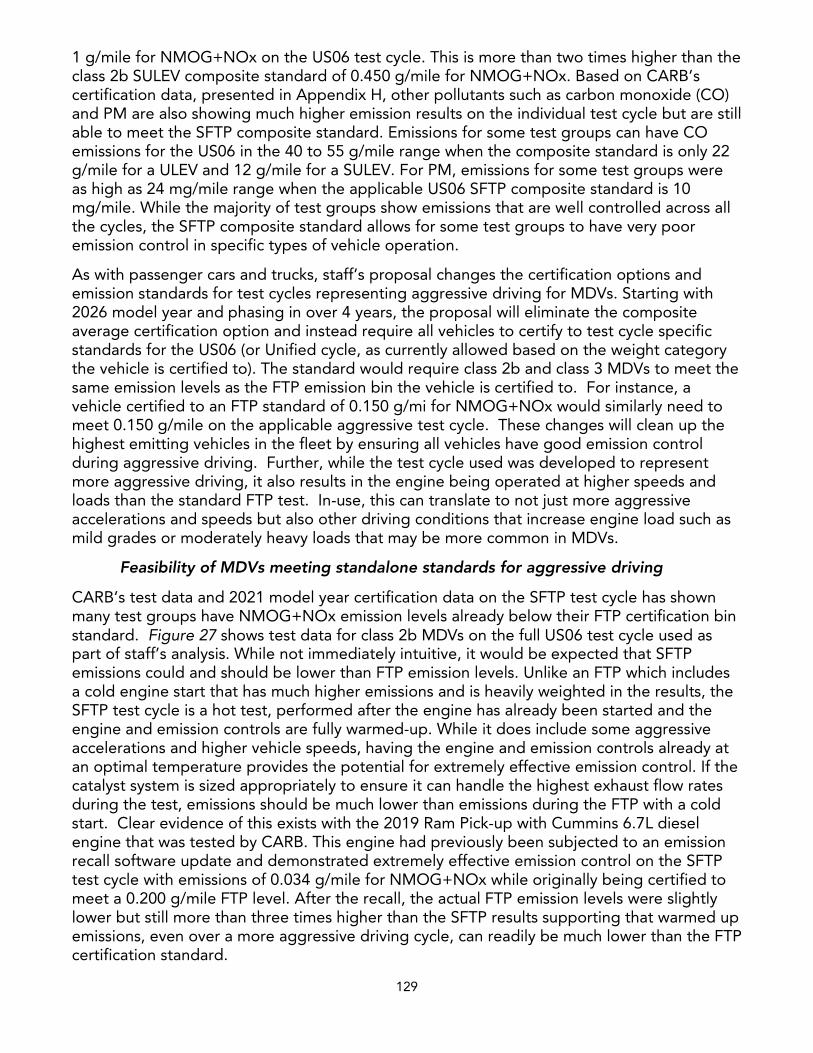
129
1 g/mile for NMOG+NOx on the US06 test cycle. This is more than two times higher than the class 2b SULEV composite standard of 0.450 g/mile for NMOG+NOx. Based on CARB’s certification data, presented in Appendix H, other pollutants such as carbon monoxide (CO) and PM are also showing much higher emission results on the individual test cycle but are still able to meet the SFTP composite standard. Emissions for some test groups can have CO emissions for the US06 in the 40 to 55 g/mile range when the composite standard is only 22 g/mile for a ULEV and 12 g/mile for a SULEV. For PM, emissions for some test groups were as high as 24 mg/mile range when the applicable US06 SFTP composite standard is 10 mg/mile. While the majority of test groups show emissions that are well controlled across all the cycles, the SFTP composite standard allows for some test groups to have very poor emission control in specific types of vehicle operation.
As with passenger cars and trucks, staff’s proposal changes the certification options and emission standards for test cycles representing aggressive driving for MDVs. Starting with 2026 model year and phasing in over 4 years, the proposal will eliminate the composite average certification option and instead require all vehicles to certify to test cycle specific standards for the US06 (or Unified cycle, as currently allowed based on the weight category the vehicle is certified to). The standard would require class 2b and class 3 MDVs to meet the same emission levels as the FTP emission bin the vehicle is certified to. For instance, a vehicle certified to an FTP standard of 0.150 g/mi for NMOG+NOx would similarly need to meet 0.150 g/mile on the applicable aggressive test cycle. These changes will clean up the highest emitting vehicles in the fleet by ensuring all vehicles have good emission control during aggressive driving. Further, while the test cycle used was developed to represent more aggressive driving, it also results in the engine being operated at higher speeds and loads than the standard FTP test. In-use, this can translate to not just more aggressive accelerations and speeds but also other driving conditions that increase engine load such as mild grades or moderately heavy loads that may be more common in MDVs.
Feasibility of MDVs meeting standalone standards for aggressive driving
CARB’s test data and 2021 model year certification data on the SFTP test cycle has shown many test groups have NMOG+NOx emission levels already below their FTP certification bin standard. Figure 27 shows test data for class 2b MDVs on the full US06 test cycle used as part of staff’s analysis. While not immediately intuitive, it would be expected that SFTP emissions could and should be lower than FTP emission levels. Unlike an FTP which includes a cold engine start that has much higher emissions and is heavily weighted in the results, the SFTP test cycle is a hot test, performed after the engine has already been started and the engine and emission controls are fully warmed-up. While it does include some aggressive accelerations and higher vehicle speeds, having the engine and emission controls already at an optimal temperature provides the potential for extremely effective emission control. If the catalyst system is sized appropriately to ensure it can handle the highest exhaust flow rates during the test, emissions should be much lower than emissions during the FTP with a cold start. Clear evidence of this exists with the 2019 Ram Pick-up with Cummins 6.7L diesel engine that was tested by CARB. This engine had previously been subjected to an emission recall software update and demonstrated extremely effective emission control on the SFTP test cycle with emissions of 0.034 g/mile for NMOG+NOx while originally being certified to meet a 0.200 g/mile FTP level. After the recall, the actual FTP emission levels were slightly lower but still more than three times higher than the SFTP results supporting that warmed up emissions, even over a more aggressive driving cycle, can readily be much lower than the FTP certification standard.
130
Manufacturers would be expected to use the same robust emission control already deployed during the FTP test to achieve very low emissions levels on the warmed-up portions of that test to similarly achieve very low emission levels during the warmed-up SFTP test. For diesel engine vehicles, this primarily consists of expanding the same level of emission control to minimize engine out emissions and ensure proper dosing of diesel exhaust fluid for the SCR catalyst to handle the engine out NOx. This also appears to be consistent with the actions taken by Cummins for the emission recall noted above that consisted solely of a software update and resulted in minimal change in the FTP emission levels (where the system already exhibited reasonable emission control even during the warmed-up portion of the test) but a dramatic 90 plus percent reduction in warmed up test cycle results such as the SFTP. Directionally, the much more extensive changes manufacturers will need to make to comply with the future MAW standards described above will also help as they will need to ensure they have better capability to achieve high SCR conversion efficiency and low engine out emissions during higher exhaust flow rates.
For gasoline engine vehicles, manufacturers appear to already be quite capable of meeting the proposed SFTP standards. Directionally, this is expected as warmed-up gasoline operation even on the FTP results in very low emissions relative to the cold start emission levels that dominate the FTP test. As described for light-duty emission standards earlier, the primary tools to ensure emissions are well controlled on the SFTP include a sufficient catalyst system volume and loading to handle the higher exhaust flow rates and good transient fuel control to precisely match fuel quantity to the rapidly changing air mass during accelerations. With today’s suite of controls including electronic throttle that manufacturers use to more predictably and precisely match fueling to the air change, variable valve timing and controls to influence air mixing and charge as well as function in place of an exhaust gas recirculation system, and wide-range air fuel ratio sensors to provide more detailed information for feedback to the closed loop fuel control system, manufacturers are largely able to maintain a stoichiometric ratio under the vast majority, if not all, of the test cycle. This allows the most complete combustion and fewest byproducts of criteria pollutants that otherwise occur in temporary lean and rich excursions. Further, today’s gasoline three-way catalysts are able to maintain good conversion efficiency of hydrocarbons even in temporary rich excursions that may occur on some MDVs operated at heavier sustained loads that trigger power enrichment or catalyst overtemperature protection strategies that rely on enrichment to keep the catalyst from reaching excessive temperatures. This was seen even in CARB development tests exploring testing of MDVs at simulated higher test weights or payloads where the control system entered enrichment, CO emissions were elevated, but hydrocarbon emissions remained at relatively moderate well-controlled levels.
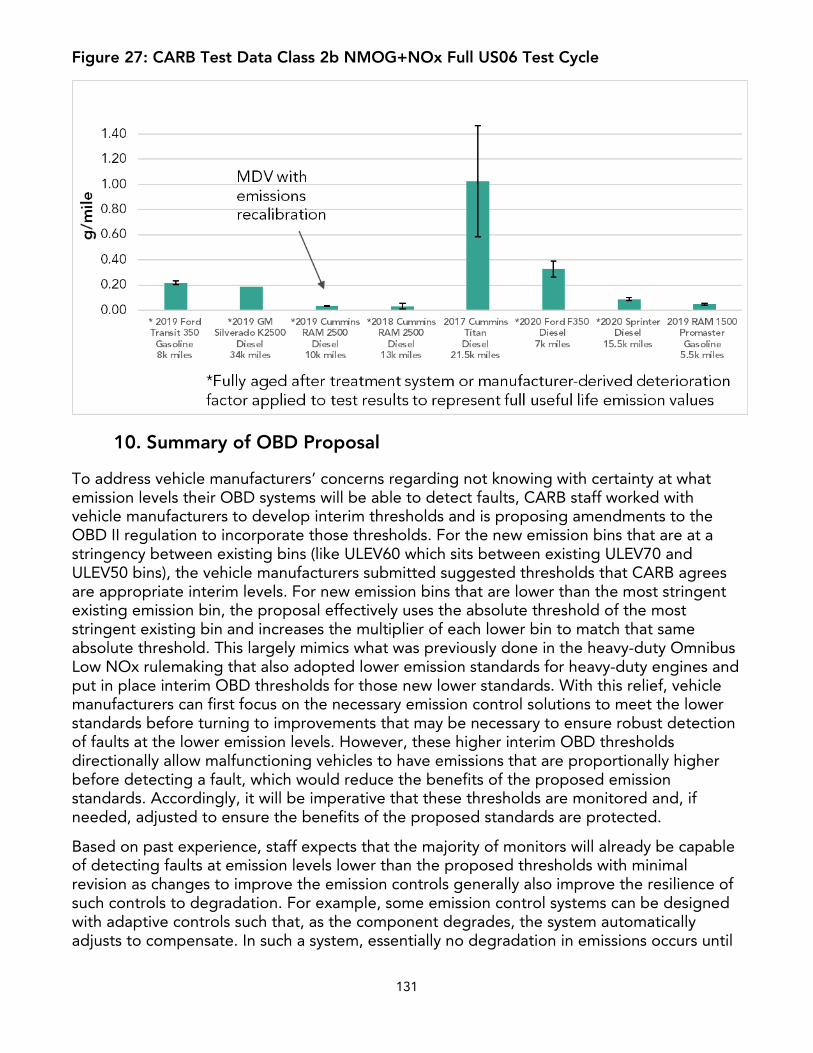
131
Figure 27: CARB Test Data Class 2b NMOG+NOx Full US06 Test Cycle
10. Summary of OBD Proposal
To address vehicle manufacturers’ concerns regarding not knowing with certainty at what emission levels their OBD systems will be able to detect faults, CARB staff worked with vehicle manufacturers to develop interim thresholds and is proposing amendments to the OBD II regulation to incorporate those thresholds. For the new emission bins that are at a stringency between existing bins (like ULEV60 which sits between existing ULEV70 and ULEV50 bins), the vehicle manufacturers submitted suggested thresholds that CARB agrees are appropriate interim levels. For new emission bins that are lower than the most stringent existing emission bin, the proposal effectively uses the absolute threshold of the most stringent existing bin and increases the multiplier of each lower bin to match that same absolute threshold. This largely mimics what was previously done in the heavy-duty Omnibus Low NOx rulemaking that also adopted lower emission standards for heavy-duty engines and put in place interim OBD thresholds for those new lower standards. With this relief, vehicle manufacturers can first focus on the necessary emission control solutions to meet the lower standards before turning to improvements that may be necessary to ensure robust detection of faults at the lower emission levels. However, these higher interim OBD thresholds directionally allow malfunctioning vehicles to have emissions that are proportionally higher before detecting a fault, which would reduce the benefits of the proposed emission standards. Accordingly, it will be imperative that these thresholds are monitored and, if needed, adjusted to ensure the benefits of the proposed standards are protected.
Based on past experience, staff expects that the majority of monitors will already be capable of detecting faults at emission levels lower than the proposed thresholds with minimal revision as changes to improve the emission controls generally also improve the resilience of such controls to degradation. For example, some emission control systems can be designed with adaptive controls such that, as the component degrades, the system automatically adjusts to compensate. In such a system, essentially no degradation in emissions occurs until
132
the system is so degraded that the system reaches its maximum control authority and can no longer compensate. From the information submitted during OBD certification, staff would be able to verify both the emission level at which faults are actually being detected and the level of degradation of the component being detected. If manufacturers are able to calibrate the system to delay detection of faults until even more component degradation occurs than is typical of today’s OBD systems, it will be a clear indication that the malfunction threshold relief at these lower emission bins is not needed and will support an immediate further tightening of the threshold. Accordingly, staff expects to track manufacturers’ progress at these lower emission standards and pursue adoption of more appropriate malfunction emission thresholds at a future OBD regulatory update.
D. Other Test Procedure Modifications
1. Proposed Split of California’s Light- and Medium-Duty Vehicle TestProcedure
California’s “California 2015 and Subsequent Model Criteria Pollutant Exhaust Emission Standards and Test Procedures and 2017 and Subsequent Model Greenhouse Gas Exhaust Emission Standards and Test Procedures for Passenger Cars, Light Duty Trucks, and Medium Duty Vehicles” is being split into two separate test procedures to correspond with the adoption of new criteria pollutant emission standards and test requirements for 2026 and subsequent model year light- and medium-duty vehicles. The portions of this test procedure that will no longer apply to 2026 and subsequent model year vehicles have been removed from the new procedure. The renamed “California 2015 and Subsequent through 2025 Model Criteria Pollutant Exhaust Emission Standards and Test Procedures and 2017 and Subsequent Model Greenhouse Gas Exhaust Emission Standards and Test Procedures for Passenger Cars, Light Duty Trucks, and Medium Duty Vehicles” will be used to certify all 2025 and prior model year light-duty and medium-duty vehicles certifying to the requirements in title 13, CCR, section 1961.2. The new “California 2026 and Subsequent Model Criteria Pollutant Exhaust Emission Standards and Test Procedures for Passenger Cars, Light Duty Trucks, and Medium Duty Vehicles” will be used to certify all 2026 and subsequent model year light-duty and medium-duty vehicles certifying to the requirements in title 13, CCR, section 1961.4, including those that continue to certify to SFTP standards in title 13, CCR, section 1961.2 during the phase-in of the new SFTP standards.
2. Proposed Split of California’s Evaporative Emissions Test Procedure
California’s ““California Evaporative Emission Standards and Test Procedures for 2001 and Subsequent Model Years” is being split into two separate test procedures to correspond with the adoption of evaporative emission standards and test requirements for 2026 and subsequent model year light- and medium-duty vehicles. The portions of this test procedure that will no longer apply to 2026 and subsequent model year vehicles have been removed from the new procedure. The renamed “California Evaporative Emission Standards and Test Procedures for 2001 through 2025 Model Passenger Cars, Light-Duty Trucks, Medium-Duty Vehicles, and Heavy-Duty Vehicles and 2001 and Subsequent Model Motor VehiclesMotorcycles” will be used to certify all 2021 through 2025 model year light-duty, medium-duty, and heavy-duty vehicles. The new “California Evaporative Emission Standards and Test Procedures for 2026 and Subsequent Model Year Passenger Cars, Light-Duty
133
Trucks, Medium-Duty Vehicles, and Heavy-Duty Vehicles” will be used to certify all 2026 and subsequent model year light-duty, medium-duty, and heavy-duty vehicles.
3. Proposed Amendments to California’s Non-Methane Organic GasTest Procedure
The “California Non-Methane Organic Gas Test Procedures for 2017 and Subsequent Model Year Vehicles” contains a number of references to the current “California 2015 and Subsequent Model Criteria Pollutant Exhaust Emission Standards and Test Procedures and 2017 and Subsequent Model Greenhouse Gas Exhaust Emission Standards and Test Procedures for Passenger Cars, Light-Duty Trucks, and Medium-Duty Vehicles.” Since this test procedure is being split into two test procedures, as noted above, it is necessary to modify the “California Non-Methane Organic Gas Test Procedures for 2017 and Subsequent Model Year Vehicles” to reflect this change.
4. Proposed Amendments to California’s Test Procedures for EvaluatingSubstitute Fuels and New Clean Fuels
The “California Test Procedures for Evaluating Substitute Fuels and New Clean Fuels in 2015 and Subsequent Years” is currently used to evaluate the potential emissions impact of proposed substitute fuels and new clean fuels on vehicles that certify to the LEV II standards in title 13, CCR, section 1961 and the LEV III standards in title 13, CCR, section 1961.2. This test procedure is being modified to also allow it to be used to evaluate the potential emissions impact of proposed substitute fuels and new clean fuels on vehicles that certify to the LEV IV standards in title 13, CCR, sections 1961.4. References to the current “California 2015 and Subsequent Model Criteria Pollutant Exhaust Emission Standards and Test Procedures and 2017 and Subsequent Model Greenhouse Gas Exhaust Emission Standards and Test Procedures for Passenger Cars, Light Duty Trucks, and Medium Duty Vehicles” have also been changed to reflect the split in this test procedure, as noted above.
V. The Specific Purpose and Rationale of Each Adoption,Amendment, or Repeal
California Government Code section 11346.2(b)(1) requires a description of the specific purpose for each proposed adoption, or amendment, the problem the agency intends to address with the proposed regulation, and the rationale for determining that each proposed adoption and amendment is reasonably necessary to both carry out the purposes of CARB staff’s proposal and to address the problems for which it is proposed.
The overarching purpose of the proposed regulation is to reduce harmful emissions from motor vehicles. The problems these emissions cause are described above in Chapter II. Appendix X: Purpose and Rationale presents the summary of each proposed amendment and describes its purpose and rationale for its role reducing emissions from motor vehicles.
134
VI. Benefits Anticipated from the Regulatory Action, Including theBenefits or Goals Provided in the Authorizing Statute
The purpose of the proposed regulation is to clean up on-road emissions from new vehicles by tightening emission standards for ICEVs and requiring an increasing percentage of sales to have zero exhaust emissions and meet certain minimum requirements. California Government Code section 11346.2(b)(1) also requires a description of the benefits of the proposed regulatory action. The benefits of the proposed regulations will be to significantly reduce criteria, toxic, and GHG emissions from this sector. Reducing these harmful emissions will protect and improve public health and contribute to stabilizing the climate.
The transition to clean technology will also have many economic benefits. It will reduce the need to expend funds on non-sustainable, non-renewable products. It will reduce comprehensive transportation expenses for consumers. It will incentivize investments in and the development of new technologies and associated goods and fixtures.
The regulatory action furthers multiple statutory directives. It furthers the maximum degree of emission reductions possible from vehicles.391 It furthers controlling emissions of toxic air contaminants to levels which prevent harm to public health.392 It furthers meeting the State’s obligations under the implementation plan required by the federal Clean Air Act to achieve health-based air quality standards.393 It furthers reducing GHG emissions to meet the State’s mandatory limits.394 It furthers improvements in access to clean transportation and in reducing disparate impacts of air pollution and climate change.395
The regulation is also an important new action to support Governor Brown’s Executive Order B-55-18, which sets a target to achieve carbon neutrality in California no later than 2045 andmaintain net negative emissions thereafter, and Governor Newsom’s Executive Order N-79-20, which establishes a target to end sales of ICE passenger vehicles by 2035.
A. Summary of Emission Benefits
The proposed regulations would increase new vehicle sales of BEVs, PHEVs and FCEVs and reduce emissions from the remaining new ICEVs sold. Increased use of ZEVs penetrating the California fleet will reduce upstream and vehicle GHG, criteria (HC, NOx, PM2.5), and toxic emissions. Through the proposed regulation, California will see a cumulative reduction over the period of 2026 to 2040 of 69,569 tons NOX, 4,469 tons PM2.5 and 383.5 MMT of CO2 emissions (well-to-wheels emissions accounting for fuel production). These emission reductions are described in further detail in Appendix D.
California needs these emission reductions, especially of the pollutants that cause ozone. For the South Coast and San Joaquin Valley air basins, there are impending deadlines to attain various NAAQS: 2022 for 1-hour ozone, 2023 for 80 ppb ozone, 2024 for 24-hour PM2.5, 2025 for annual PM2.5, and 2031 for 75 ppb ozone, as well as later years. Attaining these
391 Health & Saf. Code, § 43018. 392 Health & Saf. Code, § 39650. 393 Health & Saf. Code, § 39602.5. 394 Health & Saf. Code, § 38562. 395 Health & Saf. Code, §§ 38565, 44391.2.
135
NAAQS, especially for ozone, requires sustained, comprehensive action to reduce emissions from all categories of sources. For instance, to achieve the ozone standards by 2031, CARB must reduce smog-forming NOx emissions from on-road light-and heavy-duty vehicles by 85% from 2015 levels.396
B. Summary of Health Benefits
The proposed regulation reduces NOx and PM2.5 emissions, resulting in health benefits for individuals in California. CARB analyzed the value of health benefits associated with four health outcomes under the proposed regulation and potential alternatives: cardiopulmonary mortality, hospitalizations for cardiovascular illness, hospitalizations for respiratory illness, and emergency room (ER) visits for asthma. The proposal is estimated to lead to 1,242 fewer cardiopulmonary deaths; 208 fewer hospital admissions for cardiovascular illness; 249 fewer hospital admissions for respiratory illness; and 639 fewer emergency room visits for asthma.
These and other health impacts have been identified by U.S. EPA as having a causal or likely causal relationship with exposure to PM2.5 based on a substantial body of scientific evidence.397 U.S. EPA has determined that both long-term and short-term exposure to PM2.5 plays a causal role in premature mortality, meaning that a substantial body of scientific evidence shows a relationship between PM2.5 exposure and increased risk of death.397 This relationship persists when other risk factors such as smoking rates, poverty and other factors are taken into account.397 U.S. EPA has also determined a causal relationship between non-mortality cardiovascular effects and short- and long-term exposure to PM2.5, and a likely causal relationship between non-mortality respiratory effects (including worsening asthma) and short- and long-term PM2.5 exposure.397 These effects lead to hospitalizations and ER visits, and are included in this analysis.
Staff evaluated a limited number of statewide non-cancer health impacts associated with exposure to PM2.5 and NOx emissions from light-duty vehicles. NOx includes nitrogen dioxide, a potent lung irritant, which can aggravate lung diseases such as asthma when inhaled.398 The health impacts from NOx that are quantifiable by CARB staff occur from the conversion of NOx into fine particles (PM2.5) of ammonium nitrate through atmospheric chemical processes. PM2.5 formed in this manner is termed secondary PM2.5. Both directly emitted (primary) PM2.5 and secondary PM2.5 from light-duty vehicles are associated with adverse health outcomes, such as cardiopulmonary mortality, hospitalizations for cardiovascular illness and respiratory illness, and ER visits for asthma. As a result, reductions in PM2.5 and NOx emissions are associated with reductions in these health outcomes.
1. Incidence-Per-Ton Methodology
CARB uses the incidence-per-ton (IPT) methodology to quantify the health benefits of emission reductions in cases where modeled concentrations are not available. A description
396 See, e.g., CARB 2016. California must also meet its own state ambient air quality standards that are more stringent than the federal counterparts. 397 EPA 2019. United State Environmental Protection Agency. Integrated Science Assessment for Particulate Matter (Issue EPA/600/R-19/188). 2019. https://cfpub.epa.gov/ncea/isa/recordisplay.cfm?deid=347534. 398 EPA 2016. United State Environmental Protection Agency. Integrated Science Assessment for Oxides of Nitrogen – Health Criteria, EPA/600/R-15/068, January 2016. (web link: http://ofmpub.epa.gov/eims/eimscomm.getfile?p_download_id=526855 )
136
of this method is included on CARB’s webpage.399 CARB’s IPT methodology is based on a methodology developed by U.S. EPA.400, 401, 402
Under the IPT methodology, changes in emissions are approximately proportional to resulting changes in health outcomes. IPT factors are derived by calculating the number of health outcomes associated with exposure to PM2.5 for a baseline scenario using measured ambient concentrations and dividing by the emissions of PM2.5 or a precursor. To estimate the reduction in health outcomes, the emission reductions in each air basin from the Proposed Regulation in multiplied by the IPT factor. For future years, the number of outcomes is adjusted to account for population growth. CARB’s current IPT factors are based on a 2014-2016 baseline scenario, which represents the most recent data available at the time the current IPT factors were computed. IPT factors are computed for the two types of PM2.5: primary and secondary PM2.5 emissions of ammonium nitrate aerosols formed from precursors.
Emission reductions from both vehicle and upstream emissions sources were combined for health benefit quantification using the IPT method. To estimate the reductions in primary PM2.5 from non-mobile sources, relative statewide potency factors were applied specifically to the projected emissions from upstream sources, derived from an analysis of exposures from multiple sources in California.309, 403 The health benefits in the next section were calculated by the five major air basins as well as statewide.
2. Reduction in Adverse Health Impacts
CARB staff evaluated the reduction in adverse health impacts including cardiopulmonary mortality, hospitalizations for cardiovascular and respiratory illness, and emergency room (ER) visits for asthma. Staff estimates that the total number of cases statewide, along with the range in the estimate under a 95 percent confidence interval (CI), that would be reduced from 2026 to 2040 from implementing the Proposed Regulation are as follows:
• 1,272 cardiopulmonary deaths reduced (994 to 1,555, 95 percent CI);• 208 hospital admissions for cardiovascular illness reduced (0 to 408, 95 percent CI);• 249 hospital admissions for respiratory illness reduced (58 to 439, 95 percent CI); and• 639 emergency room visits for asthma reduced (404 to 875, 95 percent CI).
399 CARB 2022g. California Air Resources Board. CARB’s Methodology for Estimating the Health Effects of Air Pollution. (web link: https://ww2.arb.ca.gov/resources/documents/carbs-methodology-estimating-health-effects-air-pollution (Accessed March 18, 2022. https://ww2.arb.ca.gov/resources/documents/carbs-methodology-estimating-health-effects-air-pollution. 400 Fann et al 2019. Fann N, Fulcher CM, Hubbell BJ., The influence of location, source, and emission type in estimates of the human health benefits of reducing a ton of air pollution, Air Quality, Atmosphere & Health, 2:169-176, 2019. (web link: https://www.ncbi.nlm.nih.gov/pmc/articles/PMC2770129/) 401 Fann et al 2012. Fann N, Baker KR, Fulcher CM., Characterizing the PM2.5-related health benefits of emission reductions for 17 industrial, area and mobile emission sectors across the U.S. Environ Int.; 49:141-51, November 15, 2012. (web link: https://www.sciencedirect.com/science/article/pii/S0160412012001985) 402 Fann et al 2018. Fann N, Baker K, Chan E, Eyth A, Macpherson A, Miller E, Snyder J., Assessing Human Health PM2.5 and Ozone Impacts from U.S. Oil and Natural Gas Sector Emissions in 2025, Environ. Sci. Technol. 52 (15), pp 8095–8103, 2018. (web link: https://pubs.acs.org/doi/abs/10.1021/acs.est.8b02050) 403 Apte 2019.
137
Table VI-1 shows the estimated avoided cardiopulmonary mortality, hospitalizations, and emergency room visits because of the proposed ACC II regulations for 2026 through 2040, relative to the baseline. The largest estimated health benefits are expected to occur in the South Coast, San Francisco Bay, San Diego, San Joaquin Valley, South Central Coast air basins. These five air basins comprise about 98% of the total health benefits. The benefits for the other ten air basins are presented as the “Rest of the State”.
Note that because CARB staff are evaluating a limited number of health impacts, the full health benefits of the Proposed Regulation are expected to be underestimated. An expansion of the assessment of outcomes, including, but not limited to, reduction of additional cardiovascular and respiratory illnesses, nonfatal/fatal cancers, and lost workdays would provide a more complete picture of the benefits from reduced exposure to air pollution. Additionally, CARB’s mortality and illness assessment is only calculated for a portion of PM2.5 emissions, and there are other pollutants that can cause health issues. For instance, while NOx can lead to the formation of secondary PM2.5 particles, NOx can also react with other compounds to form ozone, which can cause respiratory problems. And toxic air contaminants (TACs) present in emissions can cause cancer and other adverse health outcomes. Altogether, CARB’s current PM2.5 mortality and illness evaluation represent only a portion of the benefits of the proposal.
Lastly, the results presented in Table VI-1 are estimated at a regional scale, at the air basin level. In addition, it is important to consider that the proposed ACC II regulations may decrease the exposure to air pollution of those who live and work near roadways as well as fuel distribution facilities. This is especially important as these individuals are likely at higher risks of developing cardiovascular and respiratory issues as a result of PM emissions, compared to those who live farther away from roadways and fuel distribution facilities. Therefore, although staff cannot quantify the potential effect on near-source exposures, the proposal is expected to provide significant health benefits for these individuals.
Table VI-1: Avoided Mortality and Morbidity Incidents for the Five Major Air Basins and Statewide from 2026 to 2040 under the Proposed Regulation*
Air Basin Avoided Cardiopulmonary Deaths
Avoided Hospitalizations for Cardiovascular Illness
Avoided Hospitalizations for Respiratory Illness
Avoided ER visits for Asthma
San Diego County 59 (46 - 73) 8 (0 - 17) 10 (2 - 18) 24 (15 - 33) San Francisco Bay 182 (142 - 223) 29 (0 - 56) 34 (8 - 60) 99 (63 - 136) San Joaquin Valley 40 (31 - 49) 5 (0 - 10) 6 (1 - 10) 15 (9 - 20) South Central Coast 16 (12 - 19) 2 (0 - 5) 3 (1 - 5) 7 (4 - 9) South Coast 962 (752 - 1176) 162 (0 - 318) 194 (45 - 342) 489 (310 - 669) Rest of the State 13 (10 - 16) 2 (0 - 3) 2 (0 - 4) 5 (3 - 7) Statewide 1272 (994 - 1555) 208 (0 - 408) 249 (58 - 439) 639 (404 - 875)
*Values in parentheses represent estimates within the 95-percent confidence interval. Totalsmay not add due to rounding. Except for the five major air basins, results for the rest of the
138
state are presented at a more regional scale due to the uncertain nature of upstream emission estimates included in the calculations.
3. Uncertainties Associated with the Mortality and Illness Analysis
Although the estimated health outcomes presented in this report are based on a well-established methodology, they are subject to uncertainty. Uncertainty is reflected in the 95-percent confidence intervals included with the central estimates in Table VI-1. These confidence intervals take into account uncertainties in translating air quality changes into health outcomes.
Other sources of uncertainty include the following:
• The relationship between changes in pollutant concentrations and changes in pollutantor precursor emissions is assumed to be proportional, although this is anapproximation.
• Emissions are reported at an air basin resolution, and do not capture local variations,especially with respect to upstream emission estimates.
• Future population estimates are subject to increasing uncertainty as they are projectedfurther into the future.
• Baseline incidence rates can experience year-to-year variation.• Separate policy, regulatory, or industry actions – such as changing import/export
balance decisions at refineries -- could cause different results, though the vast majorityof emission benefits occur from the vehicle emission reductions.404
4. Monetization of Health Impacts
Consistent with U.S. EPA practice, health outcomes are monetized by multiplying each incident by a standard value derived from economic studies.405 The value per incident is shown in Table VI-2. The value for avoided premature mortality is based on willingness to pay, which is a statistical construct based on the aggregated dollar amount that a large group of people would be willing to pay for a reduction in their individual risks of dying in a year.406 While the cost-savings associated with premature mortality are important to account for in the analysis, the valuation of avoided premature mortality does not correspond to changes in expenditures, and is not included in the macroeconomic modeling. As avoided hospitalizations and emergency room visits result in reductions in household expenditures on health care, these values are included in the macroeconomic modeling.
Unlike mortality valuation, the cost-savings for avoided hospitalizations and emergency room visits are based on a combination of typical costs associated with hospitalization and the willingness of surveyed individuals to pay to avoid the adverse outcomes that occur when
404 Given the potentially large impacts of this specific regulation upon transportation fuels as a result of its scope and ambition, an upstream fuels discussion was deemed appropriate in this instance. 405 EPA 2010. United State Environmental Protection Agency., Appendix B: Mortality Risk Valuation Estimates, Guidelines for Preparing Economic Analyses (240-R-10-001). 2010. Accessed May 2021. 406 EPA 2000. United State Environmental Protection Agency, An SAB Report on EPA’s White Paper Valuing the Benefits of Fatal Cancer Risk Reduction (EPA-SAB-EEAC-00-013), 2000 (web link: https://yosemite.epa.gov/sab%5CSABPRODUCT.NSF/41334524148BCCD6852571A700516498/$File/eeacf013.pdf, accessed May 2021).
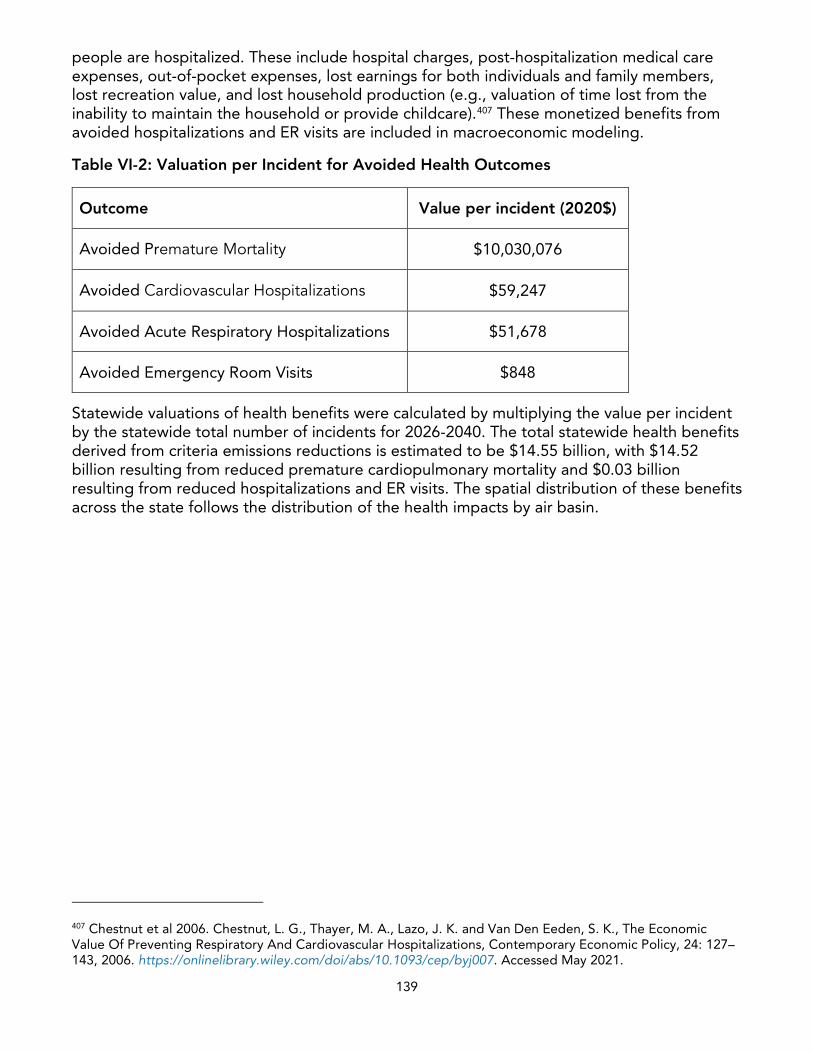
139
people are hospitalized. These include hospital charges, post-hospitalization medical care expenses, out-of-pocket expenses, lost earnings for both individuals and family members, lost recreation value, and lost household production (e.g., valuation of time lost from the inability to maintain the household or provide childcare).407 These monetized benefits from avoided hospitalizations and ER visits are included in macroeconomic modeling.
Table VI-2: Valuation per Incident for Avoided Health Outcomes
Outcome Value per incident (2020$)
Avoided Premature Mortality $10,030,076
Avoided Cardiovascular Hospitalizations $59,247
Avoided Acute Respiratory Hospitalizations $51,678
Avoided Emergency Room Visits $848
Statewide valuations of health benefits were calculated by multiplying the value per incident by the statewide total number of incidents for 2026-2040. The total statewide health benefits derived from criteria emissions reductions is estimated to be $14.55 billion, with $14.52 billion resulting from reduced premature cardiopulmonary mortality and $0.03 billion resulting from reduced hospitalizations and ER visits. The spatial distribution of these benefits across the state follows the distribution of the health impacts by air basin.
407 Chestnut et al 2006. Chestnut, L. G., Thayer, M. A., Lazo, J. K. and Van Den Eeden, S. K., The Economic Value Of Preventing Respiratory And Cardiovascular Hospitalizations, Contemporary Economic Policy, 24: 127– 143, 2006. https://onlinelibrary.wiley.com/doi/abs/10.1093/cep/byj007. Accessed May 2021.
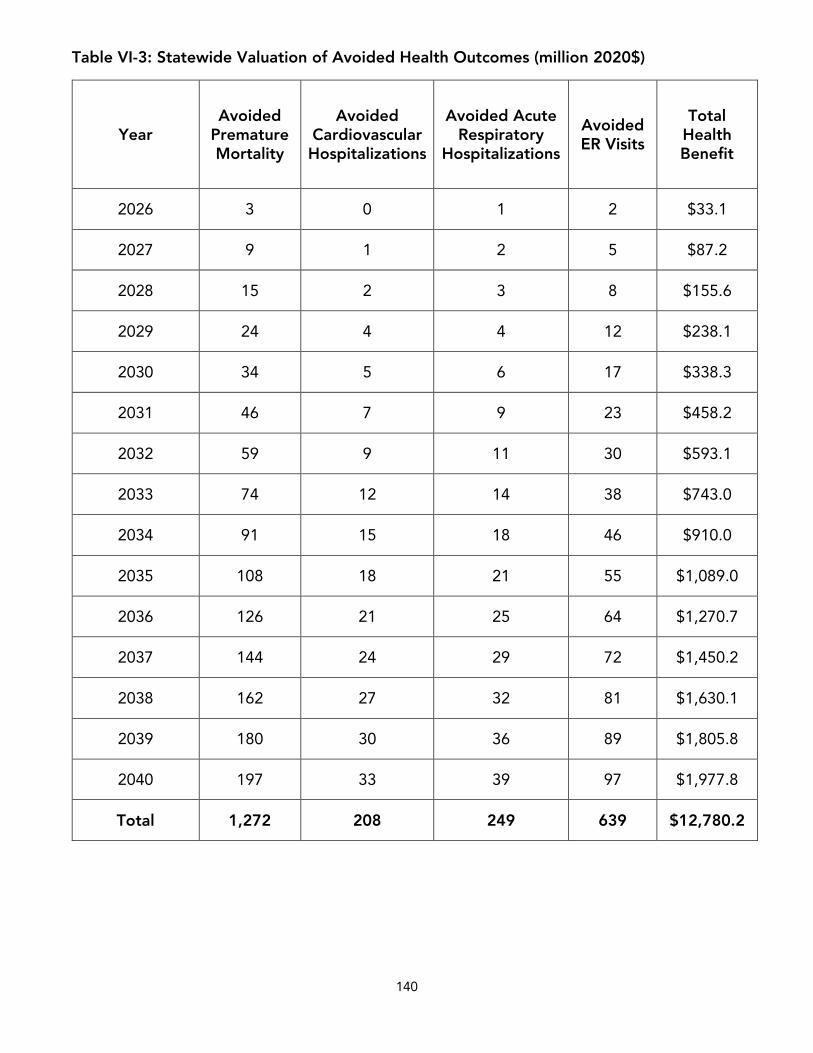
140
Table VI-3: Statewide Valuation of Avoided Health Outcomes (million 2020$)
Year Avoided
Premature Mortality
Avoided Cardiovascular Hospitalizations
Avoided Acute Respiratory
Hospitalizations
Avoided ER Visits
Total Health Benefit
2026 3 0 1 2 $33.1
2027 9 1 2 5 $87.2
2028 15 2 3 8 $155.6
2029 24 4 4 12 $238.1
2030 34 5 6 17 $338.3
2031 46 7 9 23 $458.2
2032 59 9 11 30 $593.1
2033 74 12 14 38 $743.0
2034 91 15 18 46 $910.0
2035 108 18 21 55 $1,089.0
2036 126 21 25 64 $1,270.7
2037 144 24 29 72 $1,450.2
2038 162 27 32 81 $1,630.1
2039 180 30 36 89 $1,805.8
2040 197 33 39 97 $1,977.8
Total 1,272 208 249 639 $12,780.2
141
C. Greenhouse Gas Reduction Benefits - Social Cost of Carbon
Table VII-1 summarizes the estimated total upstream and downstream (or well-to-wheel, WTW408) GHG emissions from the proposed regulation, in units of MMT of CO2 per year. Staff expects the proposed regulation to reduce cumulative WTW GHG emissions by an estimated 383.5 MMT of CO2 relative to the baseline from 2026 to 2040.
These expected reductions will come from replacing ICEVs with ZEV technologies. The benefit of these GHG emission reductions can be estimated using the social cost of carbon (SC-CO2), which provides a dollar valuation of the damages caused by one ton of carbon pollution and represents the monetary benefit today of avoiding those future damages by reducing future carbon emissions.
In the analysis of the SC-CO2 for the proposed regulation, CARB utilizes the current Interagency Working Group (IWG)-supported SC-CO2 values to consider the social costs of actions taken to reduce GHG emissions. This is consistent with the approach presented in the Revised 2017 Climate Change Scoping Plan, is in line with U.S. Government Executive Orders including 13990 and the Office of Management and Budget’s Circular A-4 of September 17, 2003, and reflects the best available science in the estimation of the socio-economic impacts of carbon.409,410
IWG describes the social costs of carbon as follows:
The SC-CO2 for a given year is an estimate, in dollars, of the present discounted value of the future damage caused by a 1-metric ton increase in CO2 emissions into the atmosphere in that year or, equivalently, the benefits of reducing CO2 emissions by the same amount in that year. The SC-CO2 is intended to provide a comprehensive measure of the net damages – that is, the monetized value of the net impacts from global climate change that result from an additional ton of CO2.
Those damages include, but are not limited to, changes in net agricultural productivity, energy use, human health, property damage from increased flood risk, as well as nonmarket damages, such as the services that natural ecosystems provide to society. Many of these damages from CO2 emissions today will affect economic outcomes throughout the next several centuries.411
The SC-CO2 is year-specific and is highly sensitive to the discount rate used to discount the value of the damages in the future due to CO2. The SC-CO2 increases over time as systems become more stressed from the aggregate impacts of climate change and as future emissions cause incrementally larger damages. This discount rate accounts for the preference for current costs and benefits over future costs and benefits, and a higher discount rate decreases the value today of future environmental damages. While the proposed regulation
408 Upstream emissions are also referred to as well-to-tank (WTT) and downstream emissions are also referred to as tank-to-wheel (TTW). 409 CARB 2017c. 410 OMB 2003. Office of Management and Budgets, Circular A-4, 2003 (web link: https://www.transportation.gov/sites/dot.gov/files/docs/OMB%20Circular%20No.%20A-4.pdf, accessed May 2021). 411 NAS 2017. National Academies of Sciences, Engineering, Medicine, Valuing Climate Damages: Updating Estimation of Carbon Dioxide, 2017 (web link: http://www.nap.edu/24651, accessed May 2021).
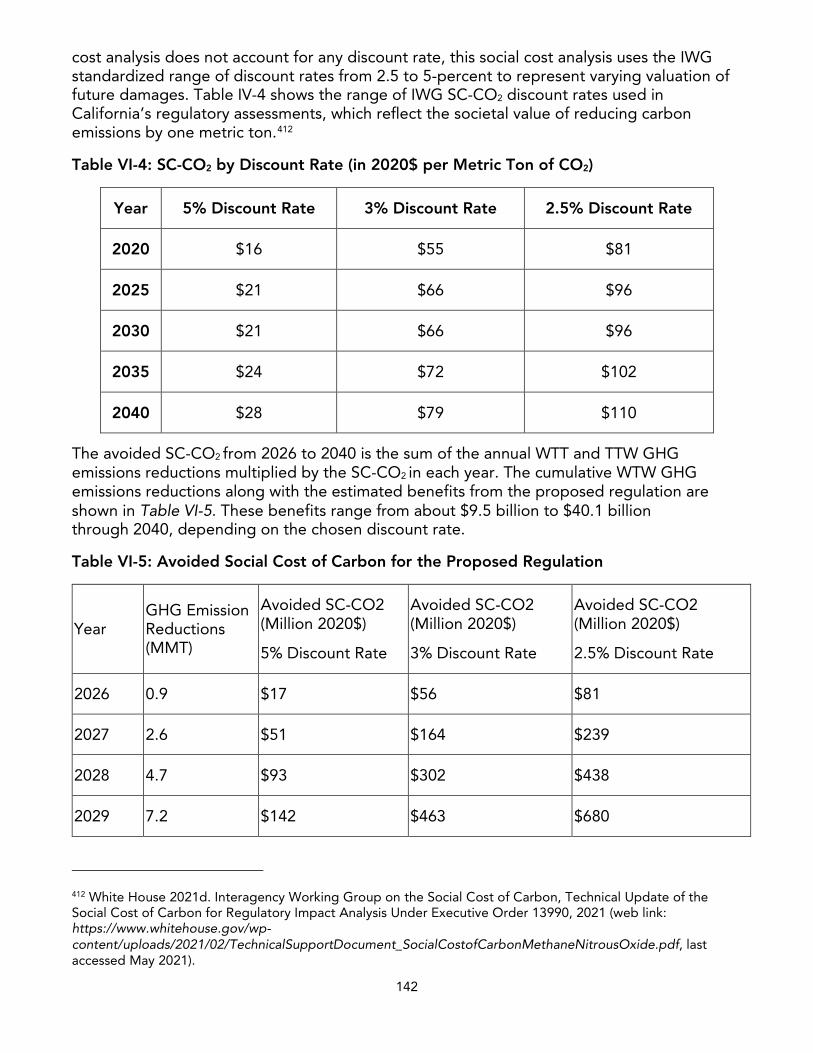
142
cost analysis does not account for any discount rate, this social cost analysis uses the IWG standardized range of discount rates from 2.5 to 5-percent to represent varying valuation of future damages. Table IV-4 shows the range of IWG SC-CO2 discount rates used in California’s regulatory assessments, which reflect the societal value of reducing carbon emissions by one metric ton.412
Table VI-4: SC-CO2 by Discount Rate (in 2020$ per Metric Ton of CO2)
Year 5% Discount Rate 3% Discount Rate 2.5% Discount Rate
2020 $16 $55 $81
2025 $21 $66 $96
2030 $21 $66 $96
2035 $24 $72 $102
2040 $28 $79 $110
The avoided SC-CO2 from 2026 to 2040 is the sum of the annual WTT and TTW GHG emissions reductions multiplied by the SC-CO2 in each year. The cumulative WTW GHG emissions reductions along with the estimated benefits from the proposed regulation are shown in Table VI-5. These benefits range from about $9.5 billion to $40.1 billion through 2040, depending on the chosen discount rate.
Table VI-5: Avoided Social Cost of Carbon for the Proposed Regulation
Year GHG Emission Reductions (MMT)
Avoided SC-CO2 (Million 2020$)
5% Discount Rate
Avoided SC-CO2 (Million 2020$)
3% Discount Rate
Avoided SC-CO2 (Million 2020$)
2.5% Discount Rate
2026 0.9 $17 $56 $81
2027 2.6 $51 $164 $239
2028 4.7 $93 $302 $438
2029 7.2 $142 $463 $680
412 White House 2021d. Interagency Working Group on the Social Cost of Carbon, Technical Update of the Social Cost of Carbon for Regulatory Impact Analysis Under Executive Order 13990, 2021 (web link: https://www.whitehouse.gov/wp-content/uploads/2021/02/TechnicalSupportDocument_SocialCostofCarbonMethaneNitrousOxide.pdf, last accessed May 2021).
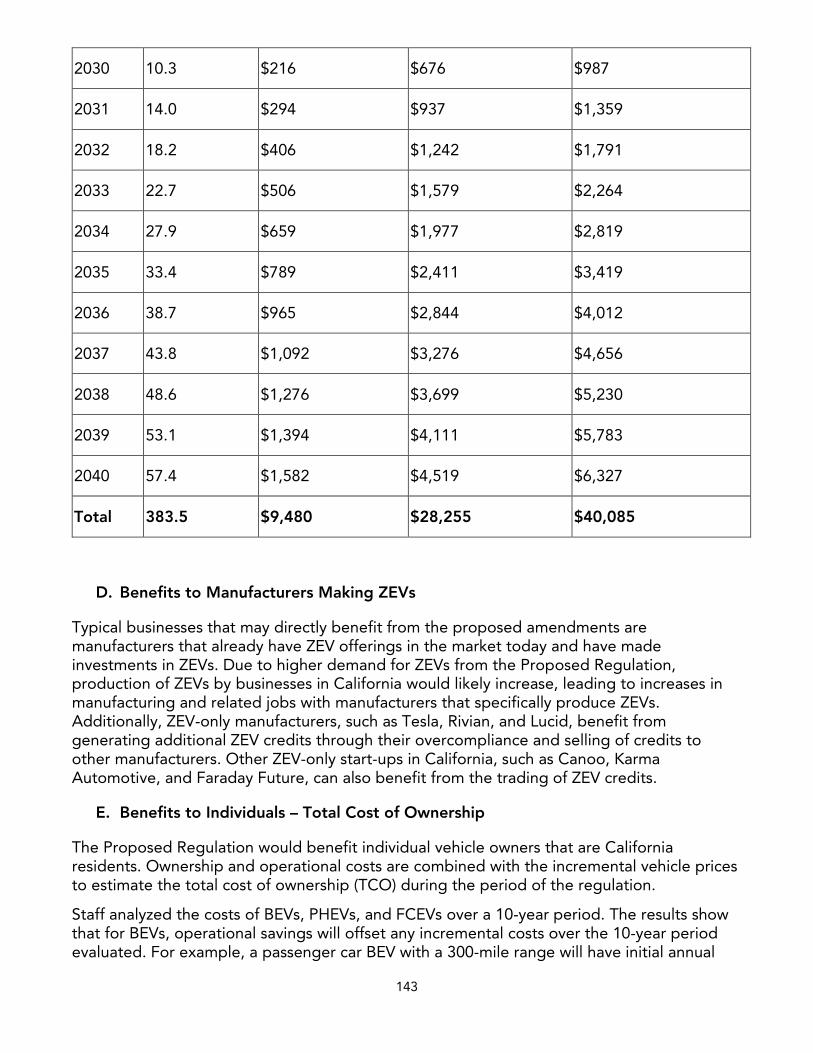
143
2030 10.3 $216 $676 $987
2031 14.0 $294 $937 $1,359
2032 18.2 $406 $1,242 $1,791
2033 22.7 $506 $1,579 $2,264
2034 27.9 $659 $1,977 $2,819
2035 33.4 $789 $2,411 $3,419
2036 38.7 $965 $2,844 $4,012
2037 43.8 $1,092 $3,276 $4,656
2038 48.6 $1,276 $3,699 $5,230
2039 53.1 $1,394 $4,111 $5,783
2040 57.4 $1,582 $4,519 $6,327
Total 383.5 $9,480 $28,255 $40,085
D. Benefits to Manufacturers Making ZEVs
Typical businesses that may directly benefit from the proposed amendments are manufacturers that already have ZEV offerings in the market today and have made investments in ZEVs. Due to higher demand for ZEVs from the Proposed Regulation, production of ZEVs by businesses in California would likely increase, leading to increases in manufacturing and related jobs with manufacturers that specifically produce ZEVs. Additionally, ZEV-only manufacturers, such as Tesla, Rivian, and Lucid, benefit from generating additional ZEV credits through their overcompliance and selling of credits to other manufacturers. Other ZEV-only start-ups in California, such as Canoo, Karma Automotive, and Faraday Future, can also benefit from the trading of ZEV credits.
E. Benefits to Individuals – Total Cost of Ownership
The Proposed Regulation would benefit individual vehicle owners that are California residents. Ownership and operational costs are combined with the incremental vehicle prices to estimate the total cost of ownership (TCO) during the period of the regulation.
Staff analyzed the costs of BEVs, PHEVs, and FCEVs over a 10-year period. The results show that for BEVs, operational savings will offset any incremental costs over the 10-year period evaluated. For example, a passenger car BEV with a 300-mile range will have initial annual
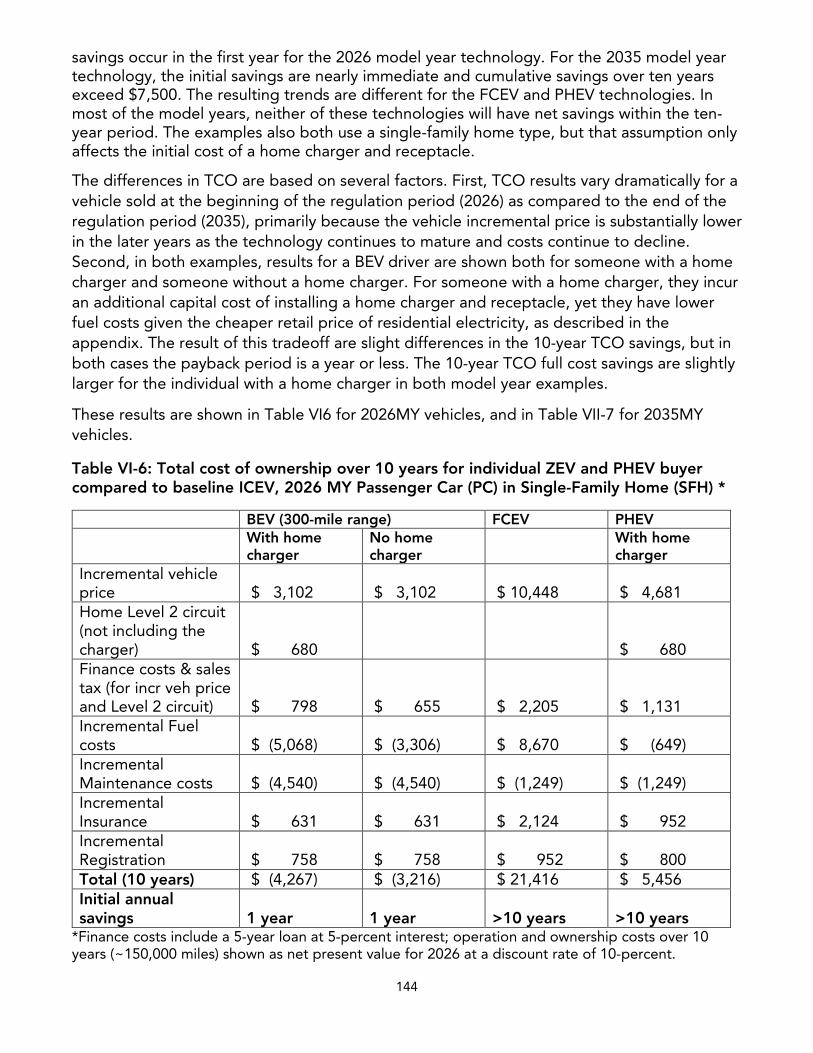
144
savings occur in the first year for the 2026 model year technology. For the 2035 model year technology, the initial savings are nearly immediate and cumulative savings over ten years exceed $7,500. The resulting trends are different for the FCEV and PHEV technologies. In most of the model years, neither of these technologies will have net savings within the ten-year period. The examples also both use a single-family home type, but that assumption only affects the initial cost of a home charger and receptacle.
The differences in TCO are based on several factors. First, TCO results vary dramatically for a vehicle sold at the beginning of the regulation period (2026) as compared to the end of the regulation period (2035), primarily because the vehicle incremental price is substantially lower in the later years as the technology continues to mature and costs continue to decline. Second, in both examples, results for a BEV driver are shown both for someone with a home charger and someone without a home charger. For someone with a home charger, they incur an additional capital cost of installing a home charger and receptacle, yet they have lower fuel costs given the cheaper retail price of residential electricity, as described in the appendix. The result of this tradeoff are slight differences in the 10-year TCO savings, but in both cases the payback period is a year or less. The 10-year TCO full cost savings are slightly larger for the individual with a home charger in both model year examples.
These results are shown in Table VI6 for 2026MY vehicles, and in Table VII-7 for 2035MY vehicles.
Table VI-6: Total cost of ownership over 10 years for individual ZEV and PHEV buyer compared to baseline ICEV, 2026 MY Passenger Car (PC) in Single-Family Home (SFH) *
BEV (300-mile range) FCEV PHEV With home charger
No home charger
With home charger
Incremental vehicle price $ 3,102 $ 3,102 $ 10,448 $ 4,681 Home Level 2 circuit (not including the charger) $ 680 $ 680 Finance costs & sales tax (for incr veh price and Level 2 circuit) $ 798 $ 655 $ 2,205 $ 1,131 Incremental Fuel costs $ (5,068) $ (3,306) $ 8,670 $ (649)Incremental Maintenance costs $ (4,540) $ (4,540) $ (1,249) $ (1,249) Incremental Insurance $ 631 $ 631 $ 2,124 $ 952 Incremental Registration $ 758 $ 758 $ 952 $ 800 Total (10 years) $ (4,267) $ (3,216) $ 21,416 $ 5,456 Initial annual savings 1 year 1 year >10 years >10 years
*Finance costs include a 5-year loan at 5-percent interest; operation and ownership costs over 10years (~150,000 miles) shown as net present value for 2026 at a discount rate of 10-percent.
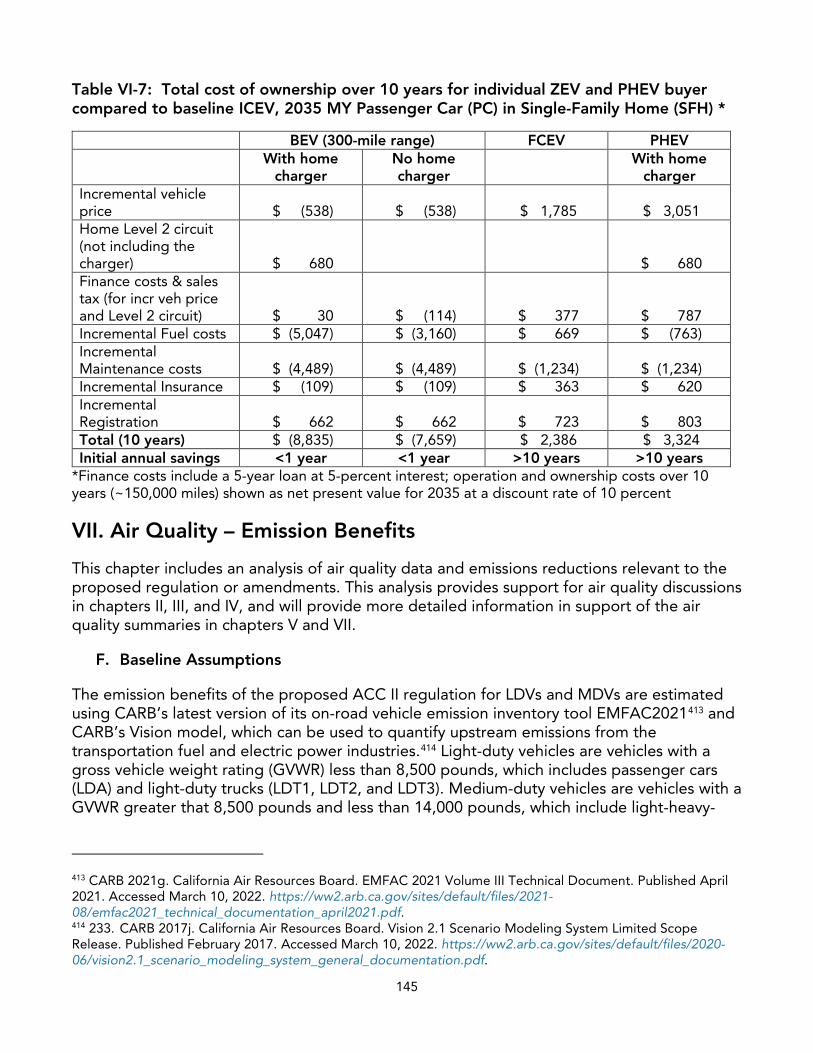
145
Table VI-7: Total cost of ownership over 10 years for individual ZEV and PHEV buyer compared to baseline ICEV, 2035 MY Passenger Car (PC) in Single-Family Home (SFH) *
BEV (300-mile range) FCEV PHEV With home
charger No home charger
With home charger
Incremental vehicle price $ (538) $ (538) $ 1,785 $ 3,051 Home Level 2 circuit (not including the charger) $ 680 $ 680 Finance costs & sales tax (for incr veh price and Level 2 circuit) $ 30 $ (114) $ 377 $ 787 Incremental Fuel costs $ (5,047) $ (3,160) $ 669 $ (763)Incremental Maintenance costs $ (4,489) $ (4,489) $ (1,234) $ (1,234) Incremental Insurance $ (109) $ (109) $ 363 $ 620 Incremental Registration $ 662 $ 662 $ 723 $ 803 Total (10 years) $ (8,835) $ (7,659) $ 2,386 $ 3,324 Initial annual savings <1 year <1 year >10 years >10 years
*Finance costs include a 5-year loan at 5-percent interest; operation and ownership costs over 10years (~150,000 miles) shown as net present value for 2035 at a discount rate of 10 percent
VII. Air Quality – Emission Benefits
This chapter includes an analysis of air quality data and emissions reductions relevant to the proposed regulation or amendments. This analysis provides support for air quality discussions in chapters II, III, and IV, and will provide more detailed information in support of the air quality summaries in chapters V and VII.
F. Baseline Assumptions
The emission benefits of the proposed ACC II regulation for LDVs and MDVs are estimated using CARB’s latest version of its on-road vehicle emission inventory tool EMFAC2021413 and CARB’s Vision model, which can be used to quantify upstream emissions from the transportation fuel and electric power industries.414 Light-duty vehicles are vehicles with a gross vehicle weight rating (GVWR) less than 8,500 pounds, which includes passenger cars (LDA) and light-duty trucks (LDT1, LDT2, and LDT3). Medium-duty vehicles are vehicles with a GVWR greater that 8,500 pounds and less than 14,000 pounds, which include light-heavy-
413 CARB 2021g. California Air Resources Board. EMFAC 2021 Volume III Technical Document. Published April 2021. Accessed March 10, 2022. https://ww2.arb.ca.gov/sites/default/files/2021-08/emfac2021_technical_documentation_april2021.pdf. 414 233. CARB 2017j. California Air Resources Board. Vision 2.1 Scenario Modeling System Limited Scope Release. Published February 2017. Accessed March 10, 2022. https://ww2.arb.ca.gov/sites/default/files/2020-06/vision2.1_scenario_modeling_system_general_documentation.pdf.
146
duty trucks. EMFAC2021 reflects California-specific driving and environmental conditions, passenger vehicle fleet mix, and most importantly the impact of California’s unique mobile source regulations. These include all currently adopted regulations such as the LEV, LEV II and LEV III programs, the existing ZEV regulation, and California inspection and maintenance programs. The EMFAC2021 model is based on CARB’s ACC regulations but also considers updated California Department of Motor Vehicles data through calendar year 2019 and improved projections of ZEV sales to forecast future ZEV populations, which show overcompliance with the current ZEV requirements in the ACC regulations. It should be noted that the current model is only capable of representing business-as-usual conditions and is made using the best available data, and factors such as COVID-19 introduce both short- and long-range uncertainties in the ability of the model to accurately forecast future trends.
To assess the impact of the proposed regulation, the EMFAC2021 model with customized “annual average” settings was run to estimate statewide light-duty vehicle emissions by calendar year, vehicle category, fuel type, and model year projected to occur for the years of 2026 through 2050. The default number of ZEVs in the EMFAC2021 fleet was also adjusted to account for recent changes to the U.S. EPA vehicle standards up to model year 2026. This is described in further detail in later sections.
G. Total Emission Benefits
The combined emission benefits associated with upstream fuel production and vehicle emissions (i.e., well-to-wheel) are summarized in the table below. Given the potentially large impacts of this specific regulation upon transportation fuels as a result of its scope and ambition, an upstream fuels discussion was deemed appropriate in this instance and is provided here with appropriate caveats and transparency as to its assumptions. In particular, separate policy, regulatory, or industry actions – such as changing import/export balance decisions at refineries -- could cause different results. A complete policy portfolio of both technology and upstream regulations will affect the ultimate outcome. This analysis reflects one reasonable scenario.
The upstream, or well-to-tank (WTT), emissions, were quantified via the same approach used in the 2020 Mobile Source Strategy415 with updated assumptions for fuel and energy supply. WTT emissions include sources from fuel production facilities such as electricity power plants, hydrogen, biofuel production, and gasoline refineries, in addition to fuel feedstock collection (e.g. crude oil extraction from in-state wells) and finished fuel product transportation and distribution. The WTT emission factors capture criteria emissions emitted in California and GHG emissions within the scope of AB 32. WTT emission factors for gasoline, diesel, and hydrogen fuels were developed based on California-specific data, including Low Carbon Fuel
415 CARB 2021a.
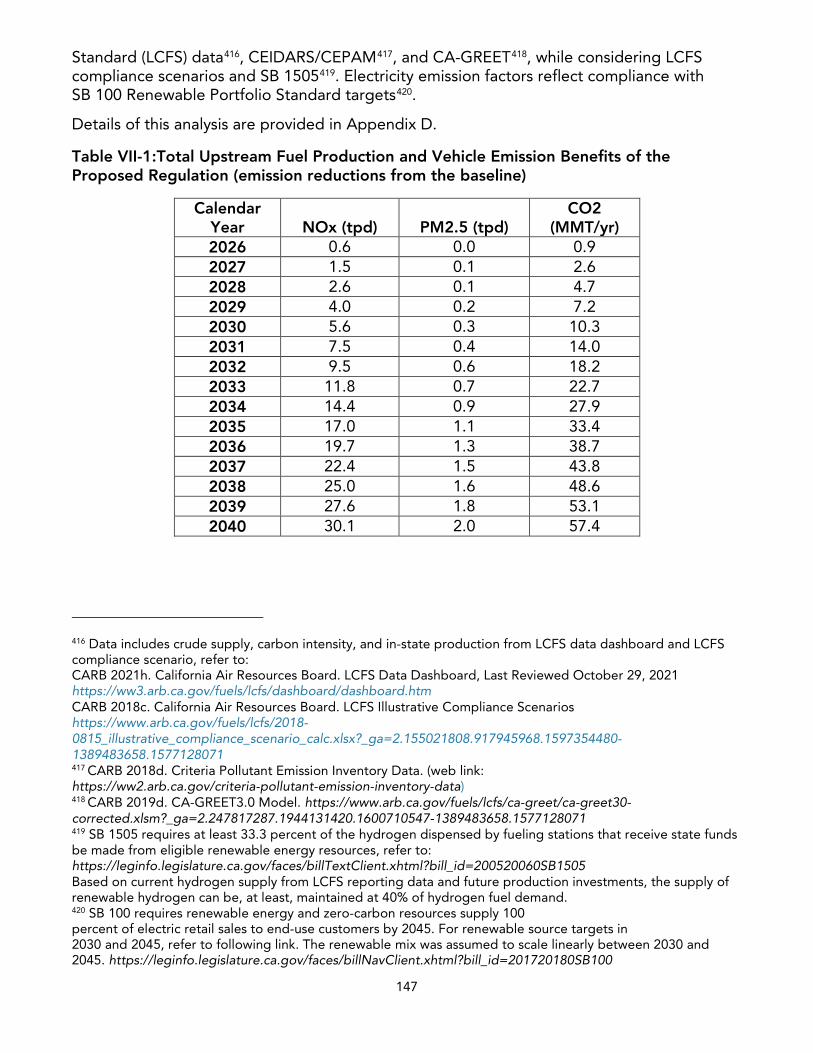
147
Standard (LCFS) data416, CEIDARS/CEPAM417, and CA-GREET418, while considering LCFS compliance scenarios and SB 1505419. Electricity emission factors reflect compliance with SB 100 Renewable Portfolio Standard targets420.
Details of this analysis are provided in Appendix D.
Table VII-1:Total Upstream Fuel Production and Vehicle Emission Benefits of the Proposed Regulation (emission reductions from the baseline)
Calendar Year NOx (tpd) PM2.5 (tpd)
CO2 (MMT/yr)
2026 0.6 0.0 0.9 2027 1.5 0.1 2.6 2028 2.6 0.1 4.7 2029 4.0 0.2 7.2 2030 5.6 0.3 10.3 2031 7.5 0.4 14.0 2032 9.5 0.6 18.2 2033 11.8 0.7 22.7 2034 14.4 0.9 27.9 2035 17.0 1.1 33.4 2036 19.7 1.3 38.7 2037 22.4 1.5 43.8 2038 25.0 1.6 48.6 2039 27.6 1.8 53.1 2040 30.1 2.0 57.4
416 Data includes crude supply, carbon intensity, and in-state production from LCFS data dashboard and LCFS compliance scenario, refer to: CARB 2021h. California Air Resources Board. LCFS Data Dashboard, Last Reviewed October 29, 2021 https://ww3.arb.ca.gov/fuels/lcfs/dashboard/dashboard.htm CARB 2018c. California Air Resources Board. LCFS Illustrative Compliance Scenarios https://www.arb.ca.gov/fuels/lcfs/2018-0815_illustrative_compliance_scenario_calc.xlsx?_ga=2.155021808.917945968.1597354480-1389483658.1577128071 417 CARB 2018d. Criteria Pollutant Emission Inventory Data. (web link: https://ww2.arb.ca.gov/criteria-pollutant-emission-inventory-data) 418 CARB 2019d. CA-GREET3.0 Model. https://www.arb.ca.gov/fuels/lcfs/ca-greet/ca-greet30- corrected.xlsm?_ga=2.247817287.1944131420.1600710547-1389483658.1577128071 419 SB 1505 requires at least 33.3 percent of the hydrogen dispensed by fueling stations that receive state funds be made from eligible renewable energy resources, refer to: https://leginfo.legislature.ca.gov/faces/billTextClient.xhtml?bill_id=200520060SB1505 Based on current hydrogen supply from LCFS reporting data and future production investments, the supply of renewable hydrogen can be, at least, maintained at 40% of hydrogen fuel demand. 420 SB 100 requires renewable energy and zero-carbon resources supply 100 percent of electric retail sales to end-use customers by 2045. For renewable source targets in 2030 and 2045, refer to following link. The renewable mix was assumed to scale linearly between 2030 and 2045. https://leginfo.legislature.ca.gov/faces/billNavClient.xhtml?bill_id=201720180SB100
148
VIII. Environmental Analysis
CARB is the lead agency for the proposed regulation and has prepared an environmental analysis (EA) pursuant to its certified regulatory program (title 17, CCR, sections 60000 through 60008) to comply with the requirements of the California Environmental Quality Act (CEQA). CARB’s regulatory program, which involves the adoption, approval, amendment, or repeal of standards, rules, regulations, or plans for the protection and enhancement of the State’s ambient air quality has been certified by the California Secretary for Natural Resources under Public Resources Code section 21080.5 of CEQA (title 14, CCR, section 15251(d)). Public Resources Code section 21080.5 allows public agencies with certified regulatory programs to prepare a “functionally equivalent” or substitute document in lieu of an environmental impact report or negative declaration, once the program has been certified by the Secretary for the Resources Agency as meeting the requirements of CEQA. CARB, as a lead agency, prepares a substitute environmental document (referred to as an “Environmental Analysis” or “EA”) as part of the Staff Report to comply with CEQA (title 17, CCR, section 60005).
The Draft Environmental Analysis (Draft EA) for the proposed regulation is included in Appendix D. The Draft EA provides a programmatic environmental analysis of an illustrative, reasonably foreseeable compliance scenario that could result from implementation of the proposed regulation. The Draft EA states that implementation of the proposed regulation could result in beneficial impacts to PM, NOx, and GHGs through substantial reductions in emissions from light- and medium-duty vehicles in California.
For the purpose of determining whether the proposed regulation will have a potential adverse effect on the environment, CARB evaluated the potential physical changes to the environment resulting from a reasonable, foreseeable compliance scenario. Implementation of the proposed regulation could result in certain impacts, including, but not limited to: the construction and operation of new or expanded manufacturing facilities for ZEV technologies; the construction of supporting infrastructure, such as electric chargers and hydrogen fueling stations; increased demand for electricity and hydrogen fuel and therefore more electricity and hydrogen generation and distribution; the displacement of fossil fuel extraction, refinement, manufacture, distribution, and combustion; new or modified recycling or refurbishment facilities to accommodate battery and fuel cell refurbishment, reuse, and disposal; and increased demand for the extraction of raw minerals used in the production of batteries and fuel cells, such as lithium and platinum from source countries and states.
While many impacts associated with the compliance responses identified for the proposed regulation could be reduced to less-than-significant levels through conditions of approval applied and mitigation measures to project-specific development, the authority to apply that mitigation lies with land use agencies or other agencies approving the development projects, not with CARB. Consequently, the EA takes a conservative approach in its significance conclusions and discloses for CEQA compliance purposes, that impacts from the development of new facilities, charging infrastructure and fueling stations associated with reasonably foreseeable compliance responses to the proposed regulation, could be potentially significant and unavoidable. Table VIII-1 summarizes the potential environmental impacts of the proposed regulation.
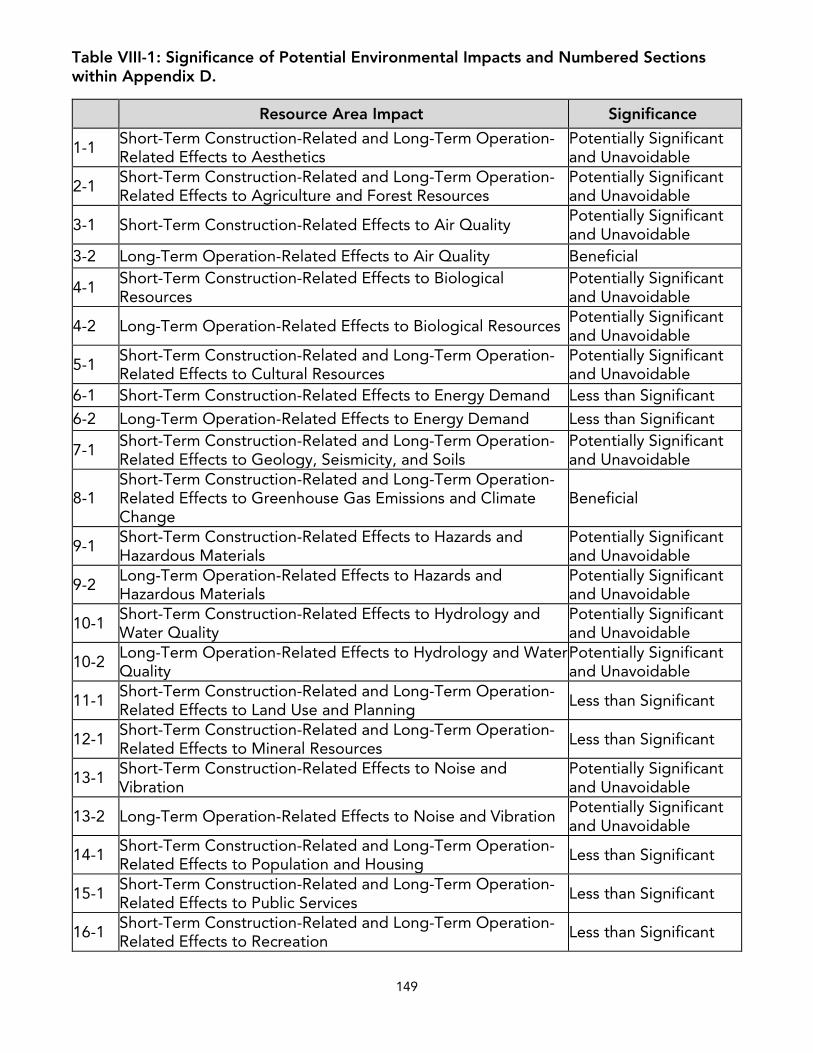
149
Table VIII-1: Significance of Potential Environmental Impacts and Numbered Sections within Appendix D.
Resource Area Impact Significance
1-1Short-Term Construction-Related and Long-Term Operation-Related Effects to Aesthetics
Potentially Significant and Unavoidable
2-1Short-Term Construction-Related and Long-Term Operation-Related Effects to Agriculture and Forest Resources
Potentially Significant and Unavoidable
3-1 Short-Term Construction-Related Effects to Air Quality Potentially Significant and Unavoidable
3-2 Long-Term Operation-Related Effects to Air Quality Beneficial
4-1Short-Term Construction-Related Effects to Biological Resources
Potentially Significant and Unavoidable
4-2 Long-Term Operation-Related Effects to Biological Resources Potentially Significant and Unavoidable
5-1Short-Term Construction-Related and Long-Term Operation-Related Effects to Cultural Resources
Potentially Significant and Unavoidable
6-1 Short-Term Construction-Related Effects to Energy Demand Less than Significant 6-2 Long-Term Operation-Related Effects to Energy Demand Less than Significant
7-1Short-Term Construction-Related and Long-Term Operation-Related Effects to Geology, Seismicity, and Soils
Potentially Significant and Unavoidable
8-1Short-Term Construction-Related and Long-Term Operation-Related Effects to Greenhouse Gas Emissions and Climate Change
Beneficial
9-1Short-Term Construction-Related Effects to Hazards and Hazardous Materials
Potentially Significant and Unavoidable
9-2Long-Term Operation-Related Effects to Hazards and Hazardous Materials
Potentially Significant and Unavoidable
10-1Short-Term Construction-Related Effects to Hydrology and Water Quality
Potentially Significant and Unavoidable
10-2Long-Term Operation-Related Effects to Hydrology and Water Quality
Potentially Significant and Unavoidable
11-1Short-Term Construction-Related and Long-Term Operation-Related Effects to Land Use and Planning Less than Significant
12-1Short-Term Construction-Related and Long-Term Operation-Related Effects to Mineral Resources Less than Significant
13-1Short-Term Construction-Related Effects to Noise and Vibration
Potentially Significant and Unavoidable
13-2 Long-Term Operation-Related Effects to Noise and Vibration Potentially Significant and Unavoidable
14-1 Short-Term Construction-Related and Long-Term Operation-Related Effects to Population and Housing Less than Significant
15-1Short-Term Construction-Related and Long-Term Operation-Related Effects to Public Services Less than Significant
16-1Short-Term Construction-Related and Long-Term Operation-Related Effects to Recreation Less than Significant
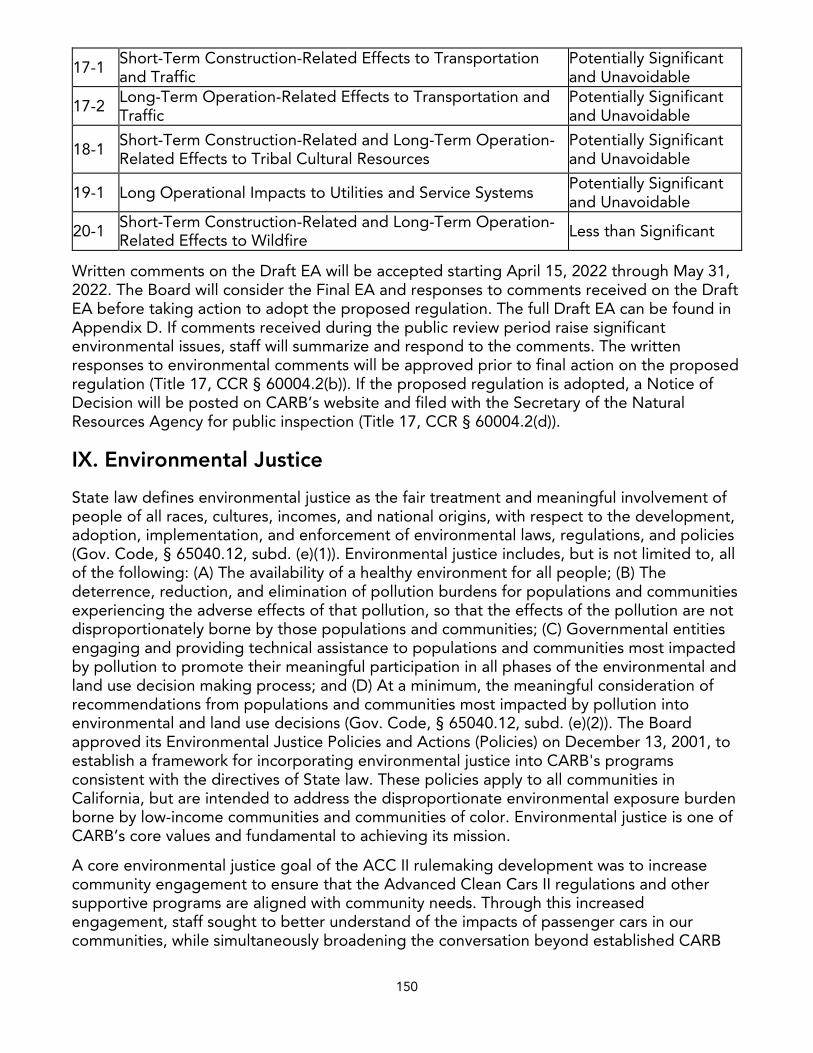
150
17-1Short-Term Construction-Related Effects to Transportation and Traffic
Potentially Significant and Unavoidable
17-2Long-Term Operation-Related Effects to Transportation and Traffic
Potentially Significant and Unavoidable
18-1Short-Term Construction-Related and Long-Term Operation-Related Effects to Tribal Cultural Resources
Potentially Significant and Unavoidable
19-1 Long Operational Impacts to Utilities and Service Systems Potentially Significant and Unavoidable
20-1 Short-Term Construction-Related and Long-Term Operation-Related Effects to Wildfire Less than Significant
Written comments on the Draft EA will be accepted starting April 15, 2022 through May 31, 2022. The Board will consider the Final EA and responses to comments received on the Draft EA before taking action to adopt the proposed regulation. The full Draft EA can be found in Appendix D. If comments received during the public review period raise significant environmental issues, staff will summarize and respond to the comments. The written responses to environmental comments will be approved prior to final action on the proposed regulation (Title 17, CCR § 60004.2(b)). If the proposed regulation is adopted, a Notice of Decision will be posted on CARB’s website and filed with the Secretary of the Natural Resources Agency for public inspection (Title 17, CCR § 60004.2(d)).
IX. Environmental Justice
State law defines environmental justice as the fair treatment and meaningful involvement of people of all races, cultures, incomes, and national origins, with respect to the development, adoption, implementation, and enforcement of environmental laws, regulations, and policies (Gov. Code, § 65040.12, subd. (e)(1)). Environmental justice includes, but is not limited to, all of the following: (A) The availability of a healthy environment for all people; (B) The deterrence, reduction, and elimination of pollution burdens for populations and communities experiencing the adverse effects of that pollution, so that the effects of the pollution are not disproportionately borne by those populations and communities; (C) Governmental entities engaging and providing technical assistance to populations and communities most impacted by pollution to promote their meaningful participation in all phases of the environmental and land use decision making process; and (D) At a minimum, the meaningful consideration of recommendations from populations and communities most impacted by pollution into environmental and land use decisions (Gov. Code, § 65040.12, subd. (e)(2)). The Board approved its Environmental Justice Policies and Actions (Policies) on December 13, 2001, to establish a framework for incorporating environmental justice into CARB's programs consistent with the directives of State law. These policies apply to all communities in California, but are intended to address the disproportionate environmental exposure burden borne by low-income communities and communities of color. Environmental justice is one of CARB’s core values and fundamental to achieving its mission.
A core environmental justice goal of the ACC II rulemaking development was to increase community engagement to ensure that the Advanced Clean Cars II regulations and other supportive programs are aligned with community needs. Through this increased engagement, staff sought to better understand of the impacts of passenger cars in our communities, while simultaneously broadening the conversation beyond established CARB

151
partners to include voices that have been historically marginalized, such as our underserved communities, rural communities, and tribal communities. As part of this engagement, staff also informed communities about the future of electric transportation and what is being done to make ZEV technologies more accessible. For example, staff conducted a transportation equity community listening session and participated in existing local community and environmental justice coalition meetings to discuss the ACC II rulemaking. In developing the regulatory proposals and analysis, staff have met with more than 20 national, state, and local advocacy organizations to learn more about the recommendations these groups may have regarding staff’s proposals and how transportation electrification could be made more equitable. Staff’s approach to environmental justice and equity in ACC II is multi-faceted and draws on these recommendations and staff’s own analysis.
As of February 2022, staff have conducted 36 meetings with the public, environmental justice (EJ) advocates, and community-based organizations. Meeting formats included public workshops, community meetings, informal meetings, and phone calls. Due to the COVID-19 pandemic, these meetings were all held virtually. At these meetings, staff discussed draft concepts and solicited input from affected stakeholders on the ACC II regulations. Table IX-1 below provides a list of the environmental justice/community focused workshops and meetings conducted during the development process for the proposed regulations.
Table IX-1. List of Public Workshops, Listening Sessions, and Meetings with EJ Advocates and Community Organizations
Date Primary Meeting Attendees Type of Meeting September 16, 2020 Public/Stakeholders Public Workshop
January 22, 2021 Charge Ahead Coalition (Greenlining, Communities for a Better Environment, EarthJustice, Better World Group) EJ Meeting
April 6, 2021 NGO Coalition EJ Meeting April 26, 2021 Charge Ahead Coalition EJ Meeting
May 3, 2021 Environmental Justice Advisory Committee (Physicians for Social Responsibility, Comite Civico del Valle, Reclaim Our Power)
EJ Meeting
May 6, 2021 Public/Stakeholders Public Workshop May 12, 2021 Los Angeles Physicians for Social Responsibility EJ Meeting May 17, 2021 Charge Ahead Coalition EJ Meeting June 7, 2021 Charge Ahead Coalition EJ Meeting June 28, 2021 Charge Ahead Coalition EJ Meeting June 29, 2021 Public/Stakeholders/EJ Community Listening Session July 20, 2021 Sacramento PEV Collaborative EJ Meeting July 26, 2021 Charge Ahead Coalition EJ Meeting August 11, 2021 Public/Stakeholders Public Workshop August 27, 2021 American Lung Association EJ Meeting August 30, 2021 Charge Ahead Coalition EJ Meeting September 9, 2021 Central Valley Air Quality Coalition (CVAQ) EJ Meeting September 13, 2021 Charge Ahead Coalition EJ Meeting September 20, 2021 Charge Ahead Coalition EJ Meeting September 28, 2021 Prove It Campaign EJ Meeting
September 30, 2021 Center for Energy Efficiency and Renewable Technologies EJ Meeting
October 1, 2021 Center for Sustainable Energy EJ Meeting
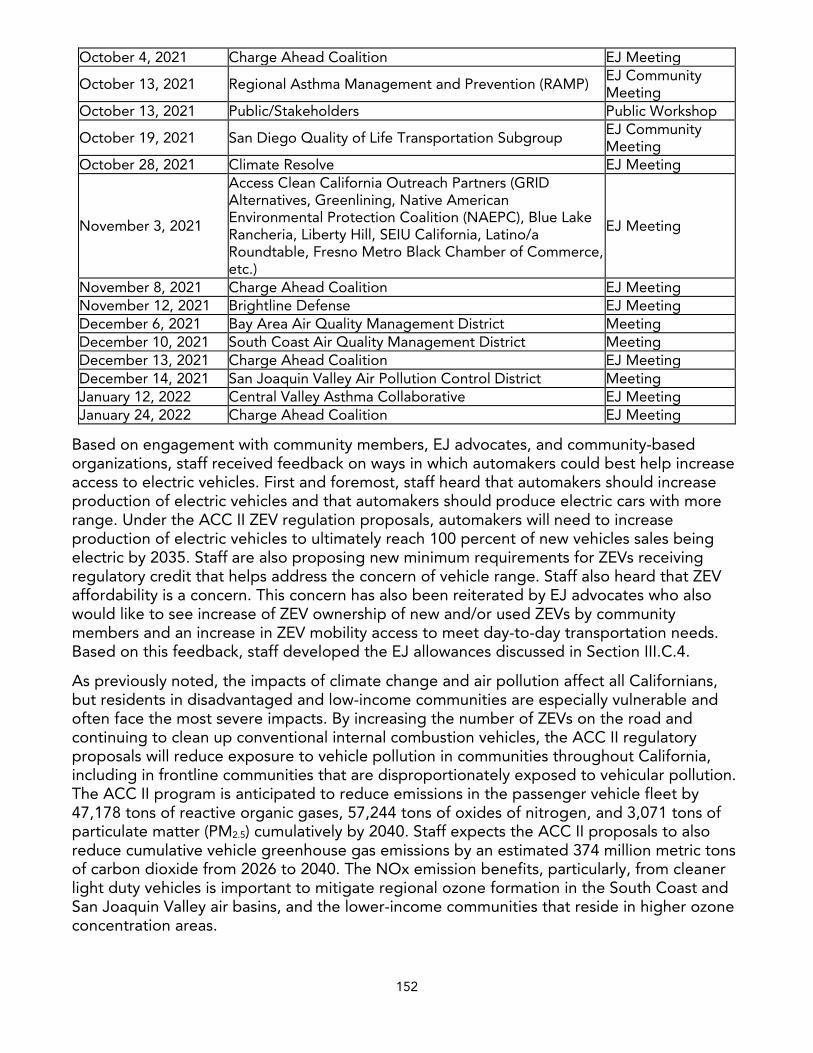
152
October 4, 2021 Charge Ahead Coalition EJ Meeting
October 13, 2021 Regional Asthma Management and Prevention (RAMP) EJ Community Meeting
October 13, 2021 Public/Stakeholders Public Workshop
October 19, 2021 San Diego Quality of Life Transportation Subgroup EJ Community Meeting
October 28, 2021 Climate Resolve EJ Meeting
November 3, 2021
Access Clean California Outreach Partners (GRID Alternatives, Greenlining, Native American Environmental Protection Coalition (NAEPC), Blue Lake Rancheria, Liberty Hill, SEIU California, Latino/a Roundtable, Fresno Metro Black Chamber of Commerce, etc.)
EJ Meeting
November 8, 2021 Charge Ahead Coalition EJ Meeting November 12, 2021 Brightline Defense EJ Meeting December 6, 2021 Bay Area Air Quality Management District Meeting December 10, 2021 South Coast Air Quality Management District Meeting December 13, 2021 Charge Ahead Coalition EJ Meeting December 14, 2021 San Joaquin Valley Air Pollution Control District Meeting January 12, 2022 Central Valley Asthma Collaborative EJ Meeting January 24, 2022 Charge Ahead Coalition EJ Meeting
Based on engagement with community members, EJ advocates, and community-based organizations, staff received feedback on ways in which automakers could best help increase access to electric vehicles. First and foremost, staff heard that automakers should increase production of electric vehicles and that automakers should produce electric cars with more range. Under the ACC II ZEV regulation proposals, automakers will need to increase production of electric vehicles to ultimately reach 100 percent of new vehicles sales being electric by 2035. Staff are also proposing new minimum requirements for ZEVs receiving regulatory credit that helps address the concern of vehicle range. Staff also heard that ZEV affordability is a concern. This concern has also been reiterated by EJ advocates who also would like to see increase of ZEV ownership of new and/or used ZEVs by community members and an increase in ZEV mobility access to meet day-to-day transportation needs. Based on this feedback, staff developed the EJ allowances discussed in Section III.C.4.
As previously noted, the impacts of climate change and air pollution affect all Californians, but residents in disadvantaged and low-income communities are especially vulnerable and often face the most severe impacts. By increasing the number of ZEVs on the road and continuing to clean up conventional internal combustion vehicles, the ACC II regulatory proposals will reduce exposure to vehicle pollution in communities throughout California, including in frontline communities that are disproportionately exposed to vehicular pollution. The ACC II program is anticipated to reduce emissions in the passenger vehicle fleet by 47,178 tons of reactive organic gases, 57,244 tons of oxides of nitrogen, and 3,071 tons of particulate matter (PM2.5) cumulatively by 2040. Staff expects the ACC II proposals to also reduce cumulative vehicle greenhouse gas emissions by an estimated 374 million metric tons of carbon dioxide from 2026 to 2040. The NOx emission benefits, particularly, from cleaner light duty vehicles is important to mitigate regional ozone formation in the South Coast and San Joaquin Valley air basins, and the lower-income communities that reside in higher ozone concentration areas.
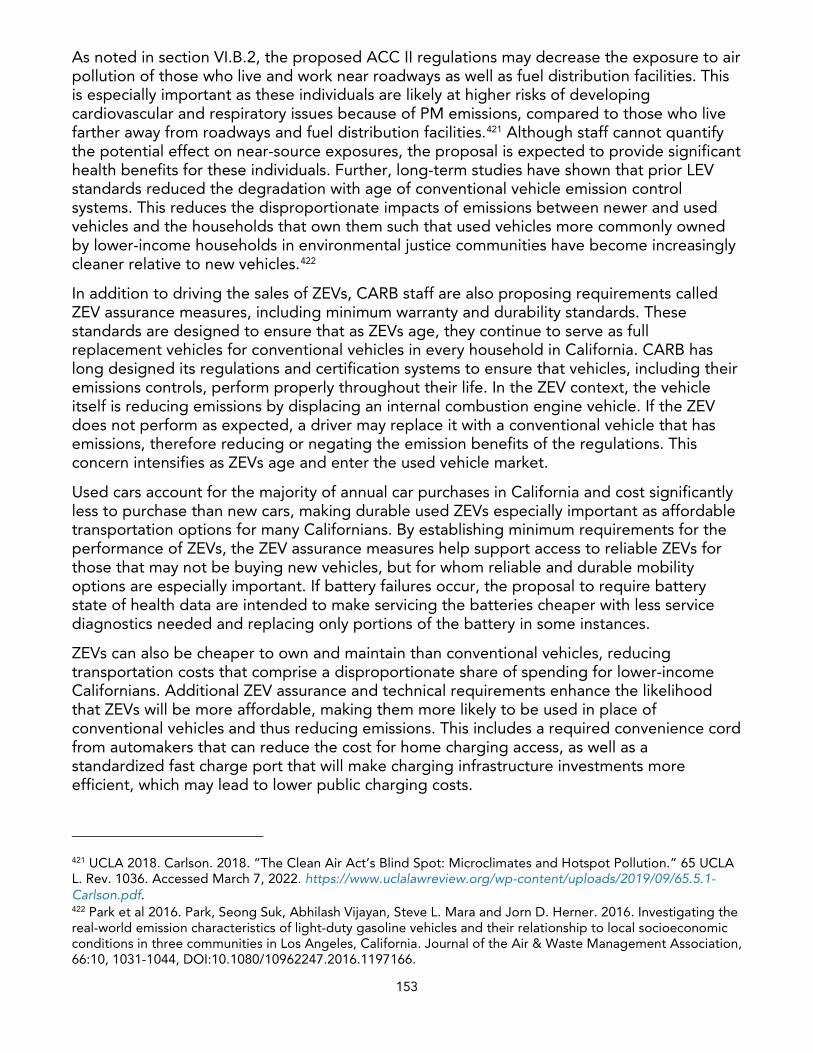
153
As noted in section VI.B.2, the proposed ACC II regulations may decrease the exposure to air pollution of those who live and work near roadways as well as fuel distribution facilities. This is especially important as these individuals are likely at higher risks of developing cardiovascular and respiratory issues because of PM emissions, compared to those who live farther away from roadways and fuel distribution facilities.421 Although staff cannot quantify the potential effect on near-source exposures, the proposal is expected to provide significant health benefits for these individuals. Further, long-term studies have shown that prior LEV standards reduced the degradation with age of conventional vehicle emission control systems. This reduces the disproportionate impacts of emissions between newer and used vehicles and the households that own them such that used vehicles more commonly owned by lower-income households in environmental justice communities have become increasingly cleaner relative to new vehicles.422
In addition to driving the sales of ZEVs, CARB staff are also proposing requirements called ZEV assurance measures, including minimum warranty and durability standards. These standards are designed to ensure that as ZEVs age, they continue to serve as full replacement vehicles for conventional vehicles in every household in California. CARB has long designed its regulations and certification systems to ensure that vehicles, including their emissions controls, perform properly throughout their life. In the ZEV context, the vehicle itself is reducing emissions by displacing an internal combustion engine vehicle. If the ZEV does not perform as expected, a driver may replace it with a conventional vehicle that has emissions, therefore reducing or negating the emission benefits of the regulations. This concern intensifies as ZEVs age and enter the used vehicle market.
Used cars account for the majority of annual car purchases in California and cost significantly less to purchase than new cars, making durable used ZEVs especially important as affordable transportation options for many Californians. By establishing minimum requirements for the performance of ZEVs, the ZEV assurance measures help support access to reliable ZEVs for those that may not be buying new vehicles, but for whom reliable and durable mobility options are especially important. If battery failures occur, the proposal to require battery state of health data are intended to make servicing the batteries cheaper with less service diagnostics needed and replacing only portions of the battery in some instances.
ZEVs can also be cheaper to own and maintain than conventional vehicles, reducing transportation costs that comprise a disproportionate share of spending for lower-income Californians. Additional ZEV assurance and technical requirements enhance the likelihood that ZEVs will be more affordable, making them more likely to be used in place of conventional vehicles and thus reducing emissions. This includes a required convenience cord from automakers that can reduce the cost for home charging access, as well as a standardized fast charge port that will make charging infrastructure investments more efficient, which may lead to lower public charging costs.
421 UCLA 2018. Carlson. 2018. “The Clean Air Act’s Blind Spot: Microclimates and Hotspot Pollution.” 65 UCLA L. Rev. 1036. Accessed March 7, 2022. https://www.uclalawreview.org/wp-content/uploads/2019/09/65.5.1-Carlson.pdf.422 Park et al 2016. Park, Seong Suk, Abhilash Vijayan, Steve L. Mara and Jorn D. Herner. 2016. Investigating thereal-world emission characteristics of light-duty gasoline vehicles and their relationship to local socioeconomicconditions in three communities in Los Angeles, California. Journal of the Air & Waste Management Association,66:10, 1031-1044, DOI:10.1080/10962247.2016.1197166.
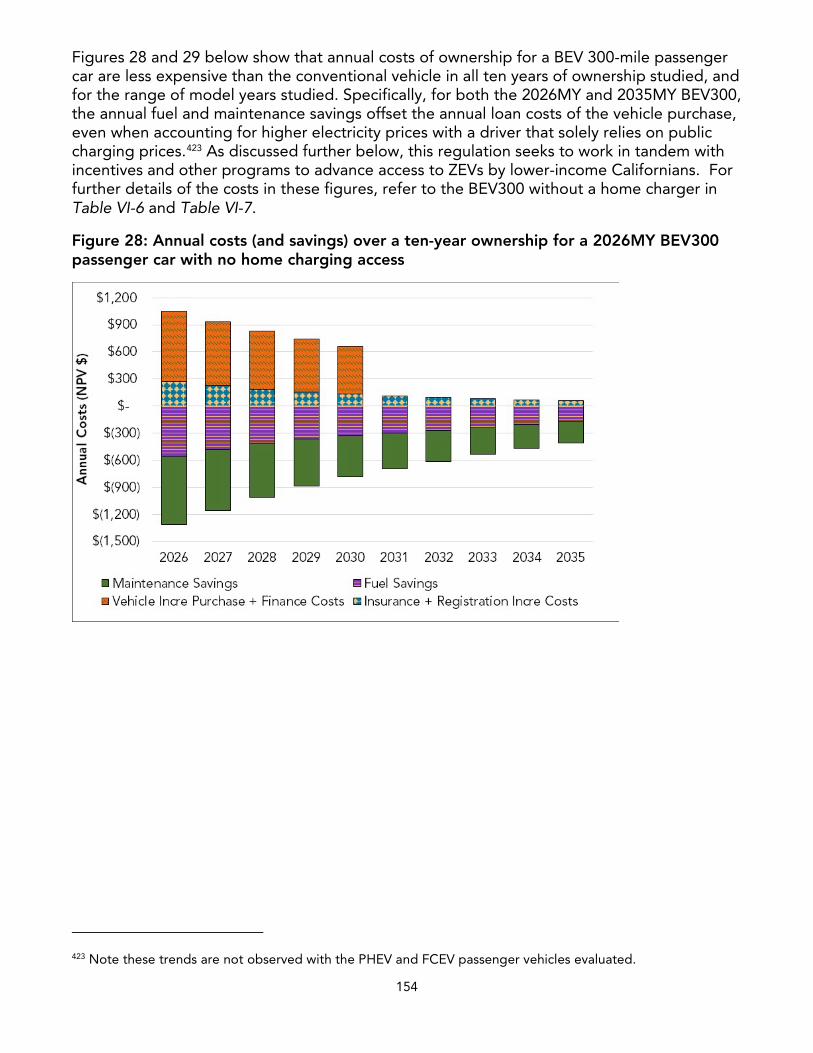
154
Figures 28 and 29 below show that annual costs of ownership for a BEV 300-mile passenger car are less expensive than the conventional vehicle in all ten years of ownership studied, and for the range of model years studied. Specifically, for both the 2026MY and 2035MY BEV300, the annual fuel and maintenance savings offset the annual loan costs of the vehicle purchase, even when accounting for higher electricity prices with a driver that solely relies on public charging prices.423 As discussed further below, this regulation seeks to work in tandem with incentives and other programs to advance access to ZEVs by lower-income Californians. For further details of the costs in these figures, refer to the BEV300 without a home charger in Table VI-6 and Table VI-7.
Figure 28: Annual costs (and savings) over a ten-year ownership for a 2026MY BEV300 passenger car with no home charging access
423 Note these trends are not observed with the PHEV and FCEV passenger vehicles evaluated.
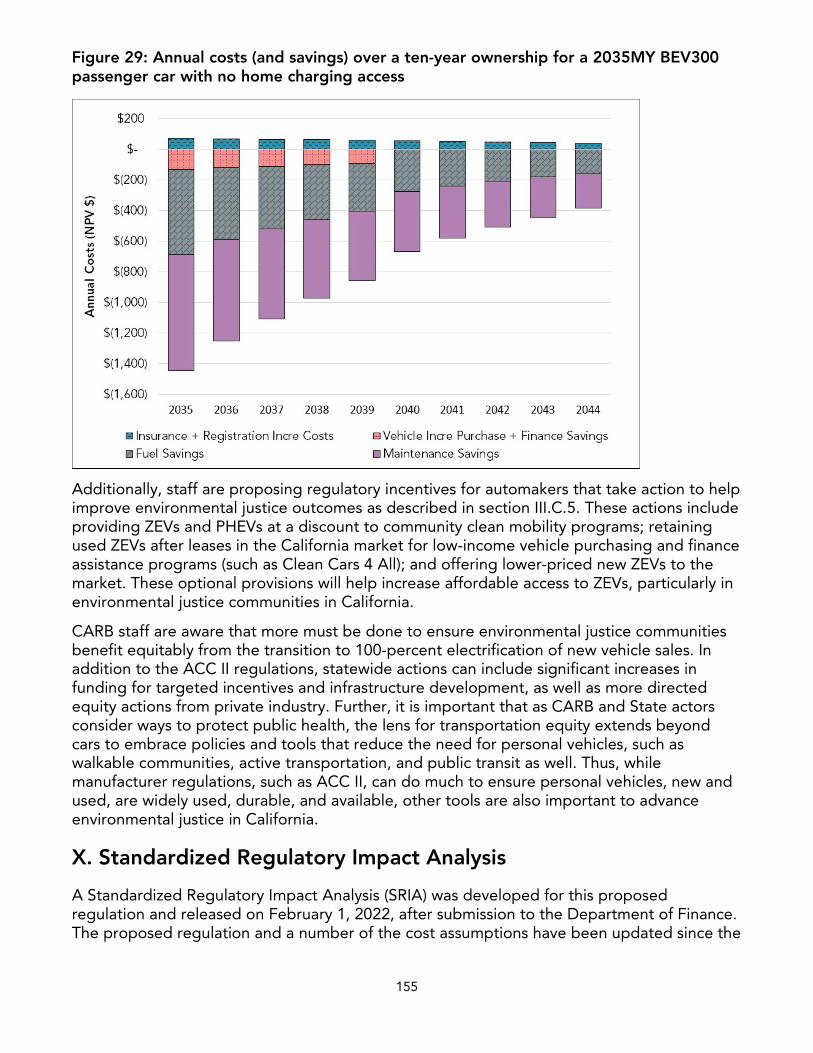
155
Figure 29: Annual costs (and savings) over a ten-year ownership for a 2035MY BEV300 passenger car with no home charging access
Additionally, staff are proposing regulatory incentives for automakers that take action to help improve environmental justice outcomes as described in section III.C.5. These actions include providing ZEVs and PHEVs at a discount to community clean mobility programs; retaining used ZEVs after leases in the California market for low-income vehicle purchasing and finance assistance programs (such as Clean Cars 4 All); and offering lower-priced new ZEVs to the market. These optional provisions will help increase affordable access to ZEVs, particularly in environmental justice communities in California.
CARB staff are aware that more must be done to ensure environmental justice communities benefit equitably from the transition to 100-percent electrification of new vehicle sales. In addition to the ACC II regulations, statewide actions can include significant increases in funding for targeted incentives and infrastructure development, as well as more directed equity actions from private industry. Further, it is important that as CARB and State actors consider ways to protect public health, the lens for transportation equity extends beyond cars to embrace policies and tools that reduce the need for personal vehicles, such as walkable communities, active transportation, and public transit as well. Thus, while manufacturer regulations, such as ACC II, can do much to ensure personal vehicles, new and used, are widely used, durable, and available, other tools are also important to advance environmental justice in California.
X. Standardized Regulatory Impact Analysis
A Standardized Regulatory Impact Analysis (SRIA) was developed for this proposed regulation and released on February 1, 2022, after submission to the Department of Finance. The proposed regulation and a number of the cost assumptions have been updated since the
156
SRIA was submitted to the Department of Finance. This chapter provides the updated assumptions and the economic and health impacts of the revised targets.
Similar to the emissions impact analysis in Chapter VI, the economic impacts of the Proposed Amendments are evaluated against the baseline scenario for the analysis period from 2026 through 2050. As previously stated in Chapter VI, the baseline vehicle inventory includes the vehicle sales and population growth assumptions currently reflected in CARB’s EMFAC2021 emissions inventory model, but with adjustments in areas such as the ZEV baseline population projections, as described below.
A. Changes since the release of the SRIA
Staff’s proposal and economic impact analysis has evolved in a number of ways since the SRIA was posted on February 1, 2022, as described further below. (The SRIA is attached as Appendix C-1 and also is available on the California Department of Finance’s website.424)
1. Updated Technology Package Cost
For the SRIA, CARB staff assessed ZEV technologies available on the market today and estimated expected technical advancements in the time frame of the regulation to develop vehicle efficiencies, electric motor power, and other attributes to assign costs to each technology package. After finalizing costs for the SRIA, CARB staff continued to work closely with stakeholders to refine costs and compliance scenarios. The changes from the SRIA are presented in this section.
First, stakeholders requested that CARB review its ZEV attributes and cost data and take into account new data from ANL’s 2021 Light Duty Vehicle Technology report,425 which was released after the SRIA analysis had been completed. The 2021 ANL report contains the most up-to-date modeling information from U.S. DOE and ANL which better represents BEV, PHEV, and FCEV attributes than previous reports and provides a consistent comparison of attributes between ZEV types. In the SRIA, where existing models (BEV and PHEV) were not available in a vehicle class, the National Renewable Energy Laboratory’s (NREL) Future Automotive Systems Technology Simulator (FastSim) tool was used to convert existing conventional vehicles to a BEV or PHEV technology and size the ZEV powertrain components while ANL’s 2020 publication was used for all FCEV component sizing. Staff updated the SRIA BEV, PHEV, and FCEV sizing to values based on the more recent 2021 ANL report for this final analysis.
Second, CARB staff continues to work with U.S. EPA staff on non-battery component costs. Further analysis of the vehicle teardown reports with U.S. EPA staff, which were used for
424 Department of Finance’s website for Major Regulations SRIAs and Calendar (web link: http://www.dof.ca.gov/Forecasting/Economics/Major_Regulations/Major_Regulations_Table/) 425 ANL 2021. Islam, Ehsan Sabri, Ram Vijayagopal, Ayman Moawad, Namdoo Kim, Benjamin Dupont, Daniela Nieto Prada, and Aymeric Rousseau. 2021. A Detailed Vehicle Modeling & Simulation Study Quantifying Energy Consumption and Cost Reduction of Advanced Vehicle Technologies Through 2050. Report to the US Department of Energy, Contract ANL/ESD-21/10, Energy Systems Division, Argonne National Laboratory. https://publications.anl.gov/anlpubs/2021/06/167626.pdf.
157
developing the non-battery costs in the SRIA, showed that refinements to non-battery cost projections should be made. Those refinements, which apply to all ZEV technologies, include:
• Increased permanent magnet motor-specific costs from $3.6/kW to $3.9/kW.• Increased induction motor-specific costs from $2.1/kW to $2.4/kW.• Increased single-speed gearbox cost from $400 to $413.44 per system.• Combined the integrated onboard AC charger (OBC) and DC-DC converter costs such
that the specific cost is $39.75/kW and is applied to the sum of OBC and DC-DCconverter power. The DC-DC converter power is fixed at 3kW across all vehicle types.
• Increased DC-FC circuitry specific cost from $150/kW to $156.28/kW.• Combined the fixed-cost portion of the OBC cost of $765 and integrated housing,
plus other cost of $65, into a single cost of $719.12, which absorbed the integratedhigh voltage (HV) controller cost of $185.
• Increased the HV cabling cost of $180 to $187.44.• Increased Powertrain cooling cost from $300 to $302.22.
Third, stakeholders commented that performance between the CARB-modeled ZEV technologies was not consistent. CARB staff addressed those comments by adjusting electric motor power for each of the ZEV technologies, further explained in the following sections. Despite the increase in per unit costs for motors and other non-battery components, the adjustments made to the motor power of the different ZEV technology packages reduced total non-battery system costs not including fuel cell vehicle specific components where applicable.
Fourth, stakeholder comments on all-wheel drive (AWD) and towing packages were considered. Stakeholders commented that costs for traditional ICEV AWD systems were not being accounted for and appropriately removed. To estimate those costs, staff found two currently available vehicles that offer nearly identical trims in both front-wheel drive (FWD) and AWD variants: the 2021MY Toyota RAV4 and 2021 MY Honda CR-V. Table X-1 shows how the MSRP differences between the variants were used to derive an estimate of the additional component costs required for AWD over FWD drivetrains. From those differences in MSRP, the direct manufacturing cost (DMC) of the mechanical AWD components that are not used for an eAWD has been determined to be $500 which becomes the delete cost for eAWD systems. Towing packages have been updated for all ZEV technologies in the vehicle classes where the towing packages can be applied to include additional power.
Table X-1: AWD Mechanical Delete Costs Estimates
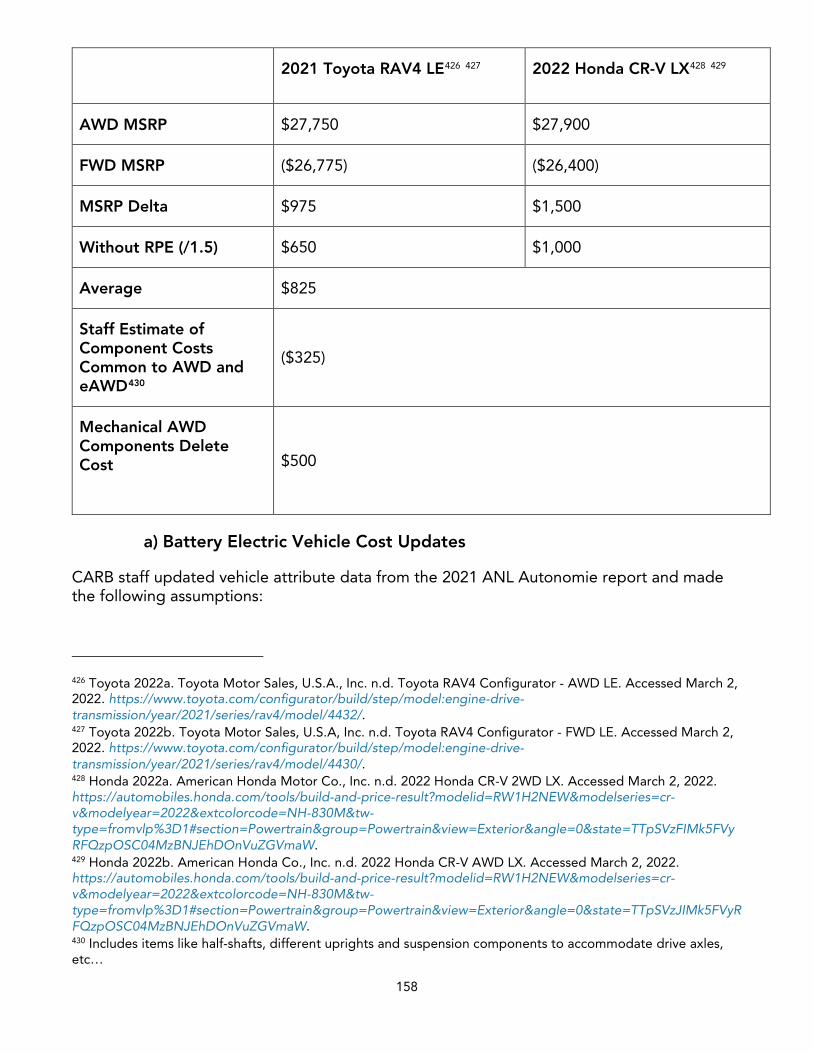
158
2021 Toyota RAV4 LE426 427 2022 Honda CR-V LX428 429
AWD MSRP $27,750 $27,900
FWD MSRP ($26,775) ($26,400)
MSRP Delta $975 $1,500
Without RPE (/1.5) $650 $1,000
Average $825
Staff Estimate of Component Costs Common to AWD and eAWD430
($325)
Mechanical AWD Components Delete Cost $500
a) Battery Electric Vehicle Cost Updates
CARB staff updated vehicle attribute data from the 2021 ANL Autonomie report and made the following assumptions:
426 Toyota 2022a. Toyota Motor Sales, U.S.A., Inc. n.d. Toyota RAV4 Configurator - AWD LE. Accessed March 2, 2022. https://www.toyota.com/configurator/build/step/model:engine-drive-transmission/year/2021/series/rav4/model/4432/. 427 Toyota 2022b. Toyota Motor Sales, U.S.A, Inc. n.d. Toyota RAV4 Configurator - FWD LE. Accessed March 2, 2022. https://www.toyota.com/configurator/build/step/model:engine-drive-transmission/year/2021/series/rav4/model/4430/. 428 Honda 2022a. American Honda Motor Co., Inc. n.d. 2022 Honda CR-V 2WD LX. Accessed March 2, 2022. https://automobiles.honda.com/tools/build-and-price-result?modelid=RW1H2NEW&modelseries=cr-v&modelyear=2022&extcolorcode=NH-830M&tw-type=fromvlp%3D1#section=Powertrain&group=Powertrain&view=Exterior&angle=0&state=TTpSVzFIMk5FVyRFQzpOSC04MzBNJEhDOnVuZGVmaW. 429 Honda 2022b. American Honda Co., Inc. n.d. 2022 Honda CR-V AWD LX. Accessed March 2, 2022. https://automobiles.honda.com/tools/build-and-price-result?modelid=RW1H2NEW&modelseries=cr-v&modelyear=2022&extcolorcode=NH-830M&tw-type=fromvlp%3D1#section=Powertrain&group=Powertrain&view=Exterior&angle=0&state=TTpSVzJIMk5FVyRFQzpOSC04MzBNJEhDOnVuZGVmaW. 430 Includes items like half-shafts, different uprights and suspension components to accommodate drive axles, etc…
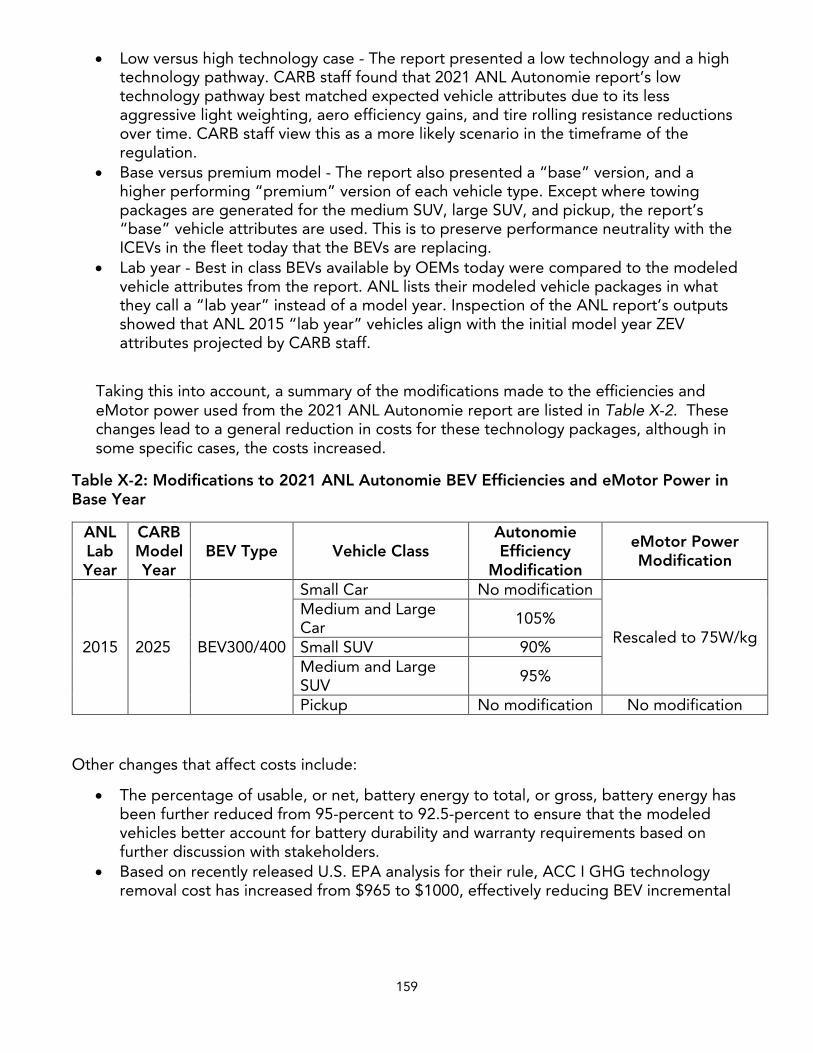
159
• Low versus high technology case - The report presented a low technology and a hightechnology pathway. CARB staff found that 2021 ANL Autonomie report’s lowtechnology pathway best matched expected vehicle attributes due to its lessaggressive light weighting, aero efficiency gains, and tire rolling resistance reductionsover time. CARB staff view this as a more likely scenario in the timeframe of theregulation.
• Base versus premium model - The report also presented a “base” version, and ahigher performing “premium” version of each vehicle type. Except where towingpackages are generated for the medium SUV, large SUV, and pickup, the report’s“base” vehicle attributes are used. This is to preserve performance neutrality with theICEVs in the fleet today that the BEVs are replacing.
• Lab year - Best in class BEVs available by OEMs today were compared to the modeledvehicle attributes from the report. ANL lists their modeled vehicle packages in whatthey call a “lab year” instead of a model year. Inspection of the ANL report’s outputsshowed that ANL 2015 “lab year” vehicles align with the initial model year ZEVattributes projected by CARB staff.
Taking this into account, a summary of the modifications made to the efficiencies and eMotor power used from the 2021 ANL Autonomie report are listed in Table X-2. These changes lead to a general reduction in costs for these technology packages, although in some specific cases, the costs increased.
Table X-2: Modifications to 2021 ANL Autonomie BEV Efficiencies and eMotor Power in Base Year
ANL Lab Year
CARB Model Year
BEV Type Vehicle Class Autonomie Efficiency
Modification
eMotor Power Modification
2015 2025 BEV300/400
Small Car No modification
Rescaled to 75W/kg
Medium and Large Car 105%
Small SUV 90% Medium and Large SUV
95%
Pickup No modification No modification
Other changes that affect costs include:
• The percentage of usable, or net, battery energy to total, or gross, battery energy hasbeen further reduced from 95-percent to 92.5-percent to ensure that the modeledvehicles better account for battery durability and warranty requirements based onfurther discussion with stakeholders.
• Based on recently released U.S. EPA analysis for their rule, ACC I GHG technologyremoval cost has increased from $965 to $1000, effectively reducing BEV incremental
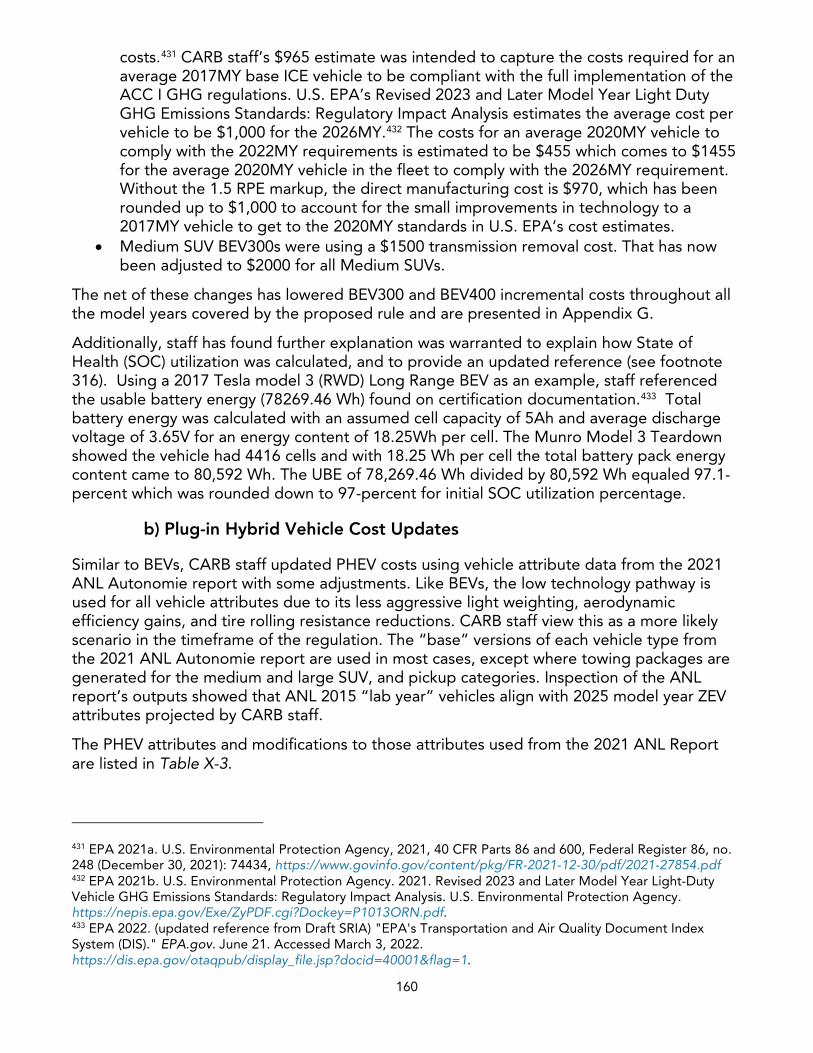
160
costs.431 CARB staff’s $965 estimate was intended to capture the costs required for an average 2017MY base ICE vehicle to be compliant with the full implementation of the ACC I GHG regulations. U.S. EPA’s Revised 2023 and Later Model Year Light Duty GHG Emissions Standards: Regulatory Impact Analysis estimates the average cost per vehicle to be $1,000 for the 2026MY.432 The costs for an average 2020MY vehicle to comply with the 2022MY requirements is estimated to be $455 which comes to $1455 for the average 2020MY vehicle in the fleet to comply with the 2026MY requirement. Without the 1.5 RPE markup, the direct manufacturing cost is $970, which has been rounded up to $1,000 to account for the small improvements in technology to a 2017MY vehicle to get to the 2020MY standards in U.S. EPA’s cost estimates.
• Medium SUV BEV300s were using a $1500 transmission removal cost. That has nowbeen adjusted to $2000 for all Medium SUVs.
The net of these changes has lowered BEV300 and BEV400 incremental costs throughout all the model years covered by the proposed rule and are presented in Appendix G.
Additionally, staff has found further explanation was warranted to explain how State of Health (SOC) utilization was calculated, and to provide an updated reference (see footnote 316). Using a 2017 Tesla model 3 (RWD) Long Range BEV as an example, staff referenced the usable battery energy (78269.46 Wh) found on certification documentation.433 Total battery energy was calculated with an assumed cell capacity of 5Ah and average discharge voltage of 3.65V for an energy content of 18.25Wh per cell. The Munro Model 3 Teardown showed the vehicle had 4416 cells and with 18.25 Wh per cell the total battery pack energy content came to 80,592 Wh. The UBE of 78,269.46 Wh divided by 80,592 Wh equaled 97.1-percent which was rounded down to 97-percent for initial SOC utilization percentage.
b) Plug-in Hybrid Vehicle Cost Updates
Similar to BEVs, CARB staff updated PHEV costs using vehicle attribute data from the 2021 ANL Autonomie report with some adjustments. Like BEVs, the low technology pathway is used for all vehicle attributes due to its less aggressive light weighting, aerodynamic efficiency gains, and tire rolling resistance reductions. CARB staff view this as a more likely scenario in the timeframe of the regulation. The “base” versions of each vehicle type from the 2021 ANL Autonomie report are used in most cases, except where towing packages are generated for the medium and large SUV, and pickup categories. Inspection of the ANL report’s outputs showed that ANL 2015 “lab year” vehicles align with 2025 model year ZEV attributes projected by CARB staff.
The PHEV attributes and modifications to those attributes used from the 2021 ANL Report are listed in Table X-3.
431 EPA 2021a. U.S. Environmental Protection Agency, 2021, 40 CFR Parts 86 and 600, Federal Register 86, no. 248 (December 30, 2021): 74434, https://www.govinfo.gov/content/pkg/FR-2021-12-30/pdf/2021-27854.pdf 432 EPA 2021b. U.S. Environmental Protection Agency. 2021. Revised 2023 and Later Model Year Light-Duty Vehicle GHG Emissions Standards: Regulatory Impact Analysis. U.S. Environmental Protection Agency. https://nepis.epa.gov/Exe/ZyPDF.cgi?Dockey=P1013ORN.pdf. 433 EPA 2022. (updated reference from Draft SRIA) "EPA's Transportation and Air Quality Document Index System (DIS)." EPA.gov. June 21. Accessed March 3, 2022. https://dis.epa.gov/otaqpub/display_file.jsp?docid=40001&flag=1.
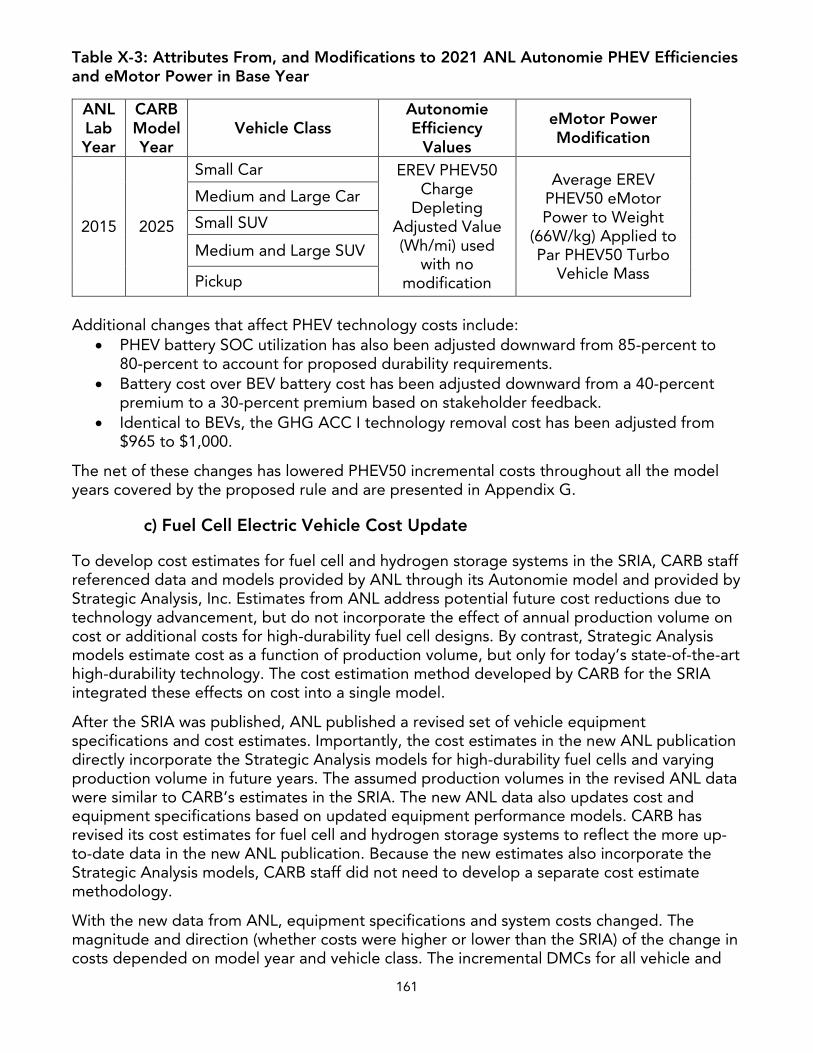
161
Table X-3: Attributes From, and Modifications to 2021 ANL Autonomie PHEV Efficiencies and eMotor Power in Base Year
ANL Lab Year
CARB Model Year
Vehicle Class Autonomie Efficiency
Values
eMotor Power Modification
2015 2025
Small Car EREV PHEV50 Charge
Depleting Adjusted Value (Wh/mi) used
with no modification
Average EREV PHEV50 eMotor Power to Weight
(66W/kg) Applied to Par PHEV50 Turbo
Vehicle Mass
Medium and Large Car
Small SUV
Medium and Large SUV
Pickup
Additional changes that affect PHEV technology costs include: • PHEV battery SOC utilization has also been adjusted downward from 85-percent to
80-percent to account for proposed durability requirements.• Battery cost over BEV battery cost has been adjusted downward from a 40-percent
premium to a 30-percent premium based on stakeholder feedback.• Identical to BEVs, the GHG ACC I technology removal cost has been adjusted from
$965 to $1,000.
The net of these changes has lowered PHEV50 incremental costs throughout all the model years covered by the proposed rule and are presented in Appendix G.
c) Fuel Cell Electric Vehicle Cost Update
To develop cost estimates for fuel cell and hydrogen storage systems in the SRIA, CARB staff referenced data and models provided by ANL through its Autonomie model and provided by Strategic Analysis, Inc. Estimates from ANL address potential future cost reductions due to technology advancement, but do not incorporate the effect of annual production volume on cost or additional costs for high-durability fuel cell designs. By contrast, Strategic Analysis models estimate cost as a function of production volume, but only for today’s state-of-the-art high-durability technology. The cost estimation method developed by CARB for the SRIA integrated these effects on cost into a single model.
After the SRIA was published, ANL published a revised set of vehicle equipment specifications and cost estimates. Importantly, the cost estimates in the new ANL publication directly incorporate the Strategic Analysis models for high-durability fuel cells and varying production volume in future years. The assumed production volumes in the revised ANL data were similar to CARB’s estimates in the SRIA. The new ANL data also updates cost and equipment specifications based on updated equipment performance models. CARB has revised its cost estimates for fuel cell and hydrogen storage systems to reflect the more up-to-date data in the new ANL publication. Because the new estimates also incorporate the Strategic Analysis models, CARB staff did not need to develop a separate cost estimate methodology.
With the new data from ANL, equipment specifications and system costs changed. The magnitude and direction (whether costs were higher or lower than the SRIA) of the change in costs depended on model year and vehicle class. The incremental DMCs for all vehicle and
162
technology combinations is shown in Appendix G: ACC II ZEV Technology Assessment. In all cases, hydrogen storage system costs are higher in the revised estimates than previously reported in the SRIA. Fuel cell system costs are also generally higher than previously reported in the SRIA, with the exception of Medium Cars, Medium SUVs, and Pickups in model years 2032 and later.
d) Towing Package Updates
Power for all ZEV and PHEV towing packages has been revised relative to the modeling completed for the SRIA. The source of the revisions comes from the 2021 ANL Autonomie report. Towing packages in the SRIA did not account for additional power where they now do for this analysis. Towing package medium and large SUVs, and pickups use the 2021 ANL Autonomie report’s “premium” vehicle variants’ higher electric motor power as shown in Table X-4. The FCEV towing variants also receive additional power for their batteries and fuel cell stack as described in Section IV Battery Assumptions and Cost of Appendix G. The electric motor power for those packages is shown in Table X-4 and the additive costs of the towing package is shown in Table X-5.
Table X-4. Attributes From 2021 ANL Autonomie eMotor Power in Base Year for BEV, PHEV, and FCEV Towing Packages
ANL Lab Year
CARB Model Year
Vehicle Class Towing Package eMotor Power Basis
2015 2025
Small Car
N/A Medium and Large Car
Small SUV
Medium and Large SUV “Premium” Vehicle Version eMotor Power (kW) used with no modification Pickup
Table X-5. Towing Package eMotor Power Updates from the SRIA for the 2031MY
Vehicle Class Technology SRIA
Values (kW)
Updated Values (kW)
Medium and Large SUV
BEV300/400 184/218 211 FCEV 144 166 PHEV 155 165
Pickup BEV300/400 214/234 265
FCEV 166 201 PHEV 201 207
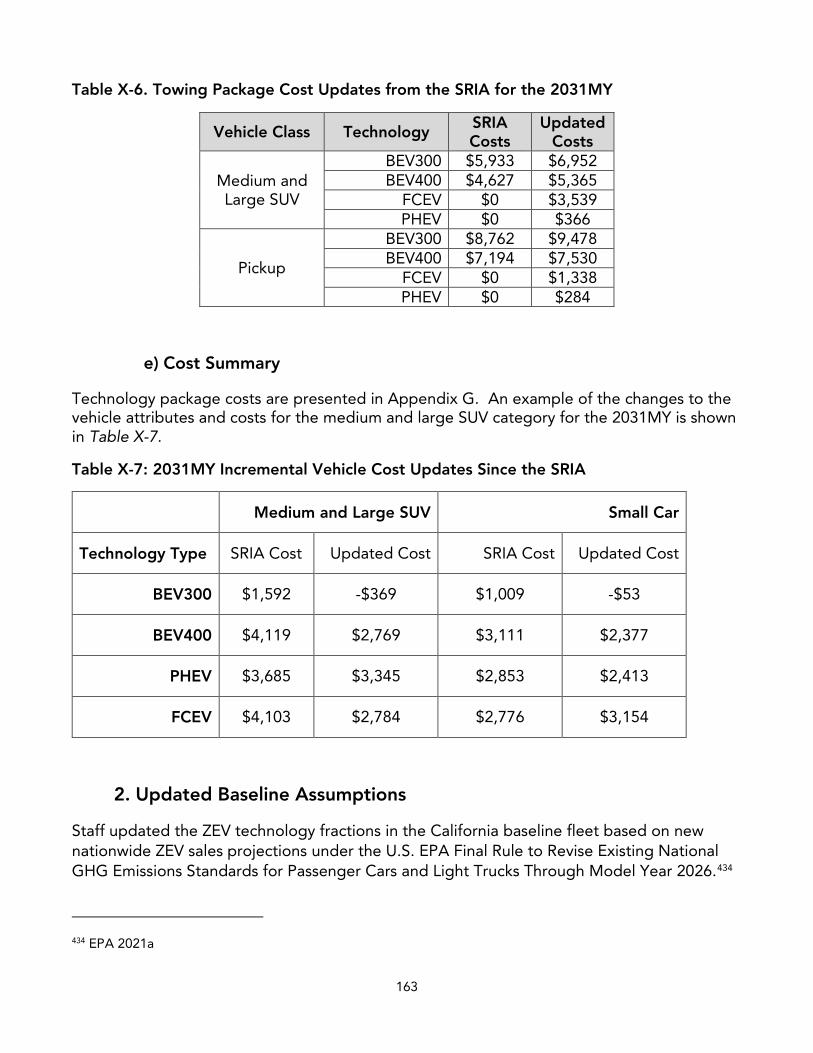
163
Table X-6. Towing Package Cost Updates from the SRIA for the 2031MY
Vehicle Class Technology SRIA Costs
Updated Costs
Medium and Large SUV
BEV300 $5,933 $6,952 BEV400 $4,627 $5,365
FCEV $0 $3,539 PHEV $0 $366
Pickup
BEV300 $8,762 $9,478 BEV400 $7,194 $7,530
FCEV $0 $1,338 PHEV $0 $284
e) Cost Summary
Technology package costs are presented in Appendix G. An example of the changes to the vehicle attributes and costs for the medium and large SUV category for the 2031MY is shown in Table X-7.
Table X-7: 2031MY Incremental Vehicle Cost Updates Since the SRIA
Medium and Large SUV Small Car
Technology Type SRIA Cost Updated Cost SRIA Cost Updated Cost
BEV300 $1,592 -$369 $1,009 -$53
BEV400 $4,119 $2,769 $3,111 $2,377
PHEV $3,685 $3,345 $2,853 $2,413
FCEV $4,103 $2,784 $2,776 $3,154
2. Updated Baseline Assumptions
Staff updated the ZEV technology fractions in the California baseline fleet based on new nationwide ZEV sales projections under the U.S. EPA Final Rule to Revise Existing National GHG Emissions Standards for Passenger Cars and Light Trucks Through Model Year 2026.434
434 EPA 2021a
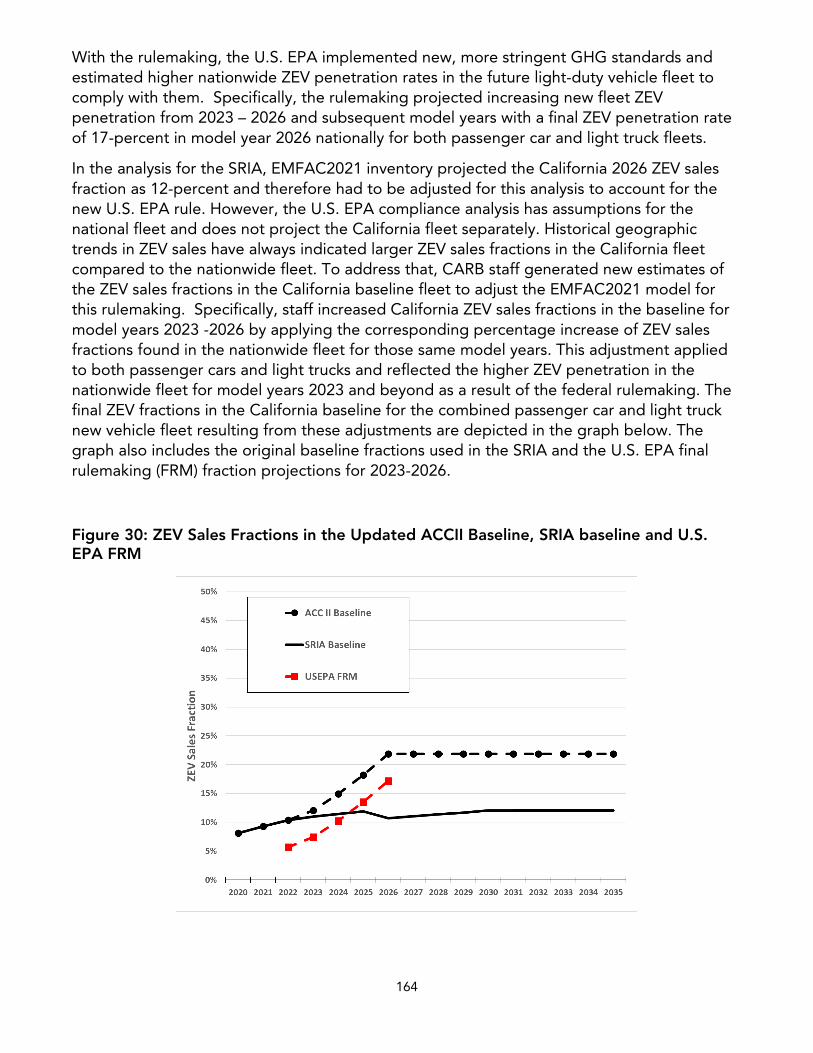
164
With the rulemaking, the U.S. EPA implemented new, more stringent GHG standards and estimated higher nationwide ZEV penetration rates in the future light-duty vehicle fleet to comply with them. Specifically, the rulemaking projected increasing new fleet ZEV penetration from 2023 – 2026 and subsequent model years with a final ZEV penetration rate of 17-percent in model year 2026 nationally for both passenger car and light truck fleets.
In the analysis for the SRIA, EMFAC2021 inventory projected the California 2026 ZEV sales fraction as 12-percent and therefore had to be adjusted for this analysis to account for the new U.S. EPA rule. However, the U.S. EPA compliance analysis has assumptions for the national fleet and does not project the California fleet separately. Historical geographic trends in ZEV sales have always indicated larger ZEV sales fractions in the California fleet compared to the nationwide fleet. To address that, CARB staff generated new estimates of the ZEV sales fractions in the California baseline fleet to adjust the EMFAC2021 model for this rulemaking. Specifically, staff increased California ZEV sales fractions in the baseline for model years 2023 -2026 by applying the corresponding percentage increase of ZEV sales fractions found in the nationwide fleet for those same model years. This adjustment applied to both passenger cars and light trucks and reflected the higher ZEV penetration in the nationwide fleet for model years 2023 and beyond as a result of the federal rulemaking. The final ZEV fractions in the California baseline for the combined passenger car and light truck new vehicle fleet resulting from these adjustments are depicted in the graph below. The graph also includes the original baseline fractions used in the SRIA and the U.S. EPA final rulemaking (FRM) fraction projections for 2023-2026.
Figure 30: ZEV Sales Fractions in the Updated ACCII Baseline, SRIA baseline and U.S. EPA FRM
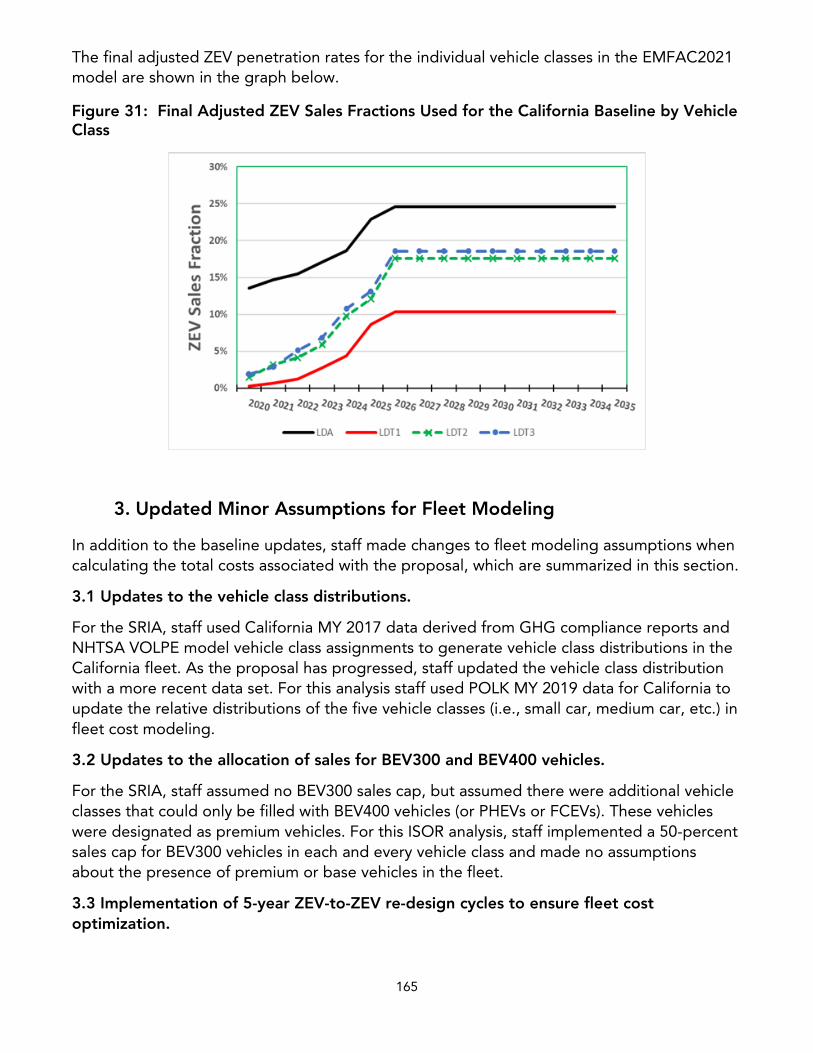
165
The final adjusted ZEV penetration rates for the individual vehicle classes in the EMFAC2021 model are shown in the graph below.
Figure 31: Final Adjusted ZEV Sales Fractions Used for the California Baseline by Vehicle Class
3. Updated Minor Assumptions for Fleet Modeling
In addition to the baseline updates, staff made changes to fleet modeling assumptions when calculating the total costs associated with the proposal, which are summarized in this section.
3.1 Updates to the vehicle class distributions.
For the SRIA, staff used California MY 2017 data derived from GHG compliance reports and NHTSA VOLPE model vehicle class assignments to generate vehicle class distributions in the California fleet. As the proposal has progressed, staff updated the vehicle class distribution with a more recent data set. For this analysis staff used POLK MY 2019 data for California to update the relative distributions of the five vehicle classes (i.e., small car, medium car, etc.) in fleet cost modeling.
3.2 Updates to the allocation of sales for BEV300 and BEV400 vehicles.
For the SRIA, staff assumed no BEV300 sales cap, but assumed there were additional vehicle classes that could only be filled with BEV400 vehicles (or PHEVs or FCEVs). These vehicles were designated as premium vehicles. For this ISOR analysis, staff implemented a 50-percent sales cap for BEV300 vehicles in each and every vehicle class and made no assumptions about the presence of premium or base vehicles in the fleet.
3.3 Implementation of 5-year ZEV-to-ZEV re-design cycles to ensure fleet cost optimization.
166
For the SRIA, staff assumed all conversions of ICEVs to a particular ZEV technology in a particular vehicle class were permanent for the duration of the regulatory timeframe (2026-2035). This essentially created a built-in modeling assumption that the most cost-effective ZEV technology initially assigned to any ICEV vehicle class in a particular model year would remain the most cost-effective technology for all future model years in that vehicle class. In the case of the SRIA, this was a valid assumption for all vehicle classes since the relative cost-effectiveness of any ZEV technology did not change between the year the ZEV technology was implemented to the end of the regulatory timeframe. For example, if a particular vehicle class was assigned BEV technology due to it being the most cost-effective technology (relative to PHEVs and FCEVs) for that model year, staff assumed this same trend would continue for the remaining model years and that PHEVs or FCEVs would not become more cost-effective in future calendar years.
For this ISOR analysis, staff performed post-modeling output reviews of the ZEV technology assignments in each model year to determine if the ZEV technology assignments to each vehicle class were the most cost-effective choice for that vehicle class. Based on these reviews, staff determined the technology assignments for all vehicle classes in all model years were appropriate except for small cars with 2WD. Specifically, this vehicle class was assigned PHEV technology in MY 2028 based on it having the lowest average incremental cost over the next 5-year time period (i.e., it was the most cost-effective option for this vehicle class in that 5-year time period). By MY 2031, however, the 5-year average incremental cost for BEV400s was lower than PHEVs, which indicated BEV400s were the most cost-effective option for fleet compliance in that vehicle class for future model years. In recognition of this, staff manually updated the fleet cost model output to incorporate a ZEV-to-ZEV (i.e., PHEV to BEV400) technology re-design in that vehicle class in 2034, which recognizes that OEMs typically allow for major re-designs of vehicle technologies every five years. By doing this, the model output more accurately reflected how OEMs would comply with the regulation. The figure below provides a comparison of the fleet incremental cost output with and without the ZEV-to-ZEV redesign in 2034 for the small car 2WD vehicle class.
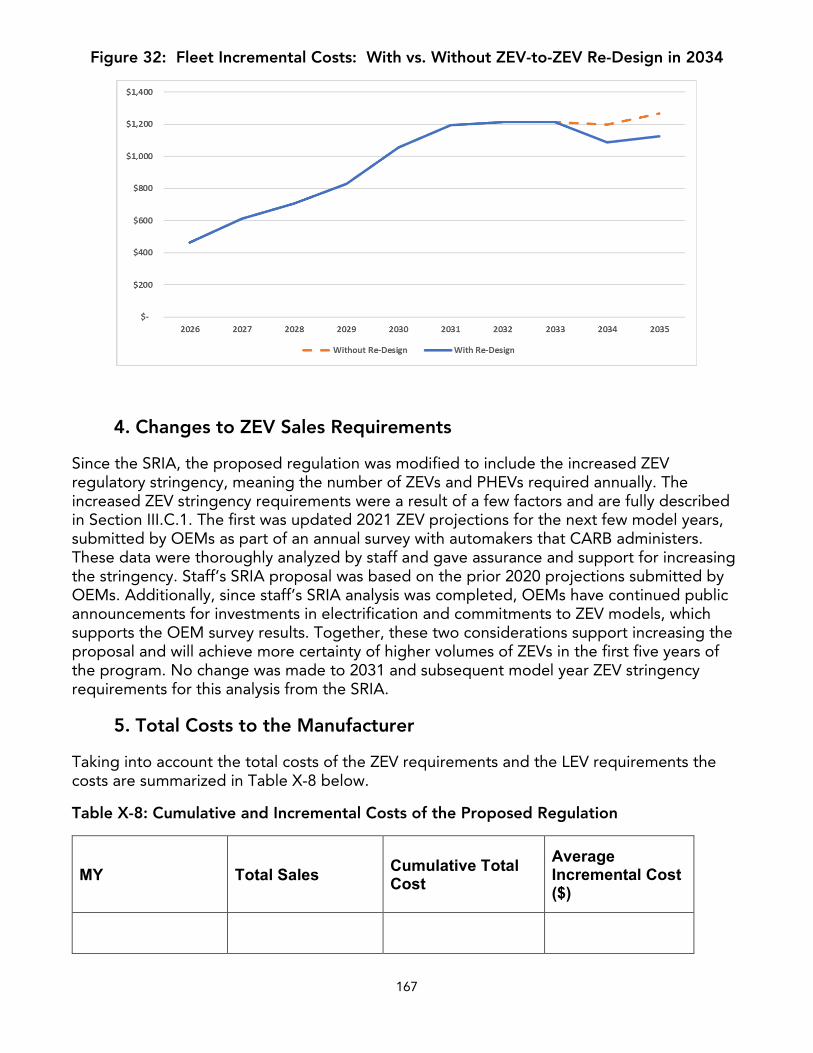
167
Figure 32: Fleet Incremental Costs: With vs. Without ZEV-to-ZEV Re-Design in 2034
4. Changes to ZEV Sales Requirements
Since the SRIA, the proposed regulation was modified to include the increased ZEV regulatory stringency, meaning the number of ZEVs and PHEVs required annually. The increased ZEV stringency requirements were a result of a few factors and are fully described in Section III.C.1. The first was updated 2021 ZEV projections for the next few model years, submitted by OEMs as part of an annual survey with automakers that CARB administers. These data were thoroughly analyzed by staff and gave assurance and support for increasing the stringency. Staff’s SRIA proposal was based on the prior 2020 projections submitted by OEMs. Additionally, since staff’s SRIA analysis was completed, OEMs have continued public announcements for investments in electrification and commitments to ZEV models, which supports the OEM survey results. Together, these two considerations support increasing the proposal and will achieve more certainty of higher volumes of ZEVs in the first five years of the program. No change was made to 2031 and subsequent model year ZEV stringency requirements for this analysis from the SRIA.
5. Total Costs to the Manufacturer
Taking into account the total costs of the ZEV requirements and the LEV requirements the costs are summarized in Table X-8 below.
Table X-8: Cumulative and Incremental Costs of the Proposed Regulation
MY Total Sales Cumulative Total Cost
Average Incremental Cost ($)
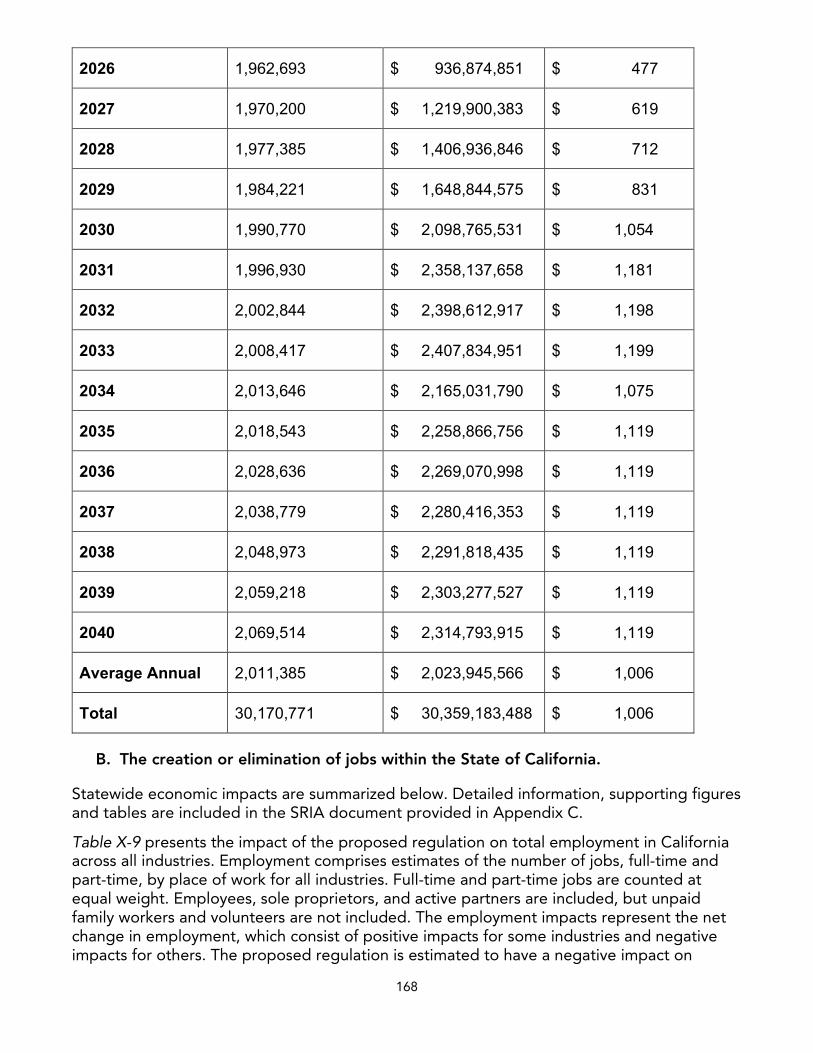
168
2026 1,962,693 $ 936,874,851 $ 477
2027 1,970,200 $ 1,219,900,383 $ 619
2028 1,977,385 $ 1,406,936,846 $ 712
2029 1,984,221 $ 1,648,844,575 $ 831
2030 1,990,770 $ 2,098,765,531 $ 1,054
2031 1,996,930 $ 2,358,137,658 $ 1,181
2032 2,002,844 $ 2,398,612,917 $ 1,198
2033 2,008,417 $ 2,407,834,951 $ 1,199
2034 2,013,646 $ 2,165,031,790 $ 1,075
2035 2,018,543 $ 2,258,866,756 $ 1,119
2036 2,028,636 $ 2,269,070,998 $ 1,119
2037 2,038,779 $ 2,280,416,353 $ 1,119
2038 2,048,973 $ 2,291,818,435 $ 1,119
2039 2,059,218 $ 2,303,277,527 $ 1,119
2040 2,069,514 $ 2,314,793,915 $ 1,119
Average Annual 2,011,385 $ 2,023,945,566 $ 1,006
Total 30,170,771 $ 30,359,183,488 $ 1,006
B. The creation or elimination of jobs within the State of California.
Statewide economic impacts are summarized below. Detailed information, supporting figures and tables are included in the SRIA document provided in Appendix C.
Table X-9 presents the impact of the proposed regulation on total employment in California across all industries. Employment comprises estimates of the number of jobs, full-time and part-time, by place of work for all industries. Full-time and part-time jobs are counted at equal weight. Employees, sole proprietors, and active partners are included, but unpaid family workers and volunteers are not included. The employment impacts represent the net change in employment, which consist of positive impacts for some industries and negative impacts for others. The proposed regulation is estimated to have a negative impact on
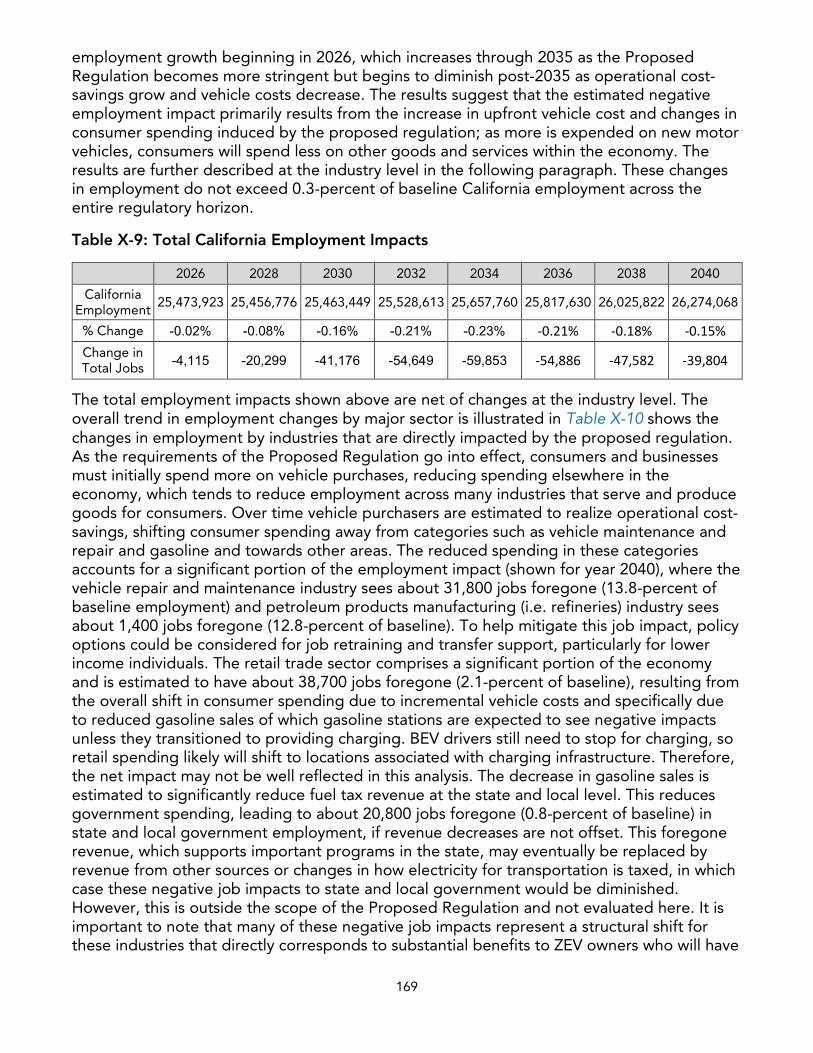
169
employment growth beginning in 2026, which increases through 2035 as the Proposed Regulation becomes more stringent but begins to diminish post-2035 as operational cost-savings grow and vehicle costs decrease. The results suggest that the estimated negative employment impact primarily results from the increase in upfront vehicle cost and changes in consumer spending induced by the proposed regulation; as more is expended on new motor vehicles, consumers will spend less on other goods and services within the economy. The results are further described at the industry level in the following paragraph. These changes in employment do not exceed 0.3-percent of baseline California employment across the entire regulatory horizon.
Table X-9: Total California Employment Impacts
2026 2028 2030 2032 2034 2036 2038 2040
California Employment
25,473,923 25,456,776 25,463,449 25,528,613 25,657,760 25,817,630 26,025,822 26,274,068
% Change -0.02% -0.08% -0.16% -0.21% -0.23% -0.21% -0.18% -0.15%Change in Total Jobs -4,115 -20,299 -41,176 -54,649 -59,853 -54,886 -47,582 -39,804
The total employment impacts shown above are net of changes at the industry level. The overall trend in employment changes by major sector is illustrated in Table X-10 shows the changes in employment by industries that are directly impacted by the proposed regulation. As the requirements of the Proposed Regulation go into effect, consumers and businesses must initially spend more on vehicle purchases, reducing spending elsewhere in the economy, which tends to reduce employment across many industries that serve and produce goods for consumers. Over time vehicle purchasers are estimated to realize operational cost-savings, shifting consumer spending away from categories such as vehicle maintenance and repair and gasoline and towards other areas. The reduced spending in these categories accounts for a significant portion of the employment impact (shown for year 2040), where the vehicle repair and maintenance industry sees about 31,800 jobs foregone (13.8-percent of baseline employment) and petroleum products manufacturing (i.e. refineries) industry sees about 1,400 jobs foregone (12.8-percent of baseline). To help mitigate this job impact, policy options could be considered for job retraining and transfer support, particularly for lower income individuals. The retail trade sector comprises a significant portion of the economy and is estimated to have about 38,700 jobs foregone (2.1-percent of baseline), resulting from the overall shift in consumer spending due to incremental vehicle costs and specifically due to reduced gasoline sales of which gasoline stations are expected to see negative impacts unless they transitioned to providing charging. BEV drivers still need to stop for charging, so retail spending likely will shift to locations associated with charging infrastructure. Therefore, the net impact may not be well reflected in this analysis. The decrease in gasoline sales is estimated to significantly reduce fuel tax revenue at the state and local level. This reduces government spending, leading to about 20,800 jobs foregone (0.8-percent of baseline) in state and local government employment, if revenue decreases are not offset. This foregone revenue, which supports important programs in the state, may eventually be replaced by revenue from other sources or changes in how electricity for transportation is taxed, in which case these negative job impacts to state and local government would be diminished. However, this is outside the scope of the Proposed Regulation and not evaluated here. It is important to note that many of these negative job impacts represent a structural shift for these industries that directly corresponds to substantial benefits to ZEV owners who will have
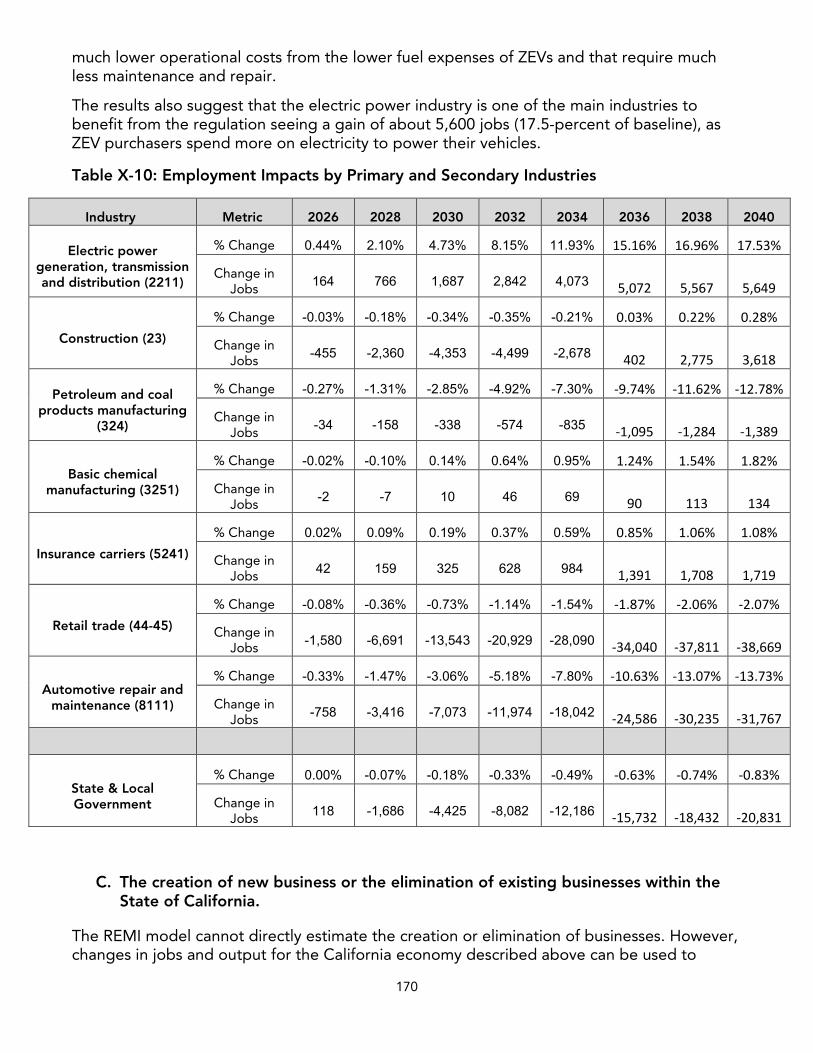
170
much lower operational costs from the lower fuel expenses of ZEVs and that require much less maintenance and repair.
The results also suggest that the electric power industry is one of the main industries to benefit from the regulation seeing a gain of about 5,600 jobs (17.5-percent of baseline), as ZEV purchasers spend more on electricity to power their vehicles.
Table X-10: Employment Impacts by Primary and Secondary Industries
Industry Metric 2026 2028 2030 2032 2034 2036 2038 2040
Electric power generation, transmission and distribution (2211)
% Change 0.44% 2.10% 4.73% 8.15% 11.93% 15.16% 16.96% 17.53%
Change in Jobs 164 766 1,687 2,842 4,073 5,072 5,567 5,649
Construction (23)
% Change -0.03% -0.18% -0.34% -0.35% -0.21% 0.03% 0.22% 0.28%
Change in Jobs -455 -2,360 -4,353 -4,499 -2,678 402 2,775 3,618
Petroleum and coal products manufacturing
(324)
% Change -0.27% -1.31% -2.85% -4.92% -7.30% -9.74% -11.62% -12.78%
Change in Jobs -34 -158 -338 -574 -835 -1,095 -1,284 -1,389
Basic chemical manufacturing (3251)
% Change -0.02% -0.10% 0.14% 0.64% 0.95% 1.24% 1.54% 1.82%
Change in Jobs -2 -7 10 46 69 90 113 134
Insurance carriers (5241)
% Change 0.02% 0.09% 0.19% 0.37% 0.59% 0.85% 1.06% 1.08%
Change in Jobs 42 159 325 628 984 1,391 1,708 1,719
Retail trade (44-45)
% Change -0.08% -0.36% -0.73% -1.14% -1.54% -1.87% -2.06% -2.07%
Change in Jobs -1,580 -6,691 -13,543 -20,929 -28,090 -34,040 -37,811 -38,669
Automotive repair and maintenance (8111)
% Change -0.33% -1.47% -3.06% -5.18% -7.80% -10.63% -13.07% -13.73%
Change in Jobs -758 -3,416 -7,073 -11,974 -18,042 -24,586 -30,235 -31,767
State & Local Government
% Change 0.00% -0.07% -0.18% -0.33% -0.49% -0.63% -0.74% -0.83%
Change in Jobs 118 -1,686 -4,425 -8,082 -12,186 -15,732 -18,432 -20,831
C. The creation of new business or the elimination of existing businesses within theState of California.
The REMI model cannot directly estimate the creation or elimination of businesses. However, changes in jobs and output for the California economy described above can be used to
171
understand some potential impacts. The overall jobs and output impacts of the Proposed Regulation are small relative to the total California economy, representing changes of no greater than 0.4-percent. However, impacts to specific industries are larger as described in previous sections. The trend of increasing demand for electricity in the electric power sector similarly sees large increases in sales, but its services are provided primarily by existing utilities. New utilities are not expected to be created to meet this increased demand. The decreasing trend in demand for gasoline has the potential to result in the elimination of businesses in this industry and downstream industries, such as gasoline stations and vehicle repair businesses, if sustained over time. As described above the vehicle repair and maintenance service industry is estimated to see negative impacts, including dealerships that have service departments, as ZEVs become a greater portion of the fleet. This trend would suggest that the number of businesses providing the services may decrease along with the reduced demand.
D. The expansion of businesses currently doing business within the State ofCalifornia.
The Proposed Regulation will increase the total amount of electric vehicle miles traveled in the state, which in turn will increase the demand for electricity. Electricity generation and installation of infrastructure needed to charge BEVs and PHEVs represents the single largest growth area for electric utility companies as traditional areas of growth have been dampened by energy conservation efforts.
ZEVs also provide an opportunity to mitigate disruptions in supplying electrical power for use other than transportation. In recent years, the utility companies in California have been proactively shutting down large sections of the grid, at times for several days, to avoid starting wildfires during windy dry seasons, primarily from trees that are blown or fall into electrical distribution and transmission lines. The use of ZEVs to provide grid services and decentralized backup power for California residents is feasible within the regulation period. This would be accomplished through features on vehicles that enable them to discharge electrical energy in their batteries to supply external needs, such as in a home. This could create another revenue stream for commercial ZEV fleet operators and reduce costs to electric utilities compared to investments in stationary backup power systems.
The Proposed Regulation also helps the state’s investor-owned utilities meet the goals of Senate Bill 350, the Clean Energy and Pollution Reduction Act of 2015, with a faster financial return on infrastructure investments. Senate Bill 350 requires the state’s investor-owned utilities to develop programs “to accelerate widespread transportation electrification,” with goals to reduce dependence on petroleum, increase the adoption of zero-emission vehicles, help meet air quality standards, and reduce greenhouse gas emissions. Southern California Edison (SCE) and San Diego Gas & Electric (SDG&E) have both proposed programs that are awaiting approval by the Public Utilities Commission to extend light-duty electric vehicle infrastructure pilots that use ratepayer funds to support investment in electric vehicle charging infrastructure. Pacific Gas & Electric has been approved for a direct current fast charging make-ready program, and the three smaller investor-owned utilities have also been approved for light-duty electric vehicle infrastructure programs. Furthermore, PG&E, SCE, and SDG&E have either proposed or have been approved to establish new electricity rates for commercial ZEV infrastructure. By ensuring additional electric vehicles will be available to make use of these utility investments, the Proposed Regulation supports the utilities’ programs and the goals of SB 350.
172
In addition to the electric utilities that will supply additional electricity to BEVs and PHEVs under the proposed regulation, ZEV infrastructure businesses will benefit as well. These include companies that manufacture, install, operate, and maintain electric vehicle charging stations and hydrogen dispensing equipment. Electric Vehicle Supply Equipment (EVSE) providers and hydrogen station operators will also benefit from increased demand for their equipment in home and public fueling stations. The Proposed Regulation will increase the total amount of electric vehicle miles travelled in the state, which in turn could increase utilization of charging and hydrogen stations across the state and lead to increased revenue for these businesses, making the business model for their investment more stable and predictable. This allows investor capital and venture capital funds to be accessed to accelerate deployment of ZEV infrastructure. Increased use of public charging stations may also have benefits to retail businesses near charging stations. Many charging stations are near shopping, food, or other services. Customers may increase accessing these services while their vehicles refuel.
E. Significant Statewide Adverse Economic Impact Directly Affecting Business,Including Ability to Compete
The Executive Officer has made an initial determination that the proposed regulatory action would not have a significant statewide adverse economic impact directly affecting businesses, including the ability of California businesses to compete with businesses in other state, or on representative private persons.
F. The competitive advantages or disadvantages for businesses currently doingbusiness within the state
While CARB is not aware of any evidence of the extent to which this is occurring under existing requirements, automakers that are already producing ZEVs may have an advantage in growing market share under more stringent ZEV requirements over manufacturers that have not yet come to market with a widely available product. Though some consumers may be holding out for a specific manufacturer’s product, many consumers will purchase products that have wide distribution networks. As the requirements increase towards 100-percent, this advantage may decline as every automaker invests in ZEV technology and products at a wide scale.
G. The increase or decrease of investment in the state
Private domestic investment consists of purchases of residential and nonresidential structures and of equipment and software by private businesses and nonprofit institutions. It is used as a proxy for impacts on investments in California because it provides an indicator of the future productive capacity of the economy.
The relative changes to growth in private investment for the Proposed Regulation are illustrated in Table X-11. These results show a decrease in private investment of about $690 million in 2030, which is followed by a positive trend resulting in an increase of $4.9 billion in 2040. This trend follows the cost impacts for private industries which will purchase ZEVs for businesses purposes, whereas operational savings begin to accumulate over time, production costs decrease, which leads to expanding market share and investment. These changes in investment do not exceed 0.9-percent baseline investment across the regulatory horizon.
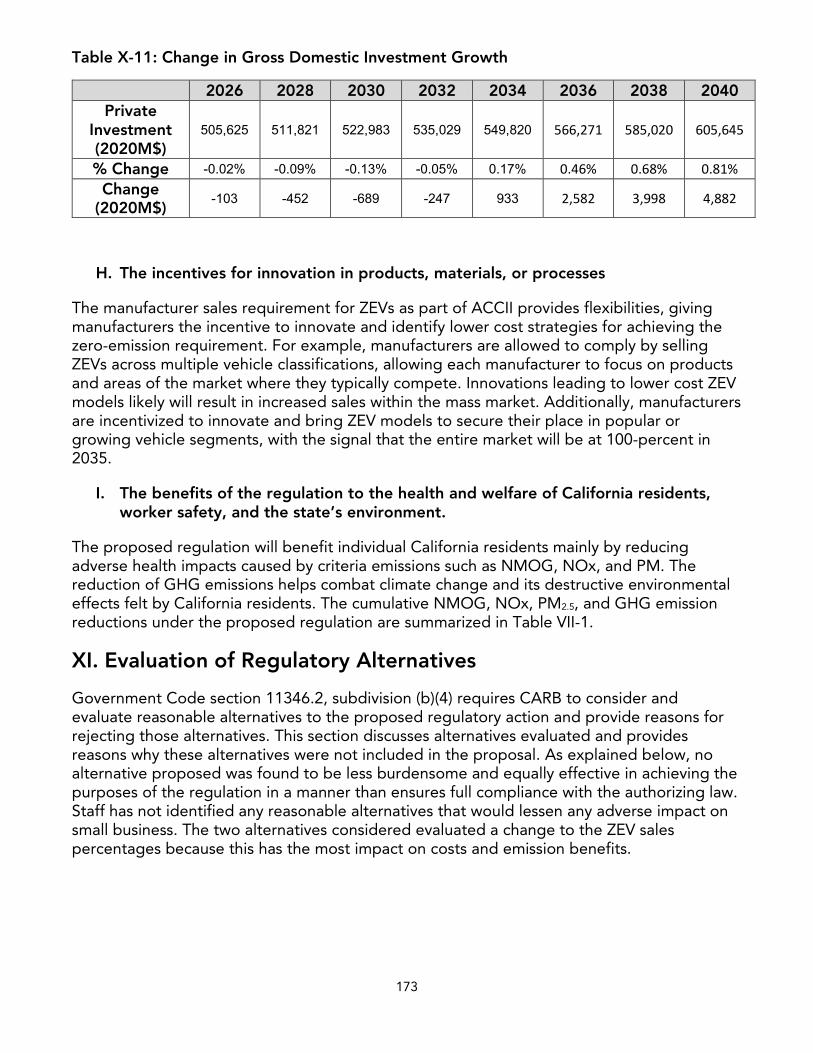
173
Table X-11: Change in Gross Domestic Investment Growth
2026 2028 2030 2032 2034 2036 2038 2040 Private
Investment (2020M$)
505,625 511,821 522,983 535,029 549,820 566,271 585,020 605,645
% Change -0.02% -0.09% -0.13% -0.05% 0.17% 0.46% 0.68% 0.81% Change
(2020M$) -103 -452 -689 -247 933 2,582 3,998 4,882
H. The incentives for innovation in products, materials, or processes
The manufacturer sales requirement for ZEVs as part of ACCII provides flexibilities, giving manufacturers the incentive to innovate and identify lower cost strategies for achieving the zero-emission requirement. For example, manufacturers are allowed to comply by selling ZEVs across multiple vehicle classifications, allowing each manufacturer to focus on products and areas of the market where they typically compete. Innovations leading to lower cost ZEV models likely will result in increased sales within the mass market. Additionally, manufacturers are incentivized to innovate and bring ZEV models to secure their place in popular or growing vehicle segments, with the signal that the entire market will be at 100-percent in 2035.
I. The benefits of the regulation to the health and welfare of California residents,worker safety, and the state’s environment.
The proposed regulation will benefit individual California residents mainly by reducing adverse health impacts caused by criteria emissions such as NMOG, NOx, and PM. The reduction of GHG emissions helps combat climate change and its destructive environmental effects felt by California residents. The cumulative NMOG, NOx, PM2.5, and GHG emission reductions under the proposed regulation are summarized in Table VII-1.
XI. Evaluation of Regulatory Alternatives
Government Code section 11346.2, subdivision (b)(4) requires CARB to consider and evaluate reasonable alternatives to the proposed regulatory action and provide reasons for rejecting those alternatives. This section discusses alternatives evaluated and provides reasons why these alternatives were not included in the proposal. As explained below, no alternative proposed was found to be less burdensome and equally effective in achieving the purposes of the regulation in a manner than ensures full compliance with the authorizing law. Staff has not identified any reasonable alternatives that would lessen any adverse impact on small business. The two alternatives considered evaluated a change to the ZEV sales percentages because this has the most impact on costs and emission benefits.
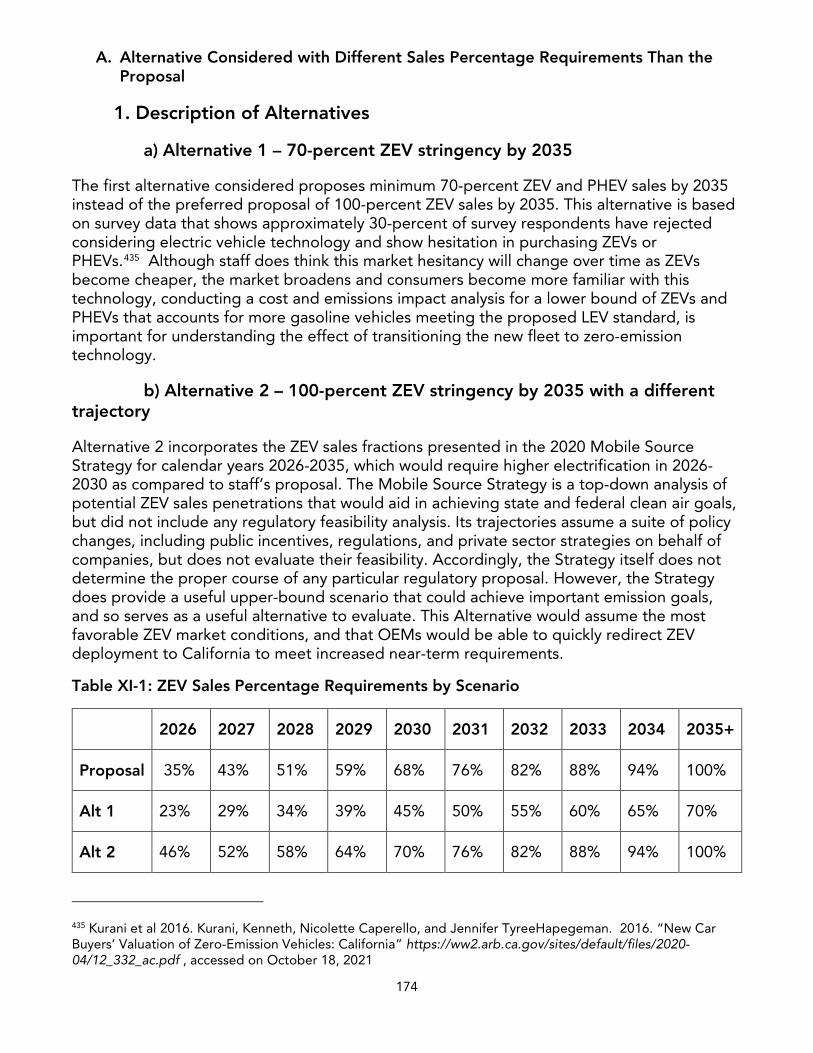
174
A. Alternative Considered with Different Sales Percentage Requirements Than theProposal
1. Description of Alternatives
a) Alternative 1 – 70-percent ZEV stringency by 2035
The first alternative considered proposes minimum 70-percent ZEV and PHEV sales by 2035 instead of the preferred proposal of 100-percent ZEV sales by 2035. This alternative is based on survey data that shows approximately 30-percent of survey respondents have rejected considering electric vehicle technology and show hesitation in purchasing ZEVs or PHEVs.435 Although staff does think this market hesitancy will change over time as ZEVs become cheaper, the market broadens and consumers become more familiar with this technology, conducting a cost and emissions impact analysis for a lower bound of ZEVs and PHEVs that accounts for more gasoline vehicles meeting the proposed LEV standard, is important for understanding the effect of transitioning the new fleet to zero-emission technology.
b) Alternative 2 – 100-percent ZEV stringency by 2035 with a differenttrajectory
Alternative 2 incorporates the ZEV sales fractions presented in the 2020 Mobile Source Strategy for calendar years 2026-2035, which would require higher electrification in 2026-2030 as compared to staff’s proposal. The Mobile Source Strategy is a top-down analysis of potential ZEV sales penetrations that would aid in achieving state and federal clean air goals, but did not include any regulatory feasibility analysis. Its trajectories assume a suite of policy changes, including public incentives, regulations, and private sector strategies on behalf of companies, but does not evaluate their feasibility. Accordingly, the Strategy itself does not determine the proper course of any particular regulatory proposal. However, the Strategy does provide a useful upper-bound scenario that could achieve important emission goals, and so serves as a useful alternative to evaluate. This Alternative would assume the most favorable ZEV market conditions, and that OEMs would be able to quickly redirect ZEV deployment to California to meet increased near-term requirements.
Table XI-1: ZEV Sales Percentage Requirements by Scenario
2026 2027 2028 2029 2030 2031 2032 2033 2034 2035+
Proposal 35% 43% 51% 59% 68% 76% 82% 88% 94% 100%
Alt 1 23% 29% 34% 39% 45% 50% 55% 60% 65% 70%
Alt 2 46% 52% 58% 64% 70% 76% 82% 88% 94% 100%
435 Kurani et al 2016. Kurani, Kenneth, Nicolette Caperello, and Jennifer TyreeHapegeman. 2016. “New Car Buyers’ Valuation of Zero-Emission Vehicles: California” https://ww2.arb.ca.gov/sites/default/files/2020-04/12_332_ac.pdf , accessed on October 18, 2021
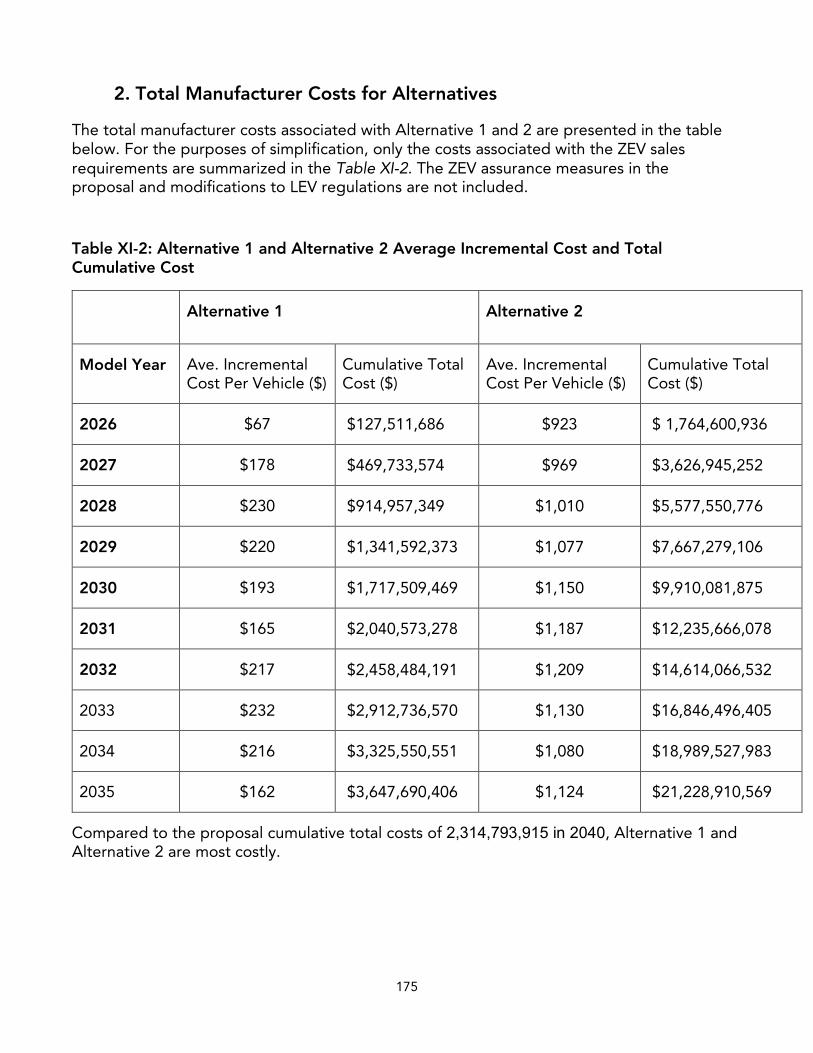
175
2. Total Manufacturer Costs for Alternatives
The total manufacturer costs associated with Alternative 1 and 2 are presented in the table below. For the purposes of simplification, only the costs associated with the ZEV sales requirements are summarized in the Table XI-2. The ZEV assurance measures in the proposal and modifications to LEV regulations are not included.
Table XI-2: Alternative 1 and Alternative 2 Average Incremental Cost and Total Cumulative Cost
Alternative 1 Alternative 2
Model Year Ave. Incremental Cost Per Vehicle ($)
Cumulative Total Cost ($)
Ave. Incremental Cost Per Vehicle ($)
Cumulative Total Cost ($)
2026 $67 $127,511,686 $923 $ 1,764,600,936
2027 $178 $469,733,574 $969 $3,626,945,252
2028 $230 $914,957,349 $1,010 $5,577,550,776
2029 $220 $1,341,592,373 $1,077 $7,667,279,106
2030 $193 $1,717,509,469 $1,150 $9,910,081,875
2031 $165 $2,040,573,278 $1,187 $12,235,666,078
2032 $217 $2,458,484,191 $1,209 $14,614,066,532
2033 $232 $2,912,736,570 $1,130 $16,846,496,405
2034 $216 $3,325,550,551 $1,080 $18,989,527,983
2035 $162 $3,647,690,406 $1,124 $21,228,910,569
Compared to the proposal cumulative total costs of 2,314,793,915 in 2040, Alternative 1 and Alternative 2 are most costly.
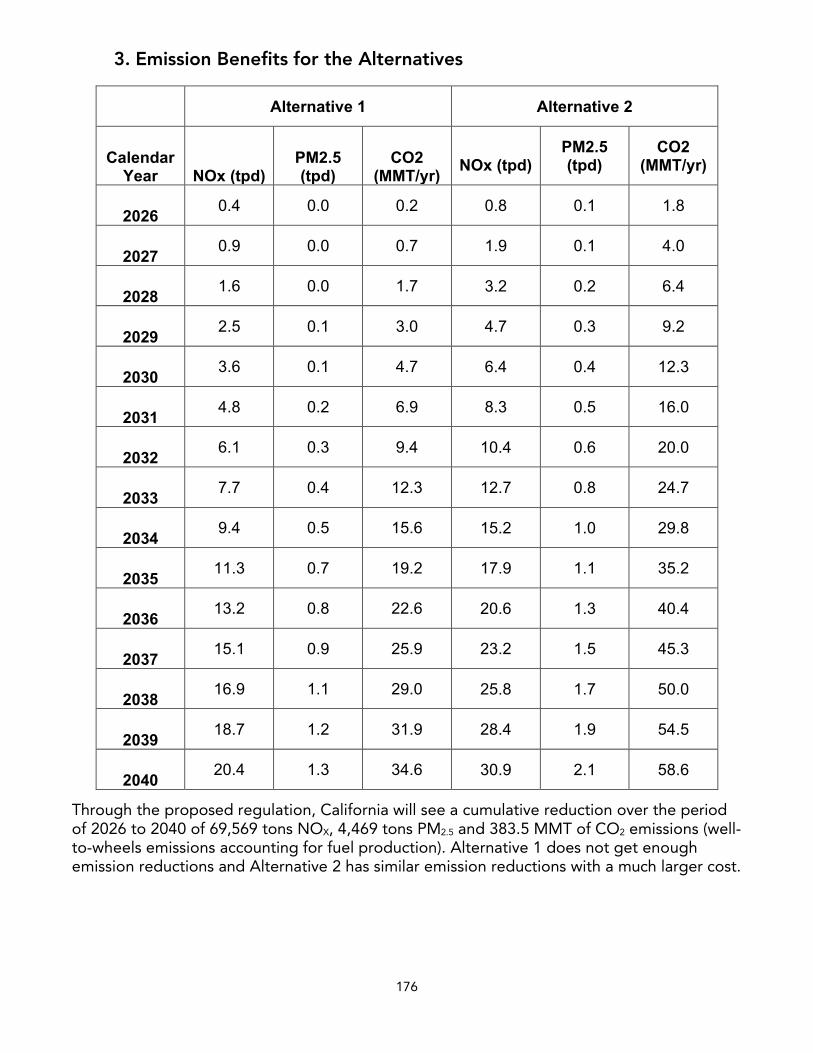
176
3. Emission Benefits for the Alternatives
Alternative 1 Alternative 2
Calendar Year NOx (tpd)
PM2.5 (tpd)
CO2 (MMT/yr) NOx (tpd)
PM2.5 (tpd)
CO2 (MMT/yr)
2026 0.4 0.0 0.2 0.8 0.1 1.8
2027 0.9 0.0 0.7 1.9 0.1 4.0
2028 1.6 0.0 1.7 3.2 0.2 6.4
2029 2.5 0.1 3.0 4.7 0.3 9.2
2030 3.6 0.1 4.7 6.4 0.4 12.3
2031 4.8 0.2 6.9 8.3 0.5 16.0
2032 6.1 0.3 9.4 10.4 0.6 20.0
2033 7.7 0.4 12.3 12.7 0.8 24.7
2034 9.4 0.5 15.6 15.2 1.0 29.8
2035 11.3 0.7 19.2 17.9 1.1 35.2
2036 13.2 0.8 22.6 20.6 1.3 40.4
2037 15.1 0.9 25.9 23.2 1.5 45.3
2038 16.9 1.1 29.0 25.8 1.7 50.0
2039 18.7 1.2 31.9 28.4 1.9 54.5
2040 20.4 1.3 34.6 30.9 2.1 58.6
Through the proposed regulation, California will see a cumulative reduction over the period of 2026 to 2040 of 69,569 tons NOX, 4,469 tons PM2.5 and 383.5 MMT of CO2 emissions (well-to-wheels emissions accounting for fuel production). Alternative 1 does not get enough emission reductions and Alternative 2 has similar emission reductions with a much larger cost.
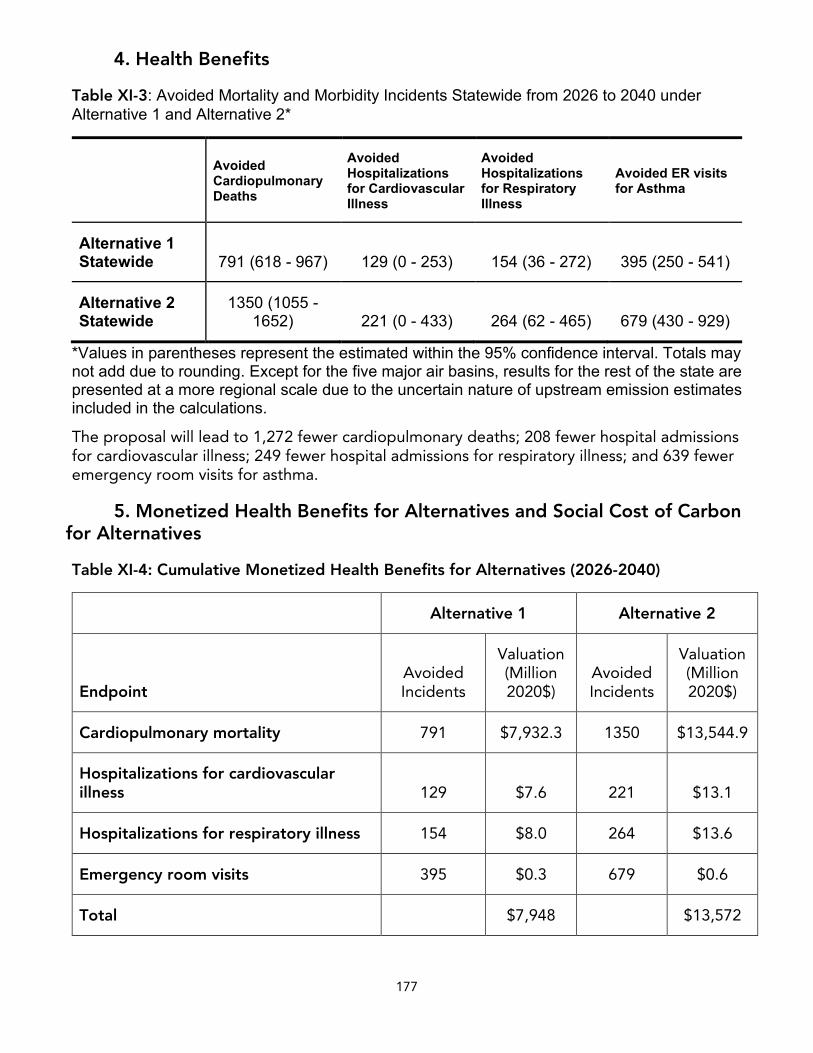
177
4. Health Benefits
Table XI-3: Avoided Mortality and Morbidity Incidents Statewide from 2026 to 2040 under Alternative 1 and Alternative 2*
Avoided Cardiopulmonary Deaths
Avoided Hospitalizations for Cardiovascular Illness
Avoided Hospitalizations for Respiratory Illness
Avoided ER visits for Asthma
Alternative 1 Statewide 791 (618 - 967) 129 (0 - 253) 154 (36 - 272) 395 (250 - 541)
Alternative 2 Statewide
1350 (1055 - 1652) 221 (0 - 433) 264 (62 - 465) 679 (430 - 929)
*Values in parentheses represent the estimated within the 95% confidence interval. Totals maynot add due to rounding. Except for the five major air basins, results for the rest of the state arepresented at a more regional scale due to the uncertain nature of upstream emission estimatesincluded in the calculations.
The proposal will lead to 1,272 fewer cardiopulmonary deaths; 208 fewer hospital admissions for cardiovascular illness; 249 fewer hospital admissions for respiratory illness; and 639 fewer emergency room visits for asthma.
5. Monetized Health Benefits for Alternatives and Social Cost of Carbonfor Alternatives
Table XI-4: Cumulative Monetized Health Benefits for Alternatives (2026-2040)
Alternative 1 Alternative 2
Endpoint Avoided Incidents
Valuation (Million 2020$)
Avoided Incidents
Valuation (Million 2020$)
Cardiopulmonary mortality 791 $7,932.3 1350 $13,544.9
Hospitalizations for cardiovascular illness 129 $7.6 221 $13.1
Hospitalizations for respiratory illness 154 $8.0 264 $13.6
Emergency room visits 395 $0.3 679 $0.6
Total $7,948 $13,572
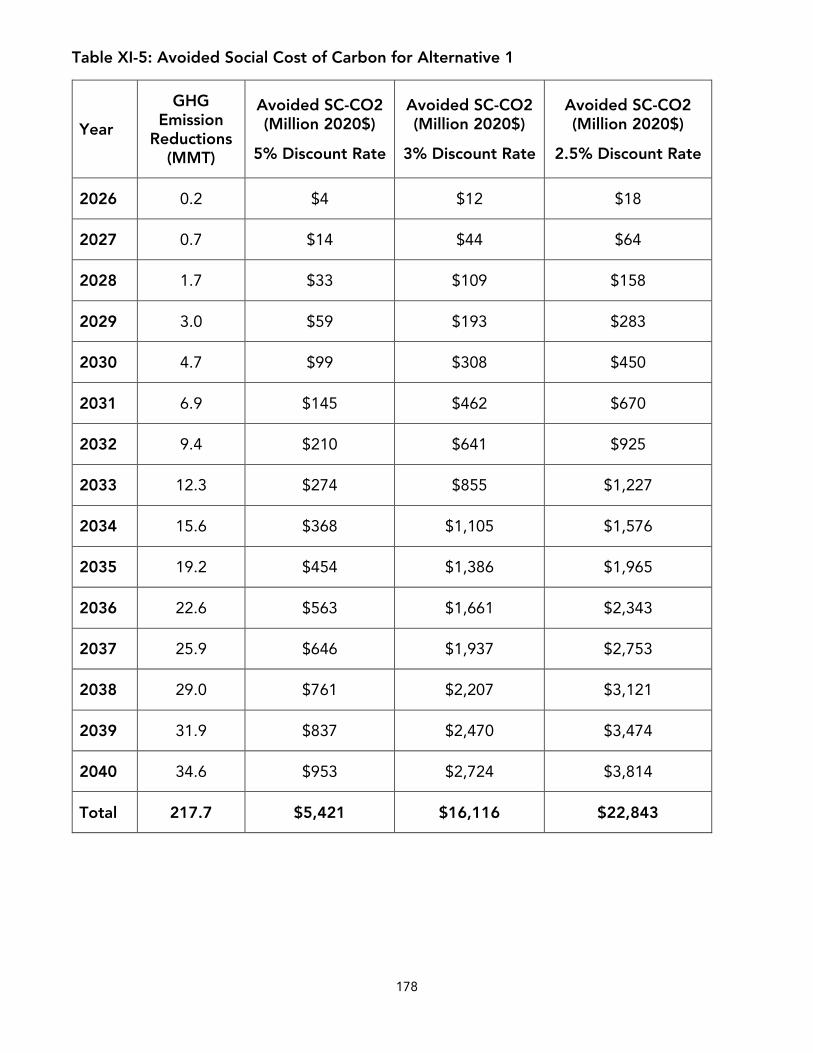
178
Table XI-5: Avoided Social Cost of Carbon for Alternative 1
Year
GHG Emission
Reductions (MMT)
Avoided SC-CO2 (Million 2020$)
5% Discount Rate
Avoided SC-CO2 (Million 2020$)
3% Discount Rate
Avoided SC-CO2 (Million 2020$)
2.5% Discount Rate
2026 0.2 $4 $12 $18
2027 0.7 $14 $44 $64
2028 1.7 $33 $109 $158
2029 3.0 $59 $193 $283
2030 4.7 $99 $308 $450
2031 6.9 $145 $462 $670
2032 9.4 $210 $641 $925
2033 12.3 $274 $855 $1,227
2034 15.6 $368 $1,105 $1,576
2035 19.2 $454 $1,386 $1,965
2036 22.6 $563 $1,661 $2,343
2037 25.9 $646 $1,937 $2,753
2038 29.0 $761 $2,207 $3,121
2039 31.9 $837 $2,470 $3,474
2040 34.6 $953 $2,724 $3,814
Total 217.7 $5,421 $16,116 $22,843
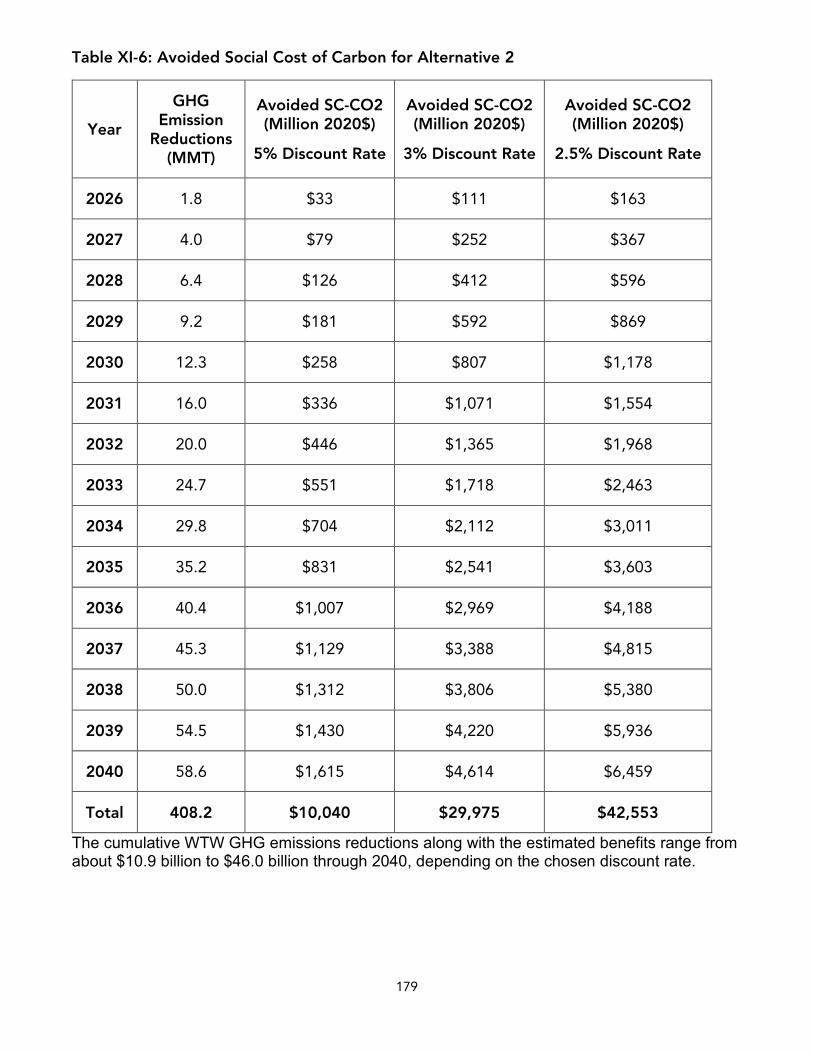
179
Table XI-6: Avoided Social Cost of Carbon for Alternative 2
Year
GHG Emission
Reductions (MMT)
Avoided SC-CO2 (Million 2020$)
5% Discount Rate
Avoided SC-CO2 (Million 2020$)
3% Discount Rate
Avoided SC-CO2 (Million 2020$)
2.5% Discount Rate
2026 1.8 $33 $111 $163
2027 4.0 $79 $252 $367
2028 6.4 $126 $412 $596
2029 9.2 $181 $592 $869
2030 12.3 $258 $807 $1,178
2031 16.0 $336 $1,071 $1,554
2032 20.0 $446 $1,365 $1,968
2033 24.7 $551 $1,718 $2,463
2034 29.8 $704 $2,112 $3,011
2035 35.2 $831 $2,541 $3,603
2036 40.4 $1,007 $2,969 $4,188
2037 45.3 $1,129 $3,388 $4,815
2038 50.0 $1,312 $3,806 $5,380
2039 54.5 $1,430 $4,220 $5,936
2040 58.6 $1,615 $4,614 $6,459
Total 408.2 $10,040 $29,975 $42,553
The cumulative WTW GHG emissions reductions along with the estimated benefits range from about $10.9 billion to $46.0 billion through 2040, depending on the chosen discount rate.
180
6. Reason for Rejection for Alternatives
Alternative 1 is rejected because it fails to maximize the number of ZEVs deployed, and does not maximize NOx, PM2.5, and GHG reductions. The benefit to cost ratio for this alternative is better, however, it gets less emission benefits than the proposal. The Proposed ACC II Regulation is identified as a measure in the State SIP Strategy as well as part of the Climate Change Scoping Plan as a necessary component needed to improve California’s air quality consistent with federal and state legal requirements and achieve the state’s climate protection goals. Alternative 1 does not maximize the number of ZEVs deployed in California as it requires a lower number of ZEVs to be produced. This would likely delay the spread of zero-emission technology to other sectors because it would stifle maturation of the technology, delay associated cost reductions, and delay deployment of charging infrastructure from stunted demand. Because of the low number of vehicles deployed and its attendant effects, Alternative 1 does not maximize NOx and PM2.5 emission reductions from the transportation sector which are necessary to meet SIP attainment goals. Alternative 1 also does not reduce GHG emissions, failing to meet the goals of the Climate Change Scoping Plan.
Alternative 2 is rejected as the more aggressive early requirements would require tripling of the ZEV market in California in the next 3 model years, as model years 2022 and 2023 are fully planned. This kind of market growth is unprecedented, and there is a lack of evidence as to how to prove a feasible path for manufacturers to comply even in the first model year of this alternative.
B. Small Business Alternative
The Board has not identified any reasonable alternatives that would lessen any adverse impact of the Advanced Clean Cars II proposal on small business. The proposed LEV regulations do not apply directly to small businesses.
The decreasing trend in demand for gasoline has the potential to result in the elimination of businesses in this industry and downstream industries, such as gasoline stations and vehicle repair businesses, if sustained over time, unless they adapt and provide charging and repair services for ZEVs that enable them to continue offering other services to drivers, such as convenience foods, that tend to be their profit centers. As ZEVs become a greater portion of the fleet, the vehicle repair and maintenance service industry are estimated to see negative impacts, including dealerships that have service departments, due to the lower maintenance requirements for ZEVs compared with ICEVs. This trend would suggest that the number of businesses providing the services may decrease along with the reduced demand.
Staff is proposing changes to the California Service Information Regulation, California Code of Regulations, section 1969, explained in further detail in Section III.C.4. Changes to this regulation are expected to increase participation of small independent repair shops in the transition to ZEV technologies due to the fact that these repair shops will now be guaranteed access to repair information for ZEVs.
C. Performance Standards in Place of Prescriptive Standards
Government Code section 11346.2(b)(4)(A) requires that when CARB proposes a regulation that would mandate the use of specific technologies or equipment, or prescribe specific
181
actions or procedures, it must consider performance standards as an alternative. The Proposed ACC II Regulation, consisting of the proposed LEV IV regulation and the proposed ZEV regulation, is a performance standard. For the proposed LEV IV regulation, no specific technology is mandated. The regulation sets a performance standard that does not define the sole or any specific means of compliance and that can be feasibly met with a variety of technologies in a cost-effective way, as the analysis here shows. The proposed ZEV regulation does not prescribe one specific technology or one specific avenue for compliance; rather, manufacturers can meet this proposed regulation requirements using BEV, PHEV or FCEV technologies and with several options for securing ZEV values. The proposed regulations encourage innovation by allowing manufacturers to determine the most cost-effective means of compliance.
Even if the Proposed ACC II Regulation were considered to be a prescriptive standard, to the extent it establishes specific measurements, actions, or quantifiable means of limiting emissions or producing ZEVs, it would still be preferred over other performance-based alternatives. Anything less prescriptive than ACC II in terms of emission limits and requirements for ZEVs erodes the proposal’s ability to secure the emissions reductions needed for meeting California’s public health and climate goals and State and federal air quality standards because. Less prescriptive measures would allow, by omission, additional flexibilities on technology, valuation, fleet mixing, and assurance measures that would likely not achieve the same magnitude of emissions reductions or support for the ZEV market. More performance-based alternatives would thus undermine the goals of this action.
D. Health and Safety Code section 57005 Major Regulation Alternatives
CARB estimates the proposed regulation will have an economic impact on the state’s business enterprises of more than $10 million in one or more years of implementation. CARB will evaluate alternatives submitted to CARB and considered whether there is a less costly alternative or combination of alternatives that would be equally as effective in achieving increments of environmental protection in full compliance with statutory mandates within the same amount of time as the proposed regulatory requirements, as required by Health and Safety Code section 57005.
XII. Justification for Adoption of Regulations Different fromFederal Regulations Contained in the Code of Federal Regulations
The proposed regulations address two aspects of motor vehicle emissions, one for exhaust emissions from conventional vehicles and another for zero-emission vehicles. They do not duplicate or conflict with federal regulations that address the same issues, and to the extent they are different from existing federal regulations they are authorized by law and are justified by their benefits to human health, public welfare, and the environment.
Currently, California’s LEV III and U.S. EPA’s Tier 3 vehicle emission standards and other emission-related requirements have largely been harmonized, to enable the regulated industry to design and produce a single product line of vehicles that can be certified to both U.S. EPA and CARB emission standards and sold in all 50 states.
However, as discussed in Chapter IV, the LEV III and Tier 3 vehicle emission standards do not adequately reduce excess emissions that occur during real world driving conditions or prevent backsliding of emissions from ICEVs as the fleet transitions to ZEVs. The proposed
182
LEV IV regulations focus on achieving additional control of emissions from light- and medium-duty vehicles under real world driving conditions.
The proposed LEV IV regulations control emissions of criteria pollutants from the exhaust of conventional motor vehicles. They would apply to vehicles delivered for sale in California beginning with the 2026 model year. They are more stringent than the existing federal Tier 3 standards for the same pollutants from motor vehicles for the 2025 and subsequent model years that were set by the U.S. Environmental Protection Agency (U.S. EPA). (Cf. Control of Air Pollution From Motor Vehicles: Tier 3 Motor Vehicle Emission and Fuel Standards, 79 Fed. Reg. 23,414, 23,417, April 28, 2014 [federal Tier 3 standards are harmonized with CARB’s current LEV III standards through model year 2025]; 40 C.F.R. § 86.1811-17.) Thus, vehicles that comply with CARB’s proposed standards will comply with federal emission standards. This does not present a conflict with federal regulations because CARB’s standards may be more stringent than federal standards, under a provision in the Clean Air Act that directs the Administrator of the U.S. EPA to waive federal preemption of California’s motor vehicle emission standards when they meet the listed criteria, which have been met here. (Clean Air Act, § 209(b), 42 U.S.C. § 7543(b).) Moreover, under that provision vehicles that comply with CARB’s standards are deemed to comply with federal standards for the same pollutants. (Clean Air Act, § 209(b)(3), 42 U.S.C. § 7543(b)(3).)
The proposed ZEV regulations would require manufacturers to deliver for sale increasing percentages of ZEVs as a portion of their overall product deliveries between model years 2026 and 2035 (and after). There are no comparable federal standards for sales of zero-emission vehicles. Federal and state regulations for greenhouse gas emissions from manufacturers’ fleets of motor vehicles allow manufacturers to get credit for the lack of exhaust emissions from ZEVs when determining compliance. (Cal. Code Regs., tit. 13, § 1961.3; 40 C.F.R. §§ 86.1818-12 [emission standards]; 86.1866-12 [value for ZEVs].) The ZEV regulation will facilitate compliance with federal and state greenhouse gas emission standards.
To the extent that California’s proposed LEV IV regulations differ from current federal Tier 3 regulations for the same pollutants and sources, or that the proposed ZEV regulations differ from either the current federal Tier 3 regulations or greenhouse gas emission standards, CARB has authority under state and federal law to set California’s own standards to reduce emissions from motor vehicles to meet federal and state ambient air quality standards and climate change requirements and goals. It also has authority to require additional and separate reporting than required under federal law. California has plenary authority under the state and federal constitutions to protect public health and welfare. The California Health and Safety Code directs CARB to exercise this authority to reduce and eliminate harmful emissions from motor vehicles. These statutory obligations are identified in the authority citations for the proposed regulations. The federal Clean Air Act directs the Administrator of the U.S. EPA to exempt California’s motor vehicle emission standards from federal preemption when they meet the listed criteria, which have been met here. (Clean Air Act, § 209(b), 42 U.S.C. § 7543(b).)
As shown in this staff report and accompanying analyses, the cost of the state regulations is justified by the substantial additional benefits to human health, public welfare, and the environment described above and in the accompanying materials. The proposed regulations will provide significant benefits for all these factors. They will reduce emissions harmful to human health and the environment. The value of the benefits outweighs the costs. The
183
regulations will reduce overall costs for transportation. These improvements and savings will improve the public welfare.
XIII. Public Process for Development of the Proposed Action
Consistent with the Board’s long-standing practice, staff have engaged in an extensive public process in developing the Proposed Regulation. Staff sought input from stakeholders through various outreach and engagement events, including public workshops, stakeholder working groups, informal meetings and phone calls, and a community listening session. Staff conducted meetings with manufacturers and component suppliers, environmental and equity advocacy organizations, community-based organizations, and other interested stakeholders. These informal pre-rulemaking discussions provided staff with useful information, particularly on the ZEV regulatory stringency, incremental vehicle costs, and battery lifetime performance, that was considered during development of the Proposal.
CARB staff conducted four virtual public workshops to discuss regulatory concepts and to solicit feedback on various elements of the proposals and analyses, including feedback on the CEQA scope, alternatives to evaluate, and the data and methods used to develop cost impacts. Staff notified stakeholders of all workshops via email distribution of a public notice at least two weeks prior to their occurrence. These notices were posted to the program’s website and distributed through several public list serves. The public workshops were open to all members of the public. The workshops discussed all aspects of the proposals, including the benefits of the regulations on the “communities in California with the most significant exposure to air contaminants.”436 Meeting materials, including slide presentations, cost workbooks, draft regulatory documents, and event recordings, were posted and available to the public. Staff solicited for regulatory alternatives and comments on the scope of the environmental analysis at the August 11, 2021 public workshop. Recordings of the workshops were posted online and remain available for public viewing. A complete listing of previously held public outreach events appears in Table XIII-1.
436 Health & Saf. Code, § 43018.5, subd. (c)(4).
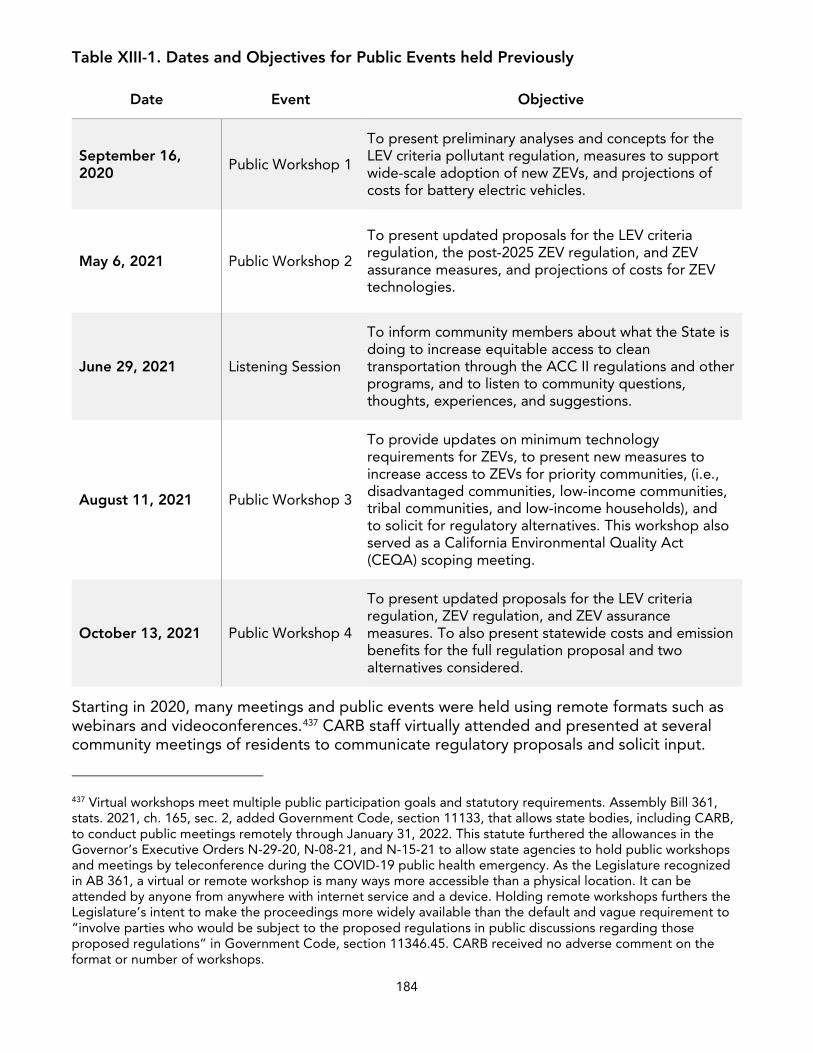
184
Table XIII-1. Dates and Objectives for Public Events held Previously
Date Event Objective
September 16, 2020 Public Workshop 1
To present preliminary analyses and concepts for the LEV criteria pollutant regulation, measures to support wide-scale adoption of new ZEVs, and projections of costs for battery electric vehicles.
May 6, 2021 Public Workshop 2
To present updated proposals for the LEV criteria regulation, the post-2025 ZEV regulation, and ZEV assurance measures, and projections of costs for ZEV technologies.
June 29, 2021 Listening Session
To inform community members about what the State is doing to increase equitable access to clean transportation through the ACC II regulations and other programs, and to listen to community questions, thoughts, experiences, and suggestions.
August 11, 2021 Public Workshop 3
To provide updates on minimum technology requirements for ZEVs, to present new measures to increase access to ZEVs for priority communities, (i.e., disadvantaged communities, low-income communities, tribal communities, and low-income households), and to solicit for regulatory alternatives. This workshop also served as a California Environmental Quality Act (CEQA) scoping meeting.
October 13, 2021 Public Workshop 4
To present updated proposals for the LEV criteria regulation, ZEV regulation, and ZEV assurance measures. To also present statewide costs and emission benefits for the full regulation proposal and two alternatives considered.
Starting in 2020, many meetings and public events were held using remote formats such as webinars and videoconferences.437 CARB staff virtually attended and presented at several community meetings of residents to communicate regulatory proposals and solicit input.
437 Virtual workshops meet multiple public participation goals and statutory requirements. Assembly Bill 361, stats. 2021, ch. 165, sec. 2, added Government Code, section 11133, that allows state bodies, including CARB, to conduct public meetings remotely through January 31, 2022. This statute furthered the allowances in the Governor’s Executive Orders N-29-20, N-08-21, and N-15-21 to allow state agencies to hold public workshops and meetings by teleconference during the COVID-19 public health emergency. As the Legislature recognized in AB 361, a virtual or remote workshop is many ways more accessible than a physical location. It can be attended by anyone from anywhere with internet service and a device. Holding remote workshops furthers the Legislature’s intent to make the proceedings more widely available than the default and vague requirement to “involve parties who would be subject to the proposed regulations in public discussions regarding those proposed regulations” in Government Code, section 11346.45. CARB received no adverse comment on the format or number of workshops.
185
These meetings included environmental justice advocacy organizations and community-based organizations. Furthermore, all public workshops and a community listening session were held virtually to solicit comments on the proposed regulations under development. Virtual or remote workshops and meetings are in many ways more accessible than a physical location, as they can be attended by anyone from anywhere with internet service or a cellular device. Holding remote workshops can help make events more widely available than merely involving parties who would be subject to the proposed regulations.
These informal pre-rulemaking engagement events and discussions provided staff with useful information that was considered during development of the Proposed Regulation and the impact assessment. CARB solicited informal public comment following each workshop; stakeholders submitted 36 comments, which CARB has both considered and posted online.438 CARB staff posted cost workbooks detailing cost data and the assumptions and methods used for determining incremental costs of ZEV technologies. Stakeholders provided input on various cost elements, such as battery costs, component costs, vehicle range assumptions, and vehicle design assumptions. This specific cost feedback, in addition to input from stakeholders in other forums, helped shape the data, methods, and assumptions for the impact assessment. Public input was also considered in determining regulatory alternatives for the Proposed Regulation. Staff will continue to engage stakeholders throughout the development of this regulation.439
XIV. Next Steps
California’s ZEV regulation is one piece of the overarching strategy across state agencies to electrify passenger vehicles. Transforming to a zero-emission transportation system equitably requires a coordinated, collaborative, and cross-cutting approach. Although outside the scope of this rulemaking, a comprehensive set of complementary programs and policies are being implemented by many state agencies to address what is needed for a successful ZEV market, led by the GoBiz ZEV Market Development Strategy, and CARB intends to continue engaging in these efforts. As noted earlier, these actions include agency collaboration and investments to address ZEV fueling infrastructure, consumer outreach and education, and incentives for vehicles and fuel. These supporting programs work together to accelerate the ZEV market by fostering vehicle demand which leads to cost reductions across all phases of ZEV technology commercialization and market development. With this suite of policy actions the state will be ready for the rapidly growing ZEV market.
438 CARB 2022h. Workshop Comments Log. California Air Resources Board. https://www.arb.ca.gov/lispub/comm2/bccommlog.php?listname=accii-comments-w3-ws. Accessed March 11, 2022. 439 Health and Safety Code section 38564 requires CARB to consult with other states and nations and the federal government to identify the most effective strategies and methods to reduce GHGs and develop integrated, cost-effective control programs. Staff has engaged with other states throughout the rulemaking development and even had representatives from two Section 177 states present at our October 2021 workshop. Staff also have robust routine engagement with the federal EPA, as well as with other nations through the International ZEV Alliance and direct engagement with Environment and Climate Change Canada. Additionally, staff participate in international committees and work groups developing protocols and best practices for ZEVs and batteries.
186
XV. References
AB 8 2013. Assembly Bill No. 8 (Perea, Statutes of 2013, Chapter 401). https://leginfo.legislature.ca.gov/faces/billNavClient.xhtml?bill_id=201320140AB8
AFDC 2022. U.S. DOE Alternative Fuels Data Center. 2022. “Developing Infrastructure to Charge Plug-In Electric Vehicles.” Accessed March 9, 2022. https://afdc.energy.gov/fuels/electricity_infrastructure.html#level2.
ALA 2021. American Lung Association. 2021. State of the Air: 2021. Accessed March 16, 2022. https://www.lung.org/getmedia/17c6cb6c-8a38-42a7-a3b0-6744011da370/sota-2021.pdf
ANL 2021. Islam, Ehsan Sabri, Ram Vijayagopal, Ayman Moawad, Namdoo Kim, Benjamin Dupont, Daniela Nieto Prada, and Aymeric Rousseau. 2021. “A Detailed Vehicle Modeling & Simulation Study Quantifying Energy Consumption and Cost Reduction of Advanced Vehicle Technologies Through 2050.” Report to the US Department of Energy, Contract ANL/ESD-21/10, Energy Systems Division, Argonne National Laboratory. https://publications.anl.gov/anlpubs/2021/06/167626.pdf.
AP 2021. Beam, Adam. 2021. “California Oks new spending on drought, wildfire prevention.” Associated Press. September 9, 2021. Accessed March 9, 2022. https://apnews.com/article/business-health-fires-climate-california-eec48e6279099449851b3c7f150cda33.
Apte 2019. Apte, Joshua S, Sarah E Chambliss, Christopher W Tessum, and Julian D Marshall. 2019. “A Method to Prioritize Sources for Reducing High PM2.5 Exposures in Environmental Justice Communities in California.” CARB Contract Number 17RD006. November 21, 2019. Accessed February 25, 2022. https://ww2.arb.ca.gov/sites/default/files/classic/research/apr/past/17rd006.pdf.
Archsmith et al 2021. Archsmith, James, Erich Muehlegger, and David S. Rapson. 2021. “Future Paths of Electric Vehicle Adoption in the United States: Predictable Determinants, Obstacles and Opportunities.” Published July 6, 2021. https://www.nber.org/system/files/chapters/c14584/c14584.pdf.
BLS 2022. U.S. Bureau of Labor Statistics. 2022. “Databases, Tables & Calculators by Subject.” CPI for All Urban Consumers, new vehicles index, new vehicles in U.S. city average, all urban consumers, not seasonally adjusted. Accessed March 11, 2022. https://data.bls.gov/timeseries/CUUR0000SETA01
BNEF 2020. Bloomberg New Energy Finance. 2020. “Battery Pack Prices Cited Below $100/kWh for the First Time in 2020, While Market Average Sits at $137/kWh.” December 16, 2020. Accessed March 22, 2022. https://about.bnef.com/blog/battery-pack-prices-cited-below-100-kwh-for-the-first-time-in-2020-while-market-average-sits-at-137-kwh/.
BNEF 2021. Bloomberg New Energy Finance. 2021. “Battery Pack Prices Fall to an Average of $132/kWh, But Rising Commodity Prices Start to Bite” Released November 30, 2021.
187
Accessed March 22, 2022. https://about.bnef.com/blog/battery-pack-prices-fall-to-an-average-of-132-kwh-but-rising-commodity-prices-start-to-bite/.
Burke et al. 2021. Burke, Marshall, Anne Driscoll, Sam Heft-Neal, Jiani Xue, Jennifer Burney, and Michael Wara. “The Changing Risk and Burden of Wildfire in the United States.” PNAS 118(2) e2011048118, January 12. 2021. Accessed March 16, 2022. https://doi.org/10.1073/pnas.2011048118.
Busch 2021. Energy Innovation Policy & Technology LLC. 2021. Busch, C. Energy Innovation Policy & Technology LLC. “Used Electric Vehicles Deliver Consumer Savings Over Gas Cars: Policy Implications and Total Ownership Cost Analysis for Non-Luxury Used Cars Available to California Consumers Today.” June 2021. Accessed January 31, 2022. https://energyinnovation.org/wp-content/uploads/2021/06/Used-Electric-Vehicles-Deliver-Consumer-Savings-Over-Gas-Cars.pdf.
CAFCP 2022a. California Fuel Cell Partnership. 2022. “About Us.” Accessed March 10, 2022. https://cafcp.org/about_us.
CaFCP 2022b. California Fuel Cell Partnership. 2022. “By The Numbers.” January 25, 2022. https://cafcp.org/sites/default/files/FCEV-Sales-Tracking.pdf.
CaFCP 2022c. California Fuel Cell Partnership. 2022. “CAFCP Station Map.” January 25, 2022. Accessed March 10, 2022. https://cafcp.org/stationmap.
CalISO 2017. California ISO. 2017. “Impacts of renewable energy on grid operations.” https://www.caiso.com/documents/curtailmentfastfacts.pdf
Canepa et al 2019. Canepa, Kathryn, Scott Hardman, and Gil Tal. 2021. “An early look at plug-in electric vehicle adoption in disadvantaged communities in California.” Transport Policy, 78, 19–30. June 2019. Accessed March 9, 2022. https://doi.org/10.1016/j.tranpol.2019.03.009.
Car and Driver 2021. Vanderwerp, Dave. 2021. “How GM's Ultium Battery Will Help It Commit to an Electric Future.” Car and Driver. Posted July 21, 2021. Accessed March 11, 2022. https://www.caranddriver.com/features/a36877532/general-motors-ev-ultium-battery-electric-future/.
Car and Driver 2022. Car and Driver. 2022. “Tesla Won't Bring Cybertruck, Roadster, Semi to Market in 2022.” January 26, 2022. Accessed March 10, 2022. https://www.caranddriver.com/news/a38902936/teslas-elon-musk-future/.
CARB 2009a. California Air Resources Board. 2009. “White Paper: Summary of Staff’s Preliminary Assessment of the Need for Revisions to the Zero Emission Vehicle Regulation.” November 25, 2009.
CARB 2009b. California Air Resources Board. 2009. Resolution 09-66. December 9, 2009. Accessed January 31, 2022. https://www.arb.ca.gov/board/res/2009/res09-66.pdf.
188
CARB 2016. California Air Resources Board. 2016. “Mobile Source Strategy.” Released May 2016. Accessed February 8, 2022. https://ww3.arb.ca.gov/planning/sip/2016sip/2016mobsrc.pdf.
CARB 2017a. California Air Resources Board. 2017. “Advanced Clean Cars Midterm Review: Resolution 17-3.” March 24, 2017. Accessed March 4, 2022. https://ww2.arb.ca.gov/sites/default/files/2020-02/acc_mtr_resolution_17_3_ac.pdf.
CARB 2017b. California Air Resources Board. 2017. “Revised Proposed 2016 State Strategy for the State Implementation Plan.” March 7, 2017. Accessed January 20, 2022. https://ww3.arb.ca.gov/planning/sip/2016sip/rev2016statesip.pdf.
CARB 2017c. California Air Resources Board. 2017. “California's 2017 Climate Change Scoping Plan: The strategy for achieving California’s 2030 greenhouse gas target.” November 2017. Accessed January 31, 2022. https://ww2.arb.ca.gov/sites/default/files/classic/cc/scopingplan/scoping_plan_2017.pdf.
CARB 2017d. California Air Resources Board. 2017. California’s Advanced Clean Cars Midterm Review. Appendix B: Consumer Acceptance of Zero Emission Vehicles and Plug-in Hybrids Electric Vehicles. Released January 18, 2017. Accessed January 31, 2022. https://ww2.arb.ca.gov/sites/default/files/2020-01/appendix_b_consumer_acceptance_ac.pdf.
CARB 2017e. California Air Resources Board. 2017. Appendix A: Analysis of Zero Emission Vehicle Regulation Compliance Scenarios. Released January 18, 2017. Accessed January 28, 2022. https://ww2.arb.ca.gov/sites/default/files/2020-01/appendix_a_minimum_zev_regulation_compliance_scenarios_formatted_ac.pdf.
CARB 2017f. California Air Resources Board. 2017. California’s Advanced Clean Cars Midterm Review. Appendix G: Plug-in Electric Vehicle In Use and Charging Data Analysis. Released January 18, 2017. Accessed January 18, 2017. https://ww2.arb.ca.gov/sites/default/files/2020-01/appendix_g_pev_in_use_and_charging_data_analysis_ac.pdf.
CARB 2017g. California Air Resources Board. 2017. California’s Advanced Clean Cars Midterm review: Summary Report for the technical Analysis of the Light-Duty Vehicle Standards. Pg. 39-40. Released January 18, 2017. Accessed January 28, 2022. https://ww2.arb.ca.gov/sites/default/files/2020-01/ACC%20MTR%20Summary_Ac.pdf.
CARB 2017h. California Air Resources Board. 2017. CARB’s Advanced Clean Cars Midterm Review. Appendix F: Scenario Planning: Evaluating impact of varying plug-in hybrid electric vehicle (PHEV) assumptions on emissions. Released January 18, 2017. Accessed January 28, 2022. https://ww2.arb.ca.gov/sites/default/files/2020-01/appendix_f_ldf_scenario_planning_ac.pdf.
CARB 2017i. California Air Resources Board. 2017. Appendix H: Plug-in Hybrid Electric Vehicle Emissions Testing. Posted January 18, 2017. https://ww2.arb.ca.gov/sites/default/files/2020-01/appendix_h_phev_testing_ac.pdf
189
CARB 2017j. California Air Resources Board. 2017. “Vision 2.1 Scenario Modeling System Limited Scope Release.” Published February 2017. Accessed March 10, 2022. https://ww2.arb.ca.gov/sites/default/files/2020-06/vision2.1_scenario_modeling_system_general_documentation.pdf.
CARB 2018a. California Air Resources Board. 2018. Community Air Protection Program Blueprint, Appendix D – Statewide Actions. October 2018. Accessed January 31, 2022. https://ww2.arb.ca.gov/sites/default/files/2020-06/final_community_air_protection_blueprint_october_2018_appendix_d_acc.pdf.
CARB 2018b. California Air Resources Board. 2018. “EMFAC 2017 Volume III - Technical Documentation.” Published July 20, 2018. https://ww3.arb.ca.gov/msei/downloads/emfac2017-volume-iii-technical-documentation.pdf.
CARB 2018c. California Air Resources Board. 2018. “LCFS Illustrative Compliance Scenario.” August 15, 2018. https://www.arb.ca.gov/fuels/lcfs/2018-0815_illustrative_compliance_scenario_calc.xlsx?_ga=2.155021808.917945968.1597354480-1389483658.1577128071
CARB 2018d. California Air Resources Board. 2018. “Criteria Pollutant Emission Inventory Data.” https://ww2.arb.ca.gov/criteria-pollutant-emission-inventory-data.
CARB 2019a. California Air Resources Board. 2019. “Public Hearing to Consider the Proposed Advanced Clean Trucks Regulation: Initial Statement of Reasons.” Released October 22, 2019. Accessed January 31, 2022. https://ww2.arb.ca.gov/sites/default/files/barcu/regact/2019/act2019/isor.pdf.
CARB 2019b. California Air Resources Board. 2019. CA-GREET3.0 Model. https://www.arb.ca.gov/fuels/lcfs/ca-greet/ca-greet30-corrected.xlsm?_ga=2.247817287.1944131420.1600710547-1389483658.1577128071.
CARB 2020a. California Air Resources Board. 2020. “Initial Statement of Reasons: Proposed Amendments to the Exhaust Emissions Standards and Test Procedures for 2024 and Subsequent Model Year Heavy-Duty Engines and Vehicles, Heavy-Duty On-Board Diagnostic System Requirements, Heavy-Duty In-Use Testing Program, Emissions Warranty Period and Useful Life Requirements, Emissions Warranty Information and Reporting Requirements, and Corrective Action Procedures, In-Use Emissions Data Reporting Requirements, and Phase 2 Heavy-Duty Greenhouse Gas Regulations, and Powertrain Test Procedures.” Released June 23, 2020. Accessed January 31, 2022. https://ww2.arb.ca.gov/sites/default/files/barcu/regact/2020/hdomnibuslownox/isor.pdf.
CARB 2020b. California Air Resources Board. 2020. Unofficial electronic version of the Low Carbon Fuel Standard Regulation, June 30, 2020. https://ww2.arb.ca.gov/sites/default/files/2020-07/2020_lcfs_fro_oal-approved_unofficial_06302020.pdf.
CARB 2020c. California Air Resources Board. 2020. “Standardized Regulatory Impact Assessment (SRIA): Proposed Heavy-Duty Engine and Vehicle Omnibus Regulation and Associated Amendments.” DOF, CARB, 2020. https://dof.ca.gov/wp-
190
content/uploads/Forecasting/Economics/Documents/Heavy-Duty-Inspection-and-Maintenance-SRIA.pdf
CARB 2021a. California Air Resources Board. 2021. “2020 Mobile Source Strategy.” Released September 28, 2021. Accessed January 31, 2022. https://ww2.arb.ca.gov/sites/default/files/2021-09/Proposed_2020_Mobile_Source_Strategy.pdf.
CARB 2021b. California Air Resources Board. 2021. “California Greenhouse Gas Emissions for 2000 to 2019: Trends of Emissions and Other Indicators.” July 28, 2021. Accessed January 31, 2022. https://ww3.arb.ca.gov/cc/inventory/pubs/reports/2000_2019/ghg_inventory_trends_00-19.pdf
CARB 2021c. California Air Resources Board. 2021. 2021 Annual Evaluation of Fuel Cell Electric Vehicle Deployment and Hydrogen Fuel Station Network Development. https://ww2.arb.ca.gov/sites/default/files/2021-09/2021_AB-8_FINAL.pdf.
CARB 2021d. California Air Resources Board. 2021. 2020 Zero-Emission Vehicle Credits. Released December 2021. Accessed January 28, 2022. https://ww2.arb.ca.gov/sites/default/files/2021-12/2020_zev_credit_annual_disclosure_ac.pdf”.
CARB 2021e. California Air Resources Board. 2021. EFMP Retire and Replace Program Statistics. September 9, 2021 https://ww2.arb.ca.gov/sites/default/files/2021-09/EFMP%20Website%20Statistics%20Tables%20Cumulative%202021_Q2%2009-21-21.pdf
CARB 2021f. California Air Resources Board. 2021. Low Carbon Transportation Investment Project Summaries. Released October 2021. Accessed January 31, 2022. https://ww2.arb.ca.gov/sites/default/files/2021-10/fy21-22_fundingplan_appendix_g.pdf.
CARB 2021g. California Air Resources Board. EMFAC 2021 Volume III Technical Document. Published April 2021. Accessed March 10, 2022. https://ww2.arb.ca.gov/sites/default/files/2021-08/emfac2021_technical_documentation_april2021.pdf.
CARB 2021h. California Air Resources Board. 2021. LCFS Data Dashboard, Last Reviewed October 29, 2021. Accessed March 11, 2022. https://ww3.arb.ca.gov/fuels/lcfs/dashboard/dashboard.htm
CARB 2022a. California Air Resources Board. 2022. “Draft 2022 State Strategy for the State Implementation Plan.” Released January 31, 2022. Accessed February 1, 2022. https://ww2.arb.ca.gov/sites/default/files/2022-01/Draft_2022_State_SIP_Strategy.pdf.
CARB 2022b. California Air Resources Board. 2022. Electric Vehicle Supply Equipment Standards Technology Review. Published February 2022. Accessed March 1, 2022. https://ww2.arb.ca.gov/sites/default/files/2022-02/EVSE%20Standards%20Technology%20Review%204Feb22.pdf.
191
CARB 2022c. California Air Resources Board. 2022. “Volkswagen Zero-Emission Vehicle (ZEV) Investment Commitment.” Accessed March 10, 2022. https://ww2.arb.ca.gov/our-work/programs/volkswagen-zero-emission-vehicle-zev-investment-commitment.
CARB 2022d. California Air Resources Board. 2021 and 2020 Confidential Survey Results, Figure 3. Excel Spreadsheet. CARB 2022e. California Air Resources Board. 2022. “States that have Adopted California's Vehicle Standards under Section 177 of the Federal Clean Air Act.” Updated March 17, 2022. https://ww2.arb.ca.gov/sites/default/files/2022-01/177_states_12062021_nada_sales.pdf
CARB 2022f. California Air Resources Board. 2022. Sustainable Transportation Equity Project (STEP) Implementation Grant. Accessed January 31, 2022. https://ww2.arb.ca.gov/lcti-stockton-mobility-collective.
CARB 2022g. California Air Resources Board. CARB’s Methodology for Estimating the Health Effects of Air Pollution. Accessed March 18, 2022. https://ww2.arb.ca.gov/resources/documents/carbs-methodology-estimating-health-effects-air-pollution.
CARB 2022h. California Air Resources Board. 2022. “Workshop Comments Log.” Accessed March 11, 2022. https://www.arb.ca.gov/lispub/comm2/bccommlog.php?listname=accii-comments-w3-ws.
Casals et al 2018. Casals, Lluc Canals, B. Amante Garcia, and Camille Canal. 2018. "Second life batteries lifespan: Rest of useful life and environmental analysis." Journal of Environmental Management, 232 (2019) 354-363. https://www.sciencedirect.com/science/article/pii/S0301479718313124.
CEC 2021a. California Energy Commission. 2021. 2021–2023 Investment Plan Update for the Clean Transportation Program, California Energy Commission, December 2021. Accessed February 11, 2022. https://www.energy.ca.gov/publications/2021/2021-2023-investment-plan-update-clean-transportation-program.
CEC 2021b. Alexander, Matt, Noel Crisostomo, Wendell Krell, Jeffrey Lu, and Raja Ramesh. 2021. Assembly Bill 2127 Electric Vehicle Charging Infrastructure Assessment: Analyzing Charging Needs to Support Zero-Emission Vehicles in 2030 – Commission Report. California Energy Commission. Publication Number: CEC-600-2021-001-CMR. July 2021. https://efiling.energy.ca.gov/GetDocument.aspx?tn=239615.
CEC 2021d. Baronas, Jean, Belinda Chen, et al. 2021. Joint Agency Staff Report on Assembly Bill 8: 2021 Annual Assessment of Time and Cost Needed to Attain 100 Hydrogen Refueling Stations in California. California Energy Commission and California Air Resources Board. Publication Number: CEC-600-2021-040. https://www.energy.ca.gov/sites/default/files/2021-12/CEC-600-2021-040.pdf.
CEC 2022a. California Energy Commission. 2022. "New ZEV Sales." California Energy Commission Zero Emission Vehicle and Infrastructure Statistics Data. January 31. Accessed March 2, 2022. https://www.energy.ca.gov/files/zev-and-infrastructure-stats-data.
192
CEC 2022b. Alexander, Matt. 2022. Home Charging Access in California. California Energy Commission. California Energy Commission Publication Number: CEC-600-2022-021. https://www.energy.ca.gov/sites/default/files/2022-01/CEC-600-2022-021.pdf.
CEC 2022c. California Energy Commission. (Workshop) ZEV Infrastructure Plan. Accessed March 10, 2022. https://www.energy.ca.gov/event/workshop/2022-01/workshop-zero-emission-vehicle-infrastructure-plan.
CEC 2022d. California Energy Commission. 2022. “California Energy Commission Zero-Emission Vehicle and Infrastructure Statistics.” Data last updated January 31, 2022. Accessed February 08, 2022. https://www.energy.ca.gov/data-reports/energy-insights/zero-emission-vehicle-and-charger-statistics.
CEC 2022e. California Energy Commission. 2022. “New ZEV Sales in California: Sales in 2021. ZEV Sales Share.” Accessed March 15, 2022. https://www.energy.ca.gov/data-reports/energy-insights/zero-emission-vehicle-and-infrastructure-statistics/new-zev-sales.
Census 2022. United States Census Bureau. 2022. "81111: Automotive mechanical and electrical repair and maintenance.” Accessed March 21, 2022. https://data.census.gov/cedsci/profile?g=0400000US06&n=81111.
Chestnut et al 2006. Chestnut, L. G., Thayer, M. A., Lazo, J. K. and Van Den Eeden, S. K., The Economic Value Of Preventing Respiratory And Cardiovascular Hospitalizations, Contemporary Economic Policy, 24: 127– 143, 2006. Accessed May 2021. https://onlinelibrary.wiley.com/doi/abs/10.1093/cep/byj007.
Choi 2021. Choi, Joseph. Massachusetts to require 100 percent of car sales to be electric by 2035, January 5, 2021. Accessed February 11, 2022. https://thehill.com/policy/energy-environment/532684-massachusetts-to-require-100-percent-of-car-sales-to-be.
CleanTechnica 2018. CleanTechnica. 2018. “Tesla Model 3 In Europe Will Come With A CCS Charging Port”. November 14, 2018. Accessed March 11, 2022. https://cleantechnica.com/2018/11/14/tesla-model-3-in-europe-will-come-with-a-ccs-charging-port/.
CleanTechnica 2022. Casey, Tina. 2022. “GM Announces $7 Billion Investment in EVs, Solid-State Battery Supply Chain.” CleanTechnica, January 26, 2022. Accessed March 21, 2022. https://cleantechnica.com/2022/01/26/gm-buries-solid-state-ev-battery-supply-chain-lede-under-historic-7-billion-auto-news/.
Climate Action 2018. Wentworth, Adam. 2018. “Amsterdam Arena Installs Major New Battery Storage” Accessed March 11, 2022. https://www.climateaction.org/news/amsterdam-arena-installs-major-new-battery-storage.
CNCDA 2022a. California New Car Dealers Association. 2022. “About Us.” Accessed March 11, 2022. https://www.cncda.org/about/.
CNCDA 2022b. California New Car Dealers Association. 2022. California Auto Outlook: Comprehensive information on the California vehicle market. February. Accessed March 4, 2022. https://www.cncda.org/wp-content/uploads/Cal-Covering-4Q-21.pdf
193
Consumer Reports 2019. New survey shows strong support for electric vehicles across economic spectrum. July 2019. Accessed January 31, 2022. https://advocacy.consumerreports.org/press_release/evsurvey2019/.
Consumer Reports 2020. Consumer Reports. 2020. “Consumer Interest and Knowledge of Electric Vehicles: 2020 Survey Results.” Published December 2020. https://advocacy.consumerreports.org/wp-content/uploads/2020/12/CR-National-EV-Survey-December-2020-2.pdf.
Consumer Reports 2021. Consumer Reports. 2021. “Consumer Attitudes Towards Electric Vehicles and Fuel Efficiency in California: 2020 Survey Results.” Published March 2021. https://advocacy.consumerreports.org/wp-content/uploads/2021/03/California-EV-FE-Survey-Report-3.8.21.pdf.
Cox 2019. Cox Automotive. 2021. “Overcoming Electric Vehicle Misconceptions is Crucial to Converting Consideration to Sales.” Press release. Published August 19, 2019. Accessed February 11, 2022. https://www.coxautoinc.com/news/overcoming-electric-vehicle-misconceptions-is-crucial-to-converting-consideration-to-sales/.
Cox 2021a. Cox Automotive. 2021. “2021 Cox Automotive Path to EV Adoption Study”. Conducted June/July 2021. Accessed January 21, 2021. https://www.coxautoinc.com/wp-content/uploads/2021/11/2021-Cox-Automotive-Path-to-EV-Adoption-Study-Highlights.pdf.
Cox 2021b. Cox Automotive. 2021. “Cox Automotive Commentary: June and First Half of 2021 U.S. Auto Sales.” Published July 1, 2021. https://www.coxautoinc.com/market-insights/cox-automotive-commentary-june-and-first-half-2021-u-s-auto-sales/.
CPUC 2021. California Public Utilities Commission. 2022. “Approved TE Investments.” Accessed March 10, 2022. https://www.cpuc.ca.gov/industries-and-topics/electrical-energy/infrastructure/transportation-electrification/approved-te-investments.
CPUC 2022a. California Public Utilities Commission. 2022. “Disadvantaged Communities Advisory Group (ca.gov).” Accessed February 17, 2022. https://www.cpuc.ca.gov/industries-and-topics/electrical-energy/infrastructure/disadvantaged-communities/disadvantaged-communities-advisory-group.
CPUC 2022b. California Public Utilities Commission. 2022. “Transportation Electrification.” January 26, 2022. Accessed March 10, 2022. https://www.cpuc.ca.gov/industries-and-topics/electrical-energy/infrastructure/transportation-electrification.
CPUC 2022c. California Public Utilities Commission. 2022. “Electricity Rates and Cost of Fueling.” January 26, 2022. Accessed March 10, 2022. https://www.cpuc.ca.gov/industries-and-topics/electrical-energy/infrastructure/transportation-electrification/electricity-rates-and-cost-of-fueling.
CPUC 2022d. California Public Utilities Commission. 2022. “California Public Utilities Commission Takes Action to Modernize Electric Grid for High Distributed Energy Resources Future.” January 26, 2022. https://www.cpuc.ca.gov/news-and-updates/all-news/cpuc-takes-action-to-modernize-electric-grid-for-high-distributed-energy-resources-future.
194
CSE 2022. Center for Sustainable Energy for the California Air Resources Board Clean Vehicle Rebate Project. Rebate Statistics. Data last updated February 2, 2022. Accessed March 11, 2022. https://cleanvehiclerebate.org/en/rebate-statistics.
Current Results 2022. Average Annual Temperatures for Cities in California. Accessed March 11, 2022. https://www.currentresults.com/Weather/California/average-annual-city-temperatures.php.
CVAP 2022. Clean Vehicle Assistance Program. Program Learnings & Data Transparency. Accessed March 11, 2022. https://cleanvehiclegrants.org/program-data/.
Deloitte 2020. Deloitte. 2020. “2020 Global Automotive Consumer Study.” Accessed November 1,2021. https://www2.deloitte.com/content/dam/Deloitte/us/Documents/manufacturing/us-2020-global-automotive-consumer-study-global-focus-countries.pdf.
Deloitte 2022. Deloitte. 2022. “2022 Global Automotive Consumer Study.” Published January 2022. https://www2.deloitte.com/content/dam/Deloitte/global/Documents/Consumer-Business/us-2022-global-automotive-consumer-study-global-focus-final.pdf.
Deukmajian et al 1981. Deukmejian, George and Anthony s. Da Vigo. 1981. “Legal Opinions of the Attorney General.” 64 Ops.Cal.Atty.Gen. 425. May 27,1981. https://oag.ca.gov/system/files/opinions/pdfs/80-718.pdf.
DOE 2011. United States Department of Energy. 2011. Critical materials strategy. December 2011. https://www.energy.gov/sites/prod/files/DOE_CMS2011_FINAL_Full.pdf
DOE 2015. United States Department of Energy. Fuel Economy Guide Model year 2015. Updated January 25, 2022. Accessed March 9, 2022. https://fueleconomy.gov/feg/pdfs/guides/FEG2015.pdf.
DOE 2016. US Department of Energy. 2016. Hydrogen and Fuel Cell Technologies Office Multi-Year Research, Development, and Demonstration Plan: Fuel Cells Section, 2016. Accessed February 11, 2022. https://www.energy.gov/sites/default/files/2017/05/f34/fcto_myrdd_fuel_cells.pdf
DOE 2022a. US Department of Energy. 2022. Fact of the week #1221. “January 17, 2022: Model Year 2021 All-Electric Vehicles Had a Median Driving Range about 60% That of Gasoline Powered Vehicles” Accessed March 9, 2022. https://www.energy.gov/eere/vehicles/articles/fotw-1221-january-17-2022-model-year-2021-all-electric-vehicles-had-median.
DOE 2022b. United States Department of Energy. 2022. Learn About the Label. Accessed March 9, 2022. https://www.fueleconomy.gov/feg/Find.do?action=bt1.
DOE 2022c. United States Environmental Protection Agency and United States Department of Energy. 2022. Compare Side-by-Side: 2018 Tesla Model 3 Long Range AWD, 2022 Tesla Model 3 Long Range AWD. Accessed March 9, 2022. https://www.fueleconomy.gov/feg/Find.do?action=sbs&id=40385&id=45011.
195
DOE 2022d. United States Department of Energy. 2022. Compare Side-by-Side: 2012 Toyota Prius, 2017 Toyota Prius Prime, and 2021 Toyota Rav-4 Prime. Accessed March 9, 2022. https://www.fueleconomy.gov/feg/Find.do?action=sbs&id=32484&id=38531&id=42793.
DOE 2022e. U.S. Department of Energy and the U.S. Environmental Protection Agency. n.d. 2013 Ford C-MAX Energi Plug-in Hybrid, 2013 Ford Fusion Energi Plug-in Hybrid, 2020 Ford Escape FWD PHEV. FuelEconomy.gov. Accessed February 25, 2022. https://www.fueleconomy.gov/feg/Find.do?action=sbs&id=33336&id=33398&id=42743.
DOE 2022f. United States Department of Energy. Fuel Economy Guide Model year 2022. Updated January 25, 2022. Accessed March 9, 2022. https://fueleconomy.gov/feg/pdfs/guides/FEG2022.pdf.
Duniway et al. 2019. Duniway, M.C., A. A. Pfennigwerth, S. E. Fick, T. W. Nauman, J. Belnap, and N. N. Barger. 2019. “Wind Erosion and Dust from US Drylands: A Review of Causes, Consequences, and Solutions in a Changing World.” Ecosphere 10(3). https://doi.org/10.1002/ecs2.2650.
Dunn 2021. Jessica Dunn, Margaret Slattery, Alissa Kendall, Hanjiro Ambrose, and Shuhan Shen. 2021. “Circularity of Lithium-Ion Battery Materials in Electric Vehicles.” Environ. Sci. Technol. 2021, 55, 8, 5189–5198. March 25, 2021. Accessed March 28, 2022. https://pubs.acs.org/doi/abs/10.1021/acs.est.0c07030.
EA 2018. Electrify America. 2018. California ZEV Investment Plan: Cycle 2. October 3, 2018. https://www.electrifyamerica.com/assets/pdf/Cycle 2 California ZEV Investment Plan.3e6ce81a.pdf.
EA 2021. Electrify America. 2021. California ZEV Investment Plan: Cycle 3. May 2021. https://www.electrifyamerica.com/assets/pdf/cycle3_invesment_plan.2338a9b6.pdf.
Edmunds 2018. Montoya, Ronald. 2018. “The Pros and Cons of Buying a Used EV.” Edmunds. Published March 5, 2018. Accessed January 31, 2022. https://www.edmunds.com/car-buying/the-pros-and-cons-of-buying-a-used-ev.html.
EIA 2014. U.S. Energy Information Administration. 2014. “Today in Energy: Consumer Energy Expenditures are Roughly 5% of Disposable Income, Below Long-Term Average.” October 21, 2014. Accessed March 18, 2022. https://www.eia.gov/todayinenergy/detail.php?id=18471.
Ellencweig et al 2019. Ben Ellencweig, Sam Ezratty, Dan Fleming, and Itai Miller. 2019. “Used Cars, New Platforms: Accelerating Sales in a Digitally Disrupted Market.” Mckinsey & Company. Published June 2019. https://www.mckinsey.com/industries/automotive-and-assembly/our-insights/used-cars-new-platforms-accelerating-sales-in-a-digitally-disrupted-market.
EPA 2000. United State Environmental Protection Agency., An SAB Report on EPA’s White Paper Valuing the Benefits of Fatal Cancer Risk Reduction (EPA-SAB-EEAC-00-013), 2000. Accessed May 2021. https://nepis.epa.gov/Exe/ZyPDF.cgi/P100JOK2.PDF?Dockey=P100JOK2.PDF
196
EPA 2010. United State Environmental Protection Agency. Appendix B: Mortality Risk Valuation Estimates, Guidelines for Preparing Economic Analyses (240-R-10-001). 2010. Accessed May 2021. https://www.epa.gov/sites/production/files/2017-09/documents/ee-0568-22.pdf
EPA 2016. United States Environmental Protection Agency, Integrated Science Assessment for Oxides of Nitrogen – Health Criteria, EPA/600/R-15/068, January 2016. http://ofmpub.epa.gov/eims/eimscomm.getfile?p_download_id=526855.
EPA 2019. United State Environmental Protection Agency. Integrated Science Assessment for Particulate Matter (Issue EPA/600/R-19/188). 2019. https://cfpub.epa.gov/ncea/isa/recordisplay.cfm?deid=347534.
EPA 2021a. U.S. Environmental Protection Agency, Revised 2023 and Later Model Year Light Duty Vehicle GHG Emissions Standards: Regulatory Impact Analysis, EPA-420-R-21-028, December 2021, p. 3-24, https://nepis.epa.gov/Exe/ZyPDF.cgi?Dockey=P1013ORN.pdf
EPA 2021b. U.S. Environmental Protection Agency, “Revised 2023 and Later Model Year Light-Duty Vehicle GHG Emissions Standards.” Federal Register 86, no. 248 (December 30, 2021): 74434. https://www.govinfo.gov/content/pkg/FR-2021-12-30/pdf/2021-27854.pdf.
EPA 2021c. United States Environmental Protection Agency. 2021. Climate Change and Social Vulnerability in the United States: A Focus on Six Impact Sectors. EPA 430-R-21-003. September 2021. Accessed March 9, 2022. https://www.epa.gov/cira/social-vulnerability-report.
EPA 2021d. U.S. Environmental Protection Agency. “California State Motor Vehicle Pollution Control Standards; Advanced Clean Car Program; Reconsideration of a Previous Withdrawal of a Waiver of Preemption; Opportunity for Public Hearing and Public Comment.” Federal Register 86, no. 80 (April 28, 2021): 22421. https://www.govinfo.gov/content/pkg/FR-2021-04-28/pdf/2021-08826.pdf EPA 2022. "EPA's Transportation and Air Quality Document Index System (DIS)." EPA.gov. June 21. Accessed March 3, 2022. https://dis.epa.gov/otaqpub/display_file.jsp?docid=40001&flag=1.
Fann et al 2012. Fann N, Baker KR, Fulcher CM., Characterizing the PM2.5-related health benefits of emission reductions for 17 industrial, area and mobile emission sectors across the U.S. Environ Int.; 49:141-51, November 15, 2012. https://www.sciencedirect.com/science/article/pii/S0160412012001985.
Fann et al 2018. Fann N, Baker K, Chan E, Eyth A, Macpherson A, Miller E, Snyder J. 2018. “Assessing Human Health PM2.5 and Ozone Impacts from U.S. Oil and Natural Gas Sector Emissions in 2025.” Environ. Sci. Technol. 52 (15), pp 8095–8103, 2018. https://www.ncbi.nlm.nih.gov/pmc/articles/PMC6718951/.
Fann et al 2019. Fann N, Fulcher CM, Hubbell BJ. The influence of location, source, and emission type in estimates of the human health benefits of reducing a ton of air pollution, Air
197
Quality, Atmosphere & Health, 2:169-176, 2019. Accessed March 11, 2022. https://www.ncbi.nlm.nih.gov/pmc/articles/PMC2770129/.
Forbes 2022. By Alan Ohnsman. “Panasonic To Make Tesla Battery Cells With Recycled Material From JB Straubel’s Redwood.” Posted January 2, 2022. Accessed March 11, 2022. https://www.forbes.com/sites/alanohnsman/2022/01/04/panasonic-to-make-tesla-battery-cells-with-recycled-material-from-jb-straubels-redwood/?sh=762260956e82.
Ford 2021. Ford Motor Company. 2021. “Superior Value From EVs, Commercial Business, Connected Services is Strategic Focus of Today’s ‘Delivering Ford+’ Capital Markets Day.” Press Release. May 26, 2021. Accessed March 10, 2022. https://media.ford.com/content/fordmedia/fna/us/en/news/2021/05/26/capital-markets-day.html.
Ford 2022. Ford Mach-e Specifications. 2022. “Charge Capability” and “Ford Mobile Power Cord.” Accessed March 10, 2022. https://www.ford.com/suvs/mach-e/?intcmp=charging-bb-vhp-mach-e.
Geotab 2020. Argue, Charlotte. 2020. “What can 6,000 EVs tell us about EV battery health.” Geotab. July 7, 2020. Accessed March 11, 2022. https://www.geotab.com/blog/ev-battery-health/#:~:text=First%20and%20foremost%2C%20based%20on,usable%20life%20of%20the%20vehicle.
GM 2020. “GM Reveals New Ultium Batteries and a Flexible Global Platform to Rapidly Grow its EV Portfolio.” Posted March 4, 2020. Accessed February 14, 2022. https://media.gm.com/media/us/en/gm/home.detail.html/content/Pages/news/us/en/2020/mar/0304-ev.html.
GO 2018. Governor Jerry Brown. 2018. Executive Order B-55-18. September 10, 2018. Accessed March 7, 2022. https://www.ca.gov/archive/gov39/wp-content/uploads/2018/09/9.10.18-Executive-Order.pdf.
GO 2020. Governor Gavin Newsom. Executive Order N-79-20. Released September 23, 2020. Accessed January 31, 2022. https://www.gov.ca.gov/wp-content/uploads/2020/09/9.23.20-EO-N-79-20-Climate.pdf.
GO 2022. State of California. 2022. Governor’s Budget Summary: 2022-2023. January 10, 2022. Accessed February 11, 2022. https://www.ebudget.ca.gov/2022-23/pdf/BudgetSummary/FullBudgetSummary.pdf
GO-BIZ 2021. California Governor’s Office of Business and Economic Development. 2021. “California Zero-Emission Vehicle Market Development Strategy.” Published February 2021. Accessed February 11, 2022. https://static.business.ca.gov/wp-content/uploads/2021/02/ZEV_Strategy_Feb2021.pdf.
GO-BIZ 2022a. California Governor’s Office of Business and Economic Development. 2022. “Agency ZEV Action Plans.” Accessed March 10, 2022. https://business.ca.gov/industries/zero-emission-vehicles/zev-strategy/agency-zev-action-plans/.
198
GO-BIZ 2022b. Governor’s Office of Business and Economic Development. Permitting Olympics. Accessed February 11, 2022. https://business.ca.gov/industries/zero-emission-vehicles/plug-in-readiness/permitting-olympics/
Gov Info 2022. 15 U.S.C. 1232 - Label and entry requirements. Accessed March 11, 2022. https://www.govinfo.gov/content/pkg/USCODE-2011-title15/pdf/USCODE-2011-title15-chap28-sec1232.pdf.
Green Car 2011. Green Car Reports. 2011. “Tesla’s 2012 Model S Charging Equipment.” Accessed March 11, 2022. https://www.greencarreports.com/news/1066861_teslas-2012-model-s-charging-equipment-redesign-for-redesigns-sake.
Green Car 2020. Green Car Congress. 2021. “Continental Mobility Study 2020 Finds People Still Have Doubts About EVs.” Published January 8, 2021. https://www.greencarcongress.com/2021/01/20210108-conti.html.
Green Car 2021a. Green Car Congress, “Strategy Analytics: Overall UX of BEVs Does Not Match Price Point”. Published April 15, 2021. Accessed March 10, 2022. https://www.greencarcongress.com/2021/04/20210414-saux.html.
Green Car 2021b. Green Car Congress. 2021. “Continental Mobility Study 2020 Finds People Still Have Doubts About EVs.” Published January 8, 2021. Accessed March 18, 2022. https://www.greencarcongress.com/2021/01/20210108-conti.html.
Green Car 2022. Edelstein, Stephen. 2022. “CEO: Ford plans to “reengineer” Mustang Mach-E incrementally, won’t save improvements for mid-cycle refresh.” Green Car Congress. Posted February 2, 2022. Accessed March 9. 2022. https://www.greencarreports.com/news/1134986_ceo-ford-plans-to-reengineer-mustang-mach-e-incrementally-wont-save-improvements.
Green Car Reports 2018. Evartas, Eric. 2018. “Nissan Begins Offering Rebuilt Leaf Battery Packs.” Green Car Reports. May 14, 2018. Accessed March 11, 2022. https://www.greencarreports.com/news/1116722_nissan-begins-offering-rebuilt-leaf-battery-packs.
Hardman 2021. Hardman, Scott and Gil Tal. 2021 “Discontinuance Among California’s Electric Vehicle Buyers: Why are Some Consumers Abandoning Electric Vehicles?” Research Report, University of California, Davis, National Center for Sustainable Transportation. Published April 1, 2021. https://escholarship.org/uc/item/11n6f4hs.
Herron 2016. Herron. 2016. “EV Fast Charging Standards – CHAdeMO, CCS, SAE Combo, Tesla Supercharger.” Accessed March 10, 2022. https://greentransportation.info/ev-charging/range-confidence/chap8-tech/ev-dc-fast-charging-standards-chademo-ccs-sae-combo-tesla-supercharger-etc.html.
Honda 2021. Honda News Room. 2021. “Summary of Honda Global CEO Inaugural Press Conference,” April 23, 2021. Accessed March 10, 2022. https://global.honda/newsroom/news/2021/c210423eng.html.
199
Honda 2022a. American Honda Motor Co., Inc. n.d. 2022 Honda CR-V 2WD LX. Accessed March 2, 2022. https://automobiles.honda.com/tools/build-and-price-result?modelid=RW1H2NEW&modelseries=cr-v&modelyear=2022&extcolorcode=NH-830M&tw-type=fromvlp%3D1#section=Powertrain&group=Powertrain&view=Exterior&angle=0&state=TTpSVzFIMk5FVyRFQzpOSC04MzBNJEhDOnVuZGVmaW.
Honda 2022b. American Honda Co., Inc. n.d. 2022 Honda CR-V AWD LX. Accessed March 2, 2022. https://automobiles.honda.com/tools/build-and-price-result?modelid=RW1H2NEW&modelseries=cr-v&modelyear=2022&extcolorcode=NH-830M&tw-type=fromvlp%3D1#section=Powertrain&group=Powertrain&view=Exterior&angle=0&state=TTpSVzJIMk5FVyRFQzpOSC04MzBNJEhDOnVuZGVmaW.
Hyundai 2021. Hyundai Motor Group. 2021. “Hyundai Motor Group’s next-generation fuel cell system, a key technology for popularizing hydrogen energy.” September 7, 2021. Accessed March 9, 2022. https://tech.hyundaimotorgroup.com/article/hyundai-motor-groups-next-generation-fuel-cell-system-a-keytechnology-for-popularizing-hydrogen-energy/.
ICCT 2019. Nicholas, Michael, Dale Hall and Nic Lutsey. 2019. Quantifying the Electric Vehicle Charging Gap Across U.S. Markets. International Council on Clean Transportation. https://theicct.org/wp-content/uploads/2021/06/US_charging_Gap_20190124.pdf.
ICCT 2021a. International Council on Clean Transportation. 2021. Update on the Global Transition to Electric Vehicles Through 2020 (Briefing). October 2021. Accessed January 31, 2022. https://theicct.org/sites/default/files/publications/global-update-evs-transition-oct21.pdf.
ICCT 2021b. Tankou, A., Lutsey, N., & Hall, D. The International Council on Climate and Transportation. Understanding and Supporting the Used Zero-Emission Vehicle Market. December 2021. Accessed January 31, 2022. https://theicct.org/wp-content/uploads/2021/12/ZEVA-used-EVs-white-paper-v2.pdf.
IEA 2021a. International Energy Agency. 2021. Global electric vehicle stock by region, 2010-2020. IEA, Paris. April 28, 2021. Accessed March 9, 2022. https://www.iea.org/data-and-statistics/charts/global-electric-vehicle-stock-by-region-2010-2020.
IEA 2021b. International Energy Agency. 2021. Global EV Outlook 2021: Accelerating ambitions despite the pandemic. IEA, Paris. Accessed March 1, 2022. https://iea.blob.core.windows.net/assets/ed5f4484-f556-4110-8c5c-4ede8bcba637/GlobalEVOutlook2021.pdf.
Inside EVs 2019. Inside EVs. 2019. Tesloop Explains Various Causes For Tesla Battery Degradation. April 22. Accessed March 11, 2022. https://insideevs.com/news/345589/tesloop-reasons-cause-battery-degradation/.
IPCC 2021. Intergovernmental Panel on Climate Change. 2021. The Physical Science Basis: Summary for Policymakers. IPCC, Switzerland. October 2021. https://www.ipcc.ch/report/ar6/wg1/downloads/report/IPCC_AR6_WGI_SPM_final.pdf.
200
IRENA 2019. International Renewable Energy Agency (IRENA). 2019. “Innovation Outlook: Smart Charging for Electric Vehicles.” https://www.irena.org/-/media/Files/IRENA/Agency/Publication/2019/May/IRENA_Innovation_Outlook_EV_smart_charging_2019.pdf.
J.D. Power 2021a. JD Power. 2021. “Majority of Electric Vehicle Owners Are Intent on Purchasing Another One in the Future, J.D. Power Finds.” Press release. Published January 21, 2021. https://www.jdpower.com/sites/default/files/file/2021-01/2021005%20U.S.%20EVX%20Ownership_0.pdf.
J.D. Power 2021b. J.D. Power. 2021. “Battleground for Electric Vehicle Purchase Consideration is Wide Open, J.D. Power Finds.“ Press Release. Published February 25, 2021. https://www.jdpower.com/business/press-releases/2021-us-electric-vehicle-consideration-evc-study.
J.D. Power 2021c. J.D. Power. 2021. “Level Up: Electric Vehicle Owners with Permanently Installed Level 2 Chargers Reap Benefits form Their Investment, J.D. Power Finds.” Press Release. Published February 3, 2021. https://www.jdpower.com/business/press-releases/2021-us-electric-vehicle-experience-evx-home-charging-study.
Jones et al 2020. Jones, Caitlin G. Ana G. Rappold, Jason Vargo, Wayne E. Cascio, Martin Kharrazi, Bryan McNally, and Sumi Hoshiko. 2020. “Out-of-Hospital Cardiac Arrests and Wildfire-Related Particulate Matter During 2015-2017 California Wildfires.” Journal of the American Heart Association 9(8). https://doi.org/10.1161/JAHA.119.014125
Kalashnikov et al. 2022. Kalashnikov, Dmitri, Jordan L. Schnell, John T. Abatzoglou, Daniel L. Swain, Deepti Singh. 2022. “Increasing co-occurrence of fine particulate matter and ground-level ozone extremes in the western United States.” Science Advances 8, eabi9386. January 5, 2022. Accessed March 9, 2022. https://www.science.org/doi/pdf/10.1126/sciadv.abi9386.
Keil 2015. Keil, Peter, and Andreas Jossen. 2015. "Aging of Lithium-Ion Batteries in Electric Vehicles: Impact of Regenerative Braking." World Electric Vehicle Journal 7.
Kurani et al 2016. Kurani, Kenneth, Nicolette Caperello, and Jennifer Tyree Hapegeman. 2016. “New Car Buyers’ Valuation of Zero-Emission Vehicles: California.” Accessed October 18, 2021. https://ww2.arb.ca.gov/sites/default/files/2020-04/12_332_ac.pdf.
KVPR 2021. Kline, Kerry. 2021. “As temperatures rise, air quality experts keep an eye on ’ozone climate penalty’.” Valley Public Radio. November 16, 2021. Accessed March 9, 2022. https://www.kvpr.org/health/2021-11-16/as-temperatures-rise-air-quality-experts-keep-an-eye-on-ozone-climate-penalty.
LA Times 2021a. Myers, John. 2021. “California unveils sweeping wildfire prevention plan amid record fire losses and drought.” L.A. Times. April 8, 2021. Accessed March 9, 2022. https://www.latimes.com/california/story/2021-04-08/california-wildfire-prevention-536-million-newsom-lawmakers.
LA Times 2021b. Barboza, Tony. 2021. “Wildfire smoke now causes up to half the fine-particle pollution in Western U.S., study finds.” L.A. Times, Jan. 13, 2021. Accessed March
201
10, 2022. https://www.latimes.com/california/story/2021-01-13/wildfire-smoke-fine-particle-pollution-western-us-study.
Laduzinsky 2019. Laduzinsky, Paige. 2019. “The Disproportionate Impact of Climate Change on Indigenous Communities.” KCET. December 19, 2019. Accessed March 9, 2022. https://www.kcet.org/shows/tending-nature/the-disproportionate-impact-of-climate-change-on-indigenous-communities.
Land Rover 2022. Land Rover. 2022. “New Range Rover: Orders Open for Flagship SV Model and Extended Range Plug-In Hybrid With 48 Miles Of EV Range”. Published January 27, 2022. Accessed February 25, 2022. https://media.landrover.com/en-us/news/2022/01/new-range-rover-orders-open-flagship-sv-model-and-extended-range-plug-hybrid-48-miles.
LAO 2020. Legislative Analyst’s Office. 2020. State Wildfire Response Costs Estimated to Be Higher Than Budgeted, Fig. 3. October 19, 2020. https://lao.ca.gov/Publications/Report/4285.
Legal 2014. Engine Manufacturers Association v. State Air Resources Board (2014) 231 Cal.App.4th 1022. Accessed March 11, 2022. https://www.leagle.com/decision/incaco20141124052
Liu et al. 2017. Liu, Xiaoxi et al. 2017. “Airborne Measurements of Western U.S. Wildfire Emissions: Comparison with Prescribed Burning and Air Quality Implications.” Journal of Geophysical Research: Atmospheres, 122, 6108-6129. June 14, 2017. doi:10.1002/2016JD 026315
Lucid 2021. Witt, Daniel. 2021. RE: Lucid Comments on May 6, 2021 Advanced Clean Cars II Workshop. Comment letter submitted to CARB by Lucid Motors. June 11, 2021.
MacInnis 2020. MacInnis, Bo and Jon A. Krosnick. 2020. “Climate Insights 2020: Surveying American Public Opinion on Climate Change and the Environment.” Resources for the Future, Washington, DC. Accessed January 24, 2022. https://media.rff.org/documents/Climate_Insights_2020_Electric_Vehicles.pdf.
Maldonado et al 2013. Julie Koppel Maldonado, Christine Shearer, Robin Bronen, Kristina Peterson, and Health Lazrus. 2013. “The Impact of Climate Change on Tribal Communities in the US: Displacement, Relocation, and Human Rights.” Climate Change (2013) 120:601-614. Published April 9, 2013. Accessed January 31, 2022. http://wordpress.ei.columbia.edu/climate-adaptation/files/2017/10/Maldonado-et-al-2011-Tribal-resettlement-US_ClimaticChange.pdf.
McClure 2018. McClure, Crystal D. and Daniel A. Jaffe. 2018. “US particulate matter air quality improves except in wildfire-prone areas.” PNAS 18; 115(31):7901-7906. July 16, 2018. https://doi.org/10.1073/pnas.1804353115
McKinsey 2019. McKinsey and Company. “Second-life EV batteries: The newest value pool in energy storage.” Accessed March 11, 2022. https://www.mckinsey.com/industries/automotive-and-assembly/our-insights/second-life-ev-batteries-the-newest-value-pool-in-energy-storage#.
202
Mercedes 2021. Mercedes-Benz. 2021. “Mercedes-Benz prepares to go all-electric.” Press Release. July 22, 2021. Accessed March 10, 2022. https://group-media.mercedes-benz.com/marsMediaSite/en/instance/ko/Mercedes-Benz-prepares-to-go-all-electric.xhtml?oid=50834319.
Mobile Power Solutions 2021. Mobile Power Solutions. 2021. “Q1-1695 Cell Cycle Life Test Report”. Prepared by Mobile Power Solutions for Quantum Scope. Spencer Poff. October 21, 2021. Accessed February 14, 2022. https://www.quantumscape.com/wp-content/uploads/2022/01/FINAL-20211027-Q1-1695-Cell-Cycle-Life.pdf.
Morning 2021a. Lisa Martine Jenkins. 2021. “The Electric Car Consumers Want: Lower Cost, Higher Mileage.” Morning Consult. Published February 9, 2021. Accessed March 10, 2022. https://morningconsult.com/2021/02/09/energy-efficiency-series-electric-vehicles-consumers-polling/.
Morning 2021b. Lisa Martine Jenkins. 2021. The Coming Electric Vehicle Wave: In 2022, Consumers Get Options. Published December 22, 2021. Accessed March 11, 2022. https://morningconsult.com/2021/12/22/electric-vehicles-consumers-2022/.
Motor Authority 2021. Edelstein, Stephen. 2022. “2022 GMC Hummer EV Edition 1 to have 329 miles of range, too heavy for official EPA rating”. November 24, 2021. Accessed March 9, 2022. https://www.motorauthority.com/news/1134272_2022-gmc-hummer-ev-edition-1-to-have-329-miles-of-range-too-heavy-for-official-epa-rating.
MOU 2014. Right to Repair Memorandum of Understanding. Released January 15, 2014. Accessed March 11, 2022. https://wanada.org/wp-content/uploads/2021/01/R2R-MOU-and-Agreement-SIGNED.pdf.
Muehlegger et al 2018. Muehlegger, Erich and David Rapson. 2018. “Understanding the Distributional Impacts of Vehicle Policy: Who Buys New and Used Alternative Vehicles?” National Center for Sustainable Transportation: UC Davis. February 2018. https://escholarship.org/uc/item/0tn4m2tx.
Muratori et al 2021. Matteo Muratori et al. 2021. “The rise of electric vehicles—2020 status and future expectations.” Progress in Energy 3 (2021) 022002. March 25, 2021. https://iopscience.iop.org/article/10.1088/2516-1083/abe0ad/pdf.
NADA 2021a. Manzi, Patrick. 2021. “NADA Market Beat: December 2021.” National Automobile Dealers Association. December. Accessed March 3, 2022. https://www.nada.org/WorkArea/DownloadAsset.aspx?id=21474865289.
NADA 2021b. National Automobile Dealers Association. NADA Data 2021: Annual Financial Profile of America’s Franchised New-Car Dealerships. Accessed March 18, 2022. https://www.nada.org/WorkArea/DownloadAsset.aspx?id=21474864928.
NAS 2017. National Academies of Sciences, Engineering, Medicine, Valuing Climate Damages: Updating Estimation of the Social Cost of Carbon Dioxide, 2017. Accessed May 2021. http://www.nap.edu/24651.
203
NAS 2021. National Academies of Sciences, Engineering, and Medicine. 2021. Assessment of Technologies for Improving Light-Duty Vehicle Fuel Economy—2025-2035. Washington, DC: The National Academies Press. March 31, 2021. Accessed January 31, 2022. https://doi.org/10.17226/26092.
NHTSA 2020. FCA Emissions Recall VB6 Diesel Engine Calibration, February 2020: “The engine control software… must be updated with an upgraded calibration as required by the US Environmental Protection Agency and California Air Resources Board for better emission performance. https://static.nhtsa.gov/odi/tsbs/2020/MC-10173340-9999.pdf.
NHTSA 2021. Department of Transportation. “Corporate Average Fuel Economy (CAFE) Preemption.” Federal Register 86, no. 247 (December 29, 2021): 74236. https://www.govinfo.gov/content/pkg/FR-2021-12-29/pdf/2021-28115.pdf Nissan 2022. Nissan USA. 2022. 2022 Nissan LEAF Range, Charging & Battery: Impressive range, impressive power. Accessed March 9, 2022. https://www.nissanusa.com/vehicles/electric-cars/leaf/features/range-charging-battery.html.
NOAA 2020. National Oceanic and Atmospheric Administration. 2020. “Earth just had its hottest September on record.” October 14, 2020. Accessed March 9, 2022. https://www.noaa.gov/news/earth-just-had-its-hottest-september-on-record.
NREL 2019. Kurtz, Jennifer, Sam Sprik, Genevieve Saur, and Shaun Onorato. 2019. Fuel Cell Electric Vehicle Durability and Fuel Cell Performance. Golden, CO: National Renewable Energy Laboratory. NREL/TP-5400-73011. https://www.nrel.gov/docs/fy19osti/73011.pdf.
NREL 2021a. National Renewable Energy Laboratory. 2021. “Electric Vehicle Registrations by State.” Published June 2021. https://afdc.energy.gov/data/10962.
NREL 2021b. Ge, Yanbo, Christina Simeone, Andrew Duvall and Eric Wood. 2021 There’s No Place Like Home: Residential Parking for the Future of Electric Vehicle Charging Infrastructure. National Renewable Energy Laboratory. Published October 2021. https://www.nrel.gov/docs/fy22osti/81065.pdf.
NREL 2022. National Renewable Energy Laboratory. 2017. “2010-2012 California Household Travel Survey”. Accessed March 2, 2022. https://www.nrel.gov/transportation/secure-transportation-data/tsdc-california-travel-survey.html.
NY Times 2020. Fuller, Thomas and Christopher Flavelle. 2020. “A Climate Reckoning in Fire-Stricken California.” New York Times. Updated October 27, 2020. Accessed March 9, 2022. https://www.nytimes.com/2020/09/10/us/climate-change-california-wildfires.html.
NY Times 2021. Neal E. Boudette and Coral Davenport. 2021. “G.M. Will Sell Only Zero-Emission Vehicles by 2035.” New York Times. Updated Oct. 1, 2021. Accessed March 10, 2022. https://www.nytimes.com/2021/01/28/business/gm-zero-emission-vehicles.html.
NY Times 2022. Ewing, Jack. 2022. “Mercedes opens a battery plant in Alabama, part of a Southern Wave.” New York Times. March 16, 2022. Accessed March 21, 2022.
204
https://www.nytimes.com/2022/03/16/business/energy-environment/mercedes-battery-factory-alabama.html
OEHHA 2010. Office of Environmental Health Hazard Assessment (OEHHA). 2010. Indicators of Climate Change in California: Environmental Justice Impacts. Released December 31, 2010. Accessed January 31, 2022. https://oehha.ca.gov/climate-change/document/indicators-climate-change-california-environmental-justice-impacts-report.
OEHHA 2018. Office of Environmental Health Hazard Assessment, California Environmental Protection Agency. 2018. Indicators of Climate Change in California. May 2018. https://oehha.ca.gov/media/downloads/climate-change/report/2018caindicatorsreportmay2018.pdf.
OMB 2003. Office of Management and Budgets. 2003. Circular A-4. Accessed May 2021. https://www.transportation.gov/sites/dot.gov/files/docs/OMB%20Circular%20No.%20A-4.pdf.
OPR 2022. Governor’s Office of Planning and Research. 2022. “Zero-Emission Vehicles.” Accessed February 11, 2022. https://opr.ca.gov/planning/transportation/zev.html
Park et al 2016. Park, Seong Suk, Abhilash Vijayan, Steve L. Mara and Jorn D. Herner. 2016. “Investigating the real-world emission characteristics of light-duty gasoline vehicles and their relationship to local socioeconomic conditions in three communities in Los Angeles, California.” Journal of the Air & Waste Management Association, 66:10, 1031-1044, DOI:10.1080/10962247.2016.1197166.
Patnik et al 2020. Patnaik, Aneesh, Jiahn Son, Alice Feng, and Crystal Ade. 2020. “Racial Disparities and Climate Change.” Princeton Student Climate Initiative. Released August 15, 2020. Accessed March 9, 2022. https://psci.princeton.edu/tips/2020/8/15/racial-disparities-and-climate-change.
Petkova 2016. Petkova, Elisaveta. 2016. “The Disproportionate Consequences of Climate Change.” Columbia Climate School National Center for Disaster Preparedness. February 12, 2016. Accessed March 9, 2022. https://ncdp.columbia.edu/ncdp-perspectives/the-disproportionate-consequences-of-climate-change/.
Pew 2021. Alison Spencer and Cary Funk. 2021. “Electric Vehicles Get Mixed Reception From American Consumers.” Pew Research Center. Published June 3, 2021. https://www.pewresearch.org/fact-tank/2021/06/03/electric-vehicles-get-mixed-reception-from-american-consumers/.
PIA 2021. Plug in America. 2021. “Satisfied Drivers, Optimistic Intenders.” Published February 2021. https://pluginamerica.org/wp-content/uploads/2021/02/2021-PIA-Survey-Report.pdf.
PNNL 2020. Kintner-Meyer, M., S. Davis, S. Sridhar, D. Bhatnagar, S. Mahserejian, and M. Ghosal. 2020. Electric Vehicles at Scale – Phase I Analysis: High EV Adoption Impacts on the Western U.S. Power Grid. Pacific Northwest National Laboratory. July 2020. https://www.pnnl.gov/sites/default/files/media/file/EV-AT-SCALE_1_IMPACTS_final.pdf
205
Presidential Documents 2021. Presidential Documents 2021. “Protecting Public Health and the Environment and Restoring Science To Tackle the Climate Crisis.” Federal Register 86, no. 14 (January 25, 2021): 7037. https://www.govinfo.gov/content/pkg/FR-2021-01-25/pdf/2021-01765.pdf Rivian 2021. Rivian. 2021. “Portable Charger Guide.” Accessed February 14, 2022. https://assets.rivian.com/k534zewngntr/6tSeP1ckHvnfK1Er0P3I3w/0a5ea4d419dcb86019db1e6a3a576b3f/portable-charger-guide.pdf.
Satyapal 2021. Satyapal, Sunita. 2021. “2021 AMR Plenary Session.” Presentation, US Department of Energy Hydrogen Technology Office Annual Merit Review. June 7, 2021. https://www.hydrogen.energy.gov/pdfs/review21/plenary5_satyapal_2021_o.pdf.
Shupeng et al. 2019. Zhu, Shupeng, Jeremy R Horne, Michael Mac Kinnon, G.S. Samuelsen, and Donald Dabdub. 2019. “Comprehensively Assessing the Drivers of Future Air Quality in California.” Environment International 125: 386–98. February 08, 2019. Accessed March 9, 2022. https://doi.org/10.1016/j.envint.2019.02.007.
Stanke et al 2013. Stanke, Carla, Marko Kerac, Christel Prudhomme, Jolyon Medlock, and Virginia Murray. 2013. “Health Effects of Drought: A Systematic Review of the Evidence.” PLoS Currents, 5 (2013). https://pubmed.ncbi.nlm.nih.gov/23787891/
Stellantis 2021a. Stellantis. 2021. “World Environment Day 2021 – Comparing Visions: Olivier Francois and Stefano Boeri, in Conversation to Rewrite the Future of Cities.” Press Release. June 4, 2021. Accessed March 10, 2022. https://www.media.stellantis.com/em-en/fiat/press/world-environment-day-2021-comparing-visions-olivier-franois-and-stefano-boeri-in-conversation-to-rewrite-the-future-of-cities.
Stellantis 2021b. Stellantis. 2021. “Stellantis Intensifies Electrification While Targeting Sustainable Double-Digit Adjusted Operating Income Margins in the Mid-Term.” Press Release. July 8, 2021. Accessed March 10, 2022. https://www.stellantis.com/en/news/press-releases/2021/july/stellantis-intensifies-electrification-while-targeting-sustainable-double-digit-adjusted-operating-income-margins-in-the-mid-term.
Tanim 2018. Tanim, Tanvir R., Matthew G. Shirk, Randy L. Bewley, Eric J. Dufek, and Bor Yann Liaw. 2018. “The implications of fast charge in lithium ion battery performance and life: cell vs. pack.” Study, Energy Storage and Advanced Vehicles Department, Idaho National Laboratory, Idaho Falls, Idaho: Idaho National Laboratory.
Tesla 2012. Tesla. 2012. “Tesla Motors Launches Revolutionary Supercharger Enabling Convenient Long Distance Driving.” Accessed March 11, 2022. https://ir.tesla.com/press-release/tesla-motors-launches-revolutionary-supercharger-enabling.
Tesla 2019. Tesla. 2019. “2019 Tesla Impact Report.” Released 2020. Accessed July 14, 2021. https://www.tesla.com/ns_videos/2019-tesla-impact-report.pdf.
Tesla 2020. Tesla. 2020. “2020 Tesla Impact Report.” Released 2021. Accessed January 31, 2022.https://www.tesla.com/ns_videos/2020-tesla-impact-report.pdf.
206
Tesla 2022a. Tesla. 2022. “Wall Connector.” Accessed January 17, 2022. https://shop.tesla.com/product/wall-connector.
Tesla, 2022b. Tesla. 2022. “Mobile Connector.” Accessed January 17, 2022. https://www.tesla.com/support/home-charging-installation/mobile-connector.
Toyota 2020. Toyota. 2020. “Toyota Introduces Second-Generation Mirai Fuel Cell Electric Vehicle as Design and Technology Flagship Sedan.” Toyota Newsroom. December 16, 2020. Accessed March 9, 2022. https://pressroom.toyota.com/toyota-introduces-second-generation-mirai-fuel-cell-electric-vehicle-as-design-and-technology-flagship-sedan/.
Toyota 2021. Toyota Europe Newsroom. 2021. “European premiere of the all-new Toyota bZ4X.” Posted December 2, 2021. Accessed March 11, 2022. https://newsroom.toyota.eu/european-premiere-of-the-all-new-toyota-bz4x/.
Toyota 2022a. Toyota Motor Sales, U.S.A., Inc. n.d. Toyota RAV4 Configurator - AWD LE. Accessed March 2, 2022. https://www.toyota.com/configurator/build/step/model:engine-drive-transmission/year/2021/series/rav4/model/4432/
Toyota 2022b. Toyota Motor Sales, U.S.A, Inc. n.d. Toyota RAV4 Configurator - FWD LE. Accessed March 2, 2022. https://www.toyota.com/configurator/build/step/model:engine-drive-transmission/year/2021/series/rav4/model/4430/
Turrentine et al 2018. Turrentine, Thomas, Gil Tal and David Rapson. 2018. “The Dynamics of Plug- in Electric Vehicles in the Secondary Market and Their Implications for Vehicle Demand, Durability, and Emissions.” April 13, 2018. Accessed January 31, 2022. https://ww2.arb.ca.gov/sites/default/files/classic/research/apr/past/14-316.pdf
UCLA 2018. Carlson. 2018. “The Clean Air Act’s Blind Spot: Microclimates and Hotspot Pollution.” 65 UCLA L. Rev. 1036. Accessed March 7, 2022. https://www.uclalawreview.org/wp-content/uploads/2019/09/65.5.1-Carlson.pdf.
UCLA 2019. Popper, Navarro, Lanfrankie, and Caro. “The (Potential) Value of Labelling in Lithium Ion Battery Supply Chain.” UCLA Anderson Global Supply Chain Blog. Accessed on March 11, 2022. https://blogs.anderson.ucla.edu/global-supply-chain/2019/03/the-potential-value-of-labeling-in-the-lithium-ion-battery-supply-chain.html.
UMich 2022. University of Michigan. 2022. “1,000-cycle lithium-sulfur battery could quintuple electric vehicle ranges.” Posted January 12, 2022. Accessed March 11, 2022. https://news.umich.edu/1000-cycle-lithium-sulfur-battery-could-quintuple-electric-vehicle-ranges/.
UN 2016. United Nations. 2016. World Economic and Social Survey 2016: Climate Change Resilience—an Opportunity for Reducing Inequalities. Released October 2016. Accessed March 11, 2022. https://www.un.org/sustainabledevelopment/blog/2016/10/report-inequalities-exacerbate-climate-impacts-on-poor/.
UN 2022. United Nations. 2021. “2021 joins top 7 warmest years on record: WMO.” UN News. January 19, 2022. Accessed March 9, 2022. https://news.un.org/en/story/2022/01/1110022.
207
US Code 1990a. Enforcement for Severe and Extreme ozone nonattainment areas for failure to attain, U.S Code 42 (1990), § 7511d.
US Code 1990b. Sanctions and consequences of failure to attain. U.S Code 42 (1990), § 7509.
US DRIVE 2019. U.S. DRIVE. 2019. Summary Report on EVs at Scale and the U.S. Electric Power System. U.S. Driving Research and Innovation for Vehicle Efficiency and Energy Sustainability (DRIVE). November 2019. Accessed March 10, 2022. https://www.energy.gov/sites/prod/files/2019/12/f69/GITT%20ISATT%20EVs%20at%20Scale%20Grid%20Summary%20Report%20FINAL%20Nov2019.pdf
USGCRP 2018. U.S. Global Change Research Program. 2018. Impacts, Risks, and Adaptation in the United States: Fourth National Climate Assessment, Volume II. [Reidmiller, D.R., C.W. Avery, D.R. Easterling, K.E. Kunkel, K.L.M. Lewis, T.K. Maycock, and B.C. Stewart (eds.)]. U.S. GCRP, Washington, DC, USA, 1515 pp. doi: 10.7930/NCA4.2018.
Veloz 2019. Veloz Opposites Attract Campaign Summary, October 22, 2019, Accessed February 11, 2022. https://www.electricforall.org/wp-content/uploads/2020/04/opposites_attract_summary-min.pdf.
Veloz 2020. Veloz Electric For All Kicking Gas Campaign, June 16, 2020. Accessed February 11, 2022. https://www.electricforall.org/wp-content/uploads/2020/06/kicking_gas_campaign_overview-min.pdf.
Veloz 2021. Veloz 2020-2021 Annual Report. Accessed February 11, 2022. https://www.veloz.org/resource/2020-2021-veloz-annual-report/.
Veloz 2022. Veloz. 2022. “Electric Vehicle Sales in California and the U.S.” (Quarterly Dashboard from California Energy Commission Data). Accessed February 23, 2022. https://www.veloz.org/wp-content/uploads/2022/02/Q4_2021_Dashboard_PEV_Sales_veloz_V3.pdf.
Volvo 2021. Volvo Car Group. 2021. “Volvo Cars to be fully electric by 2030.” Press Release. March 2, 2021. Accessed March 10, 2022. https://www.media.volvocars.com/us/en-us/media/pressreleases/277409/volvo-cars-to-be-fully-electric-by-2030.
VW 2017. Volkswagen Group of America. 2017. California ZEV Investment Plan: Cycle 1. https://www.electrifyamerica.com/assets/pdf/California ZEV Investment Plan Cycle 1.3bc672a3.pdf.
VW 2021. Volkswagen Newsroom. 2021. “Strategy update at Volkswagen: The transformation to electromobility was only the beginning.” March 5, 2021. Accessed March 10, 2022. https://www.volkswagen-newsroom.com/en/stories/strategy-update-at-volkswagen-the-transformation-to-electromobility-was-only-the-beginning-6875.
White House 2021a. White House, United States. 2021. The Infrastructure Investment and Jobs Act will Deliver for California. Accessed March 11, 2022.
208
https://www.whitehouse.gov/wp-content/uploads/2021/08/CALIFORNIA_The-Infrastructure-Investment-and-Jobs-Act-State-Fact-Sheet.pdf.
White House 2021b. White House. 2021. Updated Fact Sheet: Bipartisan Infrastructure Investment and Jobs Act. August 2, 2021. https://www.whitehouse.gov/briefing-room/statements-releases/2021/08/02/updated-fact-sheet-bipartisan-infrastructure-investment-and-jobs-act/.
White House 2021c. White House. 2021. Fact Sheet: The Biden-Harris Electric Vehicle Charging Action Plan. December 13, 2021. Accessed February 11, 2022. https://www.whitehouse.gov/briefing-room/statements-releases/2021/12/13/fact-sheet-the-biden-harris-electric-vehicle-charging-action-plan/.
White House 2021d. Interagency Working Group on the Social Cost of Carbon, Technical Update of the Social Cost of Carbon for Regulatory Impact Analysis Under Executive Order 13990, 2021. Accessed May 2021. https://www.whitehouse.gov/wp-content/uploads/2021/02/TechnicalSupportDocument_SocialCostofCarbonMethaneNitrousOxide.pdf.
Williams et al. 2019. Williams, A. Park, John Abatzoglou, Alexander Gershunov, Janin Guzman‐Morales, J., Bishop, D. A., Balch, J. K., and Lettenmaier, D. P. 2019. “Observed impacts of anthropogenic climate change on wildfire in California.” Earth's Future, 7, 892–910. July 15, 2019. https://doi.org/10.1029/2019EF001210.
Yang 2018. Yang et. al “Considering Battery Degradation in Life Cycle Greenhouse Gas Emission Analysis of Electric Vehicles.” 25th CIRP Life Cycle Engineering (LCE) Conference 505-510. doi:10.1016/j.procir.2017.12.008
Yoshida 2020. Yoshida. 2020. “CHAdeMO Charging Standard Future Direction.” February 17. Accessed March 11, 2022. https://www.itf-oecd.org/sites/default/files/docs/charging-infrastructure-standardisation-developments-yoshida.pdf.
Zhang et al 2018a. Zhang J, Jorgenson J, Markel T and Walkowicz K 2019 Value to the grid from managed charging based on California's high renewables study IEEE Trans. Power Syst. 34 831–40.
Zhang et al 2018b. Zhang, X., Li, L., Fan, E., Xue, Q., Bian, Y., Wu, F., & Chen, R. 2018. Toward sustainable and systematic recycling of spent rechargeable batteries. Chemical Society Reviews, 47(19), 7239-7302. doi: 10.1039/c8cs00297e.
Zhuo et al 2021. Kai Zhou, Qiang Xie, Baohua Li, and Arumugam Manthiram. 2021. “An in-depth understanding of the effect of aluminum doping in high-nickel cathodes for lithium-ion batteries.” Energy Storage Materials, Volume 34, 2021, Pages 229-240, ISSN 2405-8297, https://doi.org/10.1016/j.ensm.2020.09.015.
209
Referenced in Appendix F (F-7):
Tal et al. 2020. Gil Tal, et al. Figure 51 “Share of Daily VMT by Distance Bin: Weekdays vs Weekends.” Advanced Plug-in Electric Vehicle Travel and Charging Behavior Final Report (CARB Contract 12-319 – Funding from CARB and CEC). April 10, 2020. https://csiflabs.cs.ucdavis.edu/~cjnitta/pubs/2020_03.pdf.