abstract williams, jada octavia. predicting
TRANSCRIPT
ABSTRACT
WILLIAMS, JADA OCTAVIA. Predicting Technology Use in Post-Secondary Teaching. (Under the direction of Dr. James Bartlett, II).
This study examined the relationships between UTAUT scores, academic discipline,
institutional characteristics, and technology use in post-secondary teaching. UTAUT
variables (performance expectancy, effort expectancy, social influence, facilitating
conditions) were examined to describe possible correlations with how frequently instructors
use applications and devices in their teaching. Institutional characteristics such as Carnegie
Classification and Governance structure also were examined to describe possible correlations
with how frequently instructors use applications and devices in their teaching.
The research methodology included a survey design utilizing the Unified Theory of
Acceptance and Use of Technology (UTAUT) framework. The sample was drawn from
EDUCAUSE Instructional Technology Constituent Group listserv subscribers. The study was
expected to describe the variance that UTAUT variables, academic discipline, and
institutional characteristics explained about how frequently instructors use applications and
devices in teaching. The purpose of this study was to provide decision-makers with an
understanding of influences for technology use in various higher education settings to help
design strategies to increase faculty technology use in higher education.
© Copyright 2015 by Jada Octavia Williams
All Rights Reserved
Predicting Technology Use in Post-Secondary Teaching
by Jada Octavia Williams
A dissertation submitted to the Graduate Faculty of North Carolina State University
in partial fulfillment of the requirements for the degree of
Doctor of Education
Adult and Community College Education
Raleigh, North Carolina 2015
APPROVED BY:
_______________________________ ______________________________ Dr. James Bartlett, II Dr. Diane Chapman Committee Chair
________________________________ ______________________________ Dr. Brad Mehlenbacher Dr. Donna Petherbridge
ii
BIOGRAPHY
I’m employed as an in instructional designer for a Fortune 100 financial services
organization after spending several years as an instructional designer for a small, private,
nonprofit university in North Carolina.
I currently live in Charlotte, North Carolina with my husband, Greg, and our 1 year
old daughter, Kaylyn. Now that this study is complete, I have more time to enjoy with my
family.
iii
TABLE OF CONTENTS
LIST OF TABLES ................................................................................................................. vi TABLE OF FIGURES .......................................................................................................... vii CHAPTER ONE: INTRODUCTION & BACKGROUND ................................................ 1
Introduction ......................................................................................................................... 1 Problem Statement.............................................................................................................. 3 Purpose Statement .............................................................................................................. 5 Theory and Conceptual Framework ................................................................................. 5
The UTAUT model ......................................................................................................... 5 Research Questions ............................................................................................................. 7 Significance of Study........................................................................................................... 8
Organizational Challenges ............................................................................................. 9 Societal Challenges........................................................................................................ 12 Meeting Challenges ....................................................................................................... 14
Definition of Terms ........................................................................................................... 18 CHAPTER TWO: LITERATURE REVIEW .................................................................... 21
Historical Overview of Technology Integration ............................................................. 21 Theoretical Framework .................................................................................................... 24
Kotrlik and Redmann Technology Integration Model© ........................................... 24 Roger’s Diffusion of Innovations ................................................................................. 26 Variables Associated with Adoption ........................................................................... 29 The Four Constructs of the UTAUT ........................................................................... 29
Other Factors .................................................................................................................... 31 Discipline ........................................................................................................................ 31 Institutional Characteristics ........................................................................................ 32 Leadership and Adoption ............................................................................................. 33
Summary of Literature Review ....................................................................................... 35 CHAPTER THREE: METHODOLOGY .......................................................................... 37
Research Design ................................................................................................................ 37 Population .......................................................................................................................... 37 Instrumentation................................................................................................................. 39 Data Collection .................................................................................................................. 41 Data Analysis ..................................................................................................................... 43 Summary of Methods ....................................................................................................... 47
CHAPTER FOUR: RESULTS ............................................................................................ 49 Introduction ....................................................................................................................... 49 Demographics .................................................................................................................... 49 How frequently are instructors in the Instructional Technology Constituent Group
using technology in their teaching? ............................................................................ 52 What is the level of UTAUT for performance expectancy, effort expectancy, social
influence, facilitating conditions for instructors in the Instructional Technology Constituent Group? ..................................................................................................... 60
iv
What is the relationship between Instructional Technology Constituent Group instructors’ UTAUT levels and how frequently they use technology in their teaching? ....................................................................................................................... 62
What is the relationship between Instructional Technology Constituent Group instructors’ academic discipline and how frequently they use technology in their teaching? ....................................................................................................................... 64
What is the relationship between Instructional Technology Constituent Group instructors’ institutional characteristics where they teach and how frequently they use technology in their teaching?................................................................................ 66
Do UTAUT variables, academic discipline, and institutional characteristics influence how frequently Instructional Technology Constituent Group instructors’ use technology in their teaching? ...................................................................................... 68
Summary of Results .......................................................................................................... 70 CHAPTER FIVE: CONCLUSION ..................................................................................... 73
Discussion of Findings ...................................................................................................... 73 Demographic Data ........................................................................................................ 73 Conclusion 1: How frequently are instructors in the Instructional Technology
Constituent Group using technology in their teaching? ...................................... 74 Conclusion 2: What is the level of UTAUT for performance expectancy, effort
expectancy, social influence, facilitating conditions for instructors in the Instructional Technology Constituent Group? ..................................................... 75
Conclusion 3: What is the relationship between Instructional Technology Constituent Group instructors’ UTAUT levels and how frequently they use technology in their teaching? .................................................................................. 76
Conclusion 4: What is the relationship between Instructional Technology Constituent Group instructors’ academic discipline and how frequently they use technology in their teaching? ........................................................................... 77
Conclusion 5: What is the relationship between Instructional Technology Constituent Group instructors’ institutional characteristics where they teach and how frequently they use technology in their teaching? ................................ 77
Conclusion 6: Do UTAUT variables, academic discipline, and institutional characteristics influence how frequently Instructional Technology Constituent Group instructors’ use technology in their teaching? .......................................... 78
Summary of Conclusions .................................................................................................. 78 Recommendations ............................................................................................................. 79
General Recommendations .......................................................................................... 79 Implications for Practice and Policy ........................................................................... 80 Recommendations for Future Research ..................................................................... 83
Limitations ......................................................................................................................... 84 Delimitations ...................................................................................................................... 84
REFERENCES ...................................................................................................................... 85 APPENDICES ....................................................................................................................... 95
Appendix A ........................................................................................................................ 96 Notification Letter -1st Contact .................................................................................... 96 Notification Letter – 2nd Contact ................................................................................. 98
Appendix B ...................................................................................................................... 100
v
Informed Consent – 1st Contact ................................................................................. 100 Informed Consent – 2nd Contact ................................................................................ 102
Appendix C ...................................................................................................................... 104 Survey Instrument ...................................................................................................... 104

vi
LIST OF TABLES
Table 1 Frequency and Percent for Full-Time, Part-Time, Nonidentified Status, and All Respondents by Academic Discipline ......................................................................... 50
Table 2 Frequency and Percent of Full-time Instructors by Carnegie Classification ........... 51 Table 3 Frequency and Percent of Full-time Instructors by Governance Structure .............. 52 Table 4 Mean, Median, Standard Deviation for Individual Application Type ....................... 54 Table 5 Mean, Median, Standard Deviation for Individual Device Type ............................... 57 Table 6 Mean, Median, Standard Deviation for Summated Application and Device Use
Scores for Full-Time, Part-Time, Nonidentified Status, and All Respondents ........... 59 Table 7 Mean, Median, Standard Deviation for UTAUT Score for Full-Time, Part-Time,
Nonidentified Status, and All Respondents ................................................................. 62 Table 8 Correlations for Frequency of Device Use and Frequency of Application Use by
UTAUT Score .............................................................................................................. 63 Table 9 Correlations for Frequency of Device Use by Construct Scores ............................... 63 Table 10 Correlations for Frequency of Application Use by Construct Scores ..................... 64 Table 11 Crosstabulation for Frequency of Application Use by Academic Discipline .......... 65 Table 12 Crosstabulation for Frequency of Device Use by Academic Discipline ................. 66 Table 13 Crosstabulation for Frequency of Application Use and Frequency of Device Use for
Full-time Instructors by Carnegie Classification ....................................................... 67 Table 14 Crosstabulation for Frequency of Application Use and Frequency of Device Use for
Full-time Instructors by Governance Structure .......................................................... 68 Table 15 Logistic Regression Analysis for Frequency of Application Use ............................ 68 Table 16 Logistic Regression Analysis for Frequency of Device Use .................................... 69 Table 17 Questions To Use When Predicting Technology Use in Teaching .......................... 81
vii
TABLE OF FIGURES
Figure 1. UTAUT (p.447) .......................................................................................................... 6 Figure 2. Conceptual Framework ............................................................................................. 7
1
CHAPTER ONE: INTRODUCTION & BACKGROUND
Introduction
Adult education scholars have long acknowledged the barriers educators face which
often prevent them from embracing instructional technologies (Baltaci-Goktalay & Mehmet,
2006; Furuholt & Orvik, 2006). These barriers exist at both the individual and organizational
level. At the organizational level, each post-secondary institution has its own characteristics
(Levin, Stephan, & Winkler, 2012; Levin, Kater, & Wagoner, 2006; Birnbaum, 1991; Weick,
1976) that play a role in technology use (Matthews, 2008; Roberts, 2008; Owen & Demb,
2004). Organizations have been viewed in variety of manners in terms of their
characteristics. Several categorizations of organizations have been developed, including
Weick’s (1976) distinction between organizations, seeing them as either “tightly coupled” or
“loosely coupled” and Birnbaum’s (1991) characterization of four institution types in higher
education as collegial, bureaucratic, political, and anarchical.
Likewise, faculty members who belong to these institutions have their own set of
characteristics and needs, which play a role in their technology use choices as well.
Individual characteristics that have been studied in relation to technology use include gender,
professional area (Agbonlahor, 2008; Matthews, 2008; Li & Linder, 2007; Diaz & Cheslock,
2006), employment status and workload (Jackowski & Akroyd, 2010; Meyer & Xu, 2009;
Sahin & Thompson, 2006; Diaz &Cheslock, 2006). These are just a few of the many factors
that have been found to influence technology use among faculty at post-secondary
institutions.
Surry and Land (2000) described a framework that higher education administrators
can use to increase the utilization of technology on their campuses. In their research they
2
found,
A key element in the effective utilization of any innovation in higher
education is promoting faculty buy-in. Faculty motivation to use technology
will not be increased simply by purchasing more technology. It is important
for administrators to realize that increasing technology use is not a goal that
can be simply added to existing frameworks or strategic plans. Rather,
increasing faculty motivation must be part of a university’s overall change
strategy. (p. 152)
There are numerous reasons why instructional technology implementations have not
been successful (Matthews, 2008). Within the last 10 years, the process for adopting
technologies has generally been a "top-down" process where the administrators made the
decisions from beginning to end with little input from faculty members (Matthews, 2008;
Sahin & Thompson 2006; Carman, 2003). However, research has shown that leaving faculty
out of the adoption and implementation process can be a barrier to adoption and make
implementation efforts unsuccessful (Reid, 2012; Matthews, 2008; Sahin & Thompson 2006;
Carmen, 2003). Therefore, both a top-down and a “bottom-up” approach involving
administrators and faculty at various points would likely be best as an implementation
strategy (Matthews, 2008; Sahin & Thompson 2006; Carman, 2003). When organizations are
in the midst of disruptive change, such as making a major change in technology used in their
daily jobs, tension and anxiety levels are high and times are uncertain (Johnson, Wisniewski,
Kuhlemeyer, Isaacs, & Krzykowski, 2012; Kotrlik & Redmann, 2009; Park & Ertmer, 2007;
Brinkerhoff, 2006). Long-term success in this integration of technology is dependent upon
the careful planning and decision-making of leaders (Owen & Demb, 2004) and the
3
champions (Aitken & Shedletsky, 2001; Matthews, 2008) they employ. Possible solutions for
preparing faculty for change when implementing instructional technology include planning,
providing support, and recognizing and rewarding effort, although scholars (Aitken &
Shedletsky, 2001; Kidd, 2009; Kinuthia, 2005) have identified several other factors pertinent
to the adoption process.
Problem Statement
While research has found an increase in the number of technology-enhanced courses
since 1991, there is evidence of continued varying usage levels of technology among
educators belonging to different institution types (Birnbaum, 1991; Dahlstrom, 2011) and
varying adoption rates across institutions types (Levin, Stephan, & Winkler, 2012).
According to Birnbaum (1991), “The technology employed by an open admissions college in
educating students is likely to be considerably different from technology utilized by a
selective liberal arts college” (p. 54). Echoing Birnbaum’s statement nearly 20 years later, a
recent research report found that technology use among community college faculty was low
compared to technology use among faculty at research universities (Dahlstrom, 2011). To be
more specific, compared to four-year, public and private institutions, community college
instructors were less likely to use laptops, projectors, Wi-Fi, student response systems,
document cameras, USB thumb drives, interactive whiteboards, smartphones, webcams,
iPads, and digital and flip video cameras (Dahlstrom, 2011). Birnbaum (1991) said,
Systems theory makes it easier to understand why these differences in the
technical subsystem are almost certain to be reflected in differences in other
subsystems as well. In particular, administrators should be aware that the
management subsystems of two different institutions are likely to be different,
4
and indeed, that if their technologies vary, then their management systems
should vary. We must therefore learn to be wary of any normative statement
of administration or management that does not clearly specify the
characteristics of the type of organization to which it is to apply. (p.54)
Furthermore, Whetten and Cameron (1985) suggested that “administrators who move
from one institution to another may be ineffective because of preconceptions ‘linked to
previous personal successes at other universities’” (p. 41). And, not only does research
suggest that administrators take into account the unique characteristics of the organizations
for which they work, but the literature suggests that technology usage levels vary across
academic disciplines, too, as a result of their uniqueness (Kagima and Hausafus, 2000; Li and
Lindner, 2007).
Therefore, if administrators don’t understand the characteristics of the organization
for which they work nor unique environments contributing to faculty motivations for
technology use enough to proactively implement it, then efforts to increase technology use
likely won’t be successful. And, because of the flexibility that modern technologies allow,
research has shown that when faculty do not integrate technology, students often struggle
with meeting the logistical challenges associated with balancing demands from home, work,
school, and family (Johnson et al., 2012). Also, research has shown that students perform
better and demonstrate improved literacy when exposed to technology in the classroom
(George, 2000). In addition, Johnson, Adams, and Cummins (2012) found that the integration
of collaborative technologies better prepares students for teamwork and group
communication that is necessary in the workplace.
5
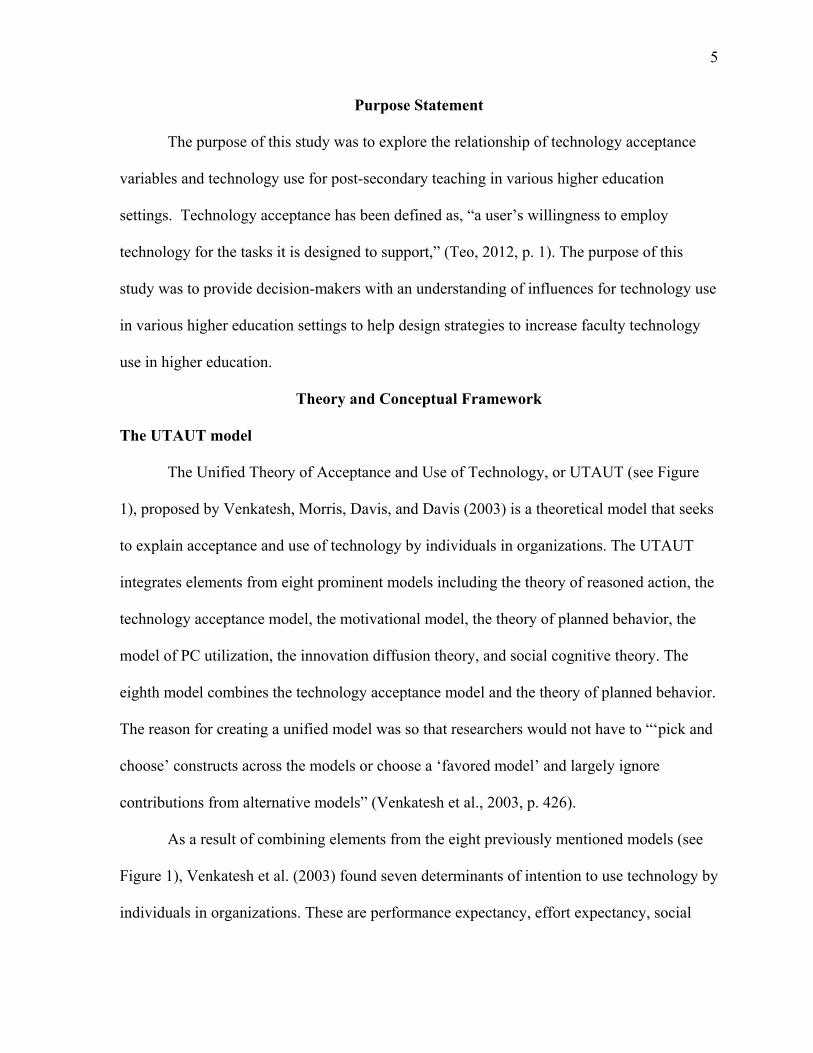
Purpose Statement
The purpose of this study was to explore the relationship of technology acceptance
variables and technology use for post-secondary teaching in various higher education
settings. Technology acceptance has been defined as, “a user’s willingness to employ
technology for the tasks it is designed to support,” (Teo, 2012, p. 1). The purpose of this
study was to provide decision-makers with an understanding of influences for technology use
in various higher education settings to help design strategies to increase faculty technology
use in higher education.
Theory and Conceptual Framework
The UTAUT model
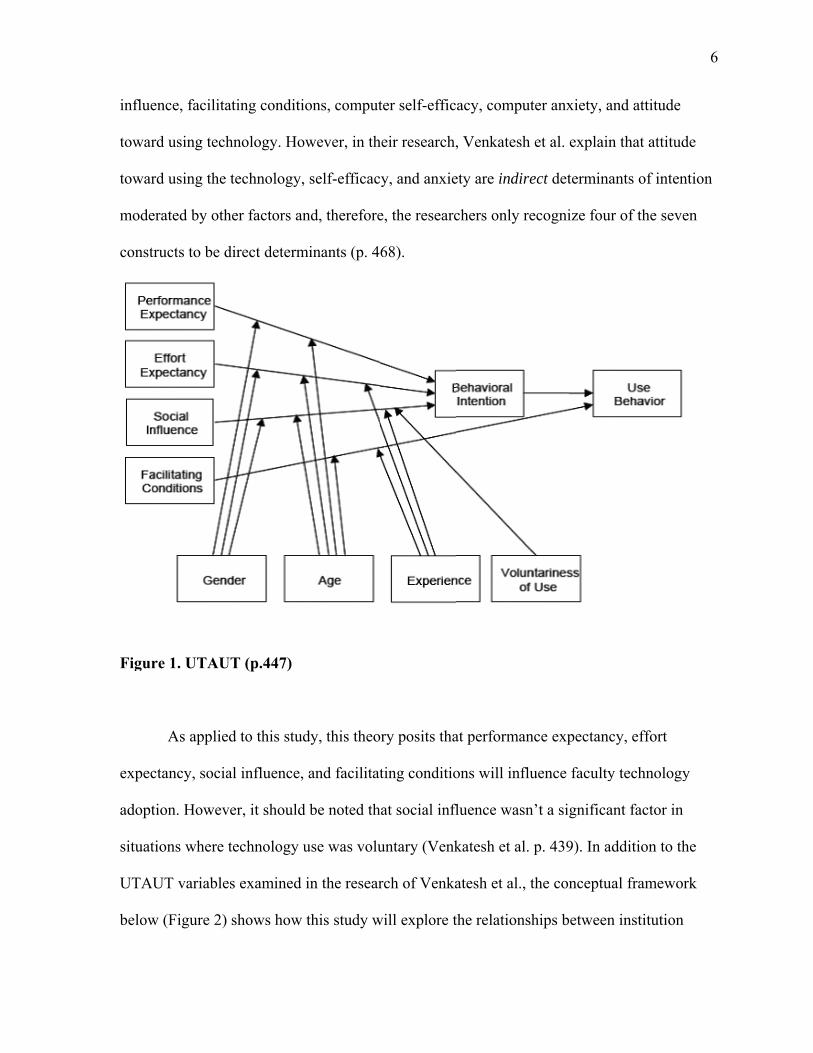
The Unified Theory of Acceptance and Use of Technology, or UTAUT (see Figure
1), proposed by Venkatesh, Morris, Davis, and Davis (2003) is a theoretical model that seeks
to explain acceptance and use of technology by individuals in organizations. The UTAUT
integrates elements from eight prominent models including the theory of reasoned action, the
technology acceptance model, the motivational model, the theory of planned behavior, the
model of PC utilization, the innovation diffusion theory, and social cognitive theory. The
eighth model combines the technology acceptance model and the theory of planned behavior.
The reason for creating a unified model was so that researchers would not have to “‘pick and
choose’ constructs across the models or choose a ‘favored model’ and largely ignore
contributions from alternative models” (Venkatesh et al., 2003, p. 426).
As a result of combining elements from the eight previously mentioned models (see
Figure 1), Venkatesh et al. (2003) found seven determinants of intention to use technology by
individuals in organizations. These are performance expectancy, effort expectancy, social
influe
towar
towar
mode
const
Figur
expec
adopt
situat
UTA
below
ence, facilita
rd using tech
rd using the
erated by oth
tructs to be d
re 1. UTAU
As applie
ctancy, socia
tion. Howev
tions where t
AUT variable
w (Figure 2)
ating conditi
hnology. Ho
technology,
her factors an
direct determ
UT (p.447)
d to this stud
al influence,
ver, it should
technology u
es examined
shows how
ons, comput
owever, in th
self-efficac
nd, therefore
minants (p. 4
dy, this theo
and facilitat
d be noted th
use was volu
in the resear
this study w
ter self-effic
heir research,
y, and anxie
e, the researc
68).
ry posits tha
ting conditio
hat social infl
untary (Venk
rch of Venka
will explore t
acy, comput
, Venkatesh
ety are indire
chers only re
at performan
ons will influ
fluence wasn
katesh et al.
atesh et al., t
the relationsh
ter anxiety, a
et al. explain
ect determin
ecognize fou
nce expectan
uence faculty
n’t a significa
p. 439). In a
the conceptu
hips between
and attitude
n that attitud
ants of inten
ur of the seve
ncy, effort
y technology
ant factor in
addition to th
ual framewor
n institution
6
de
ntion
en
y
he
rk

chara
techn
Figur
1. H
te
2. W
in
C
3. W
U
4. W
ac
5. W
acteristics, ac
nology in tea
re 2. Concep
How frequent
echnology in
What is the le
nfluence, fac
Constituent G
What is the re
UTAUT leve
What is the re
cademic disc
What is the re
cademic disc
aching.
ptual Fram
tly are instru
n their teachi
evel of UTA
cilitating con
Group?
elationship b
ls and how f
elationship b
cipline and h
elationship b
ciplines, tech
mework
Rese
uctors in the
ing?
AUT for perfo
nditions for i
between Inst
frequently th
between Inst
how frequen
between Inst
hnology acce
earch Quest
Instructiona
formance exp
instructors in
tructional Te
hey use techn
tructional Te
ntly they use
tructional Te
eptance vari
tions
al Technolog
pectancy, eff
n the Instruc
echnology C
nology in the
echnology C
technology
echnology C
iables, and a
gy Constitue
fort expectan
ctional Techn
onstituent G
eir teaching?
onstituent G
in their teac
onstituent G
ctual use of
ent Group us
ncy, social
nology
Group instruc
?
Group instruc
ching?
Group instruc
7
ing
ctors’
ctors’
ctors’
8
institutional characteristics where they teach and how frequently they use technology in
their teaching?
6. Do UTAUT variables, academic discipline, and institutional characteristics influence
how frequently Instructional Technology Constituent Group instructors’ use technology
in their teaching?
Significance of Study
Organizational and societal challenges have been known to impact technology
adoption in higher education (Levin, et al., 2012; Amirault & Visser, 2009). According to the
recent research of Levin, Stephan, and Winkler (2012), factors contributing to the diffusion
of technology in higher education have to do with:
(1) benefits received from adoption (e.g. type of institution by
teaching/research mission and number of previous adopters); (2) costs of
adoption (e.g. geographic location, size of institution and faculty ‘know-
how’); (3) the industry or social environment (e.g. whether a public or private
institution, region and percentage female faculty) and (4) uncertainty and
information (e.g. whether a branch of a doctoral institution). p. 1766
Based on these findings, the researchers concluded, “Innovations in higher education are
unlikely to be adopted by all institutions at the same time, with the speed of adoption largely
depending upon the goals, needs and primary funding source of the institution” (p. 1779).
Higher education has survived over many years since its inception, for the most part,
because of its ability to adapt to intellectual, political, and technological change (Amirault &
Visser, 2009). Today, higher education is faced with the task of meeting the demands of a
growing knowledge economy and re-inventing itself by the careful exploitation of
9
instructional technologies (Amirault & Visser, 2009). Although, Amirault and Visser (2009)
suggested that technology can play a critical role in helping higher education meet various
organizational and societal challenges, the adoption of technology can be a challenge unto
itself (Straub, 2009; Nicolle & Lou, 2008; Roberts, 2008; Owen & Demb, 2004; Sahin &
Thompson, 2006).
Organizational Challenges
According to the UTAUT, four moderators or factors are likely to be related to
performance expectancy, effort expectancy, social influence, and facilitating conditions.
These factors are gender, age, experience, voluntariness (Venkatesh et al., 2003, p.447).
Although not included in the original UTAUT study, there have been several studies
conducted outside of the framework of the UTAUT that suggest organizational and societal
culture play a role in faculty’s acceptance of technology. For example, Owen and Demb
(2004) found,
Institutional cultures are not easily changed; they shift at a glacial pace
inconsistent with the new modes of interaction. Unpredictable changes in the
availability and capability of new technology generate anxiety for decision-
makers who are trying to select effective technology options, and frustrate
users trying to stay current with software and hardware. (p. 658-659)
For this reason, careful planning and support are needed from higher education leadership.
Implementing instructional technology is a fragile process because so many things can go
wrong and unexpected roadblocks may arise along the way, not to mention the current
personal and institutional barriers such as attitudes, culture, and facilitating conditions (i.e.
training, technology infrastructure, etc.) that need improvement for implementation and
10
adoption to be a success (Baltaci-Goktalay & Mehmet, 2006; Owen & Demb, 2004; Carman,
2003; Jackowski & Akroyd, 2010).
Walker, Armenakis, and Bernerth (2007) said that “change efforts are influenced by
content, contextual, process issues, and individual differences that exist among the change
targets” (p. 762). Furthermore, they suggested that, “… identifying the nature in which these
factors interact will add to the understanding of employee responses to change and
ultimately, aid management in … ensuring employee commitment to change” (Walker et al.
2007, p.762). The research conducted by Walker et al. (2007) suggested that the manner in
which change is implemented may have an effect on employee attitudes towards the change
being implemented. In higher education, the manner in which new instructional technologies
are introduced potentially could impact the attitudes of faculty members and students.
Surry and Land (2000) described a framework that higher education administrators
can use to increase the utilization of technology on their campuses. In their research they
found,
A key element in the effective utilization of any innovation in higher
education is promoting faculty buy-in. Faculty motivation to use technology
will not be increased simply by purchasing more technology. It is important
for administrators to realize that increasing technology use is not a goal that
can be simply added to existing frameworks or strategic plans. Rather,
increasing faculty motivation must be part of a university’s overall change
strategy. (152)
Sahin and Thompson (2006) concluded, “It is crucial that faculty development efforts
in instructional technologies emphasize collegial interaction and communication (p.91).” The
11
faculty in their study stressed the importance of both, collegial interaction and administrative
support while reporting a lack of the latter. Therefore, in order for adoption to take place, it is
necessary for faculty and administrators to work together. This involves faculty
communicating their needs and the needs of their students to administrators and
administrators responding to those needs accordingly. Responding to the technological needs
of faculty and students requires planning, and this planning should include faculty. In
addition to faculty concerns, other factors also exist that may have an impact on planning.
Internally these factors might include what Ford, Ford, and McNamara (2002) called
“background conversations.” According to Ford et al. (2002), “a background conversation is
an implicit, unspoken ‘background’ or ‘backdrop’ against which explicit, foreground
conversations occur; it is both a context and a reality (p. 108).” They propose that there are
three types of background conversations that result in resistance to change. These are
complacency, resignation, and cynicism (Ford et al., 2002, p.107). The researchers conclude
that “unless and until these backgrounds themselves are addressed and changed, resistance
will continue” (Ford et al., 2002, p.114). Therefore, it may be necessary to address these
background conversations in the planning stages.
Roberts (2008) cited other internal factors such as “resources, organizational culture,
faculty readiness and anticipated degree of resistance, and how widely the new way of
practice varies from the status quo” (p.7). Straub (2009) concluded, “First, technology
adoption is a complex, inherently social, developmental process. Secondly, individuals
construct unique (but malleable) perceptions of technology that influence the adoption
process. Lastly, successfully facilitating a technology adoption needs to address cognitive,
emotional, and contextual concerns” (p. 645). Straub added that future research should
12
include looking at how negative experiences with technology influences an instructor’s
current and future use of technology. Straub cautioned that, “So much of the current research
focuses on technology adoption as a find-and-replace strategy, but what may be perceived as
a slight change may have deeper repercussions for the future” (p. 645).
Societal Challenges
In terms of societal challenges in relation to technology integration, Lenoar Foster
(2001) wrote,
The demands for and the supposed efficacy of technology in higher education
today have been spurred on by a number of societal transformations and
expectations, all challenging the traditional context and operations of the
higher education enterprise. These transformations, in great part, include the
need of higher education institutions to: (a) respond to the educational needs
of large numbers of nontraditional learners in the information age; (b)
conform to the emerging profile of students as life-long learners; (c) compete
effectively for students with other distance education providers; and (d) offer
cost-effective programs that continue the traditional mission of higher
education institutions amid public calls and legislative mandates for
restructuring and outsourcing. (p. 116)
In addition, scholars projected that by 2015, 85 percent of new jobs would require more than
a high school diploma (Amirault & Visser, 2009; Gunderson et al., 2004). The problem this
poses to higher education is the growing emergence and interest in private sector training
institutions, corporate universities, and content brokers (Amirault & Visser, 2009; World
Bank, 2003). The number of corporate universities alone grew by 500 percent between 1988
13
and 2002 (ThinkEquity, 2002). As a result of this demand for post-secondary education and
the emergence of legitimate competitors, colleges and universities have begun to re-imagine
a vision of meeting these demands and have begun to re-invent themselves via the
exploitation of the technologies that are available to them (Amirault & Visser, 2009).
Therefore, while technology is a driver of change, it is also used to help solve current
challenges (Foster, 2001: Amirault et al., 2009).
Research also has shown an increase in the number of nontraditional student
enrollments, over the age of 25, with projected increases over the next decade do to the
increased demand for knowledge workers and changing workforce requirements (Amirault
&Visser, 2009). According to Amirault & Visser (2009),
Instructional technology can be leveraged to respond to the unique
circumstances of learners who, in addition to pursuing their studies, are
already actively involved in the workforce. For working adults, creating and
sustaining access to University education requires the use of innovative
instructional technologies that make University studies feasible in spite of
competing priorities. Universities, cognizant of the growing demand from
working professionals, have steadily increased their distance and distributed
learning program offerings. The question remains, however, as to whether a
simple change in modality is sufficient to meet the learning needs. (p. 70)
Also, a culture of lifelong learning has emerged in our society. In order to serve the needs of
the new economic and social environment, scholars suggest that higher education transition
from ‘‘one time’’ learning to ‘‘lifelong’’ learning (Amirault & Visser, 2009). Amirault &
Visser (2009) wrote, attending school once to get a four-year degree in order to get a job is
14
“no longer adequate for a knowledge workforce,” who is involved in the “persistent process
of adapting and improving its knowledge and know how, “ (p. 71). Therefore, lifelong
learning is the key to knowledge workers keeping their skills in demand. And, higher
education should respond to the need by leveraging instructional technology as it was
suggested in meeting the demand of nontraditional student enrollments (Amirault &Visser,
2009; World Bank, 2007).
In addition to the aforementioned challenges, higher education is seeing an increase
in student demand for technology integration and mobile applications. A recent EDUCAUSE
Center for Applied Research (ECAR) study (2012) found that students expect their
instructors to use technology in the classroom. The expectation was up from 47 percent in
2011 to 68 percent in 2012. Results also indicated that more instructors are responding to this
demand. In addition, with ownership of smartphones and tablets increasing, more students
are bringing these devices into the classroom signaling a need for and a trend towards mobile
learning. As a result, colleges and universities have enabled mobile access to grading
systems, course materials, and many other campus systems (Dahlstrom, 2012, p. 15-16).
Meeting Challenges
Responding to and implementing both organizational and societal change requires
strong leadership throughout the organization and from administration (Garrison & Akyol,
2009). Garrison and Akyol (2009) wrote, “New approaches are required based less on
individual charismatic leadership and more on productive collaboration…successful
implementation of instructional technology requires collaborative effort and cooperation
among leaders at various levels of an organization,” (p. 26). Also helpful in meeting
organizational and societal challenges is the strategic change process.
15
Worley, Hitchin, and Ross (1996) found that the strategic change process is
comprised of four basic steps. These steps are 1) strategic analysis, 2) strategy making, 3)
strategic plan design, and 4) implementation of the plan. The first step, the strategic analysis
stage, involves analyzing the organization’s external environment, its current strategic
orientation, and whether the organization is meeting is serving its purpose. The second step,
the strategy making stage, involves looking towards the future and strategizing how the
organization can transition from its current state to its desired state. The third step, strategic
plan design, involves how the transition from present state to future state will be
accomplished, taking into account the current organizational culture and possible points of
resistance as a result of the change. And the fourth, the implementation stage, is where the
actual transition takes place (p. 3).
Instead of a four step process, Bolman and Deal (2008) outlined a four frame model
for viewing and dealing with change in response to the common occurrence of the failed
implementations of managers and policymakers alike. The model calls for viewing a given
situation from four different perspectives: structural, human resource, political, and symbolic.
“The essence of this process,” the authors wrote, “is matching situational clues with a well-
learned mental framework” (p. 11). The authors noted that use of the four frames does not
guarantee success as a change agent, but they are meant to help managers and leaders
“understand and influence what’s really going on” within their organizations (p. 42).
As Foster (2001) predicted over a decade ago, “The pressures to integrate technology
into all areas of the business of higher education—structure and organization, funding,
teaching and learning, research, assessment, service delivery, and policy concerns—will not
abate in the near future,” (p. 122). And, they haven’t due to various demands placed on
16
institutions as a result of societal changes. However, higher education’s key to meeting its
challenges lies in its willingness to adapt to these external demands (Foster, 2001; Amirault
& Visser, 2009). According to Amirault & Visser (2009), a college or university’s success
“is, as it always has been, inexorably correlated to its willingness to accept, adapt, and
innovate within new educational landscapes” (p. 66). In other words, higher education must
adapt to change or become irrelevant. This begins with the recognition of technology as not
only a catalyst for change, but a conduit for innovation and reinvention as well.
Long-term success of technology adoption is dependent upon the careful planning
and decision-making of leaders (Owen & Demb, 2004) and the champions (Aitken &
Shedletsky, 2001; Matthews, 2008) they employ. In an effort to understand the dynamics
associated with an institution-wide effort to integrate technology into teaching and learning,
Owen and Demb (2004) found that many faculty adopt a wait-and-see attitude because they
need to know that adopting a particular technology is worth their time and effort. For this
reason, it is important for administrators in higher education to be able to gauge the level of
uncertainty among faculty and know the motivations, needs, and preferences of their faculty
as they relate to technology use for teaching and learning, in order to promote technology
integration (Surry & Land, 2000). Utilizing Rogers’ (2003) theory in their research, Zayim,
Yildirim, and Saka, (2006) discovered that a key ingredient to successful campus-wide
adoption is in learning as much about the faculty’s needs as possible. They concluded,
If the goal of the higher education institution is the integration of technology
for a transformative change, then rather than the acquisition of technology
itself, there must be a clear focus on the faculty members who use technology.
For large-scale technology integration to occur in teaching, it is essential to
17
understand and address differentiating needs of faculty in faculty development
and support systems. (220)
The UTAUT, as well, has been utilized to measure technology use based on attitudes
surrounding its four constructs. Researchers have found it useful for explaining why faculty
decide to adopt technology for teaching and learning purposes (Oye, Iahad, & Rahim, 2012).
Perhaps administrators overseeing technology integration would find such studies relevant
and insightful for planning and solving their own problems as they pertain to technology
integration.
Since the turn of the 21st century, educational technology has evolved and improved
(Sherer et al., 2003). Furthermore, the emergence of new technologies has the tendency to
bring about uncertainty and unease (Straub, 2009; Nicolle & Lou, 2008; Roberts, 2008;
Owen & Demb, 2004; Sahin & Thompson, 2006). Straub (2009) referred to technology
adoption as “a complex, inherently social, developmental process” (p. 641) because there are
so many factors that influence adoption. Straub questioned whether technology adoption was
an “uphill battle” and likened it to “a Sisyphusian task” or “pushing a boulder up a mountain,
only to have to roll it back down again” (p. 643). The research suggests that technological
change can be disruptive and can cause a mix of emotions among unprepared faculty such as
tension and anxiety, which can be barriers to adoption and harmful to the implementation
process. This type of change challenges assumptions, roles, values, and norms. It can be
uncomfortable and inconvenient for those who are not readily adaptable to such change
(Straub, 2009; Nicolle & Lou, 2008; Roberts, 2008; Sahin & Thompson, 2006). But, with
technology changing so rapidly, the only thing we can be certain of is uncertainty (and
change). Therefore, the need exists to continue producing research in technology integration.
18
Definition of Terms
The terms defined below are used throughout this study.
● Academic Discipline – Academic discipline is the field of study or subject matter that
the instructor teaches.
● Acceptance – Acceptance is “a user’s willingness to employ technology for the tasks
it is designed to support” Teo, 2012, p. 1).
● Adoption – Like acceptance, adoption is “a user’s willingness to employ technology
for the tasks it is designed to support” Teo, 2012, p. 1).
● Associate's Colleges – “Includes institutions where all degrees are at the associate's
level, or where bachelor's degrees account for less than 10 percent of all
undergraduate degrees. Excludes institutions eligible for classification as Tribal
Colleges or Special Focus Institutions” (Carnegie Classifications, 2013).
● Baccalaureate Colleges– “Includes institutions where baccalaureate degrees represent
at least 10 percent of all undergraduate degrees and where fewer than 50 master's
degrees or 20 doctoral degrees were awarded during the update year. Excludes
Special Focus Institutions and Tribal Colleges” (Carnegie, 2013).
● Doctorate-granting Universities– “Includes institutions that awarded at least 20
research doctoral degrees during the update year (excluding doctoral-level degrees
that qualify recipients for entry into professional practice, such as the JD, MD,
PharmD, DPT, etc.). Excludes Special Focus Institutions and Tribal Colleges”
(Carnegie, 2013).
● Effort Expectancy - Effort expectancy is “the degree of ease associated with the use of
the system” (Venkatesh et al., 2003, p.450).
19
● Facilitating Conditions – Facilitating conditions are “the degree to which an
individual believes that an organizational and technical infrastructure exists to support
use of the system” (Venkatesh et al., 2003, p.454).
● Institution Type – The institution type is according to the Carnegie Classification and
governance (Public; Private, nonprofit; Private, for-profit) as reported by the National
Center for Education Statistics (Knapp, Kelly-Reid, & Ginder, 2012).
● Instructional Technology – Instructional technology is any electronic technology or
digital media used to carry out instruction.
● Instructor – An instructor is someone who teaches in any capacity (full-time, part-
time, or other). This is used interchangeably with “faculty” in this study.
● Integration –Integration is the use of any electronic technology or digital media “to
support, enhance, inspire, and create learning” (Redmann & Kotrlik, 2004, p. 78).
● Master's Colleges and Universities– “Generally includes institutions that awarded at
least 50 master's degrees and fewer than 20 doctoral degrees during the update year.
Excludes Special Focus Institutions and Tribal Colleges” (Carnegie, 2013).
● Performance Expectancy - Performance expectancy is “the degree to which an
individual believes that using the system will help him or her to attain gains in job
performance” (Venkatesh et al., 2003, p. 447).
● Special Focus Institutions– “Institutions awarding baccalaureate or higher-level
degrees where a high concentration of degrees (above 75%) is in a single field or set
of related fields. Excludes Tribal Colleges” (Carnegie, 2013).
● Social Influence - Social influence is “the degree to which an individual perceives
that important others believe he or she should use the new system” (Venkatesh et al.,
20
2003, p.451).
● Usage behavior –In this study, usage behavior is the frequency at which technology is
used.
● Use – Unlike acceptance and adoption, use is defined as the actual application of
technology.
● UTAUT – Unified Theory of Acceptance and Use of Technology (“UTAUT”)
explains a person’s intention to use technology and whether he or she actually uses
the technology.
Summary
Research has suggested several models for explaining technology adoption
(Venkatesh et al., 2003). As the necessity to leverage technology has become more apparent
in the recent re-envisioning of higher education (Amirault & Visser, 2009), so have the many
barriers to adoption become more apparent as they are highlighted in recent research
(Baltaci-Goktalay & Mehmet, 2006; Furuholt & Orvik, 2006). How well institutions adapt to
this changing landscape of higher education has to do in part with organizational
characteristics (Levin, Stephan, & Winkler, 2012; Levin, Kater, & Wagoner, 2006;
Birnbaum, 1991; Weick, 1976), leadership strategies (Reid, 2012;Matthews, 2008; Roberts,
2008; Owen & Demb, 2004), and meeting the needs of faculty (Reid, 2012; Agbonlahor,
2008; Matthews, 2008; Li & Linder, 2007). This study attempted to bridge the gaps in the
research by revealing the uniqueness of various higher education settings as it pertains to
technology use by faculty.
21
CHAPTER TWO: LITERATURE REVIEW
Over the last 100 years, some devices used to deliver instruction have been replaced
and others improved upon (Reiser, 2001). While a medium like instructional radio is no
longer popular, still the textbook remains a popular instructional medium in the classroom
(Reiser, 2001). Advances in Internet technology have brought about improvements to printed
texts as many are now available in electronic format. And, instructional video delivered via
the Internet has made it possible for students to view lectures outside of the classroom and on
personal computers and mobile devices. Still, one question has remained the same: Why do
some technology integration efforts fail while others succeed? The following literature
review will provide a historical overview of technology integration and discuss societal
challenges. Additionally, the review will include organizational and individual factors
impacting technology integration in post-secondary education.
Historical Overview of Technology Integration
Reiser (2001) defined instructional technology (media) as “the physical means via
which instruction is presented to learners” (p. 54). With this definition, “every physical
means of instructional delivery, from the live instructor to the textbook to the computer and
so on, would be classified as an instructional medium” (p.54). Therefore, if the textbook is
considered to be instructional technology, then it could be said that technology integration
has been present in teaching and learning for centuries. When looking at technology
integration with the exception of the textbook (and chalkboard), there is research indicating
the presence of instructional technology as far back as the late 19th century (Reiser, 2001).
Around the first decade of the 20th century, roaming school museums serving as a
22
supplement to the curriculum sprang up, employing such technology as stereographs (three
dimensional photographs), slides, and films. By 1913, the adoption of instructional film had
such a profound impact on Thomas Edison, that he believed films would replace textbooks
(Reiser, 2001). Edison said, “Books will soon be obsolete in the schools…It is possible to
teach every branch of human knowledge with the motion picture. Our school system will be
completely changed in the next ten years" (Saettler, 1968, p. 98).
Despite Edison’s proclamation, film never replaced the textbook. And, at least up
until the time of Reiser’s (2001) article, the textbook remained the most used instructional
technology amongst the constant introduction and adoption of new and improved
technologies since the late 19th century. Contrary to beliefs that some new technology of the
era would replace the textbook, this had yet to happen. According to Reiser, “By the early
1930s, many audiovisual enthusiasts were hailing radio as the medium that would
revolutionize education” (p. 56). In the 1960s, instructional television followed but failed for
various reasons, including “teacher resistance to the use of television in their classrooms, the
expense of installing and maintaining television systems in schools, and the inability of
television alone to adequately present the various conditions necessary for student learning”
(p. 59).
In the 1980’s, there was a demand for computer-aided instruction brought about by
the availability of the personal computer. At that time, computers were smaller, inexpensive,
and could compute just as well as their larger, more expensive predecessors, making them
more attractive to educators. Reiser (2001) noted, “since 1995, rapid advances in computer
and other digital technology, as well as the Internet, have led to a rapidly increasing interest
in, and use of, these media for instructional purposes” (p. 60).
23
Since Reiser’s (2001) article, research has shown even larger growth in technology
integration (Lin et al., 2010). As the failure of the widespread adoption of instructional
television in the 1970s indicates, teacher resistance, lack of finances and usefulness are not
new problems in terms of technology integration (Lin et al., 2010; Foster, 2001). These
issues are present today as well, and among other factors, are viewed as barriers to
technology integration (Lin et al., 2010; Foster, 2001). Furthermore, in the decision to use
technology, Lin, Singer, and Ha (2010) found that faculty members belonging to institutions
of higher education are often pulled between their own organization’s culture and societal
influences. They wrote,
The grand ideals of academia represent one well-established structure (rules
and resources) that university members have been exposed to and inculcated
with through the long period of anticipatory/vocational socialization. On the
other hand, the corporatization of higher education institutions signifies an
emergent structure that university members may resist…While one pushes for
use of technology; the other could constitute a source of resistance. (p. 39)
Bolman and Deal (2008) wrote, “Revolutionary changes in technology, the rise of the
global economy, and shortened product life cycles have spawned a flurry of activity to design
faster, more flexible organizational forms” (p. 10). Higher education institutions are not to be
excluded. Because of rapid advances in technology, higher education has recently been
forced to evolve and rethink its mission. And although the institution has undergone
incremental changes over the last century with regards to technological changes and societal
shifts, the pressure to reinvent itself could be at the highest point today as it has ever been
(Amirault & Visser, 2009).
24
Theoretical Framework
Research offers several reasons why technology integration rates vary (Oye, Iahad, &
Rahim, 2012; Kotrlik and Redmann, 2005; Rogers, 2003; Venkatesh et al., 2003). Kotrlik
and Redmann (2002) developed the Kotrlik and Redmann Technology Integration Model©
to assess both the levels of integration and the factors that predict integration. However,
perhaps the most widely used framework explaining technology integration is Roger’s
diffusion of innovations theory (Rogers, 2003). Although many others appear throughout the
literature, the Unified Theory of Acceptance and Use of Technology, or UTAUT (see Figure
1), claims to be a more comprehensive framework for explaining technology integration, as it
is derived from eight other frameworks, including Roger’s theory (Venkatesh et al., 2003).
Because there are so many variables involved with technology adoption, an element of
uncertainty exists among those overseeing efforts to integrate technology with teaching and
learning (Straub, 2009; Owen & Demb, 2004; Surry & Land, 2000). The uncertainty in
organizations or systems is demonstrated by Roger’s (2003) late adopters and laggards who
will not adopt an innovation until they are absolutely certain that it is safe to use. The
UTAUT model uses several constructs that explain how uncertainty, beliefs, and concerns
among potential users are manifested in levels of performance expectancy, effort expectancy,
social influence, and facilitating conditions (Venkatesh et al., 2003).
Kotrlik and Redmann Technology Integration Model©
Joe Kotrlik and Donna Redmann have conducted extensive research on technology
integration among secondary educators (Kotrlik & Redmann, 2005; Kotrlik & Redmann,
2003; Redmann, 2002). From their research, the two developed the Kotrlik-Redmann
Technology Integration Model© (2002). The Kotrlik-Redmann Technology Integration
25
Model consists of four levels: Exploration, experimentation, adoption, and advanced
integration (Kotrlik & Redmann, 2005). Kotrlik and Redmann (2005) provided the following
explanation for each level of integration,
1. Exploration—thinking about using technology. Teachers seek to learn
about technology and how to use it.
2. Experimentation—beginning to use technology. Physical changes start
to occur in classrooms and laboratories. Instructors focus more on
using technology in instruction by presenting information using
presentation software and doing a few instructional exercises using
spreadsheets, databases, word processors, games, simulations, the
Internet, and/or other computer tools.
3. Adoption—using technology regularly. Physical changes are very
evident in the classroom and/or laboratory with the computers
becoming a focal point in the classroom and/or laboratory
organization. Instructors employ presentation software and
technology-based instructional exercises using games, simulations,
spreadsheets, databases, word processors, the Internet, or other
technology tools as a regular and normal feature of instructional
activities. Students shared responsibility for learning emerges as a
major instructional theme.
4. Advanced integration—using technology innovatively. Instructors
pursue innovative ways to use technology to improve learning.
Students take on new challenges beyond traditional assignments and
26
activities. Learners use technology to collaborate with others from
various disciplines to gather and analyze information for student
learning projects. The integration of technology into the teaching-
learning process has led to a higher level of learning. (p. 208)
In their study on Adult Basic Education teachers, which was based on their model,
Kotrlik and Redmann (2005) found that as teachers’ perceived barriers to technology
integration increase, their integration of technology decreases. And, with the availability of
computers and Internet access in the classroom, technology integration increases.
Roger’s Diffusion of Innovations
Everett M. Rogers (2003) developed the "diffusion of innovations" model that
suggested that members of an organization are at varying levels which indicates the order in
which they are likely to become engaged with an innovation. Rogers, “discouraged by the
confusing disarray of terms used for adopter categories and the looseness of methods of
categorization,” classified members of an organization based on innovativeness, “the degree
to which an individual or other unit of adoption is relatively earlier in adopting new ideas
than other members of a social system” (p. 278-279). The adopter categories are labeled as
follows: “I” for innovators, “EA” for early adopters, “EM” for early majority, “LM” for late
majority, and “L” for laggards (p. 281).
Roger’s characterizes innovators as “venturesome,” able to “understand and apply
complex technical knowledge,” and “able to cope with a high degree of uncertainty about
innovation at the time he or she adopts,” (p. 282). And, Rogers stated, “While an innovator
may not be respected by other members of a local system,” he or she is important to the
diffusion process, playing a “gatekeeping role in the flow of new ideas into a system” (p.
27
283).
Early adopters, the next category, typically have what Rogers described as “the
highest degree leadership” as potential adopters look to them for insight and guidance
regarding an innovation (p. 283). They are “role models”, “respected” by their peers, and
their use of an innovation has been known to “decrease uncertainty” among later adopters (p.
283). Early adopters are often chosen as evangelists to bring their peers onboard to using an
innovation.
Comprised of one-third of all members of a system, the early majority are said to
adopt an innovation “just before the average member of a system” (p. 283). They interact
frequently with their peers but are not viewed as opinion leaders as are the early adopters.
“They follow with deliberate willingness in adopting innovations but seldom lead” (p. 284)
noted Rogers.
Making up another one-third of all members of a system is the late majority, who
“adopt new ideas just after the average member,” (p. 284). The late majority typically adopts
an innovation only after eventually giving in to peer pressure or because they have no other
choice. Rogers cited peer pressure as “necessary to motivate adoption” with this group. And,
“most of the uncertainty about a new idea must be removed before the late majority feel that
it is safe to adopt” (p. 284).
Lastly, laggards do so because, like the late majority, their resources are scarce, and
“they must be certain that a new idea will not fail before they can adopt” (p. 284-285). Their
decision to adopt typically rests on the success or failure of past innovations. And although
not opinion leaders themselves, laggards (and the late majority as well) “place greatest
credibility in their peers’ subjective experiences with the innovation, conveyed to them
28
through interpersonal networks” (p. 294).
From his research, Rogers found, among other factors, that if an innovation is too
difficult to use, then an individual will not be likely adopt it. Rogers called this attribute
“complexity,” which he defined as “the degree to which an innovation is perceived as
difficult to understand and use” (p. 16).
Keengwe, Kidd, and Kyei-Blankson (2008) found that several researchers believed
Rogers’ theory to be helpful in explaining the adoption of technology in higher education.
Keengwe et al. cited Dooley, Metcalf, and Martinez (1999) and Stuart (2000) who found
Rogers’ theory to be a widely used theoretical framework in the area of technology diffusion
and adoption, and Medlin (2001) and Parisot (1997) who suggested that Rogers’ theory is
“most appropriate for investigating the adoption of technology in higher education and other
educational environments” (p. 24). In reference to Rogers’ model and its application to
faculty adoption of technology in teaching, Hartman et al. (2007) made the following points,
First, the motivations, incentives, and support required for each population of
adopters are different. At each stage, the adopters become more pragmatic,
less likely to adopt an innovation for its own sake, and more entrenched in
traditional beliefs and practices. It will therefore take higher levels of energy
and resources to support an innovation such as technology-facilitated teaching
and learning as it moves through an institution. Second, after an innovation
passes from the early adopters to the early and late majorities, the size of the
population that must be supported increases dramatically. Third, the later
stages of diffusion will involve large populations at various levels of adoption,
bringing the new challenge of supporting multiple populations with differing
29
needs and attitudes. (p. 74)
Variables Associated with Adoption
There are several variables associated with technology adoption in general. These
include, but are not limited to, the usefulness of the technology, the ease of use, the influence
of others, and the extent of training (Venkatesh et al., 2003; Rogers, 2003). The Unified
Theory of Acceptance and Technology (UTAUT) that Venkatesh et al. (2003) proposed
provides a thorough explanation of these variables and how they are related to technology
adoption in general. However, in higher education, additional variables associated with
technology adoption exist, which will be discussed later in this chapter.
The Four Constructs of the UTAUT
The four constructs of the UTAUT are performance expectancy, effort expectancy,
social influence, and facilitating conditions, which are described in more detail later in this
chapter (Venkatesh et al., 2003). In conducting their research, Venkatesh et al. (2003) studied
organizations in the entertainment industry, telecom services, banking, and public
administration. The technologies used by individuals in these organizations included an
online meeting manager, a database application, a portfolio organizer, and accounting
systems for organizational bookkeeping (Venkatesh et al., 2003, p. 438).
Performance expectancy. The first construct of the UTAUT examined was
performance expectancy. Performance expectancy is “the degree to which an individual
believes that using the system will help him or her to attain gains in job performance” (p.
447). Performance expectancy was derived from core constructs belonging to the technology
acceptance model (perceived usefulness), the motivational model (extrinsic motivation), the
model of PC utilization (job-fit), innovation of diffusion theory (relative advantage), and
30
social cognitive theory (outcome expectations). The researchers found performance
expectancy to be the strongest predictor of intention in situations where the technology use
was both voluntary and mandatory (Venkatesh et al., 2003, p. 447).
Effort expectancy. The second construct examined was effort expectancy. Effort
expectancy is “the degree of ease associated with the use of the system” (p.450). For effort
expectancy, the UTAUT borrows constructs from three models including the technology
acceptance model (perceived ease of use), the model of PC utilization (complexity), and
innovation of diffusion theory (ease of use). The study found effort expectancy to be
significant in situations where the technology use was both voluntary and mandatory, but
became less important in post-training periods as employees used the systems more and more
(Venkatesh et al., 2003, p.450).
Social influence. The third construct examined was social influence. Social influence
is “the degree to which an individual perceives that important others believe he or she should
use the new system” (p.451). Social influence was derived from subjective norms in the
theory of reasoned action, the technology acceptance model, the theory of planned behavior,
and the combined technology acceptance model and theory of planned behavior. It also
borrows from the social factors in the model of PC utilization and image in the innovation of
diffusion theory. The researchers did not find social influence to be significant when
technology use was voluntary, but found each of its constructs to be significant when
technology use was mandatory (Venkatesh et al., 2003, p.451). However, the research found
that social influence weakened over time and became less of an influence on individual
intention as experience became a more instrumental basis for determining whether to use a
system (Venkatesh, 2003, p.453).
31
Facilitating conditions. The fourth construct examined was facilitating conditions.
Facilitating conditions are “the degree to which an individual believes that an organizational
and technical infrastructure exists to support use of the system” (p.454). For facilitating
conditions, the UTAUT borrows constructs from three models including the theory of
planned behavior (perceived behavioral control), the model of PC utilization (facilitating
conditions), and innovation of diffusion theory (compatibility). The researchers point out that
because facilitating conditions are so closely related to effort expectancy, they become a non-
significant construct for predicting intention, but have a direct influence on usage. The effect
is predicted to increase over time as users gain more experience with the system and find
more means for support throughout the organization (Venkatesh et al., 2003, p.454). Figure 1
shows the UTAUT model.
Other Factors
Besides the factors that Venkatesh et al. (2003) found to be related to technology
adoption, other studies have shown other factors to be related to adoption in higher
education. These other factors include academic discipline (Agbonlahor, 2008; Matthews,
2008; Li & Linder, 2007; Diaz & Cheslock, 2006), institutional characteristics (Levin,
Stephan, & Winkler, 2012; Meyer & Xu, 2009; Levin, Kater, & Wagoner, 2006; Matthews,
2008; Roberts, 2008; Owen & Demb, 2004), and the extent and nature of the institution’s
leaders in the adoption efforts (Reid, 2012; Matthews, 2008).
Discipline
Li and Lindner (2007) found that faculty members from social science-related
disciplines were more active in adopting web-based technologies for distance education than
faculty from biological science and engineering disciplines. Likewise, Kagima and Hausafus
32
(2000) found that faculty members in the College of Family and Consumer Sciences
exhibited a lower level of self-efficacy than faculty members belonging to the Colleges of
Agriculture and Education. Furthermore, academic discipline may moderate UTAUT
constructs. For example, in terms of perceived usefulness, an individual may believe that the
technology will not enhance their teaching or student learning. If so, then this individual may
opt out of using a particular technology.
Institutional Characteristics
Institutional characteristics are related to technology adoption (Levin, et al., 2012).
Levin, Stephan, and Winkler (2012) investigated the diffusion of technology across 1348
institutions of higher education. Their research indicated that large, urban research
universities, composed of a mostly male faculty would be more likely to adopt technology at
a quicker rate than small, non-select, liberal arts universities with a mostly female faculty
(Levin, et al., 2012). While the cause of these phenomena cannot be determined, the research
suggests that larger universities adopt technologies quicker because they benefit from
economies of scale (Levin, et al., 2012). And, institutions emphasizing programs in the
natural sciences tend to value technology more so that institutions emphasizing humanities
and social sciences (Levin, et al., 2012). Technology adoption rates also varied by region, as
Southern institutions tended to adopt technology at a slower rate than institutions located
elsewhere in the United States (Levin, et al., 2012).
Several scholars have commented on the unique characteristics of community
colleges in relation to technology use for teaching and learning (Barber, 2011; Jackowski &
Akroyd, 2010; Diaz & Cheslock, 2006). They found that the decision to use technology is
driven by many things, including organization culture, which Barber (2011) called the “the
33
governance structures, processes, and principles of a community college” (p. 74).
Furthermore, a recent study involving the National Survey of Postsecondary Faculty
(NSOPF: 04) data found significant differences in technology use among faculty employed
by institutions of different Carnegie types (Meyer & Xu, 2009). Meyer & Xu (2009) noted
that “Although a number of institutional influences on technology use (i.e., appropriations,
enrollment size) were evaluated in a previous study (Meyer & Xu, 2007), only the Carnegie
classification of institutions was found to explain variations in technology use in teaching”
(p. 61).
Leadership and Adoption
According to Yukl (2010), “Most definitions of leadership reflect the assumption that
it involves a process whereby intentional influence is exerted over other people to guide,
structure, and facilitate activities and relationships in a group or organization” (p. 3).
Leadership is important to technology adoption (Reid, 2012). A lack of institutional support,
a clear idea of goals for adoption, and no change in policies and procedures can negatively
impact the overall adoption of instructional technologies (Reid, 2012). Reid (2012) said those
in leadership positions “may not understand the complexities of the technologies, or the time
needed to master them. Further, administration may be controlling access without
considering faculty needs” (p. 12).
Other recent literature on the topic of leadership and instructional technology
adoption and implementation also suggested that faculty concerns must be met in order for
acceptance and use of technology to take place (Aitken & Shedletsky, 2001; Kidd, 2009, p.
164; Kinuthia, 2005).Owen and Demb (2004) conducted a qualitative study to explore
current leadership models for guiding large-scale technology implementation efforts, which
34
factors affecting the change process seem most important to participants in the context of
technology change, and the distinctive dynamics of change involving technology
implementation (p. 630).The authors referenced Carter and Alfred’s (1998) community
college change model which proposes five key dimensions for managing change:
understanding fundamentals, forging strategy, identifying champions, supporting innovation,
and communicating and celebrating success. According to Owen and Demb (2004), this
model allows for the integration of leadership strategies, participatory involvement,
environmental scanning, and communication” (p. 641). In terms of social influence, all of
these dimensions (including those proposed by Aitken & Shedletsky (2001), Kidd (2009),
and Kinuthia (2005) can project that technology adoption is a priority for administrators.
Matthews (2008) found that another factor contributing to acceptance or resistance is
the extent of departmental leadership’s involvement in the adoption of technology.
Discussions with staff within the faculty revealed that “in schools where permanent directors
were absent or were preoccupied with pressing funding issues, much less progress was made
in the adoption of the software” (p. 39). In the article, Matthews (2008) also stated academic
staff’s negative view of “top-down management,” or direction from formal leaders. As one
department head commented, “The interest in the technology from her staff would have been
dampened had she forced staff to engage with the WSL package” (Matthews, 2008, p. 39). In
summary, Matthews (2008) suggested a less formal approach would have been more
effective in the implementation, in addition to the use of discipline-based champions
stressing pedagogical reasons for adopting the new technology. Likewise, Sahin and
Thompson (2006) suggested that faculty development efforts involve early adopters, who are
“more likely to hold leadership roles in the social system,” in order to aid in the diffusion of
35
instructional technology (p. 92).
Leadership might also consider visioning (Baltaci-Goktalay & Mehmet, 2006) and
the changes that faculty undergo in an institution-wide effort to integrate technology with
teaching and learning (Owen & Demb, 2004). Walker et al. (2007) said that “change efforts
are influenced by content, contextual, process issues, and individual differences that exist
among the change targets” (p. 762). Furthermore, they suggest that, “… identifying the
nature in which these factors interact will add to the understanding of employee responses to
change and ultimately, aid management in … ensuring employee commitment to change”
(Walker et al. 2007, p.762). The research conducted by Walker et al. (2007) suggested that
the manner in which change is implemented may have an effect on employee attitudes
towards the change being implemented. In higher education, the manner in which new
instructional technologies are introduced may impact the attitudes of faculty members
(Carman, 2003).
Summary of Literature Review
The literature on technology use in post-secondary teaching provides insight
surrounding the topic by identifying several potential factors influencing faculty technology
use in higher education. Not only does the literature provide a snapshot of factors influencing
technology integration in higher education today as depicted in the Kotrlik -Redmann
Technology Integration Model (Kotrlik & Redmann, 2005; Kotrlik & Redmann, 2003),
Roger’s Diffusion of Innovations (Rogers, 2003), and the UTAUT (Venkatesh et al., 2003),
but it provides a historical overview of technology integration since the first decade of the
20th century.
This chapter also addressed the UTAUT, the theoretical framework guiding this
36
study, in addition to differences between academic disciplines and institutions in relation to
technology use. Most studies reviewed were one-institution or one-discipline studies. The
next chapter presents the research design of this study, which seeks to involve the study of
multiple institutions and various disciplines.
37
CHAPTER THREE: METHODOLOGY
This chapter on methods provides an overview of the methods to be used to conduct
the research study. The research design will be presented followed by a detailed discussion of
the population, sampling, instrumentation, and data collection and analysis. The chapter will
end with a summary of the methods.
Research Design
To address the research questions, a non-experimental, cross-sectional (data collected
at one point in time), predictive survey design was used. Natalie Sproull (2002) wrote that a
nonexperimental design is, “A research design in which an experimental variable is not
introduced by the researcher but measures can be taken,” and is purposeful for assessing
relationships between variables (p. 153). Furthermore, nonexperimental designs are often
used to predict future events (Sproull, 2002). A survey design “provides a quantitative or
numeric description of trends, attitudes, or opinions of a population by studying a sample of
that population” (Creswell, 2008, p. 234). Therefore, a nonexperimental, predictive survey
was appropriate for collecting data on the trends in technology use among faculty. Data was
collected via an Internet survey and administered online due to the rapid turnaround in data
collection (Creswell, 2008).
Population
The population for this study is college instructors subscribed to the EDUCAUSE
Instructional Technology Constituent Group listserv, which included approximately 1,313
total subscribers at the time of data collection. A census survey of faculty was conducted via
the listserv. A statement on the official EDUCAUSE website explains that the Instructional
38
Technology Constituent Group,
…provides a forum for the exchange and archiving of information and for
discussions of key issues relating to information technologies. Topics range
from learner-centered principles to technology selection. This group meets at
the EDUCAUSE annual conference and uses the electronic discussion list to
discuss issues throughout the year. (http://www.educause.edu)
This study utilized binary logistic regression analysis to analyze survey data. As a
rule, this type of analysis should include at least 10 cases for every predictor variable
(Hosmer & Lemeshow, 2000). The authors wrote that “the simplest answer to the ‘do I have
enough data’ question is to suggest that the model contain no more than p + 1 ≤ min(n1,n0)/10
parameters,” (p. 346). The logistic regression analysis involved seven predictor variables:
Carnegie classification of the instructor’s primary employer, governance structure of the
instructor’s primary employer, Academic discipline, level of performance expectancy, level
of effort expectancy, level of social influence, level of facilitating conditions. In addition, this
study involved one binary dependent variable, frequency of use (high/low). The formula for
calculating the number of cases required for this study is as follows: p + 1(10) ≤ min(n1,n0),
where p equals number of parameters or predictor variables, and where min(n1,n0) equals the
minimum number of events. Because 7 + 1(10) ≤ min(n1,n0), the minimum number of events
must be greater than or equal to 80. Therefore, this analysis included at least 80 cases in
order to avoid problems resulting from too few cases relative to the number of predictor
variables. In order to make generalizations to the population, Bartlett, Kotrlik, and Higgins
(2001) suggested a sample size of 106 (α=.05, t=1.96) for a population of 1,000 (p. 48). After
several attempts, the desired sample size of 106 was not met, nor was the suggested sample
39
size of n=80 met per Hosmer and Lemeshow’s (2000) “rule of ten.”
Instrumentation
“An instrument is whatever device is used to measure variables and can range from
written or oral materials to physical devices” (Sproull, 2002, p.177). To measure technology
acceptance variables, the UTAUT instrument was utilized (Venkatesh et al., 2003). The
instrument is comprised of four constructs (performance expectancy, effort expectancy,
social influence, facilitating conditions), each composed of four likert-like items a piece
based on a scale from “strongly disagree” to “strongly agree.”
Additional items included in the instrument are voluntariness of use, academic
discipline, Carnegie classification, and governance structure. With voluntariness of use being
the exception, these variables are not part of the original instrument as proposed by
Venkatesh et al. (2003). However, recent research indicates there are relationships between
these variables and faculty technology use. For this reason, data was collected on those
aforementioned demographic variables. In addition, the following preliminary questions will
appear on the survey to differentiate between instructors belonging to the sample.
Select all that apply. I teach…
● Traditional/Face-to-Face classes
● Online classes
● Hybrid classes
Which best describes your employment situation? I teach…
● Full-time
● Part-time
● Other
40
Empirical testing of the UTAUT model showed that the model explained 70 percent
of the variance in information technology use behavior in an organizational setting in the
U.S. (Venkatesh et al., 2003). Utilizing partial least squares, Venkatesh et al. (2003)
developed the UTAUT instrument and found it valid and reliable for explaining participants’
intention to use technology. They wrote,
Specifically, 48 separate validity tests (two studies, eight models, three time
periods each) were run to examine convergent and discriminant validity…The
loading pattern was found to be acceptable with most loadings being .70 or
higher. All internal consistency reliabilities were greater than .70. The patterns
of results found in the current work are highly consistent with the results of
previous research. (p. 439)
Using convenience sampling, Birch and Irvine (2009) administered a survey,
consisting of UTAUT items, to preservice teachers enrolled in a post degree professional
program or bachelor of education program at a mid-sized western Canadian university. The
purpose of the research was to “explore the factors that influence preservice teachers’
acceptance of information and communication technology (ICT) integration in the
classroom” (p. 295). The researchers received 85 completed surveys for a 53 percent return
rate. Cronbach’s alpha (α) was calculated to determine the reliability of the items for each of
the UTAUT constructs. Performance expectancy (α=.69) and effort expectancy (α=.86) had
acceptable Cronbach’s alphas with the inclusion of all four items for each construct. Social
influence (α=.52) and facilitating conditions (α=.60) each had reliability issue when of all
four items were included in each construct. However, the researchers found that for social
influence,
41
Removal of item 9 (“Senior K-12 officials would be helpful in the use of
technology for teaching in the K-12 classroom”) raised the alpha slightly, but
only to .57. Omission of both items 9 and also 5 (“In general, senior K-12
officials would support the use of technology in the K-12 classroom”) gave a
Cronbach’s of .63, indicating that the two remaining items worked together to
provide a reliable measure of the social influence construct. The Cronbach’s
alpha for facilitating conditions was .60 when all four items were included.
When item 16 (“Using technology for teaching in the K-12 classroom would
not be compatible with other teaching responsibilities that I have”) was
deleted, the alpha was increased to .72. (p. 300)
Sumak, Polancic, and Hericko (2010) administered a survey, consisting of UTAUT
items, to undergraduate students in a college of engineering at a Slovenian university. The
purpose of the research was to explore the factors that influence perceptions of the virtual
learning environment, Moodle. The researchers received 235 completed surveys for a 39
percent return rate. From this point, the researchers performed confirmatory factor analysis
and found the estimated values for internal consistency above 0.70 for all UTAUT constructs
proposed in the research of Venkatesh et al. (2003).
Items used in measuring UTAUT levels that have been adopted for this study and the
demographic variables adopted for this study are found in Appendix C.
Data Collection
For this study, approval from the Institutional Review Board (IRB) at North Carolina
State University was secured. The survey was then distributed to the participants through the
EDUCAUSE Instructional Technology Constituent Group listserv subscription services using
42
Qualtrics online survey software. After results were obtained, SPSS was used to analyze the
data.
This study employed instrument administration as the data collection method.
According to Sproull (2002), instrument administration involves a person giving instruments
to subjects, then collecting all of the instruments after the subjects have responded. For this
study, a census survey was distributed via an online listserv. The study population consisted
of a census sample of all subscribers to the listserv. Leslie Kish (1979) noted that census
samples are appropriate for obtaining “data in great detail for small domains” (p. 101). And,
Kish said, “Because they are large and complete, censuses are precise and detailed” (p. 101).
Web-administered surveys, such as those administered via online listserv, are more cost-
effective than mailed surveys, have a quicker turnaround time, result in reduced human error
from data entry, allow for a more dynamic survey process, and allow for effective and
economic census surveying (Dillman, 2007;Umbach, 2004).
According to Don Dillman (2007), web-administered surveys where all answers to
survey items are voluntary run the increased risk of item nonresponse bias, where
respondents do not complete the survey, resulting in missing data, which renders the data
invalid and unreliable. To handle missing data, Mertler and Vannatta (2010) suggested
creating a dichotomous dummy variable where respondents who supply information on a
given variable are coded “0” and respondents who don’t supply information on a given
variable are coded “1” (p. 26). After doing so, an independent samples t-test would be run to
determine any significant differences between the two groups. Mertler and Vannatta also
suggested repeating the analysis on complete cases noting, “If the results are similar, one can
be confident in the results” (p. 27). Out of 66 instructors who responded, only one failed to
43
complete the survey. This case was not included in the analysis.
To address a low response rate, Dillman (2007) suggested sending a pre-notification
letter to subjects, a thank-you message for their response, a follow-up reminder for
nonrespondents to complete the survey, and a final contact. Dillman also found methods for
increasing response rates for mailed surveys to be as effective for emailed surveys as well.
Although Dillman warned that listserv procedures should be avoided, data collection for this
study included a notification letter to subjects including a link to complete the survey, and a
second contact including a link to complete the survey, posted to the EDUCAUSE
Instructional Technology Constituent Group listserv. The second contact included a thank-
you message to respondents and encouraged nonrespondents to complete the survey. Because
listserv members are subscribed, copies of all communications were forwarded to their email
address. Following the second contact, and because the desired sample size was not met by
this time, non-respondents who completed the survey were asked if they would like to be
entered into a random drawing to win a $25 Amazon gift card. The gift card winner was
randomly selected via SPSS, and the gift card incentive was delivered via email. The drawing
occurred after the second contact for those respondents who completed the survey after the
second contact, and who agreed to be entered into the drawing; after which no other contact
was made via listserv. Those respondents who completed the survey before the second
contact were not eligible for the drawing.
Data Analysis
To answer the first and second research questions, “How frequently are Instructional
Technology Constituent Group instructors using technology in their teaching,” and “What is
the level of UTAUT for performance expectancy, effort expectancy, social influence,
44
facilitating conditions for Instructional Technology Constituent Group instructors,”
descriptive statistics were examined. These included the mean, standard deviation,
frequencies, and percentages.
A measure of central tendency is a number that represents a typical value in a given
set of data (Mertler & Vannatta, 2010). Craig Mertler and Rachel Vannatta (2010) explained,
the mean is, “the preferred measure of central tendency because it takes into account the
actual values of all scores in a distribution,” (p. 7). The mean is calculated by taking the
average of a set of scores. And, it is used more frequently than other measures of central
tendency (Mertler & Vannatta, 2010). And, while measures of central tendency are useful to
researchers, they don’t “adequately describe a distribution of scores,” as measures of
variability, such as standard deviation, do (p. 7).
Mertler and Vannatta (2010) defined standard deviation as, “a special type of average
distance of scores away from the mean,” and is “an appropriate measure of variability when
variables are measured on an interval or ratio scale,” and it is “the most stable because it
takes into account every score in the distribution” (p. 8). To calculate the standard deviation,
first, the mean is calculated by adding up all of the scores and dividing the total by the total
number of scores. Next, the mean is subtracted from each individual score. Individual
differences are then squared and the sum calculated. Lastly, the average of the sum is
calculated to get the variance, and the square root of the variance calculated to get the
standard deviation. The larger the standard deviation, the farther the scores are from the
mean. The smaller the standard deviation, the closer the scores are to the mean. Mertler and
Vannatta noted, “The mean and standard deviation taken together do a fairly good job of
describing a set of scores” (p. 8).
45
When looking at categorical data, the number of observations in a given category is
called the frequency (Agresti & Finlay, 2009). Agresti and Finlay (2009) said, “To make is
easier to compare different categories, we also report proportions or percentages, also called
relative frequencies,” (p. 31). The percentage is calculated by dividing the number of
observations in a category by the total number of observations, then multiplying the result by
100. When reporting frequencies in a table, the researcher should also report percentages and
the total sample size. Agresti and Finlay said, when reporting percentages only, without the
frequencies, “always include the total sample size” (p. 32).
For the third, fourth, and fifth research questions, “What is the relationship between
Instructional Technology Constituent Group instructors’ UTAUT levels and how frequently
they use technology in their teaching,” “What is the relationship between Instructional
Technology Constituent Group instructors’ academic discipline and how frequently they use
technology in their teaching,” and “What is the relationship between Instructional
Technology Constituent Group instructors’ institutional characteristics where they teach and
how frequently they use technology in their teaching,” relationships were examined. Scores
from the behavior usage survey item were summated for both applications and devices, then
cut at the half point to create the variables Q12_hilo (for applications) and Q13_hilo (for
devices) to examine the data in terms of two groups: high and low frequency of use.
To examine the relationships between academic discipline and how frequently
Instructional Technology Constituent Group instructors use technology in their teaching, and
institutional characteristics and how frequently Instructional Technology Constituent Group
instructors use technology in their teaching, Pearson's Chi-square test was used. According to
Agresti and Finlay (2009), the chi-squared test of independence “compares the observed
46
frequencies in the contingency table with values that satisfy the null hypothesis of
independence” (p. 225). The values that satisfy the null hypothesis are called the expected
frequencies. In other words, the chi-squared test compares observed frequencies to expected
frequencies. The chi-squared statistic “summarizes how close the expected frequencies fall to
the observed frequencies” (p. 225).
To calculate the chi-squared statistic, a summation of all cells in the contingency table
is taken and the difference between the observed and expected frequencies is squared. The
square is then divided by the expected frequency (Agresti & Finlay, 2009). Agresti and
Finlay (2009) also noted, “The sampling distribution of the chi-squared test statistic indicates
how large the chi-squared statistic must be before strong evidence exists that the null
hypothesis is false” (p. 226). And, in terms of the characteristics of the chi-squared
distribution— the test statistic cannot be negative, it is skewed to the right, and its shape
depends on the degrees of freedom (p. 226).
To examine the relationship between UTAUT variables and how frequently
Instructional Technology Constituent Group instructors use technology in their teaching
specifically, the point bi-serial correlation was used. Point bi-serial correlation coefficients
are interpreted like Pearson correlation coefficients. However, unlike the Pearson correlation
coefficient which measures the relationship between two continuous variables, the point bi-
serial correlation coefficient measures the relationship between a continuous variable and a
binary variable (Tate, 1954). Scores for each UTAUT variable were summated, and the
relationship between the participants’ summated scores and their frequency of use of
technology were examined. Additionally, Pearson correlations were examined for frequency
of use of technology and instructors’ scores on each individual UTAUT variable.
47
For the sixth research question, “Do UTAUT variables, academic discipline, and
institutional characteristics influence how frequently Instructional Technology Constituent
Group instructors’ use technology in their teaching?” binary logistic regression was used.
Binary logistic regression is a form of regression which is used when the dependent variable
is dichotomous and the independent variables are categorical or continuous. Continuous
variables are not used as dependents in logistic regression, and there can be only one
dependent variable. Because the dependent variable is dichotomous, the researcher should
use logistic regression when looking at two groups. The advantages are that the assumptions
for linearity and normality do not apply for logistic regression as they do with discriminant
analysis and regression analysis. And with logistic regression, the researcher can use dummy
coded non-metric variables (Hair et al, 2009; Mertler & Vannatta, 2010).
Perhaps one of the most appealing elements about binary logistic regression is that
the technique can be used to make predictions about group membership based on continuous
and/or categorical independent variables. The impact of predictor variables is usually
explained in terms of odds ratios. Estimated values must not fall outside of the range of 0 to
1; therefore the probability is expressed as odds, or the ratio of the probability of the two
outcomes. A probability of .50 results in odds of 1.0, meaning both outcomes have an equal
chance of occurring. Odds less than 1.0 represent probabilities less than .50. And, odds
greater than 1.0 represent probabilities greater than .50 (Hair et al, 2009; Mertler & Vannatta,
2010).
Summary of Methods
This study used an electronically delivered survey to collect information from
instructors subscribed to the EDUCAUSE Instructional Technology Constituent Group
48
listserv. Logistic regression analysis was conducted to evaluate the relationship between
predictor variables (Carnegie classification, governance structure, academic discipline,
performance expectancy, effort expectancy, social influence, and facilitating conditions) and
usage behavior. The next chapter provides an analysis of the results.
49
CHAPTER FOUR: RESULTS
Introduction
The following chapter includes demographic data and results for research questions 1
through 6: 1) How frequently are instructors in the Instructional Technology Constituent
Group using technology in their teaching?; 2) What is the level of UTAUT for performance
expectancy, effort expectancy, social influence, facilitating conditions for instructors in the
Instructional Technology Constituent Group?; 3) What is the relationship between
Instructional Technology Constituent Group instructors’ UTAUT levels and how frequently
they use technology in their teaching?; 4); What is the relationship between Instructional
Technology Constituent Group instructors’ academic discipline and how frequently they use
technology in their teaching? 5) What is the relationship between Instructional Technology
Constituent Group instructors’ institutional characteristics where they teach and how
frequently they use technology in their teaching?; and 6) Do UTAUT variables, academic
discipline, and institutional characteristics influence how frequently Instructional Technology
Constituent Group instructors’ use technology in their teaching?
Demographics
Out of 1,313 subscribers to the EDUCAUSE Instructional Technology Constituent
Group listserv, only 65 who completed the survey were identified as instructors. There were
98 respondents not included in the analysis because they were not identified as instructors. If
the number of respondents not identified as instructors (n=98) and the number of respondents
who are instructors (n=65) are representative of the population, then approximately 867
subscribers to the listserv could be identified as instructors. Therefore, this resulted in a
response rate of 7.5 percent (n=65). Of those 65 instructors whose responses were included
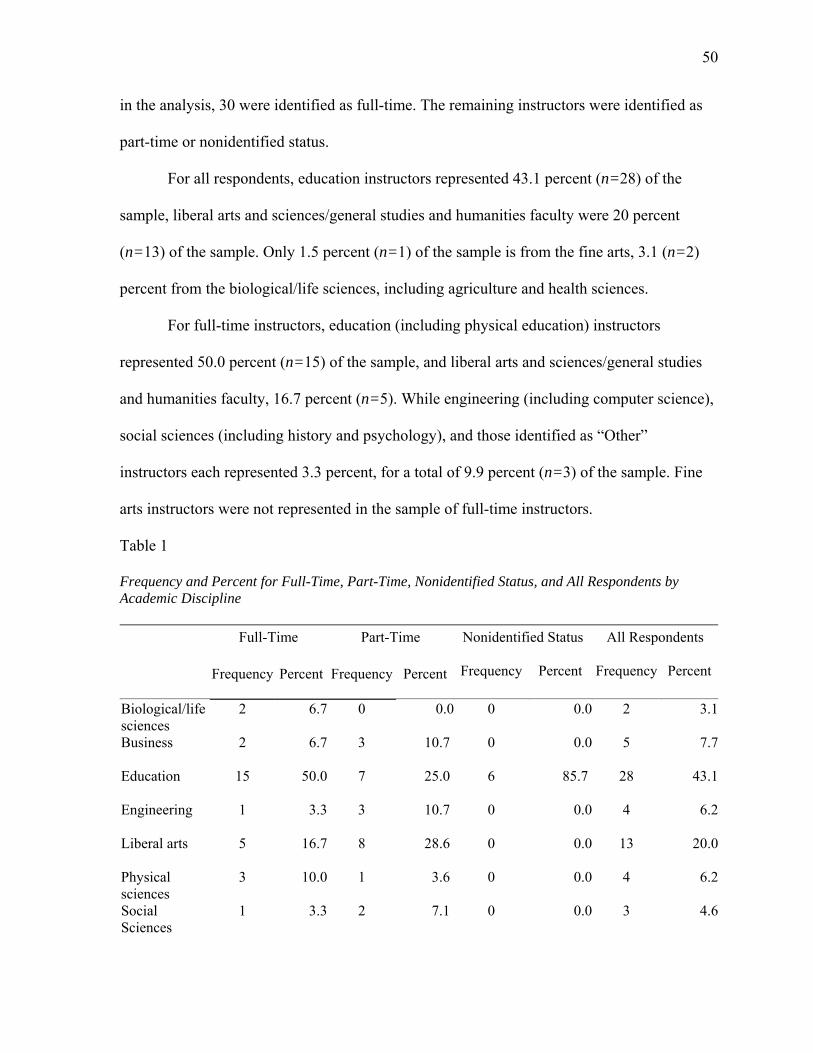
50
in the analysis, 30 were identified as full-time. The remaining instructors were identified as
part-time or nonidentified status.
For all respondents, education instructors represented 43.1 percent (n=28) of the
sample, liberal arts and sciences/general studies and humanities faculty were 20 percent
(n=13) of the sample. Only 1.5 percent (n=1) of the sample is from the fine arts, 3.1 (n=2)
percent from the biological/life sciences, including agriculture and health sciences.
For full-time instructors, education (including physical education) instructors
represented 50.0 percent (n=15) of the sample, and liberal arts and sciences/general studies
and humanities faculty, 16.7 percent (n=5). While engineering (including computer science),
social sciences (including history and psychology), and those identified as “Other”
instructors each represented 3.3 percent, for a total of 9.9 percent (n=3) of the sample. Fine
arts instructors were not represented in the sample of full-time instructors.
Table 1
Frequency and Percent for Full-Time, Part-Time, Nonidentified Status, and All Respondents by Academic Discipline
Full-Time Part-Time Nonidentified Status All Respondents
Frequency Percent Frequency Percent Frequency Percent Frequency Percent
Biological/life sciences
2 6.7 0 0.0 0 0.0 2 3.1
Business 2 6.7 3 10.7 0 0.0 5 7.7
Education 15 50.0 7 25.0 6 85.7 28 43.1
Engineering 1 3.3 3 10.7 0 0.0 4 6.2
Liberal arts 5 16.7 8 28.6 0 0.0 13 20.0
Physical sciences
3 10.0 1 3.6 0 0.0 4 6.2
Social Sciences
1 3.3 2 7.1 0 0.0 3 4.6
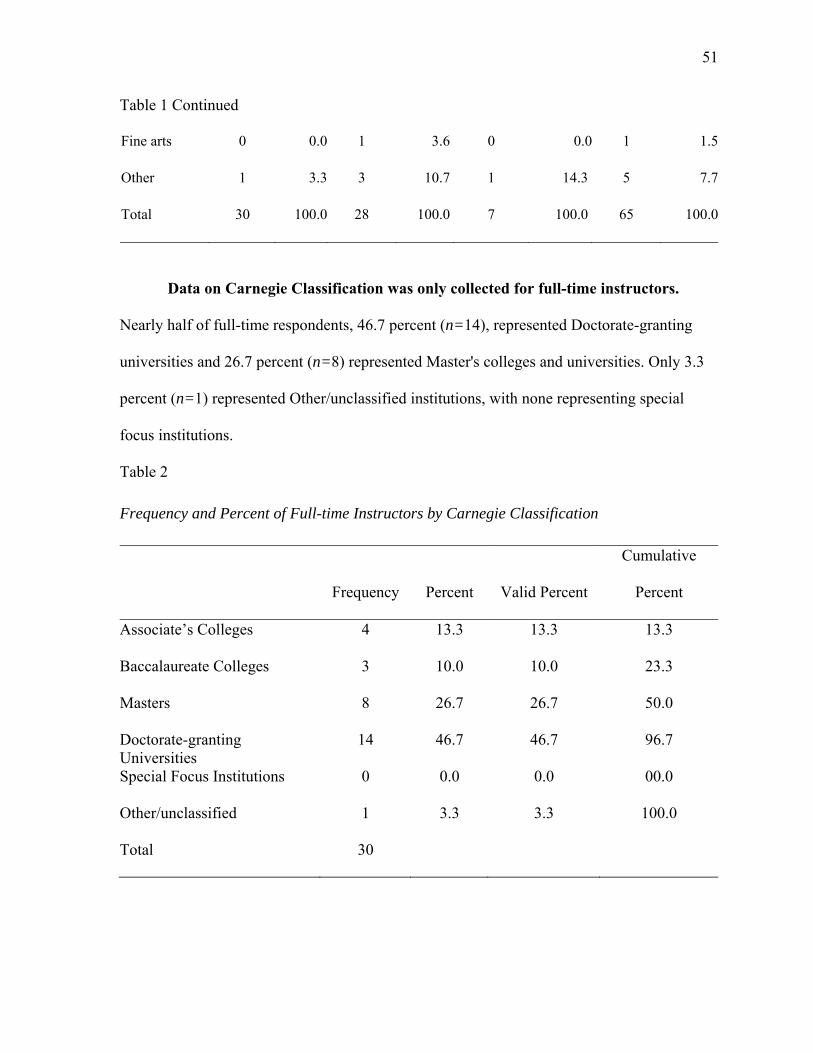
51
Table 1 Continued
Fine arts 0 0.0 1 3.6 0 0.0 1 1.5
Other 1 3.3 3 10.7 1 14.3 5 7.7
Total 30 100.0 28 100.0 7 100.0 65 100.0
Data on Carnegie Classification was only collected for full-time instructors.
Nearly half of full-time respondents, 46.7 percent (n=14), represented Doctorate-granting
universities and 26.7 percent (n=8) represented Master's colleges and universities. Only 3.3
percent (n=1) represented Other/unclassified institutions, with none representing special
focus institutions.
Table 2
Frequency and Percent of Full-time Instructors by Carnegie Classification
Frequency Percent Valid Percent
Cumulative
Percent
Associate’s Colleges 4 13.3 13.3 13.3
Baccalaureate Colleges 3 10.0 10.0 23.3
Masters 8 26.7 26.7 50.0
Doctorate-granting Universities
14 46.7 46.7 96.7
Special Focus Institutions 0 0.0 0.0 00.0
Other/unclassified 1 3.3 3.3 100.0
Total 30
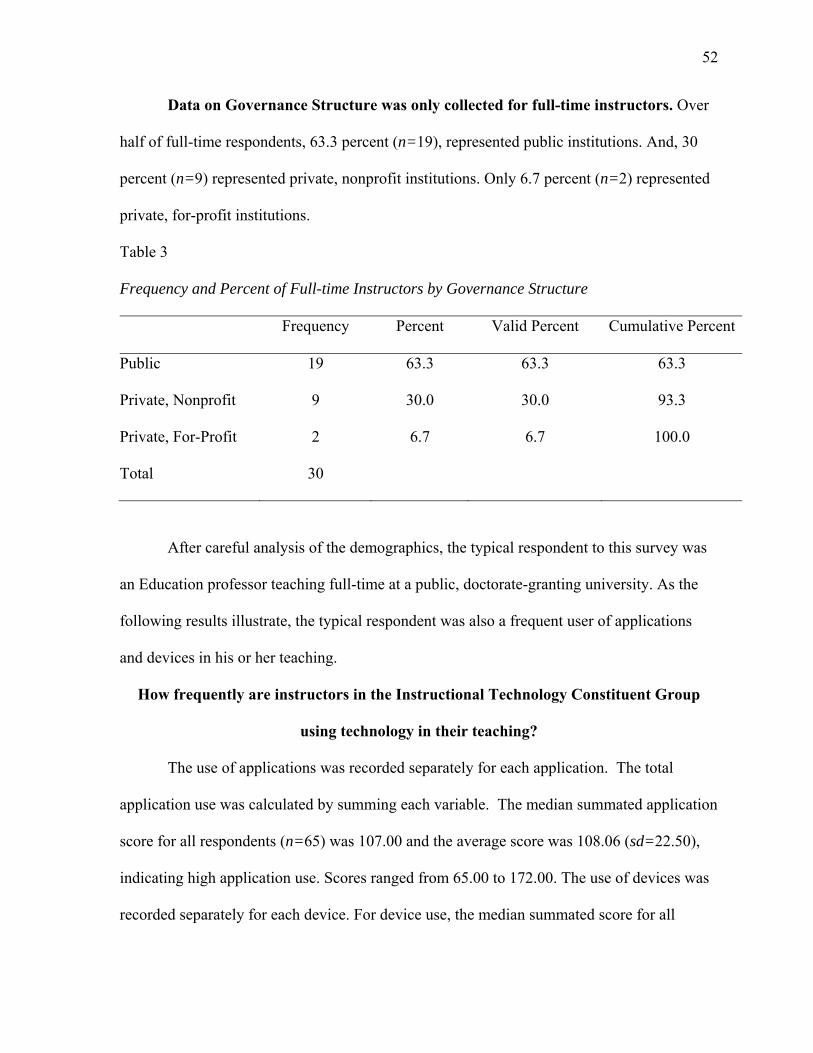
52
Data on Governance Structure was only collected for full-time instructors. Over
half of full-time respondents, 63.3 percent (n=19), represented public institutions. And, 30
percent (n=9) represented private, nonprofit institutions. Only 6.7 percent (n=2) represented
private, for-profit institutions.
Table 3
Frequency and Percent of Full-time Instructors by Governance Structure
Frequency Percent Valid Percent Cumulative Percent
Public 19 63.3 63.3 63.3
Private, Nonprofit 9 30.0 30.0 93.3
Private, For-Profit 2 6.7 6.7 100.0
Total 30
After careful analysis of the demographics, the typical respondent to this survey was
an Education professor teaching full-time at a public, doctorate-granting university. As the
following results illustrate, the typical respondent was also a frequent user of applications
and devices in his or her teaching.
How frequently are instructors in the Instructional Technology Constituent Group
using technology in their teaching?
The use of applications was recorded separately for each application. The total
application use was calculated by summing each variable. The median summated application
score for all respondents (n=65) was 107.00 and the average score was 108.06 (sd=22.50),
indicating high application use. Scores ranged from 65.00 to 172.00. The use of devices was
recorded separately for each device. For device use, the median summated score for all
53
respondents (n=65) was 82.00 and the average score was 84.60 (sd=21.70), indicating high
device use. Scores ranged from 49.00 to 162.00.
For application use, the median summated score for full-time instructors (n=30) was
112.50 and the average was 111.73, sd=25.70), indicating slightly low application use, but
high use of applications when compared to all respondents. Scores ranged from 65.00 to
172.00. For device use, the median summated score for all full-time respondents (n=30) was
85.50 and the average was 87.93 (sd=24.34), indicating high device use. Scores ranged from
49.00 to 162.00.
When looking at use for each application individually, presentation software
(PowerPoint, Keynote, Google Presentations, etc.) was used most frequently for teaching. On
a scale of 1 to 5, average scores under 1.5 fall under Never or Not Applicable (N/A); average
scores between1.5 and 2.5 fall under Rarely; average scores between 2.5 and 3.5 fall under
Sometimes; average scores between 3.5 and 4.5 fall under Very Often; and average scores
between 4.5 and 5 fall under Always. The average of scores being 4.74 indicates that
instructors always use presentation software (M=5.00, sd=.477). Wikis (Wikipedia, course
wiki, etc.) was the next most used application for teaching with an average score of 4.60
(M=5.00, sd=.553). Telephone-like communication over the Internet (Skype, Google Voice,
Video Chat, etc.) and geo-tagging, geo-tagged environments were the least used applications.
Average scores of 1.46 (M=1.00, sd=.812) and 1.40 (M=1.00, sd=.915) respectively, indicate
instructors rarely use telephone-like communication over the Internet and never use geo-
tagging, geo-tagged environments.
When looking at use for each device individually, clickers or student response
systems were used most frequently for teaching. On a scale of 1 to 5, average scores under
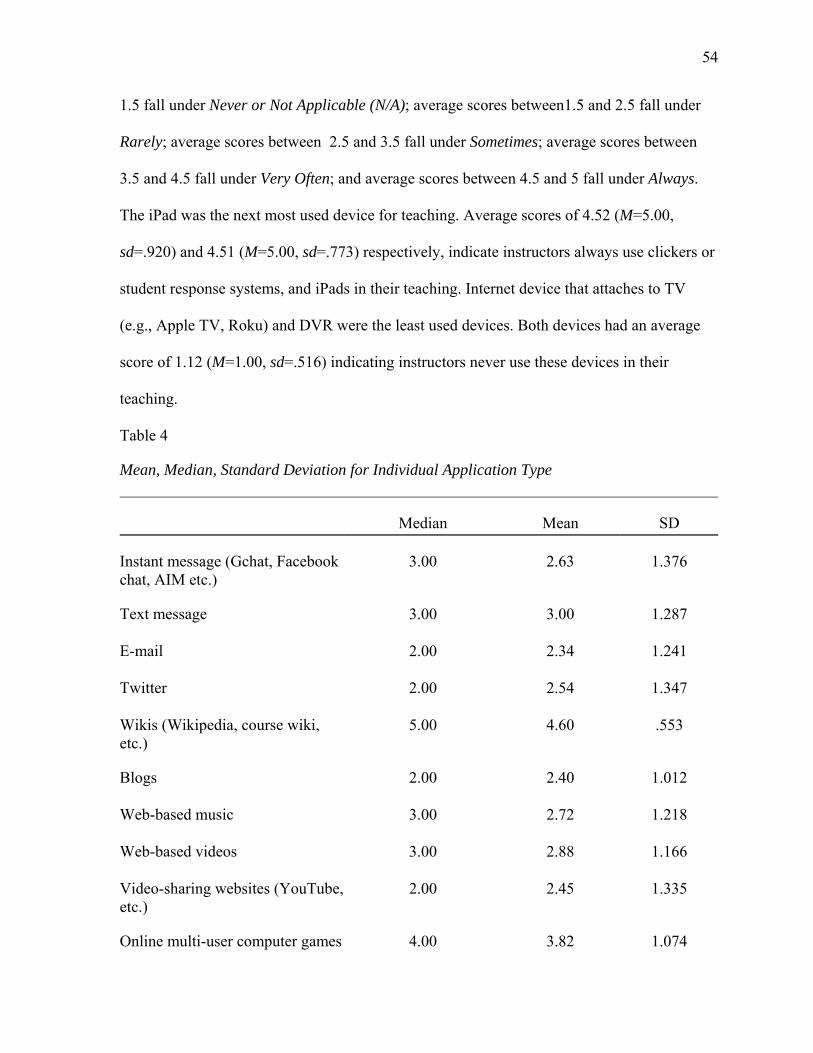
54
1.5 fall under Never or Not Applicable (N/A); average scores between1.5 and 2.5 fall under
Rarely; average scores between 2.5 and 3.5 fall under Sometimes; average scores between
3.5 and 4.5 fall under Very Often; and average scores between 4.5 and 5 fall under Always.
The iPad was the next most used device for teaching. Average scores of 4.52 (M=5.00,
sd=.920) and 4.51 (M=5.00, sd=.773) respectively, indicate instructors always use clickers or
student response systems, and iPads in their teaching. Internet device that attaches to TV
(e.g., Apple TV, Roku) and DVR were the least used devices. Both devices had an average
score of 1.12 (M=1.00, sd=.516) indicating instructors never use these devices in their
teaching.
Table 4
Mean, Median, Standard Deviation for Individual Application Type
Median Mean SD
Instant message (Gchat, Facebook chat, AIM etc.)
3.00 2.63 1.376
Text message 3.00 3.00 1.287
E-mail 2.00 2.34 1.241
Twitter 2.00 2.54 1.347
Wikis (Wikipedia, course wiki, etc.)
5.00 4.60 .553
Blogs 2.00 2.40 1.012
Web-based music 3.00 2.72 1.218
Web-based videos 3.00 2.88 1.166
Video-sharing websites (YouTube, etc.)
2.00 2.45 1.335
Online multi-user computer games 4.00 3.82 1.074

55
Table 4 Continued
Online virtual worlds (Second Life, Forterra, etc.)
4.00 3.92 .889
Telephone-like communication over the Internet (Skype, Google Voice, Video Chat, etc.)
1.00 1.46 .812
Podcasts and webcasts 1.00 1.49 .831
Facebook 3.00 2.98 1.097
LinkedIn 3.00 3.15 1.019
Other social networking websites (MySpace, etc.)
2.00 2.14 1.310
Recommend an article or information online by tagging/bookmarking/liking (Delicious, Digg, Newsvine, Twine, etc.)
2.00 2.18 1.211
Photo-sharing websites (Flickr, Snapfish, Picasa, etc.)
1.00 1.68 1.032
Internet content via a TV (Apple TV, Roku)
2.00 2.69 1.413
Online forums or bulletin boards 2.00 2.52 1.264
Social studying sites (Cramster, CourseHero, GradeGuru, etc.)
2.00 2.18 1.402
Online chats, chat events, webinars 4.00 3.40 1.272
Geo-tagging, geo-tagged environments
1.00 1.40 .915
College/university library website 3.00 3.00 1.186
Course or learning management system (Blackboard, Moodle, WebCT, Desire@Learn, Sakai, etc.)
1.00 1.49 .850
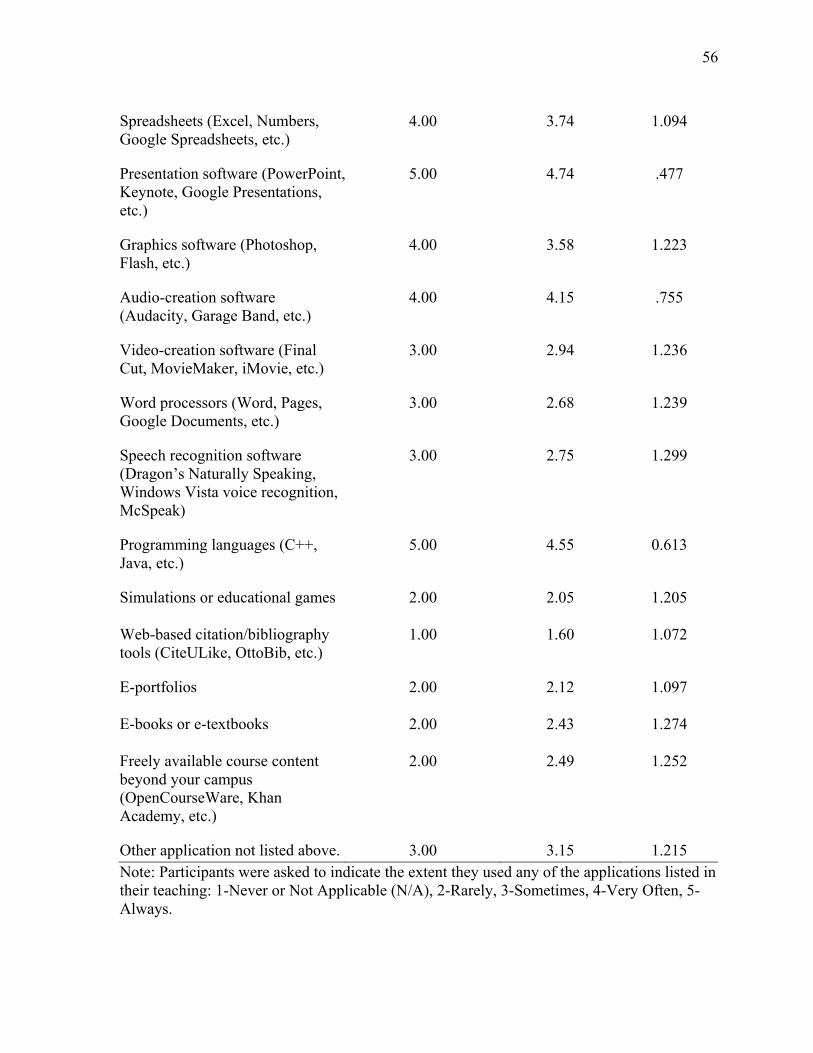
56
Spreadsheets (Excel, Numbers, Google Spreadsheets, etc.)
4.00 3.74 1.094
Presentation software (PowerPoint, Keynote, Google Presentations, etc.)
5.00 4.74 .477
Graphics software (Photoshop, Flash, etc.)
4.00 3.58 1.223
Audio-creation software (Audacity, Garage Band, etc.)
4.00 4.15 .755
Video-creation software (Final Cut, MovieMaker, iMovie, etc.)
3.00 2.94 1.236
Word processors (Word, Pages, Google Documents, etc.)
3.00 2.68 1.239
Speech recognition software (Dragon’s Naturally Speaking, Windows Vista voice recognition, McSpeak)
3.00 2.75 1.299
Programming languages (C++, Java, etc.)
5.00 4.55 0.613
Simulations or educational games 2.00 2.05 1.205
Web-based citation/bibliography tools (CiteULike, OttoBib, etc.)
1.00 1.60 1.072
E-portfolios 2.00 2.12 1.097
E-books or e-textbooks 2.00 2.43 1.274
Freely available course content beyond your campus (OpenCourseWare, Khan Academy, etc.)
2.00 2.49 1.252
Other application not listed above. 3.00 3.15 1.215 Note: Participants were asked to indicate the extent they used any of the applications listed in their teaching: 1-Never or Not Applicable (N/A), 2-Rarely, 3-Sometimes, 4-Very Often, 5-Always.
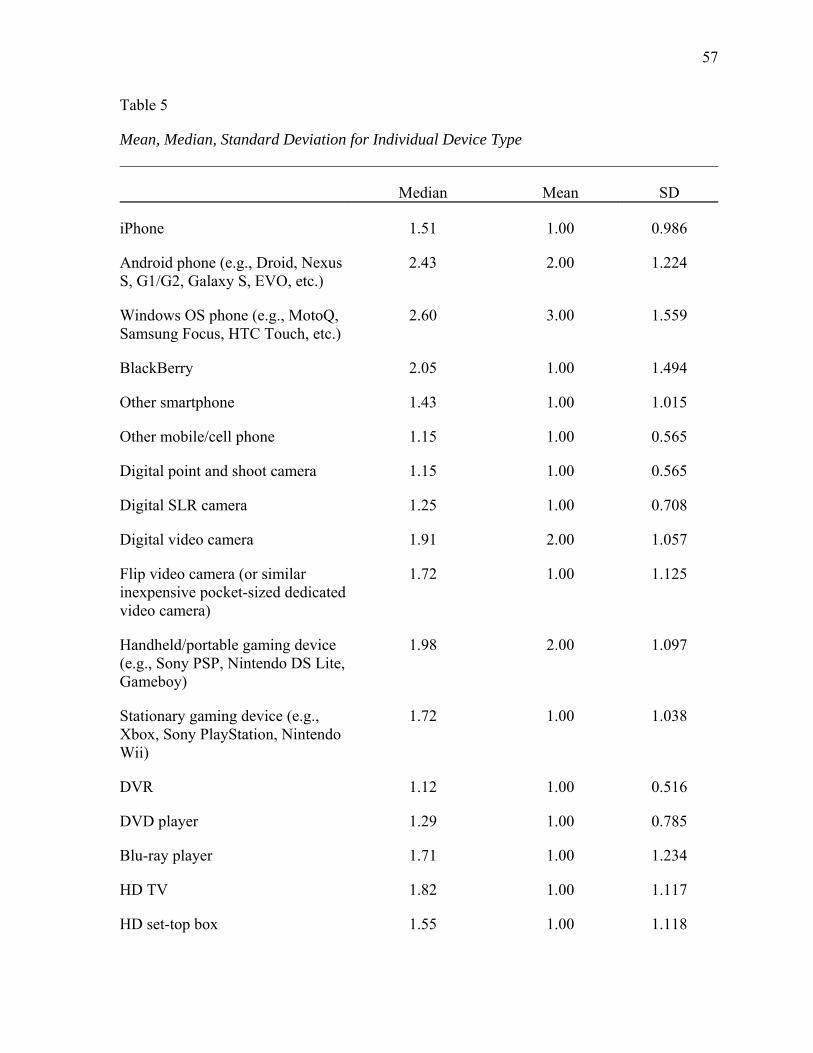
57
Table 5
Mean, Median, Standard Deviation for Individual Device Type
Median Mean SD
iPhone 1.51 1.00 0.986
Android phone (e.g., Droid, Nexus S, G1/G2, Galaxy S, EVO, etc.)
2.43 2.00 1.224
Windows OS phone (e.g., MotoQ, Samsung Focus, HTC Touch, etc.)
2.60 3.00 1.559
BlackBerry 2.05 1.00 1.494
Other smartphone 1.43 1.00 1.015
Other mobile/cell phone 1.15 1.00 0.565
Digital point and shoot camera 1.15 1.00 0.565
Digital SLR camera 1.25 1.00 0.708
Digital video camera 1.91 2.00 1.057
Flip video camera (or similar inexpensive pocket-sized dedicated video camera)
1.72 1.00 1.125
Handheld/portable gaming device (e.g., Sony PSP, Nintendo DS Lite, Gameboy)
1.98 2.00 1.097
Stationary gaming device (e.g., Xbox, Sony PlayStation, Nintendo Wii)
1.72 1.00 1.038
DVR 1.12 1.00 0.516
DVD player 1.29 1.00 0.785
Blu-ray player 1.71 1.00 1.234
HD TV 1.82 1.00 1.117
HD set-top box 1.55 1.00 1.118
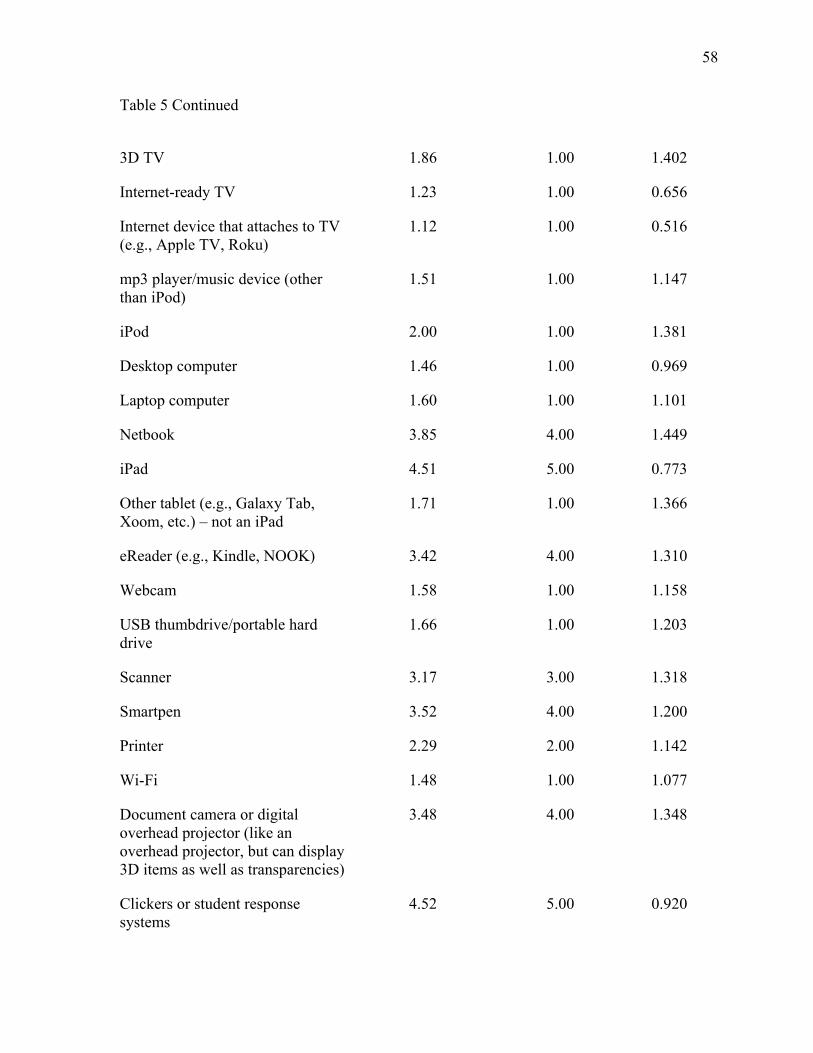
58
Table 5 Continued
3D TV 1.86 1.00 1.402
Internet-ready TV 1.23 1.00 0.656
Internet device that attaches to TV (e.g., Apple TV, Roku)
1.12 1.00 0.516
mp3 player/music device (other than iPod)
1.51 1.00 1.147
iPod 2.00 1.00 1.381
Desktop computer 1.46 1.00 0.969
Laptop computer 1.60 1.00 1.101
Netbook 3.85 4.00 1.449
iPad 4.51 5.00 0.773
Other tablet (e.g., Galaxy Tab, Xoom, etc.) – not an iPad
1.71 1.00 1.366
eReader (e.g., Kindle, NOOK) 3.42 4.00 1.310
Webcam 1.58 1.00 1.158
USB thumbdrive/portable hard drive
1.66 1.00 1.203
Scanner 3.17 3.00 1.318
Smartpen 3.52 4.00 1.200
Printer 2.29 2.00 1.142
Wi-Fi 1.48 1.00 1.077
Document camera or digital overhead projector (like an overhead projector, but can display 3D items as well as transparencies)
3.48 4.00 1.348
Clickers or student response systems
4.52 5.00 0.920
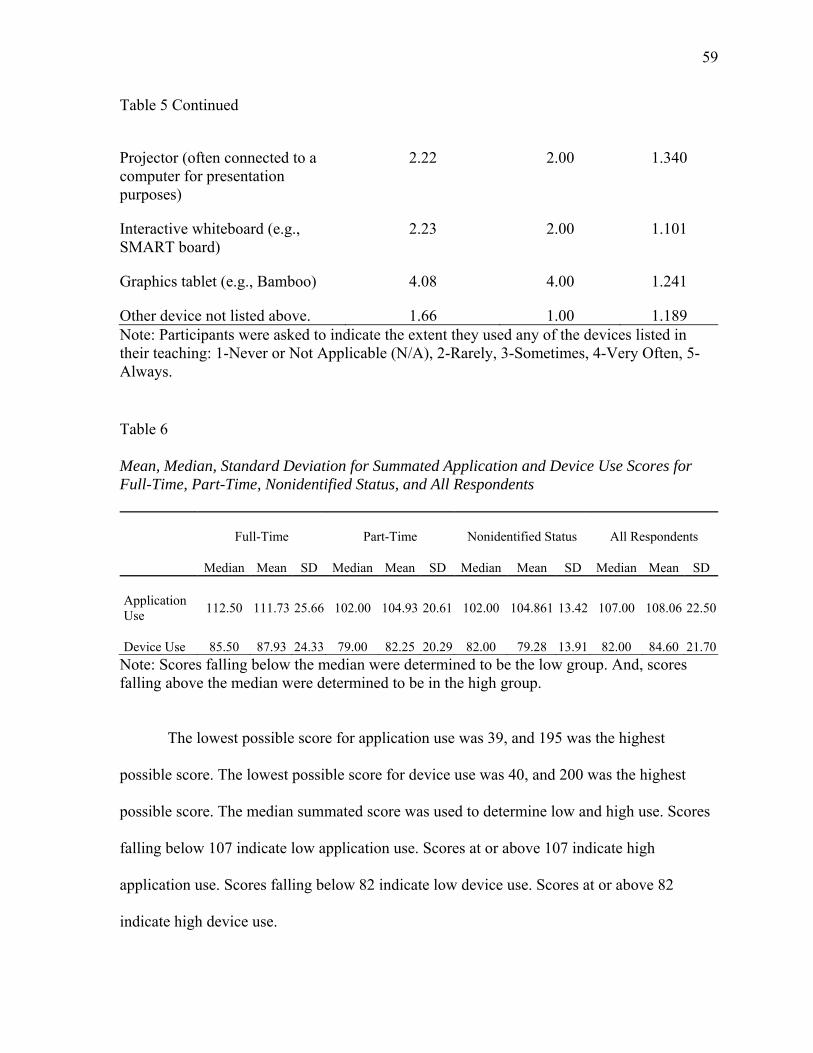
59
Table 5 Continued
Projector (often connected to a computer for presentation purposes)
2.22 2.00 1.340
Interactive whiteboard (e.g., SMART board)
2.23 2.00 1.101
Graphics tablet (e.g., Bamboo) 4.08 4.00 1.241
Other device not listed above. 1.66 1.00 1.189 Note: Participants were asked to indicate the extent they used any of the devices listed in their teaching: 1-Never or Not Applicable (N/A), 2-Rarely, 3-Sometimes, 4-Very Often, 5-Always.
Table 6
Mean, Median, Standard Deviation for Summated Application and Device Use Scores for Full-Time, Part-Time, Nonidentified Status, and All Respondents
Full-Time Part-Time Nonidentified Status All Respondents
Median Mean SD Median Mean SD Median Mean SD Median Mean SD
Application Use
112.50 111.73 25.66 102.00 104.93 20.61 102.00 104.861 13.42 107.00 108.06 22.50
Device Use 85.50 87.93 24.33 79.00 82.25 20.29 82.00 79.28 13.91 82.00 84.60 21.70Note: Scores falling below the median were determined to be the low group. And, scores falling above the median were determined to be in the high group.
The lowest possible score for application use was 39, and 195 was the highest
possible score. The lowest possible score for device use was 40, and 200 was the highest
possible score. The median summated score was used to determine low and high use. Scores
falling below 107 indicate low application use. Scores at or above 107 indicate high
application use. Scores falling below 82 indicate low device use. Scores at or above 82
indicate high device use.
60
What is the level of UTAUT for performance expectancy, effort expectancy, social
influence, facilitating conditions for instructors in the Instructional Technology
Constituent Group?
Participants were asked to select the response that best describes their agreement or
disagreement with each statement: 1-Strongly Disagree; 2-Disagree; 3-Somewhat Disagree;
4-Neutral; 5-Somewhat Agree; 6-Agree; 7-Strongly Agree; Not Applicable (N/A) for each of
the four statements under each of the four constructs of the UTAUT (performance
expectancy, effort expectancy, social influence, facilitating conditions). The median score
was used to determine low and high use. Scores falling below the median were determined to
be the low group, with 0 being the lowest possible score for a single construct. And, scores
falling above the median were determined to be in the high group, with 28 being the highest
possible score for a single construct.
For performance expectancy, the median score for all respondents (n=65) was 24.00
and the average was 23.92 (sd=3.10). The scores ranged from 16 to 29 and the average
score. A score of 23.92 would indicate that on average the respondents agreed that they find
instructional technology useful in their jobs. For effort expectancy, the median score for all
respondents (n=65) was 26.00 and the average score was 25.43 (sd=2.61). A score of 25.43
would indicate that on average the respondents agreed that they find instructional technology
easy to learn how to use. Scores ranged from 17.00 to 28.00. For social influence, the median
score for all respondents (n=65) was 24.00 and the average score was 22.22 (sd=4.40). A
score of 22.22 would indicate that on average the respondents agreed that those important to
them think they should use technology in their teaching. Scores ranged from 9.00 to 28.00.
For facilitating conditions, the median score for all respondents (n=65) was 22.00 and the
61
average score was 21.52 (sd=2.50). A score of 21.52 would indicate that on average the
respondents somewhat agreed; meaning on average, they somewhat believe they have the
resources and support necessary to use technology in their teaching. Scores ranged from
15.00 to 28.00.
For performance expectancy, the median score for full-time instructors (n=30) was
23.50 and the average score was 23.83 (sd=2.83). A score of 23.83 would indicate that on
average the respondents agreed that they find instructional technology useful in their jobs.
Scores ranged from 20.00 to 29.00. For effort expectancy, the median score for full-time
instructors (n=30) was 25.50 and the average score was 25.10 (sd=2.90). A score of 25.10
would indicate that on average the respondents agreed that they find instructional technology
easy to learn how to use. Scores ranged from 17.00 to 28.00. For social influence, the median
score for full-time instructors (n=30) was 24.00 and the average score was 22.10 (sd=4.20).
A score of 22.10 would indicate that on average the respondents agreed those important to
them think they should use technology in their teaching. Scores ranged from 15.00 to 28.00.
For facilitating conditions, the median score for full-time instructors (n=30) was 22.00 and
the average score was 21.30, sd=2.50). A score of 21.30 would indicate that on average the
respondents somewhat agreed; meaning on average, they somewhat believe they have the
resources and support necessary to use technology in their teaching. Scores ranged from
15.00 to 26.00.
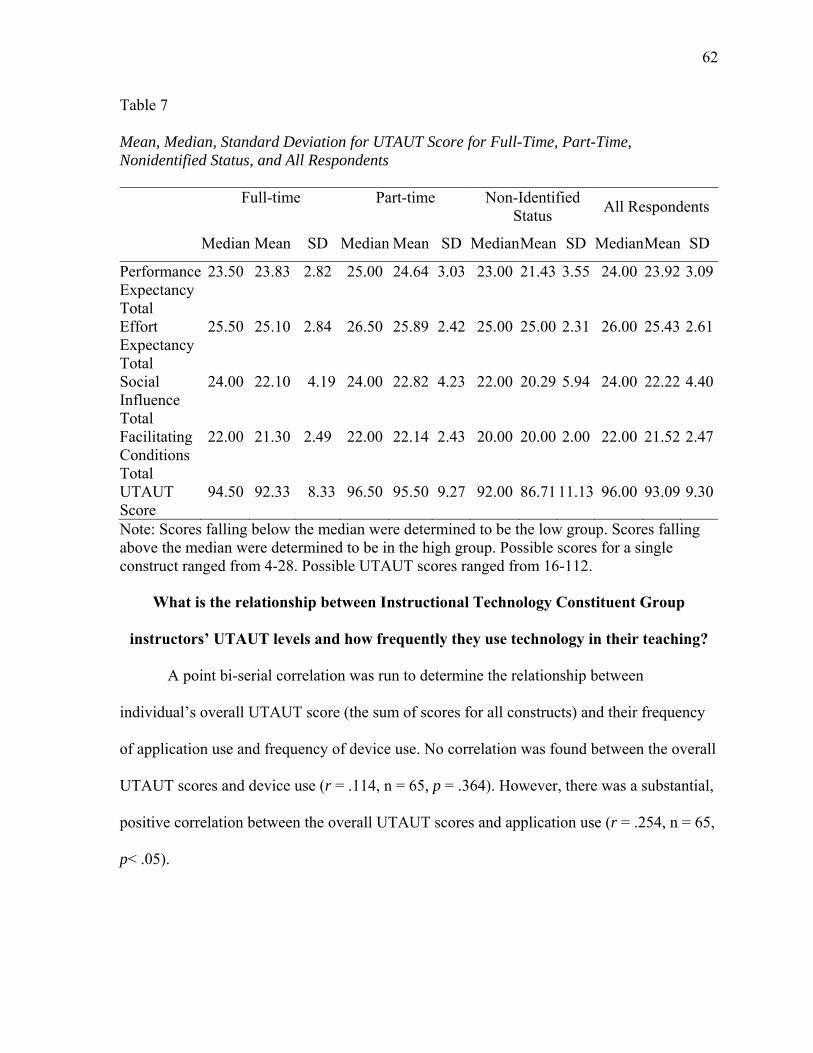
62
Table 7
Mean, Median, Standard Deviation for UTAUT Score for Full-Time, Part-Time, Nonidentified Status, and All Respondents Full-time
Part-time
Non-Identified
Status All Respondents
Median Mean SD Median Mean SD MedianMean SD Median Mean SD
Performance Expectancy Total
23.50 23.83 2.82 25.00 24.64 3.03 23.00 21.43 3.55 24.00 23.92 3.09
Effort Expectancy Total
25.50 25.10 2.84 26.50 25.89 2.42 25.00 25.00 2.31 26.00 25.43 2.61
Social Influence Total
24.00 22.10 4.19 24.00 22.82 4.23 22.00 20.29 5.94 24.00 22.22 4.40
Facilitating Conditions Total
22.00 21.30 2.49 22.00 22.14 2.43 20.00 20.00 2.00 22.00 21.52 2.47
UTAUT Score
94.50 92.33 8.33 96.50 95.50 9.27 92.00 86.7111.13 96.00 93.09 9.30
Note: Scores falling below the median were determined to be the low group. Scores falling above the median were determined to be in the high group. Possible scores for a single construct ranged from 4-28. Possible UTAUT scores ranged from 16-112.
What is the relationship between Instructional Technology Constituent Group
instructors’ UTAUT levels and how frequently they use technology in their teaching?
A point bi-serial correlation was run to determine the relationship between
individual’s overall UTAUT score (the sum of scores for all constructs) and their frequency
of application use and frequency of device use. No correlation was found between the overall
UTAUT scores and device use (r = .114, n = 65, p = .364). However, there was a substantial,
positive correlation between the overall UTAUT scores and application use (r = .254, n = 65,
p< .05).
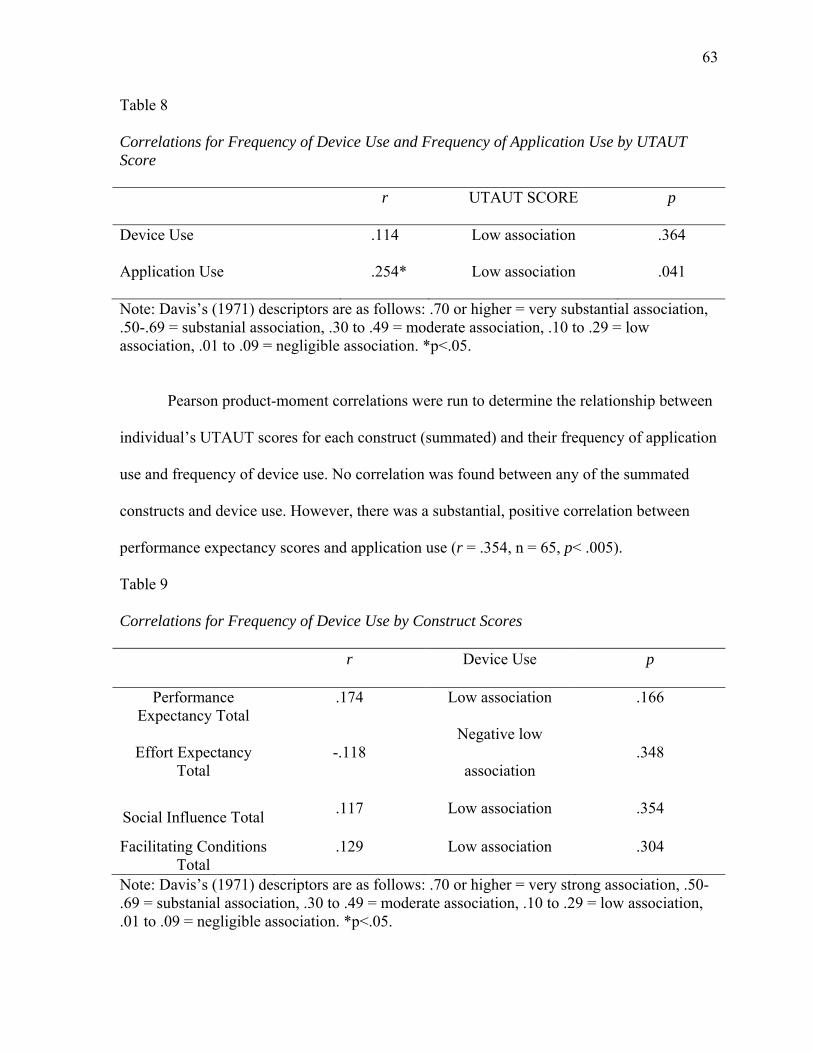
63
Table 8
Correlations for Frequency of Device Use and Frequency of Application Use by UTAUT Score r UTAUT SCORE p
Device Use .114 Low association .364
Application Use .254* Low association .041
Note: Davis’s (1971) descriptors are as follows: .70 or higher = very substantial association, .50-.69 = substanial association, .30 to .49 = moderate association, .10 to .29 = low association, .01 to .09 = negligible association. *p<.05.
Pearson product-moment correlations were run to determine the relationship between
individual’s UTAUT scores for each construct (summated) and their frequency of application
use and frequency of device use. No correlation was found between any of the summated
constructs and device use. However, there was a substantial, positive correlation between
performance expectancy scores and application use (r = .354, n = 65, p< .005).
Table 9
Correlations for Frequency of Device Use by Construct Scores
r Device Use p
Performance Expectancy Total
.174 Low association .166
Effort Expectancy Total
-.118 Negative low
association .348
Social Influence Total .117 Low association .354
Facilitating Conditions Total
.129 Low association .304
Note: Davis’s (1971) descriptors are as follows: .70 or higher = very strong association, .50-.69 = substanial association, .30 to .49 = moderate association, .10 to .29 = low association, .01 to .09 = negligible association. *p<.05.

64
Table 10
Correlations for Frequency of Application Use by Construct Scores
r Application Use p
Performance Expectancy Total
.354* Substanial
association .004
Effort Expectancy Total
.020 Negligible
association .877
Social Influence Total .193 Low association .124
Facilitating Conditions Total
.148 Low association .240
Note: Davis’s (1971) descriptors are as follows: .70 or higher = very strong association, .50-.69 = substanial association, .30 to .49 = moderate association, .10 to .29 = low association, .01 to .09 = negligible association. *p<.05.
What is the relationship between Instructional Technology Constituent Group
instructors’ academic discipline and how frequently they use technology in their
teaching?
The use of applications was recorded separately for each application. Then all scores
were summated and divided into a high usage and low usage group based on the median
score. There was no statistically significant association between Academic Discipline and
frequency of application use; that is, all disciplines used applications equally as often
(χ(8)=9.593, p=.295).
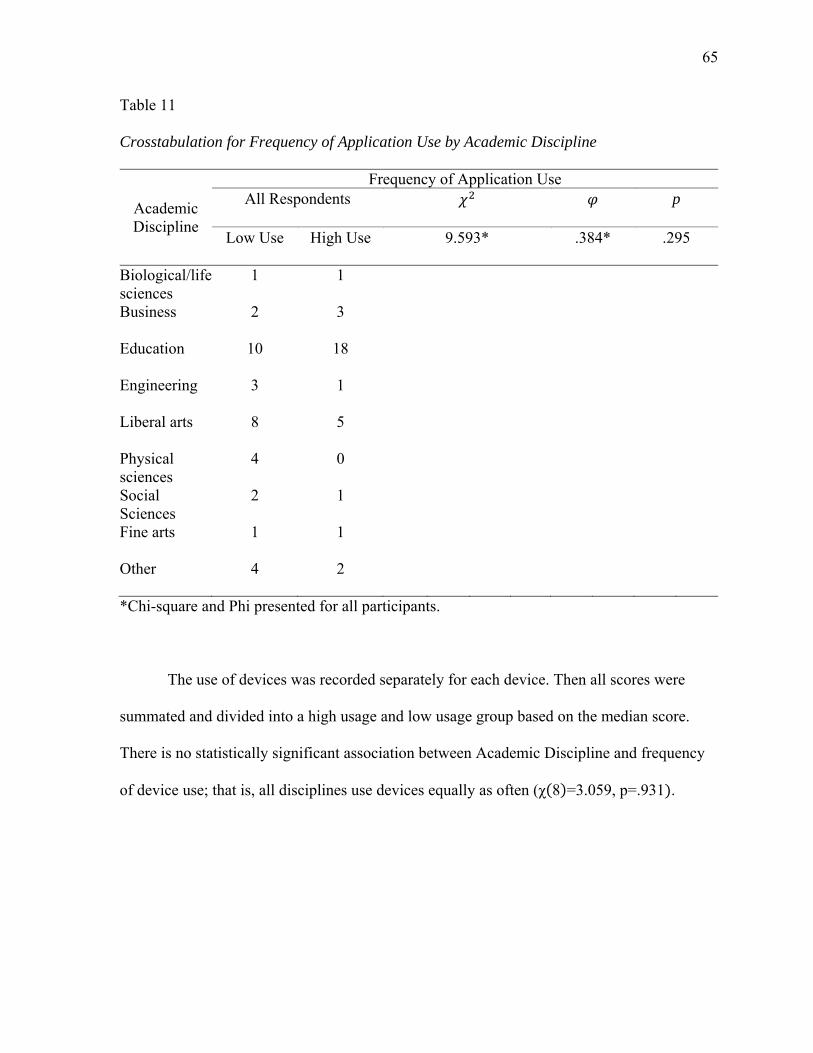
65
Table 11
Crosstabulation for Frequency of Application Use by Academic Discipline
Academic Discipline
Frequency of Application Use All Respondents p
Low Use High Use 9.593* .384* .295
Biological/life sciences
1 1
Business 2 3
Education 10 18
Engineering 3 1
Liberal arts 8 5
Physical sciences
4 0
Social Sciences
2 1
Fine arts 1 1
Other 4 2
*Chi-square and Phi presented for all participants.
The use of devices was recorded separately for each device. Then all scores were
summated and divided into a high usage and low usage group based on the median score.
There is no statistically significant association between Academic Discipline and frequency
of device use; that is, all disciplines use devices equally as often (χ 8 =3.059, p=.931 .
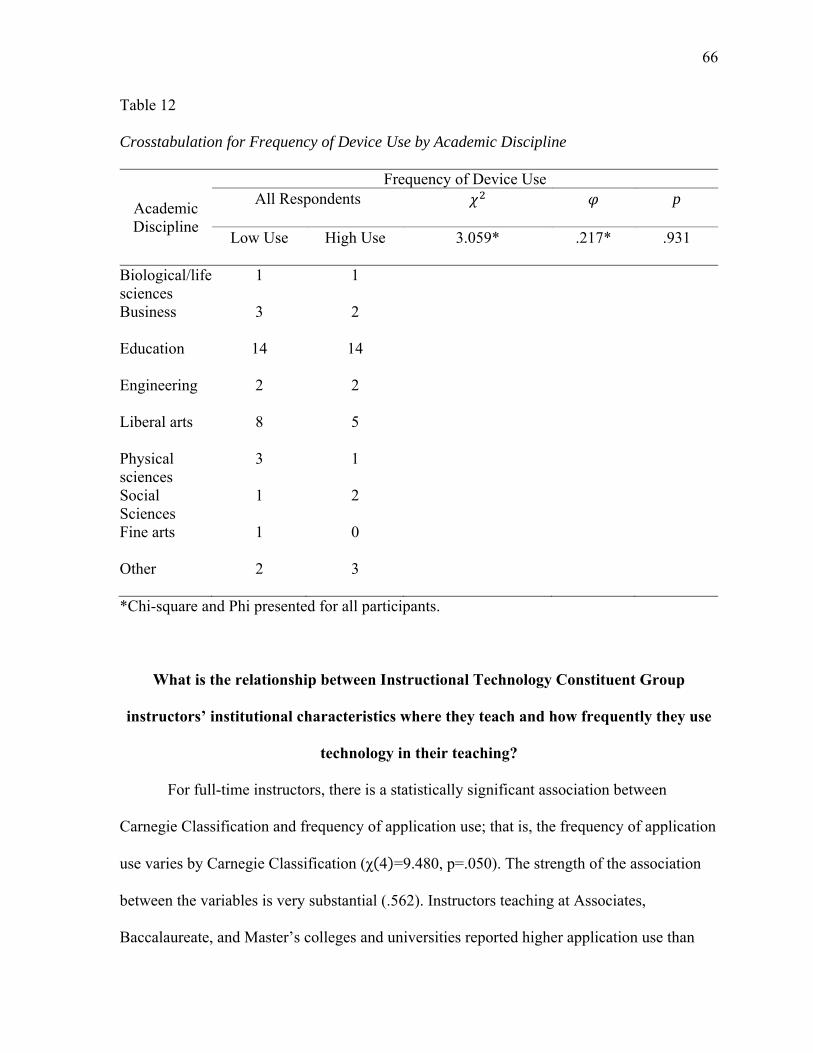
66
Table 12
Crosstabulation for Frequency of Device Use by Academic Discipline
Academic Discipline
Frequency of Device Use All Respondents p
Low Use High Use 3.059* .217* .931
Biological/life sciences
1 1
Business 3 2
Education 14 14
Engineering 2 2
Liberal arts 8 5
Physical sciences
3 1
Social Sciences
1 2
Fine arts 1 0
Other 2 3
*Chi-square and Phi presented for all participants.
What is the relationship between Instructional Technology Constituent Group
instructors’ institutional characteristics where they teach and how frequently they use
technology in their teaching?
For full-time instructors, there is a statistically significant association between
Carnegie Classification and frequency of application use; that is, the frequency of application
use varies by Carnegie Classification (χ 4 =9.480, p=.050). The strength of the association
between the variables is very substantial (.562). Instructors teaching at Associates,
Baccalaureate, and Master’s colleges and universities reported higher application use than
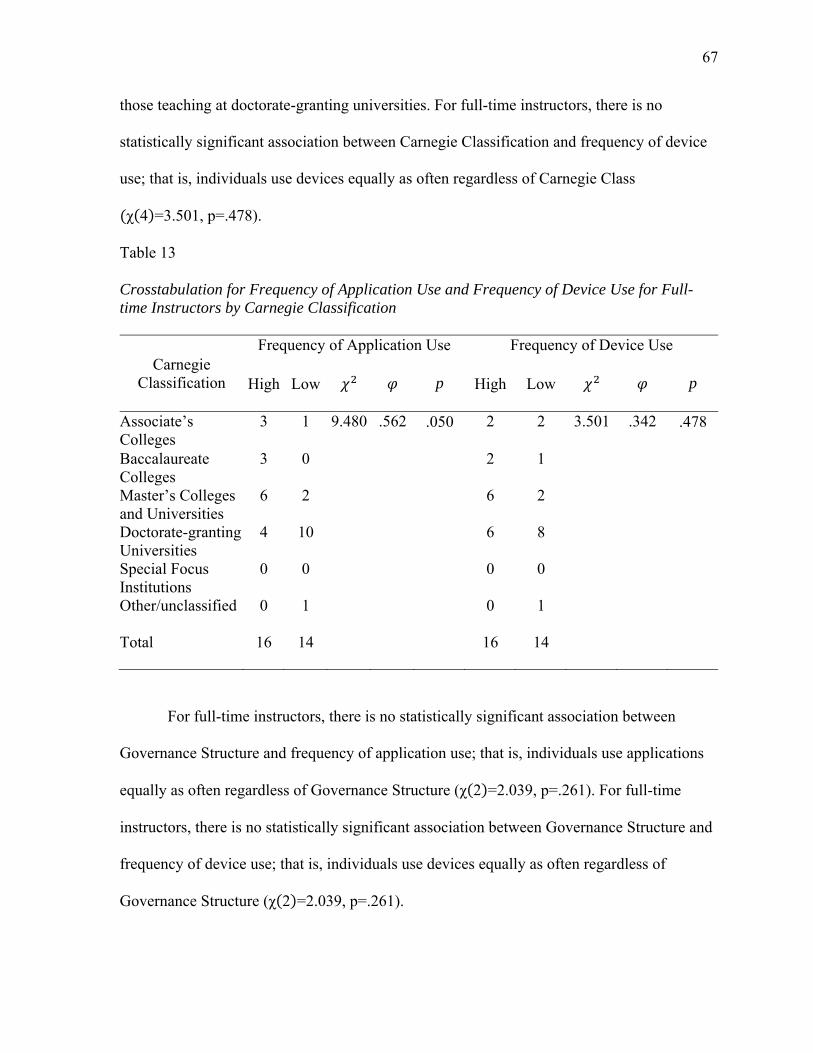
67
those teaching at doctorate-granting universities. For full-time instructors, there is no
statistically significant association between Carnegie Classification and frequency of device
use; that is, individuals use devices equally as often regardless of Carnegie Class
χ 4 =3.501, p=.478).
Table 13
Crosstabulation for Frequency of Application Use and Frequency of Device Use for Full-time Instructors by Carnegie Classification
Carnegie Classification
Frequency of Application Use Frequency of Device Use
High Low p High Low p
Associate’s Colleges
3 1 9.480 .562 .050 2 2 3.501 .342 .478
Baccalaureate Colleges
3 0 2 1
Master’s Colleges and Universities
6 2 6 2
Doctorate-granting Universities
4 10 6 8
Special Focus Institutions
0 0 0 0
Other/unclassified 0 1 0 1
Total 16 14 16 14
For full-time instructors, there is no statistically significant association between
Governance Structure and frequency of application use; that is, individuals use applications
equally as often regardless of Governance Structure (χ 2 =2.039, p=.261). For full-time
instructors, there is no statistically significant association between Governance Structure and
frequency of device use; that is, individuals use devices equally as often regardless of
Governance Structure (χ 2 =2.039, p=.261).
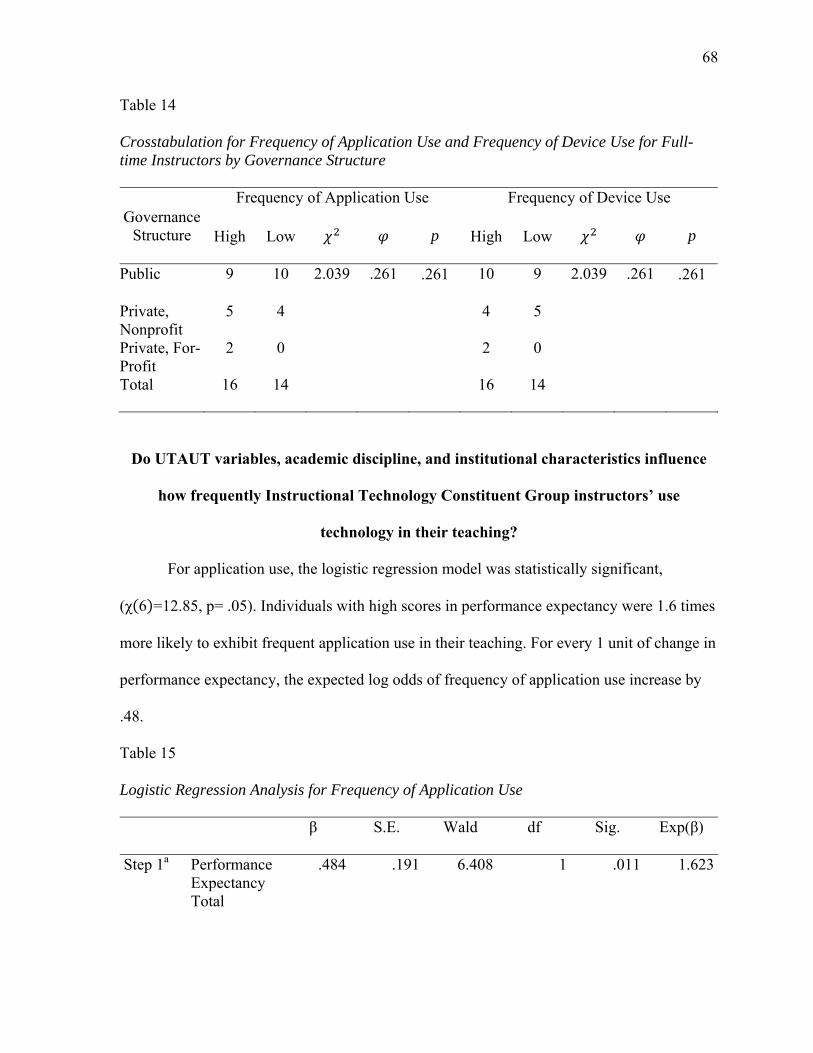
68
Table 14
Crosstabulation for Frequency of Application Use and Frequency of Device Use for Full-time Instructors by Governance Structure
Governance Structure
Frequency of Application Use Frequency of Device Use
High Low p High Low p
Public 9 10 2.039 .261 .261 10 9 2.039 .261 .261
Private, Nonprofit
5 4 4 5
Private, For-Profit
2 0 2 0
Total 16 14 16 14
Do UTAUT variables, academic discipline, and institutional characteristics influence
how frequently Instructional Technology Constituent Group instructors’ use
technology in their teaching?
For application use, the logistic regression model was statistically significant,
(χ 6 =12.85, p= .05). Individuals with high scores in performance expectancy were 1.6 times
more likely to exhibit frequent application use in their teaching. For every 1 unit of change in
performance expectancy, the expected log odds of frequency of application use increase by
.48.
Table 15
Logistic Regression Analysis for Frequency of Application Use
β S.E. Wald df Sig. Exp(β)
Step 1a Performance Expectancy Total
.484 .191 6.408 1 .011 1.623
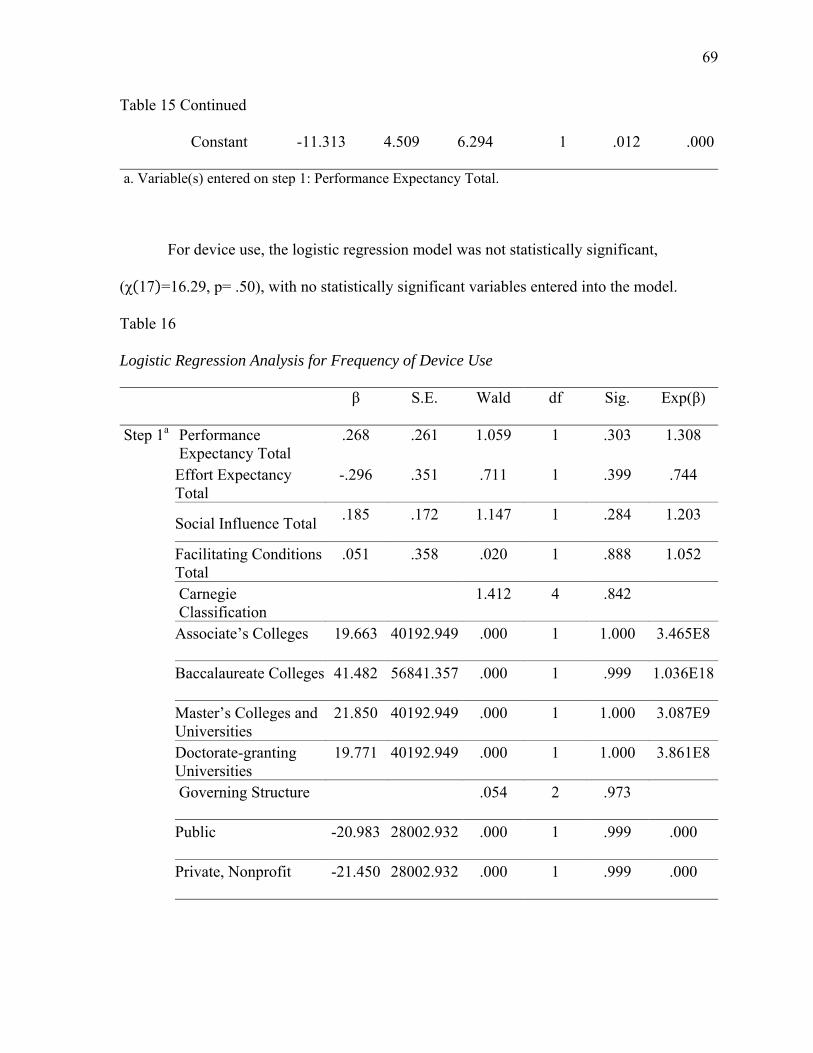
69
Table 15 Continued
Constant -11.313 4.509 6.294 1 .012 .000
a. Variable(s) entered on step 1: Performance Expectancy Total.
For device use, the logistic regression model was not statistically significant,
(χ 17 =16.29, p= .50), with no statistically significant variables entered into the model.
Table 16
Logistic Regression Analysis for Frequency of Device Use
β S.E. Wald df Sig. Exp(β)
Step 1a Performance Expectancy Total
.268 .261 1.059 1 .303 1.308
Effort Expectancy Total
-.296 .351 .711 1 .399 .744
Social Influence Total .185 .172 1.147 1 .284 1.203
Facilitating Conditions Total
.051 .358 .020 1 .888 1.052
Carnegie Classification
1.412 4 .842
Associate’s Colleges 19.663 40192.949 .000 1 1.000 3.465E8
Baccalaureate Colleges 41.482 56841.357 .000 1 .999 1.036E18
Master’s Colleges and Universities
21.850 40192.949 .000 1 1.000 3.087E9
Doctorate-granting Universities
19.771 40192.949 .000 1 1.000 3.861E8
Governing Structure .054 2 .973
Public -20.983 28002.932 .000 1 .999 .000
Private, Nonprofit -21.450 28002.932 .000 1 .999 .000
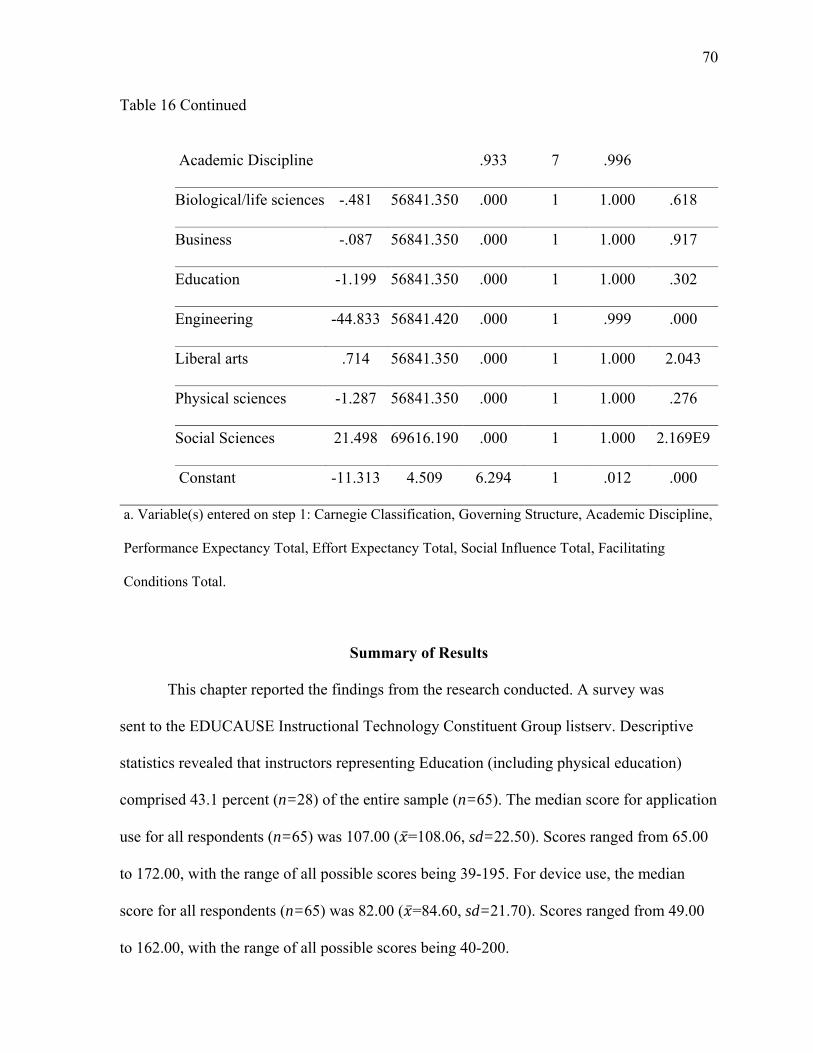
70
Table 16 Continued
Academic Discipline .933 7 .996
Biological/life sciences -.481 56841.350 .000 1 1.000 .618
Business -.087 56841.350 .000 1 1.000 .917
Education -1.199 56841.350 .000 1 1.000 .302
Engineering -44.833 56841.420 .000 1 .999 .000
Liberal arts .714 56841.350 .000 1 1.000 2.043
Physical sciences -1.287 56841.350 .000 1 1.000 .276
Social Sciences 21.498 69616.190 .000 1 1.000 2.169E9
Constant -11.313 4.509 6.294 1 .012 .000
a. Variable(s) entered on step 1: Carnegie Classification, Governing Structure, Academic Discipline,
Performance Expectancy Total, Effort Expectancy Total, Social Influence Total, Facilitating
Conditions Total.
Summary of Results
This chapter reported the findings from the research conducted. A survey was
sent to the EDUCAUSE Instructional Technology Constituent Group listserv. Descriptive
statistics revealed that instructors representing Education (including physical education)
comprised 43.1 percent (n=28) of the entire sample (n=65). The median score for application
use for all respondents (n=65) was 107.00 ( ̅=108.06, sd=22.50). Scores ranged from 65.00
to 172.00, with the range of all possible scores being 39-195. For device use, the median
score for all respondents (n=65) was 82.00 ( ̅=84.60, sd=21.70). Scores ranged from 49.00
to 162.00, with the range of all possible scores being 40-200.
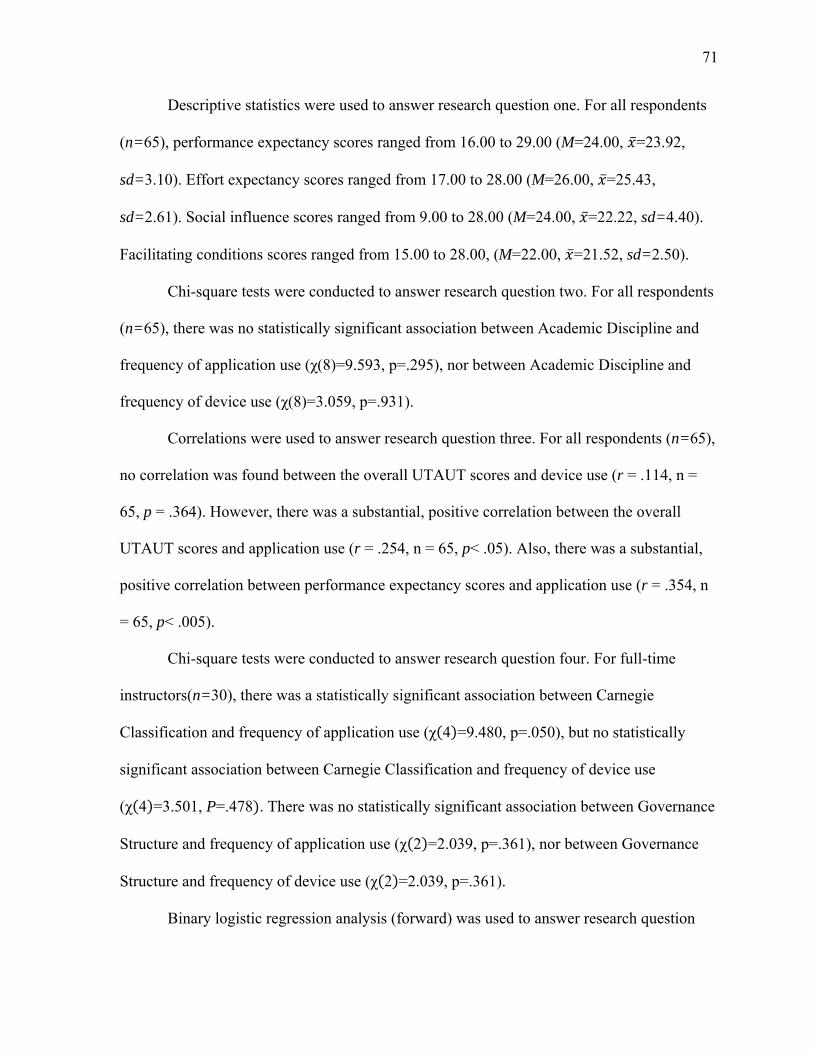
71
Descriptive statistics were used to answer research question one. For all respondents
(n=65), performance expectancy scores ranged from 16.00 to 29.00 (M=24.00, ̅=23.92,
sd=3.10). Effort expectancy scores ranged from 17.00 to 28.00 (M=26.00, ̅=25.43,
sd=2.61). Social influence scores ranged from 9.00 to 28.00 (M=24.00, ̅=22.22, sd=4.40).
Facilitating conditions scores ranged from 15.00 to 28.00, (M=22.00, ̅=21.52, sd=2.50).
Chi-square tests were conducted to answer research question two. For all respondents
(n=65), there was no statistically significant association between Academic Discipline and
frequency of application use (χ(8)=9.593, p=.295), nor between Academic Discipline and
frequency of device use (χ(8)=3.059, p=.931).
Correlations were used to answer research question three. For all respondents (n=65),
no correlation was found between the overall UTAUT scores and device use (r = .114, n =
65, p = .364). However, there was a substantial, positive correlation between the overall
UTAUT scores and application use (r = .254, n = 65, p< .05). Also, there was a substantial,
positive correlation between performance expectancy scores and application use (r = .354, n
= 65, p< .005).
Chi-square tests were conducted to answer research question four. For full-time
instructors(n=30), there was a statistically significant association between Carnegie
Classification and frequency of application use (χ 4 =9.480, p=.050), but no statistically
significant association between Carnegie Classification and frequency of device use
(χ 4 =3.501, P=.478 . There was no statistically significant association between Governance
Structure and frequency of application use (χ 2 =2.039, p=.361), nor between Governance
Structure and frequency of device use (χ 2 =2.039, p=.361).
Binary logistic regression analysis (forward) was used to answer research question
72
five. Performance expectancy was determined to be the only significant factor in the model.
Analysis of the five research questions in this study gives insight into which factors influence
technology use in teaching at the college level. Knowledge of factors that influence
instructors from using technology in their teaching allows for discussion and
recommendations.
73
CHAPTER FIVE: CONCLUSION
In this chapter a review of research results, along with a discussion of significant
findings, are presented. Demographic data provided details surrounding the academic
disciplines institutional characteristics, and employment status of respondents. Conclusion 1
discusses the overall level of UTAUT for respondents along with descriptive statistics for
each construct: performance expectancy, effort expectancy, social influence, and facilitating
conditions. Conclusion 2 discusses the relationship between the academic disciplines of
respondents and technology use. Conclusion 3 discusses the relationship between UTAUT
scores and technology use. Conclusion 4 discusses the relationship between institutional
characteristics and technology use. And, Conclusion 5 discusses the results of the binary
logistic regression analysis involving all independent variables and technology use.
Recommendations will also be presented for further research and practical implication.
Discussion of Findings
Demographic Data
Work related demographic data were reported with means, standard deviations,
frequencies, and percentages. The respondents (n=65, 7.5%) to this study were subscribers to
the EDUCAUSE Instructional Technology Constituent Group listserv who teach at the
college level. Work related demographic variables included employment status, institutional
characteristics, and academic discipline. A majority of respondents were Education
instructors who taught at public institutions. Less than half of respondents (N=30) were full-
time instructors.
74
Conclusion 1: How frequently are instructors in the Instructional Technology
Constituent Group using technology in their teaching?
The analysis of instructors’ use of 39 applications and 40 devices shows that
instructors reported using applications such as presentation software (e.g. PowerPoint) and
wikis (e.g. Wikipedia) most often in their teaching. Applications similar to Skype or Google
Voice, and geo-tagging were the least used applications. As for devices, instructors used
iPads and clickers most often in their teaching, and used devices such as Apple TV or Roku,
and DVRs the least. The frequent use of iPads supports recent research, which found that 54
percent of faculty said the use of mobile devices in class can enhance learning (Dahlstrom &
Brooks, 2014). The same study found only 18 percent of instructors surveyed reported
banning or discouraging the use of iPads and other tablets in their classes (Dahlstrom &
Brooks, 2014). This means 82 percent of their respondents neither discouraged nor
encouraged tablet use or required it in the classroom. Dahlstrom and Brooks (2014), said
that instructors who banned or discouraged tablet use,
…may be more willing to use these devices in their courses, but many don’t
know where to start or what exactly to do to harness the power of the
smartphone or tablet so as to avoid the student disengagement or
zombification that they fear will occur with the use of such devices (p. 27).
In conclusion, the findings of this study don’t necessarily mean that respondents are
using any particular application or device by choice. Nor do they imply that respondents are
required to use the applications and devices they reported using. These findings may imply
that instructors are using the applications and devices that are available to them where they
teach; therefore, they use a given device more frequently because the institution has adopted
75
it. Further analysis not included in this study would be needed to make this determination.
Conclusion 2: What is the level of UTAUT for performance expectancy, effort
expectancy, social influence, facilitating conditions for instructors in the Instructional
Technology Constituent Group?
Research question two sought to describe the overall level of UTAUT as measured by
the four constructs making up the UTAUT scale: performance expectancy, effort expectancy,
social influence, and facilitating conditions. For all respondents, the overall UTAUT score
and the median scores for performance expectancy, effort expectancy, social influence, and
facilitating conditions were relatively high, considering the maximum score for each
construct was 28. Full-time instructors yielded similar results, but had slightly higher average
scores when compared to part-time faculty and those of nonidentified status, although this
study provided no statistical analysis of this observation. These results are in line with
Jackowski and Akroyd (2010) study on community college faculty, which indicated that part-
time faculty had less access to technology than their full-time counterparts. Specifically, the
study concluded,
Faculty status (part-time versus full-time) was also found to be associated
with use of the web for instructional purposes. Part-time faculty are less likely
than full-time faculty to use the web for instructional purposes. This finding is
consistent with the findings of the U.S. Department of Education report that
full-time faculty are more likely to use course specific websites than their
part-time counterparts (Warburton, Chen, & Bradburn, 2002). More
specifically, a greater percentage of full-time faculty (87%) have access to the
Internet at work and at work and home than do part-time faculty (58%). Thus,

76
full-time faculty have the resources they need to create and use instructional
websites. (p. 638)
Furthermore, it may come as no surprise that the UTAUT scores for this sample were high,
given the sample was drawn from a population with an active interest in instructional
technology.
Conclusion 3: What is the relationship between Instructional Technology Constituent
Group instructors’ UTAUT levels and how frequently they use technology in their
teaching?
Research question three sought to describe the relationship between UTAUT scores
and frequency of use. The results for all respondents showed a substantial correlation
between UTAUT score and frequency of application use; such that the higher the UTAUT
score, the more frequently applications are used in teaching. For all respondents and full-time
instructors, there was also a substantial correlation between performance expectancy and
frequency of application use; such that the more one thinks the application can help them do
their job better, the more frequently they use it in their teaching. These results were
consistent with prior research suggesting that one’s use of technology is related to how they
perceive it (Park, et al., 2008; Venkatesh et al., 2003; Davis, 1989). In other words, if
instructors perceive technology will be useful in their teaching, then this is related to their
use.
Given that the sample consisted of mostly Education instructors with an interest in
information/instructional technology, it may be assumed that the typical respondent is
positioned more towards the left of Roger’s (2003) Diffusion of Innovations scale and their
use of technology would have nothing to do with effort expectancy, social influence, or
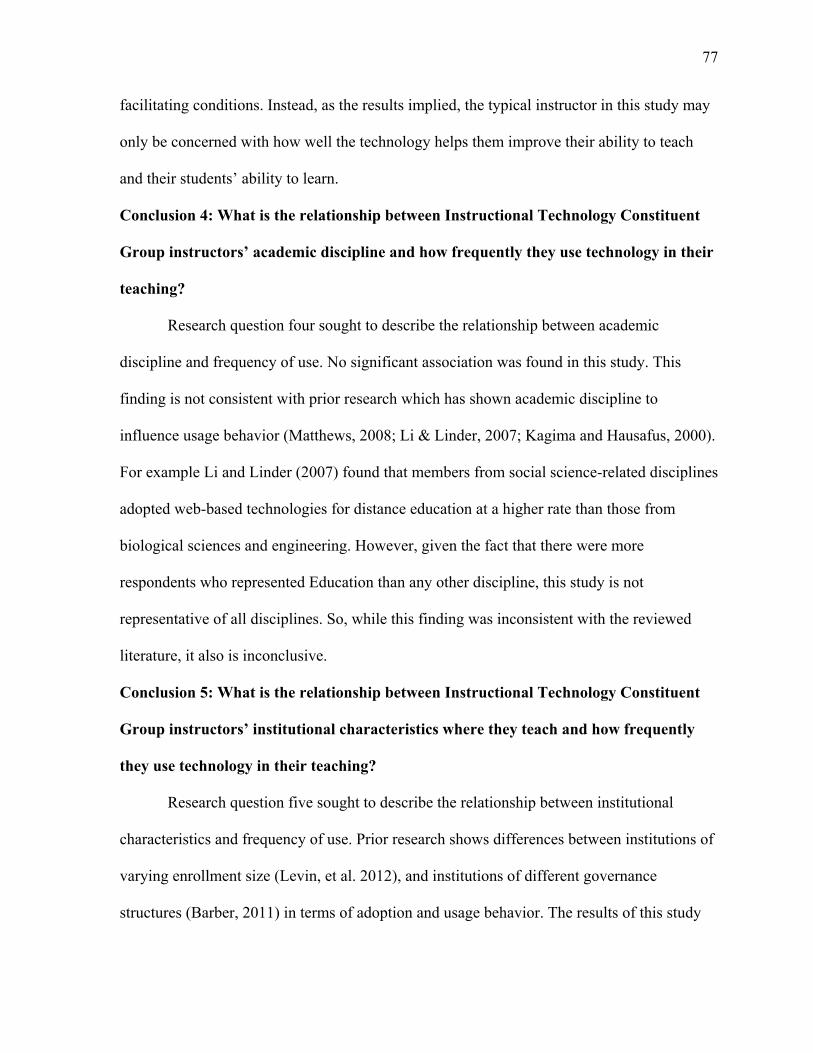
77
facilitating conditions. Instead, as the results implied, the typical instructor in this study may
only be concerned with how well the technology helps them improve their ability to teach
and their students’ ability to learn.
Conclusion 4: What is the relationship between Instructional Technology Constituent
Group instructors’ academic discipline and how frequently they use technology in their
teaching?
Research question four sought to describe the relationship between academic
discipline and frequency of use. No significant association was found in this study. This
finding is not consistent with prior research which has shown academic discipline to
influence usage behavior (Matthews, 2008; Li & Linder, 2007; Kagima and Hausafus, 2000).
For example Li and Linder (2007) found that members from social science-related disciplines
adopted web-based technologies for distance education at a higher rate than those from
biological sciences and engineering. However, given the fact that there were more
respondents who represented Education than any other discipline, this study is not
representative of all disciplines. So, while this finding was inconsistent with the reviewed
literature, it also is inconclusive.
Conclusion 5: What is the relationship between Instructional Technology Constituent
Group instructors’ institutional characteristics where they teach and how frequently
they use technology in their teaching?
Research question five sought to describe the relationship between institutional
characteristics and frequency of use. Prior research shows differences between institutions of
varying enrollment size (Levin, et al. 2012), and institutions of different governance
structures (Barber, 2011) in terms of adoption and usage behavior. The results of this study
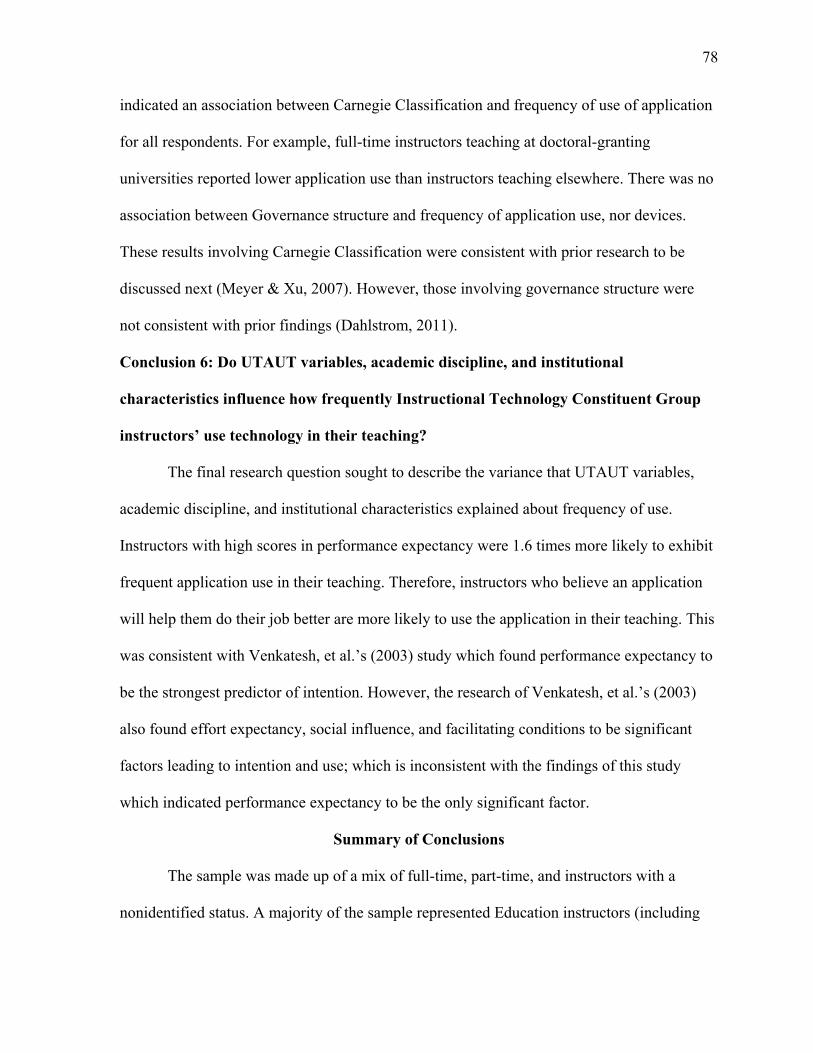
78
indicated an association between Carnegie Classification and frequency of use of application
for all respondents. For example, full-time instructors teaching at doctoral-granting
universities reported lower application use than instructors teaching elsewhere. There was no
association between Governance structure and frequency of application use, nor devices.
These results involving Carnegie Classification were consistent with prior research to be
discussed next (Meyer & Xu, 2007). However, those involving governance structure were
not consistent with prior findings (Dahlstrom, 2011).
Conclusion 6: Do UTAUT variables, academic discipline, and institutional
characteristics influence how frequently Instructional Technology Constituent Group
instructors’ use technology in their teaching?
The final research question sought to describe the variance that UTAUT variables,
academic discipline, and institutional characteristics explained about frequency of use.
Instructors with high scores in performance expectancy were 1.6 times more likely to exhibit
frequent application use in their teaching. Therefore, instructors who believe an application
will help them do their job better are more likely to use the application in their teaching. This
was consistent with Venkatesh, et al.’s (2003) study which found performance expectancy to
be the strongest predictor of intention. However, the research of Venkatesh, et al.’s (2003)
also found effort expectancy, social influence, and facilitating conditions to be significant
factors leading to intention and use; which is inconsistent with the findings of this study
which indicated performance expectancy to be the only significant factor.
Summary of Conclusions
The sample was made up of a mix of full-time, part-time, and instructors with a
nonidentified status. A majority of the sample represented Education instructors (including
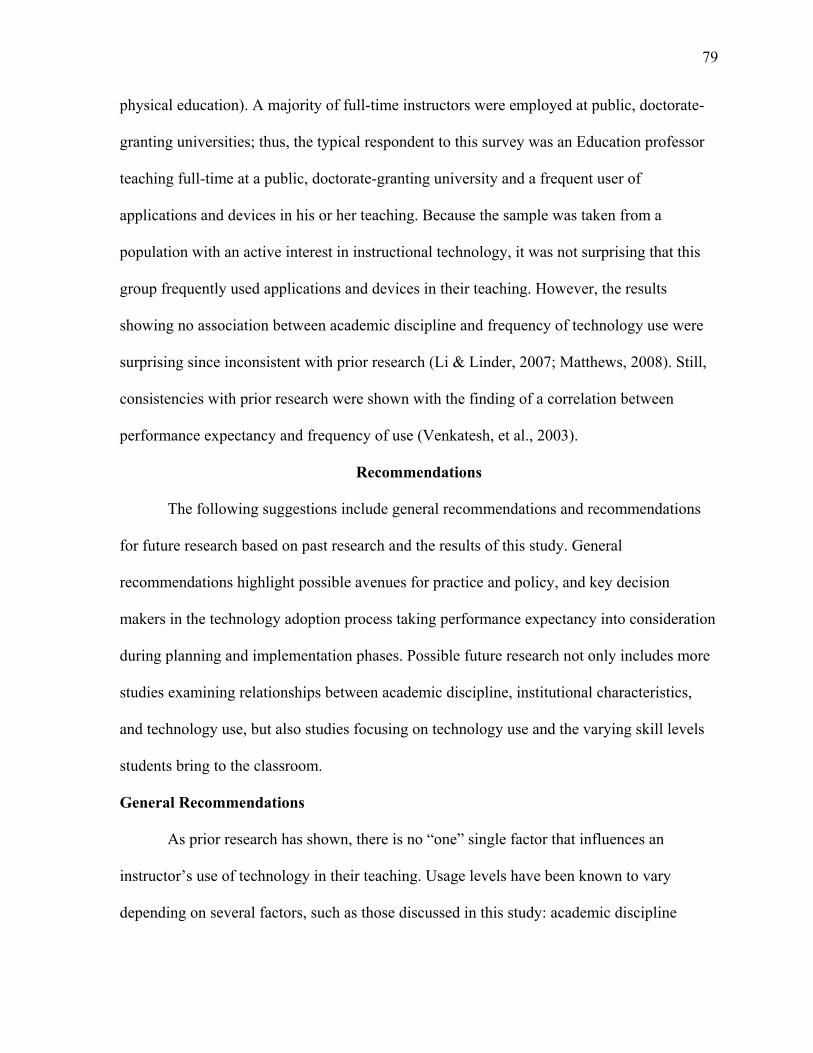
79
physical education). A majority of full-time instructors were employed at public, doctorate-
granting universities; thus, the typical respondent to this survey was an Education professor
teaching full-time at a public, doctorate-granting university and a frequent user of
applications and devices in his or her teaching. Because the sample was taken from a
population with an active interest in instructional technology, it was not surprising that this
group frequently used applications and devices in their teaching. However, the results
showing no association between academic discipline and frequency of technology use were
surprising since inconsistent with prior research (Li & Linder, 2007; Matthews, 2008). Still,
consistencies with prior research were shown with the finding of a correlation between
performance expectancy and frequency of use (Venkatesh, et al., 2003).
Recommendations
The following suggestions include general recommendations and recommendations
for future research based on past research and the results of this study. General
recommendations highlight possible avenues for practice and policy, and key decision
makers in the technology adoption process taking performance expectancy into consideration
during planning and implementation phases. Possible future research not only includes more
studies examining relationships between academic discipline, institutional characteristics,
and technology use, but also studies focusing on technology use and the varying skill levels
students bring to the classroom.
General Recommendations
As prior research has shown, there is no “one” single factor that influences an
instructor’s use of technology in their teaching. Usage levels have been known to vary
depending on several factors, such as those discussed in this study: academic discipline
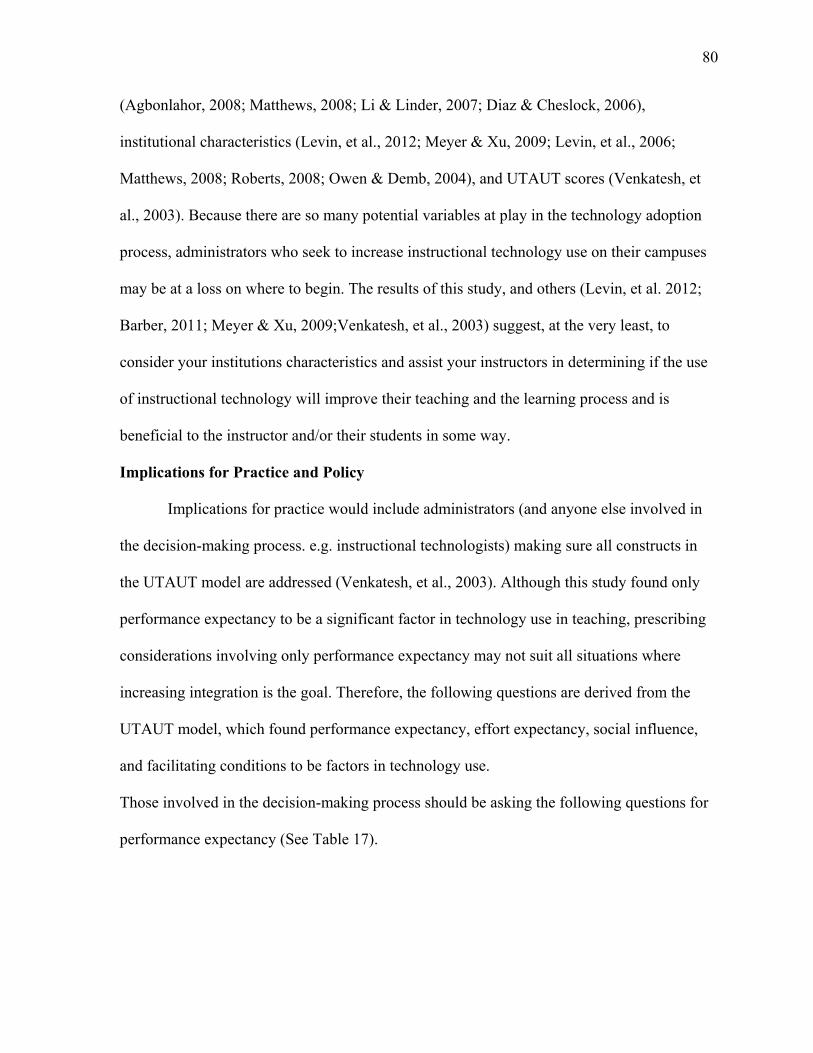
80
(Agbonlahor, 2008; Matthews, 2008; Li & Linder, 2007; Diaz & Cheslock, 2006),
institutional characteristics (Levin, et al., 2012; Meyer & Xu, 2009; Levin, et al., 2006;
Matthews, 2008; Roberts, 2008; Owen & Demb, 2004), and UTAUT scores (Venkatesh, et
al., 2003). Because there are so many potential variables at play in the technology adoption
process, administrators who seek to increase instructional technology use on their campuses
may be at a loss on where to begin. The results of this study, and others (Levin, et al. 2012;
Barber, 2011; Meyer & Xu, 2009;Venkatesh, et al., 2003) suggest, at the very least, to
consider your institutions characteristics and assist your instructors in determining if the use
of instructional technology will improve their teaching and the learning process and is
beneficial to the instructor and/or their students in some way.
Implications for Practice and Policy
Implications for practice would include administrators (and anyone else involved in
the decision-making process. e.g. instructional technologists) making sure all constructs in
the UTAUT model are addressed (Venkatesh, et al., 2003). Although this study found only
performance expectancy to be a significant factor in technology use in teaching, prescribing
considerations involving only performance expectancy may not suit all situations where
increasing integration is the goal. Therefore, the following questions are derived from the
UTAUT model, which found performance expectancy, effort expectancy, social influence,
and facilitating conditions to be factors in technology use.
Those involved in the decision-making process should be asking the following questions for
performance expectancy (See Table 17).
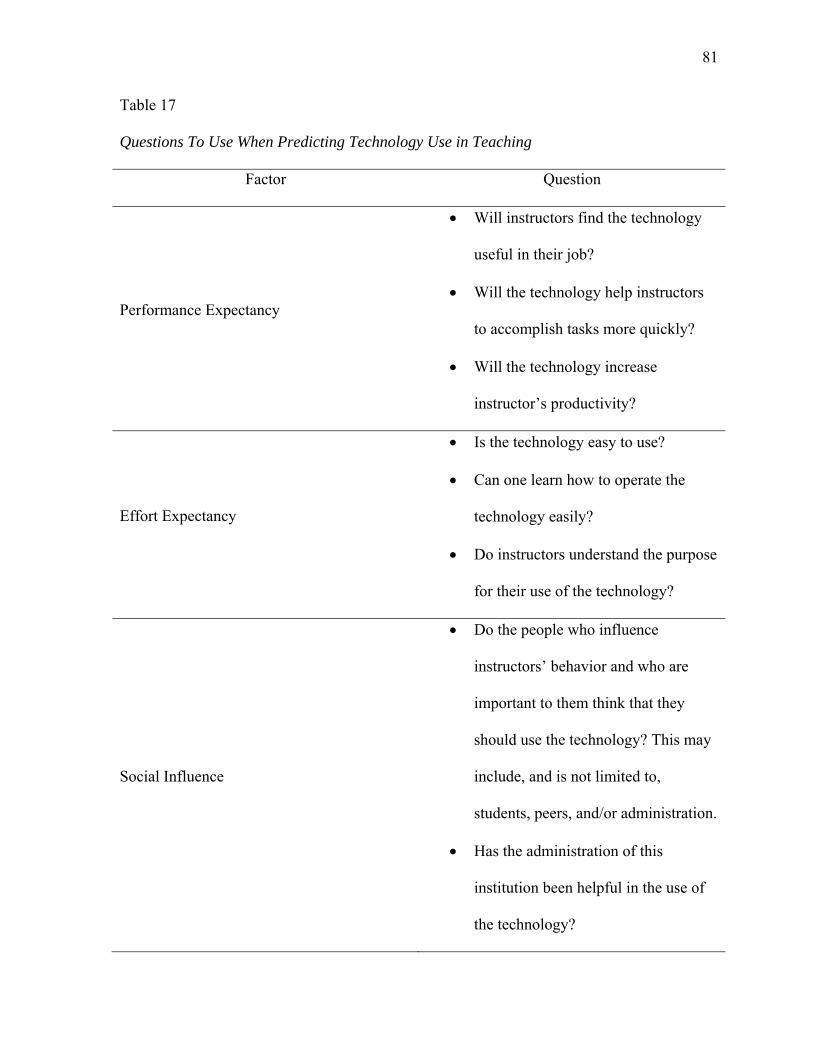
81
Table 17
Questions To Use When Predicting Technology Use in Teaching
Factor Question
Performance Expectancy
Will instructors find the technology
useful in their job?
Will the technology help instructors
to accomplish tasks more quickly?
Will the technology increase
instructor’s productivity?
Effort Expectancy
Is the technology easy to use?
Can one learn how to operate the
technology easily?
Do instructors understand the purpose
for their use of the technology?
Social Influence
Do the people who influence
instructors’ behavior and who are
important to them think that they
should use the technology? This may
include, and is not limited to,
students, peers, and/or administration.
Has the administration of this
institution been helpful in the use of
the technology?
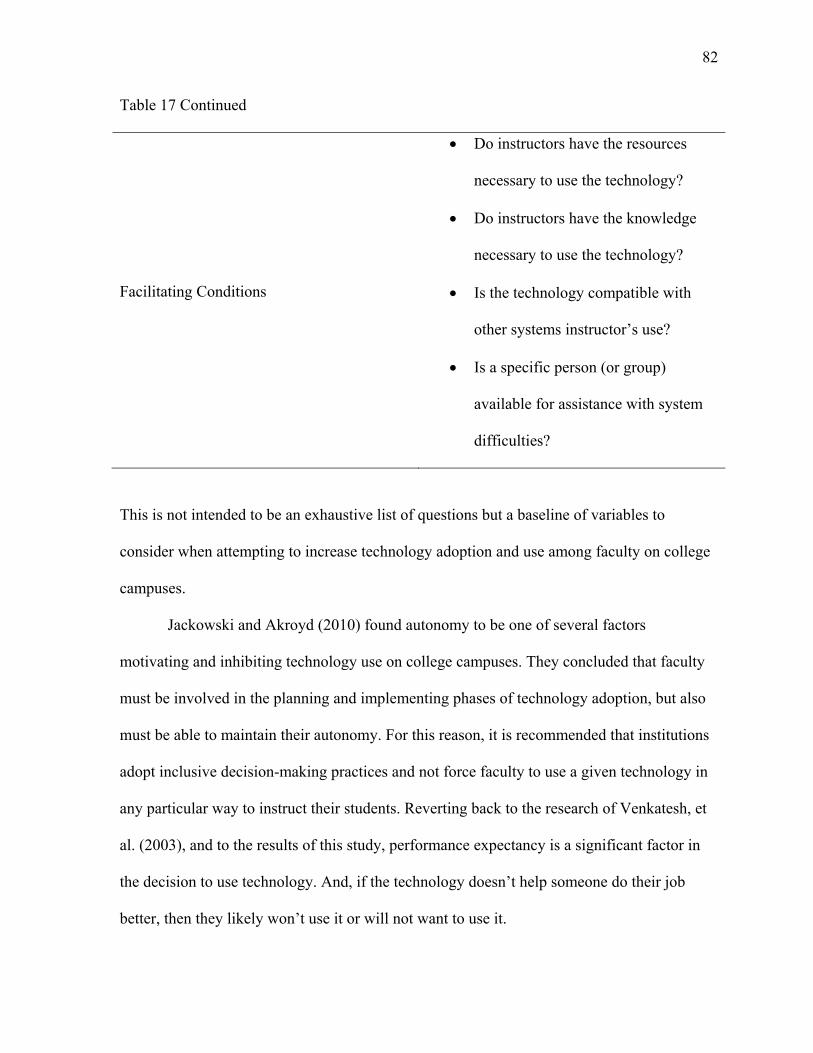
82
Table 17 Continued
Facilitating Conditions
Do instructors have the resources
necessary to use the technology?
Do instructors have the knowledge
necessary to use the technology?
Is the technology compatible with
other systems instructor’s use?
Is a specific person (or group)
available for assistance with system
difficulties?
This is not intended to be an exhaustive list of questions but a baseline of variables to
consider when attempting to increase technology adoption and use among faculty on college
campuses.
Jackowski and Akroyd (2010) found autonomy to be one of several factors
motivating and inhibiting technology use on college campuses. They concluded that faculty
must be involved in the planning and implementing phases of technology adoption, but also
must be able to maintain their autonomy. For this reason, it is recommended that institutions
adopt inclusive decision-making practices and not force faculty to use a given technology in
any particular way to instruct their students. Reverting back to the research of Venkatesh, et
al. (2003), and to the results of this study, performance expectancy is a significant factor in
the decision to use technology. And, if the technology doesn’t help someone do their job
better, then they likely won’t use it or will not want to use it.

83
Recommendations for Future Research
Although this study examines several factors influencing technology use, there are
other factors to consider for future research such as student perspectives and their impact on
instructional technology use in the classroom. According to Owen and Demb (2004),
“Tensions experienced by students often stem from the wide range of skills students bring to
the classroom e.g., from writing HTML, disassembling computers, and participating in e-
commerce to never having turned on a computer” (p. 655). More recent research has found
differences in confidence levels and skill levels in using technology for learning between
male and female students such that males tended to be more confident in and skillful at using
technology for learning purposes (Venkatesh, Croteau, & Rabah, 2014). Therefore, students’
input on the technology that is to aid in or enhance the learning process can be beneficial in
the planning and evaluation stages.
Lastly, studies examining relationships between academic discipline, institutional
characteristics, and technology use are lacking in particular in the literature. As discussed in
the coming Limitations section, similarly designed studies of larger sample sizes and of
various faculty populations are needed. An example of a possible study could take a deeper
look into why certain devices are used or not used in teaching. And, it’s worth noting that the
results of this study may differ from studies involving a faculty population that is more
diverse in terms of academic discipline and institutional characteristics. The sample for this
study mostly represented Education instructors and those instructors employed at public,
doctorate-granting universities. And, the sample was drawn from a population consisting of
instructors who are actively interested in instructional technology.
84
Limitations
This study was limited by the self-reported perceptions and responses from
approximately 65 instructors who subscribed to the EDUCAUSE Instructional Technology
Constituent Group listserv. In addition, there was a limitation in the narrow literature
regarding the relationship between academic institution type and technology use, and the
relationship between academic discipline and technology use.
Delimitations
Being that this study employed a census survey for data collection, the study may be
limited in its generalizability as it targeted EDUCAUSE Instructional Technology
Constituent Group listserv subscribers. Although a listserv is not the preferred method for
administering surveys (Dillman, 2007), there was no other feasible, cost effective or time
effective way to recruit subjects from a variety of institutions to complete the survey for this
study. Because part-time instructors or adjunct instructors may teach at more than one
university, portions of this study also were bound to those listserv subscribers teaching full-
time at any one institution.
85
REFERENCES
Agbonlahor, R. O. (2008). Individual characteristics as correlates of attitudes to information
technology among Nigerian university lecturers. African Journal of Library,
Archives, and Information Science, 18(2), 131-146.
Agresti, A. & Finlay, B. (2009). Statistical methods for the social sciences.4th ed. Upper
Saddle River, NJ. Prentice Hall.
Aitken, J. E. & Shedletsky, L. J. (2001).Administrative strategies for successful adoption of
computer technology. Journal of the Association for Communication Administration, 30,
39-49.
Alvesson, M. 1993.Cultural perspectives on organisations. Cambridge: Cambridge
University Press.
Amirault, R. J., & Visser, Y. L. (2009). The University in periods of technological change: A
historically grounded perspective. Journal of Computing in Higher Education, 21: 62-
79.
Baltaci-Goktalay, S. & Mehmet, O. A. (2006).Faculty adoption of online technology in
higher education. The Turkish Online Journal of Educational Technology, 5(4), 37-
43.
Barber, B. (2011). Faculty leadership and instructional technologies: Who decides? New
Directions for Community Colleges, 2011(154), 73-85.
Bartlett, J. E., Kotrlik, J. W., & Higgins, C. C. (2001). Organizational research: Determining
appropriate sample size in survey research. Information Technology, Learning, and
Performance Journal, 19(1), 43-50.
Birch, A., & Irvine, V. (2009).Preservice teachers’ acceptance of ICT integration in the
86
classroom: applying the UTAUT model. Educational media international,46(4), 295-
315.
Birnbaum, R. (1988). How colleges work: The cybernetics of academic organization and
leadership. San Francisco: Jossey-Bass.
Bolman, L., & Deal, T. (2008). Reframing organizations. San Francisco, CA: Jossey-Bass.
Brinkerhoff, J. D. (2006). Effects of a long-duration, professional development academy on
technology skills, computer self-efficacy, and technology integration beliefs and
practices. Journal of Research on Technology in Education, 39(1), 22.
Carman, B. (2003). Factors affecting adoption. Retrieved from
http://www.eepsea.org/geh/ev-30723-201-1-DO_TOPIC.html.
Carnegie Classification Descriptions. (n.d.) Retrieved on August 6, 2015 from
http://classifications.carnegiefoundation.org/descriptions/basic.php.
Carter, P., & Alfred, R. (1998/1999). Making change happen. Critical Issues Paper. Ann
Arbor, MI: University of Michigan, Consortium for Community College
Development.
Creswell, J. W. (2008). Research design: Qualitative, quantitative, and mixed methods
approaches. Sage Publications, Incorporated.
Dahlstrom, E. (2012). The ECAR national study of undergraduate students and information
technology. Boulder, Colorado: EDUCAUSE Center for Applied Research. Retrieved
from http://www.educause.edu/ecar.
Dahlstrom, E., and Brooks, C. (2014). The ECAR national study of undergraduate students
and information technology. Boulder, Colorado: EDUCAUSE Center for Applied
Research. Retrieved from http://www.educause.edu/ecar.
87
Davis, F. D. (1989). Perceived usefulness, perceived ease of use, and user acceptance.
MISQuarterly, 13(3), 319–340.
Diaz, V., and Cheslock, J. (2006).Faculty Use of Instructional Technology and Distributed
Learning. In JS Levin, S. Kater, and RL Wagoner (eds.), Community College Faculty:
At Work in the New Economy, pp. 63–79. New York: Palgrave Macmillan.
Dillman, D. A. (2007). Mail and internet surveys: The tailored design method. John Wiley &
Sons.
Dooley, L. M., Metcalf, T., & Martinez, A. (1999).The adoption of computer technology and
telecommunications by teachers. International Forum on Educational Technology
and Society, 2(4).
Ford, J.D., Ford, L.W., McNamara, R.T. (2002). Resistance and the background
conversations of change. Journal of Organizational Change Management, 15(2), 105-
121.
Foster, L. (2001). Technology: Transforming the landscape of higher education. The Review
of Higher Education, 25(1), 115–124.
Furuholt, B. & Orvik, T. (2006). Implementation of information technology in Africa:
understanding and explaining the results of ten years of implementation effort in a
Tanzanian organization. Information Technology for Development, 12(1) 45–62.
Garrison, R., & Akyol, Z. (2009). Role of instructional technology in the transformation of
higher education. Journal of Computing in Higher Education, 21, 19–30.
George, P. (2000). Breaking ranks. Principal Leadership, 1(4), 56-61.
Hair, J., Black, W., Babin, B., & Anderson, R. (2010).Multivariate data analysis. 7th Ed.
Upper Saddle River, NJ. Prentice Hall.
88
Hirji, K. F., C. R. Mehta, and N. R. Patel. 1987. Computing distributions for exact logistic
regression. Journal of the American Statistical Association 82: 1110-1117.
Hosmer, D. W. & Lemeshow, S. (2000) Applied logistic regression. New York: Wiley.
Jackowski, M. B., & Akroyd, D. (2010). Technology usage among community college
faculty. Community college journal of research & practice, 34(8), 624-644.
doi:10.1080/10668920701831530
Johnson, L., Adams, S., & Cummins, M. (2012). NMC horizon report: 2012.
Johnson, T., Wisniewski, M. A., Kuhlemeyer, G., Isaacs, G., & Krzykowski, J. (2012).
Technology Adoption in Higher Education: Overcoming Anxiety through Faculty
Bootcamp. Journal of Asynchronous Learning Networks, 16(2), 63-72.
Kagima, L. & Hausafus, C. (2000). Integration of electronic communication in higher
education: Contributions of faculty computer self-efficacy. The Internet and Higher
Education, 2(4) 221-235.
Keengwe, J., Kidd, T., & Kyei-Blankson, L. (2008). Faculty and technology: Implications for
faculty training and technology leadership. Journal of Science Education Technology,
18, 23–28.
Kidd, T. (2009). Faculty and technology: Implications for faculty training and technology
leadership. Journal of Science Education and Technology, 15, 155–170.
Kinuthia, W. (2005). Planning faculty development for successful implementation of web-
based instruction. Campus-Wide Information Systems, 22(4), 189-200. Levin, J. S.,
Kater, S., & Wagoner, R. L. (2006). Community college faculty: At work in the new
economy. New York: Palgrave Macmillan.
Knapp, L.G., Kelly-Reid, J.E., and Ginder, S.A. (2012).Enrollment in Postsecondary
89
Institutions, Fall 2010; Financial Statistics, Fiscal Year 2010; and Graduation Rates,
Selected Cohorts, 2002-07 (NCES 2012-280). U.S. Department of Education.
Washington, DC: National Center for Education Statistics. Retrieved January 7, 2013
from http://nces.ed.gov/pubsearch.
Kotrlik, J. W., & Redmann, D. H. (2009). Technology Adoption for Use in Instruction by
Secondary Technology Education Teachers. Technology, 21(1).
Kotrlik, J. W. & Redmann, D. H. (2005). Extent of technology integration in instruction by
adult basic education teachers. Adult Education Quarterly, 55(3), 200-219.
Kotrlik, J. W., & Redmann, D. H. (2002).Kotrlik-Redmann technology integration model.
Baton Rouge: Louisiana State University
Levin, J. S., Kater, S., & Wagoner, R. L. (2006). Community college faculty: At work in the
new economy. Palgrave Macmillan.
Levin, S. G., Stephan, P. E., & Winkler, A. E. (2012). Innovation in academe: the diffusion
of information technologies. Applied Economics, 44(14), 1765-1782.
Li, Y. & Lindner, J. R. (2007). Faculty adoption behaviour about web-based distance
education: A case study from China Agricultural University. British Journal of
Educational Technology, 38(1), 83-94.
Lin, C., Singer, R., & Ha, L. (2010). Why university members use and resist technology? A
structure enactment perspective. Journal of Computing in Higher Education, 22, 38-
59.
Malm, E., & Defranco, J. F. (2011). Toward a Student-Centered Measure of Learning
Management System Utilization. Journal of Educational Technology Systems, 40(4),
401-413.
90
Matthews, N. (2008). Conflicting perceptions and complex change: Promoting web-
supported learning in an arts and social sciences faculty. Learning, Media and
Technology, 33(1), 35-44.
Medlin, B. D. (2001). The factors that may influence a faculty member’s decision to adopt
electronic technologies in instruction.(Doctoral dissertation, Virginia Polytechnic
Institute and State University, 2001). ProQuest Digital Dissertations. (UMI No. AAT
3095210).
Mertler, C. & Vannatta, R. (2010). Advanced and multivariate statistical methods: Practical
application and interpretation. 4th Ed.. Glendale, CA. Pyrczak Publishing.
Meyer, K. A., & Xu, Y. J. (2009). A causal model of factors influencing faculty use of
technology. Journal of Asynchronous Learning Networks, 13(2), 58–70.
Meyer, K. A., & Xu, Y. J. (2007). A Bayesian analysis of the institutional and individual
factors influencing faculty technology use. The Internet and Higher Education, 10(3),
184-195.
Nicolle, P. S. & Lou, Y. (2008). Technology adoption into teaching and learning by
mainstream university faculty: a mixed methodology study revealing the “how, when,
why, and why not". Journal of Educational Computing Research, 39(3), 235-265.
Owen, P. S. & Demb, A. (2004). Change dynamics and leadership in technology
implementation. The Journal of Higher Education, 75(6), 636-666.
Oye, N.D., Iahad, N. A. & Rahim, N.(2012). The history of UTAUT model and its impact
on ICT acceptance and usage by academicians. Education and Information
Technologies.
Parisot A. H. (1997). Distance education as a catalyst for changing teaching in the
91
community college: implications for institutional policy. New Directions for
Community Colleges, 99, 5–13.
Park, S. H., & Ertmer, P. A. (2007). Impact of problem-based learning (PBL) on teachers'
beliefs regarding technology use. Journal of Research on Technology in
Education, 40(2), 247.
Redmann, D. H. & Kotrlik, J. W. (2004). Analysis of technology integration in the
teaching/learning process in selected career and technical education programs.
Journal of Career and Technical Education, 29(1), 76-91.
Reid, P. (2012). Categories for barriers to adoption of instructional technologies. Education
and Information Technologies, 1-25.
Reiser, Robert A. “A History of Instructional Design and Technology: Part I: A History of
Instructional Media.” Educational Technology Research and Development49 (2001):
53-64.
Roberts, C. (2008). Implementing educational technology in higher education: A strategic
approach. The Journal of Educators Online,5(1), 1-16.
Rogers, E. M., (2003). Diffusion of Innovations, 5th ed., New York: Free Press.
Saettler, P. (1968). A history of instructional technology. New York: McGraw-Hill.
Sahin, I. & Thompson, A. (2006). Using Rogers’ theory to interpret instructional computer
use by COE faculty. Journal of Research on Technology in Education, 39(1), 81-104.
Sherer, P. D., Shea, T. P., & Kristensen, E. (2003). Online Communities of Practice: A
Catalyst for Faculty Development. Innovative Higher Education, 27(3), 183.
Sproull, N L. (2002).Handbook of research methods: A guide for practitioners and students
in the social sciences, 2nd ed. Lanham, Maryland: Scarecrow Press, Inc.
92
Straub, E. T. (2009). Understanding technology adoption: Theory and future directions for
informal learning. Review of Educational Research, 79(2), 625-649.
Stuart, W. D. (2000). Influence of sources of communication, user characteristics and
innovation characteristics on adoption of a communication technology (Doctoral
dissertation, The University of Kansas, 2000). ProQuest Digital Dissertations (UMI
No. AAT 9998115).
Sumak, B., Polancic, G., & Hericko, M. (2010). An empirical study of virtual learning
environment adoption using UTAUT. In Mobile, Hybrid, and On-Line Learning,
2010. ELML'10.Second International Conference on (pp. 17-22). IEEE.
Surry, D. W., & Land, S. M. (2000). Strategies for motivating higher education faculty to use
technology. Innovations in Education & Training International, 37(2), 145-153.
Tate, R. F. (1954). Correlation between a discrete and a continuous variable. Point-biserial
correlation. The Annals of mathematical statistics, 603-607.
Teo, T. (2011). Technology acceptance research in education. Technology Acceptance in
Education: Research and Issues, 1.
ThinkEquity. (2002). Emerging trends in post-secondary education—The view to 2012.
Retrieved from http://www.usdla.org/html/aboutUs/researchInfo.htm.
Venkatesh, V., Croteau, A. M., & Rabah, J. (2014, January). Perceptions of effectiveness of
instructional uses of technology in higher education in an era of Web 2.0. In System
Sciences (HICSS), 2014 47th Hawaii International Conference on (pp. 110-119). IEEE.
Venkatesh, V., Morris, M., Davis, G., & Davis, F. (2003). User acceptance of information
technology: Toward a unified view. MIS Quarterly, 27(3), 425-478.
Walker, J., Armenakis, A., & Bernerth, J. (2007). Factors influencing organizational change
93
efforts. Journal of Organizational Change Management, 20(6), 761-773.
Webber, C.F. 2003.New technologies and educative leadership. Journal of Educational
Administration41, no. 2: 119–123.
Weick, K. E. 1976.Educational organizations of loosely coupled systems. Administrative
Science Quarterly, 21: 1-19.
Whetten, D. A., and Cameron, K. S. Administrative effectiveness in higher education.
Review of Higher Education, 9, 35-49.
World Bank. (2003). Lifelong learning in the global knowledge economy: Challenges for
developing countries. Washington, DC: The World Bank.
World Bank. (2007). Knowledge economies: Advanced strategies for development.
Washington, DC: The World Bank.
Worley, C., Hitchin, D. & Ross, W. (1996).Integrated Strategic Change. Reading, MA:
Addison-Wesley Publishing Company.
Yohon, T. & Zimmerman, D. (2006). An exploratory study of adoption of software and
hardware by faculty in the liberal arts and sciences. Journal of Technical Writing and
Communication, 36(1), 9-27.
Yukl, G. (2009). Power and the interpersonal influence of leaders. In Tjosvold, D. and
Wisse, B. (Eds.), Power and interdependence in organizations. Cambridge University
Press, pp. 207-223.
Yukl, G. (2010). Leadership in organizations. 7th ed. Upper Saddle River, NJ: Prentice Hall.
Zayim, N., Yildirim, S. & Saka, O. (2006). Technology adoption of medical faculty in
teaching: Differentiating factors in adopter categories. Educational Technology &
Society, 9 (2), 213-222.
94
Zhou, G. & Xu, J. (2007). Adoption of educational technology: How does gender matter?
The International Journal of Teaching and Learning in Higher Education, 19(2), 140-
153.

95
APPENDICES
96
Appendix A
Notification Letter -1st Contact
Dear EDUCAUSE Instructional Technology Constituent Group Subscribers:
Please assist me in completing my dissertation research and take the Predicting
Technology Use in Post-Secondary Teaching survey at
http://ncsu.qualtrics.com//SE/?SID=SV_bayLXDFHtLjlq1T. The purpose of this study is to
explore the relationship of technology acceptance variables and technology use for post-
secondary teaching in various higher education settings. This study will provide decision-
makers with an understanding of motivators for the use of technology in various higher
education settings to help design strategies to increase faculty technology use in higher
education.
While your participation is completely voluntary, I encourage you to take some time
to share your experiences with me.
The survey will be available until December 15, 2014. It should take no longer than 5
minutes to complete.
If you choose to participate, no reference will be made in oral or written reports
which could link you to the study. You will NOT be asked to write your name on any study
materials so that no one can match your identity to the answers that you provide.
If you have any questions about the survey, please contact me at
Thank you for your participation. I look forward to sharing the results of the study
with this group!
97
Jada Williams, EdD (ABD)
Doctoral Candidate,
Department of Leadership, Policy and Adult and Higher Education
North Carolina State University
98
Notification Letter – 2nd Contact
Dear EDUCAUSE Instructional Technology Constituent Group Subscribers:
Last week, I posted a link inviting you to participate in the Predicting Technology
Use in Post-Secondary Teaching survey at
http://ncsu.qualtrics.com//SE/?SID=SV_cG8FpteH2eLPzh3. If you have completed it since
then, thank you! If not, while your participation is completely voluntary, I encourage you to
take some time to share your experiences with me.
The purpose of this study is to explore the relationship of technology acceptance
variables and technology use for post-secondary teaching in various higher education
settings. This study will provide decision-makers with an understanding of motivators for the
use of technology in various higher education settings to help design strategies to increase
faculty technology use in higher education.
The survey is available online now until December 15, 2014. It should take no longer
than 5 minutes to complete.
To show my appreciation, at the end of the survey you may enter a random drawing
for a chance to win a $50 Amazon eGift card.
If you choose to participate, no reference will be made in oral or written reports
which could link you to the study. You will NOT be asked to write your name on any study
materials so that no one can match your identity to the answers that you provide.
If you have any questions about the survey, please contact me at
Thank you for your participation. I look forward to sharing the results of the study
with this group!
99
Jada Williams, EdD (ABD)
Doctoral Candidate,
Department of Leadership, Policy and Adult and Higher Education
North Carolina State University
100
Appendix B
Informed Consent – 1st Contact
You are being asked to take part in a research study titled, “Predicting Technology
Use in Post-Secondary Teaching. Your participation in this study is voluntary. You have the
right to be a part of this study, to choose not to participate or to stop participating at any time
without penalty.
The purpose of this study is to explore the relationship of technology acceptance
variables and technology use for post-secondary teaching in various higher education
settings. This study will provide decision-makers with an understanding of motivators for the
use of technology in various higher education settings to help design strategies to increase
faculty technology use in higher education.
If you agree to participate in this study, you will be asked to complete and submit an
online survey by clicking on the link posted to the EDUCAUSE Instructional Technology
Constituent Group listserv. The survey will take approximately five (5) minutes to
complete.
There are no foreseeable risks or discomforts associated with participation in
this study. Data will be kept anonymous and stored securely in Qualtrics, an online
survey software tool. No reference will be made in oral or written reports which could
link you to the study. You will NOT be asked to write your name on any study
materials so that no one can match your identity to the answers that you provide.
If at any time you have questions about your participation, do not hesitate to contact
the researcher, Jada Williams, at [email protected].
If you feel you have not been treated according to the descriptions in this form, or your rights
101
as a participant in research have been violated during the course of this project, you may
contact Deb Paxton, Regulatory Compliance Administrator, Box 7514, NCSU Campus
(919/515-4514).
Consent To Participate
“I have read and understand the above information. I have received a copy of this form. I
agree to participate in this study with the understanding that I may choose not to participate
or to stop participating at any time without penalty or loss of benefits to which I am
otherwise entitled.”
If you agree to participate in this study, select "I agree."
102
Informed Consent – 2nd Contact
You are being asked to take part in a research study titled, “Predicting Technology
Use in Post-Secondary Teaching. Your participation in this study is voluntary. You have the
right to be a part of this study, to choose not to participate or to stop participating at any time
without penalty.
The purpose of this study is to explore the relationship of technology acceptance
variables and technology use for post-secondary teaching in various higher education
settings. This study will provide decision-makers with an understanding of motivators for the
use of technology in various higher education settings to help design strategies to increase
faculty technology use in higher education.
If you agree to participate in this study, you will be asked to complete and submit an
online survey by clicking on the link posted to the EDUCAUSE Instructional Technology
Constituent Group listserv. The survey will take approximately five (5) minutes to complete.
There are no foreseeable risks or discomforts associated with participation in
this study. Data will be kept anonymous and stored securely in Qualtrics, an online
survey software tool. No reference will be made in oral or written reports which could
link you to the study. You will NOT be asked to write your name on any study
materials so that no one can match your identity to the answers that you provide.
Upon submission of this survey, you will be asked to participate in a random drawing to
win a $50 Amazon.com eGift card. If you are selected, the eGift card will be delivered via
the email address you provide on the Prize Entry form. Those respondents who do not
submit the survey will not be eligible for the drawing.
103
If at any time you have questions about your participation, do not hesitate to contact
the researcher, Jada Williams, at [email protected].
If you feel you have not been treated according to the descriptions in this form, or your rights
as a participant in research have been violated during the course of this project, you may
contact Deb Paxton, Regulatory Compliance Administrator, Box 7514, NCSU Campus
(919/515-4514).
Consent To Participate
“I have read and understand the above information. I have received a copy of this form. I
agree to participate in this study with the understanding that I may choose not to participate
or to stop participating at any time without penalty or loss of benefits to which I am
otherwise entitled.”
If you agree to participate in this study, select "I agree."
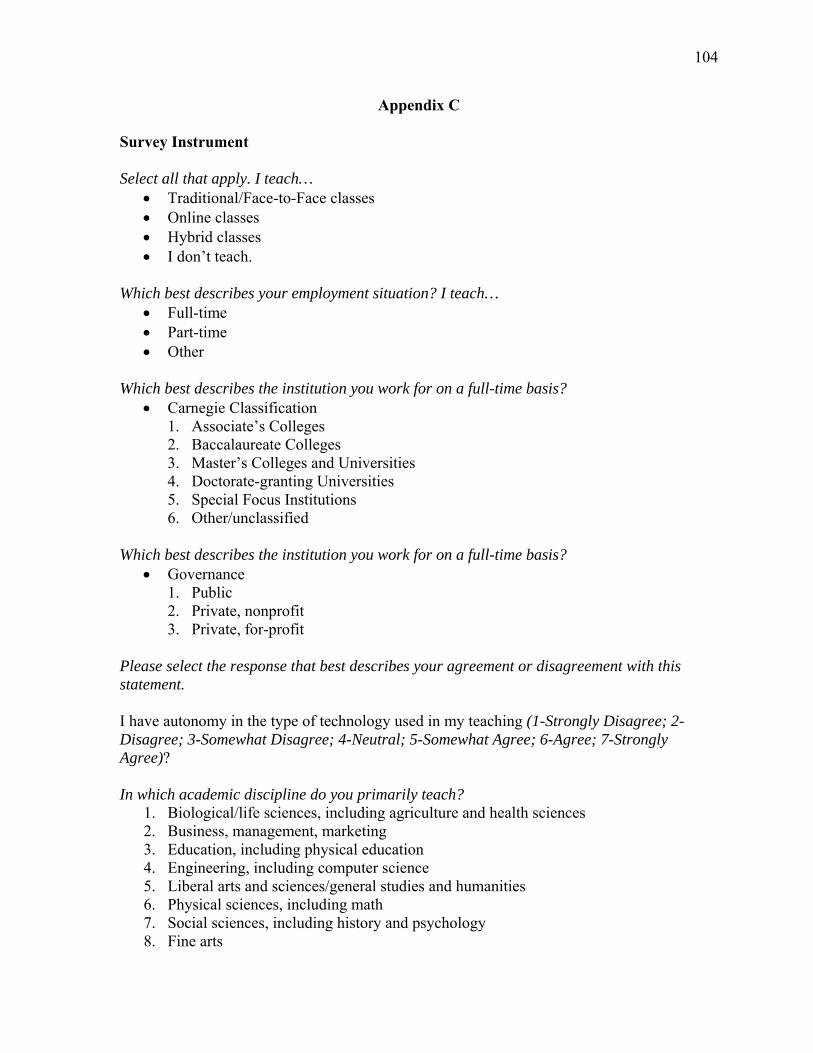
104
Appendix C
Survey Instrument
Select all that apply. I teach… Traditional/Face-to-Face classes Online classes Hybrid classes I don’t teach.
Which best describes your employment situation? I teach…
Full-time Part-time Other
Which best describes the institution you work for on a full-time basis?
Carnegie Classification 1. Associate’s Colleges 2. Baccalaureate Colleges 3. Master’s Colleges and Universities 4. Doctorate-granting Universities 5. Special Focus Institutions 6. Other/unclassified
Which best describes the institution you work for on a full-time basis?
Governance 1. Public 2. Private, nonprofit 3. Private, for-profit
Please select the response that best describes your agreement or disagreement with this statement. I have autonomy in the type of technology used in my teaching (1-Strongly Disagree; 2-Disagree; 3-Somewhat Disagree; 4-Neutral; 5-Somewhat Agree; 6-Agree; 7-Strongly Agree)? In which academic discipline do you primarily teach?
1. Biological/life sciences, including agriculture and health sciences 2. Business, management, marketing 3. Education, including physical education 4. Engineering, including computer science 5. Liberal arts and sciences/general studies and humanities 6. Physical sciences, including math 7. Social sciences, including history and psychology 8. Fine arts
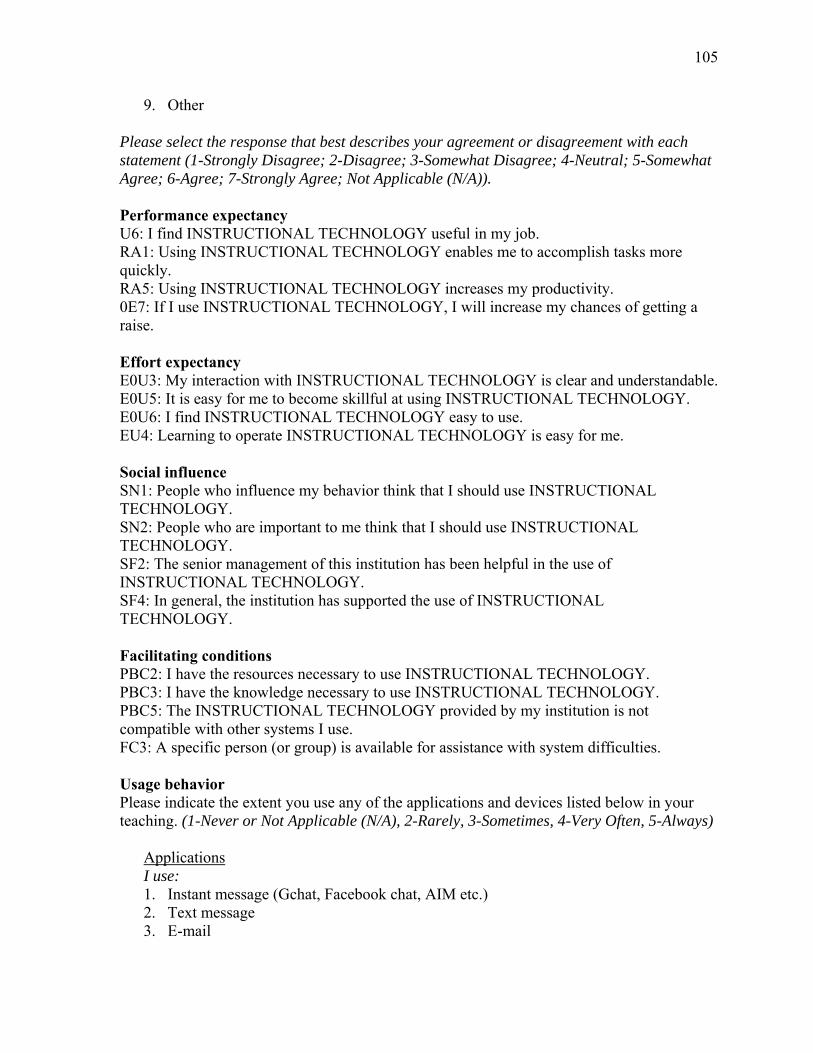
105
9. Other Please select the response that best describes your agreement or disagreement with each statement (1-Strongly Disagree; 2-Disagree; 3-Somewhat Disagree; 4-Neutral; 5-Somewhat Agree; 6-Agree; 7-Strongly Agree; Not Applicable (N/A)). Performance expectancy U6: I find INSTRUCTIONAL TECHNOLOGY useful in my job. RA1: Using INSTRUCTIONAL TECHNOLOGY enables me to accomplish tasks more quickly. RA5: Using INSTRUCTIONAL TECHNOLOGY increases my productivity. 0E7: If I use INSTRUCTIONAL TECHNOLOGY, I will increase my chances of getting a raise. Effort expectancy E0U3: My interaction with INSTRUCTIONAL TECHNOLOGY is clear and understandable. E0U5: It is easy for me to become skillful at using INSTRUCTIONAL TECHNOLOGY. E0U6: I find INSTRUCTIONAL TECHNOLOGY easy to use. EU4: Learning to operate INSTRUCTIONAL TECHNOLOGY is easy for me. Social influence SN1: People who influence my behavior think that I should use INSTRUCTIONAL TECHNOLOGY. SN2: People who are important to me think that I should use INSTRUCTIONAL TECHNOLOGY. SF2: The senior management of this institution has been helpful in the use of INSTRUCTIONAL TECHNOLOGY. SF4: In general, the institution has supported the use of INSTRUCTIONAL TECHNOLOGY. Facilitating conditions PBC2: I have the resources necessary to use INSTRUCTIONAL TECHNOLOGY. PBC3: I have the knowledge necessary to use INSTRUCTIONAL TECHNOLOGY. PBC5: The INSTRUCTIONAL TECHNOLOGY provided by my institution is not compatible with other systems I use. FC3: A specific person (or group) is available for assistance with system difficulties. Usage behavior Please indicate the extent you use any of the applications and devices listed below in your teaching. (1-Never or Not Applicable (N/A), 2-Rarely, 3-Sometimes, 4-Very Often, 5-Always)
Applications I use: 1. Instant message (Gchat, Facebook chat, AIM etc.) 2. Text message 3. E-mail
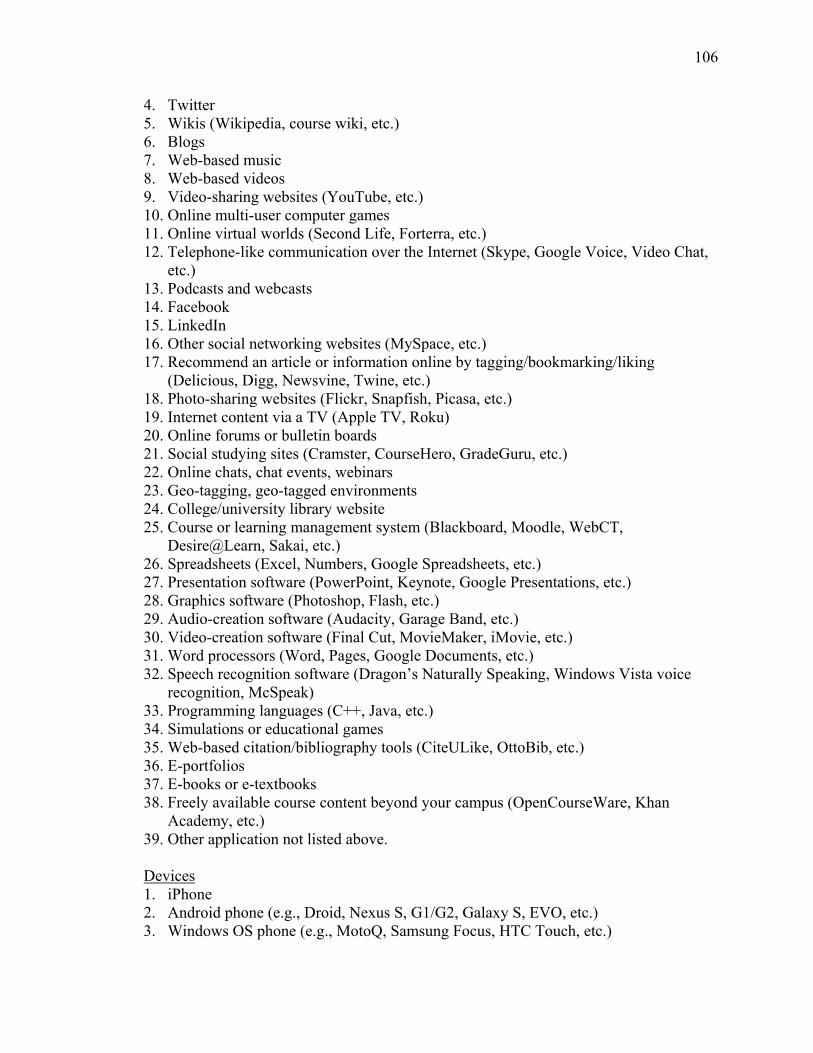
106
4. Twitter 5. Wikis (Wikipedia, course wiki, etc.) 6. Blogs 7. Web-based music 8. Web-based videos 9. Video-sharing websites (YouTube, etc.) 10. Online multi-user computer games 11. Online virtual worlds (Second Life, Forterra, etc.) 12. Telephone-like communication over the Internet (Skype, Google Voice, Video Chat,
etc.) 13. Podcasts and webcasts 14. Facebook 15. LinkedIn 16. Other social networking websites (MySpace, etc.) 17. Recommend an article or information online by tagging/bookmarking/liking
(Delicious, Digg, Newsvine, Twine, etc.) 18. Photo-sharing websites (Flickr, Snapfish, Picasa, etc.) 19. Internet content via a TV (Apple TV, Roku) 20. Online forums or bulletin boards 21. Social studying sites (Cramster, CourseHero, GradeGuru, etc.) 22. Online chats, chat events, webinars 23. Geo-tagging, geo-tagged environments 24. College/university library website 25. Course or learning management system (Blackboard, Moodle, WebCT,
Desire@Learn, Sakai, etc.) 26. Spreadsheets (Excel, Numbers, Google Spreadsheets, etc.) 27. Presentation software (PowerPoint, Keynote, Google Presentations, etc.) 28. Graphics software (Photoshop, Flash, etc.) 29. Audio-creation software (Audacity, Garage Band, etc.) 30. Video-creation software (Final Cut, MovieMaker, iMovie, etc.) 31. Word processors (Word, Pages, Google Documents, etc.) 32. Speech recognition software (Dragon’s Naturally Speaking, Windows Vista voice
recognition, McSpeak) 33. Programming languages (C++, Java, etc.) 34. Simulations or educational games 35. Web-based citation/bibliography tools (CiteULike, OttoBib, etc.) 36. E-portfolios 37. E-books or e-textbooks 38. Freely available course content beyond your campus (OpenCourseWare, Khan
Academy, etc.) 39. Other application not listed above. Devices 1. iPhone 2. Android phone (e.g., Droid, Nexus S, G1/G2, Galaxy S, EVO, etc.) 3. Windows OS phone (e.g., MotoQ, Samsung Focus, HTC Touch, etc.)
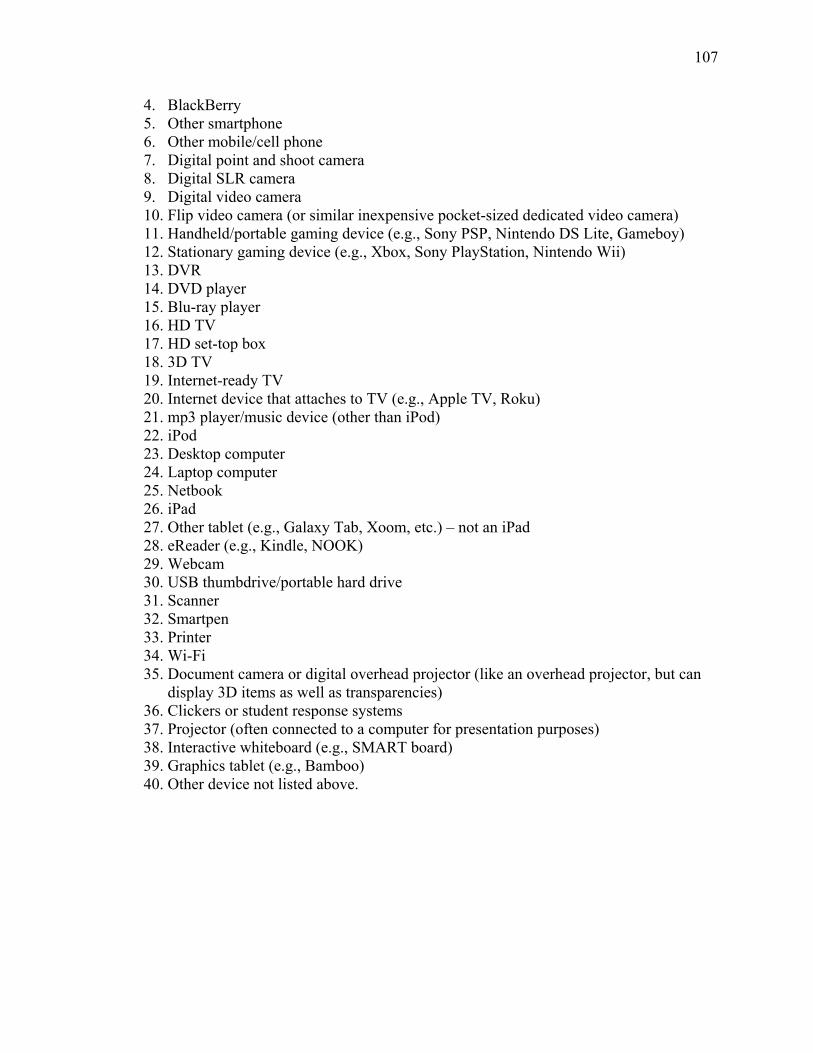
107
4. BlackBerry 5. Other smartphone 6. Other mobile/cell phone 7. Digital point and shoot camera 8. Digital SLR camera 9. Digital video camera 10. Flip video camera (or similar inexpensive pocket-sized dedicated video camera) 11. Handheld/portable gaming device (e.g., Sony PSP, Nintendo DS Lite, Gameboy) 12. Stationary gaming device (e.g., Xbox, Sony PlayStation, Nintendo Wii) 13. DVR 14. DVD player 15. Blu-ray player 16. HD TV 17. HD set-top box 18. 3D TV 19. Internet-ready TV 20. Internet device that attaches to TV (e.g., Apple TV, Roku) 21. mp3 player/music device (other than iPod) 22. iPod 23. Desktop computer 24. Laptop computer 25. Netbook 26. iPad 27. Other tablet (e.g., Galaxy Tab, Xoom, etc.) – not an iPad 28. eReader (e.g., Kindle, NOOK) 29. Webcam 30. USB thumbdrive/portable hard drive 31. Scanner 32. Smartpen 33. Printer 34. Wi-Fi 35. Document camera or digital overhead projector (like an overhead projector, but can
display 3D items as well as transparencies) 36. Clickers or student response systems 37. Projector (often connected to a computer for presentation purposes) 38. Interactive whiteboard (e.g., SMART board) 39. Graphics tablet (e.g., Bamboo) 40. Other device not listed above.