abstract title of dissertation: effects of soil cross
TRANSCRIPT

ABSTRACT
Title of Dissertation: EFFECTS OF SOIL CROSS-
SECTIONAL MODELING ON THE SITE DESIGN SPECTRA AND FUNDAMENTAL PERIOD
Musaid A Assaf, Ph.D., 2004 Dissertation Directed By: Professor M. Sherif Aggour,
Department of Civil and Environmental Engineering
The most important tools in earthquake engineering are the site
design spectra and fundamental period. Design spectra allow the
determination of the expected ground acceleration as a function of the
structure’s period, while a site fundamental period indicates the resonance
period of the site. The National Earthquake Hazard Reduction Program
(NEHRP) Provisions allow the determination of a site design spectrum by
a general procedure, which applies to most of the locations within the
U.S.A. and its territories, or by a site specific method for some locations
that have a certain class of weak soils. This dissertation addresses the
general procedure that uses site classification to determine the site design
spectra. A site classification can be determined from a soil profile
modeling by one of three methods; the site weighted average standard

penetration test uncorrected blow counts, the site weighted average shear
wave velocity, and the site weighted undrained shear strength. The shear
wave velocity profile for a certain location can be determined by invasive
tests such as cross-hole tests, or by the more economical non-invasive
tests such as Controlled Source Spectral Analysis of Surface Waves
method, which is also referred to as the CXW test. In addition, NEHRP
Provisions require modeling of only the top 30 m of the soil cross-
section.
The dissertation has four main objectives: to examine the effects of
the various soil profile modeling methods on the site design response
spectra; to examine the effects of the various soil profile modeling
methods on the site fundamental period; to examine the effects of
increasing the bedrock depth beyond the NEHRP depth of 30 m on the
site fundamental period; and to examine the effects of the presence of
embedded soft soil layers within the soil profile on the site fundamental
period.
To achieve these objectives, a seismically active site was chosen for
field testing, as well as a five-station seismic array was installed and
utilized. Different tests were performed and seismic activities were
recorded at different locations within the site, then dynamic analyses
were performed that were then used to accomplish the dissertation’s
objectives.

EFFECTS OF SOIL CROSS-SECTIONAL MODELING ON THE SITE DESIGN SPECTRA AND FUNDAMENTAL PERIOD
By
Musaid A Assaf.
Dissertation submitted to the Faculty of the Graduate School of the University of Maryland, College Park, in partial fulfillment
of the requirements for the degree of Doctor of Philosophy
2004
Advisory Committee: Professor M. S. Aggour, Chair Professor Amde m. Amde Professor Bilal M. Ayyub Professor Amr M. Baz Professor Chung C. Fu

© Copyright by Musaid A. Assaf
2004

ii
Dedication
To my mother, my wife, my sons Khalid, Mohammed, Abdulaziz, and to
my daughter Sara.

iii
Acknowledgements
I am truly indebted to so many individuals whose guidance and
assistance were essential to the completion of this dissertation. My
sincere thanks and gratitude go to my academic advisor, the dissertation
director, and dissertation committee chairman, Prof. M. S. Aggour. Prof.
Aggour graciously devoted a great deal of his time on this project. His
continuous encouragement, interest and support made this dissertation
possible. I am also very grateful to all of the other members of the
dissertation committee, especially Prof. Ayyub and Prof. Fu, for their
helpful suggestions.
The field work was supported by King Abdulaziz City for Science
and Technology (KACST), under project number AR-19-46. The
financial and technical support from KACST is highly appreciated. In
addition, I would like to thank the President of KACST, Dr. Al-Athel and
his two Vice Presidents, Dr. Al-Rasheed and DR. Al-Swyel for their
support. I would also like to thank the Director of KACST’s Scientific
Support Department and the Director of KACST Space Research Institute
for their cooperation in this project. My special thanks go to the Director
and staff of KACST Institute of Astronomy and Geophysics for their
cooperation as well as for providing the equipment and technicians for
some of the field work.

iv
I am also very grateful to my dear friend Dr. Mohammed Al-
Haddad, head of the Research Center at King Saud University in Riyadh,
who was the primary investigator for the KACST project. Dr. Al-
Haddad’s suggestions and experience in the field work were extremely
valuable. In addition, Dr. Al-Amri of King Saud University was kind
enough to share his experience in interpreting the raw data of the vertical
electric sounding tests in the Al-Durrah site. My sincere thanks also go to
Dr. Assakkaf at UMCP and Dr. Erdal at the USGS for their support.
Last, but not least, my sincere thanks to the Saudi Cultural Attaché,
Dr Mazyed Al-Mazyed, and all of the Cultural Mission’s staff for their
moral support and encouragement.

v
Table of Contents
DEDICATION .................................................................................................. II
ACKNOWLEDGEMENTS............................................................................... III
TABLE OF CONTENTS ..................................................................................V
LIST OF TABLES ...........................................................................................XI
LIST OF FIGURES ....................................................................................... XV
CHAPTER 1: INTRODUCTION....................................................................... 1
1.1 Background....................................................................................................................................... 1
1.2 Problem Statement ........................................................................................................................... 4 1.2.1 General ....................................................................................................................................... 4 1.2.2 Effects of the Soil Cross-section Modeling Methods on the Design .......................................... 5 Response Spectrum ............................................................................................................................. 5 1.2.3 Effects of the Soil Cross-section Modeling Methods on the Site ............................................... 7 Fundamental Period............................................................................................................................. 7 1.2.4 Effects of Increasing the Bedrock Depth on the Site Fundamental ............................................ 8 Period................................................................................................................................................... 8 1.2.5 Effects of the Presence of an Embedded Soft Soil Layer on the Site ......................................... 9 Fundamental Period............................................................................................................................. 9 1.2.6 Summary of the Dissertation Objectives .................................................................................. 10 1.2.7 Methodology............................................................................................................................. 11
1.3 Background information on The Research Project..................................................................... 12
1.4 Organization of Dissertation ......................................................................................................... 12
CHAPTER 2: DETERMINATION OF DESIGN RESPONSE SPECTRA ....... 16
2.1 Introduction to NEHRP Provisions .............................................................................................. 16 2.1.1 The General Method................................................................................................................. 17 2.1.2 Site-Specific Method ................................................................................................................ 23
CHAPTER 3: DETERMINATION OF SITE FUNDAMENTAL FREQUENCY. 25

vi
3.1 General ............................................................................................................................................ 25
3.2 The Approximate Method ............................................................................................................. 25
3.3 Microtremors Spectral Ratio Method .......................................................................................... 29 3.3.1 General ..................................................................................................................................... 29 3.3.2 The Discrete Fast Fourier Transform........................................................................................ 29 3.3.3 Procedure for Generating Microtremors Spectral Ratio ........................................................... 30
3.4 Dynamic Site Response Analysis Method..................................................................................... 34 3.4.1 Introduction to the Dynamic Site Response Analysis Computer.............................................. 34 Program ProShake ............................................................................................................................. 34 3.4.2 Input Manager .......................................................................................................................... 35 3.4.3 The Solution Manager .............................................................................................................. 37 3.4.4 The Output Manager................................................................................................................. 37 3.4.5 The Report ................................................................................................................................ 38
CHAPTER 4: SITE INFORMATION .............................................................. 39
4.1 Site Location ................................................................................................................................... 39 4.1.1 Al-Durrah ................................................................................................................................. 39 4.1.2 East-West Seismic Array.......................................................................................................... 43
4.2 Site Structural Geology.................................................................................................................. 44 4.2.1 AL-Durrah Area ....................................................................................................................... 44 4.2.2 East-West Array ....................................................................................................................... 47
4.3 Regional Earthquake History and Characteristics...................................................................... 48
CHAPTER 5: FIELD TEST METHODS ......................................................... 52
5.1 General ............................................................................................................................................ 52
5.2 Tests Background and Procedures ............................................................................................... 53 5.2.1 Standard Penetration Test (SPT)............................................................................................... 53 5.2.2 Cross-Hole (CH) Method ......................................................................................................... 54 5.2.3 The Controlled Source Spectral Analysis of Surface Waves.................................................... 55 (CXW) Method.................................................................................................................................. 55
5.2.3a Theoretical Background ..................................................................................................... 55 5.2.3b Testing Procedures............................................................................................................. 62
5.2.4 Vertical Electric Sounding (VES) Method ............................................................................... 63 5.2.4a Theoretical Background ..................................................................................................... 63 5.2.4b Testing Procedure .............................................................................................................. 68 5.2.5 Seismic Data Acquisition:.................................................................................................... 68
5.2.5a General .......................................................................................................................... 68 5.2.5b Seismic Recording Systems .......................................................................................... 69
CHAPTER 6: FIELD WORK TASKS AND EQUIPMENT INFORMATION..... 71
6.1 General ............................................................................................................................................ 71
6.2 Field Work Tasks Participants...................................................................................................... 71
6.3 Details of Testing Equipment and Instrumentation .................................................................... 73

vii
6.3.1 Standard Penetration Test (SPT): ............................................................................................. 74 6.3.2 Cross-hole (CH) Test:............................................................................................................... 75 6.3.3 The Controlled Source Spectral Analysis of Surface Waves (CXW)....................................... 75 Test: ................................................................................................................................................... 75 6.3.4 Vertical Electric Sounding (VES)............................................................................................. 76 6.3.5 Global Positioning System (GPS): ........................................................................................... 77 6.3.6 Seismic Data Acquisition Systems: .......................................................................................... 79
CHAPTER 7: FIELD TESTS RESULTS ........................................................ 84
7.1 General ............................................................................................................................................ 84
7.2 Al-Durrah Site ................................................................................................................................ 85 7.2.1 Standard Penetration Tests (SPT) ............................................................................................. 85
7.2.1a General............................................................................................................................... 85 7.2.1b Test Results........................................................................................................................ 88
7.2.2 Cross-Hole Tests....................................................................................................................... 90 7.2.2a General............................................................................................................................... 90 7.2.2b Cross-Hole Data Correction............................................................................................... 91 7.2.2c Cross-hole Test Results...................................................................................................... 94
7.2.3 Controlled Source Spectral Analysis of Surface Waves (CXW)............................................ 100 Tests................................................................................................................................................. 100
7.2.3a General............................................................................................................................. 100 7.2.3b CXW Test Results ........................................................................................................... 100
7.2.4 Vertical Electric Sounding (VES) Test................................................................................... 116 7.2.4a General............................................................................................................................. 116 7.2.4b Al-Durrah VES Test Results............................................................................................ 117
7.2.5 Microtremors Measurements .................................................................................................. 119 7.2.5a General............................................................................................................................. 119 7.2.5b Microtremors Results....................................................................................................... 120
7.3. East-West Seismic Array ............................................................................................................ 130 7.3.1 Vertical Electric Sounding...................................................................................................... 130
7.3.1a General............................................................................................................................. 130 7.3.1b (VES) Tests Results ......................................................................................................... 132
7.3.2 Records of Actual Events ....................................................................................................... 132 7.3.2a Actual Seismic Event Information ................................................................................... 132 7.3.2b Actual Seismic Event Records:........................................................................................ 133
7.3.3 Microtremors Measurements .................................................................................................. 143 7.3.3a General............................................................................................................................. 143 7.3.3b Microtremors Results....................................................................................................... 143
CHAPTER8: ANALYTICAL METHODS FUNDAMENTAL PERIODS
RESULTS.................................................................................................... 145
8.1 General .......................................................................................................................................... 145
8.2 Al-Durrah Analytical Results...................................................................................................... 146 8.2.1 The Approximate Method....................................................................................................... 146
8.2.1a General............................................................................................................................. 146 8.2.1b Al-Durrah Fundamental Periods and Frequencies by the ................................................ 147 Approximate Method.................................................................................................................. 147
8.2.2 Al-Durrah Dynamic Site Response Analysis Results ............................................................. 149 8.2.2b Input Motions (Synthetic Earthquakes) ........................................................................... 150 8.2.2c ProShake Analysis Results............................................................................................... 150

viii
8.1.2d Short Period (Ss), and One Second (S1), Accelerations for............................................... 152 Al-Durrah Soil Profiles............................................................................................................... 152 8.2.2e Effects of Varying the Depth of Bedrock on the Site....................................................... 154 Fundamental Period .................................................................................................................... 154
8.2 East-West Seismic Array Results................................................................................................ 159 8.2.1 General ................................................................................................................................... 159 8.2.2 Soil Profile Modeling Assumptions........................................................................................ 159 8.2.3a Seismic Array Stations Fundamental Periods ....................................................................... 160 8.2.3b Summary of the Results........................................................................................................ 177
CHAPTER 9: EFFECTS OF SOIL CROSS-SECTION MODELING METHODS
ON AL-DURRAH DESIGN RESPONSE SPECTRA.................................... 180
9.1 General .......................................................................................................................................... 180
9.2 Analysis of the Al-Durrah Standard Penetration Test (SPT) Results...................................... 181 9.2.1 The Al-Durrah site soil characteristics ................................................................................... 181 9.2.2 Al-Durrah NEHRP-SPT Site Classification ........................................................................... 183
9.3 The Controlled Source Spectral Analysis of Surface Waves .................................................... 185
(CXW) and the Cross-hole (CH) Tests Results................................................................................ 185 9.3.1 Comparison of the Shear Wave Velocities (SWV) Profiles from........................................... 185 the CXW and CH Tests ................................................................................................................... 185 9.3.2 The Al-Durrah Site Classification by the CXW and CH Sear Wave...................................... 191 Velocity (SWV) Profiles ................................................................................................................. 191
9.4 Effects of Soil Cross-sectional Modeling Methods on the Site.................................................. 194
Design Response Spectra. .................................................................................................................. 194 9.4.1 Introduction ............................................................................................................................ 194 9.4.2 Effects of the Al-Durrah Site soil cross-sectional modeling methods on its Design .............. 196 Response Spectra............................................................................................................................. 196 9.4.3 Evaluation of the Results ........................................................................................................ 202
CHAPTER 10: EFFECTS OF SOIL CROSS-SECTION MODELING
METHODS ON AL-DURRAH SITE FUNDAMENTAL PERIOD................... 209
10.1 General ........................................................................................................................................ 209
10.2 The Al-Durrah Site Fundamental Period................................................................................. 210 10.2a The Al-Durrah Site Cross-section Modeling ......................................................................... 210 10.2b The Al-Durrah Site Fundamental Period by the Approximate Method ................................. 211 10.2c The Al-Durrah Site Fundamental Period by the Microtremors Method ................................ 216 10.2d The Al-Durrah Site Fundamental Period by the Dynamic Site Response Analysis Method219 10.2e The Al-Durrah Site Fundamental Period Comparative Analysis ........................................... 227
CHAPTER 11: THE EFFECTS OF BEDROCK DEPTH VARIATION ON THE
AL-DURRAH SITE FUNDAMENTAL PERIODS.......................................... 250

ix
11.1 General ........................................................................................................................................ 250
11.2 Effects of Increasing the Bedrock Depth on the Al-Durrah Site ............................................ 251
Fundamental Period........................................................................................................................... 251 11.2a Dynamic Site Response Analysis Input Information ............................................................. 251 11.2b Effects of Increasing the Depth of Bedrock on the Al-Durrah Site ....................................... 252 Fundamental Period......................................................................................................................... 252 11.2c Analysis of the Soil Profiles with Significantly Variable ...................................................... 268 Fundamental Periods ....................................................................................................................... 268 11.2d Effects of Embedded Soft Layers on the Fundamental Period .............................................. 292 11.2e Analysis of the East-west Seismic Array............................................................................... 300
CHAPTER 12: CONCLUSIONS AND RECOMMENDATIONS OF THE
DISSERTATION.......................................................................................... 308
12.1 General ........................................................................................................................................ 308
12.2 Chapters Review......................................................................................................................... 309
12.3 Results and Conclusions of the Dissertation Objectives.......................................................... 315 12.3a Effects of the Different Soil Cross-section Modeling Methods on ........................................ 315 the Site Classification and the Site Design Response Spectra ......................................................... 315 12.3b Effects of the Different Soil Cross-section Modeling Methods on........................................ 318 the Site Fundamental Period............................................................................................................ 318 12.3c Effects of Increasing the Bedrock Depth beyond NEHRP 30 m ........................................... 344 Depth, on the Site Fundamental Period ........................................................................................... 344 12.3d Effects of the Presence of an Embedded Soft Layer Within the Soil .................................... 355 Cross-section on the Site Fundamental Period ................................................................................ 355 12.3e Analysis of the East-West Seismic Array .............................................................................. 362
12.4 Summary of Conclusions ........................................................................................................... 369
12.5 Recommendations ...................................................................................................................... 372
APPENDIX A: PROSHAKE THEORETICAL BACKGROUND..................... 373
APPENDIX B: SAMPLE SPT LOGS............................................................ 385
APPENDIX C: CROSS-HOLE AND DOWN-HOLE CALCULATIONS ......... 388
APPENDIX D: CXW CALCULATIONS ........................................................ 399
APPENDIX E: SAMPLE VERTICAL ELECTRIC SOUNDING (VES) FIELD
DATA........................................................................................................... 423

x
APPENDIX F: MICROTREMORS CALCULATIONS ................................... 431
APPENDIX G: SEISMIC RECORDS MANIPULATION AND SCALING ...... 636
APPENDIX H: DYNAMIC SITE RESPONSE ANALYSIS DATA.................. 647
1. Analysis Input Earthquakes .......................................................................................................... 647
2. Shear Moduli and Damping Curves ............................................................................................. 648
3. Al-Durrah Site Input Soil Profiles ................................................................................................ 649
4. Dynamic Analysis (ProShake) Results for Al-Durrah Site ........................................................ 706
5. Dynamic Site Response Analysis (ProShake) for the East-west ................................................ 948
Seismic Array...................................................................................................................................... 948
6. Effects of the Presence of an Embedded Soft Soil Layer ........................................................... 971
BIBLIOGRAPHY........................................................................................ 1034

xi
List of Tables Table 2.1: NEHRP Site Classifications [3]...........................................................................20 Table 2.2: NEHRP Values of Fa...........................................................................................21 Table 2.3: NEHRP values of Fv ...........................................................................................21 Table (7.1a): Summary of SPT-N Values (60m Boreholes) and Water depths....................88 Table (7.1b): Summary of SPT-N Values (30m Boreholes) and..........................................89 Water table depth ..................................................................................................................89 Table (7.2): Summary SPT NEHRP Average SPT- values ..................................................90 Table 7.3: Cross-hole Correction Data .................................................................................94 Table7.4: Cross-hole Tests Results.......................................................................................95 Table7.5: CXW average SWV Summary ...........................................................................101 Table 7.6: Depth of the bed rock at the East-west ..............................................................132 Seismic Array stations. .......................................................................................................132 Table 8.1: Approximate Fundamental periods for Al-Durrah soil profiles. .......................148 Table 8.2: ProShake dynamic analysis fundamental periods..............................................151 for Al-Durrah profiles (bedrock at NEHRP depth).............................................................151 Table 8.3: Short period (Ss), and one second (S1), accelerations........................................154 for Al-Durrah ......................................................................................................................154 Table 8.4: Variation of the fundamental periods with the variation ...................................155 of the depth of bedrock for RAN230 at 5% damping.........................................................155 Table 8.5: Variation of the fundamental periods with the variation ...................................156 of the depth of bedrock for RAN230 at 10% damping.......................................................156 Table 8.6: Variation of the fundamental periods with the variation ...................................157 of the depth of bedrock for RAN330 at 5% damping.........................................................157 Table 8.7: Variation of the fundamental periods with the variation ...................................158 of the depth of bedrock for RAN330 at 10% damping.......................................................158 Table 8.8: Fundamental periods for the east-west ..............................................................177 component of array earthquake (5% damping)...................................................................177 Table 8.9: Fundamental periods for the east-west ..............................................................177 component of Array earthquake (10% damping)................................................................177 Table 8.10: Fundamental periods for the north-south.........................................................178 component of array earthquake (5% damping)...................................................................178 Table 8.11: Fundamental periods for the north-south.........................................................178 component of array earthquake (10% damping).................................................................178 Table 8.12: Fundamental frequencies (and periods) for .....................................................178 the north-south component of array earthquake .................................................................178 Table 8.13: Fundamental frequencies (and periods) for .....................................................179 the north-south component of array earthquake .................................................................179 Table 9.1: NEHRP SPT-N value site classifications [3].....................................................184 Table 9.2: Summary of Al-Durrah NEHRP-SPT site classifications .................................184 Table 9.3: Al-Durrah NEHRP average SWV for the CXW ...............................................192 and cross-hole tests .............................................................................................................192 Table 9.4: NEHRP average SWV site classifications [3] ...................................................192 Table 9.5: Al-Durrah NEHRP site classifications by .........................................................193 CXW, SPT, and CH tests....................................................................................................193 Table 9.6: Values of NEHRP Fa [3]...................................................................................195 Table 9.7: Values of NEHRP Fv [3]...................................................................................195 Table 9.8: Short period (Ss), and one second (S1), accelerations for Al-Durrah ................197

xii
Table10.1: The approximate values of the fundamental periods........................................213 of Al-Durrah soil profiles....................................................................................................213 Table 10.2: Average values and standard deviations of the approximate...........................214 values of the fundamental periods of Table10.1a ...............................................................214 Table 10.3: Differences between the approximate fundamental ........................................216 periods of the CH tests and the corresponding CXW tests.................................................216 Table 10.4a: Al-Durrah site fundamental periods of the ....................................................218 microtremors mean ratios ...................................................................................................218 Table 10.4b: Al-Durrah site fundamental periods of the ....................................................218 microtremors simple ratios (east-west component) ............................................................218 Table 10.4c: Al-Durrah site fundamental periods of the ....................................................218 microtremors simple ratios (north-south component).........................................................218 Table 10.5: Al-Durrah site fundamental periods summary and averages...........................218 Table 10.6: Al-Durrah site fundamental periods by the dynamic.......................................220 site response analysis ..........................................................................................................220 Table10. 7: Al-Durrah site fundamental period averages and standard..............................223 deviations for the results of dynamic site response analysis...............................................223 Table 10.8: Percentages of the differences between the average values ............................224 of the fundamental periods of the CH and CXW tests........................................................224 Table10.9: The difference between the values of the fundamental ....................................226 periods of the CH and CXW tests that were performed at the............................................226 same locations (expressed as percentage of the lower value).............................................226 Table 10.10: Comparison of the average values of the fundamental periods at Al-
Durrah .........................................................................................................................230 Table 10.11: Comparison of the average values of the fundamental periods at Al-
Durrah .........................................................................................................................234 Table 10.12: Comparison of the average values of the fundamental periods at Al-
Durrah .........................................................................................................................238 Table 10.13: Comparison of the average values of the fundamental periods at Al-
Durrah .........................................................................................................................242 Table 10.14: Properties of the ideal profile’s layers ...........................................................246 Table 11.1: Definitions of bedrock depths for ....................................................................253 the dynamic site response analysis .....................................................................................253 Table 11. 2: Variation of the peak periods of the Ground response ...................................254 spectra with depth using earthquake RAN230 at 5% damping ..........................................254 Table 11. 3: Variation of the peak periods of the Ground response ...................................257 spectra with depth using earthquake RAN230 at 10% damping ........................................257 Table 11.4: Variation of the peak periods of the Ground response ....................................261 spectra with depth using earthquake RAN330 at 5% damping ..........................................261 Table 11.5: Variation of the peak periods of the Ground response ....................................265 spectra with depth using earthquake RAN330 at 10% damping ........................................265 Table 11.6: Coefficient of Variation (COV).......................................................................270 of the fundamental periods (as a percentage) .....................................................................270 Table 11.7: Summary of Al-Durrah soil cross-section average SPT, NEHRP SWV,
and effect of bedrock depth variation .........................................................................274 Table 11.8a: Results of the dynamic response analysis of Profiles D1ac and D1N ...........295 With damping ratio of 5%...................................................................................................295 Table 11.8b: Results of the dynamic response analysis of Profiles D1ac and D1N...........295 With damping ratio of 10%.................................................................................................295

xiii
Table 11.9: Seismic stations of the East-west seismic........................................................302 array and their bedrock depths...........................................................................................302 Table 11.10: Fundamental periods for the east-west component .......................................304 of array earthquake (5% damping) .....................................................................................304 Table 11.11: Fundamental periods for the east-west component .......................................304 of Array earthquake (10% damping) ..................................................................................304 Table 11.12: Fundamental periods for the north-south component....................................304 of array earthquake (5% damping) .....................................................................................304 Table 11.13: Fundamental periods for the north-south component....................................305 of array earthquake (10% damping) ...................................................................................305 Table 11.14: Fundamental frequencies (and periods) for the .............................................306 East-west component of array earthquake ..........................................................................306 Table 11.15: Fundamental frequencies (and periods) for the .............................................306 north-south component of array earthquake .......................................................................306 Table 12.1: Average values and standard deviations of the................................................319 approximate values of the fundamental periods .................................................................319 Table 12.2: Differences between the approximate fundamental ........................................320 periods of the CH tests and the corresponding CXW tests.................................................320 Table 12.3: Al-Durrah site fundamental periods summary and averages...........................322 Table 12.4: Al-Durrah site fundamental period averages and standard..............................324 deviations for the results of dynamic site response analysis...............................................324 Table 12.5: Percentages of the differences between the average values of ........................325 the fundamental periods of the CH and CXW tests............................................................325 Table 12.6: The difference between the values of the fundamental ...................................326 periods of the CH and CXW tests that were performed at the............................................326 same locations (expressed as percentage of the lower value).............................................326 Table 12.7: Comparison of the average values of the fundamental....................................329 periods at Al-Durrah ...........................................................................................................329 Table 12.8: Comparison of the average values of the fundamental....................................332 periods at Al-Durrah ...........................................................................................................332 Table 12.9: Comparison of the average values of the fundamental periods at Al-
Durrah .........................................................................................................................335 Table 12.10: Comparison of the average values of the fundamental periods at Al-
Durrah .........................................................................................................................338 Table 12.11: Properties of the ideal profile ........................................................................342 Table 12.12: Definitions of bedrock depths for the dynamic .............................................346 site response analysis ..........................................................................................................346 Table 12.13: Coefficients of variation (COV) of the fundamental.....................................351 periods of Al-Durrah soil cross-section models..................................................................351 Table 12.14: Summary of Al-Durrah soil cross-section average SPT, NEHRP SWV,......352 and effect of bedrock depth variation .................................................................................352 Table 12.15: Seismic stations of the East-west seismic......................................................364 array and their bedrock depths............................................................................................364 Table 12.16a: Fundamental periods for the east-west ........................................................366 component of array earthquake (5% damping)...................................................................366 Table 12.16b: Fundamental periods for the east-west ........................................................366 Component of Array earthquake (10% damping)..............................................................366 Table 12.17a: Fundamental periods for the north-south.....................................................366 component of array earthquake (5% damping)...................................................................366

xiv
Table 12.17b: Fundamental periods for the north-south.....................................................367 Component of array earthquake (10% damping)...............................................................367 Table 12.18: Fundamental frequencies (and periods) for the .............................................368 East-west component of array earthquake ..........................................................................368 Table 12.19: Fundamental frequencies (and periods) for the .............................................368 North-south component of array earthquake ......................................................................368

xv
List of Figures Figure1.1: Schematic representation of hypocenter and epicenter [1] ..........................2 Figure1.2: Main types of body waves; (a) p-wave, (b) sv-wave [2]..............................3 Figure1.3: Main types of surface waves; .......................................................................4 Figure 2.1: NEHRP Provisions Design response spectrum [3] ...................................23 Figure 3.1: Effects of increased frequency on peak amplification factors [1].............27 Figure 3.2: A triangular unit window for 4000 values segment ..................................32 Figure 3.3: Parzen Smoothing Window.......................................................................33 Figure 4.1: Location of Al-Durrah...............................................................................40 Figure 4.2: A Close up of the location and coordinates of the Al-Durrah Site............40 Figure 4.3: Satellite image of Haqil City and the Al-Durrah area. ..............................41 Figure 4.4: A satellite overview of Al-Durrah.............................................................42 Figure 4.5: General view of Al-Durrah and the Gulf of Aqaba (looking west)...........43 Figure 4.6: General view of the East-west Seismic Array...........................................44 (looking north-east)......................................................................................................44 Figure 4.7: Lower level of Al-Durrah (looking east from the beach)..........................46 Figure 4.8: Middle level of Al-Durrah (looking north) ...............................................46 Figure 4.9: East-West Seismic Array (looking east) ...................................................47 Figure 4.10: The first rock outcrop east of Al-Durrah.................................................48 Figure 4.11: 3-D images of hypocenters distribution for the Gulf of Aqaba...............50 For the period of 1985-2000 in the Gulf of Aqaba region [17]. ..................................50 Figure 4.12: Epicenter distribution for the October 1995............................................51 earthquakes in the Gulf of Aqaba region [17]. ............................................................51 Figure 5.1a: Cross-Hole Tests; (a) Two holes, (b) Multi holes [1]..............................54 Figure 5.1b: Down-hole test illustration. .....................................................................55 Figure 5.2: Example of a Rayleigh waves' dispersion curve [19]. ..............................58 Figure 5.3: SASW test configuration [1]. ....................................................................59 Figure 5.4: Schematic representation of a CXW test [19]. ..........................................61 Figure 5.5: Schlumberger VES Test Arrangement [22]. .............................................65 Figure 5.6: Point electrodes on homogenous infinite soil layer; .................................66 (a) single electrode, and (b) two electrodes [21]..........................................................66 Figure 6.1: Preparations for SPT .................................................................................74 Figure 6.2: Setting up a cross-hole test ........................................................................75 Figure 6.3: CXW testing system components..............................................................76 Figure 6.4: The SYSCAL R2 Deep Resistivity / IP System [25] ................................77 Figure 6.5: Conducting VES at a seismic station in the East-west array.....................77 Figure 6.6: The 5700 CORS GPS system; (a) The base unit in the background.........78 Figure 6.6-continued: The 5700 CORS GPS system; (b) the mobile unit...................79 Figure 6.7: Portable Very-Broad-Band Tri-Axial........................................................80 Seismometer STS-2 IRIS Special [23]. .......................................................................80 Figure 6.8: EpiSensor Force Balance Accelerometer ..................................................80 (Model FBA EST) [24]................................................................................................80 Figure 6.9: Quanterra Q330 Data engine digitizer [24]. ..............................................81 Figure 6.10: The Quanterra Q330 Packet Baler Data Storage Devices [24]. ..............81 Figure 6.11: The Seismometer and EpiSensor in the seismic......................................82 station of the rock outcrop (the reference point)..........................................................82 Figure 6.12: A complete seismic station setup including the solar panel. ...................83

xvi
Figure 7.1: Schematic layout of the Al-Durrah site tests locations .............................87 Figure 7.2: Profile of SWV of CH D5. ........................................................................96 Figure 7.3: Profile of SWV of CH D6. ........................................................................97 Figure 7.4: Profile of SWV of CH D11. ......................................................................98 Figure 7.5: Profile of SWV of CH D12. ......................................................................99 Figure 7.6: D1 (A10) CXW SWV Profile .................................................................102 Figure 7.7: D2 (A6) CXW SWV profile....................................................................103 Figure 7.8: D3 (A14) CXW SWV profile..................................................................104 Figure 7.9: D4 (A11) CXW SWV profile..................................................................105 Figure 7.10: D5 (A3a) CXW SWV profile................................................................106 Figure 7.11: D5a (A3b) CXW SWV profile..............................................................107 Figure 7.12: D6 (A12) CXW SWV profile................................................................108 Figure 7.13: D7 (A13) CXW SWV profile................................................................109 Figure 7.14: D8 (A5) CXW SWV profile..................................................................110 Figure 7.15: D9 (A4) CXW SWV profile..................................................................111 Figure 7.16: D11 (A1) CXW SWV profile................................................................112 Figure 7.17: D12 (A7) CXW SWV profile................................................................113 Figure 7.18: (A8) CXW SWV Profile .......................................................................114 Figure 7.19: (A9) CXW SWV profile........................................................................115 Figure 7.20: Vertical Electric Sounding tests locations in the Al-Durrah area. ........117 Figure 7.21: (VES1) cross-section at Al-Durrah .......................................................118 Figure 7.22: (VES) Cross-section (Al-Durrah-Wadi Mubrak) ..................................119 Figure 7.23: Al-Durrah approximate east-west cross-section....................................121 Figure 7.24: (a) Mean ratios spectra of DRA1, (b) The east-west component of the
microtremors record showing the occurrence of a micro event.........................123 Figure 7.25: (a) Mean ratios spectra of DRA2, (b) The east-west component of the
microtremors record showing the occurrence of a micro event.........................124 Figure 7.26: (a) Mean ratios spectra of DRB1, (b) The east-west component of the
microtremors record showing the occurrence of a micro event.........................125 Figure 7.27: (a) Mean ratios spectra of DRB3, (b) and (c) The two..........................127 east-west component segments of the microtremors ................................................127 record showing the occurrence of a micro event. ......................................................127 Figure 7.28: DRA1 direct ratios spectra. ...................................................................128 Figure 7.29: DRA2 direct ratios spectra. ...................................................................128 Figure 7.30: DRB1 direct ratios spectra. ...................................................................129 Figure 7.31: DRB3 direct ratios spectra. ...................................................................129 Figure 7.32: A Schematic illustration of the East-west Seismic Array (Scales are
exaggerated).......................................................................................................131 Figure 7.33: Components of Reference (DREFF) Station Record; ...........................134 (a) E-W, (b) N-S. .......................................................................................................134 Figure 7.33-continued: Components of Reference (DREFF) Station Record; (c)
vertical components. ..........................................................................................135 Figure 7.34: Components of (RD0) Station Record; (a) E-W, ..................................136 Figure 7.34-continued: Components of (RD0) Station Record; (c) vertical
components. .......................................................................................................136 Figure7.35: Components of (RD2) Station Record; (a) E-W, (b) N-S ......................137 components. ...............................................................................................................137 Figure7.35-continued: Components of (RD2) Station Record; .................................138 (c) vertical component. ..............................................................................................138

xvii
Figure 7.36: Components of (RD3) Station Record; .................................................139 (a) E-W, (b) N-S components. ...................................................................................139 Figure 7.36-continued: Components of (RD3) Station Record; ................................140 (c) vertical component. ..............................................................................................140 Figure 7.37: Components of (DRA2) Station Record; ..............................................141 (a) E-W, (b) N-S components. ...................................................................................141 Figure 7.37-continued: Components of (DRA2) Station Record; .............................142 (c) vertical component. ..............................................................................................142 Figure 7.38: Microtremors plots for station RD0 ......................................................143 Figure 7.39: Microtremors plot for station RD2........................................................144 Figure 8.1: Synthetic earthquakes used in the DSRA; (a) RAN230, (b) RAN330....150 Figure 8.2: ProShake analysis fundamental periods distribution...............................152 for Al-Durrah profiles (bedrock at NEHRP depth)....................................................152 Figure 8.3: Variation of fundamental periods with depth of .....................................156 bedrock for earthquake RAN230 with 5% damping..................................................156 Figure 8.4: Variation of the fundamental periods with the variation.........................157 of the depth of bedrock for RAN230 at 10% damping..............................................157 Figure 8.5: Variation of the fundamental periods with the variation of ....................158 the depth of bedrock for earthquake RAN330 and 5% damping...............................158 Figure 8.6: Variation of the fundamental periods with the variation.........................159 of the depth of bedrock for RAN330 at 10% damping..............................................159 Figure 8.7: Input motion earthquakes of rock outcrop; .............................................162 (a) E-W component, and (b) N-S component ............................................................162 Figure 8.8: Ground response spectrum for RD0 (E-W) component;.........................163 5% damping. ..............................................................................................................163 Figure 8.9: Ground response spectrum for RD0 (N-S) component; ..........................164 5% damping. ..............................................................................................................164 Figure 8.10: Ground response spectrum for RD0 (E-W) component;.......................165 10% damping. ............................................................................................................165 Figure 8.11: Ground response spectrum for RD0 (N-S) component;........................165 10% damping. ............................................................................................................165 Figure 8.12: Ground response spectrum for RD2 (E-W) component;.......................166 5% damping. ..............................................................................................................166 Figure 8.13: Ground response spectrum for RD2 (N-S) component;........................166 5% damping. ..............................................................................................................166 Ts= 0.077 sec. ............................................................................................................166 Figure 8.14: Ground response spectrum for RD2 (E-W) component;.......................167 10% damping. ............................................................................................................167 Figure 8.15: Ground response spectrum for RD2 (N-S) component;........................167 10% damping. ............................................................................................................167 Figure 8.16: Ground response spectrum for RD3 (E-W) component;.......................168 5% damping. ..............................................................................................................168 Figure 8.17: Ground response spectrum for RD3 (N-S) component;........................168 5% damping. ..............................................................................................................168 Figure 8.18: Ground response spectrum for RD3 (E-W) component;.......................169 10% damping. ............................................................................................................169 Figure 8.19: Ground response spectrum for RD3 (N-S) component;........................169 10% damping. ............................................................................................................169 Figure 8.20: Ground response spectrum for DRA2 (E-W) component; ....................170 5% damping. ..............................................................................................................170

xviii
Figure 8.21: Ground response spectrum for DRA2 (N-S) component; .....................170 5% damping. ..............................................................................................................170 Figure 8.22: Ground response spectrum for DRA2 (E-W) component; ....................171 10% damping. ............................................................................................................171 Figure 8.23: Ground response spectrum for DRA2 (N-S) component; .....................171 10% damping. ............................................................................................................171 Figure 8.24: Frequency domain earthquake record of station DREFF;.....................172 (a) (E-W) component, and (b) (N-S) component;......................................................172 Figure 8.25: Frequency domain earthquake record of station RD0;..........................173 (a) (E-W) component, and (b) (N-S) component;......................................................173 Figure 8.26: Frequency domain earthquake record of station RD2;..........................174 (a) (E-W) component, and (b) (N-S) component;......................................................174 Figure 8.27: Frequency domain earthquake record of station RD3;..........................175 (a) (E-W) component, and (b) (N-S) component;......................................................175 Figure 8.28: Frequency domain earthquake record of station DRA2;.......................176 (a) (E-W) component, and (b) (N-S) component;......................................................176 Figure 9.1: The main soil features of AL-Durrah ......................................................182 Figure 9.2: A geological cross-section of Al-Durrah between borings D3 and D4...183 Figure 9.3: Comparison of shear wave velocity profiles for CXW, uncorrected ......186 CH, and corrected CH at D5 and A3a location..........................................................186 Figure 9.4: Comparison of shear wave velocity profiles for CXW, uncorrected ......187 CH, and corrected CH at D5 and A3b location .........................................................187 Figure 9.5: Comparison of shear wave velocity profiles for CXW, uncorrected ......188 CH, and corrected CH at D6 and A12 location .........................................................188 Figure 9.6: Comparison of shear wave velocity profiles for CXW, uncorrected ......189 CH, and corrected CH at D11 and A1 location .........................................................189 Figure 9.7: Comparison of shear wave velocity profiles for CXW, uncorrected ......190 CH, and corrected CH at D12 A7 location ................................................................190 Figure 9.8: Al-Durrah NEHRP Design response spectra for soil classes C and D....201 based on ProShake analysis results............................................................................201 Figure 9.9: Design response spectra for site Classes C and D for a site in................204 Region 2 of NEHRP maps .........................................................................................204 Figure 9.10: Design response spectra for site Classes C and D for a site in..............206 Southern California of NEHRP maps ........................................................................206 Figure 10.1 Al-Durrah site VES cross-section ..........................................................211 Figure 10.2: Average fundamental periods and standard ..........................................215 deviations For the results of the approximate method ...............................................215 Figure 10.3: The Al-Durrah site approximate east-west cross-section......................217 Figure 10.4: Al-Durrah site microtremors spectra fundamental periods ...................219 Figure10.5: ProShake analysis fundamental periods distribution for Al-Durrah
profiles (bedrock at NEHRP depth)...................................................................221 Figure 10.6a: Al-Durrah site average fundamental periods of the dynamic site
response Analysis...............................................................................................224 Figure 10.6b: Al-Durrah site fundamental periods standard deviations ....................225 Figure 10.7: The difference between the values of the fundamental.........................226 periods of the CH and CXW tests that were performed at the...................................226 same locations (expressed as percentage of the lower value)....................................226 Figure 10.8a: Plots of the average values of Al-Durrah fundamental periods...........231 Figure 10.8b: Plots of the ratios of average fundamental periods of each method over the fundamental periods of the other two methods....................................................232

xix
Figure 10.9a: Plots of the average values of Al-Durrah fundamental periods...........235 Figure 10.9b: Plots of the ratios of average fundamental periods of each method over
............................................................................................................................236 the fundamental periods of the other two methods....................................................236 Figure 10.10a: Plots of the average values of Al-Durrah fundamental periods.........239 Figure 10.10b: Plots of the ratios of average fundamental periods of each method..240 over the fundamental periods of the other two methods............................................240 Figure 10.11a: Plots of the average values of Al-Durrah fundamental periods.........243 Figure 10.11b: Plots of the ratios of average fundamental periods of each method..244 over the fundamental periods of the other two methods............................................244 Figure 10.12: Ideal profile .........................................................................................245 Figure 10.13: Re-arranged layers of ideal profile......................................................247 Figure 11.1 Al-Durrah site VES cross-section ..........................................................252 Figure 11.2: Variation of Al-Durrah fundamental periods with increasing...............255 depth of bedrock for earthquake RAN230 at 5% damping........................................255 Figure 11.3: Variation of Al-Durrah fundamental periods with increasing...............256 depth of bedrock for earthquake RAN230 at 5% damping........................................256 Figure 11.4: Variation of Al-Durrah fundamental periods with increasing...............258 depth of bedrock for earthquake RAN230 at 10% damping......................................258 Figure 11.5: Variation of Al-Durrah fundamental periods with increasing...............259 depth of bedrock for earthquake RAN230 at 10% damping......................................259 Figure 11.6: Variation of Al-Durrah fundamental periods with increasing...............262 depth of bedrock for earthquake RAN330 at 5% damping........................................262 Figure 11.7: Variation of Al-Durrah fundamental periods with increasing...............263 depth of bedrock for earthquake RAN330 at 5% damping........................................263 Figure 11.8a: Variation of Al-Durrah fundamental periods with increasing.............266 depth of bedrock for earthquake RAN330 at 10% damping......................................266 Figure 11.8b: Variation of Al-Durrah fundamental periods with increasing.............267 depth of bedrock for earthquake RAN330 at 10% damping......................................267 Figure 11.9: Coefficients of Variation of the fundamental periods ...........................271 of Al-Durrah (as a percentage) ..................................................................................271 Figure 11.10a: Location D1-CXW test soil profile ...................................................276 Figure 11.10b: Location D2-CXW test soil profile ...................................................277 Figure 11.10c: Location D3-CXW test soil profile ...................................................278 Figure 11.10d: Location D4-CXW test soil profile ...................................................279 Figure 11.10e: Location D5-CXW test soil profile ...................................................280 Figure 11.10f: Location D5b-CXW test soil profile..................................................281 Figure 11.10g: Location D5-CH test soil profile .......................................................282 Figure 11.10h: Location D6-CXW test soil profile ...................................................283 Figure 11.10i: Location D6-CH test soil profile........................................................284 Figure 11.10j: Location D7-CXW test soil profile ....................................................285 Figure 11.10k: Location D8-CXW test soil profile ...................................................286 Figure 11.10l: Location D9-CXW test soil profile ....................................................287 Figure 11.10m: Location D11-CXW test soil profile ................................................288 Figure 11.10n: Location D11-CH test soil profile .....................................................289 Figure 11.10o: Location D12-CXW test soil profile .................................................290 Figure 11.10p: Location D12-CH test soil profile .....................................................291 Figure 11.11: Variations of the fundamental period with variations of bedrock depth
and embedded soft layer thickness (5% damping) ............................................296

xx
Figure 11.11-continued: Variations of the fundamental period with.........................297 variations of bedrock depth and embedded ..............................................................297 soft layer thickness (5% damping).............................................................................297 Figure 11.12: Variations of the fundamental period with variations .........................298 of bedrock depth and embedded soft layer thickness (10% damping) ......................298 Figure 11.12-continued: Variations of the fundamental period.................................299 with variations of bedrock depth and embedded soft ...............................................299 layer thickness (10% damping)..................................................................................299 Figure 11.13: East-west seismic array ......................................................................303 Figure 12.1: Al-Durrah design response spectra for soil class C and D ....................316 Figure 12.2: Plots of the average values of Al-Durrah fundamental periods ............330 Figure 12.3: Plots of the ratios of average fundamental periods of each...................331 method over the fundamental periods of the other two methods...............................331 Figure 12.4: Plots of the average values of Al-Durrah fundamental periods ............333 Figure 12.5: Plots of the ratios of average fundamental periods of each...................334 method over the fundamental periods of the other two methods...............................334 Figure 12.6: Plots of the average values of Al-Durrah fundamental period..............336 Figure 12.7: Plots of the ratios of average fundamental periods of ...........................337 each method over the fundamental periods of the other two methods ......................337 Figure 12.8: Plots of the average values of Al-Durrah fundamental periods ............339 Figure 12.9: Plots of the ratios of average fundamental periods of ...........................340 each method over the fundamental periods of the other two methods ......................340 Figure 12.10: Ideal profile .........................................................................................342 Figure 12.11: Ideal profile .........................................................................................343 Figure 12.12: Results of the dynamic site response analysis fundamental................347 periods with increasing bedrock depth using earthquake RAN230...........................347 Figure 12.13: Results of the dynamic site response analysis fundamental................348 periods with increasing bedrock depth using earthquake RAN330...........................348 Figure 12.14: Variations of the fundamental period with variations .........................358 of bedrock depth and embedded soft layer thickness (5% damping) ........................358 Figure 12.14-continued: Variations of the fundamental period with.........................359 variations of bedrock depth and embedded soft layer ...............................................359 thickness (5% damping).............................................................................................359 Figure 12.15: Variations of the fundamental period with..........................................360 variations of bedrock depth and embedded soft layer ...............................................360 thickness (10% damping)...........................................................................................360 Figure 12.15-continued: Variations of the fundamental period.................................361 with variations of bedrock depth and embedded soft layer .......................................361 thickness (10% damping)...........................................................................................361 Figure 12.16: East-west seismic array ......................................................................365

1
Chapter 1: Introduction
1.1 Background Earthquakes are considered to be the most powerful natural disaster.
Seismic hazards include ground shaking, structural failures, liquefaction,
land slides, and lifelines damages. Most earthquakes can be explained by
the two theories of plate tectonics and elastic rebound.
The former suggests that the earth’s crust is composed of plates that
are separated by boundaries. Plate boundaries include spreading ridge,
subduction zone, and transform fault boundaries. Plates separated by
spreading ridge boundaries move away from one another without
building up any significant stress. At subduction zone boundaries, one
plate subducts or dives beneath the other, whereas transform fault
boundaries exist where plates move past one another.
The elastic rebound theory suggests that elastic strain energy is
stored in the materials near the subduction zone and transform fault
boundaries as shear stress increases on the fault planes that separate the
plates. As the shear stress approaches the shear strength of the rock
material along the fault, the rock material begins to fail and releases the
stored energy. If the rock material is strong and brittle, the level of the
stored energy can be very high. In addition, rupture along the plain of the
fault will be rapid and the energy release will be violent. The location

2
within a fault where rupture takes place is called the hypocenter, and the
point on the earth’s surface directly above the hypocenter, is called the
epicenter, Figure (1.1) [1].
Figure1.1: Schematic representation of hypocenter and epicenter [1] The released energy is transmitted through the earth in the form of
many types of seismic waves. These waves fall into two main categories,
namely, body waves and surface waves, Figures (1.2) and (1.3). Body
waves include primary and secondary waves (p-waves and s-waves,
respectively). The surface waves include Rayleigh waves and Love
waves. The most destructive component of seismic waves are Rayleigh
waves, since they carry about two third of the energy of an earthquake.
The “size” of an earthquake can be characterized or measured by a
number of methods. Qualitative as well as quantitive scales have been
developed for such purposes.

3
Figure1.2: Main types of body waves; (a) p-wave, (b) sv-wave [2]
Qualitative methods are subjective and they describe the effects of
earthquakes on humans and properties. Qualitative scales include the
Modified Mercalli (MMI), Rossi-Forel (RF), the Japanese Meteorological
Agency (JMA), and the Medvedev-Spoonheuer-Karnik (MSK) scales.
Quantitative or magnitude scales, which are more recent, are based on
seismometer measurements. Magnitude scales include the Richter,
surface wave, body wave, and moment scales [1].

4
Figure1.3: Main types of surface waves;
(a) Raleigh -wave, (b) Love-wave [2]
1.2 Problem Statement
1.2.1 General Earthquake engineers require certain tools to calculate the forces
that earthquakes exert on structures that exist on the site where
earthquakes occur. The most commonly used tools for this purpose are
the design response spectra and the site fundamental period. The design
response spectrum indicates the magnitude of the ground acceleration as a
function of the period of the structure, while the site fundamental period
represents the resonance period of the site. Design response spectra can
be determined by the General Method of the National Earthquake Hazard
Reduction Program (NEHRP) Provisions that is presented in Chapter 2
[3]. The site fundamental period can be estimated by the approximate

5
method, microtremors method, or it can be calculated more accurately by
performing dynamic site response analysis. These methods are presented
in Chapter 3. The methods of determining a site design response
spectrum as well as a site fundamental period are based on determining
the soil cross-section models of the site being studied. The soil cross-
section models can be established by a number of different tests, which
are presented in Chapter 5. The following sections present the possible
implications of using the different tests for soil cross-sectional modeling
on the site design response spectrum and the site fundamental period. In
addition, other implications that stem from using NEHRP Provisions
method are also examined.
1.2.2 Effects of the Soil Cross-section Modeling Methods on the Design
Response Spectrum NEHRP Provisions allow the determination of a design response
spectrum for the design of structures by the General Method. This method
requires the establishment of the soil cross-sectional model (or profile)
for the top 30 m of the site by one of the following tests [3]:
1. The site weighted average standard penetration test (SPT)
uncorrected blow counts ( N ) (or N ch for cohesionless soils)
2. The site weighted average shear wave velocity (v S )
3. The site weighted average undrained shear strength ( SU )

6
These methods, with the exception of the undrained shear strength test,
are also presented in detail in subsequent chapters. The undrained shear
strength was not included in this research since no significant cohesive
soils were encountered at the site where the research was conducted. The
shear wave velocity (SWV) of the soil cross-section can be determined by
invasive tests such as the cross-hole (CH) test, or by non-invasive tests
such as the Controlled Source Spectral Analysis of Surface Waves
method, which is also referred to in the literature as the (CXW) method.
Details of these tests and their theoretical background are presented in
chapter 5. NEHRP Commentary indicates that using the N or the SU
methods instead of the v S method for the determination of the site
classification, may lead to more conservative results [5].
The first objective of this dissertation is to examine the effects of
the different soil cross-section modeling methods on the site classification
and the site design response spectra. To achieve this objective, a
seismically active site was selected, and soil cross-section models were
established in a number of locations within the site by the following tests:
i. Twelve SPT borings (one of the SPT borings was performed just
outside the site where the lowest ground surface exists)
ii. Four CH tests
iii. Fourteen CXW tests

7
The tests were arranged so that at each CH test boring location, one SPT
boring and one CXW test were undertaken. In addition, each SPT boring
was also accompanied by a CXW test. The cross-sectional models that
were established were used to determine the site classification and the site
design response spectra in accordance with NEHRP Provisions. The
resulting spectra were then analyzed and compared to examine the effects
of the different soil cross-sectional modeling methods on the site design
response spectra.
1.2.3 Effects of the Soil Cross-section Modeling Methods on the Site
Fundamental Period
The site fundamental period can be estimated by the approximate
method, the microtremors method, or it can be calculated more accurately
by the dynamic site response analysis using a computer. However, the
approximate method and the dynamic site response analysis require the
use of the site soil cross-sectional SWV models. The soil cross-section
SWV models can be generated by CH tests or by CXW tests. The second
objective of this dissertation is to examine the effects of the different soil-
cross-sectional modeling on the site fundamental period. The same SWV
soil cross-section models that were used for the analysis of the design
response spectra were used to estimate the site fundamental period by the
approximate method, and were also used in an extensive dynamic site

8
response analysis to determine the site fundamental period. The results
were then analyzed to examine the effects of the different soil cross-
sectional modeling methods on the site fundamental period.
1.2.4 Effects of Increasing the Bedrock Depth on the Site Fundamental
Period NEHRP Provisions allow sites to be classified based on the soil
cross-section model of only the top 30 m (100 ft) of the site. This
effectively disregards the actual depths of the bedrock that are greater
than 30 m. Thus, the third objective of this dissertation is to examine the
implications of limiting the soil model depth to the top 30 m of the site,
on the site fundamental period.
These implications were examined in two ways. First, the dynamic
site response analysis that was performed to determine the site
fundamental period was repeated using incrementally increasing bedrock
depth for each soil cross-section model, up to the estimated actual
bedrock depth. The resulting fundamental periods for the various
bedrock depths were then analyzed to examine the effects of increasing
the bedrock depths, on the site fundamental period.
Second, a seismic array of five co-linear seismic stations was
established near the selected site. The seismic stations started at a rock
outcrop, and had increasing bedrock depths that included an approximate

9
NEHRP specified depth, as well as other greater depths. Simultaneous
records of an actual earthquake at all of the array stations were used to
evaluate the effects of increasing the bedrock depths on the site
fundamental period.
1.2.5 Effects of the Presence of an Embedded Soft Soil Layer on the Site
Fundamental Period NEHRP Commentary states that “Site response studies have shown
that continuous, thin, soft clay strata may increase the site amplification”
[5]. However, NEHRP Commentary does not offer any direct cause and
effect between the presence of embedded soft layers and the fundamental
period of the site. In addition, non-invasive tests such as the CXW test
can not always detect the presence of such embedded soft strata, which
can be critical to the fundamental period [4]. The fourth objective of this
dissertation is to examine the effects of the presence of an embedded soft
soil layer in conjunction with increasing bedrock depth, on the site
fundamental period. A soil cross-section at the selected site was used for
this analysis, and all of its embedded soft layers were removed. The soil
cross-section was then modeled twice. The first model was assigned the
NEHRP depth of 30 m, while the second model was assigned the actual
bedrock depth which was much higher than NEHRP depth. A soft soil
layer with a specific thickness and SWV was inserted into both soil cross-

10
section models at the same depth. The dynamic site response analysis
was performed repeatedly for both profiles with varying soft layer
thickness and SWV. In each analysis, the soft layer SWV was decreased
incrementally. For each soft layer SWV, the analysis was repeated four
times using increasing soft layer thickness. The overall analysis was
performed twice using soil damping ratios of 5% and 10%. The
fundamental periods were determined after each analysis, and the results
were used to examine the effects of the presence of an embedded soft soil
layer on the fundamental period.
1.2.6 Summary of the Dissertation Objectives The objectives of this dissertation as presented in the previous
sections can be summarized as follows:
1. Examine the effects of the various soil cross-section modeling
methods on the site design response spectrum
2. Examine the effects of the various soil cross-section modeling
methods on the site fundamental period
3. Examine the effects of increasing the bedrock depth beyond the
NEHRP depth of 30 m, on the site fundamental period.
4. Examine the effects of the presence of an embedded soft soil layer
within the soil cross-section model on the site fundamental period.

11
1.2.7 Methodology In order to achieve the dissertation objectives, a seismically active
site in Saudi Arabia was selected for this purpose. The site, which is
called Al-Durrah, is located in the northwest of Saudi Arabia along the
coast of the Gulf of Aqaba. In addition, a seismic array of five co-linear
seismic stations that started at a rock outcrop east of Al-Durrah was
established. Additional information about the Al-Durrah site and the
seismic array is presented in Chapter 4. The soil cross-section models at
Al-Durrah were established by the following tests:
i. Twelve SPT borings, (9 tests to a depth of 30 m and 3 tests to a
depth of 60 m)
ii. Four CH tests
iii. Fourteen CXW tests.
In addition six vertical electric sounding (VES) tests were performed in
and around Al-Durrah to establish the actual depth of the bedrock at the
site. The theoretical background and testing procedure for the VES are
presented in Chapter 5. In addition, actual seismic records of earthquakes
and microtremors were recorded at Al-Durrah as well as the seismic
array. The bedrock depth at each seismic station along the array was
estimated by VES tests. The procedures for using seismic records are
presented in Chapter 3.

12
1.3 Background information on The Research Project This research was carried out as part of a larger pilot project to
establish seismic zoning for the northwestern region of Saudi Arabia.
The project was supported financially and technically by the King
Abdulaziz City for Science and Technology (KACST). KACST is a
Saudi government organization that funds and oversees most of the
scientific research in the Kingdom. Most of the equipment and
instrumentation were provided by KACST. The organization also
provided the necessary technicians to operate the equipment. The rest of
the field work that required specialization or heavy machinery were
carried out by specialized contractors or consultants who were contracted
to do the work. However, all of the field work pertaining to this
dissertation was carried out under my direct or indirect supervision.
1.4 Organization of Dissertation The dissertation was arranged so that each chapter can be read
individually. In addition, the Chapters were organized in a manner that
presented information in a logical order. Some of the data tables, graphs,
and other materials were reproduced more than once for convenience
when it was appropriate. The following is a brief description of the
contents of each chapter of the dissertation:

13
1. Chapter 2 presents the NEHRP General Method for determining
the site classification and the site design response spectra.
2. Chapter 3 presents the methods for determining the site
fundamental period. These methods include the approximate
method, the microtremors method, and the dynamic site response
analysis.
3. Chapter 4 presents information on the selected site, including its
coordinates, and its structural geology. The chapter includes the
Al-Durrah site as well as the seismic array. In addition, this
chapter presents the regional earthquake history and characteristics.
4. Chapter 5 presents the field test methods, including the tests
theoretical background and procedures. The tests include the SPT,
CH, CXW, and VES. The chapter also presents the seismic data
acquisition methods and systems that were used in this research.
5. Chapter 6 presents the field work tasks and equipment information.
The chapter identifies the participants in the field work, and gives
detailed information on the equipment and instruments that were
used in the field tests. These include the SPT, CH, CXW, and VES
tests, as well as the seismic instruments and the advanced global
positioning system (GPS) that were used in the field.
6. Chapter 7 presents the results of the field tests. These tests include
the SPT, CH, CXW, and VES tests. In addition, seismic records in

14
the form of microtremors and actual earthquakes are presented in
this chapter. The results were not discussed or analyzed in this
Chapter due to the relevance of the results of other tests and
analyses that were presented in Chapter 8.
7. Chapter 8 presents the results of the analytical methods, including
the approximate method and the dynamic site response analysis.
The dynamic site response analyses of this chapter include the Al-
Durrah site as well as the seismic array. Again, the results were
not discussed or analyzed in this chapter due to the relevance of the
results of some of the tests in Chapter 7 to those in Chapter 8. The
results of Chapters 7 and 8 were rearranged and reproduced in
Chapters 9, 10 and 11, where they are discussed and analyzed.
8. Chapter 9 examines the effects of the different soil cross-sectional
modeling methods on the site design response spectra. The
analysis is based on the results of the SPT, the CH, and the CXW
tests.
9. Chapter 10 examines the effects of the different soil cross-sectional
modeling methods on the site fundamental period. The analysis
examines the results of the approximate method, the microtremors
methods, and the dynamic site response analysis method. Initially,
the results of each method are analyzed separately from the results

15
of the other two methods. This is followed by a comparative
analysis of the three methods.
10. Chapter 11 examines the effects of increasing the bedrock depth
beyond the NEHRP depth of 30 m on the site fundamental period.
In addition, this chapter examines the effects of the presence of an
embedded soft soil layer within the soil cross-section, in
conjunction with increasing the bedrock depth, on the site
fundamental period.
11. Chapter12 presents the conclusions and recommendations of the
dissertation.

16
Chapter 2: Determination of Design Response Spectra
2.1 Introduction to NEHRP Provisions One of the most difficult aspects of earthquake engineering is the
determination of accurate design response spectra, and the site
fundamental period. A number of methods, such as code based methods
and more recently, NEHRP Provisions have been used for that goal [3].
The NEHRP Provisions permit the determination of response spectra by
using either the General Method, or by the Site-specific Method. Both
methods require the use of NEHRP seismic spectral acceleration maps
(Maps 1 through 24), and site coefficients tables (Tables 4.1.2.4a and
4.1.2.4b of NEHRP Provisions). Maps 1 and 2, respectively, provide two
parameters Ss and S1 based on a national seismic hazard study conducted
by the U.S. Geological Survey. Ss is the mapped value, from Map 1 of the
5 percent damped maximum considered earthquake spectral response
acceleration , for short period structures founded on Class B (competent
rock with moderate weathering and fracturing) sites. The short period
acceleration has been determined at a period of 0.2 seconds. This is
because it was concluded that 0.2 seconds was reasonably representative
of the shortest effective period of buildings and structures that are
designed by NEHRP Provisions. Similarly, S1 is the mapped value from
Map 2 of the 5 percent damped maximum considered earthquake spectral
response acceleration at a period of 1 second on Site Class B. The

17
spectral response acceleration at periods other than 1 second can typically
be derived from the acceleration at 1 second. Consequently, these two
response acceleration parameters, SS and S1, are sufficient to define an
entire response spectrum for the period range of importance for most
buildings and structures. The generalized method and the site-specific
method are summarized in the following two sections [3].
2.1.1 The General Method The General Method applies to site that have values of
Ss > 0.15g or values of S1 > 0.04g. This method classifies sites in
categories A to F, with F-class requiring site-specific evaluation. Site
classification by this method is determined in the following manner [3]:
1- Check for Site Class F. If applicable, use site-specific procedure.
Soils requiring site-specific evaluation are:
• Soils susceptible to potential failure or collapse
(Exception: structures with T < 0.5 sec.)
• Peats and/or highly organic clays with thickness H > 10 ft
• Very high plasticity clays (H > 25 ft with PI > 75)
• Very thick soft/medium stiff clays (H > 120 ft)
2- Check for the existence of soft clay with total thickness > 10 ft, and
(Su < 500psf, w ≥ 40%, PI>20). If applicable classify as Site
Class-E

18
3- Categories A to E can be classified by one of the following
methods applied to the top 100 ft (30 m) of the soil:
a) The sv method
This method is based on the weighted average of the shear wave
velocity (sv ) through the soil profile. For a given soil profile with n
layers, the weighted average sv is defined as follows:
nin
i sivid
n
iid
sv ,.......3,2,1
1
1 =
∑= ⎟
⎟
⎠
⎞⎜⎜
⎝
⎛
∑==
Where di and vsi are the thickness and shear wave velocity for layer
(i), respectively.
b) The _
N method
This method is based on the weighted average of blow counts (_
N )
of the Standard Penetration Resistance (ASTM D1586-84) not to exceed
100 blow/ft as directly measured in the field without correction. The
weighted average (_
N ) is defined as:

19
ni
n
i iNid
n
iid
N ......3,2,1
1
1 =
∑=
⎟⎟⎠
⎞⎜⎜⎝
⎛
∑==
Where iN_
is the standard penetration resistance within (i), not
exceeding 100 blows/ft uncorrected.
c) The US_
method
This method uses chN_
(weighted average of blow count for SPT) for
cohesionless soil layers (PI < 20), and average −
us (weighted
average undrained shear strength) for cohesive soil layers (PI >20).
chN_
and −
us are defined as follows:
ni
m
i iNid
sdchN ,....3,2,1
1
=
∑= ⎟
⎟
⎠
⎞
⎜⎜
⎝
⎛=
where sm
ii dd =∑
=1, and sd is the total thickness of cohesionless soil
layers in the top 100 ft, and:
ni
k
i uisid
cduS ,.....3,2,1
1
=
∑=
=

20
where cdk
iid =∑
=1, and cd is the total thickness (100- ds) of
cohesive soil layers in the top 100 ft
Table (2.1) shows the relationship between these parameters
and the site classifications. Each of these methods applies the resulting
weighted averaged parameter in conjunction with Tables and seismic
maps to determine the design earthquake and response spectra.
Site Class sv (ft/sec) N or chN us (psf)
A > 5,000 N/A N/A
B 2500< sv ≤ 5000 N/A N/A
C 1200 < sv ≤ 2500 >50 >2000
D 600≤ sv ≤ 1200 15 to 50 1000≤ uS ≤2000
E < 600 < 15 < 1000
F Soils requiring site-specific evaluation
Table 2.1: NEHRP Site Classifications [3]
The maximum considered earthquake spectral response acceleration
at short period (SS) and at 1 second (S1) are determined from seismic
spectral acceleration maps 1 through 24. The maximum considered
earthquake spectral response acceleration at short period (SMS) and at 1
second (SM1), adjusted for site class effects, are determined as follows:
SMS = Fa SS
And

21
SM1 = Fv S1
where Fa and Fv are site coefficients that are tabulated in the NEHRP
provisions, and can be obtained using site classification. NEHRP values
of Fa and Fv are reproduced in Tables (2.2) and (2.3), respectively.
Mapped Maximum Considered Earthquake Spectral Response Acceleration at Short Periods (SS)
Site Class
SS ≤0.25 SS = 0.50 SS = 0.75 SS =1.00 SS ≥1.25
A 0.8 0.8 0.8 0.8 0.8
B 1.0 1.0 1.0 1.0 1.0
C 1.2 1.2 1.1 1.0 1.0
D 1.6 1.4 1.2 1.1 1.0
E 2.5 1.7 1.2 0.9 0.9
Table 2.2: NEHRP Values of Fa
Mapped Maximum Considered Earthquake Spectral Response Acceleration at 1 Second Periods (S1)
Site Class
S1 ≤ 0.1 S1 = 0.2 S1 = 0.3 S1 =1.00 S1 ≥ 0.5
A 0.8 0.8 0.8 0.8 0.8
B 1.0 1.0 1.0 1.0 1.0
C 1.7 1.6 1.5 1.4 1.3
D 2.4 2.0 1.8 1.6 1.5
E 3.5 3.2 2.8 2.4 2.4
Table 2.3: NEHRP values of Fv

22
The design earthquake spectral response acceleration at short
period (SDS) and at 1 second (SD1), are determined as follows:
MSDS SS32
=
and
11 32
MD SS =
The general design response spectrum curve can be developed as
shown in Figure (2.1), by the following procedure:
• For periods ≤ T0, the design spectral response acceleration Sa is
determined as:
DSDS
a STTS
S 4.06.00
+=
• For periods equal to T0 and equal or less than Ts:
Sa = SDS
• For periods greater than Ts:
TS
S Da
1=
where:
SDS = the design spectral response acceleration at short period;
SD1 = the design spectral response acceleration at 1 second period;
T = the fundamental period of the structure (in seconds);

23
DSD
SS
T 10 2.0= ; and
DS
DS S
ST 1=
Figure 2.1: NEHRP Provisions Design response spectrum [3]
2.1.2 Site-Specific Method
Site-specific procedures are required to account for regional
seismicity and geology, the expected recurrence rates and maximum
magnitudes of events on known faults and source zones, the location of
the site with respect to these, near source effects if any, and the
characteristics of subsurface site conditions. Site-specific methods
produce site-specific spectra based on the following regional parameters:

24
• The probabilistic maximum considered earthquake
• Evaluating the deterministic limit on maximum considered
earthquake ground motion [3].
This method, however, is outside the scope of this research

25
Chapter 3: Determination of Site Fundamental Frequency
3.1 General One of the most important objectives of earthquake engineering is
the determination of site fundamental or resonant frequency. A resonant
frequency is defined as the input motion (or forcing) frequency at which
the largest response amplitude occurs. The resonant frequency ωd for a
damped system is defined as:
221 ξ
ωω
−= n
d
where ωn is the system’s natural frequency and ξ is the system damping.
However, for typical values of soil damping in the range of 5 to 10
percent, the difference between ωn and ωd is negligible, and ωn can be
assumed to be the resonant or fundamental frequency [6]
3.2 The Approximate Method
For uniform, isotropic, linear elastic damped soil on rigid rock, the
simplified amplification function at the free surface for a wave generated
by a horizontal motion at the base is [1].
)..()kH(kHcos
|)(F| 12322
12
ξω
+≈
where:

26
k = the wave number = vs
ω
H = the soil depth
ξ = soil damping ratio.
The maximum amplification occurs when:
cos2 (kH) = 0
or
)2.2.3(,...3,2,1,02
∞=+= nnkH ππ
substituting for (k) in equation (3.2.2):
)3.2.3(,...3,2,1,02
∞=+= nnvs
H ππω
From equation (3.2.3), the nth natural frequency of the soil is given by:
)4.2.3(,...3,2,1,0)2
( ∞=+= nnHsv
n ππω

27
Amplification factor Versus Frequency(5% Damping)
0
2
4
6
8
10
12
14
0 2 4 6 8 10 12 14
kH
Ampl
ifica
tion
Fact
or
Figure 3.1: Effects of increased frequency on peak amplification factors [1].
Figure (3.1) is a plot of equation (3.2.1) with a damping ratio of
(5%). The graph shows a decreasing value of the peak amplification
factor with increasing frequency (since both H and vs are assumed
constant for this site). Therefore, the largest amplification factor will
occur at the lowest natural frequency, which is the site fundamental
frequency. From equation (3.2.4), the fundamental frequency is given by:
)5.2.3(2Hvs
oπ
ω =
The period corresponding to the fundamental frequency is the site
fundamental period (also called the site characteristic period), and is
given
by [1]:

28
)6.2.3(42
sns v
HT ==ωπ
For a multi-layered site the procedure is far more complicated, and
essentially requires the use of dynamic analysis that involves the use of
soil profiles modeling with certain computer programs (section 3.4 of this
chapter). However, the Uniform Building Code Standard Number 23-X
offers a simplified procedure based on equation (3.2.6). The procedure is
called the Equivalent Single Layer Method, and for a site with n layers,
the approximate fundamental period can be determined as:
)7.2.3(4vs
TsH
=
Where: vS is the profile average shear wave velocity as defined by the
NEHRP Provisions and can be calculated as:
nin
i sivid
n
iid
sv ,.......3,2,1
1
1 =
∑= ⎟
⎟
⎠
⎞⎜⎜
⎝
⎛
∑==
Equation (3.2.7) was used in conjunction with field tests that
generated the site profile’s shear wave velocities, to establish the site
approximate fundamental period.

29
3.3 Microtremors Spectral Ratio Method
3.3.1 General
Microtremors method refers to the technique that uses the
spectral ratio of horizontal-to-vertical (H/V) components of ambient
noise (or microtremors) at the ground surface to estimate the site
fundamental frequency. Based on the original method proposed by
Kanai and Tanaka [7], Nakamura and Ueno [8] proposed a revised
method in which they proposed a quasi-transfer function model. This
model states that the horizontal-to-vertical (HB/VB) motion at the base
(bedrock) is approximately one. The model also states that the vertical
component of the motion does not change as it travels upward to the
surface. Therefore, the peak spectral H/V at the surface becomes a
good indicator of the site response to motions occurring at the base [9].
3.3.2 The Discrete Fast Fourier Transform Before addressing the step-by-step procedure for generating
microtremors spectral ratios, the topic of discrete fast Fourier transform
will be presented here because of its relevance to the procedure. The
Fourier transform provides the means of transforming a signal defined in
the time domain, such as an earthquake signal, into one defined in the
frequency domain. The discrete Fourier transform (DFT) is used in the

30
case where both the time and the frequency variables are discrete [10].
For a variable x(tk), k= 1,2..N, where tk=k∆t, the DFT is given by
[1]:
]sin)(cos)1
([)( kkkk tntixtnN
ktxtnX ωωω −∑
=∆=
where ωn = n∆ω = (2πn)/(N∆t),
and N=total number of sample points in variable x(tk).
The DFT is very tedious, even for a small value of N. Cooly and Tukey
developed an algorithm for the case where N is a power of 2 that makes
the process much more efficient. This algorithm is known as the fast
Fourier transform (FFT). [1]. However, for this research a software
called Seismosignal by Seismosoft, which is readily available online, was
used to for the Fourier transform of the microtremors signals components
[11].
3.3.3 Procedure for Generating Microtremors Spectral Ratio
The microtremors method has been subject to number of
modifications and improvements. Currently, there are two commonly
used methods for generating microtremors ratio spectra:
1. The direct H/V ratios method
2. The mean ratio spectra (H/V)m method

31
A direct H/V ratio spectrum can be generated by applying fast Fourier
transform to the microtremors components (east-west, north-south, and
vertical components), and calculating the ratios of the east-west and
north-south component to the vertical component. [12]. Therefore, the
direct spectra for a microtremors record with an east-west component
(SEW), a north-south component (SNS), and a vertical component (SV),
can be found as follows:
The east-west spectrum: SS
V
Ew
VH
= (3.3.2a)
And the north-south spectrum: SS
V
NS
VH
= (3.3.2b)
The mean ratio spectra (H/V)m is defined as [8]:
V
NSEWm S
SSVH 22
)(+
= (3.3.2c)
where:
SEW = the east-west component of the record.
SNS = the north-south component of the record.
SV = the vertical component of the record.
The step-by step procedure for generating microtremors mean
ratio spectra from raw, 3-components microtremors record is as
follows [8]:

32
1. Select sections of the record (for all three components) to be
analyzed.
2. Segment signals into non-overlapping time windows of about
(20-30) seconds each.
3. Taper each segment by multiplying it by a triangular unit
window function and perform FFT on the segment. Tapering the
segment is important to minimize frequency leakage when the
FFT is performed [13]. Figure (3.2) show an example of
triangular unit window that can be used for a 4000 point seismic
record
Triangular Unit Window
0
0.2
0.4
0.6
0.8
1
1.2
0 1000 2000 3000 4000 5000
Figure 3.2: A triangular unit window for 4000 values segment

33
4. Smooth the resulting spectra using a Parzen window function. A
Parzen window function is a unity function, and is defined as
[14]:
(2+x)3 -2 ≤ x < -1 4-6x2-3x3 -1 ≤ x < 0
Parzen (x) = 0.25 4-6x2+3x3 0 ≤ x < 1
(2-x)3 1 ≤ x <2
0 else
0
0.2
0.4
0.6
0.8
1
1.2
-3 -2 -1 0 1 2 3
Series1
Figure 3.3: Parzen Smoothing Window Figure (3.3) is a plot of a standard Parzen window. Although the
range of a Parzen window is from -2 to 2, it can be scaled to fit any
required window width. Smoothing with Parzen window minimizes rapid
fluctuations, and emphasizes the underlying trends of the spectra [13].
5. Compute the mean ratio spectra by using equation (3.3.2c).

34
6. Compute the average mean ratio spectra.
7. Plot the resulting graphs simultaneously.
8. Compute the direct ratio spectra by using equation (3.3.2a) and
(3.3.2b)
9. Compute the average direct ratio spectra.
10. Plot the resulting graphs simultaneously.
11. Determine the fundamental frequency (or period) from the
largest common peak of the graphs.
3.4 Dynamic Site Response Analysis Method
3.4.1 Introduction to the Dynamic Site Response Analysis Computer
Program ProShake Soil dynamic analysis uses certain computer programs, such as
ProShake, to generate ground response to an input earthquake. The
analysis requires soil profile modeling in terms of soil properties at each
soil layer. Typically, a one-dimensional soil column extending from the
ground surface to the bedrock is adequate to capture first-order site
response characteristics [5]. ProShake is a one-dimensional, linear soil
dynamic analysis computer program. ProShake was used for the analysis
of soil profiles in Al-Durrah and the East-west Seismic Array. Once a
soil profile is analyzed, the output file allows the determination of ground
response spectra, from which the soil fundamental period can be found.

35
ProShake evolved from an attempt to provide a simpler interface to
SHAKE for geotechnical earthquake engineering. ProShake uses a
frequency domain approach to solve the ground response problem.
ProShake automatically performs a fast Fourier transform on the input
ground motion, thereby breaking it into its components of sine and cosine
waves. It then applies each wave to the profile, and calculates the
response to each individual wave. The total response is obtained by the
summation of all responses to the input waves. ProShake is organized
into three “managers”- an Input Manager, a Solution Manager, and an
Output Manage. Data and plots from the Input and Output Managers can
be copied to the Report section of the program [15]. The theoretical
background for ProShake is presented in Appendix (A).
3.4.2 Input Manager
The Input Manager allows the entry of soil profiles and input
motion data. Among the ProShake Input Manager’s features are [15]:
• The ability to enter soil profile data in English, metric, or mixed
units. For example, unit weight can be in pound per square foot
(pcf) while shear wave velocity in m/sec - ProShake will
automatically convert units to a single system.

36
• Soil profile data can be entered quickly using drag-and-drop
techniques, and can be checked graphically for errors prior to
analysis.
• Built-in soil models can be selected from pulldown menus, or user-
defined models can be input and saved for subsequent use.
• Input motions can be entered and applied as outcrop or within
profile motions at any layer. A ProShake utility allows conversion
of input motions from any format to ProShake format, and
converted motions can then be saved as ProShake motions.
The input manager requires the input of the following
information for the soil profile:
1. Soil layers shear wave velocities or maximum shear modulus
of each soil layer up to the bedrock
2. Thickness of each soil layer
3. Unit weight of the soil of each layer
4. Depth of the water table
5. Selection of a modulus reduction curve
6. Selection of a damping ratio curve
For input motion, the input manager requires the following information:
1. The number of input motions (earthquakes)
2. maximum number of iterations
3. strain ratio

37
4. Error tolerance
5. The input motion earthquake record
6. The object motion location within the soil profile
7. Selection of the input motion as an outcrop motion or not
3.4.3 The Solution Manager The Solution Manager reads the input file (.dat file) prepared by the
Input Manager, performs the analysis, and then writes an output file (.lyr
file) that can be read by the ProShake Output Manager. The ProShake
Solution Manager's features include a completely rewritten analysis code
that features a state-of-the-art FFT algorithm [15]:
3.4.4 The Output Manager
The Output Manager has a graphical interface that allows easy
review and interpretation of ProShake results. The Output Manager
allows ProShake results to be plotted in a variety of ways. Among the
features of the Output Manager are [15]:
• The ability to rapidly plot time histories of parameters such as
acceleration, velocity, displacement, shear stress, and shear strain.
Multiple time histories can be superimposed, if desired, for
comparative purposes. Acceleration time histories can be saved as
ProShake input motions.

38
• The ability to rapidly plot response spectra in linear or logarithmic
form. Acceleration, velocity, and displacement spectra can be
plotted as functions of period or frequency. Multiple spectra can be
plotted on the same plot.
• All ProShake plots can be copied to the ProShake Report.
• The raw data for each plot can be written to a data file.
3.4.5 The Report
The ProShake Report serves a number of purposes [15]:
• It documents the conditions of each analysis. By simply opening
the Report, tabular summaries of the soil profile and input motion
data are inserted into the Report. The summaries include all
information that would be required to recreate the analysis at a later
time.
• The Report allows the analyst to insert notes and comments
regarding conditions, assumptions, etc. as the analysis proceeds.
• The Report can receive graphics - any plot produced by ProShake
can be copied into the Report.

39
Chapter 4: Site Information
4.1 Site Location
4.1.1 Al-Durrah In order to perform the field test for this dissertation, a seismically
active site was selected. Since the overall research project was sponsored
by King Abdulaziz City for Science and Technology (KACST), the
selected site had to be in Saudi Arabia. The selected site is located on the
northeastern coast of the Gulf of Aqaba, which is the most seismically
active area of Saudi Arabia. The general site coordinates are
approximately 34o 57.3” east, and 29o 21.5” north, Figures (4.1) and (4.2).
The site is called Al-Durrah, and is located about five miles north of the
city of Haqil. Figures (4.3), (4.4), and (4.5) show a satellite view and a
general view of the site at Al-Durrah [16]. The site includes many
buildings and hangers.

40
Figure 4.1: Location of Al-Durrah.
Agaba
Haqil
Figure 4.2: A Close up of the location and coordinates of the Al-Durrah Site.

41
Figure 4.3: Satellite image of Haqil City and the Al-Durrah area.

42
Figure 4.4: A satellite overview of Al-Durrah.

43
Figure 4.5: General view of Al-Durrah and the Gulf of Aqaba (looking west).
4.1.2 East-West Seismic Array The objectives of the study of the seismic array as described in the
Problem Statement earlier played a major role in selecting the location
and orientation of the East-west Array. The selected array had to start at
a rock outcrop and the bed rock depth had to increase gradually as one
moved away from the rock outcrop. Earlier parts of this research have
established that the bedrock depth at Al-Durrah was approximately 350
m. The first rock outcrop is located about 9 kilometers (approximately 6
miles) east of Al-Durrah, and the superficial soil seemed uniform from
areas immediately east of Al-Durrah to the rock outcrop. Therefore this

44
particular array was selected. Figure (4.6) shows part of the East-west
Seismic Array, and the first rock outcrop appears in the distance.
Figure 4.6: General view of the East-west Seismic Array
(looking north-east) The locations of the seismic stations along the array was determined
and fixed using a high precision, advanced global positioning system
(GPS). The GPS system is presented in the Equipment and
Instrumentation chapter (Chapter 6).
4.2 Site Structural Geology
4.2.1 AL-Durrah Area The Geological terrain of Saudi Arabia is divided into the shield
area consisting of Precambrian rocks, and the area of younger
sedimentary rocks. Various sedimentary rocks from the Paleozoic era to

45
recent times overlie the northwestern part of the Arabian Shield. The
research area is on the west edge of the Arabian Plate, adjacent to the
Sinai and Nubian Plates. The Arabian and Nubian Plates are separated by
the axial trough that exists in the central part of the Red Sea. Many active
faults exist in this area. The Sinai and Arabian Plates are separated by a
transform fault branching from the axial trough of the Red Sea. The Gulf
of Aqaba is situated in this part. The Dead Sea Trench starts in the
northern part of the Gulf of Aqaba, which is a pull-apart basin. The “Gulf
of Aqaba-Dead Sea Fault” is the transform fault boundary connecting the
Zagros-Taurus Fault Belt (Iran and Turkey) as a converging boundary,
and the Red Sea as a spreading boundary [17].
The Al-Durrah area is characterized by a narrow, irregular fault
controlled coastal plain. This plain is low, flat, loose and overlain by
recent Quaternary alluvium deposits composed of saturated coarse to
medium sand, silt and little gravel. In addition, a strip of fossiliferous
coralline limestone also exists along the shore line that is black stained in
certain places. A raised terrace exists in the south of the area. The
northwestern corner is completely overlain by raised terraces of
fossiliferous coralline limestone, reaching 15m high on the shore line
[16]. Figures (4.7) and (4.8) show some of the superficial geological
features in Al-Durrah.

46
Figure 4.7: Lower level of Al-Durrah (looking east from the beach)
Figure 4.8: Middle level of Al-Durrah (looking north)

47
4.2.2 East-West Array To the east of Al-Durrah, the soil material is composed of very
dense unconsolidated natural deposits of boulders of different sizes and
composition consisting of gravel and very coarse to medium sand. The
estimated slope towards the Gulf of Aqaba as a result of the uplift
associated with the Dead Sea transform fault is 10° [16]. Figures (4.9)
and (4.10) show a general view of the array and the first rock outcrop in
the area.
Figure 4.9: East-West Seismic Array (looking east)

48
Figure 4.10: The first rock outcrop east of Al-Durrah.
4.3 Regional Earthquake History and Characteristics
The “Dead Sea Transform Fault” in relation to the expansion of the
Red
Sea controls the tectonics in the area. Previous earthquakes were reported
in historical records and are evident from trench surveys [17].
Judging by the past 2,000-year historic record; it is estimated that
the cycle of the earthquakes in the area is 40 years for Ms ≥ 4.5, 400
years for Ms ≥ 5.75, and 4000 years for Ms ≥ 7.0. The seismic activity in
the Gulf of Aqaba is more active than that in the Red Sea Rift area. It is
assumed that the earthquakes observed around the Gulf of Aqaba during
the period of 1985 to 1989 have been caused by the extensional tectonic
movement. The last major event was recorded on October 1995, and had

49
a magnitude of (MD = 5.8), figures (4.11) and (4.12) [17], where MD = the
duration magnitude, and MS = the surface wave magnitude.
The interpretation of the “Aqaba-Dead Sea Fault Belt” earthquake
mechanism indicates that almost all earthquakes show strike-slip
displacement caused by tension components. A normal faulting activity in
the area between the Gulf of Aqaba and Midyan area to the northeast has
been confirmed by data obtained from air-borne magnetic survey and the
distribution of hypocenters in that area. The survey shows that the
normal faulting is especially active in the Elat Deep in the northern part
of the Gulf of Aqaba; figure (4.11) [17].

50
Figure 4.11: 3-D images of hypocenters distribution for the Gulf of Aqaba
For the period of 1985-2000 in the Gulf of Aqaba region [17].

51
Figure 4.12: Epicenter distribution for the October 1995
earthquakes in the Gulf of Aqaba region [17].

52
Chapter 5: Field Test Methods
5.1 General Two separate sets of tests for the purpose of this research were
conducted, one set at the Al-Durrah site, and a second set in the East-west
array. The Al-Durrah set of tests included the following:
• Standard penetration test (SPT)
• Cross-hole test
• Controlled Source Spectral Analysis of Surface Waves
(CSSASW); also referred to as the (CXW) method
• Vertical Electric Sounding (VES) Test
• Microtremors recording
The aim of conducting this group of tests was to achieve the
following objectives:
1. Establish soil profiles at various locations within the site
based on conventional exploration and shear wave velocity
(SWV) tests.
2. Establish the depth of bedrock at the site
3. Record seismic activities and microtremors at the site
4. Determine the fundamental period and ground response
spectra at the site by the various methods including,

53
NEHRP, profiles modeling analysis, and actual seismic
records.
At the East-west Seismic Array, the set of tests included the following:
• VES at each seismic station to establish the depth of bedrock
• Recording of an actual earthquake simultaneously at all stations
within the array
• microtremors recording
The aim of conducting this group of tests was to achieve the
following objectives:
1. Establish the depth of bedrock at each seismic station
2. Study the effects of increasing bedrock depth on the
Fundamental period of soil profiles.
3. Determine the site fundamental period at each station from
records of actual earthquake events and microtremors.
5.2 Tests Background and Procedures
5.2.1 Standard Penetration Test (SPT) The standard penetration test (SPT) is one of the oldest and most
commonly used in situ tests in geotechnical as well as earthquake
engineering. In the SPT, a standard split-barrel sampler is driven into the
soil at the bottom of a borehole by repeated blows (30 to 40 blows per
minute) using a 140-Ib hammer released from a height of 30 in. The

54
sampler is usually driven 18 in. and the number of blows required to
achieve the last 12 in. of penetration is taken as the standard penetration
resistance, N. [1]. NERHP general procedure requires the use of the
Standard Penetration Resistance (ASTM D1586-84) not to exceed 100
blows/ft as directly measured in the field without correction [3].
5.2.2 Cross-Hole (CH) Method
This method uses two or more boreholes to measure wave
propagation velocities along horizontal paths. The simplest cross-hole
test consists of two boreholes, one that contains an impulse source and
the other a receiver. By fixing both the source and the receiver at the
same depth in each borehole, the wave propagation velocity at that depth
is measured by dividing the distance between the boreholes by the
measured time of the wave travel. Repeating this process at depths
corresponding to various soil layers gives the shear wave velocity for that
particular location. Figure (5.1a) shows a schematic illustration of cross-
hole setups [1].
Figure 5.1a: Cross-Hole Tests; (a) Two holes, (b) Multi holes [1].

55
A modified version of the cross-hole test is the down-hole test,
which utilizes a single borehole. In down-hole tests a signal source is
placed on the ground surface and a receiver is lowered in the borehole
and fixed to borehole wall at certain depth, Figure (5.1b). A signal from
the source to the receiver is timed, and the process is repeated at different
depths. Each measurement gives the average shear wave velocity for the
soil between the source and the receiver [1].
Figure 5.1b: Down-hole test illustration.
5.2.3 The Controlled Source Spectral Analysis of Surface Waves
(CXW) Method 5.2.3a Theoretical Background
If a harmonic exciter is used to generate harmonic Raleigh
waves on the surface of a semi-infinite, homogenous soil layer,
Raleigh waves will travel along the surface inducing a harmonic
response. If two receivers are placed at two points close to the
Source
Receiver

56
source and as close to one another, while they pick up the signal in
phase, the distance between the receivers is equal to the wave
length of the generated Rayleigh waves. The phase velocity (vR) of
the generated Rayleigh waves can be found by [1]:
λRR fv = (5.1)
where:
f = frequency
λR = Rayleigh wave length
The velocity of a surface wave, such as Rayleigh waves,
depends on the shear wave velocity (vs) of the soil. For a Rayleigh
wave with a velocity (vR), propagating through a soil layer with
constant properties and a shear wave velocity (vs), the relationship
between the two velocities is given by [18]:
vR=Svs (5.2)
where (S) is a function of Poisson’s ratio (µ), and varies between
0.875 and 0.995 for (µ) values of 0.0 to 0.5 [4]. It can be seen
from equation (5.2) that for a homogeneous soil layer that has
constant shear wave velocity and Poisson’s ratio with depth,
Rayleigh waves with different wave lengths travel at the same
velocity.
If the soil is layered, and shows variations of shear wave
velocity with depth, then Rayleigh waves of different wavelengths

57
have different phase velocities causing waves dispersion. In
addition, a number of studies showed that the measured phase
velocity of surface waves correspond to the soil properties at
depths ranging from λR/3 to λR/2 [18]. By varying the frequency of
the exciter, the variation of the soil shear wave velocity with depth
can be estimated. The resulting dispersion of the phase velocity can
be used to estimate the shear wave velocity variation with depth
[1]. This can be achieved by analyzing dispersion curves, which
are plots of phase velocities versus depth (or wavelength), Figure
(5.2) [19].

58
Figure 5.2: Example of a Rayleigh waves' dispersion curve [19].
The simple harmonic loading method evolved subsequently
into the Spectral Analysis of Surface Waves (SASW) test. In this
type of test, a source that can generate waves with random
frequencies is used. This eliminated the need of repeating field
tests at different frequencies in the previous method. SASW tests
are done by placing two receivers on ground surface and in line
with a random frequency wave source, Figure (5.3) [1].

59
Source Receiver Receiver
Figure 5.3: SASW test configuration [1].
The two receivers record the wave signals and transform
them into the frequency domain by fast Fourier transform. The
phase difference Φ (f) is then computed for each frequency. The
travel time between the two receivers for each frequency can be
calculated by:
f)f()f(t
πφ2
=∆
The distance between the two receivers is:
(∆d) = d2 – d1
The Rayleigh wave phase velocity (vR), and wave length (λR) can
be calculated as follows [1]:
)f(td)f(vR ∆
∆=
d1
d2

60
and
f)f(vR
R =λ
The results of SASW field measurements can be plotted to
produce Rayleigh waves' dispersion curves. Current applications
of this method employ controlled sources that can generate
predetermined frequencies. Therefore, this method came to be
known as the Controlled Source Spectral Analysis of Surface
Waves (CSSASW) systems. The CSSASW is also referred to in
the literature as the CXW method. Rodriguez-Ordonez
formulated algorithms to compute basic parameters controlling
VR [19]. The determination of the properties (shear wave
velocities and layers thickness) of the tested soil, involves an
iterative procedure to match the dispersion curve of a theoretical
soil profile to the measured dispersion curve.

61
Figure 5.4: Schematic representation of a CXW test [19].
Most current CXW systems come programmed to produce
dispersion curves on site in real time. Figure (5.4) shows a
schematic representation of a CXW test [16].

62
5.2.3b Testing Procedures
The test procedure for the CXW test is very similar to that of
SASW. The CXW differs from SASW in the source type and the
CXW use of multi-receivers arrangements. The measurement
procedure of wave dispersion, using the CXW requires the use of a
system that includes an excitation source, appropriate receivers
(usually two), control unit, and an electric generator. A typical
CXW system is shown in Figure (5.4) [19]. The method is carried
out as follows [19]:
1- A source-receivers’ geometry is selected, while ensuring the
source is firmly placed on a flat surface. The receivers should
also be securely attached to the test surface in alignment with
the source at selected distances.
2- The frequency range and other control unit settings are selected
for the test. This defines the type of excitation either random or
frequency sweep, the frequency content, and the frequency step.
3- The control unit acquires data approximately every three
seconds and averages it according to the averaging setting as it
becomes available.
4- The averaged dispersion data are displayed and evaluated. If the
measurement is satisfactory the data is saved for further
analysis.

63
5- Steps 2 to 4 are repeated for different excitations, and steps 1 to
4 are repeated for other source-receivers’ arrangements.
Both of SASW and CXW have the advantage of being economical
and relatively easy to mobilize, however, both methods have the
following disadvantages:
1. They require very specialized equipment and highly experienced
operators/analyzers [1].
2. The methods do not yield a unique SWV velocity profile. Scatter
of the measured data allows for multiple interpretations [4].
3. It is not possible to detect the thickness and shear wave velocity
of relatively thin layers embedded in the profile [19].
5.2.4 Vertical Electric Sounding (VES) Method 5.2.4a Theoretical Background In Earth resistivity methods, a direct electric current is
introduced into the ground by means of two electrodes connected to the
terminals of a portable electric source. The resulting potential distribution
on the ground, mapped by means of two probes is capable of yielding
information about the distribution of electric resistivity below the surface
[20]. Vertical Electric Sounding (VES) tests, also called DC Resistivity
Tests are used to estimate the depth of bedrock or the level of water table
in the ground [21]

64
Based on Ohm’s Law for the potential difference (dV), the electric current
(I), and the resistance (R):
R
dVI −= (5.2.1)
R is directly proportional to the length of the conductor (dL), and
inversely proportional to the cross-section area of the conductor (dA):
dAdLR ρ= (5.2.1)
where ρ is the constant of proportionality and is the resistivity in Ohms of
the material of the conductor. From equations (5.2.1) and (5.2.2):
dL
dVdAI
ρ−= (5.2.3)
The current density (j) (current per unit area of the conductor cross-
section), and the electric field (E) is defined as:
dAIj =
and dLdVE =
From equation (5.2.3): jE ρ= (5.2.4)
Equation (5.2.4) expresses Ohm’s law for a homogenous isotropic
material [20].
Vertical electric sounding (VES) tests are carried out by electrifying
two electrodes that penetrate the top of the soil, and measuring the

65
potential across a pair of probes that also penetrates the top of the soil.
The depth of penetration of both pairs is only a few inches. There are
many versions of the VES test, and different versions use different
electrodes’ arrangements to achieve their objectives. One of the most
commonly used versions is the Schlumberger method. For this research,
the Schlumberger method was used to estimate the depth and inclination
of the bedrock at the site. A Schlumberger array is shown in Figure (5.5)
below. Electrodes A and B are the electric sources, while electrodes M
and N are the voltage measurement electrodes [22].
+ -
A M N B p
LAB=
2 lMN
=2
Figure 5.5: Schlumberger VES Test Arrangement [22].
X

66
Figure (5.6) shows a single electrode on the surface of a homogenous,
isotropic soil layer extending to infinity in the downward direction. If we
consider a hemisphere around the electrode with a radius (r) and a
thickness (dr), then symmetry dictates that the current at any point on the
shell is along the radius. The voltage drop across the shell is given by
equation (5.2.3) [20]:
r
drIV22π
ρ−=∆ (5.2.5)
where I =the current of the electrode
Figure 5.6: Point electrodes on homogenous infinite soil layer;
(a) single electrode, and (b) two electrodes [21].
The voltage at a distance (r) can be found by integrating equation (5.2.5):
Cr
IV +=πρ
2 (5.2.6)
When r = ∞, V = 0, therefore C= 0 and equation (5.2.6) becomes:
r
IVπρ
2=
A Schlumberger array has two electrodes, positive electrode (A) and
negative electrode (B). For a point in the soil at a distance (r) from (A)

67
and ( r’) from (B), Figure (5.6b), the total drop in voltage is given by
[20]:
)rr
(IV'
112
−=πρ (5.2.7)
For an arbitrary point (p) on the ground surface within the
Schlumberger array of Figure (5.6) equation (5.2.7) gives:
)xLxL
(IV
−−
+=
112πρ (5.2.8)
Differentiating with respect to (x), gives:
))xL()xL(
(IdxdV
−+
+−= 22
112πρ
At the center of the array (x = 0), therefore:
L
IdxdV
2π
ρ−=
and the apparent resistivity is:
)dxdV(
IL −=
2πρ
Since (MN = 2l) is very small, we can assume that (-dV/dx = VMN/2l),
where
VMN is the measured potential difference between M and N [21]:
)(2
2Il
V MNLπρ =

68
5.2.4b Testing Procedure When conducting a Schlumberger VES, the voltage meter
electrodes are normally centered with respect to the electrifying
electrodes in
a symmetric manner. It is also important to maintain a distance MN
(=2l) that is much smaller than the distance AB (=2L). Electrodes A
and B are moved out co-linearly and symmetrically in steps and the
voltage difference between M and N is measured each time. The steps
are repeated until the MN voltage difference approaches the accuracy
limit of the voltmeter being used, [22].
Data of apparent resistivity versus depth is interpreted using
established guide curves; however, most current systems use
specialized soft wares to interpret the data [16].
5.2.5 Seismic Data Acquisition:
5.2.5a General
Microtremors and actual earthquakes were recorded in both of Al-
Durrah and the East-west Seismic Array. Microtremors recording can
normally be done in 5 to 15 minutes sessions at each testing point [8]
[11]. For this project , however, the records were of much longer
durations. In the East-west Seismic Array, the objective was to record at
least one actual earthquake event by all stations in the array

69
simultaneously. Once the systems were installed and become operational
in all stations, daily contacts were made with the shift operators of the
Saudi National Seismic Network monitoring office in King Abdulaziz
City for Science and Technology (KACST) to gather information on
seismic activities in the area. When information on occurrence of an
actual earthquake was confirmed, the systems in all stations were checked
to verify that the same event has been recorded by all of them.
5.2.5b Seismic Recording Systems Two types of seismic recording systems were used:
1. Portable Very-Wide-Band Tri-Axial Seismometer: This system
is a very advanced seismometer and has a commercial name of
STS2 IRIS Special, This device is an electronic force-feedback
sensor that provides a three-components output signal
proportional to the ground velocity over a range of 0.08 to 40
(Hz). The system must be placed on a firm surface on the
ground, and has a built-in bubble level and three adjustable legs
for leveling [23].
2. EpiSensor Force Balance Accelerometer: The EpiSensor is a
triaxial accelerometer optimized for earthquake recordings with
three orthogonal mounted low-noise force balance
accelerometer sensors.

70
It has a user selectable recording ranges of ± 4g, ± 2g, ± 1g,
±0.5g, ± 0.25g. The EpiSensor has a band width to 200 Hz.
The EpiSensor must be anchored by a bolt that fits into a
bracket on the bottom side of the device. The anchor bolt must
be screwed into a solid surface such as rock or concrete for
proper ground motion recording [24]. To meet this requirement,
concrete platforms with a surface area of 1 m2 will be cast over
rough soil surface.
The output data from both systems was digitized using a
system called the Quanterra Q330 Data engine. Digitized data was
then stored in another device called the Quanterra Q330 Packet
Baler, which has a memory capacity of 20 gigabytes [24]. The
system keeps track of its location and the time of recording by
means of a global positioning system (GPS) that connects to the
system’s assembly. The complete system is powered by a DC
battery that is complemented with a solar panel. More information
on all of the systems is presented in Chapter 6.

71
Chapter 6: Field Work Tasks and Equipment Information
6.1 General
A number of field tests and seismic recordings were performed at
the Al-Durrah site and the East-west seismic array. The research field
tasks were carried out in three phases. The first phase took place in the
spring of 2001. In this phase, the site selection for Al-Durrah was
finalized, and the testing locations were selected and marked. In the
second phase, all of the major tests were carried out in Al-Durrah. This
included the standard penetration test (SPT), the cross-hole test (CH), The
Controlled Source Spectral Analysis of Surface Waves (CXW), and
vertical electric sounding (VES). The third phase included the
establishment of the East-west seismic array, and microtremors recording
in Al-Durrah. As stated in section (1.2), other contractors, consultants,
and government staff and technicians were involved in executing the field
work. The following sections detail the different parties’ participation in
the project tasks.
6.2 Field Work Tasks Participants
The overall tasks were carried out as follows:
• Adel Engineering Office (AEO) (Jeddah, Saudi Arabia):
Conventional soil exploration, including SPT borings, logging, and
soil analysis. AEO also prepared borings and casing for the cross-

72
hole tests. In addition, AEO provided a truck with a mounted crane
for handling of the 700 kg CXW shaker and additional set up
equipment. The contractor truck-mounted drilling equipment was
later modified for use as an impact source for wave amplitude
measurements. AEO provided all logistical support for other
fieldwork, including laborers as needed.
• ENSOL, Inc. (Cary, NC): Dr. Jorge A. Rodriguez from ENSOL
was the technical supervisor for all wave propagation
measurements. Dr. Rodriguez also personally performed the CXW
and cross-hole/down-hole measurements.
• King Saud University (KSU), (Riyadh, Saudi Arabia): Dr. Al-
Amri, Department of Geology KSU, provided assistance as a
consultant for the vertical electric sounding VES in Al-Durrah that
was carried out by KACST technicians.
• KACST: Provided and delivered the equipment for the CXW and
wave propagation measurements (cross-hole and down-hole tests)
in Al-Durrah, which included:
1. A complete set of CXW equipment, made by Vibration
Instruments Company, Ltd. VIC, Tokyo, Japan.
2. A support Jeep Cherokee and trailer for the CXW equipment
3. Geometrics Strata View 48 channels engineering exploration
seismograph.

73
4. Geostuff, three-component down-hole geophone with servo
controlled orientation, motor driven clamping device, cables and
control unit.
5. Down-hole Hammer Source with pneumatic packer, trigger and
cables.
6. A pickup-truck-mounted impact source for shallow geophysical
measurements.
In addition, KACST technicians carried out the VES testing in Al-
Durrah. For the tasks in the East-west seismic array, KACST
technicians did or assisted in the following tasks:
1. Mark the locations of the seismic stations that were selected using
the 5700 CORS advanced GPS system.
2. Prepare the stations’ concrete base platforms to support the seismic
recording systems
3. Install and run the seismometers and accelerometers at each
station.
4. Conduct VES test at each station to establish the depth of bed rock.
6.3 Details of Testing Equipment and Instrumentation This section presents brief descriptions for the main equipment and
instruments that were used in this research project. The information and
most of the pictures were taken from the user’s manuals and/or suppliers’

74
websites (when available). These websites provide extensive information
and specification for their products.
6.3.1 Standard Penetration Test (SPT):
The soil borings were performed by means of hollow stem
augers with a standard safety hammer. The boring was performed
using a truck mounted safety hammer that drove hollow stem augers
with an inner diameter of 8.3 cm. Figure (6.1) shows the actual rig
used in this project.
Figure 6.1: Preparations for SPT

75
6.3.2 Cross-hole (CH) Test:
The holes were drilled and cased using the same truck mounted
stem auger that was used for SPT. However, due to the break down of
stem auger rig, the last two cross-hole tests (D11 and D12) were
prepared using two truck-mounted water- well rigs. Figure (6.2),
shows one of the cross-holes tests.
Figure 6.2: Setting up a cross-hole test
6.3.3 The Controlled Source Spectral Analysis of Surface Waves (CXW)
Test:
The CXW system included a real time GR824 Signal Analyzer,
controlled-source shaker model GR812/E500, with a frequency range

76
of (3—200 Hz), and its driving amplifier, two receivers (piezoelectric
accelerometers), cables, accessories, tools, and power generator,
Figure (6.3).
Figure 6.3: CXW testing system components
6.3.4 Vertical Electric Sounding (VES):
The VES system utilized a deep resistivity system, the SYSCAL
R2 Deep Resistivity / IP System, Figure (6.4) [25]. It also included a
DC/DC transformer capable of a voltage difference of 800 volts.

77
Figure 6.4: The SYSCAL R2 Deep Resistivity / IP System [25]
Figure 6.5: Conducting VES at a seismic station in the East-west array
6.3.5 Global Positioning System (GPS):
The project utilized a state of the art GPS system that is accurate
to about 2 mm. The system brand is the 5700 CORS System [26],

78
Figure (6.6). Although this high accuracy was not necessary, it was
helpful in aligning the East-West Seismic array.
Figure 6.6: The 5700 CORS GPS system; (a) The base unit in the background

79
(b)
Figure 6.6-continued: The 5700 CORS GPS system; (b) the mobile unit
6.3.6 Seismic Data Acquisition Systems: The seismic data acquisition system consisted of the following components:
1. Portable Very-Broad-Band Tri-Axial Seismometer (STS-2 IRIS
Special), Figure (6.7).

80
Figure 6.7: Portable Very-Broad-Band Tri-Axial
Seismometer STS-2 IRIS Special [23].
2. EpiSensor Force Balance Accelerometer-Model FBA ES-T, Figure (6.8).
Figure 6.8: EpiSensor Force Balance Accelerometer
(Model FBA EST) [24].

81
3. Quanterra Q330 Data Engine Digitizer, Figure (6.9)
Figure 6.9: Quanterra Q330 Data engine digitizer [24].
4. Quanterra Q330 Packet Baler Data Storage Device, Figure (6.10).
Figure 6.10: The Quanterra Q330 Packet Baler Data Storage Devices [24].

82
Figure 6.11: The Seismometer and EpiSensor in the seismic
station of the rock outcrop (the reference point).

83
Figure 6.12: A complete seismic station setup including the solar panel.
The digitizer and data storage devices are kept in the ice box for protection from the elements.

84
Chapter 7: Field Tests Results
7.1 General Chapter 7 presents all the field test results for Al-Durrah as well as
the East-west seismic array. Al-Durrah tests results include the
following:
1. SPT test blow counts and the NEHRP average uncorrected
number of blow counts for each profile
2. Cross-hole test shear wave velocity (SWV) profiles and the
NEHRP average SWV for each profile
3. Controlled Source Spectral Analysis of Surface Waves
(CXW) test SWV profiles and the NEHRP average SWV for
each profile
4. Vertical electric sounding (VES) test results
5. Microtremors ratio spectra
The East-west seismic array tests results include the following:
6. VES tests results
7. Records of an actual earthquake that was recorded at all
seismic stations simultaneously
8. Microtremors ratio spectra
The results are not discussed or analyzed in this chapter because of
relevance of some tests to one another. In addition, the results of the

85
dynamic site response analysis that are presented in Chapter 8 are needed
for the analysis of some of the results of Chapter 7. Therefore, the tests
results of Chapters 7 and 8 are regrouped and reproduced in Chapters 9,
10, and 11 where they are discussed and analyzed.
7.2 Al-Durrah Site
7.2.1 Standard Penetration Tests (SPT) 7.2.1a General Twelve SPT borings were performed at the Al-Durrah site. All
borings were drilled to a depth of 30m, except for D1, D3, and D9 that
were drilled to a depth of 60m.Figure (7.1) shows a schematic layout of
the tests locations within the Al-Durrah site. Test D10 is not shown
because it was performed just out site the northeastern corner of the site.
The location of test D10 was selected because it was the lowest point in
the whole area. Hollow stem augers were used for this field
investigation. The SPT was performed at 1.5 m intervals and disturbed
samples were recovered for soil analysis by laboratory testing that
included sieve analysis and unit weight measurements. The Contractor
for this work, AEO submitted their reports pertaining to the results of the
boring at each site [16]. Sample SPT logs are presented in Appendix B.
Tables (7.1a) and (7.1b) summarize the data of the SPT-N values and

86
depths to the water table. Table (7.2) summarizes the resulting NEHRP
average SPT blow counts.

87
North
Legend: SPT test CH test CXW test
Figure 7.1: Schematic layout of the Al-Durrah site tests locations

88
7.2.1b Test Results
Boring No. D1 D3 D9
Water Depth (m) 8 29 25
Depth (m) SPT N-Values (Uncorrected)
1.75 60 45 100 3.25 72 17 30 4.75 75 47 100 6.25 48 100 100 7.75 60 100 100 9.25 62 65 100
10.75 100 100 100 12.25 100 100 100 13.75 100 100 100 15.25 100 75 100 16.75 100 75 100 18.25 100 100 100 19.75 100 100 100 21.25 100 100 100 22.75 100 100 100 24.25 100 100 54 25.75 100 100 65 27.25 100 100 48 28.75 100 65 58 30.25 100 75 70 31.75 100 100 55 33.25 100 100 60 34.75 100 55 54 36.25 100 50 50 37.75 100 53 52 39.25 100 40 40 40.75 100 53 60 42.25 100 63 58 43.75 100 75 80 45.25 100 77 79 46.75 100 100 79 48.25 100 100 100 49.75 100 77 100 51.25 100 80 100 52.75 100 100 100 54.25 100 100 100 55.75 100 100 100 57.25 100 100 100 58.75 100 100 100 60.25 100 100 100
Table (7.1a): Summary of SPT-N Values (60m Boreholes)
and Water depths

89
Summary of SPT N-values and Water Table depths Boring No. D2 D4 D5 D6 D7 D8 D10 D11 D12 Water Depth m 28 2.5 3 25 26 25 2.6 12 12
Depth (m) SPT-N Values (Uncorrected)
0.5 N/A N/A N/A 15 37 50 N/A N/A N/A
1.75 20 100 100 100 58 100 100 8 40
3.25 25 100 52 40 40 50 100 15 100
4.75 100 38 50 100 50 100 60 22 100
6.25 100 22 18 60 22 100 48 20 100
7.75 100 23 58 100 40 100 50 15 100
9.25 100 27 100 100 52 100 40 23 100
10.75 100 61 58 100 100 100 32 100 100
12.25 62 60 70 100 52 100 65 20 100
13.75 100 75 42 100 100 100 80 22 100
15.25 72 45 58 100 100 82 65 20 100
16.75 75 30 100 100 100 100 52 28 100
18.25 100 28 100 58 100 100 45 30 100
19.75 100 35 100 100 100 100 25 64 100
21.25 100 31 100 100 100 100 42 100 100
22.75 100 30 100 100 100 100 36 55 100
24.25 100 22 100 100 100 100 28 42 100
25.75 100 20 100 100 100 100 28 54 100
27.25 100 28 100 100 100 100 29 62 100
28.75 70 52 100 100 100 100 55 100 100
30.25 100 35 100 100 100 100 40 40 100
Table (7.1b): Summary of SPT-N Values (30m Boreholes) and
Water table depth

90
SPT Test Location
NEHRP Average No. of blows
D1 83.92 D2 67.57 D3 70.74 D4 34.48 D5 65.84 D6 80.84 D7 65.62 D8 92.85 D9 74.30
D10 43.76 D11 25.85 D12 92.01
Table (7.2): Summary NEHRP Average SPT- values
7.2.2 Cross-Hole Tests 7.2.2a General The Al-Durrah site cross-hole (CH) measurements were performed
at four locations. Two drilling systems were used for the test boreholes, a
hollow-stem augers and a water-well truck-mounted boring machine.
The soils at the sites were mostly clean sands, which were highly unstable
during drilling, especially under the water table. These conditions were
aggravated by frequent microtremors, making casing installation for the
tests very difficult. Based on the field notes from the installation crews,
the cased borings D5 and D6 were installed by hollow-stem augers.
However, boreholes D11 and D12 were drilled with the water-well boring
machine that was about 40 cm in diameter, while the casing had an outer
diameter of 7.6 cm. Therefore, the holes had to be backfilled after the
casing was lowered into the borehole [16].
−
N

91
The boreholes were backfilled from the surface, and the backfill
could not be compacted. Thus, based on field observations it is likely
that backfill compaction around the casing was highly irregular, and that
some voids could have been left around the casing by backfill arching
that developed between the casing and borehole walls. Consequently, the
corresponding CH results were most likely affected due to velocity
change adjacent to the casing over the thickness of the void-laden
borehole backfill, which was significant relative to the test distance of
3.0 m between boreholes. These effects were accounted for by the
procedure that is presented in the next section. The complete cross-hole
profiles’ calculation is presented in Appendix (C).
7.2.2b Cross-Hole Data Correction
Correction of raw CH data is based on considering the space
between the boreholes as consisting of two types of materials. One
material corresponds to the natural soil being tested, and the other
material is the loose backfill immediately adjacent to the casings in the
boreholes. The correction method models the two materials in a way that
is similar to the modeling of soil layers in NEHRP general procedure
(Section 2.1.1). This is an approximate correction model for such
conditions. In addition to the measured CH data, the correction model
required the determination of the average soil velocity by performing
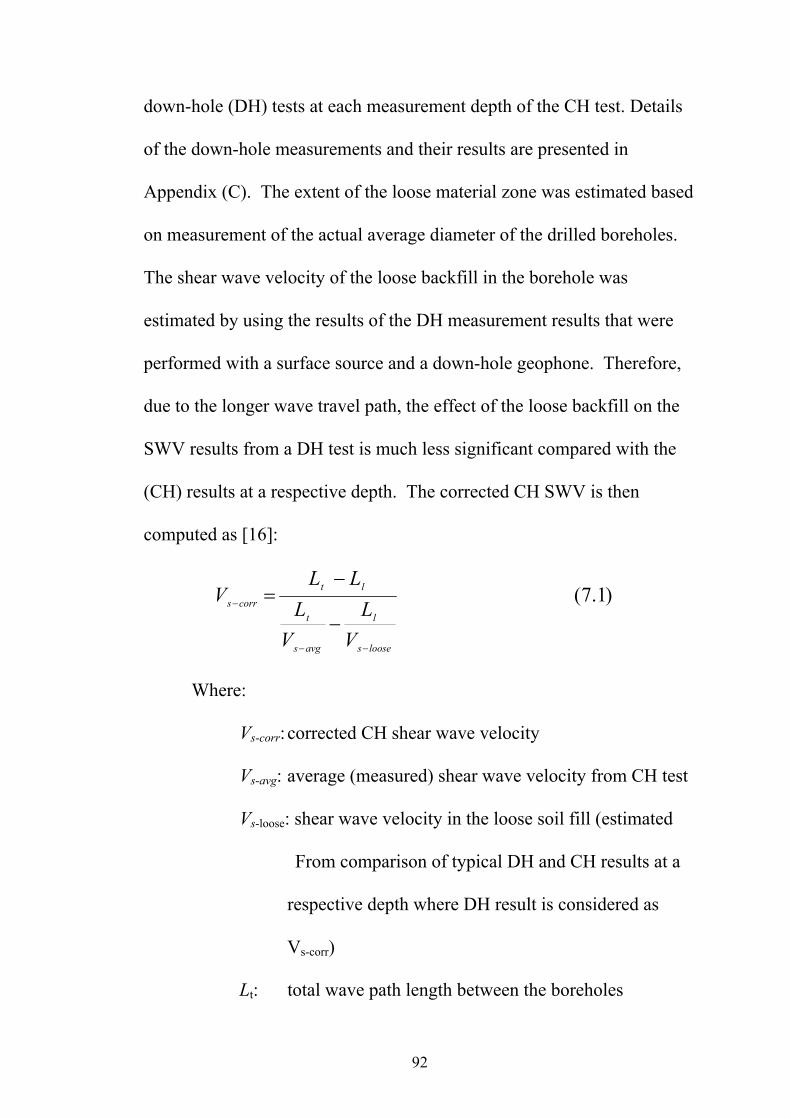
92
down-hole (DH) tests at each measurement depth of the CH test. Details
of the down-hole measurements and their results are presented in
Appendix (C). The extent of the loose material zone was estimated based
on measurement of the actual average diameter of the drilled boreholes.
The shear wave velocity of the loose backfill in the borehole was
estimated by using the results of the DH measurement results that were
performed with a surface source and a down-hole geophone. Therefore,
due to the longer wave travel path, the effect of the loose backfill on the
SWV results from a DH test is much less significant compared with the
(CH) results at a respective depth. The corrected CH SWV is then
computed as [16]:
)1.7(
looses
l
avgs
t
ltcorrs
VL
VL
LLV
−−
−
−
−=
Where:
Vs-corr: corrected CH shear wave velocity
Vs-avg: average (measured) shear wave velocity from CH test
Vs-loose: shear wave velocity in the loose soil fill (estimated
From comparison of typical DH and CH results at a
respective depth where DH result is considered as
Vs-corr)
Lt: total wave path length between the boreholes

93
Ll: wave path length of loose soil
Equation (7.1) above is analogous to the NEHRP formula for calculating
the average shear wave velocity for a profile (Section 2.1.1 of this
dissertation):
)2..7(,.......3,2,1
1
1 nin
i sivid
n
i id
sv =
∑= ⎟
⎟
⎠
⎞
⎜⎜
⎝
⎛
∑==
The ratio of the corrected SWV to the uncorrected SWV from
the CH test is defined as the correction factor:
SWVdUncorrecteSWVCorrected
factorcorrectionThe =
The correction factors used for each CH SWV measurement are shown
in Table (7.3).

94
Table 7.3:
Cross-hole
Correction Data
7.2.2c Cross-hole Test Results
Generall
y, the
cross-
hole
(CH) shear wave velocity (SWV) profiles showed more irregular
behavior compared to the Controlled Source Spectral Analysis of Surface
Waves (CXW) SWV profiles. In addition, the cross-hole SWV results
are generally lower than those obtained from the respective results from
CXW tests at the same locations. This effect was more noticeable at the
sites where large diameter boreholes were drilled. In order to correct for
the large diameter borehole effects, the model previously discussed in
Section 7.1.2.b was used for the respective test interpretation. The
corrected CH SWV results are presented along with the uncorrected
measurement data in Figures (7.2) to (7.5) [16].
CH-D5 CH-D6 CH-D11 CH-D12 Depth Correction Depth Correction Depth Correction Depth Correction
(m) Factor (m) Factor (m) Factor (m) Factor 2 1 2 1 0.25 1.43 1 1.48 4 1 4 1 1.25 1.81 2 1.54 6 1 6 1 2.25 1.91 3 1.4 7 1.57 8 1 3.25 1.54 4 1.21 8 1 9 1 4.25 1.44 5 1.09 9 1 10 1 5.25 1.53 6 1.09
10 1.49 12 1 6.25 1.61 7 1.09 11 1.37 13 1 7.25 1.73 8 1.09 12 1.64 14 2 8.25 1.51 9 1.09 13 1 15 1 9.25 1.54 10 1.09 14 1 16 2 10.25 1.45 11 1.09 15 1 16.5 2 11.25 1.45 12 1.49 16 1 18 1.28 12.25 1.45 13 2.19 17 1 18.5 2 13.25 1.45 14 2.3 18 1.54 21 1.71 14.25 1.45 15 1.09 19 1.62 22 1.38 15.25 1.45 16 1.09 20 2.48 23 1.38 16.25 1.45 17 1.09 21 2.48 17.25 1.45 18 2.35 22 2.16 18.25 1.45 19 1.09
19.25 1 20 1.31 20.25 1 21 1.06 22 1.09 23 1.53

95
An air compressor was used to remove water from three CH tests
borings, namely D5, D11, and D12. The water table depth was
3 m at D5, and 12m at D11 and D12. For CH measurements, water
should be removed from the casing prior to using the down-hole hammer.
Although geophones can be used under water, it is generally preferred
that the hole be dry to prevent signals from traveling through the water
which can introduce difficulties in data interpretation.
The site average shear wave velocities as determined by the
corrected cross-hole tests are presented in Table 7.4.
Test Location
Cross-hole NEHRP Average SWV (m/s)
D5 316 D6 438 D11 381 D12 223
Table7.4: Cross-hole Tests Results.

96
Cross-Hole Location: D5- CH (Vs)cor = 315.64 m/s
0
100
200
300
400
500
600
0 5 10 15 20 25 30
Depth (m)
Wav
e V
eloc
ity (
m/s
ec
Vs (m/sec) Vs CH Corrected
AL- DurraH - Boring D5 Cross Hole
Figure 7.2: Profile of SWV of CH D5.
=∑
∑
Vsididi

97
Cross-Hole Location.: D6-CH (Vs)cor = 438.33 m/s
Al-Durrah-Boring D6Cross-Hole
0
100
200
300
400
500
600
700
800
900
0 5 10 15 20 25 30
Depth (m)
Wav
e V
eloc
ity (
m/s
ec)
Vs (m/sec) Vs CH Corrected
Figure 7.3: Profile of SWV of CH D6.
=∑
∑
Vsididi

98
Cross-Hole Location: D11- CH (Vs)cor = 381.00 m/s
Al- Durrah - Boring D11Cross Hole
0
100
200
300
400
500
600
700
0 5 10 15 20 25 30
Depth (m)
Wav
e V
eloc
ity (m
/sec
Vs CH (m/sec) Vs CH Corrected
Figure 7.4: Profile of SWV of CH D11.
=∑
∑
Vsididi

99
Cross-Hole Location: D12- CH (Vs)cor = 272.68 m/s
0.0
100.0
200.0
300.0
400.0
500.0
600.0
0 5 10 15 20 25 30
Depth (m)
Wav
e V
eloc
ity (m
/sec
)
Vs (m/sec) Vs CH Corrected
Al-Durrah-Boring D12Cross-Hole
Figure 7.5: Profile of SWV of CH D12.
=∑
∑
Vsididi

100
7.2.3 Controlled Source Spectral Analysis of Surface Waves (CXW)
Tests 7.2.3a General
CXW tests were conducted by ENSOL [16] at 14 locations in Al-
Durrah. Most of the tests were located as close as possible to the points
where other tests (SPT and CH) were conducted. Two or three
measurements were performed at each point using source to receiver
(STR) and receiver to receiver (RTR) spacing (STR/RTR) of (15/15m),
(15/5m), and (15/2m). The (CXW) results were calibrated using data
from other tests (SPT and CH) [16]. Additional CXW tests details are
presented in Appendix (D).
7.2.3b CXW Test Results Table 7.5 shows the result of the CXW tests. The CXW Shear wave
velocity (SWV) is the average shear wave velocity of each profile
calculated from the individual CXW shear wave velocity of the soil
layers within the top 100 ft (30m) of the soil. The average SWV is
calculated in accordance with NEHRP Provisions equation (7.2).
Figures (7.6) to (7.19) show the CXW SWV profiles.

101
Test Location
SPT CXW
CXW Tests NEHRP Average Shear Wave
Velocities (SWV) (m/s)
D1 A10 420. D2 A6 439 D3 A14 410 D4 A11 422 D5 A3a 465 D5a A3b 523 D6* A5 333 D7 A13 466 D8* A12 424 D9 A4 476 D11 A1 371 D12 A7 353 N/A A8 392 N/A A9 387
* D6 and D8 numbers in the figures were switched
Table7.5: CXW average NEHRP SWV Summary

102
0
5
10
15
20
25
30
0 200 400 600 800 1000
Phase Velocity (m/s)
1/2
Wav
e Le
ngth
(m)
Measured Data Computed Data CXW
0
5
10
15
20
25
30
0 200 400 600 800
Shear Wave Velocity (m/s)
Dep
th (m
)
CXW VS=483SC
Figure 7.6: D1 (A10) CXW SWV Profile

103
0
5
10
15
20
25
30
0 200 400 600 800
Phase Velocity (m/s)
1/2
Wav
e Le
ngth
(m)
Measured Data Computed Data CXW
0
5
10
15
20
25
30
0 200 400 600 800 1000
Shear Wave Velocity (m/s)
Dep
th (m
)
CXW VS=445, SC
Figure 7.7: D2 (A6) CXW SWV profile

104
0
5
10
15
20
25
30
0 200 400 600 800
Phase Velocity (m/s)
1/2
Wav
e Le
ngth
(m)
Measured Data Computed Data CXW
0
5
10
15
20
25
30
0 200 400 600
Shear Wave Velocity (m/s)
Dep
th (m
)CXW VS=410, SC
Figure 7.8: D3 (A14) CXW SWV profile.

105
0
5
10
15
20
25
30
0 500 1000 1500 2000
Phase Velocity (m/s)
1/2
Wav
e Le
ngth
(m)
Measured Data Computed Data CXW
0
5
10
15
20
25
30
0 200 400 600 800 1000
Shear Wave Velocity (m/s)
Dept
h (m
)CXW VS=422, SC
Figure 7.9: D4 (A11) CXW SWV profile.

106
0
5
10
15
20
25
30
0 200 400 600 800 1000
Phase Velocity (m/s)
1/2
Wav
e Le
ngth
(m)
Measured Data Computed Data CXW
CXW VS=523, SC
0
5
10
15
20
25
30
0 200 400 600 800 1000
Shear Wave Velocity (m/s)
Dept
h (m
)CXW VS=523, SC
Figure 7.10: D5 (A3a) CXW SWV profile.

107
0
5
10
15
20
25
30
0 200 400 600 800 1000
Phase Velocity (m/s)
1/2
Wav
e Le
ngth
(m)
Measured Data Computed Data CXW
0
5
10
15
20
25
30
0 200 400 600 800 1000
Shear Wave Velocity (m/s)
Dep
th (m
)CXW VS=465, SC
Figure 7.11: D5a (A3b) CXW SWV profile.

108
0
5
10
15
20
25
30
0 200 400 600 800 1000 1200
Phase Velocity (m/s)
1/2
Wav
e Le
ngth
(m)
Measured Data Computed Data CXW
0
5
10
15
20
25
30
0 100 200 300 400 500 600
Shear Wave Velocity (m/s)
Dep
th (m
)CXW VS=425, SC
Figure 7.12: D6 (A12) CXW SWV profile.

109
0
5
10
15
20
25
30
0 200 400 600 800 1000
Phase Velocity (m/s)
1/2
Wav
e Le
ngth
(m
Measured Data Computed Data CXW
0
5
10
15
20
25
30
0 100 200 300 400 500 600
Shear Wave Velocity (m/s)
Dep
th (m
)CXW VS=466, SC
Figure 7.13: D7 (A13) CXW SWV profile.

110
0
5
10
15
20
25
30
0 200 400 600 800 1000 1200
Phase Velocity (m/s)
1/2
Wav
e Le
ngth
(m)
Measured Data Computed Data CXW
0
5
10
15
20
25
30
0 100 200 300 400 500 600
Shear Wave Velocity (m/s)
Dep
th (m
)CXW VS=425, SC
Figure 7.14: D8 (A5) CXW SWV profile

111
0
5
10
15
20
25
30
0 200 400 600 800 1000 1200
Phase Velocity (m/s)
1/2
Wav
e Le
ngth
(m
Measured Data Computed Data CXW
0
5
10
15
20
25
30
0 200 400 600 800
Shear Wave Velocity (m/s)
Dep
th (m
)CXW VS=476, SC
Figure 7.15: D9 (A4) CXW SWV profile.

112
0
5
10
15
20
25
30
0 100 200 300 400 500 600
Phase Velocity (m/s)
1/2
Wav
e Le
ngth
(m)
Measured Data Computed Data CXW
CXW VS=372, SC
0
5
10
15
20
25
30
0 100 200 300 400 500 600
Shear Wave Velocity (m/s)
Dept
h (m
)CXW VS=372, SC
Figure 7.16: D11 (A1) CXW SWV profile

113
0
5
10
15
20
25
30
0 200 400 600 800
Phase Velocity (m/s)
1/2
Wav
e Le
ngth
(m)
Measured Data Computed Data CXW
0
5
10
15
20
25
30
0 100 200 300 400 500
Shear Wave Velocity (m/s)
Dep
th (m
)CXW VS=354, SD
Figure 7.17: D12 (A7) CXW SWV profile.

114
0
5
10
15
20
25
30
0 200 400 600 800 1000
Phase Velocity (m/s)
1/2
Wav
e Le
ngth
(m)
Measured Data Computed Data CXW
0
5
10
15
20
25
30
0 100 200 300 400 500
Shear Wave Velocity (m/s)
Dept
h (m
)CXW VS=392, SC
Figure 7.18: (A8) CXW SWV Profile

115
0
5
10
15
20
25
30
0 100 200 300 400 500 600
Phase Velocity (m/s)
1/2
Wav
e Le
ngth
(m)
Measured Data Computed Data CXW
0
5
10
15
20
25
30
0 100 200 300 400 500
Shear Wave Velocity (m/s)
Dept
h (m
)
CXW VS=387, SC
Figure 7.19: (A9) CXW SWV profile.

116
7.2.4 Vertical Electric Sounding (VES) Test 7.2.4a General Six tests were carried out at and near the site at Wadi Mabrak,
Figure (7.20). A special instrument (The SYSCAL R2 Deep Resistivity /
IP System) [25], was used to read the resistivity measurement. The
maximum current electrode half spacing (AB/2) in the Shlumberger
method was 1000 m, which corresponded to depths of 330 to 360 m. The
number of measurements was 6 per arrangement, at an AB/2 value of:
3, 4, 6, 8, 10, 15, 20, 30, 40, 60, 80, 100, 150, 200, 300, 400, 600, 800,
and 1000 m. Plots of apparent resistivity versus electrodes spacing is
shown in Appendix (E).

117
Figure 7.20: Vertical Electric Sounding tests locations in the Al-Durrah area. 7.2.4b Al-Durrah VES Test Results The results of the VES are shown in figures (7.20) and (7.21). The
results are discussed and analyzed in Chapters 9 and 10. Figure (7.21)
shows a cross-section at Al-Durrah near the shore line to a depth of 120
m. Figure (7.22) shows the combined VES interpretations for VES1 at
Al-Durrah, and VES3 at Wadi Mubrak (Figure 7.20). The resulting
north-south cross-section indicates that the bedrock depth at Al-Durrah is
approximately 350 to 375 m. For the purpose of the dynamic site

118
response analysis of Chapter 8, the actual bedrock depth was assumed to
be 350 m.
Figure 7.21: (VES1) cross-section at Al-Durrah

119
Figure 7.22: (VES) Cross-section (Al-Durrah-Wadi Mubrak)
7.2.5 Microtremors Measurements 7.2.5a General Several microtremors recordings took place at four points in Al-
Durrah, and at all of the seismic stations of the East-west seismic array.
Each seismic recording session lasted for at least one day, and utilized all
of the seismic station system equipment as described earlier in section
(6.3.6) of Chapter 6. The systems recoded all three components of
microtremors (two horizontal and one vertical), and the digital records
were manipulated using the procedure outlined in section (3.3) of
Chapter 3. Two types of ratios spectra were produced for each of the Al-
Durrah’s stations. The first type is the mean ratio spectra, and the second

120
is the direct (Fourier amplitude (H/V)) ratio spectra. In addition, the
horizontal component of the microtremors record is shown to
demonstrate the effects of the presence of an earthquake event or a
microevent on the spectra. If there are very small or no earthquake events
in the microtremors record being analyzed, then the ratio spectra
segments tend to have common and focused peaks. If a significant
earthquake is present within the microtremors record being analyzed, then
the ratio spectra tend to lose coherence and common peaks become hard
to identify. Specific examples of these cases are presented in the
following section.
7.2.5b Microtremors Results The resulting microtremors ratio spectra plot are presented in this
section. Microtremors records DRA1 and DRA2 were recorded at
level A of the site, while records DRB1 and DRB3 were recorded at level
B, of the site as shown in Figure (7.23).

121
East
Figure 7.23: Al-Durrah approximate east-west cross-section.
Figures (7.24a) and (7.26a) are microtremors mean ratio spectra
plots from microtremors records DRA1 and DRB1, respectively. Figures
(7.24b) and (7.26b) show the east-west component of the same
microtremors records. The east-west components of DRA1 and DRB1
show that no significant earthquake events are present. The resulting
mean ratio spectra share common peaks and tend to become focused at
certain frequencies. The mean ratio spectra and the east-west component
of the microtremors record for DRA2 are shown in Figures (7.25a) and
(7.25b), respectively. The east-west component of the microtremors
record indicates the presence of a relatively significant earthquake within
the record. The presence of the earthquake causes the mean ratio spectra
plots to lose coherence thus making the identification of common peaks
Al-Durrah approximate east-west cross section
Level A Level BGulf of
Aqaba

122
more difficult. Figure (7.27a) shows ratio spectra that were generated
from two microtremors records from the same seismic station. Both
records had a significant earthquake as shown in Figures (7.27b) and
(7.27c). The microtremors segments that were used to generate the ratio
spectra were taken from the records parts that were as far as possible
from the earthquake. The resulting ratio spectra plots have peaks at
common frequencies, however the peaks themselves are not focused,
Figure (7.27a). Figures (7.28) to (7.31) show the simple direct ratio
spectra for the same stations. Additional mean ratio spectra calculations
information are presented in Appendix (F)

123
A) Al-Durrah mean ratios spectra
• Al-Durrah DRA1 Seismic Station:
DRA1 MEAN RATIOS (PARZEN SMOOTHING)
00.5
11.5
22.5
3
0.01 0.1 1 10 100
Frequency (Hz)
Four
ier
Ratio
s A
mpl
it.
S1S2S3Average
(a)
Start Time: 2003/10/21 04:23:06.564 ! Sensor Information:EPISENSOR Sensor ID: DRA1 SCC Component Name: HLE
-200
-150
-100
-50
0
50
100
150
200
0 5000 10000 15000 20000 25000 30000 35000
Start Time: 2003/10/2104:23:06.564 ! SensorInformation:EPISENSORSensor ID: DRA1 SCCComponent Name: HLE
(b)
Figure 7.24: (a) Mean ratios spectra of DRA1, (b) The east-west component of the microtremors record showing the occurrence of a micro event.

124
• Al-Durrah Station DRA2 Seismic Station
DRA2 Mean Ratios (Parzen Smoothing)(Effects of Events)
00.5
11.5
22.5
0.01 0.1 1 10 100
Frequency (Hz)
Four
ier M
ean
Ratio
Am
plit
S1S2S3S4S5S6Average
C
(a)
! Sensor Information:Episensor Sensor ID: DRA2 ACC Component Name: HLE
-1000-800-600-400-200
0200400600800
0 10000 20000 30000 40000
! SensorInformation:EpisensorSensor ID: DRA2 ACC ComponentName: HLE
(b)
Figure 7.25: (a) Mean ratios spectra of DRA2, (b) The east-west component of the microtremors record showing the occurrence of a micro event.

125
• Al-Durrah Station RDB1 Seismic Station:
DRB1 MEAN RATIOS (Parzen Smoothing)
00.5
11.5
22.5
33.5
0.01 0.1 1 10 100
Frequency (Hz)
Four
ier
Ratio
s A
mpl
it
S1S2S3S4S5S6Average
(a)
Start Time: 2003/10/17 08:04:53.664 ! Sensor Information: EPISENSOR Sensor ID: DRB1 ACC Component Name: HLE
-200
-150
-100
-50
0
50
100
150
0 5000 10000 15000 20000 25000 30000
Start Time: 2003/10/1708:04:53.664 ! SensorInformation: EPISENSORSensor ID: DRB1 ACCComponent Name: HLE
(b)
Figure 7.26: (a) Mean ratios spectra of DRB1, (b) The east-west component of the microtremors record showing the occurrence of a micro event.

126
• Al-Durrah Station DRB3 Seismic Station:
DRB3 MEAN RATIOS (PARZEN SMOOTHING)
0123456
0.01 0.1 1 10 100
Frequency (Hz)
Four
ier
Ratio
Am
plit.
S1S2S4AAverage
(a)
! PSN ASCII Event File Format 2.0 Start Time: 2003/10/19 11:38:56.229 Start Time Offset: 0 Number of Samples: 61151
SPS: 200 Lock Indicator: L Data Minimum: -8632.97 Data Maximum: 7611 Data Mean: -0.00167411 ! Sensor Information:
Sensor Latitude: 0 Sensor
-10000
-5000
0
5000
10000
0 10000 20000 30000 40000
! PSN ASCII EventFile Format 2.0 StartTime: 2003/10/1911:38:56.229 StartTime Offset: 0Number of Samples:
(b)

127
! Sensor Information:EPISENSOR Sensor ID: DRB3 ACC Component Name: HLE
-10000
-8000
-6000
-4000
-2000
0
2000
4000
6000
8000
10000
0 5000 10000 15000 20000 25000 30000 35000
! SensorInformation:EPISENSORSensor ID: DRB3 ACCComponent Name: HLE
(c)
Figure 7.27: (a) Mean ratios spectra of DRB3, (b) and (c) The two
east-west component segments of the microtremors
record showing the occurrence of a micro event.

128
B) Al-Durrah Direct Ratio Spectra
DRA1 Spectral Ratios (Parzen Smoothing)
0
0.5
1
1.5
2
2.5
0.01 0.1 1 10 100
Frequency (Hz)
Four
ier R
atio
s A
mpl
it
E/Z1N/Z1E/Z2N/Z2E/Z6N/Z6Average EAverage N
Figure 7.28: DRA1 direct ratios spectra.
DRA2 Spectral Ratios (Parzen Smoothing)(Effects of Events)
0
0.2
0.4
0.6
0.8
1
1.2
1.4
1.6
1.8
2
0.01 0.1 1 10 100
Frequency (Hz)
Four
ier R
atio
s A
mpl
i
E/Z1
N/Z1
E/Z2
N/Z2
E/Z3
N/Z3
E/Z4
N/Z4
E/Z5
N/Z5
E/Z6
N/Z6
E-AVE
N-Ave
Figure 7.29: DRA2 direct ratios spectra.

129
DRB1 Spectral Ratios (Parzen Smoothing)
0
0.5
1
1.5
2
2.5
0.01 0.1 1 10 100Frequency (Hz)
Four
ier R
atio
s A
mpl
it.
E1/Z1N1/Z1E/Z2N/Z2E3/Z3N3/Z3E4/Z4N4/Z4E5/Z5N5/Z5E6/Z6N6/Z6DRB1EAVDRB1NAV
Figure 7.30: DRB1 direct ratios spectra.
DRB3 Spectral Ratios (Parzen Smoothing)
0
1
2
3
4
5
6
0.01 0.1 1 10 100
Frequency (Hz)
Four
ier R
atio
Am
plit
E/Z1N/Z1E/Z3N/Z3E/Z4N/Z4Average EAverage N
Figure 7.31: DRB3 direct ratios spectra.

130
7.3. East-West Seismic Array
7.3.1 Vertical Electric Sounding 7.3.1a General It was first estimated that the bedrock depth at Station RD1 of the
array, corresponded to NEHRP bedrock depth of 30 m. However, upon
conducting a vertical electric sounding (VES) test, the bedrock depth
turned out to be at about 95 to 100 m deep. Station RD1 was about 830 m
away from the bedrock outcrop, therefore, another location that was
closer to the bedrock outcrop had to be selected. Another VES test was
conducted 400 m west from the bedrock outcrop, and the bedrock depth
turned out to be about 35 m deep. This point was designated as Station
RD0 and was used as the first point of the seismic array after the
reference point of the bedrock outcrop (DREFF). The East-west seismic
array stations were selected to be on an approximately collinear east-west
line using the advanced global positioning system (The 5700 CORS GPS)
system) [26]. Actual events, as well as microtremors were recorded
simultaneously by all stations. The results of the vertical electric
sounding test and the three components of the event record at each station
are presented in this section. One of the events records were used in the
dynamic site response analysis in Chapter 8, and the results are discussed
further in Chapter 11. Sample plots of apparent resistivity versus
electrodes spacing are shown in Appendix (E).

131
Figure 7.32: A Schematic illustration of the East-west Seismic Array (Scales are exaggerated).
DREFF - Outcrop
Bedrock
≈ 9 Km
RD0 RD1- Noise only
≈ 35 m ≈ 95 m
RD2 RD3 RD4 - Cancelled
DRA2
≈ 225 m ≈ 170 m ≈ 350 m
400 m
830 m
2300 m
4800 m
Al-Durrah
EAST
East-West Seismic Array

132
7.3.1b (VES) Tests Results
Table (7.6) below shows the bedrock depth at each seismic
station:
Location Bedrock Depth
(m) RD0 35-40
RD1 90-95
RD2 ≈ 170
RD3 ≈ 225
DRA2 ≈350
Table 7.6: Depth of the bed rock at the
East-west seismic array stations.
7.3.2 Records of Actual Events 7.3.2a Actual Seismic Event Information The actual earthquake was detected by The Saudi National
Seismic Network, and was recorded by all five seismic stations in the
East-west array. The earthquake occurred on October 23, 2003 at
11:58:56 am. Its relevant information is:
Magnitude: ML= 1.59 ( ML = the local or Richter magnitude)
Epicenter location coordinates:
Latitude: 29o 37’ North Longitude: 34o 86’ East

133
7.3.2b Actual Seismic Event Records: The amplitudes of the actual records at the seismic stations of the
array were too small for the dynamic site response analysis, and had to be
scaled up for this purpose. All of the records shown here represent the
scaled record. The raw field records and the methodology of obtaining
the final version of the records are presented in Appendix (G).

134
• Station: DREFF
DREFF (E_W) Component
-0.01
-0.008
-0.006
-0.004
-0.002
0
0.002
0.004
0.006
0.008
0.01
0 5 10 15 20 25 30
Time (sec)
Acc
. (g)
Series1
(a)
DREFF (N-S) Componenet
-0.015
-0.01
-0.005
0
0.005
0.01
0 5 10 15 20 25 30
Time (sec)
Acc.
(g)
Series1
(b)
Figure 7.33: Components of Reference (DREFF) Station Record;
(a) E-W, (b) N-S.

135
DREFF Vertical Componenet
-0.005
-0.004
-0.003
-0.002
-0.001
0
0.001
0.002
0.003
0.004
0.005
0 5 10 15 20 25 30
Time (sec)
Acc
. (g)
Series1
(c)
Figure 7.33-continued: Components of Reference (DREFF) Station Record; (c) vertical components.
• Station: RD0 (RD0)
RD0 (E-W Component)
-0.02
-0.015
-0.01
-0.005
0
0.005
0.01
0.015
0.02
0 5 10 15 20 25 30
Time (sec)
Acc
. (g)
Series1
(a)

136
RD0 (N-S Component)
-0.02
-0.015
-0.01
-0.005
0
0.005
0.01
0.015
0.02
0 5 10 15 20 25 30
Time (sec)
Acc
. (g)
Series1
(b)
Figure 7.34: Components of (RD0) Station Record; (a) E-W,
(b) N-S components.
RD0 Vertical Component
-0.015
-0.01
-0.005
0
0.005
0.01
0.015
0 5 10 15 20 25 30
Time (sec)
ACc.
(g)
Series1
(c)
Figure 7.34-continued: Components of (RD0) Station Record; (c) vertical components.

137
• Station: RD2 (RD2)
RD2 (E-W Component)
-0.02
-0.015
-0.01
-0.005
0
0.005
0.01
0.015
0 5 10 15 20 25 30
Time (sec)
Acc
(g)
Series1
(a)
RD2 (N-S Component)
-0.015
-0.01
-0.005
0
0.005
0.01
0.015
0.02
0 5 10 15 20 25 30
Time (sec)
Acc.
(g)
Series1
(b)
Figure7.35: Components of (RD2) Station Record; (a) E-W, (b) N-S
components.

138
RD2 Vertical Component
-0.01
-0.008
-0.006
-0.004
-0.002
0
0.002
0.004
0.006
0.008
0.01
0.012
0 5 10 15 20 25 30
Time (sec)
Acc
. (g)
Series1
(c)
Figure7.35-continued: Components of (RD2) Station Record;
(c) vertical component.

139
• Station: RD3:
RD3 (E-W COmponent)
-0.04
-0.03
-0.02
-0.01
0
0.01
0.02
0.03
0.04
0 5 10 15 20 25 30
Time (sec)
ACC.
(g)
Series1
(a)
RD3 (N-S Component)
-0.03
-0.02
-0.01
0
0.01
0.02
0.03
0 5 10 15 20 25 30
Time (sec)
acc
(g)
Series1
(b)
Figure 7.36: Components of (RD3) Station Record;
(a) E-W, (b) N-S components.

140
RD3 Vertical Component
-0.05
-0.04
-0.03
-0.02
-0.01
0
0.01
0.02
0.03
0.04
0.05
0.06
0 5 10 15 20 25 30
Time (sec)
Acc
. (g)
Series1
(c)
Figure 7.36-continued: Components of (RD3) Station Record;
(c) vertical component.

141
• Station: DRA2:
DRA2 (E-W Component)
-0.025
-0.02
-0.015
-0.01
-0.005
0
0.005
0.01
0.015
0.02
0 5 10 15 20 25 30
Time (sec)
Acc.
(g)
Series1
(a)
DRA2 (N-S Component)
-0.03
-0.02
-0.01
0
0.01
0.02
0.03
0.04
0 5 10 15 20 25 30
Time (sec)
Acc
. (g)
Series1
(b)
Figure 7.37: Components of (DRA2) Station Record;
(a) E-W, (b) N-S components.

142
DRA2 Vertical Component
-0.025
-0.02
-0.015
-0.01
-0.005
0
0.005
0.01
0.015
0.02
0 5 10 15 20 25 30
Time (sec)
Acc
. (g)
Series1
(c)
Figure 7.37-continued: Components of (DRA2) Station Record;
(c) vertical component.

143
7.3.3 Microtremors Measurements 7.3.3a General The effects of the presence of earthquakes within microtremors
records were discussed in section (7.2.5a). The selected records segments
for the seismic stations of the East-west array included the record of the
actual earthquake. This caused the microtremors plots for these stations to
be distorted and meaningless as can be seen from figures (7.35) and
(7.36). Therefore, seismic analysis along the East-west Array was limited
to dynamic site response analysis using the actual event only.
7.3.3b Microtremors Results
RD0 Mean Spectral Ratios (Parzen Smoothing)
0
0.5
1
1.5
2
2.5
3
3.5
4
0.01 0.1 1 10 100
Frequency (Hz)
Ampl
itude
S1S2S3S4
Figure 7.38: Microtremors plots for station RD0

144
RD2 Mean Spectral Ratios
0
0.5
1
1.5
2
2.5
3
0.01 0.1 1 10 100
Frequency
Ampl
itude
S1S2S3S4
Figure 7.39: Microtremors plot for station RD2

145
Chapter8: Analytical Methods Fundamental Periods Results
8.1 General
Chapter 8 presents the results of the analytical methods for
determining Al-Durrah fundamental periods (or frequencies) and the
NEHRP short period acceleration, Ss and one second acceleration, S1 for
the Al-Durrah site. These results include the following:
1- Al-Durrah fundamental periods by the approximate method
that was presented in Chapter 3:
vsTs
H4=
2- Al-Durrah fundamental periods by performing dynamic site
response analysis using ProShake
3- Al-Durrah site short period, Ss and one second period, S1
accelerations from ProShake analysis. These values are then
used in the generation of the site design response spectra
4- The effects of increasing bedrock depths on the site
fundamental period by:
• Repeating the dynamic site response analysis
(ProShake) on the Al-Durrah soil profiles with
increasing bedrock depth

146
• Determining the fundamental period at increasing
bedrock depths along the East-west seismic array by
performing dynamic site response analysis using
records of the actual earthquake.
Additional details are provided with the results of each method.
The results however, are not discussed or analyzed in this chapter because
of the relevance of some methods to one another or to other tests’ results
in Chapter 7. The results are regrouped and reproduced in Chapters 9,10,
and 11 where they are discussed, analyzed, and when applicable
correlated.
8.2 Al-Durrah Analytical Results
8.2.1 The Approximate Method 8.2.1a General Using the NEHRP weighted averages of the shear velocity of each
soil profile in Al-Durrah, and equation (3.2.7), reproduced here for
convenience, Al-Durrah approximate fundamental periods were
computed.
v sH
T s4
=
where H = 30 m (As defined by the NEHRP Provisions).

147
8.2.1b Al-Durrah Fundamental Periods and Frequencies by the Approximate Method Table (8.1) presents the approximate values of the fundamental
periods and frequencies for Al-Durrah soil cross-sections (or profiles).
The soil cross-sectional shear wave velocity (SWV) profiles that were
determined by the cross-hole (CH) tests, and the Controlled Source
Spectral Analysis of Surface Waves (CXW), were used to calculate the
average SWV (v s ) in equation (3.2.7).

148
Table 8.1: Approximate Fundamental periods for Al-Durrah soil profiles.
Test Type
Test
Location
NEHRP Average SWV
v s (m/s)
Site Fundamental Period
Ts (sec)
Site Fundamental Frequency
fs (Hz)
D1(A10) 420 0.2857 3.501
D2(A6) 439 0.2733 3.658
D3(A14) 410 0.2927 3.417
D4(A11) 422 0.2844 3.517
D5(A3a) 465 0.2581 3.875
D5(A3b) 523 0.2294 4.358
D6(A5) 333 0.3604 2.775
D7(A13) 466 0.2575 3.883
D8(A12) 424 0.2830 3.533
D9(A4) 476 0.2521 3.967
D11(A1) 371 0.3235 3.092
D12(A7) 353 0.3399 2.942
(A8) 392 0.3061 3.267
CXW
(A9) 387 0.3101 3.225
D5(CH) 315 0.3810 2.625
D6(CH) 438 0.2740 3.650
D11(CH) 381 0.3150 3.175
Cross-hole
D12(CH) 273 0.4396 2.275

149
8.2.2 Al-Durrah Dynamic Site Response Analysis Results 8.2.2a General
By the end of phase two of the research which was concluded by
performing the field tests, no records of actual earthquakes for the Al-
Durrah area were available. The work that became phase three (including
recording of an actual event) was not planned at that time. Therefore, a
synthetic earthquake was needed in order to carry out the dynamic site
response analysis for the site. A previous study showed that the expected
peak ground acceleration (PGA) for 10% probability of being exceeded in
50 and 100 years for the research area were about 0.2g and 0.3g
respectively [27]. Therefore, any synthetic earthquake had to produce a
PGA at Al-Durrah that is compatible with this value. ENSOL presented
synthetic earthquake records that were based on the 1995 Gulf of Aqaba
earthquake records in other countries in the region [16]. These
earthquakes were used as a base to generate a number of random
earthquakes. The random earthquakes were scaled down in amplitude to
conform to the expected PGA of the site. Scaling techniques are
presented in Appendix (G). The Random earthquakes were used in
dynamic site response analysis (DSRA) for the Al-Durrah soil profiles,
and the two earthquakes that produced the most reasonable PGA were
selected. The selected earthquakes were designated as RAN230 and
RAN330, and are shown in Figure (8.1).

150
8.2.2b Input Motions (Synthetic Earthquakes)
RAN230
-6.00E-02
-4.00E-02
-2.00E-02
0.00E+00
2.00E-02
4.00E-02
6.00E-02
0 5 10 15 20 25 30 35 40 45
Time (sec)
Am
p. (g
)
(a)
RAN330
-0.06
-0.04
-0.02
0
0.02
0.04
0.06
0 10 20 30 40 50 60
Time (sec)
Ampl
. (g)
(b)
Figure 8.1: Synthetic earthquakes used in the DSRA; (a) RAN230, (b) RAN330
8.2.2c ProShake Analysis Results The fundamental periods for all the soil profiles at Al-Durrah were
determined by ProShake analysis. The basic analysis placed the bedrock

151
depth at 100 ft (30m), as stipulated by NEHRP provisions. The results are
presented in Table (8.2) and Figure (8.2). Detailed information on the
dynamic analysis including assumptions, input profiles, soil properties,
and output data is presented in Appendix (H).
Site Fundamental Periods (sec)
Earthquake RAN230 Earthquake RAN330
Test Type
SWV Profile location 5%
Damping 10%
Damping 5%
Damping 10% Damping
D1 0.064 0.064 0.098 0.088 D2 0.054 0.054 0.098 0.098 D3 0.2 0.077 0.2 0.078 D4 0.088 0.064 0.098 0.098
D5A 0.077 0.077 0.088 0.077 D5B 0.064 0.064 0.25 0.064 D6 0.064 0.054 0.32 0.098 D7 0.088 0.088 0.098 0.098 D8 0.077 0.077 0.098 0.11 D9 0.077 0.077 0.077 0.077
D11 0.077 0.077 0.098 0.098
CXW Tests
D12 0.064 0.054 0.077 0.054
D5CH 0.064 0.054 0.088 0.088 D6CH 0.064 0.054 0.098 0.098
D11CH 0.064 0.064 0.098 0.077
Cross Hole Tests
D12CH 0.077 0.064 0.33 0.064
Table 8.2: ProShake dynamic analysis fundamental periods
for Al-Durrah profiles (bedrock at NEHRP depth)

152
ProShake Dynamic Analysis Fundamental Periods (Al-Durrah)
0
0.05
0.1
0.15
0.2
0.25
0.3
0.35
5%Damping
10%Damping
5%Damping
10%Damping
Earthquake RAN230 Earthquake RAN330
Perio
d (s
ec)
D1D2D3D4D5AD5BD6D7D8D9D11D12D5CHD6CHD11CHD12CH
Figure 8.2: ProShake analysis fundamental periods distribution
for Al-Durrah profiles (bedrock at NEHRP depth).
8.1.2d Short Period (Ss), and One Second (S1), Accelerations for Al-Durrah Soil Profiles The short period acceleration, SS, and the one second acceleration,
S1,are defined by NEHRP provisions as the mapped values of the 5%
damped maximum considered earthquake spectral response accelerations
at the periods of 0.2 second and 1.0 second respectively [3]. SS and S1 for
a certain site are the two basic values that are needed for determining
NEHRP design response spectra for that site. NEHRP maps 1 to 24
provide SS and S1 for the U.S. and its territories. The maps present the
values of SS and S1 for site class B, which can be adjusted to other site

153
classes in accordance with the procedure that was presented in Chapter 2.
However, No similar maps are available for Saudi Arabia, including Al-
Durrah. Although it is not the intent of this dissertation to establish SS
and S1 maps for Al-Durrah, it is necessary to estimates their values for
site class B in Al-Durrah in order to generate and compare design
response spectra for different site classifications in Al-Durrah.
The dynamic site response analysis was performed for all of the soil
profiles of Al-Durrah using the program ProShake. The analysis was
performed using two earthquakes (RAN230 and RAN330), and two
damping ratios of 5% and 10%. Each ProShake analysis of the Al-
Durrah soil profiles yielded ground response spectra for the profile being
analyzed. Values of Ss and S1 with 5% damping were taken from each
spectrum (to conform to the definition of Ss and S1). These SS and S1
values do not necessarily correspond to site class B as is the case in
NEHRP Provisions maps. However, for the purpose of this research,
these values were assumed to correspond to site class B. This assumption
is discussed further in Chapter 9. The SS and S1 values for all of the Al-
Durrah soil profiles are shown in Table (8.7).
These values were obtained from the analysis of Al-Durrah soil
profiles at a bedrock depth of 30 m (TA), which corresponds to the
NEHRP specified profile depth. A site is required to be classified by the
NEHRP Provisions general procedure if (Ss > 0.15) or (S1 >0.04) [3]. Ss

154
values in Table (8.3) exceeded this limit once in earthquake RAN230
analysis at location D11CH, while S1 values in both earthquakes analysis
are far below the NEHRP limit of (0.04).
Earthquake RAN230 Earthquake RAN330 Test Designation Ss S1 Ss S1
D1CXW 0.12 0.013 0.083 0.009 D2CXW 0.12 0.013 0.099 0.01 D3CXW 0.13 0.013 0.11 0.01 D4CXW 0.11 0.013 0.1 0.01
D5ACXW 0.15 0.013 0.1 0.01 D5CXW 0.1 0.013 0.09 0.009 D5CH 0.1 0.014 0.085 0.01
D6CXW 0.12 0.014 0.095 0.011 D6CH 0.12 0.013 0.091 0.01
D7CXW 0.15 0.013 0.096 0.01 D8CXW 0.14 0.013 0.095 0.009 D9CXW 0.12 0.013 0.093 0.009
D11CXW 0.11 0.014 0.1 0.01 D11CH 0.18 0.013 0.14 0.01
D12CXW 0.1 0.014 0.092 0.01 D12CH 0.1 0.014 0.11 0.013
Table 8.3: Short period (Ss), and one second (S1), accelerations
for Al-Durrah
8.2.2e Effects of Varying the Depth of Bedrock on the Site Fundamental Period
NEHRP Provisions limit the site-profiles to the top 100 ft (30 m) of
the soil, even if the actual bedrock depth is much larger than 100 ft. To
examine the effects of greater depths of bedrock on the site fundamental
period, the bedrock depth in Al-Durrah was modeled at 5 different
depths. The first selected depth is the actual depth (TAC= 350 m) as
estimated by the VES tests. The other four depths are (TA= 30m), (TB
=100 m), (TC =200 m), and (TD =300 m). The depth TA = 30 m
corresponds to NEHRP depth. For each bedrock depth, a ProShake

155
dynamic analysis using all of the soil profiles that were generated by the
CXW and cross-hole tests, was completed. The analysis was repeated for
each input earthquake twice using damping ratios of 5% and 10%. The
resulting fundamental periods are then plotted versus depth, as shown in
Tables (8.4) to (8.7) and Figures (8.3) to (8.6). Detailed information on
the site dynamic response analysis including input profiles, soil
properties, and output data is presented in Appendix (H).
1. Input Motion: RAN230
A) Damping Ratio: 5%
Bedrock Depth TAC TA TB TC TD Test Designation Site Fundamental Periods (sec)
D1 0.069 0.064 0.077 0.054 0.054 D2 0.09 0.054 0.077 0.088 0.077 D3 0.13 0.2 0.077 0.088 0.14 D4 0.079 0.088 0.077 0.077 0.077
D5A 0.079 0.077 0.077 0.088 0.054 D5B 0.057 0.064 0.054 0.054 0.054 D6 0.069 0.064 0.064 0.054 0.054 D7 0.12 0.088 0.17 0.077 0.14 D8 0.13 0.077 0.16 0.064 0.054 D9 0.069 0.077 0.054 0.077 0.054 D11 0.079 0.077 0.078 0.064 0.077
CXW Tests
D12 0.069 0.064 0.069 0.054 0.054
D5CH 0.079 0.064 0.064 0.064 0.077 D6CH 0.057 0.064 0.054 0.054 0.077
D11CH 0.09 0.064 0.079 0.064 0.054
Cross Hole Tests
D12CH 0.057 0.077 0.056 0.054 0.054
Table 8.4: Variation of the fundamental periods with the variation
of the depth of bedrock for RAN230 at 5% damping

156
Variation of Fundamental Period with Depth(RAN230 @ 5% Damping)
0
0.05
0.1
0.15
0.2
0.25
0 100 200 300 400Bedrock Depth (m)
Perio
d Se
c.
D1CXWD2CXWD3CXWD4CXWD5ACXWD5BCXWD5CHCD6CXWD6CHCD7CXWD8CXWD9CXWD11CXWD11CHCD12CXWD12CHC
Figure 8.3: Variation of fundamental periods with depth of
bedrock for earthquake RAN230 with 5% damping. B) 10% Damping
Bedrock Depth TAC TA TB TC TD Test Designation Site Fundamental Periods (sec)
D1 0.069 0.064 0.077 0.064 0.064 D2 0.1 0.054 0.077 0.077 0.077 D3 0.06 0.077 0.054 0.064 0.09 D4 0.077 0.064 0.095 0.077 0.077
D5A 0.069 0.077 0.077 0.064 0.054 D5B 0.069 0.064 0.054 0.054 0.054 D6 0.069 0.054 0.054 0.064 0.054 D7 0.091 0.088 0.088 0.077 0.054 D8 0.079 0.077 0.078 0.077 0.054 D9 0.057 0.077 0.054 0.064 0.054 D11 0.079 0.077 0.078 0.077 0.077
CXW Tests
D12 0.057 0.054 0.057 0.054 0.054
D5CH 0.069 0.054 0.054 0.064 0.054 D6CH 0.057 0.054 0.054 0.054 0.064
D11CH 0.069 0.064 0.079 0.054 0.064
Cross Hole Tests
D12CH 0.069 0.064 0.057 0.054 0.054
Table 8.5: Variation of the fundamental periods with the variation
of the depth of bedrock for RAN230 at 10% damping

157
Variation of Fundamental Period with Depth(RAN230 @ 10% Damping)
0
0.02
0.04
0.06
0.08
0.1
0.12
0 50 100 150 200 250 300 350 400
Bedrock Depth (m)
Perio
d (s
ec)
D1CXW
D2CXW
D3CXW
D4CXW
D5ACXW
D5BCXW
D5CHC
D6CXW
D6CHC
D7CXW
D8CXW
D9CXW
D11CXW
D11CHC
D12CXW
D12CHC
Figure 8.4: Variation of the fundamental periods with the variation
of the depth of bedrock for RAN230 at 10% damping
2. Input Motion: RAN330 A) Damping Ratio: 5%
Bedrock Depth TAC TA TB TC TD Test Designation Site Fundamental Periods (sec)
D1 0.079 0.098 0.088 0.077 0.077 D2 0.11 0.098 0.11 0.088 0.1 D3 0.11 0.2 0.16 0.16 0.1 D4 0.27 0.098 0.26 0.27 0.1
D5A 0.091 0.088 0.088 0.088 0.077 D5B 0.054 0.25 0.05 0.077 0.1 D6 0.079 0.32 0.29 0.054 0.1 D7 0.17 0.098 0.098 0.098 0.11 D8 0.17 0.098 0.15 0.11 0.17 D9 0.079 0.077 0.1 0.11 0.077 D11 0.1 0.098 0.079 0.077 0.077
CXW Tests
D12 0.1 0.077 0.077 0.11 0.11
D5CH 0.079 0.088 0.077 0.064 0.1 D6CH 0.11 0.098 0.088 0.098 0.11
D11CH 0.079 0.098 0.1 0.077 0.077
Cross Hole Tests
D12CH 0.29 0.33 0.077 0.16 0.077
Table 8.6: Variation of the fundamental periods with the variation
of the depth of bedrock for RAN330 at 5% damping

158
Variation of Fundamental Period with Depth of Bedrocks(RAN330 @ 5% Damping)
0
0.05
0.1
0.15
0.2
0.25
0.3
0.35
0 50 100 150 200 250 300 350 400
Depth of Bedrock (m)
Per
iod
(sec
)
D1CXWD2CXWD3CXWD4CXWD5ACXWD5BCXWD5CHCD6CXWD6CHCD7CXWD8CXWD9CXWD11CXWD11CHCD12CXWD12CHC
Figure 8.5: Variation of the fundamental periods with the variation of
the depth of bedrock for earthquake RAN330 and 5% damping
B) 10% Damping:
Bedrock Depth TAC TA TB TC TD Test Designation Site Fundamental Periods (sec)
D1 0.079 0.088 0.077 0.077 0.077 D2 0.11 0.098 0.098 0.077 0.1 D3 0.11 0.078 0.12 0.11 0.1 D4 0.07 0.098 0.095 0.098 0.1
D5A 0.091 0.077 0.098 0.077 0.077 D5B 0.1 0.064 0.1 0.077 0.1 D6 0.079 0.098 0.077 0.064 0.1 D7 0.091 0.098 0.11 0.11 0.1 D8 0.079 0.11 0.16 0.11 0.12 D9 0.079 0.077 0.1 0.098 0.077 D11 0.1 0.098 0.079 0.077 0.11
CXW Tests
D12 0.11 0.054 0.077 0.11 0.1
D5CH 0.079 0.088 0.054 0.054 0.1 D6CH 0.1 0.098 0.077 0.098 0.1
D11CH 0.11 0.077 0.1 0.09 0.077
Cross Hole Tests
D12CH 0.1 0.064 0.054 0.11 0.077
Table 8.7: Variation of the fundamental periods with the variation
of the depth of bedrock for RAN330 at 10% damping

159
Variation of Fundamental Period with Depth of Bedrock(RAN330 @ 10% Damping
0
0.02
0.04
0.06
0.08
0.1
0.12
0.14
0.16
0.18
0 50 100 150 200 250 300 350 400
Depth of Bedrock (m)
Per
iod
(sec
)D1CXWD2CXWD3CXWD4CXWD5ACXWD5BCXWD5CHCD6CXWD6CHCD7CXWD8CXWD9CXWD11CXWD11CHCD12CXWD12CHC
Figure 8.6: Variation of the fundamental periods with the variation
of the depth of bedrock for RAN330 at 10% damping
8.2 East-West Seismic Array Results
8.2.1 General The dynamic site response analysis of the seismic array was
performed using the earthquake of magnitude 1.59 that was presented in
Section (7.2.2). At each station, the two horizontal components of the
earthquake that were recorded at the rock outcrop were used individually
as the input motion in ProShake to determine the corresponding
fundamental frequency (or period) at each station.
8.2.2 Soil Profile Modeling Assumptions
Apart from the Vertical Electric Sounding (VES) tests that
established the bedrock depth at each station, no other information is
available for the soil profiles along the East-west array, with the

160
exception of station DRA2 which is part of the Al-Durrah site. The
closest estimate to the area was the soil profiles in Al-Durrah. Therefore,
the average minimum and maximum shear wave velocities were
computed for all the profiles in Al-Durrah and used for profiles along the
array. The top 30 m of each profile was divided into six equal layers. The
top soil layer was assigned the average minimum SWV, while the last
layer at the NEHRP depth of 30 m was assigned the average maximum
SWV. The shear wave velocity for the intermediate layers within
NEHRP depth increased linearly from top to bottom. All layers below
NEHRP bedrock depth and above the actual bedrock were assigned the
average maximum SWV. Complete input and output data for this
analysis is presented in Appendix (H)
8.2.3a Seismic Array Stations Fundamental Periods
The fundamental period of the soil profile at each station of the
seismic array was calculated twice. First, the fundamental periods were
determined by performing a dynamic site response analysis using the rock
outcrop earthquake record. The dynamic site response analysis was
performed four times at each station using the earthquake east-west and
north-south components, and two damping ratios of 5% and 10%.
Second, the fundamental period at each seismic station was determined
from the earthquake record at that station. The time domain earthquake

161
records were converted to frequency domain records using the computer
program ProShake. The fundamental period of each frequency domain
record was determined at the maximum amplitude of the records.
1- The following ground response spectra are the result of
performing dynamic site response analysis using ProShake for
each seismic station along the East-west seismic array. The
east-west and north-south components of the actual earthquake
records of the rock outcrop were used individually in the
analysis at each station. Each component was analyzed using
damping ratios equal to 5% and 10%.
Input Motions: Rock outcrop (DREFF) earthquake components records

162
DREFF (E_W) Component
-0.01
-0.008
-0.006
-0.004
-0.002
0
0.002
0.004
0.006
0.008
0.01
0 5 10 15 20 25 30
Time (sec)
Acc
. (g)
Series1
(a)
DREFF (N-S) Componenet
-0.015
-0.01
-0.005
0
0.005
0.01
0 5 10 15 20 25 30
Time (sec)
Acc.
(g)
Series1
(b)
Figure 8.7: Input motion earthquakes of rock outcrop;
(a) E-W component, and (b) N-S component • Station: ARRAY RD0 :

163
Input Motion: DREFF (E-W) (5% Damping)
Response Spectra
Layer: 1 - EQ No: 1 - Damping: 5.00% - Outcrop: No
Acce
lera
tion
(g)
Period (sec)
0.00
0.05
0.10
0.15
0 2 4 6 8 10
Figure 8.8: Ground response spectrum for RD0 (E-W) component;
5% damping.
Ts= 0.098 sec.

164
Input Motion: DREFF (N-S) (5% Damping) Response Spectra
Layer: 1 - EQ No: 1 - Damping: 5.00% - Outcrop: No
Acce
lera
tion
(g)
Period (sec)
0.00
0.05
0.10
0.15
0.20
0.25
0.30
0 2 4 6 8 10
Figure 8.9: Ground response spectrum for RD0 (N-S) component;
5% damping.
Ts=0.077 sec.

165
Input Motion: DREFF (E-W) (10% Damping)
Response Spectra
Layer: 1 - EQ No: 1 - Damping: 10.00% - Outcrop: No
Acce
lera
tion
(g)
Period (sec)
0.00
0.05
0.10
0.15
0 2 4 6 8 10
Figure 8.10: Ground response spectrum for RD0 (E-W) component;
10% damping.
Ts=0.11 sec
Response Spectra
Layer: 1 - EQ No: 1 - Damping: 10.00% - Outcrop: No
Acce
lera
tion
(g)
Period (sec)
0.00
0.05
0.10
0.15
0.20
0 2 4 6 8 10
Figure 8.11: Ground response spectrum for RD0 (N-S) component;
10% damping.
To=0.077 sec

166
• Station Array RD2 Input Motion: DREFF (E-W) (5% Damping)
Response Spectra
Layer: 1 - EQ No: 1 - Damping: 5.00% - Outcrop: No
Acce
lera
tion
(g)
Period (sec)
0.00
0.05
0.10
0.15
0.20
0 2 4 6 8 10
Figure 8.12: Ground response spectrum for RD2 (E-W) component;
5% damping. Ts=0.098 sec Input Motion: DREFF (N-S) (5% Damping)
Response Spectra
Layer: 1 - EQ No: 1 - Damping: 5.00% - Outcrop: No
Acce
lera
tion
(g)
Period (sec)
0.00
0.05
0.10
0.15
0.20
0 2 4 6 8 10
Figure 8.13: Ground response spectrum for RD2 (N-S) component;
5% damping.
Ts= 0.077 sec.
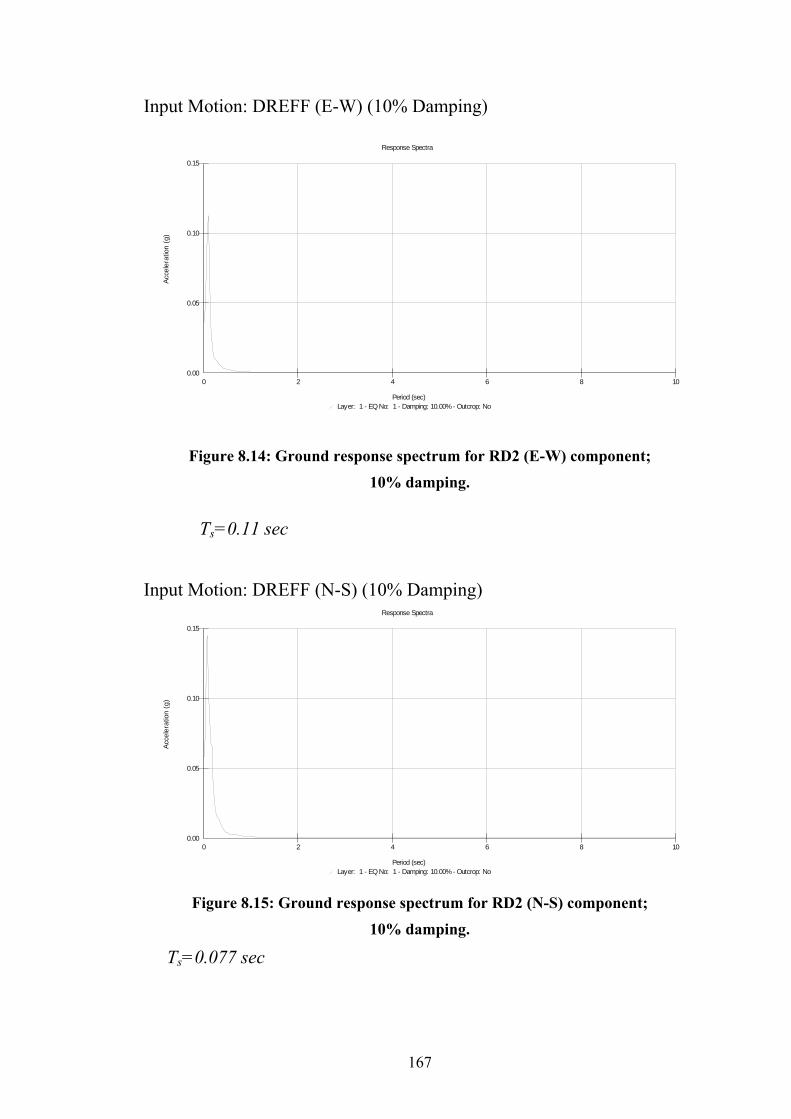
167
Input Motion: DREFF (E-W) (10% Damping)
Response Spectra
Layer: 1 - EQ No: 1 - Damping: 10.00% - Outcrop: No
Acce
lera
tion
(g)
Period (sec)
0.00
0.05
0.10
0.15
0 2 4 6 8 10
Figure 8.14: Ground response spectrum for RD2 (E-W) component;
10% damping.
Ts=0.11 sec Input Motion: DREFF (N-S) (10% Damping)
Response Spectra
Layer: 1 - EQ No: 1 - Damping: 10.00% - Outcrop: No
Acce
lera
tion
(g)
Period (sec)
0.00
0.05
0.10
0.15
0 2 4 6 8 10
Figure 8.15: Ground response spectrum for RD2 (N-S) component;
10% damping.
Ts=0.077 sec

168
• Station Array RD3
Input Motion: DREFF (E-W) (5% Damping) Response Spectra
Layer: 1 - EQ No: 1 - Damping: 5.00% - Outcrop: No
Acce
lera
tion
(g)
Period (sec)
0.00
0.05
0.10
0.15
0.20
0 2 4 6 8 10
Figure 8.16: Ground response spectrum for RD3 (E-W) component;
5% damping.
Ts= 0.098 sec. Input Motion: DREFF (N-S) (5% Damping)
Response Spectra
Layer: 1 - EQ No: 1 - Damping: 5.00% - Outcrop: No
Acce
lera
tion
(g)
Period (sec)
0.00
0.05
0.10
0.15
0.20
0 2 4 6 8 10
Figure 8.17: Ground response spectrum for RD3 (N-S) component;
5% damping.
Ts= 0.077 sec

169
Input Motion: DREFF (E-W) (10% Damping)
Response Spectra
Layer: 1 - EQ No: 1 - Damping: 10.00% - Outcrop: No
Acce
lera
tion
(g)
Period (sec)
0.00
0.05
0.10
0.15
0 2 4 6 8 10
Figure 8.18: Ground response spectrum for RD3 (E-W) component;
10% damping.
Ts= 0.11 sec. Input Motion: DREFF (N-S) (10% Damping)
Response Spectra
Layer: 1 - EQ No: 1 - Damping: 10.00% - Outcrop: No
Acce
lera
tion
(g)
Period (sec)
0.00
0.05
0.10
0.15
0 2 4 6 8 10
Figure 8.19: Ground response spectrum for RD3 (N-S) component;
10% damping. Ts= 0077 sec.

170
• Station Array DRA2
Input Motion: DREFF (E-W) (5% Damping) Response Spectra
Layer: 1 - EQ No: 1 - Damping: 5.00% - Outcrop: No
Acce
lera
tion
(g)
Period (sec)
0.00
0.05
0.10
0.15
0.20
0 2 4 6 8 10
Figure 8.20: Ground response spectrum for DRA2 (E-W) component;
5% damping.
Ts= 0.098 sec. Input Motion: DREFF (N-S) (5% Damping)
Response Spectra
Layer: 1 - EQ No: 1 - Damping: 5.00% - Outcrop: No
Acce
lera
tion
(g)
Period (sec)
0.00
0.05
0.10
0.15
0.20
0 2 4 6 8 10
Figure 8.21: Ground response spectrum for DRA2 (N-S) component;
5% damping.
Ts=0.077 sec

171
Input Motion: DREFF (E-W) (10% Damping) Response Spectra
Layer: 1 - EQ No: 1 - Damping: 10.00% - Outcrop: No
Acce
lera
tion
(g)
Period (sec)
0.00
0.05
0.10
0.15
0 2 4 6 8 10
Figure 8.22: Ground response spectrum for DRA2 (E-W) component;
10% damping.
Ts= 0.11 sec. Input Motion: DREFF (N-S) (10% Damping)
Response Spectra
Layer: 1 - EQ No: 1 - Damping: 10.00% - Outcrop: No
Acce
lera
tion
(g)
Period (sec)
0.00
0.05
0.10
0.15
0 2 4 6 8 10
Figure 8.23: Ground response spectrum for DRA2 (N-S) component;
10% damping.
Ts=0.077 sec

172
2. The following frequency domain spectra are the results of
converting the earthquake records at each station from time
domain to frequency domain
• Station DREFF Acceleration Fourier Spectrum
Ampl
itude
(g)
Frequency (Hz)
0.00000
0.00005
0.00010
0.00015
0.00020
0 20 40 60 80 100
DREFFEW-FS f=9.37 T=0.107
(a)
Acceleration Fourier Spectrum
Ampl
itude
(g)
Frequency (Hz)
0.00000
0.00005
0.00010
0.00015
0.00020
0 20 40 60 80 100
DREFFNS-FS f=11.22 T=0.089
(b)
Figure 8.24: Frequency domain earthquake record of station DREFF;
(a) (E-W) component, and (b) (N-S) component;

173
Acceleration Fourier Spectrum
Ampl
itude
(g)
Frequency (Hz)
0.00000
0.00005
0.00010
0.00015
0.00020
0.00025
0.00030
0 20 40 60 80 100
RD0EW f=22.24 T=0.043
(a)
Acceleration Fourier Spectrum
Ampl
itude
(g)
Frequency (Hz)
0.0000
0.0001
0.0002
0.0003
0.0004
0 20 40 60 80 100
RD0NS f=16.84 T=0.059
(b)
Figure 8.25: Frequency domain earthquake record of station RD0;
(a) (E-W) component, and (b) (N-S) component;

174
Acceleration Fourier Spectrum
Ampl
itude
(g)
Frequency (Hz)
0.00000
0.00005
0.00010
0.00015
0.00020
0.00025
0.00030
0 20 40 60 80 100
RD2EW f=8.15 T=0.123
(a)
Acceleration Fourier Spectrum
Ampl
itude
(g)
Frequency (Hz)
0.0000
0.0001
0.0002
0.0003
0.0004
0 20 40 60 80 100
RD2NS f= 15.71 T=0.064
(b)
Figure 8.26: Frequency domain earthquake record of station RD2;
(a) (E-W) component, and (b) (N-S) component;

175
Acceleration Fourier Spectrum
Ampl
itude
(g)
Frequency (Hz)
0.0000
0.0001
0.0002
0.0003
0.0004
0.0005
0 20 40 60 80 100
RD3EW f=12.36 T= 0.081
(a)
Acceleration Fourier Spectrum
Ampl
itude
(g)
Frequency (Hz)
0.0000
0.0001
0.0002
0.0003
0.0004
0.0005
0 20 40 60 80 100
RD3NS f=22.05 T=0.046
(b)
Figure 8.27: Frequency domain earthquake record of station RD3;
(a) (E-W) component, and (b) (N-S) component;

176
Acceleration Fourier Spectrum
Ampl
itude
(g)
Frequency (Hz)
0.0000
0.0001
0.0002
0.0003
0.0004
0 20 40 60 80 100
DRA2EW f=54.48 t=0.018
(a)
Acceleration Fourier Spectrum
Ampl
itude
(g)
Frequency (Hz)
0.0000
0.0001
0.0002
0.0003
0.0004
0 20 40 60 80 100
DRA2NS f=59.78 T=0.017
(b)
Figure 8.28: Frequency domain earthquake record of station DRA2;
(a) (E-W) component, and (b) (N-S) component;

177
8.2.3b Summary of the Results
1- Results of the Dynamic Site Response Analysis
Tables (8.8) to (8.11) present the site fundamental periods at each
seismic station along the East-west array. These values were
obtained from the ground response spectra that were generated by
the dynamic site response analysis of the previous section.
A) East- west Components
• 5% Damping
Station
RD0 RD2 RD3 A2
Fund. Period (sec.)
0.098 0.098 0.08 0.08
Table 8.8: Fundamental periods for the east-west
component of array earthquake (5% damping)
• 10% Damping
Station
RD0 RD2 RD3 A2
Fund. Period (sec.)
0.11 0.11 0.11 0.11
Table 8.9: Fundamental periods for the east-west
component of Array earthquake (10% damping)

178
B) North-south Components
• 5% Damping
Station
RD0 RD2 RD3 A2
Fund. Period (sec.)
0.077 0.077 0.077 0.077
Table 8.10: Fundamental periods for the north-south
component of array earthquake (5% damping)
• 10% Damping
Station RD0 RD2 RD3 A2
Fund. Period (sec.)
0.077 0.077 0.077 0.077
Table 8.11: Fundamental periods for the north-south
component of array earthquake (10% damping)
2- Frequency Domain Spectra Fundamental Periods A) East-west Components
Station DREFF RD0 RD2 RD3 A2
Frequency Hz
9.37 23.24 8.15 12.36 54.48
Fundamental Period (sec.)
0.107 0.043 0.123 0.081 0.018
Table 8.12: Fundamental frequencies (and periods) for
the north-south component of array earthquake

179
B) North-south Components
Station DREFF RD0 RD2 RD3 A2
Frequency Hz
11.22 16.84 15.71 22.05 59.78
Fundamental Period (sec.)
0.089 0.059 0.064 0.046 0.017
Table 8.13: Fundamental frequencies (and periods) for
the north-south component of array earthquake

180
Chapter 9: Effects of Soil Cross-section Modeling Methods on Al-Durrah Design Response Spectra
9.1 General In this Chapter the data analysis pertaining to the site soil
information, NEHRP site classification, and the effects of site profiling
on the design response spectra for the Al-Durrah site are presented.
Other results that deal with the site fundamental period are presented and
analyzed in Chapters 10 and 11. The Al-Durrah site data analysis
presented in this Chapter includes the following:
1. Data from the SPT and the VES tests is analyzed to establish
the Al-Durrah site soil characteristics and bed rock depth
2. Analysis and comparison of the NEHRP site classifications
from the standard penetration tests (SPT), from the cross-
hole (CH) tests, and from the Controlled Source Spectral
Analysis of Surface Waves (CXW) tests
3. Determination and analysis of the Al-Durrah design response
spectra based on the resulting different site classifications,
As well as the data from the site dynamic response analysis
(ProShake analysis).

181
9.2 Analysis of the Al-Durrah Standard Penetration Test (SPT) Results
9.2.1 The Al-Durrah site soil characteristics Based on the SPT results that were presented in Table (7.1) and the
soil testing of the disturbed samples from the SPT, the soils encountered
in all borings were recent surfacial soils with occasional silt or sand.
Local coralline limestone layers of different thickness were present at or
near the surface of some borings. The soil deposits at Al-Durrah can be
divided into two main categories based on the SPT blow counts (N):
1. Soil deposits with high N-values as in the case of borings
D1, D2, D6, D8, and D12.
2. Soil deposits with medium to low N-values as in the case of
borings D3, D4, D5, D7, D9, D10, and D11...
Comparison of borings D1 and D9 indicates that silty sand layers are
dominant at depths ranging from 5 to 20 m below sea level. Figure (9.1)
shows the main surfacial geological features of the Al-Durrah site, and
Figure (9.2) shows a geological cross-section at Al-Durrah between
borings D3 and D4.

182
Figure 9.1: The main soil features of AL-Durrah

183
Figure 9.2: A geological cross-section of Al-Durrah between borings D3 and D4
9.2.2 Al-Durrah NEHRP-SPT Site Classification
NEHRP Provisions criteria for classifying sites according to the
SPT results tests were introduced in Chapter (2). The criteria are
presented again in Table (9.1) for convenience. Based on the results of
the SPT borings’ average number of blows ( N ), that were presented in
Table (7.2), the Al-Durrah soil site classifications are shown in Table
(9.2)

184
.NEHRP Average SPT – Blows Number N Site Classification
N > 50 C
15 < N < 50 D
N < 15 E
Table 9.1: NEHRP SPT-N value site classifications [3]
SPT Test location
NEHRP Average No. of blows
NEHRP Site Classification
D1 83.92 C D2 67.57 C D3 70.74 C D4 34.48 D D5 65.84 C D6 80.84 C D7 65.62 C D8 92.85 C D9 74.30 C D10 43.76 D D11 25.85 D D12 92.01 C
Table 9.2: Summary of Al-Durrah NEHRP-SPT site classifications
Table (9.2) shows that Al-Durrah site has locations that can be
classified as soil class C, and other locations that can be classified as soil
class D. Twenty five percent of the SPT resulted in NEHRP site
classification D, while the other seventy five percent resulted in site
classification C. The difference between the two classes in terms of the
response design acceleration can be significant. This is demonstrated

185
when the design response spectra are constructed for Al-Durrah site
subsequently.
9.3 The Controlled Source Spectral Analysis of Surface Waves
(CXW) and the Cross-hole (CH) Tests Results
9.3.1 Comparison of the Shear Wave Velocities (SWV) Profiles from
the CXW and CH Tests
SWV profiles were established for a number of locations within
Al-Durrah by two different methods. Fourteen CXW and four CH tests
were conducted at the site. Each of the CH tests was accompanied by one
of the CXW tests and one of the SPT. The CH tests shear wave velocity
(SWV) profiles were corrected for the presence of casing and/or voids
around the casing according to the procedure that was presented in
Chapter 7. Figures (9.3) to (9.7) show comparisons of the SWV profile
obtained by cross-hole tests (both corrected and uncorrected), with the
profiles obtained by CXW tests at the same locations. Figures (9.3) to
(9.7) show that the cross-hole SWV profiles tend to be lower than those
of the CXW, especially at shallow depths.

186
Shear Wave Velocity (SWV) Profiles at Location D5 and A3a
0
200
400
600
800
1000
0 10 20 30 40
Depth (m)
SWV
(m/s
)
CXWCH CorrectedCH
Figure 9.3: Comparison of shear wave velocity profiles for CXW, uncorrected
CH, and corrected CH at D5 and A3a location

187
Shear Wave Velocity (SWV) Profiles at Location D5 and A3b
0200400600800
0 10 20 30 40
Depth (m)
SWV
(m/s
)
CXWCH CorrectedCH
Figure 9.4: Comparison of shear wave velocity profiles for CXW, uncorrected
CH, and corrected CH at D5 and A3b location

188
Shear Wave Velocity (SWV) Profilesat Location D6 and A12
0
200
400
600
800
1000
0 20 40 60 80Depth (m)
SWV
(m/s
) CXWCH CorrectedCH
Figure 9.5: Comparison of shear wave velocity profiles for CXW, uncorrected
CH, and corrected CH at D6 and A12 location

189
Shear Wave Velocity (SWV) Profiles at Location D11 and A1
0100200300400500600700
0 10 20 30 40
Depth (m)
SWV
(m/s
)
CXWCH CorrectedCH
Figure 9.6: Comparison of shear wave velocity profiles for CXW, uncorrected
CH, and corrected CH at D11 and A1 location

190
Shear Wave Velocity (SWV) Profiles at Location D12 and A7
0
100
200
300
400
500
600
0 10 20 30 40
Depth (m)
SWV
(m/s
)
CXWCH CorrectedCH
Figure 9.7: Comparison of shear wave velocity profiles for CXW, uncorrected
CH, and corrected CH at D12 A7 location

191
9.3.2 The Al-Durrah Site Classification by the CXW and CH Sear Wave
Velocity (SWV) Profiles
The average NEHRP SWV ( v s ) that was calculated in sections
(7.1.2) and (7.1.3) for the cross-hole and CXW tests, respectively, are
presented simultaneously in Table (9.3) for comparison. These values
were used in accordance with NEHRP General procedure (section 2.1.1
of Chapter 2) to determine NEHRP site classification for each test
location. Chapter (2) presented NEHRP provisions criteria for site
classification according to the site average SWV. The criteria are shown
in Table (9.4) again for convenience [3]. The resulting NEHRP site
classification for the CXW, SPT, and the cross-hole tests are shown in
Table (9.5).

192
Test Designation NEHRP Average SWV (m/s)
SPT CXW CXW Cross-Hole D1 A10 420. D2 A6 439 D3 A14 410 D4 A11 422 D5 A3a 465 316 D5a A3b 523 316 D6 A5 333 438 D7 A13 466 D8 A12 424 D9 A4 476 D11 A1 371 381 D12 A7 353 223 N/A A8 392 N/A A9 387
Table 9.3: Al-Durrah NEHRP average SWV for the CXW
and cross-hole tests
Site NEHRP Average SWV (m/s)v s
Site Classification
v s > 1500 A
760 < v s ≤ 1500 B
360 < v s ≤ 760 C
180 ≤ v s ≤ 360 D
v s < 180 E
Site specific evaluation F
Table 9.4: NEHRP average SWV site classifications [3]

193
Test Designation The Al-Durrah Site NEHRP Soil Classification
SPT CXW CXW SPT Cross-hole D1 A10 C C D2 A6 C C D3 A14 C C D4 A11 C D D5 A3a C C D D5a A3b C C D D6 A5 D C C D7 A13 C C D8 A12 C C D9 A4 C C D10 N/A N/A D D11 A1 C D C D12 A7 D C D N/A A8 C N/A A9 C
Table 9.5: Al-Durrah NEHRP site classifications by
CXW, SPT, and CH tests
The SPT site classification results (Table 9.2) showed that SPT tests
at different locations within the site can yield different soil classifications.
Table (9.5) presents NEHRP site classification for the CXW, the SPT,
and the CH tests. Two CXW tests, representing 14.3% of the tests,
resulted in site classification D, while the other 12 tests, representing
85.7% of the tests resulted in site classification C. The corresponding
percentages for the SPT tests are 25% and 75% respectively. The CH
tests resulted in 50% of the tests yielding site Class C, and the other 50%
yielding site class D (note that locations D5 and D5a have the same CH
test). Table (9.5) indicates that performing different tests at one specific

194
location could yield different soil classifications for that same location.
The CXW and SPT tests results classified location D5 as NEHRP site
class C, while the cross-hole test result classified the same location as site
class D. Test locations D6, D11, and D12 also showed disagreement
between the results of the three tests leading to soil classifications of both
C and D at each location. The difference between soil class C and soil
class D in terms of the site design response spectra is addressed in the
following section.
9.4 Effects of Soil Cross-sectional Modeling Methods on the Site
Design Response Spectra.
9.4.1 Introduction
The previous section demonstrated that performing different site
soil cross-sectional modeling methods at one location can lead to
different site classifications for that same location. This section examines
the possible effects of this result on the site design response spectra.
NEHRP Provisions procedure for generating a site design response
spectra was presented in Chapter (2). The method is based on the site
classification, its short period acceleration (SS), and its one second
acceleration (S1). NEHRP Provisions maps provide SS and S1 for the U.S.
and its territories. The values of SS and S1 in NEHRP maps are for site
class B, which can be corrected for other site classes using NEHRP

195
factors Fa and Fv that are provided by the Provisions. Tables (9.6) and
(9.7) present the values of Fa and Fv, respectively.
Mapped Maximum Considered Earthquake Spectral Response Acceleration at Short Periods (SS)
Site
Class SS ≤0.25 SS = 0.50 SS = 0.75 SS =1.00 SS ≥1.25
A 0.8 0.8 0.8 0.8 0.8
B 1.0 1.0 1.0 1.0 1.0
C 1.2 1.2 1.1 1.0 1.0
D 1.6 1.4 1.2 1.1 1.0
E 2.5 1.7 1.2 0.9 0.9
Table 9.6: Values of NEHRP Fa [3]
Mapped Maximum Considered Earthquake Spectral Response Acceleration at 1 Second Periods (S1)
Site
Class S1 ≤ 0.1 S1 = 0.2 S1 = 0.3 S1 =1.00 S1 ≥ 0.5
A 0.8 0.8 0.8 0.8 0.8
B 1.0 1.0 1.0 1.0 1.0
C 1.7 1.6 1.5 1.4 1.3
D 2.4 2.0 1.8 1.6 1.5
E 3.5 3.2 2.8 2.4 2.4
Table 9.7: Values of NEHRP Fv [3]

196
There are no equivalent maps for the Al-Durrah site. The site short
period acceleration, SS, and the one second acceleration, S1, for Al-Durrah
were determined from the site dynamic response analysis that was
presented in section (8.1.2d). In order to follow NEHRP procedure for
site classification correction, the Al-Durrah SS and S1 values were
assumed to correspond to site class B to conform to NEHRP maps values.
This assumption was made so that Al-Durrah SS and S1 can be used with
NEHRP site correction factors for other site classes to illustrate the
effects of a site classification on its design response spectra. This
assumption is reasonable because the objective of this analysis is to
examine the implications of selecting one site class over another, and not
establish the actual values of SS and S1 of the Al-Durrah site.
9.4.2 Effects of the Al-Durrah Site soil cross-sectional modeling methods on its Design
Response Spectra
Chapter (8) presented the dynamic site response analysis of Al-
Durrah site that was performed using two synthetic earthquakes
(RAN230 and RAN330). In addition, the results of the dynamic response
analysis including the Al-Durrah SS and S1 values were also presented in
Chapter (8.). The SS and S1 values for Al-Durrah site profiles are
reproduced here in Table (9.8) for convenience. Table (9.8) presents the
results of the dynamic site response analysis for each of the two synthetic

197
earthquakes (RAN230 and RAN330) using two damping ratios of 5% and
10%.
Earthquake RAN230 Earthquake RAN330 Test Location Ss S1 Ss S1
D1CXW 0.12 0.013 0.083 0.009 D2CXW 0.12 0.013 0.099 0.01 D3CXW 0.13 0.013 0.11 0.01 D4CXW 0.11 0.013 0.1 0.01
D5ACXW 0.15 0.013 0.1 0.01 D5CXW 0.1 0.013 0.09 0.009 D5CH 0.1 0.014 0.085 0.01
D6CXW 0.12 0.014 0.095 0.011 D6CH 0.12 0.013 0.091 0.01
D7CXW 0.15 0.013 0.096 0.01 D8CXW 0.14 0.013 0.095 0.009 D9CXW 0.12 0.013 0.093 0.009 D11CXW 0.11 0.014 0.1 0.01 D11CH 0.18 0.013 0.14 0.01
D12CXW 0.1 0.014 0.092 0.01 D12CH 0.1 0.014 0.11 0.013
Table 9.8: Short period (Ss), and one second (S1), accelerations for Al-Durrah
Al-Durrah NEHRP site classification results from section (9.2.3)
along with the values of SS and S1, were used to construct the Al-Durrah
site design response spectra. NEHRP Provisions require a site to be
classified by the general procedure if its short period acceleration Ss is
greater than 0.15, or if its one second acceleration, S1, is greater than 0.4.
From Table (9.8), the values of SS and S1 for location D11CH under
earthquake RAN230 and 5% damping were selected to be used in the
NEHRP generalized method to determine Al-Durrah’s NEHRP design
response spectra. These values were selected because they include the

198
largest SS value of all the profiles (Ss = 0.18g), which also exceeds the
NEHRP limit (SS > 0.15) [3].
Al-Durrah NEHRP design response spectra for soil classes C and D
were obtained following the procedure of NEHRP Provisions section
4.1.2.4 that were presented in Chapter 2, as follows:
From Table (9.8) and for test location D11CH under earthquake
RAN330:
Ss = 0.18
S1 = 0.013
These values were assumed to correspond to site class B. In order to
adjust the values of SS and S1 for site classes C and D, the correction
factors Fa for SS, and Fv for S1 were obtained from Tables (9.6) and (9.7).
The proper values of Fa and Fv for site classes C and D were determined
as follows [3]:
Ss = 0.18 ≤ 0.25 (Table (9.6))
S1 = 0.013 ≤ 0.1 (Table (9.7))
From Table (9.6):
(Fa)C = 1.2 for class C
and
(Fa)D = 1.6 for class D
From Table (9.7):
(Fv)C = 1.7 for class C

199
and
(Fv)D = 2.4 for class D
The maximum considered earthquake spectral response acceleration for
short period, SMS, and at one second SM1, adjusted for site class effects are
defined as:
SMS = Fa Ss
and
SM1 = Fv S1
From NEHRP Provisions section 4.1.2.5, the design earthquake spectral
response acceleration at short period, SDS, and at one second, SD1, are
defined as:
SS MSDS 32
=
and
SS MD 11 32
=
The values of SDS and SD1 for the soil classifications under consideration
are:
• For soil class C: SDS = 0.144
And SD1 = 0.0147
• For soil class D: SDS = 0.192

200
And SD1 = 0.0208
Defining the following parameters as:
T = The fundamental period of the structure
T0= 0.2SD1/SDS
TS= SD1/SDS
For soil class C: T0 = 0.0204 sec. and TS = 0.1013 sec
For soil class D: T0 = 0.0217 sec. and TS = 0.1083 sec
The design response spectra, Sa curves for soil classes C and D are
developed as follows [3]:
1. For periods equal or less than T0:
STTSS DS
DSa 4.06.0
0
+=
2. For periods equal to or greater than T0 and less than or equal to TS:
Sa = SDS
3. For periods greater than TS:
T
SS Da
1=
The resulting design response spectra for soil classes C and D are shown
in Figure (9.8).

201
NEHRP Design Response Spectra for Al-Durrah Soil Classes C and D
0
0.05
0.1
0.15
0.2
0.25
0 0.5 1 1.5 2 2.5
Period T (sec)
Spec
tral
Res
pons
e A
ccel
erat
ion
Sa (g
)
SaCSaD
Figure 9.8: Al-Durrah NEHRP Design response spectra for soil classes C and D
based on ProShake analysis results

202
The difference between the two spectra in terms of spectral response
acceleration varies with the period. However, Figure (9.8) shows that the
maximum difference in terms of spectral response acceleration occurs at:
T= 0.1083 sec., which corresponds to Ts of site class D.
At this period:
(Sa)D = 0.192g
(Sa)C = 0.136 g
The Maximum difference between the two curves is:
(Sa)D – (Sa)C = 0.192 -0.136 = 0.056 g
This maximum difference is the equivalent of 41% of the value of the
spectral response acceleration (Sa)C of site class C.
9.4.3 Evaluation of the Results
To compare the results of the previous section with actual NEHRP
sites, the same analysis for soil classes C and D was performed for two
actual locations that were selected from NEHRP maps. The locations
were selected so that both low and high values of SS and S1 are included.
The first location was selected in Region 2 (the Mid-west), and has the
following site information:
• Site location coordinates:
Latitude: 40o
Longitude: -113.5o

203
• Site mapped acceleration:
SS = 0.29g
S1 = 0.096
The design response spectra for site classes C and D for this
location were obtained following the same NEHRP procedure that was
undertaken for the Al-Durrah site. The Design response spectra for site
classes C and D at this location are shown in Figure (9.9).
Figure (9.9) shows that the maximum difference in terms of spectral
response acceleration occurs at:
T= 0.507 sec., which corresponds to Ts for class D.
The Maximum difference between the two curves is:
0.3031-0.2147 = 0.0884g
Again, this difference is the equivalent of 41% of the value of the spectral
response acceleration of site class C at this location, which agrees with
the Al-Durrah site results.

204
Figure 9.9: Design response spectra for site Classes C and D for a site in
Region 2 of NEHRP maps
NEHRP Design Response Spectra for a Mid-western Location for Soil Classes C and D
00.05
0.10.15
0.20.25
0.30.35
0 0.5 1 1.5 2 2.5Period T (sec)
Spec
tral R
espo
nse
Acc
eler
atio
n Sa
(g) SaC
SaD

205
The second location was selected from NEHRP maps for Region 1
(Southern California). The site information is as follows:
• Site location coordinates:
Latitude: = 33o
Longitude: -115o
• Site mapped accelerations:
SS = 0.97g
S1 = 0.303g
The Design response spectra for site classes C and D for this location are
shown in Figure (9.10).

206
NEHRP Design Response Spectra for a Southern California Location Soil Classes C and D
00.10.20.30.40.50.60.70.8
0 0.5 1 1.5 2 2.5
Period T (sec)
Spe
ctra
l Res
pons
e Ac
cele
ratio
n S
a (g
)
SaCSaD
Figure 9.10: Design response spectra for site Classes C and D for a site in
Southern California of NEHRP maps

207
Figure (9.10) shows that the maximum difference in terms of
spectral response acceleration occurs at:
T= 0.489 sec., which corresponds to Ts for class D.
The Maximum difference between the two curves is:
0.719-0.607 = 0.112 g
This difference is the equivalent of over18% of the value of the spectral
response acceleration of site class C at this location.
The maximum difference between each pair of curves in the
previous examples reflects the largest possible increase in the value of
(Sa) due to selecting site class D instead of site class C. It can be seen
from Tables (9.6) and (9.7) that the design response spectrum for a given
location depends on the site classification and the values of SS and S1 at
the location. Since SS and S1 are allocated constants for each location
within the NEHRP maps, site classification becomes the critical factor in
determining a site design response spectrum.
Table (9.5) shows that different tests at the Al-Durrah site locations
D4, D5, D6, D11, and D12, resulted in different site classifications for
each location. Each test location can be classified as site class C or site
class D. However, as demonstrated by the previous examples, the
difference in the value of the spectral acceleration between classifications
C and D can be as high as 41%. Different soil profiling methods at a

208
specific location can lead to different NEHRP site classifications for the
same specific location. Selecting one site classification over another for
the same location can lead to a significant overestimation (or
underestimation) of the value of the spectral response acceleration. This
is a clear indication of the effects of different soil cross-sectional
modeling methods on the site design response spectra. If no further soil
testing is possible or desirable, then the lower site classification (such as
site class D in Al-Durrah case) must be selected despite the implications
of higher costs.

209
Chapter 10: Effects of Soil Cross-section Modeling Methods on Al-Durrah Site Fundamental Period
10.1 General This Chapter examines the effects of the different soil cross-
sectional modeling methods on the site fundamental period. The Al-
Durrah site shear wave velocity (SWV) profiles were established by the
following methods:
a). The Controlled Source Spectral Analysis of Surface Waves (CXW)
b). The cross-hole (CH) tests
These profiles were used to determine the site fundamental period by:
i. The approximate method
ii. The dynamic site response analysis (ProShake)
The Approximate Method background and procedure were presented in
Chapter 3. The computer program (ProShake) that was used for Al-
Durrah dynamic site response analysis, was also introduced in Chapter 3.
The two synthetic earthquakes, designated as RAN230 and RAN330, that
were used in the analysis were introduced in Chapter 8. In addition, the
site fundamental period was estimated by the microtremors method. The
microtremors method background and procedure were presented in
Chapter 3, and the resulting plots of the Al-Durrah site microtremors
records plots were presented in Chapter 7. The results of the three
methods of determining the Al-Durrah site fundamental period including

210
the approximate method, the microtremors ratio spectra, and the dynamic
site response analysis are regrouped, tabulated, and analyzed in this
Chapter. Initially, the results of the methods are analyzed separately.
The objective of this part of the analysis is to examine the effects of
modeling the soil cross-section at the same location by different methods,
such as the .CH and CXW tests, on the values of the site fundamental
periods. Following this analysis is a comparative analysis of all three
methods. The objectives of this part of the analysis are to compare the
results of the three methods, and the effects of using each method on the
site fundamental period.
10.2 The Al-Durrah Site Fundamental Period
10.2a The Al-Durrah Site Cross-section Modeling The results of the Standard Penetration Test (SPT), the Vertical
Electric Sounding (VES), and the Shear Wave Velocity (SWV) tests were
used for developing the site profiles for the Al-Durrah site. The SWV
tests included the CXW and the CH tests. The VES interpretation results
that were presented in Chapter 7 indicated that the bedrock depth at the
Al-Durrah site was 350 m to 375 m. The VES interpretation result is
reproduced here for convenience, Figure (10.1).

211
Figure 10.1 Al-Durrah site VES cross-section NEHRP Provisions requires the profiling of the top 30 m (100
ft ) of the site. Therefore, for the purpose of determining the Al-Durrah
site fundamental period by the approximate method and by the dynamic
site response analysis, each test location was modeled to a depth of 30 m
regardless of the actual depth of the bedrock.
10.2b The Al-Durrah Site Fundamental Period by the Approximate
Method
The Al-Durrah site approximate fundamental periods were
calculated as follows:
v s
HT s
4=
where:
TS = the site approximate fundamental period

212
H = NEHRP defined bedrock depth ≡ 30 m
v s = NEHRP weighted site average SWV as defined in Chapter 2
The results of the Al-Durrah site approximate fundamental periods
(or frequencies) were calculated in Chapter 8, and reproduced here
(Table10.1), for comparison with the results of the other methods
subsequently.
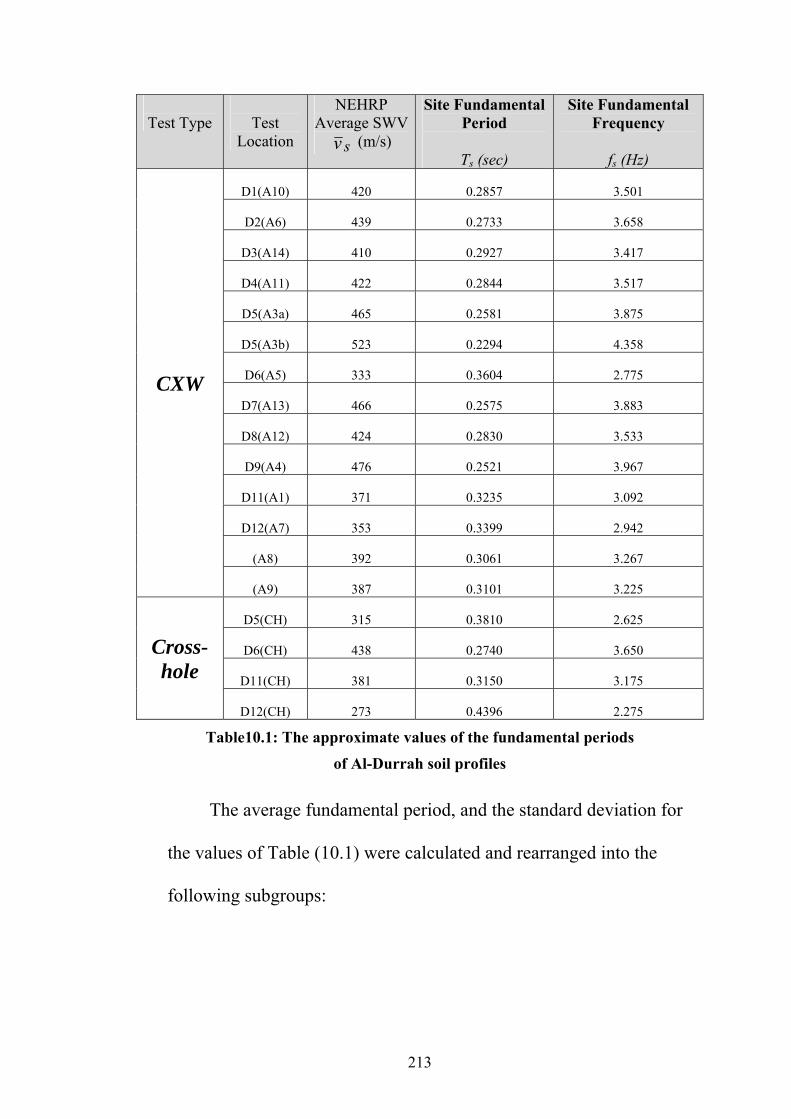
213
Table10.1: The approximate values of the fundamental periods
of Al-Durrah soil profiles
The average fundamental period, and the standard deviation for
the values of Table (10.1) were calculated and rearranged into the
following subgroups:
Test Type
Test
Location
NEHRP Average SWV
v s (m/s)
Site Fundamental Period
Ts (sec)
Site Fundamental Frequency
fs (Hz)
D1(A10) 420 0.2857 3.501
D2(A6) 439 0.2733 3.658
D3(A14) 410 0.2927 3.417
D4(A11) 422 0.2844 3.517
D5(A3a) 465 0.2581 3.875
D5(A3b) 523 0.2294 4.358
D6(A5) 333 0.3604 2.775
D7(A13) 466 0.2575 3.883
D8(A12) 424 0.2830 3.533
D9(A4) 476 0.2521 3.967
D11(A1) 371 0.3235 3.092
D12(A7) 353 0.3399 2.942
(A8) 392 0.3061 3.267
CXW
(A9) 387 0.3101 3.225
D5(CH) 315 0.3810 2.625
D6(CH) 438 0.2740 3.650
D11(CH) 381 0.3150 3.175
Cross-hole
D12(CH) 273 0.4396 2.275

214
Tests Subgroup Average Fundamental Period (sec)
Standard Deviation (sec)
All Profiles (1) 0.304 0.051
All CXW (2) 0.290 0.036
All CH (3) 0.352 0.073
All CXW at CH (4) 0.302 0.056
Table 10.2: Average values and standard deviations of the approximate
values of the fundamental periods of Table10.1a
(1). The average value of the fundamental periods of all the profiles
(2). The average value of the fundamental periods of all the CXW
profiles
(3). The average value of the fundamental periods of all the CH
profiles
(4). The average value of the fundamental periods of the CXW
profiles that were performed at the same location of the CH tests

215
Average Fundamental Periods and Standard Deviations for Al-Durrah Tests
00.10.20.30.4
ALL CXW CH CXW-CH
Tests Groups
Perio
d se
c
(Ts)aveSTDEV
Figure 10.2: Average fundamental periods and standard
deviations For the results of the approximate method Table (10.2) presents the average value and the standard deviation
for each subgroup’s fundamental period, and Figure (10.2) show plots of
these values for each group of tests. The average site approximate
fundamental period for the CH tests is 21% higher than that of the entire
CXW tests. However, if the average CH fundamental period is compared
with the average fundamental period of only the CXW tests that were
performed at CH tests’ locations, then the difference decreases to about
17%. If the value of the fundamental period of each CH test is compared
with the value of the fundamental period for the corresponding CXW at
the same location, then the differences can be much higher. Table (10.3)
shows that the difference between the values of the fundamental periods
of the two tests at each location can be as high as 66% (expressed as a
percentage of the lower fundamental period value).
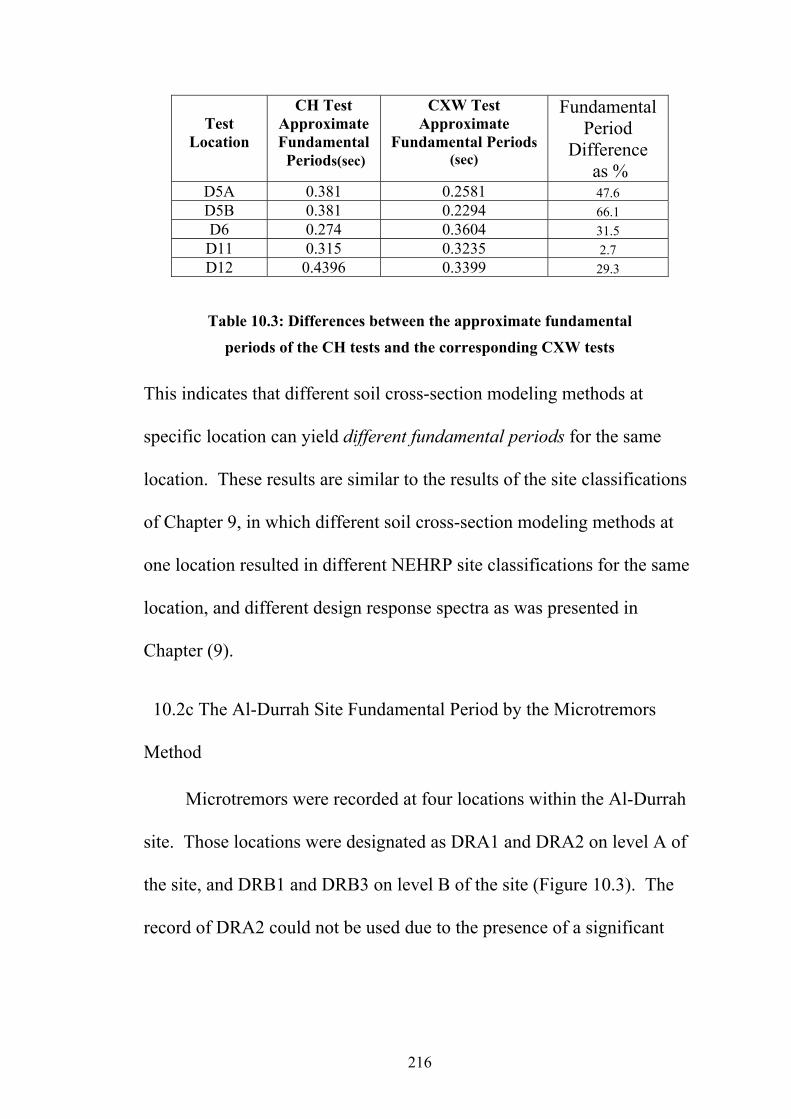
216
Test
Location
CH Test Approximate Fundamental Periods(sec)
CXW Test Approximate
Fundamental Periods (sec)
Fundamental Period
Difference as %
D5A 0.381 0.2581 47.6 D5B 0.381 0.2294 66.1 D6 0.274 0.3604 31.5 D11 0.315 0.3235 2.7 D12 0.4396 0.3399 29.3
Table 10.3: Differences between the approximate fundamental
periods of the CH tests and the corresponding CXW tests
This indicates that different soil cross-section modeling methods at
specific location can yield different fundamental periods for the same
location. These results are similar to the results of the site classifications
of Chapter 9, in which different soil cross-section modeling methods at
one location resulted in different NEHRP site classifications for the same
location, and different design response spectra as was presented in
Chapter (9).
10.2c The Al-Durrah Site Fundamental Period by the Microtremors
Method
Microtremors were recorded at four locations within the Al-Durrah
site. Those locations were designated as DRA1 and DRA2 on level A of
the site, and DRB1 and DRB3 on level B of the site (Figure 10.3). The
record of DRA2 could not be used due to the presence of a significant

217
earthquake within the record. The effects of the presence of an
earthquake within a microtremors record was addressed in Chapter 7.
Figure 10.3: The Al-Durrah site approximate east-west cross-section
Two types of microtremors plots were presented in Chapter 7. The
first type was generated from the ratios of the square root of the sum of
the squares of the horizontal components of the microtremors to the
vertical component. The second type of plots was generated by simply
taking separate ratios of the east-west component and the north-south
component to the vertical component of the microtremors and plotting the
generated curves simultaneously. The Al-Durrah site fundamental
periods as determined by the microtremors method are summarized in
Table (10.4a), (10.4b), and (10.4c) for comparison with the results of the
Al-Durrah approximate east-west cross section
Level A Level BGulf of
Aqaba

218
other methods subsequently. Table (10.5) and Figure (10.4) present the
average fundamental periods of the three microtremors records.
Al-Durrah Record Location DRA1 DRA2 DRB1 DRB3
Fundamental Frequency (Hz) 3.4 N/A 6.3 14.11
Fundamental Period (sec) 0.294 N/A 0.159 0.070872
Table 10.4a: Al-Durrah site fundamental periods of the
microtremors mean ratios
Al-Durrah Record Location DRA1 DRA2 DRB1 DRB3
Fundamental Frequency (Hz) 3.1 N/A 6.4 18.7
Fundamental Period (sec) 0.323 N/A 0.156 0.053
Table 10.4b: Al-Durrah site fundamental periods of the
microtremors simple ratios (east-west component)
Al-Durrah Record Location DRA1 DRA2 DRB1 DRB3
Fundamental Frequency (Hz) 3.3 N/A 6.4 14.3
Fundamental Period (sec) 0.303 N/A 0.156 0.070
Table 10.4c: Al-Durrah site fundamental periods of the
microtremors simple ratios (north-south component)
Record Location Microtremors Plot Type
DRA1 DRB1 DRB3 Mean Spectra 0.294 0.159 0.0709 Simple Spectra E-W 0.323 0.156 0.053 Simple Spectra N-S 0.303 0.156 0.07 Average Fund. Period 0.307 0.157 0.065
Table 10.5: Al-Durrah site fundamental periods summary and averages

219
Al-Durrah Microtremors Fundamental Periods (sec)
00.050.1
0.150.2
0.250.3
0.35
MeanSpectra
SimpleSpectra
E-W
SimpleSpectra
N-S
AverageFund.Period
Perio
d (s
ec)
DRA1DRB1DRB3
Figure 10.4: Al-Durrah site microtremors spectra fundamental periods
The large difference between DRA1 fundamental period values and
those of DRB1 and DRB3 can be attributed to the site level difference of
test group A and test group B (Figure 10.2). These results are used in the
comparative analysis of all three methods, subsequently.
10.2d The Al-Durrah Site Fundamental Period by the Dynamic Site
Response Analysis Method
From the results of the dynamic site response analysis of the Al-
Durrah site that were presented in Chapter 8, the fundamental periods
were obtained from the ground response spectra of each soil profile.
Each soil profile was subjected to the two synthetic earthquakes,
RAN230 and RAN330. The analysis of each earthquake was performed
twice using 5% and 10% damping ratios. The results are reproduced in

220
Table (10.5) and Figure (10.2) for analysis and comparison with the
results of the other methods.
Site Fundamental Periods (sec)
Earthquake RAN230 Earthquake RAN330
Test Type
Test Location
5% Damping 10% Damping 5% Damping 10% Damping
D1 0.064 0.064 0.098 0.088 D2 0.054 0.054 0.098 0.098 D3 0.2 0.077 0.2 0.078 D4 0.088 0.064 0.098 0.098
D5A 0.077 0.077 0.088 0.077 D5B 0.064 0.064 0.25 0.064 D6 0.064 0.054 0.32 0.098 D7 0.088 0.088 0.098 0.098 D8 0.077 0.077 0.098 0.11 D9 0.077 0.077 0.077 0.077 D11 0.077 0.077 0.098 0.098
CXW Tests D12 0.064 0.054 0.077 0.054
D5CH 0.064 0.054 0.088 0.088 D6CH 0.064 0.054 0.098 0.098
D11CH 0.064 0.064 0.098 0.077
Cross Hole Tests D12CH 0.077 0.064 0.33 0.064
Table 10.6: Al-Durrah site fundamental periods by the dynamic
site response analysis

221
ProShake Dynamic Analysis Fundamental Periods (Al-Durrah)
0
0.05
0.1
0.15
0.2
0.25
0.3
0.35
5%Damping
10%Damping
5%Damping
10%Damping
Earthquake RAN230 Earthquake RAN330
Perio
d (s
ec)
D1D2D3D4D5AD5BD6D7D8D9D11D12D5CHD6CHD11CHD12CH
Figure10.5: ProShake analysis fundamental periods distribution for Al-Durrah profiles (bedrock at NEHRP depth).
Figure (10.5) shows the variation in the values of the fundamental
periods of the entire profiles at the Al-Durrah site. The values of the
fundamental period show better agreement at 10% damping for both
earthquakes. The results of Table (10.6) were averaged and rearranged
into the following subgroups:
• The average value of the fundamental periods of all the profiles
• The average value of the fundamental periods of all the CXW
profiles
• The average value of the fundamental periods of all the CH
profiles

222
• The average value of the fundamental periods of the CXW
profiles that were performed at the same location of the CH tests
The average values of the fundamental periods and the standard
deviations for the subgroups are presented in Table (10.7), which shows
that the standard deviations for the 10% damping analysis of RAN230
and RAN330 (for all profiles) are 0.011 and 0.016 respectively. This is a
much lower value than the standard deviation values corresponding to the
same two groups at 5% damping, which are 0.034 and 0.086 respectively.
Figure (10.5) indicates that the main contribution to the increase in the
value of the standard deviation for earthquake RAN230 at 5% damping
comes from the relatively large value of the fundamental period of profile
D3CXW. D3CXW refers to the profile generated by the CXW test at the
location of boring D3. Similarly, the larger increase in the value of the
standard deviation of earthquake RAN330 at 5% damping can be
attributed to profiles D3CXW, D5BCXW, D6CXW, and D12CH. Figures
(10.6a) and (10.6b) present plots of the average fundamental periods and
the standard deviations for each group of tests in Table (10.7).

223
Al-Durrah Site Average Fundamental Period and Standard Deviations (sec)
Earthquake RAN230 Earthquake RAN330
5% Damping
10% Damping
5% Damping
10% Damping
Average of all Profiles fund.
period 0.078938 0.066438
0.1384
0.0853 Standard Dev
0.033688 0.011033
0.0863
0.0158 Average of CXW
fund. period 0.082364 0.068917 0.133333 0.0865 Standard Dev 0.040173 0.011405 0.079081 0.0166
Average of CH tests fund. period 0.06725 .059
0.1535
0.0818
Standard Dev 0.0065 .0058 0.1178 0.0146 Average of fund. periods of CXW
tests at CH locations 0.0692 .0652
0.1666
0.0782 Standard Dev 0.00712 0.01152 0.11113 0.019829
Table10. 7: Al-Durrah site fundamental period averages and standard
deviations for the results of dynamic site response analysis
Table (10.8) shows the variation in the average values of the
fundamental periods of the CH and CXW tests (in terms of percentage of
the lower value of each pair). The difference in the value of the average
fundamental period between all the CXW tests and all the CH tests ranges
from a minimum of about 6% under earthquake RAN330 (10% damping)
to a maximum of about 22.5% under earthquake RAN230 (5% damping).
However, Table (10.8) shows that if the average fundamental periods of
only CXW tests that were performed at CH locations are considered, the
range of the differences becomes from 3% (under RAN230-5% damping)
to 10.5% (under AN230-10% damping) respectively.

224
Percentages of the Difference Between the Average Values of the
Fundamental Periods of the CXW and CH tests Earthquake RAN230 Earthquake RAN330
Values of fund. Periods being Compared 5%
Damping10%
Damping 5%
Damping 10%
Damping Average of all CH Versus average of
All CXW 22.5 16.8 15.1 5.7 Average of all CH Versus average of
CXW at CH
2.9 10.5 8.5 4.6
Table 10.8: Percentages of the differences between the average values
of the fundamental periods of the CH and CXW tests
Dynamic Response Fundamental Periods Averges
0
0.05
0.1
0.15
0.2
RAN230 RAN330 RAN230 RAN530
5% Damping 10% Damping
Dynamic Response FundamentalPeriods Averages
Perio
d (s
ec)
Av AllAv CXWAv CHAv CXW @ CH
Figure 10.6a: Al-Durrah site average fundamental periods of the dynamic site
response Analysis

225
Dynamic Rsponse Analysis Fundamental Periods Standard Deviations
00.05
0.10.15
RA
N23
0
RA
N33
0
RA
N23
0
RA
N53
0
5%Damping
10%Damping
Fundamental Periods Standard Deviations
Perio
d (s
ec)
STD AllSTD CXWSTD CHSTD CXW @ CH
Figure 10.6b: Al-Durrah site fundamental periods standard deviations
Comparison of each individual result of the CH test with the
corresponding result of the CXW tests that was performed at the same
location led to more significant variations as shown in Table (10.9) and
Figure (10.7). Each pair of values from the CH and the CXW tests was
compared, and the difference is expressed as a percentage of the value of
the lower fundamental period. The difference between the results of the
two tests ranges from 0% to 328%. Table (10.9) indicates that in 6 cases
there was no difference in the values of the fundamental period as
determined by a CH test or a CXW test. This represents 30% of all the
cases of Table (10.8). Eleven cases representing 55% of all the cases had
a difference in the value of the fundamental period of two tests that

226
ranged from 14% to 42.5%. The remaining three cases that represent
15% of all the cases, showed a difference in the value of the fundamental
period that ranged from 184% to 328.5%.
Earthquake RAN230 Earthquake RAN330 Test Location 5% Damping 10% Damping 5% Damping 10% Damping
D5A 20.3 42.5 0 14.2 D5B 0 18.5 184.0 37.5 D6 0 0 226.5 0 D11 20.3 20.3 0 27.2 D12 20.3 18.5 328.5 18.5
Table10.9: The difference between the values of the fundamental
periods of the CH and CXW tests that were performed at the
same locations (expressed as percentage of the lower value)
Percentage of differnce between the fundamental periods of CH and CXW tests for
the same locations
050
100150200250300350
5% 10% 5% 10%
RAN230 RAN330
% o
f the
diff
ernc
e
D5AD5BD6D11D12
Figure 10.7: The difference between the values of the fundamental
periods of the CH and CXW tests that were performed at the
same locations (expressed as percentage of the lower value)

227
These results show that modeling a soil cross-section at a specific
location by two different methods can result in a significantly different
fundamental period for the same location.
10.2e The Al-Durrah Site Fundamental Period Comparative Analysis
This section presents the comparative analysis of the Al-Durrah
fundamental periods from the results of the approximate method, the
microtremors method, and the dynamic site response analysis method. In
the dynamic site response analysis, the soil damping ratio value must be
selected for each profile’s analysis. The dynamic site response analysis
was performed four times using the two synthetic earthquakes (RAN230
and RAN330), and the two damping ratios of 5% and 10% with each
earthquake analysis. Therefore, there are four sets of results from the
dynamic site response analysis, and only one set for each of the
approximate method and the microtremors method. In order to compare
the four sets of results from the four dynamic analyses with the results of
the approximate method and the microtremors method, the comparison
was repeated four times. Each comparison included the same values of
the average fundamental periods from the approximate method and
microtremors method, and one of the results of the dynamic analysis. The
results of the approximate method and the dynamic site response analysis
were divided into subgroups.

228
These subgroups include:
• The average value of the fundamental periods of all the profiles
• The average value of the fundamental periods of all the CXW
profiles
• The average value of the fundamental periods of all the CH
profiles
• The average value of the fundamental periods of the CXW
profiles that were performed at the same location of the CH tests
Tables (10.10) to (10.13) and Figures (10.8a) to (10.11a) show the
values of each comparison including the values for the subgroups of each
method. The four sets of comparisons are presented next:
I. Comparison of the results of the approximate method, the
microtremors, and the dynamic response analysis with the synthetic
earthquake RAN230 and 5% damping:
Table (10.10) and Figure (10.8a) present the values of the average
fundamental period for each method with the results of the dynamic
response analysis of RAN230 and 5% damping. It can be seen from
Figure (10.8a) that the values of the average fundamental period of
microtremors record DRB3 and the dynamic response analysis are very
close with a value range of 0.07 to 0.08 second. The values of the
average fundamental period by the approximate method and its subgroups
are much higher than the dynamic response analysis and DRB3.

229
However, the average fundamental period of microtremors record DRA1
and the average fundamental periods of two subgroups of the
approximate method showed good agreement. The two subgroups are
(the average of all the approximate method) and (the average of all the
CXW- approximate method). To visually illustrate the differences
between the values of the average fundamental period of the three
methods, the ratios of the average fundamental periods of each method
over the average fundamental periods of the other two methods were
taken and plotted as shown in Figure (10.8b). The ratios of the
approximate method average fundamental periods to those of the
microtremors ranged from 1 to about 5. The ratios of the average
fundamental periods of the microtremors to those of the dynamic
response analysis are ranged from 1 to about 4.5.

230
Table 10.10: Comparison of the average values of the fundamental periods at Al-Durrah
Approximate Method
Microtremors
Dynamic Site Response AnalysisRAN230 at 5% damping
Av All
Av CXW
Av CH
Av CXW @ CH DRA1 DRB1 DRB3
Av All
Av CXW
Av CH
Av CXW @ CH
Average Fundamental Period (sec) 0.313 0.302 0.352 0.337 0.307 0.157 0.065 0.079 0.082 0.067 0.069
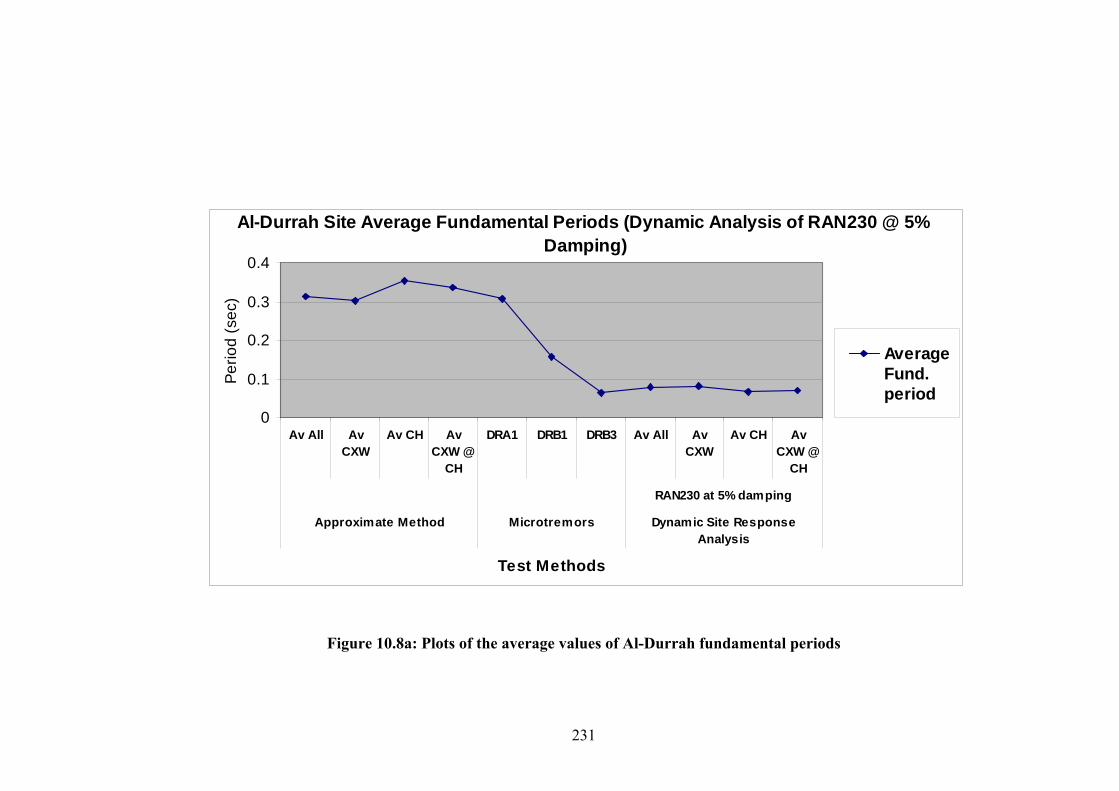
231
Figure 10.8a: Plots of the average values of Al-Durrah fundamental periods
0
0.1
0.2
0.3
0.4
Av All AvCXW
Av CH AvCXW @
CH
DRA1 DRB1 DRB3 Av All AvCXW
Av CH AvCXW @
CH
RAN230 at 5% damping
Approximate Method Microtremors Dynamic Site ResponseAnalysis
Test Methods
Perio
d (s
ec)
AverageFund.period
Al-Durrah Site Average Fundamental Periods (Dynamic Analysis of RAN230 @ 5% Damping)

232
0
1
2
3
4
5
6al
lap
pal
lcx
w
all C
H
CX
2C
H
DR
A1
DR
B1
DR
B3 all
all
cxw
all C
H
Cx
@C
H
Approx Method Microtremors Dynamic Resp
Test Method
Rat
io o
f Fun
d. P
erio
d
Approx All
Approx All CXW
Approx All CH
Approx CXW at CH
DRA1
DRB1
DRB3
Dynamic All
Dynamic all cxw
Dynamic allCH
Dynamic CXW at CH
Ratios of the Average Fundamental Periods of the Three Methods over Each Other(Dynamic Response Analysis of RAN230-5% damping)
Figure 10.8b: Plots of the ratios of average fundamental periods of each method over
the fundamental periods of the other two methods

233
II. Comparison of the results of the approximate method, the
microtremors, and the dynamic response analysis with RAN330 and
5% damping:
Table (10.11) and Figure (10.9a) present the values of the average
fundamental period for each method with the dynamic response analysis
of RAN330 and 5% damping. There are no changes in the values of
average fundamental periods of the approximate and microtremors
methods. Figure (10.9a) shows that the values of the average
fundamental period of microtremors record DRA1 shows good agreement
with the values of the approximate method, while the value of
microtremors record DRB1 shows good agreement with the dynamic
analysis results. Figure (10.9b) shows plots of the ratios of the values of
each method over the other two. The ratios of the average fundamental
periods of the approximate method over those of the microtremors
method ranged from 1 to about 5, and the ratios of the approximate
method values to the dynamic analysis values ranged from 1.8 to 2.5.
The ratios of the dynamic analysis values over the microtremors values
ranged from 0.5 to 2.5.

234
Table 10.11: Comparison of the average values of the fundamental periods at Al-Durrah
Approximate Method
Microtremors
Dynamic Site Response AnalysisRAN330 at 5% damping
Av All Av CXWAv CH Av CXW @ CH DRA1 DRB1 DRB3
Av All
Av CXW
Av CH
Av CXW @ CH
Average Fundamental period (sec) 0.313 0.302 0.3524 0.337 0.307 0.157 0.065 0.138 0.133 0.154 0.167

235
Figure 10.9a: Plots of the average values of Al-Durrah fundamental periods
0
0.1
0.2
0.3
0.4
Av All AvCXW
Av CH AvCXW@ CH
DRA1 DRB1 DRB3 Av All AvCXW
Av CH AvCXW@ CH
RAN330 at 5% damping
Approximate Method Microtremors Dynamic Site ResponseAnalysis
Test Methods
Perio
d (s
ec)
AverageFund.period
Al-Durrah Site Average Fundamental Periods (Dynamic Analysis of RAN330 @ 5% Damping)

236
0
1
2
3
4
5
6al
lap
pal
lcx
w
all C
H
CX
2C
H
DR
A1
DR
B1
DR
B3 all
all
cxw
all C
H
Cx
@C
H
Approx Method Microtremors Dynamic Resp
Test Method
Rat
io o
f Fun
d. P
erio
dApprox All
Approx All CXW
Approx All CH
Approx CXW at CH
DRA1
DRB1
DRB3
Dynamic All
Dynamic all cxw
Dynamic allCH
Dynamic CXW at CH
Ratios of the Average Fundamental Periods of the Three Methods over Each Other(Dynamic Response Analysis of RAN330-5% damping)
Figure 10.9b: Plots of the ratios of average fundamental periods of each method over
the fundamental periods of the other two methods

237
III. Comparison of the results of the approximate method, the
microtremors, and the dynamic response analysis with RAN230 and
10% damping:
Table (10.12) and Figure (10.10a) present the values of the average
fundamental period for each method with the dynamic response analysis
of RAN230 and 10% damping. There are no changes in the values of
average fundamental periods of the approximate and microtremors
methods. It can be seen from Figure (10.10a) that the values of the
average fundamental period of microtremors record DRB3 and the
dynamic response analysis are very close with a value range of 0.06 to
0.07 second. Figure (10.10b) shows plots of the ratios of the values of
each method over the other two. The ratios of the average fundamental
periods of the approximate method over those of the microtremors
method ranged from 1 to 5, and the ratios of the approximate method
values to the dynamic analysis values ranged from 4.5 to 6.0. The ratios
of the dynamic analysis values over the microtremors values ranged from
0.2 to1.

238
Table 10.12: Comparison of the average values of the fundamental periods at Al-Durrah
Approximate Method
Microtremors
Dynamic Site Response Analysis RAN230 at 10% damping
Av All
Av CXW
Av CH
Av CXW @ CH DRA1 DRB1 DRB3
Av All Av CXW Av CH
Av CXW @ CH
Average Fundamental l period (sec) 0.313 0.302 0.352 0.337 0.307 0.157 0.065 0.066 0.069 0.059 0.065

239
Figure 10.10a: Plots of the average values of Al-Durrah fundamental periods
0
0.1
0.2
0.3
0.4
Av All AvCXW
Av CH AvCXW@ CH
DRA1 DRB1 DRB3 Av All AvCXW
Av CH AvCXW@ CH
RAN230 at 10% damping
Approximate Method Microtremors Dynamic Site ResponseAnalysis
Test Methods
Perio
d (s
ec)
AverageFundamental period
Al-Durrah Site Average Fundamental Periods (Dynamic Analysis of RAN230 @ 10% Damping)

240
01234567
all
app
all
cxw
all C
H
CX
2C
H
DR
A1
DR
B1
DR
B3 all
all
cxw
all C
H
Cx
@C
H
Approx Method Microtremors Dynamic Resp
Test Method
Rat
io o
f Fun
d. P
erio
d
Approx All
Approx All CXW
Approx All CH
Approx CXW at CH
DRA1
DRB1
DRB3
Dynamic All
Dynamic all cxw
Dynamic allCH
Dynamic CXW at CH
Ratios of the Average Fundamental Periods of the Three Methods over Each Other(Dynamic Response Analysis of RAN230-10% damping)
Figure 10.10b: Plots of the ratios of average fundamental periods of each method
over the fundamental periods of the other two methods

241
IV. Comparison of the results of the approximate method, the
microtremors, and the dynamic response analysis with RAN330 and
10% damping:
Table (10.13) and Figure (10.11a) present the values of the average
fundamental period for each method with the dynamic response analysis
of RAN330 and 10% damping. There are no changes in the values of
average fundamental periods of the approximate and microtremors
methods. It can be seen from Figure (10.11a) that the values of the
average fundamental period microtremors record DRB3 and the dynamic
response analysis are very close. Figure (10.11b) shows plots of the
ratios of the values of each method over the other two. The ratios of the
average fundamental periods of the approximate method over those of the
microtremors method range from 1to about 5, and the ratios of the
approximate method values to the dynamic analysis values ranged from
3.5 to 4.5. The ratios of the dynamic analysis values over the
microtremors values ranged from 0.25 to 1.3.

242
Table 10.13: Comparison of the average values of the fundamental periods at Al-Durrah
Approximate Method
Microtremors
Dynamic Site Response AnalysisRAN330 at 10% damping
Av All
Av CXW
Av CH
Av CXW @ CH DRA1 DRB1 DRB3
Av All
Av CXW
Av CH
Av CXW @ CH
Average Fundamental period (sec) 0.313 0.302 0.352 0.337 0.307 0.157 0.065 0.085 0.087 0.082 0.078

243
Al-Durrah Site Average Fundamental Periods (Dynamic Analysis of RAN330 @ 10% Damping)
00.10.20.30.4
Av
All
Av
CX
W Av CH
Av
CX
WD
RA
1
DR
B1
DR
B3
Av
All
Av
CX
W Av CH
Av
CX
W
RAN330 at 10%
Approximate Microtremors Dynamic Site
Test Metods
Per
iod
(sec
)
AverageFundamentalperiod
Figure 10.11a: Plots of the average values of Al-Durrah fundamental periods

244
0
1
2
3
4
5
6al
lap
pal
lcx
w
all C
H
CX
2C
H
DR
A1
DR
B1
DR
B3 all
all
cxw
all C
H
Cx
@C
H
Approx Method Microtremors Dynamic Resp
Test Method
Rat
io o
f Fun
d. P
erio
dApprox All
Approx All CXW
Approx All CH
Approx CXW at CH
DRA1
DRB1
DRB3
Dynamic All
Dynamic all cxw
Dynamic allCH
Dynamic CXW at CH
Ratios of the Average Fundamental Periods of the Three Methods over Each Other(Dynamic Response Analysis of RAN330-10% damping)
Figure 10.11b: Plots of the ratios of average fundamental periods of each method
over the fundamental periods of the other two methods

245
In all four rounds of comparisons, the ratios of the approximate
method average fundamental periods to those of the dynamic site
response analysis ranged from 2 to5. This significant difference may be
attributed to the over simplifications of the approximate method.
Examples of these over simplifications include ignoring the effects of
embedded soft soil layers within the profile, and ignoring the effects of
the damping ratio. The effects of the presence of soft layers within the
soil profile are discussed and analyzed in Chapter 11.
To illustrate the difference between the approximate method and the
dynamic site response analysis method, an ideal soil profile in which the
SWV increases incrementally with depth was established. The profile
has the NEHRP depth of 30 m, Figure (10.12) and Table (10.14).
SWV Unit weight
Figure 10.12: Ideal profile

246
Layer Number
Layer Thickness
LayerSWV
1 5 200 2 5 300 3 5 400 4 5 500 5 5 600 6 5 700
7 (Bedrock) Infinite 1500
Table 10.14: Properties of the ideal profile’s layers
Analysis of this profile by the approximate method and the dynamic site
response analysis (earthquake RAN230 at 5% damping) yielded:
The approximate method fundamental period, T = 0.318 sec.
The dynamic site response analysis fundamental period, T= 0.0636 sec.
If the properties of the profile layers were kept the same, but the sequence
of the layers was rearranged so that stiffer layers are on top of softer
layers such as shown in Figure (10.13), then the fundamental periods by
the two methods became:
The approximate method fundamental period, T = 0.318 sec.
The dynamic site response analysis fundamental period, T= 0.42 sec.
The fundamental period by the approximate method remained the same
while the fundamental period by the dynamic site response analysis
increased by 560%. This illustrates the lack of sensitivity of the
approximate method to the presence of softer layers beneath the stiffer
one

247
SWV Unit weight
Figure 10.13: Re-arranged layers of ideal profile
The variation in the value of the fundamental periods of DRA1 on
one hand and DRB1 and DRB3 on the other hand, might be due to the
difference in the site level, Figure (10.3). The difference between levels
A and B of the Al-Durrah site is 15 to 20 m. However, there is no
apparent explanation for the difference in values of the fundamental
period of DRB1 and DRB3. The fundamental period of DRA1 was very
close to the fundamental periods of the approximate method, while the
fundamental period of DRB3 was very close to Dynamic site response
analysis fundamental period.

248
From the previous analyses, it can be seen that the fundamental
periods of the Al-Durrah site soil profiles are influenced by the following:
1 The soil cross-sectional modeling method
2 The input earthquake
3 The damping ratio of the soil
The effects of the different profiling methods are obvious from
Tables (10.2) and (10.7). Different profiling methods could lead to
different fundamental periods of the same location. In the case of the Al-
Durrah site, the difference was as high as 66% for the approximate
method, and 328% for the dynamic response analysis.
The second source of influence, which is the input earthquake, can
be seen by comparing the fundamental periods of earthquakes RAN230
and RAN330. In earthquake RAN230 analysis only one soil profile
(D3CXW) showed a significant variation in the value of the fundamental
period compared with the rest of profiles. The analysis of earthquake
RAN330 with 5% damping shows significant variations in the values of
the fundamental period of profiles D3CXW, D5BCXW, D6 CXW, and
D12CH.
The influence of the damping ratio is demonstrated by comparing
the fundamental periods at the 5% and 10 % damping ratios of each
earthquake. The fundamental periods associated with both earthquakes

249
show significant variations at the 5% damping ratio and no significant
variations at the 10% damping ratio.

250
Chapter 11: The Effects of Bedrock Depth Variation on the Al-Durrah Site Fundamental Periods
11.1 General
The general procedure of NEHRP Provisions for generating a site
design response spectrum was presented in Chapter 2. The method
requires the modeling of the soil cross-section of the site top 30 m (100
ft). Therefore, the method in effect places the bedrock at a depth of 30m
even if the actual bedrock depth is much larger. The implications of
limiting the soil profile to the top 100 ft (30 m) of the site by NEHRP
Provisions are examined in this Chapter. This analysis includes the
examination of the effects of increasing the bedrock depth on the site
fundamental period. This part of the analysis is based on the results of
the dynamic site response analysis of the Al-Durrah site and the East-
west seismic array. The dynamic site response analysis was performed
using the computer program ProShake, which was introduced in chapter
3. The results of the dynamic site response analysis for the Al-Durrah
site as well as the East-west seismic array were presented in Chapter 8.
Finally, and as an extension of this analysis, the effects of the presence of
an embedded soft soil layers within a soil profile are also examined.

251
11.2 Effects of Increasing the Bedrock Depth on the Al-Durrah Site
Fundamental Period
11.2a Dynamic Site Response Analysis Input Information The computer program ProShake, which was introduced in Chapter
3, was used in the analysis of the effects of increasing the bedrock depth
at the Al-Durrah site. The two synthetic earthquakes RAN230 and
RAN330 that were introduced in Chapter 8 were also used in this
analysis. Each earthquake analysis was performed twice using damping
ratios of 5% and 10%. The soil shear wave velocity (SWV) profiles that
were used in the analysis are the same profiles that were generated by the
Controlled Source Spectral Analysis of Surface Waves (CXW) and the
cross-hole (CH) tests, which were presented in Chapter 7. The only
difference is that for this analysis the bedrock depth was increased in
increments from NEHRP specified depth of 30 m up to the actual depth
of 350m. Each profile’s name indicates the boring location of the profile
and the type of SWV test that was performed at that location. As an
example, D6CXW refers to the SWV profile of the CXW test at boring
number 6.
The vertical electric sounding (VES) results that were presented in
Chapter 8 are shown in Figure 11.1 for convenience. The VES result
indicates that the bedrock depth at the Al-Durrah site is 350 m to 375 m.

252
For the purpose of this part of the analysis the bedrock depth was
assumed to be at 350m.
Figure 11.1 Al-Durrah site VES cross-section
11.2b Effects of Increasing the Depth of Bedrock on the Al-Durrah Site
Fundamental Period To examine the effects of increasing the bedrock depth on the site
fundamental period, each SWV profile from the CXW and CH was
assigned five different bedrock depths. These depths ranged from the
NEHRP depth of 30 m to the estimated actual depth of 350 m. The five
selected depths are shown in Table (11.1). The SWV for soil depths
larger than 30 m were assumed to be equal to the SWV of the soil at
NEHRP depth of 30 m, and remained constant up to the selected bedrock

253
depth. Each SWV profile was analyzed at each depth four times using the
two synthetic earthquakes and the two damping ratios of 5% and 10%.
Bedrock Depth
Designation
Bedrock
Depth (m)
TAC Actual Depth = 350
TA NEHRP Depth = 30
TB 100
TC 200
TD 300
Table 11.1: Definitions of bedrock depths for
the dynamic site response analysis
The results of the analysis are presented in four parts based on the
synthetic earthquake being used and the damping ratio:
I. Earthquake RAN230 and 5% Damping
Table (11.2) and Figures (11.2) and (11.3) show the results of the
dynamic site response analysis for the Al-Durrah site SWV profiles at the
selected depths. Profiles D3CXW, D7CXW, and D8CXW showed the
largest fluctuations in the values of the site fundamental period with the
variation of the bedrock depth. This is evident from the relatively large
standard deviations associated with these three profiles.

254
The rest of the profiles showed much smaller variations. The three
profiles that showed large variations in the values of the fundamental
period with the variation in the depth of the bedrock are examined in the
next section.
Ground Response Spectra Peak Periods RAN230 @ 5% Damping
Test Location TAC TA TB TC TD Average STDEV D1 0.069 0.064 0.077 0.054 0.054 0.0636 0.009915D2 0.09 0.054 0.077 0.088 0.077 0.0772 0.014307D3 0.13 0.2 0.077 0.088 0.14 0.127 0.048806D4 0.079 0.088 0.077 0.077 0.077 0.0796 0.004775
D5A 0.079 0.077 0.077 0.088 0.054 0.075 0.01259 D5B 0.057 0.064 0.054 0.054 0.054 0.05725 0.004336D6 0.069 0.064 0.064 0.054 0.054 0.061 0.006708D7 0.12 0.088 0.17 0.077 0.14 0.119 0.037974D8 0.13 0.077 0.16 0.064 0.054 0.097 0.045815D9 0.069 0.077 0.054 0.077 0.054 0.0662 0.011606
D11 0.079 0.077 0.078 0.064 0.077 0.075 0.006205
CXW Test
D12 0.069 0.064 0.069 0.054 0.054 0.062 0.007583
D5CH 0.079 0.064 0.064 0.064 0.077 0.0696 0.007701D6CH 0.057 0.064 0.054 0.054 0.077 0.0612 0.009731
D11CH 0.09 0.064 0.079 0.064 0.054 0.0702 0.01422 Cross Hole Tests D12CH 0.057 0.077 0.056 0.054 0.054 0.0596 0.009813
Table 11. 2: Variation of the peak periods of the Ground response
spectra with depth using earthquake RAN230 at 5% damping

255
Variation of Fundamental Period with Depth(RAN230 @ 5% Damping)
0
0.05
0.1
0.15
0.2
0.25
0 50 100 150 200 250 300 350 400Bedrock Depth (m)
Perio
d (S
ec.)
D1CXWD2CXWD3CXWD4CXWD5ACXWD5BCXWD5CHCD6CXWD6CHCD7CXWD8CXWD9CXWD11CXWD11CHCD12CXWD12CHC
Figure 11.2: Variation of Al-Durrah fundamental periods with increasing
depth of bedrock for earthquake RAN230 at 5% damping

256
Figure 11.3: Variation of Al-Durrah fundamental periods with increasing
depth of bedrock for earthquake RAN230 at 5% damping
Variation of Fundamental Period with Increased Bedrock Depth (RAN230:5%d)
0
0.05
0.1
0.15
0.2
0.25
D1 D2 D3 D4
D5A
D5B D6 D7 D8 D9
D11
D12D5CHD6CHD11
CHD12
CH
Testing Location
F un
d. P
erio
d (s
ec)
TACTATBTCTD

257
II. Earthquake RAN230 and 10% Damping
Table (11.3) and Figures (11.4) and (115) show the results of the
dynamic site response analysis for the Al-Durrah site SWV profiles at the
selected depths. Profiles D2CXW, D3CXW, D4CXW, D7CXW, and
D8CXW showed the largest fluctuations in the values of the site
fundamental period with the variation of the bedrock depth, which are
less than the fluctuations at 5% damping ratios. These profiles are
examined in the next section.
Ground Response Spectra Peak Periods RAN230 @ 10% Damping
Test Location TAC TA TB TC TD Average STDEV D1 0.069 0.064 0.077 0.064 0.064 0.0676 0.005683D2 0.1 0.054 0.077 0.077 0.077 0.077 0.016263D3 0.06 0.077 0.054 0.064 0.09 0.069 0.014457D4 0.077 0.064 0.095 0.077 0.077 0.078 0.011045
D5A 0.069 0.077 0.077 0.064 0.054 0.0682 0.00968 D5B 0.069 0.064 0.054 0.054 0.054 0.059 0.007071D6 0.069 0.054 0.054 0.064 0.054 0.059 0.007071D7 0.091 0.088 0.088 0.077 0.054 0.0796 0.015274D8 0.079 0.077 0.078 0.077 0.054 0.073 0.010654D9 0.057 0.077 0.054 0.064 0.054 0.0612 0.009731
D11 0.079 0.077 0.078 0.077 0.077 0.0776 0.000894
CXW Test
D12 0.057 0.054 0.057 0.054 0.054 0.0552 0.001643
D5CH 0.069 0.054 0.054 0.064 0.054 0.059 0.007071D6CH 0.057 0.054 0.054 0.054 0.064 0.0566 0.004336
D11CH 0.069 0.064 0.079 0.054 0.064 0.066 0.009083Cross Hole Tests D12CH 0.069 0.064 0.057 0.054 0.054 0.0596 0.006656
Table 11. 3: Variation of the peak periods of the Ground response
spectra with depth using earthquake RAN230 at 10% damping

258
Variation of Fundamental Period with Depth(RAN230 @ 10% Damping)
0
0.02
0.04
0.06
0.08
0.1
0.12
0 50 100 150 200 250 300 350 400
Bedrock Depth (m)
Perio
d (s
ec)
D1CXW
D2CXW
D3CXW
D4CXW
D5ACXW
D5BCXW
D5CHC
D6CXW
D6CHC
D7CXW
D8CXW
D9CXW
D11CXW
D11CHC
D12CXW
D12CHC
Figure 11.4: Variation of Al-Durrah fundamental periods with increasing
depth of bedrock for earthquake RAN230 at 10% damping

259
Figure 11.5: Variation of Al-Durrah fundamental periods with increasing
depth of bedrock for earthquake RAN230 at 10% damping
00.020.040.060.08
0.10.12
D1 D2 D3 D4
D5A
D5B D6 D7 D8 D9
D11 D12D5CHD6CHD11
CHD12CH
Testing Locations
Fund
. Per
iod
(sec
)
TACTATBTCTD
Variation of Fundamental Period with Increased Bedrock Depth (RAN230:10%d)

260
III. Earthquake RAN330 and 5% Damping
Table (11.4) and Figures (11.6) and (11.7) show the results of the
dynamic site response analysis for the Al-Durrah site SWV profiles at the
selected depths. Profiles D3CXW, D4CXW, D5bCXW, D6CXW,
D7CXW, D8CXW, and D12CH showed the largest fluctuations in the
values of the site fundamental period with the variation of the bedrock
depth. This is evident from the relatively large standard deviations
associated with these three profiles.
The rest of the profiles showed much smaller variations. The
profiles that showed large variations in the values of the fundamental
period with the variation in the depth of the bedrock are examined in the
next section.

261
Ground Response Spectra Peak Periods RAN330 @ 5% Damping
Test Location TAC TA TB TC TD Average STDEV D1 0.079 0.098 0.088 0.077 0.077 0.0838 0.009149D2 0.11 0.098 0.11 0.088 0.1 0.1012 0.00923 D3 0.11 0.2 0.16 0.16 0.1 0.146 0.040988D4 0.27 0.098 0.26 0.27 0.1 0.1996 0.091928
D5A 0.091 0.088 0.088 0.088 0.077 0.0864 0.005413D5B 0.054 0.25 0.05 0.077 0.1 0.1062 0.082844D6 0.079 0.32 0.29 0.054 0.1 0.1686 0.126023D7 0.17 0.098 0.098 0.098 0.11 0.1148 0.031292D8 0.17 0.098 0.15 0.11 0.17 0.1396 0.033776D9 0.079 0.077 0.1 0.11 0.077 0.0886 0.015405
D11 0.1 0.098 0.079 0.077 0.077 0.0862 0.011735
CXW Tests D12 0.1 0.077 0.077 0.11 0.11 0.0948 0.016754
D5CH 0.079 0.088 0.077 0.064 0.1 0.0816 0.01339 D6CH 0.11 0.098 0.088 0.098 0.11 0.1008 0.009338
D11CH 0.079 0.098 0.1 0.077 0.077 0.0862 0.011735Cross Hole Tests D12CH 0.29 0.33 0.077 0.16 0.077 0.1868 0.118308
Table 11.4: Variation of the peak periods of the Ground response
spectra with depth using earthquake RAN330 at 5% damping

262
Variation of Fundamental Period with Depth of Bedrocks(RAN330 @ 5% Damping)
0
0.05
0.1
0.15
0.2
0.25
0.3
0.35
0 50 100 150 200 250 300 350 400
Depth of Bedrock (m)
Perio
d (s
ec)
D1CXWD2CXWD3CXWD4CXWD5ACXWD5BCXWD5CHCD6CXWD6CHCD7CXWD8CXWD9CXWD11CXWD11CHCD12CXWD12CHC
Figure 11.6: Variation of Al-Durrah fundamental periods with increasing
depth of bedrock for earthquake RAN330 at 5% damping

263
Figure 11.7: Variation of Al-Durrah fundamental periods with increasing
depth of bedrock for earthquake RAN330 at 5% damping
00.050.1
0.150.2
0.250.3
0.35
D1 D2 D3 D4D5A D5B D6 D7 D8 D9
D11 D12D5C
HD6C
HD11
CHD12
CH
Testing Locations
Fund
. Per
iod
(sec
) TACTATBTCTD
Variation of Fundamental Period with Increased Bedrock Depth (RAN330:5%d)

264
IV. Earthquake RAN330 and 10% Damping
Table (11.5) and Figures (11.7) and (11.8) show the results of the
dynamic site response analysis for Al-Durrah site SWV profiles at the
selected bedrock depths. Profiles D8CXW, D12CXW, and D12CH
showed the largest fluctuations in the values of the site fundamental
period with the variation of the bedrock depth. This is evident from the
relatively large standard deviations associated with these three profiles.
The overall magnitude of the fluctuations in the values of the
fundamental period is much less than the magnitude at 5% damping ratio.
The rest of the profiles showed much smaller fluctuations in the
values of the fundamental periods as a result of increasing the bedrock
depth. The profiles that showed large variations in the values of the
fundamental period with the variation in the depth of the bedrock are
examined in the next section.

265
Ground Response Spectra Peak Periods RAN330 @ 10% Damping
Test Location TAC TA TB TC TD Average STDEV D1 0.079 0.088 0.077 0.077 0.077 0.0796 0.004775D2 0.11 0.098 0.098 0.077 0.1 0.0966 0.012033D3 0.11 0.078 0.12 0.11 0.1 0.1036 0.015962D4 0.07 0.098 0.095 0.098 0.1 0.0922 0.012538
D5A 0.091 0.077 0.098 0.077 0.077 0.084 0.009899D5B 0.1 0.064 0.1 0.077 0.1 0.0882 0.016799D6 0.079 0.098 0.077 0.064 0.1 0.0836 0.015209D7 0.091 0.098 0.11 0.11 0.1 0.1018 0.008198D8 0.079 0.11 0.16 0.11 0.12 0.1158 0.029124D9 0.079 0.077 0.1 0.098 0.077 0.0862 0.011735
D11 0.1 0.098 0.079 0.077 0.11 0.0928 0.014272
CXW Tests
D12 0.11 0.054 0.077 0.11 0.1 0.0902 0.024315
D5CH 0.079 0.088 0.054 0.054 0.1 0.075 0.020567D6CH 0.1 0.098 0.077 0.098 0.1 0.0946 0.009889D11CH 0.11 0.077 0.1 0.09 0.077 0.0908 0.014446
Cross Hole Tests D12CH 0.1 0.064 0.054 0.11 0.077 0.081 0.023643
Table 11.5: Variation of the peak periods of the Ground response
spectra with depth using earthquake RAN330 at 10% damping

266
Variation of Fundamental Period with Depth of Bedrock(RAN330 @ 10% Damping
0
0.02
0.04
0.06
0.08
0.1
0.12
0.14
0.16
0.18
0 50 100 150 200 250 300 350 400
Depth of Bedrock (m)
Perio
d (s
ec)
D1CXWD2CXWD3CXWD4CXWD5ACXWD5BCXWD5CHCD6CXWD6CHCD7CXWD8CXWD9CXWD11CXWD11CHCD12CXWD12CHC
Figure 11.8a: Variation of Al-Durrah fundamental periods with increasing
depth of bedrock for earthquake RAN330 at 10% damping

267
Figure 11.8b: Variation of Al-Durrah fundamental periods with increasing
depth of bedrock for earthquake RAN330 at 10% damping
0
0.05
0.1
0.15
0.2
D1 D2 D3 D4
D5A
D5B D6 D7 D8 D9
D11 D12D5CHD6CHD11
CHD12
CH
Testing Locationss
Fund
. Per
iod
(sec
)
TACTATBTCTD
Variation of Fundamental Period with Increased Bedrock Depth (RAN330:10%d)

268
11.2c Analysis of the Soil Profiles with Significantly Variable
Fundamental Periods The results of the previous section showed that the site fundamental
period values of certain soil profiles at the Al-Durrah site were influenced
by the increased depth of the bedrock. Different profiles exhibited
different fluctuations in the values of the fundamental period depending
on the selection of the synthetic earthquake and the damping ratio that
were used in the dynamic site response analysis.
The fluctuations in the values of the fundamental periods with the
increased depth of the bedrock ranged from very insignificant change in
some cases, to very significant changes in others. In order to categorize
these fluctuations into significant and insignificant fluctuations, a
criterion was selected. The average value of the fundamental period of a
profile in Tables (11.2) to (11.5) represents the average of all
fundamental periods of that profile at the various selected depths. The
best statistical tool that characterizes fluctuation for a certain variable is
its coefficient of variation (COV), which is defined as [28]:
COV = (The standard deviation ÷ the mean) X 100
COV is commonly expressed as a percentage. Higher COV values
indicate higher fluctuations in the values of the data being analyzed. The
COV of fundamental periods in Tables (11.2) to (11.5) were calculated.

269
The results are summarized in Table (11.6) and plotted in Figure (11.9).
A COV limit of 20% was selected to separate profiles with significant
fluctuations from those with no significant fluctuations. If the COV of
the fundamental period at a certain soil profile is less than 20%, then the
fundamental period at this profile is assumed not to be influenced by
increasing the bedrock depth. On the other hand, a COV of more than
20% was considered to indicate significant fluctuation in the value of the
fundamental period due to increased bedrock depth. This assumption was
applied to all profiles that had a ratio of more than 20% under any
analysis of the two synthetic earthquakes. Based on this criterion, Table
(11.6) and Figure (11.9) show that the following profiles had significant
fluctuations in the values of the fundamental period as a result of
increasing the bedrock depth:
D2CXW, D3CXW, D4CXW, D5BCXW, D6CXW, D7CXW, D8CXW,
D12CXW, D5CH, and D12CH.

270
Coefficient of Variation (COV) of the Fundamental Period (%)
Earthquake RAN230 Earthquake RAN330
Test Type
Test Location
5% Damping
10% Damping
5% Damping
10% Damping
D1 15.59 8.41 10.92 6.00 D2 18.53 21.12 9.12 12.46 D3 38.43 20.95 28.07 15.41 D4 6.00 14.16 46.06 13.60
D5A 16.79 14.19 6.26 11.79 D5B 7.57 11.98 78.01 19.05 D6 11.00 11.98 74.75 18.19 D7 31.91 19.19 27.26 8.05 D8 47.23 14.59 24.19 25.15 D9 17.53 15.90 17.39 13.61
D11 8.27 1.15 13.61 15.38
CXW
D12 12.23 2.98 17.67 26.96 D5 11.06 11.98 16.41 27.42 D6 15.90 7.66 9.26 10.45
D11 20.00 13.76 13.61 15.91
CH D12 16.47 11.17 63.33 29.19
Table 11.6: Coefficient of Variation (COV)
of the fundamental periods (as a percentage)

271
Coefficient of Variation (COV) of the Fundamental Period
0.0010.0020.0030.0040.0050.0060.0070.0080.0090.00
D1 D2 D3 D4D5AD5B D6 D7 D8 D9D11D12
D5CHD6CHD11C
HD12C
H
Test Location and Type
CO
V (%
) RAN330 5%RAN330 10%RAn230 5%RAn230 10%
Figure 11.9: Coefficients of Variation of the fundamental periods
of Al-Durrah (as a percentage)

272
The next step is to determine the soil characteristics that cause the
fundamental period of some profiles to vary with increasing bedrock
depth. Table (11.7) presents a summary of the Al-Durrah field tests
results for each soil profile and its corresponding site classifications.
These results were presented in Chapter 7. The last column of Table
(11.7) identifies the profiles that exhibited significant fundamental period
fluctuation due the bedrock depth variation. The field tests results and
their corresponding NEHRP site classifications do not provide any
indications on whether a profile’s fundamental period will be influenced
by the bedrock depth variation. For example, test location D11 with a
NEHRP SPT average blow count of 25.85 did not exhibit any fluctuation
in the fundamental period as a result of bedrock depth variation, while
test location D7 with a NEHRP SPT average blow count of 92.85 did
exhibit fluctuation. Similarly, test location D11 with a CXW average
SWV of 371 (m/s) did not exhibit any fluctuation in the fundamental
period with the variation of the bedrock depth, while test location D5b
with a CXW average SWV of 523 (m/s) did. Similar cases can also be
found in the cross-hole test results. No definite conclusions can be made
about the relationship between a profile’s NHERP site classifications,
NEHRP average SWV, and its fundamental period fluctuation with
increased bedrock depth. Therefore, it is necessary to look for other
factors that cause some of the soil profiles to exhibit significant

273
fundamental period fluctuation with increasing bedrock depth, while not
having the same effect on other softer profiles.

274
Table 11.7: Summary of Al-Durrah soil cross-section average SPT, NEHRP SWV,
and effect of bedrock depth variation
Test Location
NEHRP SPT Average No.
of blows
NEHRP SPT Site
Classification
CXW Average
SWV
CXW NEHRP Site
Classification
Cross-Hole Average
SWV
Cross-hole NEHRP Site Classification
Sig. Fundamental Period
Fluctuation D1 83.92 C 420. C No D2 67.57 C 439 C Yes D3 70.74 C 410 C Yes D4 34.48 D 422 C Yes
D5A 65.84 C 465 C 316 D No D5b 65.84 C 523 C 316 D Yes (CXW) D6 80.84 C 333 D 438 C Yes (CXW) D7 65.62 C 466 C Yes D8 92.85 C 424 C Yes D9 74.30 C 476 C No D11 25.85 D 371 C 381 C No D12 92.01 C 353 D 223 D Yes (CXW & CH)

275
Figures (11.10a) to (11.10p) show the SWV of each of the Al-
Durrah soil profiles that were used in the dynamic site response analysis.
These profiles were generated by the computer program ProShake, based
on the input SWV of each profile. The input SWV profiles were based
on the results of the CXW and the CH field tests. All of the profiles that
showed significant fundamental period fluctuations are characterized by
the presence of embedded soft layers that are sandwiched by stiffer
layer(s). On the other hand, embedded soft layers were also present in
some of the profiles that did not show significant fluctuations. This
suggests That the presence of embedded soft layers may cause significant
fluctuations in the value of the fundamental period due to variation in the
bedrock depth. In order to determine the factors that cause embedded
soft layers to influence the fundamental period, further dynamic site
response analysis was performed. In this analysis, the effects of
increasing the thickness and the SWV of an embedded soft layer on the
fundamental period were examined. The results of the analysis are
presented in the next section.

276
SWV unit weight
Figure 11.10a: Location D1-CXW test soil profile

277
SWV unit weight
K
Figure 11.10b: Location D2-CXW test soil profile

278
SWV unit weight
Figure 11.10c: Location D3-CXW test soil profile

279
SWV unit weight
Figure 11.10d: Location D4-CXW test soil profile

280
SWV unit weight
Figure 11.10e: Location D5-CXW test soil profile

281
SWV unit weight
Figure 11.10f: Location D5b-CXW test soil profile

282
SWV unit weight
C K
Figure 11.10g: Location D5-CH test soil profile

283
SWV unit weight
Figure 11.10h: Location D6-CXW test soil profile

284
SWV unit weight
Figure 11.10i: Location D6-CH test soil profile

285
SWV unit weight
Figure 11.10j: Location D7-CXW test soil profile

286
SWV unit weight
K
Figure 11.10k: Location D8-CXW test soil profile

287
SWV unit weight
Figure 11.10l: Location D9-CXW test soil profile

288
SWV unit weight
Figure 11.10m: Location D11-CXW test soil profile

289
SWV unit weight
Figure 11.10n: Location D11-CH test soil profile

290
SWV unit weight
Figure 11.10o: Location D12-CXW test soil profile

291
SWV unit weight
Figure 11.10p: Location D12-CH test soil profile

292
11.2d Effects of Embedded Soft Layers on the Fundamental Period
The effects of the presence of an embedded soft layer within a
soil profile are examined in this section. The effects are analyzed in
conjunction with increasing the bedrock depth. The soil profile D1CXW
that is shown in Figure (11.10a) was used in this analysis. This profile
was selected because it did not show significant fluctuation in the values
of the fundamental period with increasing bedrock depth. The original
profile had a very thin soft layer at the ground surface, and another one
beginning at a depth of 3.25 m. However for the purpose of this analysis,
both layers were removed initially and the profile was assumed to have a
constant SWV of 500 m/s. The bedrock depth was placed at NEHRP
depth of 30 m, and the profile was designated as D1N.
Another profile identical to D1N with the exception of the bedrock depth
was also established and designated as D1ac. The bedrock depth of
profile D1ac was placed at the estimated actual depth of 350 m. The
analysis was performed using the program ProShake and the synthetic
earthquake RAN330 with two damping ratios of 5% and 10%.
The relationship between the thickness of an embedded soft layer,
the depth of bedrock, and the site fundamental period is presented next.
The dynamic site response analysis was performed repeatedly for both
profiles with varying soft layer thickness and SWV. In each analysis, the
soft layer thickness was increased incrementally from 3 to 15 m. At each

293
damping ratio, the analysis was repeated four times using four values of
the SWV of the soft layer including 350, 300, 250, 200 m/s. The
embedded soft layer was placed at a depth of 3.25m in both profiles,
similar to the original profile of D1CXW. The results of the analysis are
presented in Table (11.8) and Figures (11.11) and (11.12). Details of the
analysis including input and output data are presented in Appendix (H).
Figures (11.11a) to (11.11d) show the results of the analysis at 5%
damping ratio. At the lower values of the soft layer thickness, there was
little or no variation in the fundamental period. At soft layer thickness of
7 m and higher, the four Figures clearly show that the variation in the
fundamental period between the two profiles increases with increasing
soft layer thickness. The variation of the fundamental period also
increased with decreasing the SWV of soft layer.
Figures (11.12a) to (11.12d) show the results of the analysis at 10%
damping ratio. Again, at the lower values of the soft layer thickness,
there was little or no variation in the fundamental period. Figures
(11.12a, b, and c) show that the variation of the fundamental period starts
increasing at the soft layer thickness of 5m, then starts decreasing after
reaching the thickness of 9m. Figure (11.12d) which has a soft layer
SWV of 200 m/s, shows that the variation of the fundamental period
increased with increasing soft layer thickness. All of the four figures

294
indicate that the variation of the fundamental period between the two
profiles increased with decreasing the SWV of the soft layer.
The analyses that were presented in Sections 11.2c and 11.2d
suggest that the presence of soft embedded layers of significant thickness
within a soil profile makes the fundamental period sensitive to the depth
of the bedrock. If no significant soft layers are embedded within a
profile, then the depth of the bedrock becomes irrelevant to the site
fundamental period. The effects of the presence of embedded soft soil
layers on a soil cross-section’s fundamental period will depend on the
soft layers’ thickness, SWV, location, and the damping ratio of the soil.
To verify these findings, the analysis of the East-west seismic array is
presented in the following section.

295
Soft Layer SWV (m/s) 350 350 300 300 250 250 200 200
Soft Layer
Thickness (m) Dac D1N Dac D1N Dac D1N Dac D1N 3 0.077 0.077 0.077 0.077 0.098 0.098 0.12 0.098 5 0.098 0.098 0.098 0.098 0.12 0.12 0.16 0.14 7 0.12 0.098 0.13 0.12 0.16 0.14 0.16 0.31 9 0.12 0.12 0.14 0.12 0.16 0.33 0.077 0.077
11 0.16 0.11 0.16 0.33 0.077 0.077 0.29 0.098 13 0.16 0.088 0.077 0.077 0.077 0.088 0.33 0.098 15 0.077 0.077 0.077 0.077 0.28 0.098 0.35 0.077
Table 11.8a: Results of the dynamic response analysis of Profiles D1ac
and D1N With damping ratio of 5%
Soft Layer SWV (m/s)- 350 350 300 300 250 250 200 200,
Soft Layer Thickness (m)
Dac D1N Dac D1N Dac D1N Dac D1N 3 0.077 0.077 0.077 0.077 0.098 0.077 0.12 0.0985 0.098 0.077 0.1 0.088 0.12 0.077 0.16 0.14 7 0.12 0.098 0.13 0.077 0.16 0.077 0.19 0.27 9 0.12 0.077 0.12 0.077 0.098 0.098 0.077 0.077
11 0.11 0.077 0.098 0.098 0.077 0.077 0.27 0.05413 0.099 0.088 0.077 0.077 0.088 0.077 0.35 0.07715 0.098 0.098 0.077 0.077 0.077 0.098 0.34 0.077
Table 11.8b: Results of the dynamic response analysis of Profiles D1ac
and D1N With damping ratio of 10%

296
Fundamental Periods for D1ac & D1N with Soft Layer SWV=350 (m/s) D=5%
0
0.05
0.1
0.15
0.2
0 5 10 15 20
Thickness of Soft Layer (m)
Perio
d (s
ec)
DacD1N
(a)
Fundamental Periods for D1ac & D1N with Soft Layer SWV=300 (m/s) D=5%
00.050.1
0.150.2
0.250.3
0.35
0 5 10 15 20
Thickness of Soft Layer (m)
Perio
d (s
ec)
DacD1N
(b)
Figure 11.11: Variations of the fundamental period with variations of bedrock depth and embedded soft layer thickness (5% damping)

297
Fundamental Periods for D1ac & D1N with Soft Layer SWV=250 (m/S) D=5%
00.050.1
0.150.2
0.250.3
0.35
0 5 10 15 20
Thickness of Soft Layer (m)
Per
uiod
(s)
DacD1N
(c)
Fundamental Periods for D1ac & D1N with Soft Layer SWV=200 (m/s) D=5%
00.050.1
0.150.2
0.250.3
0.350.4
0 5 10 15 20
Thickness of Soft Layer (m)
Fund
amen
tal P
erio
d (s
ec) Dac
D1N
(d)
Figure 11.11-continued: Variations of the fundamental period with
variations of bedrock depth and embedded
soft layer thickness (5% damping)

298
Fundamental Periods for D1c & D1N with Soft Layer SWV=350 (m/s) D=10%
00.020.040.060.080.1
0.120.14
0 5 10 15 20
Thickness of Soft Layer (m)
Per
iod
(sec
)
DacD1N
(a)
Fundamental Periods for D1ac & D1N with Soft Layer SWV=300 (m/s) D=10%
00.020.040.060.080.1
0.120.14
0 5 10 15 20
Thickness of Soft Layer (m)
Per
iod
(sec
)
DacD1N
(b)
Figure 11.12: Variations of the fundamental period with variations
of bedrock depth and embedded soft layer thickness (10% damping)

299
Fundamental Periods for D1ac & D1N withSoft Layer SWV=250 (m/s) D=10%
0
0.05
0.1
0.15
0.2
0 5 10 15 20
Thickness of Soft Layer (m)
Per
iod
(sec
)
DacD1N
(c)
Fundamental Periods for D1ac & D1N with Soft Layer SWV=200 (m/s) D=10%
00.050.1
0.150.2
0.250.3
0.350.4
0 5 10 15 20
Thickness of Soft Layer (m)
Per
iod
(sec
)
DacD1N
(d)
Figure 11.12-continued: Variations of the fundamental period
with variations of bedrock depth and embedded soft
layer thickness (10% damping)

300
11.2e Analysis of the East-west Seismic Array
The East-west seismic array was presented in Chapter 7. The array
extended from the Al-Durrah site to the first rock outcrop located 6 miles
east of Al-Durrah. The array illustration that was shown in Chapter 7 is
reproduced in Figure (11.13) for convenience. Five collinear seismic
stations including a rock outcrop at the eastern end of the array were
established using the advanced global positioning system. The bedrock
depth at each station was estimated by vertical electric sounding (VES)
tests. Table (11.9) summarizes the bedrock depth at each station. An
actual earthquake was recorded simultaneously at all four stations as well
as on the rock outcrop, and the earthquake records were presented in
Chapter 7. The magnitude and epicenter information of the earthquake
were also presented in Chapter 7. The fundamental period at each station
was determined by two methods. First, using the earthquake record of the
rock outcrop as the input motion, a dynamic site response analysis was
performed at the other four stations and from the results of these analyses
the fundamental period of each station was determined. Second, the time
domain earthquake records at each station were converted into a
frequency domain records, and the fundamental period was determined at
the maximum amplitude. The results of these two methods are presented
in the following two sections.

301
1- Analysis of the results of the Dynamic Site Response Analysis
Apart from the VES tests that established the bedrock depth at each
station, no other information was available for the soil profiles along the
East-west seismic array, with the exception of station DRA2 which was
part of the Al-Durrah site. The closest estimate to the soil properties at
the array stations was the soil properties of the Al-Durrah soil profiles.
Therefore, the average minimum and maximum shear wave velocities
were computed for all the profiles in the Al-Durrah site. These values
were then used for the soil profiles of the seismic stations along the array.
The top 30 m of each profile was divided into six equal layers. The top
soil layer was assigned the average minimum SWV, while the last layer
at the NEHRP depth of 30 m was assigned the average maximum SWV.
The shear wave velocity for the intermediate layers within NEHRP depth
increased linearly from top to bottom. All layers below NEHRP bedrock
depth and above the actual bedrock were assigned the average maximum
SWV. The analysis was repeated for 5% and 10% damping ratios. The
results of the analysis were presented in Chapter 8, and reproduced here
in Tables (11.10) for the east-west component of the earthquake, and in
Table (11.11) for the north-south component.

302
Location Bedrock Depth(m)
RD0 35-40 RD2 ≈ 170 RD3 ≈ 225 DRA2 ≈ 350
Table 11.9: Seismic stations of the East-west seismic
array and their bedrock depths

303
East
Figure 11.13: East-west seismic array
DREFF - Outcrop
Bedrock
≈ 9 Km
RD0 RD1- Noise only
≈ 35 m ≈ 95 m
RD2 RD3 RD4 - Cancelled
DRA2
≈ 225 m ≈ 170 m ≈ 350 m
400 m
830 m
2300 m
4800 m
Al-Durrah
East-West Seismic Array

304
A) East- west Components
• 5% Damping
Station RD0 RD2 RD3 A2 FundamentalPeriod (sec.)
0.098 0.098 0.08 0.08
Table 11.10: Fundamental periods for the east-west component
of array earthquake (5% damping)
• 10% Damping
Station RD0 RD2 RD3 A2 FundamentalPeriod (sec.)
0.11 0.11 0.11 0.11
Table 11.11: Fundamental periods for the east-west component
of Array earthquake (10% damping)
B) North-south Components
• 5% Damping
Station RD0 RD2 RD3 A2 FundamentalPeriod (sec.)
0.077 0.077 0.077 0.077
Table 11.12: Fundamental periods for the north-south component
of array earthquake (5% damping)

305
• 10% Damping
Station RD0 RD2 RD3 A2 FundamentalPeriod (sec.)
0.077 0.077 0.077 0.077
Table 11.13: Fundamental periods for the north-south component
of array earthquake (10% damping)
Table (11.10) shows that the dynamic site response analysis for the east-
west component of the earthquake at both damping ratios and at all four
stations resulted in site fundamental periods of 0.098 and 0.11 second.
Table (11.11) shows that the dynamic site response analysis for the
north-south component of the earthquake at both damping ratios and at
all four stations resulted in a site fundamental period of 0.077 second.
The dynamic site response analysis of the East-west seismic array
was performed with the assumption that no embedded soft layers were
present in any of the stations’ profiles. The results confirm that if no
embedded soft layers are present in the profile, the bedrock depth is
irrelevant to the site fundamental period.

306
2- Frequency Domain Spectra Fundamental Periods A) East-west Components
Station DREFF RD0 RD2 RD3 A2 Frequency
Hz 9.37 23.24 8.15 12.36 54.48
Fundamental Period (sec.)
0.107 0.043 0.123 0.081 0.018
Table 11.14: Fundamental frequencies (and periods) for the
East-west component of array earthquake
B) North-south Components
Station DREFF RD0 RD2 RD3 A2 Frequency
Hz 11.22 16.84 15.71 22.05 59.78
Fundamental Period (sec.)
0.089 0.059 0.064 0.046 0.017
Table 11.15: Fundamental frequencies (and periods) for the
north-south component of array earthquake
Tables (11.14) and (11.15) present the fundamental periods based on
the frequency domain records of the earthquake at each station. Contrary
to the results of the dynamic site response analysis, the frequency domain
fundamental periods show variations in the values of the fundamental
period with increased bedrock depth. In the dynamic site response
analysis, the soil cross-sectional models were assumed to be “normal”,
meaning that their shear wave velocity increased with depth and there
were no embedded soft soil layers. However, the results of the frequency
domain fundamental period suggest that the soil profiles at the stations

307
may not be “normal”. Since the only subsurface soil information at the
stations’ locations is that of the vertical electric sounding, the only certain
way to verify the characteristics of the soil profiles is to conduct soil
explorations similar to the ones that were performed at the Al-Durrah site
including standard penetration tests (SPT) and cross-hole (CH) tests.

308
Chapter 12: Conclusions and Recommendations of the Dissertation
12.1 General Chapters 1 through 11 presented the problem statement, the objectives of
the dissertation, field tests and their equipment, tests results, analysis of
the data, and the results of the analyses. The contents of each chapter are
summarized in the next section followed by the conclusions and
recommendations of the dissertation. However, the main objectives of
the dissertation are reintroduced here for convenience. These objectives
are:
1. Examine the effects of the different soil cross-sectional modeling
methods on the site NEHRP classification and the site design
response spectra.
2. Examine the effects of the different soil cross-section modeling
methods on the site fundamental period.
3. Examine the effects of increasing the bedrock depth beyond
NEHRP 30 m depth, on the site fundamental period
4. Examine the effects of the presence of an embedded soft layer
within the soil profile in conjunction with increasing the bedrock
depth, on the site fundamental period.

309
12.2 Chapters Review
The following is a brief description of the contents of Chapters 1
through 11 of the dissertation.
• Chapter 1 presented general information about earthquakes, their
magnitude scales, and other related definitions. Chapter 1 also
introduced the dissertation problem statement, the dissertation
objectives, and the methodology for achieving these objectives. As
stated in the chapter, earthquakes are the most powerful natural
disaster. Forces that are induced by earthquakes into the ground
must be taken into consideration by design engineers. The most
important tools in earthquake engineering are the site design
response spectra and the site fundamental period. A site design
response spectrum indicates the magnitude of the ground
acceleration as a function of the period or frequency of the
structures, while a site fundamental period indicates the resonance
period of that site. The determination of a site design response
spectrum or fundamental period requires the determination of the
site soil cross-sectional models. The National Earthquake Hazard
Reduction Program (NEHRP) Provisions require the soil cross-
sectional modeling of only the top 30 m of a site. In addition the
Provisions allow the soil cross-section model to be established by

310
a number of tests. The soil cross-sectional modeling tests that
were performed for this dissertation included:
i. The cross-hole (CH) test
ii. The Controlled Source Spectral Analysis of Surface Waves
(CXW)
iii. The standard penetration test (SPT).
Additional tests were also conducted for other site information
including:
i. Vertical electric sounding test (VES) for estimating the
actual bedrock depth
ii. Seismic recordings of microtremors and actual earthquake
events to verify the results of the other tests.
Details of these tests and their theoretical background were
presented in Chapter 5. The results of these tests were used in
different analyses for achieving the objectives of the dissertation.
• Chapter 2 presented the general procedure of NEHRP Provisions
for site classification and determining the design response spectra
for the design of structures. The method requires the
determination of the soil cross-section model for the top 30 m (100
ft) of the site of the structure [3]. The NEHRP general procedure
then classifies the site based on its soil cross-section model (or

311
profile). The soil cross-section model can be determined by one
of the following tests:
1. The site weighted average shear wave velocity (SWV)
(v s ).
2. The site weighted average standard penetration test (SPT)
uncorrected blow counts ( N ).
3. The site weighted average undrained shear strength ( S u ).
NEHRP Provisions also provide 24 maps to establish two
accelerations, (Ss and S1) values for the site being studied. These
values are then used in conjunction with the site classification to
establish the site design response spectra. NEHRP maps are
allocated for the U.S. and its territories, but there are no equivalent
maps for Saudi Arabia.
• Chapter 3 presented the three methods that were used to determine
the site fundamental period. These methods were the approximate
method, the microtremors spectral ratio method, and the dynamic
site response analysis method. The theoretical background and the
procedure of each method were presented in detail in this Chapter.
The approximate method and the dynamic site response analysis
method were designated as the analytical methods to be used. The
site fundamental period was determined by the analytical methods

312
using the soil cross-sectional models that were used for
determining the site design response spectrum by the NEHRP
general procedure. These soil cross-sectional models were based
on the results of the CXW, and the CH tests.
• Chapter 4 presented the selected site location, its geological
information, and its seismic background. The field tests and
seismic recordings were performed at two separate locations. The
first location is called Al-Durrah, which is located in the northwest
of Saudi Arabia along the coast of the Gulf of Aqaba. All the
conventional tests including the SPT, CH, CXW, and VES test, as
well as microtremors recordings were performed at this location.
The second location is the East-west seismic array. This array
extended eastward from Al-Durrah for approximately 6 miles,
where it reaches the first rock outcrop. Five seismic stations were
installed along this array, and the bedrock depth at these stations
ranged from zero m at the rock outcrop to 350 m at Al-Durrah.
The bedrock depth at each seismic station was estimated by VES
tests. An actual earthquake was recorded simultaneously by all
five stations. The objective of the seismic array was to verify the
effects of increasing the bedrock depth beyond NEHRP depth of
30 m, on the site fundamental period.

313
• Chapter 5 presented the field tests theoretical background and
procedures. These tests included the SPT, CH, CXW, and VES.
In addition, this chapter presented the seismic data acquisition
methods and systems that were used in the recording of
microtremors and actual earthquake events in the field.
• Chapter 6 presented the chronological order of the field work and
its phases. In addition, third parties’ participation in the field work
were also highlighted in this chapter. Third parties that
participated in the field work included equipment technicians,
field work contractors and field work consultants. This chapter
also presented additional information on the field testing
equipment.
• Chapter 7 presented the results of the field tests including the SPT,
CH, CXW, VES, the microtremors, and the actual earthquake
records. The results of these tests were not analyzed in this
chapter due to the relevance of the results of other analyses and
methods that were presented in Chapter 8.
• Chapter 8 presented the results of the analytical methods including
the approximate method and the dynamic site response analysis
method. The dynamic site response analysis results were for the
Al-Durrah site as well as the East-west seismic array. The results
of these methods were not analyzed in this Chapter due to the need

314
to regroup the results of Chapters 7 and 8, which were rearranged
and reproduced in Chapters 9, 10, and 11, where they were
discussed and analyzed.
• Chapter 9 presented the analysis of the effects of the different site
soil cross-section modeling methods on the site NEHRP
classification, and the site design response spectra.
• Chapter 10 presented the results of the analyses of the effects of
the different site soil cross-section modeling methods on the site
fundamental period.
• Chapter 11 presented the results of the analysis of the effects of
increasing the bedrock depth on the site fundamental period. In
addition, Chapter 11 showed the effects of the presence of an
embedded soft soil layer within the soil cross-section model in
conjunction with increasing the bedrock depth, on its fundamental
period. Furthermore, this chapter presented the results and
analysis of the East-west seismic array.

315
12.3 Results and Conclusions of the Dissertation Objectives
12.3a Effects of the Different Soil Cross-section Modeling Methods on
the Site Classification and the Site Design Response Spectra
The results of Chapter 9 showed that using the same test for
determining the soil cross-sectional models at different locations within
the same site could yield different NEHRP site classifications. Different
NEHRP classifications for different locations within the same site can be
attributed to soil variations throughout the site. However, the results also
showed that performing different tests such as the CXW, CH, and SPT at
the same location can also yield different NEHRP site classifications for
that location. In the case of the AL-Durrah site, the tests yielded site soil
classifications C and D simultaneously in many locations. The procedure
for generating a site design response spectrum was presented in Chapter
2. Chapter 9’s analyses of the Al-Durrah site showed that the maximum
difference between the design response spectra for soil classes C and D in
terms of ground response spectral acceleration can be as high as 41%,
Figure (12.1).

316
NEHRP Design Response Spectra for Al-Durrah Soil Classes C and D
0
0.05
0.1
0.15
0.2
0.25
0 0.5 1 1.5 2 2.5
Period T (sec)
Spec
tral
Res
pons
e A
ccel
erat
ion
Sa (g
)
SaCSaD
Figure 12.1: Al-Durrah design response spectra for soil class C and D To study the effects of earthquake magnitude on such differences in
design response spectral accelerations, two random locations on NEHRP
maps were selected. The first location was in Region 2, and had NEHRP
map accelerations Ss and S1, that were comparable to Al-Durrah
accelerations. In this site, the maximum difference between the design
response spectra for soil classes C and D in terms of ground response
spectral acceleration was also 41%, which was similar to the result
obtained at the Al-Durrah site. The second site was selected from
NEHRP maps Region 1, and has NEHRP map accelerations Ss and S1, that
are much higher than the Al-Durrah accelerations. In this site, the
maximum difference between the design response spectra for soil classes
C and D in terms of ground response spectral acceleration was over 18%.

317
Although the difference between the design response spectra of soil
classes C and D tended to decrease with increasing earthquake
magnitudes, it is important to note that the vast majority of earthquakes
have small to medium magnitudes [29]. This indicated that the difference
between the spectra of the two soil classes will more likely be significant
for most sites.
These results lead to the following conclusions:
• Different soil cross-section modeling methods can yield different
site classifications for the same location, which leads to different
design response spectra.
• Selecting one site classification over another can lead to a
significant overestimation or underestimation of the value of the
spectral response acceleration. This is a clear indication of the
effects of different soil cross-section modeling methods on the site
design response spectra.
• If no further soil testing is possible or desirable, then the lower (or
softer) site classification (such as site class D in Al-Durrah’s case
instead of class C) must be selected despite the implications of
higher costs.

318
12.3b Effects of the Different Soil Cross-section Modeling Methods on
the Site Fundamental Period Chapter 10 presented the analysis of the effects of the different soil
cross-section modeling methods on the site fundamental period. Al-
Durrah site’s fundamental period was calculated by the following
methods:
i. The approximate method
ii. The microtremors method
iii. The dynamic site response analysis.
The theoretical backgrounds as well as the procedures of the three
methods were presented in Chapter 3. The analysis of the results was
conducted in two steps. First, the results of each method were analyzed
independently from the results of the other two methods. Second, the
results of all three methods were examined in a comparative analysis.
I. Conclusions of the Methods’ Individual Analyses
i. The approximate method
For the purpose of the individual analysis, averages of the
fundamental periods of the approximate method were recalculated to
establish the following fundamental period subgroups:
(1). The average value of the fundamental periods of all the soil
cross-section models

319
(2). The average value of the fundamental periods of all the CXW
soil cross-section models
(3). The average value of the fundamental periods of all the CH
soil cross-section models
(4). The average value of the fundamental periods of the CXW
soil cross-section models that were performed at the same
locations at the CH tests
The results are reproduced in Table (12.1) for convenience.
Tests Subgroup Average Fundamental Period (sec)
Standard Deviation (sec)
All Profiles (1) 0.304 0.051
All CXW (2) 0.290 0.036
All CH (3) 0.352 0.073
All CXW at CH (4) 0.302 0.056
Table 12.1: Average values and standard deviations of the
approximate values of the fundamental periods
Comparison of subgroups (2) and (3) showed that the average
fundamental period of the CH tests was 21% higher than that of the entire
CXW tests. Comparison of subgroups (3) and (4), which represent the
fundamental periods of the CH tests and the CXW tests that were
performed at the CH tests’ locations, showed a decrease in the difference

320
of the average fundamental period to 17%. However, individual
comparison of the actual fundamental period of each CH test with the
corresponding fundamental period of the CXW test that was performed at
the same location showed differences as high as 66% in the value of the
fundamental period of the two tests. These results are reproduced in
Table 12.2
Test
Location CH Test Approximate Fundamental Periods
(sec)
CXW Test Approximate
Fundamental Periods (sec)
Fundamental Period
Difference as % (Absolute Value)
D5A 0.381 0.2581 47.6 D5B 0.381 0.2294 66.1 D6 0.274 0.3604 31.5 D11 0.315 0.3235 2.7 D12 0.4396 0.3399 29.3
Table 12.2: Differences between the approximate fundamental
periods of the CH tests and the corresponding CXW tests This is a clear indication of the effects of the different soil cross-section
modeling methods on the site fundamental period. These results are
similar to the results of the site classifications of Chapter 9, in which
different soil cross-section modeling methods at one location resulted in
different NEHRP site classifications, and different design response
spectra for the same location. These results lead to the following
conclusions:

321
• Different soil cross-section modeling methods at a specific location
can yield significantly different approximate site fundamental
period for that specific location.
• The results of this part of the analysis agree with the results of the
NEHRP site classification and design response spectra analysis that
were presented in Section (12.3a).
• If no further testing is possible or desirable, then the most critical
fundamental period (i.e., the fundamental period that is the closest
to the period of the structure) must be taken as the site fundamental
period despite the implications of higher costs.
ii. The microtremors method
Two types of microtremors’ plots were generated from
microtremors records at the Al-Durrah site. These included mean spectra
and simple ratio spectra plots. Both plot types were introduced in
Chapter 3. The results of the microtremors method were presented in
Chapter 7, and included two sets of stations. The first set included
stations DRA1 and DRA2 that were records on the lower level (level A)
of the Al-Durrah site. However, record DRA2 could not be used because
it included the record of an actual earthquake. The effects of the presence
of an earthquake within a microtremors record were presented in Chapter
7. The second set included stations DRB1 and DRB3. The results of
DRA1, DRB1, and DRB3 are reproduced in Table 12.3. These values

322
were used in the comparative analysis of the three methods, which is
presented subsequently.
Record Location Microtremors Plot Type
DRA1 DRB1 DRB3 Mean Spectra Period (sec) 0.294 0.159 0.0709 Simple Spectra E-W Period (sec) 0.323 0.156 0.053 Simple Spectra N-S Period (sec) 0.303 0.156 0.07 Average Fund. Period (sec) 0.307 0.157 0.065
Table 12.3: Al-Durrah site fundamental periods summary and averages
The results of the microtremors spectra analysis, lead to the
following conclusions:
• The results of the microtremors method were not consistent.
• The variation in the value of the fundamental periods of DRA1
on one hand and DRB1 and DRB3 on the other hand, might be
due to the difference in their site levels. The difference
between levels A and B of Al-Durrah site is 15 to 20 m.
• There is no apparent explanation for the difference in values of
the fundamental period of DRB1 and DRB3, except the fact
that the two stations were located far apart within the site.
iii. The dynamic site response analysis method The results of the dynamic site response analysis were presented in
Chapter 8. The analysis was performed using the computer program
ProShake and the two synthetic earthquakes that were designated

323
RAN230 and RAN330, which were also presented in Chapter 8. Each
earthquake analysis was performed twice using two soil damping ratios of
5% and 10%. The site soil cross-section models that were determined for
the site design response spectra by the CH and CXW tests were used in
this analysis. The fundamental periods were determined four times for
each soil cross-section model using the two earthquakes and the two soil
damping ratios. The fundamental periods of each earthquake analysis,
were then averaged and grouped into the same subgroups as the
approximate method. These subgroups included:
(1). The average value of the fundamental periods of all the soil
cross-section models
(2). The average value of the fundamental periods of all the CXW
soil cross-section models
(3). The average value of the fundamental periods of all the CH
soil cross-section models
(4). The average value of the fundamental periods of the CXW
soil cross-section models that were performed at the same
location as the CH tests
These subgroups are reproduced in Table (12.4) for convenience. Table
(12.5) shows the variation of the average values of the fundamental
periods of the CH and CXW tests (in terms of percentage of the lower
value of each pair). The difference in the value of the average

324
fundamental period between all the CXW tests and all the CH tests ranges
from a minimum of about 6% under earthquake RAN330 (10% damping)
to a maximum of about 22.5% under earthquake RAN230 (5% damping).
Al-Durrah Site Average Fundamental Period and Standard Deviations (sec)
Earthquake RAN230 Earthquake RAN330
5% Damping
10% Damping
5% Damping
10% Damping
Average of all Profiles fund.
Period (1) 0.078938 0.066438
0.1384
0.0853 Standard Dev 0.033688 0.011033 0.0863 0.0158
Average of CXW fund. Period (2) 0.082364 0.068917 0.133333 0.0865 Standard Dev 0.040173 0.011405 0.079081 0.0166
Average of CH tests fund. Period (3) 0.06725 .059
0.1535
0.0818
Standard Dev 0.0065 .0058 0.1178 0.0146 Average of fund.
periods of CXW tests at CH locations (4) 0.0692 .0652
0.1666
0.0782 Standard Dev 0.00712 0.01152 0.11113 0.019829
Table 12.4: Al-Durrah site fundamental period averages and standard
deviations for the results of dynamic site response analysis

325
Percentages of the Difference Between the Average Values of the
Fundamental Periods of the CXW and CH tests Earthquake RAN230 Earthquake RAN330
Fund. Periods being Compared 5%
Damping10%
Damping 5%
Damping 10%
Damping Average of all CH Versus average of
All CXW 22.5 16.8 15.1 5.7 Average of all CH Versus average of
CXW at CH 2.9 10.5 8.5 4.6
Table 12.5: Percentages of the differences between the average values of
the fundamental periods of the CH and CXW tests
Comparison of each individual fundamental period of the CH test
with the corresponding fundamental period of the CXW tests that were
performed at the same location led to more significant variations as
shown in Table (12.6). Each pair of values of fundamental periods from
the CH and CXW tests were compared, and the difference was expressed
as a percentage of the value of the lower fundamental period. The
difference between the results of the two tests ranged from 0% to 328%.
Table (12.6) indicates that in 6 cases there was no difference in the values
of the fundamental period as determined by a CH test or a CXW test.
This represents 30% of all the cases of Table (12.6). Eleven cases
representing 55% of all the cases had a difference in the value of the
fundamental period of the two tests ranging from 14% to 42.5%. The

326
remaining three cases representing 15% of all the cases, showed a
difference in the value of the fundamental period ranging from 184% to
328.5%.
Earthquake RAN230 Earthquake RAN330 Test Location
5% Damping 10% Damping 5% Damping 10% DampingD5A 20.3 42.5 0 14.2 D5B 0 18.5 184.0 37.5 D6 0 0 226.5 0 D11 20.3 20.3 0 27.2 D12 20.3 18.5 328.5 18.5
Table 12.6: The difference between the values of the fundamental
periods of the CH and CXW tests that were performed at the
same locations (expressed as percentage of the lower value) These results lead to following conclusions:
• Modeling a soil cross-section at a specific location by different
methods can result in significantly different fundamental periods
for the same location.
• The dynamic site response analysis of the fundamental periods of
Al-Durrah site soil profiles were influenced by the following:
o The soil cross-section modeling method
o The input earthquake of the dynamic site response analysis
o The damping ratio of the soil
• The results of this part of the analysis are compatible with the
results of the site classification and design response spectra
analysis that was presented in Section (12.3a), as well as the results
from the approximate method.

327
• If no further testing is possible or desirable, then the most critical
fundamental period (i.e. the fundamental period that is the closest
to the period of the structure) must be taken as the site fundamental
period despite the implications of higher costs.
II. Conclusions of the Results of the Comparative Analysis of the Fundamental Periods of the Three Methods This section presents a comparative analysis of Al-Durrah’s
fundamental periods from the results of the approximate method, the
microtremors method, and the dynamic site response analysis method. In
the dynamic site response analysis, the soil damping ratio value must be
selected for each soil profile’s analysis. The dynamic site response
analysis was performed four times using the two synthetic earthquakes
(RAN230 and RAN330), and the two soil damping ratios of 5% and 10%
with each earthquake analysis. Therefore, there were four sets of results
from the dynamic site response analysis, and only one set for each of the
approximate method and the microtremors method. In order to compare
the four sets of results from the four dynamic analyses with the results of
the approximate method and the microtremors method, the comparison
was repeated four times. Each comparison included the same values of
the average fundamental periods from the approximate method and
microtremors method, and one of the results of the dynamic analysis. The

328
results of the approximate method and the dynamic site response analysis
were averaged and regrouped into the following subgroups:
1. The average value of the fundamental periods of all the soil
cross-section models
2. The average value of the fundamental periods of all the CXW
soil cross-section models
3. The average value of the fundamental periods of all the CH soil
cross-section models
4. The average value of the fundamental periods of the CXW soil
cross-section models performed at the same location as the CH
tests.
These subgroups are presented in Tables (12.7) to (12.10), and their
values and ratios are plotted in Figures (12.2) to (12.9). The ratio plots
show the ratios of the fundamental periods of each method over the
values of the fundamental periods of the other two methods.

329
Table 12.7: Comparison of the average values of the fundamental
periods at Al-Durrah
Approximate Method Microtremors Dynamic Site Response Analysis RAN230 at 5% damping
Av All
Av CXW
Av CH
Av CXW
@ CH DRA1 DRB1 DRB3 Av All
Av CXW
Av CH
Av CXW @ CH
Average Fundamental period(sec) 0.313 0.302 0.352 0.337 0.307 0.157
0.0646 0.079 0.082 0.067 0.069

330
Figure 12.2: Plots of the average values of Al-Durrah fundamental periods
0
0.1
0.2
0.3
0.4
Av All AvCXW
Av CH AvCXW @
CH
DRA1 DRB1 DRB3 Av All AvCXW
Av CH AvCXW @
CH
RAN230 at 5% damping
Approximate Method Microtremors Dynamic Site ResponseAnalysis
Test Methods
Perio
d (s
ec)
AverageFund.period
Al-Durrah Site Average Fundamental Periods (Dynamic Analysis of RAN230 @ 5% Damping)

331
0
1
2
3
4
5
6al
lap
pal
lcx
w
all C
H
CX
2C
H
DR
A1
DR
B1
DR
B3 all
all
cxw
all C
H
Cx
@C
H
Approx Method Microtremors Dynamic Resp
Test Method
Rat
io o
f Fun
d. P
erio
dApprox All
Approx All CXW
Approx All CH
Approx CXW at CH
DRA1
DRB1
DRB3
Dynamic All
Dynamic all cxw
Dynamic allCH
Dynamic CXW at CH
Ratios of the Average Fundamental Periods of the Three Methods over Each Other(Dynamic Response Analysis of RAN230-5% damping)
Figure 12.3: Plots of the ratios of average fundamental periods of each
method over the fundamental periods of the other two methods

332
Table 12.8: Comparison of the average values of the fundamental
periods at Al-Durrah
Approximate Method Microtremors Dynamic Site Response Analysis
RAN330 at 5% damping
Av All
Av CXW
Av CH
Av CXW @ CH DRA1 DRB1 DRB3
Av All
Av CXW
Av CH
Av CXW @ CH
Average Fundamental Period (sec) 0.313 0.302 0.3524 0.337 0.307 0.157 0.064 0.138 0.133 0.154 0.167

333
Figure 12.4: Plots of the average values of Al-Durrah fundamental periods
0
0.1
0.2
0.3
0.4
Av All AvCXW
Av CH AvCXW@ CH
DRA1 DRB1 DRB3 Av All AvCXW
Av CH AvCXW@ CH
RAN330 at 5% damping
Approximate Method Microtremors Dynamic Site ResponseAnalysis
Test Methods
Per
iod
(sec
)
AverageFund.period
Al-Durrah Site Average Fundamental Periods (Dynamic Analysis of RAN330 @ 5% Damping)

334
0
1
2
3
4
5
6A
llA
pp All
CX
W All
CH
CX
W@
CH
DR
A1
DR
B1
DR
B3 all
all
cxw
all C
H
Cx
@C
H
Approx Method Microtremors Dynamic Resp
Test Method
Rat
io o
f Fun
d. P
erio
dApprox All
Approx All CXW
Approx All CH
Approx CXW at CH
DRA1
DRB1
DRB3
Dynamic All
Dynamic all cxw
Dynamic allCH
Dynamic CXW at CH
Ratios of the Average Fundamental Periods of the Three Methods over Each Other (Dynamic Response Analysis of RAN330-5% damping)
Figure 12.5: Plots of the ratios of average fundamental periods of each
method over the fundamental periods of the other two methods

335
Table 12.9: Comparison of the average values of the fundamental periods at Al-Durrah
Approximate Method Microtremors Dynamic Site Response Analysis
RAN230 at 10% damping
Av All
Av CXW
Av CH
Av CXW @ CH DRA1 DRB1 DRB3
Av All
Av CXW
Av CH
Av CXW @ CH
Average Fundamental Period (sec) 0.313 0.302 0.352 0.337 0.307 0.157 0.065 0.066 0.069 0.059 0.065

336
Al-Durrah Fundamental Period Averages and Standard Deviation (Dynamic Analysis of RAN230 & 10% D)
00.10.20.30.4
Av All AvCXW
Av CH AvCXW @
CH
DRA1 DRB1 DRB3 Av All AvCXW
Av CH AvCXW @
CH
Approximate Method MicrotremorsMethods
RAN230 at 10% Dynamic Site
Test Methods
Peri
od (s
ec)
AverageFundamentalPeriod
Figure 12.6: Plots of the average values of Al-Durrah fundamental period

337
01234567
All
App All
CX
W All
CH
CX
W@
CH
DR
A1
DR
B1
DR
B3 all
all
cxw
all C
H
Cx
@C
H
Approx Method Microtremors Dynamic Resp
Test Method
Rat
io o
f Fun
d. P
erio
dApprox All
Approx All CXW
Approx All CH
Approx CXW at CH
DRA1
DRB1
DRB3
Dynamic All
Dynamic all cxw
Dynamic allCH
Dynamic CXW at CH
Ratios of the Average Fundamental Periods of the Three Methods over Each Other (Dynamic Response Analysis of RAN230-10% damping)
Figure 12.7: Plots of the ratios of average fundamental periods of
each method over the fundamental periods of the other two methods

338
Table 12.10: Comparison of the average values of the fundamental periods at Al-Durrah
Approximate Method Microtremors Dynamic Site Response Analysis RAN330 at 10% damping
Av All
Av CXW
Av CH
Av CXW @ CH DRA1 DRB1 DRB3
Av All
Av CXW
Av CH
Av CXW @ CH
Average Fundamental period (sec) 0.313 0.302 0.3524 0.337 0.306667 0.157 0.064633 0.0853 0.0865 0.0818 0.0782

339
Figure 12.8: Plots of the average values of Al-Durrah fundamental periods
Al-Durrah Site Average Fundamental Periods (Dynamic Analysis of RAN330 @ 10% Damping)
00.10.20.30.4
AvAll
AvCXW
AvCH
AvCXW
@CH
DRA1 DRB1 DRB3 AvAll
AvCXW
AvCH
AvCXW
@CH
RAN330 at 10%damping
Approximate Method Microtremors Dynamic SiteResponse Analysis
Test Methods
Per
iod
(sec
)
AverageFund.period

340
0
1
2
3
4
5
6A
llA
pp All
CX
W All
CH
CX
W@
CH
DR
A1
DR
B1
DR
B3 all
all
cxw
all C
H
Cx
@C
H
Approx Method Microtremors Dynamic Resp
Test Method
Rat
io o
f Fun
d. P
erio
dApprox All
Approx All CXW
Approx All CH
Approx CXW at CH
DRA1
DRB1
DRB3
Dynamic All
Dynamic all cxw
Dynamic allCH
Dynamic CXW at CH
Ratios of the Average Fundamental Periods of the Three Methods over Each Other (Dynamic Response Analysis of RAN330-10% damping)
Figure 12.9: Plots of the ratios of average fundamental periods of
each method over the fundamental periods of the other two methods

341
Each method’s subgroup average fundamental periods were
compared with the average fundamental periods of the other two
methods. The previous analyses lead to the following conclusions:
• In all four rounds of comparisons, the ratios of the approximate
method subgroups average fundamental periods to those of the
dynamic site response analysis ranged from 2 to 5.
• This significant difference may be attributed to over simplifications
of the approximate method. Examples of these over simplifications
include ignoring the effects of the presence of embedded soft soil
layers within the soil cross-section model, and ignoring the effects of
the damping ratio.
To illustrate the difference between the approximate method and the
dynamic site response analysis method, an ideal soil profile in which the
SWV increases incrementally with depth was established. The profile
has the NEHRP depth of 30 m, Figure (12.10) and Table (10.11).

342
SWV Unit weight
Figure 12.10: Ideal profile
Layer Number
Layer Thickness
LayerSWV
1 5 200 2 5 300 3 5 400 4 5 500 5 5 600 6 5 700
7 (Bedrock) Infinite 1500
Table 12.11: Properties of the ideal profile
Analysis of this profile by the approximate method and the dynamic site
response analysis (ProShake with earthquake RAN230 at 5% damping)
yield:
The approximate method fundamental period, T = 0.318 sec.

343
The dynamic site response analysis fundamental period, T= 0.0636 sec.
If the properties of the profile’s layers are kept the same, but the sequence
of the layers is rearranged so that stiffer layers are on top of softer layers
such as shown in Figure (10.13), then the fundamental periods by the two
methods are:
The approximate method fundamental period, T = 0.318 sec.
The dynamic site response analysis fundamental period, T= 0.42 sec.
The fundamental period by the approximate method remains the same
while the fundamental period by the dynamic site response analysis
increased by 560%. This illustrates the lack of sensitivity of the
approximate method to the presence of softer layers beneath stiffer one
SWV Unit weight
Figure 12.11: Ideal profile

344
• The fundamental period of microtremors at station DRA1 was
very close to the fundamental periods of the approximate
method, while the fundamental period of microtremors at
station DRB3 was very close to dynamic site response analysis
fundamental period. However, since the dynamic site response
analysis results showed good agreement with the results of the
East-west seismic array, then the dynamic site response analysis
results are considered to be more accurate than the results of the
approximate and microtremors methods.
12.3c Effects of Increasing the Bedrock Depth beyond NEHRP 30 m
Depth, on the Site Fundamental Period
a). General
The NEHRP Provisions General Method for determining a site
design response spectra requires the modeling of the soil cross-section of
the site’s top 30 m (100 ft). Therefore, the method, in effect, places the
bedrock at a depth of 30 m even if the bedrock is at a much greater depth.
The implications of limiting the soil profile to the top 30 m of the site by
NEHRP Provisions were examined in Chapter 11. The analysis
examined the effects of increasing the bedrock depth on the site
fundamental period. This part of the analysis was based on the results of

345
the dynamic site response analysis of the Al-Durrah site and the East-
west seismic array. The dynamic site response analysis was performed
using the computer program ProShake, which was introduced in
Chapter 3. The results of the dynamic site response analysis for Al-
Durrah site as well as the East-west seismic array were presented in
Chapter 8.
The two synthetic earthquakes, RAN230 and RAN330 that were
introduced in Chapter 8 were used in this analysis. Each earthquake
analysis was performed twice using soil damping ratios of 5% and 10%.
The vertical electric sounding (VES) results were presented in Chapter 8,
and indicated that the bedrock depth at Al-Durrah site was 350m to
375 m. For the purpose of this part of the analysis the bedrock depth was
assumed to be at 350 m. The soil shear wave velocity (SWV) profiles
that were used in this analysis are the same profiles that were generated
by the CXW and the CH tests, which were presented in Chapter 7. The
only difference is that for this analysis the bedrock depth was increased in
increments from the NEHRP specified depth of 30 m to the bedrock
actual depth of 350m. Each profile’s name indicates the boring location
of the profile and the type of SWV test that was performed at that
location. As an example, D6CXW refers to the SWV profile of the CXW
test at boring number 6.
b). Summary of the results of the analyses of the effects of increasing

346
the Depth of Bedrock on Al-Durrah Site Fundamental Period
To examine the effects of increasing the bedrock depth on the site’s
fundamental period, each SWV profile from the CXW and CH was
assigned five different bedrock depths. These depths ranged from the
NEHRP depth of 30 m to the estimated actual depth of 350 m. The five
selected depths are shown in Table (12.12). The SWV for soil depths
greater than 30 m were assumed to be equal to the SWV of the soil at
NEHRP depth of 30 m, and remained constant to the selected bedrock
depth. Each SWV profile was analyzed at each depth four times using the
two synthetic earthquakes and the two damping ratios of 5% and 10%.
The results of the analyses are reproduced in Figures (12.12) and (12.13)
Bedrock Depth Designation
Bedrock Depth (m)
TAC Actual Depth = 350
TA NEHRP Depth = 30
TB 100
TC 200
TD 300
Table 12.12: Definitions of bedrock depths for the dynamic
site response analysis

347
Variation of Fundamental Period with Depth(RAN230 @ 5% Damping)
0
0.05
0.1
0.15
0.2
0.25
0 50 100 150 200 250 300 350 400Bedrock Depth (m)
Perio
d (S
ec)
D1CXWD2CXWD3CXWD4CXWD5ACXWD5BCXWD5CHCD6CXWD6CHCD7CXWD8CXWD9CXWD11CXWD11CHCD12CXWD12CHC
(a)
Variation of Fundamental Period with Depth(RAN230 @ 10% Damping)
0
0.02
0.04
0.06
0.08
0.1
0.12
0 50 100 150 200 250 300 350 400
Bedrock Depth (m)
Perio
d (s
ec)
D1CXW
D2CXW
D3CXW
D4CXW
D5ACXW
D5BCXW
D5CHC
D6CXW
D6CHC
D7CXW
D8CXW
D9CXW
D11CXW
D11CHC
D12CXW
D12CHC
(b)
Figure 12.12: Results of the dynamic site response analysis fundamental
periods with increasing bedrock depth using earthquake RAN230

348
Variation of Fundamental Period with Depth of Bedrock(RAN330 @ 5% Damping)
0
0.05
0.1
0.15
0.2
0.25
0.3
0.35
0 50 100 150 200 250 300 350 400
Depth of Bedrock (m)
Per
iod
(sec
)D1CXWD2CXWD3CXWD4CXWD5ACXWD5BCXWD5CHCD6CXWD6CHCD7CXWD8CXWD9CXWD11CXWD11CHCD12CXWD12CHC
(a)
Variation of Fundamental Period with Depth of Bedrock(RAN330 @ 10% Damping
0
0.02
0.04
0.06
0.08
0.1
0.12
0.14
0.16
0.18
0 50 100 150 200 250 300 350 400
Depth of Bedrock (m)
Per
iod
(sec
)
D1CXWD2CXWD3CXWD4CXWD5ACXWD5BCXWD5CHCD6CXWD6CHCD7CXWD8CXWD9CXWD11CXWD11CHCD12CXWD12CHC
(b)
Figure 12.13: Results of the dynamic site response analysis fundamental
periods with increasing bedrock depth using earthquake RAN330

349
c). Conclusions of the Analyses of the Effects of Increasing the Bedrock
Depth on the Site Fundamental Period
The results of the previous section showed that the site fundamental
period values of certain soil profiles at Al-Durrah site were influenced by
the increased depth of the bedrock. Different profiles exhibited different
fluctuations in the values of the fundamental period depending on the
selection of the synthetic earthquake and the damping ratio that were used
in the dynamic site response analysis.
The fluctuations in the values of the fundamental periods with the
increased depth of the bedrock ranged from insignificant change in some
cases, to very significant changes in others. In order to categorize these
fluctuations into significant and insignificant fluctuations, a criterion was
selected. The average value of the fundamental periods of each profile
shown in Tables (11.2) to (11.5) represent the average of all fundamental
periods of that profile at the various selected depths. The best statistical
tool that characterizes fluctuation for a certain variable is its coefficient of
variation (COV), which is defined as [28]:
COV = (the standard deviation ÷ the mean) X 100
COV is commonly expressed as a percentage. Higher COV values
indicate higher fluctuations in the values of the data being analyzed. The
COV of the fundamental periods in Tables (11.2) to (11.5) were
calculated, and the results are reproduced in Table (12.12). A COV limit

350
of 20% was selected to separate profiles with significant fluctuations
from those with no significant fluctuations. If the COV of the
fundamental period at a certain soil profile is less than 20%, then the
fundamental period at this profile is considered not to be influenced by
increasing the bedrock depth. On the other hand, a COV of more than
20% was considered to indicate significant fluctuation in the value of the
fundamental period due to increased bedrock depth. This criterion was
applied to all profiles that had a ratio of more than 20% under any
analysis of the two synthetic earthquakes. Based on this criterion, Table
(12.13) shows that the following profiles had significant fluctuations in
the values of the fundamental period as a result of increasing the bedrock
depth:
D2CXW, D3CXW, D4CXW, D5BCXW, D6CXW, D7CXW, D8CXW,
D12CXW, D5CH, and D12CH.
The next step was to determine the soil characteristics that caused
the fundamental period of some profiles to vary with increasing bedrock
depth. Table (12.14) presents a summary of Al-Durrah’s field tests
results for each soil profile and its corresponding site classifications. The
last column of Table (12.14) identifies the soil cross-section models that
exhibited significant fundamental period fluctuation due the bedrock
depth variation.

351
Coefficient of Variation (COV) of the Fundamental Period (%)
Earthquake RAN230 Earthquake RAN330
Test Type
Test Location
5% Damping
10% Damping
5% Damping
10% Damping
D1 15.59 8.41 10.92 6.00 D2 18.53 21.12 9.12 12.46 D3 38.43 20.95 28.07 15.41 D4 6.00 14.16 46.06 13.60
D5A 16.79 14.19 6.26 11.79 D5B 7.57 11.98 78.01 19.05 D6 11.00 11.98 74.75 18.19 D7 31.91 19.19 27.26 8.05 D8 47.23 14.59 24.19 25.15 D9 17.53 15.90 17.39 13.61
D11 8.27 1.15 13.61 15.38
CXW
D12 12.23 2.98 17.67 26.96 D5 11.06 11.98 16.41 27.42 D6 15.90 7.66 9.26 10.45
D11 20.00 13.76 13.61 15.91
CH D12 16.47 11.17 63.33 29.19
Table 12.13: Coefficients of variation (COV) of the fundamental
periods of Al-Durrah soil cross-section models

352
Table 12.14: Summary of Al-Durrah soil cross-section average SPT, NEHRP SWV,
and effect of bedrock depth variation
Test
Location
NEHRP SPT Average No.
of blows
NEHRP SPT Site
Classification
CXW Average
SWV
CXW NEHRP Site Classification
Cross-Hole Average
SWV
Cross-hole NEHRP Site Classification
Significant Fundamental
Period Fluctuation
D1 83.92 C 420. C No
D2 67.57 C 439 C Yes
D3 70.74 C 410 C Yes
D4 34.48 D 422 C Yes
D5A 65.84 C 465 C 316 D No
D5b 65.84 C 523 C 316 D Yes (CXW)
D6 80.84 C 333 D 438 C Yes (CXW)
D7 65.62 C 466 C Yes
D8 92.85 C 424 C Yes
D9 74.30 D 476 C No
D11 25.85 D 371 C 381 C No
D12 92.01 C 353 D 223 D Yes (CXW,CH)

353
From Table (12.14), the field tests’ results and their corresponding
NEHRP site classifications do not provide any indications on whether a
soil cross-section model’s fundamental period will be influenced by the
bedrock depth variation. For example, test location D11 with a NEHRP
SPT average blow count of 25.85 did not exhibit any significant
fluctuation in the fundamental period as a result of bedrock depth
variation, while test location D7 with a higher NEHRP SPT average blow
count of 92.85 did exhibit significant fluctuation. Similarly, test location
D11 with a CXW average SWV of 371 (m/s) did not exhibit any
significant fluctuation in the fundamental period with the variation of the
bedrock depth, while test location D5b with a higher CXW average SWV
of 523 (m/s) did. Similar cases can also be found in the cross-hole test
results. No definite conclusions can be made about the relationship
between a profile’s NHERP site classifications, its NEHRP average
SWV, and its fundamental period sensitivity to increased bedrock depth.
Therefore, it was necessary to look for other factors that caused some of
the soil profiles to exhibit significant fundamental period fluctuation with
increasing bedrock depth, while not having the same effect on other softer
profiles.
Figures (11.10a) to (11.10p) showed the SWV of each of Al-
Durrah’s soil cross-section model (or profiles), that were used in the
dynamic site response analysis. These profiles were generated by

354
ProShake, based on the input SWV of each profile. The input SWV
profiles were based on the results of the CXW and the CH field tests. All
of the profiles that showed significant fundamental period fluctuations are
characterized by the presence of embedded soft layers that are
sandwiched by stiffer layers. On the other hand, embedded soft layers
were also present in some of the profiles that did not show significant
fluctuations. These results lead to the following conclusions:
• Variation of the bedrock depth at site could influence the
fundamental period of the site.
• The effects of increasing the bedrock depth on the site
fundamental period can not be predicted based on the site
classification, or the site average SWV (v s ).
• The presence of embedded soft layer(s) within the soil cross-
section model may be critical to the sensitivity of the site
fundamental period to variations of the depth of the bedrock at
the site.
In order to determine the factors that cause embedded soft layers to
influence the fundamental period of some of the soil profiles, further
dynamic site response analysis was performed using two soil cross-
section models. The results and conclusions of this analysis are presented
in the next section.

355
12.3d Effects of the Presence of an Embedded Soft Layer Within the Soil
Cross-section on the Site Fundamental Period The effects of the presence of an embedded soft layer within a soil
cross-section were analyzed in conjunction with increasing the bedrock
depth. The soil cross-section model D1CXW that was shown in Figure
(11.10a) was used in this analysis. This soil cross-section model was
selected because it did not show significant fluctuation in the values of
the fundamental period with increasing the bedrock depth. The original
profile had a very thin soft layer at the ground surface, and another one
that began at a depth of 3.25 m. However, for the purpose of this
analysis, both layers were removed initially and the profile was assumed
to have a constant SWV of 500 m/s. The bedrock depth was placed at the
NEHRP depth of 30 m, and this soil cross-section model was designated
as D1N.
In order to compare the profile D1N with a soil profile that has an
actual bedrock depth of 350 m, another soil cross-section model identical
to D1N with the exception of the bedrock depth was also established and
designated as D1ac. The bedrock depth of profile D1ac was placed at the
estimated actual bedrock depth of 350 m. The analysis was performed
using ProShake and the synthetic earthquake RAN330 with two soil
damping ratios of 5% and 10%.

356
A soft soil layer was embedded into both soil models at a depth of
3.25 m, which was the case in the original profile. The dynamic site
response analysis was performed repeatedly for both profiles with
varying soft layer thicknesses. In each analysis, the soft layer thickness
was increased incrementally from 3 to 15 m. At each damping ratio, the
analysis was repeated four times using four values for the SWV of the
soft layer including 350, 300, 250, 200 m/s. The results of the analysis
are reproduced in Figures (12.14) and (12.15) for convenience.
Figures (12.14a) to (12.142d) show the results of the analysis at 5%
soil damping ratio. For a small thickness of soft layer, there was little or
no variation in the fundamental period between the two soil cross-section
models. For a soft layer thickness of 7 m and higher, the four figures
clearly show that the variation in the fundamental period between the two
profiles increases with increasing soft layer thickness. The variation of
the fundamental period also increased with decreasing the SWV of the
soft layer.
Figures (12.15a) to (12.15d) show the results of the analysis at 10%
soil damping ratio. Again, at the lower values of the soft layer thickness,
there was little or no variation in the fundamental period. Figures
(12.15a, b, and c) show that the variation of the fundamental period starts
increasing at the soft layer thickness of 5m, then starts decreasing after
reaching the thickness of 9m. Figure (12.15d) which has the soft layer

357
lowest SWV of 200 m/s, shows that the variation of the fundamental
period increased with increasing soft layer thickness. All of the four
figures indicate that the variation of the fundamental period between the
two profiles increased with decreasing the SWV of the soft layer.
The analyses that were presented in Sections 12.3c and 12.3d lead
to the following conclusions:
• The presence of embedded soft soil layer(s) within a soil cross-
section model can influence the sensitivity of the fundamental
period to variations in the bedrock depth.
• The effects of the embedded soft soil layer on the site
fundamental period depends on the soft layer’s thickness, its
SWV, its location, and on the damping ratio of the soil.

358
Fundamental Periods for D1ac & D1N with Soft Layer SWV=350 (m/s) D=5%
0
0.05
0.1
0.15
0.2
0 5 10 15 20
Thickness of Soft Layer (m)
Per
iod
(sec
)
DacD1N
(a)
Fundamental Periods for D1ac & D1N with Soft Layer SWV=300 (m/s) D=5%
00.050.1
0.150.2
0.250.3
0.35
0 5 10 15 20
Thickness of Soft Layer (m)
Peri
od (s
ec)
DacD1N
(b)
Figure 12.14: Variations of the fundamental period with variations
of bedrock depth and embedded soft layer thickness (5% damping)

359
Fundamental Periods for D1ac & D1N with Soft Layer SWV=250 (m/S) D=5%
00.050.1
0.150.2
0.250.3
0.35
0 5 10 15 20
Thickness of Soft Layer (m)
Peru
iod
(s)
DacD1N
(c)
(d)
Figure 12.14-continued: Variations of the fundamental period with
variations of bedrock depth and embedded soft layer
thickness (5% damping)
Fundamental Periods for D1ac & D1N with
Soft Layer SWV=200 (m/s) D=5%
0
0.1
0.2
0.3
0.4
0 5 10 15 20
Thickness of Soft Layer (m)
Per
iod
(sec
)
Dac
D1N

360
(a)
Fundamental Periods for D1ac & D1N with Soft Layer SWV=300 (m/s) D=10%
00.020.040.060.080.1
0.120.14
0 5 10 15 20
Thickness of Soft Layer (m)
Peri
od (s
ec)
DacD1N
(b)
Figure 12.15: Variations of the fundamental period with
variations of bedrock depth and embedded soft layer
thickness (10% damping)
Fundamental Periods for D1ac & D1N with Soft Layer SWV=350 (m/s) D=10%
00.020.040.060.080.1
0.120.14
0 5 10 15 20
Thickness of Soft Layer (m)
Perio
d (s
ec)
DacD1N

361
Fundamental Periods for D1ac & D1N withSoft Layer SWV=250 (m/s) D=10%
0
0.05
0.1
0.15
0.2
0 5 10 15 20
Thickness of Soft Layer (m)
Peri
od (s
ec)
DacD1N
(c)
Fundamental Periods for D1ac & D1N with Soft Layer SWV=200 (m/s) D=10%
00.050.1
0.150.2
0.250.3
0.350.4
0 5 10 15 20
Thickness of Soft Layer (m)
Peri
od (s
ec)
DacD1N
(d)
Figure 12.15-continued: Variations of the fundamental period
with variations of bedrock depth and embedded soft layer
thickness (10% damping)

362
12.3e Analysis of the East-West Seismic Array
The East-west seismic array was presented in Chapter 7. The array
extended approximately eastward from the Al-Durrah site to the first rock
outcrop located at a distance of about 6 miles. The array illustration is
reproduced in Figure (12.16) for convenience. Five collinear seismic
stations were established along the array. The first seismic station was
established on the rock outcrop, and the bedrock depth at the other four
seismic stations was estimated by VES tests. Table (12.15) summarizes
the bedrock depth at each station. An actual earthquake was recorded
simultaneously at all five stations, and the records of the earthquakes
were presented in Chapter 7. The magnitude and epicenter information of
the earthquake were also presented in Chapter 7. The fundamental
periods at the stations were determined by two methods. First, the
earthquake record of the rock outcrop was used in a dynamic site
response analysis for a soil cross-section model at each of the other four
stations. The fundamental period at each station was determined from the
results of these analyses. The earthquake record at the rock outcrop was
assumed to represent the motion at the bedrock at each station (i.e., the
bedrock was assumed to be infinitely rigid) [3]. Second, the earthquake
time domain records were converted to frequency domain records, and
the fundamental periods were determined at the maximum amplitudes.

363
Apart from the VES tests that established the bedrock estimated
depth at each station, no other information was available for the soil
profiles of the stations along the East-west array, with the exception of
station DRA2, which was part of the Al-Durrah site tests locations. The
closest estimate to the soil properties at the array stations was the soil
properties of Al-Durrah soil profiles. Therefore, the average minimum
and maximum shear wave velocities were computed for all the soil cross-
section models in Al-Durrah and these values were used for soil cross-
section models along the array. The top 30 m of each soil cross-section
model was divided into six equal layers. The number of layers is not
critical to the analysis as long as the SWV distribution is kept consistent.
The top soil layer was assigned the average minimum SWV, while the
last layer at the NEHRP depth of 30 m was assigned the average
maximum SWV. The shear wave velocity for the intermediate layers
within the NEHRP depth increased linearly from the ground surface to
the NEHRP depth of 30 m. All layers below the NEHRP depth and
above the actual bedrock were assigned the same average maximum
SWV. The analysis was repeated for 5% and 10% soil damping ratios.
The results of the analysis are reproduced in Tables (12.16) for the east-
west component of the earthquake, and in Table (12.17) for the north-
south component.

364
Location Bedrock Depth (m)
RD0 35-40 RD2 ≈ 170 RD3 ≈ 225
DRA2 ≈ 350
Table 12.15: Seismic stations of the East-west seismic
array and their bedrock depths

365
East
Figure 12.16: East-west seismic array
DREFF - Outcrop
Bedrock
≈ 9 Km = 6 miles
RD0 RD1- Noise only
≈ 35 m ≈ 95 m
RD2 RD3 RD4 - Cancelled
DRA2
≈ 225 m ≈ 170 m ≈ 350 m
400 m
830 m
2300 m
4800 m
Al-Durrah
East-West Seismic Array

366
1- The Dynamic Site Response Analysis Fundamental Periods
A) East- west Components
• 5% Damping
Station RD0 RD2 RD3 A2 FundamentalPeriod (sec.)
0.098 0.098 0.08 0.08
Table 12.16a: Fundamental periods for the east-west
component of array earthquake (5% damping)
• 10% Damping
Station RD0 RD2 RD3 A2 FundamentalPeriod (sec.)
0.11 0.11 0.11 0.11
Table 12.16b: Fundamental periods for the east-west
Component of Array earthquake (10% damping)
B) North-south Components
• 5% Damping
Station RD0 RD2 RD3 A2 FundamentalPeriod (sec.)
0.077 0.077 0.077 0.077
Table 12.17a: Fundamental periods for the north-south
component of array earthquake (5% damping)

367
• 10% Damping
Station RD0 RD2 RD3 A2
FundamentalPeriod (sec.)
0.077 0.077 0.077 0.077
Table 12.17b: Fundamental periods for the north-south
Component of array earthquake (10% damping)
Table (12.16) shows that the dynamic site response analysis for the
east-west component of the earthquake at both damping ratios and at all
four stations resulted in site fundamental periods of 0.098 and 0.11
second. Table (12.17) shows that the dynamic site response analysis for
the north-south component of the earthquake at both damping ratios and
at all four stations resulted in a site fundamental period of 0.077 second.
The dynamic site response analysis of the East-west seismic array
was performed with the assumption that no embedded soft layers were
present in any of the stations soil profiles. The results confirm that if no
embedded soft layers are present in the profile, the bedrock depth is
irrelevant to the site fundamental period.

368
2- Frequency Domain Spectra Fundamental Periods A) East-west Components
Station DREFF RD0 RD2 RD3 A2 Frequency
Hz 9.37 23.24 8.15 12.36 54.48
Fundamental Period (sec.)
0.107 0.043 0.123 0.081 0.018
Table 12.18: Fundamental frequencies (and periods) for the
East-west component of array earthquake
B) North-south Components
Station DREFF RD0 RD2 RD3 A2
Frequency Hz
11.22 16.84 15.71 22.05 59.78
Fundamental Period (sec.)
0.089 0.059 0.064 0.046 0.017
Table 12.19: Fundamental frequencies (and periods) for the
North-south component of array earthquake
Tables (12.18) and (12.19) present the fundamental periods based on
the frequency domain records of the earthquake at each station. Contrary
to the results of the dynamic site response analysis, the frequency domain
fundamental periods show variation with increased bedrock depth. In the
dynamic site response analysis, the soil cross-sectional models were
assumed to be “normal”, meaning that their shear wave velocity
increased with depth and there were no embedded soft soil layers.
However, the results of the frequency domain fundamental period, which

369
represent the actual fundamental period at each station, suggest that the
soil profiles at the stations may not be “normal”. Since the only
subsurface soil information at the stations’ locations is that of the vertical
electric sounding, the only certain way to verify the characteristics of the
soil profiles is to conduct soil explorations similar to the ones that were
performed at the Al-Durrah site. The results of the analysis lead to the
following conclusions:
• If no embedded soft layers are present in the profile, then
increasing the bedrock depth beyond NEHRP depth of 30 m does
not affect the site fundamental period.
12.4 Summary of Conclusions
We have different methods for determining the soil cross-sectional
modeling profile such as the invasive methods of SPT and CH, and
noninvasive methods such as CXW. The use of any of these methods is
acceptable for determining the site design response spectra and the site
fundamental period as per NEHRP Provisions.
This research project has the unique advantage of using all methods of
testing the same site, thus the advantage and limitations of using one
method over another could be determined.
It was found that:

370
• Different methods of field testing the same location can provide
different soil profiles and thus different site classification.
• Different site classifications, can lead to significantly different
design response spectra, and significantly different fundamental
periods for the same location. Different tests at the Al-Durrah site
led to two different site classifications that led to two different
design spectra with a maximum difference, in terms of the spectral
acceleration, of 41%. These two classifications were compared at
two sites on NEHRP maps. The first site had seismic characteristics
(Ss and S1) that were similar to the Al-Durrah site representing
medium to low earthquakes. The design spectra for the two
classifications at the first site also had a maximum difference of
41%. The second site Ss and S1 values were much higher than at Al-
Durrah site, and the spectral acceleration difference in this case was
18%. Although the difference between the design response spectra
of the sites tended to decrease with increasing earthquake
magnitudes, it is important to note that the vast majority of
earthquakes had small to medium magnitudes [29]. This indicated
that the difference between the spectra of the two site classes would
more likely be significant for most sites. If no further testing is
possible or desirable, then the weaker (softer) classification must be
selected for the site despite the implications of higher costs.

371
• Caution should be exercised when using non-invasive soil cross-
section modeling methods, such as the CXW, that do not always
detect the presence of soft embedded soil strata. If a site’s soil cross-
section is modeled by such methods, and embedded soft profiles are
not accounted for, then the resulting site fundamental period may not
be accurate, especially if the bedrock depth at the site is much higher
than the NEHRP bedrock depth of 30 m.
• The effects of embedded soft soil strata on the fundamental period
will depend on their thickness, stiffness, location, and damping.
• The microtremors results were inconsistent in determining the site
fundamental period and the approximate method does not account
for the effects of embedded soft soil strata on the fundamental
period, which was shown to be significant. On the other hand, the
dynamic site response analysis accounted for the effects of strain
level, damping, and the presence of embedded soft soil strata, thus it
was expected to be the most accurate method. The results of the
dynamic site response analyses showed good agreement with the
results of the East-west seismic array for an actual earthquake, which
confirmed that the dynamic site response analysis is the most
accurate method for determining the site fundamental period, as was
expected.

372
12.5 Recommendations Further study is needed to establish correlations between the various
soil cross-section modeling methods in order to determine which one is
more appropriate and at which site. This research has shown that these
methods affect the design response spectrum and the fundamental period,
and thus it should be of concern for the designer. Establishing the actual
shear wave velocity profiles for the East-west seismic array through
invasive modeling that can detect the presence of soft embedded layers
will lead to a better understanding of the effects of increasing the bedrock
depth on the site fundamental period. In addition, subsequent
earthquakes will be analyzed based on the actual soil cross-sectional
model and will lead to more benefit from the use of the array.

373
Appendix A: ProShake Theoretical Background A1. Introduction ProShake dynamic site response analysis is based on the one-
dimensional ground response analysis theory, which follows the general
approach of Kramer’s work [1]. The theory is first presented for a single
layer in order to demonstrate the principles behind it in a simplified
manner. The theory is then extended to multi-layers situations. A.2 Theoretical Background This section was taken directly from ProShake manual, with
permission of EduPro Civil Systems. The user manual is also readily
available on line at EduPro website. A.3 ProShake Theory
ProShake uses a frequency domain approach to solve the ground response
problem. In simple terms, the input motion is represented as the sum of a
series of sine waves of different amplitudes, frequencies, and phase
angles. A relatively simple solution for the response of the soil profile to
sine waves of different frequencies (in the form of a transfer function) is
used to obtain the response of the soil deposit to each of the input sine
waves. The overall response is obtained by summing the individual
responses to each of the input sine waves. This section describes the
basic mathematics of the process for a problem involving a single soil
layer, illustrates how that problem can be solved using a widely available

374
mathematical programming language, and extends the approach to the
layered systems.
Single Soil Layer ZS
The following paragraphs describe AS BS H
The basis of the analysis used in
ProShake and follow the general Zr
approach of Kramer (1996). Ar Br
That reference provided substantial background material and a more
detailed description of ground response analyses than is presented in this
User’s Manual.
To illustrate the basic approach used in ProShake, consider a uniform soil
layer lying on an elastic layer of rock that extends to infinite depth, as
illustrated to the right. If the subscripts s and r refer to soil and rock,
respectively, the horizontal displacements due to vertically propagating
harmonic s-waves in each material can be written as
)()( **),( ssss zkti
szkti
sss eBeAtzU −+ += ωω (1)
)()( **),( rrrr zkti
rzkti
rrs eBeAtzU −+ += ωω (2)
Where ω is the circular frequency of the harmonic wave and k* is the
complex wave number. No shear stress can exist at the ground surface
(zs = 0), so

375
0),0(
),0( * =∂
∂=
s
ss z
tuGtτ (3)
Where )21(* ξiGGs += is the complex shear modulus of the soil.
Substituting Equation (1) into Equation (3) and differentiating gives
0)()( *)0()0(* =−=− − tissss
tiiks
iksss eBAikGeeBeAikG ss ωω (4)
Which is satisfied when As = Bs. Compatibility of displacements and
continuity of stresses at the soil/rock boundary require
)0()( === rrss zUHzU (5)
)0()( === rrss zHz ττ (6)
Substituting Equations (1) and (2) into Equation (5)
rrHikHik
s BAeeA ss +=+ − )(**
(7)
From Equation (6) and the definition of shear stress )( *z
UGs ∂∂=τ
)()( **** **rrrr
HikHiksss BAkiGeekiGA ss −=− −
Or

376
rrHikHik
srr
ss BAeeAkG
kG ss −=− − )(**
**
** (8)
The ratio
***
*z
rr
rss
kG
kGα=
Where *zα is known as the complex impedance ratio. Solving Equations
(7) and (8) simultaneously gives
⎥⎦⎤
⎢⎣⎡ −++= − Hik
zHik
zsr ss eeAA**
)1()1(21 ** αα (9a)
⎥⎦⎤
⎢⎣⎡ ++−= − Hik
zHik
zsr ss eeAB**
)1()1(21 ** αα (9b)
If a vertically propagating shear wave of amplitude, A, traveled upward
through the rock and the soil was not present, the free surface effect at the
rock outcrop would produce a bedrock outcropping motion of amplitude
2A. If the soil was present, the free surface motion amplitude would be
Hikz
Hikz
sss ee
AA**
)1()1(
42** −−++
=αα
The transfer function, F(w), defined as the ratio of the soil surface
amplitude to the rock outcrop amplitude, is given by

377
Hikz
Hikz ss ee
F**
)1()1(
2)(** −−++
=αα
ω
Obviously, the transfer function is a complex function. It can be
rewritten using Euler’s Law as
HkiHkF
szs*** sincos
1)(α
ω+
= (10)
Solution of Single Layer Problem
Because the transfer function is defined as the ratio of the soil surface
amplitude to the rock outcrop amplitude, the soil surface amplitude can
be obtained as the product of the rock outcrop amplitude and the transfer
function. Therefore, the response of the soil layer to a periodic input
motion can be obtained by the following steps:
1. Express the input (rock outcrop) motion in the frequency domain
as a Fourier series (as the sum of a series of sine waves of different
amplitudes, frequencies, and phase angles). For an earthquake
motion, this Fourier series will have both real and imaginary parts.
2. Define the transfer function (Equation 10). The transfer function
will have both real and imaginary parts.
3. Compute the Fourier series of the output (ground surface) motion
as the product of the Fourier series of the input (bedrock) motion
and the transfer function. This Fourier series will also have both
real and imaginary parts.

378
4. Express the output motion in the time domain by means of an
inverse Fourier transform.
These steps are coded into a program using the mathematical
processing program MATLAB in the box located below. The syntax
of a MATLAB program is similar to common languages such as
FORTRAN and BASIC, but MATLAB contains high-level functions
that allow many complicated calculations and graphics commands to
be processed in a single line of text. The MATLAB program is well-
commented, and should be relatively easy to follow.
The variables defined in the first part of the MATLAB program
correspond to Example 7.3 in Kramer (1996). This example considers
the response of a 540 ft thick soil layer of soil (vss = 1500 ft/sec, γ =
125 pcf, and ζ= 5%) overlying bedrock (vsr = 5000 ft/sec, γ = 160 pcf,
and ζ = 2%).

379
% EX73.M - A MATLAB script for computing the seismic response of a uniform
% damped soil layer on elastic bedrock. Input data corresponds to % Example 7.3 in Kramer, S. L. (1996), Geotechnical Earthquake % Eingineering, Prentice Hall. 653 pp. height=540; % soil layer thickness vss=1500; % soil shear wave velocity vsr=5000; % rock shear wave velocity rho_s=125; % soil unit weight rho_r=160; % rock unit weight xs=0.05; % soil damping ratio xr=0.02; % rock damping ratio load gle.dat % load input motion n=length(gle); for j=2: n+1 a(j) = gle (j-1)/981; % shift and conver input motion to g’s end a(1) = 0.0 dt = 0.02; % time step df =1./(n*dt); % frequency increment t = 0.0 : dt : n*dt; % set up time vector f = 0.0 :df : n*df; % set up frequency vector afft = fft (a)/n; absfft = abs (aft); for j=1 : n/2+1 % set up single-sided FAS b (j) = 2.*absfft (j); ff (j) = f (j); end alpha_z = (rho_s*vss (1+i*xs)) / (rho_r*vsr* (1+i*xr)); % complex impedance ratio h (1) = 1.0; for j = 2 :n/2+1 ksH (j) = 2*pi*f (j)*height / (vss+xs*i*vss) % wave number x thickness h (j) = 1. / (cos(ksH (j))+ i*alpha_z*sin(ksH (j))); % left half of transfer function h (n+3-j) = conj (h (j)); % right half of transfer function end for j = 1 : n / 2+1 habs (j) = abs (h (j)); % modulus of transfer function (for plotting) end subplot (5,1,1) plot (t,a) % plot input motion (time domain) subplot (5,1,2) plot (ff,b) % plot FAS of input motion (frequency domain subplot (5,1,3) plot (ff,habs) % plot modulus of transfer function ( freq. domain) for j = 1 : n+1 acc (j) = aft (j)*h (j); % compute output motion in frequency domain end for j = 1 : n /2+1 acc1 (j) =2.*abs (acc (j)); % compute FAS of output motion end subplot (5,1,4) plot (ff,acc1) % plot FAS of output motion (frequency domain) atime = n*real (ifft (acc)); subplot (5,1,5) plot (t,atime) % plot output motion (time domain)

380
The MATLAB generates the plots shown below
The first of these plots shows a time history of acceleration of the 40-
sec input motion in the time domain. Immediately below this is the
Fourier amplitude spectrum of the input motion-the Fourier amplitude
spectrum shows a variation of amplitude with frequency for each of
the frequencies in the Fourier series. The abscissas of the second,
third, and fourth plots are frequency Hz. The third plot shows the
modulus (the square root of the sum of the squares of the real and
imaginary parts) of the transfer function. The transfer function is
clearly seen to have a series of local peaks that illustrate the nature of
amplification that will take place at the natural frequencies of the soil
layer; note that the greatest amplification will take place at the natural
frequency (where the transfer function reaches its global maximum).

381
The fourth plot shows the Fourier amplitude spectrum of the output
(ground surface) motion which is numerically equal to the product of
the input motion (second plot) and the transfer function (third plot).
The origin of this spectrum is clearly seen by comparing the second,
third, and fourth plots-the peaks in the fourth plot (the output motion)
are related to the peaks in the second plot (the input motion) and the
third plot (the transfer function). Finally, the last plot shows the
output (ground surface) motion in the time domain as obtained by
taking the inverse Fourier transform of the output motion in the
frequency domain.
Multiple Soil Layers
The basic approach described in the preceding sections is also used to
analyze layered soil deposits in ProShake-the only difference is that
the transfer function is different for a layered soil deposit. The
transfer function for a layered soil deposit must account for the
transmission and reflection of waves at boundaries between adjacent
layers, much as those factors were accounted for at the soil/rock
boundary in the previous section.

382
Z1 h1 G1 x1 r1
Z2 h2 G2 x2 r2
zΦ hΦ GΦ xΦ rΦ
zΦ-1 hΦ-1 GΦ-1 xΦ-1 rΦ-1
zN hN GN xN rN
zN+1 GN+1 xN+1 rN+!
Consider the soil deposit shown to the right. Within a given layer, say
layer j, the horizontal displacements will be given by
tizikj
zikjjj eeBeAtzU jjjj ω)(),(
** −+= (11)
At the boundary between layer j and layer j+1, compatibility of
displacements requires that
jjjj hikj
hikjjj eBeABA
**
11−
++ +=+ (12)
Continuity of shear stresses requires that

383
⎟⎟⎠
⎞⎜⎜⎝
⎛−=+
−
++++
jsjs hikj
hikj
jj
jjjj eBeA
kG
kGBA
**
*1
*1
**
11 (13)
Note that Equations (12) and (13) are analogous to Equations (7) and
(8), respectively. Defining *jα as the complex impedance ratio at the
boundary between layers j and j+1, the wave amplitudes for layer j+1
can be obtained from the amplitudes of layer j by solving Equations
(12) and (13)
jjjj hikjj
hikjjj eBeAA
**)1(
21)1(
21 **
1−
+ −++= αα (14a)
jjjj hikjj
hikjjj eBeAB
**)1(
21)1(
21 **
1−
+ ++−= αα (14b)
At the ground surface (z1 = 0), the requirement that the shear stress
must be zero means that A1=B1. Applying Equations (14) recursively
for j =1, 2, 3, ……, N, the coefficients Aj+1 and Bj+1 can be related to
Aj and Bj by
111 )( AaA jj ω++ = (15a)
111 )( BbB jj ω++ = (15b)
Where the functions )(1 ω+ja and )(1 ω+jb represent the effects of the
wave interactions that take place at all of the layer interfaces above

384
layer j+1. Then, a transfer function relating the motions at the tops of
any two layers, say layers i and j, can be expressed as
)()()()(
)(ωωωω
ωjj
iiij ba
baF
++
= (16)
This transfer function can become quite complicated, but it is used in
exactly the same way as the much simpler transfer function developed
for the single layer case. In fact, the MATLAB program that
illustrated the single layer case could be used to compute the response
for a multi-layered problem by changing only one line – the line
where the transfer function is defined (with the comment % left half of
transfer function).

385
Appendix B: Sample SPT Logs The Following plots are a sample standard penetration test (SPT) logs for
boring D2 Al-Durrah site.

386
SPT D2

387
SPT D2-cont.

388
Appendix C: Cross-hole and Down-hole Calculations 1. Cross-hole Profiles Calculations
ni
vdd
vn
i
si
i
n
i i
s,.......3,2,1
1
1 =
⎟⎟⎠
⎞⎜⎜⎝
⎛=
∑
∑
=
=
Where di and vsi are the thickness and shear wave velocity for layer
(i), respectively.

389
Boring Location: D5- CH
Depth (m) From To
Thickness di(m)
(Vsi)raw (m/s)
(Vsi)correctr(m/s)
di/(Vsi)correctec
0 2 2 280 276 0.007246 2 4 2 350 348 0.005747 4 6 2 260 259 0.007722 6 7 1 159 249 0.004016 7 8 1 350 348 0.002874 8 9 1 477 475 0.002105 9 10 1 149 222 0.004505
10 11 1 131 179 0.005587 11 12 1 167 273 0.003663 12 13 1 414 413 0.002421 13 14 1 350 348 0.002874 14 15 1 521 519 0.001927 15 16 1 500 498 0.002008 16 17 1 301 300 0.003333 17 18 1 155 239 0.004184 18 19 1 164 266 0.003759 19 20 1 228 565 0.00177 20 21 1 228 565 0.00177 21 22 1 211 457 0.002188
0.069699
=
∑=
⎟⎟⎠
⎞⎜⎜⎝
⎛
∑== n
i sivid
n
iid
sv
1
1 315.6 m/s
∑ =

390
Bring LOcation: D6-CH
Depth (m) From To
Thickness di(m)
(Vsi)raw (m/s)
(Vsi)correctr(m/s)
di/(Vsi)correctec
0 2 2 381 381 0.005249 2 4 2 848 848 0.002358 4 6 2 467 467 0.004283 6 7 1 233 233 0.004292 7 8 1 267 267 0.003745 8 9 1 389 389 0.002571 9 10 1 284 284 0.003521
10 11 1 431 431 0.00232 11 12 1 175 350 0.002857 12 13 1 431 431 0.00232 13 15 2 189 374 0.005348 15 16 1 350 448 0.002232 16 17 1 171 341 0.002933 17 18 1 350 599 0.001669 18 19 1 400 599 0.001669 19 25 6 400 550 0.011494 25 30 5 400 550 0.009579
0.068441
=
∑=
⎟⎟⎠
⎞⎜⎜⎝
⎛
∑== n
i sivid
n
iid
sv
1
1 438.6 m/s
∑ =

391
Boring Location: D11- CH
Depth (m) From To
Thickness di(m)
(Vsi)raw (m/s)
(Vsi)correctr(m/s)
di/(Vsi)correctec
0 1 1 130 307 0.003257 1 2 1 170 340 0.002941 2 3 1 178 221 0.004525 3 4 1 144 170 0.005882 4 5 1 131 216 0.00463 5 6 1 142 244 0.004098 6 7 1 151 280 0.003571 7 8 1 162 209 0.004785 8 9 1 139 221 0.004525 9 10 1 144 352 0.002841
10 12 2 165 340 0.005882 12 13 1 175 314 0.003185 13 14 1 236 308 0.003247 14 15 1 218 505 0.00198 15 16 1 213 498 0.002008 16 17 1 350 367 0.002725 17 18 1 345 562 0.001779 18 19 1 255 625 0.0016 19 20 1 560 720 0.001389 20 25 5 650 720 0.006944 25 30 5 650 720 0.006944
0.07874
=
∑=
⎟⎟⎠
⎞⎜⎜⎝
⎛
∑== n
i sivid
n
iid
sv
1
1 381.2 m/s
∑ =

392
Boring No.: D12- CH
Depth (m) From To
Thickness di(m)
(Vsi)raw (m/s)
(Vsi)correctr(m/s)
di/(Vsi)correctec
0 2 2 116 171 0.011696 2 4 2 123 188 0.010638 4 6 2 80 113 0.017699 6 7 1 158 191 0.005236 7 9 2 183 184 0.01087 9 10 1 258 281 0.003559
10 12 2 249 271 0.00738 12 13 1 320 348 0.002874 13 14 1 335 365 0.00274 14 15 1 261 388 0.002577 15 16 1 160 350 0.002857 16 17 1 160 382 0.002618 17 18 1 373 406 0.002463 18 19 1 440 479 0.002088 19 20 1 356 388 0.002577 20 21 1 147 346 0.00289 21 22 1 350 381 0.002625 22 23 1 303 398 0.002513 23 24 1 415 452 0.002212 24 25 1 408 445 0.002247 25 26 1 273 419 0.002387 26 30 4 550 550 0.007273
0.110017
=
∑=
⎟⎟⎠
⎞⎜⎜⎝
⎛
∑== n
i sivid
n
iid
sv
1
1 223 m/s
∑ =

393
2. Down-hole Profiles and Sample Calculations
0100200300400500600700800900
1000
0 5 10 15 20 25 30
Depth (m)
Wav
e V
eloc
ity (
m/s
ec)
Vs DH Vs (m/sec) Vs CH Corrected
FIGURE I-CH-1a - Ad Durra - Boring D5 Cross Hole and Down Hole
Figure C1: D5 Profiles

394
FIGURE I-CH-2a - Ad Durra - Boring D6 Cross Hole and Down Hole
0
200
400
600
800
1000
1200
0 5 10 15 20 25 30
Depth (m)
Wav
e V
eloc
ity (
m/s
ec)
Vs (m/sec) Vs DH Corrected
Figure C2: D56Profiles

395
FIGURE I-CH-3a - Ad Durra - Boring D11Cross Hole and Down Hole
0
200
400
600
800
1000
1200
1400
0 5 10 15 20 25 30
Depth (m)
Wav
e V
eloc
ity (m
/sec
)
Vs CH (m/sec) Vs Down HoleVp Down Hole Vs CH Corrected
Figure C3: D11 Profiles

396
3. Sample Calculations Cross-hole Corrections To illustrate the cross-hole correction method using equation (7.1), which is reproduced below, cross-hole Haq-5 calculations are presented here
(note that this cross-hole profile was part of the research project, but was
not in Al-Durrah site. In addition, this correction method is an empirical
method and should not be used without a through understanding of the
nature of the soil profile and the availability of supporting data from other
tests):
)1.7(
looses
l
avgs
t
ltcorrs
VL
VL
LLV
−−
−
−
−=
Step 1. Calculate Xnu:
))(1(2
)(2
2
2
VVVV
X
s
ps
p
nu−
−=
The calculations of Xnu are presented in Table (C1)

397
Table (C1)
Depth (m) Wave Travel Time (ms)
Distance Of Wave
(Vp) Travel
m
Vs
CH
Vp
DH
2)(VV
s
p
Xmu
1 1.62 1.12 212.00 690.00 10.59 0.45 3 11.50 4.37 211.00 380.00 3.24 0.28 5 20.50 5.02 120.00 245.00 4.17 0.34 7 18.75 7.01 122.60 374.00 9.31 0.44 9 15.62 9.01 154.70 577.00 13.91 0.46
11 18.62 10.99 140.70 590.00 17.58 0.47 13 19.50 13.01 134.30 667.00 24.67 0.48 15 23.00 15.00 122.10 652.00 28.51 0.48 17 25.00 17.00 129.10 680.00 27.74 0.48 19 24.25 18.99 132.50 783.00 34.92 0.49
Average= 0.45
Step 2. Use Xnu to calculate Vs-Loose from Vs-ave, which measured from the
cross-hole test:
Vs-Loose = Xmu (Vs-ave)
Vs-ave = Distance between source and receiver / time of travel
=2.95 / time of travel
The results are shown in Table (C2)
Table (C2)

398
Depth m
Time of travel ms
Vs-ave m/s
Vs-Loose m/s
(Vs)corrected m/s
1 17.37 169.83 76.42 212.66 2 21.50 137.21 61.74 171.81 3 17.50 168.57 75.86 211.08 4 26.25 112.38 50.57 140.72 5 30.62 96.34 43.35 120.64 6 28.50 103.51 46.58 129.61 7 30.12 97.94 44.07 122.64 8 29.00 101.72 45.78 127.38 9 23.87 123.59 55.61 154.75
10 22.62 130.42 58.69 163.30 11 26.25 112.38 50.57 140.72 12 30.75 95.93 43.17 120.13 13 27.50 107.27 48.27 134.32 14 29.37 100.44 45.20 125.77 15 30.25 97.52 43.88 122.11 16 34.00 86.76 39.04 108.64 17 28.62 103.07 46.38 129.07 18 28.62 103.07 46.38 129.07 19 27.87 105.85 47.63 132.54
19.5 27.87 105.85 47.63 132.54

399
Appendix D: CXW Calculations
Note: In addition to determining the shear wave velocity for the soil profile, the same information was used for each profile’s Dynamic site response analysis (ProShake). ∑di =30 m for all CXW profiles
Boring No.: D1- CXW(A10)
Area CXW Site Boring North East Elev. MORPHOLOGY
Al- Durah A10
D1 29 20.393 34 56.95 19 Level 1
sm
vdd
v
si
ii
CXWs /15.471)( =∑
∑=
Depth (m) FRom To
Layer Thickness(di) (m)
SWV (Vsi)m/s
vdsi
i
0 0 0 0 0 2 2 2 2 2 4 4 4 4 4 7 7 7 7 7
10 10 10 10 10 15 15 15 15 15 20 20 20 20 20 23 23 23 23 23 25 25 25 25 25
∑ = 0.063674

400
0
5
10
15
20
25
30
0 200 400 600 800 1000
Phase Velocity (m/s)
1/2
Wav
e Le
ngth
(m
Measured Data Computed Data CXW
0
5
10
15
20
25
30
0 200 400 600 800
Shear Wave Velocity (m/s)
Dep
th (m
)CXW VS=483SC
D1CXW

401
Boring: D2- CXW(A6)
Area CXW Site Boring North East Elev. MORPHOLOGY
Al-Durrah A6 D2
29 20.47 34 57.13 Fill over level 2
Depth (m) From To
Layer Thickness(di) (m)
SWV (Vsi)m/s
vdsi
i
0 1 1 200 0.005 1 6 5 800 0.00625 6 11.5 5.5 300 0.018333
11.5 15 3.5 450 0.007778 15 20 5 450 0.011111 20 26.5 6.5 450 0.014444
26.5 30 3.5 650 0.005385
∑ = 0.06830
sm
vdd
v
si
ii
CXWs /24.439)( =∑
∑=

402
0
5
10
15
20
25
30
0 200 400 600 800
Phase Velocity (m/s)
1/2
Wav
e Le
ngth
(m
Measured Data Computed Data CXW
0
5
10
15
20
25
30
0 200 400 600 800 1000
Shear Wave Velocity (m/s)
Dep
th (m
)CXW VS=445, SC
D2CXW

403
Boring No.: D3- CXW(A14)
Area CXW Site Boring North East Elev. MORPHOLOGY
Al-Durrah A14 D3
29 20.75 34 57.33 Cut on Level 2
Depth (m)From To
Layer Thickness(di) (m)
SWV (Vsi)m/s
vdsi
i
0 1 1 250 0.004 1 6 5 450 0.011111 6 11 5 250 0.02
11 15 4 500 0.008 15 20 5 500 0.01 20 25 5 500 0.01 25 30 5 500 0.01
∑ = 0.07311
sm
vdd
v
si
ii
CXWs /33.410)( =∑
∑=

404
0
5
10
15
20
25
30
0 200 400 600 800
Phase Velocity (m/s)
1/2
Wav
e Le
ngth
(m
Measured Data Computed Data CXW
0
5
10
15
20
25
30
0 100 200 300 400 500 600
Shear Wave Velocity (m/s)
Dep
th (m
)CXW VS=410, SC
D3CXW

405
Boring No.: D4- CXW(A11)
Area CXW Site Boring North East Elev. MORPHOLOGY
Al-Durrah A11 D4
29 21 34 57.4 Level 1
Depth (m)From To
Layer Thickness(di) (m)
SWV (Vsi)m/s
vdsi
i
0 1 1 300 0.003333 1 6 5 950 0.005263 6 11 5 250 0.02
11 15 4 350 0.011429 15 21 6 350 0.017143 21 25 4 650 0.006154 25 30 5 650 0.007692
∑ = 0.071014
sm
vdd
v
si
ii
CXWs /45.422)( =∑
∑=

406
0
5
10
15
20
25
30
0 500 1000 1500 2000
Phase Velocity (m/s)
1/2
Wav
e Le
ngth
(m
Measured Data Computed Data CXW
0
5
10
15
20
25
30
0 200 400 600 800 1000
Shear Wave Velocity (m/s)
1/2
Wav
e Le
ngth
(mCXW VS=422, SC Computed Data CXW
D4CXW

407
Boring D5A-CXW (A3a)
Area CXW Site Boring North East Elev. MORPHOLOGY
Al-Durrah A3a D5
29 20.567 34 57.0264 16 Level 1
Depth (m)From To
Layer Thickness(di) (m)
SWV (Vsi)m/s
vdsi
i
0 2 2 250 0.008 2 5 3 800 0.00375 5 7 2 800 0.0025 7 10 3 350 0.008571
10 15 5 600 0.008333 15 17 2 600 0.003333 17 20 3 475 0.006316 20 22 2 475 0.004211 22 25 3 650 0.004615 25 30 5 650 0.007692
∑ = 0.05732
sm
si
ii
CXWs
vdd
v /36.523)( =∑
∑=

408
0
5
10
15
20
25
30
0 200 400 600 800 1000
Phase Velocity (m/s)
1/2
Wav
e Le
ngth
(m
Measured Data Computed Data CXW
CXW VS=523, SC
0
5
10
15
20
25
30
0 200 400 600 800 1000
Shear Wave Velocity (m/s)
Dep
th (m
)CXW VS=523, SC
D5ACXW

409
Boring D5- CXW(A3)
Area CXW Site Boring North East Elev. MORPHOLOGY
Al-Durrah A3b D5
29 20.567 34 57.0264 16 Level 1
sm
vdd
v
si
ii
CXWs /75.464)( =∑
∑=
Depth (m) From To
Layer Thickness (di) (m)
SWV (Vsi) m/s
vdsi
i
0 1 1 350 0.002857 1 5 4 700 0.005714 5 6 1 450 0.002222 6 10 4 600 0.006667
10 12 2 275 0.007273 12 16 4 400 0.01 16 18 2 250 0.008 18 20 2 550 0.003636 20 25 5 550 0.009091 25 30 5 550 0.009091
∑ = 0.064551

410
0
5
10
15
20
25
30
0 200 400 600 800 1000
Phase Velocity (m/s)
1/2
Wav
e Le
ngth
(m
Computed Data CXW Measured Data
0
5
10
15
20
25
30
0 200 400 600 800 1000
Shear Wave Velocity (m/s)
Dep
th (m
)CXW VS=465, SC
D5CXW

411
Boring No.: D6-CXW (A5)
Area CXW Site Boring
Cross Hole K2 North East
Ad Durah A5 D6 CH Site 3 29 20.737 34
sm
vdd
v
si
ii
CXWs /07.333)( =∑
∑=
Depth (m)From To
Layer Thickness(di) (m)
SWV (Vsi)m/s
vdsi
i
0 1 1 250 0.004 1 4 3 400 0.0075 4 10 6 200 0.03
10 15 5 350 0.014286 15 20 5 350 0.014286 20 25 5 500 0.01 25 30 5 500 0.01
∑ = 0.090071

412
0
5
10
15
20
25
30
0 200 400 600 800
Phase Velocity (m/s)
1/2
Wav
e Le
ngth
(m
Measured Data Computed Data CXW
CXW VS=333, SD
0
5
10
15
20
25
30
0 100 200 300 400 500 600
Shear Wave Velocity (m/s)
Dep
th (m
)CXW VS=333, SD
D6CXW

413
Boring No.: D7- CXW (A13)
Area CXW Site Boring North
East
MORPHOLOGY
Ad-Durrah A13 D7 20.9 34.57.3
Fill over Level 2
sm
vdd
v
si
ii
CXWs /54.466)( =∑
∑=
Depth (m) From To
Layer Thickness(di) (m)
SWV (Vsi)m/s
vdsi
i
0 1 1 250 0.004 1 6 5 550 0.009091 6 11 5 300 0.016667
11 15 4 550 0.007273 15 20 5 550 0.009091 20 25 5 550 0.009091 25 30 5 550 0.009091
0.064303
∑ = 0.064303

414
0
5
10
15
20
25
30
0 200 400 600 800 1000
Phase Velocity (m/s)
1/2
Wav
e Le
ngth
(m
Measured Data Computed Data CXW
0
5
10
15
20
25
30
0 100 200 300 400 500 600
Shear Wave Velocity (m/s)
Dep
th (m
)CXW VS=466, SC
D7CXW
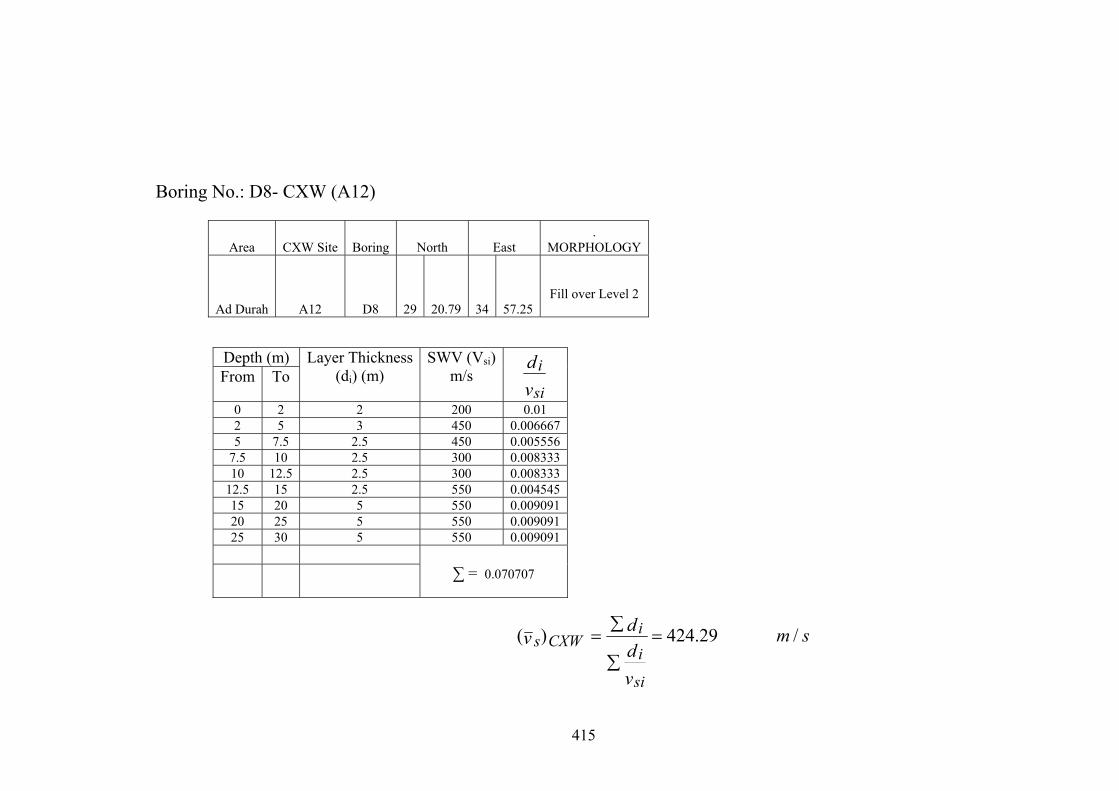
415
Boring No.: D8- CXW (A12)
Area CXW Site Boring North East .
MORPHOLOGY
Ad Durah A12 D8 29 20.79 34 57.25
Fill over Level 2
sm
vdd
v
si
ii
CXWs /29.424)( =∑
∑=
Depth (m) From To
Layer Thickness(di) (m)
SWV (Vsi)m/s
vdsi
i
0 2 2 200 0.01 2 5 3 450 0.006667 5 7.5 2.5 450 0.005556
7.5 10 2.5 300 0.008333 10 12.5 2.5 300 0.008333
12.5 15 2.5 550 0.004545 15 20 5 550 0.009091 20 25 5 550 0.009091 25 30 5 550 0.009091
∑ = 0.070707

416
0
5
10
15
20
25
30
0 200 400 600 800 1000 1200
Phase Velocity (m/s)
1/2
Wav
e Le
ngth
(m
Measured Data Computed Data CXW
0
5
10
15
20
25
30
0 100 200 300 400 500 600
Shear Wave Velocity (m/s)
Dep
th (m
)CXW VS=425, SC
D8CXW

417
Boring No.: D9- CXW (A4)
Area CXW Site Boring North East MORPHOLOGY
Al-Durrah A4 D9 29 20.66 34 57.27
Level 2
Depth (m) From To
Layer Thickness(di) (m)
SWV (Vsi)m/s
vdsi
i
0 1 1 200 0.005 1 5 4 650 0.006154 5 9 4 650 0.006154 9 14 5 350 0.014286
14 20 6 450 0.013333 20 24 4 450 0.008889 24 30 6 650 0.009231
0.063046
∑ = 0.063046
sm
vdd
v
si
ii
CXWs /84.475)( =∑
∑=

418
0
5
10
15
20
25
30
0 200 400 600 800 1000 1200
Phase Velocity (m/s)
1/2
Wav
e Le
ngth
(m
Measured Data Computed Data CXW
0
5
10
15
20
25
30
0 200 400 600 800
Shear Wave Velocity (m/s)
Dep
th (m
)CXW VS=476, SC
D9CXW

419
Boring No.: D11- CXW (A1)
Area CXW Site Boring North East Elev. MORPHOLOGY
Al-Durrah A1 D11 29 20.52 34 57.061 18 Fill over level 1
Depth (m) From To
Layer Thickness(di) (m)
SWV (Vsi)m/s
vdsi
i
0 1 1 275 0.003636 1 4 3 300 0.01 4 10 6 325 0.018462
10 15 5 350 0.014286 15 20 5 350 0.014286 20 25 5 500 0.01 25 30 5 500 0.01
∑ = 0.080067
sm
vdd
v
si
ii
CXWs /89.371)( =∑
∑=

420
0
5
10
15
20
25
30
0 200 400 600 800
Phase Velocity (m/s)
1/2
Wav
e Le
ngth
(m
Measured Data Computed Data CXW
CXW VS=372, SC
0
5
10
15
20
25
30
0 100 200 300 400 500 600
Shear Wave Velocity (m/s)
Dep
th (m
)CXW VS=372, SC
D11CXW

421
Boring No.: D12- CXW (A7)
Area CXW Site Boring North East MORPHOLOGY
Al-Durrah A7 D12 29 20.55 34 57.27 Cut on Level 2
sm
vdd
v
si
ii
CXWs /00.354)( =∑
∑=
Depth (m) From To
Layer Thickness(di) (m)
SWV (Vsi)m/s
vdsi
i
0 2 2 200 0.01 2 5 3 400 0.0075 5 7 2 250 0.008 7 11 4 275 0.014545
11 15 4 425 0.009412 15 20 5 425 0.011765 20 25 5 425 0.011765 25 30 5 425 0.011765
∑ = 0.084751

422
0
5
10
15
20
25
30
0 200 400 600 800
Phase Velocity (m/s)
1/2
Wav
e Le
ngth
(m
Measured Data Computed Data CXW
0
5
10
15
20
25
30
0 100 200 300 400 500
Shear Wave Velocity (m/s)
Dep
th (m
)CXW VS=354, SD
D12CXW

423
Appendix E: Sample Vertical Electric Sounding (VES) Field Data Appendix E presents sample (VES) depth plots and calculations that were
performed at the East-west seismic array. Figure (E1) shows the
locations of the stations as was determined by the advanced global
positioning system (GPS) that was presented in Chapter 6.

424
Figure E1: Al-Durrah and the East-west seismic array stations locations

425

426

427

428

429

430

431
Appendix F: Microtremors Calculations
The step-by step procedure for generating microtremors mean ratio
spectra from raw, 3-components microtremors record was presented in
Chapter 3, and is reproduced here for convenience [8]:
5. Select portion of the record (for all three components) to be
analyzed.
6. Segment signals into non-overlapping time windows (S-
segment) of about (20-30) seconds each.
7. Taper each segment by multiplying it by a triangular unit
window function and compute its spectra by performing FFT.
Tapering the segment is important to minimize frequency
leakage when the FFT is performed [13]. Figure (F.1) show an
example of triangular unit window that can be used for a 4000
point seismic record

432
Triangular Unit Window
0
0.2
0.4
0.6
0.8
1
1.2
0 1000 2000 3000 4000 5000
Figure F.1: A triangular unit window for 4000 values segment
4. Smooth the resulting spectra using a Parzen window function.
A Parzen window function is a unity function, and is defined as [14]
(2+x)3 -2 ≤ x < -1 4-6x2-3x3 -1 ≤ x < 0
Parzen (x) = 0.25 4-6x2+3x3 0 ≤ x < 1
(2-x)3 1 ≤ x <2
0 else

433
0
0.2
0.4
0.6
0.8
1
1.2
-3 -2 -1 0 1 2 3
Series1
Figure F.2: Parzen Smoothing Window Figure (F.2) is a plot of a standard Parzen window. Although the
range of a Parzen window is from -2 to 2, it can be scaled to fit any
required window width. Smoothing with Parzen window minimizes rapid
fluctuations, and emphasizes the underlying trends of the spectra [13].
5. Compute the mean ratio spectra by using equation (3.3.2c).
6. Compute the average mean ratio spectra.
7. Plot the resulting graphs simultaneously.
8. Compute the direct ratio spectra by using equation (3.3.2a) and
(3.3.2b)
9. Compute the average direct ratio spectra.

434
10. Plot the resulting graphs simultaneously.
11. Determine the fundamental frequency (or period) from the
largest common peak of the graphs.

435
Microtremors Segment:A1-S1
Raw Data Tapered Data
FFT Data Parzen Filtered Data
Simple Ratio Spectrum
Z E N
Tapering Function
Z E N Z E N Z E N
Frequency Hz
E/Z N/Z
Mean SQRT Spectrum
26.79 5.86 -15.33 0.26 6.95 1.52 -3.98 1.31 1.13 1.81 0.23 0.30 0.50 30.03 1.28 2.48 -30.20 -5.13 -4.28 0.26 -7.82 -1.33 -1.11 0.29 0.19 1.31 0.24 0.30 0.50 29.98 1.27 2.45 8.85 -3.10 -13.23 0.26 2.29 -0.80 -3.42 1.08 1.18 0.31 0.24 0.30 0.50 29.93 1.25 2.42 29.77 -3.08 -12.16 0.26 7.68 -0.79 -3.14 0.43 0.73 0.52 0.24 0.30 0.50 29.88 1.24 2.39 -33.22 -5.05 -6.11 0.26 -8.55 -1.30 -1.57 0.63 0.68 1.16 0.25 0.30 0.50 29.83 1.22 2.36 24.81 -4.02 -7.07 0.26 6.37 -1.03 -1.82 0.60 0.37 1.25 0.25 0.30 0.50 29.79 1.21 2.33 -9.22 -1.00 -2.04 0.26 -2.37 -0.26 -0.52 0.76 0.67 0.51 0.25 0.30 0.50 29.74 1.20 2.29 -5.19 -1.98 0.98 0.26 -1.33 -0.51 0.25 0.61 1.52 1.15 0.26 0.30 0.49 29.69 1.18 2.26 8.81 -7.95 -3.01 0.26 2.25 -2.03 -0.77 0.29 1.60 0.85 0.26 0.30 0.49 29.64 1.17 2.23
-19.17 6.07 -7.97 0.26 -4.89 1.55 -2.03 0.29 1.64 0.35 0.26 0.31 0.49 29.59 1.16 2.20 11.85 1.07 2.06 0.25 3.02 0.27 0.52 0.56 0.47 0.83 0.27 0.31 0.49 29.54 1.16 2.17 -16.14 -3.92 5.06 0.25 -4.10 -0.99 1.28 1.40 0.48 1.51 0.27 0.31 0.48 29.49 1.15 2.14 4.89 9.09 -15.91 0.25 1.24 2.30 -4.03 1.36 0.85 1.44 0.27 0.31 0.48 29.44 1.15 2.11 -0.12 -8.90 -0.86 0.25 -0.03 -2.25 -0.22 0.74 0.58 1.12 0.27 0.31 0.48 29.39 1.15 2.09 -3.11 -2.87 22.11 0.25 -0.78 -0.72 5.58 1.42 0.46 0.75 0.28 0.32 0.47 29.35 1.15 2.07 6.89 6.14 8.07 0.25 1.74 1.55 2.03 1.11 0.48 1.05 0.28 0.32 0.47 29.30 1.15 2.05
-28.06 -5.85 10.04 0.25 -7.06 -1.47 2.53 0.72 0.80 0.49 0.28 0.32 0.47 29.25 1.15 2.04 22.95 1.17 5.03 0.25 5.76 0.29 1.26 0.58 0.96 1.27 0.28 0.32 0.47 29.20 1.16 2.03 -8.07 -11.80 -10.95 0.25 -2.02 -2.96 -2.74 0.32 1.28 1.43 0.28 0.33 0.46 29.15 1.16 2.02 -12.03 -1.76 -1.91 0.25 -3.01 -0.44 -0.48 0.79 0.84 2.45 0.28 0.33 0.46 29.10 1.17 2.02 7.98 19.22 6.10 0.25 1.99 4.80 1.52 0.80 0.96 1.48 0.28 0.33 0.46 29.05 1.18 2.01
-36.95 6.18 9.08 0.25 -9.20 1.54 2.26 0.21 1.38 0.82 0.28 0.33 0.46 29.00 1.18 2.01 21.08 2.17 2.07 0.25 5.24 0.54 0.52 0.11 0.94 0.28 0.28 0.34 0.46 28.96 1.19 2.01 -13.93 -11.79 -8.90 0.25 -3.45 -2.92 -2.21 0.81 0.33 0.81 0.28 0.34 0.46 28.91 1.20 2.02 -7.88 8.22 8.12 0.25 -1.95 2.04 2.01 1.25 0.41 1.77 0.28 0.34 0.46 28.86 1.21 2.02 36.07 28.16 14.09 0.25 8.91 6.96 3.48 0.91 1.05 2.18 0.28 0.34 0.45 28.81 1.21 2.02 -35.93 -6.87 1.07 0.25 -8.86 -1.69 0.26 1.80 0.81 2.32 0.28 0.34 0.45 28.76 1.22 2.02 11.13 11.14 4.07 0.25 2.74 2.74 1.00 0.22 0.72 1.60 0.28 0.34 0.45 28.71 1.23 2.03 -0.89 22.08 3.07 0.25 -0.22 5.42 0.75 0.49 1.11 1.12 0.28 0.35 0.45 28.66 1.23 2.03 -8.87 -4.94 4.07 0.25 -2.17 -1.21 1.00 0.30 0.48 1.29 0.28 0.35 0.45 28.61 1.23 2.03 36.08 1.08 12.05 0.24 8.82 0.26 2.95 0.88 0.12 0.66 0.28 0.35 0.45 28.56 1.24 2.03 -28.93 8.07 5.03 0.24 -7.06 1.97 1.23 0.79 0.17 0.15 0.28 0.35 0.45 28.52 1.24 2.02 5.13 5.05 2.03 0.24 1.25 1.23 0.50 0.76 1.02 0.19 0.28 0.35 0.45 28.47 1.24 2.02

436
Raw Data Tapered Data
FFT Data Parzen Filtered Data
Simple Ratio Spectrum
Z E N
Tapering Function
Z E N Z E N Z E N
Frequency Hz
E/Z N/Z
Mean SQRT Spectrum
10.10 -7.93 3.04 0.24 2.45 -1.93 0.74 0.97 1.01 1.45 0.28 0.35 0.45 28.42 1.23 2.02 1.08 8.08 -7.94 0.24 0.26 1.96 -1.93 0.97 1.07 0.50 0.28 0.34 0.45 28.37 1.23 2.01 26.03 22.03 -9.89 0.24 6.30 5.33 -2.39 0.74 1.02 1.40 0.28 0.34 0.44 28.32 1.23 2.00 -11.99 -11.98 -6.84 0.24 -2.90 -2.89 -1.65 0.94 0.85 0.27 0.28 0.34 0.44 28.27 1.22 1.99 16.00 -4.93 -13.79 0.24 3.86 -1.19 -3.32 1.02 1.12 1.18 0.28 0.34 0.44 28.22 1.21 1.99 18.94 19.05 -9.73 0.24 4.55 4.58 -2.34 0.61 0.68 1.21 0.28 0.34 0.44 28.17 1.21 1.98 -2.09 -2.97 0.31 0.24 -0.50 -0.71 0.07 0.32 0.36 0.45 0.28 0.34 0.44 28.13 1.20 1.97 -8.07 -8.94 -4.67 0.24 -1.93 -2.14 -1.12 0.21 0.47 1.23 0.28 0.34 0.44 28.08 1.19 1.96 16.92 8.08 -10.63 0.24 4.04 1.93 -2.54 0.39 0.04 1.73 0.28 0.33 0.44 28.03 1.18 1.95 26.83 -0.93 -8.57 0.24 6.40 -0.22 -2.04 0.19 0.22 0.88 0.28 0.33 0.44 27.98 1.17 1.94 -29.16 -1.91 -7.53 0.24 -6.94 -0.45 -1.79 0.37 0.80 1.22 0.28 0.33 0.44 27.93 1.16 1.93 13.88 17.07 -6.49 0.24 3.30 4.05 -1.54 0.58 0.29 1.31 0.28 0.33 0.44 27.88 1.16 1.92 13.82 8.03 -6.44 0.24 3.28 1.90 -1.53 1.20 0.60 1.54 0.29 0.33 0.44 27.83 1.15 1.91 -12.18 -15.94 -4.41 0.24 -2.88 -3.77 -1.04 1.03 0.51 2.10 0.29 0.33 0.44 27.78 1.14 1.90 4.84 -4.89 -2.38 0.24 1.14 -1.15 -0.56 0.94 0.65 1.59 0.29 0.32 0.44 27.73 1.13 1.90 -23.12 13.11 -7.35 0.24 -5.44 3.09 -1.73 0.36 0.41 1.23 0.29 0.32 0.44 27.69 1.12 1.89 4.92 -6.90 5.67 0.24 1.16 -1.62 1.33 0.29 0.64 0.33 0.29 0.32 0.44 27.64 1.11 1.89 -16.05 -1.87 14.64 0.23 -3.76 -0.44 3.43 0.45 1.56 0.99 0.29 0.32 0.44 27.59 1.10 1.88 -10.99 21.11 7.61 0.23 -2.57 4.94 1.78 1.16 1.65 1.21 0.29 0.31 0.44 27.54 1.10 1.88 17.00 -7.91 -1.38 0.23 3.97 -1.85 -0.32 1.50 2.02 0.66 0.29 0.31 0.44 27.49 1.09 1.88 -24.98 -12.86 -6.35 0.23 -5.82 -3.00 -1.48 2.29 1.56 1.55 0.29 0.31 0.44 27.44 1.08 1.88 18.04 3.17 14.64 0.23 4.19 0.74 3.40 1.64 0.59 0.73 0.29 0.31 0.44 27.39 1.08 1.87 1.00 2.17 13.60 0.23 0.23 0.50 3.16 1.01 0.56 0.76 0.29 0.31 0.44 27.34 1.07 1.87 -17.96 1.18 2.58 0.23 -4.16 0.27 0.60 0.86 1.33 0.41 0.28 0.30 0.44 27.29 1.06 1.87 15.05 -8.80 10.57 0.23 3.48 -2.03 2.44 0.28 1.12 0.15 0.28 0.30 0.44 27.25 1.06 1.87 -5.96 8.22 -0.44 0.23 -1.37 1.89 -0.10 0.73 0.35 1.01 0.28 0.30 0.44 27.20 1.05 1.87 10.03 0.21 6.56 0.23 2.31 0.05 1.51 0.27 0.44 1.75 0.28 0.29 0.44 27.15 1.04 1.87 -13.95 -24.73 8.55 0.23 -3.20 -5.68 1.96 0.30 0.77 1.08 0.28 0.29 0.44 27.10 1.04 1.86 4.07 0.33 -7.44 0.23 0.93 0.08 -1.70 0.17 0.63 0.56 0.28 0.29 0.44 27.05 1.03 1.86 3.06 6.33 -4.40 0.23 0.70 1.45 -1.01 0.78 0.97 0.51 0.28 0.29 0.43 27.00 1.03 1.86 -21.90 -3.67 12.59 0.23 -4.99 -0.84 2.87 1.04 0.71 0.56 0.28 0.29 0.43 26.95 1.02 1.86

437
Raw Data Tapered Data
FFT Data Parzen Filtered Data
Simple Ratio Spectrum
Z E N
Tapering Function
Z E N Z E N Z E N
Frequency Hz
E/Z N/Z
Mean SQRT Spectrum
-21.90 -3.67 12.59 0.23 -4.99 -0.84 2.87 1.04 0.71 0.56 0.28 0.29 0.43 26.95 1.02 1.55 1.86 34.08 -4.64 9.56 0.23 7.75 -1.06 2.18 0.74 0.93 1.42 0.28 0.28 0.43 26.90 1.02 1.55 1.85 -15.95 -5.61 -7.43 0.23 -3.62 -1.27 -1.69 0.81 0.78 0.72 0.28 0.28 0.43 26.86 1.02 1.55 1.85 -11.89 -2.58 2.60 0.23 -2.69 -0.58 0.59 1.05 0.31 0.99 0.28 0.28 0.43 26.81 1.01 1.54 1.85 9.12 -3.56 -1.39 0.23 2.06 -0.80 -0.31 0.75 0.36 1.26 0.28 0.28 0.43 26.76 1.01 1.54 1.84 -17.86 6.45 -15.34 0.23 -4.03 1.45 -3.46 0.44 0.73 1.01 0.28 0.28 0.42 26.71 1.01 1.53 1.84 15.15 -5.54 14.67 0.23 3.41 -1.25 3.30 0.42 1.15 1.00 0.28 0.28 0.42 26.66 1.01 1.53 1.83 -3.87 -3.51 1.65 0.22 -0.87 -0.79 0.37 0.25 0.83 1.00 0.28 0.28 0.42 26.61 1.00 1.52 1.82 14.11 14.48 -45.25 0.22 3.16 3.24 -10.14 0.21 1.12 1.19 0.28 0.28 0.42 26.56 1.00 1.51 1.81 -13.88 -14.51 -19.10 0.22 -3.10 -3.24 -4.27 0.67 1.24 0.47 0.28 0.28 0.42 26.51 1.00 1.50 1.81 -6.84 -8.45 4.94 0.22 -1.52 -1.89 1.10 1.24 0.35 0.42 0.28 0.28 0.42 26.46 1.00 1.49 1.80 38.11 11.55 -12.03 0.22 8.48 2.57 -2.68 0.44 0.96 0.56 0.28 0.28 0.41 26.42 1.01 1.48 1.79 -27.91 -2.46 1.00 0.22 -6.20 -0.55 0.22 0.28 1.30 1.10 0.28 0.28 0.41 26.37 1.01 1.47 1.78 -1.85 -2.43 2.01 0.22 -0.41 -0.54 0.45 0.81 0.82 0.77 0.28 0.29 0.41 26.32 1.01 1.45 1.77 10.14 -15.39 -11.95 0.22 2.24 -3.40 -2.64 0.85 1.00 0.43 0.28 0.29 0.41 26.27 1.01 1.44 1.76 3.12 -0.34 8.07 0.22 0.69 -0.08 1.78 0.73 1.22 0.73 0.29 0.29 0.41 26.22 1.01 1.42 1.75 -1.88 9.65 14.04 0.22 -0.41 2.12 3.09 0.41 1.09 1.10 0.29 0.29 0.41 26.17 1.02 1.41 1.74 -17.84 -17.33 -4.97 0.22 -3.92 -3.80 -1.09 0.62 0.26 0.58 0.29 0.30 0.40 26.12 1.02 1.39 1.73 25.15 5.71 -10.92 0.22 5.51 1.25 -2.39 0.44 0.26 0.13 0.29 0.30 0.40 26.07 1.03 1.38 1.72 -21.85 14.68 -10.86 0.22 -4.77 3.21 -2.37 0.10 0.16 0.68 0.29 0.30 0.40 26.03 1.03 1.36 1.71 -11.78 0.66 -1.82 0.22 -2.57 0.14 -0.40 0.48 0.22 0.49 0.29 0.30 0.39 25.98 1.04 1.35 1.70 13.22 8.65 7.18 0.22 2.88 1.88 1.56 0.70 0.39 0.89 0.29 0.31 0.39 25.93 1.05 1.33 1.69 -27.74 0.65 -1.82 0.22 -6.02 0.14 -0.39 0.95 0.44 1.31 0.29 0.31 0.39 25.88 1.05 1.32 1.69 3.31 -3.34 0.20 0.22 0.72 -0.72 0.04 1.44 0.78 2.05 0.29 0.31 0.38 25.83 1.06 1.31 1.68 2.30 4.67 -2.78 0.22 0.50 1.01 -0.60 1.31 0.60 2.51 0.29 0.31 0.38 25.78 1.07 1.30 1.68 -2.69 2.67 -3.75 0.22 -0.58 0.57 -0.81 1.15 0.71 1.56 0.29 0.32 0.38 25.73 1.07 1.29 1.68 -18.64 -1.32 -0.73 0.22 -4.01 -0.28 -0.16 0.82 0.72 0.35 0.29 0.32 0.37 25.68 1.08 1.28 1.67 -7.59 -1.31 -26.66 0.21 -1.63 -0.28 -5.72 0.71 0.38 0.54 0.29 0.32 0.37 25.63 1.09 1.27 1.68 37.36 -0.29 -12.56 0.21 7.99 -0.06 -2.69 1.17 0.84 0.38 0.29 0.32 0.37 25.59 1.10 1.27 1.68 -15.68 -1.28 28.42 0.21 -3.35 -0.27 6.07 1.65 0.71 0.81 0.29 0.32 0.36 25.54 1.11 1.26 1.68 -9.63 -2.26 -10.60 0.21 -2.05 -0.48 -2.26 1.53 0.22 0.81 0.28 0.32 0.36 25.49 1.12 1.26 1.69

438
Raw Data Tapered Data
FFT Data Parzen Filtered Data
Simple Ratio Spectrum
Z E N
Tapering Function
Z E N Z E N Z E N
Frequency Hz
E/Z N/Z
Mean SQRT Spectrum
-9.66 1.74 25.49 0.21 -2.05 0.37 5.40 1.42 0.26 0.68 0.28 0.32 0.35 25.39 1.14 1.26 1.70 -9.62 -0.25 8.44 0.21 -2.03 -0.05 1.79 1.10 0.24 1.24 0.28 0.32 0.35 25.34 1.15 1.26 1.70 5.39 9.74 -11.54 0.21 1.14 2.06 -2.43 0.77 0.44 0.78 0.27 0.31 0.34 25.29 1.15 1.26 1.71 19.35 -2.26 10.48 0.21 4.07 -0.48 2.21 0.95 0.10 0.56 0.27 0.31 0.34 25.24 1.16 1.26 1.71 -15.66 -3.24 21.43 0.21 -3.29 -0.68 4.50 1.38 0.13 0.29 0.27 0.31 0.34 25.20 1.16 1.27 1.72 6.37 8.76 19.36 0.21 1.33 1.84 4.06 1.16 0.35 0.63 0.27 0.31 0.34 25.15 1.16 1.27 1.72 33.29 1.75 -12.64 0.21 6.96 0.37 -2.64 1.73 0.18 2.09 0.26 0.31 0.34 25.10 1.16 1.27 1.72 -21.73 8.74 -3.59 0.21 -4.53 1.82 -0.75 3.14 0.98 2.66 0.26 0.30 0.33 25.05 1.16 1.27 1.72 13.29 -2.26 11.41 0.21 2.77 -0.47 2.37 3.72 0.41 2.84 0.26 0.30 0.33 25.00 1.15 1.27 1.72 15.24 -6.23 -5.59 0.21 3.16 -1.29 -1.16 1.72 0.94 2.74 0.26 0.30 0.33 24.95 1.14 1.27 1.71 -0.78 12.77 1.43 0.21 -0.16 2.64 0.30 0.83 1.07 1.85 0.26 0.29 0.33 24.90 1.13 1.27 1.70 23.17 2.75 -15.53 0.21 4.79 0.57 -3.21 0.23 0.11 1.76 0.26 0.29 0.33 24.85 1.11 1.27 1.68 8.12 8.73 -3.47 0.21 1.67 1.80 -0.72 0.69 0.51 1.61 0.26 0.29 0.33 24.80 1.09 1.26 1.66 10.08 11.70 11.53 0.21 2.07 2.41 2.37 0.88 0.35 0.89 0.27 0.28 0.33 24.76 1.06 1.25 1.64 1.06 -8.29 -4.47 0.21 0.22 -1.70 -0.92 0.69 0.86 0.85 0.27 0.28 0.33 24.71 1.03 1.24 1.61 11.04 -8.25 7.53 0.20 2.26 -1.69 1.54 0.32 0.97 0.50 0.27 0.27 0.33 24.66 1.00 1.22 1.58 3.02 -7.21 1.53 0.20 0.62 -1.47 0.31 0.33 0.85 1.06 0.28 0.27 0.34 24.61 0.96 1.21 1.55 5.01 -8.16 4.53 0.20 1.02 -1.66 0.92 0.67 0.63 1.15 0.28 0.26 0.34 24.56 0.93 1.19 1.51 13.97 0.86 -2.46 0.20 2.84 0.17 -0.50 0.69 0.34 0.40 0.29 0.26 0.34 24.51 0.89 1.18 1.48 -9.03 6.86 -16.41 0.20 -1.83 1.39 -3.32 0.95 0.87 0.13 0.30 0.25 0.35 24.46 0.85 1.16 1.44 19.95 -2.14 17.61 0.20 4.03 -0.43 3.56 1.01 1.34 0.78 0.31 0.25 0.35 24.41 0.81 1.14 1.40 -8.07 -2.12 0.58 0.20 -1.63 -0.43 0.12 0.88 1.00 1.25 0.31 0.24 0.35 24.37 0.77 1.13 1.37 11.92 -9.09 -20.36 0.20 2.40 -1.83 -4.09 0.29 1.00 0.56 0.32 0.24 0.36 24.32 0.73 1.11 1.33 24.85 -20.02 10.67 0.20 4.98 -4.01 2.14 0.40 1.08 0.74 0.33 0.23 0.36 24.27 0.70 1.09 1.30 -50.09 14.00 -5.33 0.20 -10.02 2.80 -1.07 0.47 0.83 0.67 0.34 0.23 0.37 24.22 0.66 1.08 1.27 15.98 0.99 -14.27 0.20 3.19 0.20 -2.85 0.12 0.50 0.80 0.35 0.22 0.38 24.17 0.63 1.07 1.24 1.95 -19.97 -8.21 0.20 0.39 -3.97 -1.63 0.49 0.52 1.36 0.36 0.22 0.38 24.12 0.60 1.05 1.21
-32.99 18.05 -19.14 0.20 -6.55 3.58 -3.80 1.05 0.90 1.17 0.37 0.21 0.39 24.07 0.58 1.04 1.19 25.03 2.02 1.91 0.20 4.96 0.40 0.38 0.52 0.42 0.99 0.38 0.21 0.39 24.02 0.55 1.03 1.17 -11.99 -12.95 4.91 0.20 -2.37 -2.56 0.97 0.30 0.32 1.06 0.39 0.21 0.40 23.97 0.53 1.03 1.16 -2.96 7.08 -4.08 0.20 -0.58 1.39 -0.80 0.93 0.35 0.31 0.40 0.21 0.41 23.93 0.51 1.02 1.14

439
Raw Data Tapered
Data FFT Data Parzen Filtered
Data Simple Ratio
Spectrum Z E N
Tapering Function
Z E N Z E N Z E N
Frequency Hz
E/Z N/Z
Mean SQRT Spectrum
12.03 -4.92 3.93 0.20 2.36 -0.97 0.77 1.17 0.92 1.38 0.41 0.20 0.41 23.88 0.50 1.02 1.13 -4.98 -8.88 -0.06 0.20 -0.98 -1.74 -0.01 0.33 0.68 1.41 0.41 0.20 0.42 23.83 0.49 1.02 1.13 -7.95 -7.83 -3.04 0.20 -1.55 -1.53 -0.59 1.25 0.23 1.30 0.42 0.20 0.43 23.78 0.48 1.02 1.12 -11.91 -6.79 -4.01 0.20 -2.32 -1.32 -0.78 0.60 0.41 1.27 0.42 0.20 0.43 23.73 0.47 1.02 1.12 1.12 -1.76 6.00 0.19 0.22 -0.34 1.17 0.36 1.17 0.82 0.43 0.20 0.44 23.68 0.47 1.02 1.12
-14.85 -6.74 7.99 0.19 -2.88 -1.31 1.55 0.89 1.19 0.62 0.43 0.20 0.44 23.63 0.47 1.03 1.13 -1.82 -5.70 3.98 0.19 -0.35 -1.10 0.77 0.52 0.47 0.62 0.43 0.20 0.45 23.58 0.47 1.03 1.13 -16.77 1.32 19.95 0.19 -3.24 0.25 3.85 0.56 0.35 1.44 0.43 0.21 0.45 23.54 0.48 1.04 1.14 1.26 6.32 21.88 0.19 0.24 1.22 4.21 0.54 1.09 1.37 0.43 0.21 0.45 23.49 0.48 1.05 1.15 20.22 7.30 3.84 0.19 3.88 1.40 0.74 0.26 1.76 1.62 0.43 0.21 0.45 23.44 0.49 1.06 1.17 -19.78 -7.69 -9.14 0.19 -3.79 -1.47 -1.75 0.49 1.48 1.68 0.42 0.21 0.45 23.39 0.51 1.07 1.18 29.21 -18.62 8.88 0.19 5.58 -3.56 1.70 0.59 0.58 2.03 0.42 0.22 0.45 23.34 0.52 1.08 1.20 -16.81 -1.57 22.83 0.19 -3.20 -0.30 4.35 0.93 0.88 1.30 0.41 0.22 0.45 23.29 0.54 1.10 1.22 -9.75 6.43 4.79 0.19 -1.85 1.22 0.91 0.90 0.90 0.36 0.41 0.23 0.45 23.24 0.56 1.11 1.24 44.18 -0.57 -9.19 0.19 8.37 -0.11 -1.74 0.80 0.48 1.49 0.40 0.23 0.45 23.19 0.58 1.13 1.27 -33.84 3.44 -3.15 0.19 -6.40 0.65 -0.60 0.88 0.66 0.61 0.39 0.23 0.45 23.14 0.61 1.15 1.30 12.21 9.42 9.85 0.19 2.30 1.78 1.86 0.36 0.29 0.94 0.38 0.24 0.44 23.10 0.63 1.17 1.33 4.18 6.40 -4.15 0.19 0.79 1.20 -0.78 0.20 0.98 0.83 0.37 0.24 0.44 23.05 0.66 1.19 1.36
-22.78 -19.56 0.87 0.19 -4.27 -3.67 0.16 0.10 1.11 0.89 0.36 0.25 0.43 23.00 0.69 1.21 1.39 18.24 2.49 17.85 0.19 3.41 0.46 3.34 0.11 1.66 0.32 0.35 0.25 0.43 22.95 0.72 1.23 1.42 -9.78 28.44 -4.17 0.19 -1.82 5.30 -0.78 0.75 2.28 0.51 0.34 0.26 0.42 22.90 0.75 1.25 1.46 -0.75 -16.58 2.85 0.19 -0.14 -3.08 0.53 0.54 1.81 0.43 0.33 0.26 0.42 22.85 0.79 1.27 1.50 -7.73 -5.52 5.85 0.19 -1.43 -1.02 1.08 0.60 0.63 0.95 0.32 0.26 0.42 22.80 0.82 1.30 1.54 11.27 18.46 -6.14 0.19 2.08 3.42 -1.14 0.67 0.26 1.21 0.31 0.27 0.41 22.75 0.85 1.32 1.58 -3.75 -7.55 17.85 0.18 -0.69 -1.39 3.29 0.79 0.70 0.85 0.30 0.27 0.41 22.71 0.89 1.35 1.62 -17.70 -7.50 6.82 0.18 -3.26 -1.38 1.25 0.02 0.67 0.43 0.29 0.27 0.40 22.66 0.92 1.38 1.66 34.27 -3.47 -16.15 0.18 6.29 -0.64 -2.96 0.15 0.86 1.10 0.29 0.27 0.40 22.61 0.96 1.41 1.70 -8.78 7.53 2.89 0.18 -1.61 1.38 0.53 0.66 0.77 1.23 0.28 0.28 0.40 22.56 0.99 1.43 1.74 -14.72 -4.46 -8.09 0.18 -2.69 -0.81 -1.48 1.38 0.47 0.43 0.27 0.28 0.40 22.51 1.03 1.46 1.78 -1.69 -10.42 -8.04 0.18 -0.31 -1.90 -1.46 1.31 0.56 1.91 0.27 0.28 0.40 22.46 1.06 1.49 1.82 4.31 12.59 21.94 0.18 0.78 2.28 3.98 1.09 0.48 1.97 0.26 0.28 0.39 22.41 1.09 1.51 1.86

440
Raw Data Tapered
Data FFT Data Parzen Filtered
Data Simple Ratio
Spectrum Z E N
Tapering Function
Z E N Z E N Z E N
Frequency Hz
E/Z N/Z
Mean SQRT Spectrum
1.30 -3.42 0.91 0.18 0.24 -0.62 0.17 0.72 1.37 0.42 0.26 0.29 0.39 22.36 1.11 1.54 1.90 -21.65 -2.40 -22.03 0.18 -3.91 -0.43 -3.98 2.17 1.57 0.56 0.25 0.29 0.39 22.31 1.14 1.56 1.93 20.36 4.61 -10.95 0.18 3.66 0.83 -1.97 1.99 0.99 0.27 0.25 0.29 0.39 22.27 1.17 1.58 1.97 -13.65 -15.36 -5.90 0.18 -2.45 -2.76 -1.06 0.73 0.42 1.58 0.25 0.29 0.40 22.22 1.19 1.60 2.00 -3.62 -1.31 -2.87 0.18 -0.65 -0.24 -0.51 0.15 0.56 0.75 0.24 0.30 0.40 22.17 1.22 1.62 2.03 20.35 -1.30 4.14 0.18 3.63 -0.23 0.74 0.63 0.92 0.71 0.24 0.30 0.40 22.12 1.24 1.64 2.06 -14.65 -12.26 1.14 0.18 -2.61 -2.18 0.20 0.63 1.34 0.84 0.24 0.30 0.40 22.07 1.27 1.66 2.09 17.35 -2.22 -4.84 0.18 3.08 -0.39 -0.86 0.67 1.43 0.50 0.24 0.31 0.40 22.02 1.29 1.67 2.11 -3.68 -5.19 -19.77 0.18 -0.65 -0.92 -3.50 1.24 1.26 1.66 0.24 0.31 0.40 21.97 1.31 1.68 2.13 5.32 -8.15 -15.69 0.18 0.94 -1.44 -2.77 0.57 0.74 1.90 0.24 0.31 0.40 21.92 1.33 1.69 2.15
-10.66 -0.12 17.32 0.18 -1.88 -0.02 3.05 0.69 0.36 0.30 0.23 0.32 0.40 21.88 1.35 1.69 2.17 -9.62 2.88 1.30 0.18 -1.69 0.51 0.23 0.18 0.66 0.91 0.23 0.32 0.40 21.83 1.37 1.69 2.18 45.31 6.88 -17.65 0.18 7.93 1.20 -3.09 0.78 0.64 0.59 0.23 0.32 0.40 21.78 1.39 1.69 2.19 -32.71 -1.12 -2.60 0.17 -5.71 -0.20 -0.45 0.79 1.54 0.77 0.23 0.33 0.39 21.73 1.40 1.69 2.19 -5.63 -2.11 -2.57 0.17 -0.98 -0.37 -0.45 0.96 1.76 0.90 0.23 0.33 0.39 21.68 1.41 1.68 2.19 13.36 21.87 -2.55 0.17 2.32 3.79 -0.44 0.65 1.06 1.26 0.24 0.33 0.39 21.63 1.42 1.66 2.19 -22.61 0.83 1.47 0.17 -3.91 0.14 0.25 0.68 0.74 0.85 0.24 0.34 0.39 21.58 1.43 1.64 2.18 22.39 -25.11 10.46 0.17 3.86 -4.33 1.80 0.84 1.16 1.13 0.24 0.34 0.39 21.53 1.43 1.62 2.16 -12.63 6.94 5.44 0.17 -2.17 1.19 0.94 1.12 1.28 0.71 0.24 0.34 0.38 21.48 1.43 1.60 2.15 6.39 -3.06 -6.55 0.17 1.10 -0.52 -1.12 0.83 0.90 1.32 0.24 0.34 0.38 21.44 1.43 1.58 2.13 7.37 -27.98 0.48 0.17 1.26 -4.78 0.08 0.99 1.18 1.99 0.24 0.35 0.38 21.39 1.42 1.55 2.10
-10.62 3.08 8.48 0.17 -1.81 0.53 1.45 0.42 1.29 0.88 0.25 0.35 0.37 21.34 1.41 1.52 2.07 13.38 5.08 10.45 0.17 2.27 0.86 1.78 0.51 0.68 0.64 0.25 0.35 0.37 21.29 1.40 1.49 2.04 -16.61 -28.86 -2.55 0.17 -2.82 -4.89 -0.43 0.93 0.19 0.77 0.25 0.35 0.37 21.24 1.38 1.46 2.01 3.42 -2.79 5.46 0.17 0.58 -0.47 0.92 0.64 0.65 1.09 0.26 0.35 0.37 21.19 1.37 1.43 1.98 2.41 21.19 11.44 0.17 0.41 3.57 1.93 0.69 0.89 0.95 0.26 0.35 0.36 21.14 1.35 1.40 1.94 -3.58 -14.81 -14.54 0.17 -0.60 -2.49 -2.44 0.64 1.26 1.06 0.26 0.35 0.36 21.09 1.33 1.37 1.91 -10.55 -3.76 -4.49 0.17 -1.77 -0.63 -0.75 0.36 0.91 0.51 0.27 0.35 0.36 21.04 1.31 1.34 1.87 0.47 -1.74 4.53 0.17 0.08 -0.29 0.76 0.70 0.16 0.60 0.27 0.35 0.36 21.00 1.29 1.32 1.84 22.43 -13.70 -6.46 0.17 3.73 -2.28 -1.07 0.89 0.58 1.49 0.28 0.35 0.36 20.95 1.27 1.29 1.81 -25.56 23.29 12.55 0.17 -4.24 3.87 2.08 0.61 0.67 2.02 0.28 0.35 0.36 20.90 1.26 1.27 1.79

441
Raw Data Tapered
Data FFT Data Parzen Filtered
Data Simple Ratio
Spectrum Z E N
Tapering Function
Z E N Z E N Z E N
Frequency Hz
E/Z N/Z
Mean SQRT Spectrum
15.46 -7.72 12.51 0.17 2.56 -1.28 2.07 0.46 0.97 0.06 0.29 0.35 0.36 20.85 1.24 1.25 1.76 14.41 -12.67 -1.50 0.17 2.38 -2.09 -0.25 0.86 0.61 1.16 0.29 0.35 0.36 20.80 1.23 1.24 1.74 -18.58 43.28 -1.48 0.16 -3.06 7.12 -0.24 1.02 0.61 0.89 0.29 0.35 0.36 20.75 1.21 1.22 1.72 15.43 -0.79 -10.44 0.16 2.53 -0.13 -1.71 0.66 1.14 0.41 0.30 0.36 0.36 20.70 1.20 1.21 1.71 -7.58 -14.75 2.59 0.16 -1.24 -2.41 0.42 0.80 1.44 0.89 0.30 0.36 0.36 20.65 1.20 1.20 1.70 -14.53 17.26 12.57 0.16 -2.37 2.81 2.05 1.25 1.09 0.81 0.30 0.36 0.36 20.61 1.19 1.20 1.69 -12.47 -0.77 -7.43 0.16 -2.03 -0.12 -1.21 1.59 1.11 0.55 0.30 0.36 0.36 20.56 1.19 1.19 1.68 -0.44 12.22 -8.38 0.16 -0.07 1.98 -1.36 1.55 0.20 0.71 0.30 0.36 0.36 20.51 1.18 1.19 1.68 -6.43 13.18 -3.34 0.16 -1.04 2.13 -0.54 0.93 0.67 0.63 0.30 0.36 0.36 20.46 1.18 1.19 1.68 -19.37 -15.80 -5.31 0.16 -3.12 -2.54 -0.86 0.72 1.02 0.77 0.30 0.36 0.36 20.41 1.18 1.19 1.68 11.65 0.24 -5.28 0.16 1.87 0.04 -0.85 1.48 0.74 1.06 0.30 0.36 0.36 20.36 1.19 1.20 1.69 -2.36 11.23 -8.23 0.16 -0.38 1.80 -1.32 1.74 0.77 0.51 0.30 0.36 0.36 20.31 1.19 1.20 1.69 -4.35 -7.76 1.79 0.16 -0.69 -1.24 0.29 1.28 0.93 0.44 0.30 0.36 0.37 20.26 1.19 1.21 1.70 -3.33 6.25 4.79 0.16 -0.53 0.99 0.76 0.63 0.42 0.91 0.30 0.36 0.37 20.21 1.20 1.21 1.70 13.66 20.21 -8.19 0.16 2.16 3.20 -1.30 0.97 0.83 0.85 0.30 0.36 0.37 20.17 1.20 1.22 1.71 15.60 -17.78 -10.14 0.16 2.47 -2.81 -1.60 0.55 0.45 0.83 0.30 0.36 0.37 20.12 1.20 1.23 1.72 -13.40 -16.70 -4.09 0.16 -2.11 -2.63 -0.64 0.99 1.14 1.02 0.30 0.36 0.37 20.07 1.20 1.23 1.72 33.57 20.30 4.92 0.16 5.27 3.19 0.77 0.60 0.78 0.50 0.30 0.36 0.37 20.02 1.21 1.24 1.73 -8.48 -2.72 11.90 0.16 -1.33 -0.43 1.86 0.05 0.52 0.29 0.30 0.36 0.37 19.97 1.21 1.24 1.73 -16.43 -15.67 2.89 0.16 -2.56 -2.44 0.45 1.11 0.60 0.63 0.30 0.36 0.37 19.92 1.20 1.24 1.73 23.56 11.35 -9.09 0.16 3.66 1.76 -1.41 1.28 1.17 1.08 0.30 0.35 0.37 19.87 1.20 1.25 1.73 -29.42 -10.64 4.93 0.16 -4.56 -1.65 0.76 0.31 0.93 0.43 0.29 0.35 0.37 19.82 1.19 1.24 1.72 13.62 -16.57 18.90 0.15 2.10 -2.56 2.92 0.57 0.74 0.50 0.30 0.35 0.37 19.78 1.19 1.24 1.72 -9.39 8.45 -5.11 0.15 -1.45 1.30 -0.79 0.84 0.53 1.09 0.30 0.35 0.36 19.73 1.18 1.23 1.70 -32.30 -9.53 -11.07 0.15 -4.96 -1.46 -1.70 0.98 1.21 0.12 0.30 0.35 0.36 19.68 1.16 1.22 1.69 29.71 -4.49 11.95 0.15 4.55 -0.69 1.83 1.55 1.17 0.88 0.30 0.34 0.36 19.63 1.15 1.21 1.67 -5.34 3.52 5.92 0.15 -0.81 0.54 0.90 1.65 0.41 0.73 0.30 0.34 0.36 19.58 1.13 1.20 1.65 -0.32 -15.44 0.92 0.15 -0.05 -2.35 0.14 0.82 0.58 0.12 0.30 0.34 0.36 19.53 1.12 1.18 1.62 9.67 -7.38 10.91 0.15 1.46 -1.12 1.65 0.55 0.09 0.75 0.30 0.33 0.35 19.48 1.10 1.16 1.60 6.64 -1.35 5.89 0.15 1.00 -0.20 0.89 1.15 1.21 0.95 0.31 0.33 0.35 19.43 1.08 1.14 1.57 13.60 -9.32 -4.10 0.15 2.05 -1.40 -0.62 1.73 1.10 1.15 0.31 0.33 0.35 19.38 1.06 1.12 1.54

442
Raw Data Tapered
Data FFT Data Parzen Filtered
Data Simple Ratio
Spectrum Z E N
Tapering Function
Z E N Z E N Z E N
Frequency Hz
E/Z N/Z
Mean SQRT Spectrum
-11.40 -9.27 8.91 0.15 -1.71 -1.39 1.34 0.58 0.99 0.57 0.31 0.33 0.34 19.34 1.04 1.09 1.51 -4.36 1.76 14.87 0.15 -0.65 0.26 2.22 0.83 0.55 0.80 0.32 0.32 0.34 19.29 1.02 1.07 1.48 14.62 13.74 6.84 0.15 2.18 2.05 1.02 0.23 0.11 0.68 0.32 0.32 0.34 19.24 1.00 1.05 1.45 28.54 10.70 11.82 0.15 4.24 1.59 1.76 0.75 0.25 0.20 0.33 0.32 0.33 19.19 0.98 1.02 1.42 -19.48 1.69 7.79 0.15 -2.88 0.25 1.15 0.12 0.39 0.71 0.33 0.32 0.33 19.14 0.96 1.00 1.39 0.56 -1.30 -9.19 0.15 0.08 -0.19 -1.36 0.57 1.06 0.67 0.33 0.32 0.32 19.09 0.95 0.97 1.36 34.50 -0.29 -3.15 0.15 5.07 -0.04 -0.46 1.04 0.91 1.19 0.34 0.31 0.32 19.04 0.93 0.95 1.33 -43.48 -2.27 3.86 0.15 -6.37 -0.33 0.57 1.32 1.22 1.74 0.34 0.31 0.32 18.99 0.92 0.93 1.30 4.60 18.71 -9.12 0.15 0.67 2.73 -1.33 1.00 1.21 1.02 0.34 0.31 0.31 18.95 0.90 0.91 1.28 9.58 9.67 -10.06 0.15 1.39 1.41 -1.46 1.29 1.13 0.96 0.35 0.31 0.31 18.90 0.89 0.89 1.26
-30.38 -23.29 -2.03 0.15 -4.40 -3.38 -0.29 1.55 1.29 0.78 0.35 0.31 0.30 18.85 0.88 0.87 1.24 9.67 9.74 -9.99 0.14 1.40 1.41 -1.44 1.24 0.78 0.37 0.35 0.31 0.30 18.80 0.87 0.85 1.22 -3.34 -2.26 -17.92 0.14 -0.48 -0.33 -2.58 0.34 0.69 1.27 0.35 0.30 0.30 18.75 0.86 0.84 1.20 2.67 -13.22 -10.85 0.14 0.38 -1.90 -1.56 0.18 0.62 1.07 0.35 0.30 0.29 18.70 0.86 0.82 1.19
-14.31 9.80 -6.80 0.14 -2.05 1.40 -0.97 0.09 0.66 0.40 0.36 0.30 0.29 18.65 0.85 0.81 1.18 -0.27 -28.15 -18.73 0.14 -0.04 -4.01 -2.67 0.42 0.71 0.76 0.36 0.30 0.29 18.60 0.85 0.80 1.17 19.69 -8.06 -13.65 0.14 2.80 -1.14 -1.94 1.07 1.91 0.49 0.36 0.30 0.28 18.55 0.84 0.79 1.16 -14.31 12.94 3.38 0.14 -2.03 1.83 0.48 1.62 2.14 0.84 0.36 0.30 0.28 18.51 0.84 0.79 1.15 -7.27 -3.07 2.38 0.14 -1.02 -0.43 0.34 0.66 0.89 1.19 0.36 0.30 0.28 18.46 0.84 0.78 1.15 -13.22 5.94 -2.60 0.14 -1.86 0.83 -0.37 0.37 1.09 1.31 0.36 0.30 0.28 18.41 0.84 0.78 1.14 18.77 -15.03 -5.57 0.14 2.63 -2.10 -0.78 0.30 1.55 0.42 0.35 0.30 0.27 18.36 0.84 0.77 1.14 0.74 1.01 -0.54 0.14 0.10 0.14 -0.08 0.72 1.28 1.03 0.35 0.30 0.27 18.31 0.84 0.77 1.14
-21.22 9.00 1.47 0.14 -2.95 1.25 0.20 0.62 0.35 0.31 0.35 0.30 0.27 18.26 0.84 0.77 1.14 5.82 -14.97 -5.51 0.14 0.81 -2.07 -0.76 0.72 0.68 1.00 0.35 0.30 0.27 18.21 0.84 0.78 1.15
-15.16 8.05 7.50 0.14 -2.09 1.11 1.04 0.58 0.51 1.30 0.35 0.30 0.27 18.16 0.85 0.78 1.15 1.87 11.03 8.48 0.14 0.26 1.52 1.17 0.50 0.23 0.46 0.35 0.30 0.27 18.12 0.85 0.78 1.16 -0.13 -4.97 -11.50 0.14 -0.02 -0.68 -1.58 1.15 0.58 0.89 0.35 0.30 0.27 18.07 0.86 0.79 1.17 17.84 -8.93 9.52 0.14 2.44 -1.22 1.30 0.37 0.93 0.63 0.35 0.30 0.28 18.02 0.86 0.80 1.18 5.80 -8.88 15.48 0.14 0.79 -1.21 2.11 0.58 0.89 2.28 0.34 0.30 0.28 17.97 0.87 0.81 1.19
-18.17 -3.85 1.46 0.14 -2.46 -0.52 0.20 0.95 1.17 1.66 0.34 0.30 0.28 17.92 0.88 0.81 1.20 28.81 -6.81 20.43 0.14 3.89 -0.92 2.76 1.06 1.22 0.18 0.34 0.30 0.28 17.87 0.89 0.83 1.21

443
Raw Data Tapered
Data FFT Data Parzen Filtered
Data Simple Ratio
Spectrum Z E N
Tapering Function
Z E N Z E N Z E N
Frequency Hz
E/Z N/Z
Mean SQRT Spectrum
-15.21 8.20 7.39 0.13 -2.05 1.10 0.99 0.66 0.61 2.49 0.34 0.30 0.28 17.82 0.90 0.84 1.23 7.81 7.18 -15.58 0.13 1.05 0.96 -2.09 0.06 0.91 2.65 0.34 0.31 0.28 17.77 0.91 0.85 1.24 7.78 -12.80 -4.52 0.13 1.04 -1.71 -0.60 0.26 1.42 0.89 0.33 0.31 0.29 17.72 0.92 0.86 1.26
-24.18 -11.74 11.48 0.13 -3.22 -1.56 1.53 0.35 0.73 0.49 0.33 0.31 0.29 17.68 0.94 0.88 1.28 33.80 -4.69 16.43 0.13 4.48 -0.62 2.18 0.27 0.29 0.69 0.33 0.31 0.29 17.63 0.95 0.89 1.30 -28.20 27.28 5.40 0.13 -3.72 3.60 0.71 0.36 0.67 1.09 0.33 0.32 0.30 17.58 0.97 0.91 1.33 -12.12 10.21 14.38 0.13 -1.59 1.34 1.89 0.72 0.74 0.72 0.32 0.32 0.30 17.53 0.99 0.92 1.35 37.83 -42.71 8.35 0.13 4.96 -5.59 1.09 0.99 1.81 1.51 0.32 0.32 0.30 17.48 1.01 0.94 1.38 -16.21 4.38 -14.63 0.13 -2.11 0.57 -1.91 1.07 1.13 1.12 0.32 0.33 0.31 17.43 1.03 0.96 1.41 -11.15 26.33 6.40 0.13 -1.45 3.42 0.83 0.57 0.20 0.43 0.32 0.33 0.31 17.38 1.05 0.98 1.43 0.88 -1.70 6.39 0.13 0.11 -0.22 0.83 0.34 1.03 0.80 0.31 0.33 0.31 17.33 1.07 1.00 1.46 11.86 24.26 -16.58 0.13 1.53 3.13 -2.14 0.81 0.67 0.57 0.31 0.34 0.32 17.29 1.09 1.02 1.49 -12.14 8.21 -2.52 0.13 -1.56 1.05 -0.32 0.84 0.68 0.84 0.31 0.34 0.32 17.24 1.11 1.05 1.53 5.88 -11.77 3.49 0.13 0.75 -1.51 0.45 0.69 0.29 1.00 0.30 0.34 0.32 17.19 1.13 1.07 1.56 20.83 4.26 -4.50 0.13 2.66 0.54 -0.57 0.47 0.72 0.67 0.30 0.35 0.33 17.14 1.16 1.10 1.59 -27.15 -9.72 -2.47 0.13 -3.45 -1.23 -0.31 0.29 1.67 0.66 0.30 0.35 0.33 17.09 1.18 1.12 1.63 14.88 15.28 -10.43 0.13 1.88 1.93 -1.32 0.77 1.94 0.50 0.29 0.35 0.34 17.04 1.20 1.15 1.66 3.84 23.22 -21.35 0.13 0.48 2.93 -2.69 0.38 1.45 0.39 0.29 0.35 0.34 16.99 1.22 1.18 1.70 -8.14 -13.79 -12.27 0.13 -1.02 -1.73 -1.54 0.54 0.97 0.40 0.28 0.35 0.34 16.94 1.25 1.21 1.74 8.86 4.24 3.76 0.13 1.11 0.53 0.47 1.02 0.85 0.09 0.28 0.35 0.35 16.89 1.27 1.24 1.77 -3.15 9.23 -5.22 0.12 -0.39 1.15 -0.65 1.19 0.94 0.61 0.28 0.36 0.35 16.85 1.29 1.27 1.81 16.83 -4.77 0.80 0.12 2.09 -0.59 0.10 0.27 0.90 1.00 0.27 0.36 0.36 16.80 1.30 1.30 1.84 -29.14 10.23 11.79 0.12 -3.60 1.26 1.46 0.88 0.91 0.91 0.27 0.36 0.36 16.75 1.32 1.34 1.88 -3.07 9.20 -15.19 0.12 -0.38 1.13 -1.87 0.60 1.41 3.04 0.27 0.36 0.36 16.70 1.34 1.37 1.91 22.89 -4.79 -15.12 0.12 2.80 -0.59 -1.85 3.27 4.38 6.26 0.26 0.35 0.37 16.65 1.35 1.40 1.95 -34.08 -20.73 -0.07 0.12 -4.16 -2.53 -0.01 0.92 3.59 2.12 0.26 0.35 0.37 16.60 1.36 1.43 1.98 -0.01 -1.67 3.94 0.12 0.00 -0.20 0.48 2.34 2.19 1.75 0.26 0.35 0.37 16.55 1.38 1.46 2.01 1.99 13.31 16.91 0.12 0.24 1.61 2.05 1.49 0.34 0.54 0.25 0.35 0.38 16.50 1.39 1.49 2.03
-15.98 -13.67 0.89 0.12 -1.93 -1.65 0.11 1.86 0.87 0.28 0.25 0.35 0.38 16.46 1.40 1.51 2.06 4.05 9.35 -18.07 0.12 0.49 1.12 -2.17 0.89 1.48 0.44 0.25 0.35 0.38 16.41 1.41 1.54 2.08 2.04 25.29 8.97 0.12 0.24 3.02 1.07 0.59 1.75 0.11 0.25 0.35 0.38 16.36 1.41 1.56 2.10

444
Raw Data Tapered
Data FFT Data Parzen Filtered
Data Simple Ratio
Spectrum Z E N
Tapering Function
Z E N Z E N Z E N
Frequency Hz
E/Z N/Z
Mean SQRT Spectrum
-7.94 1.25 24.91 0.12 -0.94 0.15 2.96 0.76 1.26 0.09 0.25 0.35 0.39 16.31 1.42 1.57 2.12 -8.90 -7.73 2.87 0.12 -1.05 -0.92 0.34 0.54 0.62 0.40 0.24 0.35 0.39 16.26 1.43 1.58 2.13 19.08 -22.65 6.86 0.12 2.25 -2.67 0.81 0.59 0.35 0.51 0.24 0.35 0.39 16.21 1.43 1.59 2.14 -9.93 8.39 8.85 0.12 -1.17 0.99 1.04 0.53 0.83 1.08 0.24 0.35 0.39 16.16 1.44 1.60 2.15 -8.89 12.36 -3.15 0.12 -1.04 1.45 -0.37 0.76 0.87 0.27 0.24 0.35 0.39 16.11 1.45 1.59 2.15 23.09 -25.60 14.84 0.12 2.69 -2.98 1.73 0.59 0.97 0.53 0.24 0.35 0.39 16.06 1.45 1.59 2.15 -13.92 -2.53 4.81 0.12 -1.62 -0.29 0.56 0.80 0.31 1.44 0.25 0.36 0.39 16.02 1.45 1.58 2.15 -13.86 0.48 1.81 0.12 -1.60 0.06 0.21 0.51 0.42 1.02 0.25 0.36 0.39 15.97 1.46 1.56 2.14 -4.82 -17.47 10.80 0.12 -0.55 -2.01 1.24 0.29 0.22 0.64 0.25 0.37 0.39 15.92 1.46 1.55 2.13 -4.80 -1.42 -12.18 0.11 -0.55 -0.16 -1.39 0.83 0.99 0.46 0.25 0.37 0.39 15.87 1.46 1.53 2.11 -15.75 7.58 -8.13 0.11 -1.80 0.86 -0.93 0.65 0.89 0.09 0.26 0.38 0.39 15.82 1.46 1.50 2.10 5.27 1.57 0.90 0.11 0.60 0.18 0.10 0.42 0.31 0.52 0.26 0.38 0.39 15.77 1.46 1.48 2.08 12.24 8.56 -7.07 0.11 1.38 0.97 -0.80 0.81 0.61 0.52 0.27 0.39 0.39 15.72 1.46 1.45 2.06 -20.73 7.54 0.95 0.11 -2.33 0.85 0.11 1.48 1.04 0.31 0.27 0.40 0.39 15.67 1.46 1.43 2.04 4.30 -6.45 -1.03 0.11 0.48 -0.72 -0.12 1.15 1.52 1.17 0.28 0.40 0.39 15.63 1.46 1.40 2.02 -4.69 6.57 -6.01 0.11 -0.52 0.73 -0.67 0.58 1.55 0.68 0.28 0.41 0.39 15.58 1.45 1.37 2.00 28.27 24.52 -5.97 0.11 3.14 2.72 -0.66 0.76 1.45 0.75 0.29 0.42 0.39 15.53 1.45 1.35 1.98 -10.76 21.44 -11.92 0.11 -1.19 2.37 -1.32 1.31 1.35 0.63 0.30 0.43 0.39 15.48 1.44 1.32 1.96 -39.66 4.40 -3.87 0.11 -4.36 0.48 -0.43 0.87 0.46 0.93 0.30 0.44 0.39 15.43 1.44 1.29 1.93 55.32 1.40 1.15 0.11 6.06 0.15 0.13 0.60 1.10 0.59 0.31 0.44 0.39 15.38 1.43 1.27 1.91 -25.74 11.38 4.15 0.11 -2.81 1.24 0.45 0.56 2.07 0.58 0.32 0.45 0.39 15.33 1.42 1.24 1.89 3.31 8.35 -2.84 0.11 0.36 0.91 -0.31 0.46 0.90 0.86 0.32 0.45 0.39 15.28 1.41 1.22 1.87 48.21 11.33 -18.78 0.11 5.21 1.22 -2.03 0.74 0.79 1.29 0.33 0.46 0.39 15.23 1.41 1.20 1.85 -33.81 -14.66 5.26 0.11 -3.63 -1.58 0.57 0.56 0.65 1.37 0.33 0.46 0.39 15.19 1.40 1.18 1.83 22.22 -22.57 5.25 0.11 2.38 -2.42 0.56 1.05 0.91 1.08 0.34 0.47 0.39 15.14 1.39 1.17 1.81 -13.79 18.45 -23.70 0.11 -1.47 1.96 -2.52 0.61 0.31 0.95 0.34 0.47 0.39 15.09 1.38 1.15 1.79 -14.73 -3.57 12.34 0.11 -1.56 -0.38 1.31 1.21 0.44 0.66 0.34 0.47 0.39 15.04 1.37 1.13 1.77 35.23 -24.50 9.31 0.11 3.72 -2.58 0.98 1.76 0.84 1.13 0.35 0.47 0.39 14.99 1.35 1.12 1.76 -19.80 5.55 -30.63 0.11 -2.08 0.58 -3.22 0.67 0.82 1.16 0.35 0.47 0.38 14.94 1.34 1.10 1.74 -4.74 20.51 13.41 0.10 -0.50 2.14 1.40 1.85 1.20 0.18 0.35 0.47 0.38 14.89 1.33 1.09 1.72 7.26 15.45 17.37 0.10 0.75 1.61 1.81 0.83 0.89 0.78 0.35 0.46 0.37 14.84 1.32 1.07 1.70

445
Raw Data Tapered
Data FFT Data Parzen Filtered
Data Simple Ratio
Spectrum Z E N
Tapering Function
Z E N Z E N Z E N
Frequency Hz
E/Z N/Z
Mean SQRT Spectrum
7.26 15.45 17.37 0.10 0.75 1.61 1.81 0.83 0.89 0.78 0.35 0.46 0.37 14.84 1.32 1.07 1.70 -5.74 -0.57 -22.61 0.10 -0.59 -0.06 -2.34 0.27 1.08 1.29 0.35 0.46 0.37 14.79 1.31 1.06 1.68 -8.71 -4.55 -1.55 0.10 -0.90 -0.47 -0.16 2.61 0.85 0.47 0.35 0.45 0.36 14.75 1.30 1.04 1.67 8.30 -0.53 -5.52 0.10 0.85 -0.05 -0.57 3.34 0.48 0.64 0.35 0.45 0.36 14.70 1.29 1.03 1.65 -2.71 5.48 -4.48 0.10 -0.28 0.56 -0.46 1.58 0.61 0.52 0.34 0.44 0.35 14.65 1.28 1.02 1.63 -21.65 7.46 26.49 0.10 -2.20 0.76 2.69 1.36 1.42 1.01 0.34 0.43 0.34 14.60 1.27 1.00 1.62 15.36 -5.53 11.42 0.10 1.55 -0.56 1.15 2.31 1.90 1.38 0.34 0.43 0.34 14.55 1.26 0.99 1.60 -6.65 -8.49 -5.57 0.10 -0.67 -0.85 -0.56 2.98 1.73 1.04 0.34 0.42 0.33 14.50 1.25 0.98 1.59 12.35 -0.46 7.44 0.10 1.23 -0.05 0.74 4.02 2.29 0.83 0.33 0.41 0.32 14.45 1.23 0.97 1.57 18.29 9.53 10.41 0.10 1.82 0.95 1.04 2.59 3.01 0.84 0.33 0.41 0.32 14.40 1.22 0.96 1.56 -22.70 5.51 3.40 0.10 -2.25 0.55 0.34 2.28 2.49 0.10 0.33 0.40 0.31 14.36 1.21 0.95 1.54 17.32 -3.48 4.40 0.10 1.71 -0.34 0.43 2.16 2.30 1.19 0.33 0.39 0.31 14.31 1.20 0.94 1.52 7.27 11.51 -0.60 0.10 0.71 1.13 -0.06 2.10 2.00 1.48 0.33 0.39 0.30 14.26 1.19 0.93 1.51 -1.73 7.49 0.42 0.10 -0.17 0.73 0.04 1.72 1.91 0.70 0.33 0.38 0.30 14.21 1.17 0.92 1.49 15.24 3.48 0.43 0.10 1.48 0.34 0.04 1.35 1.74 0.10 0.33 0.38 0.30 14.16 1.16 0.91 1.47 14.19 3.47 -13.53 0.10 1.37 0.34 -1.31 1.30 0.95 0.48 0.33 0.37 0.29 14.11 1.14 0.90 1.45 7.15 -4.51 -3.48 0.10 0.69 -0.43 -0.33 2.77 1.16 0.73 0.33 0.37 0.29 14.06 1.12 0.89 1.43 -14.83 4.50 -5.45 0.10 -1.42 0.43 -0.52 2.42 0.70 1.40 0.33 0.37 0.29 14.01 1.11 0.87 1.41 17.17 2.50 -15.39 0.10 1.63 0.24 -1.46 1.40 0.31 0.87 0.34 0.37 0.29 13.96 1.09 0.86 1.39 8.13 14.47 5.64 0.09 0.77 1.37 0.53 1.32 1.04 0.41 0.35 0.37 0.29 13.92 1.07 0.85 1.36 -6.87 14.43 -1.36 0.09 -0.65 1.36 -0.13 1.10 1.94 0.16 0.35 0.37 0.29 13.87 1.05 0.83 1.33 18.11 -17.56 -27.28 0.09 1.69 -1.64 -2.55 2.27 1.86 1.17 0.36 0.37 0.30 13.82 1.02 0.81 1.31 3.07 8.47 -13.19 0.09 0.29 0.79 -1.23 3.01 1.21 0.95 0.37 0.37 0.30 13.77 1.00 0.80 1.28 5.06 22.42 7.84 0.09 0.47 2.07 0.72 2.57 0.57 0.21 0.39 0.38 0.30 13.72 0.98 0.78 1.25 5.04 -0.61 -2.16 0.09 0.46 -0.06 -0.20 1.86 1.01 0.28 0.40 0.38 0.30 13.67 0.95 0.76 1.22 13.01 13.37 -8.13 0.09 1.19 1.22 -0.74 0.74 1.13 1.03 0.41 0.39 0.30 13.62 0.93 0.73 1.19 -8.99 8.34 2.90 0.09 -0.82 0.76 0.26 1.32 0.34 0.87 0.43 0.39 0.31 13.57 0.91 0.71 1.16 -16.94 0.34 0.90 0.09 -1.53 0.03 0.08 0.12 0.52 0.51 0.45 0.40 0.31 13.53 0.89 0.69 1.13 18.06 8.33 -5.07 0.09 1.63 0.75 -0.46 0.82 0.81 0.39 0.46 0.40 0.31 13.48 0.87 0.67 1.10 -11.94 -2.67 -10.03 0.09 -1.07 -0.24 -0.90 0.44 1.36 0.58 0.48 0.41 0.31 13.43 0.85 0.65 1.07 12.06 13.32 1.00 0.09 1.07 1.19 0.09 0.84 1.37 1.06 0.50 0.42 0.31 13.38 0.84 0.63 1.05

446
Raw Data Tapered
Data FFT Data Parzen Filtered
Data Simple Ratio
Spectrum Z E N
Tapering Function
Z E N Z E N Z E N
Frequency Hz
E/Z N/Z
Mean SQRT Spectrum
14.01 2.30 3.01 0.09 1.24 0.20 0.27 1.35 0.70 1.83 0.52 0.43 0.32 13.33 0.82 0.61 1.02 -15.98 -31.63 -9.96 0.09 -1.41 -2.78 -0.88 1.98 0.97 0.82 0.54 0.44 0.32 13.28 0.81 0.59 1.00 25.01 -5.55 21.03 0.09 2.19 -0.49 1.84 1.19 0.93 1.92 0.56 0.45 0.32 13.23 0.80 0.57 0.98 1.96 -5.52 5.99 0.09 0.17 -0.48 0.52 0.81 0.38 1.27 0.58 0.45 0.32 13.18 0.79 0.55 0.96
-14.02 -4.48 -17.97 0.09 -1.21 -0.39 -1.55 0.51 0.63 0.64 0.60 0.46 0.32 13.13 0.78 0.53 0.94 10.00 14.51 14.05 0.09 0.86 1.25 1.21 0.62 0.68 0.47 0.61 0.47 0.32 13.09 0.77 0.52 0.93 9.96 11.46 14.01 0.09 0.85 0.98 1.20 1.03 1.00 1.59 0.63 0.48 0.32 13.04 0.76 0.50 0.91
-14.03 -3.54 16.96 0.09 -1.19 -0.30 1.44 0.18 0.97 1.89 0.64 0.49 0.31 12.99 0.76 0.49 0.90 -2.99 -32.46 7.92 0.08 -0.25 -2.74 0.67 0.39 1.12 1.40 0.66 0.49 0.31 12.94 0.75 0.48 0.89 17.98 6.61 -6.07 0.08 1.51 0.55 -0.51 0.59 0.84 0.84 0.67 0.50 0.31 12.89 0.75 0.47 0.88 -21.01 27.55 3.95 0.08 -1.75 2.30 0.33 0.62 0.83 0.95 0.68 0.50 0.31 12.84 0.74 0.46 0.87 2.04 -17.46 3.95 0.08 0.17 -1.45 0.33 0.89 1.17 0.51 0.69 0.51 0.31 12.79 0.74 0.45 0.87 0.04 8.57 40.87 0.08 0.00 0.71 3.37 1.28 0.64 0.68 0.69 0.51 0.31 12.74 0.74 0.44 0.86
-14.93 13.53 25.75 0.08 -1.22 1.11 2.11 0.88 0.34 1.52 0.70 0.51 0.31 12.70 0.74 0.44 0.86 -4.89 -15.45 -14.26 0.08 -0.40 -1.26 -1.16 1.80 1.40 0.96 0.70 0.51 0.31 12.65 0.73 0.44 0.85 -16.84 4.58 3.78 0.08 -1.36 0.37 0.31 1.65 2.01 0.26 0.70 0.51 0.30 12.60 0.73 0.44 0.85 16.17 3.57 -16.18 0.08 1.30 0.29 -1.30 1.38 2.39 4.04 0.70 0.51 0.30 12.55 0.73 0.44 0.85 -17.82 -4.41 3.86 0.08 -1.43 -0.35 0.31 0.73 1.82 4.65 0.69 0.51 0.30 12.50 0.73 0.44 0.85 -8.77 -0.39 17.83 0.08 -0.70 -0.03 1.42 1.29 2.27 0.90 0.69 0.50 0.30 12.45 0.73 0.44 0.86 2.25 -3.37 -42.11 0.08 0.18 -0.27 -3.33 0.50 1.58 0.52 0.68 0.50 0.30 12.40 0.73 0.45 0.86
-23.70 -2.35 -9.99 0.08 -1.86 -0.18 -0.78 1.60 1.77 0.88 0.67 0.49 0.30 12.35 0.74 0.46 0.87 23.30 1.66 24.99 0.08 1.82 0.13 1.95 0.85 1.17 1.02 0.66 0.48 0.31 12.30 0.74 0.47 0.87 -15.71 5.66 7.94 0.08 -1.22 0.44 0.62 1.03 1.39 0.41 0.64 0.48 0.31 12.26 0.74 0.48 0.88 2.32 3.65 -1.06 0.08 0.18 0.28 -0.08 1.07 0.67 2.17 0.63 0.47 0.31 12.21 0.74 0.49 0.89 11.30 8.63 -25.00 0.08 0.86 0.66 -1.91 0.80 0.63 2.11 0.61 0.46 0.31 12.16 0.75 0.51 0.91 -24.67 -3.37 11.04 0.08 -1.87 -0.26 0.84 0.22 0.42 1.56 0.60 0.45 0.32 12.11 0.75 0.53 0.92 36.31 -10.33 6.02 0.08 2.74 -0.78 0.45 0.21 0.47 1.03 0.58 0.44 0.32 12.06 0.76 0.55 0.94 -4.75 3.70 -32.91 0.08 -0.36 0.28 -2.47 0.66 0.38 0.86 0.57 0.43 0.33 12.01 0.77 0.58 0.96 -19.69 0.70 9.15 0.07 -1.47 0.05 0.68 1.22 0.84 0.78 0.55 0.43 0.33 11.96 0.78 0.61 0.99 18.32 5.70 -17.82 0.07 1.36 0.42 -1.32 0.78 0.68 0.85 0.53 0.42 0.34 11.91 0.79 0.64 1.01 -1.71 7.68 -22.72 0.07 -0.13 0.56 -1.67 1.52 1.54 1.28 0.52 0.41 0.35 11.87 0.80 0.67 1.05

447
Raw Data Tapered
Data FFT Data Parzen Filtered
Data Simple Ratio
Spectrum Z E N
Tapering Function
Z E N Z E N Z E N
Frequency Hz
E/Z N/Z
Mean SQRT Spectrum
0.29 -1.32 36.27 0.07 0.02 -0.10 2.65 2.12 2.54 1.33 0.50 0.41 0.35 11.82 0.81 0.71 1.08 2.29 6.68 -2.79 0.07 0.17 0.48 -0.20 3.24 2.22 1.82 0.48 0.40 0.36 11.77 0.83 0.75 1.12 13.27 4.67 -11.74 0.07 0.96 0.34 -0.85 3.99 2.28 1.11 0.47 0.40 0.37 11.72 0.85 0.79 1.16 -10.73 7.65 8.28 0.07 -0.77 0.55 0.59 4.33 2.38 1.05 0.46 0.40 0.38 11.67 0.87 0.83 1.20 9.27 12.62 -9.71 0.07 0.66 0.90 -0.69 4.09 2.01 1.23 0.44 0.39 0.39 11.62 0.89 0.87 1.25 16.23 -8.38 12.30 0.07 1.14 -0.59 0.87 3.67 2.86 1.61 0.43 0.39 0.40 11.57 0.91 0.92 1.29 -21.76 -6.34 10.27 0.07 -1.52 -0.44 0.72 4.81 2.51 1.01 0.42 0.39 0.41 11.52 0.93 0.96 1.34 20.25 14.66 -11.71 0.07 1.41 1.02 -0.81 4.21 1.46 2.46 0.41 0.40 0.42 11.47 0.95 1.00 1.39 9.19 7.62 -4.67 0.07 0.63 0.53 -0.32 3.61 1.54 2.02 0.41 0.40 0.43 11.43 0.98 1.04 1.43 -3.81 -16.35 -5.63 0.07 -0.26 -1.12 -0.39 3.02 0.80 1.17 0.40 0.40 0.43 11.38 1.00 1.08 1.47 7.18 -16.27 -3.60 0.07 0.49 -1.11 -0.24 2.62 0.65 1.03 0.40 0.41 0.44 11.33 1.02 1.12 1.51 12.15 1.77 2.42 0.07 0.82 0.12 0.16 3.60 1.35 0.77 0.39 0.41 0.45 11.28 1.04 1.14 1.55 11.11 7.76 8.41 0.07 0.74 0.52 0.56 2.34 1.28 0.67 0.39 0.42 0.46 11.23 1.05 1.17 1.57 -27.86 -1.24 -2.59 0.07 -1.85 -0.08 -0.17 1.97 1.25 0.43 0.39 0.42 0.47 11.18 1.07 1.18 1.59 9.19 -0.23 2.42 0.07 0.61 -0.02 0.16 3.33 1.02 1.64 0.40 0.43 0.47 11.13 1.07 1.19 1.61 -2.82 12.75 9.41 0.07 -0.18 0.84 0.62 5.26 2.09 1.32 0.40 0.43 0.48 11.08 1.08 1.20 1.61 -16.78 0.74 -20.55 0.07 -1.09 0.05 -1.34 4.27 1.96 1.11 0.41 0.44 0.49 11.04 1.08 1.19 1.61 11.24 -4.25 -0.49 0.06 0.72 -0.27 -0.03 2.81 1.20 2.74 0.42 0.45 0.49 10.99 1.07 1.18 1.59 -0.78 5.76 25.47 0.06 -0.05 0.37 1.63 4.84 1.61 2.12 0.43 0.45 0.50 10.94 1.06 1.16 1.57 16.19 -1.24 -4.56 0.06 1.03 -0.08 -0.29 4.14 1.08 1.49 0.44 0.46 0.50 10.89 1.05 1.14 1.54 -23.79 -5.21 -6.52 0.06 -1.50 -0.33 -0.41 4.08 1.93 1.46 0.46 0.47 0.50 10.84 1.03 1.11 1.51 4.25 4.80 5.49 0.06 0.27 0.30 0.34 3.06 2.56 0.98 0.47 0.47 0.51 10.79 1.00 1.07 1.47 19.21 9.78 -6.49 0.06 1.19 0.61 -0.40 3.15 2.08 0.62 0.49 0.48 0.51 10.74 0.98 1.03 1.42 -37.75 0.77 -4.45 0.06 -2.32 0.05 -0.27 2.47 2.17 0.27 0.51 0.49 0.51 10.69 0.95 0.99 1.37 22.29 7.76 3.56 0.06 1.36 0.47 0.22 1.23 1.16 1.11 0.54 0.50 0.51 10.64 0.92 0.95 1.32 -1.75 14.73 -14.40 0.06 -0.11 0.89 -0.87 1.38 0.77 0.35 0.57 0.50 0.51 10.60 0.89 0.90 1.27 -19.70 -7.28 -7.35 0.06 -1.18 -0.44 -0.44 3.54 1.85 1.29 0.59 0.51 0.51 10.55 0.86 0.86 1.22 9.32 5.73 -1.31 0.06 0.55 0.34 -0.08 2.80 1.53 1.58 0.62 0.52 0.51 10.50 0.83 0.82 1.16
-13.66 0.73 -10.28 0.06 -0.81 0.04 -0.61 1.16 0.92 0.42 0.66 0.52 0.51 10.45 0.80 0.78 1.11 9.35 -27.20 11.73 0.06 0.55 -1.59 0.69 1.55 0.98 1.34 0.69 0.53 0.51 10.40 0.77 0.74 1.07 -4.66 11.84 -3.27 0.06 -0.27 0.69 -0.19 1.73 0.75 1.10 0.72 0.54 0.51 10.35 0.74 0.70 1.02

448
Raw Data Tapered
Data FFT Data Parzen Filtered
Data Simple Ratio
Spectrum Z E N
Tapering Function
Z E N Z E N Z E N
Frequency Hz
E/Z N/Z
Mean SQRT Spectrum
-1.64 7.81 -9.23 0.06 -0.09 0.45 -0.53 2.61 2.46 2.43 0.76 0.54 0.51 10.30 0.71 0.67 0.98 -0.63 -22.15 17.77 0.06 -0.04 -1.26 1.01 0.72 1.02 1.40 0.80 0.55 0.51 10.25 0.69 0.64 0.94 -7.61 -8.08 -10.23 0.06 -0.43 -0.46 -0.58 1.13 1.74 1.85 0.83 0.55 0.51 10.21 0.67 0.61 0.90 18.37 -1.05 -16.17 0.06 1.03 -0.06 -0.91 2.17 2.85 2.19 0.87 0.56 0.50 10.16 0.64 0.58 0.87 -2.65 9.94 -2.12 0.06 -0.15 0.55 -0.12 2.19 2.13 1.60 0.91 0.57 0.50 10.11 0.63 0.56 0.84 12.33 -10.05 -7.08 0.06 0.68 -0.55 -0.39 1.37 1.48 0.54 0.94 0.57 0.50 10.06 0.61 0.53 0.81 7.30 -11.00 10.92 0.05 0.40 -0.60 0.60 0.57 1.18 0.45 0.97 0.58 0.50 10.01 0.59 0.51 0.78 -4.70 23.99 -3.08 0.05 -0.25 1.30 -0.17 0.84 0.86 0.84 1.01 0.58 0.50 9.96 0.58 0.50 0.76 7.29 -7.04 -0.06 0.05 0.39 -0.38 0.00 1.90 1.17 1.58 1.03 0.58 0.50 9.91 0.56 0.48 0.74 4.28 -17.98 14.93 0.05 0.23 -0.95 0.79 2.63 1.38 1.38 1.06 0.59 0.50 9.86 0.55 0.47 0.72 22.23 15.04 -12.07 0.05 1.17 0.79 -0.63 1.08 0.77 0.72 1.08 0.59 0.50 9.81 0.54 0.46 0.71 -7.80 -0.98 -2.02 0.05 -0.41 -0.05 -0.11 0.50 1.62 0.72 1.11 0.59 0.49 9.77 0.54 0.45 0.70 4.21 -15.93 11.97 0.05 0.22 -0.82 0.62 1.37 2.19 1.60 1.12 0.59 0.49 9.72 0.53 0.44 0.69 4.20 5.10 8.94 0.05 0.21 0.26 0.46 1.20 1.55 1.36 1.14 0.60 0.49 9.67 0.52 0.43 0.68
-17.77 8.08 6.92 0.05 -0.90 0.41 0.35 1.84 1.07 1.49 1.15 0.60 0.49 9.62 0.52 0.43 0.67 20.23 -11.90 -17.04 0.05 1.01 -0.59 -0.85 2.24 1.79 2.65 1.15 0.60 0.49 9.57 0.52 0.42 0.67 -11.78 -5.85 -22.95 0.05 -0.58 -0.29 -1.14 0.32 2.84 3.22 1.16 0.60 0.49 9.52 0.52 0.42 0.67 -0.75 3.16 -3.88 0.05 -0.04 0.15 -0.19 2.44 0.48 1.58 1.16 0.60 0.49 9.47 0.52 0.42 0.67 18.21 -16.80 13.12 0.05 0.88 -0.81 0.64 2.56 2.15 1.29 1.15 0.60 0.49 9.42 0.52 0.42 0.67 -18.78 -9.74 30.04 0.05 -0.90 -0.47 1.44 1.31 1.69 2.25 1.14 0.60 0.48 9.38 0.52 0.42 0.67 11.24 8.28 20.95 0.05 0.53 0.39 1.00 1.73 0.40 0.83 1.13 0.60 0.48 9.33 0.53 0.43 0.68 8.20 -10.71 -18.04 0.05 0.39 -0.50 -0.85 0.88 0.94 0.44 1.12 0.60 0.48 9.28 0.53 0.43 0.69
-11.79 -9.66 -12.96 0.05 -0.55 -0.45 -0.60 0.22 1.48 0.61 1.10 0.60 0.48 9.23 0.54 0.44 0.70 4.23 -1.62 19.04 0.05 0.19 -0.07 0.88 0.68 1.24 1.69 1.08 0.59 0.48 9.18 0.55 0.45 0.71 4.22 -0.61 1.01 0.05 0.19 -0.03 0.05 0.76 1.47 1.12 1.06 0.59 0.48 9.13 0.56 0.46 0.72
-19.74 6.39 -8.96 0.05 -0.89 0.29 -0.40 0.60 1.46 0.89 1.03 0.59 0.48 9.08 0.57 0.47 0.74 11.28 -4.60 6.06 0.04 0.50 -0.20 0.27 1.29 1.77 2.31 1.01 0.59 0.48 9.03 0.59 0.48 0.76 18.22 6.41 7.05 0.04 0.80 0.28 0.31 1.05 1.44 0.69 0.98 0.59 0.48 8.98 0.60 0.49 0.78 -31.75 10.38 5.04 0.04 -1.38 0.45 0.22 1.33 1.20 1.04 0.95 0.59 0.48 8.94 0.62 0.50 0.80 23.27 -4.62 -16.92 0.04 1.00 -0.20 -0.73 1.12 1.26 0.93 0.93 0.59 0.48 8.89 0.63 0.52 0.82 0.23 4.39 3.12 0.04 0.01 0.19 0.13 1.44 1.41 0.15 0.90 0.59 0.48 8.84 0.65 0.54 0.85

449
Raw Data Tapered
Data FFT Data Parzen Filtered
Data Simple Ratio
Spectrum Z E N
Tapering Function
Z E N Z E N Z E N
Frequency Hz
E/Z N/Z
Mean SQRT Spectrum
-24.72 11.37 31.06 0.04 -1.04 0.48 1.30 2.15 0.39 1.01 0.87 0.58 0.49 8.79 0.67 0.56 0.87 34.27 17.33 -17.95 0.04 1.42 0.72 -0.74 1.53 1.16 2.11 0.84 0.58 0.49 8.74 0.69 0.58 0.90 -26.74 5.29 -18.86 0.04 -1.10 0.22 -0.77 0.95 0.75 1.77 0.81 0.58 0.49 8.69 0.71 0.60 0.93 -2.68 -0.71 21.15 0.04 -0.11 -0.03 0.86 0.63 1.18 1.31 0.79 0.58 0.49 8.64 0.74 0.62 0.97 12.30 13.28 -2.87 0.04 0.49 0.53 -0.11 1.07 1.13 0.93 0.76 0.58 0.49 8.59 0.76 0.65 1.00 -14.69 -2.73 -14.83 0.04 -0.58 -0.11 -0.59 1.89 0.53 0.95 0.74 0.58 0.50 8.54 0.78 0.67 1.03 26.29 -5.71 9.20 0.04 1.03 -0.22 0.36 1.27 0.48 1.66 0.72 0.58 0.50 8.50 0.81 0.70 1.07 -20.71 3.31 2.19 0.04 -0.80 0.13 0.08 0.38 0.67 2.51 0.69 0.57 0.50 8.45 0.83 0.72 1.10 4.32 11.29 -22.75 0.04 0.16 0.43 -0.86 1.86 1.08 1.30 0.67 0.57 0.50 8.40 0.85 0.75 1.13 22.27 13.25 -11.67 0.04 0.84 0.50 -0.44 2.49 1.90 1.60 0.65 0.57 0.51 8.35 0.87 0.78 1.17 -19.73 -6.75 5.36 0.04 -0.73 -0.25 0.20 0.89 1.21 2.19 0.64 0.57 0.51 8.30 0.89 0.80 1.20 12.29 0.27 -5.63 0.04 0.45 0.01 -0.21 2.04 0.94 0.94 0.62 0.57 0.51 8.25 0.91 0.83 1.23 6.26 4.27 -14.58 0.04 0.23 0.15 -0.52 2.14 2.16 3.13 0.61 0.56 0.51 8.20 0.93 0.85 1.26 -5.74 -6.71 -7.52 0.04 -0.20 -0.24 -0.27 2.64 2.15 1.43 0.59 0.56 0.52 8.15 0.95 0.87 1.29 -3.72 0.31 9.49 0.04 -0.13 0.01 0.33 2.70 2.63 0.91 0.58 0.56 0.52 8.11 0.96 0.89 1.31 13.27 7.31 -2.51 0.03 0.46 0.25 -0.09 2.23 3.40 0.98 0.57 0.55 0.52 8.06 0.98 0.91 1.34 2.24 6.29 -23.44 0.03 0.08 0.21 -0.80 1.78 2.81 0.60 0.56 0.55 0.52 8.01 0.99 0.93 1.36 -7.74 -9.69 8.60 0.03 -0.26 -0.32 0.29 1.39 1.05 1.03 0.55 0.55 0.52 7.96 1.00 0.95 1.38 14.25 -15.63 7.59 0.03 0.47 -0.52 0.25 2.03 1.27 1.41 0.54 0.54 0.52 7.91 1.01 0.96 1.39 -12.75 3.40 -19.38 0.03 -0.41 0.11 -0.63 3.41 1.48 2.28 0.53 0.54 0.52 7.86 1.01 0.98 1.41 6.26 -3.59 -8.31 0.03 0.20 -0.11 -0.27 2.50 0.77 1.47 0.53 0.53 0.52 7.81 1.02 0.99 1.42 7.24 -11.55 -21.23 0.03 0.23 -0.36 -0.67 1.75 0.43 0.75 0.52 0.53 0.52 7.76 1.02 1.00 1.43 -3.76 -1.51 -8.16 0.03 -0.12 -0.05 -0.25 1.81 1.57 0.66 0.52 0.53 0.52 7.71 1.02 1.01 1.43 9.23 -14.47 21.83 0.03 0.28 -0.44 0.67 2.04 3.12 0.73 0.51 0.52 0.52 7.67 1.02 1.01 1.44 -4.77 -3.42 -5.19 0.03 -0.14 -0.10 -0.16 2.29 1.35 1.00 0.51 0.52 0.52 7.62 1.02 1.02 1.44 6.23 2.59 -3.16 0.03 0.18 0.08 -0.09 1.04 1.00 0.67 0.51 0.51 0.52 7.57 1.01 1.02 1.44 -5.77 -30.34 10.84 0.03 -0.17 -0.88 0.31 1.35 0.88 1.72 0.51 0.51 0.52 7.52 1.01 1.02 1.43 20.20 -16.24 -9.15 0.03 0.58 -0.46 -0.26 3.56 1.32 1.97 0.51 0.51 0.51 7.47 1.00 1.02 1.43 20.13 -2.19 -7.10 0.03 0.56 -0.06 -0.20 3.57 2.44 1.09 0.51 0.50 0.51 7.42 0.99 1.01 1.42 -16.88 -14.15 16.89 0.03 -0.46 -0.39 0.46 1.85 2.12 0.31 0.51 0.50 0.51 7.37 0.98 1.01 1.41 14.13 -14.08 20.83 0.03 0.38 -0.38 0.56 1.57 1.46 1.88 0.51 0.50 0.51 7.32 0.97 1.00 1.39

450
Raw Data Tapered Data
FFT Data Parzen Filtered Data
Simple Ratio Spectrum
Z E N
Tapering Function
Z E N Z E N Z E N
Frequency Hz
E/Z N/Z
Mean SQRT Spectrum
5.10 -18.00 -2.19 0.03 0.14 -0.48 -0.06 2.57 1.71 1.18 0.52 0.50 0.51 7.28 0.96 0.99 1.38 -9.89 -0.95 -8.16 0.03 -0.26 -0.02 -0.21 3.26 2.55 0.80 0.52 0.50 0.51 7.23 0.95 0.98 1.37 1.13 -4.93 1.87 0.03 0.03 -0.13 0.05 1.88 3.80 0.75 0.53 0.50 0.51 7.18 0.93 0.97 1.35 3.13 -7.89 -4.11 0.03 0.08 -0.20 -0.10 1.73 5.43 1.01 0.54 0.50 0.52 7.13 0.92 0.96 1.33
-10.86 11.11 0.91 0.02 -0.27 0.27 0.02 1.81 3.96 2.07 0.55 0.50 0.52 7.08 0.91 0.94 1.31 -16.80 -3.89 1.92 0.02 -0.40 -0.09 0.05 2.61 2.55 1.27 0.56 0.50 0.52 7.03 0.90 0.93 1.29 3.23 8.11 9.91 0.02 0.08 0.19 0.23 1.98 3.87 1.07 0.57 0.50 0.52 6.98 0.89 0.91 1.27 -4.76 11.08 23.85 0.02 -0.11 0.25 0.55 2.42 1.88 2.42 0.58 0.51 0.52 6.93 0.88 0.89 1.26 -3.74 -5.92 -3.17 0.02 -0.08 -0.13 -0.07 1.35 4.07 1.59 0.59 0.51 0.52 6.88 0.87 0.88 1.24 -3.72 4.10 -5.14 0.02 -0.08 0.09 -0.11 1.25 4.27 1.41 0.60 0.52 0.52 6.84 0.86 0.86 1.22 6.28 -3.89 9.86 0.02 0.13 -0.08 0.21 2.53 0.67 0.80 0.62 0.53 0.52 6.79 0.86 0.84 1.20 7.26 7.11 -0.14 0.02 0.15 0.15 0.00 3.54 2.39 0.49 0.63 0.54 0.52 6.74 0.85 0.82 1.18
-17.72 6.10 7.86 0.02 -0.36 0.13 0.16 2.67 2.67 1.52 0.64 0.54 0.52 6.69 0.84 0.80 1.17 11.30 3.09 0.85 0.02 0.23 0.06 0.02 0.68 1.71 1.23 0.66 0.55 0.52 6.64 0.84 0.78 1.15 2.27 23.05 -7.12 0.02 0.04 0.45 -0.14 0.99 1.06 1.35 0.67 0.56 0.52 6.59 0.84 0.77 1.14
-16.69 1.01 8.89 0.02 -0.32 0.02 0.17 1.87 2.20 2.41 0.69 0.58 0.51 6.54 0.84 0.75 1.12 -1.65 16.99 -8.10 0.02 -0.03 0.31 -0.15 2.48 1.24 0.61 0.70 0.59 0.51 6.49 0.84 0.73 1.11 -2.64 10.94 -13.04 0.02 -0.05 0.20 -0.23 2.37 0.47 2.34 0.71 0.60 0.51 6.45 0.84 0.71 1.10 -3.63 -21.03 10.98 0.02 -0.06 -0.37 0.19 1.28 1.72 1.78 0.73 0.61 0.51 6.40 0.84 0.70 1.10 -7.60 26.97 -4.02 0.02 -0.13 0.46 -0.07 0.62 3.62 0.58 0.74 0.63 0.50 6.35 0.85 0.68 1.09 17.39 11.90 -18.96 0.02 0.29 0.20 -0.31 0.61 3.42 1.27 0.75 0.64 0.50 6.30 0.86 0.67 1.09 -10.62 -17.07 -15.88 0.02 -0.17 -0.27 -0.25 1.08 2.28 0.15 0.76 0.65 0.50 6.25 0.86 0.66 1.08 -12.57 13.94 -10.81 0.02 -0.19 0.22 -0.17 4.01 2.64 0.92 0.77 0.67 0.49 6.20 0.87 0.64 1.08 32.39 -0.07 0.22 0.02 0.49 0.00 0.00 3.71 1.68 0.48 0.78 0.69 0.49 6.15 0.88 0.63 1.09 -22.63 -8.05 -10.74 0.01 -0.33 -0.12 -0.16 2.45 2.48 2.08 0.78 0.70 0.49 6.10 0.90 0.62 1.09 4.41 -0.02 -5.69 0.01 0.06 0.00 -0.08 3.06 3.42 0.89 0.79 0.72 0.49 6.05 0.91 0.62 1.10 25.36 -0.01 13.31 0.01 0.34 0.00 0.18 4.47 3.64 3.43 0.80 0.74 0.48 6.01 0.92 0.61 1.11 -13.66 9.98 -5.70 0.01 -0.18 0.13 -0.07 2.62 2.84 3.81 0.80 0.75 0.48 5.96 0.94 0.60 1.12 9.35 -11.01 -12.64 0.01 0.12 -0.14 -0.16 2.50 2.72 4.94 0.80 0.77 0.48 5.91 0.96 0.60 1.13
-16.63 -14.94 5.39 0.01 -0.20 -0.18 0.06 2.55 1.52 3.02 0.81 0.78 0.48 5.86 0.97 0.59 1.14 20.37 1.09 -1.61 0.01 0.23 0.01 -0.02 1.66 1.29 4.64 0.81 0.80 0.48 5.81 0.99 0.59 1.15

451
Raw Data Tapered
Data FFT Data Parzen Filtered
Data Simple Ratio
Spectrum Z E N
Tapering Function
Z E N Z E N Z E N
Frequency Hz
E/Z N/Z
Mean SQRT Spectrum
6.32 -12.87 -2.59 0.01 0.07 -0.14 -0.03 1.27 0.96 2.08 0.81 0.82 0.48 5.76 1.01 0.59 1.17 -43.61 -2.83 12.41 0.01 -0.46 -0.03 0.13 2.29 4.70 1.73 0.81 0.83 0.48 5.71 1.02 0.59 1.18 28.43 2.18 -2.60 0.01 0.28 0.02 -0.03 1.76 4.94 5.18 0.81 0.85 0.48 5.66 1.04 0.59 1.20 -20.58 -12.78 -2.57 0.01 -0.20 -0.12 -0.02 3.36 1.46 3.75 0.81 0.86 0.48 5.62 1.06 0.59 1.21 -17.50 -1.74 -1.55 0.01 -0.16 -0.02 -0.01 3.05 1.15 0.41 0.81 0.87 0.48 5.57 1.08 0.60 1.23 35.46 -0.73 -8.51 0.01 0.30 -0.01 -0.07 2.00 0.67 0.65 0.81 0.88 0.49 5.52 1.09 0.60 1.25 -32.54 -11.69 5.51 0.01 -0.26 -0.09 0.04 1.36 1.12 0.99 0.81 0.89 0.49 5.47 1.11 0.61 1.26 0.53 -12.63 -14.46 0.01 0.00 -0.09 -0.11 6.82 3.30 10.95 0.81 0.90 0.49 5.42 1.12 0.61 1.28 17.50 -6.58 -8.40 0.01 0.12 -0.05 -0.06 8.47 3.73 14.16 0.80 0.91 0.50 5.37 1.13 0.62 1.29 -14.50 9.42 13.60 0.01 -0.09 0.06 0.09 2.14 3.51 3.27 0.80 0.92 0.50 5.32 1.14 0.63 1.30 8.51 -2.58 -10.39 0.01 0.05 -0.02 -0.06 2.03 3.25 0.45 0.80 0.92 0.51 5.27 1.15 0.64 1.31 -1.50 -8.55 -14.32 0.01 -0.01 -0.05 -0.08 1.64 2.60 0.77 0.80 0.93 0.52 5.22 1.15 0.65 1.32 -2.49 3.47 -0.28 0.01 -0.01 0.02 0.00 0.79 1.50 0.59 0.80 0.93 0.53 5.18 1.16 0.66 1.33 7.51 -10.50 12.71 0.00 0.03 -0.05 0.06 1.90 0.59 0.82 0.80 0.93 0.54 5.13 1.16 0.67 1.34 -9.48 -3.46 10.68 0.00 -0.04 -0.01 0.04 1.17 0.25 1.06 0.81 0.93 0.55 5.08 1.15 0.69 1.34 8.52 13.53 -2.32 0.00 0.03 0.05 -0.01 1.99 5.46 2.02 0.81 0.93 0.57 5.03 1.15 0.70 1.35 17.47 2.51 13.67 0.00 0.05 0.01 0.04 3.24 9.23 8.54 0.81 0.93 0.58 4.98 1.15 0.72 1.35 -25.51 -10.46 17.62 0.00 -0.06 -0.03 0.04 1.15 5.47 7.23 0.82 0.93 0.60 4.93 1.14 0.74 1.36 1.55 7.55 -9.38 0.00 0.00 0.02 -0.02 1.81 3.29 1.91 0.82 0.93 0.62 4.88 1.13 0.75 1.36 4.54 20.51 -4.34 0.00 0.01 0.03 -0.01 0.04 2.64 1.73 0.83 0.93 0.64 4.83 1.12 0.77 1.36
-27.41 -9.50 19.64 0.00 -0.03 -0.01 0.02 1.44 0.92 0.89 0.84 0.93 0.66 4.79 1.11 0.79 1.36 31.58 -2.47 -4.37 0.00 0.02 0.00 0.00 1.00 1.43 1.23 0.84 0.93 0.69 4.74 1.10 0.81 1.37

452
Microtremors Segment: A1-S2 Raw Data Tapered
Data FFT Data Parzen Filtered
Data Simple Ratio
Spectrum Z E N
Tapering Function
Z E N Z E N Z E N
Frequency Hz
E/Z N/Z
Mean SQRT Spectrum
22.86 -27.79 14.55 0.26 5.93 -7.21 3.77 1.16 1.06 0.84 21.30 20.45 38.11 30.03 0.96 1.79 2.030551 41.74 40.20 -2.46 0.26 10.81 10.41 -0.64 0.71 0.99 0.69 21.83 20.42 37.93 29.98 0.94 1.74 1.972836 -50.24 14.10 8.55 0.26 -12.99 3.65 2.21 0.96 0.96 0.74 22.38 20.41 37.68 29.93 0.91 1.68 1.915137 22.82 -14.88 -4.44 0.26 5.89 -3.84 -1.14 0.47 0.44 1.58 22.92 20.41 37.38 29.88 0.89 1.63 1.858204 11.76 33.09 -6.40 0.26 3.03 8.52 -1.65 0.70 0.94 2.34 23.46 20.43 37.03 29.83 0.87 1.58 1.802744 -39.18 3.03 10.62 0.26 -10.07 0.78 2.73 0.66 0.81 1.33 23.98 20.46 36.62 29.79 0.85 1.53 1.749408 17.87 -22.91 2.61 0.26 4.58 -5.88 0.67 1.01 0.41 0.82 24.47 20.51 36.16 29.74 0.84 1.48 1.698693 -9.14 20.10 -1.37 0.26 -2.34 5.15 -0.35 0.39 0.57 0.94 24.94 20.56 35.67 29.69 0.82 1.43 1.650946 -2.11 8.06 3.64 0.26 -0.54 2.06 0.93 0.56 0.81 1.55 25.36 20.63 35.14 29.64 0.81 1.39 1.606483 12.87 -3.93 7.64 0.26 3.28 -1.00 1.95 0.56 0.25 1.05 25.75 20.71 34.58 29.59 0.80 1.34 1.565584 -24.10 18.05 -6.34 0.25 -6.13 4.59 -1.61 0.71 0.60 0.19 26.08 20.80 34.01 29.54 0.80 1.30 1.528439 16.92 6.01 -3.30 0.25 4.30 1.53 -0.84 1.42 0.82 1.18 26.37 20.90 33.43 29.49 0.79 1.27 1.495196 14.86 11.99 14.70 0.25 3.77 3.04 3.73 0.31 1.81 2.42 26.60 21.01 32.85 29.44 0.79 1.24 1.466009 -19.12 8.96 -7.30 0.25 -4.84 2.27 -1.85 2.01 1.65 2.05 26.77 21.12 32.29 29.39 0.79 1.21 1.441052 21.88 -19.01 -16.23 0.25 5.52 -4.80 -4.10 2.01 0.64 0.96 26.89 21.23 31.75 29.35 0.79 1.18 1.420419 13.81 12.02 -5.17 0.25 3.48 3.03 -1.30 1.24 1.22 0.49 26.94 21.35 31.23 29.30 0.79 1.16 1.404181 -15.18 27.95 -7.12 0.25 -3.82 7.03 -1.79 0.71 1.84 1.48 26.94 21.47 30.75 29.25 0.80 1.14 1.392313 13.83 -13.06 -7.07 0.25 3.47 -3.28 -1.77 0.60 0.82 1.63 26.88 21.59 30.31 29.20 0.80 1.13 1.384714 24.75 -7.01 -8.02 0.25 6.20 -1.76 -2.01 0.21 1.09 0.66 26.76 21.71 29.92 29.15 0.81 1.12 1.38131 -23.24 11.99 -2.98 0.25 -5.81 3.00 -0.74 0.28 0.41 0.25 26.59 21.83 29.57 29.10 0.82 1.11 1.382013 -16.16 -6.01 -13.92 0.25 -4.03 -1.50 -3.47 0.83 0.52 0.96 26.38 21.94 29.27 29.05 0.83 1.11 1.386679 35.81 7.00 -15.84 0.25 8.92 1.74 -3.94 1.61 0.38 1.08 26.12 22.04 29.01 29.00 0.84 1.11 1.395077 -35.19 12.97 -3.78 0.25 -8.74 3.22 -0.94 1.10 0.80 1.37 25.83 22.14 28.81 28.96 0.86 1.12 1.406866 -18.07 -14.01 -16.72 0.25 -4.48 -3.47 -4.15 0.87 0.57 1.27 25.52 22.24 28.66 28.91 0.87 1.12 1.421674 61.84 9.01 -4.65 0.25 15.31 2.23 -1.15 0.94 1.45 0.71 25.18 22.33 28.55 28.86 0.89 1.13 1.439165 -37.20 24.96 -0.62 0.25 -9.19 6.16 -0.15 0.49 0.63 1.43 24.85 22.41 28.49 28.81 0.90 1.15 1.458973 -26.07 -3.08 -14.57 0.25 -6.43 -0.76 -3.59 3.04 0.58 1.82 24.50 22.49 28.47 28.76 0.92 1.16 1.480608 56.88 5.93 4.47 0.25 13.99 1.46 1.10 3.37 0.37 1.35 24.17 22.55 28.50 28.71 0.93 1.18 1.503519 -35.16 7.91 1.48 0.25 -8.63 1.94 0.36 1.33 1.04 0.89 23.85 22.61 28.56 28.66 0.95 1.20 1.527123 -28.03 -9.07 -6.49 0.25 -6.87 -2.22 -1.59 0.12 0.21 0.62 23.56 22.66 28.65 28.61 0.96 1.22 1.550811 57.92 10.94 9.53 0.24 14.16 2.67 2.33 0.64 1.15 1.62 23.29 22.71 28.77 28.56 0.98 1.24 1.573902

453
Raw Data Tapered
Data FFT Data Parzen Filtered
Data Simple Ratio
Spectrum Z E N
Tapering Function
Z E N Z E N Z E N
Frequency Hz
E/Z N/Z
Mean SQRT Spectrum
-30.04 -13.06 -16.40 0.24 -7.31 -3.18 -3.99 1.04 0.17 0.67 22.87 22.80 29.08 28.47 1.00 1.27 1.615623 35.96 -10.00 5.64 0.24 8.74 -2.43 1.37 1.31 0.50 0.73 22.72 22.83 29.25 28.42 1.01 1.29 1.633132 -14.08 0.03 8.63 0.24 -3.41 0.01 2.09 0.82 1.00 1.29 22.61 22.86 29.42 28.37 1.01 1.30 1.64785 -3.04 12.02 -0.36 0.24 -0.74 2.91 -0.09 0.74 1.60 0.54 22.55 22.89 29.59 28.32 1.02 1.31 1.659414 14.94 5.00 5.65 0.24 3.61 1.21 1.36 0.56 0.60 0.63 22.52 22.91 29.76 28.27 1.02 1.32 1.667457 -5.07 0.00 -14.31 0.24 -1.22 0.00 -3.45 0.32 0.59 0.92 22.55 22.92 29.92 28.22 1.02 1.33 1.671698 9.92 -2.98 -7.25 0.24 2.39 -0.72 -1.74 0.62 0.27 1.94 22.62 22.93 30.07 28.17 1.01 1.33 1.672005
-11.07 -1.96 17.75 0.24 -2.66 -0.47 4.26 0.46 0.70 2.18 22.73 22.92 30.21 28.13 1.01 1.33 1.668485 3.95 6.04 -9.24 0.24 0.95 1.45 -2.21 0.59 1.11 0.77 22.88 22.91 30.33 28.08 1.00 1.33 1.66145 9.93 -0.95 -9.18 0.24 2.37 -0.23 -2.20 0.94 0.64 0.44 23.06 22.89 30.43 28.03 0.99 1.32 1.651249
-10.07 13.03 12.83 0.24 -2.40 3.11 3.06 1.13 1.05 1.26 23.28 22.87 30.52 27.98 0.98 1.31 1.638196 27.90 4.01 -1.17 0.24 6.64 0.95 -0.28 0.70 0.84 1.31 23.53 22.83 30.60 27.93 0.97 1.30 1.622655 3.85 -17.95 6.84 0.24 0.91 -4.26 1.62 0.16 0.64 2.04 23.80 22.79 30.66 27.88 0.96 1.29 1.605104
-18.12 6.09 11.82 0.24 -4.29 1.44 2.80 0.28 0.38 1.42 24.09 22.74 30.71 27.83 0.94 1.27 1.586147 26.87 5.08 -8.16 0.24 6.35 1.20 -1.93 1.04 0.41 1.09 24.38 22.67 30.74 27.78 0.93 1.26 1.566402 6.81 -10.90 10.85 0.24 1.61 -2.57 2.56 0.81 0.94 0.72 24.68 22.59 30.76 27.73 0.92 1.25 1.546413
-13.18 0.13 19.81 0.24 -3.10 0.03 4.67 0.95 1.43 0.62 24.96 22.48 30.76 27.69 0.90 1.23 1.526715 2.85 0.15 -14.18 0.24 0.67 0.03 -3.33 0.24 0.21 1.00 25.22 22.37 30.75 27.64 0.89 1.22 1.507699 -8.13 7.14 4.86 0.23 -1.91 1.68 1.14 0.37 0.46 0.13 25.46 22.24 30.73 27.59 0.87 1.21 1.489631 3.88 11.12 31.81 0.23 0.91 2.60 7.44 0.55 1.57 0.66 25.68 22.09 30.70 27.54 0.86 1.20 1.472733 -1.12 3.10 -5.22 0.23 -0.26 0.72 -1.22 1.56 1.13 0.77 25.88 21.94 30.67 27.49 0.85 1.19 1.457247 -3.10 14.08 -2.19 0.23 -0.72 3.28 -0.51 1.10 0.38 0.85 26.04 21.77 30.64 27.44 0.84 1.18 1.44345 2.90 17.03 11.81 0.23 0.67 3.96 2.75 0.58 0.73 0.48 26.16 21.60 30.60 27.39 0.83 1.17 1.431642
-22.05 -3.99 -15.16 0.23 -5.12 -0.92 -3.52 1.41 0.43 0.51 26.25 21.43 30.56 27.34 0.82 1.16 1.422102 12.97 -10.94 11.87 0.23 3.00 -2.53 2.75 1.54 0.51 1.15 26.29 21.26 30.52 27.29 0.81 1.16 1.415025 6.93 12.07 22.82 0.23 1.60 2.79 5.27 0.49 0.69 1.20 26.28 21.08 30.49 27.25 0.80 1.16 1.410458
-35.00 3.05 -13.18 0.23 -8.07 0.70 -3.04 0.95 0.23 1.41 26.22 20.91 30.44 27.20 0.80 1.16 1.408388 28.02 -6.93 -0.13 0.23 6.44 -1.59 -0.03 1.28 0.40 0.69 26.12 20.74 30.40 27.15 0.79 1.16 1.408839 11.94 0.09 -1.11 0.23 2.74 0.02 -0.25 0.89 1.51 0.79 25.97 20.57 30.35 27.10 0.79 1.17 1.411879 -40.00 -11.87 -8.07 0.23 -9.16 -2.72 -1.85 0.72 0.41 0.43 25.77 20.41 30.29 27.05 0.79 1.18 1.41757 27.04 10.14 14.94 0.23 6.18 2.32 3.41 0.14 0.38 0.49 25.52 20.25 30.23 27.00 0.79 1.18 1.425797

454
Raw Data Tapered Data
FFT Data Parzen Filtered Data
Simple Ratio Spectrum
Z E N
Tapering Function
Z E N Z E N Z E N
Frequency Hz
E/Z N/Z
Mean SQRT Spectrum
8.97 -3.86 -11.05 0.23 2.04 -0.88 -2.52 0.95 0.81 0.65 25.24 20.11 30.15 26.95 0.80 1.19 1.436229 -34.97 -13.81 -19.96 0.23 -7.96 -3.14 -4.54 0.55 0.47 0.62 24.92 19.98 30.07 26.90 0.80 1.21 1.448474 26.05 18.19 10.08 0.23 5.91 4.13 2.29 1.21 0.34 0.60 24.59 19.86 29.97 26.86 0.81 1.22 1.462114 -3.99 -10.81 -0.92 0.23 -0.90 -2.45 -0.21 1.02 0.74 1.40 24.24 19.76 29.85 26.81 0.82 1.23 1.476726 -22.93 0.22 -1.89 0.23 -5.18 0.05 -0.43 0.47 0.79 2.76 23.88 19.67 29.71 26.76 0.82 1.24 1.49197 22.08 5.22 -1.86 0.23 4.98 1.18 -0.42 0.96 0.68 2.04 23.52 19.59 29.56 26.71 0.83 1.26 1.507505 -11.94 -24.73 -8.82 0.23 -2.69 -5.56 -1.99 0.33 0.55 1.56 23.17 19.53 29.39 26.66 0.84 1.27 1.522897 1.09 2.33 7.20 0.22 0.25 0.52 1.62 0.63 0.34 1.19 22.82 19.47 29.20 26.61 0.85 1.28 1.537659 9.08 -1.66 -4.78 0.22 2.03 -0.37 -1.07 0.52 0.99 1.24 22.49 19.41 28.98 26.56 0.86 1.29 1.551279
-16.90 3.35 1.25 0.22 -3.78 0.75 0.28 0.72 0.33 0.27 22.18 19.36 28.75 26.51 0.87 1.30 1.563217 36.07 26.30 7.25 0.22 8.04 5.87 1.62 0.63 0.74 1.43 21.89 19.32 28.51 26.46 0.88 1.30 1.572987 -4.99 -3.73 -9.72 0.22 -1.11 -0.83 -2.16 0.24 1.31 0.44 21.63 19.27 28.24 26.42 0.89 1.31 1.580268 -30.91 -4.70 0.32 0.22 -6.86 -1.04 0.07 0.58 1.15 0.33 21.41 19.22 27.97 26.37 0.90 1.31 1.584909 34.09 8.30 -10.64 0.22 7.55 1.84 -2.36 0.37 0.38 0.45 21.22 19.16 27.68 26.32 0.90 1.30 1.586803 -43.89 -6.69 -2.59 0.22 -9.70 -1.48 -0.57 0.39 1.16 0.13 21.06 19.11 27.40 26.27 0.91 1.30 1.58586 -14.76 -0.66 15.40 0.22 -3.26 -0.15 3.40 0.43 0.81 1.10 20.94 19.04 27.10 26.22 0.91 1.29 1.582021 62.15 4.34 -10.59 0.22 13.67 0.96 -2.33 0.45 0.96 1.60 20.85 18.98 26.81 26.17 0.91 1.29 1.575394 -50.87 -3.65 -4.54 0.22 -11.17 -0.80 -1.00 0.50 0.79 1.01 20.79 18.91 26.52 26.12 0.91 1.28 1.566426 2.23 -20.59 14.47 0.22 0.49 -4.51 3.17 0.59 0.60 0.83 20.76 18.83 26.24 26.07 0.91 1.26 1.555777 53.13 -15.50 4.45 0.22 11.61 -3.39 0.97 0.90 1.48 1.23 20.75 18.75 25.98 26.03 0.90 1.25 1.544124 -53.86 6.53 9.44 0.22 -11.74 1.42 2.06 0.62 1.61 1.73 20.75 18.66 25.74 25.98 0.90 1.24 1.532148 5.24 -0.47 5.43 0.22 1.14 -0.10 1.18 0.51 0.58 2.36 20.76 18.57 25.53 25.93 0.89 1.23 1.520496 28.18 10.52 -12.53 0.22 6.11 2.28 -2.72 0.60 0.83 1.52 20.78 18.48 25.35 25.88 0.89 1.22 1.509759 -34.80 7.50 -0.48 0.22 -7.53 1.62 -0.10 0.19 0.23 0.69 20.79 18.39 25.21 25.83 0.88 1.21 1.500509 7.26 -6.49 -2.46 0.22 1.57 -1.40 -0.53 0.57 0.66 1.20 20.80 18.30 25.09 25.78 0.88 1.21 1.493313 11.23 1.53 -8.41 0.22 2.42 0.33 -1.81 0.75 0.52 1.31 20.79 18.22 25.02 25.73 0.88 1.20 1.488644 -22.74 -9.45 17.59 0.22 -4.89 -2.03 3.78 1.43 0.20 0.87 20.76 18.14 24.97 25.68 0.87 1.20 1.4869 -2.69 1.58 3.57 0.21 -0.58 0.34 0.77 0.98 1.16 0.59 20.71 18.08 24.96 25.63 0.87 1.21 1.488428 0.32 -0.41 -12.39 0.21 0.07 -0.09 -2.65 0.83 1.23 0.92 20.63 18.04 24.98 25.59 0.87 1.21 1.493458
-12.64 -16.36 2.65 0.21 -2.70 -3.49 0.56 1.20 0.61 0.99 20.53 18.01 25.03 25.54 0.88 1.22 1.502073 -13.59 -0.32 -13.31 0.21 -2.89 -0.07 -2.84 1.67 0.85 1.08 20.40 18.00 25.10 25.49 0.88 1.23 1.514317

455
Raw Data Tapered
Data FFT Data Parzen Filtered
Data Simple Ratio
Spectrum Z E N
Tapering Function
Z E N Z E N Z E N
Frequency Hz
E/Z N/Z
Mean SQRT Spectrum
-13.53 0.70 -14.23 0.21 -2.87 0.15 -3.02 1.99 0.74 0.43 20.24 18.01 25.20 25.44 0.89 1.24 1.530236 27.45 -7.28 13.79 0.21 5.82 -1.54 2.92 0.99 0.36 0.62 20.06 18.04 25.31 25.39 0.90 1.26 1.549826 14.38 1.74 6.77 0.21 3.04 0.37 1.43 1.06 0.53 0.83 19.85 18.09 25.46 25.34 0.91 1.28 1.573038 -25.60 6.74 -0.22 0.21 -5.40 1.42 -0.05 0.74 0.36 0.72 19.63 18.16 25.62 25.29 0.92 1.31 1.59965 24.41 -5.25 12.77 0.21 5.14 -1.11 2.69 1.16 0.89 0.59 19.39 18.25 25.80 25.24 0.94 1.33 1.629256 0.37 -1.23 -5.22 0.21 0.08 -0.26 -1.10 1.37 1.01 1.17 19.15 18.36 25.99 25.20 0.96 1.36 1.661334
-37.55 9.77 -4.18 0.21 -7.87 2.05 -0.88 0.63 0.52 0.14 18.91 18.48 26.18 25.15 0.98 1.38 1.69527 17.50 -0.24 12.82 0.21 3.66 -0.05 2.68 1.34 0.92 2.24 18.66 18.63 26.38 25.10 1.00 1.41 1.730272 -0.53 3.77 -8.17 0.21 -0.11 0.79 -1.70 2.26 0.64 1.14 18.43 18.78 26.56 25.05 1.02 1.44 1.765382 -27.47 3.76 11.85 0.21 -5.71 0.78 2.46 1.84 1.20 2.90 18.21 18.95 26.73 25.00 1.04 1.47 1.799551 20.55 -6.22 20.80 0.21 4.26 -1.29 4.32 2.66 1.42 2.17 18.01 19.12 26.89 24.95 1.06 1.49 1.831625 -8.47 5.79 -28.16 0.21 -1.75 1.20 -5.83 1.04 0.33 1.23 17.85 19.29 27.03 24.90 1.08 1.51 1.860404 -20.40 7.78 6.90 0.21 -4.21 1.61 1.43 0.82 1.09 1.57 17.73 19.47 27.16 24.85 1.10 1.53 1.884709 29.59 3.77 28.85 0.21 6.09 0.78 5.94 0.36 1.40 0.99 17.66 19.64 27.28 24.80 1.11 1.54 1.903472 -7.45 -2.22 -25.14 0.21 -1.53 -0.46 -5.17 0.90 0.48 0.84 17.64 19.80 27.38 24.76 1.12 1.55 1.915781 -3.42 -4.20 -1.06 0.21 -0.70 -0.86 -0.22 0.88 0.94 0.72 17.68 19.95 27.48 24.71 1.13 1.55 1.920977 26.54 9.80 9.94 0.20 5.43 2.00 2.03 0.52 0.28 1.01 17.78 20.09 27.56 24.66 1.13 1.55 1.918666 -9.49 3.79 -30.00 0.20 -1.94 0.77 -6.12 0.39 0.42 0.97 17.94 20.22 27.64 24.61 1.13 1.54 1.908713 9.51 -5.20 0.08 0.20 1.94 -1.06 0.02 0.55 0.29 1.18 18.17 20.32 27.71 24.56 1.12 1.53 1.891342 26.45 2.82 16.07 0.20 5.37 0.57 3.26 0.45 1.20 1.33 18.46 20.41 27.77 24.51 1.11 1.50 1.867098 -4.59 -13.15 -13.91 0.20 -0.93 -2.66 -2.82 0.64 1.14 1.05 18.81 20.49 27.82 24.46 1.09 1.48 1.836782 3.42 -19.07 1.13 0.20 0.69 -3.85 0.23 0.40 0.39 0.86 19.21 20.54 27.85 24.41 1.07 1.45 1.80139 14.39 10.96 2.15 0.20 2.90 2.21 0.43 0.49 0.83 0.80 19.67 20.58 27.88 24.37 1.05 1.42 1.762012 0.37 8.93 -21.79 0.20 0.07 1.79 -4.38 0.22 0.41 0.71 20.17 20.59 27.90 24.32 1.02 1.38 1.719756 -9.61 -9.06 2.27 0.20 -1.93 -1.82 0.46 0.77 1.00 0.98 20.71 20.60 27.93 24.27 0.99 1.35 1.675746 -5.57 7.95 4.28 0.20 -1.11 1.59 0.86 1.13 1.36 0.59 21.28 20.59 27.96 24.22 0.97 1.31 1.631117 14.42 2.94 -14.68 0.20 2.88 0.59 -2.93 0.92 0.88 0.90 21.89 20.57 27.99 24.17 0.94 1.28 1.586947 -8.59 -4.04 6.36 0.20 -1.71 -0.80 1.27 0.85 0.35 0.11 22.51 20.54 28.04 24.12 0.91 1.25 1.544188 -19.53 14.95 0.37 0.20 -3.88 2.97 0.07 0.34 0.79 0.82 23.14 20.51 28.10 24.07 0.89 1.21 1.503627 24.47 4.92 0.39 0.20 4.84 0.97 0.08 0.21 1.44 0.98 23.76 20.48 28.17 24.02 0.86 1.19 1.465922 -6.56 -1.07 10.39 0.20 -1.30 -0.21 2.05 1.30 0.51 1.05 24.36 20.44 28.25 23.97 0.84 1.16 1.431557
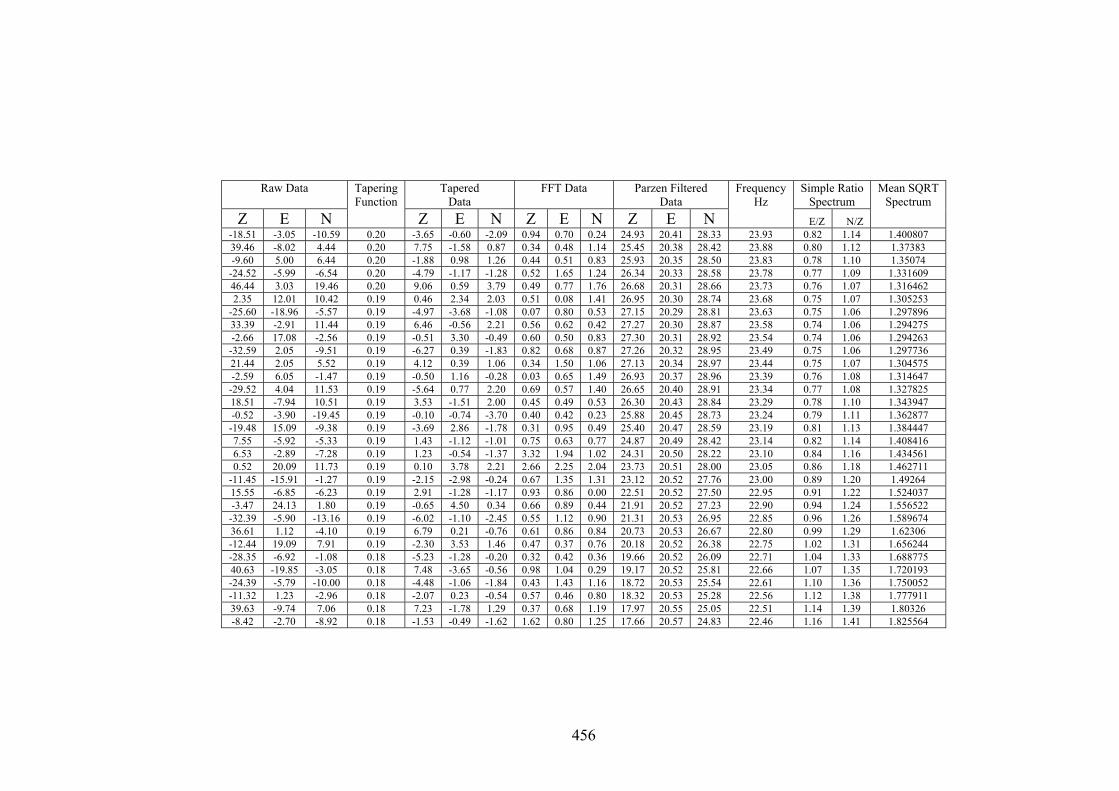
456
Raw Data Tapered Data
FFT Data Parzen Filtered Data
Simple Ratio Spectrum
Z E N
Tapering Function
Z E N Z E N Z E N
Frequency Hz
E/Z N/Z
Mean SQRT Spectrum
-18.51 -3.05 -10.59 0.20 -3.65 -0.60 -2.09 0.94 0.70 0.24 24.93 20.41 28.33 23.93 0.82 1.14 1.400807 39.46 -8.02 4.44 0.20 7.75 -1.58 0.87 0.34 0.48 1.14 25.45 20.38 28.42 23.88 0.80 1.12 1.37383 -9.60 5.00 6.44 0.20 -1.88 0.98 1.26 0.44 0.51 0.83 25.93 20.35 28.50 23.83 0.78 1.10 1.35074 -24.52 -5.99 -6.54 0.20 -4.79 -1.17 -1.28 0.52 1.65 1.24 26.34 20.33 28.58 23.78 0.77 1.09 1.331609 46.44 3.03 19.46 0.20 9.06 0.59 3.79 0.49 0.77 1.76 26.68 20.31 28.66 23.73 0.76 1.07 1.316462 2.35 12.01 10.42 0.19 0.46 2.34 2.03 0.51 0.08 1.41 26.95 20.30 28.74 23.68 0.75 1.07 1.305253
-25.60 -18.96 -5.57 0.19 -4.97 -3.68 -1.08 0.07 0.80 0.53 27.15 20.29 28.81 23.63 0.75 1.06 1.297896 33.39 -2.91 11.44 0.19 6.46 -0.56 2.21 0.56 0.62 0.42 27.27 20.30 28.87 23.58 0.74 1.06 1.294275 -2.66 17.08 -2.56 0.19 -0.51 3.30 -0.49 0.60 0.50 0.83 27.30 20.31 28.92 23.54 0.74 1.06 1.294263 -32.59 2.05 -9.51 0.19 -6.27 0.39 -1.83 0.82 0.68 0.87 27.26 20.32 28.95 23.49 0.75 1.06 1.297736 21.44 2.05 5.52 0.19 4.12 0.39 1.06 0.34 1.50 1.06 27.13 20.34 28.97 23.44 0.75 1.07 1.304575 -2.59 6.05 -1.47 0.19 -0.50 1.16 -0.28 0.03 0.65 1.49 26.93 20.37 28.96 23.39 0.76 1.08 1.314647 -29.52 4.04 11.53 0.19 -5.64 0.77 2.20 0.69 0.57 1.40 26.65 20.40 28.91 23.34 0.77 1.08 1.327825 18.51 -7.94 10.51 0.19 3.53 -1.51 2.00 0.45 0.49 0.53 26.30 20.43 28.84 23.29 0.78 1.10 1.343947 -0.52 -3.90 -19.45 0.19 -0.10 -0.74 -3.70 0.40 0.42 0.23 25.88 20.45 28.73 23.24 0.79 1.11 1.362877 -19.48 15.09 -9.38 0.19 -3.69 2.86 -1.78 0.31 0.95 0.49 25.40 20.47 28.59 23.19 0.81 1.13 1.384447 7.55 -5.92 -5.33 0.19 1.43 -1.12 -1.01 0.75 0.63 0.77 24.87 20.49 28.42 23.14 0.82 1.14 1.408416 6.53 -2.89 -7.28 0.19 1.23 -0.54 -1.37 3.32 1.94 1.02 24.31 20.50 28.22 23.10 0.84 1.16 1.434561 0.52 20.09 11.73 0.19 0.10 3.78 2.21 2.66 2.25 2.04 23.73 20.51 28.00 23.05 0.86 1.18 1.462711
-11.45 -15.91 -1.27 0.19 -2.15 -2.98 -0.24 0.67 1.35 1.31 23.12 20.52 27.76 23.00 0.89 1.20 1.49264 15.55 -6.85 -6.23 0.19 2.91 -1.28 -1.17 0.93 0.86 0.00 22.51 20.52 27.50 22.95 0.91 1.22 1.524037 -3.47 24.13 1.80 0.19 -0.65 4.50 0.34 0.66 0.89 0.44 21.91 20.52 27.23 22.90 0.94 1.24 1.556522 -32.39 -5.90 -13.16 0.19 -6.02 -1.10 -2.45 0.55 1.12 0.90 21.31 20.53 26.95 22.85 0.96 1.26 1.589674 36.61 1.12 -4.10 0.19 6.79 0.21 -0.76 0.61 0.86 0.84 20.73 20.53 26.67 22.80 0.99 1.29 1.62306 -12.44 19.09 7.91 0.19 -2.30 3.53 1.46 0.47 0.37 0.76 20.18 20.52 26.38 22.75 1.02 1.31 1.656244 -28.35 -6.92 -1.08 0.18 -5.23 -1.28 -0.20 0.32 0.42 0.36 19.66 20.52 26.09 22.71 1.04 1.33 1.688775 40.63 -19.85 -3.05 0.18 7.48 -3.65 -0.56 0.98 1.04 0.29 19.17 20.52 25.81 22.66 1.07 1.35 1.720193 -24.39 -5.79 -10.00 0.18 -4.48 -1.06 -1.84 0.43 1.43 1.16 18.72 20.53 25.54 22.61 1.10 1.36 1.750052 -11.32 1.23 -2.96 0.18 -2.07 0.23 -0.54 0.57 0.46 0.80 18.32 20.53 25.28 22.56 1.12 1.38 1.777911 39.63 -9.74 7.06 0.18 7.23 -1.78 1.29 0.37 0.68 1.19 17.97 20.55 25.05 22.51 1.14 1.39 1.80326 -8.42 -2.70 -8.92 0.18 -1.53 -0.49 -1.62 1.62 0.80 1.25 17.66 20.57 24.83 22.46 1.16 1.41 1.825564

457
Raw Data Tapered Data
FFT Data Parzen Filtered Data
Simple Ratio Spectrum
Z E N
Tapering Function
Z E N Z E N Z E N
Frequency Hz
E/Z N/Z
Mean SQRT Spectrum
-10.38 -11.66 -15.85 0.18 -1.88 -2.12 -2.88 1.46 0.13 1.44 17.41 20.60 24.64 22.41 1.18 1.41 1.84 15.62 -19.59 -0.79 0.18 2.83 -3.55 -0.14 1.02 0.44 1.37 17.22 20.65 24.47 22.36 1.20 1.42 1.86 12.57 -0.54 1.23 0.18 2.27 -0.10 0.22 0.94 0.93 1.57 17.09 20.71 24.32 22.31 1.21 1.42 1.87 -16.42 -8.51 -6.74 0.18 -2.96 -1.53 -1.21 1.56 1.02 1.81 17.01 20.78 24.20 22.27 1.22 1.42 1.88 7.60 0.52 10.28 0.18 1.36 0.09 1.84 0.62 0.05 1.45 16.98 20.87 24.09 22.22 1.23 1.42 1.88 31.53 -5.46 7.26 0.18 5.64 -0.98 1.30 0.47 0.42 1.07 17.01 20.98 24.00 22.17 1.23 1.41 1.87 -28.47 -18.40 -2.72 0.18 -5.08 -3.28 -0.49 0.08 0.85 0.82 17.09 21.09 23.93 22.12 1.23 1.40 1.87 -4.40 7.64 8.29 0.18 -0.78 1.36 1.47 1.54 0.44 1.32 17.21 21.22 23.86 22.07 1.23 1.39 1.86 30.56 -10.34 -9.69 0.18 5.42 -1.84 -1.72 3.23 1.02 1.40 17.37 21.36 23.81 22.02 1.23 1.37 1.84 -20.46 -8.29 12.33 0.18 -3.62 -1.47 2.18 2.43 1.51 1.24 17.57 21.50 23.77 21.97 1.22 1.35 1.82 7.57 10.71 28.27 0.18 1.34 1.89 4.99 0.85 0.59 0.91 17.79 21.64 23.74 21.92 1.22 1.33 1.81 30.50 -13.27 -4.76 0.18 5.37 -2.34 -0.84 0.43 0.55 1.44 18.05 21.79 23.72 21.88 1.21 1.31 1.78 -11.53 -8.21 31.21 0.18 -2.02 -1.44 5.48 0.30 0.57 1.70 18.33 21.93 23.72 21.83 1.20 1.29 1.76 4.49 4.81 26.11 0.18 0.79 0.84 4.57 0.35 0.25 1.02 18.64 22.07 23.72 21.78 1.18 1.27 1.74 28.43 0.81 -15.89 0.17 4.96 0.14 -2.77 0.51 0.23 0.20 18.97 22.20 23.74 21.73 1.17 1.25 1.71 7.36 8.80 22.12 0.17 1.28 1.53 3.85 1.26 1.15 0.97 19.31 22.32 23.77 21.68 1.16 1.23 1.69
-13.62 8.78 11.08 0.17 -2.36 1.52 1.92 0.96 0.37 1.58 19.67 22.43 23.81 21.63 1.14 1.21 1.66 7.40 -4.22 -11.90 0.17 1.28 -0.73 -2.06 0.26 1.20 1.64 20.03 22.51 23.87 21.58 1.12 1.19 1.64 10.37 -6.18 12.12 0.17 1.79 -1.07 2.09 0.50 1.12 0.85 20.41 22.58 23.95 21.53 1.11 1.17 1.61 -8.63 12.81 3.11 0.17 -1.48 2.20 0.53 0.21 1.22 0.63 20.78 22.61 24.06 21.48 1.09 1.16 1.59 22.35 2.80 6.11 0.17 3.83 0.48 1.05 0.27 1.63 0.78 21.15 22.62 24.19 21.44 1.07 1.14 1.57 10.29 -4.19 3.11 0.17 1.76 -0.72 0.53 0.68 0.43 0.63 21.50 22.60 24.34 21.39 1.05 1.13 1.54 -21.68 12.81 -10.85 0.17 -3.70 2.18 -1.85 0.44 0.30 0.62 21.84 22.54 24.51 21.34 1.03 1.12 1.52 13.34 -3.20 19.15 0.17 2.27 -0.54 3.26 0.37 1.08 0.38 22.17 22.45 24.71 21.29 1.01 1.11 1.51 6.30 2.81 4.13 0.17 1.07 0.48 0.70 0.32 0.35 0.89 22.47 22.34 24.93 21.24 0.99 1.11 1.49
-13.68 20.78 -27.81 0.17 -2.31 3.51 -4.70 0.60 0.96 1.14 22.77 22.20 25.17 21.19 0.97 1.11 1.47 21.31 8.73 6.26 0.17 3.59 1.47 1.05 0.96 0.17 0.54 23.05 22.04 25.44 21.14 0.96 1.10 1.46 1.27 16.69 5.26 0.17 0.21 2.80 0.88 0.94 0.31 0.62 23.31 21.85 25.72 21.09 0.94 1.10 1.45
-20.68 12.65 -17.70 0.17 -3.46 2.12 -2.96 0.35 0.27 0.57 23.56 21.66 26.02 21.04 0.92 1.10 1.44 16.33 1.63 -3.64 0.17 2.73 0.27 -0.61 0.16 0.09 1.07 23.77 21.45 26.33 21.00 0.90 1.11 1.43 0.30 3.63 -8.59 0.17 0.05 0.60 -1.43 0.25 0.65 0.34 23.96 21.23 26.65 20.95 0.89 1.11 1.42
-15.66 4.63 -1.55 0.17 -2.60 0.77 -0.26 0.57 0.56 0.64 24.12 21.00 26.96 20.90 0.87 1.12 1.42

458
Raw Data Tapered
Data FFT Data Parzen Filtered
Data Simple Ratio
Spectrum Z E N
Tapering Function
Z E N Z E N Z E N
Frequency Hz
E/Z N/Z
Mean SQRT Spectrum
24.33 19.59 -0.52 0.17 4.03 3.24 -0.09 0.63 1.14 0.64 24.24 20.77 27.26 20.85 0.86 1.12 1.41 10.26 -2.43 -19.46 0.17 1.69 -0.40 -3.21 0.62 0.42 0.40 24.32 20.54 27.55 20.80 0.84 1.13 1.41
-19.71 -10.40 -1.40 0.16 -3.24 -1.71 -0.23 0.71 0.94 0.60 24.36 20.32 27.81 20.75 0.83 1.14 1.41 14.30 11.61 -0.38 0.16 2.35 1.90 -0.06 0.61 0.39 1.16 24.36 20.11 28.04 20.70 0.83 1.15 1.42
3.27 -4.39 -12.33 0.16 0.54 -0.72 -2.02 0.90 1.18 1.35 24.31 19.91 28.24 20.65 0.82 1.16 1.42 -13.70 6.62 1.71 0.16 -2.23 1.08 0.28 0.96 1.01 1.42 24.22 19.73 28.39 20.61 0.81 1.17 1.43
9.31 16.58 -2.26 0.16 1.51 2.69 -0.37 0.23 0.14 1.39 24.08 19.57 28.50 20.56 0.81 1.18 1.44 -17.67 -8.42 -15.21 0.16 -2.86 -1.36 -2.46 0.65 0.84 2.01 23.91 19.42 28.55 20.51 0.81 1.19 1.44 -23.58 -3.39 -16.12 0.16 -3.81 -0.55 -2.60 0.78 0.39 2.20 23.69 19.30 28.56 20.46 0.81 1.21 1.45
3.47 -4.36 -1.07 0.16 0.56 -0.70 -0.17 1.05 0.54 1.66 23.44 19.19 28.52 20.41 0.82 1.22 1.47 10.45 -7.33 9.93 0.16 1.68 -1.18 1.59 1.07 0.34 0.94 23.14 19.09 28.43 20.36 0.82 1.23 1.48 -5.56 0.70 3.93 0.16 -0.89 0.11 0.63 0.36 0.87 1.47 22.81 19.00 28.29 20.31 0.83 1.24 1.49 -8.53 -9.27 3.93 0.16 -1.36 -1.48 0.63 0.29 0.47 0.52 22.43 18.92 28.10 20.26 0.84 1.25 1.51 18.46 -11.22 0.95 0.16 2.94 -1.78 0.15 0.74 0.60 1.61 22.02 18.84 27.88 20.21 0.86 1.27 1.53 -8.55 -9.17 4.95 0.16 -1.36 -1.45 0.79 0.75 0.30 0.86 21.58 18.77 27.62 20.17 0.87 1.28 1.55 3.46 -16.10 8.95 0.16 0.55 -2.54 1.41 1.22 0.24 1.05 21.13 18.70 27.32 20.12 0.89 1.29 1.57
33.39 -9.04 7.93 0.16 5.26 -1.42 1.25 1.44 0.58 0.85 20.66 18.64 27.01 20.07 0.90 1.31 1.59 -19.63 0.99 19.90 0.16 -3.08 0.16 3.12 1.48 0.82 0.15 20.19 18.57 26.67 20.02 0.92 1.32 1.61
-3.58 -19.96 9.86 0.16 -0.56 -3.12 1.54 0.87 0.66 0.85 19.72 18.50 26.34 19.97 0.94 1.34 1.63 31.37 -19.87 -1.14 0.16 4.89 -3.10 -0.18 0.49 0.80 0.78 19.26 18.43 26.00 19.92 0.96 1.35 1.65
-24.64 15.15 14.86 0.16 -3.83 2.36 2.31 0.49 0.15 0.73 18.82 18.35 25.68 19.87 0.97 1.36 1.68 -22.54 -3.86 19.81 0.16 -3.49 -0.60 3.07 0.30 1.11 0.62 18.40 18.25 25.38 19.82 0.99 1.38 1.70 28.46 -19.80 15.76 0.15 4.40 -3.06 2.43 0.81 0.64 0.62 18.02 18.15 25.11 19.78 1.01 1.39 1.72
-11.57 11.23 12.72 0.15 -1.78 1.73 1.96 1.07 1.03 0.48 17.67 18.04 24.87 19.73 1.02 1.41 1.74 -16.51 -7.76 -0.28 0.15 -2.53 -1.19 -0.04 1.03 0.34 1.14 17.36 17.92 24.68 19.68 1.03 1.42 1.76 33.46 -9.72 16.70 0.15 5.12 -1.49 2.56 0.92 1.15 1.19 17.09 17.78 24.54 19.63 1.04 1.44 1.77
-12.58 4.31 24.64 0.15 -1.92 0.66 3.76 0.70 1.17 0.28 16.86 17.65 24.45 19.58 1.05 1.45 1.79 -23.50 -16.65 -6.38 0.15 -3.57 -2.53 -0.97 0.75 1.09 0.64 16.69 17.50 24.40 19.53 1.05 1.46 1.80 33.49 12.37 -6.33 0.15 5.07 1.87 -0.96 1.04 0.97 1.38 16.56 17.36 24.39 19.48 1.05 1.47 1.81 -2.57 14.33 11.68 0.15 -0.39 2.16 1.76 0.82 0.52 1.20 16.48 17.22 24.44 19.43 1.04 1.48 1.81
-36.49 -9.67 6.66 0.15 -5.49 -1.46 1.00 0.55 0.57 0.58 16.46 17.09 24.52 19.38 1.04 1.49 1.82

459
Raw Data Tapered
Data FFT Data Parzen Filtered
Data Simple Ratio
Spectrum Z E N
Tapering Function
Z E N Z E N Z E N
Frequency Hz
E/Z N/Z
Mean SQRT Spectrum
23.54 13.33 -4.32 0.15 3.53 2.00 -0.65 0.97 1.24 0.64 16.48 16.96 24.64 19.34 1.03 1.49 23.54 8.49 5.31 -3.29 0.15 1.27 0.79 -0.49 1.36 0.69 0.32 16.55 16.84 24.78 19.29 1.02 1.50 8.49
-35.46 -2.68 6.73 0.15 -5.28 -0.40 1.00 0.94 0.14 0.83 16.67 16.73 24.96 19.24 1.00 1.50 -35.46 14.59 5.32 4.72 0.15 2.17 0.79 0.70 0.39 0.85 1.63 16.82 16.63 25.15 19.19 0.99 1.50 14.59 9.55 5.31 -13.24 0.15 1.41 0.79 -1.96 0.76 0.36 1.68 17.01 16.54 25.34 19.14 0.97 1.49 9.55
-21.42 12.29 -9.18 0.15 -3.16 1.81 -1.35 0.77 1.26 2.16 17.22 16.46 25.54 19.09 0.96 1.48 -21.42 5.62 0.28 6.85 0.15 0.83 0.04 1.01 0.35 0.99 0.85 17.46 16.40 25.74 19.04 0.94 1.47 5.62 13.58 -6.70 -3.14 0.15 1.99 -0.98 -0.46 0.29 0.32 2.20 17.72 16.36 25.92 18.99 0.92 1.46 13.58 0.56 11.31 -8.10 0.15 0.08 1.65 -1.18 0.59 0.63 1.43 17.99 16.34 26.08 18.95 0.91 1.45 0.56 -1.43 16.26 -6.05 0.15 -0.21 2.37 -0.88 1.27 0.41 1.06 18.27 16.34 26.21 18.90 0.89 1.43 -1.43 19.54 -2.75 -9.00 0.15 2.83 -0.40 -1.30 0.97 0.54 1.29 18.55 16.36 26.31 18.85 0.88 1.42 19.54 8.48 3.26 -0.96 0.14 1.23 0.47 -0.14 0.42 0.53 0.38 18.83 16.40 26.37 18.80 0.87 1.40 8.48
-11.50 27.21 -10.91 0.14 -1.66 3.92 -1.57 0.35 0.44 0.14 19.11 16.46 26.40 18.75 0.86 1.38 -11.50 5.51 -5.82 -14.84 0.14 0.79 -0.84 -2.13 0.30 0.75 0.30 19.38 16.54 26.39 18.70 0.85 1.36 5.51 8.49 -7.78 16.18 0.14 1.21 -1.11 2.31 0.26 0.59 0.58 19.64 16.64 26.35 18.65 0.85 1.34 8.49 -1.52 26.19 11.14 0.14 -0.22 3.73 1.59 0.90 0.25 0.98 19.88 16.75 26.28 18.60 0.84 1.32 -1.52 1.49 -6.83 -19.82 0.14 0.21 -0.97 -2.81 1.15 1.76 1.41 20.11 16.88 26.18 18.55 0.84 1.30 1.49 3.48 -3.80 -9.74 0.14 0.49 -0.54 -1.38 1.60 2.21 0.93 20.32 17.01 26.07 18.51 0.84 1.28 3.48
-12.50 10.20 -7.69 0.14 -1.76 1.44 -1.08 1.33 0.71 1.50 20.51 17.16 25.93 18.46 0.84 1.26 -12.50 -5.45 -9.79 -12.62 0.14 -0.77 -1.38 -1.77 1.31 0.56 1.88 20.67 17.31 25.79 18.41 0.84 1.25 -5.45 0.56 8.23 -0.58 0.14 0.08 1.15 -0.08 1.03 2.01 0.92 20.81 17.47 25.65 18.36 0.84 1.23 0.56
-12.41 -0.78 5.43 0.14 -1.73 -0.11 0.76 0.61 1.61 0.75 20.92 17.63 25.51 18.31 0.84 1.22 -12.41 27.56 -3.76 15.41 0.14 3.83 -0.52 2.14 0.58 1.06 0.70 21.01 17.80 25.39 18.26 0.85 1.21 27.56 5.50 12.24 3.40 0.14 0.76 1.69 0.47 0.70 1.19 1.01 21.07 17.97 25.28 18.21 0.85 1.20 5.50
-33.44 -12.75 -1.59 0.14 -4.61 -1.76 -0.22 0.43 1.39 0.61 21.11 18.13 25.20 18.16 0.86 1.19 -33.44 36.56 6.28 11.41 0.14 5.03 0.86 1.57 0.62 0.89 1.35 21.14 18.30 25.14 18.12 0.87 1.19 36.56 -3.50 9.26 -3.58 0.14 -0.48 1.27 -0.49 0.30 0.73 0.84 21.14 18.46 25.11 18.07 0.87 1.19 -3.50 -31.42 -10.73 6.43 0.14 -4.29 -1.46 0.88 0.59 0.28 1.08 21.13 18.61 25.11 18.02 0.88 1.19 -31.42 70.50 15.27 24.39 0.14 9.59 2.08 3.32 0.55 0.64 1.68 21.10 18.76 25.14 17.97 0.89 1.19 70.50 -7.62 -8.73 10.34 0.14 -1.03 -1.18 1.40 0.15 0.46 1.46 21.05 18.91 25.20 17.92 0.90 1.20 -7.62 -36.52 -24.65 -0.66 0.14 -4.93 -3.33 -0.09 0.18 0.91 0.54 21.00 19.05 25.28 17.87 0.91 1.20 -36.52

460
Raw Data Tapered Data
FFT Data Parzen Filtered Data
Simple Ratio Spectrum
Z E N
Tapering Function
Z E N Z E N Z E N
Frequency Hz
E/Z N/Z
Mean SQRT Spectrum
66.42 5.40 3.36 0.13 8.93 0.73 0.45 0.52 0.56 0.76 20.93 19.19 25.38 17.82 0.92 1.21 1.52 -29.65 -10.58 16.34 0.13 -3.97 -1.42 2.19 0.38 0.74 0.58 20.85 19.33 25.51 17.77 0.93 1.22 1.53 -30.52 -19.50 5.31 0.13 -4.07 -2.60 0.71 0.79 0.88 0.45 20.77 19.47 25.65 17.72 0.94 1.24 1.55 57.43 0.55 -4.67 0.13 7.64 0.07 -0.62 0.83 0.90 1.24 20.68 19.62 25.81 17.68 0.95 1.25 1.57 -31.62 -2.44 -1.64 0.13 -4.19 -0.32 -0.22 0.06 1.18 1.28 20.59 19.77 25.98 17.63 0.96 1.26 1.59 -17.52 -6.41 -14.58 0.13 -2.31 -0.85 -1.93 0.14 0.58 0.12 20.50 19.94 26.15 17.58 0.97 1.28 1.60 41.44 3.61 -1.53 0.13 5.45 0.47 -0.20 0.58 0.86 0.74 20.41 20.11 26.32 17.53 0.99 1.29 1.62 -20.60 1.61 6.48 0.13 -2.70 0.21 0.85 0.85 1.12 1.51 20.33 20.30 26.48 17.48 1.00 1.30 1.64 -15.52 -10.36 0.48 0.13 -2.03 -1.35 0.06 0.36 1.06 0.84 20.24 20.50 26.63 17.43 1.01 1.32 1.66 15.49 -10.30 9.48 0.13 2.01 -1.34 1.23 1.27 0.85 0.91 20.15 20.71 26.76 17.38 1.03 1.33 1.68 -1.54 4.72 -7.50 0.13 -0.20 0.61 -0.97 0.54 0.75 0.70 20.06 20.93 26.86 17.33 1.04 1.34 1.70 -13.50 -0.28 -13.44 0.13 -1.74 -0.04 -1.73 0.42 0.74 0.72 19.97 21.16 26.95 17.29 1.06 1.35 1.72 -1.47 -17.23 -2.39 0.13 -0.19 -2.21 -0.31 0.76 0.19 1.07 19.87 21.39 27.00 17.24 1.08 1.36 1.73 12.52 11.79 -3.35 0.13 1.60 1.51 -0.43 0.72 0.57 1.56 19.76 21.63 27.04 17.19 1.09 1.37 1.75 -19.47 19.74 2.67 0.13 -2.48 2.52 0.34 1.04 1.04 2.19 19.65 21.88 27.05 17.14 1.11 1.38 1.77 -11.40 -12.26 -7.30 0.13 -1.45 -1.56 -0.93 0.49 0.70 1.78 19.53 22.12 27.05 17.09 1.13 1.39 1.79 22.58 1.77 -10.25 0.13 2.86 0.22 -1.30 0.46 1.05 0.58 19.39 22.36 27.03 17.04 1.15 1.39 1.81 -37.38 9.76 7.78 0.13 -4.71 1.23 0.98 1.04 1.22 0.42 19.25 22.59 27.00 16.99 1.17 1.40 1.83 -9.28 -1.24 0.78 0.13 -1.16 -0.16 0.10 0.51 0.10 0.51 19.10 22.81 26.95 16.94 1.19 1.41 1.85 45.65 6.76 1.80 0.13 5.71 0.84 0.22 0.30 0.70 0.50 18.94 23.02 26.89 16.89 1.22 1.42 1.87 -39.36 4.75 5.80 0.12 -4.90 0.59 0.72 0.84 1.06 0.82 18.76 23.20 26.81 16.85 1.24 1.43 1.89 8.71 -4.24 -13.17 0.12 1.08 -0.53 -1.63 1.27 0.38 0.73 18.57 23.36 26.72 16.80 1.26 1.44 1.91 42.61 -8.20 -1.12 0.12 5.26 -1.01 -0.14 0.68 1.65 0.25 18.36 23.50 26.62 16.75 1.28 1.45 1.93 -46.38 -15.15 2.90 0.12 -5.70 -1.86 0.36 1.80 3.00 2.02 18.14 23.60 26.51 16.70 1.30 1.46 1.96 34.65 -10.08 -2.08 0.12 4.24 -1.24 -0.25 5.65 8.17 5.34 17.92 23.67 26.39 16.65 1.32 1.47 1.98 26.53 7.93 22.90 0.12 3.24 0.97 2.79 3.49 3.26 2.97 17.69 23.72 26.28 16.60 1.34 1.49 2.00 -48.42 6.92 6.86 0.12 -5.88 0.84 0.83 1.35 0.72 1.03 17.47 23.73 26.18 16.55 1.36 1.50 2.02 27.63 5.90 -7.12 0.12 3.34 0.71 -0.86 0.60 0.35 0.91 17.25 23.73 26.08 16.50 1.38 1.51 2.04 -2.42 4.89 1.91 0.12 -0.29 0.59 0.23 0.03 0.29 0.50 17.06 23.71 26.00 16.46 1.39 1.52 2.06 -25.36 -14.07 4.91 0.12 -3.04 -1.69 0.59 0.50 0.50 0.35 16.88 23.68 25.94 16.41 1.40 1.54 2.08 25.65 5.95 14.89 0.12 3.07 0.71 1.78 0.98 0.34 0.21 16.74 23.65 25.90 16.36 1.41 1.55 2.10

461
Raw Data Tapered
Data FFT Data Parzen Filtered
Data Simple Ratio
Spectrum Z E N
Tapering Function
Z E N Z E N Z E N
Frequency Hz
E/Z N/Z
Mean SQRT Spectrum
-13.37 23.91 -8.10 0.12 -1.59 2.84 -0.96 0.05 0.64 0.86 16.63 23.62 25.87 16.31 1.42 1.56 2.11 -32.27 -14.10 -7.05 0.12 -3.82 -1.67 -0.84 0.63 0.63 0.95 16.56 23.60 25.87 16.26 1.43 1.56 2.11 11.77 -14.03 8.97 0.12 1.39 -1.66 1.06 0.54 0.46 1.13 16.53 23.60 25.88 16.21 1.43 1.57 2.12 20.71 6.99 -3.02 0.12 2.43 0.82 -0.36 0.82 0.22 1.32 16.56 23.61 25.91 16.16 1.43 1.56 2.12 -26.27 -16.97 5.99 0.12 -3.07 -1.99 0.70 1.01 1.07 0.91 16.63 23.65 25.96 16.11 1.42 1.56 2.11 -5.20 -3.92 7.98 0.12 -0.61 -0.46 0.93 0.88 0.80 0.78 16.76 23.73 26.03 16.06 1.42 1.55 2.10 36.74 23.05 10.96 0.12 4.26 2.67 1.27 0.51 0.39 0.59 16.95 23.85 26.13 16.02 1.41 1.54 2.09 -17.29 -2.97 2.95 0.12 -2.00 -0.34 0.34 0.59 0.09 0.39 17.21 24.01 26.25 15.97 1.40 1.53 2.07 -10.23 -8.94 -8.02 0.12 -1.18 -1.03 -0.92 0.30 0.33 0.30 17.53 24.22 26.40 15.92 1.38 1.51 2.04 28.73 -0.91 11.00 0.11 3.29 -0.10 1.26 0.86 0.50 0.70 17.91 24.49 26.59 15.87 1.37 1.48 2.02 -20.28 5.10 -1.00 0.11 -2.31 0.58 -0.11 1.15 0.49 0.63 18.37 24.82 26.80 15.82 1.35 1.46 1.99 -8.22 35.03 -7.96 0.11 -0.93 3.98 -0.90 0.74 0.68 0.44 18.88 25.20 27.03 15.77 1.33 1.43 1.96 18.77 14.94 -0.93 0.11 2.12 1.69 -0.10 0.94 1.11 0.55 19.44 25.63 27.29 15.72 1.32 1.40 1.93 -41.18 -15.05 2.09 0.11 -4.63 -1.69 0.24 1.07 0.21 0.55 20.04 26.09 27.55 15.67 1.30 1.37 1.89 -9.08 14.97 12.08 0.11 -1.02 1.68 1.35 1.13 0.05 0.64 20.67 26.57 27.82 15.63 1.29 1.35 1.86 41.86 13.92 -2.92 0.11 4.67 1.55 -0.33 0.71 0.83 0.32 21.31 27.07 28.08 15.58 1.27 1.32 1.83 -27.16 -22.05 6.10 0.11 -3.01 -2.45 0.68 1.07 0.36 0.53 21.96 27.57 28.33 15.53 1.26 1.29 1.80 -9.08 15.97 20.06 0.11 -1.00 1.77 2.22 0.39 0.38 1.02 22.60 28.05 28.56 15.48 1.24 1.26 1.77 43.85 31.89 -1.95 0.11 4.82 3.51 -0.21 0.14 0.61 0.83 23.23 28.51 28.77 15.43 1.23 1.24 1.74 -42.14 -16.13 0.07 0.11 -4.61 -1.77 0.01 0.27 0.87 0.76 23.84 28.94 28.95 15.38 1.21 1.21 1.72 -23.01 -2.08 2.08 0.11 -2.51 -0.23 0.23 1.11 0.58 1.27 24.41 29.32 29.09 15.33 1.20 1.19 1.69 67.91 -2.06 0.10 0.11 7.37 -0.22 0.01 1.00 0.97 1.46 24.95 29.64 29.20 15.28 1.19 1.17 1.67 -35.15 -7.03 3.11 0.11 -3.80 -0.76 0.34 0.76 0.82 1.62 25.44 29.90 29.27 15.23 1.18 1.15 1.65 -39.00 10.97 -14.84 0.11 -4.19 1.18 -1.60 0.85 0.65 0.90 25.86 30.08 29.30 15.19 1.16 1.13 1.62 58.97 -1.04 -3.79 0.11 6.31 -0.11 -0.41 0.35 0.78 1.00 26.23 30.18 29.27 15.14 1.15 1.12 1.60 -53.04 15.95 14.21 0.11 -5.65 1.70 1.51 0.32 0.75 1.07 26.52 30.18 29.19 15.09 1.14 1.10 1.58 -20.89 14.90 -3.79 0.11 -2.21 1.58 -0.40 1.01 1.07 0.75 26.73 30.07 29.05 15.04 1.12 1.09 1.56 68.02 -15.09 -2.76 0.11 7.18 -1.59 -0.29 2.25 1.28 1.40 26.86 29.85 28.85 14.99 1.11 1.07 1.55 -56.99 -12.03 10.25 0.11 -5.98 -1.26 1.08 1.48 0.60 1.07 26.89 29.52 28.57 14.94 1.10 1.06 1.53 -7.86 3.00 -5.74 0.10 -0.82 0.31 -0.60 0.40 0.60 1.38 26.85 29.09 28.24 14.89 1.08 1.05 1.51 55.05 8.99 -11.69 0.10 5.73 0.94 -1.22 1.14 0.55 1.30 26.73 28.56 27.86 14.84 1.07 1.04 1.49

462
Raw Data Tapered Data
FFT Data Parzen Filtered Data
Simple Ratio Spectrum
Z E N
Tapering Function
Z E N Z E N Z E N
Frequency Hz
E/Z N/Z
Mean SQRT Spectrum
-37.97 -3.01 3.35 0.10 -3.93 -0.31 0.35 0.44 0.37 0.27 26.54 27.95 27.44 14.79 1.05 1.03 1.48 15.08 -7.98 -1.64 0.10 1.55 -0.82 -0.17 2.36 0.81 1.04 26.31 27.28 26.98 14.75 1.04 1.03 1.46 34.98 12.03 -4.60 0.10 3.59 1.23 -0.47 1.72 1.47 0.94 26.02 26.55 26.51 14.70 1.02 1.02 1.44 -37.01 10.00 3.42 0.10 -3.77 1.02 0.35 0.70 0.49 0.35 25.70 25.79 26.02 14.65 1.00 1.01 1.43 12.05 -11.99 -6.56 0.10 1.22 -1.22 -0.67 1.21 1.35 0.45 25.35 25.00 25.54 14.60 0.99 1.01 1.41 22.98 16.01 -0.52 0.10 2.32 1.62 -0.05 1.24 1.22 1.10 24.98 24.19 25.06 14.55 0.97 1.00 1.39 -30.00 26.94 -1.50 0.10 -3.01 2.71 -0.15 1.03 1.04 1.49 24.60 23.38 24.59 14.50 0.95 1.00 1.38 6.05 -32.04 -12.45 0.10 0.61 -3.20 -1.25 0.46 0.48 1.36 24.22 22.59 24.14 14.45 0.93 1.00 1.37 20.01 -18.93 7.58 0.10 1.99 -1.88 0.75 0.05 1.00 0.36 23.84 21.82 23.73 14.40 0.92 1.00 1.35 -19.99 6.11 9.56 0.10 -1.98 0.61 0.95 0.71 0.59 0.62 23.48 21.09 23.34 14.36 0.90 0.99 1.34 -1.94 -13.86 4.55 0.10 -0.19 -1.37 0.45 0.74 0.57 0.69 23.14 20.41 23.00 14.31 0.88 0.99 1.33 18.04 7.16 19.53 0.10 1.77 0.70 1.91 0.62 0.37 0.70 22.83 19.78 22.70 14.26 0.87 0.99 1.32 -10.97 -13.81 2.50 0.10 -1.07 -1.35 0.24 0.62 1.02 1.05 22.56 19.23 22.46 14.21 0.85 1.00 1.31 -2.94 -7.75 -13.46 0.10 -0.29 -0.75 -1.31 0.15 0.35 0.91 22.33 18.75 22.28 14.16 0.84 1.00 1.30 27.02 10.25 4.58 0.10 2.61 0.99 0.44 0.35 0.60 0.49 22.16 18.36 22.15 14.11 0.83 1.00 1.30 -11.01 -30.70 4.58 0.10 -1.06 -2.95 0.44 0.49 1.11 1.14 22.04 18.05 22.09 14.06 0.82 1.00 1.29 -13.95 19.34 -2.41 0.10 -1.33 1.85 -0.23 0.96 0.93 0.35 21.97 17.83 22.09 14.01 0.81 1.01 1.29 25.03 24.26 23.57 0.10 2.38 2.31 2.24 0.12 0.75 0.71 21.94 17.68 22.14 13.96 0.81 1.01 1.29 -30.95 -33.71 18.51 0.09 -2.93 -3.19 1.75 2.26 1.01 0.72 21.96 17.60 22.23 13.92 0.80 1.01 1.29 -29.83 11.35 -12.49 0.09 -2.80 1.07 -1.17 5.31 1.13 0.48 22.01 17.59 22.36 13.87 0.80 1.02 1.29 34.17 3.33 -8.43 0.09 3.19 0.31 -0.79 1.85 0.87 0.41 22.10 17.63 22.51 13.82 0.80 1.02 1.29 -31.83 -14.63 -0.39 0.09 -2.96 -1.36 -0.04 0.98 0.50 0.16 22.22 17.72 22.69 13.77 0.80 1.02 1.30 -31.70 21.37 8.61 0.09 -2.93 1.98 0.80 1.30 1.01 1.06 22.37 17.86 22.87 13.72 0.80 1.02 1.30 49.28 -3.66 17.58 0.09 4.53 -0.34 1.62 1.09 0.68 1.41 22.54 18.04 23.06 13.67 0.80 1.02 1.30 -23.77 5.35 -8.42 0.09 -2.17 0.49 -0.77 0.38 0.18 1.55 22.72 18.24 23.25 13.62 0.80 1.02 1.30 -30.66 19.31 -3.38 0.09 -2.79 1.76 -0.31 0.21 0.48 1.60 22.92 18.47 23.43 13.57 0.81 1.02 1.30 50.31 -1.71 18.61 0.09 4.55 -0.15 1.68 2.13 1.02 0.32 23.12 18.70 23.59 13.53 0.81 1.02 1.30 -31.72 21.26 -5.39 0.09 -2.85 1.91 -0.49 2.93 0.95 1.18 23.33 18.95 23.74 13.48 0.81 1.02 1.30 -26.60 11.21 -4.36 0.09 -2.38 1.00 -0.39 0.98 0.74 1.09 23.54 19.20 23.86 13.43 0.82 1.01 1.30 59.34 -7.79 17.64 0.09 5.28 -0.69 1.57 0.28 0.84 1.22 23.75 19.43 23.95 13.38 0.82 1.01 1.30 -28.71 9.22 10.60 0.09 -2.54 0.82 0.94 1.69 0.40 1.01 23.95 19.66 24.01 13.33 0.82 1.00 1.30

463
Raw Data Tapered
Data FFT Data Parzen Filtered
Data Simple Ratio
Spectrum Z E N
Tapering Function
Z E N Z E N Z E N
Frequency Hz
E/Z N/Z
Mean SQRT Spectrum
-7.63 2.21 -4.40 0.09 -0.67 0.19 -0.39 1.20 1.07 0.35 24.15 19.87 24.03 13.28 0.82 1.00 1.29 61.26 -8.76 -2.36 0.09 5.36 -0.77 -0.21 0.76 0.43 0.29 24.34 20.06 24.02 13.23 0.82 0.99 1.29 -29.79 4.26 11.64 0.09 -2.59 0.37 1.01 1.01 1.74 0.22 24.52 20.23 23.98 13.18 0.83 0.98 1.28 6.26 12.23 -0.37 0.09 0.54 1.06 -0.03 1.87 1.16 1.03 24.70 20.39 23.90 13.13 0.83 0.97 1.27 48.16 -10.76 -6.33 0.09 4.14 -0.93 -0.54 1.38 1.71 1.52 24.89 20.52 23.80 13.09 0.82 0.96 1.26 -17.90 -0.72 17.66 0.09 -1.53 -0.06 1.51 0.90 0.63 0.47 25.09 20.63 23.67 13.04 0.82 0.94 1.25 26.09 24.24 17.61 0.09 2.22 2.06 1.50 0.91 0.59 1.35 25.30 20.73 23.53 12.99 0.82 0.93 1.24 23.00 -1.79 -7.39 0.08 1.94 -0.15 -0.62 1.52 0.56 0.77 25.52 20.80 23.37 12.94 0.82 0.92 1.23 -20.01 5.21 -10.34 0.08 -1.68 0.44 -0.87 0.16 0.30 0.64 25.76 20.86 23.20 12.89 0.81 0.90 1.21 22.99 26.16 0.70 0.08 1.92 2.18 0.06 0.96 0.21 0.74 26.00 20.89 23.03 12.84 0.80 0.89 1.20 14.92 -2.88 2.71 0.08 1.24 -0.24 0.23 0.53 0.85 0.80 26.27 20.92 22.85 12.79 0.80 0.87 1.18 -18.07 3.13 3.72 0.08 -1.49 0.26 0.31 0.89 0.19 1.22 26.55 20.93 22.69 12.74 0.79 0.85 1.16 16.94 15.11 -0.27 0.08 1.39 1.24 -0.02 1.26 0.86 0.52 26.85 20.93 22.53 12.70 0.78 0.84 1.15 23.86 -8.89 0.75 0.08 1.94 -0.72 0.06 0.81 0.57 0.31 27.17 20.92 22.39 12.65 0.77 0.82 1.13 -30.12 5.13 3.76 0.08 -2.44 0.42 0.30 1.64 1.17 1.07 27.51 20.91 22.27 12.60 0.76 0.81 1.11 8.93 15.10 -5.22 0.08 0.72 1.22 -0.42 1.87 4.29 3.55 27.87 20.90 22.16 12.55 0.75 0.80 1.09 31.85 -12.90 -5.18 0.08 2.55 -1.03 -0.41 0.08 3.68 3.06 28.24 20.89 22.07 12.50 0.74 0.78 1.08 -36.13 -3.85 -0.15 0.08 -2.87 -0.31 -0.01 1.68 2.24 0.95 28.62 20.88 22.00 12.45 0.73 0.77 1.06 13.91 11.14 -5.12 0.08 1.10 0.88 -0.40 1.03 1.18 0.67 29.00 20.88 21.95 12.40 0.72 0.76 1.04 17.86 -11.84 -16.06 0.08 1.40 -0.93 -1.26 0.92 1.03 0.64 29.39 20.89 21.92 12.35 0.71 0.75 1.03 -39.10 -15.78 -5.00 0.08 -3.05 -1.23 -0.39 2.48 1.04 0.86 29.76 20.90 21.92 12.30 0.70 0.74 1.02 18.95 -16.70 1.02 0.08 1.47 -1.29 0.08 3.34 1.12 0.84 30.12 20.94 21.94 12.26 0.70 0.73 1.01 12.89 -10.64 -23.91 0.08 0.99 -0.82 -1.84 1.42 0.50 0.53 30.46 20.98 21.98 12.21 0.69 0.72 1.00 -46.04 9.38 -3.84 0.08 -3.52 0.72 -0.29 0.66 0.93 0.37 30.76 21.05 22.05 12.16 0.68 0.72 0.99 10.04 -2.62 7.18 0.08 0.76 -0.20 0.55 1.67 1.27 1.05 31.02 21.13 22.14 12.11 0.68 0.71 0.99 31.96 2.39 -13.79 0.08 2.41 0.18 -1.04 2.07 1.56 1.25 31.25 21.24 22.25 12.06 0.68 0.71 0.98 -47.01 -1.60 2.25 0.08 -3.53 -0.12 0.17 1.91 1.75 0.42 31.45 21.37 22.38 12.01 0.68 0.71 0.98 -4.90 -20.55 4.26 0.07 -0.36 -1.53 0.32 0.73 0.78 1.28 31.61 21.53 22.52 11.96 0.68 0.71 0.99 33.05 -3.49 7.25 0.07 2.45 -0.26 0.54 0.62 0.39 1.10 31.74 21.71 22.67 11.91 0.68 0.71 0.99 -48.91 -6.46 6.24 0.07 -3.60 -0.47 0.46 1.01 0.94 0.89 31.84 21.94 22.83 11.87 0.69 0.72 0.99 14.16 -11.41 -10.73 0.07 1.03 -0.83 -0.78 0.47 0.91 1.86 31.90 22.19 23.01 11.82 0.70 0.72 1.00

464
Raw Data Tapered
Data FFT Data Parzen Filtered
Data Simple Ratio
Spectrum Z E N
Tapering Function
Z E N Z E N Z E N
Frequency Hz
E/Z N/Z
Mean SQRT Spectrum
42.05 5.61 4.30 0.07 3.05 0.41 0.31 1.02 1.35 0.69 31.93 22.48 23.20 11.77 0.70 0.73 1.01 -54.91 9.59 4.31 0.07 -3.95 0.69 0.31 1.53 0.95 0.74 31.94 22.81 23.40 11.72 0.71 0.73 1.02 8.18 4.58 -1.68 0.07 0.59 0.33 -0.12 2.22 0.44 0.94 31.93 23.18 23.61 11.67 0.73 0.74 1.04 21.13 5.57 1.34 0.07 1.50 0.40 0.10 1.62 0.87 2.15 31.89 23.59 23.83 11.62 0.74 0.75 1.05 -42.82 5.56 -5.63 0.07 -3.02 0.39 -0.40 0.78 1.90 3.71 31.85 24.03 24.07 11.57 0.75 0.76 1.07 33.20 -3.44 -2.60 0.07 2.32 -0.24 -0.18 1.55 1.95 2.91 31.81 24.50 24.31 11.52 0.77 0.76 1.09 13.12 1.58 0.43 0.07 0.91 0.11 0.03 1.21 1.52 0.97 31.77 24.99 24.56 11.47 0.79 0.77 1.10 -36.83 -4.40 1.44 0.07 -2.54 -0.30 0.10 0.79 1.55 1.07 31.74 25.50 24.82 11.43 0.80 0.78 1.12 36.18 -1.38 -3.54 0.07 2.48 -0.09 -0.24 1.94 0.62 1.67 31.73 26.02 25.07 11.38 0.82 0.79 1.14 0.11 17.60 0.49 0.07 0.01 1.20 0.03 2.41 1.21 2.36 31.75 26.55 25.33 11.33 0.84 0.80 1.16
-35.82 -4.42 7.49 0.07 -2.42 -0.30 0.51 1.40 1.90 1.89 31.80 27.08 25.58 11.28 0.85 0.80 1.17 42.18 8.59 -9.49 0.07 2.83 0.58 -0.64 0.26 1.49 0.88 31.88 27.62 25.84 11.23 0.87 0.81 1.19 12.07 22.53 -13.42 0.07 0.80 1.50 -0.89 0.87 1.20 1.18 31.99 28.16 26.11 11.18 0.88 0.82 1.20 -38.87 -21.46 -1.37 0.07 -2.57 -1.42 -0.09 1.56 0.87 1.71 32.12 28.69 26.38 11.13 0.89 0.82 1.21 30.15 1.59 2.65 0.07 1.98 0.10 0.17 1.76 1.34 0.79 32.28 29.20 26.67 11.08 0.90 0.83 1.22 13.07 30.54 -13.31 0.07 0.85 1.99 -0.87 0.53 2.10 1.73 32.46 29.69 26.96 11.04 0.91 0.83 1.24 -41.87 -0.51 -15.24 0.06 -2.70 -0.03 -0.98 0.88 2.16 2.04 32.66 30.15 27.26 10.99 0.92 0.83 1.24 35.15 8.49 12.79 0.06 2.25 0.54 0.82 0.98 1.86 1.01 32.88 30.57 27.57 10.94 0.93 0.84 1.25 1.09 4.47 0.78 0.06 0.07 0.28 0.05 1.25 0.33 1.39 33.11 30.95 27.89 10.89 0.93 0.84 1.26
-36.84 -21.48 -15.17 0.06 -2.32 -1.35 -0.96 1.66 0.70 0.63 33.34 31.29 28.22 10.84 0.94 0.85 1.26 52.14 -4.42 -0.12 0.06 3.26 -0.28 -0.01 0.59 0.51 1.92 33.58 31.57 28.56 10.79 0.94 0.85 1.27 -26.91 -15.37 0.89 0.06 -1.67 -0.95 0.06 0.95 0.37 1.24 33.82 31.81 28.91 10.74 0.94 0.85 1.27 -27.79 -3.32 -2.08 0.06 -1.71 -0.20 -0.13 0.85 1.23 0.86 34.05 32.00 29.28 10.69 0.94 0.86 1.27 71.12 35.63 -8.04 0.06 4.34 2.17 -0.49 1.01 0.88 1.30 34.27 32.17 29.68 10.64 0.94 0.87 1.28 -42.93 -13.41 0.99 0.06 -2.60 -0.81 0.06 0.97 0.80 0.92 34.46 32.30 30.09 10.60 0.94 0.87 1.28 -18.80 -14.34 -1.99 0.06 -1.13 -0.86 -0.12 2.55 0.67 2.41 34.63 32.40 30.52 10.55 0.94 0.88 1.29 80.08 28.64 -18.93 0.06 4.76 1.70 -1.13 2.26 2.65 3.54 34.77 32.47 30.98 10.50 0.93 0.89 1.29 -41.99 -15.38 -12.84 0.06 -2.48 -0.91 -0.76 1.43 1.23 1.51 34.88 32.53 31.46 10.45 0.93 0.90 1.30 -18.86 -15.30 -1.80 0.06 -1.10 -0.90 -0.11 2.22 1.18 2.32 34.96 32.56 31.95 10.40 0.93 0.91 1.30 65.05 10.72 10.21 0.06 3.77 0.62 0.59 1.81 2.03 1.42 35.00 32.57 32.46 10.35 0.93 0.93 1.31 -40.99 -17.26 -1.79 0.06 -2.36 -0.99 -0.10 2.59 3.77 1.93 35.01 32.56 32.98 10.30 0.93 0.94 1.32

465
Raw Data Tapered
Data FFT Data Parzen Filtered
Data Simple Ratio
Spectrum Z E N
Tapering Function
Z E N Z E N Z E N
Frequency Hz
E/Z N/Z
Mean SQRT Spectrum
-4.90 -8.20 -3.76 0.06 -0.28 -0.47 -0.21 1.38 2.46 1.39 35.00 32.55 33.50 10.25 0.93 0.96 1.33 47.02 2.83 4.26 0.06 2.66 0.16 0.24 0.58 1.87 1.71 34.96 32.53 34.02 10.21 0.93 0.97 1.35 -41.98 16.80 -8.71 0.06 -2.35 0.94 -0.49 0.69 2.24 2.37 34.90 32.52 34.55 10.16 0.93 0.99 1.36 5.10 28.72 2.32 0.06 0.28 1.59 0.13 0.82 1.27 3.04 34.83 32.51 35.06 10.11 0.93 1.01 1.37 33.02 -8.31 7.32 0.06 1.82 -0.46 0.40 1.18 0.90 3.16 34.74 32.51 35.58 10.06 0.94 1.02 1.39 -16.00 4.71 7.31 0.05 -0.87 0.26 0.40 1.05 0.65 2.11 34.63 32.53 36.08 10.01 0.94 1.04 1.40 3.03 20.67 29.26 0.05 0.16 1.12 1.58 1.07 0.68 0.77 34.52 32.57 36.57 9.96 0.94 1.06 1.42 0.02 -11.34 1.22 0.05 0.00 -0.61 0.07 2.65 0.92 0.88 34.40 32.62 37.05 9.91 0.95 1.08 1.44 1.03 -8.29 -16.73 0.05 0.05 -0.44 -0.89 3.03 2.28 0.31 34.28 32.69 37.50 9.86 0.95 1.09 1.45 -1.97 18.70 -0.68 0.05 -0.10 0.98 -0.04 1.71 1.93 1.34 34.16 32.77 37.93 9.81 0.96 1.11 1.47 -0.96 16.64 -17.62 0.05 -0.05 0.87 -0.92 0.76 1.36 1.32 34.05 32.86 38.33 9.77 0.96 1.13 1.48 12.03 -7.37 1.43 0.05 0.62 -0.38 0.07 0.93 0.67 1.76 33.97 32.96 38.72 9.72 0.97 1.14 1.50 -8.98 1.65 17.41 0.05 -0.46 0.08 0.89 1.51 0.18 0.46 33.90 33.08 39.08 9.67 0.98 1.15 1.51 14.02 -9.32 -15.57 0.05 0.71 -0.47 -0.79 1.09 1.78 0.71 33.86 33.22 39.43 9.62 0.98 1.16 1.52 -8.99 -23.25 -7.51 0.05 -0.45 -1.16 -0.38 0.35 0.77 1.06 33.85 33.37 39.76 9.57 0.99 1.17 1.53 -17.93 23.76 9.51 0.05 -0.89 1.18 0.47 0.87 0.83 0.82 33.86 33.53 40.07 9.52 0.99 1.18 1.54 37.04 12.70 -14.46 0.05 1.81 0.62 -0.71 1.90 0.73 1.91 33.91 33.72 40.37 9.47 0.99 1.19 1.55 -31.97 -14.29 -26.36 0.05 -1.55 -0.69 -1.28 1.12 0.35 1.29 33.98 33.93 40.66 9.42 1.00 1.20 1.56 -11.88 7.74 1.71 0.05 -0.57 0.37 0.08 0.82 0.82 0.81 34.08 34.14 40.93 9.38 1.00 1.20 1.56 43.07 -18.23 -0.28 0.05 2.05 -0.87 -0.01 1.14 1.30 1.23 34.19 34.37 41.20 9.33 1.01 1.20 1.57 -48.92 -10.16 -26.20 0.05 -2.30 -0.48 -1.23 1.44 0.67 1.07 34.33 34.60 41.45 9.28 1.01 1.21 1.57 15.16 35.80 -11.11 0.05 0.70 1.66 -0.52 0.15 0.55 1.82 34.48 34.82 41.70 9.23 1.01 1.21 1.58 33.06 -15.23 -11.04 0.05 1.52 -0.70 -0.51 0.31 0.14 1.05 34.65 35.05 41.93 9.18 1.01 1.21 1.58 -58.88 -36.12 -19.96 0.05 -2.68 -1.64 -0.91 0.89 1.52 1.44 34.83 35.26 42.15 9.13 1.01 1.21 1.58 41.16 19.92 0.10 0.05 1.85 0.90 0.00 0.65 1.47 1.42 35.02 35.47 42.35 9.08 1.01 1.21 1.58 10.06 -8.09 -8.86 0.04 0.45 -0.36 -0.39 0.50 0.15 1.67 35.22 35.67 42.53 9.03 1.01 1.21 1.58 -52.85 -43.97 -18.79 0.04 -2.33 -1.93 -0.83 0.69 0.56 0.89 35.43 35.85 42.68 8.98 1.01 1.20 1.57 53.16 -18.84 -6.71 0.04 2.31 -0.82 -0.29 2.07 1.56 1.96 35.62 36.01 42.80 8.94 1.01 1.20 1.57 1.05 -12.76 -6.67 0.04 0.05 -0.55 -0.29 2.36 0.99 1.28 35.80 36.14 42.89 8.89 1.01 1.20 1.57
-28.89 0.27 -0.63 0.04 -1.23 0.01 -0.03 0.88 1.33 1.28 35.95 36.24 42.93 8.84 1.01 1.19 1.56 40.09 -1.71 2.39 0.04 1.68 -0.07 0.10 1.66 0.75 2.92 36.07 36.30 42.92 8.79 1.01 1.19 1.56

466
Raw Data Tapered Data
FFT Data Parzen Filtered Data
Simple Ratio Spectrum
Z E N
Tapering Function
Z E N Z E N Z E N
Frequency Hz
E/Z N/Z
Mean SQRT Spectrum
-3.97 -13.67 3.40 0.04 -0.16 -0.57 0.14 2.25 0.86 3.53 36.15 36.30 42.87 8.74 1.00 1.19 1.55 -31.90 8.35 -4.58 0.04 -1.31 0.34 -0.19 0.89 1.48 3.84 36.19 36.25 42.76 8.69 1.00 1.18 1.55 14.14 -4.64 -7.54 0.04 0.57 -0.19 -0.31 0.87 0.62 3.01 36.19 36.14 42.61 8.64 1.00 1.18 1.54 6.11 -11.60 11.48 0.04 0.24 -0.46 0.46 0.70 1.61 0.88 36.15 35.96 42.40 8.59 0.99 1.17 1.54
-32.83 7.42 -1.52 0.04 -1.30 0.29 -0.06 0.63 2.25 0.70 36.06 35.72 42.16 8.54 0.99 1.17 1.53 10.22 -17.55 -3.49 0.04 0.40 -0.68 -0.14 1.73 1.62 1.40 35.94 35.41 41.87 8.50 0.99 1.17 1.53 3.19 -5.49 18.50 0.04 0.12 -0.21 0.71 1.24 1.18 0.33 35.77 35.06 41.54 8.45 0.98 1.16 1.52
-23.76 19.50 20.44 0.04 -0.90 0.74 0.78 1.86 2.69 1.63 35.57 34.65 41.19 8.40 0.97 1.16 1.51 28.23 -17.50 11.40 0.04 1.06 -0.66 0.43 2.69 4.70 2.58 35.32 34.19 40.81 8.35 0.97 1.16 1.51 -14.79 -2.44 -3.60 0.04 -0.55 -0.09 -0.13 1.45 2.50 1.12 35.05 33.70 40.41 8.30 0.96 1.15 1.50 -22.71 20.53 13.40 0.04 -0.83 0.75 0.49 0.86 1.85 1.30 34.73 33.18 40.02 8.25 0.96 1.15 1.50 40.26 -17.46 19.36 0.04 1.45 -0.63 0.70 0.96 1.19 3.09 34.39 32.63 39.64 8.20 0.95 1.15 1.49 -34.74 2.58 -13.63 0.04 -1.23 0.09 -0.48 0.48 1.24 1.12 34.02 32.08 39.28 8.15 0.94 1.15 1.49 -11.65 22.54 9.39 0.04 -0.41 0.79 0.33 0.72 1.38 0.81 33.64 31.52 38.95 8.11 0.94 1.16 1.49 52.28 -8.48 22.35 0.03 1.80 -0.29 0.77 0.94 1.68 1.77 33.25 30.97 38.66 8.06 0.93 1.16 1.49 -58.71 -2.44 -15.64 0.03 -2.00 -0.08 -0.53 0.29 1.66 1.21 32.87 30.44 38.42 8.01 0.93 1.17 1.49 8.40 2.57 -0.59 0.03 0.28 0.09 -0.02 0.31 0.30 1.14 32.51 29.96 38.25 7.96 0.92 1.18 1.49 60.27 2.57 7.42 0.03 1.99 0.08 0.24 1.01 1.41 2.64 32.16 29.52 38.15 7.91 0.92 1.19 1.50 -73.70 20.53 -7.56 0.03 -2.40 0.67 -0.25 2.19 2.65 3.12 31.84 29.15 38.13 7.86 0.92 1.20 1.51 18.42 -0.49 12.45 0.03 0.59 -0.02 0.40 1.12 1.60 1.45 31.54 28.85 38.17 7.81 0.91 1.21 1.52 56.27 -7.47 1.44 0.03 1.77 -0.24 0.05 1.27 0.25 0.45 31.28 28.64 38.29 7.76 0.92 1.22 1.53 -65.71 12.53 -7.53 0.03 -2.04 0.39 -0.23 1.79 1.32 1.46 31.05 28.52 38.47 7.71 0.92 1.24 1.54 26.38 -9.46 0.51 0.03 0.80 -0.29 0.02 1.61 1.26 1.87 30.85 28.51 38.71 7.67 0.92 1.25 1.56 38.25 0.57 -7.46 0.03 1.15 0.02 -0.22 1.16 0.74 1.98 30.69 28.59 39.00 7.62 0.93 1.27 1.58 -63.69 34.51 2.57 0.03 -1.88 1.02 0.08 1.44 1.85 1.15 30.56 28.77 39.35 7.57 0.94 1.29 1.59 35.37 -1.54 -9.40 0.03 1.03 -0.04 -0.27 1.08 1.29 1.15 30.48 29.06 39.74 7.52 0.95 1.30 1.62 23.26 -7.52 -12.33 0.03 0.66 -0.21 -0.35 0.41 0.99 1.03 30.43 29.44 40.16 7.47 0.97 1.32 1.64 -59.67 26.46 -0.29 0.03 -1.67 0.74 -0.01 0.93 0.91 0.57 30.41 29.91 40.61 7.42 0.98 1.34 1.66 45.37 -1.58 -12.24 0.03 1.25 -0.04 -0.34 2.56 1.21 1.05 30.43 30.45 41.07 7.37 1.00 1.35 1.68 9.26 -1.56 3.80 0.03 0.25 -0.04 0.10 1.54 1.03 0.42 30.48 31.07 41.53 7.32 1.02 1.36 1.70
-51.65 19.41 3.80 0.03 -1.37 0.51 0.10 0.50 1.46 0.91 30.54 31.74 41.98 7.28 1.04 1.37 1.72

467
Raw Data Tapered
Data FFT Data Parzen Filtered
Data Simple Ratio
Spectrum Z E N
Tapering Function
Z E N Z E N Z E N
Frequency Hz
E/Z N/Z
Mean SQRT Spectrum
48.36 -5.61 -12.16 0.03 1.26 -0.15 -0.32 1.39 1.04 1.27 30.62 32.45 42.41 7.23 1.06 1.38 1.74 -5.72 -6.57 4.87 0.03 -0.15 -0.17 0.12 1.48 0.40 1.07 30.70 33.20 42.80 7.18 1.08 1.39 1.76 -35.63 4.45 1.88 0.03 -0.89 0.11 0.05 2.49 0.90 1.30 30.79 33.96 43.15 7.13 1.10 1.40 1.78 58.33 2.44 -6.09 0.02 1.43 0.06 -0.15 3.03 0.98 0.86 30.87 34.72 43.45 7.08 1.12 1.41 1.80 -13.75 2.44 -3.05 0.02 -0.33 0.06 -0.07 1.79 0.55 1.50 30.95 35.48 43.69 7.03 1.15 1.41 1.82 -17.69 1.45 4.96 0.02 -0.42 0.03 0.12 1.02 2.34 0.18 31.03 36.20 43.86 6.98 1.17 1.41 1.83 50.25 1.45 10.95 0.02 1.16 0.03 0.25 0.41 2.08 2.12 31.10 36.88 43.96 6.93 1.19 1.41 1.84 -42.76 -8.52 -10.03 0.02 -0.96 -0.19 -0.23 1.31 1.06 1.67 31.18 37.51 44.00 6.88 1.20 1.41 1.85 -7.65 0.50 2.01 0.02 -0.17 0.01 0.04 0.40 2.49 2.69 31.26 38.07 43.98 6.84 1.22 1.41 1.86 56.25 9.50 17.99 0.02 1.21 0.20 0.39 1.61 3.80 2.96 31.33 38.55 43.90 6.79 1.23 1.40 1.86 -36.78 -7.50 -15.00 0.02 -0.77 -0.16 -0.31 1.57 4.20 3.15 31.40 38.94 43.75 6.74 1.24 1.39 1.87 -10.68 -4.46 -0.95 0.02 -0.22 -0.09 -0.02 1.13 2.14 2.58 31.46 39.25 43.55 6.69 1.25 1.38 1.86 40.26 -1.44 25.03 0.02 0.81 -0.03 0.50 1.06 1.67 1.59 31.52 39.46 43.29 6.64 1.25 1.37 1.86 -35.74 -11.40 -4.00 0.02 -0.70 -0.22 -0.08 0.76 0.91 1.87 31.58 39.58 42.99 6.59 1.25 1.36 1.85 -22.62 -7.35 -0.97 0.02 -0.43 -0.14 -0.02 2.26 1.41 2.38 31.64 39.62 42.63 6.54 1.25 1.35 1.84 48.33 2.67 13.03 0.02 0.89 0.05 0.24 1.63 1.18 1.21 31.71 39.58 42.24 6.49 1.25 1.33 1.83 -17.72 16.64 -1.97 0.02 -0.32 0.30 -0.04 1.20 0.47 3.10 31.79 39.47 41.82 6.45 1.24 1.32 1.81 -40.60 -0.38 -6.93 0.02 -0.71 -0.01 -0.12 1.40 0.43 1.59 31.90 39.30 41.38 6.40 1.23 1.30 1.79 30.42 -20.33 6.09 0.02 0.52 -0.35 0.10 1.60 1.69 0.92 32.02 39.09 40.93 6.35 1.22 1.28 1.77 -30.57 11.70 10.07 0.02 -0.50 0.19 0.17 1.23 1.80 2.27 32.17 38.83 40.48 6.30 1.21 1.26 1.74 -26.45 7.67 -1.92 0.02 -0.42 0.12 -0.03 2.05 2.38 2.70 32.35 38.55 40.04 6.25 1.19 1.24 1.72 49.51 -21.29 -5.89 0.02 0.77 -0.33 -0.09 6.21 4.79 3.05 32.55 38.25 39.63 6.20 1.18 1.22 1.69 -42.50 -4.23 0.15 0.02 -0.64 -0.06 0.00 7.13 3.32 2.42 32.77 37.95 39.24 6.15 1.16 1.20 1.67 -27.36 -0.21 -4.82 0.01 -0.40 0.00 -0.07 6.22 0.32 2.73 33.00 37.67 38.90 6.10 1.14 1.18 1.64 31.64 -13.17 -6.78 0.01 0.44 -0.18 -0.09 1.91 0.87 1.08 33.25 37.41 38.60 6.05 1.13 1.16 1.62 -43.33 -10.11 9.23 0.01 -0.58 -0.14 0.12 1.69 1.02 2.10 33.52 37.20 38.37 6.01 1.11 1.14 1.59 15.73 -14.05 -3.76 0.01 0.20 -0.18 -0.05 2.75 2.85 3.81 33.81 37.05 38.20 5.96 1.10 1.13 1.57 38.63 -3.01 -22.68 0.01 0.48 -0.04 -0.28 2.64 2.54 2.98 34.13 36.96 38.11 5.91 1.08 1.12 1.56 -52.34 -0.99 8.37 0.01 -0.63 -0.01 0.10 1.15 2.46 1.84 34.48 36.94 38.09 5.86 1.07 1.10 1.54 21.72 -17.94 9.35 0.01 0.25 -0.21 0.11 1.04 2.24 3.99 34.87 37.00 38.16 5.81 1.06 1.09 1.52 24.64 0.11 -5.64 0.01 0.27 0.00 -0.06 0.40 2.38 4.73 35.29 37.13 38.32 5.76 1.05 1.09 1.51

468
Raw Data Tapered
Data FFT Data Parzen Filtered
Data Simple Ratio
Spectrum Z E N
Tapering Function
Z E N Z E N Z E N
Frequency Hz
E/Z N/Z
Mean SQRT Spectrum
-50.31 3.12 11.37 0.01 -0.53 0.03 0.12 2.69 1.27 1.95 35.75 37.34 38.58 5.71 1.04 1.08 1.50 40.72 -24.83 -2.63 0.01 0.41 -0.25 -0.03 3.40 2.03 2.64 36.25 37.62 38.93 5.66 1.04 1.07 1.49 14.61 -16.73 -6.59 0.01 0.14 -0.16 -0.06 2.15 1.37 1.98 36.79 37.96 39.38 5.62 1.03 1.07 1.49 -46.32 6.30 5.43 0.01 -0.42 0.06 0.05 1.45 1.05 1.14 37.37 38.37 39.92 5.57 1.03 1.07 1.48 46.69 -8.68 6.43 0.01 0.40 -0.07 0.05 1.40 0.72 1.52 38.00 38.84 40.56 5.52 1.02 1.07 1.48 -10.38 -10.63 7.42 0.01 -0.08 -0.09 0.06 0.21 1.00 1.25 38.68 39.36 41.28 5.47 1.02 1.07 1.47 -36.28 15.37 -10.55 0.01 -0.27 0.12 -0.08 4.30 8.36 9.86 39.41 39.93 42.08 5.42 1.01 1.07 1.47 66.66 2.35 4.48 0.01 0.47 0.02 0.03 6.42 8.17 14.50 40.20 40.54 42.96 5.37 1.01 1.07 1.47 -21.43 -4.64 16.46 0.01 -0.14 -0.03 0.11 0.80 3.57 7.67 41.06 41.20 43.91 5.32 1.00 1.07 1.47 -36.30 3.38 -7.54 0.01 -0.22 0.02 -0.05 0.39 2.09 2.61 41.99 41.88 44.94 5.27 1.00 1.07 1.46 59.65 -6.60 2.49 0.01 0.33 -0.04 0.01 2.25 2.16 2.39 42.99 42.57 46.03 5.22 0.99 1.07 1.46 -29.40 18.38 5.50 0.01 -0.15 0.09 0.03 2.81 1.24 2.61 44.06 43.28 47.19 5.18 0.98 1.07 1.45 -14.31 8.34 -4.49 0.00 -0.06 0.04 -0.02 0.42 1.45 2.97 45.18 43.98 48.40 5.13 0.97 1.07 1.45 44.63 -23.62 8.53 0.00 0.18 -0.09 0.03 1.54 0.37 2.32 46.34 44.69 49.66 5.08 0.96 1.07 1.44 -49.35 20.40 4.52 0.00 -0.17 0.07 0.02 1.93 6.54 4.11 47.53 45.38 50.98 5.03 0.95 1.07 1.44 7.74 13.35 0.53 0.00 0.02 0.04 0.00 1.91 6.76 9.79 48.74 46.08 52.35 4.98 0.95 1.07 1.43 47.63 -19.63 1.55 0.00 0.12 -0.05 0.00 0.90 1.43 8.47 49.96 46.77 53.76 4.93 0.94 1.08 1.43 -34.39 6.41 -1.44 0.00 -0.07 0.01 0.00 1.15 2.14 1.06 51.17 47.47 55.23 4.88 0.93 1.08 1.42 17.65 -2.59 11.56 0.00 0.03 0.00 0.02 1.40 0.61 1.05 52.36 48.17 56.75 4.83 0.92 1.08 1.42 10.60 -3.56 5.55 0.00 0.01 0.00 0.01 1.36 1.84 1.28 53.53 48.89 58.32 4.79 0.91 1.09 1.42 -36.35 11.43 -0.44 0.00 -0.02 0.01 0.00 1.67 3.98 1.63 54.65 49.62 59.95 4.74 0.91 1.10 1.42

469
Microtremors Segment: A1-S3
Raw Data Tapered Data
FFT Data Parzen Filtered Data
Simple Ratio Spectrum
Z E N
Tapering Function
Z E N Z E N Z E N
Frequency Hz
E/Z N/Z
Mean SQRT Spectrum
-5.52 -5.24 -6.40 0.26 -1.43 -1.36 -1.66 2.05 0.95 0.93 0.28 0.43 0.45 30.03 1.55 1.63 2.25 -8.49 -7.20 1.63 0.26 -2.20 -1.86 0.42 0.95 0.38 0.50 0.28 0.43 0.45 29.98 1.54 1.62 2.24 -20.43 -9.15 11.63 0.26 -5.28 -2.37 3.01 0.76 0.79 1.39 0.28 0.43 0.45 29.93 1.52 1.61 2.22 1.61 0.88 11.60 0.26 0.42 0.23 2.99 2.45 1.39 1.23 0.28 0.42 0.45 29.88 1.51 1.60 2.20 -7.38 -14.08 4.59 0.26 -1.90 -3.63 1.18 4.82 0.93 1.52 0.28 0.42 0.45 29.83 1.49 1.59 2.18 -11.34 -14.01 0.60 0.26 -2.91 -3.60 0.15 2.90 1.08 0.91 0.29 0.42 0.45 29.79 1.48 1.58 2.16 2.68 -2.96 10.60 0.26 0.69 -0.76 2.72 1.14 0.67 1.02 0.29 0.42 0.45 29.74 1.46 1.56 2.14
-18.29 -16.91 3.59 0.26 -4.68 -4.33 0.92 0.45 1.14 0.75 0.29 0.42 0.45 29.69 1.44 1.54 2.11 -3.24 7.13 -11.38 0.26 -0.83 1.82 -2.91 0.87 1.49 1.21 0.29 0.42 0.45 29.64 1.42 1.53 2.09 -7.22 8.11 9.65 0.26 -1.84 2.07 2.46 0.37 1.03 2.33 0.30 0.42 0.45 29.59 1.40 1.51 2.06 -13.18 -17.85 10.63 0.25 -3.35 -4.54 2.70 0.88 1.38 2.13 0.30 0.42 0.45 29.54 1.38 1.48 2.03 20.81 10.18 -23.33 0.25 5.28 2.59 -5.92 1.20 0.66 1.28 0.30 0.42 0.45 29.49 1.36 1.46 2.00 -14.21 7.16 -9.24 0.25 -3.60 1.81 -2.34 0.42 1.27 1.22 0.31 0.42 0.44 29.44 1.35 1.44 1.97 -11.15 -0.84 9.78 0.25 -2.82 -0.21 2.47 0.27 1.06 2.39 0.31 0.42 0.44 29.39 1.33 1.41 1.94 29.81 11.16 -18.18 0.25 7.53 2.82 -4.59 0.84 0.57 1.55 0.32 0.42 0.44 29.35 1.31 1.38 1.90 -14.22 0.15 -12.10 0.25 -3.58 0.04 -3.05 1.13 0.80 1.22 0.32 0.42 0.44 29.30 1.29 1.36 1.87 -15.16 5.15 5.93 0.25 -3.81 1.30 1.49 0.69 0.39 1.24 0.33 0.42 0.44 29.25 1.27 1.33 1.84 20.83 1.15 0.94 0.25 5.23 0.29 0.24 0.54 0.73 0.68 0.33 0.42 0.43 29.20 1.25 1.31 1.81 -15.18 3.16 0.95 0.25 -3.80 0.79 0.24 1.14 0.32 0.92 0.34 0.42 0.43 29.15 1.23 1.28 1.77 -15.12 7.15 -18.99 0.25 -3.78 1.79 -4.75 0.37 1.03 1.50 0.34 0.42 0.43 29.10 1.21 1.25 1.74 16.88 -16.81 -11.91 0.25 4.21 -4.19 -2.97 0.31 0.72 2.99 0.35 0.42 0.43 29.05 1.19 1.23 1.71 -7.14 9.22 16.10 0.25 -1.78 2.30 4.01 0.32 1.43 1.56 0.36 0.42 0.43 29.00 1.17 1.20 1.68 -11.10 25.16 -1.90 0.25 -2.76 6.25 -0.47 0.79 2.02 0.66 0.36 0.41 0.43 28.96 1.14 1.18 1.64 11.90 -11.85 -5.87 0.25 2.95 -2.94 -1.46 0.48 0.94 0.16 0.37 0.41 0.43 28.91 1.12 1.16 1.61 3.87 -4.80 -0.83 0.25 0.96 -1.19 -0.21 1.27 0.94 0.98 0.38 0.41 0.43 28.86 1.10 1.14 1.58 -4.13 12.20 0.19 0.25 -1.02 3.01 0.05 0.36 1.02 1.16 0.38 0.41 0.43 28.81 1.08 1.12 1.55 3.87 -3.80 9.19 0.25 0.95 -0.94 2.27 2.10 0.63 2.07 0.39 0.41 0.43 28.76 1.06 1.10 1.53 1.86 -4.77 -13.78 0.25 0.46 -1.17 -3.39 1.78 0.18 1.05 0.39 0.41 0.43 28.71 1.04 1.09 1.51 -1.14 5.24 -14.70 0.25 -0.28 1.29 -3.61 1.11 0.58 0.07 0.40 0.41 0.43 28.66 1.02 1.08 1.49 -1.13 -4.74 14.32 0.25 -0.28 -1.16 3.51 0.71 1.04 1.13 0.40 0.40 0.43 28.61 1.00 1.07 1.47 -2.12 -19.68 7.30 0.24 -0.52 -4.81 1.78 0.67 2.13 2.37 0.41 0.40 0.44 28.56 0.98 1.07 1.45

470
Raw Data Tapered
Data FFT Data Parzen Filtered
Data Simple Ratio
Spectrum Z E N
Tapering Function
Z E N Z E N Z E N
Frequency Hz
E/Z N/Z
Mean SQRT Spectrum
4.85 3.40 -8.63 0.24 1.18 0.83 -2.10 0.83 1.01 1.25 0.42 0.40 0.44 28.47 0.95 1.07 1.43 -3.15 -13.57 12.38 0.24 -0.77 -3.30 3.01 0.70 1.43 1.18 0.42 0.39 0.45 28.42 0.94 1.07 1.42 -13.12 -4.52 20.34 0.24 -3.18 -1.10 4.93 0.64 1.48 0.83 0.42 0.39 0.45 28.37 0.93 1.07 1.42 -9.07 -7.48 1.32 0.24 -2.20 -1.81 0.32 0.72 1.31 0.41 0.42 0.39 0.46 28.32 0.92 1.08 1.42 14.92 -8.43 2.33 0.24 3.60 -2.04 0.56 0.42 0.30 1.08 0.42 0.39 0.46 28.27 0.91 1.09 1.42 7.88 8.58 10.32 0.24 1.90 2.07 2.49 0.80 0.28 1.72 0.42 0.38 0.46 28.22 0.91 1.10 1.43
-21.10 -1.42 13.30 0.24 -5.07 -0.34 3.20 1.22 0.10 0.99 0.42 0.38 0.47 28.17 0.91 1.12 1.44 -8.04 2.60 8.27 0.24 -1.93 0.62 1.99 2.38 0.54 1.96 0.42 0.38 0.47 28.13 0.91 1.13 1.45 0.98 4.60 -2.72 0.24 0.23 1.10 -0.65 2.64 0.33 1.47 0.42 0.38 0.48 28.08 0.91 1.15 1.47
-15.99 -11.37 4.30 0.24 -3.82 -2.72 1.03 2.77 0.84 1.04 0.41 0.38 0.48 28.03 0.91 1.17 1.49 0.04 11.64 12.29 0.24 0.01 2.78 2.93 2.06 1.38 1.10 0.41 0.37 0.49 27.98 0.92 1.19 1.51 0.05 -0.37 1.28 0.24 0.01 -0.09 0.30 1.57 0.38 0.61 0.40 0.37 0.49 27.93 0.93 1.22 1.53
-11.93 -27.30 -14.67 0.24 -2.83 -6.48 -3.48 1.72 0.95 0.91 0.40 0.37 0.49 27.88 0.94 1.24 1.55 -6.89 8.75 3.37 0.24 -1.63 2.07 0.80 0.96 0.92 1.64 0.39 0.37 0.49 27.83 0.95 1.26 1.58 2.12 5.74 16.35 0.24 0.50 1.36 3.87 1.38 0.58 1.51 0.39 0.37 0.50 27.78 0.96 1.29 1.60 -4.87 -9.24 -12.64 0.24 -1.15 -2.18 -2.98 1.33 1.19 0.66 0.38 0.37 0.50 27.73 0.97 1.31 1.62 -13.83 -1.20 -5.58 0.24 -3.26 -0.28 -1.31 0.75 0.37 1.15 0.38 0.37 0.50 27.69 0.98 1.33 1.65 4.19 -14.15 18.41 0.24 0.98 -3.33 4.33 1.44 0.22 2.18 0.37 0.37 0.50 27.64 0.99 1.34 1.67 -1.81 -1.11 6.38 0.23 -0.42 -0.26 1.50 0.98 1.13 0.80 0.37 0.37 0.50 27.59 1.00 1.36 1.69 -14.78 3.90 -2.60 0.23 -3.46 0.91 -0.61 0.81 1.43 0.45 0.36 0.37 0.50 27.54 1.01 1.37 1.70 -2.74 -15.06 -7.56 0.23 -0.64 -3.52 -1.77 0.27 1.10 0.94 0.36 0.37 0.50 27.49 1.02 1.38 1.71 5.26 -7.00 -7.51 0.23 1.23 -1.63 -1.75 0.96 2.09 1.39 0.36 0.37 0.50 27.44 1.02 1.38 1.72 5.24 4.02 -2.47 0.23 1.22 0.93 -0.57 0.21 2.29 1.58 0.36 0.37 0.49 27.39 1.03 1.38 1.72
-12.74 -4.96 -0.45 0.23 -2.96 -1.15 -0.10 0.44 1.20 2.38 0.36 0.37 0.49 27.34 1.03 1.37 1.72 -7.70 -10.92 4.56 0.23 -1.78 -2.53 1.06 0.77 0.71 1.47 0.36 0.37 0.49 27.29 1.02 1.36 1.71 -0.68 9.10 1.57 0.23 -0.16 2.10 0.36 1.00 0.73 1.04 0.36 0.37 0.49 27.25 1.02 1.35 1.69 -3.67 9.08 -7.40 0.23 -0.85 2.09 -1.70 0.49 1.83 0.94 0.36 0.37 0.48 27.20 1.01 1.33 1.67 15.31 -6.91 -14.33 0.23 3.52 -1.59 -3.30 0.57 2.16 1.13 0.37 0.37 0.48 27.15 0.99 1.31 1.64 7.27 16.09 -1.28 0.23 1.67 3.69 -0.29 0.97 1.12 1.02 0.37 0.36 0.48 27.10 0.98 1.28 1.61 -7.73 22.03 11.72 0.23 -1.77 5.04 2.68 0.35 0.92 1.26 0.38 0.36 0.48 27.05 0.96 1.26 1.58 8.27 -2.00 -10.26 0.23 1.89 -0.46 -2.35 0.48 0.43 0.14 0.38 0.36 0.47 27.00 0.94 1.23 1.55

471
Raw Data Tapered
Data FFT Data Parzen Filtered
Data Simple Ratio
Spectrum Z E N
Tapering Function
Z E N Z E N Z E N
Frequency Hz
E/Z N/Z
Mean SQRT Spectrum
13.23 2.02 -16.19 0.23 3.02 0.46 -3.69 0.86 1.19 0.60 0.39 0.36 0.47 26.95 0.93 1.21 1.52 -1.79 10.01 -0.14 0.23 -0.41 2.28 -0.03 0.66 1.20 1.52 0.40 0.36 0.47 26.90 0.91 1.18 1.49 6.20 2.00 8.86 0.23 1.41 0.45 2.01 0.28 1.08 1.34 0.40 0.36 0.47 26.86 0.89 1.16 1.46 17.16 -6.97 14.84 0.23 3.89 -1.58 3.36 0.90 1.85 1.57 0.41 0.36 0.47 26.81 0.87 1.13 1.43 -12.85 -2.94 -0.17 0.23 -2.90 -0.66 -0.04 0.19 1.12 0.94 0.42 0.36 0.46 26.76 0.86 1.11 1.40 -12.80 2.08 -0.15 0.23 -2.89 0.47 -0.03 0.99 0.66 0.38 0.42 0.36 0.46 26.71 0.84 1.09 1.38 3.23 0.09 15.84 0.23 0.73 0.02 3.56 1.01 0.13 0.76 0.43 0.36 0.46 26.66 0.83 1.08 1.36
-12.75 3.10 3.82 0.22 -2.86 0.70 0.86 0.71 0.56 0.93 0.43 0.36 0.46 26.61 0.82 1.06 1.34 -2.72 2.10 6.82 0.22 -0.61 0.47 1.53 0.46 0.32 1.46 0.44 0.36 0.46 26.56 0.81 1.05 1.33 8.27 -6.87 15.79 0.22 1.85 -1.54 3.53 0.50 1.14 0.87 0.44 0.36 0.46 26.51 0.81 1.04 1.32 -2.74 -9.82 3.77 0.22 -0.61 -2.19 0.84 0.08 1.73 0.78 0.44 0.36 0.46 26.46 0.80 1.04 1.31 -3.72 0.21 7.77 0.22 -0.83 0.05 1.73 1.17 0.87 0.38 0.44 0.36 0.46 26.42 0.81 1.03 1.31 -8.70 2.22 10.75 0.22 -1.93 0.49 2.39 1.07 0.89 0.91 0.44 0.36 0.46 26.37 0.81 1.03 1.31 1.32 -1.77 6.74 0.22 0.29 -0.39 1.49 0.59 0.53 0.79 0.44 0.36 0.46 26.32 0.82 1.04 1.32 10.30 -5.74 5.73 0.22 2.28 -1.27 1.27 0.72 1.01 0.57 0.44 0.36 0.46 26.27 0.83 1.04 1.33 -21.67 -6.70 -3.26 0.22 -4.78 -1.48 -0.72 1.05 1.29 0.72 0.43 0.37 0.46 26.22 0.85 1.05 1.35 -12.60 -0.67 -8.21 0.22 -2.77 -0.15 -1.81 0.35 0.80 0.38 0.43 0.37 0.46 26.17 0.87 1.06 1.37 28.37 2.35 -13.15 0.22 6.23 0.52 -2.89 0.60 1.56 1.19 0.42 0.37 0.45 26.12 0.89 1.08 1.40 -2.68 -1.64 -7.09 0.22 -0.59 -0.36 -1.55 0.66 2.49 1.46 0.41 0.38 0.45 26.07 0.91 1.09 1.42 -10.65 -14.59 6.93 0.22 -2.33 -3.19 1.51 0.97 2.74 1.67 0.41 0.38 0.45 26.03 0.94 1.11 1.46 22.33 -0.55 -4.06 0.22 4.87 -0.12 -0.88 1.01 2.19 1.06 0.40 0.39 0.45 25.98 0.97 1.13 1.49 -14.69 16.44 -10.01 0.22 -3.19 3.58 -2.18 1.28 1.23 0.54 0.39 0.39 0.45 25.93 1.01 1.16 1.53 -15.62 -14.55 -0.97 0.22 -3.39 -3.16 -0.21 1.58 0.45 0.71 0.38 0.39 0.45 25.88 1.04 1.18 1.58 23.36 -13.48 -2.94 0.22 5.06 -2.92 -0.64 1.49 0.80 0.23 0.37 0.40 0.44 25.83 1.08 1.21 1.62 -7.67 14.53 -11.89 0.22 -1.66 3.14 -2.57 2.45 1.08 0.68 0.36 0.40 0.44 25.78 1.13 1.24 1.67 -6.63 -7.46 -3.84 0.22 -1.43 -1.61 -0.83 3.93 1.99 0.77 0.35 0.41 0.44 25.73 1.17 1.26 1.72 13.35 -13.41 10.17 0.22 2.87 -2.88 2.19 1.75 1.00 0.31 0.34 0.41 0.44 25.68 1.21 1.29 1.77 -8.65 2.63 1.17 0.21 -1.86 0.56 0.25 0.21 0.94 0.31 0.33 0.41 0.43 25.63 1.25 1.32 1.82 4.36 -8.34 -1.81 0.21 0.93 -1.79 -0.39 0.17 0.77 0.72 0.32 0.41 0.43 25.59 1.30 1.34 1.86 16.32 -4.30 0.21 0.21 3.48 -0.92 0.04 0.30 0.90 0.47 0.31 0.42 0.42 25.54 1.34 1.36 1.91 -5.70 -2.27 -10.75 0.21 -1.21 -0.48 -2.29 0.42 0.59 0.87 0.30 0.42 0.42 25.49 1.37 1.38 1.95

472
Raw Data Tapered
Data FFT Data Parzen Filtered
Data Simple Ratio
Spectrum Z E N
Tapering Function
Z E N Z E N Z E N
Frequency Hz
E/Z N/Z
Mean SQRT Spectrum
-0.68 -0.25 -1.70 0.21 -0.15 -0.05 -0.36 0.57 0.50 0.87 0.30 0.42 0.41 25.44 1.41 1.39 1.98 12.29 4.75 -0.68 0.21 2.61 1.01 -0.14 0.87 1.10 1.19 0.29 0.42 0.41 25.39 1.44 1.40 2.00 -4.72 -10.22 -11.64 0.21 -1.00 -2.16 -2.46 0.38 1.90 0.92 0.29 0.42 0.40 25.34 1.46 1.40 2.02 1.29 9.80 12.38 0.21 0.27 2.07 2.61 0.40 2.20 0.57 0.29 0.42 0.40 25.29 1.48 1.40 2.04 9.27 7.78 12.35 0.21 1.95 1.64 2.60 0.92 2.09 0.78 0.28 0.42 0.39 25.24 1.49 1.39 2.04 -0.74 -22.18 -4.64 0.21 -0.16 -4.66 -0.97 0.96 2.01 0.89 0.28 0.42 0.39 25.20 1.50 1.38 2.04 -8.72 4.87 4.38 0.21 -1.83 1.02 0.92 0.62 1.77 0.38 0.28 0.42 0.38 25.15 1.50 1.36 2.02 -18.66 9.86 0.39 0.21 -3.90 2.06 0.08 1.66 0.68 1.78 0.28 0.42 0.38 25.10 1.50 1.33 2.01 -0.62 -5.13 7.39 0.21 -0.13 -1.07 1.54 2.72 0.79 1.61 0.29 0.43 0.37 25.05 1.49 1.30 1.98 0.38 7.88 7.38 0.21 0.08 1.64 1.54 3.90 1.42 3.95 0.29 0.43 0.37 25.00 1.48 1.27 1.95
-20.58 -1.12 -6.60 0.21 -4.27 -0.23 -1.37 3.52 1.43 3.19 0.29 0.43 0.36 24.95 1.46 1.24 1.92 -0.53 -8.09 18.40 0.21 -0.11 -1.67 3.81 2.23 2.31 0.73 0.30 0.43 0.36 24.90 1.45 1.20 1.88 1.47 4.93 14.35 0.21 0.30 1.02 2.96 1.79 2.62 1.48 0.30 0.43 0.35 24.85 1.43 1.16 1.84
-19.49 5.93 -4.65 0.21 -4.02 1.22 -0.96 1.39 2.10 0.44 0.31 0.43 0.35 24.80 1.41 1.12 1.80 -0.45 3.92 12.35 0.21 -0.09 0.81 2.54 1.50 0.46 1.04 0.32 0.44 0.34 24.76 1.38 1.08 1.76 12.53 2.93 6.34 0.21 2.57 0.60 1.30 0.31 0.85 0.67 0.32 0.44 0.34 24.71 1.36 1.05 1.72 -17.46 -2.06 7.33 0.20 -3.57 -0.42 1.50 0.14 0.54 0.98 0.33 0.44 0.33 24.66 1.34 1.01 1.68 -15.39 5.95 7.32 0.20 -3.14 1.21 1.49 0.42 0.24 1.36 0.34 0.45 0.33 24.61 1.32 0.98 1.64 4.63 3.94 -13.65 0.20 0.94 0.80 -2.78 1.31 1.36 0.50 0.35 0.45 0.33 24.56 1.30 0.95 1.61
-14.34 -8.03 4.39 0.20 -2.91 -1.63 0.89 1.50 1.21 0.29 0.35 0.45 0.33 24.51 1.28 0.92 1.58 -16.28 1.99 14.37 0.20 -3.30 0.40 2.91 1.15 1.29 0.73 0.36 0.46 0.32 24.46 1.26 0.90 1.55 8.74 6.99 -15.61 0.20 1.77 1.41 -3.15 1.23 1.42 0.78 0.37 0.46 0.32 24.41 1.25 0.87 1.52 -1.27 5.98 -16.52 0.20 -0.26 1.21 -3.33 0.74 1.17 0.97 0.38 0.47 0.32 24.37 1.23 0.85 1.50 -17.23 9.96 2.52 0.20 -3.46 2.00 0.51 0.49 0.55 0.94 0.39 0.47 0.32 24.32 1.21 0.84 1.47 1.80 -0.04 12.51 0.20 0.36 -0.01 2.51 0.45 1.00 1.96 0.40 0.47 0.32 24.27 1.20 0.82 1.45 11.78 2.97 13.48 0.20 2.36 0.59 2.70 0.51 0.57 1.20 0.40 0.48 0.33 24.22 1.18 0.81 1.43 -8.23 12.95 0.47 0.20 -1.64 2.58 0.09 1.06 1.17 0.84 0.41 0.48 0.33 24.17 1.17 0.80 1.42 -7.19 -3.05 -0.51 0.20 -1.43 -0.61 -0.10 0.37 0.18 1.53 0.42 0.48 0.33 24.12 1.15 0.79 1.40 2.82 -0.03 4.50 0.20 0.56 -0.01 0.89 0.55 0.69 0.59 0.43 0.49 0.34 24.07 1.14 0.79 1.39
-10.16 7.97 -7.47 0.20 -2.01 1.58 -1.48 1.29 0.87 1.12 0.43 0.49 0.34 24.02 1.13 0.78 1.37 2.86 -12.01 -3.43 0.20 0.56 -2.37 -0.68 1.75 1.20 0.65 0.44 0.49 0.35 23.97 1.12 0.78 1.36

473
Raw Data Tapered
Data FFT Data Parzen Filtered
Data Simple Ratio
Spectrum Z E N
Tapering Function
Z E N Z E N Z E N
Frequency Hz
E/Z N/Z
Mean SQRT Spectrum
25.80 -5.96 9.57 0.20 5.08 -1.17 1.89 0.58 1.76 0.51 0.45 0.49 0.35 23.93 1.11 0.78 1.36 0.75 12.05 -2.42 0.20 0.15 2.37 -0.48 1.31 0.76 0.64 0.45 0.50 0.36 23.88 1.10 0.79 1.35 -2.24 -3.95 -7.38 0.20 -0.44 -0.77 -1.45 0.10 0.32 0.26 0.46 0.50 0.36 23.83 1.09 0.79 1.34 19.73 -12.90 -7.33 0.20 3.86 -2.52 -1.43 0.46 0.54 1.28 0.47 0.50 0.37 23.78 1.08 0.79 1.34 7.67 2.13 -16.27 0.20 1.50 0.42 -3.17 0.44 0.22 0.97 0.47 0.50 0.38 23.73 1.07 0.80 1.33 0.66 6.13 11.76 0.19 0.13 1.19 2.29 0.10 1.10 0.97 0.47 0.50 0.38 23.68 1.06 0.80 1.33 1.66 -5.85 9.74 0.19 0.32 -1.14 1.89 0.28 2.61 1.70 0.48 0.50 0.39 23.63 1.05 0.81 1.32 11.63 0.17 -30.20 0.19 2.25 0.03 -5.84 1.17 1.84 0.95 0.48 0.50 0.39 23.58 1.04 0.82 1.32 14.58 16.16 -11.10 0.19 2.81 3.12 -2.14 1.64 0.84 0.21 0.48 0.50 0.40 23.54 1.03 0.82 1.32 -12.42 -6.85 -2.05 0.19 -2.39 -1.32 -0.40 0.65 1.63 0.48 0.49 0.50 0.40 23.49 1.02 0.83 1.32 -4.38 -13.79 -12.01 0.19 -0.84 -2.65 -2.31 1.39 1.91 0.48 0.49 0.50 0.41 23.44 1.02 0.84 1.32 3.62 8.24 3.03 0.19 0.69 1.58 0.58 1.98 2.17 0.13 0.49 0.49 0.41 23.39 1.01 0.85 1.32 2.61 -11.74 1.04 0.19 0.50 -2.24 0.20 2.15 1.68 0.65 0.49 0.49 0.42 23.34 1.01 0.86 1.32 5.60 -16.67 4.05 0.19 1.07 -3.18 0.77 1.95 1.28 1.20 0.48 0.48 0.42 23.29 1.00 0.87 1.33
-19.37 -0.62 5.05 0.19 -3.68 -0.12 0.96 1.74 0.81 0.75 0.48 0.48 0.42 23.24 1.00 0.87 1.33 4.66 -8.58 -5.93 0.19 0.88 -1.63 -1.12 1.27 1.24 0.63 0.47 0.48 0.42 23.19 1.00 0.88 1.34 27.60 -7.54 11.08 0.19 5.22 -1.42 2.09 1.92 0.66 0.27 0.47 0.47 0.42 23.14 1.00 0.89 1.34 -8.43 -14.48 9.06 0.19 -1.59 -2.73 1.71 1.72 0.58 0.79 0.46 0.46 0.42 23.10 1.00 0.90 1.35 -1.41 -6.42 -5.92 0.19 -0.27 -1.21 -1.11 1.97 1.09 1.52 0.46 0.46 0.42 23.05 1.00 0.91 1.35 24.54 0.61 9.09 0.19 4.60 0.11 1.70 0.74 0.67 0.10 0.45 0.45 0.41 23.00 1.01 0.92 1.36 0.50 -20.34 9.07 0.19 0.09 -3.80 1.70 0.53 1.07 1.22 0.44 0.45 0.41 22.95 1.01 0.93 1.37
-10.48 1.72 3.07 0.19 -1.95 0.32 0.57 0.40 0.89 0.79 0.43 0.44 0.41 22.90 1.02 0.93 1.38 2.54 16.70 0.08 0.19 0.47 3.11 0.01 0.79 1.30 0.48 0.43 0.44 0.40 22.85 1.02 0.94 1.39 4.53 -12.30 -8.88 0.19 0.84 -2.28 -1.65 0.58 1.17 1.14 0.42 0.43 0.40 22.80 1.03 0.95 1.40 4.51 -6.24 2.15 0.19 0.83 -1.15 0.40 0.83 1.12 1.68 0.41 0.43 0.39 22.75 1.04 0.95 1.41 -7.48 11.76 10.14 0.18 -1.38 2.17 1.87 1.12 0.79 1.60 0.40 0.42 0.39 22.71 1.05 0.96 1.42 -12.44 -5.23 8.13 0.18 -2.29 -0.96 1.50 0.88 0.97 1.26 0.40 0.42 0.38 22.66 1.06 0.96 1.43 -1.41 -10.19 -9.85 0.18 -0.26 -1.87 -1.81 0.34 0.93 0.27 0.39 0.42 0.37 22.61 1.07 0.96 1.44 3.59 9.83 -10.79 0.18 0.66 1.80 -1.97 0.76 0.15 0.91 0.38 0.41 0.37 22.56 1.08 0.96 1.44 -5.40 5.81 10.23 0.18 -0.99 1.06 1.87 1.08 0.41 1.44 0.38 0.41 0.36 22.51 1.08 0.96 1.45 -11.37 -2.18 3.22 0.18 -2.07 -0.40 0.59 1.19 1.42 0.91 0.38 0.41 0.36 22.46 1.09 0.95 1.45

474
Raw Data Tapered
Data FFT Data Parzen Filtered
Data Simple Ratio
Spectrum Z E N
Tapering Function
Z E N Z E N Z E N
Frequency Hz
E/Z N/Z
Mean SQRT Spectrum
-3.33 9.82 6.22 0.18 -0.61 1.78 1.13 1.01 1.64 1.91 0.37 0.41 0.35 22.41 1.10 0.94 1.45 1.67 11.80 19.19 0.18 0.30 2.14 3.47 1.02 0.52 1.68 0.37 0.41 0.35 22.36 1.10 0.93 1.44 13.64 11.76 -0.83 0.18 2.46 2.12 -0.15 1.35 1.46 0.91 0.37 0.41 0.34 22.31 1.10 0.92 1.44 1.62 9.74 -8.79 0.18 0.29 1.75 -1.58 0.87 0.92 1.25 0.37 0.41 0.34 22.27 1.11 0.90 1.43
-14.35 7.72 5.24 0.18 -2.58 1.39 0.94 0.14 0.89 0.60 0.38 0.41 0.33 22.22 1.11 0.89 1.42 10.66 6.70 1.24 0.18 1.91 1.20 0.22 1.19 1.03 1.30 0.38 0.42 0.33 22.17 1.10 0.87 1.41 -2.36 -7.28 -5.73 0.18 -0.42 -1.30 -1.02 0.92 0.20 2.05 0.38 0.42 0.33 22.12 1.10 0.86 1.39 -12.33 -9.23 -1.69 0.18 -2.19 -1.64 -0.30 0.82 0.76 0.34 0.38 0.42 0.32 22.07 1.09 0.84 1.38 6.69 -4.19 -4.66 0.18 1.19 -0.74 -0.83 0.23 1.44 1.48 0.39 0.42 0.32 22.02 1.09 0.83 1.37 2.67 -2.16 -4.62 0.18 0.47 -0.38 -0.82 0.43 0.78 0.62 0.39 0.43 0.32 21.97 1.08 0.81 1.35 15.64 2.86 -14.57 0.18 2.76 0.50 -2.57 0.59 0.75 0.54 0.40 0.43 0.32 21.92 1.07 0.80 1.34 -8.37 -9.12 -6.51 0.18 -1.47 -1.60 -1.14 0.36 1.00 0.86 0.40 0.43 0.32 21.88 1.06 0.79 1.32 -24.30 -8.07 10.51 0.18 -4.27 -1.42 1.84 0.57 1.55 0.53 0.41 0.43 0.32 21.83 1.06 0.78 1.31 20.71 4.96 -17.46 0.18 3.62 0.87 -3.06 0.27 1.71 0.32 0.41 0.43 0.32 21.78 1.05 0.77 1.30 2.66 -12.01 -12.38 0.17 0.46 -2.10 -2.16 0.38 1.49 0.69 0.41 0.43 0.32 21.73 1.04 0.77 1.29
-17.31 -20.93 11.64 0.17 -3.01 -3.64 2.03 0.69 0.86 0.33 0.42 0.43 0.32 21.68 1.03 0.77 1.28 -4.26 -3.87 1.63 0.17 -0.74 -0.67 0.28 0.72 0.29 0.51 0.42 0.43 0.32 21.63 1.02 0.77 1.28 0.75 6.15 7.63 0.17 0.13 1.06 1.32 0.15 1.41 1.00 0.42 0.42 0.33 21.58 1.01 0.78 1.28 -6.24 -4.84 -5.35 0.17 -1.08 -0.84 -0.92 0.64 0.96 0.77 0.42 0.42 0.33 21.53 1.01 0.78 1.28 -12.20 -7.80 -19.28 0.17 -2.10 -1.34 -3.32 0.80 1.07 0.81 0.42 0.42 0.33 21.48 1.00 0.80 1.28 9.81 7.22 14.74 0.17 1.68 1.24 2.53 0.91 0.95 1.73 0.42 0.42 0.34 21.44 1.00 0.81 1.29
-16.17 0.22 17.70 0.17 -2.77 0.04 3.03 0.96 1.01 1.35 0.41 0.41 0.34 21.39 1.00 0.82 1.30 -9.12 2.23 1.68 0.17 -1.55 0.38 0.29 0.81 0.89 0.23 0.41 0.41 0.35 21.34 1.00 0.84 1.31 2.90 8.23 -0.30 0.17 0.49 1.40 -0.05 0.53 0.50 0.95 0.41 0.41 0.35 21.29 1.00 0.86 1.32
-22.06 -1.77 -16.25 0.17 -3.74 -0.30 -2.75 0.49 0.23 1.18 0.40 0.40 0.35 21.24 1.00 0.89 1.34 11.96 13.22 -15.17 0.17 2.02 2.23 -2.56 0.39 0.53 0.75 0.39 0.40 0.36 21.19 1.01 0.91 1.36 -6.05 7.20 4.87 0.17 -1.02 1.21 0.82 1.02 0.67 0.50 0.39 0.39 0.36 21.14 1.02 0.94 1.38 -9.01 -0.80 18.84 0.17 -1.51 -0.13 3.17 0.50 0.61 1.15 0.38 0.39 0.37 21.09 1.03 0.97 1.41 24.96 8.20 15.79 0.17 4.18 1.37 2.65 1.66 0.83 0.80 0.37 0.39 0.37 21.04 1.04 0.99 1.44 -22.04 3.19 3.77 0.17 -3.68 0.53 0.63 0.45 0.92 0.45 0.37 0.38 0.37 21.00 1.05 1.02 1.47 -6.98 16.17 7.77 0.17 -1.16 2.69 1.29 1.45 0.91 0.56 0.36 0.38 0.38 20.95 1.07 1.05 1.50

475
Raw Data Tapered
Data FFT Data Parzen Filtered
Data Simple Ratio
Spectrum Z E N
Tapering Function
Z E N Z E N Z E N
Frequency Hz
E/Z N/Z
Mean SQRT Spectrum
23.99 9.14 2.77 0.17 3.98 1.52 0.46 1.08 1.16 0.71 0.35 0.38 0.38 20.90 1.08 1.09 1.53 -29.00 0.13 4.77 0.17 -4.80 0.02 0.79 1.11 0.69 0.84 0.34 0.38 0.38 20.85 1.10 1.12 1.57 -11.91 12.12 13.75 0.17 -1.97 2.00 2.27 0.24 0.58 0.24 0.33 0.37 0.38 20.80 1.12 1.14 1.60 13.09 -1.88 2.74 0.16 2.15 -0.31 0.45 0.88 0.64 1.07 0.33 0.37 0.38 20.75 1.15 1.17 1.64 -19.89 9.12 2.74 0.16 -3.26 1.50 0.45 0.52 0.50 0.13 0.32 0.37 0.38 20.70 1.17 1.20 1.67 13.12 6.11 -5.23 0.16 2.15 1.00 -0.86 0.59 0.36 0.73 0.31 0.37 0.38 20.65 1.19 1.22 1.71 20.06 -16.86 -0.20 0.16 3.27 -2.75 -0.03 0.42 0.17 0.76 0.30 0.37 0.38 20.61 1.22 1.24 1.74 -8.96 9.17 14.79 0.16 -1.46 1.49 2.40 0.45 0.48 2.09 0.30 0.37 0.38 20.56 1.24 1.26 1.77 11.04 3.16 -23.18 0.16 1.79 0.51 -3.75 0.22 0.88 1.65 0.29 0.37 0.37 20.51 1.27 1.28 1.80 -1.97 -10.80 -21.07 0.16 -0.32 -1.74 -3.40 0.60 0.53 0.90 0.29 0.37 0.37 20.46 1.29 1.29 1.82 0.03 0.23 12.97 0.16 0.01 0.04 2.09 0.23 1.65 0.50 0.28 0.37 0.37 20.41 1.31 1.30 1.84 30.98 -5.74 -2.04 0.16 4.97 -0.92 -0.33 0.83 1.26 0.91 0.28 0.37 0.36 20.36 1.32 1.31 1.86 -8.07 0.29 -9.00 0.16 -1.29 0.05 -1.44 0.64 1.29 0.63 0.27 0.36 0.36 20.31 1.34 1.31 1.87 -19.01 -12.67 -4.95 0.16 -3.03 -2.02 -0.79 1.25 1.16 0.43 0.27 0.36 0.35 20.26 1.35 1.31 1.88 18.99 -7.62 -4.91 0.16 3.02 -1.21 -0.78 1.39 0.55 0.96 0.27 0.36 0.35 20.21 1.36 1.31 1.89 -2.04 11.39 6.11 0.16 -0.32 1.81 0.97 0.86 1.19 1.66 0.26 0.36 0.34 20.17 1.36 1.31 1.89 -2.02 -8.60 0.11 0.16 -0.32 -1.36 0.02 1.22 1.13 1.67 0.26 0.36 0.34 20.12 1.36 1.30 1.88 23.93 3.43 -5.86 0.16 3.77 0.54 -0.92 1.98 1.30 0.67 0.26 0.35 0.34 20.07 1.36 1.29 1.87 -10.09 9.42 5.16 0.16 -1.58 1.48 0.81 0.44 1.40 0.95 0.26 0.35 0.33 20.02 1.35 1.28 1.86 6.92 -7.57 4.16 0.16 1.08 -1.18 0.65 1.11 0.98 0.13 0.26 0.35 0.33 19.97 1.34 1.27 1.84 20.87 -7.53 -8.81 0.16 3.26 -1.17 -1.37 0.38 1.14 1.02 0.26 0.35 0.33 19.92 1.33 1.25 1.83 -31.11 -15.46 -0.77 0.16 -4.84 -2.40 -0.12 0.12 1.20 0.43 0.26 0.34 0.32 19.87 1.31 1.24 1.80 7.94 -4.41 20.21 0.16 1.23 -0.68 3.13 0.33 0.44 0.87 0.26 0.34 0.32 19.82 1.29 1.23 1.78 23.88 -0.38 -5.80 0.15 3.69 -0.06 -0.90 0.55 0.42 1.27 0.26 0.33 0.32 19.78 1.27 1.22 1.76 -28.11 -15.33 -18.73 0.15 -4.33 -2.36 -2.88 1.46 0.34 0.88 0.26 0.33 0.32 19.73 1.25 1.20 1.74 -1.05 0.71 1.32 0.15 -0.16 0.11 0.20 1.52 0.48 0.74 0.27 0.33 0.32 19.68 1.23 1.19 1.71 3.95 7.71 -10.64 0.15 0.60 1.18 -1.63 0.68 0.50 1.93 0.27 0.32 0.32 19.63 1.21 1.18 1.69
-12.03 -1.29 2.40 0.15 -1.83 -0.20 0.37 1.17 0.65 1.23 0.27 0.32 0.31 19.58 1.19 1.17 1.67 5.99 -4.26 19.37 0.15 0.91 -0.65 2.94 1.17 1.19 0.78 0.27 0.32 0.31 19.53 1.17 1.16 1.65
-13.99 -0.23 -0.65 0.15 -2.12 -0.04 -0.10 0.93 1.83 1.07 0.27 0.31 0.31 19.48 1.15 1.16 1.63 -6.95 17.75 2.37 0.15 -1.05 2.68 0.36 0.12 1.13 1.74 0.27 0.31 0.31 19.43 1.14 1.15 1.62

476
Raw Data Tapered
Data FFT Data Parzen Filtered
Data Simple Ratio
Spectrum Z E N
Tapering Function
Z E N Z E N Z E N
Frequency Hz
E/Z N/Z
Mean SQRT Spectrum
-1.93 -2.27 1.38 0.15 -0.29 -0.34 0.21 0.41 0.77 1.18 0.28 0.31 0.32 19.38 1.13 1.15 1.61 -17.88 -23.20 -17.57 0.15 -2.68 -3.48 -2.64 0.45 1.27 1.12 0.28 0.31 0.32 19.34 1.11 1.14 1.59 14.13 3.85 -17.48 0.15 2.11 0.58 -2.61 1.18 1.13 0.51 0.28 0.31 0.32 19.29 1.10 1.14 1.59 -6.88 -0.14 -1.42 0.15 -1.03 -0.02 -0.21 0.54 1.41 0.68 0.28 0.31 0.32 19.24 1.10 1.14 1.58 -15.83 -17.09 2.60 0.15 -2.35 -2.54 0.39 0.82 1.69 1.29 0.28 0.31 0.32 19.19 1.09 1.14 1.57 26.15 1.96 -15.36 0.15 3.87 0.29 -2.27 0.97 0.73 1.01 0.28 0.31 0.32 19.14 1.09 1.14 1.57 -10.88 16.94 -26.26 0.15 -1.60 2.50 -3.87 0.51 0.45 1.10 0.29 0.31 0.32 19.09 1.08 1.14 1.57 -12.83 4.91 -5.17 0.15 -1.89 0.72 -0.76 1.23 1.09 0.81 0.29 0.31 0.33 19.04 1.08 1.14 1.57 24.15 -2.08 4.85 0.15 3.54 -0.30 0.71 1.46 0.65 0.33 0.29 0.31 0.33 18.99 1.09 1.14 1.57 0.11 14.91 -16.11 0.15 0.02 2.18 -2.35 0.50 0.90 0.71 0.29 0.32 0.33 18.95 1.09 1.14 1.58 -5.88 12.87 -7.05 0.15 -0.85 1.87 -1.03 0.39 0.37 1.29 0.29 0.32 0.33 18.90 1.09 1.14 1.58 -0.86 6.85 4.98 0.15 -0.12 0.99 0.72 0.73 1.37 0.94 0.29 0.32 0.34 18.85 1.09 1.15 1.59 -6.84 18.81 -6.00 0.14 -0.99 2.72 -0.87 0.90 1.94 0.50 0.30 0.32 0.34 18.80 1.10 1.15 1.59 -2.82 9.77 12.01 0.14 -0.41 1.41 1.73 1.03 0.52 1.01 0.30 0.33 0.34 18.75 1.10 1.15 1.59 -2.80 2.76 5.99 0.14 -0.40 0.40 0.86 1.87 0.62 0.73 0.30 0.33 0.35 18.70 1.11 1.15 1.60 -3.78 1.77 -9.98 0.14 -0.54 0.25 -1.43 1.27 0.51 0.47 0.30 0.33 0.35 18.65 1.11 1.16 1.60 -4.76 3.77 12.03 0.14 -0.68 0.54 1.71 0.71 1.70 1.28 0.30 0.34 0.35 18.60 1.11 1.16 1.61 1.25 16.75 10.01 0.14 0.18 2.38 1.42 0.16 1.18 1.46 0.30 0.34 0.35 18.55 1.12 1.16 1.61 9.23 -1.27 -0.99 0.14 1.31 -0.18 -0.14 0.20 0.51 1.27 0.31 0.34 0.36 18.51 1.12 1.16 1.62
-14.75 -1.25 9.01 0.14 -2.08 -0.18 1.27 1.19 1.30 0.87 0.31 0.35 0.36 18.46 1.13 1.17 1.62 -3.71 20.73 2.01 0.14 -0.52 2.91 0.28 1.09 1.98 0.48 0.31 0.35 0.36 18.41 1.13 1.17 1.63 18.26 7.69 -8.96 0.14 2.56 1.08 -1.25 0.84 1.34 0.45 0.31 0.35 0.36 18.36 1.13 1.17 1.63 -23.72 4.68 -8.90 0.14 -3.31 0.65 -1.24 0.86 1.93 0.06 0.31 0.35 0.37 18.31 1.14 1.17 1.63 -11.65 9.66 -6.85 0.14 -1.62 1.34 -0.95 0.99 1.57 0.32 0.31 0.36 0.37 18.26 1.14 1.18 1.64 18.34 3.65 3.18 0.14 2.54 0.51 0.44 1.08 0.76 0.64 0.31 0.36 0.37 18.21 1.14 1.18 1.64 -10.67 -2.34 7.18 0.14 -1.47 -0.32 0.99 0.98 0.37 0.62 0.31 0.36 0.37 18.16 1.14 1.18 1.64 -4.64 0.68 -0.82 0.14 -0.64 0.09 -0.11 0.32 1.56 1.27 0.31 0.36 0.37 18.12 1.15 1.18 1.64 0.38 10.67 3.20 0.14 0.05 1.46 0.44 0.94 0.82 0.83 0.32 0.36 0.37 18.07 1.15 1.18 1.65 -6.61 -0.33 9.19 0.14 -0.90 -0.05 1.25 0.96 1.16 0.52 0.32 0.36 0.37 18.02 1.15 1.18 1.65 -5.58 -4.31 0.19 0.14 -0.76 -0.59 0.03 0.14 1.92 0.16 0.32 0.37 0.37 17.97 1.16 1.18 1.65 -14.53 -1.28 4.20 0.14 -1.97 -0.17 0.57 0.14 1.36 0.55 0.32 0.37 0.37 17.92 1.16 1.18 1.65

477
Raw Data Tapered
Data FFT Data Parzen Filtered
Data Simple Ratio
Spectrum Z E N
Tapering Function
Z E N Z E N Z E N
Frequency Hz
E/Z N/Z
Mean SQRT Spectrum
4.49 -6.25 1.21 0.14 0.61 -0.84 0.16 0.52 0.24 0.45 0.32 0.37 0.37 17.87 1.16 1.17 1.65 -4.50 7.76 -9.75 0.13 -0.61 1.04 -1.31 0.33 0.76 0.48 0.32 0.37 0.37 17.82 1.17 1.17 1.65 -7.48 4.75 7.27 0.13 -1.00 0.64 0.97 0.85 0.64 0.23 0.32 0.37 0.37 17.77 1.17 1.16 1.65 19.50 -5.23 4.27 0.13 2.60 -0.70 0.57 0.13 1.80 0.79 0.32 0.37 0.37 17.72 1.18 1.16 1.65 1.47 12.77 -12.69 0.13 0.20 1.70 -1.69 0.83 1.76 1.55 0.32 0.38 0.37 17.68 1.18 1.15 1.65 -0.53 -4.24 -4.64 0.13 -0.07 -0.56 -0.61 0.36 0.18 0.80 0.32 0.38 0.36 17.63 1.19 1.14 1.65 2.47 -3.21 -2.61 0.13 0.33 -0.42 -0.34 0.31 0.87 0.37 0.32 0.38 0.36 17.58 1.19 1.13 1.65 -9.51 23.77 -5.57 0.13 -1.25 3.13 -0.73 0.52 0.93 0.81 0.32 0.38 0.36 17.53 1.20 1.12 1.64 -1.49 -1.26 5.45 0.13 -0.19 -0.17 0.71 1.18 1.13 0.46 0.32 0.39 0.36 17.48 1.21 1.11 1.64 -8.46 -10.22 8.44 0.13 -1.10 -1.33 1.10 0.98 1.56 0.77 0.32 0.39 0.35 17.43 1.21 1.10 1.64 12.54 -8.17 -5.55 0.13 1.63 -1.06 -0.72 0.72 1.69 1.03 0.32 0.39 0.35 17.38 1.22 1.09 1.64 10.49 -10.12 -8.50 0.13 1.36 -1.31 -1.10 0.30 1.77 0.28 0.32 0.39 0.34 17.33 1.23 1.08 1.64 -22.48 15.88 0.54 0.13 -2.90 2.05 0.07 0.62 0.86 1.04 0.32 0.40 0.34 17.29 1.24 1.06 1.64 3.56 -1.13 -1.44 0.13 0.46 -0.15 -0.19 0.70 1.34 0.56 0.32 0.40 0.33 17.24 1.25 1.05 1.64 4.55 -7.10 -1.42 0.13 0.58 -0.91 -0.18 0.80 0.79 0.11 0.32 0.40 0.33 17.19 1.27 1.04 1.64 -9.43 15.90 8.59 0.13 -1.20 2.03 1.10 0.49 0.57 0.46 0.32 0.41 0.32 17.14 1.28 1.03 1.64 -1.41 -13.09 7.58 0.13 -0.18 -1.66 0.96 1.02 0.78 1.18 0.32 0.41 0.32 17.09 1.29 1.02 1.65 -7.39 -2.05 1.58 0.13 -0.93 -0.26 0.20 1.54 1.40 1.09 0.31 0.41 0.31 17.04 1.31 1.00 1.65 0.63 17.93 5.58 0.13 0.08 2.26 0.70 0.44 1.35 0.15 0.31 0.41 0.31 16.99 1.33 1.00 1.66 -6.35 -10.07 5.58 0.13 -0.80 -1.26 0.70 0.66 0.38 0.27 0.31 0.42 0.31 16.94 1.34 0.99 1.67 1.66 0.97 3.58 0.13 0.21 0.12 0.45 0.25 0.26 0.08 0.31 0.42 0.30 16.89 1.36 0.98 1.68 7.65 1.98 1.59 0.12 0.95 0.25 0.20 0.80 0.36 1.20 0.30 0.42 0.30 16.85 1.38 0.97 1.69
-14.33 -4.01 -8.38 0.12 -1.78 -0.50 -1.04 1.55 0.95 0.61 0.30 0.42 0.29 16.80 1.41 0.97 1.71 11.68 6.01 -2.34 0.12 1.44 0.74 -0.29 1.02 0.68 0.55 0.30 0.42 0.29 16.75 1.43 0.96 1.72 -3.34 -10.97 9.67 0.12 -0.41 -1.35 1.19 0.49 0.98 0.51 0.29 0.43 0.28 16.70 1.45 0.96 1.74 -25.27 0.07 6.65 0.12 -3.10 0.01 0.82 3.48 5.08 3.64 0.29 0.43 0.28 16.65 1.47 0.96 1.76 14.75 11.06 9.64 0.12 1.80 1.35 1.18 3.98 6.75 4.95 0.29 0.43 0.27 16.60 1.50 0.96 1.78 -5.26 -3.94 1.64 0.12 -0.64 -0.48 0.20 2.26 2.29 3.19 0.28 0.43 0.27 16.55 1.52 0.96 1.79 -17.21 4.08 0.65 0.12 -2.08 0.49 0.08 0.34 0.76 1.60 0.28 0.43 0.27 16.50 1.54 0.96 1.81 16.79 -0.92 13.64 0.12 2.02 -0.11 1.64 0.12 0.14 0.58 0.28 0.43 0.26 16.46 1.56 0.96 1.83 -7.22 -12.87 -1.36 0.12 -0.87 -1.54 -0.16 0.57 0.57 0.46 0.27 0.43 0.26 16.41 1.58 0.96 1.85

478
Raw Data Tapered
Data FFT Data Parzen Filtered
Data Simple Ratio
Spectrum Z E N
Tapering Function
Z E N Z E N Z E N
Frequency Hz
E/Z N/Z
Mean SQRT Spectrum
-18.17 -7.82 13.63 0.12 -2.17 -0.93 1.63 0.48 0.69 1.01 0.27 0.43 0.26 16.36 1.60 0.97 1.87 5.86 -11.76 8.60 0.12 0.70 -1.40 1.02 0.12 0.39 0.35 0.27 0.43 0.26 16.31 1.61 0.97 1.88 -9.12 -0.72 -35.32 0.12 -1.08 -0.09 -4.19 0.95 0.36 0.56 0.27 0.43 0.26 16.26 1.62 0.97 1.89 -16.07 1.29 2.76 0.12 -1.90 0.15 0.33 1.11 0.69 0.53 0.26 0.43 0.26 16.21 1.63 0.98 1.90 0.97 -9.68 29.71 0.12 0.11 -1.14 3.49 1.17 0.99 0.23 0.26 0.43 0.26 16.16 1.63 0.98 1.91 6.96 10.34 -2.32 0.12 0.81 1.21 -0.27 0.93 0.77 0.65 0.26 0.43 0.26 16.11 1.64 0.98 1.91 -9.03 9.31 3.69 0.12 -1.05 1.09 0.43 0.73 1.00 0.26 0.27 0.43 0.26 16.06 1.63 0.98 1.91 -7.00 -7.67 10.68 0.12 -0.81 -0.89 1.24 0.98 1.29 0.91 0.27 0.43 0.26 16.02 1.62 0.99 1.90 9.00 9.34 -9.30 0.12 1.04 1.08 -1.07 0.13 1.35 0.23 0.27 0.43 0.27 15.97 1.61 0.99 1.89 4.98 4.32 -6.25 0.12 0.57 0.50 -0.72 0.25 2.02 0.26 0.27 0.44 0.27 15.92 1.60 0.99 1.88
-11.00 -10.65 22.74 0.11 -1.26 -1.22 2.60 1.36 1.55 0.58 0.28 0.44 0.27 15.87 1.58 0.99 1.87 -11.95 -3.60 18.67 0.11 -1.36 -0.41 2.13 0.96 1.21 1.20 0.28 0.44 0.28 15.82 1.56 0.99 1.85 22.03 -1.58 -7.33 0.11 2.50 -0.18 -0.83 1.27 1.42 1.60 0.29 0.44 0.29 15.77 1.54 0.99 1.83 8.98 10.42 -10.28 0.11 1.01 1.18 -1.16 1.45 1.37 0.49 0.29 0.45 0.29 15.72 1.52 0.99 1.81
-19.00 -0.59 8.74 0.11 -2.14 -0.07 0.98 0.97 1.23 0.72 0.30 0.45 0.30 15.67 1.50 0.99 1.80 2.04 -8.55 18.71 0.11 0.23 -0.96 2.10 0.51 0.75 0.69 0.31 0.45 0.31 15.63 1.47 0.99 1.78 3.04 23.43 -1.31 0.11 0.34 2.61 -0.15 0.69 0.37 0.86 0.31 0.46 0.31 15.58 1.45 1.00 1.76 4.03 -4.59 -1.29 0.11 0.45 -0.51 -0.14 0.35 0.45 0.32 0.32 0.46 0.32 15.53 1.43 1.00 1.74 8.01 -22.52 4.72 0.11 0.88 -2.49 0.52 0.16 0.90 0.42 0.33 0.46 0.33 15.48 1.41 1.00 1.73 5.99 17.50 -7.25 0.11 0.66 1.93 -0.80 1.58 0.52 0.41 0.34 0.47 0.34 15.43 1.39 1.00 1.71 1.97 2.48 11.76 0.11 0.22 0.27 1.29 2.11 0.99 0.16 0.34 0.47 0.34 15.38 1.37 1.00 1.70 -1.02 9.47 10.73 0.11 -0.11 1.03 1.17 1.04 0.91 1.43 0.35 0.48 0.35 15.33 1.35 1.00 1.68 4.98 34.40 -13.25 0.11 0.54 3.73 -1.44 0.31 0.48 1.83 0.36 0.48 0.36 15.28 1.34 1.00 1.67 -9.01 -2.65 -2.20 0.11 -0.97 -0.29 -0.24 0.98 1.50 1.01 0.36 0.48 0.36 15.23 1.33 1.00 1.66 6.00 8.35 -6.16 0.11 0.64 0.90 -0.66 1.78 0.74 0.73 0.37 0.49 0.37 15.19 1.31 1.00 1.65 14.96 18.31 -8.11 0.11 1.60 1.96 -0.87 1.74 0.48 0.67 0.37 0.49 0.38 15.14 1.30 1.00 1.65 -23.02 -10.69 7.90 0.11 -2.45 -1.14 0.84 1.70 0.32 1.32 0.38 0.49 0.38 15.09 1.30 1.00 1.64 -2.96 18.31 -10.07 0.11 -0.31 1.94 -1.07 0.59 0.73 1.02 0.38 0.49 0.38 15.04 1.29 1.00 1.63 15.02 13.26 -15.00 0.11 1.58 1.40 -1.58 4.01 0.63 0.11 0.38 0.49 0.38 14.99 1.28 1.00 1.63 -6.99 -6.74 0.04 0.11 -0.73 -0.71 0.00 3.40 0.18 1.46 0.39 0.49 0.38 14.94 1.28 1.00 1.62 2.03 19.25 -7.92 0.10 0.21 2.01 -0.83 2.42 1.58 1.20 0.39 0.49 0.38 14.89 1.27 0.99 1.61

479
Raw Data Tapered
Data FFT Data Parzen Filtered
Data Simple Ratio
Spectrum Z E N
Tapering Function
Z E N Z E N Z E N
Frequency Hz
E/Z N/Z
Mean SQRT Spectrum
7.01 -2.77 -5.88 0.10 0.73 -0.29 -0.61 2.18 1.33 1.25 0.39 0.49 0.38 14.84 1.26 0.99 1.61 6.99 -12.72 0.15 0.10 0.72 -1.32 0.02 1.62 0.96 1.02 0.39 0.49 0.38 14.79 1.26 0.98 1.60 9.96 4.31 -8.81 0.10 1.03 0.44 -0.91 0.19 1.36 0.48 0.39 0.48 0.38 14.75 1.25 0.98 1.59 -8.04 -2.68 -7.76 0.10 -0.82 -0.27 -0.80 0.23 1.35 0.76 0.38 0.48 0.37 14.70 1.24 0.97 1.58 0.98 11.32 7.26 0.10 0.10 1.15 0.74 0.14 1.39 0.41 0.38 0.47 0.37 14.65 1.23 0.96 1.56 18.95 17.28 19.23 0.10 1.92 1.75 1.95 1.17 2.05 0.89 0.38 0.47 0.36 14.60 1.22 0.95 1.55 -8.07 -11.72 11.19 0.10 -0.82 -1.18 1.13 2.13 1.34 0.57 0.38 0.46 0.36 14.55 1.21 0.93 1.53 -2.05 -20.64 -5.81 0.10 -0.21 -2.07 -0.58 1.41 0.52 0.80 0.38 0.46 0.35 14.50 1.20 0.92 1.51 -3.03 -10.57 5.21 0.10 -0.30 -1.06 0.52 1.23 0.60 0.52 0.38 0.45 0.34 14.45 1.18 0.91 1.49 -17.98 4.46 -1.78 0.10 -1.79 0.44 -0.18 0.93 1.93 1.33 0.38 0.44 0.34 14.40 1.16 0.89 1.46 25.01 16.43 -17.72 0.10 2.48 1.63 -1.75 1.36 1.22 0.95 0.38 0.44 0.33 14.36 1.14 0.87 1.44 -5.03 -4.58 6.32 0.10 -0.50 -0.45 0.62 1.99 0.49 1.07 0.38 0.43 0.33 14.31 1.12 0.86 1.41 -31.95 -7.54 12.30 0.10 -3.13 -0.74 1.21 2.65 1.85 0.94 0.39 0.42 0.32 14.26 1.09 0.84 1.38 19.08 4.48 12.27 0.10 1.86 0.44 1.20 2.43 2.41 0.80 0.39 0.41 0.32 14.21 1.07 0.82 1.34 10.03 -7.50 6.26 0.10 0.97 -0.73 0.61 2.28 1.11 1.13 0.39 0.41 0.31 14.16 1.04 0.80 1.31 -6.97 3.53 -5.73 0.10 -0.67 0.34 -0.55 2.37 1.71 1.48 0.40 0.40 0.31 14.11 1.01 0.78 1.27 -4.94 4.52 23.26 0.10 -0.47 0.43 2.23 1.32 0.95 0.57 0.40 0.39 0.31 14.06 0.97 0.76 1.24 -3.92 -13.44 6.21 0.10 -0.37 -1.28 0.59 1.38 1.52 0.76 0.41 0.39 0.31 14.01 0.94 0.75 1.20 15.06 -0.40 -18.74 0.10 1.43 -0.04 -1.78 2.29 0.54 1.32 0.42 0.38 0.31 13.96 0.91 0.73 1.17 -6.95 12.59 8.30 0.09 -0.66 1.19 0.78 1.71 0.23 0.75 0.43 0.38 0.31 13.92 0.89 0.71 1.14 -7.91 5.57 4.29 0.09 -0.74 0.52 0.40 1.52 0.75 0.56 0.44 0.38 0.31 13.87 0.86 0.70 1.11 19.07 7.56 -1.70 0.09 1.78 0.71 -0.16 2.88 0.64 0.95 0.45 0.37 0.31 13.82 0.83 0.69 1.08 -8.95 1.55 12.30 0.09 -0.83 0.14 1.14 2.01 1.09 0.54 0.46 0.37 0.31 13.77 0.81 0.67 1.05 -9.90 3.56 14.26 0.09 -0.92 0.33 1.32 3.33 3.27 0.23 0.47 0.37 0.31 13.72 0.79 0.66 1.03 -0.88 22.52 -2.74 0.09 -0.08 2.07 -0.25 3.52 0.94 0.46 0.48 0.37 0.31 13.67 0.77 0.65 1.01 -7.85 -3.51 -8.70 0.09 -0.72 -0.32 -0.80 3.84 1.56 0.95 0.49 0.37 0.31 13.62 0.75 0.64 0.99 16.14 -12.46 2.33 0.09 1.47 -1.13 0.21 2.39 1.42 1.28 0.50 0.37 0.32 13.57 0.74 0.63 0.97 -4.88 19.54 4.34 0.09 -0.44 1.77 0.39 2.54 0.72 1.45 0.51 0.37 0.32 13.53 0.73 0.62 0.96 -12.84 5.50 14.32 0.09 -1.16 0.50 1.29 1.68 0.87 1.10 0.52 0.37 0.32 13.48 0.72 0.61 0.94 14.16 -3.49 -0.69 0.09 1.27 -0.31 -0.06 0.75 0.99 1.19 0.53 0.38 0.32 13.43 0.71 0.61 0.93 -10.84 11.51 -10.65 0.09 -0.96 1.02 -0.95 1.80 0.88 0.55 0.54 0.38 0.32 13.38 0.70 0.60 0.92

480
Raw Data Tapered
Data FFT Data Parzen Filtered
Data Simple Ratio
Spectrum Z E N
Tapering Function
Z E N Z E N Z E N
Frequency Hz
E/Z N/Z
Mean SQRT Spectrum
-10.79 10.48 8.37 0.09 -0.96 0.93 0.74 2.35 1.38 0.23 0.55 0.38 0.33 13.33 0.69 0.59 0.91 -0.76 2.47 -1.63 0.09 -0.07 0.22 -0.14 1.76 0.76 1.10 0.56 0.39 0.33 13.28 0.69 0.58 0.90 -13.73 -2.52 10.37 0.09 -1.20 -0.22 0.91 1.38 0.37 0.64 0.57 0.39 0.33 13.23 0.69 0.58 0.90 1.30 3.49 10.35 0.09 0.11 0.30 0.90 1.83 0.21 0.52 0.58 0.40 0.33 13.18 0.69 0.57 0.89
-17.66 1.50 -22.61 0.09 -1.53 0.13 -1.96 0.90 0.85 0.69 0.59 0.40 0.33 13.13 0.68 0.56 0.89 -15.59 3.50 2.45 0.09 -1.34 0.30 0.21 1.70 1.05 1.15 0.60 0.41 0.33 13.09 0.68 0.55 0.88 17.42 4.50 17.43 0.09 1.49 0.38 1.49 1.11 1.86 0.29 0.61 0.42 0.33 13.04 0.68 0.55 0.87 -16.58 2.50 -10.57 0.09 -1.41 0.21 -0.90 0.81 0.83 0.62 0.62 0.42 0.33 12.99 0.68 0.54 0.87 -3.53 13.48 -15.50 0.08 -0.30 1.14 -1.31 1.44 1.40 0.47 0.63 0.43 0.33 12.94 0.68 0.53 0.86 19.44 2.46 -8.43 0.08 1.63 0.21 -0.71 2.45 1.61 0.72 0.64 0.43 0.33 12.89 0.67 0.52 0.85 -19.55 -8.51 -4.39 0.08 -1.63 -0.71 -0.37 0.47 1.22 0.78 0.65 0.43 0.33 12.84 0.67 0.52 0.85 16.46 -6.47 -3.35 0.08 1.37 -0.54 -0.28 0.41 0.55 1.37 0.66 0.44 0.33 12.79 0.67 0.51 0.84 29.37 -10.42 -11.31 0.08 2.42 -0.86 -0.93 0.32 1.46 1.43 0.67 0.44 0.33 12.74 0.66 0.50 0.83 -28.63 0.61 -3.26 0.08 -2.35 0.05 -0.27 1.66 1.60 1.76 0.68 0.44 0.33 12.70 0.66 0.49 0.82 -2.56 -9.36 10.74 0.08 -0.21 -0.76 0.88 1.66 1.21 1.20 0.69 0.45 0.33 12.65 0.65 0.48 0.81 22.41 -11.30 -7.24 0.08 1.82 -0.92 -0.59 2.08 1.79 1.56 0.70 0.45 0.33 12.60 0.64 0.48 0.80 -2.63 8.72 -4.20 0.08 -0.21 0.70 -0.34 1.20 1.50 3.94 0.71 0.45 0.33 12.55 0.64 0.47 0.79 -3.61 -11.26 15.79 0.08 -0.29 -0.90 1.26 3.31 0.97 3.32 0.72 0.45 0.33 12.50 0.63 0.46 0.78 2.40 -17.19 -3.22 0.08 0.19 -1.37 -0.26 2.62 0.27 0.85 0.72 0.45 0.33 12.45 0.62 0.46 0.77 20.36 0.85 -3.19 0.08 1.61 0.07 -0.25 2.45 1.19 1.55 0.73 0.45 0.33 12.40 0.62 0.45 0.76 -7.66 7.85 0.84 0.08 -0.60 0.62 0.07 3.97 0.73 2.06 0.74 0.45 0.33 12.35 0.61 0.45 0.76 -30.58 1.85 -5.14 0.08 -2.38 0.14 -0.40 3.96 0.91 1.55 0.74 0.45 0.33 12.30 0.60 0.44 0.75 21.45 -12.12 15.86 0.08 1.66 -0.94 1.23 3.75 1.42 0.60 0.75 0.45 0.33 12.26 0.60 0.44 0.74 12.39 -6.07 11.82 0.08 0.95 -0.47 0.91 3.12 1.15 0.79 0.75 0.44 0.33 12.21 0.59 0.44 0.74 -4.63 -7.03 0.82 0.08 -0.35 -0.54 0.06 2.18 1.01 1.23 0.75 0.44 0.33 12.16 0.59 0.44 0.73 11.37 -1.00 3.82 0.08 0.86 -0.08 0.29 3.80 1.97 1.71 0.75 0.44 0.33 12.11 0.58 0.44 0.73 -19.61 3.01 -4.16 0.08 -1.48 0.23 -0.31 3.07 1.47 1.84 0.75 0.44 0.33 12.06 0.58 0.44 0.73 0.43 -14.95 7.85 0.08 0.03 -1.12 0.59 2.84 1.29 0.63 0.75 0.43 0.33 12.01 0.58 0.44 0.73 23.39 10.07 4.85 0.07 1.74 0.75 0.36 2.40 1.04 1.75 0.75 0.43 0.33 11.96 0.58 0.44 0.73 -24.60 19.03 -10.13 0.07 -1.82 1.41 -0.75 1.58 1.71 1.15 0.74 0.43 0.33 11.91 0.58 0.45 0.73 -19.51 -11.97 1.91 0.07 -1.43 -0.88 0.14 0.95 0.48 0.30 0.74 0.43 0.34 11.87 0.58 0.46 0.74

481
Raw Data Tapered
Data FFT Data Parzen Filtered
Data Simple Ratio
Spectrum Z E N
Tapering Function
Z E N Z E N Z E N
Frequency Hz
E/Z N/Z
Mean SQRT Spectrum
28.48 -13.90 -7.06 0.07 2.08 -1.02 -0.52 2.08 0.84 0.21 0.73 0.43 0.34 11.82 0.58 0.46 0.74 5.42 6.13 -8.02 0.07 0.39 0.44 -0.58 2.88 1.40 1.04 0.73 0.43 0.35 11.77 0.58 0.47 0.75
-18.55 16.10 7.00 0.07 -1.34 1.16 0.50 1.17 1.01 1.04 0.72 0.42 0.35 11.72 0.59 0.48 0.76 9.47 -9.90 -2.99 0.07 0.68 -0.71 -0.21 2.13 1.27 0.77 0.72 0.42 0.36 11.67 0.59 0.50 0.77 5.45 -5.86 0.04 0.07 0.39 -0.42 0.00 2.43 1.87 0.91 0.71 0.42 0.36 11.62 0.59 0.51 0.78 -7.54 17.13 12.03 0.07 -0.53 1.21 0.85 1.17 1.72 0.52 0.71 0.42 0.37 11.57 0.59 0.52 0.79 -15.49 -4.88 -1.97 0.07 -1.08 -0.34 -0.14 1.15 1.05 1.48 0.71 0.42 0.38 11.52 0.60 0.54 0.80 -18.41 3.14 -12.92 0.07 -1.28 0.22 -0.90 2.06 1.21 0.89 0.71 0.42 0.39 11.47 0.60 0.55 0.81 16.60 11.13 8.10 0.07 1.15 0.77 0.56 2.39 1.86 1.02 0.71 0.42 0.40 11.43 0.60 0.56 0.82 0.57 -6.87 12.08 0.07 0.04 -0.47 0.83 3.26 0.89 0.90 0.71 0.43 0.41 11.38 0.60 0.57 0.83
-10.41 13.13 -12.90 0.07 -0.71 0.89 -0.88 4.29 2.55 0.79 0.71 0.43 0.42 11.33 0.60 0.59 0.84 8.60 15.09 -12.83 0.07 0.58 1.02 -0.87 1.62 0.62 0.89 0.72 0.43 0.43 11.28 0.60 0.60 0.84
-10.39 5.06 6.20 0.07 -0.70 0.34 0.42 1.62 1.62 1.20 0.72 0.43 0.44 11.23 0.59 0.60 0.85 27.58 3.06 7.19 0.07 1.83 0.20 0.48 1.19 2.17 0.26 0.73 0.43 0.45 11.18 0.59 0.61 0.85 8.52 -5.92 12.17 0.07 0.56 -0.39 0.80 2.17 1.01 1.36 0.74 0.43 0.45 11.13 0.59 0.61 0.85
-42.41 5.10 7.15 0.07 -2.78 0.33 0.47 2.13 0.54 1.19 0.75 0.44 0.46 11.08 0.58 0.62 0.85 14.65 2.10 -23.80 0.07 0.95 0.14 -1.55 1.57 1.51 1.13 0.76 0.44 0.47 11.04 0.58 0.62 0.84 13.60 -4.88 -1.73 0.06 0.88 -0.32 -0.11 1.43 2.45 2.20 0.77 0.44 0.48 10.99 0.57 0.62 0.84 -21.38 5.13 19.25 0.06 -1.37 0.33 1.23 2.59 2.15 2.13 0.78 0.44 0.48 10.94 0.56 0.61 0.83 -5.32 1.13 -4.76 0.06 -0.34 0.07 -0.30 3.75 0.93 1.57 0.80 0.45 0.49 10.89 0.56 0.61 0.83 11.67 1.14 -3.72 0.06 0.74 0.07 -0.23 2.62 0.66 0.65 0.81 0.45 0.49 10.84 0.55 0.60 0.82 7.64 -4.84 -15.67 0.06 0.48 -0.30 -0.98 2.21 2.09 0.26 0.82 0.45 0.49 10.79 0.55 0.60 0.81
-27.31 -15.78 -10.60 0.06 -1.69 -0.98 -0.66 3.08 1.64 0.56 0.83 0.45 0.49 10.74 0.54 0.59 0.80 -14.22 -2.73 20.40 0.06 -0.87 -0.17 1.25 3.14 0.36 1.34 0.84 0.46 0.49 10.69 0.54 0.58 0.79 9.79 10.27 -9.60 0.06 0.60 0.63 -0.59 1.73 1.16 1.63 0.85 0.46 0.49 10.64 0.54 0.57 0.79 -5.21 -2.74 -21.52 0.06 -0.32 -0.17 -1.30 1.59 1.16 0.95 0.86 0.46 0.49 10.60 0.53 0.56 0.78 10.78 -9.70 -1.46 0.06 0.65 -0.58 -0.09 0.46 0.08 0.45 0.87 0.46 0.48 10.55 0.53 0.56 0.77 3.76 10.32 -10.42 0.06 0.22 0.61 -0.62 2.48 1.08 0.98 0.88 0.47 0.48 10.50 0.53 0.55 0.76
-18.20 1.31 0.62 0.06 -1.07 0.08 0.04 3.38 1.38 2.57 0.88 0.47 0.47 10.45 0.54 0.54 0.76 2.83 -13.66 1.63 0.06 0.17 -0.80 0.10 1.71 1.62 1.59 0.88 0.47 0.47 10.40 0.54 0.53 0.75 7.82 -0.61 -7.34 0.06 0.45 -0.04 -0.43 0.49 2.27 1.16 0.88 0.48 0.46 10.35 0.54 0.52 0.75

482
Raw Data Tapered
Data FFT Data Parzen Filtered
Data Simple Ratio
Spectrum Z E N
Tapering Function
Z E N Z E N Z E N
Frequency Hz
E/Z N/Z
Mean SQRT Spectrum
-7.18 2.40 10.68 0.06 -0.41 0.14 0.61 2.58 3.43 2.02 0.89 0.48 0.45 10.30 0.54 0.51 0.75 -0.16 5.40 0.67 0.06 -0.01 0.31 0.04 2.37 1.06 1.01 0.88 0.48 0.45 10.25 0.55 0.51 0.75 10.83 6.39 -19.27 0.06 0.61 0.36 -1.09 2.72 2.11 1.08 0.88 0.49 0.44 10.21 0.55 0.50 0.75 7.80 0.39 -1.21 0.06 0.44 0.02 -0.07 0.73 0.51 1.11 0.88 0.49 0.44 10.16 0.56 0.49 0.75 6.77 8.38 17.77 0.06 0.38 0.47 0.99 1.63 0.31 0.80 0.88 0.49 0.43 10.11 0.56 0.49 0.75 14.74 0.38 4.74 0.06 0.81 0.02 0.26 2.30 0.66 1.88 0.87 0.50 0.42 10.06 0.57 0.49 0.75 15.68 8.37 -0.25 0.05 0.85 0.46 -0.01 2.52 1.62 1.53 0.87 0.50 0.42 10.01 0.58 0.48 0.75 -0.34 27.32 2.77 0.05 -0.02 1.48 0.15 2.89 2.08 0.57 0.87 0.51 0.42 9.96 0.58 0.48 0.76 -1.33 9.26 2.77 0.05 -0.07 0.50 0.15 1.27 3.04 0.78 0.86 0.51 0.41 9.91 0.59 0.48 0.76 3.67 0.25 14.75 0.05 0.19 0.01 0.78 1.18 2.55 1.53 0.86 0.51 0.41 9.86 0.60 0.48 0.77
-11.31 -3.73 1.74 0.05 -0.59 -0.20 0.09 0.25 1.04 1.11 0.85 0.51 0.41 9.81 0.60 0.48 0.77 0.72 0.29 -10.23 0.05 0.04 0.02 -0.53 1.97 1.43 0.65 0.85 0.52 0.41 9.77 0.61 0.48 0.78 31.66 13.28 3.81 0.05 1.63 0.68 0.20 2.25 1.42 0.24 0.85 0.52 0.41 9.72 0.61 0.48 0.78 25.55 -2.73 5.80 0.05 1.30 -0.14 0.30 2.42 1.79 0.85 0.84 0.52 0.41 9.67 0.62 0.49 0.79 -1.50 4.28 6.80 0.05 -0.08 0.22 0.34 0.52 0.46 0.97 0.84 0.52 0.41 9.62 0.62 0.49 0.79 0.51 7.27 -4.19 0.05 0.03 0.36 -0.21 1.80 0.27 0.35 0.84 0.52 0.41 9.57 0.62 0.49 0.80 -1.48 -9.71 -17.13 0.05 -0.07 -0.48 -0.85 0.77 0.31 1.20 0.83 0.52 0.42 9.52 0.63 0.50 0.80 -25.42 14.29 -4.07 0.05 -1.25 0.70 -0.20 2.10 1.17 0.14 0.83 0.53 0.42 9.47 0.63 0.50 0.81 6.62 14.25 -4.04 0.05 0.32 0.69 -0.20 1.83 0.63 1.77 0.83 0.53 0.42 9.42 0.64 0.51 0.81 25.56 -3.76 -13.98 0.05 1.23 -0.18 -0.67 1.01 0.62 1.88 0.83 0.53 0.43 9.38 0.64 0.51 0.82 -3.48 3.25 -0.93 0.05 -0.17 0.15 -0.04 1.18 1.00 1.62 0.83 0.53 0.43 9.33 0.64 0.52 0.83 16.50 -3.73 2.08 0.05 0.78 -0.18 0.10 0.83 1.26 1.27 0.82 0.53 0.43 9.28 0.64 0.53 0.83 17.44 -2.71 -20.86 0.05 0.81 -0.13 -0.97 1.32 1.48 0.26 0.82 0.53 0.44 9.23 0.65 0.53 0.84 -16.55 5.30 -27.75 0.05 -0.76 0.24 -1.28 2.84 1.93 1.13 0.82 0.53 0.44 9.18 0.65 0.54 0.84 -14.49 5.29 2.32 0.05 -0.66 0.24 0.11 3.56 2.70 2.33 0.81 0.53 0.44 9.13 0.65 0.54 0.85 -0.45 -2.70 12.31 0.05 -0.02 -0.12 0.55 2.69 2.11 2.29 0.81 0.53 0.44 9.08 0.66 0.55 0.86 13.53 -14.65 -13.67 0.04 0.60 -0.65 -0.61 1.23 0.35 0.84 0.80 0.53 0.44 9.03 0.66 0.55 0.86 2.50 4.38 -10.60 0.04 0.11 0.19 -0.47 2.04 0.52 2.19 0.80 0.53 0.45 8.98 0.67 0.56 0.87 -3.49 7.37 -1.56 0.04 -0.15 0.32 -0.07 2.54 1.72 2.37 0.79 0.53 0.45 8.94 0.67 0.56 0.88 12.50 -9.61 -10.51 0.04 0.54 -0.41 -0.45 1.12 2.12 2.45 0.79 0.53 0.45 8.89 0.68 0.57 0.89 3.47 -9.56 -8.46 0.04 0.15 -0.41 -0.36 0.98 0.48 1.26 0.78 0.53 0.45 8.84 0.69 0.58 0.90

483
Raw Data Tapered
Data FFT Data Parzen Filtered
Data Simple Ratio
Spectrum Z E N
Tapering Function
Z E N Z E N Z E N
Frequency Hz
E/Z N/Z
Mean SQRT Spectrum
0.47 -9.51 -19.38 0.04 0.02 -0.40 -0.81 0.90 0.46 2.41 0.77 0.53 0.45 8.79 0.69 0.58 0.90 -2.52 -1.47 -19.29 0.04 -0.10 -0.06 -0.80 1.07 1.85 2.35 0.77 0.53 0.45 8.74 0.70 0.59 0.91 -5.50 -10.43 7.75 0.04 -0.23 -0.43 0.32 0.79 1.83 1.64 0.76 0.53 0.45 8.69 0.71 0.59 0.92 9.49 -24.35 -4.23 0.04 0.38 -0.99 -0.17 1.11 0.79 0.86 0.75 0.53 0.45 8.64 0.71 0.59 0.93 1.48 -5.28 -5.20 0.04 0.06 -0.21 -0.21 2.25 1.50 0.67 0.74 0.53 0.44 8.59 0.72 0.60 0.94
-10.50 2.74 18.80 0.04 -0.41 0.11 0.74 0.18 1.62 0.88 0.73 0.53 0.44 8.54 0.73 0.60 0.94 2.52 -15.22 -1.22 0.04 0.10 -0.59 -0.05 1.84 1.15 1.79 0.73 0.53 0.44 8.50 0.73 0.61 0.95 4.51 -3.17 -6.19 0.04 0.17 -0.12 -0.24 0.93 0.62 0.97 0.72 0.53 0.44 8.45 0.74 0.62 0.96 -6.48 9.83 5.83 0.04 -0.25 0.37 0.22 0.97 2.78 0.34 0.71 0.53 0.44 8.40 0.74 0.62 0.97 -4.45 -11.15 4.83 0.04 -0.17 -0.42 0.18 1.56 2.94 2.46 0.70 0.52 0.44 8.35 0.75 0.63 0.98 -5.42 -4.11 15.81 0.04 -0.20 -0.15 0.58 1.71 1.07 1.57 0.69 0.52 0.44 8.30 0.75 0.64 0.98 -2.40 6.90 2.79 0.04 -0.09 0.25 0.10 0.04 0.18 2.11 0.69 0.52 0.44 8.25 0.76 0.64 0.99 -16.36 -5.09 -8.18 0.04 -0.59 -0.18 -0.29 1.84 1.04 1.99 0.68 0.52 0.44 8.20 0.76 0.65 1.00 -1.32 -1.06 12.83 0.04 -0.05 -0.04 0.46 1.78 1.43 0.54 0.67 0.51 0.45 8.15 0.76 0.66 1.01 5.68 1.95 11.80 0.04 0.20 0.07 0.41 1.44 0.88 0.72 0.67 0.51 0.45 8.11 0.77 0.67 1.02
-28.27 3.95 7.78 0.03 -0.98 0.14 0.27 0.79 0.77 0.35 0.66 0.51 0.45 8.06 0.77 0.68 1.03 11.77 -2.04 5.77 0.03 0.40 -0.07 0.20 0.08 1.41 1.16 0.66 0.51 0.46 8.01 0.77 0.69 1.04 -0.25 -10.00 -10.21 0.03 -0.01 -0.34 -0.34 1.26 1.23 0.34 0.65 0.50 0.46 7.96 0.77 0.71 1.05 -32.18 1.03 12.81 0.03 -1.06 0.03 0.42 2.04 0.83 2.00 0.65 0.50 0.47 7.91 0.77 0.72 1.06 18.85 -0.96 11.78 0.03 0.61 -0.03 0.38 0.64 1.03 2.76 0.64 0.50 0.47 7.86 0.78 0.73 1.07 5.81 2.06 -17.19 0.03 0.19 0.07 -0.55 0.91 0.30 2.82 0.64 0.50 0.48 7.81 0.78 0.75 1.08
-22.15 1.06 9.84 0.03 -0.70 0.03 0.31 0.93 1.55 1.59 0.63 0.50 0.49 7.76 0.78 0.77 1.10 -19.06 -13.90 6.82 0.03 -0.59 -0.43 0.21 1.23 1.38 1.00 0.63 0.49 0.49 7.71 0.79 0.79 1.11 7.97 1.14 -20.13 0.03 0.24 0.03 -0.61 1.74 1.14 1.02 0.62 0.49 0.50 7.67 0.79 0.80 1.13 10.93 7.14 -0.07 0.03 0.33 0.21 0.00 1.11 1.85 0.95 0.62 0.49 0.51 7.62 0.80 0.82 1.14 -22.04 -7.85 -10.03 0.03 -0.65 -0.23 -0.30 1.07 2.29 0.34 0.61 0.49 0.52 7.57 0.80 0.84 1.16 3.01 -2.81 -8.98 0.03 0.09 -0.08 -0.26 3.19 1.34 1.60 0.61 0.49 0.52 7.52 0.81 0.86 1.18 13.98 8.19 8.04 0.03 0.40 0.23 0.23 3.91 0.20 1.99 0.60 0.49 0.53 7.47 0.82 0.88 1.20 -5.03 10.17 -10.93 0.03 -0.14 0.28 -0.31 1.97 0.45 1.40 0.60 0.49 0.54 7.42 0.83 0.90 1.22 -17.98 -3.83 -5.88 0.03 -0.49 -0.11 -0.16 1.93 0.80 1.04 0.59 0.49 0.54 7.37 0.84 0.92 1.24 3.06 1.19 -5.84 0.03 0.08 0.03 -0.16 1.01 0.13 0.42 0.58 0.49 0.55 7.32 0.85 0.94 1.26

484
Raw Data Tapered
Data FFT Data Parzen Filtered
Data Simple Ratio
Spectrum Z E N
Tapering Function
Z E N Z E N Z E N
Frequency Hz
E/Z N/Z
Mean SQRT Spectrum
27.00 23.16 -9.79 0.03 0.72 0.61 -0.26 1.04 0.69 0.86 0.58 0.49 0.55 7.28 0.86 0.95 27.00 -6.03 5.11 4.24 0.03 -0.16 0.13 0.11 1.22 0.11 1.21 0.57 0.50 0.55 7.23 0.87 0.97 -6.03 6.97 -2.88 -17.71 0.03 0.18 -0.07 -0.45 1.91 1.06 2.02 0.56 0.50 0.56 7.18 0.88 0.99 6.97 23.92 17.11 -9.64 0.03 0.60 0.43 -0.24 2.59 1.69 4.20 0.56 0.50 0.56 7.13 0.89 1.00 23.92 5.86 7.07 15.37 0.02 0.14 0.17 0.38 1.15 3.21 3.64 0.55 0.50 0.56 7.08 0.90 1.02 5.86 14.83 -7.91 -5.63 0.02 0.36 -0.19 -0.14 1.75 2.11 1.46 0.54 0.50 0.56 7.03 0.91 1.03 14.83 7.79 10.10 1.40 0.02 0.18 0.24 0.03 1.40 3.44 1.61 0.54 0.49 0.56 6.98 0.92 1.04 7.79 -0.22 5.08 3.40 0.02 -0.01 0.12 0.08 1.20 2.84 3.12 0.53 0.49 0.56 6.93 0.93 1.05 -0.22 13.76 -23.87 -3.58 0.02 0.31 -0.54 -0.08 1.36 0.33 1.00 0.52 0.49 0.56 6.88 0.94 1.06 13.76 16.70 4.18 2.45 0.02 0.37 0.09 0.05 2.24 2.46 1.88 0.52 0.49 0.55 6.84 0.94 1.07 16.70 3.66 8.17 -19.50 0.02 0.08 0.18 -0.42 5.19 5.42 3.43 0.52 0.49 0.55 6.79 0.95 1.07 3.66 9.64 -18.79 0.56 0.02 0.20 -0.39 0.01 2.62 2.33 1.19 0.51 0.49 0.55 6.74 0.95 1.07 9.64 7.61 4.25 21.53 0.02 0.16 0.09 0.44 0.79 1.56 0.57 0.51 0.48 0.55 6.69 0.95 1.08 7.61 -5.39 -8.73 -8.48 0.02 -0.11 -0.17 -0.17 2.53 3.13 3.70 0.51 0.48 0.55 6.64 0.95 1.07 -5.39 -5.36 -19.66 -2.44 0.02 -0.10 -0.38 -0.05 2.44 2.93 3.87 0.51 0.48 0.54 6.59 0.94 1.07 -5.36 -10.32 3.39 2.58 0.02 -0.20 0.06 0.05 3.33 1.74 1.82 0.51 0.48 0.54 6.54 0.94 1.07 -10.32 13.68 -13.58 -0.40 0.02 0.25 -0.25 -0.01 3.52 0.66 2.05 0.51 0.47 0.54 6.49 0.93 1.06 13.68 0.65 -12.51 11.59 0.02 0.01 -0.23 0.21 1.18 0.36 0.99 0.51 0.47 0.54 6.45 0.92 1.05 0.65
-12.32 -1.47 -2.41 0.02 -0.22 -0.03 -0.04 1.07 0.62 0.98 0.52 0.47 0.54 6.40 0.91 1.05 -12.32 8.70 -21.41 6.60 0.02 0.15 -0.36 0.11 0.57 1.07 0.95 0.52 0.47 0.54 6.35 0.90 1.04 8.70
-18.28 -11.33 9.59 0.02 -0.30 -0.19 0.16 1.22 1.57 2.36 0.53 0.47 0.55 6.30 0.89 1.03 -18.28 -0.24 2.70 -11.39 0.02 0.00 0.04 -0.18 0.86 0.94 0.74 0.54 0.47 0.55 6.25 0.88 1.02 -0.24 5.76 -8.27 1.65 0.02 0.09 -0.13 0.03 1.20 2.42 1.11 0.54 0.47 0.55 6.20 0.87 1.01 5.76
-27.19 -2.24 5.65 0.02 -0.41 -0.03 0.08 2.23 1.98 1.27 0.55 0.48 0.56 6.15 0.86 1.01 -27.19 -5.12 3.77 14.63 0.01 -0.07 0.05 0.21 3.28 0.30 2.67 0.56 0.48 0.56 6.10 0.85 1.00 -5.12 13.86 5.77 7.61 0.01 0.19 0.08 0.11 1.83 1.54 1.63 0.57 0.48 0.57 6.05 0.85 0.99 13.86 -5.15 3.76 -18.35 0.01 -0.07 0.05 -0.25 1.26 1.52 2.41 0.58 0.49 0.58 6.01 0.84 0.99 -5.15 -6.12 -12.20 -1.30 0.01 -0.08 -0.16 -0.02 4.45 3.53 5.34 0.59 0.50 0.58 5.96 0.84 0.98 -6.12 17.86 4.82 0.72 0.01 0.22 0.06 0.01 3.24 1.69 4.19 0.60 0.51 0.59 5.91 0.84 0.98 17.86 1.83 10.81 -7.25 0.01 0.02 0.13 -0.09 2.42 1.25 1.35 0.61 0.52 0.60 5.86 0.84 0.98 1.83 -8.15 -22.16 -11.19 0.01 -0.09 -0.25 -0.13 2.28 3.67 2.23 0.63 0.53 0.61 5.81 0.84 0.97 -8.15

485
Raw Data Tapered
Data FFT Data Parzen Filtered
Data Simple Ratio
Spectrum Z E N
Tapering Function
Z E N Z E N Z E N
Frequency Hz
E/Z N/Z
Mean SQRT Spectrum
-1.13 4.89 -19.11 0.01 -0.01 0.05 -0.21 1.85 5.79 5.99 0.64 0.54 0.62 5.76 0.84 0.97 1.29 10.86 12.87 -4.04 0.01 0.11 0.14 -0.04 1.83 2.71 7.33 0.65 0.55 0.63 5.71 0.85 0.97 1.29 14.81 -19.10 -7.00 0.01 0.15 -0.19 -0.07 0.65 3.57 4.93 0.66 0.56 0.64 5.66 0.85 0.97 1.29 -13.19 10.93 -6.96 0.01 -0.13 0.10 -0.07 0.99 1.62 2.64 0.67 0.57 0.65 5.62 0.86 0.97 1.30 -2.15 17.89 1.07 0.01 -0.02 0.16 0.01 0.19 1.03 1.04 0.68 0.59 0.66 5.57 0.86 0.97 1.30 1.86 2.86 -12.88 0.01 0.02 0.02 -0.11 0.86 0.75 1.95 0.69 0.60 0.67 5.52 0.87 0.97 1.31 -1.14 1.86 -6.82 0.01 -0.01 0.01 -0.05 0.77 2.97 2.57 0.70 0.61 0.68 5.47 0.88 0.98 1.31 20.83 -9.11 -1.79 0.01 0.16 -0.07 -0.01 4.02 5.21 9.70 0.71 0.62 0.69 5.42 0.88 0.98 1.32 2.79 15.89 -3.76 0.01 0.02 0.11 -0.03 5.67 4.76 11.29 0.72 0.64 0.70 5.37 0.89 0.98 1.33
-10.19 14.84 7.25 0.01 -0.07 0.10 0.05 2.16 1.82 2.48 0.72 0.65 0.71 5.32 0.90 0.99 1.33 21.79 -13.14 -1.74 0.01 0.13 -0.08 -0.01 0.95 5.66 1.38 0.73 0.66 0.72 5.27 0.90 0.99 1.34 9.73 10.87 -4.71 0.01 0.05 0.06 -0.03 0.67 3.90 0.29 0.74 0.67 0.73 5.22 0.91 1.00 1.35
-26.23 18.83 4.31 0.01 -0.13 0.09 0.02 0.34 1.76 2.22 0.74 0.68 0.74 5.18 0.91 1.01 1.36 6.81 -6.18 8.31 0.00 0.03 -0.03 0.04 1.50 2.16 2.39 0.75 0.69 0.76 5.13 0.92 1.01 1.37 6.79 -2.15 3.30 0.00 0.03 -0.01 0.01 1.96 3.07 0.80 0.75 0.69 0.77 5.08 0.93 1.03 1.38
-12.19 6.85 -6.67 0.00 -0.04 0.02 -0.02 1.21 4.34 2.73 0.75 0.70 0.78 5.03 0.93 1.04 1.40 3.83 2.85 6.35 0.00 0.01 0.01 0.02 1.71 3.02 10.73 0.76 0.71 0.80 4.98 0.94 1.05 1.41 -8.15 5.84 7.34 0.00 -0.02 0.01 0.02 2.04 4.68 6.27 0.76 0.72 0.81 4.93 0.95 1.07 1.43 -2.13 -3.15 -2.65 0.00 0.00 -0.01 -0.01 3.05 1.97 2.87 0.76 0.73 0.83 4.88 0.95 1.09 1.45 2.88 2.87 3.37 0.00 0.00 0.00 0.01 1.02 1.34 2.19 0.76 0.73 0.85 4.83 0.96 1.11 1.47
-10.10 13.85 7.37 0.00 -0.01 0.01 0.01 1.32 0.09 1.70 0.76 0.74 0.86 4.79 0.97 1.13 1.50 -3.07 -3.16 16.34 0.00 0.00 0.00 0.01 1.58 3.32 1.63 0.76 0.75 0.88 4.74 0.99 1.16 1.52

486
Microtremors Segment: B2-S1 Raw Data Tapered
Data FFT Data Parzen Filtered
Data Simple Ratio
Spectrum Z E N
Tapering Function
Z E N Z E N Z E N
Frequency Hz
E/Z N/Z
Mean SQRT Spectrum
0.68 -21.00 3.79 0.26 0.18 -5.45 0.98 3.03 1.92 1.50 2.83 1.11 0.93 30.03 0.39 0.33 0.51 -17.24 -30.89 17.80 0.26 -4.46 -8.00 4.61 3.61 1.96 1.20 2.79 1.09 0.91 29.98 0.39 0.32 0.51 -0.15 -23.78 10.80 0.26 -0.04 -6.15 2.79 5.00 2.11 1.51 2.75 1.07 0.88 29.93 0.39 0.32 0.50 -6.09 -15.70 7.81 0.26 -1.57 -4.05 2.02 3.41 0.84 1.50 2.70 1.04 0.85 29.88 0.38 0.32 0.50 -13.00 -20.63 28.79 0.26 -3.35 -5.31 7.41 3.19 1.15 1.42 2.65 1.01 0.83 29.83 0.38 0.31 0.49 9.06 -24.54 36.72 0.26 2.33 -6.31 9.44 2.57 2.42 0.55 2.60 0.98 0.80 29.79 0.38 0.31 0.49
-11.89 -12.46 25.65 0.26 -3.05 -3.20 6.58 3.43 2.45 2.05 2.55 0.95 0.77 29.74 0.37 0.30 0.48 -54.70 -9.42 24.60 0.26 -14.00 -2.41 6.30 2.32 2.29 0.97 2.50 0.93 0.74 29.69 0.37 0.30 0.47 -56.43 -9.38 30.54 0.26 -14.42 -2.40 7.80 4.45 2.21 0.18 2.44 0.90 0.71 29.64 0.37 0.29 0.47 -18.23 14.61 31.47 0.26 -4.65 3.73 8.03 3.16 1.19 0.71 2.39 0.87 0.68 29.59 0.37 0.29 0.46 13.83 26.53 32.40 0.25 3.52 6.75 8.25 1.38 0.53 1.90 2.34 0.85 0.65 29.54 0.36 0.28 0.46 0.85 9.46 36.31 0.25 0.22 2.40 9.22 1.48 0.44 2.52 2.29 0.82 0.63 29.49 0.36 0.28 0.45
-13.07 -6.54 38.22 0.25 -3.31 -1.66 9.69 2.68 0.38 1.02 2.24 0.80 0.61 29.44 0.36 0.27 0.45 2.00 2.46 32.13 0.25 0.51 0.62 8.13 5.64 0.41 1.83 2.20 0.78 0.59 29.39 0.35 0.27 0.44 -8.93 10.44 25.07 0.25 -2.26 2.64 6.33 5.58 2.43 2.52 2.16 0.76 0.57 29.35 0.35 0.26 0.44 -21.82 -19.54 20.03 0.25 -5.50 -4.92 5.05 2.85 2.33 1.86 2.13 0.74 0.55 29.30 0.35 0.26 0.44 -1.72 -33.43 10.02 0.25 -0.43 -8.41 2.52 2.55 2.14 1.21 2.09 0.73 0.54 29.25 0.35 0.26 0.43 -9.65 -0.36 -6.93 0.25 -2.42 -0.09 -1.74 3.33 2.02 1.13 2.06 0.72 0.53 29.20 0.35 0.26 0.43 -5.56 14.61 -19.83 0.25 -1.39 3.66 -4.97 3.35 1.98 1.26 2.03 0.70 0.52 29.15 0.35 0.26 0.43 23.45 5.57 -22.69 0.25 5.86 1.39 -5.67 1.63 1.41 1.40 2.00 0.69 0.52 29.10 0.35 0.26 0.43 -10.52 9.54 -37.52 0.25 -2.63 2.38 -9.36 3.53 2.02 3.08 1.97 0.68 0.51 29.05 0.35 0.26 0.43 -34.38 9.50 -43.30 0.25 -8.56 2.37 -10.78 3.90 0.63 0.67 1.95 0.68 0.51 29.00 0.35 0.26 0.43 23.69 8.47 -25.11 0.25 5.89 2.10 -6.24 2.67 0.64 0.74 1.92 0.67 0.51 28.96 0.35 0.26 0.44 39.62 13.43 -31.95 0.25 9.82 3.33 -7.92 1.87 1.48 1.18 1.89 0.66 0.50 28.91 0.35 0.27 0.44 -2.41 13.37 -52.72 0.25 -0.60 3.31 -13.05 0.83 0.50 1.69 1.87 0.66 0.51 28.86 0.35 0.27 0.45 -0.35 7.33 -36.49 0.25 -0.09 1.81 -9.01 5.90 0.91 1.98 1.84 0.66 0.51 28.81 0.36 0.27 0.45 7.69 -10.66 -13.34 0.25 1.89 -2.63 -3.29 2.29 2.24 0.74 1.82 0.65 0.51 28.76 0.36 0.28 0.46
-13.25 -21.59 -19.22 0.25 -3.26 -5.31 -4.73 8.57 3.41 1.84 1.79 0.65 0.51 28.71 0.36 0.28 0.46 13.80 -7.54 -30.06 0.25 3.39 -1.85 -7.38 10.20 3.87 2.34 1.77 0.65 0.51 28.66 0.37 0.29 0.47 35.75 4.47 -26.89 0.25 8.76 1.10 -6.59 7.85 1.49 1.97 1.74 0.64 0.52 28.61 0.37 0.30 0.47 -0.27 -3.53 -32.72 0.24 -0.07 -0.86 -8.00 7.63 3.18 0.79 1.72 0.64 0.52 28.56 0.37 0.30 0.48 -5.21 -1.52 -25.55 0.24 -1.27 -0.37 -6.23 5.63 0.61 0.97 1.69 0.64 0.52 28.52 0.38 0.31 0.49 0.68 -21.00 3.79 0.26 0.18 -5.45 0.98 3.03 1.92 1.50 2.83 1.11 0.93 30.03 0.39 0.33 0.51

487
Raw Data Tapered Data
FFT Data Parzen Filtered Data
Simple Ratio Spectrum
Z E N
Tapering Function
Z E N Z E N Z E N
Frequency Hz
E/Z N/Z
Mean SQRT Spectrum
9.84 11.46 9.54 0.24 2.40 2.79 2.32 5.53 1.17 0.14 1.66 0.64 0.52 28.47 0.38 0.32 0.50 11.84 13.41 17.54 0.24 2.88 3.26 4.26 4.87 2.74 1.30 1.64 0.64 0.53 28.42 0.39 0.32 0.50 -9.11 22.34 8.54 0.24 -2.21 5.42 2.07 3.46 2.66 1.25 1.61 0.63 0.53 28.37 0.39 0.33 0.51 -34.97 20.26 28.52 0.24 -8.46 4.90 6.90 1.26 0.94 1.30 1.59 0.63 0.53 28.32 0.40 0.34 0.52 7.14 -2.78 42.44 0.24 1.72 -0.67 10.25 0.44 1.21 0.42 1.56 0.63 0.54 28.27 0.40 0.34 0.53 12.15 -12.74 19.37 0.24 2.93 -3.07 4.67 2.87 2.04 0.42 1.54 0.63 0.54 28.22 0.41 0.35 0.54 -33.76 -25.67 12.36 0.24 -8.12 -6.17 2.97 1.79 1.92 1.40 1.52 0.63 0.54 28.17 0.41 0.36 0.54 -24.59 -47.52 30.33 0.24 -5.90 -11.40 7.28 0.52 2.28 0.26 1.50 0.62 0.54 28.13 0.42 0.36 0.55 -20.45 -51.32 32.25 0.24 -4.90 -12.29 7.73 1.97 1.45 0.86 1.48 0.62 0.54 28.08 0.42 0.37 0.56 -24.30 -33.15 27.19 0.24 -5.81 -7.92 6.50 2.11 2.23 0.52 1.47 0.62 0.55 28.03 0.42 0.37 0.56 -24.15 -18.04 20.15 0.24 -5.76 -4.30 4.81 2.56 2.26 0.90 1.45 0.62 0.55 27.98 0.43 0.38 0.57 -29.00 -14.98 16.13 0.24 -6.90 -3.56 3.84 1.12 0.83 2.42 1.44 0.62 0.55 27.93 0.43 0.38 0.57 -3.88 -1.94 20.11 0.24 -0.92 -0.46 4.78 1.53 2.14 2.48 1.43 0.62 0.55 27.88 0.43 0.38 0.58 -0.82 7.05 15.09 0.24 -0.19 1.67 3.58 1.58 2.60 2.05 1.43 0.62 0.55 27.83 0.43 0.39 0.58 5.23 3.03 12.09 0.24 1.24 0.72 2.86 3.84 1.55 1.43 1.42 0.62 0.55 27.78 0.43 0.39 0.58 24.22 10.01 13.09 0.24 5.72 2.36 3.09 1.08 1.06 0.64 1.42 0.62 0.55 27.73 0.43 0.39 0.58 -4.76 21.95 1.12 0.24 -1.12 5.17 0.26 1.93 2.08 0.50 1.42 0.62 0.55 27.69 0.43 0.39 0.58 -10.68 8.89 -0.83 0.24 -2.51 2.09 -0.20 0.23 0.96 0.45 1.42 0.62 0.55 27.64 0.44 0.39 0.58 2.39 -10.11 1.22 0.23 0.56 -2.37 0.29 1.84 0.35 0.41 1.43 0.62 0.55 27.59 0.44 0.38 0.58
-17.53 -0.09 -18.69 0.23 -4.10 -0.02 -4.37 1.43 0.88 0.48 1.43 0.62 0.55 27.54 0.44 0.38 0.58 -14.41 9.90 -17.57 0.23 -3.37 2.31 -4.10 1.34 2.28 1.85 1.44 0.63 0.54 27.49 0.44 0.38 0.58 8.65 -3.12 -0.48 0.23 2.02 -0.73 -0.11 2.06 1.18 2.10 1.44 0.63 0.54 27.44 0.44 0.37 0.58 31.62 -5.10 -16.39 0.23 7.35 -1.19 -3.81 1.61 0.39 0.19 1.45 0.64 0.54 27.39 0.44 0.37 0.57 32.55 6.90 -36.23 0.23 7.55 1.60 -8.41 1.67 0.77 0.40 1.46 0.64 0.53 27.34 0.44 0.37 0.57 -3.46 -3.10 -34.04 0.23 -0.80 -0.72 -7.88 0.41 2.77 0.90 1.46 0.64 0.53 27.29 0.44 0.36 0.57 -9.38 -11.07 -28.86 0.23 -2.17 -2.56 -6.67 1.60 3.67 0.97 1.46 0.65 0.52 27.25 0.44 0.36 0.57 12.66 10.93 -25.69 0.23 2.92 2.52 -5.92 1.36 2.11 0.68 1.46 0.65 0.52 27.20 0.45 0.35 0.57 23.64 19.87 -12.56 0.23 5.44 4.57 -2.89 2.33 1.05 0.68 1.46 0.66 0.51 27.15 0.45 0.35 0.57 30.59 -2.17 3.51 0.23 7.02 -0.50 0.81 1.29 1.43 0.56 1.45 0.66 0.51 27.10 0.46 0.35 0.57 25.53 -4.15 3.55 0.23 5.85 -0.95 0.81 2.14 1.67 0.97 1.44 0.67 0.50 27.05 0.46 0.35 0.58 9.51 0.86 -6.39 0.23 2.17 0.20 -1.46 1.65 1.05 1.77 1.43 0.67 0.49 27.00 0.47 0.34 0.58 9.84 11.46 9.54 0.24 2.40 2.79 2.32 5.53 1.17 0.14 1.66 0.64 0.52 28.47 0.38 0.32 0.50 11.84 13.41 17.54 0.24 2.88 3.26 4.26 4.87 2.74 1.30 1.64 0.64 0.53 28.42 0.39 0.32 0.50

488
Raw Data Tapered Data
FFT Data Parzen Filtered Data
Simple Ratio Spectrum
Z E N
Tapering Function
Z E N Z E N Z E N
Frequency Hz
E/Z N/Z
Mean SQRT Spectrum
9.52 -22.10 6.66 0.23 2.17 -5.04 1.52 0.52 0.73 1.16 1.42 0.67 0.49 26.95 0.48 0.34 0.59 -1.44 -31.99 19.66 0.23 -0.33 -7.28 4.47 0.22 1.68 0.37 1.40 0.68 0.48 26.90 0.48 0.34 0.59 -29.33 -24.87 2.67 0.23 -6.66 -5.65 0.61 0.94 3.14 0.64 1.37 0.68 0.47 26.86 0.49 0.35 0.60 -5.21 -19.78 6.71 0.23 -1.18 -4.48 1.52 1.70 1.41 0.21 1.34 0.68 0.47 26.81 0.51 0.35 0.61 17.82 -14.71 20.71 0.23 4.03 -3.32 4.68 2.25 0.76 0.30 1.31 0.68 0.46 26.76 0.52 0.35 0.63 -31.11 -9.66 9.70 0.23 -7.01 -2.18 2.19 1.44 0.18 0.63 1.28 0.68 0.45 26.71 0.53 0.36 0.64 -63.86 7.35 1.73 0.23 -14.37 1.65 0.39 2.14 1.22 1.94 1.24 0.68 0.45 26.66 0.55 0.36 0.65 -20.64 1.33 18.74 0.22 -4.63 0.30 4.21 2.89 3.46 2.31 1.20 0.68 0.44 26.61 0.56 0.37 0.67 29.39 -13.64 32.69 0.22 6.58 -3.05 7.32 2.70 5.11 3.86 1.16 0.67 0.44 26.56 0.58 0.38 0.69 6.37 9.37 21.64 0.22 1.42 2.09 4.84 2.63 2.55 1.32 1.12 0.67 0.43 26.51 0.60 0.38 0.71
-14.56 15.33 36.57 0.22 -3.25 3.42 8.16 1.41 1.76 0.94 1.08 0.67 0.43 26.46 0.62 0.39 0.73 10.50 5.29 42.47 0.22 2.34 1.18 9.45 1.09 2.07 2.91 1.04 0.66 0.42 26.42 0.64 0.41 0.76 -36.39 -1.72 6.42 0.22 -8.08 -0.38 1.43 1.21 2.02 1.95 1.00 0.66 0.42 26.37 0.66 0.42 0.78 -76.11 3.28 13.43 0.22 -16.86 0.73 2.98 0.59 1.02 0.81 0.96 0.66 0.41 26.32 0.68 0.43 0.81 -1.90 12.25 33.39 0.22 -0.42 2.71 7.38 2.72 0.97 3.11 0.92 0.65 0.41 26.27 0.71 0.45 0.84 8.14 -4.76 13.35 0.22 1.79 -1.05 2.94 2.50 1.36 4.15 0.88 0.65 0.41 26.22 0.73 0.46 0.87
-33.76 -11.72 1.37 0.22 -7.43 -2.58 0.30 1.33 1.88 1.56 0.84 0.64 0.40 26.17 0.76 0.48 0.90 5.35 -0.70 7.41 0.22 1.17 -0.15 1.63 1.72 1.63 1.13 0.81 0.64 0.40 26.12 0.79 0.49 0.93 15.36 -2.69 -0.56 0.22 3.36 -0.59 -0.12 2.49 3.13 0.74 0.78 0.64 0.40 26.07 0.81 0.51 0.96 -22.57 9.30 -14.47 0.22 -4.93 2.03 -3.16 5.25 3.05 1.64 0.75 0.63 0.39 26.03 0.84 0.52 0.99 -7.46 10.26 -4.38 0.22 -1.63 2.24 -0.96 5.30 3.47 0.93 0.73 0.63 0.39 25.98 0.87 0.54 1.02 33.55 -9.73 4.67 0.22 7.30 -2.12 1.02 3.98 2.59 0.79 0.70 0.63 0.39 25.93 0.89 0.56 1.05 33.46 -0.71 -6.28 0.22 7.26 -0.15 -1.36 1.52 0.84 0.98 0.69 0.63 0.39 25.88 0.91 0.57 1.08 1.45 11.27 -17.18 0.22 0.31 2.44 -3.72 2.45 0.52 1.80 0.67 0.62 0.39 25.83 0.93 0.59 1.10 -0.50 1.25 -14.06 0.22 -0.11 0.27 -3.04 1.31 0.58 1.55 0.65 0.62 0.39 25.78 0.95 0.60 1.13 41.47 -24.70 -10.96 0.22 8.94 -5.32 -2.36 1.08 0.40 1.62 0.64 0.63 0.39 25.73 0.97 0.61 1.15 52.33 -36.58 -22.84 0.22 11.25 -7.86 -4.91 3.67 2.19 1.56 0.64 0.63 0.40 25.68 0.99 0.63 1.17 17.25 -7.49 -20.70 0.21 3.70 -1.61 -4.44 4.53 2.59 1.04 0.63 0.63 0.40 25.63 1.00 0.64 1.19 0.26 -0.47 -6.59 0.21 0.06 -0.10 -1.41 2.14 2.24 1.08 0.62 0.63 0.41 25.59 1.01 0.65 1.20 -0.68 1.53 -17.49 0.21 -0.15 0.33 -3.73 1.00 1.91 0.56 0.62 0.64 0.41 25.54 1.02 0.66 1.22 -11.61 31.47 -26.35 0.21 -2.47 6.70 -5.61 2.01 0.67 0.67 0.62 0.64 0.42 25.49 1.03 0.67 1.23 9.52 -22.10 6.66 0.23 2.17 -5.04 1.52 0.52 0.73 1.16 1.42 0.67 0.49 26.95 0.48 0.34 0.59 -1.44 -31.99 19.66 0.23 -0.33 -7.28 4.47 0.22 1.68 0.37 1.40 0.68 0.48 26.90 0.48 0.34 0.59

489
Raw Data Tapered Data
FFT Data Parzen Filtered Data
Simple Ratio Spectrum
Z E N
Tapering Function
Z E N Z E N Z E N
Frequency Hz
E/Z N/Z
Mean SQRT Spectrum
5.46 20.37 -9.23 0.21 1.16 4.33 -1.96 2.20 1.47 0.31 0.63 0.65 0.43 25.44 1.03 0.68 1.24 38.42 3.32 -4.15 0.21 8.15 0.70 -0.88 2.22 2.26 1.31 0.63 0.65 0.43 25.39 1.04 0.69 1.25 13.37 14.29 -10.07 0.21 2.83 3.02 -2.13 5.67 1.82 3.87 0.63 0.66 0.44 25.34 1.04 0.70 1.25 -7.59 4.26 2.00 0.21 -1.60 0.90 0.42 7.98 4.94 4.09 0.64 0.66 0.45 25.29 1.03 0.71 1.25 8.46 -14.72 14.02 0.21 1.78 -3.10 2.95 2.01 4.36 0.75 0.65 0.67 0.47 25.24 1.03 0.72 1.25
-11.48 -19.65 -2.94 0.21 -2.41 -4.13 -0.62 6.06 2.29 2.02 0.66 0.67 0.48 25.20 1.02 0.72 1.25 -33.34 -11.59 0.11 0.21 -6.98 -2.43 0.02 3.08 0.66 0.61 0.67 0.68 0.49 25.15 1.01 0.73 1.25 -23.17 -19.52 32.10 0.21 -4.84 -4.08 6.71 1.76 1.23 0.31 0.68 0.69 0.50 25.10 1.00 0.73 1.24 -24.03 -35.41 23.04 0.21 -5.01 -7.38 4.80 2.84 0.37 2.70 0.70 0.69 0.51 25.05 0.99 0.73 1.23 -14.90 -19.29 11.03 0.21 -3.10 -4.01 2.29 1.06 2.45 0.84 0.71 0.70 0.52 25.00 0.98 0.73 1.22 14.16 -2.25 38.98 0.21 2.94 -0.47 8.09 4.89 2.66 3.02 0.73 0.70 0.53 24.95 0.97 0.73 1.21 8.16 -6.23 34.88 0.21 1.69 -1.29 7.22 10.22 2.92 3.79 0.74 0.71 0.54 24.90 0.95 0.73 1.20
-22.75 -10.19 9.85 0.21 -4.70 -2.10 2.03 10.19 2.23 4.36 0.76 0.71 0.55 24.85 0.94 0.72 1.18 -19.62 -2.16 7.86 0.21 -4.04 -0.45 1.62 3.05 3.00 1.09 0.78 0.72 0.56 24.80 0.92 0.72 1.17 -1.52 2.84 15.87 0.21 -0.31 0.58 3.26 1.43 2.41 0.18 0.80 0.72 0.56 24.76 0.90 0.71 1.15 -19.43 9.82 14.86 0.21 -3.98 2.01 3.05 0.88 2.69 0.57 0.82 0.72 0.57 24.71 0.88 0.70 1.13 -38.26 21.76 0.88 0.20 -7.82 4.45 0.18 2.44 2.40 1.19 0.84 0.72 0.58 24.66 0.87 0.69 1.11 -17.09 -1.28 3.92 0.20 -3.49 -0.26 0.80 3.70 2.02 1.21 0.86 0.73 0.58 24.61 0.85 0.68 1.09 -4.99 -29.22 15.93 0.20 -1.02 -5.95 3.24 3.85 2.67 1.97 0.88 0.73 0.58 24.56 0.83 0.67 1.06 -22.89 -18.12 -0.05 0.20 -4.65 -3.68 -0.01 3.24 3.32 0.54 0.90 0.73 0.59 24.51 0.81 0.65 1.04 -36.71 -6.07 -2.99 0.20 -7.43 -1.23 -0.61 2.84 2.08 0.83 0.92 0.73 0.59 24.46 0.79 0.64 1.02 -19.54 -32.99 17.03 0.20 -3.95 -6.66 3.44 2.36 2.40 1.54 0.94 0.73 0.59 24.41 0.78 0.63 1.00 -1.45 -50.81 -0.95 0.20 -0.29 -10.24 -0.19 2.29 1.90 1.23 0.97 0.74 0.59 24.37 0.76 0.61 0.98 -11.37 -13.68 -17.86 0.20 -2.29 -2.75 -3.59 4.83 2.99 1.27 0.99 0.74 0.59 24.32 0.74 0.60 0.95 5.70 16.32 -9.75 0.20 1.14 3.27 -1.96 6.51 4.76 4.05 1.01 0.74 0.59 24.27 0.73 0.58 0.93 24.69 11.27 -23.64 0.20 4.94 2.25 -4.73 6.32 2.32 4.23 1.04 0.74 0.59 24.22 0.72 0.57 0.92 5.68 10.23 -33.47 0.20 1.13 2.04 -6.68 2.88 1.73 2.16 1.06 0.74 0.59 24.17 0.70 0.56 0.90 28.67 12.19 -32.29 0.20 5.71 2.43 -6.42 5.60 2.41 2.56 1.08 0.75 0.59 24.12 0.69 0.55 0.88 60.54 12.14 -18.13 0.20 12.02 2.41 -3.60 19.67 7.84 9.34 1.11 0.75 0.59 24.07 0.68 0.54 0.86 23.43 22.08 -4.04 0.20 4.64 4.37 -0.80 37.11 14.20 15.66 1.13 0.76 0.59 24.02 0.67 0.52 0.85 -14.54 33.97 -16.94 0.20 -2.87 6.71 -3.35 13.80 4.07 5.44 1.16 0.76 0.60 23.97 0.66 0.51 0.84 5.46 20.37 -9.23 0.21 1.16 4.33 -1.96 2.20 1.47 0.31 0.63 0.65 0.43 25.44 1.03 0.68 1.24
38.42 3.32 -4.15 0.21 8.15 0.70 -0.88 2.22 2.26 1.31 0.63 0.65 0.43 25.39 1.04 0.69 1.25

490
Raw Data Tapered
Data FFT Data Parzen Filtered
Data Simple Ratio
Spectrum Z E N
Tapering Function
Z E N Z E N Z E N
Frequency Hz
E/Z N/Z
Mean SQRT Spectrum
-11.43 29.84 -3.85 0.20 -2.25 5.88 -0.76 3.20 2.02 1.28 1.18 0.77 0.60 23.93 0.65 0.51 0.82 -12.33 13.76 11.19 0.20 -2.42 2.70 2.20 2.86 0.50 0.91 1.21 0.77 0.60 23.88 0.64 0.50 0.81 -11.23 13.71 -2.77 0.20 -2.20 2.69 -0.54 3.45 1.87 1.61 1.23 0.78 0.60 23.83 0.63 0.49 0.80 11.82 10.66 11.26 0.20 2.31 2.08 2.20 2.76 2.59 3.28 1.26 0.79 0.61 23.78 0.63 0.48 0.79 41.77 -8.34 20.25 0.20 8.14 -1.63 3.95 3.38 3.42 4.10 1.29 0.80 0.62 23.73 0.62 0.48 0.78 29.68 -7.31 2.26 0.19 5.77 -1.42 0.44 2.39 1.05 2.81 1.32 0.81 0.62 23.68 0.62 0.47 0.78 -15.30 7.70 1.30 0.19 -2.97 1.49 0.25 4.29 3.24 2.69 1.34 0.82 0.63 23.63 0.61 0.47 0.77 -14.19 -0.31 26.30 0.19 -2.74 -0.06 5.09 4.35 6.06 6.26 1.37 0.83 0.64 23.58 0.61 0.47 0.76 -10.08 -9.29 35.23 0.19 -1.95 -1.79 6.80 1.41 2.05 3.09 1.40 0.85 0.65 23.54 0.60 0.46 0.76 -26.96 0.73 23.16 0.19 -5.19 0.14 4.46 3.15 0.33 0.55 1.44 0.86 0.66 23.49 0.60 0.46 0.76 -7.83 4.72 31.11 0.19 -1.50 0.91 5.97 2.78 0.86 0.55 1.47 0.87 0.67 23.44 0.59 0.46 0.75 5.23 -4.28 39.02 0.19 1.00 -0.82 7.47 0.71 1.05 0.29 1.51 0.89 0.69 23.39 0.59 0.46 0.75
-12.71 1.73 21.94 0.19 -2.43 0.33 4.19 0.65 0.68 0.90 1.54 0.91 0.71 23.34 0.59 0.46 0.74 -11.60 4.72 17.91 0.19 -2.21 0.90 3.41 1.94 1.18 0.98 1.59 0.93 0.72 23.29 0.58 0.46 0.74 -13.50 -26.23 20.89 0.19 -2.56 -4.98 3.97 2.69 0.59 1.07 1.63 0.94 0.74 23.24 0.58 0.46 0.74 -44.33 -29.12 22.85 0.19 -8.40 -5.52 4.33 2.82 0.61 1.14 1.67 0.96 0.77 23.19 0.58 0.46 0.74 -56.07 0.94 25.80 0.19 -10.60 0.18 4.88 1.93 1.36 0.38 1.72 0.98 0.79 23.14 0.57 0.46 0.73 -16.87 -3.05 9.78 0.19 -3.18 -0.58 1.84 0.39 1.05 0.92 1.77 1.00 0.81 23.10 0.57 0.46 0.73 4.21 -14.02 -2.18 0.19 0.79 -2.63 -0.41 1.10 0.42 1.50 1.81 1.02 0.84 23.05 0.56 0.46 0.73
-14.72 4.01 -0.13 0.19 -2.76 0.75 -0.02 2.44 0.13 0.91 1.86 1.04 0.87 23.00 0.56 0.47 0.73 0.37 19.96 -1.08 0.19 0.07 3.73 -0.20 3.23 0.94 1.31 1.91 1.06 0.89 22.95 0.55 0.47 0.73 19.38 2.92 -7.01 0.19 3.61 0.54 -1.31 1.13 1.45 1.05 1.96 1.08 0.92 22.90 0.55 0.47 0.72 -15.57 -1.08 -21.90 0.19 -2.90 -0.20 -4.07 1.28 1.76 0.85 2.00 1.09 0.95 22.85 0.55 0.47 0.72 -30.42 11.90 -27.75 0.19 -5.64 2.21 -5.15 1.56 1.17 1.76 2.04 1.11 0.98 22.80 0.54 0.48 0.72 9.67 -7.10 -7.63 0.19 1.79 -1.31 -1.41 2.27 3.54 0.98 2.08 1.12 1.00 22.75 0.54 0.48 0.72 3.70 -12.06 2.43 0.18 0.68 -2.23 0.45 3.59 1.50 1.41 2.11 1.13 1.03 22.71 0.54 0.49 0.72
-36.18 18.93 -10.50 0.18 -6.66 3.48 -1.93 5.49 0.89 5.27 2.14 1.14 1.05 22.66 0.53 0.49 0.72 -1.05 28.83 -4.42 0.18 -0.19 5.29 -0.81 7.55 0.79 6.08 2.17 1.15 1.07 22.61 0.53 0.49 0.72 60.89 -0.22 0.63 0.18 11.14 -0.04 0.12 2.34 0.76 0.70 2.18 1.15 1.09 22.56 0.53 0.50 0.73 54.71 -2.21 -6.30 0.18 9.98 -0.40 -1.15 0.91 0.54 1.07 2.19 1.15 1.10 22.51 0.52 0.50 0.73 22.61 30.73 -4.23 0.18 4.11 5.59 -0.77 1.86 0.72 0.71 2.19 1.14 1.11 22.46 0.52 0.51 0.73 -11.43 29.84 -3.85 0.20 -2.25 5.88 -0.76 3.20 2.02 1.28 1.18 0.77 0.60 23.93 0.65 0.51 0.82 -12.33 13.76 11.19 0.20 -2.42 2.70 2.20 2.86 0.50 0.91 1.21 0.77 0.60 23.88 0.64 0.50 0.81

491
Raw Data Tapered
Data FFT Data Parzen Filtered
Data Simple Ratio
Spectrum Z E N
Tapering Function
Z E N Z E N Z E N
Frequency Hz
E/Z N/Z
Mean SQRT Spectrum
29.56 0.67 -5.16 0.18 5.36 0.12 -0.94 3.69 2.19 0.88 2.18 1.14 1.12 22.41 0.52 0.51 0.73 27.50 -29.27 -6.09 0.18 4.98 -5.30 -1.10 2.49 0.55 1.02 2.17 1.12 1.12 22.36 0.52 0.52 0.73 -7.49 13.77 -15.99 0.18 -1.35 2.48 -2.89 2.52 1.26 1.02 2.14 1.11 1.12 22.31 0.52 0.52 0.74 1.58 30.68 -18.87 0.18 0.28 5.52 -3.40 0.39 0.39 0.15 2.11 1.09 1.12 22.27 0.52 0.53 0.74 44.54 7.61 -9.77 0.18 7.99 1.37 -1.75 1.92 0.53 1.08 2.06 1.07 1.10 22.22 0.52 0.54 0.75 41.42 -2.40 -26.64 0.18 7.41 -0.43 -4.77 1.30 0.87 0.45 2.01 1.04 1.09 22.17 0.52 0.54 0.75 3.38 0.60 -29.48 0.18 0.60 0.11 -5.26 2.70 0.13 1.16 1.96 1.02 1.07 22.12 0.52 0.55 0.75 -7.56 -8.38 -12.34 0.18 -1.34 -1.49 -2.20 3.76 0.78 1.31 1.90 0.99 1.05 22.07 0.52 0.55 0.76 3.51 -22.31 -12.24 0.18 0.62 -3.96 -2.17 5.14 0.85 1.30 1.84 0.96 1.03 22.02 0.52 0.56 0.76
-25.40 -11.24 -15.14 0.18 -4.50 -1.99 -2.68 3.11 1.68 1.43 1.77 0.92 1.00 21.97 0.52 0.57 0.77 -46.20 -7.20 -0.05 0.18 -8.15 -1.27 -0.01 0.95 2.15 0.98 1.70 0.89 0.97 21.92 0.52 0.57 0.77 -20.01 -6.17 13.97 0.18 -3.52 -1.09 2.46 2.06 0.57 0.11 1.63 0.85 0.94 21.88 0.52 0.58 0.78 -16.89 9.82 2.99 0.18 -2.96 1.72 0.52 1.50 1.19 0.99 1.56 0.82 0.91 21.83 0.52 0.58 0.78 -43.71 5.79 18.00 0.18 -7.65 1.01 3.15 4.21 1.38 1.31 1.49 0.78 0.88 21.78 0.53 0.59 0.79 -10.55 -14.19 45.92 0.17 -1.84 -2.48 8.01 4.22 0.72 1.45 1.43 0.75 0.85 21.73 0.53 0.59 0.79 25.48 -27.10 22.83 0.17 4.43 -4.72 3.97 1.75 0.66 1.33 1.36 0.72 0.82 21.68 0.53 0.60 0.80 -5.51 -13.02 21.80 0.17 -0.96 -2.26 3.78 1.31 2.83 1.53 1.30 0.68 0.79 21.63 0.52 0.60 0.80 4.55 -11.96 50.70 0.17 0.79 -2.07 8.77 4.49 2.25 0.58 1.25 0.65 0.76 21.58 0.52 0.61 0.80 13.57 -30.87 35.58 0.17 2.34 -5.33 6.14 5.64 3.14 1.89 1.20 0.62 0.73 21.53 0.52 0.61 0.80 -34.34 -7.79 13.53 0.17 -5.91 -1.34 2.33 5.82 4.17 1.00 1.15 0.60 0.71 21.48 0.52 0.61 0.80 -39.14 11.20 20.51 0.17 -6.71 1.92 3.52 2.23 2.48 3.08 1.12 0.57 0.68 21.44 0.51 0.61 0.80 -18.96 -4.81 27.46 0.17 -3.24 -0.82 4.70 1.53 0.59 1.98 1.08 0.55 0.66 21.39 0.51 0.61 0.80 -16.84 -3.79 18.42 0.17 -2.87 -0.65 3.14 1.96 0.40 2.06 1.05 0.53 0.64 21.34 0.50 0.61 0.79 -15.72 3.22 -6.55 0.17 -2.67 0.55 -1.11 3.67 1.29 0.34 1.03 0.51 0.63 21.29 0.50 0.61 0.78 -26.58 1.21 -6.48 0.17 -4.50 0.21 -1.10 3.34 1.13 0.66 1.01 0.50 0.61 21.24 0.49 0.60 0.78 -18.43 11.19 12.56 0.17 -3.11 1.89 2.12 2.23 2.39 1.35 1.00 0.48 0.60 21.19 0.48 0.60 0.77 -1.34 26.12 -13.39 0.17 -0.23 4.40 -2.26 3.76 2.68 1.94 0.99 0.47 0.59 21.14 0.47 0.59 0.76 -9.26 11.05 -12.29 0.17 -1.56 1.86 -2.06 1.78 1.26 2.29 0.99 0.46 0.58 21.09 0.47 0.58 0.75 -2.18 -0.97 35.71 0.17 -0.37 -0.16 5.98 4.82 1.63 0.86 0.98 0.45 0.57 21.04 0.46 0.58 0.74 28.82 25.99 14.66 0.17 4.81 4.34 2.45 3.05 1.43 0.49 0.98 0.44 0.56 21.00 0.45 0.57 0.73 51.72 31.87 -22.27 0.17 8.61 5.31 -3.71 1.42 1.03 0.93 0.98 0.44 0.55 20.95 0.45 0.56 0.72 29.56 0.67 -5.16 0.18 5.36 0.12 -0.94 3.69 2.19 0.88 2.18 1.14 1.12 22.41 0.52 0.51 0.73 27.50 -29.27 -6.09 0.18 4.98 -5.30 -1.10 2.49 0.55 1.02 2.17 1.12 1.12 22.36 0.52 0.52 0.73

492
Raw Data Tapered
Data FFT Data Parzen Filtered
Data Simple Ratio
Spectrum Z E N
Tapering Function
Z E N Z E N Z E N
Frequency Hz
E/Z N/Z
Mean SQRT Spectrum
40.59 14.78 -12.15 0.17 6.74 2.45 -2.02 1.78 0.87 0.52 0.99 0.44 0.54 20.90 0.44 0.55 0.71 12.53 2.75 -21.04 0.17 2.07 0.46 -3.48 3.05 0.32 0.74 0.99 0.44 0.54 20.85 0.44 0.54 0.70 -0.43 -8.24 -30.88 0.17 -0.07 -1.36 -5.10 4.48 1.09 0.45 1.00 0.44 0.53 20.80 0.44 0.53 0.69 11.60 -1.21 -19.73 0.16 1.91 -0.20 -3.25 4.21 1.93 0.78 1.01 0.44 0.52 20.75 0.44 0.52 0.68 17.59 2.78 -16.61 0.16 2.89 0.46 -2.72 3.09 0.65 0.75 1.01 0.44 0.52 20.70 0.44 0.51 0.67 -2.38 18.74 -27.47 0.16 -0.39 3.06 -4.49 2.91 1.30 1.06 1.02 0.44 0.51 20.65 0.44 0.50 0.67 12.65 37.63 -30.31 0.16 2.06 6.13 -4.94 2.19 2.22 0.61 1.03 0.45 0.51 20.61 0.44 0.49 0.66 29.62 9.54 -4.19 0.16 4.81 1.55 -0.68 2.00 1.93 1.13 1.04 0.46 0.50 20.56 0.44 0.49 0.66 9.60 2.52 2.87 0.16 1.55 0.41 0.46 2.56 1.64 0.51 1.04 0.46 0.50 20.51 0.44 0.48 0.65 6.62 30.45 -15.06 0.16 1.07 4.92 -2.43 2.17 1.22 0.62 1.05 0.47 0.50 20.46 0.45 0.47 0.65 26.61 10.37 2.02 0.16 4.28 1.67 0.33 1.87 1.21 1.29 1.06 0.48 0.49 20.41 0.45 0.47 0.65 14.58 -13.62 15.04 0.16 2.34 -2.19 2.41 1.42 1.42 1.17 1.07 0.49 0.49 20.36 0.46 0.46 0.65 -47.30 -3.58 1.05 0.16 -7.57 -0.57 0.17 1.42 2.69 0.85 1.08 0.50 0.49 20.31 0.46 0.45 0.65 -55.04 -7.56 13.08 0.16 -8.78 -1.21 2.09 2.92 4.83 2.64 1.08 0.50 0.48 20.26 0.47 0.45 0.65 -20.84 -15.51 32.04 0.16 -3.31 -2.47 5.09 3.45 2.14 1.12 1.09 0.51 0.48 20.21 0.47 0.44 0.65 -23.69 -11.45 27.97 0.16 -3.76 -1.82 4.43 0.59 1.10 2.09 1.10 0.52 0.48 20.17 0.48 0.44 0.65 -11.57 -15.40 13.93 0.16 -1.83 -2.43 2.20 1.12 1.96 3.29 1.10 0.53 0.48 20.12 0.48 0.43 0.65 27.46 -37.29 14.92 0.16 4.32 -5.87 2.35 2.10 2.38 2.75 1.11 0.54 0.48 20.07 0.49 0.43 0.65 11.43 -40.13 16.91 0.16 1.79 -6.30 2.65 3.89 6.32 6.24 1.11 0.55 0.47 20.02 0.49 0.43 0.65 -40.45 -17.01 -9.06 0.16 -6.33 -2.66 -1.42 0.67 3.24 1.37 1.12 0.56 0.47 19.97 0.50 0.42 0.65 -22.27 -21.93 -13.96 0.16 -3.47 -3.42 -2.18 0.90 1.24 0.70 1.12 0.56 0.47 19.92 0.50 0.42 0.66 12.80 -26.83 11.09 0.16 1.99 -4.17 1.73 0.98 1.46 4.01 1.12 0.57 0.47 19.87 0.51 0.42 0.66 -21.13 -8.75 4.11 0.16 -3.27 -1.36 0.64 2.06 2.68 3.32 1.13 0.58 0.47 19.82 0.51 0.42 0.66 -38.95 -12.71 -13.82 0.15 -6.02 -1.96 -2.13 2.28 1.76 1.71 1.13 0.58 0.47 19.78 0.52 0.41 0.66 -5.81 -25.63 6.25 0.15 -0.89 -3.95 0.96 0.46 1.72 2.11 1.13 0.59 0.47 19.73 0.52 0.41 0.67 -12.71 -22.53 14.26 0.15 -1.95 -3.46 2.19 1.22 1.18 1.63 1.12 0.59 0.46 19.68 0.53 0.41 0.67 -55.52 -6.47 -12.70 0.15 -8.49 -0.99 -1.94 1.84 2.01 2.70 1.12 0.60 0.46 19.63 0.53 0.41 0.67 -39.27 -10.43 -4.61 0.15 -5.99 -1.59 -0.70 1.99 2.45 4.63 1.12 0.60 0.46 19.58 0.54 0.41 0.68 -8.12 -31.34 20.40 0.15 -1.23 -4.76 3.10 1.92 1.62 2.77 1.11 0.60 0.46 19.53 0.54 0.41 0.68 -10.03 -1.27 -4.58 0.15 -1.52 -0.19 -0.69 2.41 0.19 1.94 1.10 0.61 0.46 19.48 0.55 0.42 0.69 5.04 27.68 -6.51 0.15 0.76 4.18 -0.98 1.41 0.57 1.14 1.10 0.61 0.46 19.43 0.56 0.42 0.70 40.59 14.78 -12.15 0.17 6.74 2.45 -2.02 1.78 0.87 0.52 0.99 0.44 0.54 20.90 0.44 0.55 0.71 12.53 2.75 -21.04 0.17 2.07 0.46 -3.48 3.05 0.32 0.74 0.99 0.44 0.54 20.85 0.44 0.54 0.70

493
Raw Data Tapered
Data FFT Data Parzen Filtered
Data Simple Ratio
Spectrum Z E N
Tapering Function
Z E N Z E N Z E N
Frequency Hz
E/Z N/Z
Mean SQRT Spectrum
22.04 12.61 9.54 0.15 3.32 1.90 1.44 1.96 1.26 0.59 1.09 0.62 0.46 19.38 0.57 0.43 0.71 29.99 18.55 -20.39 0.15 4.50 2.78 -3.06 3.87 1.52 1.46 1.08 0.62 0.46 19.34 0.58 0.43 0.72 40.91 42.43 -28.24 0.15 6.12 6.34 -4.22 5.81 1.54 1.91 1.06 0.63 0.47 19.29 0.59 0.44 0.74 43.79 32.28 -0.14 0.15 6.53 4.81 -0.02 4.35 1.57 1.34 1.05 0.63 0.47 19.24 0.60 0.45 0.75 41.68 9.20 8.89 0.15 6.19 1.37 1.32 3.28 0.59 1.36 1.04 0.64 0.48 19.19 0.62 0.46 0.77 17.61 36.11 -8.06 0.15 2.61 5.34 -1.19 4.87 0.69 1.22 1.02 0.65 0.49 19.14 0.63 0.48 0.79 4.62 40.96 -4.98 0.15 0.68 6.04 -0.73 5.08 1.48 2.07 1.00 0.65 0.50 19.09 0.65 0.50 0.82 22.63 -0.12 13.05 0.15 3.33 -0.02 1.92 4.74 1.11 1.74 0.99 0.66 0.51 19.04 0.67 0.52 0.85 22.59 5.87 -0.92 0.15 3.31 0.86 -0.14 5.49 1.33 1.59 0.97 0.67 0.52 18.99 0.69 0.54 0.88 4.59 25.81 -8.85 0.15 0.67 3.77 -1.29 3.68 0.55 1.06 0.95 0.68 0.54 18.95 0.71 0.56 0.91
-32.30 -0.23 10.19 0.15 -4.70 -0.03 1.48 4.12 2.27 0.62 0.94 0.69 0.55 18.90 0.74 0.59 0.94 -28.12 -33.17 9.21 0.15 -4.08 -4.81 1.33 2.91 1.21 1.64 0.92 0.70 0.57 18.85 0.76 0.62 0.98 20.95 -21.05 6.22 0.14 3.03 -3.04 0.90 2.87 3.57 1.78 0.91 0.71 0.59 18.80 0.78 0.65 1.01 -0.04 -8.99 7.25 0.14 -0.01 -1.29 1.04 4.14 1.05 2.19 0.89 0.72 0.60 18.75 0.80 0.68 1.05 -24.94 -26.92 -1.71 0.14 -3.58 -3.86 -0.25 1.62 2.06 0.59 0.88 0.72 0.62 18.70 0.82 0.71 1.09 -16.80 -11.84 2.33 0.14 -2.40 -1.69 0.33 2.27 2.62 0.53 0.87 0.73 0.64 18.65 0.84 0.74 1.12 -16.67 5.18 10.36 0.14 -2.38 0.74 1.48 1.32 1.38 1.07 0.86 0.73 0.66 18.60 0.86 0.77 1.16 2.41 2.17 10.37 0.14 0.34 0.31 1.47 3.13 4.87 1.27 0.85 0.74 0.68 18.55 0.87 0.80 1.18 2.46 18.13 -3.60 0.14 0.35 2.57 -0.51 3.29 5.59 0.98 0.84 0.74 0.70 18.51 0.88 0.83 1.21
-28.44 25.05 -9.52 0.14 -4.01 3.53 -1.34 2.04 2.58 2.11 0.84 0.74 0.71 18.46 0.89 0.85 1.23 -26.27 1.00 16.51 0.14 -3.69 0.14 2.32 3.66 2.08 0.59 0.84 0.74 0.73 18.41 0.89 0.87 1.24 2.83 -26.95 29.47 0.14 0.40 -3.77 4.13 8.60 3.27 1.08 0.84 0.74 0.74 18.36 0.88 0.88 1.25 -7.10 -19.85 16.43 0.14 -0.99 -2.77 2.29 3.83 1.16 0.47 0.85 0.74 0.75 18.31 0.87 0.89 1.25 -37.96 -0.80 12.42 0.14 -5.28 -0.11 1.73 0.58 0.73 0.34 0.85 0.73 0.76 18.26 0.86 0.89 1.24 -21.78 -16.77 13.41 0.14 -3.02 -2.32 1.86 2.68 1.19 0.60 0.87 0.73 0.77 18.21 0.84 0.89 1.22 -8.66 -16.70 -5.55 0.14 -1.20 -2.30 -0.77 5.23 4.08 3.38 0.88 0.72 0.77 18.16 0.82 0.88 1.20 -31.52 11.32 -15.46 0.14 -4.33 1.56 -2.13 4.58 2.64 2.90 0.90 0.71 0.77 18.12 0.80 0.86 1.18 -17.37 9.28 9.60 0.14 -2.38 1.27 1.32 2.50 0.65 1.49 0.91 0.71 0.77 18.07 0.77 0.85 1.15 9.70 -7.72 23.58 0.14 1.32 -1.05 3.22 3.65 2.94 0.61 0.93 0.70 0.77 18.02 0.75 0.82 1.11
-12.23 8.28 12.56 0.14 -1.66 1.13 1.71 2.58 4.82 2.21 0.96 0.69 0.77 17.97 0.72 0.80 1.08 -23.11 26.22 6.57 0.14 -3.13 3.55 0.89 2.59 5.85 3.46 0.98 0.68 0.76 17.92 0.70 0.77 1.04 22.04 12.61 9.54 0.15 3.32 1.90 1.44 1.96 1.26 0.59 1.09 0.62 0.46 19.38 0.57 0.43 0.71 29.99 18.55 -20.39 0.15 4.50 2.78 -3.06 3.87 1.52 1.46 1.08 0.62 0.46 19.34 0.58 0.43 0.72

494
Raw Data Tapered
Data FFT Data Parzen Filtered
Data Simple Ratio
Spectrum Z E N
Tapering Function
Z E N Z E N Z E N
Frequency Hz
E/Z N/Z
Mean SQRT Spectrum
7.98 10.15 5.59 0.14 1.08 1.37 0.75 3.87 1.28 7.42 1.00 0.68 0.75 17.87 0.67 0.75 1.00 11.00 13.10 -5.36 0.13 1.48 1.76 -0.72 5.13 2.00 2.24 1.03 0.67 0.74 17.82 0.65 0.72 0.97 -3.96 29.02 -12.28 0.13 -0.53 3.89 -1.65 12.07 6.40 7.65 1.06 0.66 0.73 17.77 0.63 0.69 0.93 26.06 14.94 0.79 0.13 3.48 1.99 0.11 20.56 11.47 11.49 1.08 0.66 0.71 17.72 0.61 0.66 0.90 51.96 6.90 0.84 0.13 6.91 0.92 0.11 5.08 5.46 5.03 1.11 0.66 0.70 17.68 0.60 0.63 0.87 18.87 20.84 -11.09 0.13 2.50 2.76 -1.47 1.48 0.92 3.59 1.13 0.66 0.69 17.63 0.58 0.61 0.84 -1.11 20.76 -16.99 0.13 -0.15 2.74 -2.24 2.98 1.47 0.79 1.16 0.66 0.67 17.58 0.57 0.58 0.82 32.89 -3.27 -21.86 0.13 4.32 -0.43 -2.87 4.73 0.91 0.49 1.18 0.67 0.66 17.53 0.57 0.56 0.79 26.82 -2.26 -22.72 0.13 3.51 -0.30 -2.98 2.95 1.15 1.92 1.20 0.68 0.65 17.48 0.56 0.54 0.78 8.81 21.70 -33.56 0.13 1.15 2.83 -4.38 3.10 0.73 1.92 1.23 0.69 0.64 17.43 0.56 0.52 0.76 25.79 10.64 -19.40 0.13 3.35 1.38 -2.52 3.94 0.67 2.17 1.25 0.70 0.63 17.38 0.56 0.50 0.75 -7.19 -6.37 3.68 0.13 -0.93 -0.82 0.48 2.85 0.16 0.40 1.27 0.71 0.62 17.33 0.56 0.49 0.74 -23.07 -0.35 -12.26 0.13 -2.98 -0.05 -1.58 1.23 2.34 2.06 1.28 0.73 0.61 17.29 0.57 0.48 0.74 20.99 -1.34 -6.17 0.13 2.70 -0.17 -0.79 1.51 2.42 1.28 1.30 0.74 0.61 17.24 0.57 0.47 0.74 16.97 -12.32 12.87 0.13 2.17 -1.58 1.65 1.97 1.69 3.42 1.32 0.76 0.61 17.19 0.58 0.46 0.74 -6.00 -7.27 -0.11 0.13 -0.76 -0.93 -0.01 0.53 1.75 2.25 1.34 0.78 0.61 17.14 0.59 0.46 0.74 -10.91 -18.22 -2.06 0.13 -1.39 -2.31 -0.26 0.89 1.95 0.93 1.35 0.80 0.61 17.09 0.59 0.45 0.75 -5.82 -50.08 9.98 0.13 -0.74 -6.34 1.26 0.33 0.34 0.54 1.37 0.83 0.62 17.04 0.60 0.45 0.76 0.25 -37.90 9.99 0.13 0.03 -4.78 1.26 0.11 0.44 0.24 1.39 0.85 0.63 16.99 0.61 0.46 0.76
-34.63 -8.81 8.00 0.13 -4.35 -1.11 1.00 1.33 1.47 1.15 1.40 0.87 0.65 16.94 0.62 0.46 0.77 -31.44 -11.76 8.02 0.13 -3.93 -1.47 1.00 1.12 0.83 3.09 1.42 0.90 0.66 16.89 0.63 0.47 0.78 12.66 -17.70 16.02 0.12 1.58 -2.20 1.99 2.95 2.43 4.88 1.44 0.92 0.68 16.85 0.64 0.48 0.80 5.68 -10.64 18.00 0.12 0.70 -1.32 2.23 3.55 3.34 7.32 1.46 0.94 0.71 16.80 0.64 0.48 0.81 2.72 18.35 24.96 0.12 0.34 2.27 3.08 1.10 3.71 6.22 1.48 0.96 0.73 16.75 0.65 0.49 0.82 13.74 12.29 47.86 0.12 1.69 1.51 5.89 5.13 3.52 5.31 1.50 0.98 0.76 16.70 0.66 0.50 0.83 -18.20 -26.68 37.74 0.12 -2.23 -3.27 4.62 10.01 3.77 21.62 1.51 1.00 0.78 16.65 0.66 0.52 0.84 -32.04 -9.60 2.71 0.12 -3.91 -1.17 0.33 4.89 3.62 25.13 1.53 1.01 0.81 16.60 0.66 0.53 0.85 -7.90 -6.56 -2.25 0.12 -0.96 -0.80 -0.27 7.06 16.11 12.38 1.54 1.03 0.84 16.55 0.66 0.54 0.86 -10.81 -35.48 -4.18 0.12 -1.31 -4.29 -0.51 4.84 14.35 8.27 1.56 1.04 0.86 16.50 0.67 0.55 0.87 -42.64 -26.35 -24.08 0.12 -5.14 -3.18 -2.90 0.69 3.92 3.10 1.57 1.05 0.89 16.46 0.67 0.57 0.88 -14.47 -34.22 -28.93 0.12 -1.74 -4.11 -3.47 0.70 1.10 3.70 1.58 1.05 0.92 16.41 0.67 0.58 0.89 7.98 10.15 5.59 0.14 1.08 1.37 0.75 3.87 1.28 7.42 1.00 0.68 0.75 17.87 0.67 0.75 1.00 11.00 13.10 -5.36 0.13 1.48 1.76 -0.72 5.13 2.00 2.24 1.03 0.67 0.74 17.82 0.65 0.72 0.97

495
Raw Data Tapered
Data FFT Data Parzen Filtered
Data Simple Ratio
Spectrum Z E N
Tapering Function
Z E N Z E N Z E N
Frequency Hz
E/Z N/Z
Mean SQRT Spectrum
52.51 -48.05 -21.78 0.12 6.27 -5.74 -2.60 0.87 0.58 3.35 1.58 1.06 0.95 16.36 0.67 0.60 0.90 8.44 -13.93 -12.66 0.12 1.00 -1.66 -1.51 1.77 3.44 2.14 1.59 1.06 0.98 16.31 0.67 0.61 0.91
-45.43 4.10 -12.56 0.12 -5.38 0.49 -1.49 1.85 1.74 0.56 1.59 1.06 1.00 16.26 0.67 0.63 0.92 16.69 -10.88 -13.46 0.12 1.97 -1.28 -1.59 2.36 2.45 1.85 1.59 1.06 1.03 16.21 0.67 0.65 0.93 34.64 2.14 -5.37 0.12 4.07 0.25 -0.63 2.48 3.87 2.50 1.58 1.05 1.06 16.16 0.67 0.67 0.95 -6.36 41.06 -8.29 0.12 -0.74 4.80 -0.97 4.93 1.77 4.14 1.57 1.05 1.09 16.11 0.67 0.69 0.96 -0.29 43.89 -1.23 0.12 -0.03 5.11 -0.14 10.75 14.41 6.46 1.55 1.04 1.11 16.06 0.67 0.72 0.98 20.73 19.77 5.81 0.12 2.40 2.29 0.67 27.05 42.23 16.07 1.53 1.04 1.14 16.02 0.67 0.74 1.00 17.71 13.71 -20.11 0.12 2.05 1.58 -2.32 18.67 21.95 14.07 1.51 1.03 1.17 15.97 0.68 0.77 1.03 -6.26 14.65 -18.98 0.12 -0.72 1.68 -2.18 1.33 0.74 3.94 1.49 1.02 1.20 15.92 0.69 0.80 1.06 3.80 9.61 0.11 0.11 0.44 1.10 0.01 1.91 5.21 3.13 1.46 1.02 1.23 15.87 0.70 0.84 1.09 25.80 1.59 -15.81 0.11 2.94 0.18 -1.80 1.68 2.93 3.16 1.44 1.02 1.27 15.82 0.71 0.88 1.13 -10.17 -6.40 -21.69 0.11 -1.15 -0.73 -2.46 1.58 0.37 0.93 1.41 1.02 1.30 15.77 0.73 0.92 1.18 -22.05 -5.37 -7.58 0.11 -2.49 -0.61 -0.86 1.64 1.30 1.21 1.38 1.03 1.35 15.72 0.74 0.97 1.22 20.01 7.63 -1.51 0.11 2.25 0.86 -0.17 2.90 2.46 0.77 1.36 1.04 1.39 15.67 0.77 1.02 1.28 24.98 19.58 -10.44 0.11 2.80 2.19 -1.17 0.34 1.96 2.11 1.34 1.06 1.44 15.63 0.79 1.08 1.34 -3.01 22.50 -9.35 0.11 -0.34 2.51 -1.04 0.71 1.75 3.97 1.32 1.08 1.49 15.58 0.82 1.13 1.40 -5.94 3.45 17.68 0.11 -0.66 0.38 1.96 1.66 1.64 3.14 1.30 1.11 1.54 15.53 0.85 1.19 1.46 3.12 -5.55 14.67 0.11 0.35 -0.61 1.62 3.36 2.05 1.08 1.29 1.14 1.60 15.48 0.89 1.24 1.52 -2.82 18.43 -6.30 0.11 -0.31 2.03 -0.69 1.58 1.81 0.82 1.28 1.18 1.65 15.43 0.92 1.29 1.59 -27.70 9.38 8.74 0.11 -3.03 1.03 0.96 2.24 2.59 3.03 1.27 1.22 1.71 15.38 0.96 1.34 1.65 -39.51 -37.56 20.73 0.11 -4.31 -4.09 2.26 2.71 1.54 3.24 1.27 1.27 1.76 15.33 1.00 1.39 1.71 -18.34 -43.39 2.74 0.11 -1.99 -4.71 0.30 2.64 3.39 1.39 1.27 1.32 1.82 15.28 1.04 1.43 1.76 -3.24 -28.25 -1.22 0.11 -0.35 -3.05 -0.13 1.90 2.62 4.81 1.28 1.38 1.87 15.23 1.07 1.46 1.81 6.81 -40.11 21.79 0.11 0.73 -4.31 2.34 1.12 0.97 9.70 1.30 1.44 1.93 15.19 1.11 1.48 1.85 8.84 -27.97 33.73 0.11 0.95 -2.99 3.61 3.07 2.51 7.88 1.32 1.51 1.98 15.14 1.14 1.50 1.88 -4.11 -15.87 14.68 0.11 -0.44 -1.69 1.56 7.03 3.40 3.29 1.35 1.58 2.02 15.09 1.17 1.50 1.91 -0.05 -40.75 9.68 0.11 -0.01 -4.32 1.03 4.47 0.67 1.87 1.37 1.65 2.07 15.04 1.20 1.50 1.93 -1.99 -22.62 36.64 0.11 -0.21 -2.39 3.87 1.93 3.07 1.81 1.40 1.72 2.10 14.99 1.23 1.50 1.94 -28.87 21.39 22.57 0.11 -3.03 2.25 2.37 3.01 2.12 3.47 1.43 1.79 2.13 14.94 1.25 1.48 1.94 -36.68 13.32 -9.41 0.10 -3.83 1.39 -0.98 3.17 1.83 0.68 1.47 1.86 2.15 14.89 1.27 1.47 1.94 52.51 -48.05 -21.78 0.12 6.27 -5.74 -2.60 0.87 0.58 3.35 1.58 1.06 0.95 16.36 0.67 0.60 0.90 8.44 -13.93 -12.66 0.12 1.00 -1.66 -1.51 1.77 3.44 2.14 1.59 1.06 0.98 16.31 0.67 0.61 0.91

496
Raw Data Tapered
Data FFT Data Parzen Filtered
Data Simple Ratio
Spectrum Z E N
Tapering Function
Z E N Z E N Z E N
Frequency Hz
E/Z N/Z
Mean SQRT Spectrum
6.44 -4.69 7.64 0.10 0.67 -0.49 0.79 5.61 2.36 2.22 1.50 1.92 2.16 14.84 1.28 1.44 1.93 27.43 8.31 1.67 0.10 2.84 0.86 0.17 4.36 1.42 1.07 1.53 1.98 2.16 14.79 1.29 1.42 1.92 -22.52 18.26 -2.28 0.10 -2.32 1.88 -0.24 2.43 1.66 1.28 1.55 2.03 2.16 14.75 1.30 1.39 1.91 -20.38 2.22 16.74 0.10 -2.09 0.23 1.72 4.42 0.70 0.70 1.58 2.07 2.15 14.70 1.31 1.36 1.89 8.70 -10.76 -3.24 0.10 0.89 -1.10 -0.33 1.74 2.14 0.84 1.60 2.11 2.13 14.65 1.31 1.33 1.87
-43.17 4.26 -12.16 0.10 -4.38 0.43 -1.23 1.50 2.11 3.04 1.62 2.14 2.11 14.60 1.32 1.30 1.85 -25.97 5.25 7.89 0.10 -2.62 0.53 0.80 1.76 3.29 3.00 1.64 2.16 2.08 14.55 1.32 1.27 1.83 47.04 -7.74 3.92 0.10 4.73 -0.78 0.39 2.62 2.66 1.35 1.65 2.17 2.05 14.50 1.31 1.24 1.81 16.97 16.24 -25.99 0.10 1.70 1.62 -2.60 3.37 1.82 2.36 1.66 2.17 2.01 14.45 1.31 1.21 1.78 -10.98 32.15 -26.84 0.10 -1.09 3.20 -2.67 6.85 0.58 2.94 1.66 2.16 1.96 14.40 1.30 1.18 1.76 50.99 17.06 3.26 0.10 5.05 1.69 0.32 5.94 1.40 2.45 1.65 2.14 1.92 14.36 1.30 1.16 1.74 74.80 20.99 -3.69 0.10 7.37 2.07 -0.36 1.25 2.63 3.69 1.64 2.11 1.87 14.31 1.29 1.14 1.72 15.68 38.87 -29.58 0.10 1.54 3.81 -2.90 1.66 3.83 2.57 1.63 2.07 1.82 14.26 1.27 1.12 1.69 3.69 33.73 -7.45 0.10 0.36 3.29 -0.73 3.49 2.85 1.36 1.61 2.02 1.76 14.21 1.26 1.10 1.67 21.70 13.64 16.58 0.10 2.10 1.32 1.61 3.52 2.94 2.62 1.58 1.97 1.71 14.16 1.24 1.08 1.65 -20.25 14.58 -6.40 0.10 -1.95 1.41 -0.62 2.45 1.94 1.48 1.56 1.91 1.66 14.11 1.22 1.06 1.62 -64.02 21.51 -3.33 0.10 -6.15 2.07 -0.32 3.41 1.34 3.20 1.53 1.84 1.61 14.06 1.20 1.05 1.60 -42.75 1.47 27.67 0.10 -4.08 0.14 2.64 9.67 3.15 1.70 1.50 1.77 1.56 14.01 1.18 1.04 1.57 19.35 -5.52 8.65 0.10 1.84 -0.52 0.82 24.63 7.97 4.07 1.47 1.70 1.51 13.96 1.16 1.03 1.55 40.29 -6.49 -21.28 0.09 3.81 -0.61 -2.01 26.80 10.84 5.74 1.44 1.63 1.46 13.92 1.13 1.02 1.52 12.24 -33.41 -8.17 0.09 1.15 -3.14 -0.77 8.98 2.89 4.69 1.41 1.56 1.42 13.87 1.10 1.01 1.49 -1.72 -43.25 -1.10 0.09 -0.16 -4.04 -0.10 5.49 4.52 3.16 1.39 1.48 1.38 13.82 1.07 1.00 1.46 -33.59 -28.10 -17.02 0.09 -3.12 -2.61 -1.58 9.67 4.61 4.15 1.36 1.41 1.34 13.77 1.04 0.99 1.43 -35.40 -14.01 -22.89 0.09 -3.27 -1.30 -2.12 8.35 3.65 4.01 1.34 1.34 1.31 13.72 1.00 0.98 1.40 18.70 -13.95 0.20 0.09 1.72 -1.28 0.02 3.28 3.80 0.91 1.32 1.28 1.27 13.67 0.97 0.97 1.37 22.67 -16.89 14.22 0.09 2.07 -1.55 1.30 7.20 6.33 4.62 1.30 1.22 1.24 13.62 0.93 0.95 1.33 12.66 -9.83 -2.75 0.09 1.15 -0.89 -0.25 8.36 4.33 3.56 1.29 1.16 1.21 13.57 0.90 0.94 1.30 19.65 -19.77 0.30 0.09 1.78 -1.79 0.03 8.25 3.98 2.51 1.29 1.11 1.18 13.53 0.86 0.92 1.26 -2.33 -39.64 20.31 0.09 -0.21 -3.57 1.83 4.76 4.55 3.93 1.29 1.06 1.16 13.48 0.83 0.90 1.22 -32.20 -38.48 22.27 0.09 -2.88 -3.44 1.99 1.56 3.14 3.08 1.29 1.03 1.13 13.43 0.79 0.88 1.18 -46.99 -33.33 30.22 0.09 -4.18 -2.97 2.69 1.00 2.44 0.29 1.30 0.99 1.11 13.38 0.76 0.85 1.14 6.44 -4.69 7.64 0.10 0.67 -0.49 0.79 5.61 2.36 2.22 1.50 1.92 2.16 14.84 1.28 1.44 1.93 27.43 8.31 1.67 0.10 2.84 0.86 0.17 4.36 1.42 1.07 1.53 1.98 2.16 14.79 1.29 1.42 1.92

497
Raw Data Tapered Data
FFT Data Parzen Filtered Data
Simple Ratio Spectrum
Z E N
Tapering Function
Z E N Z E N Z E N
Frequency Hz
E/Z N/Z
Mean SQRT Spectrum
-27.78 -31.20 34.14 0.09 -2.46 -2.76 3.02 0.49 6.19 2.95 1.32 0.97 1.09 13.33 0.73 0.83 1.11 -22.62 -12.10 9.10 0.09 -1.99 -1.07 0.80 3.51 4.39 2.77 1.35 0.95 1.08 13.28 0.71 0.80 1.07 -34.45 8.91 11.10 0.09 -3.01 0.78 0.97 5.69 3.22 1.87 1.38 0.94 1.06 13.23 0.68 0.77 1.03 10.66 0.89 26.08 0.09 0.93 0.08 2.27 5.82 1.64 1.03 1.41 0.93 1.05 13.18 0.66 0.74 0.99 21.65 3.89 6.06 0.09 1.87 0.34 0.52 4.96 1.72 1.16 1.45 0.93 1.04 13.13 0.64 0.71 0.96 -5.32 25.84 -1.90 0.09 -0.46 2.22 -0.16 2.72 2.26 1.78 1.50 0.93 1.03 13.09 0.62 0.68 0.93 8.73 28.73 16.12 0.09 0.75 2.46 1.38 2.71 1.40 0.88 1.55 0.94 1.02 13.04 0.61 0.66 0.89 1.77 16.65 23.09 0.09 0.15 1.42 1.96 5.09 2.29 1.79 1.61 0.96 1.02 12.99 0.59 0.63 0.87 -2.17 14.59 -6.90 0.08 -0.18 1.23 -0.58 3.27 3.83 2.91 1.67 0.97 1.01 12.94 0.58 0.61 0.84 11.87 10.55 -17.80 0.08 1.00 0.89 -1.50 1.41 3.78 2.20 1.74 1.00 1.01 12.89 0.57 0.58 0.82 15.87 -28.41 23.23 0.08 1.33 -2.37 1.94 2.48 1.75 0.66 1.80 1.02 1.01 12.84 0.57 0.56 0.80 15.86 -38.27 14.21 0.08 1.32 -3.18 1.18 3.61 3.37 2.10 1.87 1.05 1.01 12.79 0.56 0.54 0.78 -0.11 7.79 -33.71 0.08 -0.01 0.64 -2.78 5.76 4.23 4.90 1.94 1.08 1.02 12.74 0.56 0.52 0.76 10.93 13.75 -30.53 0.08 0.90 1.13 -2.50 7.94 4.01 12.50 2.00 1.11 1.02 12.70 0.55 0.51 0.75 29.90 -14.24 -20.38 0.08 2.44 -1.16 -1.66 6.39 2.02 12.81 2.07 1.14 1.02 12.65 0.55 0.50 0.74 -5.09 -0.20 -35.22 0.08 -0.41 -0.02 -2.85 3.97 14.41 3.91 2.13 1.17 1.03 12.60 0.55 0.48 0.73 -19.98 13.77 -36.03 0.08 -1.61 1.11 -2.90 14.78 11.41 8.88 2.19 1.20 1.04 12.55 0.55 0.47 0.72 3.11 -7.23 -23.86 0.08 0.25 -0.58 -1.91 16.79 9.83 11.41 2.24 1.23 1.04 12.50 0.55 0.47 0.72
-16.81 9.77 -23.72 0.08 -1.34 0.78 -1.89 5.31 5.89 3.30 2.29 1.26 1.05 12.45 0.55 0.46 0.72 -25.66 35.68 -12.60 0.08 -2.03 2.82 -1.00 3.99 2.76 1.09 2.33 1.29 1.06 12.40 0.55 0.45 0.72 19.41 10.59 2.47 0.08 1.52 0.83 0.19 1.85 0.81 1.04 2.37 1.32 1.07 12.35 0.56 0.45 0.72 32.36 -6.41 -0.49 0.08 2.52 -0.50 -0.04 1.26 4.41 3.13 2.40 1.34 1.07 12.30 0.56 0.45 0.72 -0.64 -3.39 -3.43 0.08 -0.05 -0.26 -0.27 2.28 0.59 2.42 2.42 1.37 1.08 12.26 0.57 0.45 0.72 -8.57 -13.35 -1.37 0.08 -0.66 -1.03 -0.11 3.41 0.83 2.59 2.43 1.39 1.09 12.21 0.57 0.45 0.72 11.49 -30.25 -0.32 0.08 0.88 -2.31 -0.02 3.10 4.36 5.87 2.43 1.41 1.09 12.16 0.58 0.45 0.73 11.50 -26.14 -10.25 0.08 0.87 -1.99 -0.78 2.86 2.91 4.89 2.43 1.42 1.10 12.11 0.59 0.45 0.74 -11.44 1.92 -8.16 0.08 -0.86 0.14 -0.62 1.54 1.94 1.50 2.42 1.44 1.10 12.06 0.59 0.46 0.75 3.63 27.86 2.90 0.08 0.27 2.09 0.22 1.77 5.92 1.23 2.40 1.45 1.11 12.01 0.60 0.46 0.76 27.62 36.74 -1.06 0.07 2.06 2.74 -0.08 5.70 8.56 4.96 2.38 1.46 1.12 11.96 0.61 0.47 0.77 -14.35 23.62 3.98 0.07 -1.06 1.75 0.29 7.06 10.31 5.69 2.35 1.47 1.12 11.91 0.62 0.48 0.79 -28.20 2.58 20.98 0.07 -2.07 0.19 1.54 4.01 8.72 4.48 2.32 1.47 1.13 11.87 0.64 0.49 0.80 -27.78 -31.20 34.14 0.09 -2.46 -2.76 3.02 0.49 6.19 2.95 1.32 0.97 1.09 13.33 0.73 0.83 1.11 -22.62 -12.10 9.10 0.09 -1.99 -1.07 0.80 3.51 4.39 2.77 1.35 0.95 1.08 13.28 0.71 0.80 1.07

498
Raw Data Tapered Data
FFT Data Parzen Filtered Data
Simple Ratio Spectrum
Z E N
Tapering Function
Z E N Z E N Z E N
Frequency Hz
E/Z N/Z
Mean SQRT Spectrum
12.89 -10.40 32.92 0.07 0.94 -0.76 2.40 2.45 4.17 0.99 2.28 1.48 1.14 11.82 0.65 0.50 0.82 -3.08 -2.37 26.85 0.07 -0.22 -0.17 1.95 2.99 1.89 4.15 2.25 1.48 1.16 11.77 0.66 0.52 0.84 -35.94 -9.34 2.84 0.07 -2.59 -0.67 0.20 3.98 1.42 0.50 2.21 1.49 1.17 11.72 0.67 0.53 0.86 -14.78 -36.25 1.88 0.07 -1.06 -2.59 0.13 4.30 2.66 3.87 2.17 1.49 1.19 11.67 0.69 0.55 0.88 5.30 -29.11 16.89 0.07 0.38 -2.07 1.20 2.36 1.39 1.23 2.13 1.50 1.21 11.62 0.70 0.57 0.90
-13.63 -10.03 11.88 0.07 -0.96 -0.71 0.84 3.83 0.61 3.88 2.10 1.51 1.22 11.57 0.72 0.58 0.93 14.43 -30.94 11.88 0.07 1.01 -2.17 0.83 3.56 2.64 2.72 2.06 1.52 1.25 11.52 0.73 0.60 0.95 63.33 -48.77 13.87 0.07 4.40 -3.39 0.96 5.16 8.27 7.80 2.03 1.52 1.27 11.47 0.75 0.62 0.98 11.24 -30.61 -1.10 0.07 0.78 -2.11 -0.08 5.62 10.52 9.06 2.00 1.53 1.29 11.43 0.77 0.65 1.00 -31.66 3.45 14.92 0.07 -2.17 0.24 1.02 2.66 6.33 1.54 1.97 1.54 1.32 11.38 0.78 0.67 1.03 -1.54 11.43 36.86 0.07 -0.10 0.78 2.51 1.83 6.40 2.78 1.95 1.55 1.34 11.33 0.80 0.69 1.05 -0.47 -0.58 11.81 0.07 -0.03 -0.04 0.80 5.35 5.98 4.00 1.93 1.57 1.37 11.28 0.81 0.71 1.08 -4.41 3.42 -0.17 0.07 -0.30 0.23 -0.01 3.84 5.24 5.85 1.91 1.58 1.39 11.23 0.83 0.73 1.10 14.63 2.41 10.86 0.07 0.97 0.16 0.72 0.80 5.25 4.34 1.89 1.59 1.42 11.18 0.84 0.75 1.13 10.64 6.40 -8.10 0.07 0.70 0.42 -0.53 3.14 5.88 2.85 1.88 1.61 1.44 11.13 0.86 0.77 1.15 -13.30 19.36 -35.96 0.07 -0.87 1.27 -2.36 3.52 3.79 1.81 1.86 1.62 1.46 11.08 0.87 0.78 1.17 -10.19 1.32 -34.78 0.07 -0.66 0.09 -2.26 2.80 1.81 2.69 1.85 1.64 1.48 11.04 0.88 0.80 1.19 0.88 -24.63 -15.63 0.06 0.06 -1.59 -1.01 2.68 3.09 0.28 1.84 1.65 1.50 10.99 0.90 0.82 1.21
-30.00 -8.55 -30.49 0.06 -1.92 -0.55 -1.95 6.43 7.92 1.25 1.83 1.67 1.52 10.94 0.91 0.83 1.23 -37.81 27.41 -48.28 0.06 -2.40 1.74 -3.07 12.61 14.97 8.25 1.81 1.68 1.53 10.89 0.93 0.84 1.25 15.30 6.35 -16.10 0.06 0.96 0.40 -1.01 6.44 5.64 2.38 1.80 1.69 1.54 10.84 0.94 0.85 1.27 21.28 -20.61 -4.01 0.06 1.33 -1.29 -0.25 1.81 4.16 3.20 1.78 1.71 1.54 10.79 0.96 0.86 1.29 -14.67 0.44 -18.92 0.06 -0.91 0.03 -1.17 2.12 3.70 2.79 1.77 1.72 1.54 10.74 0.97 0.87 1.31 15.39 9.42 -3.83 0.06 0.95 0.58 -0.24 3.54 6.34 3.93 1.75 1.73 1.54 10.69 0.99 0.88 1.32 48.32 1.41 19.19 0.06 2.95 0.09 1.17 1.25 6.52 1.65 1.73 1.73 1.54 10.64 1.00 0.89 1.34 19.24 -1.59 13.17 0.06 1.16 -0.10 0.80 3.00 2.86 6.57 1.71 1.74 1.53 10.60 1.02 0.90 1.36 4.25 -4.57 -10.78 0.06 0.25 -0.27 -0.65 2.14 2.34 7.47 1.69 1.75 1.53 10.55 1.04 0.91 1.38 9.28 -6.54 -15.68 0.06 0.55 -0.39 -0.93 2.25 3.25 3.15 1.67 1.76 1.52 10.50 1.06 0.91 1.39 -8.66 -9.50 -17.56 0.06 -0.51 -0.56 -1.04 2.76 4.07 1.04 1.65 1.77 1.51 10.45 1.07 0.92 1.41 -24.54 -8.46 -25.43 0.06 -1.44 -0.49 -1.49 4.38 2.41 2.99 1.63 1.78 1.50 10.40 1.09 0.92 1.43 -22.39 -11.41 -6.32 0.06 -1.30 -0.66 -0.37 5.51 1.64 1.40 1.60 1.79 1.49 10.35 1.11 0.93 1.45 12.89 -10.40 32.92 0.07 0.94 -0.76 2.40 2.45 4.17 0.99 2.28 1.48 1.14 11.82 0.65 0.50 0.82 -3.08 -2.37 26.85 0.07 -0.22 -0.17 1.95 2.99 1.89 4.15 2.25 1.48 1.16 11.77 0.66 0.52 0.84

499
Raw Data Tapered Data
FFT Data Parzen Filtered Data
Simple Ratio Spectrum
Z E N
Tapering Function
Z E N Z E N Z E N
Frequency Hz
E/Z N/Z
Mean SQRT Spectrum
-4.27 -2.38 -3.25 0.06 -0.25 -0.14 -0.19 4.91 3.94 3.96 1.58 1.79 1.48 10.30 1.13 0.93 1.47 -7.19 17.60 -7.18 0.06 -0.41 1.00 -0.41 1.72 4.13 2.76 1.56 1.80 1.46 10.25 1.15 0.94 1.48 -28.06 8.55 16.85 0.06 -1.59 0.48 0.95 2.65 4.73 1.04 1.55 1.81 1.45 10.21 1.17 0.94 1.50 -16.92 -9.44 26.81 0.06 -0.95 -0.53 1.50 3.22 2.69 1.63 1.53 1.82 1.44 10.16 1.19 0.94 1.52 -7.81 -8.40 32.74 0.06 -0.43 -0.47 1.82 2.14 2.12 5.21 1.51 1.83 1.43 10.11 1.21 0.94 1.53 -4.72 4.62 32.66 0.06 -0.26 0.25 1.80 3.24 3.34 4.88 1.50 1.84 1.42 10.06 1.23 0.95 1.55 6.33 7.60 32.57 0.05 0.35 0.41 1.78 3.66 4.11 2.67 1.49 1.85 1.41 10.01 1.24 0.95 1.56 12.35 -4.40 39.48 0.05 0.67 -0.24 2.13 0.58 5.06 3.21 1.48 1.86 1.40 9.96 1.26 0.95 1.58 13.36 -6.37 15.42 0.05 0.71 -0.34 0.82 2.80 1.24 2.77 1.47 1.87 1.39 9.91 1.27 0.95 1.59 4.38 -4.34 3.42 0.05 0.23 -0.23 0.18 2.32 3.64 1.64 1.46 1.88 1.39 9.86 1.29 0.95 1.60 2.43 -20.29 20.42 0.05 0.13 -1.07 1.07 1.99 4.67 2.62 1.46 1.89 1.38 9.81 1.30 0.95 1.61 -5.51 -27.18 16.40 0.05 -0.29 -1.41 0.85 1.27 4.70 5.85 1.45 1.90 1.38 9.77 1.31 0.95 1.61 -33.37 -17.09 1.41 0.05 -1.72 -0.88 0.07 1.06 2.76 5.84 1.45 1.91 1.37 9.72 1.32 0.95 1.62 -23.20 -12.02 -1.54 0.05 -1.18 -0.61 -0.08 2.54 1.15 4.59 1.45 1.91 1.37 9.67 1.32 0.94 1.63 1.90 1.01 3.50 0.05 0.10 0.05 0.18 4.20 0.99 6.29 1.44 1.92 1.36 9.62 1.33 0.94 1.63 -8.02 15.98 -5.45 0.05 -0.40 0.80 -0.27 4.29 2.28 3.14 1.44 1.92 1.36 9.57 1.33 0.94 1.63 3.05 8.94 -9.37 0.05 0.15 0.44 -0.46 2.27 2.69 4.00 1.44 1.92 1.35 9.52 1.33 0.94 1.63 27.04 3.92 1.69 0.05 1.33 0.19 0.08 2.42 2.28 4.14 1.43 1.91 1.35 9.47 1.34 0.94 1.63 -14.92 21.87 -9.25 0.05 -0.72 1.06 -0.45 2.46 2.21 2.63 1.43 1.90 1.34 9.42 1.33 0.94 1.63 -39.75 36.76 -19.14 0.05 -1.91 1.76 -0.92 2.82 4.14 2.32 1.42 1.90 1.34 9.38 1.33 0.94 1.63 13.36 21.65 -9.04 0.05 0.63 1.03 -0.43 4.14 5.31 4.79 1.42 1.88 1.33 9.33 1.33 0.94 1.63 36.32 10.59 -16.94 0.05 1.71 0.50 -0.80 4.61 7.51 5.41 1.41 1.87 1.33 9.28 1.33 0.94 1.63 1.30 17.54 -24.81 0.05 0.06 0.82 -1.15 3.51 3.22 4.77 1.40 1.85 1.32 9.23 1.32 0.94 1.63
-26.59 4.51 -14.68 0.05 -1.22 0.21 -0.68 1.07 1.69 5.36 1.39 1.83 1.32 9.18 1.32 0.95 1.62 -8.46 -14.47 -16.57 0.05 -0.38 -0.66 -0.75 1.27 5.46 2.78 1.38 1.81 1.31 9.13 1.31 0.95 1.62 11.60 -23.38 -21.45 0.05 0.52 -1.05 -0.97 2.34 5.38 2.18 1.36 1.78 1.31 9.08 1.31 0.96 1.62 1.63 -16.30 -20.32 0.04 0.07 -0.73 -0.90 2.22 2.68 3.66 1.35 1.75 1.30 9.03 1.30 0.97 1.62 30.62 -9.24 -11.21 0.04 1.35 -0.41 -0.49 2.23 0.12 1.65 1.33 1.72 1.30 8.98 1.29 0.98 1.62 29.56 -8.20 -2.13 0.04 1.29 -0.36 -0.09 1.58 2.85 3.54 1.31 1.69 1.30 8.94 1.29 0.99 1.62 -15.41 5.81 -8.06 0.04 -0.66 0.25 -0.35 1.80 1.09 9.07 1.30 1.66 1.30 8.89 1.28 1.00 1.62 27.63 -1.19 0.00 0.04 1.17 -0.05 0.00 2.28 1.74 6.81 1.28 1.62 1.30 8.84 1.27 1.01 1.63 -4.27 -2.38 -3.25 0.06 -0.25 -0.14 -0.19 4.91 3.94 3.96 1.58 1.79 1.48 10.30 1.13 0.93 1.47 -7.19 17.60 -7.18 0.06 -0.41 1.00 -0.41 1.72 4.13 2.76 1.56 1.80 1.46 10.25 1.15 0.94 1.48

500
Raw Data Tapered Data
FFT Data Parzen Filtered Data
Simple Ratio Spectrum
Z E N
Tapering Function
Z E N Z E N Z E N
Frequency Hz
E/Z N/Z
Mean SQRT Spectrum
43.54 -14.15 13.03 0.04 1.83 -0.59 0.55 1.23 1.81 4.01 1.26 1.59 1.30 8.79 1.26 1.03 1.63 -25.44 -2.11 -2.95 0.04 -1.06 -0.09 -0.12 1.09 1.86 7.47 1.24 1.56 1.30 8.74 1.26 1.05 1.64 -19.29 1.89 -11.87 0.04 -0.79 0.08 -0.49 0.57 2.36 3.70 1.22 1.53 1.30 8.69 1.25 1.07 1.64 29.75 -7.09 -2.79 0.04 1.20 -0.29 -0.11 0.42 5.37 3.53 1.20 1.50 1.31 8.64 1.24 1.09 1.65 -8.23 -15.04 -9.72 0.04 -0.33 -0.60 -0.39 0.75 6.54 4.86 1.18 1.47 1.31 8.59 1.24 1.11 1.66 -80.00 -14.97 1.35 0.04 -3.16 -0.59 0.05 2.63 5.06 3.24 1.17 1.44 1.32 8.54 1.23 1.13 1.67 -47.68 -13.90 32.33 0.04 -1.86 -0.54 1.26 3.18 1.36 1.75 1.15 1.41 1.33 8.50 1.23 1.16 1.69 10.45 -21.82 31.25 0.04 0.40 -0.84 1.20 2.32 5.23 2.57 1.13 1.39 1.34 8.45 1.23 1.18 1.70 -12.49 -19.73 15.20 0.04 -0.47 -0.75 0.58 1.82 2.39 9.78 1.11 1.36 1.35 8.40 1.22 1.21 1.72 -17.37 -3.68 11.20 0.04 -0.65 -0.14 0.42 2.57 8.69 7.75 1.10 1.34 1.36 8.35 1.22 1.24 1.74 15.70 1.33 7.21 0.04 0.58 0.05 0.27 4.23 8.01 9.83 1.08 1.32 1.37 8.30 1.22 1.26 1.76 4.72 -4.65 3.24 0.04 0.17 -0.17 0.12 2.42 8.91 6.97 1.07 1.31 1.38 8.25 1.22 1.29 1.78
-16.20 5.35 4.27 0.04 -0.58 0.19 0.15 1.60 0.88 1.37 1.06 1.29 1.40 8.20 1.23 1.32 1.80 13.86 5.34 5.30 0.04 0.49 0.19 0.19 2.77 0.80 1.91 1.04 1.28 1.41 8.15 1.23 1.35 1.83 40.81 -3.66 -2.66 0.04 1.43 -0.13 -0.09 1.72 2.98 2.38 1.03 1.27 1.42 8.11 1.23 1.38 1.85 -5.20 1.36 -7.59 0.03 -0.18 0.05 -0.26 2.81 1.59 3.12 1.02 1.26 1.44 8.06 1.24 1.42 1.88 -58.01 -2.63 4.46 0.03 -1.97 -0.09 0.15 2.99 3.16 3.26 1.01 1.26 1.46 8.01 1.25 1.45 1.91 -29.78 -7.60 13.47 0.03 -1.00 -0.25 0.45 0.84 0.13 4.60 0.99 1.25 1.47 7.96 1.26 1.48 1.94 -4.65 9.40 3.49 0.03 -0.15 0.31 0.12 3.22 3.10 6.91 0.98 1.25 1.49 7.91 1.27 1.52 1.98 -35.51 8.37 -6.46 0.03 -1.15 0.27 -0.21 2.57 2.08 3.95 0.97 1.24 1.51 7.86 1.28 1.55 2.01 -21.33 -4.63 -3.39 0.03 -0.68 -0.15 -0.11 0.97 2.41 1.86 0.96 1.24 1.52 7.81 1.30 1.59 2.05 13.74 -0.61 -1.34 0.03 0.43 -0.02 -0.04 2.33 0.78 1.03 0.95 1.24 1.54 7.76 1.31 1.63 2.09 -9.21 19.36 -8.27 0.03 -0.29 0.60 -0.26 2.24 2.17 1.05 0.94 1.25 1.56 7.71 1.33 1.66 2.13 -10.11 32.26 3.79 0.03 -0.31 0.98 0.12 5.04 4.26 2.35 0.92 1.25 1.57 7.67 1.35 1.70 2.17 17.94 18.17 6.81 0.03 0.54 0.55 0.20 3.30 1.12 3.52 0.91 1.25 1.59 7.62 1.37 1.74 2.22 22.92 10.12 -16.12 0.03 0.68 0.30 -0.48 6.02 9.07 6.54 0.90 1.26 1.60 7.57 1.39 1.78 2.26 46.84 17.07 -16.01 0.03 1.36 0.50 -0.46 5.81 12.18 8.18 0.89 1.26 1.62 7.52 1.42 1.82 2.31 46.71 -0.95 -7.91 0.03 1.33 -0.03 -0.23 2.14 6.82 3.43 0.88 1.27 1.63 7.47 1.44 1.86 2.35 6.66 -19.90 -5.84 0.03 0.19 -0.56 -0.16 1.43 6.00 2.14 0.87 1.27 1.65 7.42 1.46 1.90 2.40 8.69 -23.81 -0.78 0.03 0.24 -0.65 -0.02 2.06 4.10 2.51 0.86 1.28 1.66 7.37 1.49 1.93 2.44 14.70 -22.71 -0.73 0.03 0.40 -0.61 -0.02 1.42 3.74 4.69 0.85 1.29 1.67 7.32 1.51 1.96 2.48 43.54 -14.15 13.03 0.04 1.83 -0.59 0.55 1.23 1.81 4.01 1.26 1.59 1.30 8.79 1.26 1.03 1.63 -25.44 -2.11 -2.95 0.04 -1.06 -0.09 -0.12 1.09 1.86 7.47 1.24 1.56 1.30 8.74 1.26 1.05 1.64

501
Raw Data Tapered
Data FFT Data Parzen Filtered
Data Simple Ratio
Spectrum Z E N
Tapering Function
Z E N Z E N Z E N
Frequency Hz
E/Z N/Z
Mean SQRT Spectrum
-4.26 -9.64 1.32 0.03 -0.11 -0.26 0.04 0.83 1.92 3.47 0.84 1.29 1.68 7.28 1.53 1.99 2.52 0.81 -15.58 -5.62 0.03 0.02 -0.41 -0.15 2.61 1.15 2.91 0.84 1.30 1.69 7.23 1.55 2.02 2.55 15.84 -13.51 -6.55 0.03 0.40 -0.34 -0.17 2.38 0.59 5.45 0.83 1.31 1.70 7.18 1.57 2.04 2.58 2.86 -12.45 4.50 0.03 0.07 -0.31 0.11 3.03 2.15 4.51 0.83 1.32 1.71 7.13 1.59 2.06 2.60 -2.08 -33.35 -6.45 0.02 -0.05 -0.82 -0.16 5.38 3.90 5.07 0.83 1.33 1.71 7.08 1.60 2.07 2.62 7.96 -10.26 -10.36 0.02 0.19 -0.25 -0.25 2.00 2.31 3.44 0.83 1.33 1.71 7.03 1.62 2.08 2.63 -5.98 -0.23 14.67 0.02 -0.14 -0.01 0.34 3.85 4.33 2.36 0.83 1.34 1.71 6.98 1.62 2.07 2.63 -17.87 -20.18 29.63 0.02 -0.41 -0.46 0.68 3.16 9.04 4.85 0.83 1.35 1.71 6.93 1.63 2.07 2.63 -7.76 -9.11 34.55 0.02 -0.17 -0.20 0.78 2.03 5.32 3.13 0.83 1.35 1.71 6.88 1.62 2.05 2.62 14.28 -1.08 26.48 0.02 0.31 -0.02 0.58 3.55 1.86 1.09 0.84 1.36 1.71 6.84 1.62 2.03 2.60 15.28 -18.03 8.45 0.02 0.33 -0.39 0.18 2.65 3.01 0.66 0.85 1.36 1.70 6.79 1.61 2.01 2.58 -40.61 -16.95 16.45 0.02 -0.85 -0.36 0.35 3.19 1.89 0.68 0.85 1.37 1.69 6.74 1.60 1.98 2.55 -58.35 7.07 15.43 0.02 -1.20 0.15 0.32 4.00 3.78 2.16 0.86 1.37 1.68 6.69 1.59 1.94 2.51 9.81 3.06 10.43 0.02 0.20 0.06 0.21 2.16 3.08 4.72 0.88 1.38 1.67 6.64 1.58 1.91 2.47 36.78 -9.92 17.42 0.02 0.72 -0.19 0.34 4.12 2.06 6.57 0.89 1.38 1.66 6.59 1.56 1.87 2.43 5.75 14.09 -2.56 0.02 0.11 0.27 -0.05 3.12 0.54 5.55 0.90 1.39 1.64 6.54 1.54 1.83 2.39 -4.19 35.99 -13.48 0.02 -0.08 0.67 -0.25 4.01 3.74 3.03 0.91 1.39 1.63 6.49 1.53 1.78 2.35 1.87 10.91 -2.41 0.02 0.03 0.20 -0.04 9.73 10.18 8.47 0.93 1.40 1.61 6.45 1.51 1.74 2.30
-33.00 6.88 -1.35 0.02 -0.58 0.12 -0.02 14.20 14.17 11.67 0.94 1.40 1.59 6.40 1.49 1.70 2.26 -62.75 39.80 0.70 0.02 -1.07 0.68 0.01 19.64 9.21 2.27 0.95 1.40 1.58 6.35 1.47 1.66 2.22 -5.55 9.70 8.72 0.02 -0.09 0.16 0.14 14.73 9.73 1.57 0.97 1.41 1.56 6.30 1.46 1.62 2.18 32.45 -10.29 -3.24 0.02 0.52 -0.16 -0.05 4.29 6.63 10.06 0.98 1.41 1.55 6.25 1.44 1.58 2.13 -11.53 2.74 -23.14 0.02 -0.18 0.04 -0.36 2.29 5.29 9.26 0.99 1.41 1.53 6.20 1.42 1.54 2.10 -1.44 -22.22 -6.04 0.02 -0.02 -0.33 -0.09 2.04 3.59 3.28 1.01 1.42 1.52 6.15 1.41 1.50 2.06 32.56 -21.12 7.01 0.01 0.47 -0.31 0.10 5.99 17.72 3.50 1.02 1.42 1.50 6.10 1.39 1.47 2.02 5.54 -9.05 -16.92 0.01 0.08 -0.13 -0.24 7.93 25.49 14.50 1.04 1.43 1.49 6.05 1.37 1.43 1.98 8.57 -8.01 -15.81 0.01 0.12 -0.11 -0.21 53.86 13.93 54.09 1.06 1.44 1.48 6.01 1.36 1.40 1.95 47.52 -2.98 -7.72 0.01 0.62 -0.04 -0.10 57.17 15.38 44.65 1.08 1.45 1.47 5.96 1.34 1.37 1.92 27.43 -6.95 -27.60 0.01 0.34 -0.09 -0.34 12.24 0.97 8.63 1.10 1.45 1.46 5.91 1.33 1.33 1.88 -18.53 6.06 -39.42 0.01 -0.22 0.07 -0.47 3.31 3.93 3.22 1.12 1.47 1.46 5.86 1.31 1.30 1.85 16.53 -5.93 -32.23 0.01 0.19 -0.07 -0.37 2.65 5.88 8.16 1.14 1.48 1.46 5.81 1.29 1.27 1.81 -4.26 -9.64 1.32 0.03 -0.11 -0.26 0.04 0.83 1.92 3.47 0.84 1.29 1.68 7.28 1.53 1.99 2.52 0.81 -15.58 -5.62 0.03 0.02 -0.41 -0.15 2.61 1.15 2.91 0.84 1.30 1.69 7.23 1.55 2.02 2.55

502
Raw Data Tapered Data
FFT Data Parzen Filtered Data
Simple Ratio Spectrum
Z E N
Tapering Function
Z E N Z E N Z E N
Frequency Hz
E/Z N/Z
Mean SQRT Spectrum
46.47 -22.87 -12.09 0.01 0.51 -0.25 -0.13 9.49 4.42 17.72 1.17 1.49 1.46 5.76 1.27 1.24 1.78 0.43 11.17 3.97 0.01 0.00 0.12 0.04 2.92 5.51 11.30 1.21 1.51 1.46 5.71 1.25 1.21 1.74
-18.47 14.12 1.01 0.01 -0.18 0.14 0.01 5.82 8.59 4.43 1.25 1.53 1.48 5.66 1.22 1.18 1.70 3.62 2.10 -4.93 0.01 0.03 0.02 -0.05 4.76 4.85 8.93 1.29 1.55 1.49 5.62 1.20 1.16 1.66 -0.33 10.09 -13.85 0.01 0.00 0.09 -0.12 3.90 3.02 8.50 1.35 1.57 1.52 5.57 1.17 1.13 1.62 -12.24 -5.91 -7.76 0.01 -0.10 -0.05 -0.07 4.53 2.44 9.67 1.41 1.60 1.55 5.52 1.14 1.10 1.58 -2.16 -24.84 22.26 0.01 -0.02 -0.20 0.18 2.81 3.38 5.67 1.48 1.64 1.59 5.47 1.11 1.08 1.54 9.89 -27.73 30.21 0.01 0.07 -0.21 0.23 2.39 9.81 7.95 1.55 1.68 1.63 5.42 1.08 1.05 1.51 -5.06 -26.61 13.17 0.01 -0.04 -0.19 0.09 3.20 9.93 3.38 1.64 1.72 1.69 5.37 1.05 1.03 1.47 -16.96 -6.54 20.15 0.01 -0.11 -0.04 0.13 3.25 2.16 3.56 1.73 1.77 1.75 5.32 1.02 1.01 1.44 5.12 -19.47 35.08 0.01 0.03 -0.12 0.21 4.17 1.34 6.52 1.83 1.82 1.82 5.27 0.99 0.99 1.40 -3.82 -41.34 30.00 0.01 -0.02 -0.23 0.17 3.30 3.60 6.94 1.94 1.87 1.90 5.22 0.97 0.98 1.38 -17.72 4.74 23.94 0.01 -0.09 0.02 0.12 0.84 0.79 5.21 2.05 1.93 1.99 5.18 0.94 0.97 1.35 27.33 20.70 24.89 0.00 0.12 0.09 0.11 2.09 4.52 3.03 2.18 1.99 2.09 5.13 0.92 0.96 1.33 26.28 -10.31 22.84 0.00 0.11 -0.04 0.09 2.76 5.61 4.23 2.31 2.06 2.20 5.08 0.89 0.95 1.31 -26.66 11.69 11.82 0.00 -0.09 0.04 0.04 3.85 1.76 11.36 2.44 2.13 2.31 5.03 0.87 0.95 1.29 -19.51 26.63 11.81 0.00 -0.06 0.08 0.04 3.25 4.13 14.67 2.57 2.19 2.43 4.98 0.85 0.95 1.27 -1.41 -5.41 15.80 0.00 0.00 -0.01 0.04 2.05 1.69 1.85 2.71 2.26 2.56 4.93 0.84 0.94 1.26 -23.30 -2.38 -8.17 0.00 -0.05 0.00 -0.02 2.01 3.18 1.27 2.84 2.33 2.69 4.88 0.82 0.95 1.25 -27.14 12.61 -19.06 0.00 -0.04 0.02 -0.03 1.08 1.66 0.79 2.97 2.39 2.82 4.83 0.81 0.95 1.25 -3.02 -15.38 -4.97 0.00 0.00 -0.02 0.00 2.88 0.96 2.65 3.09 2.46 2.95 4.79 0.79 0.95 1.24 -17.91 -29.28 -4.90 0.00 -0.01 -0.01 0.00 0.67 0.95 3.50 3.20 2.51 3.07 4.74 0.78 0.96 1.24 -44.73 -7.20 -16.81 0.00 0.00 0.00 0.00 1.43 1.11 3.10 3.30 2.56 3.20 4.69 0.78 0.97 1.24

503
Microtremors Segment: B1-S2
Raw Data Tapered Data
FFT Data Parzen Filtered Data
Simple Ratio Spectrum
Z E N
Tapering Function
Z E N Z E N Z E N
Frequency Hz
E/Z N/Z
Mean SQRT Spectrum
43.75 19.37 3.73 0.26 11.35 7.34 0.97 2.59 0.70 1.16 2.54 1.21 0.96 30.03 0.48 0.38 0.61 18.68 28.28 13.75 0.26 4.84 5.23 3.56 6.75 0.79 1.41 2.52 1.20 0.94 29.98 0.48 0.37 0.60 6.67 20.19 -5.21 0.26 1.72 -1.77 -1.35 5.07 0.62 1.62 2.48 1.18 0.91 29.93 0.48 0.37 0.60 2.70 -6.84 -14.11 0.26 0.70 -6.65 -3.64 6.10 0.54 1.01 2.44 1.16 0.88 29.88 0.48 0.36 0.60
-15.23 -25.77 -3.02 0.26 -3.92 -4.04 -0.78 2.37 0.62 1.04 2.39 1.14 0.85 29.83 0.48 0.35 0.59 -22.10 -15.68 1.04 0.26 -5.68 -8.12 0.27 2.89 1.39 0.30 2.33 1.11 0.81 29.79 0.48 0.35 0.59 5.98 -31.58 10.07 0.26 1.53 -9.86 2.58 3.50 1.53 0.14 2.27 1.09 0.78 29.74 0.48 0.34 0.59 25.96 -38.44 3.10 0.26 6.65 1.44 0.79 1.86 1.58 1.08 2.20 1.06 0.74 29.69 0.48 0.34 0.59 -20.00 5.63 -23.80 0.26 -5.11 9.59 -6.08 2.80 1.32 1.30 2.13 1.03 0.70 29.64 0.48 0.33 0.58 -50.81 37.55 -34.63 0.26 -12.96 7.76 -8.83 2.22 1.13 2.12 2.06 0.99 0.67 29.59 0.48 0.32 0.58 1.33 30.42 -25.46 0.25 0.34 5.43 -6.48 1.34 0.57 3.02 1.99 0.96 0.63 29.54 0.48 0.32 0.58 10.36 21.32 -6.34 0.25 2.63 11.23 -1.61 2.57 1.06 3.54 1.91 0.93 0.60 29.49 0.49 0.31 0.58 -17.58 44.19 0.73 0.25 -4.46 13.44 0.19 3.12 2.26 0.67 1.84 0.90 0.57 29.44 0.49 0.31 0.58 4.50 53.00 -3.21 0.25 1.14 10.07 -0.81 1.74 1.53 2.38 1.77 0.87 0.55 29.39 0.49 0.31 0.58 15.50 39.82 -7.13 0.25 3.91 9.26 -1.80 2.81 1.65 3.88 1.70 0.84 0.52 29.35 0.50 0.31 0.58 -7.46 36.67 -24.01 0.25 -1.88 5.18 -6.05 1.40 1.45 0.25 1.64 0.82 0.50 29.30 0.50 0.31 0.59 -41.32 20.56 -12.88 0.25 -10.39 -0.87 -3.24 4.59 0.91 1.62 1.58 0.79 0.49 29.25 0.50 0.31 0.59 -19.15 -3.48 26.15 0.25 -4.81 -2.87 6.56 2.87 0.85 1.79 1.52 0.77 0.47 29.20 0.51 0.31 0.59 1.93 -11.44 20.11 0.25 0.48 -1.85 5.04 0.86 1.09 0.90 1.47 0.75 0.46 29.15 0.51 0.31 0.60
-52.92 -7.40 2.13 0.25 -13.23 -5.34 0.53 1.18 1.09 2.18 1.42 0.73 0.45 29.10 0.51 0.32 0.61 -20.72 -21.34 22.13 0.25 -5.17 -10.03 5.52 1.80 1.26 1.19 1.38 0.71 0.45 29.05 0.52 0.32 0.61 38.30 -40.22 12.12 0.25 9.54 -3.26 3.02 3.41 1.57 1.77 1.34 0.70 0.44 29.00 0.52 0.33 0.62 -23.69 -13.11 -17.81 0.25 -5.89 1.47 -4.43 0.93 2.26 2.46 1.31 0.68 0.44 28.96 0.52 0.34 0.62 -50.49 5.91 -3.71 0.25 -12.52 -5.22 -0.92 1.86 1.31 2.46 1.28 0.67 0.44 28.91 0.53 0.35 0.63 15.63 -21.05 23.31 0.25 3.87 -0.74 5.77 4.67 2.92 0.49 1.25 0.66 0.44 28.86 0.53 0.36 0.64 32.58 -3.00 30.25 0.25 8.05 5.42 7.47 11.35 2.97 3.92 1.23 0.65 0.45 28.81 0.53 0.36 0.64 6.56 21.96 22.21 0.25 1.62 -4.69 5.47 12.18 4.13 6.18 1.21 0.64 0.45 28.76 0.53 0.37 0.65 48.49 -19.04 10.20 0.25 11.93 -6.87 2.51 9.68 5.18 9.80 1.19 0.63 0.46 28.71 0.53 0.38 0.66 58.33 -27.94 -4.76 0.25 14.32 -0.46 -1.17 21.14 3.73 11.70 1.18 0.63 0.47 28.66 0.53 0.39 0.66 -35.67 -1.88 -21.65 0.25 -8.74 -3.15 -5.30 14.49 2.81 10.18 1.17 0.62 0.47 28.61 0.53 0.40 0.67 -54.44 -12.85 -25.50 0.24 -13.31 -8.25 -6.23 10.18 1.78 9.29 1.16 0.61 0.48 28.56 0.53 0.41 0.67 -9.26 -33.75 -15.36 0.24 -2.26 -5.77 -3.75 11.46 3.19 9.12 1.16 0.61 0.49 28.52 0.53 0.42 0.68 43.75 19.37 3.73 0.26 11.35 7.34 0.97 2.59 0.70 1.16 2.54 1.21 0.96 30.03 0.48 0.38 0.61

504
Raw Data Tapered Data
FFT Data Parzen Filtered Data
Simple Ratio Spectrum
Z E N
Tapering Function
Z E N Z E N Z E N
Frequency Hz
E/Z N/Z
Mean SQRT Spectrum
-24.15 -23.63 -0.27 0.24 -5.88 -2.57 -0.07 11.53 1.05 7.43 1.15 0.60 0.50 28.47 0.52 0.44 0.68 -12.03 -10.56 16.75 0.24 -2.92 -6.68 4.07 7.61 1.34 4.90 1.15 0.60 0.51 28.42 0.52 0.45 0.68 37.97 -27.48 27.72 0.24 9.21 -4.94 6.72 8.43 1.32 5.09 1.15 0.59 0.53 28.37 0.51 0.46 0.69 46.85 -20.38 11.69 0.24 11.34 0.40 2.83 7.99 0.69 6.00 1.15 0.59 0.54 28.32 0.51 0.47 0.69 36.73 1.67 -6.26 0.24 8.87 -0.32 -1.51 10.28 1.41 5.24 1.16 0.58 0.56 28.27 0.50 0.48 0.69 30.64 -1.33 13.78 0.24 7.39 0.64 3.32 9.50 0.53 3.71 1.17 0.58 0.57 28.22 0.50 0.49 0.70 20.59 2.67 33.74 0.24 4.95 1.36 8.11 5.62 0.09 3.77 1.18 0.58 0.59 28.17 0.49 0.50 0.70 7.58 5.66 29.67 0.24 1.82 -1.76 7.12 6.26 1.41 4.75 1.19 0.58 0.61 28.13 0.48 0.52 0.71 -3.38 -7.33 30.60 0.24 -0.81 -3.66 7.33 6.17 2.06 2.76 1.21 0.58 0.64 28.08 0.48 0.53 0.71 -11.30 -15.28 33.53 0.24 -2.70 1.61 8.01 4.92 1.75 3.12 1.23 0.58 0.67 28.03 0.47 0.54 0.72 -31.17 6.74 15.49 0.24 -7.43 8.27 3.69 4.46 2.14 1.74 1.26 0.58 0.70 27.98 0.46 0.55 0.72 -46.96 34.66 -14.46 0.24 -11.18 6.08 -3.44 4.52 0.77 0.73 1.29 0.58 0.73 27.93 0.45 0.57 0.73 -37.75 25.54 -6.37 0.24 -8.96 3.67 -1.51 4.67 1.47 2.75 1.33 0.59 0.77 27.88 0.44 0.58 0.73 -31.56 15.47 19.66 0.24 -7.48 6.73 4.66 6.68 0.75 2.98 1.38 0.60 0.81 27.83 0.43 0.59 0.73 -26.39 28.38 -2.32 0.24 -6.24 7.63 -0.55 10.15 1.43 5.43 1.43 0.60 0.86 27.78 0.42 0.60 0.73 -10.27 32.26 -0.26 0.24 -2.42 6.64 -0.06 7.21 2.44 3.67 1.49 0.61 0.91 27.73 0.41 0.61 0.74 -10.18 28.15 27.74 0.24 -2.40 9.42 6.53 5.65 0.48 3.38 1.55 0.62 0.96 27.69 0.40 0.62 0.74 -31.05 40.01 6.73 0.24 -7.30 10.77 1.58 5.98 1.80 2.66 1.62 0.63 1.02 27.64 0.39 0.63 0.74 -13.91 45.84 -16.20 0.23 -3.26 4.39 -3.80 2.83 1.86 1.35 1.70 0.64 1.07 27.59 0.38 0.63 0.74 38.09 18.72 -15.08 0.23 8.91 1.09 -3.53 3.70 0.67 0.54 1.78 0.65 1.13 27.54 0.37 0.64 0.73 20.03 4.67 -13.97 0.23 4.68 2.25 -3.26 4.74 2.37 2.58 1.86 0.66 1.19 27.49 0.36 0.64 0.73 -14.93 9.64 -29.83 0.23 -3.48 -0.78 -6.95 2.32 3.05 1.72 1.95 0.67 1.25 27.44 0.35 0.64 0.73 25.10 -3.37 -43.62 0.23 5.83 -5.42 -10.14 4.72 0.80 1.15 2.04 0.68 1.32 27.39 0.34 0.64 0.73 18.06 -23.31 -37.40 0.23 4.19 -4.92 -8.68 2.88 2.87 2.72 2.13 0.69 1.38 27.34 0.33 0.65 0.72 -44.84 -21.22 -37.20 0.23 -10.38 0.65 -8.61 2.97 2.45 4.49 2.22 0.70 1.43 27.29 0.32 0.65 0.72 -36.63 2.82 -27.01 0.23 -8.46 0.65 -6.24 3.95 0.87 3.22 2.31 0.71 1.49 27.25 0.31 0.65 0.71 4.49 2.81 -5.89 0.23 1.03 -2.80 -1.36 3.40 3.43 1.68 2.39 0.71 1.54 27.20 0.30 0.64 0.71 4.52 -12.17 1.17 0.23 1.04 1.57 0.27 2.50 4.24 2.83 2.48 0.72 1.59 27.15 0.29 0.64 0.71 -7.42 6.85 12.20 0.23 -1.70 0.42 2.80 3.77 2.13 2.87 2.55 0.72 1.63 27.10 0.28 0.64 0.70 25.59 1.83 18.20 0.23 5.86 -5.30 4.17 1.34 1.71 1.63 2.62 0.72 1.67 27.05 0.28 0.64 0.70 33.52 -23.12 15.19 0.23 7.66 -1.16 3.47 3.18 1.62 1.89 2.68 0.72 1.70 27.00 0.27 0.64 0.69 -24.15 -23.63 -0.27 0.24 -5.88 -2.57 -0.07 11.53 1.05 7.43 1.15 0.60 0.50 28.47 0.52 0.44 0.68 -12.03 -10.56 16.75 0.24 -2.92 -6.68 4.07 7.61 1.34 4.90 1.15 0.60 0.51 28.42 0.52 0.45 0.68

505
Raw Data Tapered Data
FFT Data Parzen Filtered Data
Simple Ratio Spectrum
Z E N
Tapering Function
Z E N Z E N Z E N
Frequency Hz
E/Z N/Z
Mean SQRT Spectrum
-23.45 -5.06 1.21 0.23 -5.35 -1.60 0.28 1.88 1.22 3.42 2.73 0.72 1.73 26.95 0.26 0.63 0.69 -4.35 -7.04 -15.70 0.23 -0.99 -6.36 -3.57 1.42 4.01 4.74 2.77 0.72 1.74 26.90 0.26 0.63 0.68 43.62 -27.96 -6.60 0.23 9.90 -5.42 -1.50 1.37 2.11 2.61 2.80 0.71 1.75 26.86 0.25 0.63 0.68 -4.40 -23.86 -5.52 0.23 -1.00 -8.77 -1.25 3.07 4.98 1.94 2.82 0.71 1.76 26.81 0.25 0.62 0.67 -34.28 -38.73 -10.43 0.23 -7.75 -10.52 -2.36 4.68 3.78 3.21 2.83 0.70 1.75 26.76 0.25 0.62 0.67 0.84 -46.55 6.63 0.23 0.19 -4.83 1.50 6.07 3.15 2.67 2.83 0.69 1.74 26.71 0.25 0.62 0.66 20.84 -21.41 15.64 0.23 4.69 0.14 3.52 6.68 2.07 2.28 2.82 0.69 1.73 26.66 0.24 0.61 0.66 18.81 0.63 6.65 0.22 4.22 2.38 1.49 3.59 1.43 4.21 2.80 0.68 1.70 26.61 0.24 0.61 0.65 35.75 10.61 5.69 0.22 8.01 0.13 1.27 5.44 3.44 5.17 2.77 0.67 1.67 26.56 0.24 0.60 0.65 43.64 0.60 15.70 0.22 9.75 -0.54 3.51 7.56 4.01 4.66 2.73 0.67 1.64 26.51 0.25 0.60 0.65 -16.36 -2.40 5.71 0.22 -3.65 4.36 1.27 7.76 3.78 3.48 2.68 0.66 1.61 26.46 0.25 0.60 0.65 -48.18 19.57 2.75 0.22 -10.72 3.45 0.61 6.52 1.74 2.95 2.63 0.66 1.57 26.42 0.25 0.60 0.65 -13.01 15.51 11.78 0.22 -2.89 -0.34 2.61 6.48 2.89 2.72 2.57 0.66 1.52 26.37 0.26 0.59 0.65 -30.88 -1.52 -9.17 0.22 -6.84 4.53 -2.03 8.53 3.03 2.66 2.51 0.66 1.48 26.32 0.26 0.59 0.65 -39.68 20.45 -27.04 0.22 -8.77 2.52 -5.98 10.73 0.51 2.06 2.44 0.66 1.44 26.27 0.27 0.59 0.65 12.42 11.39 -17.90 0.22 2.74 -4.32 -3.95 8.46 3.67 2.32 2.37 0.66 1.39 26.22 0.28 0.59 0.65 23.40 -19.59 -10.78 0.22 5.15 0.98 -2.37 8.19 4.02 3.27 2.30 0.67 1.35 26.17 0.29 0.59 0.66 7.39 4.44 -13.68 0.22 1.62 1.85 -3.00 10.10 1.65 4.25 2.22 0.68 1.31 26.12 0.30 0.59 0.66 -7.56 8.42 -6.58 0.22 -1.66 -3.63 -1.44 7.65 4.56 3.81 2.15 0.68 1.27 26.07 0.32 0.59 0.67 -17.46 -16.56 28.43 0.22 -3.82 -1.20 6.21 8.46 2.10 2.70 2.08 0.69 1.24 26.03 0.33 0.59 0.68 -19.34 -5.51 26.38 0.22 -4.22 4.03 5.75 6.96 3.60 3.18 2.02 0.71 1.21 25.98 0.35 0.60 0.69 -42.17 18.46 -11.59 0.22 -9.17 4.65 -2.52 5.34 0.51 4.27 1.96 0.72 1.18 25.93 0.37 0.60 0.71 -10.01 21.39 0.49 0.22 -2.17 2.02 0.11 6.30 3.22 2.53 1.90 0.74 1.15 25.88 0.39 0.61 0.72 4.05 9.33 13.51 0.22 0.88 1.80 2.93 5.72 2.81 0.84 1.85 0.75 1.13 25.83 0.41 0.61 0.74
-48.81 8.30 -18.42 0.22 -10.54 1.35 -3.98 6.48 0.74 1.84 1.80 0.77 1.12 25.78 0.43 0.62 0.75 -22.62 6.27 -23.28 0.22 -4.87 -2.52 -5.02 4.51 1.62 2.87 1.76 0.79 1.10 25.73 0.45 0.62 0.77 20.44 -11.71 -6.16 0.22 4.39 -2.72 -1.33 5.77 2.46 2.05 1.73 0.81 1.09 25.68 0.47 0.63 0.78 3.44 -12.66 -18.06 0.21 0.74 -0.14 -3.87 8.30 3.95 4.04 1.71 0.83 1.08 25.63 0.48 0.63 0.80
-19.48 -0.63 -38.89 0.21 -4.17 -2.27 -8.32 6.72 2.14 3.89 1.69 0.85 1.08 25.59 0.50 0.64 0.81 -1.38 -10.61 -9.73 0.21 -0.30 -1.62 -2.08 5.33 1.72 2.91 1.68 0.86 1.08 25.54 0.51 0.64 0.82 27.61 -7.57 16.31 0.21 5.88 2.43 3.47 4.95 2.95 2.89 1.68 0.88 1.08 25.49 0.52 0.64 0.83 -23.45 -5.06 1.21 0.23 -5.35 -1.60 0.28 1.88 1.22 3.42 2.73 0.72 1.73 26.95 0.26 0.63 0.69 -4.35 -7.04 -15.70 0.23 -0.99 -6.36 -3.57 1.42 4.01 4.74 2.77 0.72 1.74 26.90 0.26 0.63 0.68

506
Raw Data Tapered Data
FFT Data Parzen Filtered Data
Simple Ratio Spectrum
Z E N
Tapering Function
Z E N Z E N Z E N
Frequency Hz
E/Z N/Z
Mean SQRT Spectrum
-21.35 11.43 3.33 0.21 -4.54 -2.03 0.71 6.89 1.53 1.76 1.69 0.90 1.08 25.44 0.53 0.64 0.83 -33.19 -9.57 18.34 0.21 -7.04 -9.00 3.89 4.16 2.55 1.65 1.70 0.92 1.09 25.39 0.54 0.64 0.83 46.84 -42.46 34.29 0.21 9.91 -4.09 7.25 4.43 3.21 0.70 1.72 0.93 1.09 25.34 0.54 0.63 0.83 37.72 -19.34 17.25 0.21 7.96 3.10 3.64 5.13 4.24 1.87 1.75 0.95 1.10 25.29 0.54 0.63 0.83 -31.25 14.68 -4.72 0.21 -6.58 0.14 -0.99 4.77 3.79 3.27 1.78 0.96 1.10 25.24 0.54 0.62 0.82 3.86 0.65 -2.65 0.21 0.81 -1.33 -0.56 2.86 2.24 1.32 1.82 0.98 1.11 25.20 0.54 0.61 0.81 32.84 -6.33 17.38 0.21 6.88 2.65 3.64 1.10 1.31 1.83 1.86 0.99 1.12 25.15 0.53 0.60 0.80 -24.13 12.66 17.36 0.21 -5.04 3.68 3.63 1.87 0.49 3.21 1.91 1.00 1.13 25.10 0.52 0.59 0.79 -18.00 17.60 19.35 0.21 -3.75 -0.51 4.03 3.39 1.40 4.60 1.96 1.01 1.13 25.05 0.51 0.58 0.77 21.05 -2.43 15.33 0.21 4.38 -2.58 3.19 2.94 2.26 4.16 2.01 1.01 1.14 25.00 0.50 0.57 0.76 -9.92 -12.39 -6.63 0.21 -2.06 2.20 -1.38 8.96 2.18 3.45 2.06 1.02 1.14 24.95 0.49 0.55 0.74 -41.77 10.61 -5.55 0.21 -8.65 -1.12 -1.15 12.26 2.66 8.73 2.11 1.02 1.15 24.90 0.48 0.54 0.73 0.36 -5.39 7.50 0.21 0.08 -2.96 1.55 10.74 3.18 7.56 2.16 1.02 1.15 24.85 0.47 0.53 0.71 57.30 -14.35 3.54 0.21 11.80 5.90 0.73 3.90 0.48 1.91 2.21 1.03 1.15 24.80 0.46 0.52 0.70 39.16 28.62 2.58 0.21 8.05 2.37 0.53 4.39 2.17 1.48 2.25 1.03 1.15 24.76 0.46 0.51 0.68 14.10 11.55 13.61 0.21 2.89 -2.55 2.79 7.21 1.85 2.40 2.29 1.02 1.15 24.71 0.45 0.50 0.67 19.08 -12.45 9.62 0.20 3.90 2.77 1.97 5.88 1.65 1.86 2.33 1.02 1.15 24.66 0.44 0.49 0.66 -0.90 13.55 -8.33 0.20 -0.18 3.37 -1.70 4.79 3.05 1.31 2.36 1.02 1.14 24.61 0.43 0.48 0.65 -25.80 16.50 -19.22 0.20 -5.25 0.30 -3.91 3.78 2.61 1.50 2.39 1.02 1.14 24.56 0.43 0.48 0.64 -27.64 1.46 -13.10 0.20 -5.61 -1.73 -2.66 2.85 2.78 1.54 2.41 1.01 1.14 24.51 0.42 0.47 0.63 -18.50 -8.52 -17.98 0.20 -3.75 -0.71 -3.64 6.28 2.87 1.04 2.42 1.01 1.13 24.46 0.42 0.47 0.63 -10.39 -3.49 -21.84 0.20 -2.10 -0.50 -4.41 7.56 1.02 1.70 2.43 1.00 1.13 24.41 0.41 0.46 0.62 3.67 -2.48 17.22 0.20 0.74 -4.52 3.47 3.59 0.34 1.77 2.43 0.99 1.12 24.37 0.41 0.46 0.62 4.71 -22.42 34.18 0.20 0.95 -1.08 6.87 2.43 1.16 1.88 2.43 0.99 1.11 24.32 0.41 0.46 0.61 -2.25 -5.36 5.15 0.20 -0.45 1.13 1.03 3.14 3.79 3.30 2.42 0.98 1.11 24.27 0.41 0.46 0.61 9.79 5.64 -1.80 0.20 1.96 -3.07 -0.36 4.44 6.39 5.21 2.41 0.97 1.10 24.22 0.40 0.46 0.61
-17.15 -15.34 5.25 0.20 -3.42 1.93 1.05 4.80 5.44 5.32 2.39 0.97 1.10 24.17 0.40 0.46 0.61 -58.95 9.68 -8.68 0.20 -11.73 4.90 -1.73 4.56 1.85 4.28 2.37 0.96 1.09 24.12 0.40 0.46 0.61 -35.70 24.61 -14.58 0.20 -7.09 -4.05 -2.89 9.14 0.52 1.61 2.35 0.95 1.09 24.07 0.41 0.46 0.62 13.39 -20.39 -1.49 0.20 2.65 -6.00 -0.30 31.99 14.63 4.54 2.32 0.95 1.09 24.02 0.41 0.47 0.62 36.34 -30.29 3.56 0.20 7.18 4.09 0.70 25.30 15.91 4.70 2.30 0.94 1.09 23.97 0.41 0.47 0.63 -21.35 11.43 3.33 0.21 -4.54 -2.03 0.71 6.89 1.53 1.76 1.69 0.90 1.08 25.44 0.53 0.64 0.83 -33.19 -9.57 18.34 0.21 -7.04 -9.00 3.89 4.16 2.55 1.65 1.70 0.92 1.09 25.39 0.54 0.64 0.83

507
Raw Data Tapered Data
FFT Data Parzen Filtered Data
Simple Ratio Spectrum
Z E N
Tapering Function
Z E N Z E N Z E N
Frequency Hz
E/Z N/Z
Mean SQRT Spectrum
18.28 20.73 -16.36 0.20 3.60 5.84 -3.22 8.27 4.00 4.24 2.27 0.93 1.09 23.93 0.41 0.48 0.63 7.28 29.64 -32.20 0.20 1.43 -0.87 -6.33 6.34 3.14 4.86 2.24 0.93 1.09 23.88 0.41 0.48 0.64 14.29 -4.41 -22.04 0.20 2.80 -2.62 -4.32 1.61 3.77 3.85 2.22 0.92 1.09 23.83 0.41 0.49 0.64 -28.63 -13.37 -29.88 0.20 -5.60 -4.16 -5.84 3.25 2.63 2.24 2.20 0.92 1.09 23.78 0.42 0.49 0.65 -61.40 -21.30 -28.70 0.20 -11.97 -6.47 -5.60 5.16 4.71 0.06 2.18 0.91 1.09 23.73 0.42 0.50 0.65 -20.18 -33.19 11.39 0.19 -3.93 -4.88 2.22 5.58 4.02 0.49 2.16 0.91 1.09 23.68 0.42 0.51 0.66 9.89 -25.07 13.40 0.19 1.92 -0.97 2.60 3.32 2.19 2.78 2.14 0.91 1.09 23.63 0.42 0.51 0.66 3.91 -5.00 -1.57 0.19 0.76 -0.38 -0.30 2.96 7.53 5.70 2.13 0.91 1.10 23.58 0.43 0.51 0.67 26.90 -1.98 21.45 0.19 5.19 -1.15 4.14 1.53 4.05 2.71 2.12 0.91 1.10 23.54 0.43 0.52 0.67 66.77 -5.96 31.40 0.19 12.85 0.97 6.04 0.42 2.59 2.59 2.12 0.91 1.10 23.49 0.43 0.52 0.68 31.62 5.04 7.38 0.19 6.07 0.97 1.42 1.53 1.43 2.72 2.12 0.92 1.11 23.44 0.43 0.52 0.68 -0.39 5.03 -0.58 0.19 -0.08 -1.53 -0.11 2.44 0.67 0.77 2.12 0.93 1.11 23.39 0.44 0.52 0.68 56.54 -7.96 11.46 0.19 10.80 -1.51 2.19 1.89 0.84 0.99 2.13 0.94 1.11 23.34 0.44 0.52 0.68 50.38 -7.93 21.45 0.19 9.60 1.35 4.09 2.52 0.65 1.36 2.15 0.95 1.12 23.29 0.44 0.52 0.68 -16.64 7.08 25.41 0.19 -3.16 -0.56 4.83 2.04 1.37 1.79 2.16 0.97 1.12 23.24 0.45 0.52 0.68 -3.55 -2.93 12.39 0.19 -0.67 -3.58 2.35 1.75 1.06 3.31 2.18 0.99 1.12 23.19 0.45 0.51 0.69 1.51 -18.88 -0.58 0.19 0.28 2.11 -0.11 0.77 1.38 1.44 2.20 1.01 1.12 23.14 0.46 0.51 0.69
-49.35 11.14 1.48 0.19 -9.30 0.96 0.28 1.58 2.12 1.83 2.23 1.04 1.13 23.10 0.46 0.50 0.69 -46.11 5.11 14.50 0.19 -8.67 -5.05 2.73 3.39 1.74 1.63 2.26 1.06 1.13 23.05 0.47 0.50 0.69 18.00 -26.84 23.48 0.19 3.37 -2.20 4.40 2.81 0.67 1.03 2.29 1.09 1.13 23.00 0.48 0.49 0.69 46.92 -11.76 8.48 0.19 8.77 1.73 1.58 3.37 0.53 0.48 2.31 1.12 1.13 22.95 0.49 0.49 0.69 10.85 9.25 -10.46 0.19 2.02 -0.89 -1.95 5.43 2.23 0.77 2.34 1.15 1.13 22.90 0.49 0.48 0.69 -22.07 -4.75 -10.37 0.19 -4.11 -1.81 -1.93 4.58 2.69 0.16 2.37 1.19 1.13 22.85 0.50 0.48 0.69 -34.91 -9.72 -16.26 0.19 -6.48 6.54 -3.02 4.41 1.12 1.27 2.39 1.22 1.13 22.80 0.51 0.47 0.70 -65.66 35.23 -22.12 0.19 -12.15 6.12 -4.09 2.99 8.59 5.18 2.41 1.25 1.13 22.75 0.52 0.47 0.70 -56.36 33.10 0.98 0.18 -10.40 -1.65 0.18 2.01 9.34 4.61 2.42 1.28 1.13 22.71 0.53 0.47 0.70 28.74 -8.94 9.01 0.18 5.29 1.85 1.66 5.03 4.14 4.28 2.43 1.31 1.13 22.66 0.54 0.46 0.71 62.61 10.06 -8.93 0.18 11.49 2.21 -1.64 6.26 1.97 2.27 2.44 1.34 1.13 22.61 0.55 0.46 0.72 26.48 12.02 -5.84 0.18 4.85 -3.84 -1.07 6.32 1.44 1.95 2.44 1.36 1.12 22.56 0.56 0.46 0.72 26.43 -20.96 4.21 0.18 4.82 -1.62 0.77 1.52 3.38 0.95 2.43 1.38 1.12 22.51 0.57 0.46 0.73 21.38 -8.90 -0.74 0.18 3.89 3.84 -0.13 2.56 1.21 1.20 2.42 1.40 1.11 22.46 0.58 0.46 0.74 18.28 20.73 -16.36 0.20 3.60 5.84 -3.22 8.27 4.00 4.24 2.27 0.93 1.09 23.93 0.41 0.48 0.63 7.28 29.64 -32.20 0.20 1.43 -0.87 -6.33 6.34 3.14 4.86 2.24 0.93 1.09 23.88 0.41 0.48 0.64

508
Raw Data Tapered Data
FFT Data Parzen Filtered Data
Simple Ratio Spectrum
Z E N
Tapering Function
Z E N Z E N Z E N
Frequency Hz
E/Z N/Z
Mean SQRT Spectrum
-50.51 21.08 10.30 0.18 -9.17 2.73 1.87 0.80 1.00 1.44 2.40 1.41 1.10 22.41 0.59 0.46 0.75 -96.16 15.01 36.27 0.18 -17.41 -2.71 6.56 2.54 0.54 0.63 2.37 1.42 1.10 22.36 0.60 0.46 0.76 -36.85 -14.98 34.18 0.18 -6.65 -1.07 6.17 2.22 1.11 1.50 2.33 1.42 1.09 22.31 0.61 0.47 0.77 12.25 -5.94 7.15 0.18 2.21 3.97 1.29 0.60 2.42 0.40 2.29 1.42 1.08 22.27 0.62 0.47 0.78 0.28 22.03 -19.77 0.18 0.05 1.25 -3.55 2.82 0.36 1.67 2.24 1.41 1.06 22.22 0.63 0.47 0.79 34.26 6.98 -20.63 0.18 6.13 -1.43 -3.69 3.66 1.08 1.01 2.19 1.40 1.05 22.17 0.64 0.48 0.80 36.17 -8.01 -7.52 0.18 6.46 0.54 -1.34 5.31 1.10 1.13 2.13 1.39 1.04 22.12 0.65 0.49 0.81 -23.80 3.00 -21.40 0.18 -4.24 0.71 -3.81 1.91 0.26 0.62 2.07 1.37 1.02 22.07 0.66 0.49 0.83 -21.66 3.99 -23.25 0.18 -3.84 -1.07 -4.13 4.26 1.30 0.53 2.00 1.35 1.00 22.02 0.67 0.50 0.84 0.43 -6.00 -7.14 0.18 0.08 -0.17 -1.26 3.61 0.78 1.93 1.94 1.32 0.98 21.97 0.68 0.51 0.85 -9.50 -0.99 -20.03 0.18 -1.68 -1.58 -3.53 5.05 0.94 2.72 1.87 1.29 0.97 21.92 0.69 0.52 0.87 -3.42 -8.96 -15.90 0.18 -0.60 -4.91 -2.80 4.21 1.69 1.24 1.80 1.27 0.95 21.88 0.70 0.53 0.88 43.55 -27.88 2.19 0.18 7.64 -1.90 0.38 5.15 1.53 1.18 1.73 1.24 0.93 21.83 0.71 0.54 0.89 33.45 -10.80 2.24 0.18 5.85 2.13 0.39 0.48 1.73 1.50 1.67 1.21 0.91 21.78 0.72 0.54 0.90 -13.54 12.20 10.27 0.17 -2.36 0.90 1.79 4.38 2.83 0.07 1.61 1.18 0.89 21.73 0.73 0.55 0.92 48.44 5.17 16.27 0.17 8.43 -2.23 2.83 4.70 1.37 0.69 1.55 1.14 0.87 21.68 0.74 0.56 0.93 67.26 -12.81 10.28 0.17 11.67 -2.91 1.78 1.37 0.38 1.19 1.50 1.12 0.85 21.63 0.75 0.57 0.94 -28.77 -16.75 -11.66 0.17 -4.98 -0.47 -2.02 2.78 0.83 1.56 1.45 1.09 0.84 21.58 0.75 0.58 0.95 -21.62 -2.71 -15.55 0.17 -3.73 0.91 -2.68 5.21 2.16 3.03 1.40 1.06 0.82 21.53 0.76 0.58 0.95 16.44 5.29 10.51 0.17 2.83 3.83 1.81 7.06 5.01 2.56 1.36 1.03 0.80 21.48 0.76 0.59 0.96 -40.46 22.24 -12.43 0.17 -6.94 6.20 -2.13 4.44 2.75 1.34 1.33 1.01 0.79 21.44 0.76 0.59 0.96 -61.21 36.13 -29.28 0.17 -10.47 1.72 -5.01 1.26 1.60 0.71 1.30 0.99 0.77 21.39 0.76 0.59 0.96 3.96 10.04 13.80 0.17 0.68 -0.34 2.35 0.85 0.20 1.48 1.28 0.97 0.76 21.34 0.76 0.59 0.96 58.88 -1.97 19.79 0.17 10.01 2.89 3.36 1.12 1.08 0.72 1.26 0.95 0.74 21.29 0.75 0.59 0.95 17.78 17.00 -4.18 0.17 3.01 2.19 -0.71 2.62 0.67 1.04 1.25 0.93 0.73 21.24 0.74 0.58 0.95 -4.20 12.94 -10.09 0.17 -0.71 0.32 -1.71 5.52 0.23 1.50 1.24 0.91 0.72 21.19 0.74 0.58 0.94 47.77 1.92 -2.01 0.17 8.05 2.00 -0.34 5.15 0.89 2.01 1.23 0.90 0.71 21.14 0.73 0.57 0.93 11.70 11.89 9.03 0.17 1.97 1.15 1.52 3.96 0.74 1.76 1.23 0.88 0.69 21.09 0.72 0.57 0.91 -29.22 6.86 5.06 0.17 -4.89 -3.87 0.85 1.12 1.00 1.80 1.23 0.86 0.68 21.04 0.70 0.56 0.90 -0.11 -23.11 6.09 0.17 -0.02 -4.18 1.02 0.93 0.48 1.02 1.23 0.85 0.67 21.00 0.69 0.55 0.88 -17.02 -25.01 10.12 0.17 -2.83 -0.99 1.68 0.53 1.15 0.67 1.23 0.83 0.66 20.95 0.68 0.54 0.86 -50.51 21.08 10.30 0.18 -9.17 2.73 1.87 0.80 1.00 1.44 2.40 1.41 1.10 22.41 0.59 0.46 0.75 -96.16 15.01 36.27 0.18 -17.41 -2.71 6.56 2.54 0.54 0.63 2.37 1.42 1.10 22.36 0.60 0.46 0.76

509
Raw Data Tapered Data
FFT Data Parzen Filtered Data
Simple Ratio Spectrum
Z E N
Tapering Function
Z E N Z E N Z E N
Frequency Hz
E/Z N/Z
Mean SQRT Spectrum
-35.87 -5.94 -8.83 0.17 -5.95 -3.96 -1.47 0.34 0.68 1.23 1.23 0.82 0.65 20.90 0.66 0.53 0.85 -19.71 -23.88 -21.71 0.17 -3.26 -4.93 -3.59 2.12 1.68 2.21 1.24 0.80 0.64 20.85 0.65 0.52 0.83 -11.59 -29.77 -18.57 0.17 -1.91 0.38 -3.06 1.08 1.81 2.42 1.24 0.78 0.63 20.80 0.63 0.51 0.81 -8.50 2.29 -17.44 0.16 -1.40 0.87 -2.87 3.62 1.31 1.91 1.25 0.77 0.62 20.75 0.61 0.50 0.79 -10.41 5.28 8.63 0.16 -1.71 -3.39 1.42 4.03 1.17 1.76 1.25 0.75 0.61 20.70 0.60 0.49 0.77 5.65 -20.68 35.60 0.16 0.92 -3.04 5.82 3.57 0.10 1.52 1.26 0.73 0.60 20.65 0.58 0.48 0.75 6.67 -18.60 23.54 0.16 1.09 -1.07 3.84 4.56 0.19 1.93 1.26 0.72 0.59 20.61 0.57 0.47 0.74
-30.23 -6.55 10.53 0.16 -4.91 -4.14 1.71 3.21 1.25 1.29 1.27 0.70 0.58 20.56 0.55 0.46 0.72 -12.09 -25.48 16.53 0.16 -1.96 -5.57 2.68 1.48 1.37 0.66 1.27 0.69 0.58 20.51 0.54 0.45 0.71 35.91 -34.35 7.54 0.16 5.80 -2.14 1.22 1.43 0.62 1.45 1.27 0.67 0.57 20.46 0.53 0.45 0.69 16.86 -13.25 -13.39 0.16 2.71 -0.20 -2.16 2.02 0.51 0.59 1.27 0.65 0.56 20.41 0.51 0.44 0.68 -1.12 -1.22 -1.30 0.16 -0.18 -0.35 -0.21 2.21 1.47 0.79 1.27 0.64 0.56 20.36 0.50 0.44 0.67 13.90 -2.21 15.73 0.16 2.22 1.41 2.52 0.98 1.18 2.13 1.27 0.62 0.55 20.31 0.49 0.43 0.66 9.90 8.78 -0.25 0.16 1.58 3.31 -0.04 5.04 2.45 3.01 1.27 0.61 0.55 20.26 0.48 0.43 0.65 8.92 20.73 -8.17 0.16 1.42 2.01 -1.30 8.08 1.13 3.85 1.27 0.60 0.54 20.21 0.47 0.43 0.64 13.92 12.67 1.89 0.16 2.21 2.63 0.30 3.59 0.95 1.07 1.26 0.59 0.54 20.17 0.46 0.43 0.63 -13.03 16.61 -7.04 0.16 -2.06 5.77 -1.11 0.88 0.89 2.25 1.26 0.58 0.54 20.12 0.46 0.43 0.63 -36.88 36.51 -5.95 0.16 -5.81 3.53 -0.94 0.67 2.13 3.41 1.25 0.56 0.54 20.07 0.45 0.43 0.62 -15.72 22.40 16.08 0.16 -2.47 -0.26 2.52 3.57 6.55 6.05 1.24 0.55 0.54 20.02 0.45 0.43 0.62 29.30 -1.64 18.07 0.16 4.59 0.68 2.83 3.39 3.44 3.27 1.23 0.55 0.54 19.97 0.44 0.44 0.62 51.19 4.36 10.07 0.16 7.99 0.83 1.57 0.92 0.35 2.28 1.22 0.54 0.54 19.92 0.44 0.44 0.62 44.05 5.34 1.11 0.16 6.85 -1.34 0.17 2.24 1.10 1.72 1.21 0.53 0.54 19.87 0.44 0.45 0.62 41.93 -8.65 -4.83 0.16 6.50 0.37 -0.75 1.74 1.16 1.04 1.20 0.52 0.54 19.82 0.43 0.45 0.63 -0.11 2.37 -4.75 0.15 -0.02 2.83 -0.73 1.77 0.96 1.27 1.19 0.51 0.55 19.78 0.43 0.46 0.63 -80.89 18.33 -18.65 0.15 -12.46 0.97 -2.87 1.26 1.39 1.93 1.18 0.51 0.55 19.73 0.43 0.47 0.64 -73.53 6.28 -6.54 0.15 -11.29 -0.26 -1.00 2.30 1.56 2.46 1.16 0.50 0.56 19.68 0.43 0.48 0.64 -14.31 -1.72 22.48 0.15 -2.19 3.40 3.44 3.75 0.90 2.36 1.15 0.49 0.56 19.63 0.43 0.49 0.65 -25.18 22.24 16.46 0.15 -3.84 6.12 2.51 1.69 0.25 0.95 1.14 0.49 0.57 19.58 0.43 0.50 0.66 -18.04 40.12 8.47 0.15 -2.74 1.67 1.29 1.84 1.15 2.19 1.12 0.48 0.57 19.53 0.43 0.51 0.66 39.97 11.02 11.48 0.15 6.06 0.30 1.74 1.74 1.13 3.23 1.11 0.48 0.58 19.48 0.43 0.52 0.67 21.89 2.00 5.51 0.15 3.31 4.07 0.83 1.89 2.06 2.34 1.10 0.47 0.58 19.43 0.43 0.53 0.68 -35.87 -5.94 -8.83 0.17 -5.95 -3.96 -1.47 0.34 0.68 1.23 1.23 0.82 0.65 20.90 0.66 0.53 0.85 -19.71 -23.88 -21.71 0.17 -3.26 -4.93 -3.59 2.12 1.68 2.21 1.24 0.80 0.64 20.85 0.65 0.52 0.83

510
Raw Data Tapered Data
FFT Data Parzen Filtered Data
Simple Ratio Spectrum
Z E N
Tapering Function
Z E N Z E N Z E N
Frequency Hz
E/Z N/Z
Mean SQRT Spectrum
-27.04 26.94 17.52 0.15 -4.07 0.58 2.64 3.10 1.74 1.39 1.09 0.47 0.59 19.38 0.43 0.55 0.70 -10.92 3.88 37.46 0.15 -1.64 -1.37 5.62 2.37 1.91 1.30 1.08 0.47 0.60 19.34 0.43 0.56 0.71 26.10 -9.11 26.39 0.15 3.90 1.03 3.95 1.57 1.30 1.98 1.07 0.46 0.61 19.29 0.44 0.57 0.72 -6.88 6.90 3.39 0.15 -1.03 -3.59 0.50 2.18 1.96 1.53 1.06 0.46 0.62 19.24 0.44 0.59 0.73 -35.75 -24.06 -6.55 0.15 -5.31 -6.97 -0.97 4.38 2.66 0.47 1.05 0.46 0.63 19.19 0.44 0.60 0.75 27.32 -46.92 -5.47 0.15 4.04 -1.75 -0.81 2.95 1.32 0.80 1.04 0.47 0.64 19.14 0.45 0.61 0.76 27.26 -11.79 -13.38 0.15 4.02 1.51 -1.97 0.07 0.61 0.99 1.03 0.47 0.65 19.09 0.45 0.63 0.77 -45.65 10.21 -9.27 0.15 -6.71 -1.73 -1.36 0.98 1.09 1.19 1.03 0.47 0.66 19.04 0.46 0.64 0.79 -15.48 -11.78 27.74 0.15 -2.27 -3.33 4.06 0.88 2.13 0.79 1.02 0.48 0.67 18.99 0.46 0.66 0.81 52.50 -22.71 41.66 0.15 7.67 0.34 6.08 3.56 0.86 2.47 1.02 0.48 0.68 18.95 0.47 0.67 0.82 29.39 2.34 26.58 0.15 4.28 1.36 3.87 2.01 1.27 3.52 1.01 0.49 0.70 18.90 0.48 0.69 0.84 -17.59 9.32 14.55 0.15 -2.55 -2.71 2.11 1.30 0.98 1.67 1.01 0.49 0.71 18.85 0.49 0.70 0.86 -3.49 -18.66 7.56 0.14 -0.50 -2.97 1.09 2.85 1.10 1.72 1.00 0.50 0.72 18.80 0.50 0.72 0.87 3.56 -20.58 0.60 0.14 0.51 1.79 0.09 3.14 1.43 1.71 1.00 0.51 0.73 18.75 0.51 0.73 0.89
-36.33 12.44 -16.31 0.14 -5.21 3.64 -2.34 1.87 1.65 1.80 0.99 0.52 0.74 18.70 0.52 0.74 0.91 -11.18 25.37 -20.18 0.14 -1.60 3.47 -2.89 2.04 1.65 0.73 0.99 0.52 0.75 18.65 0.53 0.76 0.92 46.80 24.27 -15.05 0.14 6.67 2.88 -2.15 2.44 1.29 0.74 0.98 0.53 0.76 18.60 0.54 0.77 0.94 12.73 20.19 -29.91 0.14 1.81 -0.12 -4.25 1.61 0.80 0.76 0.98 0.54 0.77 18.55 0.55 0.78 0.96 -1.24 -0.85 -38.72 0.14 -0.18 -0.40 -5.48 4.97 1.26 1.53 0.97 0.54 0.77 18.51 0.56 0.80 0.97 43.73 -2.84 -40.50 0.14 6.17 2.98 -5.71 3.14 1.93 1.56 0.96 0.55 0.78 18.46 0.57 0.81 0.99 26.64 21.13 -50.26 0.14 3.74 5.62 -7.06 6.37 0.66 2.01 0.96 0.56 0.78 18.41 0.58 0.82 1.00 10.61 40.01 -17.07 0.14 1.49 1.53 -2.39 9.71 2.30 1.93 0.95 0.56 0.78 18.36 0.59 0.83 1.02 37.56 10.91 13.00 0.14 5.24 -3.36 1.81 5.75 2.29 1.34 0.94 0.57 0.78 18.31 0.60 0.83 1.03 22.49 -24.06 -6.96 0.14 3.13 -0.70 -0.97 2.64 3.09 1.39 0.93 0.57 0.78 18.26 0.61 0.84 1.04 -17.47 -5.00 -7.87 0.14 -2.42 0.55 -1.09 1.54 1.23 2.16 0.92 0.57 0.78 18.21 0.62 0.85 1.05 4.61 4.00 -10.78 0.14 0.64 -1.65 -1.49 2.67 1.53 1.05 0.92 0.57 0.78 18.16 0.63 0.85 1.05 21.61 -11.98 -30.64 0.14 2.97 -1.91 -4.21 1.86 2.08 1.24 0.91 0.57 0.77 18.12 0.63 0.85 1.06 -41.31 -13.92 -18.48 0.14 -5.66 -0.40 -2.53 5.03 2.88 3.74 0.90 0.57 0.77 18.07 0.64 0.85 1.06 -40.09 -2.89 -9.37 0.14 -5.47 0.29 -1.28 2.46 1.94 2.98 0.90 0.57 0.76 18.02 0.64 0.85 1.06 31.97 2.12 -15.26 0.14 4.35 0.42 -2.08 2.53 2.85 3.64 0.89 0.57 0.75 17.97 0.64 0.84 1.06 -1.04 3.11 -18.13 0.14 -0.14 2.58 -2.46 2.00 3.28 4.24 0.89 0.57 0.74 17.92 0.64 0.83 1.05 -27.04 26.94 17.52 0.15 -4.07 0.58 2.64 3.10 1.74 1.39 1.09 0.47 0.59 19.38 0.43 0.55 0.70 -10.92 3.88 37.46 0.15 -1.64 -1.37 5.62 2.37 1.91 1.30 1.08 0.47 0.60 19.34 0.43 0.56 0.71

511
Raw Data Tapered Data
FFT Data Parzen Filtered Data
Simple Ratio Spectrum
Z E N
Tapering Function
Z E N Z E N Z E N
Frequency Hz
E/Z N/Z
Mean SQRT Spectrum
-62.86 19.07 -11.02 0.14 -8.49 1.35 -1.49 3.57 6.99 10.90 0.89 0.57 0.73 17.87 0.64 0.83 1.05 -24.63 10.01 11.04 0.13 -3.31 -1.48 1.48 4.31 6.83 6.54 0.89 0.57 0.72 17.82 0.64 0.82 1.04 9.45 -10.98 24.03 0.13 1.27 1.21 3.22 3.50 3.47 4.88 0.89 0.57 0.71 17.77 0.64 0.80 1.03
-10.50 9.02 30.98 0.13 -1.40 1.07 4.14 10.16 8.08 9.54 0.89 0.57 0.70 17.72 0.64 0.79 1.02 -5.42 7.99 33.90 0.13 -0.72 -2.79 4.51 3.57 6.87 6.38 0.89 0.57 0.69 17.68 0.63 0.78 1.00 25.59 -20.98 39.81 0.13 3.39 -3.69 5.28 2.68 1.33 2.78 0.90 0.57 0.68 17.63 0.63 0.76 0.99 11.57 -27.88 43.70 0.13 1.53 -4.46 5.77 0.64 1.16 0.60 0.91 0.57 0.68 17.58 0.62 0.74 0.97 -42.32 -33.75 26.62 0.13 -5.56 -5.73 3.50 0.29 1.12 2.64 0.92 0.57 0.67 17.53 0.62 0.73 0.96 -47.09 -43.59 28.56 0.13 -6.17 -5.95 3.74 2.15 1.81 3.43 0.93 0.57 0.66 17.48 0.61 0.71 0.94 -41.86 -45.41 38.49 0.13 -5.46 -3.30 5.02 1.22 1.32 5.66 0.95 0.57 0.66 17.43 0.61 0.70 0.93 -67.59 -25.27 18.43 0.13 -8.79 -0.94 2.40 1.94 0.66 2.91 0.96 0.58 0.66 17.38 0.60 0.69 0.91 -32.33 -7.20 -0.55 0.13 -4.19 -2.22 -0.07 1.71 1.61 1.48 0.98 0.59 0.66 17.33 0.60 0.68 0.90 30.72 -17.14 12.48 0.13 3.96 -1.56 1.61 1.61 2.83 1.65 1.00 0.59 0.67 17.29 0.59 0.67 0.90 36.64 -12.08 37.44 0.13 4.71 0.25 4.81 2.13 4.02 0.84 1.02 0.60 0.68 17.24 0.59 0.66 0.89 41.53 1.94 31.35 0.13 5.32 -0.77 4.01 1.05 2.31 0.90 1.04 0.62 0.69 17.19 0.59 0.66 0.89 77.35 -6.04 14.32 0.13 9.86 0.00 1.83 2.55 0.44 1.99 1.06 0.63 0.70 17.14 0.59 0.66 0.89 55.13 -0.03 16.31 0.13 7.00 3.17 2.07 2.48 1.56 2.21 1.08 0.65 0.72 17.09 0.60 0.66 0.89 -10.91 24.93 -6.65 0.13 -1.38 2.51 -0.84 1.07 1.25 0.63 1.10 0.67 0.74 17.04 0.60 0.67 0.90 -22.79 19.84 -25.53 0.13 -2.87 -0.40 -3.22 3.33 3.17 1.15 1.13 0.69 0.76 16.99 0.61 0.67 0.91 2.30 -3.19 10.55 0.13 0.29 -0.15 1.32 4.47 3.18 3.02 1.15 0.71 0.78 16.94 0.62 0.68 0.92 3.34 -1.18 17.55 0.13 0.42 0.35 2.19 2.36 1.93 4.93 1.17 0.73 0.81 16.89 0.63 0.70 0.94 4.38 2.83 -20.39 0.12 0.54 -0.39 -2.54 2.93 6.59 6.48 1.18 0.76 0.84 16.85 0.64 0.71 0.96 15.39 -3.17 -23.24 0.12 1.91 0.48 -2.88 2.32 5.51 6.56 1.20 0.78 0.87 16.80 0.65 0.73 0.98 -9.57 3.83 -13.12 0.12 -1.18 1.95 -1.62 2.06 2.00 6.36 1.21 0.81 0.91 16.75 0.67 0.75 1.00 -25.45 15.80 -30.97 0.12 -3.13 2.18 -3.81 5.89 9.66 15.95 1.22 0.84 0.94 16.70 0.68 0.77 1.03 8.63 17.73 -14.82 0.12 1.06 2.04 -1.82 17.26 18.34 42.11 1.23 0.86 0.98 16.65 0.70 0.79 1.06 14.64 16.67 14.23 0.12 1.79 2.51 1.74 8.88 3.60 31.92 1.24 0.89 1.02 16.60 0.72 0.82 1.09 -0.34 20.60 4.25 0.12 -0.04 1.89 0.52 8.72 14.01 15.22 1.24 0.91 1.05 16.55 0.74 0.85 1.12 25.66 15.53 12.27 0.12 3.10 -1.39 1.49 4.51 10.27 8.02 1.24 0.94 1.09 16.50 0.76 0.88 1.16 40.57 -11.48 11.28 0.12 4.89 -3.18 1.36 2.41 1.78 3.71 1.24 0.97 1.13 16.46 0.78 0.91 1.19 19.50 -26.40 -21.64 0.12 2.34 0.32 -2.60 4.20 0.93 4.64 1.24 0.99 1.16 16.41 0.80 0.94 1.23 -62.86 19.07 -11.02 0.14 -8.49 1.35 -1.49 3.57 6.99 10.90 0.89 0.57 0.73 17.87 0.64 0.83 1.05 -24.63 10.01 11.04 0.13 -3.31 -1.48 1.48 4.31 6.83 6.54 0.89 0.57 0.72 17.82 0.64 0.82 1.04

512
Raw Data Tapered Data
FFT Data Parzen Filtered Data
Simple Ratio Spectrum
Z E N
Tapering Function
Z E N Z E N Z E N
Frequency Hz
E/Z N/Z
Mean SQRT Spectrum
1.51 2.65 -33.47 0.12 0.18 0.67 -4.00 1.11 0.25 1.31 1.23 1.01 1.20 16.36 0.82 0.97 1.27 5.55 5.64 -23.30 0.12 0.66 -2.89 -2.77 4.23 1.30 3.20 1.23 1.03 1.24 16.31 0.84 1.01 1.32 -1.41 -24.32 -7.19 0.12 -0.17 -0.86 -0.85 2.48 2.16 1.77 1.22 1.06 1.27 16.26 0.87 1.05 1.36 -52.25 -7.25 0.88 0.12 -6.17 -0.15 0.10 2.53 3.57 2.95 1.21 1.08 1.31 16.21 0.89 1.08 1.40 -42.01 -1.23 1.93 0.12 -4.94 -2.84 0.23 2.91 2.33 3.35 1.20 1.10 1.35 16.16 0.91 1.12 1.45 13.10 -24.17 -5.00 0.12 1.53 -1.65 -0.59 3.90 5.08 1.36 1.19 1.11 1.39 16.11 0.93 1.16 1.49 -15.85 -14.09 -9.92 0.12 -1.85 0.69 -1.16 3.17 9.59 2.66 1.18 1.13 1.43 16.06 0.96 1.21 1.54 -56.65 5.93 -5.83 0.12 -6.57 -0.24 -0.68 11.48 32.25 9.08 1.17 1.15 1.47 16.02 0.98 1.25 1.59 -25.44 -2.08 5.23 0.12 -2.94 0.57 0.60 23.57 38.70 16.32 1.17 1.17 1.51 15.97 1.00 1.29 1.63 -1.33 4.92 31.21 0.12 -0.15 2.97 3.59 9.74 9.89 8.25 1.16 1.18 1.56 15.92 1.02 1.34 1.68 -6.27 25.86 41.12 0.11 -0.72 0.55 4.71 4.28 2.63 1.01 1.16 1.20 1.61 15.87 1.04 1.38 1.73 33.73 4.81 30.04 0.11 3.85 -1.50 3.42 3.32 1.81 1.87 1.17 1.23 1.66 15.82 1.05 1.43 1.77 37.64 -13.17 14.00 0.11 4.27 0.21 1.59 1.57 1.94 2.51 1.17 1.25 1.72 15.77 1.07 1.47 1.82 -35.31 1.85 0.03 0.11 -3.99 0.66 0.00 2.40 1.57 3.80 1.18 1.28 1.79 15.72 1.08 1.51 1.86 -38.12 5.84 -1.91 0.11 -4.29 -0.36 -0.21 1.71 1.87 3.65 1.20 1.31 1.86 15.67 1.10 1.55 1.90 17.98 -3.16 -1.85 0.11 2.01 -0.80 -0.21 0.97 3.81 3.42 1.22 1.35 1.93 15.63 1.11 1.59 1.94 42.90 -7.14 -3.78 0.11 4.78 -0.68 -0.42 4.07 3.15 2.95 1.24 1.39 2.01 15.58 1.12 1.62 1.97 -0.13 -6.11 -4.71 0.11 -0.01 -0.01 -0.52 5.45 2.50 1.68 1.26 1.43 2.08 15.53 1.13 1.65 2.00 -22.04 -0.09 10.34 0.11 -2.43 0.98 1.14 2.15 0.56 1.38 1.29 1.48 2.16 15.48 1.14 1.67 2.03 44.97 8.90 19.33 0.11 4.95 2.51 2.13 2.40 1.35 1.19 1.32 1.53 2.24 15.43 1.15 1.69 2.05 30.87 22.84 -10.63 0.11 3.38 1.84 -1.16 3.90 2.28 2.18 1.36 1.58 2.32 15.38 1.16 1.70 2.06 -9.12 16.76 -23.50 0.11 -0.99 -0.79 -2.56 3.10 1.76 3.40 1.40 1.64 2.39 15.33 1.17 1.71 2.08 43.86 -7.25 -1.40 0.11 4.76 -0.46 -0.15 2.35 1.77 5.05 1.44 1.70 2.46 15.28 1.18 1.72 2.08 27.76 -4.23 2.66 0.11 3.00 -0.24 0.29 5.29 1.47 2.60 1.48 1.76 2.53 15.23 1.19 1.71 2.09 -27.19 -2.21 1.70 0.11 -2.92 -3.24 0.18 6.71 0.27 5.63 1.52 1.83 2.59 15.19 1.20 1.71 2.09 -19.05 -30.14 8.74 0.11 -2.04 -4.81 0.93 5.46 3.78 4.00 1.56 1.90 2.65 15.14 1.21 1.69 2.08 -11.93 -44.99 1.77 0.11 -1.27 -2.65 0.19 8.63 7.10 2.83 1.61 1.97 2.70 15.09 1.22 1.68 2.08 -16.82 -24.84 -7.16 0.11 -1.78 0.76 -0.76 4.45 4.73 4.19 1.65 2.04 2.73 15.04 1.23 1.66 2.07 -13.71 7.20 -5.08 0.11 -1.45 0.97 -0.54 1.42 4.05 2.57 1.69 2.10 2.76 14.99 1.24 1.63 2.05 23.32 9.17 -11.99 0.11 2.45 0.23 -1.26 0.80 0.50 3.40 1.73 2.17 2.78 14.94 1.25 1.60 2.04 33.26 2.15 -17.87 0.10 3.48 2.31 -1.87 4.19 1.81 1.22 1.76 2.22 2.78 14.89 1.26 1.57 2.02 1.51 2.65 -33.47 0.12 0.18 0.67 -4.00 1.11 0.25 1.31 1.23 1.01 1.20 16.36 0.82 0.97 1.27 5.55 5.64 -23.30 0.12 0.66 -2.89 -2.77 4.23 1.30 3.20 1.23 1.03 1.24 16.31 0.84 1.01 1.32

513
Raw Data Tapered Data
FFT Data Parzen Filtered Data
Simple Ratio Spectrum
Z E N
Tapering Function
Z E N Z E N Z E N
Frequency Hz
E/Z N/Z
Mean SQRT Spectrum
-4.75 22.10 2.21 0.10 -0.49 1.98 0.23 2.26 2.42 3.10 1.80 2.28 2.77 14.84 1.27 1.54 1.99 24.26 19.03 19.23 0.10 2.51 -1.14 1.99 0.84 0.72 5.31 1.82 2.32 2.74 14.79 1.27 1.50 1.97 43.17 -10.99 24.20 0.10 4.45 0.42 2.49 1.78 0.47 3.38 1.85 2.37 2.71 14.75 1.28 1.47 1.95 -27.81 4.03 34.13 0.10 -2.85 2.15 3.50 0.41 2.69 4.00 1.87 2.40 2.67 14.70 1.28 1.43 1.92 -52.59 20.98 33.06 0.10 -5.36 0.30 3.37 5.83 3.66 4.59 1.89 2.43 2.62 14.65 1.29 1.39 1.89 -22.39 2.94 33.98 0.10 -2.27 0.20 3.45 3.04 0.40 4.67 1.90 2.45 2.56 14.60 1.29 1.35 1.87 -23.25 1.93 33.89 0.10 -2.35 0.40 3.42 2.68 1.18 1.08 1.91 2.46 2.49 14.55 1.29 1.31 1.84 -11.13 3.93 15.85 0.10 -1.12 -1.01 1.59 2.35 1.85 2.35 1.91 2.46 2.42 14.50 1.29 1.27 1.81 -5.05 -10.06 14.84 0.10 -0.50 -1.50 1.48 5.97 3.99 2.52 1.91 2.45 2.35 14.45 1.28 1.23 1.78 -35.92 -15.00 11.84 0.10 -3.57 0.00 1.18 8.46 4.68 1.86 1.91 2.43 2.27 14.40 1.28 1.19 1.74 -38.71 0.03 -9.11 0.10 -3.83 1.88 -0.90 8.20 3.97 0.72 1.90 2.40 2.19 14.36 1.27 1.15 1.71 -21.54 19.00 -11.01 0.10 -2.12 0.68 -1.08 4.78 1.57 1.54 1.89 2.37 2.10 14.31 1.26 1.12 1.68 -18.41 6.95 2.06 0.10 -1.80 0.58 0.20 2.55 0.83 3.32 1.87 2.32 2.02 14.26 1.24 1.08 1.65 -18.28 5.93 17.08 0.10 -1.78 2.91 1.66 1.11 0.41 1.42 1.85 2.26 1.94 14.21 1.22 1.05 1.61 -12.17 29.86 22.05 0.10 -1.18 1.05 2.14 4.39 4.49 1.60 1.83 2.20 1.86 14.16 1.21 1.02 1.58 15.87 10.78 17.03 0.10 1.53 -0.79 1.64 2.43 4.84 3.15 1.80 2.14 1.79 14.11 1.18 0.99 1.55 46.80 -8.22 0.05 0.10 4.49 0.65 0.00 7.18 2.85 0.82 1.78 2.06 1.72 14.06 1.16 0.97 1.51 23.71 6.78 -26.84 0.10 2.26 -0.59 -2.56 6.18 3.64 5.65 1.75 1.99 1.66 14.01 1.14 0.95 1.48 9.69 -6.21 -38.66 0.10 0.92 -2.20 -3.67 14.25 7.22 7.31 1.72 1.91 1.60 13.96 1.11 0.93 1.45 20.68 -23.15 -11.50 0.09 1.95 -1.33 -1.09 15.82 8.62 3.42 1.70 1.83 1.55 13.92 1.08 0.91 1.41 -32.24 -14.07 14.55 0.09 -3.03 -1.50 1.37 2.60 3.21 1.07 1.67 1.76 1.50 13.87 1.05 0.90 1.38 -51.02 -16.01 -0.43 0.09 -4.77 -2.42 -0.04 1.32 1.76 3.75 1.64 1.68 1.46 13.82 1.02 0.89 1.35 7.12 -25.92 -9.35 0.09 0.66 -1.29 -0.87 8.49 3.42 4.61 1.62 1.60 1.42 13.77 0.99 0.88 1.32 34.09 -13.84 -0.28 0.09 3.15 0.85 -0.03 9.05 1.55 3.91 1.59 1.53 1.38 13.72 0.96 0.87 1.29 24.02 9.17 -21.18 0.09 2.21 0.01 -1.95 1.78 3.34 2.05 1.57 1.45 1.35 13.67 0.92 0.86 1.26 12.00 0.16 -30.02 0.09 1.10 -0.72 -2.75 9.09 7.40 3.00 1.55 1.39 1.33 13.62 0.89 0.85 1.24 13.00 -7.82 -4.90 0.09 1.18 0.84 -0.45 8.98 6.74 1.92 1.54 1.32 1.30 13.57 0.86 0.85 1.21 8.01 9.18 -10.81 0.09 0.72 0.38 -0.98 3.21 2.47 2.91 1.52 1.27 1.28 13.53 0.83 0.84 1.18 16.01 4.16 -5.72 0.09 1.44 -0.97 -0.52 3.24 1.57 2.07 1.51 1.22 1.26 13.48 0.80 0.84 1.16 55.92 -10.82 13.32 0.09 5.00 -0.34 1.19 5.35 2.50 2.22 1.50 1.17 1.25 13.43 0.78 0.83 1.14 32.79 -3.79 -8.64 0.09 2.92 0.73 -0.77 5.58 2.01 1.77 1.50 1.14 1.23 13.38 0.76 0.82 1.12 -4.75 22.10 2.21 0.10 -0.49 1.98 0.23 2.26 2.42 3.10 1.80 2.28 2.77 14.84 1.27 1.54 1.99 24.26 19.03 19.23 0.10 2.51 -1.14 1.99 0.84 0.72 5.31 1.82 2.32 2.74 14.79 1.27 1.50 1.97

514
Raw Data Tapered Data
FFT Data Parzen Filtered Data
Simple Ratio Spectrum
Z E N
Tapering Function
Z E N Z E N Z E N
Frequency Hz
E/Z N/Z
Mean SQRT Spectrum
-24.17 8.20 -19.53 0.09 -2.14 -0.69 -1.73 6.12 2.12 4.59 1.50 1.11 1.22 13.33 0.74 0.81 1.10 -12.05 -7.79 -11.41 0.09 -1.06 -0.59 -1.00 4.40 1.48 3.95 1.51 1.08 1.21 13.28 0.72 0.80 1.08 -3.97 -6.76 -6.32 0.09 -0.35 1.68 -0.55 1.60 4.79 0.92 1.52 1.06 1.20 13.23 0.70 0.79 1.06 -37.83 19.22 -1.25 0.09 -3.29 -0.24 -0.11 2.96 4.52 0.27 1.53 1.05 1.19 13.18 0.69 0.78 1.04 -19.67 -2.81 -2.18 0.09 -1.70 -2.23 -0.19 2.84 1.82 2.85 1.55 1.04 1.18 13.13 0.67 0.76 1.02 42.34 -25.75 2.87 0.09 3.64 0.03 0.25 1.97 3.52 3.42 1.57 1.04 1.18 13.09 0.66 0.75 1.00 23.26 0.31 1.92 0.09 1.99 2.24 0.16 2.53 1.05 1.69 1.59 1.04 1.17 13.04 0.65 0.73 0.98 -49.64 26.26 -3.02 0.09 -4.22 2.73 -0.26 0.61 2.17 4.49 1.62 1.04 1.16 12.99 0.64 0.72 0.96 -13.46 32.14 22.99 0.08 -1.14 2.20 1.94 1.78 2.09 3.61 1.65 1.05 1.15 12.94 0.64 0.70 0.94 34.55 26.03 56.89 0.08 2.90 1.84 4.78 5.98 2.23 3.28 1.69 1.07 1.15 12.89 0.63 0.68 0.93 -13.45 21.94 53.72 0.08 -1.12 0.57 4.49 10.46 4.30 2.58 1.72 1.08 1.14 12.84 0.63 0.66 0.91 5.62 6.88 30.61 0.08 0.47 -2.83 2.54 5.62 3.61 4.25 1.76 1.10 1.13 12.79 0.62 0.65 0.90 54.55 -34.06 16.56 0.08 4.50 -3.46 1.37 0.94 3.28 3.68 1.79 1.11 1.13 12.74 0.62 0.63 0.88 -3.50 -41.90 -12.39 0.08 -0.29 -2.03 -1.02 9.11 1.72 9.12 1.83 1.13 1.12 12.70 0.62 0.61 0.87 -64.31 -24.77 -33.24 0.08 -5.24 -3.31 -2.71 8.97 7.34 12.35 1.86 1.15 1.12 12.65 0.62 0.60 0.86 -67.00 -40.63 -14.09 0.08 -5.43 -3.28 -1.14 4.04 4.13 5.56 1.90 1.17 1.12 12.60 0.62 0.59 0.85 -34.74 -40.46 17.95 0.08 -2.80 -0.67 1.45 15.40 3.72 6.99 1.93 1.19 1.11 12.55 0.62 0.58 0.84 1.37 -8.36 44.88 0.08 0.11 -0.51 3.59 12.99 4.02 11.84 1.96 1.21 1.11 12.50 0.61 0.57 0.84 16.39 -6.33 43.76 0.08 1.30 -2.17 3.48 2.74 1.56 9.66 1.99 1.22 1.11 12.45 0.61 0.56 0.83 34.34 -27.25 32.66 0.08 2.71 -1.20 2.58 1.58 2.81 1.69 2.01 1.24 1.11 12.40 0.61 0.55 0.83 15.29 -15.16 18.61 0.08 1.20 0.62 1.46 1.59 2.35 3.24 2.03 1.25 1.11 12.35 0.62 0.55 0.82 -10.67 7.86 -2.37 0.08 -0.83 -0.40 -0.18 1.02 4.57 1.56 2.05 1.26 1.11 12.30 0.62 0.54 0.82 28.35 -5.15 -5.30 0.08 2.20 -0.24 -0.41 0.94 5.87 0.68 2.06 1.27 1.12 12.26 0.62 0.54 0.82 24.30 -3.12 -7.22 0.08 1.87 1.61 -0.56 1.99 3.15 2.28 2.07 1.28 1.12 12.21 0.62 0.54 0.82 -15.67 20.85 -16.12 0.08 -1.20 0.14 -1.23 2.41 3.11 6.40 2.07 1.28 1.13 12.16 0.62 0.54 0.82 3.41 1.81 -15.00 0.08 0.26 -1.23 -1.14 0.52 3.31 6.15 2.07 1.28 1.13 12.11 0.62 0.55 0.83 1.45 -16.16 -6.91 0.08 0.11 -0.08 -0.52 1.78 1.63 1.24 2.06 1.29 1.14 12.06 0.62 0.55 0.83
-34.44 -1.12 -19.80 0.08 -2.58 0.07 -1.48 7.48 4.45 4.69 2.06 1.29 1.15 12.01 0.63 0.56 0.84 -16.28 0.88 -40.62 0.07 -1.21 -0.38 -3.03 8.93 1.36 6.33 2.05 1.28 1.16 11.96 0.63 0.57 0.85 17.77 -5.10 -32.42 0.07 1.31 0.95 -2.40 8.38 5.39 5.13 2.03 1.28 1.18 11.91 0.63 0.58 0.86 18.74 12.89 -25.25 0.07 1.38 1.90 -1.86 8.97 4.02 3.28 2.02 1.28 1.20 11.87 0.63 0.59 0.87 -24.17 8.20 -19.53 0.09 -2.14 -0.69 -1.73 6.12 2.12 4.59 1.50 1.11 1.22 13.33 0.74 0.81 1.10 -12.05 -7.79 -11.41 0.09 -1.06 -0.59 -1.00 4.40 1.48 3.95 1.51 1.08 1.21 13.28 0.72 0.80 1.08

515
Raw Data Tapered Data
FFT Data Parzen Filtered Data
Simple Ratio Spectrum
Z E N
Tapering Function
Z E N Z E N Z E N
Frequency Hz
E/Z N/Z
Mean SQRT Spectrum
24.71 25.81 -26.09 0.07 1.80 0.42 -1.90 5.53 1.43 1.23 2.00 1.27 1.22 11.82 0.63 0.61 0.88 43.62 5.76 -6.97 0.07 3.16 -0.16 -0.51 5.23 0.71 2.85 1.99 1.27 1.24 11.77 0.64 0.62 0.89 33.52 -2.25 4.09 0.07 2.41 2.07 0.29 7.90 0.64 1.61 1.97 1.26 1.26 11.72 0.64 0.64 0.90 -27.45 28.70 -2.86 0.07 -1.96 2.26 -0.20 3.24 3.60 2.56 1.96 1.25 1.29 11.67 0.64 0.66 0.92 -19.30 31.59 7.19 0.07 -1.37 0.25 0.51 1.59 2.94 0.77 1.94 1.25 1.32 11.62 0.64 0.68 0.94 47.69 3.52 18.19 0.07 3.36 0.04 1.28 2.41 2.57 2.35 1.93 1.24 1.35 11.57 0.65 0.70 0.95 -30.29 0.52 3.20 0.07 -2.12 0.04 0.22 0.75 2.51 2.06 1.91 1.24 1.38 11.52 0.65 0.72 0.97 -116.95 0.52 -5.74 0.07 -8.13 -0.73 -0.40 2.44 8.11 7.89 1.90 1.23 1.41 11.47 0.65 0.74 0.99 -32.59 -10.46 3.32 0.07 -2.25 -0.58 0.23 4.33 11.22 9.79 1.89 1.23 1.45 11.43 0.65 0.76 1.00 43.44 -8.41 -1.62 0.07 2.98 0.66 -0.11 2.27 4.56 1.62 1.88 1.23 1.48 11.38 0.65 0.79 1.02 4.39 9.59 0.43 0.07 0.30 1.60 0.03 5.79 2.08 2.11 1.87 1.23 1.51 11.33 0.66 0.81 1.04 -3.56 23.53 32.42 0.07 -0.24 0.57 2.19 3.26 2.62 3.44 1.87 1.23 1.54 11.28 0.66 0.83 1.06 31.44 8.47 54.30 0.07 2.11 0.30 3.64 1.65 0.58 3.39 1.86 1.23 1.57 11.23 0.66 0.85 1.07 -5.56 4.44 51.15 0.07 -0.37 1.36 3.40 1.76 1.29 2.84 1.86 1.23 1.60 11.18 0.66 0.86 1.09
-31.44 20.40 55.99 0.07 -2.07 0.48 3.70 1.67 1.89 1.30 1.86 1.23 1.63 11.13 0.66 0.88 1.10 10.65 7.35 62.80 0.07 0.70 -0.04 4.11 2.55 1.52 2.93 1.85 1.23 1.65 11.08 0.67 0.89 1.11 1.68 -0.66 47.63 0.07 0.11 1.06 3.10 3.78 3.16 3.04 1.85 1.24 1.67 11.04 0.67 0.90 1.12
-34.20 16.31 20.55 0.06 -2.21 -0.05 1.33 2.59 1.92 4.68 1.85 1.24 1.69 10.99 0.67 0.91 1.13 -12.06 -0.72 -15.41 0.06 -0.77 -1.90 -0.99 1.91 6.28 12.39 1.85 1.24 1.70 10.94 0.67 0.92 1.14 9.00 -29.65 -42.24 0.06 0.57 -0.99 -2.68 12.51 6.42 16.57 1.84 1.24 1.71 10.89 0.68 0.93 1.15
-10.94 -15.56 -34.04 0.06 -0.69 0.22 -2.14 6.14 0.99 10.02 1.84 1.25 1.71 10.84 0.68 0.93 1.15 -28.81 3.47 -28.86 0.06 -1.80 -0.97 -1.80 3.67 2.01 2.61 1.83 1.25 1.71 10.79 0.68 0.93 1.16 3.29 -15.50 -17.71 0.06 0.20 -1.64 -1.10 4.45 1.43 1.81 1.82 1.25 1.70 10.74 0.69 0.94 1.16
40.25 -26.42 0.38 0.06 2.48 0.04 0.02 2.57 0.48 0.63 1.81 1.25 1.70 10.69 0.69 0.94 1.16 21.18 0.64 -13.54 0.06 1.29 -0.20 -0.83 0.96 4.37 3.04 1.80 1.26 1.69 10.64 0.70 0.94 1.17 9.17 -3.35 -3.45 0.06 0.56 -1.47 -0.21 1.82 3.43 4.82 1.79 1.26 1.67 10.60 0.70 0.94 1.17 9.19 -24.29 11.59 0.06 0.55 -0.01 0.70 2.69 3.75 1.88 1.77 1.26 1.66 10.55 0.71 0.93 1.17 -7.76 -0.24 -15.35 0.06 -0.46 0.64 -0.91 2.98 5.15 2.17 1.76 1.26 1.64 10.50 0.72 0.93 1.18 14.28 10.75 -20.23 0.06 0.84 -0.96 -1.19 1.41 2.36 0.65 1.74 1.26 1.62 10.45 0.72 0.93 1.18 40.22 -16.24 -3.13 0.06 2.35 -1.35 -0.18 1.07 1.09 3.05 1.73 1.26 1.61 10.40 0.73 0.93 1.18 29.13 -23.16 -15.04 0.06 1.69 -0.99 -0.87 4.50 1.99 4.35 1.71 1.26 1.59 10.35 0.74 0.93 1.19 24.71 25.81 -26.09 0.07 1.80 0.42 -1.90 5.53 1.43 1.23 2.00 1.27 1.22 11.82 0.63 0.61 0.88 43.62 5.76 -6.97 0.07 3.16 -0.16 -0.51 5.23 0.71 2.85 1.99 1.27 1.24 11.77 0.64 0.62 0.89

516
Raw Data Tapered Data
FFT Data Parzen Filtered Data
Simple Ratio Spectrum
Z E N
Tapering Function
Z E N Z E N Z E N
Frequency Hz
E/Z N/Z
Mean SQRT Spectrum
17.09 -17.07 -21.91 0.06 0.98 -1.84 -1.26 2.68 2.79 5.56 1.69 1.26 1.57 10.30 0.74 0.93 1.19 2.10 -31.97 -6.80 0.06 0.12 -1.64 -0.39 2.50 4.52 6.29 1.67 1.26 1.56 10.25 0.75 0.93 1.20 -5.84 -28.84 -10.71 0.06 -0.33 0.29 -0.60 4.98 4.24 2.62 1.65 1.26 1.54 10.21 0.76 0.94 1.21 -20.74 5.21 -23.58 0.06 -1.16 1.35 -1.32 3.03 2.93 4.63 1.63 1.25 1.53 10.16 0.77 0.94 1.22 -22.60 24.16 -10.46 0.06 -1.25 0.62 -0.58 3.68 1.52 0.77 1.60 1.25 1.52 10.11 0.78 0.95 1.23 34.43 11.09 6.60 0.06 1.89 0.66 0.36 2.26 5.29 4.72 1.58 1.25 1.52 10.06 0.79 0.96 1.24 63.28 12.05 -1.35 0.05 3.45 1.63 -0.07 3.99 6.83 7.92 1.56 1.25 1.51 10.01 0.80 0.97 1.26 18.17 29.97 -12.27 0.05 0.98 1.02 -0.66 1.92 3.89 9.61 1.54 1.25 1.51 9.96 0.81 0.98 1.27 14.15 18.88 15.78 0.05 0.76 1.33 0.84 2.21 3.73 10.30 1.52 1.24 1.52 9.91 0.82 1.00 1.29 18.14 24.80 30.74 0.05 0.96 2.31 1.63 2.70 0.50 7.08 1.50 1.24 1.52 9.86 0.83 1.02 1.31 -34.78 43.66 16.70 0.05 -1.83 1.18 0.88 1.48 1.56 3.33 1.48 1.24 1.53 9.81 0.84 1.04 1.33 -19.62 22.53 31.65 0.05 -1.02 0.34 1.65 0.91 0.91 3.14 1.46 1.23 1.54 9.77 0.84 1.05 1.35 10.45 6.48 33.58 0.05 0.54 0.69 1.73 1.40 4.54 3.10 1.44 1.23 1.55 9.72 0.85 1.08 1.37 -49.42 13.44 -5.43 0.05 -2.52 0.53 -0.28 1.12 3.76 0.44 1.43 1.22 1.56 9.67 0.86 1.10 1.39 -62.15 10.40 -25.31 0.05 -3.14 -0.59 -1.28 1.69 2.19 1.89 1.41 1.22 1.58 9.62 0.87 1.12 1.42 -6.96 -11.60 -19.17 0.05 -0.35 -0.93 -0.96 2.07 2.17 3.19 1.39 1.21 1.59 9.57 0.87 1.14 1.44 -17.86 -18.53 -2.07 0.05 -0.88 0.17 -0.10 0.91 2.93 2.99 1.37 1.21 1.60 9.52 0.88 1.17 1.46 -62.64 3.50 27.93 0.05 -3.07 -0.02 1.37 0.72 3.27 1.28 1.36 1.20 1.62 9.47 0.89 1.19 1.48 3.53 -0.50 43.84 0.05 0.17 -1.23 2.13 0.74 0.80 1.95 1.34 1.20 1.63 9.42 0.89 1.21 1.51 84.40 -25.44 31.74 0.05 4.05 -0.64 1.52 2.26 5.27 2.49 1.33 1.19 1.64 9.38 0.90 1.24 1.53 26.23 -13.36 13.71 0.05 1.25 -0.16 0.65 6.86 3.23 3.13 1.31 1.19 1.65 9.33 0.91 1.26 1.55 -2.77 -3.33 -1.26 0.05 -0.13 -1.00 -0.06 6.29 6.17 6.60 1.30 1.19 1.66 9.28 0.91 1.28 1.57 49.19 -21.27 -5.20 0.05 2.29 -0.75 -0.24 1.33 6.69 4.61 1.28 1.18 1.67 9.23 0.92 1.30 1.60 12.12 -16.19 -11.11 0.05 0.56 0.31 -0.51 0.84 6.49 4.44 1.27 1.18 1.68 9.18 0.93 1.32 1.62 -56.74 6.83 -15.01 0.05 -2.58 -0.24 -0.68 0.37 7.54 5.36 1.26 1.18 1.68 9.13 0.94 1.34 1.64 -28.52 -5.17 -2.92 0.05 -1.28 -1.53 -0.13 3.52 2.27 4.74 1.24 1.18 1.69 9.08 0.95 1.36 1.66 13.56 -34.09 10.12 0.04 0.60 -1.16 0.45 3.98 5.11 2.49 1.22 1.18 1.69 9.03 0.96 1.38 1.68 -43.33 -25.96 8.14 0.04 -1.91 -0.35 0.36 3.16 3.35 1.09 1.21 1.18 1.69 8.98 0.97 1.40 1.70 -64.06 -7.89 17.14 0.04 -2.79 -0.43 0.75 2.34 1.97 3.38 1.19 1.18 1.69 8.94 0.99 1.42 1.73 -2.87 -9.85 35.09 0.04 -0.12 -0.08 1.51 2.80 4.59 5.03 1.17 1.18 1.69 8.89 1.00 1.44 1.75 -3.81 -1.82 14.04 0.04 -0.16 0.47 0.60 1.56 4.75 5.19 1.16 1.18 1.68 8.84 1.02 1.46 1.78 17.09 -17.07 -21.91 0.06 0.98 -1.84 -1.26 2.68 2.79 5.56 1.69 1.26 1.57 10.30 0.74 0.93 1.19 2.10 -31.97 -6.80 0.06 0.12 -1.64 -0.39 2.50 4.52 6.29 1.67 1.26 1.56 10.25 0.75 0.93 1.20

517
Raw Data Tapered Data
FFT Data Parzen Filtered Data
Simple Ratio Spectrum
Z E N
Tapering Function
Z E N Z E N Z E N
Frequency Hz
E/Z N/Z
Mean SQRT Spectrum
-12.72 11.17 -5.92 0.04 -0.53 -0.04 -0.25 2.35 3.93 2.64 1.14 1.18 1.68 8.79 1.04 1.48 1.81 35.28 -0.85 5.14 0.04 1.46 -0.70 0.21 4.21 6.64 2.11 1.12 1.19 1.68 8.74 1.06 1.50 1.83 68.13 -16.81 -2.82 0.04 2.79 0.17 -0.12 3.31 6.26 0.75 1.10 1.19 1.67 8.69 1.08 1.52 1.86 66.91 4.22 -19.72 0.04 2.71 0.78 -0.80 1.02 5.70 2.42 1.08 1.20 1.67 8.64 1.10 1.54 1.89 50.72 19.18 -27.57 0.04 2.03 0.13 -1.10 0.87 2.48 3.05 1.07 1.20 1.66 8.59 1.13 1.55 1.92 43.58 3.14 -23.41 0.04 1.72 0.83 -0.92 2.24 3.70 1.39 1.05 1.21 1.65 8.54 1.15 1.57 1.95 32.48 21.09 -6.30 0.04 1.27 1.33 -0.25 2.04 6.42 2.69 1.03 1.22 1.64 8.50 1.18 1.59 1.98 2.46 33.99 1.76 0.04 0.09 0.15 0.07 4.46 7.02 3.77 1.01 1.22 1.63 8.45 1.21 1.61 2.01 -1.49 3.92 3.81 0.04 -0.06 0.00 0.14 7.53 3.64 2.75 1.00 1.23 1.62 8.40 1.24 1.62 2.04 -5.43 -0.09 -2.14 0.04 -0.20 0.93 -0.08 2.05 3.96 7.84 0.98 1.25 1.61 8.35 1.27 1.64 2.07 -49.27 24.87 -7.07 0.04 -1.82 0.51 -0.26 6.25 11.48 10.58 0.97 1.26 1.60 8.30 1.30 1.65 2.10 -38.04 13.79 1.99 0.04 -1.39 -0.74 0.07 4.10 12.34 11.07 0.96 1.27 1.58 8.25 1.33 1.66 2.12 1.08 -20.19 12.02 0.04 0.04 -0.04 0.43 1.80 5.95 8.47 0.94 1.29 1.57 8.20 1.36 1.66 2.15
-38.79 -1.14 12.02 0.04 -1.38 1.38 0.43 1.62 5.13 4.79 0.94 1.30 1.55 8.15 1.39 1.66 2.17 -21.62 38.79 17.02 0.04 -0.76 0.90 0.60 2.68 3.05 5.39 0.93 1.32 1.54 8.11 1.42 1.66 2.19 40.39 25.66 38.96 0.03 1.39 0.50 1.34 1.86 3.03 5.23 0.92 1.34 1.52 8.06 1.45 1.65 2.20 -2.63 14.58 48.84 0.03 -0.09 0.87 1.66 1.62 4.08 3.47 0.92 1.36 1.51 8.01 1.48 1.65 2.21 -38.50 25.51 28.73 0.03 -1.29 0.25 0.96 1.60 2.38 1.73 0.91 1.38 1.49 7.96 1.51 1.64 2.22 -17.34 7.44 15.70 0.03 -0.57 -0.45 0.52 2.14 1.32 4.13 0.91 1.40 1.48 7.91 1.54 1.62 2.23 -0.25 -13.54 -11.26 0.03 -0.01 0.05 -0.37 2.64 1.89 7.03 0.91 1.43 1.47 7.86 1.56 1.61 2.24 -19.16 1.49 -37.11 0.03 -0.61 -0.08 -1.19 2.81 3.13 4.90 0.92 1.45 1.45 7.81 1.59 1.59 2.24 -35.00 -2.51 -17.95 0.03 -1.10 -1.18 -0.57 2.63 5.31 3.63 0.92 1.48 1.44 7.76 1.61 1.57 2.25 12.10 -37.43 9.12 0.03 0.37 -0.88 0.28 2.35 4.56 2.14 0.93 1.51 1.43 7.71 1.63 1.55 2.25 18.09 -28.29 23.11 0.03 0.55 0.08 0.70 1.04 1.87 1.34 0.93 1.53 1.43 7.67 1.65 1.53 2.25 -23.85 2.77 11.09 0.03 -0.72 -0.49 0.33 1.95 6.15 6.76 0.94 1.56 1.42 7.62 1.67 1.51 2.25 9.23 -16.20 -2.87 0.03 0.27 -0.80 -0.08 7.42 12.23 5.42 0.95 1.59 1.42 7.57 1.68 1.50 2.25 36.19 -27.11 -6.80 0.03 1.05 0.00 -0.20 7.14 8.91 2.84 0.96 1.62 1.41 7.52 1.70 1.48 2.25 -12.80 -0.05 -26.68 0.03 -0.36 -0.03 -0.76 2.13 1.96 2.01 0.97 1.65 1.42 7.47 1.71 1.47 2.25 -33.66 -1.05 -29.51 0.03 -0.94 -0.62 -0.83 0.58 4.32 3.66 0.98 1.68 1.42 7.42 1.72 1.46 2.25 7.44 -22.00 -19.36 0.03 0.20 -0.41 -0.53 1.94 5.04 5.06 0.99 1.71 1.43 7.37 1.73 1.45 2.26 17.45 -14.92 -29.21 0.03 0.47 -0.19 -0.79 0.36 4.61 1.35 1.00 1.73 1.44 7.32 1.74 1.44 2.26 -12.72 11.17 -5.92 0.04 -0.53 -0.04 -0.25 2.35 3.93 2.64 1.14 1.18 1.68 8.79 1.04 1.48 1.81 35.28 -0.85 5.14 0.04 1.46 -0.70 0.21 4.21 6.64 2.11 1.12 1.19 1.68 8.74 1.06 1.50 1.83

518
Raw Data Tapered Data
FFT Data Parzen Filtered Data
Simple Ratio Spectrum
Z E N
Tapering Function
Z E N Z E N Z E N
Frequency Hz
E/Z N/Z
Mean SQRT Spectrum
-10.52 -6.87 -29.04 0.03 -0.28 -0.63 -0.77 2.29 3.86 3.72 1.01 1.76 1.45 7.28 1.75 1.44 2.26 20.51 -23.81 -20.89 0.03 0.53 -0.67 -0.54 2.57 3.07 5.44 1.02 1.78 1.46 7.23 1.75 1.44 2.27 50.42 -25.70 -18.75 0.03 1.29 0.01 -0.48 1.51 0.72 2.53 1.03 1.80 1.48 7.18 1.76 1.44 2.28 -0.63 0.35 -1.66 0.03 -0.02 -0.07 -0.04 4.61 3.35 3.42 1.03 1.83 1.50 7.13 1.77 1.45 2.28 -6.56 -2.64 19.36 0.02 -0.16 -0.65 0.47 3.17 5.52 2.10 1.04 1.84 1.52 7.08 1.77 1.46 2.29 46.41 -26.57 30.32 0.02 1.11 -0.42 0.73 2.09 4.70 5.70 1.05 1.86 1.54 7.03 1.77 1.47 2.30 20.33 -17.48 17.27 0.02 0.48 0.11 0.41 4.03 10.46 7.89 1.05 1.87 1.56 6.98 1.78 1.48 2.31 -3.66 4.55 -10.69 0.02 -0.08 0.04 -0.25 4.19 10.42 5.82 1.06 1.88 1.58 6.93 1.78 1.49 2.32 37.33 1.54 -4.60 0.02 0.84 0.01 -0.10 2.23 4.57 0.25 1.06 1.89 1.60 6.88 1.78 1.50 2.33 38.22 0.54 -3.53 0.02 0.84 0.45 -0.08 2.23 5.37 4.16 1.07 1.90 1.62 6.84 1.78 1.52 2.34 3.19 20.51 -18.43 0.02 0.07 0.61 -0.40 0.69 6.02 6.59 1.07 1.90 1.64 6.79 1.78 1.53 2.35
-13.74 28.41 2.65 0.02 -0.29 0.53 0.06 2.00 4.74 1.98 1.07 1.90 1.66 6.74 1.78 1.54 2.35 14.31 25.31 16.67 0.02 0.29 0.56 0.34 1.91 3.68 4.71 1.07 1.91 1.67 6.69 1.77 1.56 2.36 29.27 27.21 -1.31 0.02 0.59 0.20 -0.03 1.85 3.88 4.53 1.07 1.91 1.69 6.64 1.77 1.57 2.37 -22.69 10.14 -2.25 0.02 -0.44 -0.35 -0.04 3.69 4.18 3.73 1.07 1.90 1.70 6.59 1.77 1.58 2.37 -27.54 -17.84 8.79 0.02 -0.52 -0.19 0.17 4.63 3.99 3.31 1.07 1.90 1.71 6.54 1.77 1.59 2.38 -9.42 -9.78 11.80 0.02 -0.17 0.58 0.22 4.92 7.80 8.72 1.07 1.89 1.71 6.49 1.77 1.60 2.38 -47.25 31.18 25.78 0.02 -0.85 0.51 0.46 2.08 16.57 20.19 1.07 1.89 1.71 6.45 1.77 1.60 2.39 -33.04 28.07 54.67 0.02 -0.58 0.05 0.96 15.16 12.39 15.27 1.06 1.88 1.71 6.40 1.77 1.61 2.39 -7.91 3.01 61.49 0.02 -0.13 0.03 1.05 21.74 13.58 4.28 1.06 1.88 1.71 6.35 1.77 1.61 2.39 -37.77 2.00 44.33 0.02 -0.62 -0.05 0.73 11.64 7.90 5.09 1.06 1.87 1.70 6.30 1.77 1.61 2.39 -18.60 -2.99 37.22 0.02 -0.30 -0.24 0.60 2.44 2.47 3.40 1.06 1.87 1.70 6.25 1.77 1.61 2.39 10.46 -14.95 18.16 0.02 0.16 0.05 0.28 1.79 3.68 3.12 1.05 1.86 1.69 6.20 1.77 1.60 2.38 -32.44 3.07 -7.81 0.02 -0.49 0.45 -0.12 2.52 6.36 7.03 1.05 1.86 1.68 6.15 1.77 1.60 2.38 -54.21 30.01 8.24 0.01 -0.79 0.04 0.12 6.66 17.01 21.50 1.05 1.86 1.67 6.10 1.77 1.59 2.38 -19.02 2.95 24.23 0.01 -0.27 -0.18 0.34 25.43 38.40 46.70 1.05 1.86 1.67 6.05 1.77 1.58 2.37 -0.92 -13.03 22.19 0.01 -0.01 0.18 0.30 66.27 34.00 68.41 1.06 1.87 1.66 6.01 1.77 1.57 2.36 -13.84 12.98 29.14 0.01 -0.18 0.05 0.38 49.56 17.51 50.59 1.06 1.88 1.65 5.96 1.77 1.56 2.36 21.19 3.95 25.08 0.01 0.26 -0.25 0.31 1.10 2.99 16.90 1.07 1.89 1.65 5.91 1.77 1.55 2.35 60.08 -20.02 14.05 0.01 0.72 -0.32 0.17 2.37 2.26 8.89 1.08 1.90 1.65 5.86 1.76 1.53 2.34 -22.94 -26.92 4.07 0.01 -0.26 -0.18 0.05 1.22 4.98 5.59 1.09 1.92 1.66 5.81 1.75 1.52 2.32 -10.52 -6.87 -29.04 0.03 -0.28 -0.63 -0.77 2.29 3.86 3.72 1.01 1.76 1.45 7.28 1.75 1.44 2.26 20.51 -23.81 -20.89 0.03 0.53 -0.67 -0.54 2.57 3.07 5.44 1.02 1.78 1.46 7.23 1.75 1.44 2.27

519
Raw Data Tapered Data
FFT Data Parzen Filtered Data
Simple Ratio Spectrum
Z E N
Tapering Function
Z E N Z E N Z E N
Frequency Hz
E/Z N/Z
Mean SQRT Spectrum
-73.69 -15.83 -12.87 0.01 -0.81 -0.21 -0.14 3.46 5.86 7.68 1.11 1.94 1.68 5.76 1.74 1.51 2.30 0.50 -18.76 -21.75 0.01 0.01 -0.30 -0.23 2.90 7.04 4.63 1.14 1.97 1.70 5.71 1.73 1.49 2.28 -1.44 -28.66 -29.59 0.01 -0.01 -0.02 -0.30 5.79 8.07 5.06 1.17 2.00 1.73 5.66 1.71 1.48 2.26 -57.27 -1.59 -34.41 0.01 -0.54 -0.03 -0.33 3.96 2.29 1.69 1.21 2.03 1.77 5.62 1.68 1.46 2.23 -17.07 -3.58 -23.24 0.01 -0.15 -0.11 -0.21 3.62 5.87 2.80 1.26 2.08 1.82 5.57 1.65 1.45 2.20 39.94 -12.54 -21.10 0.01 0.34 0.21 -0.18 3.42 4.91 0.41 1.31 2.13 1.88 5.52 1.62 1.44 2.17 23.86 24.44 -23.96 0.01 0.19 0.24 -0.19 2.08 2.22 2.47 1.37 2.18 1.96 5.47 1.59 1.42 2.13 36.79 30.34 -9.84 0.01 0.28 -0.09 -0.07 1.04 6.23 4.04 1.45 2.24 2.04 5.42 1.55 1.41 2.09 93.58 -11.70 2.23 0.01 0.66 -0.10 0.02 1.65 7.19 6.21 1.53 2.30 2.14 5.37 1.51 1.40 2.06 51.34 -13.64 1.27 0.01 0.33 0.15 0.01 2.51 4.65 5.29 1.62 2.37 2.25 5.32 1.46 1.39 2.02 -11.69 22.35 15.29 0.01 -0.07 0.14 0.09 4.51 4.52 3.28 1.72 2.44 2.37 5.27 1.42 1.38 1.98 14.36 23.26 20.27 0.01 0.08 0.05 0.11 4.54 3.82 2.40 1.83 2.52 2.50 5.22 1.38 1.37 1.94 46.29 8.20 -0.72 0.01 0.23 0.09 0.00 1.49 2.81 3.26 1.94 2.60 2.64 5.18 1.34 1.36 1.91 24.20 18.15 -10.64 0.00 0.11 0.12 -0.05 0.34 1.84 2.30 2.07 2.69 2.80 5.13 1.30 1.35 1.88 -4.79 26.07 -15.54 0.00 -0.02 0.05 -0.06 0.24 3.26 1.13 2.20 2.77 2.96 5.08 1.26 1.35 1.85 5.26 12.99 -21.41 0.00 0.02 0.06 -0.07 4.19 3.78 6.20 2.33 2.86 3.13 5.03 1.23 1.34 1.82 -6.69 16.93 -10.30 0.00 -0.02 0.09 -0.03 9.10 6.90 16.05 2.47 2.94 3.31 4.98 1.19 1.34 1.79 -53.52 30.84 6.76 0.00 -0.13 0.00 0.02 3.53 2.02 6.29 2.61 3.03 3.48 4.93 1.16 1.33 1.77 -62.23 0.78 4.79 0.00 -0.12 -0.03 0.01 1.15 3.24 2.41 2.74 3.11 3.65 4.88 1.13 1.33 1.75 -62.93 -15.19 -11.14 0.00 -0.09 0.03 -0.02 0.55 2.14 0.88 2.87 3.18 3.81 4.83 1.11 1.33 1.73 -35.68 17.81 -12.04 0.00 -0.04 0.02 -0.01 2.15 1.88 2.00 2.99 3.25 3.97 4.79 1.09 1.33 1.71 19.40 16.75 7.02 0.00 0.01 -0.01 0.00 2.49 1.46 1.19 3.11 3.31 4.11 4.74 1.07 1.32 1.70

520
Microtremors Segment: B1-S3
Raw Data Tapered Data
FFT Data Parzen Filtered Data
Simple Ratio Spectrum
Z E N
Tapering Function
Z E N Z E N Z E N
Frequency Hz
E/Z N/Z
Mean SQRT Spectrum
50.46 22.69 26.24 0.26 13.09 5.89 6.81 6.77 1.51 2.20 3.54 1.16 0.92 30.03 0.33 0.26 0.42 63.28 32.59 36.17 0.26 16.39 8.44 9.37 2.39 1.20 2.11 3.54 1.15 0.90 29.98 0.32 0.26 0.41 32.13 44.43 16.12 0.26 8.31 11.49 4.17 1.29 1.91 1.53 3.52 1.13 0.89 29.93 0.32 0.25 0.41 1.11 18.31 10.13 0.26 0.29 4.72 2.61 0.44 2.24 1.77 3.50 1.11 0.87 29.88 0.32 0.25 0.40
-25.80 -33.66 7.15 0.26 -6.64 -8.67 1.84 4.15 3.64 3.25 3.46 1.09 0.85 29.83 0.32 0.25 0.40 -26.65 -46.50 -8.79 0.26 -6.85 -11.95 -2.26 8.39 1.81 3.72 3.41 1.07 0.83 29.79 0.31 0.24 0.40 8.43 -24.35 3.27 0.26 2.16 -6.25 0.84 0.73 2.16 0.39 3.36 1.05 0.81 29.74 0.31 0.24 0.39 53.35 2.69 20.28 0.26 13.66 0.69 5.19 3.17 3.56 3.26 3.29 1.03 0.79 29.69 0.31 0.24 0.39 18.25 24.64 5.28 0.26 4.66 6.30 1.35 6.60 2.69 0.94 3.22 1.00 0.77 29.64 0.31 0.24 0.39 -53.64 27.54 -11.65 0.26 -13.68 7.02 -2.97 5.13 1.31 0.92 3.15 0.98 0.75 29.59 0.31 0.24 0.39 -52.38 19.45 -3.56 0.25 -13.33 4.95 -0.91 7.77 0.63 1.57 3.07 0.96 0.73 29.54 0.31 0.24 0.39 -12.21 10.39 -11.48 0.25 -3.10 2.64 -2.92 4.72 2.02 1.64 2.99 0.94 0.72 29.49 0.32 0.24 0.40 14.83 6.36 -39.32 0.25 3.76 1.61 -9.97 5.33 1.07 1.11 2.92 0.93 0.70 29.44 0.32 0.24 0.40 50.74 -7.64 -36.11 0.25 12.84 -1.93 -9.14 5.93 0.60 3.52 2.84 0.91 0.69 29.39 0.32 0.24 0.40 65.55 -7.61 -2.98 0.25 16.55 -1.92 -0.75 2.97 1.75 5.17 2.77 0.90 0.68 29.35 0.32 0.25 0.41 -3.53 28.35 10.06 0.25 -0.89 7.15 2.54 2.38 0.12 3.69 2.70 0.88 0.68 29.30 0.33 0.25 0.41 -43.39 33.23 -7.89 0.25 -10.91 8.36 -1.98 3.37 2.22 1.72 2.63 0.87 0.68 29.25 0.33 0.26 0.42 13.71 17.13 -17.78 0.25 3.44 4.30 -4.46 1.97 2.85 0.98 2.57 0.86 0.67 29.20 0.34 0.26 0.43 33.66 6.09 -23.64 0.25 8.43 1.52 -5.92 4.08 1.59 2.90 2.51 0.86 0.67 29.15 0.34 0.27 0.43 5.62 -20.88 -26.48 0.25 1.41 -5.22 -6.62 4.38 3.03 1.48 2.46 0.85 0.68 29.10 0.35 0.28 0.44
-14.32 -39.76 -8.36 0.25 -3.57 -9.92 -2.08 2.03 3.20 1.16 2.41 0.85 0.68 29.05 0.35 0.28 0.45 -48.15 -43.59 -0.28 0.25 -11.99 -10.85 -0.07 2.12 2.31 2.15 2.37 0.85 0.69 29.00 0.36 0.29 0.46 -63.88 -40.42 12.75 0.25 -15.87 -10.04 3.17 7.94 1.32 1.81 2.34 0.85 0.69 28.96 0.36 0.30 0.47 -51.60 -40.26 27.72 0.25 -12.80 -9.98 6.88 23.88 4.36 9.85 2.30 0.84 0.70 28.91 0.37 0.30 0.48 -30.40 -37.10 6.71 0.25 -7.52 -9.18 1.66 55.68 15.53 34.07 2.27 0.84 0.71 28.86 0.37 0.31 0.48 9.69 -4.01 -5.24 0.25 2.39 -0.99 -1.29 31.70 20.36 23.47 2.25 0.85 0.72 28.81 0.38 0.32 0.49 5.70 25.94 0.83 0.25 1.41 6.40 0.20 5.34 7.09 3.19 2.23 0.85 0.72 28.76 0.38 0.33 0.50 1.73 13.87 7.87 0.25 0.43 3.41 1.94 9.22 8.82 0.81 2.21 0.85 0.73 28.71 0.38 0.33 0.51 34.70 12.82 27.85 0.25 8.52 3.15 6.84 3.12 1.53 2.43 2.19 0.85 0.74 28.66 0.39 0.34 0.52 15.65 28.74 21.81 0.25 3.83 7.04 5.34 3.47 3.93 1.03 2.18 0.85 0.76 28.61 0.39 0.35 0.52 6.65 13.65 0.82 0.24 1.63 3.34 0.20 5.39 2.38 2.16 2.17 0.85 0.77 28.56 0.39 0.35 0.53 -8.31 6.61 -4.12 0.24 -2.03 1.61 -1.00 5.13 4.28 2.23 2.16 0.85 0.78 28.52 0.40 0.36 0.54 50.46 22.69 26.24 0.26 13.09 5.89 6.81 6.77 1.51 2.20 3.54 1.16 0.92 30.03 0.33 0.26 0.42

521
Raw Data Tapered Data
FFT Data Parzen Filtered Data
Simple Ratio Spectrum
Z E N
Tapering Function
Z E N Z E N Z E N
Frequency Hz
E/Z N/Z
Mean SQRT Spectrum
-35.17 7.59 -16.02 0.24 -8.57 1.85 -3.90 8.86 2.76 3.28 2.15 0.86 0.80 28.47 0.40 0.37 0.54 -31.00 0.57 -10.91 0.24 -7.53 0.14 -2.65 6.01 0.71 3.99 2.14 0.86 0.81 28.42 0.40 0.38 0.55 -14.86 5.56 17.13 0.24 -3.60 1.35 4.15 8.48 0.35 3.92 2.14 0.86 0.83 28.37 0.40 0.39 0.56 45.12 -7.43 29.10 0.24 10.92 -1.80 7.04 5.55 0.93 2.27 2.14 0.87 0.85 28.32 0.41 0.40 0.57 29.02 -19.38 24.04 0.24 7.01 -4.68 5.81 11.46 0.82 0.99 2.15 0.88 0.87 28.27 0.41 0.41 0.58 -23.95 -18.30 6.04 0.24 -5.77 -4.41 1.46 6.71 2.69 2.34 2.16 0.89 0.90 28.22 0.41 0.42 0.58 -23.81 -8.24 -23.87 0.24 -5.73 -1.98 -5.74 4.49 1.17 0.67 2.18 0.90 0.93 28.17 0.41 0.43 0.59 -17.68 17.74 -35.69 0.24 -4.24 4.26 -8.57 3.04 4.01 2.66 2.20 0.91 0.96 28.13 0.41 0.44 0.60 32.34 5.69 -18.53 0.24 7.74 1.36 -4.44 13.49 1.48 2.96 2.23 0.93 1.00 28.08 0.42 0.45 0.61 72.17 -27.26 7.55 0.24 17.25 -6.52 1.80 10.65 4.99 6.09 2.27 0.95 1.04 28.03 0.42 0.46 0.62 73.92 -23.16 7.58 0.24 17.63 -5.52 1.81 7.87 2.46 8.45 2.31 0.97 1.08 27.98 0.42 0.47 0.63 -18.15 -11.09 -19.35 0.24 -4.32 -2.64 -4.60 2.10 3.37 5.31 2.37 1.00 1.13 27.93 0.42 0.48 0.64 -103.86 5.93 -27.20 0.24 -24.67 1.41 -6.46 8.95 3.04 1.47 2.43 1.03 1.17 27.88 0.42 0.48 0.64 -23.56 24.87 -24.04 0.24 -5.58 5.89 -5.70 10.47 0.92 5.39 2.49 1.06 1.23 27.83 0.42 0.49 0.65 28.47 26.77 -23.88 0.24 6.73 6.33 -5.65 10.28 2.10 8.41 2.56 1.09 1.28 27.78 0.43 0.50 0.66 57.35 19.67 -10.76 0.24 13.53 4.64 -2.54 8.04 1.23 6.58 2.63 1.13 1.33 27.73 0.43 0.51 0.66 115.04 6.62 13.29 0.24 27.09 1.56 3.13 3.39 1.89 5.19 2.71 1.16 1.38 27.69 0.43 0.51 0.67 51.75 -5.38 23.28 0.24 12.16 -1.26 5.47 4.12 5.17 3.70 2.79 1.20 1.44 27.64 0.43 0.52 0.67 -56.20 -23.32 12.26 0.23 -13.18 -5.47 2.88 7.17 2.97 1.48 2.87 1.24 1.49 27.59 0.43 0.52 0.68 -77.89 -44.18 14.27 0.23 -18.23 -10.34 3.34 3.03 4.93 4.32 2.95 1.27 1.54 27.54 0.43 0.52 0.68 -18.65 -40.01 13.27 0.23 -4.35 -9.34 3.10 7.22 5.78 3.67 3.03 1.31 1.59 27.49 0.43 0.52 0.68 -26.51 -24.88 -0.70 0.23 -6.18 -5.80 -0.16 2.33 2.30 2.79 3.11 1.34 1.63 27.44 0.43 0.53 0.68 -54.31 -29.77 -0.64 0.23 -12.63 -6.92 -0.15 6.54 4.56 2.89 3.18 1.37 1.67 27.39 0.43 0.53 0.68 34.77 -48.61 11.39 0.23 8.07 -11.28 2.64 9.41 1.86 3.38 3.25 1.40 1.71 27.34 0.43 0.53 0.68 41.67 -38.43 14.40 0.23 9.65 -8.90 3.33 9.51 1.64 1.66 3.31 1.42 1.74 27.29 0.43 0.53 0.68 -40.29 -15.32 -1.57 0.23 -9.31 -3.54 -0.36 5.94 3.91 1.55 3.36 1.44 1.77 27.25 0.43 0.53 0.68 -48.07 -14.25 -1.51 0.23 -11.08 -3.29 -0.35 4.00 3.69 2.99 3.41 1.46 1.79 27.20 0.43 0.53 0.68 -51.83 6.77 6.54 0.23 -11.92 1.56 1.50 5.23 1.42 3.78 3.44 1.46 1.80 27.15 0.43 0.52 0.68 -91.50 31.69 -3.41 0.23 -21.00 7.27 -0.78 7.62 6.74 3.41 3.46 1.47 1.81 27.10 0.42 0.52 0.67 -72.12 18.60 19.61 0.23 -16.52 4.26 4.49 11.11 3.84 2.59 3.47 1.47 1.81 27.05 0.42 0.52 0.67 4.06 27.51 43.54 0.23 0.93 6.29 9.95 7.12 1.93 1.36 3.47 1.46 1.81 27.00 0.42 0.52 0.67
-35.17 7.59 -16.02 0.24 -8.57 1.85 -3.90 8.86 2.76 3.28 2.15 0.86 0.80 28.47 0.40 0.37 0.54 -31.00 0.57 -10.91 0.24 -7.53 0.14 -2.65 6.01 0.71 3.99 2.14 0.86 0.81 28.42 0.40 0.38 0.55

522
Raw Data Tapered Data
FFT Data Parzen Filtered Data
Simple Ratio Spectrum
Z E N
Tapering Function
Z E N Z E N Z E N
Frequency Hz
E/Z N/Z
Mean SQRT Spectrum
36.03 56.34 30.45 0.23 8.21 12.85 6.94 8.76 1.92 2.93 3.47 1.45 1.81 26.95 0.42 0.52 0.67 39.92 54.12 21.40 0.23 9.08 12.31 4.87 9.51 2.55 5.47 3.45 1.44 1.80 26.90 0.42 0.52 0.67 65.75 50.91 2.41 0.23 14.93 11.56 0.55 3.04 4.61 4.33 3.43 1.42 1.78 26.86 0.41 0.52 0.66 63.54 27.76 -12.52 0.23 14.39 6.29 -2.84 6.72 2.17 4.37 3.40 1.40 1.77 26.81 0.41 0.52 0.66 7.44 -12.27 -5.43 0.23 1.68 -2.77 -1.23 7.37 0.68 5.36 3.37 1.38 1.75 26.76 0.41 0.52 0.66
-24.48 -41.16 5.63 0.23 -5.52 -9.28 1.27 8.71 1.84 6.00 3.33 1.35 1.73 26.71 0.41 0.52 0.66 -4.38 -68.94 16.64 0.23 -0.99 -15.51 3.74 1.99 5.57 2.67 3.28 1.33 1.71 26.66 0.40 0.52 0.66 9.65 -47.70 30.60 0.22 2.17 -10.71 6.87 3.56 0.81 1.26 3.23 1.30 1.69 26.61 0.40 0.52 0.66 16.65 -6.59 37.52 0.22 3.73 -1.48 8.40 8.72 3.90 2.22 3.18 1.28 1.66 26.56 0.40 0.52 0.66 21.61 4.42 13.47 0.22 4.83 0.99 3.01 11.48 3.41 3.79 3.13 1.26 1.64 26.51 0.40 0.52 0.66 -4.38 31.35 -17.47 0.22 -0.98 6.99 -3.89 5.09 2.67 4.60 3.07 1.23 1.62 26.46 0.40 0.53 0.66 -21.28 46.19 -27.32 0.22 -4.74 10.28 -6.08 3.36 1.29 3.14 3.02 1.21 1.60 26.42 0.40 0.53 0.66 1.80 24.06 -20.17 0.22 0.40 5.34 -4.48 9.08 2.10 3.05 2.97 1.19 1.57 26.37 0.40 0.53 0.67 4.83 32.94 -8.06 0.22 1.07 7.30 -1.79 11.90 0.82 3.71 2.92 1.18 1.56 26.32 0.40 0.53 0.67 7.85 52.77 -11.96 0.22 1.74 11.66 -2.64 9.79 0.46 1.48 2.88 1.17 1.54 26.27 0.41 0.53 0.67 25.83 40.59 -6.87 0.22 5.70 8.95 -1.51 9.50 1.56 2.59 2.83 1.16 1.52 26.22 0.41 0.54 0.67 16.79 36.43 12.17 0.22 3.69 8.02 2.68 10.31 2.42 2.53 2.80 1.15 1.50 26.17 0.41 0.54 0.68 20.76 25.31 8.19 0.22 4.56 5.56 1.80 8.55 3.95 4.25 2.76 1.14 1.49 26.12 0.41 0.54 0.68 7.74 -2.73 -21.73 0.22 1.70 -0.60 -4.76 3.38 1.82 1.77 2.73 1.14 1.48 26.07 0.42 0.54 0.68 -4.22 -21.69 -41.55 0.22 -0.92 -4.74 -9.08 3.77 3.56 2.74 2.71 1.14 1.46 26.03 0.42 0.54 0.68 13.80 -50.54 -6.39 0.22 3.01 -11.02 -1.39 5.26 1.13 2.25 2.69 1.14 1.45 25.98 0.42 0.54 0.69 -20.14 -54.33 23.63 0.22 -4.38 -11.82 5.14 7.83 2.87 2.05 2.67 1.14 1.44 25.93 0.43 0.54 0.69 -21.01 -46.12 -7.35 0.22 -4.56 -10.01 -1.59 3.47 2.49 1.66 2.65 1.14 1.42 25.88 0.43 0.54 0.69 33.00 -58.91 -4.27 0.22 7.15 -12.75 -0.92 5.69 3.49 2.83 2.64 1.14 1.41 25.83 0.43 0.54 0.69 33.91 -37.72 27.74 0.22 7.33 -8.15 5.99 6.58 3.39 1.28 2.63 1.14 1.40 25.78 0.43 0.53 0.69 -14.08 -7.62 25.69 0.22 -3.03 -1.64 5.54 7.50 1.86 2.00 2.62 1.14 1.39 25.73 0.43 0.53 0.68 -33.94 -14.58 10.67 0.22 -7.30 -3.13 2.29 4.37 2.40 2.00 2.62 1.14 1.38 25.68 0.43 0.53 0.68 -17.79 -13.52 -4.29 0.21 -3.82 -2.90 -0.92 3.86 1.79 2.00 2.62 1.14 1.37 25.63 0.43 0.52 0.68 -21.67 0.51 -1.22 0.21 -4.64 0.11 -0.26 10.29 2.78 2.21 2.62 1.13 1.36 25.59 0.43 0.52 0.68 -30.52 -1.48 8.82 0.21 -6.52 -0.32 1.88 7.65 4.60 0.98 2.62 1.13 1.35 25.54 0.43 0.51 0.67 -22.37 17.49 0.85 0.21 -4.77 3.73 0.18 5.50 3.65 0.77 2.62 1.12 1.33 25.49 0.43 0.51 0.67 36.03 56.34 30.45 0.23 8.21 12.85 6.94 8.76 1.92 2.93 3.47 1.45 1.81 26.95 0.42 0.52 0.67 39.92 54.12 21.40 0.23 9.08 12.31 4.87 9.51 2.55 5.47 3.45 1.44 1.80 26.90 0.42 0.52 0.67

523
Raw Data Tapered Data
FFT Data Parzen Filtered Data
Simple Ratio Spectrum
Z E N
Tapering Function
Z E N Z E N Z E N
Frequency Hz
E/Z N/Z
Mean SQRT Spectrum
-23.24 46.36 -4.08 0.21 -4.94 9.85 -0.87 8.62 2.45 2.00 2.63 1.12 1.32 25.44 0.43 0.50 0.66 -19.11 28.22 -2.02 0.21 -4.05 5.98 -0.43 6.60 0.52 0.66 2.63 1.11 1.31 25.39 0.42 0.50 0.65 -3.02 2.16 2.04 0.21 -0.64 0.46 0.43 7.12 0.85 3.95 2.64 1.10 1.30 25.34 0.42 0.49 0.65 -5.96 11.13 4.08 0.21 -1.26 2.35 0.86 5.22 1.48 4.45 2.64 1.09 1.29 25.29 0.41 0.49 0.64 -11.87 6.10 -18.83 0.21 -2.50 1.28 -3.96 0.26 3.40 4.93 2.65 1.08 1.28 25.24 0.41 0.48 0.63 13.17 -30.85 -24.69 0.21 2.77 -6.48 -5.18 2.85 3.38 2.19 2.66 1.07 1.27 25.20 0.40 0.48 0.62 32.12 -47.69 5.41 0.21 6.73 -9.99 1.13 4.22 1.70 2.94 2.66 1.05 1.26 25.15 0.40 0.47 0.62 -6.88 -32.53 -8.53 0.21 -1.44 -6.80 -1.78 3.42 1.69 2.65 2.67 1.04 1.25 25.10 0.39 0.47 0.61 -38.75 -18.42 -23.41 0.21 -8.08 -3.84 -4.88 5.15 4.91 1.66 2.67 1.03 1.23 25.05 0.39 0.46 0.60 1.37 -13.35 5.68 0.21 0.29 -2.78 1.18 1.72 1.94 3.07 2.67 1.02 1.22 25.00 0.38 0.46 0.59 30.35 -7.31 6.71 0.21 6.30 -1.52 1.39 14.82 5.71 3.99 2.67 1.00 1.21 24.95 0.38 0.45 0.59 24.29 7.69 -10.23 0.21 5.03 1.59 -2.12 11.88 0.33 4.69 2.67 0.99 1.19 24.90 0.37 0.45 0.58 41.20 8.66 0.85 0.21 8.51 1.79 0.18 9.34 4.15 9.85 2.67 0.98 1.17 24.85 0.37 0.44 0.57 35.09 9.63 4.89 0.21 7.23 1.98 1.01 4.28 1.78 7.21 2.67 0.97 1.16 24.80 0.37 0.43 0.57 -24.88 43.53 -12.04 0.21 -5.11 8.94 -2.47 9.00 0.43 3.67 2.66 0.97 1.14 24.76 0.36 0.43 0.56 -47.69 30.38 -9.94 0.21 -9.78 6.23 -2.04 8.84 1.81 3.86 2.65 0.96 1.13 24.71 0.36 0.42 0.56 11.42 0.32 3.13 0.20 2.34 0.07 0.64 7.31 2.98 1.77 2.65 0.95 1.11 24.66 0.36 0.42 0.55 32.38 28.27 5.17 0.20 6.61 5.77 1.06 4.90 4.05 3.26 2.63 0.95 1.09 24.61 0.36 0.41 0.55 -2.64 19.17 9.20 0.20 -0.54 3.90 1.87 1.24 2.05 3.08 2.62 0.94 1.08 24.56 0.36 0.41 0.55 43.33 -20.82 10.22 0.20 8.80 -4.23 2.07 8.26 3.63 1.85 2.61 0.94 1.06 24.51 0.36 0.41 0.54 67.15 -33.71 10.23 0.20 13.60 -6.83 2.07 6.04 2.03 3.20 2.59 0.94 1.04 24.46 0.36 0.40 0.54 -30.88 -39.56 0.27 0.20 -6.24 -7.99 0.05 2.30 3.93 5.00 2.57 0.94 1.03 24.41 0.36 0.40 0.54 -49.68 -49.38 -15.65 0.20 -10.01 -9.95 -3.15 4.46 5.16 5.01 2.56 0.93 1.02 24.37 0.37 0.40 0.54 32.40 -54.17 -1.56 0.20 6.51 -10.89 -0.31 3.52 0.99 1.56 2.54 0.93 1.01 24.32 0.37 0.40 0.54 27.33 -42.97 13.48 0.20 5.48 -8.62 2.70 3.13 3.72 2.95 2.52 0.94 1.00 24.27 0.37 0.40 0.54 -49.59 -40.80 15.47 0.20 -9.92 -8.16 3.09 10.78 1.36 3.78 2.50 0.94 1.00 24.22 0.37 0.40 0.55 -39.36 -37.64 39.42 0.20 -7.85 -7.51 7.86 19.09 4.14 7.42 2.48 0.94 0.99 24.17 0.38 0.40 0.55 26.71 8.42 47.30 0.20 5.31 1.68 9.41 17.19 2.85 3.54 2.46 0.94 0.99 24.12 0.38 0.40 0.56 -0.30 44.32 29.20 0.20 -0.06 8.80 5.80 13.12 2.14 0.89 2.45 0.94 1.00 24.07 0.39 0.41 0.56 -39.18 36.16 35.13 0.20 -7.76 7.16 6.96 14.54 9.79 5.21 2.43 0.95 1.00 24.02 0.39 0.41 0.57 -7.04 39.02 25.06 0.20 -1.39 7.71 4.95 1.28 7.08 8.21 2.42 0.95 1.01 23.97 0.39 0.42 0.57 -23.24 46.36 -4.08 0.21 -4.94 9.85 -0.87 8.62 2.45 2.00 2.63 1.12 1.32 25.44 0.43 0.50 0.66 -19.11 28.22 -2.02 0.21 -4.05 5.98 -0.43 6.60 0.52 0.66 2.63 1.11 1.31 25.39 0.42 0.50 0.65

524
Raw Data Tapered Data
FFT Data Parzen Filtered Data
Simple Ratio Spectrum
Z E N
Tapering Function
Z E N Z E N Z E N
Frequency Hz
E/Z N/Z
Mean SQRT Spectrum
-11.96 54.83 -11.91 0.20 -2.36 10.80 -2.35 12.33 1.56 8.72 2.41 0.95 1.02 23.93 0.40 0.42 0.58 -22.85 52.62 -1.83 0.20 -4.49 10.34 -0.36 6.15 0.32 5.98 2.40 0.96 1.04 23.88 0.40 0.43 0.59 8.23 39.44 15.20 0.20 1.61 7.73 2.98 7.50 0.60 5.62 2.39 0.96 1.05 23.83 0.40 0.44 0.60 16.22 28.30 8.21 0.20 3.17 5.53 1.60 7.85 1.77 6.23 2.38 0.97 1.07 23.78 0.41 0.45 0.61 -14.74 13.22 12.22 0.20 -2.87 2.58 2.38 5.97 6.75 3.15 2.38 0.97 1.09 23.73 0.41 0.46 0.61 -53.55 -13.78 10.23 0.19 -10.42 -2.68 1.99 4.93 7.18 2.62 2.38 0.97 1.12 23.68 0.41 0.47 0.62 -45.31 -17.71 10.24 0.19 -8.79 -3.44 1.99 5.62 0.31 0.36 2.38 0.98 1.14 23.63 0.41 0.48 0.63 -34.11 -1.67 -10.70 0.19 -6.60 -0.32 -2.07 6.64 5.46 5.74 2.39 0.99 1.17 23.58 0.41 0.49 0.64 -47.90 -9.64 -42.54 0.19 -9.24 -1.86 -8.21 5.43 0.64 7.14 2.40 0.99 1.19 23.54 0.41 0.50 0.65 -16.72 -25.57 -27.34 0.19 -3.22 -4.92 -5.26 10.98 2.64 7.40 2.41 1.00 1.22 23.49 0.41 0.51 0.65 19.32 -17.48 -37.16 0.19 3.71 -3.36 -7.13 7.26 5.23 5.80 2.42 1.01 1.25 23.44 0.41 0.51 0.66 -0.67 -10.43 -58.91 0.19 -0.13 -2.00 -11.28 14.38 5.78 10.38 2.44 1.01 1.27 23.39 0.41 0.52 0.67 4.37 -30.34 -17.70 0.19 0.83 -5.80 -3.38 9.35 1.13 6.50 2.46 1.02 1.30 23.34 0.41 0.53 0.67 24.36 -19.24 -6.60 0.19 4.64 -3.66 -1.26 2.52 3.27 8.13 2.49 1.03 1.33 23.29 0.41 0.53 0.68 0.35 19.76 -25.48 0.19 0.07 3.75 -4.84 3.78 1.77 7.73 2.51 1.04 1.36 23.24 0.41 0.54 0.68 -9.58 22.68 2.62 0.19 -1.82 4.30 0.50 7.30 3.77 10.01 2.54 1.05 1.38 23.19 0.41 0.54 0.68 29.42 28.58 3.67 0.19 5.56 5.40 0.69 6.85 4.96 8.24 2.57 1.06 1.41 23.14 0.41 0.55 0.69 61.29 58.41 -37.21 0.19 11.55 11.01 -7.01 5.90 4.41 8.79 2.60 1.07 1.43 23.10 0.41 0.55 0.69 63.08 54.18 -42.99 0.19 11.86 10.19 -8.08 3.31 3.54 5.19 2.64 1.09 1.46 23.05 0.41 0.55 0.69 38.92 31.01 -17.81 0.19 7.30 5.82 -3.34 3.40 3.86 5.03 2.67 1.10 1.49 23.00 0.41 0.56 0.69 -4.10 21.91 4.27 0.19 -0.77 4.10 0.80 4.48 0.66 3.95 2.71 1.11 1.51 22.95 0.41 0.56 0.69 -33.98 6.85 13.29 0.19 -6.34 1.28 2.48 2.72 5.95 0.47 2.74 1.13 1.54 22.90 0.41 0.56 0.70 -10.85 -19.12 17.29 0.19 -2.02 -3.56 3.22 2.84 6.26 2.75 2.77 1.14 1.56 22.85 0.41 0.56 0.70 57.10 -39.01 12.28 0.19 10.59 -7.24 2.28 1.30 3.29 3.55 2.81 1.15 1.59 22.80 0.41 0.57 0.70 34.96 -27.87 -25.63 0.19 6.47 -5.16 -4.74 6.57 4.20 4.09 2.84 1.17 1.62 22.75 0.41 0.57 0.70 -64.93 -32.75 -48.43 0.18 -11.98 -6.04 -8.93 7.89 2.91 7.44 2.87 1.18 1.64 22.71 0.41 0.57 0.71 -62.63 -58.56 -17.24 0.18 -11.52 -10.78 -3.17 9.32 3.25 8.05 2.89 1.19 1.67 22.66 0.41 0.58 0.71 -14.43 -29.38 -1.14 0.18 -2.65 -5.39 -0.21 5.17 3.04 5.78 2.92 1.21 1.70 22.61 0.41 0.58 0.72 -2.36 12.65 17.88 0.18 -0.43 2.32 3.27 7.12 3.77 3.95 2.94 1.22 1.73 22.56 0.42 0.59 0.72 16.66 31.57 40.82 0.18 3.04 5.76 7.45 8.38 0.85 4.48 2.95 1.23 1.76 22.51 0.42 0.60 0.73 12.65 37.43 7.78 0.18 2.30 6.81 1.42 10.78 3.33 4.49 2.96 1.25 1.80 22.46 0.42 0.61 0.74 -11.96 54.83 -11.91 0.20 -2.36 10.80 -2.35 12.33 1.56 8.72 2.41 0.95 1.02 23.93 0.40 0.42 0.58 -22.85 52.62 -1.83 0.20 -4.49 10.34 -0.36 6.15 0.32 5.98 2.40 0.96 1.04 23.88 0.40 0.43 0.59

525
Raw Data Tapered Data
FFT Data Parzen Filtered Data
Simple Ratio Spectrum
Z E N
Tapering Function
Z E N Z E N Z E N
Frequency Hz
E/Z N/Z
Mean SQRT Spectrum
-27.28 34.29 -16.15 0.18 -4.95 6.22 -2.93 6.94 7.12 3.36 2.97 1.26 1.83 22.41 0.42 0.62 0.75 -36.11 32.16 -4.05 0.18 -6.54 5.82 -0.73 5.48 5.49 2.11 2.97 1.27 1.86 22.36 0.43 0.63 0.76 17.97 -3.90 8.00 0.18 3.24 -0.70 1.44 6.92 1.64 4.91 2.97 1.28 1.90 22.31 0.43 0.64 0.77 51.88 -28.83 21.00 0.18 9.34 -5.19 3.78 6.83 3.69 4.05 2.96 1.29 1.93 22.27 0.43 0.65 0.78 5.81 -20.73 21.97 0.18 1.04 -3.72 3.94 8.11 5.60 4.63 2.94 1.29 1.96 22.22 0.44 0.67 0.80
-30.10 -39.61 9.96 0.18 -5.39 -7.09 1.78 4.49 5.46 4.98 2.93 1.30 1.99 22.17 0.44 0.68 0.81 -18.95 -56.42 -3.00 0.18 -3.38 -10.07 -0.53 2.38 6.03 5.09 2.90 1.31 2.02 22.12 0.45 0.70 0.83 -26.82 -57.18 6.05 0.18 -4.77 -10.18 1.08 5.64 2.50 2.58 2.88 1.32 2.05 22.07 0.46 0.71 0.85 -55.61 -51.96 28.04 0.18 -9.87 -9.22 4.98 7.60 7.51 3.16 2.85 1.32 2.08 22.02 0.46 0.73 0.86 -36.38 -20.81 35.97 0.18 -6.44 -3.68 6.37 13.98 7.10 2.36 2.82 1.33 2.10 21.97 0.47 0.75 0.88 17.71 18.19 36.88 0.18 3.13 3.21 6.51 16.40 3.94 5.82 2.78 1.33 2.12 21.92 0.48 0.76 0.90 -3.28 39.08 31.80 0.18 -0.58 6.88 5.60 11.00 4.78 2.29 2.75 1.34 2.14 21.88 0.49 0.78 0.92 -31.16 36.93 25.74 0.18 -5.47 6.48 4.52 6.93 3.10 0.54 2.71 1.34 2.16 21.83 0.50 0.80 0.94 7.93 34.79 12.72 0.18 1.39 6.09 2.23 6.58 4.92 2.87 2.67 1.35 2.17 21.78 0.51 0.81 0.96
-18.00 29.66 -1.25 0.17 -3.14 5.18 -0.22 5.69 7.88 2.48 2.63 1.36 2.18 21.73 0.52 0.83 0.97 -39.84 -7.38 20.76 0.17 -6.93 -1.28 3.61 8.56 7.57 2.27 2.59 1.36 2.18 21.68 0.52 0.84 0.99 17.25 -31.30 36.70 0.17 2.99 -5.43 6.37 2.22 10.51 2.15 2.56 1.37 2.18 21.63 0.53 0.85 1.01 22.22 -24.18 2.68 0.17 3.84 -4.18 0.46 6.81 9.39 3.28 2.53 1.38 2.17 21.58 0.54 0.86 1.02 25.17 -14.11 -27.22 0.17 4.34 -2.43 -4.69 2.51 6.43 4.28 2.50 1.38 2.16 21.53 0.55 0.87 1.03 34.10 -16.04 -25.06 0.17 5.86 -2.76 -4.31 5.83 6.40 3.85 2.47 1.39 2.15 21.48 0.56 0.87 1.04 16.04 -8.99 -36.88 0.17 2.75 -1.54 -6.32 9.42 3.70 2.29 2.45 1.40 2.13 21.44 0.57 0.87 1.04 28.00 -4.96 -56.63 0.17 4.79 -0.85 -9.68 11.20 3.75 1.96 2.43 1.41 2.11 21.39 0.58 0.87 1.04 37.91 -17.91 -47.37 0.17 6.46 -3.05 -8.08 9.15 8.25 3.05 2.42 1.42 2.09 21.34 0.59 0.86 1.04 48.79 11.11 -13.19 0.17 8.29 1.89 -2.24 6.67 4.65 3.08 2.41 1.44 2.06 21.29 0.60 0.85 1.04 4.72 50.98 1.89 0.17 0.80 8.64 0.32 2.34 9.24 1.68 2.41 1.45 2.03 21.24 0.60 0.84 1.04
-72.10 49.78 -13.03 0.17 -12.18 8.41 -2.20 4.23 7.07 2.37 2.41 1.47 2.00 21.19 0.61 0.83 1.03 -13.88 37.61 -20.91 0.17 -2.34 6.34 -3.52 9.72 5.01 5.24 2.42 1.49 1.96 21.14 0.61 0.81 1.02 45.10 29.48 -22.77 0.17 7.58 4.95 -3.82 13.98 6.83 6.25 2.43 1.51 1.93 21.09 0.62 0.79 1.01 -16.91 13.39 -27.61 0.17 -2.83 2.24 -4.62 11.92 2.33 5.42 2.44 1.53 1.89 21.04 0.63 0.78 1.00 -23.78 -24.58 -18.46 0.17 -3.97 -4.11 -3.08 14.00 7.34 4.14 2.46 1.55 1.85 21.00 0.63 0.75 0.98 -1.69 -39.45 2.63 0.17 -0.28 -6.57 0.44 11.45 3.55 3.86 2.48 1.58 1.81 20.95 0.64 0.73 0.97 -27.28 34.29 -16.15 0.18 -4.95 6.22 -2.93 6.94 7.12 3.36 2.97 1.26 1.83 22.41 0.42 0.62 0.75 -36.11 32.16 -4.05 0.18 -6.54 5.82 -0.73 5.48 5.49 2.11 2.97 1.27 1.86 22.36 0.43 0.63 0.76

526
Raw Data Tapered Data
FFT Data Parzen Filtered Data
Simple Ratio Spectrum
Z E N
Tapering Function
Z E N Z E N Z E N
Frequency Hz
E/Z N/Z
Mean SQRT Spectrum
-45.54 -33.30 1.68 0.17 -7.56 -5.53 0.28 11.25 10.28 7.13 2.50 1.60 1.77 20.90 0.64 0.71 0.96 -58.29 -39.16 1.73 0.17 -9.65 -6.48 0.29 5.55 2.69 1.38 2.52 1.63 1.73 20.85 0.65 0.69 0.94 13.84 -12.05 15.75 0.17 2.28 -1.99 2.60 7.80 5.15 3.23 2.55 1.66 1.70 20.80 0.65 0.66 0.93 39.78 18.94 6.76 0.16 6.54 3.12 1.11 7.77 4.49 5.60 2.58 1.70 1.66 20.75 0.66 0.64 0.92 -40.17 20.86 21.76 0.16 -6.59 3.42 3.57 7.69 3.76 8.50 2.61 1.73 1.62 20.70 0.66 0.62 0.91 -41.96 29.76 47.68 0.16 -6.86 4.87 7.80 13.39 7.97 6.93 2.63 1.76 1.58 20.65 0.67 0.60 0.90 23.13 33.63 47.55 0.16 3.77 5.48 7.75 15.06 2.05 6.00 2.66 1.80 1.55 20.61 0.68 0.58 0.89 -1.87 40.49 45.42 0.16 -0.30 6.58 7.38 7.09 1.63 2.15 2.69 1.84 1.52 20.56 0.68 0.56 0.89 -38.74 47.31 42.30 0.16 -6.28 7.66 6.85 3.63 5.44 5.47 2.71 1.87 1.49 20.51 0.69 0.55 0.88 -16.59 35.15 40.19 0.16 -2.68 5.68 6.49 5.79 4.98 2.40 2.74 1.91 1.46 20.46 0.70 0.53 0.88 12.47 19.04 11.14 0.16 2.01 3.07 1.79 5.72 8.01 1.77 2.77 1.95 1.43 20.41 0.70 0.52 0.87 -10.49 -7.98 -8.81 0.16 -1.68 -1.28 -1.41 10.47 5.23 3.60 2.79 1.98 1.41 20.36 0.71 0.50 0.87 -24.37 -41.88 11.24 0.16 -3.90 -6.70 1.80 11.38 4.82 1.21 2.82 2.02 1.39 20.31 0.72 0.49 0.87 13.70 -65.66 -14.70 0.16 2.18 -10.47 -2.34 13.37 3.28 6.90 2.84 2.05 1.37 20.26 0.72 0.48 0.87 4.71 -75.38 -39.53 0.16 0.75 -11.99 -6.29 12.08 5.15 12.29 2.86 2.08 1.35 20.21 0.73 0.47 0.87 1.74 -57.11 -24.35 0.16 0.28 -9.05 -3.86 3.62 2.40 6.37 2.89 2.11 1.34 20.17 0.73 0.46 0.87 53.68 -20.95 -23.20 0.16 8.48 -3.31 -3.67 7.24 4.85 4.02 2.91 2.13 1.33 20.12 0.73 0.46 0.86 41.53 30.03 -27.04 0.16 6.54 4.73 -4.26 11.14 6.24 5.36 2.93 2.16 1.32 20.07 0.74 0.45 0.86 -12.48 64.84 -28.87 0.16 -1.96 10.18 -4.53 12.52 6.81 5.21 2.95 2.18 1.32 20.02 0.74 0.45 0.86 -21.37 62.59 -6.75 0.16 -3.34 9.80 -1.06 7.03 7.29 5.65 2.98 2.19 1.32 19.97 0.74 0.44 0.86 10.70 50.36 14.29 0.16 1.67 7.86 2.23 5.70 8.70 6.73 3.00 2.21 1.33 19.92 0.74 0.44 0.86 41.64 14.23 11.30 0.16 6.48 2.21 1.76 4.36 3.95 2.56 3.02 2.22 1.34 19.87 0.73 0.44 0.86 29.55 -22.75 11.31 0.16 4.58 -3.53 1.75 8.82 2.03 2.74 3.05 2.22 1.35 19.82 0.73 0.44 0.85 39.45 -26.65 6.33 0.15 6.10 -4.12 0.98 7.37 5.56 1.45 3.07 2.23 1.36 19.78 0.72 0.44 0.85 28.36 -15.56 -5.61 0.15 4.37 -2.40 -0.86 4.52 6.95 0.95 3.10 2.22 1.38 19.73 0.72 0.44 0.84 -32.58 -20.49 -25.50 0.15 -5.00 -3.14 -3.91 9.95 1.18 3.94 3.13 2.22 1.40 19.68 0.71 0.45 0.84 9.51 -40.36 -37.31 0.15 1.45 -6.18 -5.71 9.86 3.79 0.95 3.15 2.21 1.42 19.63 0.70 0.45 0.83 50.43 -36.21 -52.08 0.15 7.69 -5.52 -7.94 1.42 7.96 4.69 3.18 2.20 1.44 19.58 0.69 0.45 0.83 3.37 -38.06 -54.81 0.15 0.51 -5.78 -8.33 7.82 5.94 1.89 3.20 2.19 1.46 19.53 0.68 0.46 0.82
-16.56 -38.90 -14.61 0.15 -2.51 -5.89 -2.21 2.02 3.25 5.68 3.23 2.18 1.49 19.48 0.68 0.46 0.82 -27.43 -8.80 9.46 0.15 -4.14 -1.33 1.43 6.25 6.65 4.75 3.25 2.16 1.51 19.43 0.67 0.46 0.81 -45.54 -33.30 1.68 0.17 -7.56 -5.53 0.28 11.25 10.28 7.13 2.50 1.60 1.77 20.90 0.64 0.71 0.96 -58.29 -39.16 1.73 0.17 -9.65 -6.48 0.29 5.55 2.69 1.38 2.52 1.63 1.73 20.85 0.65 0.69 0.94

527
Raw Data Tapered Data
FFT Data Parzen Filtered Data
Simple Ratio Spectrum
Z E N
Tapering Function
Z E N Z E N Z E N
Frequency Hz
E/Z N/Z
Mean SQRT Spectrum
-35.26 5.21 9.48 0.15 -5.31 0.78 1.43 2.79 11.11 4.31 3.27 2.15 1.54 19.38 0.66 0.47 0.81 -28.08 7.18 18.48 0.15 -4.21 1.08 2.77 3.51 13.25 3.33 3.29 2.13 1.56 19.34 0.65 0.47 0.80 -0.98 21.13 16.47 0.15 -0.15 3.16 2.46 2.94 7.58 1.60 3.31 2.11 1.58 19.29 0.64 0.48 0.80 1.07 39.01 9.47 0.15 0.16 5.81 1.41 4.76 4.83 5.97 3.33 2.09 1.61 19.24 0.63 0.48 0.79
-77.73 36.86 9.49 0.15 -11.54 5.47 1.41 7.87 5.93 3.78 3.34 2.07 1.63 19.19 0.62 0.49 0.79 -47.44 4.78 27.48 0.15 -7.02 0.71 4.07 6.97 9.32 1.24 3.35 2.06 1.65 19.14 0.62 0.49 0.79 48.61 6.76 59.36 0.15 7.17 1.00 8.76 1.68 9.75 5.38 3.35 2.04 1.67 19.09 0.61 0.50 0.79 8.54 30.68 39.22 0.15 1.26 4.51 5.76 5.73 7.24 8.20 3.35 2.03 1.69 19.04 0.61 0.50 0.79
-22.39 27.57 3.19 0.15 -3.28 4.04 0.47 6.84 3.39 2.41 3.35 2.02 1.70 18.99 0.60 0.51 0.79 -2.29 27.46 23.19 0.15 -0.33 4.01 3.39 5.83 5.81 3.13 3.34 2.01 1.71 18.95 0.60 0.51 0.79 -1.24 28.35 36.13 0.15 -0.18 4.12 5.26 7.75 5.54 5.04 3.33 2.00 1.72 18.90 0.60 0.52 0.79 -16.15 10.27 31.05 0.15 -2.34 1.49 4.50 7.01 2.87 6.60 3.31 1.99 1.72 18.85 0.60 0.52 0.80 -15.05 -3.74 32.98 0.14 -2.17 -0.54 4.77 6.31 7.61 3.59 3.29 1.99 1.73 18.80 0.61 0.53 0.80 19.99 3.26 21.92 0.14 2.88 0.47 3.16 2.30 7.39 0.35 3.26 1.99 1.73 18.75 0.61 0.53 0.81 -22.96 3.25 9.91 0.14 -3.29 0.47 1.42 8.02 2.36 3.31 3.23 1.99 1.73 18.70 0.62 0.53 0.81 -51.76 -25.71 13.92 0.14 -7.40 -3.68 1.99 6.78 4.01 2.52 3.20 2.00 1.72 18.65 0.62 0.54 0.82 5.38 -46.56 26.89 0.14 0.77 -6.63 3.83 3.85 5.87 3.67 3.16 2.00 1.71 18.60 0.63 0.54 0.83 7.40 -58.35 24.84 0.14 1.05 -8.29 3.53 5.18 4.58 5.74 3.12 2.01 1.71 18.55 0.64 0.55 0.84
-38.49 -56.12 13.82 0.14 -5.45 -7.94 1.96 7.69 1.02 2.27 3.08 2.03 1.69 18.51 0.66 0.55 0.86 -31.30 -33.93 -3.15 0.14 -4.41 -4.78 -0.44 8.08 2.69 1.43 3.03 2.04 1.68 18.46 0.67 0.55 0.87 9.79 -16.83 -22.04 0.14 1.38 -2.36 -3.10 7.54 5.22 3.52 2.98 2.06 1.67 18.41 0.69 0.56 0.89
-13.16 8.19 -32.88 0.14 -1.84 1.15 -4.60 8.64 3.83 5.86 2.93 2.08 1.65 18.36 0.71 0.56 0.91 -6.07 36.10 -40.67 0.14 -0.85 5.04 -5.67 9.50 3.04 3.69 2.88 2.10 1.64 18.31 0.73 0.57 0.92 64.86 49.93 -24.49 0.14 9.02 6.94 -3.40 3.76 3.58 2.09 2.83 2.12 1.62 18.26 0.75 0.57 0.94 37.70 73.69 -19.35 0.14 5.22 10.21 -2.68 6.74 5.68 3.03 2.77 2.14 1.60 18.21 0.77 0.58 0.97 2.67 73.39 -18.21 0.14 0.37 10.13 -2.51 8.14 5.14 7.28 2.72 2.17 1.59 18.16 0.80 0.58 0.99 44.62 35.17 3.87 0.14 6.14 4.84 0.53 12.27 6.01 4.83 2.67 2.19 1.57 18.12 0.82 0.59 1.01 42.49 6.09 3.91 0.14 5.82 0.83 0.54 14.74 7.99 9.53 2.62 2.21 1.56 18.07 0.84 0.59 1.03 -3.54 -39.84 -2.04 0.14 -0.48 -5.44 -0.28 1.62 5.45 1.98 2.57 2.23 1.54 18.02 0.87 0.60 1.05 -2.48 -82.59 -1.97 0.14 -0.34 -11.23 -0.27 3.70 1.94 2.25 2.52 2.25 1.53 17.97 0.89 0.61 1.08 45.48 -61.31 -14.88 0.14 6.16 -8.31 -2.02 5.86 4.24 1.91 2.48 2.26 1.52 17.92 0.91 0.61 1.10 -35.26 5.21 9.48 0.15 -5.31 0.78 1.43 2.79 11.11 4.31 3.27 2.15 1.54 19.38 0.66 0.47 0.81 -28.08 7.18 18.48 0.15 -4.21 1.08 2.77 3.51 13.25 3.33 3.29 2.13 1.56 19.34 0.65 0.47 0.80

528
Raw Data Tapered Data
FFT Data Parzen Filtered Data
Simple Ratio Spectrum
Z E N
Tapering Function
Z E N Z E N Z E N
Frequency Hz
E/Z N/Z
Mean SQRT Spectrum
17.40 -33.11 -15.77 0.14 2.35 -4.47 -2.13 3.03 10.48 8.77 2.44 2.28 1.51 17.87 0.93 0.62 1.12 -49.49 -34.98 -7.66 0.13 -6.66 -4.70 -1.03 4.54 9.43 12.50 2.40 2.29 1.49 17.82 0.95 0.62 1.14 -16.31 -15.87 -8.58 0.13 -2.19 -2.13 -1.15 6.67 3.00 0.39 2.37 2.30 1.49 17.77 0.97 0.63 1.15 -3.23 26.11 -20.46 0.13 -0.43 3.49 -2.73 11.65 3.94 6.89 2.34 2.30 1.48 17.72 0.98 0.63 1.17 -30.11 31.99 -30.30 0.13 -4.01 4.26 -4.03 10.45 3.00 5.28 2.32 2.30 1.47 17.68 0.99 0.63 1.18 5.98 15.90 -21.14 0.13 0.79 2.11 -2.80 0.96 2.12 2.90 2.30 2.30 1.47 17.63 1.00 0.64 1.18 27.96 7.85 -19.01 0.13 3.69 1.04 -2.51 1.70 5.28 5.21 2.29 2.29 1.46 17.58 1.00 0.64 1.19 -3.05 -0.16 -15.88 0.13 -0.40 -0.02 -2.09 2.91 4.17 4.63 2.28 2.28 1.46 17.53 1.00 0.64 1.19 -22.95 -1.16 9.19 0.13 -3.01 -0.15 1.20 5.02 1.52 2.60 2.28 2.27 1.46 17.48 1.00 0.64 1.18 19.11 11.82 34.16 0.13 2.49 1.54 4.46 4.80 2.48 4.81 2.28 2.25 1.46 17.43 0.99 0.64 1.18 23.07 24.75 29.09 0.13 3.00 3.22 3.78 6.12 4.19 1.66 2.28 2.23 1.46 17.38 0.98 0.64 1.17 -40.85 10.68 9.07 0.13 -5.29 1.38 1.17 5.70 3.07 5.97 2.29 2.21 1.46 17.33 0.97 0.64 1.16 -6.71 -9.32 14.08 0.13 -0.87 -1.20 1.82 5.43 4.35 5.84 2.30 2.19 1.47 17.29 0.95 0.64 1.14 31.29 -2.29 29.05 0.13 4.02 -0.29 3.73 6.73 7.11 5.12 2.31 2.16 1.47 17.24 0.93 0.64 1.13 -46.63 4.70 37.97 0.13 -5.97 0.60 4.86 8.25 7.81 0.82 2.33 2.13 1.48 17.19 0.92 0.63 1.11 -69.35 -11.28 44.86 0.13 -8.84 -1.44 5.72 11.34 7.21 1.99 2.35 2.11 1.49 17.14 0.90 0.63 1.10 -7.15 -20.22 35.75 0.13 -0.91 -2.57 4.54 6.45 4.14 2.42 2.37 2.08 1.49 17.09 0.88 0.63 1.08 13.88 -3.17 15.71 0.13 1.76 -0.40 1.99 3.96 6.46 3.93 2.38 2.05 1.50 17.04 0.86 0.63 1.07 -15.07 -21.12 2.72 0.13 -1.90 -2.66 0.34 5.42 9.46 5.30 2.40 2.02 1.51 16.99 0.84 0.63 1.05 -22.95 -42.99 -12.20 0.13 -2.88 -5.40 -1.53 1.70 5.53 2.27 2.42 2.00 1.53 16.94 0.83 0.63 1.04 -6.84 -24.85 -29.06 0.13 -0.85 -3.11 -3.63 9.67 0.93 4.22 2.44 1.97 1.54 16.89 0.81 0.63 1.03 -16.74 -28.74 -27.89 0.12 -2.08 -3.58 -3.47 10.45 2.02 5.75 2.45 1.95 1.55 16.85 0.80 0.63 1.02 -17.63 -24.63 -24.73 0.12 -2.19 -3.05 -3.07 10.92 6.58 3.13 2.46 1.93 1.56 16.80 0.78 0.63 1.01 31.39 18.38 -29.57 0.12 3.88 2.27 -3.65 10.96 5.19 7.26 2.47 1.91 1.58 16.75 0.77 0.64 1.00 49.28 46.25 -16.42 0.12 6.06 5.69 -2.02 8.80 14.04 12.12 2.48 1.89 1.59 16.70 0.76 0.64 1.00 5.22 44.07 7.65 0.12 0.64 5.40 0.94 5.49 41.58 24.23 2.49 1.88 1.61 16.65 0.75 0.65 0.99 16.22 29.93 10.67 0.12 1.98 3.65 1.30 12.66 17.36 21.73 2.49 1.86 1.62 16.60 0.75 0.65 0.99 57.12 38.79 0.71 0.12 6.94 4.71 0.09 8.17 15.15 13.69 2.49 1.85 1.63 16.55 0.74 0.66 0.99 17.02 48.62 3.75 0.12 2.06 5.88 0.45 4.24 6.24 11.69 2.49 1.85 1.65 16.50 0.74 0.66 0.99 -1.96 24.47 11.78 0.12 -0.24 2.95 1.42 9.75 0.98 4.86 2.48 1.84 1.66 16.46 0.74 0.67 1.00 47.99 25.37 -1.19 0.12 5.76 3.04 -0.14 9.85 3.44 7.27 2.48 1.84 1.67 16.41 0.74 0.67 1.00 17.40 -33.11 -15.77 0.14 2.35 -4.47 -2.13 3.03 10.48 8.77 2.44 2.28 1.51 17.87 0.93 0.62 1.12 -49.49 -34.98 -7.66 0.13 -6.66 -4.70 -1.03 4.54 9.43 12.50 2.40 2.29 1.49 17.82 0.95 0.62 1.14

529
Raw Data Tapered Data
FFT Data Parzen Filtered Data
Simple Ratio Spectrum
Z E N
Tapering Function
Z E N Z E N Z E N
Frequency Hz
E/Z N/Z
Mean SQRT Spectrum
34.87 21.28 -4.12 0.12 4.17 2.54 -0.49 8.19 4.94 6.94 2.47 1.84 1.68 16.36 0.74 0.68 1.01 -27.10 -24.72 8.93 0.12 -3.22 -2.94 1.06 9.91 4.96 7.41 2.46 1.84 1.70 16.31 0.75 0.69 1.02 -18.96 -51.56 0.96 0.12 -2.25 -6.11 0.11 11.56 1.18 11.35 2.46 1.85 1.71 16.26 0.75 0.70 1.03 13.10 -64.33 -4.97 0.12 1.55 -7.59 -0.59 6.28 3.60 3.56 2.45 1.86 1.72 16.21 0.76 0.70 1.04 -19.84 -64.07 13.07 0.12 -2.33 -7.53 1.54 8.67 3.29 7.46 2.44 1.88 1.74 16.16 0.77 0.71 1.05 -15.73 -46.85 32.03 0.12 -1.84 -5.48 3.75 0.36 7.22 1.78 2.44 1.89 1.75 16.11 0.78 0.72 1.06 38.27 -30.69 37.95 0.12 4.46 -3.58 4.42 6.82 13.61 5.87 2.44 1.91 1.77 16.06 0.79 0.73 1.07 -14.73 -11.60 8.91 0.12 -1.71 -1.35 1.03 23.09 32.40 11.72 2.44 1.94 1.79 16.02 0.80 0.73 1.08 -73.50 -8.56 -38.98 0.12 -8.49 -0.99 -4.50 32.72 36.75 17.51 2.44 1.97 1.81 15.97 0.81 0.74 1.10 -21.27 -5.53 -63.72 0.12 -2.45 -0.64 -7.33 10.20 8.01 9.09 2.44 2.00 1.83 15.92 0.82 0.75 1.11 11.80 15.45 -51.43 0.11 1.35 1.77 -5.89 2.69 5.24 2.47 2.45 2.04 1.86 15.87 0.83 0.76 1.13 -1.17 9.40 -0.27 0.11 -0.13 1.07 -0.03 7.16 5.56 3.71 2.46 2.09 1.90 15.82 0.85 0.77 1.14 5.86 -4.60 47.69 0.11 0.67 -0.52 5.41 7.15 7.97 2.71 2.48 2.14 1.93 15.77 0.86 0.78 1.16 8.88 20.37 56.54 0.11 1.00 2.30 6.39 8.76 5.31 6.17 2.50 2.19 1.98 15.72 0.88 0.79 1.18
-15.06 36.26 31.42 0.11 -1.69 4.08 3.53 4.08 2.69 2.40 2.53 2.25 2.02 15.67 0.89 0.80 1.20 -26.93 27.13 4.40 0.11 -3.02 3.04 0.49 7.28 1.82 4.53 2.56 2.32 2.07 15.63 0.91 0.81 1.22 -5.82 24.03 -8.53 0.11 -0.65 2.68 -0.95 3.92 3.19 2.86 2.59 2.39 2.13 15.58 0.92 0.82 1.23 -22.71 4.97 -12.44 0.11 -2.52 0.55 -1.38 11.20 0.83 1.20 2.63 2.46 2.19 15.53 0.93 0.83 1.25 -59.50 -20.00 5.63 0.11 -6.57 -2.21 0.62 9.59 1.51 1.69 2.67 2.53 2.25 15.48 0.95 0.84 1.27 6.65 -20.91 28.62 0.11 0.73 -2.30 3.15 8.66 1.06 5.52 2.71 2.60 2.31 15.43 0.96 0.85 1.28 52.58 -0.87 32.55 0.11 5.76 -0.09 3.56 17.31 3.36 1.55 2.76 2.68 2.38 15.38 0.97 0.86 1.30 -34.41 10.12 33.47 0.11 -3.75 1.10 3.65 11.78 4.84 6.74 2.81 2.75 2.44 15.33 0.98 0.87 1.31 -60.17 -2.90 40.38 0.11 -6.53 -0.31 4.38 13.23 7.69 11.14 2.86 2.83 2.51 15.28 0.99 0.88 1.32 6.99 7.10 33.29 0.11 0.75 0.77 3.60 12.59 1.75 8.01 2.91 2.90 2.57 15.23 1.00 0.89 1.33 24.97 39.00 11.25 0.11 2.68 4.19 1.21 24.74 5.38 3.59 2.96 2.98 2.64 15.19 1.01 0.89 1.34 8.95 30.87 -23.67 0.11 0.96 3.30 -2.53 21.15 6.86 9.14 3.01 3.05 2.70 15.14 1.01 0.90 1.35 24.93 23.76 -51.46 0.11 2.65 2.53 -5.48 15.98 8.74 10.57 3.07 3.12 2.75 15.09 1.02 0.90 1.36 39.85 41.63 -51.20 0.11 4.22 4.41 -5.43 12.75 2.52 5.55 3.12 3.18 2.80 15.04 1.02 0.90 1.36 3.81 22.50 -42.96 0.11 0.40 2.37 -4.53 15.68 3.19 7.63 3.17 3.23 2.84 14.99 1.02 0.90 1.36 13.82 -8.53 -26.76 0.11 1.45 -0.90 -2.81 21.46 4.21 5.00 3.23 3.28 2.88 14.94 1.02 0.89 1.35 53.73 -9.49 -17.62 0.10 5.61 -0.99 -1.84 13.65 8.69 1.65 3.28 3.32 2.90 14.89 1.01 0.89 1.35 34.87 21.28 -4.12 0.12 4.17 2.54 -0.49 8.19 4.94 6.94 2.47 1.84 1.68 16.36 0.74 0.68 1.01 -27.10 -24.72 8.93 0.12 -3.22 -2.94 1.06 9.91 4.96 7.41 2.46 1.84 1.70 16.31 0.75 0.69 1.02

530
Raw Data Tapered Data
FFT Data Parzen Filtered Data
Simple Ratio Spectrum
Z E N
Tapering Function
Z E N Z E N Z E N
Frequency Hz
E/Z N/Z
Mean SQRT Spectrum
7.65 -8.46 -23.48 0.10 0.80 -0.88 -2.44 12.82 2.64 4.02 3.33 3.35 2.92 14.84 1.01 0.88 1.34 -27.26 -12.42 -17.34 0.10 -2.82 -1.28 -1.79 17.67 0.92 4.07 3.38 3.37 2.93 14.79 1.00 0.87 1.32 4.83 -2.39 -3.24 0.10 0.50 -0.25 -0.33 13.77 3.55 5.75 3.43 3.39 2.93 14.75 0.99 0.86 1.31 11.84 5.61 5.81 0.10 1.21 0.57 0.60 9.55 4.42 5.63 3.47 3.39 2.92 14.70 0.98 0.84 1.29 -33.07 4.59 13.82 0.10 -3.37 0.47 1.41 8.45 6.90 2.72 3.52 3.38 2.90 14.65 0.96 0.82 1.27 -9.93 -5.41 15.82 0.10 -1.01 -0.55 1.61 6.83 5.46 2.88 3.57 3.37 2.88 14.60 0.94 0.81 1.24 61.01 -17.36 15.81 0.10 6.16 -1.75 1.60 5.71 0.16 4.49 3.62 3.35 2.85 14.55 0.93 0.79 1.22 -2.06 -20.29 22.79 0.10 -0.21 -2.04 2.29 5.84 5.45 2.58 3.67 3.32 2.81 14.50 0.90 0.77 1.19 -45.92 -43.16 21.76 0.10 -4.59 -4.32 2.18 7.07 8.30 3.06 3.72 3.28 2.77 14.45 0.88 0.75 1.16 18.19 -57.96 -1.23 0.10 1.81 -5.77 -0.12 8.61 6.67 4.38 3.77 3.23 2.73 14.40 0.86 0.72 1.12 -16.77 -33.77 -6.16 0.10 -1.66 -3.34 -0.61 10.81 2.25 2.74 3.82 3.18 2.68 14.36 0.83 0.70 1.09 -50.59 -24.65 3.90 0.10 -4.98 -2.43 0.38 14.02 3.20 7.16 3.88 3.11 2.63 14.31 0.80 0.68 1.05 1.56 -4.59 -4.04 0.10 0.15 -0.45 -0.40 10.59 5.44 8.12 3.93 3.04 2.57 14.26 0.77 0.65 1.01 8.58 56.31 -8.96 0.10 0.84 5.49 -0.87 5.56 4.88 6.47 3.99 2.96 2.52 14.21 0.74 0.63 0.98
-17.35 61.07 -21.84 0.10 -1.68 5.92 -2.12 8.71 1.94 4.13 4.05 2.88 2.47 14.16 0.71 0.61 0.94 -36.20 28.89 -17.71 0.10 -3.49 2.79 -1.71 10.22 4.21 4.25 4.10 2.80 2.42 14.11 0.68 0.59 0.90 -3.07 29.78 16.35 0.10 -0.29 2.86 1.57 5.47 5.05 1.81 4.16 2.72 2.37 14.06 0.65 0.57 0.87 21.94 13.69 12.35 0.10 2.10 1.31 1.18 9.55 3.93 3.90 4.22 2.64 2.32 14.01 0.62 0.55 0.83 -8.04 -25.29 11.36 0.10 -0.76 -2.40 1.08 11.51 10.02 2.81 4.28 2.55 2.28 13.96 0.60 0.53 0.80 18.99 -39.16 30.33 0.09 1.79 -3.70 2.87 29.35 7.91 7.85 4.34 2.47 2.24 13.92 0.57 0.52 0.77 31.93 -26.03 14.30 0.09 3.00 -2.45 1.34 22.56 2.41 2.70 4.40 2.39 2.20 13.87 0.54 0.50 0.74 -27.03 -30.91 12.30 0.09 -2.53 -2.89 1.15 14.81 4.70 5.43 4.46 2.32 2.17 13.82 0.52 0.49 0.71 -28.87 -42.76 47.23 0.09 -2.69 -3.98 4.39 12.15 4.69 7.69 4.51 2.24 2.14 13.77 0.50 0.47 0.69 14.21 -16.64 41.11 0.09 1.31 -1.54 3.80 15.06 7.21 8.64 4.55 2.17 2.11 13.72 0.48 0.46 0.67 7.21 4.39 28.03 0.09 0.66 0.40 2.58 11.49 3.57 4.59 4.60 2.11 2.09 13.67 0.46 0.45 0.65 -3.75 -2.62 38.95 0.09 -0.34 -0.24 3.56 5.46 1.41 4.27 4.63 2.05 2.06 13.62 0.44 0.45 0.63 32.24 -12.58 12.90 0.09 2.93 -1.15 1.17 3.61 4.51 6.46 4.66 1.99 2.04 13.57 0.43 0.44 0.61 28.17 1.44 -12.05 0.09 2.55 0.13 -1.09 2.55 4.73 0.66 4.68 1.95 2.02 13.53 0.42 0.43 0.60 -19.80 28.38 3.02 0.09 -1.78 2.55 0.27 3.81 5.82 2.93 4.70 1.90 2.00 13.48 0.40 0.43 0.59 -4.71 17.29 15.04 0.09 -0.42 1.55 1.35 3.33 4.75 3.01 4.71 1.87 1.99 13.43 0.40 0.42 0.58 25.30 31.20 12.04 0.09 2.25 2.78 1.07 3.98 4.93 3.56 4.71 1.84 1.97 13.38 0.39 0.42 0.57 7.65 -8.46 -23.48 0.10 0.80 -0.88 -2.44 12.82 2.64 4.02 3.33 3.35 2.92 14.84 1.01 0.88 1.34
-27.26 -12.42 -17.34 0.10 -2.82 -1.28 -1.79 17.67 0.92 4.07 3.38 3.37 2.93 14.79 1.00 0.87 1.32

531
Raw Data Tapered Data
FFT Data Parzen Filtered Data
Simple Ratio Spectrum
Z E N
Tapering Function
Z E N Z E N Z E N
Frequency Hz
E/Z N/Z
Mean SQRT Spectrum
9.28 55.02 0.07 0.09 0.82 4.87 0.01 4.08 8.11 8.19 4.71 1.81 1.96 13.33 0.38 0.42 0.57 2.30 31.85 -12.85 0.09 0.20 2.80 -1.13 7.58 4.24 3.77 4.70 1.79 1.94 13.28 0.38 0.41 0.56 29.29 33.72 -29.71 0.09 2.56 2.95 -2.60 4.67 8.96 6.21 4.68 1.78 1.93 13.23 0.38 0.41 0.56 57.16 30.59 -46.51 0.09 4.97 2.66 -4.05 6.42 5.61 5.30 4.66 1.77 1.92 13.18 0.38 0.41 0.56 13.06 -0.47 -45.27 0.09 1.13 -0.04 -3.92 5.55 2.15 3.74 4.63 1.76 1.90 13.13 0.38 0.41 0.56 -6.90 -7.45 -30.06 0.09 -0.59 -0.64 -2.59 5.82 3.38 0.51 4.60 1.75 1.89 13.09 0.38 0.41 0.56 37.08 -10.42 -22.90 0.09 3.17 -0.89 -1.96 9.51 11.04 7.09 4.56 1.75 1.88 13.04 0.38 0.41 0.56 -23.90 -16.37 -8.78 0.09 -2.03 -1.39 -0.75 13.77 5.97 8.86 4.52 1.75 1.86 12.99 0.39 0.41 0.57 -88.62 -23.29 5.28 0.08 -7.49 -1.97 0.45 11.45 11.29 8.08 4.48 1.75 1.85 12.94 0.39 0.41 0.57 -8.38 -37.16 -4.66 0.08 -0.70 -3.12 -0.39 12.48 7.83 8.79 4.44 1.76 1.84 12.89 0.40 0.42 0.57 41.60 -43.00 0.40 0.08 3.47 -3.59 0.03 18.78 11.05 8.98 4.40 1.77 1.83 12.84 0.40 0.42 0.58 -18.40 -34.85 10.43 0.08 -1.53 -2.89 0.87 15.35 9.30 10.86 4.35 1.77 1.83 12.79 0.41 0.42 0.58 -15.29 -11.75 27.41 0.08 -1.26 -0.97 2.26 18.76 11.18 10.67 4.31 1.78 1.82 12.74 0.41 0.42 0.59 10.77 9.26 46.32 0.08 0.88 0.76 3.80 4.24 5.12 7.15 4.26 1.79 1.81 12.70 0.42 0.43 0.60 -71.06 18.20 25.23 0.08 -5.79 1.48 2.06 15.02 7.23 11.84 4.22 1.80 1.81 12.65 0.43 0.43 0.60 -91.69 16.13 12.21 0.08 -7.43 1.31 0.99 26.06 4.27 7.91 4.17 1.81 1.81 12.60 0.43 0.43 0.61 -4.45 -2.89 30.18 0.08 -0.36 -0.23 2.43 26.06 12.93 11.06 4.13 1.82 1.81 12.55 0.44 0.44 0.62 8.59 -7.87 28.12 0.08 0.69 -0.63 2.25 12.99 4.08 3.32 4.09 1.84 1.81 12.50 0.45 0.44 0.63
-14.35 4.14 14.09 0.08 -1.14 0.33 1.12 25.41 12.70 14.13 4.04 1.85 1.81 12.45 0.46 0.45 0.64 24.68 17.10 17.08 0.08 1.95 1.35 1.35 22.10 2.78 11.42 4.00 1.87 1.81 12.40 0.47 0.45 0.65 25.62 34.00 23.05 0.08 2.01 2.67 1.81 23.27 16.45 15.63 3.96 1.88 1.82 12.35 0.48 0.46 0.66 -43.29 15.90 23.01 0.08 -3.38 1.24 1.79 18.56 5.95 10.72 3.92 1.90 1.83 12.30 0.48 0.47 0.67 -34.09 -4.13 24.97 0.08 -2.64 -0.32 1.94 21.72 16.50 10.83 3.89 1.92 1.84 12.26 0.49 0.47 0.68 30.97 0.88 23.92 0.08 2.38 0.07 1.84 18.40 2.36 7.54 3.85 1.94 1.86 12.21 0.50 0.48 0.70 21.91 -25.07 16.90 0.08 1.68 -1.92 1.29 17.97 15.05 13.94 3.82 1.97 1.88 12.16 0.51 0.49 0.71 -17.05 -46.93 10.89 0.08 -1.30 -3.57 0.83 14.52 2.88 1.80 3.80 1.99 1.90 12.11 0.53 0.50 0.72 35.96 -21.79 -6.06 0.08 2.71 -1.64 -0.46 7.78 4.80 6.78 3.77 2.02 1.92 12.06 0.54 0.51 0.74 66.80 0.26 -25.95 0.08 5.01 0.02 -1.95 8.88 0.84 3.09 3.76 2.05 1.95 12.01 0.55 0.52 0.75 -9.27 1.25 -21.80 0.07 -0.69 0.09 -1.62 4.56 7.18 1.13 3.75 2.09 1.98 11.96 0.56 0.53 0.77 -20.16 6.24 -8.68 0.07 -1.49 0.46 -0.64 5.58 10.43 10.82 3.75 2.13 2.02 11.91 0.57 0.54 0.78 12.90 7.21 -12.59 0.07 0.95 0.53 -0.93 6.20 2.13 6.14 3.76 2.17 2.06 11.87 0.58 0.55 0.79 9.28 55.02 0.07 0.09 0.82 4.87 0.01 4.08 8.11 8.19 4.71 1.81 1.96 13.33 0.38 0.42 0.57 2.30 31.85 -12.85 0.09 0.20 2.80 -1.13 7.58 4.24 3.77 4.70 1.79 1.94 13.28 0.38 0.41 0.56

532
Raw Data Tapered Data
FFT Data Parzen Filtered Data
Simple Ratio Spectrum
Z E N
Tapering Function
Z E N Z E N Z E N
Frequency Hz
E/Z N/Z
Mean SQRT Spectrum
11.90 -8.78 -23.46 0.07 0.87 -0.64 -1.71 6.26 4.99 2.51 3.78 2.21 2.10 11.82 0.58 0.56 0.81 20.88 -15.73 -22.32 0.07 1.51 -1.14 -1.62 6.27 0.24 2.25 3.81 2.25 2.15 11.77 0.59 0.56 0.82 27.83 -2.69 -20.18 0.07 2.00 -0.19 -1.45 7.57 3.38 5.05 3.85 2.30 2.20 11.72 0.60 0.57 0.83 31.76 14.29 -10.06 0.07 2.27 1.02 -0.72 4.54 5.64 9.81 3.90 2.34 2.25 11.67 0.60 0.58 0.83 20.70 17.22 -1.98 0.07 1.47 1.22 -0.14 3.90 3.96 8.59 3.97 2.39 2.31 11.62 0.60 0.58 0.84 9.68 0.19 -14.90 0.07 0.68 0.01 -1.05 4.17 8.00 4.39 4.04 2.44 2.37 11.57 0.60 0.59 0.84 12.68 10.17 -3.80 0.07 0.89 0.71 -0.27 4.19 6.48 3.35 4.12 2.48 2.43 11.52 0.60 0.59 0.84 -3.29 19.11 8.24 0.07 -0.23 1.33 0.57 4.32 9.66 11.98 4.22 2.53 2.49 11.47 0.60 0.59 0.84 -2.23 -13.90 -15.69 0.07 -0.15 -0.96 -1.08 5.28 11.14 11.35 4.32 2.58 2.55 11.43 0.60 0.59 0.84 7.80 -25.82 -29.55 0.07 0.53 -1.77 -2.02 3.50 3.88 1.31 4.42 2.62 2.62 11.38 0.59 0.59 0.84
-15.13 -22.72 -21.39 0.07 -1.03 -1.54 -1.45 3.62 3.19 4.41 4.53 2.66 2.68 11.33 0.59 0.59 0.83 -13.03 -33.61 -1.29 0.07 -0.88 -2.27 -0.09 5.48 4.47 2.08 4.64 2.70 2.74 11.28 0.58 0.59 0.83 33.97 -38.46 21.73 0.07 2.28 -2.58 1.46 5.07 1.45 3.24 4.74 2.74 2.80 11.23 0.58 0.59 0.83 21.91 -43.29 21.69 0.07 1.46 -2.88 1.44 3.80 3.18 2.21 4.84 2.77 2.85 11.18 0.57 0.59 0.82 -32.03 -18.17 16.67 0.07 -2.11 -1.20 1.10 5.96 4.81 4.62 4.94 2.79 2.90 11.13 0.57 0.59 0.82 -24.86 9.85 18.65 0.07 -1.63 0.65 1.22 6.87 1.61 5.46 5.02 2.81 2.94 11.08 0.56 0.59 0.81 -11.74 13.80 15.64 0.07 -0.76 0.90 1.02 5.37 2.66 4.30 5.10 2.83 2.98 11.04 0.56 0.58 0.81 -14.65 12.75 20.62 0.06 -0.94 0.82 1.33 4.39 4.49 2.58 5.15 2.84 3.01 10.99 0.55 0.58 0.80 9.41 -1.27 27.58 0.06 0.60 -0.08 1.76 10.64 1.99 6.65 5.20 2.84 3.03 10.94 0.55 0.58 0.80 36.37 -4.26 14.55 0.06 2.31 -0.27 0.92 9.99 19.38 2.43 5.22 2.84 3.05 10.89 0.54 0.58 0.80 14.31 8.74 6.56 0.06 0.90 0.55 0.41 8.37 11.85 7.07 5.23 2.83 3.06 10.84 0.54 0.59 0.80 -50.57 6.71 11.58 0.06 -3.16 0.42 0.72 8.10 3.24 3.67 5.21 2.82 3.06 10.79 0.54 0.59 0.80 -42.34 -5.29 6.59 0.06 -2.62 -0.33 0.41 1.07 0.96 7.83 5.18 2.80 3.05 10.74 0.54 0.59 0.80 -1.20 -9.26 0.63 0.06 -0.07 -0.57 0.04 2.36 0.53 10.07 5.12 2.78 3.04 10.69 0.54 0.59 0.80 -39.07 -7.23 7.67 0.06 -2.38 -0.44 0.47 2.42 6.84 5.01 5.05 2.75 3.01 10.64 0.55 0.60 0.81 -56.83 -3.20 8.69 0.06 -3.44 -0.19 0.53 2.98 4.77 7.99 4.95 2.72 2.98 10.60 0.55 0.60 0.81 17.29 4.79 4.71 0.06 1.04 0.29 0.28 2.17 8.41 2.05 4.84 2.68 2.95 10.55 0.55 0.61 0.82 45.22 13.76 15.73 0.06 2.69 0.82 0.94 2.29 9.28 4.71 4.72 2.65 2.91 10.50 0.56 0.62 0.83 -33.76 9.71 13.72 0.06 -1.99 0.57 0.81 2.17 3.67 4.20 4.58 2.60 2.86 10.45 0.57 0.62 0.84 -35.57 -3.30 0.74 0.06 -2.08 -0.19 0.04 4.34 4.77 2.78 4.43 2.56 2.81 10.40 0.58 0.63 0.86 41.46 7.70 0.79 0.06 2.40 0.45 0.05 2.21 3.33 4.64 4.27 2.52 2.76 10.35 0.59 0.65 0.87 11.90 -8.78 -23.46 0.07 0.87 -0.64 -1.71 6.26 4.99 2.51 3.78 2.21 2.10 11.82 0.58 0.56 0.81 20.88 -15.73 -22.32 0.07 1.51 -1.14 -1.62 6.27 0.24 2.25 3.81 2.25 2.15 11.77 0.59 0.56 0.82

533
Raw Data Tapered Data
FFT Data Parzen Filtered Data
Simple Ratio Spectrum
Z E N
Tapering Function
Z E N Z E N Z E N
Frequency Hz
E/Z N/Z
Mean SQRT Spectrum
24.38 24.63 9.83 0.06 1.40 1.42 0.56 1.65 5.13 2.95 4.11 2.47 2.70 10.30 0.60 0.66 0.89 11.36 18.55 21.82 0.06 0.65 1.06 1.24 1.85 6.66 4.67 3.94 2.43 2.65 10.25 0.62 0.67 0.91 57.26 16.48 5.81 0.06 3.24 0.93 0.33 4.67 3.19 7.39 3.78 2.38 2.59 10.21 0.63 0.69 0.93 14.17 19.41 -12.12 0.06 0.79 1.09 -0.68 2.36 1.69 7.94 3.61 2.34 2.53 10.16 0.65 0.70 0.96 -56.70 -1.63 -4.04 0.06 -3.15 -0.09 -0.22 1.25 1.71 1.62 3.45 2.30 2.48 10.11 0.67 0.72 0.98 -13.51 -24.57 -4.97 0.06 -0.74 -1.35 -0.27 4.16 4.24 2.70 3.29 2.26 2.42 10.06 0.69 0.74 1.01 23.52 -27.47 -15.87 0.05 1.28 -1.50 -0.87 2.06 3.04 0.85 3.14 2.23 2.37 10.01 0.71 0.76 1.04 -33.42 -16.38 -14.76 0.05 -1.80 -0.88 -0.80 0.99 1.89 2.61 2.99 2.20 2.32 9.96 0.73 0.78 1.07 -38.23 2.65 -13.65 0.05 -2.05 0.14 -0.73 2.68 2.73 5.84 2.86 2.17 2.27 9.91 0.76 0.80 1.10 35.83 9.63 -22.52 0.05 1.90 0.51 -1.19 0.74 5.26 2.91 2.73 2.14 2.23 9.86 0.78 0.82 1.13 52.70 14.58 -19.38 0.05 2.77 0.77 -1.02 1.14 2.71 5.98 2.61 2.12 2.19 9.81 0.81 0.84 1.16 -11.34 27.50 3.70 0.05 -0.59 1.43 0.19 1.25 1.17 3.49 2.51 2.09 2.15 9.77 0.84 0.86 1.20 -21.23 31.38 11.72 0.05 -1.09 1.62 0.60 1.23 2.06 1.66 2.41 2.07 2.11 9.72 0.86 0.88 1.23 33.80 39.24 -9.23 0.05 1.72 2.00 -0.47 3.43 1.51 3.13 2.32 2.06 2.08 9.67 0.89 0.90 1.26 0.77 25.11 -21.11 0.05 0.04 1.27 -1.07 4.04 3.57 2.35 2.24 2.04 2.05 9.62 0.91 0.92 1.29
-55.07 -1.94 -15.99 0.05 -2.75 -0.10 -0.80 1.48 3.91 1.10 2.16 2.03 2.03 9.57 0.94 0.94 1.33 14.06 -5.92 -11.88 0.05 0.70 -0.29 -0.59 2.79 2.34 7.06 2.09 2.02 2.00 9.52 0.96 0.96 1.36 33.01 -23.86 -10.78 0.05 1.62 -1.17 -0.53 2.25 2.70 5.85 2.03 2.00 1.98 9.47 0.99 0.97 1.39 -34.94 -31.75 -21.66 0.05 -1.69 -1.54 -1.05 2.44 3.31 3.46 1.97 1.99 1.96 9.42 1.01 0.99 1.42 3.17 -13.66 -15.53 0.05 0.15 -0.66 -0.75 7.50 9.13 2.29 1.92 1.98 1.94 9.38 1.03 1.01 1.45 17.18 0.37 5.55 0.05 0.82 0.02 0.26 6.85 5.23 3.81 1.87 1.97 1.93 9.33 1.06 1.03 1.48 -43.72 10.35 -3.40 0.05 -2.05 0.49 -0.16 8.18 6.57 8.03 1.82 1.96 1.91 9.28 1.08 1.05 1.50 -24.53 -4.66 -7.33 0.05 -1.14 -0.22 -0.34 7.70 4.60 4.80 1.77 1.95 1.89 9.23 1.10 1.07 1.53 23.52 -26.60 2.73 0.05 1.08 -1.22 0.13 3.84 1.18 1.36 1.72 1.93 1.88 9.18 1.12 1.09 1.56 -3.48 -17.51 5.77 0.05 -0.16 -0.80 0.26 2.02 1.89 3.78 1.68 1.91 1.86 9.13 1.14 1.11 1.59 -29.36 -4.46 21.77 0.05 -1.32 -0.20 0.98 2.44 1.98 7.04 1.63 1.90 1.85 9.08 1.16 1.13 1.62 32.68 -0.45 40.70 0.04 1.45 -0.02 1.81 2.36 2.34 7.33 1.58 1.87 1.83 9.03 1.18 1.16 1.66 35.59 14.52 38.59 0.04 1.57 0.64 1.70 2.38 3.34 6.68 1.54 1.85 1.82 8.98 1.20 1.18 1.69 -58.32 18.45 24.52 0.04 -2.54 0.80 1.07 0.80 1.70 5.42 1.49 1.83 1.80 8.94 1.23 1.21 1.72 -42.07 2.41 18.49 0.04 -1.81 0.10 0.80 2.45 1.96 6.94 1.45 1.80 1.78 8.89 1.24 1.23 1.75 28.01 5.40 27.45 0.04 1.19 0.23 1.17 2.51 1.79 2.00 1.40 1.78 1.77 8.84 1.26 1.26 1.78 24.38 24.63 9.83 0.06 1.40 1.42 0.56 1.65 5.13 2.95 4.11 2.47 2.70 10.30 0.60 0.66 0.89 11.36 18.55 21.82 0.06 0.65 1.06 1.24 1.85 6.66 4.67 3.94 2.43 2.65 10.25 0.62 0.67 0.91

534
Raw Data Tapered Data
FFT Data Parzen Filtered Data
Simple Ratio Spectrum
Z E N
Tapering Function
Z E N Z E N Z E N
Frequency Hz
E/Z N/Z
Mean SQRT Spectrum
-10.98 -5.60 21.40 0.04 -0.46 -0.24 0.90 1.42 4.26 6.26 1.36 1.75 1.75 8.79 1.28 1.28 1.81 -14.88 -32.52 10.39 0.04 -0.62 -1.35 0.43 3.13 5.32 7.52 1.32 1.72 1.73 8.74 1.30 1.31 1.84 62.07 -15.43 17.39 0.04 2.55 -0.63 0.71 0.64 2.06 2.39 1.29 1.69 1.71 8.69 1.31 1.33 1.87 37.92 2.60 0.41 0.04 1.54 0.11 0.02 1.54 3.74 8.69 1.25 1.65 1.69 8.64 1.32 1.35 1.89 -29.05 3.59 -15.51 0.04 -1.16 0.14 -0.62 1.65 6.97 4.78 1.22 1.62 1.68 8.59 1.33 1.37 1.91 -22.90 5.57 -7.41 0.04 -0.90 0.22 -0.29 1.81 6.63 3.61 1.19 1.59 1.66 8.54 1.33 1.39 1.93 2.19 -4.43 -14.31 0.04 0.09 -0.17 -0.56 1.09 8.37 4.21 1.17 1.56 1.64 8.50 1.33 1.41 1.94 9.22 -10.40 -30.17 0.04 0.35 -0.40 -1.16 2.67 8.45 2.76 1.15 1.53 1.63 8.45 1.33 1.42 1.94 25.20 -6.36 -31.99 0.04 0.96 -0.24 -1.22 1.88 6.00 4.72 1.13 1.50 1.62 8.40 1.32 1.43 1.94 58.08 10.63 -22.83 0.04 2.18 0.40 -0.86 3.03 5.88 7.70 1.12 1.47 1.61 8.35 1.31 1.43 1.94 25.95 35.54 -18.69 0.04 0.96 1.31 -0.69 2.58 11.38 6.99 1.12 1.45 1.60 8.30 1.30 1.43 1.93 -45.96 44.38 -4.59 0.04 -1.68 1.62 -0.17 1.12 2.74 3.17 1.11 1.43 1.59 8.25 1.28 1.43 1.92 -34.75 27.23 6.46 0.04 -1.25 0.98 0.23 3.26 3.13 1.81 1.11 1.41 1.59 8.20 1.27 1.43 1.91 21.33 10.16 -5.49 0.04 0.76 0.36 -0.19 1.33 2.57 1.84 1.11 1.39 1.59 8.15 1.25 1.43 1.90 8.31 -6.85 0.57 0.04 0.29 -0.24 0.02 1.30 0.21 5.29 1.11 1.37 1.59 8.11 1.23 1.43 1.89
-46.56 -36.76 4.61 0.03 -1.61 -1.27 0.16 2.95 3.66 5.08 1.12 1.36 1.59 8.06 1.22 1.43 1.88 -28.37 -36.61 -5.33 0.03 -0.96 -1.24 -0.18 1.26 2.43 1.35 1.12 1.35 1.60 8.01 1.20 1.42 1.87 -4.25 -44.45 4.72 0.03 -0.14 -1.49 0.16 1.25 5.12 3.40 1.13 1.35 1.61 7.96 1.19 1.43 1.86 5.79 -66.23 0.77 0.03 0.19 -2.19 0.03 2.43 3.98 3.05 1.14 1.35 1.62 7.91 1.18 1.43 1.86 29.77 -47.99 3.81 0.03 0.97 -1.56 0.12 1.50 4.42 5.44 1.14 1.35 1.64 7.86 1.18 1.43 1.86 -26.19 -22.85 28.80 0.03 -0.84 -0.73 0.92 2.20 5.43 7.72 1.15 1.35 1.65 7.81 1.18 1.44 1.86 -91.91 -1.80 17.76 0.03 -2.90 -0.06 0.56 0.31 7.73 2.73 1.15 1.35 1.67 7.76 1.18 1.45 1.87 -65.54 -6.78 -4.21 0.03 -2.03 -0.21 -0.13 2.02 7.99 3.38 1.15 1.36 1.69 7.71 1.18 1.46 1.88 2.63 -22.72 -7.14 0.03 0.08 -0.69 -0.22 1.58 6.00 4.41 1.15 1.37 1.70 7.67 1.19 1.48 1.90 38.60 -5.66 2.92 0.03 1.16 -0.17 0.09 2.18 5.34 6.41 1.15 1.39 1.72 7.62 1.21 1.50 1.93 32.51 4.35 13.94 0.03 0.96 0.13 0.41 3.53 9.35 11.51 1.14 1.40 1.74 7.57 1.23 1.53 1.96 35.42 5.33 12.94 0.03 1.03 0.15 0.38 5.95 13.15 6.34 1.13 1.42 1.76 7.52 1.26 1.55 2.00 12.37 4.31 14.94 0.03 0.35 0.12 0.43 1.93 5.92 3.61 1.12 1.44 1.77 7.47 1.29 1.58 2.04 -32.54 -4.68 0.96 0.03 -0.91 -0.13 0.03 1.30 2.87 4.82 1.10 1.46 1.79 7.42 1.32 1.62 2.09 -18.39 -16.64 -5.98 0.03 -0.51 -0.46 -0.16 5.83 4.16 7.72 1.09 1.48 1.80 7.37 1.36 1.65 2.14 22.65 -13.58 11.07 0.03 0.61 -0.37 0.30 4.72 1.60 11.22 1.07 1.50 1.81 7.32 1.41 1.69 2.20 -10.98 -5.60 21.40 0.04 -0.46 -0.24 0.90 1.42 4.26 6.26 1.36 1.75 1.75 8.79 1.28 1.28 1.81 -14.88 -32.52 10.39 0.04 -0.62 -1.35 0.43 3.13 5.32 7.52 1.32 1.72 1.73 8.74 1.30 1.31 1.84

535
Raw Data Tapered Data
FFT Data Parzen Filtered Data
Simple Ratio Spectrum
Z E N
Tapering Function
Z E N Z E N Z E N
Frequency Hz
E/Z N/Z
Mean SQRT Spectrum
15.62 18.42 8.08 0.03 0.41 0.49 0.21 1.55 3.36 7.80 1.05 1.53 1.82 7.28 1.45 1.73 2.26 -24.31 38.30 9.10 0.03 -0.63 1.00 0.24 1.33 1.71 2.68 1.03 1.55 1.83 7.23 1.51 1.77 2.33 -0.21 44.14 14.11 0.03 -0.01 1.13 0.36 1.03 2.06 3.36 1.01 1.58 1.83 7.18 1.57 1.82 2.40 4.82 52.95 9.11 0.03 0.12 1.32 0.23 1.50 3.99 2.07 0.99 1.61 1.83 7.13 1.63 1.86 2.47
-49.04 33.78 16.12 0.02 -1.20 0.83 0.39 1.88 1.87 2.12 0.96 1.63 1.84 7.08 1.69 1.90 2.55 -14.86 13.68 21.09 0.02 -0.36 0.33 0.51 2.28 4.77 3.97 0.94 1.66 1.84 7.03 1.76 1.95 2.62 -17.75 6.64 3.10 0.02 -0.42 0.16 0.07 4.57 2.40 3.10 0.92 1.68 1.83 6.98 1.82 1.99 2.70 -66.53 -4.36 -12.83 0.02 -1.53 -0.10 -0.30 7.66 3.21 1.38 0.90 1.71 1.83 6.93 1.89 2.03 2.77 20.61 -5.34 -2.75 0.02 0.46 -0.12 -0.06 5.05 2.19 2.98 0.88 1.73 1.83 6.88 1.96 2.07 2.85 113.39 -3.32 -7.67 0.02 2.49 -0.07 -0.17 0.83 2.34 10.10 0.87 1.76 1.83 6.84 2.02 2.10 2.92 81.05 -7.30 -24.56 0.02 1.74 -0.16 -0.53 1.18 2.15 9.40 0.85 1.78 1.82 6.79 2.09 2.13 2.98 4.93 -16.25 -41.37 0.02 0.10 -0.34 -0.87 1.95 3.54 2.12 0.84 1.80 1.82 6.74 2.14 2.16 3.04 11.94 -17.19 -44.15 0.02 0.24 -0.35 -0.91 1.41 3.36 3.08 0.83 1.82 1.82 6.69 2.19 2.18 3.09 38.89 0.85 -15.97 0.02 0.78 0.02 -0.32 3.53 4.25 4.04 0.83 1.84 1.82 6.64 2.23 2.20 3.13 -33.08 17.81 -11.86 0.02 -0.64 0.35 -0.23 5.41 5.63 3.64 0.82 1.86 1.82 6.59 2.26 2.21 3.16 -36.89 12.75 -17.75 0.02 -0.70 0.24 -0.34 1.61 4.51 8.34 0.82 1.87 1.82 6.54 2.29 2.22 3.19 52.13 1.72 10.32 0.02 0.96 0.03 0.19 3.70 3.16 6.23 0.82 1.88 1.82 6.49 2.30 2.22 3.20 16.04 1.72 9.33 0.02 0.29 0.03 0.17 6.94 12.25 1.19 0.82 1.89 1.82 6.45 2.31 2.22 3.20 -32.88 -14.26 -7.62 0.02 -0.58 -0.25 -0.13 9.37 12.41 13.60 0.82 1.90 1.82 6.40 2.30 2.21 3.19 41.15 -33.16 10.43 0.02 0.70 -0.56 0.18 9.09 4.49 7.10 0.83 1.90 1.83 6.35 2.29 2.21 3.18 43.03 -31.03 16.43 0.02 0.71 -0.51 0.27 11.71 5.21 9.34 0.84 1.90 1.84 6.30 2.27 2.19 3.16 -51.90 -27.91 0.45 0.02 -0.83 -0.45 0.01 2.04 5.68 6.31 0.85 1.90 1.84 6.25 2.24 2.18 3.13 -58.63 -30.79 2.50 0.02 -0.91 -0.48 0.04 5.97 4.25 5.34 0.86 1.89 1.85 6.20 2.21 2.16 3.09 3.52 -30.67 10.53 0.02 0.05 -0.46 0.16 7.96 8.89 1.73 0.87 1.89 1.86 6.15 2.17 2.14 3.04 -9.42 -12.58 -9.42 0.01 -0.14 -0.18 -0.14 3.34 12.80 15.28 0.89 1.88 1.87 6.10 2.12 2.11 2.99 -31.29 -4.54 -32.29 0.01 -0.44 -0.06 -0.45 12.51 26.86 14.78 0.90 1.87 1.88 6.05 2.07 2.08 2.94 49.72 2.47 -13.14 0.01 0.67 0.03 -0.18 57.96 17.45 35.96 0.92 1.85 1.89 6.01 2.02 2.05 2.88 79.51 22.42 -0.06 0.01 1.03 0.29 0.00 48.14 18.17 41.29 0.94 1.84 1.89 5.96 1.96 2.02 2.81 2.40 29.32 -11.98 0.01 0.03 0.37 -0.15 0.78 3.84 7.12 0.96 1.82 1.90 5.91 1.90 1.99 2.75
-18.52 24.21 4.09 0.01 -0.22 0.29 0.05 1.62 6.50 8.68 0.98 1.81 1.91 5.86 1.84 1.95 2.68 -5.43 29.11 40.05 0.01 -0.06 0.33 0.46 4.46 0.50 11.57 1.01 1.79 1.92 5.81 1.78 1.91 2.61 15.62 18.42 8.08 0.03 0.41 0.49 0.21 1.55 3.36 7.80 1.05 1.53 1.82 7.28 1.45 1.73 2.26 -24.31 38.30 9.10 0.03 -0.63 1.00 0.24 1.33 1.71 2.68 1.03 1.55 1.83 7.23 1.51 1.77 2.33

536
Raw Data Tapered
Data FFT Data Parzen Filtered
Data Simple Ratio
Spectrum Z E N
Tapering Function
Z E N Z E N Z E N
Frequency Hz
E/Z N/Z
Mean SQRT Spectrum
-32.31 19.01 40.94 0.01 -0.36 0.21 0.45 5.55 4.85 13.84 1.04 1.78 1.94 5.76 1.71 1.87 2.53 -36.12 -32.96 22.87 0.01 -0.38 -0.35 0.24 3.10 1.01 9.54 1.07 1.77 1.95 5.71 1.65 1.82 2.46 0.00 -46.80 30.82 0.01 0.00 -0.47 0.31 0.42 6.54 6.34 1.11 1.76 1.97 5.66 1.58 1.77 2.38 -0.95 -12.68 8.79 0.01 -0.01 -0.12 0.08 2.24 5.36 3.52 1.15 1.75 1.98 5.62 1.52 1.72 2.30 -36.83 -3.64 -17.14 0.01 -0.33 -0.03 -0.15 3.19 5.61 3.41 1.20 1.75 2.01 5.57 1.46 1.67 2.22 -18.67 2.36 20.90 0.01 -0.16 0.02 0.18 3.71 1.21 5.76 1.25 1.75 2.03 5.52 1.40 1.62 2.15 2.41 23.31 43.83 0.01 0.02 0.19 0.35 2.33 2.73 2.85 1.31 1.76 2.06 5.47 1.35 1.57 2.07
-43.46 37.19 21.75 0.01 -0.33 0.28 0.16 2.60 6.35 4.49 1.38 1.78 2.10 5.42 1.29 1.53 2.00 -12.29 29.06 14.73 0.01 -0.09 0.20 0.10 1.27 3.04 8.74 1.45 1.80 2.14 5.37 1.24 1.48 1.93 70.64 10.98 30.69 0.01 0.46 0.07 0.20 2.57 1.91 7.51 1.52 1.82 2.19 5.32 1.20 1.44 1.87 35.47 -5.03 17.64 0.01 0.21 -0.03 0.11 3.02 1.76 5.86 1.61 1.86 2.24 5.27 1.15 1.39 1.81 -19.51 -28.96 -13.31 0.01 -0.11 -0.16 -0.07 3.19 1.86 7.20 1.70 1.90 2.30 5.22 1.12 1.36 1.76 7.56 -27.84 5.75 0.01 0.04 -0.14 0.03 2.91 2.93 1.72 1.80 1.94 2.37 5.18 1.08 1.32 1.71 37.52 -6.77 20.75 0.00 0.17 -0.03 0.09 2.89 0.81 2.78 1.90 1.99 2.45 5.13 1.05 1.29 1.66 11.47 -9.74 -0.24 0.00 0.05 -0.04 0.00 2.76 4.63 1.49 2.01 2.05 2.53 5.08 1.02 1.26 1.62 -15.48 -28.66 -7.17 0.00 -0.05 -0.10 -0.03 5.00 4.52 4.53 2.12 2.11 2.62 5.03 1.00 1.24 1.59 -8.38 -21.56 -15.07 0.00 -0.03 -0.06 -0.05 8.02 5.07 15.35 2.23 2.17 2.71 4.98 0.97 1.22 1.56 -12.29 18.45 -40.91 0.00 -0.03 0.05 -0.10 3.31 1.58 8.03 2.34 2.23 2.80 4.93 0.95 1.20 1.53 -13.19 40.34 -49.68 0.00 -0.03 0.08 -0.10 1.83 1.91 4.76 2.45 2.29 2.90 4.88 0.94 1.18 1.51 11.86 35.19 -21.48 0.00 0.02 0.05 -0.03 4.88 2.03 2.73 2.55 2.35 2.99 4.83 0.92 1.17 1.49 15.85 36.05 -4.38 0.00 0.02 0.04 0.00 3.95 2.67 2.16 2.65 2.40 3.09 4.79 0.91 1.16 1.48 -19.09 21.93 -19.28 0.00 -0.01 0.01 -0.01 1.79 4.24 6.09 2.75 2.45 3.18 4.74 0.89 1.16 1.46 -9.99 -7.10 -13.16 0.00 0.00 0.00 0.00 2.39 2.04 3.85 2.83 2.50 3.27 4.69 0.88 1.15 1.45

537
Microtremors Segment: B1-S4
Raw Data Tapered Data
FFT Data Parzen Filtered Data
Simple Ratio Spectrum
Z E N
Tapering Function
Z E N Z E N Z E N
Frequency Hz
E/Z N/Z
Mean SQRT Spectrum
-36.13 24.31 18.56 0.26 -9.38 6.31 4.82 5.13 2.42 2.83 3.91 1.04 1.19 30.03 0.27 0.30 0.40 2.99 18.24 24.51 0.26 0.77 4.72 6.35 5.70 1.52 4.61 3.83 1.02 1.17 29.98 0.27 0.30 0.40 17.00 14.19 26.45 0.26 4.39 3.67 6.84 4.27 4.17 4.58 3.75 1.01 1.14 29.93 0.27 0.30 0.41 19.98 -6.81 9.42 0.26 5.15 -1.76 2.43 3.81 3.30 3.21 3.65 0.99 1.11 29.88 0.27 0.31 0.41 -10.99 -31.71 4.43 0.26 -2.83 -8.17 1.14 3.07 4.00 2.70 3.54 0.97 1.09 29.83 0.27 0.31 0.41 -29.86 -17.60 -2.53 0.26 -7.67 -4.52 -0.65 5.78 3.49 3.43 3.42 0.95 1.06 29.79 0.28 0.31 0.42 -21.70 -15.52 -36.41 0.26 -5.57 -3.98 -9.34 8.78 3.36 3.50 3.29 0.93 1.03 29.74 0.28 0.31 0.42 -30.54 -38.39 -21.26 0.26 -7.82 -9.83 -5.44 8.66 5.58 1.95 3.16 0.91 1.00 29.69 0.29 0.32 0.43 3.56 -21.25 6.81 0.26 0.91 -5.43 1.74 6.89 6.66 2.02 3.03 0.90 0.97 29.64 0.30 0.32 0.44 13.58 11.78 -14.13 0.26 3.46 3.00 -3.60 2.11 1.41 1.00 2.89 0.88 0.94 29.59 0.30 0.33 0.45 -10.37 -5.22 -24.02 0.25 -2.64 -1.33 -6.11 2.09 0.67 2.73 2.76 0.86 0.92 29.54 0.31 0.33 0.46 48.60 -16.16 -2.92 0.25 12.35 -4.10 -0.74 1.28 1.32 2.54 2.62 0.85 0.90 29.49 0.32 0.34 0.47 58.44 16.86 7.11 0.25 14.81 4.27 1.80 2.28 2.32 1.69 2.49 0.84 0.87 29.44 0.34 0.35 0.49 -5.61 13.81 -1.86 0.25 -1.42 3.50 -0.47 3.64 4.40 1.00 2.37 0.83 0.86 29.39 0.35 0.36 0.50 -9.53 -5.19 0.18 0.25 -2.41 -1.31 0.05 2.98 5.25 2.73 2.26 0.82 0.84 29.35 0.36 0.37 0.52 3.53 11.82 4.22 0.25 0.89 2.98 1.06 3.80 1.28 2.05 2.15 0.81 0.83 29.30 0.38 0.39 0.54 -2.42 23.76 -9.73 0.25 -0.61 5.98 -2.45 6.12 1.53 1.23 2.06 0.81 0.82 29.25 0.39 0.40 0.56 -9.34 9.71 -19.63 0.25 -2.34 2.44 -4.93 3.04 3.33 0.38 1.97 0.81 0.82 29.20 0.41 0.41 0.58 1.73 -13.26 -16.52 0.25 0.43 -3.32 -4.14 1.17 3.24 1.54 1.89 0.80 0.81 29.15 0.43 0.43 0.60 21.73 -15.19 -23.40 0.25 5.43 -3.80 -5.85 2.43 6.45 3.34 1.82 0.81 0.81 29.10 0.44 0.44 0.63 10.72 -10.12 -21.27 0.25 2.67 -2.53 -5.31 4.98 7.48 3.93 1.77 0.81 0.81 29.05 0.46 0.46 0.65 8.73 -20.05 -11.16 0.25 2.17 -4.99 -2.78 1.95 3.71 4.29 1.72 0.82 0.81 29.00 0.48 0.47 0.67 39.68 -20.95 -4.09 0.25 9.86 -5.21 -1.02 2.47 3.93 1.01 1.68 0.83 0.81 28.96 0.49 0.49 0.69 32.59 -8.87 6.95 0.25 8.08 -2.20 1.72 4.50 2.70 2.47 1.64 0.84 0.82 28.91 0.51 0.50 0.71 -10.40 4.16 11.95 0.25 -2.57 1.03 2.96 5.43 5.25 2.51 1.62 0.85 0.83 28.86 0.52 0.51 0.73 -16.30 11.14 21.92 0.25 -4.03 2.75 5.42 2.05 1.90 2.78 1.60 0.86 0.83 28.81 0.54 0.52 0.75 -16.18 25.09 19.88 0.25 -3.99 6.18 4.90 6.08 0.13 2.06 1.59 0.88 0.84 28.76 0.55 0.53 0.77 -18.06 24.00 4.87 0.25 -4.44 5.90 1.20 5.32 3.68 2.15 1.58 0.89 0.85 28.71 0.57 0.54 0.78 -5.96 -0.03 9.88 0.25 -1.46 -0.01 2.43 4.84 4.95 2.07 1.57 0.91 0.86 28.66 0.58 0.55 0.80 -10.88 14.96 7.89 0.25 -2.66 3.66 1.93 1.56 1.14 2.54 1.57 0.93 0.87 28.61 0.59 0.55 0.81 -35.73 27.89 -2.08 0.24 -8.74 6.82 -0.51 2.15 3.62 1.26 1.57 0.95 0.88 28.56 0.61 0.56 0.82 -34.54 -1.15 1.96 0.24 -8.43 -0.28 0.48 5.15 0.92 1.75 1.57 0.97 0.88 28.52 0.62 0.56 0.84 -36.13 24.31 18.56 0.26 -9.38 6.31 4.82 5.13 2.42 2.83 3.91 1.04 1.19 30.03 0.27 0.30 0.40

538
Raw Data Tapered
Data FFT Data Parzen Filtered
Data Simple Ratio
Spectrum Z E N
Tapering Function
Z E N Z E N Z E N
Frequency Hz
E/Z N/Z
Mean SQRT Spectrum
21.54 7.85 5.99 0.24 5.25 1.91 1.46 2.89 1.69 1.36 1.57 1.00 0.89 28.47 0.63 0.57 0.85 46.46 27.80 0.01 0.24 11.29 6.76 0.00 4.63 2.61 2.61 1.58 1.02 0.90 28.42 0.65 0.57 0.86 13.39 -0.24 -4.94 0.24 3.25 -0.06 -1.20 3.92 1.47 4.01 1.58 1.04 0.90 28.37 0.66 0.57 0.87 17.38 -18.19 4.11 0.24 4.21 -4.40 0.99 5.06 2.58 2.69 1.58 1.06 0.90 28.32 0.67 0.57 0.88 26.34 -18.10 7.13 0.24 6.36 -4.37 1.72 4.34 3.94 2.30 1.58 1.08 0.91 28.27 0.68 0.57 0.89 5.33 -17.01 -2.84 0.24 1.28 -4.10 -0.69 4.52 2.57 4.02 1.58 1.10 0.91 28.22 0.70 0.58 0.91
-13.60 -6.95 19.17 0.24 -3.27 -1.67 4.61 5.88 2.78 3.05 1.58 1.12 0.91 28.17 0.71 0.58 0.92 -19.48 -7.90 27.11 0.24 -4.68 -1.90 6.51 3.20 1.88 2.60 1.57 1.14 0.91 28.13 0.73 0.58 0.93 6.59 0.13 -5.89 0.24 1.58 0.03 -1.41 4.70 1.02 3.69 1.57 1.16 0.91 28.08 0.74 0.58 0.94
-12.34 -9.83 -7.82 0.24 -2.95 -2.35 -1.87 6.52 1.21 3.29 1.56 1.17 0.91 28.03 0.75 0.58 0.95 -42.18 -28.74 2.23 0.24 -10.06 -6.85 0.53 1.45 2.72 3.74 1.55 1.19 0.91 27.98 0.77 0.58 0.96 13.93 3.33 -16.70 0.24 3.31 0.79 -3.97 1.30 2.45 4.31 1.54 1.20 0.91 27.93 0.78 0.59 0.97 5.94 5.33 -25.57 0.24 1.41 1.27 -6.07 1.89 1.44 2.44 1.53 1.21 0.90 27.88 0.79 0.59 0.99
-39.94 -12.64 -11.46 0.24 -9.47 -3.00 -2.72 5.22 2.07 2.53 1.52 1.22 0.90 27.83 0.80 0.59 1.00 9.17 3.39 -4.39 0.24 2.17 0.80 -1.04 3.53 2.76 2.73 1.51 1.23 0.90 27.78 0.81 0.59 1.00 37.13 -6.58 -5.33 0.24 8.76 -1.55 -1.26 3.14 2.00 0.11 1.51 1.24 0.89 27.73 0.82 0.59 1.01 -4.88 -9.53 -0.27 0.24 -1.15 -2.25 -0.06 2.59 2.34 2.45 1.50 1.24 0.89 27.69 0.83 0.60 1.02 -1.82 15.47 4.76 0.24 -0.43 3.64 1.12 1.49 2.24 3.19 1.49 1.24 0.89 27.64 0.83 0.60 1.03 53.13 25.41 10.77 0.23 12.46 5.96 2.52 4.69 2.53 1.71 1.48 1.24 0.89 27.59 0.84 0.60 1.03 39.99 7.36 6.77 0.23 9.36 1.72 1.58 4.23 2.42 1.55 1.47 1.24 0.89 27.54 0.84 0.60 1.04 25.91 -14.61 -6.19 0.23 6.05 -3.41 -1.44 1.41 0.59 2.08 1.46 1.23 0.89 27.49 0.84 0.61 1.04 75.76 14.41 -10.11 0.23 17.65 3.36 -2.36 0.83 2.02 2.40 1.46 1.23 0.89 27.44 0.84 0.61 1.04 17.62 31.33 -21.01 0.23 4.10 7.28 -4.88 4.22 1.10 4.28 1.46 1.22 0.89 27.39 0.84 0.61 1.04 -70.22 -2.71 -31.86 0.23 -16.29 -0.63 -7.39 2.12 1.47 4.59 1.45 1.21 0.90 27.34 0.83 0.62 1.04 -15.00 3.30 -12.73 0.23 -3.47 0.76 -2.95 2.97 1.31 3.56 1.45 1.20 0.90 27.29 0.82 0.62 1.03 17.05 25.26 -0.66 0.23 3.94 5.84 -0.15 4.15 2.84 2.92 1.45 1.18 0.90 27.25 0.82 0.62 1.03 -26.88 -6.76 -14.59 0.23 -6.20 -1.56 -3.36 5.01 5.30 2.92 1.45 1.17 0.91 27.20 0.81 0.63 1.02 3.22 -24.68 7.46 0.23 0.74 -5.68 1.72 2.72 4.08 2.12 1.45 1.15 0.92 27.15 0.79 0.63 1.01 28.20 10.37 23.44 0.23 6.47 2.38 5.38 1.80 2.47 1.98 1.45 1.13 0.92 27.10 0.78 0.64 1.01 -24.75 15.33 -8.55 0.23 -5.67 3.51 -1.96 1.39 1.82 1.39 1.45 1.11 0.93 27.05 0.77 0.64 1.00 -31.59 -23.64 8.50 0.23 -7.22 -5.40 1.94 2.72 1.32 2.30 1.45 1.10 0.94 27.00 0.76 0.65 0.99 21.54 7.85 5.99 0.24 5.25 1.91 1.46 2.89 1.69 1.36 1.57 1.00 0.89 28.47 0.63 0.57 0.85 46.46 27.80 0.01 0.24 11.29 6.76 0.00 4.63 2.61 2.61 1.58 1.02 0.90 28.42 0.65 0.57 0.86

539
Raw Data Tapered Data
FFT Data Parzen Filtered Data
Simple Ratio Spectrum
Z E N
Tapering Function
Z E N Z E N Z E N
Frequency Hz
E/Z N/Z
Mean SQRT Spectrum
23.48 -21.53 37.45 0.23 5.35 -4.91 8.54 1.06 2.97 3.10 1.45 1.08 0.95 26.95 0.74 0.65 0.99 34.41 -0.47 10.39 0.23 7.83 -0.11 2.36 4.18 3.43 2.64 1.45 1.06 0.95 26.90 0.73 0.66 0.98 2.39 -14.42 2.41 0.23 0.54 -3.27 0.55 3.44 2.76 3.23 1.45 1.04 0.96 26.86 0.72 0.66 0.98 7.42 -21.33 8.42 0.23 1.68 -4.83 1.91 3.14 1.97 2.63 1.45 1.02 0.97 26.81 0.70 0.67 0.97 22.41 -3.27 5.44 0.23 5.06 -0.74 1.23 4.03 0.26 3.97 1.44 1.00 0.98 26.76 0.69 0.68 0.97 1.41 -0.24 7.45 0.23 0.32 -0.06 1.68 5.49 2.89 3.55 1.44 0.98 0.99 26.71 0.68 0.69 0.97
-10.52 -20.19 19.44 0.23 -2.37 -4.54 4.37 2.38 2.80 2.74 1.43 0.96 0.99 26.66 0.67 0.69 0.97 17.52 -10.11 36.37 0.22 3.93 -2.27 8.16 3.69 2.87 0.86 1.42 0.95 1.00 26.61 0.66 0.70 0.97 16.50 16.89 25.28 0.22 3.70 3.78 5.66 4.58 2.10 2.62 1.41 0.93 1.01 26.56 0.66 0.71 0.97 -15.45 -0.12 8.26 0.22 -3.45 -0.03 1.85 2.44 3.76 3.74 1.40 0.92 1.01 26.51 0.65 0.72 0.97 -3.37 -1.10 13.25 0.22 -0.75 -0.25 2.96 2.00 4.29 3.66 1.39 0.90 1.02 26.46 0.65 0.73 0.98 -2.30 16.88 7.25 0.22 -0.51 3.76 1.61 5.50 1.94 1.82 1.38 0.89 1.02 26.42 0.65 0.74 0.98 -22.20 -6.12 -7.71 0.22 -4.93 -1.36 -1.71 2.88 1.83 1.37 1.37 0.88 1.03 26.37 0.64 0.75 0.99 -24.06 -9.07 -9.63 0.22 -5.33 -2.01 -2.13 0.83 2.76 2.31 1.35 0.87 1.03 26.32 0.65 0.76 1.00 -25.91 11.94 -16.54 0.22 -5.73 2.64 -3.66 1.16 1.14 0.99 1.34 0.87 1.03 26.27 0.65 0.77 1.01 -8.79 2.92 -26.41 0.22 -1.94 0.64 -5.82 3.30 1.76 2.09 1.32 0.86 1.03 26.22 0.65 0.78 1.02 -5.71 -25.02 -34.25 0.22 -1.26 -5.50 -7.54 1.03 1.14 1.85 1.31 0.86 1.03 26.17 0.66 0.79 1.03 -6.63 -22.90 -30.08 0.22 -1.46 -5.03 -6.60 5.14 2.15 1.04 1.29 0.85 1.04 26.12 0.66 0.80 1.04 18.39 6.15 -21.94 0.22 4.03 1.35 -4.80 3.86 2.77 1.23 1.28 0.85 1.04 26.07 0.67 0.81 1.05 12.38 -2.84 -40.77 0.22 2.71 -0.62 -8.91 2.94 3.55 1.59 1.26 0.85 1.04 26.03 0.67 0.82 1.06 10.39 -14.79 -42.56 0.22 2.26 -3.22 -9.28 2.74 4.89 1.43 1.25 0.85 1.04 25.98 0.68 0.83 1.07 22.37 8.24 -13.41 0.22 4.87 1.79 -2.92 2.24 4.81 0.61 1.24 0.86 1.04 25.93 0.69 0.84 1.09 9.36 6.23 -10.32 0.22 2.03 1.35 -2.24 2.86 2.70 3.36 1.23 0.86 1.03 25.88 0.70 0.84 1.10 2.38 -17.73 -14.23 0.22 0.52 -3.84 -3.08 4.59 3.97 5.40 1.21 0.86 1.03 25.83 0.71 0.85 1.11 4.42 -8.66 5.83 0.22 0.95 -1.87 1.26 4.61 2.69 4.21 1.21 0.87 1.03 25.78 0.72 0.86 1.12 -1.53 13.35 7.85 0.22 -0.33 2.88 1.69 3.41 1.99 2.37 1.20 0.87 1.03 25.73 0.73 0.86 1.13 21.48 4.33 6.86 0.22 4.62 0.93 1.47 1.52 2.36 1.42 1.19 0.88 1.03 25.68 0.74 0.86 1.13 37.41 -6.65 15.85 0.21 8.02 -1.43 3.40 1.61 1.86 2.27 1.18 0.88 1.02 25.63 0.74 0.87 1.14 12.36 12.36 1.86 0.21 2.64 2.64 0.40 1.38 3.22 1.85 1.18 0.89 1.02 25.59 0.75 0.87 1.15 4.37 9.33 -1.10 0.21 0.93 1.99 -0.23 3.33 5.11 0.89 1.18 0.89 1.02 25.54 0.76 0.87 1.15 9.40 -21.63 8.93 0.21 2.00 -4.61 1.90 3.16 1.26 2.17 1.17 0.90 1.01 25.49 0.77 0.86 1.16 23.48 -21.53 37.45 0.23 5.35 -4.91 8.54 1.06 2.97 3.10 1.45 1.08 0.95 26.95 0.74 0.65 0.99 34.41 -0.47 10.39 0.23 7.83 -0.11 2.36 4.18 3.43 2.64 1.45 1.06 0.95 26.90 0.73 0.66 0.98

540
Raw Data Tapered Data
FFT Data Parzen Filtered Data
Simple Ratio Spectrum
Z E N
Tapering Function
Z E N Z E N Z E N
Frequency Hz
E/Z N/Z
Mean SQRT Spectrum
1.42 -13.54 9.93 0.21 0.30 -2.88 2.11 2.80 5.65 1.34 1.17 0.91 1.01 25.44 0.78 0.86 1.16 -20.49 2.50 4.94 0.21 -4.34 0.53 1.05 3.17 2.43 3.71 1.17 0.91 1.00 25.39 0.78 0.86 1.16 -11.37 -21.44 2.97 0.21 -2.41 -4.54 0.63 3.38 2.63 2.51 1.17 0.92 1.00 25.34 0.79 0.85 1.16 27.64 -18.35 18.97 0.21 5.83 -3.87 4.00 3.92 2.49 3.82 1.17 0.93 0.99 25.29 0.79 0.85 1.16 8.62 21.67 29.91 0.21 1.81 4.56 6.30 4.26 4.99 1.65 1.17 0.93 0.99 25.24 0.80 0.84 1.16
-17.31 28.58 20.85 0.21 -3.64 6.00 4.38 4.42 4.71 1.37 1.17 0.94 0.98 25.20 0.80 0.84 1.16 -2.23 12.52 18.81 0.21 -0.47 2.62 3.94 1.55 1.12 1.68 1.17 0.94 0.97 25.15 0.81 0.83 1.16 -2.17 10.49 21.77 0.21 -0.45 2.19 4.55 1.72 2.03 1.60 1.17 0.95 0.96 25.10 0.81 0.82 1.16 -14.08 14.46 16.73 0.21 -2.94 3.01 3.49 2.89 3.03 3.56 1.17 0.96 0.95 25.05 0.82 0.82 1.16 -35.93 -2.55 23.69 0.21 -7.47 -0.53 4.93 8.09 3.66 5.97 1.17 0.97 0.95 25.00 0.83 0.81 1.16 -27.76 -12.50 29.62 0.21 -5.76 -2.59 6.15 13.77 4.17 6.02 1.17 0.97 0.94 24.95 0.83 0.80 1.16 10.33 9.52 1.60 0.21 2.14 1.97 0.33 13.01 3.61 10.32 1.17 0.98 0.93 24.90 0.84 0.79 1.16 -1.64 5.51 -14.33 0.21 -0.34 1.14 -2.96 7.48 1.45 8.94 1.17 0.99 0.92 24.85 0.85 0.79 1.16 7.40 -24.44 5.72 0.21 1.52 -5.03 1.18 3.19 2.91 3.51 1.17 1.00 0.91 24.80 0.85 0.78 1.16 31.37 -23.33 23.70 0.21 6.45 -4.79 4.87 2.64 5.10 1.37 1.17 1.00 0.90 24.76 0.86 0.78 1.16 3.35 -6.25 14.67 0.21 0.69 -1.28 3.01 3.82 1.94 0.74 1.17 1.01 0.90 24.71 0.87 0.77 1.16
-11.58 -18.18 -10.30 0.20 -2.37 -3.72 -2.11 4.54 4.13 2.71 1.17 1.02 0.89 24.66 0.87 0.76 1.16 -2.50 -20.09 0.76 0.20 -0.51 -4.10 0.15 1.36 1.82 1.14 1.17 1.03 0.89 24.61 0.88 0.76 1.16 -1.45 -2.03 1.79 0.20 -0.29 -0.41 0.36 1.43 2.86 3.91 1.17 1.04 0.88 24.56 0.89 0.76 1.17 0.61 -18.97 -30.11 0.20 0.12 -3.85 -6.11 3.12 3.75 3.89 1.17 1.05 0.88 24.51 0.89 0.75 1.17 9.64 -30.85 -16.98 0.20 1.95 -6.25 -3.44 3.49 2.91 0.93 1.18 1.06 0.88 24.46 0.90 0.75 1.17 32.60 15.20 -19.86 0.20 6.59 3.07 -4.01 2.44 1.36 3.24 1.18 1.07 0.88 24.41 0.90 0.75 1.17 32.52 36.12 -50.68 0.20 6.55 7.28 -10.21 3.66 0.90 4.92 1.19 1.08 0.88 24.37 0.91 0.74 1.17 0.50 13.04 -32.47 0.20 0.10 2.62 -6.53 7.61 3.54 2.08 1.20 1.09 0.89 24.32 0.91 0.74 1.17 14.52 12.00 -21.32 0.20 2.91 2.41 -4.28 5.26 2.05 1.70 1.21 1.10 0.90 24.27 0.91 0.74 1.17 23.50 13.97 -28.18 0.20 4.70 2.79 -5.64 4.20 3.36 1.33 1.22 1.11 0.91 24.22 0.91 0.74 1.17 -14.47 1.96 -11.06 0.20 -2.89 0.39 -2.21 14.54 5.46 3.78 1.24 1.12 0.92 24.17 0.90 0.74 1.17 8.59 -10.01 -1.00 0.20 1.71 -1.99 -0.20 6.44 6.48 6.68 1.25 1.12 0.93 24.12 0.90 0.74 1.16 49.52 -20.93 -16.92 0.20 9.83 -4.15 -3.36 4.47 3.56 3.96 1.27 1.13 0.94 24.07 0.89 0.74 1.16 23.42 -28.81 -19.81 0.20 4.64 -5.70 -3.92 8.32 8.05 2.27 1.30 1.14 0.96 24.02 0.88 0.74 1.15 2.42 -29.68 -5.71 0.20 0.48 -5.86 -1.13 9.24 4.65 3.14 1.32 1.15 0.98 23.97 0.87 0.74 1.14 1.42 -13.54 9.93 0.21 0.30 -2.88 2.11 2.80 5.65 1.34 1.17 0.91 1.01 25.44 0.78 0.86 1.16
-20.49 2.50 4.94 0.21 -4.34 0.53 1.05 3.17 2.43 3.71 1.17 0.91 1.00 25.39 0.78 0.86 1.16

541
Raw Data Tapered
Data FFT Data Parzen Filtered
Data Simple Ratio
Spectrum Z E N
Tapering Function
Z E N Z E N Z E N
Frequency Hz
E/Z N/Z
Mean SQRT Spectrum
36.39 12.38 -7.64 0.20 7.17 2.44 -1.51 3.61 2.03 3.52 1.34 1.15 1.00 23.93 0.86 0.74 1.13 39.29 35.30 -8.57 0.20 7.72 6.94 -1.68 0.67 4.87 3.66 1.37 1.16 1.02 23.88 0.84 0.74 1.12 -18.71 8.23 -4.50 0.20 -3.67 1.61 -0.88 7.14 5.96 0.95 1.40 1.16 1.04 23.83 0.83 0.74 1.11 -13.60 26.18 -4.44 0.20 -2.66 5.12 -0.87 5.20 3.98 2.89 1.43 1.17 1.06 23.78 0.82 0.74 1.10 15.45 40.06 1.61 0.20 3.01 7.81 0.31 0.80 2.57 1.79 1.46 1.17 1.08 23.73 0.80 0.74 1.09 -40.45 15.97 7.63 0.19 -7.87 3.11 1.48 4.32 0.88 2.43 1.49 1.18 1.10 23.68 0.79 0.74 1.08 -40.24 24.90 16.62 0.19 -7.81 4.83 3.22 0.32 1.28 2.55 1.52 1.18 1.12 23.63 0.77 0.74 1.07 7.87 36.80 34.56 0.19 1.52 7.12 6.69 8.81 4.23 9.94 1.55 1.18 1.14 23.58 0.76 0.74 1.06
-25.05 26.68 37.46 0.19 -4.83 5.15 7.23 8.38 3.09 4.85 1.59 1.19 1.16 23.54 0.75 0.73 1.05 -31.88 -2.35 26.37 0.19 -6.14 -0.45 5.08 8.37 3.15 4.58 1.62 1.19 1.18 23.49 0.74 0.73 1.04 9.21 -30.27 29.30 0.19 1.77 -5.81 5.63 5.97 1.90 6.20 1.65 1.19 1.20 23.44 0.72 0.73 1.03 10.22 -27.13 33.22 0.19 1.96 -5.20 6.36 5.24 1.95 2.10 1.68 1.19 1.21 23.39 0.71 0.72 1.02 -7.74 -29.00 22.14 0.19 -1.48 -5.54 4.23 4.84 2.42 0.18 1.70 1.20 1.23 23.34 0.70 0.72 1.01 -11.65 -20.89 18.10 0.19 -2.22 -3.98 3.45 3.75 1.59 1.97 1.73 1.20 1.24 23.29 0.69 0.72 1.00 -6.56 2.17 22.06 0.19 -1.25 0.41 4.19 1.33 1.01 0.83 1.76 1.21 1.25 23.24 0.69 0.71 0.99 -26.45 -0.82 10.04 0.19 -5.01 -0.15 1.90 5.51 1.99 1.29 1.78 1.21 1.26 23.19 0.68 0.71 0.98 -37.27 -17.76 -5.93 0.19 -7.04 -3.36 -1.12 2.49 1.82 3.54 1.81 1.22 1.27 23.14 0.67 0.70 0.97 -1.14 -14.68 6.11 0.19 -0.22 -2.77 1.15 1.63 0.63 2.98 1.83 1.22 1.27 23.10 0.67 0.70 0.97 2.90 -0.63 15.11 0.19 0.55 -0.12 2.84 3.88 4.45 0.45 1.85 1.23 1.27 23.05 0.67 0.69 0.96
-19.02 -8.60 5.11 0.19 -3.57 -1.61 0.96 2.23 2.03 1.62 1.86 1.24 1.28 23.00 0.66 0.68 0.95 -10.91 -5.55 14.11 0.19 -2.04 -1.04 2.64 3.75 2.77 0.77 1.88 1.24 1.28 22.95 0.66 0.68 0.95 -6.82 3.47 11.10 0.19 -1.27 0.65 2.07 4.05 2.60 2.34 1.90 1.25 1.27 22.90 0.66 0.67 0.94 3.24 -24.47 -9.87 0.19 0.60 -4.55 -1.84 5.33 1.61 5.40 1.91 1.26 1.27 22.85 0.66 0.67 0.94 26.23 -23.35 -7.79 0.19 4.87 -4.33 -1.45 2.79 2.39 5.58 1.92 1.27 1.27 22.80 0.66 0.66 0.93 15.19 -5.28 -12.71 0.19 2.81 -0.98 -2.35 5.91 5.94 3.03 1.93 1.27 1.27 22.75 0.66 0.66 0.93 17.18 -16.22 -15.61 0.18 3.17 -2.99 -2.88 9.76 6.25 8.92 1.94 1.28 1.26 22.71 0.66 0.65 0.92 50.09 -7.15 -6.53 0.18 9.22 -1.32 -1.20 2.50 4.38 6.69 1.95 1.28 1.26 22.66 0.66 0.65 0.92 28.98 5.87 -15.45 0.18 5.32 1.08 -2.83 9.15 4.76 5.65 1.96 1.28 1.26 22.61 0.66 0.64 0.92 15.94 14.85 -11.35 0.18 2.92 2.72 -2.08 1.98 5.89 5.79 1.96 1.29 1.25 22.56 0.65 0.64 0.91 43.87 15.80 -7.27 0.18 8.01 2.88 -1.33 5.57 3.70 6.30 1.97 1.29 1.25 22.51 0.65 0.64 0.91 23.78 -18.17 -14.19 0.18 4.33 -3.31 -2.58 0.75 4.65 1.40 1.97 1.28 1.25 22.46 0.65 0.63 0.91 36.39 12.38 -7.64 0.20 7.17 2.44 -1.51 3.61 2.03 3.52 1.34 1.15 1.00 23.93 0.86 0.74 1.13 39.29 35.30 -8.57 0.20 7.72 6.94 -1.68 0.67 4.87 3.66 1.37 1.16 1.02 23.88 0.84 0.74 1.12

542
Raw Data Tapered Data
FFT Data Parzen Filtered Data
Simple Ratio Spectrum
Z E N
Tapering Function
Z E N Z E N Z E N
Frequency Hz
E/Z N/Z
Mean SQRT Spectrum
-2.21 -23.07 0.88 0.18 -0.40 -4.19 0.16 3.39 5.86 2.62 1.97 1.28 1.24 22.41 0.65 0.63 0.91 1.84 8.97 -1.08 0.18 0.33 1.62 -0.20 2.31 2.22 2.56 1.96 1.28 1.24 22.36 0.65 0.63 0.91 8.86 12.95 -3.03 0.18 1.60 2.34 -0.55 6.61 1.77 2.92 1.96 1.27 1.24 22.31 0.65 0.63 0.90 7.88 6.93 8.99 0.18 1.42 1.25 1.62 5.95 3.04 1.28 1.95 1.26 1.23 22.27 0.65 0.63 0.90
-12.07 13.90 -4.97 0.18 -2.17 2.50 -0.89 6.14 1.62 2.99 1.95 1.25 1.23 22.22 0.64 0.63 0.90 -3.99 13.87 -7.91 0.18 -0.71 2.48 -1.42 2.19 0.70 4.77 1.94 1.24 1.23 22.17 0.64 0.63 0.90 -0.93 8.84 6.14 0.18 -0.17 1.58 1.10 2.09 2.52 0.86 1.93 1.23 1.23 22.12 0.64 0.64 0.90 -26.83 15.81 -0.83 0.18 -4.78 2.81 -0.15 3.03 4.50 4.21 1.91 1.22 1.23 22.07 0.64 0.64 0.90 -5.71 30.73 -5.78 0.18 -1.01 5.45 -1.03 4.07 3.75 3.45 1.90 1.20 1.23 22.02 0.63 0.65 0.90 0.35 14.66 2.27 0.18 0.06 2.59 0.40 1.43 1.21 1.35 1.89 1.19 1.23 21.97 0.63 0.65 0.91 -3.60 1.64 1.30 0.18 -0.64 0.29 0.23 8.79 3.61 0.78 1.87 1.18 1.23 21.92 0.63 0.66 0.91 12.43 22.61 5.33 0.18 2.19 3.98 0.94 0.56 2.17 2.79 1.85 1.17 1.23 21.88 0.63 0.66 0.92 -8.53 0.58 19.32 0.18 -1.50 0.10 3.39 4.56 3.20 2.86 1.84 1.16 1.23 21.83 0.63 0.67 0.92 -2.46 -31.34 29.26 0.18 -0.43 -5.48 5.12 5.09 3.94 0.43 1.82 1.15 1.23 21.78 0.63 0.68 0.93 -10.38 -17.22 26.19 0.17 -1.81 -3.01 4.57 3.61 1.92 1.22 1.80 1.14 1.24 21.73 0.63 0.69 0.94 -49.22 -10.15 18.14 0.17 -8.56 -1.77 3.16 1.84 0.67 1.13 1.79 1.14 1.24 21.68 0.64 0.70 0.94 -27.01 -9.10 13.12 0.17 -4.69 -1.58 2.28 6.22 4.39 3.24 1.77 1.14 1.25 21.63 0.64 0.71 0.95 0.09 -1.06 1.13 0.17 0.02 -0.18 0.19 4.28 2.60 3.50 1.75 1.14 1.25 21.58 0.65 0.72 0.97 2.13 1.96 -6.82 0.17 0.37 0.34 -1.18 4.30 0.41 1.83 1.74 1.14 1.26 21.53 0.65 0.73 0.98
-12.80 -6.02 1.23 0.17 -2.20 -1.03 0.21 14.13 2.62 7.65 1.72 1.14 1.27 21.48 0.66 0.73 0.99 -25.67 -16.95 4.26 0.17 -4.40 -2.91 0.73 3.08 0.56 6.48 1.71 1.14 1.27 21.44 0.67 0.74 1.00 13.40 2.10 -11.69 0.17 2.29 0.36 -2.00 2.51 1.79 2.44 1.70 1.15 1.28 21.39 0.68 0.75 1.01 18.39 8.09 -24.58 0.17 3.14 1.38 -4.19 2.15 3.85 1.52 1.69 1.16 1.28 21.34 0.69 0.76 1.03 2.39 -12.88 -18.45 0.17 0.41 -2.19 -3.14 3.16 4.87 2.46 1.68 1.17 1.29 21.29 0.70 0.77 1.04 32.37 -21.79 -7.36 0.17 5.49 -3.69 -1.25 1.43 1.77 1.90 1.67 1.17 1.30 21.24 0.70 0.78 1.05 18.32 -33.66 -4.30 0.17 3.10 -5.69 -0.73 3.61 2.29 1.61 1.66 1.18 1.30 21.19 0.71 0.78 1.06 15.30 -43.49 -0.25 0.17 2.58 -7.33 -0.04 3.64 4.71 1.73 1.65 1.19 1.30 21.14 0.72 0.79 1.07 53.21 -26.33 -1.21 0.17 8.94 -4.42 -0.20 5.59 4.25 0.96 1.64 1.20 1.30 21.09 0.73 0.79 1.08 24.11 -6.24 -10.14 0.17 4.04 -1.05 -1.70 2.29 2.59 1.86 1.64 1.20 1.30 21.04 0.74 0.80 1.08 -10.87 -7.20 -29.02 0.17 -1.82 -1.20 -4.85 1.29 4.67 3.23 1.63 1.21 1.30 21.00 0.74 0.80 1.09 -4.79 -20.12 -15.89 0.17 -0.80 -3.35 -2.65 2.04 5.63 3.51 1.63 1.21 1.30 20.95 0.75 0.80 1.09 -2.21 -23.07 0.88 0.18 -0.40 -4.19 0.16 3.39 5.86 2.62 1.97 1.28 1.24 22.41 0.65 0.63 0.91 1.84 8.97 -1.08 0.18 0.33 1.62 -0.20 2.31 2.22 2.56 1.96 1.28 1.24 22.36 0.65 0.63 0.91

543
Raw Data Tapered Data
FFT Data Parzen Filtered Data
Simple Ratio Spectrum
Z E N
Tapering Function
Z E N Z E N Z E N
Frequency Hz
E/Z N/Z
Mean SQRT Spectrum
14.23 -11.04 12.15 0.17 2.36 -1.83 2.02 4.26 4.49 1.89 1.62 1.21 1.29 20.90 0.75 0.80 1.09 19.21 15.97 -2.82 0.17 3.18 2.64 -0.47 0.78 5.79 2.35 1.62 1.21 1.28 20.85 0.75 0.79 1.09 -3.77 26.90 15.19 0.17 -0.62 4.44 2.51 3.36 3.83 2.05 1.61 1.21 1.27 20.80 0.75 0.79 1.09 5.28 35.79 36.13 0.16 0.87 5.89 5.94 2.13 1.40 2.22 1.61 1.21 1.26 20.75 0.75 0.78 1.08 32.25 33.67 9.08 0.16 5.29 5.52 1.49 4.23 2.30 0.79 1.61 1.20 1.25 20.70 0.75 0.78 1.08 18.19 9.60 8.08 0.16 2.97 1.57 1.32 0.91 2.92 3.22 1.60 1.20 1.23 20.65 0.75 0.77 1.07 13.18 3.60 12.08 0.16 2.15 0.59 1.97 1.54 2.85 4.06 1.60 1.19 1.22 20.61 0.74 0.76 1.06 38.12 21.56 3.09 0.16 6.19 3.50 0.50 3.93 2.66 2.01 1.60 1.18 1.20 20.56 0.74 0.75 1.05 11.07 20.50 5.11 0.16 1.79 3.32 0.83 5.04 2.62 1.81 1.59 1.17 1.19 20.51 0.73 0.74 1.05 -10.88 1.47 1.14 0.16 -1.76 0.24 0.18 6.90 3.68 2.67 1.59 1.16 1.17 20.46 0.73 0.74 1.04 3.18 1.48 5.17 0.16 0.51 0.24 0.83 2.82 2.30 2.27 1.58 1.15 1.15 20.41 0.73 0.73 1.03
-18.74 13.47 5.19 0.16 -3.01 2.16 0.83 4.27 2.58 1.77 1.58 1.14 1.13 20.36 0.72 0.72 1.02 -30.60 6.45 -7.77 0.16 -4.90 1.03 -1.24 5.81 3.96 2.35 1.57 1.13 1.12 20.31 0.72 0.71 1.01 -31.43 -0.54 2.28 0.16 -5.01 -0.09 0.36 0.53 4.10 0.17 1.57 1.12 1.10 20.26 0.72 0.70 1.01 -15.29 24.43 17.28 0.16 -2.43 3.88 2.75 3.11 2.39 5.25 1.56 1.12 1.09 20.21 0.72 0.70 1.00 3.78 28.34 21.24 0.16 0.60 4.49 3.37 1.78 2.96 5.37 1.55 1.11 1.07 20.17 0.72 0.69 1.00 -1.17 10.28 29.18 0.16 -0.19 1.62 4.61 3.58 4.52 4.30 1.54 1.11 1.06 20.12 0.72 0.69 0.99 9.86 15.25 25.11 0.16 1.55 2.40 3.96 0.40 3.90 2.35 1.53 1.11 1.05 20.07 0.72 0.68 0.99
-42.03 7.22 13.07 0.16 -6.60 1.13 2.05 3.59 5.86 7.71 1.52 1.11 1.03 20.02 0.73 0.68 0.99 -68.76 -16.75 13.06 0.16 -10.76 -2.62 2.04 1.33 6.11 2.08 1.51 1.11 1.02 19.97 0.73 0.68 1.00 -2.57 -28.64 6.06 0.16 -0.40 -4.47 0.95 2.13 4.59 0.88 1.50 1.11 1.01 19.92 0.74 0.68 1.00 -16.48 -35.49 0.09 0.16 -2.56 -5.52 0.01 3.88 2.01 0.25 1.48 1.12 1.01 19.87 0.75 0.68 1.01 -25.35 -31.34 -4.87 0.16 -3.93 -4.86 -0.75 5.04 1.12 3.07 1.47 1.12 1.00 19.82 0.76 0.68 1.02 16.71 -22.21 -29.76 0.15 2.58 -3.43 -4.60 7.51 2.34 3.96 1.45 1.13 0.99 19.78 0.78 0.68 1.04 -6.26 -12.13 -38.58 0.15 -0.96 -1.87 -5.94 4.56 0.92 4.18 1.43 1.14 0.99 19.73 0.79 0.69 1.05 -8.18 -14.06 -32.40 0.15 -1.26 -2.16 -4.97 3.24 3.04 2.48 1.42 1.15 0.98 19.68 0.81 0.69 1.07 5.87 -26.95 -33.23 0.15 0.90 -4.12 -5.08 3.17 3.55 1.83 1.40 1.16 0.98 19.63 0.83 0.70 1.08 -7.08 -10.86 -2.12 0.15 -1.08 -1.66 -0.32 3.34 2.86 4.25 1.38 1.17 0.97 19.58 0.85 0.70 1.10 20.94 24.13 17.89 0.15 3.18 3.67 2.72 2.65 1.97 3.28 1.37 1.18 0.97 19.53 0.86 0.71 1.12 33.88 31.04 -5.10 0.15 5.13 4.70 -0.77 4.13 3.19 1.13 1.35 1.19 0.97 19.48 0.88 0.71 1.14 26.81 23.95 -9.03 0.15 4.05 3.62 -1.36 3.58 3.30 1.85 1.34 1.20 0.96 19.43 0.90 0.72 1.16 14.23 -11.04 12.15 0.17 2.36 -1.83 2.02 4.26 4.49 1.89 1.62 1.21 1.29 20.90 0.75 0.80 1.09 19.21 15.97 -2.82 0.17 3.18 2.64 -0.47 0.78 5.79 2.35 1.62 1.21 1.28 20.85 0.75 0.79 1.09

544
Raw Data Tapered Data
FFT Data Parzen Filtered Data
Simple Ratio Spectrum
Z E N
Tapering Function
Z E N Z E N Z E N
Frequency Hz
E/Z N/Z
Mean SQRT Spectrum
35.73 16.89 1.03 0.15 5.38 2.54 0.15 6.75 4.11 2.73 1.32 1.22 0.96 19.38 0.92 0.73 1.18 7.69 6.86 4.05 0.15 1.15 1.03 0.61 2.46 3.72 0.86 1.31 1.23 0.96 19.34 0.94 0.74 1.19 -2.27 10.84 9.07 0.15 -0.34 1.62 1.36 4.64 3.14 0.85 1.29 1.24 0.97 19.29 0.96 0.75 1.21 8.76 12.81 15.06 0.15 1.31 1.91 2.24 3.69 3.60 2.48 1.28 1.24 0.97 19.24 0.97 0.76 1.23 -0.21 9.78 7.05 0.15 -0.03 1.45 1.05 3.54 2.47 3.69 1.27 1.25 0.97 19.19 0.99 0.76 1.25 39.76 20.74 -15.89 0.15 5.88 3.07 -2.35 2.55 1.33 2.52 1.26 1.26 0.97 19.14 1.00 0.77 1.26 34.66 10.69 -11.80 0.15 5.11 1.58 -1.74 2.29 0.87 3.20 1.25 1.26 0.98 19.09 1.01 0.78 1.28 10.61 -1.31 3.26 0.15 1.56 -0.19 0.48 4.26 1.06 1.98 1.25 1.27 0.98 19.04 1.02 0.79 1.29 42.55 6.70 -4.70 0.15 6.23 0.98 -0.69 6.64 0.97 1.56 1.24 1.27 0.99 18.99 1.02 0.79 1.30 24.46 -0.30 -7.63 0.15 3.57 -0.04 -1.11 5.59 4.21 2.94 1.24 1.27 0.99 18.95 1.03 0.80 1.30 35.39 8.70 10.40 0.15 5.15 1.27 1.51 4.54 2.85 1.44 1.24 1.28 1.00 18.90 1.03 0.81 1.31 45.27 28.65 25.37 0.15 6.56 4.15 3.68 2.29 1.38 2.23 1.24 1.28 1.01 18.85 1.03 0.81 1.31 -23.72 1.60 17.32 0.14 -3.43 0.23 2.50 2.87 2.53 2.03 1.24 1.27 1.01 18.80 1.03 0.82 1.31 -39.55 -18.35 9.31 0.14 -5.70 -2.64 1.34 4.04 1.89 0.49 1.24 1.27 1.02 18.75 1.02 0.82 1.31 -46.33 9.69 17.29 0.14 -6.65 1.39 2.48 3.98 1.98 1.37 1.25 1.27 1.03 18.70 1.02 0.82 1.31 -53.09 15.65 8.28 0.14 -7.59 2.24 1.18 2.28 2.94 1.10 1.25 1.27 1.03 18.65 1.01 0.82 1.30 -13.91 -21.32 -12.67 0.14 -1.98 -3.04 -1.81 3.09 3.02 1.01 1.26 1.26 1.04 18.60 1.00 0.82 1.29 -9.81 -32.19 -8.59 0.14 -1.39 -4.57 -1.22 4.43 2.60 1.09 1.27 1.26 1.04 18.55 0.99 0.82 1.29 -15.71 -14.08 -3.53 0.14 -2.22 -1.99 -0.50 2.81 2.18 1.17 1.28 1.25 1.04 18.51 0.98 0.82 1.28 -17.60 -22.99 -15.45 0.14 -2.48 -3.24 -2.18 1.07 2.52 1.42 1.29 1.24 1.05 18.46 0.97 0.81 1.26 -17.48 -28.87 -5.37 0.14 -2.46 -4.06 -0.75 3.47 3.86 0.95 1.30 1.24 1.05 18.41 0.95 0.81 1.25 2.60 -1.79 7.67 0.14 0.36 -0.25 1.07 5.11 0.45 0.34 1.31 1.23 1.05 18.36 0.94 0.80 1.23 -4.35 8.22 -5.30 0.14 -0.61 1.15 -0.74 3.54 3.75 1.17 1.32 1.22 1.04 18.31 0.92 0.79 1.22 -1.30 -14.75 -2.25 0.14 -0.18 -2.05 -0.31 5.20 3.31 1.49 1.33 1.21 1.04 18.26 0.91 0.78 1.20 29.70 -27.65 4.79 0.14 4.11 -3.83 0.66 4.65 3.40 4.67 1.34 1.20 1.03 18.21 0.89 0.77 1.18 -4.31 -20.53 -3.18 0.14 -0.59 -2.83 -0.44 6.63 2.17 4.84 1.35 1.18 1.03 18.16 0.88 0.76 1.16 -48.16 -24.42 -7.12 0.14 -6.62 -3.36 -0.98 4.19 2.66 1.40 1.36 1.17 1.02 18.12 0.86 0.75 1.14 -31.95 -32.29 -6.05 0.14 -4.38 -4.42 -0.83 1.75 0.71 2.41 1.37 1.16 1.01 18.07 0.84 0.74 1.12 -21.79 -25.16 -3.99 0.14 -2.97 -3.43 -0.54 2.36 3.61 2.68 1.38 1.14 1.00 18.02 0.83 0.72 1.10 -12.68 -21.04 -22.90 0.14 -1.72 -2.86 -3.11 3.97 5.52 4.03 1.39 1.13 0.98 17.97 0.81 0.71 1.08 4.39 -5.97 -37.74 0.14 0.59 -0.81 -5.11 2.53 2.89 4.43 1.40 1.12 0.97 17.92 0.80 0.69 1.06 35.73 16.89 1.03 0.15 5.38 2.54 0.15 6.75 4.11 2.73 1.32 1.22 0.96 19.38 0.92 0.73 1.18 7.69 6.86 4.05 0.15 1.15 1.03 0.61 2.46 3.72 0.86 1.31 1.23 0.96 19.34 0.94 0.74 1.19

545
Raw Data Tapered Data
FFT Data Parzen Filtered Data
Simple Ratio Spectrum
Z E N
Tapering Function
Z E N Z E N Z E N
Frequency Hz
E/Z N/Z
Mean SQRT Spectrum
18.39 13.03 -27.57 0.14 2.48 1.76 -3.72 5.04 6.91 12.68 1.41 1.10 0.96 17.87 0.78 0.68 1.04 23.36 18.99 -19.43 0.13 3.14 2.55 -2.61 5.16 6.40 10.06 1.41 1.09 0.94 17.82 0.77 0.67 1.02 -6.63 27.92 -17.32 0.13 -0.89 3.74 -2.32 4.24 1.59 3.96 1.42 1.07 0.92 17.77 0.76 0.65 1.00 22.39 29.82 4.75 0.13 2.99 3.98 0.63 8.24 7.28 7.75 1.43 1.06 0.91 17.72 0.74 0.64 0.98 59.27 36.70 25.73 0.13 7.88 4.88 3.42 0.73 7.43 6.52 1.43 1.05 0.89 17.68 0.73 0.62 0.96 1.19 41.57 16.68 0.13 0.16 5.51 2.21 4.89 2.17 2.59 1.43 1.04 0.88 17.63 0.72 0.61 0.95 12.21 8.48 18.65 0.13 1.61 1.12 2.46 1.52 4.12 2.01 1.44 1.03 0.86 17.58 0.71 0.60 0.93 49.14 -16.48 28.59 0.13 6.46 -2.17 3.76 2.37 1.75 0.43 1.44 1.02 0.85 17.53 0.71 0.59 0.92 -11.89 -2.43 26.52 0.13 -1.56 -0.32 3.47 2.35 2.33 1.70 1.44 1.01 0.84 17.48 0.70 0.58 0.91 -25.77 6.58 27.45 0.13 -3.36 0.86 3.58 1.61 2.64 5.62 1.44 1.00 0.82 17.43 0.69 0.57 0.90 22.29 9.57 14.41 0.13 2.90 1.24 1.87 2.48 2.08 5.76 1.44 1.00 0.82 17.38 0.69 0.57 0.89 25.24 12.54 -9.56 0.13 3.27 1.62 -1.24 2.87 4.61 3.15 1.44 0.99 0.81 17.33 0.69 0.56 0.89 -11.74 15.50 -24.46 0.13 -1.51 2.00 -3.15 2.55 3.26 3.44 1.44 0.99 0.81 17.29 0.69 0.56 0.89 -27.62 21.45 -15.34 0.13 -3.55 2.76 -1.97 0.49 3.03 4.83 1.44 0.99 0.81 17.24 0.69 0.56 0.89 -4.51 13.40 8.72 0.13 -0.58 1.71 1.12 1.42 3.77 2.03 1.44 1.00 0.81 17.19 0.69 0.56 0.89 3.54 13.36 16.70 0.13 0.45 1.70 2.13 3.23 1.89 1.74 1.44 1.00 0.82 17.14 0.70 0.57 0.90 -8.40 19.31 16.68 0.13 -1.07 2.45 2.12 3.20 1.81 0.49 1.44 1.01 0.83 17.09 0.70 0.58 0.91 4.65 15.26 28.62 0.13 0.59 1.93 3.62 1.39 0.17 1.38 1.44 1.02 0.84 17.04 0.71 0.59 0.92 16.66 8.23 33.54 0.13 2.10 1.04 4.23 3.18 2.37 2.72 1.44 1.03 0.86 16.99 0.72 0.60 0.94 -10.31 -9.75 8.49 0.13 -1.29 -1.22 1.07 2.55 1.23 1.83 1.43 1.04 0.88 16.94 0.73 0.62 0.95 -39.16 -30.65 -6.47 0.13 -4.90 -3.83 -0.81 4.36 4.26 2.83 1.43 1.06 0.91 16.89 0.74 0.64 0.97 -41.95 -16.54 10.56 0.12 -5.22 -2.06 1.31 4.46 4.27 3.69 1.43 1.07 0.94 16.85 0.75 0.66 1.00 -36.75 2.51 13.55 0.12 -4.56 0.31 1.68 4.09 7.89 2.57 1.43 1.09 0.97 16.80 0.76 0.68 1.02 -34.56 -4.47 -4.43 0.12 -4.27 -0.55 -0.55 5.15 6.11 3.98 1.42 1.11 1.01 16.75 0.78 0.71 1.05 -15.41 -0.44 -6.37 0.12 -1.90 -0.05 -0.78 0.66 9.34 18.46 1.42 1.13 1.04 16.70 0.79 0.73 1.08 -4.32 5.56 -3.32 0.12 -0.53 0.68 -0.41 11.32 16.70 34.74 1.42 1.15 1.08 16.65 0.81 0.76 1.11 -19.23 -1.43 -17.24 0.12 -2.35 -0.17 -2.10 12.97 12.57 13.36 1.41 1.17 1.12 16.60 0.83 0.79 1.15 -8.12 -4.40 -11.14 0.12 -0.99 -0.53 -1.35 7.43 14.24 8.30 1.40 1.19 1.16 16.55 0.85 0.82 1.18 5.93 0.63 -2.08 0.12 0.72 0.08 -0.25 5.09 13.50 5.63 1.40 1.21 1.19 16.50 0.86 0.85 1.21 -9.02 4.64 -20.99 0.12 -1.09 0.56 -2.53 3.11 1.01 3.12 1.39 1.22 1.23 16.46 0.88 0.89 1.25 16.02 -14.33 -17.88 0.12 1.92 -1.72 -2.15 3.51 2.77 1.62 1.38 1.24 1.27 16.41 0.90 0.92 1.29 18.39 13.03 -27.57 0.14 2.48 1.76 -3.72 5.04 6.91 12.68 1.41 1.10 0.96 17.87 0.78 0.68 1.04 23.36 18.99 -19.43 0.13 3.14 2.55 -2.61 5.16 6.40 10.06 1.41 1.09 0.94 17.82 0.77 0.67 1.02

546
Raw Data Tapered Data
FFT Data Parzen Filtered Data
Simple Ratio Spectrum
Z E N
Tapering Function
Z E N Z E N Z E N
Frequency Hz
E/Z N/Z
Mean SQRT Spectrum
33.96 -32.22 -9.78 0.12 4.06 -3.85 -1.17 2.75 1.57 1.77 1.37 1.26 1.31 16.36 0.92 0.96 1.33 4.93 -22.09 -17.69 0.12 0.59 -2.63 -2.10 2.62 4.08 0.75 1.36 1.28 1.35 16.31 0.94 0.99 1.36 0.97 -30.96 -12.59 0.12 0.11 -3.67 -1.49 3.17 1.81 1.09 1.35 1.30 1.38 16.26 0.96 1.02 1.40 -3.98 -42.80 -21.48 0.12 -0.47 -5.05 -2.53 2.56 4.05 1.52 1.34 1.31 1.41 16.21 0.98 1.05 1.44 29.02 -7.68 -31.33 0.12 3.41 -0.90 -3.68 3.29 6.18 2.14 1.33 1.33 1.44 16.16 1.00 1.09 1.48 58.89 23.31 -27.18 0.12 6.89 2.73 -3.18 6.96 2.05 2.49 1.32 1.35 1.47 16.11 1.02 1.12 1.51 -6.17 14.25 -38.01 0.12 -0.72 1.66 -4.43 12.05 10.71 7.31 1.31 1.37 1.50 16.06 1.04 1.14 1.55 -13.08 16.21 -35.82 0.12 -1.52 1.88 -4.15 27.39 38.48 18.82 1.30 1.38 1.53 16.02 1.06 1.17 1.58 5.98 28.14 -24.66 0.12 0.69 3.25 -2.85 16.58 23.51 11.64 1.30 1.40 1.55 15.97 1.08 1.20 1.61
-28.93 12.08 -20.53 0.12 -3.33 1.39 -2.36 7.08 2.93 4.96 1.29 1.42 1.58 15.92 1.10 1.22 1.65 13.15 4.06 -1.44 0.11 1.51 0.47 -0.17 2.57 3.22 6.01 1.29 1.45 1.61 15.87 1.12 1.24 1.68 62.05 18.04 7.59 0.11 7.07 2.06 0.86 7.08 9.83 4.29 1.29 1.47 1.63 15.82 1.14 1.27 1.70 44.88 1.02 -1.38 0.11 5.09 0.12 -0.16 6.31 7.25 0.77 1.30 1.50 1.66 15.77 1.16 1.28 1.73 19.80 -26.91 -7.33 0.11 2.24 -3.04 -0.83 1.08 2.68 3.96 1.31 1.54 1.69 15.72 1.18 1.30 1.75 1.80 -6.83 1.73 0.11 0.20 -0.77 0.19 3.95 2.78 4.67 1.32 1.58 1.73 15.67 1.20 1.31 1.77 5.83 10.19 4.75 0.11 0.65 1.14 0.53 3.97 0.60 4.06 1.34 1.62 1.76 15.63 1.21 1.32 1.79
-14.11 -7.80 -2.21 0.11 -1.57 -0.87 -0.25 0.35 4.07 4.12 1.36 1.67 1.79 15.58 1.23 1.32 1.80 -23.98 -13.74 6.82 0.11 -2.66 -1.53 0.76 4.06 4.78 3.89 1.38 1.71 1.83 15.53 1.24 1.32 1.81 25.06 -6.68 10.83 0.11 2.77 -0.74 1.20 3.61 2.12 6.69 1.41 1.77 1.87 15.48 1.25 1.32 1.82 21.02 1.35 21.80 0.11 2.31 0.15 2.40 2.64 3.96 4.78 1.45 1.82 1.90 15.43 1.26 1.31 1.82 -24.93 8.35 41.71 0.11 -2.73 0.91 4.57 5.45 2.73 3.60 1.48 1.88 1.94 15.38 1.27 1.31 1.82 -12.81 17.31 41.59 0.11 -1.40 1.89 4.53 4.30 1.30 5.18 1.53 1.94 1.98 15.33 1.27 1.29 1.82 2.26 25.25 49.44 0.11 0.25 2.74 5.36 1.91 4.01 6.52 1.57 2.01 2.01 15.28 1.28 1.28 1.81
-11.68 6.20 50.28 0.11 -1.26 0.67 5.43 2.78 5.04 2.74 1.62 2.08 2.05 15.23 1.28 1.27 1.80 -12.58 -13.76 32.16 0.11 -1.35 -1.48 3.46 5.29 4.96 4.91 1.67 2.15 2.09 15.19 1.29 1.25 1.79 -20.47 -11.69 17.10 0.11 -2.19 -1.25 1.83 3.35 1.84 4.74 1.72 2.22 2.12 15.14 1.29 1.23 1.78 -38.30 -22.61 6.09 0.11 -4.08 -2.41 0.65 2.74 3.50 6.25 1.78 2.29 2.15 15.09 1.29 1.21 1.76 -43.09 -39.46 8.10 0.11 -4.57 -4.18 0.86 2.97 3.27 3.12 1.84 2.36 2.18 15.04 1.28 1.19 1.75 -29.90 -23.32 10.10 0.11 -3.15 -2.46 1.07 2.44 1.25 3.81 1.89 2.42 2.21 14.99 1.28 1.17 1.73 4.20 -16.22 6.10 0.11 0.44 -1.70 0.64 1.58 1.60 3.85 1.94 2.48 2.22 14.94 1.28 1.14 1.71 13.21 -28.11 1.13 0.10 1.38 -2.94 0.12 2.80 1.42 2.83 2.00 2.54 2.24 14.89 1.27 1.12 1.70 33.96 -32.22 -9.78 0.12 4.06 -3.85 -1.17 2.75 1.57 1.77 1.37 1.26 1.31 16.36 0.92 0.96 1.33 4.93 -22.09 -17.69 0.12 0.59 -2.63 -2.10 2.62 4.08 0.75 1.36 1.28 1.35 16.31 0.94 0.99 1.36

547
Raw Data Tapered Data
FFT Data Parzen Filtered Data
Simple Ratio Spectrum
Z E N
Tapering Function
Z E N Z E N Z E N
Frequency Hz
E/Z N/Z
Mean SQRT Spectrum
9.21 -5.03 -6.82 0.10 0.96 -0.52 -0.71 1.37 2.87 4.24 2.04 2.58 2.25 14.84 1.27 1.10 1.68 20.20 7.99 -3.76 0.10 2.09 0.83 -0.39 5.01 2.49 5.00 2.09 2.63 2.25 14.79 1.26 1.08 1.66 -19.75 -9.99 4.27 0.10 -2.03 -1.03 0.44 5.34 2.76 1.23 2.13 2.66 2.25 14.75 1.25 1.06 1.64 -29.60 -6.94 5.29 0.10 -3.03 -0.71 0.54 6.18 1.03 2.80 2.16 2.69 2.25 14.70 1.25 1.04 1.62 24.45 15.07 3.31 0.10 2.49 1.54 0.34 4.08 2.28 4.67 2.19 2.71 2.24 14.65 1.24 1.02 1.60 2.45 10.03 -6.64 0.10 0.25 1.02 -0.67 5.25 2.61 5.98 2.21 2.72 2.23 14.60 1.23 1.01 1.59 0.49 -16.93 -18.55 0.10 0.05 -1.71 -1.87 4.57 2.10 4.57 2.23 2.73 2.21 14.55 1.22 0.99 1.57 41.45 -5.87 -15.45 0.10 4.17 -0.59 -1.55 6.88 2.27 3.21 2.24 2.72 2.20 14.50 1.21 0.98 1.56 3.41 16.13 -23.33 0.10 0.34 1.61 -2.33 5.31 3.17 3.26 2.25 2.71 2.18 14.45 1.20 0.97 1.54
-11.53 -2.88 -38.17 0.10 -1.15 -0.29 -3.80 2.16 1.59 2.08 2.25 2.68 2.15 14.40 1.19 0.96 1.53 21.50 -3.84 -30.99 0.10 2.13 -0.38 -3.07 3.64 0.62 3.00 2.24 2.65 2.13 14.36 1.18 0.95 1.52 20.46 27.13 -17.85 0.10 2.02 2.67 -1.76 6.04 2.40 2.13 2.22 2.61 2.10 14.31 1.17 0.95 1.51 15.44 23.05 -11.75 0.10 1.51 2.26 -1.15 4.01 5.41 2.25 2.20 2.55 2.07 14.26 1.16 0.94 1.50 -1.54 3.01 -11.67 0.10 -0.15 0.29 -1.14 2.30 3.20 4.78 2.17 2.49 2.04 14.21 1.15 0.94 1.49 -15.46 16.00 -16.57 0.10 -1.50 1.55 -1.61 2.71 2.38 4.72 2.13 2.43 2.01 14.16 1.14 0.94 1.48 -8.37 33.91 -24.45 0.10 -0.81 3.27 -2.36 2.64 4.34 3.09 2.09 2.36 1.98 14.11 1.13 0.95 1.47 2.69 32.80 -21.32 0.10 0.26 3.15 -2.05 2.22 2.12 3.96 2.05 2.28 1.95 14.06 1.11 0.95 1.47 49.63 24.70 -11.21 0.10 4.74 2.36 -1.07 6.19 1.39 1.83 2.01 2.20 1.93 14.01 1.10 0.96 1.46 53.47 33.60 -13.12 0.10 5.08 3.19 -1.25 14.37 12.44 4.85 1.96 2.12 1.90 13.96 1.08 0.97 1.45 3.40 31.49 -4.05 0.09 0.32 2.98 -0.38 22.39 19.60 8.08 1.91 2.04 1.87 13.92 1.07 0.98 1.45 -2.55 2.44 13.97 0.09 -0.24 0.23 1.31 8.12 6.46 4.39 1.87 1.96 1.85 13.87 1.05 0.99 1.44 -10.48 0.45 19.94 0.09 -0.98 0.04 1.86 3.50 2.82 3.64 1.82 1.88 1.82 13.82 1.03 1.00 1.44 -28.36 9.45 17.91 0.09 -2.64 0.88 1.67 2.80 6.31 3.73 1.78 1.79 1.80 13.77 1.01 1.01 1.43 -1.25 -1.55 19.87 0.09 -0.12 -0.14 1.84 5.52 2.54 1.45 1.74 1.71 1.77 13.72 0.99 1.02 1.42 21.75 -20.49 24.82 0.09 2.00 -1.88 2.28 5.81 2.08 2.12 1.70 1.64 1.75 13.67 0.97 1.03 1.41 3.75 -33.36 5.80 0.09 0.34 -3.05 0.53 8.69 3.59 4.56 1.66 1.57 1.72 13.62 0.94 1.04 1.40
-26.16 -24.23 -8.16 0.09 -2.38 -2.20 -0.74 6.70 4.55 2.87 1.63 1.50 1.70 13.57 0.92 1.04 1.39 -15.03 -25.11 22.85 0.09 -1.36 -2.27 2.07 6.79 2.36 1.77 1.61 1.44 1.67 13.53 0.89 1.04 1.37 6.03 -25.99 35.78 0.09 0.54 -2.34 3.22 0.73 2.91 0.23 1.59 1.38 1.65 13.48 0.87 1.04 1.36 4.06 -6.91 14.71 0.09 0.36 -0.62 1.32 1.87 2.87 0.95 1.57 1.33 1.63 13.43 0.85 1.04 1.34 26.04 -17.84 19.68 0.09 2.32 -1.59 1.75 5.70 2.30 1.43 1.56 1.29 1.61 13.38 0.82 1.03 1.32 9.21 -5.03 -6.82 0.10 0.96 -0.52 -0.71 1.37 2.87 4.24 2.04 2.58 2.25 14.84 1.27 1.10 1.68 20.20 7.99 -3.76 0.10 2.09 0.83 -0.39 5.01 2.49 5.00 2.09 2.63 2.25 14.79 1.26 1.08 1.66

548
Raw Data Tapered Data
FFT Data Parzen Filtered Data
Simple Ratio Spectrum
Z E N
Tapering Function
Z E N Z E N Z E N
Frequency Hz
E/Z N/Z
Mean SQRT Spectrum
13.01 -7.77 22.64 0.09 1.15 -0.69 2.00 6.16 2.23 1.99 1.56 1.25 1.59 13.33 0.80 1.02 1.30 -42.88 20.23 -14.34 0.09 -3.77 1.78 -1.26 4.82 1.12 1.14 1.57 1.22 1.57 13.28 0.78 1.00 1.27 -38.67 -15.76 -26.22 0.09 -3.38 -1.38 -2.29 5.91 2.64 2.34 1.57 1.20 1.55 13.23 0.76 0.99 1.25 -1.55 -27.66 -9.11 0.09 -0.13 -2.41 -0.79 2.75 3.68 1.66 1.59 1.19 1.53 13.18 0.75 0.97 1.22 12.48 16.38 -15.02 0.09 1.08 1.42 -1.30 3.90 3.43 1.80 1.61 1.18 1.52 13.13 0.74 0.94 1.20 17.46 17.33 -21.91 0.09 1.50 1.49 -1.88 2.10 2.62 2.48 1.63 1.18 1.50 13.09 0.72 0.92 1.17 27.42 -4.67 -12.80 0.09 2.34 -0.40 -1.09 4.52 3.01 3.83 1.66 1.18 1.48 13.04 0.72 0.89 1.15 44.32 13.33 -7.72 0.09 3.77 1.13 -0.66 4.55 3.48 3.28 1.69 1.19 1.47 12.99 0.71 0.87 1.12 16.25 27.27 -6.65 0.08 1.37 2.30 -0.56 1.97 2.11 1.45 1.72 1.21 1.45 12.94 0.70 0.84 1.10 -27.68 0.23 -5.59 0.08 -2.33 0.02 -0.47 1.83 4.12 2.44 1.75 1.23 1.44 12.89 0.70 0.82 1.08 3.41 -9.73 3.45 0.08 0.28 -0.81 0.29 7.27 4.91 2.50 1.79 1.25 1.42 12.84 0.70 0.79 1.06 21.41 10.28 12.46 0.08 1.78 0.85 1.03 4.71 1.72 2.60 1.83 1.27 1.41 12.79 0.70 0.77 1.04 -23.54 -3.71 0.47 0.08 -1.94 -0.31 0.04 0.73 2.45 1.96 1.86 1.30 1.39 12.74 0.70 0.75 1.02 -23.40 -34.61 0.51 0.08 -1.92 -2.84 0.04 10.81 1.23 2.23 1.90 1.33 1.38 12.70 0.70 0.72 1.01 19.65 -10.51 9.53 0.08 1.60 -0.86 0.78 15.24 8.36 2.42 1.94 1.36 1.36 12.65 0.70 0.70 0.99 11.63 26.48 -14.42 0.08 0.94 2.15 -1.17 6.79 5.47 4.31 1.97 1.38 1.35 12.60 0.70 0.68 0.98 -11.32 13.42 -24.30 0.08 -0.91 1.08 -1.96 21.70 5.85 5.28 2.00 1.41 1.33 12.55 0.71 0.66 0.97 30.68 -4.58 -14.19 0.08 2.45 -0.37 -1.13 16.24 4.87 4.56 2.03 1.44 1.31 12.50 0.71 0.65 0.96 58.55 12.42 -23.07 0.08 4.65 0.99 -1.83 2.19 0.89 5.24 2.06 1.46 1.29 12.45 0.71 0.63 0.95 7.46 20.38 -16.95 0.08 0.59 1.61 -1.34 0.15 4.39 6.57 2.08 1.48 1.28 12.40 0.71 0.61 0.94
-32.44 14.33 -6.86 0.08 -2.55 1.12 -0.54 0.78 3.43 3.09 2.10 1.49 1.26 12.35 0.71 0.60 0.93 -11.31 24.27 -4.80 0.08 -0.88 1.89 -0.37 1.24 2.64 2.10 2.12 1.51 1.24 12.30 0.71 0.58 0.92 2.75 25.18 6.24 0.08 0.21 1.95 0.48 1.21 2.66 0.78 2.13 1.52 1.22 12.26 0.71 0.57 0.91 3.79 -2.84 9.25 0.08 0.29 -0.22 0.71 0.73 0.75 2.39 2.14 1.52 1.20 12.21 0.71 0.56 0.91 15.79 -9.80 16.23 0.08 1.21 -0.75 1.24 3.49 5.76 4.40 2.14 1.52 1.18 12.16 0.71 0.55 0.90 1.80 7.22 9.22 0.08 0.14 0.55 0.70 4.72 5.67 1.16 2.14 1.52 1.16 12.11 0.71 0.54 0.89
-36.08 -7.76 -20.71 0.08 -2.72 -0.59 -1.56 3.03 2.02 1.04 2.14 1.51 1.14 12.06 0.71 0.53 0.88 -28.91 -36.65 -9.61 0.08 -2.17 -2.75 -0.72 3.01 5.83 1.77 2.14 1.51 1.12 12.01 0.70 0.52 0.88 -4.80 -36.48 9.43 0.07 -0.36 -2.72 0.70 5.81 1.07 4.10 2.14 1.50 1.10 11.96 0.70 0.51 0.87 -22.70 -24.34 2.44 0.07 -1.68 -1.80 0.18 2.45 9.16 3.32 2.13 1.48 1.08 11.91 0.70 0.51 0.86 -35.53 -19.24 16.44 0.07 -2.61 -1.41 1.21 6.48 6.64 7.60 2.12 1.47 1.06 11.87 0.69 0.50 0.85 13.01 -7.77 22.64 0.09 1.15 -0.69 2.00 6.16 2.23 1.99 1.56 1.25 1.59 13.33 0.80 1.02 1.30 -42.88 20.23 -14.34 0.09 -3.77 1.78 -1.26 4.82 1.12 1.14 1.57 1.22 1.57 13.28 0.78 1.00 1.27

549
Raw Data Tapered Data
FFT Data Parzen Filtered Data
Simple Ratio Spectrum
Z E N
Tapering Function
Z E N Z E N Z E N
Frequency Hz
E/Z N/Z
Mean SQRT Spectrum
-35.53 -19.24 16.44 0.07 -2.61 -1.41 1.21 6.48 6.64 7.60 2.12 1.47 1.06 11.87 0.69 0.50 0.85 -2.41 -5.17 18.41 0.07 -0.18 -0.38 1.34 9.08 4.72 7.57 2.12 1.45 1.05 11.82 0.69 0.50 0.85 -0.36 14.83 -3.58 0.07 -0.03 1.08 -0.26 6.47 7.74 4.65 2.11 1.44 1.04 11.77 0.68 0.49 0.84 -42.23 -9.16 13.44 0.07 -3.04 -0.66 0.97 3.89 4.07 5.85 2.10 1.42 1.03 11.72 0.68 0.49 0.83 -18.06 -25.08 27.40 0.07 -1.29 -1.79 1.96 3.01 0.78 4.42 2.10 1.41 1.02 11.67 0.67 0.49 0.83 17.99 7.98 6.37 0.07 1.28 0.57 0.45 4.13 3.43 2.39 2.09 1.39 1.01 11.62 0.66 0.48 0.82 -4.99 2.98 -0.60 0.07 -0.35 0.21 -0.04 2.25 4.47 2.69 2.09 1.38 1.01 11.57 0.66 0.48 0.82 -3.93 -12.99 5.43 0.07 -0.27 -0.91 0.38 1.62 1.19 3.59 2.09 1.37 1.01 11.52 0.66 0.49 0.82 12.10 5.05 3.45 0.07 0.84 0.35 0.24 8.39 12.98 9.64 2.08 1.36 1.01 11.47 0.65 0.49 0.81 -8.86 -4.93 -0.52 0.07 -0.61 -0.34 -0.04 10.06 15.00 12.65 2.08 1.35 1.02 11.43 0.65 0.49 0.81 3.20 -24.85 -7.46 0.07 0.22 -1.70 -0.51 2.96 6.49 6.25 2.08 1.35 1.03 11.38 0.65 0.49 0.81 43.15 1.21 -0.41 0.07 2.93 0.08 -0.03 6.15 2.21 6.00 2.08 1.34 1.04 11.33 0.65 0.50 0.82 24.06 37.16 -6.35 0.07 1.62 2.51 -0.43 7.03 4.64 5.33 2.08 1.35 1.05 11.28 0.65 0.50 0.82 5.05 22.06 -25.25 0.07 0.34 1.48 -1.69 1.39 3.98 3.76 2.08 1.35 1.06 11.23 0.65 0.51 0.83 32.02 -1.96 -16.13 0.07 2.13 -0.13 -1.07 2.94 4.71 2.32 2.08 1.36 1.08 11.18 0.65 0.52 0.83 23.96 28.00 -22.01 0.07 1.58 1.85 -1.45 5.78 1.66 2.22 2.08 1.37 1.10 11.13 0.66 0.53 0.84 -10.03 40.88 -29.87 0.07 -0.66 2.68 -1.96 3.40 5.56 3.87 2.08 1.38 1.12 11.08 0.66 0.54 0.85 -2.96 -4.17 -8.75 0.07 -0.19 -0.27 -0.57 2.89 4.39 2.97 2.07 1.39 1.14 11.04 0.67 0.55 0.87 35.03 -1.14 -0.69 0.06 2.26 -0.07 -0.04 3.30 1.01 2.26 2.07 1.41 1.16 10.99 0.68 0.56 0.88 30.94 40.79 -12.62 0.06 1.98 2.61 -0.81 9.22 6.33 3.78 2.06 1.43 1.19 10.94 0.69 0.58 0.90 -21.04 17.70 -33.49 0.06 -1.34 1.12 -2.13 12.78 11.74 12.70 2.05 1.44 1.21 10.89 0.70 0.59 0.92 -13.92 -2.32 -27.33 0.06 -0.88 -0.15 -1.72 3.74 11.39 8.71 2.04 1.47 1.24 10.84 0.72 0.61 0.94 28.10 18.67 -13.21 0.06 1.76 1.17 -0.83 1.48 3.83 1.40 2.02 1.49 1.27 10.79 0.73 0.63 0.97 10.06 20.61 -26.09 0.06 0.62 1.28 -1.62 0.47 2.03 1.56 2.01 1.51 1.29 10.74 0.75 0.64 0.99 -2.91 7.57 -18.96 0.06 -0.18 0.47 -1.17 1.80 2.23 3.22 1.99 1.53 1.32 10.69 0.77 0.66 1.02 40.06 2.57 -8.86 0.06 2.44 0.16 -0.54 3.97 5.94 5.60 1.97 1.56 1.35 10.64 0.79 0.69 1.05 49.93 -0.42 -14.77 0.06 3.02 -0.03 -0.89 2.69 4.98 5.26 1.96 1.59 1.38 10.60 0.81 0.71 1.08 -2.12 -15.37 0.30 0.06 -0.13 -0.92 0.02 2.49 3.86 5.63 1.94 1.61 1.41 10.55 0.83 0.73 1.11 -15.04 -6.31 14.31 0.06 -0.90 -0.38 0.85 2.22 3.92 2.92 1.92 1.64 1.44 10.50 0.85 0.75 1.14 18.99 13.69 10.30 0.06 1.12 0.81 0.61 1.74 6.61 1.22 1.90 1.67 1.47 10.45 0.88 0.77 1.17 4.99 0.68 12.30 0.06 0.29 0.04 0.72 3.00 2.73 3.73 1.89 1.69 1.51 10.40 0.90 0.80 1.20
-35.53 -19.24 16.44 0.07 -2.61 -1.41 1.21 6.48 6.64 7.60 2.12 1.47 1.06 11.87 0.69 0.50 0.85 -2.41 -5.17 18.41 0.07 -0.18 -0.38 1.34 9.08 4.72 7.57 2.12 1.45 1.05 11.82 0.69 0.50 0.85

550
Raw Data Tapered Data
FFT Data Parzen Filtered Data
Simple Ratio Spectrum
Z E N
Tapering Function
Z E N Z E N Z E N
Frequency Hz
E/Z N/Z
Mean SQRT Spectrum
-17.94 -14.27 28.26 0.06 -1.04 -0.83 1.64 4.87 2.89 3.20 1.87 1.72 1.54 10.35 0.92 0.82 1.23 6.13 -17.19 35.17 0.06 0.35 -0.99 2.02 3.84 3.96 4.69 1.86 1.75 1.57 10.30 0.94 0.84 1.27 23.11 -19.10 21.10 0.06 1.32 -1.09 1.20 1.08 0.49 3.82 1.84 1.77 1.60 10.25 0.96 0.87 1.30 1.11 -39.97 8.08 0.06 0.06 -2.26 0.46 1.09 1.02 1.80 1.83 1.80 1.62 10.21 0.98 0.89 1.33
-28.79 -53.76 5.10 0.06 -1.61 -3.01 0.29 3.22 0.21 2.82 1.82 1.82 1.65 10.16 1.00 0.91 1.35 -23.65 -33.57 8.11 0.06 -1.31 -1.86 0.45 0.56 1.52 6.00 1.80 1.84 1.68 10.11 1.02 0.93 1.38 -17.52 -27.42 4.12 0.06 -0.96 -1.51 0.23 3.06 0.87 10.92 1.79 1.86 1.70 10.06 1.04 0.95 1.41 -29.38 -26.30 7.14 0.05 -1.60 -1.43 0.39 3.05 4.01 3.86 1.79 1.88 1.72 10.01 1.05 0.96 1.43 -17.24 -11.20 10.15 0.05 -0.93 -0.60 0.55 0.82 3.70 4.35 1.78 1.90 1.74 9.96 1.07 0.98 1.45 -8.15 -15.13 -3.83 0.05 -0.44 -0.81 -0.20 5.09 6.13 2.77 1.77 1.92 1.76 9.91 1.08 0.99 1.47 1.91 -19.04 6.21 0.05 0.10 -1.01 0.33 4.89 9.12 4.68 1.76 1.93 1.77 9.86 1.09 1.01 1.49 15.92 7.00 8.22 0.05 0.84 0.37 0.43 4.06 4.75 5.20 1.75 1.94 1.79 9.81 1.11 1.02 1.50 7.92 30.95 -14.73 0.05 0.41 1.61 -0.77 3.23 3.05 2.69 1.74 1.95 1.80 9.77 1.12 1.03 1.52 -9.04 20.86 -10.64 0.05 -0.47 1.07 -0.55 0.16 4.11 3.55 1.73 1.95 1.80 9.72 1.12 1.04 1.53 -14.94 5.83 -7.56 0.05 -0.76 0.30 -0.39 0.89 4.84 3.07 1.72 1.95 1.81 9.67 1.13 1.05 1.54 17.10 26.78 -11.48 0.05 0.86 1.35 -0.58 4.06 4.61 2.27 1.70 1.95 1.81 9.62 1.14 1.06 1.56 25.06 46.65 -21.37 0.05 1.25 2.33 -1.07 6.26 1.44 2.71 1.69 1.94 1.80 9.57 1.15 1.07 1.57 -13.92 20.54 -18.25 0.05 -0.69 1.02 -0.90 3.82 2.25 4.82 1.67 1.93 1.80 9.52 1.16 1.08 1.58 -2.84 4.51 10.80 0.05 -0.14 0.22 0.53 2.57 3.86 2.31 1.65 1.92 1.79 9.47 1.16 1.09 1.59 5.20 29.46 4.81 0.05 0.25 1.43 0.23 4.34 3.82 2.77 1.63 1.90 1.79 9.42 1.17 1.10 1.61
-22.72 23.37 -13.13 0.05 -1.09 1.12 -0.63 3.40 9.07 2.57 1.60 1.88 1.78 9.38 1.18 1.11 1.62 0.37 3.33 -15.04 0.05 0.02 0.16 -0.71 3.72 6.14 3.82 1.58 1.86 1.77 9.33 1.18 1.12 1.63 24.36 21.30 -23.92 0.05 1.15 1.00 -1.12 7.32 5.61 5.04 1.55 1.84 1.75 9.28 1.19 1.13 1.64 18.32 12.25 -12.80 0.05 0.85 0.57 -0.60 6.81 3.95 2.27 1.52 1.82 1.74 9.23 1.20 1.15 1.66 23.28 -12.73 -0.73 0.05 1.07 -0.59 -0.03 0.97 4.40 1.32 1.49 1.79 1.73 9.18 1.20 1.16 1.67 30.22 15.28 -2.69 0.05 1.37 0.70 -0.12 2.99 6.89 2.30 1.46 1.76 1.71 9.13 1.21 1.18 1.69 24.15 39.19 -4.63 0.05 1.09 1.76 -0.21 1.56 4.81 2.67 1.43 1.74 1.70 9.08 1.21 1.19 1.70 -0.85 11.11 -9.56 0.04 -0.04 0.49 -0.43 2.95 4.18 0.58 1.40 1.71 1.69 9.03 1.22 1.21 1.72 -2.80 -14.86 11.48 0.04 -0.12 -0.65 0.50 1.19 2.05 0.60 1.37 1.68 1.67 8.98 1.23 1.22 1.73 24.20 1.18 29.43 0.04 1.05 0.05 1.28 1.77 2.53 3.02 1.34 1.65 1.66 8.94 1.23 1.24 1.74 -1.80 10.18 16.38 0.04 -0.08 0.44 0.70 2.27 4.61 4.34 1.31 1.62 1.64 8.89 1.24 1.25 1.76 -17.94 -14.27 28.26 0.06 -1.04 -0.83 1.64 4.87 2.89 3.20 1.87 1.72 1.54 10.35 0.92 0.82 1.23 6.13 -17.19 35.17 0.06 0.35 -0.99 2.02 3.84 3.96 4.69 1.86 1.75 1.57 10.30 0.94 0.84 1.27

551
Raw Data Tapered Data
FFT Data Parzen Filtered Data
Simple Ratio Spectrum
Z E N
Tapering Function
Z E N Z E N Z E N
Frequency Hz
E/Z N/Z
Mean SQRT Spectrum
-31.69 -18.79 28.33 0.04 -1.35 -0.80 1.20 1.08 2.83 4.68 1.29 1.60 1.63 8.84 1.24 1.26 1.77 -3.57 -22.69 43.23 0.04 -0.15 -0.95 1.82 1.27 6.05 5.16 1.27 1.58 1.62 8.79 1.24 1.28 1.78 -11.50 -21.58 17.15 0.04 -0.48 -0.90 0.71 1.36 10.82 5.23 1.25 1.56 1.60 8.74 1.25 1.29 1.79 -40.35 -36.45 -5.83 0.04 -1.65 -1.49 -0.24 3.16 5.86 5.16 1.23 1.54 1.59 8.69 1.25 1.29 1.80 -7.21 -22.31 2.21 0.04 -0.29 -0.90 0.09 2.36 5.90 4.76 1.21 1.52 1.58 8.64 1.25 1.30 1.81 16.81 -6.24 1.25 0.04 0.67 -0.25 0.05 3.09 5.35 3.95 1.20 1.51 1.56 8.59 1.26 1.30 1.81 4.81 -7.19 -18.68 0.04 0.19 -0.28 -0.74 3.82 0.79 4.57 1.19 1.50 1.55 8.54 1.26 1.30 1.81 2.84 -1.16 -2.60 0.04 0.11 -0.05 -0.10 2.52 6.47 3.09 1.18 1.49 1.53 8.50 1.26 1.30 1.81 -0.12 19.83 9.43 0.04 0.00 0.76 0.36 2.47 11.30 3.62 1.18 1.49 1.52 8.45 1.27 1.29 1.81 2.92 25.75 -5.54 0.04 0.11 0.98 -0.21 2.80 10.62 3.40 1.17 1.49 1.50 8.40 1.27 1.28 1.80 -4.03 -9.26 5.50 0.04 -0.15 -0.35 0.21 4.36 10.02 5.45 1.17 1.50 1.49 8.35 1.28 1.27 1.80 -24.93 -9.21 2.53 0.04 -0.92 -0.34 0.09 2.99 3.94 3.31 1.17 1.50 1.47 8.30 1.28 1.26 1.79 -34.77 13.80 -21.40 0.04 -1.27 0.50 -0.78 2.13 3.57 1.72 1.17 1.51 1.46 8.25 1.29 1.24 1.79 -40.57 1.79 -23.27 0.04 -1.46 0.06 -0.84 1.56 5.19 4.35 1.18 1.53 1.44 8.20 1.30 1.22 1.78 -26.39 -14.17 -7.16 0.04 -0.94 -0.50 -0.25 1.20 3.28 5.59 1.18 1.54 1.42 8.15 1.31 1.21 1.78 -15.26 -22.08 -8.09 0.04 -0.53 -0.77 -0.28 1.13 3.24 2.71 1.18 1.56 1.41 8.11 1.32 1.19 1.77 -25.14 -11.99 -20.00 0.03 -0.87 -0.41 -0.69 1.08 2.02 2.77 1.18 1.58 1.39 8.06 1.33 1.17 1.77 10.94 5.04 -1.91 0.03 0.37 0.17 -0.07 3.11 0.89 1.74 1.19 1.60 1.37 8.01 1.35 1.16 1.78 52.85 5.04 4.12 0.03 1.77 0.17 0.14 4.36 0.32 0.98 1.19 1.62 1.36 7.96 1.36 1.15 1.78 28.73 10.03 -14.81 0.03 0.95 0.33 -0.49 3.63 2.12 1.49 1.19 1.64 1.35 7.91 1.38 1.13 1.79 26.67 4.02 -10.72 0.03 0.87 0.13 -0.35 2.43 4.25 3.81 1.19 1.66 1.33 7.86 1.40 1.12 1.80 41.57 -2.96 -1.66 0.03 1.33 -0.09 -0.05 0.57 4.34 7.13 1.18 1.69 1.32 7.81 1.43 1.12 1.81 31.47 31.00 -5.60 0.03 0.99 0.98 -0.18 1.73 1.69 4.29 1.18 1.71 1.31 7.76 1.45 1.11 1.83 39.37 40.87 -6.54 0.03 1.22 1.27 -0.20 4.18 1.72 3.32 1.17 1.74 1.30 7.71 1.48 1.11 1.85 19.30 9.79 -5.47 0.03 0.59 0.30 -0.17 3.78 7.78 5.32 1.17 1.76 1.30 7.67 1.51 1.11 1.88 -0.70 13.76 -3.41 0.03 -0.02 0.41 -0.10 3.86 8.08 4.46 1.16 1.79 1.29 7.62 1.54 1.12 1.90 9.33 21.71 -12.34 0.03 0.28 0.64 -0.36 6.37 6.10 4.71 1.15 1.81 1.29 7.57 1.57 1.12 1.93 18.32 7.67 -20.23 0.03 0.53 0.22 -0.59 7.80 5.02 4.14 1.14 1.83 1.29 7.52 1.61 1.13 1.97 39.25 17.63 -11.13 0.03 1.12 0.50 -0.32 2.10 1.36 1.50 1.13 1.85 1.29 7.47 1.64 1.14 2.00 11.19 30.55 -29.01 0.03 0.31 0.86 -0.81 1.57 3.38 4.92 1.11 1.87 1.29 7.42 1.68 1.16 2.04 -29.73 19.47 -37.83 0.03 -0.82 0.54 -1.04 1.16 6.19 7.78 1.10 1.89 1.29 7.37 1.71 1.18 2.08 -31.69 -18.79 28.33 0.04 -1.35 -0.80 1.20 1.08 2.83 4.68 1.29 1.60 1.63 8.84 1.24 1.26 1.77 -3.57 -22.69 43.23 0.04 -0.15 -0.95 1.82 1.27 6.05 5.16 1.27 1.58 1.62 8.79 1.24 1.28 1.78

552
Raw Data Tapered Data
FFT Data Parzen Filtered Data
Simple Ratio Spectrum
Z E N
Tapering Function
Z E N Z E N Z E N
Frequency Hz
E/Z N/Z
Mean SQRT Spectrum
-2.62 8.43 7.27 0.03 -0.07 0.23 0.20 3.64 4.00 10.45 1.09 1.90 1.30 7.32 1.75 1.20 2.12 18.39 17.40 11.28 0.03 0.49 0.46 0.30 2.96 3.75 6.89 1.07 1.91 1.31 7.28 1.78 1.22 2.16 2.39 8.36 -5.69 0.03 0.06 0.22 -0.15 0.47 12.42 2.97 1.06 1.92 1.31 7.23 1.81 1.24 2.20
-22.53 -25.59 15.33 0.03 -0.57 -0.65 0.39 2.12 13.94 2.31 1.05 1.93 1.32 7.18 1.84 1.26 2.23 1.56 -39.44 33.27 0.03 0.04 -0.99 0.83 3.83 6.96 2.19 1.04 1.94 1.33 7.13 1.87 1.28 2.26 36.52 -30.28 36.18 0.02 0.89 -0.74 0.89 8.39 2.59 1.12 1.03 1.94 1.34 7.08 1.89 1.30 2.29 -15.48 -28.15 29.09 0.02 -0.37 -0.68 0.70 7.26 1.33 6.26 1.02 1.94 1.35 7.03 1.90 1.32 2.31 -35.33 -39.99 35.00 0.02 -0.83 -0.94 0.82 2.11 4.53 5.55 1.01 1.94 1.36 6.98 1.91 1.34 2.33 19.74 -42.81 38.89 0.02 0.45 -0.98 0.89 4.38 4.43 3.32 1.01 1.93 1.36 6.93 1.92 1.35 2.35 13.72 -39.62 16.82 0.02 0.31 -0.89 0.38 0.29 5.20 2.48 1.00 1.92 1.37 6.88 1.92 1.37 2.35 -40.19 -31.46 19.78 0.02 -0.88 -0.69 0.44 0.49 10.16 4.80 1.00 1.91 1.38 6.84 1.91 1.38 2.36 -37.99 -12.36 26.73 0.02 -0.82 -0.27 0.57 2.10 7.01 8.09 1.00 1.90 1.39 6.79 1.90 1.39 2.35 -9.85 5.68 18.68 0.02 -0.21 0.12 0.39 0.31 4.65 5.31 1.00 1.89 1.40 6.74 1.88 1.40 2.35 -27.73 6.67 18.64 0.02 -0.57 0.14 0.38 5.30 3.13 3.91 1.01 1.88 1.41 6.69 1.86 1.40 2.33 -15.60 6.66 11.62 0.02 -0.31 0.13 0.23 3.87 2.30 1.25 1.01 1.86 1.42 6.64 1.84 1.40 2.31 29.42 29.61 -2.36 0.02 0.57 0.58 -0.05 3.02 4.44 7.57 1.02 1.85 1.43 6.59 1.81 1.40 2.29 15.37 30.51 -10.29 0.02 0.29 0.58 -0.20 1.83 3.85 2.39 1.03 1.84 1.44 6.54 1.79 1.40 2.27 -14.59 6.45 -12.21 0.02 -0.27 0.12 -0.23 12.14 9.26 16.85 1.04 1.82 1.45 6.49 1.76 1.40 2.25 -10.50 2.45 -7.13 0.02 -0.19 0.04 -0.13 9.38 6.93 13.71 1.05 1.81 1.46 6.45 1.73 1.39 2.22 -12.41 6.45 -3.07 0.02 -0.22 0.11 -0.05 3.08 10.76 5.53 1.06 1.80 1.47 6.40 1.70 1.39 2.20 -26.28 10.44 -17.99 0.02 -0.45 0.18 -0.31 4.78 6.96 13.31 1.07 1.79 1.48 6.35 1.68 1.39 2.17 -4.18 8.42 -32.85 0.02 -0.07 0.14 -0.54 3.87 4.91 7.09 1.08 1.79 1.50 6.30 1.65 1.38 2.15 18.83 24.37 -31.68 0.02 0.30 0.39 -0.51 4.32 2.37 8.68 1.10 1.79 1.51 6.25 1.63 1.38 2.13 -15.13 40.26 -38.49 0.02 -0.23 0.62 -0.60 3.95 4.14 7.62 1.11 1.79 1.53 6.20 1.61 1.37 2.12 -19.02 28.14 -25.33 0.02 -0.29 0.42 -0.38 9.66 7.71 12.94 1.13 1.79 1.54 6.15 1.59 1.37 2.10 37.99 34.03 -6.22 0.01 0.55 0.49 -0.09 6.08 7.78 25.39 1.14 1.80 1.56 6.10 1.58 1.37 2.09 48.86 47.88 -12.14 0.01 0.68 0.67 -0.17 7.68 17.45 23.40 1.16 1.81 1.58 6.05 1.57 1.37 2.08 19.76 37.73 3.91 0.01 0.27 0.51 0.05 56.51 32.57 55.32 1.17 1.82 1.60 6.01 1.56 1.37 2.07 23.72 18.63 11.92 0.01 0.31 0.24 0.15 53.28 33.18 47.93 1.19 1.84 1.62 5.96 1.55 1.37 2.07 38.64 4.60 2.93 0.01 0.48 0.06 0.04 7.23 13.03 9.28 1.20 1.86 1.65 5.91 1.55 1.37 2.07 7.59 -8.37 10.95 0.01 0.09 -0.10 0.13 1.65 5.80 5.50 1.22 1.88 1.68 5.86 1.54 1.38 2.07 -2.62 8.43 7.27 0.03 -0.07 0.23 0.20 3.64 4.00 10.45 1.09 1.90 1.30 7.32 1.75 1.20 2.12 18.39 17.40 11.28 0.03 0.49 0.46 0.30 2.96 3.75 6.89 1.07 1.91 1.31 7.28 1.78 1.22 2.16

553
Raw Data Tapered Data
FFT Data Parzen Filtered Data
Simple Ratio Spectrum
Z E N
Tapering Function
Z E N Z E N Z E N
Frequency Hz
E/Z N/Z
Mean SQRT Spectrum
-17.35 -11.32 5.95 0.01 -0.20 -0.13 0.07 1.45 5.28 6.15 1.24 1.90 1.71 5.81 1.54 1.38 2.07 16.69 -7.26 0.98 0.01 0.18 -0.08 0.01 1.72 1.46 10.72 1.26 1.93 1.75 5.76 1.53 1.39 2.07 4.69 -22.19 -6.97 0.01 0.05 -0.23 -0.07 3.77 1.38 13.91 1.28 1.95 1.79 5.71 1.53 1.40 2.07
-47.18 -33.06 -9.89 0.01 -0.47 -0.33 -0.10 3.65 5.64 3.35 1.31 1.99 1.84 5.66 1.52 1.40 2.07 -0.04 -15.94 6.15 0.01 0.00 -0.15 0.06 1.74 3.66 3.36 1.34 2.02 1.89 5.62 1.51 1.41 2.07 28.94 -5.88 0.18 0.01 0.26 -0.05 0.00 6.02 2.37 2.35 1.37 2.05 1.95 5.57 1.49 1.42 2.06 -3.07 0.14 5.21 0.01 -0.03 0.00 0.04 3.90 2.83 4.30 1.41 2.09 2.02 5.52 1.48 1.43 2.06 12.96 13.14 33.18 0.01 0.10 0.11 0.27 1.62 2.68 5.79 1.46 2.13 2.10 5.47 1.46 1.44 2.05 -0.03 5.12 28.09 0.01 0.00 0.04 0.21 3.16 1.07 3.59 1.51 2.17 2.18 5.42 1.44 1.45 2.04 -36.91 -13.85 17.04 0.01 -0.26 -0.10 0.12 5.68 1.49 0.15 1.56 2.21 2.28 5.37 1.41 1.46 2.03 -6.78 -18.77 30.99 0.01 -0.04 -0.12 0.20 5.95 2.58 1.56 1.63 2.25 2.38 5.32 1.39 1.46 2.02 34.21 -8.69 21.92 0.01 0.21 -0.05 0.13 2.58 2.85 6.58 1.70 2.30 2.49 5.27 1.36 1.47 2.00 7.17 0.34 4.91 0.01 0.04 0.00 0.03 3.36 3.55 7.96 1.77 2.35 2.62 5.22 1.33 1.48 1.99
-48.71 -5.63 7.92 0.01 -0.24 -0.03 0.04 5.31 0.93 5.84 1.85 2.40 2.75 5.18 1.29 1.48 1.97 -20.53 -17.57 -1.05 0.00 -0.09 -0.08 0.00 3.11 1.91 4.89 1.94 2.45 2.88 5.13 1.26 1.48 1.95 6.54 -11.49 -9.99 0.00 0.03 -0.05 -0.04 1.47 1.66 5.21 2.04 2.51 3.03 5.08 1.23 1.48 1.93
-30.37 6.54 -7.92 0.00 -0.11 0.02 -0.03 0.70 4.40 7.03 2.14 2.56 3.18 5.03 1.20 1.48 1.91 -15.23 -12.44 1.14 0.00 -0.05 -0.04 0.00 4.86 1.22 8.92 2.24 2.62 3.32 4.98 1.17 1.48 1.89 -9.14 -12.37 15.14 0.00 -0.02 -0.03 0.04 5.82 2.79 9.14 2.35 2.67 3.47 4.93 1.14 1.48 1.87 -23.03 18.64 3.15 0.00 -0.05 0.04 0.01 3.94 0.53 1.34 2.45 2.72 3.62 4.88 1.11 1.48 1.85 23.01 -2.38 -8.80 0.00 0.03 0.00 -0.01 4.25 1.57 1.65 2.55 2.77 3.76 4.83 1.09 1.48 1.83 52.90 -13.33 8.24 0.00 0.05 -0.01 0.01 3.93 0.74 6.50 2.65 2.82 3.90 4.79 1.06 1.47 1.82 43.75 15.68 -0.74 0.00 0.02 0.01 0.00 0.43 1.16 4.32 2.74 2.85 4.02 4.74 1.04 1.47 1.80

554
Microtremors Segment: B1-S5
Raw Data Tapered Data
FFT Data Parzen Filtered Data
Simple Ratio Spectrum
Z E N
Tapering Function
Z E N Z E N Z E N
Frequency Hz
E/Z N/Z
Mean SQRT Spectrum
31.95 -12.77 -5.54 0.26 8.29 -3.31 -1.44 3.25 1.63 0.71 3.53 0.99 1.02 30.03 0.28 0.29 0.40 -6.05 -14.69 -13.47 0.26 -1.57 -3.80 -3.49 3.42 1.18 1.49 3.51 0.98 1.00 29.98 0.28 0.29 0.40 -16.95 -7.62 -3.40 0.26 -4.38 -1.97 -0.88 0.52 1.87 1.87 3.47 0.96 0.99 29.93 0.28 0.28 0.40 -0.87 -5.57 -9.34 0.26 -0.22 -1.44 -2.41 1.69 2.85 0.48 3.42 0.94 0.97 29.88 0.27 0.28 0.39 -49.72 -7.52 -7.27 0.26 -12.80 -1.94 -1.87 2.08 3.35 3.19 3.36 0.91 0.94 29.83 0.27 0.28 0.39 -49.47 17.48 10.76 0.26 -12.71 4.49 2.77 1.24 0.78 3.59 3.29 0.89 0.92 29.79 0.27 0.28 0.39 22.64 23.43 12.75 0.26 5.81 6.01 3.27 3.26 0.92 1.76 3.21 0.86 0.90 29.74 0.27 0.28 0.39 16.61 1.40 4.75 0.26 4.25 0.36 1.22 3.25 1.24 3.60 3.12 0.84 0.88 29.69 0.27 0.28 0.39 -39.30 -3.57 -2.22 0.26 -10.04 -0.91 -0.57 2.97 1.53 2.24 3.02 0.82 0.85 29.64 0.27 0.28 0.39 -19.13 1.45 5.81 0.26 -4.88 0.37 1.48 0.77 0.37 1.51 2.92 0.79 0.83 29.59 0.27 0.28 0.39 28.90 8.46 -1.16 0.25 7.36 2.15 -0.30 1.72 1.50 0.31 2.82 0.77 0.81 29.54 0.27 0.29 0.40 0.90 5.45 -28.07 0.25 0.23 1.39 -7.13 1.31 0.47 1.64 2.72 0.75 0.79 29.49 0.27 0.29 0.40 -1.05 8.45 -21.93 0.25 -0.27 2.14 -5.56 1.91 0.87 2.32 2.62 0.72 0.77 29.44 0.28 0.29 0.40 52.89 -0.54 -4.84 0.25 13.38 -0.14 -1.23 1.59 1.29 1.85 2.52 0.70 0.75 29.39 0.28 0.30 0.41 29.78 -25.47 -19.76 0.25 7.52 -6.43 -4.99 3.33 1.36 1.40 2.42 0.69 0.74 29.35 0.28 0.30 0.42 -16.20 -6.38 -29.62 0.25 -4.08 -1.61 -7.47 3.66 1.45 2.21 2.33 0.67 0.73 29.30 0.29 0.31 0.42 -6.11 1.65 -6.52 0.25 -1.54 0.42 -1.64 3.29 1.17 1.41 2.24 0.65 0.72 29.25 0.29 0.32 0.43 -17.01 -7.31 5.52 0.25 -4.27 -1.84 1.39 2.30 2.07 1.42 2.16 0.64 0.71 29.20 0.30 0.33 0.44 -29.86 11.70 6.54 0.25 -7.48 2.93 1.64 2.15 1.72 1.60 2.08 0.63 0.70 29.15 0.30 0.34 0.45 -7.74 3.69 25.51 0.25 -1.93 0.92 6.38 2.52 0.73 3.11 2.01 0.62 0.70 29.10 0.31 0.35 0.47 -18.63 5.70 24.44 0.25 -4.65 1.42 6.10 4.75 4.34 0.93 1.94 0.61 0.70 29.05 0.32 0.36 0.48 -35.48 5.70 -10.55 0.25 -8.83 1.42 -2.63 5.36 5.65 0.76 1.88 0.61 0.70 29.00 0.32 0.37 0.49 -0.35 -5.28 -17.46 0.25 -0.09 -1.31 -4.34 4.60 5.48 1.68 1.83 0.60 0.70 28.96 0.33 0.38 0.50 27.64 29.70 -5.38 0.25 6.86 7.36 -1.33 2.18 5.33 2.74 1.78 0.60 0.70 28.91 0.34 0.39 0.52 26.59 25.61 -10.31 0.25 6.58 6.34 -2.55 3.20 4.81 3.67 1.73 0.59 0.70 28.86 0.34 0.40 0.53 47.49 -3.41 -3.24 0.25 11.73 -0.84 -0.80 6.00 1.68 1.32 1.69 0.59 0.70 28.81 0.35 0.42 0.54 66.31 9.60 1.79 0.25 16.35 2.37 0.44 6.50 2.81 3.03 1.65 0.59 0.71 28.76 0.36 0.43 0.56 17.19 18.56 -18.14 0.25 4.23 4.57 -4.46 16.19 4.94 4.15 1.61 0.59 0.71 28.71 0.37 0.44 0.57 -49.69 16.52 -25.01 0.25 -12.20 4.05 -6.14 6.80 3.76 1.74 1.57 0.59 0.72 28.66 0.37 0.46 0.59 -42.46 4.50 -16.89 0.25 -10.40 1.10 -4.14 6.73 1.24 2.56 1.54 0.59 0.72 28.61 0.38 0.47 0.61 3.67 6.50 -11.80 0.24 0.90 1.59 -2.88 1.75 3.27 2.33 1.50 0.59 0.73 28.56 0.39 0.48 0.62 33.64 13.48 -13.71 0.24 8.21 3.29 -3.35 3.41 2.88 2.75 1.47 0.60 0.73 28.52 0.41 0.50 0.64 31.95 -12.77 -5.54 0.26 8.29 -3.31 -1.44 3.25 1.63 0.71 3.53 0.99 1.02 30.03 0.28 0.29 0.40

555
Raw Data Tapered Data
FFT Data Parzen Filtered Data
Simple Ratio Spectrum
Z E N
Tapering Function
Z E N Z E N Z E N
Frequency Hz
E/Z N/Z
Mean SQRT Spectrum
53.52 -6.51 -9.63 0.24 13.03 -1.59 -2.34 4.27 1.20 2.28 1.44 0.60 0.73 28.47 0.42 0.51 0.66 41.38 -8.46 0.43 0.24 10.06 -2.06 0.10 1.95 1.19 0.38 1.40 0.60 0.74 28.42 0.43 0.53 0.68 -8.64 2.58 -2.53 0.24 -2.09 0.62 -0.61 5.39 0.74 2.54 1.37 0.61 0.74 28.37 0.44 0.54 0.70 -40.49 -8.39 -7.47 0.24 -9.80 -2.03 -1.81 5.82 1.83 2.09 1.35 0.62 0.74 28.32 0.46 0.55 0.72 -21.32 -6.34 7.56 0.24 -5.15 -1.53 1.83 6.87 2.00 1.31 1.32 0.62 0.74 28.27 0.47 0.56 0.74 -6.21 4.69 10.56 0.24 -1.50 1.13 2.55 4.83 1.72 1.98 1.30 0.63 0.75 28.22 0.49 0.58 0.75 -45.06 -7.28 -12.40 0.24 -10.84 -1.75 -2.98 0.94 1.22 1.70 1.28 0.64 0.75 28.17 0.50 0.59 0.77 -48.82 -7.23 -8.32 0.24 -11.72 -1.74 -2.00 2.97 2.16 0.80 1.26 0.65 0.75 28.13 0.52 0.60 0.79 9.31 -3.19 14.71 0.24 2.23 -0.76 3.52 4.71 3.75 1.41 1.24 0.66 0.75 28.08 0.53 0.60 0.81 33.28 -17.12 11.69 0.24 7.95 -4.09 2.79 3.44 3.23 0.54 1.23 0.68 0.75 28.03 0.55 0.61 0.82 29.20 -17.03 19.66 0.24 6.96 -4.06 4.69 1.53 1.83 2.04 1.23 0.69 0.75 27.98 0.56 0.61 0.83 38.12 -1.97 39.58 0.24 9.07 -0.47 9.42 2.23 0.92 2.02 1.23 0.71 0.75 27.93 0.58 0.61 0.84 19.05 5.05 12.51 0.24 4.52 1.20 2.97 1.64 1.05 1.73 1.23 0.73 0.75 27.88 0.59 0.61 0.85 -26.88 -9.92 2.52 0.24 -6.37 -2.35 0.60 2.66 0.66 0.76 1.24 0.75 0.75 27.83 0.60 0.61 0.85 -55.67 -21.83 25.50 0.24 -13.17 -5.16 6.03 4.21 1.97 0.51 1.26 0.77 0.76 27.78 0.61 0.60 0.86 -53.40 -20.72 12.46 0.24 -12.60 -4.89 2.94 3.82 3.42 0.96 1.28 0.79 0.76 27.73 0.62 0.59 0.85 -37.17 -28.60 7.45 0.24 -8.75 -6.74 1.76 4.91 1.16 0.89 1.30 0.81 0.76 27.69 0.62 0.58 0.85 9.94 -24.47 15.44 0.24 2.34 -5.75 3.63 8.98 0.92 2.76 1.32 0.83 0.76 27.64 0.62 0.57 0.85 69.83 -14.37 11.42 0.23 16.37 -3.37 2.68 3.40 0.68 2.22 1.35 0.84 0.76 27.59 0.63 0.56 0.84 73.59 1.68 31.37 0.23 17.22 0.39 7.34 0.94 0.69 2.60 1.38 0.86 0.76 27.54 0.63 0.55 0.83 25.44 11.68 35.28 0.23 5.94 2.73 8.24 4.67 2.21 2.93 1.41 0.88 0.76 27.49 0.62 0.54 0.83 -31.50 -8.30 14.21 0.23 -7.34 -1.93 3.31 3.24 2.17 3.41 1.44 0.90 0.76 27.44 0.62 0.53 0.82 -28.33 0.74 6.21 0.23 -6.59 0.17 1.44 3.11 2.55 3.07 1.48 0.91 0.76 27.39 0.62 0.52 0.81 -15.19 35.69 -3.77 0.23 -3.52 8.28 -0.87 5.07 1.77 1.46 1.51 0.93 0.76 27.34 0.61 0.51 0.80 -19.07 35.57 -16.69 0.23 -4.41 8.23 -3.86 4.48 1.54 0.84 1.54 0.94 0.77 27.29 0.61 0.50 0.79 29.96 27.46 -23.57 0.23 6.92 6.34 -5.45 3.50 1.69 1.32 1.57 0.94 0.76 27.25 0.60 0.49 0.78 23.90 34.36 -30.43 0.23 5.51 7.92 -7.01 0.68 1.02 1.40 1.59 0.95 0.76 27.20 0.60 0.48 0.77 -42.01 20.28 -31.27 0.23 -9.66 4.66 -7.19 3.30 1.20 2.60 1.62 0.95 0.76 27.15 0.59 0.47 0.76 -38.80 8.24 -25.12 0.23 -8.90 1.89 -5.77 4.04 1.43 1.47 1.63 0.95 0.76 27.10 0.58 0.47 0.75 -15.64 17.22 -13.01 0.23 -3.58 3.94 -2.98 3.69 3.79 0.48 1.65 0.95 0.76 27.05 0.58 0.46 0.74 -35.49 3.20 -12.92 0.23 -8.11 0.73 -2.95 4.74 3.82 0.28 1.66 0.95 0.75 27.00 0.57 0.45 0.73 53.52 -6.51 -9.63 0.24 13.03 -1.59 -2.34 4.27 1.20 2.28 1.44 0.60 0.73 28.47 0.42 0.51 0.66 41.38 -8.46 0.43 0.24 10.06 -2.06 0.10 1.95 1.19 0.38 1.40 0.60 0.74 28.42 0.43 0.53 0.68

556
Raw Data Tapered Data
FFT Data Parzen Filtered Data
Simple Ratio Spectrum
Z E N
Tapering Function
Z E N Z E N Z E N
Frequency Hz
E/Z N/Z
Mean SQRT Spectrum
-28.31 -9.77 -12.83 0.23 -6.45 -2.23 -2.93 3.57 5.02 2.68 1.67 0.94 0.75 26.95 0.56 0.45 0.72 40.72 3.27 6.21 0.23 9.26 0.74 1.41 1.32 4.01 2.11 1.67 0.93 0.75 26.90 0.56 0.45 0.71 63.56 12.26 18.20 0.23 14.43 2.78 4.13 2.34 4.18 1.32 1.67 0.92 0.74 26.86 0.55 0.44 0.71 17.45 7.24 19.16 0.23 3.95 1.64 4.34 0.91 3.68 2.28 1.67 0.91 0.73 26.81 0.54 0.44 0.70 35.39 -1.74 3.15 0.23 8.00 -0.39 0.71 1.16 3.37 1.73 1.66 0.89 0.73 26.76 0.54 0.44 0.69 55.26 12.26 -2.81 0.23 12.46 2.76 -0.63 2.24 2.83 1.98 1.65 0.88 0.72 26.71 0.53 0.44 0.69 -9.78 14.23 0.23 0.23 -2.20 3.20 0.05 1.25 1.17 3.37 1.64 0.86 0.72 26.66 0.53 0.44 0.68 -32.65 -16.74 -10.71 0.22 -7.33 -3.76 -2.41 1.01 1.87 3.42 1.62 0.85 0.71 26.61 0.52 0.44 0.68 -4.52 -9.67 5.33 0.22 -1.01 -2.17 1.19 2.00 2.67 3.15 1.61 0.83 0.70 26.56 0.52 0.44 0.68 -8.45 -9.61 11.33 0.22 -1.89 -2.15 2.53 1.46 1.65 1.59 1.59 0.82 0.70 26.51 0.51 0.44 0.68 -7.37 -37.49 -4.64 0.22 -1.64 -8.36 -1.04 2.53 0.77 2.07 1.57 0.80 0.69 26.46 0.51 0.44 0.67 43.61 -19.35 22.36 0.22 9.70 -4.31 4.97 2.77 0.14 1.48 1.55 0.79 0.69 26.42 0.51 0.44 0.67 91.39 4.70 19.31 0.22 20.29 1.04 4.29 3.78 0.29 2.86 1.53 0.78 0.68 26.37 0.51 0.45 0.68 15.22 -9.27 -18.66 0.22 3.37 -2.05 -4.13 3.20 1.68 1.16 1.51 0.77 0.68 26.32 0.51 0.45 0.68 -78.60 -1.22 -21.54 0.22 -17.37 -0.27 -4.76 4.84 2.92 1.47 1.49 0.76 0.68 26.27 0.51 0.45 0.68 -40.31 30.74 -5.45 0.22 -8.89 6.78 -1.20 4.70 1.87 3.72 1.47 0.75 0.67 26.22 0.51 0.46 0.69 -45.09 19.66 4.59 0.22 -9.92 4.33 1.01 8.52 0.33 2.50 1.45 0.75 0.67 26.17 0.52 0.46 0.69 -83.78 3.64 -13.36 0.22 -18.39 0.80 -2.93 5.17 2.68 1.79 1.43 0.75 0.67 26.12 0.52 0.47 0.70 1.43 9.64 -18.26 0.22 0.31 2.11 -4.00 6.58 3.22 2.25 1.41 0.75 0.67 26.07 0.53 0.48 0.71 66.35 18.60 -3.18 0.22 14.50 4.06 -0.70 2.00 2.75 1.70 1.39 0.75 0.67 26.03 0.54 0.48 0.72 36.19 20.55 -15.11 0.22 7.89 4.48 -3.29 4.40 2.53 2.33 1.38 0.75 0.68 25.98 0.55 0.49 0.73 11.15 -5.46 -14.02 0.22 2.42 -1.19 -3.05 3.07 1.67 0.91 1.36 0.76 0.68 25.93 0.56 0.50 0.75 4.17 -12.40 -1.95 0.22 0.90 -2.69 -0.42 1.91 2.49 1.30 1.34 0.76 0.68 25.88 0.57 0.51 0.76
-23.75 -11.33 -10.89 0.22 -5.14 -2.45 -2.36 1.30 1.19 2.82 1.32 0.77 0.69 25.83 0.58 0.52 0.78 -48.55 -38.21 -2.82 0.22 -10.49 -8.25 -0.61 1.61 2.15 4.22 1.30 0.78 0.69 25.78 0.60 0.53 0.80 -13.38 -24.06 8.20 0.22 -2.88 -5.19 1.77 2.88 1.25 1.61 1.29 0.79 0.69 25.73 0.61 0.54 0.82 28.64 -4.98 -10.76 0.22 6.16 -1.07 -2.31 0.14 0.52 2.42 1.27 0.80 0.70 25.68 0.63 0.55 0.84 13.61 -18.91 -18.66 0.21 2.92 -4.06 -4.00 6.17 1.75 0.50 1.25 0.81 0.70 25.63 0.64 0.56 0.86 28.57 -8.83 -6.58 0.21 6.11 -1.89 -1.41 4.60 1.99 1.48 1.24 0.82 0.71 25.59 0.66 0.57 0.87 78.41 8.19 -11.50 0.21 16.74 1.75 -2.46 2.06 2.38 1.76 1.22 0.83 0.72 25.54 0.68 0.58 0.89 39.22 5.19 -12.42 0.21 8.35 1.11 -2.65 0.17 0.91 2.20 1.21 0.84 0.72 25.49 0.69 0.60 0.91 -28.31 -9.77 -12.83 0.23 -6.45 -2.23 -2.93 3.57 5.02 2.68 1.67 0.94 0.75 26.95 0.56 0.45 0.72 40.72 3.27 6.21 0.23 9.26 0.74 1.41 1.32 4.01 2.11 1.67 0.93 0.75 26.90 0.56 0.45 0.71

557
Raw Data Tapered
Data FFT Data Parzen Filtered
Data Simple Ratio
Spectrum Z E N
Tapering Function
Z E N Z E N Z E N
Frequency Hz
E/Z N/Z
Mean SQRT Spectrum
-28.31 -9.77 -12.83 0.23 -6.45 -2.23 -2.93 3.57 5.02 2.68 1.67 0.94 0.75 26.95 0.56 0.45 0.72 40.72 3.27 6.21 0.23 9.26 0.74 1.41 1.32 4.01 2.11 1.67 0.93 0.75 26.90 0.56 0.45 0.71 63.56 12.26 18.20 0.23 14.43 2.78 4.13 2.34 4.18 1.32 1.67 0.92 0.74 26.86 0.55 0.44 0.71 17.45 7.24 19.16 0.23 3.95 1.64 4.34 0.91 3.68 2.28 1.67 0.91 0.73 26.81 0.54 0.44 0.70 35.39 -1.74 3.15 0.23 8.00 -0.39 0.71 1.16 3.37 1.73 1.66 0.89 0.73 26.76 0.54 0.44 0.69 55.26 12.26 -2.81 0.23 12.46 2.76 -0.63 2.24 2.83 1.98 1.65 0.88 0.72 26.71 0.53 0.44 0.69 -9.78 14.23 0.23 0.23 -2.20 3.20 0.05 1.25 1.17 3.37 1.64 0.86 0.72 26.66 0.53 0.44 0.68 -32.65 -16.74 -10.71 0.22 -7.33 -3.76 -2.41 1.01 1.87 3.42 1.62 0.85 0.71 26.61 0.52 0.44 0.68 -4.52 -9.67 5.33 0.22 -1.01 -2.17 1.19 2.00 2.67 3.15 1.61 0.83 0.70 26.56 0.52 0.44 0.68 -8.45 -9.61 11.33 0.22 -1.89 -2.15 2.53 1.46 1.65 1.59 1.59 0.82 0.70 26.51 0.51 0.44 0.68 -7.37 -37.49 -4.64 0.22 -1.64 -8.36 -1.04 2.53 0.77 2.07 1.57 0.80 0.69 26.46 0.51 0.44 0.67 43.61 -19.35 22.36 0.22 9.70 -4.31 4.97 2.77 0.14 1.48 1.55 0.79 0.69 26.42 0.51 0.44 0.67 91.39 4.70 19.31 0.22 20.29 1.04 4.29 3.78 0.29 2.86 1.53 0.78 0.68 26.37 0.51 0.45 0.68 15.22 -9.27 -18.66 0.22 3.37 -2.05 -4.13 3.20 1.68 1.16 1.51 0.77 0.68 26.32 0.51 0.45 0.68 -78.60 -1.22 -21.54 0.22 -17.37 -0.27 -4.76 4.84 2.92 1.47 1.49 0.76 0.68 26.27 0.51 0.45 0.68 -40.31 30.74 -5.45 0.22 -8.89 6.78 -1.20 4.70 1.87 3.72 1.47 0.75 0.67 26.22 0.51 0.46 0.69 -45.09 19.66 4.59 0.22 -9.92 4.33 1.01 8.52 0.33 2.50 1.45 0.75 0.67 26.17 0.52 0.46 0.69 -83.78 3.64 -13.36 0.22 -18.39 0.80 -2.93 5.17 2.68 1.79 1.43 0.75 0.67 26.12 0.52 0.47 0.70 1.43 9.64 -18.26 0.22 0.31 2.11 -4.00 6.58 3.22 2.25 1.41 0.75 0.67 26.07 0.53 0.48 0.71 66.35 18.60 -3.18 0.22 14.50 4.06 -0.70 2.00 2.75 1.70 1.39 0.75 0.67 26.03 0.54 0.48 0.72 36.19 20.55 -15.11 0.22 7.89 4.48 -3.29 4.40 2.53 2.33 1.38 0.75 0.68 25.98 0.55 0.49 0.73 11.15 -5.46 -14.02 0.22 2.42 -1.19 -3.05 3.07 1.67 0.91 1.36 0.76 0.68 25.93 0.56 0.50 0.75 4.17 -12.40 -1.95 0.22 0.90 -2.69 -0.42 1.91 2.49 1.30 1.34 0.76 0.68 25.88 0.57 0.51 0.76
-23.75 -11.33 -10.89 0.22 -5.14 -2.45 -2.36 1.30 1.19 2.82 1.32 0.77 0.69 25.83 0.58 0.52 0.78 -48.55 -38.21 -2.82 0.22 -10.49 -8.25 -0.61 1.61 2.15 4.22 1.30 0.78 0.69 25.78 0.60 0.53 0.80 -13.38 -24.06 8.20 0.22 -2.88 -5.19 1.77 2.88 1.25 1.61 1.29 0.79 0.69 25.73 0.61 0.54 0.82 28.64 -4.98 -10.76 0.22 6.16 -1.07 -2.31 0.14 0.52 2.42 1.27 0.80 0.70 25.68 0.63 0.55 0.84 13.61 -18.91 -18.66 0.21 2.92 -4.06 -4.00 6.17 1.75 0.50 1.25 0.81 0.70 25.63 0.64 0.56 0.86 28.57 -8.83 -6.58 0.21 6.11 -1.89 -1.41 4.60 1.99 1.48 1.24 0.82 0.71 25.59 0.66 0.57 0.87 78.41 8.19 -11.50 0.21 16.74 1.75 -2.46 2.06 2.38 1.76 1.22 0.83 0.72 25.54 0.68 0.58 0.89 39.22 5.19 -12.42 0.21 8.35 1.11 -2.65 0.17 0.91 2.20 1.21 0.84 0.72 25.49 0.69 0.60 0.91 -28.31 -9.77 -12.83 0.23 -6.45 -2.23 -2.93 3.57 5.02 2.68 1.67 0.94 0.75 26.95 0.56 0.45 0.72 40.72 3.27 6.21 0.23 9.26 0.74 1.41 1.32 4.01 2.11 1.67 0.93 0.75 26.90 0.56 0.45 0.71

558
Raw Data Tapered Data
FFT Data Parzen Filtered Data
Simple Ratio Spectrum
Z E N
Tapering Function
Z E N Z E N Z E N
Frequency Hz
E/Z N/Z
Mean SQRT Spectrum
13.19 7.40 -18.80 0.20 2.60 1.46 -3.70 7.26 1.72 5.87 1.46 0.66 0.90 23.93 0.45 0.62 0.77 46.12 4.40 -27.67 0.20 9.06 0.86 -5.44 4.55 0.36 1.18 1.48 0.65 0.91 23.88 0.44 0.62 0.76 17.05 20.37 -46.49 0.20 3.34 3.99 -9.11 5.36 1.05 0.80 1.51 0.65 0.93 23.83 0.43 0.62 0.75 -38.86 14.33 -35.29 0.20 -7.60 2.80 -6.90 2.17 1.75 0.59 1.53 0.64 0.94 23.78 0.42 0.62 0.75 -4.72 -0.68 -12.16 0.20 -0.92 -0.13 -2.37 4.03 1.40 0.19 1.56 0.64 0.96 23.73 0.41 0.62 0.74 65.20 6.33 -15.07 0.19 12.68 1.23 -2.93 1.92 2.59 2.32 1.58 0.63 0.97 23.68 0.40 0.62 0.73 59.00 13.32 -16.96 0.19 11.45 2.58 -3.29 2.47 4.52 3.22 1.61 0.63 0.99 23.63 0.39 0.61 0.73 41.85 9.29 7.09 0.19 8.10 1.80 1.37 2.44 7.11 4.67 1.64 0.62 1.00 23.58 0.38 0.61 0.72 40.73 -3.70 10.09 0.19 7.86 -0.71 1.95 2.68 2.73 2.68 1.66 0.62 1.02 23.54 0.37 0.61 0.72 -14.27 -6.65 -16.86 0.19 -2.75 -1.28 -3.24 3.23 1.15 1.26 1.69 0.61 1.03 23.49 0.36 0.61 0.71 -64.07 -12.59 -11.76 0.19 -12.30 -2.42 -2.26 3.21 0.49 3.30 1.71 0.61 1.04 23.44 0.36 0.61 0.70 -25.84 -25.49 4.29 0.19 -4.95 -4.88 0.82 3.78 1.90 1.56 1.73 0.61 1.05 23.39 0.35 0.61 0.70 25.21 -8.40 2.31 0.19 4.82 -1.60 0.44 5.14 1.54 1.97 1.76 0.61 1.06 23.34 0.35 0.60 0.70 10.19 -19.32 -9.64 0.19 1.94 -3.68 -1.84 3.93 0.75 1.43 1.78 0.61 1.07 23.29 0.34 0.60 0.69 21.17 -30.20 -21.54 0.19 4.02 -5.74 -4.09 2.61 1.00 2.33 1.80 0.61 1.07 23.24 0.34 0.60 0.69 65.05 3.87 -11.43 0.19 12.33 0.73 -2.17 1.19 2.56 2.00 1.81 0.61 1.08 23.19 0.34 0.60 0.68 6.95 3.88 -3.37 0.19 1.31 0.73 -0.64 1.55 4.50 1.78 1.83 0.62 1.08 23.14 0.34 0.59 0.68
-72.87 -12.08 5.66 0.19 -13.74 -2.28 1.07 3.54 3.43 3.05 1.84 0.62 1.08 23.10 0.34 0.59 0.68 -35.60 -3.03 20.65 0.19 -6.69 -0.57 3.88 3.45 1.68 1.02 1.85 0.63 1.08 23.05 0.34 0.59 0.68 -8.46 13.98 11.62 0.19 -1.59 2.62 2.18 1.61 1.97 2.05 1.86 0.63 1.08 23.00 0.34 0.58 0.67 -45.31 13.94 3.63 0.19 -8.47 2.61 0.68 3.28 1.06 0.98 1.87 0.64 1.08 22.95 0.34 0.58 0.67 -21.13 -10.04 9.64 0.19 -3.94 -1.87 1.80 2.10 0.77 1.58 1.87 0.65 1.08 22.90 0.35 0.57 0.67 12.94 -1.99 -1.34 0.19 2.41 -0.37 -0.25 1.08 2.49 2.41 1.88 0.66 1.07 22.85 0.35 0.57 0.67 -4.03 -0.97 -7.29 0.19 -0.75 -0.18 -1.35 0.91 1.92 0.98 1.88 0.67 1.07 22.80 0.36 0.57 0.67 -3.96 -32.87 4.75 0.19 -0.73 -6.08 0.88 2.94 2.53 3.01 1.88 0.68 1.06 22.75 0.36 0.57 0.67 6.08 -7.77 3.77 0.18 1.12 -1.43 0.70 1.52 4.73 0.99 1.88 0.69 1.06 22.71 0.37 0.56 0.67
-17.85 25.22 -5.19 0.18 -3.28 4.64 -0.96 5.68 3.49 1.34 1.87 0.71 1.05 22.66 0.38 0.56 0.68 -25.71 -11.78 -0.14 0.18 -4.72 -2.16 -0.03 1.72 4.31 2.35 1.86 0.72 1.05 22.61 0.39 0.56 0.68 -0.61 -16.70 7.88 0.18 -0.11 -3.06 1.44 1.56 2.97 2.09 1.85 0.73 1.04 22.56 0.39 0.56 0.69 7.43 29.29 14.87 0.18 1.36 5.35 2.71 3.80 0.10 1.89 1.84 0.74 1.03 22.51 0.40 0.56 0.69 28.41 21.22 9.85 0.18 5.17 3.86 1.79 0.83 0.30 2.91 1.82 0.76 1.02 22.46 0.41 0.56 0.70 13.19 7.40 -18.80 0.20 2.60 1.46 -3.70 7.26 1.72 5.87 1.46 0.66 0.90 23.93 0.45 0.62 0.77 46.12 4.40 -27.67 0.20 9.06 0.86 -5.44 4.55 0.36 1.18 1.48 0.65 0.91 23.88 0.44 0.62 0.76

559
Raw Data Tapered Data
FFT Data Parzen Filtered Data
Simple Ratio Spectrum
Z E N
Tapering Function
Z E N Z E N Z E N
Frequency Hz
E/Z N/Z
Mean SQRT Spectrum
50.30 11.17 3.86 0.18 9.13 2.03 0.70 2.94 0.91 1.40 1.81 0.77 1.02 22.41 0.42 0.56 0.70 54.14 31.11 15.86 0.18 9.80 5.63 2.87 2.23 1.25 0.47 1.79 0.78 1.01 22.36 0.44 0.56 0.71 50.97 9.05 -0.14 0.18 9.20 1.63 -0.02 2.47 1.18 0.64 1.76 0.79 1.00 22.31 0.45 0.57 0.72 -0.08 -13.91 -13.07 0.18 -0.01 -2.50 -2.35 1.00 1.64 2.66 1.74 0.80 0.99 22.27 0.46 0.57 0.73 -17.00 -8.84 0.99 0.18 -3.05 -1.59 0.18 4.10 2.22 0.45 1.71 0.81 0.98 22.22 0.47 0.57 0.74 3.08 -1.80 -9.96 0.18 0.55 -0.32 -1.78 4.58 0.35 1.07 1.68 0.82 0.97 22.17 0.49 0.58 0.75
-16.85 -6.76 -18.86 0.18 -3.01 -1.21 -3.37 2.49 1.86 2.20 1.64 0.82 0.96 22.12 0.50 0.58 0.77 2.23 -10.70 -1.79 0.18 0.40 -1.90 -0.32 2.73 0.85 1.43 1.61 0.83 0.94 22.07 0.52 0.59 0.78 32.21 -1.65 1.25 0.18 5.72 -0.29 0.22 2.91 1.74 1.56 1.57 0.84 0.93 22.02 0.53 0.59 0.80 10.17 -1.62 -8.70 0.18 1.80 -0.29 -1.54 1.96 1.90 1.92 1.54 0.84 0.92 21.97 0.55 0.60 0.81 -16.77 0.40 -2.64 0.18 -2.96 0.07 -0.47 3.61 0.74 2.07 1.50 0.85 0.91 21.92 0.56 0.61 0.83 -5.68 15.39 4.39 0.18 -1.00 2.71 0.77 1.77 1.06 0.40 1.46 0.85 0.89 21.88 0.58 0.61 0.85 16.35 17.35 5.41 0.18 2.87 3.04 0.95 4.70 0.69 1.33 1.42 0.85 0.88 21.83 0.60 0.62 0.86 -5.62 5.33 19.40 0.18 -0.98 0.93 3.39 6.38 0.90 1.11 1.38 0.85 0.87 21.78 0.62 0.63 0.88 4.43 0.34 35.32 0.17 0.77 0.06 6.16 5.66 1.54 0.94 1.34 0.85 0.85 21.73 0.63 0.64 0.90 45.38 1.36 24.24 0.17 7.90 0.24 4.22 4.31 1.42 1.03 1.30 0.85 0.84 21.68 0.65 0.64 0.92 10.31 -11.60 -12.75 0.17 1.79 -2.01 -2.21 2.85 1.56 1.06 1.27 0.85 0.82 21.63 0.67 0.65 0.93 -37.59 -26.50 -16.65 0.17 -6.50 -4.58 -2.88 3.29 2.37 1.56 1.23 0.85 0.81 21.58 0.69 0.66 0.95 -24.42 -24.37 3.41 0.17 -4.21 -4.20 0.59 4.42 1.45 2.22 1.20 0.84 0.79 21.53 0.70 0.66 0.97 -9.30 -9.28 -18.53 0.17 -1.60 -1.60 -3.19 9.17 2.69 6.31 1.17 0.84 0.78 21.48 0.72 0.67 0.98 -22.19 -9.22 -15.42 0.17 -3.81 -1.58 -2.64 5.89 3.70 6.51 1.14 0.83 0.77 21.44 0.73 0.67 0.99 -21.05 -8.16 9.63 0.17 -3.60 -1.40 1.65 2.45 2.06 2.35 1.12 0.83 0.75 21.39 0.74 0.67 1.00 1.03 20.83 -4.35 0.17 0.18 3.55 -0.74 4.52 0.88 1.37 1.10 0.82 0.74 21.34 0.75 0.68 1.01 -8.90 27.76 -3.30 0.17 -1.51 4.72 -0.56 2.92 2.10 1.72 1.08 0.81 0.73 21.29 0.75 0.68 1.01 -6.82 9.71 1.74 0.17 -1.16 1.65 0.30 0.85 2.03 1.11 1.06 0.80 0.72 21.24 0.75 0.67 1.01 30.18 9.69 1.77 0.17 5.10 1.64 0.30 1.44 0.95 1.68 1.05 0.79 0.71 21.19 0.75 0.67 1.01 -3.83 -2.30 -1.19 0.17 -0.64 -0.39 -0.20 3.35 2.12 2.98 1.04 0.78 0.70 21.14 0.75 0.67 1.00 -74.62 -34.20 -13.13 0.17 -12.54 -5.75 -2.21 2.58 1.99 2.91 1.04 0.77 0.69 21.09 0.74 0.66 0.99 -58.30 -24.06 3.93 0.17 -9.77 -4.03 0.66 1.64 1.43 0.98 1.04 0.76 0.68 21.04 0.73 0.65 0.98 27.81 9.99 12.93 0.17 4.64 1.67 2.16 4.32 2.03 0.72 1.04 0.75 0.67 21.00 0.72 0.65 0.97 22.75 7.98 4.93 0.17 3.79 1.33 0.82 4.48 1.43 0.71 1.04 0.74 0.66 20.95 0.71 0.64 0.95 50.30 11.17 3.86 0.18 9.13 2.03 0.70 2.94 0.91 1.40 1.81 0.77 1.02 22.41 0.42 0.56 0.70 54.14 31.11 15.86 0.18 9.80 5.63 2.87 2.23 1.25 0.47 1.79 0.78 1.01 22.36 0.44 0.56 0.71

560
Raw Data Tapered Data
FFT Data Parzen Filtered Data
Simple Ratio Spectrum
Z E N
Tapering Function
Z E N Z E N Z E N
Frequency Hz
E/Z N/Z
Mean SQRT Spectrum
-30.18 -6.00 4.94 0.17 -5.01 -1.00 0.82 3.56 2.00 0.89 1.05 0.73 0.66 20.90 0.69 0.63 0.93 14.90 -5.96 3.96 0.17 2.47 -0.99 0.66 3.20 2.31 1.53 1.06 0.71 0.65 20.85 0.67 0.62 0.91 35.84 -0.92 -1.01 0.17 5.91 -0.15 -0.17 0.13 1.75 0.97 1.07 0.70 0.65 20.80 0.65 0.60 0.89 11.80 5.10 -16.94 0.16 1.94 0.84 -2.79 3.50 0.54 2.14 1.09 0.69 0.65 20.75 0.63 0.59 0.87 19.78 12.09 -20.82 0.16 3.24 1.98 -3.42 4.99 0.81 2.18 1.11 0.68 0.64 20.70 0.61 0.58 0.85 23.74 32.02 -11.72 0.16 3.88 5.24 -1.92 3.23 0.76 1.62 1.12 0.67 0.64 20.65 0.59 0.57 0.83 17.71 35.91 -21.62 0.16 2.89 5.85 -3.52 0.27 0.85 1.77 1.14 0.66 0.64 20.61 0.58 0.56 0.81 10.70 14.83 -6.53 0.16 1.74 2.41 -1.06 1.83 1.74 1.47 1.16 0.65 0.65 20.56 0.56 0.56 0.79 46.63 16.79 8.51 0.16 7.55 2.72 1.38 2.06 0.40 1.14 1.18 0.64 0.65 20.51 0.54 0.55 0.77 54.48 15.75 -28.42 0.16 8.80 2.54 -4.59 2.73 0.88 0.87 1.20 0.64 0.65 20.46 0.53 0.54 0.76 -27.53 -0.26 -31.26 0.16 -4.43 -0.04 -5.03 5.27 0.70 0.83 1.22 0.63 0.66 20.41 0.51 0.54 0.74 -34.36 1.76 2.83 0.16 -5.51 0.28 0.45 4.01 1.06 0.73 1.24 0.62 0.66 20.36 0.50 0.53 0.73 2.75 3.77 1.86 0.16 0.44 0.60 0.30 2.47 1.97 1.25 1.26 0.62 0.67 20.31 0.49 0.53 0.72
-29.15 -1.22 -14.08 0.16 -4.65 -0.19 -2.25 3.45 2.34 2.12 1.28 0.62 0.67 20.26 0.48 0.53 0.71 -13.02 -5.18 -12.99 0.16 -2.07 -0.82 -2.07 0.46 4.53 4.91 1.30 0.62 0.68 20.21 0.48 0.52 0.71 31.99 -0.15 2.07 0.16 5.07 -0.02 0.33 3.70 4.69 1.84 1.31 0.62 0.69 20.17 0.47 0.52 0.70 24.93 12.85 1.10 0.16 3.94 2.03 0.17 7.17 1.41 1.05 1.32 0.62 0.69 20.12 0.47 0.52 0.70 13.90 -2.15 -9.84 0.16 2.19 -0.34 -1.55 4.52 5.53 5.17 1.33 0.62 0.70 20.07 0.46 0.52 0.70 6.90 -2.12 3.21 0.16 1.08 -0.33 0.50 0.85 7.41 4.73 1.34 0.62 0.70 20.02 0.46 0.52 0.70 13.91 21.87 8.22 0.16 2.18 3.42 1.29 1.97 1.98 4.76 1.35 0.62 0.71 19.97 0.46 0.53 0.70 3.92 3.84 1.24 0.16 0.61 0.60 0.19 3.69 1.16 2.36 1.35 0.62 0.71 19.92 0.46 0.53 0.70 -2.04 -7.13 8.26 0.16 -0.32 -1.11 1.28 2.14 0.60 3.49 1.35 0.62 0.72 19.87 0.46 0.53 0.70 30.95 -7.08 6.26 0.16 4.80 -1.10 0.97 1.52 1.17 2.20 1.35 0.63 0.72 19.82 0.46 0.53 0.71 -28.01 -20.01 7.27 0.15 -4.33 -3.09 1.12 2.90 0.81 2.52 1.34 0.63 0.72 19.78 0.47 0.54 0.71 -93.72 -15.91 25.24 0.15 -14.43 -2.45 3.89 4.35 2.28 1.60 1.33 0.63 0.72 19.73 0.47 0.54 0.72 -39.40 -6.84 25.18 0.15 -6.05 -1.05 3.87 2.92 1.23 1.72 1.33 0.63 0.72 19.68 0.48 0.54 0.72 -22.23 9.17 3.16 0.15 -3.40 1.40 0.48 1.66 2.09 2.05 1.32 0.63 0.72 19.63 0.48 0.55 0.73 -63.01 1.18 -13.78 0.15 -9.61 0.18 -2.10 1.38 3.22 1.68 1.31 0.64 0.72 19.58 0.49 0.55 0.74 -34.77 -5.79 -14.69 0.15 -5.28 -0.88 -2.23 2.21 2.41 2.53 1.29 0.64 0.72 19.53 0.49 0.56 0.74 10.33 9.22 -14.59 0.15 1.57 1.40 -2.21 2.77 2.38 1.70 1.28 0.64 0.72 19.48 0.50 0.56 0.75 5.35 8.21 -11.51 0.15 0.81 1.24 -1.74 2.49 3.29 0.99 1.27 0.64 0.71 19.43 0.51 0.56 0.76
-30.18 -6.00 4.94 0.17 -5.01 -1.00 0.82 3.56 2.00 0.89 1.05 0.73 0.66 20.90 0.69 0.63 0.93 14.90 -5.96 3.96 0.17 2.47 -0.99 0.66 3.20 2.31 1.53 1.06 0.71 0.65 20.85 0.67 0.62 0.91

561
Raw Data Tapered Data
FFT Data Parzen Filtered Data
Simple Ratio Spectrum
Z E N
Tapering Function
Z E N Z E N Z E N
Frequency Hz
E/Z N/Z
Mean SQRT Spectrum
13.36 25.17 2.55 0.15 2.01 3.79 0.38 5.14 0.95 1.68 1.25 0.64 0.71 19.38 0.51 0.57 0.77 46.29 23.09 4.57 0.15 6.94 3.46 0.69 3.98 2.00 0.38 1.24 0.65 0.71 19.34 0.52 0.57 0.78 52.14 -15.90 3.59 0.15 7.79 -2.38 0.54 3.62 2.88 2.70 1.23 0.65 0.71 19.29 0.53 0.58 0.79 9.07 -31.78 2.62 0.15 1.35 -4.74 0.39 4.93 3.63 2.36 1.22 0.66 0.71 19.24 0.54 0.59 0.80
-17.87 -24.64 -4.34 0.15 -2.65 -3.66 -0.65 3.40 1.84 1.85 1.20 0.66 0.71 19.19 0.55 0.59 0.81 -6.77 -13.55 7.69 0.15 -1.00 -2.00 1.14 0.77 3.81 0.27 1.19 0.67 0.72 19.14 0.56 0.60 0.82 -20.67 -17.46 16.67 0.15 -3.05 -2.58 2.46 3.65 2.01 2.97 1.18 0.68 0.72 19.09 0.57 0.61 0.84 -7.56 -13.37 12.65 0.15 -1.11 -1.97 1.86 3.03 0.61 2.02 1.17 0.69 0.72 19.04 0.58 0.62 0.85 46.41 17.64 12.64 0.15 6.80 2.58 1.85 6.61 1.62 1.25 1.17 0.69 0.73 18.99 0.60 0.63 0.86 36.29 24.58 12.62 0.15 5.30 3.59 1.84 3.19 2.31 1.82 1.16 0.70 0.74 18.95 0.61 0.64 0.88 -2.73 20.51 3.63 0.15 -0.40 2.98 0.53 3.63 2.11 3.35 1.15 0.72 0.74 18.90 0.62 0.65 0.90 -9.66 39.41 -8.33 0.15 -1.40 5.71 -1.21 2.51 2.08 4.38 1.15 0.73 0.75 18.85 0.63 0.66 0.91 -21.55 34.29 -9.26 0.14 -3.11 4.95 -1.34 8.31 3.38 3.30 1.14 0.74 0.76 18.80 0.65 0.67 0.93 -28.40 2.24 -16.17 0.14 -4.09 0.32 -2.33 3.30 0.86 2.48 1.14 0.75 0.77 18.75 0.66 0.68 0.94 -1.29 7.24 -8.09 0.14 -0.19 1.04 -1.16 1.47 1.20 2.10 1.14 0.76 0.78 18.70 0.67 0.69 0.96 23.71 6.24 3.96 0.14 3.39 0.89 0.57 3.71 2.75 1.77 1.14 0.78 0.79 18.65 0.68 0.70 0.98 23.66 -29.70 -8.99 0.14 3.37 -4.23 -1.28 4.88 1.69 1.36 1.14 0.79 0.80 18.60 0.69 0.71 0.99 33.60 -23.57 1.06 0.14 4.77 -3.35 0.15 3.20 1.01 2.07 1.14 0.80 0.81 18.55 0.71 0.72 1.00 38.50 13.48 11.07 0.14 5.45 1.91 1.57 0.99 1.93 1.36 1.14 0.81 0.82 18.51 0.72 0.72 1.02 2.47 18.43 8.07 0.14 0.35 2.60 1.14 2.15 1.55 1.93 1.14 0.82 0.83 18.46 0.72 0.73 1.03
-40.41 -4.57 7.07 0.14 -5.68 -0.64 0.99 2.04 0.98 3.70 1.14 0.83 0.84 18.41 0.73 0.73 1.04 -25.23 -13.51 -11.88 0.14 -3.53 -1.89 -1.66 3.38 1.54 3.03 1.14 0.84 0.84 18.36 0.74 0.74 1.04 7.85 0.54 -11.80 0.14 1.10 0.07 -1.65 1.60 1.21 1.11 1.14 0.85 0.85 18.31 0.74 0.74 1.05 -8.10 -7.43 -2.73 0.14 -1.13 -1.03 -0.38 4.05 0.73 3.13 1.15 0.85 0.85 18.26 0.74 0.74 1.05 -9.02 -0.39 -5.68 0.14 -1.25 -0.05 -0.79 2.80 1.17 4.39 1.15 0.86 0.85 18.21 0.75 0.74 1.05 17.01 26.58 9.35 0.14 2.35 3.67 1.29 4.64 0.89 1.02 1.16 0.86 0.85 18.16 0.75 0.74 1.05 -12.95 1.55 19.33 0.14 -1.78 0.21 2.66 2.86 2.68 1.43 1.16 0.87 0.85 18.12 0.74 0.73 1.04 -60.75 -17.40 15.30 0.14 -8.32 -2.38 2.10 1.72 3.35 4.90 1.17 0.87 0.85 18.07 0.74 0.73 1.04 -40.50 3.65 16.27 0.14 -5.53 0.50 2.22 4.60 3.67 5.25 1.18 0.87 0.85 18.02 0.74 0.72 1.03 1.62 2.66 19.23 0.14 0.22 0.36 2.62 3.09 2.03 1.05 1.19 0.87 0.85 17.97 0.73 0.71 1.02 0.67 -22.28 -0.77 0.14 0.09 -3.02 -0.10 3.76 2.79 4.80 1.19 0.86 0.84 17.92 0.72 0.71 1.01 13.36 25.17 2.55 0.15 2.01 3.79 0.38 5.14 0.95 1.68 1.25 0.64 0.71 19.38 0.51 0.57 0.77 46.29 23.09 4.57 0.15 6.94 3.46 0.69 3.98 2.00 0.38 1.24 0.65 0.71 19.34 0.52 0.57 0.78

562
Raw Data Tapered Data
FFT Data Parzen Filtered Data
Simple Ratio Spectrum
Z E N
Tapering Function
Z E N Z E N Z E N
Frequency Hz
E/Z N/Z
Mean SQRT Spectrum
4.71 -23.16 -22.68 0.14 0.64 -3.13 -3.06 5.89 7.01 14.45 1.20 0.86 0.84 17.87 0.72 0.70 1.00 59.63 -7.08 -14.57 0.13 8.02 -0.95 -1.96 3.87 7.77 11.07 1.21 0.86 0.84 17.82 0.71 0.69 0.99 51.45 -2.04 -12.48 0.13 6.89 -0.27 -1.67 8.24 2.78 1.00 1.22 0.85 0.84 17.77 0.70 0.69 0.98 -15.57 10.97 -15.39 0.13 -2.08 1.46 -2.05 15.27 7.27 4.37 1.23 0.84 0.83 17.72 0.69 0.68 0.97 7.49 3.96 -8.31 0.13 1.00 0.53 -1.10 15.90 8.96 5.82 1.24 0.84 0.83 17.68 0.68 0.67 0.95 39.44 -7.01 -0.25 0.13 5.23 -0.93 -0.03 6.46 3.08 2.56 1.24 0.83 0.83 17.63 0.67 0.67 0.94 5.40 9.01 0.78 0.13 0.71 1.19 0.10 4.96 0.53 0.41 1.25 0.82 0.83 17.58 0.66 0.67 0.94 -7.55 12.98 -6.17 0.13 -0.99 1.71 -0.81 8.61 2.01 1.62 1.26 0.82 0.84 17.53 0.65 0.66 0.93 -3.48 23.93 4.87 0.13 -0.46 3.14 0.64 7.73 4.25 1.75 1.27 0.81 0.84 17.48 0.64 0.66 0.92 -11.40 25.86 9.87 0.13 -1.49 3.37 1.29 8.01 3.66 1.01 1.28 0.81 0.85 17.43 0.63 0.66 0.92 -0.33 -12.15 6.88 0.13 -0.04 -1.58 0.89 2.31 2.72 4.01 1.29 0.80 0.86 17.38 0.62 0.67 0.91 32.65 -21.06 23.85 0.13 4.23 -2.73 3.09 0.76 0.82 3.04 1.29 0.80 0.87 17.33 0.62 0.67 0.91 29.58 -5.98 26.78 0.13 3.82 -0.77 3.46 2.00 1.18 2.22 1.30 0.79 0.88 17.29 0.61 0.68 0.91 -14.41 -5.94 6.75 0.13 -1.85 -0.76 0.87 1.71 1.47 3.05 1.31 0.79 0.89 17.24 0.60 0.68 0.91 -11.31 -1.90 -10.20 0.13 -1.45 -0.24 -1.31 2.15 1.00 2.77 1.32 0.79 0.91 17.19 0.60 0.69 0.91 33.69 -3.86 -24.10 0.13 4.30 -0.49 -3.07 2.84 0.26 1.92 1.34 0.80 0.93 17.14 0.60 0.70 0.92 29.61 -22.79 -31.95 0.13 3.76 -2.89 -4.06 2.70 1.30 0.56 1.35 0.80 0.95 17.09 0.59 0.70 0.92 6.59 -13.69 -31.79 0.13 0.83 -1.73 -4.02 0.98 0.48 4.24 1.37 0.81 0.97 17.04 0.59 0.71 0.93 40.54 18.32 -27.63 0.13 5.11 2.31 -3.48 1.66 1.88 3.17 1.38 0.82 1.00 16.99 0.59 0.72 0.93 25.45 17.27 -18.50 0.13 3.19 2.17 -2.32 1.57 4.25 2.06 1.40 0.83 1.02 16.94 0.59 0.73 0.94 -54.44 5.25 -21.39 0.13 -6.81 0.66 -2.67 5.08 2.78 2.34 1.42 0.84 1.05 16.89 0.59 0.74 0.94 -49.19 9.24 -33.24 0.12 -6.12 1.15 -4.14 5.29 5.82 2.62 1.45 0.86 1.08 16.85 0.59 0.74 0.95 -11.02 9.23 -30.07 0.12 -1.37 1.14 -3.73 3.46 7.91 0.84 1.47 0.87 1.10 16.80 0.59 0.75 0.95 -23.90 8.22 -18.94 0.12 -2.95 1.01 -2.34 1.58 6.02 1.52 1.50 0.89 1.13 16.75 0.59 0.75 0.96 -9.79 2.22 -4.85 0.12 -1.20 0.27 -0.60 2.30 1.69 2.68 1.53 0.91 1.16 16.70 0.59 0.75 0.96 22.23 -9.74 5.18 0.12 2.72 -1.19 0.63 3.81 17.70 12.22 1.57 0.93 1.18 16.65 0.60 0.75 0.96 -16.73 -13.67 24.16 0.12 -2.04 -1.67 2.95 8.65 21.11 9.73 1.60 0.96 1.21 16.60 0.60 0.75 0.96 -51.55 -9.60 57.04 0.12 -6.26 -1.17 6.93 4.25 11.95 2.49 1.63 0.98 1.23 16.55 0.60 0.75 0.96 0.60 -2.56 54.85 0.12 0.07 -0.31 6.64 3.92 9.16 3.58 1.67 1.00 1.25 16.50 0.60 0.75 0.96 35.58 1.47 34.71 0.12 4.29 0.18 4.18 3.34 3.72 2.36 1.70 1.03 1.27 16.46 0.60 0.75 0.96 4.54 0.49 31.61 0.12 0.55 0.06 3.79 2.94 0.57 2.84 1.73 1.05 1.28 16.41 0.61 0.74 0.96 4.71 -23.16 -22.68 0.14 0.64 -3.13 -3.06 5.89 7.01 14.45 1.20 0.86 0.84 17.87 0.72 0.70 1.00 59.63 -7.08 -14.57 0.13 8.02 -0.95 -1.96 3.87 7.77 11.07 1.21 0.86 0.84 17.82 0.71 0.69 0.99

563
Raw Data Tapered Data
FFT Data Parzen Filtered Data
Simple Ratio Spectrum
Z E N
Tapering Function
Z E N Z E N Z E N
Frequency Hz
E/Z N/Z
Mean SQRT Spectrum
-24.37 11.48 26.53 0.12 -2.91 1.37 3.17 3.38 1.67 1.36 1.76 1.07 1.30 16.36 0.61 0.74 0.96 -39.19 37.41 19.47 0.12 -4.66 4.45 2.32 2.03 3.51 3.13 1.79 1.10 1.31 16.31 0.61 0.73 0.95 -48.97 30.30 18.43 0.12 -5.80 3.59 2.18 4.15 0.33 3.88 1.81 1.12 1.32 16.26 0.62 0.73 0.95 -23.78 0.26 12.40 0.12 -2.81 0.03 1.46 4.08 3.62 2.33 1.83 1.14 1.32 16.21 0.62 0.72 0.95 17.29 2.27 2.41 0.12 2.03 0.27 0.28 3.03 2.16 1.85 1.85 1.16 1.32 16.16 0.63 0.72 0.95 18.26 13.26 -6.55 0.12 2.14 1.55 -0.77 3.66 2.41 2.05 1.86 1.18 1.32 16.11 0.64 0.71 0.95 -7.71 1.26 4.49 0.12 -0.90 0.15 0.52 4.24 0.97 2.69 1.87 1.20 1.32 16.06 0.64 0.71 0.96 3.35 -13.70 12.49 0.12 0.39 -1.59 1.45 18.82 29.68 12.04 1.87 1.22 1.31 16.02 0.66 0.70 0.96 28.33 -14.62 3.50 0.12 3.27 -1.69 0.40 27.07 39.11 15.60 1.86 1.25 1.31 15.97 0.67 0.70 0.97 14.29 -15.53 0.52 0.12 1.64 -1.79 0.06 9.17 8.09 3.07 1.85 1.27 1.30 15.92 0.68 0.70 0.98 25.26 -10.46 -6.43 0.11 2.89 -1.20 -0.74 1.90 1.95 2.47 1.84 1.29 1.29 15.87 0.70 0.70 0.99 52.15 1.58 -9.36 0.11 5.95 0.18 -1.07 2.18 3.14 2.62 1.82 1.32 1.28 15.82 0.72 0.70 1.01 21.05 3.59 -17.27 0.11 2.39 0.41 -1.96 2.19 3.30 2.30 1.80 1.35 1.27 15.77 0.75 0.71 1.03 -24.89 -5.38 -23.16 0.11 -2.81 -0.61 -2.62 4.02 5.10 1.55 1.77 1.38 1.26 15.72 0.78 0.71 1.06 -16.76 -8.33 -9.06 0.11 -1.89 -0.94 -1.02 1.11 3.65 0.53 1.75 1.42 1.26 15.67 0.81 0.72 1.08 41.24 4.70 -3.99 0.11 4.62 0.53 -0.45 1.90 4.47 1.95 1.72 1.46 1.25 15.63 0.85 0.73 1.11 38.12 2.71 2.05 0.11 4.25 0.30 0.23 3.48 2.32 1.67 1.70 1.50 1.25 15.58 0.88 0.73 1.15 -39.83 -5.27 18.04 0.11 -4.42 -0.58 2.00 2.53 0.54 1.93 1.67 1.55 1.24 15.53 0.92 0.74 1.19 -31.64 6.75 23.99 0.11 -3.50 0.75 2.65 2.20 3.78 2.61 1.65 1.60 1.24 15.48 0.97 0.75 1.23 39.40 7.75 18.94 0.11 4.33 0.85 2.08 3.05 5.76 3.57 1.63 1.65 1.24 15.43 1.01 0.76 1.27 28.31 1.75 22.89 0.11 3.10 0.19 2.51 6.26 3.56 0.37 1.61 1.70 1.25 15.38 1.06 0.77 1.31 4.29 8.75 19.84 0.11 0.47 0.95 2.16 1.17 1.36 0.57 1.60 1.76 1.25 15.33 1.10 0.78 1.35 26.27 6.74 -16.13 0.11 2.85 0.73 -1.75 4.06 1.38 2.91 1.59 1.82 1.26 15.28 1.15 0.79 1.40 -4.72 10.73 -44.97 0.11 -0.51 1.16 -4.86 4.21 1.65 4.05 1.58 1.89 1.27 15.23 1.19 0.80 1.44 -55.56 10.71 -48.75 0.11 -5.97 1.15 -5.24 4.62 2.23 8.70 1.58 1.95 1.28 15.19 1.23 0.81 1.47 -14.37 -1.29 -58.50 0.11 -1.54 -0.14 -6.26 7.04 2.51 4.82 1.59 2.02 1.29 15.14 1.27 0.81 1.51 29.65 0.74 -59.23 0.11 3.16 0.08 -6.31 6.28 6.44 3.45 1.60 2.08 1.31 15.09 1.30 0.82 1.54 -1.36 -2.24 -51.97 0.11 -0.14 -0.24 -5.51 5.83 5.97 1.44 1.62 2.15 1.32 15.04 1.33 0.82 1.56 -3.31 1.79 -47.73 0.11 -0.35 0.19 -5.04 3.12 1.03 2.74 1.64 2.21 1.34 14.99 1.35 0.82 1.58 4.74 10.78 -29.54 0.11 0.50 1.13 -3.10 2.12 0.91 5.17 1.66 2.27 1.35 14.94 1.37 0.81 1.59
-36.15 -8.20 -9.42 0.10 -3.78 -0.86 -0.98 3.76 1.92 5.89 1.68 2.32 1.36 14.89 1.38 0.81 1.60 -24.37 11.48 26.53 0.12 -2.91 1.37 3.17 3.38 1.67 1.36 1.76 1.07 1.30 16.36 0.61 0.74 0.96 -39.19 37.41 19.47 0.12 -4.66 4.45 2.32 2.03 3.51 3.13 1.79 1.10 1.31 16.31 0.61 0.73 0.95

564
Raw Data Tapered Data
FFT Data Parzen Filtered Data
Simple Ratio Spectrum
Z E N
Tapering Function
Z E N Z E N Z E N
Frequency Hz
E/Z N/Z
Mean SQRT Spectrum
-29.97 -21.12 0.63 0.10 -3.12 -2.20 0.07 4.07 2.46 5.27 1.71 2.36 1.37 14.84 1.38 0.80 1.60 11.11 -1.05 6.66 0.10 1.15 -0.11 0.69 1.69 3.05 2.85 1.74 2.40 1.38 14.79 1.38 0.79 1.59 -22.82 18.93 1.68 0.10 -2.35 1.95 0.17 1.90 2.84 2.88 1.77 2.44 1.39 14.75 1.38 0.79 1.59 -47.63 13.89 -5.28 0.10 -4.88 1.42 -0.54 0.95 1.50 3.69 1.79 2.47 1.40 14.70 1.37 0.78 1.58 6.50 11.86 13.74 0.10 0.66 1.21 1.40 2.36 5.02 2.56 1.82 2.49 1.40 14.65 1.37 0.77 1.57 26.48 12.83 16.72 0.10 2.69 1.30 1.70 4.23 1.22 3.30 1.84 2.50 1.40 14.60 1.36 0.76 1.55 -10.50 -6.16 6.71 0.10 -1.06 -0.62 0.68 5.96 4.82 1.34 1.86 2.50 1.40 14.55 1.34 0.75 1.54 -5.42 -10.10 21.69 0.10 -0.55 -1.02 2.18 6.35 6.78 1.89 1.88 2.50 1.40 14.50 1.33 0.75 1.52 19.60 -8.05 28.63 0.10 1.96 -0.80 2.86 6.30 4.74 6.27 1.90 2.49 1.40 14.45 1.31 0.74 1.51 4.59 -9.99 29.55 0.10 0.46 -0.99 2.94 6.14 2.46 6.70 1.91 2.47 1.40 14.40 1.30 0.73 1.49
-10.35 -11.92 29.46 0.10 -1.02 -1.18 2.92 5.87 2.36 2.39 1.91 2.44 1.39 14.36 1.28 0.73 1.47 11.70 -19.83 19.40 0.10 1.15 -1.95 1.91 2.75 2.15 6.35 1.91 2.41 1.38 14.31 1.26 0.72 1.45 30.66 -5.76 13.37 0.10 3.00 -0.56 1.31 2.97 4.40 6.84 1.91 2.36 1.37 14.26 1.24 0.72 1.43 -0.35 0.27 3.38 0.10 -0.03 0.03 0.33 7.23 4.93 4.40 1.90 2.31 1.36 14.21 1.22 0.72 1.41 -30.25 1.29 -9.58 0.10 -2.93 0.13 -0.93 6.90 4.09 3.97 1.89 2.26 1.35 14.16 1.20 0.72 1.39 -7.12 33.25 -21.48 0.10 -0.69 3.21 -2.07 3.99 0.13 2.58 1.87 2.20 1.34 14.11 1.17 0.72 1.38 2.93 27.15 -28.34 0.10 0.28 2.61 -2.72 4.51 3.51 2.11 1.85 2.13 1.33 14.06 1.15 0.72 1.36 -7.01 -3.88 -27.19 0.10 -0.67 -0.37 -2.60 2.95 2.16 4.71 1.83 2.07 1.32 14.01 1.13 0.72 1.34 5.04 -2.84 -19.06 0.10 0.48 -0.27 -1.81 11.32 3.04 3.07 1.81 2.00 1.31 13.96 1.11 0.73 1.33 1.07 2.18 -8.97 0.09 0.10 0.21 -0.85 26.28 19.21 2.29 1.78 1.93 1.31 13.92 1.08 0.73 1.31 -2.88 0.20 -11.89 0.09 -0.27 0.02 -1.12 15.49 13.49 0.52 1.76 1.87 1.30 13.87 1.06 0.74 1.30 46.09 -11.76 4.16 0.09 4.31 -1.10 0.39 5.25 3.31 1.43 1.73 1.80 1.30 13.82 1.04 0.75 1.28 81.88 -8.69 24.14 0.09 7.61 -0.81 2.25 7.79 7.66 2.89 1.71 1.74 1.30 13.77 1.02 0.76 1.27 27.70 -1.65 9.11 0.09 2.56 -0.15 0.84 3.20 6.44 2.31 1.69 1.67 1.30 13.72 0.99 0.77 1.26 -21.26 -5.61 8.11 0.09 -1.96 -0.52 0.75 1.71 2.38 1.61 1.67 1.61 1.30 13.67 0.97 0.78 1.24 -1.17 6.41 23.09 0.09 -0.11 0.59 2.11 7.53 4.31 3.10 1.65 1.56 1.30 13.62 0.94 0.79 1.23 -0.12 0.42 24.03 0.09 -0.01 0.04 2.19 5.22 6.10 2.30 1.64 1.51 1.31 13.57 0.92 0.80 1.22 -1.08 -8.55 22.97 0.09 -0.10 -0.77 2.08 5.23 2.19 3.88 1.63 1.46 1.31 13.53 0.90 0.81 1.21 36.90 17.46 16.93 0.09 3.32 1.57 1.52 6.26 2.78 3.23 1.62 1.43 1.32 13.48 0.88 0.81 1.20 11.85 25.40 7.91 0.09 1.06 2.27 0.71 7.45 1.46 1.90 1.62 1.39 1.33 13.43 0.86 0.82 1.19 -40.05 11.34 2.93 0.09 -3.56 1.01 0.26 6.64 5.94 0.77 1.62 1.37 1.34 13.38 0.84 0.82 1.18 -29.97 -21.12 0.63 0.10 -3.12 -2.20 0.07 4.07 2.46 5.27 1.71 2.36 1.37 14.84 1.38 0.80 1.60 11.11 -1.05 6.66 0.10 1.15 -0.11 0.69 1.69 3.05 2.85 1.74 2.40 1.38 14.79 1.38 0.79 1.59

565
Raw Data Tapered
Data FFT Data Parzen Filtered
Data Simple Ratio
Spectrum Z E N
Tapering Function
Z E N Z E N Z E N
Frequency Hz
E/Z N/Z
Mean SQRT Spectrum
-21.88 1.34 2.95 0.09 -1.94 0.12 0.26 2.84 2.52 2.08 1.63 1.35 1.34 13.33 0.83 0.82 1.17 -23.74 -0.64 9.96 0.09 -2.09 -0.06 0.88 3.96 2.98 5.37 1.65 1.34 1.35 13.28 0.81 0.82 1.15 -26.60 12.36 10.96 0.09 -2.33 1.08 0.96 4.59 6.35 4.46 1.67 1.33 1.36 13.23 0.80 0.82 1.14 -1.49 14.33 -2.03 0.09 -0.13 1.25 -0.18 2.14 5.86 1.58 1.69 1.33 1.37 13.18 0.79 0.81 1.13 -20.40 22.28 -16.95 0.09 -1.76 1.93 -1.47 1.23 4.49 3.06 1.72 1.33 1.37 13.13 0.78 0.80 1.11 -32.25 24.20 -29.82 0.09 -2.77 2.08 -2.56 4.99 3.36 2.03 1.75 1.34 1.38 13.09 0.77 0.79 1.10 -24.09 -9.80 -36.65 0.09 -2.06 -0.84 -3.13 3.22 1.53 4.65 1.79 1.36 1.38 13.04 0.76 0.77 1.08 -2.99 -10.74 -28.49 0.09 -0.25 -0.91 -2.42 5.20 2.53 1.17 1.83 1.38 1.38 12.99 0.75 0.76 1.07 38.99 5.29 -24.34 0.08 3.29 0.45 -2.06 4.86 1.64 2.94 1.87 1.40 1.38 12.94 0.75 0.74 1.05 8.94 -19.66 -36.18 0.08 0.75 -1.65 -3.04 5.55 1.34 5.56 1.92 1.43 1.38 12.89 0.74 0.72 1.03
-55.92 -18.56 -36.00 0.08 -4.67 -1.55 -3.01 5.80 3.82 3.60 1.97 1.45 1.37 12.84 0.74 0.70 1.02 -29.70 -0.50 -21.85 0.08 -2.47 -0.04 -1.81 2.12 1.92 0.91 2.02 1.48 1.37 12.79 0.74 0.68 1.00 32.34 -10.46 -3.76 0.08 2.67 -0.86 -0.31 6.14 1.34 2.07 2.06 1.52 1.36 12.74 0.73 0.66 0.99 13.30 -9.39 15.25 0.08 1.09 -0.77 1.25 5.10 4.15 4.63 2.11 1.55 1.35 12.70 0.73 0.64 0.97 -13.66 11.62 26.21 0.08 -1.11 0.95 2.14 11.46 8.39 5.32 2.16 1.58 1.34 12.65 0.73 0.62 0.96 34.35 14.59 40.11 0.08 2.78 1.18 3.25 8.71 6.70 1.67 2.20 1.61 1.32 12.60 0.73 0.60 0.95 35.26 8.57 41.99 0.08 2.84 0.69 3.38 21.84 9.96 8.31 2.24 1.64 1.31 12.55 0.73 0.58 0.94 -34.70 26.52 31.87 0.08 -2.78 2.12 2.55 22.29 9.32 10.20 2.28 1.66 1.29 12.50 0.73 0.57 0.93 -41.50 37.41 32.78 0.08 -3.30 2.97 2.61 5.07 4.57 2.26 2.31 1.69 1.28 12.45 0.73 0.55 0.92 6.62 22.31 8.73 0.08 0.52 1.76 0.69 1.01 0.70 0.54 2.34 1.71 1.26 12.40 0.73 0.54 0.91 38.58 25.24 -22.20 0.08 3.03 1.98 -1.74 2.55 6.03 2.67 2.36 1.73 1.24 12.35 0.73 0.53 0.90 63.42 21.17 -9.11 0.08 4.95 1.65 -0.71 4.73 8.08 3.47 2.38 1.74 1.23 12.30 0.73 0.52 0.90 64.21 -5.84 -2.05 0.08 4.98 -0.45 -0.16 3.24 4.55 3.15 2.39 1.76 1.21 12.26 0.73 0.51 0.89 4.12 -20.77 -17.97 0.08 0.32 -1.60 -1.38 3.10 4.57 2.12 2.40 1.76 1.19 12.21 0.74 0.50 0.89 -7.83 -31.64 -26.84 0.08 -0.60 -2.42 -2.05 1.23 8.69 4.51 2.40 1.77 1.18 12.16 0.74 0.49 0.89 47.14 -28.50 -28.70 0.08 3.58 -2.17 -2.18 1.84 1.50 3.45 2.40 1.77 1.17 12.11 0.74 0.49 0.88 22.05 -13.39 -25.55 0.08 1.66 -1.01 -1.93 3.60 8.03 2.45 2.39 1.76 1.16 12.06 0.74 0.48 0.88 -31.89 -14.32 -23.42 0.08 -2.39 -1.07 -1.76 2.50 7.96 6.89 2.38 1.76 1.15 12.01 0.74 0.48 0.88 -21.74 5.72 -22.29 0.07 -1.62 0.43 -1.66 6.96 9.30 10.43 2.37 1.75 1.14 11.96 0.74 0.48 0.88 -4.64 9.71 -17.17 0.07 -0.34 0.72 -1.27 6.06 8.67 11.36 2.35 1.74 1.14 11.91 0.74 0.48 0.88 -34.51 -7.27 -13.07 0.07 -2.54 -0.53 -0.96 11.20 4.73 11.45 2.34 1.73 1.14 11.87 0.74 0.49 0.88 -21.88 1.34 2.95 0.09 -1.94 0.12 0.26 2.84 2.52 2.08 1.63 1.35 1.34 13.33 0.83 0.82 1.17 -23.74 -0.64 9.96 0.09 -2.09 -0.06 0.88 3.96 2.98 5.37 1.65 1.34 1.35 13.28 0.81 0.82 1.15

566
Raw Data Tapered Data
FFT Data Parzen Filtered Data
Simple Ratio Spectrum
Z E N
Tapering Function
Z E N Z E N Z E N
Frequency Hz
E/Z N/Z
Mean SQRT Spectrum
-48.30 7.75 4.98 0.07 -3.53 0.57 0.36 8.36 8.67 8.93 2.33 1.72 1.14 11.82 0.74 0.49 0.89 24.79 13.73 16.98 0.07 1.80 1.00 1.23 3.32 3.85 3.31 2.31 1.71 1.14 11.77 0.74 0.49 0.89 42.70 9.70 4.97 0.07 3.07 0.70 0.36 5.03 2.40 3.03 2.30 1.70 1.15 11.72 0.74 0.50 0.89 -16.30 -0.30 3.99 0.07 -1.17 -0.02 0.29 4.83 0.65 3.56 2.29 1.69 1.15 11.67 0.74 0.50 0.89 4.77 -27.22 8.00 0.07 0.34 -1.93 0.57 2.73 1.10 1.80 2.28 1.68 1.17 11.62 0.74 0.51 0.90 27.75 -26.09 -7.96 0.07 1.96 -1.84 -0.56 3.16 3.15 0.66 2.27 1.67 1.18 11.57 0.74 0.52 0.90 -31.20 -22.97 -18.87 0.07 -2.18 -1.61 -1.32 5.29 4.07 2.60 2.27 1.67 1.20 11.52 0.74 0.53 0.91 -46.00 -26.85 4.20 0.07 -3.20 -1.87 0.29 8.30 9.58 11.17 2.26 1.67 1.21 11.47 0.74 0.54 0.91 7.13 -4.76 37.15 0.07 0.49 -0.33 2.56 10.90 12.11 13.67 2.26 1.67 1.23 11.43 0.74 0.55 0.92 4.15 7.26 30.05 0.07 0.28 0.50 2.06 5.48 4.84 4.22 2.26 1.68 1.25 11.38 0.74 0.55 0.93
-27.76 13.24 9.01 0.07 -1.89 0.90 0.61 1.79 2.17 1.31 2.27 1.69 1.28 11.33 0.74 0.56 0.93 -3.65 21.19 16.00 0.07 -0.25 1.43 1.08 2.44 2.18 1.38 2.27 1.70 1.30 11.28 0.75 0.57 0.94 10.39 0.17 7.99 0.07 0.70 0.01 0.54 2.62 1.38 1.86 2.28 1.72 1.33 11.23 0.75 0.58 0.95 -9.57 -8.79 -9.97 0.07 -0.64 -0.58 -0.66 2.56 2.71 1.88 2.28 1.74 1.36 11.18 0.76 0.59 0.96 -13.48 17.21 12.06 0.07 -0.89 1.14 0.80 1.58 0.07 0.89 2.29 1.76 1.39 11.13 0.77 0.61 0.98 16.56 20.16 18.04 0.07 1.08 1.32 1.18 3.33 1.59 3.28 2.30 1.78 1.42 11.08 0.78 0.62 0.99 27.52 -3.85 -13.93 0.07 1.79 -0.25 -0.91 2.45 2.13 3.13 2.30 1.81 1.45 11.04 0.79 0.63 1.01 -12.46 -3.81 -20.83 0.06 -0.80 -0.25 -1.34 3.40 2.18 2.10 2.31 1.84 1.48 10.99 0.80 0.64 1.02 -21.35 -0.78 -6.74 0.06 -1.37 -0.05 -0.43 8.00 9.33 8.47 2.31 1.86 1.52 10.94 0.81 0.66 1.04 -9.24 -3.75 -8.67 0.06 -0.59 -0.24 -0.55 17.21 2.35 15.71 2.31 1.89 1.55 10.89 0.82 0.67 1.06 -6.16 12.25 -1.61 0.06 -0.39 0.77 -0.10 9.32 6.33 7.50 2.30 1.91 1.58 10.84 0.83 0.69 1.08 30.84 27.19 18.39 0.06 1.93 1.70 1.15 2.20 7.07 1.26 2.29 1.94 1.62 10.79 0.85 0.71 1.10 32.75 37.09 20.35 0.06 2.03 2.30 1.26 3.84 4.12 0.47 2.28 1.96 1.65 10.74 0.86 0.72 1.12 -4.26 31.97 3.34 0.06 -0.26 1.97 0.21 3.95 2.49 0.12 2.27 1.98 1.68 10.69 0.87 0.74 1.14 -14.17 15.89 -7.61 0.06 -0.86 0.97 -0.46 1.59 5.99 1.21 2.25 1.99 1.71 10.64 0.89 0.76 1.17 -18.06 3.88 -6.55 0.06 -1.09 0.23 -0.40 1.27 2.81 5.32 2.23 2.01 1.73 10.60 0.90 0.78 1.19 5.01 -24.06 -11.48 0.06 0.30 -1.44 -0.69 0.65 2.40 2.66 2.21 2.01 1.76 10.55 0.91 0.80 1.21 38.97 -33.93 -17.38 0.06 2.32 -2.02 -1.03 2.53 4.49 3.81 2.19 2.02 1.78 10.50 0.92 0.81 1.23 29.88 -7.82 -17.28 0.06 1.76 -0.46 -1.02 2.64 4.89 3.87 2.17 2.02 1.81 10.45 0.93 0.83 1.25 20.82 -5.77 -11.18 0.06 1.22 -0.34 -0.65 3.67 4.90 3.89 2.15 2.02 1.82 10.40 0.94 0.85 1.27 -12.15 -17.70 -9.10 0.06 -0.70 -1.03 -0.53 4.88 4.43 3.30 2.12 2.01 1.84 10.35 0.95 0.87 1.28 -48.30 7.75 4.98 0.07 -3.53 0.57 0.36 8.36 8.67 8.93 2.33 1.72 1.14 11.82 0.74 0.49 0.89 24.79 13.73 16.98 0.07 1.80 1.00 1.23 3.32 3.85 3.31 2.31 1.71 1.14 11.77 0.74 0.49 0.89
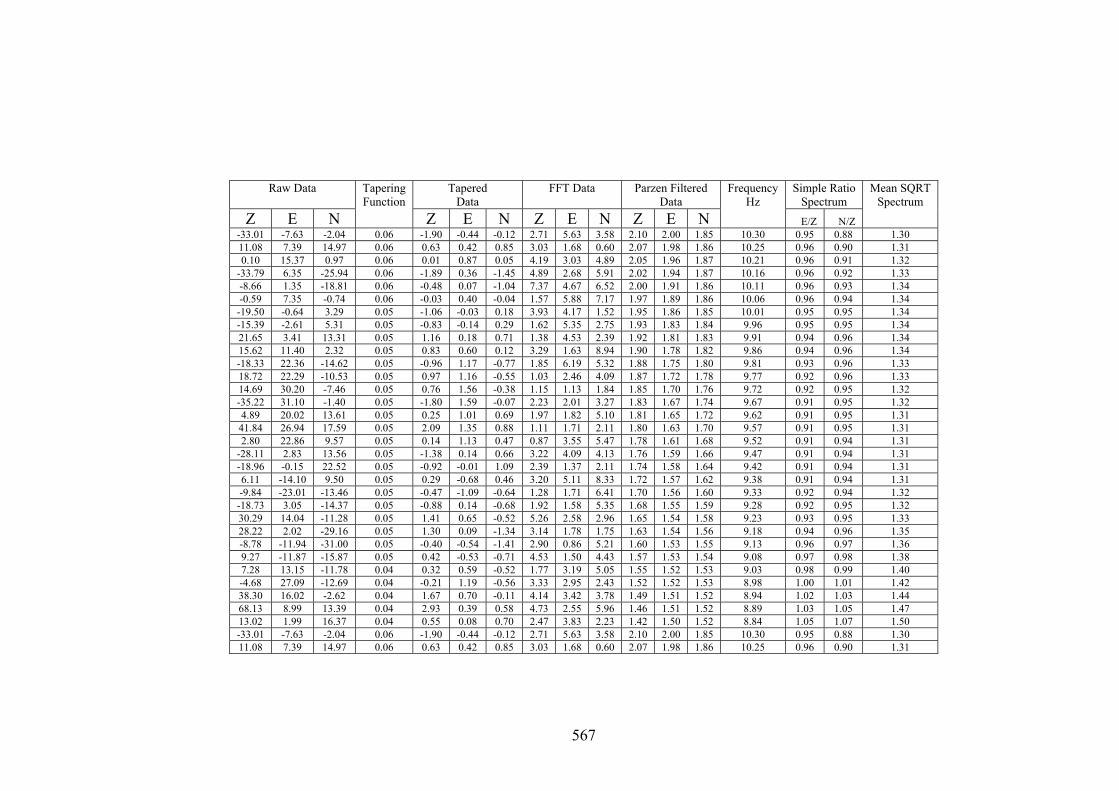
567
Raw Data Tapered Data
FFT Data Parzen Filtered Data
Simple Ratio Spectrum
Z E N
Tapering Function
Z E N Z E N Z E N
Frequency Hz
E/Z N/Z
Mean SQRT Spectrum
-33.01 -7.63 -2.04 0.06 -1.90 -0.44 -0.12 2.71 5.63 3.58 2.10 2.00 1.85 10.30 0.95 0.88 1.30 11.08 7.39 14.97 0.06 0.63 0.42 0.85 3.03 1.68 0.60 2.07 1.98 1.86 10.25 0.96 0.90 1.31 0.10 15.37 0.97 0.06 0.01 0.87 0.05 4.19 3.03 4.89 2.05 1.96 1.87 10.21 0.96 0.91 1.32
-33.79 6.35 -25.94 0.06 -1.89 0.36 -1.45 4.89 2.68 5.91 2.02 1.94 1.87 10.16 0.96 0.92 1.33 -8.66 1.35 -18.81 0.06 -0.48 0.07 -1.04 7.37 4.67 6.52 2.00 1.91 1.86 10.11 0.96 0.93 1.34 -0.59 7.35 -0.74 0.06 -0.03 0.40 -0.04 1.57 5.88 7.17 1.97 1.89 1.86 10.06 0.96 0.94 1.34 -19.50 -0.64 3.29 0.05 -1.06 -0.03 0.18 3.93 4.17 1.52 1.95 1.86 1.85 10.01 0.95 0.95 1.34 -15.39 -2.61 5.31 0.05 -0.83 -0.14 0.29 1.62 5.35 2.75 1.93 1.83 1.84 9.96 0.95 0.95 1.34 21.65 3.41 13.31 0.05 1.16 0.18 0.71 1.38 4.53 2.39 1.92 1.81 1.83 9.91 0.94 0.96 1.34 15.62 11.40 2.32 0.05 0.83 0.60 0.12 3.29 1.63 8.94 1.90 1.78 1.82 9.86 0.94 0.96 1.34 -18.33 22.36 -14.62 0.05 -0.96 1.17 -0.77 1.85 6.19 5.32 1.88 1.75 1.80 9.81 0.93 0.96 1.33 18.72 22.29 -10.53 0.05 0.97 1.16 -0.55 1.03 2.46 4.09 1.87 1.72 1.78 9.77 0.92 0.96 1.33 14.69 30.20 -7.46 0.05 0.76 1.56 -0.38 1.15 1.13 1.84 1.85 1.70 1.76 9.72 0.92 0.95 1.32 -35.22 31.10 -1.40 0.05 -1.80 1.59 -0.07 2.23 2.01 3.27 1.83 1.67 1.74 9.67 0.91 0.95 1.32 4.89 20.02 13.61 0.05 0.25 1.01 0.69 1.97 1.82 5.10 1.81 1.65 1.72 9.62 0.91 0.95 1.31 41.84 26.94 17.59 0.05 2.09 1.35 0.88 1.11 1.71 2.11 1.80 1.63 1.70 9.57 0.91 0.95 1.31 2.80 22.86 9.57 0.05 0.14 1.13 0.47 0.87 3.55 5.47 1.78 1.61 1.68 9.52 0.91 0.94 1.31
-28.11 2.83 13.56 0.05 -1.38 0.14 0.66 3.22 4.09 4.13 1.76 1.59 1.66 9.47 0.91 0.94 1.31 -18.96 -0.15 22.52 0.05 -0.92 -0.01 1.09 2.39 1.37 2.11 1.74 1.58 1.64 9.42 0.91 0.94 1.31 6.11 -14.10 9.50 0.05 0.29 -0.68 0.46 3.20 5.11 8.33 1.72 1.57 1.62 9.38 0.91 0.94 1.31 -9.84 -23.01 -13.46 0.05 -0.47 -1.09 -0.64 1.28 1.71 6.41 1.70 1.56 1.60 9.33 0.92 0.94 1.32 -18.73 3.05 -14.37 0.05 -0.88 0.14 -0.68 1.92 1.58 5.35 1.68 1.55 1.59 9.28 0.92 0.95 1.32 30.29 14.04 -11.28 0.05 1.41 0.65 -0.52 5.26 2.58 2.96 1.65 1.54 1.58 9.23 0.93 0.95 1.33 28.22 2.02 -29.16 0.05 1.30 0.09 -1.34 3.14 1.78 1.75 1.63 1.54 1.56 9.18 0.94 0.96 1.35 -8.78 -11.94 -31.00 0.05 -0.40 -0.54 -1.41 2.90 0.86 5.21 1.60 1.53 1.55 9.13 0.96 0.97 1.36 9.27 -11.87 -15.87 0.05 0.42 -0.53 -0.71 4.53 1.50 4.43 1.57 1.53 1.54 9.08 0.97 0.98 1.38 7.28 13.15 -11.78 0.04 0.32 0.59 -0.52 1.77 3.19 5.05 1.55 1.52 1.53 9.03 0.98 0.99 1.40 -4.68 27.09 -12.69 0.04 -0.21 1.19 -0.56 3.33 2.95 2.43 1.52 1.52 1.53 8.98 1.00 1.01 1.42 38.30 16.02 -2.62 0.04 1.67 0.70 -0.11 4.14 3.42 3.78 1.49 1.51 1.52 8.94 1.02 1.03 1.44 68.13 8.99 13.39 0.04 2.93 0.39 0.58 4.73 2.55 5.96 1.46 1.51 1.52 8.89 1.03 1.05 1.47 13.02 1.99 16.37 0.04 0.55 0.08 0.70 2.47 3.83 2.23 1.42 1.50 1.52 8.84 1.05 1.07 1.50 -33.01 -7.63 -2.04 0.06 -1.90 -0.44 -0.12 2.71 5.63 3.58 2.10 2.00 1.85 10.30 0.95 0.88 1.30 11.08 7.39 14.97 0.06 0.63 0.42 0.85 3.03 1.68 0.60 2.07 1.98 1.86 10.25 0.96 0.90 1.31

568
Raw Data Tapered Data
FFT Data Parzen Filtered Data
Simple Ratio Spectrum
Z E N
Tapering Function
Z E N Z E N Z E N
Frequency Hz
E/Z N/Z
Mean SQRT Spectrum
-54.85 -10.97 20.34 0.04 -2.30 -0.46 0.85 0.62 0.29 1.42 1.39 1.49 1.52 8.79 1.07 1.09 1.53 -24.65 -11.91 21.29 0.04 -1.02 -0.49 0.88 0.92 4.45 2.96 1.36 1.48 1.52 8.74 1.09 1.12 1.56 -5.54 -16.83 1.28 0.04 -0.23 -0.69 0.05 0.39 1.19 1.41 1.33 1.47 1.53 8.69 1.10 1.15 1.59 -35.42 -41.69 -25.63 0.04 -1.43 -1.69 -1.04 0.97 3.21 4.16 1.30 1.46 1.53 8.64 1.12 1.18 1.62 12.68 -39.51 -23.50 0.04 0.51 -1.58 -0.94 2.54 2.58 3.55 1.27 1.45 1.54 8.59 1.14 1.21 1.66 25.65 -14.38 -17.38 0.04 1.01 -0.57 -0.69 3.20 4.49 4.30 1.24 1.43 1.54 8.54 1.15 1.24 1.69 -32.30 -12.31 -32.24 0.04 -1.26 -0.48 -1.26 0.48 1.16 7.12 1.22 1.42 1.55 8.50 1.16 1.27 1.72 -9.17 -22.22 -3.13 0.04 -0.35 -0.86 -0.12 0.65 5.37 4.87 1.19 1.40 1.55 8.45 1.18 1.31 1.76 47.80 -14.12 35.84 0.04 1.82 -0.54 1.36 0.64 8.82 5.94 1.16 1.38 1.56 8.40 1.19 1.34 1.79 27.70 7.91 8.79 0.04 1.04 0.30 0.33 0.94 11.84 5.80 1.14 1.36 1.56 8.35 1.19 1.38 1.82 -7.30 0.91 -10.17 0.04 -0.27 0.03 -0.38 2.10 17.73 6.71 1.11 1.33 1.57 8.30 1.20 1.41 1.85 20.72 -7.05 -0.11 0.04 0.76 -0.26 0.00 1.04 7.97 2.17 1.09 1.31 1.58 8.25 1.20 1.44 1.88 10.70 7.97 -9.05 0.04 0.39 0.29 -0.33 0.89 2.86 3.30 1.07 1.29 1.58 8.20 1.20 1.47 1.90 -65.14 0.97 -8.98 0.04 -2.31 0.03 -0.32 1.16 5.80 3.85 1.06 1.27 1.58 8.15 1.20 1.50 1.92 -54.86 -10.99 5.07 0.04 -1.92 -0.38 0.18 0.68 1.81 4.12 1.04 1.25 1.59 8.11 1.20 1.53 1.94 18.26 -0.94 9.07 0.03 0.63 -0.03 0.31 1.50 0.98 2.97 1.02 1.22 1.59 8.06 1.19 1.55 1.96 7.26 0.08 -6.89 0.03 0.25 0.00 -0.23 3.39 3.75 0.86 1.01 1.21 1.59 8.01 1.19 1.57 1.97
-23.66 -9.88 -20.80 0.03 -0.79 -0.33 -0.70 2.21 4.70 5.05 1.00 1.19 1.59 7.96 1.19 1.59 1.99 11.41 -5.83 -3.71 0.03 0.38 -0.19 -0.12 1.97 1.42 7.95 0.99 1.17 1.59 7.91 1.19 1.61 2.00 13.40 20.17 11.31 0.03 0.44 0.66 0.37 2.73 3.66 1.77 0.98 1.16 1.59 7.86 1.19 1.63 2.02 -13.55 15.12 -10.65 0.03 -0.43 0.48 -0.34 1.82 4.58 3.09 0.97 1.15 1.59 7.81 1.19 1.64 2.03 6.51 -12.87 -10.57 0.03 0.21 -0.41 -0.33 3.61 2.22 3.20 0.96 1.15 1.59 7.76 1.20 1.66 2.04 22.50 8.16 26.43 0.03 0.70 0.25 0.82 4.17 4.34 2.89 0.95 1.14 1.59 7.71 1.20 1.67 2.06 0.50 27.11 31.36 0.03 0.02 0.83 0.96 3.81 3.37 0.87 0.94 1.14 1.58 7.67 1.22 1.68 2.08
-15.43 13.05 14.30 0.03 -0.46 0.39 0.43 0.96 1.31 2.92 0.93 1.15 1.58 7.62 1.23 1.70 2.10 3.64 1.05 19.27 0.03 0.11 0.03 0.57 4.61 4.92 4.02 0.92 1.16 1.57 7.57 1.26 1.71 2.12
-11.30 -6.92 13.25 0.03 -0.33 -0.20 0.38 8.09 6.14 2.09 0.91 1.17 1.57 7.52 1.28 1.72 2.15 -65.10 -5.88 -8.73 0.03 -1.86 -0.17 -0.25 3.36 1.30 3.06 0.90 1.19 1.57 7.47 1.32 1.74 2.18 -37.85 -0.84 -14.64 0.03 -1.06 -0.02 -0.41 2.35 1.04 4.26 0.89 1.21 1.56 7.42 1.36 1.75 2.22 18.24 10.16 -24.53 0.03 0.50 0.28 -0.67 2.14 2.29 2.00 0.88 1.24 1.56 7.37 1.41 1.77 2.26 17.22 10.14 -28.38 0.03 0.46 0.27 -0.77 3.55 7.02 0.84 0.87 1.27 1.55 7.32 1.46 1.79 2.31 -54.85 -10.97 20.34 0.04 -2.30 -0.46 0.85 0.62 0.29 1.42 1.39 1.49 1.52 8.79 1.07 1.09 1.53 -24.65 -11.91 21.29 0.04 -1.02 -0.49 0.88 0.92 4.45 2.96 1.36 1.48 1.52 8.74 1.09 1.12 1.56

569
Raw Data Tapered Data
FFT Data Parzen Filtered Data
Simple Ratio Spectrum
Z E N
Tapering Function
Z E N Z E N Z E N
Frequency Hz
E/Z N/Z
Mean SQRT Spectrum
24.18 -8.84 -15.26 0.03 0.64 -0.23 -0.40 3.56 10.37 8.25 0.86 1.30 1.55 7.28 1.51 1.81 2.36 14.15 -2.80 -3.18 0.03 0.37 -0.07 -0.08 1.38 10.75 4.60 0.84 1.33 1.55 7.23 1.58 1.83 2.42 -14.80 12.21 -0.14 0.03 -0.38 0.31 0.00 2.45 11.63 7.38 0.83 1.36 1.54 7.18 1.64 1.85 2.47 -1.72 4.19 -9.08 0.03 -0.04 0.10 -0.23 6.10 10.86 6.20 0.82 1.40 1.54 7.13 1.71 1.87 2.53 29.27 7.19 -0.03 0.02 0.72 0.18 0.00 4.24 5.44 8.07 0.81 1.44 1.53 7.08 1.77 1.90 2.60 38.18 30.14 2.01 0.02 0.92 0.72 0.05 1.89 5.14 4.98 0.80 1.47 1.53 7.03 1.84 1.91 2.65 10.13 32.03 -17.92 0.02 0.24 0.75 -0.42 4.66 11.01 2.79 0.79 1.51 1.53 6.98 1.90 1.93 2.71 -6.83 6.97 -20.81 0.02 -0.16 0.16 -0.48 5.36 12.01 4.30 0.78 1.54 1.52 6.93 1.96 1.94 2.76 -6.76 -3.01 -10.70 0.02 -0.15 -0.07 -0.24 1.68 5.72 3.93 0.78 1.57 1.52 6.88 2.02 1.95 2.80 -40.62 -8.97 -10.62 0.02 -0.89 -0.20 -0.23 1.51 4.91 5.40 0.78 1.60 1.51 6.84 2.07 1.95 2.84 -29.43 -17.90 -6.55 0.02 -0.63 -0.38 -0.14 1.52 3.21 7.06 0.78 1.63 1.51 6.79 2.10 1.94 2.87 33.60 -5.83 7.49 0.02 0.71 -0.12 0.16 2.45 5.63 1.49 0.78 1.66 1.50 6.74 2.13 1.93 2.88 31.52 1.20 -0.49 0.02 0.65 0.02 -0.01 3.25 3.77 2.70 0.78 1.69 1.50 6.69 2.15 1.91 2.88 -31.44 -13.75 -12.42 0.02 -0.63 -0.28 -0.25 1.84 0.83 2.98 0.79 1.71 1.49 6.64 2.16 1.89 2.87 -47.23 -11.68 -2.36 0.02 -0.92 -0.23 -0.05 2.00 2.04 6.15 0.80 1.73 1.49 6.59 2.16 1.86 2.85 6.90 20.32 -8.30 0.02 0.13 0.39 -0.16 8.35 4.24 15.13 0.81 1.74 1.48 6.54 2.14 1.82 2.81 23.88 38.23 -12.22 0.02 0.44 0.71 -0.23 13.74 10.76 17.14 0.83 1.76 1.48 6.49 2.12 1.78 2.77 -3.12 21.13 6.83 0.02 -0.06 0.38 0.12 6.08 9.96 7.88 0.85 1.77 1.47 6.45 2.09 1.74 2.72 5.93 11.08 1.86 0.02 0.10 0.19 0.03 4.63 7.00 2.18 0.87 1.79 1.47 6.40 2.06 1.69 2.67 3.95 24.03 -14.08 0.02 0.07 0.41 -0.24 4.01 6.30 3.52 0.89 1.80 1.47 6.35 2.03 1.65 2.61
-19.97 14.97 -11.99 0.02 -0.33 0.25 -0.20 7.20 5.32 5.39 0.91 1.82 1.47 6.30 1.99 1.61 2.56 -8.87 -6.03 -1.92 0.02 -0.14 -0.10 -0.03 8.56 8.81 6.59 0.94 1.83 1.47 6.25 1.96 1.57 2.51 -2.80 -3.99 8.10 0.02 -0.04 -0.06 0.13 3.45 4.90 2.71 0.96 1.85 1.47 6.20 1.92 1.53 2.45 -26.69 -4.95 13.10 0.02 -0.40 -0.07 0.20 4.26 5.32 5.06 0.99 1.87 1.48 6.15 1.89 1.49 2.41 -5.58 -9.90 23.07 0.01 -0.08 -0.14 0.33 15.28 1.54 25.24 1.02 1.89 1.48 6.10 1.86 1.46 2.36 51.37 -5.85 17.02 0.01 0.72 -0.08 0.24 18.35 27.10 27.57 1.05 1.91 1.49 6.05 1.83 1.43 2.32 36.25 -13.79 -4.96 0.01 0.49 -0.19 -0.07 48.80 15.79 24.22 1.07 1.94 1.51 6.01 1.80 1.40 2.28 -14.75 -27.69 -0.91 0.01 -0.19 -0.36 -0.01 51.88 7.26 36.97 1.10 1.96 1.52 5.96 1.78 1.38 2.25 3.32 -22.56 -1.87 0.01 0.04 -0.28 -0.02 13.17 4.80 12.62 1.13 1.99 1.54 5.91 1.76 1.36 2.22 25.31 0.50 -16.79 0.01 0.30 0.01 -0.20 2.16 2.22 4.27 1.16 2.02 1.57 5.86 1.74 1.35 2.20 -6.69 -0.48 -31.66 0.01 -0.08 -0.01 -0.36 3.86 9.06 9.21 1.19 2.05 1.59 5.81 1.72 1.34 2.17 24.18 -8.84 -15.26 0.03 0.64 -0.23 -0.40 3.56 10.37 8.25 0.86 1.30 1.55 7.28 1.51 1.81 2.36 14.15 -2.80 -3.18 0.03 0.37 -0.07 -0.08 1.38 10.75 4.60 0.84 1.33 1.55 7.23 1.58 1.83 2.42

570
Raw Data Tapered Data
FFT Data Parzen Filtered Data
Simple Ratio Spectrum
Z E N
Tapering Function
Z E N Z E N Z E N
Frequency Hz
E/Z N/Z
Mean SQRT Spectrum
-13.60 -25.41 -36.48 0.01 -0.15 -0.28 -0.40 4.06 5.81 13.39 1.23 2.08 1.63 5.76 1.69 1.33 2.15 22.43 -30.28 -28.31 0.01 0.24 -0.32 -0.30 3.67 3.61 10.47 1.26 2.11 1.67 5.71 1.67 1.32 2.13 25.38 -36.12 -25.16 0.01 0.25 -0.36 -0.25 4.25 6.56 8.38 1.30 2.15 1.71 5.66 1.65 1.31 2.11 -25.58 -50.93 1.92 0.01 -0.24 -0.48 0.02 5.43 5.36 5.63 1.35 2.18 1.76 5.62 1.62 1.30 2.08 -24.43 -42.72 25.90 0.01 -0.22 -0.38 0.23 3.94 3.55 1.89 1.40 2.22 1.81 5.57 1.59 1.30 2.05 25.61 -27.55 10.87 0.01 0.22 -0.23 0.09 1.45 1.50 2.67 1.45 2.25 1.87 5.52 1.55 1.29 2.02 -3.39 -14.45 3.88 0.01 -0.03 -0.12 0.03 2.25 3.70 3.28 1.51 2.29 1.94 5.47 1.51 1.28 1.98 -37.26 9.58 16.88 0.01 -0.28 0.07 0.13 4.74 1.07 3.57 1.58 2.32 2.01 5.42 1.47 1.27 1.95 -5.13 33.52 20.84 0.01 -0.04 0.23 0.15 5.60 3.02 7.53 1.65 2.35 2.08 5.37 1.43 1.26 1.91 -14.04 44.39 15.81 0.01 -0.09 0.29 0.10 3.53 2.15 1.91 1.73 2.38 2.16 5.32 1.38 1.25 1.86 -23.92 29.26 12.79 0.01 -0.14 0.18 0.08 1.71 3.86 3.22 1.81 2.40 2.25 5.27 1.33 1.24 1.82 48.08 26.17 -2.19 0.01 0.26 0.14 -0.01 1.12 5.95 2.45 1.90 2.43 2.34 5.22 1.28 1.23 1.77 56.91 31.08 -10.13 0.01 0.28 0.16 -0.05 1.49 5.21 5.02 2.00 2.45 2.44 5.18 1.22 1.22 1.73 -34.09 5.02 -2.07 0.00 -0.15 0.02 -0.01 2.34 2.37 2.88 2.11 2.47 2.54 5.13 1.17 1.20 1.68 -49.87 -12.94 3.97 0.00 -0.20 -0.05 0.02 1.82 2.27 3.31 2.23 2.50 2.64 5.08 1.12 1.19 1.63 9.25 -15.86 10.98 0.00 0.03 -0.06 0.04 2.57 1.96 5.22 2.35 2.51 2.75 5.03 1.07 1.17 1.59 -4.71 -19.77 2.99 0.00 -0.01 -0.06 0.01 8.13 7.00 15.12 2.47 2.53 2.86 4.98 1.02 1.16 1.55 -43.57 -1.70 12.00 0.00 -0.11 0.00 0.03 6.26 4.28 6.25 2.59 2.54 2.97 4.93 0.98 1.15 1.51 -7.42 19.28 35.94 0.00 -0.01 0.04 0.07 2.18 1.86 4.46 2.71 2.55 3.07 4.88 0.94 1.13 1.47 4.63 15.23 14.87 0.00 0.01 0.02 0.02 0.52 2.05 2.59 2.83 2.56 3.17 4.83 0.91 1.12 1.44
-29.27 -3.77 -4.11 0.00 -0.03 0.00 0.00 1.05 1.74 3.86 2.94 2.56 3.26 4.79 0.87 1.11 1.41 -30.10 -2.73 4.93 0.00 -0.02 0.00 0.00 3.35 3.93 6.69 3.04 2.56 3.35 4.74 0.84 1.10 1.39

571
Microtremors Segment: B1-T6
Raw Data Tapered Data
FFT Data Parzen Filtered Data
Simple Ratio Spectrum
Z E N
Tapering Function
Z E N Z E N Z E N
Frequency Hz
E/Z N/Z
Mean SQRT Spectrum
55.99 9.76 6.17 0.26 14.53 2.53 1.60 2.38 3.26 0.39 2.86 1.53 1.22 30.03 0.53 0.43 0.68 48.83 9.73 -19.74 0.26 12.65 2.52 -5.11 4.94 0.53 1.88 2.83 1.52 1.20 29.98 0.54 0.42 0.68 -12.19 -9.27 -13.62 0.26 -3.15 -2.40 -3.52 5.11 1.51 2.03 2.80 1.51 1.17 29.93 0.54 0.42 0.68 -5.11 -8.23 -10.52 0.26 -1.32 -2.12 -2.71 1.90 0.08 1.78 2.77 1.50 1.15 29.88 0.54 0.41 0.68 41.87 0.79 -14.41 0.26 10.78 0.20 -3.71 2.64 0.82 0.87 2.73 1.48 1.12 29.83 0.54 0.41 0.68 11.81 1.80 0.67 0.26 3.04 0.46 0.17 3.11 1.73 1.95 2.69 1.46 1.09 29.79 0.54 0.40 0.68 -4.16 10.78 0.72 0.26 -1.07 2.76 0.18 4.66 1.19 0.40 2.64 1.44 1.05 29.74 0.55 0.40 0.68 33.83 24.71 -1.22 0.26 8.66 6.33 -0.31 6.99 2.21 0.67 2.59 1.41 1.02 29.69 0.55 0.39 0.67 17.78 16.64 -3.16 0.26 4.54 4.25 -0.81 4.24 2.93 0.92 2.54 1.38 0.99 29.64 0.55 0.39 0.67 -3.20 0.61 -17.06 0.26 -0.82 0.15 -4.35 5.14 2.88 1.88 2.48 1.35 0.95 29.59 0.55 0.38 0.67 11.83 2.61 -4.96 0.25 3.01 0.66 -1.26 7.39 3.58 2.80 2.42 1.32 0.92 29.54 0.54 0.38 0.66 0.86 7.59 2.10 0.25 0.22 1.93 0.53 3.03 2.53 2.48 2.36 1.28 0.88 29.49 0.54 0.37 0.66
-30.04 -3.41 -8.84 0.25 -7.61 -0.86 -2.24 2.54 1.33 1.74 2.30 1.25 0.85 29.44 0.54 0.37 0.66 -23.88 -14.37 8.22 0.25 -6.04 -3.64 2.08 4.09 1.20 1.10 2.24 1.21 0.82 29.39 0.54 0.37 0.65 14.19 -15.30 15.23 0.25 3.58 -3.86 3.85 6.19 1.51 0.96 2.18 1.18 0.79 29.35 0.54 0.36 0.65 0.21 -35.20 16.22 0.25 0.05 -8.87 4.09 5.48 1.58 1.00 2.12 1.14 0.76 29.30 0.54 0.36 0.65
-33.67 -46.03 25.19 0.25 -8.47 -11.58 6.34 4.60 4.17 1.43 2.07 1.11 0.74 29.25 0.54 0.36 0.65 2.44 -23.88 32.13 0.25 0.61 -5.99 8.07 2.08 2.59 2.73 2.01 1.08 0.71 29.20 0.53 0.36 0.64 19.45 -7.81 40.04 0.25 4.87 -1.96 10.03 4.34 2.64 0.77 1.96 1.04 0.69 29.15 0.53 0.35 0.64 -23.50 -11.76 30.95 0.25 -5.87 -2.94 7.74 3.43 0.73 0.66 1.91 1.01 0.67 29.10 0.53 0.35 0.64 -11.38 -14.70 30.88 0.25 -2.84 -3.67 7.71 5.40 2.61 1.22 1.86 0.98 0.66 29.05 0.53 0.35 0.64 25.64 -1.66 30.81 0.25 6.39 -0.41 7.67 5.98 1.71 0.53 1.82 0.95 0.64 29.00 0.53 0.35 0.63 -0.36 -9.63 12.78 0.25 -0.09 -2.39 3.18 7.90 2.80 2.60 1.77 0.93 0.63 28.96 0.52 0.35 0.63 -26.25 -18.57 21.76 0.25 -6.51 -4.60 5.40 7.42 2.62 4.01 1.74 0.90 0.62 28.91 0.52 0.36 0.63 -11.13 -0.52 27.72 0.25 -2.75 -0.13 6.86 0.47 3.83 0.83 1.71 0.88 0.61 28.86 0.52 0.36 0.63 -28.00 -5.50 14.69 0.25 -6.92 -1.36 3.63 7.58 4.82 0.74 1.68 0.86 0.60 28.81 0.51 0.36 0.63 -54.78 -13.46 18.67 0.25 -13.50 -3.32 4.60 9.24 1.57 1.58 1.65 0.84 0.59 28.76 0.51 0.36 0.62 -20.58 -4.41 5.68 0.25 -5.06 -1.09 1.40 10.89 4.87 6.83 1.63 0.83 0.59 28.71 0.51 0.36 0.62 -10.47 -2.39 -21.24 0.25 -2.57 -0.59 -5.21 6.28 7.56 4.34 1.61 0.81 0.59 28.66 0.50 0.36 0.62 -42.31 -1.38 -15.12 0.25 -10.37 -0.34 -3.70 3.33 3.39 1.04 1.60 0.80 0.58 28.61 0.50 0.37 0.62 -3.17 13.61 -7.02 0.24 -0.78 3.33 -1.72 5.13 3.66 2.05 1.59 0.79 0.58 28.56 0.50 0.37 0.62 43.80 30.53 -14.92 0.24 10.69 7.45 -3.64 5.63 4.06 2.88 1.58 0.78 0.58 28.52 0.50 0.37 0.62 55.99 9.76 6.17 0.26 14.53 2.53 1.60 2.38 3.26 0.39 2.86 1.53 1.22 30.03 0.53 0.43 0.68

572
Raw Data Tapered
Data FFT Data Parzen Filtered
Data Simple Ratio
Spectrum Z E N
Tapering Function
Z E N Z E N Z E N
Frequency Hz
E/Z N/Z
Mean SQRT Spectrum
30.70 35.40 -16.80 0.24 7.48 8.62 -4.09 1.62 2.72 5.48 1.58 0.78 0.58 28.47 0.49 0.37 0.62 19.65 28.28 -3.71 0.24 4.78 6.87 -0.90 5.68 3.09 5.04 1.58 0.77 0.58 28.42 0.49 0.37 0.61 30.60 21.19 3.34 0.24 7.42 5.14 0.81 4.60 1.79 1.83 1.58 0.77 0.58 28.37 0.49 0.37 0.61 28.53 31.09 -14.58 0.24 6.90 7.52 -3.53 0.77 1.25 1.05 1.58 0.77 0.59 28.32 0.49 0.37 0.61 -6.46 29.98 -17.46 0.24 -1.56 7.24 -4.22 5.55 1.96 1.95 1.59 0.77 0.59 28.27 0.49 0.37 0.61 -1.40 22.88 -10.35 0.24 -0.34 5.51 -2.50 5.89 1.33 3.04 1.60 0.78 0.59 28.22 0.48 0.37 0.61 35.59 20.79 -11.26 0.24 8.56 5.00 -2.71 3.13 1.18 3.50 1.61 0.78 0.59 28.17 0.48 0.37 0.61 -1.43 -4.23 -11.16 0.24 -0.34 -1.02 -2.68 3.79 4.11 1.20 1.63 0.79 0.60 28.13 0.48 0.37 0.61 -30.32 -20.18 -15.05 0.24 -7.26 -4.83 -3.60 4.19 4.91 2.05 1.64 0.80 0.60 28.08 0.48 0.37 0.61 23.74 5.86 -5.96 0.24 5.67 1.40 -1.42 1.21 3.25 1.38 1.66 0.81 0.61 28.03 0.49 0.37 0.61 37.67 25.80 -5.88 0.24 8.98 6.15 -1.40 2.83 2.81 1.51 1.68 0.82 0.61 27.98 0.49 0.36 0.61 -0.35 6.74 -30.75 0.24 -0.08 1.60 -7.32 4.03 0.77 1.65 1.70 0.83 0.62 27.93 0.49 0.36 0.61 -9.29 -6.26 -26.58 0.24 -2.21 -1.49 -6.31 2.73 3.67 2.65 1.72 0.85 0.63 27.88 0.49 0.36 0.61 5.77 -7.22 -12.45 0.24 1.37 -1.71 -2.95 5.51 4.78 3.23 1.74 0.86 0.64 27.83 0.49 0.36 0.61 3.80 -30.14 -26.32 0.24 0.90 -7.13 -6.22 6.47 3.47 1.59 1.76 0.88 0.65 27.78 0.50 0.37 0.62
-14.13 -36.00 -14.18 0.24 -3.33 -8.50 -3.35 3.06 3.21 1.15 1.78 0.90 0.66 27.73 0.50 0.37 0.62 13.92 -9.90 12.88 0.24 3.28 -2.33 3.03 6.88 1.66 1.87 1.80 0.91 0.67 27.69 0.51 0.37 0.63 23.90 -20.84 8.89 0.24 5.62 -4.90 2.09 4.75 0.83 1.48 1.82 0.93 0.68 27.64 0.51 0.37 0.63 -25.05 -41.70 9.90 0.23 -5.87 -9.78 2.32 2.87 2.90 0.40 1.84 0.95 0.69 27.59 0.52 0.38 0.64 -25.90 -21.57 7.92 0.23 -6.06 -5.05 1.85 1.86 5.35 2.10 1.86 0.97 0.71 27.54 0.52 0.38 0.65 3.20 -12.49 -8.02 0.23 0.75 -2.92 -1.87 4.69 4.23 3.58 1.87 0.99 0.72 27.49 0.53 0.39 0.65
-10.74 -25.41 -3.94 0.23 -2.50 -5.92 -0.92 2.78 3.21 2.35 1.89 1.01 0.74 27.44 0.53 0.39 0.66 -25.62 -19.31 -3.87 0.23 -5.96 -4.49 -0.90 2.12 3.62 0.57 1.90 1.02 0.76 27.39 0.54 0.40 0.67 -17.48 -11.24 -11.79 0.23 -4.06 -2.61 -2.73 6.09 2.36 1.34 1.90 1.04 0.77 27.34 0.55 0.41 0.68 -24.34 -13.19 1.29 0.23 -5.64 -3.05 0.30 10.42 4.32 1.65 1.91 1.05 0.79 27.29 0.55 0.41 0.69 -24.20 -3.15 14.31 0.23 -5.59 -0.73 3.31 11.08 3.49 1.99 1.91 1.07 0.80 27.25 0.56 0.42 0.70 6.89 3.86 20.30 0.23 1.59 0.89 4.68 8.69 4.29 2.12 1.91 1.08 0.82 27.20 0.57 0.43 0.71 10.90 -13.11 28.25 0.23 2.51 -3.02 6.50 3.98 2.92 1.84 1.91 1.09 0.83 27.15 0.57 0.44 0.72 -18.03 -32.01 23.21 0.23 -4.14 -7.35 5.33 2.78 1.62 1.05 1.90 1.11 0.85 27.10 0.58 0.45 0.73 -17.91 -28.88 12.19 0.23 -4.10 -6.61 2.79 4.21 4.08 1.12 1.89 1.12 0.86 27.05 0.59 0.45 0.74 -5.81 -4.81 13.19 0.23 -1.33 -1.10 3.01 3.61 1.90 1.66 1.88 1.12 0.87 27.00 0.60 0.46 0.75 30.70 35.40 -16.80 0.24 7.48 8.62 -4.09 1.62 2.72 5.48 1.58 0.78 0.58 28.47 0.49 0.37 0.62 19.65 28.28 -3.71 0.24 4.78 6.87 -0.90 5.68 3.09 5.04 1.58 0.77 0.58 28.42 0.49 0.37 0.61

573
Raw Data Tapered Data
FFT Data Parzen Filtered Data
Simple Ratio Spectrum
Z E N
Tapering Function
Z E N Z E N Z E N
Frequency Hz
E/Z N/Z
Mean SQRT Spectrum
-25.69 -6.78 8.20 0.23 -5.86 -1.54 1.87 6.70 1.68 1.40 1.87 1.13 0.88 26.95 0.61 0.47 0.77 -7.58 -23.71 -0.76 0.23 -1.72 -5.39 -0.17 7.60 2.76 2.32 1.85 1.14 0.88 26.90 0.61 0.48 0.78 56.38 -6.64 6.28 0.23 12.80 -1.51 1.43 2.65 1.86 3.12 1.84 1.14 0.89 26.86 0.62 0.48 0.79 44.23 16.35 12.30 0.23 10.02 3.70 2.79 4.57 2.31 1.78 1.82 1.14 0.89 26.81 0.63 0.49 0.79 0.19 26.28 8.31 0.23 0.04 5.94 1.88 7.71 5.63 2.07 1.81 1.15 0.89 26.76 0.63 0.49 0.80 20.20 36.16 23.30 0.23 4.55 8.15 5.25 4.73 4.17 3.46 1.79 1.15 0.89 26.71 0.64 0.50 0.81 46.11 39.02 20.27 0.23 10.38 8.78 4.56 1.47 1.22 2.21 1.78 1.15 0.89 26.66 0.65 0.50 0.82 15.04 14.92 0.28 0.22 3.38 3.35 0.06 8.03 3.92 0.72 1.76 1.15 0.88 26.61 0.65 0.50 0.82 -11.91 -10.09 14.30 0.22 -2.67 -2.26 3.20 10.05 2.80 3.28 1.75 1.15 0.87 26.56 0.66 0.50 0.83 18.12 -2.05 23.28 0.22 4.05 -0.46 5.20 3.74 1.35 5.71 1.74 1.15 0.87 26.51 0.66 0.50 0.83 9.12 -16.01 15.26 0.22 2.03 -3.57 3.40 4.08 1.95 4.42 1.73 1.15 0.86 26.46 0.67 0.50 0.83
-52.74 -39.89 10.26 0.22 -11.74 -8.88 2.28 5.76 3.23 3.50 1.72 1.15 0.85 26.42 0.67 0.49 0.83 -34.52 -24.75 4.28 0.22 -7.66 -5.49 0.95 5.73 1.59 2.00 1.72 1.15 0.84 26.37 0.67 0.49 0.83 28.54 -13.67 -13.65 0.22 6.32 -3.03 -3.02 3.30 1.50 1.68 1.72 1.16 0.82 26.32 0.67 0.48 0.83 1.53 -12.60 -42.48 0.22 0.34 -2.79 -9.39 2.36 4.29 1.42 1.72 1.16 0.81 26.27 0.67 0.47 0.82
-41.34 -0.57 -34.27 0.22 -9.11 -0.13 -7.56 6.28 4.62 2.46 1.72 1.16 0.80 26.22 0.67 0.47 0.82 -5.19 26.39 -8.13 0.22 -1.14 5.81 -1.79 3.79 2.14 2.53 1.73 1.16 0.79 26.17 0.67 0.46 0.81 24.82 43.26 -5.05 0.22 5.45 9.49 -1.11 1.64 0.54 2.28 1.74 1.16 0.78 26.12 0.67 0.45 0.80 -20.14 12.15 2.01 0.22 -4.41 2.66 0.44 4.26 1.25 3.94 1.75 1.16 0.77 26.07 0.66 0.44 0.80 -27.99 0.14 24.01 0.22 -6.12 0.03 5.25 4.03 1.76 4.32 1.77 1.16 0.76 26.03 0.66 0.43 0.79 32.05 8.13 38.93 0.22 6.99 1.77 8.49 2.17 1.98 0.46 1.78 1.16 0.76 25.98 0.65 0.43 0.78 -8.94 -17.84 16.87 0.22 -1.95 -3.88 3.67 2.15 2.11 1.66 1.80 1.16 0.75 25.93 0.65 0.42 0.77 -54.77 -17.76 2.89 0.22 -11.88 -3.85 0.63 4.20 3.07 1.21 1.82 1.16 0.75 25.88 0.64 0.41 0.76 6.38 -0.72 13.91 0.22 1.38 -0.16 3.01 7.76 1.22 0.72 1.83 1.16 0.75 25.83 0.63 0.41 0.75 -3.57 -17.67 5.92 0.22 -0.77 -3.82 1.28 7.22 0.71 1.74 1.85 1.16 0.75 25.78 0.63 0.40 0.74 -52.41 -25.58 0.96 0.22 -11.29 -5.51 0.21 5.62 0.30 3.02 1.87 1.16 0.75 25.73 0.62 0.40 0.74 -13.23 -6.50 -6.98 0.22 -2.84 -1.40 -1.50 0.85 1.76 2.07 1.89 1.16 0.75 25.68 0.61 0.40 0.73 11.83 8.50 -12.88 0.21 2.54 1.82 -2.76 5.38 3.09 0.83 1.90 1.15 0.75 25.63 0.61 0.40 0.72 -45.05 5.48 10.17 0.21 -9.64 1.17 2.18 5.30 1.73 2.14 1.92 1.15 0.76 25.59 0.60 0.40 0.72 -57.79 9.46 13.18 0.21 -12.34 2.02 2.81 2.60 2.80 1.95 1.93 1.14 0.77 25.54 0.59 0.40 0.71 8.36 23.40 17.17 0.21 1.78 4.98 3.66 0.85 6.52 2.17 1.94 1.14 0.77 25.49 0.58 0.40 0.71
-25.69 -6.78 8.20 0.23 -5.86 -1.54 1.87 6.70 1.68 1.40 1.87 1.13 0.88 26.95 0.61 0.47 0.77 -7.58 -23.71 -0.76 0.23 -1.72 -5.39 -0.17 7.60 2.76 2.32 1.85 1.14 0.88 26.90 0.61 0.48 0.78

574
Raw Data Tapered Data
FFT Data Parzen Filtered Data
Simple Ratio Spectrum
Z E N
Tapering Function
Z E N Z E N Z E N
Frequency Hz
E/Z N/Z
Mean SQRT Spectrum
24.35 22.32 21.15 0.21 5.17 4.74 4.49 3.49 5.22 3.42 1.95 1.13 0.78 25.44 0.58 0.40 0.70 -12.63 12.26 8.14 0.21 -2.68 2.60 1.73 2.95 4.08 2.44 1.95 1.12 0.79 25.39 0.57 0.41 0.70 -4.54 9.22 14.15 0.21 -0.96 1.95 2.99 4.21 3.51 0.67 1.96 1.11 0.80 25.34 0.57 0.41 0.70 7.51 6.20 11.15 0.21 1.58 1.31 2.35 5.44 0.99 3.70 1.96 1.10 0.82 25.29 0.56 0.42 0.70
-11.43 -8.79 5.17 0.21 -2.41 -1.85 1.09 4.52 4.33 3.12 1.95 1.09 0.83 25.24 0.56 0.42 0.70 4.63 -12.74 6.20 0.21 0.97 -2.67 1.30 3.22 2.59 1.45 1.95 1.08 0.84 25.20 0.55 0.43 0.70 41.59 10.28 -11.74 0.21 8.71 2.15 -2.46 2.36 3.42 1.63 1.94 1.07 0.85 25.15 0.55 0.44 0.70 26.51 25.21 -23.62 0.21 5.54 5.27 -4.94 7.42 3.45 2.85 1.93 1.05 0.86 25.10 0.55 0.44 0.70 9.49 25.12 -22.47 0.21 1.98 5.24 -4.69 7.98 2.85 2.98 1.92 1.04 0.87 25.05 0.54 0.45 0.71 39.44 20.04 -17.34 0.21 8.20 4.17 -3.61 10.62 3.16 5.15 1.91 1.03 0.88 25.00 0.54 0.46 0.71 38.34 5.99 -21.21 0.21 7.96 1.24 -4.40 12.15 3.22 1.62 1.89 1.02 0.88 24.95 0.54 0.47 0.71 18.28 9.97 -18.08 0.21 3.78 2.06 -3.74 8.39 3.52 10.71 1.87 1.00 0.89 24.90 0.54 0.48 0.72 50.19 34.89 7.00 0.21 10.36 7.20 1.45 2.94 5.46 8.71 1.86 0.99 0.90 24.85 0.54 0.48 0.72 57.03 42.74 12.01 0.21 11.75 8.80 2.47 2.10 6.69 2.50 1.84 0.98 0.90 24.80 0.53 0.49 0.73 -3.03 4.65 -6.94 0.21 -0.62 0.96 -1.43 3.90 2.58 1.75 1.82 0.97 0.90 24.76 0.54 0.50 0.73 -38.90 -25.30 -13.85 0.21 -7.97 -5.19 -2.84 6.91 1.47 1.61 1.80 0.96 0.90 24.71 0.54 0.50 0.73 -20.73 -9.23 5.22 0.20 -4.24 -1.89 1.07 5.98 2.49 2.03 1.78 0.96 0.90 24.66 0.54 0.51 0.74 -11.61 -1.20 -0.74 0.20 -2.37 -0.24 -0.15 3.27 3.17 0.84 1.76 0.95 0.90 24.61 0.54 0.51 0.74 -39.46 -26.14 -16.65 0.20 -8.03 -5.32 -3.39 2.04 0.42 1.33 1.75 0.95 0.90 24.56 0.54 0.52 0.75 -5.32 -31.01 1.44 0.20 -1.08 -6.30 0.29 3.73 3.24 2.78 1.73 0.95 0.90 24.51 0.55 0.52 0.76 26.69 -10.92 -8.50 0.20 5.40 -2.21 -1.72 6.25 3.18 3.40 1.72 0.95 0.90 24.46 0.55 0.53 0.76 -22.27 -20.85 -19.39 0.20 -4.50 -4.21 -3.92 8.06 0.57 5.27 1.71 0.95 0.90 24.41 0.55 0.53 0.77 -9.15 -17.77 15.67 0.20 -1.84 -3.58 3.16 7.60 0.53 3.14 1.70 0.95 0.90 24.37 0.56 0.53 0.77 14.89 -1.72 24.64 0.20 2.99 -0.35 4.95 11.65 2.16 4.46 1.69 0.96 0.90 24.32 0.56 0.53 0.78 -25.04 -19.67 13.62 0.20 -5.02 -3.94 2.73 11.75 1.61 4.94 1.69 0.96 0.90 24.27 0.57 0.54 0.78 -27.88 -23.57 13.62 0.20 -5.58 -4.71 2.72 7.23 4.79 5.34 1.68 0.97 0.91 24.22 0.58 0.54 0.79 11.20 -0.52 8.63 0.20 2.23 -0.10 1.72 7.00 5.66 6.48 1.69 0.98 0.91 24.17 0.58 0.54 0.79 11.21 7.48 1.66 0.20 2.23 1.49 0.33 2.91 1.89 1.71 1.69 0.99 0.91 24.12 0.59 0.54 0.80 -29.70 -30.47 -2.29 0.20 -5.90 -6.05 -0.45 8.52 5.05 6.06 1.70 1.00 0.92 24.07 0.59 0.54 0.80 -41.51 -57.28 3.76 0.20 -8.22 -11.34 0.74 18.95 11.26 13.59 1.71 1.02 0.93 24.02 0.60 0.54 0.81 -20.33 -16.13 8.79 0.20 -4.02 -3.18 1.74 16.11 1.56 10.20 1.72 1.03 0.94 23.97 0.60 0.55 0.81 24.35 22.32 21.15 0.21 5.17 4.74 4.49 3.49 5.22 3.42 1.95 1.13 0.78 25.44 0.58 0.40 0.70 -12.63 12.26 8.14 0.21 -2.68 2.60 1.73 2.95 4.08 2.44 1.95 1.12 0.79 25.39 0.57 0.41 0.70

575
Raw Data Tapered Data
FFT Data Parzen Filtered Data
Simple Ratio Spectrum
Z E N
Tapering Function
Z E N Z E N Z E N
Frequency Hz
E/Z N/Z
Mean SQRT Spectrum
-26.19 8.90 2.82 0.20 -5.16 1.75 0.56 11.10 1.84 2.15 1.74 1.05 0.95 23.93 0.60 0.55 0.81 -25.03 -1.11 -2.13 0.20 -4.92 -0.22 -0.42 12.40 6.10 5.63 1.76 1.06 0.97 23.88 0.61 0.55 0.82 15.04 23.85 3.92 0.20 2.95 4.68 0.77 11.28 2.36 4.45 1.78 1.08 0.98 23.83 0.61 0.55 0.82 17.03 34.75 11.94 0.20 3.33 6.79 2.33 7.47 2.06 5.96 1.81 1.09 1.00 23.78 0.61 0.55 0.82 -13.92 7.67 8.95 0.20 -2.71 1.50 1.75 7.58 5.58 7.14 1.83 1.11 1.02 23.73 0.60 0.56 0.82 -9.82 22.62 8.97 0.19 -1.91 4.40 1.74 8.70 3.44 6.59 1.86 1.12 1.04 23.68 0.60 0.56 0.82 5.24 44.49 18.96 0.19 1.02 8.63 3.68 0.82 3.49 4.49 1.90 1.13 1.06 23.63 0.60 0.56 0.82 14.25 13.38 20.93 0.19 2.76 2.59 4.05 6.63 3.04 8.20 1.93 1.14 1.09 23.58 0.59 0.56 0.82 33.21 -1.63 1.94 0.19 6.41 -0.32 0.37 7.42 5.02 8.70 1.97 1.16 1.11 23.54 0.59 0.57 0.81 37.12 5.37 -8.00 0.19 7.15 1.03 -1.54 8.38 1.65 6.44 2.01 1.16 1.14 23.49 0.58 0.57 0.81 18.06 -5.62 -5.92 0.19 3.47 -1.08 -1.14 11.25 4.30 3.74 2.05 1.17 1.17 23.44 0.57 0.57 0.81 8.06 -15.57 -11.83 0.19 1.54 -2.98 -2.27 15.58 6.62 1.76 2.10 1.18 1.20 23.39 0.56 0.57 0.80 33.03 -17.50 -3.75 0.19 6.31 -3.34 -0.72 14.19 7.29 3.37 2.14 1.19 1.23 23.34 0.55 0.57 0.80 46.92 -5.45 -3.68 0.19 8.94 -1.04 -0.70 8.03 5.62 3.40 2.19 1.19 1.26 23.29 0.54 0.58 0.79 11.86 -11.40 -20.58 0.19 2.25 -2.17 -3.91 4.63 3.73 3.18 2.24 1.20 1.30 23.24 0.53 0.58 0.79 -5.11 -19.33 -0.48 0.19 -0.97 -3.66 -0.09 5.19 2.79 1.16 2.30 1.20 1.33 23.19 0.52 0.58 0.78 17.92 16.68 15.54 0.19 3.39 3.15 2.94 6.88 3.07 2.11 2.35 1.21 1.37 23.14 0.51 0.58 0.77 16.90 10.63 4.55 0.19 3.19 2.00 0.86 5.51 1.40 4.72 2.41 1.21 1.40 23.10 0.50 0.58 0.77 -4.07 -20.34 18.56 0.19 -0.77 -3.82 3.49 4.43 1.51 6.32 2.47 1.21 1.44 23.05 0.49 0.58 0.76 21.94 7.70 34.50 0.19 4.11 1.44 6.47 4.44 1.86 5.99 2.53 1.22 1.48 23.00 0.48 0.58 0.76 30.89 12.66 26.43 0.19 5.78 2.37 4.94 7.26 4.03 3.02 2.59 1.22 1.51 22.95 0.47 0.59 0.75 -17.09 -24.31 9.41 0.19 -3.19 -4.53 1.76 6.80 0.63 2.03 2.65 1.23 1.55 22.90 0.47 0.59 0.75 -17.97 -30.19 4.43 0.19 -3.34 -5.61 0.82 5.75 3.46 3.32 2.71 1.24 1.59 22.85 0.46 0.59 0.74 4.11 -24.07 11.45 0.19 0.76 -4.47 2.12 6.22 5.04 3.62 2.77 1.25 1.63 22.80 0.45 0.59 0.74
-24.80 -32.95 -1.51 0.19 -4.59 -6.10 -0.28 6.47 3.87 6.20 2.83 1.26 1.67 22.75 0.44 0.59 0.74 -37.62 -31.81 -7.44 0.18 -6.94 -5.87 -1.37 6.26 7.60 8.65 2.88 1.27 1.71 22.71 0.44 0.59 0.74 -4.49 1.26 17.59 0.18 -0.83 0.23 3.24 5.94 5.32 6.05 2.94 1.28 1.74 22.66 0.44 0.59 0.74 3.57 19.23 3.59 0.18 0.65 3.53 0.66 1.68 2.92 3.42 2.99 1.29 1.78 22.61 0.43 0.59 0.73
-41.31 3.20 -17.33 0.18 -7.56 0.58 -3.17 3.21 0.47 3.17 3.04 1.30 1.81 22.56 0.43 0.60 0.73 -27.12 13.17 10.74 0.18 -4.95 2.40 1.96 3.71 1.54 3.92 3.08 1.32 1.84 22.51 0.43 0.60 0.73 40.91 30.09 20.73 0.18 7.45 5.48 3.77 4.49 3.87 2.23 3.12 1.33 1.87 22.46 0.43 0.60 0.73 -26.19 8.90 2.82 0.20 -5.16 1.75 0.56 11.10 1.84 2.15 1.74 1.05 0.95 23.93 0.60 0.55 0.81 -25.03 -1.11 -2.13 0.20 -4.92 -0.22 -0.42 12.40 6.10 5.63 1.76 1.06 0.97 23.88 0.61 0.55 0.82

576
Raw Data Tapered Data
FFT Data Parzen Filtered Data
Simple Ratio Spectrum
Z E N
Tapering Function
Z E N Z E N Z E N
Frequency Hz
E/Z N/Z
Mean SQRT Spectrum
-17.09 0.04 11.71 0.18 -3.10 0.01 2.13 1.96 3.62 2.61 3.16 1.34 1.89 22.41 0.43 0.60 -17.09 -81.84 -16.91 2.73 0.18 -14.81 -3.06 0.49 8.32 2.61 4.90 3.19 1.36 1.91 22.36 0.43 0.60 -81.84 0.38 10.11 -8.20 0.18 0.07 1.82 -1.48 7.43 1.21 1.51 3.21 1.37 1.92 22.31 0.43 0.60 0.38 36.36 11.07 -11.11 0.18 6.54 1.99 -2.00 4.29 3.21 2.39 3.23 1.38 1.94 22.27 0.43 0.60 36.36 -30.60 -28.88 -11.02 0.18 -5.49 -5.18 -1.98 7.80 4.18 3.86 3.24 1.39 1.95 22.22 0.43 0.60 -30.60 -30.43 -26.76 -7.93 0.18 -5.45 -4.79 -1.42 8.04 2.53 4.73 3.24 1.40 1.95 22.17 0.43 0.60 -30.43 16.65 13.28 -12.84 0.18 2.97 2.37 -2.29 6.60 0.97 3.51 3.24 1.41 1.95 22.12 0.44 0.60 16.65 -4.32 10.24 -15.73 0.18 -0.77 1.82 -2.80 3.71 1.08 1.46 3.23 1.42 1.95 22.07 0.44 0.60 -4.32 -21.22 2.22 -9.63 0.18 -3.77 0.39 -1.71 2.10 3.34 4.46 3.21 1.42 1.94 22.02 0.44 0.60 -21.22 13.85 17.19 -16.52 0.18 2.45 3.04 -2.92 7.86 3.92 4.64 3.19 1.43 1.93 21.97 0.45 0.61 13.85 12.85 15.14 -15.41 0.18 2.27 2.67 -2.72 8.74 3.20 2.25 3.16 1.43 1.92 21.92 0.45 0.61 12.85 -20.08 14.09 -8.31 0.18 -3.53 2.48 -1.46 4.53 1.31 2.26 3.12 1.43 1.90 21.88 0.46 0.61 -20.08 9.99 26.02 -10.22 0.18 1.75 4.57 -1.79 1.48 4.15 1.98 3.08 1.43 1.88 21.83 0.46 0.61 9.99 65.89 25.92 -3.14 0.18 11.53 4.54 -0.55 5.21 6.13 1.39 3.04 1.42 1.86 21.78 0.47 0.61 65.89 34.74 6.86 1.92 0.17 6.06 1.20 0.33 8.40 3.76 4.53 2.99 1.42 1.84 21.73 0.47 0.61 34.74 -13.25 2.85 -1.03 0.17 -2.31 0.50 -0.18 2.70 3.51 1.67 2.94 1.41 1.81 21.68 0.48 0.62 -13.25 8.81 6.84 4.01 0.17 1.53 1.19 0.70 4.31 1.81 4.63 2.89 1.40 1.79 21.63 0.48 0.62 8.81 13.82 -13.14 4.05 0.17 2.39 -2.27 0.70 3.99 1.31 3.14 2.83 1.39 1.76 21.58 0.49 0.62 13.82 -9.14 -32.04 2.09 0.17 -1.58 -5.53 0.36 5.76 2.87 5.49 2.78 1.38 1.74 21.53 0.50 0.63 -9.14 6.92 -23.92 8.12 0.17 1.19 -4.11 1.40 7.00 6.06 4.95 2.72 1.37 1.71 21.48 0.50 0.63 6.92 28.90 -0.86 2.15 0.17 4.96 -0.15 0.37 1.35 1.86 2.86 2.66 1.36 1.69 21.44 0.51 0.63 28.90 -2.10 -0.85 -12.78 0.17 -0.36 -0.15 -2.18 0.90 2.23 1.61 2.61 1.34 1.66 21.39 0.51 0.64 -2.10 -26.99 -2.83 -8.68 0.17 -4.60 -0.48 -1.48 2.83 2.54 2.14 2.55 1.33 1.64 21.34 0.52 0.64 -26.99 14.08 11.16 5.38 0.17 2.39 1.90 0.91 4.93 1.70 1.70 2.50 1.32 1.61 21.29 0.53 0.64 14.08 23.06 -3.85 18.38 0.17 3.91 -0.65 3.12 1.79 4.28 1.18 2.45 1.30 1.59 21.24 0.53 0.65 23.06 -8.92 -13.80 20.35 0.17 -1.51 -2.33 3.44 3.75 1.69 0.26 2.41 1.29 1.57 21.19 0.54 0.65 -8.92 15.12 5.22 14.34 0.17 2.55 0.88 2.42 5.22 1.81 0.21 2.36 1.28 1.55 21.14 0.54 0.66 15.12 19.11 -3.77 18.32 0.17 3.21 -0.63 3.08 2.37 1.00 0.58 2.32 1.26 1.53 21.09 0.54 0.66 19.11 -17.85 -37.68 13.31 0.17 -2.99 -6.31 2.23 2.26 2.38 2.11 2.28 1.25 1.51 21.04 0.55 0.66 -17.85 -19.72 -42.51 13.31 0.17 -3.29 -7.10 2.22 5.63 1.63 4.20 2.24 1.24 1.49 21.00 0.55 0.66 -19.72 -15.60 -22.37 23.29 0.17 -2.60 -3.72 3.88 6.74 2.32 1.87 2.21 1.23 1.47 20.95 0.56 0.67 -15.60 -17.09 0.04 11.71 0.18 -3.10 0.01 2.13 1.96 3.62 2.61 3.16 1.34 1.89 22.41 0.43 0.60 -17.09 -81.84 -16.91 2.73 0.18 -14.81 -3.06 0.49 8.32 2.61 4.90 3.19 1.36 1.91 22.36 0.43 0.60 -81.84

577
Raw Data Tapered Data
FFT Data Parzen Filtered Data
Simple Ratio Spectrum
Z E N
Tapering Function
Z E N Z E N Z E N
Frequency Hz
E/Z N/Z
Mean SQRT Spectrum
-20.47 -20.27 17.26 0.17 -3.40 -3.37 2.86 5.55 1.11 2.68 2.18 1.21 1.45 20.90 0.56 0.67 0.87 -38.30 -23.18 11.25 0.17 -6.34 -3.84 1.86 3.15 0.67 0.29 2.15 1.20 1.43 20.85 0.56 0.67 0.87 -24.12 -10.10 21.23 0.17 -3.98 -1.67 3.50 0.85 1.98 1.41 2.12 1.19 1.41 20.80 0.56 0.67 0.87 29.92 -0.07 25.19 0.16 4.92 -0.01 4.14 4.54 1.02 0.08 2.10 1.18 1.39 20.75 0.57 0.67 0.87 1.91 7.93 0.19 0.16 0.31 1.30 0.03 6.65 4.13 0.68 2.07 1.17 1.37 20.70 0.57 0.66 0.87
-26.99 22.87 -1.76 0.16 -4.41 3.74 -0.29 2.81 3.44 1.31 2.05 1.17 1.36 20.65 0.57 0.66 0.87 -9.86 24.79 10.28 0.16 -1.61 4.04 1.68 3.37 2.49 2.18 2.03 1.16 1.34 20.61 0.57 0.66 0.87 -7.78 6.74 -3.68 0.16 -1.26 1.09 -0.60 2.53 1.97 2.49 2.01 1.15 1.32 20.56 0.57 0.66 0.87 11.27 -2.26 -1.62 0.16 1.83 -0.37 -0.26 2.53 2.58 3.19 1.99 1.14 1.30 20.51 0.58 0.65 0.87 14.27 3.74 -6.56 0.16 2.30 0.60 -1.06 1.59 2.07 1.98 1.97 1.14 1.28 20.46 0.58 0.65 0.87 8.28 -1.25 -22.45 0.16 1.33 -0.20 -3.61 3.78 1.26 1.36 1.95 1.13 1.25 20.41 0.58 0.64 0.87 18.28 -12.22 -11.33 0.16 2.93 -1.96 -1.82 4.41 0.95 3.13 1.92 1.12 1.23 20.36 0.58 0.64 0.87 22.25 -5.17 -0.26 0.16 3.56 -0.83 -0.04 7.21 2.03 1.94 1.90 1.11 1.21 20.31 0.59 0.64 0.86 15.23 13.82 -0.20 0.16 2.43 2.20 -0.03 4.34 2.81 2.55 1.88 1.11 1.19 20.26 0.59 0.63 0.86 -3.74 6.79 -2.15 0.16 -0.60 1.08 -0.34 3.20 2.51 2.89 1.86 1.10 1.16 20.21 0.59 0.63 0.86 4.31 3.78 -0.09 0.16 0.68 0.60 -0.01 5.14 1.50 2.00 1.83 1.09 1.14 20.17 0.59 0.62 0.86 34.28 18.74 8.94 0.16 5.42 2.96 1.41 2.40 4.04 0.51 1.81 1.08 1.12 20.12 0.60 0.62 0.86 17.23 3.71 3.96 0.16 2.71 0.58 0.62 5.84 1.00 1.55 1.79 1.07 1.09 20.07 0.60 0.61 0.86 -16.72 -20.25 5.00 0.16 -2.63 -3.18 0.78 5.28 4.48 3.81 1.76 1.06 1.07 20.02 0.60 0.61 0.85 7.35 -12.18 29.98 0.16 1.15 -1.91 4.69 1.07 1.97 3.49 1.74 1.05 1.05 19.97 0.60 0.60 0.85 31.33 9.84 29.91 0.16 4.89 1.53 4.67 4.86 1.67 3.78 1.72 1.04 1.02 19.92 0.60 0.60 0.85 -1.68 7.81 17.86 0.16 -0.26 1.21 2.78 3.84 6.57 2.30 1.69 1.02 1.00 19.87 0.61 0.59 0.85 -24.58 -7.18 11.85 0.16 -3.81 -1.11 1.84 3.39 8.86 2.53 1.67 1.01 0.97 19.82 0.61 0.58 0.84 -5.47 7.83 6.86 0.15 -0.84 1.21 1.06 8.37 8.67 4.68 1.65 1.00 0.95 19.78 0.61 0.58 0.84 3.59 14.79 2.89 0.15 0.55 2.28 0.45 3.11 6.27 8.97 1.62 0.98 0.93 19.73 0.61 0.57 0.83 -7.35 5.76 -9.05 0.15 -1.13 0.88 -1.39 5.53 5.58 5.86 1.60 0.97 0.91 19.68 0.61 0.56 0.83 19.68 9.74 -8.96 0.15 3.01 1.49 -1.37 4.42 3.47 1.64 1.58 0.96 0.88 19.63 0.60 0.56 0.82 23.64 -5.26 -4.88 0.15 3.61 -0.80 -0.74 2.32 5.22 3.94 1.57 0.95 0.86 19.58 0.60 0.55 0.82 -15.32 -9.22 -12.80 0.15 -2.33 -1.40 -1.95 5.45 6.86 4.18 1.55 0.93 0.85 19.53 0.60 0.55 0.81 -2.24 9.79 -3.71 0.15 -0.34 1.48 -0.56 8.30 4.70 4.16 1.54 0.92 0.83 19.48 0.60 0.54 0.81 11.80 4.77 8.33 0.15 1.78 0.72 1.26 3.59 6.40 5.80 1.53 0.92 0.82 19.43 0.60 0.53 0.80 -20.47 -20.27 17.26 0.17 -3.40 -3.37 2.86 5.55 1.11 2.68 2.18 1.21 1.45 20.90 0.56 0.67 0.87 -38.30 -23.18 11.25 0.17 -6.34 -3.84 1.86 3.15 0.67 0.29 2.15 1.20 1.43 20.85 0.56 0.67 0.87

578
Raw Data Tapered Data
FFT Data Parzen Filtered Data
Simple Ratio Spectrum
Z E N
Tapering Function
Z E N Z E N Z E N
Frequency Hz
E/Z N/Z
Mean SQRT Spectrum
-20.14 -8.22 0.36 0.15 -3.03 -1.24 0.05 4.33 10.49 4.77 1.52 0.91 0.80 19.38 0.60 0.53 0.80 -39.96 1.81 -0.59 0.15 -5.99 0.27 -0.09 8.03 10.62 1.93 1.51 0.90 0.79 19.34 0.60 0.53 0.80 -20.79 22.77 9.44 0.15 -3.11 3.40 1.41 8.58 10.71 2.28 1.50 0.90 0.79 19.29 0.60 0.52 0.80 -20.65 18.69 1.47 0.15 -3.08 2.79 0.22 11.99 7.76 3.11 1.50 0.90 0.78 19.24 0.60 0.52 0.80 -55.45 -14.31 -15.45 0.15 -8.23 -2.12 -2.29 11.19 3.55 3.33 1.49 0.90 0.78 19.19 0.61 0.52 0.80 -29.23 -23.22 -6.36 0.15 -4.33 -3.44 -0.94 6.97 4.03 3.39 1.49 0.91 0.78 19.14 0.61 0.52 0.80 4.88 -11.14 -3.29 0.15 0.72 -1.64 -0.49 4.43 2.50 1.50 1.49 0.92 0.79 19.09 0.62 0.53 0.81
-28.02 -9.09 -11.21 0.15 -4.12 -1.34 -1.65 4.38 0.45 2.61 1.50 0.94 0.79 19.04 0.63 0.53 0.82 -11.89 -15.04 11.84 0.15 -1.74 -2.20 1.73 2.75 2.22 6.12 1.50 0.95 0.80 18.99 0.64 0.54 0.83 50.09 -27.94 28.81 0.15 7.31 -4.08 4.21 5.53 4.23 6.71 1.51 0.98 0.82 18.95 0.65 0.54 0.85 17.00 -23.83 16.76 0.15 2.47 -3.47 2.44 11.86 4.54 6.35 1.52 1.00 0.83 18.90 0.66 0.55 0.86 -37.90 -17.73 5.77 0.15 -5.50 -2.57 0.84 16.05 4.37 10.37 1.53 1.03 0.85 18.85 0.68 0.56 0.88 8.21 -17.65 8.79 0.14 1.19 -2.55 1.27 10.02 6.30 7.75 1.54 1.07 0.88 18.80 0.69 0.57 0.90 30.19 -7.59 9.80 0.14 4.35 -1.09 1.41 2.65 7.19 1.76 1.55 1.11 0.90 18.75 0.71 0.58 0.92 -6.80 -16.53 -3.16 0.14 -0.98 -2.37 -0.45 5.81 9.26 5.74 1.57 1.15 0.93 18.70 0.73 0.59 0.94 12.24 -12.46 -3.10 0.14 1.75 -1.78 -0.44 14.28 9.76 9.51 1.59 1.20 0.95 18.65 0.75 0.60 0.96 42.18 22.53 -0.04 0.14 6.01 3.21 -0.01 13.32 8.81 7.98 1.61 1.24 0.98 18.60 0.77 0.61 0.98 2.14 16.46 -19.95 0.14 0.30 2.34 -2.83 8.57 6.97 6.27 1.64 1.30 1.02 18.55 0.79 0.62 1.01
-19.77 5.43 -15.83 0.14 -2.80 0.77 -2.24 2.18 7.94 5.69 1.66 1.35 1.05 18.51 0.81 0.63 1.03 22.28 16.39 9.23 0.14 3.14 2.31 1.30 3.28 3.41 4.09 1.69 1.41 1.08 18.46 0.83 0.64 1.05 34.22 16.34 0.26 0.14 4.81 2.30 0.04 8.35 6.58 3.40 1.72 1.46 1.11 18.41 0.85 0.65 1.07 10.18 16.28 -8.67 0.14 1.43 2.28 -1.21 8.75 7.87 1.78 1.76 1.52 1.15 18.36 0.87 0.65 1.09 12.19 -11.72 10.37 0.14 1.70 -1.63 1.45 5.60 4.30 1.36 1.79 1.58 1.18 18.31 0.88 0.66 1.10 22.17 -31.62 19.36 0.14 3.08 -4.39 2.69 5.33 3.05 4.13 1.83 1.64 1.22 18.26 0.89 0.66 1.11 1.18 -22.50 11.35 0.14 0.16 -3.12 1.57 4.56 1.98 3.54 1.88 1.70 1.25 18.21 0.90 0.67 1.12
-32.71 -27.39 4.37 0.14 -4.51 -3.78 0.60 1.40 6.38 1.67 1.92 1.75 1.29 18.16 0.91 0.67 1.13 1.41 -7.31 11.39 0.14 0.19 -1.00 1.57 5.85 3.50 6.34 1.97 1.80 1.32 18.12 0.92 0.67 1.14 38.38 6.70 5.40 0.14 5.26 0.92 0.74 8.56 2.65 7.07 2.02 1.85 1.36 18.07 0.92 0.67 1.14 -8.63 -4.29 -17.52 0.14 -1.18 -0.59 -2.39 4.58 4.37 3.78 2.07 1.90 1.39 18.02 0.92 0.67 1.14 -24.51 -7.26 -14.41 0.14 -3.33 -0.99 -1.96 10.58 3.85 4.35 2.12 1.94 1.42 17.97 0.92 0.67 1.14 0.59 5.76 -5.32 0.14 0.08 0.78 -0.72 14.07 5.59 3.82 2.17 1.98 1.46 17.92 0.91 0.67 1.13
-20.14 -8.22 0.36 0.15 -3.03 -1.24 0.05 4.33 10.49 4.77 1.52 0.91 0.80 19.38 0.60 0.53 0.80 -39.96 1.81 -0.59 0.15 -5.99 0.27 -0.09 8.03 10.62 1.93 1.51 0.90 0.79 19.34 0.60 0.53 0.80

579
Raw Data Tapered Data
FFT Data Parzen Filtered Data
Simple Ratio Spectrum
Z E N
Tapering Function
Z E N Z E N Z E N
Frequency Hz
E/Z N/Z
Mean SQRT Spectrum
-20.31 33.69 -10.24 0.14 -2.74 4.55 -1.38 13.05 9.49 7.34 2.22 2.02 1.49 17.87 0.91 0.67 1.13 -38.14 11.61 1.82 0.13 -5.13 1.56 0.25 4.83 6.68 5.55 2.27 2.06 1.52 17.82 0.90 0.67 1.12 -25.96 -9.39 14.84 0.13 -3.48 -1.26 1.99 1.34 5.46 8.87 2.33 2.09 1.55 17.77 0.90 0.67 1.12 10.12 20.60 8.84 0.13 1.35 2.75 1.18 11.63 12.88 16.25 2.38 2.11 1.58 17.72 0.89 0.67 1.11 25.10 24.52 3.87 0.13 3.34 3.26 0.51 10.31 7.55 11.72 2.43 2.13 1.61 17.68 0.88 0.66 1.10 -3.89 25.43 14.88 0.13 -0.51 3.37 1.97 0.66 2.25 4.27 2.48 2.15 1.64 17.63 0.87 0.66 1.09 -5.81 15.36 19.86 0.13 -0.77 2.03 2.62 1.28 5.43 4.00 2.52 2.17 1.67 17.58 0.86 0.66 1.09 -2.74 -21.62 19.83 0.13 -0.36 -2.84 2.61 2.60 8.66 2.62 2.56 2.18 1.69 17.53 0.85 0.66 1.08 -22.64 -8.55 23.79 0.13 -2.97 -1.12 3.12 4.38 7.92 0.98 2.60 2.19 1.72 17.48 0.84 0.66 1.07 -6.53 7.47 33.72 0.13 -0.85 0.97 4.40 6.77 5.37 1.98 2.64 2.20 1.74 17.43 0.83 0.66 1.06 20.50 -6.53 30.64 0.13 2.66 -0.85 3.98 4.30 2.44 1.49 2.67 2.20 1.77 17.38 0.82 0.66 1.06 8.49 3.49 8.61 0.13 1.10 0.45 1.11 2.91 1.86 3.26 2.70 2.20 1.79 17.33 0.82 0.66 1.05
-13.44 3.49 22.60 0.13 -1.73 0.45 2.91 1.27 4.15 3.29 2.72 2.21 1.81 17.29 0.81 0.67 1.05 -3.36 -2.50 34.53 0.13 -0.43 -0.32 4.44 0.61 3.79 2.39 2.74 2.21 1.83 17.24 0.81 0.67 1.05 24.65 5.50 5.50 0.13 3.16 0.70 0.70 3.33 1.88 2.54 2.76 2.21 1.85 17.19 0.80 0.67 1.04 31.59 -8.48 8.52 0.13 4.03 -1.08 1.09 3.65 3.21 2.76 2.77 2.21 1.86 17.14 0.80 0.67 1.04 23.53 -11.43 15.51 0.13 2.99 -1.45 1.97 6.19 2.68 3.65 2.77 2.20 1.88 17.09 0.79 0.68 1.04 -6.45 -22.36 -14.44 0.13 -0.82 -2.83 -1.83 8.72 4.92 4.63 2.78 2.20 1.89 17.04 0.79 0.68 1.04 -43.29 -40.22 -13.34 0.13 -5.46 -5.07 -1.68 7.89 2.54 4.87 2.78 2.20 1.90 16.99 0.79 0.69 1.05 -14.13 -13.10 2.73 0.13 -1.77 -1.64 0.34 8.13 6.91 3.01 2.77 2.19 1.91 16.94 0.79 0.69 1.05 23.91 2.93 -12.20 0.13 2.99 0.37 -1.53 9.66 5.07 4.47 2.76 2.19 1.92 16.89 0.79 0.70 1.06 12.89 -0.07 -21.09 0.12 1.60 -0.01 -2.63 10.86 6.52 8.37 2.75 2.19 1.93 16.85 0.80 0.70 1.06 13.88 12.92 -24.95 0.12 1.72 1.60 -3.09 7.34 5.46 8.14 2.73 2.18 1.94 16.80 0.80 0.71 1.07 29.85 4.89 -26.80 0.12 3.69 0.60 -3.31 3.68 4.12 2.84 2.71 2.18 1.94 16.75 0.80 0.72 1.08 23.79 -5.09 -12.67 0.12 2.93 -0.63 -1.56 4.30 13.20 12.87 2.69 2.17 1.95 16.70 0.81 0.72 1.09 -5.19 15.89 -0.59 0.12 -0.64 1.95 -0.07 15.95 24.23 34.51 2.66 2.17 1.95 16.65 0.81 0.73 1.09 -7.11 29.81 11.43 0.12 -0.87 3.64 1.39 4.80 15.33 25.00 2.64 2.16 1.95 16.60 0.82 0.74 1.10 4.94 24.71 4.45 0.12 0.60 3.00 0.54 12.85 11.47 12.18 2.61 2.16 1.95 16.55 0.83 0.75 1.12
-24.96 15.64 -10.49 0.12 -3.02 1.89 -1.27 4.22 4.65 6.38 2.58 2.15 1.95 16.50 0.83 0.76 1.13 -33.79 10.60 -2.42 0.12 -4.07 1.28 -0.29 3.95 3.47 7.28 2.55 2.15 1.95 16.46 0.84 0.77 1.14 25.28 14.56 -4.35 0.12 3.03 1.75 -0.52 6.85 3.78 6.94 2.52 2.14 1.95 16.41 0.85 0.78 1.15 -20.31 33.69 -10.24 0.14 -2.74 4.55 -1.38 13.05 9.49 7.34 2.22 2.02 1.49 17.87 0.91 0.67 1.13 -38.14 11.61 1.82 0.13 -5.13 1.56 0.25 4.83 6.68 5.55 2.27 2.06 1.52 17.82 0.90 0.67 1.12

580
Raw Data Tapered Data
FFT Data Parzen Filtered Data
Simple Ratio Spectrum
Z E N
Tapering Function
Z E N Z E N Z E N
Frequency Hz
E/Z N/Z
Mean SQRT Spectrum
34.21 13.51 -16.26 0.12 4.09 1.61 -1.94 8.13 2.01 3.85 2.49 2.13 1.95 16.36 0.86 0.79 1.16 -4.80 0.50 -13.16 0.12 -0.57 0.06 -1.57 2.11 0.97 3.87 2.45 2.13 1.95 16.31 0.87 0.80 1.18 26.21 -10.47 0.92 0.12 3.11 -1.24 0.11 2.97 1.79 5.08 2.42 2.12 1.95 16.26 0.88 0.81 1.19 32.15 -6.43 7.95 0.12 3.79 -0.76 0.94 2.25 1.41 2.68 2.39 2.12 1.95 16.21 0.88 0.82 1.20 -22.82 -4.40 -0.02 0.12 -2.68 -0.52 0.00 1.76 4.97 3.47 2.36 2.11 1.96 16.16 0.89 0.83 1.22 -4.71 -18.34 16.99 0.12 -0.55 -2.15 1.99 3.33 3.87 3.08 2.34 2.11 1.96 16.11 0.90 0.84 1.23 19.31 -18.26 28.95 0.12 2.25 -2.13 3.37 5.94 14.49 8.40 2.31 2.11 1.97 16.06 0.91 0.85 1.25 -22.63 -22.17 16.91 0.12 -2.63 -2.57 1.96 25.30 41.49 15.32 2.29 2.10 1.98 16.02 0.92 0.86 1.26 -30.47 -42.03 19.88 0.12 -3.52 -4.85 2.30 16.99 28.70 12.02 2.27 2.10 1.99 15.97 0.93 0.88 1.28 11.62 -37.86 15.86 0.12 1.34 -4.35 1.82 4.49 5.05 9.69 2.25 2.11 2.01 15.92 0.94 0.89 1.29 5.64 -39.69 6.86 0.11 0.65 -4.54 0.79 3.30 8.69 5.15 2.24 2.11 2.03 15.87 0.94 0.90 1.31
-45.23 -51.50 -9.09 0.11 -5.16 -5.87 -1.04 7.86 8.75 4.48 2.23 2.12 2.05 15.82 0.95 0.92 1.32 -29.03 -23.33 -13.00 0.11 -3.29 -2.65 -1.48 11.37 8.25 10.27 2.23 2.13 2.08 15.77 0.96 0.94 1.34 14.05 11.70 3.07 0.11 1.59 1.32 0.35 14.24 2.64 7.80 2.22 2.15 2.12 15.72 0.96 0.95 1.36 -18.88 9.67 -7.87 0.11 -2.12 1.09 -0.89 10.63 4.35 3.05 2.23 2.16 2.16 15.67 0.97 0.97 1.37 -14.76 6.65 3.18 0.11 -1.65 0.74 0.36 1.70 7.56 1.10 2.23 2.19 2.21 15.63 0.98 0.99 1.39 50.22 7.63 26.17 0.11 5.60 0.85 2.92 7.05 2.94 6.17 2.24 2.21 2.26 15.58 0.99 1.01 1.41 33.10 10.61 16.13 0.11 3.67 1.18 1.79 4.39 2.18 6.94 2.26 2.24 2.31 15.53 1.00 1.02 1.43 -16.88 19.56 16.12 0.11 -1.86 2.16 1.78 6.46 3.20 6.80 2.27 2.28 2.37 15.48 1.00 1.04 1.45 2.21 6.52 34.06 0.11 0.24 0.72 3.75 10.36 3.11 7.75 2.29 2.31 2.42 15.43 1.01 1.06 1.46 12.23 1.51 43.95 0.11 1.34 0.17 4.81 13.36 5.21 6.32 2.31 2.35 2.48 15.38 1.02 1.07 1.48 -24.69 7.51 38.83 0.11 -2.69 0.82 4.23 15.42 6.49 7.79 2.34 2.40 2.54 15.33 1.03 1.09 1.50 -2.58 -1.49 28.75 0.11 -0.28 -0.16 3.12 14.59 4.51 12.00 2.36 2.45 2.60 15.28 1.04 1.10 1.51 38.40 5.51 3.73 0.11 4.15 0.59 0.40 16.73 6.53 12.29 2.39 2.50 2.66 15.23 1.04 1.11 1.53 -5.62 0.51 -23.19 0.11 -0.60 0.05 -2.49 10.82 2.99 10.07 2.42 2.55 2.72 15.19 1.05 1.13 1.54 -27.50 -18.44 -11.07 0.11 -2.94 -1.97 -1.18 4.30 5.67 6.62 2.45 2.60 2.78 15.14 1.06 1.13 1.55 15.58 -14.37 0.99 0.11 1.66 -1.53 0.11 6.24 6.23 5.02 2.48 2.66 2.83 15.09 1.07 1.14 1.57 39.52 -9.31 -12.94 0.11 4.19 -0.99 -1.37 4.61 7.73 3.71 2.51 2.72 2.87 15.04 1.08 1.14 1.57 24.44 -8.26 -13.84 0.11 2.58 -0.87 -1.46 4.04 7.69 3.96 2.54 2.77 2.92 14.99 1.09 1.15 1.58 10.43 5.76 -2.76 0.11 1.09 0.60 -0.29 5.66 8.16 4.58 2.58 2.82 2.95 14.94 1.10 1.14 1.58 23.41 14.73 -1.70 0.10 2.45 1.54 -0.18 5.59 5.59 7.36 2.61 2.87 2.98 14.89 1.10 1.14 1.58 34.21 13.51 -16.26 0.12 4.09 1.61 -1.94 8.13 2.01 3.85 2.49 2.13 1.95 16.36 0.86 0.79 1.16 -4.80 0.50 -13.16 0.12 -0.57 0.06 -1.57 2.11 0.97 3.87 2.45 2.13 1.95 16.31 0.87 0.80 1.18

581
Raw Data Tapered Data
FFT Data Parzen Filtered Data
Simple Ratio Spectrum
Z E N
Tapering Function
Z E N Z E N Z E N
Frequency Hz
E/Z N/Z
Mean SQRT Spectrum
0.42 2.70 -12.63 0.10 0.04 0.28 -1.31 7.14 4.21 8.05 2.65 2.92 3.00 14.84 1.10 1.13 1.58 -25.48 -3.28 -5.54 0.10 -2.64 -0.34 -0.57 9.55 5.49 4.23 2.68 2.96 3.01 14.79 1.10 1.12 1.57 12.60 7.72 19.47 0.10 1.30 0.80 2.01 4.79 5.76 2.09 2.72 3.00 3.02 14.75 1.10 1.11 1.57 10.60 2.71 8.47 0.10 1.09 0.28 0.87 3.43 2.89 3.18 2.75 3.03 3.02 14.70 1.10 1.10 1.55 -36.30 -5.27 -22.46 0.10 -3.70 -0.54 -2.29 7.66 1.72 5.75 2.79 3.06 3.01 14.65 1.10 1.08 1.54 -21.13 4.74 -9.35 0.10 -2.14 0.48 -0.95 7.46 3.72 1.73 2.82 3.08 3.00 14.60 1.09 1.06 1.52 10.95 16.71 4.71 0.10 1.11 1.69 0.48 12.01 4.10 4.25 2.86 3.09 2.99 14.55 1.08 1.05 1.50 -12.00 18.65 -16.22 0.10 -1.21 1.87 -1.63 16.63 7.59 9.34 2.90 3.10 2.97 14.50 1.07 1.03 1.48 -33.86 17.59 -12.12 0.10 -3.39 1.76 -1.21 20.39 3.86 12.53 2.94 3.10 2.95 14.45 1.06 1.01 1.46 1.26 16.53 9.93 0.10 0.13 1.64 0.99 15.52 6.65 8.37 2.97 3.10 2.93 14.40 1.04 0.99 1.43 19.27 14.48 7.94 0.10 1.91 1.43 0.79 15.34 1.81 4.32 3.01 3.08 2.91 14.36 1.02 0.97 1.41 -32.65 5.45 0.97 0.10 -3.22 0.54 0.10 17.00 4.54 2.49 3.05 3.06 2.88 14.31 1.00 0.95 1.38 -29.47 -13.52 13.99 0.10 -2.89 -1.33 1.37 23.82 8.84 5.40 3.08 3.03 2.85 14.26 0.98 0.93 1.35 13.62 -21.44 16.97 0.10 1.33 -2.09 1.65 25.82 9.56 12.07 3.11 2.99 2.82 14.21 0.96 0.91 1.32 -27.30 -19.35 -13.99 0.10 -2.65 -1.88 -1.36 23.78 4.99 11.02 3.15 2.95 2.80 14.16 0.94 0.89 1.29 -44.11 -25.25 -12.89 0.10 -4.26 -2.44 -1.24 21.04 3.92 6.72 3.18 2.91 2.77 14.11 0.91 0.87 1.26 3.03 -13.16 10.16 0.10 0.29 -1.26 0.98 17.15 4.61 3.59 3.21 2.86 2.74 14.06 0.89 0.86 1.24 9.06 3.87 -10.79 0.10 0.87 0.37 -1.03 18.97 6.99 1.55 3.23 2.80 2.72 14.01 0.87 0.84 1.21 4.09 -11.10 -16.69 0.10 0.39 -1.05 -1.59 25.73 12.08 7.57 3.26 2.75 2.69 13.96 0.84 0.83 1.18 9.11 -0.07 11.37 0.09 0.86 -0.01 1.07 27.35 14.92 6.89 3.29 2.69 2.67 13.92 0.82 0.81 1.15 8.13 36.87 9.37 0.09 0.76 3.47 0.88 21.72 5.70 0.81 3.32 2.64 2.65 13.87 0.79 0.80 1.13 0.17 27.75 2.40 0.09 0.02 2.59 0.22 8.74 0.77 5.10 3.35 2.58 2.63 13.82 0.77 0.79 1.10
-18.74 7.69 16.41 0.09 -1.74 0.72 1.53 3.59 5.10 3.66 3.38 2.52 2.61 13.77 0.75 0.77 1.07 18.31 16.65 25.37 0.09 1.69 1.54 2.35 7.73 6.46 3.79 3.41 2.47 2.59 13.72 0.72 0.76 1.05 35.26 15.60 23.32 0.09 3.24 1.44 2.15 8.06 5.99 4.98 3.45 2.41 2.57 13.67 0.70 0.75 1.02 -14.73 -7.40 5.31 0.09 -1.35 -0.68 0.49 7.69 5.32 4.16 3.49 2.36 2.55 13.62 0.68 0.73 1.00 -4.64 -10.36 -1.66 0.09 -0.42 -0.94 -0.15 6.93 4.73 9.05 3.53 2.32 2.53 13.57 0.66 0.72 0.97 13.40 -8.31 14.36 0.09 1.21 -0.75 1.30 14.91 2.30 6.60 3.58 2.27 2.51 13.53 0.63 0.70 0.94 24.38 -23.23 4.37 0.09 2.19 -2.09 0.39 12.03 4.38 4.13 3.64 2.23 2.49 13.48 0.61 0.68 0.92 53.27 -21.13 -13.56 0.09 4.77 -1.89 -1.21 7.09 10.52 8.28 3.71 2.20 2.47 13.43 0.59 0.67 0.89 21.18 -2.08 -18.45 0.09 1.88 -0.18 -1.64 7.42 8.01 8.47 3.78 2.17 2.45 13.38 0.58 0.65 0.87 0.42 2.70 -12.63 0.10 0.04 0.28 -1.31 7.14 4.21 8.05 2.65 2.92 3.00 14.84 1.10 1.13 1.58
-25.48 -3.28 -5.54 0.10 -2.64 -0.34 -0.57 9.55 5.49 4.23 2.68 2.96 3.01 14.79 1.10 1.12 1.57

582
Raw Data Tapered Data
FFT Data Parzen Filtered Data
Simple Ratio Spectrum
Z E N
Tapering Function
Z E N Z E N Z E N
Frequency Hz
E/Z N/Z
Mean SQRT Spectrum
11.16 -2.06 -24.32 0.09 0.99 -0.18 -2.15 5.61 3.60 5.98 3.86 2.15 2.44 13.33 0.56 0.63 0.84 26.14 -14.01 -17.19 0.09 2.30 -1.23 -1.51 4.44 3.38 6.26 3.95 2.13 2.42 13.28 0.54 0.61 0.82 14.11 -3.96 -9.09 0.09 1.23 -0.35 -0.80 10.73 2.76 3.53 4.05 2.12 2.40 13.23 0.52 0.59 0.79 38.06 -0.94 -14.00 0.09 3.31 -0.08 -1.22 11.69 3.31 0.63 4.15 2.11 2.39 13.18 0.51 0.58 0.77 20.99 -13.90 -11.90 0.09 1.82 -1.20 -1.03 6.56 4.06 0.21 4.26 2.10 2.37 13.13 0.49 0.56 0.74 1.00 -10.84 -0.83 0.09 0.09 -0.93 -0.07 2.43 2.29 2.50 4.38 2.10 2.36 13.09 0.48 0.54 0.72 15.02 -10.78 -0.78 0.09 1.28 -0.92 -0.07 4.65 3.84 2.07 4.49 2.10 2.34 13.04 0.47 0.52 0.70 -24.91 -22.71 -10.71 0.09 -2.12 -1.93 -0.91 6.21 3.92 2.21 4.61 2.10 2.33 12.99 0.46 0.50 0.68 -26.75 -36.57 -2.64 0.08 -2.26 -3.09 -0.22 4.38 3.76 0.60 4.73 2.11 2.32 12.94 0.45 0.49 0.66 -4.64 -46.39 14.39 0.08 -0.39 -3.90 1.21 6.98 3.58 4.65 4.84 2.12 2.30 12.89 0.44 0.48 0.65 -45.48 -38.21 12.38 0.08 -3.80 -3.19 1.03 7.23 8.92 4.75 4.95 2.13 2.29 12.84 0.43 0.46 0.63 -39.26 -35.05 4.39 0.08 -3.26 -2.91 0.36 2.62 5.26 2.00 5.05 2.14 2.28 12.79 0.42 0.45 0.62 11.85 -34.90 8.41 0.08 0.98 -2.88 0.69 3.13 5.88 1.64 5.14 2.15 2.26 12.74 0.42 0.44 0.61 -6.11 -13.79 8.43 0.08 -0.50 -1.13 0.69 2.91 5.39 1.76 5.22 2.16 2.25 12.70 0.41 0.43 0.60 -53.94 -10.72 0.45 0.08 -4.40 -0.87 0.04 9.68 5.57 6.77 5.29 2.17 2.24 12.65 0.41 0.42 0.59 -43.69 -3.68 13.47 0.08 -3.54 -0.30 1.09 9.90 6.16 9.24 5.34 2.18 2.22 12.60 0.41 0.42 0.58 18.41 24.29 14.46 0.08 1.48 1.96 1.16 24.30 9.60 9.17 5.38 2.18 2.21 12.55 0.41 0.41 0.58 20.39 26.21 -1.52 0.08 1.63 2.10 -0.12 21.99 14.42 10.11 5.39 2.19 2.19 12.50 0.41 0.41 0.57 -33.53 14.14 17.50 0.08 -2.67 1.12 1.39 6.51 3.00 4.25 5.39 2.19 2.18 12.45 0.41 0.40 0.57 -2.41 21.08 29.45 0.08 -0.19 1.67 2.33 2.54 5.47 6.86 5.37 2.20 2.16 12.40 0.41 0.40 0.57 35.58 11.03 9.42 0.08 2.79 0.87 0.74 6.51 6.58 6.17 5.33 2.20 2.14 12.35 0.41 0.40 0.57 -7.42 -14.95 -7.54 0.08 -0.58 -1.17 -0.59 9.28 2.16 5.89 5.28 2.19 2.12 12.30 0.42 0.40 0.58 -5.34 -10.88 -9.46 0.08 -0.41 -0.84 -0.73 7.77 4.27 5.67 5.20 2.19 2.09 12.26 0.42 0.40 0.58 16.69 -1.84 3.59 0.08 1.28 -0.14 0.28 6.70 3.50 2.70 5.12 2.18 2.07 12.21 0.43 0.40 0.59 -6.28 -24.78 0.63 0.08 -0.48 -1.90 0.05 3.74 3.85 6.02 5.01 2.17 2.04 12.16 0.43 0.41 0.59 -4.21 -6.70 -3.32 0.08 -0.32 -0.51 -0.25 3.16 3.31 3.98 4.90 2.16 2.02 12.11 0.44 0.41 0.60 18.82 19.29 8.72 0.08 1.42 1.46 0.66 4.83 1.00 2.92 4.78 2.14 1.99 12.06 0.45 0.42 0.61 23.78 -4.73 -1.25 0.08 1.78 -0.35 -0.09 13.87 3.92 4.31 4.64 2.13 1.96 12.01 0.46 0.42 0.62 5.78 35.23 4.79 0.07 0.43 2.62 0.36 15.22 7.98 5.89 4.51 2.11 1.94 11.96 0.47 0.43 0.64 6.81 45.08 23.77 0.07 0.50 3.34 1.76 8.22 7.41 5.61 4.37 2.10 1.91 11.91 0.48 0.44 0.65 46.75 -2.00 7.76 0.07 3.44 -0.15 0.57 3.35 8.52 5.54 4.23 2.08 1.88 11.87 0.49 0.44 0.66 11.16 -2.06 -24.32 0.09 0.99 -0.18 -2.15 5.61 3.60 5.98 3.86 2.15 2.44 13.33 0.56 0.63 0.84 26.14 -14.01 -17.19 0.09 2.30 -1.23 -1.51 4.44 3.38 6.26 3.95 2.13 2.42 13.28 0.54 0.61 0.82

583
Raw Data Tapered Data
FFT Data Parzen Filtered Data
Simple Ratio Spectrum
Z E N
Tapering Function
Z E N Z E N Z E N
Frequency Hz
E/Z N/Z
Mean SQRT Spectrum
21.67 34.95 -5.20 0.07 1.58 2.55 -0.38 2.55 9.04 3.12 4.09 2.07 1.86 11.82 0.51 0.45 0.68 -24.28 -7.09 0.85 0.07 -1.76 -0.51 0.06 3.41 10.73 4.08 3.96 2.05 1.83 11.77 0.52 0.46 0.69 9.81 -48.97 0.89 0.07 0.71 -3.53 0.06 2.84 9.02 2.53 3.83 2.04 1.81 11.72 0.53 0.47 0.71 9.82 19.11 -6.05 0.07 0.70 1.37 -0.43 4.73 4.48 2.00 3.71 2.03 1.79 11.67 0.55 0.48 0.73 -7.13 -19.88 -11.97 0.07 -0.51 -1.41 -0.85 4.60 5.96 2.75 3.60 2.02 1.77 11.62 0.56 0.49 0.75 4.92 -29.77 -11.88 0.07 0.35 -2.10 -0.84 0.51 8.56 4.17 3.50 2.01 1.76 11.57 0.57 0.50 0.76
-10.01 31.25 -7.79 0.07 -0.70 2.19 -0.55 2.98 5.03 1.04 3.40 2.00 1.75 11.52 0.59 0.51 0.78 -3.93 -8.79 -14.70 0.07 -0.27 -0.61 -1.02 12.41 18.38 3.51 3.32 2.00 1.74 11.47 0.60 0.52 0.80 4.12 -15.72 -17.59 0.07 0.28 -1.08 -1.21 13.20 20.10 11.48 3.25 2.00 1.73 11.43 0.61 0.53 0.81 0.16 17.29 4.48 0.07 0.01 1.18 0.31 5.67 9.29 4.68 3.18 2.00 1.73 11.38 0.63 0.54 0.83 2.21 8.25 14.49 0.07 0.15 0.56 0.99 0.68 5.30 8.44 3.13 2.00 1.73 11.33 0.64 0.55 0.84
-15.71 24.20 -0.49 0.07 -1.06 1.63 -0.03 5.75 6.80 12.11 3.09 2.01 1.73 11.28 0.65 0.56 0.86 17.34 3.16 11.53 0.07 1.16 0.21 0.77 3.67 5.06 8.12 3.05 2.02 1.73 11.23 0.66 0.57 0.87 62.23 -35.77 34.48 0.07 4.14 -2.38 2.29 3.84 6.72 5.03 3.02 2.03 1.74 11.18 0.67 0.58 0.88 -5.83 4.31 22.41 0.07 -0.38 0.28 1.48 1.73 6.20 6.71 2.99 2.04 1.75 11.13 0.68 0.58 0.90 -64.64 -7.67 23.37 0.07 -4.23 -0.50 1.53 2.72 5.02 6.43 2.97 2.05 1.76 11.08 0.69 0.59 0.91 -23.41 -45.55 31.30 0.07 -1.52 -2.96 2.03 5.06 9.31 3.69 2.96 2.07 1.77 11.04 0.70 0.60 0.92 -8.29 -7.43 6.27 0.06 -0.53 -0.48 0.40 4.49 15.97 4.15 2.94 2.09 1.78 10.99 0.71 0.60 0.93 -11.20 -17.37 -8.68 0.06 -0.72 -1.11 -0.56 6.67 15.53 7.77 2.93 2.11 1.79 10.94 0.72 0.61 0.95 -1.12 -10.30 -3.61 0.06 -0.07 -0.65 -0.23 8.02 11.78 6.10 2.92 2.14 1.80 10.89 0.73 0.62 0.96 3.93 46.65 -18.52 0.06 0.25 2.94 -1.17 8.91 9.02 11.36 2.90 2.17 1.81 10.84 0.75 0.62 0.97 5.96 26.51 -21.40 0.06 0.37 1.66 -1.34 2.53 13.00 5.64 2.88 2.19 1.82 10.79 0.76 0.63 0.99
-24.95 11.45 -2.30 0.06 -1.55 0.71 -0.14 9.21 12.78 5.47 2.86 2.23 1.83 10.74 0.78 0.64 1.01 -7.83 30.38 1.74 0.06 -0.48 1.87 0.11 1.88 11.81 7.55 2.84 2.26 1.84 10.69 0.80 0.65 1.03 23.19 -1.66 -15.19 0.06 1.41 -0.10 -0.93 8.10 11.56 8.89 2.81 2.30 1.85 10.64 0.82 0.66 1.05 -16.77 -21.60 -17.08 0.06 -1.01 -1.31 -1.03 7.10 8.47 5.82 2.78 2.33 1.86 10.60 0.84 0.67 1.07 2.32 -16.51 2.00 0.06 0.14 -0.99 0.12 6.19 0.15 2.70 2.75 2.38 1.87 10.55 0.86 0.68 1.10 11.34 -31.41 -5.95 0.06 0.67 -1.87 -0.35 1.37 6.56 2.80 2.72 2.42 1.87 10.50 0.89 0.69 1.13 -38.55 -26.28 -15.86 0.06 -2.27 -1.55 -0.94 6.75 7.53 7.19 2.68 2.47 1.88 10.45 0.92 0.70 1.16 -4.41 -3.20 5.21 0.06 -0.26 -0.19 0.30 0.96 4.29 4.10 2.64 2.52 1.89 10.40 0.95 0.72 1.19 26.60 13.79 8.22 0.06 1.54 0.80 0.48 4.33 2.71 2.78 2.60 2.57 1.90 10.35 0.99 0.73 1.23 21.67 34.95 -5.20 0.07 1.58 2.55 -0.38 2.55 9.04 3.12 4.09 2.07 1.86 11.82 0.51 0.45 0.68 -24.28 -7.09 0.85 0.07 -1.76 -0.51 0.06 3.41 10.73 4.08 3.96 2.05 1.83 11.77 0.52 0.46 0.69

584
Raw Data Tapered Data
FFT Data Parzen Filtered Data
Simple Ratio Spectrum
Z E N
Tapering Function
Z E N Z E N Z E N
Frequency Hz
E/Z N/Z
Mean SQRT Spectrum
-2.40 12.75 -8.73 0.06 -0.14 0.73 -0.50 5.60 0.89 3.91 2.56 2.63 1.91 10.30 1.03 0.75 1.27 -2.34 8.72 4.33 0.06 -0.13 0.50 0.25 4.16 2.58 6.03 2.51 2.68 1.92 10.25 1.07 0.77 1.31 24.67 21.67 12.34 0.06 1.39 1.22 0.70 2.91 1.44 9.93 2.46 2.74 1.93 10.21 1.11 0.78 1.36 60.56 21.60 -12.62 0.06 3.39 1.21 -0.71 1.95 4.74 9.20 2.42 2.80 1.95 10.16 1.16 0.80 1.41 38.41 12.55 -15.52 0.06 2.13 0.70 -0.86 1.05 7.29 6.67 2.37 2.85 1.96 10.11 1.20 0.83 1.46 -2.61 2.53 3.55 0.06 -0.14 0.14 0.20 4.53 9.26 5.03 2.33 2.91 1.98 10.06 1.25 0.85 1.51 42.36 -5.45 -0.41 0.05 2.31 -0.30 -0.02 10.23 5.59 6.06 2.29 2.97 2.00 10.01 1.30 0.87 1.56 19.29 -7.41 -17.33 0.05 1.04 -0.40 -0.94 6.73 2.35 2.62 2.25 3.02 2.02 9.96 1.34 0.90 1.62 -46.60 -20.34 -13.22 0.05 -2.49 -1.09 -0.71 4.77 3.83 3.20 2.21 3.08 2.04 9.91 1.39 0.92 1.67 5.53 -24.24 -1.15 0.05 0.29 -1.28 -0.06 4.87 5.39 2.57 2.18 3.12 2.06 9.86 1.43 0.94 1.72 10.55 -10.16 -15.07 0.05 0.55 -0.53 -0.79 3.07 2.81 3.29 2.15 3.17 2.08 9.81 1.48 0.97 1.77 -39.34 -8.11 -27.94 0.05 -2.05 -0.42 -1.45 2.52 0.81 2.64 2.12 3.21 2.11 9.77 1.51 0.99 1.81 -7.19 -15.05 -11.81 0.05 -0.37 -0.77 -0.61 4.82 0.89 5.35 2.09 3.24 2.13 9.72 1.55 1.02 1.85 11.85 -6.99 5.25 0.05 0.60 -0.36 0.27 4.71 2.53 7.93 2.07 3.27 2.16 9.67 1.58 1.04 1.89 -10.10 13.02 18.25 0.05 -0.51 0.66 0.92 1.28 5.56 3.60 2.05 3.29 2.18 9.62 1.61 1.06 1.93 -2.02 15.97 28.20 0.05 -0.10 0.80 1.41 4.90 5.84 3.52 2.03 3.31 2.20 9.57 1.63 1.08 1.96 16.00 5.94 41.11 0.05 0.79 0.29 2.03 6.71 6.82 4.77 2.01 3.31 2.22 9.52 1.65 1.10 1.98 1.02 -11.03 53.96 0.05 0.05 -0.54 2.64 5.16 3.11 3.02 2.00 3.31 2.23 9.47 1.66 1.12 2.00
-30.87 -28.94 52.79 0.05 -1.50 -1.40 2.56 3.56 4.39 4.09 1.98 3.30 2.24 9.42 1.67 1.13 2.01 -6.74 -24.82 50.63 0.05 -0.32 -1.19 2.43 3.28 3.28 4.44 1.97 3.28 2.26 9.38 1.67 1.15 2.02 30.27 -24.70 33.50 0.05 1.44 -1.17 1.59 3.71 2.36 1.46 1.96 3.26 2.26 9.33 1.66 1.16 2.03 -12.72 -21.60 14.45 0.05 -0.60 -1.02 0.68 7.17 2.03 5.05 1.95 3.22 2.27 9.28 1.65 1.17 2.02 -33.57 1.46 13.44 0.05 -1.56 0.07 0.62 7.63 4.17 6.09 1.94 3.18 2.27 9.23 1.64 1.17 2.02 -11.43 22.43 2.45 0.05 -0.53 1.03 0.11 1.72 4.20 4.05 1.93 3.13 2.27 9.18 1.63 1.18 2.01 -47.26 33.33 -12.49 0.05 -2.15 1.52 -0.57 1.74 3.16 3.72 1.91 3.07 2.27 9.13 1.60 1.19 2.00 -44.02 23.23 -12.39 0.05 -1.98 1.05 -0.56 3.74 1.19 1.80 1.90 3.01 2.26 9.08 1.58 1.19 1.98 4.11 16.17 -4.32 0.04 0.18 0.72 -0.19 4.33 3.19 1.54 1.89 2.94 2.25 9.03 1.55 1.19 1.96 -2.84 22.10 0.73 0.04 -0.12 0.97 0.03 1.76 2.91 1.99 1.88 2.87 2.23 8.98 1.53 1.19 1.93 -3.77 20.03 -5.21 0.04 -0.16 0.87 -0.23 2.61 1.66 1.42 1.87 2.79 2.22 8.94 1.49 1.19 1.91 10.27 18.97 5.83 0.04 0.44 0.82 0.25 2.86 1.94 3.34 1.85 2.71 2.20 8.89 1.46 1.19 1.88 31.24 17.91 10.84 0.04 1.33 0.76 0.46 3.09 1.60 5.39 1.84 2.62 2.18 8.84 1.43 1.18 1.85 -2.40 12.75 -8.73 0.06 -0.14 0.73 -0.50 5.60 0.89 3.91 2.56 2.63 1.91 10.30 1.03 0.75 1.27 -2.34 8.72 4.33 0.06 -0.13 0.50 0.25 4.16 2.58 6.03 2.51 2.68 1.92 10.25 1.07 0.77 1.31

585
Raw Data Tapered
Data FFT Data Parzen Filtered
Data Simple Ratio
Spectrum Z E N
Tapering Function
Z E N Z E N Z E N
Frequency Hz
E/Z N/Z
Mean SQRT Spectrum
22.19 5.87 -18.10 0.04 0.93 0.25 -0.76 0.95 4.94 3.98 1.83 2.54 2.15 8.79 1.39 1.18 1.82 -25.75 -7.11 -14.00 0.04 -1.07 -0.30 -0.58 4.39 8.34 3.07 1.81 2.45 2.13 8.74 1.35 1.17 1.79 20.31 -3.08 -10.90 0.04 0.83 -0.13 -0.45 5.15 4.94 4.33 1.80 2.37 2.10 8.69 1.32 1.17 1.76 38.25 11.92 -42.75 0.04 1.55 0.48 -1.73 3.77 1.45 1.45 1.79 2.29 2.07 8.64 1.28 1.16 1.73 -11.75 6.90 -28.56 0.04 -0.47 0.28 -1.14 3.02 0.64 3.43 1.78 2.21 2.04 8.59 1.24 1.15 1.69 30.27 -6.09 -14.43 0.04 1.20 -0.24 -0.57 4.05 1.62 4.70 1.76 2.13 2.01 8.54 1.21 1.14 1.66 37.18 -0.07 -27.31 0.04 1.45 0.00 -1.06 4.83 5.66 2.26 1.75 2.05 1.98 8.50 1.17 1.13 1.63 7.15 6.93 -21.16 0.04 0.28 0.27 -0.81 3.70 7.22 5.48 1.74 1.98 1.95 8.45 1.14 1.12 1.60 22.14 22.89 -9.06 0.04 0.84 0.87 -0.34 1.88 5.03 2.06 1.72 1.91 1.92 8.40 1.11 1.11 1.57 8.13 37.78 11.98 0.04 0.30 1.42 0.45 2.75 12.44 4.31 1.71 1.85 1.88 8.35 1.08 1.10 1.54 0.17 -5.27 12.98 0.04 0.01 -0.20 0.48 5.38 12.15 3.70 1.70 1.79 1.85 8.30 1.05 1.09 1.51 -3.77 -38.17 2.99 0.04 -0.14 -1.39 0.11 3.51 1.80 9.15 1.69 1.73 1.82 8.25 1.03 1.08 1.49 -9.69 -12.06 18.99 0.04 -0.35 -0.43 0.68 0.55 1.99 6.06 1.67 1.68 1.79 8.20 1.00 1.07 1.47 8.36 -3.02 -3.00 0.04 0.30 -0.11 -0.11 3.00 2.89 4.71 1.66 1.63 1.75 8.15 0.98 1.06 1.44
-12.58 -34.93 -33.88 0.04 -0.44 -1.22 -1.19 4.56 4.22 7.90 1.65 1.59 1.72 8.11 0.97 1.05 1.42 -22.45 -29.78 -13.74 0.03 -0.77 -1.03 -0.47 2.27 4.40 4.39 1.64 1.56 1.69 8.06 0.95 1.04 1.41 17.61 -9.69 -5.66 0.03 0.60 -0.33 -0.19 1.43 5.02 3.91 1.62 1.52 1.66 8.01 0.94 1.03 1.39 9.61 -33.59 -14.57 0.03 0.32 -1.13 -0.49 1.55 3.05 2.50 1.61 1.50 1.64 7.96 0.93 1.02 1.38
-19.32 -8.49 -9.48 0.03 -0.64 -0.28 -0.31 1.81 5.09 7.75 1.60 1.47 1.61 7.91 0.92 1.01 1.37 9.75 -0.46 0.58 0.03 0.32 -0.01 0.02 3.55 7.09 6.89 1.58 1.45 1.58 7.86 0.92 1.00 1.36 27.73 -36.37 18.59 0.03 0.89 -1.16 0.59 1.25 3.42 3.32 1.57 1.43 1.56 7.81 0.92 0.99 1.35 -3.27 11.70 14.57 0.03 -0.10 0.37 0.46 0.68 1.34 3.48 1.55 1.42 1.53 7.76 0.92 0.99 1.35 -16.18 -3.31 10.56 0.03 -0.50 -0.10 0.33 0.36 4.86 1.25 1.54 1.41 1.51 7.71 0.92 0.98 1.35 11.89 -36.21 33.52 0.03 0.36 -1.10 1.02 1.26 2.78 3.94 1.52 1.40 1.49 7.67 0.92 0.98 1.35 -3.08 30.81 30.44 0.03 -0.09 0.92 0.91 1.58 2.46 6.21 1.50 1.40 1.48 7.62 0.93 0.98 1.35 -63.89 4.76 21.38 0.03 -1.88 0.14 0.63 5.29 5.60 3.76 1.49 1.40 1.46 7.57 0.94 0.98 1.36 -40.63 -14.21 29.32 0.03 -1.18 -0.41 0.85 7.11 4.26 5.67 1.47 1.40 1.45 7.52 0.96 0.99 1.37 -0.49 33.77 20.26 0.03 -0.01 0.96 0.58 0.76 4.58 1.17 1.45 1.41 1.44 7.47 0.97 1.00 1.39 -21.40 -7.27 15.23 0.03 -0.60 -0.20 0.43 4.14 5.36 3.05 1.43 1.42 1.44 7.42 0.99 1.00 1.41 12.67 1.75 23.20 0.03 0.35 0.05 0.64 3.61 6.39 3.14 1.41 1.43 1.43 7.37 1.01 1.02 1.43 37.63 37.69 27.14 0.03 1.02 1.02 0.73 1.70 4.59 2.77 1.39 1.44 1.43 7.32 1.03 1.03 1.46 22.19 5.87 -18.10 0.04 0.93 0.25 -0.76 0.95 4.94 3.98 1.83 2.54 2.15 8.79 1.39 1.18 1.82 -25.75 -7.11 -14.00 0.04 -1.07 -0.30 -0.58 4.39 8.34 3.07 1.81 2.45 2.13 8.74 1.35 1.17 1.79

586
Raw Data Tapered Data
FFT Data Parzen Filtered Data
Simple Ratio Spectrum
Z E N
Tapering Function
Z E N Z E N Z E N
Frequency Hz
E/Z N/Z
Mean SQRT Spectrum
6.59 -22.33 24.08 0.03 0.17 -0.59 0.64 2.94 4.83 3.05 1.38 1.46 1.44 7.28 1.06 1.04 1.49 19.59 0.73 21.04 0.03 0.51 0.02 0.55 2.36 5.87 4.50 1.36 1.47 1.44 7.23 1.09 1.06 1.52 43.52 40.66 31.97 0.03 1.11 1.04 0.82 1.21 4.45 0.52 1.34 1.49 1.45 7.18 1.11 1.08 1.55 20.44 -2.40 32.88 0.03 0.51 -0.06 0.82 0.95 9.05 3.06 1.32 1.51 1.46 7.13 1.14 1.11 1.59 -10.52 35.55 12.83 0.02 -0.26 0.87 0.31 2.08 5.56 2.57 1.30 1.53 1.47 7.08 1.18 1.13 1.63 8.53 42.40 9.83 0.02 0.20 1.02 0.24 4.14 4.35 0.27 1.28 1.55 1.48 7.03 1.21 1.16 1.67 49.47 -11.64 1.85 0.02 1.16 -0.27 0.04 4.50 3.30 2.02 1.26 1.57 1.50 6.98 1.24 1.19 1.72 9.40 17.36 -16.08 0.02 0.22 0.40 -0.37 1.31 5.09 2.31 1.24 1.59 1.51 6.93 1.28 1.22 1.76
-38.49 9.32 -15.97 0.02 -0.87 0.21 -0.36 1.52 3.91 2.42 1.23 1.61 1.53 6.88 1.31 1.25 1.81 3.64 -11.66 -22.85 0.02 0.08 -0.26 -0.50 4.34 4.21 5.01 1.21 1.63 1.54 6.84 1.35 1.28 1.86 13.65 13.35 -28.71 0.02 0.29 0.29 -0.62 2.32 7.00 0.63 1.19 1.65 1.56 6.79 1.39 1.31 1.91 -20.28 -6.65 -20.57 0.02 -0.43 -0.14 -0.43 2.06 10.64 4.82 1.17 1.66 1.57 6.74 1.42 1.34 1.96 0.81 -7.61 -16.45 0.02 0.02 -0.16 -0.34 1.01 9.90 7.56 1.15 1.68 1.58 6.69 1.46 1.38 2.00 -2.13 16.39 -15.34 0.02 -0.04 0.33 -0.31 2.57 5.11 6.06 1.14 1.69 1.60 6.64 1.49 1.41 2.05 -21.04 -4.62 -13.24 0.02 -0.41 -0.09 -0.26 3.70 6.58 10.54 1.12 1.70 1.60 6.59 1.52 1.43 2.09 17.02 -7.59 0.82 0.02 0.32 -0.14 0.02 0.67 9.42 15.77 1.10 1.72 1.61 6.54 1.56 1.46 2.13 38.96 12.42 13.84 0.02 0.72 0.23 0.26 5.00 5.26 14.65 1.09 1.73 1.61 6.49 1.59 1.48 2.17 -2.06 -10.57 2.85 0.02 -0.04 -0.19 0.05 3.27 6.30 15.04 1.07 1.73 1.61 6.45 1.62 1.50 2.21 -47.90 -22.49 -10.10 0.02 -0.84 -0.39 -0.18 4.90 2.32 5.00 1.06 1.74 1.61 6.40 1.65 1.52 2.24 -11.73 3.56 -2.03 0.02 -0.20 0.06 -0.03 6.82 8.06 3.58 1.05 1.75 1.61 6.35 1.67 1.53 2.27 13.32 3.56 3.01 0.02 0.22 0.06 0.05 7.87 12.53 7.48 1.04 1.76 1.60 6.30 1.70 1.54 2.30 -53.55 -3.43 0.05 0.02 -0.86 -0.05 0.00 7.75 12.56 8.13 1.02 1.77 1.59 6.25 1.73 1.55 2.32 -44.30 6.58 8.08 0.02 -0.69 0.10 0.13 3.98 7.74 8.78 1.02 1.78 1.58 6.20 1.75 1.56 2.34 27.79 6.57 6.09 0.02 0.42 0.10 0.09 3.93 10.24 8.79 1.01 1.79 1.57 6.15 1.77 1.56 2.36 2.78 -9.41 -3.87 0.01 0.04 -0.14 -0.06 9.92 2.06 12.22 1.00 1.80 1.56 6.10 1.80 1.56 2.38
-32.11 -19.34 11.16 0.01 -0.45 -0.27 0.16 20.29 21.58 34.22 1.00 1.81 1.55 6.05 1.82 1.55 2.39 -7.98 -11.27 27.12 0.01 -0.11 -0.15 0.37 55.89 27.05 62.16 0.99 1.82 1.54 6.01 1.84 1.55 2.40 2.09 -5.22 24.06 0.01 0.03 -0.07 0.31 47.64 8.99 39.63 0.99 1.84 1.53 5.96 1.85 1.54 2.41
-15.83 -5.18 15.02 0.01 -0.20 -0.06 0.19 8.17 7.20 3.68 0.99 1.86 1.53 5.91 1.87 1.53 2.42 -34.67 -1.16 -0.96 0.01 -0.42 -0.01 -0.01 1.24 4.61 3.78 1.00 1.88 1.53 5.86 1.88 1.53 2.42 9.43 -4.13 -0.92 0.01 0.11 -0.05 -0.01 2.09 1.94 7.94 1.01 1.90 1.53 5.81 1.89 1.52 2.43 6.59 -22.33 24.08 0.03 0.17 -0.59 0.64 2.94 4.83 3.05 1.38 1.46 1.44 7.28 1.06 1.04 1.49 19.59 0.73 21.04 0.03 0.51 0.02 0.55 2.36 5.87 4.50 1.36 1.47 1.44 7.23 1.09 1.06 1.52

587
Raw Data Tapered Data
FFT Data Parzen Filtered Data
Simple Ratio Spectrum
Z E N
Tapering Function
Z E N Z E N Z E N
Frequency Hz
E/Z N/Z
Mean SQRT Spectrum
39.39 -2.11 -3.86 0.01 0.43 -0.02 -0.04 5.49 1.17 11.66 1.02 1.93 1.55 5.76 1.90 1.52 2.43 -13.61 -1.08 -29.75 0.01 -0.14 -0.01 -0.31 3.19 5.22 6.82 1.04 1.96 1.57 5.71 1.90 1.52 2.43 12.44 -6.06 -22.61 0.01 0.12 -0.06 -0.23 3.06 4.79 6.35 1.06 2.00 1.60 5.66 1.89 1.52 2.42 39.39 3.96 -0.52 0.01 0.37 0.04 0.00 1.19 5.69 2.82 1.08 2.03 1.64 5.62 1.88 1.52 2.41 -14.60 5.96 -1.47 0.01 -0.13 0.05 -0.01 1.66 8.69 3.03 1.12 2.07 1.70 5.57 1.86 1.52 2.40 22.44 -5.03 5.56 0.01 0.19 -0.04 0.05 2.15 5.26 1.05 1.16 2.12 1.76 5.52 1.83 1.52 2.38 42.36 7.98 11.57 0.01 0.34 0.06 0.09 1.09 2.55 1.09 1.20 2.16 1.83 5.47 1.80 1.52 2.35 6.31 15.94 -3.40 0.01 0.05 0.12 -0.03 3.17 4.75 1.27 1.26 2.21 1.92 5.42 1.76 1.52 2.33 13.33 3.92 -10.33 0.01 0.09 0.03 -0.07 2.49 5.87 3.86 1.32 2.26 2.02 5.37 1.71 1.53 2.29 3.35 12.90 -8.25 0.01 0.02 0.08 -0.05 1.07 1.69 3.51 1.39 2.31 2.12 5.32 1.66 1.53 2.26 21.35 21.84 -9.18 0.01 0.13 0.13 -0.06 2.32 2.17 2.54 1.47 2.37 2.24 5.27 1.61 1.52 2.22 30.30 10.79 -10.10 0.01 0.17 0.06 -0.06 3.47 3.24 3.01 1.56 2.42 2.37 5.22 1.55 1.52 2.18 7.28 9.76 -6.02 0.01 0.04 0.05 -0.03 1.18 1.54 4.34 1.65 2.48 2.51 5.18 1.50 1.52 2.13 20.27 6.74 -5.95 0.00 0.09 0.03 -0.03 3.39 2.36 2.18 1.76 2.54 2.65 5.13 1.44 1.51 2.09 -4.71 -11.23 -20.86 0.00 -0.02 -0.04 -0.08 4.43 2.49 5.97 1.87 2.59 2.81 5.08 1.39 1.50 2.05 1.35 -16.16 -13.75 0.00 0.00 -0.06 -0.05 5.79 3.03 5.69 1.98 2.64 2.96 5.03 1.33 1.49 2.00 59.28 -6.11 0.32 0.00 0.18 -0.02 0.00 8.22 6.00 8.45 2.10 2.69 3.12 4.98 1.28 1.48 1.96 13.19 -12.06 -9.61 0.00 0.03 -0.03 -0.02 4.38 1.44 4.75 2.22 2.74 3.27 4.93 1.24 1.47 1.92 -25.73 -19.98 -3.54 0.00 -0.05 -0.04 -0.01 1.55 3.94 2.96 2.34 2.78 3.41 4.88 1.19 1.46 1.89 9.35 -1.92 4.50 0.00 0.01 0.00 0.01 2.17 2.44 4.64 2.45 2.82 3.55 4.83 1.15 1.45 1.85 5.37 9.08 2.53 0.00 0.01 0.01 0.00 5.33 0.70 4.60 2.56 2.85 3.68 4.79 1.11 1.44 1.82
-13.56 -2.92 24.51 0.00 -0.01 0.00 0.01 8.59 0.50 5.62 2.67 2.87 3.80 4.74 1.08 1.42 1.79 39.39 -2.11 -3.86 0.01 0.43 -0.02 -0.04 5.49 1.17 11.66 1.02 1.93 1.55 5.76 1.90 1.52 2.43 -13.61 -1.08 -29.75 0.01 -0.14 -0.01 -0.31 3.19 5.22 6.82 1.04 1.96 1.57 5.71 1.90 1.52 2.43 12.44 -6.06 -22.61 0.01 0.12 -0.06 -0.23 3.06 4.79 6.35 1.06 2.00 1.60 5.66 1.89 1.52 2.42

588
Microtremors Segment: B3-S2
Raw Data Tapered Data
FFT Data Parzen Filtered Data
Simple Ratio Spectrum
Z E N
Tapering Function
Z E N Z E N Z E N
Frequency Hz
E/Z N/Z
Mean SQRT Spectrum
71.63 -154.01 -124.25 0.26 18.59 -39.97 -32.24 1.34 24.05 5.26 3.66 5.45 4.04 30.03 1.49 1.10 1.85 26.44 169.96 87.83 0.26 6.85 44.02 22.75 8.96 17.74 3.79 3.71 5.43 4.08 29.98 1.47 1.10 1.83 21.36 200.22 133.39 0.26 5.52 51.76 34.48 4.76 7.48 5.84 3.75 5.42 4.12 29.93 1.45 1.10 1.82 17.29 121.58 -44.78 0.26 4.46 31.37 -11.55 3.02 20.68 8.38 3.78 5.40 4.16 29.88 1.43 1.10 1.80 -29.67 -86.49 -122.44 0.26 -7.64 -22.27 -31.53 1.16 39.43 6.13 3.80 5.38 4.19 29.83 1.42 1.10 1.79 7.38 -207.90 -2.19 0.26 1.90 -53.43 -0.56 7.90 27.96 3.48 3.81 5.36 4.21 29.79 1.41 1.11 1.79 40.30 -82.31 42.74 0.26 10.34 -21.11 10.96 6.28 10.74 5.21 3.81 5.35 4.23 29.74 1.40 1.11 1.79 -67.64 -21.10 -46.25 0.26 -17.32 -5.40 -11.84 3.38 13.13 1.64 3.79 5.33 4.24 29.69 1.41 1.12 1.80 -67.36 -84.88 -114.92 0.26 -17.21 -21.69 -29.36 6.22 16.74 3.77 3.77 5.31 4.25 29.64 1.41 1.13 1.81 70.65 -44.62 -19.64 0.26 18.02 -11.38 -5.01 3.64 10.67 5.24 3.73 5.31 4.24 29.59 1.42 1.14 1.82 35.45 186.10 170.06 0.25 9.02 47.36 43.28 2.12 13.59 6.60 3.68 5.30 4.23 29.54 1.44 1.15 1.84 -88.44 352.03 106.51 0.25 -22.46 89.41 27.05 2.08 19.05 4.46 3.62 5.30 4.21 29.49 1.46 1.16 1.87 -50.15 124.07 -132.43 0.25 -12.71 31.45 -33.57 5.99 17.65 4.49 3.56 5.31 4.18 29.44 1.49 1.18 1.90 111.74 -190.79 -77.01 0.25 28.27 -48.27 -19.48 2.11 13.13 9.75 3.48 5.33 4.14 29.39 1.53 1.19 1.94 100.33 -163.08 109.93 0.25 25.33 -41.18 27.76 7.73 8.69 1.84 3.40 5.35 4.09 29.35 1.58 1.21 1.98 -83.70 -106.54 -8.27 0.25 -21.09 -26.85 -2.08 2.23 10.53 3.63 3.31 5.38 4.04 29.30 1.63 1.22 2.03 -70.38 19.64 -167.91 0.25 -17.70 4.94 -42.23 5.92 12.95 1.05 3.21 5.42 3.97 29.25 1.69 1.24 2.09 24.73 186.23 -56.45 0.25 6.21 46.74 -14.17 8.15 20.18 5.91 3.12 5.46 3.90 29.20 1.75 1.25 2.15 30.63 -63.02 84.50 0.25 7.67 -15.79 21.17 3.37 19.34 7.65 3.02 5.51 3.83 29.15 1.83 1.27 2.22 53.47 -97.69 81.17 0.25 13.37 -24.42 20.29 8.28 17.25 3.79 2.92 5.57 3.75 29.10 1.91 1.28 2.30 49.27 149.21 48.92 0.25 12.29 37.23 12.20 3.23 21.89 9.11 2.82 5.63 3.66 29.05 2.00 1.30 2.38 34.11 134.64 -30.12 0.25 8.49 33.53 -7.50 3.57 17.36 9.24 2.72 5.70 3.57 29.00 2.09 1.31 2.47 -18.91 -41.55 -141.77 0.25 -4.70 -10.32 -35.23 2.18 11.41 7.27 2.63 5.77 3.47 28.96 2.20 1.32 2.56 -17.82 -262.93 -106.26 0.25 -4.42 -65.21 -26.35 2.40 1.91 6.01 2.54 5.85 3.37 28.91 2.30 1.33 2.66 27.17 20.56 12.93 0.25 6.72 5.09 3.20 2.02 9.95 10.61 2.45 5.92 3.27 28.86 2.42 1.34 2.76 -52.77 288.94 62.79 0.25 -13.03 71.37 15.51 3.63 26.87 4.79 2.37 6.00 3.17 28.81 2.53 1.34 2.86 -14.63 1.36 42.58 0.25 -3.61 0.33 10.50 2.93 19.57 2.59 2.29 6.08 3.07 28.76 2.65 1.34 2.97 97.22 44.27 27.45 0.25 23.92 10.89 6.75 5.57 7.85 3.01 2.22 6.15 2.97 28.71 2.77 1.34 3.07 33.97 128.92 91.22 0.25 8.34 31.65 22.39 5.01 11.25 5.43 2.16 6.22 2.87 28.66 2.88 1.33 3.18 -65.96 -161.02 67.91 0.25 -16.16 -39.45 16.64 1.62 19.19 13.09 2.10 6.28 2.78 28.61 3.00 1.32 3.28 -50.72 -382.93 -123.98 0.24 -12.40 -93.63 -30.31 7.86 9.54 18.23 2.04 6.34 2.69 28.56 3.11 1.32 3.37 47.30 -160.83 -167.39 0.24 11.54 -39.24 -40.84 7.23 9.87 6.52 1.99 6.40 2.60 28.52 3.21 1.31 3.46 23.17 255.98 0.95 0.24 5.64 62.33 0.23 4.76 13.23 8.63 1.95 6.44 2.52 28.47 3.30 1.29 3.55

589
Raw Data Tapered Data
FFT Data Parzen Filtered Data
Simple Ratio Spectrum
Z E N
Tapering Function
Z E N Z E N Z E N
Frequency Hz
E/Z N/Z
Mean SQRT Spectrum
-57.75 179.11 90.78 0.24 -14.03 43.52 22.06 1.09 18.56 3.24 1.91 6.48 2.45 28.42 3.39 1.28 3.62 -9.61 -85.07 12.58 0.24 -2.33 -20.63 3.05 4.05 19.33 6.96 1.88 6.50 2.39 28.37 3.46 1.27 3.69 59.30 -121.66 -48.34 0.24 14.35 -29.44 -11.70 3.70 24.24 6.17 1.85 6.52 2.33 28.32 3.53 1.26 3.75 64.07 109.37 86.59 0.24 15.47 26.41 20.91 3.32 20.05 1.34 1.82 6.53 2.27 28.27 3.58 1.25 3.79 0.94 198.75 181.06 0.24 0.23 47.90 43.63 2.41 15.28 6.56 1.80 6.53 2.23 28.22 3.63 1.24 3.83
-60.93 -46.55 -36.23 0.24 -14.65 -11.20 -8.71 11.24 21.04 11.27 1.78 6.53 2.19 28.17 3.66 1.23 3.86 -33.73 -78.30 -233.68 0.24 -8.09 -18.79 -56.08 9.96 9.67 11.49 1.76 6.51 2.16 28.13 3.69 1.22 3.89 53.24 -187.76 -106.99 0.24 12.75 -44.97 -25.63 16.21 6.14 15.64 1.75 6.49 2.13 28.08 3.71 1.22 3.90 42.06 -277.83 149.93 0.24 10.05 -66.40 35.83 8.82 12.46 2.93 1.74 6.46 2.12 28.03 3.72 1.22 3.92 -67.88 70.59 193.25 0.24 -16.19 16.84 46.09 3.17 18.12 3.93 1.72 6.42 2.11 27.98 3.73 1.22 3.92 -91.55 288.88 -27.08 0.24 -21.79 68.75 -6.45 1.88 16.28 2.81 1.71 6.38 2.10 27.93 3.72 1.23 3.92 -13.33 50.20 -119.78 0.24 -3.16 11.92 -28.45 3.78 12.32 13.80 1.70 6.34 2.11 27.88 3.72 1.24 3.92 49.61 -194.51 55.35 0.24 11.76 -46.10 13.12 9.76 8.49 1.55 1.70 6.29 2.12 27.83 3.70 1.25 3.91 -15.45 -30.05 124.00 0.24 -3.65 -7.11 29.33 8.00 22.44 6.69 1.69 6.24 2.13 27.78 3.69 1.26 3.90 -61.28 117.77 -99.05 0.24 -14.46 27.79 -23.37 3.03 15.21 6.28 1.69 6.19 2.15 27.73 3.67 1.27 3.88 37.78 93.35 -280.28 0.24 8.90 21.98 -66.01 1.91 31.71 9.19 1.69 6.14 2.17 27.69 3.64 1.29 3.86 81.55 88.99 -63.58 0.24 19.16 20.91 -14.94 4.84 31.09 3.89 1.68 6.09 2.20 27.64 3.62 1.30 3.85 17.36 -4.18 204.14 0.23 4.07 -0.98 47.87 5.28 1.94 7.15 1.68 6.05 2.23 27.59 3.59 1.32 3.83 -29.61 -66.04 108.52 0.23 -6.93 -15.45 25.39 5.39 22.36 5.70 1.69 6.00 2.26 27.54 3.56 1.34 3.81 -33.47 -104.69 -49.59 0.23 -7.82 -24.45 -11.58 5.51 14.74 10.93 1.69 5.96 2.29 27.49 3.53 1.36 3.78 3.60 0.52 -23.44 0.23 0.84 0.12 -5.46 2.28 28.36 5.84 1.69 5.93 2.33 27.44 3.50 1.37 3.76
92.42 131.26 50.52 0.23 21.49 30.52 11.74 4.63 26.09 8.01 1.70 5.90 2.36 27.39 3.47 1.39 3.74 74.09 -93.82 69.28 0.23 17.19 -21.77 16.07 0.87 18.17 8.65 1.71 5.87 2.40 27.34 3.44 1.41 3.71
-109.83 -160.30 -27.80 0.23 -25.42 -37.11 -6.43 5.30 37.87 8.13 1.72 5.85 2.43 27.29 3.40 1.42 3.69 -111.37 56.91 -159.41 0.23 -25.73 13.15 -36.82 3.98 24.47 6.81 1.73 5.83 2.47 27.25 3.37 1.43 3.66 43.77 69.66 -72.94 0.23 10.09 16.06 -16.81 2.44 9.16 3.87 1.75 5.82 2.50 27.20 3.33 1.43 3.63 19.66 118.28 185.84 0.23 4.52 27.21 42.74 7.22 30.56 8.54 1.76 5.81 2.54 27.15 3.30 1.44 3.60 -1.37 165.72 166.14 0.23 -0.31 38.03 38.13 4.56 28.99 2.21 1.78 5.82 2.57 27.10 3.26 1.44 3.57 49.54 -23.57 -147.89 0.23 11.35 -5.40 -33.87 3.93 13.35 6.93 1.80 5.82 2.60 27.05 3.23 1.44 3.54 47.36 -108.30 -206.18 0.23 10.82 -24.75 -47.11 4.88 13.72 7.92 1.82 5.83 2.62 27.00 3.20 1.44 3.51 49.17 31.85 95.05 0.23 11.21 7.26 21.67 0.37 28.76 4.62 1.85 5.85 2.65 26.95 3.17 1.43 3.48 -31.85 64.66 228.41 0.23 -7.25 14.71 51.96 3.28 20.07 9.76 1.87 5.87 2.67 26.90 3.15 1.43 3.45 -89.60 -144.18 -75.89 0.23 -20.34 -32.73 -17.23 4.62 22.54 15.25 1.89 5.90 2.69 26.86 3.12 1.42 3.43

590
Raw Data Tapered Data
FFT Data Parzen Filtered Data
Simple Ratio Spectrum
Z E N
Tapering Function
Z E N Z E N Z E N
Frequency Hz
E/Z N/Z
Mean SQRT Spectrum
9.57 -165.56 -319.09 0.23 2.17 -37.50 -72.27 4.09 9.74 17.17 1.91 5.94 2.70 26.81 3.11 1.41 3.41 71.42 -5.21 -76.29 0.23 16.14 -1.18 -17.24 2.14 15.79 12.38 1.93 5.98 2.71 26.76 3.10 1.40 3.40 -1.71 36.73 220.43 0.23 -0.39 8.28 49.71 1.94 15.67 10.62 1.95 6.03 2.72 26.71 3.09 1.40 3.39 -73.55 87.48 189.61 0.23 -16.55 19.68 42.66 5.23 21.50 9.73 1.97 6.08 2.73 26.66 3.09 1.39 3.39 -12.37 114.08 -31.70 0.22 -2.78 25.61 -7.12 8.18 20.53 13.18 1.98 6.14 2.74 26.61 3.10 1.38 3.39 30.61 26.80 -166.29 0.22 6.86 6.00 -37.25 6.07 21.77 7.33 2.00 6.21 2.74 26.56 3.11 1.37 3.40 -23.40 -197.86 -5.94 0.22 -5.23 -44.22 -1.33 4.24 25.63 13.26 2.01 6.28 2.74 26.51 3.13 1.37 3.41 -36.27 -165.13 201.67 0.22 -8.09 -36.82 44.97 3.39 20.45 7.17 2.01 6.35 2.75 26.46 3.15 1.36 3.43 -53.08 201.80 41.19 0.22 -11.81 44.90 9.17 6.75 9.03 11.16 2.02 6.43 2.75 26.42 3.19 1.36 3.46 -31.90 223.95 -223.44 0.22 -7.08 49.72 -49.60 2.05 13.96 4.02 2.02 6.51 2.75 26.37 3.23 1.36 3.50 40.10 5.49 -90.80 0.22 8.88 1.22 -20.11 2.97 4.85 4.52 2.01 6.60 2.75 26.32 3.28 1.37 3.55 6.01 -147.22 164.06 0.22 1.33 -32.54 36.26 4.41 9.97 4.85 2.00 6.68 2.75 26.27 3.34 1.37 3.61
-34.92 -135.65 121.49 0.22 -7.70 -29.91 26.79 5.83 18.57 12.05 1.99 6.77 2.76 26.22 3.40 1.38 3.67 10.14 31.56 -80.58 0.22 2.23 6.94 -17.73 6.06 18.84 4.88 1.98 6.86 2.76 26.17 3.47 1.40 3.74 34.07 95.31 -129.16 0.22 7.48 20.92 -28.35 7.02 13.70 2.77 1.96 6.95 2.77 26.12 3.55 1.41 3.82 58.89 -12.86 11.09 0.22 12.90 -2.82 2.43 7.70 18.42 20.98 1.94 7.04 2.78 26.07 3.63 1.43 3.90 89.60 -164.50 24.02 0.22 19.58 -35.94 5.25 6.17 14.88 7.33 1.92 7.12 2.79 26.03 3.72 1.45 3.99 -7.55 5.82 -38.94 0.22 -1.65 1.27 -8.49 7.43 3.45 2.75 1.89 7.20 2.80 25.98 3.81 1.48 4.08 -89.35 177.46 37.07 0.22 -19.43 38.60 8.06 5.13 15.28 3.87 1.87 7.27 2.82 25.93 3.89 1.51 4.18 -30.10 130.84 33.94 0.22 -6.53 28.39 7.36 5.30 14.30 6.77 1.84 7.34 2.84 25.88 3.98 1.54 4.27 -14.00 42.49 -15.09 0.22 -3.03 9.20 -3.27 8.71 21.32 11.92 1.82 7.40 2.87 25.83 4.07 1.58 4.37 5.03 -131.33 70.80 0.22 1.09 -28.37 15.29 9.29 12.54 15.08 1.79 7.45 2.89 25.78 4.16 1.61 4.46 73.88 -68.93 101.46 0.22 15.92 -14.85 21.86 6.68 17.20 12.93 1.77 7.49 2.92 25.73 4.24 1.65 4.55 50.64 -19.75 -14.71 0.22 10.89 -4.25 -3.16 5.86 12.61 7.87 1.75 7.52 2.95 25.68 4.31 1.69 4.63 -18.41 52.19 -82.51 0.21 -3.95 11.20 -17.70 4.28 9.21 5.89 1.73 7.55 2.98 25.63 4.37 1.73 4.70 -25.32 154.78 -22.29 0.21 -5.42 33.12 -4.77 2.80 17.39 8.24 1.71 7.56 3.02 25.59 4.42 1.77 4.76 -19.22 -115.30 -41.16 0.21 -4.10 -24.62 -8.79 5.99 9.37 2.70 1.69 7.55 3.05 25.54 4.46 1.80 4.81 -36.10 -108.85 -75.92 0.21 -7.69 -23.19 -16.17 3.10 23.35 5.10 1.68 7.54 3.08 25.49 4.48 1.83 4.84 16.95 187.00 61.12 0.21 3.60 39.74 12.99 0.27 17.78 3.77 1.68 7.51 3.12 25.44 4.48 1.86 4.85 75.78 219.18 102.80 0.21 16.06 46.47 21.79 3.05 10.67 8.30 1.67 7.48 3.15 25.39 4.47 1.89 4.85 55.52 -125.01 33.53 0.21 11.74 -26.44 7.09 6.52 2.88 11.49 1.67 7.43 3.18 25.34 4.45 1.91 4.84 -5.57 -288.18 4.46 0.21 -1.17 -60.81 0.94 11.56 5.92 11.35 1.67 7.37 3.21 25.29 4.41 1.92 4.81 -31.48 125.15 -99.34 0.21 -6.63 26.34 -20.91 11.60 14.13 9.71 1.68 7.30 3.24 25.24 4.35 1.93 4.76

591
Raw Data Tapered
Data FFT Data Parzen Filtered
Data Simple Ratio
Spectrum Z E N
Tapering Function
Z E N Z E N Z E N
Frequency Hz
E/Z N/Z
Mean SQRT Spectrum
44.50 123.65 -90.96 0.21 9.34 25.97 -19.10 2.06 14.15 15.21 1.69 7.23 3.27 25.20 4.28 1.93 4.70 60.30 -158.28 69.10 0.21 12.63 -33.16 14.48 11.14 10.60 12.41 1.70 7.15 3.29 25.15 4.20 1.93 4.62 -38.74 14.01 61.84 0.21 -8.10 2.93 12.92 12.30 17.91 12.75 1.72 7.06 3.31 25.10 4.11 1.92 4.54 -84.48 131.72 -52.17 0.21 -17.61 27.46 -10.88 3.82 5.25 13.38 1.74 6.97 3.32 25.05 4.01 1.91 4.45 -54.19 -22.50 -10.04 0.21 -11.27 -4.68 -2.09 6.16 13.07 8.70 1.76 6.87 3.33 25.00 3.91 1.89 4.34 16.89 -205.04 98.79 0.21 3.51 -42.55 20.50 1.94 8.64 20.84 1.78 6.78 3.34 24.95 3.80 1.87 4.24 62.74 -38.55 33.53 0.21 12.99 -7.98 6.94 3.55 6.81 14.95 1.81 6.67 3.34 24.90 3.69 1.85 4.13 -30.31 184.16 -126.28 0.21 -6.26 38.03 -26.08 8.93 13.12 2.57 1.83 6.57 3.34 24.85 3.58 1.82 4.02 -50.14 -2.20 -143.73 0.21 -10.33 -0.45 -29.61 6.42 6.90 7.02 1.86 6.47 3.34 24.80 3.48 1.80 3.91 109.75 -174.85 39.48 0.21 22.55 -35.93 8.11 4.96 2.17 12.58 1.89 6.37 3.34 24.76 3.37 1.77 3.81 123.29 -156.18 122.17 0.21 25.27 -32.02 25.04 10.43 8.75 12.14 1.92 6.27 3.34 24.71 3.27 1.74 3.70 -19.91 71.99 31.86 0.20 -4.07 14.72 6.52 17.67 18.61 8.61 1.95 6.17 3.33 24.66 3.17 1.71 3.60 -112.64 225.40 1.80 0.20 -22.98 45.98 0.37 21.53 26.71 10.29 1.98 6.08 3.32 24.61 3.08 1.68 3.51 -67.26 11.92 -93.01 0.20 -13.69 2.43 -18.93 12.09 2.70 7.93 2.00 5.99 3.32 24.56 2.99 1.66 3.42 56.77 -175.75 -5.80 0.20 11.52 -35.68 -1.18 2.33 23.68 19.50 2.03 5.90 3.31 24.51 2.90 1.63 3.33 64.53 -243.90 188.84 0.20 13.07 -49.39 38.24 5.15 11.19 19.23 2.06 5.81 3.31 24.46 2.82 1.61 3.25 -15.56 -36.34 -54.43 0.20 -3.14 -7.34 -10.99 15.19 4.83 34.31 2.09 5.73 3.31 24.41 2.75 1.59 3.17 -15.49 201.34 -219.87 0.20 -3.12 40.57 -44.30 22.08 17.84 13.41 2.11 5.65 3.31 24.37 2.67 1.57 3.10 -25.39 35.87 -28.37 0.20 -5.10 7.21 -5.70 22.08 20.74 35.15 2.14 5.57 3.32 24.32 2.60 1.55 3.03 -129.08 -54.10 143.41 0.20 -25.88 -10.85 28.75 9.62 20.61 38.23 2.17 5.49 3.33 24.27 2.54 1.54 2.97 -48.71 -59.86 155.82 0.20 -9.74 -11.97 31.16 17.75 35.89 41.63 2.19 5.42 3.34 24.22 2.47 1.52 2.90 91.22 13.23 -67.36 0.20 18.20 2.64 -13.44 13.79 9.26 38.99 2.22 5.35 3.36 24.17 2.41 1.52 2.85 26.99 176.86 -165.88 0.20 5.37 35.19 -33.01 20.98 52.38 40.58 2.25 5.28 3.39 24.12 2.35 1.51 2.79 41.86 79.34 58.34 0.20 8.31 15.75 11.58 18.40 25.06 13.02 2.28 5.22 3.42 24.07 2.29 1.50 2.74 62.66 3.18 109.01 0.20 12.41 0.63 21.58 13.44 31.79 34.45 2.31 5.16 3.46 24.02 2.23 1.50 2.69 -34.39 -120.58 -144.91 0.20 -6.79 -23.81 -28.62 14.24 2.00 22.26 2.34 5.10 3.51 23.97 2.18 1.50 2.64 -35.24 -187.96 -197.22 0.20 -6.94 -37.03 -38.85 14.00 23.52 42.62 2.38 5.05 3.57 23.93 2.12 1.50 2.60 44.75 61.30 116.95 0.20 8.79 12.04 22.98 14.87 7.98 22.24 2.42 5.00 3.63 23.88 2.07 1.50 2.55 66.54 94.99 240.25 0.20 13.04 18.62 47.09 9.62 30.43 15.32 2.47 4.96 3.71 23.83 2.01 1.50 2.51 -30.52 23.75 -69.09 0.20 -5.97 4.64 -13.51 6.36 32.15 7.88 2.52 4.92 3.79 23.78 1.95 1.51 2.47 -66.32 95.51 -239.47 0.20 -12.93 18.63 -46.70 9.68 25.25 13.28 2.58 4.89 3.89 23.73 1.90 1.51 2.42 -16.15 -28.62 -37.90 0.19 -3.14 -5.57 -7.37 1.90 29.78 11.55 2.64 4.87 3.99 23.68 1.84 1.51 2.39 18.86 -302.95 145.89 0.19 3.66 -58.77 28.30 2.26 37.12 16.09 2.71 4.85 4.11 23.63 1.79 1.52 2.35

592
Raw Data Tapered
Data FFT Data Parzen Filtered
Data Simple Ratio
Spectrum Z E N
Tapering Function
Z E N Z E N Z E N
Frequency Hz
E/Z N/Z
Mean SQRT Spectrum
28.77 -111.12 105.39 0.19 5.57 -21.50 20.39 4.59 25.17 10.40 2.78 4.85 4.24 23.58 1.74 1.53 2.32 -47.18 375.36 -17.78 0.19 -9.11 72.44 -3.43 14.84 24.16 23.19 2.86 4.86 4.39 23.54 1.70 1.53 2.29 -46.98 157.29 -68.60 0.19 -9.04 30.28 -13.20 21.92 32.17 5.73 2.95 4.88 4.54 23.49 1.66 1.54 2.26 40.04 -316.39 30.49 0.19 7.69 -60.75 5.85 25.92 7.02 29.36 3.04 4.91 4.71 23.44 1.62 1.55 2.24 45.88 -201.34 91.25 0.19 8.79 -38.56 17.47 19.90 26.19 21.01 3.13 4.96 4.89 23.39 1.58 1.56 2.22 -30.14 192.68 -76.77 0.19 -5.76 36.80 -14.66 9.01 17.35 3.42 3.23 5.02 5.07 23.34 1.55 1.57 2.21 -131.81 300.69 -93.42 0.19 -25.11 57.28 -17.80 4.70 23.86 8.71 3.34 5.09 5.27 23.29 1.53 1.58 2.20 -94.35 -122.66 32.71 0.19 -17.93 -23.31 6.21 10.32 6.96 9.42 3.45 5.18 5.48 23.24 1.50 1.59 2.19 105.64 -328.75 -4.34 0.19 20.02 -62.30 -0.82 8.70 18.62 6.05 3.56 5.29 5.69 23.19 1.49 1.60 2.18 169.10 -28.03 -32.26 0.19 31.96 -5.30 -6.10 3.50 25.95 6.82 3.67 5.41 5.91 23.14 1.47 1.61 2.18 -7.21 146.73 -45.10 0.19 -1.36 27.66 -8.50 6.56 31.49 21.04 3.78 5.54 6.13 23.10 1.46 1.62 2.18
-63.06 185.07 64.87 0.19 -11.86 34.79 12.20 3.89 31.61 17.99 3.89 5.68 6.35 23.05 1.46 1.63 2.19 15.04 71.56 179.39 0.19 2.82 13.42 33.63 5.48 27.87 4.98 4.00 5.83 6.57 23.00 1.46 1.64 2.20 -53.87 -126.33 -19.93 0.19 -10.07 -23.62 -3.73 5.08 28.24 3.22 4.10 6.00 6.78 22.95 1.46 1.65 2.21 -47.66 -77.92 -55.77 0.19 -8.89 -14.53 -10.40 3.68 23.79 2.34 4.20 6.17 6.98 22.90 1.47 1.66 2.22 118.21 72.10 31.29 0.19 21.99 13.41 5.82 6.09 8.53 5.06 4.29 6.35 7.17 22.85 1.48 1.67 2.23 103.78 80.79 -31.71 0.19 19.25 14.99 -5.88 3.22 18.72 8.30 4.37 6.54 7.34 22.80 1.50 1.68 2.25 -11.40 -40.28 123.12 0.19 -2.11 -7.45 22.78 3.84 22.56 7.63 4.45 6.72 7.50 22.75 1.51 1.69 2.27 -19.33 -116.97 81.71 0.18 -3.57 -21.58 15.08 2.44 18.83 9.09 4.51 6.91 7.64 22.71 1.53 1.69 2.28 -48.18 -48.63 -235.97 0.18 -8.87 -8.95 -43.42 5.04 5.22 8.83 4.57 7.10 7.76 22.66 1.56 1.70 2.30 -55.97 103.26 -36.42 0.18 -10.27 18.95 -6.68 7.18 7.94 5.49 4.61 7.29 7.85 22.61 1.58 1.70 2.32 -9.82 129.80 336.98 0.18 -1.80 23.75 61.67 3.48 12.49 9.39 4.65 7.47 7.91 22.56 1.61 1.70 2.34 -2.79 69.40 168.97 0.18 -0.51 12.67 30.84 3.73 15.50 11.28 4.67 7.64 7.95 22.51 1.64 1.70 2.36 4.22 19.22 -290.78 0.18 0.77 3.50 -52.92 3.66 15.26 4.81 4.68 7.80 7.96 22.46 1.67 1.70 2.38
-13.75 -160.49 -348.49 0.18 -2.50 -29.13 -63.25 6.28 4.66 4.97 4.68 7.95 7.94 22.41 1.70 1.70 2.40 1.28 -89.99 139.94 0.18 0.23 -16.29 25.33 2.74 2.40 3.13 4.67 8.09 7.89 22.36 1.73 1.69 2.42
60.17 92.01 370.92 0.18 10.86 16.61 66.95 6.06 16.50 5.24 4.64 8.22 7.82 22.31 1.77 1.68 2.44 62.93 -79.01 29.12 0.18 11.33 -14.22 5.24 7.32 20.47 7.31 4.61 8.33 7.71 22.27 1.81 1.67 2.46 3.81 -32.78 -275.38 0.18 0.68 -5.88 -49.43 5.12 16.61 5.02 4.56 8.42 7.59 22.22 1.85 1.66 2.49 -1.19 167.95 -215.39 0.18 -0.21 30.06 -38.55 1.87 13.67 5.15 4.50 8.50 7.44 22.17 1.89 1.65 2.51 40.74 -1.38 58.93 0.18 7.27 -0.25 10.52 6.80 11.73 19.43 4.43 8.57 7.27 22.12 1.93 1.64 2.53 -57.22 -225.92 174.47 0.18 -10.18 -40.21 31.06 1.69 4.77 11.94 4.36 8.62 7.09 22.07 1.98 1.63 2.56 -104.88 -81.30 35.06 0.18 -18.62 -14.43 6.22 1.84 9.97 3.60 4.28 8.65 6.89 22.02 2.02 1.61 2.58

593
Raw Data Tapered
Data FFT Data Parzen Filtered
Data Simple Ratio
Spectrum Z E N
Tapering Function
Z E N Z E N Z E N
Frequency Hz
E/Z N/Z
Mean SQRT Spectrum
20.30 218.43 -108.79 0.18 3.59 38.66 -19.26 2.26 16.15 5.67 4.19 8.66 6.68 21.97 2.07 1.59 2.61 56.15 36.92 -52.46 0.18 9.91 6.52 -9.26 3.00 11.89 6.81 4.09 8.65 6.46 21.92 2.11 1.58 2.64 -6.94 -213.73 161.33 0.18 -1.22 -37.62 28.39 3.50 16.31 7.76 3.99 8.63 6.23 21.88 2.16 1.56 2.67 3.08 49.61 87.84 0.18 0.54 8.71 15.42 3.09 19.27 10.65 3.89 8.59 6.00 21.83 2.21 1.54 2.70
17.05 233.04 -151.03 0.18 2.98 40.78 -26.43 4.41 7.74 14.12 3.78 8.54 5.77 21.78 2.26 1.53 2.73 -80.81 50.48 -35.65 0.17 -14.10 8.81 -6.22 1.99 5.80 14.25 3.66 8.47 5.54 21.73 2.31 1.51 2.76 -47.55 -162.30 107.21 0.17 -8.27 -28.24 18.65 5.05 8.77 12.99 3.55 8.38 5.32 21.68 2.36 1.50 2.80 105.35 -171.62 23.95 0.17 18.28 -29.78 4.16 2.46 2.72 8.91 3.43 8.29 5.10 21.63 2.42 1.49 2.84 45.06 -9.26 -43.00 0.17 7.79 -1.60 -7.44 4.06 3.95 5.75 3.31 8.18 4.89 21.58 2.47 1.48 2.88 -44.94 93.58 -104.70 0.17 -7.75 16.14 -18.06 1.88 9.32 5.29 3.19 8.06 4.69 21.53 2.53 1.47 2.92 49.07 -39.53 -129.22 0.17 8.44 -6.80 -22.23 0.65 3.68 14.67 3.07 7.93 4.50 21.48 2.58 1.46 2.97 75.82 -208.03 41.96 0.17 13.00 -35.68 7.20 3.00 6.58 20.34 2.96 7.80 4.32 21.44 2.63 1.46 3.01 -47.23 -51.50 189.50 0.17 -8.08 -8.81 32.40 1.72 6.55 7.00 2.85 7.65 4.15 21.39 2.69 1.46 3.06 -64.99 158.29 27.07 0.17 -11.08 26.99 4.62 4.68 7.88 3.94 2.74 7.49 4.00 21.34 2.74 1.46 3.10 15.12 144.69 -161.65 0.17 2.57 24.60 -27.48 4.74 11.55 5.74 2.63 7.33 3.86 21.29 2.78 1.47 3.15 -9.88 137.13 2.68 0.17 -1.68 23.24 0.45 3.15 6.38 2.15 2.53 7.16 3.73 21.24 2.83 1.48 3.19
-52.75 14.82 231.21 0.17 -8.91 2.51 39.07 4.00 6.37 1.64 2.43 6.99 3.62 21.19 2.88 1.49 3.24 3.36 -249.70 13.73 0.17 0.57 -42.07 2.31 2.43 11.65 4.26 2.34 6.82 3.52 21.14 2.92 1.51 3.28 7.35 -110.97 -204.88 0.17 1.23 -18.64 -34.42 2.00 12.28 11.04 2.25 6.65 3.43 21.09 2.96 1.53 3.33
-15.62 272.71 84.36 0.17 -2.62 45.68 14.13 1.49 12.01 7.56 2.16 6.47 3.36 21.04 2.99 1.55 3.37 45.33 195.77 222.75 0.17 7.57 32.69 37.20 0.50 10.52 5.51 2.08 6.30 3.30 21.00 3.03 1.58 3.42 25.19 -78.46 -47.59 0.17 4.19 -13.06 -7.92 1.64 10.05 7.28 2.01 6.13 3.24 20.95 3.06 1.62 3.46 -39.77 -78.15 -287.91 0.17 -6.60 -12.97 -47.79 2.21 19.16 6.41 1.93 5.96 3.20 20.90 3.08 1.66 3.50 -4.67 -20.95 -210.91 0.17 -0.77 -3.47 -34.91 1.40 13.57 0.84 1.87 5.80 3.17 20.85 3.10 1.70 3.53
111.13 -43.81 213.10 0.17 18.34 -7.23 35.16 2.52 8.69 6.96 1.81 5.63 3.15 20.80 3.11 1.74 3.57 91.73 -51.62 229.22 0.16 15.09 -8.49 37.71 1.02 4.75 10.93 1.75 5.48 3.14 20.75 3.12 1.79 3.60
-151.14 -2.51 -229.78 0.16 -24.79 -0.41 -37.68 2.40 1.69 12.11 1.70 5.32 3.13 20.70 3.13 1.84 3.63 -142.55 46.41 -218.87 0.16 -23.31 7.59 -35.79 1.78 1.45 7.75 1.65 5.17 3.12 20.65 3.13 1.89 3.65 88.57 34.25 101.37 0.16 14.44 5.58 16.52 3.20 3.27 7.27 1.61 5.03 3.13 20.61 3.13 1.94 3.68 90.22 -25.76 284.61 0.16 14.66 -4.19 46.25 2.70 9.10 3.12 1.57 4.89 3.13 20.56 3.12 2.00 3.71 -7.93 -3.70 96.85 0.16 -1.29 -0.60 15.69 1.27 8.70 4.37 1.53 4.76 3.14 20.51 3.12 2.06 3.74
-32.84 160.99 -259.82 0.16 -5.30 26.00 -41.96 0.56 5.70 7.84 1.49 4.64 3.16 20.46 3.12 2.12 3.77 -75.62 83.50 6.69 0.16 -12.17 13.44 1.08 2.20 7.96 7.60 1.45 4.52 3.17 20.41 3.11 2.18 3.80

594
Raw Data Tapered
Data FFT Data Parzen Filtered
Data Simple Ratio
Spectrum Z E N
Tapering Function
Z E N Z E N Z E N
Frequency Hz
E/Z N/Z
Mean SQRT Spectrum
-101.25 -173.32 160.37 0.16 -16.25 -27.82 25.74 2.49 12.10 3.76 1.42 4.41 3.18 20.36 3.11 2.24 3.83 -20.00 -175.62 -98.75 0.16 -3.20 -28.10 -15.80 3.19 13.63 1.32 1.39 4.31 3.19 20.31 3.10 2.30 3.86 55.94 -10.24 -47.45 0.16 8.92 -1.63 -7.57 1.16 13.09 11.29 1.36 4.21 3.19 20.26 3.10 2.35 3.89 34.77 182.42 -106.14 0.16 5.53 29.00 -16.88 2.47 6.15 4.79 1.33 4.12 3.20 20.21 3.10 2.41 3.93 -32.22 41.97 -76.76 0.16 -5.11 6.65 -12.17 2.66 3.36 2.34 1.30 4.03 3.20 20.17 3.10 2.46 3.96 27.79 -299.51 188.02 0.16 4.39 -47.32 29.71 1.13 3.09 4.43 1.27 3.95 3.20 20.12 3.11 2.52 4.00 63.62 -119.67 73.50 0.16 10.02 -18.85 11.58 1.09 10.46 1.45 1.24 3.88 3.19 20.07 3.12 2.57 4.04 -69.36 196.19 -96.44 0.16 -10.89 30.80 -15.14 2.47 9.88 3.89 1.22 3.81 3.18 20.02 3.13 2.61 4.08 -5.20 157.48 -117.01 0.16 -0.81 24.65 -18.31 3.98 9.26 10.09 1.19 3.75 3.17 19.97 3.15 2.66 4.12 39.74 -72.69 -74.62 0.16 6.20 -11.34 -11.64 2.01 12.71 5.96 1.17 3.69 3.15 19.92 3.17 2.70 4.16
-117.09 -214.11 170.20 0.16 -18.21 -33.29 26.47 1.24 10.25 2.18 1.14 3.64 3.13 19.87 3.19 2.74 4.21 -83.68 -93.49 184.50 0.16 -12.97 -14.49 28.60 3.81 5.54 1.76 1.12 3.60 3.10 19.82 3.22 2.78 4.25 66.37 40.63 -48.77 0.15 10.25 6.28 -7.54 0.52 10.83 4.69 1.09 3.55 3.07 19.78 3.25 2.81 4.30 77.09 213.12 40.25 0.15 11.87 32.82 6.20 4.30 1.09 5.49 1.07 3.52 3.04 19.73 3.29 2.84 4.35 -24.00 171.35 129.92 0.15 -3.68 26.30 19.94 3.11 8.10 1.05 1.05 3.48 3.00 19.68 3.33 2.86 4.39 -82.78 -168.65 7.65 0.15 -12.67 -25.80 1.17 1.77 2.11 2.04 1.02 3.45 2.96 19.63 3.37 2.89 4.44 -68.46 -132.04 24.59 0.15 -10.44 -20.14 3.75 2.00 6.90 6.69 1.00 3.43 2.92 19.58 3.41 2.90 4.48 19.65 39.15 11.52 0.15 2.99 5.95 1.75 3.20 8.39 5.42 0.98 3.40 2.87 19.53 3.46 2.92 4.52 103.41 96.88 -96.31 0.15 15.67 14.68 -14.59 2.43 7.55 4.51 0.96 3.38 2.83 19.48 3.50 2.93 4.57 57.10 82.53 -151.81 0.15 8.62 12.46 -22.92 1.82 4.02 3.43 0.95 3.36 2.78 19.43 3.55 2.94 4.61 -34.94 -50.54 -67.36 0.15 -5.26 -7.61 -10.14 2.62 3.21 0.70 0.93 3.34 2.74 19.38 3.60 2.95 4.65 -34.78 22.52 66.65 0.15 -5.22 3.38 10.00 1.64 5.23 1.86 0.91 3.33 2.69 19.34 3.64 2.95 4.69 107.08 -26.46 33.45 0.15 16.01 -3.96 5.00 1.75 9.72 2.59 0.90 3.31 2.64 19.29 3.69 2.94 4.72 109.66 -115.18 64.26 0.15 16.34 -17.16 9.58 1.21 10.69 1.51 0.88 3.29 2.60 19.24 3.73 2.94 4.74 -54.45 67.92 -17.82 0.15 -8.09 10.09 -2.65 2.01 7.51 4.90 0.87 3.28 2.55 19.19 3.76 2.93 4.76 -4.32 71.65 -136.51 0.15 -0.64 10.60 -20.20 0.50 3.07 3.75 0.86 3.26 2.51 19.14 3.79 2.91 4.78 21.66 -24.45 114.54 0.15 3.19 -3.61 16.89 1.96 3.72 0.37 0.85 3.25 2.46 19.09 3.81 2.89 4.78
-109.16 -64.26 90.14 0.15 -16.05 -9.45 13.25 1.32 5.91 2.09 0.84 3.23 2.42 19.04 3.83 2.86 4.78 -69.79 -48.03 -128.78 0.15 -10.22 -7.04 -18.87 2.20 7.75 0.90 0.84 3.22 2.37 18.99 3.84 2.83 4.77 68.23 33.00 11.46 0.15 9.96 4.82 1.67 2.71 3.16 5.61 0.83 3.20 2.33 18.95 3.85 2.80 4.76 103.89 151.63 83.28 0.15 15.12 22.06 12.12 3.72 5.72 6.01 0.83 3.18 2.28 18.90 3.85 2.76 4.74 23.64 148.04 -75.73 0.15 3.43 21.47 -10.98 4.60 7.20 2.56 0.82 3.17 2.24 18.85 3.84 2.72 4.71 -50.29 -191.87 -176.22 0.14 -7.27 -27.73 -25.46 3.89 2.01 5.63 0.82 3.15 2.19 18.80 3.83 2.67 4.67

595
Raw Data Tapered Data
FFT Data Parzen Filtered Data
Simple Ratio Spectrum
Z E N
Tapering Function
Z E N Z E N Z E N
Frequency Hz
E/Z N/Z
Mean SQRT Spectrum
-77.03 -149.19 25.09 0.14 -11.09 -21.48 3.61 5.38 7.65 5.87 0.82 3.13 2.15 18.75 3.81 2.62 4.63 -52.76 210.69 225.59 0.14 -7.57 30.23 32.37 3.90 6.48 2.30 0.82 3.11 2.10 18.70 3.79 2.57 4.58 42.28 58.16 -87.68 0.14 6.05 8.32 -12.54 6.49 3.20 3.14 0.82 3.08 2.06 18.65 3.76 2.51 4.52 93.01 -158.64 -215.06 0.14 13.25 -22.61 -30.65 6.29 8.40 0.88 0.82 3.06 2.01 18.60 3.72 2.45 4.46 50.74 -139.04 144.09 0.14 7.20 -19.74 20.46 4.27 7.65 0.74 0.82 3.03 1.97 18.55 3.68 2.39 4.39 -14.33 -27.70 174.45 0.14 -2.03 -3.92 24.69 2.79 8.01 1.82 0.83 3.01 1.93 18.51 3.64 2.33 4.32 -48.19 82.20 4.10 0.14 -6.80 11.59 0.58 5.75 2.89 2.49 0.83 2.98 1.88 18.46 3.59 2.27 4.25 -16.05 57.92 -206.49 0.14 -2.26 8.14 -29.01 7.34 10.58 0.91 0.83 2.95 1.84 18.41 3.54 2.20 4.17 31.92 6.79 -217.63 0.14 4.47 0.95 -30.47 5.97 13.65 4.71 0.84 2.92 1.79 18.36 3.49 2.14 4.09 -46.04 -138.94 260.29 0.14 -6.42 -19.38 36.31 6.38 0.11 6.51 0.84 2.89 1.75 18.31 3.44 2.08 4.01 -66.80 -122.41 279.22 0.14 -9.29 -17.01 38.81 6.42 8.14 0.59 0.85 2.86 1.71 18.26 3.38 2.02 3.93 72.20 185.47 -62.21 0.14 10.00 25.69 -8.62 6.04 0.97 1.82 0.85 2.83 1.67 18.21 3.32 1.95 3.85 36.99 240.62 38.84 0.14 5.10 33.21 5.36 1.97 4.33 2.23 0.86 2.80 1.63 18.16 3.26 1.89 3.76 -68.94 -32.79 132.50 0.14 -9.48 -4.51 18.22 4.14 2.09 3.49 0.87 2.77 1.59 18.12 3.19 1.83 3.68 -23.74 -218.29 -70.62 0.14 -3.25 -29.91 -9.68 3.82 4.89 2.43 0.88 2.73 1.55 18.07 3.12 1.77 3.58 53.21 -29.79 -267.94 0.14 7.26 -4.07 -36.57 2.61 5.82 5.30 0.89 2.70 1.52 18.02 3.04 1.71 3.49 62.99 134.01 -215.96 0.14 8.57 18.23 -29.37 1.38 9.74 4.64 0.90 2.67 1.48 17.97 2.96 1.65 3.39 -34.06 -99.06 48.38 0.14 -4.62 -13.42 6.56 3.47 4.81 3.87 0.91 2.63 1.45 17.92 2.88 1.59 3.29 -80.82 -185.48 198.89 0.14 -10.91 -25.04 26.85 11.17 17.01 11.45 0.93 2.60 1.42 17.87 2.80 1.53 3.19 40.27 31.83 181.14 0.13 5.42 4.28 24.36 7.63 9.37 5.51 0.95 2.57 1.39 17.82 2.71 1.47 3.09 131.94 133.51 28.72 0.13 17.68 17.89 3.85 0.11 11.58 2.93 0.97 2.54 1.37 17.77 2.63 1.41 2.98 -21.28 15.21 -167.00 0.13 -2.84 2.03 -22.29 1.39 13.61 1.29 0.99 2.51 1.34 17.72 2.54 1.36 2.88 -147.93 -137.54 -94.47 0.13 -19.67 -18.29 -12.56 0.89 4.31 2.47 1.01 2.49 1.32 17.68 2.45 1.30 2.78 10.36 -92.07 29.67 0.13 1.37 -12.20 3.93 1.21 5.83 2.60 1.04 2.47 1.30 17.63 2.37 1.25 2.67 72.20 96.93 -28.33 0.13 9.53 12.79 -3.74 3.44 2.30 3.32 1.07 2.44 1.28 17.58 2.28 1.20 2.58 -3.92 152.43 -32.20 0.13 -0.52 20.04 -4.23 2.01 4.12 1.50 1.10 2.43 1.27 17.53 2.20 1.15 2.48
-41.82 -37.79 55.76 0.13 -5.48 -4.95 7.30 1.04 6.98 1.98 1.14 2.41 1.25 17.48 2.12 1.10 2.39 -101.52 -91.53 90.47 0.13 -13.25 -11.94 11.81 2.72 12.02 3.87 1.17 2.39 1.24 17.43 2.04 1.06 2.30 -11.29 143.37 70.15 0.13 -1.47 18.64 9.12 4.55 14.37 2.42 1.21 2.38 1.23 17.38 1.97 1.02 2.22 125.50 172.74 -93.79 0.13 16.25 22.37 -12.15 5.35 4.13 1.77 1.25 2.37 1.22 17.33 1.90 0.98 2.14 49.16 -42.52 -208.18 0.13 6.34 -5.48 -26.86 3.35 15.52 6.49 1.28 2.37 1.22 17.29 1.84 0.95 2.07 -44.84 -175.08 94.05 0.13 -5.76 -22.50 12.09 3.53 1.33 6.53 1.32 2.36 1.21 17.24 1.79 0.92 2.01 -35.67 -4.71 139.59 0.13 -4.57 -0.60 17.87 5.75 10.00 6.83 1.36 2.36 1.21 17.19 1.74 0.89 1.95

596
Raw Data Tapered Data
FFT Data Parzen Filtered Data
Simple Ratio Spectrum
Z E N
Tapering Function
Z E N Z E N Z E N
Frequency Hz
E/Z N/Z
Mean SQRT Spectrum
-7.57 220.86 -178.32 0.13 -0.97 28.16 -22.74 6.67 13.10 5.28 1.40 2.36 1.20 17.14 1.69 0.86 1.90 80.29 -25.53 -99.76 0.13 10.20 -3.24 -12.67 2.11 9.41 4.59 1.43 2.37 1.20 17.09 1.66 0.84 1.86 66.01 -221.03 158.13 0.13 8.35 -27.96 20.00 0.46 6.23 2.07 1.46 2.38 1.21 17.04 1.63 0.82 1.82 -21.07 5.40 236.35 0.13 -2.66 0.68 29.78 1.63 5.62 2.19 1.49 2.39 1.21 16.99 1.60 0.81 1.80 38.90 101.19 -41.04 0.13 4.88 12.70 -5.15 2.19 15.21 3.33 1.52 2.40 1.21 16.94 1.58 0.80 1.77 31.77 10.97 -293.37 0.13 3.97 1.37 -36.67 5.55 12.50 3.88 1.54 2.42 1.22 16.89 1.57 0.79 1.76 -51.18 -64.92 -78.61 0.12 -6.37 -8.08 -9.79 9.40 18.87 5.56 1.56 2.44 1.22 16.85 1.56 0.78 1.75 -74.92 -111.56 116.32 0.12 -9.29 -13.83 14.42 6.98 18.47 1.72 1.58 2.46 1.23 16.80 1.56 0.78 1.75 -80.60 -105.12 49.99 0.12 -9.95 -12.98 6.17 6.53 49.86 3.39 1.59 2.48 1.24 16.75 1.56 0.78 1.75 -38.35 100.90 9.88 0.12 -4.72 12.41 1.22 4.14 44.99 6.79 1.59 2.51 1.25 16.70 1.57 0.78 1.76 39.66 258.18 65.73 0.12 4.86 31.63 8.05 15.61 24.20 15.56 1.60 2.54 1.26 16.65 1.59 0.79 1.77 5.58 19.63 44.52 0.12 0.68 2.39 5.43 12.73 48.63 17.53 1.60 2.57 1.27 16.60 1.61 0.80 1.79
-61.30 -100.21 45.34 0.12 -7.45 -12.18 5.51 8.01 99.46 18.77 1.59 2.61 1.28 16.55 1.63 0.80 1.82 57.72 61.87 -131.48 0.12 6.98 7.49 -15.91 10.77 61.02 12.95 1.59 2.65 1.29 16.50 1.67 0.82 1.86 62.49 133.49 -194.82 0.12 7.53 16.08 -23.48 6.59 19.60 5.10 1.58 2.69 1.31 16.46 1.71 0.83 1.90 -63.50 0.22 267.04 0.12 -7.62 0.03 32.05 6.78 57.16 4.30 1.57 2.75 1.32 16.41 1.75 0.84 1.94 -18.32 -252.27 180.15 0.12 -2.19 -30.15 21.53 11.54 49.46 3.59 1.56 2.81 1.33 16.36 1.80 0.86 2.00 51.62 -143.48 -255.69 0.12 6.14 -17.07 -30.43 7.56 34.30 5.73 1.54 2.88 1.35 16.31 1.86 0.87 2.06 40.44 139.54 -56.06 0.12 4.79 16.54 -6.64 3.57 11.18 3.04 1.53 2.96 1.37 16.26 1.93 0.89 2.13 -25.57 37.19 165.73 0.12 -3.02 4.39 19.56 1.37 18.17 2.08 1.52 3.05 1.38 16.21 2.00 0.91 2.20 -13.49 -60.76 48.30 0.12 -1.58 -7.14 5.68 0.94 16.91 2.08 1.51 3.16 1.40 16.16 2.09 0.93 2.28 86.38 51.26 -53.68 0.12 10.11 6.00 -6.28 2.95 12.15 4.99 1.51 3.28 1.42 16.11 2.17 0.94 2.37 107.00 104.95 -92.38 0.12 12.47 12.23 -10.76 4.47 14.00 7.38 1.50 3.42 1.45 16.06 2.27 0.96 2.47 -17.17 50.64 -6.18 0.12 -1.99 5.87 -0.72 1.18 18.52 4.90 1.51 3.57 1.47 16.02 2.37 0.98 2.57 -173.78 -89.28 132.57 0.12 -20.07 -10.31 15.31 0.31 17.77 2.47 1.51 3.75 1.50 15.97 2.48 0.99 2.67 -81.26 -116.86 17.28 0.12 -9.34 -13.44 1.99 2.68 9.53 3.69 1.52 3.95 1.53 15.92 2.60 1.00 2.79 108.70 104.17 -118.51 0.11 12.45 11.93 -13.57 1.79 9.39 6.94 1.53 4.17 1.56 15.87 2.72 1.02 2.90 63.36 226.51 -137.99 0.11 7.22 25.82 -15.73 3.47 8.03 7.55 1.55 4.41 1.59 15.82 2.84 1.02 3.02 -71.61 1.06 -41.63 0.11 -8.13 0.12 -4.72 5.03 12.55 7.03 1.58 4.68 1.63 15.77 2.97 1.03 3.14 13.52 -218.51 282.90 0.11 1.53 -24.69 31.97 2.28 6.55 7.87 1.61 4.97 1.67 15.72 3.09 1.04 3.26 159.18 -96.87 169.00 0.11 17.91 -10.90 19.01 1.18 7.88 4.59 1.64 5.28 1.71 15.67 3.22 1.04 3.38 56.76 137.06 -203.93 0.11 6.36 15.35 -22.84 1.85 11.38 3.13 1.68 5.61 1.76 15.63 3.34 1.05 3.50 -10.33 112.56 -94.33 0.11 -1.15 12.55 -10.52 2.68 4.48 2.08 1.72 5.95 1.80 15.58 3.47 1.05 3.62

597
Raw Data Tapered Data
FFT Data Parzen Filtered Data
Simple Ratio Spectrum
Z E N
Tapering Function
Z E N Z E N Z E N
Frequency Hz
E/Z N/Z
Mean SQRT Spectrum
6.69 -92.48 -104.92 0.11 0.74 -10.27 -11.65 1.82 12.67 5.14 1.76 6.30 1.85 15.53 3.59 1.05 3.74 -90.14 -188.91 -71.56 0.11 -9.96 -20.87 -7.91 0.65 13.43 1.41 1.80 6.66 1.90 15.48 3.70 1.05 3.85 -87.77 -67.39 148.29 0.11 -9.65 -7.41 16.31 3.26 2.60 3.65 1.84 7.03 1.95 15.43 3.81 1.06 3.96 -41.50 159.43 -31.93 0.11 -4.54 17.46 -3.50 3.80 3.82 2.17 1.89 7.39 1.99 15.38 3.92 1.06 4.06 -0.41 202.70 84.97 0.11 -0.04 22.09 9.26 1.10 4.61 5.96 1.93 7.74 2.04 15.33 4.02 1.06 4.16
100.40 69.16 234.33 0.11 10.89 7.50 25.42 3.30 10.21 6.01 1.97 8.09 2.08 15.28 4.11 1.06 4.25 43.12 -43.89 -220.69 0.11 4.66 -4.74 -23.83 1.48 10.18 0.69 2.00 8.41 2.12 15.23 4.20 1.06 4.34 -36.88 -123.55 -272.70 0.11 -3.96 -13.28 -29.31 3.40 4.41 4.40 2.03 8.71 2.16 15.19 4.29 1.07 4.42 -34.73 -134.03 49.76 0.11 -3.72 -14.34 5.32 5.95 2.59 3.79 2.06 8.99 2.20 15.14 4.37 1.07 4.50 -68.51 -2.75 88.49 0.11 -7.30 -0.29 9.42 7.26 0.74 4.90 2.08 9.23 2.23 15.09 4.45 1.08 4.58 -42.28 133.99 14.29 0.11 -4.48 14.20 1.51 2.53 1.64 2.70 2.09 9.43 2.26 15.04 4.52 1.08 4.65 56.70 93.53 -55.62 0.11 5.98 9.87 -5.87 2.59 4.04 3.40 2.09 9.59 2.28 14.99 4.58 1.09 4.71 136.33 -17.62 52.39 0.11 14.31 -1.85 5.50 4.10 8.61 0.32 2.09 9.70 2.30 14.94 4.65 1.10 4.77 42.98 -124.33 128.04 0.10 4.49 -12.99 13.38 3.95 9.98 5.26 2.08 9.77 2.31 14.89 4.70 1.11 4.83 -64.97 -57.96 51.68 0.10 -6.76 -6.03 5.38 1.68 9.79 4.17 2.06 9.78 2.31 14.84 4.75 1.12 4.88 -26.78 178.80 -51.31 0.10 -2.77 18.51 -5.31 6.83 14.09 4.55 2.03 9.74 2.31 14.79 4.79 1.13 4.92 -17.68 -13.53 -193.81 0.10 -1.82 -1.39 -19.96 7.64 10.25 2.85 2.00 9.66 2.30 14.75 4.83 1.15 4.96 8.35 -383.73 21.54 0.10 0.86 -39.33 2.21 1.29 4.29 5.38 1.96 9.52 2.28 14.70 4.85 1.16 4.99
-19.62 -130.69 142.22 0.10 -2.00 -13.33 14.51 5.21 3.62 5.29 1.92 9.35 2.26 14.65 4.87 1.18 5.01 -56.46 406.76 -28.01 0.10 -5.73 41.29 -2.84 5.71 1.36 5.28 1.87 9.13 2.24 14.60 4.88 1.20 5.03 32.60 386.17 171.71 0.10 3.29 39.00 17.34 8.05 5.71 0.35 1.82 8.87 2.21 14.55 4.88 1.22 5.03 1.54 -140.32 73.23 0.10 0.15 -14.10 7.36 9.78 7.54 2.92 1.76 8.59 2.18 14.50 4.87 1.24 5.02
-17.42 -256.52 -186.54 0.10 -1.74 -25.65 -18.65 7.86 3.58 6.11 1.71 8.27 2.15 14.45 4.84 1.26 5.01 81.47 132.73 -7.15 0.10 8.11 13.21 -0.71 1.46 2.28 4.68 1.65 7.94 2.11 14.40 4.81 1.28 4.97 55.20 -6.52 -91.94 0.10 5.46 -0.65 -9.10 3.49 1.26 6.81 1.60 7.58 2.07 14.36 4.75 1.30 4.93 -55.79 -128.25 33.18 0.10 -5.50 -12.63 3.27 3.65 3.19 8.41 1.54 7.22 2.03 14.31 4.68 1.32 4.86 -124.42 251.51 182.75 0.10 -12.19 24.65 17.91 2.30 3.05 6.07 1.49 6.85 1.99 14.26 4.59 1.33 4.78 -44.07 -63.87 -173.26 0.10 -4.30 -6.23 -16.89 3.04 12.40 6.70 1.45 6.48 1.95 14.21 4.48 1.35 4.68 97.83 -152.43 -104.70 0.10 9.49 -14.79 -10.16 2.34 13.22 1.94 1.40 6.11 1.91 14.16 4.35 1.36 4.56 54.54 222.43 93.33 0.10 5.26 21.46 9.01 7.07 14.90 18.00 1.37 5.75 1.87 14.11 4.21 1.37 4.42 -4.55 -69.87 172.81 0.10 -0.44 -6.71 16.59 22.48 23.10 31.87 1.34 5.40 1.83 14.06 4.05 1.37 4.27 40.38 -50.63 38.39 0.10 3.86 -4.84 3.67 13.62 5.91 10.89 1.31 5.07 1.79 14.01 3.87 1.37 4.11 28.25 46.38 -230.22 0.10 2.68 4.41 -21.87 5.67 7.55 5.98 1.29 4.76 1.76 13.96 3.69 1.36 3.93

598
Raw Data Tapered Data
FFT Data Parzen Filtered Data
Simple Ratio Spectrum
Z E N
Tapering Function
Z E N Z E N Z E N
Frequency Hz
E/Z N/Z
Mean SQRT Spectrum
12.18 -362.98 -11.73 0.09 1.15 -34.30 -1.11 6.73 11.76 1.00 1.28 4.48 1.73 13.92 3.50 1.35 3.75 -34.76 -115.02 51.20 0.09 -3.27 -10.81 4.81 5.60 3.46 5.99 1.27 4.21 1.70 13.87 3.31 1.34 3.57 -77.53 442.33 90.92 0.09 -7.25 41.36 8.50 10.33 11.29 3.07 1.27 3.97 1.68 13.82 3.11 1.32 3.38 11.61 58.33 96.55 0.09 1.08 5.42 8.98 13.15 17.97 4.71 1.28 3.75 1.66 13.77 2.92 1.29 3.20 78.44 -361.06 -162.32 0.09 7.26 -33.40 -15.01 7.37 17.33 2.61 1.30 3.55 1.64 13.72 2.74 1.27 3.02 -14.68 107.45 7.00 0.09 -1.35 9.89 0.64 5.83 10.63 1.28 1.32 3.37 1.63 13.67 2.56 1.24 2.85 -74.49 312.61 132.73 0.09 -6.82 28.60 12.14 11.19 3.01 6.89 1.34 3.22 1.63 13.62 2.40 1.21 2.69 21.63 -35.94 72.32 0.09 1.97 -3.27 6.58 7.58 9.09 11.20 1.37 3.09 1.63 13.57 2.25 1.19 2.55 -8.39 -45.78 21.14 0.09 -0.76 -4.14 1.91 5.35 6.05 9.92 1.41 2.97 1.63 13.53 2.12 1.16 2.41
-40.28 -31.62 -114.67 0.09 -3.63 -2.85 -10.32 1.47 3.74 4.34 1.45 2.88 1.64 13.48 1.99 1.14 2.29 60.69 -141.27 -87.26 0.09 5.43 -12.64 -7.81 4.91 9.03 5.54 1.49 2.80 1.66 13.43 1.88 1.11 2.19 70.43 119.78 1.91 0.09 6.27 10.66 0.17 8.74 7.85 5.38 1.53 2.74 1.68 13.38 1.79 1.09 2.10 15.27 158.22 13.89 0.09 1.35 14.00 1.23 11.87 23.86 6.27 1.58 2.70 1.70 13.33 1.71 1.08 2.02 -31.69 -161.77 -26.08 0.09 -2.79 -14.24 -2.30 3.13 18.46 10.67 1.63 2.67 1.74 13.28 1.63 1.06 1.95 48.29 -120.20 83.81 0.09 4.23 -10.52 7.33 16.63 18.84 14.09 1.69 2.65 1.77 13.23 1.57 1.05 1.89 91.02 -30.90 131.38 0.09 7.92 -2.69 11.43 13.47 0.96 8.12 1.74 2.64 1.82 13.18 1.52 1.04 1.84 -6.15 -102.62 -21.83 0.09 -0.53 -8.88 -1.89 18.88 18.98 7.53 1.80 2.64 1.86 13.13 1.47 1.04 1.80 -9.11 150.29 -97.59 0.09 -0.78 12.92 -8.39 27.25 39.26 4.59 1.86 2.66 1.91 13.09 1.43 1.03 1.76
-23.03 238.51 -173.04 0.09 -1.97 20.39 -14.80 21.03 36.00 7.98 1.92 2.68 1.96 13.04 1.40 1.02 1.73 -91.80 -113.74 8.29 0.09 -7.80 -9.67 0.71 15.31 16.22 7.95 1.98 2.70 2.02 12.99 1.37 1.02 1.70 -58.49 -82.35 202.88 0.08 -4.94 -6.96 17.14 4.06 16.44 11.12 2.04 2.74 2.08 12.94 1.34 1.02 1.68 19.60 126.57 -23.48 0.08 1.65 10.63 -1.97 7.66 14.07 11.87 2.11 2.78 2.13 12.89 1.32 1.01 1.66 29.51 47.22 -41.34 0.08 2.46 3.94 -3.45 8.41 10.99 7.40 2.17 2.84 2.19 12.84 1.31 1.01 1.65 41.38 4.12 177.39 0.08 3.43 0.34 14.72 5.25 11.04 2.13 2.24 2.89 2.25 12.79 1.29 1.00 1.64 38.23 -58.77 66.90 0.08 3.15 -4.85 5.52 9.88 19.42 6.30 2.30 2.96 2.30 12.74 1.28 1.00 1.63 11.14 -24.60 -198.83 0.08 0.91 -2.02 -16.30 11.32 11.16 1.37 2.37 3.03 2.36 12.70 1.28 1.00 1.62 56.01 63.32 -191.04 0.08 4.56 5.16 -15.57 6.85 10.09 2.22 2.44 3.10 2.41 12.65 1.27 0.99 1.61 -31.03 -173.45 26.29 0.08 -2.51 -14.05 2.13 2.40 3.06 3.54 2.50 3.19 2.46 12.60 1.27 0.98 1.61 -112.73 -229.64 86.08 0.08 -9.08 -18.49 6.93 4.29 8.79 5.16 2.57 3.27 2.51 12.55 1.27 0.98 1.60 27.45 158.51 -7.08 0.08 2.20 12.68 -0.57 4.19 17.79 4.26 2.64 3.36 2.55 12.50 1.27 0.97 1.60 75.25 371.45 2.94 0.08 5.98 29.53 0.23 2.20 12.36 4.95 2.71 3.46 2.59 12.45 1.27 0.96 1.59 -2.89 24.65 2.93 0.08 -0.23 1.95 0.23 3.24 6.53 3.98 2.79 3.56 2.63 12.40 1.28 0.94 1.59
-68.74 -327.74 -103.86 0.08 -5.40 -25.73 -8.15 6.47 10.84 1.83 2.86 3.66 2.66 12.35 1.28 0.93 1.58

599
Raw Data Tapered Data
FFT Data Parzen Filtered Data
Simple Ratio Spectrum
Z E N
Tapering Function
Z E N Z E N Z E N
Frequency Hz
E/Z N/Z
Mean SQRT Spectrum
-33.52 -55.97 5.34 0.08 -2.61 -4.37 0.42 4.05 8.10 3.51 2.93 3.76 2.68 12.30 1.29 0.92 1.58 87.38 268.61 134.07 0.08 6.77 20.82 10.39 4.52 10.88 2.21 3.00 3.87 2.70 12.26 1.29 0.90 1.57 74.06 113.84 -68.06 0.08 5.70 8.77 -5.24 1.15 11.61 0.44 3.07 3.98 2.72 12.21 1.30 0.89 1.57 -79.92 -108.17 -150.61 0.08 -6.11 -8.27 -11.52 1.82 9.30 4.06 3.14 4.09 2.73 12.16 1.30 0.87 1.57 -124.50 -16.92 11.67 0.08 -9.46 -1.29 0.89 3.21 2.76 6.21 3.20 4.21 2.74 12.11 1.31 0.86 1.57
5.75 137.84 110.43 0.08 0.43 10.41 8.34 4.90 3.87 4.38 3.27 4.32 2.75 12.06 1.32 0.84 1.57 24.70 14.54 105.01 0.08 1.85 1.09 7.88 3.75 3.46 2.62 3.33 4.43 2.75 12.01 1.33 0.83 1.57 4.65 -126.24 23.75 0.07 0.35 -9.40 1.77 4.52 5.36 4.22 3.38 4.53 2.75 11.96 1.34 0.81 1.57
37.57 -107.77 -30.23 0.07 2.78 -7.97 -2.24 6.84 5.60 2.47 3.44 4.64 2.74 11.91 1.35 0.80 1.57 -32.43 -31.49 -72.02 0.07 -2.38 -2.31 -5.29 7.48 10.65 5.35 3.48 4.73 2.73 11.87 1.36 0.78 1.57 0.64 63.45 -73.72 0.07 0.05 4.63 -5.38 2.77 10.32 3.89 3.52 4.83 2.72 11.82 1.37 0.77 1.57
24.60 13.30 39.36 0.07 1.78 0.96 2.85 8.32 4.66 7.11 3.55 4.91 2.70 11.77 1.38 0.76 1.58 -111.21 -50.62 36.21 0.07 -8.01 -3.64 2.61 6.89 6.40 4.27 3.58 4.99 2.68 11.72 1.39 0.75 1.58 -73.83 52.37 -42.77 0.07 -5.28 3.74 -3.06 5.71 10.85 2.53 3.60 5.05 2.66 11.67 1.41 0.74 1.59 126.07 61.15 74.17 0.07 8.95 4.34 5.27 3.47 11.20 1.02 3.60 5.11 2.63 11.62 1.42 0.73 1.59 129.57 -111.75 99.83 0.07 9.13 -7.88 7.04 8.17 6.76 1.19 3.60 5.16 2.60 11.57 1.43 0.72 1.60 -19.64 -68.39 62.51 0.07 -1.38 -4.79 4.38 9.50 7.88 7.54 3.59 5.19 2.56 11.52 1.45 0.71 1.61 -8.58 135.48 131.12 0.07 -0.60 9.42 9.11 11.48 14.83 14.10 3.57 5.21 2.53 11.47 1.46 0.71 1.62 17.41 -16.75 -114.91 0.07 1.20 -1.16 -7.93 11.42 9.68 4.34 3.53 5.22 2.48 11.43 1.48 0.70 1.64 -7.60 -152.41 -218.23 0.07 -0.52 -10.44 -14.95 8.25 5.43 3.83 3.49 5.21 2.44 11.38 1.49 0.70 1.65
-20.53 106.68 37.14 0.07 -1.40 7.25 2.53 6.09 4.78 4.33 3.44 5.19 2.40 11.33 1.51 0.70 1.66 -103.28 203.06 143.78 0.07 -6.97 13.71 9.71 3.38 2.53 3.15 3.38 5.15 2.35 11.28 1.53 0.70 1.68 -13.03 -10.33 153.19 0.07 -0.87 -0.69 10.26 3.30 5.76 2.67 3.31 5.10 2.30 11.23 1.54 0.69 1.69 135.73 -137.03 -152.81 0.07 9.03 -9.11 -10.16 4.07 6.56 5.33 3.23 5.04 2.24 11.18 1.56 0.69 1.71 46.37 -64.62 -172.15 0.07 3.06 -4.27 -11.36 6.89 3.43 4.84 3.15 4.96 2.19 11.13 1.57 0.69 1.72 -35.64 -48.39 239.72 0.07 -2.33 -3.17 15.70 7.74 4.73 0.89 3.07 4.88 2.13 11.08 1.59 0.70 1.74 -20.52 -62.17 7.22 0.07 -1.33 -4.04 0.47 6.31 8.05 4.79 2.98 4.79 2.08 11.04 1.60 0.70 1.75 -48.37 53.85 -192.40 0.06 -3.12 3.47 -12.41 4.97 7.32 3.71 2.90 4.69 2.03 10.99 1.62 0.70 1.76 36.66 88.57 3.98 0.06 2.35 5.67 0.25 6.79 0.86 3.01 2.81 4.58 1.98 10.94 1.63 0.70 1.78 106.38 -23.56 46.89 0.06 6.76 -1.50 2.98 5.88 5.91 1.44 2.73 4.47 1.93 10.89 1.64 0.71 1.79 -27.77 -198.12 61.67 0.06 -1.75 -12.48 3.89 3.58 7.98 1.43 2.64 4.36 1.88 10.84 1.65 0.71 1.80 -35.63 -8.70 -72.30 0.06 -2.23 -0.54 -4.52 4.77 10.81 2.02 2.57 4.24 1.83 10.79 1.65 0.71 1.80 18.41 275.77 -73.01 0.06 1.14 17.10 -4.53 5.11 6.03 4.98 2.49 4.13 1.79 10.74 1.65 0.72 1.80

600
Raw Data Tapered
Data FFT Data Parzen Filtered
Data Simple Ratio
Spectrum Z E N
Tapering Function
Z E N Z E N Z E N
Frequency Hz
E/Z N/Z
Mean SQRT Spectrum
-3.61 -47.69 175.79 0.06 -0.22 -2.93 10.81 3.23 3.04 3.84 2.43 4.01 1.75 10.69 1.65 0.72 1.80 -4.59 -179.23 176.09 0.06 -0.28 -10.93 10.74 1.26 7.97 5.39 2.37 3.90 1.72 10.64 1.65 0.73 1.80
-56.45 51.03 -104.05 0.06 -3.42 3.09 -6.29 1.00 6.53 3.04 2.32 3.79 1.69 10.60 1.63 0.73 1.79 -85.16 101.73 -272.29 0.06 -5.11 6.10 -16.34 0.64 5.32 1.82 2.28 3.68 1.66 10.55 1.62 0.73 1.77 27.96 43.44 79.10 0.06 1.66 2.58 4.71 3.42 10.90 2.50 2.24 3.58 1.64 10.50 1.60 0.73 1.76 134.65 -112.42 265.42 0.06 7.94 -6.63 15.66 5.39 11.26 2.53 2.22 3.49 1.62 10.45 1.57 0.73 1.73 -33.55 -77.04 -67.98 0.06 -1.96 -4.51 -3.98 2.68 5.18 3.01 2.20 3.40 1.61 10.40 1.55 0.73 1.71 -104.26 -61.76 -16.80 0.06 -6.05 -3.58 -0.97 8.97 4.47 3.26 2.19 3.31 1.60 10.35 1.52 0.73 1.68 106.74 -88.45 71.09 0.06 6.14 -5.09 4.09 7.58 5.82 1.48 2.18 3.24 1.59 10.30 1.49 0.73 1.65 100.33 42.64 -101.84 0.06 5.72 2.43 -5.81 2.38 3.78 1.47 2.18 3.17 1.58 10.25 1.45 0.73 1.63 25.09 -42.35 -32.57 0.06 1.42 -2.39 -1.84 4.34 5.30 1.67 2.18 3.10 1.58 10.21 1.42 0.72 1.60 30.98 -34.20 -49.40 0.06 1.74 -1.92 -2.77 7.97 7.54 3.01 2.19 3.04 1.57 10.16 1.39 0.72 1.57 -91.89 145.58 -86.12 0.06 -5.10 8.08 -4.78 6.58 3.95 1.61 2.19 2.99 1.57 10.11 1.36 0.71 1.54 -118.46 138.02 40.97 0.06 -6.52 7.59 2.25 1.88 3.74 2.54 2.20 2.94 1.56 10.06 1.33 0.71 1.51 34.72 -10.24 185.52 0.05 1.89 -0.56 10.11 2.10 2.47 3.40 2.21 2.89 1.56 10.01 1.31 0.71 1.49 10.64 -21.17 256.64 0.05 0.57 -1.14 13.86 0.92 7.06 2.21 2.22 2.85 1.56 9.96 1.28 0.70 1.46
-153.07 132.61 -30.81 0.05 -8.19 7.09 -1.65 3.60 3.13 2.10 2.23 2.81 1.55 9.91 1.26 0.70 1.44 10.23 9.32 -264.22 0.05 0.54 0.49 -14.00 3.53 4.18 2.12 2.23 2.78 1.55 9.86 1.25 0.69 1.43 201.81 -118.46 -112.46 0.05 10.60 -6.22 -5.90 8.05 6.92 1.67 2.23 2.74 1.54 9.81 1.23 0.69 1.41 10.39 8.77 116.54 0.05 0.54 0.46 6.06 6.14 5.13 2.01 2.23 2.71 1.53 9.77 1.22 0.69 1.40 -72.47 85.58 172.96 0.05 -3.73 4.41 8.91 2.04 1.14 2.55 2.22 2.68 1.51 9.72 1.21 0.68 1.39 -5.31 -19.55 21.57 0.05 -0.27 -1.00 1.10 4.50 4.61 1.42 2.21 2.66 1.50 9.67 1.20 0.68 1.38
-16.26 -185.14 -91.29 0.05 -0.82 -9.35 -4.61 2.25 4.93 0.85 2.19 2.63 1.48 9.62 1.20 0.68 1.38 91.60 5.23 -57.99 0.05 4.58 0.26 -2.90 5.27 3.30 1.89 2.17 2.60 1.47 9.57 1.20 0.67 1.38 94.24 164.89 69.00 0.05 4.66 8.16 3.42 2.76 2.04 2.39 2.15 2.58 1.44 9.52 1.20 0.67 1.38 -40.86 -21.40 -3.13 0.05 -2.00 -1.05 -0.15 2.67 2.24 1.52 2.12 2.56 1.42 9.47 1.20 0.67 1.38 -6.76 -51.25 -162.80 0.05 -0.33 -2.49 -7.90 5.63 1.63 3.76 2.10 2.54 1.40 9.42 1.21 0.67 1.38 38.18 2.85 3.53 0.05 1.83 0.14 0.17 5.93 0.42 1.69 2.06 2.51 1.37 9.38 1.22 0.67 1.39 -5.87 -30.09 73.38 0.05 -0.28 -1.43 3.49 1.33 3.11 1.65 2.03 2.49 1.35 9.33 1.23 0.66 1.39
-66.72 54.86 -66.63 0.05 -3.14 2.58 -3.13 7.57 4.66 0.31 2.00 2.47 1.32 9.28 1.23 0.66 1.40 -54.47 112.53 -7.48 0.05 -2.53 5.23 -0.35 8.69 7.52 3.51 1.97 2.45 1.29 9.23 1.25 0.66 1.41 59.53 -24.65 123.29 0.05 2.74 -1.13 5.67 8.28 12.96 3.70 1.93 2.42 1.27 9.18 1.26 0.66 1.42 47.32 5.39 85.87 0.05 2.15 0.25 3.91 4.83 3.68 1.73 1.90 2.40 1.24 9.13 1.27 0.65 1.42

601
Raw Data Tapered Data
FFT Data Parzen Filtered Data
Simple Ratio Spectrum
Z E N
Tapering Function
Z E N Z E N Z E N
Frequency Hz
E/Z N/Z
Mean SQRT Spectrum
-26.71 110.16 -111.07 0.05 -1.20 4.96 -5.00 1.75 4.19 2.02 1.86 2.38 1.21 9.08 1.28 0.65 1.43 -18.61 -35.99 -196.45 0.04 -0.83 -1.60 -8.74 2.48 3.73 1.61 1.83 2.35 1.18 9.03 1.28 0.65 1.44 13.40 -138.64 -39.97 0.04 0.59 -6.10 -1.76 5.60 4.38 1.82 1.80 2.33 1.16 8.98 1.29 0.64 1.44 64.26 -50.26 75.96 0.04 2.80 -2.19 3.30 4.83 2.36 2.29 1.78 2.30 1.13 8.94 1.30 0.64 1.44 23.09 104.64 87.63 0.04 0.99 4.50 3.77 5.25 6.79 3.39 1.75 2.27 1.11 8.89 1.30 0.63 1.44
-123.70 27.37 6.45 0.04 -5.26 1.16 0.27 6.84 3.94 1.37 1.73 2.25 1.08 8.84 1.30 0.62 1.44 -122.20 -129.42 -135.29 0.04 -5.13 -5.44 -5.68 6.68 2.62 1.12 1.71 2.22 1.06 8.79 1.29 0.62 1.43 86.88 -21.12 -11.99 0.04 3.61 -0.88 -0.50 6.10 7.50 1.42 1.70 2.18 1.03 8.74 1.29 0.61 1.42 144.42 41.84 174.69 0.04 5.92 1.72 7.16 6.74 7.32 1.33 1.68 2.15 1.01 8.69 1.28 0.60 1.41 -33.79 60.64 67.21 0.04 -1.37 2.46 2.72 8.84 3.35 0.72 1.67 2.12 0.99 8.64 1.27 0.59 1.40 -88.54 -7.47 -63.79 0.04 -3.54 -0.30 -2.55 6.92 10.04 2.28 1.66 2.08 0.97 8.59 1.25 0.58 1.38 5.64 -206.04 -40.58 0.04 0.22 -8.14 -1.60 6.25 2.90 2.60 1.65 2.05 0.95 8.54 1.24 0.58 1.36
55.52 -9.60 63.38 0.04 2.17 -0.37 2.47 8.91 7.29 2.51 1.65 2.01 0.94 8.50 1.22 0.57 1.34 -8.57 226.97 151.95 0.04 -0.33 8.74 5.85 7.81 8.66 4.92 1.65 1.98 0.92 8.45 1.20 0.56 1.32
-131.28 -18.45 28.59 0.04 -4.99 -0.70 1.09 5.62 8.68 4.12 1.65 1.94 0.90 8.40 1.18 0.55 1.30 -29.95 -73.26 -225.02 0.04 -1.12 -2.75 -8.44 6.08 8.43 3.48 1.65 1.91 0.89 8.35 1.15 0.54 1.27 114.89 190.50 -138.28 0.04 4.25 7.05 -5.12 6.42 2.07 8.37 1.66 1.88 0.88 8.30 1.13 0.53 1.25 18.63 116.89 225.55 0.04 0.68 4.27 8.23 6.51 2.53 5.44 1.67 1.85 0.86 8.25 1.11 0.52 1.22 -23.35 -102.14 156.78 0.04 -0.84 -3.68 5.64 2.79 3.80 0.71 1.68 1.82 0.85 8.20 1.09 0.51 1.20 -28.24 -131.67 -202.13 0.04 -1.00 -4.67 -7.18 5.01 5.11 2.14 1.69 1.80 0.84 8.15 1.06 0.50 1.18 -67.04 -164.08 -167.38 0.04 -2.35 -5.74 -5.86 1.16 2.16 2.72 1.70 1.77 0.84 8.11 1.04 0.49 1.15 22.06 -86.57 92.77 0.03 0.76 -2.99 3.20 6.98 5.15 3.76 1.72 1.76 0.83 8.06 1.02 0.48 1.13 92.84 175.25 137.32 0.03 3.16 5.96 4.67 3.82 10.68 2.98 1.73 1.74 0.82 8.01 1.00 0.47 1.11 -6.33 134.64 -37.88 0.03 -0.21 4.51 -1.27 0.66 5.14 2.68 1.75 1.73 0.82 7.96 0.99 0.47 1.09
-58.19 -125.38 -45.71 0.03 -1.92 -4.14 -1.51 1.77 3.81 1.72 1.77 1.72 0.81 7.91 0.97 0.46 1.07 48.84 -14.10 120.14 0.03 1.59 -0.46 3.90 0.62 7.64 3.91 1.79 1.72 0.81 7.86 0.96 0.45 1.06 42.66 114.70 52.80 0.03 1.37 3.67 1.69 0.46 2.91 6.27 1.82 1.72 0.81 7.81 0.95 0.45 1.05 -18.38 -78.37 -12.28 0.03 -0.58 -2.47 -0.39 1.99 4.73 4.35 1.84 1.72 0.81 7.76 0.94 0.44 1.03 -34.26 -108.99 13.72 0.03 -1.06 -3.38 0.43 3.29 5.94 2.33 1.87 1.73 0.81 7.71 0.93 0.44 1.02 -44.10 155.92 -35.23 0.03 -1.35 4.76 -1.07 1.39 4.42 6.13 1.89 1.74 0.82 7.67 0.92 0.43 1.02 25.95 177.25 34.77 0.03 0.78 5.32 1.04 1.09 6.18 3.93 1.92 1.76 0.82 7.62 0.92 0.43 1.01 -0.10 -130.85 34.63 0.03 0.00 -3.86 1.02 3.53 4.15 3.70 1.94 1.77 0.83 7.57 0.91 0.43 1.01
-47.00 -68.44 -40.36 0.03 -1.36 -1.98 -1.17 5.14 0.41 1.32 1.97 1.79 0.84 7.52 0.91 0.42 1.00

602
Raw Data Tapered Data
FFT Data Parzen Filtered Data
Simple Ratio Spectrum
Z E N
Tapering Function
Z E N Z E N Z E N
Frequency Hz
E/Z N/Z
Mean SQRT Spectrum
8.09 124.45 -43.19 0.03 0.23 3.55 -1.23 3.90 1.21 2.40 1.99 1.81 0.85 7.47 0.91 0.42 1.00 -9.90 -4.79 -68.96 0.03 -0.28 -0.13 -1.93 1.47 4.55 3.05 2.01 1.83 0.86 7.42 0.91 0.43 1.01 -1.86 -81.62 -0.81 0.03 -0.05 -2.24 -0.02 3.78 7.30 3.41 2.03 1.85 0.87 7.37 0.91 0.43 1.01 68.01 -171.11 4.18 0.03 1.84 -4.62 0.11 3.01 4.78 1.91 2.05 1.87 0.89 7.32 0.92 0.43 1.01 69.74 -60.64 -47.73 0.03 1.85 -1.61 -1.26 3.18 5.16 3.69 2.06 1.90 0.90 7.28 0.92 0.44 1.02 6.60 161.16 53.26 0.03 0.17 4.19 1.38 3.31 2.48 4.09 2.07 1.92 0.92 7.23 0.93 0.44 1.03
-92.22 9.82 56.05 0.03 -2.35 0.25 1.43 3.10 4.28 4.33 2.07 1.94 0.94 7.18 0.93 0.45 1.04 -102.82 25.75 23.89 0.03 -2.57 0.64 0.60 2.46 5.64 1.42 2.08 1.95 0.96 7.13 0.94 0.46 1.05 23.35 56.58 71.70 0.02 0.57 1.39 1.76 2.13 2.19 2.21 2.07 1.97 0.98 7.08 0.95 0.47 1.06 108.09 -157.21 -28.38 0.02 2.59 -3.77 -0.68 1.75 1.83 5.77 2.06 1.99 1.00 7.03 0.96 0.48 1.08 58.76 -66.76 -124.08 0.02 1.38 -1.57 -2.92 2.22 4.55 0.41 2.05 2.00 1.02 6.98 0.98 0.50 1.10 -41.26 106.16 19.14 0.02 -0.95 2.44 0.44 4.49 7.23 4.38 2.03 2.01 1.04 6.93 0.99 0.51 1.11 -17.14 86.78 143.81 0.02 -0.39 1.95 3.24 7.07 3.42 4.70 2.01 2.02 1.06 6.88 1.01 0.53 1.14 33.84 -40.31 7.51 0.02 0.74 -0.89 0.17 4.56 6.17 3.91 1.98 2.02 1.09 6.84 1.02 0.55 1.16 -29.16 -133.96 -80.34 0.02 -0.63 -2.88 -1.73 0.89 7.44 3.99 1.94 2.02 1.11 6.79 1.04 0.57 1.19 -23.05 -24.64 1.82 0.02 -0.48 -0.52 0.04 2.38 3.31 6.56 1.91 2.02 1.13 6.74 1.06 0.59 1.21 -33.93 135.14 -37.11 0.02 -0.70 2.77 -0.76 2.48 5.39 3.79 1.86 2.02 1.15 6.69 1.08 0.62 1.25 37.07 177.52 -107.82 0.02 0.74 3.55 -2.16 0.85 5.85 2.43 1.82 2.01 1.17 6.64 1.10 0.64 1.28 93.82 -20.80 -60.48 0.02 1.83 -0.41 -1.18 2.91 3.01 1.44 1.77 2.00 1.19 6.59 1.13 0.67 1.31 -89.18 -241.27 44.56 0.02 -1.69 -4.58 0.85 2.64 7.13 3.75 1.73 1.99 1.20 6.54 1.15 0.70 1.35 -35.92 -227.33 132.21 0.02 -0.66 -4.21 2.45 4.94 7.23 1.20 1.68 1.98 1.22 6.49 1.18 0.73 1.39 26.10 -13.84 85.77 0.02 0.47 -0.25 1.54 3.37 2.32 2.69 1.63 1.97 1.23 6.45 1.21 0.76 1.43 -57.82 315.56 -56.28 0.02 -1.01 5.52 -0.98 4.01 2.82 2.92 1.58 1.95 1.24 6.40 1.24 0.79 1.47 5.29 159.61 -68.03 0.02 0.09 2.71 -1.16 5.26 2.59 1.88 1.53 1.93 1.26 6.35 1.27 0.82 1.51
25.24 -264.18 109.89 0.02 0.42 -4.36 1.81 1.06 2.43 3.64 1.48 1.92 1.27 6.30 1.30 0.86 1.55 57.08 -129.39 65.54 0.02 0.91 -2.07 1.05 3.07 2.30 6.08 1.43 1.90 1.27 6.25 1.33 0.89 1.60 -2.02 171.53 -154.28 0.02 -0.03 2.66 -2.39 3.49 2.73 1.83 1.39 1.88 1.28 6.20 1.35 0.92 1.64
-68.87 196.79 -51.87 0.02 -1.03 2.95 -0.78 1.86 5.23 4.32 1.35 1.86 1.29 6.15 1.38 0.95 1.68 88.10 14.37 121.00 0.01 1.28 0.21 1.75 2.49 14.20 2.97 1.31 1.84 1.29 6.10 1.41 0.98 1.72 73.78 -130.40 67.62 0.01 1.03 -1.83 0.95 4.98 26.12 6.61 1.28 1.83 1.29 6.05 1.43 1.01 1.75
-142.07 -46.04 -40.43 0.01 -1.92 -0.62 -0.55 3.12 20.95 13.21 1.25 1.81 1.29 6.01 1.45 1.04 1.78 -116.55 77.90 -100.15 0.01 -1.52 1.01 -1.30 3.12 7.96 7.45 1.22 1.80 1.29 5.96 1.47 1.06 1.81 107.48 78.59 -91.76 0.01 1.34 0.98 -1.15 6.48 3.79 5.59 1.20 1.78 1.30 5.91 1.48 1.08 1.83

603
Raw Data Tapered Data
FFT Data Parzen Filtered Data
Simple Ratio Spectrum
Z E N
Tapering Function
Z E N Z E N Z E N
Frequency Hz
E/Z N/Z
Mean SQRT Spectrum
119.04 -106.36 21.38 0.01 1.43 -1.28 0.26 6.43 10.55 7.56 1.18 1.77 1.30 5.86 1.50 1.09 1.86 -12.17 -138.86 118.11 0.01 -0.14 -1.60 1.36 3.68 9.55 7.50 1.17 1.76 1.30 5.81 1.51 1.11 1.87 -15.11 79.26 -2.12 0.01 -0.17 0.87 -0.02 1.76 2.48 6.57 1.16 1.76 1.30 5.76 1.52 1.12 1.89 -31.01 24.05 -125.87 0.01 -0.33 0.25 -1.32 4.18 2.88 3.72 1.15 1.75 1.30 5.71 1.53 1.13 1.90 -37.86 -176.64 16.36 0.01 -0.38 -1.77 0.16 2.70 2.79 2.85 1.14 1.75 1.30 5.66 1.54 1.14 1.91 50.12 -123.03 220.88 0.01 0.48 -1.17 2.10 4.02 0.34 1.43 1.14 1.76 1.30 5.62 1.54 1.14 1.92 8.01 70.08 138.17 0.01 0.07 0.63 1.24 2.63 8.59 0.40 1.14 1.76 1.30 5.57 1.55 1.14 1.93 -9.98 157.63 -126.86 0.01 -0.08 1.34 -1.08 1.08 2.74 2.96 1.14 1.77 1.30 5.52 1.56 1.15 1.93 64.92 31.25 -159.28 0.01 0.52 0.25 -1.27 1.54 3.68 3.42 1.14 1.78 1.31 5.47 1.56 1.15 1.94 -6.19 -104.60 0.04 0.01 -0.05 -0.78 0.00 0.98 1.87 4.84 1.14 1.80 1.31 5.42 1.57 1.15 1.95 -18.13 -53.28 42.96 0.01 -0.13 -0.37 0.30 2.86 3.63 4.50 1.15 1.82 1.32 5.37 1.58 1.15 1.95 -20.05 17.79 -16.10 0.01 -0.13 0.12 -0.10 4.87 2.42 4.05 1.16 1.84 1.33 5.32 1.59 1.15 1.96 -82.83 18.72 -10.04 0.01 -0.50 0.11 -0.06 5.25 3.92 3.17 1.16 1.86 1.34 5.27 1.60 1.15 1.98 -26.61 83.52 3.97 0.01 -0.15 0.46 0.02 2.75 2.69 1.96 1.17 1.89 1.35 5.22 1.62 1.16 1.99 -8.53 68.22 -29.97 0.01 -0.04 0.34 -0.15 2.35 2.45 2.92 1.18 1.93 1.37 5.18 1.64 1.16 2.01 48.40 -80.75 -4.90 0.00 0.22 -0.36 -0.02 2.92 1.23 5.46 1.18 1.96 1.38 5.13 1.66 1.17 2.03 96.12 -79.43 49.01 0.00 0.38 -0.32 0.20 1.56 1.78 4.45 1.19 2.00 1.40 5.08 1.68 1.17 2.05 -24.02 -10.24 46.82 0.00 -0.08 -0.04 0.16 3.65 3.18 4.92 1.20 2.04 1.42 5.03 1.70 1.18 2.07 -46.87 -29.16 -13.24 0.00 -0.14 -0.09 -0.04 3.19 0.67 2.61 1.21 2.08 1.44 4.98 1.73 1.19 2.10 11.21 8.88 -29.15 0.00 0.03 0.02 -0.07 1.04 5.02 2.18 1.21 2.12 1.46 4.93 1.75 1.20 2.12 47.10 82.70 59.79 0.00 0.09 0.17 0.12 1.41 4.31 1.59 1.22 2.16 1.48 4.88 1.77 1.21 2.15 57.90 -69.32 78.51 0.00 0.09 -0.10 0.12 2.04 5.16 5.04 1.23 2.20 1.50 4.83 1.79 1.22 2.17
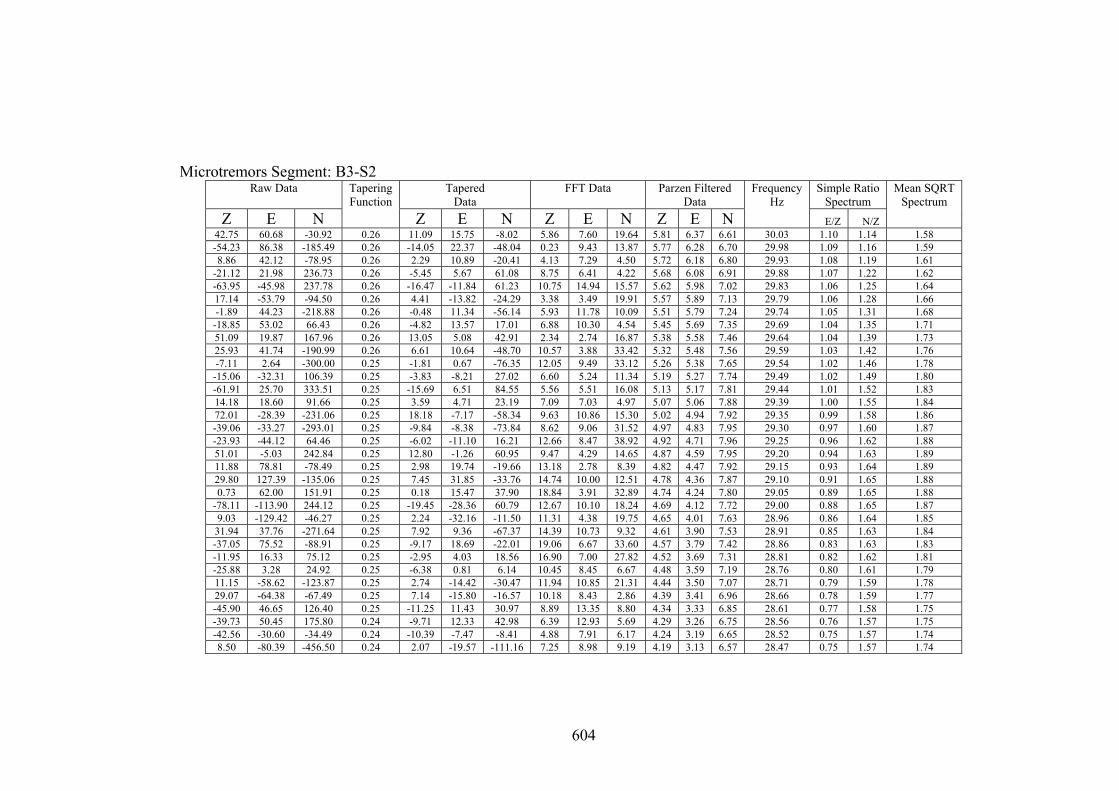
604
Microtremors Segment: B3-S2
Raw Data Tapered Data
FFT Data Parzen Filtered Data
Simple Ratio Spectrum
Z E N
Tapering Function
Z E N Z E N Z E N
Frequency Hz
E/Z N/Z
Mean SQRT Spectrum
42.75 60.68 -30.92 0.26 11.09 15.75 -8.02 5.86 7.60 19.64 5.81 6.37 6.61 30.03 1.10 1.14 1.58 -54.23 86.38 -185.49 0.26 -14.05 22.37 -48.04 0.23 9.43 13.87 5.77 6.28 6.70 29.98 1.09 1.16 1.59 8.86 42.12 -78.95 0.26 2.29 10.89 -20.41 4.13 7.29 4.50 5.72 6.18 6.80 29.93 1.08 1.19 1.61
-21.12 21.98 236.73 0.26 -5.45 5.67 61.08 8.75 6.41 4.22 5.68 6.08 6.91 29.88 1.07 1.22 1.62 -63.95 -45.98 237.78 0.26 -16.47 -11.84 61.23 10.75 14.94 15.57 5.62 5.98 7.02 29.83 1.06 1.25 1.64 17.14 -53.79 -94.50 0.26 4.41 -13.82 -24.29 3.38 3.49 19.91 5.57 5.89 7.13 29.79 1.06 1.28 1.66 -1.89 44.23 -218.88 0.26 -0.48 11.34 -56.14 5.93 11.78 10.09 5.51 5.79 7.24 29.74 1.05 1.31 1.68 -18.85 53.02 66.43 0.26 -4.82 13.57 17.01 6.88 10.30 4.54 5.45 5.69 7.35 29.69 1.04 1.35 1.71 51.09 19.87 167.96 0.26 13.05 5.08 42.91 2.34 2.74 16.87 5.38 5.58 7.46 29.64 1.04 1.39 1.73 25.93 41.74 -190.99 0.26 6.61 10.64 -48.70 10.57 3.88 33.42 5.32 5.48 7.56 29.59 1.03 1.42 1.76 -7.11 2.64 -300.00 0.25 -1.81 0.67 -76.35 12.05 9.49 33.12 5.26 5.38 7.65 29.54 1.02 1.46 1.78 -15.06 -32.31 106.39 0.25 -3.83 -8.21 27.02 6.60 5.24 11.34 5.19 5.27 7.74 29.49 1.02 1.49 1.80 -61.91 25.70 333.51 0.25 -15.69 6.51 84.55 5.56 5.51 16.08 5.13 5.17 7.81 29.44 1.01 1.52 1.83 14.18 18.60 91.66 0.25 3.59 4.71 23.19 7.09 7.03 4.97 5.07 5.06 7.88 29.39 1.00 1.55 1.84 72.01 -28.39 -231.06 0.25 18.18 -7.17 -58.34 9.63 10.86 15.30 5.02 4.94 7.92 29.35 0.99 1.58 1.86 -39.06 -33.27 -293.01 0.25 -9.84 -8.38 -73.84 8.62 9.06 31.52 4.97 4.83 7.95 29.30 0.97 1.60 1.87 -23.93 -44.12 64.46 0.25 -6.02 -11.10 16.21 12.66 8.47 38.92 4.92 4.71 7.96 29.25 0.96 1.62 1.88 51.01 -5.03 242.84 0.25 12.80 -1.26 60.95 9.47 4.29 14.65 4.87 4.59 7.95 29.20 0.94 1.63 1.89 11.88 78.81 -78.49 0.25 2.98 19.74 -19.66 13.18 2.78 8.39 4.82 4.47 7.92 29.15 0.93 1.64 1.89 29.80 127.39 -135.06 0.25 7.45 31.85 -33.76 14.74 10.00 12.51 4.78 4.36 7.87 29.10 0.91 1.65 1.88 0.73 62.00 151.91 0.25 0.18 15.47 37.90 18.84 3.91 32.89 4.74 4.24 7.80 29.05 0.89 1.65 1.88
-78.11 -113.90 244.12 0.25 -19.45 -28.36 60.79 12.67 10.10 18.24 4.69 4.12 7.72 29.00 0.88 1.65 1.87 9.03 -129.42 -46.27 0.25 2.24 -32.16 -11.50 11.31 4.38 19.75 4.65 4.01 7.63 28.96 0.86 1.64 1.85 31.94 37.76 -271.64 0.25 7.92 9.36 -67.37 14.39 10.73 9.32 4.61 3.90 7.53 28.91 0.85 1.63 1.84 -37.05 75.52 -88.91 0.25 -9.17 18.69 -22.01 19.06 6.67 33.60 4.57 3.79 7.42 28.86 0.83 1.63 1.83 -11.95 16.33 75.12 0.25 -2.95 4.03 18.56 16.90 7.00 27.82 4.52 3.69 7.31 28.81 0.82 1.62 1.81 -25.88 3.28 24.92 0.25 -6.38 0.81 6.14 10.45 8.45 6.67 4.48 3.59 7.19 28.76 0.80 1.61 1.79 11.15 -58.62 -123.87 0.25 2.74 -14.42 -30.47 11.94 10.85 21.31 4.44 3.50 7.07 28.71 0.79 1.59 1.78 29.07 -64.38 -67.49 0.25 7.14 -15.80 -16.57 10.18 8.43 2.86 4.39 3.41 6.96 28.66 0.78 1.59 1.77 -45.90 46.65 126.40 0.25 -11.25 11.43 30.97 8.89 13.35 8.80 4.34 3.33 6.85 28.61 0.77 1.58 1.75 -39.73 50.45 175.80 0.24 -9.71 12.33 42.98 6.39 12.93 5.69 4.29 3.26 6.75 28.56 0.76 1.57 1.75 -42.56 -30.60 -34.49 0.24 -10.39 -7.47 -8.41 4.88 7.91 6.17 4.24 3.19 6.65 28.52 0.75 1.57 1.74 8.50 -80.39 -456.50 0.24 2.07 -19.57 -111.16 7.25 8.98 9.19 4.19 3.13 6.57 28.47 0.75 1.57 1.74

605
Raw Data Tapered Data
FFT Data Parzen Filtered Data
Simple Ratio Spectrum
Z E N
Tapering Function
Z E N Z E N Z E N
Frequency Hz
E/Z N/Z
Mean SQRT Spectrum
18.16 58.83 466.80 0.24 4.40 14.27 113.20 13.74 4.61 35.56 4.09 3.03 6.44 28.37 0.742 1.576 1.742 -36.80 117.47 58.74 0.24 -8.91 28.43 14.22 14.05 0.34 44.19 4.04 2.99 6.40 28.32 0.741 1.583 1.748 -7.71 89.04 -175.02 0.24 -1.86 21.50 -42.27 11.06 3.66 19.29 4.00 2.96 6.37 28.27 0.741 1.593 1.757 66.17 -39.07 -42.58 0.24 15.95 -9.41 -10.26 9.52 4.12 7.86 3.96 2.93 6.35 28.22 0.741 1.605 1.768 -29.91 -106.78 92.32 0.24 -7.19 -25.68 22.20 11.55 7.80 9.47 3.92 2.91 6.34 28.17 0.741 1.618 1.780 -110.62 -56.46 198.74 0.24 -26.55 -13.55 47.70 13.95 5.39 6.55 3.89 2.89 6.35 28.13 0.741 1.632 1.792 16.56 -24.31 -14.62 0.24 3.97 -5.82 -3.50 20.09 10.76 24.63 3.87 2.87 6.37 28.08 0.741 1.645 1.804 99.33 -16.23 -269.05 0.24 23.74 -3.88 -64.30 14.53 17.08 1.15 3.85 2.86 6.39 28.03 0.741 1.658 1.816 9.11 -24.16 -173.16 0.24 2.17 -5.76 -41.30 9.96 13.32 23.61 3.85 2.85 6.42 27.98 0.740 1.670 1.826
-56.79 5.87 192.80 0.24 -13.52 1.40 45.89 7.91 7.82 11.78 3.84 2.84 6.45 27.93 0.739 1.679 1.835 24.27 46.76 229.96 0.24 5.76 11.10 54.62 13.26 9.53 32.68 3.85 2.84 6.49 27.88 0.737 1.687 1.841 11.20 18.62 -98.30 0.24 2.65 4.41 -23.30 12.16 8.83 27.44 3.86 2.83 6.52 27.83 0.735 1.692 1.844 5.16 -31.36 -176.75 0.24 1.22 -7.42 -41.80 1.64 8.75 9.42 3.87 2.83 6.56 27.78 0.731 1.693 1.844
91.97 -59.19 144.32 0.24 21.70 -13.97 34.06 10.44 23.86 17.02 3.90 2.83 6.59 27.73 0.728 1.691 1.841 -23.17 -16.05 276.48 0.24 -5.46 -3.78 65.11 11.01 11.22 19.74 3.92 2.84 6.62 27.69 0.723 1.687 1.835 -94.94 40.90 -82.91 0.24 -22.31 9.61 -19.48 13.28 11.51 6.86 3.96 2.84 6.64 27.64 0.718 1.679 1.826 35.18 59.69 -335.07 0.23 8.25 14.00 -78.57 19.93 15.38 28.18 3.99 2.85 6.66 27.59 0.713 1.669 1.815 56.00 31.50 -36.32 0.23 13.10 7.37 -8.50 23.88 14.47 23.31 4.03 2.85 6.67 27.54 0.707 1.656 1.801 -37.04 -8.56 332.09 0.23 -8.65 -2.00 77.54 20.91 7.31 33.13 4.07 2.86 6.68 27.49 0.702 1.642 1.786 -7.95 67.32 75.28 0.23 -1.85 15.69 17.54 23.13 13.41 38.72 4.11 2.86 6.68 27.44 0.697 1.627 1.770 75.91 44.09 -162.55 0.23 17.65 10.25 -37.79 23.27 9.96 24.76 4.14 2.87 6.68 27.39 0.693 1.612 1.754 -5.23 -105.80 40.70 0.23 -1.21 -24.55 9.44 9.90 7.59 4.66 4.18 2.88 6.67 27.34 0.689 1.596 1.738
-78.07 -69.45 120.38 0.23 -18.07 -16.08 27.87 2.55 16.68 18.92 4.21 2.89 6.66 27.29 0.686 1.579 1.722 -9.89 11.65 64.01 0.23 -2.29 2.69 14.79 6.05 20.28 2.44 4.25 2.90 6.64 27.25 0.683 1.563 1.706 59.01 35.55 -238.64 0.23 13.60 8.19 -55.01 18.34 6.77 26.27 4.28 2.92 6.62 27.20 0.682 1.547 1.691 22.84 44.38 -262.63 0.23 5.25 10.21 -60.40 23.38 13.93 19.05 4.31 2.93 6.60 27.15 0.681 1.532 1.677 -82.04 21.24 255.39 0.23 -18.83 4.88 58.61 20.33 15.37 24.45 4.33 2.96 6.58 27.10 0.682 1.518 1.664 -51.78 7.18 259.36 0.23 -11.86 1.64 59.39 12.53 16.33 6.96 4.36 2.98 6.56 27.05 0.684 1.505 1.653 25.28 -39.76 -78.01 0.23 5.78 -9.09 -17.82 5.42 9.56 20.75 4.38 3.01 6.54 27.00 0.686 1.493 1.643 -2.77 -1.69 -111.62 0.23 -0.63 -0.39 -25.45 6.17 7.81 11.84 4.40 3.03 6.53 26.95 0.690 1.483 1.635
-12.74 52.20 4.59 0.23 -2.90 11.88 1.04 3.93 11.84 7.78 4.42 3.07 6.52 26.90 0.694 1.474 1.629 31.22 18.05 102.38 0.23 7.09 4.10 23.24 7.07 14.32 5.57 4.44 3.11 6.52 26.86 0.699 1.467 1.625 26.11 19.97 48.08 0.23 5.91 4.52 10.89 9.86 12.70 20.66 4.47 3.15 6.52 26.81 0.705 1.460 1.621

606
Raw Data Tapered Data
FFT Data Parzen Filtered Data
Simple Ratio Spectrum
Z E N
Tapering Function
Z E N Z E N Z E N
Frequency Hz
E/Z N/Z
Mean SQRT Spectrum
23.01 8.90 -112.79 0.23 5.20 2.01 -25.49 7.86 5.47 10.41 4.49 3.19 6.53 26.76 0.711 1.455 1.619 82.79 4.86 -221.12 0.23 18.67 1.10 -49.86 8.16 13.01 17.27 4.51 3.24 6.55 26.71 0.718 1.450 1.618 8.61 24.80 22.28 0.23 1.94 5.58 5.01 11.23 1.27 17.16 4.54 3.30 6.57 26.66 0.726 1.446 1.618
-85.24 108.52 293.65 0.22 -19.14 24.36 65.93 11.84 5.29 20.91 4.57 3.36 6.59 26.61 0.734 1.442 1.618 -22.03 110.07 30.01 0.22 -4.93 24.66 6.72 14.77 10.56 18.62 4.60 3.42 6.62 26.56 0.743 1.439 1.619 25.96 -97.96 -201.65 0.22 5.80 -21.89 -45.07 13.43 6.07 30.94 4.64 3.49 6.65 26.51 0.752 1.436 1.621 -25.04 -118.54 -70.10 0.22 -5.58 -26.43 -15.63 7.92 5.33 22.46 4.67 3.55 6.69 26.46 0.761 1.433 1.622 -56.88 -0.31 71.90 0.22 -12.66 -0.07 16.00 3.34 13.95 4.10 4.70 3.62 6.73 26.42 0.771 1.430 1.625 31.17 19.64 30.69 0.22 6.92 4.36 6.81 1.74 5.40 12.70 4.74 3.70 6.77 26.37 0.780 1.428 1.627 32.04 29.53 -127.11 0.22 7.10 6.54 -28.15 3.67 5.01 16.69 4.77 3.77 6.81 26.32 0.789 1.426 1.630 -64.89 -15.50 -80.69 0.22 -14.34 -3.43 -17.83 4.86 10.22 23.92 4.81 3.84 6.85 26.27 0.798 1.424 1.632 -18.73 -84.31 60.35 0.22 -4.13 -18.59 13.31 5.78 5.67 17.74 4.84 3.91 6.88 26.22 0.807 1.422 1.635 29.25 -97.96 92.05 0.22 6.44 -21.55 20.25 6.05 15.28 13.92 4.87 3.97 6.92 26.17 0.816 1.419 1.637 22.15 29.17 18.83 0.22 4.86 6.40 4.13 9.98 9.86 4.72 4.90 4.04 6.94 26.12 0.824 1.417 1.639 53.99 156.79 -107.99 0.22 11.82 34.34 -23.65 12.10 6.28 6.29 4.92 4.10 6.97 26.07 0.832 1.415 1.642 25.83 63.34 -36.69 0.22 5.64 13.84 -8.02 8.44 9.84 16.26 4.94 4.15 6.98 26.03 0.841 1.414 1.645 -35.15 -54.69 131.12 0.22 -7.66 -11.92 28.58 8.80 9.06 26.46 4.95 4.20 6.99 25.98 0.849 1.413 1.648 -34.02 -42.50 105.65 0.22 -7.40 -9.24 22.98 11.02 9.05 28.32 4.95 4.24 6.99 25.93 0.857 1.412 1.652 6.04 30.51 -215.13 0.22 1.31 6.62 -46.68 13.95 16.55 16.25 4.94 4.27 6.99 25.88 0.865 1.413 1.657
43.94 66.31 -240.21 0.22 9.51 14.36 -52.01 14.42 3.67 14.20 4.93 4.30 6.97 25.83 0.873 1.415 1.662 -25.10 19.13 232.81 0.22 -5.42 4.13 50.29 14.47 6.72 25.20 4.90 4.32 6.95 25.78 0.881 1.418 1.669 -119.81 -37.84 201.94 0.22 -25.82 -8.16 43.52 11.54 14.00 14.73 4.87 4.33 6.93 25.73 0.888 1.422 1.677 -54.47 -63.65 -107.25 0.22 -11.71 -13.68 -23.06 5.79 11.73 1.85 4.83 4.33 6.90 25.68 0.896 1.428 1.686 32.58 -59.41 -154.72 0.21 6.99 -12.74 -33.19 5.94 3.37 14.67 4.78 4.32 6.86 25.63 0.904 1.435 1.696 35.44 -4.29 -100.21 0.21 7.58 -0.92 -21.44 1.46 11.74 19.14 4.72 4.30 6.82 25.59 0.911 1.444 1.708 53.26 63.58 123.75 0.21 11.37 13.57 26.42 1.96 23.90 15.04 4.66 4.28 6.78 25.54 0.919 1.455 1.721 23.11 17.41 138.23 0.21 4.92 3.71 29.44 10.32 19.61 11.74 4.59 4.25 6.74 25.49 0.926 1.467 1.735 -36.87 -61.51 -19.01 0.21 -7.83 -13.07 -4.04 6.23 6.09 18.45 4.52 4.22 6.69 25.44 0.934 1.481 1.751 13.18 -0.40 -126.71 0.21 2.79 -0.08 -26.86 1.96 7.36 17.72 4.44 4.18 6.64 25.39 0.941 1.497 1.769 34.08 51.49 -77.30 0.21 7.21 10.89 -16.35 1.70 1.01 8.14 4.35 4.13 6.60 25.34 0.949 1.515 1.788 -31.92 53.27 234.39 0.21 -6.74 11.24 49.46 0.57 4.10 6.74 4.27 4.08 6.55 25.29 0.957 1.535 1.809 -19.82 27.10 145.63 0.21 -4.17 5.70 30.66 7.92 5.32 28.55 4.18 4.03 6.51 25.24 0.965 1.557 1.831 40.14 -108.75 -218.22 0.21 8.43 -22.84 -45.83 6.97 12.95 33.61 4.09 3.98 6.47 25.20 0.973 1.579 1.855

607
Raw Data Tapered Data
FFT Data Parzen Filtered Data
Simple Ratio Spectrum
Z E N
Tapering Function
Z E N Z E N Z E N
Frequency Hz
E/Z N/Z
Mean SQRT Spectrum
42.97 -124.29 -161.46 0.21 9.00 -26.04 -33.83 1.81 13.35 7.34 4.01 3.93 6.43 25.15 0.981 1.604 1.880 -14.09 29.89 45.78 0.21 -2.94 6.25 9.57 7.63 9.06 8.17 3.93 3.88 6.39 25.10 0.989 1.629 1.906 -43.98 133.56 99.49 0.21 -9.17 27.85 20.74 8.84 3.61 29.63 3.85 3.83 6.36 25.05 0.997 1.655 1.932 -7.87 97.08 58.18 0.21 -1.64 20.19 12.10 4.44 14.17 26.91 3.77 3.79 6.34 25.00 1.005 1.682 1.959 20.10 -59.00 -98.74 0.21 4.17 -12.24 -20.49 9.28 18.35 18.70 3.70 3.75 6.31 24.95 1.014 1.708 1.987 -13.91 -123.65 -41.45 0.21 -2.88 -25.59 -8.58 11.02 30.77 27.60 3.63 3.71 6.29 24.90 1.023 1.735 2.014 -24.84 -15.38 211.21 0.21 -5.13 -3.18 43.61 12.42 36.85 27.30 3.56 3.67 6.28 24.85 1.032 1.762 2.042 55.10 108.43 15.76 0.21 11.35 22.34 3.25 2.61 24.95 13.00 3.50 3.65 6.26 24.80 1.041 1.788 2.069 52.88 90.02 -209.85 0.21 10.87 18.50 -43.12 5.19 16.55 16.25 3.44 3.62 6.25 24.76 1.052 1.814 2.097 -10.21 -77.02 38.50 0.21 -2.09 -15.79 7.89 9.29 21.11 25.84 3.39 3.61 6.24 24.71 1.064 1.840 2.125 44.72 -118.63 171.08 0.20 9.15 -24.26 34.99 9.18 22.59 16.29 3.34 3.60 6.23 24.66 1.077 1.865 2.153 97.44 -0.40 -10.24 0.20 19.88 -0.08 -2.09 11.90 25.27 37.65 3.30 3.59 6.23 24.61 1.091 1.889 2.182 16.20 58.47 -103.01 0.20 3.30 11.90 -20.96 11.17 29.30 29.80 3.25 3.60 6.22 24.56 1.106 1.914 2.210 -58.71 32.28 -4.79 0.20 -11.92 6.55 -0.97 6.77 18.22 10.94 3.21 3.61 6.22 24.51 1.123 1.938 2.240 -43.51 -34.73 73.07 0.20 -8.81 -7.03 14.80 13.91 22.28 11.45 3.17 3.62 6.23 24.46 1.141 1.962 2.270 -51.32 -57.55 75.78 0.20 -10.37 -11.62 15.31 10.89 28.80 19.19 3.14 3.65 6.24 24.41 1.162 1.988 2.302 12.75 15.53 -47.28 0.20 2.57 3.13 -9.53 17.06 49.58 25.06 3.10 3.67 6.25 24.37 1.185 2.014 2.336 98.53 81.32 -184.81 0.20 19.80 16.35 -37.15 32.50 63.49 16.15 3.07 3.71 6.26 24.32 1.210 2.041 2.373 -4.67 -9.83 -25.38 0.20 -0.94 -1.97 -5.09 37.01 14.78 12.49 3.03 3.76 6.28 24.27 1.239 2.070 2.412 -50.56 -84.65 220.23 0.20 -10.11 -16.93 44.05 46.60 71.91 46.04 3.00 3.81 6.30 24.22 1.271 2.100 2.454 28.48 45.42 150.49 0.20 5.68 9.06 30.02 52.74 43.38 115.44 2.97 3.88 6.32 24.17 1.306 2.130 2.499 3.42 26.27 -161.49 0.20 0.68 5.23 -32.14 17.09 18.68 87.51 2.94 3.95 6.35 24.12 1.344 2.162 2.546
-42.51 -101.59 -105.95 0.20 -8.44 -20.17 -21.03 26.48 20.75 73.99 2.91 4.04 6.39 24.07 1.386 2.194 2.595 33.51 -21.35 263.74 0.20 6.63 -4.23 52.22 42.57 16.24 103.47 2.89 4.13 6.43 24.02 1.430 2.226 2.646 24.39 25.63 134.94 0.20 4.82 5.06 26.65 30.05 17.56 71.15 2.87 4.25 6.49 23.97 1.477 2.257 2.697 -53.56 16.54 -203.93 0.20 -10.55 3.26 -40.17 19.50 36.52 11.90 2.86 4.37 6.55 23.93 1.526 2.286 2.748 40.47 66.36 -162.19 0.20 7.95 13.04 -31.87 9.64 25.50 5.89 2.86 4.51 6.62 23.88 1.574 2.312 2.797 37.31 29.16 20.10 0.20 7.31 5.72 3.94 5.58 13.35 18.43 2.87 4.66 6.71 23.83 1.623 2.335 2.843 -79.61 -22.86 146.77 0.20 -15.56 -4.47 28.69 7.29 18.15 17.02 2.89 4.83 6.81 23.78 1.669 2.353 2.885 -42.37 11.15 151.17 0.20 -8.26 2.17 29.48 8.66 30.34 16.55 2.93 5.01 6.92 23.73 1.713 2.366 2.921 35.64 -2.88 -63.01 0.19 6.93 -0.56 -12.25 15.93 7.67 22.49 2.97 5.21 7.05 23.68 1.753 2.372 2.949 46.48 -38.80 -207.46 0.19 9.02 -7.53 -40.25 24.90 17.97 66.11 3.04 5.43 7.20 23.63 1.788 2.372 2.970 -52.52 33.20 9.94 0.19 -10.16 6.42 1.92 10.28 14.68 49.44 3.11 5.66 7.36 23.58 1.816 2.364 2.981

608
Raw Data Tapered Data
FFT Data Parzen Filtered Data
Simple Ratio Spectrum
Z E N
Tapering Function
Z E N Z E N Z E N
Frequency Hz
E/Z N/Z
Mean SQRT Spectrum
-80.25 76.97 132.65 0.19 -15.49 14.86 25.60 7.81 13.29 14.68 3.21 5.90 7.54 23.54 1.838 2.349 2.983 23.86 -27.14 -77.46 0.19 4.59 -5.22 -14.91 7.21 25.12 18.34 3.32 6.16 7.73 23.49 1.853 2.328 2.975 46.72 -102.89 -185.93 0.19 8.97 -19.75 -35.70 17.62 27.99 32.49 3.45 6.42 7.95 23.44 1.860 2.301 2.958 32.55 -30.63 11.43 0.19 6.23 -5.87 2.19 17.91 16.60 38.46 3.61 6.70 8.18 23.39 1.859 2.269 2.934 -29.45 53.32 220.96 0.19 -5.63 10.18 42.20 3.33 2.63 27.06 3.77 6.99 8.44 23.34 1.851 2.235 2.902 -91.22 94.01 18.49 0.19 -17.38 17.91 3.52 13.98 24.77 44.91 3.96 7.27 8.71 23.29 1.837 2.200 2.867 -22.99 35.74 -178.19 0.19 -4.37 6.79 -33.86 10.20 25.64 32.12 4.16 7.56 9.01 23.24 1.818 2.165 2.827 45.96 -65.21 -4.82 0.19 8.71 -12.36 -0.91 7.04 15.12 16.36 4.37 7.84 9.32 23.19 1.794 2.132 2.786 55.76 11.89 84.02 0.19 10.54 2.25 15.88 1.62 9.19 10.15 4.59 8.12 9.64 23.14 1.767 2.100 2.744 58.53 48.75 67.72 0.19 11.03 9.19 12.76 3.60 7.26 16.05 4.82 8.38 9.98 23.10 1.738 2.070 2.703 -0.59 -1.35 -30.35 0.19 -0.11 -0.25 -5.71 4.16 6.55 15.89 5.05 8.63 10.32 23.05 1.708 2.042 2.662 -60.47 4.63 -158.97 0.19 -11.34 0.87 -29.81 9.87 15.73 15.05 5.29 8.87 10.67 23.00 1.677 2.018 2.624 -16.32 -52.28 13.32 0.19 -3.05 -9.78 2.49 11.65 8.54 26.17 5.51 9.08 11.01 22.95 1.647 1.997 2.588 -17.26 -21.15 211.87 0.19 -3.22 -3.94 39.51 9.62 4.76 6.83 5.74 9.28 11.35 22.90 1.617 1.978 2.555 -48.13 8.87 86.28 0.19 -8.95 1.65 16.05 5.48 8.46 7.79 5.95 9.45 11.68 22.85 1.588 1.963 2.525 8.95 -81.99 -170.55 0.19 1.66 -15.21 -31.64 7.88 5.05 25.47 6.15 9.59 12.00 22.80 1.560 1.952 2.498 27.87 1.16 -242.72 0.19 5.16 0.21 -44.90 13.94 10.86 36.95 6.33 9.70 12.30 22.75 1.533 1.943 2.475 -14.16 142.86 -9.21 0.18 -2.61 26.36 -1.70 11.03 7.45 2.70 6.49 9.79 12.58 22.71 1.507 1.938 2.456 -59.01 54.45 213.38 0.18 -10.86 10.02 39.26 5.49 4.99 15.03 6.63 9.83 12.84 22.66 1.483 1.937 2.440 1.10 -88.49 62.83 0.18 0.20 -16.24 11.53 5.48 17.45 7.33 6.74 9.85 13.08 22.61 1.461 1.939 2.428 44.01 -34.25 -100.09 0.18 8.05 -6.27 -18.32 5.47 12.20 9.12 6.83 9.84 13.28 22.56 1.440 1.944 2.419 0.92 50.71 -49.79 0.18 0.17 9.25 -9.09 8.51 8.59 6.95 6.89 9.79 13.44 22.51 1.421 1.951 2.414 20.87 35.52 20.27 0.18 3.80 6.46 3.69 11.57 8.00 17.70 6.91 9.71 13.56 22.46 1.404 1.961 2.412 -34.10 53.33 118.00 0.18 -6.19 9.68 21.42 4.48 6.17 23.50 6.91 9.60 13.64 22.41 1.390 1.973 2.414 -22.99 10.19 -34.17 0.18 -4.16 1.85 -6.18 12.35 6.01 19.51 6.88 9.47 13.67 22.36 1.377 1.987 2.418 46.96 -78.68 -222.65 0.18 8.48 -14.20 -40.19 16.54 10.54 3.41 6.82 9.32 13.65 22.31 1.367 2.003 2.425 -0.14 -11.51 7.78 0.18 -0.02 -2.07 1.40 6.66 11.14 19.65 6.73 9.14 13.60 22.27 1.358 2.020 2.434 -8.12 43.42 258.26 0.18 -1.46 7.79 46.36 8.28 9.92 18.81 6.62 8.94 13.50 22.22 1.351 2.039 2.446 -34.04 -49.58 138.46 0.18 -6.09 -8.88 24.78 6.77 4.68 5.83 6.49 8.73 13.36 22.17 1.346 2.059 2.460 -12.95 -75.34 -226.36 0.18 -2.31 -13.45 -40.41 3.85 1.77 1.66 6.34 8.51 13.19 22.12 1.342 2.080 2.476 14.05 2.79 -232.44 0.18 2.50 0.50 -41.37 2.57 3.60 0.29 6.17 8.27 12.98 22.07 1.339 2.102 2.493 0.02 -0.22 134.76 0.18 0.00 -0.04 23.92 10.56 7.92 9.61 6.00 8.02 12.74 22.02 1.338 2.125 2.511 49.92 -44.14 170.15 0.18 8.84 -7.81 30.12 10.78 10.05 13.77 5.81 7.77 12.48 21.97 1.337 2.148 2.530

609
Raw Data Tapered Data
FFT Data Parzen Filtered Data
Simple Ratio Spectrum
Z E N
Tapering Function
Z E N Z E N Z E N
Frequency Hz
E/Z N/Z
Mean SQRT Spectrum
35.74 19.90 -68.05 0.18 6.31 3.51 -12.01 6.15 14.42 16.40 5.62 7.51 12.19 21.92 1.337 2.170 2.549 28.61 92.66 -94.72 0.18 5.04 16.31 -16.67 5.11 7.61 8.51 5.42 7.25 11.88 21.88 1.338 2.192 2.568 -2.44 30.41 96.28 0.18 -0.43 5.34 16.90 9.74 5.35 5.66 5.22 7.00 11.54 21.83 1.340 2.211 2.585 -30.38 -109.45 157.77 0.18 -5.32 -19.15 27.61 4.82 9.80 11.37 5.03 6.74 11.20 21.78 1.342 2.228 2.601 41.59 -39.16 -22.50 0.17 7.26 -6.83 -3.93 5.32 10.61 25.71 4.83 6.49 10.84 21.73 1.343 2.242 2.614 7.49 174.56 -138.17 0.17 1.30 30.37 -24.04 3.80 9.48 16.67 4.65 6.25 10.47 21.68 1.345 2.252 2.623
-43.44 62.07 -6.88 0.17 -7.54 10.77 -1.19 2.05 7.75 2.98 4.48 6.02 10.11 21.63 1.345 2.258 2.628 -4.35 -130.80 149.84 0.17 -0.75 -22.63 25.92 6.13 8.23 12.36 4.31 5.79 9.74 21.58 1.343 2.260 2.629 9.64 -70.41 91.35 0.17 1.66 -12.14 15.76 4.73 9.73 16.74 4.16 5.57 9.39 21.53 1.340 2.257 2.625 39.54 47.63 -117.59 0.17 6.80 8.19 -20.23 2.14 8.79 12.30 4.02 5.36 9.04 21.48 1.335 2.249 2.615 75.31 155.21 -85.18 0.17 12.92 26.62 -14.61 5.41 4.20 7.89 3.89 5.17 8.70 21.44 1.327 2.236 2.600 -10.83 47.79 151.68 0.17 -1.85 8.17 25.94 7.25 0.39 12.16 3.78 4.98 8.38 21.39 1.317 2.217 2.579 -98.61 -189.93 177.03 0.17 -16.81 -32.38 30.18 4.93 8.41 4.44 3.68 4.80 8.06 21.34 1.305 2.194 2.553 -46.32 -149.26 -32.26 0.17 -7.87 -25.37 -5.49 6.47 3.05 14.17 3.58 4.63 7.76 21.29 1.292 2.167 2.523 36.69 55.92 -280.64 0.17 6.22 9.48 -47.57 2.20 1.86 14.00 3.50 4.47 7.47 21.24 1.278 2.136 2.489 108.40 148.50 -52.97 0.17 18.32 25.10 -8.95 5.52 4.72 12.17 3.42 4.33 7.20 21.19 1.263 2.102 2.452 95.99 14.16 195.75 0.17 16.17 2.39 32.98 2.54 5.32 1.13 3.36 4.19 6.94 21.14 1.248 2.066 2.413 -72.07 -114.65 -14.61 0.17 -12.11 -19.26 -2.45 1.50 5.71 7.00 3.30 4.06 6.69 21.09 1.232 2.029 2.373 -87.75 -6.42 5.41 0.17 -14.70 -1.07 0.91 3.42 3.59 8.62 3.24 3.95 6.46 21.04 1.216 1.991 2.333 74.28 30.53 -29.54 0.17 12.40 5.10 -4.93 1.56 6.84 18.37 3.20 3.84 6.24 21.00 1.201 1.954 2.294 57.01 -44.46 -14.45 0.17 9.49 -7.40 -2.41 3.22 12.38 14.20 3.15 3.74 6.04 20.95 1.187 1.918 2.256 -40.03 -18.34 172.23 0.17 -6.64 -3.04 28.59 6.05 11.26 3.80 3.11 3.65 5.86 20.90 1.175 1.885 2.221 6.03 -12.29 -39.04 0.17 1.00 -2.03 -6.46 5.26 8.60 7.10 3.07 3.57 5.69 20.85 1.163 1.855 2.189 57.90 1.72 -150.65 0.17 9.55 0.28 -24.86 2.56 6.17 6.88 3.03 3.49 5.53 20.80 1.154 1.828 2.162 27.73 49.61 -37.28 0.16 4.56 8.16 -6.13 3.96 6.52 2.75 2.99 3.42 5.39 20.75 1.146 1.805 2.139 -14.31 -33.43 146.51 0.16 -2.35 -5.48 24.03 2.65 4.72 14.83 2.94 3.36 5.26 20.70 1.141 1.787 2.120 -36.21 -93.19 190.83 0.16 -5.92 -15.24 31.20 1.79 5.70 16.08 2.90 3.30 5.14 20.65 1.138 1.772 2.106 -50.04 20.95 -123.31 0.16 -8.16 3.41 -20.10 5.39 4.93 17.10 2.86 3.25 5.03 20.61 1.138 1.762 2.098 -34.87 86.72 -238.58 0.16 -5.67 14.09 -38.77 1.92 2.86 16.81 2.81 3.20 4.93 20.56 1.140 1.756 2.094 7.18 -29.40 71.76 0.16 1.16 -4.76 11.62 1.95 4.23 6.55 2.76 3.16 4.84 20.51 1.145 1.755 2.095 -9.82 -75.20 264.09 0.16 -1.59 -12.15 42.65 1.50 3.23 9.38 2.71 3.11 4.76 20.46 1.151 1.758 2.101 -68.67 63.81 -62.32 0.16 -11.06 10.27 -10.03 2.08 1.76 12.25 2.65 3.07 4.68 20.41 1.160 1.766 2.113 34.40 107.46 -258.68 0.16 5.52 17.25 -41.52 2.34 2.42 5.16 2.60 3.04 4.62 20.36 1.170 1.778 2.129

610
Raw Data Tapered Data
FFT Data Parzen Filtered Data
Simple Ratio Spectrum
Z E N
Tapering Function
Z E N Z E N Z E N
Frequency Hz
E/Z N/Z
Mean SQRT Spectrum
127.07 28.18 10.82 0.16 20.33 4.51 1.73 1.84 2.16 14.05 2.54 3.00 4.56 20.31 1.182 1.795 2.149 -44.10 -56.78 210.38 0.16 -7.03 -9.06 33.56 8.56 8.05 12.42 2.48 2.96 4.50 20.26 1.196 1.817 2.175 -99.81 -83.51 85.79 0.16 -15.87 -13.28 13.64 6.05 12.00 6.30 2.42 2.93 4.46 20.21 1.211 1.842 2.205 1.38 31.59 -205.97 0.16 0.22 5.01 -32.65 1.87 7.75 7.27 2.36 2.89 4.41 20.17 1.228 1.872 2.239 -1.62 31.45 -149.26 0.16 -0.26 4.97 -23.58 4.25 6.23 6.46 2.29 2.86 4.37 20.12 1.245 1.906 2.277 6.37 -85.45 113.82 0.16 1.00 -13.46 17.93 6.81 5.51 6.11 2.23 2.82 4.34 20.07 1.265 1.943 2.318
-35.58 -35.22 75.44 0.16 -5.59 -5.53 11.84 4.14 6.49 9.70 2.17 2.79 4.30 20.02 1.285 1.983 2.363 -52.40 35.77 -92.53 0.16 -8.20 5.60 -14.48 0.81 5.32 13.29 2.11 2.75 4.27 19.97 1.306 2.026 2.410 41.61 79.53 -205.93 0.16 6.49 12.41 -32.12 1.02 2.27 5.93 2.05 2.72 4.24 19.92 1.328 2.071 2.460 25.48 81.20 -16.48 0.16 3.96 12.63 -2.56 4.12 4.82 11.63 1.99 2.69 4.21 19.87 1.350 2.118 2.512 -29.52 -43.89 283.99 0.16 -4.58 -6.80 44.02 3.13 2.93 9.21 1.93 2.65 4.19 19.82 1.372 2.167 2.565 -72.32 -63.68 93.23 0.15 -11.17 -9.84 14.40 1.14 4.13 10.82 1.88 2.62 4.16 19.78 1.394 2.218 2.620 -67.04 56.32 -254.44 0.15 -10.32 8.67 -39.18 3.45 5.81 8.75 1.82 2.58 4.14 19.73 1.415 2.270 2.675 84.92 97.01 -177.57 0.15 13.04 14.89 -27.26 8.90 6.95 21.22 1.77 2.55 4.12 19.68 1.437 2.323 2.731 148.45 -17.17 114.56 0.15 22.71 -2.63 17.53 7.41 8.63 13.14 1.72 2.51 4.10 19.63 1.458 2.377 2.788 26.10 -122.90 113.10 0.15 3.98 -18.74 17.25 2.91 6.24 9.22 1.68 2.48 4.08 19.58 1.479 2.430 2.845 -83.79 21.30 -90.94 0.15 -12.74 3.24 -13.82 4.95 6.20 17.60 1.64 2.45 4.06 19.53 1.498 2.483 2.900 13.35 196.85 -55.64 0.15 2.02 29.82 -8.43 4.13 4.12 14.76 1.60 2.42 4.04 19.48 1.517 2.534 2.954 83.15 66.31 93.29 0.15 12.56 10.01 14.09 2.22 5.73 7.63 1.56 2.39 4.02 19.43 1.535 2.583 3.005 -82.85 -166.50 112.87 0.15 -12.47 -25.06 16.99 0.76 7.12 6.57 1.52 2.36 4.01 19.38 1.551 2.630 3.053 -96.50 -138.90 45.56 0.15 -14.47 -20.83 6.83 0.81 4.80 4.07 1.49 2.34 3.99 19.34 1.565 2.673 3.098 16.66 71.23 -41.45 0.15 2.49 10.65 -6.20 1.12 5.27 14.58 1.47 2.31 3.98 19.29 1.577 2.713 3.138 54.52 77.92 -87.19 0.15 8.12 11.61 -12.99 1.44 5.96 9.04 1.44 2.29 3.96 19.24 1.587 2.749 3.174 39.32 -143.96 -46.92 0.15 5.84 -21.38 -6.97 4.27 3.50 5.87 1.42 2.27 3.95 19.19 1.594 2.782 3.206 -50.66 -200.28 108.96 0.15 -7.50 -29.64 16.13 1.17 4.25 10.46 1.40 2.24 3.94 19.14 1.600 2.811 3.235 -14.53 19.08 79.58 0.15 -2.14 2.81 11.74 2.59 7.50 13.66 1.39 2.22 3.93 19.09 1.604 2.838 3.260 69.36 165.70 -98.38 0.15 10.20 24.36 -14.46 3.06 10.52 9.03 1.37 2.21 3.93 19.04 1.607 2.861 3.281 43.13 48.26 42.74 0.15 6.32 7.07 6.26 0.67 7.51 5.88 1.36 2.19 3.92 18.99 1.608 2.881 3.299 -29.90 -78.69 169.31 0.15 -4.37 -11.49 24.72 0.51 5.66 7.12 1.35 2.17 3.92 18.95 1.607 2.897 3.313 -105.63 -17.51 1.97 0.15 -15.37 -2.55 0.29 1.74 9.09 2.31 1.34 2.16 3.91 18.90 1.606 2.910 3.324 -33.36 120.28 -115.80 0.15 -4.84 17.44 -16.79 3.01 4.55 6.30 1.34 2.15 3.91 18.85 1.603 2.920 3.331 82.54 74.87 -65.44 0.14 11.93 10.82 -9.46 3.45 6.28 2.92 1.33 2.14 3.91 18.80 1.600 2.927 3.336 23.33 -122.04 50.59 0.14 3.36 -17.57 7.29 4.94 1.32 13.54 1.33 2.13 3.90 18.75 1.597 2.932 3.339

611
Raw Data Tapered Data
FFT Data Parzen Filtered Data
Simple Ratio Spectrum
Z E N
Tapering Function
Z E N Z E N Z E N
Frequency Hz
E/Z N/Z
Mean SQRT Spectrum
-52.62 -75.66 63.36 0.14 -7.55 -10.86 9.09 5.70 2.14 11.27 1.33 2.12 3.90 18.70 1.593 2.935 3.340 4.47 153.18 5.23 0.14 0.64 21.90 0.75 2.55 2.78 5.73 1.33 2.11 3.91 18.65 1.590 2.938 3.341 -6.52 147.56 9.20 0.14 -0.93 21.03 1.31 0.32 7.01 3.98 1.33 2.11 3.91 18.60 1.588 2.940 3.342 -37.44 -61.62 34.11 0.14 -5.32 -8.75 4.84 3.45 8.35 2.14 1.33 2.11 3.91 18.55 1.587 2.944 3.345 18.60 -164.18 70.90 0.14 2.63 -23.23 10.03 1.83 6.42 5.37 1.33 2.11 3.91 18.51 1.588 2.949 3.349 -41.36 -49.76 41.68 0.14 -5.83 -7.02 5.88 3.87 5.42 9.30 1.32 2.10 3.91 18.46 1.591 2.956 3.356 -76.13 95.14 -131.14 0.14 -10.70 13.37 -18.43 6.70 12.46 13.16 1.32 2.10 3.91 18.41 1.596 2.964 3.366 48.92 96.74 -157.56 0.14 6.85 13.54 -22.06 2.05 8.10 11.92 1.31 2.11 3.91 18.36 1.603 2.974 3.379 95.63 -28.40 94.56 0.14 13.34 -3.96 13.19 2.86 1.59 3.52 1.31 2.11 3.91 18.31 1.613 2.986 3.394 4.43 -120.12 101.17 0.14 0.62 -16.70 14.06 0.90 4.84 2.57 1.30 2.11 3.90 18.26 1.624 2.999 3.410
-49.48 3.11 -104.82 0.14 -6.85 0.43 -14.52 3.62 5.55 3.38 1.29 2.12 3.89 18.21 1.639 3.012 3.429 -9.37 168.75 26.34 0.14 -1.29 23.29 3.63 1.43 2.63 1.25 1.28 2.12 3.88 18.16 1.656 3.027 3.450 2.64 92.22 147.99 0.14 0.36 12.68 20.35 2.87 6.88 4.78 1.27 2.13 3.87 18.12 1.675 3.042 3.473
-50.26 -89.80 38.61 0.14 -6.89 -12.30 5.29 4.24 9.60 3.50 1.26 2.14 3.85 18.07 1.697 3.058 3.497 -54.06 -105.42 12.51 0.14 -7.38 -14.39 1.71 2.44 13.49 2.79 1.25 2.15 3.83 18.02 1.721 3.074 3.523 51.94 -30.16 -97.32 0.14 7.06 -4.10 -13.24 0.64 12.51 8.66 1.23 2.16 3.81 17.97 1.747 3.089 3.549 110.62 -35.04 -197.73 0.14 14.99 -4.75 -26.79 2.32 7.64 7.47 1.22 2.16 3.78 17.92 1.776 3.104 3.576 -1.61 -22.93 54.56 0.14 -0.22 -3.10 7.37 16.85 22.63 8.46 1.20 2.17 3.75 17.87 1.805 3.118 3.603 -47.51 11.08 224.00 0.13 -6.39 1.49 30.13 16.79 7.79 10.47 1.19 2.18 3.71 17.82 1.836 3.129 3.628 20.54 3.04 -13.42 0.13 2.75 0.41 -1.80 4.28 12.66 8.81 1.17 2.19 3.67 17.77 1.867 3.136 3.650 -35.43 -39.89 -126.14 0.13 -4.73 -5.33 -16.84 2.75 4.88 3.12 1.16 2.19 3.63 17.72 1.899 3.139 3.668 -34.30 -37.75 50.01 0.13 -4.56 -5.02 6.65 2.87 5.45 1.34 1.14 2.20 3.58 17.68 1.930 3.135 3.682 39.69 30.26 117.68 0.13 5.26 4.01 15.59 2.17 9.90 3.85 1.13 2.21 3.53 17.63 1.960 3.125 3.688 -19.35 6.18 -37.49 0.13 -2.55 0.82 -4.95 4.11 11.59 4.10 1.12 2.22 3.47 17.58 1.989 3.106 3.688 -17.28 24.11 -155.10 0.13 -2.27 3.17 -20.40 4.18 9.58 2.94 1.11 2.23 3.41 17.53 2.015 3.079 3.680 60.63 51.94 -18.75 0.13 7.94 6.80 -2.46 7.89 10.76 3.84 1.10 2.25 3.35 17.48 2.039 3.044 3.664 6.49 -56.06 50.19 0.13 0.85 -7.32 6.55 7.89 5.45 5.25 1.10 2.26 3.29 17.43 2.061 3.000 3.640
-83.36 -13.93 -9.89 0.13 -10.84 -1.81 -1.29 3.69 3.11 7.82 1.10 2.28 3.23 17.38 2.079 2.948 3.607 -28.14 82.92 100.92 0.13 -3.64 10.74 13.07 2.91 8.69 2.60 1.10 2.29 3.16 17.33 2.093 2.888 3.567 51.81 45.66 28.66 0.13 6.68 5.89 3.70 7.24 13.34 4.17 1.10 2.31 3.10 17.29 2.104 2.820 3.518 -5.28 -29.39 -102.19 0.13 -0.68 -3.78 -13.13 8.91 4.03 5.37 1.11 2.33 3.03 17.24 2.111 2.745 3.463 -67.14 -93.15 62.89 0.13 -8.59 -11.92 8.05 5.09 25.84 0.26 1.11 2.36 2.97 17.19 2.114 2.664 3.401 -5.00 -33.91 21.72 0.13 -0.64 -4.32 2.77 1.18 17.36 5.69 1.13 2.38 2.91 17.14 2.114 2.578 3.334

612
Raw Data Tapered Data
FFT Data Parzen Filtered Data
Simple Ratio Spectrum
Z E N
Tapering Function
Z E N Z E N Z E N
Frequency Hz
E/Z N/Z
Mean SQRT Spectrum
80.85 81.99 -131.06 0.13 10.27 10.41 -16.64 5.39 17.55 5.43 1.14 2.41 2.84 17.09 2.111 2.488 3.263 41.60 139.53 -21.76 0.13 5.26 17.65 -2.75 7.29 11.48 10.39 1.16 2.45 2.78 17.04 2.105 2.395 3.188 -22.44 62.11 65.16 0.13 -2.83 7.83 8.21 8.70 4.85 5.07 1.19 2.48 2.73 16.99 2.096 2.300 3.112 8.59 -99.82 3.02 0.13 1.08 -12.53 0.38 2.86 4.41 5.48 1.21 2.53 2.67 16.94 2.086 2.205 3.035
-35.36 -96.44 -77.83 0.13 -4.42 -12.05 -9.73 9.45 19.41 3.52 1.24 2.57 2.62 16.89 2.074 2.111 2.959 -52.19 26.69 -3.66 0.12 -6.50 3.32 -0.46 11.56 8.49 3.19 1.27 2.62 2.57 16.85 2.060 2.019 2.884 67.78 99.43 87.17 0.12 8.40 12.33 10.81 4.44 9.81 5.24 1.30 2.67 2.52 16.80 2.047 1.929 2.813 62.51 34.15 -59.89 0.12 7.72 4.22 -7.40 2.74 3.53 8.68 1.34 2.72 2.47 16.75 2.033 1.843 2.744 -28.56 -53.82 -117.53 0.12 -3.51 -6.62 -14.46 3.02 17.03 5.82 1.38 2.78 2.42 16.70 2.019 1.761 2.679 -36.43 -18.69 47.61 0.12 -4.46 -2.29 5.83 2.77 34.01 4.29 1.41 2.84 2.38 16.65 2.005 1.683 2.617 33.57 9.32 52.41 0.12 4.10 1.14 6.39 10.93 31.79 2.38 1.45 2.90 2.34 16.60 1.991 1.609 2.560 50.40 20.25 -20.65 0.12 6.12 2.46 -2.51 7.09 44.07 10.17 1.50 2.96 2.30 16.55 1.978 1.539 2.507 -90.52 33.13 21.35 0.12 -10.95 4.01 2.58 10.12 35.55 4.19 1.54 3.02 2.27 16.50 1.966 1.474 2.458 -122.10 -15.92 35.24 0.12 -14.71 -1.92 4.25 9.55 17.12 9.93 1.58 3.09 2.23 16.46 1.956 1.413 2.413 16.11 -37.82 -10.81 0.12 1.93 -4.54 -1.30 4.15 30.84 12.73 1.62 3.16 2.20 16.41 1.947 1.357 2.373 22.03 16.21 -58.67 0.12 2.63 1.94 -7.01 10.75 39.09 7.44 1.66 3.23 2.17 16.36 1.940 1.305 2.338 -29.95 20.13 -17.52 0.12 -3.56 2.39 -2.08 4.89 25.24 4.60 1.71 3.30 2.14 16.31 1.935 1.257 2.307 56.99 -45.83 26.47 0.12 6.75 -5.43 3.14 1.99 24.35 5.40 1.75 3.38 2.12 16.26 1.933 1.212 2.281 52.77 -31.69 -5.58 0.12 6.23 -3.74 -0.66 5.11 29.15 3.22 1.79 3.46 2.09 16.21 1.933 1.171 2.260 -51.24 -3.63 13.41 0.12 -6.02 -0.43 1.58 6.69 18.36 2.93 1.83 3.54 2.07 16.16 1.936 1.134 2.244 -0.14 -34.56 41.30 0.12 -0.02 -4.04 4.83 3.15 23.27 4.17 1.86 3.62 2.05 16.11 1.943 1.101 2.233 32.79 -47.41 22.17 0.12 3.82 -5.52 2.58 7.81 21.64 3.60 1.90 3.71 2.03 16.06 1.953 1.071 2.227 -42.19 -42.24 -27.81 0.12 -4.89 -4.90 -3.23 5.44 8.71 8.18 1.93 3.80 2.02 16.02 1.967 1.043 2.226 -27.05 -0.17 -33.69 0.12 -3.12 -0.02 -3.89 3.83 19.01 5.62 1.97 3.91 2.01 15.97 1.984 1.019 2.231 73.85 31.76 -0.62 0.12 8.49 3.65 -0.07 2.89 19.62 2.19 2.00 4.01 1.99 15.92 2.006 0.997 2.240 66.57 51.58 10.36 0.11 7.62 5.91 1.19 5.76 4.63 2.68 2.03 4.13 1.99 15.87 2.033 0.978 2.256 -69.43 74.32 74.19 0.11 -7.91 8.47 8.46 3.90 15.99 3.43 2.06 4.25 1.98 15.82 2.064 0.962 2.278 -58.18 3.15 33.97 0.11 -6.60 0.36 3.86 2.46 21.54 4.74 2.09 4.39 1.98 15.77 2.101 0.948 2.305 34.87 0.14 -54.98 0.11 3.94 0.02 -6.21 2.96 13.71 4.16 2.11 4.53 1.98 15.72 2.144 0.936 2.339 -23.16 38.05 82.96 0.11 -2.61 4.28 9.33 4.14 7.75 0.91 2.14 4.68 1.98 15.67 2.191 0.927 2.379 -36.04 -68.90 115.56 0.11 -4.04 -7.72 12.94 1.18 10.98 2.62 2.16 4.85 1.98 15.63 2.244 0.919 2.424 15.00 -70.63 -75.52 0.11 1.67 -7.88 -8.42 5.99 7.55 1.65 2.18 5.02 1.99 15.58 2.301 0.912 2.475 34.90 68.36 -115.14 0.11 3.87 7.59 -12.78 6.79 3.29 4.63 2.20 5.20 2.00 15.53 2.363 0.908 2.531

613
Raw Data Tapered Data
FFT Data Parzen Filtered Data
Simple Ratio Spectrum
Z E N
Tapering Function
Z E N Z E N Z E N
Frequency Hz
E/Z N/Z
Mean SQRT Spectrum
72.68 77.06 -58.79 0.11 8.03 8.51 -6.50 4.78 9.40 3.75 2.22 5.38 2.01 15.48 2.428 0.905 2.591 36.46 -55.00 16.30 0.11 4.01 -6.05 1.79 5.56 6.98 2.15 2.23 5.57 2.02 15.43 2.497 0.903 2.655 -45.53 -85.73 119.03 0.11 -4.99 -9.39 13.03 3.60 2.30 8.06 2.25 5.77 2.03 15.38 2.569 0.902 2.722 -81.28 60.31 55.68 0.11 -8.86 6.57 6.07 0.51 1.14 6.78 2.26 5.96 2.04 15.33 2.643 0.902 2.792 -10.10 134.91 -56.32 0.11 -1.10 14.64 -6.11 4.32 12.11 2.61 2.27 6.16 2.04 15.28 2.718 0.903 2.864 62.80 52.52 -47.12 0.11 6.78 5.67 -5.09 2.11 10.14 6.63 2.27 6.35 2.05 15.23 2.794 0.904 2.937 -48.24 -77.44 8.96 0.11 -5.19 -8.32 0.96 4.94 11.36 5.99 2.28 6.53 2.06 15.19 2.871 0.906 3.011 -62.02 -44.21 37.87 0.11 -6.64 -4.73 4.05 2.98 15.18 5.37 2.28 6.71 2.07 15.14 2.947 0.908 3.084 73.96 98.67 -39.13 0.11 7.88 10.51 -4.17 4.70 14.35 6.30 2.27 6.87 2.07 15.09 3.022 0.911 3.156 76.65 22.42 -110.83 0.11 8.13 2.38 -11.75 5.58 9.64 4.61 2.27 7.03 2.07 15.04 3.095 0.914 3.227 3.49 -117.41 33.33 0.11 0.37 -12.39 3.52 1.45 6.80 2.54 2.26 7.16 2.07 14.99 3.164 0.917 3.294
-62.40 -78.03 173.91 0.11 -6.55 -8.19 18.26 3.15 3.40 3.32 2.25 7.27 2.07 14.94 3.230 0.919 3.358 6.71 21.08 38.48 0.10 0.70 2.20 4.02 2.68 9.79 3.00 2.24 7.36 2.06 14.89 3.290 0.922 3.417 57.58 19.98 -120.35 0.10 5.99 2.08 -12.52 1.85 13.59 1.46 2.22 7.43 2.05 14.84 3.345 0.925 3.471 -75.39 -75.92 -88.93 0.10 -7.80 -7.86 -9.20 3.20 5.02 5.04 2.20 7.47 2.04 14.79 3.394 0.928 3.519 -86.06 -108.56 48.15 0.10 -8.86 -11.18 4.96 7.70 2.48 0.90 2.18 7.48 2.03 14.75 3.436 0.931 3.560 -15.86 -47.25 79.89 0.10 -1.63 -4.84 8.19 4.69 6.61 5.39 2.15 7.47 2.01 14.70 3.471 0.934 3.595 66.04 95.64 -90.09 0.10 6.74 9.76 -9.19 3.10 7.51 0.96 2.12 7.43 1.99 14.65 3.498 0.937 3.622 82.73 125.19 -59.79 0.10 8.40 12.71 -6.07 2.27 7.33 3.48 2.09 7.36 1.97 14.60 3.517 0.939 3.641 -57.32 -86.90 105.12 0.10 -5.79 -8.78 10.62 1.52 3.62 1.91 2.06 7.27 1.94 14.55 3.528 0.942 3.652 -76.05 -133.47 31.85 0.10 -7.64 -13.41 3.20 4.67 4.35 4.14 2.03 7.16 1.92 14.50 3.530 0.945 3.654 -12.88 68.65 -20.18 0.10 -1.29 6.87 -2.02 6.05 3.62 5.30 1.99 7.02 1.89 14.45 3.524 0.949 3.649 52.04 150.20 18.83 0.10 5.18 14.94 1.87 9.57 4.65 3.04 1.96 6.86 1.86 14.40 3.509 0.953 3.636 88.76 0.89 3.78 0.10 8.79 0.09 0.37 11.61 6.03 10.48 1.92 6.69 1.84 14.36 3.485 0.957 3.614 -18.39 -116.89 -26.18 0.10 -1.81 -11.51 -2.58 8.96 10.66 12.56 1.88 6.51 1.81 14.31 3.454 0.961 3.585 -63.23 -21.62 -34.05 0.10 -6.20 -2.12 -3.34 2.95 4.38 8.99 1.85 6.31 1.78 14.26 3.414 0.966 3.548 62.77 51.31 -37.91 0.10 6.12 5.00 -3.70 2.83 10.04 3.24 1.81 6.10 1.76 14.21 3.367 0.971 3.504 54.53 13.17 -0.83 0.10 5.29 1.28 -0.08 5.28 10.46 3.86 1.78 5.89 1.74 14.16 3.312 0.976 3.453 -97.38 -30.81 118.93 0.10 -9.40 -2.97 11.48 5.95 12.06 7.28 1.74 5.67 1.71 14.11 3.251 0.982 3.396 -51.09 -35.69 71.55 0.10 -4.90 -3.43 6.87 3.42 10.70 11.56 1.71 5.45 1.69 14.06 3.184 0.988 3.334 -5.97 24.33 -67.46 0.10 -0.57 2.32 -6.44 9.98 4.17 19.25 1.68 5.24 1.67 14.01 3.112 0.994 3.267 -81.80 76.11 -8.31 0.10 -7.77 7.23 -0.79 8.71 15.26 9.39 1.66 5.03 1.66 13.96 3.036 1.000 3.197 16.33 75.80 42.62 0.09 1.54 7.16 4.03 3.83 14.04 8.10 1.63 4.83 1.64 13.92 2.957 1.007 3.124

614
Raw Data Tapered Data
FFT Data Parzen Filtered Data
Simple Ratio Spectrum
Z E N
Tapering Function
Z E N Z E N Z E N
Frequency Hz
E/Z N/Z
Mean SQRT Spectrum
75.14 -30.31 -25.41 0.09 7.06 -2.85 -2.39 4.19 8.27 3.28 1.61 4.64 1.63 13.87 2.875 1.013 75.14 -34.94 -50.16 -34.30 0.09 -3.27 -4.69 -3.21 6.83 1.49 8.11 1.59 4.45 1.62 13.82 2.793 1.019 -34.94 -9.85 121.69 15.74 0.09 -0.92 11.32 1.46 8.82 4.45 0.53 1.58 4.28 1.62 13.77 2.709 1.026 -9.85 65.04 84.26 8.69 0.09 6.02 7.79 0.80 5.99 10.85 8.36 1.57 4.12 1.62 13.72 2.627 1.032 65.04 -33.03 -55.81 5.66 0.09 -3.04 -5.13 0.52 2.26 7.98 0.99 1.56 3.97 1.62 13.67 2.545 1.037 -33.03 -81.80 -16.67 100.45 0.09 -7.48 -1.53 9.19 0.84 12.51 3.58 1.55 3.83 1.62 13.62 2.464 1.042 -81.80 13.34 1.35 24.20 0.09 1.21 0.12 2.20 5.44 9.38 6.94 1.55 3.70 1.63 13.57 2.384 1.047 13.34 32.24 -18.63 -239.37 0.09 2.92 -1.69 -21.66 4.06 4.20 10.42 1.56 3.59 1.64 13.53 2.307 1.051 32.24 -33.76 -26.55 -97.70 0.09 -3.04 -2.39 -8.79 2.97 9.41 3.64 1.56 3.49 1.65 13.48 2.231 1.054 -33.76 -75.54 -14.48 283.93 0.09 -6.76 -1.30 25.41 12.32 9.71 6.02 1.57 3.40 1.66 13.43 2.158 1.057 -75.54 -20.35 26.48 106.15 0.09 -1.81 2.36 9.45 3.45 6.19 4.21 1.59 3.31 1.68 13.38 2.089 1.060 -20.35 51.59 69.28 -315.43 0.09 4.57 6.13 -27.92 8.55 5.59 8.99 1.60 3.24 1.70 13.33 2.023 1.063 51.59 6.47 91.94 -191.42 0.09 0.57 8.09 -16.84 20.22 8.74 18.31 1.62 3.18 1.73 13.28 1.961 1.067 6.47
-57.43 -31.19 238.49 0.09 -5.02 -2.73 20.87 12.86 22.13 19.05 1.64 3.13 1.76 13.23 1.903 1.070 -57.43 -40.23 -123.90 252.50 0.09 -3.50 -10.78 21.97 9.89 24.62 16.19 1.67 3.09 1.79 13.18 1.849 1.074 -40.23 19.81 -38.58 -104.79 0.09 1.71 -3.34 -9.06 15.67 27.13 8.82 1.70 3.05 1.83 13.13 1.798 1.078 19.81 44.68 81.32 -267.05 0.09 3.84 6.99 -22.97 14.00 26.49 22.43 1.72 3.02 1.87 13.09 1.752 1.083 44.68 16.55 29.09 -78.35 0.09 1.42 2.49 -6.70 9.13 10.52 17.09 1.75 3.00 1.91 13.04 1.709 1.088 16.55 -9.46 -154.67 217.37 0.09 -0.80 -13.15 18.48 7.98 24.07 4.78 1.79 2.98 1.95 12.99 1.670 1.093 -9.46 2.55 -34.31 185.56 0.08 0.22 -2.90 15.68 12.91 38.78 17.89 1.82 2.98 2.00 12.94 1.634 1.099 2.55 14.52 140.47 -154.50 0.08 1.22 11.80 -12.98 8.95 28.34 15.65 1.86 2.97 2.05 12.89 1.601 1.105 14.52 -3.51 35.11 -184.82 0.08 -0.29 2.93 -15.43 1.69 26.06 7.59 1.89 2.98 2.10 12.84 1.573 1.111 -3.51 -39.42 -66.84 105.34 0.08 -3.27 -5.55 8.74 11.25 18.46 6.54 1.93 2.99 2.16 12.79 1.548 1.117 -39.42 -66.21 -105.51 169.78 0.08 -5.46 -8.70 14.01 8.50 11.40 6.30 1.97 3.01 2.21 12.74 1.527 1.123 -66.21 3.91 8.67 -78.40 0.08 0.32 0.71 -6.43 6.26 2.66 6.71 2.01 3.03 2.27 12.70 1.510 1.130 3.91 58.79 119.41 -171.90 0.08 4.79 9.73 -14.01 5.06 5.01 3.33 2.05 3.07 2.33 12.65 1.497 1.137 58.79 10.65 -1.84 38.37 0.08 0.86 -0.15 3.11 4.50 9.19 2.55 2.09 3.11 2.39 12.60 1.488 1.144 10.65 13.60 -58.73 126.04 0.08 1.09 -4.73 10.15 6.37 14.53 3.30 2.13 3.16 2.45 12.55 1.482 1.150 13.60 -0.43 2.37 2.78 0.08 -0.03 0.19 0.22 5.40 10.74 5.43 2.17 3.21 2.51 12.50 1.479 1.156 -0.43 -42.34 60.23 -61.10 0.08 -3.37 4.79 -4.86 5.78 4.33 7.98 2.22 3.28 2.57 12.45 1.478 1.161 -42.34 -5.25 40.02 -4.97 0.08 -0.41 3.16 -0.39 4.88 6.57 10.47 2.26 3.35 2.64 12.40 1.480 1.166 -5.25 12.74 -81.91 60.92 0.08 1.00 -6.43 4.78 3.22 2.30 6.39 2.31 3.43 2.70 12.35 1.484 1.169 12.74 -25.24 -57.64 68.66 0.08 -1.97 -4.50 5.36 4.05 1.37 9.00 2.36 3.52 2.77 12.30 1.491 1.172 -25.24

615
Raw Data Tapered Data
FFT Data Parzen Filtered Data
Simple Ratio Spectrum
Z E N
Tapering Function
Z E N Z E N Z E N
Frequency Hz
E/Z N/Z
Mean SQRT Spectrum
-34.12 95.27 -46.39 0.08 -2.64 7.38 -3.59 1.55 7.95 7.18 2.41 3.62 2.83 12.26 1.500 1.175 1.906 8.93 116.83 -142.01 0.08 0.69 9.00 -10.93 4.93 8.36 3.15 2.46 3.72 2.90 12.21 1.512 1.176 1.915
42.82 11.56 102.07 0.08 3.28 0.88 7.81 6.01 12.26 10.11 2.51 3.83 2.96 12.16 1.525 1.178 1.926 4.73 -13.45 233.40 0.08 0.36 -1.02 17.74 3.38 11.76 6.34 2.57 3.95 3.02 12.11 1.539 1.179 1.939
-39.20 55.45 -81.91 0.08 -2.96 4.19 -6.18 2.01 4.68 3.35 2.62 4.07 3.09 12.06 1.556 1.179 1.952 28.82 42.24 -215.31 0.08 2.16 3.17 -16.15 4.20 3.82 6.88 2.67 4.20 3.15 12.01 1.573 1.180 1.967 57.64 -16.82 -22.84 0.07 4.29 -1.25 -1.70 3.55 4.91 7.92 2.72 4.33 3.21 11.96 1.592 1.180 1.981 -71.33 -90.62 144.92 0.07 -5.28 -6.71 10.72 7.32 8.45 7.36 2.77 4.46 3.27 11.91 1.610 1.180 1.996 -100.99 -54.34 71.48 0.07 -7.42 -3.99 5.25 8.31 13.97 7.68 2.81 4.58 3.32 11.87 1.628 1.180 2.011 18.18 130.49 -139.38 0.07 1.33 9.53 -10.17 1.79 9.01 10.10 2.86 4.70 3.37 11.82 1.646 1.179 2.025 42.06 128.96 -99.90 0.07 3.05 9.35 -7.24 1.87 6.19 15.18 2.90 4.82 3.41 11.77 1.664 1.179 2.039 41.89 -59.20 84.13 0.07 3.02 -4.26 6.06 1.90 4.57 13.30 2.93 4.93 3.45 11.72 1.682 1.178 2.054 20.77 -156.78 98.76 0.07 1.48 -11.21 7.06 2.94 6.22 9.75 2.96 5.03 3.49 11.67 1.699 1.178 2.068 -79.12 -34.41 -23.39 0.07 -5.62 -2.44 -1.66 6.17 7.95 7.27 2.98 5.12 3.52 11.62 1.716 1.179 2.082 16.01 81.48 -137.07 0.07 1.13 5.74 -9.66 8.45 1.50 5.61 3.00 5.19 3.54 11.57 1.733 1.180 2.097 95.78 60.19 -75.64 0.07 6.70 4.21 -5.29 7.42 7.09 11.31 3.00 5.25 3.55 11.52 1.749 1.182 2.111 -5.40 21.01 113.29 0.07 -0.38 1.46 7.87 4.49 13.12 18.26 3.00 5.30 3.56 11.47 1.765 1.185 2.126 -3.38 -69.91 99.86 0.07 -0.23 -4.82 6.89 2.31 8.75 7.36 2.99 5.32 3.56 11.43 1.780 1.188 2.140 -0.38 -17.74 -114.11 0.07 -0.03 -1.22 -7.82 3.28 6.99 2.82 2.97 5.33 3.55 11.38 1.793 1.193 2.154 26.57 61.16 -121.64 0.07 1.81 4.16 -8.27 2.71 7.67 5.27 2.95 5.32 3.53 11.33 1.805 1.199 2.167 76.36 -9.96 101.40 0.07 5.15 -0.67 6.84 4.36 2.27 8.07 2.91 5.29 3.51 11.28 1.816 1.205 2.180 -18.75 18.01 95.01 0.07 -1.26 1.21 6.37 3.48 4.46 6.31 2.87 5.25 3.49 11.23 1.826 1.213 2.192 -74.57 1.95 -116.95 0.07 -4.96 0.13 -7.78 2.58 5.94 1.84 2.83 5.18 3.45 11.18 1.833 1.222 2.203 -71.28 -66.93 -65.58 0.07 -4.70 -4.42 -4.33 2.92 1.79 1.54 2.77 5.10 3.42 11.13 1.839 1.233 2.214 -48.04 -103.60 99.35 0.07 -3.15 -6.79 6.51 2.68 6.39 3.27 2.71 5.00 3.38 11.08 1.843 1.246 2.225 13.03 -80.24 37.08 0.07 0.85 -5.22 2.41 3.93 5.89 2.10 2.65 4.90 3.34 11.04 1.846 1.260 2.235 14.98 102.70 -63.87 0.06 0.97 6.62 -4.12 5.97 6.09 4.38 2.59 4.78 3.30 10.99 1.848 1.277 2.246 8.93 135.21 -50.64 0.06 0.57 8.65 -3.24 4.82 4.99 0.97 2.52 4.65 3.26 10.94 1.848 1.296 2.257
60.79 24.87 1.46 0.06 3.86 1.58 0.09 2.90 4.50 4.04 2.45 4.52 3.22 10.89 1.847 1.317 2.268 30.60 -95.00 82.29 0.06 1.93 -5.99 5.18 4.68 7.96 2.63 2.38 4.38 3.19 10.84 1.844 1.341 2.280 -67.32 -132.56 62.00 0.06 -4.21 -8.28 3.88 5.80 13.52 3.24 2.31 4.24 3.15 10.79 1.839 1.367 2.291 -5.18 54.59 -66.99 0.06 -0.32 3.38 -4.15 4.02 2.98 1.42 2.24 4.10 3.12 10.74 1.832 1.395 2.303 61.71 138.19 -77.69 0.06 3.79 8.50 -4.78 3.34 5.15 2.17 2.17 3.96 3.09 10.69 1.823 1.424 2.314

616
Raw Data Tapered Data
FFT Data Parzen Filtered Data
Simple Ratio Spectrum
Z E N
Tapering Function
Z E N Z E N Z E N
Frequency Hz
E/Z N/Z
Mean SQRT Spectrum
-1.42 30.83 -5.53 0.06 -0.09 1.88 -0.34 3.57 7.45 3.07 2.11 3.82 3.06 10.64 1.813 1.455 2.324 -50.31 -101.04 54.38 0.06 -3.04 -6.11 3.29 5.10 7.43 4.01 2.05 3.69 3.04 10.60 1.801 1.486 2.335 -39.13 -60.73 18.23 0.06 -2.35 -3.64 1.09 6.39 3.56 5.59 1.99 3.56 3.02 10.55 1.788 1.517 2.345 46.85 104.17 -104.60 0.06 2.79 6.20 -6.22 4.96 0.84 6.28 1.94 3.44 3.00 10.50 1.775 1.549 2.355 90.57 53.84 -56.27 0.06 5.34 3.18 -3.32 10.98 2.58 4.89 1.89 3.33 2.99 10.45 1.761 1.579 2.365 3.38 -27.23 78.68 0.06 0.20 -1.59 4.60 2.73 3.88 3.04 1.85 3.23 2.97 10.40 1.746 1.607 2.373
-108.41 -54.08 109.31 0.06 -6.29 -3.14 6.34 4.18 1.29 4.04 1.81 3.13 2.95 10.35 1.731 1.633 2.380 -71.05 -41.90 21.05 0.06 -4.09 -2.41 1.21 4.13 4.66 3.88 1.77 3.05 2.94 10.30 1.717 1.656 2.385 71.95 39.09 -74.84 0.06 4.10 2.23 -4.27 2.19 4.21 1.73 1.74 2.97 2.92 10.25 1.703 1.675 2.388 87.63 13.97 -28.64 0.06 4.95 0.79 -1.62 1.85 5.65 1.84 1.72 2.90 2.90 10.21 1.688 1.689 2.388 -38.47 -2.07 17.39 0.06 -2.15 -0.12 0.97 0.31 2.54 2.32 1.69 2.83 2.87 10.16 1.674 1.697 2.384 -77.24 -27.02 11.33 0.06 -4.29 -1.50 0.63 1.72 1.90 2.58 1.67 2.78 2.85 10.11 1.659 1.700 2.375 58.80 -22.93 12.28 0.06 3.23 -1.26 0.68 1.38 4.85 4.18 1.66 2.72 2.81 10.06 1.643 1.697 2.362 95.49 31.04 30.20 0.05 5.20 1.69 1.65 2.46 5.49 5.21 1.64 2.68 2.77 10.01 1.628 1.687 2.344 -23.66 -49.94 38.06 0.05 -1.28 -2.70 2.06 5.69 0.75 9.59 1.63 2.63 2.73 9.96 1.613 1.671 2.322 -90.43 -77.70 -15.98 0.05 -4.84 -4.16 -0.86 4.58 3.51 6.01 1.62 2.59 2.68 9.91 1.597 1.650 2.296 -32.19 27.39 -17.92 0.05 -1.71 1.45 -0.95 4.60 4.41 3.02 1.62 2.56 2.62 9.86 1.582 1.623 2.266 34.81 145.03 -11.86 0.05 1.83 7.61 -0.62 3.21 6.89 6.62 1.61 2.52 2.56 9.81 1.566 1.593 2.233 -15.23 56.61 9.15 0.05 -0.79 2.94 0.48 3.43 3.47 8.04 1.60 2.49 2.50 9.77 1.549 1.558 2.197 -25.15 -85.34 47.04 0.05 -1.30 -4.40 2.42 6.45 3.80 4.88 1.60 2.45 2.43 9.72 1.532 1.519 2.157 -38.03 26.76 -51.95 0.05 -1.94 1.36 -2.65 6.45 7.16 7.78 1.60 2.42 2.36 9.67 1.514 1.478 2.116 -31.89 61.57 -81.68 0.05 -1.61 3.11 -4.13 3.60 8.29 2.97 1.60 2.38 2.29 9.62 1.495 1.435 2.072 72.03 -0.57 56.37 0.05 3.60 -0.03 2.82 4.90 3.31 2.37 1.59 2.35 2.22 9.57 1.475 1.391 2.027 -6.10 -76.43 115.02 0.05 -0.30 -3.78 5.69 2.41 4.77 2.89 1.59 2.32 2.14 9.52 1.454 1.346 1.981
-114.86 -136.02 -6.20 0.05 -5.63 -6.66 -0.30 2.61 6.73 6.32 1.59 2.28 2.07 9.47 1.433 1.301 1.936 -22.58 21.20 -75.03 0.05 -1.10 1.03 -3.64 5.33 3.93 4.54 1.59 2.25 2.00 9.42 1.412 1.258 1.891 140.18 110.92 66.98 0.05 6.73 5.32 3.22 4.39 5.91 1.08 1.59 2.21 1.93 9.38 1.390 1.216 1.847 71.76 27.63 111.62 0.05 3.41 1.31 5.30 2.13 1.69 2.67 1.59 2.18 1.87 9.33 1.369 1.177 1.805
-128.13 -23.39 -6.59 0.05 -6.02 -1.10 -0.31 6.10 6.05 5.87 1.59 2.14 1.81 9.28 1.348 1.141 1.766 9.11 1.64 -27.52 0.05 0.42 0.08 -1.28 5.33 3.56 7.65 1.59 2.10 1.76 9.23 1.327 1.108 1.729
159.77 -25.33 -24.42 0.05 7.35 -1.17 -1.12 3.23 3.13 4.64 1.58 2.07 1.71 9.18 1.307 1.080 1.696 11.43 -58.17 -14.34 0.05 0.52 -2.65 -0.65 6.10 3.25 3.11 1.58 2.03 1.67 9.13 1.288 1.055 1.665
-102.39 104.72 84.52 0.05 -4.61 4.71 3.80 5.63 5.65 0.98 1.58 2.00 1.63 9.08 1.269 1.035 1.637

617
Raw Data Tapered Data
FFT Data Parzen Filtered Data
Simple Ratio Spectrum
Z E N
Tapering Function
Z E N Z E N Z E N
Frequency Hz
E/Z N/Z
Mean SQRT Spectrum
-75.04 60.37 48.25 0.04 -3.34 2.69 2.15 2.66 11.92 1.97 1.57 1.96 1.60 9.03 1.250 1.019 1.613 -20.85 -99.56 -99.65 0.04 -0.92 -4.38 -4.38 4.96 11.80 3.29 1.57 1.93 1.58 8.98 1.232 1.007 1.592 29.14 59.50 -92.26 0.04 1.27 2.59 -4.01 5.02 10.30 4.32 1.56 1.90 1.56 8.94 1.216 0.999 1.574 8.06 50.27 53.81 0.04 0.35 2.16 2.31 0.25 8.99 0.14 1.56 1.87 1.55 8.89 1.200 0.995 1.559
-106.74 -124.60 98.51 0.04 -4.54 -5.30 4.19 2.49 6.08 1.92 1.55 1.84 1.54 8.84 1.187 0.994 1.548 -68.39 -43.27 -18.66 0.04 -2.87 -1.82 -0.78 3.72 5.45 1.09 1.55 1.82 1.54 8.79 1.175 0.997 1.541 87.57 86.63 -49.52 0.04 3.63 3.59 -2.06 0.92 7.66 0.45 1.54 1.79 1.54 8.74 1.165 1.002 1.536 68.26 76.28 -6.41 0.04 2.80 3.13 -0.26 1.38 5.31 2.27 1.53 1.77 1.55 8.69 1.157 1.009 1.535 -45.78 10.10 -45.31 0.04 -1.85 0.41 -1.83 2.13 1.91 6.02 1.53 1.76 1.56 8.64 1.151 1.018 1.536 -64.56 -25.89 -26.16 0.04 -2.58 -1.04 -1.05 4.53 1.17 9.06 1.52 1.75 1.56 8.59 1.147 1.027 1.540 59.45 -13.82 51.78 0.04 2.35 -0.55 2.05 4.30 1.23 6.56 1.52 1.74 1.58 8.54 1.145 1.038 1.545 159.01 37.12 3.67 0.04 6.20 1.45 0.14 3.09 5.85 5.24 1.51 1.73 1.59 8.50 1.144 1.049 1.552 51.59 82.86 -74.19 0.04 1.99 3.19 -2.86 3.22 9.01 6.48 1.51 1.73 1.60 8.45 1.145 1.059 1.560 -82.35 42.59 -34.97 0.04 -3.13 1.62 -1.33 2.39 8.51 6.76 1.51 1.73 1.61 8.40 1.148 1.068 1.568 -48.09 -164.18 -17.86 0.04 -1.80 -6.16 -0.67 2.55 8.18 6.46 1.51 1.73 1.62 8.35 1.153 1.076 1.577 0.01 -214.43 -40.74 0.04 0.00 -7.93 -1.51 6.03 3.46 4.36 1.50 1.74 1.63 8.30 1.159 1.083 1.586
-40.91 78.83 22.29 0.04 -1.49 2.88 0.81 5.77 2.18 5.04 1.50 1.75 1.64 8.25 1.167 1.088 1.596 -42.74 100.45 45.16 0.04 -1.54 3.62 1.63 5.60 5.80 2.56 1.50 1.77 1.64 8.20 1.178 1.091 1.606 -5.65 -100.56 -50.83 0.04 -0.20 -3.57 -1.80 3.59 11.27 2.19 1.50 1.79 1.64 8.15 1.190 1.092 1.616 9.35 -31.31 -40.65 0.04 0.33 -1.10 -1.42 1.79 9.29 2.94 1.50 1.81 1.64 8.11 1.205 1.092 1.626
22.28 29.68 74.29 0.03 0.77 1.02 2.56 4.37 2.55 6.15 1.50 1.83 1.64 8.06 1.221 1.091 1.637 2.23 -27.34 20.10 0.03 0.08 -0.93 0.68 3.83 3.19 6.73 1.50 1.86 1.63 8.01 1.239 1.088 1.649
-43.68 -19.26 -2.94 0.03 -1.46 -0.65 -0.10 2.99 3.27 8.28 1.50 1.89 1.63 7.96 1.258 1.083 1.661 -8.58 60.64 69.93 0.03 -0.28 2.00 2.31 2.27 5.11 5.24 1.50 1.92 1.62 7.91 1.279 1.079 1.673 93.25 65.38 -48.12 0.03 3.03 2.12 -1.56 3.38 6.04 2.24 1.50 1.94 1.61 7.86 1.300 1.074 1.686 35.00 -75.62 -53.91 0.03 1.12 -2.42 -1.73 2.11 6.27 3.65 1.49 1.97 1.60 7.81 1.321 1.068 1.699
-128.82 -132.21 31.14 0.03 -4.06 -4.16 0.98 4.21 4.29 1.05 1.49 2.00 1.58 7.76 1.343 1.063 1.713 -31.49 -58.84 17.04 0.03 -0.98 -1.82 0.53 0.96 2.28 4.17 1.48 2.03 1.57 7.71 1.366 1.059 1.729 133.30 11.24 80.84 0.03 4.07 0.34 2.47 6.02 0.51 7.26 1.48 2.06 1.56 7.67 1.389 1.056 1.745 -5.95 24.16 -52.22 0.03 -0.18 0.72 -1.57 6.35 2.36 2.67 1.47 2.08 1.55 7.62 1.413 1.054 1.762
-89.76 29.04 -80.95 0.03 -2.65 0.86 -2.39 5.37 2.16 8.33 1.47 2.11 1.54 7.57 1.436 1.053 1.781 7.40 19.93 109.99 0.03 0.21 0.58 3.19 5.13 1.55 9.06 1.46 2.13 1.54 7.52 1.460 1.054 1.801
27.33 -84.95 40.69 0.03 0.78 -2.42 1.16 5.02 7.38 4.36 1.45 2.15 1.53 7.47 1.484 1.057 1.822

618
Raw Data Tapered Data
FFT Data Parzen Filtered Data
Simple Ratio Spectrum
Z E N
Tapering Function
Z E N Z E N Z E N
Frequency Hz
E/Z N/Z
Mean SQRT Spectrum
48.18 -1.79 20.57 0.03 1.35 -0.05 0.58 6.93 10.59 4.34 1.44 2.17 1.53 7.42 1.506 1.061 1.843 3.08 192.81 -39.40 0.03 0.08 5.30 -1.08 7.17 7.61 6.10 1.43 2.18 1.53 7.37 1.527 1.068 1.863
-66.79 23.37 -111.10 0.03 -1.80 0.63 -3.00 2.94 5.30 8.93 1.42 2.19 1.53 7.32 1.546 1.076 1.884 -5.65 -153.39 53.02 0.03 -0.15 -4.06 1.41 4.73 3.71 6.61 1.41 2.20 1.53 7.28 1.563 1.086 1.903 29.31 -12.07 68.78 0.03 0.76 -0.31 1.79 4.71 7.39 3.58 1.40 2.21 1.54 7.23 1.577 1.097 1.921 -28.70 78.78 12.61 0.03 -0.73 2.01 0.32 7.69 10.80 4.67 1.39 2.21 1.55 7.18 1.588 1.110 1.938 -60.52 18.58 -80.25 0.03 -1.51 0.46 -2.01 5.01 5.90 4.02 1.38 2.21 1.56 7.13 1.596 1.125 1.952 30.54 -31.41 -84.92 0.02 0.75 -0.77 -2.08 2.60 2.97 1.99 1.38 2.21 1.57 7.08 1.600 1.140 1.965 68.35 -21.32 82.08 0.02 1.64 -0.51 1.97 4.11 4.62 2.11 1.37 2.20 1.59 7.03 1.601 1.155 1.974 -35.72 -22.24 -2.08 0.02 -0.84 -0.52 -0.05 3.21 5.97 2.17 1.37 2.19 1.60 6.98 1.599 1.171 1.982 -119.41 2.78 -93.89 0.02 -2.75 0.06 -2.16 1.44 4.26 2.02 1.37 2.18 1.62 6.93 1.593 1.186 1.986 -40.09 64.63 18.27 0.02 -0.90 1.45 0.41 4.28 8.19 6.58 1.37 2.17 1.64 6.88 1.584 1.200 1.987 132.73 7.48 55.12 0.02 2.92 0.16 1.21 4.74 9.53 4.45 1.37 2.16 1.66 6.84 1.572 1.212 1.985 55.35 -18.52 10.99 0.02 1.19 -0.40 0.24 3.40 6.12 1.32 1.38 2.14 1.68 6.79 1.556 1.223 1.980 -65.63 71.36 -33.97 0.02 -1.38 1.50 -0.71 0.93 9.90 2.82 1.38 2.12 1.70 6.74 1.538 1.232 1.971 2.50 15.18 -0.90 0.02 0.05 0.31 -0.02 2.48 4.43 6.59 1.39 2.11 1.72 6.69 1.517 1.240 1.959
-17.47 -125.62 51.00 0.02 -0.35 -2.51 1.02 5.97 4.46 6.71 1.40 2.09 1.74 6.64 1.493 1.245 1.944 3.56 -43.29 -32.04 0.02 0.07 -0.84 -0.62 6.94 5.03 2.14 1.41 2.07 1.76 6.59 1.469 1.248 1.927
66.42 136.51 -73.82 0.02 1.26 2.59 -1.40 7.87 5.01 1.03 1.42 2.05 1.78 6.54 1.444 1.249 1.909 16.25 34.15 6.31 0.02 0.30 0.63 0.12 4.47 1.58 1.27 1.44 2.04 1.79 6.49 1.419 1.248 1.889 -24.73 -195.54 15.27 0.02 -0.45 -3.52 0.27 3.28 3.41 3.67 1.45 2.02 1.81 6.45 1.394 1.245 1.869 -47.58 -165.82 47.14 0.02 -0.83 -2.90 0.83 3.56 3.84 4.11 1.47 2.01 1.82 6.40 1.370 1.240 1.848 47.42 113.27 29.99 0.02 0.81 1.93 0.51 1.83 1.94 2.00 1.48 2.00 1.83 6.35 1.348 1.234 1.827 83.16 249.53 -120.83 0.02 1.37 4.12 -1.99 3.89 3.67 1.34 1.50 1.99 1.84 6.30 1.327 1.225 1.806
-118.77 63.89 -31.52 0.02 -1.90 1.02 -0.50 5.49 4.43 2.43 1.52 1.99 1.85 6.25 1.307 1.215 1.785 -98.34 -118.02 101.34 0.02 -1.52 -1.83 1.57 2.90 3.39 2.45 1.54 1.98 1.85 6.20 1.290 1.204 1.765 96.67 -139.51 21.09 0.02 1.45 -2.09 0.32 0.61 4.41 4.74 1.55 1.98 1.85 6.15 1.275 1.192 1.745 12.45 -43.16 -0.95 0.01 0.18 -0.63 -0.01 5.12 6.49 12.44 1.57 1.98 1.85 6.10 1.262 1.179 1.727
-114.35 107.70 8.04 0.01 -1.60 1.51 0.11 6.37 16.12 11.67 1.58 1.98 1.85 6.05 1.251 1.165 1.710 -28.06 105.26 0.02 0.01 -0.38 1.42 0.00 2.71 2.02 10.86 1.60 1.99 1.84 6.01 1.242 1.151 1.694 48.90 -63.84 56.91 0.01 0.64 -0.83 0.74 4.67 5.11 10.95 1.61 1.99 1.83 5.96 1.236 1.137 1.680 -2.19 -209.31 51.69 0.01 -0.03 -2.62 0.65 3.75 2.02 6.84 1.62 2.00 1.82 5.91 1.232 1.124 1.668
-72.04 -64.77 -87.24 0.01 -0.86 -0.78 -1.05 4.54 1.99 4.53 1.63 2.01 1.81 5.86 1.231 1.110 1.657

619
Raw Data Tapered Data
FFT Data Parzen Filtered Data
Simple Ratio Spectrum
Z E N
Tapering Function
Z E N Z E N Z E N
Frequency Hz
E/Z N/Z
Mean SQRT Spectrum
-50.79 213.92 -61.94 0.01 -0.58 2.46 -0.71 3.83 1.46 3.09 1.64 2.02 1.80 5.81 1.231 1.096 1.648 63.18 127.23 114.95 0.01 0.70 1.40 1.26 2.64 3.97 3.31 1.65 2.03 1.78 5.76 1.233 1.083 1.641 53.95 -119.80 48.62 0.01 0.57 -1.26 0.51 4.69 4.43 4.26 1.65 2.04 1.77 5.71 1.236 1.071 1.635 -77.00 -73.43 -44.39 0.01 -0.77 -0.73 -0.44 5.60 0.39 3.84 1.65 2.05 1.75 5.66 1.239 1.058 1.630 -63.72 106.49 -32.23 0.01 -0.61 1.01 -0.31 4.36 2.42 3.29 1.66 2.06 1.73 5.62 1.243 1.046 1.625 17.38 44.18 -85.00 0.01 0.16 0.40 -0.76 5.10 1.89 4.55 1.66 2.07 1.71 5.57 1.248 1.035 1.622 99.14 -90.74 2.17 0.01 0.84 -0.77 0.02 4.73 1.84 3.34 1.65 2.07 1.70 5.52 1.253 1.026 1.619 108.73 5.41 55.05 0.01 0.87 0.04 0.44 0.49 4.31 2.75 1.65 2.08 1.68 5.47 1.257 1.017 1.617 -35.42 85.22 -49.96 0.01 -0.27 0.64 -0.37 3.53 4.79 5.01 1.65 2.08 1.66 5.42 1.261 1.010 1.616 -52.24 36.96 10.12 0.01 -0.37 0.26 0.07 3.27 4.89 7.30 1.64 2.08 1.65 5.37 1.265 1.005 1.615 45.77 -76.97 86.93 0.01 0.30 -0.50 0.57 2.36 3.95 5.47 1.64 2.07 1.64 5.32 1.268 1.001 1.615 25.63 -153.52 32.69 0.01 0.15 -0.92 0.20 1.73 4.96 5.23 1.63 2.07 1.63 5.27 1.269 1.000 1.616 -70.28 -17.19 -48.28 0.01 -0.39 -0.09 -0.27 2.11 4.13 6.04 1.62 2.06 1.62 5.22 1.270 1.000 1.617 -33.07 125.58 -75.04 0.01 -0.17 0.63 -0.38 1.05 5.17 6.45 1.61 2.05 1.62 5.18 1.269 1.003 1.618 56.88 87.14 34.05 0.00 0.26 0.39 0.15 1.02 10.57 3.72 1.60 2.03 1.62 5.13 1.267 1.008 1.619 -46.14 -66.92 63.85 0.00 -0.18 -0.27 0.26 1.01 6.57 2.15 1.60 2.02 1.62 5.08 1.262 1.015 1.620 -61.92 -85.63 -20.24 0.00 -0.22 -0.30 -0.07 5.93 5.95 1.90 1.59 2.00 1.63 5.03 1.256 1.024 1.621 83.04 46.44 -2.19 0.00 0.25 0.14 -0.01 9.22 3.49 5.31 1.58 1.97 1.64 4.98 1.249 1.035 1.622 38.80 -8.65 34.74 0.00 0.10 -0.02 0.09 2.84 6.79 3.89 1.57 1.95 1.65 4.93 1.240 1.048 1.623 -66.15 -79.48 28.61 0.00 -0.13 -0.16 0.06 1.44 4.83 1.92 1.56 1.92 1.66 4.88 1.230 1.062 1.625 2.98 5.65 21.51 0.00 0.00 0.01 0.03 3.03 3.32 1.32 1.56 1.90 1.68 4.83 1.219 1.079 1.628 65.84 -10.35 -37.46 0.00 0.07 -0.01 -0.04 5.18 3.73 2.16 1.55 1.87 1.70 4.79 1.208 1.097 1.631 -18.25 -96.15 -70.24 0.00 -0.01 -0.05 -0.04 3.15 4.73 4.26 1.54 1.84 1.72 4.74 1.196 1.116 1.636

620
Microtremors Segment: B3-S3
Raw Data Tapered Data
FFT Data Parzen Filtered Data
Simple Ratio Spectrum
Z E N
Tapering Function
Z E N Z E N Z E N
Frequency Hz
E/Z N/Z
Mean SQRT Spectrum
-108.54 -59.77 -32.66 0.26 -28.17 -15.51 -8.48 7.06 9.77 14.03 3.36 6.37 3.92 30.03 1.89 1.17 2.22 52.57 3.33 -69.44 0.26 13.61 0.86 -17.99 15.22 14.82 14.71 3.37 6.32 3.97 29.98 1.88 1.18 2.21 173.11 -9.66 -40.21 0.26 44.75 -2.50 -10.39 9.62 9.73 12.72 3.37 6.26 4.02 29.93 1.85 1.19 2.20 -7.23 -16.62 180.52 0.26 -1.86 -4.29 46.57 16.14 9.15 8.39 3.38 6.19 4.08 29.88 1.83 1.21 2.19
-212.79 -26.53 21.13 0.26 -54.79 -6.83 5.44 20.87 7.81 6.51 3.39 6.13 4.14 29.83 1.81 1.22 2.18 -85.19 -25.44 -132.64 0.26 -21.89 -6.54 -34.09 6.92 18.46 3.71 3.39 6.06 4.20 29.79 1.79 1.24 2.17 157.66 44.52 53.53 0.26 40.44 11.42 13.73 19.93 14.80 11.23 3.40 5.99 4.26 29.74 1.76 1.25 2.16 77.18 44.33 121.19 0.26 19.76 11.35 31.03 9.34 7.72 12.10 3.40 5.91 4.32 29.69 1.74 1.27 2.15 -98.78 -32.70 15.93 0.26 -25.24 -8.35 4.07 10.36 9.74 9.83 3.41 5.84 4.39 29.64 1.71 1.29 2.14 -67.45 8.35 -177.73 0.26 -17.20 2.13 -45.32 16.69 19.16 7.38 3.42 5.77 4.45 29.59 1.69 1.30 2.13 24.64 60.20 -111.14 0.25 6.27 15.32 -28.29 0.47 18.84 1.23 3.43 5.69 4.50 29.54 1.66 1.31 2.12 92.40 -6.91 134.82 0.25 23.47 -1.76 34.25 13.15 8.40 11.22 3.44 5.62 4.56 29.49 1.64 1.33 2.11 -13.76 -55.79 68.43 0.25 -3.49 -14.14 17.35 9.15 2.09 15.67 3.45 5.54 4.60 29.44 1.61 1.34 2.09 -92.55 -24.64 -57.58 0.25 -23.42 -6.23 -14.57 7.14 20.73 2.06 3.46 5.47 4.64 29.39 1.58 1.34 2.08 65.50 26.35 -44.37 0.25 16.54 6.65 -11.20 7.20 26.75 10.83 3.47 5.40 4.68 29.35 1.56 1.35 2.06 57.25 22.25 -19.23 0.25 14.43 5.61 -4.84 1.25 17.82 8.73 3.48 5.32 4.70 29.30 1.53 1.35 2.04 -28.81 -47.71 19.79 0.25 -7.25 -12.00 4.98 5.30 12.14 6.14 3.49 5.25 4.71 29.25 1.50 1.35 2.02 -56.64 -32.55 14.73 0.25 -14.22 -8.17 3.70 10.88 10.59 12.88 3.51 5.18 4.72 29.20 1.48 1.34 2.00 -91.35 91.32 -51.19 0.25 -22.88 22.88 -12.82 1.46 33.46 14.87 3.53 5.11 4.71 29.15 1.45 1.33 1.97 55.72 91.95 -10.05 0.25 13.93 22.99 -2.51 1.06 25.70 18.56 3.55 5.05 4.69 29.10 1.42 1.32 1.94 120.36 -22.20 28.93 0.25 30.03 -5.54 7.22 9.11 1.81 15.90 3.57 4.98 4.67 29.05 1.40 1.31 1.91 -28.83 -17.13 -29.06 0.25 -7.18 -4.26 -7.24 6.07 14.27 1.28 3.60 4.92 4.64 29.00 1.37 1.29 1.88 -75.62 47.81 -7.97 0.25 -18.79 11.88 -1.98 12.01 18.27 11.85 3.62 4.87 4.60 28.96 1.34 1.27 1.85 74.38 37.63 -22.90 0.25 18.45 9.33 -5.68 19.88 15.10 9.68 3.65 4.81 4.55 28.91 1.32 1.25 1.81 118.99 -24.41 -49.74 0.25 29.45 -6.04 -12.31 9.42 15.24 4.77 3.68 4.77 4.50 28.86 1.29 1.22 1.78 -84.09 -54.26 1.37 0.25 -20.77 -13.40 0.34 16.13 12.91 7.29 3.71 4.72 4.44 28.81 1.27 1.20 1.75 -149.62 -22.11 20.34 0.25 -36.88 -5.45 5.01 16.31 9.99 12.01 3.74 4.68 4.38 28.76 1.25 1.17 1.71 -35.25 -31.01 4.30 0.25 -8.67 -7.63 1.06 8.11 4.22 14.43 3.77 4.65 4.32 28.71 1.23 1.14 1.68 56.70 -35.88 -42.61 0.25 13.92 -8.81 -10.46 6.35 13.74 13.75 3.80 4.63 4.26 28.66 1.22 1.12 1.65 51.48 24.13 27.44 0.25 12.61 5.91 6.72 9.60 14.19 18.74 3.83 4.61 4.19 28.61 1.21 1.10 1.63 -0.63 48.98 115.17 0.24 -0.15 11.98 28.16 12.09 10.92 7.54 3.85 4.60 4.13 28.56 1.20 1.07 1.61 49.27 18.84 -8.04 0.24 12.02 4.60 -1.96 9.77 6.15 6.83 3.87 4.60 4.07 28.52 1.19 1.05 1.59 26.12 -9.19 -96.81 0.24 6.36 -2.24 -23.57 8.92 15.26 5.46 3.89 4.61 4.01 28.47 1.19 1.03 1.57

621
Raw Data Tapered
Data FFT Data Parzen Filtered
Data Simple Ratio
Spectrum Z E N
Tapering Function
Z E N Z E N Z E N
Frequency Hz
E/Z N/Z
Mean SQRT Spectrum
-16.90 -13.15 -3.60 0.24 -4.11 -3.20 -0.87 11.21 8.01 8.37 3.90 4.63 3.96 28.42 1.19 1.02 1.56 39.05 -28.08 83.25 0.24 9.47 -6.81 20.19 8.15 2.99 4.97 3.91 4.65 3.92 28.37 1.19 1.00 1.55 3.96 -33.96 20.06 0.24 0.96 -8.22 4.85 5.59 10.15 7.27 3.92 4.68 3.87 28.32 1.20 0.99 1.55
-91.87 26.05 -83.80 0.24 -22.19 6.29 -20.24 2.15 14.74 7.42 3.92 4.72 3.84 28.27 1.20 0.98 1.55 -79.53 60.87 -65.49 0.24 -19.17 14.67 -15.78 5.22 14.05 4.87 3.91 4.76 3.81 28.22 1.22 0.97 1.56 -10.35 -15.23 64.53 0.24 -2.49 -3.66 15.52 7.65 1.97 4.54 3.90 4.81 3.78 28.17 1.23 0.97 1.57 -58.22 -72.06 141.13 0.24 -13.97 -17.29 33.87 7.54 2.68 18.10 3.89 4.86 3.76 28.13 1.25 0.97 1.58 -27.05 -10.90 -44.05 0.24 -6.48 -2.61 -10.55 20.63 5.92 25.57 3.87 4.91 3.75 28.08 1.27 0.97 1.60 98.80 45.02 -201.55 0.24 23.61 10.76 -48.17 11.42 8.07 6.23 3.85 4.96 3.74 28.03 1.29 0.97 1.61 47.50 18.89 -13.10 0.24 11.33 4.50 -3.12 9.92 1.98 6.53 3.82 5.01 3.73 27.98 1.31 0.98 1.63 -32.53 -48.06 117.70 0.24 -7.74 -11.44 28.01 6.54 6.42 7.79 3.80 5.06 3.72 27.93 1.33 0.98 1.65 -46.37 -57.85 -10.50 0.24 -11.01 -13.74 -2.49 7.31 21.74 7.12 3.77 5.11 3.72 27.88 1.35 0.99 1.68 26.66 31.19 -83.30 0.24 6.32 7.39 -19.74 13.10 12.17 11.46 3.74 5.15 3.73 27.83 1.38 1.00 1.70 72.46 70.98 -10.09 0.24 17.14 16.79 -2.39 20.62 8.59 7.32 3.71 5.18 3.73 27.78 1.40 1.00 1.72 -12.66 -19.13 61.82 0.24 -2.99 -4.51 14.59 23.89 15.19 4.06 3.69 5.21 3.74 27.73 1.41 1.01 1.74 21.32 -50.00 47.61 0.24 5.02 -11.77 11.21 19.35 11.74 4.26 3.66 5.23 3.74 27.69 1.43 1.02 1.76 28.21 36.03 -6.46 0.24 6.63 8.47 -1.52 12.49 6.15 12.01 3.64 5.24 3.75 27.64 1.44 1.03 1.77 -73.70 38.87 -39.35 0.23 -17.28 9.11 -9.23 4.61 8.98 12.11 3.62 5.24 3.76 27.59 1.45 1.04 1.78 -27.50 -7.20 -39.18 0.23 -6.44 -1.69 -9.17 1.62 18.60 7.94 3.60 5.23 3.77 27.54 1.45 1.05 1.79 23.50 24.76 33.84 0.23 5.49 5.78 7.90 7.25 16.18 7.17 3.59 5.21 3.77 27.49 1.45 1.05 1.79 27.40 39.62 55.68 0.23 6.38 9.23 12.97 7.49 18.90 13.17 3.57 5.18 3.77 27.44 1.45 1.06 1.79 36.27 4.52 -65.29 0.23 8.43 1.05 -15.18 5.14 30.51 5.31 3.57 5.14 3.78 27.39 1.44 1.06 1.79 -46.72 -4.48 -70.00 0.23 -10.84 -1.04 -16.24 11.98 22.33 9.01 3.57 5.09 3.77 27.34 1.43 1.06 1.78 -35.56 11.49 69.01 0.23 -8.23 2.66 15.98 8.11 24.83 5.02 3.57 5.03 3.77 27.29 1.41 1.06 1.76 54.40 -2.53 45.80 0.23 12.57 -0.58 10.58 7.74 32.66 8.49 3.57 4.96 3.77 27.25 1.39 1.06 1.75 30.23 -33.47 -115.05 0.23 6.97 -7.71 -26.52 4.41 25.57 9.76 3.58 4.89 3.76 27.20 1.37 1.05 1.72 -14.81 -51.30 -79.64 0.23 -3.41 -11.80 -18.32 4.80 26.25 1.62 3.59 4.82 3.76 27.15 1.34 1.05 1.70 -50.68 -54.10 124.28 0.23 -11.63 -12.42 28.52 2.60 15.31 15.93 3.60 4.74 3.75 27.10 1.32 1.04 1.68 -14.55 -14.97 76.89 0.23 -3.33 -3.43 17.61 1.85 9.85 12.34 3.62 4.66 3.74 27.05 1.29 1.03 1.65 54.36 41.97 -94.06 0.23 12.42 9.59 -21.49 6.29 19.35 0.96 3.63 4.59 3.72 27.00 1.26 1.02 1.63 29.19 54.77 -34.79 0.23 6.66 12.49 -7.93 3.78 12.21 4.44 3.65 4.52 3.71 26.95 1.24 1.02 1.60 -36.80 -6.33 54.19 0.23 -8.37 -1.44 12.33 5.20 14.17 11.29 3.67 4.45 3.69 26.90 1.21 1.00 1.58 -51.62 -32.26 53.99 0.23 -11.72 -7.32 12.25 7.76 13.77 7.00 3.69 4.40 3.67 26.86 1.19 0.99 1.55

622
Raw Data Tapered
Data FFT Data Parzen Filtered
Data Simple Ratio
Spectrum Z E N
Tapering Function
Z E N Z E N Z E N
Frequency Hz
E/Z N/Z
Mean SQRT Spectrum
44.39 36.72 68.75 0.23 10.05 8.32 15.57 0.49 8.89 14.44 3.71 4.35 3.65 26.81 1.17 0.98 1.53 87.12 34.57 -28.31 0.23 19.69 7.81 -6.40 4.46 11.18 10.01 3.73 4.31 3.63 26.76 1.16 0.97 1.51 -8.05 -20.46 -127.99 0.23 -1.81 -4.61 -28.86 10.67 14.98 13.37 3.75 4.28 3.61 26.71 1.14 0.96 1.49
-62.91 11.55 40.21 0.23 -14.15 2.60 9.05 10.61 8.87 14.48 3.76 4.27 3.58 26.66 1.14 0.95 1.48 18.18 9.50 141.85 0.22 4.08 2.13 31.85 7.58 18.30 6.97 3.77 4.27 3.56 26.61 1.13 0.94 1.47 44.05 -45.44 -52.31 0.22 9.87 -10.18 -11.72 14.87 25.08 22.62 3.78 4.29 3.54 26.56 1.13 0.94 1.47 -61.92 1.64 -101.99 0.22 -13.84 0.37 -22.79 9.78 23.99 31.03 3.78 4.32 3.52 26.51 1.14 0.93 1.47 -40.72 48.54 79.07 0.22 -9.08 10.82 17.63 6.07 11.71 22.85 3.79 4.37 3.50 26.46 1.15 0.92 1.48 7.34 -46.47 104.72 0.22 1.63 -10.34 23.30 4.47 9.89 12.52 3.78 4.43 3.48 26.42 1.17 0.92 1.49
-20.63 -76.24 -64.35 0.22 -4.58 -16.92 -14.29 1.45 12.35 8.57 3.77 4.51 3.46 26.37 1.19 0.92 1.51 -4.59 66.78 -107.99 0.22 -1.02 14.79 -23.92 8.43 17.41 12.05 3.76 4.59 3.44 26.32 1.22 0.92 1.53 5.41 60.52 5.23 0.22 1.19 13.37 1.16 9.32 14.08 3.49 3.74 4.70 3.43 26.27 1.26 0.92 1.56
31.33 -74.46 10.21 0.22 6.91 -16.42 2.25 3.51 16.52 4.42 3.71 4.81 3.42 26.22 1.29 0.92 1.59 -1.73 -7.31 -15.76 0.22 -0.38 -1.61 -3.47 3.36 18.36 1.68 3.68 4.92 3.40 26.17 1.34 0.93 1.63
-41.65 55.59 21.24 0.22 -9.14 12.20 4.66 1.40 10.79 2.04 3.64 5.04 3.40 26.12 1.38 0.93 1.67 -4.56 -20.49 -16.75 0.22 -1.00 -4.49 -3.67 2.88 19.33 1.76 3.60 5.17 3.39 26.07 1.44 0.94 1.72 33.38 -3.45 -41.62 0.22 7.29 -0.75 -9.09 1.24 13.36 4.59 3.55 5.30 3.40 26.03 1.49 0.96 1.77 21.26 16.52 34.41 0.22 4.63 3.60 7.50 1.41 6.39 8.35 3.50 5.42 3.40 25.98 1.55 0.97 1.83 -89.61 -33.45 51.25 0.22 -19.49 -7.28 11.15 4.25 6.50 7.47 3.44 5.55 3.41 25.93 1.61 0.99 1.90 -54.32 -25.34 -47.74 0.22 -11.79 -5.50 -10.36 1.23 11.10 8.80 3.37 5.67 3.42 25.88 1.68 1.01 1.96 81.62 54.59 -40.55 0.22 17.67 11.82 -8.78 4.21 8.62 17.66 3.31 5.78 3.44 25.83 1.75 1.04 2.03 35.38 67.34 47.45 0.22 7.64 14.55 10.25 2.36 19.72 20.07 3.24 5.88 3.46 25.78 1.81 1.07 2.11 4.30 -27.75 -11.61 0.22 0.93 -5.98 -2.50 5.25 15.40 12.70 3.17 5.98 3.49 25.73 1.88 1.10 2.18
42.20 -47.60 2.43 0.22 9.07 -10.23 0.52 7.80 8.76 4.31 3.11 6.06 3.51 25.68 1.95 1.13 2.26 4.10 1.48 63.31 0.21 0.88 0.32 13.58 2.61 12.22 10.49 3.04 6.13 3.55 25.63 2.02 1.17 2.33
-41.83 2.47 -41.72 0.21 -8.95 0.53 -8.93 10.33 14.75 12.35 2.97 6.19 3.58 25.59 2.09 1.21 2.41 46.16 -28.49 -13.59 0.21 9.86 -6.08 -2.90 3.40 7.14 14.45 2.90 6.24 3.62 25.54 2.15 1.25 2.49 120.82 -51.33 113.22 0.21 25.73 -10.93 24.12 9.60 9.65 5.11 2.84 6.27 3.66 25.49 2.21 1.29 2.56 -31.37 4.75 31.95 0.21 -6.67 1.01 6.79 4.32 10.05 4.66 2.77 6.28 3.71 25.44 2.27 1.34 2.63 -102.10 54.63 -107.89 0.21 -21.65 11.58 -22.87 5.76 1.08 13.20 2.71 6.29 3.75 25.39 2.32 1.38 2.70
-9.88 43.42 -25.61 0.21 -2.09 9.18 -5.42 4.84 3.85 13.94 2.65 6.28 3.79 25.34 2.37 1.43 2.77 -31.80 -16.64 87.28 0.21 -6.71 -3.51 18.42 7.28 3.54 4.62 2.59 6.26 3.83 25.29 2.41 1.48 2.83 -35.67 -89.43 6.11 0.21 -7.51 -18.83 1.29 4.06 10.30 6.62 2.54 6.23 3.86 25.24 2.45 1.52 2.89

623
Raw Data Tapered
Data FFT Data Parzen Filtered
Data Simple Ratio
Spectrum Z E N
Tapering Function
Z E N Z E N Z E N
Frequency Hz
E/Z N/Z
Mean SQRT Spectrum
19.36 7.73 -61.76 0.21 4.06 1.62 -12.97 6.23 8.63 12.60 2.49 6.19 3.90 25.20 2.49 1.56 2.94 24.26 110.48 -34.56 0.21 5.08 23.15 -7.24 2.85 6.25 10.45 2.44 6.15 3.93 25.15 2.51 1.61 2.98 11.19 31.19 27.47 0.21 2.34 6.52 5.74 7.72 12.12 8.87 2.40 6.09 3.95 25.10 2.54 1.65 3.03 -19.80 -60.76 1.43 0.21 -4.13 -12.67 0.30 6.22 10.45 12.15 2.36 6.03 3.97 25.05 2.56 1.68 3.06 -28.71 -81.48 -37.48 0.21 -5.97 -16.95 -7.80 11.67 6.12 8.97 2.32 5.96 3.99 25.00 2.57 1.72 3.10 18.31 -43.23 51.50 0.21 3.80 -8.97 10.69 12.15 11.74 4.54 2.28 5.89 4.00 24.95 2.59 1.75 3.13 59.15 17.81 36.34 0.21 12.24 3.69 7.52 11.22 9.15 5.80 2.24 5.82 4.00 24.90 2.60 1.79 3.15 10.01 61.65 -20.68 0.21 2.07 12.73 -4.27 7.21 12.02 23.15 2.20 5.74 4.01 24.85 2.60 1.82 3.17 -39.94 21.47 -8.60 0.21 -8.23 4.42 -1.77 8.91 20.65 26.65 2.17 5.65 4.00 24.80 2.60 1.84 3.19 -17.83 -56.46 -40.49 0.21 -3.66 -11.60 -8.32 5.23 25.08 14.05 2.14 5.57 3.99 24.76 2.60 1.87 3.20 -19.76 -28.30 -19.35 0.21 -4.05 -5.80 -3.97 4.86 11.60 11.53 2.11 5.48 3.97 24.71 2.60 1.89 3.21 -7.71 -6.24 46.61 0.20 -1.58 -1.28 9.53 6.39 16.26 10.26 2.08 5.39 3.96 24.66 2.59 1.90 3.22 17.27 -7.22 15.50 0.20 3.52 -1.47 3.16 7.38 8.33 8.08 2.05 5.30 3.94 24.61 2.58 1.92 3.22 12.20 51.69 -54.41 0.20 2.48 10.52 -11.07 8.31 2.92 5.49 2.03 5.22 3.91 24.56 2.57 1.93 3.21 -10.80 40.50 -27.23 0.20 -2.19 8.22 -5.53 13.31 11.77 15.54 2.01 5.13 3.89 24.51 2.55 1.94 3.20 -46.69 -34.52 45.75 0.20 -9.46 -6.99 9.26 4.95 13.06 18.29 1.99 5.04 3.87 24.46 2.53 1.94 3.19 9.38 -17.42 34.60 0.20 1.89 -3.52 6.99 2.15 11.52 7.75 1.98 4.95 3.85 24.41 2.50 1.94 3.16 39.28 66.47 -15.42 0.20 7.91 13.39 -3.11 16.67 12.00 6.95 1.97 4.86 3.83 24.37 2.46 1.94 3.14 -77.65 12.31 -31.32 0.20 -15.61 2.47 -6.29 18.45 7.45 12.71 1.97 4.77 3.82 24.32 2.42 1.94 3.10 -55.39 -89.55 -19.20 0.20 -11.11 -17.95 -3.85 7.21 8.39 17.95 1.97 4.68 3.81 24.27 2.38 1.93 3.07 84.55 -12.35 41.77 0.20 16.91 -2.47 8.35 12.25 13.91 18.32 1.97 4.60 3.80 24.22 2.33 1.93 3.02 50.27 35.60 58.58 0.20 10.03 7.10 11.69 11.37 12.34 10.74 1.98 4.52 3.79 24.17 2.28 1.91 2.97 -9.81 2.52 -26.47 0.20 -1.95 0.50 -5.27 6.10 1.88 5.75 2.00 4.44 3.79 24.12 2.22 1.90 2.92 -1.79 34.44 -62.27 0.20 -0.36 6.84 -12.36 5.39 4.76 18.76 2.02 4.37 3.79 24.07 2.16 1.88 2.86 -48.70 -4.63 8.85 0.20 -9.64 -0.92 1.75 13.50 35.71 32.32 2.05 4.30 3.80 24.02 2.10 1.86 2.80 -46.51 -38.55 82.68 0.20 -9.19 -7.61 16.33 18.45 26.96 37.16 2.08 4.24 3.82 23.97 2.04 1.83 2.74 3.57 8.50 44.44 0.20 0.70 1.68 8.75 8.51 3.01 24.00 2.12 4.19 3.83 23.93 1.98 1.81 2.68 27.50 24.43 -79.48 0.20 5.40 4.80 -15.62 10.06 1.62 14.87 2.16 4.14 3.86 23.88 1.92 1.79 2.62 37.37 25.32 -92.12 0.20 7.32 4.96 -18.06 10.17 2.75 23.58 2.20 4.10 3.89 23.83 1.86 1.76 2.56 2.29 -5.72 53.97 0.20 0.45 -1.12 10.55 18.64 12.66 5.98 2.25 4.06 3.92 23.78 1.80 1.74 2.51 -3.72 -13.69 123.63 0.20 -0.72 -2.67 24.11 7.65 8.64 11.00 2.30 4.04 3.96 23.73 1.75 1.72 2.45 -7.70 29.27 16.37 0.19 -1.50 5.69 3.18 6.52 11.55 7.33 2.36 4.02 4.00 23.68 1.70 1.69 2.40 -39.61 21.16 -33.59 0.19 -7.68 4.11 -6.52 12.32 12.98 10.69 2.42 4.00 4.04 23.63 1.66 1.67 2.35

624
Raw Data Tapered Data
FFT Data Parzen Filtered Data
Simple Ratio Spectrum
Z E N
Tapering Function
Z E N Z E N Z E N
Frequency Hz
E/Z N/Z
Mean SQRT Spectrum
6.45 -11.86 32.43 0.19 1.25 -2.30 6.28 23.88 29.81 17.45 2.48 4.00 4.09 23.58 1.61 1.65 2.31 4.43 -45.75 53.27 0.19 0.85 -8.83 10.28 13.38 24.85 17.11 2.54 4.00 4.14 23.54 1.58 1.63 2.27
-32.52 -21.63 -1.82 0.19 -6.26 -4.16 -0.35 8.57 14.56 17.19 2.60 4.01 4.20 23.49 1.54 1.61 2.23 44.45 66.28 -49.70 0.19 8.53 12.73 -9.54 9.05 15.62 18.94 2.67 4.02 4.26 23.44 1.51 1.60 2.19 66.22 26.09 -42.50 0.19 12.68 5.00 -8.14 8.85 15.60 7.12 2.74 4.04 4.32 23.39 1.48 1.58 2.16 -17.88 -95.78 -15.37 0.19 -3.41 -18.29 -2.94 7.77 2.03 4.99 2.80 4.06 4.39 23.34 1.45 1.56 2.13 -77.69 -67.46 14.65 0.19 -14.80 -12.85 2.79 7.51 4.52 10.51 2.87 4.09 4.45 23.29 1.42 1.55 2.11 -39.46 62.54 -3.36 0.19 -7.50 11.88 -0.64 14.04 7.56 14.47 2.94 4.12 4.53 23.24 1.40 1.54 2.08 33.55 43.32 -40.26 0.19 6.36 8.21 -7.63 8.51 6.64 3.50 3.00 4.15 4.60 23.19 1.38 1.53 2.06 8.46 -62.64 27.78 0.19 1.60 -11.84 5.25 2.46 8.79 2.76 3.07 4.18 4.68 23.14 1.36 1.52 2.04 -8.55 -20.48 68.60 0.19 -1.61 -3.86 12.93 4.11 2.58 10.50 3.14 4.22 4.76 23.10 1.34 1.52 2.03
-15.50 18.52 -44.43 0.19 -2.91 3.48 -8.35 6.57 4.86 19.68 3.20 4.25 4.84 23.05 1.33 1.51 2.01 -53.37 -30.47 -173.98 0.19 -10.01 -5.71 -32.62 7.79 9.19 11.12 3.27 4.28 4.92 23.00 1.31 1.51 2.00 -11.24 25.54 -87.44 0.19 -2.10 4.78 -16.35 4.38 12.44 3.25 3.33 4.31 5.00 22.95 1.29 1.50 1.98 33.71 95.29 169.41 0.19 6.29 17.77 31.60 16.03 7.20 19.11 3.40 4.34 5.08 22.90 1.28 1.50 1.97 42.55 -25.86 175.73 0.19 7.91 -4.81 32.69 23.08 4.15 10.02 3.46 4.37 5.16 22.85 1.26 1.49 1.95 9.44 -97.62 -44.52 0.19 1.75 -18.11 -8.26 20.22 11.79 22.33 3.52 4.40 5.23 22.80 1.25 1.49 1.94
-45.49 61.45 -104.20 0.19 -8.42 11.37 -19.28 6.67 3.89 28.85 3.58 4.43 5.30 22.75 1.24 1.48 1.93 14.57 79.16 -46.88 0.18 2.69 14.61 -8.65 6.00 9.13 25.60 3.64 4.45 5.37 22.71 1.22 1.48 1.92 63.41 -83.84 4.22 0.18 11.67 -15.43 0.78 4.80 14.81 16.21 3.69 4.47 5.43 22.66 1.21 1.47 1.90 4.26 -54.57 25.17 0.18 0.78 -10.01 4.62 6.41 15.44 10.47 3.74 4.49 5.48 22.61 1.20 1.46 1.89
-21.71 85.37 -25.81 0.18 -3.97 15.62 -4.72 3.92 5.46 14.58 3.79 4.50 5.53 22.56 1.19 1.46 1.88 17.30 80.03 -52.64 0.18 3.16 14.61 -9.61 8.46 8.15 8.60 3.83 4.52 5.57 22.51 1.18 1.45 1.87 58.14 -40.06 10.46 0.18 10.58 -7.29 1.90 11.12 5.41 2.57 3.87 4.52 5.60 22.46 1.17 1.45 1.86 -2.97 -84.82 78.30 0.18 -0.54 -15.39 14.21 2.41 5.23 8.29 3.90 4.53 5.62 22.41 1.16 1.44 1.85
-110.75 -24.60 10.14 0.18 -20.05 -4.45 1.83 7.05 5.90 2.88 3.93 4.53 5.63 22.36 1.15 1.43 1.84 -62.41 9.42 -127.61 0.18 -11.26 1.70 -23.03 4.80 6.13 6.54 3.96 4.52 5.64 22.31 1.14 1.42 1.83 49.61 29.34 -41.26 0.18 8.93 5.28 -7.43 6.06 3.99 7.03 3.98 4.51 5.63 22.27 1.13 1.42 1.81 55.40 13.25 107.63 0.18 9.94 2.38 19.32 9.87 6.74 6.17 3.99 4.49 5.62 22.22 1.13 1.41 1.80 4.27 -23.74 19.39 0.18 0.76 -4.25 3.47 5.99 3.31 14.36 4.00 4.47 5.60 22.17 1.12 1.40 1.79
-32.68 31.24 -55.52 0.18 -5.83 5.58 -9.91 3.71 10.47 22.01 4.00 4.45 5.57 22.12 1.11 1.39 1.78 11.36 60.05 40.52 0.18 2.02 10.69 7.21 3.53 8.65 20.20 4.00 4.42 5.53 22.07 1.10 1.38 1.77 81.17 -10.06 74.31 0.18 14.41 -1.79 13.19 7.83 3.55 17.31 3.99 4.38 5.49 22.02 1.10 1.38 1.76

625
Raw Data Tapered Data
FFT Data Parzen Filtered Data
Simple Ratio Spectrum
Z E N
Tapering Function
Z E N Z E N Z E N
Frequency Hz
E/Z N/Z
Mean SQRT Spectrum
36.93 -48.95 4.16 0.18 6.54 -8.66 0.74 5.67 6.00 13.93 3.98 4.34 5.45 21.97 1.09 1.37 1.75 -46.06 15.11 -32.76 0.18 -8.13 2.67 -5.78 7.93 6.45 8.53 3.96 4.30 5.41 21.92 1.08 1.36 1.74 -9.95 32.01 -22.64 0.18 -1.75 5.63 -3.98 3.32 7.38 4.15 3.94 4.25 5.36 21.88 1.08 1.36 1.74 61.94 -40.98 -6.56 0.18 10.87 -7.19 -1.15 2.20 5.83 7.91 3.92 4.19 5.31 21.83 1.07 1.36 1.73 8.79 -12.87 42.38 0.18 1.54 -2.25 7.42 6.53 0.71 8.70 3.89 4.13 5.26 21.78 1.06 1.35 1.72
-77.08 11.12 20.27 0.17 -13.45 1.94 3.54 9.76 6.97 13.76 3.85 4.07 5.22 21.73 1.06 1.35 1.72 -20.89 -23.86 -107.54 0.17 -3.63 -4.15 -18.71 8.29 3.90 17.30 3.82 4.00 5.17 21.68 1.05 1.36 1.71 80.99 12.16 -52.20 0.17 14.05 2.11 -9.06 7.59 15.65 27.02 3.78 3.93 5.12 21.63 1.04 1.36 1.71 31.75 19.09 122.67 0.17 5.49 3.30 21.22 22.04 14.32 22.81 3.73 3.85 5.08 21.58 1.03 1.36 1.71 -46.22 2.04 75.29 0.17 -7.97 0.35 12.99 8.65 10.87 23.77 3.69 3.78 5.04 21.53 1.02 1.37 1.71 8.85 5.02 -72.70 0.17 1.52 0.86 -12.50 7.30 18.00 19.28 3.64 3.71 5.00 21.48 1.02 1.37 1.71 21.78 17.97 -60.42 0.17 3.73 3.08 -10.36 5.51 13.70 16.13 3.59 3.63 4.97 21.44 1.01 1.38 1.71 -40.19 14.89 28.66 0.17 -6.87 2.55 4.90 8.47 3.57 15.02 3.54 3.56 4.94 21.39 1.00 1.39 1.72 -2.11 -42.06 29.56 0.17 -0.36 -7.17 5.04 7.01 7.82 2.47 3.49 3.49 4.91 21.34 1.00 1.41 1.73 37.81 -6.97 -2.48 0.17 6.43 -1.18 -0.42 4.87 3.03 2.55 3.44 3.42 4.89 21.29 0.99 1.42 1.73 -48.18 53.93 -12.43 0.17 -8.17 9.14 -2.11 6.51 10.85 6.46 3.39 3.35 4.87 21.24 0.99 1.44 1.74 -69.94 9.80 -34.32 0.17 -11.82 1.66 -5.80 7.99 6.45 17.87 3.34 3.28 4.86 21.19 0.98 1.46 1.76 36.12 -42.14 -17.20 0.17 6.09 -7.10 -2.90 9.06 8.71 13.68 3.28 3.22 4.85 21.14 0.98 1.48 1.77 28.98 -75.91 33.78 0.17 4.87 -12.75 5.67 7.66 5.92 6.76 3.23 3.16 4.83 21.09 0.98 1.50 1.79 -43.00 -7.75 27.67 0.17 -7.20 -1.30 4.63 4.20 13.19 9.99 3.18 3.11 4.83 21.04 0.98 1.52 1.80 -4.91 103.05 -22.32 0.17 -0.82 17.21 -3.73 7.41 5.02 7.72 3.13 3.06 4.82 21.00 0.98 1.54 1.82 -9.88 58.72 -15.23 0.17 -1.65 9.78 -2.54 8.33 7.69 7.88 3.08 3.02 4.81 20.95 0.98 1.56 1.84 -43.78 -51.30 23.77 0.17 -7.27 -8.52 3.95 9.88 9.55 5.85 3.04 2.98 4.81 20.90 0.98 1.58 1.86 -2.69 -71.07 -18.23 0.17 -0.45 -11.76 -3.02 1.59 9.93 8.82 2.99 2.94 4.81 20.85 0.98 1.61 1.88 2.30 14.04 -39.10 0.17 0.38 2.32 -6.45 3.22 7.02 6.47 2.95 2.91 4.81 20.80 0.99 1.63 1.90 -9.69 17.97 51.89 0.16 -1.59 2.96 8.54 0.82 8.31 15.97 2.92 2.89 4.81 20.75 0.99 1.65 1.92 16.30 -38.99 62.68 0.16 2.67 -6.39 10.28 8.13 10.28 19.62 2.88 2.87 4.82 20.70 1.00 1.67 1.95 11.23 30.02 -50.33 0.16 1.84 4.91 -8.23 7.53 3.62 11.75 2.85 2.86 4.83 20.65 1.00 1.69 1.97 -10.77 26.90 -42.13 0.16 -1.76 4.38 -6.87 5.29 5.46 6.80 2.83 2.85 4.84 20.61 1.01 1.71 1.99 19.21 -52.06 48.87 0.16 3.12 -8.46 7.94 3.79 6.80 14.84 2.81 2.85 4.86 20.56 1.01 1.73 2.01 38.09 -0.96 13.76 0.16 6.17 -0.16 2.23 7.55 7.75 17.88 2.79 2.85 4.87 20.51 1.02 1.75 2.02 -5.98 27.98 -13.22 0.16 -0.97 4.52 -2.14 9.86 7.74 12.43 2.77 2.85 4.88 20.46 1.03 1.76 2.04 -31.91 -42.00 4.81 0.16 -5.14 -6.76 0.77 8.06 6.57 3.30 2.76 2.86 4.89 20.41 1.04 1.77 2.05

626
Raw Data Tapered
Data FFT Data Parzen Filtered
Data Simple Ratio
Spectrum Z E N
Tapering Function
Z E N Z E N Z E N
Frequency Hz
E/Z N/Z
Mean SQRT Spectrum
-27.80 -41.84 -22.14 0.16 -4.46 -6.71 -3.55 9.12 9.70 10.65 2.75 2.87 4.90 20.36 1.04 1.78 2.07 38.17 3.24 20.88 0.16 6.11 0.52 3.34 10.93 5.54 8.74 2.74 2.89 4.91 20.31 1.05 1.79 2.08 53.98 -35.70 55.74 0.16 8.61 -5.69 8.89 7.84 10.48 4.03 2.74 2.90 4.91 20.26 1.06 1.79 2.08 -76.98 -19.60 -12.33 0.16 -12.24 -3.12 -1.96 7.29 7.36 2.60 2.74 2.92 4.92 20.21 1.07 1.80 2.09 -69.69 73.29 -82.13 0.16 -11.05 11.62 -13.02 6.44 11.39 4.19 2.74 2.94 4.92 20.17 1.07 1.80 2.09 38.37 21.09 -19.91 0.16 6.06 3.33 -3.14 4.67 12.82 3.84 2.74 2.96 4.92 20.12 1.08 1.79 2.10 -2.71 -90.77 109.93 0.16 -0.43 -14.30 17.31 2.73 7.25 9.19 2.74 2.99 4.92 20.07 1.09 1.79 2.10 -10.69 -37.52 58.61 0.16 -1.68 -5.89 9.20 0.51 5.93 12.10 2.75 3.01 4.91 20.02 1.10 1.79 2.10 34.26 104.34 -86.32 0.16 5.36 16.33 -13.51 3.07 4.23 7.70 2.75 3.03 4.89 19.97 1.10 1.78 2.09 -10.79 107.91 -67.00 0.16 -1.68 16.83 -10.45 6.75 4.33 2.69 2.75 3.05 4.87 19.92 1.11 1.77 2.09 -23.73 -28.26 37.08 0.16 -3.69 -4.39 5.77 7.13 10.38 3.28 2.75 3.07 4.85 19.87 1.12 1.76 2.09 -12.66 -78.05 57.90 0.16 -1.96 -12.10 8.97 8.52 8.40 8.49 2.74 3.09 4.81 19.82 1.13 1.75 2.08 -9.62 -9.88 3.80 0.15 -1.49 -1.53 0.59 8.86 8.94 7.83 2.74 3.10 4.77 19.78 1.13 1.74 2.08 42.31 36.06 -105.98 0.15 6.52 5.55 -16.32 1.78 15.08 5.95 2.73 3.12 4.73 19.73 1.14 1.73 2.07 26.17 25.93 -129.50 0.15 4.02 3.98 -19.88 8.78 5.06 6.68 2.72 3.12 4.68 19.68 1.15 1.72 2.07 -33.82 6.85 30.72 0.15 -5.18 1.05 4.70 13.20 5.32 9.35 2.71 3.13 4.63 19.63 1.15 1.71 2.06 -49.66 -43.08 129.42 0.15 -7.57 -6.57 19.74 9.22 3.06 5.43 2.70 3.13 4.57 19.58 1.16 1.69 2.05 -10.55 -60.88 66.04 0.15 -1.60 -9.25 10.04 3.78 7.95 6.03 2.69 3.13 4.51 19.53 1.16 1.68 2.04 63.34 36.17 -63.95 0.15 9.60 5.48 -9.69 5.48 4.27 1.33 2.68 3.13 4.45 19.48 1.17 1.66 2.03 30.15 60.97 -95.61 0.15 4.55 9.21 -14.44 2.21 4.15 8.73 2.66 3.13 4.39 19.43 1.18 1.65 2.02 -30.86 12.81 38.52 0.15 -4.64 1.93 5.80 1.58 1.37 9.00 2.65 3.13 4.32 19.38 1.18 1.63 2.02 -15.77 -5.21 74.31 0.15 -2.37 -0.78 11.15 0.57 1.63 6.83 2.63 3.12 4.25 19.34 1.19 1.62 2.01 -5.73 -38.13 17.14 0.15 -0.86 -5.70 2.56 2.25 3.96 8.64 2.61 3.11 4.18 19.29 1.19 1.60 1.99 12.25 8.92 18.09 0.15 1.83 1.33 2.69 1.94 6.50 8.15 2.60 3.10 4.11 19.24 1.19 1.58 1.98 17.19 37.82 -2.93 0.15 2.55 5.62 -0.43 1.64 4.27 5.28 2.58 3.09 4.04 19.19 1.20 1.57 1.97 -24.80 -22.22 -15.87 0.15 -3.67 -3.29 -2.35 5.68 7.65 10.18 2.56 3.08 3.96 19.14 1.20 1.55 1.96 -28.70 -8.16 1.17 0.15 -4.23 -1.20 0.17 4.42 5.75 13.16 2.54 3.07 3.89 19.09 1.20 1.53 1.95 54.24 8.83 0.18 0.15 7.97 1.30 0.03 2.19 10.28 11.17 2.53 3.05 3.82 19.04 1.21 1.51 1.93 66.99 -45.10 9.18 0.15 9.81 -6.61 1.35 1.26 9.95 9.47 2.51 3.04 3.74 18.99 1.21 1.49 1.92 -13.12 -89.84 0.18 0.15 -1.92 -13.12 0.03 6.39 3.50 8.43 2.50 3.02 3.67 18.95 1.21 1.47 1.90 -3.10 -11.64 -64.68 0.15 -0.45 -1.69 -9.41 7.35 17.43 9.04 2.48 3.01 3.60 18.90 1.21 1.45 1.89 19.86 109.16 -74.38 0.15 2.88 15.83 -10.79 6.06 13.28 8.90 2.47 3.00 3.53 18.85 1.21 1.43 1.88 -31.12 18.90 34.72 0.14 -4.50 2.73 5.02 5.21 6.36 4.36 2.46 2.98 3.47 18.80 1.21 1.41 1.86

627
Raw Data Tapered
Data FFT Data Parzen Filtered
Data Simple Ratio
Spectrum Z E N
Tapering Function
Z E N Z E N Z E N
Frequency Hz
E/Z N/Z
Mean SQRT Spectrum
-30.00 -89.97 71.52 0.14 -4.32 -12.96 10.30 7.23 10.05 7.75 2.44 2.97 3.40 18.75 1.21 1.39 1.85 3.04 -5.78 -6.59 0.14 0.44 -0.83 -0.95 6.34 9.46 7.19 2.43 2.95 3.33 18.70 1.22 1.37 1.83 -9.95 42.14 -49.47 0.14 -1.42 6.03 -7.07 8.24 7.17 3.10 2.41 2.93 3.27 18.65 1.22 1.36 1.82 8.05 -1.95 -22.30 0.14 1.15 -0.28 -3.18 5.82 7.19 1.06 2.39 2.92 3.21 18.60 1.22 1.34 1.81 12.00 3.05 23.71 0.14 1.70 0.43 3.37 7.68 8.78 2.51 2.37 2.90 3.15 18.55 1.22 1.33 1.80 -49.93 32.97 9.66 0.14 -7.06 4.67 1.37 4.00 4.72 5.76 2.35 2.88 3.10 18.51 1.22 1.32 1.80 -2.83 -19.07 -6.33 0.14 -0.40 -2.69 -0.89 5.51 7.03 9.55 2.33 2.85 3.05 18.46 1.23 1.31 1.79 57.06 -45.94 14.67 0.14 8.02 -6.45 2.06 6.42 0.58 7.31 2.31 2.83 3.00 18.41 1.23 1.30 1.79 -0.06 31.08 -23.30 0.14 -0.01 4.35 -3.26 7.73 6.59 11.76 2.28 2.81 2.96 18.36 1.23 1.30 1.79 -8.05 26.96 -26.18 0.14 -1.12 3.76 -3.65 9.04 5.17 6.78 2.25 2.79 2.93 18.31 1.24 1.30 1.79 -14.01 -53.99 35.82 0.14 -1.95 -7.50 4.98 2.39 5.85 2.73 2.23 2.77 2.89 18.26 1.24 1.30 1.80 -26.94 -39.81 19.72 0.14 -3.73 -5.51 2.73 0.80 6.76 3.02 2.20 2.74 2.87 18.21 1.25 1.30 1.80 37.04 33.20 -16.27 0.14 5.11 4.58 -2.24 4.15 7.10 8.49 2.17 2.72 2.84 18.16 1.25 1.31 1.81 33.89 23.08 -10.20 0.14 4.66 3.17 -1.40 14.91 0.70 11.16 2.14 2.70 2.82 18.12 1.26 1.32 1.83 -47.09 -17.93 -26.11 0.14 -6.45 -2.46 -3.58 9.20 7.39 5.63 2.11 2.69 2.81 18.07 1.27 1.33 1.84 -65.87 16.06 20.92 0.14 -8.99 2.19 2.86 2.62 7.54 6.38 2.08 2.67 2.80 18.02 1.28 1.34 1.86 -17.71 -7.96 78.74 0.14 -2.41 -1.08 10.71 9.17 1.44 5.17 2.05 2.66 2.79 17.97 1.29 1.36 1.88 28.26 -26.89 -46.31 0.14 3.83 -3.64 -6.28 9.20 8.68 5.16 2.03 2.64 2.79 17.92 1.30 1.38 1.90 10.18 40.07 -70.06 0.14 1.37 5.41 -9.46 12.09 24.32 15.18 2.00 2.63 2.79 17.87 1.32 1.39 1.92 -39.77 -1.01 86.92 0.13 -5.35 -0.14 11.69 4.45 17.02 16.60 1.98 2.63 2.79 17.82 1.33 1.41 1.93 -5.68 -15.98 66.63 0.13 -0.76 -2.14 8.93 3.92 9.62 16.15 1.96 2.62 2.79 17.77 1.34 1.42 1.95 56.21 66.91 5.50 0.13 7.50 8.93 0.73 4.08 8.30 8.33 1.94 2.62 2.79 17.72 1.35 1.44 1.97 45.00 40.69 7.49 0.13 5.99 5.41 1.00 6.35 11.27 4.10 1.93 2.62 2.79 17.68 1.36 1.45 1.98 -9.07 -18.36 -10.49 0.13 -1.20 -2.43 -1.39 7.26 8.52 2.66 1.92 2.63 2.80 17.63 1.36 1.45 1.99 -42.98 15.64 58.43 0.13 -5.67 2.06 7.71 0.90 7.09 5.82 1.92 2.63 2.80 17.58 1.37 1.46 2.00 -19.86 33.53 25.28 0.13 -2.61 4.41 3.32 3.15 7.94 12.86 1.92 2.64 2.80 17.53 1.37 1.46 2.00 -8.81 -44.45 -121.51 0.13 -1.15 -5.82 -15.92 6.12 3.79 16.22 1.93 2.65 2.80 17.48 1.38 1.45 2.00 23.16 -29.31 -48.15 0.13 3.02 -3.83 -6.28 8.28 13.64 14.16 1.93 2.66 2.80 17.43 1.38 1.45 2.00 44.02 71.60 121.72 0.13 5.72 9.31 15.82 12.22 12.50 5.03 1.95 2.68 2.80 17.38 1.38 1.44 1.99 -21.03 9.43 69.35 0.13 -2.72 1.22 8.98 13.84 3.15 6.05 1.96 2.69 2.80 17.33 1.37 1.43 1.98 -25.95 -72.45 -112.55 0.13 -3.35 -9.35 -14.52 12.63 11.40 1.87 1.98 2.70 2.79 17.29 1.36 1.41 1.96 1.10 -29.26 -81.14 0.13 0.14 -3.76 -10.43 18.22 26.26 10.03 2.00 2.72 2.79 17.24 1.36 1.39 1.95 -5.90 9.78 141.75 0.13 -0.75 1.25 18.14 14.79 15.88 2.99 2.03 2.73 2.79 17.19 1.35 1.38 1.93

628
Raw Data Tapered Data
FFT Data Parzen Filtered Data
Simple Ratio Spectrum
Z E N
Tapering Function
Z E N Z E N Z E N
Frequency Hz
E/Z N/Z
Mean SQRT Spectrum
-9.87 -2.24 93.29 0.13 -1.26 -0.29 11.90 1.96 9.66 1.60 2.05 2.75 2.78 17.14 1.34 1.36 -9.87 -6.84 -32.18 -149.58 0.13 -0.87 -4.09 -19.00 7.15 11.64 5.74 2.08 2.76 2.78 17.09 1.32 1.33 -6.84 -33.77 -35.05 -100.06 0.13 -4.27 -4.43 -12.66 13.69 21.72 3.07 2.12 2.78 2.78 17.04 1.31 1.31 -33.77 -45.62 -42.90 91.97 0.13 -5.75 -5.41 11.59 8.66 17.85 5.73 2.15 2.80 2.78 16.99 1.30 1.29 -45.62 39.39 -3.81 74.66 0.13 4.94 -0.48 9.37 3.20 19.04 2.14 2.18 2.81 2.78 16.94 1.29 1.27 39.39 21.26 61.07 -19.44 0.13 2.66 7.63 -2.43 5.07 23.00 2.20 2.22 2.84 2.79 16.89 1.28 1.26 21.26 -15.75 10.92 -6.37 0.12 -1.96 1.36 -0.79 3.96 3.00 2.79 2.25 2.86 2.80 16.85 1.27 1.24 -15.75 28.22 -25.06 -53.24 0.12 3.50 -3.11 -6.60 4.49 18.38 7.08 2.29 2.89 2.80 16.80 1.26 1.23 28.22 -15.81 11.96 -99.91 0.12 -1.95 1.48 -12.34 6.17 9.72 5.61 2.32 2.92 2.82 16.75 1.26 1.21 -15.81 -35.72 -12.04 84.14 0.12 -4.39 -1.48 10.35 9.55 12.62 4.16 2.36 2.95 2.83 16.70 1.25 1.20 -35.72 -20.61 -34.95 129.72 0.12 -2.52 -4.28 15.89 12.02 21.26 8.70 2.39 2.98 2.84 16.65 1.25 1.19 -20.61 4.42 28.05 -76.37 0.12 0.54 3.42 -9.32 22.15 31.92 9.28 2.42 3.02 2.86 16.60 1.25 1.18 4.42 13.38 61.87 -88.02 0.12 1.63 7.52 -10.69 5.98 25.86 10.31 2.46 3.07 2.87 16.55 1.25 1.17 13.38 -15.63 -35.19 83.01 0.12 -1.89 -4.26 10.04 6.95 15.68 4.72 2.49 3.12 2.89 16.50 1.25 1.16 -15.63 29.34 -106.91 123.61 0.12 3.54 -12.88 14.89 5.79 17.88 7.00 2.53 3.18 2.90 16.46 1.26 1.15 29.34 7.26 29.24 -56.51 0.12 0.87 3.51 -6.78 3.09 29.25 7.80 2.56 3.24 2.91 16.41 1.26 1.14 7.26
-69.62 125.92 -151.08 0.12 -8.32 15.05 -18.05 1.29 33.51 8.51 2.60 3.31 2.93 16.36 1.27 1.13 -69.62 -10.46 9.64 6.23 0.12 -1.25 1.15 0.74 3.26 25.15 10.64 2.63 3.39 2.93 16.31 1.29 1.11 -10.46 51.45 -35.31 138.95 0.12 6.10 -4.18 16.47 6.48 24.72 8.24 2.67 3.47 2.94 16.26 1.30 1.10 51.45 -0.66 -4.24 56.58 0.12 -0.08 -0.50 6.68 2.27 7.46 7.37 2.71 3.56 2.94 16.21 1.32 1.09 -0.66 -9.64 -11.21 -155.21 0.12 -1.13 -1.32 -18.24 9.12 3.60 3.73 2.74 3.66 2.94 16.16 1.33 1.07 -9.64 55.26 50.70 -115.65 0.12 6.47 5.93 -13.53 3.28 13.85 3.81 2.77 3.76 2.93 16.11 1.35 1.06 55.26 39.06 71.45 161.28 0.12 4.55 8.32 18.79 1.66 23.92 5.75 2.81 3.87 2.92 16.06 1.38 1.04 39.06 -14.99 -2.69 130.71 0.12 -1.74 -0.31 15.16 4.81 17.07 6.13 2.84 3.98 2.90 16.02 1.40 1.02 -14.99 7.02 -35.62 -168.20 0.12 0.81 -4.11 -19.43 9.93 16.20 5.04 2.87 4.10 2.88 15.97 1.43 1.00 7.02 31.93 -57.44 -145.56 0.12 3.67 -6.61 -16.74 6.38 9.99 4.44 2.90 4.22 2.85 15.92 1.45 0.98 31.93 -20.10 -61.21 171.41 0.11 -2.30 -7.01 19.63 1.89 5.87 3.11 2.93 4.35 2.83 15.87 1.48 0.96 -20.10 -27.01 17.87 152.78 0.11 -3.08 2.04 17.42 6.51 12.42 6.01 2.96 4.48 2.79 15.82 1.51 0.94 -27.01 9.02 52.73 -159.20 0.11 1.02 5.98 -18.07 6.92 10.33 5.07 2.98 4.62 2.76 15.77 1.55 0.93 9.02
-70.86 -3.38 -165.53 0.11 -8.01 -0.38 -18.70 5.48 1.40 2.35 3.00 4.76 2.72 15.72 1.58 0.91 -70.86 -79.56 -38.30 139.54 0.11 -8.95 -4.31 15.70 8.87 4.79 1.98 3.02 4.90 2.69 15.67 1.62 0.89 -79.56 33.52 -14.20 142.99 0.11 3.75 -1.59 16.02 0.81 10.47 3.57 3.03 5.04 2.65 15.63 1.66 0.87 33.52 20.41 43.73 -143.99 0.11 2.28 4.88 -16.05 2.30 5.91 2.53 3.04 5.18 2.61 15.58 1.70 0.86 20.41

629
Raw Data Tapered Data
FFT Data Parzen Filtered Data
Simple Ratio Spectrum
Z E N
Tapering Function
Z E N Z E N Z E N
Frequency Hz
E/Z N/Z
Mean SQRT Spectrum
-24.59 23.59 -138.41 0.11 -2.73 2.62 -15.36 5.46 13.47 5.18 3.04 5.32 2.57 15.53 1.75 0.85 1.94 17.42 -74.31 33.82 0.11 1.92 -8.21 3.74 2.06 11.14 7.58 3.04 5.46 2.54 15.48 1.80 0.84 1.98 18.34 -95.98 88.59 0.11 2.02 -10.56 9.75 3.18 8.49 9.65 3.03 5.59 2.51 15.43 1.84 0.83 2.02 -26.65 -66.65 72.29 0.11 -2.92 -7.30 7.92 4.97 15.87 10.73 3.02 5.72 2.48 15.38 1.90 0.82 2.07 -26.55 14.45 -27.79 0.11 -2.89 1.57 -3.03 4.76 11.86 4.52 3.00 5.84 2.45 15.33 1.95 0.82 2.11 38.43 110.19 -91.53 0.11 4.17 11.96 -9.93 5.04 9.63 5.95 2.98 5.95 2.42 15.28 2.00 0.81 2.16 46.25 39.89 -26.28 0.11 4.99 4.31 -2.84 3.28 5.03 7.54 2.95 6.06 2.40 15.23 2.05 0.82 2.21 -44.76 -78.04 57.68 0.11 -4.81 -8.39 6.20 5.72 11.98 3.23 2.92 6.15 2.38 15.19 2.11 0.82 2.26 -20.63 -56.78 26.53 0.11 -2.21 -6.08 2.84 6.33 13.07 1.18 2.88 6.23 2.37 15.14 2.16 0.82 2.31 24.35 14.30 -27.45 0.11 2.59 1.52 -2.92 4.02 9.06 3.96 2.84 6.30 2.35 15.09 2.22 0.83 2.37 -43.61 33.20 -11.36 0.11 -4.62 3.52 -1.20 10.60 1.59 3.98 2.79 6.35 2.34 15.04 2.27 0.84 2.42 -10.51 26.08 10.66 0.11 -1.11 2.75 1.12 7.81 3.78 4.01 2.75 6.39 2.33 14.99 2.32 0.85 2.47 42.42 -2.97 63.53 0.11 4.45 -0.31 6.67 6.98 6.55 3.42 2.70 6.41 2.32 14.94 2.38 0.86 2.53 -2.67 -17.93 45.33 0.10 -0.28 -1.87 4.74 10.50 9.43 2.35 2.65 6.41 2.31 14.89 2.42 0.87 2.58 -18.63 56.98 -119.51 0.10 -1.94 5.93 -12.43 7.00 4.66 4.54 2.59 6.40 2.31 14.84 2.47 0.89 2.62 47.31 31.80 -156.94 0.10 4.90 3.29 -16.24 1.41 5.30 4.33 2.54 6.37 2.30 14.79 2.51 0.90 2.67 56.09 -78.11 56.28 0.10 5.78 -8.05 5.80 6.61 0.77 4.22 2.48 6.32 2.29 14.75 2.54 0.92 2.71 -50.92 -12.94 168.85 0.10 -5.22 -1.33 17.31 11.10 8.63 1.41 2.43 6.26 2.28 14.70 2.57 0.94 2.74 -62.70 59.97 1.53 0.10 -6.40 6.12 0.16 7.11 2.66 0.90 2.38 6.18 2.26 14.65 2.59 0.95 2.76 10.40 32.77 -62.34 0.10 1.06 3.33 -6.33 8.90 8.41 4.43 2.33 6.08 2.25 14.60 2.61 0.97 2.78 36.30 -1.29 79.65 0.10 3.67 -0.13 8.04 9.79 5.74 4.81 2.29 5.98 2.24 14.55 2.61 0.98 2.79 15.19 -1.29 54.40 0.10 1.53 -0.13 5.47 4.41 1.01 2.99 2.24 5.86 2.22 14.50 2.61 0.99 2.79 -20.81 48.61 -96.50 0.10 -2.08 4.86 -9.65 5.78 1.75 2.80 2.20 5.74 2.20 14.45 2.60 1.00 2.79 -15.74 9.48 -53.19 0.10 -1.57 0.94 -5.29 0.99 3.30 2.62 2.17 5.60 2.18 14.40 2.59 1.01 2.78 -19.67 -6.53 79.78 0.10 -1.95 -0.65 7.90 10.57 3.35 6.92 2.13 5.46 2.16 14.36 2.56 1.01 2.75 8.34 78.32 41.55 0.10 0.82 7.71 4.09 8.88 1.14 5.06 2.10 5.31 2.14 14.31 2.53 1.02 2.72 50.22 9.14 -69.38 0.10 4.92 0.90 -6.80 4.19 0.99 4.19 2.08 5.16 2.12 14.26 2.48 1.02 2.68 7.10 -98.69 -43.13 0.10 0.69 -9.62 -4.21 1.78 3.29 6.22 2.06 5.01 2.09 14.21 2.43 1.02 2.64
-35.85 -2.49 68.83 0.10 -3.48 -0.24 6.68 15.87 5.98 7.42 2.04 4.85 2.07 14.16 2.38 1.01 2.58 -16.75 33.44 108.49 0.10 -1.62 3.23 10.47 23.76 11.94 16.78 2.03 4.70 2.04 14.11 2.31 1.01 2.52 25.23 -84.46 55.18 0.10 2.42 -8.11 5.30 10.61 7.46 2.93 2.02 4.54 2.02 14.06 2.24 1.00 2.46 -9.81 -33.23 -54.80 0.10 -0.94 -3.17 -5.23 11.93 11.00 4.97 2.02 4.39 1.99 14.01 2.17 0.98 2.38 -33.73 67.69 -127.42 0.10 -3.20 6.43 -12.11 11.23 12.57 11.42 2.03 4.24 1.96 13.96 2.09 0.97 2.31

630
Raw Data Tapered Data
FFT Data Parzen Filtered Data
Simple Ratio Spectrum
Z E N
Tapering Function
Z E N Z E N Z E N
Frequency Hz
E/Z N/Z
Mean SQRT Spectrum
35.26 19.51 14.82 0.09 3.33 1.84 1.40 5.86 9.11 3.62 2.04 4.10 1.94 13.92 2.01 0.95 2.23 5.17 -47.44 95.62 0.09 0.49 -4.46 8.99 8.41 6.10 2.61 2.05 3.96 1.91 13.87 1.93 0.93 2.15
-40.76 -73.20 -29.50 0.09 -3.81 -6.84 -2.76 8.80 8.50 4.95 2.07 3.83 1.89 13.82 1.85 0.91 2.07 25.26 -9.04 34.51 0.09 2.35 -0.84 3.21 8.71 8.16 2.30 2.09 3.70 1.87 13.77 1.77 0.89 1.98 34.14 61.85 127.20 0.09 3.16 5.72 11.77 9.86 3.50 3.82 2.11 3.58 1.84 13.72 1.69 0.87 1.90 -2.93 36.65 56.84 0.09 -0.27 3.37 5.23 11.53 4.07 9.94 2.14 3.46 1.82 13.67 1.61 0.85 1.82 -23.88 -15.40 -8.24 0.09 -2.19 -1.41 -0.75 6.79 1.94 6.52 2.18 3.34 1.80 13.62 1.53 0.83 1.74 -41.76 -25.32 -127.95 0.09 -3.80 -2.30 -11.64 7.78 6.26 1.42 2.21 3.23 1.78 13.57 1.46 0.81 1.67 4.31 10.70 -136.40 0.09 0.39 0.97 -12.34 4.21 10.91 4.20 2.25 3.13 1.77 13.53 1.39 0.78 1.59 52.19 -45.24 -1.11 0.09 4.70 -4.07 -0.10 8.15 15.20 5.27 2.30 3.03 1.75 13.48 1.32 0.76 1.52 -24.87 -101.95 77.75 0.09 -2.23 -9.12 6.96 0.52 1.08 8.01 2.34 2.93 1.74 13.43 1.25 0.74 1.46 -85.65 13.23 138.34 0.09 -7.62 1.18 12.31 12.70 8.14 5.23 2.39 2.84 1.73 13.38 1.19 0.72 1.39 -12.46 109.98 41.99 0.09 -1.10 9.73 3.72 20.57 16.78 12.20 2.44 2.76 1.72 13.33 1.13 0.71 1.33 10.53 59.63 -131.82 0.09 0.93 5.25 -11.60 14.70 17.59 20.26 2.49 2.68 1.72 13.28 1.08 0.69 1.28 20.47 -47.40 -35.46 0.09 1.79 -4.15 -3.10 10.92 24.81 16.40 2.54 2.61 1.71 13.23 1.03 0.67 1.23 24.37 -37.23 89.44 0.09 2.12 -3.24 7.78 9.61 13.28 4.35 2.60 2.54 1.72 13.18 0.98 0.66 1.18 -56.57 70.69 -28.66 0.09 -4.89 6.12 -2.48 7.99 14.58 9.03 2.65 2.48 1.72 13.13 0.94 0.65 1.14 -0.46 61.42 -99.39 0.09 -0.04 5.28 -8.55 7.60 28.31 10.86 2.71 2.43 1.73 13.09 0.90 0.64 1.10 77.38 -33.64 41.74 0.09 6.62 -2.88 3.57 15.66 27.90 10.34 2.76 2.39 1.74 13.04 0.87 0.63 1.07 14.19 -72.43 181.31 0.09 1.21 -6.16 15.41 5.03 14.91 11.46 2.82 2.36 1.76 12.99 0.84 0.62 1.04 -21.80 -33.22 48.87 0.08 -1.84 -2.81 4.13 12.83 13.31 4.54 2.87 2.33 1.77 12.94 0.81 0.62 1.02 -6.75 -22.12 -195.82 0.08 -0.57 -1.86 -16.45 10.38 2.55 3.90 2.93 2.31 1.80 12.89 0.79 0.61 1.00 4.25 -8.06 -83.25 0.08 0.35 -0.67 -6.95 10.05 1.37 4.68 2.98 2.30 1.82 12.84 0.77 0.61 0.99
-14.74 82.78 139.66 0.08 -1.22 6.87 11.59 2.23 9.91 3.39 3.03 2.30 1.85 12.79 0.76 0.61 0.98 -3.71 31.55 36.32 0.08 -0.31 2.60 3.00 13.56 14.98 7.40 3.08 2.32 1.88 12.74 0.75 0.61 0.97 42.21 -74.37 -101.54 0.08 3.46 -6.10 -8.33 9.95 4.90 6.66 3.13 2.34 1.92 12.70 0.75 0.61 0.97 16.09 -29.17 -48.22 0.08 1.31 -2.38 -3.93 9.04 1.34 6.62 3.18 2.37 1.96 12.65 0.75 0.62 0.97 -21.91 47.79 52.79 0.08 -1.77 3.87 4.28 6.90 7.48 5.80 3.22 2.41 2.00 12.60 0.75 0.62 0.97 -15.84 93.50 51.60 0.08 -1.28 7.53 4.15 4.51 6.09 3.91 3.27 2.47 2.04 12.55 0.75 0.62 0.98 -34.74 30.25 -25.44 0.08 -2.78 2.42 -2.04 10.04 7.48 5.81 3.31 2.53 2.08 12.50 0.76 0.63 0.99 -3.67 -21.77 16.59 0.08 -0.29 -1.73 1.32 8.46 9.17 6.93 3.35 2.60 2.13 12.45 0.78 0.64 1.00 64.20 0.26 45.48 0.08 5.07 0.02 3.59 2.51 1.72 5.71 3.38 2.68 2.18 12.40 0.79 0.64 1.02 1.06 -77.59 -18.55 0.08 0.08 -6.09 -1.46 4.66 6.14 5.19 3.42 2.76 2.22 12.35 0.81 0.65 1.04

631
Raw Data Tapered Data
FFT Data Parzen Filtered Data
Simple Ratio Spectrum
Z E N
Tapering Function
Z E N Z E N Z E N
Frequency Hz
E/Z N/Z
Mean SQRT Spectrum
-56.83 -57.32 19.46 0.08 -4.43 -4.47 1.52 6.96 7.54 3.85 3.45 2.86 2.27 12.30 0.83 0.66 1.06 -12.70 42.70 -10.54 0.08 -0.98 3.31 -0.82 5.41 5.96 0.65 3.48 2.95 2.32 12.26 0.85 0.67 1.08 15.29 16.58 -85.33 0.08 1.18 1.28 -6.57 3.27 3.40 2.97 3.50 3.06 2.37 12.21 0.87 0.68 1.10 11.23 -28.40 50.75 0.08 0.86 -2.17 3.88 3.96 7.67 5.62 3.52 3.16 2.42 12.16 0.90 0.69 1.13 1.20 -48.25 94.48 0.08 0.09 -3.67 7.18 5.18 10.32 4.98 3.54 3.27 2.47 12.11 0.92 0.70 1.15 4.18 8.82 -87.52 0.08 0.32 0.67 -6.61 3.27 1.76 1.98 3.56 3.37 2.51 12.06 0.95 0.71 1.18
-17.80 47.70 -104.12 0.08 -1.33 3.58 -7.81 9.84 3.91 1.70 3.58 3.48 2.55 12.01 0.97 0.71 1.21 -33.70 -36.33 34.04 0.07 -2.51 -2.71 2.54 3.32 9.10 5.20 3.59 3.58 2.59 11.96 1.00 0.72 1.23 -1.64 -87.08 8.97 0.07 -0.12 -6.44 0.66 1.49 5.63 5.59 3.59 3.67 2.63 11.91 1.02 0.73 1.26 14.33 -25.86 -2.03 0.07 1.05 -1.90 -0.15 10.60 4.37 7.92 3.60 3.76 2.66 11.87 1.05 0.74 1.28 -7.69 58.07 107.77 0.07 -0.56 4.24 7.87 12.29 6.18 3.88 3.60 3.84 2.69 11.82 1.07 0.75 1.30 -23.63 -2.05 5.56 0.07 -1.71 -0.15 0.40 8.23 11.06 6.85 3.60 3.92 2.71 11.77 1.09 0.75 1.32 15.38 -67.91 -120.19 0.07 1.11 -4.89 -8.65 1.13 7.18 3.13 3.59 3.98 2.73 11.72 1.11 0.76 1.34 11.32 -7.76 9.05 0.07 0.81 -0.55 0.65 3.34 1.46 5.36 3.58 4.03 2.75 11.67 1.13 0.77 1.36 -12.68 5.24 71.90 0.07 -0.90 0.37 5.11 10.07 6.25 7.15 3.56 4.06 2.75 11.62 1.14 0.77 1.38 28.28 42.14 -39.15 0.07 1.99 2.97 -2.76 8.53 6.22 4.55 3.54 4.09 2.75 11.57 1.15 0.78 1.39 25.17 94.86 -72.91 0.07 1.76 6.64 -5.10 6.27 10.70 6.56 3.52 4.10 2.75 11.52 1.17 0.78 1.40 -25.84 33.60 56.14 0.07 -1.80 2.34 3.90 6.37 10.43 11.73 3.49 4.10 2.74 11.47 1.17 0.78 1.41 -16.76 -34.40 63.92 0.07 -1.16 -2.37 4.41 11.88 5.94 3.09 3.46 4.08 2.72 11.43 1.18 0.79 1.42 30.21 -39.26 -104.98 0.07 2.07 -2.69 -7.19 9.81 6.49 1.41 3.42 4.05 2.70 11.38 1.18 0.79 1.42 -7.84 9.79 -52.65 0.07 -0.53 0.67 -3.58 3.19 3.92 1.14 3.38 4.01 2.67 11.33 1.19 0.79 1.42 -55.72 100.57 99.27 0.07 -3.76 6.79 6.70 8.26 11.42 2.42 3.34 3.95 2.63 11.28 1.19 0.79 1.42 -10.60 115.13 44.00 0.07 -0.71 7.71 2.95 6.82 10.59 1.12 3.29 3.89 2.59 11.23 1.18 0.79 1.42 22.37 -65.97 -66.93 0.07 1.49 -4.39 -4.45 2.24 3.27 1.62 3.24 3.82 2.55 11.18 1.18 0.79 1.42 25.27 -172.50 -78.62 0.07 1.67 -11.39 -5.19 1.69 3.57 1.44 3.18 3.74 2.51 11.13 1.17 0.79 1.41 -3.78 -38.08 -6.44 0.07 -0.25 -2.49 -0.42 4.79 6.04 1.48 3.13 3.65 2.46 11.08 1.17 0.79 1.41 -31.71 54.88 44.50 0.07 -2.06 3.57 2.89 2.16 2.54 3.15 3.07 3.56 2.41 11.04 1.16 0.78 1.40 -23.61 44.67 50.33 0.06 -1.52 2.88 3.25 5.26 3.45 3.04 3.02 3.47 2.36 10.99 1.15 0.78 1.39 -34.50 13.55 11.22 0.06 -2.21 0.87 0.72 3.52 0.53 1.79 2.96 3.38 2.31 10.94 1.14 0.78 1.38 4.56 35.45 -47.69 0.06 0.29 2.25 -3.03 2.78 5.81 3.73 2.91 3.28 2.26 10.89 1.13 0.78 1.37 55.43 65.24 30.37 0.06 3.49 4.11 1.91 3.93 9.02 4.95 2.85 3.19 2.20 10.84 1.12 0.77 1.36 4.31 -19.85 118.09 0.06 0.27 -1.24 7.38 5.52 9.99 2.17 2.80 3.10 2.16 10.79 1.11 0.77 1.35
-33.64 12.16 10.84 0.06 -2.09 0.75 0.67 5.18 1.51 2.28 2.75 3.02 2.11 10.74 1.10 0.77 1.34

632
Raw Data Tapered Data
FFT Data Parzen Filtered Data
Simple Ratio Spectrum
Z E N
Tapering Function
Z E N Z E N Z E N
Frequency Hz
E/Z N/Z
Mean SQRT Spectrum
-24.53 83.96 -91.98 0.06 -1.51 5.16 -5.66 5.67 8.71 1.40 2.70 2.94 2.06 10.69 1.09 0.76 1.33 -16.45 -54.11 -20.74 0.06 -1.00 -3.30 -1.26 8.31 6.94 1.14 2.66 2.86 2.02 10.64 1.08 0.76 1.32 4.56 -124.76 86.15 0.06 0.28 -7.55 5.21 7.73 0.22 3.25 2.62 2.80 1.98 10.60 1.07 0.76 1.31
-16.42 -34.44 82.83 0.06 -0.99 -2.07 4.97 1.30 1.11 1.51 2.58 2.74 1.94 10.55 1.06 0.75 1.30 -35.32 19.58 -2.32 0.06 -2.10 1.17 -0.14 3.91 1.48 2.62 2.55 2.68 1.91 10.50 1.05 0.75 1.29 -13.23 16.51 -66.17 0.06 -0.78 0.97 -3.90 2.09 0.32 2.56 2.52 2.64 1.88 10.45 1.05 0.75 1.29 19.75 23.42 -30.96 0.06 1.16 1.37 -1.81 2.75 2.49 1.69 2.49 2.60 1.84 10.40 1.04 0.74 1.28 48.61 17.33 84.95 0.06 2.82 1.01 4.93 3.38 5.90 4.30 2.46 2.56 1.81 10.35 1.04 0.74 1.27 -9.47 -20.66 87.62 0.06 -0.54 -1.19 5.04 1.96 4.66 2.82 2.44 2.53 1.79 10.30 1.04 0.73 1.27 -29.40 -9.61 -60.42 0.06 -1.68 -0.55 -3.44 4.32 2.94 1.27 2.42 2.51 1.76 10.25 1.04 0.73 1.26 53.54 -5.58 -71.14 0.06 3.03 -0.32 -4.02 2.58 4.66 0.67 2.40 2.48 1.73 10.21 1.03 0.72 1.26 39.35 -38.50 91.83 0.06 2.20 -2.16 5.14 0.73 1.78 2.05 2.38 2.46 1.70 10.16 1.03 0.71 1.26 8.25 39.49 90.48 0.06 0.46 2.19 5.02 4.91 0.45 3.42 2.36 2.45 1.67 10.11 1.04 0.71 1.25 40.15 53.30 -98.49 0.06 2.21 2.93 -5.42 7.08 6.21 3.84 2.35 2.43 1.64 10.06 1.04 0.70 1.25 -20.90 -54.70 -93.09 0.05 -1.14 -2.98 -5.07 8.00 13.67 1.32 2.33 2.41 1.61 10.01 1.04 0.69 1.25 -79.70 -2.59 95.92 0.05 -4.30 -0.14 5.18 9.07 4.84 4.42 2.31 2.40 1.58 9.96 1.04 0.69 1.25 -22.50 -5.58 112.52 0.05 -1.20 -0.30 6.02 3.79 3.76 3.82 2.29 2.38 1.55 9.91 1.04 0.68 1.24 30.47 -129.31 -64.56 0.05 1.62 -6.85 -3.42 7.85 2.44 1.49 2.27 2.36 1.52 9.86 1.04 0.67 1.24 26.35 -22.01 -145.12 0.05 1.38 -1.16 -7.62 1.58 4.07 1.99 2.24 2.34 1.49 9.81 1.04 0.66 1.24 -28.65 141.74 -1.81 0.05 -1.49 7.37 -0.09 6.62 6.31 0.88 2.22 2.32 1.45 9.77 1.05 0.65 1.23 -39.52 55.34 77.05 0.05 -2.04 2.85 3.97 5.18 3.44 1.11 2.19 2.30 1.41 9.72 1.05 0.65 1.23 4.55 -109.55 -33.02 0.05 0.23 -5.59 -1.68 2.96 2.52 2.07 2.16 2.27 1.38 9.67 1.05 0.64 1.23
-36.39 -57.22 -76.79 0.05 -1.84 -2.89 -3.88 9.16 2.69 1.58 2.13 2.24 1.34 9.62 1.05 0.63 1.22 -24.28 137.61 25.33 0.05 -1.21 6.88 1.27 7.31 2.11 1.91 2.10 2.21 1.31 9.57 1.05 0.62 1.22 72.62 147.04 92.11 0.05 3.59 7.28 4.56 3.48 1.37 3.79 2.07 2.17 1.27 9.52 1.05 0.61 1.22 58.35 -78.11 0.94 0.05 2.86 -3.83 0.05 1.52 4.48 1.02 2.04 2.14 1.24 9.47 1.05 0.61 1.21 -11.75 -174.61 -76.89 0.05 -0.57 -8.47 -3.73 3.81 2.19 3.44 2.00 2.10 1.20 9.42 1.05 0.60 1.21 -25.68 -3.25 -6.70 0.05 -1.23 -0.16 -0.32 6.51 1.60 3.68 1.97 2.06 1.17 9.38 1.04 0.59 1.20 11.34 128.49 62.20 0.05 0.54 6.10 2.95 6.86 5.71 4.09 1.94 2.02 1.14 9.33 1.04 0.59 1.20 40.23 92.04 38.01 0.05 1.89 4.33 1.79 4.37 2.98 4.37 1.91 1.98 1.11 9.28 1.04 0.58 1.19 10.12 -31.09 -9.03 0.05 0.47 -1.45 -0.42 2.60 3.75 4.32 1.88 1.94 1.09 9.23 1.03 0.58 1.18 -22.86 -77.87 -51.89 0.05 -1.05 -3.58 -2.39 3.68 4.09 1.34 1.86 1.90 1.06 9.18 1.03 0.57 1.17 -20.78 29.22 -71.63 0.05 -0.95 1.33 -3.26 3.31 4.60 0.70 1.83 1.87 1.04 9.13 1.02 0.57 1.17

633
Raw Data Tapered Data
FFT Data Parzen Filtered Data
Simple Ratio Spectrum
Z E N
Tapering Function
Z E N Z E N Z E N
Frequency Hz
E/Z N/Z
Mean SQRT Spectrum
-19.70 43.07 14.50 0.05 -0.89 1.94 0.65 3.69 2.95 1.43 1.81 1.83 1.02 9.08 1.01 0.56 1.16 -6.65 -47.93 106.28 0.04 -0.30 -2.13 4.73 3.95 0.95 2.78 1.79 1.80 1.00 9.03 1.00 0.56 1.15 26.30 -7.82 -2.91 0.04 1.16 -0.34 -0.13 6.00 0.68 0.72 1.78 1.76 0.99 8.98 0.99 0.55 1.14 13.21 59.07 -130.63 0.04 0.57 2.57 -5.68 3.00 3.77 1.45 1.76 1.73 0.97 8.94 0.98 0.55 1.12 -15.79 19.91 -51.25 0.04 -0.68 0.86 -2.20 1.15 6.22 0.71 1.75 1.70 0.96 8.89 0.97 0.55 1.11 2.23 -31.07 82.71 0.04 0.09 -1.32 3.52 1.99 6.04 0.61 1.75 1.67 0.95 8.84 0.96 0.54 1.10
-15.75 -39.94 118.32 0.04 -0.66 -1.68 4.97 3.39 3.29 1.04 1.74 1.65 0.94 8.79 0.95 0.54 1.09 -23.67 -49.76 -5.89 0.04 -0.98 -2.07 -0.24 3.15 3.67 3.02 1.74 1.63 0.94 8.74 0.93 0.54 1.08 27.31 -39.59 -107.65 0.04 1.12 -1.62 -4.41 3.66 4.79 4.82 1.74 1.60 0.93 8.69 0.92 0.53 1.06 20.21 50.39 12.56 0.04 0.82 2.04 0.51 2.29 4.49 2.96 1.75 1.58 0.93 8.64 0.91 0.53 1.05 -8.82 53.17 92.37 0.04 -0.35 2.13 3.69 5.28 0.81 2.76 1.75 1.57 0.92 8.59 0.90 0.53 1.04 4.18 -71.80 -2.80 0.04 0.17 -2.84 -0.11 5.61 4.16 2.44 1.75 1.55 0.92 8.54 0.88 0.52 1.03 -9.81 -26.60 -123.53 0.04 -0.38 -1.04 -4.82 2.68 1.56 1.99 1.76 1.54 0.92 8.50 0.87 0.52 1.02 -40.72 147.15 -57.15 0.04 -1.57 5.67 -2.20 2.79 4.15 2.24 1.77 1.52 0.92 8.45 0.86 0.52 1.00 -36.57 117.61 143.69 0.04 -1.39 4.47 5.46 1.27 1.49 2.25 1.77 1.51 0.91 8.40 0.85 0.52 0.99 -0.50 -80.47 52.32 0.04 -0.02 -3.02 1.96 4.84 5.00 0.82 1.78 1.50 0.91 8.35 0.84 0.51 0.99 15.47 -161.99 -117.54 0.04 0.57 -5.99 -4.35 2.74 3.73 3.14 1.78 1.48 0.91 8.30 0.83 0.51 0.98 2.42 -57.55 36.64 0.04 0.09 -2.10 1.34 3.49 2.34 3.51 1.79 1.47 0.91 8.25 0.82 0.51 0.97 16.38 36.49 111.36 0.04 0.59 1.31 4.01 4.88 3.81 2.44 1.79 1.46 0.91 8.20 0.82 0.51 0.96 13.31 0.41 -104.64 0.04 0.47 0.01 -3.71 2.39 3.97 0.86 1.79 1.45 0.91 8.15 0.81 0.51 0.96 -28.66 -20.56 -174.06 0.04 -1.00 -0.72 -6.09 1.50 2.72 3.47 1.78 1.44 0.91 8.11 0.81 0.51 0.95 -7.60 21.44 24.26 0.03 -0.26 0.74 0.84 0.21 0.89 3.52 1.78 1.43 0.91 8.06 0.80 0.51 0.95 40.33 14.36 144.93 0.03 1.37 0.49 4.93 0.78 0.76 2.21 1.77 1.42 0.91 8.01 0.80 0.51 0.95 13.22 30.27 75.51 0.03 0.44 1.01 2.53 2.59 1.31 3.71 1.76 1.41 0.90 7.96 0.80 0.51 0.95 -13.79 35.13 -64.50 0.03 -0.45 1.16 -2.13 2.02 0.98 4.47 1.75 1.40 0.90 7.91 0.80 0.52 0.95 2.23 -44.85 -119.11 0.03 0.07 -1.46 -3.87 1.62 2.77 1.00 1.73 1.39 0.90 7.86 0.80 0.52 0.95 4.21 -10.75 5.13 0.03 0.13 -0.34 0.16 4.06 4.83 5.01 1.72 1.38 0.90 7.81 0.80 0.52 0.96 10.18 14.24 134.87 0.03 0.32 0.45 4.25 2.24 1.17 2.40 1.70 1.37 0.90 7.76 0.81 0.53 0.96 17.11 -41.71 62.49 0.03 0.53 -1.29 1.94 1.42 1.35 1.70 1.67 1.36 0.89 7.71 0.81 0.53 0.97 6.06 40.29 -98.42 0.03 0.18 1.23 -3.00 0.34 3.15 1.73 1.65 1.35 0.89 7.67 0.82 0.54 0.98
-19.92 63.08 -42.13 0.03 -0.60 1.89 -1.26 0.54 2.66 3.52 1.63 1.34 0.89 7.62 0.83 0.55 0.99 -60.76 -55.94 83.81 0.03 -1.79 -1.65 2.47 0.81 4.90 5.63 1.60 1.33 0.89 7.57 0.83 0.55 1.00 -6.63 -177.48 15.62 0.03 -0.19 -5.15 0.45 1.14 3.41 1.76 1.57 1.33 0.88 7.52 0.84 0.56 1.01

634
Raw Data Tapered Data
FFT Data Parzen Filtered Data
Simple Ratio Spectrum
Z E N
Tapering Function
Z E N Z E N Z E N
Frequency Hz
E/Z N/Z
Mean SQRT Spectrum
45.28 -91.94 -59.27 0.03 1.29 -2.62 -1.69 1.60 1.93 3.34 1.55 1.32 0.88 7.47 0.85 0.57 1.03 -27.76 156.93 -30.08 0.03 -0.78 4.39 -0.84 3.43 3.67 3.02 1.52 1.31 0.88 7.42 0.86 0.58 1.04 -31.65 81.44 52.89 0.03 -0.87 2.24 1.45 4.70 2.36 0.85 1.49 1.30 0.88 7.37 0.88 0.59 1.06 10.39 -27.67 58.69 0.03 0.28 -0.75 1.58 4.65 4.44 0.70 1.46 1.30 0.88 7.32 0.89 0.60 1.07 15.33 63.26 3.58 0.03 0.41 1.68 0.09 2.37 4.38 1.78 1.43 1.29 0.88 7.28 0.90 0.62 1.09 31.23 27.07 30.52 0.03 0.81 0.70 0.79 1.43 3.28 2.12 1.40 1.28 0.88 7.23 0.91 0.63 1.11 -3.83 -4.98 -20.48 0.03 -0.10 -0.13 -0.52 1.93 0.93 0.99 1.37 1.27 0.89 7.18 0.93 0.65 1.13 -43.74 -35.90 -25.37 0.03 -1.09 -0.90 -0.63 1.76 2.67 3.72 1.34 1.26 0.89 7.13 0.94 0.66 1.15 -17.62 -31.77 75.54 0.02 -0.43 -0.78 1.85 2.82 2.28 2.37 1.31 1.25 0.89 7.08 0.96 0.68 1.17 22.36 -23.66 -27.54 0.02 0.54 -0.57 -0.66 1.62 5.11 1.06 1.28 1.24 0.90 7.03 0.97 0.70 1.20 9.29 -126.37 -69.33 0.02 0.22 -2.97 -1.63 0.41 6.25 1.58 1.26 1.23 0.91 6.98 0.98 0.72 1.22
-32.67 -15.09 58.71 0.02 -0.75 -0.35 1.35 1.37 4.17 4.93 1.23 1.22 0.91 6.93 0.99 0.74 1.24 -33.54 85.77 14.58 0.02 -0.75 1.93 0.33 5.61 0.73 6.37 1.20 1.21 0.92 6.88 1.01 0.76 1.26 -32.42 13.56 -96.24 0.02 -0.71 0.30 -2.12 6.32 3.99 5.68 1.17 1.20 0.93 6.84 1.02 0.79 1.29 -53.25 -17.43 -22.99 0.02 -1.14 -0.37 -0.49 2.61 2.80 2.04 1.15 1.18 0.93 6.79 1.03 0.81 1.31 -17.11 -26.35 94.89 0.02 -0.36 -0.55 1.99 2.38 7.02 3.34 1.12 1.17 0.94 6.74 1.05 0.84 1.34 81.75 73.55 15.68 0.02 1.68 1.51 0.32 3.11 4.47 1.44 1.10 1.16 0.95 6.69 1.06 0.87 1.37 68.44 31.34 -75.19 0.02 1.37 0.63 -1.50 1.61 2.57 3.17 1.07 1.15 0.96 6.64 1.07 0.89 1.40 -54.59 -112.50 -47.92 0.02 -1.06 -2.19 -0.93 4.17 8.02 1.64 1.05 1.14 0.96 6.59 1.09 0.92 1.42 -55.38 28.66 -51.71 0.02 -1.05 0.54 -0.98 2.85 8.44 2.83 1.02 1.13 0.97 6.54 1.10 0.95 1.45 19.69 130.34 64.29 0.02 0.36 2.41 1.19 1.40 6.49 2.69 1.00 1.12 0.98 6.49 1.12 0.98 1.48 14.62 16.04 184.80 0.02 0.26 0.29 3.33 0.94 4.62 2.20 0.98 1.11 0.99 6.45 1.13 1.00 1.51 -4.41 -82.83 24.40 0.02 -0.08 -1.45 0.43 2.73 4.02 2.76 0.96 1.11 0.99 6.40 1.15 1.03 1.54 8.57 -81.50 -99.44 0.02 0.15 -1.39 -1.69 2.42 2.97 1.86 0.95 1.10 1.00 6.35 1.16 1.05 1.57 -8.43 -1.34 16.75 0.02 -0.14 -0.02 0.28 5.23 3.84 5.53 0.93 1.10 1.00 6.30 1.18 1.08 1.60 -41.34 16.62 12.70 0.02 -0.66 0.27 0.20 6.21 2.00 7.49 0.92 1.10 1.01 6.25 1.20 1.10 1.62 -2.26 -19.37 -150.01 0.02 -0.03 -0.30 -2.33 0.49 5.32 1.05 0.91 1.10 1.01 6.20 1.22 1.11 1.65 69.60 22.62 -35.62 0.02 1.04 0.34 -0.53 4.48 3.49 3.15 0.89 1.11 1.01 6.15 1.24 1.13 1.67 58.34 74.42 201.07 0.01 0.85 1.08 2.92 1.77 12.01 7.94 0.89 1.11 1.01 6.10 1.25 1.14 1.70 -32.72 26.21 74.53 0.01 -0.46 0.37 1.04 7.71 21.58 15.88 0.88 1.12 1.02 6.05 1.27 1.15 1.72 -50.56 -21.80 -170.26 0.01 -0.68 -0.29 -2.30 6.61 12.60 8.12 0.88 1.13 1.02 6.01 1.29 1.16 1.74 25.49 11.22 -63.78 0.01 0.33 0.15 -0.83 5.17 6.65 7.80 0.88 1.15 1.02 5.96 1.31 1.17 1.76 27.38 1.19 150.07 0.01 0.34 0.01 1.88 2.68 2.73 8.46 0.88 1.16 1.02 5.91 1.33 1.17 1.77

635
Raw Data Tapered
Data FFT Data Parzen Filtered
Data Simple Ratio
Spectrum Z E N
Tapering Function
Z E N Z E N Z E N
Frequency Hz
E/Z N/Z
Mean SQRT Spectrum
9.30 -23.77 36.71 0.01 0.11 -0.29 0.44 3.57 7.23 9.80 0.88 1.18 1.03 5.86 1.35 1.17 1.78 24.22 -18.69 -105.14 0.01 0.28 -0.21 -1.21 2.16 4.57 6.60 0.88 1.21 1.03 5.81 1.37 1.17 1.80 -14.80 -27.60 -17.88 0.01 -0.16 -0.30 -0.20 1.49 2.79 5.05 0.89 1.23 1.04 5.76 1.38 1.16 1.81 -18.74 16.42 34.11 0.01 -0.20 0.17 0.36 2.69 3.33 6.84 0.90 1.26 1.04 5.71 1.40 1.16 1.82 3.28 37.30 34.98 0.01 0.03 0.37 0.35 7.41 3.89 8.46 0.91 1.29 1.05 5.66 1.42 1.16 1.83
-29.67 27.17 35.86 0.01 -0.28 0.26 0.34 4.34 1.54 5.02 0.92 1.32 1.06 5.62 1.43 1.15 1.84 -27.56 46.02 18.76 0.01 -0.25 0.41 0.17 0.23 2.48 2.14 0.93 1.35 1.07 5.57 1.45 1.15 1.85 1.48 13.89 24.69 0.01 0.01 0.12 0.21 0.46 1.06 1.30 0.95 1.39 1.09 5.52 1.47 1.15 1.87 6.46 -53.03 5.65 0.01 0.05 -0.42 0.05 1.20 1.81 3.31 0.96 1.43 1.10 5.47 1.49 1.15 1.88 17.41 -93.74 -17.32 0.01 0.13 -0.70 -0.13 2.31 4.82 5.56 0.98 1.47 1.12 5.42 1.50 1.15 1.89 27.31 -0.56 -58.15 0.01 0.19 0.00 -0.41 3.68 3.81 2.74 0.99 1.51 1.15 5.37 1.52 1.16 1.91 12.22 77.29 -26.96 0.01 0.08 0.50 -0.18 3.00 1.66 1.21 1.01 1.55 1.17 5.32 1.53 1.16 1.92 -43.72 -30.81 75.96 0.01 -0.26 -0.18 0.46 4.08 2.44 1.92 1.03 1.59 1.20 5.27 1.55 1.17 1.94 -83.47 -66.62 -16.15 0.01 -0.46 -0.37 -0.09 2.42 2.40 2.16 1.04 1.63 1.24 5.22 1.56 1.18 1.96 -7.29 1.51 -106.89 0.01 -0.04 0.01 -0.53 1.92 2.25 1.85 1.06 1.68 1.27 5.18 1.58 1.20 1.98 78.56 -8.48 47.25 0.00 0.35 -0.04 0.21 2.69 2.98 2.20 1.08 1.72 1.31 5.13 1.59 1.21 2.00 28.34 -23.42 129.91 0.00 0.11 -0.09 0.52 3.06 0.85 2.89 1.10 1.77 1.35 5.08 1.61 1.23 2.02 -46.63 43.53 -22.29 0.00 -0.16 0.15 -0.08 3.84 4.01 5.42 1.12 1.81 1.40 5.03 1.62 1.25 2.05 -18.51 72.30 -137.95 0.00 -0.06 0.22 -0.41 6.12 4.52 2.92 1.13 1.85 1.44 4.98 1.63 1.27 2.07 24.47 -14.82 -63.53 0.00 0.06 -0.04 -0.16 2.35 2.11 2.04 1.15 1.89 1.49 4.93 1.64 1.30 2.09 6.41 -54.69 56.50 0.00 0.01 -0.11 0.11 1.96 0.32 2.14 1.17 1.92 1.54 4.88 1.65 1.32 2.11
-16.58 56.31 93.21 0.00 -0.02 0.08 0.14 1.25 0.51 2.49 1.18 1.95 1.59 4.83 1.66 1.34 2.13 -36.48 90.01 -1.95 0.00 -0.04 0.09 0.00 0.53 0.47 2.63 1.19 1.98 1.64 4.79 1.66 1.37 2.15 -20.37 -53.07 -130.67 0.00 -0.01 -0.03 -0.07 1.63 1.83 5.66 1.21 2.00 1.68 4.74 1.66 1.39 2.17

636
Appendix G: Seismic Records Manipulation and Scaling The accelerometer that was used to record the earthquake at the East-west
seismic array produced amplitudes in terms of voltage counts that needed
to be converted to (g) amplitude. The following are the plots of the raw
voltage counts of the east-west and north-south components of the
seismic array stations:
1. Station DRA2
Raw DRA2 E-W Component
-1000-800-600-400-200
0200400600800
0 5 10 15 20 25 30 35 40 45 50
Time (sec)
Vol
tage
Cou
nts

637
Raw DRA2 N-S component
-1500
-1000
-500
0
500
1000
1500
0 5 10 15 20 25 30 35 40 45 50
Time (sec)
Volta
ge c
ount
s
2. Station DREFF
Raw DREFF E-W Component
-400-300-200-100
0100200300400
0 5 10 15 20 25 30 35 40 45 50
Time (sec)
vOLT
AGE
cOUN
TS

638
Raw DREFF N-S Component
-600
-400
-200
0
200
400
0 5 10 15 20 25 30 35 40 45 50
Time (sec)
Vol
tage
Cou
nts
3. Station RD0
Raw RD0 E-W Component
-800-600-400-200
0200400600800
0 5 10 15 20 25 30 35 40 45 50
Time (sec)
Vol
tage
Cou
nts
Raw RD0 N-S Component
-800-600-400-200
0200400600800
0 5 10 15 20 25 30 35 40 45 50
Time (sec)
Vol
tage
Cou
nts

639
4. Station RD2
Raw RD2 E-W Component
-800
-600
-400
-2000
200
400
600
0 5 10 15 20 25 30 35 40 45 50
Time (sec)
Vol
tage
Cou
nts
Raw RD2 N-S Component
-600
-400
-200
0200
400
600
800
0 5 10 15 20 25 30 35 40 45 50
Time (sec)
Volta
ge C
Oun
ts

640
5. Station RD3
Raw RD3 E-W Component
-1500
-1000
-500
0500
1000
1500
2000
0 5 10 15 20 25 30 35 40 45 50
Time (sec)
Vol
tage
Cou
nts
Raw RD3 N-S Component
-1500
-1000
-500
0
500
1000
1500
0 5 10 15 20 25 30 35 40 45 50
Time (sec)
Vol
tage
Cou
nts
To convert the voltage counts accelerograms to (g) accelerograms the
amplitudes must be divided by a constant that is specified by the
manufacturer of the recording system. The conversion constant for the
systems that were used is given by:

641
1 voltage count = 419430 g
However, the amplitudes of the converted accelerograms turned out to be
too small to be recognized by the dynamic site response analysis
software, and the amplitude had to be scaled up. The rule of thumb has
been not to scale by a factor larger than 2. Recent studies have shown
that as far as the shape of the elastic acceleration spectrum is concerned,
the permissible factor may be significantly larger than 2 [30]. This
argument is more acceptable when the accelerograms are scaled for the
same site where they were recorded. The smallest factor that made the
amplitudes recognizable by the dynamic analysis software was a factor of
10. The converted and scaled accelerograms are presented next:

642
1. Station DR2
DRA2 (E-W Component)
-0.025
-0.02
-0.015
-0.01
-0.005
0
0.005
0.01
0.015
0.02
0 5 10 15 20 25 30
Time (sec)
Acc
. (g)
Series1
DRA2 (N-S Component)
-0.03
-0.02
-0.01
0
0.01
0.02
0.03
0.04
0 5 10 15 20 25 30
Time (sec)
Acc
. (g)
Series1

643
2. Station: DREFF
DREFF (E_W) Component
-0.01
-0.008
-0.006
-0.004
-0.002
0
0.002
0.004
0.006
0.008
0.01
0 5 10 15 20 25 30
Time (sec)
Acc.
(g)
Series1
DREFF (N-S) Componenet
-0.015
-0.01
-0.005
0
0.005
0.01
0 5 10 15 20 25 30
Time (sec)
Acc
. (g)
Series1

644
3. Station: RD0
RD0 (E-W Component)
-0.02
-0.015
-0.01
-0.005
0
0.005
0.01
0.015
0.02
0 5 10 15 20 25 30
Time (sec)
Acc
. (g)
Series1
RD0 (N-S Component)
-0.02
-0.015
-0.01
-0.005
0
0.005
0.01
0.015
0.02
0 5 10 15 20 25 30
Time (sec)
Acc
. (g)
Series1

645
4. Station: RD2
RD2 (E-W Component)
-0.02
-0.015
-0.01
-0.005
0
0.005
0.01
0.015
0 5 10 15 20 25 30
Time (sec)
Acc
(g)
Series1
RD2 (N-S Component)
-0.015
-0.01
-0.005
0
0.005
0.01
0.015
0.02
0 5 10 15 20 25 30
Time (sec)
Acc
. (g)
Series1

646
5. Station: RD3:
RD3 (E-W COmponent)
-0.04
-0.03
-0.02
-0.01
0
0.01
0.02
0.03
0.04
0 5 10 15 20 25 30
Time (sec)
ACC
. (g)
Series1
RD3 (N-S Component)
-0.03
-0.02
-0.01
0
0.01
0.02
0.03
0 5 10 15 20 25 30
Time (sec)
acc
(g)
Series1

647
Appendix H: Dynamic Site Response Analysis Data
1. Analysis Input Earthquakes 1.1 RAN230 Earthquake
RAN230
-6.00E-02
-4.00E-02
-2.00E-02
0.00E+00
2.00E-02
4.00E-02
6.00E-02
0 10 20 30 40 50
Time (sec)
Am
p. (g
)
30%EQ2
1.2 RAN330 Earthquake
RAN330
-0.06
-0.04
-0.02
0
0.02
0.04
0.06
0 10 20 30 40 50 60
Time (sec)
Am
pl. (
g)
30%EQ3

648
2. Shear Moduli and Damping Curves a). Shear Moduli curve (from ProShake)
Sand (Seed and Idriss 1970)
Mod
ulus
Rat
io
Shear Strain (%)
0.0
0.2
0.4
0.6
0.8
1.0
0.00001 0.0001 0.001 0.01 0.1 1 10
b). Damping curve (from ProShake)
Sand (Idriss 1990)
Dam
ping
Rat
io (%
)
Shear Strain (%)
0
5
10
15
20
25
30
0.00001 0.0001 0.001 0.01 0.1 1 10

649
3. Al-Durrah Site Input Soil Profiles The following ProShake input profiles are for soil profiles with bedrock
at the SPT boring depth. Profiles for larger depths have the same profile
for the top 30 m (or 60 m for D1, D3, and D9), but the bedrock depth is
larger.

650
Profile Name: D1CXW
Water Table:26.25 ft
Number of Layers: 57
Layer No.
Material
Name
Thickness
(ft) Unit Weight
(pcf)
Gmax (ksf)
Vs
(ft/s)
Modulus Curve
Damping Curve
1 SC/SD 5.74 120 2312 787 Sand (Seed and Idriss 1970) Sand (Idriss 1990) 2 SC/SD 4.92 120 10036 1640 Sand (Seed and Idriss 1970) Sand (Idriss 1990) 3 SC/SD 4.96 120 4917 1148 Sand (Seed and Idriss 1970) Sand (Idriss 1990) 4 SC/SD 4.96 110 4508 1148 Sand (Seed and Idriss 1970) Sand (Idriss 1990) 5 SC/SD 4.96 120 10036 1640 Sand (Seed and Idriss 1970) Sand (Idriss 1990) 6 SC/SD 4.96 120 10036 1640 Sand (Seed and Idriss 1970) Sand (Idriss 1990) 7 SC/SD 4.96 130 10872 1640 Sand (Seed and Idriss 1970) Sand (Idriss 1990) 8 SC/SD 4.96 130 10872 1640 Sand (Seed and Idriss 1970) Sand (Idriss 1990) 9 SC/SD 4.96 130 10872 1640 Sand (Seed and Idriss 1970) Sand (Idriss 1990)
10 SC/SD 4.96 130 10872 1640 Sand (Seed and Idriss 1970) Sand (Idriss 1990) 11 SC/SD 4.96 130 10872 1640 Sand (Seed and Idriss 1970) Sand (Idriss 1990) 12 SC/SD 4.96 130 10872 1640 Sand (Seed and Idriss 1970) Sand (Idriss 1990) 13 SC/SD 4.96 130 10872 1640 Sand (Seed and Idriss 1970) Sand (Idriss 1990) 14 SC/SD 4.96 130 10872 1640 Sand (Seed and Idriss 1970) Sand (Idriss 1990) 15 SC/SD 4.96 130 10872 1640 Sand (Seed and Idriss 1970) Sand (Idriss 1990) 16 SC/SD 4.96 130 10872 1640 Sand (Seed and Idriss 1970) Sand (Idriss 1990) 17 SC/SD 4.96 130 10872 1640 Sand (Seed and Idriss 1970) Sand (Idriss 1990) 18 SC/SD 4.96 130 10872 1640 Sand (Seed and Idriss 1970) Sand (Idriss 1990) 19 SC/SD 4.96 130 10872 1640 Sand (Seed and Idriss 1970) Sand (Idriss 1990) 20 SC/SD 4.96 130 10872 1640 Sand (Seed and Idriss 1970) Sand (Idriss 1990) 21 SC/SD 4.96 130 10872 1640 Sand (Seed and Idriss 1970) Sand (Idriss 1990)

651
22 SC/SD 16.4 130 10872 1640 Sand (Seed and Idriss 1970) Sand (Idriss 1990) 23 SC/SD 16.4 130 10872 1640 Sand (Seed and Idriss 1970) Sand (Idriss 1990) 24 SC/SD 16.4 130 10872 1640 Sand (Seed and Idriss 1970) Sand (Idriss 1990) 25 SC/SD 16.4 130 10872 1640 Sand (Seed and Idriss 1970) Sand (Idriss 1990) 26 SC/SD 16.4 130 10872 1640 Sand (Seed and Idriss 1970) Sand (Idriss 1990) 27 SC/SD 16.4 130 10872 1640 Sand (Seed and Idriss 1970) Sand (Idriss 1990) 28 SC/SD 32.81 130 10872 1640 Sand (Seed and Idriss 1970) Sand (Idriss 1990) 29 SC/SD 32.81 130 10872 1640 Sand (Seed and Idriss 1970) Sand (Idriss 1990) 30 SC/SD 32.81 130 10872 1640 Sand (Seed and Idriss(1970) Sand (Idriss 1990) 31 SC/SD 32.81 130 10872 1640 Sand (Seed and Idriss 1970) Sand (Idriss 1990) 32 SC/SD 32.81 130 10872 1640 Sand (Seed and Idriss 1970) Sand (Idriss 1990) 33 SC/SD 32.81 130 10872 1640 Sand (Seed and Idriss 1970) Sand (Idriss 1990) 34 SC/SD 32.81 130 10872 1640 Sand (Seed and Idriss 1970) Sand (Idriss 1990) 35 SC/SD 32.81 130 10872 1640 Sand (Seed and Idriss 1970) Sand (Idriss 1990) 36 SC/SD 32.81 130 10872 1640 Sand (Seed and Idriss 1970) Sand (Idriss 1990) 37 SC/SD 32.81 130 10872 1640 Sand (Seed and Idriss 1970) Sand (Idriss 1990) 38 SC/SD 32.81 130 10872 1640 Sand (Seed and Idriss 1970) Sand (Idriss 1990) 39 SC/SD 32.81 130 10872 1640 Sand (Seed and Idriss 1970) Sand (Idriss 1990) 40 SC/SD 32.81 130 10872 1640 Sand (Seed and Idriss 1970) Sand (Idriss 1990) 41 SC/SD 32.81 130 10872 1640 Sand (Seed and Idriss 1970) Sand (Idriss 1990) 42 SC/SD 32.81 130 10872 1640 Sand (Seed and Idriss 1970) Sand (Idriss 1990) 43 SC/SD 32.81 130 10872 1640 Sand (Seed and Idriss 1970) Sand (Idriss 1990) 44 SC/SD 32.81 130 10872 1640 Sand (Seed and Idriss 1970) Sand (Idriss 1990) 45 SC/SD 32.81 130 10872 1640 Sand (Seed and Idriss 1970) Sand (Idriss 1990) 46 SC/SD 32.81 130 10872 1640 Sand (Seed and Idriss 1970) Sand (Idriss 1990) 47 SC/SD 32.81 130 10872 1640 Sand (Seed and Idriss 1970) Sand (Idriss 1990) 48 SC/SD 32.81 130 10872 1640 Sand (Seed and Idriss 1970) Sand (Idriss 1990) 49 SC/SD 32.81 130 10872 1640 Sand (Seed and Idriss 1970) Sand (Idriss 1990) 50 SC/SD 32.81 130 10872 1640 Sand (Seed and Idriss 1970) Sand (Idriss 1990) 51 SC/SD 32.81 130 10872 1640 Sand (Seed and Idriss 1970) Sand (Idriss 1990) 52 SC/SD 32.81 130 10872 1640 Sand (Seed and Idriss 1970) Sand (Idriss 1990)

652
53 SC/SD 32.81 130 10872 1640 Sand (Seed and Idriss 1970) Sand (Idriss 1990) 54 SC/SD 32.81 130 10872 1640 Sand (Seed and Idriss 1970) Sand (Idriss 1990) 55 SC/SD 32.81 130 10872 1640 Sand (Seed and Idriss 1970) Sand (Idriss 1990) 56 SC/SD 32.81 130 10872 1640 Sand (Seed and Idriss 1970) Sand (Idriss 1990) 57 Rock Infinite 150 200732 6562 Rock Rock

653
D1CXW

654
Profile Name: D2CXW Water Table:91.86 ft Number of Layers: 53
Layer No.
Material Name
Thick-ness(ft)
Unit Weight(pcf)
Gmax (ksf)
Vs (ft/s)
Modulus Curve
Damping Curve
1 SC/SD 3.28 110 1472 656 Sand (Seed and Idriss 1970) Sand (Idriss 1990) 2 SC/SD 16.4 110 23552 2624 Sand (Seed and Idriss 1970) Sand (Idriss 1990) 3 SC/SD 5.74 110 3312 984 Sand (Seed and Idriss 1970) Sand (Idriss 1990) 4 SC/SD 4.92 120 3613 984 Sand (Seed and Idriss 1970) Sand (Idriss 1990) 5 SC/SD 7.38 130 3914 984 Sand (Seed and Idriss 1970) Sand (Idriss 1990) 6 SC/SD 12.3 130 8807 1476 Sand (Seed and Idriss 1970) Sand (Idriss 1990) 7 SC/SD 4.92 120 8129 1476 Sand (Seed and Idriss 1970) Sand (Idriss 1990) 8 SC/SD 4.92 110 7452 1476 Sand (Seed and Idriss 1970) Sand (Idriss 1990) 9 SC/SD 4.92 120 8129 1476 Sand (Seed and Idriss 1970) Sand (Idriss 1990)
10 SC/SD 4.92 130 8807 1476 Sand (Seed and Idriss 1970) Sand (Idriss 1990) 11 SC/SD 17.22 120 8129 1476 Sand (Seed and Idriss 1970) Sand (Idriss 1990) 12 SC/SD 7.38 120 16961 2132 Sand (Seed and Idriss 1970) Sand (Idriss 1990) 13 SC/SD 4.92 130 18375 2132 Sand (Seed and Idriss 1970) Sand (Idriss 1990) 14 SC/SD 16.4 130 18375 2132 Sand (Seed and Idriss 1970) Sand (Idriss 1990) 15 SC/SD 16.4 130 18375 2132 Sand (Seed and Idriss 1970) Sand (Idriss 1990) 16 SC/SD 16.4 130 18375 2132 Sand (Seed and Idriss 1970) Sand (Idriss 1990) 17 SC/SD 16.4 130 18375 2132 Sand (Seed and Idriss 1970) Sand (Idriss 1990) 18 SC/SD 16.4 130 18375 2132 Sand (Seed and Idriss 1970) Sand (Idriss 1990) 19 SC/SD 16.4 130 18375 2132 Sand (Seed and Idriss 1970) Sand (Idriss 1990) 20 SC/SD 16.4 130 18375 2132 Sand (Seed and Idriss 1970) Sand (Idriss 1990) 21 SC/SD 16.4 130 18375 2132 Sand (Seed and Idriss 1970) Sand (Idriss 1990) 22 SC/SD 16.4 130 18375 2132 Sand (Seed and Idriss 1970) Sand (Idriss 1990) 23 SC/SD 16.4 130 18375 2132 Sand (Seed and Idriss 1970) Sand (Idriss 1990) 24 SC/SD 16.4 130 18375 2132 Sand (Seed and Idriss 1970) Sand (Idriss 1990) 25 SC/SD 16.4 130 18375 2132 Sand (Seed and Idriss 1970) Sand (Idriss 1990)

655
26 SC/SD 16.4 130 18375 2132 Sand (Seed and Idriss 1970) Sand (Idriss 1990) 27 SC/SD 16.4 130 18375 2132 Sand (Seed and Idriss 1970) Sand (Idriss 1990) 28 SC/SD 32.81 130 18375 2132 Sand (Seed and Idriss 1970) Sand (Idriss 1990) 29 SC/SD 32.81 130 18375 2132 Sand (Seed and Idriss 1970) Sand (Idriss 1990) 30 SC/SD 32.81 130 18375 2132 Sand (Seed and Idriss 1970) Sand (Idriss 1990) 31 SC/SD 32.81 130 18375 2132 Sand (Seed and Idriss 1970) Sand (Idriss 1990) 32 SC/SD 32.81 130 18375 2132 Sand (Seed and Idriss 1970) Sand (Idriss 1990) 33 SC/SD 32.81 130 18375 2132 Sand (Seed and Idriss 1970) Sand (Idriss 1990) 34 SC/SD 32.81 130 18375 2132 Sand (Seed and Idriss 1970) Sand (Idriss 1990) 35 SC/SD 32.81 130 18375 2132 Sand (Seed and Idriss 1970) Sand (Idriss 1990) 36 SC/SD 32.81 130 18375 2132 Sand (Seed and Idriss 1970) Sand (Idriss 1990) 37 SC/SD 32.81 130 18375 2132 Sand (Seed and Idriss 1970) Sand (Idriss 1990) 38 SC/SD 32.81 130 18375 2132 Sand (Seed and Idriss 1970) Sand (Idriss 1990) 39 SC/SD 32.81 130 18375 2132 Sand (Seed and Idriss 1970) Sand (Idriss 1990) 40 SC/SD 32.81 130 18375 2132 Sand (Seed and Idriss 1970) Sand (Idriss 1990) 41 SC/SD 32.81 130 18375 2132 Sand (Seed and Idriss 1970) Sand (Idriss 1990) 42 SC/SD 32.81 130 18375 2132 Sand (Seed and Idriss 1970) Sand (Idriss 1990) 43 SC/SD 32.81 130 18375 2132 Sand (Seed and Idriss 1970) Sand (Idriss 1990) 44 SC/SD 32.81 130 18375 2132 Sand (Seed and Idriss 1970) Sand (Idriss 1990) 45 SC/SD 32.81 130 18375 2132 Sand (Seed and Idriss 1970) Sand (Idriss 1990) 46 SC/SD 32.81 130 18375 2132 Sand (Seed and Idriss 1970) Sand (Idriss 1990) 47 SC/SD 32.81 130 18375 2132 Sand (Seed and Idriss 1970) Sand (Idriss 1990) 48 SC/SD 32.81 130 18375 2132 Sand (Seed and Idriss 1970) Sand (Idriss 1990) 49 SC/SD 32.81 130 18375 2132 Sand (Seed and Idriss 1970) Sand (Idriss 1990) 50 SC/SD 32.81 130 18375 2132 Sand (Seed and Idriss 1970) Sand (Idriss 1990) 51 SC/SD 32.81 130 18375 2132 Sand (Seed and Idriss 1970) Sand (Idriss 1990) 52 SC/SD 32.81 130 18375 2132 Sand (Seed and Idriss 1970) Sand (Idriss 1990) 53 Rock Infinite 150 200731.8 6562 Rock Rock

656
C K
D2CXW

657
Profile Name: D3CXW Water Table:95.14 ft Number of Layers: 63
Layer No.
Material Name
Thick-ness(ft)
Unit Weight(pcf)
Gmax (ksf)
Vs (ft/s)
Modulus Curve
Damping Curve
1 SC/SD 3.28 110 2300 820 Sand (Seed and Idriss 1970) Sand (Idriss 1990) 2 SC/SD 16.4 110 7452 1476 Sand (Seed and Idriss 1970) Sand (Idriss 1990) 3 SC/SD 5.74 110 2300 820 Sand (Seed and Idriss 1970) Sand (Idriss 1990) 4 SC/SD 4.92 120 2509 820 Sand (Seed and Idriss 1970) Sand (Idriss 1990) 5 SC/SD 5.74 130 2718 820 Sand (Seed and Idriss 1970) Sand (Idriss 1990) 6 SC/SD 4.1 130 10873 1640 Sand (Seed and Idriss 1970) Sand (Idriss 1990) 7 SC/SD 9.02 120 10873 1640 Sand (Seed and Idriss 1970) Sand (Idriss 1990) 8 SC/SD 15.58 120 10873 1640 Sand (Seed and Idriss 1970) Sand (Idriss 1990) 9 SC/SD 4.92 130 10873 1640 Sand (Seed and Idriss 1970) Sand (Idriss 1990)
10 SC/SD 4.92 120 10873 1640 Sand (Seed and Idriss 1970) Sand (Idriss 1990) 11 SC/SD 7.38 120 10873 1640 Sand (Seed and Idriss 1970) Sand (Idriss 1990) 12 SC/SD 12.3 120 10873 1640 Sand (Seed and Idriss 1970) Sand (Idriss 1990) 13 SC/SD 19.69 120 10873 1640 Sand (Seed and Idriss 1970) Sand (Idriss 1990) 14 SC/SD 4.92 110 9200 1640 Sand (Seed and Idriss 1970) Sand (Idriss 1990) 15 SC/SD 4.92 120 10873 1640 Sand (Seed and Idriss 1970) Sand (Idriss 1990) 16 SC/SD 4.92 120 10873 1640 Sand (Seed and Idriss 1970) Sand (Idriss 1990) 17 SC/SD 4.92 130 10873 1640 Sand (Seed and Idriss 1970) Sand (Idriss 1990) 18 SC/SD 4.92 130 10873 1640 Sand (Seed and Idriss 1970) Sand (Idriss 1990) 19 SC/SD 4.92 130 10873 1640 Sand (Seed and Idriss 1970) Sand (Idriss 1990) 20 SC/SD 4.92 130 10872 1640 Sand (Seed and Idriss 1970) Sand (Idriss 1990) 21 SC/SD 4.92 130 10872 1640 Sand (Seed and Idriss 1970) Sand (Idriss 1990) 22 SC/SD 4.92 130 10872 1640 Sand (Seed and Idriss 1970) Sand (Idriss 1990) 23 SC/SD 4.92 130 10872 1640 Sand (Seed and Idriss 1970) Sand (Idriss 1990) 24 SC/SD 4.92 130 10872 1640 Sand (Seed and Idriss 1970) Sand (Idriss 1990)

658
25 SC/SD 4.92 130 10872 1640 Sand (Seed and Idriss 1970) Sand (Idriss 1990) 26 SC/SD 4.92 130 10872 1640 Sand (Seed and Idriss 1970) Sand (Idriss 1990) 27 SC/SD 4.92 130 10872 1640 Sand (Seed and Idriss 1970) Sand (Idriss 1990) 28 SC/SD 4.92 130 10872 1640 Sand (Seed and Idriss 1970) Sand (Idriss 1990) 29 SC/SD 4.92 130 10872 1640 Sand (Seed and Idriss 1970) Sand (Idriss 1990) 30 SC/SD 16.4 130 10872 1640 Sand (Seed and Idriss 1970) Sand (Idriss 1990) 31 SC/SD 16.4 130 10872 1640 Sand (Seed and Idriss 1970) Sand (Idriss 1990) 32 SC/SD 16.4 130 10872 1640 Sand (Seed and Idriss 1970) Sand (Idriss 1990) 33 SC/SD 16.4 130 10872 1640 Sand (Seed and Idriss 1970) Sand (Idriss 1990) 34 SC/SD 16.4 130 10872 1640 Sand (Seed and Idriss 1970) Sand (Idriss 1990) 35 SC/SD 16.4 130 10872 1640 Sand (Seed and Idriss 1970) Sand (Idriss 1990) 36 SC/SD 16.4 130 10872 1640 Sand (Seed and Idriss 1970) Sand (Idriss 1990) 37 SC/SD 16.4 130 10872 1640 Sand (Seed and Idriss 1970) Sand (Idriss 1990) 38 SC/SD 32.81 130 10872 1640 Sand (Seed and Idriss 1970) Sand (Idriss 1990) 39 SC/SD 32.81 130 10872 1640 Sand (Seed and Idriss 1970) Sand (Idriss 1990) 40 SC/SD 32.81 130 10872 1640 Sand (Seed and Idriss 1970) Sand (Idriss 1990) 41 SC/SD 32.81 130 10872 1640 Sand (Seed and Idriss 1970) Sand (Idriss 1990) 42 SC/SD 32.81 130 10872 1640 Sand (Seed and Idriss 1970) Sand (Idriss 1990) 43 SC/SD 32.81 130 10872 1640 Sand (Seed and Idriss 1970) Sand (Idriss 1990) 44 SC/SD 32.81 130 10872 1640 Sand (Seed and Idriss 1970) Sand (Idriss 1990) 45 SC/SD 32.81 130 10872 1640 Sand (Seed and Idriss 1970) Sand (Idriss 1990) 46 SC/SD 32.81 130 10872 1640 Sand (Seed and Idriss 1970) Sand (Idriss 1990) 47 SC/SD 32.81 130 10872 1640 Sand (Seed and Idriss 1970) Sand (Idriss 1990) 48 SC/SD 32.81 130 1082 1640 Sand (Seed and Idriss 1970) Sand (Idriss 1990) 49 SC/SD 32.81 130 10872 1640 Sand (Seed and Idriss 1970) Sand (Idriss 1990) 50 SC/SD 32.81 130 10872 1640 Sand (Seed and Idriss 1970) Sand (Idriss 1990) 51 SC/SD 32.81 130 10872 1640 Sand (Seed and Idriss 1970) Sand (Idriss 1990) 52 SC/SD 32.81 130 10872 1640 Sand (Seed and Idriss 1970) Sand (Idriss 1990) 53 SC/SD 32.81 130 10872 1640 Sand (Seed and Idriss 1970) Sand (Idriss 1990) 54 SC/SD 32.81 130 10872 1640 Sand (Seed and Idriss 1970) Sand (Idriss 1990) 55 SC/SD 32.81 130 10872 1640 Sand (Seed and Idriss 1970) Sand (Idriss 1990)

659
56 SC/SD 32.81 130 10872 1640 Sand (Seed and Idriss 1970) Sand (Idriss 1990) 57 SC/SD 32.81 130 10872 1640 Sand (Seed and Idriss 1970) Sand (Idriss 1990) 58 SC/SD 32.81 130 10872 1640 Sand (Seed and Idriss 1970) Sand (Idriss 1990) 59 SC/SD 32.81 130 10872 1640 Sand (Seed and Idriss 1970) Sand (Idriss 1990) 60 SC/SD 32.81 130 10872 1640 Sand (Seed and Idriss 1970) Sand (Idriss 1990) 61 SC/SD 32.81 130 10872 1640 Sand (Seed and Idriss 1970) Sand (Idriss 1990) 62 SC/SD 32.81 130 10872 1640 Sand (Seed and Idriss 1970) Sand (Idriss 1990) 63 Rock Infinite 150 200731 6562 Rock Rock

660
n S h e a r W a v e V e l o c i t y U n i t W e i g h to t i o n O u t p u t
D3CXW

661
Profile Name: D4CXW Water Table:8.20 ft Number of Layers: 52 Layer No.
Material
Name Thickness
(ft) Unit Weight
(pcf) Gmax (ksf)
Vs (ft/s)
Modulus Curve
Damping Curve
1 SC/SD 3.28 130 3914 984 Sand (Seed and Idriss 1970) Sand (Idriss 1990) 2 SC/SD 7.38 130 39251 3117 Sand (Seed and Idriss 1970) Sand (Idriss 1990) 3 SC/SD 4.92 110 33212 3117 Sand (Seed and Idriss 1970) Sand (Idriss 1990) 4 SC/SD 4.1 100 30193 3117 Sand (Seed and Idriss 1970) Sand (Idriss 1990) 5 SC/SD 10.66 100 2090 820 Sand (Seed and Idriss 1970) Sand (Idriss 1990) 6 SC/SD 5.74 120 2509 820 Sand (Seed and Idriss 1970) Sand (Idriss 1990) 7 SC/SD 9.02 120 4917 1148 Sand (Seed and Idriss 1970) Sand (Idriss 1990) 8 SC/SD 9.84 110 4508 1148 Sand (Seed and Idriss 1970) Sand (Idriss 1990) 9 SC/SD 4.92 100 4098 1148 Sand (Seed and Idriss 1970) Sand (Idriss 1990)
10 SC/SD 9.02 110 15548 2132 Sand (Seed and Idriss 1970) Sand (Idriss 1990) 11 SC/SD 20.51 100 14134 2132 Sand (Seed and Idriss 1970) Sand (Idriss 1990) 12 SC/SD 9.02 120 18375 2132 Sand (Seed and Idriss 1970) Sand (Idriss 1990) 13 SC/SD 16.4 130 18375 2132 Sand (Seed and Idriss 1970) Sand (Idriss 1990) 14 SC/SD 16.4 130 18375 2132 Sand (Seed and Idriss 1970) Sand (Idriss 1990) 15 SC/SD 16.4 130 18375 2132 Sand (Seed and Idriss 1970) Sand (Idriss 1990) 16 SC/SD 16.4 130 18375 2132 Sand (Seed and Idriss 1970) Sand (Idriss 1990) 17 SC/SD 16.4 130 18375 2132 Sand (Seed and Idriss 1970) Sand (Idriss 1990) 18 SC/SD 16.4 130 18375 2132 Sand (Seed and Idriss 1970) Sand (Idriss 1990) 19 SC/SD 16.4 130 18375 2132 Sand (Seed and Idriss 1970) Sand (Idriss 1990) 20 SC/SD 16.4 130 18375 2132 Sand (Seed and Idriss 1970) Sand (Idriss 1990) 21 SC/SD 16.4 130 18375 2132 Sand (Seed and Idriss 1970) Sand (Idriss 1990) 22 SC/SD 16.4 130 18375 2132 Sand (Seed and Idriss 1970) Sand (Idriss 1990) 23 SC/SD 16.4 130 18375 2132 Sand (Seed and Idriss 1970) Sand (Idriss 1990) 24 SC/SD 16.4 130 18375 2132 Sand (Seed and Idriss 1970) Sand (Idriss 1990) 25 SC/SD 16.4 130 18375 2132 Sand (Seed and Idriss 1970) Sand (Idriss 1990) 26 SC/SD 16.4 130 18375 2132 Sand (Seed and Idriss 1970) Sand (Idriss 1990)

662
27 SC/SD 16.4 130 18375 2132 Sand (Seed and Idriss 1970) Sand (Idriss 1990) 28 SC/SD 16.4 130 18375 2132 Sand (Seed and Idriss 1970) Sand (Idriss 1990) 29 SC/SD 16.4 130 18375 2132 Sand (Seed and Idriss 1970) Sand (Idriss 1990) 30 SC/SD 16.4 130 18375 2132 Sand (Seed and Idriss 1970) Sand (Idriss 1990) 31 SC/SD 16.4 130 18375 2132 Sand (Seed and Idriss 1970) Sand (Idriss 1990) 32 SC/SD 16.4 130 18375 2132 Sand (Seed and Idriss 1970) Sand (Idriss 1990) 33 SC/SD 16.4 130 18375 2132 Sand (Seed and Idriss 1970) Sand (Idriss 1990) 34 SC/SD 16.4 130 18375 2132 Sand (Seed and Idriss 1970) Sand (Idriss 1990) 35 SC/SD 16.4 130 18375 2132 Sand (Seed and Idriss 1970) Sand (Idriss 1990) 36 SC/SD 16.4 130 18375 2132 Sand (Seed and Idriss 1970) Sand (Idriss 1990) 37 SC/SD 16.4 130 18375 2132 Sand (Seed and Idriss 1970) Sand (Idriss 1990) 38 SC/SD 16.4 130 18375 2132 Sand (Seed and Idriss 1970) Sand (Idriss 1990) 39 SC/SD 16.4 130 18375 2132 Sand (Seed and Idriss 1970) Sand (Idriss 1990) 40 SC/SD 16.4 130 18375 2132 Sand (Seed and Idriss 1970) Sand (Idriss 1990) 41 SC/SD 16.4 130 18375 2132 Sand (Seed and Idriss 1970) Sand (Idriss 1990) 42 SC/SD 16.4 130 18375 2132 Sand (Seed and Idriss 1970) Sand (Idriss 1990) 43 SC/SD 16.4 130 18375 2132 Sand (Seed and Idriss 1970) Sand (Idriss 1990) 44 SC/SD 16.4 130 18375 2132 Sand (Seed and Idriss 1970) Sand (Idriss 1990) 45 SC/SD 16.4 130 18375 2132 Sand (Seed and Idriss 1970) Sand (Idriss 1990) 46 SC/SD 16.4 130 18375 2132 Sand (Seed and Idriss 1970) Sand (Idriss 1990) 47 SC/SD 16.4 130 18375 2132 Sand (Seed and Idriss 1970) Sand (Idriss 1990) 48 SC/SD 16.4 130 18375 2132 Sand (Seed and Idriss 1970) Sand (Idriss 1990) 49 SC/SD 16.4 130 18375 2132 Sand (Seed and Idriss 1970) Sand (Idriss 1990) 50 SC/SD 16.4 130 18375 2132 Sand (Seed and Idriss 1970) Sand (Idriss 1990) 51 SC/SD 16.4 130 18375 2132 Sand (Seed and Idriss 1970) Sand (Idriss 1990) 52 Rock Infinite 150 200731 6562 Rock Rock

663
C K
D4CXW

664
Profile Name: D5CXW Water Table:26.25 ft Number of Layers: 57
Layer No.
MaterialName
Thick-ness(ft)
Unit Weight(pcf)
Gmax (ksf)
Vs (ft/s)
Modulus Curve
Damping Curve
1 SC/SD 3.28 130 5327 1148 Sand (Seed and Idriss 1970) Sand (Idriss 1990) 2 SC/SD 2.46 130 21311 2296 Sand (Seed and Idriss 1970) Sand (Idriss 1990) 3 SC/SD 4.92 120 19671 2296 Sand (Seed and Idriss 1970) Sand (Idriss 1990) 4 SC/SD 4.92 110 18032 2296 Sand (Seed and Idriss 1970) Sand (Idriss 1990) 5 SC/SD 0.82 100 16393 2296 Sand (Seed and Idriss 1970) Sand (Idriss 1990) 6 SC/SD 4.1 100 6774 1476 Sand (Seed and Idriss 1970) Sand (Idriss 1990) 7 SC/SD 4.92 120 14452 1968 Sand (Seed and Idriss 1970) Sand (Idriss 1990) 8 SC/SD 4.92 130 15657 1968 Sand (Seed and Idriss 1970) Sand (Idriss 1990) 9 SC/SD 2.46 120 14452 902 Sand (Seed and Idriss 1970) Sand (Idriss 1990)
10 SC/SD 6.56 120 3036 1312 Sand (Seed and Idriss 1970) Sand (Idriss 1990) 11 SC/SD 5.74 110 5888 1312 Sand (Seed and Idriss 1970) Sand (Idriss 1990) 12 SC/SD 4.92 120 6423 1312 Sand (Seed and Idriss 1970) Sand (Idriss 1990) 13 SC/SD 2.46 130 6958 820 Sand (Seed and Idriss 1970) Sand (Idriss 1990) 14 SC/SD 6.56 130 2718 1804 Sand (Seed and Idriss 1970) Sand (Idriss 1990) 15 SC/SD 6.56 130 13156 1804 Sand (Seed and Idriss 1970) Sand (Idriss 1990) 16 SC/SD 16.4 130 13156 1804 Sand (Seed and Idriss 1970) Sand (Idriss 1990) 17 SC/SD 16.4 130 13156 2296 Sand (Seed and Idriss 1970) Sand (Idriss 1990) 18 SC/SD 16.4 130 13156 2296 Sand (Seed and Idriss 1970) Sand (Idriss 1990) 19 SC/SD 16.4 130 13156 2296 Sand (Seed and Idriss 1970) Sand (Idriss 1990) 20 SC/SD 16.4 130 13156 2296 Sand (Seed and Idriss 1970) Sand (Idriss 1990) 21 SC/SD 16.4 130 13156 2296 Sand (Seed and Idriss 1970) Sand (Idriss 1990) 22 SC/SD 16.4 130 13156 2296 Sand (Seed and Idriss 1970) Sand (Idriss 1990) 23 SC/SD 16.4 130 13156 2296 Sand (Seed and Idriss 1970) Sand (Idriss 1990) 24 SC/SD 16.4 130 13156 2296 Sand (Seed and Idriss 1970) Sand (Idriss 1990) 25 SC/SD 16.4 130 13156 2296 Sand (Seed and Idriss 1970) Sand (Idriss 1990)

665
26 SC/SD 16.4 130 13156 2296 Sand (Seed and Idriss 1970) Sand (Idriss 1990) 27 SC/SD 16.4 130 13156 2296 Sand (Seed and Idriss 1970) Sand (Idriss 1990) 28 SC/SD 16.4 130 13156 2296 Sand (Seed and Idriss 1970) Sand (Idriss 1990) 29 SC/SD 16.4 130 13156 2296 Sand (Seed and Idriss 1970) Sand (Idriss 1990) 30 SC/SD 16.4 130 13156 2296 Sand (Seed and Idriss 1970) Sand (Idriss 1990) 31 SC/SD 16.4 130 13156 2296 Sand (Seed and Idriss 1970) Sand (Idriss 1990) 32 SC/SD 32.81 130 13156 2296 Sand (Seed and Idriss 1970) Sand (Idriss 1990) 33 SC/SD 32.81 130 13156 2296 Sand (Seed and Idriss 1970) Sand (Idriss 1990) 34 SC/SD 32.81 130 13156 2296 Sand (Seed and Idriss 1970) Sand (Idriss 1990) 35 SC/SD 32.81 130 13156 2296 Sand (Seed and Idriss 1970) Sand (Idriss 1990) 36 SC/SD 32.81 130 13156 2296 Sand (Seed and Idriss 1970) Sand (Idriss 1990) 37 SC/SD 32.81 130 13156 2296 Sand (Seed and Idriss 1970) Sand (Idriss 1990) 38 SC/SD 32.81 130 13156 2296 Sand (Seed and Idriss 1970) Sand (Idriss 1990) 39 SC/SD 32.81 130 13156 2296 Sand (Seed and Idriss 1970) Sand (Idriss 1990) 40 SC/SD 32.81 130 13156 2296 Sand (Seed and Idriss 1970) Sand (Idriss 1990) 41 SC/SD 32.81 130 13156 2296 Sand (Seed and Idriss 1970) Sand (Idriss 1990) 42 SC/SD 32.81 130 13156 2296 Sand (Seed and Idriss 1970) Sand (Idriss 1990) 43 SC/SD 32.81 130 13156 2296 Sand (Seed and Idriss 1970) Sand (Idriss 1990) 44 SC/SD 32.81 130 13156 2296 Sand (Seed and Idriss 1970) Sand (Idriss 1990) 45 SC/SD 32.81 130 13156 2296 Sand (Seed and Idriss 1970) Sand (Idriss 1990) 46 SC/SD 32.81 130 13156 2296 Sand (Seed and Idriss 1970) Sand (Idriss 1990) 47 SC/SD 32.81 130 13156 2296 Sand (Seed and Idriss 1970) Sand (Idriss 1990) 48 SC/SD 32.81 130 13156 2296 Sand (Seed and Idriss 1970) Sand (Idriss 1990) 49 SC/SD 32.81 130 13156 2296 Sand (Seed and Idriss 1970) Sand (Idriss 1990) 50 SC/SD 32.81 130 13156 2296 Sand (Seed and Idriss 1970) Sand (Idriss 1990) 51 SC/SD 32.81 130 13156 2296 Sand (Seed and Idriss 1970) Sand (Idriss 1990) 52 SC/SD 32.81 130 13156 2296 Sand (Seed and Idriss 1970) Sand (Idriss 1990) 53 SC/SD 32.81 130 13156 2296 Sand (Seed and Idriss 1970) Sand (Idriss 1990) 54 SC/SD 32.81 130 13156 2296 Sand (Seed and Idriss 1970) Sand (Idriss 1990) 55 SC/SD 32.81 130 13156 2296 Sand (Seed and Idriss 1970) Sand (Idriss 1990) 56 SC/SD 32.81 130 13156 2296 Sand (Seed and Idriss 1970) Sand (Idriss 1990)

666
57 Rock Infinite 130 200731 6562 Rock Rock

667
D5CXW

668
Profile Name: D5ACXW Water Table:9.84 ft. Number of Layers: 55
Layer No.
MaterialName
Thick- ness (ft)
Unit Weight(pcf)
Gmax (ksf)
Vs (ft/s)
Modulus Curve
Damping Curve
1 SC/SD 6.56 130 2718 820 Sand (Seed and Idriss 1970) Sand Idriss 1990 2 SC/SD 4.1 120 25693 2624 Sand (Seed and Idriss 1970) Sand Idriss 1990 3 SC/SD 5.74 120 25693 2624 Sand (Seed and Idriss 1970) Sand Idriss 1990 4 SC/SD 4.1 100 21411 2624 Sand (Seed and Idriss 1970) Sand Idriss 1990 5 SC/SD 2.46 120 25693 2624 Sand (Seed and Idriss 1970) Sand Idriss 1990 6 SC/SD 2.46 120 4917 1148 Sand (Seed and Idriss 1970) Sand Idriss 1990 7 SC/SD 4.92 130 5327 1148 Sand (Seed and Idriss 1970) Sand Idriss 1990 8 SC/SD 2.46 120 4917 1148 Sand (Seed and Idriss 1970) Sand Idriss 1990 9 SC/SD 6.56 120 14452 1968 Sand (Seed and Idriss 1970) Sand Idriss 1990
10 SC/SD 5.74 110 13248 1968 Sand (Seed and Idriss 1970) Sand Idriss 1990 11 SC/SD 4.92 120 1452 1968 Sand (Seed and Idriss 1970) Sand Idriss 1990 12 SC/SD 5.74 130 15657 1968 Sand (Seed and Idriss 1970) Sand Idriss 1990 13 SC/SD 16.4 130 9812 1558 Sand (Seed and Idriss 1970) Sand Idriss 1990 14 SC/SD 9.84 130 18375 2132 Sand (Seed and Idriss 1970) Sand Idriss 1990 15 SC/SD 16.4 130 18375 2132 Sand (Seed and Idriss 1970) Sand Idriss 1990 16 SC/SD 16.4 130 27834 2624 Sand (Seed and Idriss 1970) Sand Idriss 1990 17 SC/SD 16.4 130 27834 2624 Sand (Seed and Idriss 1970) Sand Idriss 1990 18 SC/SD 16.4 130 27834 2624 Sand (Seed and Idriss 1970) Sand Idriss 1990 19 SC/SD 16.4 130 27834 2624 Sand (Seed and Idriss 1970) Sand Idriss 1990 20 SC/SD 16.4 130 27834 2624 Sand (Seed and Idriss 1970) Sand Idriss 1990 21 SC/SD 16.4 130 27834 2624 Sand (Seed and Idriss 1970) Sand Idriss 1990 22 SC/SD 16.4 130 27834 2624 Sand (Seed and Idriss 1970) Sand Idriss 1990 23 SC/SD 16.4 130 27834 2624 Sand (Seed and Idriss 1970) Sand Idriss 1990 24 SC/SD 16.4 130 27834 2624 Sand (Seed and Idriss 1970) Sand Idriss 1990

669
25 SC/SD 16.4 130 27834 2624 Sand (Seed and Idriss 1970) Sand Idriss 1990 26 SC/SD 16.4 130 27834 2624 Sand (Seed and Idriss 1970) Sand Idriss 1990 27 SC/SD 16.4 130 27834 2624 Sand (Seed and Idriss 1970) Sand Idriss 1990 28 SC/SD 16.4 130 27834 2624 Sand (Seed and Idriss 1970) Sand Idriss 1990 29 SC/SD 16.4 130 27834 2624 Sand (Seed and Idriss 1970) Sand Idriss 1990 30 SC/SD 32.81 130 27834 2624 Sand (Seed and Idriss 1970) Sand Idriss 1990 31 SC/SD 32.81 130 27834 2624 Sand (Seed and Idriss 1970) Sand Idriss 1990 32 SC/SD 32.81 130 27834 2624 Sand (Seed and Idriss 1970) Sand Idriss 1990 33 SC/SD 32.81 130 27834 2624 Sand (Seed and Idriss 1970) Sand Idriss 1990 34 SC/SD 32.81 130 27834 2624 Sand (Seed and Idriss 1970) Sand Idriss 1990 35 SC/SD 32.81 130 27834 2624 Sand (Seed and Idriss 1970) Sand Idriss 1990 36 SC/SD 32.81 130 27834 2624 Sand (Seed and Idriss 1970) Sand Idriss 1990 37 SC/SD 32.81 130 27834 2624 Sand (Seed and Idriss 1970) Sand Idriss 1990 38 SC/SD 32.81 130 27834 2624 Sand (Seed and Idriss 1970) Sand Idriss 1990 39 SC/SD 32.81 130 27834 2624 Sand (Seed and Idriss 1970) Sand Idriss 1990 40 SC/SD 32.81 130 27834 2624 Sand (Seed and Idriss 1970) Sand Idriss 1990 41 SC/SD 32.81 130 27834 2624 Sand (Seed and Idriss 1970) Sand Idriss 1990 42 SC/SD 32.81 130 27834 2624 Sand (Seed and Idriss 1970) Sand Idriss 1990 43 SC/SD 32.81 130 27834 2624 Sand (Seed and Idriss 1970) Sand Idriss 1990 44 SC/SD 32.81 130 27834 2624 Sand (Seed and Idriss 1970) Sand Idriss 1990 45 SC/SD 32.81 130 27834 2624 Sand (Seed and Idriss 1970) Sand Idriss 1990 46 SC/SD 32.81 130 27834 2624 Sand (Seed and Idriss 1970) Sand Idriss 1990 47 SC/SD 32.81 130 27834 2624 Sand (Seed and Idriss 1970) Sand Idriss 1990 48 SC/SD 32.81 130 27834 2624 Sand (Seed and Idriss 1970) Sand Idriss 1990 49 SC/SD 32.81 130 27834 2624 Sand (Seed and Idriss 1970) Sand Idriss 1990 50 SC/SD 32.81 130 27834 2624 Sand (Seed and Idriss 1970) Sand Idriss 1990 51 SC/SD 32.81 130 27834 2624 Sand (Seed and Idriss 1970) Sand Idriss 1990 52 SC/SD 32.81 130 27834 2624 Sand (Seed and Idriss 1970) Sand Idriss 1990 53 SC/SD 32.81 130 27834 2624 Sand (Seed and Idriss 1970) Sand Idriss 1990 54 SC/SD 32.81 130 27834 2624 Sand (Seed and Idriss 1970) Sand Idriss 1990 55 Rock Infinite 150 200731 6562 Rock Rock

670
K
D5ACXW

671
Profile Name: D5CHC Water Table:9.84 ft Number of Layers: 63
Layer No.
Material Name
Thick-ness(ft)
Unit Weight(pcf)
Gmax (ksf)
Vs (ft/s)
Modulus Curve
Damping Curve
1 SC/SD 6.56 130 331 905 Sand (Seed and Idriss 1970) Sand (Idriss 1990) 2 SC/SD 4.1 120 4881 1141 Sand (Seed and Idriss 1970) Sand (Idriss 1990) 3 SC/SD 2.46 110 4508 1148 Sand (Seed and Idriss 1970) Sand (Idriss 1990) 4 SC/SD 2.46 110 2487 853 Sand (Seed and Idriss 1970) Sand (Idriss 1990) 5 SC/SD 4.1 100 2261 853 Sand (Seed and Idriss 1970) Sand (Idriss 1990) 6 SC/SD 3.28 120 2489 817 Sand (Seed and Idriss 1970) Sand (Idriss 1990) 7 SC/SD 3.28 120 4918 1148 Sand (Seed and Idriss 1970) Sand (Idriss 1990) 8 SC/SD 3.28 130 9895 1564 Sand (Seed and Idriss 1970) Sand (Idriss 1990) 9 SC/SD 3.28 120 1978 728 Sand (Seed and Idriss 1970) Sand (Idriss 1990)
10 SC/SD 3.28 120 1300 590 Sand (Seed and Idriss 1970) Sand (Idriss 1990) 11 SC/SD 3.28 120 2992 895 Sand (Seed and Idriss 1970) Sand (Idriss 1990) 12 SC/SD 3.28 110 6307 1358 Sand (Seed and Idriss 1970) Sand (Idriss 1990) 13 SC/SD 3.28 110 4508 1148 Sand (Seed and Idriss 1970) Sand (Idriss 1990) 14 SC/SD 3.28 120 10855 1706 Sand (Seed and Idriss 1970) Sand (Idriss 1990) 15 SC/SD 3.28 120 10036 1640 Sand (Seed and Idriss 1970) Sand (Idriss 1990) 16 SC/SD 3.28 130 3940 987 Sand (Seed and Idriss 1970) Sand (Idriss 1990) 17 SC/SD 3.28 130 2505 787 Sand (Seed and Idriss 1970) Sand (Idriss 1990) 18 SC/SD 3.28 130 3077 872 Sand (Seed and Idriss 1970) Sand (Idriss 1990) 19 SC/SD 3.28 130 13883 1853 Sand (Seed and Idriss 1970) Sand (Idriss 1990) 20 SC/SD 3.28 130 13883 1853 Sand (Seed and Idriss 1970) Sand (Idriss 1990) 21 SC/SD 3.28 130 9812 1558 Sand (Seed and Idriss 1970) Sand (Idriss 1990) 22 SC/SD 9.84 130 9812 1558 Sand (Seed and Idriss 1970) Sand (Idriss 1990) 23 SC/SD 16.4 130 9812 1558 Sand (Seed and Idriss 1970) Sand (Idriss 1990) 24 SC/SD 16.4 130 13883 1853 Sand (Seed and Idriss 1970) Sand (Idriss 1990) 25 SC/SD 16.4 130 13883 1853 Sand (Seed and Idriss 1970) Sand (Idriss 1990)

672
26 SC/SD 16.4 130 13883 1853 Sand (Seed and Idriss 1970) Sand (Idriss 1990) 27 SC/SD 16.4 130 13883 1853 Sand (Seed and Idriss 1970) Sand (Idriss 1990) 28 SC/SD 16.4 130 13883 1853 Sand (Seed and Idriss 1970) Sand (Idriss 1990) 29 SC/SD 16.4 130 13883 1853 Sand (Seed and Idriss 1970) Sand (Idriss 1990) 30 SC/SD 16.4 130 13883 1853 Sand (Seed and Idriss 1970) Sand (Idriss 1990) 31 SC/SD 16.4 130 13883 1853 Sand (Seed and Idriss 1970) Sand (Idriss 1990) 32 SC/SD 16.4 130 13883 1853 Sand (Seed and Idriss 1970) Sand (Idriss 1990) 33 SC/SD 16.4 130 13883 1853 Sand (Seed and Idriss 1970) Sand (Idriss 1990) 34 SC/SD 16.4 130 13883 1853 Sand (Seed and Idriss 1970) Sand (Idriss 1990) 35 SC/SD 16.4 130 13883 1853 Sand (Seed and Idriss 1970) Sand (Idriss 1990) 36 SC/SD 16.4 130 13883 1853 Sand (Seed and Idriss 1970) Sand (Idriss 1990) 37 SC/SD 16.4 130 13883 1853 Sand (Seed and Idriss 1970) Sand (Idriss 1990) 38 SC/SD 32.81 130 13883 1853 Sand (Seed and Idriss 1970) Sand (Idriss 1990) 39 SC/SD 32.81 130 13883 1853 Sand (Seed and Idriss 1970) Sand (Idriss 1990) 40 SC/SD 32.81 130 13883 1853 Sand (Seed and Idriss 1970) Sand (Idriss 1990) 41 SC/SD 32.81 130 13883 1853 Sand (Seed and Idriss 1970) Sand (Idriss 1990) 42 SC/SD 32.81 130 13883 1853 Sand (Seed and Idriss 1970) Sand (Idriss 1990) 43 SC/SD 32.81 130 13883 1853 Sand (Seed and Idriss 1970) Sand (Idriss 1990) 44 SC/SD 32.81 130 13883 1853 Sand (Seed and Idriss 1970) Sand (Idriss 1990) 45 SC/SD 32.81 130 13883 1853 Sand (Seed and Idriss 1970) Sand (Idriss 1990) 46 SC/SD 32.81 130 13883 1853 Sand (Seed and Idriss 1970) Sand (Idriss 1990) 47 SC/SD 32.81 130 13883 1853 Sand (Seed and Idriss 1970) Sand (Idriss 1990) 48 SC/SD 32.81 130 13883 1853 Sand (Seed and Idriss 1970) Sand (Idriss 1990) 49 SC/SD 32.81 130 13883 1853 Sand (Seed and Idriss 1970) Sand (Idriss 1990) 50 SC/SD 32.81 130 13883 1853 Sand (Seed and Idriss 1970) Sand (Idriss 1990) 51 SC/SD 32.81 130 13883 1853 Sand (Seed and Idriss 1970) Sand (Idriss 1990) 52 SC/SD 32.81 130 13883 1853 Sand (Seed and Idriss 1970) Sand (Idriss 1990) 53 SC/SD 32.81 130 13883 1853 Sand (Seed and Idriss 1970) Sand (Idriss 1990) 54 SC/SD 32.81 130 13883 1853 Sand (Seed and Idriss 1970) Sand (Idriss 1990) 55 SC/SD 32.81 130 13883 1853 Sand (Seed and Idriss 1970) Sand (Idriss 1990) 56 SC/SD 32.81 130 13883 1853 Sand (Seed and Idriss 1970) Sand (Idriss 1990)

673
57 SC/SD 32.81 130 13883 1853 Sand (Seed and Idriss 1970) Sand (Idriss 1990) 58 SC/SD 32.81 130 13883 1853 Sand (Seed and Idriss 1970) Sand (Idriss 1990) 59 SC/SD 32.81 130 13883 1853 Sand (Seed and Idriss 1970) Sand (Idriss 1990) 60 SC/SD 32.81 130 13883 1853 Sand (Seed and Idriss 1970) Sand (Idriss 1990) 61 SC/SD 32.81 130 13883 1853 Sand (Seed and Idriss 1970) Sand (Idriss 1990) 62 SC/SD 32.81 130 13883 1640 Sand (Seed and Idriss 1970) Sand (Idriss 1990) 63 Rock Infinite 150 200731 6562 Rock Rock

674
C K
y gp
D5CHC

675
Profile Name: D6CXW Water Table:82.02 ft Number of Layers: 57
Layer No.
Material Name
Thick-ness(ft)
Unit Weight(pcf)
Gmax (ksf)
Vs (ft/s)
Modulus Curve
Damping Curve
1 SC/SD 3.28 100 2090 820 Sand (Seed and Idriss 1970) Sand (Idriss 1990) 2 SC/SD 2.46 130 6958 1312 Sand (Seed and Idriss 1970) Sand (Idriss 1990) 3 SC/SD 4.92 110 5888 1312 Sand (Seed and Idriss 1970) Sand (Idriss 1990) 4 SC/SD 2.46 130 6958 1312 Sand (Seed and Idriss 1970) Sand (Idriss 1990) 5 SC/SD 4.92 120 1605 656 Sand (Seed and Idriss 1970) Sand (Idriss 1990) 6 SC/SD 4.92 130 1739 656 Sand (Seed and Idriss 1970) Sand (Idriss 1990) 7 SC/SD 4.92 130 1739 656 Sand (Seed and Idriss 1970) Sand (Idriss 1990) 8 SC/SD 4.92 130 1739 656 Sand (Seed and Idriss 1970) Sand (Idriss 1990) 9 SC/SD 4.92 130 5327 1148 Sand (Seed and Idriss 1970) Sand (Idriss 1990)
10 SC/SD 4.92 130 5327 1148 Sand (Seed and Idriss 1970) Sand (Idriss 1990) 11 SC/SD 6.56 130 5327 1148 Sand (Seed and Idriss 1970) Sand (Idriss 1990) 12 SC/SD 4.92 130 5327 1148 Sand (Seed and Idriss 1970) Sand (Idriss 1990) 13 SC/SD 4.92 130 5327 1148 Sand (Seed and Idriss 1970) Sand (Idriss 1990) 14 SC/SD 3.28 130 5327 1148 Sand (Seed and Idriss 1970) Sand (Idriss 1990) 15 SC/SD 3.28 130 5327 1148 Sand (Seed and Idriss 1970) Sand (Idriss 1990) 16 SC/SD 16.4 130 10872 1640 Sand (Seed and Idriss 1970) Sand (Idriss 1990) 17 SC/SD 16.4 130 10872 1640 Sand (Seed and Idriss 1970) Sand (Idriss 1990) 18 SC/SD 16.4 130 10872 1640 Sand (Seed and Idriss 1970) Sand (Idriss 1990) 19 SC/SD 16.4 130 10872 1640 Sand (Seed and Idriss 1970) Sand (Idriss 1990) 20 SC/SD 16.4 130 10872 1640 Sand (Seed and Idriss 1970) Sand (Idriss 1990) 21 SC/SD 16.4 130 10872 1640 Sand (Seed and Idriss 1970) Sand (Idriss 1990) 22 SC/SD 16.4 130 10872 1640 Sand (Seed and Idriss 1970) Sand (Idriss 1990) 23 SC/SD 16.4 130 10872 1640 Sand (Seed and Idriss 1970) Sand (Idriss 1990) 24 SC/SD 16.4 130 10872 1640 Sand (Seed and Idriss 1970) Sand (Idriss 1990) 25 SC/SD 16.4 130 10872 1640 Sand (Seed and Idriss 1970) Sand (Idriss 1990)

676
26 SC/SD 16.4 130 10872 1640 Sand (Seed and Idriss 1970) Sand (Idriss 1990) 27 SC/SD 16.4 130 10872 1640 Sand (Seed and Idriss 1970) Sand (Idriss 1990) 28 SC/SD 16.4 130 10872 1640 Sand (Seed and Idriss 1970) Sand (Idriss 1990) 29 SC/SD 16.4 130 10872 1640 Sand (Seed and Idriss 1970) Sand (Idriss 1990) 30 SC/SD 16.4 130 10872 1640 Sand (Seed and Idriss 1970) Sand (Idriss 1990) 31 SC/SD 16.4 130 10872 1640 Sand (Seed and Idriss 1970) Sand (Idriss 1990) 32 SC/SD 32.81 130 10872 1640 Sand (Seed and Idriss 1970) Sand (Idriss 1990) 33 SC/SD 32.81 130 10872 1640 Sand (Seed and Idriss 1970) Sand (Idriss 1990) 34 SC/SD 32.81 130 10872 1640 Sand (Seed and Idriss 1970) Sand (Idriss 1990) 35 SC/SD 32.81 130 10872 1640 Sand (Seed and Idriss 1970) Sand (Idriss 1990) 36 SC/SD 32.81 130 10872 1640 Sand (Seed and Idriss 1970) Sand (Idriss 1990) 37 SC/SD 32.81 130 10872 1640 Sand (Seed and Idriss 1970) Sand (Idriss 1990) 38 SC/SD 32.81 130 10872 1640 Sand (Seed and Idriss 1970) Sand (Idriss 1990) 39 SC/SD 32.81 130 10872 1640 Sand (Seed and Idriss 1970) Sand (Idriss 1990) 40 SC/SD 32.81 130 10872 1640 Sand (Seed and Idriss 1970) Sand (Idriss 1990) 41 SC/SD 32.81 130 10872 1640 Sand (Seed and Idriss 1970) Sand (Idriss 1990) 42 SC/SD 32.81 130 10872 1640 Sand (Seed and Idriss 1970) Sand (Idriss 1990) 43 SC/SD 32.81 130 10872 1640 Sand (Seed and Idriss 1970) Sand (Idriss 1990) 44 SC/SD 32.81 130 10872 1640 Sand (Seed and Idriss 1970) Sand (Idriss 1990) 45 SC/SD 32.81 130 10872 1640 Sand (Seed and Idriss 1970) Sand (Idriss 1990) 46 SC/SD 32.81 130 10872 1640 Sand (Seed and Idriss 1970) Sand (Idriss 1990) 47 SC/SD 32.81 130 10872 1640 Sand (Seed and Idriss 1970) Sand (Idriss 1990) 48 SC/SD 32.81 130 10872 1640 Sand (Seed and Idriss 1970) Sand (Idriss 1990) 49 SC/SD 32.81 130 10872 1640 Sand (Seed and Idriss 1970) Sand (Idriss 1990) 50 SC/SD 32.81 130 10872 1640 Sand (Seed and Idriss 1970) Sand (Idriss 1990) 51 SC/SD 32.81 130 10872 1640 Sand (Seed and Idriss 1970) Sand (Idriss 1990) 52 SC/SD 32.81 130 10872 1640 Sand (Seed and Idriss 1970) Sand (Idriss 1990) 53 SC/SD 32.81 130 10872 1640 Sand (Seed and Idriss 1970) Sand (Idriss 1990) 54 SC/SD 32.81 130 10872 1640 Sand (Seed and Idriss 1970) Sand (Idriss 1990) 55 SC/SD 32.81 130 10872 1640 Sand (Seed and Idriss 1970) Sand (Idriss 1990) 56 SC/SD 32.81 130 10872 1640 Sand (Seed and Idriss 1970) Sand (Idriss 1990)

677
57 Rock Infinite 150 200731 6562 Rock Rock

678
K
D6CXW

679
Profile Name: D6CHC Water Table:82.02 ft Number of Layers: 59
Layer No.
Material Name
Thick-ness(ft)
Unit Weight(pcf)
Gmax (ksf)
Vs (ft/s)
Modulus Curve
Damping Curve
1 SC/SD 3.28 100 4856 1250 Sand (Seed and Idriss 1970) Sand (Idriss 1990) 2 SC/SD 3.28 130 6313 1250 Sand (Seed and Idriss 1970) Sand (Idriss 1990) 3 SC/SD 4.1 110 26463 2782 Sand (Seed and Idriss 1970) Sand (Idriss 1990) 4 SC/SD 2.46 130 31275 2782 Sand (Seed and Idriss 1970) Sand (Idriss 1990) 5 SC/SD 6.56 120 8755 1532 Sand (Seed and Idriss 1970) Sand (Idriss 1990) 6 SC/SD 3.28 130 2361 764 Sand (Seed and Idriss 1970) Sand (Idriss 1990) 7 SC/SD 3.28 130 3100 875 Sand (Seed and Idriss 1970) Sand (Idriss 1990) 8 SC/SD 3.28 130 6581 1276 Sand (Seed and Idriss 1970) Sand (Idriss 1990) 9 SC/SD 3.28 130 3507 931 Sand (Seed and Idriss 1970) Sand (Idriss 1990)
10 SC/SD 3.28 130 8079 1414 Sand (Seed and Idriss 1970) Sand (Idriss 1990) 11 SC/SD 3.28 130 5327 1148 Sand (Seed and Idriss 1970) Sand (Idriss 1990) 12 SC/SD 3.28 130 8079 1414 Sand (Seed and Idriss 1970) Sand (Idriss 1990) 13 SC/SD 6.56 130 6083 1227 Sand (Seed and Idriss 1970) Sand (Idriss 1990) 14 SC/SD 3.28 130 8729 1469 Sand (Seed and Idriss 1970) Sand (Idriss 1990) 15 SC/SD 3.28 130 5057 1119 Sand (Seed and Idriss 1970) Sand (Idriss 1990) 16 SC/SD 3.28 130 15604 1965 Sand (Seed and Idriss 1970) Sand (Idriss 1990) 17 SC/SD 3.28 130 15604 1965 Sand (Seed and Idriss 1970) Sand (Idriss 1990) 18 SC/SD 19.69 130 11850 1712 Sand (Seed and Idriss 1970) Sand (Idriss 1990) 19 SC/SD 16.4 130 11850 1712 Sand (Seed and Idriss 1970) Sand (Idriss 1990) 20 SC/SD 16.4 130 31422 2788 Sand (Seed and Idriss 1970) Sand (Idriss 1990) 21 SC/SD 16.4 130 31422 2788 Sand (Seed and Idriss 1970) Sand (Idriss 1990) 22 SC/SD 16.4 130 31422 2788 Sand (Seed and Idriss 1970) Sand (Idriss 1990) 23 SC/SD 16.4 130 31422 2788 Sand (Seed and Idriss 1970) Sand (Idriss 1990) 24 SC/SD 16.4 130 31422 2788 Sand (Seed and Idriss 1970) Sand (Idriss 1990) 25 SC/SD 16.4 130 31422 2788 Sand (Seed and Idriss 1970) Sand (Idriss 1990)

680
26 SC/SD 16.4 130 31422 2788 Sand (Seed and Idriss 1970) Sand (Idriss 1990) 27 SC/SD 16.4 130 31422 2788 Sand (Seed and Idriss 1970) Sand (Idriss 1990) 28 SC/SD 16.4 130 31422 2788 Sand (Seed and Idriss 1970) Sand (Idriss 1990) 29 SC/SD 16.4 130 31422 2788 Sand (Seed and Idriss 1970) Sand (Idriss 1990) 30 SC/SD 16.4 130 31422 2788 Sand (Seed and Idriss 1970) Sand (Idriss 1990) 31 SC/SD 16.4 130 31422 2788 Sand (Seed and Idriss 1970) Sand (Idriss 1990) 32 SC/SD 16.4 130 31422 2788 Sand (Seed and Idriss 1970) Sand (Idriss 1990) 33 SC/SD 16.4 130 31422 2788 Sand (Seed and Idriss 1970) Sand (Idriss 1990) 34 SC/SD 32.81 130 31422 2788 Sand (Seed and Idriss 1970) Sand (Idriss 1990) 35 SC/SD 32.81 130 31422 2788 Sand (Seed and Idriss 1970) Sand (Idriss 1990) 36 SC/SD 32.81 130 31422 2788 Sand (Seed and Idriss 1970) Sand (Idriss 1990) 37 SC/SD 32.81 130 31422 2788 Sand (Seed and Idriss 1970) Sand (Idriss 1990) 38 SC/SD 32.81 130 31422 2788 Sand (Seed and Idriss 1970) Sand (Idriss 1990) 39 SC/SD 32.81 130 31422 2788 Sand (Seed and Idriss 1970) Sand (Idriss 1990) 40 SC/SD 32.81 130 31422 2788 Sand (Seed and Idriss 1970) Sand (Idriss 1990) 41 SC/SD 32.81 130 31422 2788 Sand (Seed and Idriss 1970) Sand (Idriss 1990) 42 SC/SD 32.81 130 31422 2788 Sand (Seed and Idriss 1970) Sand (Idriss 1990) 43 SC/SD 32.81 130 31422 2788 Sand (Seed and Idriss 1970) Sand (Idriss 1990) 44 SC/SD 32.81 130 31422 2788 Sand (Seed and Idriss 1970) Sand (Idriss 1990) 45 SC/SD 32.81 130 31422 2788 Sand (Seed and Idriss 1970) Sand (Idriss 1990) 46 SC/SD 32.81 130 31422 2788 Sand (Seed and Idriss 1970) Sand (Idriss 1990) 47 SC/SD 32.81 130 31422 2788 Sand (Seed and Idriss 1970) Sand (Idriss 1990) 48 SC/SD 32.81 130 31422 2788 Sand (Seed and Idriss 1970) Sand (Idriss 1990) 49 SC/SD 32.81 130 31422 2788 Sand (Seed and Idriss 1970) Sand (Idriss 1990) 50 SC/SD 32.81 130 31422 2788 Sand (Seed and Idriss 1970) Sand (Idriss 1990) 51 SC/SD 32.81 130 31422 2788 Sand (Seed and Idriss 1970) Sand (Idriss 1990) 52 SC/SD 32.81 130 31422 2788 Sand (Seed and Idriss 1970) Sand (Idriss 1990) 53 SC/SD 32.81 130 31422 2788 Sand (Seed and Idriss 1970) Sand (Idriss 1990) 54 SC/SD 32.81 130 31422 2788 Sand (Seed and Idriss 1970) Sand (Idriss 1990) 55 SC/SD 32.81 130 31422 2788 Sand (Seed and Idriss 1970) Sand (Idriss 1990) 56 SC/SD 32.81 130 31422 2788 Sand (Seed and Idriss 1970) Sand (Idriss 1990)

681
57 SC/SD 32.81 130 31422 2788 Sand (Seed and Idriss 1970) Sand (Idriss 1990) 58 SC/SD 32.81 130 31422 2788 Sand (Seed and Idriss 1970) Sand (Idriss 1990) 59 Rock Infinite 150 200731 6562 Rock Rock

682
D6CHC

683
Profile Name: D7CXW Water Table:85.30 ft Number of Layers: 52
Layer No.
Material Name
Thick-ness(ft)
Unit Weight(pcf)
Gmax (ksf)
Vs (ft/s)
Modulus Curve
Damping Curve
1 SC/SD 3.28 115 2404 820 Sand (Seed and Idriss 1970) Sand (Idriss 1990) 2 SC/SD 5.74 120 12144 1804 Sand (Seed and Idriss 1970) Sand (Idriss 1990) 3 SC/SD 9.84 110 11132 1804 Sand (Seed and Idriss 1970) Sand (Idriss 1990) 4 SC/SD 4.1 100 10120 1804 Sand (Seed and Idriss 1970) Sand (Idriss 1990) 5 SC/SD 5.74 110 3312 984 Sand (Seed and Idriss 1970) Sand (Idriss 1990) 6 SC/SD 4.92 120 3613 984 Sand (Seed and Idriss 1970) Sand (Idriss 1990) 7 SC/SD 5.74 130 3914 984 Sand (Seed and Idriss 1970) Sand (Idriss 1990) 8 SC/SD 4.1 120 12144 1804 Sand (Seed and Idriss 1970) Sand (Idriss 1990) 9 SC/SD 9.02 130 13156 1804 Sand (Seed and Idriss 1970) Sand (Idriss 1990)
10 SC/SD 13.12 130 13156 1804 Sand (Seed and Idriss 1970) Sand (Idriss 1990) 11 SC/SD 16.4 130 13156 1804 Sand (Seed and Idriss 1970) Sand (Idriss 1990) 12 SC/SD 16.4 130 13156 1804 Sand (Seed and Idriss 1970) Sand (Idriss 1990) 13 SC/SD 16.4 130 13156 1804 Sand (Seed and Idriss 1970) Sand (Idriss 1990) 14 SC/SD 16.4 130 13156 1804 Sand (Seed and Idriss 1970) Sand (Idriss 1990) 15 SC/SD 16.4 130 13156 1804 Sand (Seed and Idriss 1970) Sand (Idriss 1990) 16 SC/SD 16.4 130 13156 1804 Sand (Seed and Idriss 1970) Sand (Idriss 1990) 17 SC/SD 16.4 130 13156 1804 Sand (Seed and Idriss 1970) Sand (Idriss 1990) 18 SC/SD 16.4 130 13156 1804 Sand (Seed and Idriss 1970) Sand (Idriss 1990) 19 SC/SD 16.4 130 13156 1804 Sand (Seed and Idriss 1970) Sand (Idriss 1990) 20 SC/SD 16.4 130 13156 1804 Sand (Seed and Idriss 1970) Sand (Idriss 1990) 21 SC/SD 16.4 130 13156 1804 Sand (Seed and Idriss 1970) Sand (Idriss 1990) 22 SC/SD 16.4 130 13156 1804 Sand (Seed and Idriss 1970) Sand (Idriss 1990) 23 SC/SD 16.4 130 13156 1804 Sand (Seed and Idriss 1970) Sand (Idriss 1990) 24 SC/SD 16.4 130 13156 1804 Sand (Seed and Idriss 1970) Sand (Idriss 1990) 25 SC/SD 16.4 130 13156 1804 Sand (Seed and Idriss 1970) Sand (Idriss 1990)

684
26 SC/SD 16.4 130 13156 1804 Sand (Seed and Idriss 1970) Sand (Idriss 1990) 27 SC/SD 32.81 130 13156 1804 Sand (Seed and Idriss 1970) Sand (Idriss 1990) 28 SC/SD 32.81 130 13156 1804 Sand (Seed and Idriss 1970) Sand (Idriss 1990) 29 SC/SD 32.81 130 13156 1804 Sand (Seed and Idriss 1970) Sand (Idriss 1990) 30 SC/SD 32.81 130 13156 1804 Sand (Seed and Idriss 1970) Sand (Idriss 1990) 31 SC/SD 32.81 130 13156 1804 Sand (Seed and Idriss 1970) Sand (Idriss 1990) 32 SC/SD 32.81 130 13156 1804 Sand (Seed and Idriss 1970) and (Idriss 1990) 33 SC/SD 32.81 130 13156 1804 Sand (Seed and Idriss 1970) Sand (Idriss 1990) 34 SC/SD 32.81 130 13156 1804 Sand (Seed and Idriss 1970) Sand (Idriss 1990) 35 SC/SD 32.81 130 13156 1804 Sand (Seed and Idriss 1970) Sand (Idriss 1990) 36 SC/SD 32.81 130 13156 1804 Sand (Seed and Idriss 1970) Sand (Idriss 1990) 37 SC/SD 32.81 130 13156 1804 Sand (Seed and Idriss 1970) Sand (Idriss 1990) 38 SC/SD 32.81 130 13156 1804 Sand (Seed and Idriss 1970) Sand (Idriss 1990) 39 SC/SD 32.81 130 13156 1804 Sand (Seed and Idriss 1970) Sand (Idriss 1990) 40 SC/SD 32.81 130 13156 1804 Sand (Seed and Idriss 1970) Sand (Idriss 1990) 41 SC/SD 32.81 130 13156 1804 Sand (Seed and Idriss 1970) Sand (Idriss 1990) 42 SC/SD 32.81 130 13156 1804 Sand (Seed and Idriss 1970) Sand (Idriss 1990) 43 SC/SD 32.81 130 13156 1804 Sand (Seed and Idriss 1970) Sand (Idriss 1990) 44 SC/SD 32.81 130 13156 1804 Sand (Seed and Idriss 1970) Sand (Idriss 1990) 45 SC/SD 32.81 130 13156 1804 Sand (Seed and Idriss 1970) Sand (Idriss 1990) 46 SC/SD 32.81 130 13156 1804 Sand (Seed and Idriss 1970) Sand (Idriss 1990) 47 SC/SD 32.81 130 13156 1804 Sand (Seed and Idriss 1970) Sand (Idriss 1990) 48 SC/SD 32.81 130 13156 1804 Sand (Seed and Idriss 1970) Sand (Idriss 1990) 49 SC/SD 32.81 130 13156 1804 Sand (Seed and Idriss 1970) Sand (Idriss 1990) 50 SC/SD 32.81 130 13156 1804 Sand (Seed and Idriss 1970) Sand (Idriss 1990) 51 SC/SD 32.81 130 13156 1804 Sand (Seed and Idriss 1970) Sand (Idriss 1990) 52 Rock Infinite 150 200731 6562 Rock Rock

685
D7CXW

686
Profile Name: D8CXW Water Table:82.02 ft Number of Layers: 50
Layer No.
Material Name
Thickness(ft)
Unit Weight(pcf)
Gmax (ksf)
Vs (ft/s)
Modulus Curve
Damping Curve
1 SC/SD 1.64 110 1472 656 Sand (Seed and Idriss 1970) Sand (Idriss 1990) 2 SC/SD 4.92 130 8807 1476 Sand (Seed and Idriss 1970) Sand (Idriss 1990) 3 SC/SD 4.1 110 7452 1476 Sand (Seed and Idriss 1970) Sand (Idriss 1990) 4 SC/SD 13.94 130 8807 1476 Sand (Seed and Idriss 1970) Sand (Idriss 1990) 5 SC/SD 16.4 130 3914 984 Sand (Seed and Idriss 1970) Sand (Idriss 1990) 6 SC/SD 4.1 120 12144 1804 Sand (Seed and Idriss 1970) Sand (Idriss 1990) 7 SC/SD 4.1 130 13156 1804 Sand (Seed and Idriss 1970) Sand (Idriss 1990) 8 SC/SD 16.4 130 13156 1804 Sand (Seed and Idriss 1970) Sand (Idriss 1990) 9 SC/SD 16.4 130 13156 1804 Sand (Seed and Idriss 1970) Sand (Idriss 1990)
10 SC/SD 16.4 130 13156 1804 Sand (Seed and Idriss 1970) Sand (Idriss 1990) 11 SC/SD 16.4 130 13156 1804 Sand (Seed and Idriss 1970) Sand (Idriss 1990) 12 SC/SD 16.4 130 13156 1804 Sand (Seed and Idriss 1970) Sand (Idriss 1990) 13 SC/SD 16.4 130 13156 1804 Sand (Seed and Idriss 1970) Sand (Idriss 1990) 14 SC/SD 16.4 130 13156 1804 Sand (Seed and Idriss 1970) Sand (Idriss 1990) 15 SC/SD 16.4 130 13156 1804 Sand (Seed and Idriss 1970) Sand (Idriss 1990) 16 SC/SD 16.4 130 13156 1804 Sand (Seed and Idriss 1970) Sand (Idriss 1990) 17 SC/SD 16.4 130 13156 1804 Sand (Seed and Idriss 1970) Sand (Idriss 1990) 18 SC/SD 16.4 130 13156 1804 Sand (Seed and Idriss 1970) Sand (Idriss 1990) 19 SC/SD 16.4 130 13156 1804 Sand (Seed and Idriss 1970) Sand (Idriss 1990) 20 SC/SD 16.4 130 13156 1804 Sand (Seed and Idriss 1970) Sand (Idriss 1990) 21 SC/SD 16.4 130 13156 1804 Sand (Seed and Idriss 1970) Sand (Idriss 1990) 22 SC/SD 16.4 130 13156 1804 Sand (Seed and Idriss 1970) Sand (Idriss 1990) 23 SC/SD 16.4 130 13156 1804 Sand (Seed and Idriss 1970) Sand (Idriss 1990) 24 SC/SD 16.4 130 13156 1804 Sand (Seed and Idriss 1970) Sand (Idriss 1990)

687
25 SC/SD 32.81 130 13156 1804 Sand (Seed and Idriss 1970) Sand (Idriss 1990) 26 SC/SD 32.81 130 13156 1804 Sand (Seed and Idriss 1970) Sand (Idriss 1990) 27 SC/SD 32.81 130 13156 1804 Sand (Seed and Idriss 1970) Sand (Idriss 1990) 28 SC/SD 32.81 130 13156 1804 Sand (Seed and Idriss 1970) Sand (Idriss 1990) 29 SC/SD 32.81 130 13156 1804 Sand (Seed and Idriss 1970) Sand (Idriss 1990) 30 SC/SD 32.81 130 13156 1804 Sand (Seed and Idriss 1970) Sand (Idriss 1990) 31 SC/SD 32.81 130 13156 1804 Sand (Seed and Idriss 1970) Sand (Idriss 1990) 32 SC/SD 32.81 130 13156 1804 Sand (Seed and Idriss 1970) Sand (Idriss 1990) 33 SC/SD 32.81 130 13156 1804 Sand (Seed and Idriss 1970) Sand (Idriss 1990) 34 SC/SD 32.81 130 13156 1804 Sand (Seed and Idriss 1970) Sand (Idriss 1990) 35 SC/SD 32.81 130 13156 1804 Sand (Seed and Idriss 1970) Sand (Idriss 1990) 36 SC/SD 32.81 130 13156 1804 Sand (Seed and Idriss 1970) Sand (Idriss 1990) 37 SC/SD 32.81 130 13156 1804 Sand (Seed and Idriss 1970) Sand (Idriss 1990) 38 SC/SD 32.81 130 13156 1804 Sand (Seed and Idriss 1970) Sand (Idriss 1990) 39 SC/SD 32.81 130 13156 1804 Sand (Seed and Idriss 1970) Sand (Idriss 1990) 40 SC/SD 32.81 130 13156 1804 Sand (Seed and Idriss 1970) Sand (Idriss 1990) 41 SC/SD 32.81 130 13156 1804 Sand (Seed and Idriss 1970) Sand (Idriss 1990) 42 SC/SD 32.81 130 13156 1804 Sand (Seed and Idriss 1970) Sand (Idriss 1990) 43 SC/SD 32.81 130 13156 1804 Sand (Seed and Idriss 1970) Sand (Idriss 1990) 44 SC/SD 32.81 130 13156 1804 Sand (Seed and Idriss 1970) Sand (Idriss 1990) 45 SC/SD 32.81 130 13156 1804 Sand (Seed and Idriss 1970) Sand (Idriss 1990) 46 SC/SD 32.81 130 13156 1804 Sand (Seed and Idriss 1970) Sand (Idriss 1990) 47 SC/SD 32.81 130 13156 1804 Sand (Seed and Idriss 1970) Sand (Idriss 1990) 48 SC/SD 32.81 130 13156 1804 Sand (Seed and Idriss 1970) Sand (Idriss 1990) 49 SC/SD 32.81 130 10872 1640 Sand (Seed and Idriss 1970) Sand (Idriss 1990) 50 Rock Infinite 150 200731 6562 Rock Rock

688
K
D8CXW

689
Profile Name: D9CXW Water Table:82.02 ft Number of Layers: 50
Layer No.
Material Name
Thick-ness(ft)
Unit Weight(pcf)
Gmax (ksf)
Vs (ft/s)
Modulus Curve
Damping Curve
1 SC/SD 3.28 130 1739 656 Sand (Seed and Idriss 1970) Sand (Idriss 1990) 2 SC/SD 2.46 130 18375 2132 Sand (Seed and Idriss 1970) Sand (Idriss 1990) 3 SC/SD 4.92 100 14134 2132 Sand (Seed and Idriss 1970) Sand (Idriss 1990) 4 SC/SD 18.86 130 18375 2132 Sand (Seed and Idriss 1970) Sand (Idriss 1990) 5 SC/SD 16.4 130 5327 1148 Sand (Seed and Idriss 1970) Sand (Idriss 1990) 6 SC/SD 16.4 130 8807 1476 Sand (Seed and Idriss 1970) Sand (Idriss 1990) 7 SC/SD 16.4 130 8807 1476 Sand (Seed and Idriss 1970) Sand (Idriss 1990) 8 SC/SD 4.92 110 15548 2132 Sand (Seed and Idriss 1970) Sand (Idriss 1990) 9 SC/SD 24.61 120 16961 2132 Sand (Seed and Idriss 1970) Sand (Idriss 1990)
10 SC/SD 4.92 110 16961 2132 Sand (Seed and Idriss 1970) Sand (Idriss 1990) 11 SC/SD 4.92 120 16961 2132 Sand (Seed and Idriss 1970) Sand (Idriss 1990) 12 SC/SD 4.92 110 16961 2132 Sand (Seed and Idriss 1970) Sand (Idriss 1990) 13 SC/SD 24.61 120 16961 2132 Sand (Seed and Idriss 1970) Sand (Idriss 1990) 14 SC/SD 16.4 130 16961 2132 Sand (Seed and Idriss 1970) Sand (Idriss 1990) 15 SC/SD 16.4 130 16961 2132 Sand (Seed and Idriss 1970) Sand (Idriss 1990) 16 SC/SD 16.4 130 16961 2132 Sand (Seed and Idriss 1970) Sand (Idriss 1990) 17 SC/SD 16.4 130 16961 2132 Sand (Seed and Idriss 1970) Sand (Idriss 1990) 18 SC/SD 16.4 130 16961 2132 Sand (Seed and Idriss 1970) Sand (Idriss 1990) 19 SC/SD 16.4 130 16961 2132 Sand (Seed and Idriss 1970) Sand (Idriss 1990) 20 SC/SD 16.4 130 16961 2132 Sand (Seed and Idriss 1970) Sand (Idriss 1990) 21 SC/SD 16.4 130 16961 2132 Sand (Seed and Idriss 1970) Sand (Idriss 1990) 22 SC/SD 16.4 130 16961 2132 Sand (Seed and Idriss 1970) Sand (Idriss 1990) 23 SC/SD 16.4 130 16961 2132 Sand (Seed and Idriss 1970) Sand (Idriss 1990) 24 SC/SD 16.4 130 16961 2132 Sand (Seed and Idriss 1970) Sand (Idriss 1990) 25 SC/SD 32.81 130 16961 2132 Sand (Seed and Idriss 1970) Sand (Idriss 1990)

690
26 SC/SD 32.81 130 16961 2132 Sand (Seed and Idriss 1970) Sand (Idriss 1990) 27 SC/SD 32.81 130 16961 2132 Sand (Seed and Idriss 1970) Sand (Idriss 1990) 28 SC/SD 32.81 130 16961 2132 Sand (Seed and Idriss 1970) Sand (Idriss 1990) 29 SC/SD 32.81 130 16961 2132 Sand (Seed and Idriss 1970) Sand (Idriss 1990) 30 SC/SD 32.81 130 16961 2132 Sand (Seed and Idriss 1970) Sand (Idriss 1990) 31 SC/SD 32.81 130 16961 2132 Sand (Seed and Idriss 1970) Sand (Idriss 1990) 32 SC/SD 32.81 130 16961 2132 Sand (Seed and Idriss 1970) Sand (Idriss 1990) 33 SC/SD 32.81 130 16961 2132 Sand (Seed and Idriss 1970) Sand (Idriss 1990) 34 SC/SD 32.81 130 16961 2132 Sand (Seed and Idriss 1970) Sand (Idriss 1990) 35 SC/SD 32.81 130 16961 2132 Sand (Seed and Idriss 1970) Sand (Idriss 1990) 36 SC/SD 32.81 130 16961 2132 Sand (Seed and Idriss 1970) Sand (Idriss 1990) 37 SC/SD 32.81 130 16961 2132 Sand (Seed and Idriss 1970) Sand (Idriss 1990) 38 SC/SD 32.81 130 16961 2132 Sand (Seed and Idriss 1970) Sand (Idriss 1990) 39 SC/SD 32.81 130 16961 2132 Sand (Seed and Idriss 1970) Sand (Idriss 1990) 40 SC/SD 32.81 130 16961 2132 Sand (Seed and Idriss 1970) Sand (Idriss 1990) 41 SC/SD 32.81 130 16961 2132 Sand (Seed and Idriss 1970) Sand (Idriss 1990) 42 SC/SD 32.81 130 16961 2132 Sand (Seed and Idriss 1970) Sand (Idriss 1990) 43 SC/SD 32.81 130 16961 2132 Sand (Seed and Idriss 1970) Sand (Idriss 1990) 44 SC/SD 32.81 130 16961 2132 Sand (Seed and Idriss 1970) Sand (Idriss 1990) 45 SC/SD 32.81 130 16961 2132 Sand (Seed and Idriss 1970) Sand (Idriss 1990) 46 SC/SD 32.81 130 16961 2132 Sand (Seed and Idriss 1970) Sand (Idriss 1990) 47 SC/SD 32.81 130 16961 2132 Sand (Seed and Idriss 1970) Sand (Idriss 1990) 48 SC/SD 32.81 130 16961 2132 Sand (Seed and Idriss 1970) Sand (Idriss 1990) 49 SC/SD 32.81 130 16961 2132 Sand (Seed and Idriss 1970) Sand (Idriss 1990) 50 Rock Infinite 150 200731 6562 Rock Rock

691
K
D9CXW

692
Profile Name: D11CXW
Water Table:39.37 ft Number of Layers: 54
Layer No.
MaterialName
Thick-ness (ft)
Unit Weight
(pcf)
Gmax(ksf)
Vs (ft/sec)
Modulus Curve Damping Curve
1 SC/SD 3.28 100 25630 902 Sand (Seed and Idriss 1970) Sand (Idriss 1990)2 SC/SD 9.84 100 3010 964 Sand (Seed and Idriss1970) Sand (Idriss 1990)3 SC/SD 17.22 100 3533 1066 Sand (Seed and Idriss 970) Sand (Idriss 1990)4 SC/SD 2.46 130 4593 1066 Sand (Seed and Idriss 1970) Sand (Idriss 1990)5 SC/SD 2.46 130 5327 1148 Sand (Seed and Idriss 1970) Sand (Idriss 1990)6 SC/SD 13.94 100 4095 1148 Sand (Seed and Idriss 1970) Sand (Idriss 1990)7 SC/SD 10.66 100 4095 1148 Sand (Seed and Idriss 1970) Sand (Idriss 1990)8 SC/SD 5.74 120 4917 1148 Sand (Seed and Idriss 1970) Sand (Idriss 1990)9 SC/SD 4.92 130 10872 1640 Sand (Seed and Idriss 1970) Sand (Idriss 1990)
10 SC/SD 4.1 120 10062 1640 Sand (Seed and Idriss 1970) Sand (Idriss 1990)11 SC/SD 4.92 110 9200 1640 Sand (Seed and Idriss 1970) Sand (Idriss 1990)12 SC/SD 9.84 120 10036 1640 Sand (Seed and Idriss 1970) Sand (Idriss 1990)13 SC/SD 4.92 130 10872 1640 Sand (Seed and Idriss 1970) Sand (Idriss 1990)14 SC/SD 4.92 110 9200 1640 Sand (Seed and Idriss 1970) Sand (Idriss 1990)15 SC/SD 16.4 130 10872 1640 Sand (Seed and Idriss 1970) Sand (Idriss 1990)16 SC/SD 16.4 130 10872 1640 Sand (Seed and Idriss 1970) Sand (Idriss 1990)17 SC/SD 16.4 130 10872 1640 Sand (Seed and Idriss 1970) Sand (Idriss 1990)18 SC/SD 16.4 130 10872 1640 Sand (Seed and Idriss 1970) Sand (Idriss 1990)19 SC/SD 16.4 130 10872 1640 Sand (Seed and Idriss 1970) Sand (Idriss 1990)20 SC/SD 16.4 130 10872 1640 Sand (Seed and Idriss 1970) Sand (Idriss 1990)21 SC/SD 16.4 130 10872 1640 Sand (Seed and Idriss 1970) Sand (Idriss 1990)22 SC/SD 16.4 130 10872 1640 Sand (Seed and Idriss 1970) Sand (Idriss 1990)23 SC/SD 16.4 130 10872 1640 Sand (Seed and Idriss 1970) Sand (Idriss 1990)

693
24 SC/SD 16.4 130 10872 1640 Sand (Seed and Idriss 1970) Sand (Idriss 1990)25 SC/SD 32.81 130 10872 1640 Sand (Seed and Idriss 1970) Sand (Idriss 1990)26 SC/SD 32.81 130 10872 1640 Sand (Seed and Idriss 1970) Sand (Idriss 1990)27 SC/SD 32.81 130 10872 1640 Sand (Seed and Idriss 1970) Sand (Idriss 1990)28 SC/SD 32.81 130 10872 1640 Sand (Seed and Idriss 1970) Sand (Idriss 1990)29 SC/SD 32.81 130 10872 1640 Sand (Seed and Idriss 1970) Sand (Idriss 1990)30 SC/SD 32.81 130 10872 1640 Sand (Seed and Idriss 1970) Sand (Idriss 1990)31 SC/SD 32.81 130 10872 1640 Sand (Seed and Idriss 1970) Sand (Idriss 1990)32 SC/SD 32.81 130 10872 1640 Sand (Seed and Idriss 1970) Sand (Idriss 1990)33 SC/SD 32.81 130 10872 1640 Sand (Seed and Idriss 1970) Sand (Idriss 1990)34 SC/SD 32.81 130 10872 1640 Sand (Seed and Idriss 1970) Sand (Idriss 1990)35 SC/SD 32.81 130 10872 1640 Sand (Seed and Idriss 1970) Sand (Idriss 1990)36 SC/SD 32.81 130 10872 1640 Sand (Seed and Idriss 1970) Sand (Idriss 1990)37 SC/SD 32.81 130 10872 1640 Sand (Seed and Idriss 1970) Sand (Idriss 1990)38 SC/SD 32.81 130 10872 1640 Sand (Seed and Idriss 1970) Sand (Idriss 1990)39 SC/SD 32.81 130 10872 1640 Sand (Seed and Idriss 1970) Sand (Idriss 1990)40 SC/SD 32.81 130 10872 1640 Sand (Seed and Idriss 1970) Sand (Idriss 1990)41 SC/SD 32.81 130 10872 1640 Sand (Seed and Idriss 1970) Sand (Idriss 1990)42 SC/SD 32.81 130 10872 1640 Sand (Seed and Idriss 1970) Sand (Idriss 1990)43 SC/SD 32.81 130 10872 1640 Sand (Seed and Idriss 1970) Sand (Idriss 1990)44 SC/SD 32.81 130 10872 1640 Sand (Seed and Idriss 1970) Sand (Idriss 1990)45 SC/SD 32.81 130 10872 1640 Sand (Seed and Idriss 1970) Sand (Idriss 1990)46 SC/SD 32.81 130 10872 1640 Sand (Seed and Idriss 1970) Sand (Idriss 1990)47 SC/SD 32.81 130 10872 1640 Sand (Seed and Idriss 1970) Sand (Idriss 1990)48 SC/SD 32.81 130 10872 1640 Sand (Seed and Idriss 1970) Sand (Idriss 1990)49 SC/SD 32.81 130 10872 1640 Sand (Seed and Idriss 1970) Sand (Idriss 1990)50 SC/SD 32.81 130 10872 1640 Sand (Seed and Idriss 1970) Sand (Idriss 1990)51 SC/SD 32.81 130 10872 1640 Sand (Seed and Idriss 1970) Sand (Idriss 1990)52 SC/SD 32.81 130 10872 1640 Sand (Seed and Idriss 1970) Sand (Idriss 1990)53 SC/SD 32.81 130 10872 1640 Sand (Seed and Idriss 1970) Sand (Idriss 1990)54 Rock Infinite 150 200731 6562 Rock Rock

694
K
D11CXW

695
Profile Name: D11CHC Water Table:39.37 ft Number of Layers: 63
Layer No.
MaterialName
Thickness(ft)
Unit Weight(pcf)
Gmax (ksf)
Vs (ft/s)
Modulus Curve
Damping Curve
1 SC/SD 3.28 100 3153 1007 Sand (Seed and Idriss 1970) Sand (Idriss 1990) 2 SC/SD 3.28 100 3867 1115 Sand (Seed and Idriss 1970) Sand (Idriss 1990) 3 SC/SD 3.28 100 1633 725 Sand (Seed and Idriss 1970) Sand (Idriss 1990) 4 SC/SD 3.28 100 966 557 Sand (Seed and Idriss 1970) Sand (Idriss 1990) 5 SC/SD 3.28 100 1560 708 Sand (Seed and Idriss 1970) Sand (Idriss 1990) 6 SC/SD 3.28 100 1991 800 Sand (Seed and Idriss 1970) Sand (Idriss 1990) 7 SC/SD 3.28 100 2622 918 Sand (Seed and Idriss 1970) Sand (Idriss 1990) 8 SC/SD 3.28 100 1461 685 Sand (Seed and Idriss 1970) Sand (Idriss 1990) 9 SC/SD 4.1 100 1633 725 Sand (Seed and Idriss 1970) Sand (Idriss 1990)
10 SC/SD 4.92 100 4145 1154 Sand (Seed and Idriss 1970) Sand (Idriss 1990) 11 SC/SD 4.1 100 3867 1115 Sand (Seed and Idriss 1970) Sand (Idriss 1990) 12 SC/SD 3.28 100 3298 1030 Sand (Seed and Idriss 1970) Sand (Idriss 1990) 13 SC/SD 3.28 100 3173 1010 Sand (Seed and Idriss 1970) Sand (Idriss 1990) 14 SC/SD 3.28 100 8531 1656 Sand (Seed and Idriss 1970) Sand (Idriss 1990) 15 SC/SD 3.28 100 8297 1633 Sand (Seed and Idriss 1970) Sand (Idriss 1990) 16 SC/SD 3.28 120 8297 1204 Sand (Seed and Idriss 1970) Sand (Idriss 1990) 17 SC/SD 3.28 130 4506 1843 Sand (Seed and Idriss 1970) Sand (Idriss 1990) 18 SC/SD 5.74 120 10566 2050 Sand (Seed and Idriss 1970) Sand (Idriss 1990) 19 SC/SD 4.92 110 15682 2362 Sand (Seed and Idriss 1970) Sand (Idriss 1990) 20 SC/SD 4.92 120 22546 2362 Sand (Seed and Idriss 1970) Sand (Idriss 1990) 21 SC/SD 4.92 130 20811 2362 Sand (Seed and Idriss 1970) Sand (Idriss 1990) 22 SC/SD 9.84 130 19077 2362 Sand (Seed and Idriss 1970) Sand (Idriss 1990) 23 SC/SD 9.02 130 20811 2362 Sand (Seed and Idriss 1970) Sand (Idriss 1990) 24 SC/SD 16.4 130 20811 2362 Sand (Seed and Idriss 1970) Sand (Idriss 1990)

696
25 SC/SD 16.4 130 20811 2362 Sand (Seed and Idriss 1970) Sand (Idriss 1990) 26 SC/SD 16.4 130 20811 2362 Sand (Seed and Idriss 1970) Sand (Idriss 1990) 27 SC/SD 16.4 130 20811 2362 Sand (Seed and Idriss 1970) Sand (Idriss 1990) 28 SC/SD 16.4 130 20811 2362 Sand (Seed and Idriss 1970) Sand (Idriss 1990) 29 SC/SD 16.4 130 20811 2362 Sand (Seed and Idriss 1970) Sand (Idriss 1990) 30 SC/SD 16.4 130 20811 2362 Sand (Seed and Idriss 1970) Sand (Idriss 1990) 31 SC/SD 16.4 130 20811 2362 Sand (Seed and Idriss 1970) Sand (Idriss 1990) 32 SC/SD 16.4 130 20811 2362 Sand (Seed and Idriss 1970) Sand (Idriss 1990) 33 SC/SD 16.4 130 20811 2362 Sand (Seed and Idriss 1970) Sand (Idriss 1990) 34 SC/SD 16.4 130 20811 2362 Sand (Seed and Idriss 1970) Sand (Idriss 1990) 35 SC/SD 16.4 130 20811 2362 Sand (Seed and Idriss 1970) Sand (Idriss 1990) 36 SC/SD 16.4 130 20811 2362 Sand (Seed and Idriss 1970) Sand (Idriss 1990) 37 SC/SD 16.4 130 20811 2362 Sand (Seed and Idriss 1970) Sand (Idriss 1990) 38 SC/SD 32.81 130 20811 2362 Sand (Seed and Idriss 1970) Sand (Idriss 1990) 39 SC/SD 32.81 130 20811 2362 Sand (Seed and Idriss 1970) Sand (Idriss 1990) 40 SC/SD 32.81 130 20811 2362 Sand (Seed and Idriss 1970) Sand (Idriss 1990) 41 SC/SD 32.81 130 20811 2362 Sand (Seed and Idriss 1970) Sand (Idriss 1990) 42 SC/SD 32.81 130 20811 2362 Sand (Seed and Idriss 1970) Sand (Idriss 1990) 43 SC/SD 32.81 130 20811 2362 Sand (Seed and Idriss 1970) Sand (Idriss 1990) 44 SC/SD 32.81 130 20811 2362 Sand (Seed and Idriss 1970) Sand (Idriss 1990) 45 SC/SD 32.81 130 20811 2362 Sand (Seed and Idriss 1970) Sand (Idriss 1990) 46 SC/SD 32.81 130 20811 2362 Sand (Seed and Idriss 1970) Sand (Idriss 1990) 47 SC/SD 32.81 130 20811 2362 Sand (Seed and Idriss 1970) Sand (Idriss 1990) 48 SC/SD 32.81 130 20811 2362 Sand (Seed and Idriss 1970) Sand (Idriss 1990) 49 SC/SD 32.81 130 20811 2362 Sand (Seed and Idriss 1970) Sand (Idriss 1990) 50 SC/SD 32.81 130 20811 2362 Sand (Seed and Idriss 1970) Sand (Idriss 1990) 51 SC/SD 32.81 130 20811 2362 Sand (Seed and Idriss 1970) Sand (Idriss 1990) 52 SC/SD 32.81 130 20811 2362 Sand (Seed and Idriss 1970) Sand (Idriss 1990) 53 SC/SD 32.81 130 20811 2362 Sand (Seed and Idriss 1970) Sand (Idriss 1990) 54 SC/SD 32.81 130 20811 2362 Sand (Seed and Idriss 1970) Sand (Idriss 1990) 55 SC/SD 32.81 130 20811 2362 Sand (Seed and Idriss 1970) Sand (Idriss 1990)

697
56 SC/SD 32.81 130 20811 2362 Sand (Seed and Idriss 1970) Sand (Idriss 1990) 57 SC/SD 32.81 130 20811 2362 Sand (Seed and Idriss 1970) Sand (Idriss 1990) 58 SC/SD 32.81 130 20811 2362 Sand (Seed and Idriss 1970) Sand (Idriss 1990) 59 SC/SD 32.81 130 20811 2362 Sand (Seed and Idriss 1970) Sand (Idriss 1990) 60 SC/SD 32.81 130 20811 2362 Sand (Seed and Idriss 1970) Sand (Idriss 1990) 61 SC/SD 32.81 130 20811 2362 Sand (Seed and Idriss 1970) Sand (Idriss 1990) 62 SC/SD 32.81 130 20811 2362 Sand (Seed and Idriss 1970) Sand (Idriss 1990) 63 Rock Infinite 150 200731 6562 Rock Rock

698
K
y gp
D11CHC

699
Profile Name: D12CXW Water Table:39.37 ft Number of Layers: 48
Layer No.
MaterialName
Thick-ness(ft)
Unit Weight(pcf)
Gmax (ksf)
Vs (ft/s)
Modulus Curve
Damping Curve
1 SC/SD 6.56 100 1338 656 Sand (Seed and Idriss 1970) Sand (Idriss 1990) 2 SC/SD 9.84 130 6958 1312 Sand (Seed and Idriss 1970) Sand (Idriss 1990) 3 SC/SD 6.56 130 2718 820 Sand (Seed and Idriss 1970) Sand (Idriss 1990) 4 SC/SD 13.12 130 3289 902 Sand (Seed and Idriss 1970) Sand (Idriss 1990) 5 SC/SD 13.12 130 7855 1394 Sand (Seed and Idriss 1970) Sand (Idriss 1990) 6 SC/SD 16.4 130 7855 1394 Sand (Seed and Idriss 1970) Sand (Idriss 1990) 7 SC/SD 16.4 130 7855 1394 Sand (Seed and Idriss 1970) Sand (Idriss 1990) 8 SC/SD 16.4 130 7855 1394 Sand (Seed and Idriss 1970) Sand (Idriss 1990) 9 SC/SD 16.4 130 7855 1394 Sand (Seed and Idriss 1970) Sand (Idriss 1990)
10 SC/SD 16.4 130 7855 1394 Sand (Seed and Idriss 1970) Sand (Idriss 1990) 11 SC/SD 16.4 130 7855 1394 Sand (Seed and Idriss 1970) Sand (Idriss 1990) 12 SC/SD 16.4 130 7855 1394 Sand (Seed and Idriss 1970) Sand (Idriss 1990) 13 SC/SD 16.4 130 7855 1394 Sand (Seed and Idriss 1970) Sand (Idriss 1990) 14 SC/SD 16.4 130 7855 1394 Sand (Seed and Idriss 1970) Sand (Idriss 1990) 15 SC/SD 16.4 130 7855 1394 Sand (Seed and Idriss 1970) Sand (Idriss 1990) 16 SC/SD 16.4 130 7855 1394 Sand (Seed and Idriss 1970) Sand (Idriss 1990) 17 SC/SD 16.4 130 7855 1394 Sand (Seed and Idriss 1970) Sand (Idriss 1990) 18 SC/SD 16.4 130 7855 1394 Sand (Seed and Idriss 1970) Sand (Idriss 1990) 19 SC/SD 16.4 130 7855 1394 Sand (Seed and Idriss 1970) Sand (Idriss 1990) 20 SC/SD 16.4 130 7855 1394 Sand (Seed and Idriss 1970) Sand (Idriss 1990) 21 SC/SD 16.4 130 7855 1394 Sand (Seed and Idriss 1970) Sand (Idriss 1990) 22 SC/SD 16.4 130 7855 1394 Sand (Seed and Idriss 1970) Sand (Idriss 1990) 23 SC/SD 32.81 130 7855 1394 Sand (Seed and Idriss 1970) Sand (Idriss 1990)

700
24 SC/SD 32.81 130 7855 1394 Sand (Seed and Idriss 1970) Sand (Idriss 1990) 25 SC/SD 32.81 130 7855 1394 Sand (Seed and Idriss 1970) Sand (Idriss 1990) 26 SC/SD 32.81 130 7855 1394 Sand (Seed and Idriss 1970) Sand (Idriss 1990) 27 SC/SD 32.81 130 7855 1394 Sand (Seed and Idriss 1970) Sand (Idriss 1990) 28 SC/SD 32.81 130 7855 1394 Sand (Seed and Idriss 1970) Sand (Idriss 1990) 29 SC/SD 32.81 130 7855 1394 Sand (Seed and Idriss 1970) Sand (Idriss 1990) 30 SC/SD 32.81 130 7855 1394 Sand (Seed and Idriss 1970) Sand (Idriss 1990) 31 SC/SD 32.81 130 7855 1394 Sand (Seed and Idriss 1970) Sand (Idriss 1990) 32 SC/SD 32.81 130 7855 1394 Sand (Seed and Idriss 1970) Sand (Idriss 1990) 33 SC/SD 32.81 130 7855 1394 Sand (Seed and Idriss 1970) Sand (Idriss 1990) 34 SC/SD 32.81 130 7855 1394 Sand (Seed and Idriss 1970) Sand (Idriss 1990) 35 SC/SD 32.81 130 7855 1394 Sand (Seed and Idriss 1970) Sand (Idriss 1990) 36 SC/SD 32.81 130 7855 1394 Sand (Seed and Idriss 1970) Sand (Idriss 1990) 37 SC/SD 32.81 130 7855 1394 Sand (Seed and Idriss 1970) Sand (Idriss 1990) 38 SC/SD 32.81 130 7855 1394 Sand (Seed and Idriss 1970) Sand (Idriss 1990) 39 SC/SD 32.81 130 7855 1394 Sand (Seed and Idriss 1970) Sand (Idriss 1990) 40 SC/SD 32.81 130 7855 1394 Sand (Seed and Idriss 1970) Sand (Idriss 1990) 41 SC/SD 32.81 130 7855 1394 Sand (Seed and Idriss 1970) Sand (Idriss 1990) 42 SC/SD 32.81 130 7855 1394 Sand (Seed and Idriss 1970) Sand (Idriss 1990) 43 SC/SD 32.81 130 7855 1394 Sand (Seed and Idriss 1970) Sand (Idriss 1990) 44 SC/SD 32.81 130 7855 1394 Sand (Seed and Idriss 1970) Sand (Idriss 1990) 45 SC/SD 32.81 130 7855 1394 Sand (Seed and Idriss 1970) Sand (Idriss 1990) 46 SC/SD 32.81 130 7855 1394 Sand (Seed and Idriss 1970) Sand (Idriss 1990) 47 SC/SD 32.81 130 7855 1394 Sand (Seed and Idriss 1970) Sand (Idriss 1990) 48 Rock Infinite 150 200731 6562 Rock Rock

701
D12CXW

702
Profile Name: D12CH Water Table:39.37 ft Number of Layers: 60
Layer No.
MaterialName
Thick-ness(ft)
Unit Weight(pcf)
Gmax (ksf)
Vs (ft/s)
Modulus Curve
Damping Curve
1 SC/SD 6.56 110 1078 561 Sand (Seed and Idriss 1970) Sand (Idriss 1990) 2 SC/SD 6.56 130 1573 616 Sand (Seed and Idriss 1970) Sand (Idriss 1990) 3 SC/SD 6.56 130 555 370 Sand (Seed and Idriss 1970) Sand (Idriss 1990) 4 SC/SD 3.28 130 1566 626 Sand (Seed and Idriss 1970) Sand (Idriss 1990) 5 SC/SD 6.56 130 1472 603 Sand (Seed and Idriss 1970) Sand (Idriss 1990) 6 SC/SD 3.28 130 3434 921 Sand (Seed and Idriss 1970) Sand (Idriss 1990) 7 SC/SD 6.56 130 3194 889 Sand (Seed and Idriss 1970) Sand (Idriss 1990) 8 SC/SD 6.56 130 5481 1164 Sand (Seed and Idriss 1970) Sand (Idriss 1990) 9 SC/SD 3.28 130 6547 1272 Sand (Seed and Idriss 1970) Sand (Idriss 1990)
10 SC/SD 3.28 130 5327 1148 Sand (Seed and Idriss 1970) Sand (Idriss 1990) 11 SC/SD 3.28 130 6346 1253 Sand (Seed and Idriss 1970) Sand (Idriss 1990) 12 SC/SD 3.28 130 7169 1332 Sand (Seed and Idriss 1970) Sand (Idriss 1990) 13 SC/SD 3.28 130 9978 1571 Sand (Seed and Idriss 1970) Sand (Idriss 1990) 14 SC/SD 3.28 130 6547 1272 Sand (Seed and Idriss 1970) Sand (Idriss 1990) 15 SC/SD 3.28 130 5206 1135 Sand (Seed and Idriss 1970) Sand (Idriss 1990) 16 SC/SD 3.28 130 6313 1250 Sand (Seed and Idriss 1970) Sand (Idriss 1990) 17 SC/SD 3.28 130 6889 1305 Sand (Seed and Idriss 1970) Sand (Idriss 1990) 18 SC/SD 3.28 130 8885 1482 Sand (Seed and Idriss 1970) Sand (Idriss 1990) 19 SC/SD 3.28 130 7635 1374 Sand (Seed and Idriss 1970) Sand (Idriss 1990) 20 SC/SD 13.12 130 13156 1804 Sand (Seed and Idriss 1970) Sand (Idriss 1990) 21 SC/SD 16.4 130 13156 1804 Sand (Seed and Idriss 1970) Sand (Idriss 1990) 22 SC/SD 16.4 130 13156 1804 Sand (Seed and Idriss 1970) Sand (Idriss 1990) 23 SC/SD 16.4 130 13156 1804 Sand (Seed and Idriss 1970) Sand (Idriss 1990) 24 SC/SD 16.4 130 13156 1804 Sand (Seed and Idriss 1970) Sand (Idriss 1990) 25 SC/SD 16.4 130 13156 1804 Sand (Seed and Idriss 1970) Sand (Idriss 1990)

703
26 SC/SD 16.4 130 13156 1804 Sand (Seed and Idriss 1970) Sand (Idriss 1990) 27 SC/SD 16.4 130 13156 1804 Sand (Seed and Idriss 1970) Sand (Idriss 1990) 28 SC/SD 16.4 130 13156 1804 Sand (Seed and Idriss 1970) Sand (Idriss 1990) 29 SC/SD 16.4 130 13156 1804 Sand (Seed and Idriss 1970) Sand (Idriss 1990) 30 SC/SD 16.4 130 13156 1804 Sand (Seed and Idriss 1970) Sand (Idriss 1990) 31 SC/SD 16.4 130 13156 1804 Sand (Seed and Idriss 1970) Sand (Idriss 1990) 32 SC/SD 16.4 130 13156 1804 Sand (Seed and Idriss 1970) Sand (Idriss 1990) 33 SC/SD 16.4 130 13156 1804 Sand (Seed and Idriss 1970) Sand (Idriss 1990) 34 SC/SD 16.4 130 13156 1804 Sand (Seed and Idriss 1970) Sand (Idriss 1990) 35 SC/SD 32.81 130 13156 1804 Sand (Seed and Idriss 1970) Sand (Idriss 1990) 36 SC/SD 32.81 130 13156 1804 Sand (Seed and Idriss 1970) Sand (Idriss 1990) 37 SC/SD 32.81 130 13156 1804 Sand (Seed and Idriss 1970) Sand (Idriss 1990) 38 SC/SD 32.81 130 13156 1804 Sand (Seed and Idriss 1970) Sand (Idriss 1990) 39 SC/SD 32.81 130 13156 1804 Sand (Seed and Idriss 1970) Sand (Idriss 1990) 40 SC/SD 32.81 130 13156 1804 Sand (Seed and Idriss 1970) Sand (Idriss 1990) 41 SC/SD 32.81 130 13156 1804 Sand (Seed and Idriss 1970) Sand (Idriss 1990) 42 SC/SD 32.81 130 13156 1804 Sand (Seed and Idriss 1970) Sand (Idriss 1990) 43 SC/SD 32.81 130 13156 1804 Sand (Seed and Idriss 1970) Sand (Idriss 1990) 44 SC/SD 32.81 130 13156 1804 Sand (Seed and Idriss 1970) Sand (Idriss 1990) 45 SC/SD 32.81 130 13156 1804 Sand (Seed and Idriss 1970) Sand (Idriss 1990) 46 SC/SD 32.81 130 13156 1804 Sand (Seed and Idriss 1970) Sand (Idriss 1990) 47 SC/SD 32.81 130 13156 1804 Sand (Seed and Idriss 1970) Sand (Idriss 1990) 48 SC/SD 32.81 130 13156 1804 Sand (Seed and Idriss 1970) Sand (Idriss 1990) 49 SC/SD 32.81 130 13156 1804 Sand (Seed and Idriss 1970) Sand (Idriss 1990) 50 SC/SD 32.81 130 13156 1804 Sand (Seed and Idriss 1970) Sand (Idriss 1990) 51 SC/SD 32.81 130 13156 1804 Sand (Seed and Idriss 1970) Sand (Idriss 1990) 52 SC/SD 32.81 130 13156 1804 Sand (Seed and Idriss 1970) Sand (Idriss 1990) 53 SC/SD 32.81 130 13156 1804 Sand (Seed and Idriss 1970) Sand (Idriss 1990) 54 SC/SD 32.81 130 13156 1804 Sand (Seed and Idriss 1970) Sand (Idriss 1990) 55 SC/SD 32.81 130 13156 1804 Sand (Seed and Idriss 1970) Sand (Idriss 1990) 56 SC/SD 32.81 130 13156 1804 Sand (Seed and Idriss 1970) Sand (Idriss 1990)

704
57 SC/SD 32.81 130 13156 1804 Sand (Seed and Idriss 1970) Sand (Idriss 1990) 58 SC/SD 32.81 130 13156 1804 Sand (Seed and Idriss 1970) Sand (Idriss 1990) 59 SC/SD 32.81 130 13156 1804 Sand (Seed and Idriss 1970) Sand (Idriss 1990) 60 Rock Infinite 150 200731 6562 Rock Rock

705
K
D12CHC

706
4. Dynamic Analysis (ProShake) Results for Al-Durrah Site ProShake Report (A)
Bedrock at SPT (TA= 30 or 60 m)boring depth Soil Profile Profile Name: D1ACXW Tests Types and Designations: SPT (60)-CXW Water Table Depth: 8 m. Number of Layers: 28 Input Motion RAN230.EQ Output Locations Layers: 1 and 2 Response Spectra a) 5% Soil Damping
Response Spectra
Layer: 1 - EQ No: 1 - Damping: 5.00% - Outcrop: No Layer: 2 - EQ No: 1 - Damping: 5.00% - Outcrop: No
Acce
lera
tion
(g)
Period (sec)
0.0
0.1
0.2
0.3
0.4
0 2 4 6 8 10
Amax = 0.39 g at T= 0.064 sec.

707
b) 10% Soil Damping
Response Spectra
Layer: 1 - EQ No: 1 - Damping: 10.00% - Outcrop: No Layer: 2 - EQ No: 1 - Damping: 10.00% - Outcrop: No
Acce
lera
tion
(g)
Period (sec)
0.00
0.05
0.10
0.15
0.20
0.25
0.30
0 2 4 6 8 10
Amax =0.28g at T= 0.064 sec.

708
Input Motion RAN330.EQ Response Spectra) a) 5% Soil Damping
Response Spectra
Layer: 1 - EQ No: 1 - Damping: 5.00% - Outcrop: No Layer: 2 - EQ No: 1 - Damping: 5.00% - Outcrop: No
Acce
lera
tion
(g)
Period (sec)
0.00
0.05
0.10
0.15
0.20
0 2 4 6 8 10
Amax = 0.20g at T= 0.098 sec. b) 10% Soil Damping
Response Spectra
Layer: 1 - EQ No: 1 - Damping: 10.00% - Outcrop: No Layer: 2 - EQ No: 1 - Damping: 10.00% - Outcrop: No
Acce
lera
tion
(g)
Period (sec)
0.00
0.05
0.10
0.15
0 2 4 6 8 10
Amax = 0.15g at T= 0.088 sec.

709
Profile Name: D2A Tests Types and Designations: SPT(30)-CXW Water Table Depth: 28 m. Number of Layers: 14 Input Motion RAN230.EQ Output Locations Layers: 1 and 2 Response Spectra a) 5% Soil Damping
Response Spectra
Layer: 1 - EQ No: 1 - Damping: 5.00% - Outcrop: No Layer: 2 - EQ No: 1 - Damping: 5.00% - Outcrop: No
Acce
lera
tion
(g)
Period (sec)
0.00
0.05
0.10
0.15
0.20
0.25
0 2 4 6 8 10
Amax = 0.23g at T= 0.054 sec

710
b) 10% Soil Damping
Response Spectra
Layer: 1 - EQ No: 1 - Damping: 10.00% - Outcrop: No Layer: 2 - EQ No: 1 - Damping: 10.00% - Outcrop: No
Acce
lera
tion
(g)
Period (sec)
0.00
0.05
0.10
0.15
0.20
0 2 4 6 8 10
Amax = 0.17g at T= 0.054 sec

711
Input Motion RAN330.EQ Response Spectra a) 5% Soil Damping
Response Spectra
Layer: 1 - EQ No: 1 - Damping: 5.00% - Outcrop: No Layer: 2 - EQ No: 1 - Damping: 5.00% - Outcrop: No
Acce
lera
tion
(g)
Period (sec)
0.00
0.05
0.10
0.15
0.20
0 2 4 6 8 10
Amax = 0.20g at T= 0.098 sec b) 10% Soil Damping
Response Spectra
Layer: 1 - EQ No: 1 - Damping: 10.00% - Outcrop: No Layer: 2 - EQ No: 1 - Damping: 10.00% - Outcrop: No
Acce
lera
tion
(g)
Period (sec)
0.00
0.05
0.10
0.15
0 2 4 6 8 10
Amax = 0.12g at T= 0.098 sec

712
Soil Profile Profile Name: D3ACXW Tests Types and Designations: SPT(60)-CXW Water Table Depth: 29 m. Number of Layers: 64 Input Motion RAN230.EQ Output Locations Layers: 1 and 2 Response Spectra
a) 5% Soil Damping
Response Spectra
Layer: 1 - EQ No: 1 - Damping: 5.00% - Outcrop: No Layer: 2 - EQ No: 1 - Damping: 5.00% - Outcrop: No
Acce
lera
tion
(g)
Period (sec)
0.00
0.05
0.10
0.15
0.20
0.25
0 2 4 6 8 10
Amax = 0.23g at T= 0.20 sec

713
b) 10% Soil Damping
Response Spectra
Layer: 1 - EQ No: 1 - Damping: 10.00% - Outcrop: No
Acce
lera
tion
(g)
Period (sec)
0.00
0.05
0.10
0.15
0 2 4 6 8 10
Amax = 0.15g at T= 0.077 sec

714
Input Motion RAN330.EQ Response Spectra a) 5% Soil Damping
Response Spectra
Layer: 1 - EQ No: 1 - Damping: 5.00% - Outcrop: No Layer: 2 - EQ No: 1 - Damping: 5.00% - Outcrop: No
Acce
lera
tion
(g)
Period (sec)
0.00
0.05
0.10
0.15
0.20
0 2 4 6 8 10
Amax = 0.16g at T= 0.20 sec b) 10% Soil Damping
Response Spectra
Layer: 1 - EQ No: 1 - Damping: 10.00% - Outcrop: No Layer: 2 - EQ No: 1 - Damping: 10.00% - Outcrop: No
Acce
lera
tion
(g)
Period (sec)
0.00
0.05
0.10
0.15
0 2 4 6 8 10
Amax = 0.12g at T= 0.078 sec

715
Soil Profile Profile Name: D4ACXW Tests Types and Designations: SPT(30)-CXW Water Table Depth: 2.5 m. Number of Layers: 13 Input Motion RAN230.EQ Output Locations Layers: 1 and 2 Response Spectra a) 5% Soil Damping
Response Spectra
Layer: 1 - EQ No: 1 - Damping: 5.00% - Outcrop: No Layer: 2 - EQ No: 1 - Damping: 5.00% - Outcrop: No
Acce
lera
tion
(g)
Period (sec)
0.00
0.05
0.10
0.15
0.20
0 2 4 6 8 10
Amax = 0.16g at T= 0.088 sec

716
b) 10% Soil Damping
Response Spectra
Layer: 1 - EQ No: 1 - Damping: 10.00% - Outcrop: No Layer: 2 - EQ No: 1 - Damping: 10.00% - Outcrop: No
Acce
lera
tion
(g)
Period (sec)
0.00
0.05
0.10
0.15
0 2 4 6 8 10
Amax = 0.12g at T= 0.064 sec

717
Input Motion RAN330.EQ Response Spectra a) 5% Soil Damping
Response Spectra
Layer: 1 - EQ No: 1 - Damping: 5.00% - Outcrop: No Layer: 2 - EQ No: 1 - Damping: 5.00% - Outcrop: No
Acc
eler
atio
n (g
)
Period (sec)
0.00
0.05
0.10
0.15
0.20
0 2 4 6 8 10
Amax = 0.17g at T= 0.098 sec b) 10% Soil Damping
Response Spectra
Layer: 1 - EQ No: 1 - Damping: 10.00% - Outcrop: No Layer: 2 - EQ No: 1 - Damping: 10.00% - Outcrop: No
Acce
lera
tion
(g)
Period (sec)
0.00
0.05
0.10
0.15
0 2 4 6 8 10
Amax = 0.12g at T= 0.098 sec

718
Soil Profile Profile Name: (D5A)A(CXW) Tests Types and Designations: SPT(30)-CXW-Cross hole Water Table Depth: 3 m. Number of Layers: 16 Input Motion RAN230.EQ Output Locations Layers: 1 and 2 Response Spectra a) 5% Soil Damping
Response Spectra
Layer: 1 - EQ No: 1 - Damping: 5.00% - Outcrop: No Layer: 2 - EQ No: 1 - Damping: 5.00% - Outcrop: No
Acce
lera
tion
(g)
Period (sec)
0.0
0.1
0.2
0.3
0.4
0.5
0 2 4 6 8 10
Amax = 0.41g at T= 0.077 sec

719
b) 10% Soil Damping Response Spectra
Layer: 1 - EQ No: 1 - Damping: 10.00% - Outcrop: No Layer: 2 - EQ No: 1 - Damping: 10.00% - Outcrop: No
Acce
lera
tion
(g)
Period (sec)
0.00
0.05
0.10
0.15
0.20
0.25
0 2 4 6 8 10
Amax = 0.25g at T= 0.077 sec

720
Input Motion RAN330.EQ Response Spectra a) 5% Soil Damping
Response Spectra
Layer: 1 - EQ No: 1 - Damping: 5.00% - Outcrop: No Layer: 2 - EQ No: 1 - Damping: 5.00% - Outcrop: No
Acce
lera
tion
(g)
Period (sec)
0.00
0.05
0.10
0.15
0.20
0.25
0 2 4 6 8 10
Amax = 0.21 g at T= 0.088 sec b) 10% Soil Damping
Response Spectra
Layer: 1 - EQ No: 1 - Damping: 10.00% - Outcrop: No Layer: 2 - EQ No: 1 - Damping: 10.00% - Outcrop: No
Acce
lera
tion
(g)
Period (sec)
0.00
0.05
0.10
0.15
0 2 4 6 8 10
Amax = 0.15g at T= 0.077 sec

721
Soil Profile Profile Name: D5A2(CXW) Tests Types and Designations: SPT(30)-CXW-Cross hole Water Table Depth: 3 m. Number of Layers: 18 Input Motion RAN230.EQ Output Locations Layers: 1 and 2 Response Spectra a) 5% Soil Damping
Response Spectra
Layer: 1 - EQ No: 1 - Damping: 5.00% - Outcrop: No Layer: 2 - EQ No: 1 - Damping: 10.00% - Outcrop: No
Acce
lera
tion
(g)
Period (sec)
0.00
0.05
0.10
0.15
0.20
0.25
0.30
0 2 4 6 8 10
Amax = 0.27g at T= 0.064 sec

722
b) 10% Soil Damping Response Spectra
Layer: 1 - EQ No: 1 - Damping: 10.00% - Outcrop: No Layer: 3 - EQ No: 1 - Damping: 5.00% - Outcrop: No
Acce
lera
tion
(g)
Period (sec)
0.00
0.05
0.10
0.15
0.20
0.25
0.30
0 2 4 6 8 10
Amax = 0.26g at T= 0.064 sec

723
Input Motion RAN330.EQ Response Spectra a) 5% Soil Damping
Response Spectra
Layer: 1 - EQ No: 1 - Damping: 5.00% - Outcrop: No Layer: 2 - EQ No: 1 - Damping: 5.00% - Outcrop: No
Acce
lera
tion
(g)
Period (sec)
0.00
0.05
0.10
0.15
0 2 4 6 8 10
Amax = 0.14g at T= 0.25 sec b) 10% Soil Damping
Response Spectra
Layer: 1 - EQ No: 1 - Damping: 10.00% - Outcrop: No Layer: 2 - EQ No: 1 - Damping: 10.00% - Outcrop: No
Acce
lera
tion
(g)
Period (sec)
0.00
0.05
0.10
0.15
0 2 4 6 8 10
Amax = 0.11g at T= 0.064 sec

724
Soil Profile Profile Name: D5CHC Tests Types and Designations: SPT(30)-CXW-Cross hole Water Table Depth: 3 m. Number of Layers: 24 Input Motion RAN230.EQ Output Locations Layers: 1 and 2 Response Spectra a) 5% Soil Damping
Response Spectra
Layer: 1 - EQ No: 1 - Damping: 5.00% - Outcrop: No Layer: 2 - EQ No: 1 - Damping: 5.00% - Outcrop: No
Acce
lera
tion
(g)
Period (sec)
0.0
0.1
0.2
0.3
0.4
0 2 4 6 8 10
Amax = 0.37g at T= 0.064 sec

725
b) 10% Soil Damping
Response Spectra
Layer: 1 - EQ No: 1 - Damping: 10.00% - Outcrop: No Layer: 2 - EQ No: 1 - Damping: 10.00% - Outcrop: No
Acce
lera
tion
(g)
Period (sec)
0.00
0.05
0.10
0.15
0.20
0.25
0.30
0 2 4 6 8 10
Amax = 0.27g at T= 0.054 sec

726
Input Motion RAN330.EQ Response Spectra a) 5% Soil Damping
Response Spectra
Layer: 1 - EQ No: 1 - Damping: 5.00% - Outcrop: No Layer: 2 - EQ No: 1 - Damping: 5.00% - Outcrop: No
Acce
lera
tion
(g)
Period (sec)
0.00
0.05
0.10
0.15
0.20
0 2 4 6 8 10
Amax = 0.19g at T= 0.088 sec b) 10% Soil Damping
Response Spectra
Layer: 1 - EQ No: 1 - Damping: 10.00% - Outcrop: No Layer: 2 - EQ No: 1 - Damping: 10.00% - Outcrop: No
Acce
lera
tion
(g)
Period (sec)
0.00
0.05
0.10
0.15
0 2 4 6 8 10
Amax = 0.13g at T= 0.088 sec

727
Soil Profile Profile Name: D6A(CXW) Tests Types and Designations: SPT(30)-CXW-Cross hole Water Table Depth: 25 m. Number of Layers: 18 Input Motion RAN230.EQ Output Locations Layers: 1 and 2 Response Spectra a) 5% Soil Damping
Response Spectra
Layer: 1 - EQ No: 1 - Damping: 5.00% - Outcrop: No Layer: 2 - EQ No: 1 - Damping: 5.00% - Outcrop: No
Acce
lera
tion
(g)
Period (sec)
0.0
0.1
0.2
0.3
0.4
0 2 4 6 8 10
Amax = 0.32g at T= 0.064 sec

728
b) 10% Soil Damping
Response Spectra
Layer: 1 - EQ No: 1 - Damping: 10.00% - Outcrop: No Layer: 2 - EQ No: 1 - Damping: 10.00% - Outcrop: No
Acce
lera
tion
(g)
Period (sec)
0.00
0.05
0.10
0.15
0.20
0.25
0 2 4 6 8 10
Amax = 0.25g at T= 0.054 sec

729
Input Motion RAN330.EQ Response Spectra a) 5% Soil Damping
Response Spectra
Layer: 1 - EQ No: 1 - Damping: 5.00% - Outcrop: No Layer: 2 - EQ No: 1 - Damping: 5.00% - Outcrop: No
Acce
lera
tion
(g)
Period (sec)
0.00
0.05
0.10
0.15
0.20
0 2 4 6 8 10
Amax = 0.17g at T= 0.32 sec b) 10% Soil Damping
Response Spectra
Layer: 1 - EQ No: 1 - Damping: 10.00% - Outcrop: No Layer: 2 - EQ No: 1 - Damping: 10.00% - Outcrop: No
Acce
lera
tion
(g)
Period (sec)
0.00
0.05
0.10
0.15
0 2 4 6 8 10
Amax = 0.13g at T= 0.098 sec

730
Soil Profile Profile Name: D6ACHC Tests Types and Designations: SPT(30)-CXW-Cross hole Water Table Depth: 25 m. Number of Layers: 20 Input Motion RAN230.EQ Output Locations Layers: 1 and 2 Response Spectra a) 5% Soil Damping
Response Spectra
Layer: 1 - EQ No: 1 - Damping: 5.00% - Outcrop: No Layer: 2 - EQ No: 1 - Damping: 5.00% - Outcrop: No
Acce
lera
tion
(g)
Period (sec)
0.00
0.05
0.10
0.15
0.20
0.25
0.30
0 2 4 6 8 10
Amax = 0.28g at T= 0.064 sec

731
b) 10% Soil Damping
Response Spectra
Layer: 1 - EQ No: 1 - Damping: 10.00% - Outcrop: No Layer: 2 - EQ No: 1 - Damping: 10.00% - Outcrop: No
Acce
lera
tion
(g)
Period (sec)
0.00
0.05
0.10
0.15
0.20
0 2 4 6 8 10
Amax = 0.19g at T= 0.054 sec

732
Input Motion RAN330.EQ Response Spectra a) 5% Soil Damping
Response Spectra
Layer: 1 - EQ No: 1 - Damping: 5.00% - Outcrop: No Layer: 2 - EQ No: 1 - Damping: 5.00% - Outcrop: No
Acce
lera
tion
(g)
Period (sec)
0.00
0.05
0.10
0.15
0.20
0 2 4 6 8 10
Amax = 0.2g at T= 0.098 sec b) 10% Soil Damping
Response Spectra
Layer: 1 - EQ No: 1 - Damping: 10.00% - Outcrop: No Layer: 2 - EQ No: 1 - Damping: 10.00% - Outcrop: No
Acce
lera
tion
(g)
Period (sec)
0.00
0.05
0.10
0.15
0 2 4 6 8 10
Amax = 0.14g at T= 0.098 sec

733
Soil Profile Profile Name: D7ACXW Tests Types and Designations: SPT(30)-CXW Water Table Depth: 26 m. Number of Layers: 13 Input Motion RAN230.EQ Output Locations Layers: 1 and 2 Response Spectra a) 5% Soil Damping
Response Spectra
Layer: 1 - EQ No: 1 - Damping: 5.00% - Outcrop: No Layer: 2 - EQ No: 1 - Damping: 5.00% - Outcrop: No
Acce
lera
tion
(g)
Period (sec)
0.00
0.05
0.10
0.15
0.20
0.25
0 2 4 6 8 10
Amax = 0.22g at T= 0.088 sec

734
b) 10% Soil Damping
Response Spectra
Layer: 1 - EQ No: 1 - Damping: 10.00% - Outcrop: No Layer: 2 - EQ No: 1 - Damping: 10.00% - Outcrop: No
Acce
lera
tion
(g)
Period (sec)
0.00
0.05
0.10
0.15
0.20
0 2 4 6 8 10
Amax = 0.16g at T= 0.088 sec

735
Input Motion RAN330.EQ Response Spectra a) 5% Soil Damping
Response Spectra
Layer: 1 - EQ No: 1 - Damping: 5.00% - Outcrop: No Layer: 2 - EQ No: 1 - Damping: 5.00% - Outcrop: No
Acce
lera
tion
(g)
Period (sec)
0.00
0.05
0.10
0.15
0.20
0 2 4 6 8 10
Amax = 0.16g at T= 0.098 sec b) 10% Soil Damping
Response Spectra
Layer: 1 - EQ No: 1 - Damping: 10.00% - Outcrop: No Layer: 2 - EQ No: 1 - Damping: 10.00% - Outcrop: No
Acce
lera
tion
(g)
Period (sec)
0.00
0.05
0.10
0.15
0 2 4 6 8 10
Amax = 0.14g at T= 0.098 sec

736
Soil Profile Profile Name: D8ACXW Tests Types and Designations: SPT(30)-CXW Water Table Depth: 25 m. Number of Layers: 11 Input Motion RAN230.EQ Output Locations Layers: 1 and 2 Response Spectra a) 5% Soil Damping
Response Spectra
Layer: 1 - EQ No: 1 - Damping: 5.00% - Outcrop: No Layer: 2 - EQ No: 1 - Damping: 5.00% - Outcrop: No
Acce
lera
tion
(g)
Period (sec)
0.00
0.05
0.10
0.15
0.20
0.25
0 2 4 6 8 10
Amax = 0.23g at T= 0.077 sec

737
b) 10% Soil Damping
Response Spectra
Layer: 1 - EQ No: 1 - Damping: 10.00% - Outcrop: No Layer: 2 - EQ No: 1 - Damping: 10.00% - Outcrop: No
Acce
lera
tion
(g)
Period (sec)
0.00
0.05
0.10
0.15
0.20
0 2 4 6 8 10
Amax = 0.16g at T= 0.077 sec

738
Input Motion RAN330.EQ Response Spectra a) 5% Soil Damping
Response Spectra
Layer: 1 - EQ No: 1 - Damping: 5.00% - Outcrop: No Layer: 2 - EQ No: 1 - Damping: 5.00% - Outcrop: No
Acce
lera
tion
(g)
Period (sec)
0.00
0.05
0.10
0.15
0.20
0 2 4 6 8 10
Amax = 0.15g at T= 0.098 sec b) 10% Soil Damping
Response Spectra
Layer: 1 - EQ No: 1 - Damping: 10.00% - Outcrop: No Layer: 2 - EQ No: 1 - Damping: 10.00% - Outcrop: No
Acce
lera
tion
(g)
Period (sec)
0.00
0.05
0.10
0.15
0 2 4 6 8 10
Amax = 0.12g at T= 0.11 sec

739
Soil Profile Profile Name: D9ACXW Tests Types and Designations: SPT(60)-CXW Water Table Depth: 25 m. Number of Layers: 17 Input Motion RAN230.EQ Output Locations Layers: 1 and 2 Response Spectra a) 5% Soil Damping
Response Spectra
Layer: 1 - EQ No: 1 - Damping: 5.00% - Outcrop: No Layer: 2 - EQ No: 1 - Damping: 5.00% - Outcrop: No
Acce
lera
tion
(g)
Period (sec)
0.00
0.05
0.10
0.15
0.20
0.25
0 2 4 6 8 10
Amax = 0.24g at T= 0.077 sec

740
b) 10% Soil Damping
Response Spectra
Layer: 1 - EQ No: 1 - Damping: 10.00% - Outcrop: No Layer: 2 - EQ No: 1 - Damping: 10.00% - Outcrop: No
Acce
lera
tion
(g)
Period (sec)
0.00
0.05
0.10
0.15
0.20
0 2 4 6 8 10
Amax = 0.18g at T= 0.077 sec

741
Input Motion RAN330.EQ Response Spectra a) 5% Soil Damping
Response Spectra
Layer: 1 - EQ No: 1 - Damping: 5.00% - Outcrop: No Layer: 2 - EQ No: 1 - Damping: 5.00% - Outcrop: No
Acce
lera
tion
(g)
Period (sec)
0.00
0.05
0.10
0.15
0.20
0 2 4 6 8 10
Amax = 0.15g at T= 0.077 sec b) 10% Soil Damping
Response Spectra
Layer: 1 - EQ No: 1 - Damping: 10.00% - Outcrop: No Layer: 2 - EQ No: 1 - Damping: 10.00% - Outcrop: No
Acce
lera
tion
(g)
Period (sec)
0.00
0.05
0.10
0.15
0 2 4 6 8 10
Amax = 0.12g at T= 0.077 sec

742
Soil Profile Profile Name: D11A(CXW) Tests Types and Designations: SPT(30)-CXW-Cross hole Water Table Depth: 2.6m. Number of Layers: 15 Input Motion RAN230.EQ Output Locations Layers: 1 and 2 Response Spectra a) 5% Soil Damping
Response Spectra
Layer: 1 - EQ No: 1 - Damping: 5.00% - Outcrop: No Layer: 2 - EQ No: 1 - Damping: 5.00% - Outcrop: No
Acce
lera
tion
(g)
Period (sec)
0.0
0.1
0.2
0.3
0.4
0 2 4 6 8 10
Amax = 0.31g at T= 0.077 sec

743
b) 10% Soil Damping
Response Spectra
Layer: 1 - EQ No: 1 - Damping: 10.00% - Outcrop: No Layer: 2 - EQ No: 1 - Damping: 10.00% - Outcrop: No
Acce
lera
tion
(g)
Period (sec)
0.00
0.05
0.10
0.15
0.20
0.25
0 2 4 6 8 10
Amax = 0.21g at T= 0.077 sec

744
Input Motion RAN330.EQ Response Spectra a) 5% Soil Damping
Response Spectra
Layer: 1 - EQ No: 1 - Damping: 5.00% - Outcrop: No Layer: 2 - EQ No: 1 - Damping: 5.00% - Outcrop: No
Acce
lera
tion
(g)
Period (sec)
0.00
0.05
0.10
0.15
0.20
0.25
0.30
0 2 4 6 8 10
Amax = 0.26g at T= 0.098 sec b) 10% Soil Damping
Response Spectra
Layer: 1 - EQ No: 1 - Damping: 10.00% - Outcrop: No Layer: 2 - EQ No: 1 - Damping: 10.00% - Outcrop: No
Acce
lera
tion
(g)
Period (sec)
0.00
0.05
0.10
0.15
0.20
0 2 4 6 8 10
Amax = 0.19g at T= 0.098 sec

745
Soil Profile Profile Name: D11A (CHC) Tests Types and Designations: SPT(30)-CXW-Cross hole Water Table Depth: 2.6 m. Number of Layers: 24 Input Motion RAN230.EQ Output Locations Layers: 1 and 2 Response Spectra a) 5% Soil Damping
Response Spectra
Layer: 1 - EQ No: 1 - Damping: 5.00% - Outcrop: No Layer: 2 - EQ No: 1 - Damping: 5.00% - Outcrop: No
Acce
lera
tion
(g)
Period (sec)
0.0
0.1
0.2
0.3
0.4
0.5
0 2 4 6 8 10
Amax = 0.43g at T= 0.064 sec

746
b) 10% Soil Damping Response Spectra
Layer: 1 - EQ No: 1 - Damping: 10.00% - Outcrop: No Layer: 2 - EQ No: 1 - Damping: 10.00% - Outcrop: No
Acce
lera
tion
(g)
Period (sec)
0.0
0.1
0.2
0.3
0.4
0 2 4 6 8 10
Amax = 0.31g at T= 0.064 sec

747
Input Motion RAN330.EQ Response Spectra a) 5% Soil Damping
Response Spectra
Layer: 1 - EQ No: 1 - Damping: 5.00% - Outcrop: No Layer: 2 - EQ No: 1 - Damping: 5.00% - Outcrop: No
Acce
lera
tion
(g)
Period (sec)
0.00
0.05
0.10
0.15
0.20
0.25
0.30
0 2 4 6 8 10
Amax = 0.28g at T= 0.098 sec b) 10% Soil Damping
Response Spectra
Layer: 1 - EQ No: 1 - Damping: 10.00% - Outcrop: No Layer: 2 - EQ No: 1 - Damping: 10.00% - Outcrop: No
Acce
lera
tion
(g)
Period (sec)
0.00
0.05
0.10
0.15
0.20
0.25
0 2 4 6 8 10
Amax = 0.22g at T= 0.077 sec

748
Soil Profile Profile Name: D12A(CXW) Tests Types and Designations: SPT(30)-CXW-Cross hole Water Table Depth: 12 m. Number of Layers: 9 Input Motion RAN230.EQ Output Locations Layers: 1 and 2 Response Spectra a) 5% Soil Damping
Response Spectra
Layer: 1 - EQ No: 1 - Damping: 5.00% - Outcrop: No Layer: 2 - EQ No: 1 - Damping: 5.00% - Outcrop: No
Acce
lera
tion
(g)
Period (sec)
0.0
0.1
0.2
0.3
0.4
0.5
0 2 4 6 8 10
Amax = 0.43g at T= 0.064 sec

749
b) 10% Soil Damping
Response Spectra
Layer: 1 - EQ No: 1 - Damping: 10.00% - Outcrop: No Layer: 2 - EQ No: 1 - Damping: 10.00% - Outcrop: No
Acce
lera
tion
(g)
Period (sec)
0.00
0.05
0.10
0.15
0.20
0.25
0.30
0 2 4 6 8 10
Amax = 0.29g at T= 0.054 sec

750
Input Motion RAN330.EQ Response Spectra a) 5% Soil Damping
Response Spectra
Layer: 1 - EQ No: 1 - Damping: 5.00% - Outcrop: No Layer: 2 - EQ No: 1 - Damping: 5.00% - Outcrop: No
Acce
lera
tion
(g)
Period (sec)
0.0
0.1
0.2
0.3
0.4
0.5
0 2 4 6 8 10
Amax = 0.42g at T= 0.077 sec b) 10% Soil Damping
Response Spectra
Layer: 1 - EQ No: 1 - Damping: 10.00% - Outcrop: No Layer: 2 - EQ No: 1 - Damping: 10.00% - Outcrop: No
Acce
lera
tion
(g)
Period (sec)
0.00
0.05
0.10
0.15
0.20
0.25
0.30
0 2 4 6 8 10
Amax = 0.30g at T= 0.054 sec

751
Soil Profile Profile Name: D12A(CHC) Tests Types and Designations: SPT(30)-CXW-Cross hole Water Table Depth: 12 m. Number of Layers: 21 Input Motion RAN230.EQ Output Locations Layers: 1 and 2 Response Spectra a) 5% Soil Damping
Response Spectra
Layer: 1 - EQ No: 1 - Damping: 5.00% - Outcrop: No Layer: 2 - EQ No: 1 - Damping: 5.00% - Outcrop: No
Acce
lera
tion
(g)
Period (sec)
0.0
0.1
0.2
0.3
0.4
0.5
0 2 4 6 8 10
Amax = 0.50g at T= 0.077 sec

752
b) 10% Soil Damping
Response Spectra
Layer: 1 - EQ No: 1 - Damping: 10.00% - Outcrop: No Layer: 2 - EQ No: 1 - Damping: 10.00% - Outcrop: No
Acce
lera
tion
(g)
Period (sec)
0.0
0.1
0.2
0.3
0.4
0 2 4 6 8 10
Amax = 0.36g at T= 0.064 sec

753
Input Motion RAN330.EQ Response Spectra a) 5% Soil Damping
Response Spectra
Layer: 1 - EQ No: 1 - Damping: 5.00% - Outcrop: No Layer: 2 - EQ No: 1 - Damping: 5.00% - Outcrop: No
Acce
lera
tion
(g)
Period (sec)
0.00
0.05
0.10
0.15
0.20
0.25
0 2 4 6 8 10
Amax = 0.21g at T= 0.33 sec b) 10% Soil Damping
Response Spectra
Layer: 1 - EQ No: 1 - Damping: 10.00% - Outcrop: No Layer: 2 - EQ No: 1 - Damping: 10.00% - Outcrop: No
Acce
lera
tion
(g)
Period (sec)
0.00
0.05
0.10
0.15
0.20
0 2 4 6 8 10
Amax = 0.16g at T= 0.064 sec

754
ProShake Report (B)
Bedrock at (TB =100m) depth Soil Profile Profile Name: D1BCXW Tests Types and Designations: SPT(60)-CXW Water Table Depth: 8 m. Number of Layers: 32 Input Motion RAN230.EQ Output Locations Layers: 1 and 2 Response Spectra a) 5% Soil Damping
Response Spectra
Layer: 1 - EQ No: 1 - Damping: 5.00% - Outcrop: No Layer: 2 - EQ No: 1 - Damping: 5.00% - Outcrop: No
Acce
lera
tion
(g)
Period (sec)
0.0
0.1
0.2
0.3
0.4
0 2 4 6 8 10
Amax = 0.35 g at T= 0.077 sec.

755
b) 10% Soil Damping
Response Spectra
Layer: 1 - EQ No: 1 - Damping: 10.00% - Outcrop: No Layer: 2 - EQ No: 1 - Damping: 10.00% - Outcrop: No
Acce
lera
tion
(g)
Period (sec)
0.00
0.05
0.10
0.15
0.20
0.25
0 2 4 6 8 10
Amax =0.24g at T= 0.077 sec.

756
Input Motion RAN330.EQ Response Spectra) a) 5% Soil Damping
Response Spectra
Layer: 1 - EQ No: 1 - Damping: 5.00% - Outcrop: No Layer: 2 - EQ No: 1 - Damping: 5.00% - Outcrop: No
Acce
lera
tion
(g)
Period (sec)
0.00
0.05
0.10
0.15
0.20
0 2 4 6 8 10
Amax = 0.18g at T= 0.088 sec. b) 10% Soil Damping
Response Spectra
Layer: 1 - EQ No: 1 - Damping: 10.00% - Outcrop: No Layer: 2 - EQ No: 1 - Damping: 10.00% - Outcrop: No
Acce
lera
tion
(g)
Period (sec)
0.00
0.05
0.10
0.15
0.20
0 2 4 6 8 10
Amax = 0.17g at T= 0.077 sec.

757
Soil Profile Profile Name: D2BCXW Tests Types and Designations: SPT(30)-CXW Water Table Depth: 28 m. Number of Layers: 28 Input Motion RAN230.EQ Output Locations Layers: 1 and 2 Response Spectra a) 5% Soil Damping
Response Spectra
Layer: 1 - EQ No: 1 - Damping: 5.00% - Outcrop: No Layer: 2 - EQ No: 1 - Damping: 5.00% - Outcrop: No
Acce
lera
tion
(g)
Period (sec)
0.00
0.05
0.10
0.15
0.20
0.25
0.30
0 2 4 6 8 10
Amax = 0.25g at T= 0.077 sec

758
b) 10% Soil Damping
Response Spectra
Layer: 1 - EQ No: 1 - Damping: 15.00% - Outcrop: No Layer: 2 - EQ No: 1 - Damping: 10.00% - Outcrop: No
Acce
lera
tion
(g)
Period (sec)
0.00
0.05
0.10
0.15
0 2 4 6 8 10
Amax = 0.15g at T= 0.077 sec

759
Input Motion RAN330.EQ Response Spectra a) 5% Soil Damping
Response Spectra
Layer: 1 - EQ No: 1 - Damping: 5.00% - Outcrop: No Layer: 2 - EQ No: 1 - Damping: 5.00% - Outcrop: No
Acce
lera
tion
(g)
Period (sec)
0.00
0.05
0.10
0.15
0.20
0 2 4 6 8 10
Amax = 0.19g at T= 0.11 sec b) 10% Soil Damping
Response Spectra
Layer: 1 - EQ No: 1 - Damping: 15.00% - Outcrop: No Layer: 2 - EQ No: 1 - Damping: 10.00% - Outcrop: No
Acce
lera
tion
(g)
Period (sec)
0.00
0.05
0.10
0.15
0 2 4 6 8 10
Amax = 0.13g at T= 0.098 sec

760
Soil Profile Profile Name: D3BCXW Tests Types and Designations: SPT(60)-CXW Water Table Depth: 29 m. Number of Layers: 38 Input Motion RAN230.EQ Output Locations Layers: 1 and 2 Response Spectra a) 5% Soil Damping
Response Spectra
Layer: 1 - EQ No: 1 - Damping: 5.00% - Outcrop: No Layer: 2 - EQ No: 1 - Damping: 5.00% - Outcrop: No
Acce
lera
tion
(g)
Period (sec)
0.00
0.05
0.10
0.15
0.20
0.25
0 2 4 6 8 10
Amax = 0.20g at T= 0.14 sec

761
b) 10% Soil Damping
Response Spectra
Layer: 1 - EQ No: 1 - Damping: 10.00% - Outcrop: No Layer: 2 - EQ No: 1 - Damping: 10.00% - Outcrop: No
Acce
lera
tion
(g)
Period (sec)
0.00
0.05
0.10
0.15
0.20
0 2 4 6 8 10
Amax = 0.16g at T= 0.054 sec

762
Input Motion RAN330.EQ Response Spectra a) 5% Soil Damping
Response Spectra
Layer: 1 - EQ No: 1 - Damping: 5.00% - Outcrop: No Layer: 2 - EQ No: 1 - Damping: 5.00% - Outcrop: No
Acce
lera
tion
(g)
Period (sec)
0.00
0.05
0.10
0.15
0 2 4 6 8 10
Amax = 0.15g at T= 0.16 sec b) 10% Soil Damping
Response Spectra
Layer: 1 - EQ No: 1 - Damping: 10.00% - Outcrop: No Layer: 2 - EQ No: 1 - Damping: 10.00% - Outcrop: No
Acce
lera
tion
(g)
Period (sec)
0.00
0.05
0.10
0.15
0 2 4 6 8 10
Amax = 0.11g at T= 0.12 sec

763
Soil Profile Profile Name: D4BCXW Tests Types and Designations: SPT(30)-CXW Water Table Depth: 2.5 m. Number of Layers: 52 Input Motion RAN230.EQ Output Locations Layers: 1 and 2 Response Spectra a) 5% Soil Damping
Response Spectra
Layer: 1 - EQ No: 1 - Damping: 5.00% - Outcrop: No Layer: 2 - EQ No: 1 - Damping: 5.00% - Outcrop: No
Acce
lera
tion
(g)
Period (sec)
0.00
0.05
0.10
0.15
0.20
0 2 4 6 8 10
Amax = 0.19g at T= 0.077 sec

764
b) 10% Soil Damping
Response Spectra
Layer: 1 - EQ No: 1 - Damping: 15.00% - Outcrop: No Layer: 2 - EQ No: 1 - Damping: 15.00% - Outcrop: No
Acce
lera
tion
(g)
Period (sec)
0.00
0.02
0.04
0.06
0.08
0.10
0 2 4 6 8 10
Amax = 0.095g at T= 0.064 sec

765
Input Motion RAN330.EQ Response Spectra a) 5% Soil Damping
Response Spectra
Layer: 1 - EQ No: 1 - Damping: 5.00% - Outcrop: No Layer: 2 - EQ No: 1 - Damping: 5.00% - Outcrop: No
Acce
lera
tion
(g)
Period (sec)
0.00
0.05
0.10
0.15
0 2 4 6 8 10
Amax = 0.13g at T= 0.26 sec b) 10% Soil Damping
Response Spectra
Layer: 1 - EQ No: 1 - Damping: 15.00% - Outcrop: No Layer: 2 - EQ No: 1 - Damping: 15.00% - Outcrop: No
Acce
lera
tion
(g)
Period (sec)
0.00
0.02
0.04
0.06
0.08
0.10
0 2 4 6 8 10
Amax = 0.098g at T= 0.095 sec

766
Soil Profile Profile Name: (D5A)B(CXW) Tests Types and Designations: SPT(30)-CXW-Cross hole Water Table Depth: 3 m. Number of Layers: 30 Input Motion RAN230.EQ Output Locations Layers: 1 and 2 Response Spectra a) 5% Soil Damping
Response Spectra
Layer: 1 - EQ No: 1 - Damping: 5.00% - Outcrop: No Layer: 2 - EQ No: 1 - Damping: 5.00% - Outcrop: No
Acce
lera
tion
(g)
Period (sec)
0.0
0.1
0.2
0.3
0.4
0 2 4 6 8 10
Amax = 0.34g at T= 0.077 sec

767
b) 10% Soil Damping
Response Spectra
Layer: 1 - EQ No: 1 - Damping: 10.00% - Outcrop: No Layer: 2 - EQ No: 1 - Damping: 10.00% - Outcrop: No
Acce
lera
tion
(g)
Period (sec)
0.00
0.05
0.10
0.15
0.20
0.25
0 2 4 6 8 10
Amax = 0.21 at T= 0.077 sec

768
Input Motion RAN330.EQ Response Spectra a) 5% Soil Damping
Response Spectra
Layer: 1 - EQ No: 1 - Damping: 5.00% - Outcrop: No Layer: 2 - EQ No: 1 - Damping: 5.00% - Outcrop: No
Acce
lera
tion
(g)
Period (sec)
0.00
0.05
0.10
0.15
0.20
0.25
0 2 4 6 8 10
Amax = 0.21g at T= 0.088 sec b) 10% Soil Damping
Response Spectra
Layer: 1 - EQ No: 1 - Damping: 10.00% - Outcrop: No Layer: 2 - EQ No: 1 - Damping: 10.00% - Outcrop: No
Acce
lera
tion
(g)
Period (sec)
0.00
0.05
0.10
0.15
0 2 4 6 8 10
Amax = 0.14g at T= 0.098 sec

769
Soil Profile Profile Name: D5B2(CXW) Tests Types and Designations: SPT-CXW-Cross hole Water Table Depth: 3 m. Number of Layers: 32 Input Motion RAN230.EQ Output Locations Layers: 1 and 2 Response Spectra a) 5% Soil Damping
Response Spectra
Layer: 1 - EQ No: 1 - Damping: 5.00% - Outcrop: No Layer: 2 - EQ No: 1 - Damping: 5.00% - Outcrop: No
Acce
lera
tion
(g)
Period (sec)
0.00
0.05
0.10
0.15
0.20
0.25
0 2 4 6 8 10
Amax = 0.24g at T= 0.054 sec

770
b) 10% Soil Damping
Response Spectra
Layer: 1 - EQ No: 1 - Damping: 10.00% - Outcrop: No Layer: 2 - EQ No: 1 - Damping: 10.00% - Outcrop: No
Acce
lera
tion
(g)
Period (sec)
0.00
0.05
0.10
0.15
0.20
0 2 4 6 8 10
Amax = 0.19g at T= 0.054 sec

771
Input Motion RAN330.EQ Response Spectra a) 5% Soil Damping
Response Spectra
Layer: 1 - EQ No: 1 - Damping: 5.00% - Outcrop: No Layer: 2 - EQ No: 1 - Damping: 5.00% - Outcrop: No
Acce
lera
tion
(g)
Period (sec)
0.00
0.05
0.10
0.15
0 2 4 6 8 10
Amax = 0.12g at T= 0.045 sec b) 10% Soil Damping
Response Spectra
Layer: 1 - EQ No: 1 - Damping: 10.00% - Outcrop: No Layer: 2 - EQ No: 1 - Damping: 10.00% - Outcrop: No
Acce
lera
tion
(g)
Period (sec)
0.00
0.05
0.10
0.15
0 2 4 6 8 10
Amax = 0.10g at T= 0.054 sec

772
Soil Profile Profile Name: D5BCHC Tests Types and Designations: SPT(30)-CXW-Cross hole Water Table Depth: 3 m. Number of Layers: 38 Input Motion RAN230.EQ Output Locations Layers: 1 and 2 Response Spectra a) 5% Soil Damping
Response Spectra
Layer: 1 - EQ No: 1 - Damping: 5.00% - Outcrop: No Layer: 2 - EQ No: 1 - Damping: 5.00% - Outcrop: No
Acce
lera
tion
(g)
Period (sec)
0.0
0.1
0.2
0.3
0.4
0 2 4 6 8 10
Amax = 0.32g at T= 0.064 sec

773
b) 10% Soil Damping
Response Spectra
Layer: 1 - EQ No: 1 - Damping: 15.00% - Outcrop: No Layer: 2 - EQ No: 1 - Damping: 15.00% - Outcrop: No
Acce
lera
tion
(g)
Period (sec)
0.00
0.05
0.10
0.15
0.20
0 2 4 6 8 10
Amax = 0.18g at T= 0.054sec

774
Input Motion RAN330.EQ Response Spectra a) 5% Soil Damping
Response Spectra
Layer: 1 - EQ No: 1 - Damping: 5.00% - Outcrop: No Layer: 2 - EQ No: 1 - Damping: 5.00% - Outcrop: No
Acce
lera
tion
(g)
Period (sec)
0.00
0.05
0.10
0.15
0.20
0 2 4 6 8 10
Amax = 0.17g at T= 0.077 sec b) 10% Soil Damping
Response Spectra
Layer: 1 - EQ No: 1 - Damping: 15.00% - Outcrop: No Layer: 2 - EQ No: 1 - Damping: 15.00% - Outcrop: No
Acce
lera
tion
(g)
Period (sec)
0.00
0.05
0.10
0.15
0 2 4 6 8 10
Amax = 0.11g at T= 0.054 sec

775
C) 15% Soil Damping
Response Spectra
Layer: 1 - EQ No: 1 - Damping: 15.00% -Outcrop: No
Layer: 2 - EQ No: 1 - Damping: 15.00% -Outcrop: No
Acc
eler
atio
n (g
)
Period (sec)
0.00
0.05
0.10
0.15
0 2 4 6 8 10
Amax = 0.13g at T= 0.079 sec

776
Soil Profile Profile Name: D6B(CXW) Tests Types and Designations: SPT(30)-CXW-Cross hole Water Table Depth: 25 m. Number of Layers: 32 Input Motion RAN230.EQ Output Locations Layers: 1 and 2 Response Spectra a) 5% Soil Damping
Response Spectra
Layer: 1 - EQ No: 1 - Damping: 5.00% - Outcrop: No Layer: 2 - EQ No: 1 - Damping: 5.00% - Outcrop: No
Acce
lera
tion
(g)
Period (sec)
0.00
0.05
0.10
0.15
0.20
0.25
0 2 4 6 8 10
Amax = 0.24g at T= 0.064 sec

777
b) 10% Soil Damping Response Spectra
Layer: 1 - EQ No: 1 - Damping: 10.00% - Outcrop: No Layer: 2 - EQ No: 1 - Damping: 10.00% - Outcrop: No
Acce
lera
tion
(g)
Period (sec)
0.00
0.05
0.10
0.15
0.20
0 2 4 6 8 10
Amax = 0.18g at T= 0.054 sec

778
Input Motion RAN330.EQ Response Spectra a) 5% Soil Damping
Response Spectra
Layer: 1 - EQ No: 1 - Damping: 5.00% - Outcrop: No Layer: 2 - EQ No: 1 - Damping: 5.00% - Outcrop: No
Acce
lera
tion
(g)
Period (sec)
0.00
0.05
0.10
0.15
0 2 4 6 8 10
Amax = 0.14g at T= 0.29 sec b) 10% Soil Damping
Response Spectra
Layer: 1 - EQ No: 1 - Damping: 10.00% - Outcrop: No Layer: 2 - EQ No: 1 - Damping: 10.00% - Outcrop: No
Acce
lera
tion
(g)
Period (sec)
0.00
0.05
0.10
0.15
0 2 4 6 8 10
Amax = 0.11g at T= 0.077 sec

779
Soil Profile Profile Name: D6BCHC Tests Types and Designations: SPT(30)-CXW-Cross hole Water Table Depth: 25 m. Number of Layers: 34 Input Motion RAN230.EQ Output Locations Layers: 1 and 2 Response Spectra a) 5% Soil Damping
Response Spectra
Layer: 1 - EQ No: 1 - Damping: 5.00% - Outcrop: No Layer: 2 - EQ No: 1 - Damping: 5.00% - Outcrop: No
Acce
lera
tion
(g)
Period (sec)
0.00
0.05
0.10
0.15
0.20
0.25
0.30
0 2 4 6 8 10
Amax = 0.29g at T= 0.054 sec

780
b) 10% Soil Damping
Response Spectra
Layer: 1 - EQ No: 1 - Damping: 10.00% - Outcrop: No Layer: 2 - EQ No: 1 - Damping: 10.00% - Outcrop: No
Acce
lera
tion
(g)
Period (sec)
0.00
0.05
0.10
0.15
0.20
0.25
0 2 4 6 8 10
Amax = 0.21g at T= 0.054 sec

781
Input Motion RAN330.EQ Response Spectra a) 5% Soil Damping
Response Spectra
Layer: 1 - EQ No: 1 - Damping: 5.00% - Outcrop: No Layer: 2 - EQ No: 1 - Damping: 5.00% - Outcrop: No
Acce
lera
tion
(g)
Period (sec)
0.00
0.05
0.10
0.15
0.20
0 2 4 6 8 10
Amax = 0.15g at T= 0.088 sec b) 10% Soil Damping
Response Spectra
Layer: 1 - EQ No: 1 - Damping: 10.00% - Outcrop: No Layer: 2 - EQ No: 1 - Damping: 10.00% - Outcrop: No
Acce
lera
tion
(g)
Period (sec)
0.00
0.05
0.10
0.15
0 2 4 6 8 10
Amax = 0.14g at T= 0.077 sec

782
Input Motion Soil Profile Profile Name: D7BCXW Tests Types and Designations: SPT(30)-CXW Water Table Depth: 26 m. Number of Layers: 27 Input Motion RAN230.EQ Output Locations Layers: 1 and 2 Response Spectra a) 5% Soil Damping
Response Spectra
Layer: 1 - EQ No: 1 - Damping: 5.00% - Outcrop: No Layer: 2 - EQ No: 1 - Damping: 5.00% - Outcrop: No
Acce
lera
tion
(g)
Period (sec)
0.00
0.05
0.10
0.15
0.20
0 2 4 6 8 10
Amax = 0.19g at T= 0.17 sec

783
b) 10% Soil Damping
Response Spectra
Layer: 1 - EQ No: 1 - Damping: 15.00% - Outcrop: No Layer: 2 - EQ No: 1 - Damping: 15.00% - Outcrop: No
Acce
lera
tion
(g)
Period (sec)
0.00
0.05
0.10
0.15
0 2 4 6 8 10
Amax = 0.11g at T= 0.088 sec

784
Input Motion RAN330.EQ Response Spectra a) 5% Soil Damping
Response Spectra
Layer: 1 - EQ No: 1 - Damping: 5.00% - Outcrop: No Layer: 2 - EQ No: 1 - Damping: 5.00% - Outcrop: No
Acce
lera
tion
(g)
Period (sec)
0.00
0.05
0.10
0.15
0.20
0 2 4 6 8 10
Amax = 0.16g at T= 0.098 sec b) 10% Soil Damping
Response Spectra
Layer: 1 - EQ No: 1 - Damping: 15.00% - Outcrop: No Layer: 2 - EQ No: 1 - Damping: 15.00% - Outcrop: No
Acce
lera
tion
(g)
Period (sec)
0.00
0.05
0.10
0.15
0 2 4 6 8 10
Amax = 0.10g at T= 0.11 sec

785
Soil Profile Profile Name: D8BCXW Tests Types and Designations: SPT(30)-CXW Water Table Depth: 25 m. Number of Layers: 25 Input Motion RAN230.EQ Output Locations Layers: 1 and 2 Response Spectra a) 5% Soil Damping
Response Spectra
Layer: 1 - EQ No: 1 - Damping: 5.00% - Outcrop: No
Acce
lera
tion
(g)
Period (sec)
0.00
0.05
0.10
0.15
0.20
0 2 4 6 8 10
Amax = 0.17g at T= 0.16 sec

786
b) 10% Soil Damping
Response Spectra
Layer: 1 - EQ No: 1 - Damping: 10.00% -Outcrop: No
Layer: 2 - EQ No: 1 - Damping: 10.00% -Outcrop: No
Acc
eler
atio
n (g
)
Period (sec)
0.00
0.05
0.10
0.15
0.20
0 2 4 6 8 10
Amax = 0.17g at T= 0.0788 sec

787
Input Motion RAN330.EQ Response Spectra a) 5% Soil Damping
Response Spectra
Layer: 1 - EQ No: 1 - Damping: 5.00% -Outcrop: No
Layer: 2 - EQ No: 1 - Damping: 5.00% -Outcrop: No
Acc
eler
atio
n (g
)
Period (sec)
0.0
0.1
0.2
0.3
0.4
0 2 4 6 8 10
Amax = 0.32g at T= 0.15 sec b) 10% Soil Damping
Response Spectra
Layer: 1 - EQ No: 1 - Damping: 10.00% -Outcrop: No
Layer: 2 - EQ No: 1 - Damping: 10.00% -Outcrop: No
Acc
eler
atio
n (g
)
Period (sec)
0.00
0.05
0.10
0.15
0.20
0 2 4 6 8 10
Amax = 0.19g at T= 0.16 sec

788
Soil Profile Profile Name: D9BCXW Tests Types and Designations: SPT(60)-CXW Water Table Depth: 25 m. Number of Layers: 25 Input Motion RAN230.EQ Output Locations Layers: 1 and 2 Response Spectra a) 5% Soil Damping
Response Spectra
Layer: 1 - EQ No: 1 - Damping: 5.00% - Outcrop: No Layer: 2 - EQ No: 1 - Damping: 5.00% - Outcrop: No
Acce
lera
tion
(g)
Period (sec)
0.00
0.05
0.10
0.15
0.20
0.25
0 2 4 6 8 10
Amax = 0.22g at T= 0.054 sec

789
b) 10% Soil Damping
Response Spectra
Layer: 1 - EQ No: 1 - Damping: 10.00% - Outcrop: No Layer: 2 - EQ No: 1 - Damping: 10.00% - Outcrop: No
Acce
lera
tion
(g)
Period (sec)
0.00
0.05
0.10
0.15
0.20
0 2 4 6 8 10
Amax = 0.17g at T= 0.045 sec C) 15% Soil Damping
Response Spectra
Layer: 1 - EQ No: 1 - Damping: 15.00% -Outcrop: No
Layer: 2 - EQ No: 1 - Damping: 15.00% -Outcrop: No
Acc
eler
atio
n (g
)
Period (sec)
0.00
0.05
0.10
0.15
0 2 4 6 8 10
Amax = 0.11g at T= 0.10 sec

790
Input Motion RAN330.EQ Response Spectra a) 5% Soil Damping
Response Spectra
Layer: 1 - EQ No: 1 - Damping: 5.00% -Outcrop: No
Layer: 2 - EQ No: 1 - Damping: 5.00% -Outcrop: No
Acc
eler
atio
n (g
)
Period (sec)
0.00
0.05
0.10
0.15
0.20
0.25
0 2 4 6 8 10
Amax = 0.21g at T= 0.10 sec b) 10% Soil Damping
Response Spectra
Layer: 1 - EQ No: 1 - Damping: 10.00% -Outcrop: No
Layer: 2 - EQ No: 1 - Damping: 10.00% -Outcrop: No
Acc
eler
atio
n (g
)
Period (sec)
0.00
0.05
0.10
0.15
0 2 4 6 8 10
Amax = 0.13g at T= 0.10 sec

791
Soil Profile Profile Name: D11B(CXW) Tests Types and Designations: SPT(30)-CXW-Cross hole Water Table Depth: 2.6m. Number of Layers: 29 Input Motion RAN230.EQ Output Locations Layers: 1 and 2 Response Spectra a) 5% Soil Damping
Response Spectra
Layer: 1 - EQ No: 1 - Damping: 5.00% -Outcrop: No
Layer: 2 - EQ No: 1 - Damping: 5.00% -Outcrop: No
Acc
eler
atio
n (g
)
Period (sec)
0.0
0.1
0.2
0.3
0.4
0.5
0 2 4 6 8 10
Amax = 0.41g at T= 0.078 sec

792
b) 10% Soil Damping
Response Spectra
Layer: 1 - EQ No: 1 - Damping: 10.00% -Outcrop: No
Layer: 2 - EQ No: 1 - Damping: 10.00% -Outcrop: No
Acc
eler
atio
n (g
)
Period (sec)
0.00
0.05
0.10
0.15
0.20
0.25
0.30
0 2 4 6 8 10
Amax = 0.25g at T= 0.0788 sec

793
Input Motion RAN330.EQ Response Spectra a) 5% Soil Damping
Response Spectra
Layer: 1 - EQ No: 1 - Damping: 5.00% -Outcrop: No
Layer: 2 - EQ No: 1 - Damping: 5.00% -Outcrop: No
Acc
eler
atio
n (g
)
Period (sec)
0.00
0.05
0.10
0.15
0.20
0.25
0.30
0 2 4 6 8 10
Amax = 0.26g at T= 0.0788 sec b) 10% Soil Damping
Response Spectra
Layer: 1 - EQ No: 1 - Damping: 10.00% -Outcrop: No
Layer: 2 - EQ No: 1 - Damping: 10.00% -Outcrop: No
Acc
eler
atio
n (g
)
Period (sec)
0.00
0.05
0.10
0.15
0.20
0.25
0 2 4 6 8 10
Amax = 0.21g at T= 0.0788 sec

794
Soil Profile Profile Name: D11B (CH) Tests Types and Designations: SPT(30)-CXW-Cross hole Water Table Depth: 2.6 m. Number of Layers: 38 Input Motion RAN230.EQ Output Locations Layers: 1 and 2 Response Spectra a) 5% Soil Damping
Response Spectra
Layer: 1 - EQ No: 1 - Damping: 5.00% -Outcrop: No
Layer: 2 - EQ No: 1 - Damping: 5.00% -Outcrop: No
Acc
eler
atio
n (g
)
Period (sec)
0.0
0.1
0.2
0.3
0.4
0.5
0.6
0 2 4 6 8 10
Amax = 0.57g at T= 0.0788 sec

795
b) 10% Soil Damping
Response Spectra
Layer: 1 - EQ No: 1 - Damping: 10.00% -Outcrop: No
Layer: 2 - EQ No: 1 - Damping: 10.00% -Outcrop: No
Acc
eler
atio
n (g
)
Period (sec)
0.0
0.1
0.2
0.3
0.4
0 2 4 6 8 10
Amax = 0.37g at T= 0.0788 sec

796
Input Motion RAN330.EQ Response Spectra a) 5% Soil Damping
Response Spectra
Layer: 1 - EQ No: 1 - Damping: 5.00% -Outcrop: No
Layer: 2 - EQ No: 1 - Damping: 5.00% -Outcrop: No
Acc
eler
atio
n (g
)
Period (sec)
0.0
0.1
0.2
0.3
0.4
0.5
0 2 4 6 8 10
Amax = 0.47g at T= 0.0996 sec b) 10% Soil Damping
Response Spectra
Layer: 1 - EQ No: 1 - Damping: 10.00% -Outcrop: No
Layer: 2 - EQ No: 1 - Damping: 10.00% -Outcrop: No
Acc
eler
atio
n (g
)
Period (sec)
0.0
0.1
0.2
0.3
0.4
0 2 4 6 8 10
Amax = 0.34g at T= 0.0996 sec

797
Soil Profile Profile Name: D12B(CXW) Tests Types and Designations: SPT(30)-CXW-Cross hole Water Table Depth: 12 m. Number of Layers: 23 Input Motion RAN230.EQ Output Locations Layers: 1 and 2 Response Spectra a) 5% Soil Damping
Response Spectra
Layer: 1 - EQ No: 1 - Damping: 5.00% -Outcrop: No
Layer: 2 - EQ No: 1 - Damping: 5.00% -Outcrop: No
Acc
eler
atio
n (g
)
Period (sec)
0.00
0.05
0.10
0.15
0.20
0.25
0.30
0 2 4 6 8 10
Amax = 0.29g at T= 0.0691 sec

798
b) 10% Soil Damping
Response Spectra
Layer: 1 - EQ No: 1 - Damping: 10.00% -Outcrop: No
Layer: 2 - EQ No: 1 - Damping: 10.00% -Outcrop: No
Acc
eler
atio
n (g
)
Period (sec)
0.00
0.05
0.10
0.15
0.20
0 2 4 6 8 10
Amax = 0.20g at T= 0.0569 sec

799
Input Motion RAN330.EQ Response Spectra a) 5% Soil Damping
Response Spectra
Layer: 1 - EQ No: 1 - Damping: 5.00% -Outcrop: No
Layer: 2 - EQ No: 1 - Damping: 5.00% -Outcrop: No
Acc
eler
atio
n (g
)
Period (sec)
0.00
0.05
0.10
0.15
0.20
0 2 4 6 8 10
Amax = 0.18g at T= 0.33 sec b) 10% Soil Damping
Response Spectra
Layer: 1 - EQ No: 1 - Damping: 10.00% -Outcrop: No
Layer: 2 - EQ No: 1 - Damping: 10.00% -Outcrop: No
Acc
eler
atio
n (g
)
Period (sec)
0.00
0.05
0.10
0.15
0 2 4 6 8 10
Amax = 0.14g at T= 0.13 sec

800
Soil Profile Profile Name: D12B(CHC) Tests Types and Designations: SPT(30)-CXW-Cross hole Water Table Depth: 12 m. Number of Layers: 35 Input Motion RAN230.EQ Output Locations Layers: 1 and 2 Response Spectra a) 5% Soil Damping
Response Spectra
Layer: 1 - EQ No: 1 - Damping: 5.00% -Outcrop: No
Layer: 2 - EQ No: 1 - Damping: 5.00% -Outcrop: No
Acc
eler
atio
n (g
)
Period (sec)
0.0
0.1
0.2
0.3
0.4
0.5
0 2 4 6 8 10
Amax = 0.40g at T= 0.0564 sec

801
b) 10% Soil Damping
Response Spectra
Layer: 1 - EQ No: 1 - Damping: 10.00% -Outcrop: No
Layer: 2 - EQ No: 1 - Damping: 10.00% -Outcrop: No
Acc
eler
atio
n (g
)
Period (sec)
0.00
0.05
0.10
0.15
0.20
0.25
0.30
0 2 4 6 8 10
Amax = 0.29g at T= 0.0569 sec

802
Input Motion RAN330.EQ Response Spectra a) 5% Soil Damping
Response Spectra
Layer: 1 - EQ No: 1 - Damping: 5.00% -Outcrop: No
Layer: 2 - EQ No: 1 - Damping: 5.00% -Outcrop: No
Acc
eler
atio
n (g
)
Period (sec)
0.00
0.05
0.10
0.15
0.20
0.25
0.30
0 2 4 6 8 10
Amax = 0.29g at T= 0.33 sec b) 10% Soil Damping
Response Spectra
Layer: 1 - EQ No: 1 - Damping: 10.00% -Outcrop: No
Layer: 2 - EQ No: 1 - Damping: 10.00% -Outcrop: No
Acc
eler
atio
n (g
)
Period (sec)
0.00
0.05
0.10
0.15
0.20
0 2 4 6 8 10
Amax = 0.18g at T= 0.33 sec

803
ProShake Report (C) Bedrock at (TC =200m) depth Soil Profile Profile Name: D1CCXW Tests Types and Designations: SPT(60)-CXW Water Table Depth: 8 m. Number of Layers: 42 Input Motion RAN230.EQ Output Locations Layers: 1 and 2 Response Spectra a) 5% Soil Damping
Response Spectra
Layer: 1 - EQ No: 1 - Damping: 5.00% - Outcrop: No Layer: 2 - EQ No: 1 - Damping: 5.00% - Outcrop: No
Acce
lera
tion
(g)
Period (sec)
0.00
0.05
0.10
0.15
0.20
0.25
0.30
0 2 4 6 8 10
Amax = 0.27 g at T= 0.054 sec.

804
b) 10% Soil Damping
Response Spectra
Layer: 1 - EQ No: 1 - Damping: 10.00% - Outcrop: No Layer: 2 - EQ No: 1 - Damping: 10.00% - Outcrop: No
Acce
lera
tion
(g)
Period (sec)
0.00
0.05
0.10
0.15
0.20
0.25
0 2 4 6 8 10
Amax =0.20g at T= 0.064 sec.

805
Input Motion RAN330.EQ Response Spectra) a) 5% Soil Damping
Response Spectra
Layer: 1 - EQ No: 1 - Damping: 5.00% - Outcrop: No Layer: 2 - EQ No: 1 - Damping: 5.00% - Outcrop: No
Acce
lera
tion
(g)
Period (sec)
0.00
0.05
0.10
0.15
0.20
0 2 4 6 8 10
Amax = 0.16g at T= 0.077 sec. b) 10% Soil Damping
Response Spectra
Layer: 1 - EQ No: 1 - Damping: 10.00% - Outcrop: No Layer: 2 - EQ No: 1 - Damping: 10.00% - Outcrop: No
Acce
lera
tion
(g)
Period (sec)
0.00
0.05
0.10
0.15
0 2 4 6 8 10
Amax = 0.11g at T= 0.077 sec.

806
Soil Profile Profile Name: D2CCXW Tests Types and Designations: SPT(30)-CXW Water Table Depth: 28 m. Number of Layers: 38 Input Motion RAN230.EQ Output Locations Layers: 1 and 2 Response Spectra a) 5% Soil Damping
Response Spectra
Layer: 1 - EQ No: 1 - Damping: 5.00% - Outcrop: No Layer: 2 - EQ No: 1 - Damping: 5.00% - Outcrop: No
Acce
lera
tion
(g)
Period (sec)
0.00
0.05
0.10
0.15
0.20
0.25
0 2 4 6 8 10
Amax = 0.22g at T= 0.088 sec

807
b) 10% Soil Damping
Response Spectra
Layer: 1 - EQ No: 1 - Damping: 10.00% - Outcrop: No Layer: 2 - EQ No: 1 - Damping: 10.00% - Outcrop: No
Acce
lera
tion
(g)
Period (sec)
0.00
0.05
0.10
0.15
0.20
0 2 4 6 8 10
Amax = 0.15g at T= 0.077 sec

808
Input Motion RAN330.EQ Response Spectra a) 5% Soil Damping
Response Spectra
Layer: 1 - EQ No: 1 - Damping: 5.00% - Outcrop: No Layer: 2 - EQ No: 1 - Damping: 5.00% - Outcrop: No
Acce
lera
tion
(g)
Period (sec)
0.00
0.05
0.10
0.15
0 2 4 6 8 10
Amax = 0.14g at T= 0.088 sec b) 10% Soil Damping
Response Spectra
Layer: 1 - EQ No: 1 - Damping: 10.00% - Outcrop: No Layer: 2 - EQ No: 1 - Damping: 10.00% - Outcrop: No
Acce
lera
tion
(g)
Period (sec)
0.00
0.05
0.10
0.15
0 2 4 6 8 10
Amax = 0.12g at T= 0.077 sec

809
Soil Profile Profile Name: D3CCXW Tests Types and Designations: SPT(60)-CXW Water Table Depth: 29 m. Number of Layers: 64 Input Motion RAN230.EQ Output Locations Layers: 1 and 2 Response Spectra a) 5% Soil Damping
Response Spectra
Layer: 1 - EQ No: 1 - Damping: 5.00% - Outcrop: No Layer: 2 - EQ No: 1 - Damping: 5.00% - Outcrop: No
Acce
lera
tion
(g)
Period (sec)
0.00
0.05
0.10
0.15
0 2 4 6 8 10
Amax = 0.15g at T= 0.088 sec

810
b) 10% Soil Damping
Response Spectra
Layer: 1 - EQ No: 1 - Damping: 10.00% - Outcrop: No Layer: 2 - EQ No: 1 - Damping: 10.00% - Outcrop: No
Acce
lera
tion
(g)
Period (sec)
0.00
0.05
0.10
0.15
0 2 4 6 8 10
Amax = 0.11g at T= 0.064 sec

811
Input Motion RAN330.EQ Response Spectra a) 5% Soil Damping
Response Spectra
Layer: 1 - EQ No: 1 - Damping: 10.00% - Outcrop: No Layer: 2 - EQ No: 1 - Damping: 10.00% - Outcrop: No
Acce
lera
tion
(g)
Period (sec)
0.00
0.05
0.10
0.15
0 2 4 6 8 10
Amax = 0.12g at T= 0.16 sec b) 10% Soil Damping
Response Spectra
Layer: 1 - EQ No: 1 - Damping: 5.00% - Outcrop: No Layer: 2 - EQ No: 1 - Damping: 5.00% - Outcrop: No
Acce
lera
tion
(g)
Period (sec)
0.00
0.05
0.10
0.15
0 2 4 6 8 10
Amax = 0.10g at T= 0.11 sec

812
Soil Profile Profile Name: D4CCXW Tests Types and Designations: SPT(30)-CXW Water Table Depth: 2.5 m. Number of Layers: 37 Input Motion RAN230.EQ Output Locations Layers: 1 and 2 Response Spectra a) 5% Soil Damping
Response Spectra
Layer: 1 - EQ No: 1 - Damping: 5.00% - Outcrop: No Layer: 2 - EQ No: 1 - Damping: 5.00% - Outcrop: No
Acce
lera
tion
(g)
Period (sec)
0.00
0.05
0.10
0.15
0.20
0 2 4 6 8 10
Amax = 0.18g at T= 0.077 sec

813
b) 10% Soil Damping
Response Spectra
Layer: 1 - EQ No: 1 - Damping: 15.00% - Outcrop: No Layer: 2 - EQ No: 1 - Damping: 15.00% - Outcrop: No
Acce
lera
tion
(g)
Period (sec)
0.00
0.05
0.10
0.15
0 2 4 6 8 10
Amax = 0.10g at T= 0.077 sec

814
Input Motion RAN330.EQ Response Spectra a) 5% Soil Damping
Response Spectra
Layer: 1 - EQ No: 1 - Damping: 5.00% - Outcrop: No Layer: 2 - EQ No: 1 - Damping: 5.00% - Outcrop: No
Acce
lera
tion
(g)
Period (sec)
0.00
0.05
0.10
0.15
0 2 4 6 8 10
Amax = 0.13g at T= 0.27 sec b) 10% Soil Damping
Response Spectra
Layer: 1 - EQ No: 1 - Damping: 15.00% - Outcrop: No Layer: 2 - EQ No: 1 - Damping: 15.00% - Outcrop: No
Acce
lera
tion
(g)
Period (sec)
0.00
0.02
0.04
0.06
0.08
0.10
0 2 4 6 8 10
Amax = 0.086 at T= 0.098 sec

815
Soil Profile Profile Name: D5AC(CXW) Tests Types and Designations: SPT(30)-CXW-Cross hole Water Table Depth: 3 m. Number of Layers: 40 Input Motion RAN230.EQ Output Locations Layers: 1 and 2 Response Spectra a) 5% Soil Damping
Response Spectra
Layer: 1 - EQ No: 1 - Damping: 5.00% - Outcrop: No Layer: 2 - EQ No: 1 - Damping: 5.00% - Outcrop: No
Acce
lera
tion
(g)
Period (sec)
0.00
0.05
0.10
0.15
0.20
0.25
0.30
0 2 4 6 8 10
Amax = 0.28g at T= 0.088 sec

816
b) 10% Soil Damping
Response Spectra
Layer: 1 - EQ No: 1 - Damping: 10.00% - Outcrop: No Layer: 2 - EQ No: 1 - Damping: 10.00% - Outcrop: No
Acce
lera
tion
(g)
Period (sec)
0.00
0.05
0.10
0.15
0.20
0 2 4 6 8 10
Amax = 0.19g at T= 0.064 sec

817
Input Motion RAN330.EQ Response Spectra a) 5% Soil Damping
Response Spectra
Layer: 1 - EQ No: 1 - Damping: 5.00% - Outcrop: No Layer: 2 - EQ No: 1 - Damping: 5.00% - Outcrop: No
Acce
lera
tion
(g)
Period (sec)
0.00
0.05
0.10
0.15
0.20
0 2 4 6 8 10
Amax = 0.17g at T= 0.088 sec b) 10% Soil Damping
Response Spectra
Layer: 1 - EQ No: 1 - Damping: 10.00% - Outcrop: No Layer: 2 - EQ No: 1 - Damping: 10.00% - Outcrop: No
Acce
lera
tion
(g)
Period (sec)
0.00
0.05
0.10
0.15
0 2 4 6 8 10
Amax = 0.13g at T= 0.077 sec

818
Soil Profile Profile Name: D5C2(CXW) Tests Types and Designations: SPT(30)-CXW-Cross hole Water Table Depth: 3 m. Number of Layers: 57 Input Motion RAN230.EQ Output Locations Layers: 1 and 2 Response Spectra a) 5% Soil Damping
Response Spectra
Layer: 1 - EQ No: 1 - Damping: 5.00% - Outcrop: No Layer: 2 - EQ No: 1 - Damping: 5.00% - Outcrop: No
Acce
lera
tion
(g)
Period (sec)
0.00
0.05
0.10
0.15
0.20
0.25
0 2 4 6 8 10
Amax = 0.23g at T= 0.054 sec

819
b) 10% Soil Damping
Response Spectra
Layer: 1 - EQ No: 1 - Damping: 10.00% - Outcrop: No Layer: 2 - EQ No: 1 - Damping: 10.00% - Outcrop: No
Acce
lera
tion
(g)
Period (sec)
0.00
0.05
0.10
0.15
0.20
0 2 4 6 8 10
Amax = 0.17g at T= 0.054 sec

820
Input Motion RAN330.EQ Response Spectra a) 5% Soil Damping
Response Spectra
Layer: 1 - EQ No: 1 - Damping: 5.00% - Outcrop: No Layer: 2 - EQ No: 1 - Damping: 5.00% - Outcrop: No
Acce
lera
tion
(g)
Period (sec)
0.00
0.05
0.10
0.15
0 2 4 6 8 10
Amax = 0.10 at T= 0.077 sec b) 10% Soil Damping
Response Spectra
Layer: 1 - EQ No: 1 - Damping: 10.00% - Outcrop: No Layer: 2 - EQ No: 1 - Damping: 10.00% - Outcrop: No
Acce
lera
tion
(g)
Period (sec)
0.00
0.02
0.04
0.06
0.08
0.10
0 2 4 6 8 10
Amax = 0.09g at T= 0.077 sec

821
Soil Profile Profile Name: D5CCHC Tests Types and Designations: SPT(30)-CXW-Cross hole Water Table Depth: 3 m. Number of Layers: 48 Input Motion RAN230.EQ Output Locations Layers: 1 and 2 Response Spectra a) 5% Soil Damping
Response Spectra
Layer: 1 - EQ No: 1 - Damping: 5.00% - Outcrop: No Layer: 2 - EQ No: 1 - Damping: 5.00% - Outcrop: No
Acce
lera
tion
(g)
Period (sec)
0.00
0.05
0.10
0.15
0.20
0.25
0 2 4 6 8 10
Amax = 0.22g at T= 0.064 sec

822
b) 10% Soil Damping
Response Spectra
Layer: 1 - EQ No: 1 - Damping: 10.00% - Outcrop: No Layer: 2 - EQ No: 1 - Damping: 10.00% - Outcrop: No
Acce
lera
tion
(g)
Period (sec)
0.00
0.05
0.10
0.15
0.20
0 2 4 6 8 10
Amax = 0.16g at T= 0.064 sec

823
Input Motion RAN330.EQ Response Spectra a) 5% Soil Damping
Response Spectra
Layer: 1 - EQ No: 1 - Damping: 5.00% - Outcrop: No Layer: 2 - EQ No: 1 - Damping: 5.00% - Outcrop: No
Acce
lera
tion
(g)
Period (sec)
0.00
0.05
0.10
0.15
0 2 4 6 8 10
Amax = 0.13g at T= 0.064 sec b) 10% Soil Damping
Response Spectra
Layer: 1 - EQ No: 1 - Damping: 10.00% - Outcrop: No Layer: 2 - EQ No: 1 - Damping: 10.00% - Outcrop: No
Acce
lera
tion
(g)
Period (sec)
0.00
0.05
0.10
0.15
0 2 4 6 8 10
Amax = 0.10g at T= 0.054 sec

824
Soil Profile Profile Name: D6C(CXW) Tests Types and Designations: SPT(30)-CXW-Cross hole Water Table Depth: 25 m. Number of Layers: 42 Input Motion RAN230.EQ Output Locations Layers: 1 and 2 Response Spectra a) 5% Soil Damping
Response Spectra
Layer: 1 - EQ No: 1 - Damping: 5.00% - Outcrop: No Layer: 2 - EQ No: 1 - Damping: 5.00% - Outcrop: No
Acce
lera
tion
(g)
Period (sec)
0.00
0.05
0.10
0.15
0.20
0.25
0 2 4 6 8 10
Amax = 0.22g at T= 0.054 sec

825
b) 10% Soil Damping
Response Spectra
Layer: 1 - EQ No: 1 - Damping: 10.00% - Outcrop: No Layer: 2 - EQ No: 1 - Damping: 10.00% - Outcrop: No
Acce
lera
tion
(g)
Period (sec)
0.00
0.05
0.10
0.15
0.20
0 2 4 6 8 10
Amax = 0.16g at T= 0.064 sec

826
Input Motion RAN330.EQ Response Spectra a) 5% Soil Damping
Response Spectra
Layer: 1 - EQ No: 1 - Damping: 5.00% - Outcrop: No Layer: 2 - EQ No: 1 - Damping: 5.00% - Outcrop: No
Acce
lera
tion
(g)
Period (sec)
0.00
0.05
0.10
0.15
0.20
0.25
0 2 4 6 8 10
Amax = 0.22g at T= 0.054 sec b) 10% Soil Damping
Response Spectra
Layer: 1 - EQ No: 1 - Damping: 10.00% - Outcrop: No Layer: 2 - EQ No: 1 - Damping: 10.00% - Outcrop: No
Acce
lera
tion
(g)
Period (sec)
0.00
0.05
0.10
0.15
0.20
0 2 4 6 8 10
Amax = 0.16g at T= 0.064 sec

827
Soil Profile Profile Name: D6CCHC Tests Types and Designations: SPT(30)-CXW-Cross hole Water Table Depth: 25 m. Number of Layers: 44 Input Motion RAN230.EQ Output Locations Layers: 1 and 2 Response Spectra a) 5% Soil Damping
Response Spectra
Layer: 1 - EQ No: 1 - Damping: 5.00% - Outcrop: No Layer: 2 - EQ No: 1 - Damping: 5.00% - Outcrop: No
Acce
lera
tion
(g)
Period (sec)
0.00
0.05
0.10
0.15
0.20
0.25
0.30
0 2 4 6 8 10
Amax = 0.25g at T= 0.054 sec

828
b) 10% Soil Damping
Response Spectra
Layer: 1 - EQ No: 1 - Damping: 15.00% - Outcrop: No Layer: 2 - EQ No: 1 - Damping: 15.00% - Outcrop: No
Acce
lera
tion
(g)
Period (sec)
0.00
0.05
0.10
0.15
0.20
0 2 4 6 8 10
Amax = 0.16g at T= 0.054 sec

829
Input Motion RAN330.EQ Response Spectra a) 5% Soil Damping
Response Spectra
Layer: 1 - EQ No: 1 - Damping: 5.00% - Outcrop: No Layer: 2 - EQ No: 1 - Damping: 5.00% - Outcrop: No
Acce
lera
tion
(g)
Period (sec)
0.00
0.05
0.10
0.15
0.20
0 2 4 6 8 10
Amax = 0.16g at T= 0.098 sec b) 10% Soil Damping
Response Spectra
Layer: 1 - EQ No: 1 - Damping: 15.00% - Outcrop: No Layer: 2 - EQ No: 1 - Damping: 15.00% - Outcrop: No
Acce
lera
tion
(g)
Period (sec)
0.00
0.05
0.10
0.15
0 2 4 6 8 10
Amax = 0.12g at T= 0.098 sec

830
Soil Profile Profile Name: D7CCXW Tests Types and Designations: SPT(30)-CXW Water Table Depth: 26 m. Number of Layers: 37 Input Motion RAN230.EQ Output Locations Layers: 1 and 2 Response Spectra a) 5% Soil Damping
Response Spectra
Layer: 1 - EQ No: 1 - Damping: 5.00% - Outcrop: No Layer: 2 - EQ No: 1 - Damping: 5.00% - Outcrop: No
Acce
lera
tion
(g)
Period (sec)
0.00
0.05
0.10
0.15
0.20
0 2 4 6 8 10
Amax = 0.17g at T= 0.077 sec

831
b) 10% Soil Damping
Response Spectra
Layer: 1 - EQ No: 1 - Damping: 10.00% - Outcrop: No Layer: 2 - EQ No: 1 - Damping: 10.00% - Outcrop: No
Acce
lera
tion
(g)
Period (sec)
0.00
0.05
0.10
0.15
0 2 4 6 8 10
Amax = 0.13g at T= 0.077 sec

832
Input Motion RAN330.EQ Response Spectra a) 5% Soil Damping
Response Spectra
Layer: 1 - EQ No: 1 - Damping: 5.00% - Outcrop: No Layer: 2 - EQ No: 1 - Damping: 5.00% - Outcrop: No
Acce
lera
tion
(g)
Period (sec)
0.00
0.05
0.10
0.15
0.20
0 2 4 6 8 10
Amax = 0.15g at T= 0.098 sec b) 10% Soil Damping
Response Spectra
Layer: 1 - EQ No: 1 - Damping: 10.00% - Outcrop: No Layer: 2 - EQ No: 1 - Damping: 10.00% - Outcrop: No
Acce
lera
tion
(g)
Period (sec)
0.00
0.05
0.10
0.15
0 2 4 6 8 10
Amax = 0.12g at T= 0.11 sec

833
Soil Profile Profile Name: D8CCXW Tests Types and Designations: SPT(30)-CXW Water Table Depth: 25 m. Number of Layers: 35 Input Motion RAN230.EQ Output Locations Layers: 1 and 2 Response Spectra a) 5% Soil Damping
Response Spectra
Layer: 1 - EQ No: 1 - Damping: 5.00% - Outcrop: No Layer: 2 - EQ No: 1 - Damping: 5.00% - Outcrop: No
Acce
lera
tion
(g)
Period (sec)
0.00
0.05
0.10
0.15
0.20
0 2 4 6 8 10
Amax = 0.17g at T= 0.064 sec

834
b) 10% Soil Damping
Response Spectra
Layer: 1 - EQ No: 1 - Damping: 10.00% - Outcrop: No Layer: 2 - EQ No: 1 - Damping: 10.00% - Outcrop: No
Acce
lera
tion
(g)
Period (sec)
0.00
0.05
0.10
0.15
0 2 4 6 8 10
Amax = 0.12g at T= 0.077 sec

835
Input Motion RAN330.EQ Response Spectra a) 5% Soil Damping
Response Spectra
Layer: 1 - EQ No: 1 - Damping: 5.00% - Outcrop: No Layer: 2 - EQ No: 1 - Damping: 5.00% - Outcrop: No
Acce
lera
tion
(g)
Period (sec)
0.00
0.05
0.10
0.15
0 2 4 6 8 10
Amax = 0.14g at T= 0.11 sec b) 10% Soil Damping
Response Spectra
Layer: 1 - EQ No: 1 - Damping: 10.00% - Outcrop: No Layer: 2 - EQ No: 1 - Damping: 10.00% - Outcrop: No
Acce
lera
tion
(g)
Period (sec)
0.00
0.05
0.10
0.15
0 2 4 6 8 10
Amax = 0.11g at T= 0.11sec

836
Soil Profile Profile Name: D9CCXW Tests Types and Designations: SPT(60)-CXW Water Table Depth: 25 m. Number of Layers: 35 Input Motion RAN230.EQ Output Locations Layers: 1 and 2 Response Spectra a) 5% Soil Damping
Response Spectra
Layer: 1 - EQ No: 1 - Damping: 5.00% - Outcrop: No Layer: 2 - EQ No: 1 - Damping: 5.00% - Outcrop: No
Acce
lera
tion
(g)
Period (sec)
0.00
0.05
0.10
0.15
0.20
0 2 4 6 8 10
Amax = 0.15g at T= 0.077 sec

837
b) 10% Soil Damping
Response Spectra
Layer: 1 - EQ No: 1 - Damping: 15.00% - Outcrop: No Layer: 2 - EQ No: 1 - Damping: 15.00% - Outcrop: No
Acce
lera
tion
(g)
Period (sec)
0.00
0.02
0.04
0.06
0.08
0 2 4 6 8 10
Amax = 0.08g at T= 0.064 sec

838
Input Motion RAN330.EQ Response Spectra a) 5% Soil Damping
Response Spectra
Layer: 1 - EQ No: 1 - Damping: 5.00% - Outcrop: No Layer: 2 - EQ No: 1 - Damping: 5.00% - Outcrop: No
Acce
lera
tion
(g)
Period (sec)
0.00
0.05
0.10
0.15
0 2 4 6 8 10
Amax = 0.13g at T= 0.11 sec b) 10% Soil Damping
Response Spectra
Layer: 1 - EQ No: 1 - Damping: 15.00% - Outcrop: No Layer: 2 - EQ No: 1 - Damping: 15.00% - Outcrop: No
Acce
lera
tion
(g)
Period (sec)
0.00
0.02
0.04
0.06
0.08
0.10
0 2 4 6 8 10
Amax = 0.088g at T= 0.098 sec

839
Soil Profile Profile Name: D11C(CXW) Tests Types and Designations: SPT(30) CXW-Cross hole Water Table Depth: 2.6m. Number of Layers: 39 Input Motion RAN230.EQ Output Locations Layers: 1 and 2 Response Spectra a) 5% Soil Damping
Response Spectra
Layer: 1 - EQ No: 1 - Damping: 5.00% - Outcrop: No Layer: 2 - EQ No: 1 - Damping: 5.00% - Outcrop: No
Acce
lera
tion
(g)
Period (sec)
0.00
0.05
0.10
0.15
0.20
0.25
0.30
0 2 4 6 8 10
Amax = 0.30g at T= 0.064 sec

840
b) 10% Soil Damping
Response Spectra
Layer: 1 - EQ No: 1 - Damping: 10.00% - Outcrop: No Layer: 2 - EQ No: 1 - Damping: 10.00% - Outcrop: No
Acce
lera
tion
(g)
Period (sec)
0.00
0.05
0.10
0.15
0.20
0 2 4 6 8 10
Amax = 0.19g at T= 0.077 sec

841
Input Motion RAN330.EQ Response Spectra a) 5% Soil Damping
Response Spectra
Layer: 1 - EQ No: 1 - Damping: 5.00% - Outcrop: No Layer: 2 - EQ No: 1 - Damping: 5.00% - Outcrop: No
Acce
lera
tion
(g)
Period (sec)
0.00
0.05
0.10
0.15
0.20
0 2 4 6 8 10
Amax = 0.17g at T= 0.077 sec b) 10% Soil Damping
Response Spectra
Layer: 1 - EQ No: 1 - Damping: 10.00% - Outcrop: No Layer: 2 - EQ No: 1 - Damping: 10.00% - Outcrop: No
Acce
lera
tion
(g)
Period (sec)
0.00
0.05
0.10
0.15
0 2 4 6 8 10
Amax = 0.12g at T= 0.077 sec

842
Soil Profile Profile Name: D11C (CHC) Tests Types and Designations: SPT(30)-CXW-Cross hole Water Table Depth: 2.6 m. Number of Layers: 48 Input Motion RAN230.EQ Output Locations Layers: 1 and 2 Response Spectra a) 5% Soil Damping
Response Spectra
Layer: 1 - EQ No: 1 - Damping: 5.00% - Outcrop: No Layer: 2 - EQ No: 1 - Damping: 5.00% - Outcrop: No
Acce
lera
tion
(g)
Period (sec)
0.0
0.1
0.2
0.3
0.4
0 2 4 6 8 10
Amax = 0.35g at T= 0.064 sec

843
b) 10% Soil Damping Response Spectra
Layer: 1 - EQ No: 1 - Damping: 10.00% - Outcrop: No Layer: 2 - EQ No: 1 - Damping: 10.00% - Outcrop: No
Acce
lera
tion
(g)
Period (sec)
0.00
0.05
0.10
0.15
0.20
0.25
0.30
0 2 4 6 8 10
Amax = 0.26g at T= 0.054 sec

844
Input Motion RAN330.EQ Response Spectra a) 5% Soil Damping
Response Spectra
Layer: 1 - EQ No: 1 - Damping: 10.00% - Outcrop: No Layer: 2 - EQ No: 1 - Damping: 10.00% - Outcrop: No
Acce
lera
tion
(g)
Period (sec)
0.00
0.05
0.10
0.15
0.20
0 2 4 6 8 10
Amax = 0.19g at T= 0.077sec b) 10% Soil Damping
Response Spectra
Layer: 1 - EQ No: 1 - Damping: 10.00% - Outcrop: No Layer: 2 - EQ No: 1 - Damping: 10.00% - Outcrop: No
Acce
lera
tion
(g)
Period (sec)
0.00
0.05
0.10
0.15
0 2 4 6 8 10
Amax = 0.14g at T= 0.09 sec

845
Soil Profile Profile Name: D12C(CXW) Tests Types and Designations: SPT(30)-CXW-Cross hole Water Table Depth: 12 m. Number of Layers: 33 Input Motion RAN230.EQ Output Locations Layers: 1 and 2 Response Spectra a) 5% Soil Damping
Response Spectra
Layer: 1 - EQ No: 1 - Damping: 5.00% - Outcrop: No Layer: 2 - EQ No: 1 - Damping: 5.00% - Outcrop: No
Acce
lera
tion
(g)
Period (sec)
0.00
0.05
0.10
0.15
0.20
0 2 4 6 8 10
Amax = 0.19g at T= 0.054 sec

846
b) 10% Soil Damping
Response Spectra
Layer: 1 - EQ No: 1 - Damping: 10.00% - Outcrop: No Layer: 2 - EQ No: 1 - Damping: 10.00% - Outcrop: No
Acce
lera
tion
(g)
Period (sec)
0.00
0.05
0.10
0.15
0 2 4 6 8 10
Amax = 0.14g at T= 0.054 sec

847
Input Motion RAN330.EQ Response Spectra a) 5% Soil Damping
Response Spectra
Layer: 1 - EQ No: 1 - Damping: 5.00% - Outcrop: No Layer: 2 - EQ No: 1 - Damping: 5.00% - Outcrop: No
Acce
lera
tion
(g)
Period (sec)
0.00
0.05
0.10
0.15
0 2 4 6 8 10
Amax = 0.12g at T= 0.11 sec b) 10% Soil Damping
Response Spectra
Layer: 1 - EQ No: 1 - Damping: 10.00% - Outcrop: No Layer: 2 - EQ No: 1 - Damping: 10.00% - Outcrop: No
Acce
lera
tion
(g)
Period (sec)
0.00
0.02
0.04
0.06
0.08
0.10
0 2 4 6 8 10
Amax = 0.10g at T= 0.11 sec

848
Soil Profile Profile Name: D12C(CHC) Tests Types and Designations: SPT(30)-CXW-Cross hole Water Table Depth: 12 m. Number of Layers: 45 Input Motion RAN230.EQ Output Locations Layers: 1 and 2 Response Spectra a) 5% Soil Damping
Response Spectra
Layer: 1 - EQ No: 1 - Damping: 5.00% - Outcrop: No Layer: 2 - EQ No: 1 - Damping: 5.00% - Outcrop: No
Acce
lera
tion
(g)
Period (sec)
0.00
0.05
0.10
0.15
0.20
0.25
0.30
0 2 4 6 8 10
Amax = 0.29g at T= 0.054 sec

849
b) 10% Soil Damping
Response Spectra
Layer: 1 - EQ No: 1 - Damping: 10.00% - Outcrop: No Layer: 2 - EQ No: 1 - Damping: 10.00% - Outcrop: No
Acce
lera
tion
(g)
Period (sec)
0.00
0.05
0.10
0.15
0.20
0.25
0 2 4 6 8 10
Amax = 0.21g at T= 0.054 sec

850
Input Motion RAN330.EQ Response Spectra a) 5% Soil Damping
Response Spectra
Layer: 1 - EQ No: 1 - Damping: 5.00% - Outcrop: No Layer: 2 - EQ No: 1 - Damping: 5.00% - Outcrop: No
Acce
lera
tion
(g)
Period (sec)
0.00
0.05
0.10
0.15
0.20
0 2 4 6 8 10
Amax = 0.16g at T= 0.16 sec b) 10% Soil Damping
Response Spectra
Layer: 1 - EQ No: 1 - Damping: 10.00% - Outcrop: No Layer: 2 - EQ No: 1 - Damping: 10.00% - Outcrop: No
Acce
lera
tion
(g)
Period (sec)
0.00
0.05
0.10
0.15
0 2 4 6 8 10
Amax = 0.13g at T= 0.11 sec

851
ProShake Report (D) Bedrock at (TD =300m)depth Soil Profile Profile Name: D1DCXW Tests Types and Designations: SPT(60)-CXW Water Table Depth: 8 m. Number of Layers: 52 Input Motion RAN230.EQ Output Locations Layers: 1 and 2 Response Spectra a) 5% Soil Damping
Response Spectra
Layer: 1 - EQ No: 1 - Damping: 5.00% - Outcrop: No Layer: 2 - EQ No: 1 - Damping: 5.00% - Outcrop: No
Acce
lera
tion
(g)
Period (sec)
0.00
0.05
0.10
0.15
0.20
0.25
0 2 4 6 8 10
Amax = 0.21 g at T= 0.054 sec.

852
b) 10% Soil Damping
Response Spectra
Layer: 1 - EQ No: 1 - Damping: 10.00% - Outcrop: No Layer: 2 - EQ No: 1 - Damping: 10.00% - Outcrop: No
Acce
lera
tion
(g)
Period (sec)
0.00
0.05
0.10
0.15
0.20
0 2 4 6 8 10
Amax =0.15g at T= 0.064 sec.

853
Input Motion RAN330.EQ Response Spectra) a) 5% Soil Damping
Response Spectra
Layer: 1 - EQ No: 1 - Damping: 5.00% - Outcrop: No Layer: 2 - EQ No: 1 - Damping: 5.00% - Outcrop: No
Acce
lera
tion
(g)
Period (sec)
0.00
0.05
0.10
0.15
0 2 4 6 8 10
Amax = 0.13g at T= 0.077 sec. b) 10% Soil Damping
Response Spectra
Layer: 1 - EQ No: 1 - Damping: 10.00% - Outcrop: No Layer: 2 - EQ No: 1 - Damping: 10.00% - Outcrop: No
Acce
lera
tion
(g)
Period (sec)
0.00
0.02
0.04
0.06
0.08
0.10
0 2 4 6 8 10
Amax = 0.10g at T= 0.077 sec.

854
Soil Profile Profile Name: D2DCXW Tests Types and Designations: SPT(30)-CXW Water Table Depth: 28 m. Number of Layers: 48 Input Motion RAN230.EQ Output Locations Layers: 1 and 2 Response Spectra a) 5% Soil Damping
Response Spectra
Layer: 1 - EQ No: 1 - Damping: 5.00% - Outcrop: No Layer: 2 - EQ No: 1 - Damping: 5.00% - Outcrop: No
Acce
lera
tion
(g)
Period (sec)
0.00
0.05
0.10
0.15
0.20
0 2 4 6 8 10
Amax = 0.18g at T= 0.077 sec

855
b) 10% Soil Damping
Response Spectra
Layer: 1 - EQ No: 1 - Damping: 10.00% - Outcrop: No Layer: 2 - EQ No: 1 - Damping: 10.00% - Outcrop: No
Acce
lera
tion
(g)
Period (sec)
0.00
0.05
0.10
0.15
0 2 4 6 8 10
Amax = 0.12g at T= 0.077 sec

856
Input Motion RAN330.EQ Response Spectra a) 5% Soil Damping
Response Spectra
Layer: 1 - EQ No: 1 - Damping: 5.00% - Outcrop: No Layer: 2 - EQ No: 1 - Damping: 5.00% - Outcrop: No
Acce
lera
tion
(g)
Period (sec)
0.00
0.05
0.10
0.15
0 2 4 6 8 10
Amax = 0.13g at T= 0.10 sec b) 10% Soil Damping
Response Spectra
Layer: 1 - EQ No: 1 - Damping: 10.00% - Outcrop: No Layer: 2 - EQ No: 1 - Damping: 10.00% - Outcrop: No
Acce
lera
tion
(g)
Period (sec)
0.00
0.05
0.10
0.15
0 2 4 6 8 10
Amax = 0.11g at T= 0.10 sec

857
Soil Profile Profile Name: D3DCXW Tests Types and Designations: SPT(60)-CXW Water Table Depth: 29 m. Number of Layers: 58 Input Motion RAN230.EQ Output Locations Layers: 1 and 2 Response Spectra a) 5% Soil Damping
Response Spectra
Layer: 1 - EQ No: 1 - Damping: 5.00% - Outcrop: No Layer: 2 - EQ No: 1 - Damping: 5.00% - Outcrop: No
Acce
lera
tion
(g)
Period (sec)
0.00
0.05
0.10
0.15
0 2 4 6 8 10
Amax = 0.14g at T= 0.14 sec

858
b) 10% Soil Damping
Response Spectra
Layer: 1 - EQ No: 1 - Damping: 10.00% - Outcrop: No Layer: 2 - EQ No: 1 - Damping: 10.00% - Outcrop: No
Acce
lera
tion
(g)
Period (sec)
0.00
0.02
0.04
0.06
0.08
0.10
0 2 4 6 8 10
Amax = 0.14g at T= 0.09 sec

859
Input Motion RAN330.EQ Response Spectra a) 5% Soil Damping
Response Spectra
Layer: 1 - EQ No: 1 - Damping: 5.00% - Outcrop: No Layer: 2 - EQ No: 1 - Damping: 5.00% - Outcrop: No
Acce
lera
tion
(g)
Period (sec)
0.00
0.05
0.10
0.15
0 2 4 6 8 10
Amax = 0.12g at T= 0.10 sec b) 10% Soil Damping
Response Spectra
Layer: 1 - EQ No: 1 - Damping: 10.00% - Outcrop: No Layer: 2 - EQ No: 1 - Damping: 10.00% - Outcrop: No
Acce
lera
tion
(g)
Period (sec)
0.00
0.05
0.10
0.15
0 2 4 6 8 10
Amax = 0.10g at T= 0.10 sec

860
Soil Profile Profile Name: D4DCXW Tests Types and Designations: SPT(30)-CXW Water Table Depth: 2.5 m. Number of Layers: 47 Input Motion RAN230.EQ Output Locations Layers: 1 and 2 Response Spectra a) 5% Soil Damping
Response Spectra
Layer: 1 - EQ No: 1 - Damping: 5.00% - Outcrop: No Layer: 2 - EQ No: 1 - Damping: 5.00% - Outcrop: No
Acce
lera
tion
(g)
Period (sec)
0.00
0.05
0.10
0.15
0 2 4 6 8 10
Amax = 0.15g at T= 0.077 sec

861
b) 10% Soil Damping
Response Spectra
Layer: 1 - EQ No: 1 - Damping: 10.00% - Outcrop: No Layer: 2 - EQ No: 1 - Damping: 10.00% - Outcrop: No
Acce
lera
tion
(g)
Period (sec)
0.00
0.05
0.10
0.15
0 2 4 6 8 10
Amax = 0.10g at T= 0.077 sec

862
Input Motion RAN330.EQ Response Spectra a) 5% Soil Damping
Response Spectra
Layer: 1 - EQ No: 1 - Damping: 5.00% - Outcrop: No Layer: 2 - EQ No: 1 - Damping: 5.00% - Outcrop: No
Acce
lera
tion
(g)
Period (sec)
0.00
0.05
0.10
0.15
0 2 4 6 8 10
Amax = 0.12g at T= 0.10 sec b) 10% Soil Damping
Response Spectra
Layer: 1 - EQ No: 1 - Damping: 10.00% - Outcrop: No Layer: 2 - EQ No: 1 - Damping: 10.00% - Outcrop: No
Acce
lera
tion
(g)
Period (sec)
0.00
0.05
0.10
0.15
0 2 4 6 8 10
Amax = 0.10g at T= 0.10 sec

863
Soil Profile Profile Name: D5AD(CXW) Tests Types and Designations: SPT(30)-CXW-Cross hole Water Table Depth: 3 m. Number of Layers: 50 Input Motion RAN230.EQ Output Locations Layers: 1 and 2 Response Spectra a) 5% Soil Damping
Response Spectra
Layer: 1 - EQ No: 1 - Damping: 5.00% - Outcrop: No Layer: 2 - EQ No: 1 - Damping: 5.00% - Outcrop: No
Acce
lera
tion
(g)
Period (sec)
0.00
0.05
0.10
0.15
0.20
0.25
0 2 4 6 8 10
Amax = 0.25g at T= 0.054 sec

864
b) 10% Soil Damping
Response Spectra
Layer: 1 - EQ No: 1 - Damping: 10.00% - Outcrop: No Layer: 2 - EQ No: 1 - Damping: 10.00% - Outcrop: No
Acce
lera
tion
(g)
Period (sec)
0.00
0.05
0.10
0.15
0.20
0 2 4 6 8 10
Amax = 0.18g at T= 0.054 sec

865
Input Motion RAN330.EQ Response Spectra a) 5% Soil Damping
Response Spectra
Layer: 1 - EQ No: 1 - Damping: 5.00% - Outcrop: No Layer: 2 - EQ No: 1 - Damping: 5.00% - Outcrop: No
Acce
lera
tion
(g)
Period (sec)
0.00
0.05
0.10
0.15
0.20
0 2 4 6 8 10
Amax = 0.17g at T= 0.077 sec b) 10% Soil Damping
Response Spectra
Layer: 1 - EQ No: 1 - Damping: 10.00% - Outcrop: No Layer: 2 - EQ No: 1 - Damping: 10.00% - Outcrop: No
Acce
lera
tion
(g)
Period (sec)
0.00
0.05
0.10
0.15
0 2 4 6 8 10
Amax = 0.14g at T= 0.077 sec

866
Soil Profile Profile Name: D5D2(CXW) Tests Types and Designations: SPT(30)-CXW-Cross hole Water Table Depth: 3 m. Number of Layers: 52 Input Motion RAN230.EQ Output Locations Layers: 1 and 2 Response Spectra a) 5% Soil Damping
Response Spectra
Layer: 1 - EQ No: 1 - Damping: 5.00% - Outcrop: No Layer: 2 - EQ No: 1 - Damping: 5.00% - Outcrop: No
Acce
lera
tion
(g)
Period (sec)
0.00
0.05
0.10
0.15
0.20
0 2 4 6 8 10
Amax = 0.17g at T= 0.054 sec

867
b) 10% Soil Damping
Response Spectra
Layer: 1 - EQ No: 1 - Damping: 15.00% - Outcrop: No Layer: 2 - EQ No: 1 - Damping: 15.00% - Outcrop: No
Acce
lera
tion
(g)
Period (sec)
0.00
0.05
0.10
0.15
0 2 4 6 8 10
Amax = 0.11g at T= 0.054 sec

868
Input Motion RAN330.EQ Response Spectra a) 5% Soil Damping
Response Spectra
Layer: 1 - EQ No: 1 - Damping: 5.00% - Outcrop: No Layer: 2 - EQ No: 1 - Damping: 5.00% - Outcrop: No
Acce
lera
tion
(g)
Period (sec)
0.00
0.05
0.10
0.15
0 2 4 6 8 10
Amax = 0.10g at T= 0.10 sec b) 10% Soil Damping
Response Spectra
Layer: 1 - EQ No: 1 - Damping: 15.00% - Outcrop: No Layer: 2 - EQ No: 1 - Damping: 15.00% - Outcrop: No
Acce
lera
tion
(g)
Period (sec)
0.00
0.02
0.04
0.06
0.08
0 2 4 6 8 10
Amax = 0.075g at T= 0.10 sec

869
Soil Profile Profile Name: D5DCHC Tests Types and Designations: SPT(30)-CXW-Cross hole Water Table Depth: 3 m. Number of Layers: 58 Input Motion RAN230.EQ Output Locations Layers: 1 and 2 Response Spectra a) 5% Soil Damping
Response Spectra
Layer: 1 - EQ No: 1 - Damping: 5.00% - Outcrop: No Layer: 2 - EQ No: 1 - Damping: 5.00% - Outcrop: No
Acce
lera
tion
(g)
Period (sec)
0.00
0.05
0.10
0.15
0.20
0 2 4 6 8 10
Amax = 0.19g at T= 0.077 sec

870
b) 10% Soil Damping
Response Spectra
Layer: 1 - EQ No: 1 - Damping: 10.00% - Outcrop: No Layer: 2 - EQ No: 1 - Damping: 10.00% - Outcrop: No
Acce
lera
tion
(g)
Period (sec)
0.00
0.05
0.10
0.15
0 2 4 6 8 10
Amax = 0.14g at T= 0.054sec

871
Input Motion RAN330.EQ Response Spectra a) 5% Soil Damping
Response Spectra
Layer: 1 - EQ No: 1 - Damping: 5.00% - Outcrop: No Layer: 2 - EQ No: 1 - Damping: 5.00% - Outcrop: No
Acce
lera
tion
(g)
Period (sec)
0.00
0.05
0.10
0.15
0 2 4 6 8 10
Amax = 0.13g at T= 0.10 sec b) 10% Soil Damping
Response Spectra
Layer: 1 - EQ No: 1 - Damping: 10.00% - Outcrop: No Layer: 2 - EQ No: 1 - Damping: 10.00% - Outcrop: No
Acce
lera
tion
(g)
Period (sec)
0.00
0.05
0.10
0.15
0 2 4 6 8 10
Amax = 0.11g at T= 0.10 sec

872
Soil Profile Profile Name: D6D(CXW) Tests Types and Designations: SPT(30)-CXW-Cross hole Water Table Depth: 25 m. Number of Layers: 52 Input Motion RAN230.EQ Output Locations Layers: 1 and 2 Response Spectra a) 5% Soil Damping
Response Spectra
Layer: 1 - EQ No: 1 - Damping: 5.00% - Outcrop: No Layer: 2 - EQ No: 1 - Damping: 5.00% - Outcrop: No
Acce
lera
tion
(g)
Period (sec)
0.00
0.05
0.10
0.15
0.20
0 2 4 6 8 10
Amax = 0.16g at T= 0.,054 sec

873
b) 10% Soil Damping
Response Spectra
Layer: 1 - EQ No: 1 - Damping: 10.00% - Outcrop: No Layer: 2 - EQ No: 1 - Damping: 10.00% - Outcrop: No
Acce
lera
tion
(g)
Period (sec)
0.00
0.05
0.10
0.15
0 2 4 6 8 10
Amax = 0.12g at T= 0.054 sec

874
Input Motion RAN330.EQ Response Spectra a) 5% Soil Damping
Response Spectra
Layer: 1 - EQ No: 1 - Damping: 5.00% - Outcrop: No Layer: 2 - EQ No: 1 - Damping: 5.00% - Outcrop: No
Acce
lera
tion
(g)
Period (sec)
0.00
0.05
0.10
0.15
0 2 4 6 8 10
Amax = 0.13g at T= 0.10 sec b) 10% Soil Damping
Response Spectra
Layer: 1 - EQ No: 1 - Damping: 10.00% - Outcrop: No Layer: 2 - EQ No: 1 - Damping: 10.00% - Outcrop: No
Acce
lera
tion
(g)
Period (sec)
0.00
0.05
0.10
0.15
0 2 4 6 8 10
Amax = 0.11g at T= 0.10 sec

875
Soil Profile Profile Name: D6DCHC Tests Types and Designations: SPT(30)-CXW-Cross hole Water Table Depth: 25 m. Number of Layers: 54 Input Motion RAN230.EQ Output Locations Layers: 1 and 2 Response Spectra a) 5% Soil Damping
Response Spectra
Layer: 1 - EQ No: 1 - Damping: 5.00% - Outcrop: No Layer: 2 - EQ No: 1 - Damping: 5.00% - Outcrop: No
Acce
lera
tion
(g)
Period (sec)
0.00
0.05
0.10
0.15
0.20
0.25
0 2 4 6 8 10
Amax = 0.22g at T= 0.077 sec

876
b) 10% Soil Damping
Response Spectra
Layer: 1 - EQ No: 1 - Damping: 10.00% - Outcrop: No Layer: 2 - EQ No: 1 - Damping: 10.00% - Outcrop: No
Acce
lera
tion
(g)
Period (sec)
0.00
0.05
0.10
0.15
0.20
0 2 4 6 8 10
Amax = 0.17g at T= 0.064 sec

877
Input Motion RAN330.EQ Response Spectra a) 5% Soil Damping
Response Spectra
Layer: 1 - EQ No: 1 - Damping: 5.00% - Outcrop: No Layer: 2 - EQ No: 1 - Damping: 5.00% - Outcrop: No
Acce
lera
tion
(g)
Period (sec)
0.00
0.05
0.10
0.15
0.20
0 2 4 6 8 10
Amax = 0.16g at T= 0.11 sec b) 10% Soil Damping
Response Spectra
Layer: 1 - EQ No: 1 - Damping: 10.00% - Outcrop: No Layer: 2 - EQ No: 1 - Damping: 10.00% - Outcrop: No
Acce
lera
tion
(g)
Period (sec)
0.00
0.05
0.10
0.15
0 2 4 6 8 10
Amax = 0.12g at T= 0.10 sec

878
Soil Profile Profile Name: D7DCXW Tests Types and Designations: SPT(30)-CXW Water Table Depth: 26 m. Number of Layers: 47 Input Motion RAN230.EQ Output Locations Layers: 1 and 2 Response Spectra a) 5% Soil Damping
Response Spectra
Layer: 1 - EQ No: 1 - Damping: 5.00% - Outcrop: No Layer: 2 - EQ No: 1 - Damping: 5.00% - Outcrop: No
Acce
lera
tion
(g)
Period (sec)
0.00
0.05
0.10
0.15
0 2 4 6 8 10
Amax = 0.14g at T= 0.14 sec

879
b) 10% Soil Damping
Response Spectra
Layer: 1 - EQ No: 1 - Damping: 10.00% - Outcrop: No Layer: 2 - EQ No: 1 - Damping: 10.00% - Outcrop: No
Acce
lera
tion
(g)
Period (sec)
0.00
0.02
0.04
0.06
0.08
0.10
0 2 4 6 8 10
Amax = 0.095g at T= 0.054 sec

880
Input Motion RAN330.EQ Response Spectra a) 5% Soil Damping
Response Spectra
Layer: 1 - EQ No: 1 - Damping: 5.00% - Outcrop: No Layer: 2 - EQ No: 1 - Damping: 5.00% - Outcrop: No
Acce
lera
tion
(g)
Period (sec)
0.00
0.02
0.04
0.06
0.08
0.10
0 2 4 6 8 10
Amax = 0.097g at T= 0.11 sec b) 10% Soil Damping
Response Spectra
Layer: 1 - EQ No: 1 - Damping: 10.00% - Outcrop: No Layer: 2 - EQ No: 1 - Damping: 10.00% - Outcrop: No
Acce
lera
tion
(g)
Period (sec)
0.00
0.02
0.04
0.06
0.08
0.10
0 2 4 6 8 10
Amax = 0.08g at T= 0.10 sec

881
Soil Profile Profile Name: D8DCXW Tests Types and Designations: SPT(30)-CXW Water Table Depth: 25 m. Number of Layers: 45 Input Motion RAN230.EQ Output Locations Layers: 1 and 2 Response Spectra a) 5% Soil Damping
Response Spectra
Layer: 1 - EQ No: 1 - Damping: 5.00% - Outcrop: No Layer: 2 - EQ No: 1 - Damping: 5.00% - Outcrop: No
Acce
lera
tion
(g)
Period (sec)
0.00
0.05
0.10
0.15
0 2 4 6 8 10
Amax = 0.13g at T= 0.054 sec

882
b) 10% Soil Damping
Response Spectra
Layer: 1 - EQ No: 1 - Damping: 10.00% - Outcrop: No Layer: 2 - EQ No: 1 - Damping: 10.00% - Outcrop: No
Acce
lera
tion
(g)
Period (sec)
0.00
0.02
0.04
0.06
0.08
0.10
0 2 4 6 8 10
Amax = 0.0984g at T= 0.054 sec

883
Input Motion RAN330.EQ Response Spectra a) 5% Soil Damping
Response Spectra
Layer: 1 - EQ No: 1 - Damping: 5.00% - Outcrop: No Layer: 2 - EQ No: 1 - Damping: 5.00% - Outcrop: No
Acce
lera
tion
(g)
Period (sec)
0.00
0.02
0.04
0.06
0.08
0.10
0 2 4 6 8 10
Amax = 0.09g at T= 0.17 sec b) 10% Soil Damping
Response Spectra
Layer: 1 - EQ No: 1 - Damping: 10.00% - Outcrop: No Layer: 2 - EQ No: 1 - Damping: 10.00% - Outcrop: No
Acce
lera
tion
(g)
Period (sec)
0.00
0.02
0.04
0.06
0.08
0 2 4 6 8 10
Amax = 0.07g at T= 0.12 sec

884
Soil Profile Profile Name: D9DCXW Tests Types and Designations: SPT(60)-CXW Water Table Depth: 25 m. Number of Layers: 45 Input Motion RAN230.EQ Output Locations Layers: 1 and 2 Response Spectra a) 5% Soil Damping
Response Spectra
Layer: 1 - EQ No: 1 - Damping: 5.00% - Outcrop: No Layer: 2 - EQ No: 1 - Damping: 5.00% - Outcrop: No
Acce
lera
tion
(g)
Period (sec)
0.00
0.05
0.10
0.15
0.20
0 2 4 6 8 10
Amax = 0.15g at T= 0.054 sec

885
b) 10% Soil Damping
Response Spectra
Layer: 1 - EQ No: 1 - Damping: 10.00% - Outcrop: No Layer: 2 - EQ No: 1 - Damping: 10.00% - Outcrop: No
Acce
lera
tion
(g)
Period (sec)
0.00
0.05
0.10
0.15
0 2 4 6 8 10
Amax = 0.12g at T= 0.054 sec

886
Input Motion RAN330.EQ Response Spectra a) 5% Soil Damping
Response Spectra
Layer: 1 - EQ No: 1 - Damping: 5.00% - Outcrop: No Layer: 2 - EQ No: 1 - Damping: 5.00% - Outcrop: No
Acce
lera
tion
(g)
Period (sec)
0.00
0.05
0.10
0.15
0 2 4 6 8 10
Amax = 0.11g at T= 0.077 sec b) 10% Soil Damping
Response Spectra
Layer: 1 - EQ No: 1 - Damping: 10.00% - Outcrop: No Layer: 2 - EQ No: 1 - Damping: 10.00% - Outcrop: No
Acce
lera
tion
(g)
Period (sec)
0.00
0.02
0.04
0.06
0.08
0.10
0 2 4 6 8 10
Amax = 0.09g at T= 0.077 sec

887
Soil Profile Profile Name: D11D(CXW) Tests Types and Designations: SPT(30)-CXW-Cross hole Water Table Depth: 2.6m. Number of Layers: 49 Input Motion RAN230.EQ Output Locations Layers: 1 and 2 Response Spectra a) 5% Soil Damping
Response Spectra
Layer: 1 - EQ No: 1 - Damping: 5.00% - Outcrop: No Layer: 2 - EQ No: 1 - Damping: 5.00% - Outcrop: No
Acce
lera
tion
(g)
Period (sec)
0.00
0.05
0.10
0.15
0.20
0.25
0 2 4 6 8 10
Amax = 0.22g at T= 0..077 sec

888
b) 10% Soil Damping
Response Spectra
Layer: 1 - EQ No: 1 - Damping: 10.00% - Outcrop: No Layer: 2 - EQ No: 1 - Damping: 10.00% - Outcrop: No
Acce
lera
tion
(g)
Period (sec)
0.00
0.05
0.10
0.15
0 2 4 6 8 10
Amax = 0.14g at T= 0.077 sec

889
Input Motion RAN330.EQ Response Spectra a) 5% Soil Damping
Response Spectra
Layer: 1 - EQ No: 1 - Damping: 5.00% - Outcrop: No Layer: 2 - EQ No: 1 - Damping: 5.00% - Outcrop: No
Acce
lera
tion
(g)
Period (sec)
0.00
0.05
0.10
0.15
0 2 4 6 8 10
Amax = 0.14g at T= 0.077 sec b) 10% Soil Damping
Response Spectra
Layer: 1 - EQ No: 1 - Damping: 10.00% - Outcrop: No Layer: 2 - EQ No: 1 - Damping: 10.00% - Outcrop: No
Acce
lera
tion
(g)
Period (sec)
0.00
0.02
0.04
0.06
0.08
0.10
0 2 4 6 8 10
Amax = 0.095g at T= 0.11 sec

890
Soil Profile Profile Name: D11D (CHC) Tests Types and Designations: SPT(30)-CXW-Cross hole Water Table Depth: 2.6 m. Number of Layers: 58 Input Motion RAN230.EQ Output Locations Layers: 1 and 2 Response Spectra a) 5% Soil Damping
Response Spectra
Layer: 1 - EQ No: 1 - Damping: 5.00% - Outcrop: No Layer: 2 - EQ No: 1 - Damping: 5.00% - Outcrop: No
Acce
lera
tion
(g)
Period (sec)
0.0
0.1
0.2
0.3
0.4
0 2 4 6 8 10
Amax = 0.32g at T= 0.054 sec

891
b) 10% Soil Damping Response Spectra
Layer: 1 - EQ No: 1 - Damping: 10.00% - Outcrop: No Layer: 2 - EQ No: 1 - Damping: 10.00% - Outcrop: No
Acce
lera
tion
(g)
Period (sec)
0.00
0.05
0.10
0.15
0.20
0.25
0 2 4 6 8 10
Amax = 0.22 at T= 0.064 sec

892
Input Motion RAN330.EQ Response Spectra a) 5% Soil Damping
Response Spectra
Layer: 1 - EQ No: 1 - Damping: 5.00% - Outcrop: No Layer: 2 - EQ No: 1 - Damping: 5.00% - Outcrop: No
Acce
lera
tion
(g)
Period (sec)
0.00
0.05
0.10
0.15
0.20
0.25
0 2 4 6 8 10
Amax = 0.20g at T= 0.077 sec b) 10% Soil Damping
Response Spectra
Layer: 1 - EQ No: 1 - Damping: 10.00% - Outcrop: No Layer: 2 - EQ No: 1 - Damping: 10.00% - Outcrop: No
Acce
lera
tion
(g)
Period (sec)
0.00
0.05
0.10
0.15
0.20
0 2 4 6 8 10
Amax = 0.16g at T= 0.077 sec

893
Soil Profile Profile Name: D12D(CXW) Tests Types and Designations: SPT(30)-CXW-Cross hole Water Table Depth: 12 m. Number of Layers: 43 Input Motion RAN230.EQ Output Locations Layers: 1 and 2 Response Spectra a) 5% Soil Damping
Response Spectra
Layer: 1 - EQ No: 1 - Damping: 5.00% - Outcrop: No Layer: 2 - EQ No: 1 - Damping: 5.00% - Outcrop: No
Acce
lera
tion
(g)
Period (sec)
0.00
0.05
0.10
0.15
0 2 4 6 8 10
Amax = 0.13g at T= 0.054 sec

894
b) 10% Soil Damping
Response Spectra
Layer: 1 - EQ No: 1 - Damping: 10.00% - Outcrop: No Layer: 2 - EQ No: 1 - Damping: 10.00% - Outcrop: No
Acce
lera
tion
(g)
Period (sec)
0.00
0.02
0.04
0.06
0.08
0.10
0 2 4 6 8 10
Amax = 0.10g at T= 0.054sec

895
Input Motion RAN330.EQ Response Spectra a) 5% Soil Damping
Response Spectra
Layer: 1 - EQ No: 1 - Damping: 5.00% - Outcrop: No Layer: 2 - EQ No: 1 - Damping: 5.00% - Outcrop: No
Acce
lera
tion
(g)
Period (sec)
0.00
0.05
0.10
0.15
0 2 4 6 8 10
Amax = 0.10g at T= 0.11 sec b) 10% Soil Damping
Response Spectra
Layer: 1 - EQ No: 1 - Damping: 10.00% - Outcrop: No Layer: 2 - EQ No: 1 - Damping: 10.00% - Outcrop: No
Acce
lera
tion
(g)
Period (sec)
0.00
0.02
0.04
0.06
0.08
0.10
0 2 4 6 8 10
Amax = 0.09g at T= 0.10 sec

896
Soil Profile Profile Name: D12D(CHC) Tests Types and Designations: SPT(30)-CXW-Cross hole Water Table Depth: 12 m. Number of Layers: 55 Input Motion RAN230.EQ Output Locations Layers: 1 and 2 Response Spectra a) 5% Soil Damping
Response Spectra
Layer: 1 - EQ No: 1 - Damping: 5.00% - Outcrop: No Layer: 2 - EQ No: 1 - Damping: 5.00% - Outcrop: No
Acce
lera
tion
(g)
Period (sec)
0.00
0.05
0.10
0.15
0.20
0.25
0 2 4 6 8 10
Amax = 0.25g at T= 0.054 sec

897
b) 10% Soil Damping
Response Spectra
Layer: 1 - EQ No: 1 - Damping: 10.00% - Outcrop: No
Acce
lera
tion
(g)
Period (sec)
0.00
0.05
0.10
0.15
0.20
0 2 4 6 8 10
Amax = 0.18g at T= 0.054 sec

898
Input Motion RAN330.EQ Response Spectra a) 5% Soil Damping
Response Spectra
Layer: 1 - EQ No: 1 - Damping: 5.00% - Outcrop: No Layer: 2 - EQ No: 1 - Damping: 5.00% - Outcrop: No
Acce
lera
tion
(g)
Period (sec)
0.00
0.05
0.10
0.15
0 2 4 6 8 10
Amax = 0.15g at T= 0.077 sec b) 10% Soil Damping
Response Spectra
Layer: 1 - EQ No: 1 - Damping: 10.00% - Outcrop: No Layer: 2 - EQ No: 1 - Damping: 10.00% - Outcrop: No
Acce
lera
tion
(g)
Period (sec)
0.00
0.05
0.10
0.15
0 2 4 6 8 10
Amax = 0.12g at T= 0.077 sec

899
ProShake Report TAC Bedrock Depth at Actual Depth (TAC= 350 m) Soil Profile Profile Name: D1 Tests Types and Designations: SPT-CXW Water Table Depth: 8 m. Number of Layers: 57 Input Motion RAN230.EQ Response Spectra) a) 5% Soil Damping
Response Spectra
Layer: 1 - EQ No: 1 - Damping: 5.00% -Outcrop: Yes
Layer: 2 - EQ No: 1 - Damping: 5.00% -Outcrop: No
Acc
eler
atio
n (g
)
Period (sec)
0.00
0.05
0.10
0.15
0.20
0 2 4 6 8 10
Amax = 0.18g at T= 0.069 sec.

900
b) 10% Soil Damping
Response Spectra
Layer: 1 - EQ No: 1 - Damping: 10.00% -Outcrop: Yes
Layer: 2 - EQ No: 1 - Damping: 10.00% -Outcrop: No
Acc
eler
atio
n (g
)
Period (sec)
0.00
0.05
0.10
0.15
0 2 4 6 8 10
Amax = 0.14g at T= 0.0691 sec.

901
Input Motion RAN330.EQ Response Spectra a) 5% Soil Damping
Response Spectra
Layer: 1 - EQ No: 1 - Damping: 5.00% -Outcrop: Yes
Layer: 2 - EQ No: 1 - Damping: 5.00% -Outcrop: No
Acc
eler
atio
n (g
)
Period (sec)
0.00
0.05
0.10
0.15
0 2 4 6 8 10
Amax = 0.129g at T= 0.0788 b) 10% Soil Damping
Response Spectra
Layer: 1 - EQ No: 1 - Damping: 10.00% -Outcrop: Yes
Layer: 2 - EQ No: 1 - Damping: 10.00% -Outcrop: No
Acc
eler
atio
n (g
)
Period (sec)
0.00
0.02
0.04
0.06
0.08
0.10
0 2 4 6 8 10
Amax = 0.0852g at T= 0.0788 sec

902
Input Motion Soil Profile Profile Name: D2 Tests Types and Designations: SPT-CXW Water Table Depth: 28 m. Number of Layers: 53 Input Motion RAN230.EQ Response Spectra a) 5% Soil Damping
Response Spectra
Layer: 1 - EQ No: 1 - Damping: 5.00% -Outcrop: No
Layer: 2 - EQ No: 1 - Damping: 5.00% -Outcrop: No
Acc
eler
atio
n (g
)
Period (sec)
0.00
0.05
0.10
0.15
0.20
0 2 4 6 8 10
Amax = 0.16g at T= 0.09 sec

903
b) 10% Soil Damping
Response Spectra
Layer: 1 - EQ No: 1 - Damping: 10.00% -Outcrop: No
Layer: 2 - EQ No: 1 - Damping: 10.00% -Outcrop: No
Acc
eler
atio
n (g
)
Period (sec)
0.00
0.05
0.10
0.15
0 2 4 6 8 10
Amax = 0.12g at T= 0.10 sec.

904
Input Motion RAN330.EQ Response Spectra a) 5% Soil Damping
Response Spectra
Layer: 1 - EQ No: 1 - Damping: 5.00% -Outcrop: No
Layer: 2 - EQ No: 1 - Damping: 5.00% -Outcrop: No
Acc
eler
atio
n (g
)
Period (sec)
0.00
0.05
0.10
0.15
0 2 4 6 8 10
Amax = 0.11g at T= 0.11 sec b) 10% Soil Damping
Amax = 0.0894g at T= 0.11 sec

905
Soil Profile Profile Name: D3 Tests Types and Designations: SPT-CXW Water Table Depth: 29 m. Number of Layers: 64 Input Motion RAN230.EQ Response Spectra a) 5% Soil Damping
Response Spectra
Layer: 1 - EQ No: 1 - Damping: 5.00% -Outcrop: No
Layer: 2 - EQ No: 1 - Damping: 5.00% -Outcrop: No
Acc
eler
atio
n (g
)
Period (sec)
0.00
0.05
0.10
0.15
0.20
0 2 4 6 8 10
Amax = 0.16g at T= 0.13 sec

906
b) 10% Soil Damping
Response Spectra
Layer: 1 - EQ No: 1 - Damping: 10.00% -Outcrop: No
Layer: 2 - EQ No: 1 - Damping: 10.00% -Outcrop: No
Acc
eler
atio
n (g
)
Period (sec)
0.00
0.05
0.10
0.15
0 2 4 6 8 10
Amax = 0.11g at T= 0.06 sec

907
Input Motion RAN330.EQ Response Spectra a) 5% Soil Damping
Response Spectra
Layer: 1 - EQ No: 1 - Damping: 5.00% -Outcrop: No
Layer: 2 - EQ No: 1 - Damping: 5.00% -Outcrop: No
Acc
eler
atio
n (g
)
Period (sec)
0.00
0.05
0.10
0.15
0 2 4 6 8 10
Amax = 0.13g at T= 0.11 sec b) 10% Soil Damping
Response Spectra
Layer: 1 - EQ No: 1 - Damping: 10.00% -Outcrop: No
Layer: 2 - EQ No: 1 - Damping: 10.00% -Outcrop: No
Acc
eler
atio
n (g
)
Period (sec)
0.00
0.05
0.10
0.15
0 2 4 6 8 10
Amax = 0.12g at T= 0.11 sec

908
Soil Profile Profile Name: D4 Tests Types and Designations: SPT-CXW Water Table Depth: 2.5 m. Number of Layers: 52 Input Motion RAN30.EQ Output Locations Layers: 1 and 2 Response Spectra a) 5% Soil Damping
Response Spectra
Layer: 1 - EQ No: 1 - Damping: 5.00% - Outcrop: No Layer: 2 - EQ No: 1 - Damping: 5.00% - Outcrop: No
Acce
lera
tion
(g)
Period (sec)
0.00
0.05
0.10
0.15
0 2 4 6 8 10
Amax = 0.13g at T= 0.077 sec

909
b) 10% Soil Damping
Response Spectra
Layer: 1 - EQ No: 1 - Damping: 10.00% - Outcrop: No Layer: 2 - EQ No: 1 - Damping: 10.00% - Outcrop: No
Acce
lera
tion
(g)
Period (sec)
0.00
0.02
0.04
0.06
0.08
0.10
0 2 4 6 8 10
Amax = 0.1g at T= 0.077 sec

910
Input Motion RAN230.EQ Response Spectra a) 5% Soil Damping
Response Spectra
Layer: 1 - EQ No: 1 - Damping: 5.00% -Outcrop: No
Layer: 2 - EQ No: 1 - Damping: 5.00% -Outcrop: No
Acc
eler
atio
n (g
)
Period (sec)
0.00
0.05
0.10
0.15
0 2 4 6 8 10
Amax = 0.13g at T= 0.0788 sec b) 10% Soil Damping
Response Spectra
Layer: 1 - EQ No: 1 - Damping: 10.00% -Outcrop: No
Layer: 2 - EQ No: 1 - Damping: 10.00% -Outcrop: No
Acc
eler
atio
n (g
)
Period (sec)
0.00
0.02
0.04
0.06
0.08
0.10
0 2 4 6 8 10
Amax = 0.1g at T= 0.21 sec

911
Input Motion RAN330.EQ Response Spectra a) 5% Soil Damping
Response Spectra
Layer: 1 - EQ No: 1 - Damping: 5.00% -Outcrop: No
Layer: 2 - EQ No: 1 - Damping: 5.00% -Outcrop: No
Acc
eler
atio
n (g
)
Period (sec)
0.00
0.05
0.10
0.15
0 2 4 6 8 10
Amax = 0.11g at T= 0.27 sec b) 10% Soil Damping
Response Spectra
Layer: 1 - EQ No: 1 - Damping: 10.00% -Outcrop: No
Layer: 2 - EQ No: 1 - Damping: 10.00% -Outcrop: No
Acc
eler
atio
n (g
)
Period (sec)
0.00
0.02
0.04
0.06
0.08
0.10
0 2 4 6 8 10
Amax = 0.0838g at T= 0.27 sec

912
Soil Profile Profile Name: D5A(CXW) Tests Types and Designations: SPT-CXW-Cross hole Water Table Depth: 3 m. Number of Layers: 55 Input Motion RAN230.EQ Response Spectra a) 5% Soil Damping
Response Spectra
Layer: 1 - EQ No: 1 - Damping: 5.00% -Outcrop: No
Layer: 2 - EQ No: 1 - Damping: 5.00% -Outcrop: No
Acc
eler
atio
n (g
)
Period (sec)
0.00
0.05
0.10
0.15
0.20
0.25
0.30
0 2 4 6 8 10
Amax = 0.26g at T= 0.0788 sec

913
b) 10% Soil Damping
Response Spectra
Layer: 1 - EQ No: 1 - Damping: 10.00% -Outcrop: No
Layer: 2 - EQ No: 1 - Damping: 10.00% -Outcrop: No
Acc
eler
atio
n (g
)
Period (sec)
0.00
0.05
0.10
0.15
0.20
0 2 4 6 8 10
Amax = 0.18g at T= 0.0691 sec

914
Input Motion RAN330.EQ Response Spectra a) 5% Soil Damping
Response Spectra
Layer: 1 - EQ No: 1 - Damping: 5.00% -Outcrop: No
Layer: 2 - EQ No: 1 - Damping: 5.00% -Outcrop: No
Acc
eler
atio
n (g
)
Period (sec)
0.00
0.05
0.10
0.15
0.20
0 2 4 6 8 10
Amax = 0.15g at T= 0.091 sec b) 10% Soil Damping
Response Spectra
Layer: 1 - EQ No: 1 - Damping: 10.00% -Outcrop: No
Layer: 2 - EQ No: 1 - Damping: 10.00% -Outcrop: No
Acc
eler
atio
n (g
)
Period (sec)
0.00
0.05
0.10
0.15
0 2 4 6 8 10
Amax = 0.13g at T= 0.091 sec

915
Soil Profile Profile Name: D5(CXW) Tests Types and Designations: SPT-CXW-Cross hole Water Table Depth: 3 m. Number of Layers: 57 Input Motion RAN230.EQ Response Spectra a) 5% Soil Damping
Response Spectra
Layer: 1 - EQ No: 1 - Damping: 5.00% -Outcrop: No
Layer: 2 - EQ No: 1 - Damping: 5.00% -Outcrop: No
Acc
eler
atio
n (g
)
Period (sec)
0.00
0.05
0.10
0.15
0.20
0 2 4 6 8 10
Amax = 0.17g at T= 0.0569 sec

916
b) 10% Soil Damping
Response Spectra
Layer: 1 - EQ No: 1 - Damping: 10.00% -Outcrop: No
Layer: 2 - EQ No: 1 - Damping: 10.00% -Outcrop: No
Acc
eler
atio
n (g
)
Period (sec)
0.00
0.05
0.10
0.15
0 2 4 6 8 10
Amax = 0.13g at T= 0.0691 sec
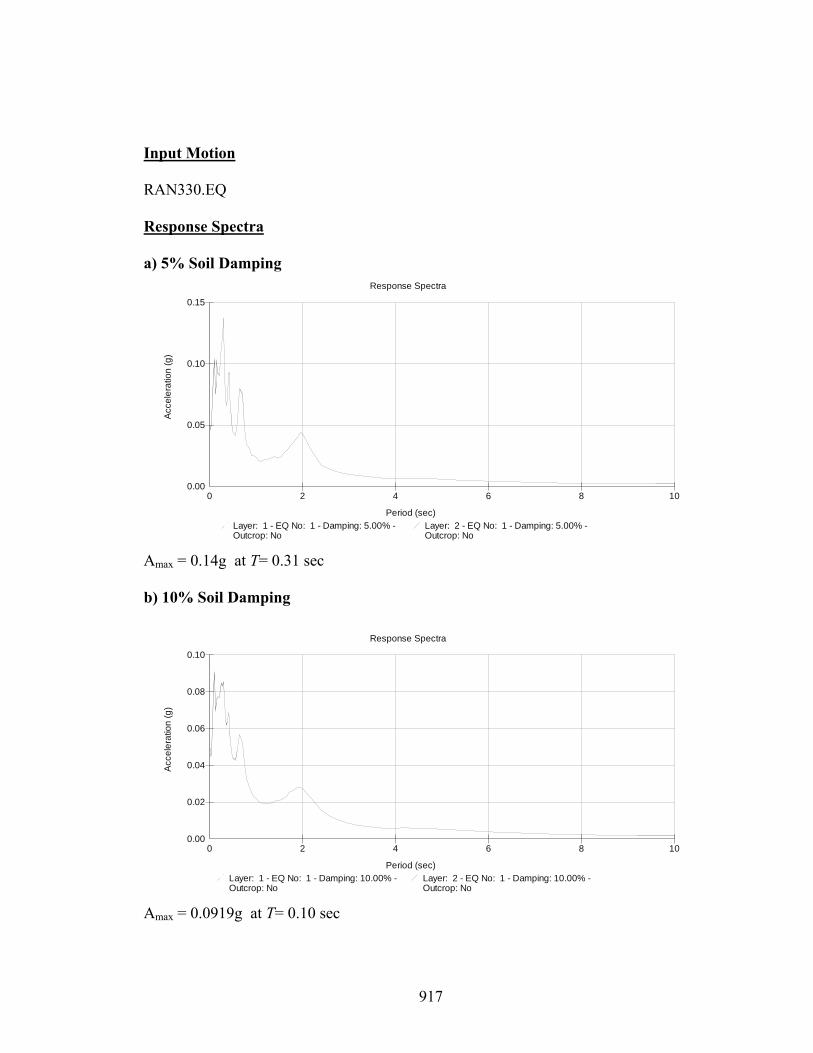
917
Input Motion RAN330.EQ Response Spectra a) 5% Soil Damping
Response Spectra
Layer: 1 - EQ No: 1 - Damping: 5.00% -Outcrop: No
Layer: 2 - EQ No: 1 - Damping: 5.00% -Outcrop: No
Acc
eler
atio
n (g
)
Period (sec)
0.00
0.05
0.10
0.15
0 2 4 6 8 10
Amax = 0.14g at T= 0.31 sec b) 10% Soil Damping
Response Spectra
Layer: 1 - EQ No: 1 - Damping: 10.00% -Outcrop: No
Layer: 2 - EQ No: 1 - Damping: 10.00% -Outcrop: No
Acc
eler
atio
n (g
)
Period (sec)
0.00
0.02
0.04
0.06
0.08
0.10
0 2 4 6 8 10
Amax = 0.0919g at T= 0.10 sec

918
Soil Profile Profile Name: D5CHC Tests Types and Designations: SPT-CXW-Cross hole Water Table Depth: 3 m. Number of Layers: 63 Input Motion RAN230.EQ Response Spectra a) 5% Soil Damping
Response Spectra
Layer: 1 - EQ No: 1 - Damping: 5.00% -Outcrop: No
Layer: 2 - EQ No: 1 - Damping: 5.00% -Outcrop: No
Acc
eler
atio
n (g
)
Period (sec)
0.00
0.05
0.10
0.15
0.20
0 2 4 6 8 10
Amax = 0.16g at T= 0.0788 sec

919
b) 10% Soil Damping
Response Spectra
Layer: 1 - EQ No: 1 - Damping: 10.00% -Outcrop: No
Layer: 2 - EQ No: 1 - Damping: 10.00% -Outcrop: No
Acc
eler
atio
n (g
)
Period (sec)
0.00
0.05
0.10
0.15
0 2 4 6 8 10
Amax = 0.13g at T= 0.0691 sec

920
Input Motion RAN330.EQ Response Spectra a) 5% Soil Damping
Response Spectra
Layer: 1 - EQ No: 1 - Damping: 5.00% -Outcrop: No
Layer: 2 - EQ No: 1 - Damping: 5.00% -Outcrop: No
Acc
eler
atio
n (g
)
Period (sec)
0.00
0.05
0.10
0.15
0 2 4 6 8 10
Amax = 0.13g at T= 0.0788 sec b) 10% Soil Damping
Response Spectra
Layer: 1 - EQ No: 1 - Damping: 10.00% -Outcrop: No
Layer: 2 - EQ No: 1 - Damping: 10.00% -Outcrop: No
Acc
eler
atio
n (g
)
Period (sec)
0.00
0.05
0.10
0.15
0 2 4 6 8 10
Amax = 0.12g at T= 0.0788 sec

921
Soil Profile Profile Name: D6(CXW) Tests Types and Designations: SPT-CXW-Cross hole Water Table Depth: 25 m. Number of Layers: 57 Input Motion RAN230.EQ Response Spectra a) 5% Soil Damping
Response Spectra
Layer: 1 - EQ No: 1 - Damping: 5.00% -Outcrop: No
Layer: 2 - EQ No: 1 - Damping: 5.00% -Outcrop: No
Acc
eler
atio
n (g
)
Period (sec)
0.00
0.05
0.10
0.15
0 2 4 6 8 10
Amax = 0.13g at T= 0.0691 sec

922
b) 10% Soil Damping
Response Spectra
Layer: 1 - EQ No: 1 - Damping: 10.00% -Outcrop: No
Layer: 2 - EQ No: 1 - Damping: 10.00% -Outcrop: No
Acc
eler
atio
n (g
)
Period (sec)
0.00
0.05
0.10
0.15
0 2 4 6 8 10
Amax = 0.10g at T= 0.0691 sec

923
Input Motion RAN330.EQ Response Spectra a) 5% Soil Damping
Response Spectra
Layer: 1 - EQ No: 1 - Damping: 5.00% -Outcrop: No
Layer: 2 - EQ No: 1 - Damping: 5.00% -Outcrop: No
Acc
eler
atio
n (g
)
Period (sec)
0.00
0.02
0.04
0.06
0.08
0.10
0 2 4 6 8 10
Amax = 0.0978g at T= 0.26 sec b) 10% Soil Damping
Response Spectra
Layer: 1 - EQ No: 1 - Damping: 10.00% -Outcrop: No
Layer: 2 - EQ No: 1 - Damping: 10.00% -Outcrop: No
Acc
eler
atio
n (g
)
Period (sec)
0.00
0.02
0.04
0.06
0.08
0.10
0 2 4 6 8 10
Amax = 0.0869g at T= 0.0788 sec

924
Soil Profile Profile Name: D6CHC Tests Types and Designations: SPT-CXW-Cross hole Water Table Depth: 25 m. Number of Layers: 59 Input Motion RAN230.EQ Response Spectra a) 5% Soil Damping
Response Spectra
Layer: 1 - EQ No: 1 - Damping: 5.00% -Outcrop: No
Layer: 2 - EQ No: 1 - Damping: 5.00% -Outcrop: No
Acc
eler
atio
n (g
)
Period (sec)
0.00
0.05
0.10
0.15
0.20
0.25
0 2 4 6 8 10
Amax = 0.22g at T= 0.0569 sec

925
b) 10% Soil Damping
Response Spectra
Layer: 1 - EQ No: 1 - Damping: 10.00% -Outcrop: No
Layer: 2 - EQ No: 1 - Damping: 10.00% -Outcrop: No
Acc
eler
atio
n (g
)
Period (sec)
0.00
0.05
0.10
0.15
0.20
0 2 4 6 8 10
Amax = 0.17g at T= 0.0569 sec

926
Input Motion RAN330.EQ Response Spectra a) 5% Soil Damping
Response Spectra
Layer: 1 - EQ No: 1 - Damping: 5.00% -Outcrop: No
Layer: 2 - EQ No: 1 - Damping: 5.00% -Outcrop: No
Acc
eler
atio
n (g
)
Period (sec)
0.00
0.05
0.10
0.15
0 2 4 6 8 10
Amax = 0.14g at T= 0.11 sec b) 10% Soil Damping
Response Spectra
Layer: 1 - EQ No: 1 - Damping: 10.00% -Outcrop: No
Layer: 2 - EQ No: 1 - Damping: 10.00% -Outcrop: No
Acc
eler
atio
n (g
)
Period (sec)
0.00
0.05
0.10
0.15
0 2 4 6 8 10
Amax = 0.12g at T= 0.10 sec

927
Soil Profile Profile Name: D7 Tests Types and Designations: SPT-CXW Water Table Depth: 26 m. Number of Layers: 52 Input Motion RAN230.EQ Response Spectra a) 5% Soil Damping
Response Spectra
Layer: 1 - EQ No: 1 - Damping: 5.00% -Outcrop: No
Layer: 2 - EQ No: 1 - Damping: 5.00% -Outcrop: No
Acc
eler
atio
n (g
)
Period (sec)
0.00
0.05
0.10
0.15
0 2 4 6 8 10
Amax = 0.14g at T= 0.15 sec

928
b) 10% Soil Damping
Response Spectra
Layer: 1 - EQ No: 1 - Damping: 10.00% -Outcrop: No
Layer: 2 - EQ No: 1 - Damping: 10.00% -Outcrop: No
Acc
eler
atio
n (g
)
Period (sec)
0.00
0.02
0.04
0.06
0.08
0.10
0 2 4 6 8 10
Amax = 0.0933g at T= 0.091 sec

929
Input Motion RAN330.EQ Response Spectra a) 5% Soil Damping
Response Spectra
Layer: 1 - EQ No: 1 - Damping: 5.00% -Outcrop: No
Layer: 2 - EQ No: 1 - Damping: 5.00% -Outcrop: No
Acc
eler
atio
n (g
)
Period (sec)
0.00
0.05
0.10
0.15
0 2 4 6 8 10
Amax = 0.11g at T= 0.17 sec b) 10% Soil Damping
Response Spectra
Layer: 1 - EQ No: 1 - Damping: 10.00% -Outcrop: No
Layer: 2 - EQ No: 1 - Damping: 10.00% -Outcrop: No
Acc
eler
atio
n (g
)
Period (sec)
0.00
0.02
0.04
0.06
0.08
0.10
0 2 4 6 8 10
Amax = 0.0877g at T= 0.091 sec

930
Soil Profile Profile Name: D8 Tests Types and Designations: SPT-CXW Water Table Depth: 25 m. Number of Layers: 50 Input Motion RAN230.EQ Response Spectra a) 5% Soil Damping
Response Spectra
Layer: 1 - EQ No: 1 - Damping: 5.00% -Outcrop: No
Layer: 2 - EQ No: 1 - Damping: 5.00% -Outcrop: No
Acc
eler
atio
n (g
)
Period (sec)
0.00
0.05
0.10
0.15
0 2 4 6 8 10
Amax = 0.12g at T= 0.13 sec

931
b) 10% Soil Damping
Response Spectra
Layer: 1 - EQ No: 1 - Damping: 10.00% -Outcrop: No
Layer: 2 - EQ No: 1 - Damping: 10.00% -Outcrop: No
Acc
eler
atio
n (g
)
Period (sec)
0.00
0.02
0.04
0.06
0.08
0 2 4 6 8 10
Amax = 0.0791g at T= 0.0788 sec

932
Input Motion RAN330.EQ Response Spectra a) 5% Soil Damping
Response Spectra
Layer: 1 - EQ No: 1 - Damping: 5.00% - Outcrop: No
Acce
lera
tion
(g)
Period (sec)
0.00
0.02
0.04
0.06
0.08
0.10
0 2 4 6 8 10
Amax = 0.0833g at T= 0.17 sec b) 10% Soil Damping
Response Spectra
Layer: 1 - EQ No: 1 - Damping: 10.00% -Outcrop: No
Layer: 2 - EQ No: 1 - Damping: 10.00% -Outcrop: No
Acc
eler
atio
n (g
)
Period (sec)
0.00
0.02
0.04
0.06
0.08
0 2 4 6 8 10
Amax = 0.0744g at T= 0.0788 sec

933
Soil Profile Profile Name: D9 Tests Types and Designations: SPT-CXW Water Table Depth: 25 m. Number of Layers: 50 Input Motion RAN230.EQ Response Spectra a) 5% Soil Damping
Response Spectra
Layer: 1 - EQ No: 1 - Damping: 5.00% -Outcrop: No
Layer: 2 - EQ No: 1 - Damping: 5.00% -Outcrop: No
Acc
eler
atio
n (g
)
Period (sec)
0.00
0.05
0.10
0.15
0 2 4 6 8 10
Amax = 0.14g at T= 0.0691 sec

934
b) 10% Soil Damping
Response Spectra
Layer: 1 - EQ No: 1 - Damping: 10.00% -Outcrop: No
Layer: 2 - EQ No: 1 - Damping: 10.00% -Outcrop: No
Acc
eler
atio
n (g
)
Period (sec)
0.00
0.05
0.10
0.15
0 2 4 6 8 10
Amax = 0.11g at T= 0.0569 sec

935
Input Motion RAN330.EQ Response Spectra a) 5% Soil Damping
Response Spectra
Layer: 1 - EQ No: 1 - Damping: 5.00% -Outcrop: No
Layer: 2 - EQ No: 1 - Damping: 5.00% -Outcrop: No
Acc
eler
atio
n (g
)
Period (sec)
0.00
0.02
0.04
0.06
0.08
0.10
0 2 4 6 8 10
Amax = 0.095g at T= 0.0788 sec b) 10% Soil Damping
Response Spectra
Layer: 1 - EQ No: 1 - Damping: 10.00% -Outcrop: No
Layer: 2 - EQ No: 1 - Damping: 10.00% -Outcrop: No
Acc
eler
atio
n (g
)
Period (sec)
0.00
0.02
0.04
0.06
0.08
0.10
0 2 4 6 8 10
Amax = 0.0832g at T= 0.0788 sec

936
Soil Profile Profile Name: D11(CXW) Tests Types and Designations: SPT-CXW-Cross hole Water Table Depth: 2.6m. Number of Layers: 54 Input Motion RAN230.EQ Response Spectra a) 5% Soil Damping
Response Spectra
Layer: 1 - EQ No: 1 - Damping: 5.00% -Outcrop: No
Layer: 2 - EQ No: 1 - Damping: 5.00% -Outcrop: No
Acc
eler
atio
n (g
)
Period (sec)
0.00
0.05
0.10
0.15
0.20
0 2 4 6 8 10
Amax = 0.18g at T= 0.0788 sec

937
b) 10% Soil Damping
Response Spectra
Layer: 1 - EQ No: 1 - Damping: 10.00% -Outcrop: No
Layer: 2 - EQ No: 1 - Damping: 10.00% -Outcrop: No
Acc
eler
atio
n (g
)
Period (sec)
0.00
0.05
0.10
0.15
0 2 4 6 8 10
Amax = 0.13g at T= 0.0788 sec

938
Input Motion RAN330.EQ Response Spectra a) 5% Soil Damping
Response Spectra
Layer: 1 - EQ No: 1 - Damping: 5.00% -Outcrop: No
Layer: 2 - EQ No: 1 - Damping: 5.00% -Outcrop: No
Acc
eler
atio
n (g
)
Period (sec)
0.00
0.05
0.10
0.15
0 2 4 6 8 10
Amax = 0.11g at T= 0.10 sec b) 10% Soil Damping
Response Spectra
Layer: 1 - EQ No: 1 - Damping: 10.00% -Outcrop: No
Layer: 2 - EQ No: 1 - Damping: 10.00% -Outcrop: No
Acc
eler
atio
n (g
)
Period (sec)
0.00
0.02
0.04
0.06
0.08
0.10
0 2 4 6 8 10
Amax = 0.0956g at T= 0.10 sec

939
Soil Profile Profile Name: D11 (CH) Tests Types and Designations: SPT-CXW-Cross hole Water Table Depth: 2.6 m. Number of Layers: 63 Input Motion RAN230.EQ Response Spectra a) 5% Soil Damping
Response Spectra
Layer: 1 - EQ No: 1 - Damping: 5.00% -Outcrop: No
Layer: 2 - EQ No: 1 - Damping: 5.00% -Outcrop: No
Acc
eler
atio
n (g
)
Period (sec)
0.0
0.1
0.2
0.3
0.4
0 2 4 6 8 10
Amax = 0.32g at T= 0.09 sec

940
b) 10% Soil Damping
Response Spectra
Layer: 1 - EQ No: 1 - Damping: 10.00% -Outcrop: No
Layer: 2 - EQ No: 1 - Damping: 10.00% -Outcrop: No
Acc
eler
atio
n (g
)
Period (sec)
0.00
0.05
0.10
0.15
0.20
0.25
0 2 4 6 8 10
Amax = 0.23g at T= 0.0691 sec

941
Input Motion RAN330.EQ Response Spectra a) 5% Soil Damping
Response Spectra
Layer: 1 - EQ No: 1 - Damping: 5.00% -Outcrop: No
Layer: 2 - EQ No: 1 - Damping: 5.00% -Outcrop: No
Acc
eler
atio
n (g
)
Period (sec)
0.00
0.05
0.10
0.15
0.20
0 2 4 6 8 10
Amax = 0.20g at T= 0.0788 sec b) 10% Soil Damping
Response Spectra
Layer: 1 - EQ No: 1 - Damping: 10.00% -Outcrop: No
Layer: 2 - EQ No: 1 - Damping: 10.00% -Outcrop: No
Acc
eler
atio
n (g
)
Period (sec)
0.00
0.05
0.10
0.15
0 2 4 6 8 10
Amax = 0.14g at T= 0.11 sec

942
Soil Profile Profile Name: D12(CXW) Tests Types and Designations: SPT-CXW-Cross hole Water Table Depth: 12 m. Number of Layers: 48 Input Motion RAN230.EQ Response Spectra a) 5% Soil Damping
Response Spectra
Layer: 1 - EQ No: 1 - Damping: 5.00% -Outcrop: No
Layer: 2 - EQ No: 1 - Damping: 5.00% -Outcrop: No
Acc
eler
atio
n (g
)
Period (sec)
0.00
0.05
0.10
0.15
0 2 4 6 8 10
Amax = 0.11g at T= 0.0691 sec

943
b) 10% Soil Damping
Response Spectra
Layer: 1 - EQ No: 1 - Damping: 10.00% -Outcrop: No
Layer: 2 - EQ No: 1 - Damping: 10.00% -Outcrop: No
Acc
eler
atio
n (g
)
Period (sec)
0.00
0.02
0.04
0.06
0.08
0.10
0 2 4 6 8 10
Amax = 0.0869g at T= 0.0569 sec

944
Input Motion RAN330.EQ Response Spectra a) 5% Soil Damping
Response Spectra
Layer: 1 - EQ No: 1 - Damping: 5.00% -Outcrop: No
Layer: 2 - EQ No: 1 - Damping: 5.00% -Outcrop: No
Acc
eler
atio
n (g
)
Period (sec)
0.00
0.02
0.04
0.06
0.08
0.10
0 2 4 6 8 10
Amax = 0.0883g at T= 0.10 sec b) 10% Soil Damping
Response Spectra
Layer: 1 - EQ No: 1 - Damping: 10.00% -Outcrop: No
Layer: 2 - EQ No: 1 - Damping: 10.00% -Outcrop: No
Acc
eler
atio
n (g
)
Period (sec)
0.00
0.02
0.04
0.06
0.08
0 2 4 6 8 10
Amax = 0.0737g at T= 0.11 sec

945
Soil Profile Profile Name: D12(CHC) Tests Types and Designations: SPT-CXW-Cross hole Water Table Depth: 12 m. Number of Layers: 60 Input Motion RAN230.EQ Response Spectra a) 5% Soil Damping
Response Spectra
Layer: 1 - EQ No: 1 - Damping: 5.00% -Outcrop: No
Layer: 2 - EQ No: 1 - Damping: 5.00% -Outcrop: No
Acc
eler
atio
n (g
)
Period (sec)
0.00
0.05
0.10
0.15
0.20
0 2 4 6 8 10
Amax = 0.2g at T= 0.0569 sec

946
b) 10% Soil Damping
Response Spectra
Layer: 1 - EQ No: 1 - Damping: 10.00% -Outcrop: No
Layer: 2 - EQ No: 1 - Damping: 10.00% -Outcrop: No
Acc
eler
atio
n (g
)
Period (sec)
0.00
0.05
0.10
0.15
0 2 4 6 8 10
Amax = 0.15g at T= 0.0691 sec

947
Input Motion RAN330.EQ Response Spectra a) 5% Soil Damping
Response Spectra
Layer: 1 - EQ No: 1 - Damping: 5.00% -Outcrop: No
Layer: 2 - EQ No: 1 - Damping: 5.00% -Outcrop: No
Acc
eler
atio
n (g
)
Period (sec)
0.00
0.05
0.10
0.15
0 2 4 6 8 10
Amax = 0.14g at T= 0.31 sec b) 10% Soil Damping
Response Spectra
Layer: 1 - EQ No: 1 - Damping: 10.00% -Outcrop: No
Layer: 2 - EQ No: 1 - Damping: 10.00% -Outcrop: No
Acc
eler
atio
n (g
)
Period (sec)
0.00
0.05
0.10
0.15
0 2 4 6 8 10
Amax = 0.11g at T= 0.10 sec

948
5. Dynamic Site Response Analysis (ProShake) for the East-west
Seismic Array 5.1 Analysis Input Profiles: Station: RD0
1
2
3
4
5
6
7
8
S D
S D
S D
S D
S D
S D
S D
B E D R O C K

949
Layer Thickness
Material Name
Thickness (ft)
Unit Weight (pcf)
Gmax (ksf)
Vs (ft/sec)
Modulus Curve
Damping Curve
1 Sc/Sd 16.4 120 1606 656 Sand (Seed and
Idriss 1970) Sand (Idriss
1990)
2 Sc/Sd 16.4 120 2970 892 Sand (Seed and
Idriss 1970) Sand (Idriss
1990)
3 Sc/Sd 16.4 120 4750 1129 Sand (Seed and
Idriss 1970) Sand (Idriss
1990)
4 Sc/Sd 16.4 120 6947 1365 Sand (Seed and
Idriss 1970) Sand (Idriss
1990)
5 Sc/Sd 16.4 120 9560 1601 Sand (Seed and
Idriss 1970) Sand (Idriss
1990)
6 Sc/Sd 16.4 120 12590 1837 Sand (Seed and
Idriss 1970) Sand (Idriss
1990)
7 Sc/Sd 16.4 120 12590 1837 Sand (Seed and
Idriss 1970) Sand (Idriss
1990) 8 Rock infinite 150 112912 4921 Rock Rock
Station RD0 input soil profile

950
Station: RD2
1
2
3
4
5
6
7
8
9
1 0
1 1
1 2
1 3
1 4
1 5
1 6
1 7
1 8
1 9
2 0
2 1
2 2
S D
S D
S D
S D
S D
S D
S D
S D
S D
S D
S D
S D
S D
S D
S D
S D
S D
S D
S D
S D
S D
R o c k

951
Layer Thickness
Material Name
Thickness (ft)
Unit Weight (pcf) Gmax (ksf)
Vs (ft/sec)
Modulus Curve
Damping Curve
1 Sc/Sd 16.4 120 1606 656 Sand (Seed and Idriss 1970) Sand (Idriss 1990) 2 Sc/Sd 16.4 120 2970 892 Sand (Seed and Idriss 1970) Sand (Idriss 1990) 3 Sc/Sd 16.4 120 4750 1129 Sand (Seed and Idriss 1970) Sand (Idriss 1990) 4 Sc/Sd 16.4 120 6947 1365 Sand (Seed and Idriss 1970) Sand (Idriss 1990) 5 Sc/Sd 16.4 120 9560 1601 Sand (Seed and Idriss 1970) Sand (Idriss 1990) 6 Sc/Sd 16.4 120 12590 1837 Sand (Seed and Idriss 1970) Sand (Idriss 1990) 7 Sc/Sd 16.4 120 12590 1837 Sand (Seed and Idriss 1970) Sand (Idriss 1990) 8 Sc/Sd 16.4 120 12590 1837 Sand (Seed and Idriss 1970) Sand (Idriss 1990) 9 Sc/Sd 16.4 120 12590 1837 Sand (Seed and Idriss 1970) Sand (Idriss 1990)
10 Sc/Sd 16.4 120 12590 1837 Sand (Seed and Idriss 1970) Sand (Idriss 1990) 11 Sc/Sd 16.4 120 12590 1837 Sand (Seed and Idriss 1970) Sand (Idriss 1990) 12 Sc/Sd 16.4 120 12590 1837 Sand (Seed and Idriss 1970) Sand (Idriss 1990) 13 Sc/Sd 16.4 120 12590 1837 Sand (Seed and Idriss 1970) Sand (Idriss 1990) 14 Sc/Sd 16.4 120 12590 1837 Sand (Seed and Idriss 1970) Sand (Idriss 1990) 15 Sc/Sd 16.4 120 12590 1837 Sand (Seed and Idriss 1970) Sand (Idriss 1990) 16 Sc/Sd 16.4 120 12590 1837 Sand (Seed and Idriss 1970) Sand (Idriss 1990) 17 Sc/Sd 16.4 120 12590 1837 Sand (Seed and Idriss 1970) Sand (Idriss 1990) 18 Sc/Sd 16.4 120 12590 1837 Sand (Seed and Idriss 1970) Sand (Idriss 1990) 19 Sc/Sd 16.4 120 12590 1837 Sand (Seed and Idriss 1970) Sand (Idriss 1990) 20 Sc/Sd 16.4 120 12590 1837 Sand (Seed and Idriss 1970) Sand (Idriss 1990) 21 Sc/Sd 16.4 120 12590 1837 Sand (Seed and Idriss 1970) Sand (Idriss 1990) 22 Rock infinite 150 112912 4921 Rock Rock
Station RD2 input soil profile

952
Station: RD3 1
2
3
4
5
6
7
8
9
1 0
1 1
1 2
1 3
1 4
1 5
1 6
1 7
1 8
1 9
2 0
2 1
2 2
2 3
2 4
2 5
2 6
2 7
S D
S D
S D
S D
S D
S D
S D
S D
S D
S D
S D
S D
S D
S D
S D
S D
S D
S D
S D
S D
S D
S D
S D
S D
S D
S D
R o c k

953
Layer
Thickness Material
Name Thickness
(ft) Unit
Weight (pcf) Gmax (ksf)
Vs (ft/sec)
Modulus Curve
Damping Curve
1 Sc/Sd 16.4 120 1606 656 Sand (Seed and Idriss 1970) Sand (Idriss 1990) 2 Sc/Sd 16.4 120 2970 892 Sand (Seed and Idriss 1970) Sand (Idriss 1990) 3 Sc/Sd 16.4 120 4750 1129 Sand (Seed and Idriss 1970) Sand (Idriss 1990) 4 Sc/Sd 16.4 120 6947 1365 Sand (Seed and Idriss 1970) Sand (Idriss 1990) 5 Sc/Sd 16.4 120 9560 1601 Sand (Seed and Idriss 1970) Sand (Idriss 1990) 6 Sc/Sd 16.4 120 12590 1837 Sand (Seed and Idriss 1970) Sand (Idriss 1990) 7 Sc/Sd 16.4 120 12590 1837 Sand (Seed and Idriss 1970) Sand (Idriss 1990) 8 Sc/Sd 16.4 120 12590 1837 Sand (Seed and Idriss 1970) Sand (Idriss 1990) 9 Sc/Sd 16.4 120 12590 1837 Sand (Seed and Idriss 1970) Sand (Idriss 1990) 10 Sc/Sd 16.4 120 12590 1837 Sand (Seed and Idriss 1970) Sand (Idriss 1990) 11 Sc/Sd 16.4 120 12590 1837 Sand (Seed and Idriss 1970) Sand (Idriss 1990) 12 Sc/Sd 16.4 120 12590 1837 Sand (Seed and Idriss 1970) Sand (Idriss 1990) 13 Sc/Sd 16.4 120 12590 1837 Sand (Seed and Idriss 1970) Sand (Idriss 1990) 14 Sc/Sd 16.4 120 12590 1837 Sand (Seed and Idriss 1970) Sand (Idriss 1990) 15 Sc/Sd 16.4 120 12590 1837 Sand (Seed and Idriss 1970) Sand (Idriss 1990) 16 Sc/Sd 16.4 120 12590 1837 Sand (Seed and Idriss 1970) Sand (Idriss 1990) 17 Sc/Sd 16.4 120 12590 1837 Sand (Seed and Idriss 1970) Sand (Idriss 1990) 18 Sc/Sd 16.4 120 12590 1837 Sand (Seed and Idriss 1970) Sand (Idriss 1990) 19 Sc/Sd 16.4 120 12590 1837 Sand (Seed and Idriss 1970) Sand (Idriss 1990) 20 Sc/Sd 16.4 120 12590 1837 Sand (Seed and Idriss 1970) Sand (Idriss 1990) 21 Sc/Sd 16.4 120 12590 1837 Sand (Seed and Idriss 1970) Sand (Idriss 1990) 22 Sc/Sd 16.4 150 12590 1837 Sand (Seed and Idriss 1970) Sand (Idriss 1990) 23 Sc/Sd 16.4 150 12590 1837 Sand (Seed and Idriss 1970) Sand (Idriss 1990) 24 Sc/Sd 16.4 150 12590 1837 Sand (Seed and Idriss 1970) Sand (Idriss 1990) 25 Sc/Sd 16.4 150 12590 1837 Sand (Seed and Idriss 1970) Sand (Idriss 1990) 26 Sc/Sd 16.4 150 12590 1837 Sand (Seed and Idriss 1970) Sand (Idriss 1990) 27 Rock infinite 150 112912 4921 Rock Rock
Station RD3 input soil profile

954
Station: DRA2
1234567891 01 11 21 31 41 51 61 71 81 92 02 12 22 32 42 52 62 7
2 8
2 9
3 0
3 1
3 2
3 3
3 4
3 5
3 6
3 7
3 8
3 9
4 0
4 1
4 2
4 3
4 4
4 5
4 6
4 7
4 8
4 9
5 0
5 1
5 2
S C / S DS C / S DS C / S DS C / S DS C / S DS C / S DS C / S DS C / S DS C / S DS C / S DS C / S DS C / S DS C / S DS C / S DS C / S DS C / S DS C / S DS C / S DS C / S DS C / S DS C / S DS C / S DS C / S DS C / S DS C / S DS C / S DS C / S D
S C / S D
S C / S D
S C / S D
S C / S D
S C / S D
S C / S D
S C / S D
S C / S D
S C / S D
S C / S D
S C / S D
S C / S D
S C / S D
S C / S D
S C / S D
S C / S D
S C / S D
S C / S D
S C / S D
S C / S D
S C / S D
S C / S D
S C / S D
S C / S D
R o c k

955
Layer Thickness
Material Name
Thick ness (ft)
Unit Weight (pcf)
Gmax (ksf)
Vs (ft/sec)
Modulus Curve
Damping Curve
1 Sc/Sd 5.74 120 2312 787 Sand (Seed and Idriss 1970) Sand (Idriss 1990) 2 Sc/Sd 4.92 120 10036 1640 Sand (Seed and Idriss 1970) Sand (Idriss 1990) 3 Sc/Sd 4.96 120 4918 1148 Sand (Seed and Idriss 1970) Sand (Idriss 1990) 4 Sc/Sd 16.4 120 4508 1148 Sand (Seed and Idriss 1970) Sand (Idriss 1990) 5 Sc/Sd 16.4 120 10036 1640 Sand (Seed and Idriss 1970) Sand (Idriss 1990) 6 Sc/Sd 16.4 120 10036 1640 Sand (Seed and Idriss 1970) Sand (Idriss 1990) 7 Sc/Sd 16.4 130 10872 1640 Sand (Seed and Idriss 1970) Sand (Idriss 1990) 8 Sc/Sd 16.4 130 10872 1640 Sand (Seed and Idriss 1970) Sand (Idriss 1990) 9 Sc/Sd 16.4 130 10872 1640 Sand (Seed and Idriss 1970) Sand (Idriss 1990)
10 Sc/Sd 16.4 130 10872 1640 Sand (Seed and Idriss 1970) Sand (Idriss 1990) 11 Sc/Sd 16.4 130 10872 1640 Sand (Seed and Idriss 1970) Sand (Idriss 1990) 12 Sc/Sd 16.4 130 10872 1640 Sand (Seed and Idriss 1970) Sand (Idriss 1990) 13 Sc/Sd 16.4 130 10872 1640 Sand (Seed and Idriss 1970) Sand (Idriss 1990) 14 Sc/Sd 16.4 130 10872 1640 Sand (Seed and Idriss 1970) Sand (Idriss 1990) 15 Sc/Sd 16.4 130 10872 1640 Sand (Seed and Idriss 1970) Sand (Idriss 1990) 16 Sc/Sd 16.4 130 10872 1640 Sand (Seed and Idriss 1970) Sand (Idriss 1990) 17 Sc/Sd 16.4 130 10872 1640 Sand (Seed and Idriss 1970) Sand (Idriss 1990) 18 Sc/Sd 16.4 130 10872 1640 Sand (Seed and Idriss 1970) Sand (Idriss 1990) 19 Sc/Sd 16.4 130 10872 1640 Sand (Seed and Idriss 1970) Sand (Idriss 1990) 20 Sc/Sd 16.4 130 10872 1640 Sand (Seed and Idriss 1970) Sand (Idriss 1990) 21 Sc/Sd 16.4 130 10872 1640 Sand (Seed and Idriss 1970) Sand (Idriss 1990) 22 Sc/Sd 16.4 130 10872 1640 Sand (Seed and Idriss 1970) Sand (Idriss 1990) 23 Sc/Sd 16.4 130 10872 1640 Sand (Seed and Idriss 1970) Sand (Idriss 1990) 24 Sc/Sd 16.4 130 10872 1640 Sand (Seed and Idriss 1970) Sand (Idriss 1990) 25 Sc/Sd 16.4 130 10872 1640 Sand (Seed and Idriss 1970) Sand (Idriss 1990) 26 Sc/Sd 16.4 130 10872 1640 Sand (Seed and Idriss 1970) Sand (Idriss 1990) 27 Sc/Sd 16.4 130 10872 1640 Sand (Seed and Idriss 1970) Sand (Idriss 1990) 28 Sc/Sd 16.4 130 10872 1640 Sand (Seed and Idriss 1970) Sand (Idriss 1990) 29 Sc/Sd 16.4 130 10872 1640 Sand (Seed and Idriss 1970) Sand (Idriss 1990) 30 Sc/Sd 16.4 130 10872 1640 Sand (Seed and Idriss 1970) Sand (Idriss 1990) 31 Sc/Sd 16.4 130 10872 1640 Sand (Seed and Idriss 1970) Sand (Idriss 1990) 32 Sc/Sd 16.4 130 10872 1640 Sand (Seed and Idriss 1970) Sand (Idriss 1990) 33 Sc/Sd 16.4 130 10872 1640 Sand (Seed and Idriss 1970) Sand (Idriss 1990)

956
34 Sc/Sd 16.4 130 10872 1640 Sand (Seed and Idriss 1970) Sand (Idriss 1990) 35 Sc/Sd 16.4 130 10872 1640 Sand (Seed and Idriss 1970) Sand (Idriss 1990) 36 Sc/Sd 16.4 130 10872 1640 Sand (Seed and Idriss 1970) Sand (Idriss 1990) 37 Sc/Sd 16.4 130 10872 1640 Sand (Seed and Idriss 1970) Sand (Idriss 1990) 38 Sc/Sd 16.4 130 10872 1640 Sand (Seed and Idriss 1970) Sand (Idriss 1990) 39 Sc/Sd 16.4 130 10872 1640 Sand (Seed and Idriss 1970) Sand (Idriss 1990) 40 Sc/Sd 16.4 130 10872 1640 Sand (Seed and Idriss 1970) Sand (Idriss 1990) 41 Sc/Sd 16.4 130 10872 1640 Sand (Seed and Idriss 1970) Sand (Idriss 1990) 42 Sc/Sd 16.4 130 10872 1640 Sand (Seed and Idriss 1970) Sand (Idriss 1990) 43 Sc/Sd 16.4 130 10872 1640 Sand (Seed and Idriss 1970) Sand (Idriss 1990) 44 Sc/Sd 16.4 130 10872 1640 Sand (Seed and Idriss 1970) Sand (Idriss 1990) 45 Sc/Sd 16.4 130 10872 1640 Sand (Seed and Idriss 1970) Sand (Idriss 1990) 46 Sc/Sd 16.4 130 10872 1640 Sand (Seed and Idriss 1970) Sand (Idriss 1990) 47 Sc/Sd 16.4 130 10872 1640 Sand (Seed and Idriss 1970) Sand (Idriss 1990) 48 Sc/Sd 16.4 130 10872 1640 Sand (Seed and Idriss 1970) Sand (Idriss 1990) 49 Sc/Sd 16.4 130 10872 1640 Sand (Seed and Idriss 1970) Sand (Idriss 1990) 50 Sc/Sd 16.4 130 10872 1640 Sand (Seed and Idriss 1970) Sand (Idriss 1990) 51 Sc/Sd 16.4 130 10872 1640 Sand (Seed and Idriss 1970) Sand (Idriss 1990) 52 Rock infinite 150 112912 4921 Rock Rock
Station DRA2

957
5.2 Dynamic Site Response Analysis Results
• Input Earthquake: DREFF Records
Acceleration Time History
Acce
lera
tion
(g)
Time (sec)
-0.005
-0.010
-0.015
0.000
0.005
0.010
0.015
0 5 10 15 20 25
DREFFEW component
Acceleration Time History
Acce
lera
tion
(g)
Time (sec)
-0.005
-0.010
-0.015
-0.020
-0.025
0.000
0.005
0.010
0.015
0.020
0 5 10 15 20 25
DREFFNS component

958
• Dynamic Site Response Analysis Results Station RD0: a) 5% Damping
Response Spectra
Layer: 1 - EQ No: 1 - Damping: 5.00% - Outcrop: No
Acce
lera
tion
(g)
Period (sec)
0.00
0.05
0.10
0.15
0 2 4 6 8 10
RD0-DREFFEW T=0.098
Response Spectra
Layer: 1 - EQ No: 1 - Damping: 5.00% - Outcrop: No
Acce
lera
tion
(g)
Period (sec)
0.00
0.05
0.10
0.15
0.20
0.25
0.30
0 2 4 6 8 10
RD0-DREFFNS T=0.077

959
b) 10% Damping
Response Spectra
Layer: 1 - EQ No: 1 - Damping: 10.00% - Outcrop: No
Acce
lera
tion
(g)
Period (sec)
0.00
0.05
0.10
0.15
0 2 4 6 8 10
RD0-DREFFEW T=0.11
Response Spectra
Layer: 1 - EQ No: 1 - Damping: 10.00% - Outcrop: No
Acce
lera
tion
(g)
Period (sec)
0.00
0.05
0.10
0.15
0.20
0 2 4 6 8 10
RD0-DREFFNS T=0.077

960
Station RD2: a) 5% Damping
Response Spectra
Layer: 1 - EQ No: 1 - Damping: 5.00% - Outcrop: No
Acce
lera
tion
(g)
Period (sec)
0.00
0.05
0.10
0.15
0.20
0 2 4 6 8 10
DREFFEW T=0.098
Response Spectra
Layer: 1 - EQ No: 1 - Damping: 5.00% - Outcrop: No
Acce
lera
tion
(g)
Period (sec)
0.00
0.05
0.10
0.15
0.20
0 2 4 6 8 10
DREFFNS T=0.077

961
b) 10% Damping
Response Spectra
Layer: 1 - EQ No: 1 - Damping: 10.00% - Outcrop: No
Acce
lera
tion
(g)
Period (sec)
0.00
0.05
0.10
0.15
0 2 4 6 8 10
DREFFEW T= 0.11
Response Spectra
Layer: 1 - EQ No: 1 - Damping: 10.00% - Outcrop: No
Acce
lera
tion
(g)
Period (sec)
0.00
0.05
0.10
0.15
0 2 4 6 8 10
DREFFNS T= .077

962
Station RD3: a) 5% Damping
Response Spectra
Layer: 1 - EQ No: 1 - Damping: 5.00% - Outcrop: No
Acce
lera
tion
(g)
Period (sec)
0.00
0.05
0.10
0.15
0.20
0 2 4 6 8 10
DREFFEW T= 0.098
Response Spectra
Layer: 1 - EQ No: 1 - Damping: 5.00% - Outcrop: No
Acce
lera
tion
(g)
Period (sec)
0.00
0.05
0.10
0.15
0.20
0 2 4 6 8 10
DREFFNS T= 0.077

963
b) 10% Damping Response Spectra
Layer: 1 - EQ No: 1 - Damping: 10.00% - Outcrop: No
Acce
lera
tion
(g)
Period (sec)
0.00
0.05
0.10
0.15
0 2 4 6 8 10
DREFFEW T=0.11
Response Spectra
Layer: 1 - EQ No: 1 - Damping: 10.00% - Outcrop: No
Acce
lera
tion
(g)
Period (sec)
0.00
0.05
0.10
0.15
0 2 4 6 8 10
DREFFNS T=0.077

964
Station DRA2: a) 5% Damping
Response Spectra
Layer: 1 - EQ No: 1 - Damping: 5.00% - Outcrop: No
Acce
lera
tion
(g)
Period (sec)
0.00
0.05
0.10
0.15
0.20
0 2 4 6 8 10
DREFFEW T=0.098
Response Spectra
Layer: 1 - EQ No: 1 - Damping: 5.00% - Outcrop: No
Acce
lera
tion
(g)
Period (sec)
0.00
0.05
0.10
0.15
0.20
0 2 4 6 8 10
DREFFNS T=0.077

965
b) 10% Damping
Response Spectra
Layer: 1 - EQ No: 1 - Damping: 10.00% - Outcrop: No
Acce
lera
tion
(g)
Period (sec)
0.00
0.05
0.10
0.15
0 2 4 6 8 10
DREFFEW T= 0.11
Response Spectra
Layer: 1 - EQ No: 1 - Damping: 10.00% - Outcrop: No
Acce
lera
tion
(g)
Period (sec)
0.00
0.05
0.10
0.15
0 2 4 6 8 10
DREFFNS T=0 .077

966
5.3 Frequency Domain Fundamental Periods Station DREFF:
Acceleration Fourier Spectrum
Ampl
itude
(g)
Frequency (Hz)
0.00000
0.00005
0.00010
0.00015
0.00020
0 20 40 60 80 100
DREFFEW f=9.37 T=0.107
Acceleration Fourier Spectrum
Ampl
itude
(g)
Frequency (Hz)
0.00000
0.00005
0.00010
0.00015
0.00020
0 20 40 60 80 100
DREFFNS f=11.22 T=0.089

967
Station RD0:
Acceleration Fourier Spectrum
Ampl
itude
(g)
Frequency (Hz)
0.00000
0.00005
0.00010
0.00015
0.00020
0.00025
0.00030
0 20 40 60 80 100
RD0EW f=22.24 T=0.043
Acceleration Fourier Spectrum
Ampl
itude
(g)
Frequency (Hz)
0.0000
0.0001
0.0002
0.0003
0.0004
0 20 40 60 80 100
RD0NS f=16.84 T=0.059

968
Station RD2:
Acceleration Fourier Spectrum
Ampl
itude
(g)
Frequency (Hz)
0.00000
0.00005
0.00010
0.00015
0.00020
0.00025
0.00030
0 20 40 60 80 100
RD2EW f=8.15 T=0.123
Acceleration Fourier Spectrum
Ampl
itude
(g)
Frequency (Hz)
0.0000
0.0001
0.0002
0.0003
0.0004
0 20 40 60 80 100
RD2NS f= 15.71 T=0.064

969
Station RD3:
Acceleration Fourier Spectrum
Ampl
itude
(g)
Frequency (Hz)
0.0000
0.0001
0.0002
0.0003
0.0004
0.0005
0 20 40 60 80 100
RD3EW f=12.36 T= 0.081
Acceleration Fourier Spectrum
Ampl
itude
(g)
Frequency (Hz)
0.0000
0.0001
0.0002
0.0003
0.0004
0.0005
0 20 40 60 80 100
RD3NS f=22.05 T=0.046

970
Station DRA2 :
Acceleration Fourier Spectrum
Ampl
itude
(g)
Frequency (Hz)
0.0000
0.0001
0.0002
0.0003
0.0004
0 20 40 60 80 100
DRA2EW f=54.48 T=0.018
Acceleration Fourier Spectrum
Ampl
itude
(g)
Frequency (Hz)
0.0000
0.0001
0.0002
0.0003
0.0004
0 20 40 60 80 100
DRA2NS f=59.78 T=0.017

971
6. Effects of the Presence of an Embedded Soft Soil Layer This section presents the variation of fundamental period of Profiles
(D1N) and (D1AC) with variations of embedded soft layer’s thickness and
SWV.
Profile (D1): Bedrock at actual depth (≈350m)
Profile (D1A): Bedrock at NEHRP depth (30m) Profile (D1AC): Bedrock at actual depth (≈350m) Profile (D1N): Bedrock at NEHRP depth (30m) Input Motion: RAN330.EQ Damping: 5% and 10% I. Soft Layer SWV=500 m/s a. Layer Thickness =0.0 m

972
Profile D1AC:
1234567891 01 11 21 31 41 51 61 71 81 92 02 12 22 32 42 52 62 72 8
2 9
3 0
3 1
3 2
3 3
3 4
3 5
3 6
3 7
3 8
3 9
4 0
4 1
4 2
4 3
4 4
4 5
4 6
4 7
4 8
4 9
5 0
5 1
5 2
5 3
5 4
5 5
5 6
5 7
S C / S DS C / S DS C / S DS C / S DS C / S DS C / S DS C / S DS C / S DS C / S DS C / S DS C / S DS C / S DS C / S DS C / S DS C / S DS C / S DS C / S DS C / S DS C / S DS C / S DS C / S DS C / S DS C / S DS C / S DS C / S DS C / S DS C / S DS C / S D
S C / S D
S C / S D
S C / S D
S C / S D
S C / S D
S C / S D
S C / S D
S C / S D
S C / S D
S C / S D
S C / S D
S C / S D
S C / S D
S C / S D
S C / S D
S C / S D
S C / S D
S C / S D
S C / S D
S C / S D
S C / S D
S C / S D
S C / S D
S C / S D
S C / S D
S C / S D
S C / S D
S C / S D
B e d r o c k

973
5% Damping: Response Spectra
Layer: 1 - EQ No: 1 - Damping: 5.00% - Outcrop: No
Acce
lera
tion
(g)
Period (sec)
0.00
0.02
0.04
0.06
0.08
0.10
0 2 4 6 8 10
T=0.077 sec 10% Damping:
Response Spectra
Layer: 1 - EQ No: 1 - Damping: 10.00% - Outcrop: No
Acce
lera
tion
(g)
Period (sec)
0.00
0.02
0.04
0.06
0.08
0 2 4 6 8 10
T=.054 sec

974
2. Profile: D1N:
1
2
3
4
5
6
7
8
9
1 0
1 1
1 2
1 3
1 4
1 5
1 6
1 7
1 8
1 9
2 0
2 1
S C / S D
S C / S D
S C / S D
S C / S D
S C / S D
S C / S D
S C / S D
S C / S D
S C / S D
S C / S D
S C / S D
S C / S D
S C / S D
S C / S D
S C / S D
S C / S D
S C / S D
S C / S D
S C / S D
S C / S D
R o c k

975
5% Damping: Response Spectra
Layer: 1 - EQ No: 1 - Damping: 5.00% - Outcrop: No
Acce
lera
tion
(g)
Period (sec)
0.00
0.05
0.10
0.15
0.20
0.25
0.30
0 2 4 6 8 10
T=0.077 sec 10% Damping:
Response Spectra
Layer: 1 - EQ No: 1 - Damping: 10.00% - Outcrop: No
Acce
lera
tion
(g)
Period (sec)
0.00
0.05
0.10
0.15
0.20
0 2 4 6 8 10
T=0.064 sec

976
II. Soft Layer SWV=350 m/s a. Soft layer thickness =3m 1. Profile D1AC
1234567891 01 11 21 31 41 51 61 71 81 92 02 12 22 32 42 52 62 72 8
2 9
3 0
3 1
3 2
3 3
3 4
3 5
3 6
3 7
3 8
3 9
4 0
4 1
4 2
4 3
4 4
4 5
4 6
4 7
4 8
4 9
5 0
5 1
5 2
5 3
5 4
5 5
5 6
5 7
S C / S DS C / S DS C / S DS C / S DS C / S DS C / S DS C / S DS C / S DS C / S DS C / S DS C / S DS C / S DS C / S DS C / S DS C / S DS C / S DS C / S DS C / S DS C / S DS C / S DS C / S DS C / S DS C / S DS C / S DS C / S DS C / S DS C / S DS C / S D
S C / S D
S C / S D
S C / S D
S C / S D
S C / S D
S C / S D
S C / S D
S C / S D
S C / S D
S C / S D
S C / S D
S C / S D
S C / S D
S C / S D
S C / S D
S C / S D
S C / S D
S C / S D
S C / S D
S C / S D
S C / S D
S C / S D
S C / S D
S C / S D
S C / S D
S C / S D
S C / S D
S C / S D
B e d r o c k

977
5%Damping:
Response Spectra
Layer: 1 - EQ No: 1 - Damping: 5.00% - Outcrop: No
Acce
lera
tion
(g)
Period (sec)
0.00
0.05
0.10
0.15
0 2 4 6 8 10
T=0.077 sec 10% Damping:
Response Spectra
Layer: 1 - EQ No: 1 - Damping: 10.00% - Outcrop: No
Acce
lera
tion
(g)
Period (sec)
0.00
0.02
0.04
0.06
0.08
0 2 4 6 8 10
T=0.077 sec

978
2. Profile: D1N:
1
2
3
4
5
6
7
8
9
1 0
1 1
1 2
1 3
1 4
1 5
1 6
1 7
1 8
1 9
2 0
2 1
S C / S D
S C / S D
S C / S D
S C / S D
S C / S D
S C / S D
S C / S D
S C / S D
S C / S D
S C / S D
S C / S D
S C / S D
S C / S D
S C / S D
S C / S D
S C / S D
S C / S D
S C / S D
S C / S D
S C / S D
R o c k

979
5% damping:
Response Spectra
Layer: 1 - EQ No: 1 - Damping: 5.00% - Outcrop: No
Acce
lera
tion
(g)
Period (sec)
0.0
0.1
0.2
0.3
0.4
0 2 4 6 8 10
T=0.077 sec 10% Damping:
Response Spectra
Layer: 1 - EQ No: 1 - Damping: 10.00% - Outcrop: No
Acce
lera
tion
(g)
Period (sec)
0.00
0.05
0.10
0.15
0.20
0 2 4 6 8 10
T=0.077 sec

980
b. Soft layer Thickness= 5m 1. Profile D1AC 5% Damping
Response Spectra
Layer: 1 - EQ No: 1 - Damping: 5.00% - Outcrop: No
Acce
lera
tion
(g)
Period (sec)
0.00
0.05
0.10
0.15
0.20
0.25
0 2 4 6 8 10
T=0.098 sec 10% Damping
Response Spectra
Layer: 1 - EQ No: 1 - Damping: 10.00% - Outcrop: No
Acce
lera
tion
(g)
Period (sec)
0.00
0.02
0.04
0.06
0.08
0.10
0 2 4 6 8 10
T=0.098 sec

981
2. Profile D1N 5% Damping:
Response Spectra
Layer: 1 - EQ No: 1 - Damping: 5.00% - Outcrop: No
Acce
lera
tion
(g)
Period (sec)
0.00
0.05
0.10
0.15
0.20
0 2 4 6 8 10
T=0.098 sec 10% Damping:
Response Spectra
Layer: 1 - EQ No: 1 - Damping: 10.00% - Outcrop: No
Acce
lera
tion
(g)
Period (sec)
0.00
0.05
0.10
0.15
0 2 4 6 8 10
T=0.077 sec

982
c. Soft layer Thickness= 7m 1. Profile D1AC 5% Damping
Response Spectra
Layer: 1 - EQ No: 1 - Damping: 5.00% - Outcrop: No
Acce
lera
tion
(g)
Period (sec)
0.00
0.05
0.10
0.15
0 2 4 6 8 10
T=0.12 sec 10% Damping
Response Spectra
Layer: 1 - EQ No: 1 - Damping: 10.00% - Outcrop: No
Acce
lera
tion
(g)
Period (sec)
0.00
0.02
0.04
0.06
0.08
0.10
0 2 4 6 8 10
T=0.12 sec

983
2. Profile D1N 5% Damping:
Response Spectra
Layer: 1 - EQ No: 1 - Damping: 5.00% - Outcrop: No
Acce
lera
tion
(g)
Period (sec)
0.00
0.05
0.10
0.15
0.20
0.25
0 2 4 6 8 10
T=0.098 sec 10% Damping:
Response Spectra
Layer: 1 - EQ No: 1 - Damping: 10.00% - Outcrop: No
Acce
lera
tion
(g)
Period (sec)
0.00
0.05
0.10
0.15
0.20
0 2 4 6 8 10
T=0.098 sec

984
d. Soft layer Thickness= 9m 1. Profile D1AC 5% Damping
Response Spectra
Layer: 1 - EQ No: 1 - Damping: 5.00% - Outcrop: No
Acce
lera
tion
(g)
Period (sec)
0.00
0.02
0.04
0.06
0.08
0.10
0 2 4 6 8 10
T=0.12 sec 10% Damping
Response Spectra
Layer: 1 - EQ No: 1 - Damping: 10.00% - Outcrop: No
Acce
lera
tion
(g)
Period (sec)
0.00
0.02
0.04
0.06
0.08
0 2 4 6 8 10
T=0.077 sec

985
2. Profile D1N 5% Damping:
Response Spectra
Layer: 1 - EQ No: 1 - Damping: 5.00% - Outcrop: No
Acce
lera
tion
(g)
Period (sec)
0.00
0.05
0.10
0.15
0.20
0 2 4 6 8 10
T=0.12 sec 10% Damping:
Response Spectra
Layer: 1 - EQ No: 1 - Damping: 10.00% - Outcrop: No
Acce
lera
tion
(g)
Period (sec)
0.00
0.05
0.10
0.15
0 2 4 6 8 10
T=0.077 sec

986
e. Soft layer Thickness= 11m 1. Profile D1AC 5% Damping
Response Spectra
Layer: 1 - EQ No: 1 - Damping: 5.00% - Outcrop: No
Acce
lera
tion
(g)
Period (sec)
0.00
0.02
0.04
0.06
0.08
0.10
0 2 4 6 8 10
T=0.16 sec 10% Damping
Response Spectra
Layer: 1 - EQ No: 1 - Damping: 10.00% - Outcrop: No
Acce
lera
tion
(g)
Period (sec)
0.00
0.02
0.04
0.06
0.08
0 2 4 6 8 10
T=0.11 sec

987
2. Profile D1N 5% Damping:
Response Spectra
Layer: 1 - EQ No: 1 - Damping: 5.00% - Outcrop: No
Acce
lera
tion
(g)
Period (sec)
0.00
0.05
0.10
0.15
0.20
0 2 4 6 8 10
T=0.11 sec 10% Damping:
Response Spectra
Layer: 1 - EQ No: 1 - Damping: 10.00% - Outcrop: No
Acce
lera
tion
(g)
Period (sec)
0.00
0.05
0.10
0.15
0 2 4 6 8 10
T+0.077 sec

988
f. Soft layer Thickness= 13m 1. Profile D1AC 5% Damping
Response Spectra
Layer: 1 - EQ No: 1 - Damping: 5.00% - Outcrop: No
Acce
lera
tion
(g)
Period (sec)
0.00
0.02
0.04
0.06
0.08
0.10
0 2 4 6 8 10
T=0.16 sec 10% Damping
Response Spectra
Layer: 1 - EQ No: 1 - Damping: 10.00% - Outcrop: No
Acce
lera
tion
(g)
Period (sec)
0.00
0.02
0.04
0.06
0.08
0 2 4 6 8 10
T=0.099 sec

989
2. Profile D1N 5% Damping:
Response Spectra
Layer: 1 - EQ No: 1 - Damping: 5.00% - Outcrop: No
Acce
lera
tion
(g)
Period (sec)
0.00
0.05
0.10
0.15
0.20
0 2 4 6 8 10
T=0.088 sec 10% Damping:
Response Spectra
Layer: 1 - EQ No: 1 - Damping: 10.00% - Outcrop: No
Acce
lera
tion
(g)
Period (sec)
0.00
0.05
0.10
0.15
0 2 4 6 8 10
T=0.088

990
g. Soft layer Thickness= 15m 1. Profile D1AC 5% Damping
Response Spectra
Layer: 1 - EQ No: 1 - Damping: 5.00% - Outcrop: No
Acce
lera
tion
(g)
Period (sec)
0.00
0.02
0.04
0.06
0.08
0.10
0 2 4 6 8 10
T=0.077 sec 10% Damping
Response Spectra
Layer: 1 - EQ No: 1 - Damping: 10.00% - Outcrop: No
Acce
lera
tion
(g)
Period (sec)
0.00
0.02
0.04
0.06
0.08
0 2 4 6 8 10
T=0.098 sec

991
2. Profile D1N 5% Damping:
Response Spectra
Layer: 1 - EQ No: 1 - Damping: 5.00% - Outcrop: No
Acce
lera
tion
(g)
Period (sec)
0.00
0.05
0.10
0.15
0.20
0 2 4 6 8 10
T=0.077 sec 10% Damping:
Response Spectra
Layer: 1 - EQ No: 1 - Damping: 10.00% - Outcrop: No
Acce
lera
tion
(g)
Period (sec)
0.00
0.05
0.10
0.15
0 2 4 6 8 10
T=0.098 sec

992
III. Soft Layer SWV=300 m/s a. Soft layer Thickness= 3m 1. Profile D1AC 5% Damping
Response Spectra
Layer: 1 - EQ No: 1 - Damping: 5.00% - Outcrop: No
Acce
lera
tion
(g)
Period (sec)
0.00
0.05
0.10
0.15
0 2 4 6 8 10
T=0.077 sec 10% Damping
Response Spectra
Layer: 1 - EQ No: 1 - Damping: 10.00% - Outcrop: No
Acce
lera
tion
(g)
Period (sec)
0.00
0.02
0.04
0.06
0.08
0.10
0 2 4 6 8 10
T=0.077 sec

993
2. Profile D1N 5% Damping:
Response Spectra
Layer: 1 - EQ No: 1 - Damping: 5.00% - Outcrop: No
Acce
lera
tion
(g)
Period (sec)
0.00
0.05
0.10
0.15
0.20
0.25
0 2 4 6 8 10
T=0.077 sec 10% Damping:
Response Spectra
Layer: 1 - EQ No: 1 - Damping: 10.00% - Outcrop: No
Acce
lera
tion
(g)
Period (sec)
0.00
0.05
0.10
0.15
0.20
0 2 4 6 8 10
T=0.077 sec

994
b. Soft layer Thickness= 5 1. Profile D1AC 5% Damping
Response Spectra
Layer: 1 - EQ No: 1 - Damping: 5.00% - Outcrop: No
Acce
lera
tion
(g)
Period (sec)
0.00
0.05
0.10
0.15
0 2 4 6 8 10
T=0.098 sec 10% Damping
Response Spectra
Layer: 1 - EQ No: 1 - Damping: 10.00% - Outcrop: No
Acce
lera
tion
(g)
Period (sec)
0.00
0.02
0.04
0.06
0.08
0.10
0 2 4 6 8 10
T=0.10 sec

995
2. Profile D1N 5% Damping:
Response Spectra
Layer: 1 - EQ No: 1 - Damping: 5.00% - Outcrop: No
Acce
lera
tion
(g)
Period (sec)
0.00
0.05
0.10
0.15
0.20
0.25
0.30
0 2 4 6 8 10
T=0.098 sec 10% Damping:
Response Spectra
Layer: 1 - EQ No: 1 - Damping: 10.00% - Outcrop: No
Acce
lera
tion
(g)
Period (sec)
0.00
0.05
0.10
0.15
0.20
0 2 4 6 8 10
T=0.088 sec

996
c. Soft layer Thickness= 7m 1. Profile D1AC 5% Damping
Response Spectra
Layer: 1 - EQ No: 1 - Damping: 5.00% - Outcrop: No
Acce
lera
tion
(g)
Period (sec)
0.00
0.05
0.10
0.15
0 2 4 6 8 10
T=0.13 sec 10% Damping
Response Spectra
Layer: 1 - EQ No: 1 - Damping: 10.00% - Outcrop: No
Acce
lera
tion
(g)
Period (sec)
0.00
0.02
0.04
0.06
0.08
0.10
0 2 4 6 8 10
T=0.13 sec

997
2. Profile D1N 5% Damping:
Response Spectra
Layer: 1 - EQ No: 1 - Damping: 5.00% - Outcrop: No
Acce
lera
tion
(g)
Period (sec)
0.00
0.05
0.10
0.15
0.20
0 2 4 6 8 10
T=0.12 10% Damping:
Response Spectra
Layer: 1 - EQ No: 1 - Damping: 10.00% - Outcrop: No
Acce
lera
tion
(g)
Period (sec)
0.00
0.05
0.10
0.15
0 2 4 6 8 10
T=0.077 sec

998
d. Soft layer Thickness= 9m 1. Profile D1AC 5% Damping
Response Spectra
Layer: 1 - EQ No: 1 - Damping: 5.00% - Outcrop: No
Acce
lera
tion
(g)
Period (sec)
0.00
0.05
0.10
0.15
0 2 4 6 8 10
T0.14 sec 10% Damping
Response Spectra
Layer: 1 - EQ No: 1 - Damping: 10.00% - Outcrop: No
Acce
lera
tion
(g)
Period (sec)
0.00
0.02
0.04
0.06
0.08
0 2 4 6 8 10
T=0.12 sec

999
2. Profile D1N 5% Damping:
Response Spectra
Layer: 1 - EQ No: 1 - Damping: 5.00% - Outcrop: No
Acce
lera
tion
(g)
Period (sec)
0.00
0.05
0.10
0.15
0.20
0 2 4 6 8 10
T=0.12 sec 10% Damping:
Response Spectra
Layer: 1 - EQ No: 1 - Damping: 10.00% - Outcrop: No
Acce
lera
tion
(g)
Period (sec)
0.00
0.05
0.10
0.15
0 2 4 6 8 10
T=0.077 sec

1000
e. Soft layer Thickness= 11m 1. Profile D1AC 5% Damping
Response Spectra
Layer: 1 - EQ No: 1 - Damping: 5.00% - Outcrop: No
Acce
lera
tion
(g)
Period (sec)
0.00
0.05
0.10
0.15
0 2 4 6 8 10
T=0.16 sec 10% Damping
Response Spectra
Layer: 1 - EQ No: 1 - Damping: 10.00% - Outcrop: No
Acce
lera
tion
(g)
Period (sec)
0.00
0.02
0.04
0.06
0.08
0 2 4 6 8 10
T=0.098 sec

1001
2. Profile D1N 5% Damping:
Response Spectra
Layer: 1 - EQ No: 1 - Damping: 5.00% - Outcrop: No
Acce
lera
tion
(g)
Period (sec)
0.00
0.05
0.10
0.15
0 2 4 6 8 10
T=0.33 sec 10% Damping:
Response Spectra
Layer: 1 - EQ No: 1 - Damping: 10.00% - Outcrop: No
Acce
lera
tion
(g)
Period (sec)
0.00
0.05
0.10
0.15
0 2 4 6 8 10
T=0.098 sec

1002
f. Soft layer Thickness= 13m 1. Profile D1AC 5% Damping
Response Spectra
Layer: 1 - EQ No: 1 - Damping: 5.00% - Outcrop: No
Acce
lera
tion
(g)
Period (sec)
0.00
0.02
0.04
0.06
0.08
0.10
0 2 4 6 8 10
T=0.077 10% Damping
Response Spectra
Layer: 1 - EQ No: 1 - Damping: 10.00% - Outcrop: No
Acce
lera
tion
(g)
Period (sec)
0.00
0.02
0.04
0.06
0.08
0 2 4 6 8 10
T=0.077 sec

1003
2. Profile D1N 5% Damping:
Response Spectra
Layer: 1 - EQ No: 1 - Damping: 5.00% - Outcrop: No
Acce
lera
tion
(g)
Period (sec)
0.00
0.05
0.10
0.15
0.20
0 2 4 6 8 10
T=0.077 sec 10% Damping:
Response Spectra
Layer: 1 - EQ No: 1 - Damping: 10.00% - Outcrop: No
Acce
lera
tion
(g)
Period (sec)
0.00
0.05
0.10
0.15
0 2 4 6 8 10
T=0.077 sec

1004
g. Soft layer Thickness= 15m 1. Profile D1AC 5% Damping
Response Spectra
Layer: 1 - EQ No: 1 - Damping: 5.00% - Outcrop: No
Acce
lera
tion
(g)
Period (sec)
0.00
0.05
0.10
0.15
0 2 4 6 8 10
T=0.077 sec 10% Damping
Response Spectra
Layer: 1 - EQ No: 1 - Damping: 10.00% - Outcrop: No
Acce
lera
tion
(g)
Period (sec)
0.00
0.02
0.04
0.06
0.08
0.10
0 2 4 6 8 10
T=0.077 sec

1005
2. Profile D1N 5% Damping:
Response Spectra
Layer: 1 - EQ No: 1 - Damping: 5.00% - Outcrop: No
Acce
lera
tion
(g)
Period (sec)
0.00
0.05
0.10
0.15
0.20
0.25
0 2 4 6 8 10
T=0.077 sec 10% Damping:
Response Spectra
Layer: 1 - EQ No: 1 - Damping: 10.00% - Outcrop: No
Acce
lera
tion
(g)
Period (sec)
0.00
0.05
0.10
0.15
0.20
0 2 4 6 8 10
T=0.077 sec

1006
IV. Soft Layer SWV= 250 m/s a. Soft layer Thickness= 3m 1. Profile D1AC 5% Damping
Response Spectra
Layer: 1 - EQ No: 1 - Damping: 5.00% - Outcrop: No
Acce
lera
tion
(g)
Period (sec)
0.00
0.05
0.10
0.15
0 2 4 6 8 10
T=0.098 sec 10% Damping
Response Spectra
Layer: 1 - EQ No: 1 - Damping: 10.00% - Outcrop: No
Acce
lera
tion
(g)
Period (sec)
0.00
0.05
0.10
0.15
0 2 4 6 8 10
T=0.098

1007
2. Profile D1N 5% Damping:
Response Spectra
Layer: 1 - EQ No: 1 - Damping: 5.00% - Outcrop: No
Acce
lera
tion
(g)
Period (sec)
0.00
0.05
0.10
0.15
0.20
0.25
0 2 4 6 8 10
T=0.098 sec 10% Damping:
Response Spectra
Layer: 1 - EQ No: 1 - Damping: 10.00% - Outcrop: No
Acce
lera
tion
(g)
Period (sec)
0.00
0.05
0.10
0.15
0.20
0 2 4 6 8 10
T=0.077 sec

1008
b. Soft layer Thickness= 5m 1. Profile D1AC 5% Damping
Response Spectra
Layer: 1 - EQ No: 1 - Damping: 5.00% - Outcrop: No
Acce
lera
tion
(g)
Period (sec)
0.00
0.05
0.10
0.15
0 2 4 6 8 10
T=0.12 sec 10% Damping
Response Spectra
Layer: 1 - EQ No: 1 - Damping: 10.00% - Outcrop: No
Acce
lera
tion
(g)
Period (sec)
0.00
0.02
0.04
0.06
0.08
0.10
0 2 4 6 8 10
T=0.12 sec

1009
2. Profile D1N 5% Damping:
Response Spectra
Layer: 1 - EQ No: 1 - Damping: 5.00% - Outcrop: No
Acce
lera
tion
(g)
Period (sec)
0.00
0.05
0.10
0.15
0.20
0 2 4 6 8 10
T=0.12 sec 10% Damping:
Response Spectra
Layer: 1 - EQ No: 1 - Damping: 10.00% - Outcrop: No
Acce
lera
tion
(g)
Period (sec)
0.00
0.05
0.10
0.15
0 2 4 6 8 10
T=0.077 sec

1010
c. Soft layer Thickness= 7m 1. Profile D1AC 5% Damping
Response Spectra
Layer: 1 - EQ No: 1 - Damping: 5.00% - Outcrop: No
Acce
lera
tion
(g)
Period (sec)
0.00
0.05
0.10
0.15
0 2 4 6 8 10
T=0.16 sec 10% Damping
Response Spectra
Layer: 1 - EQ No: 1 - Damping: 10.00% - Outcrop: No
Acce
lera
tion
(g)
Period (sec)
0.00
0.02
0.04
0.06
0.08
0.10
0 2 4 6 8 10
T=0.16 sec

1011
2. Profile D1N 5% Damping:
Response Spectra
Layer: 1 - EQ No: 1 - Damping: 5.00% - Outcrop: No
Acce
lera
tion
(g)
Period (sec)
0.00
0.05
0.10
0.15
0.20
0 2 4 6 8 10
T=0.14 sec 10% Damping:
Response Spectra
Layer: 1 - EQ No: 1 - Damping: 10.00% - Outcrop: No
Acce
lera
tion
(g)
Period (sec)
0.00
0.05
0.10
0.15
0 2 4 6 8 10
T=0.077 sec

1012
d. Soft layer Thickness= 9m 1. Profile D1AC 5% Damping
Response Spectra
Layer: 1 - EQ No: 1 - Damping: 5.00% - Outcrop: No
Acce
lera
tion
(g)
Period (sec)
0.00
0.05
0.10
0.15
0 2 4 6 8 10
T=0.16 sec 10% Damping
Response Spectra
Layer: 1 - EQ No: 1 - Damping: 10.00% - Outcrop: No
Acce
lera
tion
(g)
Period (sec)
0.00
0.02
0.04
0.06
0.08
0 2 4 6 8 10
T=0.098 sec

1013
2. Profile D1N 5% Damping:
Response Spectra
Layer: 1 - EQ No: 1 - Damping: 5.00% - Outcrop: No
Acce
lera
tion
(g)
Period (sec)
0.00
0.05
0.10
0.15
0.20
0 2 4 6 8 10
T=0.33 sec 10% Damping:
Response Spectra
Layer: 1 - EQ No: 1 - Damping: 10.00% - Outcrop: No
Acce
lera
tion
(g)
Period (sec)
0.00
0.05
0.10
0.15
0 2 4 6 8 10
T=0.098 sec

1014
e. Soft layer Thickness= 11m 1. Profile D1AC 5% Damping
Response Spectra
Layer: 1 - EQ No: 1 - Damping: 5.00% - Outcrop: No
Acce
lera
tion
(g)
Period (sec)
0.00
0.05
0.10
0.15
0 2 4 6 8 10
T=0.077 sec 10% Damping
Response Spectra
Layer: 1 - EQ No: 1 - Damping: 10.00% - Outcrop: No
Acce
lera
tion
(g)
Period (sec)
0.00
0.02
0.04
0.06
0.08
0.10
0 2 4 6 8 10
T=0.077 sec

1015
2. Profile D1N 5% Damping:
Response Spectra
Layer: 1 - EQ No: 1 - Damping: 5.00% - Outcrop: No
Acce
lera
tion
(g)
Period (sec)
0.00
0.05
0.10
0.15
0.20
0.25
0 2 4 6 8 10
T=0.077 sec 10% Damping:
Response Spectra
Layer: 1 - EQ No: 1 - Damping: 10.00% - Outcrop: No
Acce
lera
tion
(g)
Period (sec)
0.00
0.05
0.10
0.15
0.20
0 2 4 6 8 10
T=0.077 sec

1016
f. Soft layer Thickness= 13m 1. Profile D1AC 5% Damping
Response Spectra
Layer: 1 - EQ No: 1 - Damping: 5.00% - Outcrop: No
Acce
lera
tion
(g)
Period (sec)
0.00
0.05
0.10
0.15
0 2 4 6 8 10
T=0..077 sec 10% Damping
Response Spectra
Layer: 1 - EQ No: 1 - Damping: 10.00% - Outcrop: No
Acce
lera
tion
(g)
Period (sec)
0.00
0.02
0.04
0.06
0.08
0 2 4 6 8 10
T=0.088 sec

1017
2. Profile D1N 5% Damping:
Response Spectra
Layer: 1 - EQ No: 1 - Damping: 5.00% - Outcrop: No
Acce
lera
tion
(g)
Period (sec)
0.00
0.05
0.10
0.15
0.20
0 2 4 6 8 10
T=0.088 sec 10% Damping:
Response Spectra
Layer: 1 - EQ No: 1 - Damping: 10.00% - Outcrop: No
Acce
lera
tion
(g)
Period (sec)
0.00
0.05
0.10
0.15
0 2 4 6 8 10
T=0.077 sec

1018
g. Soft layer Thickness= 15m 1. Profile D1AC 5% Damping
Response Spectra
Layer: 1 - EQ No: 1 - Damping: 5.00% - Outcrop: No
Acce
lera
tion
(g)
Period (sec)
0.00
0.02
0.04
0.06
0.08
0.10
0 2 4 6 8 10
T=0.28 sec 10% Damping
Response Spectra
Layer: 1 - EQ No: 1 - Damping: 10.00% - Outcrop: No
Acce
lera
tion
(g)
Period (sec)
0.00
0.02
0.04
0.06
0.08
0 2 4 6 8 10
T=0.077 sec

1019
2. Profile D1N 5% Damping:
Response Spectra
Layer: 1 - EQ No: 1 - Damping: 5.00% - Outcrop: No
Acce
lera
tion
(g)
Period (sec)
0.00
0.05
0.10
0.15
0.20
0 2 4 6 8 10
T+0.098 sec 10% Damping:
Response Spectra
Layer: 1 - EQ No: 1 - Damping: 10.00% - Outcrop: No
Acce
lera
tion
(g)
Period (sec)
0.00
0.05
0.10
0.15
0 2 4 6 8 10
T=0.098 sec

1020
V. Soft Layer SWV= 200 m/s a. Soft layer Thickness= 3m 1. Profile D1AC 5% Damping
Response Spectra
Layer: 1 - EQ No: 1 - Damping: 5.00% - Outcrop: No
Acce
lera
tion
(g)
Period (sec)
0.00
0.05
0.10
0.15
0 2 4 6 8 10
T=0.12 sec 10% Damping
Response Spectra
Layer: 1 - EQ No: 1 - Damping: 10.00% - Outcrop: No
Acce
lera
tion
(g)
Period (sec)
0.00
0.05
0.10
0.15
0 2 4 6 8 10
T=0.12 sec

1021
2. Profile D1N 5% Damping:
Response Spectra
Layer: 1 - EQ No: 1 - Damping: 5.00% - Outcrop: No
Acce
lera
tion
(g)
Period (sec)
0.00
0.05
0.10
0.15
0.20
0.25
0 2 4 6 8 10
T=0.098 sec 10% Damping:
Response Spectra
Layer: 1 - EQ No: 1 - Damping: 10.00% - Outcrop: No
Acce
lera
tion
(g)
Period (sec)
0.00
0.05
0.10
0.15
0.20
0 2 4 6 8 10
T=0.098 sec

1022
b. Soft layer Thickness= 5m 1. Profile D1AC 5% Damping
Response Spectra
Layer: 1 - EQ No: 1 - Damping: 5.00% - Outcrop: No
Acce
lera
tion
(g)
Period (sec)
0.00
0.05
0.10
0.15
0 2 4 6 8 10
T=0.16 sec 10% Damping
Response Spectra
Layer: 1 - EQ No: 1 - Damping: 10.00% - Outcrop: No
Acce
lera
tion
(g)
Period (sec)
0.00
0.02
0.04
0.06
0.08
0.10
0 2 4 6 8 10
T=0.16 sec

1023
2. Profile D1N 5% Damping:
Response Spectra
Layer: 1 - EQ No: 1 - Damping: 5.00% - Outcrop: No
Acce
lera
tion
(g)
Period (sec)
0.00
0.05
0.10
0.15
0.20
0 2 4 6 8 10
T=0.14 sec 10% Damping:
Response Spectra
Layer: 1 - EQ No: 1 - Damping: 10.00% - Outcrop: No
Acce
lera
tion
(g)
Period (sec)
0.00
0.05
0.10
0.15
0 2 4 6 8 10
T=0.14 sec

1024
c. Soft layer Thickness= 7m 1. Profile D1AC 5% Damping
Response Spectra
Layer: 1 - EQ No: 1 - Damping: 5.00% - Outcrop: No
Acce
lera
tion
(g)
Period (sec)
0.00
0.05
0.10
0.15
0 2 4 6 8 10
T=0.16 sec 10% Damping
Response Spectra
Layer: 1 - EQ No: 1 - Damping: 10.00% - Outcrop: No
Acce
lera
tion
(g)
Period (sec)
0.00
0.02
0.04
0.06
0.08
0.10
0 2 4 6 8 10
T=0.19 sec

1025
2. Profile D1N 5% Damping:
Response Spectra
Layer: 1 - EQ No: 1 - Damping: 5.00% - Outcrop: No
Acce
lera
tion
(g)
Period (sec)
0.00
0.05
0.10
0.15
0.20
0 2 4 6 8 10
T=0.31 sec 10% Damping:
Response Spectra
Layer: 1 - EQ No: 1 - Damping: 10.00% - Outcrop: No
Acce
lera
tion
(g)
Period (sec)
0.00
0.05
0.10
0.15
0 2 4 6 8 10
T=0.27 sec

1026
d. Soft layer Thickness= 9m 1. Profile D1AC 5% Damping
Response Spectra
Layer: 1 - EQ No: 1 - Damping: 5.00% - Outcrop: No
Acce
lera
tion
(g)
Period (sec)
0.00
0.05
0.10
0.15
0 2 4 6 8 10
T=0.077 sec 10% Damping
Response Spectra
Layer: 1 - EQ No: 1 - Damping: 10.00% - Outcrop: No
Acce
lera
tion
(g)
Period (sec)
0.00
0.02
0.04
0.06
0.08
0.10
0 2 4 6 8 10
T=0.077 sec

1027
2. Profile D1N 5% Damping:
Response Spectra
Layer: 1 - EQ No: 1 - Damping: 5.00% - Outcrop: No
Acce
lera
tion
(g)
Period (sec)
0.00
0.05
0.10
0.15
0.20
0.25
0.30
0 2 4 6 8 10
T=0.077 sec 10% Damping:
Response Spectra
Layer: 1 - EQ No: 1 - Damping: 10.00% - Outcrop: No
Acce
lera
tion
(g)
Period (sec)
0.00
0.05
0.10
0.15
0.20
0 2 4 6 8 10
T=0.077 sec

1028
e. Soft layer Thickness= 11m 1. Profile D1AC 5% Damping
Response Spectra
Layer: 1 - EQ No: 1 - Damping: 5.00% - Outcrop: No
Acce
lera
tion
(g)
Period (sec)
0.00
0.05
0.10
0.15
0 2 4 6 8 10
T=0.29 sec 10% Damping
Response Spectra
Layer: 1 - EQ No: 1 - Damping: 10.00% - Outcrop: No
Acce
lera
tion
(g)
Period (sec)
0.00
0.02
0.04
0.06
0.08
0 2 4 6 8 10
T=0.27 sec

1029
2. Profile D1N 5% Damping:
Response Spectra
Layer: 1 - EQ No: 1 - Damping: 5.00% - Outcrop: No
Acce
lera
tion
(g)
Period (sec)
0.00
0.05
0.10
0.15
0.20
0 2 4 6 8 10
T=0.98 sec 10% Damping:
Response Spectra
Layer: 1 - EQ No: 1 - Damping: 10.00% - Outcrop: No
Acce
lera
tion
(g)
Period (sec)
0.00
0.05
0.10
0.15
0 2 4 6 8 10
T=0.054 sec

1030
f. Soft layer Thickness= 13m 1. Profile D1AC 5% Damping
Response Spectra
Layer: 1 - EQ No: 1 - Damping: 5.00% - Outcrop: No
Acce
lera
tion
(g)
Period (sec)
0.00
0.05
0.10
0.15
0 2 4 6 8 10
T=0.33 sec 10% Damping
Response Spectra
Layer: 1 - EQ No: 1 - Damping: 10.00% - Outcrop: No
Acce
lera
tion
(g)
Period (sec)
0.00
0.02
0.04
0.06
0.08
0 2 4 6 8 10
T=0.35 sec

1031
2. Profile D1N 5% Damping:
Response Spectra
Layer: 1 - EQ No: 1 - Damping: 5.00% - Outcrop: No
Acce
lera
tion
(g)
Period (sec)
0.00
0.05
0.10
0.15
0.20
0 2 4 6 8 10
T=0.098 sec 10% Damping:
Response Spectra
Layer: 1 - EQ No: 1 - Damping: 10.00% - Outcrop: No
Acce
lera
tion
(g)
Period (sec)
0.00
0.05
0.10
0.15
0 2 4 6 8 10
T=0.077 sec

1032
g. Soft layer Thickness= 15m 1. Profile D1AC 5% Damping
Response Spectra
Layer: 1 - EQ No: 1 - Damping: 5.00% - Outcrop: No
Acce
lera
tion
(g)
Period (sec)
0.00
0.05
0.10
0.15
0 2 4 6 8 10
T=0.35 sec 10% Damping
Response Spectra
Layer: 1 - EQ No: 1 - Damping: 10.00% - Outcrop: No
Acce
lera
tion
(g)
Period (sec)
0.00
0.02
0.04
0.06
0.08
0 2 4 6 8 10
T=0.34 sec

1033
2. Profile D1N 5% Damping:
Response Spectra
Layer: 1 - EQ No: 1 - Damping: 5.00% - Outcrop: No
Acce
lera
tion
(g)
Period (sec)
0.00
0.05
0.10
0.15
0 2 4 6 8 10
T=0.077 sec 10% Damping:
Response Spectra
Layer: 1 - EQ No: 1 - Damping: 10.00% - Outcrop: No
Acce
lera
tion
(g)
Period (sec)
0.00
0.05
0.10
0.15
0 2 4 6 8 10
T=0.077 sec

1034
Bibliography
1. Kramer, Steven L., “Geotechnical Earthquake Engineering”, Prentice Hall, Upper Saddle River, NJ, 1996.
2. Bolt, B. A., “Earthquakes”, W. H. Freeman and Company, New York, 1993.. 3. FEMA, “NEHRP Recommended Provisions for Seismic Regulations for New Buildings”, 2000 Edition, Part 1-Provisions, Washington, DC, 2001, pp. 39-48.
4. Arbelaez, M., “Controlled Source Spectral Analysis of Surface Waves for Soil
Profiling”, Master thesis, UNCC, Department of Civil Engineering, Charlotte, NC, 1992.
5. FEMA, “NEHRP Recommended Provisions for Seismic Regulations for New Buildings”, 2003 Edition, Part 2-Commentary, Washington, DC, 2004, pp. 29- 30.
6. Chopra, Anil K., “Dynamics of Structures”, Prentice Hall, Upper Saddle
River, NJ, 1995.
7. Kanai, K., and Tanaka, T., ”On Microtremors”, Bulletin, Earthquake Research Institute, Vol. 39, pp. 97-114.
8. Nakamura, Y., and Ueno, M., “A Simple Estimation of dynamic
Characteristics of Subsoil”, Proceedings of the 7th Japan Earthquake Engineering Symposium, pp. 265- 279.
9. Rodriguez, Victor, and Midorikawa, S., “Applicability of the H/V Ratio of
Microtremors in Assessing Site Effects on Seismic Motion”, Earthquake Engineering and Structural Dynamics, 2002; 31:261-279, John Wiley & Sons, Ltd., 2001.
10. “Discrete Fourier Transform and the FFT”, Internet, Available,
http://www.cage.curtin.edu.au/mechanical/info/vibrations/tut4.htm). April, 2004
11. SeismoSignal [2003] "Computer Program for Signal Processing of Strong Motion Data" , Internet, Available,
http://www.seismosoft.com. , April, 2004.
12. EDM Report On Kocaeli, Turkey Earthquake, “Chapter 5. Ground Motion Simulation in Golcuk”, Internet, Available, http://www.edm.bosai.go.jp/Turkey1999/report/chapter.5.pdf , Oct. 2001

1035
13. Lynn, Paul A., and Fuerst, W., “Introductory Digital Signal Processing”, John Wiley & Sons, New York, NY, 1998.
14. Thomas TheuBl, “On Windowing for Gradient Estimation on Volume Visualization”, internet, Available,
http://www.cg.tuwien.ac.at/studentwork/CESCG/CESCG99/TTheussl/node8.html , April, 2004.
15. EduPro Civil Systems, Inc., “ProShake Ground Response Analysis Program, Version 1.1”, User Manual, Redmond, Washington
16. Al-Haddad, M., Shaat, N., Assaf, M., “Seismic Microzonation of the City of Haqul and Al-Durrah Customs”, 2nd Annual Report, King Abdulaziz City for Science and Technology, 2002.
17. KACST, Earth Remote Sensing Data Analysis Center, “Geological Tectonic
Analysis Using Satellite Data In Eastern Coastal Area of Gulf of Aqaba, KSA”, KACST, Riyadh, KSA, March, 2000, pp. 3-9
18. Stokoe, Kenneth, and Nazarian, Soheil, “Use of Rayleigh Waves in
Liquefaction Studies”, Proceedings of a session sponsored by the Geotechnical Engineering Division of the American Society of Civil Engineers in Conjunction with the ASCE Convention in Denver, CO., May 1, 1985, p.2.
19. Rodriguez-Ordonez, J., “ A New Method for Interpretation of Surface Wave
Measurements in Soils”, Ph.D. Dissertation, NCSU, Civil Engineering Department, Raleighy, NC, 1994.
20. Parasnis, D., S., “Principles of Applied Geophysics”, Chapman And Hall, London, UK, 1986.
21. Geosciences, “Geophysical Exploration”, Monash University, Internet,
Available www.earth.monash.edu.au/~jcull/galvanic/resistivity.html , November, 2001
22. Rupple, C., D., ”Costal Hydrology & Environmental Geophysics Methods: DC Resistivity”, Internet, Available,
http://hydrate.eas.gatech.edu/sapelo/methods.dir/dcresistivity.html , Oct. 2001.
23. G. Streckeisen AG, ”Portable Very-Broad-Band Tri-Axial Seismometer”, User Manual, Pfungen, Switzerland, May, 1995.
24. Kinemetrics, Inc, Internet, Available http://www.kinemetrics.com/Q330.html , April, 2004.
25. AEGIS Instruments, “SYSCAL R2 Deep Resistivity / IP System”, Internet,

1036
Available http://www.aegis-instruments.com/syscalr2.htm , April, 2004.
26. Trimble, “5700 CORS”, Internet, Available http://www.trimble.com/cors5700.html , April, 2004.
27. Al-haddad , etal, “A Study Leading to Preliminary Seismic Design Criteria for the Kingdom”, King Abdul Aziz City for Science ant Technology, Riyadh, Saudi Arabia, 1998, p.65.
28. Ayyub, Bilal, and McCuen, "Richard, Probability, Statistics, & Reliability for
Engineers ˝, CRC Press, New York, NY, 1997, p.39. 29. USGS, ‘’Earthquake Hazard Program’’, Internet, Available,
http://neic.usgs.gov/neic/eqlists/eqstats.html , Auguest, 2004
30. Jaramillo, Ana, ‘’Seismological Criteria for Selecting and Scaling Real
Accelerograms for Use in Engineering Analysis and Design’’, Master thesis,
European School of Advanced Studies in Reduction of Seismic Risk,
Universita Degli Studi di Pavia, June, 2003, p. 131.