abstract title of document: africa's recent economic
TRANSCRIPT

ABSTRACT
Title of Document:
AFRICA’S RECENT ECONOMIC REVIVAL:
ROLE OF POLICIES, POLITICS AND
INSTITUTIONS
Niko Hobdari
Doctor of Philosophy, 2011
Directed By: Professor Allan Drazen
Department of Economics
Sub-Saharan Africa (SSA) has made significant progress in democracy and economic
performance since mid-1990s, but the continent remains by far the poorest region in
the world. This dissertation consists of three chapters. Chapter 1 reviews SSA’s
history of democracy and economic policy since independence, including a literature
review. It argues that while SSA’s disappointing economic performance is, in part,
due to its difficult geography, high incidence of disease, and colonial legacy, the main
reason for Africa’s woes until mid-1990s seem to be the failure of economic policies
adopted by most SSA governments after independence. Chapter 2 examines SSA’s
recent economic growth acceleration, and finds that such acceleration is mainly due
to better institutions and policies adopted by most SSA governments (as a result of
more open and democratic societies), as well as lower incidence of armed conflicts,
whereas the role of aid and terms of trade is relatively limited. Chapter 3 reviews the
impact on fiscal policy of competitive presidential elections in SSA during 1980-
2005, and finds that (i) the magnitude of political budget cycles has declined over
time as a result of stronger checks and balances and more experienced electorates;
and (ii) that looser fiscal policies do not help reelect incumbents.

AFRICA’S RECENT ECONOMIC REVIVAL: ROLE OF POLICIES, POLITICS
AND INSTITUTIONS
By
Niko Hobdari
Dissertation submitted to the Faculty of the Graduate School of the
University of Maryland, College Park, in partial fulfillment
of the requirements for the degree of
PhD
2011
Advisory Committee:
Allan Drazen, Chair
Kenneth Leonard, Member
Pablo D’Erasmo, Member
Peter Murrell, Member
Razvan Vlaicu, Member

© Copyright by
Niko Hobdari
2011

ii
Table of Contents
List of Tables ............................................................................................................... iv
List of Figures ............................................................................................................... v
Chapter 1: History of Electoral and Economic Policy in SSA ..................................... 1
Introduction ............................................................................................................... 1
Democracy and Elections in SSA: A Historical Perspective .................................... 3
First Wave: End of World War II to Independence .............................................. 4
Second wave: Independence to late-1980s/early-1990s ....................................... 5
Third wave: Late-1980s to Late-1990s ................................................................. 9
Economic Policy Management in SSA: A Historical Perspective.......................... 15
The First Phase: Independence to End-1970s ..................................................... 15
The Second Phase: Late-1970s to Late-1980s .................................................... 19
The Third Phase: End of the Cold War (1989) Onward ..................................... 22
Summary ................................................................................................................. 23
Chapter 2: What Explains the Recent Growth Acceleration in SSA? ........................ 25
Introduction ............................................................................................................. 25
Stylized Facts on Potential Factors Behind SSA Growth Acceleration ................. 26
Macroeconomic policies and quality of institutions ........................................... 26
Terms of trade ..................................................................................................... 27
Foreign aid .......................................................................................................... 28
Main Questions and Proposed Methodology .......................................................... 30
Criticism of traditional growth approaches ......................................................... 30

iii
In defense of traditional growth approaches ....................................................... 32
Methodological issues and main findings in literature ....................................... 34
Issues of Robustness ........................................................................................... 42
Role of Aid .......................................................................................................... 44
Results ..................................................................................................................... 47
Growth Accounting ............................................................................................. 47
Standard Panel Regressions ................................................................................ 50
Growth accelerations........................................................................................... 53
Complimentary Information ............................................................................... 56
Conclusions ............................................................................................................. 57
Chapter 3: Political Budget Cycles in SSA................................................................. 65
Introduction ............................................................................................................. 65
Some stylized facts ................................................................................................. 67
Does Evidence Support Hypothesis of Political Budget Cycles? ........................... 69
Estimation ........................................................................................................... 69
Results ................................................................................................................. 71
Robustness .......................................................................................................... 72
Do political budget cycles affect chances of reelection? ........................................ 74
Conclusions ............................................................................................................. 76
Bibliography ........................................................................................................... 87
iv
List of Tables
1.1. History of Democratic Elections in Sub-Saharan Africa ....................................................7
1.2. Presidential Elections Since Founding Multi-Party Elections in Sub-Saharan
Africa .......................................................................................................................................14
2.1. Sources of Growth in SSA, 1981-2007.............................................................................60
2.2. Growth Panel Regressions for SSA ..................................................................................61
2.3. Growth Acceleration Episodes in SSA, 1980-2007 ..........................................................62
2.4. Predictability of Growth Accelerations in SSA during 1980-2007 ..................................63
2.5. Probit Analysis of Growth Accelerations in SSA .............................................................64
3.1. Presidential Elections in Sub-Saharan Africa, 1975-2005 ................................................79
3.2. Fiscal Deficit in SSA Countries with Direct Presidential Elections, 1980-2005 ..............80
3.3. The Political Budget Cycle in Sub-Saharan Africa, OLS Panel Estimates with
Fixed Country Effects ..............................................................................................................81
3.4. Sub-Saharan Africa: Political Budget Cycle Over Time ..................................................82
3.5. Robustness Tests of Political Budget Cycles in SSA .......................................................83
3.6. Sub-Saharan Africa: Presidents of the Republic, 1975-2005 ...........................................83
3.7. Impact of Fiscal Balance, GDP Growth and Inflation on Election Results ......................86
v
List of Figures
2.1. Average Growth and Its Volatility in Sub-Saharan Africa ...............................................25
2.2. GDP Growth in SSA and the Global Economy, 1981-2007 .............................................25
2.3. Growth and Inflation in Sub-Saharan Africa, 1981-2007 .................................................26
2.4. Change in Growth and Inflation in SSA, 2001-06 vs 1990-2000 .....................................26
2.5. Sub-Saharan Africa: Democracy Indicators, 1975-2009 ..................................................27
2.6. Changes in GDP Growth and Terms of Trade in Sub-Saharan Africa .............................28
2.7. Net Official Development Assistance in Sub-Saharan Africa, 1980-2006 .......................30
2.8.Changes in Aid and GDP Growth during 2001-06 vs 1991-2000 .....................................30
2.9.Contribution of Physical Capital and TFP in SSA Growth Differences ............................49
2.10 Aid, Policy and Institutional Indicators in SSA ...............................................................59
3.1. Sub-Saharan Africa: Democracy Indicators, 1975-2004 ..................................................78
3.2. Average Annual Fiscal Balance in Sub-Saharan Africa, 1980-2005 ................................78
1
Chapter 1: History of Electoral and Economic Policy in SSA
Introduction
Sub-Saharan Africa (SSA) remains by far the poorest region in the world. To a
considerable extent this reflects its difficult geography, harsh climate, and high
incidence of disease. At the same time, the colonial rule also held Africa back,
leaving it at independence severely deprived of human and physical capital, as well as
functioning institutions. The great push for the colonization of Africa that occurred in
late-19th
century, centuries after the colonization by Europeans of Asia and Western
Hemisphere, meant that the colonial powers had better bureaucracies and thus less
need to rely on indigenous institutions. As a result, the colonial state in SSA was a
pure model of alien bureaucratic autocracy. The colonial administration was almost
entirely in the hands of Europeans, and, at independence, most SSA countries could
count only a handful of native college graduates.
Until the mid-1990s there was profound pessimism about SSA prospects. This
reflected growing refugee problems, spectacular cases of state decay and collapse,
and systematic violence (particularly Liberia, Somalia, and Rwanda), contributing to
Africa’s increasing economic marginalization. Because of low growth and rising
income inequality since independence, SSA entered the 21st century with many of the
world’s poorest countries, and an average income per capita is lower than at the end
of the 1960s (World Bank, 2000).
While SSA’s colonial history and adverse geography were highly influential, its poor
economic performance was mainly due to the choice of the political systems and
2
disastrous economic policies adopted by post-colonial governments. The dynamics
of remaining behind are perverse. Low growth undermines middle class formation,
education is neglected as a result of lack of public funds, capital flight becomes the
norm, and the migration is primarily from those that are most educated draining
human capital. This feeds into weaker governance, which feeds into lower growth,
and so on. The cost of these failed policies eventually disrupts the political order. This
is exactly what happened across SSA during the 1970s and late-1980s.
Since mid-1990s, however, economic growth in SSA has accelerated rapidly and now
Africa’s prospects look much brighter. This seems to reflect mainly the impact of
economic reforms and dramatic political liberalization that accelerated in the early-
1990s. The mutually reinforcing effects between political freedom and economic
development are well established. Roll and Talbott (2003), for example, found that
among the most significant factors in explaining variations in per capita national
income at the global level during the 1990s were several different measures of
freedom, including political rights, civil liberties, press freedom, and property rights.
Easterly (2001) also found that Africa’s higher government budget deficits, higher
financial repression, and higher black market premium explain about half of the
growth difference between East Asia and Africa over the past three decades. Within
Africa, Eifert (2003) found that the difference in political openness between the most
and least democratic African state is associated with a growth gap of over 4½
percentage points per year.
Against this background, this chapter provides a summary of history of electoral and
economic policy in SSA, including a literature review. The discussion in the

3
remainder of this chapter focuses mainly on commonalities among SSA countries, so
as to set the stage for the next two chapters. Before proceeding further, however, it is
worth noting that there were significant differences among SSA countries in terms of
their institutional structure at independence, mainly as a result of colonial legacy. As
discussed in Young (1994), for example, countries under the British rule developed
less uniformly in the superstructure of the colonial state, as a result of a less
prefectoral model of regional administration. The French colonies were at the other
extreme, with a more unified chain of command extending from the governor down to
the village level through a single hierarchy, reflecting the potent legacy of the
absolutist Bonapartist tradition on the state. Such differences shaped the institution at
independence across SSA. The colonial legacy also affected economic policy in the
post-independence period. Twelve former French colonies, for example, adopted the
CFA franc in 1945, which constrained their fiscal policies in a way that was not the
case in the rest of Africa. At a fundamental level, however, SSA countries were very
similar to each other. In particular, as discussed above, because of the fact that the
colonial state in SSA was a pure model of alien bureaucratic autocracy, and that most
SSA countries could count only a handful of native college graduates at
independence, the state forming capabilities in most SSA countries were quite
limited, and their capitalist systems very embryonic.
Democracy and Elections in SSA: A Historical Perspective
At the risk of painting developments across SSA with a broad brush, the history of
democratic movements and elections in SSA can be grouped in three waves: (i) the
first wave started to gain steam gradually since the end of World War II and
4
culminated with independence movements in the late 1950s, resulting in
independence from colonial powers in the 1960s for most SSA countries, and in the
1970s for the remainder; (ii) the second wave was in the period between
independence and late-1980s; and (iii) the third wave coincided with the global move
towards democracy in late-1980s. The first and third waves were more or less
synchronized across SSA, whereas the second wage resulted in intermittent
democratic systems in particular countries that were quickly replaced extra-legally by
civilian ―strong men‖ or military rulers.
While these three waves characterize the experience with democracy in the vast
majority of SSA countries, there are two notable exceptions—Botswana and
Mauritious that have been continuously democratic since gaining independence. Both
countries had founding leaders that, unlike in the other SSA countries, agreed to
conduct their political competition in the post-independence period within the
boundaries of democratic rule, ensured broad representation (a key factor given SSA
ethnical diversity), and enacted policies that were supportive of economic growth.
These favorable outcomes provided support for the political system, creating in turn a
virtuous cycle (see section on the history of economic policies in SSA).
First Wave: End of World War II to Independence
International hostility to colonial rule and anticolonial movements within SSA
intensified after World War II. As a result, colonial powers were forced to start
opening the formerly exclusionary institutions of rule to indigenous participation. The
combination of powerful international and domestic forces converged to create the

5
initial African wave—leading to independence of SSA from colonial powers starting
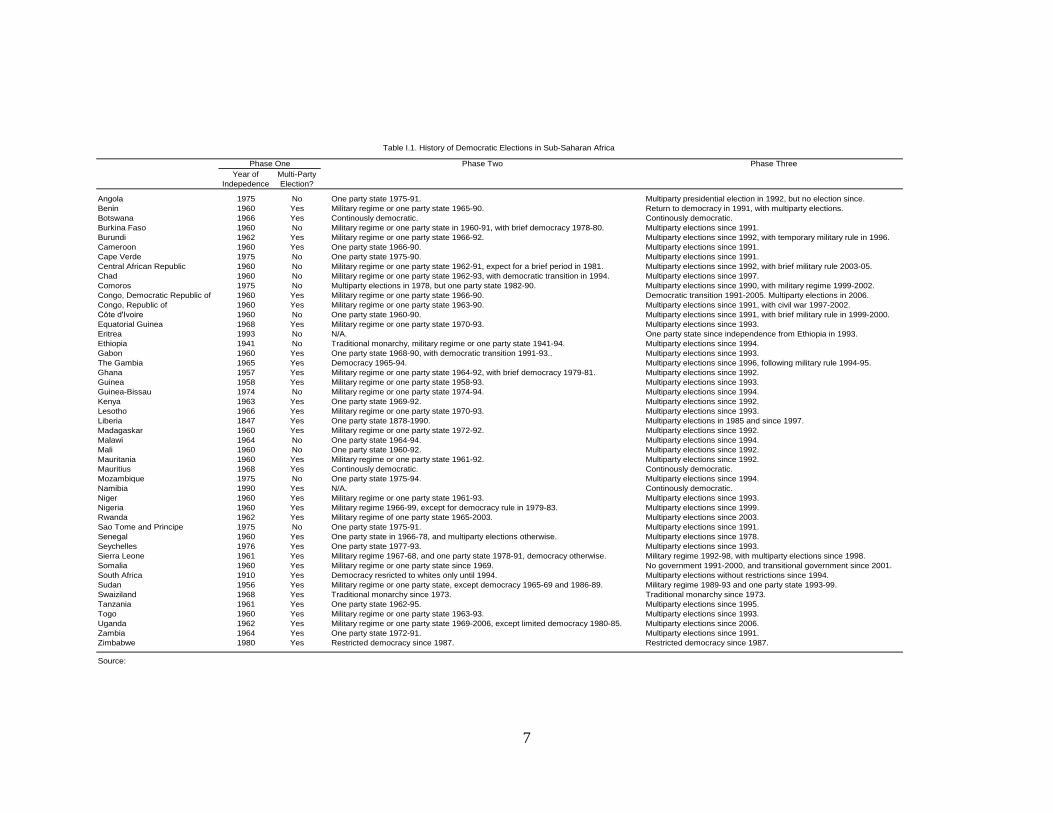
in the mid-1950s and accelerating in the 1960s. Of the 47 SSA countries listed in
Table I.1, 37 of them had become independent by 1970, and the independence
movement continued in earnest during the 1970s, with Zimbabwe in 1980 being the
last country to gain independence from colonial powers in SSA. Multiparty elections
were held soon after independence in most countries (33 out of 47 countries). In the
other countries, which included a few cases where independence was won by armed
struggle rather than negotiations (Angola, Cape Verde, Guinea-Bissau, Mozambique,
and Sao Tome and Principe), no multiparty elections were held until the third
democratization wave (see below).
Second wave: Independence to late-1980s/early-1990s
The electoral democracy in SSA that followed the first wave was short lived. The
doctrine of the mass single party as the vanguard of African progress soon took root,
embraced by the most charismatic leaders of the independence generation (Joseph
1999). These leaders argued that competitive democracy was a luxury that poor
countries could not afford, and concentration of authority would facilitate the needed
economic leapfrog through a state-led development model.
During this period, the political systems in Africa became overwhelmingly
authoritarian. The political order that emerged was, in most cases, that of a dominant
party, which was able to integrate, co-opt, or eliminate other political parties, and
ultimately install a single-party rule. In these one-party states, political power became
highly centralized around the President (de Walle 2001). Within a few years

6
following independence, the armies of Benin, Madagascar, Sudan, Togo, and Congo
(Brazzaville) overthrew their civilian leaders. This trend accelerated during the 1960s
and 1970s. By 1970, for example, only nine SSA countries – or only 25 percent of
those that had achieved political independence – retained competitive systems (Bates
in Collier et. al., 2008). Furthermore, by mid-1980s, about half of African regimes
were military (16) or quasi military (7), another third (15) had one party states or
hereditary monarchies, and only 5 countries having multiparty systems (Sandbrook
1985). Even in these latter cases, the tolerance of the party in power to opposition was
untested.
As a result, elections in Africa soon after independence were depicted as empty and
largely symbolic exercises designed to legitimate office holders. Between
independence and 1989 there were 106 presidential and 185 direct parliamentary
elections in 47 SSA countries. As noted in Bratton and de Walle (1997), in the
presidential elections the winner got on average 92 percent of the votes, and the
opposition candidate got more than a quarter of the votes in only 10 cases. The
margin of victory was smaller, though not by much, in parliamentary elections – with
the winning party getting on average 83 percent of the vote. As discussed above, only
Botswana and Mauritious were exceptions, where reasonably free and fair elections
were held on a regular basis, although, even in these two countries, there has not yet
been any alternation of power.
7
Phase Two Phase Three
Year of
Indepedence
Multi-Party
Election?
Angola 1975 No One party state 1975-91. Multiparty presidential election in 1992, but no election since.
Benin 1960 Yes Military regime or one party state 1965-90. Return to democracy in 1991, with multiparty elections.
Botswana 1966 Yes Continously democratic. Continously democratic.
Burkina Faso 1960 No Military regime or one party state in 1960-91, with brief democracy 1978-80. Multiparty elections since 1991.
Burundi 1962 Yes Military regime or one party state 1966-92. Multiparty elections since 1992, with temporary military rule in 1996.
Cameroon 1960 Yes One party state 1966-90. Multiparty elections since 1991.
Cape Verde 1975 No One party state 1975-90. Multiparty elections since 1991.
Central African Republic 1960 No Military regime or one party state 1962-91, expect for a brief period in 1981. Multiparty elections since 1992, with brief military rule 2003-05.
Chad 1960 No Military regime or one party state 1962-93, with democratic transition in 1994. Multiparty elections since 1997.
Comoros 1975 No Multiparty elections in 1978, but one party state 1982-90. Multiparty elections since 1990, with military regime 1999-2002.
Congo, Democratic Republic of 1960 Yes Military regime or one party state 1966-90. Democratic transition 1991-2005. Multiparty elections in 2006.
Congo, Republic of 1960 Yes Military regime or one party state 1963-90. Multiparty elections since 1991, with civil war 1997-2002.
Cȏte d'Ivoire 1960 No One party state 1960-90. Multiparty elections since 1991, with brief military rule in 1999-2000.
Equatorial Guinea 1968 Yes Military regime or one party state 1970-93. Multiparty elections since 1993.
Eritrea 1993 No N/A. One party state since independence from Ethiopia in 1993.
Ethiopia 1941 No Traditional monarchy, military regime or one party state 1941-94. Multiparty elections since 1994.
Gabon 1960 Yes One party state 1968-90, with democratic transition 1991-93.. Multiparty elections since 1993.
The Gambia 1965 Yes Democracy 1965-94. Multiparty elections since 1996, following military rule 1994-95.
Ghana 1957 Yes Military regime or one party state 1964-92, with brief democracy 1979-81. Multiparty elections since 1992.
Guinea 1958 Yes Military regime or one party state 1958-93. Multiparty elections since 1993.
Guinea-Bissau 1974 No Military regime or one party state 1974-94. Multiparty elections since 1994.
Kenya 1963 Yes One party state 1969-92. Multiparty elections since 1992.
Lesotho 1966 Yes Military regime or one party state 1970-93. Multiparty elections since 1993.
Liberia 1847 Yes One party state 1878-1990. Multiparty elections in 1985 and since 1997.
Madagaskar 1960 Yes Military regime or one party state 1972-92. Multiparty elections since 1992.
Malawi 1964 No One party state 1964-94. Multiparty elections since 1994.
Mali 1960 No One party state 1960-92. Multiparty elections since 1992.
Mauritania 1960 Yes Military regime or one party state 1961-92. Multiparty elections since 1992.
Mauritius 1968 Yes Continously democratic. Continously democratic.
Mozambique 1975 No One party state 1975-94. Multiparty elections since 1994.
Namibia 1990 Yes N/A. Continously democratic.
Niger 1960 Yes Military regime or one party state 1961-93. Multiparty elections since 1993.
Nigeria 1960 Yes Military regime 1966-99, except for democracy rule in 1979-83. Multiparty elections since 1999.
Rwanda 1962 Yes Military regime of one party state 1965-2003. Multiparty elections since 2003.
Sao Tome and Principe 1975 No One party state 1975-91. Multiparty elections since 1991.
Senegal 1960 Yes One party state in 1966-78, and multiparty elections otherwise. Multiparty elections since 1978.
Seychelles 1976 Yes One party state 1977-93. Multiparty elections since 1993.
Sierra Leone 1961 Yes Military regime 1967-68, and one party state 1978-91, democracy otherwise. Military regime 1992-98, with multiparty elections since 1998.
Somalia 1960 Yes Military regime or one party state since 1969. No government 1991-2000, and transitional government since 2001.
South Africa 1910 Yes Democracy resricted to whites only until 1994. Multiparty elections without restrictions since 1994.
Sudan 1956 Yes Military regime or one party state, except democracy 1965-69 and 1986-89. Military regime 1989-93 and one party state 1993-99.
Swaiziland 1968 Yes Traditional monarchy since 1973. Traditional monarchy since 1973.
Tanzania 1961 Yes One party state 1962-95. Multiparty elections since 1995.
Togo 1960 Yes Military regime or one party state 1963-93. Multiparty elections since 1993.
Uganda 1962 Yes Military regime or one party state 1969-2006, except limited democracy 1980-85. Multiparty elections since 2006.
Zambia 1964 Yes One party state 1972-91. Multiparty elections since 1991.
Zimbabwe 1980 Yes Restricted democracy since 1987. Restricted democracy since 1987.
Source:
Phase One
Table I.1. History of Democratic Elections in Sub-Saharan Africa

8
While outside Botswana and Mauritious some SSA countries allowed limited competition by
holding relatively competitive primaries within the ruling party—such as in Kenya,
Tanzania, and Zambia in the 1970s, and Cameroon, Cote d’Ivoire and Togo in the 1980s—in
essence such elections did not threaten the monopoly on power of the strong men at the top.
Even in the few cases that opposition won in SSA elections during this period, the Parliament
was dissolved extra-legally within a couple of years (Bratton and de Walle 1997).
There were some early successes in the immediate post-independence period, including
limited economic growth, increased urbanization, emergence of a national middle class, and
above all, development of sense of nationhood (Boadi 2004). However, the perils of
―development dictatorships‖ in single-party states were soon made clear, as the ensuing
autocracy that took place in many SSA created some of the most extreme cases of tyrants –
Idi Amin in Uganda, Jean-Bedel Bokassa in the Central African Republic, and Macias
Nguema in Equatorial Guinea. As a result of the abuses that followed the creation of this
―monopoly state‖ and, more importantly, the economic failures that these systems produced,
the ideological formulas that justified the exclusion and marginalization of the subject
population started to gradually lose force toward late-1970s and early-1980s. While there
were several instances of restored democratic rule in SSA, during this period, as noted earlier
those proved ephemeral until the worldwide wave of democratic reforms of the late-1990s. In
Ghana, for example, there was democratic rule in 1969-71 and also in 1979-81. Nigeria also
in 1979 was returned to democratic rule, but the colossal scale of venality and election
rigging led to a return to military rule in 1983.
The donors pushed for economic reforms in SSA starting in the early-1980s, conditioning
their external assistance on such reforms. However, these reforms failed to bring a quick

9
economic recovery in Africa. As a result, there were growing voices within the continent that
political reform was a necessary concomitant of economic liberalization. There was a
growing recognition that without a re-moralization of public institutions, and minimal
accountability and transparency, economic liberalization was destined to fail and could thus
not be sustained.
Third wave: Late-1980s to Late-1990s
The early 1990s saw a wave of competitive multiparty elections in SSA, marking a transition
from an extended period of authoritarian rule to a new era of fledging democratic
government. The economic reforms that were introduced during the 1980s to address dismal
economic performance and worsening economic conditions were not successful in most
cases (see section on the history of economic policies in SSA for a description), and, as a
result, by the late 1980s many regimes in Africa were undergoing a legitimacy crisis.
Democratic movements that hit Africa in the early 1990s started as economic protests against
the incumbent governments. Although not specifically political when they began, these
protests quickly escalated into demands for regime change (de Walle, 2001).
These democratic movements were, in part, supported by growing international recognition
on the need for a new development paradigm. In the post-Cold War era, simply professing
ideological preferences was no longer enough to earn financial support from donors. In order
to obtain development assistance, SSA countries had to show willingness to observe human
rights, hold genuine competitive elections, and start practicing efficient and honest
government.
10
However, while the international conjecture was clearly important for democratic reforms,
they seem to have played only a supportive role. Bratton and de Walle (1997), for example,
argue that while international aid donors became major players in the game of regime
transition after 1989, particularly when they began to wield the carrots and sticks of political
conditionality, they helped to create the conditions under which political change became
possible, but did not in themselves trigger or sustain regime transitions or determine the
directions the transitions took. Instead, they argue, the onset and subsequent trajectory of
regime transition depended on the constellation of domestic political forces, and reflected the
home grown discontent from economic failure and political oppression. Bates (in Collier et.
al., 2008) also finds support for the primary role of domestic factors in the path toward
political reform. He finds, for example, that the greater the percent of adult population who
were literate, and the higher the average income, the more likely that the authoritarian regime
would fall.
Democratic reforms in SSA during this period were dramatic and swift. As shown in Table
I.2, while during the period 1985-89, competitive multiparty elections were held only in nine
SSA countries, the number of African countries holding competitive elections increased to 38
during the period 1989-94 (more than ¾ of SSA countries). Of these, 29 were founding
elections, and by 1994 not a single de-jure one-party state remained in Africa (Bratton and de
Walle, 1997). Benin’s multiparty elections in 1991 were the first instance in mainland Africa
when a national leader was peacefully supplanted as a consequence of the expressed will of
the people. This was followed by another 13 similar leadership transitions in the first five
years of democratic reforms in Africa (i.e., between 1990 and 1994). As a result, the share of
peaceful transitions in SSA increased to 60 percent of cases of incumbent exits during the

11
period 1990-94, compared to about 40 percent during the 1980s, and less than 20 percent
during the 1970s (Collier, 2008).
However, despite the leadership alternation in some SSA countries in the first five years as
noted above (14), an equal number of long-standing incumbent leaders in other countries (15)
managed to survive multi-party elections. Of the 15 incumbents who retained office, 12 did
so in elections that fell short of internationally accepted standards (Bratton and de Walle
1997). Moreover, in most cases incumbent rulers openly manipulated constitutional and
electoral rules to trip up their competitors. As a result, the quality of elections in Africa in the
early years of this period varied, and in most countries the prime purpose of elections
remained the legitimation of whatever regime currently holds political power (Joseph 1999).
In addition, using privileged access to government revenue, rulers bought votes. In Kenya,
for example, Moi’s administration increased money supply by 35 percent in 1992 to spur
growth in the months before general elections (see Chapter 3 for an analysis on political
budget cycles in SSA). Even in the cases where the leader was changed, in most cases they
came from the same social and political class as before, including some who had served in
the colonial regime.
In addition, elections alone do not create functioning democracies, and, many African states
that moved to free elections, did not immediately fortify the basic democratic tenets. Several
factors stood in the way, including the incongruence between Western electoral systems and
Africa’s ethnic politics (World Bank, 2000). Since a large fraction of the population in many
SSA countries defines itself largely in terms of ethnic kinship, open elections politicized the
significant regional, ethnic, religious and racial divisions, adding to disintegrative pressures
on fragile states (Joseph 1999).

12
Such divisions escalated to widespread violence in some cases, such as in Rwanda, Burundi,
and Congo-Brazzaville (the civil strife in Somalia and Sudan are not related to democratic
movements). These instances underscore the need for acknowledging, rather than ignoring
cultural pluralism in the SSA societies, and that competitive elections are necessary but not
sufficient for democracy to function (Collier, 2007).
Many scholars were critical of these early developments. Bratton (1998), for example, argued
that Africa had returned to neopatrimonial politics, whereas others saw a continuation of
disorder and destructive politics (Chabal and Daloz, 1999), no change at all (Akinrinade,
1998), political closure (Joseph, 1999), semi-authoritarianism (Carothers, 1997), or elections
without democracy (de Walle, 2001).
Yet, even with considerable flaws in the early African multiparty elections of this period, in
most cases civil society breathed easier after partial liberalization, and the political climate
became increasingly less fear-ridden and less closed than when it first started in the late
1980s. The changes since early 1990s made Africa significantly less autocratic, even if it
remained largely neopatrimonial. The unprecedented surge in civil society, including in the
media, was a key development in the current African political renewal. Relaxation of media
censorship paved the way for the emergence of independent newspapers, radio, and
television, which were widely credited for the relatively honest elections in many countries
(e.g., Senegal and Ghana – Boadi 2004). Also, as the scheduling elections became more
regular, voting became increasingly meaningful (evidenced by greater voter participation in
elections), and appeared to have a greater impact on the selection of representatives for
Parliament (Boadi 2004).
13
As of 2005, there had been founding elections in all SSA countries except Eritrea, Swaziland
(which is a kingdom), and Zimbabwe (see Chapter 3). Multiparty elections had led to 34
alternations of political leaders, although no alternation of the leader had taken place in 15
SSA countries, out of 37 SSA countries that elect the leader in direct popular elections. In
addition, while in over two third of SSA countries the democracy is slowly moving forward,
in about a third there has been a regression in democratic qualities. For example, Niger has
had numerous regime breakdowns and struggled through multiple military coups, Zimbabwe
has not have a free and fair multiparty presidential election yet, and the Republic Democratic
of Congo has also had challenges to maintain political stability.
With the passage of time, however, democracy in SSA is consolidating, and the magnitude of
political budget cycles has also declined significantly in recent years (see Chapter 3).
Reviewing democratic qualities of elections in Africa during 1989-2003, Lindberg (2006)
finds that contrary to a number of earlier studies, more than half of all elections in Africa
during this period were free and fair, and the overall trend is stability or even slightly
positive. In particular, there is statistically significant improvement in the legitimacy of
elections. Lindberg argues that the elections in Africa have had a self-reinforcing effect, i.e.,
once regimes hold their second elections, they tend to survive, and that the regime
breakdown almost always occurs after the first election. At the same time, however, he also
finds no relationship between the quality of elections and the survival of electoral regimes,
recognizing that the continent is this in an early phase of a long democratization process.

14
Country
Date of
Election
Leadership
Alternation?
Number of
Times
Leadership
Alternation?
Total Leadership
Alternations
Angola 1992 No 0 No 0
Benin 1991 Yes 3 Yes (2) 3
Botswana 1/ None None None None None
Burkina Faso 1991 No 2 No 0
Burundi 1993 Yes 0 No 1
Cameroon 1992 No 2 No 0
Cape Verde 1991 Yes 2 Yes (1) 2
Central African Republic 1993 Yes 2 No 1
Chad 1996 No 2 No 0
Comoros 1990 No 3 Yes (1) 1
Congo, Democratic Republic of 2006 No 0 No 0
Congo, Republic of 1992 Yes 1 No 1
Cȏte d'Ivoire 1990 No 2 Yes (1) 1
Equatorial Guinea 1996 No 1 No 0
Eritrea None None None None None
Ethiopia 1/ None None None None None
Gabon 1993 No 2 No 0
The Gambia 1982 No 4 No 0
Ghana 1992 No 3 Yes (1) 1
Guinea 1993 No 2 No 0
Guinea-Bissau 1994 No 2 Yes (2) 2
Kenya 1992 No 2 Yes (1) 1
Lesotho None None None None None
Liberia 1997 Yes 1 Yes (1) 2
Madagascar 1992 Yes 2 Yes (2) 3
Malawi 1994 Yes 2 No 1
Mali 1992 Yes 2 Yes (1) 2
Mauritania 1992 Yes 2 No 1
Mauritius 1/ None None None None None
Mozambique 1994 No 2 No 0
Namibia 1994 No 2 No 0
Niger 1993 Yes 3 Yes (2) 3
Nigeria 1999 Yes 1 No 1
Rwanda 2003 No 0 No 0
Sao Tome and Principe 1991 Yes 2 No 1
Senegal 1978 No 4 Yes (1) 1
Seychelles 1993 No 2 No 3
Sierra Leone 1996 Yes 1 No 1
Somalia None None None None None
South Africa None None None None None
Sudan None None None None None
Swaiziland None None None None None
Tanzania 1995 No 2 No 0
Togo 1993 No 3 No 0
Uganda 1996 No 2 No 0
Zambia 1991 Yes 2 No 1
Zimbabwe None None None None None
Source:
1/ Botswana and Mauritius have had democratic parliamentary elections since independence, but do
not elect the president directly. Ethiopia also does not have presidential elections, but has had
founding parliamentary elections since 1994.
Founding Elections Subsequent Elections
Table I.2. Presidential Elections Since Founding Multi-Party Elections in Sub-Saharan Africa

15
Economic Policy Management in SSA: A Historical Perspective
Economic policy following independence can be divided into three distinct phases: the first
phase during 1960s and 1970s; the second phase during 1980s, and the third phase after the
end of the end of the Cold War in 1989.
The First Phase: Independence to End-1970s
Foremost among the objectives of the SSA governments in the period immediately after
independence, was to shift the basis of their economies away from the production of
agricultural commodities, and toward the production of manufactured goods. Convinced that
this strategy would leapfrog their economic development, governments in Africa intervened
in agricultural markets to extract resources they needed to build a ―modern‖ economy.
Collier et.al. (2008) stress that SSA countries at the dawn of independence were attracted by
socialist and communist ideologies. As a result, many of them adopted strategies of
development that relied on ownership of productive industries by the state, and an
industrialization strategy focused on import substitution through high trade barriers,
including an excessive taxation of exports. They note that there was a wide spectrum of the
strength of state controls on the economy across SSA countries. On the one extreme, there
were ―hard controls‖ regimes, such as those of Congo Brazzaville, or Tanzania during 1973-
85, where the banks and other main sectors of the economy were nationalized, and virtually
all private economic activity was subject to strict regulation, including extensive price
controls and investment licensing. On the other extreme, there were ―soft controls‖ regimes,
such as Zambia 1963-91, where substantial parts of the economy, including banks, remained
private and price controls were less pervasive.
16
As documented by Bates (1981), the policies adopted by SSA countries after independence
included in particular:
High taxes on the agricultural sector. Since the political base of governments was urban,
agriculture was heavily taxed. The main tool to effect the needed transfer of resources away
from agriculture and toward industry were state marketing boards, which were sanctioned
monopsonies inherited from the colonial period for the purchase and export of agricultural
goods. The original goal of marketing boards was to stabilize prices received by farmers in
view of the large volatility of world market prices. However, the prices paid to farmers were
almost always significantly below world market levels. Eventually, in most SSA countries
these Boards were expected to have surpluses and lend them to the government, whose
spending was concentrated in the urban areas and the manufacturing sector.
Direct government involvement in agricultural production. These policies included
subsidies for agricultural inputs and government-sponsored farming projects. Together with
below-market agricultural prices, these policies ended up distorting incentives and benefited
only a few privileged large farmers.
Significantly overvalued exchange rates. This resulted in lower import prices, mainly for
inputs to the manufacturing sector and consumptions goods for the urban areas, as other
imports were discouraged by high imports tariffs (see below). The supply of foreign
exchange was rationed through administrative quantitative controls, and channeled to those
close to the regime, creating a political clientele. The manipulation of the exchange rate
adversely affected upon the earnings of those producing cash crops for export.
17
High protective import tariffs for finished products. Initially, this policy was imposed
mainly to conserve foreign exchange which, as discussed above, was underpriced and thus
faced excessive demand. Over time, however, high tariffs became an instrument for
economic protection, by sheltering domestic industries from competition. Effective
protection was actually higher than suggested by nominal tariff rates, since inputs had
significantly lower tariffs (and even exempted in many cases) compared to finished products.
Financial repression to support industrialization. To encourage investment in the
industrial sector, many SSA governments imposed low interest rates, either by constraining
the lending practices of private banks or by creating state banks to offer low-cost loans to
favored industrial sectors. The result was financial repression.
Subsidies to the manufacturing sector. In many SSA countries the government invested
directly in manufacturing plants. Often these firms operated at a loss, and survived only
through continued government subsidies to cover their losses.
The development strategy based on import substitution was not unique to Africa. Similar
strategies had been adopted in many Latin American countries since the 1930s, and
continued in various forms and degrees until the late 1980s. In addition, initially the growth
model adopted by SSA governments seemed to be working. From independence until the
early 1970s, for example, average growth in Africa was more rapid than in the first half of
the century. During this period, while there were significant differences in economic
performance across SSA, the average growth in SSA and its composition were
indistinguishable from the geographically very different circumstances of south Asia (Collins
and Bosworth, 1996). However, over time the results of the disastrous economic policies

18
discussed above started to take a toll across SSA, as benefits were conferred to an organized
small group connected to the regime, and costs were spread over the masses of the
unorganized. Contrary to the intended objective, rather than supporting development, these
policies eventually undermined the agriculture sector, the most important sector in SSA’s
economies. Faced with lower prices for their products and lack of financing, farmers
produced less and less, leading to lower export earnings for SSA economies. This deprived
the state from investing in industry.
In addition, the selective subsidies for farmers’ inputs and overvalued exchange rates
established powerful private lobbies that were more interested in rent-seeking behavior rather
than engaging in productive economic activities. Furthermore, the high protection offered to
domestic industries resulted in SSA industries being dominated by monopolies, which in
many cases were owned by governments. Under such sheltered conditions, inefficient firms
survived, and consumers ended up paying higher prices. For most SSA countries terms of
trade also turned sharply negative during mid-1970s/early-1980s. With price pressures
building up, temptation increased for governments to regulate even further, adversely
affecting economic activity.
As growth faltered and contributed to lower revenues, governments cut politically popular
programs. The basis of equilibrium eroded, leading to economic and political crisis during
the course of the 1970s (Bates, 1981). In Ghana, for example, per capita income in 1983 was
below that at independence in 1957 (Easterly, 2001). This was the case in most other SSA
countries as well. When the development strategy failed, military intervention reproduced in
many SSA countries the colonial state legacy of autocracy in a different form (Young, 1994).
19
Botswana and Mauritious are the only two obvious exemptions to the above picture of
economic mismanagement and counterproductive economic policies. At the dawn of
independence, however, both countries did not look unusual in the African context.
Mauritious, for example, continued to be heavily dependent on a single primary commodity
export for many years after independence, and Botswana relied mainly on live animal exports
for its foreign exchange earnings. Botswana is also predominantly tropical and landlocked,
which many economists see as a disadvantage (see for example Bloom and Sachs, 1998).
The difference between these two countries and the rest of SSA was good policies. Their
basic system of law and contract worked reasonably well, and state predation was quite
limited. Although there were government marketing boards in both countries which, as
discussed above, was used by most African governments to extract resources from the rural
sector, this was not the case in Botswana and Mauritius. Moreover both governments
invested heavily in infrastructure, education and health. Fiscal policy has also been prudent
in the extreme and the exchange rate remained closely tied to fundamentals. Finally, both
countries never established large state-owned industries as was the case in most other SSA
countries.1
The Second Phase: Late-1970s to Late-1980s
As the economy faltered across the continent, almost all SSA countries were engaged in
some kind of economic reform program with funding from the West during the 1980s. These
programs attempted to implement stabilization and structural adjustment programs that
sought, respectively, to return to macroeconomic equilibrium in the short term, and promote
1 See Acemoglu, Johnson and Robinson (2001) for a discussion on economic policies in Botswana.

20
more rapid sustainable economic growth in the long term. The donors encouraged SSA states
to undertake these reforms in exchange for substantial financial support. As discussed in de
Walle (2001), between 1980 and 1989, for example, some 36 SSA countries contracted 241
different loans from the IMF and the World Bank to finance stabilization and adjustment
operations.
However, there was a very slow rate of initial progress during this period, as the reforms
supported by the IFIs programs were very rarely fully implemented, and also because
progress in macroeconomic management remained vulnerable to reversals. As discussed in
Easterly (2001) economic distortions remained significant in Africa. This included very high
black market exchange rate premiums, large budget deficits (net of aid), unprofitable state-
owned enterprises that continued to get large government subsidies, high inflation, and
negative real interest rates. High black market premiums acted as taxes on exporters, high
budget deficits were in most cases financed by money printing (in turn contributing to high
inflation), low real interest rates caused financial repression (by discouraging financial
savings in banks), trade protectionism (with the objective of supporting domestic
industrialization through import substitution) caused inefficient allocation of resources, and
excessive red tape and inadequate public services stifled private sector activity.
In Uganda, for example, continued lax monetary and fiscal policies kept the inflation rate at
over 50 percent as late as 1992. In Kenya also, the fiscal deficit was as high as 12 percent of
GDP as recently as 1993. The main reason was that during this period the African state elites
sought to adapt to changing circumstances without losing their hold on the state. The
currency devaluation or trade liberalization required under the IFI-supported reforms as
conditions for financing, while helping improve incentives for savings and production, also

21
deprived the powerful constituencies that had been the main beneficiaries of overvalued
exchange rates, trade protection and ad-hoc subsidies under the old system.
Progress in structural reforms also proceeded very slowly. While the 1980s witnessed the
formal abolition of many of the public agencies that states had once created to monopolize
food marketing and keep consumer prices down, in effect governments retained a central
regulatory role, if not a monopoly, on the marketing of imported foods such as rice and
wheat. Trade protection also remained very high. In the early 1990s, for example, SSA
average tariff rates were about 25 percent, or about 4 times the non-OECD average, and
foreign exchange premiums in the black market remained large in many SSA countries
through the early 1990s.
Some argue that the significant increase in aid during the 1980s, combined with ineffective
policy conditionality, were a main reason for half-hearted reforms across Africa. Such critics
stress that aid lessened the imperative to undertake reforms, and thus the incentives African
governments had to implement policy reforms. In other words, aid scaling up effectively
made policy reforms less likely, not more (de Walle, 2001, and Collier, 1997).
Since growth performance deteriorated in most SSA countries during the 1980s, and the
adjustment regime also produced a massive increase in external debt, the strong support for a
powerful state to deal with market failures was fading, and it became increasingly clear that
government failure was an equally pervasive and serious problem in Africa (Wade, 1990).
Based on work in Africa and other regions, consensus started to form that basic
macroeconomic stability was a prerequisite for growth (Rodrik, 1996). At the same time,
while it was agreed that a low inflation environment was desirable, or that African
22
governments need to bring their fiscal deficits down, there was disagreement on the speed
with which this was done and the mix of policies needed to achieve these objectives.
The Third Phase: End of the Cold War (1989) Onward
With the end of the Cold War, as discussed above, the focus and magnitude of financial
support from bilateral and multilateral donors to Africa changed drastically. However, while
affected by the global surge towards democracy at the end of the Cold War in the late 1980s,
the democratic response in Africa reflected a cathartic reaction to an alienating state (Young,
1994). Bratton and de Walle (1997) also argue that while international aid donors became
major players in the game of regime transition after 1989, particularly when they began to
wield the carrots and sticks of political conditionality, they only helped to create the
conditions under which political change became possible, but did not in themselves trigger or
sustain regime transitions or determine the directions the transitions took. Instead, they argue,
the onset and subsequent trajectory of regime transition depended on the constellation of
domestic political forces.
The change in the development paradigm in Africa in the post Cold War period is clear. The
amount of government spending to GDP in SSA, which had increased gradually from an
average of about 15 percent of GDP in 1970 to nearly 30 percent in 1990, declined to just
over 20 percent in the mid-1990s (Ndulu in Collier et. al., 2008). In addition, substantial
progress was gradually made in implementing basic stabilization policies. In particular,
exchange rate policies underwent the most dramatic improvements. While between 1975 and
1984 eighteen of the regional economies in the CFA franc zone had 50 percent black market
premium, by mid-1990s black market premiums have disappeared in nearly all countries

23
(except those with severe governance problems, such as Angola, Liberia, Nigeria, and
Congo/Zaire). More generally, the liberalization of the exchange rate started in most SSA
countries in mid-1980s and was complete by early 1990s in most cases. In addition, fiscal
deficits fell from 10 percent in 1970s and 1980s to 4½ percent in 1997 and […] percent
during the 2000s (see Chapter 2).
However, particularly during the early years of democracy, progress in macroeconomic
management was vulnerable to reversals, especially before elections to help ensure success
of the incumbents. In Ghana, for example, the fiscal deficit increased from 5 percent of GDP
in 1991 to nearly 13 percent in 1992, an election year in which Jerry Rawlings faced the
voters for the first time. Over time, however, such a tendency for political budget cycles has
declined markedly, and is no longer statistically significant (see Chapter 3).
Summary
Africa’s poor economic performance until early 1990s reflects, in part, its difficult
geography, harsh climate, and high incidence of disease. The colonial state was also alien to
African subjects, and left the continent at independence bereft of human capital, effective
state, and physical infrastructure (particularly roads, ports and irrigation). The policies
adopted by post-colonial governments were also disastrous. The costs of these failed policies
eventually affected everyone, disrupting the political order. This combination of adverse
natural conditions, colonial legacy of a weak state that was alien to the Africans, and poor
economic policies have held the continent back.
The democratic response in the early 1990s reflected mainly a cathartic reaction to an
alienating state, although it was also affected by developments in Eastern Europe. While

24
international aid donors became major players in the game of regime transition after 1989,
particularly when they began to wield the carrots and sticks of political conditionality, they
only helped create the conditions under which political change became possible, but did not
in themselves trigger or sustain regime transitions or determine the direction that the
transitions took.
The move toward democracy in many SSA countries has been accompanied by significant
policy reforms, particularly since the mid-1990s. These reforms include impressive gains in
macroeconomic stability, and a gradual strengthening of institutions, resulting in significant
growth acceleration in recent years. However, economic and political progress in SSA has
had many false starts in the past, and reversals have been all too often. The next two chapters
analyze (i) the main reasons behind the recent growth acceleration (Chapter 2), and (ii) the
experience with political budget cycles in SSA (Chapter 3).

25
Chapter 2: What Explains the Recent Growth Acceleration in SSA?
Introduction
As discussed in Chapter 1, with a few exceptions, the SSA economies experienced economic
stagnation in the post-colonialist period up until the mid-1990s, reflecting a combination of
adverse natural conditions, a colonial legacy of weak states that were alien to Africans, and
misguided policies adopted by most postcolonial SSA governments. Because of low growth
and rising income inequality since independence, at the turn of the millennium nearly half of
the SSA population fell below the poverty line of US$1.5 per day (PPP adjusted), up from 35
percent in 1970 (World Bank, 2006).
In recent years, however, economic growth in SSA has accelerated rapidly. GDP growth in
SSA averaged over 6 percent during 2001-07, more than double the growth average in the
previous two decades, and its volatility also declined (Figure 1). In addition, while SSA’s
growth performance seems to have broadly coincided with global economic cycles in recent
decades, its GDP growth rate since early 2000s has been significantly higher than the world’s
average, compared to well below world’s average during 1980-2000 (Figure 2).
Figure 1. Average Growth and its Volatility in Sub-Saharan Africa, 1981-2007
(in percent)
0.0
1.0
2.0
3.0
4.0
5.0
6.0
7.0
1981-90 1991-2000 2001-07
Mean Standard Deviation Coeffient of Variation 1/
1/ Defined as mean over stardard deviation of a series.
Figure 2. GDP Growth in SSA and the Global Economy, 1981-2007
(in percent)
-2
-1
0
1
2
3
4
5
6
7
8
1981 1986 1991 1996 2001 2006
Global Economy
SSA

26
Stylized Facts on Potential Factors behind SSA Growth Acceleration
The main hypotheses that have been put forward to explain this significant growth
acceleration in SSA in recent years, and its longer growth duration than has previously been
the case, include (i) improved macroeconomic policies and strengthened institutions, (ii)
better terms of trade, and (iii) higher external donor assistance. The main stylized facts on the
potential impact of these three potential factors are discussed below.
Macroeconomic policies and quality of institutions
Indeed, the quality of policies and institutions in most SSA countries has shown dramatic
improvements. Regarding policies, the growth acceleration has not come at the expense of
macroeconomic stability as, excluding Zimbabwe, the average inflation in SSA declined to
single digits from as high as 50 percent a year in the early-1990s (Figure 3). More
importantly, countries that were more successful in reducing inflation, also enjoyed higher
economic growth. As can be seen from Figure 4, the vast majority of countries that
experienced a decline in inflation during 2001-07 relative to the 1990s, also had higher
growth during the same period.
Figure 3. Growth and Inflation in Sub-Saharan Africa, 1981-2007
(in percent)
-15
0
15
30
45
60
1981 1986 1991 1996 2001 2006
-2
0
2
4
6
8
Inflation (left hand side)
Growth (right hand side)
Figure 4. Change in Growth and Inflation in SSA, 2001-06 vs 1990-2000
-80
-70
-60
-50
-40
-30
-20
-10
0
10
20
-15 -10 -5 0 5 10 15 20 25
Difference in Growth
Dif
feren
ce i
n i
nfl
ati
on
27
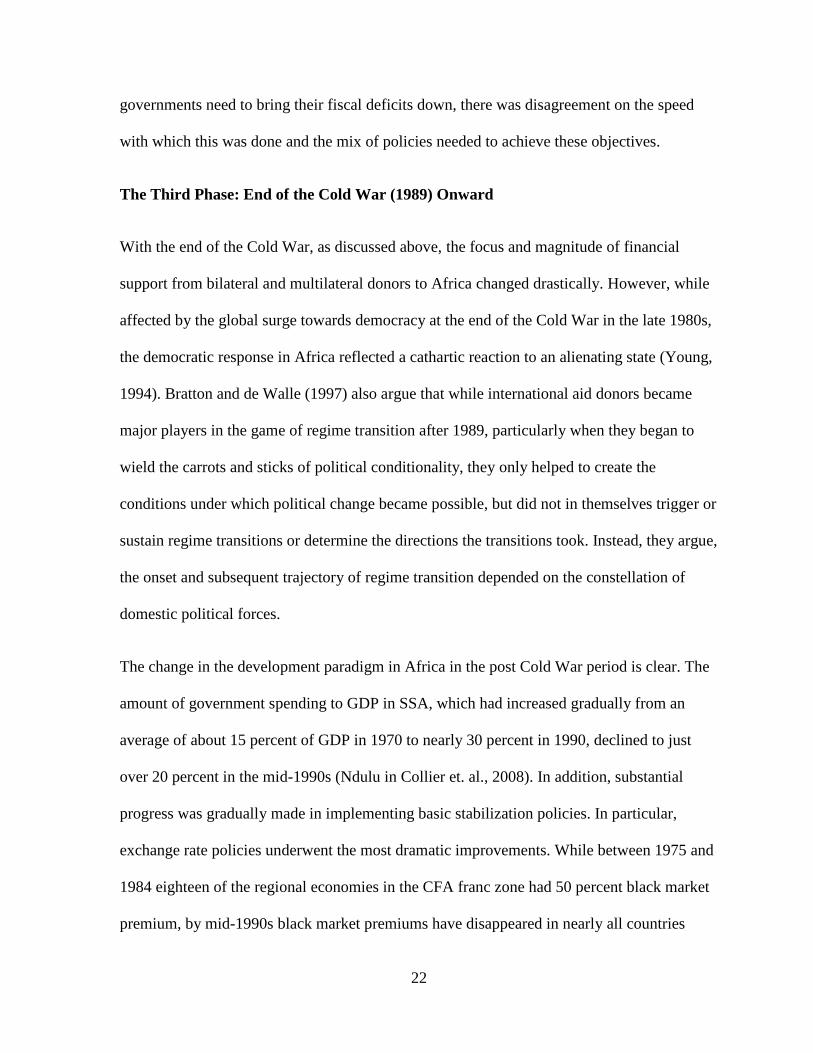
The quality of institutions in SSA has also improved significantly starting from the early
1990s, with the number of democracies nearly quadrupling between 1990 and 2005, and the
average democracy score improving significantly. However, half of SSA countries remain
undemocratic, and the average democracy score is low relative to other regions (Figure 5).
68
5 6
1619
23 23
13
17
1113
35
41
50 50
-5 -5 -6 -5
0 1 2 2
-10
0
10
20
30
40
50
60
1975 1980 1985 1990 1995 2000 2005 2009
Figure 5. Sub-Saharan Africa: Democracy Indicators, 1975-2009 1/
Number of democracies
Democracies as percent of total SSA states
Average democracy score
1/ Countries with polity2 indicator from the World Bank's CPI database with a value higher than 0 are classified
as democracies. Polity2 takes values from -10 (least democratic) to +10 (most democratic).
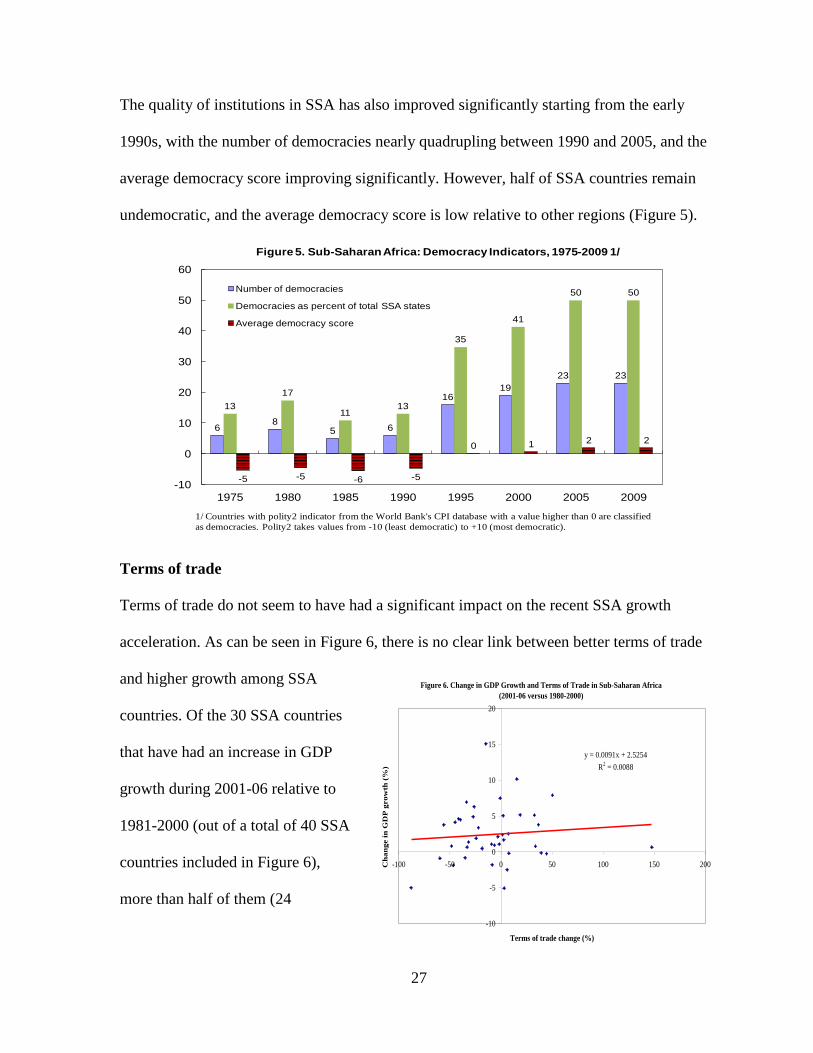
Terms of trade
Terms of trade do not seem to have had a significant impact on the recent SSA growth
acceleration. As can be seen in Figure 6, there is no clear link between better terms of trade
and higher growth among SSA
countries. Of the 30 SSA countries
that have had an increase in GDP
growth during 2001-06 relative to
1981-2000 (out of a total of 40 SSA
countries included in Figure 6),
more than half of them (24
Figure 6. Change in GDP Growth and Terms of Trade in Sub-Saharan Africa
(2001-06 versus 1980-2000)
y = 0.0091x + 2.5254
R2 = 0.0088
-10
-5
0
5
10
15
20
-100 -50 0 50 100 150 200
Terms of trade change (%)
Ch
an
ge i
n G
DP
gro
wth
(%
)
28
countries) have actually had a deterioration in terms of trade between the two periods. The
apparent lack of a clear link between better terms of trade and the recent growth acceleration
in SSA seems to defy the conventional wisdom that Africa’s recent success may have been
largely due to higher commodity prices, and consistent with findings of cross-country
regressions that terms of trade improvements play a notoriously modest role in explaining
differences in growth performance (World Bank, 2008). While the SSA oil producers have
clearly been beneficiaries (especially Angola, Gabon, and Nigeria), the majority of SSA
countries have had a deterioration in their terms of trade in recent years.
Foreign aid
A number of economists and political scientists have noted that the end of Cold War marked
a watershed for external assistance to Africa, as simply professing ideological preferences
was no longer enough to earn financial support from the two superpowers. Some argue that
external assistance after the end of the Cold War was better targeted to governments that
undertook democratic and economic reforms. However, while continuing to help good
performers, this change in aid policy undermined the legitimacy of many autocrats. As a
result, a number of governments propped up by the superpowers collapsed, and their
countries succumbed to violence (e.g., Chad, Ethiopia, Liberia, Sudan, Somalia, and Zaire).
Available data from OECD show that total external financial assistance to SSA has increased
sharply in recent years following a significant decline in the second half of the 1990s. At
unchanged US$ prices, aid to SSA increased by about 25 percent during 2001-06 relative to
1991-2000, and in 2006 it was nearly double the average of 1991-2000 (Figure 7). It is worth
noting, however, that only in 2005-06 did aid in fixed US$ prices exceed the previous peak
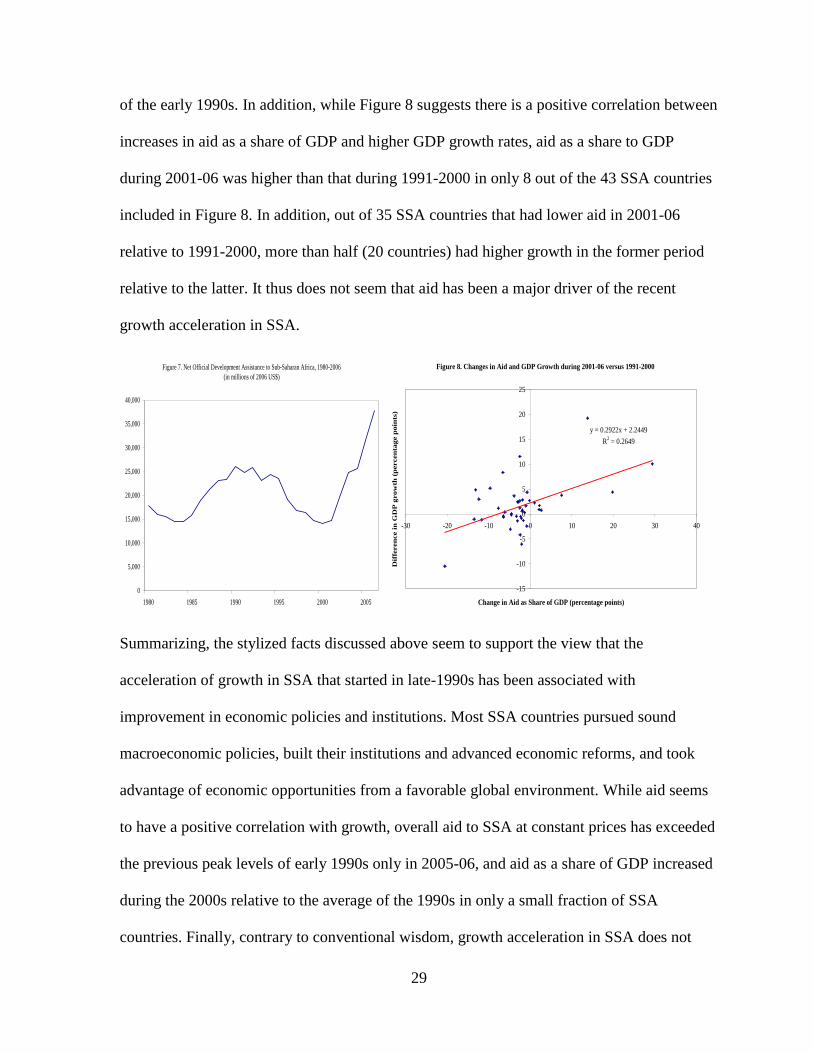
29
of the early 1990s. In addition, while Figure 8 suggests there is a positive correlation between
increases in aid as a share of GDP and higher GDP growth rates, aid as a share to GDP
during 2001-06 was higher than that during 1991-2000 in only 8 out of the 43 SSA countries
included in Figure 8. In addition, out of 35 SSA countries that had lower aid in 2001-06
relative to 1991-2000, more than half (20 countries) had higher growth in the former period
relative to the latter. It thus does not seem that aid has been a major driver of the recent
growth acceleration in SSA.
Figure 7. Net Official Development Assistance to Sub-Saharan Africa, 1980-2006
(in millions of 2006 US$)
0
5,000
10,000
15,000
20,000
25,000
30,000
35,000
40,000
1980 1985 1990 1995 2000 2005
Figure 8. Changes in Aid and GDP Growth during 2001-06 versus 1991-2000
y = 0.2922x + 2.2449
R2 = 0.2649
-15
-10
-5
0
5
10
15
20
25
-30 -20 -10 0 10 20 30 40
Change in Aid as Share of GDP (percentage points)
Dif
feren
ce i
n G
DP
gro
wth
(p
ercen
tag
e p
oin
ts)
Summarizing, the stylized facts discussed above seem to support the view that the
acceleration of growth in SSA that started in late-1990s has been associated with
improvement in economic policies and institutions. Most SSA countries pursued sound
macroeconomic policies, built their institutions and advanced economic reforms, and took
advantage of economic opportunities from a favorable global environment. While aid seems
to have a positive correlation with growth, overall aid to SSA at constant prices has exceeded
the previous peak levels of early 1990s only in 2005-06, and aid as a share of GDP increased
during the 2000s relative to the average of the 1990s in only a small fraction of SSA
countries. Finally, contrary to conventional wisdom, growth acceleration in SSA does not
30
seem to have been fueled by better terms of trade. Given the limitations on what can be
inferred from bilateral correlations between growth acceleration and potential explanatory
factors, the rest of the chapter analyzes the recent growth acceleration in SSA in a more
systematic manner.
Main Questions and Proposed Methodology
Against this background, this chapter seeks to address the following main questions related to
the recent growth acceleration in SSA:
Is the growth acceleration mainly due to factor accumulation or higher TFP?
What is the role of policies as opposed to institutions on the growth acceleration?
Is aid an important determinant of the growth acceleration?
To what extent is the growth acceleration driven by favorable terms of trade?
To examine these questions this chapter uses the three main approaches used in the growth
literature: (i) growth accounting; (ii) standard panel growth regressions; and (iii) probit
analysis focused on growth accelerations episodes. Before outlining the strategy and
specifications of these approaches, it is worth discussing the criticism on growth accounting
and growth regressions, and the defense offered by their proponents.
Criticism of traditional growth approaches
The criticism on growth accounting has been concentrated in three areas.

31
First, total productivity is measured as a residual, and given that there are a myriad of
determinants behind the residual, it should not be taken as an indicator of technical change.
Second, the decomposition is sensitive to the nature of production process and the income
shares assumed for the factors of production. Data limitations force economists to use a
Cobb-Douglas production function, and thus to assume fixed income shares for capital and
labor across countries. The use of the Cobb-Douglas production function has also an
additional implication—that TFP differences are factor neutral (i.e., we cannot tell whether
an increase in TFP is due to a more efficient use of physical capital versus that of human
capital).
Third, an accounting decomposition cannot determine fundamental causes of growth, i.e., for
a country that is experiencing rapid increases in both capital accumulation and factor
productivity, it is not clear whether the productivity growth caused the capital accumulation,
or whether the capital accumulation made additional innovations possible. Critics stress that
concerns on the endogeneity of both factor inputs suggests caution against using growth
accounts to infer a casual interpretation of the growth process.
Usefulness of standard panel growth regressions has come under fire for three main reasons.
First, endogeneity of policy and institutional variables. Some critics (e.g., Rodrik, 2005)
argue that it is difficult to find instruments for policy variables that satisfy both the
exogeneity and exclusion requirements, and that plausible instruments for such variables are
very few.

32
Second, instability of parameter estimates and model linearity. These concerns arise out of
the extreme heterogeneity of the sampled population of the economies, as well as
unreliability of data in many developing countries included in panel studies. For example,
while microeconomic evidence suggests that the private returns to education are substantial
and growth theory routinely imputes a social return to human capital investment that is as
great as the private return, growth researchers have had an extraordinarily difficult time
finding statistically and economically plausible impacts of educational variables in global
growth regressions (Pritchett, 2002). More generally, the concern about parameter instability
is that standard panel growth regressions are based on very strong assumptions about a single
linear model being appropriate for all countries at all states. As discussed by Hausmann et. al.
(2005), for instance, in models with ―poverty traps‖ the relationship between policy variables
and of growth outcomes is not linear, as a movement across a threshold can cause a switch
from a ―trap‖ state to a growth state.
Third, lack of appropriate focus on growth acceleration episodes and ignoring expectations.
Some critics have argued that the traditional focus of empirical growth research on long-
horizon in panel data growth regressions can camouflage important medium-term patterns in
a country’s growth. Some also view the role of expectations as being very important, as the
same policy intervention may have extremely different impact on resource allocations,
depending on whether it is expected to be sustained over time or quickly reversed.
In defense of traditional growth approaches
Defenders of growth accounting recognize that despite its extensive use, this method has
done surprisingly little to resolve some of the most fundamental issues under debate in

33
development literature. There is no consensus, for example, on growth determinants—such
as on the contribution of capital accumulation versus improvements in total factor
productivity, the role of increased education, or the importance of economic policy.
Defenders of traditional panel growth regressions also recognize that no effective instruments
have been found for policy variables used in this approach.
At the same time, the defenders argue that if properly implemented and interpreted, both
growth accounts and growth regressions are valuable tools, and have improved our
understanding of growth experiences across countries, e.g., Bosworth and Collins (2003) and
Frankel (2003). They note that the two approaches are useful, because used in concert they
enable researchers to explore the channels (factor accumulation versus factor productivity)
through which various determinants influence growth. Caselli (2004) also argues that while
growth accounting cannot explain the ultimate reasons why a country grows faster or slower
than another, it is a useful diagnostic tool. He stresses that, similar to a medical test, growth
accounting can identify whether a country suffers from a certain ailment (e.g., low factor
accumulation or low efficiency) and, although it cannot reveal the causes of such ailment, it
is nonetheless a useful test to perform. Defenders of cross-country regressions also note that
valid instruments have been found for institutional quality variables. In addition, Barro and
Sala-i-Martin (2004) argue that using initial conditions or lagged values of regressors, which
can be considered predetermined for an individual country, minimizes the endogeneity
concern in growth regressions. However, given that policy variables are endogenous, a
number of economists (e.g., Bosworth and Collins, 2003) also stress that the OLS results of
panel growth regressions should be interpreted descriptively and, like growth accounts, one
should be careful when using these regressions to infer the underlying causes of growth.

34
More recently, to address concerns about the strong linear assumption of panel growth
regression, which may miss turning points in economic growth, some studies begin by
identifying growth acceleration episodes, and then examining their potential determinants
(see, for example, Hausmann et. al., 2005). For this reason, this chapter includes an analysis
focusing on growth accelerations, to complement traditional growth accounting and panel
growth regression.
Methodological issues and main findings in literature
Growth accounting
The main challenges using the growth accounting approach are: (i) the accurate measurement
of income and factors of production (capital and labor), and (ii) choosing a functional form
for the income process. On the first issue, quality differences in the capital stock make it
difficult measuring capital input by relying exclusively on quantity. As for the functional
form of the income process, the standard framework relies on a Cobb-Douglas specification
of the production function, in which efficiency differences are factor neutral—i.e., if a
country uses physical capital efficiently, it also necessarily uses human capital efficiently
(Caselli, 2004).
The main approaches used in the growth literature to estimate factor shares in output consist
of (i) estimating directly the coefficients of the production function by regressing the rate of
growth of output on the growth rates of capital and labor, with the intercept measuring the
growth in TFP, and the coefficients on the factor growth rates measuring, respectively, the
shares of capital and labor; and (ii) adopting a calibration approach, i.e., using a priori
measures for capital and labor shares—in the range of 0.3-0.4 for capital and 0.6-0.7 for

35
labor (e.g., Bosworth and Collins, 2004).2 The disadvantage of the regression approach is that
the growth of capital and labor cannot usually be regarded as exogenous with respect to that
of TFP (Barro, 1999). Further, as argued by Aiyer and Dalgaard (2005), the standard Cobb-
Douglas methodology of assuming a constant capital share of about one-third for all
countries is a very good approximation to a more general formulation under which countries
have different aggregate production functions that do not require a constant elasticity of
substitution among factors.
The usual methodology for growth accounting assumes a Cobb-Douglas production function
as described below:3
)1()( HLAKY (1)
where: Y is the gross domestic product (GDP), K is the physical capital stock, A is the level
of technology (and corresponds to the standard notion of total factor productivity (TFP)), L is
labor inputs, which is assumed to be augmented by H, an index of the average level of labor
quality.4 This Cobb-Douglas production function assumes constant returns to scale. Equation
(1) can be transformed to yield the growth in output per worker (y/l) as follows:
ahlkly )1()/(/ (2)
2 See Iradian (2009) for a summary of approaches used in the literature.
3 For a detailed description of the methodology see Collins (2004).
4 An alternative formulation would have human capital (education) as an independent factor in the growth
process that can augment labor, physical capital, and TFP—not just labor—as in Mankiw, Romer and Weil
(1992), and Klenow and Rodrigruez-Claire (1997).

36
where lower case letters denote a variable’s average annual growth rate. The capital stock
measure is constructed from investment data using the perpetual inventory method as below:
1)1( ttt KIK (3)
where is depreciation rate that is usually assumed to be 0.05.
The approach used in this chapter excludes the impact of human capital (H), given that the
human capital (H) is particularly difficult to measure given lack of education data for most
SSA countries. Barro and Lee (2000) and Cohen and Soto (2001) have constructed data sets
for human capital for large samples of countries through 2000, including many SSA counties,
but no updates are made since then. This is not likely to particularly problematic for a
number of reasons:
First, the return to one additional year of schooling is relatively low—at between 10-20
percent (see Caselli, 2004). Since higher human capital in SSA proxied by additional years of
schooling, it is likely to have only a limited impact on the SSA growth acceleration.
Second, using the years of schooling as a measure of educational attainment, does not
incorporate any adjustment for quality variations. This creates problems when examining the
impact of education on income across countries. Easterly (2001), for example, argues that
despite the rapid growth in human capital over the 1960 to 1987 period in many African
countries —including Angola, Mozambique, Ghana, Zambia, Madagascar, Sudan and
Senegal—their economic growth has nevertheless been a disaster. Pritchett (1999) also
shows that while educational capital growth in SSA was much higher than that of East Asia
during 1960-85 (over 4 percent per year and less than 3 percent per year, respectively), the

37
GDP per capita growth in SSA was much lower than that of East Asia during the same period
(about 0.5 percent per year and over 4 percent per year, respectively).
Third, the quality of education data is rather noisy. De la Fuente and Domenech (2002), for
example, conclude that the average years of education in the Barro and Lee data set are rather
noisy, and argue that poor data quality explains in part why human-capital based models
often perform rather poorly.
For these reasons, while conceptually education seems quite an important ingredient for
economic growth over the long term, for relatively short horizons the link between growth
and education may be tenuous. Thus not much will be lost when making growth
decomposition excluding the H variable from the equation (1) above.
The investment series used in this chapter is based on overall investments (i.e., public plus
private investments) reported in national accounts. Given the perceived weaknesses in the
classification of public investment spending in SSA, an unsuccessful effort was made to
compile an alternative series on investment for each country based on imported equipments.
The latter could be a good proxy of investment spending based on findings by Eaton and
Kortum (2001), given that for most of the world’s capital is produced in a small number of
R&D-intensive countries, with the rest of the world generally importing their equipment.
However, data series on equipment imports were either too short, or simply not available for
most SSA countries.
Using the approach outlined in (1)-(3) above, World Bank (2008), which studies SSA growth
experience during 1960-2000, finds that the growth shortfall in the continent through mid-
1990s is due to a steady decline in physical capital accumulation per worker, both in absolute

38
term and relative to other developing countries, and that the recovery experienced during the
second half of the 1990s, by contrast, is entirely accounted for by rapid increases in the
productivity residual. In addition, they find that the empirical link between physical capital
accumulation and growth is weaker in SSA than it was in other developing regions between
1960 and 2000, which is a phenomenon widely observed in the growth literature. The
dominant interpretations of this include inefficient public sector investment (Artadi and Sala-
i-Martin, 2003), diversion of resources into rent-seeking and corruption (Vishny and Shleifer,
1993), and threshold effects (Sachs et. al., 2004).
Empirical Approaches
Early empirical work on economic growth focused mainly on cross-section econometrics,
regressing growth over a relatively long period of time (2-4 decades) against policies and a
number of control variables capturing specific country characteristics. More recently, work
has focused on two main tracks—(i) panel growth regressions, which organize data in 4-5
year averages, and (ii) empirical approaches that examine the role policies and institutions on
episodes of significant acceleration in economic growth. Both approaches are used in this
chapter, as discussed below.
Panel growth regressions
As noted in Barro and Sala-i-Martin (2004), economic theories are not precise enough to
pinpoint the exact determinants of growth. Therefore the standard empirical framework that
seeks to find such determinants uses two kinds of variables in panel regressions: first, initial
levels of state variables, such as the stock of physical capital and the stock of human capital;
and second, control variables, such the ratio of government consumption to GDP, the ratio of

39
domestic investment to GDP, the extent of international openness, movements in the terms of
trade, the fertility rate, indicators of macroeconomic stability, measurements of maintenance
of the rule of law and democracy, and so on.
A paper by Sala-i-Martin et. al. (2000) identifies a number of variables that are strongly or
robustly related to growth: human capital, initial level of per capita GDP (as a measure of
conditional convergence), life expectancy, dummy of being a tropical country, and
government consumption in GDP. Variables not robustly related to growth included,
surprisingly, the number of revolutions and coups, as well as the index of political rights,
inflation rate, spending in public education, and measures of higher education.
Bosworth and Collins (2004) use the following variables in growth regressions: (i) for initial
conditions and external shocks: the initial income per capita, life expectancy, log of
population, Frankel-Romer-Rose trade instrument, geography, and institutional quality; and
(ii) for policy variables: the budget balance, inflation, and Sachs-Warner openness variable.
As shown in World Bank (2008), which summarizes panel growth regression models used in
the literature, equation (1) can be transformed into:
itiititit zxyy ''lnln (4)
Where it is country/period disturbance, 0 is the speed of convergence along the steady-
state path, and vectors itx and iz are, respectively, time-varying and time-invariant
determinants of the growth in per capita income. In literature these determinants include a
number of theoretical variables that affect factor accumulation of productivity, such as policy
variables, institutional quality, political indicators, and geographical location. In global
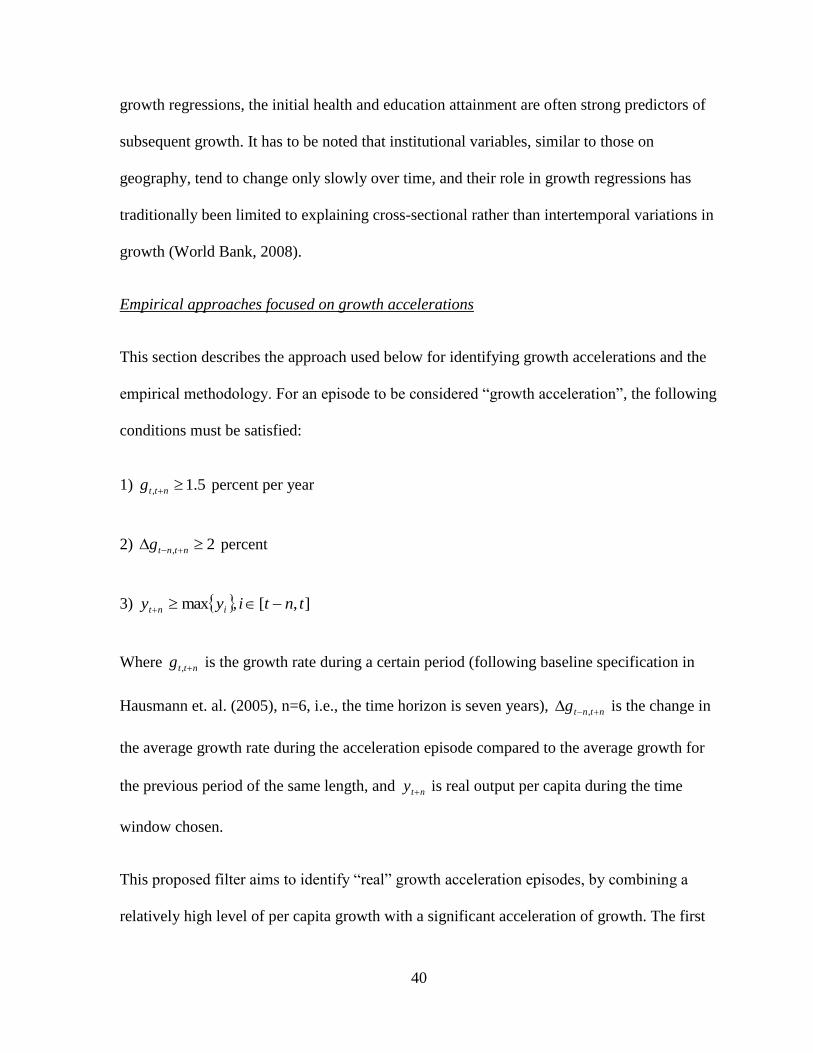
40
growth regressions, the initial health and education attainment are often strong predictors of
subsequent growth. It has to be noted that institutional variables, similar to those on
geography, tend to change only slowly over time, and their role in growth regressions has
traditionally been limited to explaining cross-sectional rather than intertemporal variations in
growth (World Bank, 2008).
Empirical approaches focused on growth accelerations
This section describes the approach used below for identifying growth accelerations and the
empirical methodology. For an episode to be considered ―growth acceleration‖, the following
conditions must be satisfied:
1) 5.1, nttg percent per year
2) 2, ntntg percent
3) ],[,max tntiyy int
Where nttg , is the growth rate during a certain period (following baseline specification in
Hausmann et. al. (2005), n=6, i.e., the time horizon is seven years), ntntg , is the change in
the average growth rate during the acceleration episode compared to the average growth for
the previous period of the same length, and nty is real output per capita during the time
window chosen.
This proposed filter aims to identify ―real‖ growth acceleration episodes, by combining a
relatively high level of per capita growth with a significant acceleration of growth. The first

41
condition is to ensure that growth is high during the acceleration period, the second condition
defines the threshold increase in the growth rate for it to be considered growth acceleration,
and the third condition to ensure that an acceleration in growth is not due to a mere recovery
from a previous decline. Setting growth at 1.5 percent as a floor for high growth may seem
like a low bar for an episode to be considered among growth accelerations, but was selected
to include cases in which the overall growth in a number of strong accelerations signaled a
clear change in the subsequent growth path relative to the pre-acceleration period, such as
Benin in 1995, Cameroon in 1996, Republic of Congo in 2000, Ghana in 2000, Senegal in
1995, Swaziland in 2003, and Uganda in 1988 (see Table 2). For robustness, tests with
minimum growth thresholds of 5.2, nttg and 5.3, nttg were also conducted, in line with
the threshold used in Hausmann et. al. (2005).
The empirical strategy is to use a probit analysis, with the dependent variable being a dummy
variable that takes the value of 1 around growth accelerations and 0 otherwise, and the
explanatory variables including a number of variables of interest—such as those on external
shocks, political changes, and economic reforms. More specifically, the dummy variable on
the growth acceleration takes the value 1 in time t-1, t, and t+1, where t is the year of
acceleration identified by the filter described above.
The explanatory variables are defined as follows:
Terms of trade (TOT): is a dummy variable that takes the value 1 when the average change
in the terms of trade in period t versus that of the previous four years (t-4) is in the upper 10
percent of the whole sample, and 0 otherwise. Such a variable is meant to capture
exceptionally favorable terms of trade.

42
Political regime change (Higher_Dem): is a dummy variable that take the value 1 in the
five-year period starting from the year in which the change in the polity2 score of the Polity
IV database increases by at least three units.
End of wars (War_End): is a dummy variable that take the value 1 in the five-year period
starting from the year in which a war ends, according to the Armed Conflicts Database.5
Economic liberalization (Econ_Lib): takes the value 1 for the first five years starting from
the year in which the index originally developed by Sachs and Warner (1995), and later
extended by Wacziarg and Welch (2003), is considered as ―open‖, and 0 otherwise. As
discussed in Hausmann et. al. (2005), this index is a good candidate for a measure that
captures broad economic reforms.
Aid increase (Aid): takes the value 1 for the three-year period starting from the year in
which the three-year average exceeds that of the previous three-year average by at least 3
percentage points of GDP. While arbitrary, the threshold of 3 percentage points of GDP on
the increase of aid is about 1/3 of median aid to SSA countries during the period 1980-2006.
Issues of Robustness
Panel Growth Regressions
One estimation problem is which explanatory variables to include in the growth equations.
Variables could be statistically significant depending on whether certain other variables are
or not included in the specifications. Growth theory does not provide a clear guide on which
5 See link at http://www.prio.no/pd/GenericPage.aspx?id=726.
43
indicators to include in the growth regressions. For this, a number of specifications were
estimated using a combination of the traditional growth explanatory variables.
Another concern is the possible sensitivity of the result to the assumed form of the growth
process. In equation (4) the explanatory variables enter linearly and independently. This
reflects an ad-hoc assumption that the marginal effect of a change in every explanatory
variable is constant, both across different levels of the variable and across different
economies. This concern was addressed by testing for nonlinearities, which was done by
introducing squared terms for particular variables, and also interacting some of the variables
of interest with a measure of country’s level of development (such as per capital income) in
the growth regressions as done in Iradian (2008).
Additional robustness checks included running different subsamples of SSA countries, such
as including and excluding resource-rich countries, and including and excluding small
islands.
Probit Analysis on Growth Accelerations
As for the approach focusing on growth accelerations, the parameters of the filter are
somewhat arbitrary. It should also be noted that qualitatively the parameters of the filter
described above are standard, but in most similar studies the first threshold is set for an
annual growth rate higher than 3-3.5 percent. The 1.4 percent threshold proposed for this
paper represents the medium growth rate in SSA during 1980-2007. The implications of
changing filter parameters will be discussed below.
44
Role of Aid
Foreign aid to most SSA countries is several points of GDP per year, and represents a
significant share in the SSA budgets. It is thus important to examine in some detail whether
aid has played any role in the recent SSA growth acceleration. The effectiveness of foreign
aid in promoting economic growth in developing countries remains a contentious are of
debate both theoretically and empirically. This section summarizes the differing theoretical
arguments, as well as conflicting empirical findings in a number of recent studies on aid
effectiveness.
Theoretically, in a simple neoclassical growth model (e.g., Solow model) aid increases
economic growth through its positive impact on investments in the aid-recipient country, as
long as the recipient’s GDP is below the level corresponding to its peak transitional growth
rate. The neoclassical model suggests that poor countries should have a high return to capital
and a fast growth rate in transition to the steady state. However, there are several factors that
could interfere with this process. With a subsistence consumption constraint and imperfect
international capital markets, poor countries will tend to grow slowly despite a high marginal
return to investment. In this context foreign aid can accelerate growth rates in the transition
to a steady state. Furthermore, various institutional and policy distortions can lower the
return to capital and reduce transitional growth rates. Burnside and Dollar (2000) show that
in such a model, the impact of aid will be greater in a low-distortion environment. In general,
developing country growth rates depend on initial income, institutional and policy
distortions, aid, and aid interacted with distortions.
45
However, in reality foreign aid is intermediated by governments, and these are not always
best thought of as benevolent social planners. The incentives faced by political figures are
not necessarily the same as those faced by a social planner. Given this, it is possible that aid
can have little or no impact on overall economic prosperity in the recipient country. Mosley
and Hudson (1996) and Svensson (1996a, 1996b), for example have shown that when the
donor-recipient relationship is modeled as a non-cooperative game, moral hazard problems
can lead to aid having little impact on the problems it is intended to alleviate. Aid may
simply relax the budget constraint of the recipient government, without having much impact
on the amount of that budget that ultimately is used to purchase capital. Furthermore, the
donor government can also be part of this game for reasons other than benevolence. Donor
interest may lead to the suboptimal use of aid and dampen any positive impact that it may
otherwise have.
In models with poverty traps, even a temporary injection of aid may help a country take off,
and reach a permanently higher level of per capita income. However, in game-theoretic
models, moral hazard and adverse selection problems reduce aid effectiveness predicted by
the simple Solow model. Aid critics also point out that, to a significant extent, aid
effectiveness is affected by the political regime, including the quality of institutions and
government policies. They also stress that aid is fungible, and additional aid may actually end
up financing an increase in consumption rather than investment.
Empirically too, there is no consensus on the effectiveness of aid on growth. By now, there is
a long and inconclusive literature on aid effectiveness, which is hampered by data
availability, debates over the mechanisms through which aid affects growth, and
disagreements over econometric specifications. On the one hand, for example, Boone (1996)
46
finds that aid increases consumption, but does not in most cases have a significant positive
impact on higher investments, or leads to an improvement in basic human development
indicators. Boone argues that his findings support the pessimistic predictions of Bauer (1971)
and Friedman (1958) that aid flows basically benefit political elites, and do not substantially
change government incentives to carry out the programs intended to be supported by the aid
flows. On the other hand, Hansen and Tarp (2000) provide overwhelming support that aid
raises the level of investment in recipient countries, and that in turn higher investments have
a positive effect on growth. They also find that the aid-growth relationship depends not only
on the level of aid, but also on key policy indicators. In another influential study, Burnside
and Dollar (2000) find that aid has a positive effect on growth in the presence of good
policies and institutions, but little effect otherwise. More recently, Clemens et. al. (2004) find
that while there is no discernible relationship between growth and overall aid, when aid flows
are divided into aid that has short-term and long-term impact, the former has a strong and
statistically significant causal relationship on economic growth.
Findings that support a positive impact of aid on economic growth in some of the above
studies have been challenged by subsequent papers that have used updated data sets, or
different model specifications. Easterly et. al. (2004), for example, find that aid effectiveness
results in Burnside and Dollar (2000) are not robust to a data set with longer time series and
that includes additional countries. While Easterly et. al., do not argue that aid is ineffective,
they suggest that ―...economists and policymakers should be less sanguine about concluding
that foreign aid will boost growth in countries with good policies.‖ Rajan and Subramanian
(2005) also find little evidence of a robust positive impact of aid on growth. While they find
some evidence of a positive relationship between aid and growth for the period 1980-2000,
47
this is not the case when outliers are excluded. In addition, they find no evidence that aid
works better in stronger policy environments, as suggested by Burnside and Dollar (2000), or
that certain kinds of aid work better than others as suggested by Clemens et. al. (2004).
Against this background, this chapter tests the aid effectiveness bearing in mind its
endogeneity with economic growth, and thus that a positive correlation between aid and
growth does not necessarily imply causality from aid to growth. Given the large size of aid to
GDP in most SSA countries, the chapter also examines whether aid has been better targeted
to governments that have undertaken democratic and economic reforms and have sought to
build better institutions.
Results
Growth Accounting
Before discussing the results of growth accounting, it is worth stressing that this approach is
probably better suited to analyze growth performance over long periods of time, given the
significant volatility at high frequencies in both labor and capital accumulation (and, as a
result, in the TFP residual as well). The usefulness of this approach therefore in analyzing
growth accelerations is somewhat limited.
Turning to the results, as can be seen in Table 1 and Figure 9, most SSA countries
experienced a significant increase in growth during 2001-07 compared to the previous two
decades, which reflected a combination of higher capital per worker as well as higher TFP. In
about 80 percent of SSA countries in Figure 9 (33 out of 42), for example, output per worker
during 2001-07 was higher relative to the 1990s. Of the 33 SSA countries that experienced
48
higher growth, 23 of them (about 70 percent) also enjoyed higher TFP growth, and in 15 of
them (about 50 percent) the increase in TFP growth exceeded that in capital per worker. The
improvement in overall growth and TFP was particularly large in countries that started
enjoying peace in the mid-1990s/early-2000s after years of disruptive wars and other civil
conflicts, and thus the turnaround reflects negative growth in earlier periods (e.g., Angola,
Democratic Republic of Congo, Ethiopia Liberia, Mozambique, Rwanda, and Sierra Leone).
A number of oil exporters (notably Angola and Nigeria) also enjoyed a significant increase in
the TFP.
Not only was SSA growth higher during 2001-07 relative to the previous two decades, but
the number of SSA countries with negative growth declined from 25 countries in 1991-2000
(more than half of SSA countries) to just 11 countries in 2001-07 (about a quarter of SSA
countries). In the latter group, negative capital contribution was the main reason, with
negative TFP accounting for only about a third of these countries (4 out of 11 countries). The
majority of countries with negative output per worker during the 2001-07 were experiencing
some sort of internal conflict (e.g., Burundi, Central African Republic, Cote d’Ivoire, Eritrea,
Guinea-Bissau, and Zimbabwe).
While both the capital per worker and TFP exhibit a wide range of variation across all
periods, the magnitude of variation has declined during 2001-07 for both indicators relative
to 1991-2000, and the variance of TFP has remained well below that of capital per worker.
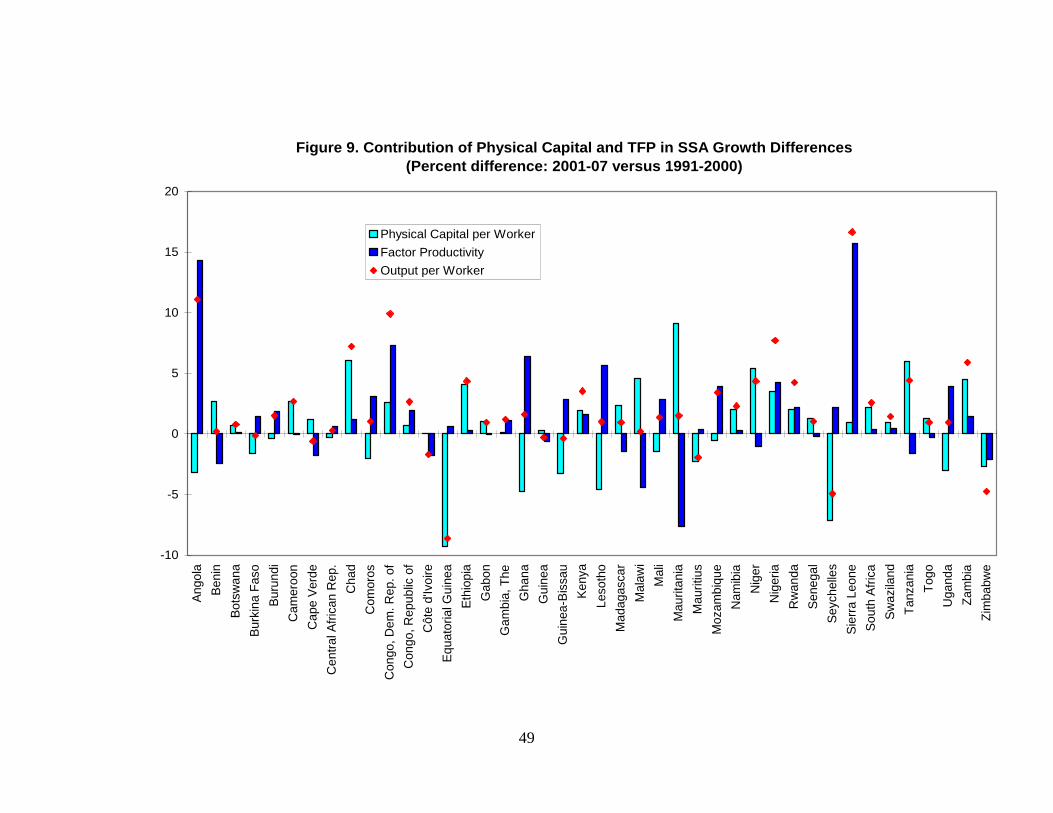
49
Figure 9. Contribution of Physical Capital and TFP in SSA Growth Differences
(Percent difference: 2001-07 versus 1991-2000)
-10
-5
0
5
10
15
20A
ngo
la
Be
nin
Bo
tsw
an
a
Bu
rkin
a F
aso
Bu
run
di
Ca
mero
on
Ca
pe V
erd
e
Ce
ntr
al A
fric
an R
ep.
Ch
ad
Co
moro
s
Co
ngo
, D
em
. R
ep.
of
Co
ngo
, R
ep
ub
lic o
f
Cô
te d
'Ivo
ire
Eq
ua
toria
l G
uin
ea
Eth
iopia
Ga
bo
n
Ga
mb
ia, T
he
Gh
an
a
Gu
inea
Gu
inea
-Bis
sa
u
Ke
nya
Leso
tho
Mad
ag
asca
r
Mala
wi
Mali
Mau
rita
nia
Mau
ritiu
s
Moza
mb
ique
Na
mib
ia
Nig
er
Nig
eria
Rw
an
da
Se
ne
ga
l
Se
ych
elle
s
Sie
rra
Le
on
e
So
uth
Afr
ica
Sw
azila
nd
Ta
nza
nia
To
go
Ug
and
a
Za
mb
ia
Zim
ba
bw
e
Physical Capital per Worker
Factor Productivity
Output per Worker

50
Standard Panel Regressions
The data used for panel regressions are four-year averages for the period 1970-2006 (a total
of nine four-year periods). The dependent variable is the average annual growth rate per
capita during each four-year period, and the explanatory variables are as follows:
Initial conditions and external shocks variables
Init_Inc—initial income per capita; and
Init_Life_Exp—initial life expectancy;
Policy variables
Gov_Bal—the budget balance as a share of GDP;
M2_GDP—ratio of M2 to GDP;
Infl_Avg—the inflation rate; and
Open_Trade—the trade openness variable originally developed by Sachs and Warner, and
later updated by Wacziarg and Welsh.

51
Institutional variables
CPIA—the World Bank’s Country Policy and Institutional Assessment index, which rates
countries against a set of 16 criteria on the quality of policies and institutions;6 and
ICRGE—the economic risk indicator from the International Country Risk Guide (ICRG)
group—as an alternative measure of governance and institutional quality.
Other variables
War—dummy variable that takes the value 1 in a particular four-year period if the country
had been a war in any year of that four-year period and 0 otherwise, with information on
wars taken from the armed conflict dataset.7
ODA_Aid—the aid to GDP ratio provided by official donors, as reported by OECD under the
official developments assistance (ODA) statistics.
Country and time fixed effects were used to control, respectively, for specific country
characteristics (that would otherwise lead to missing variables problem, such as landlocked
vs countries with sea access, British vs French colonies, incidence of disease, etc), and for
global effects (such as international business cycles).
The results are summarized in Table 2. The first two columns are fixed effects OLS
specifications—the first for the whole period and the second for post-Cold War period. The
6 For a description see World Bank’s website:
http://web.worldbank.org/WBSITE/EXTERNAL/TOPICS/ENVIRONMENT/EXTDATASTA/0,,contentMDK:
21115900~menuPK:2935553~pagePK:64168445~piPK:64168309~theSitePK:2875751,00.html.
7 For more details see http://www.prio.no/CSCW/Datasets/Armed-Conflict.
52
sign of variables is generally as expected, although for the whole period only the initial
income is statistically significant. In the post-Cold War period, however, open trade and aid
variables become statistically significant also, the former at the 1 percent level and the latter
at the 10 percent level. The inflation variable also becomes statistically significant, but has
the wrong sign although with a very small coefficient. As noted above, the OLS
specifications suffer from endogeneity problems for the policy, institutional, and aid
variables. Therefore a positive correlation of these variables with growth should not be
considered to infer causality. It is worth noting, however, that a positive correlation for aid
seems to rebut the claim that higher aid is detrimental to growth. The magnitude of the aid
coefficient for the post-Cold War period also seems consistent with that suggested by growth
theory (see Rajan and Subramanian, 2005).
To address endogeneity of aid, the third and fourth columns are fixed effects two-stage least
squares, instrumenting for aid using the approach in Clemens et. al. (2004). The results are
broadly unchanged from the OLS results, except that the magnitude of the aid variable is
larger and statistically significant for both the whole and the post-Cold War periods, and the
war variable also becomes statistically significant. It is also worth noting that the first stage
results for aid suggest that it is positively correlated with better political and institutional
indicators (CPIA and ICRGE scores), and a more open trade regime.
The last two columns represent the results from a system GMM approach. While the
magnitude of the variables remains broadly similar to the OLS and 2SLS, only the
government balance and inflation variables remain statistically significant.

53
Summarizing, as expected, initial income is negatively correlated with growth, trade
openness is positively correlated, and armed conflicts are negatively correlated. Political and
institutional indicators also seem to be positively correlated, but usually not statistically
significant, which may be because the positive effects of good policies and institutions take a
long time to show up in growth, and their effect cannot be adequately captured in standard
growth regressions. The results also suggest that the magnitude of aid’s correlation with
growth seems to have increased in the post-Cold War period, which is consistent with the
view that the end of the Cold War has been a watershed in the way donors provided aid to
SSA.
Growth accelerations
Using the filter described above with a growth threshold of 1.5 percent yields 37 growth
accelerations in SSA during the period 1980-2007 (34 if small islands are excluded) (Table
3). If instead the threshold for the growth rate in the post-acceleration period were set at 2.5
and 3.5 percent the number of growth accelerations in SSA during 1980-2007 would fall
from 37 to, respectively, 28 and 22 episodes, with a clear upward trend of growth
accelerations in SSA since 2000. In addition, the magnitude of the typical growth
acceleration in SSA has been relatively high, with the average growth acceleration during
1980-2007 amounting at about 5.9 percentage points. Only 4 accelerations are associated
with the oil boom of recent years (Angola in 2002, Chad in 2001, Republic of Congo in
2000, and Nigeria in 2000).

54
Before embarking into the probit analysis, it is useful to examine the bivariate relationship
between growth accelerations in SSA and their potential determinants. Following the
approach in Hausmann et. al. (2005), Table 4 reports two statistics.
First, the proportion of growth accelerations preceded or accompanied by changes in the four
potential determinants discussed above—i.e., terms of trade shocks, end of wars, trade
liberalization reforms, and political regime changes.
(ii) Second, the proportion of changes in these four determinants that are followed or
accompanied by growth accelerations.
The first statistic is indicative of the explanatory power of these four potential determinants
on growth accelerations, whereas the second statistic is suggestive of the success rate that
these potential determinants have in generating growth accelerations. For both statistics a
match is considered when a five-year period following the event of a potential growth
determinant overlaps with a three-year window centering on the growth accelerations events
listed in Table 2. The five-year window for potential growth determinants is to allow them to
have an effect on growth, and the three-year window on growth accelerations is to reduce the
probability of a ―near miss‖ given the arbitrariness in the parameters of the filter used to
identify growth accelerations.
The bottom line of Table 4 results is that the relationship between growth accelerations and
the five potential determinants considered is positive, but that the strength of such
relationships is relatively moderate. More specifically, the results suggest that the
explanatory power is: relatively strong for aid (46 percent), moderate for both trade
liberalization and positive change in democracy (36 and 32 percent, respectively), relatively

55
low for end of wars (21 percent), and very weak for improvements in terms of trade and for
negative changes in democracy (11 and 14 percent, respectively). The success rate of these
five determinants in generating growth accelerations is somewhat higher than their
explanatory power for three variables—trade liberalization, end of wars and positive changes
in democracy (about 40 percent for each of them), but lower for aid (30 percent) and very
weak for improvements in terms of trade (only 4 percent). The success rate of a negative
change in democracy is also surprisingly high (nearly 40 percent), although it is useful to
note that during 1980-2007 episodes of negative changes in democracy in SSA were
significantly lower than those involving positive changes (32 vs. 18). Also, it is worth noting
that while the increase in aid has the strongest explanatory power among the variables
considered in Table 3, its success rate is actually lower than for the other variables.
A probit analysis was also conducted to see in a more systematic way the role of policies and
institutions in growth accelerations in SSA. The dependent variable as discussed above is a
dummy that takes the value of 1 in the three years centered around the year in which the
algorithm described above suggests a growth acceleration (i.e., the dummy takes the value in
the period [t-1, t+1], where ―t‖ is the year identified as growth acceleration). The explanatory
variables are also dummy variables defined as discussed above.
The results are summarized in Table 5.8 The baseline specification (1) includes all the
explanatory variables—i.e., ends of wars, higher democracy, trade liberalization, better terms
of trade, and higher aid. The first two variables are statistically significant, whereas the other
three are not. Since the series for trade liberalization is missing for countries accounting for
8 The sample excludes the small island SSA countries given that for them a number of the explanatory variables
are not available.
56
more than half of the growth acceleration episodes, specification (2) drops the trade
liberalization variable, whereas (3) drops terms of trade and aid variables, both of which are
not statistically significant in specification (2). The results in both specifications (2) and (3)
remain qualitatively unchanged from specification (1), with both end of wars and higher
democracy remaining statistically significant.
To test the robustness of these results, probit tests with the same specifications as in (1)-(3)
were run for growth thresholds of 2.5 percent (specifications (4)-(6)) and 3.5 percent
(specifications (7)-(9)). In specifications (4)-(6), in which the growth threshold is set at 2.5
percent, the results are qualitatively similar to those in specifications (1)-(3), despite about a
quarter less episodes of growth accelerations in the former relative to the latter. In
specifications (7)-(9), in which the growth threshold is set at 3.5 percent, end of wars remains
statistically significant, but improvements in democracy are no longer statistically significant.
Instead the trade liberalization (specification (7)) and terms of trade (specifications (7)-(9))
become statistically significant.
Complimentary Information
This section complements the empirical results with the evolution of variables of interest
(e.g., aid, policies, quality of institutions, and terms of trade) for different groups of SSA
countries according to their growth performance during 2001-07. More specifically, SSA
countries were classified into low, medium, and high growth countries during 2001-07. The
cut-off points under this classification was set so as to ensure that each of these three groups

57
makes up about a third of the SSA countries.9 While such grouping cannot establish cause
and effect, it allows comparing the experience of fast-growing SSA countries with that of
slow-growing ones, to see if the story they paint is consistent with the results of panel growth
and probit regressions analysis.
The results, which are summarized in Figure 10, suggest that:
Democracy and Economic Freedom. High-growth countries seem to have
significantly higher democracy and economic freedom indicators compared to low-
growth ones (as measured, respectively by the polity2 and economic ICRG
indicators).
Economic policy. High-growth countries have sounder fiscal policy compared to low-
growth countries, but inflation performance has not been significantly different
relative to other SSA countries since late-1990s, and trade openness has trailed that in
medium- and low-growth countries.
Aid. High-growth countries received significantly higher aid than the other two
groups during the 1990s, but the situation reversed during the first half of the 2000s.
Conclusions
Summarizing, the analysis in this chapter suggests that the growth acceleration in SSA during
the 2000s is mainly the result of more open and democratic societies, lower incidence of
armed conflicts, as well as better institutions and policies adopted by the vast majority of
9 The cut-off points were less than 1 percent for low-growth category, 1-3 percent growth for the medium-
growth category, and over 3 percent growth for the high-growth category.

58
SSA governments. Better terms of trade and higher aid, although having an important role in
some countries, seem to have played a relatively limited role in the growth acceleration for
the continent as a whole. More specifically:
Growth accounting suggests that SSA’s growth acceleration during the 2000s
reflects a combination of higher capital accumulation, possibly reflecting lower
incidence of armed conflicts, advances in democracy, and stronger policies.
Panel growth regressions suggest that, as expected, initial income has a negative
correlation with growth (seeming to confirm conditional convergence in SSA
predicted by neoclassical growth models), trade openness has a large positive
correlation, and armed conflicts have a large negative correlation. While political and
institutional indicators have a positive correlation with growth, they do not have a
statistically significant impact, which may be because the positive effects of good
policies and institutions take a long time, and cannot be captured in standard growth
regressions.
Probit analysis focused on growth acceleration episodes also suggests that trade
liberalization, end of wars, higher democracy have a statistically significant
correlation with growth accelerations. At the same time, better terms of trade and
higher aid do not seem to have a statistically significant correlation with growth
accelerations in most specifications.
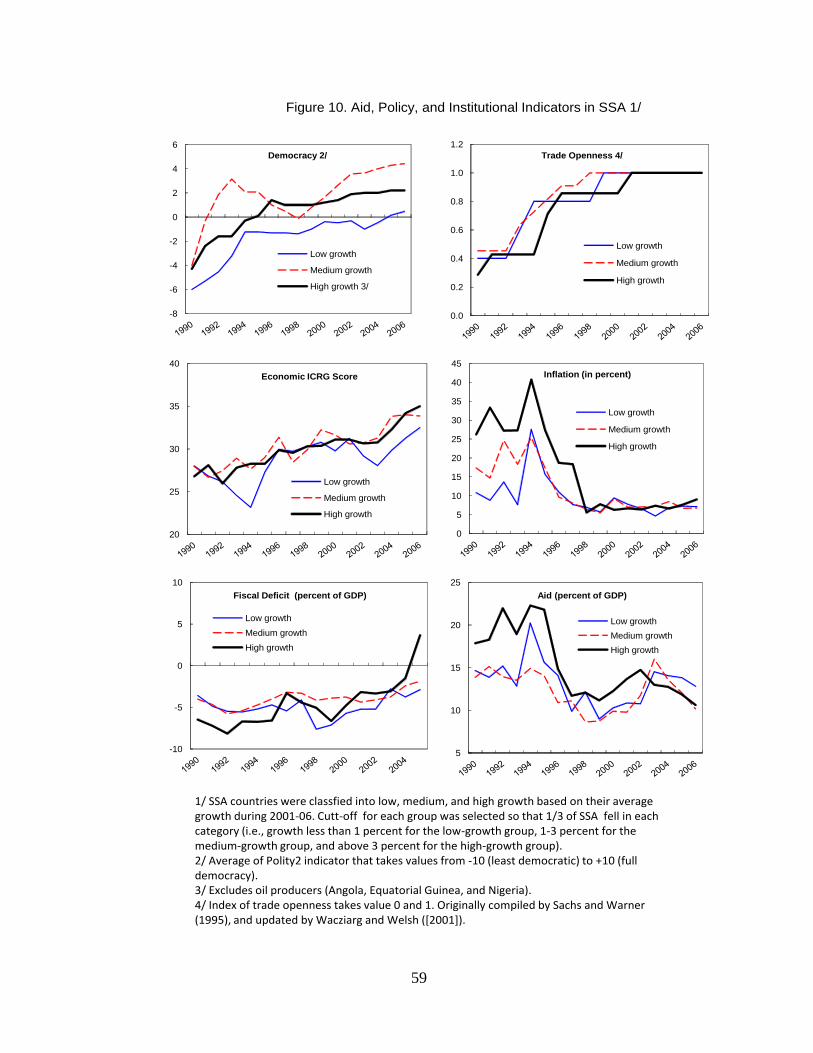
59
Figure 10. Aid, Policy, and Institutional Indicators in SSA 1/
Source:IMF World Economic Outlook database,
1/ SSA countries were classfied into low, medium, and high growth based on their average growth during 2001-06. Cutt-off for each group was selected so that 1/3 of SSA fell in each category (i.e., growth less than 1 percent for the low-growth group, 1-3 percent for the medium-growth group, and above 3 percent for the high-growth group).2/ Average of Polity2 indicator that takes values from -10 (least democratic) to +10 (full democracy).3/ Excludes oil producers (Angola, Equatorial Guinea, and Nigeria).4/ Index of trade openness takes value 0 and 1. Originally compiled by Sachs and Warner (1995), and updated by Wacziarg and Welsh ([2001]).
-8
-6
-4
-2
0
2
4
6
Democracy 2/
Low growth
Medium growth
High growth 3/
0.0
0.2
0.4
0.6
0.8
1.0
1.2
Trade Openness 4/
Low growth
Medium growth
High growth
20
25
30
35
40
Economic ICRG Score
Low growth
Medium growth
High growth
0
5
10
15
20
25
30
35
40
45
Inflation (in percent)
Low growth
Medium growth
High growth
-10
-5
0
5
10
Fiscal Deficit (percent of GDP)
Low growth
Medium growth
High growth
5
10
15
20
25
Aid (percent of GDP)
Low growth
Medium growth
High growth

60
1981-90 1991-2000 2001-07 1981-90 1991-2000 2001-07 1981-90 1991-2000 2001-07 1981-90 1991-2000 2001-07
Angola 1.8 1.3 12.9 -1.0 -1.6 9.5 -1.5 1.1 -2.0 0.4 -2.7 11.6
Benin 1.6 4.5 4.1 -2.8 0.3 0.5 -6.6 -3.9 -1.2 3.8 4.2 1.7
Botswana 10.6 6.4 5.1 7.4 3.0 3.8 4.7 4.1 4.8 2.7 -1.1 -1.0
Burkina Faso 3.0 5.3 5.6 0.4 2.2 2.0 2.0 1.4 -0.2 -1.6 0.8 2.2
Burundi 4.5 -1.7 2.8 0.8 -2.9 -1.4 1.0 -0.7 -1.1 -0.1 -2.2 -0.3
Cameroon 3.3 1.4 3.6 0.7 -1.5 1.1 1.1 -2.9 -0.2 -0.4 1.3 1.3
Cape Verde 5.2 6.8 6.5 2.8 3.5 2.9 8.9 4.0 5.2 -6.1 -0.5 -2.3
Central African Rep. 1.8 1.0 0.5 -0.7 -1.5 -1.2 0.9 -1.1 -1.5 -1.6 -0.4 0.2
Chad 4.4 2.8 10.5 0.2 -0.8 6.4 24.0 5.7 11.8 -23.8 -6.5 -5.3
Comoros 2.7 1.1 2.2 -0.1 -1.5 -0.4 1.5 0.9 -1.1 -1.6 -2.4 0.7
Congo, Dem. Rep. of 0.7 -5.6 4.7 -2.2 -8.1 1.8 … -4.3 -1.7 … -3.9 3.4
Congo, Republic of 5.8 1.4 3.5 2.6 -1.6 1.0 1.5 0.9 1.6 1.1 -2.5 -0.6
Côte d'Ivoire 1.0 3.1 0.4 -3.1 0.1 -1.6 -4.8 -2.2 -2.2 1.8 2.4 0.6
Equatorial Guinea 2.8 31.6 22.5 -1.8 28.4 19.8 10.2 24.4 15.2 -11.9 4.0 4.7
Eritrea … … 1.9 … … -2.5 … … … … … …
Ethiopia 1.9 2.9 7.1 -1.8 -1.1 3.3 1.3 -2.1 2.0 -3.1 1.0 1.3
Gabon 1.6 1.7 2.2 -1.0 -1.1 -0.2 -1.4 -1.9 -0.8 0.4 0.8 0.7
Gambia, The 3.4 4.2 4.9 -0.2 0.4 1.6 -2.5 -1.2 -1.1 2.2 1.5 2.7
Ghana 2.2 4.5 5.4 -1.0 1.2 2.8 … 8.9 4.1 … -7.7 -1.3
Guinea 3.1 4.1 2.7 0.4 0.9 0.6 4.0 3.0 3.3 -3.6 -2.1 -2.7
Guinea-Bissau 2.4 0.9 0.5 0.0 -1.9 -2.2 5.9 -0.9 -4.1 -5.8 -1.0 1.9
Kenya 4.4 1.7 4.5 0.5 -1.9 1.6 0.7 0.1 2.0 -0.3 -2.0 -0.4
Lesotho 4.5 3.8 3.8 2.3 1.9 2.9 2.6 3.9 -0.7 -0.3 -2.0 3.6
Liberia … … -1.0 … … -3.6 … … … … … …
Madagascar 0.5 1.7 3.3 -2.4 -1.3 -0.4 0.1 -0.5 1.8 -2.4 -0.8 -2.2
Malawi 2.2 3.4 3.8 -0.9 1.2 1.4 -2.1 -2.8 1.8 1.2 3.9 -0.5
Mali 3.0 3.6 5.7 1.0 1.0 2.4 6.7 2.2 0.8 -5.7 -1.2 1.6
Mauritania 2.4 2.9 4.6 -0.3 -0.2 1.3 0.9 0.5 9.6 -1.2 -0.7 -8.3
Mauritius 4.8 6.0 3.6 2.8 4.4 2.4 3.9 5.4 3.1 -1.2 -1.0 -0.7
Mozambique 0.1 6.5 8.6 -0.2 3.0 6.4 4.2 3.4 2.9 -4.4 -0.4 3.5
Namibia -1.2 3.9 5.1 -4.9 0.7 3.0 -4.4 -1.1 0.9 -0.5 1.8 2.1
Niger 0.0 1.0 5.3 -2.8 -2.6 1.7 -4.2 -4.8 0.6 1.3 2.2 1.2
Nigeria 2.4 1.9 9.6 -0.1 -0.9 6.8 -0.1 -1.3 2.1 0.1 0.4 4.6
Rwanda 2.2 0.7 6.7 -0.8 -0.7 3.6 3.0 0.7 2.7 -3.8 -1.3 0.9
São Tomé & Príncipe -1.5 1.5 6.4 -3.3 -0.6 3.6 … … … … … …
Senegal 2.6 3.1 4.4 -0.2 0.2 1.3 2.9 1.6 2.9 -3.1 -1.4 -1.6
Seychelles 3.6 4.5 1.8 1.3 3.4 -1.6 3.2 6.1 -1.1 -1.9 -2.7 -0.5
Sierra Leone 0.8 -7.6 11.7 0.3 -8.3 8.3 -1.8 -3.2 -2.2 2.1 -5.1 10.6
Somalia … … … … … … … … … … … …
South Africa 1.5 1.8 4.2 -1.4 -1.2 1.4 -1.8 -2.2 0.0 0.4 1.0 1.4
Sudan 2.5 3.5 7.3 1.0 0.3 4.6 … … … … … …
Swaziland 8.2 2.9 2.5 4.7 -0.5 0.9 … -1.2 -0.2 … 0.7 1.1
Tanzania 3.3 2.9 7.0 0.1 0.0 4.4 -0.4 1.6 7.6 0.4 -1.6 -3.2
Togo 1.7 0.9 1.7 -1.7 -2.4 -1.4 -5.3 -5.7 -4.4 3.6 3.3 3.0
Uganda 3.6 6.2 7.5 0.2 3.1 4.0 … 9.6 6.6 … -6.5 -2.6
Zambia 1.0 -0.2 5.2 -3.1 -2.7 3.2 -4.8 -4.2 0.2 1.7 1.5 3.0
Zimbabwe 4.4 0.6 -5.2 0.1 -1.7 -6.4 -0.9 1.3 -1.3 1.0 -3.0 -5.1
Source: IMF's WEO and World Bank's WDI databases.
Table 1. Sources of Growth in SSA, 1981-2007
Output
Contribution of:
Factor ProductivityPhysical Capital per WorkerOutput per Worker
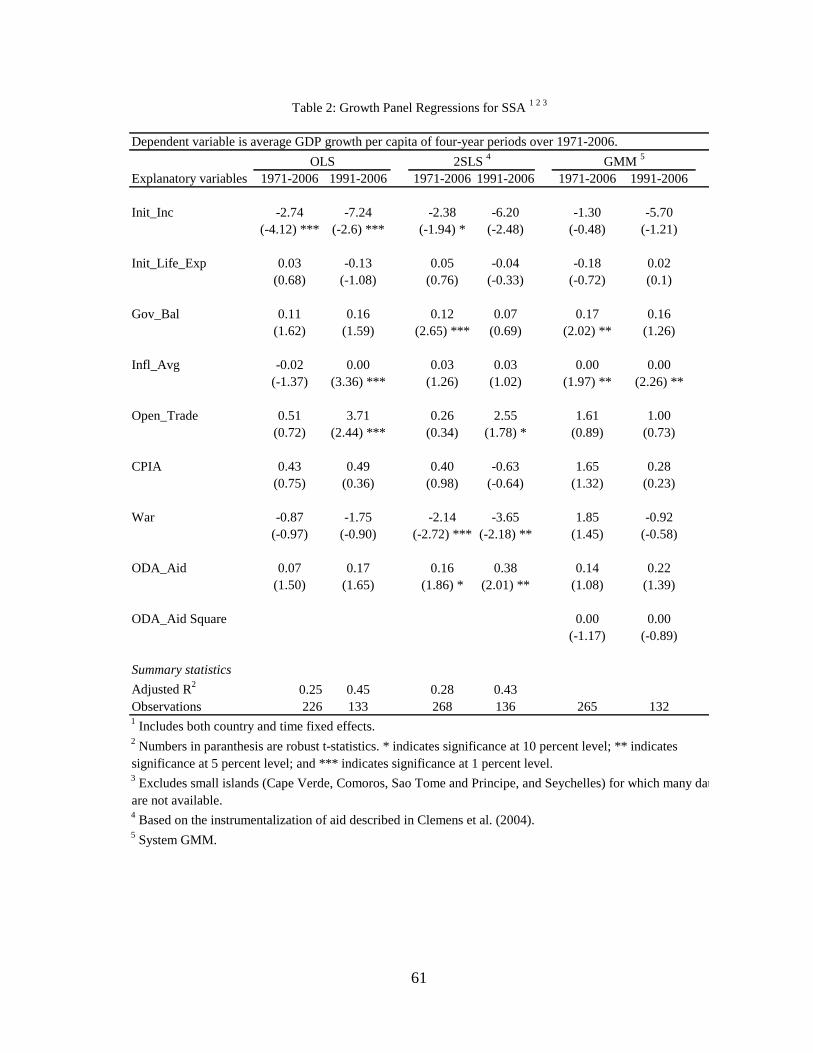
61
Dependent variable is average GDP growth per capita of four-year periods over 1971-2006.
Explanatory variables 1971-2006 1991-2006 1971-2006 1991-2006 1971-2006 1991-2006
Init_Inc -2.74 -7.24 -2.38 -6.20 -1.30 -5.70
(-4.12) *** (-2.6) *** (-1.94) * (-2.48) (-0.48) (-1.21)
Init_Life_Exp 0.03 -0.13 0.05 -0.04 -0.18 0.02
(0.68) (-1.08) (0.76) (-0.33) (-0.72) (0.1)
Gov_Bal 0.11 0.16 0.12 0.07 0.17 0.16
(1.62) (1.59) (2.65) *** (0.69) (2.02) ** (1.26)
Infl_Avg -0.02 0.00 0.03 0.03 0.00 0.00
(-1.37) (3.36) *** (1.26) (1.02) (1.97) ** (2.26) **
Open_Trade 0.51 3.71 0.26 2.55 1.61 1.00
(0.72) (2.44) *** (0.34) (1.78) * (0.89) (0.73)
CPIA 0.43 0.49 0.40 -0.63 1.65 0.28
(0.75) (0.36) (0.98) (-0.64) (1.32) (0.23)
War -0.87 -1.75 -2.14 -3.65 1.85 -0.92
(-0.97) (-0.90) (-2.72) *** (-2.18) ** (1.45) (-0.58)
ODA_Aid 0.07 0.17 0.16 0.38 0.14 0.22
(1.50) (1.65) (1.86) * (2.01) ** (1.08) (1.39)
ODA_Aid Square 0.00 0.00
(-1.17) (-0.89)
Summary statistics
Adjusted R2
0.25 0.45 0.28 0.43
Observations 226 133 268 136 265 1321 Includes both country and time fixed effects.
2 Numbers in paranthesis are robust t-statistics. * indicates significance at 10 percent level; ** indicates
significance at 5 percent level; and *** indicates significance at 1 percent level.3 Excludes small islands (Cape Verde, Comoros, Sao Tome and Principe, and Seychelles) for which many data series
are not available.4 Based on the instrumentalization of aid described in Clemens et al. (2004).
5 System GMM.
OLS 2SLS 4
GMM 5
Table 2: Growth Panel Regressions for SSA 1 2 3

62
1.5 percent 2.5 percent 3.5 percent
Angola 2002 2002 2002
Benin - - -
Botswana 1985, 1995 1985, 1995 1985, 1995
Burkina Faso 1984, 1994 1994 -
Burundi - - -
Cameroon - - -
Cape Verde 1992 1992 1992
Central African Rep. - - -
Chad 1997 1997 1997
Comoros - - -
Congo, Dem. Rep. of - - -
Congo, Republic of 1984 1984 1984
Côte d'Ivoire - - -
Equatorial Guinea 1988 1988 1988
Eritrea - - -
Ethiopia 2004 2004 2004
Gabon - - -
Gambia, The - - -
Ghana 2001 2001 -
Guinea - - -
Guinea-Bissau - - -
Kenya 2004 - -
Lesotho 1984, 2000 1984, 2003 1987, 2003
Liberia - - -
Madagascar - - -
Malawi 1993, 2003 - -
Mali 1985, 1996 1986, 1996 -
Mauritania 2003 - -
Mauritius 1986 1986 1986
Mozambique 1987, 1996 1996 1996
Namibia 2002 2002 2002
Niger 2001 - -
Nigeria 2000 2000 2001
Rwanda 2001 2001 2001
São Tomé & Príncipe 1998 1999 2001
Senegal 1997 - -
Seychelles 1984 1984 1985
Sierra Leone 2001 2001 2001
Somalia - - -
South Africa - - -
Sudan 1986, 1997 1986, 1997 1997
Swaziland 1984, 2004 1984 1984
Tanzania 1996 1996 1999
Togo - - -
Uganda 1992 1992 1992
Zambia 2001 2001 -
Zimbabwe - - -
Total accelerations 37 28 22
Excluding islands 34 25 19
1/ The filter to generate accelerations uses (i) average growth over a 7 year period
relative to the previous 4 years should be higher than 2 percentage points,
and (ii) a threshold of at least 1.5, 2.5, or 3.5 percent growth during the 7 year period.
Growth Threshold
Table 3. Growth Acceleration Episodes in SSA, 1980-2007 1/

63
Proportion of growth accelerations preceeded or accompanied by:
TOT 2
6.8%
Economic liberalization 3
36.0%
War end 4
20.5%
Improvement in democracy 5
31.8%
Deterioration in democracy 5
13.6%
Aid 6
46.5%
Proportion of occurances in the column variable accompanied or followed by growth accelerations:
TOT 2
4.1%
Economic liberalization 3
39.1%
War end 4
42.9%
Improvement in democracy 5
43.8%
Deterioration in democracy 5
38.9%
Aid 6
29.4%
1 A five year lag is allowed between a change in the underlying determinant and a growth acceleration.
The timing of the growth acceleration is the three year window centered on the initiation dates in Table 2.2 The underlying variable is a dummy variable that takes the value 1 whenever the change in the terms of trade
from year t to t-4 is in the upper 10 percent of the entire sample.3 Measured by the Sachs-Warner, and Wacziarg-Welch indexes that capture changes in economy's
openness to trade. The indicator is a dummy that takes value 1 during the first five years of a transition
towards "openness," and 0 otherwise.4 The underlying value is a dummy variable that takes the value 1 for the five-year period beginning
with the cessation of an armed conflict, and 0 otherwise.5 Improvement (deterioration) in democracy take the value 1 during the five-year period beginning with
a positive (negative) change in the polity2 score from the Polity IV dataset.6 An increase in aid is considered if the three-year average exceeds that of the previous period by
3 percentage points of GDP.
Table 4. Predictability of Growth Accelerations in SSA during 1980-2007 1

64
Dependent variable is a dummy variable taking value 1 when growth accelerates and 0 otherwise 3
(1) (2) (3) (4) (5) (6) (7) (8) (9)
War_End 0.94 0.58 0.54 1.17 0.84 0.72 2.57 1.14 0.96
(3.67)*** (2.99)*** (3.04)*** (4.38)*** (4.21)*** (3.99)*** (5.60)*** (5.67)*** (5.38)***
Higher_Dem 0.59 0.34 0.36 0.64 0.44 0.42 0.39 0.05 0.06
(3.12)*** (2.45)** (2.73)*** (3.04)*** (2.95)*** (2.97)*** (1.09) (0.27) (0.32)
Trade_Lib -0.06 0.16 0.68
(-0.31) (0.72) (2.08)**
TOT 0.51 0.15 0.60 0.14 1.80 0.35
(2.10)** (0.82) (2.17)** (0.70) (3.62)*** (1.77)*
Aid 0.29 0.19 0.16 0.12 -0.37 -0.14
(1.58) (1.41) (0.76) (0.77) (-1.00) (-0.81)
Observations 547 958 1,082 547 958 1082 547 958 1082
Growth episodes included 15/34 31/34 33/34 11/25 23/25 25/25 6/19 17/19 19/19
Pseudo R2
0.10 0.04 0.03 0.16 0.06 0.04 0.47 0.09 0.061 Excludes small islands (Cape Verde, Comoros, Sao Tome and Principe, and Seychelles) for which most data series are not available.
2 Numbers in paranthesis are robust t-statistics. * indicates significance at 10 percent level, ** indicates significance at 5 percent level;
and *** indicates significance at 1 percent level.3 An acceleration episode is identified by a filter that has the following criteria: (i) growth per capita in a 7 year period has to
be higher than the previous 4 years by at least two percentage points; (ii) growth during the same 7 year period has to exceed
a certain threshold (1.5 percent, 2.5 percent, or 3.5 percent); and (iii) level of output per capita during the 7 year period has to be
higher than the previous 4 years to make sure that the increase is not merely due to a recovery from a previous decline.
1.5 percent 2.5 percent 3.5 percent
Growth Threshold
Table 5. Probit Analysis of Growth Accelerations in SSA 1 2

65
Chapter 3: Political Budget Cycles in SSA
Introduction
As discussed in Chapter 1, Sub-Saharan Africa has made significant strides towards
democracy since the early 1990s, with the number of democracies in the continent
increasing steadily over the last decade. In addition, virtually all SSA countries allow
now opposition parties to challenge incumbents in popular elections, and the number
of cases when popular opposition parties or coalitions have won multi-party elections
is gradually growing (e.g. Benin, Ghana, Kenya, Mali, Niger, and Senegal).
Some have expressed concern, however, that while the introduction of political
competition may have stayed the hand of predatory governments, it has probably
failed to inspire them to manage the economy better. A study by Block et. al. (2003),
for example, suggests that multiparty presidential elections in Africa are associated
with: (i) higher government consumption in GDP; (ii) higher rate of money growth;
and (iii) higher inflation and exchange rate devaluations. The study also suggests that
while the relationship between electoral competition and macroeconomic distortions
peaks with the so-called founding elections (the election that occurred at the time of
transition from authoritarian rule), it is nonetheless present, albeit at a lesser
magnitude in successive elections. In view of these findings, Bates (2006) wonders
whether governments that are subject to electoral risk may be less willing to adhere to
macroeconomic (particularly fiscal) discipline.10
10
See Bates, R., 2006, ―Beyond the Ballot Box‖
http://www.imf.org/external/pubs/ft/fandd/2006/12/bates.htm.

66
Recent cross-section studies on political budget cycles in new democracies outside
SSA are consistent with the Block et al findings. Drazen and Brender (2005), for
example, find that there is a significant political budget cycle in new democracies, but
becomes less strong over time, as voters gain more experience with elections.
Using macroeconomic data and presidential elections results for the period 1980-
2005, this paper investigates the following for the SSA:
whether competitive elections are associated with higher fiscal deficits and, if
yes, what is the main channel through which this takes place (i.e., higher
spending, lower taxes, or a combination of the two);11
whether, as Africa’s democracies consolidate over time, the magnitude of the
political budget cycles in the continent tends to decline (as found by Drazen
and Brender for new democracies); and
whether re-election of incumbents is positively correlated with higher fiscal
deficits during the run-up to election or their term in office.
11
Block et. al (2003) argue, for example, that incumbents in transition elections are likely to face fewer
constraints in the form of legislatures, independent central banks, and a free press for increased
government spending to solidify their basis of support. This reasoning suggests that we should see
evidence of larger opportunistic political budget cycles in ―founding elections.‖

67
Some stylized facts
As discussed in Chapter 1, the number of democracies in SSA has increased steadily
since the 1990s, with about half of SSA countries currently classified as democracies.
Reflecting this move toward democracy, elections have become more regular in SSA
in recent years (Table 1). In the 37 SSA countries that elect the president by popular
vote, there were 35 presidential elections during 1980-1990 (an average of about 12
years between presidential election per country), and 99 presidential elections during
1991-2005 (an average of about 6 years between presidential elections per country).
Not only have the number of elections increased, but elections have also become
more competitive. First, in all the 37 SSA countries that elect the president directly,
the opposition parties are now allowed to contest the incumbent in elections.12
Second, while no opposition candidate won over an incumbent during 1980-1990 (in
35 presidential elections), during the period 1991-2006 opposition candidate won in
32 cases (out of 99 presidential elections during the period, or 30 percent of the
cases). Of these, 15 times the challenger won against the incumbent president, and 17
other times against the candidate of the same party as the incumbent (such as in the
case when the term limits were binding).
The fiscal deficit in SSA countries in recent years has, on average, been significantly
lower than in the 1980s and 1990s. In the 35 SSA countries that elect the president
12
In many of these countries, however , elections are not considered completely ―free and fair‖ and, on
the basis of the World Bank’s PolityIV database, as of 2004 less than half of them (17 countries out of
a total of 37 countries that elect the president directly) were classified as democracies (i.e., had a
nonnegative polity score).
68
directly for which fiscal data for the period 1980-2005 is available, the fiscal deficit
during the period 2001-2005 averaged 2.7 percent of GDP, compared to about 5.1
percent of GDP during the period 1980-2000 (see Table 2). As can be seen from
Figure 2 and Table 2, this decline in fiscal deficits has been observed in most SSA
countries. Only in 10 countries (Burkina Faso, Chad, Eritrea, Ethiopia, Gambia,
Guinea Bissau, Mauritania, Mauritius, Namibia, and Swaziland), representing less
than one fourth of SSA countries in this sample, was the average fiscal deficit during
2001-2005 higher than during 1980-2000.
The fiscal deficit in competitive presidential elections has, on average, been higher
than in the year preceding the election. As shown in Table 2, during the period 1980-
2000 the fiscal deficit in years of presidential elections averaged 5.9 percent of GDP
(versus an average deficit of 5.1 percent of GDP during the same period), and during
2001-2005 the deficit in presidential elections years averaged 3.9 percent of GDP
(versus an average deficit of 2.7 percent of GDP for the same period).
The average fiscal deficit in ―founding‖ elections—i.e., the first election in which
opposition presidential candidates can challenge the incumbent—was 5.8 percent of
GDP, higher than the 4.7 percent of GDP average in all competitive elections.
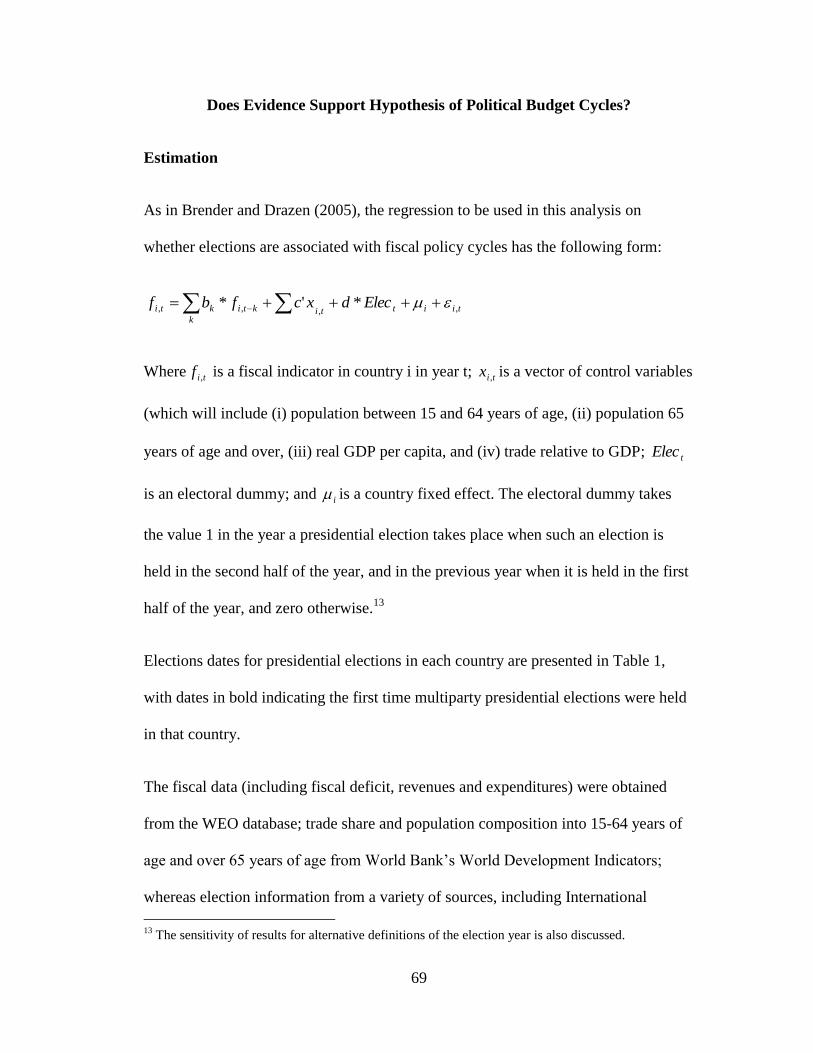
69
Does Evidence Support Hypothesis of Political Budget Cycles?
Estimation
As in Brender and Drazen (2005), the regression to be used in this analysis on
whether elections are associated with fiscal policy cycles has the following form:
k
tiittiktikti Elecdxcfbf ,,,, *'*
Where tif , is a fiscal indicator in country i in year t; tix , is a vector of control variables
(which will include (i) population between 15 and 64 years of age, (ii) population 65
years of age and over, (iii) real GDP per capita, and (iv) trade relative to GDP; tElec
is an electoral dummy; and i is a country fixed effect. The electoral dummy takes
the value 1 in the year a presidential election takes place when such an election is
held in the second half of the year, and in the previous year when it is held in the first
half of the year, and zero otherwise.13
Elections dates for presidential elections in each country are presented in Table 1,
with dates in bold indicating the first time multiparty presidential elections were held
in that country.
The fiscal data (including fiscal deficit, revenues and expenditures) were obtained
from the WEO database; trade share and population composition into 15-64 years of
age and over 65 years of age from World Bank’s World Development Indicators;
whereas election information from a variety of sources, including International
13
The sensitivity of results for alternative definitions of the election year is also discussed.
70
Institute for Democracy and Electoral Assistance (IDEA),14
Binghamton University’s
Election Results Archive (ERA),15
African Elections Database (AED),16
and Adam
Carr’s Election Archive.17
As in Block et. al (2003), the analysis is restricted to presidential elections in SSA for
two main reasons. First, given that the autocratic legacy in most SSA countries the
political power is usually concentrated in the hands of the leader, presidential
elections in SSA have significantly higher importance than parliamentary elections.
Second, presidential terms in SSA countries are for fixed terms, reducing the concern
of the potential bias of estimates if elections are endogenous (i.e., that leaders can call
early elections when they are still popular).
Unlike Brender and Drazen (2005), who restrict their study to democracies only, all
presidential elections (including in non-democracies) where the president is elected
by popular vote are included in the analysis below, provided that the opposition
parties could challenge incumbent regimes. One strong reason for this choice is that
in most cases in which the opposition president was able to unseat the incumbent in
SSA in early 1990s were not considered democracies. Restricting the study to SSA
democracies only would reduce considerably the number of observations.18
14
http://www.idea.int/vt/index.cfm
15 http://www.binghamton.edu/cdp/era/index.html
16 http://africanelections.tripod.com/
17 http://psephos.adam-carr.net/
18 As noted above, less than half of the SSA countries that elect the president directly were considered
as democracies in 2004, and many of them have become democracies only recently.
71
From the 37 SSA countries that elect the president by popular vote, fiscal data are not
available for two of them (Liberia and Sao Tome and Principe). Four small or island
economies for which data is available are also excluded (Cape Verde, Comoros,
Equatorial Guinea, and Seychelles), given concerns on the quality of their economic
statistics, as is Zimbabwe, given the lack of true multiparty competition in
presidential elections in that country. The data set is for the period 1980-2005. During
this period, there were a total of 108 presidential elections in the 30 SSA countries,
and in 86 of these cases the opposition parties were allowed to contest the incumbent.
Results
As summarized in Table 3, columns (1) and (4), panel least square regressions with
country fixed effects suggest that presidential elections are associated with higher
budget deficits in Africa. In years of competitive presidential elections the fiscal
deficit is higher by about 0.8 percentage points of GDP relative to non-election years
during the period 1980-2005, and by about 1.2 percentage points of GDP during the
period 1990-2005. Higher deficits seem to be driven by higher fiscal spending, rather
than lower taxes. As can be seen in Table 3, the magnitude of the effect of
presidential elections on (higher) fiscal spending, columns (2) and (5), is similar to
that on (lower) general government fiscal balance in the balance equation. In addition,
there does not seem to any election cycle on revenues (the coefficients of the dummy
variable on election in the revenue equations, columns (3) and (6), are not statistically
different from zero).

72
There also seems to be support for the hypothesis that, as voters and politicians
become more familiar with elections and as checks and balances improve with each
subsequent election, the magnitude of political budget cycle declines. As can be seen
in Table 4, panel regressions with fixed country effect suggest that when separate
dummy variables are introduced for the first, second, and later multiparty presidential
elections, only the variable for the first such election is statistically significant,
whereas the later elections are not. This is the case for two different specification—
i.e., one in which each of the first two multiparty elections were assigned separate
dummy variables and the rest of the elections with another, columns (2) and (4), and
another specification where the first multiparty election was assigned a separate
dummy variable and the rest of the elections with another, columns (1) and (3). Both
specifications were tested separately for the periods 1980-2005 and 1990-2005.
Robustness
This section discusses a number of robustness tests to the results of the previous
section, namely: (i) GMM tests given that the lag of the dependent variable is
included in the specification, and thus the OLS results are potentially biased; (ii)
applying an alternative definition to the election year; and (iii) discussing the results
of OLS regressions with fixed country effects on sub samples of the overall sample
that was used in the previous section.
GMM Tests
The results of GMM regressions using the Arellano and Bond approach (1991) seem
to support OLS results with fixed country effects discussed in the previous section.
73
As can be seen from Table 5, GMM estimates suggest that the impact of presidential
elections on the fiscal deficit is the same as that obtained from the OLS (Table 3) for
the period 1980-2005, and broadly similar for the period 1990-2005.
Definition of Election Year
OLS regressions using an alternative definition for the election year were also run.
Under this alternative definition, the electoral dummy takes the value 1 in the same
calendar year the presidential election takes place when the election is held during
May-December of that year (compared to the period July-December in the results
discussed above), and in the previous year when it is held in the first quarter of the
year (compared to the first half of the year in the results discussed above). As can be
seen from Table 5, results for the balance equation for the period 1980-2005 are very
similar. This is true for the expenditure and revenue equations as well, although the
results are not shown in Table 5.
Using Sub samples of the Overall Sample
To see whether results are sensitive to a particular small set of countries, separate
regression were run by dividing the overall sample of 30 countries into 3 sub samples:
(i) the first 15 countries; (ii) the last 15 countries; and (iii) the middle 20 countries. As
shown in Table 5 results are qualitatively the same, although in some cases the
estimated coefficients are not statistically significant. Depending on whether the
period is 1980-2005 or 1990-2005, the fiscal deficit in years of presidential elections
is between 0.7 and 1.3 percentage points of GDP higher than in non-election years.

74
Do political budget cycles affect chances of reelection?
Using a panel of 74 countries over the period 1960-2003, Brender and Drazen (2005)
found no evidence that deficits help reelection in any group of countries—being them
developed of less developed, new and old democracies, countries with different
government or electoral systems, and countries with different levels of democracy.19
This section examines whether these findings hold for presidential elections in SSA.
More specifically, this section asks whether either (i) increased deficits during an
election year or (ii) loose fiscal policies during the term in office or in the election
year, raise the probability of reelection of incumbent presidents (or of candidates
from the same party as the incumbent when they do not, or are not allowed to) run for
election. To explore these questions data on 108 presidential elections during the
period 1980-2005 are used, in the same set of 30 SSA countries in which the
president is elected directly.
The methodology used here in similar methodology to the one in Brender and Drazen
(2005). More specifically the analysis below uses a probit regression analysis, with
variable REELECT being a binary variable that takes value 1 if incumbent is
reelected and 0 otherwise. Information on whether incumbent is reelected or not is
collected from the same databases noted above. On this basis I have put together
Table 6 with all SSA presidents since the 1970s, and combined this information with
that in Table 1 on the timing of presidential elections and other information on
presidential candidates in each election for all 30 countries. This was used to
19
The countries in their study did not include any country from the Sub-Saharan Africa.
75
determine whether the incumbent ran for reelection and, if yes, whether he was
reelected or not, and if the incumbent did not run whether the candidate from the
same party was elected or not. In the analysis below two definition of REELECT are
used, similar to the treatment in Drazen and Brender (2005). More specifically:
“Narrow” definition: only competitive elections in which the incumbent president is
running for reelection are included. In the sample of 30 SSA countries for the period
1980-2005, incumbents ran for reelection in 69 competitive presidential elections (out
of a total of 108 direct presidential elections during this period), and in 54 cases they
won reelection (a rate of success of nearly 80 percent)..
“Expanded” definition: cases in which the incumbent cannot run due to legal term
limits are added, with the candidate from the same party treated as the incumbent.
Doing this adds 17 presidential elections compared to the narrow definition, of which
7 were won by challengers (a success rate of about 40 percent).
Measures of fiscal performance include two variables—BALCH_term, and
BALCH_ey. The first variable is calculated as the difference of average fiscal deficit
in the two years before election with that in the two years before that. The second
variable is calculated as the difference in the fiscal deficit in the election year with
that in the pre-election year. Variables on real economic growth (GDP_gr_term and
GDP_gr_ey) and inflation (infl_term and infl_ey) are calculated in the same way.
Probit estimation is used to examine the effect of fiscal deficits on the probability of
reelection. Results in Table 7 suggest that higher fiscal deficits both during the
election year and the leader’s term in office do not bring reward for incumbent
76
presidents that create them, or for the candidates of the same party as the incumbent
when the latter does not or cannot run for reelection. Actually, in the narrow sample
for all presidential elections results suggest that better fiscal balances in the election
year increase incumbent’s reelection chances.
Conclusions
Results of this chapter suggest that while there is evidence of significant political
budget cycle in SSA during 1980-2005, these results are driven by the impact of
―founding‖ elections. In addition, fiscal deficits in SSA in recent years have on
average been significantly lower than during the 1980s and 1990s. Together, these
seem to suggest that, contrary to the fears expressed by some (including recently by
Bates), increased democracy in SSA has not only reduced the predatory behavior of
governments in the continent, but also contributed to improved macroeconomic
management. Thus, while ―founding‖ elections in SSA presented both the greatest
incentives and fewest constraints for electoral economic manipulation, as voters in the
continent have become more experienced with elections, the scope for its politicians
to induce political budget cycles at the aggregate level has been gradually diminished.
It may very well be that, as found in two recent papers by Drazen and Eslava, election
year political manipulation does not take place necessarily through a higher fiscal
deficit, but can also take the form of a change in the composition of government
spending to target a fraction of voters at the expense of the others while keeping the
overall deficit broadly unchanged.

77
The findings in this paper, however, seem to indicate that higher fiscal deficits during
election years do not seem to improve reelection chances of incumbents, and this
finding is robust to the definition of election year. Actually, similar to what was found
by Drazen and Brender for developed countries and established democracies, the
results in one the four regressions shown in Table 7 (the narrow sample for all
presidential elections) suggest that better (not worse) fiscal balances in the election
year increase incumbent’s reelection chances.
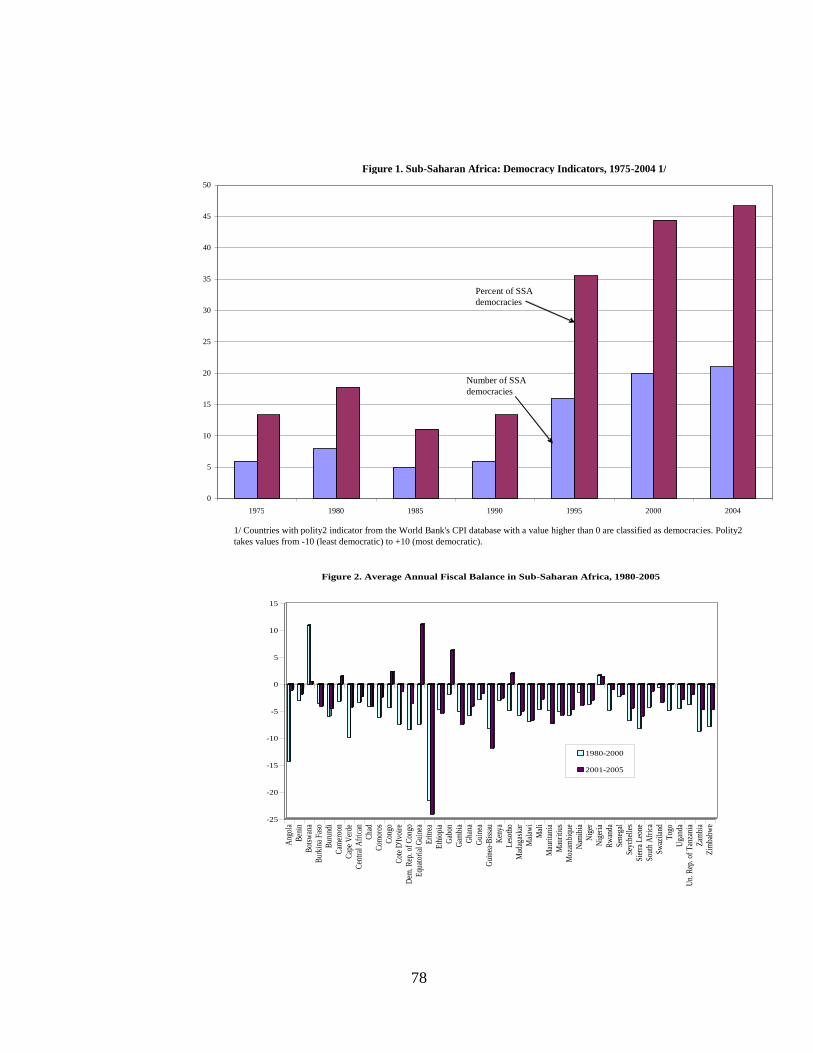
78
-25
-20
-15
-10
-5
0
5
10
15
Ang
ola
Ben
in
Bot
swan
a
Bur
kina
Fas
o
Bur
undi
Cam
eroo
n
Cap
e V
erde
Cen
tral
Afr
ican
Cha
d
Com
oros
Con
go
Cot
e D
'Ivoi
re
Dem
. Rep
. of
Con
go
Equ
ator
ial G
uine
a
Eri
trea
Eth
iopi
a
Gab
on
Gam
bia
Gha
na
Gui
nea
Gui
nea-
Bis
sau
Ken
ya
Les
otho
Mad
agas
kar
Mal
awi
Mal
i
Mau
rita
nia
Mau
riti
us
Moz
ambi
que
Nam
ibia
Nig
er
Nig
eria
Rw
anda
Sen
egal
Sey
chel
les
Sie
rra
Leo
ne
Sou
th A
fric
a
Sw
azil
and
Tog
o
Uga
nda
Un.
Rep
. of
Tan
zani
a
Zam
bia
Zim
babw
e
Figure 2. Average Annual Fiscal Balance in Sub-Saharan Africa, 1980-2005
1980-2000
2001-2005
Figure 1. Sub-Saharan Africa: Democracy Indicators, 1975-2004 1/
0
5
10
15
20
25
30
35
40
45
50
1975 1980 1985 1990 1995 2000 2004
Percent of SSA democracies
Number of SSA democracies
1/ Countries with polity2 indicator from the World Bank's CPI database with a value higher than 0 are classified as democracies. Polity2 takes values from -10 (least democratic) to +10 (most democratic).

79
Country Presidential Election Dates
Angola 29 September 1992 (I).
Benin 24 March 1991 (O,I), 18 March 1996 (O,I), 4 March 2001 (I), 5 March 2006 (O,S)
Botswana None
Burkina Faso 2/ 1 December 1991 (I), 15 November 1998 (I), 13 November 2005 (I).
Burundi 31 August 1984 (I), 1 June 1993 (O,I).
Cameroon 4 April 1980 (I), 14 January 1984 (I), 24 April 1988 (I), 11 October 1992 (I), 12 October 1997 (I), 11 October 2004 (I).
Cape Verde 17 February 1991 (O,I), 11 February 2001 (O,S), 12 February 2006 (I).
Central African Republic 3/ 15 March 1981 (I), 25 October 1992 (I), 22 August 1993 (O,I), 19 September 1999 (I), 13 March 2005 (I).
Chad 2 June 1996 (I), 20 May 2001 (I), 3 May 2006 (I).
Comoros 22 October 1978 (I), 30 September 1984 (I), 11 March 1990 (I), 6 March 1996 (I), 17 March 2002 (I), 14 May 2006 (O,S).
Congo 2 June 1992 (O,I), 10 March 2002 (I).
Côte d'Ivoire 12 October 1980 (I), 27 October 1985 (I), 28 October 1990 (I), 22 October 1995 (I), 22 October 2000 (O,I).
Democratic Republic of the Congo December 1977 (I), September 1982 (I), 30 July 2006 (I).
Equatorial Guinea 4/ 25 June 1989 (I), 25 September 1996 (I), 15 December 2002 (I).
Eritrea None.
Ethiopia None.
Gabon 30 December 1979 (I), 9 November 1986 (I), 5 December 1993 (I), 6 December 1998 (I), 27 November 2005 (I).
Gambia 4 May 1982 (I), 11 March 1987 (I), 29 April 1992 (I), 26 September 1996 (I), 18 October 2001 (I).
Ghana 18 June 1979 (O,I), 3 November 1992 (I), 7 December 1996 (I), 28 December 2000 (O,S), 7 December 2004 (I).
Guinea 9 May 1982 (I), 19 December 1993 (I), 14 December 1998 (I), 21 December 2003 (I).
Guinea-Bissau 7 August 1994 (I), 28 November 1999 (O,S), 19 June 2005 (O,S).
Kenya 29 December 1992 (I), 29 December 1997 (I), 27 December 2002 (O,S).
Lesotho None.
Liberia 15 October 1985 (I), 19 July 1997 (O,S), 11 October 2005 (O,S).
Madagascar 7 November 1982 (I), 12 March 1989 (I), 25 October 1992 (O,I), 3 November 1996 (O,I), 16 December 2001 (O,I).
Malawi 17 May 1994 (O,I), 15 June 1999 (I), 20 May 2004 (S).
Mali 19 June 1979 (I), 9 June 1985 (I), 26 April 1992 (O,S), 4 May 1997 (I), 28 April 2002 (O,S).
Mauritania 24 January 1992 (O,I), 12 December 1997 (I), 7 November 2003 (I).
Mauritius None.
Mozambique 27 October 1994 (I), 3 December 1999 (I), 1 December 2004 (S).
Namibia 7 December 1994 (I), 30 November 1999 (I), 15 November 2004 (S).
Niger 27 March 1993 (O,S), 7 July 1996 (O,I), 17 October 1999 (O,S), 16 November 2004 (I).
Nigeria 11 August 1979 (O,I), 6 August 1983 (I), 12 June 1993 (O,S), 27 February 1999 (O,I), 19 April 2003 (I).
Rwanda 24 December 1978 (I), 19 December 1983 (I), 19 December 1988 (I), 25 August 2003 (I).
Sao Tome and Principe 3 March 1991 (O,S), 21 July 1996 (I), 29 July 2001 (S).
Senegal 26 February 1978 (I), 27 February 1983 (I), 28 February 1988 (I), 21 February 1993 (I), 27 February 2000 (O,I).
Seychelles 23 July 1993 (I), 20 March 1998 (I), 31 August 2001 (I).
Sierra Leone March 1976 (I), 1 October 1985 (S), 26 February 1996 (O,S), 14 May 2002 (I).
Somalia 23 December 1986 (I).
South Africa None.
Swaziland None.
Togo 30 December 1979 (I), 21 December 1986 (I), 25 August 1993 (I), 21 June 1998 (I), 1 June 2003 (I), 24 April 2005 (S).
Uganda 9 May 1996 (I), 12 March 2001 (I), 23 February 2006 (I).
United Republic of Tanzania 26 October 1980 (I), 27 October 1985 (S), 28 October 1990 (I), 29 October 1995 (S), 29 October 2000 (I), 14 December 2005 (S).
Zambia 12 December 1978 (I), 27 October 1983 (I), 26 October 1988 (I), 31 October 1991 (O,I), 18 November 1996 (I), 27 December 2001 (S).
Zimbabwe March 1990 (I), 16 March 1996 (I), 9 March 2002 (I).
1/ Dates in bold indicate the first time when multiparty presidential elections were held in each SSA country. "I" denotes whether
incumbent reelected, and "O,I" if opposition challenger wins running against incumbent, "O,S" if opposition challenger wins against a
candidate from incumbents party, and "S" if candidate from the incumbent party wins (such as in the case of term limit for the incumbent).
2/ The opposition boycotted the 1991 elections but the elections was scheduled as a multiparty presidential election.
3/ The 1992 elections were annuled by the Supreme Court due to widespread regularities.
4/ The 1996 and 2002 elections are listed as "multiparty", although the incumbent won with over 97 percent of the vote in both cases. In 1996,
the opposition boycoted the election.
Table 1: Presidential Elections in Sub-Saharan Africa, 1975-2005 1/
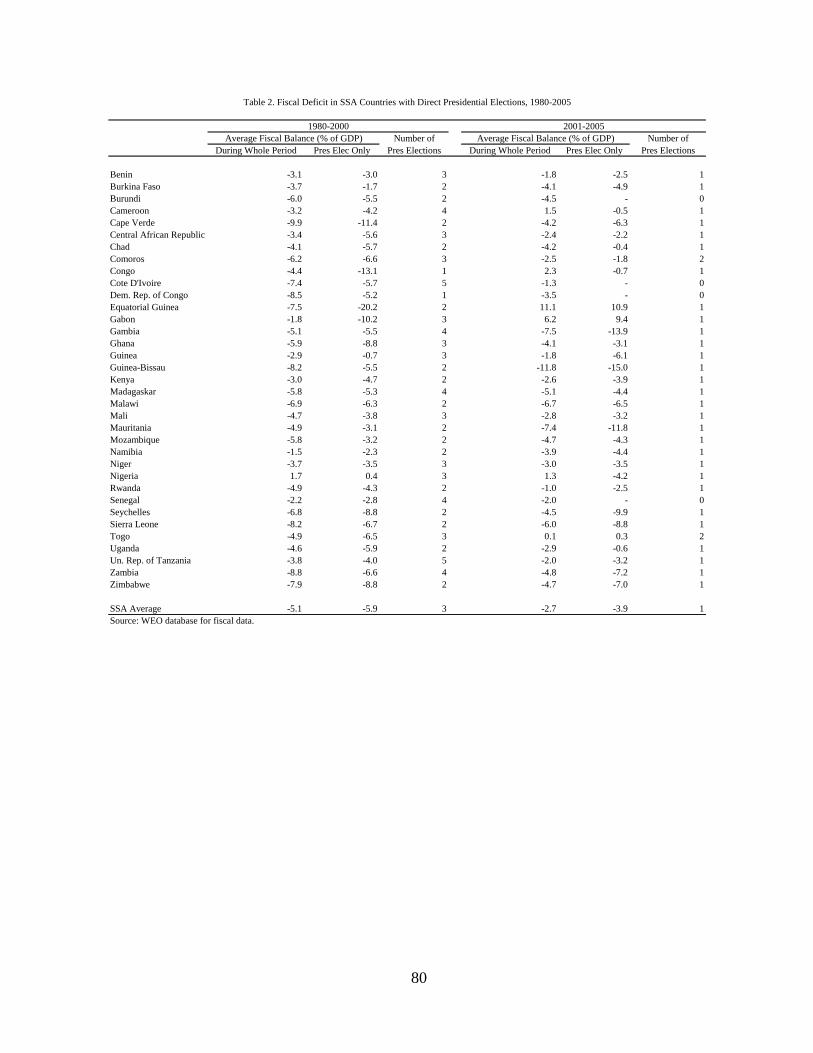
80
Number of Number of
During Whole Period Pres Elec Only Pres Elections During Whole Period Pres Elec Only Pres Elections
Benin -3.1 -3.0 3 -1.8 -2.5 1
Burkina Faso -3.7 -1.7 2 -4.1 -4.9 1
Burundi -6.0 -5.5 2 -4.5 - 0
Cameroon -3.2 -4.2 4 1.5 -0.5 1
Cape Verde -9.9 -11.4 2 -4.2 -6.3 1
Central African Republic -3.4 -5.6 3 -2.4 -2.2 1
Chad -4.1 -5.7 2 -4.2 -0.4 1
Comoros -6.2 -6.6 3 -2.5 -1.8 2
Congo -4.4 -13.1 1 2.3 -0.7 1
Cote D'Ivoire -7.4 -5.7 5 -1.3 - 0
Dem. Rep. of Congo -8.5 -5.2 1 -3.5 - 0
Equatorial Guinea -7.5 -20.2 2 11.1 10.9 1
Gabon -1.8 -10.2 3 6.2 9.4 1
Gambia -5.1 -5.5 4 -7.5 -13.9 1
Ghana -5.9 -8.8 3 -4.1 -3.1 1
Guinea -2.9 -0.7 3 -1.8 -6.1 1
Guinea-Bissau -8.2 -5.5 2 -11.8 -15.0 1
Kenya -3.0 -4.7 2 -2.6 -3.9 1
Madagaskar -5.8 -5.3 4 -5.1 -4.4 1
Malawi -6.9 -6.3 2 -6.7 -6.5 1
Mali -4.7 -3.8 3 -2.8 -3.2 1
Mauritania -4.9 -3.1 2 -7.4 -11.8 1
Mozambique -5.8 -3.2 2 -4.7 -4.3 1
Namibia -1.5 -2.3 2 -3.9 -4.4 1
Niger -3.7 -3.5 3 -3.0 -3.5 1
Nigeria 1.7 0.4 3 1.3 -4.2 1
Rwanda -4.9 -4.3 2 -1.0 -2.5 1
Senegal -2.2 -2.8 4 -2.0 - 0
Seychelles -6.8 -8.8 2 -4.5 -9.9 1
Sierra Leone -8.2 -6.7 2 -6.0 -8.8 1
Togo -4.9 -6.5 3 0.1 0.3 2
Uganda -4.6 -5.9 2 -2.9 -0.6 1
Un. Rep. of Tanzania -3.8 -4.0 5 -2.0 -3.2 1
Zambia -8.8 -6.6 4 -4.8 -7.2 1
Zimbabwe -7.9 -8.8 2 -4.7 -7.0 1
SSA Average -5.1 -5.9 3 -2.7 -3.9 1
Source: WEO database for fiscal data.
2001-2005
Table 2. Fiscal Deficit in SSA Countries with Direct Presidential Elections, 1980-2005
1980-2000
Average Fiscal Balance (% of GDP) Average Fiscal Balance (% of GDP)

81
Balance Exp Rev Balance Exp Rev (1) (2) (3) (4) (5) (6)
Dummy for Presidential Elections -0.81** 0.84 -0.02 -1.17*** 1.46*** 0.27 (-2.02) (1.55) (-0.04) (-2.99) (3.2) (0.74)
Lag of Dependent Variable 0.53*** 0.58*** 0.53*** 0.44*** 0.53*** 0.58*** (16.54) (20.96) (17.76) (10.05) (13.56) (14.48)
GDP per capita -1.04 2.48** 1.76* -0.90 2.04 1.15 (-1.33) (2.33) (1.68) (-0.74) (1.42) (0.99)
Population between 15 and 64 years of age 0.39*** 0.05 0.44** 0.59*** 0.04 0.50*** (2.92) (0.29) (2.52) (3.34) (0.21) (2.95)
Population 65 and over years of age -0.61 0.94 0.25 -2.44* 0.78 -1.12 (-0.88) (1.01) (0.27) (-1.89) (0.52) (-0.91)
Trade share to GDP 0.01* 0.01 0.03*** 0.03 -0.01 0.02** (1.84) (1.32) (2.80) (3.34) (-0.82) (2.44)
Adjusted R2 0.44 0.70 0.69 0.47 0.75 0.81
F-statistics 17.97 52.60 49.02 13.16 42.20 60.78
Durbin-Watson statistic 1.98 1.76 1.67 1.95 1.97 1.94
No of countries 30 30 30 30 30 30
Total panel 767 767 767 480 480 480
T-statistics are in parenthesis. * denotes significance at 10 percent level, ** significance at 5 percent level, and *** significance at 1 percent
level.
Multiparty Pres Elec Only 1990-2005
Table 3. The Political Budget Cycle in Sub-Saharan Africa, OLS Panel Estimates with Fixed Country Effects
Multiparty Pres Elec Only 1980-2005

82
Balance Balance Balance Balance (1) (2) (3) (4)
Elec_comp_n1 -1.62** -1.62** -1.91*** -1.90*** (-2.41) (-2.41) (-2.98) (-2.97)
Elec_comp_n2 0.01 -0.52 (-0.15) (-0.79)
Elec_comp_later -0.41 -0.69 -0.81* -1.04* (-0.86) (-1.06) (-1.73) (-1.7)
Lag of Dependent Variable 0.53*** 0.53*** 0.44*** 0.44*** (16.48) (16.48) (10.03) (10.03)
GDP per capita -1.07 -1.05 -0.94 -0.91 (3.83) (-1.34) (-0.78) (-0.74)
Population between 15 and 64 years of age 0.38*** 0.38* 0.57*** 0.58*** (2.82) (2.87) (3.21) (3.25)
Population 65 and over years of age -0.60 -0.61 -2.37* -2.40* (-0.86) (-0.87) (-1.84) (-1.86)
Trade share to GDP 0.01 0.01* 0.03*** 0.03*** (1.76) (1.76) (3.23) (3.23)
Adjusted R2 0.44 0.44 0.47 0.47
F-statistics 17.56 18.08 12.89 12.53
Durbin-Watson statistic 1.98 1.98 1.96 1.96
No of countries 30 30 30 30
Total panel 767 767 480 480
T-statistics are in parenthesis. * denotes significance at 10 percent level, ** significance at 5 percent level, and *** significance at 1 percent
level.
Table 4. Sub-Saharan Africa: Political Budget Cycle Over Time
1990-2005 1980-2005
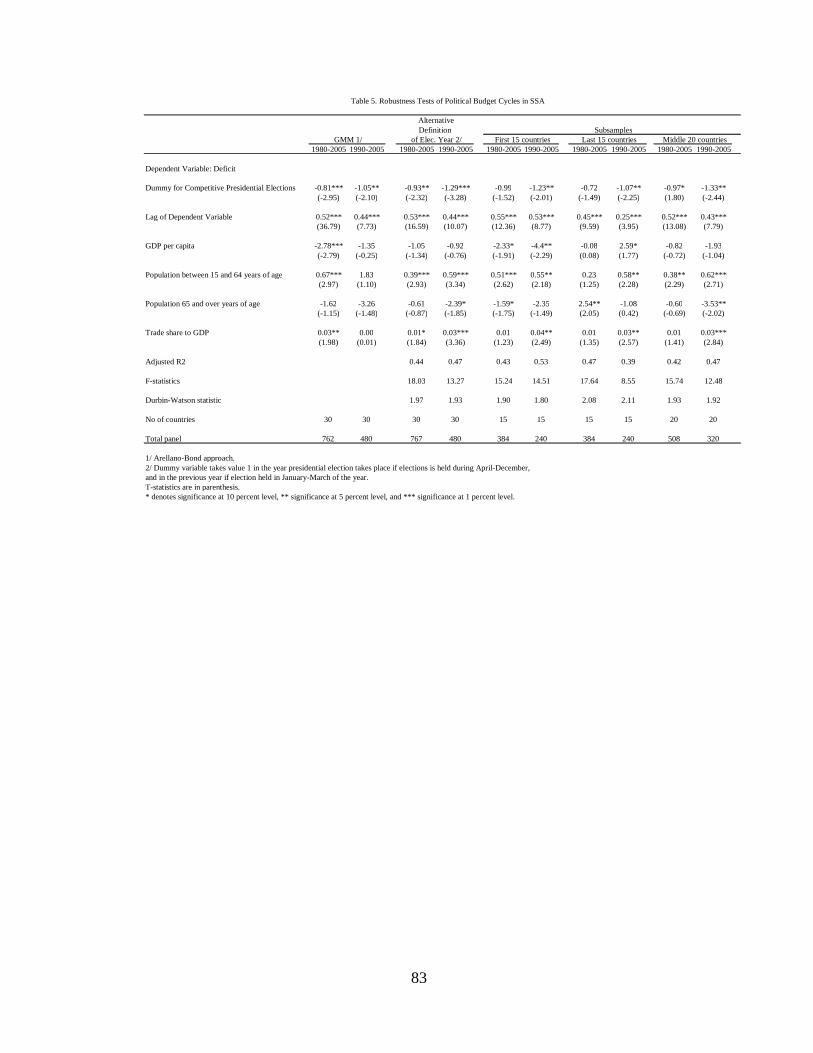
83
1980-2005 1990-2005 1980-2005 1990-2005 1980-2005 1990-2005 1980-2005 1990-2005 1980-2005 1990-2005
Dependent Variable: Deficit
Dummy for Competitive Presidential Elections -0.81*** -1.05** -0.93** -1.29*** -0.99 -1.23** -0.72 -1.07** -0.97* -1.33** (-2.95) (-2.10) (-2.32) (-3.28) (-1.52) (-2.01) (-1.49) (-2.25) (1.80) (-2.44)
Lag of Dependent Variable 0.52*** 0.44*** 0.53*** 0.44*** 0.55*** 0.53*** 0.45*** 0.25*** 0.52*** 0.43*** (36.79) (7.73) (16.59) (10.07) (12.36) (8.77) (9.59) (3.95) (13.08) (7.79)
GDP per capita -2.78*** -1.35 -1.05 -0.92 -2.33* -4.4** -0.08 2.59* -0.82 -1.93 (-2.79) (-0.25) (-1.34) (-0.76) (-1.91) (-2.29) (0.08) (1.77) (-0.72) (-1.04)
Population between 15 and 64 years of age 0.67*** 1.83 0.39*** 0.59*** 0.51*** 0.55** 0.23 0.58** 0.38** 0.62*** (2.97) (1.10) (2.93) (3.34) (2.62) (2.18) (1.25) (2.28) (2.29) (2.71)
Population 65 and over years of age -1.62 -3.26 -0.61 -2.39* -1.59* -2.35 2.54** -1.08 -0.60 -3.53** (-1.15) (-1.48) (-0.87) (-1.85) (-1.75) (-1.49) (2.05) (0.42) (-0.69) (-2.02)
Trade share to GDP 0.03** 0.00 0.01* 0.03*** 0.01 0.04** 0.01 0.03** 0.01 0.03*** (1.98) (0.01) (1.84) (3.36) (1.23) (2.49) (1.35) (2.57) (1.41) (2.84)
Adjusted R2 0.44 0.47 0.43 0.53 0.47 0.39 0.42 0.47
F-statistics 18.03 13.27 15.24 14.51 17.64 8.55 15.74 12.48
Durbin-Watson statistic 1.97 1.93 1.90 1.80 2.08 2.11 1.93 1.92
No of countries 30 30 30 30 15 15 15 15 20 20
Total panel 762 480 767 480 384 240 384 240 508 320
1/ Arellano-Bond approach. 2/ Dummy variable takes value 1 in the year presidential election takes place if elections is held during April-December, and in the previous year if election held in January-March of the year. T-statistics are in parenthesis. * denotes significance at 10 percent level, ** significance at 5 percent level, and *** significance at 1 percent level.
Table 5. Robustness Tests of Political Budget Cycles in SSA
GMM 1/
Alternative Definition
of Elec. Year 2/ First 15 countries Middle 20 countries Last 15 countries Subsamples

84
Name Period Party Pres Elected Directly Angola António Agostinho Neto 11 Nov 1975 - 10 Sep 1979 (+) MPLA Y
José Eduardo dos Santos 10 Sep 1979 - MPLA Y Benin Mathieu Kérékou 26 Oct 1972 - 4 Apr 1991 military/PRPB Y
Nicéphore Dieudonné Soglo 4 Apr 1991 - 4 Apr 1996 PRB Y Mathieu Kérékou 4 Apr 1996 - 6 Apr 2006 FARD Y Yayi Boni 6 Apr 2006 - n/p Y
Botswana Seretse Khama 30 Sep 1966 - 13 Jul 1980 (+) BDP N Quett Ketumile Joni Masire 13 Jul 1980 - 31 Mar 1998 BDP N Festus Gontebanye Mogae 1 Apr 1998 - BDP N
Burkina Faso Blaise Compaoré 24 Dec 1991 - ODP-MT, CDP Y Burundi Michel Micombero 28 Nov 1966 - 1 Nov 1976 (+1983) military/UPRONA Y
Jean-Baptiste Bagaza 2 Nov 1976 - 3 Sep 1987 military/UPRONA Y Pierre Buyoya 3 Sep 1987 - 10 Jul 1993 military/UPRONA Y Melchior Ndadaye 10 Jul 1993 - 21 Oct 1993 (+)a FRODEBU Y Cyprien Ntaryamira 5 Feb 1994 - 6 Apr 1994 (+)a FRODEBU Y Sylvestre Ntibantunganya 6 Apr 1994 - 25 Jul 1996 (acting to 1 Oct 1994) Y Pierre Buyoya 25 Jul 1996 - 20 Apr 2003 UPRONA Y Domitien Ndayizeye 30 Apr 2003 - 26 Aug 2005 FRODEBU (transitional) Y Pierre Nkurunziza 26 Aug 2005 - CNDD-FDD Y
Cameroon Ahmadou Babatoura Ahidjo 1 Jan 1960 - 6 Nov 1982 (+1989) UC, UNC (1) Y Paul Biya 6 Nov 1982 - UNC, RDPC Y
Cape Verde Aristides Maria Pereira 5 Jul 1975 - 22 Mar 1991 PAIGC, PAICV Y António Manuel Mascarenhas Gomes Monteiro 22 Mar 1991 - 22 Mar 2001 MPD Y Pedro Verona Rodrigues Pires 22 Mar 2001 - PAICV Y
Central African Republic David Dacko 20 Sep 1979 - 1 Sep 1981 UDC Y André Dieudonné Kolingba 21 Sep 1985 - 22 Oct 1993 RDC Y Ange - Félix Patassé 22 Oct 1993 - 15 Mar 2003 MLPC Y François Bozizé 15 Mar 2003 - military, n/p Y
Chad Hissène Habré 7 Jun 1982 - 1 Dec 1990 FAN, UNIR Y Jean Alingue Bawoyeu 1 Dec 1990 - 2 Dec 1990 (interim) Y Idriss Déby Itno 2 Dec 1990 - MPS (5) Y
Comoros Ahmed Abdallah Abderemane 25 Oct 1978 - 26 Nov 1989 Y Said Mohamed Djohar 26 Nov 1989 - 29 Sep 1995 UDZIMA Y Said Mohamed Djohar 26 Jan 1996 - 25 Mar 1996 UDZIMA Y Mohamed Taki Abdoulkarim 25 Mar 1996 - 6 Nov 1998 (UNDC) Y Tajiddine Ben Said Massounde 6 Nov 1998 - 29 Apr 1999 (interim) Y Azali Assoumani 29 Apr 1999 - 20 Jan 2002 (military) Y Hamada Madi Bolero 20 Jan 2002 - 26 May 2002 (interim) Y Azali Assoumani 26 May 2002 - 26 May 2006 Y Ahmed Abdallah Sambi 26 May 2006 - Y
Congo Denis Sassou-Nguesso 8 Feb 1979 - 31 Aug 1992 PCT Y Pascal Lissouba 31 Aug 1992 - 15 Oct 1997 UPADS Y Denis Sassou-Nguesso 25 Oct 1997 - PCT Y
Côte d ' Ivoire Félix Houphouët - Boigny 7 Aug 1960 - 7 Dec 1993 PDCI-RDA Y Aimé Henri Konan Bédié 7 Dec 1993 - 25 Dec 1999 PDCI-RDA Y Robert Guéi 25 Dec 1999 - 25 Oct 2000 military Y Laurent Gbagbo 26 Oct 2000 - FPI Y
Democratic Republic of the Congo Joseph Kasavubu 1 Jul 1960 - 25 Nov 1965 ABAKO Y Mobutu Sese Seko 25 Nov 1965 - 16 May 1997 military/MPR Y Laurent - Désiré Kabila 17 May 1997 - 16 Jan 2001 AFDL Y Joseph Kabila 17 Jan 2001 - AFDL, n/p, PPRD Y
Equatorial Guinea Teodoro Obiang Nguema Mbasogo 12 Oct 1982 - PDGE Y Eritrea Issayas Afeworki 24 May 1993 - PFDJ N Ethiopia Negaso Gidada 22 Aug 1995 - 8 Oct 2001 OPDO N
Girma Wolde-Giyorgis Lucha 8 Oct 2001 - EPRDF N Gabon Gabriel Léon M ' Ba 17 Ago 1960 - 28 Nov 1967 BDG Y
Omar Bongo 28 Nov 1967 - BDG/PDG Y Gambia Dawda Kairaba Jawara 24 Apr 1970 - 22 Jul 1994 PPP Y
Yahya A. J. J. Jammeh 18 Oct 1996 - APRC Y
Ghana Jerry John Rawlings 4 Jun 1979 - 24 Sep 1979 military Hilla Limann 24 Sep 1979 - 31 Dec 1981 PNP Y Jerry John Rawlings 7 Jan 1993 - 7 Jan 2001 NDC Y John Agyekum Kufuor 7 Jan 2001 - NPP Y
Guinea Ahmed Sékou Touré 28 Jan 1961 - 26 Mar 1984 PDG Y Louis Lansana Beavogui 26 Mar 1984 - 3 Apr 1984 PDG (interim head of State) Y Lansana Conté 3 Apr 1984 - military, PUP Y
Guinea-Bissau João Bernardo Vieira 16 May 1984 - 7 May 1999 PAIGC Y Malam Bacai Sanhá 13 May 1999 - 17 Feb 2000 PAIGC (acting) Y Kumba Ialá 17 Feb 2000 - 14 Sep 2003 PRS Y Henrique Pereira Rosa 28 Sep 2003 - 1 Oct 2005 n/p (interim) Y João Bernardo Vieira 1 Oct 2005 - n/p Y
Table 6. Sub-Saharan Africa: Presidents of the Republic, 1975-2005

85
Name Period Party Pres Elected Directly Kenya Jomo Kenyatta 12 Dec 1964 - 22 Aug 1978 KANU Y
Daniel arap Moi 22 Aug 1978 - 30 Dec 2002 KANU Y Mwai Kibaki 30 Dec 2002 - NARC/DP Y
Liberia William Richard Tolbert 23 Jul 1971 - 12 Apr 1980 TWP Y Samuel Kanyon Doe 25 Jul 1984 - 9 Sep 1990 NDPL Y Ghankay Charles Taylor 2 Aug 1997 - 11 Aug 2003 NPP Y Moses Zeh Blah 11 Aug 2003 - 14 Oct 2003 NPP Y Ellen Johnson-Sirleaf 16 Jan 2006 - UP Y
Madagascar Didier Ratsiraka 4 Jan 1976 - 27 Mar 1993 FNDR/AREMA Y Albert Zafy 27 Mar 1993 - 5 Sep 1996 UNDD Y Norbert Lala Ratsirahonana 5 Sep 1996 - 9 Feb 1997 AVI (acting) Y Didier Ratsiraka 9 Feb 1997 - 6 May 2002 AREMA Y Marc Ravalomanana 6 May 2002 - TIM Y
Malawi Hastings Kamuzu Banda 6 Jul 1966 - 21 May 1994 MCP Y Elson Bakili Muluzi 21 May 1994 - 24 May 2004 UDF Y Bingu wa Mutharika 24 May 2004 - UDF Y
Mali Moussa Traoré 19 Jun 1979 - 26 Mar 1991 UDPM Y Alpha Oumar Konaré 8 Jun 1992 - 8 Jun 2002 ADEMA Y Amadou Toumani Touré 8 June 2002 - n/p Y
Mauritania Moktar Ould Daddah 20 Aug 1961 - 10 Jul 1978 PRM, PPM Y Maaouya Ould Ahmed Taya 18 Apr 1992 - 3 Aug 2005 PRDS Y
Mozambique Samora Moisés Machel 25 Jun 1975 - 19 Oct 1986 FRELIMO Y Joaquim Alberto Chissano 6 Nov 1986 - 2 Feb 2005 FRELIMO Y Armando Emílio Guebuza 2 Feb 2005 - FRELIMO Y
Namibia Samuel Daniel Nujoma 21 Mar 1990 - 21 Mar 2005 SWAPO Y Hifikepunye Lucas Pohamba 21 Mar 2005 - SWAPO Y
Niger Ali Saïbou 18 Dec 1989 - 16 Apr 1993 MNSD Y Mahamane Ousmane 16 Apr 1993 - 27 Jan 1996 CDS Y Ibrahim Baré Maïnassara 7 Aug 1996 - 11 Apr 1999 UNIRD Y Mamadou Tandja 22 Dec 1999 - MNSD Y
Nigeria Shehu Shagari 1 Oct 1979 - 31 Dec 1983 NPN Y Olusegun Obasanjo 29 May 1999 - PDP Y
Rwanda Juvénal Habyarimana 5 Jul 1973 - 6 Apr 1994 military/MRND Y Théodore Sindikubwabo 9 Apr 1994 - 19 Jul 1994 MRND Y Pasteur Bizimungu 19 Jul 1994 - 24 Mar 2000 FPR Y Paul Kagame 24 Mar 2000 - FPR Y
Sao Tome and Principe Manuel Pinto da Costa 12 Jul 1975 - 4 Mar 1991 MLSTP Y Leonel Mário d ' Alva 4 Mar 1991 - 3 Apr 1991 MLSTP Y Miguel dos Anjos Trovoada 3 Apr 1991 - 15 Aug 1995 n/p, ADI Y Miguel dos Anjos Trovoada 21 Aug 1995 - 3 Sep 2001 ADI Y Fradique de Menezes 3 Sep 2001 - 16 Jul 2003 ADI, MDFM Y Fradique de Menezes 23 Jul 2003 - MDFM Y
Senegal Léopold Sédar Senghor 5 Sep 1960 - 31 Dec 1980 UPS/PSS Y Abdou Diouf 1 Jan 1981 - 1 Apr 2000 PSS Y Me Abdoulaye Wade 1 Apr 2000 - PDS Y
Seychelles James Richard Mancham 29 Jun 1976 - 5 Jun 1977 Y France - Albert René 5 Jun 1977 - 14 Apr 2004 FPPS Y James Alix Michel 14 Apr 2004 - FPPS Y
Sierra Leone Siaka Probyn Stevens 21 Apr 1971 - 28 Nov 1985 APC Y Joseph Saidu Momoh 28 Nov 1985 - 29 Apr 1992 APC Y Ahmad Tejan Kabbah 29 Mar 1996 - 25 May 1997 SLPP Y Ahmad Tejan Kabbah 10 Mar 1998 - SLPP Y
Togo Gnassingbé Eyadéma 14 Apr 1967 - 5 Feb 2005 military, RPT Y Faure Essozimna Gnassingbé 5 Feb 2005 - 25 Feb 2005 RPT Y Abbas Bonfoh 25 Feb 2005 - 4 May 2005 RPT Y Faure Essozimna Gnassingbé 4 May 2005 - RPT Y
Uganda Idi Amin Dada 25 Jan 1971 - 13 Apr 1979 military Y Yusufu Kironde Lule 13 Apr 1979 - 20 Jun 1979 UNLF Y Godfrey Lukongwa Binaisa 20 Jun 1979 - 12 May 1980 UNLF Y Apolo Milton Obote 15 Dec 1980 - 27 Jul 1985 UPC Y Yoweri Kaguta Museveni 26 Jan 1986 - military/NRM Y
United Republic of Tanzania Julius Kambarage Nyerere 26 Apr 1964 - 5 Nov 1985 TANU/CCM Y Ali Hassan Mwinyi 5 Nov 1985 - 23 Nov 1995 CCM Y Benjamin William Mkapa 23 Nov 1995 - 21 Dec 2005 CCM Y Jakaya Mrisho Kikwete 21 Dec 2005 - CCM Y
Zambia Kenneth David Kaunda 24 Oct 1964 - 2 Nov 1991 UNIP Y Frederick J. T. Chiluba 2 Nov 1991 - 2 Jan 2002 MMD Y Levy Patrick Mwanawasa 2 Jan 2002 - MMD Y
Zimbabwe Robert Gabriel Mugabe 18 Apr 1980 - 31 Dec 1987 ZANU Y
Source: [COMPLETE].
Table 6 (concluded). Sub-Saharan Africa: Presidents of the Republic, 1975-2005
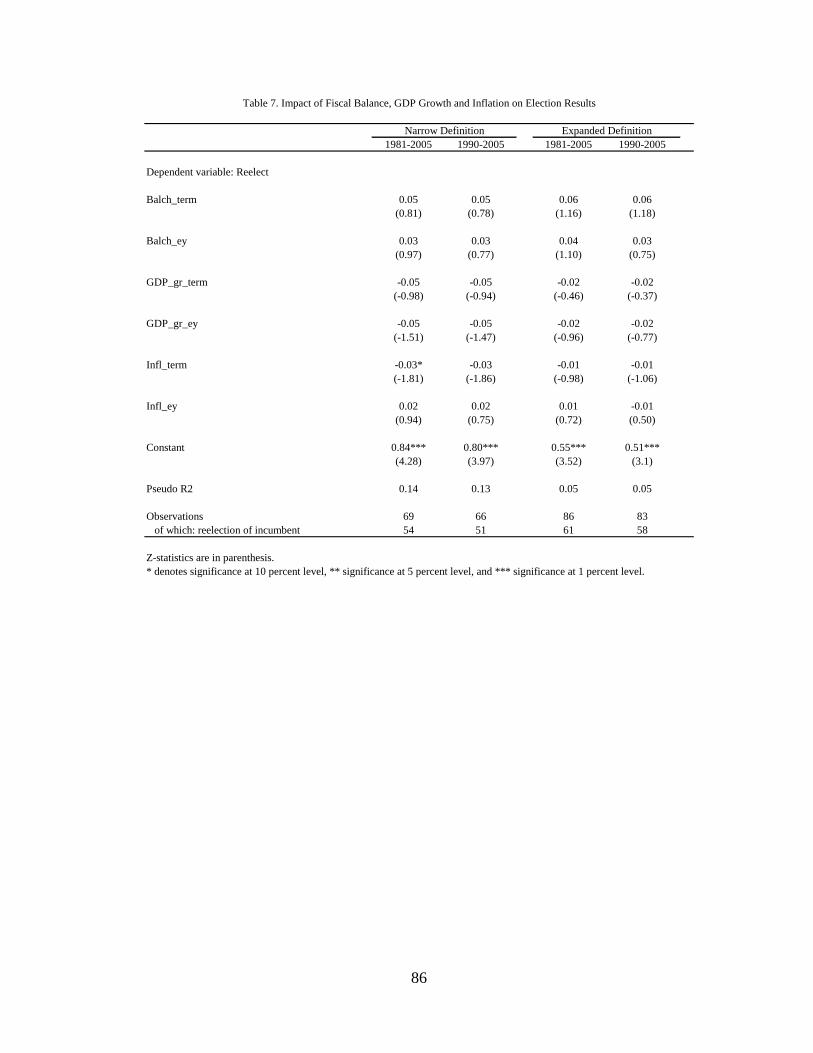
86
1981-2005 1990-2005 1981-2005 1990-2005
Dependent variable: Reelect
Balch_term 0.05 0.05 0.06 0.06
(0.81) (0.78) (1.16) (1.18)
Balch_ey 0.03 0.03 0.04 0.03
(0.97) (0.77) (1.10) (0.75)
GDP_gr_term -0.05 -0.05 -0.02 -0.02
(-0.98) (-0.94) (-0.46) (-0.37)
GDP_gr_ey -0.05 -0.05 -0.02 -0.02
(-1.51) (-1.47) (-0.96) (-0.77)
Infl_term -0.03* -0.03 -0.01 -0.01
(-1.81) (-1.86) (-0.98) (-1.06)
Infl_ey 0.02 0.02 0.01 -0.01
(0.94) (0.75) (0.72) (0.50)
Constant 0.84*** 0.80*** 0.55*** 0.51***
(4.28) (3.97) (3.52) (3.1)
Pseudo R2 0.14 0.13 0.05 0.05
Observations 69 66 86 83
of which: reelection of incumbent 54 51 61 58
Z-statistics are in parenthesis.
* denotes significance at 10 percent level, ** significance at 5 percent level, and *** significance at 1 percent level.
Narrow Definition Expanded Definition
Table 7. Impact of Fiscal Balance, GDP Growth and Inflation on Election Results
87
Bibliography
Acemoglu, D., Johnson, S., and Robinson, J., 2001, ―An African Success Story:
Botswana,‖ published in ―In Search of Prosperity: Analytical Narrative on Economic
Growth,‖ edited by Dani Rodrik‖, Princeton University Press, 2003.
Alt, J., and Lassen, D., 2005, ―The political budget cycle is where you can’t see it:
Transparency and fiscal manipulation‖, EPRU Working Paper No. 2005-03.
Berg, Andrew, Shekhar Aiyar, Mumtaz Hussain, Shaun Roache, Tokhir Mirzoev, and
Amber Mahone, 2007, The Macroeconomics of Scaling Up Aid: Lessons from Recent
Experience, IMF Occasional Paper No. 253 (Washington: International Monetary
Fund).
Bates, R., ―Beyond the ballot box‖, IMF Finance and Development, December 2006,
Volume 43, Number 4
(http://www.imf.org/external/pubs/ft/fandd/2006/12/bates.htm).
Bates, R., 1981, ―Markets and States in Tropical Africa: The Political Basis of
Agricultural Policies,‖ Berkeley: University of California Press.
Block, S., Ferree, K., and Singh, S., ―Multiparty Competition, Founding Elections
and Political Business Cycles in Africa," Journal of African Economies, Vol. 12
(September), pp. 444-68.
Block, S., 2002, Journal of Development Economics‖, Vol 67 (2002), pp 205-228.
Boadi, G. (Editor), 2004, ―Democratic Reform in Africa: The Quality of Progress,‖
Colorado: Lunne Rienner Publishers, Inc..
Boone, Peter, 1996, ―Politics and the Effectiveness of Foreign Aid,‖ European
Economic Review, Vol. 40 (February), pp. 289–329.
Bosworth, B., and Collins, S., 2003, ―The Empirics of Growth: An Update,‖
(http://www.brookings.edu/~/media/Files/rc/papers/2003/0922globaleconomics_bosw
orth/20030307.pdf).
Bratton. M., and de Walle, N., 1997, ―Democratic Experiments in Africa: Regime
Transformations in Comparative Perspective,‖ Cambridge University Press.
Brender A., and Drazen, A., ―Political budget cycles in new versus established
democracies‖, 2005, Journal of Monetary Economics, 52(2005), pp. 1271-1295.
Brender A., and Drazen, A., 2008, ―How do budget deficits and economic growth
affect reelection prospects? Evidence from a large cross-section of countries,‖
American Economic Review, Vol. 98, No. 5, December 2008, pp. 2203-20.

88
Brender, A., ―The effect of fiscal performance on local government election results in
Israel: 1989-1998‖, Journal of Public Economics, 87 (2003), pp 2187-2205.
Burnside, Craig, and David Dollar, 2000, ―Aid, Policies and Growth,‖ Vol. 90
(September), pp. 847–68.
Caselli, F., 2005, ―Accounting for Cross-Country Income Differences,‖ CEP
Discussion Paper No 667.
Clemens, Michael, Steven Radelet, and Rikhil Bhavnani, 2004, ―Counting Chickens
When They Hatch: The Short-Term Effect of Aid on Growth,‖ Center for Global
Development, Working Paper No. 44 (Washington).
Collier, P., 1997, The Failure of Conditionality,‖ in Catherine Gwin and Joan M.
Nelson (editors), ―Perspectives on Aid and Development,‖ Baltimore: John Hopkins
University Press.
Collier, P., and Jan W. Gunning, 1998, ―Explaining African Economic Performance,‖
Journal of Economic Literature 37 (March): 64–111.
Collier, P., and Jan W. Gunning, 1999, ―Why Has Africa Grown Slowly,‖ Journal of
Economic Perspectives 13 (3): 3–22.
Collier., P., 2007, ―The Bottom Billion: Why the Poorest Countries are Failing and
What Can Be Done About It,‖ Oxford University Press Inc..
Collier, P., et. al., 2008, ―The Political Economy of Economic Growth in Africa:
1960-2000,‖ Cambridge University Press, New York.
Collins, S., 2004, ―International Financial Integration and Growth in Developing
Countries: Issues and Implications for Africa, Journal of African Studies, Vol. 13,
Supplement 2.
Collins, S. and B.P. Bosworth, 1996, "Economic Growth in East Asia: Accumulation
versus Assimilation," Brookings Papers in Economic Activity, 2, pp.135-203.
De la Fuente, A., and Domenech, R., 2002, ―Human Capital in Growth Regressions:
How Much Difference Does Data Quality Make? An Update and Further Results,‖
CEPR Discussion Papers No. 3587.
Doppelhofer, G., Miller, R., and Sala-i-Martin, S., 2000, ―Determinants of Long-
Term Growth: A Bayesian Averaging of Classical Estimates Approach, NBER
Working Paper W7750.
Drazen A., and M. Eslava (2006), ―Pork Barrel Cycles‖, NBER working paper No.
12190.
89
Drazen A., and M. Eslava, 2010, ―Electoral Manipulation via Voter-Friendly
Spending: Theory and Evidence,‖Journal of Development Economics, Volume 92,
Issue 1, May 2010, pp 39-52.
Drazen, A., 2000, ―The political business cycle after 25 years‖, in NBER
Macroeconomics Annual 2000, Volume 15.
Easterly, W., 2006, ―The White Man’s Burden: Why the West's Efforts to Aid the
Rest Have Done So Much Ill and So Little Good,‖ Penguin Press.
Easterly, William, Ross Levine, and David Roodman, 2004, ―New Data, New
Doubts: A Comment on Burnside and Dollar’s Aid, Policies, and Growth,‖ American
Economic Review, Vol. 94 (June), pp. 774–80.
Easterly, W., 2001, ―The Elusive Quest for Growth: Economists’ Adventures and
Misadventures in the Tropics,‖ Cambridge: MIT Press.
Eaton, J., and Kortum, S., 2001, ―Trade in Capital Goods,‖ European Economic
Review, 45(7): 1995-1235.
Eifert, B., 2003, ―Political Equality and the Performance of African Economies,
1972-1999.‖ Senior honors thesis, Department of Economics, Stanford University.
Frankel, F., 2003, ―Comments on Bosworth and Collins, The Empirics of Growth: An
Update‖
(http://ksghome.harvard.edu/~jfrankel/Comments_on_Bosworth_and_Collins.pdf).
Hansen, Henrik, and Finn Tarp, 2001, ―Aid and Growth Regressions,‖ Journal of
Development Economics, Vol. 64 (April), pp. 547–70.
Hausmann, R., Pritchett, L., and Rodrik, D., 2004, ―Growth Accelerations,‖
KSG Working Paper No. RWP04-030.
Hayward, F., (editor), 1987, ―Elections in Independent Africa,‖ Colorado: WestView
Press, Inc...
Herbst, J., 2000, ―States and Power in Africa,‖ Princeton University Press.
Iradian, G., 2009, ―What Explains the Rapid Growth in Transition Economies,‖ IMF
Staff Papers, April, 14, 2009 (http://www.palgrave-
journals.com/imfsp/journal/vaop/ncurrent/pdf/imfsp20091a.pdf).
Joseph, R. (editor), 1999, ―State, Conflict, and Democracy in Africa,‖ Colorado:
Lynne Rienner Publishers, Inc...
Lindberg, S., 2006, ―Democracy and Elections in Africa,‖ Baltimore: The John
Hopkins University Press.

90
Nordhaus, W., ―The political business cycle‖, Review of Economic Studies, 1975, pp.
169-190.
Pritchett, L., 2001, ―Where Has All the Education Gone?‖ World Bank Economic
Review 15(3): 367-391.
Rajan, Raghuram G., and Arvind Subramanian, 2005, Aid and Growth: What Does
the Cross-Country Evidence Really Show? IMF Working Paper 05/127 (Washington:
International Monetary Fund).
Rodrik, D., 2005, ―Why We Learn Nothing from Regressing Economic Growth on
Policies (http://ksghome.harvard.edu/~drodrik/policy%20regressions.pdf).
Rodrik, D., (editor), 2003, ―In Search for Prosperity: Analytical Narrative on
Economic Growth,‖ Princeton University Press.
Rodrik, D., 1996, ―Understanding Economic Policy Reform,‖ Journal of Economic
Literature 34, pp. 9-41.
Rogoff, K., ―Equilibrium Political Budget Cycles‖, The American Economic Review,
Vol 80, March 1990, pp 21-36.
Roll, R., and Talbott, J., 2003, ―Political Freedom, Economic Liberty, and
Prosperity,‖ Journal of Democracy 14, No. 3, pp 75-89.
Sachs, J., 2005, ―The End of Poverty: Economic Possibilities of Our Time,‖ Penguin
Press.
Sandbrook, R., 1985, ―The Politics of Africa’s Economic Stagnation,‖ Cambridge
University Press.
Senhadji, Abdelhak, 1999, Sources of Economic Growth: An Extensive Growth
Accounting Exercise, IMF Working Paper 99/77 (Washington: International
Monetary Fund).
Shi, M., and Svensson, J., 2002, ―Political budget cycles in developed and developing
countries‖, working paper, IIES, Stockholm University.
Wade, R., 1990, ―Governing the Market: Economic Theory and the Role of
Government in East Asian Industrialization,‖ Princeton University Press.
Walle, N.,2001, ―African Economies and the Politics of Permanent Crisis, 1979-
1999‖ Cambridge University Press.
World Bank, 2008, ―Policy Plus: African Growth Performance 1960-2000 in The
Political Economy of Economic Growth in Africa, 1960–2000, ed. by Benno J. Ndulu,
Stephen A. O’Connell, Jean-Paul Azam, Robert H. Bates, Augustin K. Fosu, Jan

91
Willem Gunning, and Dominique Njinkeu (Cambridge: Cambridge University Press).
(http://www.swarthmore.edu/SocSci/soconne1/documents/Chap1_BNSOC.pdf).
World Bank, 2000, ―Can Africa Claim the 21st Century?‖ Washington, DC.
Young, C., 1994, ―The African Colonial State in Comparative Perspective,‖
BookCrafters, Inc., Chelsea, Michigan.