abstract ryu, gyunghyun. co-doping strategies for
TRANSCRIPT
ABSTRACT
RYU, GYUNGHYUN. Co-doping Strategies for Controlling Electrical Conduction in Oxide
Materials (Under the direction of Elizabeth C. Dickey).
The objective of this dissertation is to understand the fundamentals of the electrical
conduction mechanisms and defect chemistry of two important dielectric materials, BaTiO3
ceramics and wide band gap β-Ga2O3 single crystals, with the goal of identifying co-doping
strategies that can limit both electronic and ionic conductivity over large oxygen activity ranges.
The conductivity behaviors of several acceptor-doped and (acceptor + donor) co-doped
BaTiO3 ceramics are studied as a function of temperature and oxygen partial pressure (pO2). The
(Mn +Y) co-doped compositions exhibit the lowest insulating bulk conductivity over a wide range
of temperatures in air. Moreover, a pO2-independent bulk conductivity is obtained over the pO2
range 100.68 atm (air) – 10-4 atm across the measurement temperature range of 500 °C to 900 °C.
This particular (Mn + Y) co-doped BaTiO3 composition also exhibits no significant time-
dependent electrical degradation at 500 °C under 45 V/cm DC electric field. The pO2-independent
electrical conductivity is believed to arise from the multivalent nature of Mn.
The insulating electrical conductivity of Fe-doped (010) β-Ga2O3 single crystals are
similarly studied over a wide range of temperatures and pO2. The oxygen partial pressure (pO2)-
invariant electrical conductivity is also observed in this system over the pO2 range of 100.68 atm
(air) – 10-4 atm from 600 °C to 800 °C. The charge neutrality equation explains that the pO2-
independence of electrical conductivity originates from the low concentration of intrinsic point
defects and acceptor (Fe) and donor (Si) mutual compensation, leading to the Fermi level pinning.
© Copyright 2021 by Gyunghyun Ryu
All Rights Reserved
Co-doping Strategies for Controlling Electrical Conduction in Oxide Materials.
by
Gyunghyun Ryu
A dissertation submitted to the Graduate Faculty of
North Carolina State University
in partial fulfillment of the
requirements for the degree of
Doctor of Philosophy
Materials Science and Engineering
Raleigh, North Carolina
2021
APPROVED BY:
_______________________________ _______________________________
Dr. Elizabeth C. Dickey Dr. Douglas Irving
Committee Chair
_______________________________ _______________________________
Dr. Ramón Collazo Dr. Jesse Jur
ii
BIOGRAPHY
Gyunghyun Ryu attended the Changwon National University in South Korea from 2006 to
2014, where he completed his B.Sc. and M.Sc. in Materials Science and Engineering. During his
time there, he worked in Myong-Ho Kim’s research group studying the ferroelectric and
piezoelectric properties of ABO3 materials. In 2015, he joined in Jon-Paul Maria’s group at NC
State University as a visiting scholar for 3 months. Then, he started his Ph.D. degree in Materials
Science and Engineering at NC State University in 2016, under the direction of Elizabeth C.
Dickey.
iii
ACKNOWLEDGMENTS
I would like to thank to my advisor Beth Dickey. I was very pleased to be offered a RA
position, and still remember that you said “Ryu, you did amazing jobs in your first year”. This
enables me to finish my PhD degree successfully in our group. Your support for my PhD degree
is really appreciated. I am also thankful to our group members: Dr. Biya Cai, Dr. Daniel Long, Dr.
Nicole Creange, Dr. Matthew Cabral, Dr. Carolyn Grimley, Neal Lewis, John McGarrahan,
Stephen Funni, Corrado Harper, Steven Baro, Andrew Auman. Especially, John, our discussions
were always interesting and helpful, and you made significant contribution to our sputtering
system, pO2 system, lab safety and etc. I would like to thank to my committee members, Prof.
Douglas Irving, Prof. Ramón Collazo, and Prof. Jesse Jur. Thank you for your feedback on my
work. I want to express my thanks to my collaborators: Prof. Jon-Paul Maria, Dr. Pramod Reddy,
Dr. Preston Bowes, George N. Kotsonis. I thank to Prof. Clive Randall, Prof. Soonil Lee, Prof.
Myong-Ho Kim, Dr. Jonathon Baker, Yifeng Wu who gave me great discussion for my PhD works.
I also thank to AIF staff members: BB and Elaine Zhou and MSE department staff member: Edna
Deas. Finally, my family and friends, your sincere supports helped me a lot to endure my hard
time and to finish my degree successfully.
This work was predominantly supported by the Air Force Office of Scientific Research
under grant number FA9550-19-1-0222. This work was partially supported by the II-VI
Foundation under the Block-Gift Program. In addition, this work was performed in part at the
Analytical Instrumentation Facility (AIF) at North Carolina State University, which is supported
by the State of North Carolina and the National Science Foundation (award number ECCS-
1542015). The AIF is a member of the North Carolina Research Triangle Nanotechnology
Network (RTNN), a site in the National Nanotechnology Coordinated Infrastructure (NNCI).
iv
TABLE OF CONTENTS
LIST OF TABLES ................................................................................................................... vi
LIST OF FIGURES ................................................................................................................ vii
Chapter 1: Introduction .......................................................................................................... 1
1.1..General background ....................................................................................................... 1
1.2..Statement of the problems .............................................................................................. 4
1.3..Objectives ...................................................................................................................... 6
Chapter 2: Background and Literature Review .................................................................... 8
2.1. Defect chemistry in BaTiO3 ........................................................................................... 8
2.1.1. Electronic equilibrium ............................................................................................ 8
2.1.2. Oxygen exchange reaction ..................................................................................... 9
2.1.3. Full Schottky reaction .......................................................................................... 10
2.1.4. Partial Schottky reaction ...................................................................................... 10
2.1.5. Charge neutrality condition .................................................................................. 13
2.2. Electrical conductivity in BaTiO3 ................................................................................ 17
2.2.1. Acceptor doped BaTiO3 ....................................................................................... 17
2.2.2. Co-doped BaTiO3 ................................................................................................ 23
2.3. Degradation behavior in BaTiO3 .................................................................................. 26
2.4. Thermally stimulated depolarization current (TSDC) BaTiO3 ...................................... 28
2.5. Defect chemistry and electrical conductivity of β-Ga2O3 .............................................. 33
Chapter 3: Materials and Experimental Procedure ............................................................ 35
3.1. Synthesis of BaTiO3 ceramics ...................................................................................... 35
3.2. (010) Fe-doped β-Ga2O3 single crystal ......................................................................... 36
3.3. Four-points-probe DC method ..................................................................................... 36
3.4. AC impedance ............................................................................................................. 38
3.5. Prediction of defect structure ....................................................................................... 39
Chapter 4: Electrical Conductivity of Mg or Mn Singly Doped BaTiO3 ............................ 42
4.1. Introduction ................................................................................................................. 42
4.2. Results and discussion ................................................................................................. 43
4.3. Conclusions ................................................................................................................. 54
Chapter 5: Co-doping Strategies for Controlling Electrical Conductivity in BaTiO3 ........ 55
5.1. Abstract ....................................................................................................................... 55
5.2. Introduction ................................................................................................................. 56
5.3. Experimental setup ...................................................................................................... 57
5.4. Results ........................................................................................................................ 59
v
5.5. Discussion ................................................................................................................... 65
5.6. Conclusions ................................................................................................................. 71
Chapter 6: Origin of Electrically Semi-Insulating Properties of Fe-doped β-Ga2O3 .......... 72
6.1. Abstract ....................................................................................................................... 72
6.2. Introduction ................................................................................................................. 72
6.3. Experimental procedure ............................................................................................... 74
6.4. Results and discussion ................................................................................................. 75
6.5. Conclusions ................................................................................................................. 82
Chapter 7: Conclusions and Future Works ......................................................................... 83
7.1. Conclusions ................................................................................................................. 83
7.2. Future works................................................................................................................ 84
7.2.1. Bulk electrical conductivity of BaTiO3 ................................................................. 84
7.2.2. Grain boundary effects at low-temperature in BaTiO3 .......................................... 86
7.2.3. AC and DC conductivities versus pO2 at low-temperature in BaTiO3 .................... 87
REFERENCES ..................................................................................................................... 88
APPENDIX .......................................................................................................................... 100
Appendix A: Crystallization Behavior of BaTiO3 Thin Films ........................................... 101
vi
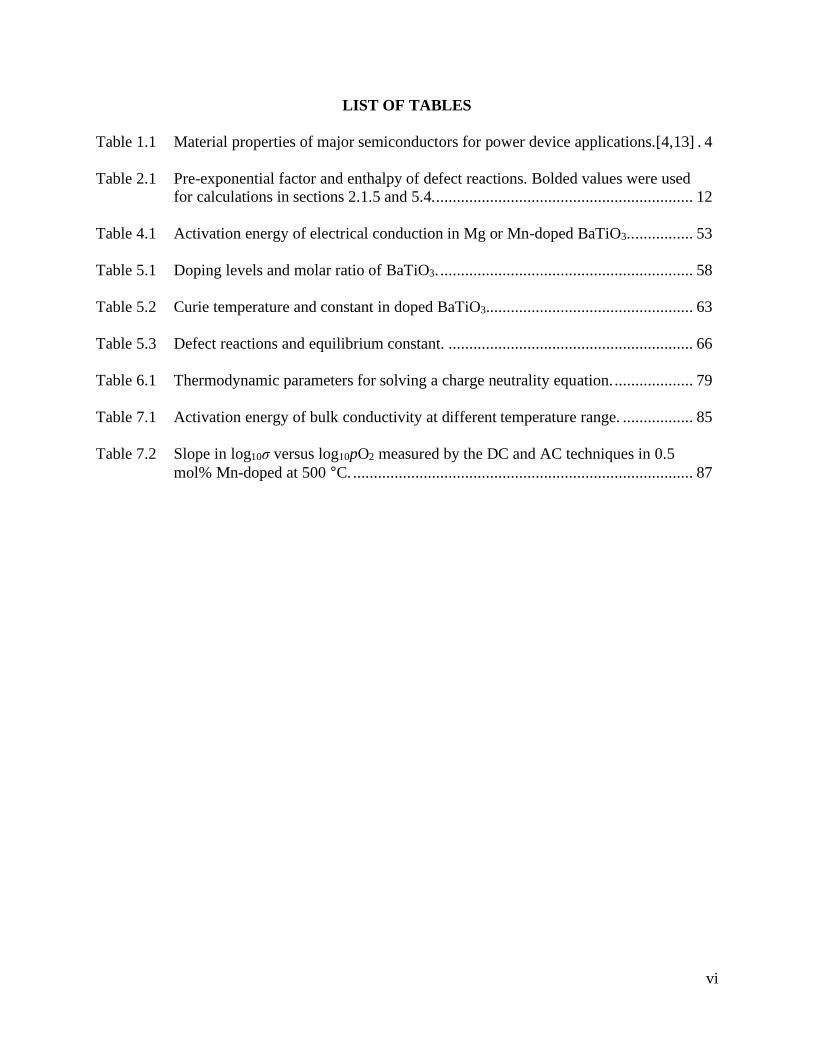
LIST OF TABLES
Table 1.1 Material properties of major semiconductors for power device applications.[4,13] . 4
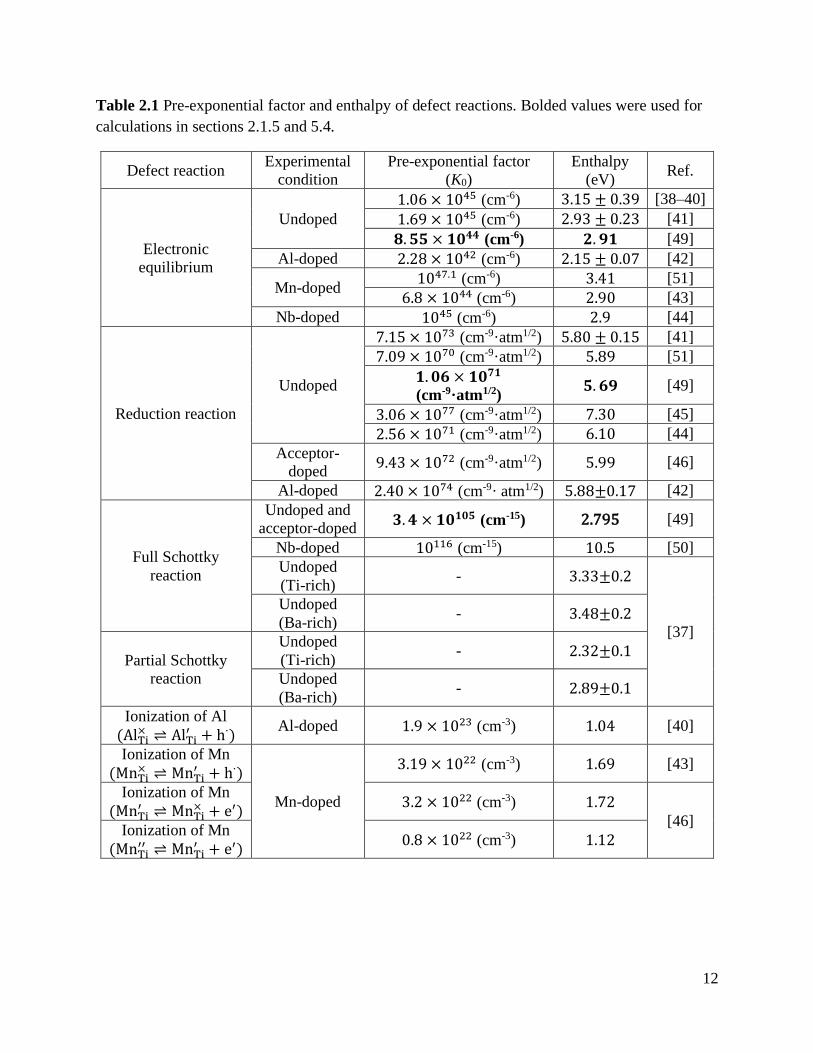
Table 2.1 Pre-exponential factor and enthalpy of defect reactions. Bolded values were used
for calculations in sections 2.1.5 and 5.4. .............................................................. 12
Table 4.1 Activation energy of electrical conduction in Mg or Mn-doped BaTiO3.. .............. 53
Table 5.1 Doping levels and molar ratio of BaTiO3. ............................................................. 58
Table 5.2 Curie temperature and constant in doped BaTiO3.................................................. 63
Table 5.3 Defect reactions and equilibrium constant. ........................................................... 66
Table 6.1 Thermodynamic parameters for solving a charge neutrality equation. ................... 79
Table 7.1 Activation energy of bulk conductivity at different temperature range. ................. 85
Table 7.2 Slope in log10σ versus log10pO2 measured by the DC and AC techniques in 0.5
mol% Mn-doped at 500 °C. .................................................................................. 87
vii
LIST OF FIGURES
Figure 1.1 Crystal structure of (a) BaTiO3 and (b) β-Ga2O3 ..................................................... 2
Figure 1.2. Oxygen vacancy concentration-dependent (a) electronic carrier and ionized Fe
concentrations and (b) total and partial electrical conductivities of Fe-doped
SrTiO3 at 210 °C. The sample was equilibrated at 900 °C and pO2 of 10-5 atm and
quenched to room temperature. Reproduced with permission from [19]. ................. 5
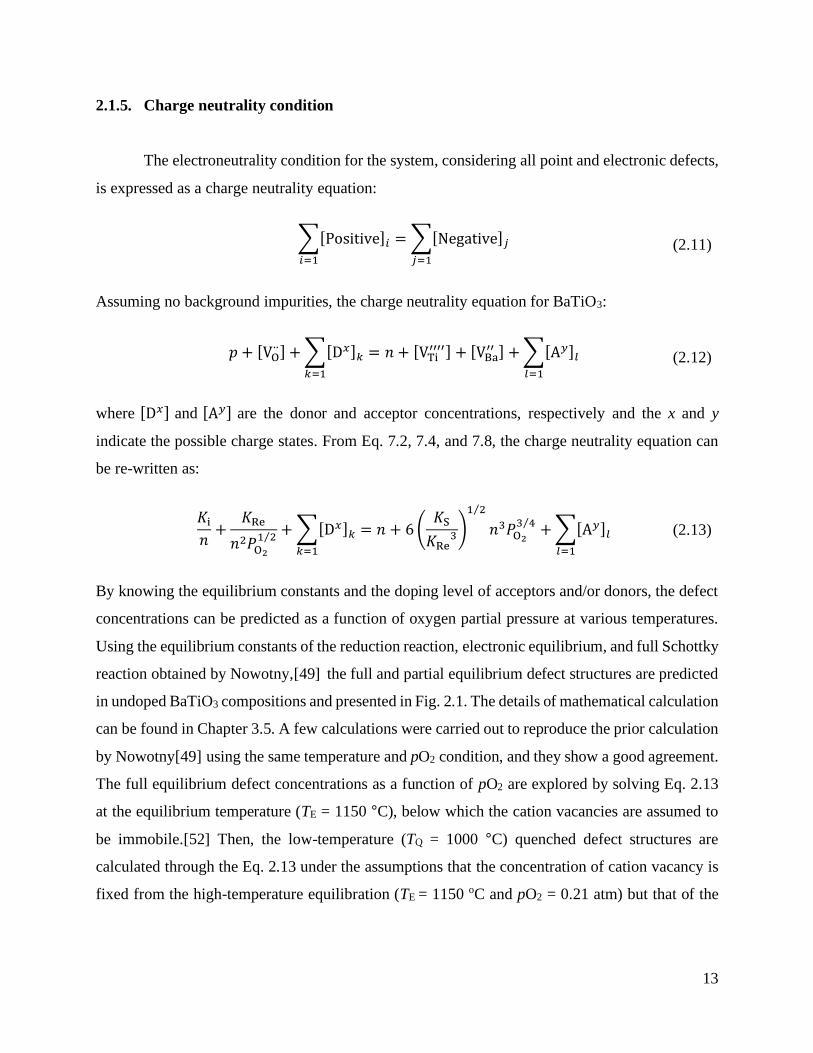
Figure 2.1 (a) Full equilibrium defect structure at 1150 °C and (b) partial equilibrium defect
structure at 1000 °C with the fixed cation vacancies equilibrated from the high-
temperature condition (1150˚C and pO2 = 0.21 atm) in undoped BaTiO3. ............. 14
Figure 2.2 Electrical conductivity versos pO2 of undoped BaTiO3 ceramics and single
crystals at 1000 °C. .............................................................................................. 15
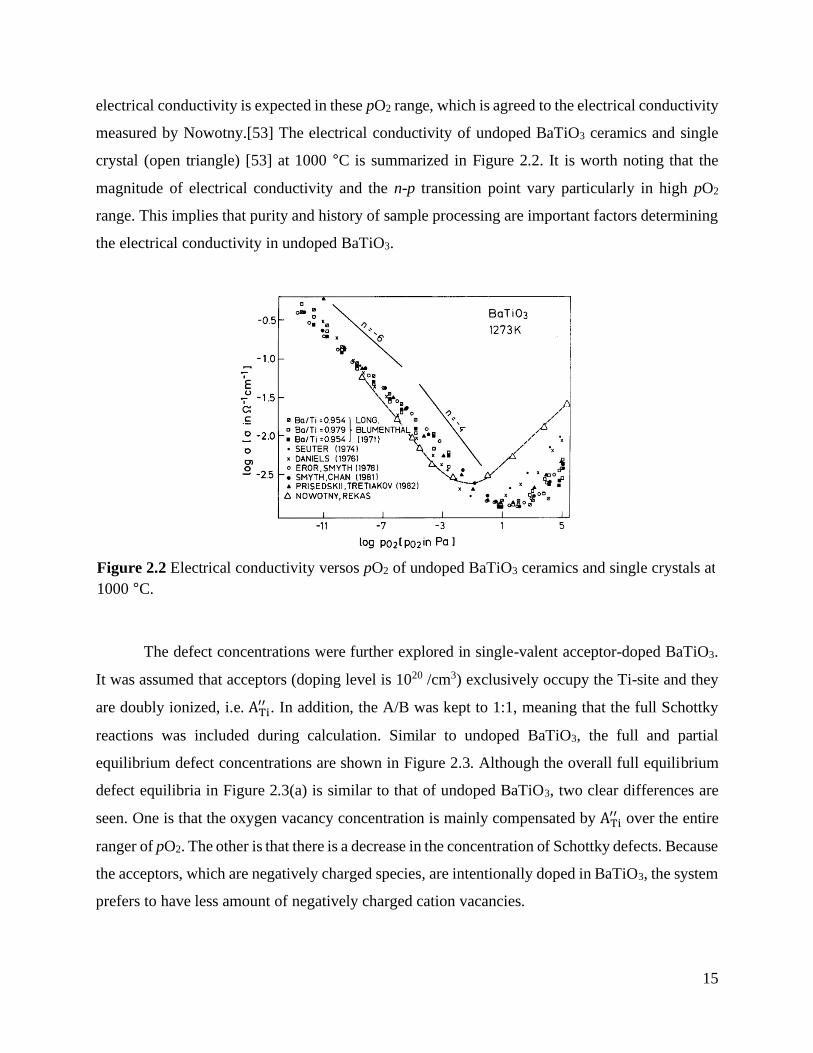
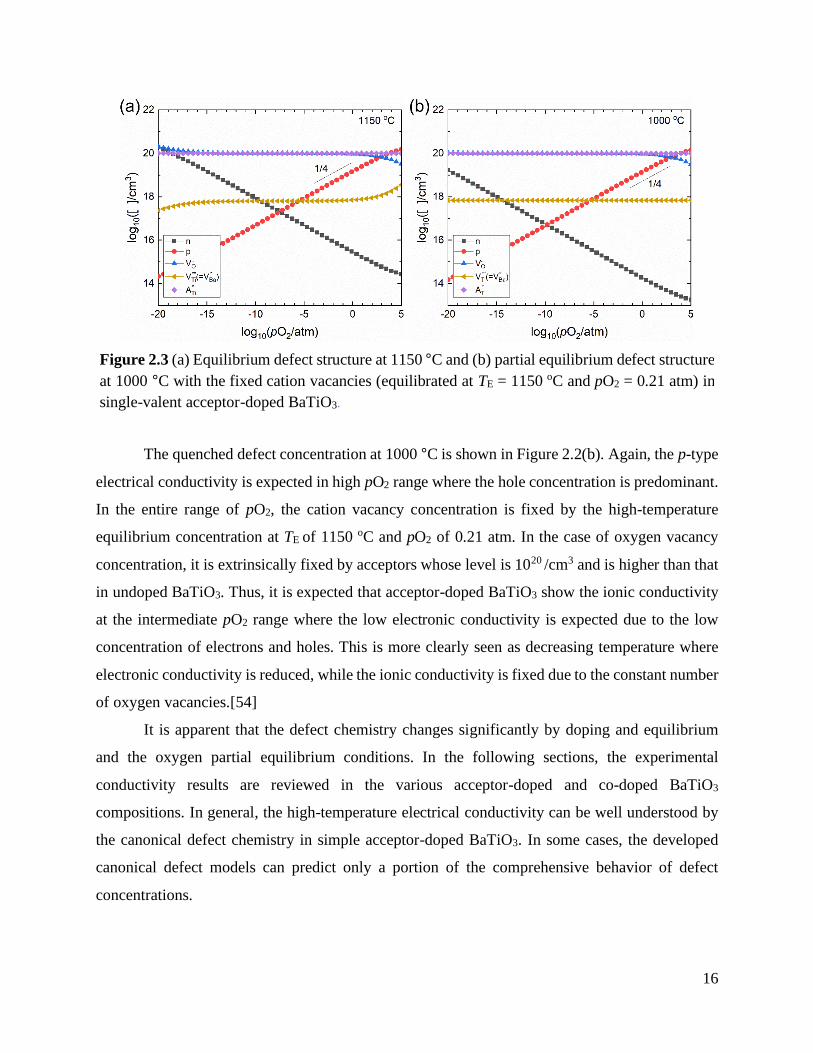
Figure 2.3 (a) Equilibrium defect structure at 1150 °C and (b) partial equilibrium defect
structure at 1000 °C with the fixed cation vacancies (equilibrated at TE = 1150 oC
and pO2 = 0.21 atm) in single-valent acceptor-doped BaTiO3. .............................. 16
Figure 2.4 Equilibrium electrical conductivity of undoped BaTiO3 and Ba(Ti1-xMgx)O3-x
(x = 0, 0.001, 0.005, 0.01) at 1000 °C. Reproduced with permission from [55]. .... 17
Figure 2.5 (a) Equilibrium electrical conductivity of undoped and Al-doped BaTiO3 at
1000°C. (b) Apparent net acceptor concentration derived from conductivity data,
compared with the amount of added Al. Reproduced with permission from [40]. .. 18
Figure 2.6 Electrical conductivity of (a) undoped BaTiO3 and (b) Mn-doped BaTiO3 vs.
oxygen partial pressure at different temperatures. Reproduced with permission
from [43]. ............................................................................................................. 19
Figure 2.7 (a) Equilibrium electrical conductivity of (Ba1-xCax)TiO3 and (BaTiO3 + xCaO)
with x = 0.5 mol% and 2 mol% at 1000 °C. (b) Equilibrium electrical
conductivities at 800 °C and 1000 °C of (BaTiO3 + xCaO) and Ba(Ti1-xCax)O3
with x = 2 mol %. Reproduced with permission from [54]. ................................... 20
Figure 2.8 Mg concentration-dependent room temperature electrical resistivities of
Mg-doped BaTiO3 sintered in different oxygen partial pressures. Reproduced
with permission from [60]. ................................................................................... 21
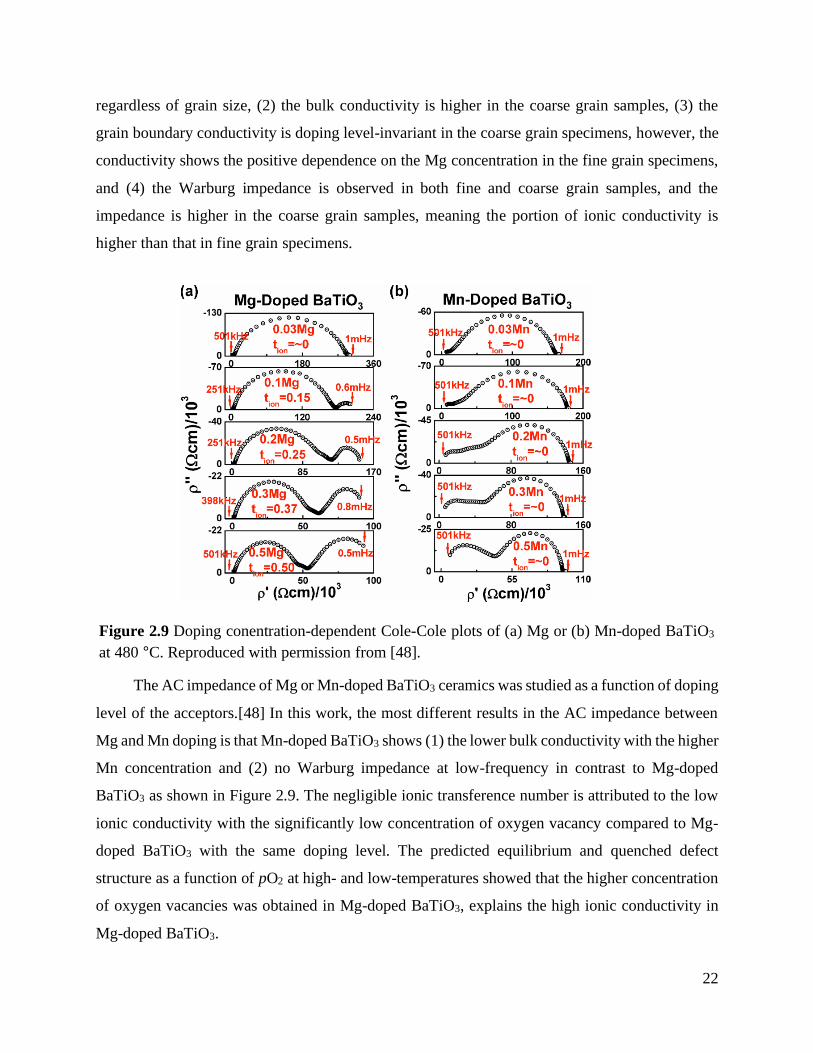
Figure 2.9 Doping conentration-dependent Cole-Cole plots of (a) Mg or (b) Mn-doped
BaTiO3 at 480 °C. Reproduced with permission from [48] ................................... 22
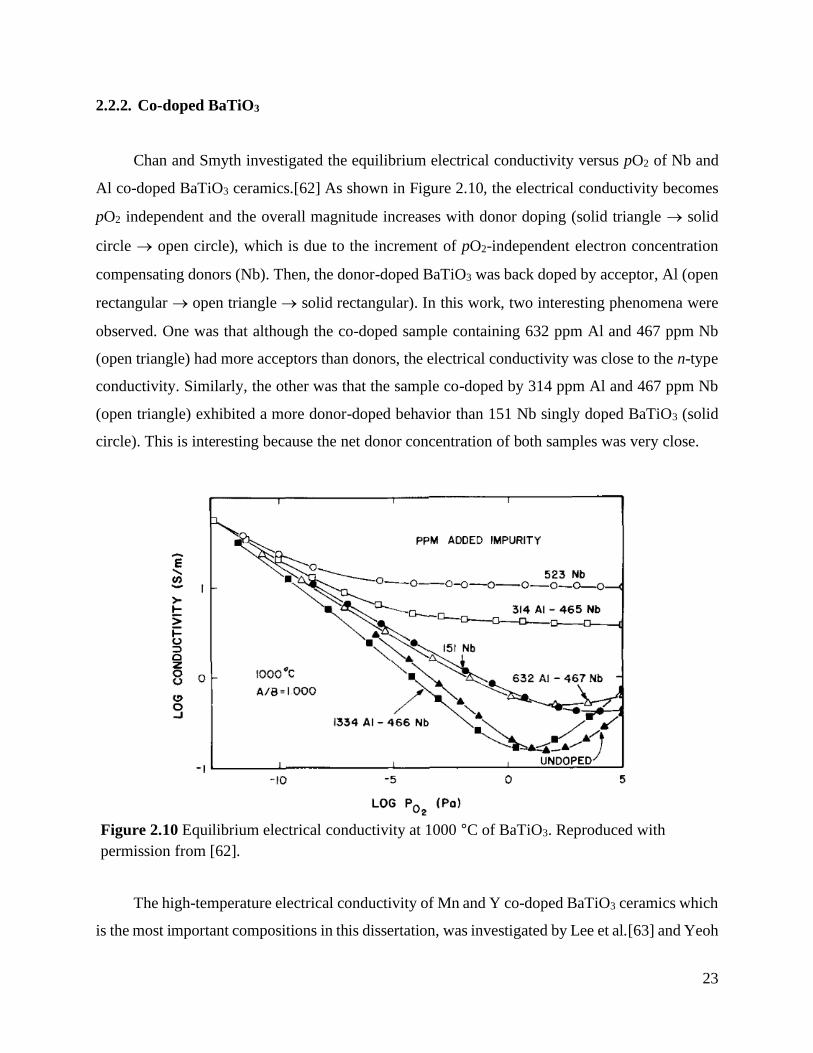
Figure 2.10 Equilibrium electrical conductivity at 1000 °C of BaTiO3. Reproduced with
permission from [62] ............................................................................................ 23
viii
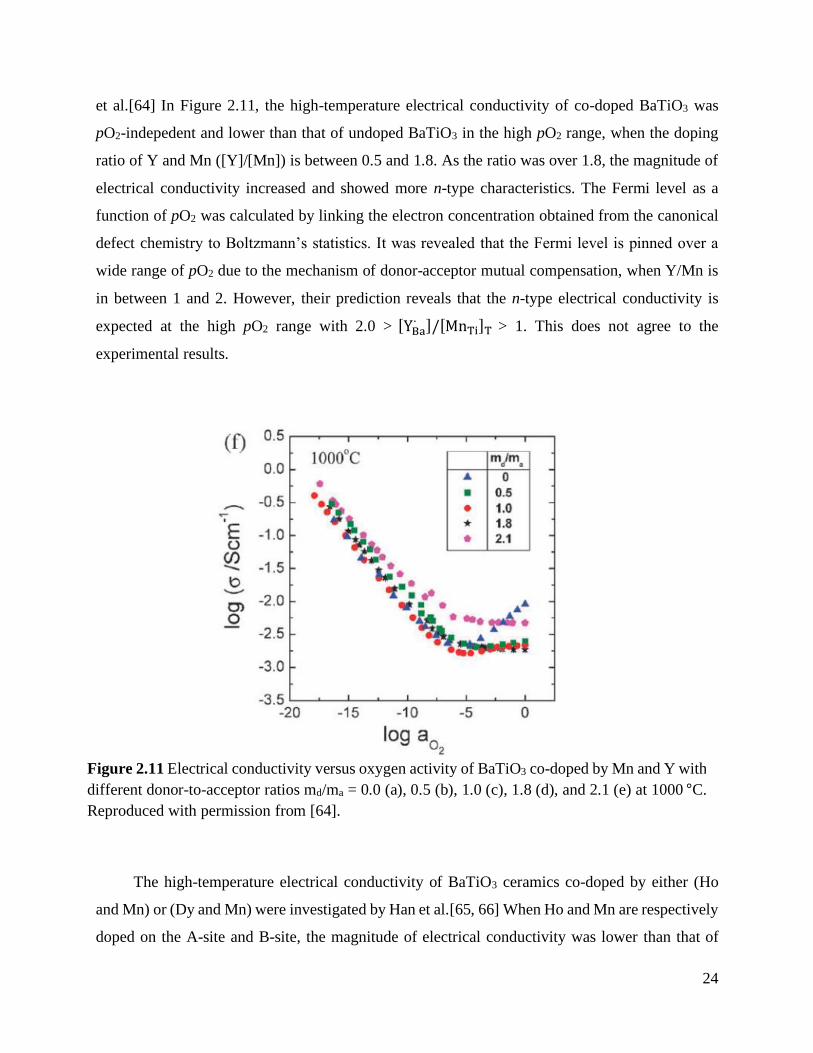
Figure 2.11 Electrical conductivity versus oxygen activity of BaTiO3 co-doped by Mn and Y
with different donor-to-acceptor ratios md/ma = 0.0 (a), 0.5 (b), 1.0 (c), 1.8 (d),
and 2.1 (e) at 1000 °C. Reproduced with permission from [64]. ............................ 24
Figure 2.12 (a) Equilibrium electrical conductivities of BaTiO3 co-doped with (a) Ho and Mn
(b) Dy and Mn at 1200 °C. Reproduced with permission from [65,66].................. 25
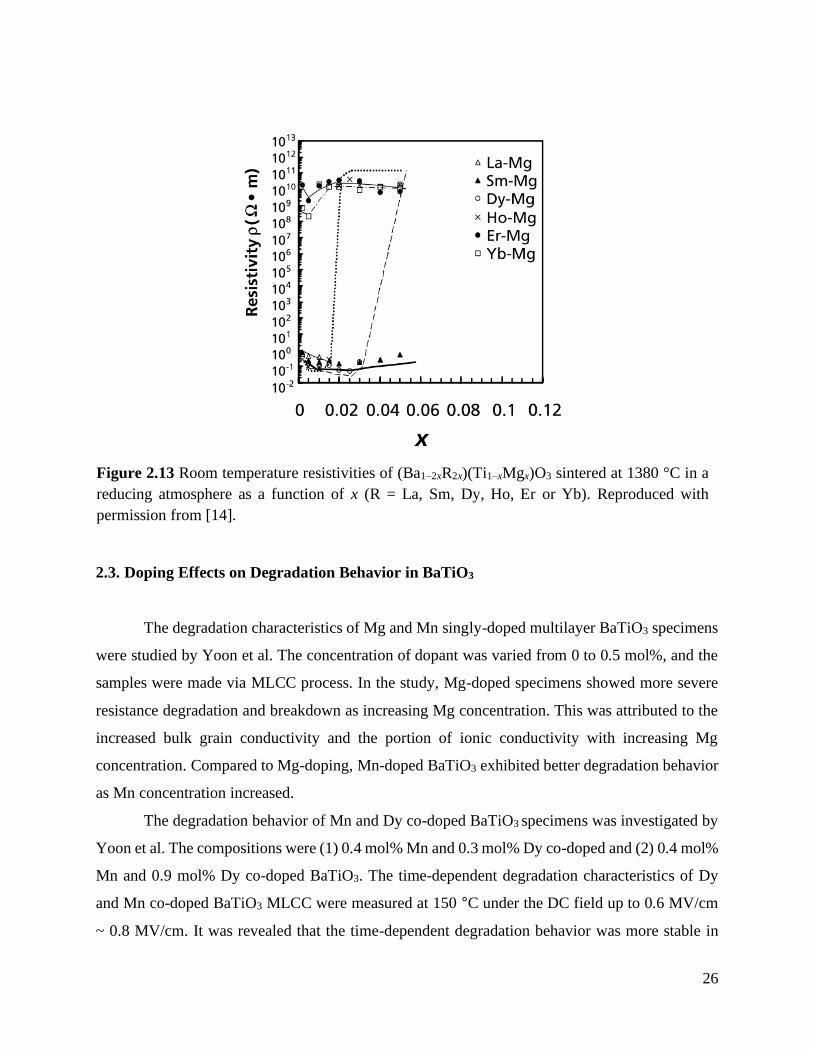
Figure 2.13 Room temperature resistivities of (Ba1–2xR2x)(Ti1–xMgx)O3 sintered at 1380 °C in a
reducing atmosphere as a function of x (R = La, Sm, Dy, Ho, Er or Yb).
Reproduced with permission from [14]. ................................................................ 26
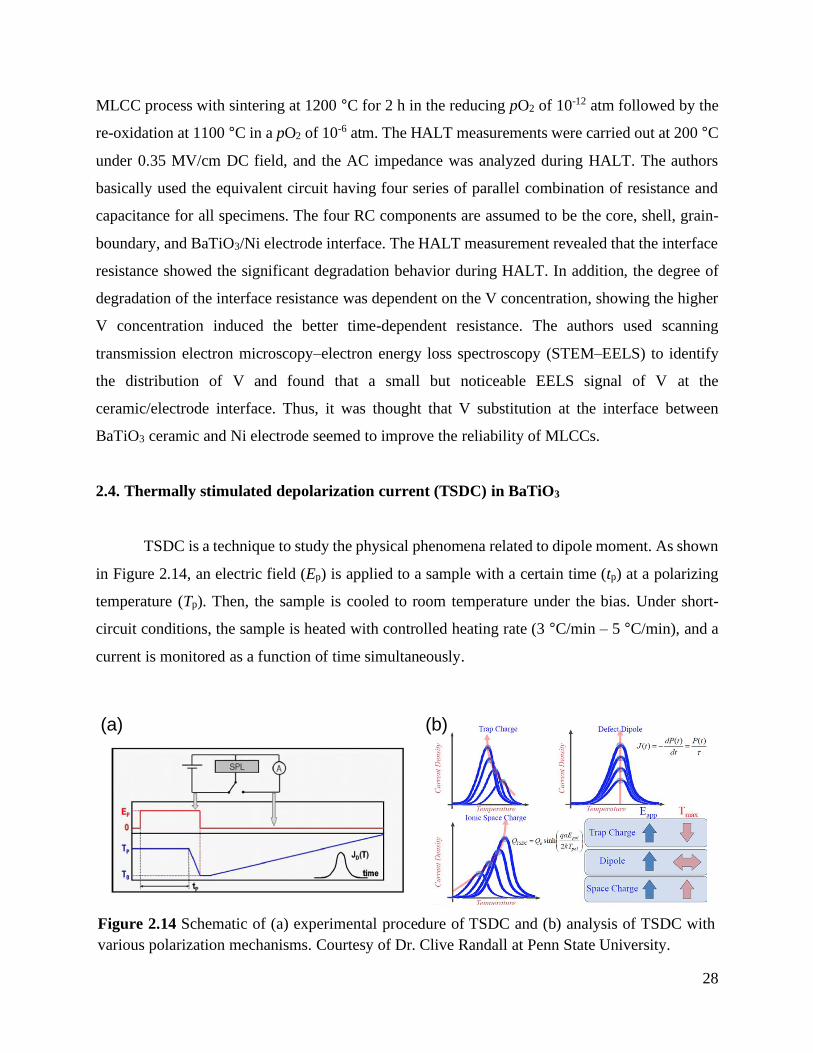
Figure 2.14 Schematic of (a) experimental procedure of TSDC and (b) analysis of TSDC with
various polarization mechanisms. Courtesy of Dr. Clive Randall at Penn State
University. ........................................................................................................... 28
Figure 2.15 TSDC spectrum of undoped BaTiO3. Reproduced with permission from [69] ....... 29
Figure 2.16 TSDC plots in Mg-doped BaTiO3 ceramics with Mg concentration of (a) 0.003
mol%, (b) 0.01 mol% (c) 0.03 mol% (d) 0.06 mol% (e) 0.1 mol%. (f) Comparison
of same magnitude of TSDC peaks of lowest (0.003 mol%) and highest Mg
concentration (0.1 mol%) of Mg-doped BaTiO3 ceramics. Reproduced with
permission from [70] ............................................................................................ 30
Figure 2.17 TSDC plots for Mn-doped BaTiO3 MLCC with (a) 0.2 mol% Mn, (b) 0.35 mol%
Mn and (c) 0.5 mol% Mn. Reproduced with permission from [72] ....................... 31
Figure 2.18 TSDC plots for Mn and V co-doped BaTiO3 MLCC with (a) 0.2 mol% Mn and
0.1 mol% V, (b) 0.2 mol% Mn and 0.3 mol% V, and (c) 0.4 mol% and
0.3 mol% V. Reproduced with permission from [73] ............................................ 32
Figure 3.1 Comparison of (a) four-point and two-point-probe DC conductivities and (b)
contact and sample resistances in Fe-doped β-Ga2O3 single crystal at different
temperature in air. ................................................................................................ 36
Figure 3.2 (a) Top view of Fe-doped (010) β-Ga2O3 single crystal and sputtered Pt electrodes
the black arrow indicates the measurement direction (b) time-dependent four-wire
resistance with a change in pO2 at a given temperature. ........................................ 37
Figure 4.1 Time-dependent DC electrical conductivity at various oxygen partial pressure in
(a) Mg-doped BaTiO3 and (b) Mn-doped BaTiO3 at 900 °C.................................. 43
Figure 4.2 DC electrical conductivity as a function of oxygen partial pressure in Mg or Mn-
doped BaTiO3 at (a) 900 °C and (b) 500 °C. ................................................................... 44
ix
Figure 4.3 (a) Cole-Cole plot of Mn-doped BaTiO3 as a function of temperature. (b) High-
frequency arc and (c) corresponding imaginary part of modulus and real part of
relative permittivity at 300 °C............................................................................... 47
Figure 4.4 Real part of relative permittivity at various temperature in (a) Mg-doped and (b)
Mn-doped BaTiO3. Curie-Weiss fitting in (c) Mg-doping and (d) Mn-doping. ...... 49
Figure 4.5 Observed and fitted Cole-Cole plots of (a) Mg-doped BaTiO3 and (b) Mn-doped
BaTiO3 at 500 °C. ................................................................................................ 50
Figure 4.6 Observed and simulated AC formalisms of (a) Mg-doped BaTiO3 and
(b) Mn-doped BaTiO3 at 500 °C. .......................................................................... 51
Figure 4.7 Temperature-dependent DC and AC electrical conductivities of (a) Mg-doped
BaTiO3 and (b) Mn-doped BaTiO3 in air. .......................................................................... 52
Figure 5.1 DC electrical conductivity as a function of oxygen partial pressure in doped
BaTiO3 with 0.1 mol% Ti-rich at (a) 900 °C and (b) 500 °C. (c) The comparison
of high-temperature DC electrical conductivity with respect to the amount of Ti-
excess. .................................................................................................................. 59
Figure 5.2 Observed and fitted Cole-Cole plots of (a) Mg-doped (b) Mn-doped (c) (Mg+Y)
co-doped and (d) (Mn+Y) co-doped BaTiO3 at 500 °C in air. Note that the real
and imaginary parts of impedance were scaled by the sample geometry for the
direct comparison of impedance magnitudes. ........................................................ 61
Figure 5.3 Curie-Weiss law fitting in (a) Mg-doped (b) Mn-doped (c) (Mg+Y) co-doped and
(d) (Mn+Y) co-doped BaTiO3. ............................................................................. 62
Figure 5.4 Temperature-dependent bulk conductivities, extracted from impedance spectra,
and activation energies in air. ............................................................................... 63
Figure 5.5 Time-dependent current density at 500 °C under (a) 10 V/cm and (b) 45 V/cm
DC electric field. .................................................................................................. 64
Figure 5.6 Predicted concentration of (a) oxygen vacancy, (b) cation vacancy, and
(c) electronic charge carrier at 900 °C in (Mg+Y) co-doped BaTiO3 with [YBa∙ ]/[MgTi
′′ ] = 0, 0.5, 1.0, 1.5, and 2.0. ............................................................... 67
Figure 5.7 Predicted defect concentration of (a) oxygen vacancy, (b) neutral and ionized Mn,
and (c) electron and hole in (Mn+Y) co-doped BaTiO3 with [YBa∙ ]/[MnTi]𝑇 = 0,
0.5, 1.0, 1.5, and 2.0. at 900 °C. ............................................................................ 69
Figure 5.8 Predicted defect concentration of (a) oxygen vacancy and (b) electron and hole in
(Mn+Y) co-doped BaTiO3 with [YBa∙ ]/[MnTi]𝑇 = 0, 0.5, 1.0, 1.5, and 2.0
at 500 oC. ............................................................................................................. 70
x
Figure 6.1 Electrical conductivity versus oxygen partial pressure in unintentionally doped β-
Ga2O3 polycrystalline. .......................................................................................... 73
Figure 6.2 (a) Cole-Cole plots versus temperature in air and capacitance and imaginary part
of modulus as a function of frequency at 500 °C in inset Figure. (b) Temperature-
dependent electrical conductivities obtained from the different techniques. .......... 76
Figure 6.3 Temperature dependent (a) carrier concentration and (b) mobility. ....................... 77
Figure 6.4 (a) Observed and calculated carrier concentrations versus temperature and (b)
predicted Fermi level. ........................................................................................... 79
Figure 6.5 (a) Oxygen partial pressure dependent DC electrical conductivity at various
temperature. (b) DC electrical conductivity versus temperature with change in
activation energy (inset Figure) at each pO2 condition. ......................................... 80
Figure 7.1 Temperature-dependent bulk conductivity of 0.5 mol% Mg-doped, 0.5 mol%
Mn-doped, (0.5 mol% Mg and 1.0 mol% Y) co-doped, and (0.5 mol% Mn and
0.5 mol% Y) co-doped BaTiO3 compositions in air. ............................................. 85
Figure 7.2 Temperature dependent bulk and grain-boundary conductivities of (a) 0.5 mol%
Mg-doped, (b) 0.5 mol% Mn-doped, (c) (0.5 mol% Mg and 1.0 mol% Y)
co-doped, and (d) (0.5 mol% Mn and 0.5 mol% Y) co-doped BaTiO3 in air. ......... 86
Figure 7.3 DC and AC electrical conductivities versus pO2 of (a) 0.5 mol% Mn-doped and
(b) (0.5 mol% Mn and 0.5 mol% Y) co-doped BaTiO3 at 500 °C. ......................... 87
1
Chapter 1
Introduction
This dissertation addresses the ionic and electronic defect chemistry of two important
dielectric materials, BaTiO3 ceramics and β-Ga2O3 single crystals. These dielectrics have very
different structural, thermal, and electrical properties, and are therefore used in different
application spaces. However, in some application areas there is a common need for these materials
to be electrically insulting over broad temperature and voltage ranges. Such high electrical
resistivity can be achieved by co-doping strategies, with both donor and acceptors, that limit
electronic conduction. The concept of mutual compensation of donors and acceptors is used in
common semiconductors of single crystal or thin film materials to pin the Fermi level.[1] This
process is not as straightforward in typical ceramic materials due to the fact that charge
compensating mechanisms are more complex in ceramics, which largely results from lower
chemical purity and the multitude of possible intrinsic lattice defects in more complex crystal
structures. Moreover, the intrinsic defect chemistry and Fermi level are also strongly modified as
oxides equilibrate with the external oxygen activity (which can vary by at least six orders of
magnitude during the processing and application of a typical BaTiO3 commercial capacitor). Thus,
systematic doping approaches are necessary for BaTiO3 ceramics to engineer their electrical
conductivity. In addition to the basic electrical insulating properties of a dielectric, the stability of
the resistivity under applied fields is equally important. In general, dielectric degradation, or a
time-dependent increase in leakage current, is associated with the electromigration of charged
intrinsic point defects in the material. Thus, it is essential that doping strategies limit the ionic
lattice defect concentrations in addition to the electronic carrier concentrations, i.e. both the ionic
and electronic conductivities must be minimized. This dissertation aims to understand electrical
conduction mechanisms in BaTiO3 ceramics and β-Ga2O3 single crystals with doping or co-doping
strategies. This goal of the research is to improve the electrical insulating properties and electrical
degradation resistance of BaTiO3 ceramics. Various measurement techniques such as direct current
2
(DC) conductivity, alternating current (AC) impedance spectroscopy, and Hall conductivity are
utilized to characterize the electrical conductivity as a function of oxygen partial pressure (pO2)
and temperature to understand the defect chemistry of the materials and the effects of acceptor and
donor co-doping.
1.1. General Background
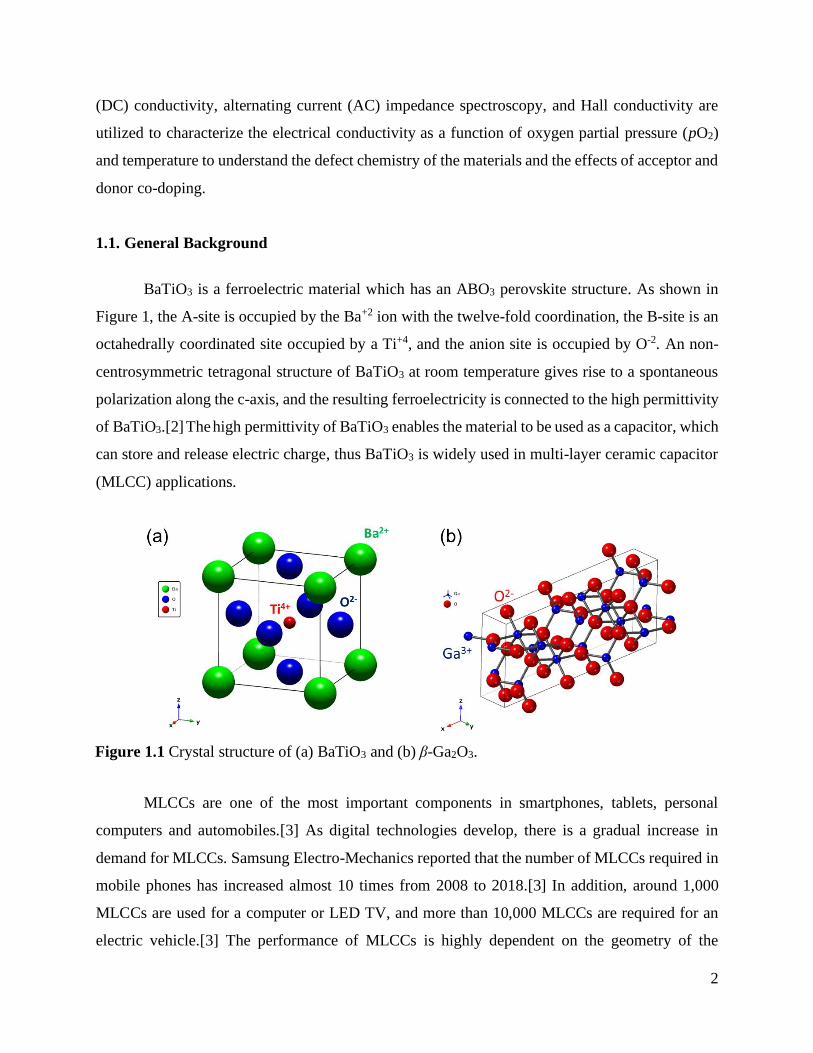
BaTiO3 is a ferroelectric material which has an ABO3 perovskite structure. As shown in
Figure 1, the A-site is occupied by the Ba+2 ion with the twelve-fold coordination, the B-site is an
octahedrally coordinated site occupied by a Ti+4, and the anion site is occupied by O-2. An non-
centrosymmetric tetragonal structure of BaTiO3 at room temperature gives rise to a spontaneous
polarization along the c-axis, and the resulting ferroelectricity is connected to the high permittivity
of BaTiO3.[2] The high permittivity of BaTiO3 enables the material to be used as a capacitor, which
can store and release electric charge, thus BaTiO3 is widely used in multi-layer ceramic capacitor
(MLCC) applications.
MLCCs are one of the most important components in smartphones, tablets, personal
computers and automobiles.[3] As digital technologies develop, there is a gradual increase in
demand for MLCCs. Samsung Electro-Mechanics reported that the number of MLCCs required in
mobile phones has increased almost 10 times from 2008 to 2018.[3] In addition, around 1,000
MLCCs are used for a computer or LED TV, and more than 10,000 MLCCs are required for an
electric vehicle.[3] The performance of MLCCs is highly dependent on the geometry of the
Figure 1.1 Crystal structure of (a) BaTiO3 and (b) β-Ga2O3.
3
capacitor that is composed of many layers of dielectric and inner electrodes. The capacitance, C,
of a MLCC is given by:
𝐶 = 휀0휀𝑟(𝑛 − 1)𝐴
𝑑 (1.1)
where 휀0 is the permittivity of vacuum, 휀𝑟 is the relative permittivity of dielectric, n is the number
of stacked inner electrodes, A is the area of electrode, and d is the thickness of the dielectric layers.
It is apparent from Eq. (1.1) that the capacitance of an MLCC can be increased by increasing the
number of dielectric layers, decreasing the thickness of the dielectric layers or increasing the
relative permittivity of the dielectric. Other ferroelectric materials such as (Bi,Na)TiO3-BaTiO3,
(Na,K)NbO3, and Pb(Zr,Ti)O3 based-perovskite materials can be also used for class 2 MLCCs
which requires a broad capacitance tolerances and a high permittivity. However, BaTiO3 is the
most appropriate material for class 2 MLCCs due to its high dielectric permittivity, good
operational temperature, and its eco-friendly components compared to Pb-based ferroelectric
materials.[3]
Monoclinic β-Ga2O3 is the most thermodynamically stable phase of Ga2O3 in the
temperature range of 25 °C – 1800 °C relative to the four other polymorphs of Ga2O3,
rhombohedral (α), defective spinel (γ), cubic (δ) and orthorhombic (ε).[4] The monoclinic structure
of β-Ga2O3 is relatively complex as shown in Figure 1.1(b). There are two different Ga lattice sites
and three different lattice sites for oxygen. One Ga is octahedrally and the other Ga is tetrahedrally
coordinated by oxygen.[5] β-Ga2O3 has the C2/m space group with lattice parameters a, b, c, and
β are respectively 12.12 – 12.34 (Å ), 3.03 – 3.04 (Å ), 5.80 – 5.87 (Å ), and 103.83 (°).[6]
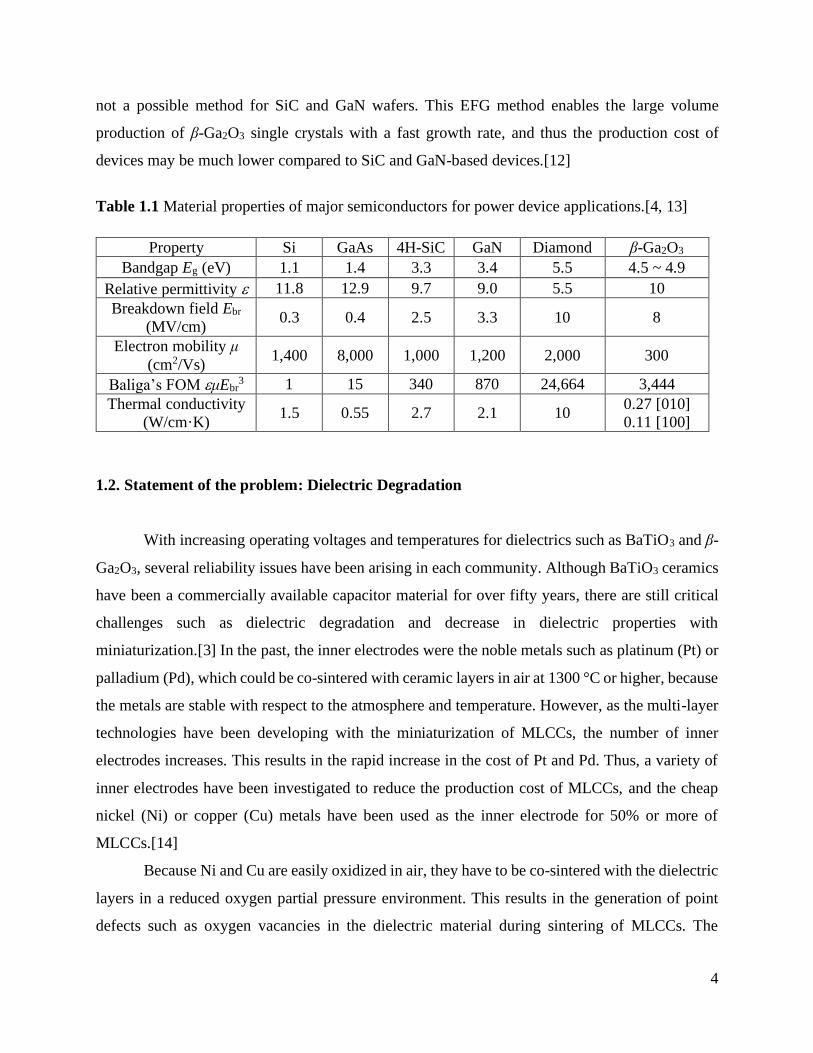
β-Ga2O3 has great advantages for power electronic devices such as transistors and diodes.
The band gap is wide between 4.5 and 4.9 eV,[7–9] the electron density can be engineered in the
range of 1015 ~ 1019 /cm3 by Si and Sn doping,[7, 9, 10] and the estimated breakdown field is very
large, 8 MV/cm.[11] In Table 1.2, various physical properties of major semiconductors are
compared. The Baliga figure of merit (BFOM) defines basic material parameters showing how
suitable a material is for power devices, and the higher value indicates the better performance.
Although SiC and GaN have attracted attention as key materials for high-efficiency power devices
in the near future, β-Ga2O3 was proposed to be another promising candidate due to the relatively
high BFOM.[4] In addition, Kuramata et al. has successfully grown high-quality β-Ga2O3 single
crystals from a melt source using the edge-defined film-fed growth (EFG) method,[12] which is
4
not a possible method for SiC and GaN wafers. This EFG method enables the large volume
production of β-Ga2O3 single crystals with a fast growth rate, and thus the production cost of
devices may be much lower compared to SiC and GaN-based devices.[12]
Table 1.1 Material properties of major semiconductors for power device applications.[4, 13]
Property Si GaAs 4H-SiC GaN Diamond β-Ga2O3
Bandgap Eg (eV) 1.1 1.4 3.3 3.4 5.5 4.5 ~ 4.9
Relative permittivity 11.8 12.9 9.7 9.0 5.5 10
Breakdown field Ebr
(MV/cm) 0.3 0.4 2.5 3.3 10 8
Electron mobility μ
(cm2/Vs) 1,400 8,000 1,000 1,200 2,000 300
Baliga’s FOM μEbr3 1 15 340 870 24,664 3,444
Thermal conductivity
(W/cm·K) 1.5 0.55 2.7 2.1 10
0.27 [010]
0.11 [100]
1.2. Statement of the problem: Dielectric Degradation
With increasing operating voltages and temperatures for dielectrics such as BaTiO3 and β-
Ga2O3, several reliability issues have been arising in each community. Although BaTiO3 ceramics
have been a commercially available capacitor material for over fifty years, there are still critical
challenges such as dielectric degradation and decrease in dielectric properties with
miniaturization.[3] In the past, the inner electrodes were the noble metals such as platinum (Pt) or
palladium (Pd), which could be co-sintered with ceramic layers in air at 1300 °C or higher, because
the metals are stable with respect to the atmosphere and temperature. However, as the multi-layer
technologies have been developing with the miniaturization of MLCCs, the number of inner
electrodes increases. This results in the rapid increase in the cost of Pt and Pd. Thus, a variety of
inner electrodes have been investigated to reduce the production cost of MLCCs, and the cheap
nickel (Ni) or copper (Cu) metals have been used as the inner electrode for 50% or more of
MLCCs.[14]
Because Ni and Cu are easily oxidized in air, they have to be co-sintered with the dielectric
layers in a reduced oxygen partial pressure environment. This results in the generation of point
defects such as oxygen vacancies in the dielectric material during sintering of MLCCs. The
5
vacancies are compensated by two electrons, which become a major electrically conducting
species at room temperature, in turn, making the capacitors electrically conductive. Therefore, the
incorporation of acceptors has been widely used to compensate for the excess electrons arising
from the oxygen vacancies. This enables the MLCCs to maintain electrically insulting properties
at room temperature.
Since the dielectric layers in MLCCs are on the order of a few micron, a typical operation
voltage of a few V causes tens of kV/cm electric field within the dielectric layer, eventually
initiating electrical degradation (an increase in leakage current) of the MLCC. The phenomenon is
regarded as a significant issue in the capacitor community and a lot of studies have been conducted
to understand the fundamental mechanisms of degradation in perovskite capacitors.[15–20] The
time-dependent degradation has been attributed to the electromigration of point defects such as
charged oxygen vacancies under simultaneous temperature and DC field stress, which results in
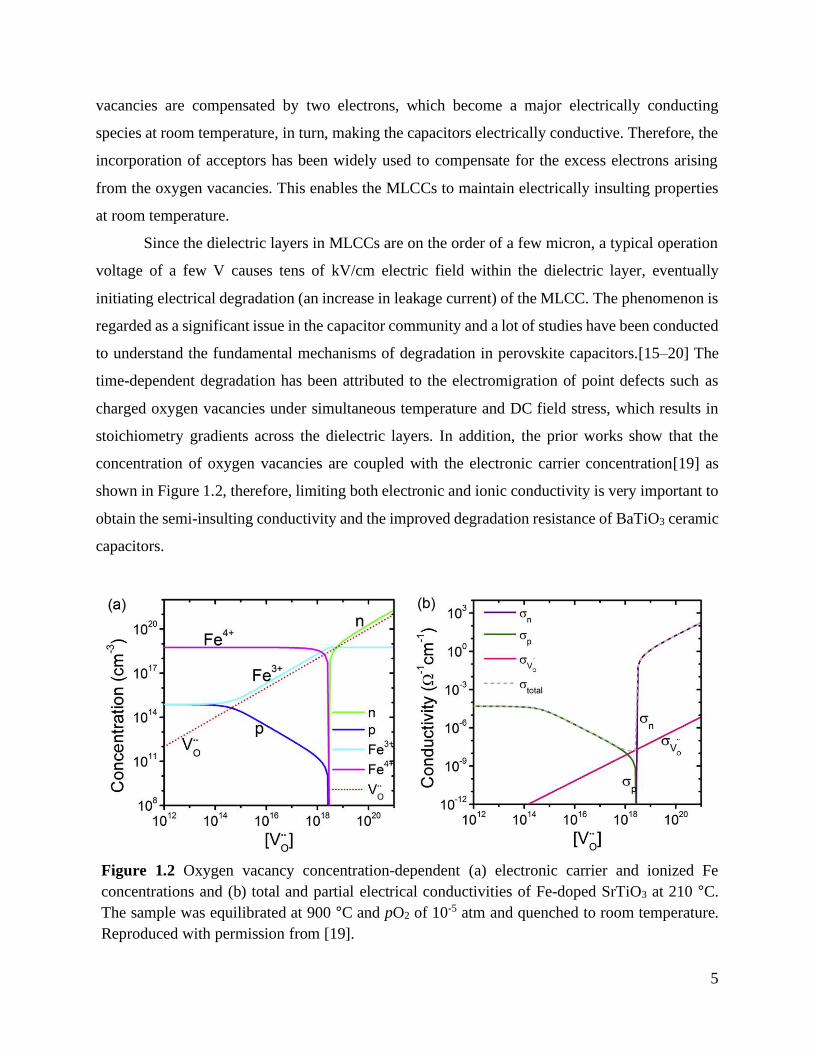
stoichiometry gradients across the dielectric layers. In addition, the prior works show that the
concentration of oxygen vacancies are coupled with the electronic carrier concentration[19] as
shown in Figure 1.2, therefore, limiting both electronic and ionic conductivity is very important to
obtain the semi-insulting conductivity and the improved degradation resistance of BaTiO3 ceramic
capacitors.
Figure 1.2 Oxygen vacancy concentration-dependent (a) electronic carrier and ionized Fe
concentrations and (b) total and partial electrical conductivities of Fe-doped SrTiO3 at 210 °C.
The sample was equilibrated at 900 °C and pO2 of 10-5 atm and quenched to room temperature.
Reproduced with permission from [19].
6
Understanding and controlling the degradation behavior is important not only in the
ceramic community but also in the semiconductor community. The high-power devices based on
β-Ga2O3 generally experience a high electric field during their operation at elevating temperature.
Even though β-Ga2O3 has a high breakdown field, time-dependent degradation may still be of
concern. However, there are only a few studies on high-temperature equilibrium defect
chemistry,[21–25] and any investigations of time-dependent degradation are not reported yet.
Recently, many investigations have been conducted to determine the electrical conduction
mechanism of n-type Si or Sn doped β-Ga2O3. It was concluded that the electrical conductivity of
n-type β-Ga2O3 is highly influenced by the extrinsic factors such as background impurities and
doping concentration.[5, 10, 26–29] However, these studies were mostly conducted at a low-
temperature range where the role of lattice point defects cannot be fully understood. In addition, a
clear understanding of an electrical conduction mechanism in semi-insulating β-Ga2O3 has not yet
been established.
1.3. Objectives
In both BaTiO3 ceramics and β-Ga2O3 single crystals, it is important to understand the
fundamentals of electrical conduction mechanisms and defect chemistry to improve the insulating
properties and degradation resistance and the lifetime of devices. Electrical conductivity at room
temperature is highly dependent on the sample’s processing history, i.e. sintering conditions,
dopants types, and their doping level. Thus, the high-temperature equilibrium conductivity as a
function of oxygen partial pressure, temperature and doping chemistry should be systematically
established. The objectives of this dissertation are to develop a fundamental understanding of
electrical conductivity and the role of doping or co-doping in BaTiO3 and β-Ga2O3. Temperature-
dependent DC electrical conductivity is measured as a function of time and oxygen partial pressure
to realize the equilibrium and partial equilibrium defect chemistry. In addition, the AC impedance
characteristics are measured over a wide range of temperatures to understand the frequency-
dependent bulk and grain-boundary characteristics. Moreover, time-dependent current densities of
doped systems were compared to identify the role of dopants in degradation characteristics.
In Chapter 2, the point defect chemistry of BaTiO3 is reviewed from a canonical mass-
action perspective. In addition, the high-temperature equilibrium electrical conductivities of
7
BaTiO3 and β-Ga2O3 are reviewed and discussed in terms of defect chemistry. In a few cases,
studies on the temperature-dependent AC impedance of BaTiO3 are reviewed for better
understanding of low-temperature partial equilibria in which only a subset of the point defects can
kinetically equilibrate with the external atmosphere. Furthermore, literature about the degradation
behavior and thermally stimulated depolarization current (TSDC) are reviewed for BaTiO3, which
gives further insight into the defect chemistry and its evolution under an applied electric voltage.
In Chapter 3, the experimental methods for processing BaTiO3 ceramics and the basic
information of the Fe-doped (010) β-Ga2O3 are discussed, and the procedures for the DC and AC
electrical measurements are explained. Moreover, the mathematical calculations for predicting the
defect concentration are included with Matlab code.
In Chapter 4, the electrical conductivity of BaTiO3 is explored with respect to the type of
acceptor dopant between single-valent Mg or multivalent Mn. The p-type electrical conductivity
of both compositions is discussed in terms of defect chemistry. In addition, the DC and AC
electrical characterization reveals that the total electrical conductivity of BaTiO3 is limited by the
bulk conductivity in the high-temperature regime and grain-boundary conductivity in the low-
temperature regime. This Chapter sets the stage for the co-doping studies.
In Chapter 5, co-doping strategies are applied to improve the bulk electrical resistance and
degradation resistance of BaTiO3 with co-dopants of either (Mg and Y) or (Mn and Y). Similar to
Chapter 5, the various DC and AC electrical characterizations are conducted to explore the co-
doping effects on the electrical conductivity. Moreover, the time-dependent degradation behavior
is compared the evaluate the relative effectiveness of the two different co-dopants. It is
demonstrated that the (Mn and Y) co-doping is much more effective relative to (Mg and Y) co-
doping for improving the degradation resistance of BaTiO3.
In Chapter 6, the origin of semi-insulating electrical properties of Fe-doped (010) β-Ga2O3
are investigated using the DC, AC, and Hall techniques. In this study a largely pO2-independent
high-temperature electrical conductivity is measured. The behavior is attributed to the low
electronic conductivity with low concentration of intrinsic point defects.
In Chapter 7, the overall conclusions of the dissertation and several important future works
are discussed.
8
Chapter 2
Background and Literature Review
2.1. Defect chemistry in BaTiO3
Understanding point defect chemistry have brought many useful insights to interpret
electrical conductivity of oxide materials. The predictions of defect structures have been studied
by the theoretical approaches such as canonical defect-modelling[19, 30, 31] and density-
functional theory (DFT) calculations.[18, 32–36] Canonical defect-chemistry modelling is based
on numerous defect chemical reactions and the laws of mass action, where the system is
constrained by the charge neutrality condition. By fitting a defect model to experimental
measurements, thermodynamic parameters associated with the various defect reactions can be
inferred. Several authors have investigated the possible defect reactions for BaTiO3[37–46] by
measuring the high-temperature equilibrium electrical conductivity. The thermodynamic
parameters for corresponding defect reactions were obtained by fitting the observed electrical
conductivity using Brower approximations, i.e. simplified defect models that consider only the
dominant defects over certain ranges of oxygen activity. The obtained parameters have been used
to further construct the low-temperature quenched defect chemistry.[47, 48] In the following, the
possible defect reactions in BaTiO3 are introduced with mass action law and charge neutrality
conditions expressed in the Kröger-Vink notation, and the thermodynamic parameters in literature
are reviewed.
9
2.1.1. Electronic equilibrium
The generation of electrons and holes from the electronic equilibrium between valence and
conduction band can be written as:
null = e′ + h∙ (2.1)
The equilibrium constant, 𝐾i is:
𝐾i = 𝑛𝑝 = 𝐾i0exp (−
∆𝐸g
𝑘𝐵𝑇) = 𝑁C𝑁Vexp(−
∆𝐸g0 − 𝛽𝑇
𝑘𝐵𝑇) (2.2)
where n and p are a concentration of electron and hole, respectively. 𝐾i0 is a pre-exponential factor,
∆𝐸g is a band gap energy, 𝑁C and 𝑁V are respectively an effective density of state in conduction
band and valence bands, ∆𝐸g0 is a band gap at 0 K, 𝛽 is a temperature coefficient of the band gap,
𝑘𝐵 is the Boltzmann constant and 𝑇 is a temperature.
The band gap and the pre-exponential term can be obtained by measuring temperature-
dependent electrical conductivity near the n-p transition point in the electrical conductivity versus
pO2 measurements. In the n-p transition point, if the ionic conductivity (σion) is constant or
negligible, the electron and hole concentration (n and p) have a simple relation with a Ki term as
shown in Eq. 2.2. By knowing the ionic conductivity and electron and hole mobilities, the
temperature-dependent Ki can be evaluated.
2.1.2. Oxygen exchange reaction
The oxygen exchange reaction in BaTiO3 can be written as a reduction reaction:
OO× = VO
∙∙ + 2e′ +1
2O2(g) (2.3)
The equilibrium constant is:
𝐾Re = [VO∙∙]𝑛2𝑃O2
1 2⁄ = 𝐾Re0 exp (−
∆𝐻Re𝑘𝐵𝑇
) (2.4)
10
where 𝐾Re0 is a pre-exponential factor, ∆𝐻Re is an enthalpy of the reduction reaction, i.e. the
formation energy of oxygen vacancies. In Eq 2.4, the pre-exponential factor and the formation
energy can be evaluated by knowing the concentration of electron and oxygen vacancy as a
function of temperature in a very low pO2 regime with mobility terms.
2.1.3. Full Schottky reaction
By the definition of Schottky reaction, the full Schottky defect reaction in BaTiO3 entails
the formation of Ba and Ti vacancies and anion O vacancy simultaneously:
BaTiO3 = VBa′′ + VTi
′′′′ + 3VO∙∙ (2.5)
The equilibrium constant can be expressed as:
𝐾S = [VBa′′ ][VTi
′′′′][VO∙∙]3 = 𝐾S
0 exp (−∆𝐻S𝑘𝐵𝑇
) (2.6)
where 𝐾S0 is a pre-exponential factor, ∆𝐻S is an formation enthalpy of the full Schottky reaction.
Nowotny obtained the equilibrium constant of the full Schottky reaction of the undoped and
acceptor doped BaTiO3 compositions by fitting the high-temperature electrical conductivity in the
high pO2 range.[49] Yoon et al. calculated the formation energy of the full Schottky defects in Nb-
doped BaTiO3 ceramics,[50] and used Brower approximations in the intermediated pO2 range
where the extrinsic Nb donors are assumed to be compensated by the full Schottky defects. These
values are summarized in Table 2.1.
2.1.4. Partial Schottky reaction
The partial Schottky defect reaction is determined by the cation nonstoichiometry in
BaTiO3. In Ti-rich BaTiO3, since the Ti, Ba and O lattice site ratios must remain 1:1:3, the partial
Schottky defect generates Ba and O vacancies as expressed by:
TiO2BaTiO3→ TiTi
× + 2OO× + VBa
′′ + VO∙∙ (2.7)
11
The equilibrium constant for this reaction is:
𝐾PS,Ti = [VBa′′ ][VO
∙∙] = 𝐾PS,Ti0 exp (−
∆𝐻PS,Ti𝑘𝐵𝑇
) (2.8)
where 𝐾PS,Ti0 is a pre-exponential factor, ∆𝐻PS,Ti is an enthalpy of the partial Schottky reaction. It
is important to note that this partial Schottky reaction occurs within the solubility regime. Once
the solubility limit of TiO2 is exceeded, secondary phase such as BaTi2O5 or Ba6Ti17O40 is formed.
In the case of Ba-rich BaTiO3 compositions, the TiO2 partial Schottky defect is expected:
BaOBaTiO3→ BaBa
× + OO× + VTi
′′′′ + 2VO∙∙ (2.9)
The equilibrium constant in an ideal solution is:
𝐾PS,Ba = [VTi′′′′][VO
∙∙]2 = 𝐾PS,Ba0 exp (−
∆𝐻PS,Ba𝑘𝐵𝑇
) (2.10)
where 𝐾PS,Ba0 is a pre-exponential factor, and ∆𝐻PS,Ba is an enthalpy of the partial Schottky
reaction. Again, the reaction occurs in the solubility regime of BaO into BaTiO3, and if the excess
of BaO exceeds the solubility, then secondary phases such as Ba2TiO4 will form.
The formation enthalpy in the full Schottky and partial Schottky reactions have been rarely
investigated compared to other point defects. Lee et al. utilized theoretical and experimental
approaches to obtain the formation energy of the full Schottky and partial Schottky defects in the
nonstoichiometric high purity undoped BaTiO3 ceramics.[37] This approach was based on the
observation of phase solubility limit between the pure BaTiO3 and the secondary phases either
BaTi2O5 and Ba6Ti17O40 on Ti-rich side or Ba2TiO4 and Ba1.054Ti0.946O2.946 on Ba-rich side.
The various pre-exponential factors and enthalpies of defect reaction are summarized in
Table 2.1. Literature reviews reveal that an equilibrium constant for corresponding specific defect
reaction can be different even in the same doping system. This is probably due to the different
background impurity concentration and the assumptions for the defect model and the mobility
terms that the authors made.
12
Table 2.1 Pre-exponential factor and enthalpy of defect reactions. Bolded values were used for
calculations in sections 2.1.5 and 5.4.
Defect reaction Experimental
condition
Pre-exponential factor
(K0)
Enthalpy
(eV) Ref.
Electronic
equilibrium
Undoped
1.06 × 1045 (cm-6) 3.15 ± 0.39 [38–40]
1.69 × 1045 (cm-6) 2.93 ± 0.23 [41]
𝟖. 𝟓𝟓 × 𝟏𝟎𝟒𝟒 (cm-6) 𝟐. 𝟗𝟏 [49]
Al-doped 2.28 × 1042 (cm-6) 2.15 ± 0.07 [42]
Mn-doped 1047.1 (cm-6) 3.41 [51]
6.8 × 1044 (cm-6) 2.90 [43]
Nb-doped 1045 (cm-6) 2.9 [44]
Reduction reaction
Undoped
7.15 × 1073 (cm-9·atm1/2) 5.80 ± 0.15 [41]
7.09 × 1070 (cm-9·atm1/2) 5.89 [51]
𝟏. 𝟎𝟔 × 𝟏𝟎𝟕𝟏
(cm-9·atm1/2) 𝟓. 𝟔𝟗 [49]
3.06 × 1077 (cm-9·atm1/2) 7.30 [45]
2.56 × 1071 (cm-9·atm1/2) 6.10 [44]
Acceptor-
doped 9.43 × 1072 (cm-9·atm1/2) 5.99 [46]
Al-doped 2.40 × 1074 (cm-9· atm1/2) 5.88± 0.17 [42]
Full Schottky
reaction
Undoped and
acceptor-doped 𝟑. 𝟒 × 𝟏𝟎𝟏𝟎𝟓 (cm-15) 2.795 [49]
Nb-doped 10116 (cm-15) 10.5 [50]
Undoped
(Ti-rich) - 3.33± 0.2
[37]
Undoped
(Ba-rich) - 3.48± 0.2
Partial Schottky
reaction
Undoped
(Ti-rich) - 2.32± 0.1
Undoped
(Ba-rich) - 2.89± 0.1
Ionization of Al
(AlTi× AlTi
′ + h∙) Al-doped 1.9 × 10²³ (cm-3) 1.04 [40]
Ionization of Mn
(MnTi× MnTi
′ + h∙)
Mn-doped
3.19 × 10²² (cm-3) 1.69 [43]
Ionization of Mn
(MnTi′ MnTi
× + e′) 3.2 × 10²² (cm-3) 1.72
[46] Ionization of Mn
(MnTi′′ MnTi
′ + e′) 0.8 × 10²² (cm-3) 1.12
13
2.1.5. Charge neutrality condition
The electroneutrality condition for the system, considering all point and electronic defects,
is expressed as a charge neutrality equation:
∑[Positive]𝑖𝑖=1
=∑[Negative]𝑗𝑗=1
(2.11)
Assuming no background impurities, the charge neutrality equation for BaTiO3:
𝑝 + [VO∙∙] +∑[D𝑥]𝑘
𝑘=1
= 𝑛 + [VTi′′′′] + [VBa
′′ ] +∑[A𝑦]𝑙𝑙=1
(2.12)
where [D𝑥] and [A𝑦] are the donor and acceptor concentrations, respectively and the x and y
indicate the possible charge states. From Eq. 7.2, 7.4, and 7.8, the charge neutrality equation can
be re-written as:
𝐾i𝑛+
𝐾Re
𝑛2𝑃O21 2⁄+∑[D𝑥]𝑘𝑘=1
= 𝑛 + 6(𝐾S
𝐾Re3)
1 2⁄
𝑛3𝑃O23 4⁄ +∑[A𝑦]𝑙
𝑙=1
(2.13)
By knowing the equilibrium constants and the doping level of acceptors and/or donors, the defect
concentrations can be predicted as a function of oxygen partial pressure at various temperatures.
Using the equilibrium constants of the reduction reaction, electronic equilibrium, and full Schottky
reaction obtained by Nowotny,[49] the full and partial equilibrium defect structures are predicted
in undoped BaTiO3 compositions and presented in Fig. 2.1. The details of mathematical calculation
can be found in Chapter 3.5. A few calculations were carried out to reproduce the prior calculation
by Nowotny[49] using the same temperature and pO2 condition, and they show a good agreement.
The full equilibrium defect concentrations as a function of pO2 are explored by solving Eq. 2.13
at the equilibrium temperature (TE = 1150 °C), below which the cation vacancies are assumed to
be immobile.[52] Then, the low-temperature (TQ = 1000 °C) quenched defect structures are
calculated through the Eq. 2.13 under the assumptions that the concentration of cation vacancy is
fixed from the high-temperature equilibration (TE = 1150 oC and pO2 = 0.21 atm) but that of the
14
electronic carriers (n and p) and oxygen vacancy are allowed to be fully equilibrated at TQ over
entire range of pO2.
Figure 2.1 shows the equilibrium and quenched defect concentrations of undoped BaTiO3.
In Figure 2.1(a), the equilibrium defect concentration at 1150 °C shows mainly three different pO2
regimes which are the highly reduced, intermediate, and relatively high pO2 regime. In the highly
reduced pO2 range (pO2 < 10-15 atm), the reduction reaction is the predominant defect reaction with
electrons as a major electrically conducting species. In the intermediate pO2 range (10-15 atm <
pO2 < 102 atm), the oxygen vacancies are ionically compensated by the cation vacancies. As
increasing pO2, the electron concentration decreases, while the hole concentration starts to
increase. The n-p transition position is located at around 10-6 atm of pO2. In oxidizing pO2 range
(pO2 > 102 atm), the oxygen vacancy concentration starts to decrease, and the holes becomes the
major charge carrier compensating the cation vacancies.
Figure 2.1(b) shows the partial equilibrium defect structure of undoped BaTiO3 in which
the cation concentration is frozen-in from the high-temperature equilibrium condition (1150˚C and
pO2 = 0.21 atm) to lower temperatures over the entire range of pO2. At 1000 °C, the ionic
compensation is observed over a wide range of oxygen partial pressure. When the pO2 is higher
than 10-8 atm, the hole concentration is higher than electron concentration, and therefore, a p-type
Figure 2.1 (a) Full equilibrium defect structure at 1150 °C and (b) partial equilibrium defect
structure at 1000 °C with the fixed cation vacancies equilibrated from the high-temperature
condition (1150˚C and pO2 = 0.21 atm) in undoped BaTiO3.
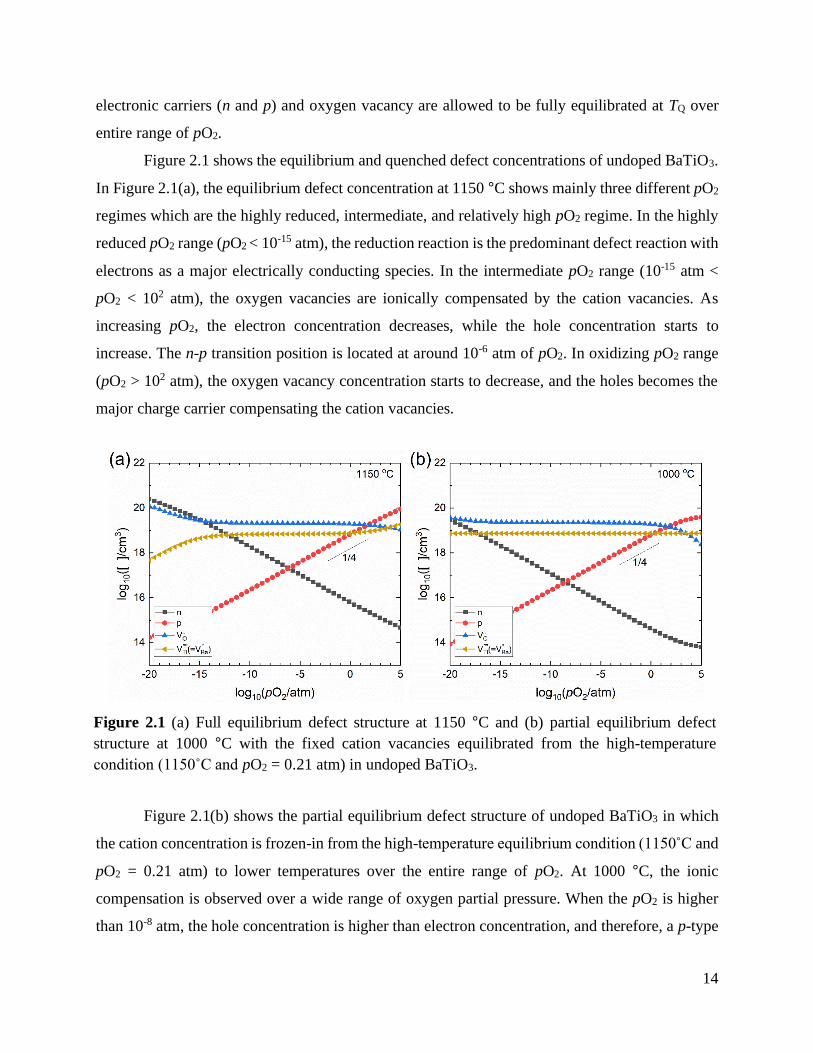
15
electrical conductivity is expected in these pO2 range, which is agreed to the electrical conductivity
measured by Nowotny.[53] The electrical conductivity of undoped BaTiO3 ceramics and single
crystal (open triangle) [53] at 1000 °C is summarized in Figure 2.2. It is worth noting that the
magnitude of electrical conductivity and the n-p transition point vary particularly in high pO2
range. This implies that purity and history of sample processing are important factors determining
the electrical conductivity in undoped BaTiO3.
The defect concentrations were further explored in single-valent acceptor-doped BaTiO3.
It was assumed that acceptors (doping level is 1020 /cm3) exclusively occupy the Ti-site and they
are doubly ionized, i.e. ATi′′ . In addition, the A/B was kept to 1:1, meaning that the full Schottky
reactions was included during calculation. Similar to undoped BaTiO3, the full and partial
equilibrium defect concentrations are shown in Figure 2.3. Although the overall full equilibrium
defect equilibria in Figure 2.3(a) is similar to that of undoped BaTiO3, two clear differences are
seen. One is that the oxygen vacancy concentration is mainly compensated by ATi′′ over the entire
ranger of pO2. The other is that there is a decrease in the concentration of Schottky defects. Because
the acceptors, which are negatively charged species, are intentionally doped in BaTiO3, the system
prefers to have less amount of negatively charged cation vacancies.
Figure 2.2 Electrical conductivity versos pO2 of undoped BaTiO3 ceramics and single crystals at
1000 °C.
16
The quenched defect concentration at 1000 °C is shown in Figure 2.2(b). Again, the p-type
electrical conductivity is expected in high pO2 range where the hole concentration is predominant.
In the entire range of pO2, the cation vacancy concentration is fixed by the high-temperature
equilibrium concentration at TE of 1150 oC and pO2 of 0.21 atm. In the case of oxygen vacancy
concentration, it is extrinsically fixed by acceptors whose level is 1020 /cm3 and is higher than that
in undoped BaTiO3. Thus, it is expected that acceptor-doped BaTiO3 show the ionic conductivity
at the intermediate pO2 range where the low electronic conductivity is expected due to the low
concentration of electrons and holes. This is more clearly seen as decreasing temperature where
electronic conductivity is reduced, while the ionic conductivity is fixed due to the constant number
of oxygen vacancies.[54]
It is apparent that the defect chemistry changes significantly by doping and equilibrium
and the oxygen partial equilibrium conditions. In the following sections, the experimental
conductivity results are reviewed in the various acceptor-doped and co-doped BaTiO3
compositions. In general, the high-temperature electrical conductivity can be well understood by
the canonical defect chemistry in simple acceptor-doped BaTiO3. In some cases, the developed
canonical defect models can predict only a portion of the comprehensive behavior of defect
concentrations.
Figure 2.3 (a) Equilibrium defect structure at 1150 °C and (b) partial equilibrium defect structure
at 1000 °C with the fixed cation vacancies (equilibrated at TE = 1150 oC and pO2 = 0.21 atm) in
single-valent acceptor-doped BaTiO3.
17
2.2. Electrical conductivity in BaTiO3
2.2.1. Acceptor-doped BaTiO3
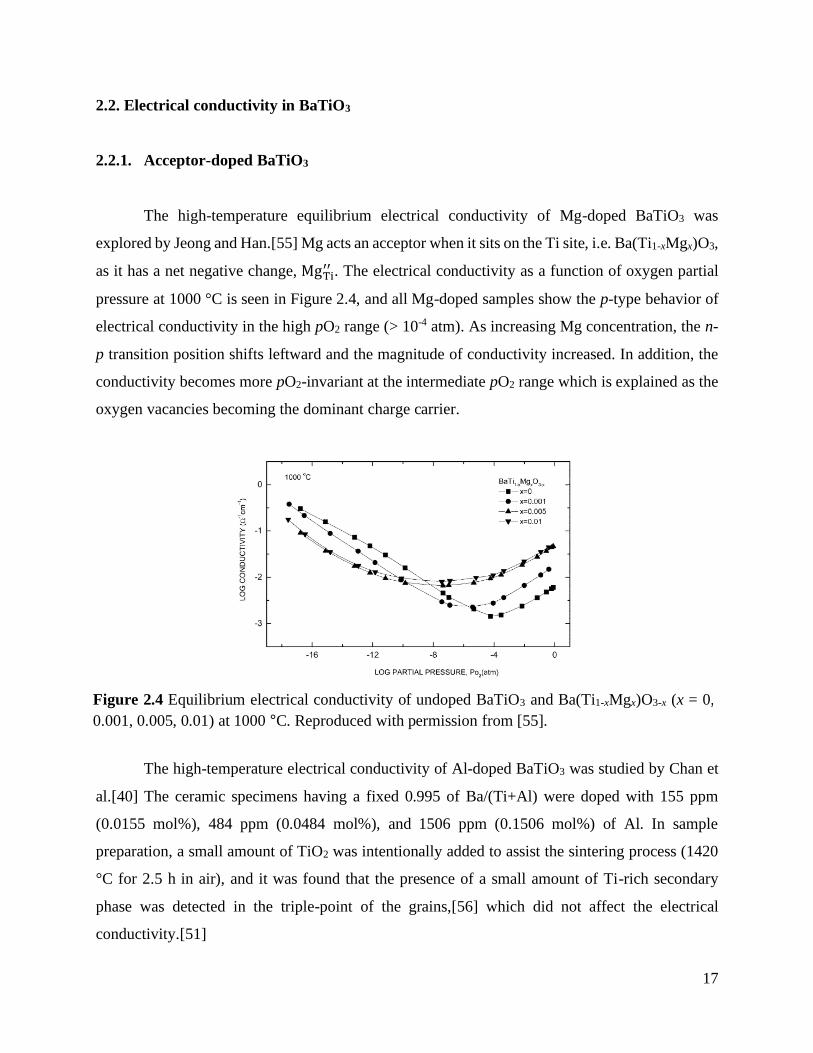
The high-temperature equilibrium electrical conductivity of Mg-doped BaTiO3 was
explored by Jeong and Han.[55] Mg acts an acceptor when it sits on the Ti site, i.e. Ba(Ti1-xMgx)O3,
as it has a net negative change, MgTi′′ . The electrical conductivity as a function of oxygen partial
pressure at 1000 °C is seen in Figure 2.4, and all Mg-doped samples show the p-type behavior of
electrical conductivity in the high pO2 range (> 10-4 atm). As increasing Mg concentration, the n-
p transition position shifts leftward and the magnitude of conductivity increased. In addition, the
conductivity becomes more pO2-invariant at the intermediate pO2 range which is explained as the
oxygen vacancies becoming the dominant charge carrier.
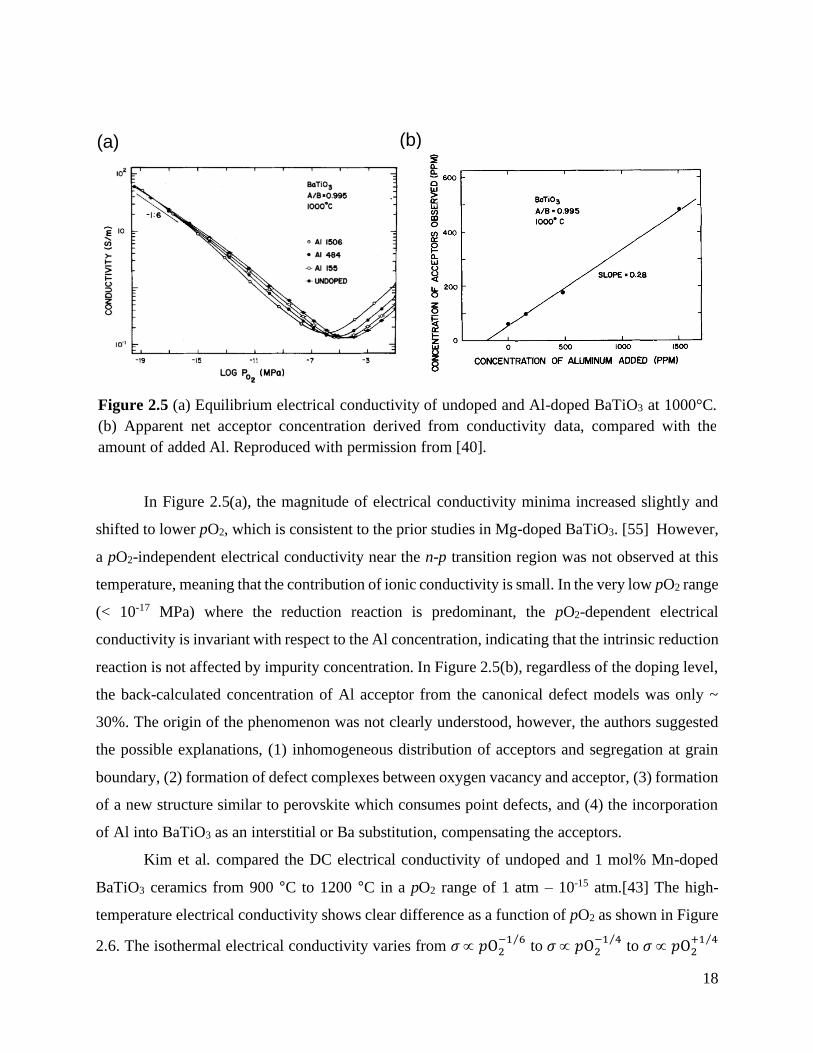
The high-temperature electrical conductivity of Al-doped BaTiO3 was studied by Chan et
al.[40] The ceramic specimens having a fixed 0.995 of Ba/(Ti+Al) were doped with 155 ppm
(0.0155 mol%), 484 ppm (0.0484 mol%), and 1506 ppm (0.1506 mol%) of Al. In sample
preparation, a small amount of TiO2 was intentionally added to assist the sintering process (1420
°C for 2.5 h in air), and it was found that the presence of a small amount of Ti-rich secondary
phase was detected in the triple-point of the grains,[56] which did not affect the electrical
conductivity.[51]
Figure 2.4 Equilibrium electrical conductivity of undoped BaTiO3 and Ba(Ti1-xMgx)O3-x (x = 0,
0.001, 0.005, 0.01) at 1000 °C. Reproduced with permission from [55].
18
In Figure 2.5(a), the magnitude of electrical conductivity minima increased slightly and
shifted to lower pO2, which is consistent to the prior studies in Mg-doped BaTiO3. [55] However,
a pO2-independent electrical conductivity near the n-p transition region was not observed at this
temperature, meaning that the contribution of ionic conductivity is small. In the very low pO2 range
(< 10-17 MPa) where the reduction reaction is predominant, the pO2-dependent electrical
conductivity is invariant with respect to the Al concentration, indicating that the intrinsic reduction
reaction is not affected by impurity concentration. In Figure 2.5(b), regardless of the doping level,
the back-calculated concentration of Al acceptor from the canonical defect models was only ~
30%. The origin of the phenomenon was not clearly understood, however, the authors suggested
the possible explanations, (1) inhomogeneous distribution of acceptors and segregation at grain
boundary, (2) formation of defect complexes between oxygen vacancy and acceptor, (3) formation
of a new structure similar to perovskite which consumes point defects, and (4) the incorporation
of Al into BaTiO3 as an interstitial or Ba substitution, compensating the acceptors.
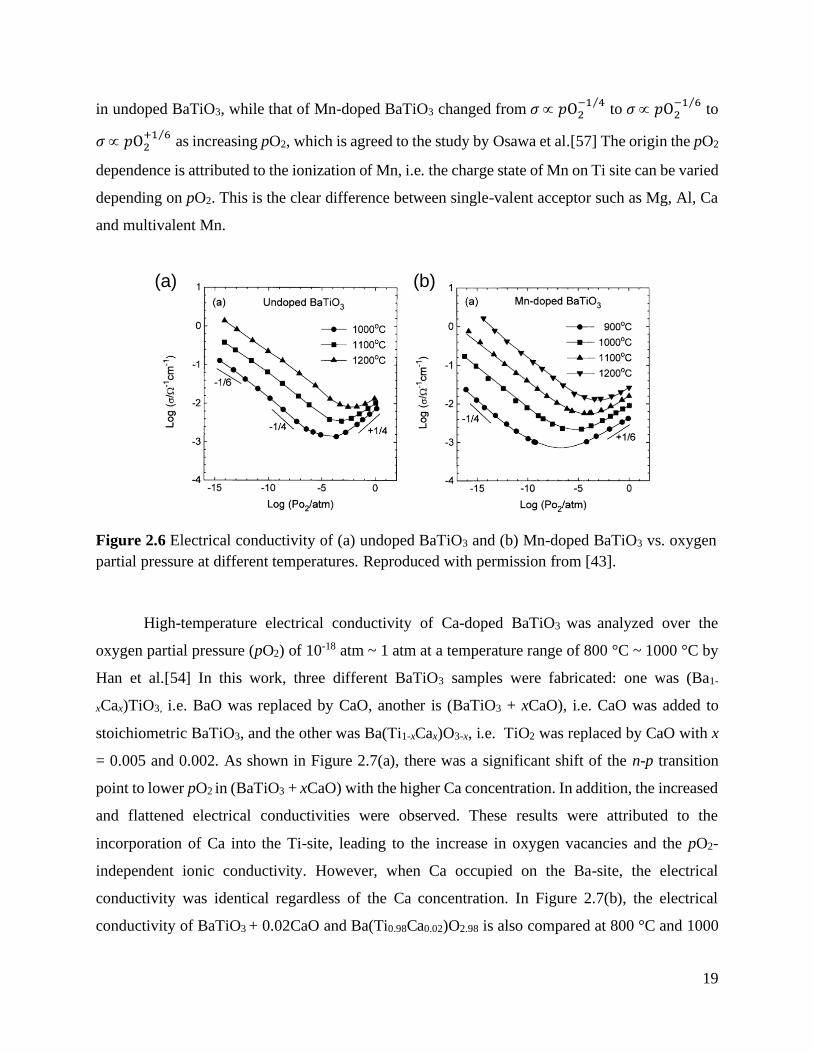
Kim et al. compared the DC electrical conductivity of undoped and 1 mol% Mn-doped
BaTiO3 ceramics from 900 °C to 1200 °C in a pO2 range of 1 atm – 10-15 atm.[43] The high-
temperature electrical conductivity shows clear difference as a function of pO2 as shown in Figure
2.6. The isothermal electrical conductivity varies from 𝜎 𝑝O2−1 6⁄
to 𝜎 𝑝O2−1 4⁄
to 𝜎 𝑝O2+1 4⁄
Figure 2.5 (a) Equilibrium electrical conductivity of undoped and Al-doped BaTiO3 at 1000°C.
(b) Apparent net acceptor concentration derived from conductivity data, compared with the
amount of added Al. Reproduced with permission from [40].
(a) (b)
19
in undoped BaTiO3, while that of Mn-doped BaTiO3 changed from 𝜎 𝑝O2−1 4⁄
to 𝜎 𝑝O2−1 6⁄
to
𝜎 𝑝O2+1 6⁄
as increasing pO2, which is agreed to the study by Osawa et al.[57] The origin the pO2
dependence is attributed to the ionization of Mn, i.e. the charge state of Mn on Ti site can be varied
depending on pO2. This is the clear difference between single-valent acceptor such as Mg, Al, Ca
and multivalent Mn.
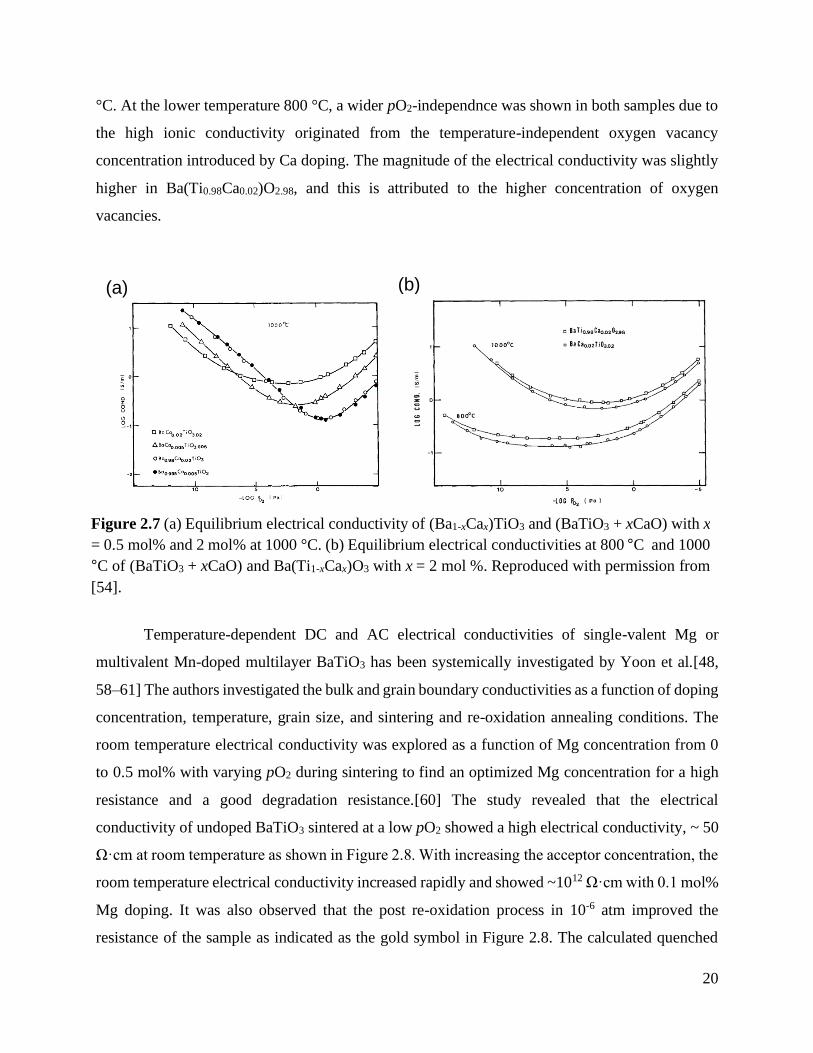
High-temperature electrical conductivity of Ca-doped BaTiO3 was analyzed over the
oxygen partial pressure (pO2) of 10-18 atm ~ 1 atm at a temperature range of 800 °C ~ 1000 °C by
Han et al.[54] In this work, three different BaTiO3 samples were fabricated: one was (Ba1-
xCax)TiO3, i.e. BaO was replaced by CaO, another is (BaTiO3 + xCaO), i.e. CaO was added to
stoichiometric BaTiO3, and the other was Ba(Ti1-xCax)O3-x, i.e. TiO2 was replaced by CaO with x
= 0.005 and 0.002. As shown in Figure 2.7(a), there was a significant shift of the n-p transition
point to lower pO2 in (BaTiO3 + xCaO) with the higher Ca concentration. In addition, the increased
and flattened electrical conductivities were observed. These results were attributed to the
incorporation of Ca into the Ti-site, leading to the increase in oxygen vacancies and the pO2-
independent ionic conductivity. However, when Ca occupied on the Ba-site, the electrical
conductivity was identical regardless of the Ca concentration. In Figure 2.7(b), the electrical
conductivity of BaTiO3 + 0.02CaO and Ba(Ti0.98Ca0.02)O2.98 is also compared at 800 °C and 1000
Figure 2.6 Electrical conductivity of (a) undoped BaTiO3 and (b) Mn-doped BaTiO3 vs. oxygen
partial pressure at different temperatures. Reproduced with permission from [43].
(a) (b)
20
°C. At the lower temperature 800 °C, a wider pO2-independnce was shown in both samples due to
the high ionic conductivity originated from the temperature-independent oxygen vacancy
concentration introduced by Ca doping. The magnitude of the electrical conductivity was slightly
higher in Ba(Ti0.98Ca0.02)O2.98, and this is attributed to the higher concentration of oxygen
vacancies.
Temperature-dependent DC and AC electrical conductivities of single-valent Mg or
multivalent Mn-doped multilayer BaTiO3 has been systemically investigated by Yoon et al.[48,
58–61] The authors investigated the bulk and grain boundary conductivities as a function of doping
concentration, temperature, grain size, and sintering and re-oxidation annealing conditions. The
room temperature electrical conductivity was explored as a function of Mg concentration from 0
to 0.5 mol% with varying pO2 during sintering to find an optimized Mg concentration for a high
resistance and a good degradation resistance.[60] The study revealed that the electrical
conductivity of undoped BaTiO3 sintered at a low pO2 showed a high electrical conductivity, ~ 50
Ω·cm at room temperature as shown in Figure 2.8. With increasing the acceptor concentration, the
room temperature electrical conductivity increased rapidly and showed ~1012 Ω·cm with 0.1 mol%
Mg doping. It was also observed that the post re-oxidation process in 10-6 atm improved the
resistance of the sample as indicated as the gold symbol in Figure 2.8. The calculated quenched
Figure 2.7 (a) Equilibrium electrical conductivity of (Ba1-xCax)TiO3 and (BaTiO3 + xCaO) with x
= 0.5 mol% and 2 mol% at 1000 °C. (b) Equilibrium electrical conductivities at 800 °C and 1000
°C of (BaTiO3 + xCaO) and Ba(Ti1-xCax)O3 with x = 2 mol %. Reproduced with permission from
[54].
(a) (b)
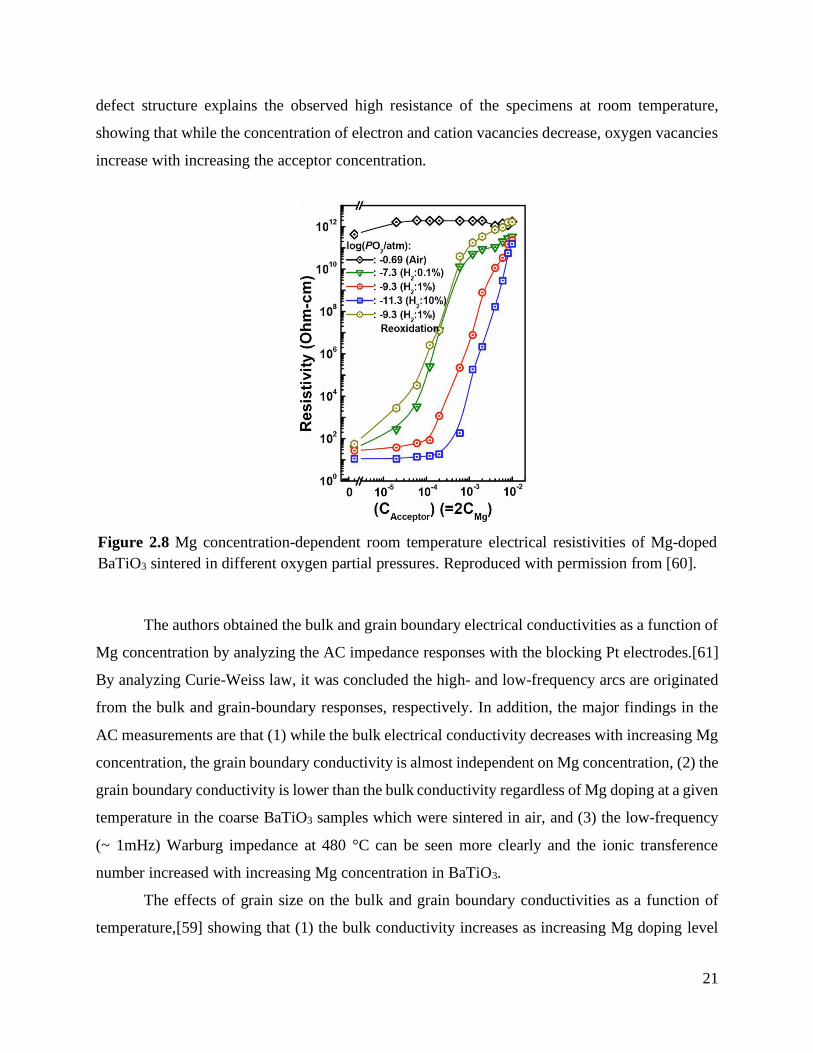
21
defect structure explains the observed high resistance of the specimens at room temperature,
showing that while the concentration of electron and cation vacancies decrease, oxygen vacancies
increase with increasing the acceptor concentration.
The authors obtained the bulk and grain boundary electrical conductivities as a function of
Mg concentration by analyzing the AC impedance responses with the blocking Pt electrodes.[61]
By analyzing Curie-Weiss law, it was concluded the high- and low-frequency arcs are originated
from the bulk and grain-boundary responses, respectively. In addition, the major findings in the
AC measurements are that (1) while the bulk electrical conductivity decreases with increasing Mg
concentration, the grain boundary conductivity is almost independent on Mg concentration, (2) the
grain boundary conductivity is lower than the bulk conductivity regardless of Mg doping at a given
temperature in the coarse BaTiO3 samples which were sintered in air, and (3) the low-frequency
(~ 1mHz) Warburg impedance at 480 °C can be seen more clearly and the ionic transference
number increased with increasing Mg concentration in BaTiO3.
The effects of grain size on the bulk and grain boundary conductivities as a function of
temperature,[59] showing that (1) the bulk conductivity increases as increasing Mg doping level
Figure 2.8 Mg concentration-dependent room temperature electrical resistivities of Mg-doped
BaTiO3 sintered in different oxygen partial pressures. Reproduced with permission from [60].
22
regardless of grain size, (2) the bulk conductivity is higher in the coarse grain samples, (3) the
grain boundary conductivity is doping level-invariant in the coarse grain specimens, however, the
conductivity shows the positive dependence on the Mg concentration in the fine grain specimens,
and (4) the Warburg impedance is observed in both fine and coarse grain samples, and the
impedance is higher in the coarse grain samples, meaning the portion of ionic conductivity is
higher than that in fine grain specimens.
The AC impedance of Mg or Mn-doped BaTiO3 ceramics was studied as a function of doping
level of the acceptors.[48] In this work, the most different results in the AC impedance between
Mg and Mn doping is that Mn-doped BaTiO3 shows (1) the lower bulk conductivity with the higher
Mn concentration and (2) no Warburg impedance at low-frequency in contrast to Mg-doped
BaTiO3 as shown in Figure 2.9. The negligible ionic transference number is attributed to the low
ionic conductivity with the significantly low concentration of oxygen vacancy compared to Mg-
doped BaTiO3 with the same doping level. The predicted equilibrium and quenched defect
structure as a function of pO2 at high- and low-temperatures showed that the higher concentration
of oxygen vacancies was obtained in Mg-doped BaTiO3, explains the high ionic conductivity in
Mg-doped BaTiO3.
Figure 2.9 Doping conentration-dependent Cole-Cole plots of (a) Mg or (b) Mn-doped BaTiO3
at 480 °C. Reproduced with permission from [48].
23
2.2.2. Co-doped BaTiO3
Chan and Smyth investigated the equilibrium electrical conductivity versus pO2 of Nb and
Al co-doped BaTiO3 ceramics.[62] As shown in Figure 2.10, the electrical conductivity becomes
pO2 independent and the overall magnitude increases with donor doping (solid triangle → solid
circle → open circle), which is due to the increment of pO2-independent electron concentration
compensating donors (Nb). Then, the donor-doped BaTiO3 was back doped by acceptor, Al (open
rectangular → open triangle → solid rectangular). In this work, two interesting phenomena were
observed. One was that although the co-doped sample containing 632 ppm Al and 467 ppm Nb
(open triangle) had more acceptors than donors, the electrical conductivity was close to the n-type
conductivity. Similarly, the other was that the sample co-doped by 314 ppm Al and 467 ppm Nb
(open triangle) exhibited a more donor-doped behavior than 151 Nb singly doped BaTiO3 (solid
circle). This is interesting because the net donor concentration of both samples was very close.
The high-temperature electrical conductivity of Mn and Y co-doped BaTiO3 ceramics which
is the most important compositions in this dissertation, was investigated by Lee et al.[63] and Yeoh
Figure 2.10 Equilibrium electrical conductivity at 1000 °C of BaTiO3. Reproduced with
permission from [62].
24
et al.[64] In Figure 2.11, the high-temperature electrical conductivity of co-doped BaTiO3 was
pO2-indepedent and lower than that of undoped BaTiO3 in the high pO2 range, when the doping
ratio of Y and Mn ([Y]/[Mn]) is between 0.5 and 1.8. As the ratio was over 1.8, the magnitude of
electrical conductivity increased and showed more n-type characteristics. The Fermi level as a
function of pO2 was calculated by linking the electron concentration obtained from the canonical
defect chemistry to Boltzmann’s statistics. It was revealed that the Fermi level is pinned over a
wide range of pO2 due to the mechanism of donor-acceptor mutual compensation, when Y/Mn is
in between 1 and 2. However, their prediction reveals that the n-type electrical conductivity is
expected at the high pO2 range with 2.0 > [YBa∙ ]/[MnTi]T > 1. This does not agree to the
experimental results.
The high-temperature electrical conductivity of BaTiO3 ceramics co-doped by either (Ho
and Mn) or (Dy and Mn) were investigated by Han et al.[65, 66] When Ho and Mn are respectively
doped on the A-site and B-site, the magnitude of electrical conductivity was lower than that of
Figure 2.11 Electrical conductivity versus oxygen activity of BaTiO3 co-doped by Mn and Y with
different donor-to-acceptor ratios md/ma = 0.0 (a), 0.5 (b), 1.0 (c), 1.8 (d), and 2.1 (e) at 1000 °C.
Reproduced with permission from [64].
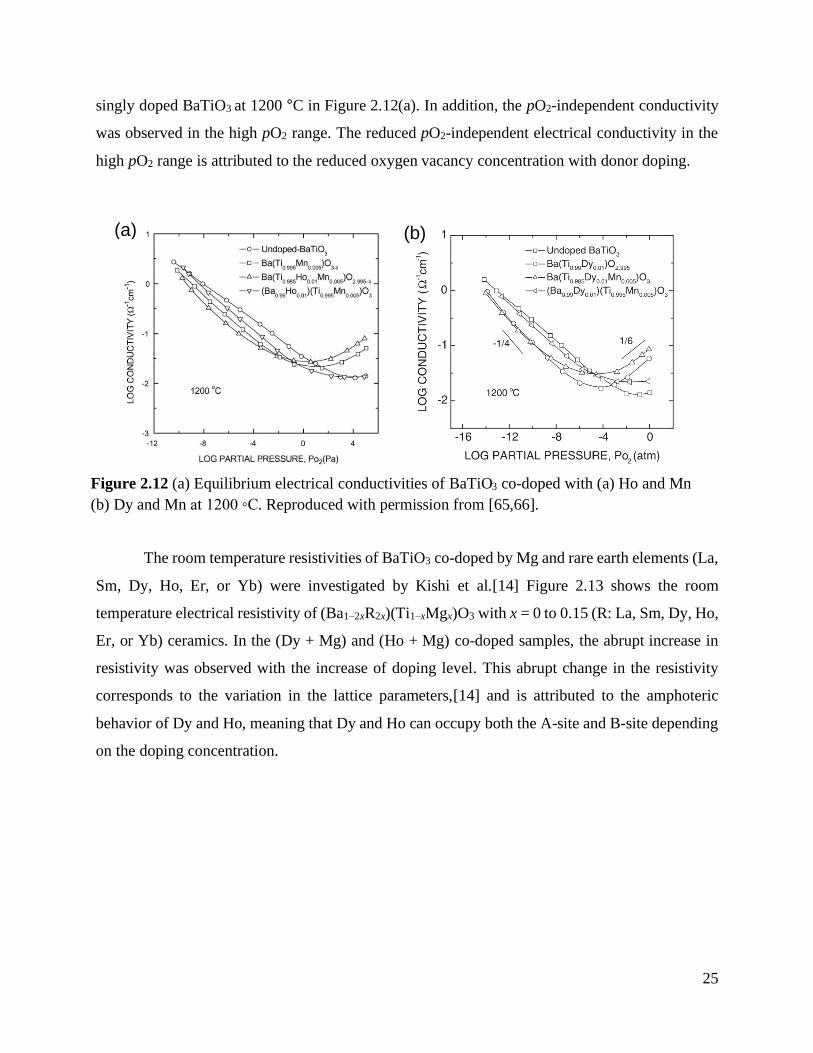
25
singly doped BaTiO3 at 1200 °C in Figure 2.12(a). In addition, the pO2-independent conductivity
was observed in the high pO2 range. The reduced pO2-independent electrical conductivity in the
high pO2 range is attributed to the reduced oxygen vacancy concentration with donor doping.
The room temperature resistivities of BaTiO3 co-doped by Mg and rare earth elements (La,
Sm, Dy, Ho, Er, or Yb) were investigated by Kishi et al.[14] Figure 2.13 shows the room
temperature electrical resistivity of (Ba1–2xR2x)(Ti1–xMgx)O3 with x = 0 to 0.15 (R: La, Sm, Dy, Ho,
Er, or Yb) ceramics. In the (Dy + Mg) and (Ho + Mg) co-doped samples, the abrupt increase in
resistivity was observed with the increase of doping level. This abrupt change in the resistivity
corresponds to the variation in the lattice parameters,[14] and is attributed to the amphoteric
behavior of Dy and Ho, meaning that Dy and Ho can occupy both the A-site and B-site depending
on the doping concentration.
Figure 2.12 (a) Equilibrium electrical conductivities of BaTiO3 co-doped with (a) Ho and Mn
(b) Dy and Mn at 1200 C. Reproduced with permission from [65,66].
(a) (b)
26
2.3. Doping Effects on Degradation Behavior in BaTiO3
The degradation characteristics of Mg and Mn singly-doped multilayer BaTiO3 specimens
were studied by Yoon et al. The concentration of dopant was varied from 0 to 0.5 mol%, and the
samples were made via MLCC process. In the study, Mg-doped specimens showed more severe
resistance degradation and breakdown as increasing Mg concentration. This was attributed to the
increased bulk grain conductivity and the portion of ionic conductivity with increasing Mg
concentration. Compared to Mg-doping, Mn-doped BaTiO3 exhibited better degradation behavior
as Mn concentration increased.
The degradation behavior of Mn and Dy co-doped BaTiO3 specimens was investigated by
Yoon et al. The compositions were (1) 0.4 mol% Mn and 0.3 mol% Dy co-doped and (2) 0.4 mol%
Mn and 0.9 mol% Dy co-doped BaTiO3. The time-dependent degradation characteristics of Dy
and Mn co-doped BaTiO3 MLCC were measured at 150 °C under the DC field up to 0.6 MV/cm
~ 0.8 MV/cm. It was revealed that the time-dependent degradation behavior was more stable in
Figure 2.13 Room temperature resistivities of (Ba1–2xR2x)(Ti1–xMgx)O3 sintered at 1380 °C in a
reducing atmosphere as a function of x (R = La, Sm, Dy, Ho, Er or Yb). Reproduced with
permission from [14].
27
the higher Dy concentration. In addition, the breakdown field was increased in the higher doping
level of Dy. Similarly, the degradation characteristics were investigated in Mn and V co-doped
BaTiO3 by the same group. Three different BaTiO3 MLCCs co-doped by (1) 0.2 mol% Mn and 0.1
mol% V, (2) 0.2 mol% Mn and 0.3 mol% V, and (3) 0.4 mol% Mn and 0.3 mol% V. The time-
dependent resistance under various DC field showed that the magnitude of resistance was higher
in the lower Mn and V compositions, such that (1) and (2) at the low DC fields. However, the time
stability of resistance was better in the higher Mn and V composition. Moreover, the higher
breakdown field was improved by the increase of Mn or V doping concentration.
Kishi et al. compared the lifetime of various X7R and Y5V MLCCs compositions by
measuring the highly accelerated life test (HALT) under 0.35 MV/cm and 0.7 MV/cm DC electric
field at 165 °C.[14] The X7R and Y5V MLCCs were doped by 1 at. % of La, Nd, Sm, Gd, Dy,
Ho, or Er. Both X7R and Y5V MLCCs exhibited the improved lifetime, when they are doped by
the rare earth amphoteric oxides such as Dy2O3, Ho2O3, Er2O3. Particularly, they are more effective
when the thickness of dielectric layer was reduced from 10 μm to 5 μm.
Kaneda et al. studied the vanadium (V) effects on the lifetime of MLCCs.[67] The
concentration of V varied from 0 to 0.15 mol% in the samples contain 0.5 mol% MgO, 0.1 mol%
MnO, 0.75 mol% Ho2O3, and 1.5 mol% SiO2. Sintering was carried out at 1280 °C for 2 h in 10-
10 atm followed the re-oxidation process at 900 °C in 10-5 atm. The HALT experiments were
conducted at 150 °C under the 0.2 MV/cm. The mean time to failure (MTTF) was improved by
the addition of V up to 0.1 mol%. With further increased V concentration, the MTTF was slightly
reduced. It was revealed that the AC impedance of dielectric-electrode interface, grain boundary,
and grain, and found that the resistances of all components were deteriorated with increasing V
concentration. Particularly, the interface resistance was significantly reduced. The decrease in the
total resistance of specimens was attributed to the increase in the electron concentration by donor
doping and the significant decrease in the interface resistance. The density functional theory (DFT)
calculations and the thermally stimulated depolarization current (TSDC) analysis showed that the
formation of oxygen vacancy was restricted by adding V in BaTiO3 and thus the improved
reliability of MLCCs was attributed to the decrease in concentration of oxygen vacancy.
Natsui et al. investigated the V effects on the time-dependent resistance in BaTiO3
MLCCs.[68] The specimens were doped by 2 mol% MnO, 0.2 mol% Mn3O4, 1 mol% Y2O3,
0.5mol % SiO2, and 0.06 mol%, 0.2 mol% or 0.3 mol% V2O5. The specimens were made via the
28
MLCC process with sintering at 1200 °C for 2 h in the reducing pO2 of 10-12 atm followed by the
re-oxidation at 1100 °C in a pO2 of 10-6 atm. The HALT measurements were carried out at 200 °C
under 0.35 MV/cm DC field, and the AC impedance was analyzed during HALT. The authors
basically used the equivalent circuit having four series of parallel combination of resistance and
capacitance for all specimens. The four RC components are assumed to be the core, shell, grain-
boundary, and BaTiO3/Ni electrode interface. The HALT measurement revealed that the interface
resistance showed the significant degradation behavior during HALT. In addition, the degree of
degradation of the interface resistance was dependent on the V concentration, showing the higher
V concentration induced the better time-dependent resistance. The authors used scanning
transmission electron microscopy–electron energy loss spectroscopy (STEM–EELS) to identify
the distribution of V and found that a small but noticeable EELS signal of V at the
ceramic/electrode interface. Thus, it was thought that V substitution at the interface between
BaTiO3 ceramic and Ni electrode seemed to improve the reliability of MLCCs.
2.4. Thermally stimulated depolarization current (TSDC) in BaTiO3
TSDC is a technique to study the physical phenomena related to dipole moment. As shown
in Figure 2.14, an electric field (Ep) is applied to a sample with a certain time (tp) at a polarizing
temperature (Tp). Then, the sample is cooled to room temperature under the bias. Under short-
circuit conditions, the sample is heated with controlled heating rate (3 °C/min – 5 °C/min), and a
current is monitored as a function of time simultaneously.
Figure 2.14 Schematic of (a) experimental procedure of TSDC and (b) analysis of TSDC with
various polarization mechanisms. Courtesy of Dr. Clive Randall at Penn State University.
(a) (b)
29
This technique provides useful information about point defects with their concentrations,
activation energies and relaxation times associated with the polarization mechanisms as shown in
Figure 2.14(b), which enables a better understanding on defect-related properties such as electrical
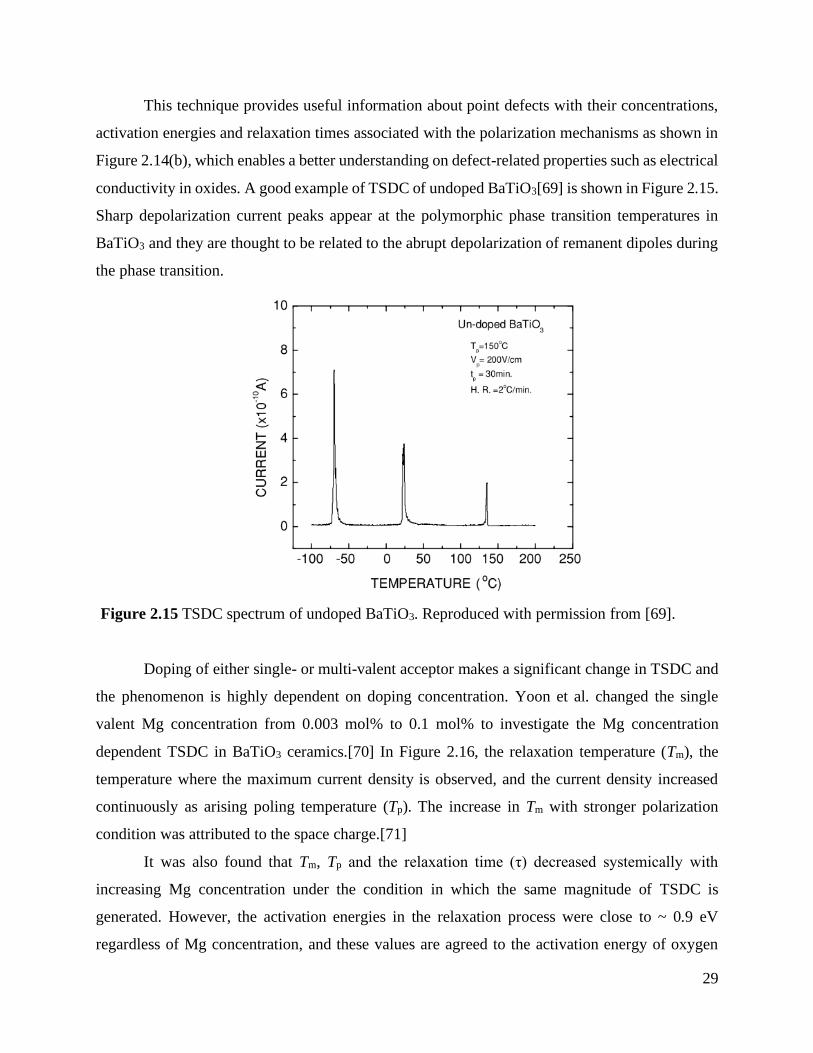
conductivity in oxides. A good example of TSDC of undoped BaTiO3[69] is shown in Figure 2.15.
Sharp depolarization current peaks appear at the polymorphic phase transition temperatures in
BaTiO3 and they are thought to be related to the abrupt depolarization of remanent dipoles during
the phase transition.
Doping of either single- or multi-valent acceptor makes a significant change in TSDC and
the phenomenon is highly dependent on doping concentration. Yoon et al. changed the single
valent Mg concentration from 0.003 mol% to 0.1 mol% to investigate the Mg concentration
dependent TSDC in BaTiO3 ceramics.[70] In Figure 2.16, the relaxation temperature (Tm), the
temperature where the maximum current density is observed, and the current density increased
continuously as arising poling temperature (Tp). The increase in Tm with stronger polarization
condition was attributed to the space charge.[71]
It was also found that Tm, Tp and the relaxation time (τ) decreased systemically with
increasing Mg concentration under the condition in which the same magnitude of TSDC is
generated. However, the activation energies in the relaxation process were close to ~ 0.9 eV
regardless of Mg concentration, and these values are agreed to the activation energy of oxygen
Figure 2.15 TSDC spectrum of undoped BaTiO3. Reproduced with permission from [69].
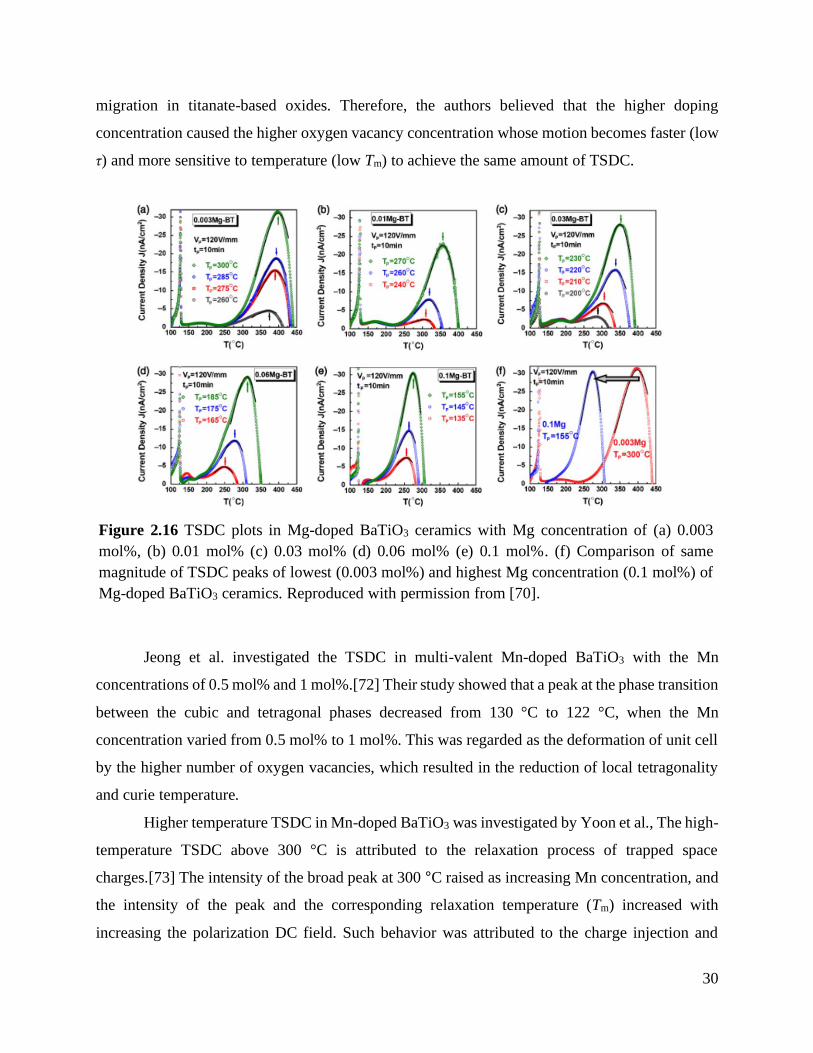
30
migration in titanate-based oxides. Therefore, the authors believed that the higher doping
concentration caused the higher oxygen vacancy concentration whose motion becomes faster (low
τ) and more sensitive to temperature (low Tm) to achieve the same amount of TSDC.
Jeong et al. investigated the TSDC in multi-valent Mn-doped BaTiO3 with the Mn
concentrations of 0.5 mol% and 1 mol%.[72] Their study showed that a peak at the phase transition
between the cubic and tetragonal phases decreased from 130 °C to 122 °C, when the Mn
concentration varied from 0.5 mol% to 1 mol%. This was regarded as the deformation of unit cell
by the higher number of oxygen vacancies, which resulted in the reduction of local tetragonality
and curie temperature.
Higher temperature TSDC in Mn-doped BaTiO3 was investigated by Yoon et al., The high-
temperature TSDC above 300 °C is attributed to the relaxation process of trapped space
charges.[73] The intensity of the broad peak at 300 °C raised as increasing Mn concentration, and
the intensity of the peak and the corresponding relaxation temperature (Tm) increased with
increasing the polarization DC field. Such behavior was attributed to the charge injection and
Figure 2.16 TSDC plots in Mg-doped BaTiO3 ceramics with Mg concentration of (a) 0.003
mol%, (b) 0.01 mol% (c) 0.03 mol% (d) 0.06 mol% (e) 0.1 mol%. (f) Comparison of same
magnitude of TSDC peaks of lowest (0.003 mol%) and highest Mg concentration (0.1 mol%) of
Mg-doped BaTiO3 ceramics. Reproduced with permission from [70].
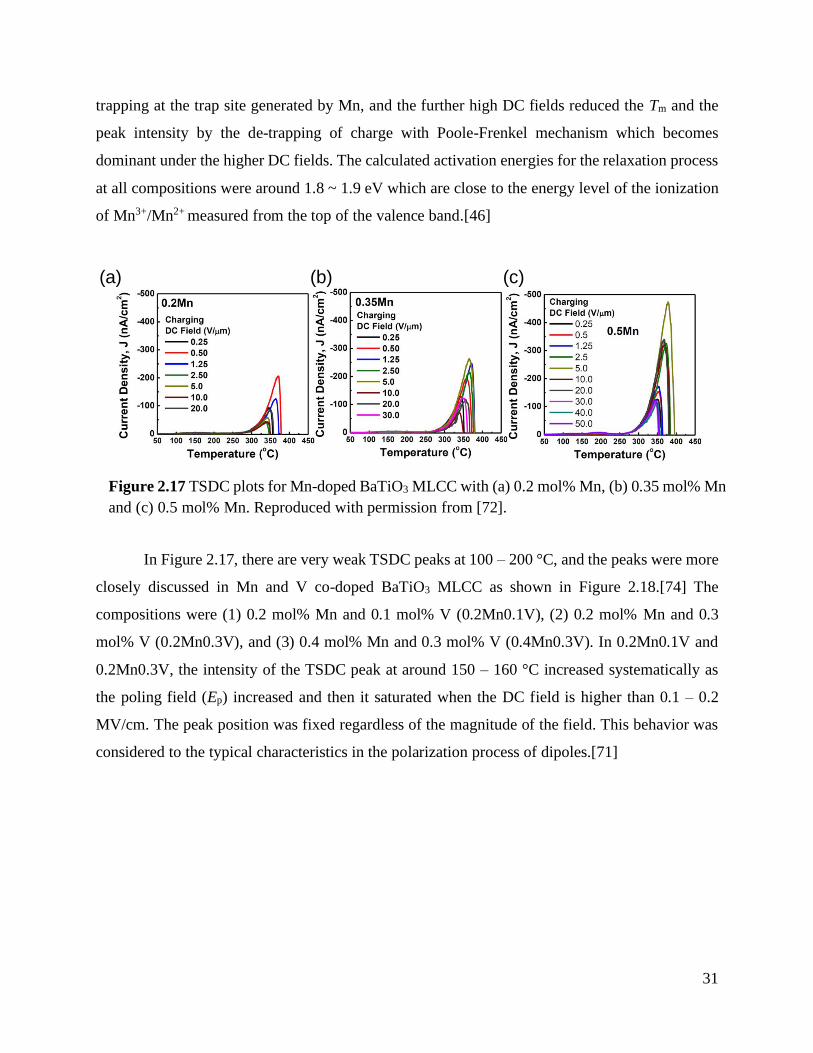
31
trapping at the trap site generated by Mn, and the further high DC fields reduced the Tm and the
peak intensity by the de-trapping of charge with Poole-Frenkel mechanism which becomes
dominant under the higher DC fields. The calculated activation energies for the relaxation process
at all compositions were around 1.8 ~ 1.9 eV which are close to the energy level of the ionization
of Mn3+/Mn2+ measured from the top of the valence band.[46]
In Figure 2.17, there are very weak TSDC peaks at 100 – 200 °C, and the peaks were more
closely discussed in Mn and V co-doped BaTiO3 MLCC as shown in Figure 2.18.[74] The
compositions were (1) 0.2 mol% Mn and 0.1 mol% V (0.2Mn0.1V), (2) 0.2 mol% Mn and 0.3
mol% V (0.2Mn0.3V), and (3) 0.4 mol% Mn and 0.3 mol% V (0.4Mn0.3V). In 0.2Mn0.1V and
0.2Mn0.3V, the intensity of the TSDC peak at around 150 – 160 °C increased systematically as
the poling field (Ep) increased and then it saturated when the DC field is higher than 0.1 – 0.2
MV/cm. The peak position was fixed regardless of the magnitude of the field. This behavior was
considered to the typical characteristics in the polarization process of dipoles.[71]
Figure 2.17 TSDC plots for Mn-doped BaTiO3 MLCC with (a) 0.2 mol% Mn, (b) 0.35 mol% Mn
and (c) 0.5 mol% Mn. Reproduced with permission from [72].
(a) (b) (c)
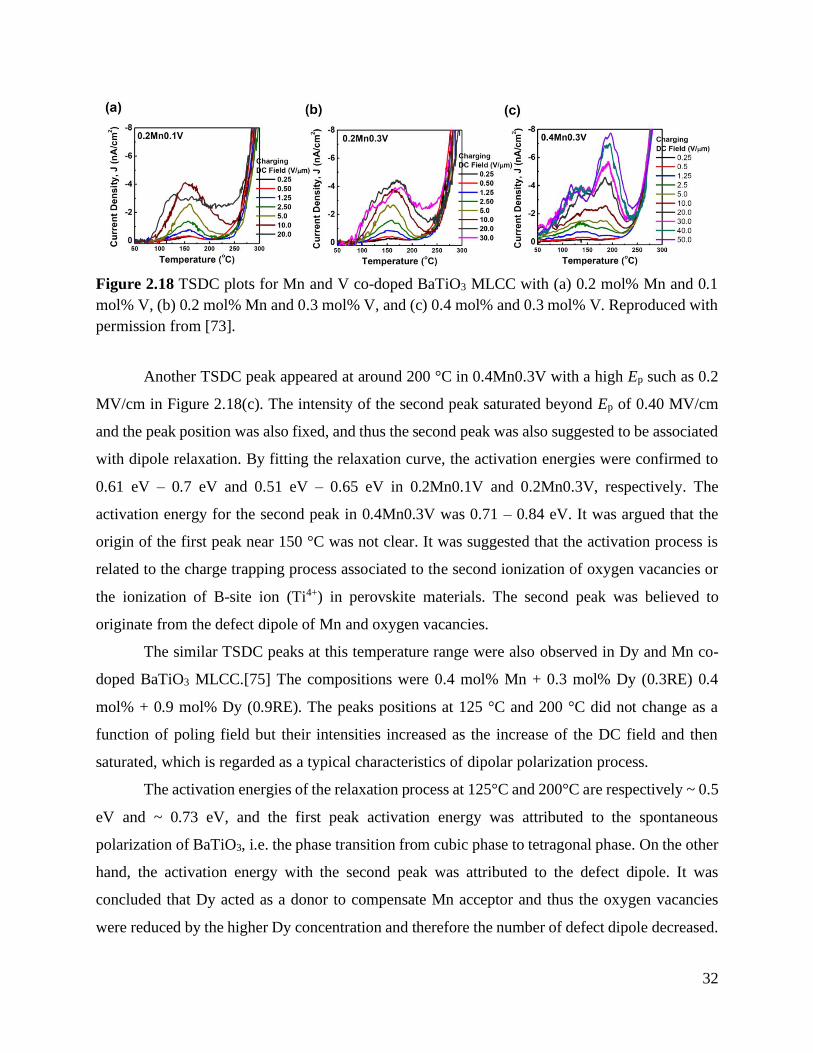
32
Another TSDC peak appeared at around 200 °C in 0.4Mn0.3V with a high Ep such as 0.2
MV/cm in Figure 2.18(c). The intensity of the second peak saturated beyond Ep of 0.40 MV/cm
and the peak position was also fixed, and thus the second peak was also suggested to be associated
with dipole relaxation. By fitting the relaxation curve, the activation energies were confirmed to
0.61 eV – 0.7 eV and 0.51 eV – 0.65 eV in 0.2Mn0.1V and 0.2Mn0.3V, respectively. The
activation energy for the second peak in 0.4Mn0.3V was 0.71 – 0.84 eV. It was argued that the
origin of the first peak near 150 °C was not clear. It was suggested that the activation process is
related to the charge trapping process associated to the second ionization of oxygen vacancies or
the ionization of B-site ion (Ti4+) in perovskite materials. The second peak was believed to
originate from the defect dipole of Mn and oxygen vacancies.
The similar TSDC peaks at this temperature range were also observed in Dy and Mn co-
doped BaTiO3 MLCC.[75] The compositions were 0.4 mol% Mn + 0.3 mol% Dy (0.3RE) 0.4
mol% + 0.9 mol% Dy (0.9RE). The peaks positions at 125 °C and 200 °C did not change as a
function of poling field but their intensities increased as the increase of the DC field and then
saturated, which is regarded as a typical characteristics of dipolar polarization process.
The activation energies of the relaxation process at 125°C and 200°C are respectively ~ 0.5
eV and ~ 0.73 eV, and the first peak activation energy was attributed to the spontaneous
polarization of BaTiO3, i.e. the phase transition from cubic phase to tetragonal phase. On the other
hand, the activation energy with the second peak was attributed to the defect dipole. It was
concluded that Dy acted as a donor to compensate Mn acceptor and thus the oxygen vacancies
were reduced by the higher Dy concentration and therefore the number of defect dipole decreased.
Figure 2.18 TSDC plots for Mn and V co-doped BaTiO3 MLCC with (a) 0.2 mol% Mn and 0.1
mol% V, (b) 0.2 mol% Mn and 0.3 mol% V, and (c) 0.4 mol% and 0.3 mol% V. Reproduced with
permission from [73].
33
2.5. Defect chemistry and electrical conductivity of β-Ga2O3
The temperature-dependent electrical conductivity in β-Ga2O3 single and polycrystalline
was investigated by Fleischer and Meixner.[76] Arrhenius behavior of electrical conductivity of
the single crystal showed the activation energy of 3.3 eV from 800 °C to 1000 °C in air. The Hall
measurements revealed that as temperature changed from 800 °C to 1000 °C in air, the electron
concentration increased from 1014 /cm3 to 1016 /cm3 with the thermal activation energy of 2.7 eV,
and Hall mobility increased from 5 cm2/Vs to 15 cm2/Vs with the activation energy of 0.6 eV.
The conductivity of polycrystalline ceramics exhibited the same activation energy of 2.1
eV from 800 °C to 1000 °C in air. Hall measurements showed that the electron concentration is
three orders of magnitude lower than the single crystal, i.e. 1013 /cm3 at 1000 °C. The activation
energies for the carrier concentration and mobility are 1.5 eV and 0.65 eV, respectively.
Sasaki and Hijikata investigated the high-temperature equilibrium conductivity as a
function of oxygen partial pressure in β-Ga2O3 ceramics.[21] In Figure 2.20, the isothermal
electrical conductivity showed the relation, 𝜎 𝑝O2−1 4⁄
from 800 °C to 950 °C in the pO2 range
of 1 atm to 10-3 atm. The pO2 dependence was discussed with the two possible intrinsic defect
reactions. One is the singly charged oxygen vacancies, and the other is doubly ionized gallium
interstitials. In both models, the 𝜎 𝑝O2−1 4⁄
relation can be obtained under the assumption that the
electron is the predominant conducting species. The temperature-dependent electrical conductivity
exhibited an Arrhenius behavior from 700°C ~ 950 °C in the same pO2 range with the activation
energy of 1.85(1) eV.
Similar pO2-dependence of electrical conductivity was reported by Cojocaru and Alecu.[23]
In the work, the electrical conductivity of β-Ga2O3 ceramics was measured from 127 °C to 727 °C
in the pO2 range of 1 atm ~ 10-3 atm. Interestingly, even at 127 °C, the electrical conductivity was
a function of –1/4.55 power of pO2, and became less pO2-dependence with increasing temperature.
At 727 °C, the 𝜎 𝑝O2−1 3.73⁄
relation was obtained. The pO2-dependence at various temperatures
was attributed to the triply charged gallium interstitial model, however, the –1/5.3 power of pO2
is expected rather than -1/4.55 in the model.
Defect chemistry of β-Ga2O3 thin films were investigated by Fleischer et al as shown in
Figure 2.21.[24] The electrical conductivity versus pO2 was measured from 850 °C to 1000 °C in
the pO2 range of 1 atm to 10-15 atm. The electrical conductivity at these conditions was a function
34
of pO2, 𝜎 𝑝O2−1 4⁄
and the activation energy was 2.1 eV, and the pO2 dependence was attributed
to the oxygen vacancies. It is important to note that the electrical conductivity dropped
significantly while the pO2 changed from of 10-14 atm to 10-15 atm at 1000 °C. This phenomenon
happened at these pO2 range from 750 °C to 1000 °C. The electrical conductivity did not recover
to its initial value after the measurement, and this phenomenon happened only above 750 °C. The
phase transition in the Ga2O3 films were discussed as the possibility of the behavior, however,
clear evidence was not suggested.
35
Chapter 3
Materials and Experimental Procedure
3.1. Synthesis of BaTiO3 ceramics
A conventional solid-state reaction method was used to make various BaTiO3 compositions.
To minimize the unintentional background impurity, the experimental procedure was designed to
allow for as little contamination from the environment as possible. High purity commercial
powders of BaTiO3 (99.995%, Sigma Aldrich), TiO2 (99.998%, CERAC TM Incorporated, USA),
MgO (99.99%, Sigma Aldrich), MnO2 (99.99%, Sigma Aldrich) and Y2O3 (99.99%, Sigma
Aldrich) were weighed in a chemical hood according to the moral ratio of compositions. The
mixture was wet-milled for 2 h with Yttrium Stabilized Zirconia (YSZ) balls in anhydrous ethanol.
It is important to note that the weight change of YSZ balls before and after the ball milling process
is ~0.0009 g. This value can be converted to 710-6 and 2.310-4 molar fractions for Y2O3 and
ZrO2, respectively, in 1 mol of BaTiO3. After ball-milling, the powders were dried at 80 °C for at
least 12 h, and then calcined at 950 for 10 h in air. Pellets 20 mm in diameter and ~3 mm in
thickness were compacted by uniaxial pressing at 45 MPa. At this point, no binder was used to
avoid any contamination. Sintering was carried out at 1350 °C for 5 h in air, and during this process
the sample was positioned on a Pt foil. The relative density measured by the Archimedes method
was around 91 ~ 94% in all compositions. After the samples were polished using SiC papers from
800 grid to 1200 grit and diamond paste (down to 1 μm). Then, the polished specimens were
thermally etched at 1200 °C for 30 min to observe the grain size. The grain size was obtained by
an optical microscope (Olympus) with x20 ~ x50 magnitudes. X-ray diffraction patters were
measured using a Smart Lab (Rigaku, Japan) x-ray diffractometer with a Cu-Kα source. The
sintered pellets exhibited a single perovskite structure with a tetragonal symmetry at room
temperature.
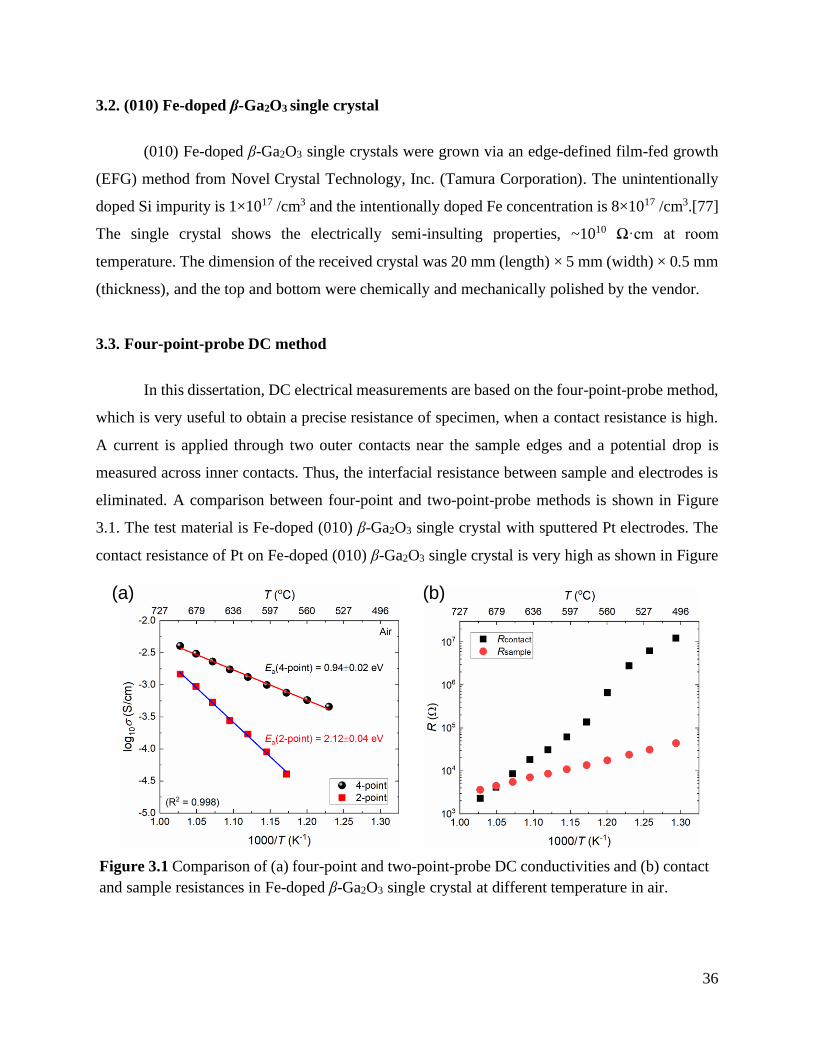
36
3.2. (010) Fe-doped β-Ga2O3 single crystal
(010) Fe-doped β-Ga2O3 single crystals were grown via an edge-defined film-fed growth
(EFG) method from Novel Crystal Technology, Inc. (Tamura Corporation). The unintentionally
doped Si impurity is 1×10¹⁷ /cm3 and the intentionally doped Fe concentration is 8×10¹⁷ /cm3.[77]
The single crystal shows the electrically semi-insulting properties, ~1010 Ω·cm at room
temperature. The dimension of the received crystal was 20 mm (length) × 5 mm (width) × 0.5 mm
(thickness), and the top and bottom were chemically and mechanically polished by the vendor.
3.3. Four-point-probe DC method
In this dissertation, DC electrical measurements are based on the four-point-probe method,
which is very useful to obtain a precise resistance of specimen, when a contact resistance is high.
A current is applied through two outer contacts near the sample edges and a potential drop is
measured across inner contacts. Thus, the interfacial resistance between sample and electrodes is
eliminated. A comparison between four-point and two-point-probe methods is shown in Figure
3.1. The test material is Fe-doped (010) β-Ga2O3 single crystal with sputtered Pt electrodes. The
contact resistance of Pt on Fe-doped (010) β-Ga2O3 single crystal is very high as shown in Figure
Figure 3.1 Comparison of (a) four-point and two-point-probe DC conductivities and (b) contact
and sample resistances in Fe-doped β-Ga2O3 single crystal at different temperature in air.
(a) (b)
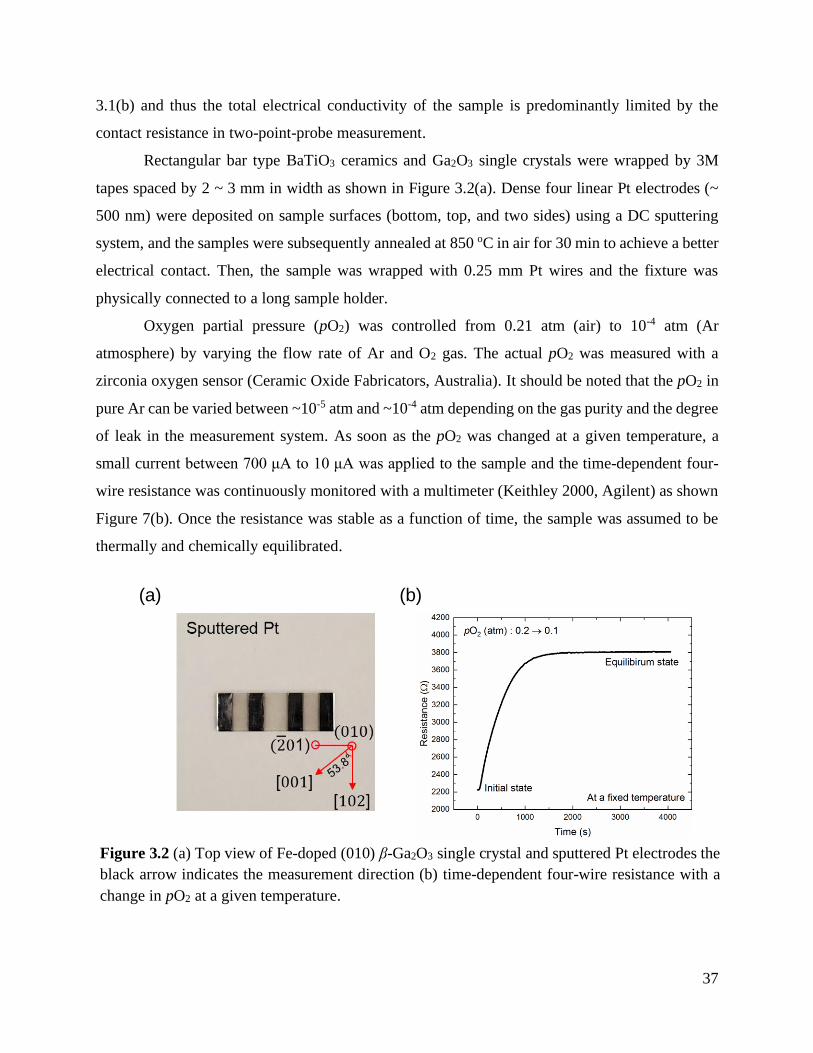
37
3.1(b) and thus the total electrical conductivity of the sample is predominantly limited by the
contact resistance in two-point-probe measurement.
Rectangular bar type BaTiO3 ceramics and Ga2O3 single crystals were wrapped by 3M
tapes spaced by 2 ~ 3 mm in width as shown in Figure 3.2(a). Dense four linear Pt electrodes (~
500 nm) were deposited on sample surfaces (bottom, top, and two sides) using a DC sputtering
system, and the samples were subsequently annealed at 850 oC in air for 30 min to achieve a better
electrical contact. Then, the sample was wrapped with 0.25 mm Pt wires and the fixture was
physically connected to a long sample holder.
Oxygen partial pressure (pO2) was controlled from 0.21 atm (air) to 10-4 atm (Ar
atmosphere) by varying the flow rate of Ar and O2 gas. The actual pO2 was measured with a
zirconia oxygen sensor (Ceramic Oxide Fabricators, Australia). It should be noted that the pO2 in
pure Ar can be varied between ~10-5 atm and ~10-4 atm depending on the gas purity and the degree
of leak in the measurement system. As soon as the pO2 was changed at a given temperature, a
small current between 700 μA to 10 μA was applied to the sample and the time-dependent four-
wire resistance was continuously monitored with a multimeter (Keithley 2000, Agilent) as shown
Figure 7(b). Once the resistance was stable as a function of time, the sample was assumed to be
thermally and chemically equilibrated.
Figure 3.2 (a) Top view of Fe-doped (010) β-Ga2O3 single crystal and sputtered Pt electrodes the
black arrow indicates the measurement direction (b) time-dependent four-wire resistance with a
change in pO2 at a given temperature.
(a) (b)
38
3.4. AC impedance
HP 4192A impedance analyzer was used to study the AC impedance characteristics of both
BaTiO3 and β-Ga2O3 samples. For BaTiO3, the top and bottom of thin samples were deposited by
a few hundreds of Pt, i.e. two-point AC technique. Then, the samples were pasted with thick (0.3
~ 0.4 mm) Pt wires using Pt paste. The fixtures were physically screwed with thick Pt leads on the
sample holder. In the case of Fe-doped (010) β-Ga2O3 single crystal, the sample and electrode
geometry were the same as the one for the DC measurement (Figure 3.2(a)), i.e. four-wire
measurement. The measurement range of temperature were between 150 ~ 800˚C in air. The real
temperature of furnace was monitored by s-type thermocouples. At a given temperature, the
samples were chemically and thermally equilibrated, meaning the resistance of samples do not
change as a function of time.
A small AC signal of 0.5 V ~ 1.0 V was applied on the samples with a frequency range of
5 MHz ~ 5 Hz to obtain AC data, which are the real and imaginary parts of admittance (Y and Y').
The collected admittance was converted to all other AC formalisms, modulus, impedance,
permittivity, and capacitance using the relations:
𝑌∗ = 𝑌′ + 𝑖𝑌′′ (3.1)
𝑌∗ =
1
𝑍∗ (3.2)
𝑀∗ = 𝑖𝜔𝐶0𝑍∗ (3.3)
𝜖∗ =
1
𝑀∗ (3.4)
where 𝑌∗ is the complex admittance, 𝑍∗ is the complex impedance, 𝑀∗ is the complex modulus, i
is the imaginary number, 𝜔 is the angular frequency, 𝐶0 is the capacitance of open cell. The real
(Z) and imaginary (Z) parts of impedance were used to construct Cole-Cole plots for analyzing
a resistance of sample. Cole-Cole plots are then fitted by multiple equivalent circuits with EIS
Spectrum Analyser.
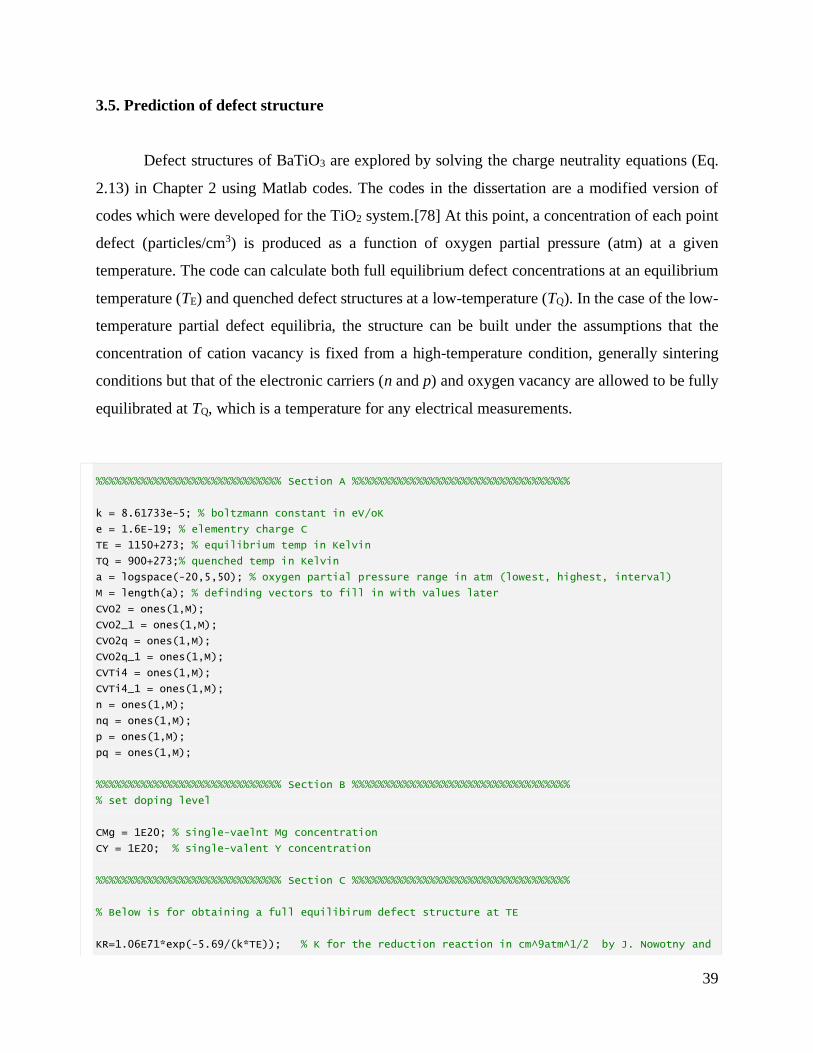
39
3.5. Prediction of defect structure
Defect structures of BaTiO3 are explored by solving the charge neutrality equations (Eq.
2.13) in Chapter 2 using Matlab codes. The codes in the dissertation are a modified version of
codes which were developed for the TiO2 system.[78] At this point, a concentration of each point
defect (particles/cm3) is produced as a function of oxygen partial pressure (atm) at a given
temperature. The code can calculate both full equilibrium defect concentrations at an equilibrium
temperature (TE) and quenched defect structures at a low-temperature (TQ). In the case of the low-
temperature partial defect equilibria, the structure can be built under the assumptions that the
concentration of cation vacancy is fixed from a high-temperature condition, generally sintering
conditions but that of the electronic carriers (n and p) and oxygen vacancy are allowed to be fully
equilibrated at TQ, which is a temperature for any electrical measurements.
%%%%%%%%%%%%%%%%%%%%%%%%%%%%% Section A %%%%%%%%%%%%%%%%%%%%%%%%%%%%%%%%%%
k = 8.61733e-5; % boltzmann constant in eV/oK
e = 1.6E-19; % elementry charge C
TE = 1150+273; % equilibrium temp in Kelvin
TQ = 900+273;% quenched temp in Kelvin
a = logspace(-20,5,50); % oxygen partial pressure range in atm (lowest, highest, interval)
M = length(a); % definding vectors to fill in with values later
CVO2 = ones(1,M);
CVO2_1 = ones(1,M);
CVO2q = ones(1,M);
CVO2q_1 = ones(1,M);
CVTi4 = ones(1,M);
CVTi4_1 = ones(1,M);
n = ones(1,M);
nq = ones(1,M);
p = ones(1,M);
pq = ones(1,M);
%%%%%%%%%%%%%%%%%%%%%%%%%%%%% Section B %%%%%%%%%%%%%%%%%%%%%%%%%%%%%%%%%%
% set doping level
CMg = 1E20; % single-vaelnt Mg concentration
CY = 1E20; % single-valent Y concentration
%%%%%%%%%%%%%%%%%%%%%%%%%%%%% Section C %%%%%%%%%%%%%%%%%%%%%%%%%%%%%%%%%%
% Below is for obtaining a full equilibirum defect structure at TE
KR=1.06E71*exp(-5.69/(k*TE)); % K for the reduction reaction in cm^9atm^1/2 by J. Nowotny and
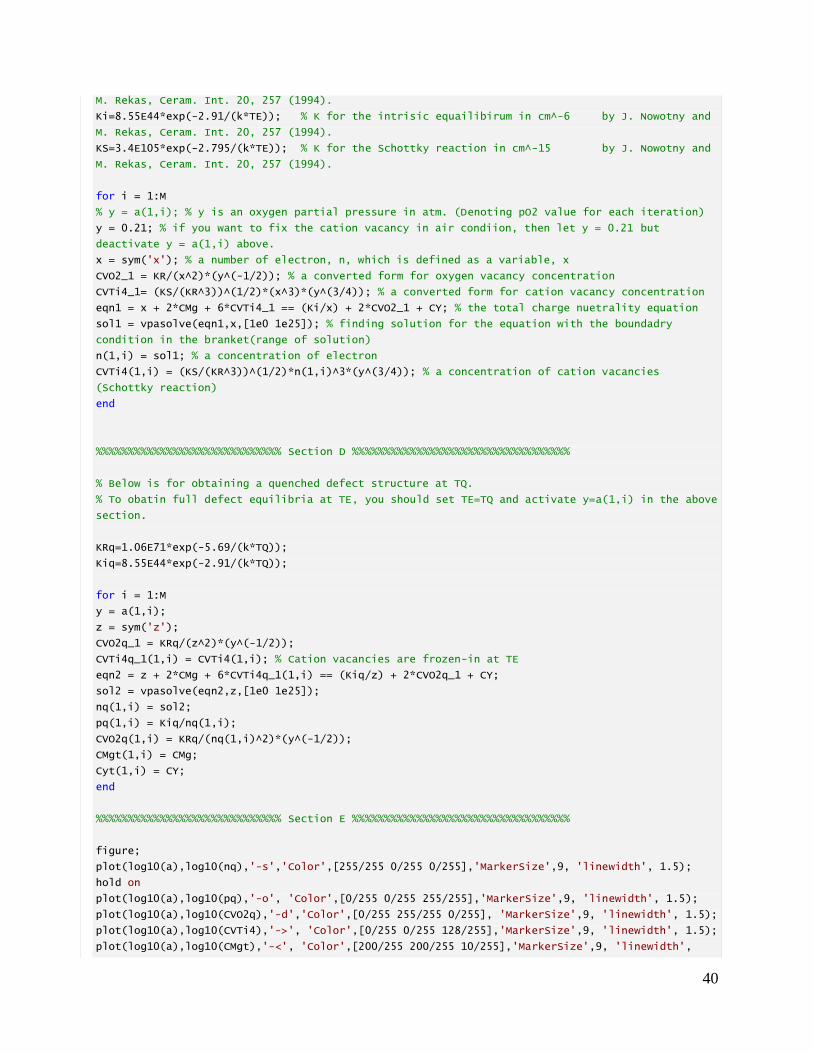
40
M. Rekas, Ceram. Int. 20, 257 (1994).
Ki=8.55E44*exp(-2.91/(k*TE)); % K for the intrisic equailibirum in cm^-6 by J. Nowotny and
M. Rekas, Ceram. Int. 20, 257 (1994).
KS=3.4E105*exp(-2.795/(k*TE)); % K for the Schottky reaction in cm^-15 by J. Nowotny and
M. Rekas, Ceram. Int. 20, 257 (1994).
for i = 1:M
% y = a(1,i); % y is an oxygen partial pressure in atm. (Denoting pO2 value for each iteration)
y = 0.21; % if you want to fix the cation vacancy in air condiion, then let y = 0.21 but
deactivate y = a(1,i) above.
x = sym('x'); % a number of electron, n, which is defined as a variable, x
CVO2_1 = KR/(x^2)*(y^(-1/2)); % a converted form for oxygen vacancy concentration
CVTi4_1= (KS/(KR^3))^(1/2)*(x^3)*(y^(3/4)); % a converted form for cation vacancy concentration
eqn1 = x + 2*CMg + 6*CVTi4_1 == (Ki/x) + 2*CVO2_1 + CY; % the total charge nuetrality equation
sol1 = vpasolve(eqn1,x,[1e0 1e25]); % finding solution for the equation with the boundadry
condition in the branket(range of solution)
n(1,i) = sol1; % a concentration of electron
CVTi4(1,i) = (KS/(KR^3))^(1/2)*n(1,i)^3*(y^(3/4)); % a concentration of cation vacancies
(Schottky reaction)
end
%%%%%%%%%%%%%%%%%%%%%%%%%%%%% Section D %%%%%%%%%%%%%%%%%%%%%%%%%%%%%%%%%%
% Below is for obtaining a quenched defect structure at TQ.
% To obatin full defect equilibria at TE, you should set TE=TQ and activate y=a(1,i) in the above
section.
KRq=1.06E71*exp(-5.69/(k*TQ));
Kiq=8.55E44*exp(-2.91/(k*TQ));
for i = 1:M
y = a(1,i);
z = sym('z');
CVO2q_1 = KRq/(z^2)*(y^(-1/2));
CVTi4q_1(1,i) = CVTi4(1,i); % Cation vacancies are frozen-in at TE
eqn2 = z + 2*CMg + 6*CVTi4q_1(1,i) == (Kiq/z) + 2*CVO2q_1 + CY;
sol2 = vpasolve(eqn2,z,[1e0 1e25]);
nq(1,i) = sol2;
pq(1,i) = Kiq/nq(1,i);
CVO2q(1,i) = KRq/(nq(1,i)^2)*(y^(-1/2));
CMgt(1,i) = CMg;
Cyt(1,i) = CY;
end
%%%%%%%%%%%%%%%%%%%%%%%%%%%%% Section E %%%%%%%%%%%%%%%%%%%%%%%%%%%%%%%%%%
figure;
plot(log10(a),log10(nq),'-s','Color',[255/255 0/255 0/255],'MarkerSize',9, 'linewidth', 1.5);
hold on
plot(log10(a),log10(pq),'-o', 'Color',[0/255 0/255 255/255],'MarkerSize',9, 'linewidth', 1.5);
plot(log10(a),log10(CVO2q),'-d','Color',[0/255 255/255 0/255], 'MarkerSize',9, 'linewidth', 1.5);
plot(log10(a),log10(CVTi4),'->', 'Color',[0/255 0/255 128/255],'MarkerSize',9, 'linewidth', 1.5);
plot(log10(a),log10(CMgt),'-<', 'Color',[200/255 200/255 10/255],'MarkerSize',9, 'linewidth',
41
1.5);
plot(log10(a),log10(Cyt),'-p', 'Color',[0/255 0/255 0/255],'MarkerSize',9, 'linewidth', 1.5);
hold off
xlabel('log_1_0\itp\rmO_2 (atm)');
ylabel('log_1_0 [ ] (cm^-^3)');
set(gca,'FontSize',14);
set(gcf, 'Position', [200, 200, 800, 700]);
legend('n','p','V_O^2^+', 'V_T_i^4^+(=V_B_a^2^+)', 'Mg_T_i^2^-', 'Y_B_a^1^+', 'Location',
'southwest');
axis([-20 5 14 22]);
t1=text(-20.0, 22.3, ['T_E = ' num2str(TE-273) ' ^oC' ' ' 'T_Q = ' num2str(TQ-273) ' ^oC']);
t1.FontSize = 14;
print cropcircledemo.png -dpng -r600 -painters
42
Chapter 4
Electrical Conductivity of Mg or Mn Singly doped BaTiO3
4.1. Introduction
The effects of single doping of acceptor on the electrical conductivity have been widely
investigated to understand the defect chemistry of BaTiO3,[43, 46, 54, 55, 57, 79–81] However,
most of the literatures were focused on the high-temperature equilibrium electrical conductivity,
and systematic investigations were not explored with reducing temperature where defect
compensating mechanism can be affected by other factors such as grain-boundary. Moreover,
capacitors are operated under two-points DC bias at low-temperature where the contact resistance
also plays a significant role. Thus, it is motivated to explore the electrical conductivity over a wide
range of temperature with both four-point and two-point DC/AC electrical measurements.
In MLCCs, single-valent Mg and multivalent Mn are widely used as acceptors.[14, 67]
Yoon et al., systematically investigated the doping effects of Mg and Mn on electrical conductivity
and degradation.[48, 58–61] Their studies revealed that the Mg has negative impacts on both bulk
conductivity and degradation resistance regardless of grain size. On the other hand, Mn is regarded
as an effective acceptor for improving degradation of BaTiO3 due to the multivalent characteristic
of Mn. Although their studies show the systematic and clear trend in electrical conductivity and
degradation behavior of Mg-doped BaTiO3, only ionic transference number and degradation
characteristics were discussed in Mn-doped BaTiO3. Thus, the effects of Mn are not very clear in
terms of the bulk and grain-boundary conductivity at changing temperature.
In this chapter, the comprehensive DC and AC electrical conductivities of BaTiO3 ceramics
doped by either 0.5 mol% of single-valent Mg or 0.5 mol% of multivalent Mn were compared in
a wide range of temperature and oxygen partial pressure to better understand the role each dopant
depending on temperature. In addition, this chapter is proposed to help readers to digest the
following co-doping effects of donor and acceptor in BaTiO3 (Chapter 5). The samples were made
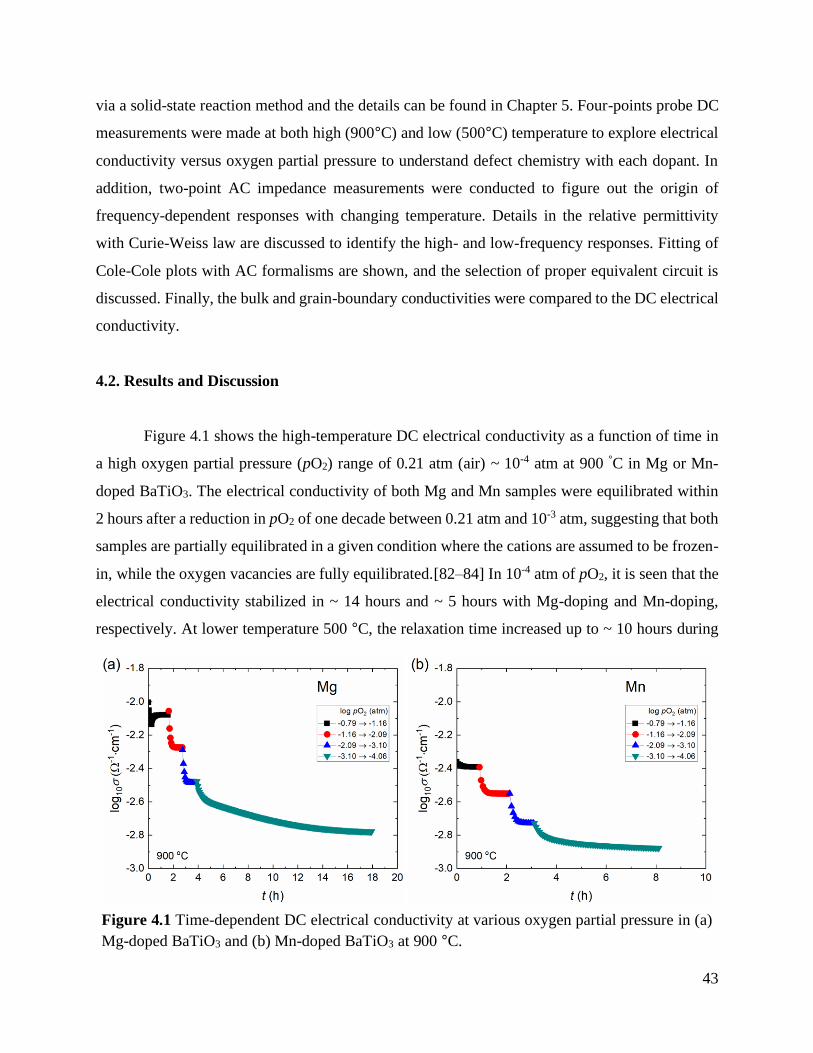
43
via a solid-state reaction method and the details can be found in Chapter 5. Four-points probe DC
measurements were made at both high (900°C) and low (500°C) temperature to explore electrical
conductivity versus oxygen partial pressure to understand defect chemistry with each dopant. In
addition, two-point AC impedance measurements were conducted to figure out the origin of
frequency-dependent responses with changing temperature. Details in the relative permittivity
with Curie-Weiss law are discussed to identify the high- and low-frequency responses. Fitting of
Cole-Cole plots with AC formalisms are shown, and the selection of proper equivalent circuit is
discussed. Finally, the bulk and grain-boundary conductivities were compared to the DC electrical
conductivity.
4.2. Results and Discussion
Figure 4.1 shows the high-temperature DC electrical conductivity as a function of time in
a high oxygen partial pressure (pO2) range of 0.21 atm (air) ~ 10-4 atm at 900 °C in Mg or Mn-
doped BaTiO3. The electrical conductivity of both Mg and Mn samples were equilibrated within
2 hours after a reduction in pO2 of one decade between 0.21 atm and 10-3 atm, suggesting that both
samples are partially equilibrated in a given condition where the cations are assumed to be frozen-
in, while the oxygen vacancies are fully equilibrated.[82–84] In 10-4 atm of pO2, it is seen that the
electrical conductivity stabilized in ~ 14 hours and ~ 5 hours with Mg-doping and Mn-doping,
respectively. At lower temperature 500 °C, the relaxation time increased up to ~ 10 hours during
Figure 4.1 Time-dependent DC electrical conductivity at various oxygen partial pressure in (a)
Mg-doped BaTiO3 and (b) Mn-doped BaTiO3 at 900 °C.
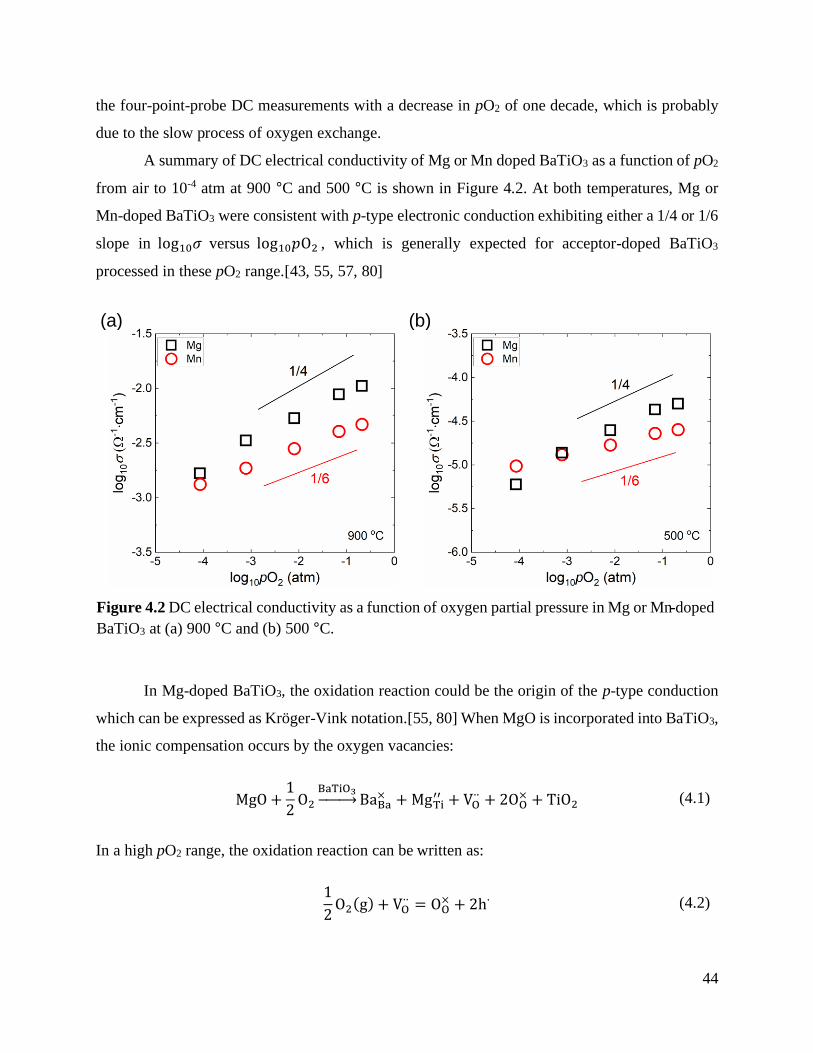
44
the four-point-probe DC measurements with a decrease in pO2 of one decade, which is probably
due to the slow process of oxygen exchange.
A summary of DC electrical conductivity of Mg or Mn doped BaTiO3 as a function of pO2
from air to 10-4 atm at 900 °C and 500 °C is shown in Figure 4.2. At both temperatures, Mg or
Mn-doped BaTiO3 were consistent with p-type electronic conduction exhibiting either a 1/4 or 1/6
slope in log10𝜎 versus log10𝑝O2 , which is generally expected for acceptor-doped BaTiO3
processed in these pO2 range.[43, 55, 57, 80]
In Mg-doped BaTiO3, the oxidation reaction could be the origin of the p-type conduction
which can be expressed as Kröger-Vink notation.[55, 80] When MgO is incorporated into BaTiO3,
the ionic compensation occurs by the oxygen vacancies:
MgO+1
2O2
BaTiO3→ BaBa
× +MgTi′′ + VO
∙∙ + 2OO× + TiO2 (4.1)
In a high pO2 range, the oxidation reaction can be written as:
1
2O2(g) + VO
∙∙ = OO× + 2h∙ (4.2)
Figure 4.2 DC electrical conductivity as a function of oxygen partial pressure in Mg or Mn-doped
BaTiO3 at (a) 900 °C and (b) 500 °C.
(a) (b)
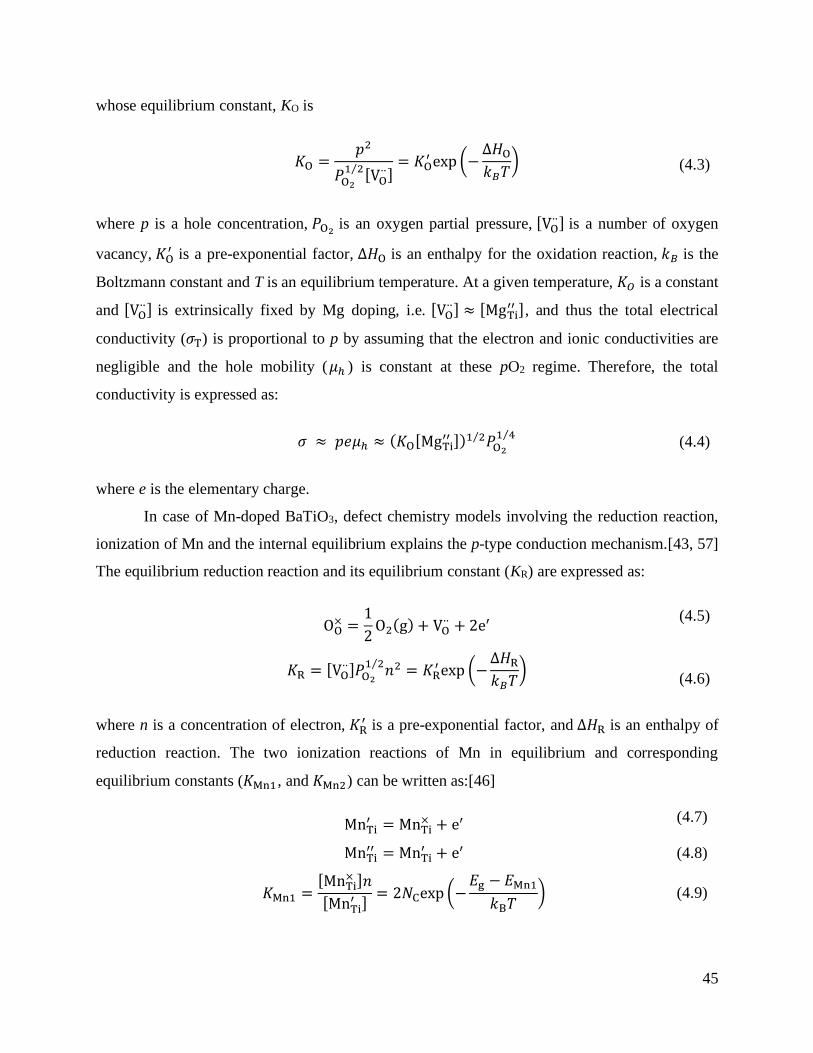
45
whose equilibrium constant, KO is
𝐾O =𝑝2
𝑃O21 2⁄ [VO
∙∙]= 𝐾O
′ exp (−∆𝐻O𝑘𝐵𝑇
) (4.3)
where p is a hole concentration, 𝑃O2 is an oxygen partial pressure, [VO∙∙] is a number of oxygen
vacancy, 𝐾O′ is a pre-exponential factor, ∆𝐻O is an enthalpy for the oxidation reaction, 𝑘𝐵 is the
Boltzmann constant and T is an equilibrium temperature. At a given temperature, 𝐾𝑂 is a constant
and [VO∙∙] is extrinsically fixed by Mg doping, i.e. [VO
∙∙] ≈ [MgTi′′ ], and thus the total electrical
conductivity (𝜎T) is proportional to p by assuming that the electron and ionic conductivities are
negligible and the hole mobility (𝜇ℎ ) is constant at these pO2 regime. Therefore, the total
conductivity is expressed as:
𝜎 ≈ 𝑝𝑒𝜇ℎ ≈ (𝐾O[MgTi′′ ])1 2⁄ 𝑃O2
1 4⁄ (4.4)
where e is the elementary charge.
In case of Mn-doped BaTiO3, defect chemistry models involving the reduction reaction,
ionization of Mn and the internal equilibrium explains the p-type conduction mechanism.[43, 57]
The equilibrium reduction reaction and its equilibrium constant (KR) are expressed as:
OO× =
1
2O2(g) + VO
∙∙ + 2e′ (4.5)
𝐾R = [VO
∙∙]𝑃O21 2⁄ 𝑛2 = 𝐾R
′exp (−∆𝐻R𝑘𝐵𝑇
) (4.6)
where n is a concentration of electron, 𝐾R′ is a pre-exponential factor, and ∆𝐻R is an enthalpy of
reduction reaction. The two ionization reactions of Mn in equilibrium and corresponding
equilibrium constants (𝐾Mn1 , and 𝐾Mn2) can be written as:[46]
MnTi
′ = MnTi× + e′ (4.7)
MnTi′′ = MnTi
′ + e′ (4.8)
𝐾Mn1 =
[MnTi× ]𝑛
[MnTi′ ]
= 2𝑁Cexp (−𝐸g − 𝐸Mn1
𝑘B𝑇) (4.9)
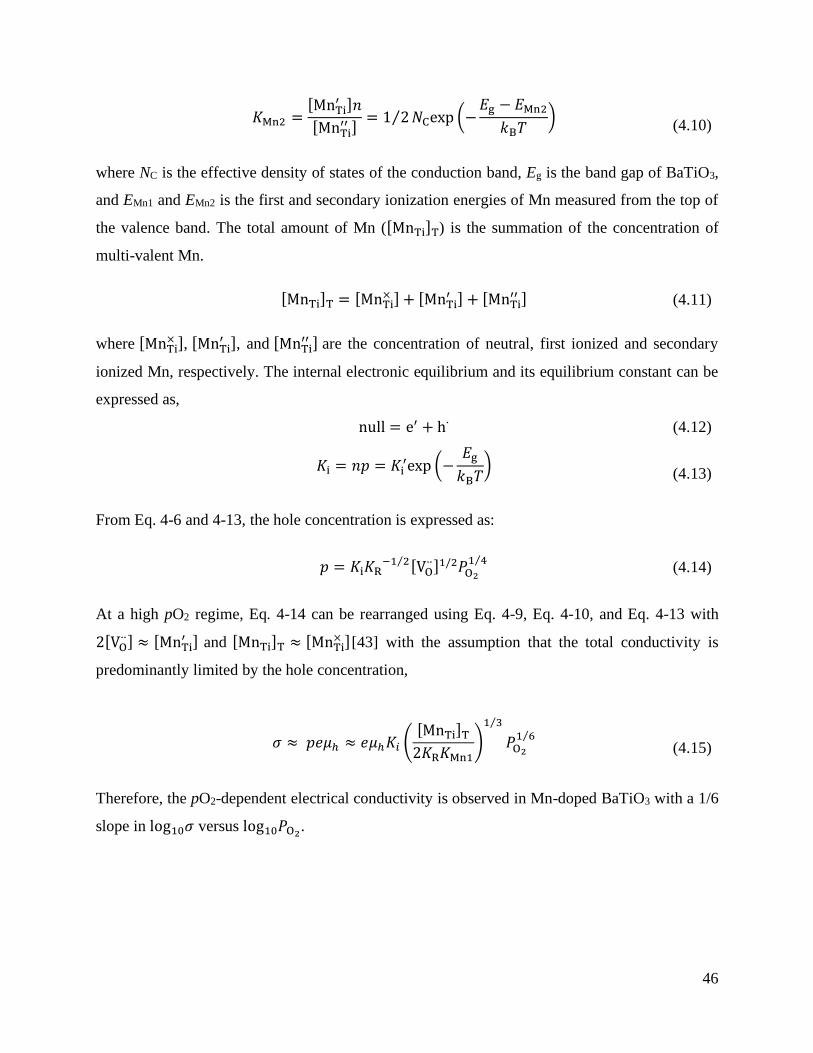
46
𝐾Mn2 =
[MnTi′ ]𝑛
[MnTi′′ ]
= 1 2⁄ 𝑁Cexp (−𝐸g − 𝐸Mn2
𝑘B𝑇)
(4.10)
where NC is the effective density of states of the conduction band, Eg is the band gap of BaTiO3,
and EMn1 and EMn2 is the first and secondary ionization energies of Mn measured from the top of
the valence band. The total amount of Mn ([MnTi]T) is the summation of the concentration of
multi-valent Mn.
[MnTi]T = [MnTi
× ] + [MnTi′ ] + [MnTi
′′ ] (4.11)
where [MnTi× ], [MnTi
′ ], and [MnTi′′ ] are the concentration of neutral, first ionized and secondary
ionized Mn, respectively. The internal electronic equilibrium and its equilibrium constant can be
expressed as,
null = e′ + h∙ (4.12)
𝐾i = 𝑛𝑝 = 𝐾i
′exp (−𝐸g
𝑘B𝑇)
(4.13)
From Eq. 4-6 and 4-13, the hole concentration is expressed as:
𝑝 = 𝐾i𝐾R−1 2⁄ [VO
∙∙]1/2𝑃O21 4⁄
(4.14)
At a high pO2 regime, Eq. 4-14 can be rearranged using Eq. 4-9, Eq. 4-10, and Eq. 4-13 with
2[VO∙∙] ≈ [MnTi
′ ] and [MnTi]T ≈ [MnTi× ][43] with the assumption that the total conductivity is
predominantly limited by the hole concentration,
𝜎 ≈ 𝑝𝑒𝜇ℎ ≈ 𝑒𝜇ℎ𝐾𝑖 (
[MnTi]T2𝐾R𝐾Mn1
)
1 3⁄
𝑃O21 6⁄
(4.15)
Therefore, the pO2-dependent electrical conductivity is observed in Mn-doped BaTiO3 with a 1/6
slope in log10𝜎 versus log10𝑃O2.
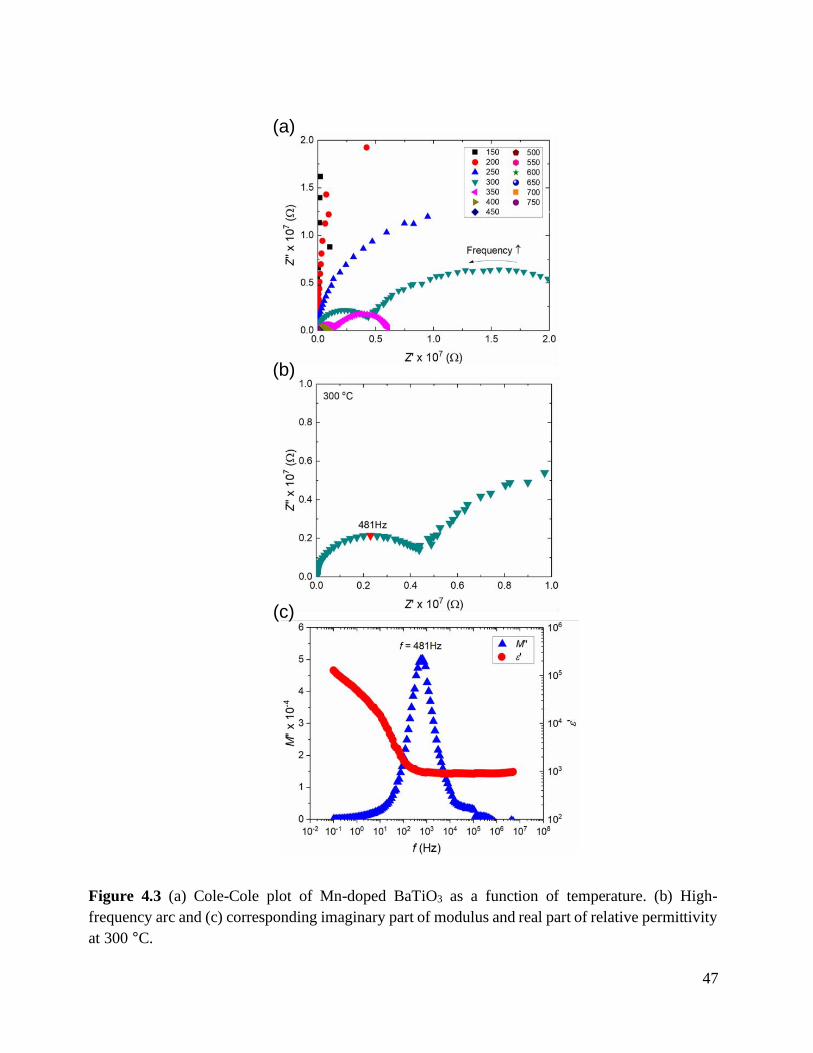
47
Figure 4.3 (a) Cole-Cole plot of Mn-doped BaTiO3 as a function of temperature. (b) High-
frequency arc and (c) corresponding imaginary part of modulus and real part of relative permittivity
at 300 °C.
(a)
(b)
(c)
48
Temperature-dependent electrical conductivity was analyzed by measuring AC impedance
in air condition. The real and imaginary parts of the impedance called Cole-Cole plots in Mn-
doped BaTiO3 are exhibited in Figure 4.3(a). At low-temperature, the resistance of sample was too
high, and thus only partial semi-circle is seen in Cole-Cole plot. At 300°C, two clear semi-circles
were observed, and the total impedance was mainly limited by the low-frequency arc. With
increasing temperature, the impedance of low-frequency arcs decreased significantly compared to
that of the high-frequency arc. To figure out the origin of two different frequency responses, the
imaginary part of modulus (M") and the real () and imaginary part () of relative permittivity
were more closely investigated. The high-frequency arc in Cole-Cole plot at 300 °C in Figure
4.3(b) corresponds to the peak of the M" and the frequency plateau of in Figure 4.3(c). The low-
frequency large semi-circle seems to correspond to the slope in the real part of relative permittivity
whose value is ~105 at a frequency range of 10-1 Hz to 100 Hz in Figure 4.3(c).
The relative permittivity is then extracted from the high-frequency plateau at various
temperature as shown in Figure 4.4(b). The obtained high-frequency relative permittivity were
around 1500 ~ 2500 at a temperature range of 150 °C ~ 250 °C, which is reasonable values for
BaTiO3.[85] The permittivity is then analyzed with respect to Curie-Weiss law:
휀 =𝐶0
(𝑇 − 𝑇0)
(5.16)
where 휀 is the relative permittivity, 𝐶0 is the Curie constant, T is the temperature, and 𝑇0 is the
Curie temperature. As shown in Figure 5.4(d), the high-frequency relative permittivity follows
Curie-Weiss law up to 250 °C. The obtained Curie temperature and Curie constant in Mn-doped
BaTiO3 were respectively 114.0±0.9 (°C) and 167209±1766 (°C), and those of Mg-doped BaTiO3
analyzed in the same manner as Mn-doped BaTiO3 were 96.8±0.2 (°C) and 114007±1861 (°C),
which are the reasonable values for BaTiO3.[70] Therefore, the high-frequency arc in Cole-Cole
plots of Mn-doped and Mg-doped BaTiO3 seems to be originated from the bulk response. On the
other hand, the low-frequency plateau of relative permittivity is almost temperature-independent,
and the capacitances corresponding to the low-frequency arcs are on the order of 10-9 F at these
temperature range in both cases, highly suggesting that the low-frequency arcs are attributed to the
grain-boundary responses.[61, 85, 86]
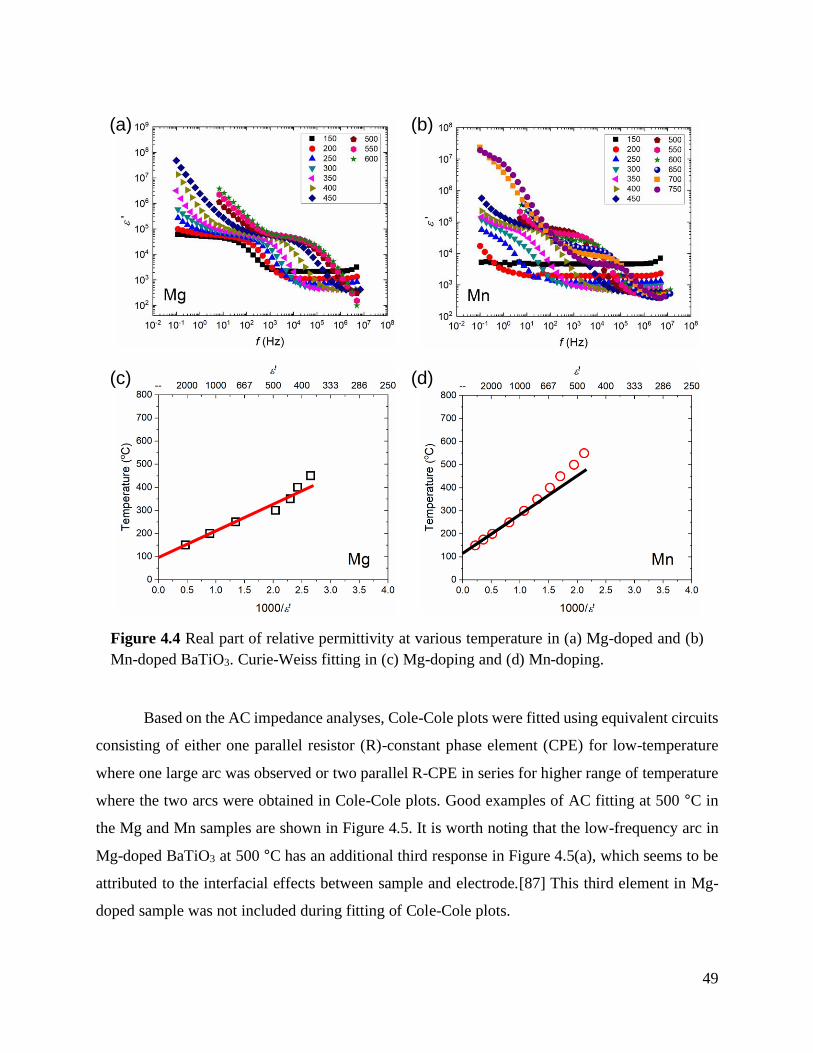
49
Based on the AC impedance analyses, Cole-Cole plots were fitted using equivalent circuits
consisting of either one parallel resistor (R)-constant phase element (CPE) for low-temperature
where one large arc was observed or two parallel R-CPE in series for higher range of temperature
where the two arcs were obtained in Cole-Cole plots. Good examples of AC fitting at 500 °C in
the Mg and Mn samples are shown in Figure 4.5. It is worth noting that the low-frequency arc in
Mg-doped BaTiO3 at 500 °C has an additional third response in Figure 4.5(a), which seems to be
attributed to the interfacial effects between sample and electrode.[87] This third element in Mg-
doped sample was not included during fitting of Cole-Cole plots.
Figure 4.4 Real part of relative permittivity at various temperature in (a) Mg-doped and (b)
Mn-doped BaTiO3. Curie-Weiss fitting in (c) Mg-doping and (d) Mn-doping.
(a) (b)
(c) (d)
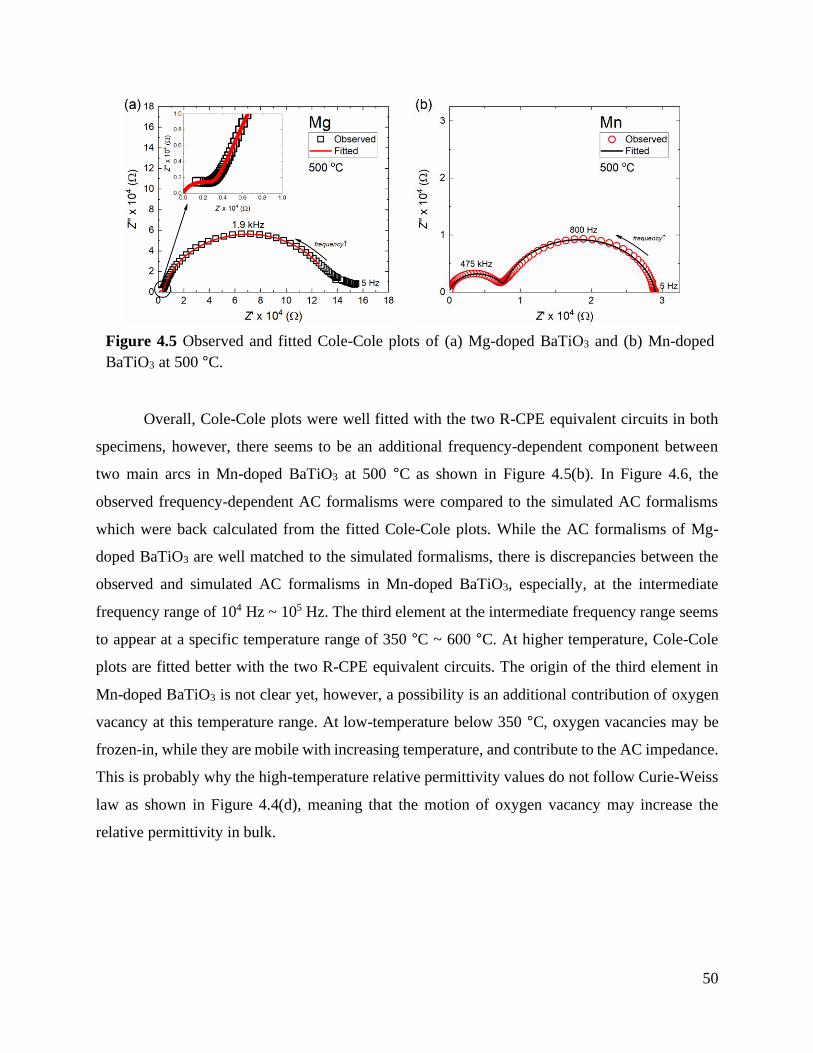
50
Overall, Cole-Cole plots were well fitted with the two R-CPE equivalent circuits in both
specimens, however, there seems to be an additional frequency-dependent component between
two main arcs in Mn-doped BaTiO3 at 500 °C as shown in Figure 4.5(b). In Figure 4.6, the
observed frequency-dependent AC formalisms were compared to the simulated AC formalisms
which were back calculated from the fitted Cole-Cole plots. While the AC formalisms of Mg-
doped BaTiO3 are well matched to the simulated formalisms, there is discrepancies between the
observed and simulated AC formalisms in Mn-doped BaTiO3, especially, at the intermediate
frequency range of 104 Hz ~ 105 Hz. The third element at the intermediate frequency range seems
to appear at a specific temperature range of 350 °C ~ 600 °C. At higher temperature, Cole-Cole
plots are fitted better with the two R-CPE equivalent circuits. The origin of the third element in
Mn-doped BaTiO3 is not clear yet, however, a possibility is an additional contribution of oxygen
vacancy at this temperature range. At low-temperature below 350 °C, oxygen vacancies may be
frozen-in, while they are mobile with increasing temperature, and contribute to the AC impedance.
This is probably why the high-temperature relative permittivity values do not follow Curie-Weiss
law as shown in Figure 4.4(d), meaning that the motion of oxygen vacancy may increase the
relative permittivity in bulk.
Figure 4.5 Observed and fitted Cole-Cole plots of (a) Mg-doped BaTiO3 and (b) Mn-doped
BaTiO3 at 500 °C.
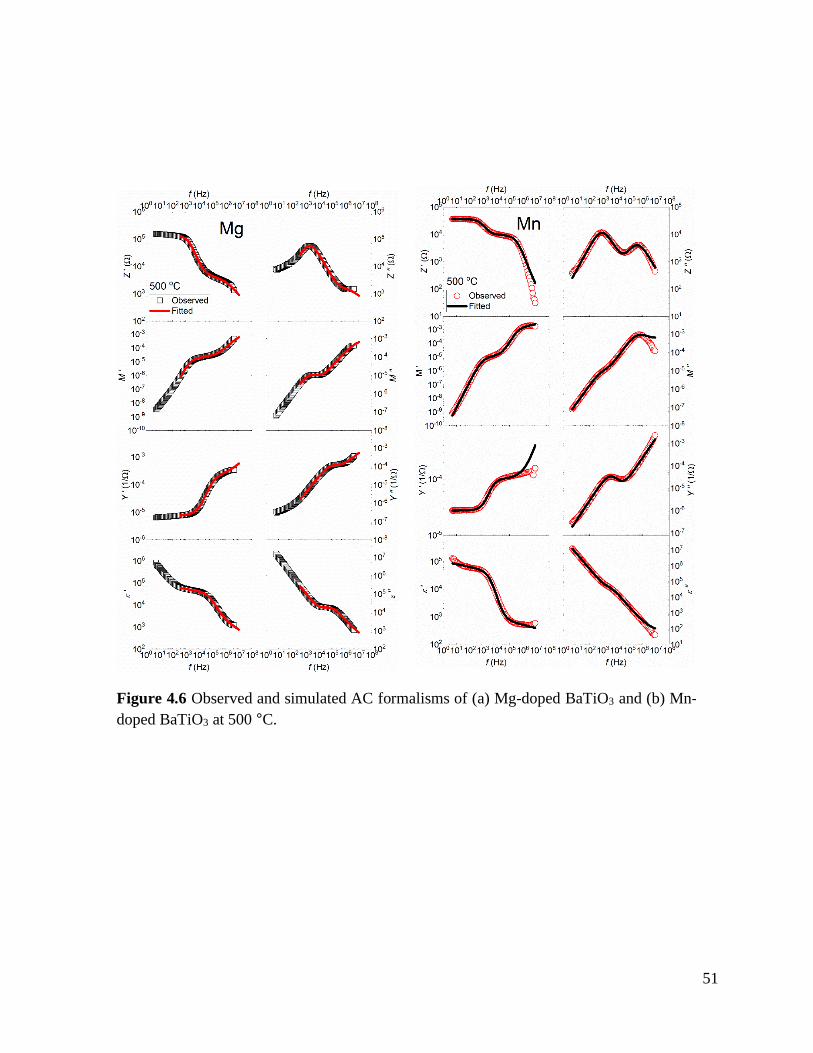
51
Figure 4.6 Observed and simulated AC formalisms of (a) Mg-doped BaTiO3 and (b) Mn-
doped BaTiO3 at 500 °C.
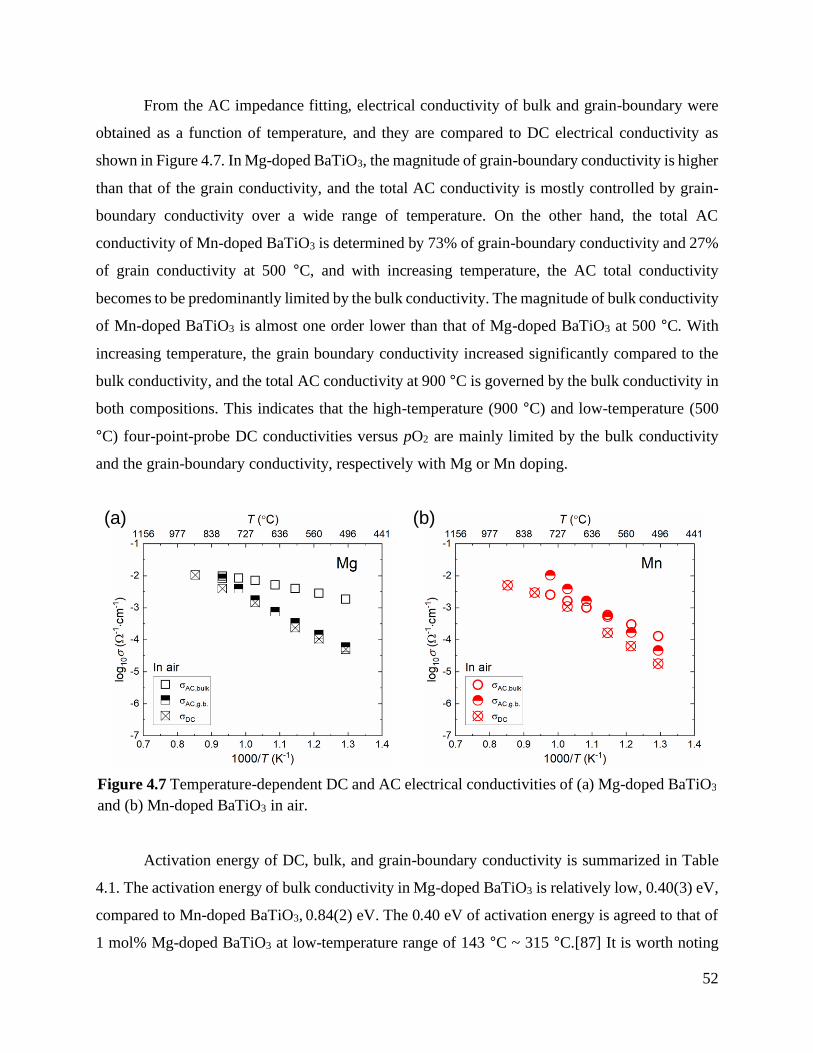
52
From the AC impedance fitting, electrical conductivity of bulk and grain-boundary were
obtained as a function of temperature, and they are compared to DC electrical conductivity as
shown in Figure 4.7. In Mg-doped BaTiO3, the magnitude of grain-boundary conductivity is higher
than that of the grain conductivity, and the total AC conductivity is mostly controlled by grain-
boundary conductivity over a wide range of temperature. On the other hand, the total AC
conductivity of Mn-doped BaTiO3 is determined by 73% of grain-boundary conductivity and 27%
of grain conductivity at 500 °C, and with increasing temperature, the AC total conductivity
becomes to be predominantly limited by the bulk conductivity. The magnitude of bulk conductivity
of Mn-doped BaTiO3 is almost one order lower than that of Mg-doped BaTiO3 at 500 °C. With
increasing temperature, the grain boundary conductivity increased significantly compared to the
bulk conductivity, and the total AC conductivity at 900 °C is governed by the bulk conductivity in
both compositions. This indicates that the high-temperature (900 °C) and low-temperature (500
°C) four-point-probe DC conductivities versus pO2 are mainly limited by the bulk conductivity
and the grain-boundary conductivity, respectively with Mg or Mn doping.
Activation energy of DC, bulk, and grain-boundary conductivity is summarized in Table
4.1. The activation energy of bulk conductivity in Mg-doped BaTiO3 is relatively low, 0.40(3) eV,
compared to Mn-doped BaTiO3, 0.84(2) eV. The 0.40 eV of activation energy is agreed to that of
1 mol% Mg-doped BaTiO3 at low-temperature range of 143 °C ~ 315 °C.[87] It is worth noting
Figure 4.7 Temperature-dependent DC and AC electrical conductivities of (a) Mg-doped BaTiO3
and (b) Mn-doped BaTiO3 in air.
(a) (b)
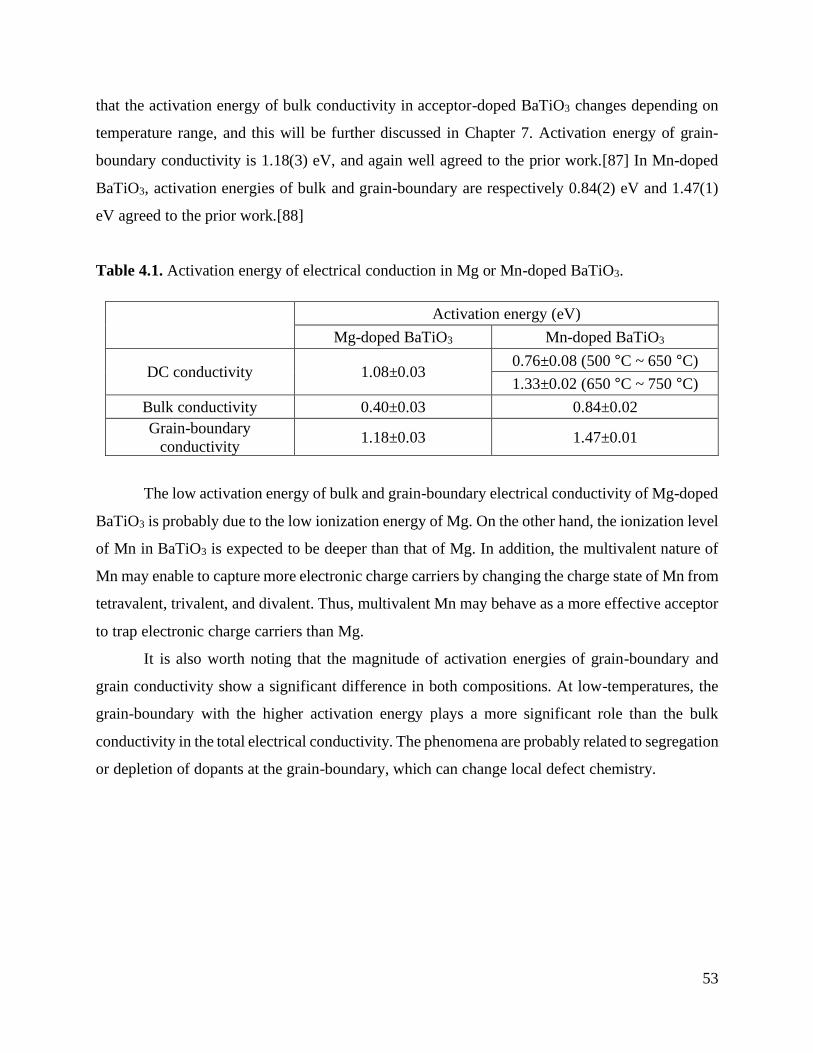
53
that the activation energy of bulk conductivity in acceptor-doped BaTiO3 changes depending on
temperature range, and this will be further discussed in Chapter 7. Activation energy of grain-
boundary conductivity is 1.18(3) eV, and again well agreed to the prior work.[87] In Mn-doped
BaTiO3, activation energies of bulk and grain-boundary are respectively 0.84(2) eV and 1.47(1)
eV agreed to the prior work.[88]
Table 4.1. Activation energy of electrical conduction in Mg or Mn-doped BaTiO3.
Activation energy (eV)
Mg-doped BaTiO3 Mn-doped BaTiO3
DC conductivity 1.08±0.03 0.76±0.08 (500 °C ~ 650 °C)
1.33±0.02 (650 °C ~ 750 °C)
Bulk conductivity 0.40±0.03 0.84±0.02
Grain-boundary
conductivity 1.18±0.03 1.47±0.01
The low activation energy of bulk and grain-boundary electrical conductivity of Mg-doped
BaTiO3 is probably due to the low ionization energy of Mg. On the other hand, the ionization level
of Mn in BaTiO3 is expected to be deeper than that of Mg. In addition, the multivalent nature of
Mn may enable to capture more electronic charge carriers by changing the charge state of Mn from
tetravalent, trivalent, and divalent. Thus, multivalent Mn may behave as a more effective acceptor
to trap electronic charge carriers than Mg.
It is also worth noting that the magnitude of activation energies of grain-boundary and
grain conductivity show a significant difference in both compositions. At low-temperatures, the
grain-boundary with the higher activation energy plays a more significant role than the bulk
conductivity in the total electrical conductivity. The phenomena are probably related to segregation
or depletion of dopants at the grain-boundary, which can change local defect chemistry.
54
4.3. Conclusions
In this chapter, the comprehensive DC and AC measurements were made as a function of
oxygen partial pressure and temperature to figure out the role of 0.5 mol% Mg and 0.5 mol% Mn
on the electrical conductivity of BaTiO3 ceramics synthesized via a solid-state reaction method.
The high (900 °C) and low (500 °C) temperature DC electrical conductivities versus pO2 revealed
that both compositions exhibit p-type electrical conductivity in high pO2 regime. The origin of p-
type conduction in Mg-doped BaTiO3 is attributed to the oxidation reaction, while the combined
defect reactions involving the ionization of Mn, reduction reaction, and internal equilibrium
explained p-type behavior in Mn-doped BaTiO3. It was confirmed from the AC impedance
analyses that the high-frequency and low-frequency arcs in Cole-Cole plots are attributed to the
bulk and grain-boundary responses, respectively, in both compositions. In addition, the DC
electrical conductivity is mainly dominated by the grain-boundary conductivity at 500 °C but by
the bulk conductivity at 900 °C. The magnitude of bulk conductivity in Mg-doped BaTiO3 is higher
than that of Mn-doped BaTiO3, which is due to the low activation energy with Mg-doping.
55
Chapter 5
Co-doping Strategies for Controlling Electrical Conductivity
of BaTiO3
(Submitted in Journal of the American Ceramic Society. Modifications were made to incorporate
it into the dissertation as a whole.)
5.1. Abstract
We explore the synergistic effects of co-doping BaTiO3 with a judicious combination of
acceptors and donors to control the point defect chemistry and electrical properties, with the goal
of simultaneously limiting the electronic and ionic conductivities over broad temperature and
oxygen partial pressure (pO2) ranges. Specifically, we compare the temperature- and pO2-
dependent electrical properties of BaTiO3 ceramics acceptor-doped with either Mn or Mg and co-
doped with Y, which serves as a donor. This paper, which is the first of a two-part series, presents
the electrical properties as a function of pO2, temperature, and time. The DC and AC electrical
conductivity measurements reveal that co-doping with Mn and Y can result in (1) improved
electrical resistivity over a broad temperature range, (2) pO2-independent electrical conductivity
in oxidizing conditions, and (3) improved dielectric degradation resistance as a function of time.
The predicted defect concentration with the canonical defect models explains the pO2-independent
electrical conductivity with the nature of multivalent characteristics of Mn, and the enhanced
degradation resistance is attributed to the reduced oxygen vacancy concentration.
56
5.1. Introduction
Understanding the fundamentals of defect chemistry in oxide materials is vital to rational
design of dielectric material properties. The coupled intrinsic and extrinsic lattice and electronic
defects not only determine the initial electrical conduction properties, but they ultimately control
the time-dependent resistance degradation.[18–20, 89] The design and control of defect chemistry
becomes even more critical as capacitors must operate at higher electric fields and temperatures.
Thus, refining our fundamental understanding of defect chemistry in important dielectric materials
such as BaTiO3 remains an outstanding challenge to the community.
Several works have studied the role of single-valent Mg and multivalent Mn acceptors on
the degradation resistance of ceramic BaTiO3.[48, 59] Mn was shown to mitigate resistance
degradation more effectively than Mg by leading to a greater reduction in the concentration of free
oxygen vacancies at the same acceptor concentration. In addition, Mn is thought to trap more
electronic charge carriers than Mg by virtue of its multivalent character.[48] Although the Mn
doping strategies seem to improve the degradation resistance by limiting both electronic and ionic
conductivities, the concentration of free oxygen vacancies is still large enough to make time-
dependent degradation in Mn singly doped BaTiO3 as observed in our present study.
Compositional design approaches have been widely investigated in BaTiO3 with co-doping
of rare-earth elements and acceptors to improve the time-dependent degradation resistance
further.[14, 75, 90] This is particularly important for improving the reliability of multi-layer
ceramic capacitors (MLCCs), which have been chemically engineered with amphoteric dopants
such as Ho, Dy, Er dopants that can occupy both cation sites in X7R and Y5V types BaTiO3
MLCCs.[14] Han et al. studied the effects of co-doping BaTiO3 with Mn and Dy or Ho on the
time-dependent degradation properties. The co-doped compositions exhibited the stable and low
leakage current densities as a function of time compared to the singly doped specimens at 150 °C
under 0.5 MV/cm electric field.[90] Improved degradation characteristics in Dy and Mn co-doped
BaTiO3 were also reported by Yoon et al. who showed the better degradation resistance versus
time and the higher breakdown voltage with more Dy.[75]
Although co-doping strategies have been experimentally shown to enhance the degradation
resistance, the origin of the improvement is not well understood in terms of defect chemistry. In
addition, there are only a few works investigating the equilibrium defect chemistry of co-doped
57
compositions.[62–64] In the prior work of Yeoh et al., the high-temperature electrical conductivity
of Mn and Y co-doped BaTiO3 was shown to be invariant as a function of oxygen partial pressure,
pO2, with a lower magnitude of conductivity in the high pO2 range than the singly acceptor-doped
compositions.[64]. This behavior was explained by pinning the Fermi level via donor-acceptor
mutual compensation, which is a strategy widely used in semi-conducing materials such as
GaAs,[1] but arguably much more difficulty to implement in most oxide ceramics because of the
pervasive background impurities in most commercial-grade materials and the multitude of intrinsic
defects, all of which contribute to the charge balance.[32]
To further explore co-doping strategies, in this work we compare the electrical conductivity
properties of BaTiO3 doped with a single-valent (Mg) or multivalent (Mn) cation and with Y as a
co-dopant. In this chapter, we measure the temperature-dependent properties of this series of
compositions and explore the effects of the Ba:Ti ratio. Both high- and low- temperature DC
conductivity measurements are made as a function of pO2, and bulk conductivities extracted from
AC impedance measurements are compared over a wide range of temperatures in air. In addition,
we measure the time-dependent leakage current to understand the effects of the doping chemistries
on the degradation kinetics. Canonical defect models are utilized to predict the defect chemistries
of Mn and Y co-doped composition to explain the improved electrical resistivity and degradation
resistance.
5.2. Experimental setup
A conventional solid-state reaction method was used to make the compositions listed in
Table 6.1 using commercial powders of BaTiO3 (99.995%, Sigma Aldrich), TiO2 (99.998%,
CERAC TM Incorporated), MgO (99.99%, Sigma Aldrich), MnO2 (99.99%, Sigma Aldrich) and
Y2O3 (99.99%, Sigma Aldrich). Considering the amphoteric behavior of Y, a small amount of
TiO2 (0.1 mol%) was added to produce A-site vacancies, and thus increased a probability that Y
occupies the A-site.[91] For the co-doped compositions, 1.0 mol% Ti-rich compositions were
additionally prepared to examine the effects of cation nonstoichiometry on high temperature
electrical conductivity.
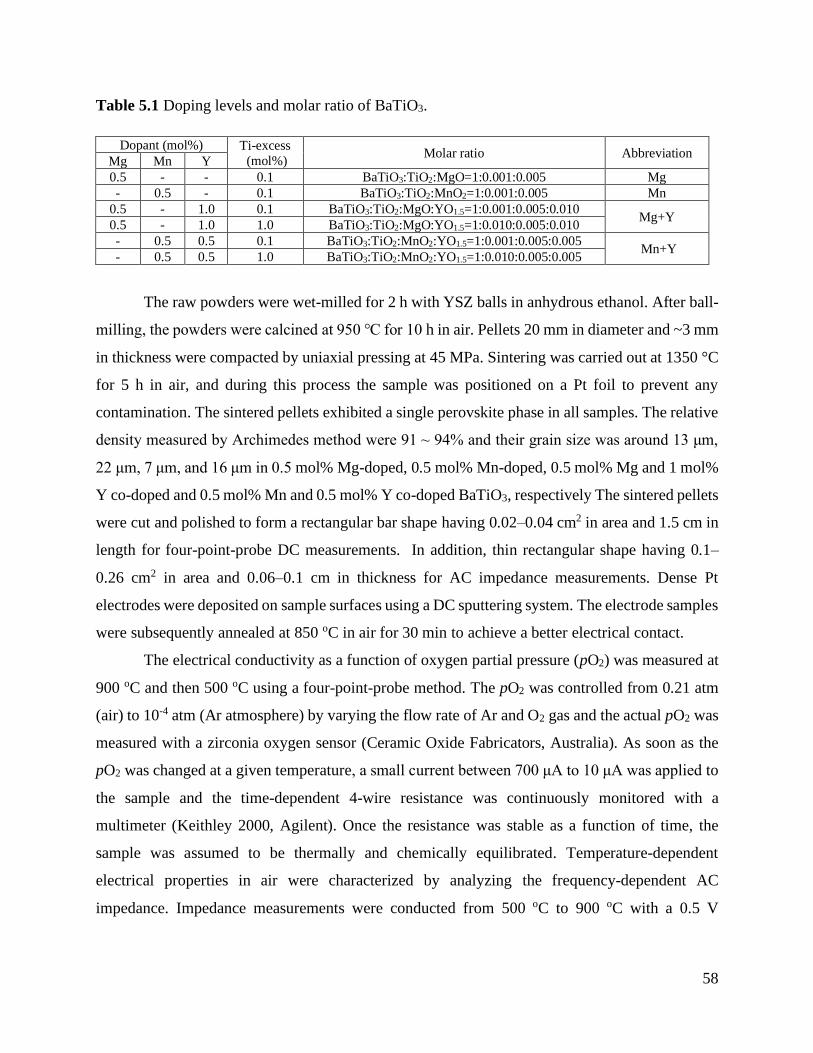
58
Table 5.1 Doping levels and molar ratio of BaTiO3.
Dopant (mol%) Ti-excess
(mol%) Molar ratio Abbreviation
Mg Mn Y
0.5 - - 0.1 BaTiO3:TiO2:MgO=1:0.001:0.005 Mg
- 0.5 - 0.1 BaTiO3:TiO2:MnO2=1:0.001:0.005 Mn
0.5 - 1.0 0.1 BaTiO3:TiO2:MgO:YO1.5=1:0.001:0.005:0.010 Mg+Y
0.5 - 1.0 1.0 BaTiO3:TiO2:MgO:YO1.5=1:0.010:0.005:0.010
- 0.5 0.5 0.1 BaTiO3:TiO2:MnO2:YO1.5=1:0.001:0.005:0.005 Mn+Y
- 0.5 0.5 1.0 BaTiO3:TiO2:MnO2:YO1.5=1:0.010:0.005:0.005
The raw powders were wet-milled for 2 h with YSZ balls in anhydrous ethanol. After ball-
milling, the powders were calcined at 950 for 10 h in air. Pellets 20 mm in diameter and ~3 mm
in thickness were compacted by uniaxial pressing at 45 MPa. Sintering was carried out at 1350 °C
for 5 h in air, and during this process the sample was positioned on a Pt foil to prevent any
contamination. The sintered pellets exhibited a single perovskite phase in all samples. The relative
density measured by Archimedes method were 91 ~ 94% and their grain size was around 13 μm,
22 μm, 7 μm, and 16 μm in 0.5 mol% Mg-doped, 0.5 mol% Mn-doped, 0.5 mol% Mg and 1 mol%
Y co-doped and 0.5 mol% Mn and 0.5 mol% Y co-doped BaTiO3, respectively The sintered pellets
were cut and polished to form a rectangular bar shape having 0.02–0.04 cm2 in area and 1.5 cm in
length for four-point-probe DC measurements. In addition, thin rectangular shape having 0.1–
0.26 cm2 in area and 0.06–0.1 cm in thickness for AC impedance measurements. Dense Pt
electrodes were deposited on sample surfaces using a DC sputtering system. The electrode samples
were subsequently annealed at 850 oC in air for 30 min to achieve a better electrical contact.
The electrical conductivity as a function of oxygen partial pressure (pO2) was measured at
900 oC and then 500 oC using a four-point-probe method. The pO2 was controlled from 0.21 atm
(air) to 10-4 atm (Ar atmosphere) by varying the flow rate of Ar and O2 gas and the actual pO2 was
measured with a zirconia oxygen sensor (Ceramic Oxide Fabricators, Australia). As soon as the
pO2 was changed at a given temperature, a small current between 700 μA to 10 μA was applied to
the sample and the time-dependent 4-wire resistance was continuously monitored with a
multimeter (Keithley 2000, Agilent). Once the resistance was stable as a function of time, the
sample was assumed to be thermally and chemically equilibrated. Temperature-dependent
electrical properties in air were characterized by analyzing the frequency-dependent AC
impedance. Impedance measurements were conducted from 500 oC to 900 oC with a 0.5 V
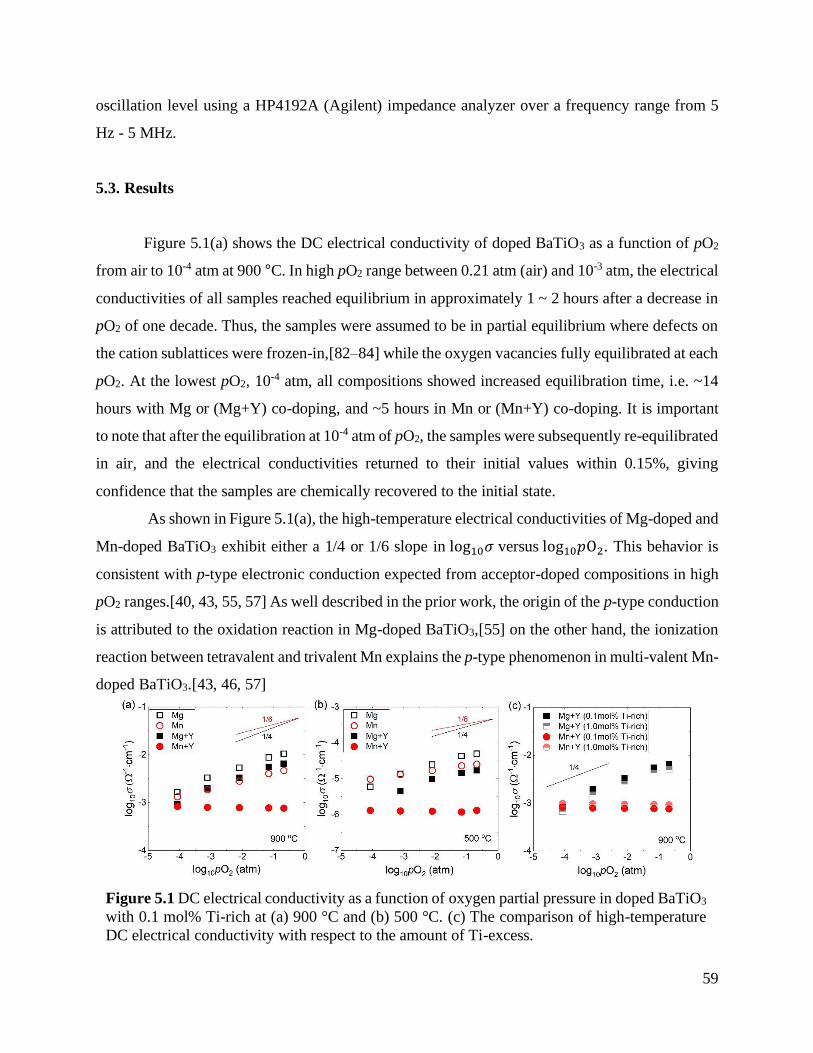
59
oscillation level using a HP4192A (Agilent) impedance analyzer over a frequency range from 5
Hz - 5 MHz.
5.3. Results
Figure 5.1(a) shows the DC electrical conductivity of doped BaTiO3 as a function of pO2
from air to 10-4 atm at 900 °C. In high pO2 range between 0.21 atm (air) and 10-3 atm, the electrical
conductivities of all samples reached equilibrium in approximately 1 ~ 2 hours after a decrease in
pO2 of one decade. Thus, the samples were assumed to be in partial equilibrium where defects on
the cation sublattices were frozen-in,[82–84] while the oxygen vacancies fully equilibrated at each
pO2. At the lowest pO2, 10-4 atm, all compositions showed increased equilibration time, i.e. ~14
hours with Mg or (Mg+Y) co-doping, and ~5 hours in Mn or (Mn+Y) co-doping. It is important
to note that after the equilibration at 10-4 atm of pO2, the samples were subsequently re-equilibrated
in air, and the electrical conductivities returned to their initial values within 0.15%, giving
confidence that the samples are chemically recovered to the initial state.
As shown in Figure 5.1(a), the high-temperature electrical conductivities of Mg-doped and
Mn-doped BaTiO3 exhibit either a 1/4 or 1/6 slope in log10𝜎 versus log10𝑝O2. This behavior is
consistent with p-type electronic conduction expected from acceptor-doped compositions in high
pO2 ranges.[40, 43, 55, 57] As well described in the prior work, the origin of the p-type conduction
is attributed to the oxidation reaction in Mg-doped BaTiO3,[55] on the other hand, the ionization
reaction between tetravalent and trivalent Mn explains the p-type phenomenon in multi-valent Mn-
doped BaTiO3.[43, 46, 57]
Figure 5.1 DC electrical conductivity as a function of oxygen partial pressure in doped BaTiO3
with 0.1 mol% Ti-rich at (a) 900 °C and (b) 500 °C. (c) The comparison of high-temperature
DC electrical conductivity with respect to the amount of Ti-excess.
60
Similar to Mg-doped BaTiO3, (Mg+Y) co-doped samples exhibit p-type conduction but
with a lower magnitude of electrical conductivity, as seen in Figure 5.1(a). In principle, adding
donor dopants should compensate for the acceptors and lower the overall electronic conductivity,
which agrees with the trends in the experimental results. In the oxidation reaction, the hole
concentration is a function of oxygen partial pressure with a ¼ exponent and a magnitude of hole
concentration is proportional to the concentration of oxygen vacancies.[80]. In Mg singly doped
BaTiO3, the concentration of oxygen vacancy is fixed by a concentration of Mg in high and
intermediate pO2 regime at a given temperature. When Mg is co-doped with Y, Y and the oxygen
vacancy are both electrically positive species that compensate Mg. Therefore, the system prefers
to have less oxygen vacancies energetically than Mg-single doping. Assuming the equilibrium
constant for the oxidation reaction is the same in both Mg and (Mg+Y) doping at 900 °C, the
magnitude of pO2-dependent electrical conductivity is decreased by the lowered oxygen vacancies
in (Mg+Y) co-doped BaTiO3 in a given same pO2 range.
In stark contrast to (Mg+Y) co-doped BaTiO3, the electrical conductivity of (Mn+Y) co-
doped BaTiO3 is significantly lower and nearly independent of pO2, which agrees well with the
prior work[63, 64] and is attributed to the multivalent nature of the Mn cation.[64] The magnitude
of electrical conductivity shows only a 1.15% difference over the measured pO2 range.
At a lower temperature of 500 °C, as shown in Figure 5.1(b), the Mg-doped, (Mg+Y) co-
doped, and Mn-doped samples continue to exhibit p-type conductivity, as evidence by the positive
pO2-dependent DC conductivity. In these samples, the equilibration time was ~ 10 hours during
the four-point-probe DC electrical measurements with a decrease in pO2 of one decade. The slow
kinetics at a lower temperature is due to the slow process of oxygen exchange in the oxidation
reaction. In case of (Mn+Y) co-doping, the DC electrical conductivity is lowest over the entire
pO2 range at this temperature. Most interestingly, the electrical conductivity of the (Mn+Y) co-
doped samples did not change within the measurement precision as a function of time and pO2 for
up to 2 hours.
The effect of cation nonstoichiometry on the high-temperature DC electrical conductivity
was examined as a function of pO2 in (Mg+Y) and (Mn+Y) co-doped BaTiO3 as shown in Figure
5.1(c). Although there is a 3 ~ 5% difference in the magnitude of log10σ in all pO2, the overall
behavior of electrical conductivity versus pO2 is almost the same in both co-doped BaTiO3
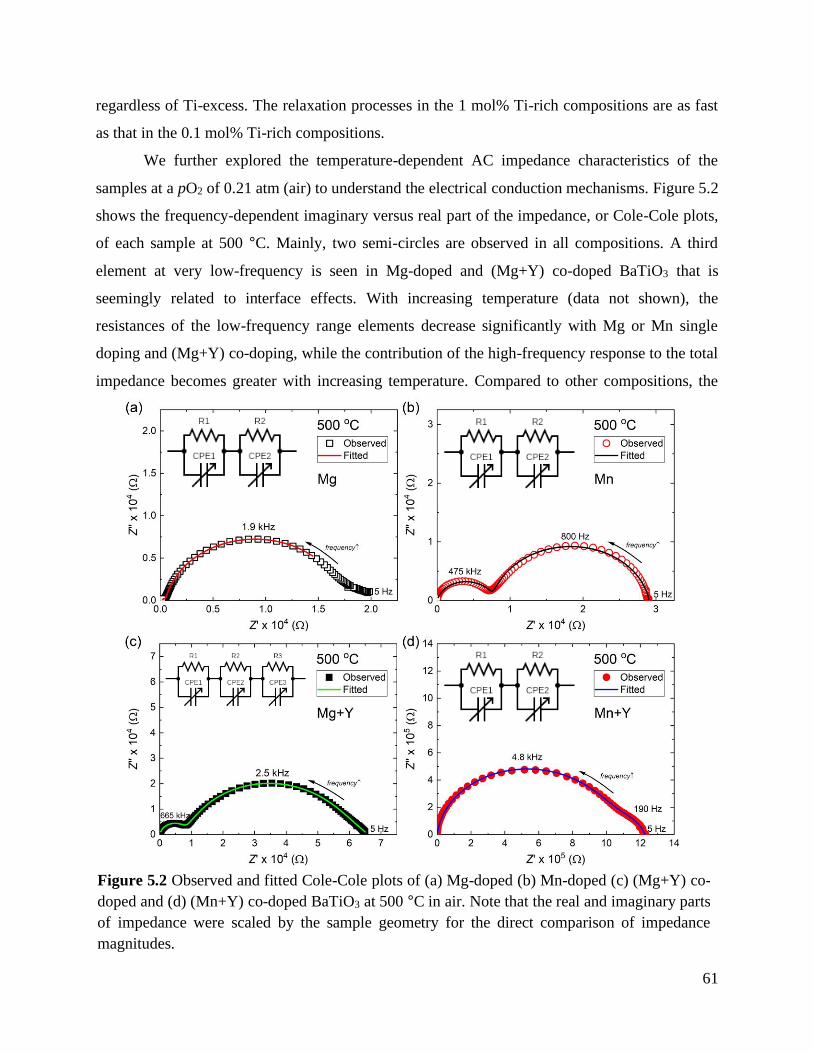
61
regardless of Ti-excess. The relaxation processes in the 1 mol% Ti-rich compositions are as fast
as that in the 0.1 mol% Ti-rich compositions.
We further explored the temperature-dependent AC impedance characteristics of the
samples at a pO2 of 0.21 atm (air) to understand the electrical conduction mechanisms. Figure 5.2
shows the frequency-dependent imaginary versus real part of the impedance, or Cole-Cole plots,
of each sample at 500 °C. Mainly, two semi-circles are observed in all compositions. A third
element at very low-frequency is seen in Mg-doped and (Mg+Y) co-doped BaTiO3 that is
seemingly related to interface effects. With increasing temperature (data not shown), the
resistances of the low-frequency range elements decrease significantly with Mg or Mn single
doping and (Mg+Y) co-doping, while the contribution of the high-frequency response to the total
impedance becomes greater with increasing temperature. Compared to other compositions, the
Figure 5.2 Observed and fitted Cole-Cole plots of (a) Mg-doped (b) Mn-doped (c) (Mg+Y) co-
doped and (d) (Mn+Y) co-doped BaTiO3 at 500 °C in air. Note that the real and imaginary parts
of impedance were scaled by the sample geometry for the direct comparison of impedance
magnitudes.
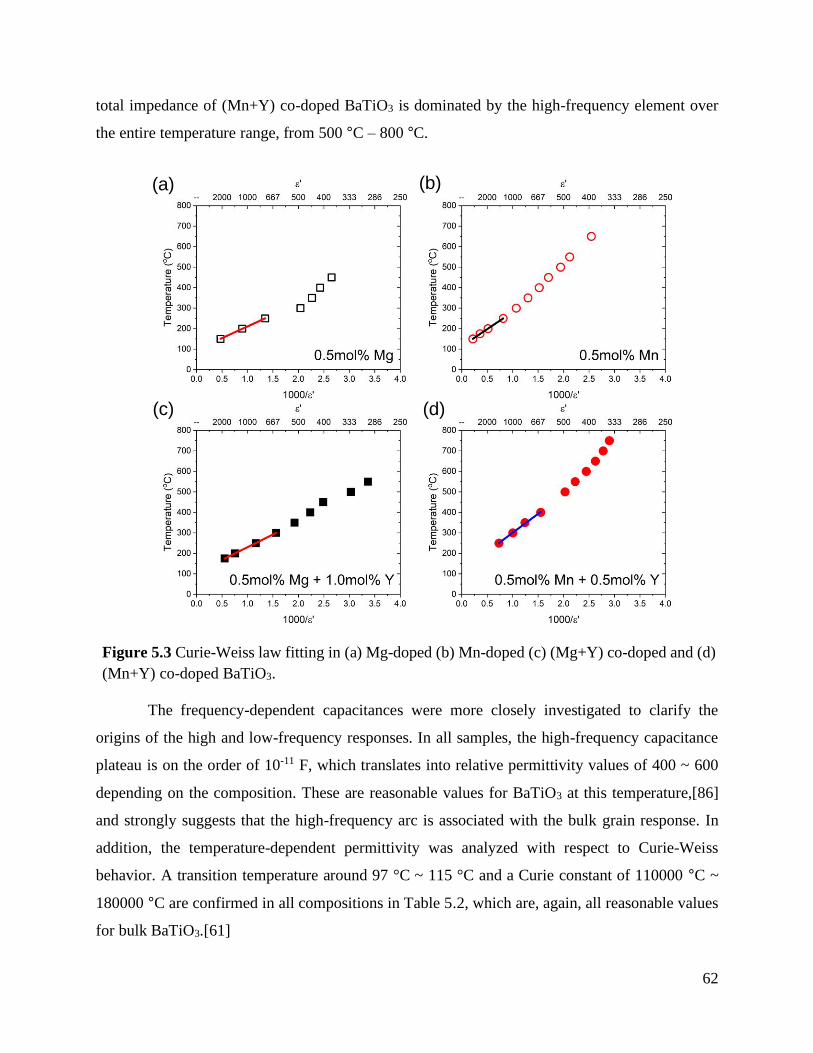
62
total impedance of (Mn+Y) co-doped BaTiO3 is dominated by the high-frequency element over
the entire temperature range, from 500 °C – 800 °C.
The frequency-dependent capacitances were more closely investigated to clarify the
origins of the high and low-frequency responses. In all samples, the high-frequency capacitance
plateau is on the order of 10-11 F, which translates into relative permittivity values of 400 ~ 600
depending on the composition. These are reasonable values for BaTiO3 at this temperature,[86]
and strongly suggests that the high-frequency arc is associated with the bulk grain response. In
addition, the temperature-dependent permittivity was analyzed with respect to Curie-Weiss
behavior. A transition temperature around 97 °C ~ 115 °C and a Curie constant of 110000 °C ~
180000 °C are confirmed in all compositions in Table 5.2, which are, again, all reasonable values
for bulk BaTiO3.[61]
(a) (b)
(c) (d)
Figure 5.3 Curie-Weiss law fitting in (a) Mg-doped (b) Mn-doped (c) (Mg+Y) co-doped and (d)
(Mn+Y) co-doped BaTiO3.
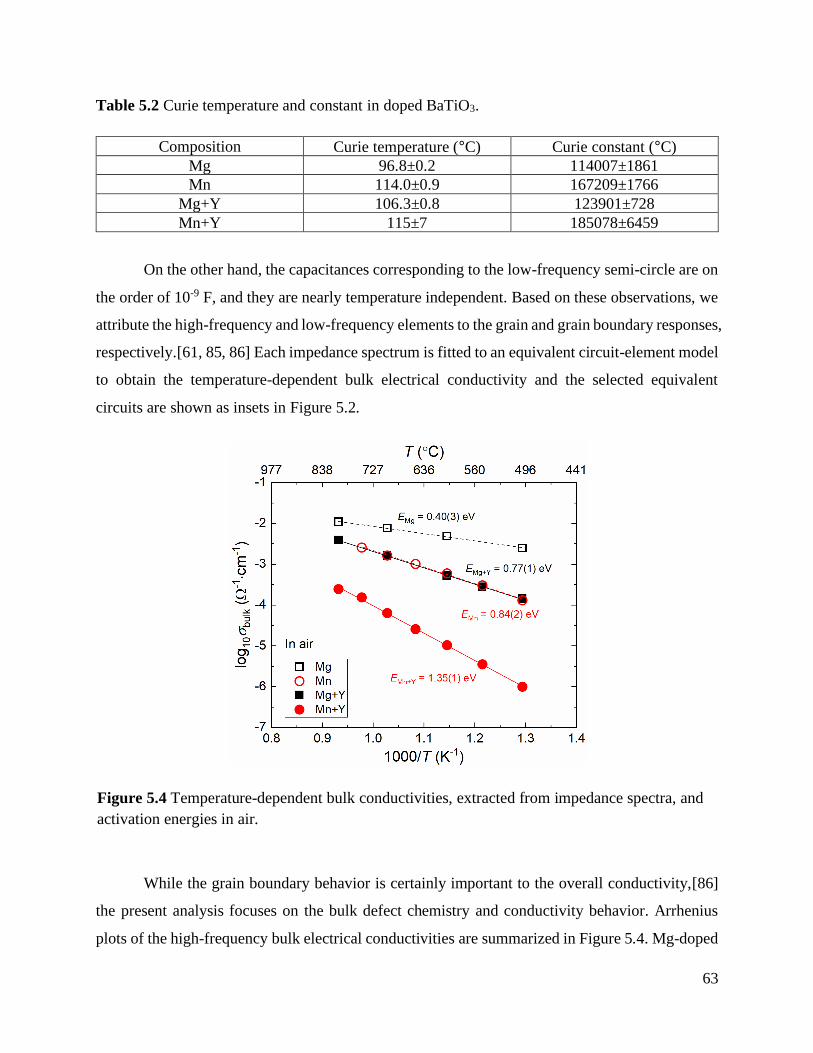
63
Table 5.2 Curie temperature and constant in doped BaTiO3.
Composition Curie temperature (°C) Curie constant (°C)
Mg 96.8±0.2 114007±1861
Mn 114.0±0.9 167209±1766
Mg+Y 106.3±0.8 123901±728
Mn+Y 115±7 185078±6459
On the other hand, the capacitances corresponding to the low-frequency semi-circle are on
the order of 10-9 F, and they are nearly temperature independent. Based on these observations, we
attribute the high-frequency and low-frequency elements to the grain and grain boundary responses,
respectively.[61, 85, 86] Each impedance spectrum is fitted to an equivalent circuit-element model
to obtain the temperature-dependent bulk electrical conductivity and the selected equivalent
circuits are shown as insets in Figure 5.2.
While the grain boundary behavior is certainly important to the overall conductivity,[86]
the present analysis focuses on the bulk defect chemistry and conductivity behavior. Arrhenius
plots of the high-frequency bulk electrical conductivities are summarized in Figure 5.4. Mg-doped
Figure 5.4 Temperature-dependent bulk conductivities, extracted from impedance spectra, and
activation energies in air.
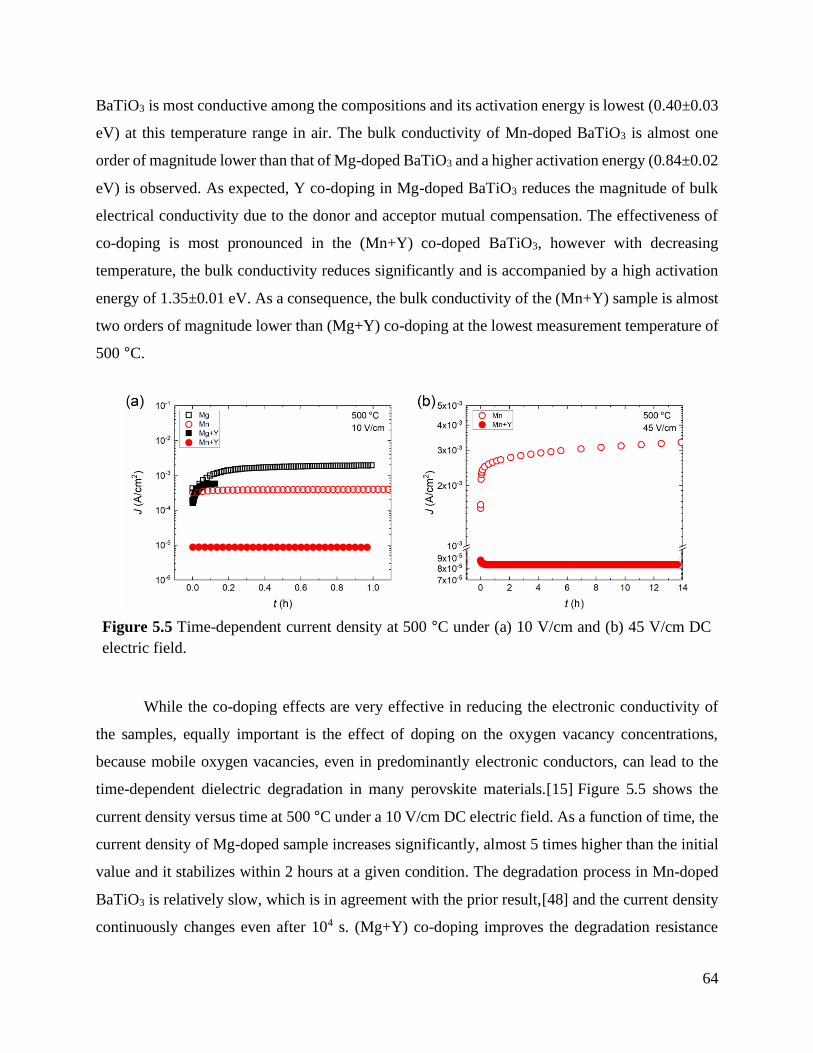
64
BaTiO3 is most conductive among the compositions and its activation energy is lowest (0.40±0.03
eV) at this temperature range in air. The bulk conductivity of Mn-doped BaTiO3 is almost one
order of magnitude lower than that of Mg-doped BaTiO3 and a higher activation energy (0.84±0.02
eV) is observed. As expected, Y co-doping in Mg-doped BaTiO3 reduces the magnitude of bulk
electrical conductivity due to the donor and acceptor mutual compensation. The effectiveness of
co-doping is most pronounced in the (Mn+Y) co-doped BaTiO3, however with decreasing
temperature, the bulk conductivity reduces significantly and is accompanied by a high activation
energy of 1.35±0.01 eV. As a consequence, the bulk conductivity of the (Mn+Y) sample is almost
two orders of magnitude lower than (Mg+Y) co-doping at the lowest measurement temperature of
500 °C.
While the co-doping effects are very effective in reducing the electronic conductivity of
the samples, equally important is the effect of doping on the oxygen vacancy concentrations,
because mobile oxygen vacancies, even in predominantly electronic conductors, can lead to the
time-dependent dielectric degradation in many perovskite materials.[15] Figure 5.5 shows the
current density versus time at 500 °C under a 10 V/cm DC electric field. As a function of time, the
current density of Mg-doped sample increases significantly, almost 5 times higher than the initial
value and it stabilizes within 2 hours at a given condition. The degradation process in Mn-doped
BaTiO3 is relatively slow, which is in agreement with the prior result,[48] and the current density
continuously changes even after 104 s. (Mg+Y) co-doping improves the degradation resistance
Figure 5.5 Time-dependent current density at 500 °C under (a) 10 V/cm and (b) 45 V/cm DC
electric field.
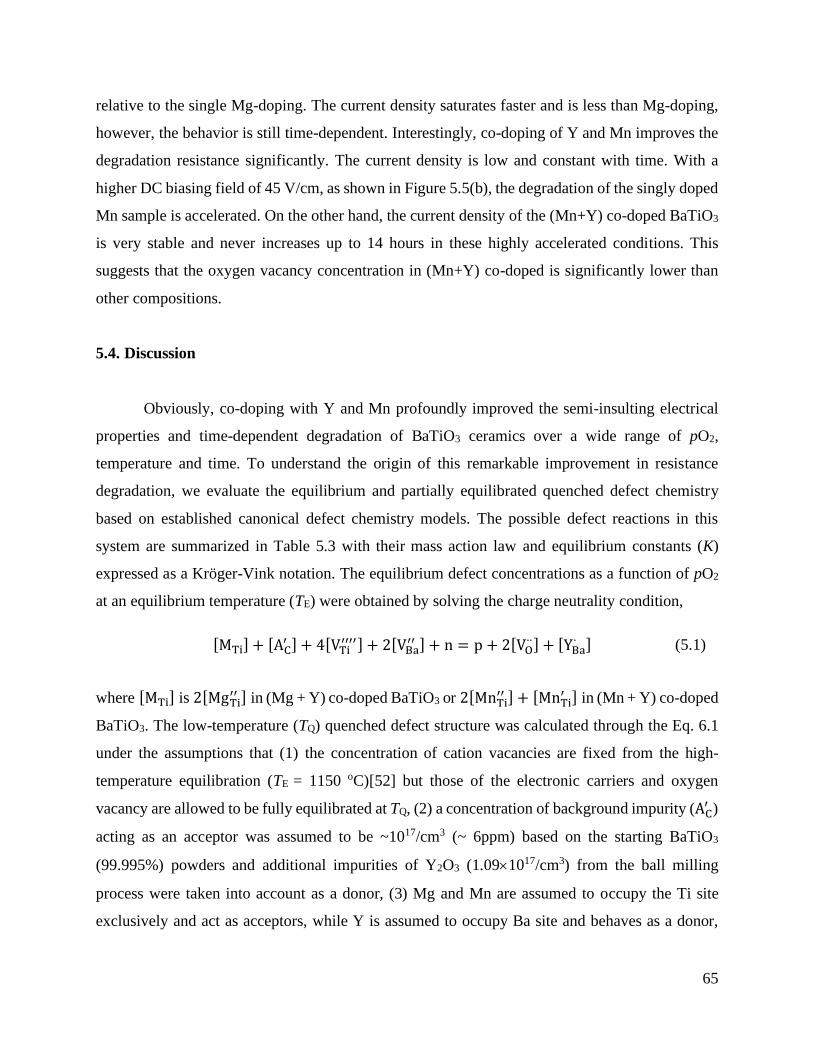
65
relative to the single Mg-doping. The current density saturates faster and is less than Mg-doping,
however, the behavior is still time-dependent. Interestingly, co-doping of Y and Mn improves the
degradation resistance significantly. The current density is low and constant with time. With a
higher DC biasing field of 45 V/cm, as shown in Figure 5.5(b), the degradation of the singly doped
Mn sample is accelerated. On the other hand, the current density of the (Mn+Y) co-doped BaTiO3
is very stable and never increases up to 14 hours in these highly accelerated conditions. This
suggests that the oxygen vacancy concentration in (Mn+Y) co-doped is significantly lower than
other compositions.
5.4. Discussion
Obviously, co-doping with Y and Mn profoundly improved the semi-insulting electrical
properties and time-dependent degradation of BaTiO3 ceramics over a wide range of pO2,
temperature and time. To understand the origin of this remarkable improvement in resistance
degradation, we evaluate the equilibrium and partially equilibrated quenched defect chemistry
based on established canonical defect chemistry models. The possible defect reactions in this
system are summarized in Table 5.3 with their mass action law and equilibrium constants (K)
expressed as a Kröger-Vink notation. The equilibrium defect concentrations as a function of pO2
at an equilibrium temperature (TE) were obtained by solving the charge neutrality condition,
[MTi] + [AC′ ] + 4[VTi
′′′′] + 2[VBa′′ ] + n = p + 2[VO
∙∙] + [YBa∙ ] (5.1)
where [MTi] is 2[MgTi′′ ] in (Mg + Y) co-doped BaTiO3 or 2[MnTi
′′ ] + [MnTi′ ] in (Mn + Y) co-doped
BaTiO3. The low-temperature (TQ) quenched defect structure was calculated through the Eq. 6.1
under the assumptions that (1) the concentration of cation vacancies are fixed from the high-
temperature equilibration (TE = 1150 oC)[52] but those of the electronic carriers and oxygen
vacancy are allowed to be fully equilibrated at TQ, (2) a concentration of background impurity (AC′ )
acting as an acceptor was assumed to be ~1017/cm3 (~ 6ppm) based on the starting BaTiO3
(99.995%) powders and additional impurities of Y2O3 (1.091017/cm3) from the ball milling
process were taken into account as a donor, (3) Mg and Mn are assumed to occupy the Ti site
exclusively and act as acceptors, while Y is assumed to occupy Ba site and behaves as a donor,
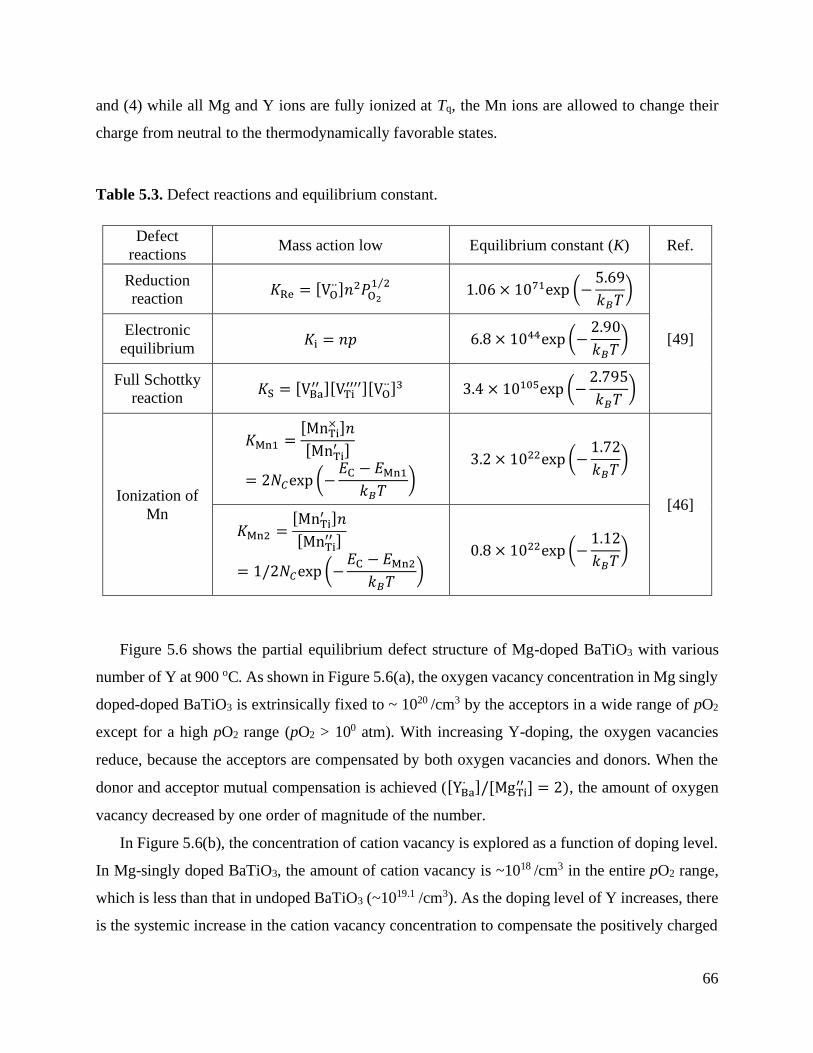
66
and (4) while all Mg and Y ions are fully ionized at Tq, the Mn ions are allowed to change their
charge from neutral to the thermodynamically favorable states.
Table 5.3. Defect reactions and equilibrium constant.
Defect
reactions Mass action low Equilibrium constant (K) Ref.
Reduction
reaction 𝐾Re = [VO
∙∙]𝑛2𝑃O21 2⁄
1.06 × 1071exp (−5.69
𝑘𝐵𝑇)
[49] Electronic
equilibrium 𝐾i = 𝑛𝑝 6.8 × 1044exp (−
2.90
𝑘𝐵𝑇)
Full Schottky
reaction 𝐾S = [VBa
′′ ][VTi′′′′][VO
∙∙]3 3.4 × 10105exp (−2.795
𝑘𝐵𝑇)
Ionization of
Mn
𝐾Mn1 =[MnTi
× ]𝑛
[MnTi′ ]
= 2𝑁𝐶exp (−𝐸C − 𝐸Mn1𝑘𝐵𝑇
)
3.2 × 10²²exp (−1.72
𝑘𝐵𝑇)
[46]
𝐾Mn2 =[MnTi
′ ]𝑛
[MnTi′′ ]
= 1/2𝑁𝐶exp (−𝐸C − 𝐸Mn2𝑘𝐵𝑇
)
0.8 × 10²²exp (−1.12
𝑘𝐵𝑇)
Figure 5.6 shows the partial equilibrium defect structure of Mg-doped BaTiO3 with various
number of Y at 900 oC. As shown in Figure 5.6(a), the oxygen vacancy concentration in Mg singly
doped-doped BaTiO3 is extrinsically fixed to ~ 1020 /cm3 by the acceptors in a wide range of pO2
except for a high pO2 range (pO2 > 100 atm). With increasing Y-doping, the oxygen vacancies
reduce, because the acceptors are compensated by both oxygen vacancies and donors. When the
donor and acceptor mutual compensation is achieved ([YBa∙ ]/[MgTi
′′ ] = 2), the amount of oxygen
vacancy decreased by one order of magnitude of the number.
In Figure 5.6(b), the concentration of cation vacancy is explored as a function of doping level.
In Mg-singly doped BaTiO3, the amount of cation vacancy is ~1018 /cm3 in the entire pO2 range,
which is less than that in undoped BaTiO3 (~1019.1 /cm3). As the doping level of Y increases, there
is the systemic increase in the cation vacancy concentration to compensate the positively charged
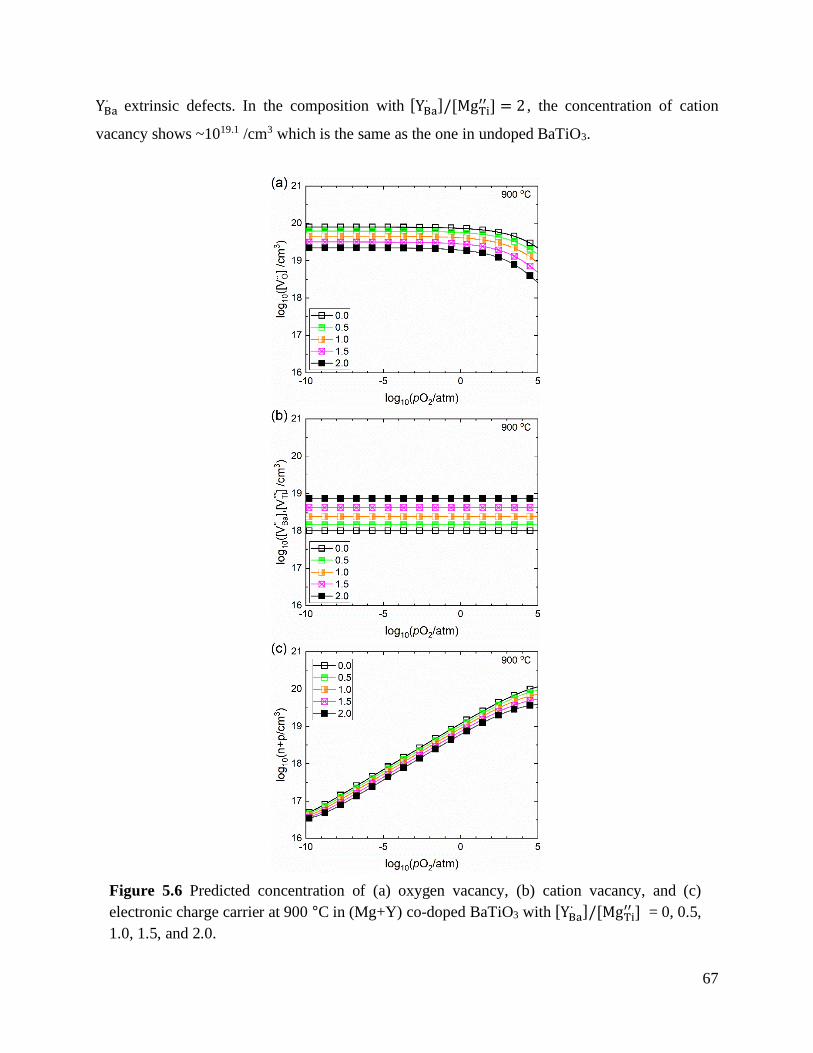
67
YBa∙ extrinsic defects. In the composition with [YBa
∙ ]/[MgTi′′ ] = 2 , the concentration of cation
vacancy shows ~1019.1 /cm3 which is the same as the one in undoped BaTiO3.
Figure 5.6 Predicted concentration of (a) oxygen vacancy, (b) cation vacancy, and (c)
electronic charge carrier at 900 °C in (Mg+Y) co-doped BaTiO3 with [YBa∙ ]/[MgTi
′′ ] = 0, 0.5,
1.0, 1.5, and 2.0.
68
The predicted electronic carrier concentration expressed as the summation of n and p is
observed in Figure 5.6(c). Mg singly doped BaTiO3 ([YBa∙ ]/[MgTi
′′ ] = 0) shows the positive pO2
dependence of electronic charge carrier in high pO2 range, which is agreed to the observed
electrical conductivity. With donor doping, there is a systematic shift of n-p transition point to
higher pO2, again well agreed to the experimental results. When the acceptors are mutually
compensated by the donors ([YBa∙ ]/[MgTi
′′ ] = 2), the concentration of electronic charge carriers is
the same as the concentration in undoped BaTiO3.
The predicted partial equilibrium defect structure in (Mn + Y) co-doped BaTiO3 is different
to (Mg + Y) co-doped BaTiO3 as shown in Figure 5.7. First of all, the oxygen vacancy
concentration in 0.5 mol% Mn singly doped BaTiO3 is lower than that of 0.5 mol% Mg singly
doped BaTiO3. This is because the number of negatively charged net acceptors is lower in Mn-
doped BaTiO3 than that of Mg-doped BaTiO3, i.e. [MnTi′ ] + [MnTi
′′ ] < [MgTi′′ ] even though the
doping level is both 0.5 mol%. Secondly, there is a variation in the relative concentration of neutral,
trivalent, and divalent Mn with respect to the donor doping and the pO2 change. In Figure 5.7(b),
the charge state of Mn is mostly neutral, i.e. [MnTi]T = [MnTi× ] + [MnTi
′ ] + [MnTi′′ ] ≈ [MnTi
× ] in
Mn singly doped BaTiO3. With donor doping, the concentration of trivalent and divalent Mn
increases, and is pinned at high-pO2 range, suggesting that the electron trapping occurs by the Mn
center, which leads to the ionization of Mn. This results in the pinning of electron concentration
in the high-pO2 range, which is observed as the pO2-independent electrical conductivity.
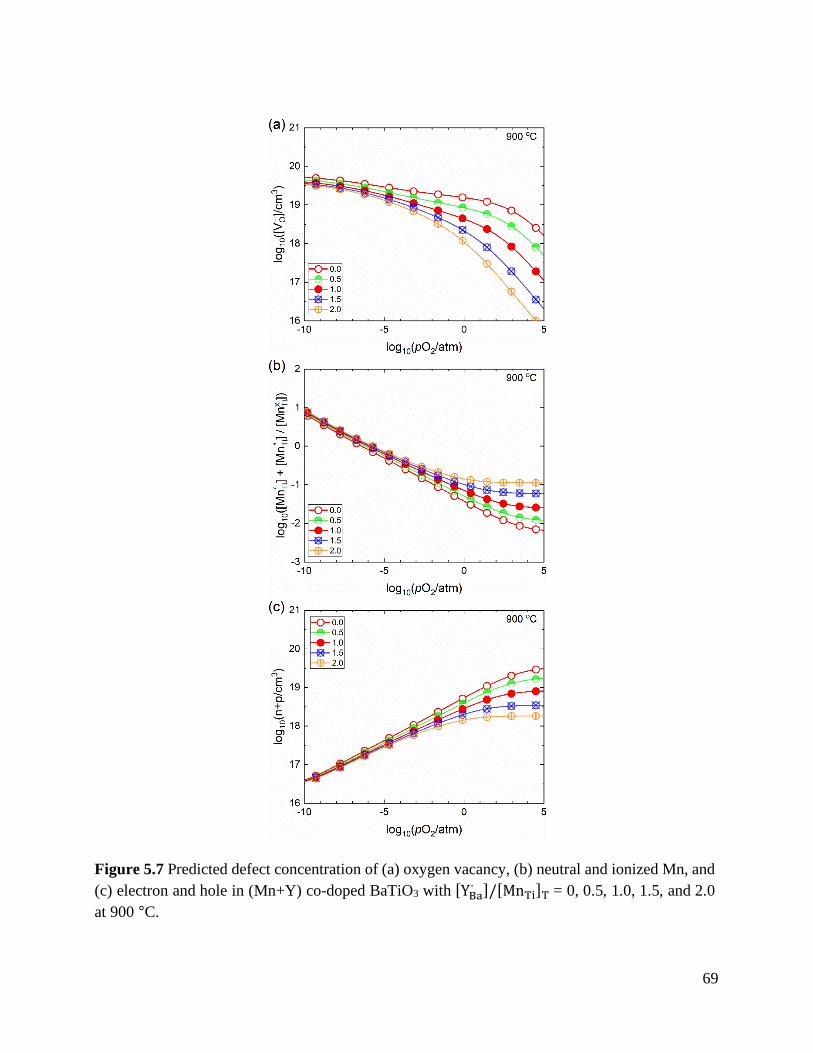
69
Figure 5.7 Predicted defect concentration of (a) oxygen vacancy, (b) neutral and ionized Mn, and
(c) electron and hole in (Mn+Y) co-doped BaTiO3 with [YBa∙ ]/[MnTi]T = 0, 0.5, 1.0, 1.5, and 2.0
at 900 °C.
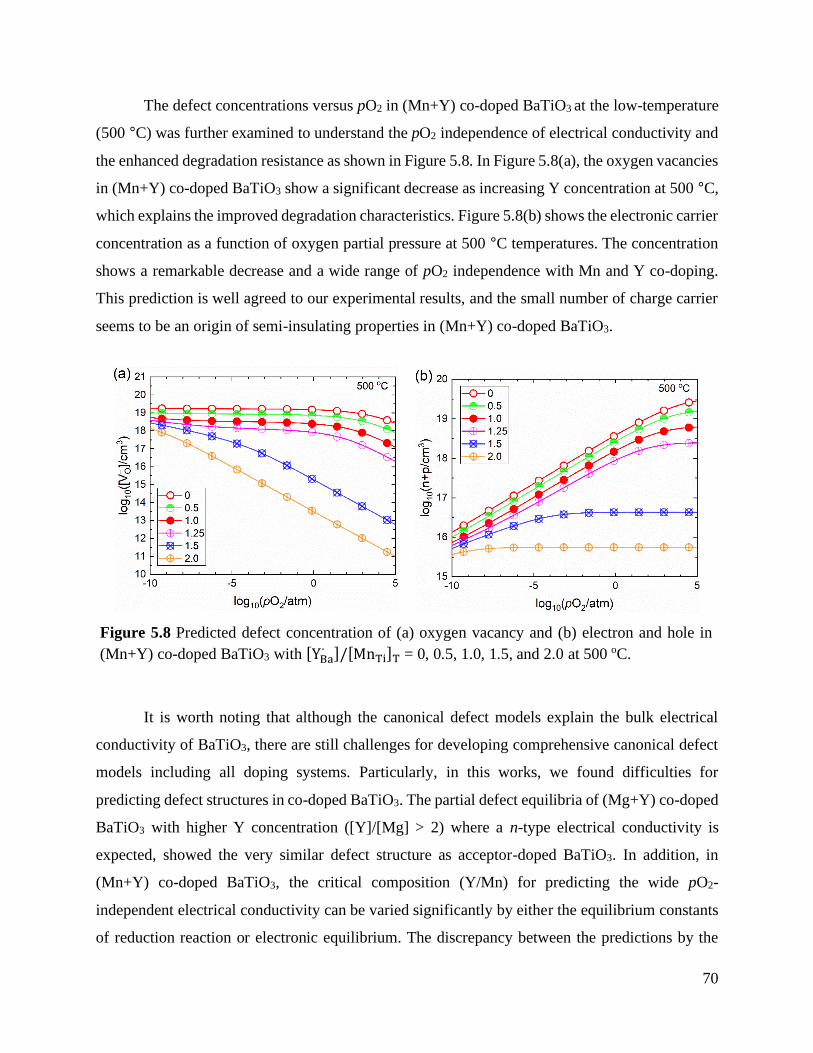
70
The defect concentrations versus pO2 in (Mn+Y) co-doped BaTiO3 at the low-temperature
(500 °C) was further examined to understand the pO2 independence of electrical conductivity and
the enhanced degradation resistance as shown in Figure 5.8. In Figure 5.8(a), the oxygen vacancies
in (Mn+Y) co-doped BaTiO3 show a significant decrease as increasing Y concentration at 500 °C,
which explains the improved degradation characteristics. Figure 5.8(b) shows the electronic carrier
concentration as a function of oxygen partial pressure at 500 °C temperatures. The concentration
shows a remarkable decrease and a wide range of pO2 independence with Mn and Y co-doping.
This prediction is well agreed to our experimental results, and the small number of charge carrier
seems to be an origin of semi-insulating properties in (Mn+Y) co-doped BaTiO3.
It is worth noting that although the canonical defect models explain the bulk electrical
conductivity of BaTiO3, there are still challenges for developing comprehensive canonical defect
models including all doping systems. Particularly, in this works, we found difficulties for
predicting defect structures in co-doped BaTiO3. The partial defect equilibria of (Mg+Y) co-doped
BaTiO3 with higher Y concentration ([Y]/[Mg] > 2) where a n-type electrical conductivity is
expected, showed the very similar defect structure as acceptor-doped BaTiO3. In addition, in
(Mn+Y) co-doped BaTiO3, the critical composition (Y/Mn) for predicting the wide pO2-
independent electrical conductivity can be varied significantly by either the equilibrium constants
of reduction reaction or electronic equilibrium. The discrepancy between the predictions by the
Figure 5.8 Predicted defect concentration of (a) oxygen vacancy and (b) electron and hole in
(Mn+Y) co-doped BaTiO3 with [YBa∙ ]/[MnTi]T = 0, 0.5, 1.0, 1.5, and 2.0 at 500 oC.
71
canonical defect models and the observed electrical conductivity is probably due to the following
issues: (1) defect complexes are not considered, and (2) cation dopants substitute either on the A
or B cation sublattices, and (3) an under- or overestimated background impurity concentration in
the canonical defect chemistry. These issues were realized to be the critical factors determining
the electrical conductivity and can be circumvented by density-functional theory (DFT)
calculations with grand canonical defect models.[32, 33] In recent DFT simulations by Bowes et
al.,[52] the observed electrical conductivity as a function of pO2 and temperature is well explained
with the grand canonical defect models in all BaTiO3 compositions in this dissertation. The Fermi
level pinning mechanism in (Mn+Y) co-doped BaTiO3 is attributed to the multivalent nature of
Mn, and the improved electrical resistivity and time-dependent degradation characteristics is
originated by the reduced oxygen vacancy concentration. In addition, the analyses also emphasize
the importance of cation vacancies and the assumed freeze-in temperature of defects on the cation
sublattices.
5.5. Conclusions
The impact of donor and acceptor co-doping on the electrical properties of BaTiO3
ceramics was investigated as a function of temperature, oxygen partial pressure and time. The
high-temperature (900 °C) four-point-probe DC conductivity in the high pO2 range revealed that
while the Mg or Mn acceptor singly doped and (Mg+Y) co-doped compositions exhibited typical
p-type electrical conductivity, co-doping with (Mn+Y) leaded to pO2-independent and
significantly lower electrical conductivity. These (Mn+Y) co-doped samples exhibited a relatively
high activation energy for bulk electrical conduction of 1.35 eV between 500 °C – 900 °C in air.
Moreover, the (Mn+Y) co-doped BaTiO3 specimens exhibit no significant time-dependent
electrical degradation at 500 °C and 45 V/cm. The predicted defect concentration with the
developed canonical defect model showed that the co-doping of (Mn+Y) in BaTiO3 can pin the
concentration of electronic carrier by the ionization of multivalent Mn in the high pO2 range,
explaining the observed pO2-independent electrical conductivity.
72
Chapter 6
Origin of Electrically Semi-Insulating Properties of
Fe-doped β-Ga2O3
(In preparation, Modifications were made to incorporate it into the dissertation as a whole.)
6.1. Abstract
In this work, we measure the DC and AC conductivity and Hall voltage to determine the origin of
electrical insulating properties of Fe-doped β-Ga2O3 single crystals perpendicular to the (201)
crystallographic planes. We find that the electrical conduction is predominantly controlled by free
electrons in the temperature range of 230 °C to 800 °C, with the compensation of the impurity
donor (Si) and acceptor dopant (Fe) explaining the low concentration of free electron and Fermi
level pinning over a wide range of temperature. Moreover, the electrical conductivity is largely
oxygen partial pressure (pO2)-independent from air to 10-4 atm at 600 °C but becomes slightly
dependent on pO2 at 800 °C, as intrinsic non-stoichiometric point defects begin to influence the
charge balance.
6.2. Introduction
Early studies on the equilibrium electrical conductivity of undoped polycrystalline β-Ga2O3
exhibited a strong pO2-dependence as shown in Figure 6.1, which is typical for electronically
conducting metal oxides. Sasaki[21] and Fleischer[24] showed that the high-temperature electrical
conductivity (σ) of unintentionally doped β-Ga2O3 ceramics and thin films have oxygen partial
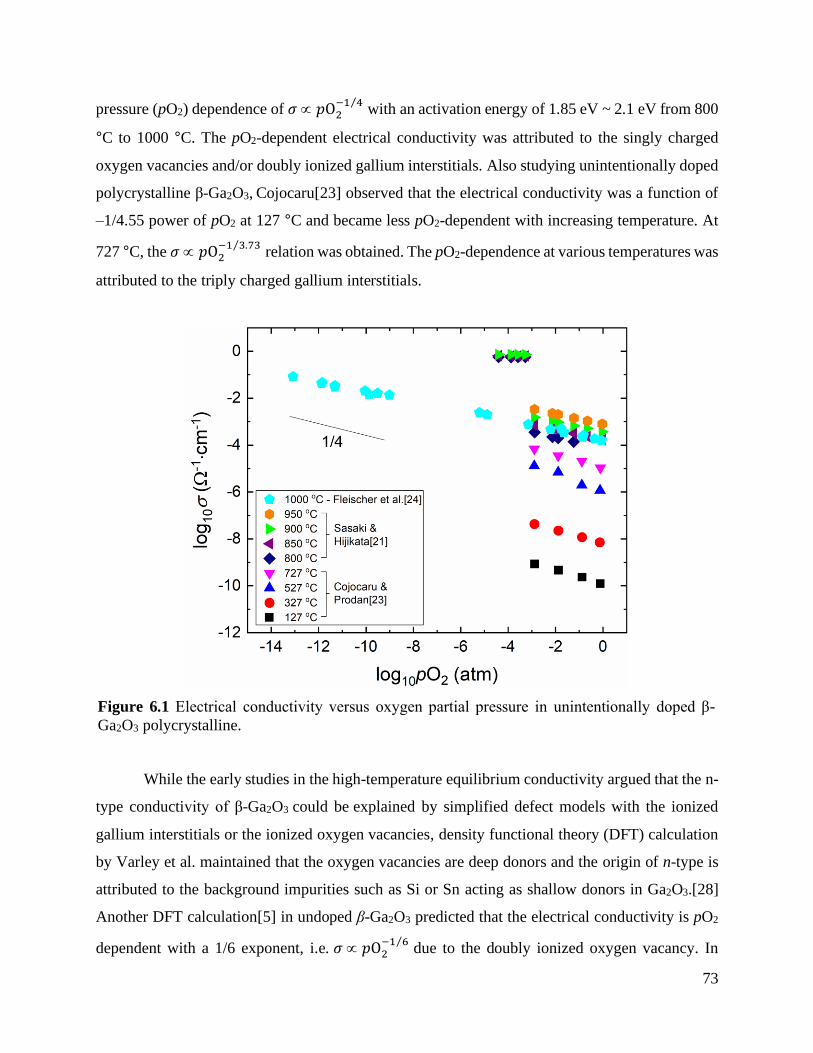
73
pressure (pO2) dependence of 𝜎 𝑝O2−1 4⁄
with an activation energy of 1.85 eV ~ 2.1 eV from 800
°C to 1000 °C. The pO2-dependent electrical conductivity was attributed to the singly charged
oxygen vacancies and/or doubly ionized gallium interstitials. Also studying unintentionally doped
polycrystalline β-Ga2O3, Cojocaru[23] observed that the electrical conductivity was a function of
–1/4.55 power of pO2 at 127 °C and became less pO2-dependent with increasing temperature. At
727 °C, the 𝜎 𝑝O2−1 3.73⁄
relation was obtained. The pO2-dependence at various temperatures was
attributed to the triply charged gallium interstitials.
While the early studies in the high-temperature equilibrium conductivity argued that the n-
type conductivity of β-Ga2O3 could be explained by simplified defect models with the ionized
gallium interstitials or the ionized oxygen vacancies, density functional theory (DFT) calculation
by Varley et al. maintained that the oxygen vacancies are deep donors and the origin of n-type is
attributed to the background impurities such as Si or Sn acting as shallow donors in Ga2O3.[28]
Another DFT calculation[5] in undoped β-Ga2O3 predicted that the electrical conductivity is pO2
dependent with a 1/6 exponent, i.e. 𝜎 𝑝O2−1 6⁄
due to the doubly ionized oxygen vacancy. In
Figure 6.1 Electrical conductivity versus oxygen partial pressure in unintentionally doped β-
Ga2O3 polycrystalline.
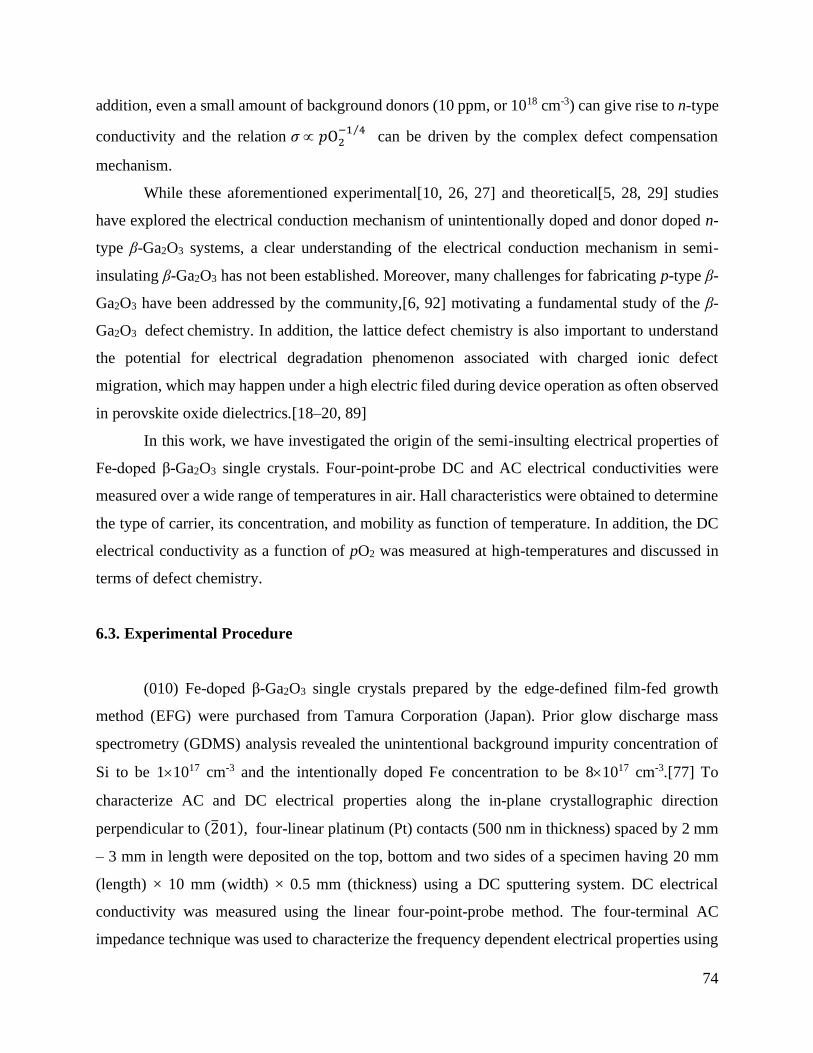
74
addition, even a small amount of background donors (10 ppm, or 1018 cm-3) can give rise to n-type
conductivity and the relation 𝜎 𝑝O2−1 4⁄
can be driven by the complex defect compensation
mechanism.
While these aforementioned experimental[10, 26, 27] and theoretical[5, 28, 29] studies
have explored the electrical conduction mechanism of unintentionally doped and donor doped n-
type β-Ga2O3 systems, a clear understanding of the electrical conduction mechanism in semi-
insulating β-Ga2O3 has not been established. Moreover, many challenges for fabricating p-type β-
Ga2O3 have been addressed by the community,[6, 92] motivating a fundamental study of the β-
Ga2O3 defect chemistry. In addition, the lattice defect chemistry is also important to understand
the potential for electrical degradation phenomenon associated with charged ionic defect
migration, which may happen under a high electric filed during device operation as often observed
in perovskite oxide dielectrics.[18–20, 89]
In this work, we have investigated the origin of the semi-insulting electrical properties of
Fe-doped β-Ga2O3 single crystals. Four-point-probe DC and AC electrical conductivities were
measured over a wide range of temperatures in air. Hall characteristics were obtained to determine
the type of carrier, its concentration, and mobility as function of temperature. In addition, the DC
electrical conductivity as a function of pO2 was measured at high-temperatures and discussed in
terms of defect chemistry.
6.3. Experimental Procedure
(010) Fe-doped β-Ga2O3 single crystals prepared by the edge-defined film-fed growth
method (EFG) were purchased from Tamura Corporation (Japan). Prior glow discharge mass
spectrometry (GDMS) analysis revealed the unintentional background impurity concentration of
Si to be 11017 cm-3 and the intentionally doped Fe concentration to be 81017 cm-3.[77] To
characterize AC and DC electrical properties along the in-plane crystallographic direction
perpendicular to (201), four-linear platinum (Pt) contacts (500 nm in thickness) spaced by 2 mm
– 3 mm in length were deposited on the top, bottom and two sides of a specimen having 20 mm
(length) × 10 mm (width) × 0.5 mm (thickness) using a DC sputtering system. DC electrical
conductivity was measured using the linear four-point-probe method. The four-terminal AC
impedance technique was used to characterize the frequency dependent electrical properties using
75
a HP4192A (Agilent) with a frequency range of 5 Hz – 5 MHz and a 0.1 V oscillation level.
Oxygen partial pressure (pO2) was controlled from 1 to 10-4 atm by changing the gas flow of O2
and Ar, and the actual pO2 was monitored by a zirconia oxygen sensor (Ceramic Oxide Fabricators,
Australia). Hall measurements were carried out from 225 °C to 500 °C in N2 atmosphere using the
van der Pauw method with ~200nm Ti electrodes.
6.4. Results and Discussion
Figure 6.2(a) presents the real part (Z′) versus imaginary part (Z″) of AC impedance, or
Cole-Cole plot, of a Fe-doped β-Ga2O3 single crystal as a function of temperature in air measured
by four-point-probe method. One slightly dispersed semi-circle was obtained from 500 °C to 700
°C, and a partial semi-circle was observed below 500 °C to 300 °C. At a given temperature, we
observed a capacitance plateau with a single response in the imaginary part of modulus as a
function of frequency as shown in the inset in Figure 6.2(a). These observations and ohmic
behavior in the current-voltage response strongly suggest that that the electrical conductivity with
the four-point-probe AC method is predominantly governed by bulk conductivity. Cole-Cole plots
were fitted by a simple equivalent circuit model having a resistance (R) with a constant phase
element (CPE) in parallel. Although the frequency response originates from the homogenous
single crystal, a constant phase element (CPE) was used rather than a perfect capacitance (C) due
to the instrumental artifacts during the four terminal AC measurement.[93] The electrical
conductivity obtained from the Cole-Cole plots shows a positive temperature dependence with
0.85(1) eV activation energy in air as shown in Figure 6.2(b). The temperature-dependent electrical
conductivity from the AC fitting is directly compared to the four-point-probe DC electrical
conductivity in Figure 6.2(b). The magnitude of electrical conductivity and the activation energies
agreed between the different techniques. The activation energies are consistent to the values
reported at lower temperatures.[94]
76
Figure 6.2 (a) Cole-Cole plots versus temperature in air and capacitance and imaginary part of
modulus as a function of frequency at 500 °C in inset Figure. (b) Temperature-dependent
electrical conductivities obtained from the different techniques.
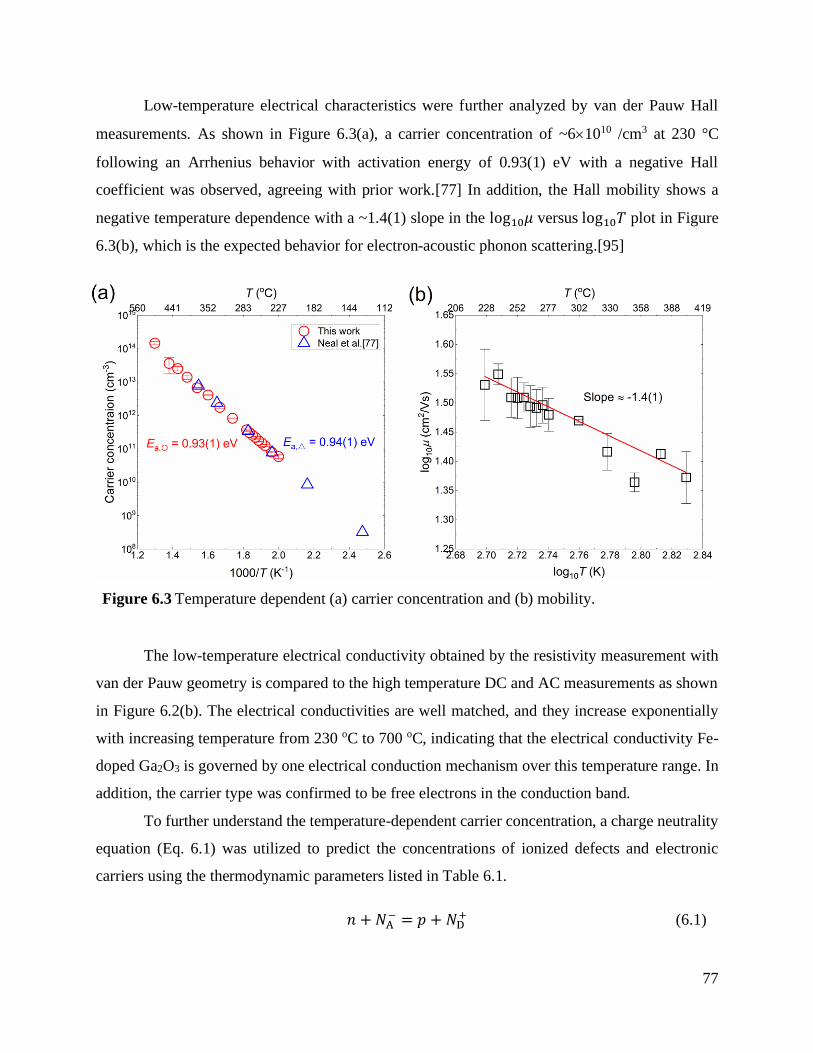
77
Low-temperature electrical characteristics were further analyzed by van der Pauw Hall
measurements. As shown in Figure 6.3(a), a carrier concentration of ~61010 /cm3 at 230 °C
following an Arrhenius behavior with activation energy of 0.93(1) eV with a negative Hall
coefficient was observed, agreeing with prior work.[77] In addition, the Hall mobility shows a
negative temperature dependence with a ~1.4(1) slope in the log10𝜇 versus log10𝑇 plot in Figure
6.3(b), which is the expected behavior for electron-acoustic phonon scattering.[95]
The low-temperature electrical conductivity obtained by the resistivity measurement with
van der Pauw geometry is compared to the high temperature DC and AC measurements as shown
in Figure 6.2(b). The electrical conductivities are well matched, and they increase exponentially
with increasing temperature from 230 oC to 700 oC, indicating that the electrical conductivity Fe-
doped Ga2O3 is governed by one electrical conduction mechanism over this temperature range. In
addition, the carrier type was confirmed to be free electrons in the conduction band.
To further understand the temperature-dependent carrier concentration, a charge neutrality
equation (Eq. 6.1) was utilized to predict the concentrations of ionized defects and electronic
carriers using the thermodynamic parameters listed in Table 6.1.
𝑛 + 𝑁A
− = 𝑝 + 𝑁D+ (6.1)
Figure 6.3 Temperature dependent (a) carrier concentration and (b) mobility.
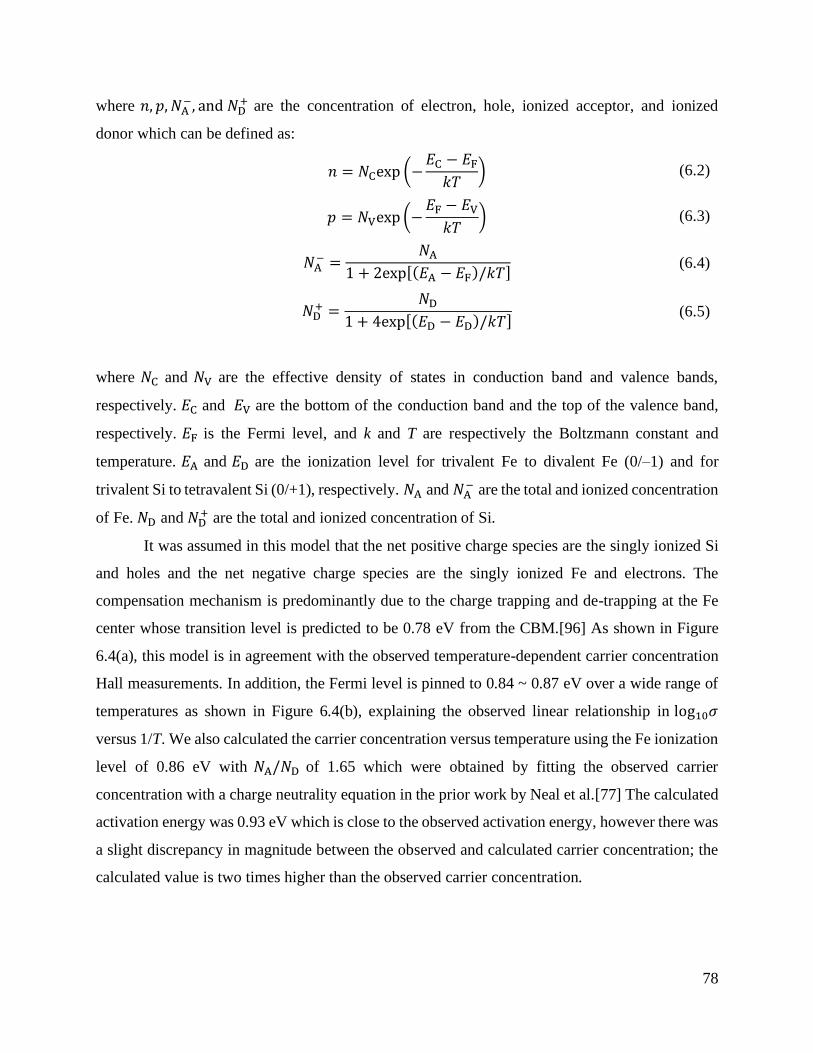
78
where 𝑛, 𝑝, 𝑁A−, and 𝑁D
+ are the concentration of electron, hole, ionized acceptor, and ionized
donor which can be defined as:
𝑛 = 𝑁Cexp (−
𝐸C − 𝐸F𝑘𝑇
) (6.2)
𝑝 = 𝑁Vexp (−
𝐸F − 𝐸V𝑘𝑇
) (6.3)
𝑁A− =
𝑁A1 + 2exp[(𝐸A − 𝐸F)/𝑘𝑇]
(6.4)
𝑁D+ =
𝑁D1 + 4exp[(𝐸D − 𝐸D)/𝑘𝑇]
(6.5)
where 𝑁C and 𝑁V are the effective density of states in conduction band and valence bands,
respectively. 𝐸C and 𝐸V are the bottom of the conduction band and the top of the valence band,
respectively. 𝐸F is the Fermi level, and k and T are respectively the Boltzmann constant and
temperature. 𝐸A and 𝐸D are the ionization level for trivalent Fe to divalent Fe (0/–1) and for
trivalent Si to tetravalent Si (0/+1), respectively. 𝑁A and 𝑁A− are the total and ionized concentration
of Fe. 𝑁D and 𝑁D+ are the total and ionized concentration of Si.
It was assumed in this model that the net positive charge species are the singly ionized Si
and holes and the net negative charge species are the singly ionized Fe and electrons. The
compensation mechanism is predominantly due to the charge trapping and de-trapping at the Fe
center whose transition level is predicted to be 0.78 eV from the CBM.[96] As shown in Figure
6.4(a), this model is in agreement with the observed temperature-dependent carrier concentration
Hall measurements. In addition, the Fermi level is pinned to 0.84 ~ 0.87 eV over a wide range of
temperatures as shown in Figure 6.4(b), explaining the observed linear relationship in log10𝜎
versus 1/T. We also calculated the carrier concentration versus temperature using the Fe ionization
level of 0.86 eV with 𝑁A/𝑁D of 1.65 which were obtained by fitting the observed carrier
concentration with a charge neutrality equation in the prior work by Neal et al.[77] The calculated
activation energy was 0.93 eV which is close to the observed activation energy, however there was
a slight discrepancy in magnitude between the observed and calculated carrier concentration; the
calculated value is two times higher than the observed carrier concentration.
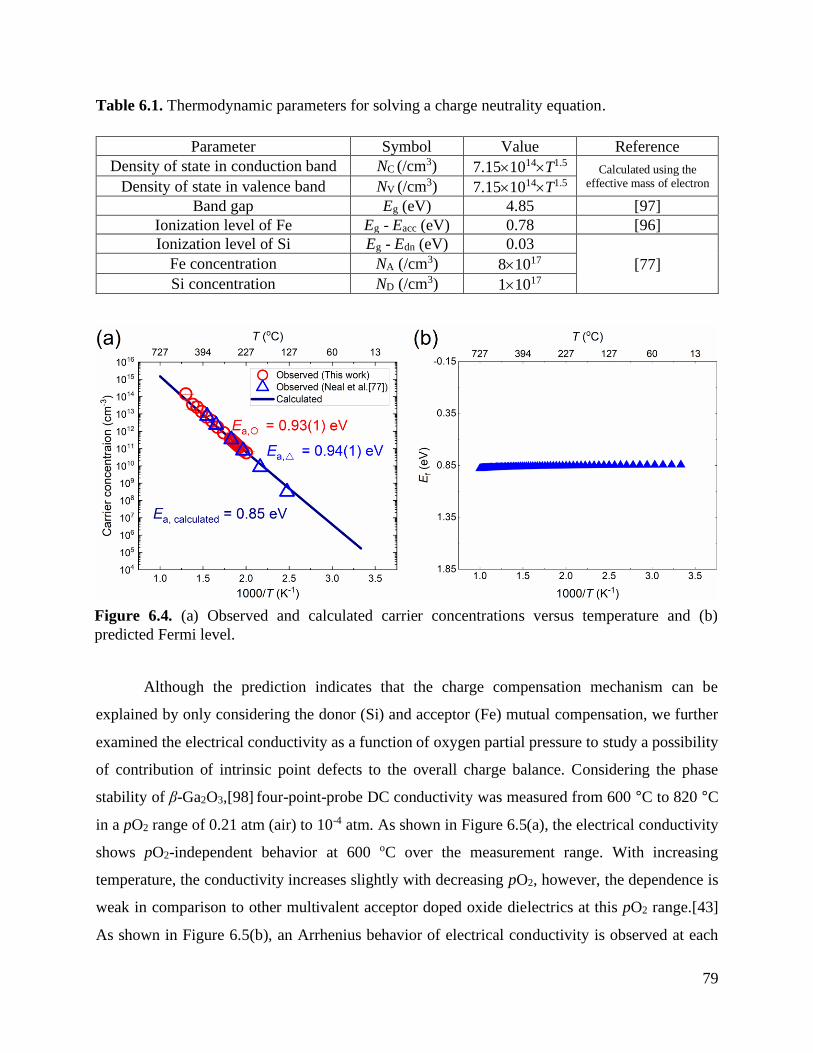
79
Table 6.1. Thermodynamic parameters for solving a charge neutrality equation.
Parameter Symbol Value Reference
Density of state in conduction band NC (/cm3) 7.151014T1.5 Calculated using the effective mass of electron Density of state in valence band NV (/cm3) 7.151014T1.5
Band gap Eg (eV) 4.85 [97]
Ionization level of Fe Eg - Eacc (eV) 0.78 [96]
Ionization level of Si Eg - Edn (eV) 0.03
[77] Fe concentration NA (/cm3) 81017
Si concentration ND (/cm3) 11017
Although the prediction indicates that the charge compensation mechanism can be
explained by only considering the donor (Si) and acceptor (Fe) mutual compensation, we further
examined the electrical conductivity as a function of oxygen partial pressure to study a possibility
of contribution of intrinsic point defects to the overall charge balance. Considering the phase
stability of β-Ga2O3,[98] four-point-probe DC conductivity was measured from 600 °C to 820 °C
in a pO2 range of 0.21 atm (air) to 10-4 atm. As shown in Figure 6.5(a), the electrical conductivity
shows pO2-independent behavior at 600 oC over the measurement range. With increasing
temperature, the conductivity increases slightly with decreasing pO2, however, the dependence is
weak in comparison to other multivalent acceptor doped oxide dielectrics at this pO2 range.[43]
As shown in Figure 6.5(b), an Arrhenius behavior of electrical conductivity is observed at each
Figure 6.4. (a) Observed and calculated carrier concentrations versus temperature and (b)
predicted Fermi level.
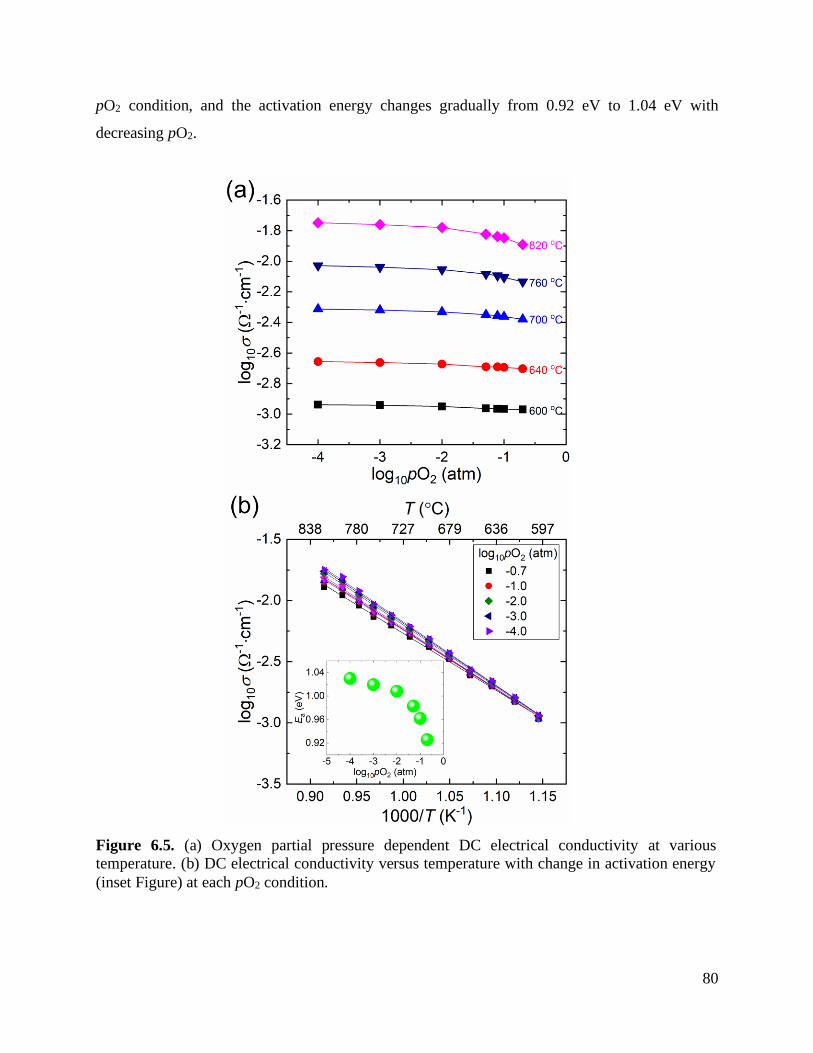
80
pO2 condition, and the activation energy changes gradually from 0.92 eV to 1.04 eV with
decreasing pO2.
Figure 6.5. (a) Oxygen partial pressure dependent DC electrical conductivity at various
temperature. (b) DC electrical conductivity versus temperature with change in activation energy
(inset Figure) at each pO2 condition.
81
A pO2-independent electrical conductivity can be explained by several defect
compensating mechanisms. One mechanism is attributed to the generation of intrinsic point defects
such as oxygen vacancies for ionically compensating dopants. This mechanism is generally
observed in acceptor-doped oxides and their defect chemistry has been well established.[54, 99,
100] When ionic compensation dominates such that the conductivity is dominated by the ionic
species, a broad pO2-independent electrical conductivity can be observed. In some cases, judicious
choices of multivalent acceptors and donors can override the ionic compensation and pin the Fermi
level over broad pO2 ranges as shown for BaTiO3 in Chapter 6 and the early studies.[63, 64] In the
Fe-doped β-Ga2O3 studied here, the pO2-independent electrical conductivity is attributed to the
pinned Fermi level due to the dominating impurity donor (Si) compensating the acceptor (Fe), and
a total electrical conductivity is predominantly governed by electron conductivity over a broad
range of pO2. According to DFT calculations,[5, 28] in reducing conditions the oxygen vacancy
formation energy is the lowest among the native point defects, except for triply ionized gallium
interstitials at very low Fermi energies, which are believed to act as a deep donors. This suggests
the low concentration of intrinsic point defects in β-Ga2O3 single crystals. Moreover, the Hall
measurement and the charge neutrality equation reveal that Si donor and the Fe acceptor mutual
compensation can explain the electronic conductivity over a wide range of temperature. Therefore,
the semi-insulting pO2-independent electrical conductivity of Fe-doped β-Ga2O3 is attributed to
the donor and multivalent acceptor co-doping mechanism with the low concentration of intrinsic
point defects.
It is important to note that with increasing temperature we observed a slight increase in the
electrical conductivity along with a transition to a slightly higher activation energy as the sample
equilibrates with a reduced pO2. This is probably due to a minor additional contribution of
electrons generated by intrinsic deeper donors such as oxygen vacancies. The influence of non-
stoichiometric lattice defects is not very significant at these measurement conditions since the
Fermi level is pinned by the Si and Fe; however, the results suggest that there is a possibility of
generating nonstoichiometric point defects with further increasing temperature or reducing pO2.
82
6.5. Conclusions
The semi-insulating properties of Fe-doped β-Ga2O3 single crystals grown via the edge-
defined film-fed method were investigated as a function of temperature and oxygen partial
pressure. It was revealed from the DC and AC conductivities and Hall measurements that the in-
plane electrical conductivity perpendicular to the (201) crystallographic planes follows an
Arrhenius behavior from 230 °C to 800 °C with an activation energy of 0.84 ~ 0.94 eV. The Hall
measurements showed that the crystal is n-type. While the carrier concentration showed a positive
temperature dependence, the mobility exhibited a negative temperature dependence, characteristic
of phonon scattering. The electrically semi-insulting conductivity was explained by a low electron
concentration, which is achieved by donor (Si) and acceptor (Fe) mutual compensation, leading to
Fermi level pinning over a wide range of temperature. The DC electrical conductivity versus pO2
was examined from 600 °C to 800 °C from air to 10-4 atm and showed that the conductivity is pO2-
independent at 600 °C, suggesting a low intrinsic point defect concentration. At higher
temperatures, the electrical conductivity increased moderately with reducing pO2, which is
probably due to the generation of electron compensating intrinsic point defects such as oxygen
vacancies.
83
Chapter 7
Conclusions and Future works
7.1. Conclusions
The works in this dissertation are desired for the fundamental understanding of electrical
conductivity and defect chemistry of two different oxides, Fe-doped β-Ga2O3 single crystal and
doped BaTiO3 ceramics. Chapter 4 and 5 investigate the DC and AC electrical conductivities and
resistance degradation behavior of Mg or Mn singly doped and (Mg+Y) or (Mn+Y) co-doped
BaTiO3 ceramics. The DC measurements reveal that the high-temperature (900 °C) p-type bulk
electrical conductivity in high pO2 range (air – 10-4 atm) can be achieved by Mg or Mn single
doping or (Mg+Y) co-doping. On the other hand, the electrical conductivity of BaTiO3 can be
pinned (i.e. the pO2-independent electrical conductivity) by co-doping of (Mn+Y) in these
measurement range. In addition, the AC impedance analyses show that (Mn+Y) co-doped BaTiO3
exhibits the lowest bulk conductivity over a wide range of temperature. Moreover, (Mn+Y) co-
doping can significantly enhance the degradation resistance of BaTiO3 at 500 °C under the electric
field of 45 V/cm. The calculated canonical defect chemistry explains that the improved resistance
of electrical conduction and degradation is attributed to (1) the pining of electronic charge carrier
as a function of pO2 at both 900 °C and 500 °C and (2) the significantly reduced oxygen vacancy
concentration by the mutual compensation of donor (Y) and multivalent acceptor (Mn).
In Chapter 6, the origin of semi-insulting electrical conductivity of Fe-doped (010) β-Ga2O3
single crystal is investigated in terms of defect chemistry. Similar to Mn and Y co-doped BaTiO3,
the pO2-independent electrical conductivity is seen over a wide range of oxygen partial pressure
(air – 10-4 atm) at various high-temperatures (600 °C – 800 °C). Hall measurement reveals that Fe-
doped β-Ga2O3 single crystal exhibits the electronic conductivity is mainly limited by the
concentration of electron at these measurement conditions. The charge neutrality equation shows
that the background Si impurities act as donors and the intentionally doped Fe ions act as acceptor.
84
Therefore, the donor (Si) and acceptor (Fe) mutual compensation is achieved, which leads to the
pinned Fermi level over a wide range of temperature with the low concentration of intrinsic point
defects.
7.2. Future works
7.2.1. Bulk electrical conductivity of BaTiO3
In Chapter 5, the temperature-dependent bulk conductivity obtained by fitting of Cole-Cole
plots reveals that the bulk conductivity is lowest in (Mn+Y) co-doped BaTiO3 from 500 °C to 900
°C in air. In Figure 7.1, we further explore the bulk conductivity below 500 °C and realize that the
bulk conductivity of (Mn+Y) co-doped BaTiO3 is lowest than the other compositions as decreasing
temperature even below 500 °C due to the relatively high activation energy. Moreover, there is a
transition of activation energy at intermediate temperature range (approximately 350 °C ~ 500 °C)
in Mg-doped, Mn-doped and (Mg+Y) co-doped compositions, while the activation energy in Mn
and Y co-doped BaTiO3 is almost temperature-invariant.
At this point an origin of the change in activation energy is not clearly understood but it
may be related to the motion of oxygen vacancies. At low-temperature, oxygen vacancies are
expected to be frozen, however, the defects may start to move with increasing temperature. At the
intermediate temperature range, the vacancies now contribute to the total electrical conductivity in
Mg, Mn, and (Mg+Y) compositions. On the other hand, in the (Mn+Y) composition, the transition
range is not seen because of the low concentration of oxygen vacancy.
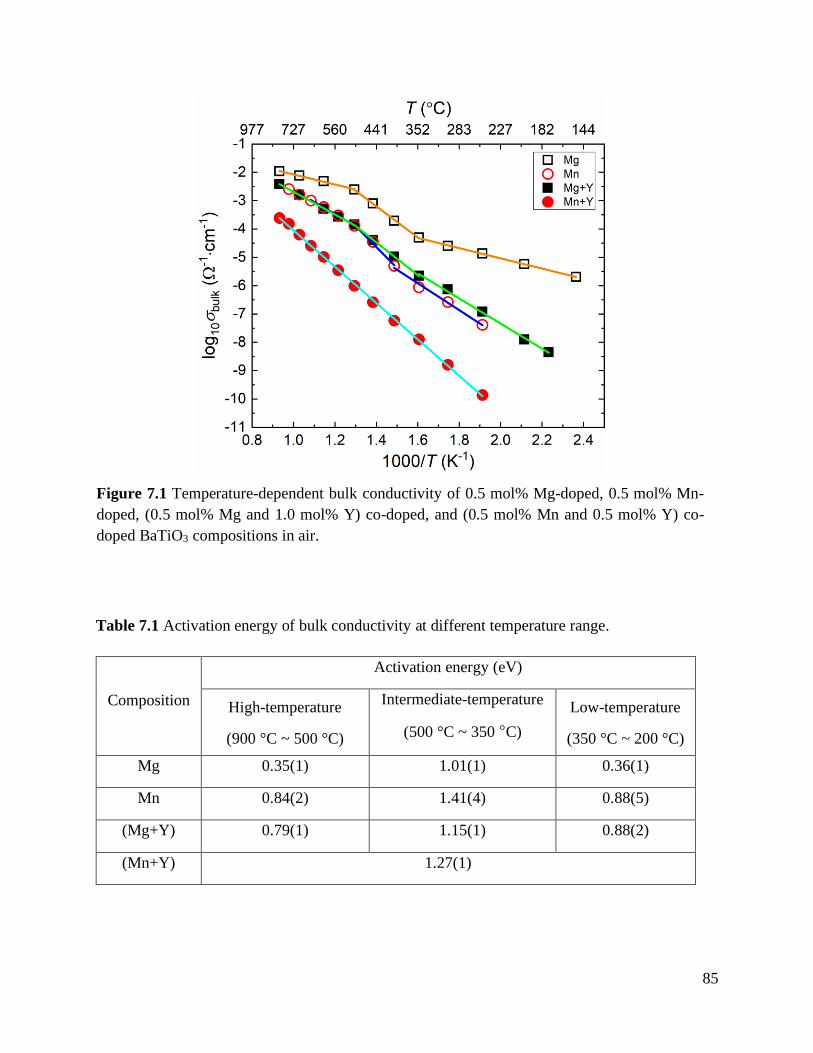
85
Table 7.1 Activation energy of bulk conductivity at different temperature range.
Composition
Activation energy (eV)
High-temperature
(900 °C ~ 500 °C)
Intermediate-temperature
(500 °C ~ 350 °C)
Low-temperature
(350 °C ~ 200 °C)
Mg 0.35(1) 1.01(1) 0.36(1)
Mn 0.84(2) 1.41(4) 0.88(5)
(Mg+Y) 0.79(1) 1.15(1) 0.88(2)
(Mn+Y) 1.27(1)
Figure 7.1 Temperature-dependent bulk conductivity of 0.5 mol% Mg-doped, 0.5 mol% Mn-
doped, (0.5 mol% Mg and 1.0 mol% Y) co-doped, and (0.5 mol% Mn and 0.5 mol% Y) co-
doped BaTiO3 compositions in air.
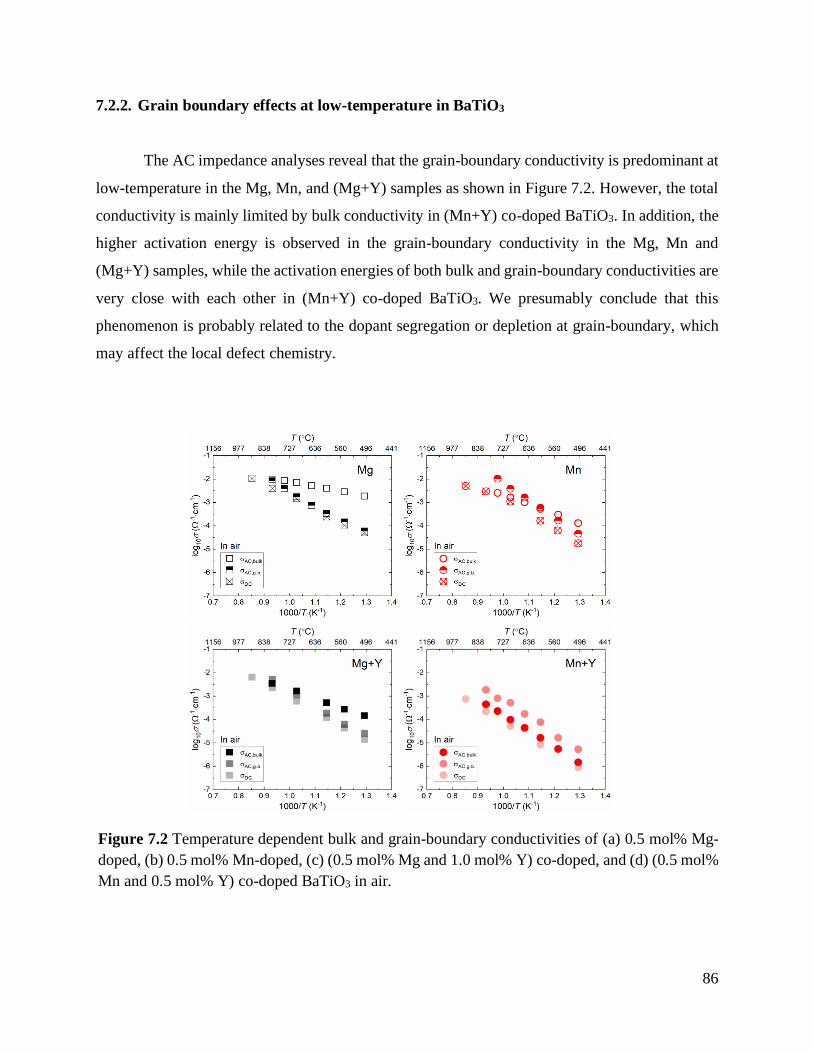
86
7.2.2. Grain boundary effects at low-temperature in BaTiO3
The AC impedance analyses reveal that the grain-boundary conductivity is predominant at
low-temperature in the Mg, Mn, and (Mg+Y) samples as shown in Figure 7.2. However, the total
conductivity is mainly limited by bulk conductivity in (Mn+Y) co-doped BaTiO3. In addition, the
higher activation energy is observed in the grain-boundary conductivity in the Mg, Mn and
(Mg+Y) samples, while the activation energies of both bulk and grain-boundary conductivities are
very close with each other in (Mn+Y) co-doped BaTiO3. We presumably conclude that this
phenomenon is probably related to the dopant segregation or depletion at grain-boundary, which
may affect the local defect chemistry.
Figure 7.2 Temperature dependent bulk and grain-boundary conductivities of (a) 0.5 mol% Mg-
doped, (b) 0.5 mol% Mn-doped, (c) (0.5 mol% Mg and 1.0 mol% Y) co-doped, and (d) (0.5 mol%
Mn and 0.5 mol% Y) co-doped BaTiO3 in air.
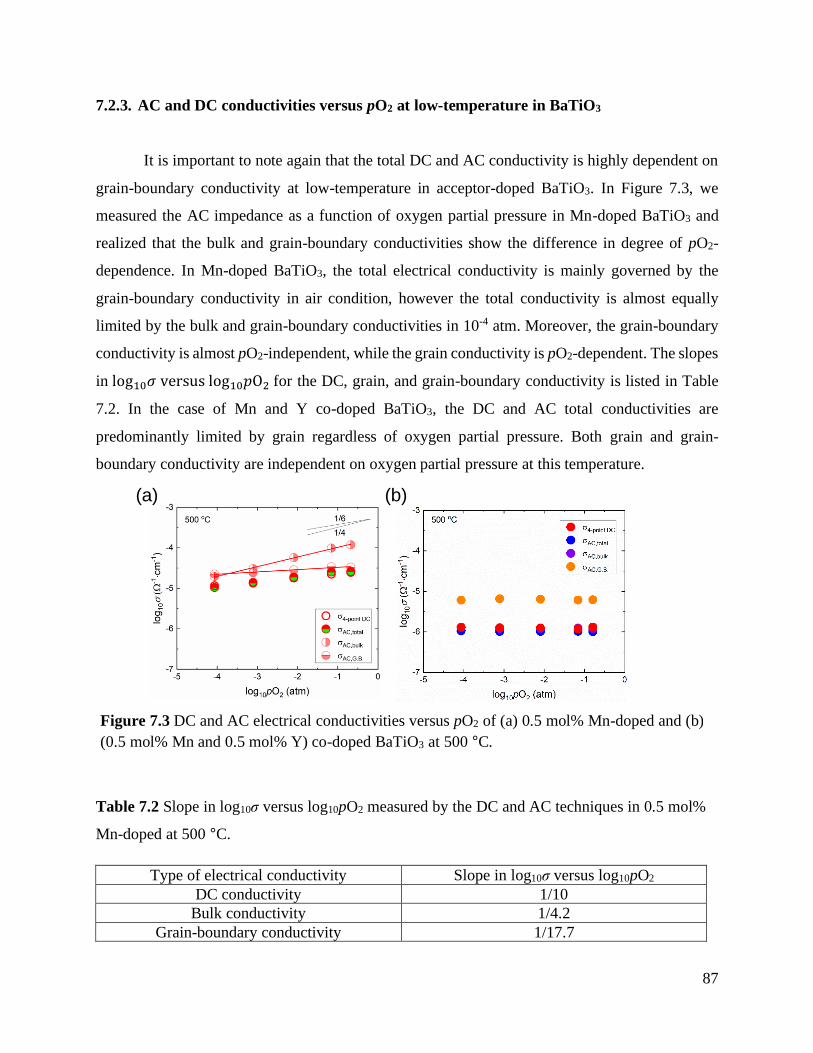
87
7.2.3. AC and DC conductivities versus pO2 at low-temperature in BaTiO3
It is important to note again that the total DC and AC conductivity is highly dependent on
grain-boundary conductivity at low-temperature in acceptor-doped BaTiO3. In Figure 7.3, we
measured the AC impedance as a function of oxygen partial pressure in Mn-doped BaTiO3 and
realized that the bulk and grain-boundary conductivities show the difference in degree of pO2-
dependence. In Mn-doped BaTiO3, the total electrical conductivity is mainly governed by the
grain-boundary conductivity in air condition, however the total conductivity is almost equally
limited by the bulk and grain-boundary conductivities in 10-4 atm. Moreover, the grain-boundary
conductivity is almost pO2-independent, while the grain conductivity is pO2-dependent. The slopes
in log10𝜎 versus log10𝑝O2 for the DC, grain, and grain-boundary conductivity is listed in Table
7.2. In the case of Mn and Y co-doped BaTiO3, the DC and AC total conductivities are
predominantly limited by grain regardless of oxygen partial pressure. Both grain and grain-
boundary conductivity are independent on oxygen partial pressure at this temperature.
Table 7.2 Slope in log10σ versus log10pO2 measured by the DC and AC techniques in 0.5 mol%
Mn-doped at 500 °C.
Type of electrical conductivity Slope in log10σ versus log10pO2
DC conductivity 1/10
Bulk conductivity 1/4.2
Grain-boundary conductivity 1/17.7
(a) (b)
Figure 7.3 DC and AC electrical conductivities versus pO2 of (a) 0.5 mol% Mn-doped and (b)
(0.5 mol% Mn and 0.5 mol% Y) co-doped BaTiO3 at 500 °C.
88
REFERENCES
[1] R. Zucca, "Electrical compensation in semi‐insulating GaAs", Journal of Applied Physics
48: 1987–1994 (1977)
[2] M. Acosta, N. Novak, V. Rojas, S. Patel, R. Vaish, J. Koruza, G.A. Rossetti, and J. Rödel,
"BaTiO3-based piezoelectrics: Fundamentals, current status, and perspectives", Applied
Physics Reviews 4: 041305 (2017)
[3] K. Hong, T.H. Lee, J.M. Suh, S.-H. Yoon, and H.W. Jang, "Perspectives and challenges in
multilayer ceramic capacitors for next generation electronics", Journal of Materials
Chemistry C 7: 9782–9802 (2019)
[4] M. Higashiwaki, K. Sasaki, H. Murakami, Y. Kumagai, A. Koukitu, A. Kuramata, T. Masui,
and S. Yamakoshi, "Recent progress in Ga2O3 power devices", Semiconductor Science and
Technology 31: 034001 (2016)
[5] T. Zacherle, P.C. Schmidt, and M. Martin, "Ab initio calculations on the defect structure of
β-Ga2O3", Physical Review B 87: 1–10 (2013)
[6] A.E. Romanov, S.I. Stepanov, V.I. Nikolaev, and V.E. Bougrov, "GALLIUM OXIDE:
PROPERTIES AND APPLICA A REVIEW", Rev Adv Mater Sci 44: 63–86 (2016)
[7] N. Ueda, H. Hosono, R. Waseda, and H. Kawazoe, "Synthesis and control of conductivity
of ultraviolet transmitting β-Ga2O3 single crystals", Applied Physics Letters 70: 3561–3563
(1997)
[8] T. Onuma, S. Fujioka, T. Yamaguchi, M. Higashiwaki, K. Sasaki, T. Masui, and T. Honda,
"Correlation between blue luminescence intensity and resistivity in β-Ga2O3 single
crystals", Applied Physics Letters 103: 041910 (2013)
89
[9] M. Orita, H. Ohta, M. Hirano, and H. Hosono, "Deep-ultraviolet transparent conductive ß-
Ga2O3 thin films", Applied Physics Letters 77: 4166–4168 (2000)
[10] E.G. Víllora, K. Shimamura, Y. Yoshikawa, T. Ujiie, and K. Aoki, "Electrical conductivity
and carrier concentration control in β-Ga2O3 by Si doping", Applied Physics Letters 92:
202120 (2008)
[11] A. Kuramata, K. Koshi, S. Watanabe, Y. Yamaoka, T. Masui, and S. Yamakoshi, "High-
quality β-Ga2O3 single crystals grown by edge-defined film-fed growth", Japanese Journal
of Applied Physics 55: 1202A2 (2016)
[12] M. Higashiwaki, K. Sasaki, A. Kuramata, T. Masui, and S. Yamakoshi, "Gallium oxide
(Ga2O3) metal-semiconductor field-effect transistors on single-crystal β-Ga2O3 (010)
substrates", Applied Physics Letters 100: 013504 (2012)
[13] S.J. Pearton, J. Yang, P.H. Cary, F. Ren, J. Kim, M.J. Tadjer, and M.A. Mastro, "A review
of Ga2O3 materials, processing, and devices", Applied Physics Reviews 5: 011301 (2018)
[14] H. Kishi, Y. Mizuno, and H. Chazono, "Base-metal electrode-multilayer ceramic capacitors:
Past, present and future perspectives", Japanese Journal of Applied Physics, Part 1:
Regular Papers and Short Notes and Review Papers 42: 1–5 (2003)
[15] G.Y. Yang, G.D. Lian, E.C. Dickey, C.A. Randall, D.E. Barber, P. Pinceloup, M.A.
Henderson, R.A. Hill, J.J. Beeson, and D.J. Skamser, "Oxygen nonstoichiometry and
dielectric evolution of BaTiO3. Part II- Insulation resistance degradation under applied dc
bias", Journal of Applied Physics 96: 7500–7508 (2004)
[16] R. Waser, T. Baiatu, and K. ‐H Härdtl, "dc Electrical Degradation of Perovskite‐Type
Titanates: I, Ceramics", Journal of the American Ceramic Society 73: 1645–1653 (1990)
90
[17] R. Waser, T. Baiatu, and K.-H. Hardtl, "dc Electrical Degradation of Perovskite-Type
Titanates: II, Single Crystals", Journal of the American Ceramic Society 73: 1654–1662
(1990)
[18] D.M. Long, B. Cai, J.N. Baker, P.C. Bowes, T.J.M. Bayer, J.J. Wang, R. Wang, L.Q. Chen,
C.A. Randall, D.L. Irving, and E.C. Dickey, "Conductivity of iron-doped strontium titanate
in the quenched and degraded states", Journal of the American Ceramic Society 102: 3567–
3577 (2019)
[19] J.J. Wang, H.B. Huang, T.J.M. Bayer, A. Moballegh, Y. Cao, A. Klein, E.C. Dickey, D.L.
Irving, C.A. Randall, and L.Q. Chen, "Defect chemistry and resistance degradation in Fe-
doped SrTiO3 single crystal", Acta Materialia 108: 229–240 (2016)
[20] T.J.M. Bayer, J.J. Wang, J.J. Carter, A. Moballegh, J. Baker, D.L. Irving, E.C. Dickey, L.Q.
Chen, and C.A. Randall, "The relation of electrical conductivity profiles and modulus data
using the example of STO:Fe single crystals: A path to improve the model of resistance
degradation", Acta Materialia 117: 252–261 (2016)
[21] T. Sasaki, and K. Hijikata, "Electrical Property of β-Gallium Sesquioxide", Proceedings of
the Institute of Natural Sciences, Nihon University 9: 29 (1974)
[22] L.N. Cojocaru, and I.D. Alecu, "Electrical Properties of β-Ga2O3", Zeitschrift für
Physikalische Chemie Neue Folge 84: 325–331 (1974)
[23] L.N. Cojocaru, and A. Prodan, "Electrical Conductivity and Thermogravimetric Studies of
β-Ga2O3", Revue Roumaine de Physique 19: 209–214 (1974)
[24] M. Fleischer, L. Hollbauer, E. Born, and H. Meixner, "Evidence for a Phase Transition of
beta-Gallium Oxide at Very Low Oxygen Pressures", Journal of American Ceramics
Society 80: 2121–2125 (1997)
91
[25] M. FLEISCHER, W. Hanrieder, and H. Meixner, "Stability of Semiconducting Gallium
Oxide Thin Film", Thin Solid Films 190: 93–102 (1990)
[26] N. Suzuki, S. Ohira, M. Tanaka, T. Sugawara, K. Nakajima, and T. Shishido, "Fabrication
and characterization of transparent conductive Sn-doped β-Ga2O3 single crystal", physica
status solidi (c) 4: 2310–2313 (2007)
[27] D. Gogova, G. Wagner, M. Baldini, M. Schmidbauer, K. Irmscher, R. Schewski, Z.
Galazka, M. Albrecht, and R. Fornari, "Structural properties of Si-doped β-Ga2O3 layers
grown by MOVPE", Journal of Crystal Growth 401: 665–669 (2014)
[28] J.B. Varley, J.R. Weber, A. Janotti, and C.G. Van de Walle, "Oxygen vacancies and donor
impurities in β-Ga2O3", Applied Physics Letters 97: 142106 (2010)
[29] S. Lany, "Defect phase diagram for doping of Ga2O3", APL Materials 6: 046103 (2018)
[30] T. Shi, Y. Chen, and X. Guo, "Defect chemistry of alkaline earth metal (Sr/Ba) titanates",
Progress in Materials Science 80: 77–132 (2016)
[31] S. Lee, and C.A. Randall, "Determination of electronic and ionic conductivity in mixed
ionic conductors: HiTEC and in-situ impedance spectroscopy analysis of isovalent and
aliovalent doped BaTiO3", Solid State Ionics 249–250: 86–92 (2013)
[32] P.C. Bowes, J.N. Baker, J.S. Harris, B.D. Behrhorst, and D.L. Irving, "Influence of
impurities on the high temperature conductivity of SrTiO3", Applied Physics Letters 112:
22902 (2018)
[33] P.C. Bowes, J.N. Baker, and D.L. Irving, "Site preference of Y and Mn in nonstoichiometric
BaTiO3 from first principles", Physical Review Materials 4: 084601 (2020)
92
[34] Y. Wu, P.C. Bowes, J.N. Baker, and D.L. Irving, "Influence of space charge on the
conductivity of nanocrystalline SrTiO3", Journal of Applied Physics 128: (2020)
[35] P.C. Bowes, J.N. Baker, and D.L. Irving, "Survey of acceptor dopants in SrTiO3: Factors
limiting room temperature hole concentration", Journal of the American Ceramic Society
103: 1156–1173 (2020)
[36] J.N. Baker, P.C. Bowes, J.S. Harris, and D.L. Irving, "Mechanisms governing metal
vacancy formation in BaTiO3 and SrTiO3", Journal of Applied Physics 124: 114101 (2018)
[37] S. Lee, C.A. Randall, and Z.K. Liu, "Comprehensive linkage of defect and phase equilibria
through ferroelectric transition behavior in BaTiO3-based dielectrics: Part 2. Defect
modeling under low oxygen partial pressure conditions", Journal of the American Ceramic
Society 91: 1753–1761 (2008)
[38] C.R. Song, and H.I. Yoo, "Chemical diffusivity of Defect chemical analysis", Physical
Review B - Condensed Matter and Materials Physics 61: 3975–3982 (2000)
[39] H.I. Yoo, and C.R. Song, "Defect structure and chemical diffusion in BaTiO3-δ", Solid State
Ionics 135: 619–623 (2000)
[40] H.I. Yoo, and K.D. Becker, "Effect of hole-trapping on mass/charge transport properties in
acceptor-doped BaTiO3", Physical Chemistry Chemical Physics 7: 2068–2073 (2005)
[41] M.B. Choi, S.Y. Jeon, H.N. Im, and S.J. Song, "Thermodynamic quantities and oxygen
nonstoichiometry of undoped BaTiO3-δ by thermogravimetric analysis", Journal of Alloys
and Compounds 513: 487–494 (2012)
[42] C.-R. Song, and H.-I. Yoo, "Chemical Diffusivity of BaTiO3−δ: IV, Acceptor-Doped Case",
Journal of the American Ceramic Society 83: 773–779 (2004)
93
[43] J.Y. Kim, C.R. Song, and H.I. Yoo, "Mn-doped BaTiO3: Electrical Transport Properties in
Equilibrium State", Journal of Electroceramics 1: 27–39 (1997)
[44] J. Daniels, and K.H. Hardtl, "Electrical Conductivity at High Temperatures of Donor-Doped
Barium Titanate Ceramics", Philips Res Rep 31: 489–504 (1976)
[45] H.-I. Yoo, C.-R. Song, and D.-K. Lee, "BaTiO3−δ: Defect Structure, Electrical Conductivity,
Chemical Diffusivity, Thermoelectric Power, and Oxygen Nonstoichiometry", Journal of
Electroceramics 8: 5–36 (2002)
[46] H.-J. Hagemann, and D. Hennings, "Reversible Weight Change of Acceptor‐Doped
BaTiO3", Journal of the American Ceramic Society 64: 590–594 (1981)
[47] H.I. Yoo, T.S. Oh, H.S. Kwon, D.K. Shin, and J.S. Lee, "Electrical conductivity-defect
structure correlation of variable-valence and fixed-valence acceptor-doped BaTiO3 in
quenched state", Physical Chemistry Chemical Physics 11: 3115–3126 (2009)
[48] S.H. Yoon, C.A. Randall, and K.H. Hur, "Difference between resistance degradation of
fixed valence acceptor (Mg) and variable valence acceptor (Mn)-doped BaTiO3 ceramics",
Journal of Applied Physics 108: (2010)
[49] J. Nowotny, and M. Rekas, "Defect structure, electrical properties and transport in Barium
Titanate. VI. General defect model", Ceramics International 20: 257–263 (1994)
[50] S.H. Yoon, K.H. Lee, and H. Kim, "Effect of acceptors on the segregation of donors in
niobium-doped barium titanate positive temperature coefficient resistors", Journal of the
American Ceramic Society 83: 2463–2472 (2000)
[51] N. ‐H CHAN, R.K. SHARMA, and D.M. SMYTH, "Nonstoichiometry in Undoped
BaTiO3", Journal of the American Ceramic Society 64: 556–562 (1981)
94
[52] P.C. Bowes, G.H. Ryu, J.N. Baker, E.C. Dickey, and D.L. Irving, "Fermi Level Pinning in
Co-doped BaTiO3 : Part II . Defect Chemistry Models",In preparation
[53] J. Nowotny, and M. Rekas, "Defect structure, electrical properties and transport in barium
titanate. III. Electrical conductivity, thermopower and transport in single crystalline
BaTiO3", Ceramics International 20: 225–235 (1994)
[54] Y.H. HAN, J.B. APPLEBY, and D.M. SMYTH, "Calcium as an Acceptor Impurity in
BaTiO3", Journal of the American Ceramic Society 70: 96–100 (1987)
[55] J. Jeong, and Y. Ho Han, "Electrical properties of MgO-doped BaTiO3", Physical Chemistry
Chemical Physics 5: 2264–2267 (2003)
[56] R.K. SHARMA, N. ‐H CHAN, and D.M. SMYTH, "Solubility of TiO2 in BaTiO3", Journal
of the American Ceramic Society 64: 448–451 (1981)
[57] S. ‐i Osawa, A. Furuzawa, and N. Fujikawa, "Effect of the Manganese Valence State on the
Electrical Conductivity of Barium Titanate", Journal of the American Ceramic Society 76:
1191–1194 (1993)
[58] S.H. Yoon, C.A. Randall, and K.H. Hur, "Effect of acceptor concentration on the bulk
electrical conduction in acceptor (Mg)-doped BaTiO3", Journal of Applied Physics 107:
103721 (2010)
[59] S.H. Yoon, C.A. Randall, and K.H. Hur, "Influence of grain size on impedance spectra and
resistance degradation behavior in acceptor (Mg)-doped BaTiO3 ceramics", Journal of the
American Ceramic Society 92: 2944–2952 (2009)
[60] S.H. Yoon, M.H. Hong, J.O. Hong, Y.T. Kim, and K.H. Hur, "Effect of acceptor (Mg)
concentration on the electrical resistance at room and high (200 °C) temperatures of
acceptor (Mg)-doped BaTiO3 ceramics", Journal of Applied Physics 102: (2007)
95
[61] S.H. Yoon, C.A. Randall, and K.H. Hur, "Effect of acceptor (Mg) concentration on the
resistance degradation behavior in acceptor (Mg)-doped BaTiO3 bulk ceramics: I.
impedance analysis", Journal of the American Ceramic Society 92: 1758–1765 (2009)
[62] N.-H. Chan, and D.M. Smyth, "Defect Chemistry of Donor‐Doped BaTiO3", Journal of the
American Ceramic Society 67: 285–288 (1984)
[63] C.E. Lee, S.H. Kang, D.S. Sinn, and H.I. Yoo, "Co-doping effect of Mn and Y on charge
and mass transport properties of BaTiO3", Journal of Electroceramics 13: 785–791 (2004)
[64] Y.Y. Yeoh, H. Jang, and H.I. Yoo, "Defect structure and Fermi-level pinning of BaTiO3 co-
doped with a variable-valence acceptor (Mn) and a fixed-valence donor (Y)", Physical
Chemistry Chemical Physics 14: 1642–1648 (2012)
[65] J. Jeong, E.J. Lee, and Y.H. Han, "Defect chemistry and electrical degradation of BaTiO3
co-doped with Ho and Mn", Journal of the European Ceramic Society 27: 1159–1163
(2007)
[66] E.J. Lee, J. Jeong, and Y.H. Han, "Defects and degradation of BaTiO3 codoped with Dy and
Mn", Japanese Journal of Applied Physics, Part 1: Regular Papers and Short Notes and
Review Papers 45: 822–825 (2006)
[67] K. Kaneda, Y. Iwazaki, and Y. Konishi, "The mechanism of lifetime improvement through
vanadium addition to multilayer ceramic capacitor with nickel electrode", Journal of the
Ceramic Society of Japan 126: 931–935 (2018)
[68] H. Natsui, T. Shibahara, Y. Yonezawa, and O. Kido, "Effect of Vanadium Addition on
Reliability and Microstructure of BaTiO3-Based Multilayer Ceramic Capacitors", Japanese
Journal of Applied Physics 51: 09LC09 (2012)
96
[69] J. Jeong, and Y.H. Han, "Effects of Mn-doping on TSDC and degradation of BaTiO3",
Journal of Electroceramics 17: 1051–1055 (2006)
[70] S.H. Yoon, C.A. Randall, and K.H. Hur, "Effect of Acceptor (Mg) concentration on the
resistance degradation behavior in acceptor (Mg)-doped BaTiO3 bulk ceramics: II.
Thermally stimulated depolarization current analysis", Journal of the American Ceramic
Society 92: 1766–1772 (2009)
[71] W. Liu, and C.A. Randall, "Thermally stimulated relaxation in Fe-doped SrTiO3 systems:
I. Single crystals", Journal of the American Ceramic Society 91: 3245–3250 (2008)
[72] J. Jeong, and Y.H. Han, "Effects of Mn-doping on TSDC and degradation of BaTiO3",
Journal of Electroceramics 17: 1051–1055 (2006)
[73] S.-H. Yoon, S.-H. Kim, and D.-Y. Kim, "Correlation between I (current)-V (voltage)
characteristics and thermally stimulated depolarization current of Mn-doped BaTiO3
multilayer ceramic capacitor", Journal of Applied Physics 114: 074102 (2013)
[74] S.H. Yoon, J.S. Park, S.H. Kim, and D.Y. Kim, "Thermally stimulated depolarization
current analysis for the dielectric aging of Mn and V-codoped BaTiO3 multi layer ceramic
capacitor", Applied Physics Letters 103: 42901 (2013)
[75] S.H. Yoon, J.B. Lim, S.H. Kim, and D.Y. Kim, "Influence of Dy on the dielectric aging and
thermally stimulated depolarization current in Dy and Mn-codoped BaTiO3 multilayer
ceramic capacitor", Journal of Materials Research 28: 3252–3256 (2013)
[76] M. Fleischer, and H. Meixner, "Electron mobility in single‐ and polycrystalline Ga2O3",
Journal of Applied Physics 74: 300–305 (1993)
97
[77] A.T. Neal, S. Mou, S. Rafique, H. Zhao, E. Ahmadi, J.S. Speck, K.T. Stevens, J.D. Blevins,
D.B. Thomson, N. Moser, K.D. Chabak, and G.H. Jessen, "Donors and deep acceptors in
β-Ga2O3", Applied Physics Letters 113: 62101 (2018)
[78] D. Long, N. Creange, A. Moballegh, and E.C. Dickey, "Electromigration-induced leakage
current enhancement and its anisotropy in single crystal TiO2", Journal of Applied Physics
125: 184101 (2019)
[79] X.W. ZHANG, Y.H. HAN, M. LAL, and D.M. SMYTH, "Defect chemistry of BaTiO3 with
additions of CaTiO3", Journal of the American Ceramic Society 70: 100–103 (1987)
[80] N.-H. CHAN, R.K. SHARMA, and D.M. SMYTH, "Nonstoichiometry in acceptor-doped
BaTiO3", Journal of the American Ceramic Society 65: 167–170 (1982)
[81] D.K. Lee, H.I. Yoo, and K.D. Becker, "Nonstoichiometry and defect structure of Mn-doped
BaTiO3-δ", Solid State Ionics 154–155: 189–193 (2002)
[82] R. Moos, and K.H. Härdtl, "Defect chemistry of donor-doped and undoped strontium
titanate ceramics between 1000° and 1400°C", Journal of the American Ceramic Society
80: 2549–2562 (1997)
[83] R.A. Maier, C.A. Randall, and J. Stevenson, "Low Temperature Ionic Conductivity of an
Acceptor-Doped Perovskite: II. Impedance of Single-Crystal BaTiO3", Journal of the
American Ceramic Society 99: 3360–3366 (2016)
[84] Y. Tsur, T.D. Dunbar, and C.A. Randall, "Crystal and defect chemistry of rare earth cations
in BaTiO3", Journal of Electroceramics 7: 25–34 (2001)
[85] N. Hirose, and A.R. West, "Impedance Spectroscopy of Undoped BaTiO3 Ceramics",
Journal of the American Ceramic Society 79: 1633–1641 (1996)
98
[86] I.J. Clark, F.B. Marques, and D.C. Sinclair, "The influence of grain boundary impedances
on the p-type conductivity of undoped BaTiO3 ceramics", Journal of the European Ceramic
Society 22: 579–583 (2002)
[87] M. Prades, N. Masó, H. Beltrán, E. Cordoncillo, and A.R. West, "Field enhanced bulk
conductivity of BaTiO3: Mg ceramics", Journal of Materials Chemistry 20: 5335–5344
(2010)
[88] M. Prades, H. Beltrán, E. Cordoncillo, P.J. Alonso, N. Masõ, and A.R. West, "Non-ohmic
phenomena in Mn-doped BaTiO3", Physica Status Solidi (A) Applications and Materials
Science 209: 2267–2272 (2012)
[89] T. Baiatu, R. Waser, and K. ‐H Härdtl, "dc Electrical Degradation of Perovskite‐Type
Titanates: III, A Model of the Mechanism", Journal of the American Ceramic Society 73:
1663–1673 (1990)
[90] D.W. Hahn, S.B. Sohn, and Y.H. Han, "Effects of rare-earth oxides on time-dependent
dielectric properties of Mn-doped BaTiO3", Japanese Journal of Applied Physics 48:
031404 (2009)
[91] Y. Tsur, A. Hitomi, I. Scrymgeour, and C.A. Randall, "Site Occupancy of Rare-Earth
Cations in BaTiO3", Japanese Journal of Applied Physics 40: 255–258 (2001)
[92] A. Kyrtsos, M. Matsubara, and E. Bellotti, "On the feasibility of p-type Ga2O3", Applied
Physics Letters 112: 032108 (2018)
[93] B.W. Veal, P.M. Baldo, A.P. Paulikas, and J.A. Eastman, "Understanding Artifacts in
Impedance Spectroscopy", Journal of The Electrochemical Society 162: H47–H57 (2015)
99
[94] A.Y. Polyakov, N.B. Smirnov, I. V Shchemerov, S.J. Pearton, F. Ren, A. V Chernykh, and
A.I. Kochkova, "Electrical properties of bulk semi-insulating β-Ga2O3(Fe)", Applied
Physics Letters 113: 142102 (2018)
[95] S.M. Sze, and K.K. Ng, Physics of Semiconductor Devices: Third Edition. John Wiley &
Sons, New York (2006)
[96] M.E. Ingebrigtsen, J.B. Varley, A.Y. Kuznetsov, B.G. Svensson, G. Alfieri, A. Mihaila, and
U. Badstübner, "Iron and intrinsic deep level states in Ga2O3", Applied Physics Letters 112:
11301 (2018)
[97] C. Janowitz, V. Scherer, M. Mohamed, A. Krapf, H. Dwelk, R. Manzke, Z. Galazka, R.
Uecker, K. Irmscher, R. Fornari, M. Michling, D. Schmeißer, J.R. Weber, J.B. Varley, and
C.G. Van de Walle, "Experimental electronic structure of In2O3 and Ga2O3", New Journal
of Physics 13: 085014 (2011)
[98] R. Togashi, K. Nomura, C. Eguchi, T. Fukizawa, K. Goto, Q.T. Thieu, H. Murakami, Y.
Kumagai, A. Kuramata, S. Yamakoshi, B. Monemar, and A. Koukitu, "Thermal stability of
β-Ga2O3 in mixed flows of H2 and N2", Japanese Journal of Applied Physics 54: 41102
(2015)
[99] C.B. Gopal, and S.M. Haile, "An electrical conductivity relaxation study of oxygen
transport in samarium doped ceria", Journal of Materials Chemistry A 2: 2405–2417 (2014)
[100] R. Waser, "Bulk Conductivity and Defect Chemistry of Acceptor‐Doped Strontium Titanate
in the Quenched State", Journal of the American Ceramic Society 74: 1934–1940 (1991)

100
APPENDIX
101
Appendix A
Crystallization Behavior of Amorphous BaTiO3 Thin Films
Published in Journal of Materials and Science (16 April 2020)
Gyung Hyun Ryu1, Neal Lewis1, George N. Kotsonis1,2, Jon-Paul Maria1,2,
and Elizabeth C. Dickey1,*
1Department of Materials Science and Engineering, North Carolina State University, Raleigh,
North Carolina 27695, USA
2Department of Materials Science and Engineering, The Pennsylvania State University,
University Park, Pennsylvania 16802, USA
Abstract
The crystallization behavior of amorphous barium titanate (BaTiO3) thin films was studied as a
function of annealing temperature from 500 to 1000 °C. Quantitative phase analysis by grazing
incidence X-ray diffractometry revealed that the metastable hexagonal phase preferentially
nucleates at lower temperatures with a transition to stable cubic nuclei at higher temperatures. The
predominance of the metastable hexagonal-phase nucleation at lower temperatures suggests that it
has the lowest nucleation barrier, in accordance with the Ostwald’s step rule. To help induce the
nucleation of the cubic phase at lower temperatures, we explored the effects of electric fields on
the crystallization behavior and found that direct-current fields moderately enhanced the cubic
phase fraction in the 500–700 °C temperature range. Although the nucleation barrier of the cubic
phase in the presence of an electric should be lowered more significantly with respect to that of
the hexagonal phase because of the former’s higher relative permittivity, the effect arising from
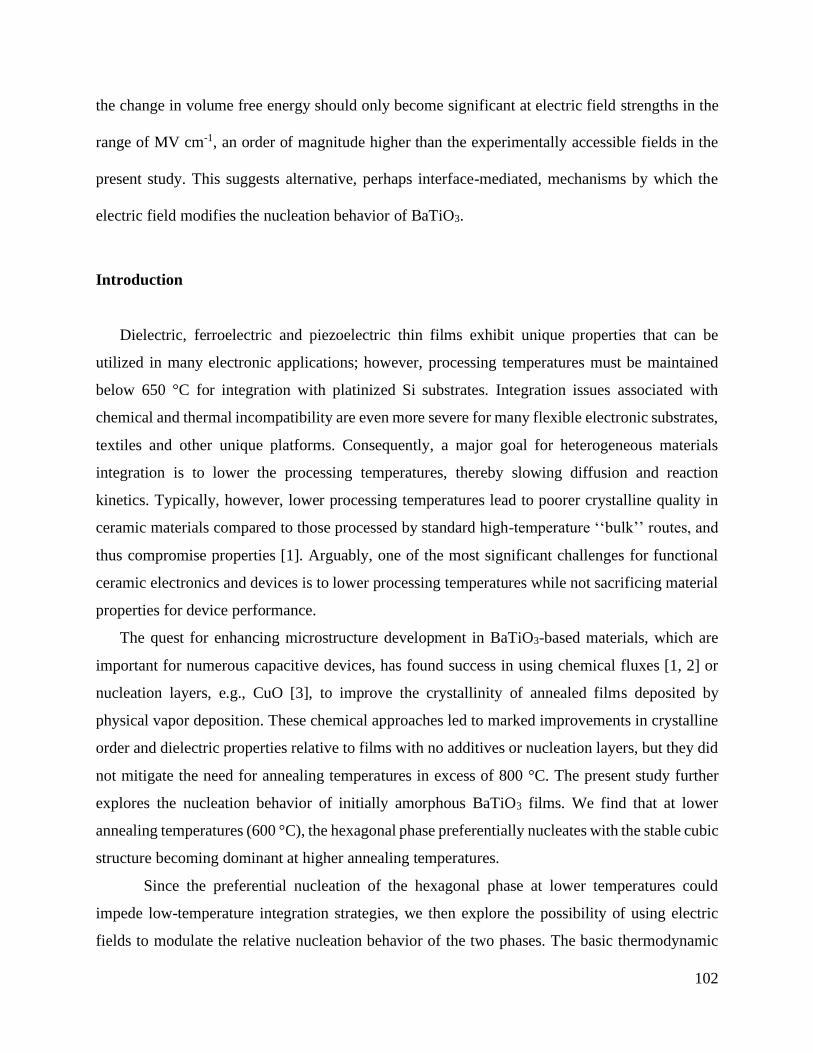
102
the change in volume free energy should only become significant at electric field strengths in the
range of MV cm-1, an order of magnitude higher than the experimentally accessible fields in the
present study. This suggests alternative, perhaps interface-mediated, mechanisms by which the
electric field modifies the nucleation behavior of BaTiO3.
Introduction
Dielectric, ferroelectric and piezoelectric thin films exhibit unique properties that can be
utilized in many electronic applications; however, processing temperatures must be maintained
below 650 °C for integration with platinized Si substrates. Integration issues associated with
chemical and thermal incompatibility are even more severe for many flexible electronic substrates,
textiles and other unique platforms. Consequently, a major goal for heterogeneous materials
integration is to lower the processing temperatures, thereby slowing diffusion and reaction
kinetics. Typically, however, lower processing temperatures lead to poorer crystalline quality in
ceramic materials compared to those processed by standard high-temperature ‘‘bulk’’ routes, and
thus compromise properties [1]. Arguably, one of the most significant challenges for functional
ceramic electronics and devices is to lower processing temperatures while not sacrificing material
properties for device performance.
The quest for enhancing microstructure development in BaTiO3-based materials, which are
important for numerous capacitive devices, has found success in using chemical fluxes [1, 2] or
nucleation layers, e.g., CuO [3], to improve the crystallinity of annealed films deposited by
physical vapor deposition. These chemical approaches led to marked improvements in crystalline
order and dielectric properties relative to films with no additives or nucleation layers, but they did
not mitigate the need for annealing temperatures in excess of 800 °C. The present study further
explores the nucleation behavior of initially amorphous BaTiO3 films. We find that at lower
annealing temperatures (600 °C), the hexagonal phase preferentially nucleates with the stable cubic
structure becoming dominant at higher annealing temperatures.
Since the preferential nucleation of the hexagonal phase at lower temperatures could
impede low-temperature integration strategies, we then explore the possibility of using electric
fields to modulate the relative nucleation behavior of the two phases. The basic thermodynamic
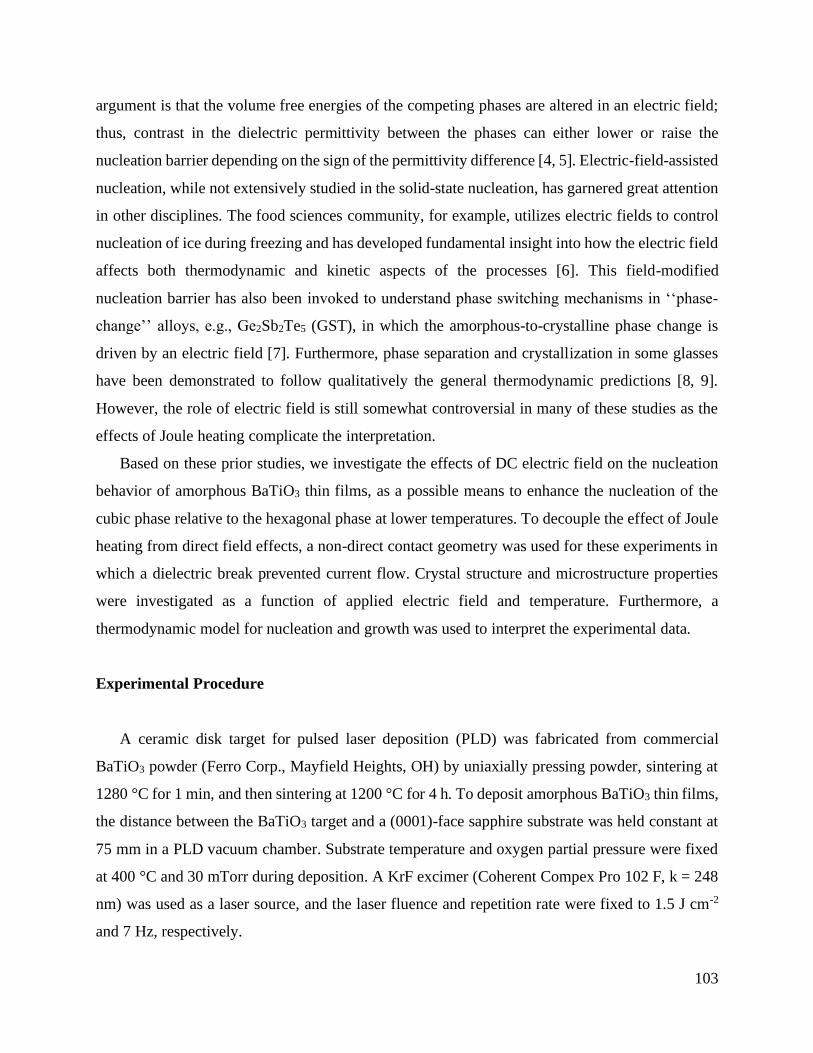
103
argument is that the volume free energies of the competing phases are altered in an electric field;
thus, contrast in the dielectric permittivity between the phases can either lower or raise the
nucleation barrier depending on the sign of the permittivity difference [4, 5]. Electric-field-assisted
nucleation, while not extensively studied in the solid-state nucleation, has garnered great attention
in other disciplines. The food sciences community, for example, utilizes electric fields to control
nucleation of ice during freezing and has developed fundamental insight into how the electric field
affects both thermodynamic and kinetic aspects of the processes [6]. This field-modified
nucleation barrier has also been invoked to understand phase switching mechanisms in ‘‘phase-
change’’ alloys, e.g., Ge2Sb2Te5 (GST), in which the amorphous-to-crystalline phase change is
driven by an electric field [7]. Furthermore, phase separation and crystallization in some glasses
have been demonstrated to follow qualitatively the general thermodynamic predictions [8, 9].
However, the role of electric field is still somewhat controversial in many of these studies as the
effects of Joule heating complicate the interpretation.
Based on these prior studies, we investigate the effects of DC electric field on the nucleation
behavior of amorphous BaTiO3 thin films, as a possible means to enhance the nucleation of the
cubic phase relative to the hexagonal phase at lower temperatures. To decouple the effect of Joule
heating from direct field effects, a non-direct contact geometry was used for these experiments in
which a dielectric break prevented current flow. Crystal structure and microstructure properties
were investigated as a function of applied electric field and temperature. Furthermore, a
thermodynamic model for nucleation and growth was used to interpret the experimental data.
Experimental Procedure
A ceramic disk target for pulsed laser deposition (PLD) was fabricated from commercial
BaTiO3 powder (Ferro Corp., Mayfield Heights, OH) by uniaxially pressing powder, sintering at
1280 °C for 1 min, and then sintering at 1200 °C for 4 h. To deposit amorphous BaTiO3 thin films,
the distance between the BaTiO3 target and a (0001)-face sapphire substrate was held constant at
75 mm in a PLD vacuum chamber. Substrate temperature and oxygen partial pressure were fixed
at 400 °C and 30 mTorr during deposition. A KrF excimer (Coherent Compex Pro 102 F, k = 248
nm) was used as a laser source, and the laser fluence and repetition rate were fixed to 1.5 J cm-2
and 7 Hz, respectively.
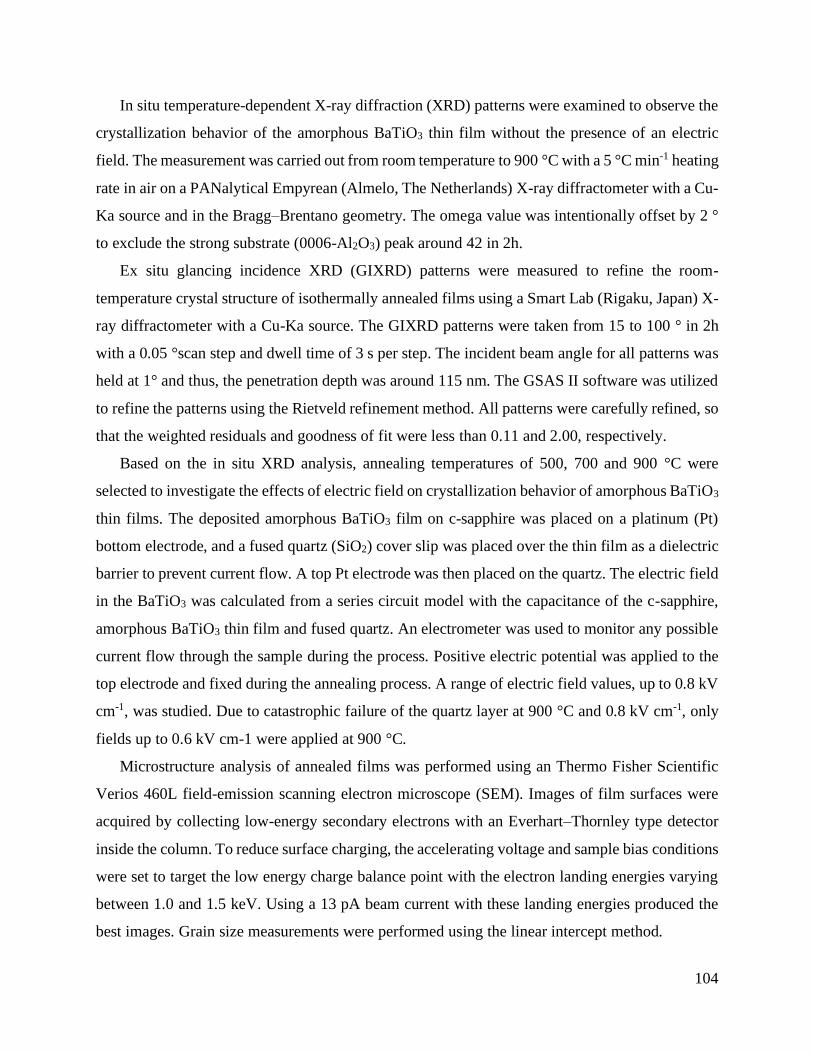
104
In situ temperature-dependent X-ray diffraction (XRD) patterns were examined to observe the
crystallization behavior of the amorphous BaTiO3 thin film without the presence of an electric
field. The measurement was carried out from room temperature to 900 °C with a 5 °C min-1 heating
rate in air on a PANalytical Empyrean (Almelo, The Netherlands) X-ray diffractometer with a Cu-
Ka source and in the Bragg–Brentano geometry. The omega value was intentionally offset by 2 °
to exclude the strong substrate (0006-Al2O3) peak around 42 in 2h.
Ex situ glancing incidence XRD (GIXRD) patterns were measured to refine the room-
temperature crystal structure of isothermally annealed films using a Smart Lab (Rigaku, Japan) X-
ray diffractometer with a Cu-Ka source. The GIXRD patterns were taken from 15 to 100 ° in 2h
with a 0.05 °scan step and dwell time of 3 s per step. The incident beam angle for all patterns was
held at 1° and thus, the penetration depth was around 115 nm. The GSAS II software was utilized
to refine the patterns using the Rietveld refinement method. All patterns were carefully refined, so
that the weighted residuals and goodness of fit were less than 0.11 and 2.00, respectively.
Based on the in situ XRD analysis, annealing temperatures of 500, 700 and 900 °C were
selected to investigate the effects of electric field on crystallization behavior of amorphous BaTiO3
thin films. The deposited amorphous BaTiO3 film on c-sapphire was placed on a platinum (Pt)
bottom electrode, and a fused quartz (SiO2) cover slip was placed over the thin film as a dielectric
barrier to prevent current flow. A top Pt electrode was then placed on the quartz. The electric field
in the BaTiO3 was calculated from a series circuit model with the capacitance of the c-sapphire,
amorphous BaTiO3 thin film and fused quartz. An electrometer was used to monitor any possible
current flow through the sample during the process. Positive electric potential was applied to the
top electrode and fixed during the annealing process. A range of electric field values, up to 0.8 kV
cm-1, was studied. Due to catastrophic failure of the quartz layer at 900 °C and 0.8 kV cm-1, only
fields up to 0.6 kV cm-1 were applied at 900 °C.
Microstructure analysis of annealed films was performed using an Thermo Fisher Scientific
Verios 460L field-emission scanning electron microscope (SEM). Images of film surfaces were
acquired by collecting low-energy secondary electrons with an Everhart–Thornley type detector
inside the column. To reduce surface charging, the accelerating voltage and sample bias conditions
were set to target the low energy charge balance point with the electron landing energies varying
between 1.0 and 1.5 keV. Using a 13 pA beam current with these landing energies produced the
best images. Grain size measurements were performed using the linear intercept method.
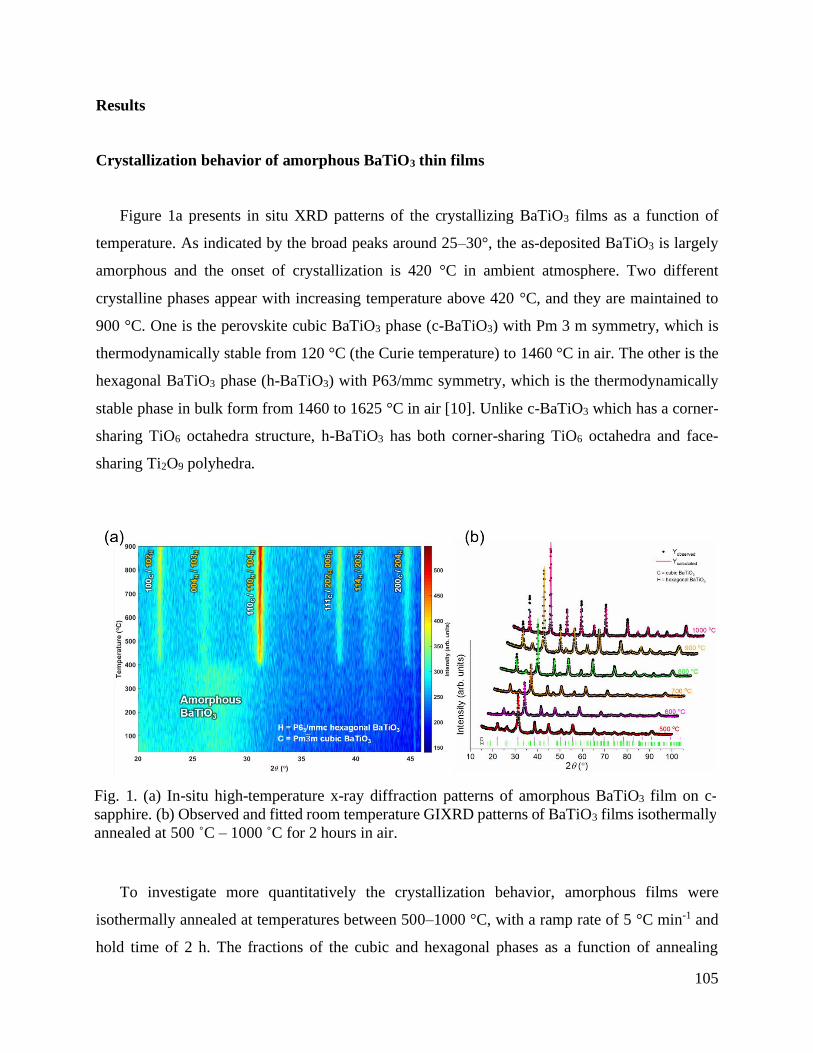
105
Results
Crystallization behavior of amorphous BaTiO3 thin films
Figure 1a presents in situ XRD patterns of the crystallizing BaTiO3 films as a function of
temperature. As indicated by the broad peaks around 25–30°, the as-deposited BaTiO3 is largely
amorphous and the onset of crystallization is 420 °C in ambient atmosphere. Two different
crystalline phases appear with increasing temperature above 420 °C, and they are maintained to
900 °C. One is the perovskite cubic BaTiO3 phase (c-BaTiO3) with Pm 3 m symmetry, which is
thermodynamically stable from 120 °C (the Curie temperature) to 1460 °C in air. The other is the
hexagonal BaTiO3 phase (h-BaTiO3) with P63/mmc symmetry, which is the thermodynamically
stable phase in bulk form from 1460 to 1625 °C in air [10]. Unlike c-BaTiO3 which has a corner-
sharing TiO6 octahedra structure, h-BaTiO3 has both corner-sharing TiO6 octahedra and face-
sharing Ti2O9 polyhedra.
To investigate more quantitatively the crystallization behavior, amorphous films were
isothermally annealed at temperatures between 500–1000 °C, with a ramp rate of 5 °C min-1 and
hold time of 2 h. The fractions of the cubic and hexagonal phases as a function of annealing
Fig. 1. (a) In-situ high-temperature x-ray diffraction patterns of amorphous BaTiO3 film on c-
sapphire. (b) Observed and fitted room temperature GIXRD patterns of BaTiO3 films isothermally
annealed at 500 ˚C – 1000 ˚C for 2 hours in air.
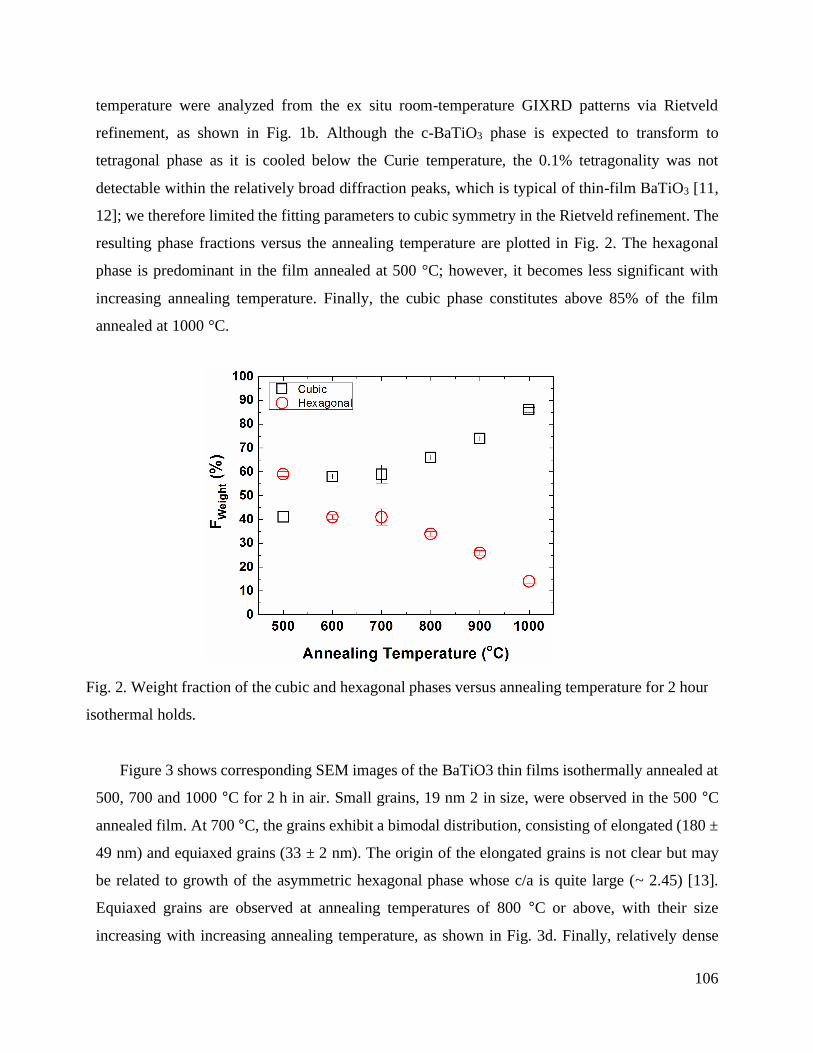
106
temperature were analyzed from the ex situ room-temperature GIXRD patterns via Rietveld
refinement, as shown in Fig. 1b. Although the c-BaTiO3 phase is expected to transform to
tetragonal phase as it is cooled below the Curie temperature, the 0.1% tetragonality was not
detectable within the relatively broad diffraction peaks, which is typical of thin-film BaTiO3 [11,
12]; we therefore limited the fitting parameters to cubic symmetry in the Rietveld refinement. The
resulting phase fractions versus the annealing temperature are plotted in Fig. 2. The hexagonal
phase is predominant in the film annealed at 500 °C; however, it becomes less significant with
increasing annealing temperature. Finally, the cubic phase constitutes above 85% of the film
annealed at 1000 °C.
Figure 3 shows corresponding SEM images of the BaTiO3 thin films isothermally annealed at
500, 700 and 1000 °C for 2 h in air. Small grains, 19 nm 2 in size, were observed in the 500 °C
annealed film. At 700 °C, the grains exhibit a bimodal distribution, consisting of elongated (180 ±
49 nm) and equiaxed grains (33 ± 2 nm). The origin of the elongated grains is not clear but may
be related to growth of the asymmetric hexagonal phase whose c/a is quite large (~ 2.45) [13].
Equiaxed grains are observed at annealing temperatures of 800 °C or above, with their size
increasing with increasing annealing temperature, as shown in Fig. 3d. Finally, relatively dense
Fig. 2. Weight fraction of the cubic and hexagonal phases versus annealing temperature for 2 hour
isothermal holds.
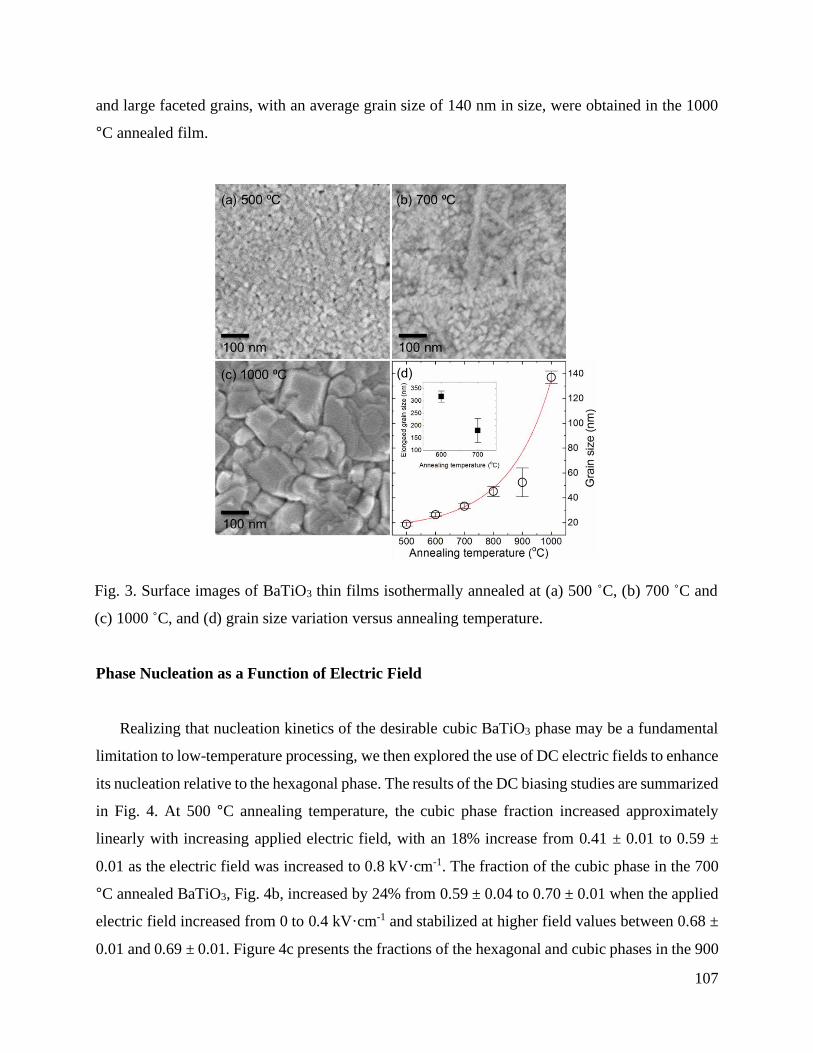
107
and large faceted grains, with an average grain size of 140 nm in size, were obtained in the 1000
°C annealed film.
Phase Nucleation as a Function of Electric Field
Realizing that nucleation kinetics of the desirable cubic BaTiO3 phase may be a fundamental
limitation to low-temperature processing, we then explored the use of DC electric fields to enhance
its nucleation relative to the hexagonal phase. The results of the DC biasing studies are summarized
in Fig. 4. At 500 °C annealing temperature, the cubic phase fraction increased approximately
linearly with increasing applied electric field, with an 18% increase from 0.41 ± 0.01 to 0.59 ±
0.01 as the electric field was increased to 0.8 kV·cm-1. The fraction of the cubic phase in the 700
°C annealed BaTiO3, Fig. 4b, increased by 24% from 0.59 ± 0.04 to 0.70 ± 0.01 when the applied
electric field increased from 0 to 0.4 kV·cm-1 and stabilized at higher field values between 0.68 ±
0.01 and 0.69 ± 0.01. Figure 4c presents the fractions of the hexagonal and cubic phases in the 900
Fig. 3. Surface images of BaTiO3 thin films isothermally annealed at (a) 500 ˚C, (b) 700 ˚C and
(c) 1000 ˚C, and (d) grain size variation versus annealing temperature.
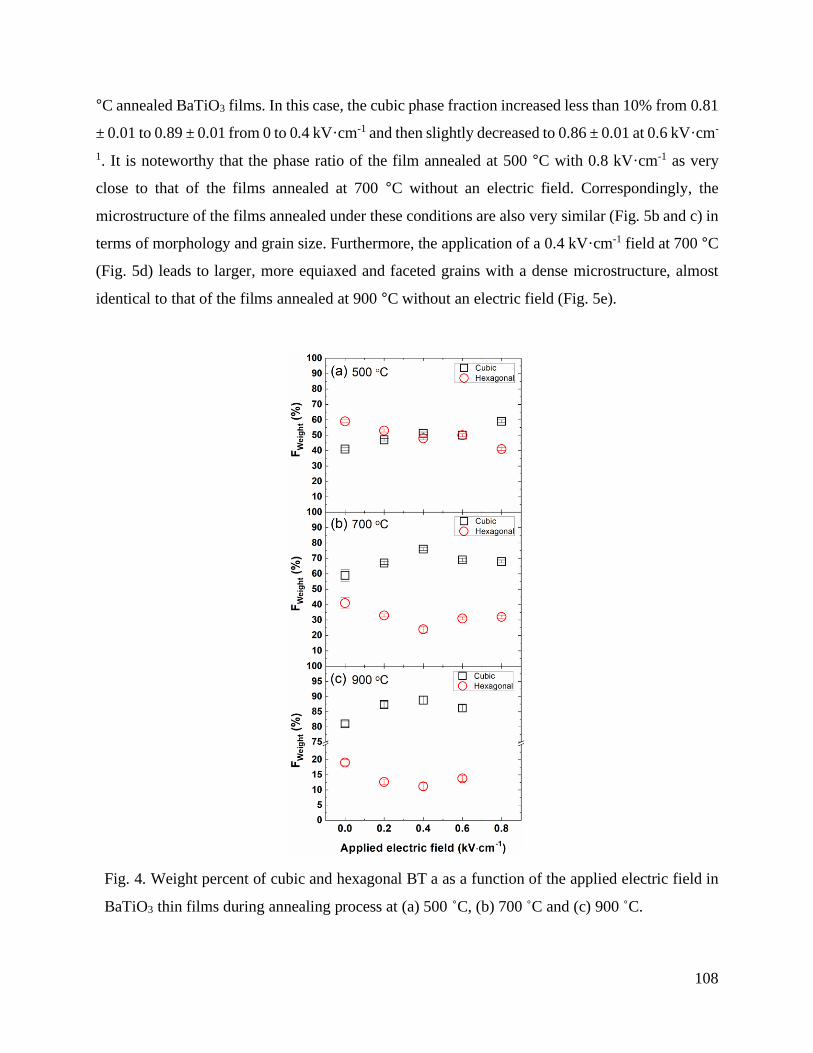
108
°C annealed BaTiO3 films. In this case, the cubic phase fraction increased less than 10% from 0.81
± 0.01 to 0.89 ± 0.01 from 0 to 0.4 kV·cm-1 and then slightly decreased to 0.86 ± 0.01 at 0.6 kV·cm-
1. It is noteworthy that the phase ratio of the film annealed at 500 °C with 0.8 kV·cm-1 as very
close to that of the films annealed at 700 °C without an electric field. Correspondingly, the
microstructure of the films annealed under these conditions are also very similar (Fig. 5b and c) in
terms of morphology and grain size. Furthermore, the application of a 0.4 kV·cm-1 field at 700 °C
(Fig. 5d) leads to larger, more equiaxed and faceted grains with a dense microstructure, almost
identical to that of the films annealed at 900 °C without an electric field (Fig. 5e).
Fig. 4. Weight percent of cubic and hexagonal BT a as a function of the applied electric field in
BaTiO3 thin films during annealing process at (a) 500 ˚C, (b) 700 ˚C and (c) 900 ˚C.
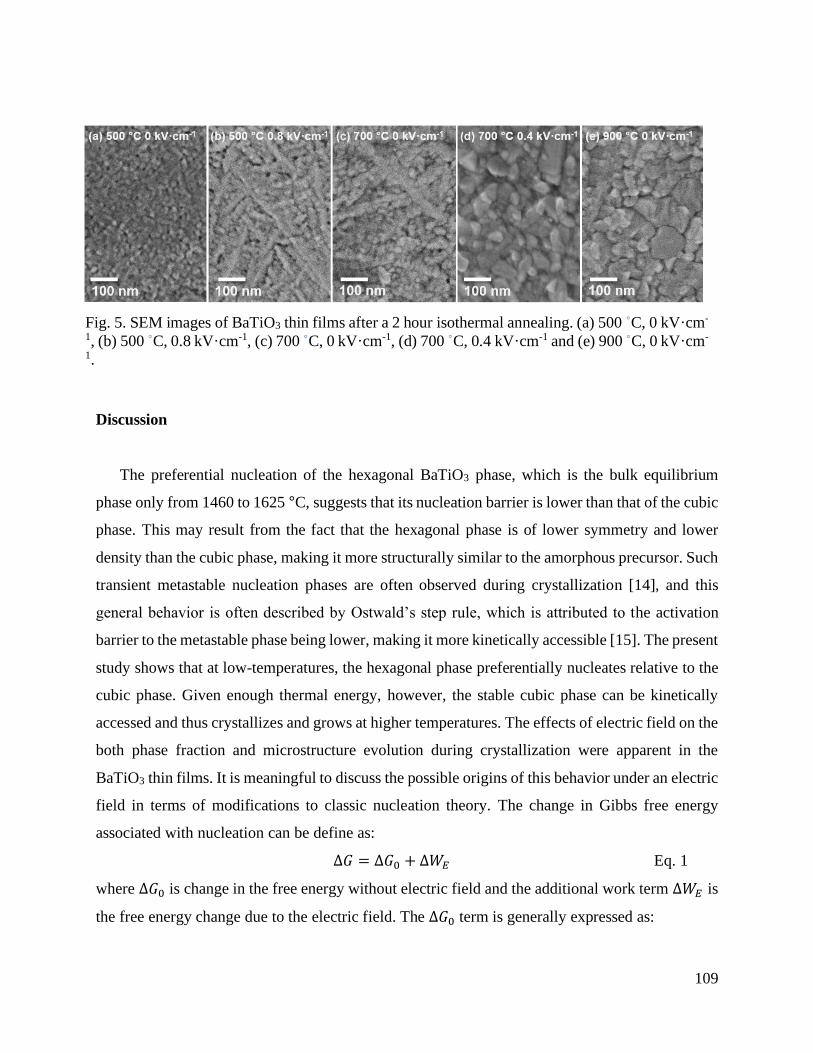
109
Discussion
The preferential nucleation of the hexagonal BaTiO3 phase, which is the bulk equilibrium
phase only from 1460 to 1625 °C, suggests that its nucleation barrier is lower than that of the cubic
phase. This may result from the fact that the hexagonal phase is of lower symmetry and lower
density than the cubic phase, making it more structurally similar to the amorphous precursor. Such
transient metastable nucleation phases are often observed during crystallization [14], and this
general behavior is often described by Ostwald’s step rule, which is attributed to the activation
barrier to the metastable phase being lower, making it more kinetically accessible [15]. The present
study shows that at low-temperatures, the hexagonal phase preferentially nucleates relative to the
cubic phase. Given enough thermal energy, however, the stable cubic phase can be kinetically
accessed and thus crystallizes and grows at higher temperatures. The effects of electric field on the
both phase fraction and microstructure evolution during crystallization were apparent in the
BaTiO3 thin films. It is meaningful to discuss the possible origins of this behavior under an electric
field in terms of modifications to classic nucleation theory. The change in Gibbs free energy
associated with nucleation can be define as:
∆𝐺 = ∆𝐺0 + ∆𝑊𝐸 Eq. 1
where ∆𝐺0 is change in the free energy without electric field and the additional work term ∆𝑊𝐸 is
the free energy change due to the electric field. The ∆𝐺0 term is generally expressed as:
Fig. 5. SEM images of BaTiO3 thin films after a 2 hour isothermal annealing. (a) 500 ˚C, 0 kV·cm-
1, (b) 500 ˚C, 0.8 kV·cm-1, (c) 700 C, 0 kV·cm-1, (d) 700 C, 0.4 kV·cm-1 and (e) 900 C, 0 kV·cm-
1.
110
∆𝐺0 = 4𝜋𝑟2𝜎 −
4
3𝜋𝑟3Δ𝐺𝑉 Eq. 2
where 𝑟 is the radius of a nuclei, 𝜎 is the surface free energy per unit area and ΔGV is the change
in volumetric energy per unit volume.
If a constant electrostatic potential is applied to the thin film during the process at constant T,
P and no changes of phase constitution are assumed, then the free energy change induced by an
electric field, ∆𝑊𝐸 , is given by [5]:
∆𝑊𝐸 = −휀𝑜(휀 − 휀𝑚)𝐸2 8𝜋𝑛⁄ Eq. 3
where 휀 is the effective relative permittivity of the medium having n nuclei per unit volume and
휀𝑚 is the relative permittivity of the matrix phase and E is the applied electric field. In this model,
the shape of the cluster is assumed to be spherical, and the 휀 for a volume fraction 𝛿 of spherical
clusters was derived by Wagner [17] and van Beek [18] as:
휀 =(1 − 𝛿)2휀𝑚
2 + (1 + 2𝛿)휀𝑚휀𝑐(1 − 𝛿)휀𝑐 + (2 + 𝛿)휀𝑚
Eq. 4
where 휀𝑐 is the relative permittivity of cluster, or nucleating phase. If the total dimensions of the
system during the annealing process are assumed to be constant and the total number of nuclei is
held constant, then the above equation reduces to [19]:
휀 = 휀𝑚[1 + 3𝛿(휀𝑐 − 휀𝑚)/(휀𝑐 + 2휀𝑚)] Eq. 5
The fraction 𝛿 is much smaller than 1, and hence the change in free energy from the electric field
is:
∆𝑊𝐸(𝑥) = −휀𝑜(휀 − 휀𝑚)𝐸2 8𝜋𝑛⁄
= −3
8𝜋𝑣𝑐𝐸
2𝑥휀𝑜휀𝑚(휀𝑐 − 휀𝑚)/(휀𝑐 + 2휀𝑚)
Eq. 6
since 𝛿 = 𝑛𝑣𝑐𝑥, where 𝑣𝑐 is mean atom volume in the cluster and x is the size of the cluster having
the relation; 𝑥 = (4𝜋/3𝑣𝑐)𝑟3. Therefore, the total Gibbs free energy change as a function of nuclei
radius is:
∆𝐺(𝑟) = 4𝜋𝑟2𝜎 −4𝜋
3
𝐻𝑓𝑇𝑚(𝑇𝑚 − 𝑇)𝑟
3 −휀𝑜휀𝑚(휀𝑐 − 휀𝑚)
2(휀𝑐 + 2휀𝑚)𝐸2𝑟3 Eq. 7
since Δ𝐺𝑉 =𝐻𝑓
𝑇𝑚(𝑇𝑚 − 𝑇) where 𝐻𝑓 is the latent heat of fusion and 𝑇𝑚 is the melting temperature
and T is an annealing temperature.
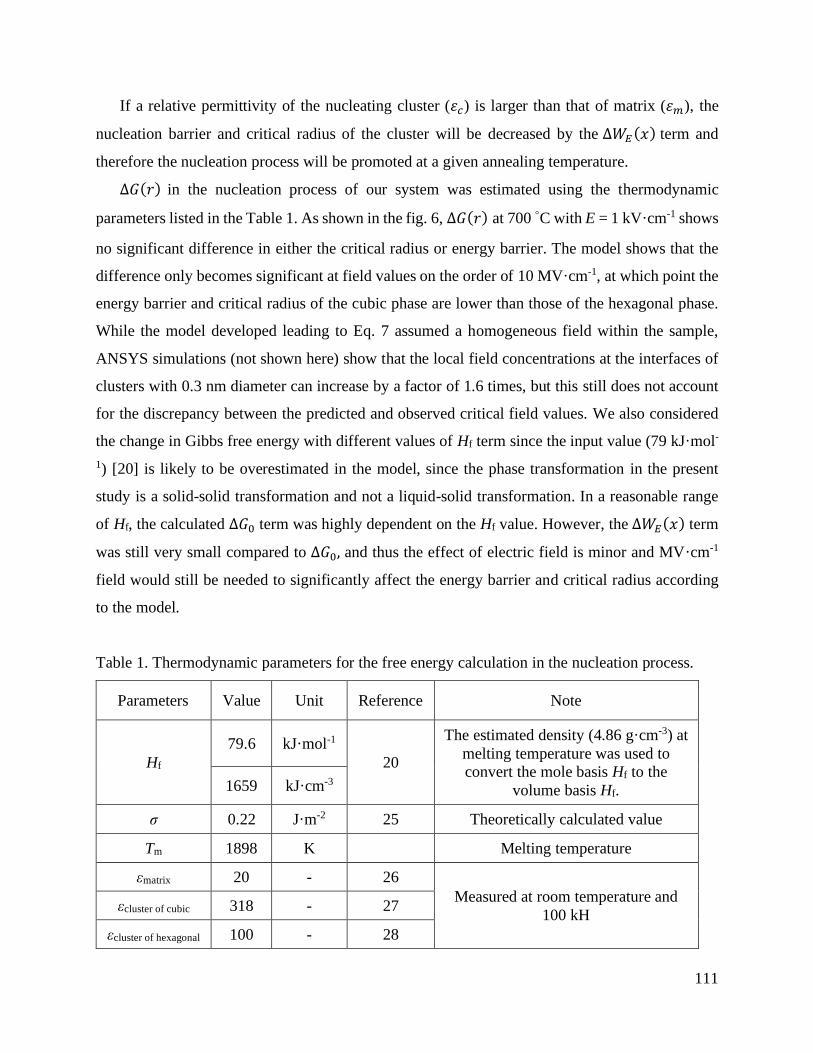
111
If a relative permittivity of the nucleating cluster (휀𝑐) is larger than that of matrix (휀𝑚), the
nucleation barrier and critical radius of the cluster will be decreased by the ∆𝑊𝐸(𝑥) term and
therefore the nucleation process will be promoted at a given annealing temperature.
∆𝐺(𝑟) in the nucleation process of our system was estimated using the thermodynamic
parameters listed in the Table 1. As shown in the fig. 6, ∆𝐺(𝑟) at 700 C with E = 1 kV·cm-1 shows
no significant difference in either the critical radius or energy barrier. The model shows that the
difference only becomes significant at field values on the order of 10 MV·cm-1, at which point the
energy barrier and critical radius of the cubic phase are lower than those of the hexagonal phase.
While the model developed leading to Eq. 7 assumed a homogeneous field within the sample,
ANSYS simulations (not shown here) show that the local field concentrations at the interfaces of
clusters with 0.3 nm diameter can increase by a factor of 1.6 times, but this still does not account
for the discrepancy between the predicted and observed critical field values. We also considered
the change in Gibbs free energy with different values of Hf term since the input value (79 kJ·mol-
1) [20] is likely to be overestimated in the model, since the phase transformation in the present
study is a solid-solid transformation and not a liquid-solid transformation. In a reasonable range
of Hf, the calculated ∆𝐺0 term was highly dependent on the Hf value. However, the ∆𝑊𝐸(𝑥) term
was still very small compared to ∆𝐺0, and thus the effect of electric field is minor and MV·cm-1
field would still be needed to significantly affect the energy barrier and critical radius according
to the model.
Table 1. Thermodynamic parameters for the free energy calculation in the nucleation process.
Parameters Value Unit Reference Note
Hf
79.6 kJ·mol-1
20
The estimated density (4.86 g·cm-3) at
melting temperature was used to
convert the mole basis Hf to the
volume basis Hf. 1659 kJ·cm-3
σ 0.22 J·m-2 25 Theoretically calculated value
Tm 1898 K Melting temperature
εmatrix 20 - 26
Measured at room temperature and
100 kH εcluster of cubic 318 - 27
εcluster of hexagonal 100 - 28
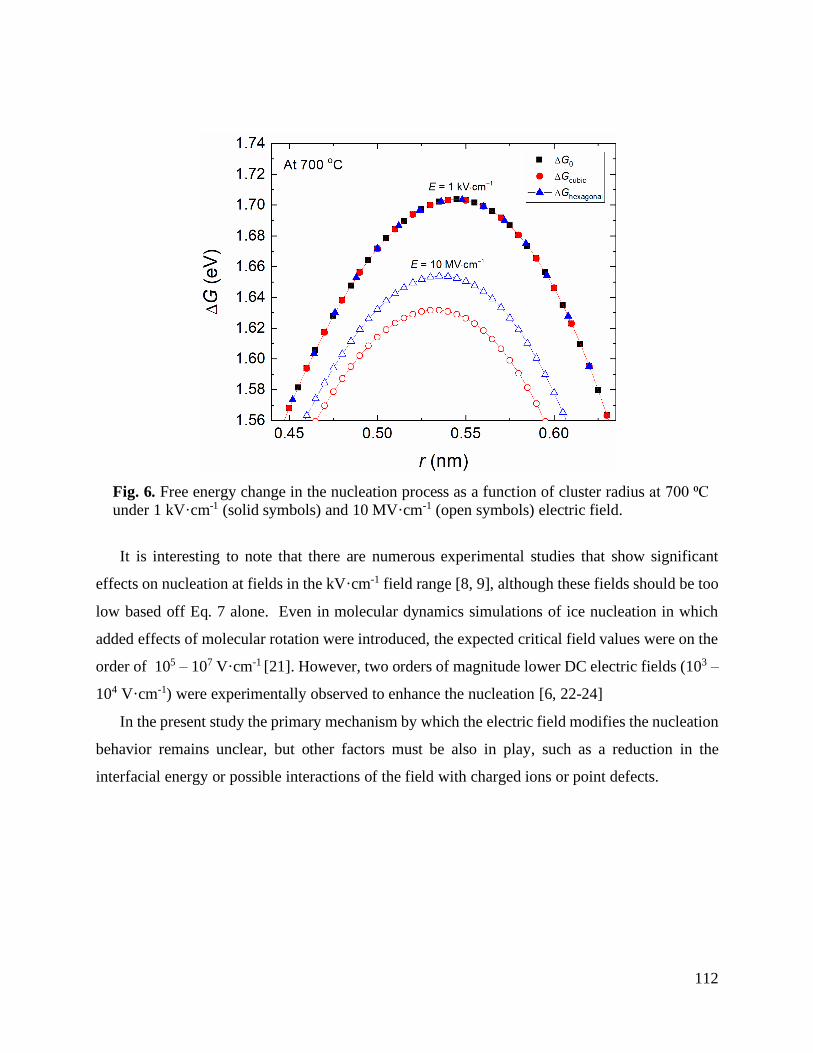
112
It is interesting to note that there are numerous experimental studies that show significant
effects on nucleation at fields in the kV·cm-1 field range [8, 9], although these fields should be too
low based off Eq. 7 alone. Even in molecular dynamics simulations of ice nucleation in which
added effects of molecular rotation were introduced, the expected critical field values were on the
order of 105 – 107 V·cm-1 [21]. However, two orders of magnitude lower DC electric fields (103 –
104 V·cm-1) were experimentally observed to enhance the nucleation [6, 22-24]
In the present study the primary mechanism by which the electric field modifies the nucleation
behavior remains unclear, but other factors must be also in play, such as a reduction in the
interfacial energy or possible interactions of the field with charged ions or point defects.
Fig. 6. Free energy change in the nucleation process as a function of cluster radius at 700 ⁰C
under 1 kV·cm-1 (solid symbols) and 10 MV·cm-1 (open symbols) electric field.
113
Conclusions
Temperature-dependent phase and microstructure evolution of initially amorphous BaTiO3
thin films was investigated to understand its crystallization behavior. Phase analysis from XRD
showed that the metastable hexagonal phase preferentially nucleates at around 420 ˚C and this
observation was explained by the rule of Ostwald step. With increasing annealing temperature, the
fraction of cubic phase increases, and finally 90% cubic phase was observed at the 1000 ˚C
annealing condition where dense and large faceted grains were obtained.
We further studied the possibility of using DC electric fields to modify the nucleation behavior.
From the quantitative XRD analysis, it was confirmed that cubic phase nucleation is enhanced
relative to the hexagonal phase under an electric field of the order of 1kV·cm-1. While classical
nucleation thermodynamics predicts that the nucleation barrier for cubic phase is lowered relative
to the hexagonal phase because of the former’s higher relative permittivity, the predicted
magnitude of DC electric field in the model is orders of magnitude larger than those field used in
the present study. Thus, we conclude that the electric field may influence other factors such as an
interfacial energy or the mobility of ions or defects at the transformation front during nucleation
process.
Acknowledgements
This work was performed in part at the Analytical Instrumentation Facility (AIF) at North
Carolina State University, which is supported by the State of North Carolina and the National
Science Foundation (award number ECCS-1542015). The AIF is a member of the North Carolina
Research Triangle Nanotechnology Network (RTNN), a site in the National Nanotechnology
Coordinated Infrastructure (NNCI). This work was partially supported by the II-VI Foundation
under the Block-Gift Program.
Compliance with ethical standards
Conflicts of interest: The authors declare that they have no conflict of interest.
114
References
[1] Ihlefeld JF, Borland WJ, Maria J-P (2007) Enhanced Dielectric and Crystalline Properties in
Ferroelectric Barium Titanate Thin Films. Adv Funct Mater 17:1199–1203.
[2] Harris DT, Burch MJ, Ihlefeld JF, et al (2013) Realizing strain enhanced dielectric properties
in BaTiO3 films by liquid phase assisted growth. Appl Phys Lett 103:012904-1–5.
[3] Harris DT, Burch MJ, Mily EJ, et al (2016) Microstructure and dielectric properties with CuO
additions to liquid phase sintered BaTiO3 thin films. J Mater Res 31:1018–1026.
[4] Kashchiev D (1972) On the influence of the electric field on nucleation kinetics. Philos Mag
25:459–470.
[5] Isard JO (1977) Calculation of the influence of an electric field on the free energy of formation
of a nucleus. Philos Mag 35:817–819.
[6] Orlowska M, Havet M, Le-Bail A (2009) Controlled ice nucleation under high voltage DC
electrostatic field conditions. Food Res Int 42:879–884.
[7] Nardone M, Karpov VG, Jackson DCS, Karpov I V. (2009) A unified model of nucleation
switching. Appl Phys Lett 94:103509-1–3.
[8] Gu XM, Liu W, Liang KM (2000) The effect of electric field on phase separation in glasses:
A model and experimental testing. Mater Sci Eng A 278:22–26.
[9] Liu W, Liang KM, Zheng YK, et al (1997) The effect of an electric field on the phase separation
of glasses. J Phys D Appl Phys 30:3366–3370.
[10] Lee S, Randall CA, Liu ZK (2007) Modified phase diagram for the barium oxide-titanium
dioxide system for the ferroelectric barium titanate. J Am Ceram Soc 90:2589–2594.
[11] Kim S, Hishita S (1997) Preparation and characterization of BaTiO3 thin films on MgO-
buffered Si(100) substrates by RF sputtering. J Mater Res 12:1152–1159.
[12] Appleby DJR, Ponon NK, Kwa KSK, et al (2014) Ferroelectric properties in thin film barium
titanate grown using pulsed laser deposition. J Appl Phys 116:124105-1–6.
[13] Akimoto J, Gotoh Y, Oosawa Y (1994) Refinement of hexagonal BaTiO3. Acta Crystallogr
Sect C Cryst Struct Commun 50:160–161.
[14] Chung SY, Kim YM, Kim JG, Kim YJ (2009) Multiphase transformation and Ostwalds rule
of stages during crystallization of a metal phosphate. Nat Phys 5:68–73.
[15] Nývlt J (1995) The Ostwald Rule of Stages. Cryst Res Technol 30:443–449.
115
[16] Kashchiev D (2000) Chapter 21. Electric field. In: Nucleation. Elsevier, pp 315–329
[17] K. W. Wagner (1914) Erklärung der dielektrischen Nachwirkungsvorgänge auf Grund
Maxwellscher Vorstellungen. Arch für Elektrotechnik 2:371
[18] Beek V, L.K.H. (1967) Dielectric behaviour of heterogeneous systems. In: J.B. Birks (ed)
Progress in Dielectrics. Heywood Books, London, pp 69–114
[19] Grossman DG, Isard JO (1970) The application of dielectric mixtures formulae to glass -
ceramic systems. J Phys D Appl Phys 3:1058–1067.
[20] Lee KJ, Lee CH, Lee GW, et al (2012) Thermophysical properties of BaTiO3 ceramics
prepared by aerodynamic levitation. Thermochim Acta 542:37–41.
[21] Vegiri A, Schevkunov S V. (2001) A molecular dynamics study of structural transitions in
small water clusters in the presence of an external electric field. J Chem Phys 115:4175–4185.
[22] Wei S, Xiaobin X, Hong Z, Chuanxiang X (2008) Effects of dipole polarization of water
molecules on ice formation under an electrostatic field. Cryobiology 56:93–99.
[23] Hozumi T, Saito A, Seiji O, Kazuharu W (2003) Effects of electrode materials on freezing of
supercooled water in electric freeze control. Int J Refrig 26:537–542.
[24] Hozumi T, Saito A, Okawa S, Eshita Y (2005) Effects of shapes of electrodes on freezing of
supercooled water in electric freeze control. Int J Refrig 28:389–395.
[25] Testino A, Buscaglia V, Buscaglia MT, et al (2005) Kinetic modeling of aqueous and
hydrothermal synthesis of barium titanate (BaTiO3). Chem Mater 17:5346–5356.
[26] Golego N, Studenikin S a, Cocivera M (1998) Properties of Dielectric BaTiO3 Thin Films
Prepared by Spray Pyrolysis. Chem Mater 10:2000–2005.
[27] Lee B, Zhang J (2001) Preparation, structure evolution and dielectric properties of BaTiO3
thin films and powders by an aqueous sol-gel process. Thin Solid Films 388:107–113.
[28] Hashemizadeh S, Biancoli A, Damjanovic D (2016) Symmetry breaking in hexagonal and
cubic polymorphs of BaTiO3. J Appl Phys 119:094105.