a perceived quality-aware cross layer monitoring framework for real-time media content adaptation
TRANSCRIPT

A Perceived Quality-aware Cross Layer Monitoring Framework for Real-Time Media Content Adaptation
M. Sidibé1, H. Koumaras2, G. Xilouris2, Ahmed Mehaoua1,3 , A. Kourtis2 1PRiSM - Univ. of Versailles, France
{mas,mea}@prism.uvsq.fr 2NCSR Demokritos, Inst. of Inform. & Tel., Greece
{koumaras,xilouris, kourtis}@iit.demokritos.gr 3Univ. Paris Descartes - CRIP5 [email protected]
Abstract— The media content provision in a variety of quality and price levels, through the concept of the Perceived Quality of Service (PQoS) is considered as the most dominant among the various future visions of multimedia networking. The concept of the PQoS-driven service provision, based on multimedia content adaptation across heterogeneous networks, will become in the near future a key-issue among service providers (SPs). This paper presents, describes and proposes a novel cross layer monitoring architecture, driven by a prototype mapping between Network QoS (NQoS) and PQoS parameters, aiming at providing perceived performance verification with respect to the QoS guarantees specified in contractual agreements between providers and end-users. Towards this, the proposed framework takes sophisticated actions for real time media content adaption with aim the optimization of the finally delivered perceptual quality and the maximization of the user experience. The validity of the proposed model is tested by a real test-bed, demonstrating satisfactory accuracy of the network measurements and the overall feasibility of the proposed monitoring solution.
Keywords: Perceived quality monitoring; End-to-end monitoring; active network measurements; NQoS; PQoS; service adaptation; integrated management.
I. INTRODUCTION Recently, it has been observed an explosive demand for
End-to-End (E2E) multimedia content across multi-domain heterogeneous networking environments, making a controversial issue the QoS-enabled service delivery to end users by the E2E management of contents, underlying networks and users terminals. Such E2E management requires real time and continuous monitoring of the current network conditions (including perceived quality) as input to management entities (e.g., service, adaptation and user terminal device management entities). These entities are to take appropriate actions for service assurance (service adaptation) through a monitoring solution that covers network and service E2E scope for cross-network audiovisual service provision. In this framework, this paper proposes a monitoring solution, which is applied across the media delivery chain, as well as at terminal and service level for service connectivity and user perceived quality monitoring.
In this work, we focus on the application level perceived quality monitoring that includes the NQoS to PQoS mapping functionalities. In addition, we also discuss in context of real test-bed the accuracy of the network measurement components and the evaluation of the NQoS to PQoS mapping algorithms. Thus, the overall solution, designed for supporting cross-network audiovisual service offering, is aimed at assisting service/network providers to verify whether the QoS-
performance guarantees (committed in service agreements) are in fact being met and providing inputs for an E2E cross layer adaptation in case of service degradation (agreement violation).
Also in this work, we assume that QoS-enabled media services are based on cooperation of several business actors (Content Providers - CPs, Service Providers - SPs, Network Providers - NPs and Content Consumer - CCs) communicating over heterogeneous multi-domain networking environment in cascaded fashion1. These actors interact through a distributed integrated management entities (Managers) [2]. In fact, a Service Manager (SM) located at the SP (SM@SP) deals with the customer subscriptions, contracts with NPs, the services provided by the SP and the chosen access to the service. Complimentary, an other SM at the NPs (SM@NP) deals only with service agreements within NP domain In the event of service disruption, the proposed monitoring system provides input to a cross-layer QoS Adaptation Manager (AM) for content adaptation.
In the field of related works, the Internet Engineering Task Force (IETF) [8] proposed a number of working groups related to measurements and monitoring such as Remote MONitoring (RMON), IP Performance Metrics (IPPM), Real-Time Flow Measurement (RTFM), IP Flow Information Export (IPFIX), and Packet Sampling (PSAMP). These working groups are in the process of defining metrics, developing a common IP traffic flow measurement technology and specifying a standard set of capabilities for sampling packets through statistical and other methods respectively. In addition, numerous monitoring tools, such as the RIPE Test Traffic Measurement (TTM), NetFlow, SFlow, NIMI (National Internet Measurement Infrastructure) [3], Network Analysis Infrastructure (NAI), cflowd, RTG high-performance SNMP statistics monitoring system, Sskitter, NeTraMet, CoralReef, and Beluga of CAIDA (Cooperative Association for Internet Data Analysis), have been created. Sources [4] and [5] provide more detailed references for these activities. These measurement tools and systems collect, analyze and visualize forms of Internet or Intranet traffic data such as network topology, traffic load, performance and routing. The IST-INTERMON, IST-MoMe, IST-SCAMPI, IST-LOBSTER and IST-AQUILA are European research projects that have been focused also in the field of inter-domain monitoring [6].
Our work differs mainly from the other mentioned related works in that: (a) Its E2E scope and business model
1 Acknowledgments: Part of this work is supported by the EU
ENTHRONE project (IST 507637) at www.ist-enthrone.org.
encompasses CPs, SPs, NPs and CCs; (b) Quality Meters [2] (PQoS probes) at the user-side measure the perceived quality level (Delivered PQoS) of an audio-visual stream; (c) Perceived quality (Derived PQoS) is assessed from measured network performances (Measured NQoS) in access/core networks. This NQoS to PQoS mapping is achieved at the application layer by using a dedicated monitoring component.
Regarding the mapping of the network QoS sensitive parameters (delay, packet loss etc.) to perceived video quality, S. Kanumuri et al constructed a very analytical statistical model of the visual impact of packet-loss on the quality of decoded MPEG-2 video sequences [12], specifying the various factors that affect perceived video quality and visibility (e.g. Maximum number of frames affected by packet loss, which frame types are subject to the packet loss etc). Similarly, in [13] another transmission/distortion model for real-time video streaming over error-prone wireless networks is presented. In this work, we choose to model impulse transmission distortion (i.e. the visual fading behavior of the transmission errors), as the previous models are very codec and content specific, while also not providing any E2E video quality estimation, namely of the degradation during the encoding process and the transmission/streaming procedure. Our work proposes a generic model for mapping NQoS Sensitive Parameters, such as packet loss to PQoS, ensuring consistency in the level of services offered by SPs.
The rest of the paper is organized as follows: Section II shows the application level PQoS-aware cross layer monitoring framework architecture and discusses the service monitoring procedure. The NQoS to PQoS mapping approach is detailed in Section III. Section IV then describes the experimental test-bed used to evaluate and validate our monitoring solution. Finally, conclusion is provided in Section V
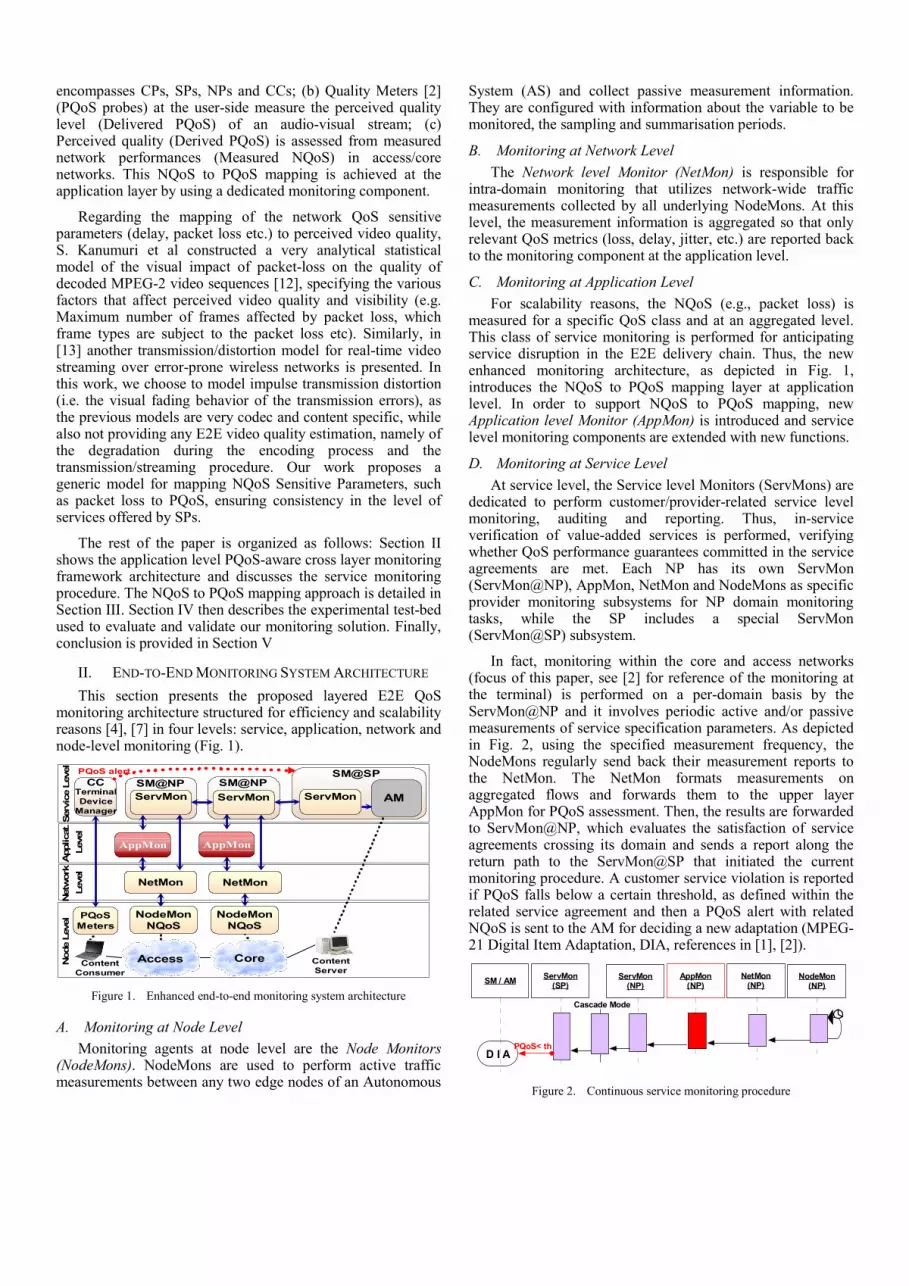
II. END-TO-END MONITORING SYSTEM ARCHITECTURE This section presents the proposed layered E2E QoS
monitoring architecture structured for efficiency and scalability reasons [4], [7] in four levels: service, application, network and node-level monitoring (Fig. 1).
ContentServer
TerminalDevice
Manager
ServMon
NetMon
Serv
ice
Leve
lN
etw
ork
Lev
elN
ode
Leve
l NodeMonNQoS
PQoSMeters
CCAM
ContentConsumer
PQoS alert
AppMon
App
licat
. L
evel
NetMon
Access Core
SM@NP
AppMon
SM@NPServMon
SM@SP
NodeMonNQoS
ServMon
Figure 1. Enhanced end-to-end monitoring system architecture
A. Monitoring at Node Level Monitoring agents at node level are the Node Monitors
(NodeMons). NodeMons are used to perform active traffic measurements between any two edge nodes of an Autonomous
System (AS) and collect passive measurement information. They are configured with information about the variable to be monitored, the sampling and summarisation periods.
B. Monitoring at Network Level The Network level Monitor (NetMon) is responsible for
intra-domain monitoring that utilizes network-wide traffic measurements collected by all underlying NodeMons. At this level, the measurement information is aggregated so that only relevant QoS metrics (loss, delay, jitter, etc.) are reported back to the monitoring component at the application level.
C. Monitoring at Application Level For scalability reasons, the NQoS (e.g., packet loss) is
measured for a specific QoS class and at an aggregated level. This class of service monitoring is performed for anticipating service disruption in the E2E delivery chain. Thus, the new enhanced monitoring architecture, as depicted in Fig. 1, introduces the NQoS to PQoS mapping layer at application level. In order to support NQoS to PQoS mapping, new Application level Monitor (AppMon) is introduced and service level monitoring components are extended with new functions.
D. Monitoring at Service Level At service level, the Service level Monitors (ServMons) are
dedicated to perform customer/provider-related service level monitoring, auditing and reporting. Thus, in-service verification of value-added services is performed, verifying whether QoS performance guarantees committed in the service agreements are met. Each NP has its own ServMon (ServMon@NP), AppMon, NetMon and NodeMons as specific provider monitoring subsystems for NP domain monitoring tasks, while the SP includes a special ServMon (ServMon@SP) subsystem.
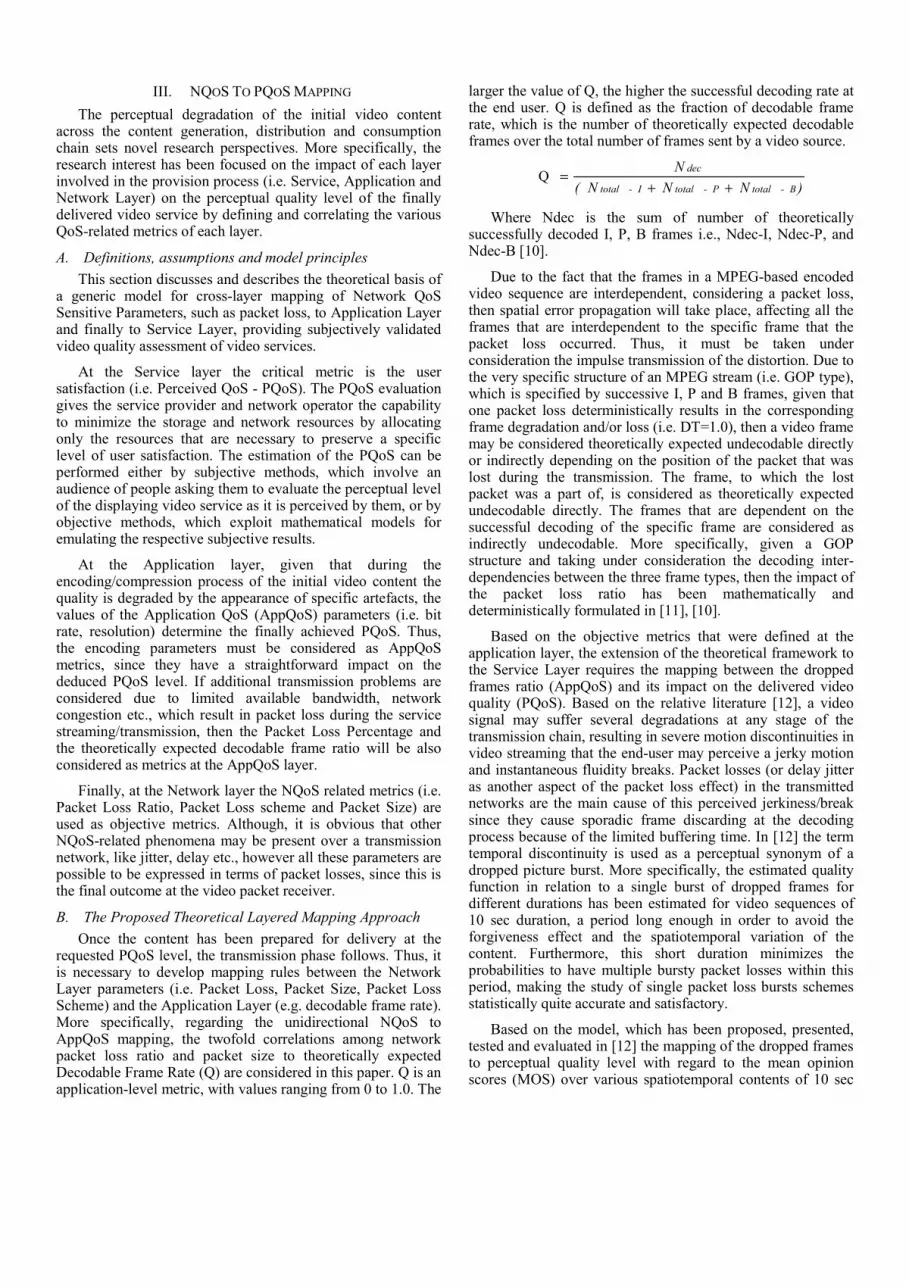
In fact, monitoring within the core and access networks (focus of this paper, see [2] for reference of the monitoring at the terminal) is performed on a per-domain basis by the ServMon@NP and it involves periodic active and/or passive measurements of service specification parameters. As depicted in Fig. 2, using the specified measurement frequency, the NodeMons regularly send back their measurement reports to the NetMon. The NetMon formats measurements on aggregated flows and forwards them to the upper layer AppMon for PQoS assessment. Then, the results are forwarded to ServMon@NP, which evaluates the satisfaction of service agreements crossing its domain and sends a report along the return path to the ServMon@SP that initiated the current monitoring procedure. A customer service violation is reported if PQoS falls below a certain threshold, as defined within the related service agreement and then a PQoS alert with related NQoS is sent to the AM for deciding a new adaptation (MPEG-21 Digital Item Adaptation, DIA, references in [1], [2]).
NodeMon(NP)
Cascade Mode
NetMon(NP)
ServMon(NP)
ServMon(SP)
AppMon(NP)
D I A
SM / AM
PQoS< th
Figure 2. Continuous service monitoring procedure
III. NQOS TO PQOS MAPPING The perceptual degradation of the initial video content
across the content generation, distribution and consumption chain sets novel research perspectives. More specifically, the research interest has been focused on the impact of each layer involved in the provision process (i.e. Service, Application and Network Layer) on the perceptual quality level of the finally delivered video service by defining and correlating the various QoS-related metrics of each layer.
A. Definitions, assumptions and model principles This section discusses and describes the theoretical basis of
a generic model for cross-layer mapping of Network QoS Sensitive Parameters, such as packet loss, to Application Layer and finally to Service Layer, providing subjectively validated video quality assessment of video services.
At the Service layer the critical metric is the user satisfaction (i.e. Perceived QoS - PQoS). The PQoS evaluation gives the service provider and network operator the capability to minimize the storage and network resources by allocating only the resources that are necessary to preserve a specific level of user satisfaction. The estimation of the PQoS can be performed either by subjective methods, which involve an audience of people asking them to evaluate the perceptual level of the displaying video service as it is perceived by them, or by objective methods, which exploit mathematical models for emulating the respective subjective results.
At the Application layer, given that during the encoding/compression process of the initial video content the quality is degraded by the appearance of specific artefacts, the values of the Application QoS (AppQoS) parameters (i.e. bit rate, resolution) determine the finally achieved PQoS. Thus, the encoding parameters must be considered as AppQoS metrics, since they have a straightforward impact on the deduced PQoS level. If additional transmission problems are considered due to limited available bandwidth, network congestion etc., which result in packet loss during the service streaming/transmission, then the Packet Loss Percentage and the theoretically expected decodable frame ratio will be also considered as metrics at the AppQoS layer.
Finally, at the Network layer the NQoS related metrics (i.e. Packet Loss Ratio, Packet Loss scheme and Packet Size) are used as objective metrics. Although, it is obvious that other NQoS-related phenomena may be present over a transmission network, like jitter, delay etc., however all these parameters are possible to be expressed in terms of packet losses, since this is the final outcome at the video packet receiver.
B. The Proposed Theoretical Layered Mapping Approach Once the content has been prepared for delivery at the
requested PQoS level, the transmission phase follows. Thus, it is necessary to develop mapping rules between the Network Layer parameters (i.e. Packet Loss, Packet Size, Packet Loss Scheme) and the Application Layer (e.g. decodable frame rate). More specifically, regarding the unidirectional NQoS to AppQoS mapping, the twofold correlations among network packet loss ratio and packet size to theoretically expected Decodable Frame Rate (Q) are considered in this paper. Q is an application-level metric, with values ranging from 0 to 1.0. The
larger the value of Q, the higher the successful decoding rate at the end user. Q is defined as the fraction of decodable frame rate, which is the number of theoretically expected decodable frames over the total number of frames sent by a video source.
)N N N (N
B-totalP-totalI-total
dec
++= Q
Where Ndec is the sum of number of theoretically
successfully decoded I, P, B frames i.e., Ndec-I, Ndec-P, and Ndec-B [10].
Due to the fact that the frames in a MPEG-based encoded video sequence are interdependent, considering a packet loss, then spatial error propagation will take place, affecting all the frames that are interdependent to the specific frame that the packet loss occurred. Thus, it must be taken under consideration the impulse transmission of the distortion. Due to the very specific structure of an MPEG stream (i.e. GOP type), which is specified by successive I, P and B frames, given that one packet loss deterministically results in the corresponding frame degradation and/or loss (i.e. DT=1.0), then a video frame may be considered theoretically expected undecodable directly or indirectly depending on the position of the packet that was lost during the transmission. The frame, to which the lost packet was a part of, is considered as theoretically expected undecodable directly. The frames that are dependent on the successful decoding of the specific frame are considered as indirectly undecodable. More specifically, given a GOP structure and taking under consideration the decoding inter-dependencies between the three frame types, then the impact of the packet loss ratio has been mathematically and deterministically formulated in [11], [10].
Based on the objective metrics that were defined at the application layer, the extension of the theoretical framework to the Service Layer requires the mapping between the dropped frames ratio (AppQoS) and its impact on the delivered video quality (PQoS). Based on the relative literature [12], a video signal may suffer several degradations at any stage of the transmission chain, resulting in severe motion discontinuities in video streaming that the end-user may perceive a jerky motion and instantaneous fluidity breaks. Packet losses (or delay jitter as another aspect of the packet loss effect) in the transmitted networks are the main cause of this perceived jerkiness/break since they cause sporadic frame discarding at the decoding process because of the limited buffering time. In [12] the term temporal discontinuity is used as a perceptual synonym of a dropped picture burst. More specifically, the estimated quality function in relation to a single burst of dropped frames for different durations has been estimated for video sequences of 10 sec duration, a period long enough in order to avoid the forgiveness effect and the spatiotemporal variation of the content. Furthermore, this short duration minimizes the probabilities to have multiple bursty packet losses within this period, making the study of single packet loss bursts schemes statistically quite accurate and satisfactory.
Based on the model, which has been proposed, presented, tested and evaluated in [12] the mapping of the dropped frames to perceptual quality level with regard to the mean opinion scores (MOS) over various spatiotemporal contents of 10 sec

duration, CIF Resolution and 25fps is analytically described by the following expression:
1 .0 1
5 3 .0 38 5 .8 5 6 21 ( )P Q o S L e v e l
x = −
+
where x is the discontinuity duration computed over all contents in msec. This equation maps the AppQoS metric of the discontinuity durations to the respective PQoS level degradation in a percentage evaluation rate based on subjectively collected MOS assessments. Due to the subjective evaluation nature of the above equation, for zero percentage of dropped frames, the formula provides 85.8 score out of 100, which corresponds to an ‘Excellent’ evaluation description according to the DSCQS5 (Double Stimulus Continuous Quality Scale) method. Considering that the duration of all the tested signals in [12] is 10 sec, then the variable x can be also expressed in terms of duration percentage of the discontinuities over 10 seconds. Thus, describing the variable x as such, this means that it can be further mapped to the percentage of the dropped frames over the total frames of the 10 sec signal. Moreover, this mapping is 1-to-1 without requiring any further sophisticated adoption. So, the variable x can be substituted by the percentage of the dropped frames (i.e. the complimentary of the Q), which has been mathematically modelled in the previous section. Upon this, the above equation can be further formulated as:
1.01
53.0385.8 5621 ( )100
PQoS Level
Q
= −+
−
Thus, the above equation between subjective MOS-based evaluation (i.e. PQoS layer) and discontinuity duration (i.e. AppQoS layer), provides the mapping between the AppQoS and PQoS layer.
IV. EXPERIMENTAL RESULTS
A. Test-bed Configuration In order to be able to test the validity of our framework and
verify the proper operation we needed to test the framework under a real network configuration. The chosen architecture is illustrated in Fig. 3. The network architecture implements DiffServ standard and uses a closed loop configuration enabling offline (i.e using IPPM framework [8]) but also using the monitoring framework, measurements. In this context, the testbed is comprised of one autonomous domain, and a Measurement PC. Three PC operated by Linux OS (kernel 2.6.xx) constitute the domain. Each PC is configured to act as a router supporting DiffServ framework. The configured Behaviour Aggregates (BAs) are: Expedited Forwarding (EF) for Golden services, Assured Forwarding (AF) for Silver services, and Best-Effort (BE) for the Bronze services. The AF BA is configured with three subclasses AF11, AF12, AF13. Two types of measurements are contacted in parallel: (i) An offline one and (ii) an active one using the monitoring framework.
For the first type of measurements, data packets are captured when they leave the Measurement PC and also captured when they are received at reception interface of the
same PC, having traversed the whole autonomous domain. Both transmission and reception events use the same clock for producing timestamps. Therefore, any further sophisticated clock synchronization is not necessary for the experimental accuracy.
Figure 3. Testbed Architecture
Regarding the second type of measurement, the routers where NodeMon is installed should have their clocks synchronized. For this purpose a Stratum 3 NTP server is installed in order to synchronise all the clocks. However, the clocks don’t manage to by completely synchronized and have an offset of approximately 7ms. Ideally a dedicated reference clock should synchronize the routers.
In order to be able to validate the accuracy of the framework, bulk data traffic is introduced to our testbed. For the generation of bulk data traffic MGEN UDP packet generator [9] is used. The data traffic profile is as follows: the packet size is 1024 bytes, the packet rate is 427 packets per second, packets are marked as EF and are generated using Poisson distribution. The resulting bulk traffic has a bit rate of 3.5 Mbits. On the other hand, the traffic that is generated by NodeMon is 3% of the generated data traffic; hence a bit rate of 105Kbps. Thus, the bulk traffic is 97% of EF, reducing the bandwidth used by NodeMon. Throughout the experiment the packet size of the probe traffic is increased incrementally from 128 bytes to 1472 bytes, while maintaining constant bit rate.
The data traffic is captured at both the egress and ingress interface of the Measurement PC for offline analysis (offline). Moreover, data traffic from NodeMon, is analyzed on-line. The outcome of those two parallel analyses is then compared in order to decide on the actual accuracy of the measurement framework. It is essential to notice that the first analysis is based on the actual data traffic whilst the second analysis is based on the probe traffic created by the monitoring system. The results of the experiments are illustrated in Fig. 4 and Fig. 5.
Fig. 4 illustrates the measured one-way delay (owd). It is obvious that the NodeMon framework measures a higher delay that the actual delay measured for the data traffic. The average offset between the offline owd value and the actively measured
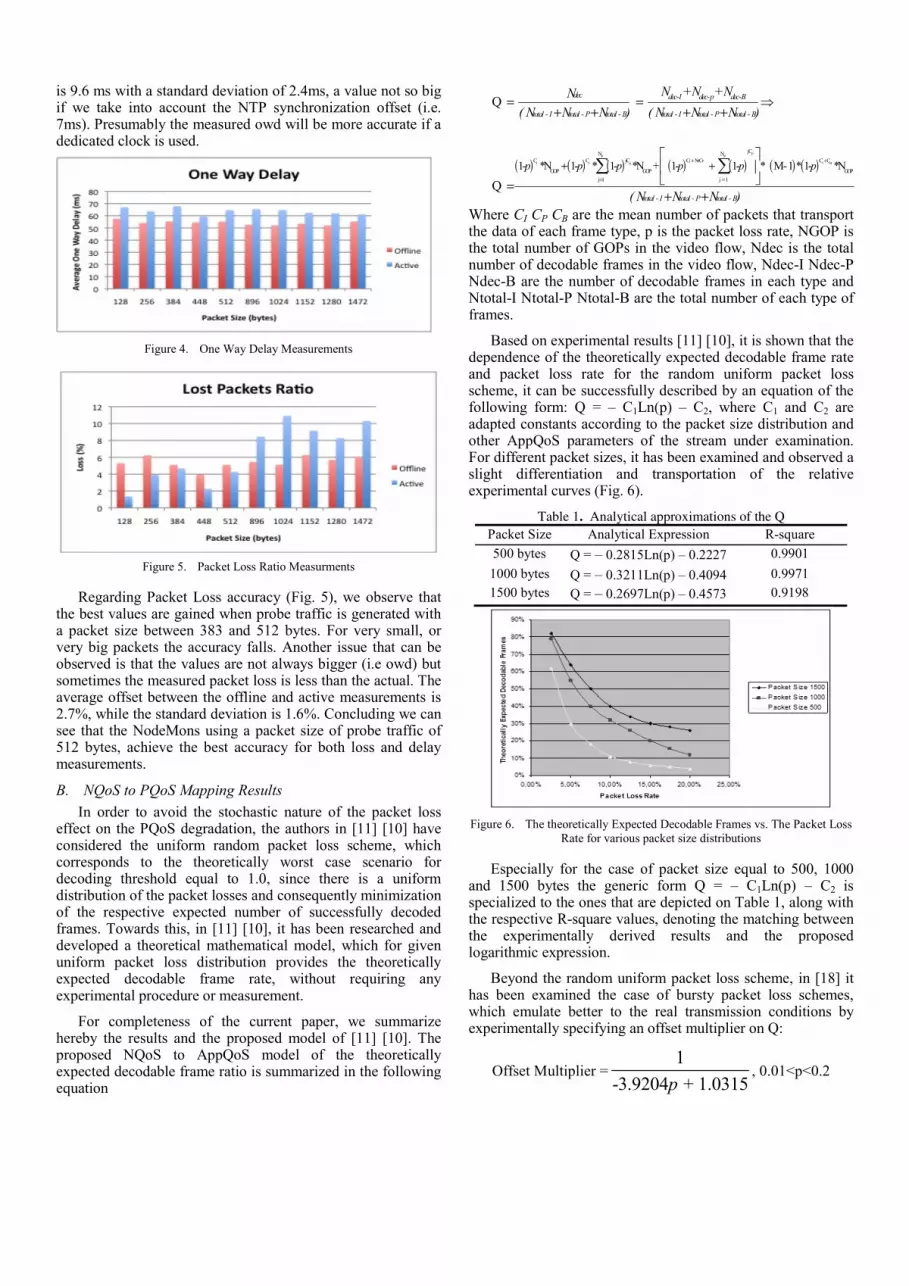
is 9.6 ms with a standard deviation of 2.4ms, a value not so big if we take into account the NTP synchronization offset (i.e. 7ms). Presumably the measured owd will be more accurate if a dedicated clock is used.
Figure 4. One Way Delay Measurements
Figure 5. Packet Loss Ratio Measurments
Regarding Packet Loss accuracy (Fig. 5), we observe that the best values are gained when probe traffic is generated with a packet size between 383 and 512 bytes. For very small, or very big packets the accuracy falls. Another issue that can be observed is that the values are not always bigger (i.e owd) but sometimes the measured packet loss is less than the actual. The average offset between the offline and active measurements is 2.7%, while the standard deviation is 1.6%. Concluding we can see that the NodeMons using a packet size of probe traffic of 512 bytes, achieve the best accuracy for both loss and delay measurements.
B. NQoS to PQoS Mapping Results In order to avoid the stochastic nature of the packet loss
effect on the PQoS degradation, the authors in [11] [10] have considered the uniform random packet loss scheme, which corresponds to the theoretically worst case scenario for decoding threshold equal to 1.0, since there is a uniform distribution of the packet losses and consequently minimization of the respective expected number of successfully decoded frames. Towards this, in [11] [10], it has been researched and developed a theoretical mathematical model, which for given uniform packet loss distribution provides the theoretically expected decodable frame rate, without requiring any experimental procedure or measurement.
For completeness of the current paper, we summarize hereby the results and the proposed model of [11] [10]. The proposed NQoS to AppQoS model of the theoretically expected decodable frame ratio is summarized in the following equation
( ) ( ) ( ) ( ) ( ) ( ) ( )P
P PI P PI I p I B
jCN NC C jC C NC C C
GOP GOP GOPj 1 j 1
1- *N 1- * 1- *N 1- 1- * M - 1 * 1- *N
Q
Q
dec dec-I dec-p dec-B
total - I total - P total - B total - I total - P total - B
to
p p p + p p p
N +N +NN( N N N ) ( N N N )
( N
+ +
= =
+ +
= = ⇒+ + + +
⎡ ⎤⎢ ⎥⎣ ⎦=
∑ ∑
tal - I total - P total - B N N )+ +Where CI CP CB are the mean number of packets that transport the data of each frame type, p is the packet loss rate, NGOP is the total number of GOPs in the video flow, Ndec is the total number of decodable frames in the video flow, Ndec-I Ndec-P Ndec-B are the number of decodable frames in each type and Ntotal-I Ntotal-P Ntotal-B are the total number of each type of frames.
Based on experimental results [11] [10], it is shown that the dependence of the theoretically expected decodable frame rate and packet loss rate for the random uniform packet loss scheme, it can be successfully described by an equation of the following form: Q = – C1Ln(p) – C2, where C1 and C2 are adapted constants according to the packet size distribution and other AppQoS parameters of the stream under examination. For different packet sizes, it has been examined and observed a slight differentiation and transportation of the relative experimental curves (Fig. 6).
Table 1. Analytical approximations of the Q Packet Size Analytical Expression R-square 500 bytes Q = – 0.2815Ln(p) – 0.2227 0.9901 1000 bytes Q = – 0.3211Ln(p) – 0.4094 0.9971 1500 bytes Q = – 0.2697Ln(p) – 0.4573 0.9198
Figure 6. The theoretically Expected Decodable Frames vs. The Packet Loss
Rate for various packet size distributions
Especially for the case of packet size equal to 500, 1000 and 1500 bytes the generic form Q = – C1Ln(p) – C2 is specialized to the ones that are depicted on Table 1, along with the respective R-square values, denoting the matching between the experimentally derived results and the proposed logarithmic expression.
Beyond the random uniform packet loss scheme, in [18] it has been examined the case of bursty packet loss schemes, which emulate better to the real transmission conditions by experimentally specifying an offset multiplier on Q:
Offset Multiplier =1
-3.9204 + 1.0315p, 0.01<p<0.2
For packet losses higher than 0.2, the offset multiplier retains its p=0.02 value. Therefore, depending on the packet loss ratio p and the packet size, the Theoretically Expected Percentage of Successfully Decodable frames (TEPSD) for burst and non-uniform packet loss schemes is provided by the following formula:
TEPSD= 1 2 ( ) - -3.9204 + 1.0315
C Ln p Cp
Thus, describing the variable x as duration percentage of the discontinuities over a period of ten seconds, it can be further mapped to the percentage of the dropped frames over the total frames of the 10 sec signal. So, the variable x (measured in msec) can be substituted by the percentage of the dropped frames (i.e. the complimentary of the TEPSD multiplied by 104). Using this, the above equation can be further formulated as:
1.014
53.0385.8 5621 ( )(1 )10
PQoS Level
TEPSD
= −+
−
Depending on the packet size distribution in the AppQoS layer, the constants C1 and C2 are respectively adapted,
specializing appropriately the above equation.
50
55
60
65
70
75
80
85
90
95
100
0 5 10 15 20
Packet Loss Ratio %
Est
imat
ed M
OS V
alue
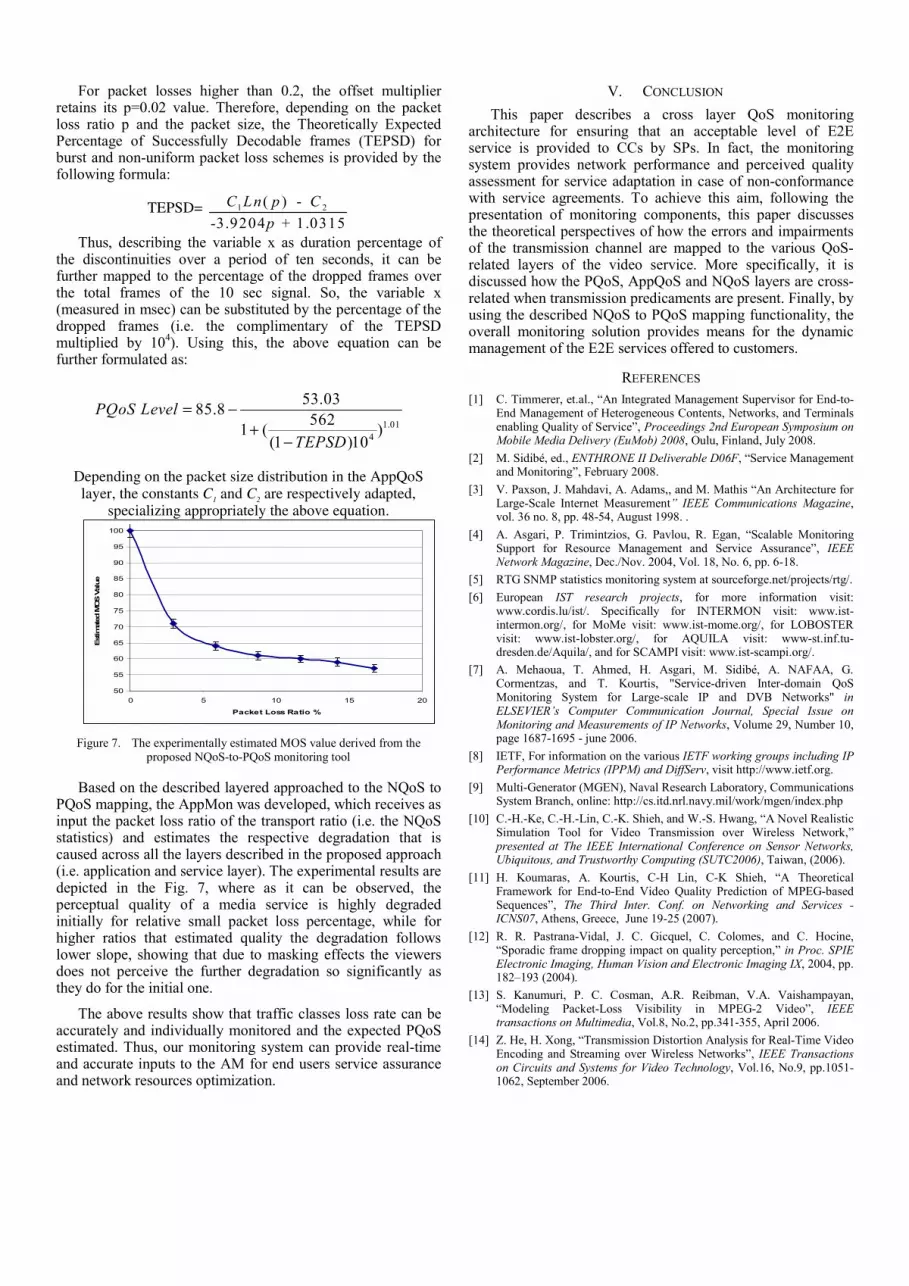
Figure 7. The experimentally estimated MOS value derived from the
proposed NQoS-to-PQoS monitoring tool
Based on the described layered approached to the NQoS to PQoS mapping, the AppMon was developed, which receives as input the packet loss ratio of the transport ratio (i.e. the NQoS statistics) and estimates the respective degradation that is caused across all the layers described in the proposed approach (i.e. application and service layer). The experimental results are depicted in the Fig. 7, where as it can be observed, the perceptual quality of a media service is highly degraded initially for relative small packet loss percentage, while for higher ratios that estimated quality the degradation follows lower slope, showing that due to masking effects the viewers does not perceive the further degradation so significantly as they do for the initial one.
The above results show that traffic classes loss rate can be accurately and individually monitored and the expected PQoS estimated. Thus, our monitoring system can provide real-time and accurate inputs to the AM for end users service assurance and network resources optimization.
V. CONCLUSION This paper describes a cross layer QoS monitoring
architecture for ensuring that an acceptable level of E2E service is provided to CCs by SPs. In fact, the monitoring system provides network performance and perceived quality assessment for service adaptation in case of non-conformance with service agreements. To achieve this aim, following the presentation of monitoring components, this paper discusses the theoretical perspectives of how the errors and impairments of the transmission channel are mapped to the various QoS-related layers of the video service. More specifically, it is discussed how the PQoS, AppQoS and NQoS layers are cross-related when transmission predicaments are present. Finally, by using the described NQoS to PQoS mapping functionality, the overall monitoring solution provides means for the dynamic management of the E2E services offered to customers.
REFERENCES [1] C. Timmerer, et.al., “An Integrated Management Supervisor for End-to-
End Management of Heterogeneous Contents, Networks, and Terminals enabling Quality of Service”, Proceedings 2nd European Symposium on Mobile Media Delivery (EuMob) 2008, Oulu, Finland, July 2008.
[2] M. Sidibé, ed., ENTHRONE II Deliverable D06F, “Service Management and Monitoring”, February 2008.
[3] V. Paxson, J. Mahdavi, A. Adams,, and M. Mathis “An Architecture for Large-Scale Internet Measurement” IEEE Communications Magazine, vol. 36 no. 8, pp. 48-54, August 1998. .
[4] A. Asgari, P. Trimintzios, G. Pavlou, R. Egan, “Scalable Monitoring Support for Resource Management and Service Assurance”, IEEE Network Magazine, Dec./Nov. 2004, Vol. 18, No. 6, pp. 6-18.
[5] RTG SNMP statistics monitoring system at sourceforge.net/projects/rtg/. [6] European IST research projects, for more information visit:
www.cordis.lu/ist/. Specifically for INTERMON visit: www.ist-intermon.org/, for MoMe visit: www.ist-mome.org/, for LOBOSTER visit: www.ist-lobster.org/, for AQUILA visit: www-st.inf.tu-dresden.de/Aquila/, and for SCAMPI visit: www.ist-scampi.org/.
[7] A. Mehaoua, T. Ahmed, H. Asgari, M. Sidibé, A. NAFAA, G. Cormentzas, and T. Kourtis, "Service-driven Inter-domain QoS Monitoring System for Large-scale IP and DVB Networks" in ELSEVIER’s Computer Communication Journal, Special Issue on Monitoring and Measurements of IP Networks, Volume 29, Number 10, page 1687-1695 - june 2006.
[8] IETF, For information on the various IETF working groups including IP Performance Metrics (IPPM) and DiffServ, visit http://www.ietf.org.
[9] Multi-Generator (MGEN), Naval Research Laboratory, Communications System Branch, online: http://cs.itd.nrl.navy.mil/work/mgen/index.php
[10] C.-H.-Ke, C.-H.-Lin, C.-K. Shieh, and W.-S. Hwang, “A Novel Realistic Simulation Tool for Video Transmission over Wireless Network,” presented at The IEEE International Conference on Sensor Networks, Ubiquitous, and Trustworthy Computing (SUTC2006), Taiwan, (2006).
[11] H. Koumaras, A. Kourtis, C-H Lin, C-K Shieh, “A Theoretical Framework for End-to-End Video Quality Prediction of MPEG-based Sequences”, The Third Inter. Conf. on Networking and Services - ICNS07, Athens, Greece, June 19-25 (2007).
[12] R. R. Pastrana-Vidal, J. C. Gicquel, C. Colomes, and C. Hocine, “Sporadic frame dropping impact on quality perception,” in Proc. SPIE Electronic Imaging, Human Vision and Electronic Imaging IX, 2004, pp. 182–193 (2004).
[13] S. Kanumuri, P. C. Cosman, A.R. Reibman, V.A. Vaishampayan, “Modeling Packet-Loss Visibility in MPEG-2 Video”, IEEE transactions on Multimedia, Vol.8, No.2, pp.341-355, April 2006.
[14] Z. He, H. Xong, “Transmission Distortion Analysis for Real-Time Video Encoding and Streaming over Wireless Networks”, IEEE Transactions on Circuits and Systems for Video Technology, Vol.16, No.9, pp.1051-1062, September 2006.