a job assignment model for conveyor-aided picking system
TRANSCRIPT
Computers & Industrial Engineering 56 (2009) 1254–1264
Contents lists available at ScienceDirect
Computers & Industrial Engineering
journal homepage: www.elsevier .com/ locate/caie
A job assignment model for conveyor-aided picking system
Jiang-Liang Hou *, Nathan Wu 1, Yu-Jen Wu 1
Department of Industrial Engineering and Engineering Management, National Tsing Hua University, 101, Section 2, Kuang-Fu Road, Hsinchu 300, Taiwan
a r t i c l e i n f o
Article history:Received 4 September 2007Received in revised form 29 April 2008Accepted 21 July 2008Available online 31 July 2008
Keywords:Picking operationConveyor-aided picking systemWorkload balance
0360-8352/$ - see front matter � 2008 Elsevier Ltd. Adoi:10.1016/j.cie.2008.07.017
* Corresponding author. Tel.: +886 3 5742658; fax:E-mail addresses: [email protected] (J.-L.
edu.tw (N. Wu), [email protected] (Y.-J. Wu).1 Tel.: +886 3 5715131x33981.
a b s t r a c t
Due to development and popularity of the information and automation technologies, the traditionallogistics industry gradually implements the automation (e.g., sorters) or semi-automation (e.g., convey-ors) techniques to support the picking operation in order to save huge labor cost of distribution centers(DCs). As for the semi-automatic picking system using the conveyor system, one of the critical issues is toappropriately assign the items to be picked to each workstation in the conveyor system in order to bal-ance workload of each workstation and to enhance the overall resource utilization of a DC. Traditionally,the job assignment of a conveyor system is conducted by means of empirical rules or arbitrary decision ofthe planner and the task is usually time-consuming. As for the job assignment of the conveyor-aidedpicking system, this study develops a model to generate workload-balanced job assignment suggestionsto the planner. In the proposed methodology, the expertise of job assignment for conveyor-aided pickingsystem is extracted via interviews in order to derive the empirical rules for conveyor job assignment.After that, the empirical rules are quantitatively converted into empirical indices and the weights ofempirical indices can be determined via the historical job assignment records. On the other hand, basedon the items denoted in the picking schedule, the candidate job assignment plans are generated ran-domly or via the exhaustion method. Afterwards, on the basis of the derived empirical indices and cor-responding weights, the optimal assignment plan can be determined. In addition to the job assignmentalgorithm, this study establishes a job assignment system for the conveyor-aided picking system. A real-world case is also presented to verify performance of the proposed methodology. In summary, the jobassignment model proposed in this study can significantly reduce the time required for job planningfor the conveyor-aided picking system and enhance applicability of the job assignment plans.
� 2008 Elsevier Ltd. All rights reserved.
1. Research background
Previous studies have pointed out that, the picking operation ina distribution center accounts for about 40% of the logistics cost.Generally speaking, the picking operation can be classified into‘‘single-order picking” and ‘‘batch picking”. Details of the two typesof picking operations are tabulated in Table 1.
Due to the development of logistics markets, more and moreDCs have used conveyor systems and utilized batch-picking ap-proaches to enhance efficiency of picking operations. Regardingthe picking operations of DCs, the preparation work can be classi-fied into two steps: aggregation of multiple customer orders andgeneration of a job assignment plan. The number of workstationsand items to be picked at each workstation should be determinedwhile generating a job assignment plan of a conveyor-aided pick-ing system. An inappropriate job assignment plan might result inthe unbalanced workload of operators. Thus, determination of
ll rights reserved.
+886 3 5722685.Hou), [email protected].
the optimal job assignment plan based on the picking scheduleof the conveyor system to balance the workload of picking opera-tors has become an important issue for a DC to enhance the pickingefficiency.
Traditionally, job assignment of the conveyor-aided picking sys-tem is usually carried out according to judgment of the decisionmaker (e.g., empirical rules) and such decision is time-consumingand might lead to low picking efficiency. In brief, the existing jobassignment approach for conveyor-aided picking system usuallygives rise to the following problems.
(1) Empirical rules for conveyor job assignment are not system-atically extracted or represented.
(2) Conveyor job assignment without expertise or empiricalrules is quite time-consuming and the corresponding jobplan is usually ineffective.
Therefore, in order to reduce the dependence on domainexperts for job assignment in the traditional logistics center, theaim of this research is to establish a job assignment model forthe conveyor-aided picking system by integrating the extractedempirical rules from domain experts. Thereafter, the picking
Table 1The difference between single-order and batch picking
Single-order pickingApproach The operators pick items from the warehouse based on each customer order. This is also a traditional picking operationAdvantage The picking operation can be performed immediately as a customer order arrives. That is, less lead time is requiredDisadvantage The picking efficiency cannot be guaranteed if similar items exist in distinct ordersApplication This approach is more appropriate for customer orders with high variations (e.g., the DCs in the cosmetic industry)
Batch pickingApproach The operators pick items based on pre-defined schedule or multiple ordersAdvantage Since the movements of the picking operations might be decreased, the picking efficiency can be enhanced. Moreover, the picking efficiency can be
significantly enhanced if the conveyor system is used to support the material handlingDisadvantage More lead time might be required since the customer orders must be accumulated to a specific numberApplication The approach is appropriate for items with similar profile patterns or customer orders with lower variations (e.g., the DCs in the printing industry)
J.-L. Hou et al. / Computers & Industrial Engineering 56 (2009) 1254–1264 1255
operation planner can rely on the job assignment system to effi-ciently acquire an optimal assignment plan.
2. Literature review
Research topics in previous studies related with pickingoperation plans and workflow balance can be classified into ‘‘opti-mization of picking operations”, ‘‘line balancing” and ‘‘decisionsupport systems for picking operations”. The following subsectionswill discuss the groundwork of related research in the three topics.
2.1. Optimization of picking operations
Previous studies on picking operation optimization for logisticscenters could be further divided into selection of optimum pickingmethods, picking cost improvement and picking efficiencyimprovement. As for selection of optimal picking methods, Tungand Chen (1995) use the FIQ method to analyze the key factors(e.g., the order number, ordered item and ordered volume) of thepicking operations in a DC and model a picking method on the ba-sis of the factors. On the other hand, Liu (2000) indicates that thelogistics key factors are usually defined ambiguously. Consideringthe nature of the key factors, a set of fuzzy rules is establishedon the basis of traditional EIQ analysis to determine the optimalpicking method for a logistics center. In brief, FIQ and EIQ methodsboth can be used to analyze the types (i.e., single-order picking andbatch picking) of picking operations in a DC. Using the FIQ method,the appropriate picking approach can be determined based on thefrequency and quantity of ordered items in customer orders. TheEIQ method can be used to analyze the operation of a DC basedon three factors including order entries, items and quantities in or-der to determine the suitable picking approach in a DC.
Regarding improvement of picking operation cost, Geng, Li, andLim (2005) establish a heuristic model to search the low-cost pick-ing plans by using the Very Large-Scale Neighborhood (VLSN) tech-nique. The proposed mathematical model is targeted to generatean optimal picking path in order to minimize the movement dis-tance for order picking. By integrating the computer simulationtechnology, Molnar and Lipovszki (2005) propose a two-stagescheduling model. The model aims at minimizing the labor costand operator idle/delay cost and maximizing the resource utiliza-tion. As a result, the generated optimal picking schedule conform-ing to the objectives can be suggested to the decision maker.
As for improvement of picking efficiency, Rosenblatt and Eynan(1989) propose categorized storage location assignment rulesbased on the inventory turnover rate. As indicated in the study,as more categories exist in the storage locations, the expected pick-ing time can be decreased. Furthermore, Brynzer and Johansson(1996) propose SLAEPS (Storage Location Assignment StrategyEmanating from Product Structure) to classify parts into differentgroups and parts belonging to identical groups are arranged at near
storage locations to reduce picking data complexity. In order toestablish a workload-balanced picking system, Bozer and White(1996) point out that picking efficiency should be concerned dur-ing picking system design. In this study, an analytical design algo-rithm integrating the approximate analytical model and costanalysis model is presented to evaluate the expected utilizationof picking operators and S/R (storage and retrieval) machines andto allocate the optimal number of picking operators in order tominimize the cycle time of picking operations and maximize re-source utilization.
2.2. Line balancing
Picking operators are requested to spend pre-defined time onputting items into cases on the conveyor system since the movingvelocity of the conveyor system has been assigned in advance. If anoperator has to spend more time in the picking operation (e.g., topick items with larger picking volumes), the error rate might be in-creased and the picking efficiency might be decreases. Thus, deter-mination of the optimal job assignment plan for a conveyor systemvia the line balance concept is an important issue for enhancing thepicking efficiency.
A lot of previous research has been dedicated to identifying thecritical factors for line balancing. According to the research scope,the related issues of line balancing can be divided into line balanc-ing with a single performance index and line balancing with multi-ple performance indices. As for the line balancing with a singlebalance index, Haq, Jayaprakash, and Rengarajan (2005) proposea hybrid genetic algorithm integrating genetic algorithm and mod-ified ranked position method to obtain the optimal work assign-ment. In this study, the modified ranked position method is firstused to reduce the candidate region and then the genetic algorithmcan be employed to minimize the workstation number. Similarly,Ozmehmet and Tunali (2005) proposed a hybrid algorithm inte-grating tabu search (TS) and genetic algorithm (GA) in order to takeadvantage of the TS banned list to reduce GA feasible region andshorten GA calculation time. Ugurdag, Rachamadugu, and Papa-christou (1997) propose a two-stage heuristic algorithm for theworkload balance problem. At first, a mathematical model is estab-lished via integer programming to generate an initial solution forjob assignment of workstations. Then, an assembly line mappingapproach is used to reduce load variation among workstations. Fi-nally, the Simplexlike method is used to obtain a job assignmentplan with balanced workload and minimum cycle time.
Regarding line balancing with multiple balance indices, Men-des, Ramos, Simaria, and Vilarinho (2005) use a video cameraassembly plant as an example to study the hybrid line balance is-sue for product assembly. At first, the simulated annealing algo-rithm is employed to minimize the workstation number andvariation of workstation workload. The derived work assignmentplan compliant with the objectives is regarded as an initial solutionand is inputted into a simulation system with manufacturing
1256 J.-L. Hou et al. / Computers & Industrial Engineering 56 (2009) 1254–1264
parameters (e.g., expected operation time, machine failure rate andrework rate) that are rarely concerned in the conventional study.Based on the simulation technique, the other performance indices(flow time and resources utilization) corresponding to the initialsolution can be obtained. Chen, Lu, and Yu (2002) study optimiza-tion of the multi-objective assembly line problem (including min-imization of cycle time, workstation load variation, tool switchingfrequency and continuous assembly complexity) and proposes ahybrid genetic algorithm to obtain an optimal solution that meetsthe performance objectives. On the other hand, a self-tuning meth-od is also used to correct unsolvable gene so as to accelerate theoverall solving process.
In addition, some important references have been added intothe revised manuscript. Scholl and Becker (2006) proposed anup-to-date and comprehensive survey of simple assembly line bal-ancing problem (SALBP) research. In this survey, the approachesused to solve SALBPs can be divided into two main categoriesnamely exact and heuristic solution procedures and illustrated byusing the identical line balancing problems. Moreover, in order toenhance the communication between researchers and practitio-ners in assembly line balancing, a classification of assembly linebalancing problems (ALBPs) were proposed (Boysen, Fliedner, &Scholl, 2007). Furthermore, Boysena, Fliednera, and Schollb(2008) analyzed the characteristics of ALBPs based on number ofmodels, line control, frequency, automation level and line of busi-ness to assist the related managers or researchers in determiningthe approach to solve ALBPs.
As shown in the literature review, the factors that affect gener-ation of the optimal job assignment plan include the number andsequences of workstations, and combinations of items. Thus, theproposed model generates candidate job assignment plans viathe exhaustion or random method and then evaluates the candi-date job assignment plans based on empirical rules for acquiringthe optimal job assignment plan.
2.3. Decision support systems for picking operations
Previous literatures on decision support systems for picking linebalance can be classified into decision support systems for order-picking sequence determination and order batching. Order batch-ing is to aggregate the customer orders. Traditionally, the pickingoperators in a DC must pick items based on each customer order.As a result, the distinct picking operators might repetitiously pickitems in identical regions of a warehouse. Therefore, in order tominimize the movements of picking operators, the order batchingmethodology can be used to analyze the correlations of customerorders and items ordered in order to reasonably aggregate the cus-tomer orders for more efficient picking. As for order-picking se-quence determination, due to the high-diversity low-volumeorders in the computer assembly industry, Chen, Lu, Yu, Tzeng,and Chang (2003) propose an integrated information mechanismfor shop-floor control systems (SFCS). In their system, a numberof information control mechanisms including the barcode system,electronic pick-to-light picking system and e-Kanban system areintegrated to increase efficiency of assembly, product packageand distribution, reduce production error rate, and enable rapid re-sponse and high throughput. Cheng (1997) introduces smart com-puter aid picking system (SCAPS) into logistics centers in order totake advantage of the visual guide of storage locations to simplifythree simple actions of picking operators, i.e., look, pick and press.Both the time required for picking operators to search for the stor-age locations and the error rate of picking operation can bereduced.
As for order-batch decision systems, Trappey and Ho (2002)propose an intelligent DC operator dispatching system to supportlogistics center activities. The basic capability of picking operators
is first measured on the basis of time and motion study. The cap-tured capability data is then inputted into a system for laborassignment. A heuristic algorithm is also used to divide all ordersinto picking lists and the derived picking lists are assigned to thecorresponding picking operators to meet their capabilities. Fur-thermore, Chen and Wu (2005) use the data mining technique todeal with the order batching problem of logistics centers. Thisstudy aims at minimizing the moving distance and moving timeof picking operators and the association rules are applied to devel-op a clustering procedure for order grouping and assignment. Inthis research, the data mining technology can be used to identifycustomer orders with highly associated items and the associatedorders are merged into one order to enhance picking efficiency.
3. Job assignment methodology for conveyor-aided pickingsystems
Previously, the job assignment of conveyor-aided picking sys-tems is usually conducted by finding a job assignment plan viaempirical rules of domain experts. However, the empirical rulesmight not be consistent for distinct domain experts and mighteven conflict with each other. It is usually difficult to generate anassignment plan based on the picking schedule and the decisionquality cannot be guaranteed. In order to propose a picking work-load balance methodology for conveyor-aided picking systems, thisstudy establishes quantitative models to convert the empiricalrules into empirical indices. On the other hand, two methods, i.e.,the exhaustion method or random sampling method, can be se-lected to generate candidate assignment plans. Finally, the quanti-tative empirical indices can be applied to the candidate plans inorder to identify an optimal assignment plan for reference of thedecision maker. In summary, the proposed job assignment meth-odology can be divided into empirical rule quantification (ERQ),candidate assignment plan generation (CAPG) and optimal assign-ment plan selection (OAPS).
3.1. Empirical rule quantification (ERQ)
In this study, we interviewed shop-floor operators in logisticscenters that use conveyor-aided picking systems in order to cap-ture their expertise in job assignment for each workstation of theconveyor. After that, the empirical rules are quantified into empir-ical indices and thereby an optimal plan can be selected on the ba-sis of these quantitative indices. After interview, the commonempirical rules used for conveyor-aided picking system can besummarized as follows:
Rule 1: The items with larger picking volumes should be as-signed to the beginning workstations since no items have beenput into the cases at the beginning workstations. This rule can as-sist the picking operators in the beginning workstations quicklyput the items into the cases, effectively utilize the case space andavoid rearranging the case space. If the items with larger pickingvolumes are assigned to other workstations, the picking operatorsin the corresponding workstations have to spend more time to ad-just the case space for allocating these items.
Rule 2: As the items with larger picking volumes have been as-signed to particular workstations, the items with less picking vol-umes should be assigned into the corresponding workstations tobalance the workload of the picking operators. If items with thelarger picking volumes are all assigned to an identical workstation,the picking operators in these workstations will have to spendmore time to perform the picking operation.
Rule 3: Since items with similar profile patterns might easilyconfuse the picking operators, the picking operators have to spendmore time and effort on recognizing the items. Therefore, items
J.-L. Hou et al. / Computers & Industrial Engineering 56 (2009) 1254–1264 1257
with similar profile patterns should be assigned to distinct work-stations in order to reduce the picking errors.
Rule 4: A weight inspection station is located on the end of theconveyor system to check the total weights of the picked items inthe case. If the items with similar weights are assigned to an iden-tical workstation, the picking operators must spend more time andeffort on recognizing these items. Thus, in order to reduce the pick-ing errors, the items with the similar weights should be assigned todistinct workstations.
Rule 5: If items with the special shape are assigned to the begin-ning workstations, the picking operators must spend more timeand effort to adjust the locations of items. In order to reduce theworkload of picking operators, the items with special shape shouldbe assigned to the ending workstations.
Rule 6: In order to reduce the ordering cost, the clients usuallyorder distinct items of a vendor at the same time. Thus, the pickingvolumes with respect to a specified order might be significantly in-creased or decreased. To balance the workload of picking opera-tors, the items from an identical vendor is better to be assignedto distinct workstations to reduce the picking volume variationof distinct client orders.
As the picking operation planner in a logistics center uses theabove empirical rules for job assignment, decision variation mightoccur due to the subjective judgment of planners. Therefore, thisstudy aims at developing quantitative models of the above sixempirical rules.
3.1.1. Quantitative model of Rule 1This model is established on the basis of the idea that the items
with the larger picking volume is assigned to the first workstationof the conveyor-aided picking system to enhance the packagingflexibility of the items with the larger picking volume. The detailedprocedure is stated as follows.
Step (A1): Acquire item profiles. On the basis of the picking sche-dule, the picking operation planner can acquire the item ID andpicking volume from the picking table. Without loss of generality,assume that the items to be picked are identified as B1 to Bk accord-ing to item sequence listed in the picking table. The correspondingpicking volumes of items are N(B1) to N(Bk).
Step (A2): Estimate the minimum number of workstations required.In order to simplify the procedure of solving the job assignmentproblem and avoid assigning too many operators in the picking oper-ations (i.e., to minimize the number of operators in the picking oper-ation), the step directly uses the maximal number of the items in theworkstations to determine a minimal number of picking operators.
In this step, we make a rough calculation of the minimum num-ber TS of the required workstations. The minimum workstationnumber can be determined by dividing the number TB of itemsto be picked by the maximal number TM of items that can beloaded on each workstation. The calculation formula is as follows:
TS ¼ TBTM
Step (A3): Generate candidate assignment plans. The exhaustion meth-od can be used to generate all candidate assignment plans (Mi) ofitems and workstations. The procedure for using the exhaustionmethod to generate job assignment plans consists of two steps. First,all item combinations can be selected via the ‘‘combination” conceptand the workstation sequences can be determined via the ‘‘permuta-tion” concept. After that, the candidate assignment plans can be gen-erated by distributing each item combination to each workstationsequence. The generated plans can be applied in the following deci-sion model to rate the plans according to the empirical rules.
However, it must take a lot of time to generate and evaluate allcandidate assignment plans via the exhaustion method while solv-ing a large-sized jog assignment problem. Therefore, the optimal
assignment plan cannot be quickly acquired. In order to enhanceefficiency for planning the picking operation, this model uses therandom method to replace the exhaustion method for reducingtime for the candidate assignment plan generation and evaluation.The procedure for using the random method to generate the candi-date assignment plans is expressed in Section 3.2.
Step (A4): Calculate workload ratio of each item. The workload ra-tio of each item can be obtained by dividing its picking volume bythe maximum picking volume, as shown in the following formula:
RðBkÞ ¼NðBkÞ
Maxall kðNðBkÞÞ
Step (A5): Calculate the picking volume score of items with respect toworkstations. In terms of the picking volumes of items, the pickingvolume score of each item with respect a workstation can be calcu-lated by dividing the workload ratio R(Bk) of the item by worksta-tion rank. Without loss of generality, for workstation Sj, theworkstation rank implies the sorted value j of that workstation withrespect to all workstation (S1, . . .,STS). The formula can be expressedas follows:
Pjk ¼RðBkÞ
j
In addition, according to Rule 1, items with larger picking volumesshould be assigned to the beginning workstations for higher pickingflexibility. Thus, in order to evaluate whether the candidate assign-ment plans conform to Rule 1, this model utilizes the workload ratioand workstation rank to calculate the picking volume scores ofworkstations. According to the expression presented in Step (A5),the picking volume scores will be greater if items with higher work-load ratio are assigned to the beginning workstations (i.e., a lowersorted value j). Furthermore, the job assignment plan with a higherpicking volume score will be regarded as a better job assignmentplan as Rule 1 is concerned.
Step (A6): Calculate picking volume score of workstations in eachassignment plan. After determining picking volume scores Pjk ofitems, the picking volume scores of workstations in each assign-ment plan TPij can be obtained by summing up the picking volumescores of items:
TPij ¼Xall k
MiðPjkÞ
Step (A7): Calculate picking volume score of each assignment plan. Thepicking volume score of each assignment plan can be obtained viathe summation of the picking volume scores of workstations in thatplan. The corresponding formula can be expressed as:
SNðiÞ ¼Xall j
TPij
3.1.2. Quantitative model of Rule 2Following the first three steps in Section 3.1.1 (i.e., Step (A1) to
Step (A3)), the minimum number of workstations can be deter-mined and all candidate assignment plans can be enumerated.After that, the workload balance score SB(i) of each assignmentplan can be derived via the following steps.
Step (B1): Calculate the expected picking volume of each worksta-tion. By dividing the total picking volume of all items to be pickedby the workstation number, the expected picking volume E(N) ofeach workstation can be acquired:
EðNÞ ¼Xall k
NðBkÞTS
Step (B2): Calculate the picking volume of each workstation in eachassignment plan. In order to compared with the expected picking
1258 J.-L. Hou et al. / Computers & Industrial Engineering 56 (2009) 1254–1264
volume, the picking load (L(Nij)) of each workstation in each assign-ment plan should be determined based on the total picking volumeof items assigned to each workstation:
LðNijÞ ¼Xall c
NðMi½Sj; Bc�Þ
Step (B3): Calculate workstation load variation of each assignmentplan. Based on the expected load, the square of difference Dij
2 be-tween the assigned workload and expected workload of each work-station can be derived. A greater workstation workload variationindicates that the workload of the corresponding workstation isfar from the expected workload. The formula can be expressed asfollows:
D2ij ¼ fLðNijÞ � EðNÞg2
Therefore, the total variation of workstation picking workload ineach assignment plan can be derived to serve as a workload balanceindicator TD2
i of the specified plan. The corresponding formula canbe expressed as follows:
TD2i ¼
XST
j¼1
fLðNijÞ � EðNÞg2
Step (B4): Derive the workload balance score of each assignment plan.An assignment plan with a greater workload balance indicator TDi
2
indicates workload unbalance of the specified plan. The workloadbalance score SB(i) of an assignment plan can be determined via re-ciprocal of the workload balance indicator. The criterion can be rep-resented as follows:
SBðiÞ ¼ 1TD2
i
3.1.3. Quantitative model of Rule 3After acquiring the minimum number of workstations and all
candidate assignment plans via Step (A1) to Step (A3), the patternvariation score of each assignment plan SC(i) can be determinedvia the following four steps.
Step (C1): Identify the item patterns. After acquiring the pickingschedule, the picking operation planner always has to identifythe patterns Ck of the items to be picked. In this step, the itemsto be picked are categorized via their patterns.
Step (C2): Calculate pattern dissimilarity index of each workstationin an assignment plan. Dissimilarity of the patterns of distinct itemsin a workstation can be converted into an indicator Zero(CIab[-Mi,Sj]) with 0 or 1 via the following equations. Here, ‘‘0” indicatesthe items are of similar patterns and ‘‘1” indicates the items are ofdistinct patterns.
CIab½Mi; Sj� ¼ Ca½Mi; Sj� � Cb½Mi; Sj�; a–b
If CIab½Mi; Sj� ¼ 0; Then ZeroðCIab½Mi; Sj�Þ ¼ 0If CIab½Mi; Sj�–0; Then ZeroðCIab½Mi; Sj�Þ ¼ 1
Step (C3): Calculate pattern dissimilarity score of each assignment plan.By summing up the indicator values of items in all workstations ofan assignment plan, the pattern dissimilarity score SC(i) of the plancan be determined. A higher score indicates a greater pattern dis-similarity of items in workstations of a specified assignment plan.The pattern dissimilarity score of an assignment plan can be derivedvia the following equation:
SCðiÞ ¼XST
j¼1
XTM
b¼1
XTM
a¼1
ZeroðCIab½Mi; Sj�Þ; a–b
3.1.4. Quantitative model of Rule 4After generating the minimum workstation number and all can-
didate assignment plans via Step (A1) to Step (A3), the weight dis-similarity score of each assignment plan (SW(i)) can be obtained bythe following four steps.
Step (D1): Acquire weights of items to be picked in the conveyor-aided picking system. In a DC, the shop-floor operators weigh allincoming items and maintain the item weights in the database. Be-fore generating the weight dissimilarity score of each assignmentplan, the weight Wk of each item Bk should be acquired.
Step (D2): Calculate weight dissimilarity of items in each worksta-tion. The pairwise weight dissimilarity of items in each workstationcan be derived via the following equation:
WIab½Mi; Sj� ¼Wa½Mi; Sj� �Wb½Mi; Sj�; a–b
Step (D3): Normalize weight dissimilarity of items in each workstation.The ratio of pairwise weight dissimilarity over the average weightWRab[Mi,Sj] can be used to denote the normalized weight dissimi-larity of items:
WRab½Mi; Sj� ¼WIab½Mi; Sj�
ðWa½Mi; Sj� þWb½Mi; Sj�Þ=2
As the weight scale at the end of the conveyor-aided picking systemis usually used to investigate the picking errors, the item weightdissimilarity should be significant as compared with the toleranceratio r of the weight scale. Therefore, this approach defines an indi-cator variable I(WIab[Mi, Sj]) to determine whether the normalizedweight dissimilarity WRab[Mi,Sj] falls within the tolerance range[1 � r,1 + r] of the weight scale for weight inspection. The ideacan be expressed via the following formula:
If 1� r 6WRab½Mi; Sj� 6 1þ r Then IðWRab½Mi; Sj�Þ ¼ 0Otherwise IðWRab½Mi; Sj�Þ ¼ 1
Step (D4): Calculate weight dissimilarity score of each assignment plan.Based on the indicator value I(WRab[Mi,Sj]) mentioned in the abovestep, the weight dissimilarity score of each assignment plan can bedetermined by summing up indicator values of items for each work-station in the assignment plans:
SWðiÞ ¼XST
j¼1
XTM
b¼1
XTM
a¼1
IðWRab½Mi; Sj�Þ; a–b
3.1.5. Quantitative model of Rule 5Following Step (A1) to Step (A3) in Section 3.1.1, the shape score
of each assignment plan SS(i) can be obtained via the followingfour steps.
Step (E1): Acquire shapes of items to be picked. In a DC, the shapesof items are identified manually and maintained in the database asthe fundamental attributes of items. For a DC, different item shapesmight influence the convenience for items to be packaged into acase and therefore the item shapes should be acquired in this step.The items can be classified into the corresponding categories Tk
based on their shapes. Usually, in a DC, the shape categories iden-tified are ‘‘special shape”, ‘‘regular shape and size” and ‘‘big size”.
Step (E2): Convert the item shapes into quantitative values. Ashape classification function can be defined to convert the shapeof each item into a quantitative value Fk in order to represent theshape type of the corresponding item:
Fk ¼2 for special shapes1 for regular shapes and sizes0 for large sizes
8><>:
Step (E3): Determine the shape score of each workstation in assignmentplans. Based on the results of Step (E2), the shape score SRc[Mi, Sj] of
J.-L. Hou et al. / Computers & Industrial Engineering 56 (2009) 1254–1264 1259
each workstation in assignment plans can be determined based onthe shape dissimilarity of items in each workstation Fc[Mi,Sj] andthe workstation rank j. The formula for deriving the shape score isas follows:
SRc½Mi; Sj� ¼Fc½Mi; Sj�
j
Step (E4): Derive the total shape score of each assignment plan. Basedon Step (E5), the shape score of each workstation in an assignmentplan can be summed up to obtain the shape score SS(i) correspond-ing to an assignment plan. The concept can be expressed via the fol-lowing formula:
SSðiÞ ¼XST
j¼1
XTM
c¼1
SRc½Mi; Sj�
3.1.6. Quantitative model of Rule 6After generating the minimum workstation number and candi-
date assignment plans, the vendor dissimilarity score SP(i) ofassignment plans can be determined by the following three steps.
Step (F1): Acquire vendor information of items to be picked. Ven-dor information is one of the typical attributes of items. Sinceitems from identical vendors usually have similar external pat-terns, it is more suitable to assign items from identical vendorsto distinct workstation to reduce picking errors. To determine thevendor dissimilarity score of each assignment plan, the vendor ofeach item Pk should be acquired.
Step (F2): Determine the vendor dissimilarity index of book foreach workstation. The vendor dissimilarity index PIab[Mi,Sj] indi-cates whether the vendors of any pairs of item are identical inthe specified workstation:
PIab½Mi; Sj� ¼ Pa½Mi; Sj� � Pb½Mi; Sj�
To obtain pairwise vendor dissimilarity of items in a workstation,this methodology defined an indicator PD(PIab[Mi,Sj]). If PD(PIab[-Mi,Sj]) is 0, it indicates that Ba and Bb are from the same vendors.
If PIab½Mi; Sj� ¼ 0 Then PDðPIab½Mi; Sj�Þ ¼ 0If PIab½Mi; Sj�–0 Then PDðPIab½Mi; Sj�Þ ¼ 1
Step (F3): Calculate vendor dissimilarity score of each assignment plan.Based on indicator variables PD(PIab[Mi,Sj]) obtained from the previ-ous step, the vendor dissimilarity score of each assignment plan canbe obtained by summing up the vendor dissimilarity index of itemsin each workstation of the specified assignment plan.
SPðiÞ ¼XST
j¼1
XTM
b¼1
XTM
a¼1
PDðPIab½Mi; Sj�Þ; a–b
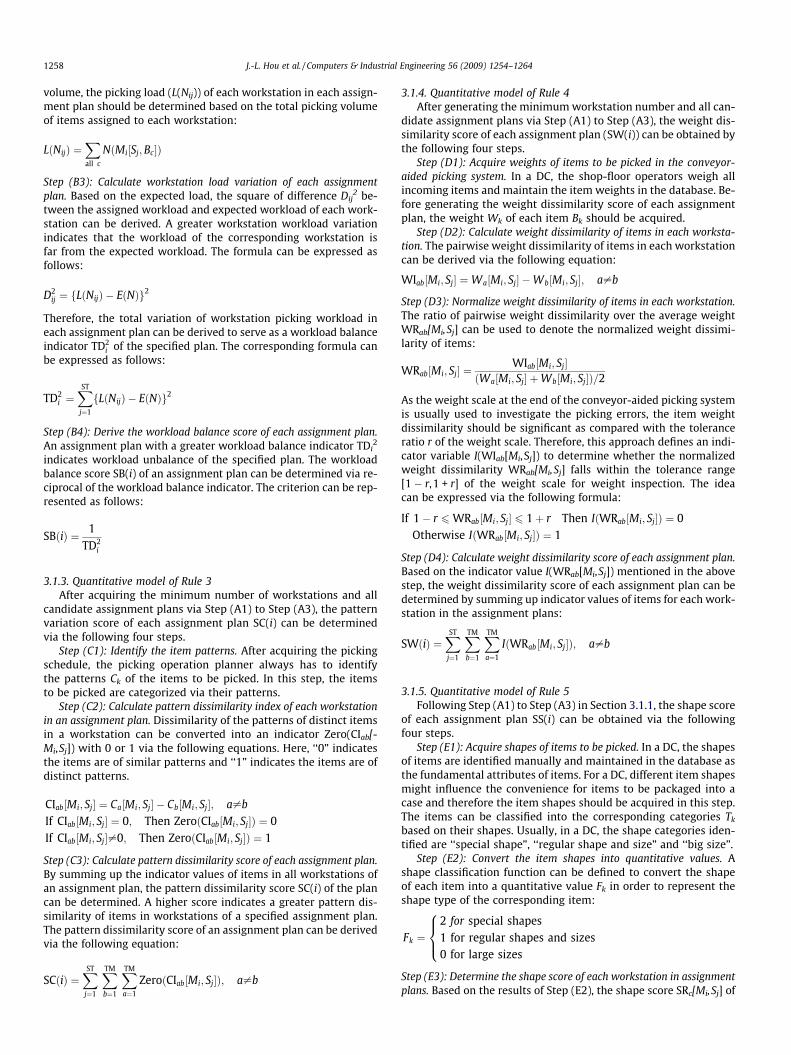
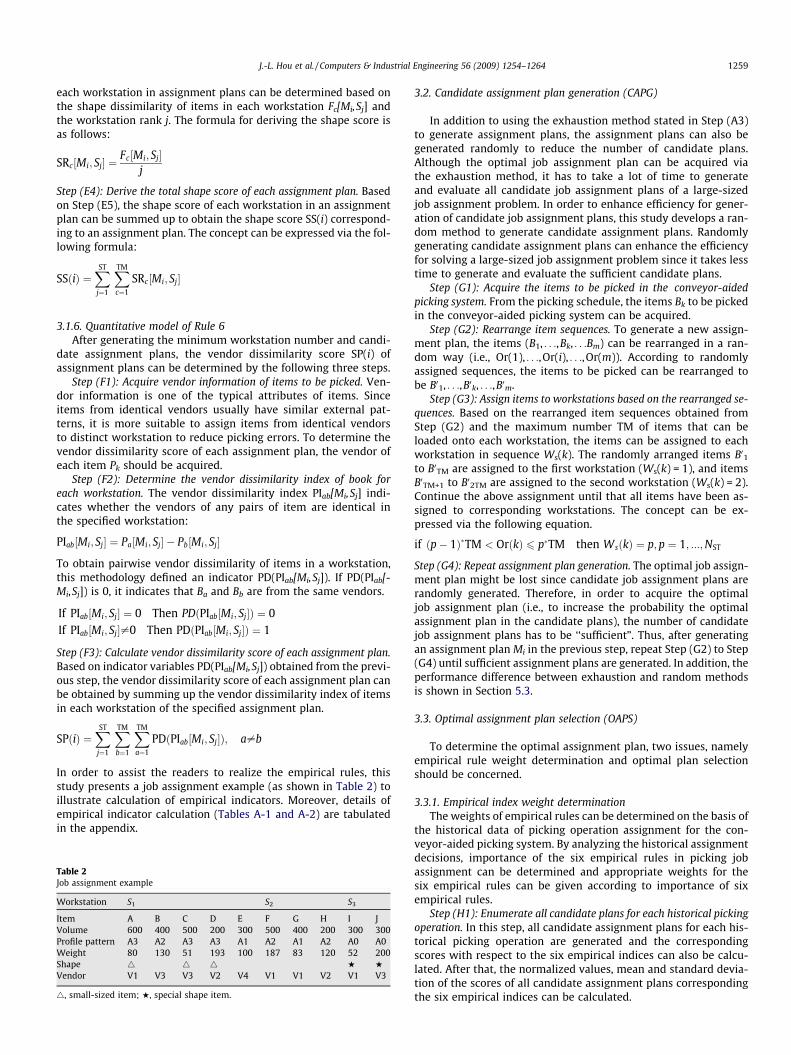
In order to assist the readers to realize the empirical rules, thisstudy presents a job assignment example (as shown in Table 2) toillustrate calculation of empirical indicators. Moreover, details ofempirical indicator calculation (Tables A-1 and A-2) are tabulatedin the appendix.
Table 2Job assignment example
Workstation S1 S2 S3
Item A B C D E F G H I JVolume 600 400 500 200 300 500 400 200 300 300Profile pattern A3 A2 A3 A3 A1 A2 A1 A2 A0 A0Weight 80 130 51 193 100 187 83 120 52 200Shape 4 4 4 H H
Vendor V1 V3 V3 V2 V4 V1 V1 V2 V1 V3
4, small-sized item; H, special shape item.
3.2. Candidate assignment plan generation (CAPG)
In addition to using the exhaustion method stated in Step (A3)to generate assignment plans, the assignment plans can also begenerated randomly to reduce the number of candidate plans.Although the optimal job assignment plan can be acquired viathe exhaustion method, it has to take a lot of time to generateand evaluate all candidate job assignment plans of a large-sizedjob assignment problem. In order to enhance efficiency for gener-ation of candidate job assignment plans, this study develops a ran-dom method to generate candidate assignment plans. Randomlygenerating candidate assignment plans can enhance the efficiencyfor solving a large-sized job assignment problem since it takes lesstime to generate and evaluate the sufficient candidate plans.
Step (G1): Acquire the items to be picked in the conveyor-aidedpicking system. From the picking schedule, the items Bk to be pickedin the conveyor-aided picking system can be acquired.
Step (G2): Rearrange item sequences. To generate a new assign-ment plan, the items (B1, . . .,Bk, . . .Bm) can be rearranged in a ran-dom way (i.e., Or(1), . . .,Or(i), . . .,Or(m)). According to randomlyassigned sequences, the items to be picked can be rearranged tobe B01, . . .,B0k, . . .,B0m.
Step (G3): Assign items to workstations based on the rearranged se-quences. Based on the rearranged item sequences obtained fromStep (G2) and the maximum number TM of items that can beloaded onto each workstation, the items can be assigned to eachworkstation in sequence Ws(k). The randomly arranged items B01to B0TM are assigned to the first workstation (Ws(k) = 1), and itemsB0TM+1 to B02TM are assigned to the second workstation (Ws(k) = 2).Continue the above assignment until that all items have been as-signed to corresponding workstations. The concept can be ex-pressed via the following equation.
if ðp� 1Þ�TM < OrðkÞ 6 p�TM then WsðkÞ ¼ p; p ¼ 1; :::;NST
Step (G4): Repeat assignment plan generation. The optimal job assign-ment plan might be lost since candidate job assignment plans arerandomly generated. Therefore, in order to acquire the optimaljob assignment plan (i.e., to increase the probability the optimalassignment plan in the candidate plans), the number of candidatejob assignment plans has to be ‘‘sufficient”. Thus, after generatingan assignment plan Mi in the previous step, repeat Step (G2) to Step(G4) until sufficient assignment plans are generated. In addition, theperformance difference between exhaustion and random methodsis shown in Section 5.3.
3.3. Optimal assignment plan selection (OAPS)
To determine the optimal assignment plan, two issues, namelyempirical rule weight determination and optimal plan selectionshould be concerned.
3.3.1. Empirical index weight determinationThe weights of empirical rules can be determined on the basis of
the historical data of picking operation assignment for the con-veyor-aided picking system. By analyzing the historical assignmentdecisions, importance of the six empirical rules in picking jobassignment can be determined and appropriate weights for thesix empirical rules can be given according to importance of sixempirical rules.
Step (H1): Enumerate all candidate plans for each historical pickingoperation. In this step, all candidate assignment plans for each his-torical picking operation are generated and the correspondingscores with respect to the six empirical indices can also be calcu-lated. After that, the normalized values, mean and standard devia-tion of the scores of all candidate assignment plans correspondingthe six empirical indices can be calculated.
Picking schedule
Item profiles
System DataMaintenance Module
Extract
Optimal Assignment Plan
Empirical Rule WeightModule
Data query & update
Job Assignment System forConveyer Aided Picking System
Operation time
User 2Update
DCER DataWeight modification
Assignemnt plans
1260 J.-L. Hou et al. / Computers & Industrial Engineering 56 (2009) 1254–1264
Step (H2): Normalize scores with respect to all empirical indices.The original scores Ok(i, j) of all candidate assignment plans corre-sponding the six empirical indices should be converted into nor-malized scores Sk (i, j) to ensure their consistency. The formula fornormalization is as follows:
Skði; jÞ ¼Okði; jÞ �Minall iðOkði; jÞÞ
Maxall iðOkði; jÞÞ �Minall iðOkði; jÞÞ
Step (H3): Calculate the mean and standard deviation of the scores ofall candidate assignment plans corresponding the six empirical indices.In this step, the mean ESk(i) and standard deviation SSk(i) of scores ofall candidate assignment plans in the ith historical picking opera-tion with respect to six empirical indices can be calculated via thefollowing equations:
ESkðiÞ ¼P
all jSkði; jÞNMi
SDSkðiÞ ¼
ffiffiffiffiffiffiffiffiffiffiffiffiffiffiffiffiffiffiffiffiffiffiffiffiffiffiffiffiffiffiffiffiffiffiffiffiffiffiffiffiffiffiffiffiffiffiffiffiffiPall jðSkði; jÞ � ESkðiÞÞ2
NMi
s
After that, the mean of ESk(i) can be acquired to denote the averageand standard deviation of expected score (AES(k) and SdES(k), respec-tively) of the kth empirical index in the historical picking assignment:
AESðkÞ ¼P
all iESkðiÞNHD
SdESðkÞ ¼
ffiffiffiffiffiffiffiffiffiffiffiffiffiffiffiffiffiffiffiffiffiffiffiffiffiffiffiffiffiffiffiffiffiffiffiffiffiffiffiffiffiffiffiffiffiffiffiffiffiffiPall iðESkðiÞ � AESðkÞÞ2
NHD
s
Step (H4): Standardize the average score of each empirical index. Thescore distributions of empirical indices might be inconsistent. In or-der to accurately determine importance of each empirical index, theaverage scores of all candidate assignment plans in the ith historicalpicking operation with respect to the kth empirical index should bestandardized Stdk(i).
StdkðiÞ ¼ESkðiÞ � AESðkÞ
SdESðkÞ
Step (H5): Calculate importance score of each empirical index. On thebasis of the standardized scores Stdk(i) of empirical indices in eachhistorical picking assignment, this step assigns the correspondingimportance scores to the six empirical indices Rk(i). Here the impor-tance score of each empirical index in the specified historical pick-ing assignment is equal to the rank of its standardized scores. Afterobtaining the importance scores of each empirical index in all his-torical picking assignments, sum up the importance scores to revealthe importance TR(k) of each empirical index in the historicalassignments:
TRðkÞ ¼Xall i
RkðiÞ
Step (H6): Calculate weight of each empirical index. The importanceTR(k) and average expected score AES(k) of each empirical indexcan be sorted into two ordered series TR(v) and AES(v). Based onthe sorted series, the weight Wk of each empirical rule can be calcu-lated by taking ratio of its actual average expected score AES(k) andthe compliant average expected score AES(v). The corresponding for-mula can be expressed as follows:
If TRðkÞ ¼ TRðvÞ Then Wk ¼AESðvÞAESðkÞ
Module Weights
Info. feedback
SettingsUser 1
Execution
Historical records
User 3
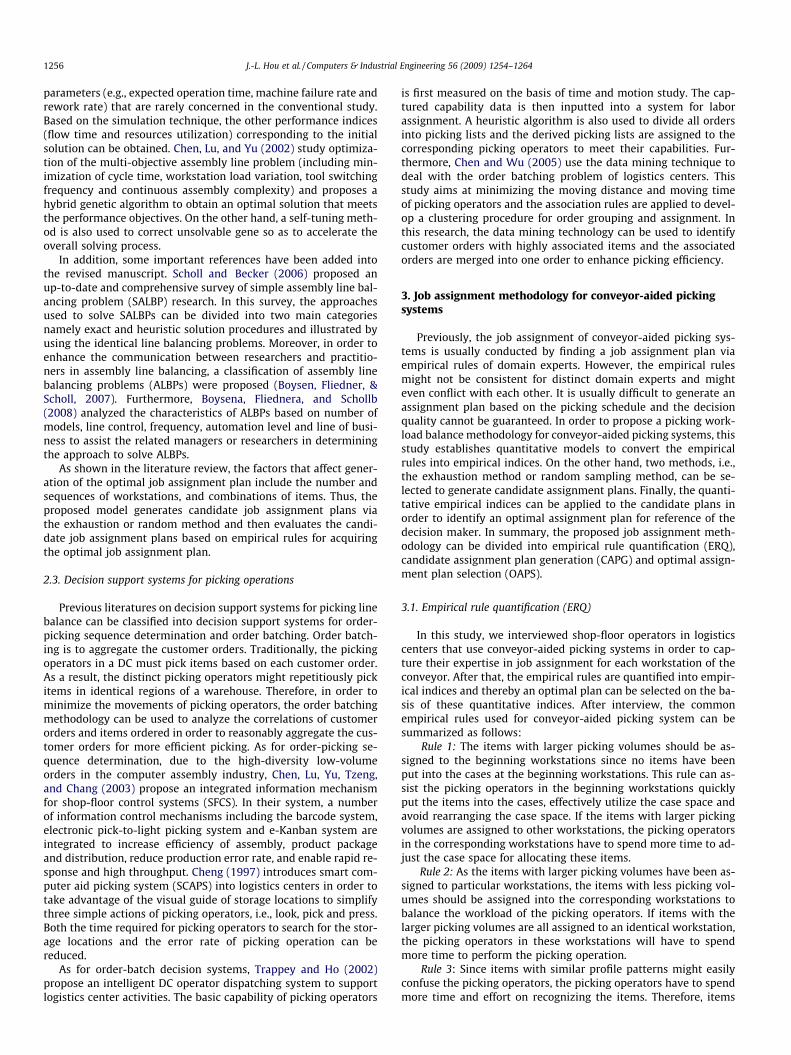
Fig. 1. Architecture of system functions.
3.3.2. Optimal assignment plan selectionThe procedure for selecting the optimal assignment plan is to
calculate the index scores of each candidate assignment plan withrespect to the six empirical rules, to calculate the total score TS(i)of each plan via the weights of empirical rules, and to determinethe optimal assignment plan for the conveyor-aided picking sys-tem. The details are explained in the following.
Step (I1): Summarize all index scores of each candidate assignmentplan. All index scores (SN(i), SB(i), SC(i), SW(i), SS(i), SP(i)) of eachcandidate assignment plan with respect to six empirical rules canbe obtained via the six quantitative models presented in Section3.1.
Step (I2): Calculate weighted empirical index score of each candi-date assignment plan. By multiplying the weights WT(i) of theempirical indices with the derived index scores (SN(i), SB(i), SC(i),SW(i), SS(i), SP(i)), the total score TS(i) of a candidate assignmentplan can be calculated via the following equations. Its calculationformula can be represented as follows.
TSðiÞ ¼WTð1Þ�SNðiÞ þWTð2Þ�SBðiÞ þWTð3Þ�SSðiÞþWTð4Þ�SCðiÞ þWTð5Þ�SWðiÞ þWTð6Þ�SPðiÞ
Step (I3): Determine the optimal assignment plan. After obtaining thetotal scores TS(i) of all candidate assignment plans, the plan withthe highest total score is regarded as the optimal assignment plan.
4. Job assignment system for conveyor-aided picking system
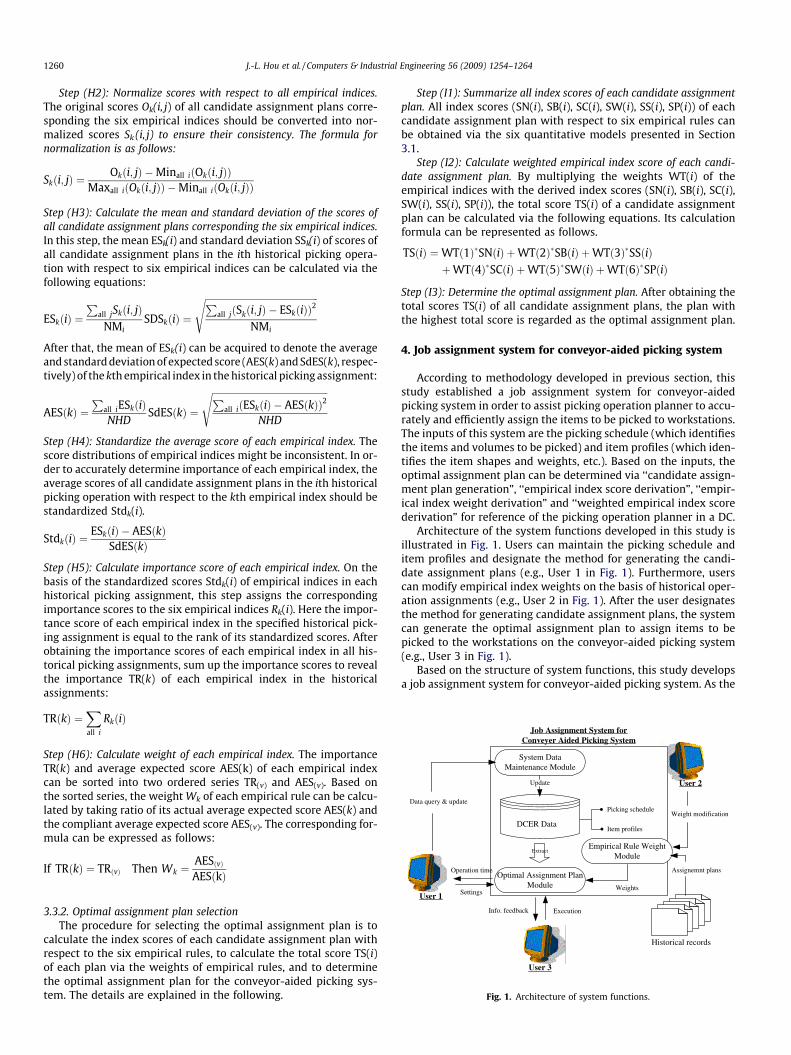
According to methodology developed in previous section, thisstudy established a job assignment system for conveyor-aidedpicking system in order to assist picking operation planner to accu-rately and efficiently assign the items to be picked to workstations.The inputs of this system are the picking schedule (which identifiesthe items and volumes to be picked) and item profiles (which iden-tifies the item shapes and weights, etc.). Based on the inputs, theoptimal assignment plan can be determined via ‘‘candidate assign-ment plan generation”, ‘‘empirical index score derivation”, ‘‘empir-ical index weight derivation” and ‘‘weighted empirical index scorederivation” for reference of the picking operation planner in a DC.
Architecture of the system functions developed in this study isillustrated in Fig. 1. Users can maintain the picking schedule anditem profiles and designate the method for generating the candi-date assignment plans (e.g., User 1 in Fig. 1). Furthermore, userscan modify empirical index weights on the basis of historical oper-ation assignments (e.g., User 2 in Fig. 1). After the user designatesthe method for generating candidate assignment plans, the systemcan generate the optimal assignment plan to assign items to bepicked to the workstations on the conveyor-aided picking system(e.g., User 3 in Fig. 1).
Based on the structure of system functions, this study developsa job assignment system for conveyor-aided picking system. As the
J.-L. Hou et al. / Computers & Industrial Engineering 56 (2009) 1254–1264 1261
picking schedule and item profiles are gathered and entered intothe system database, the planner could access this system to per-form functions of adding, deleting, modifying and querying itemdata corresponding to each picking schedule through System DataMaintenance Module. Meanwhile, the ‘‘Empirical Rule WeightModule” can be applied to determine the weight of each empiricalrule on the basis of historical assignment records. As the planneractivates the ‘‘Optimal Assignment Plan Module”, the top 3 assign-ment plans with the items to be assigned to the correspondingworkstations can be generated. In summary, the functions devel-oped in this study not only simplify the job assignment procedureof the conveyor-aided picking system but also significantly reducethe time required for job assignment and avoided inappropriatehuman decisions.
5. Case study
In order to examine applicability of the proposed methodologyand system, a real-world case, namely Nung Hsueh Co., will bedemonstrated in this section. In this study, the proposed jobassignment methodology and system is applied to the demonstra-tion case to validate feasibility and performance of the proposedmethodology. After that, effectiveness of the proposed system isanalyzed and the performance difference between the exhaustionand random methods are investigated.
5.1. Case introduction
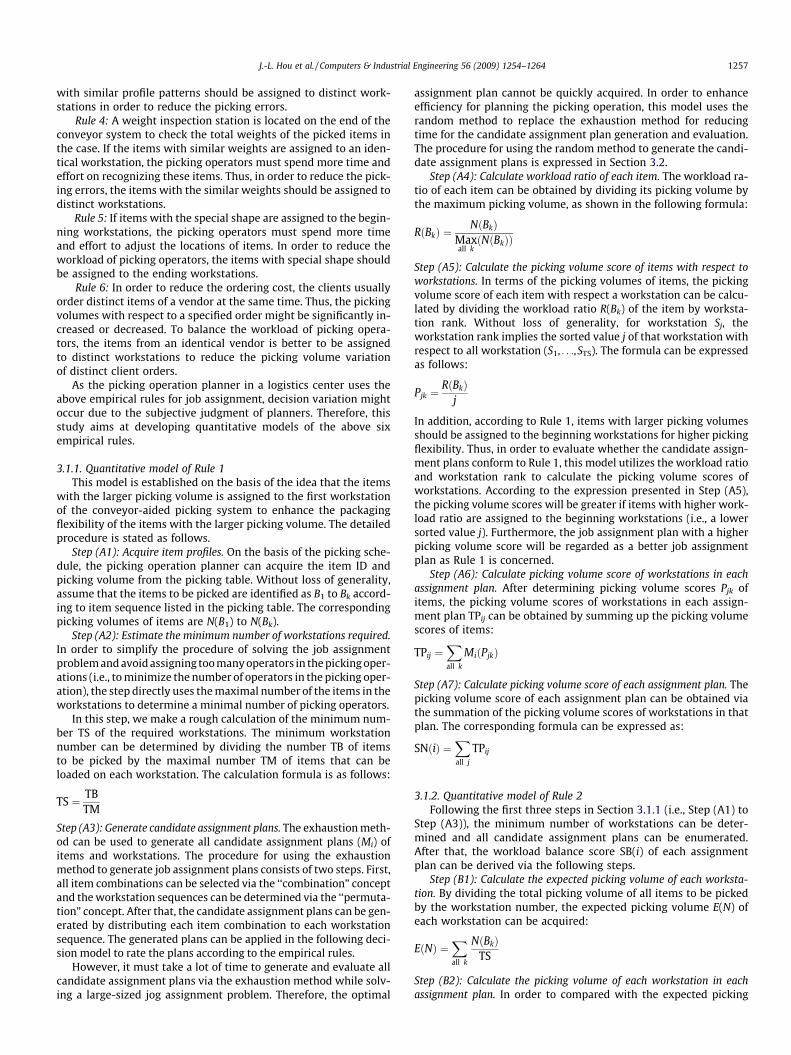
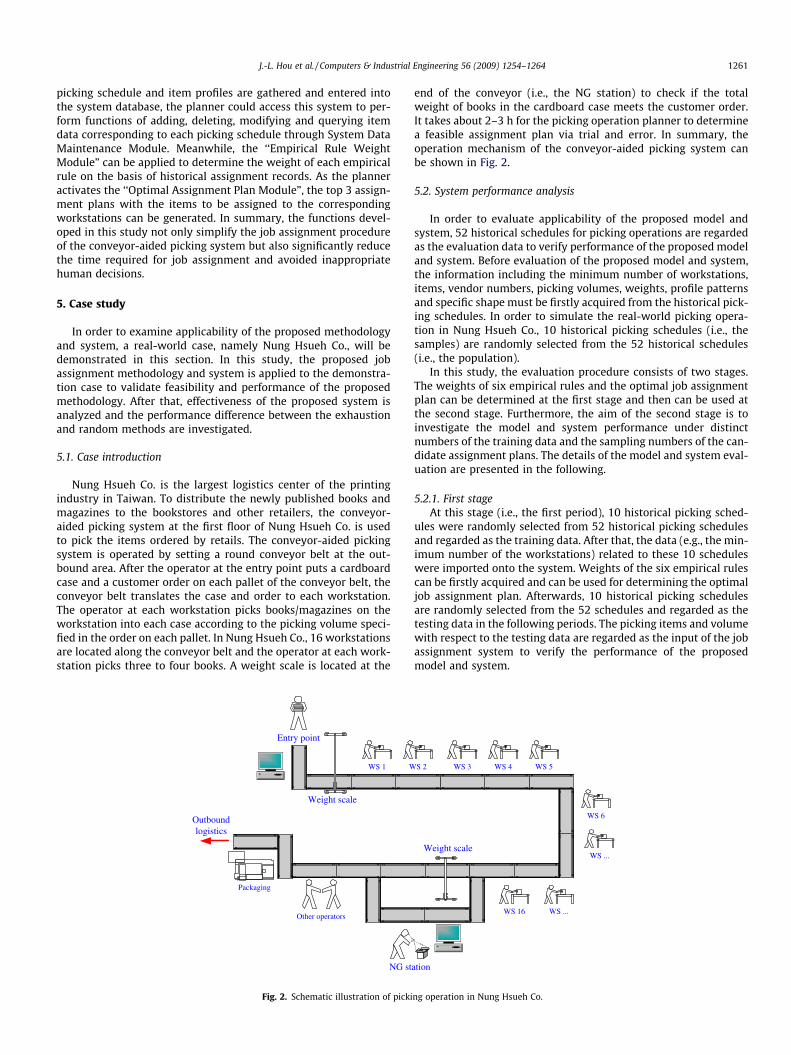
Nung Hsueh Co. is the largest logistics center of the printingindustry in Taiwan. To distribute the newly published books andmagazines to the bookstores and other retailers, the conveyor-aided picking system at the first floor of Nung Hsueh Co. is usedto pick the items ordered by retails. The conveyor-aided pickingsystem is operated by setting a round conveyor belt at the out-bound area. After the operator at the entry point puts a cardboardcase and a customer order on each pallet of the conveyor belt, theconveyor belt translates the case and order to each workstation.The operator at each workstation picks books/magazines on theworkstation into each case according to the picking volume speci-fied in the order on each pallet. In Nung Hsueh Co., 16 workstationsare located along the conveyor belt and the operator at each work-station picks three to four books. A weight scale is located at the
WS 1 W
NG st
Entry point
Other operators
Packaging
Weight scale
Outboundlogistics
Fig. 2. Schematic illustration of picki
end of the conveyor (i.e., the NG station) to check if the totalweight of books in the cardboard case meets the customer order.It takes about 2–3 h for the picking operation planner to determinea feasible assignment plan via trial and error. In summary, theoperation mechanism of the conveyor-aided picking system canbe shown in Fig. 2.
5.2. System performance analysis
In order to evaluate applicability of the proposed model andsystem, 52 historical schedules for picking operations are regardedas the evaluation data to verify performance of the proposed modeland system. Before evaluation of the proposed model and system,the information including the minimum number of workstations,items, vendor numbers, picking volumes, weights, profile patternsand specific shape must be firstly acquired from the historical pick-ing schedules. In order to simulate the real-world picking opera-tion in Nung Hsueh Co., 10 historical picking schedules (i.e., thesamples) are randomly selected from the 52 historical schedules(i.e., the population).
In this study, the evaluation procedure consists of two stages.The weights of six empirical rules and the optimal job assignmentplan can be determined at the first stage and then can be used atthe second stage. Furthermore, the aim of the second stage is toinvestigate the model and system performance under distinctnumbers of the training data and the sampling numbers of the can-didate assignment plans. The details of the model and system eval-uation are presented in the following.
5.2.1. First stageAt this stage (i.e., the first period), 10 historical picking sched-
ules were randomly selected from 52 historical picking schedulesand regarded as the training data. After that, the data (e.g., the min-imum number of the workstations) related to these 10 scheduleswere imported onto the system. Weights of the six empirical rulescan be firstly acquired and can be used for determining the optimaljob assignment plan. Afterwards, 10 historical picking schedulesare randomly selected from the 52 schedules and regarded as thetesting data in the following periods. The picking items and volumewith respect to the testing data are regarded as the input of the jobassignment system to verify the performance of the proposedmodel and system.
WS 16 WS ...
WS ...
WS 6
WS 5WS 4WS 3S 2
ation
Weight scale
ng operation in Nung Hsueh Co.
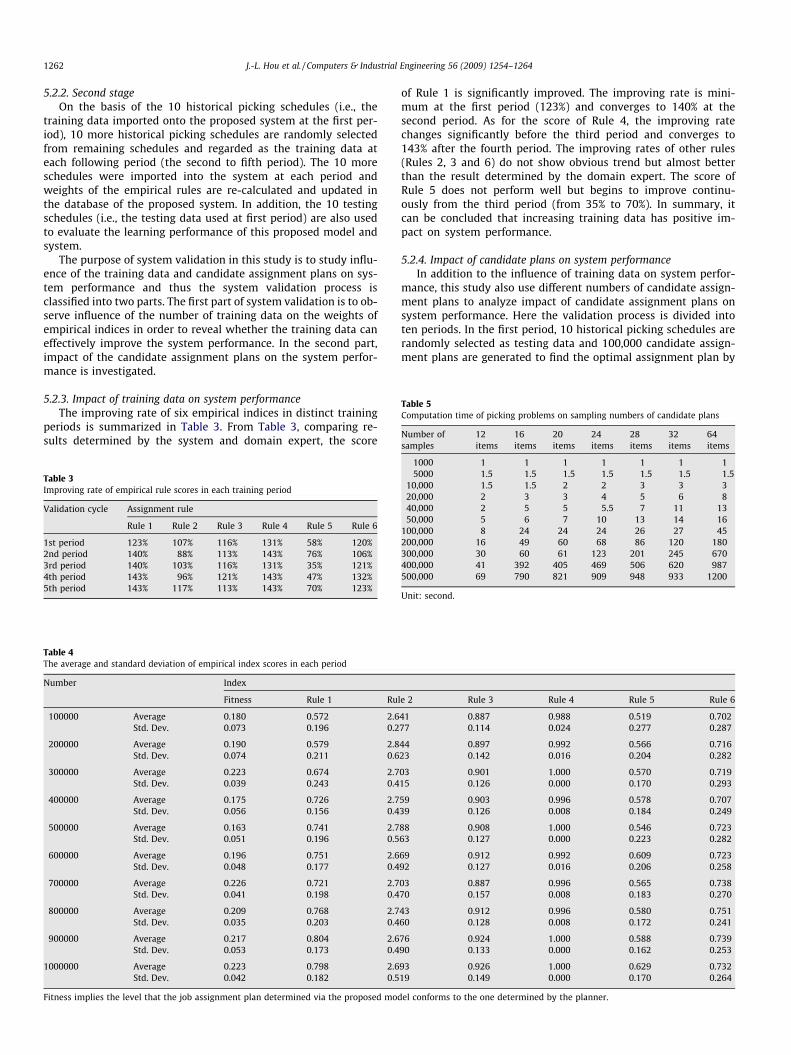
Table 5Computation time of picking problems on sampling numbers of candidate plans
Number ofsamples
12items
16items
20items
24items
28items
32items
64items
1262 J.-L. Hou et al. / Computers & Industrial Engineering 56 (2009) 1254–1264
5.2.2. Second stageOn the basis of the 10 historical picking schedules (i.e., the
training data imported onto the proposed system at the first per-iod), 10 more historical picking schedules are randomly selectedfrom remaining schedules and regarded as the training data ateach following period (the second to fifth period). The 10 moreschedules were imported into the system at each period andweights of the empirical rules are re-calculated and updated inthe database of the proposed system. In addition, the 10 testingschedules (i.e., the testing data used at first period) are also usedto evaluate the learning performance of this proposed model andsystem.
The purpose of system validation in this study is to study influ-ence of the training data and candidate assignment plans on sys-tem performance and thus the system validation process isclassified into two parts. The first part of system validation is to ob-serve influence of the number of training data on the weights ofempirical indices in order to reveal whether the training data caneffectively improve the system performance. In the second part,impact of the candidate assignment plans on the system perfor-mance is investigated.
5.2.3. Impact of training data on system performanceThe improving rate of six empirical indices in distinct training
periods is summarized in Table 3. From Table 3, comparing re-sults determined by the system and domain expert, the score
Table 3Improving rate of empirical rule scores in each training period
Validation cycle Assignment rule
Rule 1 Rule 2 Rule 3 Rule 4 Rule 5 Rule 6
1st period 123% 107% 116% 131% 58% 120%2nd period 140% 88% 113% 143% 76% 106%3rd period 140% 103% 116% 131% 35% 121%4th period 143% 96% 121% 143% 47% 132%5th period 143% 117% 113% 143% 70% 123%
Table 4The average and standard deviation of empirical index scores in each period
Number Index
Fitness Rule 1 Ru
100000 Average 0.180 0.572 2.6Std. Dev. 0.073 0.196 0.2
200000 Average 0.190 0.579 2.8Std. Dev. 0.074 0.211 0.6
300000 Average 0.223 0.674 2.7Std. Dev. 0.039 0.243 0.4
400000 Average 0.175 0.726 2.7Std. Dev. 0.056 0.156 0.4
500000 Average 0.163 0.741 2.7Std. Dev. 0.051 0.196 0.5
600000 Average 0.196 0.751 2.6Std. Dev. 0.048 0.177 0.4
700000 Average 0.226 0.721 2.7Std. Dev. 0.041 0.198 0.4
800000 Average 0.209 0.768 2.7Std. Dev. 0.035 0.203 0.4
900000 Average 0.217 0.804 2.6Std. Dev. 0.053 0.173 0.4
1000000 Average 0.223 0.798 2.6Std. Dev. 0.042 0.182 0.5
Fitness implies the level that the job assignment plan determined via the proposed mod
of Rule 1 is significantly improved. The improving rate is mini-mum at the first period (123%) and converges to 140% at thesecond period. As for the score of Rule 4, the improving ratechanges significantly before the third period and converges to143% after the fourth period. The improving rates of other rules(Rules 2, 3 and 6) do not show obvious trend but almost betterthan the result determined by the domain expert. The score ofRule 5 does not perform well but begins to improve continu-ously from the third period (from 35% to 70%). In summary, itcan be concluded that increasing training data has positive im-pact on system performance.
5.2.4. Impact of candidate plans on system performanceIn addition to the influence of training data on system perfor-
mance, this study also use different numbers of candidate assign-ment plans to analyze impact of candidate assignment plans onsystem performance. Here the validation process is divided intoten periods. In the first period, 10 historical picking schedules arerandomly selected as testing data and 100,000 candidate assign-ment plans are generated to find the optimal assignment plan by
1000 1 1 1 1 1 1 15000 1.5 1.5 1.5 1.5 1.5 1.5 1.5
10,000 1.5 1.5 2 2 3 3 320,000 2 3 3 4 5 6 840,000 2 5 5 5.5 7 11 1350,000 5 6 7 10 13 14 16
100,000 8 24 24 24 26 27 45200,000 16 49 60 68 86 120 180300,000 30 60 61 123 201 245 670400,000 41 392 405 469 506 620 987500,000 69 790 821 909 948 933 1200
Unit: second.
le 2 Rule 3 Rule 4 Rule 5 Rule 6
41 0.887 0.988 0.519 0.70277 0.114 0.024 0.277 0.287
44 0.897 0.992 0.566 0.71623 0.142 0.016 0.204 0.282
03 0.901 1.000 0.570 0.71915 0.126 0.000 0.170 0.293
59 0.903 0.996 0.578 0.70739 0.126 0.008 0.184 0.249
88 0.908 1.000 0.546 0.72363 0.127 0.000 0.223 0.282
69 0.912 0.992 0.609 0.72392 0.127 0.016 0.206 0.258
03 0.887 0.996 0.565 0.73870 0.157 0.008 0.183 0.270
43 0.912 0.996 0.580 0.75160 0.128 0.008 0.172 0.241
76 0.924 1.000 0.588 0.73990 0.133 0.000 0.162 0.253
93 0.926 1.000 0.629 0.73219 0.149 0.000 0.170 0.264
el conforms to the one determined by the planner.
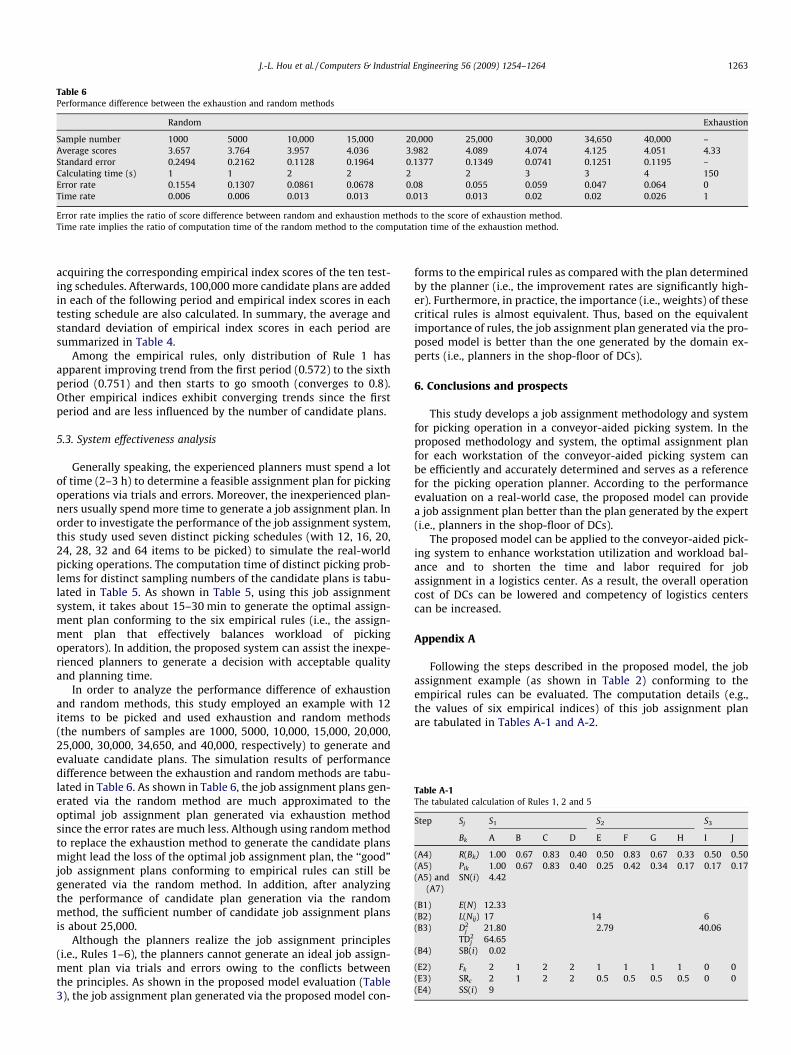
Table 6Performance difference between the exhaustion and random methods
Random Exhaustion
Sample number 1000 5000 10,000 15,000 20,000 25,000 30,000 34,650 40,000 –Average scores 3.657 3.764 3.957 4.036 3.982 4.089 4.074 4.125 4.051 4.33Standard error 0.2494 0.2162 0.1128 0.1964 0.1377 0.1349 0.0741 0.1251 0.1195 –Calculating time (s) 1 1 2 2 2 2 3 3 4 150Error rate 0.1554 0.1307 0.0861 0.0678 0.08 0.055 0.059 0.047 0.064 0Time rate 0.006 0.006 0.013 0.013 0.013 0.013 0.02 0.02 0.026 1
Error rate implies the ratio of score difference between random and exhaustion methods to the score of exhaustion method.Time rate implies the ratio of computation time of the random method to the computation time of the exhaustion method.
Table A-1The tabulated calculation of Rules 1, 2 and 5
Step Sj S1 S2 S3
Bk A B C D E F G H I J
(A4) R(Bk) 1.00 0.67 0.83 0.40 0.50 0.83 0.67 0.33 0.50 0.50(A5) Pik 1.00 0.67 0.83 0.40 0.25 0.42 0.34 0.17 0.17 0.17(A5) and
(A7)SN(i) 4.42
(B1) E(N) 12.33(B2) L(Nij) 17 14 6(B3) D2
j 21.80 2.79 40.06TD2
j 64.65(B4) SB(i) 0.02
(E2) Fk 2 1 2 2 1 1 1 1 0 0(E3) SRc 2 1 2 2 0.5 0.5 0.5 0.5 0 0(E4) SS(i) 9
J.-L. Hou et al. / Computers & Industrial Engineering 56 (2009) 1254–1264 1263
acquiring the corresponding empirical index scores of the ten test-ing schedules. Afterwards, 100,000 more candidate plans are addedin each of the following period and empirical index scores in eachtesting schedule are also calculated. In summary, the average andstandard deviation of empirical index scores in each period aresummarized in Table 4.
Among the empirical rules, only distribution of Rule 1 hasapparent improving trend from the first period (0.572) to the sixthperiod (0.751) and then starts to go smooth (converges to 0.8).Other empirical indices exhibit converging trends since the firstperiod and are less influenced by the number of candidate plans.
5.3. System effectiveness analysis
Generally speaking, the experienced planners must spend a lotof time (2–3 h) to determine a feasible assignment plan for pickingoperations via trials and errors. Moreover, the inexperienced plan-ners usually spend more time to generate a job assignment plan. Inorder to investigate the performance of the job assignment system,this study used seven distinct picking schedules (with 12, 16, 20,24, 28, 32 and 64 items to be picked) to simulate the real-worldpicking operations. The computation time of distinct picking prob-lems for distinct sampling numbers of the candidate plans is tabu-lated in Table 5. As shown in Table 5, using this job assignmentsystem, it takes about 15–30 min to generate the optimal assign-ment plan conforming to the six empirical rules (i.e., the assign-ment plan that effectively balances workload of pickingoperators). In addition, the proposed system can assist the inexpe-rienced planners to generate a decision with acceptable qualityand planning time.
In order to analyze the performance difference of exhaustionand random methods, this study employed an example with 12items to be picked and used exhaustion and random methods(the numbers of samples are 1000, 5000, 10,000, 15,000, 20,000,25,000, 30,000, 34,650, and 40,000, respectively) to generate andevaluate candidate plans. The simulation results of performancedifference between the exhaustion and random methods are tabu-lated in Table 6. As shown in Table 6, the job assignment plans gen-erated via the random method are much approximated to theoptimal job assignment plan generated via exhaustion methodsince the error rates are much less. Although using random methodto replace the exhaustion method to generate the candidate plansmight lead the loss of the optimal job assignment plan, the ‘‘good”job assignment plans conforming to empirical rules can still begenerated via the random method. In addition, after analyzingthe performance of candidate plan generation via the randommethod, the sufficient number of candidate job assignment plansis about 25,000.
Although the planners realize the job assignment principles(i.e., Rules 1–6), the planners cannot generate an ideal job assign-ment plan via trials and errors owing to the conflicts betweenthe principles. As shown in the proposed model evaluation (Table3), the job assignment plan generated via the proposed model con-
forms to the empirical rules as compared with the plan determinedby the planner (i.e., the improvement rates are significantly high-er). Furthermore, in practice, the importance (i.e., weights) of thesecritical rules is almost equivalent. Thus, based on the equivalentimportance of rules, the job assignment plan generated via the pro-posed model is better than the one generated by the domain ex-perts (i.e., planners in the shop-floor of DCs).
6. Conclusions and prospects
This study develops a job assignment methodology and systemfor picking operation in a conveyor-aided picking system. In theproposed methodology and system, the optimal assignment planfor each workstation of the conveyor-aided picking system canbe efficiently and accurately determined and serves as a referencefor the picking operation planner. According to the performanceevaluation on a real-world case, the proposed model can providea job assignment plan better than the plan generated by the expert(i.e., planners in the shop-floor of DCs).
The proposed model can be applied to the conveyor-aided pick-ing system to enhance workstation utilization and workload bal-ance and to shorten the time and labor required for jobassignment in a logistics center. As a result, the overall operationcost of DCs can be lowered and competency of logistics centerscan be increased.
Appendix A
Following the steps described in the proposed model, the jobassignment example (as shown in Table 2) conforming to theempirical rules can be evaluated. The computation details (e.g.,the values of six empirical indices) of this job assignment planare tabulated in Tables A-1 and A-2.
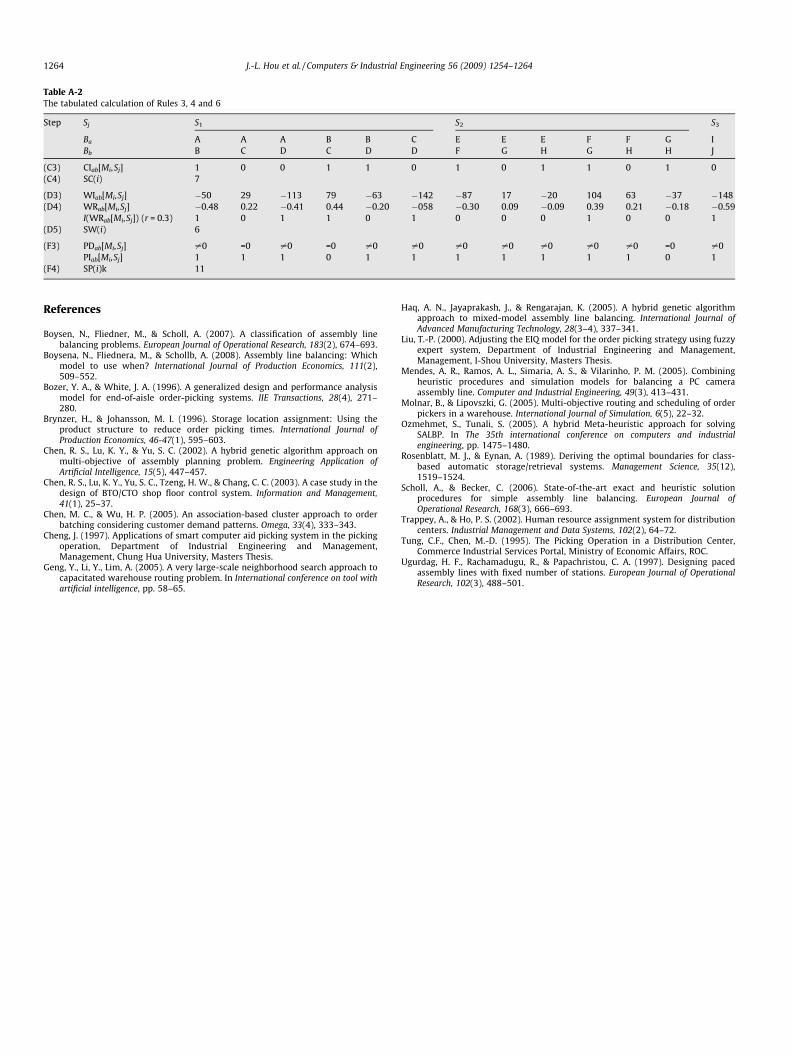
Table A-2The tabulated calculation of Rules 3, 4 and 6
Step Sj S1 S2 S3
Ba A A A B B C E E E F F G IBb B C D C D D F G H G H H J
(C3) CIab[Mi,Sj] 1 0 0 1 1 0 1 0 1 1 0 1 0(C4) SC(i) 7
(D3) WIab[Mi,Sj] �50 29 �113 79 �63 �142 �87 17 �20 104 63 �37 �148(D4) WRab[Mi,Sj] �0.48 0.22 �0.41 0.44 �0.20 �058 �0.30 0.09 �0.09 0.39 0.21 �0.18 �0.59
I(WRab[Mi,Sj]) (r = 0.3) 1 0 1 1 0 1 0 0 0 1 0 0 1(D5) SW(i) 6
(F3) PDab[Mi,Sj] –0 =0 –0 =0 –0 –0 –0 –0 –0 –0 –0 =0 –0PIab[Mi,Sj] 1 1 1 0 1 1 1 1 1 1 1 0 1
(F4) SP(i)k 11
1264 J.-L. Hou et al. / Computers & Industrial Engineering 56 (2009) 1254–1264
References
Boysen, N., Fliedner, M., & Scholl, A. (2007). A classification of assembly linebalancing problems. European Journal of Operational Research, 183(2), 674–693.
Boysena, N., Fliednera, M., & Schollb, A. (2008). Assembly line balancing: Whichmodel to use when? International Journal of Production Economics, 111(2),509–552.
Bozer, Y. A., & White, J. A. (1996). A generalized design and performance analysismodel for end-of-aisle order-picking systems. IIE Transactions, 28(4), 271–280.
Brynzer, H., & Johansson, M. I. (1996). Storage location assignment: Using theproduct structure to reduce order picking times. International Journal ofProduction Economics, 46-47(1), 595–603.
Chen, R. S., Lu, K. Y., & Yu, S. C. (2002). A hybrid genetic algorithm approach onmulti-objective of assembly planning problem. Engineering Application ofArtificial Intelligence, 15(5), 447–457.
Chen, R. S., Lu, K. Y., Yu, S. C., Tzeng, H. W., & Chang, C. C. (2003). A case study in thedesign of BTO/CTO shop floor control system. Information and Management,41(1), 25–37.
Chen, M. C., & Wu, H. P. (2005). An association-based cluster approach to orderbatching considering customer demand patterns. Omega, 33(4), 333–343.
Cheng, J. (1997). Applications of smart computer aid picking system in the pickingoperation, Department of Industrial Engineering and Management,Management, Chung Hua University, Masters Thesis.
Geng, Y., Li, Y., Lim, A. (2005). A very large-scale neighborhood search approach tocapacitated warehouse routing problem. In International conference on tool withartificial intelligence, pp. 58–65.
Haq, A. N., Jayaprakash, J., & Rengarajan, K. (2005). A hybrid genetic algorithmapproach to mixed-model assembly line balancing. International Journal ofAdvanced Manufacturing Technology, 28(3–4), 337–341.
Liu, T.-P. (2000). Adjusting the EIQ model for the order picking strategy using fuzzyexpert system, Department of Industrial Engineering and Management,Management, I-Shou University, Masters Thesis.
Mendes, A. R., Ramos, A. L., Simaria, A. S., & Vilarinho, P. M. (2005). Combiningheuristic procedures and simulation models for balancing a PC cameraassembly line. Computer and Industrial Engineering, 49(3), 413–431.
Molnar, B., & Lipovszki, G. (2005). Multi-objective routing and scheduling of orderpickers in a warehouse. International Journal of Simulation, 6(5), 22–32.
Ozmehmet, S., Tunali, S. (2005). A hybrid Meta-heuristic approach for solvingSALBP. In The 35th international conference on computers and industrialengineering, pp. 1475–1480.
Rosenblatt, M. J., & Eynan, A. (1989). Deriving the optimal boundaries for class-based automatic storage/retrieval systems. Management Science, 35(12),1519–1524.
Scholl, A., & Becker, C. (2006). State-of-the-art exact and heuristic solutionprocedures for simple assembly line balancing. European Journal ofOperational Research, 168(3), 666–693.
Trappey, A., & Ho, P. S. (2002). Human resource assignment system for distributioncenters. Industrial Management and Data Systems, 102(2), 64–72.
Tung, C.F., Chen, M.-D. (1995). The Picking Operation in a Distribution Center,Commerce Industrial Services Portal, Ministry of Economic Affairs, ROC.
Ugurdag, H. F., Rachamadugu, R., & Papachristou, C. A. (1997). Designing pacedassembly lines with fixed number of stations. European Journal of OperationalResearch, 102(3), 488–501.