a bayesian statistical analysis of human t-cell lymphotropic virus evolutionary rates
TRANSCRIPT

www.elsevier.com/locate/meegid
Infection, Genetics and Evolution 5 (2005) 291–298
A Bayesian statistical analysis of human T-cell
lymphotropic virus evolutionary rates
Philippe Lemeya,*, Oliver G. Pybusb, Sonia Van Doorena, Anne-Mieke Vandammea
aRega Institute for Medical Research, Minderbroedersstraat 10, Katholieke Universiteit Leuven, B-3000 Leuven, BelgiumbDepartment of Zoology, University of Oxford, South Parks Road, Oxford OX1 3PS, UK
Received 14 January 2004; accepted 29 April 2004
Available online 30 November 2004
Abstract
HTLV is a genetically-stable retrovirus that is considered to have evolved partly in concert with human migrations. Its rate of evolution is
low and therefore, difficult to estimate reliably. In the first part of this study, we provide an improved estimate of HTLVevolutionary rate using
anthropological calibration of phylogenetic nodes. We investigate two different anthropological calibrations using a Bayesian method that
implements a relaxed molecular clock model and can combine data from multiple genes. The analysis shows that the two calibrations are
compatible. In the second part, we develop a Bayesian statistical model to combine and compare the anthropology-based estimates of
evolutionary rate with a rate recently calculated using pedigree data from vertically HTLV-infected families. We compare the statistical power
of the two estimates and show that the current pedigree estimate, although resulting in considerably higher evolutionary rates, is too
statistically weak to warrant a re-examination of the commonly used anthropology-based estimates. Statistical uncertainty burdens HTLV rate
estimates based on both anthropological calibrations and on pedigree data; the former method rests on an untested assumption, whilst that
latter is affected by small sample sizes.
# 2004 Elsevier B.V. All rights reserved.
Keywords: HTLV; Evolutionary rate; Bayesian modelling; Anthropology; Molecular clock; Dating; Co-divergence; Phylogeny
1. Introduction
The human T-cell leukemia/lymphotropic virus (HTLV)
is a complex oncogenic retrovirus that has frequently
crossed the species barrier between simians and humans
(Liu et al., 1996; Salemi et al., 1998; Vandamme et al.,
1994). Like the related human immunodeficiency virus
(HIV), HTLV possesses an error-prone reverse transcriptase,
providing it with the potential for high rates of evolution.
However, HTLV does not appear to exploit this capacity
since natural isolates show a remarkable genetic stability.
This is evident when the within-host genetic diversity of
HIVand HTLV is compared. In one study, no mutations were
observed in proviral HTLV-1 isolated from the same person
over several years (Gessain et al., 1992). In contrast,
considerable genetic diversification can be observed during
* Corresponding author. Tel.: +32 16332160; fax: +32 16332131.
E-mail address: [email protected] (P. Lemey).
1567-1348/$ – see front matter # 2004 Elsevier B.V. All rights reserved.
doi:10.1016/j.meegid.2004.04.005
the course of a single HIV infection (Holmes et al., 1992;
Shankarappa et al., 1998). The low sequence diversity of
HTLV is thought to arise from the replication dynamics of
the virus. HTLV probably undergoes a limited number of
replications during infection; high proviral loads are
primarily maintained by clonal expansion of the infected
cells (Wattel et al., 1995). Since mitosis uses cellular DNA
polymerases, HTLV-infected daughter cells contain high-
fidelity copies of the parental provirus.
Virus populations are often sampled at different points in
time. If a statistically significant number of genetic
differences accumulate between time points then the
sampled population is defined as a measurably evolving
population (MEP) (Drummond et al., 2003). Many viruses,
particularly RNA viruses, evolve very rapidly and therefore,
satisfy this condition. A number of statistical methods have
been developed to utilize the temporal information
contained in MEPs (Drummond et al., 2002; Pybus and
Rambaut, 2002; Rambaut, 2000); these methods are

P. Lemey et al. / Infection, Genetics and Evolution 5 (2005) 291–298292
commonly used to investigate the origin of viral epidemics,
to date epidemic and evolutionary events, and to infer past
population dynamics (Korber et al., 2000; Lemey et al.,
2003; Pybus et al., 2001, 2003). The MEP concept can also
be applied to slowly-evolving organisms, provided that
sequences are sampled at sufficiently different time points.
For example, ‘ancient DNA’ has been reliably obtained from
organic material preserved for tens of thousands of years
(Drummond et al., 2003). Unfortunately, no reliable ‘‘fossil
genomes’’ of substantial sequence length are available for
slowly-evolving viruses, so methods developed for MEPs
cannot be used. However, epidemic events can still be dated
if it can be shown that the virus and its host share a common
evolutionary history (McGeoch et al., 2000). Known dates in
the evolutionary history of the host are applied to the
equivalent event in the history of the virus, thereby providing
a calibration for the evolutionary rate of the virus. This ‘co-
divergence’ method requires phylogenetic concordance
between host and pathogen (Holmes, 2003).
Two types of genetic information are now available to
investigate the tempo of HTLV evolution.
(i) Anthropology-based estimates: For the primate T-cell
lymphotropic viruses (PTLV), there is at least partially a
relationship between the phylogeny of the virus and the
geographic location of its host (Vandamme et al., 1994).
Specifically, one node in the HTLV phylogeny appears to
coincide with the earliest migration of humans to Melanesia
and Australia, and this node has been frequently used to
estimate a timescale for PTLV evolution (Meertens and
Gessain, 2003; Meertens et al., 2003; Salemi et al., 2000;
Van Dooren et al., 2001; Yanagihara et al., 1995). To satisfy
the molecular clock assumption, these studies usually
discarded data inconsistent with this null hypothesis
(Meertens and Gessain, 2003; Meertens et al., 2003; Salemi
et al., 2000; Van Dooren et al., 2001). In addition, previous
analyses have not incorporated the uncertainty in the
anthropological dates in a statistical rigorous way. The
extent to which HTLV genetic variation is representative of
human migration patterns is largely unknown; hence such
calibrations obviously depend heavily on the accuracy of the
anthropological date being used.
(ii) Pedigree-based estimates: A recent pedigree-based
study attempted to estimate the HTLV evolutionary rate
without recourse to anthropological events (Van Dooren et
al., 2004). Two different regions in the HTLV-1 genome,
LTR and env, were sampled from infected individuals
belonging to eight families. In total, only five substitutions
were observed during 419 to 1109 years of evolution,
confirming the genetic stability of HTLV. Maximum
likelihood estimates of the evolutionary rate in this study
appeared to be higher than those based on anthropological
calibrations. Although the pedigree-based study does not
satisfy the definition of a MEP, knowledge of birth dates,
ages and sampling dates for the infected families introduces
temporal information that is almost as useful as serially-
sampled sequence data.
In the first part of this study, we provide improved
anthropology-based estimates of HTLV rates using a
Bayesian method that relaxes the rate-constancy assumption
and takes into account the uncertainty in calibration dates.
We also examine the consistency of two different anthro-
pological calibrations. In the second part, we develop a
Bayesian statistical model to compare and combine the
anthropology-based phylogenetic results with the recent
pedigree-based data.
2. Materials and methods
2.1. Consistency of anthropological calibrations
We investigated the consistency of two different
anthropological calibrations using an alignment consisting
of all PTLV coding regions (gag, protease, polymerase,
envelope and tax). This data set contains 27 strains,
including PTLV-1 and PTLV-2. We did not include PTLV-
3 strains because they have a significantly different
nucleotide composition (tested using TREE-PUZZLE;
Strimmer and von Haeseler, 1996). Maximum likelihood
and Bayesian phylogenies were estimated using the GTR
substitution model with gamma-distributed rate variation in
PAUP4b10 and MrBayes, respectively (Huelsenbeck et al.,
2000; Swofford, 1998). The topologies of the ML and
Bayesian MAP trees were identical.
The molecular clock hypothesis was tested using the
likelihood ratio test and rejected in almost all cases (see
Section 3). Therefore, divergence times were estimated
using multidivtime, which implements a ‘relaxed clock’
model of rate variation. This model is best described as a
Brownian motion process that operates on the logarithm of
the rates of molecular evolution (Thorne et al., 1998). Rates
are assumed to be constant on a particular branch of a tree
but they are allowed to vary among different branches. The
autocorrelation between the rates on an ancestral branch and
its descendent depends on the time elapsed between those
branches. To enable inference under this parameter-rich
model Thorne et al. (1998) have adopted a Bayesian
framework. MULTIDIVTIME allows information from
multiple genes to be combined and also tests for correlated
changes in evolutionary rates among genes (Kishino et al.,
2001; Thorne and Kishino, 2002; Thorne et al., 1998).
MULTIDIVTIME uses a Metropolis-Hastings Markov
Chain Monte Carlo (MCMC) algorithm to obtain posterior
estimates of evolutionary rates and of the dates of each node
in a phylogeny. MCMC methods allow simulating a Markov
chain process with a stationary distribution that is the
probability density of interest. More specifically, the
Metropolis-Hastings algorithm simulates sequential values
from this chain until it converges on the stationary
distribution (the ‘burn-in’ period). The algorithm then
samples values from the state of the chain at regular intervals
to approximate independent samples from the stationary

P. Lemey et al. / Infection, Genetics and Evolution 5 (2005) 291–298 293
distribution (Hastings, 1970; Metropolis et al., 1953). We
calculated a marginal probability distribution for the dates
of the calibration nodes (see Table 2 for more algorithm
details) from 10,000 states sampled every 500th state after
burn-in.
The relaxed clock model was calibrated by constraining
the divergence time for a node in the PTLV tree to a specified
time interval that represents the upper and lower limits of a
hypothesized anthropological migration event. The most
commonly used calibration of the PTLV phylogeny is based
on the early migration of Melanesian settlers (the
‘Melanesian’ calibration). According to genetic and arche-
ological evidence, this migration from Asia to Melanesia
occurred 40,000–60,000 years ago. This time-interval
includes uncertainty in the time of the earliest migration
to these islands (Cavalli-Sforza et al., 1994; Roberts et al.,
1990; Van Dooren et al., 2001). However, there is another
putative calibration node in the PTLV phylogeny: HTLV-2 is
assumed to have an ancient African origin and several
investigators have suggested that the virus among native
American Indians was brought originally from Asia into the
Americas 15,000–35,000 years ago during the migration of
infected Asian populations over the Bering land bridge
(Biggar et al., 1996; Neel et al., 1994; Suzuki and Gojobori,
1998). This event may correspond to the common ancestor
of the HTLV-2a and HTLV-2b subtypes (the ‘Bering’
calibration).
2.2. Statistical model of HTLV evolutionary rate
We developed a Bayesian statistical model, with
evolutionary rate as its central variable, to combine and
compare the information obtained from the anthropological
and pedigree data sets. The essence of a Bayesian approach
is to calculate how the observation of new evidence (data)
changes our existing belief (prior) in a certain hypothesis.
Here, we will consider the results of the anthropological
calibration analysis as our prior belief, and the pedigree data
as our new evidence.
Evolutionary rates vary across the PTLV genome.
Therefore exactly the same genome region must be used
in the anthropological and pedigree analyses in order to
combine and compare the results in a valid manner. To this
end, we repeated the anthropological analysis (as described
above) using the exact same gene regions as used in the
pedigree study (Van Dooren et al., 2004). This resulted in
LTR and env datasets that contained 50 and 68 strains,
respectively. As before, the molecular clock hypothesis was
tested and rejected, so evolutionary rate estimates were
obtained using MULTIDIVTIME. The relaxed molecular
clock was calibrated by constraining the divergence time for
the HTLV-1c subtype (MEL5) to 40,000–60,000 years ago.
MULTIDIVTIME was used to calculate a marginal posterior
probability distribution for the average evolutionary rate
(obtained from 2000 states of posterior rates at each node,
sampled every 5000th state after burn-in).
A gamma distribution was then fitted to the MULTI-
DIVTIME marginal posterior density (using maximum
likelihood). This gamma distribution represents our prior
information about HTLV evolutionary rate in the Bayesian
statistical model. If l denotes evolutionary rate then:
l�Gammaða;bÞ (1)
where a and b are the parameters of the gamma distribution,
and ‘‘�’’ represents ‘‘is distributed according to’’.
To incorporate Van Dooren et al.’s (2004) data we used a
homogenous Poisson process to model the number
substitutions (Y) that were observed in the pedigree sequence
data (see Van Dooren et al., 2004 for more details).
Therefore:
Y � PoissonðltÞIðYlow; YupÞ (2)
where t denotes the number of years represented in the
pedigrees, and I represents an indicator function that censors
the Poisson distribution. The indicator function is needed
because some of the mutations in the pedigree analysis were
ambiguous. The lower limit (Ylow) excludes the ambiguous
mutations whilst the upper limit (Yup) includes them as
additional substitutions. In addition, the number of years
represented by the pedigrees was only known to lie within a
certain range, from tlow = 419 to tup = 1101 years. Therefore,
the number of years t is modeled as a covariate, with an
interval-censored normal distribution:
t �Normalðm; sÞIðtlow; tupÞ (3)
In our analysis, mean m = 680 years and S.D.
s = 100,000.
To obtain a posterior distribution for the evolutionary rate
that combines both the pedigree and the anthropological
data, we used MCMC, as implemented in WINBUGS v1.4
(http://www.mrc-bsu.cam.ac.uk/bugs/). Convergence was
investigated in CODA (http://www.mrc-bsu.cam.ac.uk/
bugs/classic/coda04/readme.shtml).
3. Results
3.1. Consistency of anthropological dates
We used full genome PTLV sequences to investigate
whether the assumed dates for the ‘Melanesian’ and
‘Bering’ migration events were consistent with each other
when applied to the PTLV phylogeny. As shown in Table 1,
the molecular clock was tested for each gene and for the full
genome (Table 1). The molecular clock hypothesis was
consistently rejected (except for the tax gene). Interestingly,
there is a significant correlation between alignment length
and the likelihood that the clock is rejected, for both
nucleotide (P < 0.01, R2 = 0.93) and amino acid (P < 0.01,
R2 = 0.98) alignments. In the absence of clocklike evolution,
we used a Bayesian approach that implements a relaxed
clock model and is capable of handling multigene data sets
(Thorne and Kishino, 2002).
P. Lemey et al. / Infection, Genetics and Evolution 5 (2005) 291–298294
Table 1
Molecular clock tests
Genome region Nucleotides LRS Amino acids LRS
gag 1296 59.2a 432 48.6a
prot 537 65.45a 179 45.1a
pol 2601 104.2a 867 76.0a
env 1461 78.2a 487 62.8a
tax 981 27.9 327 45.8a
Full genome 6817 211.2a 2246 132.4a
The likelihood ratio statistic (LRS) is defined as twice the difference in log
likelihood under the clock and different-rates models. Number in the
nucleotide and amino acid columns indicates the length of the input
alignment.a Indicates a significant rejection of the molecular clock hypothesis
(P < 0.05).
Fig. 1 shows the PTLV phylogeny used to estimate
divergence times. When the molecular clock was calibrated
using the dates for the ‘Melanesian’ migration event clade,
the estimated date for the ‘Bering’ calibration node was
26,860 (19,000–36,930) years ago (Table 2). When the dates
for the ‘Bering’ migration were constrained between
15,000–35,000, the estimated date for the ‘Melanesian’
calibration node was 44,980 (26,340–72,420) years ago.
Hence, the calibrations appear to be compatible. Not
surprisingly, the confidence intervals for the estimated dates
are reduced when both constraints were applied simulta-
neously (Table 2). It is interesting to note that in the
multigene data set, no pair of genes had significantly
correlated evolutionary changes.
3.2. Statistical model of HTLV evolutionary rate
We performed a Bayesian analysis to combine and
compare pedigree-based and anthropology-based estimates
of HTLV evolutionary rate. To obtain a comparable
anthropology-based estimate, we repeated the relaxed-clock
MULTIDIVTIME analysis using the exact same HTLV-1
genome regions as in the pedigree study (Van Dooren et al.,
2004). The single-rate molecular clock was significantly
rejected for both LTR and env data sets. The relaxed clock
was calibrated by constraining the date of the ‘Melanesian’
calibration node to 40,000–60,000 years ago. This resulted
in an estimated rate of 5.6 � 10�7 (1.2 � 10�7 to
1.1 � 10�6) and 2.1 � 10�7 (2.1 � 10�8 to 4.5 � 10�7)
substitutions/site/year for LTR and env, respectively. These
estimates are in good agreement with previous calculations
based on the same calibration (Salemi et al., 2000;
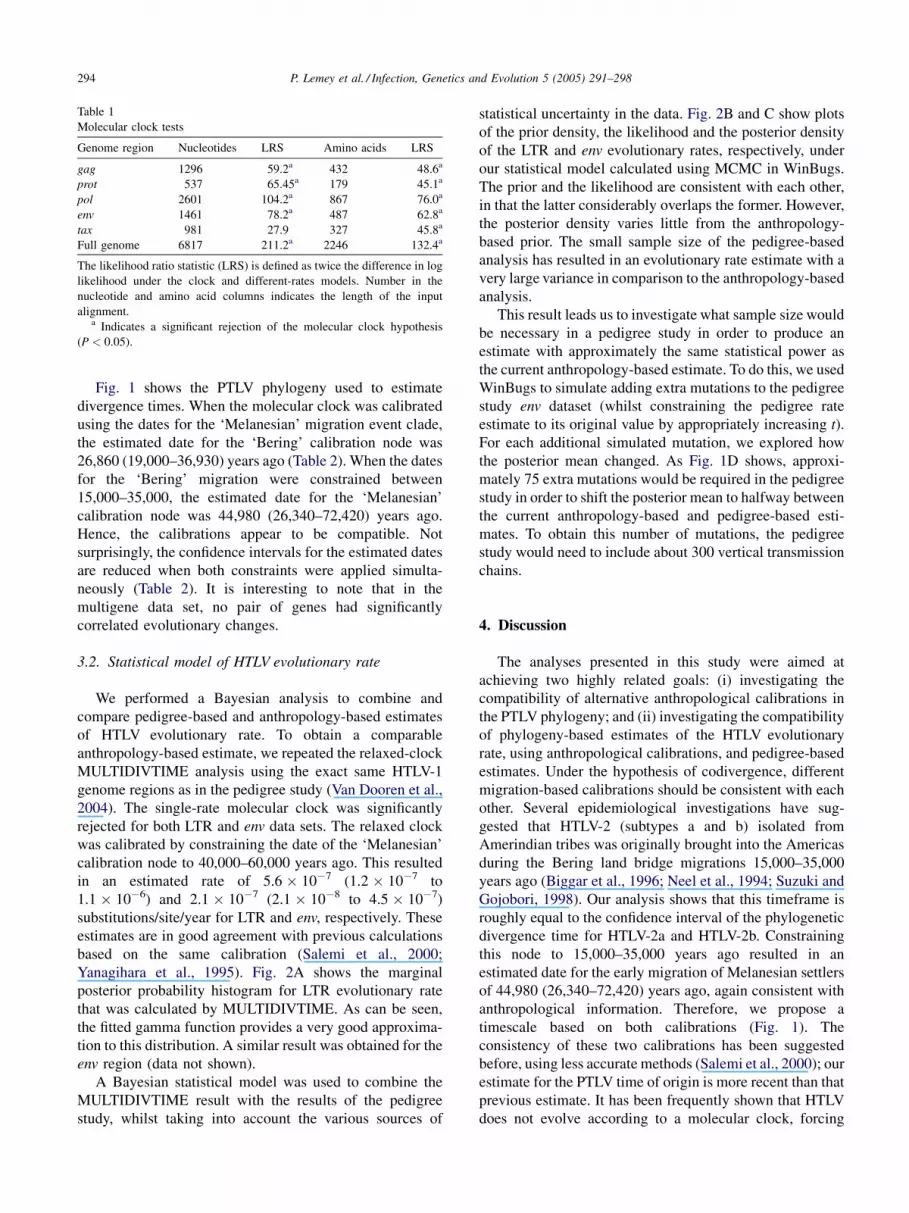
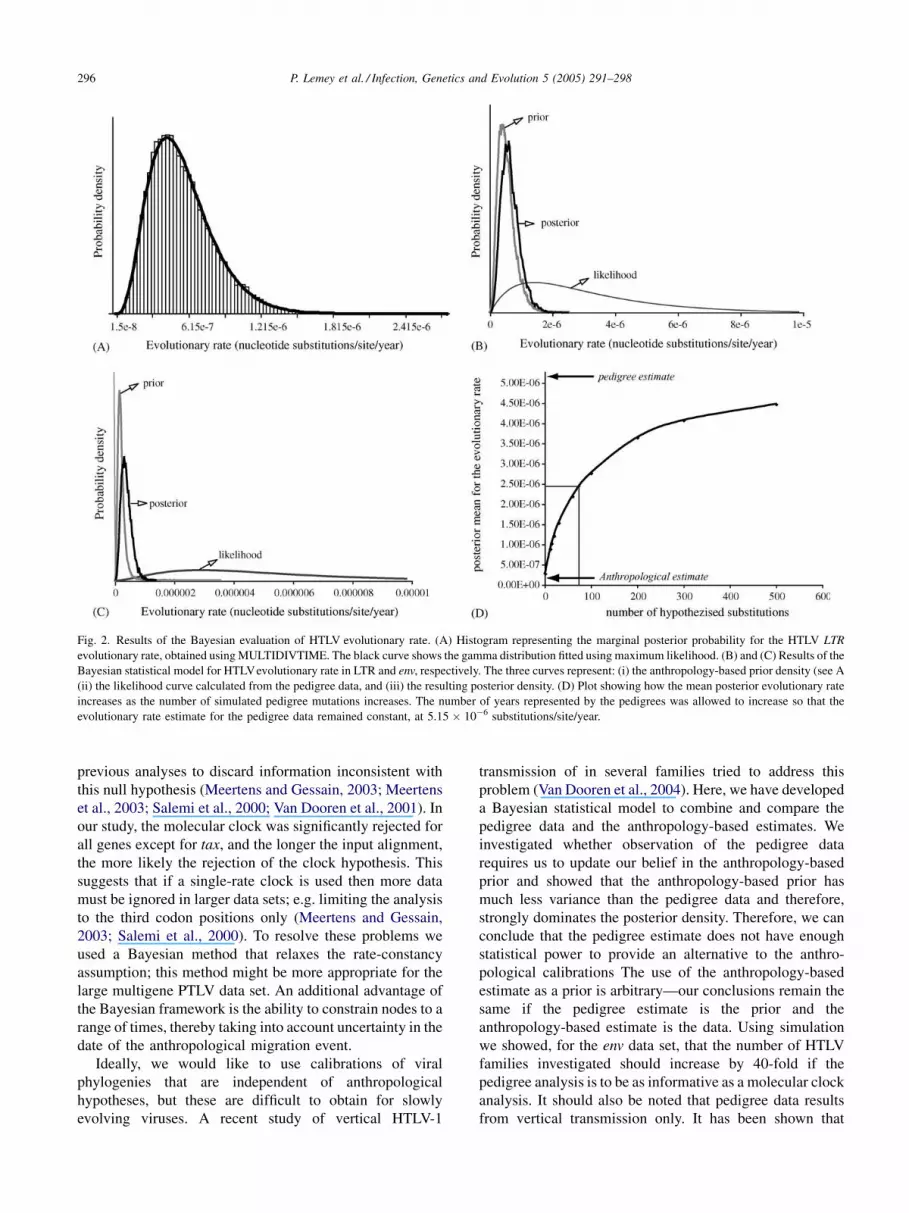
Yanagihara et al., 1995). Fig. 2A shows the marginal
posterior probability histogram for LTR evolutionary rate
that was calculated by MULTIDIVTIME. As can be seen,
the fitted gamma function provides a very good approxima-
tion to this distribution. A similar result was obtained for the
env region (data not shown).
A Bayesian statistical model was used to combine the
MULTIDIVTIME result with the results of the pedigree
study, whilst taking into account the various sources of
statistical uncertainty in the data. Fig. 2B and C show plots
of the prior density, the likelihood and the posterior density
of the LTR and env evolutionary rates, respectively, under
our statistical model calculated using MCMC in WinBugs.
The prior and the likelihood are consistent with each other,
in that the latter considerably overlaps the former. However,
the posterior density varies little from the anthropology-
based prior. The small sample size of the pedigree-based
analysis has resulted in an evolutionary rate estimate with a
very large variance in comparison to the anthropology-based
analysis.
This result leads us to investigate what sample size would
be necessary in a pedigree study in order to produce an
estimate with approximately the same statistical power as
the current anthropology-based estimate. To do this, we used
WinBugs to simulate adding extra mutations to the pedigree
study env dataset (whilst constraining the pedigree rate
estimate to its original value by appropriately increasing t).
For each additional simulated mutation, we explored how
the posterior mean changed. As Fig. 1D shows, approxi-
mately 75 extra mutations would be required in the pedigree
study in order to shift the posterior mean to halfway between
the current anthropology-based and pedigree-based esti-
mates. To obtain this number of mutations, the pedigree
study would need to include about 300 vertical transmission
chains.
4. Discussion
The analyses presented in this study were aimed at
achieving two highly related goals: (i) investigating the
compatibility of alternative anthropological calibrations in
the PTLV phylogeny; and (ii) investigating the compatibility
of phylogeny-based estimates of the HTLV evolutionary
rate, using anthropological calibrations, and pedigree-based
estimates. Under the hypothesis of codivergence, different
migration-based calibrations should be consistent with each
other. Several epidemiological investigations have sug-
gested that HTLV-2 (subtypes a and b) isolated from
Amerindian tribes was originally brought into the Americas
during the Bering land bridge migrations 15,000–35,000
years ago (Biggar et al., 1996; Neel et al., 1994; Suzuki and
Gojobori, 1998). Our analysis shows that this timeframe is
roughly equal to the confidence interval of the phylogenetic
divergence time for HTLV-2a and HTLV-2b. Constraining
this node to 15,000–35,000 years ago resulted in an
estimated date for the early migration of Melanesian settlers
of 44,980 (26,340–72,420) years ago, again consistent with
anthropological information. Therefore, we propose a
timescale based on both calibrations (Fig. 1). The
consistency of these two calibrations has been suggested
before, using less accurate methods (Salemi et al., 2000); our
estimate for the PTLV time of origin is more recent than that
previous estimate. It has been frequently shown that HTLV
does not evolve according to a molecular clock, forcing

P. Lemey et al. / Infection, Genetics and Evolution 5 (2005) 291–298 295
Fig. 1. Maximum likelihood tree for 26 full-genome PTLV strains. Types and subtypes of the viral strains are indicated at the tips of the tree. Numbers at the
nodes indicate the percentage of bootstrap samples (1000 replicates) in which the node is supported (only values >80% are shown). The ‘Melanesian’ and
‘Bering’ calibration nodes used in the relaxed molecular clock analysis are indicated with arrows. The time-scale for the tree was calculated by
MULTIDIVTIME using both calibration points. More detailed time-scales for the PTLV-1 and PTLV-2 clades separately are shown below the global
time-scale.
Table 2
Dates estimated using the anthropological calibrations
Anthropological calibration(s) used Estimated date of ‘Melanesian’ node (a) Estimated date of ‘Bering’ node (b)
Melanesian migration event 49400 (40400–59400) 26860 (19000–36930)
Bering migration event 44980 (26340–72420) 23810 (15280–34350)
Melanesian and Bering migration events 49130 (40350–59220) 26220 (19030–33900)
(a) and (b) refer to the nodes in Fig. 1. The chains in MULTIDIVTIME were run for 5 � 106 states and were sampled every 500th state after burn-in (up to 105
states). The prior for the substitution rate was normal (mean = 10�7 substitutions/site/year; S.D. = 0.0001). The prior for the root height was also normal
(mean = 106 years ago; S.D. = 109).
P. Lemey et al. / Infection, Genetics and Evolution 5 (2005) 291–298296
Fig. 2. Results of the Bayesian evaluation of HTLV evolutionary rate. (A) Histogram representing the marginal posterior probability for the HTLV LTR
evolutionary rate, obtained using MULTIDIVTIME. The black curve shows the gamma distribution fitted using maximum likelihood. (B) and (C) Results of the
Bayesian statistical model for HTLVevolutionary rate in LTR and env, respectively. The three curves represent: (i) the anthropology-based prior density (see A
(ii) the likelihood curve calculated from the pedigree data, and (iii) the resulting posterior density. (D) Plot showing how the mean posterior evolutionary rate
increases as the number of simulated pedigree mutations increases. The number of years represented by the pedigrees was allowed to increase so that the
evolutionary rate estimate for the pedigree data remained constant, at 5.15 � 10�6 substitutions/site/year.
previous analyses to discard information inconsistent with
this null hypothesis (Meertens and Gessain, 2003; Meertens
et al., 2003; Salemi et al., 2000; Van Dooren et al., 2001). In
our study, the molecular clock was significantly rejected for
all genes except for tax, and the longer the input alignment,
the more likely the rejection of the clock hypothesis. This
suggests that if a single-rate clock is used then more data
must be ignored in larger data sets; e.g. limiting the analysis
to the third codon positions only (Meertens and Gessain,
2003; Salemi et al., 2000). To resolve these problems we
used a Bayesian method that relaxes the rate-constancy
assumption; this method might be more appropriate for the
large multigene PTLV data set. An additional advantage of
the Bayesian framework is the ability to constrain nodes to a
range of times, thereby taking into account uncertainty in the
date of the anthropological migration event.
Ideally, we would like to use calibrations of viral
phylogenies that are independent of anthropological
hypotheses, but these are difficult to obtain for slowly
evolving viruses. A recent study of vertical HTLV-1
transmission of in several families tried to address this
problem (Van Dooren et al., 2004). Here, we have developed
a Bayesian statistical model to combine and compare the
pedigree data and the anthropology-based estimates. We
investigated whether observation of the pedigree data
requires us to update our belief in the anthropology-based
prior and showed that the anthropology-based prior has
much less variance than the pedigree data and therefore,
strongly dominates the posterior density. Therefore, we can
conclude that the pedigree estimate does not have enough
statistical power to provide an alternative to the anthro-
pological calibrations The use of the anthropology-based
estimate as a prior is arbitrary—our conclusions remain the
same if the pedigree estimate is the prior and the
anthropology-based estimate is the data. Using simulation
we showed, for the env data set, that the number of HTLV
families investigated should increase by 40-fold if the
pedigree analysis is to be as informative as a molecular clock
analysis. It should also be noted that pedigree data results
from vertical transmission only. It has been shown that

P. Lemey et al. / Infection, Genetics and Evolution 5 (2005) 291–298 297
horizontal HTLV transmission, most notably in injecting
drug user populations, can lead to increased substitution
rates (Salemi et al., 1999). Therefore, a phylogeny-based
evolutionary rate estimate will be a composite one (Holmes,
2003). Our estimates for the evolutionary rate resulted in a
posterior mean of 3.44 � 10�7 (confidence interval of
1.091 � 10�7 to 7.118 � 10�7) substitutions/site/year and
6.55 � 10�7 (confidence interval of 2.248 � 10�7 to
1.31 � 10�6) substitutions/site/year for env and LTR,
respectively. Not surprisingly, these rates are very similar
to previous phylogeny-based estimates (Song et al., 1994;
Yanagihara et al., 1995). Other retroviruses, like HIV,
Simian Immunodeficiency Virus, Murine Leukemia Virus,
Equine Infectious Anemia Virus and Rous Sarcoma Viruses
have rates in the order of 10�3 substitutions/site/year (Burns
and Desrosiers, 1991; Clements et al., 1988; Suzuki et al.,
2000). This difference has been explained by the replication
of HTLV proviral genomes by host DNA polymerases,
resulting in high-fidelity copies of the HTLV genome
(Wattel et al., 1995).
The question as to what extent HTLV evolution has been
shaped by human migrations is far from resolved. A more
extensive sampling of HTLV genetic diversity worldwide is
essential to address this problem. Although PTLV phylo-
genies calibrated with human migration dates result in
relatively precise estimates for the evolutionary rate, it
remains difficult to evaluate their accuracy since they rely on
an anthropological assumption that may not be correct.
Further research is necessary to estimate the probability of
the anthropological hypotheses used; this uncertainty should
then be added to the Bayesian statistical model developed
here. Pedigree-based data is important, as it is anthropology-
independent. However, much more data is needed to obtain
reliable evolutionary rate estimates. So, there is a problem of
uncertainty for both types of information: the large variance
of current pedigree data and the underlying assumption of
anthropological calibrations. Our analysis indicates that the
pedigree data does not urge for a different point of view on
the HTLVevolutionary rate. However, it should be noted that
the pedigree data at hand would not urge for a different point
of view on many different HTLV prior specifications. For
example, the estimated rate from the pedigree data would
most probably not discriminate between pre- or post-
Columbian introduction of HTLV-1 subtype in Latin
America (Miura et al., 1994; Van Dooren et al., 1998).
However, the probabilistic framework developed here might
be useful in addressing similar scenarios for other slowly
evolving viruses.
Acknowledgements
We thank A. Komarek for assistance with the Winbugs
analyses. This work was supported by the Flemish Fonds
voor Wetenschappelijk Onderzoek (FWO G.0288.01); P.L.
was supported by the Institute for the Promotion of
Innovation through Science and Technology in Flanders
(IWT Vlaanderen); O.G.P. was supported by the Welcome
Trust.
References
Biggar, R.J., Taylor, M.E., Neel, J.V., Hjelle, B., Levine, P.H., Black, F.L.,
Shaw, G.M., Sharp, P.M., Hahn, B.H., 1996. Genetic variants of human
T-lymphotrophic virus type II in American Indian groups. Virology 216,
165–173.
Burns, D.P., Desrosiers, R.C., 1991. Selection of genetic variants of simian
immunodeficiency virus in persistently infected rhesus monkeys. J.
Virol. 65, 1843–1854.
Cavalli-Sforza, L., Menozzi, L., Piazza, A., 1994. The History and Geo-
graphy of Human Genes. Princeton University Press, Princeton, N.J..
Clements, J.E., Gdovin, S.L., Montelaro, R.C., Narayan, O., 1988.
Antigenic variation in lentiviral diseases. Annu. Rev. Immunol. 6,
139–159.
Drummond, A.J., Nicholls, G.K., Rodrigo, A.G., Solomon, W., 2002.
Estimating mutation parameters, population history and genealogy
simultaneously from temporally spaced sequence data. Genetics 161,
1307–1320.
Drummond, A.J., Pybus, O.G., Rambaut, A., Forsberg, R., Rodrigo, A.G.,
2003. Measurably evolving populations. Trends Ecol. Evol. 18, 481–
488.
Gessain, A., Gallo, R.C., Franchini, G., 1992. Low degree of human T-cell
leukemia/lymphoma virus type I genetic drift in vivo as a means of
monitoring viral transmission and movement of ancient human popula-
tions. J. Virol. 66, 2288–2295.
Hastings, W.K., 1970. Monte Carlo sampling methods using Markov chains
and their applications. Biometrika 57, 97–109.
Holmes, E.C., 2003. Molecular clocks and the puzzle of RNA virus origins.
J. Virol. 77, 3893–3897.
Holmes, E.C., Zhang, L.Q., Simmonds, P., Ludlam, C.A., Brown, A.J.,
1992. Convergent and divergent sequence evolution in the surface
envelope glycoprotein of human immunodeficiency virus type 1 within
a single infected patient. Proc. Natl. Acad. Sci. U.S.A. 89, 4835–4839.
Huelsenbeck, J.P., Larget, B., Swofford, D., 2000. A compound Poisson
process for relaxing the molecular clock. Genetics 154, 1879–1892.
Kishino, H., Thorne, J.L., Bruno, W.J., 2001. Performance of a divergence
time estimation method under a probabilistic model of rate evolution.
Mol. Biol. E 18, 352–361.
Korber, B., Muldoon, M., Theiler, J., Gao, F., Gupta, R., Lapedes, A., Hahn,
B.H., Wolinsky, S., Bhattacharya, T., 2000. Timing the ancestor of the
HIV-1 pandemic strains. Science 288, 1789–1796.
Lemey, P., Pybus, O.G., Wang, B., Saksena, N.K., Salemi, M., Vandamme,
A.M., 2003. Tracing the origin and history of the HIV-2 epidemic. Proc.
Natl. Acad. Sci. U.S.A. 100, 6588–6592.
Liu, H.F., Goubau, P., Van, B., Van, L., Chen, Y.C., Desmyter, J., Van-
damme, A.M., 1996. The three human T-lymphotropic virus type I
subtypes arose from three geographically distinct simian reservoirs. J.
Gen. Virol. 77 (Pt 2), 359–368.
McGeoch, D.J., Dolan, A., Ralph, A.C., 2000. Toward a comprehensive
phylogeny for mammalian and avian herpesviruses. J. Virol. 74, 10401–
10406.
Meertens, L., Gessain, A., 2003. Divergent simian T-cell lymphotropic virus
type 3 (STLV-3) in wild-caught Papio hamadryas papio from Senegal:
widespread distribution of STLV-3 in Africa. J. Virol. 77, 782–789.
Meertens, L., Shanmugam, V., Gessain, A., Beer, B.E., Tooze, Z., Heneine,
W., Switzer, W.M., 2003. A novel, divergent simian T-cell lymphotropic
virus type 3 in a wild-caught red-capped mangabey (Cercocebus
torquatus torquatus) from Nigeria. J. Gen. Virol. 84, 2723–2727.
Metropolis, N., Rosenbluth, A.W., Rosenbluth, M.N., Teller, A.H., Teller,
E., 1953. Equation of state calculations by fast computing machines. J.
Chem. Phys. 21, 1087–1092.

P. Lemey et al. / Infection, Genetics and Evolution 5 (2005) 291–298298
Miura, T., Fukunaga, T., Igarashi, T., Yamashita, M., Ido, E., Funahashi, S.,
Ishida, T., Washio, K., Ueda, S., Hashimoto, K., 1994. Phylogenetic
subtypes of human T-lymphotropic virus type I and their relations to the
anthropological background. Proc. Natl. Acad. Sci. U.S.A. 91, 1124–
1127.
Neel, J.V., Biggar, R.J., Sukernik, R.I., 1994. Virologic and genetic studies
relate Amerind origins to the indigenous people of the Mongolia/
Manchuria/southeastern Siberia region. Proc. Natl. Acad. Sci. U.S.A.
91, 10737–10741.
Pybus, O.G., Charleston, M.A., Gupta, S., Rambaut, A., Holmes, E.C.,
Harvey, P.H., 2001. The epidemic behavior of the hepatitis C virus.
Science 292, 2323–2325.
Pybus, O.G., Drummond, A.J., Nakano, T., Robertson, B.H., Rambaut, A.,
2003. The epidemiology and iatrogenic transmission of hepatitis C virus
in Egypt: a Bayesian coalescent approach. Mol. Biol. E 20, 381–387.
Pybus, O.G., Rambaut, A., 2002. GENIE: estimating demographic history
from molecular phylogenies. Bioinformatics 18, 1404–1405.
Rambaut, A., 2000. Estimating the rate of molecular evolution: incorporat-
ing non-contemporaneous sequences into maximum likelihood phylo-
genies. Bioinformatics 16, 395–399.
Roberts, R.G., Jones, R., Smith, M.A., 1990. Report of thermoluminescence
dates supporting the arrival of people between 50 and 60 kya in southern
Australia. Nature 345, 153.
Salemi, M., Desmyter, J., Vandamme, A.M., 2000. Tempo and mode of
human and simian T-lymphotropic virus (HTLV/STLV) evolution
revealed by analyses of full-genome sequences. Mol. Biol. E 17,
374–386.
Salemi, M., Lewis, M., Egan, J.F., Hall, W.W., Desmyter, J., Vandamme,
A.M., 1999. Different population dynamics of human T cell lympho-
tropic virus type II in intravenous drug users compared with endemically
infected tribes. Proc. Natl. Acad. Sci. U.S.A. 96, 13253–13258.
Salemi, M., Van, D., Audenaert, E., Delaporte, E., Goubau, P., Desmyter, J.,
Vandamme, A.M., 1998. Two new human T-lymphotropic virus type I
phylogenetic subtypes in seroindeterminates, a Mbuti pygmy and a
Gabonese, have closest relatives among African STLV-I strains. Virol-
ogy 246, 277–287.
Shankarappa, R., Gupta, P., Learn, G.H., Rodrigo, A.G., Rinaldo, C.R.,
Gorry, M.C., Mullins, J.I., Nara, P.L., Ehrlich, G.D., 1998. Evolution of
human immunodeficiency virus type 1 envelope sequences in infected
individuals with differing disease progression profiles. Virology 241,
251–259.
Song, K.J., Nerurkar, V.R., Saitou, N., Lazo, A., Blakeslee, J.R., Miyoshi, I.,
Yanagihara, R., 1994. Genetic analysis and molecular phylogeny of
simian T-cell lymphotropic virus type I: evidence for independent virus
evolution in Asia and Africa. Virology 199, 56–66.
Strimmer, K., von Haeseler, A., 1996. Quartet puzzling: a quartet maximum
likelihood method for reconstructing tree topologies. Mol. Biol. E 13,
964–969.
Suzuki, Y., Gojobori, T., 1998. The origin and evolution of human
T-cell lymphotropic virus types I and II. Virus Genes 16, 69–
84.
Suzuki, Y., Yamaguchi-Kabata, Y., Gojobori, T., 2000. Nucleotide substitu-
tion rates of HIV-1. AIDS Rev. 2, 39–47.
Swofford, D.L., 1998. PAUP 4.0–Phylogenetic Analysis Using Parsimony
(and other methods). Sinauer Assoc., Sunderland, MA.
Thorne, J.L., Kishino, H., 2002. Divergence time and evolutionary rate
estimation with multilocus data. Syst. Biol. 51, 689–702.
Thorne, J.L., Kishino, H., Painter, I.S., 1998. Estimating the rate of
evolution of the rate of molecular evolution. Mol. Biol. E 15, 1647–
1657.
Van Dooren, S., Gotuzzo, E., Salemi, M., Watts, D., Audenaert, E., Duwe,
S., Ellerbrok, H., Grassmann, R., Hagelberg, E., Desmyter, J., Van-
damme, A.M., 1998. Evidence for a post-Columbian introduction of
human T-cell lymphotropic virus [type I] [corrected] in Latin America.
J. Gen. Virol. 79 (Pt 11), 2695–2708.
Van Dooren, S., Pybus, O.G., Salemi, M., Liu, H.F., Goubau, P., Remon-
degui, C., Talarmin, A., Gotuzzo, E., Alcantara, L.C., Galvao-Castro, B.,
Vandamme, A.M., 2004. The low evolutionary rate of human T-cell
lymphotropic virus type-1 confirmed by analysis of vertical transmis-
sion chains. Mol. Biol. E 21, 603–611.
Van Dooren, S., Salemi, M., Vandamme, A.M., 2001. Dating the origin of
the African human T-cell lymphotropic virus type-i (HTLV-I) subtypes.
Mol. Biol. E 18, 661–671.
Vandamme, A.M., Liu, H.F., Goubau, P., Desmyter, J., 1994. Primate T-
lymphotropic virus type I LTR sequence variation and its phylogenetic
analysis: compatibility with an African origin of PTLV-I. Virology 202,
212–223.
Wattel, E., Vartanian, J.P., Pannetier, C., Wain, H., 1995. Clonal expansion
of human T-cell leukemia virus type I-infected cells in asymptomatic
and symptomatic carriers without malignancy. J. Virol. 69, 2863–
2868.
Yanagihara, R., Saitou, N., Nerurkar, V.R., Song, K.J., Bastian, I., Franchini,
G., Gajdusek, D.C., 1995. Molecular phylogeny and dissemination of
human T-cell lymphotropic virus type I viewed within the context of
primate evolution and human migration. Cell Mol. Biol. 41 (Suppl. 1),
S145–S161.