5 aiee energy symposium
TRANSCRIPT

the Italian Affiliate of the
in cooperation with
5th AIEE Energy Symposium
‐ energy perspec ves beyond COVID19 ‐
Conference Proceedings
www.aieesymposium.eu

the Italian Affiliate of the
Published by: AIEE - The Italian Association of Energy Economists, Rome, Italy
5th AIEE Energy Symposium
Current and Future Challenges to Energy Security 15-17 December 2020, Italy virtual conference organized in cooperation with the SDA Bocconi School of Management

ii
5th AIEE Energy Symposium - Current and Future Challenges to Energy Security - Executive Summaries. virtual conference, 15-17 December, Italy. Published 2020 by: The Italian Association of Energy Economists (AIEE), Rome , Italy ISBN: 978-88-942781-9-4 The 5th AIEE Energy Symposium - Current and Future Challenges to Energy Security was organized by AIEE (Associazione Italiana Economisti dell’Energia) in cooperation with the SDA Bocconi School of Management © Associazione Italiana Economisti dell‘Energia (www.aiee.it). The editors and publisher assume no rcsponsibility for the views expressed by the authors or the Executive Summaries printed in this book.
iii
ACKNOWLEDGEMENTS The editors and the publisher acknowledge the support of the following sponsors of the 5thAIEE Energy Symposium on Current and Future Challenges to Energy Security
Axpo Edison
Elettricità Futura Enel ERG
Esso Italiana FEDERMANAGER
Horus Green Energy Investment Shell Italia
Teon Utilitalia
Veos

iv
v
ORGANIZATION CARLO DI PRIMIO, President, AIEE, Italy (SPONSORSHIP COMMITTEE CHAIR) CARLO ANDREA BOLLINO, Professor University of Perugia, Honorary President AIEE, Italy (GENERAL CONFERENCE CHAIR) AGIME GERBETI, President of the AIEE Scientific Committe, Italy (SCIENTIFIC COMMITTEE CHAIR) MATTEO DI CASTELNUOVO, Associate Professor of Practice, Just Energy Transition Coordinator, Sustainability Lab, SDA Bocconi School of Management, Italy (PROGRAMME COMMITTEE CHAIR) ANKA SERBU, Head of External Relations & Communication AIEE, Italy (ORGANIZATION AND COORDINATION) THE SCIENTIFIC COMMITTEE Amela Ajanovic, Professor TU WIEN, Energy Economics Group (EEG), Austria Francesco Asdrubali, Professor, Depatment of Engineering, University Roma Tre, Italy Federico Boffa, Professor of Applied Economics, Free University of Bolzano, Italy Carlo Andrea Bollino, Professor University of Perugia, Italy Christophe Bonnery, Executive Vice President IAEE, France Carlo Cambini, Professor Polytechnic University of Torino, Italy Pantelis Capros, Professor, E3MLab – Energy Economy Environment Modelling Lab, Greece Anna Creti, Professor, Université Paris Dauphine, France Çiğdem Çelik, Professor İstanbul Okan University Vittorio D’Ermo, Vice President AIEE, Italy Maria Chiara D’Errico, Post Doctoral Researcher, University of Perugia, Italy Eric Delarue, Professor KU Leuven Department of Mechanical Engineering, Belgium Matteo Di Castelnuovo, Associate Professor, Director of the Master MaGER, SDA Boocconi School of Management, Italy Paul Ekins, Director UCL Institute for Sustainable Resources, UK Ivan Faiella, Directorate General for Economics, Statistics and Research, Banca d’Italia, Italy Marco Falcone, Government Relations and Issues Manager, Esso Italiana, ExxonMobil Group, Italy
Fulvio Fontini, Professor, University of Padova, Italy Elena Fumagalli, Assistant Professor, Copernicus Institute of Sustainable Development, Utrecht University, The Netherlands Antonio Geracitano, Adjunct Professor, University Tor Vergata, Italy Monica Giulietti, Professor, Head of the Economics discipline group, Loughborough University, UK Jean Michel Glachant, European University Institute-EUI, Florence School, Vice President for Communication IAEE Nevenka Hrovatin, Professor School of Economics and Business, University of Ljubljana, Slovenia Mario Iannotti, Advisor on Sustainable Development (IMELS), Ministry of Environment, Italy Xavier Labandeira, Professor, University of Vigo, Spain Carlo Mari, Professor Department of Management and Business Administration, University of Chieti-Pescara, Italy David Newbery, Professoor, University of Cambridge, UK Spiros Papaefthimiou, Technical University of Crete, President of the HAEE, Grece

vi
Silvia Pariente-David, Consultant on energy and climate change and Senior advisor – Center for
Mediterranean Integration, World Bank, France Aaron Praktiknjo, Professor RWTH Aachen University, Council Member of IAEE, Germany Lucia Visconti Parisio, Professor, Bicocca University, Italy Alberto Ponti, Senior Partner Head of Strategy & Business Development F2i Sgr, Italy Ionut Purica, Professor Advisory Center for Energy and Environment, Romanian Academy, Romania Pippo Ranci, Profesor Florence School of Regulation European University Institute, Italy Nicoletta Rangone, Professor LUMSA University, Italy Alessandro Rubino, Professor University of Bari, Italy Federico Santi, Professor University of Rome La Sapienza, Italy Alessandro Sapio, Professor, Parthenope University of Naples, Italy Francesco Scalia, University of Cassino and Southern Lazio, Italy Mine Yücel, Senior Research Advisor, Federal Reserve Bank of Dallas, USA G.B. Zorzoli, President Coordinamento FREE (Coordination of the Development of Renewable Energy Sources), Italy THE PROGRAMME COMMITTEE Fabio Catino, Program Manager at Treccani, Founder & CTO of Rocket Capital Investment, Italy Gianluca Carrino, Junior Analyst AIEE, Italy Vittorio D’Ermo, Vice President AIEE, Italy Marco Falcone, Government Relations and Issues Manager, Esso Italiana, ExxonMobil Group, Italy Mario Iannotti, Advisor on Sustainable Development (IMELS), Italy Stefano Pogutz, Professor Sustainability Lab, SDA Bocconi School of Management, Italy Maximillian Rinck, Independent energy consultant, Germany Gianluca Salviotti, Associate Professor of Practice, Devo Lab, SDA Bocconi School of Management, Italy Francesco Scalia, Professor, University of Cassino and Southern Lazio, Italy Elisa Scarpa, Head of market analysis, Edison, Italy CONFERENCE SECRETARIAT Phone: +39.06.3227367 - Fax: +39 06 8070751 e-mail: [email protected]; [email protected];
vii
INTRODUCTION:
CURRENT AND FUTURE CHELLENGES TO ENERGY SECURITY
– energy perspectives beyond COVID19 – The AIEE - Italian Association of Energy Economists (Italian affiliate of the IAEE - The International Association for Energy Economics) has organized this international conference in cooperation with the SDA Bocconi School of Management to bring together energy experts engaged in academic, business, government, international organizations for an exchange of ideas and experiences on the present and future landscape of energy security.
The previous editions of the AIEE Symposium on Energy Security, organized in Milan and Rome, were an opportunity to explore new energy trends, challenges and creative solutions for the energy security, the availability of new technologies, the emergence of new market conditions and of new market operators.
The AIEE Energy Symposium on Energy Security has become an important yearly appointment we did not want to miss! In the turmoil of the COVID19 pandemic outbreak the “ordinary” practices of our daily work routines had to change considerably and this year we had to rethink the structure of our conference and make it virtual.
In our uncertain world of possible pandemics return when health officials recommend against large gatherings of people, hosting a virtual event was an excellent alternative.
Following up on the success of the past editions this fifth AIEE Energy Symposium to provided a fresh look on the major forthcoming issues offering an excellent occasion to continue the dialogue and to share best practice and experience with delegates from all over the world.
The President of the Scientific Committee, Agime Gerbeti, in the Opening session has given a short overview of the main energy security issues in the present geopolitical context:
"After a difficult period, it seems there are finally some good news the COVID vaccine is ready and Joe Biden, the President elect of the United States, has promised to sign the Paris Agreement. It looks like we are reaching the solutions for two important problems, the COVID19 pandemic and the medium-long term climate change.
I believe that things are unfortunately different and that after a year in which almost everything has been suspended, the difficult part is now beginning.
Let's start with the United States. Biden will certainly have more cordial relations with Europe than his predecessor, but if someone thinks that a common path between the US and the EU is about to begin again on energy, they might be wrong. Biden was Vice President when Obama chose to disengage from the Middle East, leaving Europe to deal directly with the oil producing countries and the Maghreb area for the first time since the end of World War II. Secondly, the former Democratic President has pledged to revitalize his internal crude oil production, transforming in a few years the US from an energy importer to a net exporter: so, without an immediate need for oil, the US confrontation with oil-producing countries was less "frenetic".

viii
Thirdly, although the first term presidency was born under the sign of environmentalism, Obama has given great development to shale gas, which is not exactly a green measure.
Biden will not change this line and will continue to consider Europe both a commercial partner and a productive competitor.
Another chapter: at the end of this terrible year, the only country, among the big economies, which will see its GDP grow is China.
For almost fifty years, probably since Nixon's visit in 1972, the Western Countries have seen China as a large market ready to blossom, a growing market, recognizing it with the status of a developing country, with all the related advantages. A country that, once given up the clothes of communism, would have become a great market for the European goods.
But we were wrong; we welcomed China into the WTO even though it has never been really a market economy and we contributed to its growth even if its workers did not have the rights that we recognize to ours and we imported its goods even if they were manufactured with high emissive energy.
We were open because we were confident that its development would have been in our advantage, but we were wrong to think China as the outlet market for European products. For the Chinese products, Europe is the market to penetrate.
Let's move on to Russia. In recent days, despite a thousand controversies fuelled by some virologists who claim excessive haste, we have witnessed the first Russian vaccines in response to the Covid pandemic. They called their vaccine Sputnik. Ironically I suppose, as someone might remember that Sputnik was the first satellite launched to orbit and it gave birth to the competition with the United States that went down in history as the space race.
Despite the EU regulations which aim at the reduction of its energy dependence, Russia is still the fuel supplier of Europe. It is the same for all Europe but some countries suffer Russia’s political influence with major sensitivity. Many countries of the former Soviet block, which economy is still fuelled by fossils, are suffering from the ambitious decarbonisation programs supported by the western and most liberal part of the European Union. And as we have seen during the last few days, the EU objectives have been revised upwards.
Will Russia, the world's largest gas producer and second largest oil producer, allow its European customer - without taking any action - to support its economy with wind turbines and photovoltaic panels? It is difficult to know the answer.
Finally, there is the British thorny issue. In my imagination Europe was a "bird's eye view" of the Colosseum, the Brandenburg Gate, the Eiffel Tower and the Big Ben. But it is no longer like this. The UK has become a competitor at heart of Europe. The Great Britain seeing itself downgraded economically will fight, as it has always done in its history and it will do it with pride. It will fight for fishing areas in the Channel as well as for wind farms in the North Sea; maybe with no more environmental constraints will procure gas from the USA and oil from Russia, or vice versa. In the course of history, first the Romans, then the French with Napoleon, finally the Germans in the Second World War understood that the British islanders are a very tough nut to crack.
The game for European energy security is starting now and we will have to fight on two fronts: one internal and one external.

ix
On the domestic front, it is absolutely, necessary that there should be a growing energy integration, both at the level of infrastructure and objectives. For this, an enormous communication effort will have to be made. We cannot leave national governments alone to inform the population of the decarbonisation advantages because the disadvantages of non-decarbonisation and climate change will be evident in the long term rather than the advantages of decarbonisation: it is very difficult to communicate the disadvantages of inaction. Without a shared vision of all the European countries, there are possible risks. If the first European defection occurred due to immigration policies, e.g. the Brexit, the next one could happen for the costs of the energy transition. Let's remember what happened in Paris with the yellow jackets.
On the external front, Europe should expand its areas of influence, as it is already doing with the Energy Union, to manage cross-border trade safely and in reliable conditions.
Secondly, Europe should behave more and more for energy purchases as a single negotiator, a single subject with a united vision. By allowing individual countries to negotiate their own supplies exposes them to less bargaining strength and competition with other European countries, crumbling the compactness of the European design.
If EU member States continue to compete with each other for lucrative supplies from Libya, Egypt and elsewhere, there will be no European voice in the global energy market, and ambitious decarbonisation programs will remain just funds for industrial sectors without a real impact on global emissions."
A comprehensive program, with six plenary sessions and keynote presentations, and 19 concurrent sessions gave the attendees from all over the world the occasion to participate in an interactive, collaborative networking and information sharing event, in the prestigious context of the SDA Bocconi School of Management, that was ranked 3rd in the 2019 Financial Times' European Business School Ranking and 8th in the world for business and management studies.

1
2
CONTENT PLENARY Sessions programme and keynote speakers 4
ABSTRACTS Index by Session 6
PAPERS Index by Session 12
ABSTRACTS 14
PAPERS 182
ANALYTICAL INDEX 353

3
4
PLENARY SESSIONS KEYNOTE SPEAKERS Opening Session
Carlo Di Primio, AIEE President, Italy Beppe Soda, Dean of the SDA Bocconi School of Management, Italy Matteo Di Castelnuovo, Associate Professor of Practice, Just Energy Transition Coordinator, Sustainability Lab, SDA Bocconi School of Management, Italy Agime Gerbeti, President of the AIEE Scientific Committee, Italy Carlo Andrea Bollino, Honorary President AIEE and Conference General Chair.
keynote speakers: Ivetta Gerasimchuk, Lead, Sustainable Energy Supplies, International Institute for Sustainable Development - The presentation of the Energy Policy Tracker Project Enrico Gibellieri, Consultative Commission on Industrial Change (CCMI) of the European Economic and social Committee (EESC) - Resources and Energy intensive Industries REIIs Fereidoon Sioshansi, President Menlo Economics, USA - Energy & environmental policy under new US Administration EU towards 2030 and the energy security concerns
Agime Gerbeti, President of the Scientific Committee of the AIEE, Italy Stéphanie Bouckaert, Senior Energy Analyst IEA-International Energy Agency Marco Falcone, Government Relations Manager, Esso Italiana, Exxon Mobil Group, Italy Silvia Pariente-David, Consultant on energy and climate change and Senior advisor – Center for Mediterranean Integration, World Bank, France Elena Donnari, High-level Administrator for CRM and MIT, CEER Regulatory challenges and market developments Alessandro Ortis, Honoray President of MEDREG, Past President of ARERA, Derek Bunn, Professor of Decision Sciences at London Business School, UK Giordano Colarullo, General Manager, Federation of the Italian Utilities - Utilitalia, Italy Jean Michel Glachant, Director of the Florence School of Regulation and the Holder of the Loyola de Palacio Chair Agostino Re Rebaudengo, President of Elettricità Futura and of Asja, Italy Energy industry challenges to a low-carbon economy, the RES and gas role in the transition
Carlo Di Primio, AIEE President, Italy Massimiliano Mannino, Shell Energy, Italy Country manager, Italy Luca Bragoli, Head of Public Affairs ERG, Italy Lorenzo Mottura, Strategy & Corporate Development Director, Edison, Italy Giacomo Rispoli, CEO MyRechemicals, Italy
5
Sustainable mobility challenges for the transition targets
G.B. Zorzoli, President FREE Amela Ajanovic, Assistant Professor & Senior Research Scientist, Energy Economics Group, Vienna University of Technology, Austria Vincent Schachter, Head of Global Energy Services Enel X e-Mobility, France Franco Del Manso, International Environment Affairs manager of UNEM, Italy Mariarosa Baroni, President NGV Italy Dino Marcozzi, General Secretay MOTUS-E member of the European Platform for Mobility Grid security and new technologies
Carlo Andrea Bollino, Honorary President AIEE, Italy Matteo Codazzi, CEO CESI, Italy Salvatore Pinto, President Axpo Italia Giovanni Valtorta, Manager Enel Distribution, Italy Massimo Derchi, Chief Industrial Assets Officer Snam, Italy Energy Efficiency and the future strategies of the energy industry
Gurkan Kumbaroglu – Professor University of Boğaziçi, President of TRAEE- The Turkish Association of Energy Economists, IAEE Past President Sandro Neri, Enel executive and Coordinator of the Federmanager energy commission, Italy Ferdinando Pozzani, CEO, TEON, Italy Dario Di Santo, Genergal Manager, Italian Federation for Energy Efficiency – FIRE, Italy
6
CONTENTS ABSTRACTS INDEX by session
pag.
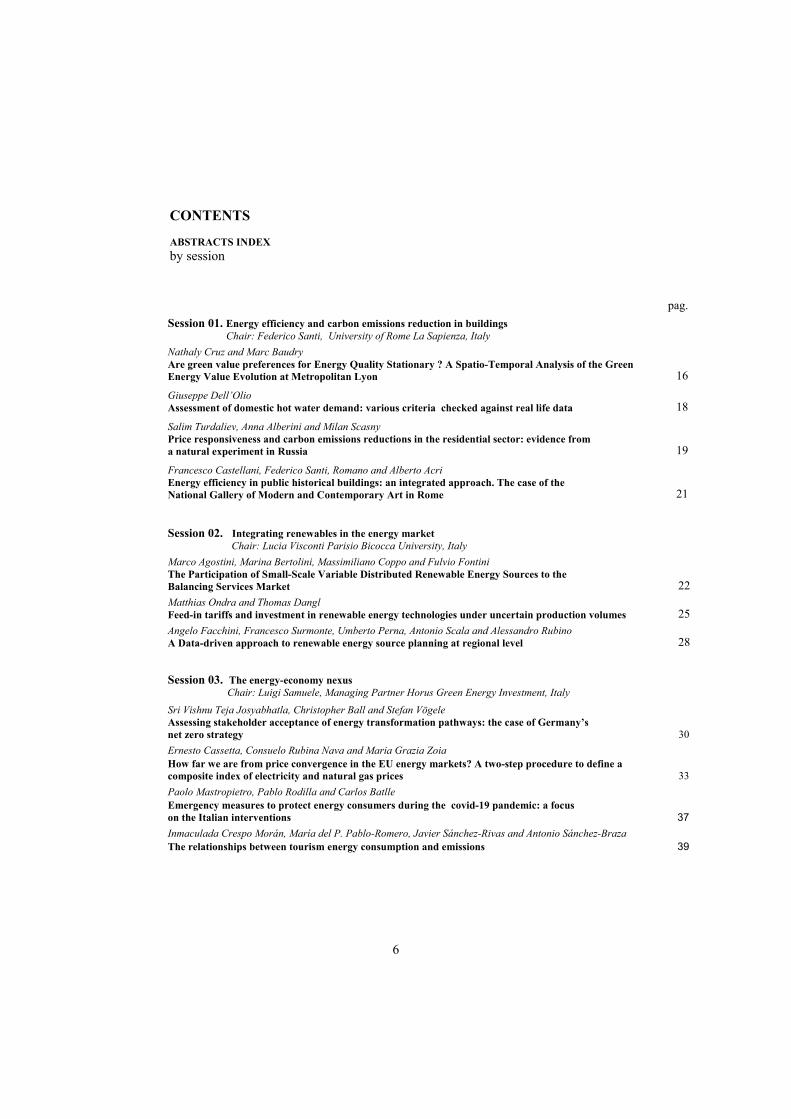
Session 01. Energy efficiency and carbon emissions reduction in buildings Chair: Federico Santi, University of Rome La Sapienza, Italy
Nathaly Cruz and Marc Baudry Are green value preferences for Energy Quality Stationary ? A Spatio-Temporal Analysis of the Green Energy Value Evolution at Metropolitan Lyon 16
Giuseppe Dell’Olio Assessment of domestic hot water demand: various criteria checked against real life data 18
Salim Turdaliev, Anna Alberini and Milan Scasny Price responsiveness and carbon emissions reductions in the residential sector: evidence from a natural experiment in Russia 19
Francesco Castellani, Federico Santi, Romano and Alberto Acri Energy efficiency in public historical buildings: an integrated approach. The case of the National Gallery of Modern and Contemporary Art in Rome 21
Session 02. Integrating renewables in the energy market Chair: Lucia Visconti Parisio Bicocca University, Italy
Marco Agostini, Marina Bertolini, Massimiliano Coppo and Fulvio Fontini The Participation of Small-Scale Variable Distributed Renewable Energy Sources to the Balancing Services Market 22Matthias Ondra and Thomas Dangl Feed-in tariffs and investment in renewable energy technologies under uncertain production volumes 25Angelo Facchini, Francesco Surmonte, Umberto Perna, Antonio Scala and Alessandro Rubino A Data-driven approach to renewable energy source planning at regional level 28
Session 03. The energy-economy nexus Chair: Luigi Samuele, Managing Partner Horus Green Energy Investment, Italy
Sri Vishnu Teja Josyabhatla, Christopher Ball and Stefan Vögele Assessing stakeholder acceptance of energy transformation pathways: the case of Germany’s net zero strategy 30
Ernesto Cassetta, Consuelo Rubina Nava and Maria Grazia Zoia How far we are from price convergence in the EU energy markets? A two-step procedure to define a composite index of electricity and natural gas prices 33
Paolo Mastropietro, Pablo Rodilla and Carlos Batlle Emergency measures to protect energy consumers during the covid-19 pandemic: a focus on the Italian interventions 37
Inmaculada Crespo Morán, María del P. Pablo-Romero, Javier Sánchez-Rivas and Antonio Sánchez-Braza The relationships between tourism energy consumption and emissions 39

7
Session 04. Current Gas Market Dynamics Chair: Vittorio D'Ermo, AIEE, Italy
Sevkat Ozgur Drivers of merger and acquisition transactions in the U.S upstream oil and gas industry
41
Amina Talipova and Sergei Parsegov Exploring Russian Gas Prices to Europe: Empirical Evidence of Price Convergence from Time Series Analysis
44
Session 05. The renewable energy reality: case studies Chair: Davide Tabarelli, NE-Nomisma Energia, Italy
François Benhmad, Jacques Percebois On the impact of wind and solar generation on Nuclear power. The case of France
46
Kathrin Kaestner, Manuel Frondel, Stephan Sommer and Colin Vance Photovoltaics and the Solar Rebound: Evidence for Germany
54
Andrej Guminski, Claudia Fiedler and Timo Limmer Modelling transformation pathways for EU27+3 final energy demand using timely and spatially resloved sector models
57
Session 07. Rethinking the energy security strategies Chair: Matteo Di Castelnuovo, SDA Bocconi School of Management, Italy
Honorata Nyga-Lukaszewska Energy security – shift of paradigms
59
Chirayu Batra and Denis Subbotnitskiy Energy Security Implications of Small Modular Reactors and Microreactors Deployment in Off-Grid Areas in Northern Regions
61
Martin Švec Europe Energy road map to 2050: a coal phase-out in the context of international investment law
64
Session 08. The price and forecasting in power system Chair: Fatma Çiğdem Çelik, Okan University, Turkey Coudray Théotime Multistep ahead forecasting of a power system residual load using a hybrid CEEMDAN-ConvLSTM model
67
Daiva Dumciuviene and Grazina Startiene Study of factors that influence the price of electricity
71
Vanshika Fotedar and Alasdair Crawford Energy Load and Price Forecasting: Methods and Variable Treatment
74
Cinzia Bonaldo, Massimiliano Caporin and Fulvio Fontini The relationship between day-ahead and futures prices in electricity market: an empirical analysis on Italy, France, Germany and Switzerland
75
8
Session 09. The Electricity market: risks and opportunities Chair: Arturo Lorenzoni, University of Padova, Italy
Markus Schindler and Lukas Gnam An optimization approach for a local electricity market
76
Íñigo del Guayo, Giuseppe Ferrari and Wojciech Drozdz The future of capacity remuneration mechanisms in the EU, revisited
78
Tunç Durmaz, Secil Acar Aytekin and Simay Kizilkaya Electricity market capacity mechanism and strategic capacity withholding in Turkey
80
Maria Chiara D’Errico Cointegration analysis of electricity demand and mobility during the first wave of COVID19 contagion
82
Session 10. Global assessment of energy efficiency and sustainability Chair: Ionut Purica, Romanian Aassociation for Energy Economics, Romania
Anam Shehzadi Firm productivity, energy efficiency and export in Asian emerging and developing countries
84
Maria Giovanna Bosco, Elisa Valeriani Regional policies to boost firms’ energy efficiency and disaster response: a comparative analysis
88
Jubair Sieed, Ryoichi Komiyama and Yasumasa Fujii Quantitaive analysis of energy security and environmental sustainability using dynamic multi-sector energy economic model
90
Paolo Bertoldi and Nives Della Valle How to unlock the human potential for promoting energy efficiency? A review on the barriers and levers
92
Session 11. Synergies between Climate Change, energy access and energy poverty Chair: Fulvio Fontini, University of Padua, Italy
Benedikt Janzen and Katharina Drescher Determinants, Persistence and Dynamics of Energy Poverty: An Empirical Assessment Using German Household Survey Data
95
Isabella Alloisio Synergies and Trade-offs between Energy Access, Climate Change and Water Use in Sub-Saharan Africa
99
Alessandro Federici and Corinna Viola Energy poverty: A multifaceted cornerstone for a sustainable and inclusive recovery. Some evidence from Italy
101
Paola Casati The dark side of energy transition: the case of cobalt and the Democratic Republic of Congo
104
Session 12. Green revolution: green economies and other technologies Chair: Antonio Geracitano, University Tor Vergata, Italy
Maria Milousi, Manolis Souliotis and Spiros Papaefthimiou Life Cycle Assessment and eco-design alternatives of Solar Thermal technologies for the promotion of circular economy
107
Kentarou Kambe, Ryoichi Komiyama and Yasumasa Fujii Impact assessment for rate design of wheeling charge system on electricity transmission sector and household sector with a technology selection model
109
Rocco De Miglio, Gabriele Cassetti and Xi Yang The BRIDGE study: “Belt and Road Initiative and the Development of Green Economies” - Challenges and opportunities for a Green BRI
111

9
Session 14. The European energy roadmap to 2050 and the fiscal policies apply Chair: Agime Gerbeti, AIEE Italy
Bastien Dufau The influence of a carbon tax on cost competitiveness
122
Agime Gerbeti Economic impact of GHG costs on the EU industry
124
Paolo Bertoldi EU Energy and Climate Policies to Reach Carbon Neutrality
126
Gianluca Carrino The circular economy: an essential pillar to achieve the EU energy roadmap to 2050
128
Session 15. The geopolitics of the global energy transition Chair: Alessandro Rubino, Unversity of Bari, Italy
Fazel M. Farimani and Seyed Reza Mirnezami Iran-China 25 year’s agreement, Energy Implications
131
Olga Garanina and Silvana Mima Energy transition in Russia: what implications for natural gas?
132
John D. Graham and John A. Rupp Understanding variation in the governance of fracking
134
Lyubomira Gancheva Opportunities to ensure affordable prices and security of natural gas supply in Bulgaria following the commitments of Gazprom Export before the European Commission"
135
Session 16. Energy transition and grid transformation Chair: Elena Fumagalli, Copernicus Institute of Sustainable Development, Utrecht University, The Netherlands
Lisa Hanna Broska The Social – A Positive Driver of the Energy Transition? Six Case Studies from Germany
137
Diyun Huang and Geert Deconinck Long term transmission rights, a game changer for cross-border electricity market and interconnection governance in Europe?
140
Andrea Biancardi What is the European electricity transmission companies approach to innovation? A novel analytical framework
142
Francesco Gracceva, Chiara Bustreo, Arturs Purvins and Marco Sangiorgi Assessing the implications of high vRES long-term scenarios by integrating energy system and dispatch models
144
Session 13. Smart Energy Services to Improve the Energy Efficiency of the European Building Stock Chair: Nicola Sorrentino, University of Calabria, Italy
Sotiris Papadelis Towards a performance-based energy economy. The increasing value of Pay for Performance schemes
114
Charles-Henri Bourgois, Arturo Lapietra and Felice Pandolfo Pay for Performance (P4P) models to foster investment in Energy Efficiency in buildings
116
Arturo Lapietra, Vincenzo D’Agostino and Luca Petrungaro Devising classes of energy efficiency measure for evaluating pay-4-performance (P4P) rate that energy provider will be willing to offerin pay-4-performance scheme
118
Filippos Anagnostopoulos, Dimitra Tzani and Vassilis Stavrakas Adaptability of Pay-for-Performance schemes for promoting energy efficiency in the EU
120
10
Session 17. Energy consumption and power demand Chair: Elisa Scarpa, Edison, Italy
Manashvi Kumar Reclaiming spaces of energy consumption through rethinking approaches to rural electrification in India
146
Thierry Badouard and Morgan Crenes 2020 Energy Consumption Estimates
150
Khadija Merzougui, Damiano Fiorillo and Alessandro Sapio How did Italian’s behavior toward energy-consumption change from late 1990s to 2012?
152
Ionut Purica Switching to full electric transport: future power demand requirements in the EU
155
Session 18. The impact of oil price fluctuation Chair: Franco Del Manso, UNEM, Italy
Gbadebo Oladosu, Paul Leiby, Rocio Uria-Martinez, David Bowman and Megan Johnson U.S. GDP, Oil Price Shocks and Domestic Oil Production: An ARDL Analysis
156
Neil A. Wilmot Time-Varying Jump Intensities and the Interconnectedness of the North American Crude Oil Complex
159
Rocio Uría-Martínez, Paul N. Leiby, Gbadebo Oladosu, Megan M. Johnson, and David C. Bowman An Exploration of the Role of Petrochemical Demand on World Oil Demand Elasticity
162
Session 19. Strategic contribution of innovation and energy storage to energy security Chair: Spiros Papaeftimiou, University of Crete, Greece
Giorgio Perico, Virginia Canazza and Antonio De Paola Could the Fast Reserve drive the investments in storage in the Italian electricity market?
165
Dina Azhgaliyeva Renewable energy deployment and energy storage: empirical evidence
168
Session 20. The hydrogen economy opportunities and challenges Chair: Emanuele Piccinno, Energy consultant, Eni, Italy
Valentino Romeri Hydrogen and fuel cell: looking back to 20 year of professional experience and looking forward beyond ‘Covid-19’ and toward ‘1.5° C Perspective’
170
Alessandro Clerici Hydrogen era: yes, but when and at what cost of delivered energy?
174
Jan Marc Schwidtal, Valerio Passarella, Marco Agostino, Fabio Bignucolo, and Arturo Lorenzoni Opening ancillary service markets: investigating emerging opportunities for P2G in Italy
177

11
12
PAPERS INDEX by Session Giuseppe Dell’Olio Assessment of domestic hot water demand: various criteria checked against real life data (session 1)
185
Claudia Fiedler, Andrej Guminski, Timo Limmer, Tobias Wagner, Süheyb Bilici, Christoph Pellinger, Serafin von Roon Modelling transformation pathways for EU27+3 final energy demand using temporally and spatially resolved sector models (session 5)
188
Coudray Théotime Forecasting power system flexibility requirements: a hybrid deep-learning approach (session 8)
237
Giuseppe Franco Ferrari, Íñigo del Guayo, Wojciech Drozdz The future of capacity remuneration mechanisms in the European Union, Revisited, with a particular attention to Italy, Poland and Spain (session 9)
258
Maria Chiara D'Errico Cointegration Analysis of Electricity Demand and Mobility during the first wave of COVID-19 Contagion (session 9)
272
Isabella Alloisio Synergies and trade-offs between energy access, climate change and water use in Sub-Saharan Africa (session 11)
285
Alessandro Fiorini, Alessandro Federici, Corinna Viola An indicator of energy vulnerability: evidence from Italian regions (session 11)
298
Agime Gerbeti Economic impact of GHG costs on the EU industry (session 14)
311
Lyubomira Gancheva Opportunities to ensure affordable prices and security of natural gas supply in Bulgaria following the commitments of Gazprom Export before the European Commission (session 15)
320
Manashvi Kumar Reclaiming spaces of energy consumption through rethinking approaches to rural electrification in India (session 17)
338

13

14
Abstracts

15
16
Session 01 - Energy efficiency and carbon emissions reduction in buildings
Nathaly Cruz and Marc Baudry ARE GREEN VALUE PREFERENCES FOR ENERGY QUALITY STATIONARY ? A SPATIO-TEMPORAL ANALYSIS OF THE GREEN ENERGY VALUE EVOLUTION AT METROPOLITAN LYON
Nathaly Cruz, EconomiX Research Lab, University of Paris Nanterre, the Climate Economics Chair, Paris, France e-mail: [email protected]
Overview The transformation of the energy quality of housing is recognized as a major factor in combating climate change. Energy performance improvement is one of the principal components of OCDE countries’ policies for energy transition processes. On the one hand, this sector represents more than 40% of the final energy consumption and on the other hand, it contributes to approximately 36% of greenhouse gas emissions. To address this issue, governments have chosen to focus their attention on new regulations for construction and thermal strainers and on developing different strategies to improve the energy efficiency quality for existing buildings through insulation and changes in heating and cooling systems. In order to deal with possible lack of information appearing on the renovation processes, governments have introduced Energy Performance Certificates procuring information about the consumption of primary energy by square meter by year. This information gives a rating to each building in the form of an estimated measure of efficiency, a color indicating the level of eco-friendliness, and an energy category (A, B, C, D, E, F, or G), the green classes and the A or B categories representing the most efficient buildings. According to different studies, the positive effect of renovation investments could be capitalized on prices. Recent research has found a small positive marginal effect on prices of superior energy quality dwellings when using real estate cross-sectional data. Nevertheless, even in a cost-effectiveness scenario, long-run dynamics about the green value reaction to public policies and natural restructuring mechanisms of the markets are today unknown. Furthermore, the analysis of the evolution of markets on a simultaneously spatial and temporal context is uncommon in applied studies. In this paper we analyze the evolution of green energy surplus of energy classes over time, we introduce spatial and temporal characteristics of the market in order to control for as many factors as possible when explaining the growth of the real estate prices in Metropolitan Lyon. Methods In this paper, we analyze the evolution of the green energy value of condominium units of Metropolitan Lyon from January 2013 to December 2018. We develop a STEM (Spatio-Temporal Error) model of Hedonic Prices [Rosen, 1974] [Anselin and Lozano-Gracia, 2009]. We study a representative sample (9,956 observations) of the real estate market transactions contained in the PERVAL data-base. We build a STEM model adapted to pooled micro-data. In order to select the subset of variables that increase the performance of the model, we use a two-directional step-wise method. The econometric treatment is, for its part, based on log-likelihood estimators and the maximization of the Akaike information criterion AIC. We control factors related to market trends, characteristics of the supply and demand, spatio-temporal factors, and spatio-temporal auto- correlation. We assume the existence of simultaneous spatial and temporal effects of proximity and auto-correlation and also that the auto-correlation is linked to the same non-observable characteristics.
17
Session 01 - Energy efficiency and carbon emissions reduction in buildings
The specification for the model is presented as follows: Y = X π β + u where u = λ π ST w π u + ϵ. where λ corresponds to the coefficient of spatio-temporal auto-correlation, STW the spatio-temporal weights matrix, and ϵ the white noise. Finally, we focus on the relative changes of coefficients related to the marginal effect of energy classes. Results We identify a negative effect of time on the green value of high and middle energy classes (A, B, C, D, E) when compared to thermal strainers (G). Otherwise, The difference in the effect of energy classes on price per squared meter seems to be more important at the beginning of the studied period. We show that the magnitude of the effect is higher for the superior quality houses which induce a reduction of green value surplus. We also identify an effect of public investments that inverse the tendencies between the marginal effect of energy classes for the period of 2015-2016. This could be explained by an increase in investments made by the Metropolitan Lyon for the development of a renovation market. The trends of the evolution of green energy value seem to be affected by other factors that are not explained by the econometric model. Conclusions The negative evolution of energy quality allows us to propose some hypotheses that could be used to identify adaptation mechanisms of the market in response to a change in the equilibrium of the energy quality market. The evolution of the energy quality surplus could explain the lack of commitment to renovations by landlord-owners. The commitment to renovations is dependent on the expected market tendencies and could also explain the behavior of Owner-Occupied. The latter could face a possible reduction of the value of their property if it is not in conformity with governmental norms and with social norms related to energy quality. We deduce that is essential to create either nudges focused on the effects of expectations on the calculation of the profitability of investments, or compensation mechanisms to partially cover the costs of renovation. It could also be necessary to inform individuals about the process of valorization of green qualities and the necessity of widespread renovations in line with climate goals. References Rosen, S. (1974). Hedonic prices and implicit markets: product differentiation in pure competition.
Journal of political economy, 82(1):34–55. Anselin, L. and Lozano-Gracia, N. (2009). Spatial hedonic models. InPalgravehandbook of econometrics,
pages 1213–1250. Springer.

18
Session 01 - Energy efficiency and carbon emissions reduction in buildings Giuseppe Dell’Olio ASSESSMENT OF DOMESTIC HOT WATER DEMAND: VARIOUS CRITERIA CHECKED AGAINST REAL LIFE DATA
Giuseppe Dell’Olio: Gestore dei Servizi Energetici – GSE S.p.A. 92, Viale M. Pilsudski-Rome, Italy, Phone:+39-349-0992610, email: [email protected]
. Overview Current methods to assess Domestic Hot Water (DHW) demand are numerous and yield very different outcomes. We have reviewed those methods and compared them to numerous, real operation data. Recommendations are finally provided to designers as to the most realistic assessment criteria. For the evaluation of DHW demand, approximate estimates are usually needed; it is therefore interesting to compare them with “real life” data, in order to evaluate their accuracy. Methods, 45 methane-fired, central heating installations in apartment buildings have been examined. The total volume of the apartments is 438,191 cubic meters, which amounts to some 1,900 average size dwellings. The above installations have been monitored for several years as a whole. Heat produced (kWh) and fuel consumed by each boiler have been measured. Results Our data analysis resulted in an average 42.68 kWht per square meter and per year consumption (draw-off temperature: 53°C; cold water temperature: 10°C). This result turned out to be highly robust and reliable. Conclusions. Based on measured data, DHW consumption can be assumed to be proportional to useful area. While several international technical Standards state or imply this circumstance, but only a few provides realistic DHW-area coefficients of proportionality . All assessments are based solely on the author’s personal opinions.
19
Session 01 - Energy efficiency and carbon emissions reduction in buildings
Salim Turdaliev, Anna Alberini, and Milan Scasny PRICE RESPONSIVNESS AND CARBON EMISSIONS REDUCTIONS IN THE RESIDENTIAL SECTOR: EVIDENCE FROM A NATURAL EXPERIMENT IN RUSSIA
Salim Turdaliev, Institute of Economic Studies, Faculty of Social Sciences, Charles University in Prague, Czech Republic
Anna Alberini, AREC, University of Maryland, College Park, USA Milan Ščasný, Institute of Economic Studies, Faculty of Social Sciences, Charles University in Prague;
Charles University Environment Centre, Czech Republic Overview A recent threat of environmental deterioration has led many policy makers to consider more rational approaches to using and pricing energy sources. Among various energy sources, responsible for hazardous emissions, the share of the residential electricity industry is considerable (Deryugina et al., 2018), and the price of electricity is considered to be one of the main determinants of its demand. Nevertheless, there is little consensus on the magnitude of the price elasticity of electricity demand either in the short or the long run (see for instance, Labandeira et al., 2017 for brief literature review). The lack of consensus is in part due to absence of quasi-experimental studies, where one can observe both an exogenous variation in price, and a suitable control group (Deryugina et al., 2017). Moreover, the majority of the past literature employed aggregated data for the analysis, which results in considerable information loss due to aggregation. This in turn creates a sizeable gap in evaluation and assessment of the governmental policies in reducing greenhouse effects. In this paper, we exploit a rich micro data on Russia; combined with implementation of the increasing block rate tariff (IBR) for residential electricity in seven experimental regions of Russia we estimate the price elasticity for electricity demand in a context of natural experiment. Method In this paper we estimate the price elasticity of residential demand using household-level data from several waves of the Russian Household Budget Survey. We have a panel dataset. We take advantage of the variation in tariffs across regions and over time, and of the introduction of increasing block tariff schemes in a number of regions. In order to overcome the endogeneity of prices in the presence of IBR tariff regime we ran two stage least squares (2SLS) analysis with full tariff schedules used as instrumental variables, combined with difference in difference econometric model. Results The IV-diagnostics for our model performs reasonably well. The most of the block-tariff scheme included as instruments are statistically significant. The Sargan-Hansen test of overidentifying restrictions with the joint null hypothesis that the instruments are valid instruments, i.e., uncorrelated with the error term, and that the excluded instruments are correctly excluded from the estimated equation also performs well. The χ squared statistics of the test is insignificant at 95-percent confidence level.

20
Session 01 - Energy efficiency and carbon emissions reduction in buildings We observe that that the elasticity of electricity demand in 2SLS context is negative 0.10, and significant at 1- percent. The income elasticity is 0.04 and is significant at 1-percent. Conclusions We show that in those regions consumers appear to be aware of the block cutoffs, even though the latter are household- and dwelling-specific, to the point that there are a total of 35 different tier cutoffs. Based on these results, and on the attentiveness of consumers, we predict consumption for a variety of tariff schemes and quantify the associated emissions reductions, as well the (welfare loss) cost of achieving them. We also assess whether the system is financially sustainable, with heavier consumers subsidizing the consumption of poorer households. References Deryugina, T., MacKay, A., & Reif, J. (2018). The Long-Run Dynamics of Electricity Demand: Evidence
From Municipal Aggregation. SSRN Electronic Journal. https://doi.org/10.2139/ssrn.3274708
Labandeira, X., Labeaga, J. M., & López-Otero, X. (2017). A meta-analysis on the price elasticity of energy demand. Energy Policy. https://doi.org/10.1016/j.enpol.2017.01.002
21
Session 01 - Energy efficiency and carbon emissions reduction in buildings Francesco Castellani, Federico Santi, Romano Alberto Acri ENERGY EFFICIENCY IN PUBLIC HISTORICAL BUILDINGS: AN INTEGRATED APPROACH. THE CASE OF THE NATIONAL GALLERY OF MODERN AND CONTEMPORARY ART IN ROME Francesco Castellani, Project Engineer, Studio Santi, Via Latina 57 - 00058 Santa Marinella (RM), Italy,
Buildings are responsible of almost 40% of the world carbon emissions: the national energy strategies are focusing heavily on this sector and since 2013 the buildings’ carbon emissions are lowering. The Public Administration owns a lot of inefficient buildings, and it could become an important driver of this efficiency process. Especially in Europe and even more in Italy, very often public buildings are also historical buildings, part of the cultural heritage of the nation, and this could be an handicap in developing these processes. The case of the National Gallery of Modern and Contemporary Art in Rome shows how this challenge can be undertaken: since 2017 (“International Year of Sustainable Tourism for Development” promoted by UNWTO) the museum is following an integrated approach that is leading to an energy efficient public historical building. This approach can be replicated in similar buildings all over the world.
22
Session 02 - Integrating renewables in the energy market
Marco Agostini, Marina Bertolini, Massimiliano Coppo, Fulvio Fontini
THE PARTICIPATION OF SMALL-SCALE VARIABLE DISTRIBUTED RENEWABLE ENERGY SOURCES TO THE BALANCING SERVICES MARKET
Marco Agostini, University of Padova, Department of Industrial Engineering and Levi Cases, Italy
Marina Bertolini, University of Padova, Department of Economics and Management and CRIEP and Levi Cases, Via del Santo 33, Padova, Italy
Massimiliano Coppo, University of Padova, Dep. of Industrial Engineering and Levi Cases, Italy Fulvio Fontini, University of Padova, Department of Economics and Management and Levi Cases, Italy
Overview The diffusion of new energy production plants, especially the non-dispatchable ones, made grid management much more challenging in the past years, for example increasing the costs for the reserve margins provision [1] and giving rise to the risk of unintentional islanding of portions of the power system [2] due to the large diffusion of small scale units, especially at low voltage level [3]. This condition asked for a deep rethinking of energy network functioning, including data communication protocols and rules for the operators [4, 5]. Designing new markets is a major issue for the functioning of the energy system as a whole. Moving from technical studies and from the results obtained by other projects in recent years ([6]; [7] [8]) in the paper we establish the cost effect of two possible market frameworks for balancing energy supplied by V-DER. Under the first type of market participation, that stems form the characteristics of the existing (high voltage) balancing markets and replicates such a market design at the distribution level, aggregators operate grouping V- DER, regardless of any technical feasibility of the load profile supplied by V-DER. The DSO is in charge of keeping grid’s technical reliability. Under the second, polar case, the DSO is responsible for keeping an agreed exchange path with the TSO, being thus responsible for local balancing and choosing resources to be called in the market. Balancing energy offered by aggregators is accepted on the basis of both economic and technical feasibility. The two solutions have different implications in the technical management of the grid: the economic analysis aims at identifying the effects of the two alternatives on overall social cost for balancing services Methods We first setup a theoretical reference model and then perform a simulation using a rich enough reference Low Voltage network, under the two polar market scenarios. This allows establishing the impact that different market rules have on network externalities and social welfare. Different market rules will lead to different levels of system costs (bared by different agents): a careful analysis of the results coming from possible alternatives will help regulators and decision makers in setting the functioning rules. Results Looking at the balancing cost results, in both models lower costs are found as the Wind penetration increases at the expenses of the PV share, as a consequence of the uncorrelation in production forecast errors and lower balancing needs. Furthermore, cost savings are associated to larger shares of V-DER availability for upward service, obtained through higher derating, in particular in the cases in which the demand for upward balancing is high due to positive correlation among forecast errors on the supply (i.e. large penetration of PV).
23
Session 02 - Integrating renewables in the energy market This has the effect of containing the energy curtailments and the amount of upward activated offers from high voltage resources. Comparing the social costs of the two models we see that they can be higher or lower according to the scenario. They are higher in model 1, when the limited de-rating of V-DER implies that relatively more high voltage upward energy is purchased under model 1 than for model 2. However, the result depends also on the relative share of Wind and the cost of curtailments. Conclusions Looking at the simulations, we noticed that there are substantial differences between the two market frameworks with respect to the occurrences of the curtailments. The first model can lead to curtailments of V-DER supply in case there is a possible violation of technical constraints: this causes a cost of curtailments that represents the missing value of integration, since when a violation of technical constraints occurs all V-DER in the balancing market are curtailed. Moreover, there is an increase in balancing needs, as the curtailed energy must be balanced with high voltage resources. Overall, the results of our simulations show that the commercial aggregation is preferable when the penalty price for curtailments is null or low, the share of PV is high and the V-DER reserve capacity is high too. On the contrary, as the share of wind prevails and for low levels of V-DER de-rated capacity or with high explicit penalties for curtailments the technical aggregation that attributes to the DSO the responsibility of balancing V-DER is to be preferred. Clearly, our results are just a first tentative to explicitly take into account the impact of market regulation of the efficiency of V-DER balancing energy provision, and depend on several assumptions References [1] Živa Bricman Rejc and Marko Čepin. Estimating the additional operating reserve in power systems
with installed renewable energy sources. International Journal of Electrical Power and Energy Systems, 62:654–664, 2014.
[2] R. Caldon, M. Coppo, R. Sgarbossa, L. Sgarbossa, and R. Turri. Risk of unintentional islanding in LV distribution networks with inverter-based DGs. In Proceedings of the Universities Power Engineering Conference, 2013.
[3] Alejandro Navarro-Espinosa and Luis F. Ochoa. Probabilistic Impact Assessment of Low Carbon Technologies in LV Distribution Systems. IEEE Transactions on Power Systems, 31(3):2192–2203, may 2016.
[4] Shaun Howell, Yacine Rezgui, Jean Laurent Hippolyte, Bejay Jayan, and Haijiang Li. Towards the next generation of smart grids: Semantic and holonic multi-agent management of distributed energy resources. Renewable and Sustainable Energy Reviews, 77:193–214, sep 2017.
[5] Keith Bell and Simon Gill. Delivering a highly distributed electricity system: Technical, regulatory and policy challenges. Energy Policy, 113:765–777, feb 2018.
[6] Gianluigi Migliavacca, Marco Rossi, Daan Six, Mario Džamarija, Seppo Horsmanheimo, Carlos Madina, Ivana Kockar, and Juan Miguel Morales. SmartNet: H2020 project analysing TSODSO interaction to enable ancillary services provision from distribution networks. In CIRED - Open Access Proceedings Journal, volume 2017, pages 1998–2002. Institution of Engineering and Technology, oct 2017.

24
Session 02 - Integrating renewables in the energy market
[7] Shengfei Yin, Jianhui Wang, and Feng Qiu. Decentralized electricity market with transactive energy – a path forward. The Electricity Journal, 32(4):7 – 13, 2019. Special Issue on Strategies for a sustainable, reliable and resilient grid.
[8] Diego Godoy-González, Esteban Gil, and Guillermo Gutiérrez-Alcaraz. Ramping ancillary service for cost-based electricity markets with high penetration of variable renewable energy. Energy Economics, 2020.
25
Session 02 - Integrating renewables in the energy market
Matthias Ondra, Thomas Dangl FEED-IN TARIFFS AND INVESTMENT IN RENEWABLE ENERGY TECHNOLOGIES UNDER UNCERTAIN PRODUCTION VOLUMES
Matthias Ondra, Vienna University of Technology, Austria Thomas Dangl, Vienna University of Technology, Austria
Overview From the investor’s point of view, risks emerging because of investment acitivies in power plants are due to the fact that future cash flows depend on risky electricity prices and risky fuel/carbon prices. When the energy manager decides to invest in renewable energy sources (RES), the intermittent and non-dispatchable character of renewable energy technologies additionally introduces risk via uncertain production volumes. Typically, investors evaluate the investment decision by maximizing the expected net-present-value of the renewable energy project subject to a budget constraint. This situation changes when we consider an enerterprise who has to cover its electricity demand. However, every enterprise participating in the liberalized electricity market can act as a prosumer and cover its own demand by investing in renewable self-generation facilities. From the prosumer’s point of view, investment in renewable energy technologies comes along with additional costs in case of a power shortage to cover the demand. In order to overcome the investment barriers to promote renewable energy technologies, remuneration policies like feed-in tariffs (FITs) are used. In the presence of uncertainty, FITs can be used to manage the energy manager’s exposure to risk. Therefore, also a prosumer who aims at minimizing the total power procurement costs is compensated for delivering excess power to the grid, which is not needed to cover the demand. This paper aims at investigating the prosumer’s investment decision in renewable energy technologies in the presence of uncertain production volumes of the renewable energy technologies and compensations for delivering excess power to the grid by a FIT. We consider a market independend FIT policy, i.e. excess power sold to the grid comes at a fixed price. We consider the energy manager to be a price taker who evaluates the total expected costs of the energy park by including (i) investment costs in renewable energy technologies, (ii) expected costs for purchasing power at the market in case of a shortfall in the power supply and (iii) expected remunerations from selling excess power to the grid at the FIT. Moreover, we compare the prosumer’s investment decision with a profit maximizing investor and evaluate how the level of the FIT affects the optimal investment decision. The fundemantal difference is, that the investor does not face a supply-demand constraint and determines the optimal renewable energy portfolio by maximizing the expected net-present-value. Methods This paper proposes a stochastic optimization framework to evaluate the prosumer’s investment decision in renewable energy technologies. We consider a data-driven optimization approach and sample from real-world output data of renewable energy technologies. The energy manager aims at minimizing the total expected costs of the energy park subject to a budget constraint, which restricts the investment in renewable energy technologies.
26
Session 02 - Integrating renewables in the energy market In the course of the investment decision, the energy manager therefore has to choose optimally installed capacities of the different technologies and thereby shape the risk distribution associated with the stochastic costs of a shortfall in the power supply. We study how changes in the level of the FIT and the energy price affects the prosumer’s optimal investment decision. In order to demonstrate the applicability of the model, we illustrate the findings in a use-case, where the energy manager aims at minimizing the total expected costs, when he or she considers investing in wind and solar technology for a typical location in Central Europe. Results We show, that an energy manager who considers the total expected costs of the energy park including expected costs in case of a power shortfall and expected remunerations for selling excess power, evaluates riskiness of the costs associated with the energy park via the Conditional Value-at-Risk. Depending on the energy price and the level of the FIT, we classify the optimal level of investment into three regions characterizing the energy manager’s investment decision. The “no-investment-region” is characterized by the absence of an investment in renewable energy technologies. In this region, the energy manager refuses to invest in RES due to the high capital expenditures associated with renewable energy technologies and purchases total power to cover the demand at the market. Both, the energy price and the level of the FIT are low and hence investment in RES is an inferior alternative. In the “remuneration-region” the energy manager increases investment in RES and is compensated for delivering excess power to the grid. In this region, the energy manager is incentivized to invest in RES by the remuneration scheme of the FIT. Consequently, we observe increasing investment in RES with increasing level of the FIT. In view of the uncertain production volumes associated with RES technology, this corresponds to the fact that the energy manager chooses a higher probability of demand coverage associated with the energy park. The boundary of these regions determines the threshold energy price, below which the energy manager does not invest in RES. The “profit-region” is characterized by high energy prices and high levels of the FIT. In this region, the energy manger chooses a high optimal level of investment in renewable energy technologies. Firstly, due to the high energy price investment in RES becomes an increasingly valuable option. Second, expected remunerations in case of excess power being available reinforces this investment decision. However, in this scenario the energy manager is overcompensated by the high levels of the FIT and obtaints profits in the overall evaluation of the costs associated with the energy park. In this regime, the energy manager opts for a non-diversified technology portfolio and invests only in wind technology, due to the higher levels of the excess energy that can be delivered to the grid compared to solar power. To evaluate the effectiveness of the FIT scheme, we quantify the effect of a FIT compared to the benchmark case of no FIT. The application to the use case shows, that from the prosumer’s point of view, the cost reduction potential as measured by the relative decrease of the total costs compared to the scenario of no FIT, increases in a non-linear way with the level of the FIT. From the investor’s point of view, however, we the expected revenues increase linearly. Therefore, in the presence of uncertain production volumes, increasing the level of the FIT has a different effect on the optimal investment decision for a prosumer and an investor, respectively.

27
Session 02 - Integrating renewables in the energy market
Conclusions In this paper we analyze to the prosumer’s decision to invest in renewable energy technologies in the presence of uncertain production volumes and a remuneration policy of a feed-in tariff. We quantify the cost reduction potential of different levels of the feed-in tariff and the energy price and thereby evaluate the effectiveness of a fixed market- independent feed-in tariff. The application of the model to the use case shows, that the relative cost reduction effect is increasing in a nonlinear way with the level of the FIT. Since effectiveness of remuneration policies to incentivize investment in renewable energy technologies can be measured in terms of cost effectiveness, this model evealuates the policy mechanism of a fixed market-independent feed-in tariff.
28
Session 02 - Integrating renewables in the energy market
Francesco Surmonte,Umberto Perna, Antonio Scala and Alessandro Rubino A DATA-DRIVEN APPROACH TO RENEWABLE ENERGY SOURCE PLANNING AT REGIONAL LEVEL
Francesco Surmonte, University of Bologna Bologna, Italy Umberto Perna, Italian Section, Society of Petroleum Engineers, Milan, Italy
Antonio Scala, ISC National Research Council, Rome, Italy Alessandro Rubino, , University of Bari Aldo Moro, Taranto, Italy
Angelo Facchini, IMT School for Advanced Studies Lucca, Lucca, Italy
Overview A correlation analysis based on Markowitz Portfolio Theory [1] and data from meteorological station are used to aid develop a decision-making tool for the optimal spatial installation of renewable energy sources from Wind turbines and PV panels. As a case study is developed to analyse an investment scenario over an existing portfolio of power stations considering two possible investment strategies: 1. Expansion strategy: Increase the current capacity of a single RES generation units by 50% of its nominal capacity; 2. Green field Investments: Invest by building a green field RES generation plant with a nominal capacity of 3.6MWp The optimality condition is achieved when, after the addition of generation capacity as defined above, the global fluctuations of the portfolio generation is minimised while maximising its average production over the time span of one year. To define the type and territorial distribution of the station follows the actual distribution of the power stations located in Tuscany we used the positions of the actual RES that are positioned near the weather stations. Results show that temporal correlations of solar and wind generation profiles are characterized by correlation and anti-correlation. This feature is used for supporting decision on investments in renewable energy at territorial level. Methods Original data series from wind speed and solar radiation have been recorded from weather stations for a period of 1 year (01-Jan-2018 to 12-Dec-2018) with a sampling time of 15 minutes. The 15-minutes Wind Speed (m/s) recordings in 2018 have been transformed in potential Yearly kWh time series by using real Wind turbine power curves models. On the same way, solar radiation data have been converted in energy produced by a standard silica polycrystalline panel. After data cleaning, a total of 50 stations have resulted eligible for the computation of the correlation matrix computed using Pearson’s correlation coefficient. Results Correlation analysis shows that that solar power stations are strongly correlated among them, and the same happens when considering the correlations among wind power generation stations. On the contrary wind and solar stations are negatively or very weakly correlated. Negative or weak correlation should be considered as the most favourable case, and experimental data suggest that a portfolio composed with PV and wind generators should be considered. This fact confirms the theoretical computations made in [2]. Results also show that by refurbishing the existing generation plants (Expansion Strategy) we can achieve an increase in the total annual production of about 1GWh for wind and 1.6GWh for solar (representing 0.76% and 1.1% of the total production, respectively) whereases by pursuing the Green Field Strategy we can increase 3.2GWh wind and 4GWh solar in the total production (representing a 2.43% and 2.89% of the total production, respectively).
29
Session 02 - Integrating renewables in the energy market
The analysis of the standard deviation offers important information on the effective contribution of any given plant to the overall portfolio of available generation. Conclusions By taking into account the possible anticorrelation in power generation within a given geographic region we provide an additional measure of efficiency of the installed generation that is currently not considered by energy investors and planners. As the need for larger share of renewable electricity penetration becomes more pressing, to accelerate the energy transition, the necessity to manage their fluctuation become more urgent. Given the many constraints that might exist on the geographic positioning of such plants (due to the presence of already existing real estate/infrastructure, harshness of terrain, etc.) the feasible portfolios will always be sub-optimal and such a strategy cannot be considered a panacea for the non-programmability of such forms of power generation, but it does configure to be a cheaper option than relying on ancillary markets/spinning reserves. References [1] H. M. Markowitz, Portfolio Selection: Efficient Diversification of Investments. Yale University
Press, 1959. [2] A. Scala, A. Facchini, U. Perna, and R. Basosi, “Portfolio analysis and geographical allocation of
renewable sources: A stochastic approach,” Energy Policy, 2019. [3] A. S. Brouwer, M. Van Den Broek, A. Seebregts, and A. Faaij, “Impacts of large-scale Intermittent
Renewable Energy Sources on electricity systems, and how these can be modeled,” Renewable and Sustainable Energy Reviews, vol. 33, no. May 2014, pp. 443–466, 2014.
30
Session 03 - The energy-economy nexus
Sri Vishnu Teja Josyabhatla, Christopher Ball, Stefan Vögele ASSESSING STAKEHOLDER ACCEPTANCE OF ENERGY TRANSFORMATION PATHWAYS: THE CASE OF GERMANY’S NET ZERO STRATEGY
Sri Vishnu Teja Josyabhatla, Institute of Energy and Climate Research - Systems Analysis and Technology Evaluation
Christopher Ball, Institute of Energy and Climate Research - Systems Analysis and Technology Evaluation
Stefan Vögele, Institute of Energy and Climate Research - Systems Analysis and Technology Evaluation, Forschungszentrum Jülich, D-52425 Jülich, Germany
Overview The project’s main goal is to understand to what extent different stakeholders support or reject energy transformation pathways that could help achieve Germany’s Net Zero Strategy [1]. Looking at the primary benefits of an energy transformation pathway, namely the resulting climate protection, will only tell half of the story. To completely understand the overall impact, it is necessary to understand, alongside primary benefits, the ancillary benefits and costs of the transformation [2]. These are the stakeholder-specific private benefits and costs associated with an energy transformation pathway. Six different scenarios for the decarbonization of the German power system to 2050 are analyzed in this study from the viewpoint of different actors. Each energy scenario is characterized by different mixes of technologies and a different speed of transformation and consists of the main sectors of the energy system, namely: power generation, heat, industry and transport. These scenarios include four basic scenarios, taken from the network of transmission system operators’ ten-year development plans [3], DG and ST, along with a scenario heavily reliant on wind (DLR-40) [4] and another in which hydrogen plays a significant role (IEK3-95) [5]. Two additional scenarios with CCS (carbon capture and storage) technology have also been added (STCCS, DLR-40CCS). The preferences of four stakeholders towards the energy transformation scenarios, namely: households, energy- intensive industries, government and energy utilities are analysed using a multi-actor-multi-criteria framework. As the household stakeholder group is too big and has disparities within itself, this group is further subdivided into 6 sub-sets based on their income. Crucially, these preferences are differentiated by decade: 2020, 2030 and 2040, so that dynamcis over time can be captured. Methods We employ PROMETHEE [6], in form of multi-actor-multi-criteria analysis, A total of six criteria associated with the transformation pathways, namely benefit, adaptation, risk, complementarities, information and network effects represent the preferences of stakeholders. These 6 criteria are quantified using indicators. While indicators related to benefit are mostly quantitative, the majority of the rest of the indicators are qualitative. Due to the presence of qualitative indicators, PROMETHEE becomes one of the best available techniques for the analysis [6]. Each stakeholder perceives the costs and benefits in different ways, with different
31
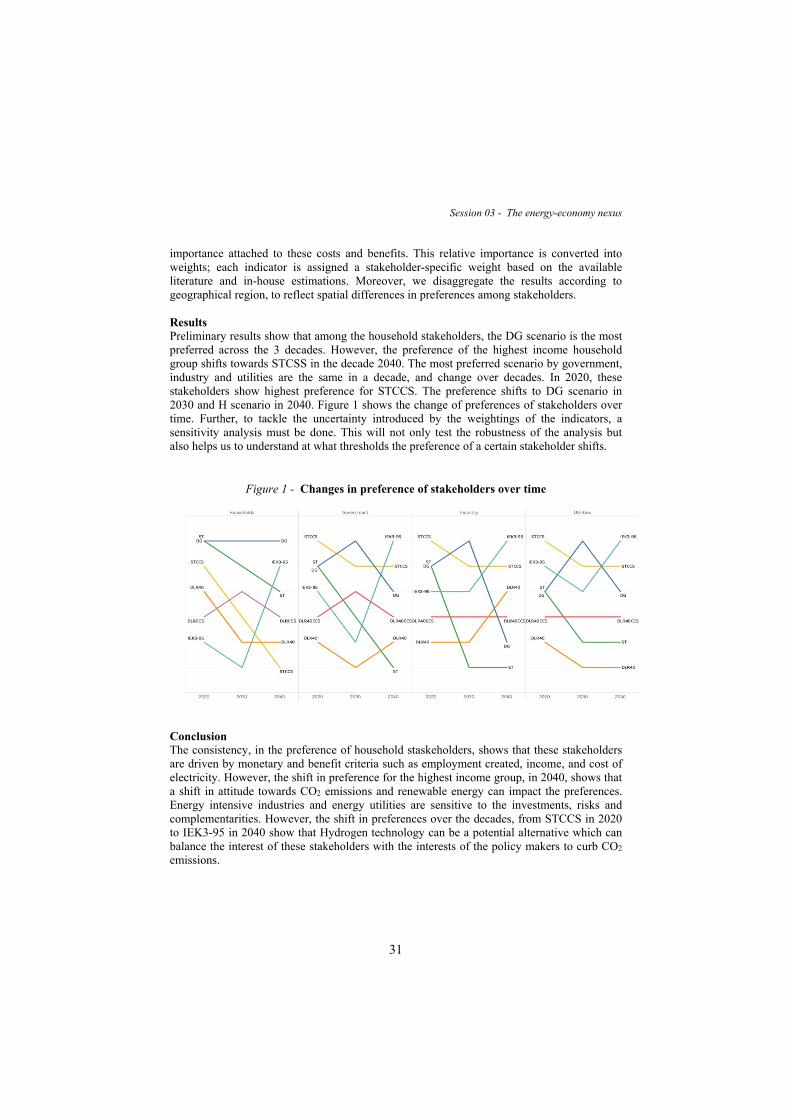
Session 03 - The energy-economy nexus importance attached to these costs and benefits. This relative importance is converted into weights; each indicator is assigned a stakeholder-specific weight based on the available literature and in-house estimations. Moreover, we disaggregate the results according to geographical region, to reflect spatial differences in preferences among stakeholders. Results Preliminary results show that among the household stakeholders, the DG scenario is the most preferred across the 3 decades. However, the preference of the highest income household group shifts towards STCSS in the decade 2040. The most preferred scenario by government, industry and utilities are the same in a decade, and change over decades. In 2020, these stakeholders show highest preference for STCCS. The preference shifts to DG scenario in 2030 and H scenario in 2040. Figure 1 shows the change of preferences of stakeholders over time. Further, to tackle the uncertainty introduced by the weightings of the indicators, a sensitivity analysis must be done. This will not only test the robustness of the analysis but also helps us to understand at what thresholds the preference of a certain stakeholder shifts.
Figure 1 - Changes in preference of stakeholders over time
Conclusion The consistency, in the preference of household staskeholders, shows that these stakeholders are driven by monetary and benefit criteria such as employment created, income, and cost of electricity. However, the shift in preference for the highest income group, in 2040, shows that a shift in attitude towards CO2 emissions and renewable energy can impact the preferences. Energy intensive industries and energy utilities are sensitive to the investments, risks and complementarities. However, the shift in preferences over the decades, from STCCS in 2020 to IEK3-95 in 2040 show that Hydrogen technology can be a potential alternative which can balance the interest of these stakeholders with the interests of the policy makers to curb CO2
emissions.

32
Session 03 - The energy-economy nexus
References
[1] Helmholtz Gemeinschaft, Hi-CAM: Helmholtz-Initiative Climate Adaptation and Mitigation: two Sides of the same Coin. 2019, Helmholtz Gemeinschaft: Bonn,Berlin.
[2] Vögele, S., C. Ball, and W. Kuckshinrichs, Multi-criteria approaches to ancillary effects: the example of e- mobility, in Ancillary Benefits of Climate Policy. 2020, Springer. p. 157-178.
[3] ENTSO-E, TYNDP 2018 Scenario Report. 2019, European Network of Transmission System Operators: Brussels.
[4] DLR, Langfristszenarien und Strategien für den Ausbau der erneuerbaren Energien in Deutschland bei Berücksichtigung der Entwicklung in Europa und global: Schlussbericht. 2012, Deutsches Zentrum für Luft- und Raumfahrt (DLR), Fraunhofer Institut für Windenergie und Energiesystemtechnik (IWES), Kassel Ingenieurbüro für neue Energien (IFNE): Stuttgart. p. 1 - 345.
[5] Robinius, M., et al., WEGE FÜR DIE ENERGIEWENDE Kosteneffiziente und klimagerechte Transformations-strategien für das deutsche Energiesystem bis zum Jahr 2050. 2019, Institut für Energie und Klima, Forschungszentrum Jülich: Jülich.
[6] Brans, J.-P. and B. Mareschal, PROMETHEE methods, in Multiple criteria decision analysis: state of the art surveys. 2005, Springer. p. 163-186.
33
Session 03 - The energy-economy nexus
Ernesto Cassetta, Consuelo R. Nava and Maria Grazia Zoia HOW FAR WE ARE FROM PRICE CONVERGENCE IN THE EU ENERGY MARKETS? A TWO-STEP PROCEDURE FOR DEFINING A COMPOSITE INDEX OF ELECTRICITY AND NATURAL GAS PRICES
Ernesto Cassetta: Department of Economics and Statistics, University of Udine, Italy
Consuelo R. Nava: Department of Economics and Statistics Cognetti de Martiis, University of Turin,Italy Maria Grazia Zoia: Department of Economic Policy, Università Cattolica del Sacro Cuore, Italy
Overview
In the European Union, one of the five dimensions of the energy union strategy is to build a fully integrated internal energy market enabling the free flow of energy through the design of common energy market rules and the construction of cross-border infrastructures. In a fully integrated internal energy market, energy can be produced in one country and delivered to industrial and domestic consumers in another thus creating competition between energy suppliers. In turn, competition should force down prices and foster their convergence between countries leading to an increase in efficiency and welfare (Helpman & Krugman, 1985; Miljkovic, 1999). At policy level, price changes and price dispersion are thus commonly regarded as important indicators of market integration. The European Commission periodically assesses the degree of convergence of retail electricity and gas natural prices for both household and industrial customers by using the relative standard deviation of the prices in individual Member States as a metric (see, for instance, European Commission, 2020a, 2020b). Extent academic research has been devoted to estimate whether the European single market has reduced average prices and price dispersion as we would expect from theory. Results remain mixed (Batalla, Paniagua, & Trujillo-Baute, 2019; Bower, 2002; Castagneto-Gissey, Chavez, & De Vico Fallani, 2014; Dreger, Kholodilin, Lommatzsch, Slacalek, & Wozniak, 2007; Robinson, 2007; Saez, Mochon, Corona, & Isasi, 2019; Telatar & Yaşar, 2020; Zachmann, 2008), thus suggesting the need for further research to measuring impacts on electricity and natural gas prices of EU energy policy. Different methodologies ranging from cointegration techniques to principal component analysis have been applied to analyse price convergence across European electricity and natural gas market. Actually, there are no econometric approaches allow a simultaneous analysis over time and space. In light of this premise, the purpose of the article is to introduce an innovative two-stage methodology to provide policy makers with a tool for estimating price trends over time in the different countries of the European Union and analysing the price convergence process.
Methods
To analyse price trends over time in the different EU countries, we have firstly computed the purchase power parity (PPP) over time by means of the multilateral Country-Product- Dummy (CDP) price index (see Diewert, 2005; Rao & Hajargasht, 2016) across EU countries for each year. CPD is computed over the electricity and natura gas prices for
34
Session 03 - The energy-economy nexus domestic and industrial consumers. We focus on this index as it represents the approach used by the International Comparison Program (ICP) at the World Bank. At EU level, the CPD index is employed to study the expenditure behavior of EU households and industries, while the OECD-Eurostat ICP program currently takes advantage of the Gini-Elteto-Köves-Szulc (GESK) index (Rao, 2013). Then, the EU countries have been clustered according to the values of the CPD index over time, by using the hierarchical Ward method and the Euclidean distance of the PPPs. Finally, the Hodrick-Prescott filter has been applied to estimate the trend component of the PPPs for each country over time. All data are obtained from the official Eurostat statistics and refer to the period 2008–2018 for a total of 44 observations per country. The reference basket is composed of two commodities (electricity and natural gas) for two different type of users (domestic and industrial consumers), with the euro zone (EU-28) chosen as the base country for the study. Greece, Malta and Republic of Cyprus have been excluded from the analysis to avoid distortions, due to an excessive lack of information on energy and gas prices for private and non-private uses. The average national before tax prices paid for electricity and natural gas by medium size industrial consumers (respectively with annual consumption between 500 and 2000 MWh for electricity and with annual consumption between 10000 and 100000 GJ for natural gas) and household consumers (respectively with annual consumption between 2500 and 5000 kWh for electricity and with annual consumption between 20 and 200 GJ for natural gas) have been used.
Results
The methodology introduced in this work allows for the identification of four clusters: Cluster 1 (labelled as “Low-priced”) is composed of countries with a constantly
below average CPD index and PPP; Cluster 2 (“Low average-priced”) includes countries with an average CPD index
slightly below average CPD index and PPP; Cluster 3 (“High average-priced”) identifies countries with an average CPD index
slightly above average CPD index and PPP; Cluster 4 (“High-priced”) comprises countries with a constantly above the average
CPD index and PPP. From Figure 1, Bulgaria, Estonia, Finland, and Romania belong to the “Low-priced” cluster, while Denmark, Germany, Ireland, Italy, Portugal, Spain and Sweden are included in the “High-priced” cluster. The remaining fourteen nations: Croatia, Czech Republic, France, Hungary, Latvia, Lithuania, Poland, UK – on the one hand – Austria, Belgium, Luxembourg, Netherlands, Slovakia, Slovenia – on the other hand – form average priced-markets, respectively belonging to Cluster 2 and 3. On a temporal perspective, from 2011 to 2018 Ireland and Spain show a constant increase in the level of CPD index and PPP, while Romania, Estonia and Bulgaria always exhibit the lowest price index levels in the time span 2008-2018. Interestingly, while Luxembourg, Hungary, Netherlands, and Slovakia have experienced a progressive contraction of both electricity and natural gas prices in the whole period, France, UK, Denmark, and Sweden show, especially in the last two years, an opposite trend. The four clusters so identified are capable of capturing also the group-specific interdependence of electricity and gas natural prices and quantities, over the time span considered. For instance, in all the market a positive correlation exists across energy consumed by households and transport, services, and industries.

35
Session 03 - The energy-economy nexus Similarly, a positive correlation exists between the consumption of electricity and natural gas for services and industries.
Figure 1 - Map of the clusterisation
Figure 2 - Trend component of the PPP for each county given the Hodrick-Prescott filter split by clusters.
By applying the Hodrick-Prescott filter for estimating cyclical and trend component of the PPP for each country and cluster (see Figure 2), our findings show that all clusters in 2013 exhibit a within cluster convergence. However, during the following years it seems that a progressively slight disconcertedness of the CPD and PPP trends is revealed. At the same time, both the average trend of CPD and PPP of clusters 1, 2 and 3 highlight a progressive convergence.
36
Session 03 - The energy-economy nexus
Conclusions The article introduces a novel two-step procedure to analyse the level of electricity and gas natural prices in EU Member States, enriched with the extraction of the trend component via the Hodrick-Prescott filter. As such, the proposed approach can support regulators in comparing trends in electricity and natural gas prices and in exploring convergence patterns in energy prices also at the light of the economic integration of the internal energy market. Notwithstanding significant effort in market harmonization and integration, our findings suggest that electricity and natural gas prices have experienced limited reductions. Moreover, country-specific factors continue to play a major role in determining both the absolute level of retail prices and their trend over time.
References Batalla, J., Paniagua, J., & Trujillo-Baute, E. (2019). Energy Market Integration and Electricity Trade.
Economics of Energy & Environmental Policy, 8(2), 53–67. https://doi.org/10.5547/2160-5890.8.2.jbat
Bower, J. (2002). Seeking the single European electricity market : evidence from an empirical analysis of wholesale market prices (No. EL 01). Oxford, UK. Retrieved from https://ora.ox.ac.uk/objects/uuid:b3aa59b6-4c86-4aef-8b0a-db4bb66173ae
Castagneto-Gissey, G., Chavez, M., & De Vico Fallani, F. (2014). Dynamic Granger-causal networks of electricity spot prices: A novel approach to market integration. Energy Economics, 44, 422–432. https://doi.org/10.1016/j.eneco.2014.05.008
Diewert, E. (2005). Weighted Country Product Dummy Variable Regressions and Index Number Formulae. Review of Income and Wealth, 51(4), 561–570. https://doi.org/10.1111/j.1475-4991.2005.00168.x
Dreger, C., Kholodilin, K., Lommatzsch, K., Slacalek, J., & Wozniak, P. (2007). Price convergence in the enlarged internal market. Brussels, Belgium: European Commission, Directorate-General for Economic and Financial Affairs.
European Commission. (2020a). Quarterly Report on European Electricity Markets with special focus on the impact of the pandemic (Vol. 13). Brussel – Belgium.
European Commission. (2020b). Quarterly Report on European Gas Markets (Vol. 13). Brussel – Belgium.
Helpman, E., & Krugman, P. R. (1985). Market structure and foreign trade: Increasing returns, imperfect competition, and the international economy. Cambridge, MA: MIT press.
Miljkovic, D. (1999). The Law of One Price in International Trade: A Critical Review. Applied Economic Perspectives and Policy, 21(1), 126–139. https://doi.org/10.2307/1349976
Rao, D. S. P. (2013). Computation of basic heading purchasing power parities (PPPs) for comparisons within and between regions. In The World Bank (Ed.), Measuring the Real Size of the World Economy (pp. 93–119). Washington, D.C.: World Bank.
Rao, D. S. P., & Hajargasht, G. (2016). Stochastic approach to computation of purchasing power parities in the International Comparison Program (ICP). Journal of Econometrics, 191(2), 414–425. https://doi.org/10.1016/j.jeconom.2015.12.012
Robinson, T. (2007). The convergence of electricity prices in Europe. Applied Economics Letters, 14(7), 473–476. https://doi.org/10.1080/13504850500461597
Saez, Y., Mochon, A., Corona, L., & Isasi, P. (2019). Integration in the European electricity market : A machine learning-based convergence analysis for the Central Western Europe region. Energy Policy, 132(May), 549–566. https://doi.org/10.1016/j.enpol.2019.06.004
Telatar, M. E., & Yaşar, N. (2020). The Convergence of Electricity Prices for European Union Countries. In A. Dorsman, Ö. Arslan-Ayaydin, & J. Thewissen (Eds.), Regulations in the Energy Industry (pp. 55–63). Springer, Cham. https://doi.org/10.1007/978-3-030-32296-0_4
Zachmann, G. (2008). Electricity wholesale market prices in Europe: Convergence? Energy Economics, 30(4), 1659–1671. https://doi.org/10.1016/j.eneco.2007.07.002
37
Session 03 - The energy-economy nexus
EMERGENCY MEASURES TO PROTECT ENERGY CONSUMERS DURING THE COVID-19 PANDEMIC: A FOCUS ON THE ITALIAN INTERVENTIONS
Paolo Mastropietro, Institute for Research in Technology, Comillas Pontifical University, Madrid, Spain,
Pablo Rodilla nstitute for Research in Technology, Comillas Pontifical University, Madrid, Spain, Carlos Batlle, MIT Energy Initiative, MIT, USA and Florence School of Regulation, EUI, Italy
Overview The Covid-19 outbreak that spread worldwide in the first months of 2020 has obliged many governments to undertake confinement measures. These interventions had a massive impact on the world economy, provoking, in many countries, an unprecedented destruction of employment. The pandemic also had a tremendous impact on the energy sector, with a plunge in total energy demand, driven by a decline in commercial and industrial activities. On the other hand, confinement measures increased domestic demand for energy due to a larger occupancy. The combination of financial hardship for many households and increased residential energy needs has exacerbated pre-existing energy poverty (EU EPO, 2020; Engager, 2020), prompting many governments around the world to introduce emergency measures to protect energy consumers. These interventions, although very diverse in nature, are all based on the same underlying assumption: if the government requires people to stay home, then it must ensure that the basic energy needs of the household are satisfied (WEF, 2020). In this context, the Italian experience is of special interest. Italy was the first Western country to be affected by the pandemic and it suffered one of the most restrictive lockdown among democratic countries. The Italian Government was the first one to introduce protection measures for energy consumers. Among the interventions of the regulator (ARERA, 2020), we can find: Bill postponement for the eleven municipalities that were initially isolated. Postponement of the deadlines for the renewal of social tariffs. Disconnection ban for residential users in the entire national territory during the
lockdown. Specific measures for small and medium enterprises (bill reductions). Creation of a 1.5 billion € “COVID account” in order to guarantee the financial stability
of energy retailing companies. The objective of this study is to qualitatively assess the efficiency of these measures, comparing them with other international experiences. Methods Also as part of previous researches on the topic (Mastropietro et al., 2020), the emergency measures for consumers protection have been monitored worldwide during the initial phase of the pandemic.
38
Session 03 - The energy-economy nexus
This allowed to define a taxonomy of these policies, dividing them into six groups: disconnection bans, payment extension plans, enhanced assistance programmes, energy bills reduction or cancellation, measures for commercial and industrial users, and creation of financing mechanisms. The review also allowed to identify the key parameters of each of these measures. The interventions introduced in Italy have been qualitatively analysed in a comparative analysis with these international experiences, in order to identify its pros and cons. Results The comparative analysis shows that Italy acted promptly to protect its energy consumers during the pandemic. The Government shielded domestic consumers through the disconnection ban and later enlarged the protection to small commercial consumers, through specific bill reductions. The creation of the COVID account and other financial interventions improved the financial robustness of these measures, without creating a dangerous burden on retailing companies in this very delicate phase. On the other hand, Italy did not enhanced its assistance programmes, as many jurisdictions did. The pool of beneficiaries was not enlarged and eligibility requirements were not simplified. This would have provided a partial solution also for the aftermath of the crisis. Beyond that, the disconnection ban should have included some sort of ex- post eligibility check. Also this measure represents an economic aid for consumers and, as all aid, should be properly targeted in order not to waste the economic resources available. Conclusions If citizens are legally required to stay home, their basic residential energy needs must be guaranteed, especially if their income has been negatively affected by the outbreak and they have difficulty in paying energy bills. However, this protection must be provided as efficiently as possible, without creating a financial stress to the companies of the sector and without providing perverse incentives to customers. This research analyses the Italian protection measures and qualitatively assesses their efficiency, based also on a comprehensive review of international experiences. The Italian regulator managed to support energy consumers during the crisis, but there is room for improvement. These lessons learned could be useful in other stress events in the future. References ARERA, Autorità di Regolazione per Energia Reti e Ambiente, 2020. Information and press releases
from the website https://www.arera.it/it/elenchi.htm?type=stampa-20. Engager, Energy Poverty Action, 2020. European Energy Poverty: Agenda Co-Creation and Knowledge
Innovation. Call for action. EU EPO, European Union Energy Poverty Observatory, 2020. Information from the website
https://www.energypoverty.eu/. Mastropietro, P., Rodilla, P., Batlle, C., 2020. Emergency Measures to Protect Energy Consumers during
the Covid- 19 Pandemic: A Global Review and Critical Analysis. Energy Research & Social Science, vol. 68, art. 101678.
WEF, World Economic Forum, 2020. Here's Why Energy Security Is a Vital Tool in Tackling a Pandemic. News release.
39
Session 03 - The energy-economy nexus
Inmaculada Crespo Morán, María del P. Pablo-Romero, Javier Sánchez-Rivas, Antonio Sánchez-Braza THE RELATIONSHIPS BETWEEN TOURISM, ENERGY CONSUMPTION AND EMMISIONS: A REVIEW
Inmaculada Crespo Morán, University of Seville, Spain María del P. Pablo-Romero, Javier Sánchez-Rivas, Antonio Sánchez-Braza
Overview Tourism is an activity that has had extensive development in recent decades. At the end of 2019, according to the United Nations World Tourism Organization (UNWTO 2020), international tourist arrivals reached almost 15.5 billion. This growth of the sector has had a strong impact on economic growth, with its activity representing more than 10% of world GDP. However, this growth was accompanied by significant CO2 emissions. Although difficult to measure, the recent study by Lenzen et al (2018) valued these emissions at 4.3 billion metric tons emitted per year, mostly derived from energy consumption linked to transportation. However, the growth of the sector has been stunted by the global pandemic. In such a way that in the first half of 2020, international tourist arrivals fell by more than 65%, anticipating reaching more than 75% in the year 2020 as a whole. This decrease in activity has been accompanied by a considerable decrease in emissions, which has contributed to the global decrease in emissions in the world. The question that must be asked is whether the recovery of the sector in the future, once the pandemic is over, will lead us down the same path of economic growth and emissions, or if this strong negative impact on the sector may have repercussions on future growth that mitigates energy consumption and emissions associated with the sector. In order to take advantage of the opportunity for sustainable future tourism, it is necessary to first know how this activity has been related to energy consumption and the consequent CO2 emissions. To date, some studies have been carried out that try to analyze the relationship of these variables. The aim of this study is to review the related existing literature, in order to highlight what is the state of art currently. The interest is clear, since the sector is a clear source of economic growth worldwide, but at the same time a great source of co2 emissions growth. Method Studies that analyze the causality between emissions of CO2 (or energy consumption) and tourism and/or estimate in the long term the functional relationship between CO2 emissions (or energy consumption) and tourism are collected. This collection has been made thorough a related studies search. In a first phase, the search has been executed introducing in the Google Academic website words such as energy, tourism and emissions of CO2. Secondly, this search has been completed by reviewing the citations of the selected studied. From this search, the studies have been classified, according to several characteristics, extracting the main conclusions from them.
Results The empirical study of the relationships between CO2 emissions, tourism and, where appropriate, energy can be considered relatively recent, since all the studies that have been analyzed (the number of studies found has been 56) have been published since 2008, with a strong growth since 2014.
40
Session 03 - The energy-economy nexus They can be classified into three types of studie. Type1 1: those that only investigates the causal relationships between variables (10 studies), Type 2: those that only empirically determinate the long run estimates (20 studies), Type 3: those which combine both types of procedure (26). It is worth noting, that there are 18 studies which long run estimates can be considered special, as they define the emissions function in order to contrast the tourism EKC- They are special cases of Type 2 and 3 studies. Tourism arrivals are the most used indicator to assess the tourism variable in the studies analyzed. In fact, 37 studies use this variable. Tourism receipts are the second most used indicator (in 16 studies), while Tourism expenditure is used in 8 studies. In relation to the methodology used, of the 56 studies carried out, 54.5% of them use time series, while 56.4% use panel data (the percentages do not add up to 100 as some studies use both methodologies). The predominance of panel data is more evident when they are studies that contrast the tourism EKC. The following results are fond, depending on type of studies Type 1 studies: T→CO2 in 4 studies and some countries, RE→ T in 1 study and some countries, TA ↔EC in 1 study and some countries and TA →EC in 2 studies and some countries Type 2 studies: T→E in 3 studies, T→Co2 in 8 studies and some countries, E→ T in one study, T→↓CO2 in 3 studies and some countries and E → ↓T in one study. The EKC is confirmed in 2studies and some regions and EKC is rejected in 2 studies Type 3 studies: The long run causalities studies indicates that CO2→T in 2 studies, T→CO2 in 10 studies and some regions and countries, T→E in 2 studies and some countries, T→↓CO2 in 8 studies and some regions and countries, E→ T in one study and some countries and E → ↓T in one study. The EKC is confirmed in 6 studies and in some regions or countries and EKC is rejected in 3 studies. Conclusions 56 studies have been found published until the first date of 2020. Much of them are recent studies. Different methodology is employment and the studies focus on causality, long run estimation function and contrast of the EKC for tourism. Tourism arrivals are the most used indicator and panel data and time series are employed. The relationship more observed is T→CO2. and T→E are the most frequent results, but T→↓CO2 is also frequently found. The EKC is confirmed also in many studies. It is usual to find different results depending on country or region.
References UNWTO (2020) World Tourism Barometer and Statistical Annex, August/September
Lenzen, M., Sun, Y. Y., Faturay, F., Ting, Y. P., Geschke, A., & Malik, A. (2018). The carbon footprint of global tourism. Nature Climate Change, 8(6), 522-528.
41
Session 04 - Current Gas Market Dynamics
Sevkat Ozgur DRIVERS OF MERGER AND ACQUISITION TRANSACTIONS IN THE U.S UPSTREAM OIL AND GAS INDUSTRY
Sevkat Ozgur, Faculty of Business, Economics and Statistics, University of Vienna, Austria,
Overview Attempts to explain oil and gas investments and its underlying motivation and drivers, particularly model any present or future investments face a challenge due to the complexity of the oil and gas industry and the fact that there are various theories and a set of theoretical models which can explain underlying motivation and drivers of such investments from different aspects. This complexity is the result of the interaction of elements such as resource availability, geographical characteristics, technological advancements and innovations, dynamic supply and demand, volatile commodity prices, the (inter)national competition subject to different institutional, geopolitical conditions, and other factors. Due to the critical concern of the future energy supply, important role of oil and gas industry for the world economy and many other strategic reasons (e.g., transportation, diplomatic security), to analyze and understand the dynamics and various patterns of the oil and gas industry and for instance, its strategic investments such as mergers and acquisitions (M&A) is a crucial endeavor. Over the past decades, parallel to the development of new technologies, activities in the oil and gas industry have gained speed which have led economic responses and various perspectives on the investments (Hsu et al., 2017). M&A transactions, particularly the upstream oil and gas M&A transactions showed changing patterns. Based on given figures in IHS Markit Transaction Analysis database (2019), the numbers of transactions in the upstream oil and gas industry increased in recent years. Major triggers of the M&A market in the upstream oil and gas industry are organic reserve replacement challenges, pursuit of cost efficiencies, higher cost of debt, volatility of oil price, pressure for capital discipline by investors and challenging global market conditions. Particularly, the U.S has been the epicenter of M&A investments over decades (and over more than a century, expert in drilling) and remains a major player in the oil and gas industry. This has a strong impact not only on the U.S economy and its domestic M&A market with its increased number of transactions but also on the global M&A market. This paper investigates the unique drivers of the upstream oil and gas M&A transactions in the U.S. Concurrently, our research complements to the study of Hsu et al., (2017). Different than M&A studies in general, the study conducts a unique sector-specific analysis of M&A transactions. Namely, we will test how existing findings and proposed factors feature the drivers of upstream oil and gas M&A investments and what are other potential crucial factors which might drive oil and gas investments in the U.S. Hsu et al., (2017) propose that between 2004 and 2013, upstream oil and gas M&A activity in terms of number of deals in the U.S is mostly influenced by industry-specific factors (e.g., oil production, oil price). Moreover, general economic conditions and financial market have less impact on the deals.

42
Session 04 - Current Gas Market Dynamics Different than Hsu et al., (2017), our study extends the period of analysis and analyzes the drivers of upstream oil and gas M&A transactions in terms of deal value and number of deals. Furthermore, it suggests further factors which might have impact on the deals and explains underlying facts on various patterns of the U.S deals. This study offers a unique contribution to the investment and M&A literature, energy economics, oil and gas industry and future directions by presenting empirical evidence and it motivates for further research in this field. Methods The upstream oil and gas M&A transaction data is obtained from IHS Markit, Connect database. The sample contains all mergers and acquisitions announced between 01/01/2000 and 31/12/2019, which includes both domestic and cross-border transactions in the upstream oil and gas industry. It lists 25,461 transactions over this period. This study focuses only on the U.S M&A transactions, particularly, focuses on the upstream oil and gas deals (i.e., 4,132 domestic upstream oil and gas deals). To analyse the drivers of cross-border oil and gas M&A transactions in the upstream industry, we applied empirical model, multiple regression analysis. Our dependent variables, “Number of Deals” and “Total Deal Value”, are calculated based on the year-region pair level, (i.e., we derive various regions of the U.S). Independent variables fall into categories such as macroeconomic drivers and oil and gas industry-specific drivers. Addition to that, we add several dummy variables (e.g., certain political events, technological innovation) to analyze their impact on the deals. The variables which can proxy these categories are obtained from several data sources such as World Bank, UNCTAD. Besides that we analyze the drivers of various patterns of the deals, such as corporate versus asset, unconventional versus conventional deals. Preliminary Results The major finding supports the view that drivers of M&A in general and M&A across various industries can vary and can be influenced by industry-specific stylized facts (Kang and Johansonn, 2000). Based on our large data set, is that instead of standard economic factors, industry-specific and technology-specific factors play a more important role to explain drivers of upstream oil and gas M&A transactions in the U.S. The results show similar patterns to Hsu et al., (2017). However, different than the prior findings, the factors which can proxy market liquidity and stock market has an impact on the deal value. Furthermore, various patterns of the deals are driven by different underlying motives. Conclusions Investment in the upstream oil and gas industry is an important activity both at the national and corporate level, as it directly affects the future oil and gas production and replacement of reserves which in turn also affects economic activities and continuous growth of oil and gas companies. Our particular focus deals with the question what are the proposed drivers of upstream oil and gas deals, what other factors might drive the upstream oil and gas M&A deals and if potentially, those factors has an impact on certain patterns/trends of the deals. The upstream industry is very technology and capital-intensiv and carries high risks, affected by global politics and strict environment regulations which causes more difficulties for investment activities. In that line, merger and acquisition transactions offer growth opportunities, and strategy is applied by resource seekers, capital or technology seekers or strategic access seekers. Also in the future, acquisitions will remain a part of companies’ strategic options because organic growth continues to be a challenge and has been more expensive than M&A transactions.
43
Session 04 - Current Gas Market Dynamics In this regard, the study makes a contribution for participants of M&A markets in the oil and gas industry. Moreover, it contributes to literature by complementing the study of Hsu et al. (2017), Ng and Donker (2013) and Dowling and Vanwalleghem (2018), which use a sample of Canadian oil and gas transactions, the U.S oil and gas transactions and Gulf Cooperation Council oil and gas transactions. And although we cannot address the dramatic effect of the current crisis due to an almost world-wide temporary economic lockdown due to the covid-19 virus and we conjecture that will have an effect beyond the relatively brief economic interruption, many of our observations should apply to a post-Corona world oil and gas market. Accordingly, the study suggests further research and provide recommendations for future studies. References Dowling, M., and Vanwalleghem D., (2018). Gulf Cooperation Council cross-border M&A: institutional
determinants of target nation selection. International Business and Finance, 46, 471-489.
Hsu, K., Wright, M., and Zhu, Z., (2017). What motivates merger and acquisition activities in the upstream oil and gas sectors in the U.S? Energy Economics, 65, 240-250,
https://doi.org/10.1016/j.eneco.2017.04.028
Kang, N., and Johansson, S., (2000). Cross Border Mergers and Acquisitions: Their role in Industrial Globalization, OECD Science, Technology and Industry Working Papers.
IHS Markit, Global Upstream M&A Review, (2018).
Ng, A., and Donker, H., (2013). Purchasing reserves and commodity market timing as takeover motivates in the oil and gas industry. Energy Economics, 37, 167-181.
Volpin, S., and Rossi, P., F., (2003). Cross-country determinants of mergers and acquisitions. Journal of Financial Economics, 74, 277-304.

44
Session 04 - Current Gas Market Dynamics
Amina Talipova, Sergei Parsegov EXPLORING RUSSIAN GAS PRICES TO EUROPE: EMPIRICAL EVIDENCE OF PRICE CONVERGENCE FROM TIME SERIES ANALYSIS
Amina Talipova, Higher School of Economics, Russia Sergei Parsegov, Texas A&M University
Overview EU is increasingly dependent on natural gas imports (77.9% in 2018 compared to 74.4% in 2017), which is the second energy source after oil and accounts for 23-26% in energy balance 1. With own fast production decrease, EU imports a quarter of global LNG and two-thirds of Russian pipeline gas exports. In 2019, EU absorbed almost 80% of world LNG production increase. Amid hub prices decline, LNG accounted for 28% of all imported gas and, for the first time, exceeded 100 bcm/year (GIINGL 2019). In the same period, Gazprom was selling gas to EU consumers at a 16-year low. German border gas in Q4 2019 price was $170/MCM, though, Russia saved market share at 39% of total gas imports. Real LNG imports to the EU in 4Q 2019 grew by a record of 42%. Continuing global LNG market maturation brings available substantial volumes, coming from new producers. On the supply side, as time goes and LNG projects sunk costs largely amortized, sellers will be more flexible to engage short-term trading and developing the global spot market. On the demand side, in the matured market, short-term supplies can balance peaks and changing prevailed long-term trade. These processes will go even without the ability to replace Russian pipeline gas in Europe entirely. However, it is unnecessary, since Gazprom cannot physically change the final delivery point, but only defiantly reduce volumes, as happened during Ukraine- Russia gas disputes in winter 2009. Significant LNG volumes came to Europe from the USA, Russia, and historically from Nigeria and Qatar (Figure 2). Russian LNG flow from Yamal in Europe gives an excellent example of analyzing the rivalry of pipeline gas and LNG. Any possible LNG-pipeline competition justifies authorities to maintain Gazprom’s status quo as a monopolist in pipeline gas export. Reinforced LNG volumes are consistent due to objective economic factors, and Gazprom competes with all LNG suppliers, not with Yamal or Arctic LNG. Furthermore, pipeline and LNG deliveries statistics show that Gazprom’s supply grew in the same countries where most of the LNG volumes from Yamal have been absorbed in the EU (France, Netherlands) and remained or slightly decreased in the rest countries. Meanwhile, Russian LNG showed >300% growth. Methods Our hypothesis suggests that Gazprom lost negotiation position and price-making privilege. It weakens Russian gas competitiveness and calls for LNG export liberalization. The analysis covers the last 12 years of EU hub and Russian pipeline gas prices through Nord Stream and Yamal Europe. We imply price convergence theory and particularly a pairwise time-series test. We have also tested pipeline price convergence and hubs cross-convergence with the Brent crude oil and US LNG to exclude false-positive conclusions. Some modifications of the classic test have been made to comply with energy market fundamentals.
Results The findings show the convergence of Gazprom’s price and hubs from 2015 and until the COVID-19 pandemic. However, a strong convergence was observed between Russian pipeline gas and Brent from January 2008 till June 2020 with nine months lag.
45
Session 04 - Current Gas Market Dynamics
Results indicate that Gazprom is no longer a price-maker but still uses its dominance in several European countries. Conclusions The European market transformed from the "seller’s market" in early 2000s to the "buyer’s market" with integrated and well-developed infrastructure during the past decade. Given rapid changes and new challenges together with numerous of competition laws violations, it is crucial for Russia to review its market share saving strategy for the pipeline gas export and market expansion strategy for LNG exports. Consequently, relevant and timely changes in the regulation are the foremost measures that should be taken. To be successful, these strategies should provide unification and liberalization of exports for LNG producers with the removal of targeted tax preferences. In addition, it is necessary to reassess the prospects of TPA regime from the pipeline exports standpoint. While export TPA access is still the subject for broad discussions, the shortcomings of LNG export barriers today are obvious. European gas market today opens a window of opportunity for Russian gas and it is a due time for policymakers to reassess if they are ready to open it by eliminating existing purposeless regulation and privileges for particular companies, or leave it for others.
46
Session 05 - The renewable energy reality: case studies
François Benhmad, Jacques Percebois ON THE IMPACT OF WIND AND SOLAR GENERATION ON NUCLEAR POWER THE CASE OF FRANCE
François Benhmad, Montpellier University, Site Richter, Avenue Raymond Dugrand, CS79606, 34960 Montpellier Cedex2, France
Jacques Percebois, Montpellier University, Site Richter, Avenue Raymond Dugrand , CS79606, 34960 Montpellier Cedex2, France
Abstract: The increasing deployment of intermittent renewable energy sources to decarbonize the French electricity system constitutes a high challenge for nuclear energy fleet which represents 72% contribution to the electricity mix. In this paper, we carry out an empirical analysis in order to investigate the impact of wind feed-in and solar power generation on nuclear electricity production and profitability. Our empirical findings show that nuclear energy can be considered sometimes as a back-up of renewables and sometimes as a victim trough a crowding-out effect of renewables. A "nuclear paradox" could be observed if nuclear power serves as a back-up because excess nuclear electricity would be transformed into hydrogen (power-to-gas), whereas logically it is renewables that should be stored in this form. Keywords: Nuclear, Solar, Wind, Energy transition JEL classification: Q41, Q42, Q48
1. Introduction The EU energy strategy has been mainly driven by the need to decarbonise the energy sector. The objectives of the Second Climate and Energy Package released in 2014, with targets for 2030, are (compared to 1990 levels) 40% GHG emissions reductions, 27% renewable energy share in the primary energy mix, and 27% energy efficiency improvement (European Commission, 2015). Various support schemes for renewable energy sources (RES) are operating in Europe, mainly feed-in tariffs, fixed premiums, and green certificate systems. The feed-in tariff (FIT) is the most favourable one for a variety of RES especially for wind and solar power generation. There is also a growing use of the auction mechanism to set the level of subsidies for renewable. The RES were also given priority access to grid over conventional power plants, i.e. fossil-fuel, nuclear-fuel and hydro-based power plants. It is also because their marginal cost is close to zero, which gives them an advantage in a market based on merit order based on marginal costs. It is worth noting that The RES development induced a disruption of electricity generation across Europe. Some power generators were forced to mothball. Some other power plants closed as they were not used enough to be profitable. Some other power plants, among them nuclear plants, couldn’t quickly accommodate swings in supply and demand. Although the nuclear energy share is more than 70% in France whereas combined generation from wind and solar power accounted for less than 6 or 7 per cent of gross electricity production. EDF (Electricité de France), operating the world’s largest fleet of nuclear reactors, is thus challenged by the growing market share of intermittent energy sources like wind and solar. In this paper, we carry out an empirical analysis in order to investigate the impact of wind feed-in and solar power production on nuclear electricity generation profitability in France.
47
Session 05 ‐ The renewable energy reality: case studies Moreover, we explore the ability of nuclear power to provide flexibility, to behave as a back- up capacity to cope with renewables intermittency replacing carbon-emitting technologies, predominantly gas-fired plants, and thus making this integration more possible. This study makes two main contributions to the literature. Firstly, an OLS regression is used to explore the joint impact of wind and solar photovoltaic feed-in on nuclear energy generation, using 2018 year as a dataset. Secondly, we take into account electricity exchanges with Germany impact on nuclear generation and we control for power demand in France (load) throughout the 24 hours of the day over the 365 days of our data sample. Our main empirical findings confirm that increasing the share of wind generation and solar feed-in could have a downward impact on nuclear generation. Therefore, nuclear energy could be a victim of crowding-out effect from renewables as it will increasingly play a role of a back-up technology to cope with intermittence of renewables. This load following behavior of nuclear plants could jeopardize their profitability. That is a “nuclear paradox”. The paper is organized as follows. Section 2 provides the background on RES effect and the corresponding literature review. In section 3, we present the results and discuss the main findings. In section 4, we conclude and explore the policy implications of our findings. 2. Background and Literature review In order to supply electricity, different power generation technologies compete with each other according to their availability of supply and their marginal cost of production (fossil fuels such as coal or natural gas, nuclear power, renewable energy sources such as hydroelectric generators, wind and solar energy). The electricity market operates on the basis of day-ahead bidding. Transmission system operators receive bids from all power producers for the quantity and cost for each hour of the next day and then assign dispatch based on the lowest cost producer until demand is met. All dispatching producers get the marginal price of the last producer that dispatched. This approach, ranking the power plants of the system in ascending order of their marginal cost of generation, is called the merit order. Traditionally, hydroelectric power plants are the first to be dispatched on to the grid. They are followed, in order, by nuclear plants, coal-fired and/or combined-cycle gas turbines (CCGT), open cycle gas turbine (OCGT) plants and oil-fired units with the highest fuel costs. Although power plants with oil-fired gas turbines have the highest marginal cost, gas plants are usually marginal producers and consequently the cost of gas is very relevant to the setting of wholesale electricity prices. The principle behind the functioning of the electricity market is that producers with low variable costs (e.g. nuclear or hydroelectric) recover the fixed costs of during peak periods, when their generated electricity is sold on the market at a spot price corresponding to the sum of variable cost and fixed costs of thermal energy(turbines running natural gas or diesel fuel). Thus, the investment of baseload power plants (nuclear, hydro) can be recovered. However, pricing based on marginal costs can not allow RES to recover their fixed costs. Indeed, photovoltaic (PV) and wind power plants have a high average cost and their load factor is too low due to intermittency. Therefore, subsidizing renewable energy sources, through a feed-in tariff scheme or another support scheme enabling their average costs to be recovered, constitutes an extra-market support mechanism. By producing an economic return above the market price, these support schemes have promoted RES development in several European electricity markets.
48
Session 05 - The renewable energy reality: case studies Moreover, as renewable energy sources (RES) have the privilege of priority for grid access and thus for dispatch, electricity from RES participating in the auction process at zero marginal cost replaces every other energy source with higher marginal cost. This results in a downward pressure on equilibrium price level on the spot market, the so-called merit order effect (Sioshansi, 2013). The merit order effect has gained increasing attention in the literature both theoretically and empirically. Jensen and Skytte (2002) point out that RES generation enters at the base of the merit order function, thus shifting the supply curve to the right and crowding the most expensive marginal plants out of the market, with a reduction of the wholesale clearing electricity price. Several papers have carried out empirical analyses on the impact of RES in electricity markets, finding evidence of the merit order effect. Indeed, one of the central empirical findings in the literature on renewable energy (RES) is that an increase in generation from intermittent sources would put downward pressure on the spot electricity market price by displacing high fuel-cost marginal generation. Although RES installations are very capital- intensive, they have almost zero marginal generation cost and thus are always dispatched to meet demand. More expensive conventional power plants are crowded out, and the electricity price falls. The impact of a massive development of renewable energies at zero marginal cost has been for a long time well addressed in the literature (Benhmad and Percebois, 2016 and 2018; Bode and Groscurth, 2006; Cludius 2014; Escribano et al 2011; Gelabert et al 2011; Hardle and Truck 2010; Huisman et al 200; Keles et al 2013; Ketterer 201; Knittel and Roberts 2005; Moreno et al 2012; Mugele et al 2005; Munksgaard and Morthorst 2008; Neubarth et al 2006; Nicolosi and Fursch 2009; Percebois and Pommeret, 2018; Phan and Roques, 2015; Rivard and Yatchew, 2016; Sensfuß et al., 2008); Wurzburg et al 2013). Increasing penetration of zero marginal cost intermittent renewable technologies as solar or wind causes the decline of wholesale electricity prices due to the merit-order effect. The consequence is a «cannibalization effect» since the profitability of investments in renewables becomes lower (Lopez et al 2020). Moreover (Oosthuizen et al., 2019) found that the merit-order effect is more pronounced for small markets than for larger ones. High penetration of intermittent renewable energies (RES) leads both to depressed and volatile electricity due to the volatility of renewables.
(Wozabal et al., 2016) critically review the general view that the introduction RES increases the price variance on spot market. They observed that small or moderate quantities of RES tend to decrease the price variance, whereas large quantities have the opposite effect. Investing in new renewables capacity is less attractive with lower market prices and requires higher feed-in tariffs as suggested by (Gross et al., 2010). It is therefore necessary to increase taxes to finance the gap between the guaranteed price and the market price, leading to a higher final electricity price for the consumer. The "paradox" of falling renewable energy production costs and rising final electricity prices is well known. As pointed out by (Blazquez et al., 2018), policymakers have to pay attention to “The renewable energy policy Paradox”. 3. Empirical evidence: 3.1 Data The analysis is based on time-series data of the French power system as provided by ENTSOE.

49
Session 05 - The renewable energy reality: case studies
Our dataset is based on hourly information on nuclear power feed-in and RES electricity generation (wind and photovoltaic). The sample data covers the period from January 1st 2018 to December 31st 2018, summing to 8760 hourly data. Figure 1 provides a plot of the data for the whole period.
Figure 1. Nuclear power feed-in (hourly)
It is easy to see that the nuclear power feed-in exhibits a clear seasonal profile which can be subdivided in two semesters : The first semester beginning in October and ending in late March, the second semester from April to end September.
Figure 2. Wind power feed-in (hourly)
The wind power feed-in exhibits a clear seasonal profile which can be subdivided in two semesters : The first semester beginning in October and ending in late March, the second semester from April to end September.
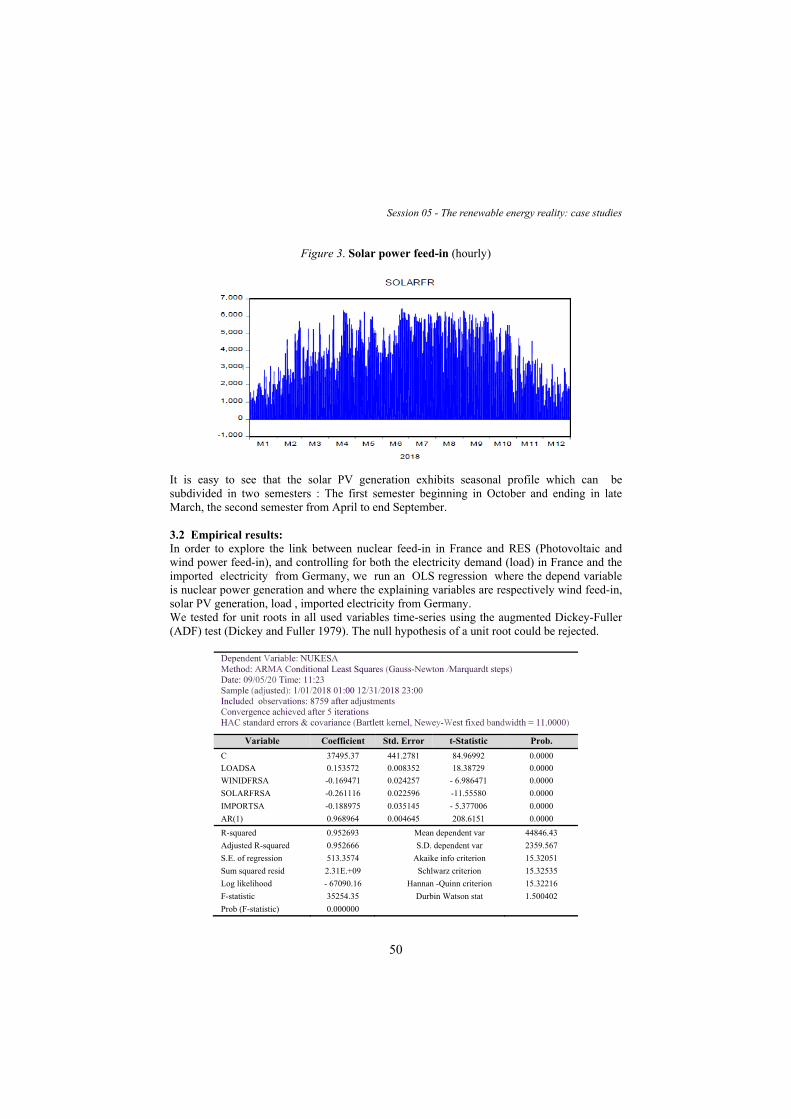
50
Session 05 - The renewable energy reality: case studies
Figure 3. Solar power feed-in (hourly)
It is easy to see that the solar PV generation exhibits seasonal profile which can be subdivided in two semesters : The first semester beginning in October and ending in late March, the second semester from April to end September.
3.2 Empirical results: In order to explore the link between nuclear feed-in in France and RES (Photovoltaic and wind power feed-in), and controlling for both the electricity demand (load) in France and the imported electricity from Germany, we run an OLS regression where the depend variable is nuclear power generation and where the explaining variables are respectively wind feed-in, solar PV generation, load , imported electricity from Germany. We tested for unit roots in all used variables time-series using the augmented Dickey-Fuller (ADF) test (Dickey and Fuller 1979). The null hypothesis of a unit root could be rejected.
Dependent Variable: NUKESA Method: ARMA Conditional Least Squares (Gauss-Newton /Marquardt steps) Date: 09/05/20 Time: 11:23 Sample (adjusted): 1/01/2018 01:00 12/31/2018 23:00 Included observations: 8759 after adjustments Convergence achieved after 5 iterations HAC standard errors & covariance (Bartlett kernel, Newey-West fixed bandwidth = 11.0000)
Variable Coefficient Std. Error t-Statistic Prob.
C 37495.37 441.2781 84.96992 0.0000
LOADSA 0.153572 0.008352 18.38729 0.0000
WINIDFRSA -0.169471 0.024257 - 6.986471 0.0000
SOLARFRSA -0.261116 0.022596 -11.55580 0.0000
IMPORTSA -0.188975 0.035145 - 5.377006 0.0000
AR(1) 0.968964 0.004645 208.6151 0.0000
R-squared 0.952693 Mean dependent var 44846.43
Adjusted R-squared 0.952666 S.D. dependent var 2359.567
S.E. of regression 513.3574 Akaike info criterion 15.32051
Sum squared resid 2.31E.+09 Schlwarz criterion 15.32535
Log likelihood - 67090.16 Hannan -Quinn criterion 15.32216
F-statistic 35254.35 Durbin Watson stat 1.500402
Prob (F-statistic) 0.000000
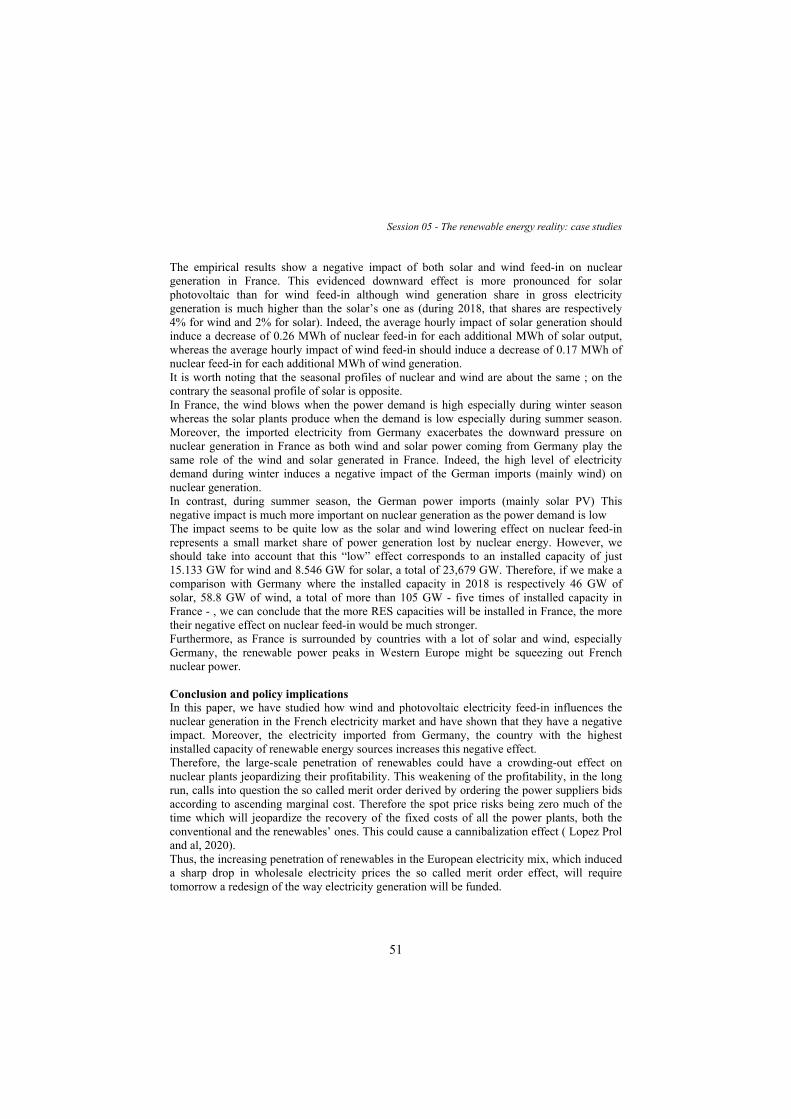
51
Session 05 - The renewable energy reality: case studies
The empirical results show a negative impact of both solar and wind feed-in on nuclear generation in France. This evidenced downward effect is more pronounced for solar photovoltaic than for wind feed-in although wind generation share in gross electricity generation is much higher than the solar’s one as (during 2018, that shares are respectively 4% for wind and 2% for solar). Indeed, the average hourly impact of solar generation should induce a decrease of 0.26 MWh of nuclear feed-in for each additional MWh of solar output, whereas the average hourly impact of wind feed-in should induce a decrease of 0.17 MWh of nuclear feed-in for each additional MWh of wind generation. It is worth noting that the seasonal profiles of nuclear and wind are about the same ; on the contrary the seasonal profile of solar is opposite. In France, the wind blows when the power demand is high especially during winter season whereas the solar plants produce when the demand is low especially during summer season. Moreover, the imported electricity from Germany exacerbates the downward pressure on nuclear generation in France as both wind and solar power coming from Germany play the same role of the wind and solar generated in France. Indeed, the high level of electricity demand during winter induces a negative impact of the German imports (mainly wind) on nuclear generation. In contrast, during summer season, the German power imports (mainly solar PV) This negative impact is much more important on nuclear generation as the power demand is low The impact seems to be quite low as the solar and wind lowering effect on nuclear feed-in represents a small market share of power generation lost by nuclear energy. However, we should take into account that this “low” effect corresponds to an installed capacity of just 15.133 GW for wind and 8.546 GW for solar, a total of 23,679 GW. Therefore, if we make a comparison with Germany where the installed capacity in 2018 is respectively 46 GW of solar, 58.8 GW of wind, a total of more than 105 GW - five times of installed capacity in France - , we can conclude that the more RES capacities will be installed in France, the more their negative effect on nuclear feed-in would be much stronger. Furthermore, as France is surrounded by countries with a lot of solar and wind, especially Germany, the renewable power peaks in Western Europe might be squeezing out French nuclear power. Conclusion and policy implications In this paper, we have studied how wind and photovoltaic electricity feed-in influences the nuclear generation in the French electricity market and have shown that they have a negative impact. Moreover, the electricity imported from Germany, the country with the highest installed capacity of renewable energy sources increases this negative effect. Therefore, the large-scale penetration of renewables could have a crowding-out effect on nuclear plants jeopardizing their profitability. This weakening of the profitability, in the long run, calls into question the so called merit order derived by ordering the power suppliers bids according to ascending marginal cost. Therefore the spot price risks being zero much of the time which will jeopardize the recovery of the fixed costs of all the power plants, both the conventional and the renewables’ ones. This could cause a cannibalization effect ( Lopez Prol and al, 2020). Thus, the increasing penetration of renewables in the European electricity mix, which induced a sharp drop in wholesale electricity prices the so called merit order effect, will require tomorrow a redesign of the way electricity generation will be funded.

52
Session 05 - The renewable energy reality: case studies The energy-only market cannot operate with a high proportion of renewable electricity with zero variable cost. Hence the need to combine a sustainable capacity market to finance fixed costs and ensure that the plants will be well available to meet the demand for electricity. It is a complete reform of electricity pricing mechanisms that is expected: a wholesale market based on the "merit order" works well as long as the fleet of plants is a heterogeneous park composed of several categories of power stations presenting highly differentiated variable costs. It is conceivable to set prices according to average costs, opt for a "Ramsey-Boiteux" type of pricing, which would be tantamount to fixing the price per kWh above marginal cost, the differential between this price and the marginal cost being inversely proportional to the price elasticity of demand, or choosing non-linear pricing in which the fixed part would be very important and adjusted to finance the fixed costs of the called equipment. In the latter case, this amounts to permanently backing up a capacity market for the spot market.
References Benhmad F., Percebois, J. (2018), Photovoltaic and wind power feed-in impact on electricity prices: the
case of Germany, Energy policy, 2018, Vol.119, pp. 317-326
Benhmad, F., Percebois, J., 2016. Wind power feed-in impact on electricity prices in Germany 2009 2013. Eur. J. Comp. Econ. 13, 81–96.
Blazquez, J., Fuentes-Bracamontes, R., Bollino, C.A., Nezamuddin, N., 2018. The renewable energy policy Paradox. Renew. Sustain. Energy Rev. 82, 1–5.
Bode S., Groscurth H.M. (2006), The Effect of the German Renewable Energy Act (EEG) on the electricity price, HWWA Discussion Paper (348).
Cludius, J., Hermann, H., Matthes, F., and Graichen, V. (2014). The merit order effect of wind and photovoltaic electricity generation in Germany 2008–2016: Estimation and distributional implications, Energy Economics , 302-313.
Escribano A., Ignacio Peña J., Villaplana P., (2011), Modeling electricity prices: International evidence Oxford Bulletin of Economics and Statistics (73), 622-650.
Gelabert L., Labandeira X., Linares, P., (2011), An ex-post analysis of the effect of renewable and cogeneration on Spanish electricity prices, Energy Economics (33), S59-S65.
Gross, R., Blyth, W., Heptonstall, P., 2010. Risks, revenues and investment in electricity generation: Why policy needs to look beyond costs. Energy Econ.
Hardle, W. and S. Truck (2010) The dynamics of hourly electricity prices, SFB 649 Discussion Paper Huisman, R. C. Huurman and R. Mahieu (2007), Hourly electricity prices in day-ahead markets, Energy Economics, vol.29(2), 240-248
Keles D., Genoese M., Most D., Ortlieb S., and Fichtner W., (2013), A combined modeling approach for wind power feed-in and electricity spot prices, Energy Policy (59), 213-225.
Knittel C.R., Roberts M.R., (2005), An empirical examination of restructured electricity prices’, Energy Economics (27), 791-817.
Ketterer J.C., (2014), The impact of wind power generation on the electricity price in Germany, Energy Economics (44), 270-280
López Prol, J., Steininger, K.W., Zilberman, D., 2020. The cannibalization effect of wind and solar in the California wholesale electricity market. Energy Econ. 85,
Mugele C., Rachev S.T., Trück S., (2005), Stable modeling of different European power markets, Investment Management and Financial Innovations (2), 65–85.
Munksgaard J., Morthorst P.E., (2008), Wind power in the Danish liberalised power market Policy measures, price impact and investor incentives, Energy Policy (36), 3940–3947.
Neubarth J., Woll O., and Weber C., Gerecht M., (2006), Influence of Wind Electricity Generation on Spot Prices, Energiewirtschaftliche (56) , 42–45.

53
Session 05 - The renewable energy reality: case studies
Nicolosi M., Fürsch M., (2009), The impact of an increasing share of RES-E on the conventional power market - The example of Germany, Zeitschrift für Energiewirtschaft (33), 246–254.
Oosthuizen, A., Inglesi-Lotz, R., Thopil, G., 2019. The relationship between renewable energy and retail electricity prices: Panel evidence from OECD countries (No. 797), ERSA working paper 797
Sensfuß F., Ragwitz M., and Genoese M., (2008), The merit-order effect: A detailed analysis of the price effect of renewable electricity generation on spot market prices in Germany, Energy Policy, (36):3086-3094.
Sioshansi F., (2013), Evolution of global Electricity markets,. Ed.Elsevier, June 2013.
Wozabal, D., Graf, C., Hirschmann, D., 2016. The effect of intermittent renewables on the electricity price variance. OR Spectr. 38, 687–709. https://doi.org/10.1007/s00291-015- 0395-x
Wurzburg K., Labandeira X., and Linares P., (2013), Renewable generation and electricity prices:Taking stock and new evidence for Germany and Austria, Energy Economics(40), 159- 171.
54
Session 05 - The renewable energy reality: case studies
Kathrin Kaestner, Manuel Frondel, Stephan Sommer and Colin Vance
PHOTOVOLTAICS AND THE SOLAR REBOUND: EVIDENCE FOR GERMANY
Kathrin Kaestner, RWI – Leibniz Institute for Economic Research, Hohenzollernstr. 1-3, 45128 Essen, Germany
Manuel Frondel, RWI – Leibniz Institute for Economic Research and Ruhr University Bochum (RUB) Stephan Sommer, RWI – Leibniz Institute for Economic Research PColin Vance, RWI – Leibniz
Institute for Economic Research and Jacobs University Bremen
Overview Recent research suggests that households would increase their electricity consumption in the aftermath of installing photovoltaic (PV) panels, a behavioral change commonly referred to as the solar rebound. Drawing on panel data originating from the German Residential Energy Consumption Survey (GRECS) spanning the period from 2004 to 2015, we employ panel estimation methods and the dynamic system estimator developed by Blundell and Bond (1998) to investigate the solar rebound effect, thereby accounting for simultaneity and endogeneity issues relating to PV installation and the electricity price. Our empirical results suggest that PV panel adoption of households hardly reduces the amount of electricity taken from the grid. As we derive theoretically, this outcome implies that the rebound reaches an upper bound of about 30% for German households. Yet, we are skeptical of whether there is such a large solar rebound effect given the strong economic incentives to feed solar electricity into the public grid in the past. Methods Without exception, German solar households are net-metered customers whose solar electricity production is first consumed by themselves, while only the excess solar electricity is sold to the grid operator. Since the amount of solar electricity produced by a household in Germany is generally not metered, neither data on solar electricity production, nor on the feed-in of solar electricity into the grid is available for individual German households. As only the amount of electricity that households take from the public grid, eg, is known, we are unable to exactly quantify the solar rebound, but we can preclude the case of a maximum solar rebound by testing the following null hypothesis 𝐻0 against the alternative hypothesis 𝐻1:
∂ln(𝑒𝑔) ∂ln(𝑒𝑔) 𝐻0 : ∂𝑃𝑉
= 0 versus 𝐻1 : ∂𝑃𝑉 < 0
(1)
If 𝐻0 holds true, i.e. the amount of electricity taken from the grid remains unchanged after PV adoption, the solar rebound reaches its maximum since solar households first consume a share of their generated PV electricity, such that overall consumption increases. To identify the impact of PV ownership on consumption of grid electricity eg and to account for sluggish appliance stock adjustments and inflexible utilization behavior in the short run, we estimate the following dynamic panel model:

55
Session 05 - The renewable energy reality: case studies
(2)
where ln(𝑒𝑔𝑖𝑡 ) is the natural logarithm of the annual amount of electricity that household i takes in year t from the grid, 𝛽𝑡−1 is the coefficient on the lagged dependent variable 𝑒𝑔𝑖,𝑡−1 and PV is an indicator variable of PV ownership, equaling unity if the household owns a PV system and zero otherwise. ln(p) denotes the natural logarithm of the marginal electricity price and x is a vector comprising a set of socio-economic variables. 𝜏𝑡 denotes year fixed effects that account for a general trend in the average household electricity consumption, 𝜇𝑖 designates individual-specific fixed effects, capturing unobservable, time-invariant household characteristics, and 𝜗𝑖𝑡 denotes an idiosyncratic error term. By including fixed effects, we tackle potential problems of omitted variable bias due to time-invariant and individual-specific unobservables, such as a respondent’s environmental attitude that may influence the probability of a household to install a PV system and thus may be correlated with the PV indicator. To tackle the well-known Nickell bias (Nickell, 1981) arising in dynamic models when estimated using fixed- effects methods and to consistently estimate equation (2), we employ the GMM system estimator by Blundell and Bond (1998), which builds on a system of two sets of equations, these being the original equation, as well as the equation in first differences to eliminate the individual effects. By using both lagged differences of 𝑒𝑔𝑖𝑡 to instrument for levels and lagged levels of 𝑒𝑔𝑖𝑡 as instruments for differences of the lagged dependent variable, we are able to exploit all orthogonality conditions between the lagged values of 𝑒𝑔𝑖𝑡 and the error term 𝜗𝑖𝑡 as in the Arellano-Bond difference estimator (Arellano and Bond, 1991) and improve efficiency by invoking the additional assumption that the first differences of instrumental variables are uncorrelated with the fixed effects, which allows the introduction of more instruments. Finally, to cope with the likely endogeneity of electricity prices and PV ownership, we incorporate the sum of regulated price components as instrumental variable 𝑧𝑝 for prices, as well as the number of installed PV systems per zip code as instrument 𝑧𝑃𝑉 for PV ownership. Results Based on the statistically insignificant estimate of -0.029 for our coefficient on PV obtained from estimating equation 2 , we cannot reject our null hypothesis that solar households do not change the amount of electricity taken from the grid. That we cannot reject the null hypothesis suggests that the solar rebound reaches a maximum: The amount of electricity taken from the grid remains unchanged but solar households’ overall electricity consumption increases as German solar households additionally self-consume parts of their solar electricity. For German households, the share of self-consumed solar electricity lies around 30% if a household has no battery storage capacities (VZ, 2020). Hence, the maximum solar rebound is bounded by this share of self-consumption. Yet, given the strong economic incentives in our sample period to feed solar electricity into the public grid, we are skeptical that there is such a strong solar rebound effect. Moreover, as the overwhelming majority of our sample households were guaranteed feed-in tariffs that were much higher than their electricity prices, households faced a strong economic incentive to limit the self-consumption of solar electricity and, hence, we expect the rebound effect to be much lower than 30%.
56
Session 05 - The renewable energy reality: case studies In fact, a back-of-the-envelope calculation demonstrates that foregone remunerations due to a 30% solar rebound may be easily in the range of average residential electricity costs per annum. At last, we additionally include an interaction term PV x ln(p) to test whether solar households’ price awareness is influenced by the PV installation and may explain observed consumption behavior. However, our results do not reveal any statistically significant difference in the price responsiveness of solar and other households. Conclusions Our dynamic system estimates indicate that PV panel adoption hardly reduces the amount of electricity that households take from the public grid. As we derive theoretically, this outcome suggests that the solar rebound is bounded by about 30% for German households. Yet, we are skeptical that there is such a large rebound effect, given the strong economic incentives to feed solar electricity into the public grid, particularly in the years 2000 to 2012. Our skepticism about a substantial rebound is further corroborated by empirical studies for Australia and the United States, which estimate the solar rebound effect to be substantially lower than 30% (Havas et al., 2015; Qiu et al., 2019). Despite the fact that feed-in tariffs were drastically reduced in recent years, it is to be expected that the solar rebound will remain moderate in the German residential sector, as further increasing electricity prices may increase both the incentive to substitute electricity taken from the grid by self-produced solar electricity and the disincentive to overly consume electricity, irrespective of being self-produced or taken from the grid. Finally, with respect to the environmental benefits of producing solar electricity, the waterbed phenomenon (Perino et al., 2019) describes the fact that in the short run emission reductions resulting from additional policies, such as the boost of PV capacities in Germany, will not lead to additional net emission reductions in the EU. In the end, ignoring solar rebound effects may thus imply the overestimation of environmental benefits other than diminishing greenhouse gases, such as the reduction of local environmental pollutants, but renders the greenhouse gas balance unaffected. References Arellano, M. and Bond, S. (1991) “Some tests of specification for panel data: Monte Carlo evidence and
an application to employment equations”, Review of Economic Studies, 58(2): 277–297. Blundell, R. and Bond, S. (1998) “Initial conditions and moment restrictions in dynamic panel data
models”, Journal of Econometrics, 87(1): 115–143. Havas, L., Ballweg, J., Penna, C., and Race, D. (2015) “Power to change: Analysis of household
participation in a renewable energy and energy efficiency programme in Central Australia”, Energy Policy, 87: 325–333.
Nickell, S. (1981) “Biases in dynamic models with fixed effects”, Econometrica, 49(6): 1417–1426. Perino, G., Ritz, R. A., and Van Benthem, A. (2019) “Understanding overlapping policies: Internal
carbon leakage and the punctured waterbed”, NBER Working Paper No. 25643. Qiu, Y. L., Kahn, M. E., and Xing, B. (2019) “Quantifying the rebound effects of residential solar panel
adoption”, Journal of Environmental Economics and Management, 96: 310–341. VZ (2020) “Photovoltaics: What is important when planning a solar plant”, Consumer advice center.
https://www.verbraucherzentrale.de/wissen/energie/erneuerbare-energien/photovoltaik-was-bei-der-planungeiner-solaranlage-wichtig-ist-5574 .
57
Session 05 - The renewable energy reality: case studies
Claudia Fiedler, Andrej Guminski, Timo Limmer, Tobias Wagner, Süheyb Bilici, Christoph Pellinger, Serafin von Roon MODELLING TRANSFORMATION PATHWAYS FOR EU27+3 FINAL ENERGY DEMAND USING TEMPORALLY AND SPATIALLY RESOLVED SECTOR MODELS
Claudia Fiedler: FfE, Am Bluetenanger 71, 80995 Munich, Germany Andrej Guminski: FfE, Am Bluetenanger 71, 80995 Munich, Germany Timo Limmer: FfE, Am Bluetenanger 71, 80995 Munich, Germany
Tobias Wagner: FfE, Am Bluetenanger 71, 80995 Munich Süheyb Bilici: FfE, Am Bluetenanger 71, 80995 Munich, Germany
Christoph Pellinger: FfE, Am Bluetenanger 71, 80995 Munich, Germany Serafin von Roon: FfE, Am Bluetenanger 71, 80995 Munich, Germany
Overview National and international climate targets often play a major role in scenarios that model the development of the final energy consumption in the future. However, how would the final energy consumption until 2050 develop with the current measures and promotion initiatives taken so far? Such a scenario is the object of this analysis. This scenario offers a benchmark for comparison with other scenarios in the project eXtremOS, which assume climate targets and extreme characteristics. Each final energy sector is specifically characterized by its components. Therefore, the final energy sectors private households, tertiary, industry, and transport are considered separately in the project eXtremOS. Method The development of the final energy consumption in European countries (EU27 + UK, NO and CH) is the base for the energy system modelling on a European scale. The current final energy consumption per sector and energy carrier is based on data published by Eurostat [1]. By using further datasets like [2], [3], and [4], the final energy consumption can be split into applications and branches [5]. The development of the individual sectors is modelled at NUTS-0 (countries) level up to 2050, assuming that previous actions and funding initiatives will continue. For example, in the private household and tertiary sector the substitution of heat pumps for fossil fuel boilers orients itself at previous market observations. According to the ten-year network development plan, the replacement of the combustion engine by electric vehicles is conservative. In the industry sector 31 energy intensive industrial processes and more than 100 abatement measures are modelled bottom-up. In the scenario at hand, first, a baseline energy demand until 2050 is derived, by projecting energy intensity development excluding efficiency gains using historical values and an external gross domestic product scenario. Then, process and cross-sectional efficiency measures are implemented to derive a scenario, which approximates current industrial behaviour. The sector-, energy carrier-, application- and branch-specific final energy consumption is distributed to the NUTS-3 (districts) level by sector-specific regionalization logics. The temporal distribution is obtained by load profiles depending on the technology, application and branch.

58
Session 05 - The renewable energy reality: case studies Results The final energy consumption, the electricity demand and the change of the ratio of the energy carriers from 2020 to 2050 of the scenario are reported. Furthermore, the spatial and temporal distribution of the final energy consumption are shown using selected examples. To promote transparency and comparability with the study presented, the results can be looked up at [6] as open data. Conclusions Together with the renewable energy potentials [7], the scenario results of the final energy sectors form the basis for the energy system modelling, in which the power plant park and renewable energy plants are operated and expanded using a linear cost optimization model. The spatial distribution of NUTS-3 level is relevant for a detailed grid modelling. Methodology and results were developed within the project eXtremOS, which is supported by the Federal Ministry for Economic Affairs and Energy of Germany (funding id: 03ET4062A). References [1] Eurostat Energiebilanzen – Daten 2017 (Ausgabe 2019):
https://ec.europa.eu/eurostat/de/web/energy/data/energy - balances; Luxemburg: European Commission – Eurostat, 2019.
[2] Profile of heating and cooling demand in 2015: Karlsruhe: Fraunhofer Institute for Systems and Innovation Research (ISI), TEP Energy GmbH (TEP), University Utrecht ARMINES, 2017.
[3] Rohde, Clemens: Erstellung von Anwendungsbilanzen für die Jahre 2013 bis 2017 – Studie für dieArbeitsgemeinschaft Energiebilanzen e.V. (AGEB). Karlsruhe: Fraunhofer-Institut für System - und Innovationsforschung (ISI), 2018.
[4] Energy consumption in households: http://ec.europa.eu/eurostat/statistics-explained/index.php/Energy_consumption_in_households; Luxenburg: European Commission – Eurostat, 2017.
[5] Forschungsstelle für Energiewirtschaft e.V. et al.: eXtremOS - Country profiles of 17 European countries were developed. In: www.ffe.de/en/xos/countryprofiles. (Abruf am 2020-06-03); München: Forschungsstelle für Energiewirtschaft e.V., Forschungsgesellschaft für Energiewirtschaft mbH, 2020.
[6] Sector-specific final energy consumption: http://opendata.ffe.de/extremos/aiee2020; München: Forschungsstelle für Energiewirtschaft e. V. (FfE), 2020.
[7] Ebner, Michael et al.: Regionalized Potential Assessment of Variable Renewable Energy Sources in Europe. In: 16th International Conference on the European Energy Market (EEM). Piscataway: IEEE, 2019.
59
Session 07 - Rethinking the energy security strategies
Honorata Nyga-Lukaszewska ENERGY SECURITY – SHIFT OF PARADIGMS
Honorata Nyga-Lukaszewska, Warsaw School of Economics, Phone: +48 22 564 93 61,
Abstract Energy security gains more and more importance. Even though, the notion is broadly investigated there is no common understanding. Thus, presented research offers a closer look at the energy security from the international economics perspective. That allows for an innovative extenstion of an existing international economics. Presented study is of theoretical nature therefore predominant method is a systematic literature review employing logical synthesis and analysis.Conclusions stemming from the research are not only limited to theory. One of the most important conclusions is the idea of transit countries and their role in the energy security. Following that logic transit states should enjoy the same position as energy importers that is why their import policy and international economic strategy should include that aspect. However apart from recommendations for transit countries, study shows also set of institutional solutions employed by energy exporters that ensure security of stable and long-term export incomes. Overview Energy security gains more and more importance. Even though, the notion is broadly investigated (Winzer, 2012; Ang, Choong Ng, 2015) there is no common understanding what energy security really is, that is why it is often described as a “blurred concept” (Loeschel, Moslener Ruebbelke, 2010). Majority of the scientific research in this area roots in politics, while economics’, especially international economics’ perspective is still missing. Thus, presented research offers a closer look at the energy security from the international economics perspective. That allows for an innovative extenstion of an existing international economics. The paper is organised as follows: after the introduction, the second section gives a brief overview about the theory of energy security.The third section describes methodology that has been used in the paper, while in the fourth section, I present the conducted research and its results. In the final section policy implications are derived. Methodology Presented study is of theoretical nature therefore predominant method is a systematic literature review determining the object of study, application of search restrictions, selection of data and content analysis. It utilizes search strategies to make sure that maximum and relevant papers on the phenomenon are investigated. I employ logical synthesis and analysis in order to thoroughly investigate the energy security idea. The concept is broken down into the supply and demand dimensions. Research embeds energy security in the field of classical and neoclassical trade models with dominant position of Hecksher-Ohlin theorem and its extensions. That includes Stolper-Samuelson theorem and Hecksher-Ohlin-Vanek model, and numerous contributions of D. Trefler and E.A. Leamer. Study uses also Rybczynski theorem, immiserIzing growth idea of Bhagwati, resource curse (or paradox of plenty) to describe the situation of energy exporters. Results First, study investigates the theoretical aspects of the energy security phenomenon. Study offers logical exploration of a system of beliefs and assumptions on energy security and sums up existing theoretical efforts in this area and offers framework to assess the phenomenon of
60
Session 07 - Rethinking the energy security strategies
energy security in energy imports and exports. Second, study offers a comprehensive framework for energy security analysis in the field of international economics. That includes a set of trade models and their connections with the analysed concept. It specifically shows which concepts can be applied to security of energy exportes and energy importers. Third, study shows the evolution of the energy security concept throught time (Nyga-Łukaszewska, 2019). Fourth, study shows limitations of theoretical approach and proposes next research steps. Conclusions Conclusions stemming from the research are not only limited to theory. One of the most important conclusions is the idea of transit countries and their role in the energy security. Following that logic transit states should enjoy the same position as energy importers that is why their import policy and international economic strategy should include that aspect. However apart from recommendations for transit countries, study shows also set of institutional solutions employed by energy exporters that ensure security of stable and long-term export incomes. References (selected) Ang B. W., Choong W. L. and Ng T. S. (2015), “Energy security: Definitions, dimensions and indexes”,
Renewable and Sustainable Energy Reviews, No. 42.
Hillman A., Bullard C. (1978), “Energy, the Heckscher-Ohlin Theorem, and U.S. International Trade”,The American Economic Review, No. 68 (1).
Kemp M., Long N. (1979), “International Trade with an Exhaustible Resource: A Theorem of Rybczynski Type”, International Economic Review, No. 20 (3) .
Loeschel A., Moslener U. and Ruebbelke D. T. G. (2010), “Indicators of energy security in industrialised countries”, Energy policy, No. 38.
Nyga-Łukaszewska, H. (2019). ‘Energy security in the international gas market” (in Polish). SGH, Warsaw.
Sovacool B. and Mukherjee I. (2011), “Conceptualizing and measuring energy security: A synthesized approach”, Energy Policy, No. 36.
Trefler D. (1995), “The Case of the Missing Trade and Other Mysteries”, The American Economic Review”, No. 85 (5).
Winzer Ch. (2012), “Conceptualizing energy security”, Energy Policy, No. 46.
61
Session 07 - Rethinking the energy security strategies Denis Subbotnitskiy and Chirayu Batra ENERGY SECURITY IMPLICATIONS OF SMALL MODULAR REACTORS AND MICROREACTORS DEPLOYMENT IN OFF-GRID AREAS IN NORTHERN REGIONS
Denis Subbotnitskiy, International Atomic Energy Agency, Vienna International Centre, PO Box 100, 1400 Vienna, Austria
Chirayu Batra, International Atomic Energy Agency, Vienna International Centre, PO Box 100, 1400 Vienna, Austria
Overview Since its introduction as commercially available source of energy in 1950s nuclear power was an important component of national energy security in many countries [1]. Stability of supply, predictability of costs (with operational costs constituting relatively small part of the total lifetime expenditure of the power plant), and low life cycle greenhouse gas (GHG) emissions remain among the main arguments in favour of developing national nuclear programmes. Historically, nuclear power was emerging in the context of centralized energy grids with the main technological focus on large Light Water Reactors (LWRs). Natural line of progress for these reactors was the use of economies of scale with the newer reactor designs gradually getting larger nameplate capacity and with multiple reactor units being installed at the sites of the NPPs. Recent developments in energy sphere with decentralized energy markets, higher role of small- or micro-grids, increasing use of renewable sources of energy (primarily solar and wind) [2], and global goal to secure energy access for all by 2030 [3] significantly changed the landscape for nuclear industry requiring to propose the solutions for new markets around the globe. Among the needs of these markets is the reliable energy supply for the areas currently being off-grid, specifically, the Northern regions or smaller islands. The option addressing this challenge and overcoming some limitations associated with traditional LWRs is the Small Modular Reactors (SMRs) and Microreactors. The International Atomic Energy Agency (IAEA) defines SMRs as advanced (new generation) reactors with nameplate capacity of up to 300 MW(e) per module, with an option of factory production of components and systems and shipment of these modules to the installation sites [4]. SMRs is actually a family of different reactor designs using different technologies, however, they normally have some common characteristics, specifically, enhanced safety performance based on the introduction of inherent and passive safety features and an option to be installed as a single- or multi-module plant. Microreactors have lower capacity than SMRs (1-20 MW(e)) with most of the proposed designs being portable. Methods This paper analyses the potential for SMR and microreactor deployment in isolated Northern areas and associated implications for the energy security. Extreme climate conditions determine specific requirements for the sources of energy supply deployable in the North. Determining the set of these requirements and applying it to different power sources allows understanding the potential for SMR and microreactor deployment in the Northern energy markets.
62
Session 07 - Rethinking the energy security strategies The proposed set of requirements includes five major components:
i reliable operation with predictable output without grid connection, i.e. dispatchability of energy technology;
ii infrequent refuelling, i.e. reduction of fuel transportation costs and minimization of outage time;
iii minimal dependency on the external climate conditions, i.e. long-term operation without outages caused by maintenances and climate-related breakages;
iv minimized life-cycle GHG emissions; v installed capacity cap, i.e. possibility to install power plants with smaller capacity due to
the limited energy needs (smaller population, isolated production facilities);
All these requirements, except of the last one, are related to energy security, which is not unexpected, given that extreme natural conditions over most of the year make uninterrupted energy supply the issue of vital importance. The first three requirements were historically applied to energy supply in isolated regions with extreme climate (from scientific research stations in polar regions to human settlements and mineral resources’ extraction facilities), however, the role of the fourth one, on GHG emissions reductions, will be increasing over the next decades. Global efforts to limit climate change as determined by the Paris Climate Agreement with specific goal to keep the global average temperature increase well below 2 °C would require universal and comprehensive decarbonization of energy system and isolated Northern regions would not stay aside of this trend. Results The analysis below is structured by the requirements introduced in the previous section.
a) Reliable operation without grid connection. The importance of reliable and predictable energy output from the power plants operating off grid makes dispatchability the main factor affecting the choice of energy sources in the North. In practice, the requirement to operate without the link to the national grid resulted in the dominance of hydrocarbons (usually, diesel fuel) in the energy mix. Nuclear power was offering the alternative with Bilibino NPP operating in the Northern part of Russia since 1974 and a nuclear reactor providing power for the U.S. McMurdo Station in Antarctica in 1968-1972. SMRs builds up upon this experience with the first SMR put in operation globally being the floating NPP ‘Akademik Lomonosov’ in North Russia (since December 2019).
b) Infrequent refuelling. Necessity to deliver diesel fuel for the power generators in the North significantly increases the operational costs due to the complicated logistics. Specifically, the electricity costs in Northern Canada (over 30 cents per kWꞏh) are more than twice higher than the country average (12.9 cents per kWꞏh) [5]. Nuclear power technology does not require significant physical amount of fuel and therefore the costs of the SMR or microreactor operation in the North will not be drastically different from the operation of the same reactor in mainland areas. For current SMR designs refuelling cycle is usually a few years, e.g. for RITM-200 design it is expected to be six years [6].
c) Reduced dependency on external climate conditions. Power sources in the North should be resilient to extreme temperatures and climate conditions (e.g., polar night). Hydrocarbons historically proved to be a reliable energy source fulfilling this requirement.
63
Session 07 - Rethinking the energy security strategies
Renewable energy sources (solar, wind), however, by nature are dependent on climate and weather conditions that would significantly increase their operation costs (maintenance, delivery of spare parts) in Northern regions. Conversely, nuclear power, including SMRs and microreactors, is designed to withstand the impacts of external environment.
d) Minimized life-cycle GHG emissions. Deep decarbonization of energy systems around the globe will be needed to fulfil the goals of Paris Climate Agreement. Over the next decades it would lead to increasing pressure on the use of hydrocarbons, including the Northern regions, stimulating energy providers to look for low-carbon alternatives from available technologies. Given the low-carbon profile of nuclear (both traditional large LWRs, SMRs and microreactors) it would be among the possible options allowing Northern countries to decrease their carbon footprints.
e) Scalability of installed capacity. Human settlements in the North require the reliable source of energy all year round. However, these settlements are relatively small (most commonly not more than a few thousands of people) and even the mineral resources extraction facilities located in the North would require the amount of energy much less than normally provided by the conventional power plants used in the mainland. This is not a major challenge for hydrocarbons and renewables; however, it is problematic for conventional NPPs. SMRs are designed to consist of the number of smaller units, thus the total installed capacity of the power plant could be adjusted depending on the local needs. Microreactors are specifically designed to address the energy needs of small off-grid consumers. Conclusions In this paper the analytical framework based on the set of requirements for the energy sources in Northern regions is proposed and applied to different energy technologies, including SMRs and microreactors. SMRs and microreactors satisfy these requirements, specifically, they can operate off-grid; have long refuelling cycle; have minimal dependency on natural and climate conditions during operation; have low life cycle GHG emissions; and have low minimal installed capacity, which can normally be expanded as needed by installing additional modules. References [1] Oecd Nuclear Energy Agency, The Security of Energy Supply and the Contribution of Nuclear
Energy, NEA No 6358, OECD (2010).
[2] Oecd Nuclear Energy Agency, The Costs of Decarbonisation: System Costs with High Shares of Nuclear and Renewables, NEA No 7299, OECD (2019).
[3] International Energy Agency; International Renewable Energy Agency; United Nations Statistics Division; World Bank; World Health Organization. 2020. Tracking SDG 7: The Energy Progress Report 2020. World Bank, Washington, DC (2020).
[4] International Atomic Energy Agency, Advances in Small Modular Reactor Technology Developments: 2018 Edition, IAEA, Vienna (2018).
[5] Canada Energy Regulator, Market Snapshot: Explaining the high cost of power in northern Canada, CER (2020), https://www.cer-rec.gc.ca/nrg/ntgrtd/mrkt/snpsht/2017/02-03hghcstpwr-eng.html
[6] Mikhailov, O., “Rosatom SMR Energy solution”, Presentation to IAEA Technical Meeting on Costing Approaches for Nuclear Technology Developers, Vienna, 2019.
64
Session 07 - Rethinking the energy security strategies Martin Švec EUROPE ENERGY ROAD MAP TO 2050: A COAL PHASE-OUT IN THE CONTEXT OF INTERNATIONAL INVESTMENT LAW
Martin Svec, PhD Candidate, Masaryk University, Masaryk University, Faculty of Law, Veveří 70, 611 80, Brno, Czech Republic, Phone: +420 721 417610, e-mail: [email protected]
Overview Climate change is the biggest environmental crisis of our time. Especially in recent years, our planet has been exposed to environmental challenges caused or exacerbated by climate change. The effects of climate change include heatwaves, droughts, more frequent and powerful tropical cyclones, heavier monsoon rains, accelerated sea level rise or biodiversity loss. Recognizing that climate change represents an urgent and potentially irreversible threat to human societies and the planet, 197 countries agreed to hold global average temperature increase to well below 2°C and to pursue efforts to limit it to 1.5°C (Article 2 of the Paris Agreement).
The UN climate-related goals cannot be achieved in the absence of an effective implementation mechanism. An appropriate and effective mix of policy, regulatory and legal frameworks affecting all sectors will have to be adopted and put in place. Nonetheless, the energy sector is central to efforts to combat climate change. It is worth mentioning that coal-fired electricity generation accounted for 30% of global CO2 emissions. A pathway toward transformation of the global energy sector from fossil-based to zero-carbon is referred to as an energy transition. According to the IRENA (International Renewable Energy Agency), the reduction of energy-related CO2 emissions (decarbonisation of the energy sector) should be achieved by an adoption of integrated approach that includes policies to increase the uptake of renewables, decrease energy use by making energy efficiency mandatory, and accelerate the phase out of fossil fuels. Multiple countries have set coal phase-out deadlines, including the UK, France, Canada and Germany. Governments, businesses and organisations united in taking action to accelerate clean growth and climate protection through the rapid phase-out of traditional coal power joined the Powering Past Coal Alliance.
Investment law has been recognized as a core policy tool to promote investments. The key objective of investment law is to provide for investment protection and mitigate risks inherent in a future intervention of the host state. Subsequent flow of capital is supposed to enhance economic development of concerned countries. The source of contemporary investment law is bilateral investment treaties (BITs), investment chapters of free trade agreements (FTA) or regional treaties (such as the Energy Charter Treaty referred to as “the ECT”). Most of the international investment agreements contain a unique investor-state dispute mechanism (ISDS). The use of BITs has spread to the point that they are widely used throughout the investment world today. Globally, there are more than 2300 bilateral investment treaties in force, according to UNCTAD.
Methods The author analyses substantive obligations arising from IIAs likely to be claimed by foreign investors in response to a coal phase-out. Special attention will be given to the relationship between investor’s legitimate expectations and state’s right to regulate as well as the potential impact of climate change related international obligations on the legal relationship between an investor and a state. The paper seeks to discuss whether international obligations arising from IIAs can lead to regulatory chill.
65
Session 07 - Rethinking the energy security strategies Results Even when states have entered into treaty commitments, such commitments do not always prevent them from taking measures to protect interests specified in provisions acknowledging the right to regulate or exception clauses. These provisions may be invoked by states implementing the coal phase-out strategy. The right to regulate can be found in the new generation of international investment agreements. For instance, the EU - Singapore Investment Protection Agreement signed in 2018 reads as follows: “The Parties reaffirm their right to regulate within their territories to achieve legitimate policy objectives, such as the protection of public health, social services, public education, safety, environment or public morals, social or consumer protection privacy and data protection and the promotion and protection of cultural diversity.” The exception clauses vary and refer to objectives ranging from the protection of security interests to the protection of human, animal or plant life or health. Conclusions The reform of the IIA regime is needed in order to ensure that it works for all stakeholders, it is better suited for today’s policy challenges and safeguards the right to regulate for pursuing sustainable development objectives. References
Negotiating Directives for the Modernisation of the Energy Charter Treaty. Tienhaara, Kyla, Regulatory Chill and the Threat of Arbitration: A View from Political Science (October
28, 2010). EVOLUTION IN INVESTMENT TREATY LAW AND ARBITRATION, Chester Brown, Kate Miles, eds., Cambridge University Press, 2011.
The 2030 climate and energy framework. COMMUNICATION FROM THE COMMISSION TO THE EUROPEAN PARLIAMENT, THE
EUROPEAN COUNCIL, THE COUNCIL, THE EUROPEAN ECONOMIC AND SOCIAL COMMITTEE AND THE COMMITTEE OF THE REGIONS The European Green Deal.
COM (2015) 80 final. Communication from the Commission to the European Parliament, the Council, the European Economic and Social Committee, the Committee of the Regions and the European Investment Bank: Framework Strategy for a Resilient Energy Union with a Forward-Looking Climate Change Policy.
Council conclusions: Energy and Development (November 2016). 98/181/EC, ECSC, Euratom: Council and Commission Decision of 23 September 1997 on the conclusion,
by the European Communities, of the Energy Charter Treaty and the Energy Charter Protocol on energy efficiency and related environmental aspects. 2006/500/EC: Council Decision of 29 May 2006 on the conclusion by the European Community of the
Energy Community Treaty. Craig Paul, De Búrca Gráinne. EU Law: Text, Cases, and Materials, Oxford University Press 2015.
University Press 2015. Rafael Leal-Arcas, Jan Wouters. Research Handbook on EU Energy Law and Policy,
Cheltenham: Edward Elgar Publishing, 2017. Ioanna Mersinia, Sirja-Leena Penttinen. Energy transitions: regulatory and policy trends. Cambridge:
Intersentia, 2017. Martha M. Roggenkamp, Olivia Woolley. European energy law. Report IX. Cambridge: Intersentia,
2012. Jakub M. Godzimirski. EU leadership in energy and environmental governance: global and local
challenges and responses. Basingstoke: Palgrave Macmillan, 2016.

66
Session 07 - Rethinking the energy security strategies Marc Bungenberg, Stephan Hobe. Permanent sovereignty over natural resources. Cham: Springer, 2015. Leal-Arcas, Rafael, International energy governance: selected legal issues. Cheltenham: Edward Elgar,
2014. Marise Cremona and Anne Thies, The European court of justice and external relations law:
constitutional challenges. Oxford: Hart publishing, 2014. Barry Barton, Energy security: managing risk in a dynamic legal and regulatory environment. Oxford;
New York: Oxford University Press, 2004. Marise Cremona, Structural principles in EU external relations law. Oxford: Hart publishing, 2018.

67
Session 08 - The price and forecasting in power system
Coudray Théotime MULTISTEP AHEAD FORECASTING OF A POWER SYSTEM RESIDUAL LOAD USING A HYBRID CEEMDAN-CONVLSTM MODEL
Coudray Théotime, University of Montpellier-ART-Dev laboratory and Climate Economics Chair
Overview Variable and Renewable Energies (VRE) are growing fast among power systems all around the world. If their ability to reduce green-house gases emissions is undeniable, they also require significant changes in power systems to ensure the security of supply. VRE output forecasting is a critical way to make them more affordable and reliable. Recent developments of machine and deeplearning methods can help produce precise forecasts at multiple timescales. In this paper, we use a state-of-the-art combination of time-series decomposition (CEEMDAN) and Artificial Neural Network model (ConvLSTM) to produce a one year of hourly Residual Load (RL) forecast of French region Occitanie power system. The results show that this combination surpasses other classical methods in terms of forecasting error, computational resources and forecasting horizon. Thus, we intend to show in this article that with little effort and no prior deep knowledge of deep learning techniques, it is possible to enhance drastically our ability to predict both electricity consumption and VRE output (combined together to calculate our RL curve), and therefore reduce overall costs and optimize power more easily. Methods Following the idea of residual load (RL) curve being a good proxy of a power system flexibility requirements [1, 2, 3, 4], we start by calculating the hourly historical RL of Occitanie power system. The data used to perform this calculation is downloaded from Open Data Réseaux Energies website, which is an open-source platform where French energy stakeholders share data to the public. Thus, we use Occitanie hourly power consumption and wind and solar photovoltaics (PV) production data to create a time-series of RL, using the following equation:
𝑅𝑒𝑠𝑖𝑑𝑢𝑎𝑙 𝐿𝑜𝑎𝑑 = 𝐶𝑜𝑛𝑠𝑢𝑚𝑝𝑡𝑖𝑜𝑛 − (𝑊𝑖𝑛𝑑 𝑝𝑟𝑜𝑑𝑢𝑐𝑡𝑖𝑜𝑛 + 𝑃𝑉 𝑝𝑟𝑜𝑑𝑢𝑐𝑡𝑖𝑜𝑛) The data covers the period from 01/01/2013 00:00 to 31/12/2019 23:00, which provides us with 61 344 data points of historical RL. Then, the hybrid forecasting method consists in two main parts. First, we use Complete Ensemble Empirical Mode Decomposition with Adaptive Noise (CEEMDAN) [5], which is an extension of the Empirical Mode Decomposition (EMD) method introduced in [6]. The decomposition algorithm is the following: 1. Identify all local extrema of the initial series and calculate the average between upper and
lower envelopes. 2. Add white noise to this average envelope.
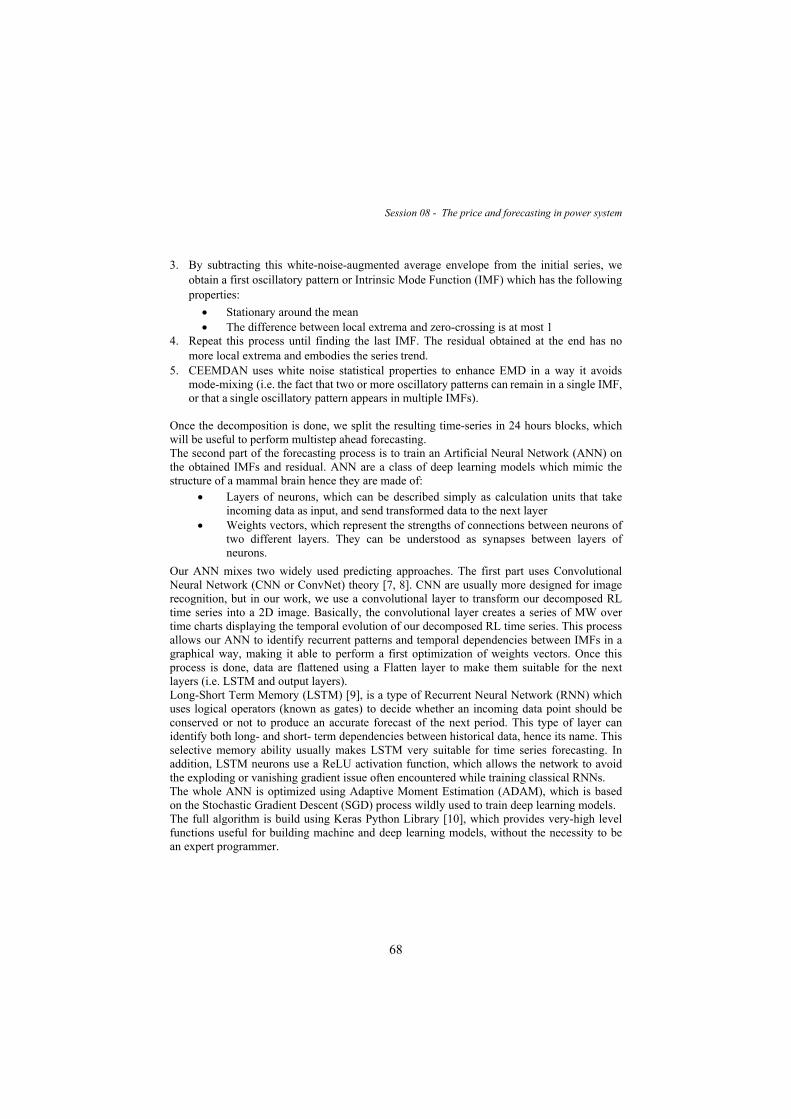
68
Session 08 - The price and forecasting in power system
3. By subtracting this white-noise-augmented average envelope from the initial series, we obtain a first oscillatory pattern or Intrinsic Mode Function (IMF) which has the following properties:
Stationary around the mean The difference between local extrema and zero-crossing is at most 1
4. Repeat this process until finding the last IMF. The residual obtained at the end has no more local extrema and embodies the series trend.
5. CEEMDAN uses white noise statistical properties to enhance EMD in a way it avoids mode-mixing (i.e. the fact that two or more oscillatory patterns can remain in a single IMF, or that a single oscillatory pattern appears in multiple IMFs).
Once the decomposition is done, we split the resulting time-series in 24 hours blocks, which will be useful to perform multistep ahead forecasting. The second part of the forecasting process is to train an Artificial Neural Network (ANN) on the obtained IMFs and residual. ANN are a class of deep learning models which mimic the structure of a mammal brain hence they are made of:
Layers of neurons, which can be described simply as calculation units that take incoming data as input, and send transformed data to the next layer
Weights vectors, which represent the strengths of connections between neurons of two different layers. They can be understood as synapses between layers of neurons.
Our ANN mixes two widely used predicting approaches. The first part uses Convolutional Neural Network (CNN or ConvNet) theory [7, 8]. CNN are usually more designed for image recognition, but in our work, we use a convolutional layer to transform our decomposed RL time series into a 2D image. Basically, the convolutional layer creates a series of MW over time charts displaying the temporal evolution of our decomposed RL time series. This process allows our ANN to identify recurrent patterns and temporal dependencies between IMFs in a graphical way, making it able to perform a first optimization of weights vectors. Once this process is done, data are flattened using a Flatten layer to make them suitable for the next layers (i.e. LSTM and output layers). Long-Short Term Memory (LSTM) [9], is a type of Recurrent Neural Network (RNN) which uses logical operators (known as gates) to decide whether an incoming data point should be conserved or not to produce an accurate forecast of the next period. This type of layer can identify both long- and short- term dependencies between historical data, hence its name. This selective memory ability usually makes LSTM very suitable for time series forecasting. In addition, LSTM neurons use a ReLU activation function, which allows the network to avoid the exploding or vanishing gradient issue often encountered while training classical RNNs. The whole ANN is optimized using Adaptive Moment Estimation (ADAM), which is based on the Stochastic Gradient Descent (SGD) process wildly used to train deep learning models. The full algorithm is build using Keras Python Library [10], which provides very-high level functions useful for building machine and deep learning models, without the necessity to be an expert programmer.
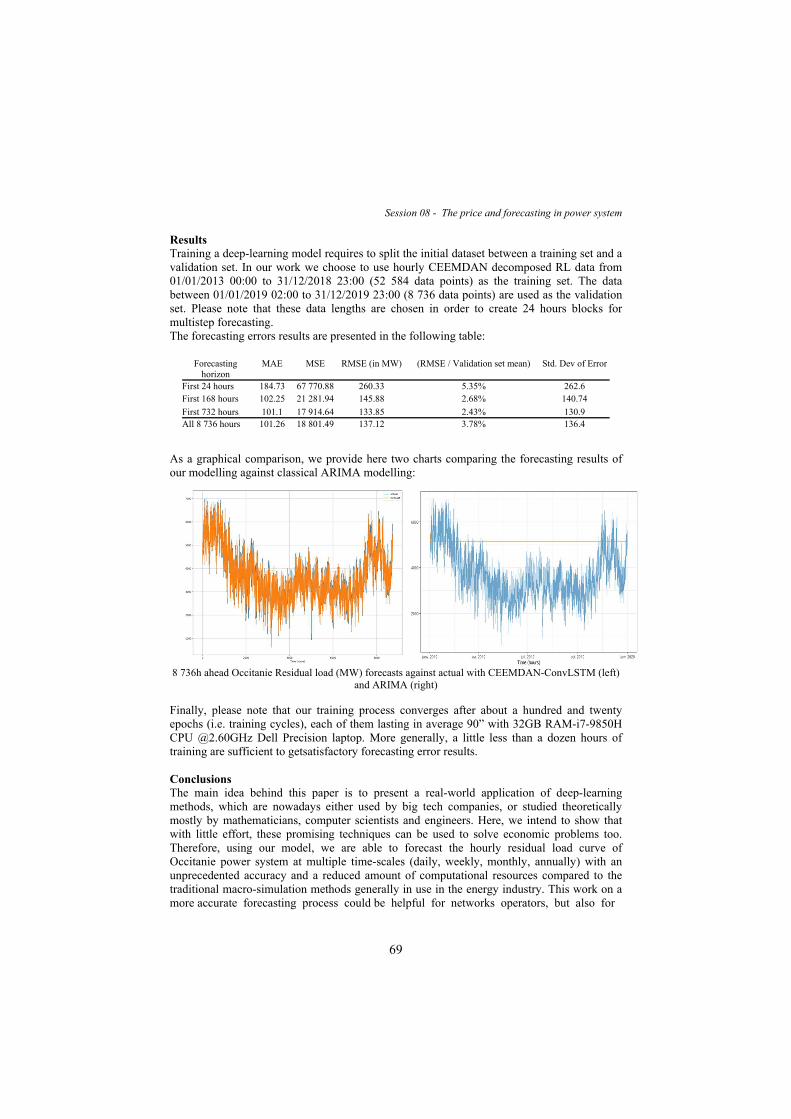
69
Session 08 - The price and forecasting in power system Results Training a deep-learning model requires to split the initial dataset between a training set and a validation set. In our work we choose to use hourly CEEMDAN decomposed RL data from 01/01/2013 00:00 to 31/12/2018 23:00 (52 584 data points) as the training set. The data between 01/01/2019 02:00 to 31/12/2019 23:00 (8 736 data points) are used as the validation set. Please note that these data lengths are chosen in order to create 24 hours blocks for multistep forecasting. The forecasting errors results are presented in the following table:
Forecasting horizon
MAE MSE RMSE (in MW) (RMSE / Validation set mean) Std. Dev of Error
First 24 hours 184.73 67 770.88 260.33 5.35% 262.6 First 168 hours 102.25 21 281.94 145.88 2.68% 140.74
First 732 hours 101.1 17 914.64 133.85 2.43% 130.9 All 8 736 hours 101.26 18 801.49 137.12 3.78% 136.4
As a graphical comparison, we provide here two charts comparing the forecasting results of our modelling against classical ARIMA modelling:
8 736h ahead Occitanie Residual load (MW) forecasts against actual with CEEMDAN-ConvLSTM (left) and ARIMA (right)
Finally, please note that our training process converges after about a hundred and twenty epochs (i.e. training cycles), each of them lasting in average 90” with 32GB RAM-i7-9850H CPU @2.60GHz Dell Precision laptop. More generally, a little less than a dozen hours of training are sufficient to getsatisfactory forecasting error results. Conclusions The main idea behind this paper is to present a real-world application of deep-learning methods, which are nowadays either used by big tech companies, or studied theoretically mostly by mathematicians, computer scientists and engineers. Here, we intend to show that with little effort, these promising techniques can be used to solve economic problems too. Therefore, using our model, we are able to forecast the hourly residual load curve of Occitanie power system at multiple time-scales (daily, weekly, monthly, annually) with an unprecedented accuracy and a reduced amount of computational resources compared to the traditional macro-simulation methods generally in use in the energy industry. This work on a more accurate forecasting process could be helpful for networks operators, but also for
70
Session 08 - The price and forecasting in power system investors and public decision makers since the lasts could anticipate better the state of a given production unit or whole power system much more in advance. Finally, this kind of work could be the starting point of even more applied problems, such as real-time economic optimization and dispatching of both production and flexibility units in a given power system. We want to emphasize on the fact that nowadays, no deep computer science knowledge is necessary to build this kind of predictive model : the modeling framework and coding was performed by a single 1st year PhD student in energy economics, who had no prior coding competence before starting this work. It only required time (around 6 months), commitment and curiosity. References
[1] Holttinen, Hannele, Aidan Tuohy, Michael Milligan, Eamonn Lannoye, Vera Silva, Simon Muller, et Lennart Soder. «The Flexibility Workout: Managing Variable Resources and Assessing the Need for Power System Modification». IEEE Power and Energy Magazine 11, no 6 (November 2013): 53-62. https://doi.org/10.1109/MPE.2013.2278000 .
[2] Steinke, Florian, Philipp Wolfrum, et Clemens Hoffmann. «Grid vs. Storage in a 100% Renewable Europe». Renewable Energy 50 (Ferburary 2013): 826-32. https://doi.org/10.1016/j.renene.2012.07.044 .
[3] Schill, Wolf-Peter. « Residual Load, Renewable Surplus Generation and Storage Requirements in Germany ». Energy Policy 73 (October 2014): 65-79. https://doi.org/10.1016/j.enpol.2014.05.032 .
[4] Belderbos, Andreas, Ana Virag, William D’haeseleer, et Erik Delarue. «Considerations on the Need for Electricity Storage Requirements: Power versus Energy». Energy Conversion and Management 143 (July 2017): 137-49. https://doi.org/10.1016/j.enconman.2017.03.074 .
[5] Torres, Maria E., Marcelo A. Colominas, Gaston Schlotthauer, et Patrick Flandrin. «A Complete Ensemble Empirical Mode Decomposition with Adaptive Noise». In 2011 IEEE International Conference on Acoustics, Speech and Signal Processing (ICASSP), 4144-47. Prague, Czech Republic: IEEE, 2011.
[6] https://doi.org/10.1109/ICASSP.2011.5947265.
[7] Huang, Norden E., Zheng Shen, Steven R. Long, Manli C. Wu, Hsing H. Shih, Quanan Zheng, Nai- Chyuan Yen, Chi Chao Tung, et Henry H. Liu. «The Empirical Mode Decomposition and the Hilbert Spectrum for Nonlinear and Non-Stationary Time Series Analysis». Proceedings of the Royal Society of London. Series A: Mathematical, Physical and Engineering Sciences 454, no 1971 (March 8th, 1998): 903-95.
https://doi.org/10.1098/rspa.1998.0193.
[8] Fukushima, Kunihiko. « Neocognitron: A Self-Organizing Neural Network Model for a Mechanism of Pattern Recognition Unaffected by Shift in Position ». Biological Cybernetics 36, no 4 (avril 1980): 193-202. https://doi.org/10.1007/BF00344251.
[9] Bengio, Yoshua, Yann Lecun, et Yann Lecun. Convolutional Networks for Images, Speech, and Time- Series, 1995.
[10] Hochreiter, Sepp, et Jürgen Schmidhuber. «Long Short-Term Memory». Neural Computation 9, no 8 (1 novembre 1997): 1735-80. https://doi.org/10.1162/neco.1997.9.8.1735.
[11] Chollet, F. & others, 2015. Keras. Available at: https://github.com/fchollet/keras .
71
Session 08 - The price and forecasting in power system Daiva Dumciuviene, Grazina Startiene STUDY OF FACTORS THAT INFLUENCE THE PRICE OF ELECTRICITY
Daiva Dumciuviene, Kaunas University of Technology, Lithuania Grazina Startiene, Kaunas University of Technology, Lithuania
Overview Since electricity is an integral part of the production of many commodities, a variety of services and everyday household use, its price has impact on the entire national economy. It is necessary to note that the nature of factors affecting electricity price and the level of their effect often depend on specific characteristics of a particular market or a country (Erni, 2012, Hirth, 2018). The extent to which electricity production resources are used vary in different countries, consumers have different usage habits and the structure of electricity network differs. The complexity of factors affecting electricity is revealed well through the analysis of a particular factors (Zweifel et al. (2017), Ngondya and Mwangoka (2017), Sorknæs, Djørup, Lund and Thellufsen (2019), Dong et al. (2019)). The majority of studies focus on the factors affecting electricity price in developed countries where electricity market is liberalised. However, there is lack of such research in Eastern European countries, where the processes of electricity market liberalisation started only after 1990 and are still continuing. Lithuania is one of such countries. The aim of this study is to identify the factors influencing electricity price and expand research in the field while analysing the case of Lithuania. Methods Based on the research works and considering the specific nature of Lithuanian wholesale electricity market, the following nine factors that are likely to affect the price of electricity have been identified: total electricity consumption, the number of producers, electricity generation inside the country (local production), net imports, the price of imported natural gas, the price of biofuel in the Lithuanian market, the volume of energy generated from renewable resources, the share of consumed electricity acquired in the energy exchange, the number of independent electricity suppliers operating in the market. To assess the factors affecting the price of electricity in Lithuania, quarterly data of the period 2013-2018 are used. This period is chosen because 2013 was the first time Lithuania participated in the single market of Nordic and Baltic States for the entire year. Using the data of quarterly electricity price of 2013-2018 and nine factors affecting the price, correlation analysis is performed. In order to quantitatively evaluate the impact of the factors on electricity price a multiple linear regression model is developed and simple nonlinear regression models are designed. Results The regressive analysis revealed that five out of nine chosen factors - local electricity generation, net imports, price of fuel (natural gas or biofuel) and electricity generation using renewable energy sources - influence the average wholesale price of electricity in the Lithuanian electricity market. Nonlinear regression models were developed with all of the mentioned factors. Having chosen local electricity production as an independent variable, the obtained regression model was described using second degree polynomial. Since the coefficient at the variable is negative, one could argue that increasing electricity production in Lithuania results in lower average wholesale price of electricity in the country.

72
Session 08 - The price and forecasting in power system The coefficient of the nonlinear model that measures the impact of net imports on electricity price is negative at squared variable and positive at cubed variable. Based on this model, it could be conclude that with an increase in net electricity imports, the price of electricity drops at first; but after a certain volume (i.e. 2019.7 GWh) is reached, additional net imports lead to increased electricity price in Lithuania. This could be explained by the tendency to import cheaper energy than that produced locally. Hence, with increasing import, the average wholesale price of electricity tends to decrease. The most accurate of all nonlinear regression models was obtained when the price of imported natural gas was chosen as an independent variable. The type of developed model is third degree polynomial. Coefficients of the equation show that an increase in the price of natural gas causes an increase in the average wholesale electricity price. When estimating the impact of biofuel price on electricity price, an exponential trend model was obtained. Since the coefficient of the variable is positive, an increase in biofuel price leads to growth of the average price of electricity, which shows the importance of electricity generation using biofuel in Lithuania, it is not substituted by electricity generated from other energy sources. To assess the impact of electricity generation from renewable energy sources on the price of electricity, the model of exponential trend with negative coefficient at the independent variable has been developed. This reveals that increased production of electricity from renewable sources results in reduced average electricity price in the wholesale market. Among the models with highest accuracy, the multiple linear regression model was developed which includes biofuel price and electricity production from renewable energy sources as independent variables. This confirms the findings of studies performed by a variety of authors (Erni (2012), Aggarwal et al. (2009)) that to understand changes in electricity price the complex evaluation of different variables on the price of electricity must be done. Conclusions Having performed literature review, it were identified the factors that influence the price of electricity. The research in the field mostly focuses on the following factors: market structure and competition in the market, energy consumption and demand resource management, and electricity generation using renewable energy sources. It is considered that competition among producers and suppliers reduces the market price, whereas competition among network operators increases it. Various studies reveal varied impact of electricity generation using renewable energy resources on the price of electricity. All the reviewed authors argue that using wind energy for electricity generation reduces its wholesale price. The impact of solar energy-based electricity generation is treated differently in various studies. The majority of studies show that using solar energy to generate electricity raises the price of electricity. The impact of other renewable energy sources on electricity price received little attention in the research. To determine the factors that influence electricity price in Lithuania, quarterly average wholesale electricity price was chosen as an independent variable, while nine factors that possibly affect the price - energy consumption, number of producers, local electricity production, net imports, the price of natural gas, biofuel price, electricity generated from renewable energy sources, the share of consumed electricity acquired in the exchange and the number of independent suppliers operating in the market—were selected as dependent variables in the study. Correlation analysis led to the finding that average price of imported gas, average biofuel price and the volume of electricity generated from renewable energy sources have significant linear correlation with quarterly average wholesale energy price.

73
Session 08 - The price and forecasting in power system On the other hand, nonlinear regression analysis revealed that Lithuania’s average wholesale electricity price is influenced by the volume of domestically produced electricity, net imports, average biofuel price, average price of imported natural gas and the volume of electricity generated from renewable energy sources. Five simple nonlinear regression models were developed. The modelling helped to determine that local electricity production and electricity generation from renewable energy sources diminishes electricity price in Lithuania’s wholesale market. In addition, rising price of biofuel increases electricity price, whereas the impact of natural gas price and net imports on the quarterly average wholesale electricity price is ambiguous. Multiple linear regression modelling comprising biofuel price and electricity generation from renewable energy sources as independent variables confirmed the results of simple nonlinear regression modelling. According to the model, biofuel price raises the price of electricity in Lithuania’s wholesale market, whereas electricity generation from renewable energy sources diminishes it. Considering the findings of our study, we can state that to reduce the wholesale price of electricity in Lithuania, it is recommended to promote the development of electricity generation from renewable energy sources, to introduce new competitive capacities of electricity production in the country, to retain the present interconnections and establish new connections. It is also recommended to develop Lithuania’s biofuel energy sector and to work towards reducing the price of imported natural gas through attraction of new trade partners. References Aggarwal, S. K., Saini, L. M., & Kumar, A. (2009). Electricity price forecasting in deregulated markets:
A review and evaluation. International Journal of Electrical Power and Energy Systems, 31(1), 13-22. https://doi:10.1016/j.ijepes.2008.09.003
Dong, S., Li, H., Wallin, F., Avelin, A., Zhang, Q., & Yu, Z. (2019). Volatility of electricity price in Denmark and Sweden. Energy Procedia, 158(1), 4331-4337.
https://doi:10.1016/j.egypro.2019.01.788
Erni, D. (2012). Day-Ahead Electricity Spot Prices – Fundamental Modelling and the Role of Expected Wind Electricity Infeed at the European Energy Exchange: Doctoral thesis. The University of St. Gallen, Retrieved from https://www.econbiz.de/Record/day-ahead-electricity-spot-prices-fundamental-modelling-and-the-role-of-expected-wind-electricity-infeed-at-the-european-energy-exchange-erni-david/10009713290
Hirth, L. (2018). What Caused the Drop in European Electricity Prices? A Factor Decomposition Analysis. The Energy Journal, 39(1), 143-158. https://doi.org/10.5547/01956574.39.1.lhir
Ngondya, D., & Mwangoka, J. (2017). Demand-supply equilibrium in deregulated electricity markets for future smartgrid. Cogent Engineering, 4(1), 1-19. https://doi.org/10.1080/23311916.2017.1392410
Sorknæs, P., Djørup, S. R., Lund, H., & Thellufsen, J. Z. (2019). Quantifying the influence of wind power and photovoltaic on future electricity market prices. Energy Conversion and Management, 180(1), 312-324. https://doi.org/10.1016/j.enconman.2018.11.007
Zweifel, P., Praktiknjo, A., & Erdmann, G. (2017). Energy Economics: Theory and Applications. Berlin: Springer

74
Session 08 - The price and forecasting in power system
Vanshika Fotedar, Alasdair Crawford ENERGY LOAD AND PRICE FORECASTING: METHODS AND VARIABLE TREATMENT
Vanshika Fotedar, Energy Policy & Economics Group at Pacific Northwest National Laboratory (PNNL), Portland, USA
Alasdair Crawford, Pacific Northwest National Laboratory (PNNL), USA
Abstract: Most economic assessments of energy storage rely on an assumption of perfect foresight when it comes to variables like price and load, while declaring that benefits evaluated from such an assessment, represents an upper bound on the value that could be obtained. The research, which includes imperfect foresight with respect to load and price, typically does so by building a simplistic regression model using historical data for variables. Under this project, novel forecasting techniques and methods were developed which take the continuous nature of time (as an independent variable) into account. This is done by adding Fourier terms to account for periodicity of load along with their interactions with exogenous variables. Additionally, the climatic approach of dealing with temperature in predicting load is highlighted and methods for incorporating continuous variables are explored. A “climate based” approach does not depend on the assumption that temperature values in the future are known, and is, as a result, more realistic. For forecasts that are only a few days out, the load forecasting techniques can be used in an ensemble model. It can be combined with a model which includes temperature forecasts as an independent variable. Various data exploratory techniques are also discussed, which helps design better models for a particular dataset.
75
Session 08 - The price and forecasting in power system
Cinzia Bonaldo, Massimiliano Caporin, Fulvio Fontini THE RELATIONSHIP BETWEEN DAY-AHEAD AND FUTURES PRICES IN ELECTRICITY MARKET: AN EMPIRICAL ANALYSIS ON ITALY, FRANCE, GERMANY AND SWITZERLAND
Cinzia Bonaldo, Department of Economics and Management and Department of Civil Environmental and
Architectural Engineering, University of Padua, Italy Massimiliano Caporin, Department of Statistics, University of Padua, Italy
Fulvio Fontini, Department of Economics and Management, University of Padua, Italy Among the tools to finance investments in the capacity market there are derivatives, in particular futures contracts. They allow hedging investment risk over time. It is important to evaluate the relationship between electricity day-ahead and future prices following the hedging pressure theory, which explains the difference between future prices and expected spot prices in terms of market players’ risk aversion. We calculate the sign and intensity of the risk premia ex-post in the electricity market of Italy, France, Switzerland and Germany during the last decade and for all products traded, namely, monthly, quarterly, yearly futures and distinguishing between base-load and peak-price futures. We show that in all the countries there is no convergence of future prices to the underlying day ahead ones; moreover, for most of future contracts, the premium rises as contracts approach the delivery. For Italy and Switzerland this means that an inversion of the sing occurs, since on average risk premia are negative at the beginning of the trading period but become positive as the delivery period comes closer. The hedging pressure theory implies that in these Countries premia are on average paid by power producers at the beginning of the period and by suppliers (i.e. power buyers) when coming close to the delivery. On the contrary, in France and Germany risk premia are both positive at the begging and at the end of the trading period, signaling that on average buyers are relatively more risk averse during the whole trading period. In addition, when considering the duration of the delivery period, contracts with longer delivery periods have, on average, higher negative risk premia.
76
Session 09 - The Electricity market: risks and opportunities
Markus Schindler, Lukas Gnam AN OPTIMIZATION APPROACH FOR A LOCAL ELECTRICITY MARKET
Markus Schindler, Forschung Burgenland, 7000 Eisenstadt, Austria, Lukas Gnam, Forschung Burgenland, 7000 Eisenstadt, Austria,
Overview The ongoing increase of renewable energy sources in the existing power systems lead to a decentralization of the classically centralized grid, i.e., there are more and more active customers in the doing both, procuring energy from the grid and feeding potential surplus energy (e.g., from photovoltaic (PV) systems) into the grid. The increasing number of these so-called prosumers yield on the one hand new possibilities (e.g., more renewable energy sources in the grid) but pose on the other hand additional challenges (e.g., grid stability). Generally, a prosumer sells the existing surplus energy, for example, from a photovoltaic system, to the network operator, often at a relatively low fixed feed-in tariff. In order to increase the attractiveness of such PV systems it is of utmost importance to increase the revenues for the prosumers. One approach is to form a so-called Local Energy Community (LEC) [1], where energy can be traded directly between prosumers and consumers (or prosumers). Hence, the network operator’s role is mainly in the context of the grid supply, the monitoring of the grid stability, or the billing process. Due to the increasing development of information technology the billing process can be digitized and automated [2]. This creates the possibility to market electricity directly in the local grid. Methods An algorithm to calculate the electricity costs for each individual is derived as a linear program and formulated as a so-called transport problem [3]. The costs for the consumers are calculated depending on their distance to the prosumer. As upper limit for the local distance-dependent energy price and as lower limit the procurement price from the grid and a fixed feed-in tariff are used, respectively. Based on these assumptions, incentives are created for both the consumer and the prosumer to sell the electricity locally. The cost function for consumers is used as the target function for the minimization problem. Since the consumers receive the most favorable electricity tariff when they buy electricity from a local prosumer, the revenue of the prosumer implicitly increases. They achieve the highest revenue when they sell electricity in the local grid. To evaluate this approach, the developed model and algorithm were implemented using the Python library Pyomo [4]. As solver Gurobi [5] was applied. The input data was generated with the software Load Profile Generator [6]. Results To evaluate the distance-based tariff, a simple example of a LEC, consisting of one prosumer (with a 10 kWp PV system) and three consumers, is evaluated. The simulation results show that in a LEC based on the presented billing model the procurement from the grid for all four participants can be reduced by 13%. In the investigated scenario, the additional revenues for the prosumer lead to a cost reduction of 42%.
77
Session 09 - The Electricity market: risks and opportunities
Conclusion The simulation shows that the costs of a prosumer can be significantly reduced if this allocation model is applied. This creates a financial incentive to build a photovoltaic plant in order to reduce his own costs. The distance-based electricity tariff also prevents an oversupply of prosumers. With an increasing number of prosumers, the electricity price in the grid decreases and thus the incentive to build a PV system falls. Furthermore, the energy inflow from the grid can be significantly reduced, reducing stress on the supply lines increasing their lifetime. This circumstance ensure a cost reduction for the network operator. To what extent this cost reduction can be passed on to the end customer is an object for future studies. Additionally, different distance metrics (e.g., based on the network topology) are promising options for implementation. Acknowledgement This project has been funded by partners of the ERA-Net SES 2018 joint call RegSys (www.eranet-smartenergysystems.eu) - a network of 30 national and regional RTD funding agencies of 23 European countries. As such, this project has received funding from the European Union’s Horizon 2020 research and innovation programme under grant agreement no. 775970. References [1] S. Soeiro and M.F. Dias. “Renewable energy community and the European energy market: main
motivations”. Helyio 6.7 (2020).
[2] I. Petri, M. Barati, Y. Rezgui, and O.F.Raner. “Blockchain for energy sharing and trading in distributed prosumer communities”. Computers in Industry 123 (2020).
[3] R.J. Vanderbei. Linear Programming. 4th ed. Springer US, 2014.
[4] E.W. Hart, C.D. Laird, J.P. Watson, D.L. Woodruff, G.A. Hackebeil, B.L. Nicholson and J.D. Siirola. Pyomo Optimization Modelling in Python. Springer, 2017.
[5] Gurobi Optimization, LLC. Gurobi Optimizer Reference Manual. URL: http://www.gurobi.com . (10.Sep.2020).
[6] N. Pflugradt. LoadProfileGenerator. URL: https://www.loadprofilegenerator.de . (10.Sep.2020).
78
Session 09 - The Electricity market: risks and opportunities
Íñigo del Guayo, Giuseppe Ferrari and Wojciech Drozdz THE FUTURE OF CAPACITY REMUNERATION MECHANISMS IN THE EU, REVISITED
Giuseppe Franco Ferrari, Full Professor in Constitutional Law, Bocconi University, Department of law and legal studies "A. Sraffa”, Via Röntgen, 1, Room 1.D1-9 20136 Milano, Italy
Iñigo del Guayo, Full Professor in Administrative Law, Universidad de Almería Departamento de Derecho, Cañada de San Urbano, s/n, 04071 Almería, Spain
Wojciech Drozdz, Professor of Szczecin University, Vice president of ENEA, ENEA Operator Sp. Z o.o. 58 Strzeszynska St, Poznan 60-479, Poland
Overview This paper tries to present briefly which role are playing and will pay capacity remuneration mechanisms in the EU. Capacity mechanisms are measures taken by Member States to ensure that electricity supply can match demand in the medium and long term. Capacity mechanisms are designed to support investment to fill the expected capacity gap and ensure security of supply. Typically, capacity mechanisms offer additional rewards to capacity providers, on top of income obtained by selling electricity on the market, in return for maintaining existing capacity or investing in new capacity needed to guarantee security of electricity supplies. Capacity mechanisms have an impact on competition in the internal electricity market. Many of these mechanisms involve State aid, so they are subject to EU State aid rules. This paper will examine the provisions of the Regulation no 943/2019 and will compare the situation in Italy, Poland and Spain. The Guidelines on State aid for environmental protection and energy 2014-2020 (EEAG) contain rules to assess capacity mechanisms (Section 3.9 of the EEAG). This is a relatively new field in State aid policy. Method The method we shall use is to collect as much evidence as possible of the consensus around the need to design capacity remuneration mechanisms in such a way that competition is not distorted. We shall examine the decisions already taken by the European Commission, in relation to a number of countries. We shall review the situation of capacity remuneration mechanisms in Italy, Poland and Spain. After this “factual” approach, we shall evaluate them at the light of Regulation 943/2019. In the accompanying Memorandum of that 2019 regulation, the European Commission states its preference for the so-called 'energy-only market' option. However, the Commission remarks that this does not discard the possibility for Member States of using capacity mechanisms, provided these are based on a shared resource adequacy assessment methodology carried out in full transparency through ENTSO-E and ACER and comply with common design features for better compatibility between national capacity mechanisms and harmonised cross-border cooperation. Legislation is needed in this area to address the issues in a consistent way. Results The result of this regulatory approach of the European Commission lead to the approval of Regulation 943/2019, which contains new and very relevant provisions on capacity mechanisms. New Chapter IV (articles 20 to 27) of said norm contains specific rules, which we are going to analyse. In particular, we want to explain if and how the approval of said norm influences the existing mechanisms.

79
Session 09 - The Electricity market: risks and opportunities Conclusions We want to examine the existing mechanisms, in particular the Italian and Polish ones, which were approved by the European Commission. In the case of Spain, the existing capacity payments were abolished in 2018, but the Government is considering the possibility of introducing new ones. We want to conclude by making an assessment on the three systems. References Hancher, L., De Houteclocque, A. y Sadowska, M. (editores), Capacity Mechanisms in the EU Energy
Market. Law, Policy, and Economics, Oxford University Press, Oxford 2015.
Hesmondalgh, Serena, Johannes Pfeifenberger and David Robinson, “Resource Adequacy and Renewable Energy in Competitive Wholesale Markets”, The Brattle Group, September 2010.

80
Session 09 - The Electricity market: risks and opportunities
Tunç Durmaz, Sevil Acar Aytekin, Simay Kizilkaya ELECTRICITY MARKET CAPACITY MECHANISM AND STRATEGIC CAPACITY WITHHOLDING IN TURKEY
Tunç Durmaz, Economics Department, Yildiz Technical University, Esenler 34220, Istanbul,
Sevil Acar Aytekin, Department of Tourism Administration, Bogazici Univresity, Simay Kizilkaya, School of Business Administration, Altinbas University,
Overview Following the 2009 Electricity Energy Market and Supply Security Strategy Document, domestic and renewable resources have been identified as “priority resources” in meeting Turkey’s electrical energy needs. However, on the policy level, the government sustains subsidies through legislative and regulatory measures and political discourse to create a social license for coal investments. Moreover, the Regulation on the Electricity Market Capacity Mechanism entered into force to establish sufficient installed power capacity, including the reserve capacity, to assure the security of supply in the electricity market and/or protect the installed reliable power capacity that can assure long-term system security. The mechanism nevertheless excludes alternative capacity providers such as renewable energy generators and demand-side response. This paper aims to bring attention to the adverse outcomes that a poorly-designed capacity mechanism may lead to. Firstly, we find that electricity price significantly increases the duration of failures; that is, there is evidence for strategic capacity withholding in the electricity market. Secondly, capacity payments extend the durations of power failures of the generators that receive these payments. Lastly, renewable energy has a positive impact on the duration of failures. Methods Due to the simultaneity of failures and price, we apply instrumental variable techniques (IV) and instrument for day- ahead electricity prices by the natural gas price. In the second stage, the dependent variables are the duration of power plant failures measured in minutes. We apply the following structural equation in the second stage:
𝐹𝑎𝑖𝑙𝑢𝑟𝑒t = 𝛽0 + 𝛽1𝑃𝑟𝑖𝑐𝑒t + 𝛽2𝑊𝑖𝑛𝑑t + 𝛽3𝐿𝑜𝑎𝑑t + 𝐶𝑀t + 𝜖t , where 𝐹𝑎𝑖𝑙𝑢𝑟𝑒t stands for the duration of failures in minutes, 𝑃𝑟𝑖𝑐𝑒t is the electricity price instrumented by natural gas electricity price, 𝑊𝑖𝑛𝑑t is the share of renewable energy in the total energy supply, 𝐿𝑜𝑎𝑑t is the load forecast plan. We use aggregated day-ahead predicted load for each day as an indicator of system load, instead of that day’s realized load, because real time demand is endogenous in relation to failures. The potential collinearity between load and electricity price is handled and automatically corrected via instrumenting electricity price by natural gas price. To take account of the the power generators that receive subsides through the capacity remuneration mechanism, we include a dummy variable (𝐶𝑀t) that equals 1 if the specific generator is in the mechanism. We use hourly data in the analysis. The data starts from September 01, 2018. This is because Energy Exchange Istanbul (EXIST), the currently administrating electricity exchange market,

81
Session 09 - The Electricity market: risks and opportunities started its wholesale activities both in the electricity as well as the natural gas market as of September 01, 2018. Apart from the data on capacity payments, all the data were obtained from EXIST’s Transparency Platform. The data on capacity payments were retrieved from Turkish Electricity Transmission Corporation’s website. The failure data, 𝐹𝑎𝑖𝑙𝑢𝑟𝑒t obtained from the Market Message System which provides the facility outage and maintenance notifications communicated to participants under generation, consumption and transmission categories. The data consists of plants’ names, their injection/withdrawal units, the start and end dates of the failures, installed capacities in operation as well as the affected capacity at the time of the failure, and finally, the reason of the failure. Since we are concerned with strategic capacity withholding, we only utilize outage failures and in particular the ones data that were reported after the incidents had taken place. Moreover, we excluded failures that had a duration of more than one day. Results Results indicate that electricity price significantly increases the duration of failures; more specifically, a 1% increase in price causes a 0.55-minute increase in failure duration. This finding is in line with the previous case studies of Fogelberg and Lazarczyk (2019) and Bergler et al. (2017) for the Swedish and German-Austrian markets, respectively,in which strategic failures are positively affected by prices. On the other hand, the share of wind energy has a positive impact on failure duration. Bergler et al. (2017) find a similar result for wind power generation in the German-Austrian market. Interestingly, we find that the duration of failures is approximately 150 minutes higher among the generators that obtain funding through the capacity remuneration mechanism. Conclusions In conclusion, our results suggest strategic withholding through failures (“market manipulation”) in the electricity market. The current setup of the capacity mechanism adds to the duration of the failures in the market. The evidence for the strategic capacity withholding suggests that a mechanism may be required to investigate those failures. Furthermore, the capacity payments’ positive effect on the number of failures suggests that the mechanism may need to be redesigned/updated.
References Bergler, J., Heim, S. and Hüschelrath, K. (2017). Strategic capacity withholding through failures in the
German-Austrian electricity market. Energy Policy, 102, 210–221.
Fogelberg, Sara and Ewa Lazarczyk (2019). Strategic Withholding through Production Failures. Energy Journal 40(5), 247–266.
Spees, K., Newell, S. A., & Pfeifenberger, J. P. (2013). Capacity Markets—Lessons Learned from the First Decade. Economics of Energy & Environmental Policy, 2(2), 1-26.
82
Session 09 - The Electricity market: risks and opportunities
Maria Chiara D’Errico COINTEGRATION ANALYSIS OF ELECTRICITY DEMAND AND MOBILITY DURING THE FIRST WAVE OF COVID19 CONTAGION
Maria Chiara D’Errico, University of Perugia, Italy
Abstract The magnitude of the impact of the pandemia on key variables, such as electricity demand, mobility of people and number of COVID-19 hospitalization cases is unprecedented. Existing economic models lack historical data to estimate the impact of such events. We investigate the nexus among electricity demand, shifting behavior of mobility at work and ant home, and COVID-19 contagion with econometric estimation techniques at high frequency. We assume a multivariate explanatory model where the electricity demand is a function of human activity (economic production and residential household decisions). In turn, human activity interacts with COVID-19 contagion intensity. Introduction The impact of the pandemic Covid shock has produced deep consequences and disruptions on the economic life. We explore the impact on key variables of the Covid pandemic shock in Italy in the period 24 February – 30 June 2020. Italy has been one the first hit countries in Europe since the end of February 2020 and it is an interesting case to analyze the nexus among the economic activity a d the health emergency. In our analysis, we use three variables at the daily frequency: electricity demand; mobility of people and mobility of workers, which is a proxy for economic activity; health variables related to the contagion of the Covid pandemic, like total hospitalization and hospitalization with intensive care. Our approach is based on classical economic analysis, so we postulate a theoretical model which is estimated and determined on a daily basis. We consider the period between the 23rd of February and the 30 June. It is the period in which Italy has been hardly hit, from the first relevant cases of contagion to the relaxation of the restrictions. The significant shocks during the Covid pandemic and the lockdown period, which in Italy has been characterized by four events: 23 February – first case of contagion in Italy; 10 March – general lockdown of all activities and mobility (with some exceptions, such as food supermarkets, strategic industries, some public offices); 4 May – gradual relaxation of the lockdown – 3 June - complete relaxation of activity and mobility restrictions, with maintenance of social distance and mask wearing obligations. Many epidemiologist and other mathematical modelers have tried to estimate epidemic curves and the parameters R-zero of contagion diffusion, but scarce attention has been devoted to the short term impact on the economic activity. We want to analyze the short-term impact in this period. This paper shows two novel approaches. First, we estimate a daily electric energy demand function; second, we analyze the Energy-Mobility-Covid nexus, testing the causality nexus among electricity demand, slowdown of economic activity, contagion diffusion.
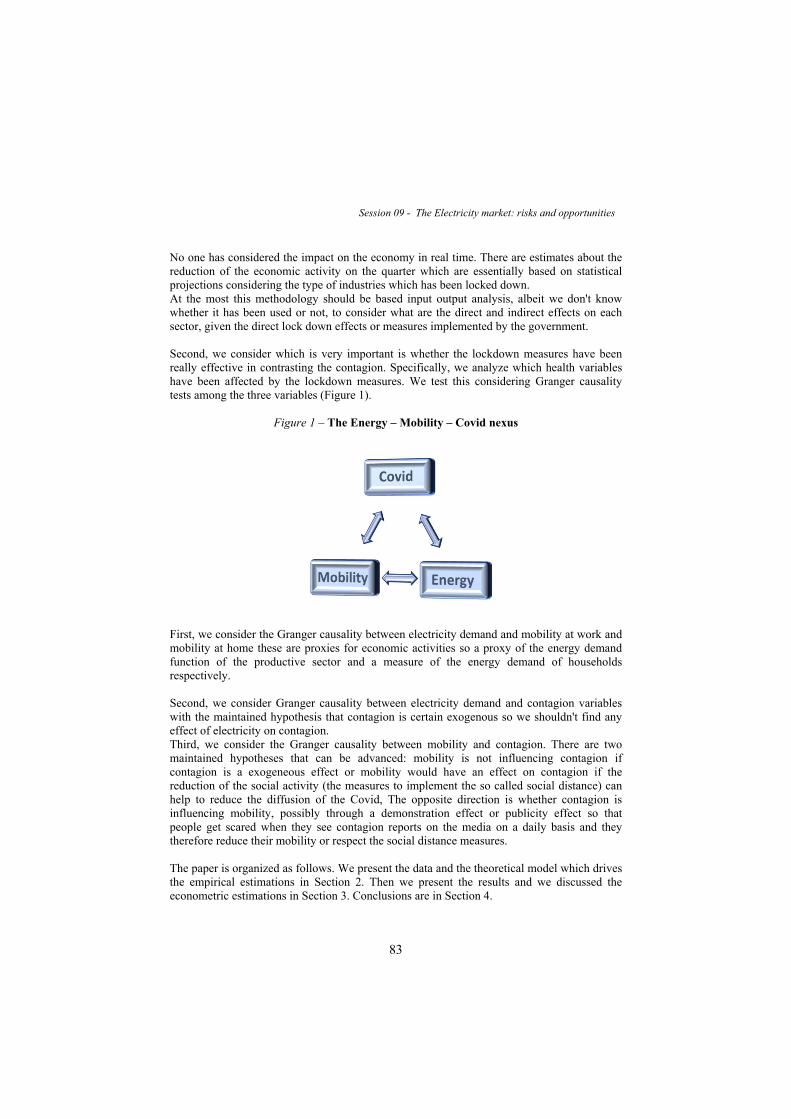
83
Session 09 - The Electricity market: risks and opportunities
No one has considered the impact on the economy in real time. There are estimates about the reduction of the economic activity on the quarter which are essentially based on statistical projections considering the type of industries which has been locked down. At the most this methodology should be based input output analysis, albeit we don't know whether it has been used or not, to consider what are the direct and indirect effects on each sector, given the direct lock down effects or measures implemented by the government. Second, we consider which is very important is whether the lockdown measures have been really effective in contrasting the contagion. Specifically, we analyze which health variables have been affected by the lockdown measures. We test this considering Granger causality tests among the three variables (Figure 1).
Figure 1 – The Energy – Mobility – Covid nexus
First, we consider the Granger causality between electricity demand and mobility at work and mobility at home these are proxies for economic activities so a proxy of the energy demand function of the productive sector and a measure of the energy demand of households respectively. Second, we consider Granger causality between electricity demand and contagion variables with the maintained hypothesis that contagion is certain exogenous so we shouldn't find any effect of electricity on contagion. Third, we consider the Granger causality between mobility and contagion. There are two maintained hypotheses that can be advanced: mobility is not influencing contagion if contagion is a exogeneous effect or mobility would have an effect on contagion if the reduction of the social activity (the measures to implement the so called social distance) can help to reduce the diffusion of the Covid, The opposite direction is whether contagion is influencing mobility, possibly through a demonstration effect or publicity effect so that people get scared when they see contagion reports on the media on a daily basis and they therefore reduce their mobility or respect the social distance measures. The paper is organized as follows. We present the data and the theoretical model which drives the empirical estimations in Section 2. Then we present the results and we discussed the econometric estimations in Section 3. Conclusions are in Section 4.
84
Session 10 - Global assessment of energy efficiency and sustainability
Anam Shehzadi FIRM PRODUCTIVITY, ENERGY EFFICIENCY AND EXPORT IN ASIAN EMERGING AND DEVELOPING COUNTRIES
Anam Shehzadi, University of Kassel, Germany
Overview The decline in energy efficiency and productivity in the Asian emerging and developing countries11 demand the need for necessary policymaking. To date, Asia has the fastest-growing population in the world. However, weak international trade is dragging down its exports (IMF Regional Economic Outlook). This study investigates the relationship between energy efficiency, exports, and firm productivity in two aspects; (1) how energy efficiency plays a role in firm productivity (2) how energy efficiency and productivity are related to exports. This research work is contributing to the empirical literature by making the first attempt to provide a detailed investigation of energy efficiency for these specific Asian countries. This study utilizes three parameters of energy efficiency for an extensive review of firm-level energy efficiency. To this end, the study uses cross-sectional data collected from World Bank Enterprise Surveys (WBES) over the period from 2011-2016. By applying the pooled OLS method, the results show that firm productivity has a positive relation with energy efficiency. The probit model estimates the positive relationship between exports and energy efficiency in the Asian emerging and developing countries. The results validate the porter hypothesis, which states that the improvement in energy efficiency plays a positive role in productivity and trade. The findings from this study demand that the policies related to energy-saving, firm productivity, and export perspective be revisited and updated in emerging and developing Asian countries. Methods The purpose of this study is to examine the association between energy efficiency, firm productivity, and exports in Asian Emerging and Developing Countries. For the empirical assessment of the relationship between energy efficiency and firm productivity, the study employs the pooled OLS method on an extended version of the Cobb-Douglas production function. 𝑙𝑛𝑦𝑖 = 𝛼𝑜 + 𝛼1𝐿𝑖 +𝛼2𝑙𝑛𝐾𝑖+𝛼3 𝐸𝐸𝑖+𝛼4𝑇𝑖+ 𝛼5𝐸𝑋𝑖+ 𝐷𝑐 +𝐷𝑖 +𝜀𝑖 Where 𝑦𝑖 indicates the log of firm productivity proxied by labor productivity. It refers to the total revenue of a firm per worker. 𝐿𝑖 symbolizes labor, it refers to the percentage of permanent full-time workers completed high school education out of total permanent workes, 𝐾𝑖 uses for the capital intensity of a firm in log form and calculated as a fixed investment per worker. 𝐸𝐸𝑖 Presents the energy efficiency of a firm, using three different measures of energy efficiency. (1) The inverse of the proportion of energy cost to total revenue. (2) The inverse of the ratio of energy cost to annual value-added. (3) The inverse of energy cost to total variable cost ratio.
1 By the definition of the IMF, Asian emerging and developing countries includes Bangladesh, Bhutan, China, India, Indonesia, Malaysia, Nepal, Philippines, Sri Lanka, Vietnam (IMF 2017).
85
Session 10 - Global assessment of energy efficiency and sustainability 𝑇𝑖 use for technological innovation, Crespi et al. (2016) find the possible relationship between productivity, energy efficiency and innovation, so there is a rationale to include technological innovation as a control variable for better understanding. Technological innovation is a dummy variable in nature and created by the addition of the following characteristics of the firm; (1)the firm has an international quality certificate; (2) the firm has a technology license from a foreign company; (3) the firm uses own website and e-mail as telecommunication. Firm exports indicate by 𝐸𝑋𝑖, followed by a firm involved in direct export or not. Direct exports refer to the firm directly sold its product at the international level. Exports play a role in good management practice, which leads to energy efficiency (Bloom and Van Reenen, 2010; Bloom et al., 2010). Further, 𝐷𝑐 and 𝐷𝑖 are dummy variables to control for bias in data
due to unobserved features for country and industry, respectively. 𝜀𝑖 𝑑𝑒𝑛𝑜𝑡𝑒𝑠 the white noise error term. For the empirical analysis of the association between export, energy efficiency, and firm productivity, the study uses a binary probit model. The Probit analysis is based on the cumulative normal probability distribution. It is a statistical probability model suited to the dichotomous nature of the export variable ranges from 0 to 1, for exporting firms is 1 and 0 for otherwise (Liao, 1994).
(1)
The dependant variable 𝐸𝑋∗ depends on m observable variables 𝑋𝑚 where m= 1,…,M (Aldrich and Nelson). Where Є is independently normally distributed (0,σ2) to account for serial correlation. 𝐸𝑋 is a dummy variable and observed by 𝐸𝑋∗.
EX= {1 if 𝐸𝑋∗ > 0 and 0 otherwise (2)
The point of discussion is the probability that EX =1. From the above equation 1, the observable variables are energy efficiency, firm productivity, foreign-owned firms, labor, technology use, and firm size. This model also accounts for sectors and country heterogeneity.
Results The empirical results about the extended cobb-Douglas production function with all three measures of energy efficiency. The pooled ordinary least square method employs for model estimation. Estimates for all firms support the statistically significant and positive association between firm productivity, labor, capital intensity, and the firm size in Asian emerging and developing countries. These results are in line with productivity theory and confirm by employing three different proxies of energy efficiency. Regarding the primary variable of interest, energy efficiency it presents the higher productivity of firm associates with higher energy efficiency. This relationship is consistent with the “Porter hypothesis” (Porter & Van der Linde, 1995) and confirmed by analysis of different regressions by the firm size in Asian emerging and developing countries. Estimates corroborate that exports contribute significantly positive towards firm productivity. Similarly, Cui (2017) and Forslid et al. (2018) reports that export can promote firm productivity and thus enable the firm to choose cleaner technology and adopt abatement methods.
86
Session 10 - Global assessment of energy efficiency and sustainability
Moreover, it diagnoses that only medium and large firms are involved in direct exports, which indicates relative efficiency. It implies that relatively efficient firms may engage in exports (Melitz, 2003). The analysis extends to introduce another exciting relationship between export and energy efficiency in Asian emerging and developing countries. Few studies have prior investigated this relation for different countries and find mixed results. The literature on international trade indicates that exporting firms have some potentially implicit factors arising due to two possible reasons. First is, more productive firms can manage the additional expenditures of exports; it is also called self-selection phenomena (Melitz, 2003). Another phenomenon is learning by exporting stated as; exporting firms are leading towards improved performance by practicing knowledge transfer, high competition in the international trade market, and technological assistance and transmission (Bernard et al., 2007; Wagner, 2007). Therefore, the nature of the relationship between export and energy efficiency is still under discussion. Some studies favor that increasing energy efficiency associate with increasing exports. Given this literature it highlights that exports should be positively related to technological innovation. Mostly, innovations refer to energy saving. Another correlation is about exports; it induces better management activities in the context of learning by experience. Conclusions This study finds the connection between energy efficiency, firm productivity, and exports in Asian emerging and developing countries. To the best of the author’s knowledge, this is the first attempt to study the said relation for the Asian emerging and developing countries. The following research highlights a relevant outcome in the environmental context of energy saving on exporting and productivity. Cross-sectional data on 10 Asian emerging and developing countries for the period of 2011 to 2016 is collected from the World Bank Enterprise Survey. The Pooled OLS approach and the Probit model use to carry out the analysis. The empirical results specify the positive correlation between energy efficiency and labor productivity. They are consistent with three different proxies of energy efficiency. The probit estimates are also supporting the positive relationship between exports and energy efficiency. These findings are consistent with the results of (Montalbano & Nenci, 2019) they also found that labor productivity has a positive relation with energy efficiency. These results also support porter hypotheses, which implies that environmental policies aimed at that increase in energy efficiency cause an increase in productivity. These results indicate significant policy implications related to energy saving. As an energy resource of the country can determine economic growth and development, current findings also showing the strong relationship between energy and output production. Also, there is still possible to increase energy efficiency in some sectors. Improving energy efficiency could contribute to lessening the necessity for investments in energy infrastructure, a reduction in fuel price volatility, low fuel costs, high competitiveness, improvement in total well-being, and enlarged energy affordability. References Batrakova, S., & Davies, R. B. (2012). Is there an environmental benefit to being an exporter? Evidence
from firm-level data. Review of World Economics, 148(3), 449-474.

87
Session 10 - Global assessment of energy efficiency and sustainability
Bernard, A. B., Jensen, J. B., Redding, S. J., & Schott, P. K. (2007). Firms in international trade. Journal of Economic perspectives, 21(3), 105-130.
Boyd, G. A., & Pang, J. X. (2000). Estimating the linkage between energy efficiency and productivity. Energy policy, 28(5), 289-296.
Bloom, N., & Van Reenen, J. (2010). Why do management practices differ across firms and countries? Journal of economic perspectives, 24(1), 203-24.
Bloom, N., Genakos, C., Martin, R., & Sadun, R. (2010). Modern management: good for the environment or just hot air?. The Economic Journal, 120(544), 551-572.
Cui, J. (2017). Induced clean technology adoption and international trade with heterogeneous firms. The Journal of International Trade & Economic Development, 26(8), 924-954.

88
Session 10 - Global assessment of energy efficiency and sustainability
REGIONAL POLICIES TO BOOST FIRMS’ ENERGY EFFICIENCY AND DISASTER RESPONSE: A COMPARATIVE ANALYSIS
Elisa Valeriani, Università di Modena e Reggio-Emilia, Italy Maria Giovanna Bosco, Università di Modena e Reggio-Emilia, Italy
Overview In this article we illustrate the energy efficiency measures undertaken by the region Emilia-Romagna in the north of Italy in the aftermath of the 2012 earthquake. We illustrate the economic rationale and potential economic impact of such measures in the light of the current studies on energy retrofit and referring to a number of cases of energy retrofit policy initiatives in various areas of the world. We embed our discussion in the framework of the opportunities and challenges offered by natural disasters in the perspective of building social and economic resilience. Methods We analyze the features of firms applying and obtaining the specific public contribution for energy retrofit in Emilia- Romagna after the 2012 earthquake. We run a survey of business-oriented energy retrofit policy interventions to evaluate the potential economic impact of the energy retrofitting of business buildings in Emilia-Romagna after the 2012 earthquake. Results We expect positive short run and medium run effects from energy retrofit of industrial and commercial building in the affected area. Conclusions Since it is rare to observe data over individual firms energy retrofit expenditure, we might be able to produce an accurate estimation of the expected impact over firms in terms of energy savings, direct and indirect job creation, sales performance and TFP growth. References Abadie, L.M., Ortiz, R.A., Galarraga, I., (2012), Determinants of energy efficiency investments in the
US. Energy Policy 45:551e66. https://doi.org/10.1016/j.enpol.2012.03.002 Aflaki S, Kleindorfer, PR, de Miera Polvorinos, VS. (2012), Finding and implementing energy efficiency
projects in industrial facilities, Production and Operations Management 22(3): 503–517. https://doi.org/10.1111/j.1937-5956.2012.01377.x
BP Group, (2020), Statistical Review of World Energy, 2020 | 69th edition, https://www.bp.com/content/dam/bp/business-sites/en/global/corporate/pdfs/energy-
economics/statisticalreview/bp-stats-review-2020-full-report.pdf Brown, M.A., (2001), Market failures and barriers as a basis for clean energy policies. Energy Policy 29,
1197–1207. https://doi.org/10.1016/S0301-4215(01)00067-2 Chou, J-S., Ongkowijoyo, C.S., (2014), Risk-based group decision making regarding renewable
energyschemes using a stochastic graphical matrix model. Automation in Construction 37; 37:98e109. https://doi.org/10.1016/j.autcon.2013.10.010
Copenhagen Economics, (2012). Multiple benefits of investing in energy efficient renovation of buildings: Impact on Public Finances. Commissioned by Renovate Europe.
89
Session 10 - Global assessment of energy efficiency and sustainability Cortazar, G., Schwartz, E.S., (2003), Implementing a stochastic model for oil futures prices. Energy
Economics 25:215e38. https://doi.org/10.1016/S0140-9883(02)00096-8 Deng, Q., Zhang, L., Cui, Q., Jiang, X., (2014), A simulation-based decision model for designing contract
period in building energy performance contracting. Build Environ 71: 71e80.m http://dx.doi.org/10.1016/j.buildenv.2013.09.010 Esen, Ö,. Bayrak, M., (2017), Does More Energy Consumption Support Economic Growth in Net
Energy- Importing Countries?, Journal of Economics, Finance and Administrative Science 22, No. 42, pp. 75-8. https://ssrn.com/abstract=3005645
Fanfani, R. e Pieri, R. (a cura di) (2013). Il Sistema Agro-Alimentare dell’Emilia-Romagna. Rapporto 2012, Maggioli Editore.
Feng, W., Huang, K., Levine, M., Zhou, N., Zhang, S., (2014) Evaluation of Energy Savings of the New Chinese Commercial Building Energy Standard, the American Council for An Energy-Efficient Economy
(ACEEE) 2014 Summer Study on Energy Efficiency. The American Council for an Energy-Efficient Economy, Pacific Grove, CA.
Hartenberger, U., Lorenz, D., Sayce, S., & Toth, Z. (2017). Crerating an energy efficient mortgage for Europe: Mortgage lending valuation and the impact of energy efficiency: an overview of current practice. London, UK: RICS. Retrieved from https://eemap.energyefficientmortgages.eu/wp-content/uploads/2018/04/EeMAPTechnical-Report-on-Mortgage-Lending-Valuation-and-the-Impact-of-Energy-Efficiency.pdf
Hong, T., Li, C., Yan, D., (2015). Updates to the China design standard for energy efficiency in public buildings. Energy Policy 87,187–198.
Hirst, E., Brown, M., (1990). Closing the efficiency gap: barriers to the efficient use of energy, Resources, Conservation and Recycling vol.3, n. 4, 267–281. https://doi.org/10.1016/0921-3449(90)90023-W
ICF GHK, (2013), Evaluation of the ENWORKS Project: “Embedding Resource Efficiency in Key Sectors” 2009‐2013, Final Report,
http://www.enworksinabox.com/sites/default/files/EREiKS%20Evaluation%20FR.pdf Jackson J., (2010, Promoting energy efficiency investments with risk management decision tools. Energy
Policy 38: 3865e73. https://doi.org/10.1016/j.enpol.2010.03.006 Lü, X., Lu, T., Kibert, C.J., Viljanen. M., (2014), A novel dynamic modeling approach for predicting
building energy performance. Applied Energy 114:91e103, https://doi.org/10.1016/j.apenergy.2013.08.093 Maxwell, D., Owen, P., McAndrew. L, Muehmel, K., Neubauer, A., Addressing the Rebound Effect, a
report for the European Commission DG Environment, 26 April 2011. Mehrara, M., (2007), Energy consumption and economic growth: the case of oil exporting countries,
Energy Policy, 35 No. 5, pp. 2939-2945, https://doi.org/10.1016/j.enpol.2006.10.018 Mikulić, D., Rašić Bakarić I and Slijepčević, S. , (2016), The economic impact of energy saving retrofits
of residential and public buildings in Croatia, Energy Policy, 96, pp. 630–644, http://dx.doi.org/10.1016/j.enpol.2016.06.040 Muthulingam, S., Corbett, C.J., Benartzi, S., Oppenheim, B., (2013), Energy Efficiency in Small and
Medium- Sized Manufacturing Firms, Manufacturing & Service Operations Management 15(4), pp. 596–615, https://doi.org/10.1287/msom.2013.0439
OECD/IEA; (2014), Energy efficiency market report. Paris, France. https://www.iea.org/Textbase/npsum/EEMR2014SUM.pdf Saunders, H. D., (1992), The Khazzoom-Brookes Postulate and Neoclassical Growth,The Energy Journal
13, No. 4, pp. 131-148, https://www.jstor.org/stable/41322471?seq=1#page_scan_tab_contents Singh, N., Ma, J. and Yang, J., (2016), Optimizing environmental expenditures for maximizing economic
performance, Management Decision, vol. 54 No. 10, pp. 2544-2561, https://doi.org/10.1108/MD-01-2016-0037
Stern, D.I. and Cleveland, C.C. (2004), Energy and economic growth, Rensselaer Working Papers in economics, No. 0410, pp. 1-41. U.S. Department of Energy, (2020), “Winter 2020 IAC Newsletter”,
https://www.energy.gov/sites/prod/files/2020/03/f72/IAC_Winter2020_Final.pdf Zancanella, P., Bertoldi, P., and Boza-kiss, B., (2018), Energy efficiency, the value of buildings and the
payment default risk, EUR 29471 EN, Publications Office of the European Union, Luxembourg, 2018, ISBN 978-92-79-97751-0, JRC113215, doi:10.2760/267367.
90
Session 10 - Global assessment of energy efficiency and sustainability
Jubair Sieed, Ryoichi Komiyama, Yasumasa Fujii QUANTITATIVE ANALYSIS OF ENERGY SECURITY AND ENVIRONMENTAL SUSTAINABILITY USING DYNAMIC MULTI-SECTOR ENERGY ECONOMIC MODEL
Jubair Sieed, The University of Tokyo, 7-3-1, Bunkyo-ku, Tokyo, 113-8656, Japan Ryoichi Komiyama, The University of Tokyo, Japan
Yasumasa Fujii, The University of Tokyo, Japan
Overview As energy demand grows at a faster rate in developing regions, energy security and environmental sustainability become issues of concern. The transition from traditional fuels to modern forms of energy requires huge infrastructure development and poses greater financial risk at the same time. In this study, we analyse the long-term energy growth scenario of one of the fastest developing regions of the world, Bangladesh using a dynamic multi-sector energy economic model. We also evaluate the interrelation between energy consumption and environmental emission by imposing different emission limits as per national commitments and international agreements. The social implications and optimal power generation mix for different policy scenarios have been investigated. Methods The Dynamic Multi-Sector Energy Economic (DMSEE) model developed for this analysis, uses linear programming approach to quantitatively analyse the interrelationship among Top-Down (TD) economic sectors and thus elaborate the Bottom-Up (BU) electricity sector in term of different power generation technologies considering techno-economic and environmental constraints. We used the TD information obtained from Global Trade Analysis Project (GTAP) 10 database that represents the world economy through bilateral trade information. For the BU electricity sectors, seven power generation technologies were considered: coal-fired, gas-fired, oil-fired, nuclear, hydro, solar PV and wind power generation. The objective function of the model is to maximize utility for consumptions. The constraints include supply-demand balance, resource balance, capital investment limit, labour availability from TD perspective and other technical limitations from the BU electricity sector. Different carbon-emission limits are imposed to obtain optimal generation mix for different scenarios. Results Our model computes results for 9 time points starting from 2025 to 2105 at 10 years interval. Hourly electricity generation from different technologies is obtained to generate optimal power generation mix for a particular year. We consider 3 different economic scenarios naming Business As Usual (BAU), Low Growth (LG) and High Growth (HG) with annual household consumption growth of 1.75%, 1% and 2.5% respectively. Carbon emission limit was introduced by imposing carbon tax at a rate of 10$ per ton of CO2. The GDP over the years, import, and export were also calculated in addition to electricity generation mix for these scenarios. The results for different scenarios imply that imposing carbon emission limits have a profound impact on the energy mix. In order to satisfy environmental policy concerns, advance planning and adjustment with new technologies need to be ensured for continuous and sustainable development.
91
Session 10 - Global assessment of energy efficiency and sustainability Conclusions Developing countries experience increasing energy and electricity demand as they transform into industry based economy and people’s purchase power increase. The interrelation between economic growth and energy is important for national policy planning and sustainable growth, especially for the electricity sector. It is the environmental factors that could bring positive changes towards a sustainable future with diversified energy and electricity generation technologies if taken into consideration in time ensuring energy security and environmental sustainability simultaneously. Acknowledgment This work was supported by JSPS KAKENHI Grant Number JP20H02679. References [1] Isogai, Motoi & Komiyama, Ryoichi & Fujii, Yasumasa.; Develpoment of Dynamic Multi-sector
Energy Economic Model Elaborating Energy Sectors and Suggestions for Optimum Power Generation Mix in Japan in 2050, IEEJ Transactions of Power and Energy, Vol.139, No.7, pp.461-469, February 2019.
[2] Otani, Naoyuki & Komiyama, Ryoichi & Fujii, Yasumasa.; Assessment for Economic Impact by Dynamic Multi-sector Energy Economic Model Considering Engineering Characteristics of Automobile Industry and Power Sector, Journal of Japan Society of Energy and Resources, Vol.41, No.3, pp.77-86, May 2020.
92
Session 10 - Global assessment of energy efficiency and sustainability
Paolo Bertoldi, Nives Della Valle
HOW TO UNLOCK THE HUMAN POTENTIAL FOR PROMOTING ENERGY EFFICIENCY? A REVIEW ON THE BARRIERS AND LEVERS
Paolo Bertoldi, European Commission, Joint Research Centre Nives Della Valle, European Commission, Joint Research Centre
Overview There is a strong consent that reducing or capping global energy demand is a key component of the strategies to reach the Paris Agreement climate target, and in particular carbon neutrality by mid-century [1]. One way to do so is by leveraging the human potential. In particular, a very large number of individuals´ decisions (such as those related to reaching the workplace, to the purchase and use of home and office appliances, and to renovating a house) embed a huge potential to reduce global energy demand and the associated CO2 emissions. However, cognitive biases [2], as well as contextual factors [3], often prevent this potential to be fully tapped, giving rise to the so-called energy efficiency gap [4]. In this context, key decisions are those related to adoption of energy efficiency technologies and services. Methods The paper presents an updated review of barriers to energy efficiency as analysed and proposed so far by scholars, with a particular focus on consumer behaviour and the behavioural mechanisms underlying investment decisions, including risk aversion, discount rates, time preferences, values, beliefs and attitudes. Policies options to eliminate, reduce or overcome behavioural barriers are presented. The data collection is based on literature reviews of peer reviewed articles in ISI journal (based on a search of the Scopus and Web of Science databases). Results Scholars have identified a number of barriers [5] to energy efficiency investments and proposed the adoption of energy efficiency policies and policies packages to overcome them [6]. Barriers to energy efficiency have been investigated and classified by different scholars in different categories. Reddy [7] classified the barriers in the following categories, related to the different actors: (i) consumer-related; (ii) equipment manufacturer-related; (iii) utility-related; (iv) financial and institution-related; and (v) government-related. Weber [8] proposed the following classification of barriers based on different activities and structures: (i) institutional barriers; ii) market barriers; (iii) organizational; (iv) behavioural barriers. Sorrell [9] proposed a taxonomy of barriers in three categories: (i) neo-classical, (ii) behavioural, and (iii) organizational. Reddy [10] categorized the barriers combining the two above classifications into (i) financial-economic, (ii) technical, (iii) awareness and information, (iv) institutional-organizational, (v) regulatory, and (vi) personnel and behavioural barriers. In a second study Sorrell [11] identified the following barriers with an economic focus: (i) risk; (ii) imperfect information; (iii) hidden costs; (iv) access to capital; (v) split incentives: (vi) bounded rationality. More recently, Cagno [12] classified barriers mixing the type of actors, the function and the economics into: (i) market; (ii) government/politics; (iii) technology/service suppliers; (iv) designers and manufacturers; (v) energy suppliers; (vi) capital suppliers; (vii) organisational;

93
Session 10 - Global assessment of energy efficiency and sustainability
(viii) economic; (ix) behavioural; (x) competence; (xi) awareness. Gillingham [13] and Cattaneo [14] identified several behavioural factors that prevent energy-efficiency investment decisions drawing from the field of behavioural sciences. Similarly, a number of scholars have investigated and classified energy efficiency policies [15]. However only a limited number of papers related policies to barriers. Conclusions In recent years, developments in behavioural sciences have equipped national and local governments with a framework that acknowledges that people´s behaviour reflects fundamental aspects of human nature, thus enhancing the design and the prediction of policies [16]. Therefore, this paper, in addition to providing a review of traditional interventions to overcome the identified barriers, will also propose interventions that draw from behavioural sciences, including social norms [17]. References [1] IPCC Special report on Global Warming of 1.5 ºC, available at https://www.ipcc.ch/sr15/
[2] Tversky, Amos, and Daniel Kahneman. "Judgment under uncertainty: Heuristics and biases." Science 185.4157 (1974): 1124-1131
[3] Wilhite, Harold, et al. "The legacy of twenty years of energy demand management: we know more about individual behaviour but next to nothing about demand." Society, behaviour, and climate change mitigation. Springer, Dordrecht, 2000. 109-126.
[4] Jaffe, Adam B., and Robert N. Stavins. "The energy-efficiency gap What does it mean?" Energy policy 22.10 (1994): 804-810
[5] Howarth R. B. and Andersson B., “Market barriers to energy efficiency,” Energy Economics, pp. 262–272, 1993
[6] Hirst E., Brown M. Closing the efficiency gap: barriers to the efficient use of energy. Resour Conserv Recycl 1990; 3:267–81.
[7] Reddy, Amulya K. N., ‘Barriers to Improvements in Energy Efficiency’. Energy Policy, 1991, 19 (10): 953-61
[8] Weber, Lukas. ‘Some Reflections on Barriers to the Efficient Use of Energy’. 1997, Energy Policy, 25 (10): 833-35
[9] Sorrell S., Scleich J., Scott S., O'Malley E., Trace F., Boede U., Ostertag K., Radgen P., Reducing barriers to energy efficiency in private and public organisations, Report to the European Commission, in the framework of the Non-Nuclear Energy Programme, 2000, JOULE III. Brighton
[10] Reddy, Sudhakara B., ‘Barriers to the Diffusion of Renewable Energy Technologies’. Monograph, Centre for Energy and Environment, 2002, UNEP, Denmark
[11] Sorrell S., Mallett A., Nye S. Development Policy, Statistics and Research Branch. Barriers to industrial energy efficiency: A literature review. Working paper 10/2011. United Nations Industrial Development Organisation
[12] Cagno E., Worrell E., Trianni A., Pugliese G., Dealing with barriers to industrial energy efficiency: an innovative taxonomy. In proceedings of ECEEE 2012 Summer Study on Energy Efficiency in Industry.
[13] Gillingham, Kenneth, Richard G. Newell, and Karen Palmer. "Energy efficiency economics and policy." Annu. Rev. Resour. Econ. 1.1 (2009): 597-620.
[14] Cattaneo, Cristina. "Internal and external barriers to energy efficiency: which role for policy interventions?." Energy efficiency 12.5 (2019): 1293-1311

94
Session 10 - Global assessment of energy efficiency and sustainability
[15] Safarzadeh S., Rasti-Barzoki M., Hejazi S.R., A review of optimal energy policy instruments on industrial energy efficiency programs, rebound effects, and government policies, Energy Policy, Volume 139, 2020, 111342
[16] Chetty, R. (2015). Behavioral economics and public policy: A pragmatic perspective. American Economic Review, 105(5), 1–33.
[17] Schultz P.W. The Constructive, Destructive, and Reconstructive Power of Social Norms. Psychological Science, 2007. Volume 18—Number
95
Session 11 - Synergies between climate change, energy access and energy poverty
Benedikt Janzen, Katharina Drescher DETERMINANTS, PERSISTENCE AND DYNAMICS OF ENERGY POVERTY: AN EMPIRICAL ASSESSMENT USING GERMAN HOUSEHOLD SURVEY DATA
Benedikt Janzen, University of Bern, Switzerland Katharina Drescher, Statistics Austria
Overview Energy affordability receives increasing attention in developed countries. It refers to a state of experiencing difficulties to reach adequate levels of domestic energy services, related to high energy expenditures, low income and inefficient energy use. To pursue energy poverty reduction policies, policy maker need a correct identification of the determinants and dynamics of energy poverty. In this paper we employ a dynamic random-effects probit model on three waves of panel data from Germany to identify socio-economic and socio-demographic characteristics as well as housing conditions and household preferences that influence the probability of being energy poor. The longitudinal data structure allows us to examine the persistence and dynamics of energy poverty. Our findings suggest that households that are energy poor in one period are between 6.1 and 19.9 percent more likely to be energy poor in the subsequent period depending on the indicator chosen. Furthermore, we employ multinomial logistic regression to establish differences between chronic and transient energy poverty. Our results show that differences between chronic and transient energy poverty can be mainly attributed to household composition, labor force status, energy efficiency measures and in particular the heating system in place. Methods For this study we resort to the German Socio-Economic Panel (GSOEP), which is a nationally representative household panel study for Germany that started in 1984. The survey is conducted annually, with the latest available data being from 2018. To assess energy poverty, we use both an expenditure-based energy poverty measure and a consensual approach. The expenditure-based approach is based on monthly household expenditures on domestic energy services relative to household income, with a household considered energy poor if the share of income spent on energy is greater than twice the national median. The subjective (or consensual) indicator labels households as energy poor if they self-report difficulties keeping their home comfortably warm in the colder months due to financial reasons. Since a survey question on consensual energy poverty was only introduced in 2016 (wave 33) we restrict our sample to the period covering 2016 and each year thereafter (i.e., waves 33 to 35). To identify the driving factors and the persistence of energy poverty, we employ a dynamic panel data model with random effects.
The model can be summarised as follows:
where 𝒚*it is the latent dependent variable, 𝒚it−1 is the energy poverty state in period
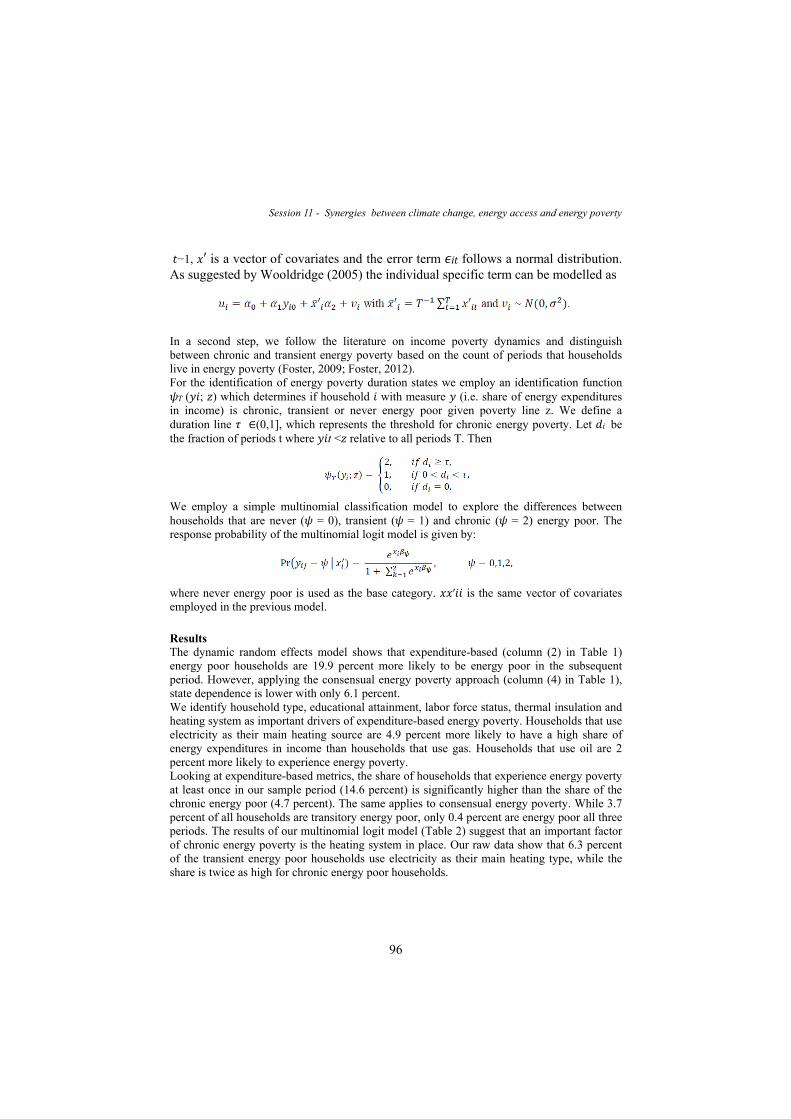
96
Session 11 - Synergies between climate change, energy access and energy poverty
𝑡−1, 𝑥′ is a vector of covariates and the error term 𝜖it follows a normal distribution. As suggested by Wooldridge (2005) the individual specific term can be modelled as
In a second step, we follow the literature on income poverty dynamics and distinguish between chronic and transient energy poverty based on the count of periods that households live in energy poverty (Foster, 2009; Foster, 2012). For the identification of energy poverty duration states we employ an identification function 𝜓𝑇 (𝑦𝑖; 𝑧) which determines if household 𝑖 with measure 𝑦 (i.e. share of energy expenditures in income) is chronic, transient or never energy poor given poverty line z. We define a duration line 𝜏 ∈(0,1], which represents the threshold for chronic energy poverty. Let 𝑑𝑖 be the fraction of periods t where 𝑦𝑖t <𝑧 relative to all periods T. Then
We employ a simple multinomial classification model to explore the differences between households that are never (𝜓 = 0), transient (𝜓 = 1) and chronic (𝜓 = 2) energy poor. The response probability of the multinomial logit model is given by:
where never energy poor is used as the base category. 𝑥𝑥′𝑖𝑖 is the same vector of covariates employed in the previous model.
Results The dynamic random effects model shows that expenditure-based (column (2) in Table 1) energy poor households are 19.9 percent more likely to be energy poor in the subsequent period. However, applying the consensual energy poverty approach (column (4) in Table 1), state dependence is lower with only 6.1 percent. We identify household type, educational attainment, labor force status, thermal insulation and heating system as important drivers of expenditure-based energy poverty. Households that use electricity as their main heating source are 4.9 percent more likely to have a high share of energy expenditures in income than households that use gas. Households that use oil are 2 percent more likely to experience energy poverty. Looking at expenditure-based metrics, the share of households that experience energy poverty at least once in our sample period (14.6 percent) is significantly higher than the share of the chronic energy poor (4.7 percent). The same applies to consensual energy poverty. While 3.7 percent of all households are transitory energy poor, only 0.4 percent are energy poor all three periods. The results of our multinomial logit model (Table 2) suggest that an important factor of chronic energy poverty is the heating system in place. Our raw data show that 6.3 percent of the transient energy poor households use electricity as their main heating type, while the share is twice as high for chronic energy poor households.

97
Session 11 - Synergies between climate change, energy access and energy poverty
We identify single parents and one-person households as most vulnerable to chronic energy poverty. The results imply that environmental preferences also play a role for energy poverty. Households that have serious climate change concerns have a lower chance of being chronic energy poor, whereas the effect is non-existent for transient energy poverty. Conclusion This paper contributes to the rather limited literature on energy poverty dynamics in a developed country. While we do find evidence of state dependencies, energy poverty is mostly a transitory state. Understanding the nature of energy poverty is imperative for policy makers, since alleviating transient and chronic energy poverty requires different policy responses. Short-term measures like direct subsidies for energy costs might reduce entries into energy poverty. However, for reducing chronic energy poverty long-term measures like improving energy performance of housing is the most appropriate response. References Foster, J. (2009). A class of chronic poverty measures, Poverty Dynamics: Interdisciplinary Perspectives,
T. Addison, D. Hulme and R. Kanbur (eds.), Oxford University Press, Oxford, pp 59-76.
Foster, J. and Santos, M. (2012). Measuring Chronic Poverty, OPHI Working Paper, Oxford Department of International Development, Oxford.
Socio-Economic Panel (2019), data for years 1984-2017, version 34, doi: 10.5684/soep.v34.
Wooldridge, JM. (2005), Simple solutions to the initial conditions problem in dynamic, non-linear panel data models with unobserved heterogeneity. Journal of Applied Econometrics 20: 39–54.
Table 1: Regression Results: Dynamic Random Effects Probit Estimator
Expenditure Based Consensual (1) (2) (3) (4) Expenditure-based t-1 0.374*** 0.199*** (0.013) (0.015) Expenditure-based t=0 0.132*** (0.013) Consensual t-1 0.198*** 0.061'*** (0.023) (0,016) Consensual t=0 0,066*** (0,016) Couple without children Ref. Ref. Ref. Ref. Single parent 0.068*** 0,070*** 0,010** 0,009* (0,011) (0,011) (0,004) (0,004) One person household 0.067*** 0.064*** 0.004* 0.004° (0.007) (0.007) (0.002) (0.002) Couple with chi1dren -0.020 -0.019 -0.002 - 0.002 (0.005) (0.005) (0.002) (0.002) Other 0.010 0.011 -0.002 -0.002 (0.015) (0.015) (0.004) (0.004) Gender 0.007° 0.007° 0.002 0.001 (0.004) (0.004) (0.001) (0.001) Migration background 0.032*** 0.030*** 0.001 0.001 (0.008) (0.008) (0.002) (0.002) Care 0.008 0.008 0.003 0.004 (0.008) (0.008) (0.004) (0.004) Region 0.012* 0.014** 0.002 0.003 (0.005) (0.005) (0.002) (0.002)
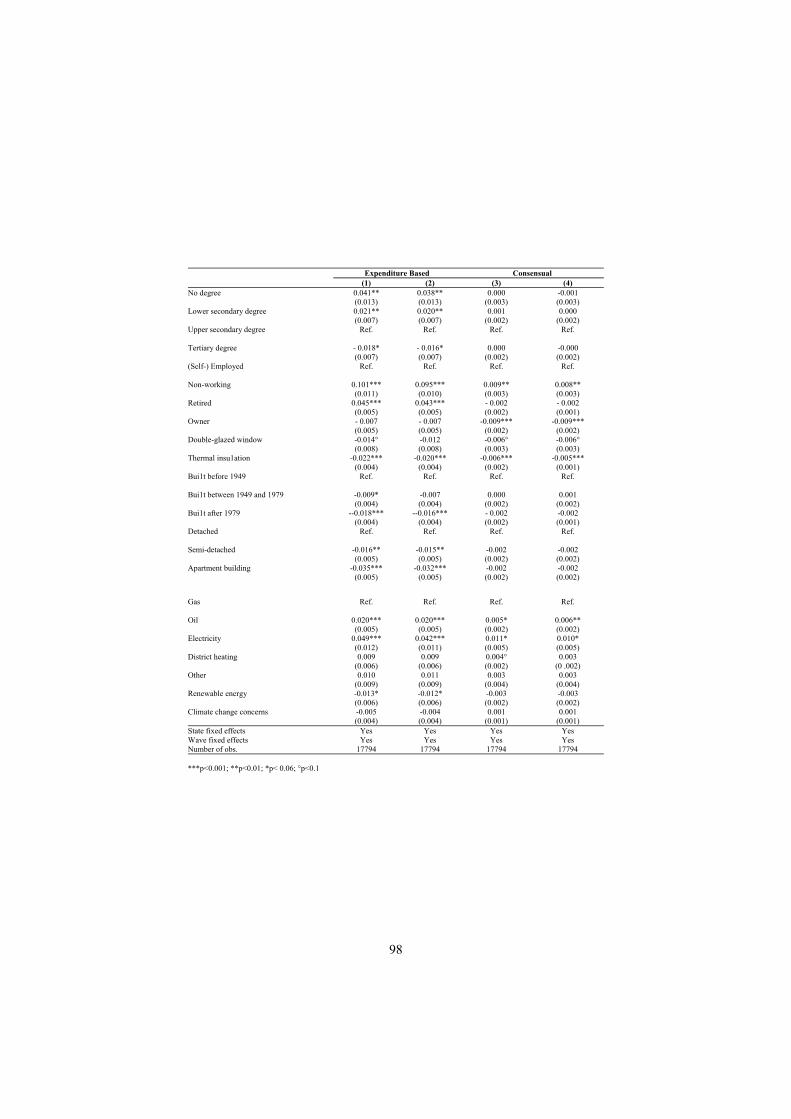
98
Expenditure Based Consensual (1) (2) (3) (4) No degree 0.041** 0.038** 0.000 -0.001 (0.013) (0.013) (0.003) (0.003) Lower secondary degree 0.021** 0.020** 0.001 0.000 (0.007) (0.007) (0.002) (0.002) Upper secondary degree Ref. Ref. Ref. Ref. Tertiary degree - 0.018* - 0.016* 0.000 -0.000 (0.007) (0.007) (0.002) (0.002) (Self-) Employed Ref. Ref. Ref. Ref. Non-working 0.101*** 0.095*** 0.009** 0.008** (0.011) (0.010) (0.003) (0.003) Retired 0.045*** 0.043*** - 0.002 - 0.002 (0.005) (0.005) (0.002) (0.001) Owner - 0.007 - 0.007 -0.009*** -0.009*** (0.005) (0.005) (0.002) (0.002) Double-glazed window -0.014° -0.012 -0.006° -0.006° (0.008) (0.008) (0.003) (0.003) Thermal insu1ation -0.022*** -0.020*** -0.006*** -0.005*** (0.004) (0.004) (0.002) (0.001) Bui1t before 1949 Ref. Ref. Ref. Ref. Bui1t between 1949 and 1979 -0.009* -0.007 0.000 0.001 (0.004) (0.004) (0.002) (0.002) Bui1t after 1979 --0.018*** --0.016*** - 0.002 -0.002 (0.004) (0.004) (0.002) (0.001) Detached Ref. Ref. Ref. Ref. Semi-detached -0.016** -0.015** -0.002 -0.002 (0.005) (0.005) (0.002) (0.002) Apartment building -0.035*** -0.032*** -0.002 -0.002 (0.005) (0.005) (0.002) (0.002)
Gas Ref. Ref. Ref. Ref. Oil 0.020*** 0.020*** 0.005* 0.006** (0.005) (0.005) (0.002) (0.002) Electricity 0.049*** 0.042*** 0.011* 0.010* (0.012) (0.011) (0.005) (0.005) District heating 0.009 0.009 0.004° 0.003 (0.006) (0.006) (0.002) (0 .002) Other 0.010 0.011 0.003 0.003 (0.009) (0.009) (0.004) (0.004) Renewable energy -0.013* -0.012* -0.003 -0.003 (0.006) (0.006) (0.002) (0.002) Climate change concerns -0.005 -0.004 0.001 0.001 (0.004) (0.004) (0.001) (0.001) State fixed effects Yes Yes Yes Yes Wave fixed effects Yes Yes Yes Yes Number of obs. 17794 17794 17794 17794 ***p<0.001; **p<0.01; *p< 0.06; °p<0.1
99
Session 11 - Synergies between climate change, energy access and energy poverty
Isabella Alloisio SYNERGIES AND TRADE-OFFS BETWEEN ENERGY ACCESS, CLIMATE CHANGE AND WATER USE IN SUB-SAHARAN AFRICA
Isabella Alloisio, Research Associate, Florence School of Regulation Energy and Climate - European University Institute
Overview Access to energy is an enabling factor for sustainable development and has positive spillover effects on e.g., human health, education, freshwater availability, and economic growth. However, energy access could constrain the options for achieving climate mitigation and may, in turn, be constrained by climate change and water availability. By 2040 there will be a shift towards more energy-intensive water and water-intensive energy. Energy is essential in the water sector, whilst the energy sector can switch to renewable resources that are less water and carbon intensive, although they are more vulnerable to climate change. Sub-Saharan Africa (SSA), one of the most affected regions by climate change impacts, has the highest rates of energy poverty, water scarcity and energy carbon intensity. Electricity access rate in SSA is very low and unevenly distributed, and it is projected to remain the lowest by 2030, when nine out of ten people without access live in SSA.
Methods The paper novel approach is represented by the analysis of the Water-Energy-Climate Nexus under the energy access perspective in SSA, including not only the impact of growing energy demand on CO2 emissions, but also the impact of climate change on energy supply and water availability, as well as the linkage between climate policies, energy prices and affordability of energy access in SSA.
Results Results show that providing universal access in Sub-Saharan Africa is expected to have a negligible impact on global CO2 emissions. Climate policy could offset this increase and a shift to renewable energies, especially solar PV, wind and geothermal, would allow for a more sustainable energy supply and consumption and a more efficient water use. Moreover, if coherent carbon pricing policies and consistent low carbon energy investments are undertaken, these will allow SSA countries to meet their climate targets, to cope with climate change impacts, and to fill their energy access gap.
Conclusions Sustainable energy access is key for socio-economic development and is the enabling factor of many other SDGs, including those pertaining to the Nexus, i.e. water availability and climate change mitigation. Climate change will exacerbate the pressures and risks associated with variations in the availability and distribution of water resources and will have an impact on energy supply and demand. Since the energy sector, and especially the electricity sector, is the largest contributor to GHG emissions, providing electricity access could constrain the options to mitigate climate change. The deployment of low carbon and more efficient energy sources could offset the projected increase in emissions and tackle at the same time the trade-offs between energy access and climate change and energy access and water use. A new Nexus approach instead of an old silo approach would reduce the trade-offs and maximize synergies across sectors and contribute to
100
Session 11 - Synergies between climate change, energy access and energy poverty several co-benefits among multiple SDGs, such as health, employment and agriculture productivity. An integrated resource planning of water and energy should be carried out and addressed regionally, since the water sector has specific regional characteristics and local climate change impacts. Climate change impacts affect low income countries asymmetrically, both through unequal mitigation and adaptation costs. For these reasons, SSA policymakers should be careful in decoupling economic growth from emissions and environmental degradation and adopt consistent mitigation and adaptation strategies. Ad-hoc solutions for sustainably improving energy access and water use, whilst mitigating climate change already exist, and others need to be developed further. References Bazilian, M., Nussbaumer, P., Rogner, H.H., Brew-Hammond, A., Foster, V., Pachauri, S., Williams, E.,
et al., 2012. Energy access scenarios to 2030 for the power sector in sub-Saharan Africa, Utilities Policies, Vol. 20 (1), pp. 1-16.
Chakravarty, S. and Tavoni M., 2013. Energy poverty alleviation and climate change mitigation: Is there a trade off?. Energy Economics. 40 (1), pp. 67–73.
Conway, D., Archer van Garderen, E., Deryng, D., Dorling, S., Krueger, T., Landman, W., Lankford, B., et al., 2015. Climate and southern Africa’s water–energy–food nexus. Nature Climate Change 5, pp. 837-846.
Dagnachew, A.G., Lucas, P.L., Hof, A.F., Van Vuuren D.P., 2018. Trade-offs and synergies between universal electricity access and climate change mitigation in Sub-Saharan Africa. Energy Policy 114, pp. 355-366.
IPCC, 2008. Climate Change and Water. Technical Paper VI. Bates, B., Kundzewicz, Z.W., Wu, S., Palutikof, J. (eds). IPCC, Bonn
IPCC, 2014. Climate Change 2014 Impacts, Adaptation, and Vulnerability Part B: Regional Aspects. Prepared by Working Group II of the Intergovernmental Panel on Climate Change. Contribution to the Fifth Assessment Report of the IPCC. Barros, V.R., et al. (eds.). Cambridge University Press, Cambridge, United Kingdom and New York, NY, USA.
Pachauri, S., Van Ruijven, B.J., Nagai, Y, Riahi, K., Van Vuuren, D.P., Brew-Hammond A., Nakicenovic, N., 2013. Pathways to achieve universal household access to modern energy by 2030. Environmental Research Letters 8(2).
Stern, D.I., Kander, A., 2012. The Role of Energy in the Industrial Revolution and Modern Economic Growth, The Energy Journal, Volume 33, N.3, pp. 125-152.
IEA, 2016b. Water Energy Nexus, excerpt from World Energy Outlook, 2016. IEA/OECD, Paris
IEA, 2017. World Energy Outlook 2017, Special Report on Energy Access, 2017, IEA/OECD, Paris
IEA, 2019a. Global Energy and CO2 Status Report 2018. IEA/OECD, Paris
IEA, 2019b. Africa Energy Outlook 2019. IEA/OECD, Paris
101
Session 11 - Synergies between climate change, energy access and energy poverty AN INDICATOR OF ENERGY VULNERABILITY: EVIDENCE FROM ITALIAN REGIONS
Alessandro Fiorini: ENEA, Unit-Department for Energy Efficiency, Lab. Monitoring Energy Efficiency Policies, Lungotevere Thaon di Revel, 76, 00196, Rome, Italy
Alessandro Federici: ENEA, Unit-Department for Energy Efficiency, Lab. Monitoring Energy Efficiency Policies, Lungotevere Thaon di Revel, 76, 00196, Rome, Italy
Corinna Viola: ENEA, Unit-Department for Energy Efficiency, Lab. Monitoring Energy Efficiency Policies, Lungotevere Thaon di Revel, 76, 00196, Rome
Overview Energy poverty is a worldwide structural problem. Evidence shows that the phenomenon is highly shaped by context-specific heterogeneities. A critical review of a large body of literature on the topic reveals a strong focus on setting up a flexible definition of energy poverty and formalise it for the quantification of the share of population involved. This leads to describe the multiple aspects of the phenomenon by pinpointing ex-post attributes of households that fall into the perimeter drawn by the specific definition adopted. Conversely, a comparable effort has not been spent so far on building a systematic understanding of the connection between ex-ante energy vulnerability factors and the occurrence of a condition in which “household lacks a socially and materially necessitated level of energy services in the home” (Bouzarovski 2014). In this work the latter approach is considered a more correct interpretation of the phenomenon, for two reasons. First, it ascribes to households’ vulnerability determinants the origin of the multifaceted nature of energy poverty. Second, reinforces its interpretation as the occurrence of prevalent risk factors. This is the framework in which the research need is identified, and the contribution of this work is placed. The research question is answered by testing two underlying assumptions: i) following the rationale behind the new methodology proposed by Comboni et al. (2020) a vulnerability metric must be shaped as a function of the risk to fall into energy poverty; (ii) the bridge between vulnerability and energy poverty must be designed as the connection between an ex-ante (potential) risk condition and an ex-post (realised) phenomenon. The study contributes to filling the research gap introducing a new indicator of regional vulnerability towards energy poverty combining a micro (households) and macro (regional context) level of analysis. The novelty is also represented by the specific list of variables considered and the specific application to Italian regions. The indicator synthetises the intensity of risk associated to micro-founded socio-economic factors and macro systemic determinants. Method Along the lines of the research branch on multidimensional analysis of energy poverty (Nussbaumer et al. 2012, Okushima 2017), and similarly to Scarpellini et al. (2015), Primc et al. (2019) and Camboni et al. (2020), the empirical strategy is divided in three steps. First, a set of variables relevant for the assessment of household’s energy vulnerability is identified. Variables do not include expenditure by energy-related class of good and services to avoid overlaps with the variables used for the construction of the energy poverty indicators and are grouped in seven dimensions: personal characteristics of households’ components, housing characteristics, economic condition, availability of basic home appliances, availability of ICT devices, availability of energy carriers, availability of energy and utilities

102
Session 11 - Synergies between climate change, energy access and energy poverty services. Values assumed by the variables are turned into an indicator of risk bounded between 0 (low exposure to energy poverty) and 1 (high exposure to energy poverty) using information from evidence and econometric modelling. The validity of the set of variables, and of the specific measure, is tested throughout the next two steps. Second step concerns the households’ level. Each selected variable is regressed against the probability to lie under the energy poverty threshold, as expressed by the LIHC-type indicator designed for the Italian NECP. Building on the information provided by the model, in step three risk measures are aggregated in a composite indicator for each dimension and computed by region. A set of macro variables is also used to build a similar metric that considers factors having impact on energy vulnerability at regional level. The macro dimensions control for energy market openness, climate, technological lead on energy efficiency in buildings, energy consumptions and global wealth. In conclusion, a single regional micro, macro, and general vulnerability index is presented and its connection with energy poverty is tested. Data and information are collected from ISTAT and EUROSTAT databases, with reference year 2018. Results The methodology is suitable to summarise the ex-ante multifaceted nature of vulnerability in energy consumption faced by Italian households and traceable in Italian regions. Vulnerability meaning the combined effect of factors that have impact on the exposure to energy poverty. Sign and magnitude of estimated parameters in step two meet the expectations and give comparable results with other works. At households’ level, the probability to fall in energy poverty is mostly explained by the number of components, working condition and overall capacity of the family to face economic fluctuations. Significant deviations are also explained by sex, nationality, and level of education of the household’s head, as well as the tenure type. Availability of devices and appliances, and energy carriers are also strong predictors. The model also accounts for significant regional effects. This suggest running a distinct level of analysis through territorial aggregation. Statistical testing shows that at regional level, households’ vulnerability is strictly positively associated to the share of households identified in energy poverty. This degree of association is increased if the contextual (macro) factors are included in the analysis. The analysis is robust against possible misinterpretation of the intensity of the link between the two indicators. Vulnerability indicators for each micro and macro dimension give a good description about the positioning of each region with respect to the others. Despite the different results obtained in each dimension, the indicator that couple macro and micro measures of vulnerability describe condition of condition of disadvantage suffered by the southern regions with respect to the centre-north. Conclusions The multifaceted nature of energy poverty should not be detected in the characteristics of households categorised as energy poor, by definition. It rather should be assessed through the complex set of personal, socio-economic, and contextual drivers that define their status. The paper presents a vulnerability index designed to capture this heterogeneity in a sample of households. The results of the analysis suggest important highlights for policy purposes, useful to overcome the target identification problem policy makers cope with. First, the impact of some traits of households’ energy vulnerability makes explicit what to address and what is the expected outcome. The exacerbation of economic hardship, inequalities based on gender and nationality, and educational divide likely increase the share of energy poverty, so
103
Session 11 - Synergies between climate change, energy access and energy poverty must be taken as priorities in the identification of target groups and in the selection of measures. Second, the consequences in terms of energy poverty associated with the age of the building and with the availability of energy carriers at home suggest that the benefits of an effective deep renovation of the energy performance of the housing stock and a tailored incentive scheme would be more than proportional to the cost undertaken. References Betto, F.; Garengo, P. and Lorenzoni, A. (2020) “A new measure of Italian hidden energy poverty”,
Energy Policy, 138(2020): 111237.
Bouzarovski, S. (2014) “Energy poverty in the European Union: Landscapes of vulnerability, WIREs: Energy and Environment, 3(2014): 276-289.
Camboni, R.; Corsini, A.; Miniaci, R. and Valbonesi, P. (2020) “Mapping fuel poverty risk at the municipal level: A Small-Scale Analysis of Italian Energy Performance Certificate, Census and Survey data”, Marco Fanno Working Papers 202, dSEA, University of Padua
Nussbaumer, P.; Bazilianb, M. and Modic, V. (2012) “Measuring energy poverty: Focusing on what matters”, Renewable and Sustainable Energy Reviews, 16(1): 231-243.
Okushima, S (2017) “Gauging energy poverty: a multidimensional approach”, Energy, 137 (2017): 1159-1166.
Primc, K., Slabe-Erker, R. and Majcen, B. (2019) “Constructing energy poverty profiles for an effective energy policy”, Energy Policy, 128(2019): 727-734.
Scarpellini, S.; Rivera-Torres, P. Suárez-Perales, I. and Aranda-Usón, A. (2015) “Analysis of energy poverty intensity from the perspective of the regional administration: Empirical evidence from households in southern Europe”, Energy Policy, 86(2015), 729-738.
104
Session 11 - Synergies between climate change, energy access and energy poverty Paola Casati THE DARK SIDE OF ENERGY TRANSITION: THE CASE OF COBALT AND THE DEMOCRATIC REPUBLIC OF CONGO
Paola Casati, Sustainability Lab and Africa Lab Researcher at SDA Bocconi School of Management,
Via Sarfatti 10, 20136 Milano, Italy
Overview The current transition to a more sustainable energy system involves the use on a global scale of clean technologies, such as solar PV, wind turbines, energy storage and electric vehicles. The manufacturing process of these technologies requires the use of specific critical materials, some of which are particularly abundant in the African continent. Among these materials, cobalt has become an essential input for today’s energy transition, in particular due to its unique properties that allow it to be perfectly suitable for key green technologies, especially lithium-ion batteries that are playing an increasingly crucial role in the world economy and represent a decisive technological solution for decarbonization processes. However, the large majority of its reserves are located in a single country. Indeed, according to the data provided by the United States Geological Survey (USGS), 71% of the world's cobalt is mined in the Democratic Republic of Congo (DRC), in the middle of the so-called Copperbelt, a region between the Zambian border known for the richness of its copper and cobalt deposits. Today, lithium-ion batteries are being used not only for computers or for smartphones, but their application is increasingly expanding into both mobile (e.g. electric car batteries) and stationary storage applications (such as grid-connected batteries to balance intermittent renewables). According to the BNEF’s Electric Vehicle Outlook 2019, the demand for lithium-ion batteries for the electric car sector alone, which in 2016 was about 30 GWh, is set to increase exponentially to more than 1,748 GWh per year by 2030. Such an increase will translate into an equally rapid consumption of those materials that are needed for battery manufacturing, starting from cobalt. However, minerals required for the energy transition are often particularly abundant in developing countries that are characterized by fragile economies, political instability and widespread corruption. Some of the global players extracting cobalt in the African continent have been the subject of a worrying number of allegations related to their mining operations, particularly child labor and human rights violations concerning the so-called artisanal or informal mining sector. Hence, it is crucial to understand how companies at the end of the supply chain (e.g. manufacturers of electric vehicles) can act in order to address these issues ensuring a sustainable and safe supply chain for these green technologies. African territories, due to their richness in term of critical minerals, are vital for the advancement of the transition towards clean energies. Therefore, sustainable practices in the global value chain are decisive not only to foster decarbonization but also to promote economic and social development worldwide, especially in the most fragile regions. Methodology In order to perform this research a variety of sources were employed to gather and analyze information about the mining of cobalt associated with low-carbon technologies. Data about mining companies have been collected from the Transition Mineral Tracker, an online platform developed by the Business & Human Rights Resource Centre (BHRRC) that tracks the human rights policies and practice of top players mining minerals key to energy transition.
105
Session 11 - Synergies between climate change, energy access and energy poverty The tracker currently holds data on the main companies producing six key minerals, including cobalt, for the supply chain of green technologies. Currently, the platform contains data about 37 top global players, as well as top players in South Africa, of which 5 extracting cobalt in the DRC. Data collected from the Transition Mineral Tracker have been complemented by public information available on reports and documented news, in order to detect the impact of companies’ practices on the local population and the environment. Particular attention was also posed to the 2015 Amnesty International report, denouncing the human rights abuses in the DRC related to cobalt extraction, and finally to data collected by Center for Effective Global Action (CEGA) analyzing artisanal mining communities of the Copperbelt. Results The Democratic Republic of Congo is ranked first in the world for number of allegations and these claims mainly concern the mining of cobalt and copper. However, cobalt remains the most alleged metal in the DRC. After further research on cobalt mining companies operating in the DRC, it was apparent that all of these present allegations were related to their mining activity, especially concerning safety, health, human rights and environmental abuses. In 2016, Amnesty International, together with the NGO African Resource Watch, published a study showing that most of the companies involved in cobalt production, especially the Asian Congo Dongfang Mining International, are responsible for these violations. The core of this analysis is the presence in the DRC of a continuously expanding artisanal or small-scale mining (ASM) sector that, due to increased demand, has moved from just 6% in 2016 to 20% in 2018 of global mined cobalt supply. Although the majority of Congolese cobalt is mined by industrial operations, i.e. the so-called large-scale mining (LSM), 90% of cobalt miners and their families rely on artisanal mining as a primary source of income. While 74% of artisanal miners work on artisanal sites, CEGA reports that 16% of them operate using illegal concession granted by industrial activities, demonstrating that ASM and LSM are intricately intertwined. It is estimated that this informal sector provides employment to at least 100.000 miners, who dig underground tunnel either by hand or by using very rudimental tools, without any protection and supervision. According to data provided by CEGA, in the artisanal sector children make up about 15% of the labor force, half of which under 14 years old. Accidents, that are often fatal, are frequent due to the precarious conditions of the local working environment. In addition, they face a constant exposure to dust containing cobalt that leads to serious respiratory diseases, not to mention the enormous environmental damage resulting in the destruction of entire natural habitats and the pollution of reservoirs. However, it should be emphasized that, despite several negative social impacts, artisanal cobalt mining has the potential to alleviate poverty. Moreover, our analysis indicates that, while several businesses, like Apple, have taken action in response to the concerns raised by Amnesty International and deserve recognition, cutting Congolese ASM cobalt from global supply chains will not solve the problems, and may in fact exacerbate them in some ways. Indeed, disengaging from artisanal mining could certainly decrease the prevalence child labor; however, the same disengagement could have detrimental effects for a large number of households living in the DRC copper cobalt belt due to lowering household incomes. Conclusions By simply shifting demand away from artisanal and toward industrial mining, end-user companies may inadvertently further feed corruption and poverty in the Democratic Republic of Congo. The potential for artisanal extraction should not be demonized, as it reflects a concrete opportunity to create a diversified and inclusive mining sector, which relies upon

106
Session 11 - Synergies between climate change, energy access and energy poverty local resources with a synergic intent. Thus, a possible response could be to strengthen and reorganize rather than eradicate ASM. This recalls the urgent need to foster the development of a sustainable and safe global value chain of clean technologies. Enhancing sensitivity to these issues by all the involved stakeholders, as well as the commitment to undertake joint efforts to promote a sustainable artisanal extraction, could strengthen the vulnerable and unstable foundations underlying the development and evolution of the transition towards a more sustainable economy and society worldwide. References This is What We Die For: Human Rights Abuses in the Democratic Republic of the Congo Power the
Global Trade in Cobalt. African Resource Watch and Amnesty International, 2016
Faber, B., Krause, B. & De La Sierra R. S. (2017). Artisanal Mining, Livelihoods, and Child Labor in the Cobalt Supply Chain of the Democratic Republic of Congo. California: Center for Effective Global Action
Casati, P., Di Castelnuovo, M. (2020), Cobalt: Blue Gold in the Energy Transition. Economia & Management, 2020/3
Mineral Commodity Summaries 2020. United States Geological Survey
Electric Vehicle Outlook 2019. Bloomberg NEF
With cobalt from the DRC rising, tracing the source is vital – could Blockchain tech be the solution?. CRU Insight, 2019
Transition Mineral Tracker. For more information, see:
https://trackers.business-humanrights.org/transition-minerals/
107
Session 12 - Green revolution: green economies and other technologies
Maria Milousi, Manolis Souliotis, Spiros Papaefthimiou LIFE CYCLE ASSESSMENT AND ECO-DESIGN ALTERNATIVES OF SOLAR THERMAL TECHNOLOGIES FOR THE PROMOTION OF CIRCULAR ECONOMY
Maria Milousi, School of Production Engineering and Management, Technical University of Crete, Chania, Greece
Manolis Souliotis, Chemical Engineering Department, University of Western Macedonia, Kozani, Greece,
Spiros Papaefthimiou, School of Production Engineering and Management, Technical University of Crete, Chania, Greece
Overview Although solar energy is considered a ‘‘clean’’ energy form both manufacture and final disposal of Domestic Solar Hot Water Systems (DSHWS) are associated with environmental transactions. This is due to the energy required for the raw material extraction and the final product formation and assembly as well as due to the final disposal and/or recycle of the system at the end of its life. Therefore, it is necessary to evaluate solar technology accounting for the indirect environmental impacts caused by these systems over their whole life cycle. The objective of this study is a holistic evaluation of the energy and environmental profile of the most commonly used types of solar thermal collectors: flat plate and vacuum tube systems. The two technologies are available in the commercial market and can substantially cover significant thermal demands. The application of eco-design principles in solar thermal collectors is yet in initial stages and needs to be improved as their recycling potential is high due to the large quantities of metals included. Methods In order to validate the environmental hot spots of the studied systems a Cradle-to-Grave life cycle assessment (LCA) has been implemented from raw material extraction through manufacture use and end of life (conducted via SimaPro). From an environmental point of view, the application of eco-design principles in solar thermal collectors can contribute towards either increased adoption of recycling or extended reuse in selected components of a new generation of solar thermal systems. Results The studied systems reveal hot spots during their production phase and through their operation they manage to mitigate significant amounts of emitted greenhouse gases due to the avoided use of fossil fuels. Furthermore, they exhibit similar environmental impacts in most life cycle impact categories but the vacuum tube collector, has highest values, in most cases. Eco-design aspects for solar thermal systems focus on new designs that allow the devices to be disassembled thus improving their recycling potential. Moreover, the storage tank can be made of stainless steel as steel and aluminium can be cleanly separated and reused. All the above mentioned results are helpful to distinguish the impacts of each solar system and can be used when installing such solar energy harvesting technologies.

108
Session 12 - Green revolution: green economies and other technologies Conclusions The linear "take-make-consume-dispose" economic system practiced within Renewable Energy Systems will inevitably undermine their sustainable status without an effective end-of-life management strategy. Circular economy philosophy attempts to close the supply chain loop by reducing the need for virgin materials via the eco-design and with "Reduce, Reuse, Recycle" principles can minimize waste throughout a product's life-cycle. Therefore, eco-design and LCA are important and related tools that enable this perspective. The obtained results of the evaluation identify the products’ hot-spots and provide insights and drivers on choosing the most appropriate technology for optimized design based on the circular economy guidelines. References [1] “SimaPro, The World’s Leading LCA Software.” Available online: www.simapro.com.
[2] “RETScreen Expert, Natural Resources Canada.” Available online: www.nrcan.gc.ca/energy/retscreen
[3] M. Milousi, M. Souliotis, G. Arampatzis, S. Papaefthimiou, “Evaluating the Environmental Performance of Solar Energy Systems Through a Combined Life Cycle Assessment and Cost Analysis,” Sustainability, vol. 11, no. 9, p. 2539, May 2019.
[4] N. Arnaoutakis, M. Milousi, S. Papaefthimiou, P. A. Fokaides, Y. G. Caouris, and M. Souliotis, “Life cycle assessment as a methodological tool for the optimum design of integrated collector storage solar water heaters,” Energy, vol. 182, 2019.
109
Session 12 - Green revolution: green economies and other technologies
Kentarou Kambe, Ryoichi Komiyama, Yasumasa Fujii IMPACT ASSESSMENT FOR RATE DESIGN OF WHEELING CHARGE SYSTEM ON ELECTRICITY TRANSMISSION SECTOR AND HOUSEHOLD SECTOR WITH A TECHNOLOGY SELECTION MODEL
Kentarou Kambe, The University of Tokyo, 7-3-1, Bunkyo-ku, Tokyo, 113-8656, Japan Ryoichi Komiyama, The University of Tokyo, Japan
Yasumasa Fujii, The University of Tokyo, Japan
Overview This paper develops a technology selection model for assessing the impact of alternative wheeling charge systems on the financial burden of end-user such as household sector and the capital recovery of transmission and distribution (T&D) sector. Currently, solar photovoltaic (PV) system has penetrated widespread in Japan since FIT program which began in 2012 and has phased out after 2019, and the self-sufficiency of electricity supply has increased in end-users such as household sector. As a result, it has pushed less requirement for electricity from power grid and the utilization of T&D system has shown a decreasing trend, and it eventually causes the critical problem of decreasing collection of wheeling charge from end-users and a shortfall of wheeling charge revenue for recovering the capital cost of T&D sector. Simultaneously, PV introduction worsens the disparity in cost burden of electricity between PV owner and its non-owner. This paper assumes alternative wheeling charge systems and analyzes the optimal wheeling charge system with a technology selection model. The result reveals that the current wheeling charge system in Japan requires an increase in the unit price of wheeling charge and causes cost burden disparity of power system. As solutions, the paper suggests the increase in basic charge ratio (kW charge ratio) and to introduce a partial charge of T&D cost on power generators. Methods This paper assesses the impact of alternative wheeling charge system on power generation mix and household energy supply and demand dynamics with a technology selection model. In this model, power generation and household sectors can be analyzed in hourly temporal resolution throughout a year, i.e., 8,760 hours. In addition, the household sector is categorized into 100 types of households to account for a wide-variety of electricity and hot water demand characteristics in each household. The authors assume four different scenarios with respect to wheeling charge system: a metered charge-driven case(BAU), a partial charge of T&D cost on power generatior (CFS), a basic charge-driven case(FIX), and a combined implementation of CFS and FIX (FIX&CFS). Through these four cases, the authors aim to identify the system that allows for the recovery of T&D capital cost and eliminates the problem of cost burden disparities between households. Results The analysis shows that many residential PV installations significantly increase T&D cost, and in BAU, non PV households incur the most of T&D costs. It implies that PV households need to adequately shoulder more cost for reinforcing T&D infrascructures for accommodating PV in power system and cost burden disparity of electricity system can be

110
Session 12 - Green revolution: green economies and other technologies
observed under the current chage system. The FIX & CFS case is the only case where this disparity could be resolved. Conclusions In this study, the authors develop a new technology selection model that allows us to analyze the power and household sectors in 8760 hour resolution to assess the impact of alternative wheeling charge systems on each household under mass residential PV deployment. The results suggest that the current wheeling charge system causes cost burden disparity problems, and that this problem could be solved by reforming the current system. Acknowledgment This work was supported by JSPS KAKENHI Grant Number 20H02679 References [1] Y, Kawakami., R, Komiyama. and Y, Fujii.; Analysis on CO2 Reduction in Japan Using a Multi-
Region Bottom-Up Energy System Model Incorporating a High-Temporal-Resolution Power Generation Sector, Journal of Japan Society of Energy and Resources, Vol.39, No.4, pp.10-19, June 2018.
[2] D,Mountouri, F,Kienzle,V,Poulios, C,Dobeli, H,Luternauer; Suitable Network Tariff Design For The Grid Integration Of Decentralized Generation And Storage,In proc. CIRED 23rd International Conference on Electricity Distribution,Paper 1062, June 2015
111
Session 12 - Green revolution: green economies and other technologies
THE BRIDGE STUDY: “BELT AND ROAD INITIATIVE AND THE DEVELOPMENT OF GREEN ECONOMIES” - CHALLENGES AND OPPORTUNITIES FOR A GREEN BRI
Rocco De Miglio, E4SMA S.r.l. Via Livorno 60, I-10144, Torino, Italy Gabriele Cassetti, E4SMA S.r.l. Via Livorno 60, I-10144, Torino, Italy
Xi Yang, CUPB Fuxue Road, Changping District, Beijing 102249, China
Overview Green Belt and Road Initiative (BRI) involves different economies connected by energy, economy and climate East- West “corridors” and advocates a low-carbon, circular and sustainable development. The BRIDGE study focuses on the question of defining scenario pathways for a Green BRI, by providing insights on the trade-offs and synergies among economic opportunities of regional cooperation and co-development, possible challenges/risks and energy-/climate-related impacts of the “Initiative” at “country level” as well as at a “trans-country” scale. Methods The “BRI” is interpreted as a frame of regional co-development and cooperation and translated in a number of inputs / assumptions / drivers / conditions of national systems (represented through specific models) with the aim to explore multiple trade-offs and impacts at “country level” as well as at a “trans-country” scale.
The analysis is designed on the basis of the following pillars and steps: Model-based analysis and scenario-based outlooks (horizon: 2050) Energy-Economy-Climate/Environmental variables (e.g. fuel substitution, renewable
share, carbon mitigation targets, new technologies and energy efficiency) Different modelling tools employed (energy system models + complementary tools or
additional non-standard features) in stand-alone (harmonized) manner or via soft-linked methods.
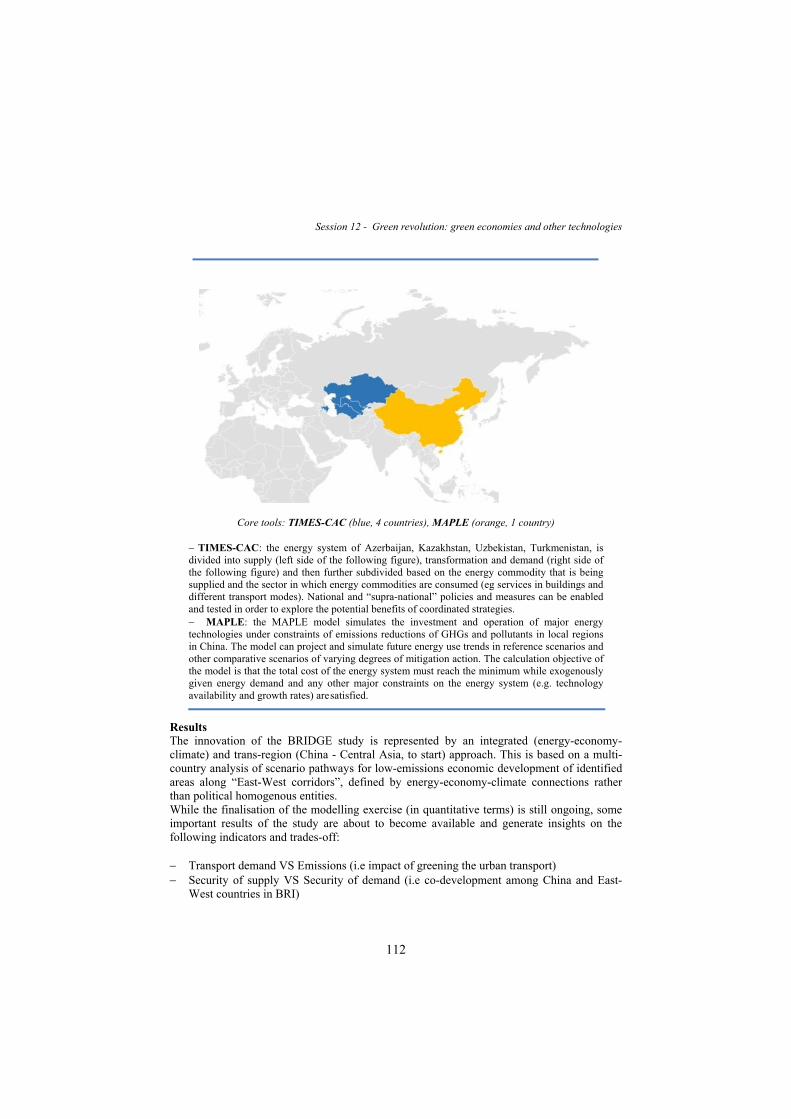
112
Session 12 - Green revolution: green economies and other technologies
Core tools: TIMES-CAC (blue, 4 countries), MAPLE (orange, 1 country)
TIMES-CAC: the energy system of Azerbaijan, Kazakhstan, Uzbekistan, Turkmenistan, is divided into supply (left side of the following figure), transformation and demand (right side of the following figure) and then further subdivided based on the energy commodity that is being supplied and the sector in which energy commodities are consumed (eg services in buildings and different transport modes). National and “supra-national” policies and measures can be enabled and tested in order to explore the potential benefits of coordinated strategies. MAPLE: the MAPLE model simulates the investment and operation of major energy technologies under constraints of emissions reductions of GHGs and pollutants in local regions in China. The model can project and simulate future energy use trends in reference scenarios and other comparative scenarios of varying degrees of mitigation action. The calculation objective of the model is that the total cost of the energy system must reach the minimum while exogenously given energy demand and any other major constraints on the energy system (e.g. technology availability and growth rates) are satisfied.
Results The innovation of the BRIDGE study is represented by an integrated (energy-economy-climate) and trans-region (China - Central Asia, to start) approach. This is based on a multi-country analysis of scenario pathways for low-emissions economic development of identified areas along “East-West corridors”, defined by energy-economy-climate connections rather than political homogenous entities. While the finalisation of the modelling exercise (in quantitative terms) is still ongoing, some important results of the study are about to become available and generate insights on the following indicators and trades-off: Transport demand VS Emissions (i.e impact of greening the urban transport) Security of supply VS Security of demand (i.e co-development among China and East-
West countries in BRI)
113
Session 12 - Green revolution: green economies and other technologies
Climate ambitions VS Industrial activities and structure of the economy (i.e greening the current fossil dominant BRI projects, impacts of decarbonization of energy system, potential use of hydrogen as a substitute in industrial activities)
Country RES potentials VS Country electricity needs (i.e impacts on electrification) Burden sharing agreement VS Investment sharing agreement (i.e equity and resource re-
allocation in BRI countries) Other positive externalities VS Other negative externalities (i.e local environmental
externalities vs global climate risk externalities). Conclusions Green Belt and Road Initiative advocates a low-carbon, circular and sustainable development. Providing (quantitative) informed analysis for interested countries along the BRI corridors is important to the cause of regional and global development. National and regional decision makers, key stakeholders of the areas, and international donors can get more insights on the trade-offs and synergies among economic opportunities of regional cooperation, possible challenges/risks and energy-/climate-related impacts of the “Initiative” to better design/adopt policies and prepare investments plans. The possible outcomes of this study are outlooks, visuals, reports, workshops for both national policy makers and stakeholders. They can find the space for integration and regional/local cooperation for cross-country projects, measures, objectives, standards, practices, etc. This study is inspired and partially supported by the ongoing H2020 European Commission Projects PARIS REINFORCE” under grant agreement No. 820846. References World Bank. “Belt and Road Economics - Opportunities and Risks of Transport Corridors.” Washington,
D.C.: World Bank Group, June 2019,
https://openknowledge.worldbank.org/bitstream/handle/10986/31878/9781464813924.pdf
Chinese Government (2016), “China’s National Plan on Implementation of the 2030 Agenda for Sustainable Development”. www.fmprc.gov.cn/web/ziliao_674904/zt_674979/dnzt_674981/qtzt/2030kcxfzyc_686343/P02017041489023442403.pdf
Cai, P. (2017), “Understanding China’s Belt and Road Initiative, Lowy Institute”, Sydney. www.lowyinstitute.org/publications/understanding-belt-and-road-initiative#_ednref1
De Miglio, R., Akhmetbekov, Y., Baigarin, K., Bakdolotov, A., & Tosato, G. (2014). “Cooperation benefits of Caspian countries in their energy sector development”. Energy Strategy Reviews, 4, 52–60. https://doi.org/10.1016/j.esr.2014.09.002
114
Session 13 - Smart Energy Services to Improve the Energy Efficiency of the European Building Stock (SENSEI)
Sotiris Papadelis TOWARDS A PERFORMANCE-BASED ENERGY ECONOMY. THE INCREASING VALUE OF PAY FOR PERFORMANCE SCHEMES.
Sotiris Papadelis, HEBES Intelligence, Grece
Overview Pay‐for‐performance programs have been around for more than 25 years with the experience so far indicating a spectrum of both payment structures (“pay”) and measurement methods (“performance”) that have been and continue to be used in P4P models, including some of those used by various traditional Energy Efficiency (EE) programs. While there is a wide range of models, a “pay for performance” approach to EE is usually marked by a combination of dynamic savings estimation and payments. This paper uses the term P4P to generally mean an EE approach in which payments are awarded for energy savings, indicating the EE project’s performance, on an ongoing basis as the savings occur. To that end, the paper proposes an innovative P4P transactional model which can shift the risks and rewards for all entities involved: participants, utilities, implementers/aggregators, and regulators, as well as form the basis for certain recommendations on future P4P design choices. Methods The P4P case studies use a wide range of savings estimation methods, including deemed savings, building simulations, direct device measurement, and analysis of meter or billing data at various time intervals. Consistent with the guidance prescribed by several M&V protocols for estimating and paying for savings for individual buildings the choice of methodology is driven largely by the type of targeted measure. The methodological framework covers this paper utilizes such available data and energy consumption curves from building performance – compiling different performing profiles into portfolios – to develop a performance model that actually can simulate the evolution of an energy efficiency program. Results The paper proposes and supports an innovative pay-for-performance (P4P) scheme, according to which payments for energy efficiency are made only after the efficiency improvement and are based on proven and measured savings (using pre-agreed measurement and verification methods). This P4P scheme is the key concept behind the SENSEI business model, that allow for the energy efficiency to become a manageable procurable resource contributing to bring more flexibility into the grid. In that sense SENSEI P4P model will consist an innovative transaction model that will dramatically improve energy distribution balance and financing towards measures beneficial for all the involved parties reconsidering all risk implications. Conclusions P4P approaches across the world have a long and varied history, with many distinct designs that reflect policy goals and regulatory and market influences of the particular time and place. This paper concludes with all activities necessary and best practices approaches to model interpretability to increase awareness on P4P models, including SENSEI P4P scheme, and incentivize stakeholders to critically think about new contractual arrangements to govern the
115
Session 13 - Smart Energy Services to Improve the Energy Efficiency of the European Building Stock (SENSEI)
transactions between the involved parties so that energy efficiency can become an exploitable resource for the power grid. References Touzani, S., Granderson, J. and Fernandes, S., 2018 “Gradient boosting machine for modelling the energy
consumption of commercial buildings,” Energy and Buildings, 158, pp. 1533-1543
Samir Touzani, Jessica Granderson, David Jump, Derrick Rebello (2019) “Evaluation of methods to assess the uncertainty in estimated energy savings,” Energy and Buildings, 193, pp. 216-225
Wei Tian, Yeonsook Heo, Pieter de Wilde, Zhanyong Li, Da Yan, Cheol Soo Park, Xiaohang Feng, and Godfried Augenbroe. “A review of uncertainty analysis in building energy assessment". In: Renewable and Sustainable Energy Reviews 93 (2018), pp. 285-301.
Herman Carstens, Xiaohua Xia, and Sarma Yadavalli. “Bayesian Energy Measurement and Verification Analysis". In: Energies 11.2 (2018), p. 380.
David Lindelf, Mohammad Alisafaee, Pierluca Bors, Christian Grigis, and Jean Viaene “Bayesian verification of an energy conservation measure". In: Energy and Buildings 171 (2018), pp. 1-10.
Bill Koran, Erik Boyer, M. Sami Khawaja, Josh Rushton, and Jim Stewart. “A Comparison of Approaches to Estimating the Time-Aggregated Uncertainty of Savings Estimated from Meter Data". In: (2017), p. 13
Zadok Olinga, Xiaohua Xia, and Xianming Ye. “A cost-effective approach to handle measurement and verification uncertainties of energy savings,” In: Energy 141 (2017), pp. 1600-1609

116
Session 13 - Smart Energy Services to Improve the Energy Efficiency of the European Building Stock (SENSEI)
Charles-Henri Bourgois, Arturo Lapietra, Felice Pandolfo PAY FOR PERFORMANCE (P4P) MODELS TO FOSTER INVESTMENT IN ENERGY EFFICIENCY IN BUILDINGS
Charles-Henri Bourgois, Geert Goorden, Factor4, Belgium Arturo Lapietra, Felice Pandolfo, Omnia Energia, Italy
Overview Buildings account for 40 percent of the EU’s final energy consumption and implementing energy efficiency (EE) in buildings has been identified by the European Commission as a major objective. Despite its potential, building renovation rates in EU remain low especially due to the difficulty to attract private capital. Energy Efficiency Measures (EEM) in buildings have for long been known to deliver more benefits than solely the primary energy cost savings, and this has been addressed in numerous publications in recent years. At EE programme level, i.e. a directed aggregation of EE projects like for example in an EE obligation scheme, additional benefits are produced for the Power System Operator in terms of avoided network and capacity extension costs and in terms of achievement of carbon emission reduction goals. These can be quantified at the meter and aggregated for a large number of EE project sites, offering batches of EE resource at a scale large enough to be turned in investable assets and made more attractive for Third Party Investors (TPI). Other additional benefits appear at individual EE project level, some financially quantifiable and some not, but nevertheless real and tangible. In this paper we explore the interaction of P4P models with the existing EE services contractual frameworks and business case. We analyse to what extent a P4P model, operated by an Aggregator as new market player, can be integrated in or on top of the existing EE services market approaches, and how it can improve securitization options to make energy efficiency investments more attractive for TPI. Methods A selected set of existing mechanisms for internalizing multiple benefits into the EE project’s business is analysed. Specific attention is paid to the possibilities and methods available to quantify and monetize the benefits. Additionally the methods are screened on ease and simplicity to be applied at a larger programme scale. In this context, the role of the Aggregator is very crucial: it has access to buildings data for energy consumption, energy bills, envelope structure and installed system for the ex- ante calculation of benefits. The goal is to reduce the transaction costs for aggregators by identifying the minimum information set about a building that is necessary and sufficient for structuring the different agreements of the P4P scheme. Existing models for aggregating EE projects like in some public-private ESCOs or larger EE project investment funds are a source of information on methods and tools, also with regard to the possibility for securitisation of investments in large numbers of EE projects. Finally, the identified methods and processes for quantification ex-ante are used to test integration with existing EE services market models like Energy Performance Contracting (EPC), in order to identify transactional process integration options at programme and project level.
117
Session 13 - Smart Energy Services to Improve the Energy Efficiency of the European Building Stock (SENSEI)
Results It appears that the integration of multiple benefits and aggregating large number of EE Projects is a quite common practice in the existing EE services market. Integrating a P4P scheme will not be problematic from a conceptual point of view. Challenges remain however regarding the exact definition of the aggregator’s role, and the subsequent allocation of responsibilities in terms of risk management regarding financially under-performing EE projects. Another challenge is the optimal allocation of the cash-flow from EE benefits to all players in the P4P model, i.e. building owner and tenant, ESCO, Aggregator, Grid Operator, taking into account that it needs to fit within a robust contractual framework between the players. Conclusions The analysis performed on the internalization of multiple benefits into the EE project’s business case through a stacked approach, and on the integration of mechanisms to aggregate large number of metered EE projects, thus securitizing verified monetized benefits, leads to careful optimism regarding the deployment of P4P schemes in and on top of existing EE Services market contractual mechanisms. At this end an identification process of data requirements, metrics and indicators about a building for its eligibility in the P4P model is necessary and preliminary. We propose the concept to be dry-run tested in negotiation games with friendly-user stakeholders of the SENSEI project to identify optimal market framework for one or more pilot projects in the EU. References Bleyl, J. et al.(2018), Office building deep energy retrofit: life cycle cost benefit analyses using cash flow analysis and multiple benefits on project level, (https://link.springer.com/article/10.1007/s12053-018-9707-8#Sec2)
Jim Lazar and Ken Colburn, RAP, (2013), Recognizing the Full Value of Energy Efficiency.
Matt Golden, Adam Scheer, Carmen Best, Decarbonization of electricity requires market-based demand flexibility, The Electricity Journal 32 (2019) 106621
(https://www.sciencedirect.com/science/article/abs/pii/S1040619019302027?via%3Dihub)
118
Session 13 - Smart Energy Services to Improve the Energy Efficiency of the European Building Stock (SENSEI)
Arturo Lapietra, Vincenzo D’Agostino, Luca Petrungaro DEVISING CLASSES OF ENERGY EFFICIENCY MEASURE FOR EVALUATING PAY-4-PERFORMANCE (P4P) RATE THAT ENERGY PROVIDER WILL BE WILLING TO OFFER IN PAY-4-PERFORMANCE SCHEME
Arturo Lapietra, Omnia Energia, Italy
Vincenzo D’Agostino, Omnia Energia, Italy Luca Petrungaro, Omnia Energia, Italy
Overview Energy efficiency in buildings has been identified by the European Commission as a very real opportunity. Despite its potential the current building renovation rates in EU is very low in particular due to the lacking of private investments. In this challenge context, the SENSEI project proposes of a Pay-for-Performance (P4P) business model in the EU, which offers an effective way to engage both energy providers and third-party investors in energy efficiency. One idea behind a P4P scheme for financing an energy retrofit project is that an organisation is willing to pay to support energy savings to projects. From the analysis of P4P scheme outside the EU, utilities and energy provider are in charge of channelling the payments to the entity which is tasked with delivering the performance. In the context above explained, a detailed knowledge of the possible energy efficiency measures is essential, not only in terms of generated energy savings, but also in terms of grid needs and building or usage characteristics. Therefore analysis and classification of energy efficiency measures (EEMs) have been devised in order to provide an estimation of P4P rates that energy provider will be willing to offer in P4P scheme. Methods The methodological approach starts from the basic concept of the energy efficiency measure (EEM). We use the acronym EEMs to refer to both: measures that decrease energy consumption and the deployment of solutions for on-site generation of renewable energy sources and/or or renewables-based solutions for heating and cooling. Considering the value that the energy efficiency measures bring to the overall energy system it is a very crucial point when dealing with P4P schemes. Assuming that energy providers are both willing and able to take energy efficiency to the markets that can monetize it, P4P schemes can act as the vehicle for compensating energy efficiency as an energy resource. The main goal is to identify the different characteristics of an energy efficiency measure considering energy efficiency as an energy resource and quantifying the market value of energy savings from the energy providers’ perspective. With this regard, the first step was related to the definition of an evaluation scheme of different EEMs (classes of EEMs). A class of “goodness” is calculated for each EEM from the higher value to the lower. 7 different categories of EEMs were identified and 4 different tables for evaluating the EEMs were devised. After devising the classes of EEMs the P4P rate concept is presented through the mechanism of the Energy Efficiency obligation schemes and considering the energy providers perspective.
119
Session 13 - Smart Energy Services to Improve the Energy Efficiency of the European Building Stock (SENSEI)
Results The classification of schemes of EEMS results from the definition of 3 tables and their integration. We devised 3 different tables, each of which conducts an independent analysis, to evaluate the EEMs. At the end of each analysis a class of goodness is resulted for each EEM, from the higher value (A) to the lower (J). A conclusive evaluation that integrates the effects of the 3 tables resulted in the Class X, as the classes of EEMs. After devising the classes of EEMs the P4P rate concept is presented through the mechanism of the Energy Efficiency obligation schemes and considering the energy provider (TSO and DSO) perspective. These entities (distribution companies and energy providers) could be willing to offer incentives for EEMs assuring long-term impact (energy consumption savings, stability resilience, security off the grid) on the entire energy system. The main idea behind the evalation of P4P rates is that the higher the class of EEMs value the greater the P4P rate that energy provider could be willing to offer. Conclusions The study provided an estimation of P4P rates that energy provider is willing to offer (in the pay-4-performance scheme) according to the classification of Energy efficiency measures (EEMs). The results was not focused on quantifying the P4P rates (only simple calculation examples are shown), but on identifying which variables can affect these rates, considering the analysis carried out in the classes of EEMs. After devising the classes of EEMs the P4P rate concept is presented through the mechanism of the Energy Efficiency obligation schemes and considering the energy providers perspective. These entities could be willing to offer incentives for EEMs assuring long-term impact on the entire energy system. Associating these benefits with consistent returns and stable long-term cash flows could results in making energy efficiency more attractive to investors. References https://buildingsync.net/schema/v1.0/datadictionary/
https://bcl.nrel.gov/nrel/types/measure
Rosenow J., Thomas S. (2020): Rewarding energy efficiency for energy system services through markets: opportunities and challenges in Europe
https://www.terna.it/it/sistema-elettrico/rete/piano-sviluppo-rete
120
Session 13 - Smart Energy Services to Improve the Energy Efficiency of the European Building Stock (SENSEI)
Filippos Anagnostopoulos, Dimitra Tzani, Vassilis Stavrakas
ADAPTABILITY OF PAY-FOR-PERFORMANCE SCHEMES FOR PROMOTING ENERGY EFFICIENCY IN THE EU
Filippos Anagnostopoulos, Institute for European Energy and Climate Policy, Greece Dimitra Tzani, Institute for European Energy and Climate Policy, Greece
Vassilis Stavrakas, Institute for European Energy and Climate Policy, Greece Overview This paper explores the ways that policy and regulatory developments in the EU may become a risk or an opportunity for energy efficiency Pay-for-Performance (P4P) schemes. The developments under consideration are related to the possible ways the implementation of the Clean Energy for All Europeans proposals can affect the viability and efforts of setting up and running P4P schemes. The goal of this study is to devise strategies for either adapting to unfavourable developments or exploiting the opportunities that may emerge. Methods The methodological framework used in the current paper covers six main tasks: the review of the current energy efficiency legal framework and energy market conditions; the identification and description of legislative and implementation gaps; the development of scenarios, assuming policy paths to address the policy gaps related to P4P schemes; a Strengths, Weaknesses, Opportunities, and Threats (SWOT) analysis to identify potential opportunities and risks regarding the scenarios previously developed; semi-structured interviews with all the types of stakeholders involved in the value chain; and eventually the development of strategies for ensuring adaptability of P4P under all potential scenarios. Results The paper provides a comprehensive understanding of the current legal framework and its implementation; and develops potential future trajectories and policy scenarios of its development based on the most prevalent themes and trends. The viability of P4P schemes are being evaluated in each of these future scenarios. Their results allow for concrete recommendations that are developed for policymakers and market actors who wish to ensure a robust functioning of Measurement and Verification (M&V) processes, and of P4P schemes. Conclusions The paper concludes with strategies to ensure the adaptability of P4P schemes under the most likely scenarios of energy market policy evolution. These strategies are justified and drawn on the conclusions of the framework review, SWOT analysis, and on the consultation of relevant stakeholders. References Directive on common rules for the internal market for electricity (EU) 2019/944
Rosenow, J., Thomas, S., (2020) Rewarding energy efficiency for energy system services through markets: opportunities and challenges in Europe

121
Session 13 - Smart Energy Services to Improve the Energy Efficiency of the European Building Stock (SENSEI)
Regulation on the internal market for electricity (EU) 2019/943
Marion Santini, Dimitra Tzani, Samuel Thomas, Vassilis Stavrakas, Jan Rosenow, & Alessandro Celestino. (2020, June 10). Experience and Lessons Learned from Pay-for-Performance (P4P) pilots for Energy Efficiency. Zenodo. http://doi.org/10.5281/zenodo.3887823
122
Session 14 - The European energy roadmap to 2050 and the fiscal policies apply Bastien Dufau THE INFLUENCE OF A CARBON TAX ON COST COMPETITIVENESS
Bastien Dufau : Université de Bordeaux, 146 Rue Léo Saignat, 33076 Bordeaux, France
Overview Difficulties to adopt an international price of carbon has highlighted one of the most important objectives of countries: preserve their industries’ competitiveness. These difficulties are mainly based on the high cost of reduction of CO2 emissions for countries under the agreement that make free-riding incentive stronger than incentive to cooperate. In the case of a carbon tax, additional cost incurred by a firm located in a country under the international environmental agreements (IEA) could be seen as a competitive disadvantage compared with a firm located in a country that doesn’t respect the IEA. This article aims to evaluate the multisectoral and international impact of an energy shock. More precisely, the focus is made on a carbon tax (40$/tCO2 and an 80$/tCO2) and its impact on unit cost of production. Method This study is based on a multi-regional input-output model. This is a complete MRIO model with multi-directional trade. Its main contributions are to use a set of 6 aggregated major sectors in 7 European countries and 11 international countries. Input-output analysis relies on strong assumptions of constant return to scale and fixed technical coefficient. In order to introduce substitutability in the system we need to change the implicit Leontief production function into another one with flexibility. We choose to use the generalized Leontief production function for two reasons. Firstly, the use of Shephard’s Lemma leads to flexible technical coefficients. Flexible technical coefficients permit the use of an input-output model with data in physical units. Secondly, solving Input-output models in physical units leads to equilibrium prices. Results Results show that a European carbon tax has different impacts among countries (Poland is the most impacted) and among sectors (Energy and Manufacturing). Although a 40$/tCO2 carbon tax seems sustainable for the majority of sectors, an 80$/tCo2 tends to impact more severely competitiveness. Heterogeneity among European countries leads to a potential heterogeneity of unit costs’ increases among European countries and sectors. The spread of the tax through intermediate goods is weak in the case of a national carbon tax, even if the tax is of 80$/tCO2. That means that a country taxing unilaterally its industries would not deteriorate its partners’ competitiveness. Then, adopting the tax at the European level accentuate by more than 20% the increase in unit costs compared to the same level of tax at the national level. Conclusions The high level of trade among European industries tends to accentuate the indirect effect of the tax by increasing the costs of intermediate goods all along the supply chain. Among European countries, sectors importing from partners less impacted by the tax are improving their competitiveness compared to their European competitors. These problems of heterogeneity have limited the adoption of a European carbon tax so far and countries have to
123
Session 14 - The European energy roadmap to 2050 and the fiscal policies apply act by making their own level of taxation. Building a national carbon tax allows each country to adapt the specificity of the tax to its national competitivity. Recycling the tax on most impacted industries could attenuate the loss of competitiveness. Finally, the spread of the tax through intermediate goods is weak in the case of a national carbon tax, even if the tax is of 80$/tCO2. That means that a country taxing unilaterally its industries would not deteriorate its partners’ competitiveness. References Berndt, Ernst R., et David O. Wood. «Technology, Prices, and the Derived Demand for Energy». The
Review of Economics and Statistics 57, no 3 (1975): 259-68. https://doi.org/10.2307/1923910 .
Bordigoni, Mathieu. «Détermination du rôle de l’énergie dans la compétitivité de l’industrie manufacturière: Études économétriques et modélisation des interdépendances». Thesis, Paris, ENMP, 2012.
Griffin, James M., et Paul R. Gregory. « An Intercountry Translog Model of Energy Substitution Responses ». The American Economic Review 66, no 5 (1976): 845-57
Morrison, Catherine. «Quasi-fixed Inputs in U.S. and Japanese Manufacturing: a Generalized Leontief Restricted Cost Function Approach». The Review of Economics and Statistics 70, no 2 (1988): 275-87. https://doi.org/10.2307/1928312.
124
Session 14 - The European energy roadmap to 2050 and the fiscal policies apply
Agime Gerbeti ECONOMIC IMPACT OF GHG COSTS ON THE EU INDUSTRY
Agime Gerbeti, AIEE - Italian Association of Energy Economists, Italy, e-mail:
Overview Globalization has created a sort of “industrial nomadism” i.e. companies: are interested to produce in countries that guarantees better production and tax conditions and move in search of incentives, tax exemptions jumping from a corporate paradise to a fiscal one. They often reach emissive paradises, i.e. those territories that have no environmental obligations and limits. Faced with these difficulties EU has acted mainly through environmental markets, like Emission trading scheme, which suffer several global economic phenomena. If we want all producers, not only in EU, to limit GHG emissions, it is necessary that their production traded in EU, comply with its environmental standards. A measure that could rewards the clean companies and limit emissions globally is the Charge on added emissions. It suggests to give an economic value to the CO2 emissions produced during the manufacture of goods, applies regardless their country of origin, within the VAT. Methods The evaluation is carried out based on official data, i.e. taking into account the global scenario of the trend of emissions compared to the trend of EU emissions. An assessment is also made on the trend of international market shares in some key sectors subject to the ETS, such as steel and ceramics. The economic impact of GHG costs on the EU industry, based on the carbon price, is growing. The EU environmental - energy policies, the political scenario, are considered such as, the will of the EU Commission to solve the issues of industrial competitiveness with third countries that have no binding environmental constraints or mandatory CO2 costs to pay. The EU proposal on the introduction of a carbon border adjustment mechanism (CBAM) and its effectiveness in the EU economy and its effects are analyzed. The compatibility with the regulatory context of the introduction of standards and the charge on added emissions mechanism for reducing emissions globally and helping the EU industry, the cleaner, to gain competitiveness is analyzed. Results In the industrial field, the limits of a structured regulation on the national territorial spaces has become evident and inadequate due to changes of world trade and production. The EU is the only legal system in the world that sets binding environmental limits. Based on the data there are some circumstantial evidence that give evidence of delocalization of industries, which is a complex issue and an ongoing phenomena. A CBAM seems to promise a protection to companies from the carbon leakage risk but has several limits. The legislators should remember that no virtuous behavior will ever be adopted in a structured way by companies if this behavior is not perceived as beneficial. Only the UE companies cannot escape from the environmental obligations and its economic impact of GHG costs is growing and economically weighs more and more. An effective way to limit emissions, reward competitiveness for clean industry and raise globally consumer’s awareness is to differentiate the products based on their carbon intensity.
125
Session 14 - The European energy roadmap to 2050 and the fiscal policies apply Conclusions It is clear that EU industry is suffering the globalization for several factors; one is represented by the environmental obligations and its related costs while competing in a global market. There many circumstantial evidences that creaks regarding the reallocation of businesses which is an ongoing but very complex phenomenon. An environmental regulation that aims to reduce emissions territorially i.e. only in EU, does not work because, as seen, production shifts. Therefore, it makes no sense to impose obligations on production. But we must turn our attention to consumption. For these reasons the EU environmental regulations and emission reduction should become the driving force of technological and economic development i.e. EU should transform environment sustainability into an interest and a competitive need. Therefore, the adoption of competitive environmental standards, such as the charge on added emission, which has a series of advantageous including the shift of environmental objectives from public to private; not affected by the territorial limitation to which laws are subject. This approach cannot be adapted for all environmental needs. Nevertheless, a correct application of this way of thinking will help to recognize in advance incentives that only represent a tourist attraction for those nomadic industries. References Tientenberg, T. (2010) Cap and trade: The evolution of an economic Idea. Agricultural and Resource Economics Review 39/3 page 359–367.
Hong, A. (2020) Vietnam remains promising destination for foreign investors, Hanoitimes - Economic and Urban Newspaper Jan 02, 2020.
Sunjka, N. (2019) International sourcing and relocation of business functions. EUROSTAT.
Gerbeti, A. (2014). CO2 nei beni e competitività industriale europea. Editoriale delfino. Milano.
126
Session 14 - The European energy roadmap to 2050 and the fiscal policies apply
Paolo Bertoldi EU ENERGY AND CLIMATE POLICIES TO REACH CARBON NEUTRALITY
Paolo Bertoldi, European Commission, Joint Research Centre Overview The Paris Agreement reached at COP 21 in December 2015, has underlined the importance of containing global temperatures rises well below 2.0°C with the aim of limiting global warming to 1.5°C. The Paris Agreement has established a bottom-up approach where countries voluntary commit (pledge) to climate targets in their National Determine Contributions (NDCs). NDCs will be ratcheted up every 5 years to increase their ambition following a global stocktaking of emissions. European Union has been since the 1992 Rio Summit at the forefront of climate change negotiations and has always showed leadership, for example by ratifying the Kyoto Protocol and by submitting an ambitious NDC in the frame of the Paris Agreement. At the same time, the EU has adopted energy and climate targets for 2020 and 2030 (the latter corresponding to the EU NDC under the Paris Agreement). The EU has over the years implemented a number of policies and measures to meet the climate targets and its international obligations, such as the Emission Trading Scheme, the Effort Sharing Directive and Regulation, the energy efficiency and renewable energies legislation, and more recently the Regulation on the Governance of the Energy Union and Climate Action. This is complemented by support to R&I and several financial programmes. Recently, the EU has adopted the goal to be a carbon neutral economy by 2050 as announced in the Green Deal Communication. More recently the European Commission has announced the proposal to increase the 2030 GHG reduction target from -40% to -55%, including, this is accompanied by the impact assessment of the proposal. Methods The paper and presentation reviews the current EU climate and energy policies and compared it with other international competitors. The assessment is based on the analysis of the EU policies (Directive, Regulations, Action Plans, Communication) and the relevant literature, with priority to peer reviewed articles in ISI journal (based on a search of the Scopus and Web of Science databases). The paper and presentation focus in particular on the EU end-use energy efficiency sector policies and targets. Results The ambitious new EU climate and energy targets can be meet with a combination of existing and new (additional) policies and measures covering the different sectors of the economies. Different policy instruments are implemented from market based instruments (e.g. ETS), to regulation (for buildings and appliances), to incentives, taxation, information. There are synergies and trade-offs among the policy instruments. A key role is also played by national policies and measures as presented in the 2020 EU Member States National Energy and Climate Action Plans. In 2023 a new wave of plans will be submitted by Member States.

127
Session 14 - The European energy roadmap to 2050 and the fiscal policies apply
Conclusions The large number of countries around the globe have signed the Paris Agreement. The countries commit to contribute to limit the temperature increase to below 2.0 C. In order to stabilize the temperature global net GHG emission at around 2050 should be zero. A number of countries have made a pledge to reach carbon or climate neutrality by 2050. The EU is among the first countries to commit to carbon neutrality, to increase the ambition of its NDC in the frame of the Paris Agreement, to introduce new policies and to reinforce the existing one. The EU experience presented in the paper could be an example for international collaboration and policies.
128
Session 14 - The European energy roadmap to 2050 and the fiscal policies apply
Gianluca Carrino THE CIRCULAR ECONOMY: AN ESSENTIAL PILLAR TO ACHIEVE THE EU ENERGY ROADMAP TO 2050
Gianluca Carrino, AIEE, Italy
Overview In a scenario where the process of transition to a sustainable zero-emission economy has an increasingly growing influence, a concrete use of the circularity’s principles is needed to reduce and prevent waste from being dispersed into the environment or in landfills. Circular economy is a model of production and consumption, which involves sharing, leasing, reusing, repairing, refurbishing and recycling existing materials and products as long as possible and collect them locally and responsibly. In this way the life cycle of products is extended. How the European Directive 2006/12 /CE said:”Each European Member State is required to: consider waste as a raw material, reaching autonomy in eliminating waste and Minimizing waste transport and their environmental impact”. Giving an intrinsic value to waste may turn into an incentive to manage it correctly and prevent its dispersion in the environment, increasing the GDP and decreasing the dependence on foreign countries (Cash From Trash). Only a new energy model will make EU system secure, competitive and sustainable in the long-term. For this reason, with the application of the Green Deal, Europe can rethink the energy markets. This roadmap covers all sectors of the economy, seeking to transform the economic model through a series of ambitious reforms, such as: eliminating pollution, building and renovating, sustainable industry, implement circular economy, clean energy, sustainable mobility, biodiversity and ecosystems, sustainable finance and from farm to fork. EU Green Deal is a comprehensive roadmap announced by President Von der Leyen, seeking to make Europe the first climate-neutral continent in 2050 by cutting greenhouse gas emissions, improving the health and well-being of citizens and protecting the environment and wildlife. The Green Deal is the main pillar for the Next Generation giving the 2030 Key targets to achieve decarbonisation, such as: the Reduction of 55% of greenhouse gas emissions (compared to 1990 levels), a minimum of 32% of renewable energy and an improvement of at least 32.5% in energy efficiency. Method To achieve energy efficiency’s target of the Green Deal, it is fundamental to develop energy communities and smart infrastructures, phasing out of fossil fuels and decarbonising the power sector. The Circular Economy action plan presents measures to make sustainable products the norm in the EU, to minimise EU waste’s exports to tackle illegal shipment, to empower consumers and public buyers, to lead global efforts on circular economy, to ensure less waste and to integrate circularity within people, regions and cities. The new plan focuses on sectors that use the most resources and where the potential for circularity is high, such as electronics, batteries and vehicles, packaging, plastics, textiles, construction and food. The transition towards a circular economy is already underway, with businesses, consumers and public authorities in Europe embracing this sustainable model.
129
Session 14 - The European energy roadmap to 2050 and the fiscal policies apply
The European Commission will make sure that the circular economy transition delivers opportunities for all, leaving no one behind. The circular economy will have net positive benefits in terms of GDP growth and jobs' creation. In addiction, applying these ambitious measures, Europe, by 2030, can Increase the GDP by an additional 0.5% and it cam create around 700,000 new jobs. Tacking in to account our country, the Italian strategy to achieve the long-term goals focuses on the national integrated plan for energy and climate (PNIEC). To build a path consistent with "circularity", the reduction of emissions in the waste sector is mainly linked to: reduce of landfills (10% in 2035), increase separate waste collection and the consequent recycle and the energy recovery. To better understand the circularity process will be interesting to focus on the waste collection for example plastic collection composed by energy recovery, recycling and landfills. Zero landfill is needed to achieve the circular economy targets. Results Since 2006 the amount of EU plastic waste sent to recycling has doubled. The 25% of plastic post-consumer waste was still sent to landfill in 2018. The Percentage change in 2018 (2018/2006) are +100% recycling, +77% Energy Recovery and -44% Landfill comparing with 2006. Countries with landfill restrictions of recyclable and recoverable waste have higher recycling rates of plastic post-consumer waste. Although the total EU situation is improving, in many countries, landfill is still the first or second option of treatment for plastic post-consumer waste (such as Italy, Greece and Malta). Using plastic waste destined for landfills to recycling or energy recovery would reduce the environmental problem giving an intrinsic value to the waste itself (Cash from trash). However, since 2018, it is possible to observe a decline of the European plastics industry production. The COVID-19 pandemic has clearly intensified this decline. After a sharp drop in production due to COVID-19 in the first six months of the year 2020, the production has started to recover again in the second half of the year, and it will continue in 2021. The speed of recovery depends on the impact of the pandemic and on the demand for plastics from important customer industries such as automotive and construction sectors. Therefore, the production level before the COVID-19 will not be reached before 2022. The attended reduction could stimulate the use of biodegradable plastic derived from biological substances rather than petroleum. In order to follow the circular economy’s principles, the Energy recovery could be considered such as an important solution. It is, in fact, a process that converts non-recyclable waste materials into useable heat, electricity, or fuel through a variety of processes, including combustion, gasification, pyrolization, anaerobic digestion, and landfill gas (LFG) recovery. It reduces carbon emissions by decreasing the need for fossil fuel-based energy sources and also reduces methane emissions generated by landfills respecting the circular economy principles. Conclusion The circular economy is an important driving force for reducing greenhouse gas emissions, respecting the planet’s limits and achieving the United Nations Sustainable Development Goals.

130
Session 14 - The European energy roadmap to 2050 and the fiscal policies apply
In this scenario, one solution should be the promotion of circularity at a systemic level in all the value chain. In order to achieve this goal it is necessary to encourage the use of economic instruments such as environmental taxation, green tax reforms and an extended producer responsibility. Promoting the circular economy and more sustainable production and consumption models, and improving waste management are possible solutions to reduce the dispersion of waste in the environment respecting the principles of circularity. The transition to the circular economy will be systemic, deep and transformative. It will require an alignment and cooperation of all stakeholders at all levels – EU, national, regional, local, and international. Therefore, the EU Commission in order to achieve the 2050 energy goals proposed by the roadmap, invites institutions and bodies to endorse the Circular Economy Action Plan and actively contribute to its implementation encouraging Member States to adopt or update their national circular economy strategies, plans and measures faster than possible.

131
Session 15 - The geopolitics of the global energy transition
Fazel M. Farimani, Seyed Reza Mirnezami IRAN-CHINA 25 YEAR’S AGREEMENT, ENERGY IMPLICATIONS
Fazel M. Farimani, Shahid Beheshti University, Tehran, Iran Seyed Reza Mirnezami, Sharif University of Technology, Tehran, Iran, +989122021642,
Overview It’s been more than two years that some rumour on Iran-China mega deal was publicized in the news. There were no clear indication on the scope and details of the deal other than few journalistic speculations. Recently, a document has become available claimed to be the so called deal. This document does not provide much details on the energy issues other than a general article, however, this alongside other available valuable papers, interviews and articles can give a relatively clear understanding on the deal framework and its scope. The paper discusses the potential areas for mutual investments and discusses implication of the deal for both Iran and China and also touches its international implications. In particular the following questions are discussed: What are the main areas of interest for both countries? How Iran can best benefit from Chinese upstream technology? How China would be able to maximize its energy access using the deal? What are the main bottlenecks in front of the deal execution? Methods We mainly rely on qualitative methods in this research. The “text analysis” method is employed to discuss the deal and its implications. We would also utilize simple quantitative methods to evaluate the energy interdependencies between Iran and China over the past decades. Results The research is still undergo, however, early results show that: For Iran it is essential to develop a more flexible upstream contractual framework to deal
with China. Iran must focus on mid-stream and downstream side as well as upstream to boost energy
sector growth in its country. Iranian Side barely trust Chinese companies, so this is the bottleneck for both government
to tackle. Conclusions Given the pressure both countries receive from west and in particular US, they both need such a long term relationship. Energy is the best area for work and both countries has shown successful working relationships over the past. It is essential for both countries to align their interest in both upstream and downstream separately.
132
Session 15 - The geopolitics of the global energy transition
Olga Garanina, Silvana Mima ENERGY TRANSITION IN RUSSIA: WHAT IMPLICATIONS FOR NATURAL GAS?
Olga Garanina, Graduate School of Management, St Petersburg University, Russia
Silvana Mima, CNRS-GAEL, University Grenoble-Alpes, France
Overview Energy transition implies uncertain impacts for the natural industry. Being available, cleaner than coal and economically competitive, gas presents clear decarbonization advantages which drive the gas demand in medium run. But in longer term, gas is challenged by renewables, which approach the market breakeven point and benefit from favorable regulatory context. Therefore, although the global gas consumption is expected to rise till 2040 (IEA, 2019), longer term projections suggest that gas demand could plausibly reach the plateau after 2040 (World Energy Council, 2019), which poses significant risks for traditional gas exporters. Russia has the largest hydrocarbon reserves in the world. Oil and gas account for over 60 percent of total exports, and oil and gas taxes contribute for more than 40 percent of Russia’s budget returns. High dependency on oil and gas, as well as economic and political instabilities make Russia extremely slow in terms of climate policy commitments. Country’s Climate Doctrine dates back to 2009 and has only a framework character. Although in 2019 Russia formally adopted the Paris Agreement, no stringent regulations of GHG emissions, i.e. quotas, carbon taxes, etc., are still envisioned. Under the Paris deal, Russia pledged to reduce its emissions by 25-30 percent below the 1990 levels by 2030, subject to the maximum possible account of absorbing capacity of forests. This allows to slightly increase the carbon footprint, for the reason of emissions downturn during the economic transition crisis of the 1990s. The recently elaborated project of the Strategy of the Long-Term Low-Carbon Economic Development for the period till 2050 reiterates a very cautious approach towards decarbonization, forecasting the emissions at the level of 64-67 percent of 1990 by 2030 (taking into account LULUCF), and 64-52% by 2050 depending on scenario (Ministry of Economic Development of the Russian Federation, 2020). The targets are not binding and the main effort of low-carbon development is postponed for the period after 2030. How these developments could affect the natural gas industry? Gas accounts for about half of Russia’s energy mix and plays a dominant role the power sector. Russia’s official Energy Strategy for the period till 2035 forecasts the growth of natural gas production by 18-37 percent by 2035, relying essentially by LNG demand growth and pipeline diversification towards Asia, with a tiny growth of domestic gas consumption. How do these strategic orientations correspond to longer run decarbonization trends? Despite rising research attention to the features of Russia’s decarbonization policies (Mitrova & Melnikov, 2019; Makarov, Chen & Paltsev, 2020), there’s still limited academic literature on Russian energy transition scenarios by energy source, in particular with a focus natural gas. Although several institutions provide scenarios till 2040, to our knowledge, no detailed forecast for the period beyond 2040-2050 has been developed with a particular focus on Russia. In this paper, we intend to address the following questions. Is natural gas to become the winner of energy transition in Russia, and why?
133
Session 15 - The geopolitics of the global energy transition
What are the main drivers of natural gas demand, and what are the possible constraints? What are the implications for export volumes, and what kind of energy dependency can be profiled for Russia in a long-run perspective? We build scenarios for the perspective till 2100 to delineate the magnitude of possible changes in Russia’s energy mix in context of the energy transition. We intend to observe whether, when and in what types of use gas may face increasing competitive pressures from lower carbon energy sources. The first part of the paper will introduce Russia’s clean energy policies with emphasis on the role of natural gas. The following sections will consecutively study the natural gas demand by sector, natural supply and exports in perspective till 2100, basing on modelling results. Last section will discuss the findings. Methods We develop scenario analysis using POLES model of the world energy system. POLES is a partial equilibrium bottom- up model, which deals with 66 countries and regions detailed by energy carrier and by sector, with year-by-year simulation of supply, demand and price interactions till 2100. We build two scenarios which reflect possible pathways for Russia’s energy transition: Ref - Reference scenario is a business as usual situation which reflects elements of
policy likely to occur in the period and a minimum degree of political initiative in climate policy in all regions of the world.
2D - corresponds to a 2° type of scenarios. In this scenario the Nationally Determined Contributions (NDC) are taken into account.
Results Expected results will propose an assessment of gas demand and supply drivers in Russia under different climate policy scenarios. This will allow to derive implications concerning domestic energy mix structure, as well as export dependency. Conclusions Preliminary modelling findings show that natural gas is challenged by low-carbon energy sources both in the domestic market and in export markets in the 2D scenario, but globally preserves its place in Russia’s domestic mix till 2100 in the Reference scenario. Ensuring smooth energy transition requires pro-active policy approach on behalf of the main industry stakeholders. References Energy Strategy of Russian Federation for the period till 2035. Approved on 09 June, 2020 (in Russian).
IEA (2019). World Energy Outlook. Paris: IEA/OECD.
Makarov I., Chen H. & S. Paltsev (2020). Impacts of climate change policies worldwide on the Russian economy, Climate Policy, DOI: 10.1080/14693062.2020.1781047
Ministry of Economic Development of the Russian Federation. (2020). Project of the Strategy of the Long-Term Low- Carbon Economic Development for the period till 2050 (in Russian).
Mitrova T. & Yu. Melnikov (2019). Energy transition in Russia, Energy Transitions 3:73–80.
World Energy Council (2019). World Energy Insights Brief - Global Energy Scenarios Comparison Review.

134
Session 15 - The geopolitics of the global energy transition
John D. Graham, John A. Rupp UNDERSTANDING VARIATION IN THE GOVERNANCE OF FRACKING
John D. Graham, Professor, O’Neill School of Public and Environmental Affairs, Indiana University, Bloomington,1315 E 10th St, Suite 415, Bloomington, IN 47405, USA
John A. Rupp. Lecturer, O’Neill School of Public and Environmental Affairs, Indiana University, Bloomington, Indiana.
This paper examines the wide variation in how unconventional methods of oil and gas development are regulated in different political jurisdictions. Drawing from theories in cognitive psychology, microeconomics, political science and law, case studies of “fracking governance” are performed in five jurisdictions: France, the United Kingdom, Texas, North Dakota and Pennsylvania. The authors find that a variety of factors contribute to the differences in how fracking technologies are regulated: public risk perceptions, amplification of technological stigma in the mass media, the extent of public familiarity with – and trust in – regulatory regimes for conventional oil and gas development, the stances of national and subnational political leaders, the ownership of mineral rights and associated royalty policies, interests in economic development, and local, regional, national and global concerns about the risks of fossil fuel development. Looking forward, the authors hypothesize that the growing concerns about climate change complicate the commercial future of fracking technologies in many parts of the world.
135
Session 15 - The geopolitics of the global energy transition
Lyubomira Gancheva OPPORTUNITIES TO ENSURE AFFORDABLE PRICES AND SECURITY OF NATURAL GAS SUPPLY IN BULGARIA FOLLOWING THE COMMITMENTS OF GAZPROM EXPORT BEFORE THE EUROPEAN COMMISSION
Lyubomira Gancheva, Sofia University, ‘St. Kliment Ohridski’, Faculty of Economics and Business Administration
Overview The current 2020 is a key stage in the development of the European natural gas market. The EU and the Russian Federation are interconnected and despite the opposing views on how these relations should develop in the future (caused by the contradictions between the European idea of a single energy gas market in the Union and Russia's practice of long-term bilateral agreements), the EU cannot easily switch, nor Russia to replace its main market for blue fuel exports. It is therefore interesting how Union policy and legislation affect the supplier's actions and price. What is more, natural gas is a key tool for achieving the goals of the so-called. "Energy transition", while providing solutions that are both cost-effective, climate-friendly, technologically feasible, environmentally efficient, affordable, universal in terms of commissioning and reliable. The strong dependence on the sole supplier brings the topic of security of supply of blue fuel as a leader in the behaviour of Bulgaria and the EU as a whole. The paper will address a particular case from the main topic of the future partnership between the European Union and the Russian Federation regarding natural gas supply, namely the results of the EC antitrust case against Gazprom Export and whether they affect the delivery price and security of supplies to Bulgaria? The significance of the topic lies in the fact that the issue of managing the long-term partnership with the strategic supplier of natural gas is a key factor for the development of the energy sector, for the economic and overall development of Bulgaria. The study analyses whether there is an opportunity for Bulgaria to benefit from the agreement in the case of improving the security of its supplies and an affordable price and will offer recommendations for a future strategy in the short and medium term. The subject of the study is the organization and practice of ensuring security of supply of natural gas and affordable price in Bulgaria and in particular how they are affected by the commitments of the Russian side in the antitrust case. In order to achieve the main research goal, several tasks are formulated, which will be achieved by examining the commitments of the Russian side in the antitrust case with an emphasis on their impact on Bulgaria. The scientific literature will be reviewed and statistical data on price levels will be processed and analysed before, during and after the trial. The results of this will serve as a basis for a recommendation for future action. Methods A study on the regulatory framework, summary and analysis of statistical information, study of policies, strategic documents and specific actions and their comparison were conducted. The basis of the empirical research are publications of institutions, scientists, experts and companies, publications mainly by foreign authors, review of specialized literature and personal contacts with representatives of stakeholders in the industry. Much of the data is from primary sources.

136
Session 15 - The geopolitics of the global energy transition
There are also secondary sources of information from research institutions and research. An integrated, interdisciplinary, systematic, statistical, geopolitical and complex scientific approach and the following methods were used: description, analysis and synthesis, inductive and deductive method, modelling, comparative analysis (benchmarking), graphical method, method of causation and others. The search method is a systematic search and search in sequence on a chain basis. A cited bibliography of a researcher's material provided new sources of information. Results The study examined chronologically the documentary and conceptual development of the concept of a single European energy market and the EC antitrust case against Gazprom Export. Analysis was conducted on the pricing and trading practices of Gazprom Export in the supply of natural gas to European countries. An empiric research was made on the renegotiated contracts between Gazprom Export and European customers for the period 2009-2014 and export prices of Gazprom Export for 2010-2014. An empirical study of EC data on supply prices for the EU in the period 2013 - June 2020. Conclusions The consequences of the antitrust agreement between the EC and Gazprom Export LLC for the eight affected countries was analysed (Poland, Lithuania, Latvia, Estonia, Hungary, Slovakia, the Czech Republic and Bulgaria). In them all results are similar - improvement of trading conditions and lower prices. Even in Member States of the EU, where prices were lower on the eve of the trial than in other European countries, prices were further reduced and trade clauses in the contract were relaxed. The possibilities for ensuring security of supply and affordability in Europe are considered. Forecasts for the development of the sector at regional, European and global level are presented and a strategy for action of the public supplier and the system gas operator in Bugaria was formulated. Theoretical research on the topic and the author's documentary study showed that Gazprom Export's commitments in connection with the EC antitrust case against it provide Bulgaria with a direct and real opportunity to ensure an affordable price and security of supply of natural gas.
137
Session 16 - Energy transition and grid transformation Lisa Hanna Broska THE SOCIAL – A POSITIVE DRIVER OF THE ENERGY TRANSITION? Six Case Studies from Germany
Lisa Hanna Broska, Institute of Energy and Climate Research - Systems Analysis and Technology Evaluation, (IEK-STE), Research Centre Juelich, 52425 Jülich, Germany /
Freiberg University of Mining and Technology, Germany
Overview Behavior change towards sustainable lifestyles and adoption of renewable energy technologies are demanded as significant elements in the fight against anthropogenic climate change. Increasingly, private households can be observed to take up different renewable energy technologies; however, the introduction of these technologies is not accompanied by other ecological behaviors, like energy conservation [1]. Group settings and social factors on the other hand seem to promote the uptake of wide-ranging sustainability measures [2-4]. Six case studies were conducted among different sustainable community projects in Germany to shed light on whether and how ‘the social’ promotes the energy transition and broader sustainability transformation in such settings. The six projects exhibit a broad range of measures that transformed their members’ homes and lives towards being more sustainable. Hence, what motives people had in joining, initiating, or creating these projects, as well as what experiences they had, and what challenges they faced were central questions. Findings suggest that ‘the social’ indeed constitutes a positive driver of the energy transition by being the predominant motive to participate in sustainable projects rather than environmental motives, by facilitating collective action through social capital, and by rendering social norms surrounding sustainable behaviors effective. Methods In order to choose viable projects as case studies, a number of selection criteria were determined: The projects had to consist of (1) a group of (2) private citizens (3) jointly active and (4) investing their private capital in a community initiative, which (5) includes in its endeavors the implementation of sustainable energy systems and/or energy efficiency measures in their members' homes. The six community projects studied in this research were chosen because they represent the panoply of forms, organization types, locations, and actions that are in existence in Germany. They are located in urban, suburban, and rural areas, they represent different housing types and forms of living in terms of members' closeness, and apply a broad range of sustainability measures targeting the energy supply and usage in members' homes. These projects are located in five different states of Germany, were founded between 1992 and 2014, and are two eco-settlements, two housing cooperatives, one energy cooperative, and one ecovillage. To gather data on the initiatives and their activities, documentary analysis and site visits were carried out. In order to answer the posed research questions concerning motives, challenges, experiences, as well as gather further details on each project's activities, thirty-one semi-structured interviews were conducted anonymously among members of all six community
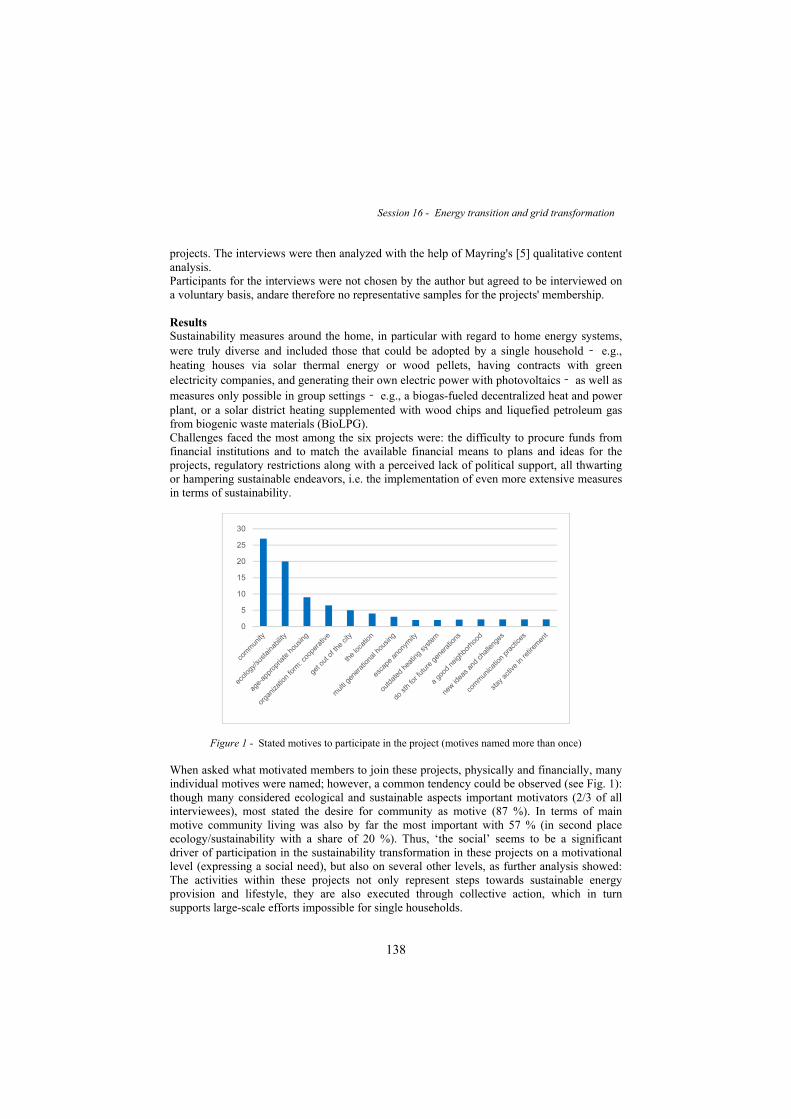
138
Session 16 - Energy transition and grid transformation projects. The interviews were then analyzed with the help of Mayring's [5] qualitative content analysis. Participants for the interviews were not chosen by the author but agreed to be interviewed on a voluntary basis, andare therefore no representative samples for the projects' membership. Results Sustainability measures around the home, in particular with regard to home energy systems, were truly diverse and included those that could be adopted by a single household – e.g., heating houses via solar thermal energy or wood pellets, having contracts with green electricity companies, and generating their own electric power with photovoltaics – as well as measures only possible in group settings – e.g., a biogas-fueled decentralized heat and power plant, or a solar district heating supplemented with wood chips and liquefied petroleum gas from biogenic waste materials (BioLPG). Challenges faced the most among the six projects were: the difficulty to procure funds from financial institutions and to match the available financial means to plans and ideas for the projects, regulatory restrictions along with a perceived lack of political support, all thwarting or hampering sustainable endeavors, i.e. the implementation of even more extensive measures in terms of sustainability.
Figure 1 - Stated motives to participate in the project (motives named more than once)
When asked what motivated members to join these projects, physically and financially, many individual motives were named; however, a common tendency could be observed (see Fig. 1): though many considered ecological and sustainable aspects important motivators (2/3 of all interviewees), most stated the desire for community as motive (87 %). In terms of main motive community living was also by far the most important with 57 % (in second place ecology/sustainability with a share of 20 %). Thus, ‘the social’ seems to be a significant driver of participation in the sustainability transformation in these projects on a motivational level (expressing a social need), but also on several other levels, as further analysis showed: The activities within these projects not only represent steps towards sustainable energy provision and lifestyle, they are also executed through collective action, which in turn supports large-scale efforts impossible for single households.
0
5
10
15
20
25
30
139
Session 16 - Energy transition and grid transformation Within these groups or communities, preexisting social capital was used or entirely new social capital was forged and then utilized in collective action to further the community goals. Instances were recounted, in which strong social norms in relation to environmental behaviors are held, perceived and sustained. Members subsequently exhibited or reported pronounced environmentally friendly behaviors, while stating that previously it had not been a concern for them. Through social capital collective action is made successful and both in turn make the creation of communities (i.e. social structures) possible. Conclusions Most other studies into the influence of social factors on the energy transition focus on one kind of social factor, stage interventions, or have experimental settings. This work compiles real-world data on very different projects and reveals striking commonalities across all of them when it comes to various aspects of ‘the social’. Aspects like social capital, social structures, social norms, collective action, and social needs are all interwoven and play a positive role in the adoption of far-reaching sustainability measures. While research into motivations to participate in community energy activities has revealed time and again a number of motives, first among them always environmental concern (e.g. [6]), the present study highlights this not necessarily to be the case. Instead, if a person joins a living environment where sustainable energy provision is established, and does so for reasons other than environmental concern, that person is essentially facing a green default option. A lack of pro-environmental values does not influence her/his household’s energy provision. Additionally, if in that community strong social norms surrounding environmental behaviors are established, that person is more likely to exhibit wide-ranging pro-environmental behaviors, like energy conservation, without having strong environmental attitudes. Further research should try to quantify the amount of people needed in a group or community who harbor environmental attitudes versus the numbers of those who are indifferent towards the environment but see other goals satisfied to such an extent that they accept ecological measures as part of the project, to push the implementation of sustainable options through. References [1] I. Wittenberg, E. Matthies, Solar policy and practice in Germany: How do residential households with
solar panels use electricity?, Energy Research & Social Science 21 (2016) 199-211.
[2] M. Ferreira, R. van den Wijngaard, Pro-Environmental Behaviour - We Care Because Others Do, in: A. Samson (Ed.), The Behavioral Economics Guide 2019 (2019) 121-130.
[3] B.J. Kalkbrenner, J. Roosen, Citizens’ willingness to participate in local renewable energy projects: The role of community and trust in Germany, Energy Research & Social Science 13 (2016) 60-70.
[4] H. Lovell, Eco-Communities, in: S.J. Smith (Ed.), International Encyclopedia of Housing and Home, Elsevier, San Diego (2012) 1-5.
[5] P. Mayring, Qualitative content analysis: theoretical foundation, basic procedures and software solution, Beltz, Klagenfurt, Austria (2014).
[6] B.P. Koirala, Y. Araghi, M. Kroesen, A. Ghorbani, R.A. Hakvoort, P.M. Herder, Trust, awareness, and independence: Insights from a socio-psychological factor analysis of citizen knowledge and participation in community energy systems, Energy Research & Social Science 38 (2018) 33-40.
140
Session 16 - Energy transition and grid transformation
Diyun Huang, Geert Deconinck LONG TERM TRANSMISSION RIGHTS, A GAME CHANGER FOR CROSS-BORDER ELECTRICITY MARKET AND INTERCONNECTION GOVERNANCE IN EUROPE?
Diyun Huang, ESAT-ELECTA, KU Leuven, Kasteelpark Arenberg 10, 3001 Leuven, Belgium and EnergyVille, Thor Park 8300, 3600 Genk, Belgium
Geert Deconinck, ESAT-ELECTA, KU Leuven, Kasteelpark Arenberg 10, 3001 Leuven, Belgium and EnergyVille, Thor Park 8300, 3600 Genk, Belgium
Overview The climate change awareness is driving households, cities and industries towards sustainable energy consumption. Interests for renewable power purchase agreement (PPA) are on the rise world-wide. One salient feature of such bilateral long-term contract is that it allows the buyers to express preferences in terms of technology choice. This is one of the drivers for large consumers that prefer to have the green electricity label to look for long term renewable PPA both within a country or across the border. At the same time, energy intensive consumers, can also be potential beneficiaries of cross border renewable PPA as they are competing on energy costs and constantly look for low cost energy. A well-tailored long-term contract should be able to allocate the risks to parties who can best manage it and charges risk premium accordingly. Access to transmission network and firm transmission rights on interconnections provide certainties for contracting parties of long-term contract to be delivered and enables investment in new generation capacity. At the same time, the paradigm changes for the renewable investments with the phasing out of subsidies. Long-term revenue stability for both transmission and renewable investors are at the center of future European market design to send investment signals. The long-term transmission rights in the European cross-border electricity market that offer market players the hedge for congestion costs thus stand at the conjunction point of the electricity market and renewable investment paradigm shift. The Clean Energy Package in Europe has mandated 70% utilization rate on the electricity interconnections. A key question is whether the inconsistency between transmission models in different market time frames becomes the barrier for high level of interconnection utilization. In particular, if the zonal pricing in European electricity market and its implied grid management, planning and the market functions applies to the long-term market, can the transmission right reserved well in advance across-borders be made firm? Methodology First, this paper introduces two types of transmission rights: flow gate righs (FGR) and financial transmission rights (FTR). The governance implications of the two rights are analysed with the technicalities. It is not without significant governance implications to introduce transmission rights under different pricing schemes. Looking ahead, are the current market designs in Europe compatible with the long-term financial transmission rights? The European zonal pricing models are first briefly described and analysed in a four node model following the example from Aertrycke and Smeers.
141
Session 16 - Energy transition and grid transformation Firmness of long-term FTR under the zonal pricing are calculated from the derivation of the simplified grid model and the computation of zonal PTDFs. Second, the impact of this lack of firmness from the long-term transmission rights are elaborated on the long-term market design. The angle of information sharing for transmission right market design and interconnection governance has not been well documented in the interconnection studies. In this research, case studies are constructed by assuming different levels of information sharing and utilization under different settings of market coordination for transmission right determination. The case study shows that the firmness of long-term transmission rights on interconnections is not separated with internal network constraint and network expansion volume and timing within the bidding zones. Results and Conclusion An important question for the European electricity market is whether to move towards developing long-term transmission rights is a right step without reforming the pricing schemes, i.e moving to the nodal pricing. The information angle taken in this study further shows the incompatibility between the current implemented zonal pricing and firmness of long-term transmission right. Moving to nodal pricing is not only about price transparency and granularity, it has a significant impact on keeping network and market modelling consistency in the long-term, day-ahead and real-time market. For an optimal determination of cross-border long-term transmission right that ensures high network utilization, a centralized entity is deemed necessary to gather information of network parameters and market transactions over the whole system. From the planning perspective, a central entity with an overview of the system that takes into account previously reserved FTR awards in the system and helps to mitigate the externality problem from expansion is indispensable in the network expansion. References [1] G. D’Aertrycke, Y. Smeers, . Book chapter, Financial Transmission Rights Analysis, Experience and
Prospects. Springer 2013.
[2] S. Oren, Point to Point and Flow-Based Financial Transmission Rights. Book chapter, Financial Transmission Rights Analysis, Experience and Prospects. Springer 2013.
[3] Hamburg Commercial Bank, Corporate PPA, Green electricity for corporate consumers, Industry study, March 2019.

142
Session 16 - Energy transition and grid transformation
Andrea Biancardi WHAT IS THE EUROPEAN ELECTRICITY TRANSMISSION COMPANIES APPROACH TO INNOVATION? A NOVEL ANALYTICAL FRAMEWORK
Andrea Biancardi, Research Fellow, SDA Bocconi School of Management,
Overview This article looks at the innovation of European electricity Transmission System Operators (TSOs). In the last fifteen to twenty years the combination of power sector reforms, technological progress, climate change awareness and the implementation of progressive low-carbon policies have triggered a revolution on an unprecedented time scale for the entire energy sector with implications to economic fundamentals, investment opportunities and business strategies for all market players (Biancardi & Di Castelnuovo, 2020); Helm, 2017; Sioshansi, 2016). Electricity Transmission system operators (TSOs), which have the fundamental role of guaranteeing the security and quality of the electricity system (i.e. to keep the lights on), are not exempt from the transformations occurring in the industry. To cope with the higher complexity of the electricity sector and to develop a smarter and more reliable electricity system, there is an increasing need for TSOs to invest in research and innovation, eventually embracing new technologies or exploring new activities and business solutions. The peculiar nature of their business (i.e. regulated infrastructure), however, is such that network companies will hardly undertake investments in innovative technologies or new business solutions in the absence of sufficient incentives (Poudineh et al., 2017). Indeed, regulatory schemes of network companies in many countries are primarily designed to incentivise cost efficiency, thus deterring TSOs to undertake projects that my risky and costly innovative activities. Discussion has begun around the need for energy utilities to innovate and evolve (Pereira et al., 2018; Nillesen & Pollitt, 2016) but few studies have specifically focused on the innovation required by transmission system operators and research on how to adapt regulatory schemes to stimulate innovation of network companies tend to focus more on Distribution System Operators (DSOs) rather than on TSOs (World Energy Council, 2020; Pereira et al., 2017; Eurelectric, 2016), This study aims to fill in the gap in literature by investigating how TSOs are responding to the challenges occurring in the sector and how they are changing their way of doing business. The questions it aims to answer are: “What approaches are European electricity TSOs adopting towards innovation?” and “Does regulation affect European electricity TSOs innovativeness?”. Methods We considered 12 TSOs in Europe with the aim to obtain a representative sample of the huge diversity across European TSOs, hence of the geographical and technological challenges that they face. We then analysed the regulations in each relative country and their reference to innovation and related concepts, to determine whether national regulatory schemes are favourable, neutral or not favourable towards innovation.
143
Session 16 - Energy transition and grid transformation Afterwards, we created a conceptual framework for evaluating the innovativeness of TSOs, based on four steps: 1. we selected key technologies to analyse (i.e. Power-to-Hydrogen, offshore wind, cross-border interconnections, electric vehicles, storage batteries, blockchain); 2. we assessed the investments and projects undertook by each TSOs in those technologies; 3. we identified different approaches of European TSOs towards business model innovation; 4. we attributed an innovation score to each TSO in each technological area and we ranked TSOs by the resulting scores. Results The results indicate that TSOs tend to have a conservative approach to innovation, developing projects which have the lowest impact on their current business model. Moreover, TSOs operating within more favourable regulatory frameworks tend to be more innovative and to explore new business opportunities compared to other TSOs operating in countries with neutral or less favourable regulatory frameworks which, instead, tend to be rather “passive”. These results are aligned with previous studies on electricity network companies according to which these companies tend to avoid investments in innovative activities, unless they are adequately encouraged or incentivized. Conclusions National Regulatory Authorities must urgently correct regulation when this create disincentives or it does not adequately incentivise investments in innovative technologies, also by means of regulatory experimentation and innovation, e.g. regulatory sandboxes which allow small scale derogations from existing rules, regulatory pilots, etc. Similarly, policymakers at both national and supra-national level must push for the development of an innovation strategy and must provide adequate incentive tools for TSOs investments in research and innovation. References Biancardi & Di Castelnuovo (2020), “A New paradigm in the electricity sector. Key trends and stock
performance of European utilities”. European Energy & Climate Journal, Vol. 9, Issue 1.
Eurelectric (2016), “Innovation incentives for DSOs - a must in the new energy market development”.
Helm, D. (2017), “Burn Out: The Endgame for Fossil Fuels”
Nillesen, P. and Pollit, M., Witteler, E., (2016) New business models for utilities to meet the challenge of the energy transition. In: Sioshansi, F (ed.), Future of Utilities. Utilities of the Future. pp. 283-303
Pereira, G. I., Specht, J. M., Pereira Silva, P., Madlener, R. (2018), “Technology, business model, and market design adaptation toward smart electricity distribution: Insights for policy making”. Energy Policy, Vol. 121 (2018), pp. 426–440
Pereira, G. I., Pereira da Silva, P., Soule, D. (2017), "Policies for an EU smarter grid environment: A Delphi study on DSOs," 2017 14th International Conference on the European Energy Market (EEM), Dresden, 2017, pp. 1-6.
Poudineh, R., Peng, D., Mirnezami, S. R. (2017), “ Electricity Networks: Technology, Future Role and Economic Incentives for Innovation”. Oxford Institute for Energy Studies.
Sioshansi, F. (2016), “Future of Utilities. Utilities of the Future”.
World Economic Forum (2017). Game changers in the energy-system. Emerging themes reshaping the energy landscape.
World Energy Council (2020), “Performing while transforming. The role of transmission companies in the energy transition. Innovation Insights Brief 2020”.
144
Session 16 - Energy transition and grid transformation
Francesco Gracceva, Chiara Bustreo, Arturs Purvins, Marco Sangiorgi ASSESSING THE IMPLICATIONS OF HIGH VRES LONG-TERM SCENARIOS BY INTEGRATING ENERGY SYSTEM AND DISPATCH MODELS
Francesco Gracceva, Italian National Agency for New Technologies, Energy and Sustainable Economic
Development (ENEA), Italia Chiara Bustreo, Consorzio RFX (CNR, ENEA, INFN, Università di Padova,
Acciaierie Venete SpA), Italia Arturs Purvins, EC Joint Research Centre
Marco Sangiorgi, EC Joint Research Centre
Overview The European energy system is on the critical path to meet the EU’s climate change objectives. The sector undergoing the stronger changes is the power system, where the two main low-carbon options are renewable and nuclear energy, together with thermal generation with CCS, which is however at an early stage of development. This study, developed through a cooperation between the EUROfusion SES programme and the Joint Research Centre, aims at assessing the techno-economic implications for the European power system of a range of alternative decarbonization trajectories. Method The analysis has been developed through a soft-link between the EUROfusion global energy system TIMES model (ETM) and the JRC PLEXOS-EU power system model, which describes the operation of the power system corresponding to each future picture of the system projected by ETM. Indeed, long term energy systems models, like ETM, may oversimplify the ability of power systems to accommodate high shares of variable Renewable Energy Sources (vRES), due to the temporal and technical simplifying assumptions used in such model to characterize the power system (Collins et al. 2017). This work started from a wide scenario analysis carried out through the ETM, depicting a high number (up to 120) of different global long-term scenarios. All of them are consistent with the overall objective of keeping global warming below 2°C by the end of the century, but they differ in the way the objective is reached. For a wide exploration of the EU power system in 2050 the set of scenarios can be limited to 24, the two extremes of which (in terms of vRES penetration) have been analyzed more in-depth for this study through the JRC PLEXOS-EU model. Results The global energy system model ETM shows that net-zero emissions scenarios require a relevant amount of carbon dioxide removal (CDR) already before 2050 (in agreement with the literature; Hilaire 2019). Thanks to CDR only one out of 24 scenarios is infeasible, namely the one combining the most stringent CO2 emission reduction trajectory with conservative assumptions on nuclear deployment and excluding the availability of CCS. Very different net-zero pathways, with vRES penetration ranging between 70% and 50% of total EU production by 2050, are equally possible as results of the energy system model, even though total system cost increases significantly when low-carbon options like nuclear and CCS are limited or excluded.
145
Session 16 - Energy transition and grid transformation The subsequent in-depth analysis of the two “extreme” pictures of the EU power system, done through the dispatch model PLEXOS-EU, shows how these two pictures can have very different implications on the technical operation of the power system as well as on its economic outcomes. Indeed the scenario with the highest vRES penetration implies a substantial amount of unserved energy and power as well as line congestions and frequent price peaks. Annual unserved energy is about 5% on average at EU level, but exceeds 10% in some countries, particularly in winter months. If extreme scenarios in terms of national generation and demand profiles are considered, the most critical under-generation events happen in December in Germany, because of the negligible wind production, followed by still large but less serious events in Poland and France. Even under a copper-plate assumption some unserved energy (1% of demand) is still present. But critical events can be mitigated if both the grid is enhanced well beyond what assumed by ENTSO-E (Sustainable Transition scenario 2040) and a relevant base-load flexible capacity is added in each country. On the other hand, the amount of unserved energy is limited to 0,5% of demand in the scenario with a vRES share of 50%. Conclusions This analysis confirmed that energy system models can underestimate the need for flexible capacity required by a power system with very high share of vRES. The actual implementation of long-term net-zero emissions scenarios will require a deep enhancement of the transmission grid and a careful assessment of the necessary amount of low-carbon dispatchable power (e.g. nuclear and hydro) as well as of other flexibility options. This study, still ongoing, is the basis to assess the optimal balance between different options to address the implications the increasing share of vRES, and more generally the widely debated issue of the maximum level of vRES that can be managed by the system. References Collins S. et al., 2017, Integrating short term variations of the power system into integrated energy system
models: A methodological review, Renewable and Sustainable Energy Reviews 76:839-856.
ENTSO-E, European, Ten-Year-Network-Development plan 2018, https://tyndp.entsoe.eu/tyndp2018/.
Hilaire J. et al., 2019, Negative emissions and international climate goals – learning from and about mitigation scenarios, Climatic Change (2019) 157:189–219.
146
Session 17 - Energy consumption and power demand
Manashvi Kumar RECLAIMING SPACES OF ENERGY CONSUMPTION THROUGH RETHINKING APPROACHES TO RURAL ELECTRIFICATION IN INDIA
Manashvi Kumar, Department of Revenue, Relief, Rehabilitation and Disaster Management, Government of Punjab, Chandigarh-160001, India
Overview The rural energy landscape of India comprises a plural and complex heterogeneous mix of energy demand. Should there be an ideal case to be- access to modern energy services in rural areas become a perceptible reality in the times to come; the future of power systems shall rest upon twin dogmatic paradigms: 1) comprehensive demand aggregation and profiling of a rural, domestic consumer situated in a geo-cultural, climatic zone/space and a distinct physiographic terrain, and 2) local renewable energy resource assessment. This exercise should emphatically be for a given geographic territory and on a given temporal horizon. It should take into account seasonal variability as well. However, it is always easier said and remains a wishful thinking. Mega generation systems are not designed to account for local, small and sporadic demands (loads or load centres). The current energy policy framework remains non-cognizant towards the essence of realization of user value of rural electrification. As a result, rural electrification process still remains an unfinished agenda in India, being completely oblivious to the basic needs of the rural societies, and in terms of the effects of quantity and quality of service in their domestic lives. The ability of users to appreciate the intrinsic and extrinsic value of access to energy remains abysmally dismal. The rural, energy consumption ecosystem warrants an in-situ, longitudinal study. The provision of state sponsored subsidies stands on a slippery ground, as there is lack of concurrence on profiling of rural, domestic demand for energy, regressively construed in terms of electricity distribution network extension. The rural, domestic- individual and community clusters (as users), and the productive-sector (energy intensive sector) users should ideally be similarly placed, and considered on principles of equity pricing in lieu of access to energy. As, every society makes an effort towards ‘commodious living’ in space and time, it is extremely important that incremental improvements in quality and reliability of energy services access be given its due in rural areas as well. Methods The sphere of this paper spans across two major components. The first part deals with scoping of this work through an understanding of the energy governance architecture that seeks to emancipate rural India from the drudgery of archaic methods of access to primary energy. The paper tries to unravel the trajectory of various centralized rural electrification policies that appear to be bereft of the conceptual understanding of energy poverty. The policy process appears to be ideologically and functionally distant from two principal essentialities- firstly the local socio-cultural focus, and secondly, recognition of incongruency of load demand as the pivotal theme of the contemporary rural electrification policy. The second part is a comprehensive narrative of the travails of the policy recipients experienced through an immersion procedure. Towards attainment of this objective; grounded theory, mixed methods and action research methods were adopted. A multi-method approach is essential for a comprehensive evaluation of the true ‘relativist’ nature and rural flavour of energy access as a widespread phenomenon. Deconstruction of policy documents and policy narratives has been a special feature.

147
Session 17 - Energy consumption and power demand
Results A big push aimed at extension of rural electrification infrastructure in rural areas, increases the visibility of rural electricity infrastructure by covering all below poverty line (BPL) families. It involved setting up a uniform village infrastructure at a community development (CD) block level, for catering to non-domestic demand for power. These initiatives, however, were all aimed at pushing through the overlapping extension activities proposed under different flagship programs for rural electrification. Nevertheless, quality and reliability of supply remained a serious un-addressed issue. Rural electrification, as a process, is prohibitively costly given the conditions of terrain and other locale-specific realities which are normally ignored. The process has a lot of scope for recurring revision on account of the fact that 'the context gets missed out' quite often. There is still a dire need for creation of base line energy consumption data including terrain specific modelling. An empirical approach for demand aggregation shall require creation of robust, autonomous institutions for data capture and analysis. The extension of the central grid for providing access shall remain the sole plausible option, till the time any alternative model for providing on-site generation and consumption of energy is designed. Any switchover to alternate energy systems and technologies that are 'contextually' grounded, and 'smaller in scale' would entail usage of distinctly disparate simulation tools for micro-planning. It is further necessary, that the planning tool must adept to local complexities and highlight them appropriately, rather than relying on secondary data from different agencies of the state. The electricity sector follows mainly two distinguishing approaches for planning of rural electrification with a given time horizon - a) the so-called techno-economic approach, which aims only to optimize an economic criterion (objective function) by allowing narrow investment choice based on maximized generation of energy produced by limited non-comparative technologies, and b) the so-called multi-sector approach, which also entails an economic optimization, to say the least, identical to the previous one, but is vehemently skewed toward one particular energy source within the 'framework of non-conventional energy sector; driven largely by the reductionist 'quantitative’ dimension of attaining massive (Gigawatt scale) targets. The focus which is primarily driven by the objective of creation of visible infrastructure in any given territory, given the associated constraints- political, technical, financial, and strategic. This approach is strongly symbolic in character, too locked in structurally in scope. It distances itself yet again from the 'innate, anthropogenic dimension of energy.' What is required, is an altogether different 'systems approach’ to convert human (local) energy inaction to local (human) energy in action by tapping/harnessing the local resource base. The focus needs to shift to localized production and consumption, driven by the concept of 'prosumerism' (Toffler,1980). Conclusions The aim of rural electrification planning is to fulfil the general objectives defined under the national electricity policy 2005. The overall purpose was to extend access to electricity within a given territory and within a given time horizon. However, this single, sovereign approach missed upon one essential aspect- integration of spatial planning, within the scope of rural electrification to increase the social and economic impact of the process. As a result, this program did not infuse confidence in the private sector. Thought it was visible, but it had no takers apart from the state utilities.
148
Session 17 - Energy consumption and power demand
As Lahimer et. al (2013) puts it- "rural electrification is a complicated issue because of user affordability, rural in accessibility and remoteness, low population densities and dispersed households, low project profitability, fiscal deficit, scarcity of energy sources, population growth, lack of professionalism and over-dependence on subsidies. It is an accepted fact that the development of a sub-sectoral policy on rural electrification is conceived and designed by the 'MACRO' (the union) whereas, the responsibility for effective implementation of the policy lies upon 'MESO' (the state distribution utilities and the power/energy departments of the respective states). There is no involvement of the 'MICRO' (the III tier architecture of local governance) whatsoever. Rural electrification has been since decades, the sole imperative and prerogative of the central government. The electricity act, 2003 has been instrumental in overhauling the 'mega-picture' of the electricity sector, however, a lot remains to be done with regard to the approach towards rural electrification, especially decentralized distributed generation (DDG) based on non-conventional sources of energy including off-grid, stand-alone systems. There is a pressing need for an enabling environment for active community partnership, both as generators and consumers of electrical energy. A greater precision is required in the enabling provisions of regulatory policies and programs of rural electrification as a whole. The contemporary institutional set up, the central agencies and their functional structures need to adopt a more granular approach in terms of engaging with the MESO in a reciprocal manner-to reduce institutional compartmentalization. This shall involve a closer association with the MICRO- the three-tier local governance structure (the district, the block and the village). Local understanding of the basic needs of any given geo-spatial terrain, in terms of demand aggregation and its subsequent profiling should be effectively through the MICRO- anon-existent entity at present vis-à-vis energy governance framework. There is a strongly felt need for- a) decentralization, delegation, and devolution at the level of 'MESO' directed towards ‘MICRO' all along the different phases as a sub-sectoral strategy, b) planning and, c) investment programming and execution. Thus, there is a much-desired push in terms of unequivocal sharing of responsibilities between the 'entities’ to be entrusted with this paradigmatic shift. There is even a greater need to build capacities in terms of boosting human capital allow local communities to have a greater choice in terms of local generation and distribution planning. This ought to be commensurate with, the general 'tendency' at the top towards multi-sector collaboration in terms of energy-mix (renewables and conventional fuels). However, whether the proposed endeavour shall progressively lead to de-compartmentalization in electrification (energy) planning and execution of small projects, at the 'MICRO' level between the key actors and rural development sectors shall primarily depend upon norms of reciprocity amongst the actors, and the networks of civic engagements that evolve later between actors and the enabling agents. The existing framework is closed for any lateral substitution for accelerating the process of rural integration especially in terms of openings for alternate sources of energy, open access to the distribution network, alternate tariff structure etc. Consequently, in the interest of optimizing the access to electricity for all, the need is to first identify and establish the sufficient and good reasons for this policy dose. What should be the drivers? Electricity has the potential to create user-value by broadening the perception of a 'product experience' rather than just 'object interaction’ (passive consumerism). However, the Indian experience of rural electrification is reflective of the fact that development work typically focuses on economic and physical aspects of development and often neglects the needs of the local communities that are affected by it.

149
Session 17 - Energy consumption and power demand Keywords: energy access, policy discourse analysis, inter-disciplinary approach, rural electrification, prosumerism. References: Lahimer, A. A., Razykov, T. M., Sopian, Alghoul, M. A., Amin, N., K. and Yousif, F. (2013). Research
and development aspects on decentralized electrification options for rural household, renewable and sustainable energy reviews, volume 24, pp.314-324. https://doi.org/10.1016/j.rser.2013.03.057.
Toffler, A. (1980). The third wave, First published by William Morrow and company, ISBN0688035973, pp.544.
National electricity policy (2005). The gazette of India, resolution no. 23/40/2004- R and R, volume 2, dated 12/2/2005, pp. 1-17.
Central electricity act, (2003). The gazette of India, part-II, registered no. DL-33004/2003, dated: 26/5/2003, legislative department, ministry of law and justice, government of India, pp.1-134.
Disclaimer: The views expressed are personal and exclusive in character, for an academic discourse.

150
Session 17 - Energy consumption and power demand
Morgan Crénès, Thierry Badouard 2020 ENERGY CONSUMPTION ESTIMATES
Morgan Crénès, Head of Market Research, Enerdata, France Thierry Badouard, Data & research department, Enerdata, France
Overview The covid-19 pandemic that has struck since early 2020 has disrupted the global energy system. It represents a sudden break in the trend of increasing global energy consumption observed since the last global shock in 2009. Expanding on Enerdata’s Global Energy Trends and looking at multiple indicators, we will be highlighting some elements of analysis for 2020, with several scenarios for the post-pandemic period. - Following the health and economic crisis, where are we going to land in 2020? - What can be expected afterwards?
We will be looking at the evolution of energy demand and energy consumption, the evolution of CO2 emissions, and possible impacts on the energy transition, among other things. Methodology To estimate the consequences of the covid-19 pandemic on energy consumption and the resulting CO2 emissions, Enerdata has developed a mixed methodology based on economic projections from international institutions (mainly GDP) and on sectoral elasticities of energy consumption to GDP, which measure the change in consumption relative to the change in GDP. To take into account the exceptional situation of 2020, these elasticities are derived from historical values observed during periods of severe recession (2009 for most of the OECD countries). The reduction in consumption linked to the confinement is based on the reductions in gasoline, diesel and jet fuel consumption observed during the months of confinement. The total energy consumption is calculated by adding to the final consumption the energy input for power generating and for other energy activities (refining, extraction, etc.). To project the production of electricity and the electricity mix, we use the data observed over the first part of 2020 and a modelling of the mix on the rest of the year. The estimates are calculated on the assumptions of the GDP evolution of the European Commission for European countries, of the OECD for non-European countries belonging to the OECD and of the IMF for the other countries covered. Results The year 2019 was marked by a global economic slowdown (-0,6 growth points) that translated into a much lower energy consumption growth (0,6%, compared to 2,2% in 2018). The beginning of 2020, for its part, was disrupted by an unpredictable event and the year is very different from previous trends. National containment measures put in place by the countries have strongly impacted energy consumption, with lockdowns imposed on certain economic sectors, school closures and traffic restrictions all resulting in a tremendous activity reduction, and consequently in a severe energy consumption dip. Certain restrictions still in effect this summer continued to influence energy demand. International institutions consider that a return to a level of activity similar to that of 2019, that is to say, before the outbreak of the covid-19 pandemic, will not come back any time soon.

151
Session 17 - Energy consumption and power demand We show that the energy consumption drop over 2020 will be extensive, but, depending on which economic policies recovery will be implemented, it could be long-lasting or not. Conclusions Energy demand trends are still strongly correlated with those of GDP at world level, with some country-level discrepancies. China’s GDP will be the less affected relatively, China being the only large country showing a growth, albeit small (+1%). Energy consumption is to drop by 12% in the USA, by 8% in Europe, and to grow by a mere 0.5% in China. The share of renewables in power generation will be significantly increasing due to their operating cost competitiveness in a lower electricity consumption context. Consequently, CO2 emissions are to drop by 9% globally. References Our annual Global Energy Trends publication, Our latest analysis on the pandemic consequences: “Covid-19: A Tremendous Impact on Energy
Demand”, Our previous Covid19 impact analyses: Covid19: the drop in energy consumption in 2020 will be unprecedented Economy - Energy & Climate: what are the possible post-Covid19 futures?
152
Session 17 - Energy consumption and power demand Damiano Fiorillo, Khadija Merzougui, Alessandro Sapio HOW DID ITALIAN’S BEHAVIOR TOWARD ENERGY-CONSUMPTION CHANGE FROM LATE 1990S TO 2012?
Damiano Fiorillo, Department of Business and Economics, University of Napoli “Parthenope”, 13 Avenue Parisi, Naples, Italy
Khadija Merzougui, Department of Business and Economics, University of Napoli “Parthenope”, 13 Avenue Parisi, Naples, Italy
Alessandro Sapio, Department of Business and Economics, University of Napoli “Parthenope”, 13 Avenue Parisi, Naples, Italy
Overview One of the main channels in dealing with the problem of global warming in today’s world is saving energy or employing an efficient use of energy household. Energy consumption has been largely discussed in the literature on energy policy and economics (Gillingham et al., 2009). Recently, considerable research has been conducted to better understand the process determining energy saving behaviors (Fiorillo et al., 2019) which has attracted growing attention of policy makers because without significant reductions in the electricity use, it will be impossible to lower carbon dioxide (CO2) emissions and mitigate the risks of global warming (Lomas, 2009). Electricity market liberalization, for the first time in the history of electricity utility, gives consumer a choice. Italy has implemented the EU directive on internal electricity market since 1999 (Polo et al. 2003). So far, the process of market liberalization has not come to an end yet. In this framework, the main objectives of the paper is to investigate how did energy use of Italian households change from 1990 to 2012 (before and after market liberalization), and to explore the role of additional drivers of electricity-saving behaviors, specifically cultural and social drivers since a large literature in this regard has not been developed yet. Methods We conducted an analysis along the lines of the one conducted previously by the authors (Fiorillo et al., 2019) to investigate if the market liberalization operated in 1990s, therefore the household’s choice in energy consumption, had some impact on their energy consumption behavior, as well as exploring the role of additional determinants of energy- saving, i.e social and cultural ones. We apply probit models on micro data gathered from the Multipurpose Household Survey dataset, conducted by the Italian Statistical Office in 2012. After deleting observations with missing data, the final dataset is a cross-section of 39.339 observations about individuals aged between 16 and 90 and includes a large selection of information on the habits and the problems faced in everyday life. The unit of analysis is the individual. This research, as the previous one, studies monetary and non-monetary drivers of energy savings in Italy, where the key dependent variable is the frequency with which individuals switch the light off when leaving a room. Monetary drivers are related to dwelling features, home appliances features, perceived economic situation and resources, while non- monetary motives are measured by proxies of pro-environmental attitudes, environmental information, and pro-social behaviors.
153
Session 17 - Energy consumption and power demand The pro-environmental attitudes regards the individual interest towards environmental issues, environmental information sketches the way in which individuals get informed about environmental issues, while pro-social behaviors describes factors that are related to the influence of social norms, of the valuation of environmental beliefs, environmental concerns and the moral obligation to act pro-environmentally. Despite to the previous study, this one includes further social proxies such as if the respondents think that people are trustworthy or not. The hypothesis is that social trust plays a role in household energy consumption, since people will not save energy if they feel others are not minimizing their energy use (Martinsson et al., 2011; Leygue et al., 2017). The other innovative determinant is given by individuals' participation in cultural activities such as theatre, cinema, opera…etc interest in political issues; the hypothesis behind is that some cultural consumptions may determine greater social awareness of energy alternatives and growing concern about increasing climate problems and future generations (Quaglione et al., 2017). Results Roughly, from the marginal effect results of the probit model, a number of explanatory variables appear significantly associated with the light-off behavior. Positive marginal effects are indicative of a higher propensity to switch the light off when leaving a room (energy saving). More precisely, all the marginal effects on home features, home appliances, energy service and income variables present negative signs, statistically significant at least at the conventional level (5%). This may indicate that individuals with a good economic situation tend to value more self-comfort and less energy saving. All variables that represent pro-environmental attitudes show positive signs and are statistically significant at least at 5%, this means that even if the individual is interested or not in environmental issues, is more careful to save energy. Conversely, people that keep informed about environmental issues through passive channels (tv, radio, newspapers…etc) do not care about energy saving, while people that keep informed actively by participating to conferences, associations, …etc, show more interest to save energy. Private and public pro-environmental behavior variables are both positive and statistically significant at 1% level, meaning that people who care about not wasting water at home and not throwing papers in the street care about not wasting energy too. Regarding the pro-social behavior variables, active membership in associations and church attendance are not significantly correlated with energy saving, while meeting friends is negative and statistically significant at 10%, this confirm the idea that individuals put their comfort first. Similarly, trust in people is negative and statistically significant at 5% level, this does not go in line with the hypothesis of the literature may be because self comfort is stronger than social believes. Where participation in cultural activities is positively and statistically related to the switching off the light behavior, this confirm the hypothesis that participation in cultural activities creates a mind openness which plays a boosting role in energy saving. Conclusion Even after electricity market liberalization, the monetary motives remain primary in determining energy saving besides the socio-demographic drivers, while environmental issues seem not to be crucial.

154
Session 17 - Energy consumption and power demand Moreover, our results provide evidence that individuals who have trust in the others and individuals who participate in some cultural activities show less interest to adopt electricity saving behaviors at home. References Fiorillo, D.; Sapio, A. Energy saving in Italy in the late 1990s: Which role for non-monetary motivations?
(2019. Ecol. Econ. 2019, 165.
Gillingham, K., Newell, R.G., Palmer, K., (2009). Energy efficiency economics and policy. Ann. Rev. Resour. Econ. 1, 597–620.
Leygue, C.; Ferguson, E.; Spence, A. (2017). Saving energy in the workplace: Why, and for whom? J. Environ. Psychol., 53, 50–62.
J. Martinsson, L.J. Lundqvist, A. Sundstrom, (2011). Energy saving in Swedish households. The (relative) importance of environmental attitudes, Energy Policy. 39, 5182–5191.
K. J. Lomas. Carbon reduction in existing buildings: a transdisciplinary approach. Bldg. Res. & Info. 2011;38(1):1- 11.
Quaglione, D., Cassetta, E., Crociata, A., & Sarra, A. (2017). Exploring additional determinants of energy-saving behaviour: The influence of individuals' participation in cultural activities. Energy Policy, 108, 503-511.
Polo M, Scarpa C. (2003). The liberalization of energy markets in Europe and Italy. Milano: IGIER, Universita Bocconi.
155
Session 17 - Energy consumption and power demand
Ionut Purica, ASSESSING THE LIMITS TO TRANSPORT ENERGY CONVERSION FROM FUEL TO ELECTRIC IN THE FRAMEWORK OF THE EU GREEN DEAL
Ionut Purica, REEA-Romanian Energy & Economy Association
Ever since the Club of Rome published their report on the limits to growth there was extensive research done by for example Marchetti at IIASA on the logistic development and technology penetration, of various components of the economy. One important drive parameter of the development is the credibility of the strategies that may be modeled with ‘meme’s a concept introduced by Dawkins in the seventies. Combining all these concept Purica was able to model the crises with an example for the financial crises. The EU commission Green deal asks for neutral emissions by 2050 and transport is one of the important domains to consider for the change of new technologies. The upcoming electric transport is the main technology to consider and in the future there will be a need for more installed electric power to load the batteries of the future electric vehicles fleet. There is though a limit to how much power EU should build every year till say 2060 to convert all road transport to electric. This yearly installed power is assessed by converting to electric power the fuel consumption of present vehicles and the figures resulting represent a challenge to the EU member countries (cca. 5000MWi/year). Considering the present emissions of the road transport the new power will have to be much less than 300kgCO2/MWh to be effective in making a reduction of emissions. If emissions must be zero then, only nuclear (fission and fusion), renewables and future Hydrogen technologies may be used. The research and innovation in these fields must be highly enhanced to reach this ambitious goal.
156
Session 18 - The impact of oil price fluctuation
Gbadebo Oladosu, Paul Leiby, Rocio Uria-Martinez, David Bowman, Megan Johnson, U.S. GDP, OIL PRICE SHOCKS AND DOMESTIC OIL PRODUCTION: AN ARDL ANALYSIS
Gbadebo Oladosu, Oak Ridge National Laboratory, Oak Ridge, TN, USA Paul Leiby, Oak Ridge National Laboratory, USA
Rocio Uria-Martinez, Oak Ridge National Laboratory, USA David Bowman, University of Tennesse, USA
Megan Johnson,Oak Ridge National Laboratory, USA
Overview The surge in domestic production of crude oil in the United States (U.S.) since 2012 has led to dramatic changes in the pattern of net U.S. oil trade balances, and discussions of what this means for the economic impacts of oil price shocks. A few studies have shown that increases in domestic oil production contribute positively to the U.S. economy (Bordoff and Houser, 2015; Vidas et al., 2014). An initial 2014 study (U.S. Whitehouse, 2014) used a single equation model of the growth in gross domestic product (GDP) as a function of oil price change and oil import expenditure share. The specification allows the GDP impact of an oil price shock to decline to zero as the net oil import expenditure goes to zero, but excludes other factors. However, the economic response to an oil price shock depends on a complex set of factors beyond import expenditures that should be accounted for when estimating the GDP elasticity, even with recent increases in domestic production. First, the extent to which domestic production can be increased to mitigate an oil supply disruption is limited, particularly in the short run because adding oil production capacity takes some time. U.S. oil supply, as well as domestic demand, remains highly inelastic to changes in the price of oil (Newell and Prest, 2019; Smith and Lee, 2017). In addition, since oil refineries are designed and optimized to process specific combinations of oil types, switching the types of crudes processed would incur additional costs in the short run. Lastly, prices of different crudes are determined to a large extent by changes in the global oil market, so that price shocks arising from anywhere in the world would be felt in the domestic market, even under complete oil self-sufficiency. Thus, even with zero net oil imports oil market shocks can affect the domestic market, imposing GDP costs through aggregate and allocative effects on oil-using and other economic activities. The overall economic impact of an oil price shock is summarized in the literature by the oil price elasticity of the GDP, referred to as the “GDP elasticity”, and is a key metric for the cost-benefit analysis of potential policy responses to an oil price shock. As shown in a recent meta-analysis (Oladosu et al., 2018), estimates of the GDP elasticity vary widely, depending on how channels of interactions between oil prices and the economy are captured, the underlying data, as well as study-specific characteristics (Herrera and Rangaraju, 2019). The current study examines the question of whether the GDP elasticity would change significantly after controlling for changes in U.S. oil market variables, as well as macroeconomic factors. Methods This study evaluates the response of the U.S. economy to changes in the oil price, considering asymmetric price effects and controlling for important oil market variables (U.S. petroleum production, imports, consumption and inventory).
157
Session 18 - The impact of oil price fluctuation
The study also controls for macroeconomic factors by including the consumer price index, federal funds rate, real exchange rate and an index of global economic performance (measured by the OECD+6 index). The data are monthly, spanning the period from 1986 to 2018. Although the official GDP data from the U.S. Bureau of Economic Analysis (BEA) are quarterly, novel monthly GDP estimates were obtained as follows. Official monthly estimates of U.S. valued-added components that account for about 70% of the GDP were obtained from the BEA, and the remaining 30% were estimated by interpolating the corresponding quarterly data. The data was used to estimate an autoregressive distributed lag model (ARDL) of real U.S. GDP in error-correction form with an intercept and monthly dummies. We first test for stationarity, structural breaks and weak exogeneity of the regressor variables relative to the GDP. We account for differences in the effects of positive and negative oil price changes by separating the oil price variable into these two components, leading to the non-linear or asymmetric form of the ARDL model (Shin, Yu and Greenwood-Nimmo, 2014). Diagnostics for serial correlation, heteroscedasticity, residual normality and model stability were performed on the final specification. The bootstrapped PSS bounds test (Pesaran, Shin and Smith, 2001; McNown, Sam and Goh, 2018) was used to test for cointegration of the model variables. Results Unit root tests show that most of the variables are non-stationary but none are I(2), so these are valid for the ARDL model. We use the approach in Enders and Jones (2016) to deal with indications of structural breaks in a few variables. A lag of 4 months was found to show no serial correlation of the residuals. The Wu-Hausmann test found that the independent variables are weakly exogenous with respect to the real U.S. GDP. Cumulative sum stability tests show that the model coefficients are stable. Since diagnostic tests reject normality and homoscedasticity of the residuals, we added two dummy variables for data points that were significant outliers and used a heteroscedastic-consistent estimate of the covariance matrix to deal with remaining heteroscedasticity. The bootstrapped PSS bounds test found that the variables are cointegrated, confirming the validity of the long-run parameter estimates. Long-run and short-run coefficients on the lagged GDP variable are almost all significant with p-values below 1%. About half of the monthly dummies and one of the four structural break variables are also significant at the 5% level and below. The long-run parameter for the positive oil price changes variable is significant at the 10% level, but the short-run parameters are not. Only the second short-run parameter of the negative oil price changes variable is significant at the 5% level. Among the oil market quantity variables (production, imports, and consumption), only petroleum consumption coefficients are significant with a positive long-run estimate of about 0.06 and p-value of 8%, and negative short-run estimates on the first two lags of -0.037 and -0.057, with p-values of 9% and 1%, respectively. Several of the parameters on the four macroeconomic variables are also significant at the 10% level or below. In this study, short-run coefficients in the Error Correction version of the ARDL model are the same as the short-run elasticities and the long-run elasticity estimates are calculated. For the positive oil price changes variable, the long-run estimate of the oil price elasticity of GDP is about -0.022. Conclusions The results of this study show that the U.S. real GDP is cointegrated with the oil market and economic variables examined. Studies on the role of changing oil production and imports in U.S. economic sensitivity to oil market shocks must account for these interactions.

158
Session 18 - The impact of oil price fluctuation
The parameter estimates imply that a 1% positive and permanent oil price shock would have a long-run impact of -0.022% on the U.S. economy, but the short-run parameter estimates on the positive (month 1 to 4) oil price changes are not significant at the 10% level. Although the long-run parameter on the negative oil price changes variable is not significant, the implied elasticity is about -0.016. These elasticity estimates are in line with those found in the meta-analysis of Oladosu et al. (2018) which focused on literature post-2005 (many include data back to the 1970s) with a value of -0.020 and a 68% confidence interval of -0.035 to -0.006, four quarters after a shock. Thus, the results of this study mean that controlling for abundant domestic U.S. oil production and oil trade changes does not significantly change the GDP elasticity. However, the GDP elasticity estimate differs from the net GDP impacts of an oil market shock, where the latter incorporates both the net oil price response and the GDP elasticity. The net oil price impact of an oil market shock depends on both market conditions and adjustments to the shock within the economy, including non-market interventions such as use of strategic oil reserves. Thus, while the net GDP impacts of a given shock may change over time due to changes in the price response, this study finds that the GDP elasticity itself has not changed significantly due to recent changes in U.S. domestic oil production and imports. References Vidas, H., Adams, B., and Nguyen, T. (2014). The Impacts of US Crude Oil Exports on Domestic Crude
Production, GDP, Employment, Trade, and Consumer Costs. ICF International. https://www.api.org/~/media/files/policy/lng-exports/api-crude-exports-study-by-icf-3-31-2014.pdf
Bordoff, J., and Houser, T. (2015). Navigating the US oil export debate. Center on Global Energy Policy, Columbia Univ.
Newell, R. G., and Prest, B. C. (2019). The unconventional oil supply boom: Aggregate price response from microdata. The Energy Journal, 40(3).
Smith, J. L., and Lee, T. K. (2017). The price elasticity of US shale oil reserves. Energy Economics, 67, 121-135.
U.S. Whitehouse (2014). The all-of-the-above energy strategy as a path to sustainable economic growth. https://obamawhitehouse.archives.gov/sites/default/files/docs/aota_energy_strategy_as_a_path_to_sustainable_economic_growth.pdf
Herrera, Ana Maria, and Sandeep Kumar Rangaraju. (2019) The Effect of Oil Supply Shocks on US Economic Activity: What Have We Learned? Journal of Applied Econometrics.
Oladosu, Gbadebo A., Paul N. Leiby, David C. Bowman, Rocio Uría-Martínez, and Megan M. Johnson. (2018) Impacts of Oil Price Shocks on the United States Economy: A Meta-Analysis of the Oil Price Elasticity of GDP for Net Oil-Importing Economies. Energy Policy 115): 523–544.
Pesaran, M Hashem, Yongcheol Shin and Richard J Smith. (2001). Bounds testing approaches to the analysis of level relationships. Journal of Applied Econometrics 16(3):289-326.
McNown, Robert, Chung Yan Sam, and Soo Khoon Goh. (2018). Bootstrapping the Autoregressive Distributed Lag Test for Cointegration. Applied Economics 50, no. 13: 1509–1521.
Enders, Walter, and Paul Jones. (2016). Grain Prices, Oil Prices, and Multiple Smooth Breaks in a VAR. Studies in Nonlinear Dynamics & Econometrics 20, no. 4: 399–419.
Shin, Y., Yu, B., & Greenwood-Nimmo, M. (2014). Modelling asymmetric cointegration and dynamic multipliers in a nonlinear ARDL framework. In Festschrift in honor of Peter Schmidt (pp. 281-314). Springer, New York, NY
159
Session 18 - The impact of oil price fluctuation
Neil A. Wilmot TIME-VARYING JUMP INTENSITIES AND THE INTERCONNECTEDNESS OF THE NORTH AMERICAN CRUDE OIL COMPLEX
Neil A. Wilmot, University of Minnesota Duluth, USA
Overview Since the turn of the millennium, energy markets have experienced a number of shocks, particularly on the supply side. The rise of unconventional methods of production in the United States and the changing role of OPEC have impacted energy commodity markets. The financialization of commodity markets also played a role in the volatility observed in energy markets. The commingling of such events, over the last 15 years, could have impacts on the interconnectedness of energy commodity markets. The hypothesis pertaining to the interconnectedness of energy commodity markets dates to the early work of Adelman (1992), and continues today with the investigation of a ‘global pool’ hypotheses in oil markets [Wilmot, 2013; Dar 2018], typically with a focus on the univariate or bilateral properties of the commodities price series. Yet, a particularly salient feature of many commodity markets is the unexpectedly rapid changes that result from the arrival of new information. The discontinuous arrival of information necessitates a stochastic process that incorporates this feature, and as such jump processes have become an important tool in the analysis of energy markets. Recent research has established the relevance of discontinuities for modeling oil prices, and recognized that the arrival of new information can lead to “jumps” [Askari and Krichene, 2008; Lee et al, 2010; Mason and Wilmot, 2014; Postali and Picchetti, 2006; Wilmot and Mason, 2013]. In general, the adoption of a stochastic process which incorporates the discontinuous arrival of information has allowed for multiple jumps to occur in a period, however the jump intensity is assumed to be constant over time. This latter feature is of particular importance for energy markets as they are frequently hit with unexpected news. Examples include natural disasters (hurricanes, earthquakes), geopolitical developments (nationalization, strikes) strategic actions (OPEC), and other unforeseen events (spills, pipeline disruptions). These sorts of effects can lead to periods of unexpectedly large changes in energy futures prices, either upwards or downwards. Chan and Maheu (2002) developed a conditional jump model (ARJI), with a time conditional jump intensity, which is modelled as an autoregressive moving average (ARMA) form. The jump model is coupled with a generalized autoregressive conditional heteroscedasticity (GARCH) specification of volatility. The results indicate significant evidence of time variation in the conditional jump intensity. Recently, Wilmot and Mason (2019) have applied the model to three energy commodity futures prices (crude oil, natural gas, coal). Based on daily futures price returns, the results demonstrate the importance of incorporating time-varying jump intensities in energy markets. Herein, the autoregressive conditional jump intensity model (ARJI) is adopted, with an emphasis on the time-varying jump intensity, for use in examining the interconnectedness across tiers of the North American crude oil market. As Fatouh (2011) notes, the pricing formulae used in oil markets centre on key ‘physical’ benchmarks such as West Texas Intermediate (WTI). If jumps are important at the benchmark level, what role have they to play in the secondary (Louisianna Light, Mars, Mex. Maya, Louisianna Heavy, etc.) markets?
160
Session 18 - The impact of oil price fluctuation According to Fattouh (2011) as the market becomes thinner – lower volume of production – the pricing process becomes more difficult. Furthermore, the author notes that markets with low volumes of production influence the price for markets with higher volumes. Do discontinuities in one crude oil market influence arrival of discontinuities in another? The potential presence of bilateral relationships across an array of crude oil prices, from different regions of North America, is investigated. Finally, the period of study is dissected into sub-periods (pre- and post 2008) due to what would be described as a structural break, with one possible cause due to the rapid increase shale oil production [Brown and Yucel, 2013; Killian, 2017 ] Methods Using daily data on crude oil (spot) prices, from secondary North American markets and the WTI benchmark series. A series of time-varying jump intensity values, based on the ARJI model of Chan and Maheu (2002) are obtained.
The ARJI model should be useful in capturing time series dynamics of the conditional jump intensity. To investigate the existence of spillovers multivariate GARCH methods are employed. The model allows for an examination of linkages across and within the crude oil tiers. Results Prior to estimation of the jump diffusion process, conventional tests were utilized to determine the existence of a unit root. The ADF, Phillips – Perron, as well as the modified ADF test indicate that price (levels) appear to be nonstationarity while (log) returns (calculated as 1st – differences) are stationary over the period of study. The role of discontinuities (jumps) for the idiosyncratic (or secondary) crude series is noted, which aligns with previous results for the benchmark series (Wilmot and Mason, 2013). Univarite GARCH results demonstrate the time-varying properties of the autroregressive jump intensity terms, across the various blends. Preliminary results from the multivariate GARCH analysis suggests evidence of a bi-directional relationship. The finding of the CCC model indicate positive and statistically significant correlation between the secondary crude oils, with a high correlation of 0.91 occuring between blends with differing characterisitics. The BEKK specification supports the bi-directional hypothesis, both between the benchmark and secondary blends, and across the variaous secondary blends. Significance is observed across the ‘shock’ coefficeints as well as the previous uncertainty in the volatility equations. Conclusions Evidence of a bi-directional relationship could have implications for producers, traders, and governments. The result that suggest that secondary crudes can impact the benchmark could have broad implications, particularly for the dynamics of hedging strategies. The data are generally available starting in 2000, through the end of 2018. The period contains numerous events (Great Recession, Katrina, Shale Revolution) that are likely to produce a structural break. Based on the results of a structural break analysis, sub periods were formulated References Adelman, M.A. 1984. International oil agreements. The Energy Journal, 5(3), 1–9. Askari, H., and Krichene, N., 2008. Oil price dynamics (2002–2006). Energy Economics. 30, 2134–2153.
161
Session 18 - The impact of oil price fluctuation Brown, S.P., and Yucel, M.K., 2013. The shale gas and tight oil boom: US states’ economic gains and
vulnerabilities. Council on Foreign Relations. Chan, W. H., and Maheu, J.M., 2002. Conditional jump dynamics in stock market returns. Journal of
Business and Economic Studies. 20, 377–389. Dar, A.B. 2018. The globalization-regionaliation debate in internation crude oil markets: old wine in new
bottles. OPEC Energy Review, 42(3) 244 – 261 Fattouh, B. 2011. The dynamics of crude oil price differentials. Energy Economics, 32, 334–342. Kilian, L. (2017). The Impact of the Fracking Boom on Arab Oil Producers, The Energy Journal 38: 137–160. Lee, Y. H., Hu, H. and Chiou, J., 2010. Jump dynamics with structural breaks for crude oil prices. Energy
Economics 32: 343 – 350. Mason, C.F. and N.A. Wilmot. 2014. Jump Processes in Natural Gas Markets. Energy Economics. 46
(Dec): S69 – S79 Postali, F. and Picchetti, P. 2006. Geometric Brownian motion and structural breaks in oil prices: A
quantitative analysis, Energy Economics 28: 506 – 522. Wilmot, N.A., 2013, Cointegration in the Oil Market among Regional Blends. International Journal of
Energy Economics and Policy, 3(4) 424 - 433. Wilmot, N.A., and Mason, C.F. 2013. Jump processes in the market for crude oil. The Energy Journal,
34(1), 33–48. Wilmot, N.A., and Mason, C.F. 2019. Jumps in energy commodity markets. in Handbook of Energy
Finance: Theory, Practice and Simulations. Ed. Goutte, S. and Nguyen, K.D. World Scientific Forthcoming
162
Session 18 - The impact of oil price fluctuation
Rocío Uría-Martínez, Paul N. Leiby, Gbadebo Oladosu, David Bowman, Megan Johnson, AN EXPLORATION OF THE ROLE OF PETROCHEMICAL DEMAND ON WORLD OIL DEMAND ELASTICITY
Rocío Uría-Martínez, ORNL, One Bethel Valley Road. Oak Ridge, TN 37831. USA
Paul N. Leiby, Oak Ridge National Laboratory, USA Gbadebo Oladosu, Oak Ridge National Laboratory, USA
David Bowman, Econotech, USA Megan Johnson, Oak Ridge National LaboratoryUSA
Overview Chemical feedstock is projected to account for 30%-50% of global oil demand growth in the next decades (IEA, 2018). With that growth, the share of world oil demand consumed by the petrochemical sector would increase from 12% in 2017 to 16% in 2050 and become the largest non-transportation use of oil. Chemical feedstock is consumed by steam crackers whose outputs (a combination of ethylene, propylene, butadiene, and aromatics) are the inputs for producing plastics, synthetic fibers, and rubber. Projected growth in oil use in the petrochemical sector is underpinned by strong increases in demand for plastics in non-OECD countries. This analysis applies time series econometrics to estimate the elasticity of demand for petrochemical feedstocks and to provide insight on how the projected growth in petrochemical sector oil demand may affect total world oil demand responsiveness to crude oil price. Global oil demand elasticity is an important parameter for applied economists and policymakers assessing the economic impact of oil supply shocks and the effectiveness of policy interventions affecting the oil market. Despite the growing importance of the petrochemical sector in global oil demand, few oil demand elasticity estimates focused on the petrochemical sector have been published to date. Past research has typically produced energy demand elasticities for the aggregate industrial sector. An exception is Dargay & Gately (2010) which estimate regional elasticities for a sector composed of petrochemical feedstock, liquefied petroleum gas, and other miscellaneous uses. Using annual data for 1971-2008, they find oil use in that sector to not be price responsive for China and oil exporting countries and for elasticities to range from -0.015 to -0.027 in the short run and from -0.18 to -0.31 in the long-run in OECD countries. Although the petrochemical sector is an important part of the industrial sector, it is distinct in that approximately 60% of its energy demand is for energy liquids and gases as chemical feedstock rather than process energy. Thus, estimates for the entire industrial sector might not accurately depict price responsiveness in the petrochemical sector. Another interesting aspect of the analysis of petrochemical oil demand arises from the substitution relationships among feedstocks. Petroleum feedstocks for the chemical sector originate both from oil refineries (naphtha, gasoil) and natural gas fractionation plants (ethane, propane, butane). Ethane is the primary feedstock in North America and the Middle East; the rest of the world relies more heavily on oil-based feedstocks. There is some degree of substitutability between oil-based feedstocks and natural gas liquids (NGLs) as well as among the individual feedstocks within those categories. In the short-run, much of the input flexibility comes from dual-fuel steam cracker units. Additionally, steam crackers typically have multiple units using different feedstocks. Of the 34 steam crackers in the United States in 2015, only four specialized in a single feedstock (Oil and Gas Journal, 2015).
163
Session 18 - The impact of oil price fluctuation Based on data availability and the difficulty to disentangle naphtha use in refining versus petrochemical operations at the global level, the initial focus of this analysis is on estimation of demand elasticities in the U.S. petrochemical sector. Given the large share of NGLs in U.S. steam cracking (ethane use in the U.S. petrochemical sector increased 75% in the past decade), this analysis estimates demand elasticity for oil-based feedstocks (naphtha plus gasoil) and NGLs (ethane plus propane) with respect to oil and natural gas prices. Methods We fit Autoregressive Distributed Lag (ARDL) models for two types of petrochemical inputs in terms of their own lagged values, and measures of current and lagged oil and gas prices and industrial production. The dataset used for this analysis includes 1) domestic consumption of ethane, propane, naphtha, and gasoil in the U.S. petrochemical sector, oil (WTI) and natural gas (Henry Hub) prices, and an industrial production index to capture overall patterns in economic activity.2 The two quantity series to be used in the analysis (“Oil Feedstocks” and “NGL Feedstocks”) are constructed as the sum of the naptha-gasoil and ethane-propane pairs, respectively, and were adjusted for seasonality. All data series are monthly and cover the period from January 2010 to February 2020. The production index series was retrieved from the Federal Reserve Bank of Saint Louis (FRED) website; all other series are from the Energy Information Administration. The ADF, Phillips Perron, and KPSS unit root tests were performed on the logarithmic transformation of each variable. For the price and production index series, all the tests support the existence of a unit root. However, for petrochemical feedstock use, the results are inconsistent across tests; the KPSS test rejects the null hypothesis of stationarity, the Phillips-Perron test rejects the existence of a unit root, and the ADF test rejects the existence of a unit root only at the 10% level of significance. All tests were consistent in their finding of stationarity for the first difference of all the series ruling out orders of integration greater than Given the inconclusive results from the unit root tests for the petrochemical feedstock consumption series, the Pesaran bounds test was selected as appropriate to test for the existence of a long-run relationship among the series in each demand equation (Pesaran et al., 2001). For performing the bounds test, the first step is selecting the lag order for the ARDL model. Following the recommendation in Cuddington and Dragher (2015) to avoid imposing implausible restrictions in the ratio between short-run and long-run elasticities, at least two terms (contemporaneous level and one lag) are included for all independent variables. Based on the Bayesian information criterion, the selected ARDL models (in terms of their own lags and those of oil price, gas price, and industrial production) are (1,1,1,1) for both groups of feedstocks. For the NGL feedstocks, the selected ARDL specification contains a trend variable. Next, multiple tests were conducted on the residuals of the selected ARDL models, for serial correlation, normality, structural breaks, and heteroskedasticity. The Ljung-Box test did not find evidence of remaining serial correlation in the residuals of the selected ARDL models. The Shapiro-Wilk test did not reject the null hypothesis of normally distributed residuals. Based on the CUSUM test for structural change, the residuals of all the equations were dynamically stable during the period of analysis. Finally, the Breusch Pagan test does not reject the null hypothesis of homoskedastic residuals in either of the equations.
2 The propane consumption series covers propane consumption across all industrial sectors. No data were available for consumption in the petrochemical industry alone.
164
Session 18 - The impact of oil price fluctuation Results The null hypothesis of no long-run relationship in the Pesaran bounds test is rejected for all feedstocks at the 5% level of significance in the selected ARDL specifications. Based on the results of the bounds test, we estimated the unrestricted error correction equations for each of the feedstock demand equations and calculated the resulting short and long-run elasticities. The short-run (one-month) elasticities with respect to WTI and Henry Hub prices are not statistically significant for any of the feedstocks. In the long-run, the elasticity of oil-based feedstock use with respect to the Henry Hub price is 0.16 and the elasticity with respect to the WTI price is very close to zero in value and not statistically significant. The long-run response from NGL feedstocks is positive with respect to the WTI price and negative with respect to the Henry Hub price. The values of the NGL price elasticities are 0.137 with respect to the WTI price and -0.08 with respect to the Henry Hub price.
Conclusions Based on these initial results, oil-based feedstocks and NGL feedstocks are substitutes for each other in the long-run (use of oil-based feedstocks responds by 0.16% to a 1% increase in the price of natural gas and use of NGL feedstocks increases by 0.14% when the WTI price increases by 1%). However, in the short-run (one-month), neither of the feedstock categories responds significantly to changes in the WTI and Henry Hub price. For comparison, based on a meta-analysis of published elasticity estimates, Uría-Martínez et al. (2018) found long-run elasticities of transportation and non-transportation oil demand with respect to crude oil price of -0.18 and -0.32). Therefore, demand elasticity in the petrochemical sector appears to be closer to that of the more inelastic transportation sector suggesting that an increase in the relative weight of petrochemical oil demand on global oil demand would tend to decrease (in absolute value) world oil demand elasticity. Further work on the topic of petrochemical feedstock demand elasticities includes investigating the relationships between feedstock use and feedstock prices for each of the individual feedstocks rather than the broad categories analyzed here and considering alternative model specifications to capture more fully the substitutions among feedstocks. References Cuddington, J.T., & Dagher L. (2015). Estimating Short and Long-Run Demand Elasticities: A Primer
with Energy-Sector Applications. The Energy Journal Vol. 36, No. 1., pp. 185-209.
Dargay, J.M., & Gately D. (2010). World oil demand’s shift toward faster growing and less price-responsive products and regions. Energy Policy 38: 6261-6277.
IEA (2018). The Future of Petrochemicals. Toward more sustainable plastics and fertilisers.
Oil and Gas Journal. (2015). International Ethylene Survey.
Pesaran, M.H., Shin Y., & Smith, R.J. (2001). Bounds testing approaches to the analysis of level relationships. Journal of applied econometrics 16(3), 289-326.
Uría-Martínez, R., Leiby, P. N., Oladosu, G., Bowman, D.C., & Johnson, M.M. (2018). “Using Meta-Analysis to Estimate World Oil Demand Elasticity”. ORNL/TM-2018/1070.
165
Session 19 - Strategic contribution of innovation and energy storage to energy security
Giorgio Perico, Virginia Canazza, Antonio De Paola COULD FAST RESERVE DRIVE THE INVESTMENTS IN STORAGE IN THE ITALIAN ELECTRICITY MARKET?
Giorgio Perico, REF-E srl, manager, Italy Virginia Canazza, REF-E srl, partner and CEO, Italy
Antonio De Paola, REF-E srl, expert consultant, Italy
Overview The Italian electricity market is not yet completely open to electrochemical storage, still presenting a number of barriers, from a regulatory, authorization and economical point of view: indeed, the rules to participate in the markets have been designed for conventional generation assets and need to be revised to allow a full integration of limited-capacity assets such as storage; the authorization process is not yet well defined, particularly for stand-alone batteries; and finally, the spot electricity markets lack adequate price signals to stimulate investments in such technology, given the still high costs (although expected to fall sharply in the next years). However, in the National Energy Plan, the need for a relevant amount of storage capacity (6 GW of large-scale storage, in addition to other 4 GW of distributed small-scale batteries) is highlighted, to support the expected penetration of non-programmable renewable sources towards the national targets set for 2030. Therefore, the need emerges to remove the existing barriers and, above all, to create adequate price signals for investments: for this purpose, the Italian TSO is going to create a new market for Fast Reserve, in which the assets capable to provide the system with this service (mainly electrochemical storage) can participate in forward auctions, to get a 5-years remuneration for guaranteeing their availability. The study carried out in this paper is aimed to assess whether the introduction of the Fast Reserve market can be successful in stimulating investments in storage and if it is enough to drive the penetration of batteries in the market up to the target level. Methods The first step of the analysis was to estimate the Levelized Cost of Energy for Storage (LCOS). The capex have been determined according to data collected from player in the energy sector and to the latest technical report published by the National Renewable Energy Laboratory: this results in 300-350 €/kWh of initial investment for a lithium-ion battery with c-rate 1 (that is 1-hour storage capacity). The operational costs have been estimated as a fixed portion of the capex, in the range 2%-3% per year. Battery degradation is considered by assuming a limited number of life cycles (5,000 cycles) for a fixed depth-of-discharge level (80%). The revenues for the storage systems depend on the possibility to purchase and withdraw energy from the grid (charge) in the hours in which the price is lower and to sell it back and inject in the grid (discharge) in the hours in which the price is higher, maximizing the spread between sale and purchase prices. By balancing costs and revenues (discounted to take into account the required minimum return on investment), it was possible to estimate the cost per cycle, that is the minimum spread to be captured on the market to reach the target return.

166
Session 19 - Strategic contribution of innovation and energy storage to energy security
This spread had to be increased by a factor depending on efficiency, to take into consideration that the amount of sold energy is only a portion of the purchase (assumed around 90%). The LCOS was then directly obtained from the cost per cycle, assuming an expected purchase price for energy, either on the day-ahead market (DAM) or on the balancing market (BM). The second step was to assess the contestable market room for storage, expected in the medium-long term. A business-as-usual scenario was built up to 2040, considering the expected trend of fundamentals, for both the day-ahead and the balancing market: expected prices and volumes on the different market sessions have been obtained from a simulation of the scenario, performed through a suite of structural and econometric REF-E models. In particular, on the BM, a price-volume distribution was projected in the future, by considering a persistency of the price spreads between DAM and BM: this distribution was intersected at the LCOS level to determine the portion of volumes on which the storage can compete year by year, replacing the most expensive resources on the system. The final step was to estimate the expected level of batteries that could join the market. The amount of contestable volumes was distributed among the batteries, to find the optimal equilibrium of the system, corresponding to which no further batteries will join the market (because the market room would shrink for everyone, reducing the expected return on investment) and no less batteries will join the market (because the positive return on investment would attract some other players). This approach was performed considering or not considering the contribution to the remuneration coming from the Fast Reserve project. Results Without the Fast Reserve project, the LCOS results very high compared to the prices expected on the spot markets, not only on the DAM, but also on the BM. Only in some market zones, such as Centre-South, where the BM is very concentrated and the prices can reach extremely high peaks (up to 500 €/MWh), it makes sense to consider purely merchant investment in batteries, but only starting from the medium term (2025). So, we focused on the case with the Fast Reserve project, assuming that the batteries could receive a fixed remuneration at 80,000 €/MW/year (the auction cap) for 5 years on at least the 30% of their power. The result is quite different: the LCOS is significantly reduced, falling to levels within the range 130 €/MWh-150 €/MWh. Also in this case, the prices on the DAM are not expected to reach a level sufficient to support the investment, while it makes sense to evaluate investments aimed to operate on the BM. The amount of balancing volumes expected to be purchased at a price more expensive than the LCOS, for which the storage could compete, was estimated around 500-600 GWh in the short term (2022, the first year of the expected delivery of Fast Reserve, which now has been delayed to 2023). In the long term, this market room is expected to significantly grow up, up to 2 TWh in 2030-2035, due to the sharp reduction in the capex (which affects the LCOS) and to the expected growth of the balancing needs of the system. Given this market room, 1.6 GW of power-intensive storage (c-rate 1) could enter the market, starting from 2022. There will be, in any case, relevant differences on a zonal basis: indeed, almost half of this capacity could be located in the Centre-South zone, characterized by the higher price spreads on the BM. The installed capacity of power-intensive storage then could furtherly increase in the following years, reaching 5 GW between 2030 and 2035.

167
Session 19 - Strategic contribution of innovation and energy storage to energy security
New power intensive storage GW
Source: REF-E estimations From 2035 onwards, also energy-intensive applications could become profitable, because of two main factors: the relevant decrease of the technology costs and the increasing price spreads on the DAM, mostly driven by the increasing penetration of solar generation. Large storage systems (up to 4 hours of storage capacity) could contribute to mitigate the increasing risk of overgeneration in the long run: other 7 GW of storage (corresponding to 28 GWh of storage capacity) could join the market after 2035. Of course, these results are extremely sensitive to the scenario assumptions which were considered in the analysis, in particular to the trend of penetration of non-programmable renewable capacity. For example, in a more “green” scenario, in which renewables are assumed to grow up to reach the ambitious national targets, the storage penetration can be faster, due to the major emphasis of price spreads (up to +30%-40% compared to the base estimate). Conclusions The Fast Reserve project seems to be an adequate instrument to drive investments in storage technology. If the auctions will be confirmed not only for 2023, but also for the next years, the trend of penetration of storage in the Italian market could be quite consistent with the expected needs highlighted in the National Plan. However, it is plausible that investments will be mainly focused on power-intensive applications in the short-medium term and only in the long term they could be aimed to energy-intensive applications: the non-programmable renewables will affect the price spreads on the spot markets, generating the price signals for investors. References CS Lai, MD McCulloch (2017) “Levelized cost of electricity for solar photovoltaic and electrical energy
storage”, Applied energy, Volume 190, 15 March 2017: 191-203.
I Pawel (2013) “The cost of storage-how to calculate the levelized cost of stored energy (LCOE) and applications to renewable energy generation”, Energy Procedia 46 (2014): 68-77.
V Jülch (2016) “Comparison of electricity storage options using levelized cost of storage (LCOS) method”, Applied Energy, Volume 183, 1 December 2016: 1594-1606.

168
Session 19 - Strategic contribution of innovation and energy storage to energy security
Dina Azhgaliyeva
ENERGY STORAGE POLICIES: EMPIRICAL EVIDENCE
Dina Azhgaliyeva, Asian Development Bank Institute, Japan Zhong Sheng, Energy Studies Institute, National University of Singapore
Overview Most energy storage technologies are immature and require investments in R&D in order to improve performance, safety and reduce cost. Many countries introduced policies supporting renewable energy storage to accommodate the growing share of renewable energy generation and to further increase deployment of renewable energy. One of the main disadvantage of energy storage, especially batteries, is high cost. Thus, most policies target to reduce cost of energy storage using policy instruments, such as public expenditure in RD&D, or by providing subsidies and loans Methods Using panel data from all OECD countries over the period 1985-2016 this study the determinants of investments in R&D of energy storage technologies. To obtain the basic results, we apply both random effects estimator and fixed effects estimator to our basic specification, together with the Hausman test. Our primary econometric specification considers the share of public energy storage R&D budget in country 𝑖’s GDP in year 𝑡, 𝑅𝐷 , , which is associated with a series of determinants, as shown below: ln 𝑅𝐷 , 𝑎 𝑎 ln 𝐸𝐼 , 𝑎 ln 𝐸𝑃 , 𝑎 ln 𝐸𝑃𝐴𝑇 , 𝑎 ln 𝑅𝐷_𝐸𝑋𝑃 , 𝑎 ln 𝐹𝑆 ,𝑎 ln 𝐸𝑅𝑆 , 𝑢 𝜀 , , where 𝐸𝐼 , reflects the energy intensity of country 𝑖 in year 𝑡. 𝐸𝑃 , is the dummy variable for energy storage policy. 𝐸𝑃𝐴𝑇 , measures country 𝑖’s innovation capability in environmental or low carbon technologies (Cantore & Cheng, 2018). 𝑅𝐷_𝐸𝑋𝑃 , indicates the share of overall R&D expenditure in GDP in the previous year 𝑡 1. 𝐹𝑆 , is the share of fossil fuels consumption in total energy use of country 𝑖 in year 𝑡. 𝐸𝑅𝑆 , measures the environmental regulation stringency of country 𝑖 in year 𝑡. In this paper, we consider two different measures of environmental regulation stringency, i.e., the share of environmental tax in GDP and the share of energy tax in GDP (Cantore & Cheng, 2018; Costantini & Mazzanti, 2012). 𝑢 captures the fixed-effect that corresponds to country 𝑖. Note that 𝑢 captures the time-invariant and economy-specific effects. 𝜀 , is the error term. Results The results are summarised as following:
Energy storage policies are effective in promoting investments. Availability of fossil fuels in the energy structure use decreases then need to invest
in energy storage.
169
Session 19 - Strategic contribution of innovation and energy storage to energy security Conclusions Countries with a low, but growing, share of renewable energy in their energy mix need to plan expenditure on energy storage and policies promoting investments in energy storage. Countries with high share of fossil fuel in energy use structure invest less in energy storage technologies, and thus require more incentives for promoting investments in energy storage. References Cantore, N. and C. F. C. Cheng (2018). "International Trade of Environmental Goods in Gravity Models."
Journal of Environmental Management 223: 1047-1060.
Costantini, V. and M. Mazzanti (2012). "On the Green and Innovative Side of Trade Competitiveness? The Impact of Environmental Policies and Innovation on EU Exports." Research Policy 41(1): 132-153.
170
Session 20 - The hydrogen economy opportunities and challenges Mario Valentino Romeri HYDROGEN AND FUEL CELL: LOOKING BACK TO 20 YEAR OF PROFESSIONAL EXPERIENCE AND LOOKING FORWARD BEYOND ‘COVID-19’ AND TOWARD ‘1.5° C PERSPECTIVE’
Mario Valentino Romeri, Energy Consultant, Italy
Overview In the first part of this paper I’ll describe my personal point of view about the fact that hydrogen and fuel cell have seen several waves of interest in recent history, none of which fully translated into rising, sustainable investment. My view is based on my professional experience in which, in July 2000, I wrote my first published comment on hydrogen-oxigen fuel cell and, during these 20 years, I made a wide range of analysis, research and advisory, I participated or attended to national and international program, forum and platform, I wrote presented and published articles and papers. For long time hydrogen energy vector and fuel cells technologies seem to be a Cinderella low-carbon solution in energy, transport and climate change debates but recently something happened. In recent years this low-carbon solution has made a strong comeback in energy portfolio options and, in recent months, it is considered as one of possible ‘game changer’. This new perspective growth rapidly during the Covid-19 pandemic thanks to the European Commission proposals of the “European Climate Law” and new plan for “A hydrogen strategy for a climate-neutral Europe”. This trend was confirmed in July when, at the European Council, EU leaders have agreed a comprehensive recovery package of EUR 1,824.3 billion to tackle the socio- economic consequences of the COVID-19 pandemic that combines the new “Multiannual Financial Framework” and an extraordinary recovery effort under the “Next Generation EU” instrument. And according to IEA ETP 2020 words: “governments and businesses are finally putting serious resources into the clean energy potential of hydrogen, which this report makes clear will be critical for reaching net-zero emissions”. From longtime I underlined the possible relevant implication of hydrogen and fuel cell use in stationary and transport applications and, in recent years I presented works in which I argued that it’s time to consider Fuel Cell Vehicle (FCV) as a relevant possible low-carbon solution in energy debate. The electricity produced by a hydrogen fuel cell can be used both for stationary and transport application and the traditional model to link transport to energy sector is the Vehicle-to-Grid (V2G) approach. But I think that it is time to consider the link between the transport sector and the energy sector not only in a V2G approach but in another perspective more direct, relevant and disruptive. In fact the Hydrogen Fuel Cell Powertrain (H2FCPowertrain) or, in other words, the propulsion system of a FCV, is a small power generation plant (typically the H2FCPowertrain size is around 100 kW). In the coming years the high volume associated with the possible FCVs mass production will permit to reduce dramatically the FC system manufacturing costs, in order to be competitive with gasoline in hybrid-electric vehicles. In a mass production perspective, H2FCPowertrain will be so cost competitive to be useful adopted also for stationary power generation application, also in LCOE terms. From 2010 I wrote, presented and published studies where I compared the H2FCPowertrain LCOE, based on the U.S. Department of Energy (DOE) public data, with the traditional power generation technologies with very promising results, in the U.S. context and in many other contexts around the world. From 2017 in my analysis I started to use also the

171
Session 20 - The hydrogen economy opportunities and challenges International Energy Agency (IEA) data for the H2 production costs. In the second part of this paper, starting from the conclusions of my 2019 “The history could repeat itself: hydrogen-oxygen fuel cell is the ‘game changer’” and 2018 “Consideration about Hydrogen and Fuel Cells in the Paris Agreement 1.5°C Perspective”, I analyse the most recent published data and elaborate other considerations in light of the Covid-19 pandemic effects and the recent EU above mentioned proposals and agreements. Methods First part: Historical and economic analysis. Second part: LCOE analysis. Results Hydrogen and fuel cell technologies seem to have overcome the past periodical waves of interest and today this low-carbon solution is generally considered as one of possible ‘game changer’. In a global perspective of more and more rapid development of hydrogen and fuel cell application, the H2FCPowertrain technology appears competitive, in LCOE terms, with many of the power generation technologies and, in the most favorable conditions of low H2 production costs, with almost all the technologies currently adopted. The economic advantage ‘to consider an H2FCPowertrain as power generation plant’ is confirmed, but this option has still not been considered in the general debate. Conclusions According to IPCC SR15 in the next few years it will be necessary to start unprecedented changes and to speed up CO2 emissions reduction. For these reasons next few years are probably the most important in our history. Paradoxically, the Covid-19 pandemic can facilitate the start of that tremendous technological change necessary to reach the IPCC ‘1.5°C’ perspective accelerating the transitions underway and making huge amounts of funds available to invest in recovery initiatives. So, in my opinion, today ‘political will’ is the most precious element necessary to move rapidly beyond Covid-19 and toward ‘1.5°C’ perspective. Today this ‘political will’ seem to be present both at the EU Commission, Council and Parliament levels, both in different European Countries. As I wrote in my 2019 paper that remembered the 50th anniversary of the moon landings: “The history could repeat itself. In 1969 the hydrogen-oxygen fuel cell invention made Neil Armstrong’s ‘small step’ possible. Today, the ‘state of the art’ hydrogen- oxygen fuel cells seems to be able to be, in next future, the ‘game changer’ against the “climate emergency”, to play a relevant role in the “economy of tomorrow” and maybe to be a new ‘giant leap for mankind’”. Today, according to Holy Father Francis words: “The pandemic is a crisis, and we do not emerge from a crisis the same as before: either we come out of it better, or we come out of it worse. We must come out of it better, to counter social injustice and environmental damage”. I can only add a hope: that Covid-19 tragedy maybe could really have a positive effect in the near future and to be a global transition accelerator toward a more sustainable and equitable world.

172
Session 20 - The hydrogen economy opportunities and challenges References BloombergNEF, 2020: “Hydrogen Economy Outlook Key Messages” <
https://data.bloomberglp.com/professional/sites/24/BNEF-Hydrogen-Economy- Outlook-Key-Messages-30-Mar-2020.pdf ;
E. Hall (University of Cambridge, Department of Chemical Engineering and Biotechnology), 2019: “Powering Apollo 11: the fuel cell that took us to the moon”, https://www.ceb.cam.ac.uk/news/powering-apollo-11-fuel-cell-took-us-moon ;
Holy Father Francis, 2015: Encyclical Letter “LAUDATO SI’ on Care for Our Common Home”, http://w2.vatican.va/content/francesco/en/encyclicals/documents/papa-
francesco_20150524_enciclica-laudato-si.html; Holy Father Francis, 2020: “General Audience, 19 August”,
http://w2.vatican.va/content/francesco/en/audiences/2020/documents/papa- francesco_20200819_udienza-generale.html;
European Commission, “4.3.2020 COM(2020) 80 final – European Commission - Proposal for a Regulation of the European Parliament and of the Council, establishing the framework for achieving climate neutrality and amending Regulation (EU) 2018/1999 (European Climate Law)”
https://eur-lex.europa.eu/legal-content/EN/TXT/PDF/?uri=CELEX:52020PC0080&from=EN; European Commission, Directorate-General for Energy, 2020: “Impact of the use of the biomethane and
hydrogen potential on trans-European infrastructure” https://ec.europa.eu/energy/studies/impact-use-biomethane-and-hydrogen-potential-trans-european-infrastructure_en;
European Commission, Press release, 2020, “Powering a climate-neutral economy: Commission sets out plans for the energy system of the future and clean hydrogen” https://ec.europa.eu/commission/presscorner/detail/en/ip_20_1259;
European Commission, Proposal, Brussels, 2020 “Com(2020) 301 Final Communication from the Commission to the European Parliament, the Council, the European Economic and Social Committee and the Committee of the Regions a hydrogen strategy for a climate-neutral Europe” https://ec.europa.eu/energy/sites/ener/files/hydrogen_strategy.pdf ;
European Council, “Special European Council, 17-21 July 2020 - Main results” https://www.consilium.europa.eu/en/meetings/european- council/2020/07/17-21/?fbclid=IwAR0xj_tleo2ywRGhhrZeGGaxLj8ZxuO8gF47fqnxTqPL0NNNgC7z-6lwyuo ;
The Federal Government, Federal Ministry for Economic Affairs and Energy, 2020: “Securing a global leadership role on hydrogen technologies: Federal Government adopts National Hydrogen Strategy and establishes National Hydrogen Council”
https://www.bmwi.de/Redaktion/EN/Pressemitteilungen/2020/20200610-securing-a-global-leadership-role-on-hydrogen-technologies.html and “The National Hydrogen Strategy”
https://www.bmwi.de/Redaktion/EN/Publikationen/Energie/the-national-hydrogen-strategy.html; Government of the Netherlands, 2020: “Government Strategy on Hydrogen” https://www.government.nl/binaries/government/documents/publications/2020/04/06/government-strategy-
on-hydrogen/Hydrogen-Strategy-TheNetherlands.pdf; Hydrogen Council, 2020: “Path to Hydrogen Competitiveness: A Cost Perspective” https://hydrogencouncil.com/wp-content/uploads/2020/01/Path-to-Hydrogen-Competitiveness_Full-
Study-1.pdf ; Hydrogen Europe, 2020: “Green Hydrogen for a European Green Deal A 2x40 GW Initiative” https://hydrogeneurope.eu/sites/default/files/Hydrogen%20Europe_2x40%20GW%20Green%20H2%
20Initative%20Paper.pdf ; Intergovernmental Panel on Climate Change (IPCC), 2018: “Global Warming of 1.5 ºC, an IPCC Special
report on the impacts of global warming of 1.5ºC above pre-industrial levels and related global greenhouse gas emission pathways, in the context of strengthening the global response to the threat of climate change, sustainable development, and efforts to eradicate poverty”
https://www.ipcc.ch/sr15/ ;

173
Session 20 - The hydrogen economy opportunities and challenges IEA, 2020: “Energy Technology Perspectives 2020” (ETP 2020), https://www.iea.org/reports/energy-
technology-perspectives-2020; M.V. Romeri, 2018: “Consideration about Hydrogen and Fuel Cells in the Paris Agreement 1.5°C
Perspective” in “3rd AIEE Energy Symposium Conference Proceedings”, Milan, 2018, pp. 294-307. http://www.aieeconference2018milan.eu/documents/AIEE_SYMPOSIUM_2018_proceedings.pdf;
M.V. Romeri, 2019: “The history could repeat itself: hydrogen-oxygen fuel cell is the ‘game changer’” in “4th AIEE Energy Symposium Conference Proceedings” Rome, Italy, 2019, p. 258-269. http://www.aieeconference2019rome.eu/documents/AIEE_Symposium_Proceedings_4.pdf ;
U. von der Leyen, 2020: “Opening statement by Ursula von der Leyen, President of the European Commission, on the EU Recovery package, extract from the Plenary Session of the EP”,
https://audiovisual.ec.europa.eu/en/video/I-191611?lg=EN&tin=11&tout=950&fbclid=IwAR0Bf4wrj5yBzGbNF1daGwqCTdCgVW-LTUhdUi9x1-jaE2Ppuz9cqZKPLlk .
174
Session 20 - The hydrogen economy opportunities and challenges
Alessandro Clerici HYDROGEN ERA: YES, BUT WHEN AND AT WHAT COST OF DELIVERED ENERGY? Alessandro Clerici, Senior Advisor Energy & Power Systems, WEC Italy and FAST-Italian Federation of
Technical & Scientific Associations, Italy Overview Green hydrogen, produced from renewables and which by burning generates water, it is clearly an appealing option for energy transition with its potential multi-sector uses and possibility to alleviate the challenges posed to power systems by the variability of wind and solar. With an escalation in last two years, hydrogen has become all around the world the main subject in the energy arena involving political institutions, energy agencies and associations. A lot of papers, webinars, headlines in the media and a lot of numbers on its possible uses, new jobs created etc are spread around but very few numbers on its characteristics and costs of final energy got from it. In the complete chain from production, compression, transport, storage, distribution and the very many possible uses the paper refers mainly to green H2 development and present and future expected costs at the production level together with comments on its transport. Methods From a critical analysis of data presented at specific events or reported in publications of key international energy institutions, a survey on present production and uses and possible future trends are reported; this together with an evaluation mainly of production cost of green hydrogen in terms of its energy content. An evaluation of the challenges posed by the intrinsic characteristics of hydrogen are derived for its possible diffusion and eventual utilization of the existing methane infrastructures and machinery/equipment/devices for its final uses. Results Data on present typologies of production and final uses of hydrogen are reported; it is underlined that hydrogen does not exist free on earth and it must be produced with different technologies from fossil fuels with a lot of CO2 emissions: the dominant production is from methane with high temperature steam reforming (SMR) causing around 9 kg of CO2 for 1 kg of H2 produced. Some comparisons on different presumed evolution up to 2050 from key agencies and the envisaged different shares for transport, industries, buildings and electricity production are reported for the global level, EU and Italy. With reference to the H2 characteristics A brief explanation on the “colors” of hydrogen considered in the paper is given .Both in the gaseous and liquid state H2 has a low specific energy content per unit volume, less than 1/3 of that of methane; the transportation in the liquid state (-253°C) requires 1/3 of its energy content for liquefaction alone and the energy needed to keep the low temperature. Apart from diffusion coefficient and flammability, hydrogen present technical and economic challenges for transport and distribution with respect to methane and some considerations on H2 direct or indirect ways of transport are summarized.

175
Session 20 - The hydrogen economy opportunities and challenges Key figures for comparisons in the paper are: 1 N cubic meter H2= 2,77 kWh (CH4 =8.75 kWh /N cubic meter) and 1kg H2 =33,24 kWh With reference to the development of green hydrogen production cost, as from the 2019 “Hydrogen: Bridging Sectors and Regions” event in September 2019 WEC conference in Abu Dhabi, it is possible to summarize the situation as follows, translating the data to the pure cost of energy content:
the 2019 cost of black hydrogen from fossil fuels is $1.25-$2.5/kg H2 (41.5-83€/MWh) the cost of green H2 at exit of an electrolyzer placed at the RES plant site to minimize the
transport costs of H2 or of electricity is: in 2019 – 7.8€/kg from onshore wind in Germany (260€/MWh)
With large technological development and large size of electrolyzers in 2030 – 3€/kg from offshore wind in Germany (100€/MWh) in 2050 (IRENA) H2 would cost 1.4 $/kg (39€/MWh)
with CAPEX of electrolyser 1/5 of present value ,and electricity at 20$/MWh with RES load factor of 4,200 hours per year ( the combined values for electricity cost and load factor are practically impossible to be considered for Central and Western Europe). It is worth mentioning that the EU pool price in 2020 was 13 €/MWh, pre COVID 19, that is 1/3 of expected value of green H2 in 2050 at the electrolyzer placed close to the RES plant.
Data on different types of electrolyzers are reported with diagrams to show the expected reduction on their CAPEX as due to unit size increase and technological developments, bringing also to higher efficiency. With reference to the possible blending of H2 in existing CH4 infrastructures, a 10% in volume of H2 (still to be verified in feasibility and legislation for gas networks with references to present characteristics of pipes/flanges, compressing stations, underground storages etc) provides a reduction of 7% in the calorific value of the overall transported/distributed mixture with respect to methane: the clearly strong impacts of this reduction are reported in the paper for the Italian case. The possible use of existing pipelines with 100% H2 (if feasible and at low costs for upgrading) reduces by over 3 times the energy transfer capacity of the infrastructure working at the present methane pressure . As to Gas to Power (G2P), a transformation of H2 to electricity, even with an efficiency of around 60%, the pure fuel cost component of the produced MWh is 165 €/MWh in 2030 and 65 €/MWh in 2050 and one has to add capital and O&M costs of a G2P plant tailor made for H2. This compares to 25€/MWh for the fuel cost component in EU of produced MWh in a natural gas CCGT plant (plus capital and O&M costs of a conventional and well performing plant).
176
Session20‐Thehydrogeneconomyopportunitiesandchallenges A P2G hydrogen followed by a G2P is not efficient and convenient in general and the electricity produced is more expensive than that directly got from RES; it could be limited for storage purposes to counteract daily and seasonal variability of wind and photovoltaic and must be compared to other alternatives. With reference to the envisaged hydrogen combination with CO2 to produce synthetic methane, from the STORE&GO project financed by EC, the cost in EU of synthetic gas would be of around 50-120 €/MWh in 2050, even with strong technological and economic development of both electrolyzers and methanation plants. The higher cost per unit of energy of the synthetic gas with respect to H2 has however a great advantage due to the possible use at no additional costs of the present gas infrastructures for transport and distribution of gas and of the well developed machinery/equipment/devices for CH4 use with many years of experience. For the Italian situation with respect to green hydrogen, data are provided on the possible cost of its production starting from the envisaged cost of MWh got from possible wind and PV large plants (but how much is feasible in Italy compared to the 1 GW size in some countries?) The Italian values of the MWh costs from RES compared to foreign off shore wind plants with around 5000 equivalent hours per year (we have 2200) or PV ones where eg in the UAE the offered electricity is at 15-20 €/MWh-From these data the expected Italian cost of production of green hydrogen are derived-Considerations are provided on the effects of possible blending in the Italian gas transport network and RES requirement to substitute with green H2 the present production of hydrogen from fossil fuels. Taking care Italy will not be competitive in hydrogen production it is mandatory to examine carefully where to address R&D investments and experiments in the complete chain production/transport/distribution/ final users in order to support an effective development of national industries. Conclusions Further holistic technical and economic analyses and international standards and legislations are required with long term experiments; this will affect the identification of the best option between a possible massive sectorial use of H2 or a wide use of synthetic methane from H2
and CO2 that could have a great use of present gas infrastructures. Other solutions for a competitive decarbonization are emerging or could emerge in next years and should be considered together with a combined optimal and coordinated development of H2 offer and demand which requires time. A possible cheap era of hydrogen is fascinating with inter sectorial connections of electrons and molecules but does not seem close yet; and are very welcome R&D investments and demonstration projects as essential to arrive at lower costs solutions .It is necessary to be cautious to promise now future low costs of energy from green hydrogen; strong reactions could emerge from final clients once the real costs become evident and make a serious impact on a future hydrogen era and on a stable and durable transition-Effective communication must be implemented to get the involvement of the energy users in spending more in energy for a possible better world environment. A pragmatic and rational approach is necessary even if sometimes it appears pessimistic in front of enthusiastic ideological approaches. The numbers envisaged for the future cost of green hydrogen underline the challenging travel H2 has to go through to become a competitive serious option. Per aspera ad astra.
177
Session 20 - The hydrogen economy opportunities and challenges
Jan Marc Schwidtal, Valerio Passarella, Marco Agostini, Fabio Bignucolo, Arturo Lorenzoni OPENING ANCILLARY SERVICE MARKETS: INVESTIGATING EMERGING P2G OPPORTUNITIES IN ITALY
Jan Marc Schwidtal, University of Padua, Department of Industrial Engineering, Via G. Gradenigo 6/a, 35131 Padova (PD), Italy
Valerio Passarella, University of Padua, Department of Industrial Engineering Marco Agostini, University of Padua, Centro studi di economia e tecnica dell'energia
Giorgio Levi Cases, Italy Fabio Bignucolo, University of Padua, Department of Industrial Engineering, Italy
Arturo Lorenzoni, University of Padua, Department of Industrial Engineering, Italy
Overview As the energy transition proceeds, new regulations like the European Clean Energy Package are paving the way for the European energy roadmap to 2050 take shape. With a growing share of renewable energies, reaching now already around 30% of the European electricity mix, the “low hanging fruits” are somewhat reaped and an increasingly holistic integrational approach is required to tackle the upcoming challenge of achieving an even more decarbonised energy system that incorporates an even bigger share of renewable energies, without compromising neither security of supply nor competitiveness. With a growing number of conventional energy units fading out, new development trajectories to ensure resource adequacy on a short to middle term as well as security of supply especially on a seasonal level are needed. In this direction the recent hydrogen-strategy of the European industry set the target of 2x 40 GW electrolyser capacity to be installed until 2030. Such electrolysers would on the one hand produce green hydrogen needed to reduce emissions in those economic sectors which are as of now hard to decarbonize. On the other hand, the installed electrolyser capacity could offer much needed short-term system flexibility for an electricity system composed by more and more non- programmable units from inherently volatile resources. Moreover, the potential re-integration of energy temporary stored in the energy vector of hydrogen could provide an opportunity for seasonal energy balancing and respective security of supply. To enable such development, it needs economic opportunities facilitating and eventually triggering respective investments. One often favoured course of action is to establish market-based incentives, creating a level playing field for new technologies to compete in the existent system and enabling full access to all markets and market segments, especially those ones with the most attractive remuneration. For the electricity system these are the ancillary service markets, valuing flexibility from enabled units significantly higher than mere energy markets. Granting access to such markets tackles thereby not only the need for increased flexibility from system operators, but untaps also new value streams for plant operators, rendering the respective investment considerations eventually even more competitive and less subsidy-dependent. In line with that the recent UVAM pilot project opened ancillary service markets in Italy to distributed energy resources to provide upward or downward balancing services with a minimum bid size of 1 MW. As of now more than 1 GW from formerly not-enabled units participate under this scheme, representing a significant step towards full integration of renewable and decentralized energies resources.
178
Session 20 - The hydrogen economy opportunities and challenges The objective of this paper is to approximate effective economic opportunities for a power-to-gas (P2G) plant in as emerged through the UVAM framework and based on as realistic boundary conditions as possible. The focus is thereby not on specific technologic optimization of the plant, but to benchmark the current status of economic opportunities and to highlight potential remaining gaps. Method To picture the economic opportunities, the operation of a P2G plant is simulated on multiple Italian markets as it would be enabled through the recent UVAM framework. With the focus being on plant-market-interactions, elementary but realistic operating figures from existent plants are used on the one hand to build a simplified P2G model. On the other hand, actual market data from Italian electricity, ancillary services and natural gas markets is used to represent the market side. Interaction is modelled by performing an ex-post analysis with the simplified P2G model to operate with a capacity of 5 MWel for one year on the Italian market. Based on different bidding strategies, market zones and market segments to be operated on, the resulting cashflows from operation are calculated and then further utilized to evaluate a potential investment decision through the assessment of the respective Net Present Values (NPV) and payback periods. The profitability analysis is split in four sections with a special focus on the electrolysis stage of a P2G unit, generating hydrogen from electricity. In a first step the unit is modelled to operate on the electricity day-ahead market only, selling hydrogen for a fixed price. In a second step the interaction of the very same unit with ancillary service markets through upward or downward balancing services is analysed. Bidding strategies are varied to highlight both hypothetical possible profits for an omniscient operator as well as the comparable results for a rather realistic operator that has no knowledge of upcoming prices bot full knowledge of past prices. Thirdly a plant extension with a methanation unit is analysed, processing the hydrogen to synthetic natural gas (SNG) and selling the resulting product at varying prices on the Italian day-ahead gas market. Last, a brief sensitivity analysis is performed to highlight the sensitivity impact of changing boundary conditions. Two macro parameters are varied therefore, namely the input electricity price and the output hydrogen price, being applied for both case scenarios of operation on energy markets only or also on balancing markets. Results Based on the implemented plant characteristics and a fixed hydrogen sales price of 3 €/kgH2 we derived a maximum electricity price of 48.3 €/MWh that the P2G plants is able to accept to recover its internal marginal costs (without repaying any CAPEX or OPEX costs) for the production of hydrogen only. In cases of additional sale of the by-product oxygen, the acceptable electricity price rises to 61.3 €/MWh. Operating on this basis on the day-ahead electricity market, we find slightly different results depending on respective zonal prices of the six different physical market zones, but on average the plant is barely able to recover its costs. Only with the additional sell of the by-product oxygen OPEX can be recovered, the NPV however remains always strongly negative. When opening the electrolyser operation to ancillary service markets, results improve but differ even stronger by market zone. This is caused not only by diverging prices, but also in terms of accepted quantity. When the P2G plant operates then on the balancing market, it can potentially decide to offer its capacity entirely as upward or downward capacity, or also only in parts.
179
Session 20 - The hydrogen economy opportunities and challenges The overall most promising market zone is the one of North, representing a potential gross profit from offering upward balancing services of more than 1,100,000 € in 2019 for the hypothetical case of an omniscient operator. Payback period in this case amounts to around 14 years, while the NPV remains negative. The next most promising market zone in terms of potential profit is the one of Sicily, representing however already a reduction to less than 800,000 € of potential gross profit in 2019. Comparing potentially realistic bidding strategies with the previous idealistic strategies of an omniscient operator unveils the difficulties of the pay-as-bid pricing scheme of ancillary service markets with hardly predictable price fluctuations and respectively accepted quantities. For the market zone of North for example, the actual operating hours reduce nearly by half with our applied bidding strategies of a realistic operator, potential profits reduce comparably. Downward balancing services are in contrast to upward balancing services more requested in terms of accepted quantities by the market, however, as of now this operation mode turns out to be less attractive due to reduced profits from comparably less attractive market prices. Nonetheless also this operating mode still representing considerably increased economic opportunities compared to the previous operation on electricity markets only. Adding the additional process of methanation and extending the P2G unit to produce SNG in general does not improve the economic opportunities under the given economic boundaries. Especially the cost of CO2 turns out to be too high in combination with the comparably low natural gas market prices to make the P2G unit competitive. An additional constraint is represented by the different time horizons, having an input electricity price that varies on an hourly-basis while gas prices are varying on a daily-basis only. Overall, we find no positive cashflow as of now for such a unit on the Italian markets, neither operating on energy markets only, nor combining it with balancing services from ancillary service markets. Conclusions With the opening of ancillary service markets for decentralized energy resources, a notable new opportunity for P2G plants has been opened up in Italy. While mere operation on electricity markets is hardly recovering marginal costs, the more attractive price levels of balancing services enable significantly improved profits and reduced payback periods for a potential investment. Nonetheless NPVs remain negative, indicating the remaining gap to comparably industry investments. This work quantifies thereby not only the difference from operating on different electricity market types with different products and services being offered, but also how much economic opportunities vary within the different market zones of Italy and benchmarks between a power-to-hydrogen and a power-to-SNG plant. Derived from these analyses we will highlight on the one hand key factors that enable already existent opportunities for P2G in the Italian market and on the other hand the decisive factors which result in a remaining gap in economic efficiency under certain conditions. Further revenue streams through potential eligibility for green certificates, revenue stacking with offerings of additional services such as primary or secondary reserve as well as the direct coupling with generating units of electricity from non-programmable renewable energy sources are subject to future work. References A. Buttler and H. Spliethoff, “Current status of water electrolysis for energy storage, grid balancing and
sector coupling via power-to-gas and power-to-liquids: A review,” Renew. Sustain. Energy Rev., vol. 82, pp. 2440–2454, 2018.

180
Session 20 - The hydrogen economy opportunities and challenges J. Vandewalle, K. Bruninx, and W. D’haeseleer, “Effects of large-scale power to gas conversion on the
power, gas and carbon sectors and their interactions,” Energy Convers. Manag., vol. 94, pp. 28–39, 2015.
J. Gorre, F. Ruoss, H. Karjunen, J. Schaffert, and T. Tynjälä, “Cost benefits of optimizing hydrogen storage and methanation capacities for Power-to-Gas plants in dynamic operation,” Appl. Energy, vol. 257, p. 113967, 2020.
M. Götz et al., “Renewable Power-to-Gas: A technological and economic review,” Renew. Energy, vol. 85, pp. 1371– 1390, 2016.

181

182
Papers

183
184
ASSESSMENT OF DOMESTIC HOT WATER DEMAND: VARIOUS CRITERIA CHECKED AGAINST REAL LIFE DATA Giuseppe Dell’Olio, Gestore dei Servizi Energetici – GSE S.p.A., Rome, Italy Overview One of the data needed for designing the heating installation a flat or in an apartment building is the yearly need for Domestic Hot Water. However, DHW demand depends on such circumstances as the number of people living in the dwelling, the supply temperature of cold water and, of course, the utilization temperature of hot water. Since such information is not always available at time of designing, approximate estimates are usually needed. Several attempts have been made in this regard. Reference [1] assumes that, in general, the bigger the apartment, the more numerous are the occupants, and the more DHW is needed. As a result, DHW demand (whether in cubic meter per day, or in kWh per day) is assumed to increase approximately linearly with apartment area, except when very large (>200 square meters) or very small (<50 square meters) areas are involved, in which cases DHW demand is constant. Reference [2] directly links DHW demand to number of inhabitants and to dwelling facilities. Three respective cases are envisaged: single person; family with shower use; family of three with bath and shower use. For each case, an average daily pattern of DHW need is defined (including, e.g. one shower, two dishwashings, two baths etc.), along with relevant DHW consumptions (expressed both as heat and as volume). As already mentioned, such estimates are inevitably approximate; it is therefore interesting to compare them with “real life” data, in order to evaluate their accuracy. Methods 45 methane-fired, central heating installations in apartment buildings have been examined. Each one of them provides both heating and DHW production. The total volume of the apartments is 438,191 cubic meters, which amounts to some 1,900 average size dwellings. The above installations have been monitored for several years as a whole. Heat produced (kWh) and fuel consumed by each boiler have been measured. Hereinafter, data resulting from those measurements, whether directly or after processing, will be generally referred to as “Actual Operation Data”, or AOD. First, AOD were checked for verisimilitude. To this goal, two indexes have been calculated by weight-averaging: load factor and efficiency. Load factor (denoted by “Fc”) can be defined both for each individual boiler, and for all the boilers taken as a whole (overall load factor). For each boiler, Fc is the ratio of heat (kWh) that was in fact produced during the monitoring time to maximum heat (kWh) that could have been produced. The latter (maximum heat) is in turn the product of boiler power (kW) times monitoring time (hours). The overall load factor is the weight-average of individual load factors, weights being the respective maximum heats that could have been produced. Hypothetically, if all boilers had been constantly operated at full (rated) power, all individual Fc’s, as well as overall Fc, would be 1. In real life, however, DHW load profiles are far from constant: they include very high peaks for short times, and zero load for long times. As a result, average load is much lower than peak load (average-to-peak ratio is low). Since DHW boiler powers are chosen based on peak, rather than on average, load, a low load factor (namely, Fc<<1) is to be expected overall. Indeed, in the present case, overall load factor is 0.178, which confirms expectations: AOD are realistic. This corroborates following analysis.

185
Boilers’ overall efficiencies were also calculated, including both heating and DHW. Not surprisingly, a few efficiencies turned out to exceed 100%, which is consistent with the ever increasing spread of condensation boilers. The lowest efficiency was 0.92; the highest was 1.116. The latter figure was regarded as possibly inaccurate and processed accordingly, as described below. Results First, we tried to ascertain whether yearly DHW consumption in a flat can be regarded as proportional to the useful area of the flat, as per [1]. As flat areas were not known, we estimated them for each apartment building based on the relevant overall volume, assuming that the ceiling height was 3 meters. We then checked for correlation between building useful area and yearly DHW heat production (kWht/year). Correlation turned out to be very strong, as it exhibits a 0.92 covariance. It can be concluded that the general criterion used in [1] is realistic. Once ascertained that DHW consumption is in fact proportional to useful area, we established a comparison between AOD and results yielded by [1]. AOD analysis resulted in an average 42.68 kWht per square meter and per year consumption (draw-off temperature: 53°C; cold water temperature: 10°C). This result is highly robust and reliable: after excluding boilers with very high efficiencies (which might arise the suspect of inaccurate data collection), the outcome was 41.79 kWht per square meter and per year. In order to perform a calculation based on [1], the average dwelling area in Italy (76.8 square meters, [3]) was chosen as a typical useful area. For this value, [2] yields a 16.38 kWh/m2 yearly demand. Although based on a realistic approach (DHW consumption proportional to useful area), reference [1] turned out to underestimate DHW yearly demand for dwellings: after adjusting for temperature difference (60-10 °C), AOD exceed estimated demand by more than 50%. It is therefore recommended that a review of proportionality coefficients be considered in future editions of [1]. A more precise assessment is yielded by [2] (Table E.4; family of three, with bath and shower). Of course, in order to compare with the above, it is necessary to assume that a family of three tipically lives in an average apartment. Under this reasonable hypothesis, and assuming a 60-10°C temperature difference, estimated data based on [2] exceed AOD by 11%. Not only is this a much more accurate evaluation: it is also “on the safe side” (overestimate). For the sake of completeness, the daily load profile in Table E.4 of [2] was then modified to better reflect modern life style: one of the daily baths was replaced with a shower. Comparison to AOD provided yet another underestimate, as was the case with [1], but a more precise one: estimated data turned out to be 90% of AOD (temperature difference: 60-10°C, as usual). Conclusions The DHW yearly demand of an apartment can be reasonably regarded as proportional to the apartment’s useful area, in the most common cases anyway. Based on measured data, a sound assumption for the proportionality coefficient is 43 kWht per square meter and per year. The closest prediction of the above figure is provided by European Standard EN 15450 [2] in Table E.4, which features good accuracy and is conservative. Besides, after a realistic modification, Table E.4 still represents a very close underestimate. Assessments in the above text are based solely on the author’s personal opinions.

186
References [1] UNI/TS 11300-2, “Energy performance of buildings – Part.2: Evaluation of primary energy need and of system efficiencies for space heating, domestic hot water production, ventilation and lighting for non-residential buildings”, October 2014.
[2] European Standard EN 15450, “Heating systems in buildings – Design of heat pump heating systems”, October 2007.
[3] S.Bergero, P.Cavalletti, M.Michelini, “Termoregolazione e contabilizzazione: convenienza economica per zona climatica di unità immobiliare italiana tipo mediante aggregazione di dati campione”, in “La Termotecnica”, Novembre 2016, pag. 58 (in Italian).
187
MODELLING TRANSFORMATION PATHWAYS FOR EU27+3 FINAL ENERGY DEMAND USING TEMPORALLY AND SPATIALLY RESOLVED SECTOR MODELS Claudia Fiedler, Andrej Guminski, Timo Limmer, Tobias Wagner, Süheyb Bilici, Christoph Pellinger, Serafin von Roon Research Center for Energy Economics (FfE), Germany
Abstract In order to quantify possible futures of the European energy system a set of demand and supply-side models is required, which allows for the detailed modelling of sectoral transformation pathways. In this publication, we quantify the qualitative quEU scenario storyline using the five-step word to value procedure. We subsequently show how the resulting demand-side transformation pathways can be translated to a quantitative framework, with hourly resolution at NUTS-3 level, for each energy end-use sector: industry, households, tertiary and transport. In the quEU scenario, the socio-political context in Europe worsens compared to today and society perceives that the costs of containing climate change outweigh the benefits. The lack of incentives to promote fuel switch measures beyond today’s trends results in only a moderate phase-in of electric vehicles and heat pumps in the household, tertiary and transport sector. The energy transition in the industrial sector is slowed significantly and solely efficiency improvements are realized, while industry structure and process technologies remain similar to today. Due to these developments final energy consumption in Europe decreases by 18% from 13,350 TWh in 2020 to 2050, whereas the electricity consumption increases by 14% to 3,500 TWh in 2050. Feedstock demand and process emissions increase by 25% and 19% respectively. Keywords: Energy system analysis, final energy consumption, energy end-use models, energy demand modelling, Regionalization of energy demand, Load profiles, European modeling, Storytelling, Quantification of scenario storylines 1. Introduction The energy system is subject to continuous transformation. Depending on which transformation paths are taken, different future characteristics of our energy system are thinkable. Energy system models like the integrated simulation model for plant operation and expansion planning with regionalization (ISAaR), developed at FfE [1], are tools for mapping these futures. Using ISAaR the cornerstones of energy system analysis such as the expansion and use of the conventional power plant park and of (variable) renewable energy sources (vRES) as well as grid expansion and utilization are evaluated. Hereby, a critical input parameter is the spatially and temporally resolved final energy consumption (FEC). In the context of the eXtremOS project [2], the spatially and temporally resolved FEC is derived using four sector models: SmInd EU for Industry, TraM for transport, PriHM for households and the tertiary model TerM. Each sector model consists of three modules: I) final (energy) consumption II) regionalization and III) load profile module. For each sector, the respective modules follow different methodologies depending on the unique characteristics of each sector. The final consumption (FC) modules calculate the annual FC for the 27 member countries of the EU plus Great Britain, Norway and Switzerland (EU27+3) at country level and for the time horizon 2017 to 2050. Across all sectors, FC is differentiated according to energy carriers and applications (e.g. lighting, process heat). Further aggregation levels according to sectors are: - industry branch (e.g. Iron&steel, Non-metallic minerals) and production process (e.g.
Primary steel, Cement),

188
- transport category (e.g. road, rail), type (e.g. passenger, cargo) and class (e.g. small, medium)
- household heating technology (e.g. heat pump, gas boiler) and - service sector branch (e.g. hospitals, offices) and heating technology (e.g. heat pump, gas
boiler)
Changes in FC result from the development of macroeconomic data such population growth or development of gross value added and the implementation greenhouse gas abatement measures. In the regionalization modules, various sector-specific distribution keys are used to disaggregate the annual consumption from NUTS-0 to NUTS-3 level.1 Amongst others, the population, climatic differences and industrial emission data are taken into account. This regionalization creates the basis for a detailed analysis of the energy system, including the simulation of transmission network utilization. Ultimately, the temporal resolution of the annual FEC at NUTS-3 level is increased. To do so, it is scaled with synthetic hourly and daily load profiles2, which are available at NUTS-3 level and represent characteristics of different energy carriers or technologies. Scaled load profiles at NUTS-3 level (aggregated across all FC sectors) represent the spatially and temporally resolved load data used as a basis for the energy system model ISAaR. The focus of this paper is to provide detailed insights into the data and methodology implemented in each sector model (cf. section 0). Furthermore, results for the European scenario quEU, which is characterized in more detail in section 0, are shown and discussed (section 0). 2. The quEU scenario The quEU scenario is one of the extreme scenarios developed in the project eXtremOS. The latter are defined as scenarios
with a low probability of occurrence from today’s perspective, which are extreme for individual actors or the energy system as a whole, with respect to the status quo or a defined reference.
Hereby, a scenario can be extreme due to its sociopolitical context and/or its quantitative energy economic framework. Starting point for the development of quEU is a context scenario (i.e. qualitative storyline), developed by the Institute for Technology Assessment and Systems Analysis (ITAS) of the Karlsruhe Institute of Technology (KIT), within the project eXtremOS [3]. The title of the storyline is “No climate target in a fragmented Europe” [3]. The scenario describes a socio-political setting, in which further countries, besides the United Kingdom, exit the European Union. As a result, nationalist politicians gain influence in several European countries. Society perceives that the costs of containing climate change outweigh the benefits. This in turn, triggers that climate targets are neglected, leading to less availability of public and private funding for renewable technologies. Especially research and development funding for
1 The NUTS (Nomenclature of territorial units for statistics) classification is a hierarchical system in which the economic territory of the EU27+3 is split. The NUTS-0 level represents the country level, the NUTS-3 smaller units such as districts in Germany. 2 In this paper we differentiate load profiles and scaled load profiles. The former are normalized time-series (i. e. the sum of all hourly values in one year equals one), while the latter refer to the energy demand profile (i. e. the sum of all hourly values in one year corresponds to the annual FEC).
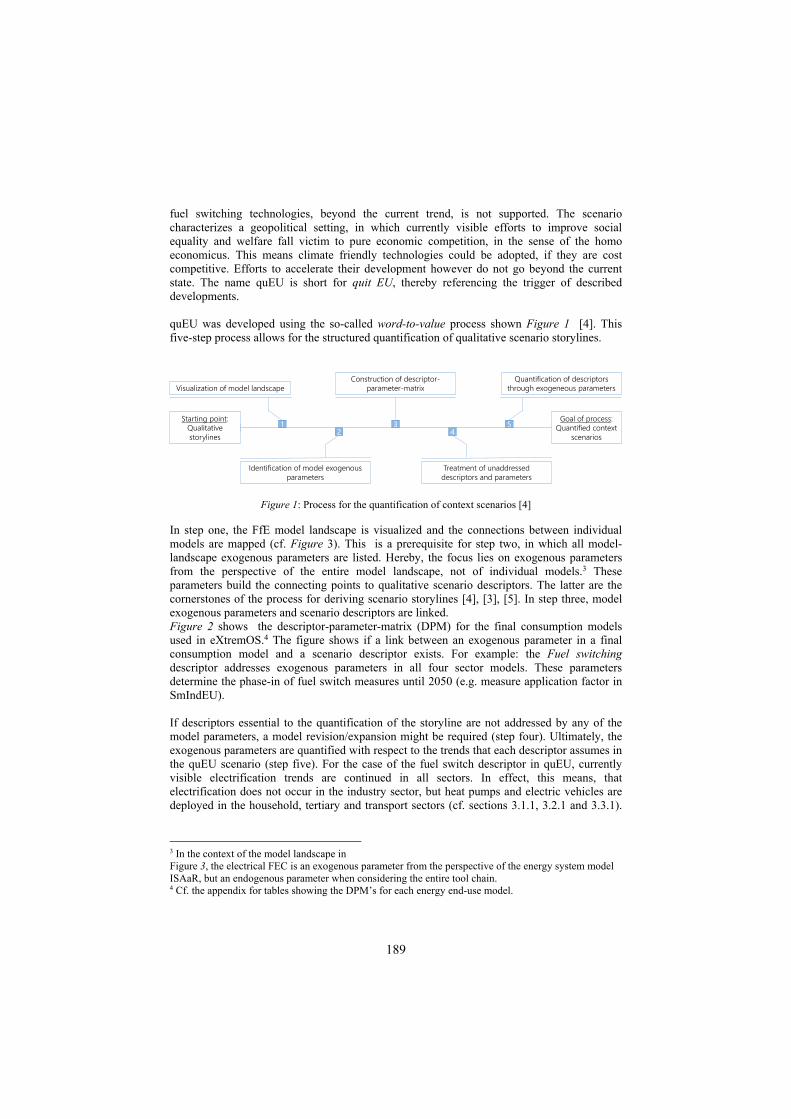
189
fuel switching technologies, beyond the current trend, is not supported. The scenario characterizes a geopolitical setting, in which currently visible efforts to improve social equality and welfare fall victim to pure economic competition, in the sense of the homo economicus. This means climate friendly technologies could be adopted, if they are cost competitive. Efforts to accelerate their development however do not go beyond the current state. The name quEU is short for quit EU, thereby referencing the trigger of described developments. quEU was developed using the so-called word-to-value process shown Figure 1 [4]. This five-step process allows for the structured quantification of qualitative scenario storylines.
Figure 1: Process for the quantification of context scenarios [4] In step one, the FfE model landscape is visualized and the connections between individual models are mapped (cf. Figure 3). This is a prerequisite for step two, in which all model-landscape exogenous parameters are listed. Hereby, the focus lies on exogenous parameters from the perspective of the entire model landscape, not of individual models.3 These parameters build the connecting points to qualitative scenario descriptors. The latter are the cornerstones of the process for deriving scenario storylines [4], [3], [5]. In step three, model exogenous parameters and scenario descriptors are linked. Figure 2 shows the descriptor-parameter-matrix (DPM) for the final consumption models used in eXtremOS.4 The figure shows if a link between an exogenous parameter in a final consumption model and a scenario descriptor exists. For example: the Fuel switching descriptor addresses exogenous parameters in all four sector models. These parameters determine the phase-in of fuel switch measures until 2050 (e.g. measure application factor in SmIndEU). If descriptors essential to the quantification of the storyline are not addressed by any of the model parameters, a model revision/expansion might be required (step four). Ultimately, the exogenous parameters are quantified with respect to the trends that each descriptor assumes in the quEU scenario (step five). For the case of the fuel switch descriptor in quEU, currently visible electrification trends are continued in all sectors. In effect, this means, that electrification does not occur in the industry sector, but heat pumps and electric vehicles are deployed in the household, tertiary and transport sectors (cf. sections 3.1.1, 3.2.1 and 3.3.1).
3 In the context of the model landscape in Figure 3, the electrical FEC is an exogenous parameter from the perspective of the energy system model ISAaR, but an endogenous parameter when considering the entire tool chain. 4 Cf. the appendix for tables showing the DPM’s for each energy end-use model.
Starting point:Qualitativestorylines
Visualization of model landscape
Identification of model exogenousparameters
Goal of process:Quantified context
scenarios
Construction of descriptor-parameter-matrix
Treatment of unaddresseddescriptors and parameters
Quantification of descriptorsthrough exogeneous parameters
12
34
5
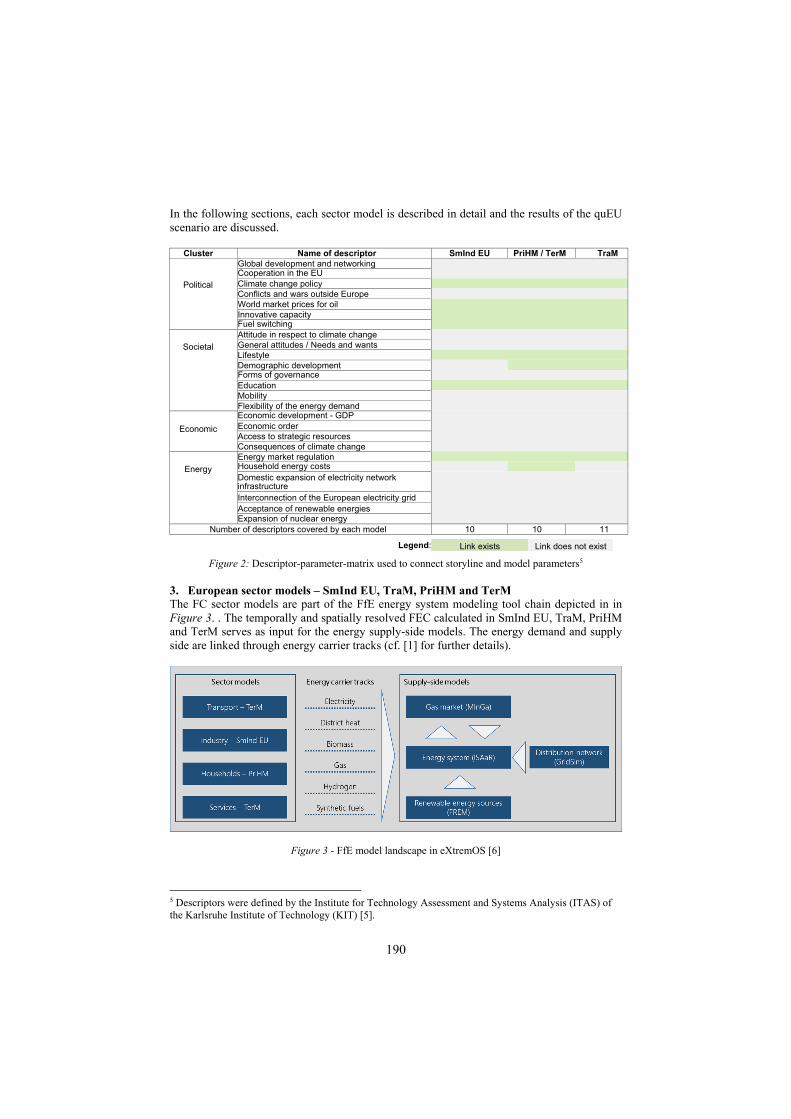
190
In the following sections, each sector model is described in detail and the results of the quEU scenario are discussed.
Cluster Name of descriptor SmInd EU PriHM / TerM TraM
Political
Global development and networking Cooperation in the EU Climate change policy
Conflicts and wars outside Europe
World market prices for oil Innovative capacity Fuel switching
Societal
Attitude in respect to climate change General attitudes / Needs and wants Lifestyle
Demographic development
Forms of governance
Education
Mobility Flexibility of the energy demand
Economic
Economic development - GDP Economic order Access to strategic resources Consequences of climate change
Energy
Energy market regulation
Household energy costs
Domestic expansion of electricity network infrastructure
Interconnection of the European electricity grid Acceptance of renewable energies Expansion of nuclear energy
Number of descriptors covered by each model 10 10 11
Legend: Link exists Link does not exist
Figure 2: Descriptor-parameter-matrix used to connect storyline and model parameters5 3. European sector models – SmInd EU, TraM, PriHM and TerM The FC sector models are part of the FfE energy system modeling tool chain depicted in in Figure 3. . The temporally and spatially resolved FEC calculated in SmInd EU, TraM, PriHM and TerM serves as input for the energy supply-side models. The energy demand and supply side are linked through energy carrier tracks (cf. [1] for further details).
Figure 3 - FfE model landscape in eXtremOS [6]
5 Descriptors were defined by the Institute for Technology Assessment and Systems Analysis (ITAS) of the Karlsruhe Institute of Technology (KIT) [5].

191
Each FEC model is structured into 3 modules, according to Figure 4: Module 1: annual and country specific final (energy) consumption development from
2017 until 2050 (cf. 0, 0, 0). Module 2: regionalization of FC to NUTS-3 level (cf. 0, 0, 0). Module 3: increased temporal resolution of regionalized FC via load profiles (cf. 0, 0, 0)
Technical advantages of the modular structure include the flexible adaptation and easy maintenance of each module. Figure 4 also shows that a differentiation between (historical) input data and exogenous model parameters is made. This distinction is relevant since the FC development in all sector models occurs scenario based. As described in section 0, the scenario storyline is quantified by linking scenario descriptors and model parameters. To do so, scenario dependent exogenous model parameters are separated from scenario independent input data and endogenous parameters. The latter, are (intermediate) model results and depend on scenario specific model configuration. The results of each module are stored and processed to load curves at NUTS-3 level in the FfE PostgreSQL database FREM. The database also poses the link to the supply side models.
Figure 4 - Modular structure of the sector models In the following subsections, each sector model is described in detail. The sectoral FC development is determined based on a set of macroeconomic parameters such as population or gross value added development (baseline) and a set of abatement measures. The latter are structured into the abatement measure clusters energy efficiency, fuel substitution and carbon capture [7].6 Figure 5 provides an overview of the component influencing sectoral FC development. In this paper, the focus lies on the model components, which are relevant for the quEU scenario.
6 The fourth measure cluster: energy and material sufficiency is not considered.
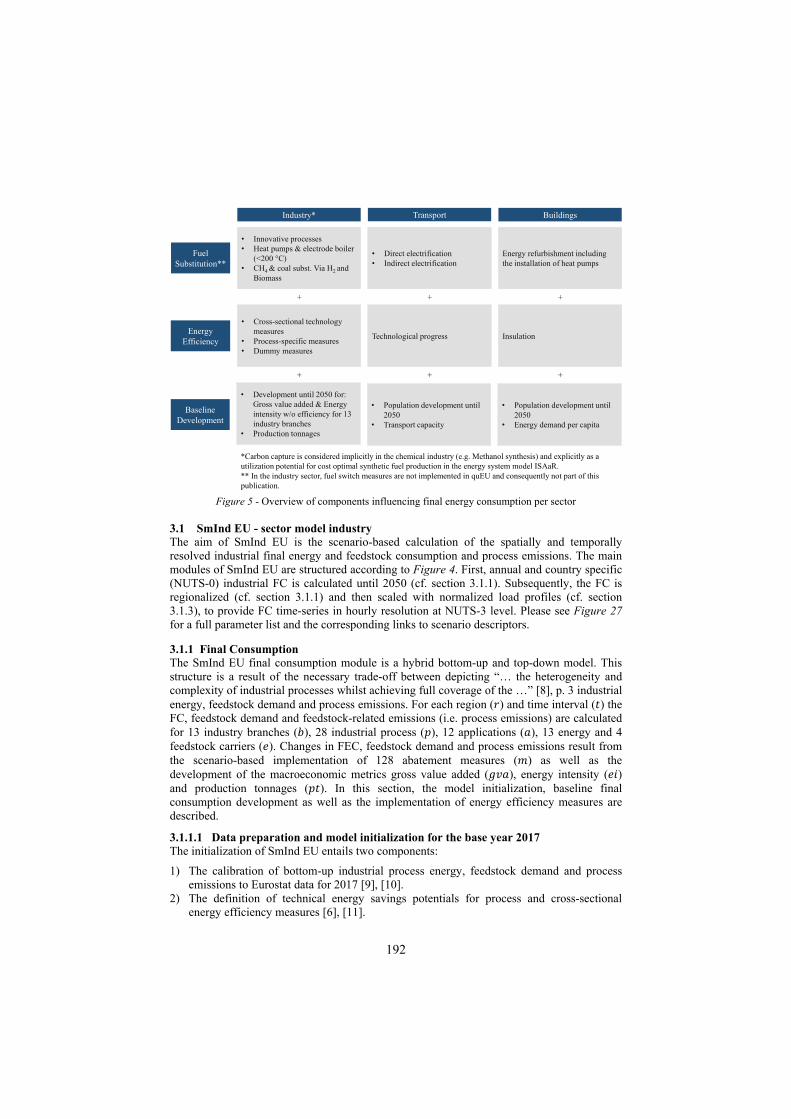
192
Figure 5 - Overview of components influencing final energy consumption per sector
3.1 SmInd EU - sector model industry The aim of SmInd EU is the scenario-based calculation of the spatially and temporally resolved industrial final energy and feedstock consumption and process emissions. The main modules of SmInd EU are structured according to Figure 4. First, annual and country specific (NUTS-0) industrial FC is calculated until 2050 (cf. section 3.1.1). Subsequently, the FC is regionalized (cf. section 3.1.1) and then scaled with normalized load profiles (cf. section 3.1.3), to provide FC time-series in hourly resolution at NUTS-3 level. Please see Figure 27 for a full parameter list and the corresponding links to scenario descriptors.
3.1.1 Final Consumption The SmInd EU final consumption module is a hybrid bottom-up and top-down model. This structure is a result of the necessary trade-off between depicting “… the heterogeneity and complexity of industrial processes whilst achieving full coverage of the …” [8], p. 3 industrial energy, feedstock demand and process emissions. For each region (𝑟) and time interval (𝑡) the FC, feedstock demand and feedstock-related emissions (i.e. process emissions) are calculated for 13 industry branches (𝑏), 28 industrial process (𝑝), 12 applications (𝑎), 13 energy and 4 feedstock carriers (𝑒). Changes in FEC, feedstock demand and process emissions result from the scenario-based implementation of 128 abatement measures (𝑚) as well as the development of the macroeconomic metrics gross value added (𝑔𝑣𝑎), energy intensity (𝑒𝑖) and production tonnages (𝑝𝑡). In this section, the model initialization, baseline final consumption development as well as the implementation of energy efficiency measures are described.
3.1.1.1 Data preparation and model initialization for the base year 2017 The initialization of SmInd EU entails two components:
1) The calibration of bottom-up industrial process energy, feedstock demand and process emissions to Eurostat data for 2017 [9], [10].
2) The definition of technical energy savings potentials for process and cross-sectional energy efficiency measures [6], [11].
++ +
++ +
Technological progress
• Cross-sectional technologymeasures
• Process-specific measures• Dummy measures
InsulationEnergy
Efficiency
• Population development until2050
• Transport capacity
• Development until 2050 for: Gross value added & Energyintensity w/o efficiency for 13 industry branches
• Production tonnages
• Population development until2050
• Energy demand per capita
Baseline Development
• Direct electrification• Indirect electrification
• Innovative processes• Heat pumps & electrode boiler
(<200 °C)• CH4 & coal subst. Via H2 and
Biomass
Energy refurbishment including the installation of heat pumps
Fuel Substitution**
*Carbon capture is considered implicitly in the chemical industry (e.g. Methanol synthesis) and explicitly as a utilization potential for cost optimal synthetic fuel production in the energy system model ISAaR.** In the industry sector, fuel switch measures are not implemented in quEU and consequently not part of thispublication.
TransportIndustry* Buildings

193
The basis for these initialization steps is the process and greenhouse gas measure abatement identification and selection methodology for the industry sector, as described in [6] and [11]. This method is applied to Europe, to ensure that the most energy and emission intensive processes and hence, the largest levers for emission reduction are identified. To do so, first, application based energy and emission balances are derived for the European industry sector [12], [13].
Figure 6 shows, that for the EU27 + NO, UK and CH 78% of energy and process related emissions in the industry sector result from the industry branches Iron & steel (29%), Chemical and petrochemical (19%), Non-metallic minerals (18%), Food and tobacco and paper (7%), pulp and print (5%). From these industry branches, the most energy and emission intensive processes are selected for bottom-up modeling in SmInd-EU [14].
Figure 6 - European (left) and German (right) energy and process related CO2 emissions by industry branch in 2017 in Mt CO2
7 In SmInd EU, 19 incumbent (and 9 innovative) energy and emission intensive industrial processes are modeled bottom-up.8 This is done using annual production tonnages (cf. Table 2 in the appendix) and specific consumption data (cf. Table 5, Table 6, Table 7 and Table 8 in the appendix) for the different energy carrier types; fuel, electricity feedstock and process emissions (cf. expression (3-1)) [8], [15].9 Furthermore, expression (3-2) is used to
7 Own illustration based on [13]. Energy consumption data (mainly) from [9]. Emission factors taken from national inventory reports of the respective countries: e.g. [16] for Germany. Process emissions from [10]. Balancing according to polluter pays principle. 8 Primary, secondary and direct reduced iron steel, olefines (Ethylene and Polyethylene), aromatics (Benzene, Toluol and Xylol), ammonia, methanol, chlorine, cement, lime, container and flat glass, dairy, paper, recycled paper, wood and chemical pulp as well as primary and secondary aluminum. Despite low emissions in the industry branch non-ferrous metals, aluminum production processes are considered due to high process emissions and specific electricity consumption. 9 Process emissions are classified as abatable emissions and non-abatable emissions. Hence, for technical reasons process emissions are treated as two different energy carriers.
31%
21%12%
7%
6%6%
4%4%
4%27%
19%
18%
8%
6%
6%
5%3% 2%
Total CO2emissions1,206 Mt CO2
Total CO2emissions289 Mt CO2
Chemical and Petrochemical industryIron & steel industry
Non-ferrous metal industry
Wood and Wood ProductsNon-metallic MineralsTransport Equipment
MachineryMining and QuarryingFood and TabaccoPaper, Pulp and Print
Construction
Non-specified (Industry)Textile and Leather
GermanyEU 27 + 3
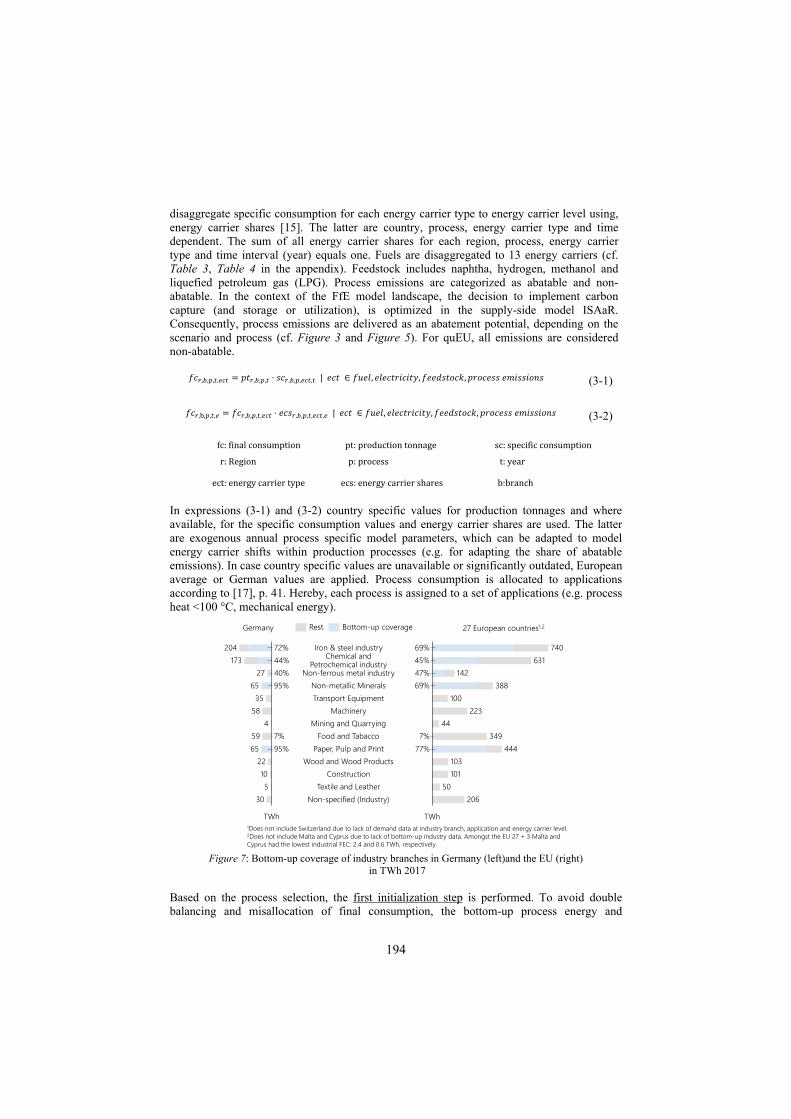
194
disaggregate specific consumption for each energy carrier type to energy carrier level using, energy carrier shares [15]. The latter are country, process, energy carrier type and time dependent. The sum of all energy carrier shares for each region, process, energy carrier type and time interval (year) equals one. Fuels are disaggregated to 13 energy carriers (cf. Table 3, Table 4 in the appendix). Feedstock includes naphtha, hydrogen, methanol and liquefied petroleum gas (LPG). Process emissions are categorized as abatable and non-abatable. In the context of the FfE model landscape, the decision to implement carbon capture (and storage or utilization), is optimized in the supply-side model ISAaR. Consequently, process emissions are delivered as an abatement potential, depending on the scenario and process (cf. Figure 3 and Figure 5). For quEU, all emissions are considered non-abatable.
𝑓𝑐 , , , , 𝑝𝑡 , , , ⋅ 𝑠𝑐 , , , , | 𝑒𝑐𝑡 ∈ 𝑓𝑢𝑒𝑙, 𝑒𝑙𝑒𝑐𝑡𝑟𝑖𝑐𝑖𝑡𝑦, 𝑓𝑒𝑒𝑑𝑠𝑡𝑜𝑐𝑘, 𝑝𝑟𝑜𝑐𝑒𝑠𝑠 𝑒𝑚𝑖𝑠𝑠𝑖𝑜𝑛𝑠 (3-1)
𝑓𝑐 , , , , 𝑓𝑐 , , , , ⋅ 𝑒𝑐𝑠 , , , , , | 𝑒𝑐𝑡 ∈ 𝑓𝑢𝑒𝑙, 𝑒𝑙𝑒𝑐𝑡𝑟𝑖𝑐𝑖𝑡𝑦, 𝑓𝑒𝑒𝑑𝑠𝑡𝑜𝑐𝑘, 𝑝𝑟𝑜𝑐𝑒𝑠𝑠 𝑒𝑚𝑖𝑠𝑠𝑖𝑜𝑛𝑠 (3-2)
In expressions (3-1) and (3-2) country specific values for production tonnages and where available, for the specific consumption values and energy carrier shares are used. The latter are exogenous annual process specific model parameters, which can be adapted to model energy carrier shifts within production processes (e.g. for adapting the share of abatable emissions). In case country specific values are unavailable or significantly outdated, European average or German values are applied. Process consumption is allocated to applications according to [17], p. 41. Hereby, each process is assigned to a set of applications (e.g. process heat <100 °C, mechanical energy).
Figure 7: Bottom-up coverage of industry branches in Germany (left)and the EU (right)
in TWh 2017 Based on the process selection, the first initialization step is performed. To avoid double balancing and misallocation of final consumption, the bottom-up process energy and
444
Iron & steel industry
103
69%Chemical and
Petrochemical industry 45%47%
Wood and Wood Products
Non-ferrous metal industry69%Non-metallic Minerals
Transport Equipment
44Food and Tabacco
MachineryMining and Quarrying
TWh
7%
100
77%Paper, Pulp and Print
Construction50
631
Textile and LeatherNon-specified (Industry)
740
142388
223
349
101
206
72%
TWh
4
44%27 40%
95%
7%95%
204173
6535
58
5965
22105
30
Rest Bottom-up coverageGermany 27 European countries1,2
1Does not include Switzerland due to lack of demand data at industry branch, application and energy carrier level.2Does not include Malta and Cyprus due to lack of bottom-up industry data. Amongst the EU 27 + 3 Malta andCyprus had the lowest industrial FEC: 2.4 and 0.6 TWh, respectively.
fc: final consumption pt: production tonnage sc: specific consumption
r: Region p: process t: year
ect: energy carrier type ecs: energy carrier shares b:branch
195
feedstock demand by energy carrier is calibrated to the top-down final consumption reported in the Eurostat energy balances. This is especially relevant for processes, which
both consume and transform energy (e.g. primary steel) and/or use the same feedstock for energy and non-energy use (e.g. steamcracking).
In both cases, misallocation of final consumption and/or process emissions can occur if the balancing area of bottom-up specific consumption values differs from the Eurostat balancing area [9]. Figure 7 shows the degree of bottom-up FEC industry branch coverage as a result of this calibration procedure. In total, 48% of German and 42% of European industrial FEC is covered through bottom-up modelling of industrial processes. This equates to 51% and 45% of CO2 emissions, respectively. Processes covered bottom-up are directly addressed by abatement measures, while parts of industrial energy consumption not covered bottom-up are addressed by proxy measures in SmInd EU. In the second initialization step, abatement measures are defined according to the methodology in [11], [6] and [8]. As shown in Figure 5 , energy efficiency, fuel switch and carbon capture measures are implemented in SmInd EU. Since the quEU scenario predominantly focuses on the implementation of efficiency measures in the industry sector (cf. section 2), , this initialization step is only described for this measure type. For both process and cross-sectional technology efficiency, the full list of measures is taken from [6], [11]. Hereby, process efficiency measures address the FEC of processes modeled bottom-up. The applications affected by these measures are a subset of the process applications. CST efficiency measures address the total FEC of one or more applications (e.g. lighting) and are industry branch independent. Abatement measures are quantified based on primary abatement measure data as well as international and German literature sources. Absolute technical savings potentials are calculated using expression (3-3) [8]:
The specific fuel and electricity savings as well as application factors of each abatement measure were defined from today’s perspective.10 Hence, the technical measure potential for these measures is defined for the base year (2017). Each parameter was validated by experts for industrial processes and CST in Germany [11]. For the purpose of the analysis at hand, it is assumed, that industrial plants have a similar technical standard across Europe [17].11 Confidential communication with industry experts has shown that plant specific differences exist, but depend predominantly on the age (not the location) of industry plants. As the age structure of most of the selected processes and CST across Europe is not (publicly) available, specific energy savings potentials are not differentiated by country. They are consequently process or application, but primarily not country specific. Absolute technical measure potentials however are country dependent, due to the country dependency of the activity
10 The application factor defines the share of production tonnage or businesses for which a measure is applicable. 11 This is supported by the analysis of specific consumption values, where country specific variations are an exception.
𝑝𝑜𝑡 , , , 𝑠𝑒𝑠 , , ⋅ 𝑎𝑐𝑡 , , , , ⋅ 𝑎𝑓 , , | 𝑒𝑐𝑡 ∈ 𝑓𝑢𝑒𝑙, 𝑒𝑙𝑒𝑐𝑡𝑟𝑖𝑐𝑖𝑡𝑦 (3-3)
pot: technical measure potential ses: specific energy savings act: activity figure af: application factor r: region country m: abatement measure
ect: energy carrier type b: branch p: industrial process
196
figures. The latter are production tonnages for process measures and the number of businesses in each country for CST [8].
The share of FEC not covered by bottom-up modeling is addressed by so-called proxy efficiency measures. In analogy to [8], proxy measures are constructed under the assumption, that the share of total technical energy savings for processes covered bottom-up is also achieved for the uncovered FEC share. Depending on whether or not partial or no coverage is achieved in an industry branch, a different heuristic for calculating efficiency proxy measure potential is implemented. 3.1.1.2 Baseline development until 2050 The baseline calculation considers the effect of economic growth and long-term trends in energy intensity development on industrial final consumption until 2050. Since the industry sector is only partially modeled via bottom-up processes, baseline FC development requires different activity figures for the industry branch and process level are required.
On an industry branch level, both gross value added (GVA) and the industrial production index are suitable indicators [18]. However, to the best of the author’s knowledge, a European long-term industrial activity scenario (until 2050) only exists expressed in terms of GVA. Hence, the GVA scenario in [19] is used as the activity indicator on industry branch level. For the modeled industrial processes, final consumption and process emissions are directly linked to production tonnage development [8]. The latter is an exogenous model parameter and based on the reference scenario in [20] (cf. Figure 30 in the appendix). Consistency between both activity figures is given for SmInd EU, as [20] builds on the GVA development in [19]. Furthermore, both GVA and production tonnage development are consistent with the economic development descriptor in quEU (cf. section 0) While production tonnage development is directly linked to the FC development of a specific process, GVA and industrial FEC development are not perfectly correlated [21], [22]. Especially in developed countries, the energy intensity (MWh / €) of industrial goods has decreased over the past decades. This results from a decoupling of GVA and FEC development. Depending on the industrial good, one or more of the following factors triggered this development [21], [22]: The real value of the good has increased, while the energy demand for production
stayed constant. The structure of the industry sector has shifted towards products with lower energy
intensities and/or the import of intermediate goods has increased, leading to a higher intermediate consumption intensity.
Energy efficiency progress lead to lower FEC per unit of output. Consequently, in order to use GVA as an activity figure, a scenario for the change in energy intensity development is determined. Subsequently, the annual change in baseline FEC at industry branch level is calculated according to expression (3-4).
∆𝑓𝑒𝑐 , , , ∆𝑒𝑖 , , , ⋅ ∆𝑔𝑣𝑎 , , | 𝑒𝑐𝑡 ∈ 𝑓𝑢𝑒𝑙, 𝑒𝑙𝑒𝑐𝑡𝑟𝑖𝑐𝑖𝑡𝑦 (3-4).
r: region b: industry branch t: year fc: final energy consumption ei: energy intensity ect: energy carrier type
gva: gross value added
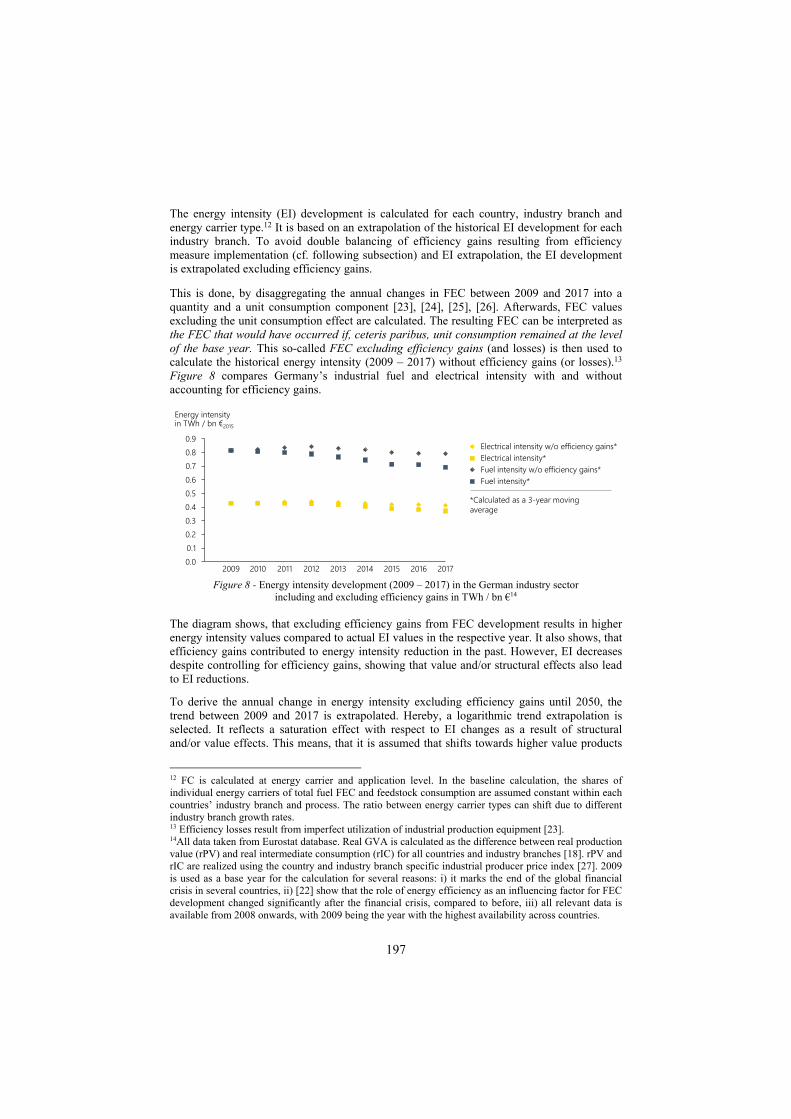
197
The energy intensity (EI) development is calculated for each country, industry branch and energy carrier type.12 It is based on an extrapolation of the historical EI development for each industry branch. To avoid double balancing of efficiency gains resulting from efficiency measure implementation (cf. following subsection) and EI extrapolation, the EI development is extrapolated excluding efficiency gains.
This is done, by disaggregating the annual changes in FEC between 2009 and 2017 into a quantity and a unit consumption component [23], [24], [25], [26]. Afterwards, FEC values excluding the unit consumption effect are calculated. The resulting FEC can be interpreted as the FEC that would have occurred if, ceteris paribus, unit consumption remained at the level of the base year. This so-called FEC excluding efficiency gains (and losses) is then used to calculate the historical energy intensity (2009 – 2017) without efficiency gains (or losses).13 Figure 8 compares Germany’s industrial fuel and electrical intensity with and without accounting for efficiency gains.
Figure 8 - Energy intensity development (2009 – 2017) in the German industry sector
including and excluding efficiency gains in TWh / bn €14 The diagram shows, that excluding efficiency gains from FEC development results in higher energy intensity values compared to actual EI values in the respective year. It also shows, that efficiency gains contributed to energy intensity reduction in the past. However, EI decreases despite controlling for efficiency gains, showing that value and/or structural effects also lead to EI reductions.
To derive the annual change in energy intensity excluding efficiency gains until 2050, the trend between 2009 and 2017 is extrapolated. Hereby, a logarithmic trend extrapolation is selected. It reflects a saturation effect with respect to EI changes as a result of structural and/or value effects. This means, that it is assumed that shifts towards higher value products
12 FC is calculated at energy carrier and application level. In the baseline calculation, the shares of individual energy carriers of total fuel FEC and feedstock consumption are assumed constant within each countries’ industry branch and process. The ratio between energy carrier types can shift due to different industry branch growth rates. 13 Efficiency losses result from imperfect utilization of industrial production equipment [23]. 14All data taken from Eurostat database. Real GVA is calculated as the difference between real production value (rPV) and real intermediate consumption (rIC) for all countries and industry branches [18]. rPV and rIC are realized using the country and industry branch specific industrial producer price index [27]. 2009 is used as a base year for the calculation for several reasons: i) it marks the end of the global financial crisis in several countries, ii) [22] show that the role of energy efficiency as an influencing factor for FEC development changed significantly after the financial crisis, compared to before, iii) all relevant data is available from 2008 onwards, with 2009 being the year with the highest availability across countries.
*Calculated as a 3-year movingaverage
0.00.10.20.30.40.50.60.70.80.9
Energy intensityin TWh / bn €2015
2009 20142010 2011 2012 2013 2015 2016 2017
Electrical intensity w/o efficiency gains*
Fuel intensity w/o efficiency gains*Electrical intensity*
Fuel intensity*
198
and or product value increases behave asymptotic. It can also be interpreted as a dampening effect, which reduces the influence of GVA on the FEC development [21]. Ultimately, the compounded annual growth rate for the change in EI between 2017 and 2050 is calculated for use in expression (3-4)
In conclusion, the baseline calculation considers the effect of economic growth and long-term trends in energy intensity development on industrial final consumption until 2050. The resulting FEC can be interpreted as the final consumption that would occur…
… as a result of growth in gross value added, if production efficiency would remain at the 2009 level and structural changes in the industry sectors of each country would continue with a
gradually decreasing intensity.
3.1.1.3 Energy efficiency measure implementation–process and cross-sectional measures In order to derive the industrial transformation path for the quEU scenario, efficiency measures are applied to the baseline FEC. Feedstock demand and process emissions are not affected by efficiency measure implementation. In this section, the method for determining the change in final energy consumption due to efficiency measure implementation on process and industry branch level is described.
The change in fuel and electricity consumption due to measure implementation is derived by the following expression [8], [28]:
The starting year of measure implementation can be selected for each of the measures individually [28]. Total measure potential increases and decreases proportionally to the change in production volume of the respective processes, compared to the base year. For the quEU scenario, measure implementation commences 2021 for CST and 2030 for process measures, unless the technology readiness level only allows for a later starting point. Starting years for measures are exogenous model parameters. The quantification in line with the quEU storyline since the vast majority of implemented efficiency measures exhibit lifecycle cost savings for industrial actors [29], [30], [31]. Measure application ends, when the total measure potential is implemented (i.e. 𝑒𝑟 , 1) or 2050 is reached.
The effect on energy consumption at industry branch and process level is a direct result of measure implementation and the change in production tonnages. The effect on energy consumption at industry branch level is calculated differently, depending on whether a process efficiency or cross-sectional technology efficiency measure is implemented. This results from differing calculations with respect to the energy carrier type application share (ectas). The latter is used to disaggregate changes in fuel and feedstock demand to energy carrier and application level. In the baseline calculation, the ectas values within a country and industry branch are assumed constant. This is no longer the case as soon as abatement measures are implemented. In each calculation step, only FEC of applications, which are directly addressed by efficiency measure, is affected. For CST measures the ectas is calculated based on the total industrial FEC in a country (cf. left part expression (3-6)). For
∆𝑓𝑐 , , , 𝑝𝑜𝑡 , , , ⋅ 𝑦 ⋅ 𝑒𝑟 ,
| 𝑒𝑟 ,1𝑙
| 𝑒𝑐𝑡 ∈ 𝑓𝑢𝑒𝑙, 𝑒𝑙𝑒𝑐𝑡𝑟𝑖𝑐𝑖𝑡𝑦 (3-5)
fc: final consumption pot: technical measure potential er: exchange rate
ect: energy carrier type r: country m: abatement measure t: year p: industrial process y: year of implementation l: lifetime of technology
199
process measures, the industry branch specific FEC is used (cf. right part expression (3-6)). The resulting change in FEC is subsequently determined using expression (3-7).
𝑒𝑐𝑡𝑎𝑠 , , , , , 𝑓𝑒𝑐 , , , , ,
𝑓𝑒𝑐 , , , , , | 𝑒𝑐𝑡𝑎𝑠 , , , , ,
𝑓𝑒𝑐 , , , , ,
𝑓𝑒𝑐 , , , , , | 𝑒𝑐𝑡 ∈ 𝑓𝑢𝑒𝑙, 𝑒𝑙𝑒𝑐𝑡𝑟𝑖𝑐𝑖𝑡𝑦
(3-6)
𝑓𝑐 , , , , 𝑓𝑐 , , , , ∆𝑓𝑐 , , , , , 𝑓𝑒𝑐 , , , , ∆𝑓𝑒𝑐 , , , , , ⋅ 𝑒𝑐𝑡𝑎𝑠 , , , , , (3-7))
On the process level, final consumption and the resulting new specific consumption values are calculated (cf. expressions, (3-8), (3-9)) [15]. Compared to the industry branch level, the ectas is replaced with the previously mentioned energy carrier shares. The latter are country, process (and therefore industry branch), time and energy carrier specific.
𝑓𝑐 , , , , 𝑓𝑐 , , , , ∆𝑓𝑐 , , , , , 𝑓𝑐 , , , , ∆𝑓𝑐 , , , , , ∙ 𝑒𝑐𝑠 , , , , , (3-8)
𝑠𝑐 , , , ,fc , , , ,
𝑝𝑡 , , , (3-9)
Changes to process emissions and feedstock consumption do not occur as a result of efficiency measure implementation. 3.1.1.4 Development of industrial final energy consumption, feedstock demand and process emissions in quEU Main drivers for the development of industrial FC in the quEU scenario are economic growth and efficiency improvements. Fuel switch measures and industrial carbon capture are not implemented in the quEU scenario. Direct and indirect electrification measures impose significant additional lifecycle costs to industrial actors and are therefore not considered in the quEU scenario [32], [33]. Furthermore, the study overview [34] and [31] show, that also industrial carbon capture is a costly greenhouse gas abatement measure, which is only part of deep decarbonization scenarios (i.e. 95% greenhouse gas abatement w.r.t. 1990). For both measure types, the absence of climate targets and the lack of funding for research and development for fuel switch measures in quEU does not imply cost alleviations over time (cf. section 0).
Figure 9 shows the total FEC in the baseline and quEU scenario as well as the development of application shares and energy carriers between 2020 and 2050. In the quEU scenario, European FEC increases from 3,650 TWh to 3,823 TWh between 2020 and 2050. This occurs despite strong efficiency increases, which reduce 2050 FEC in quEU by 764 TWh, compared to the baseline scenario. The latter exhibits 4,587 TWh FEC in 2050. The baseline development shows that economic growth significantly impacts FEC development in the absence of efficiency measures.
Through efficiency measure implementation a 0,65% p.a. decrease in FEC between 2020 and 2050 is achieved between 2020 in quEU, compared to the baseline. Hereby, electrical annual savings (1% p.a.) exceed fuel savings (0.5% p.a.). This is a result of CST efficiency measures implementation, which drives electricity savings in lighting, mechanical energy, information
ectas: energy carrier type ap. share e:energy carrier ect: energy carrier type r: region a: application m: abatement measure
indtot: industry total t: year b: industry branch
pt: production tonnage ecs: energy carrier shares sc:specific consumption
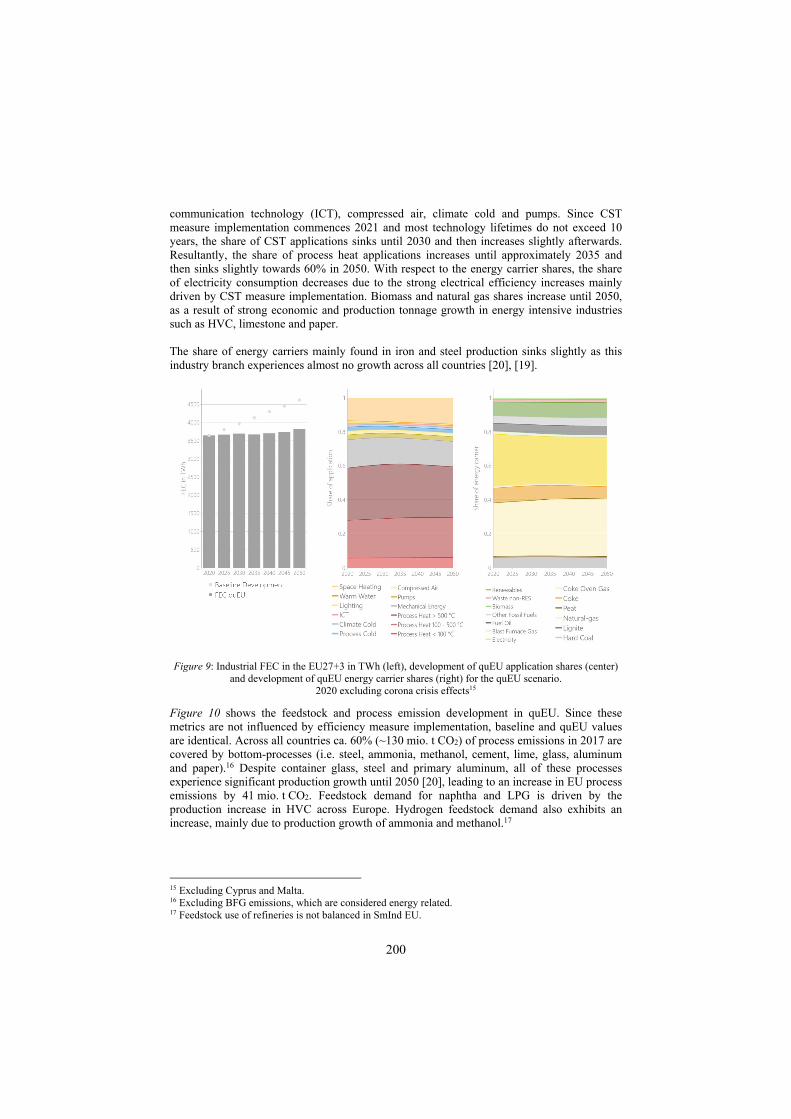
200
communication technology (ICT), compressed air, climate cold and pumps. Since CST measure implementation commences 2021 and most technology lifetimes do not exceed 10 years, the share of CST applications sinks until 2030 and then increases slightly afterwards. Resultantly, the share of process heat applications increases until approximately 2035 and then sinks slightly towards 60% in 2050. With respect to the energy carrier shares, the share of electricity consumption decreases due to the strong electrical efficiency increases mainly driven by CST measure implementation. Biomass and natural gas shares increase until 2050, as a result of strong economic and production tonnage growth in energy intensive industries such as HVC, limestone and paper. The share of energy carriers mainly found in iron and steel production sinks slightly as this industry branch experiences almost no growth across all countries [20], [19].
Figure 9: Industrial FEC in the EU27+3 in TWh (left), development of quEU application shares (center) and development of quEU energy carrier shares (right) for the quEU scenario.
2020 excluding corona crisis effects15
Figure 10 shows the feedstock and process emission development in quEU. Since these metrics are not influenced by efficiency measure implementation, baseline and quEU values are identical. Across all countries ca. 60% (~130 mio. t CO2) of process emissions in 2017 are covered by bottom-processes (i.e. steel, ammonia, methanol, cement, lime, glass, aluminum and paper).16 Despite container glass, steel and primary aluminum, all of these processes experience significant production growth until 2050 [20], leading to an increase in EU process emissions by 41 mio. t CO2. Feedstock demand for naphtha and LPG is driven by the production increase in HVC across Europe. Hydrogen feedstock demand also exhibits an increase, mainly due to production growth of ammonia and methanol.17
15 Excluding Cyprus and Malta. 16 Excluding BFG emissions, which are considered energy related. 17 Feedstock use of refineries is not balanced in SmInd EU.
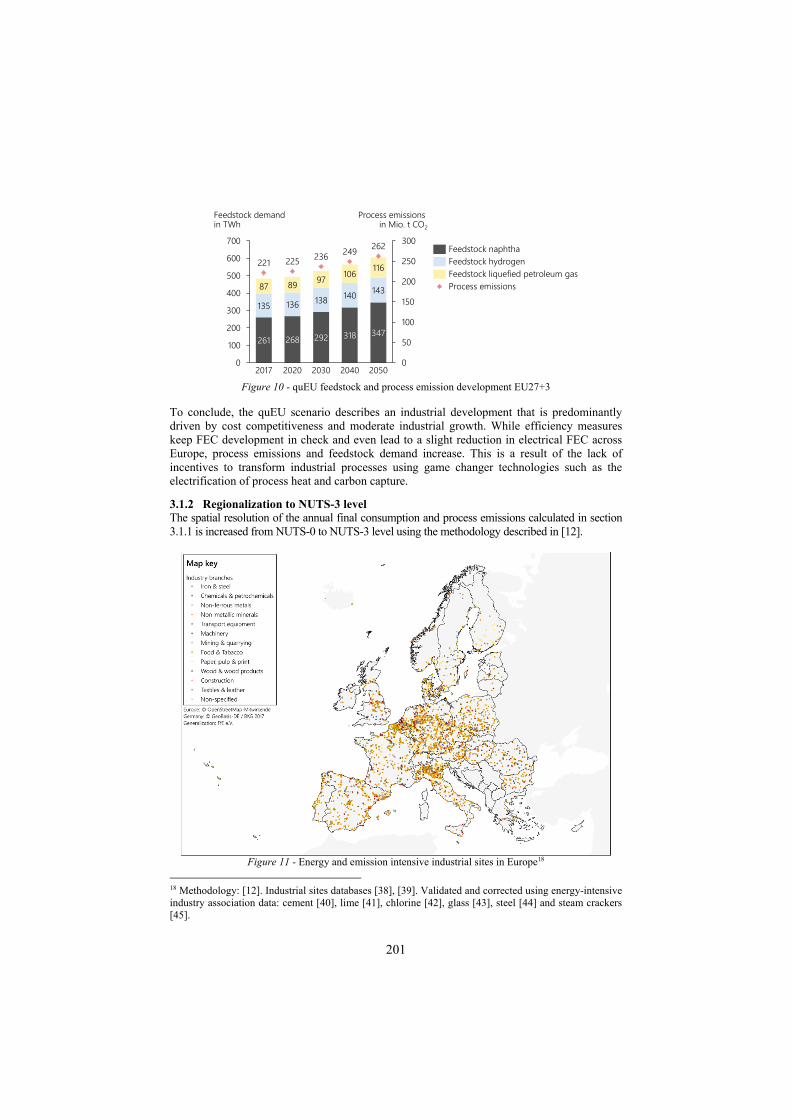
201
Figure 10 - quEU feedstock and process emission development EU27+3
To conclude, the quEU scenario describes an industrial development that is predominantly driven by cost competitiveness and moderate industrial growth. While efficiency measures keep FEC development in check and even lead to a slight reduction in electrical FEC across Europe, process emissions and feedstock demand increase. This is a result of the lack of incentives to transform industrial processes using game changer technologies such as the electrification of process heat and carbon capture.
3.1.2 Regionalization to NUTS-3 level The spatial resolution of the annual final consumption and process emissions calculated in section 3.1.1 is increased from NUTS-0 to NUTS-3 level using the methodology described in [12].
Figure 11 - Energy and emission intensive industrial sites in Europe18
18 Methodology: [12]. Industrial sites databases [38], [39]. Validated and corrected using energy-intensive industry association data: cement [40], lime [41], chlorine [42], glass [43], steel [44] and steam crackers [45].
261 268 292 318 347
135 136 138 140 14387 89 97 106 116221 225 236 249 262
0
50
100
150
200
250
300
0100200300400500600700
Feedstock demandin TWh
Process emissionsin Mio. t CO2
204020202017 20502030
Feedstock naphtha
Process emissions
Feedstock hydrogenFeedstock liquefied petroleum gas

202
Basis for the regionalization are point coordinates for emission and energy-intensive industry branches (cf. Figure 11) as well as employee and population data [35], [36]. Final consumption for process applications (e.g. process heat, process cooling, mechanical energy) in the energy intensive industry branches (i.e. Iron & steel industry, Chemical & Petrochemical industry, Non-ferrous metal industry, Non-metallic Minerals and Paper, Pulp and Print) is allocated to NUTS-3 regions according to the share of site-specific emissions in each industry branch and country. For non-energy intensive industries, a share of FC for process applications is allocated via site-specific emissions. This share corresponds to the share of emissions covered by the industry sites with point coordinates compared to total industry branch emissions in the respective country (based on 2015 emissions reported in the emission databases). The remaining FC is regionalized using employee data in NUTS-2 [37] resolution and then via population data to NUTS-3 level. For all non-process applications (e.g. lighting, space heating), independent of the industry branch, FC is regionalized via the latter approach. 3.1.3 Temporal distribution based on load profiles The load profile module of SmInd EU is used to increase the temporal resolution from annual to hourly or daily FC values. This is done by scaling the load with country, industry branch and energy-carrier specific synthetic load profiles. For heating and hot water it is assumed, that the industry sector behaves similar to the tertiary sector. Hence, the same profile is used as in the tertiary sector(cf. section 3.3.3). The methodology for deriving synthetic load profiles for all other industrial applications has been developed over a series of dissertations and publications: [46], [47], [6] and most recently [48]. The methodology derives synthetic load profiles based on real load data collected in energy audits performed by FfE in Austria and Germany [48]. It includes three steps:
i) data preparation, ii) regression analysis and iii) load profile synthetization.
In the first step, each real load curve is allocated to an industry branch and data artefacts such as negative values are eliminated. Furthermore, if necessary, heating and hot water data is separated from process heat data. Ultimately, real load data is normalized, so that all profiles can be used in the regression analysis [48]. The regression analysis is performed for every load profile and day-type and hour of day. Five typical days are defined: Monday, Tuesday to Thursday, Friday, Saturday and Sunday or public holiday. Since it is assumed, that process load profiles are independent of weather conditions (unlike heating and hot water) the only external regression parameter used is the monthly, country and industry branch specific production index taken from Eurostat (sts_inpr_m) [48].19 In step three, the regression results for each profile, day-type and hour of day are averaged in two steps:
a) For each company and fuel or electricity, if several load curves from the same company but different years exist and
b) for fuels and electricity within an industry branch and across companies.
The result of the load profile synthesis are country specific process heat and electricity profiles for all industry branches. Due to a lack of real load data, a constant profile was used for the iron & steel and the paper, pulp and print industry. Since these branches are characterized by high full-load hours, a constant load profile is justifiable. As depicted in Figure 25 on page 26, the combination of results from the final consumption, regionalization and load profile modules allows for the analysis of final conumption at NUTS-3 level, in hourly resolution, for Europe.
19 In case of data gaps either a country specific branch independent production index or the German branch specific index are used.
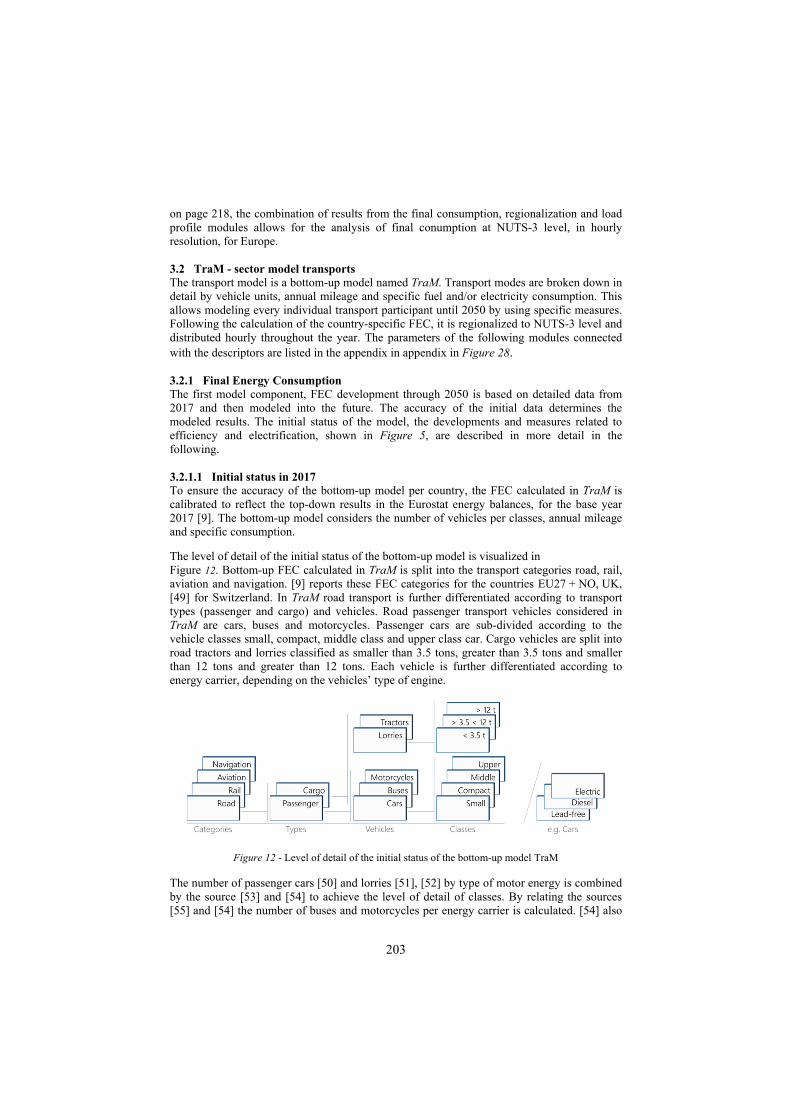
203
on page 218, the combination of results from the final consumption, regionalization and load profile modules allows for the analysis of final conumption at NUTS-3 level, in hourly resolution, for Europe. 3.2 TraM - sector model transports The transport model is a bottom-up model named TraM. Transport modes are broken down in detail by vehicle units, annual mileage and specific fuel and/or electricity consumption. This allows modeling every individual transport participant until 2050 by using specific measures. Following the calculation of the country-specific FEC, it is regionalized to NUTS-3 level and distributed hourly throughout the year. The parameters of the following modules connected with the descriptors are listed in the appendix in appendix in Figure 28. 3.2.1 Final Energy Consumption The first model component, FEC development through 2050 is based on detailed data from 2017 and then modeled into the future. The accuracy of the initial data determines the modeled results. The initial status of the model, the developments and measures related to efficiency and electrification, shown in Figure 5, are described in more detail in the following. 3.2.1.1 Initial status in 2017 To ensure the accuracy of the bottom-up model per country, the FEC calculated in TraM is calibrated to reflect the top-down results in the Eurostat energy balances, for the base year 2017 [9]. The bottom-up model considers the number of vehicles per classes, annual mileage and specific consumption.
The level of detail of the initial status of the bottom-up model is visualized in Figure 12. Bottom-up FEC calculated in TraM is split into the transport categories road, rail, aviation and navigation. [9] reports these FEC categories for the countries EU27 + NO, UK, [49] for Switzerland. In TraM road transport is further differentiated according to transport types (passenger and cargo) and vehicles. Road passenger transport vehicles considered in TraM are cars, buses and motorcycles. Passenger cars are sub-divided according to the vehicle classes small, compact, middle class and upper class car. Cargo vehicles are split into road tractors and lorries classified as smaller than 3.5 tons, greater than 3.5 tons and smaller than 12 tons and greater than 12 tons. Each vehicle is further differentiated according to energy carrier, depending on the vehicles’ type of engine.
Figure 12 - Level of detail of the initial status of the bottom-up model TraM
The number of passenger cars [50] and lorries [51], [52] by type of motor energy is combined by the source [53] and [54] to achieve the level of detail of classes. By relating the sources [55] and [54] the number of buses and motorcycles per energy carrier is calculated. [54] also

204
publishes country-specific annual mileage for different vehicle classes. In case country specific values are unavailable or significantly outdated, European average or German values are applied. The combination of the mentioned data and the specific consumption [31] per vehicle, class and energy carrier results in the bottom-up FEC calculated in TraM. Only the FEC of the categories rail, national aviation and national navigation are extracted from the Eurostat energy balances [9].
The results of this analysis are the starting point for modeling the transport transformation pathway until 2050. The differentiation according to categories, types, vehicles, classes and type of engine enables the detailed modeling of technological measures.
3.2.1.2 Baseline development until 2050 The final energy consumption of the transport sector is calculated in five-year intervals from 2020 until 2050. The stock of vehicles in the road transport category changes according to country-specific population development, assuming that the specific number of vehicles per person remains constant over the years.
Figure 13: Population development of EU27+3 countries and selected European countries using the population development factor
Figure 13 shows the population development of selected European countries [56]. This model exogenous parameter directly address the population development descriptor (cf. section 2). . The population in Europe will grow by 3% by 2050 compared to 2017. Italy and Poland indicate a decrease in population, whereas Netherlands, Spain, France, Denmark, United Kingdom and Sweden show an increase until 2050. 3.2.1.3 Energy efficiency driven by technological progress The specific consumption of each type of engine and vehicle per class decreases over the years due to technological improvements (cf. Table 1) [31]. The efficiency improvement ranges between 10% and 25% with an average value of 17% from 2020 to 2050. Assuming that the annual mileage remains constant over the years the country specific FEC for the category road transport including all types, vehicles and classes is modelled. The FEC development of air transport in all countries is based on [21] with a slight increase until 2030 and a linear extrapolation until 2050. The development of the FEC in the categories rail and shipping transport per country remains constant over the years.
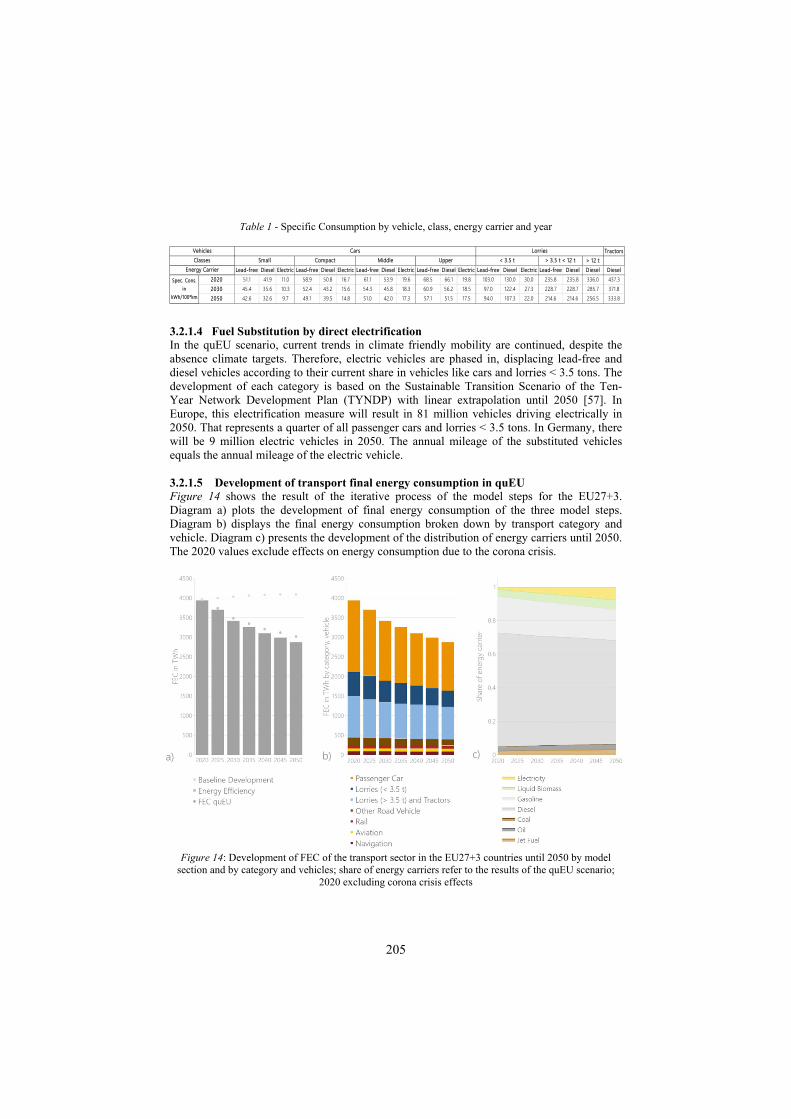
205
Table 1 - Specific Consumption by vehicle, class, energy carrier and year
3.2.1.4 Fuel Substitution by direct electrification In the quEU scenario, current trends in climate friendly mobility are continued, despite the absence climate targets. Therefore, electric vehicles are phased in, displacing lead-free and diesel vehicles according to their current share in vehicles like cars and lorries < 3.5 tons. The development of each category is based on the Sustainable Transition Scenario of the Ten-Year Network Development Plan (TYNDP) with linear extrapolation until 2050 [57]. In Europe, this electrification measure will result in 81 million vehicles driving electrically in 2050. That represents a quarter of all passenger cars and lorries < 3.5 tons. In Germany, there will be 9 million electric vehicles in 2050. The annual mileage of the substituted vehicles equals the annual mileage of the electric vehicle. 3.2.1.5 Development of transport final energy consumption in quEU Figure 14 shows the result of the iterative process of the model steps for the EU27+3. Diagram a) plots the development of final energy consumption of the three model steps. Diagram b) displays the final energy consumption broken down by transport category and vehicle. Diagram c) presents the development of the distribution of energy carriers until 2050. The 2020 values exclude effects on energy consumption due to the corona crisis.
Figure 14: Development of FEC of the transport sector in the EU27+3 countries until 2050 by model
section and by category and vehicles; share of energy carriers refer to the results of the quEU scenario; 2020 excluding corona crisis effects
Tractors> 12 t
Lead-free Diesel Electric Lead-free Diesel Electric Lead-free Diesel Electric Lead-free Diesel Electric Lead-free Diesel Electric Lead-free Diesel Diesel Diesel2020 51.1 41.9 11.0 58.9 50.8 16.7 61.1 53.9 19.6 68.5 66.1 19.8 103.0 130.0 30.0 235.8 235.8 336.0 437.32030 45.4 35.6 10.3 52.4 43.2 15.6 54.3 45.8 18.3 60.9 56.2 18.5 97.0 122.4 27.3 228.7 228.7 285.7 371.82050 42.6 32.6 9.7 49.1 39.5 14.8 51.0 42.0 17.3 57.1 51.5 17.5 94.0 107.3 22.0 214.6 214.6 256.5 333.8
Lorries
Spec. Cons. in
kWh/100*km
VehiclesClasses
Energy Carrier
CarsSmall Compact Middle Upper < 3.5 t > 3.5 t < 12 t
a) b) c)

206
In 2020, the transport sector in the EU27+3 countries will require almost 4,000 TWh. The FEC decreases to almost 2,700 TWh in the quEU scenario, which represents the last step of the model. The value of the second step, the energy efficiency measures, is only slightly higher at around 3,000 TWh in 2050. In comparison, the difference to the baseline development is much higher, with a gap of more than 1,000 TWh. The baseline development increases slightly until 2050 due to a positive population development (cf. Figure 13).
Consequently, most of the reduction in final energy consumption in the quEU FEC is caused by the energy efficiency measures. The electrification measures have only a minor impact on the final energy consumption reduction in the quEU scenario. The largest share of the FEC, 46% in 2020, is allocated to cars. In 2050, 43% of FEC remains to cars. The share of lorries < 3.5 tons also decreases very slightly due to the electrification measure. If the electrification measures in cars and lorries < 3.5 tons would be higher, the consumption would shift significantly towards the other transport components due to the lower specific consumption of electric vehicles. The minor electrification is also reflected in diagram c. The electricity consumption increases from 1% in 2020 to 7% in 2050 while gasoline and diesel consumption sinks. 3.2.2 Regionalization to NUTS-3 level The dataset containing the units of vehicles (cars, lorries, buses, motorcycles) on NUTS-2 level [55] determines the regionalization of the country-specific FEC. The units of vehicles per NUTS-2 region determine the shares per NUTS-2 region that indicate how much of the country's FEC is distributed to each NUTS-2 region. The sum of the shares of all NUTS 2 regions is equal to one for each country. To achieve the desired NUTS-3 level, the subsequent regionalization then pursues the population at the NUTS-3 level in the same way [35]. The latter approach is also applied to the FEC of the other categories like rail, air and shipping transport. The result is shown in subsection 0 in Figure 24. 3.2.3 Temporal distribution via load profiles For the energy system with regard to the supply of electricity, not only the absolute quantity with a regional distribution of the electricity is important, but also the time when the electricity is consumed. In the transport sector, this means that it must be specified when the electric vehicles are charged. This temporal resolution is indicated in load profiles whose calculation is explained at a high level in the following. The modelling of load profiles of privately and commercially used electric passenger cars and light commercial vehicles (LNF) is described in detail in [58], [59] and [6]. Therefore, only a brief summary of the methodology is given here. Figure 15 gives an overview of the data sources used and the underlying methodology. The transport survey "Mobility in Germany 2017 (MiD2017)" [60] and the “German Mobility Panel” (MOP) [61] serve as the data basis for modelling the annual mobility profiles and load curves. Both studies contain a large number of high-resolution daily (MID) or weekly (MOP) movement profiles of individual users of (mainly) conventional vehicles. The load profiles include calendar year-dependent parameters such as information like holidays, public holidays and bridge days. In addition, these load profiles are dependent on the weather of the specific year. Based on the coupling of these daily profiles, annual driving profiles are generated using various linkage criteria and taking into account the weekly driving patterns derived from the MOP dataset. Under the assumption of various technical and behavior-specific parameters such as battery capacities, available charging infrastructure and different charging strategies, the final annual normalized load profile is derived. In the quEU scenario, bidirectional charging is not pursued. The profiles modeled with German data were

207
transferred to other European countries, taking into account the mileage per country. The profile for traction current is the same for all NUTS-3 regions and is based on [62]. Profiles for other electric vehicles such as trucks and busses are not described in detail here because they are not part of the quEU scenario. The FEC for non-electric vehicles is evenly distributed over all hours of the year. The combination of the annual normalized load profile with the absolute consumption results in the temporally resolved consumption that must be provided by the supply side.
Figure 15 - Overview of the underlying data sources and methodology
3.3 PriHM & TerM - sector models buildings The FEC in buildings is determined in two models, the Private Household Model named PriHM and the Tertiary Model named TerM. The basic procedures in both models are the same, only the input data, some parameter quantifications and the load profiles differ. The aim of the sector models is to calculate the final energy consumption until 2050 in five-year steps with a spatial resolution on NUTS-3 level and a temporal resolution of the electricity consumption in hours. The parameters of the following modules connected with the descriptors are listed in the appendix in Figure 29. 3.3.1 Final Energy Consumption The initial basis of both models is the energy balance in 2017 of each European [9], [49]. By using further datasets like [63], [64], [65], [66] the final energy consumption per sector and energy carrier was split into applications and into branches in the tertiary sector. Two measures are applied for energy reduction until 2050: insulation and energy-related modernization by installing heat pumps (cf. Figure 5). These two measures regarding heat follow the measures with the highest CO2 reduction potentials, determined in [67]. The following values visualized in Figure 16, published at [9], [49] and available at [68], [69], also show that the majority of FEC in the buildings sector is accounted by heating applications. Therefore, only measures in this field are applied. 64% of final energy consumption in the private household sector is used for space heating and 15% for warm water in the EU27+3 countries. In the tertiary sector, 50% in space heating and 5% in warm water. 55% of the CO2 emissions in private households was generated in space heating and warm water by fossil fuels such as gas, oil and coal, which account for 55% of in in the mentioned countries. In the tertiary sector this value amount to 39% of CO2 emissions.
Calendardates
Public holidays
Weekly drivingpatterns
Daily drivingprofiles
Annual drivingprofiles
Calculation ofannual load profiles
Outdoor temperature
User behaviour
Consumptionmodel
Vehicle parameters
Charginginfrastructure
MID 2017raw data
MOPraw data
Statistical analysis,
filtering and plausibility
checks
Annual load profiles for:
Cars/LCV BEV/PHEV
Commuter/non commuter
Direct charging
Unidirectional optimization
Bidirectional optimization
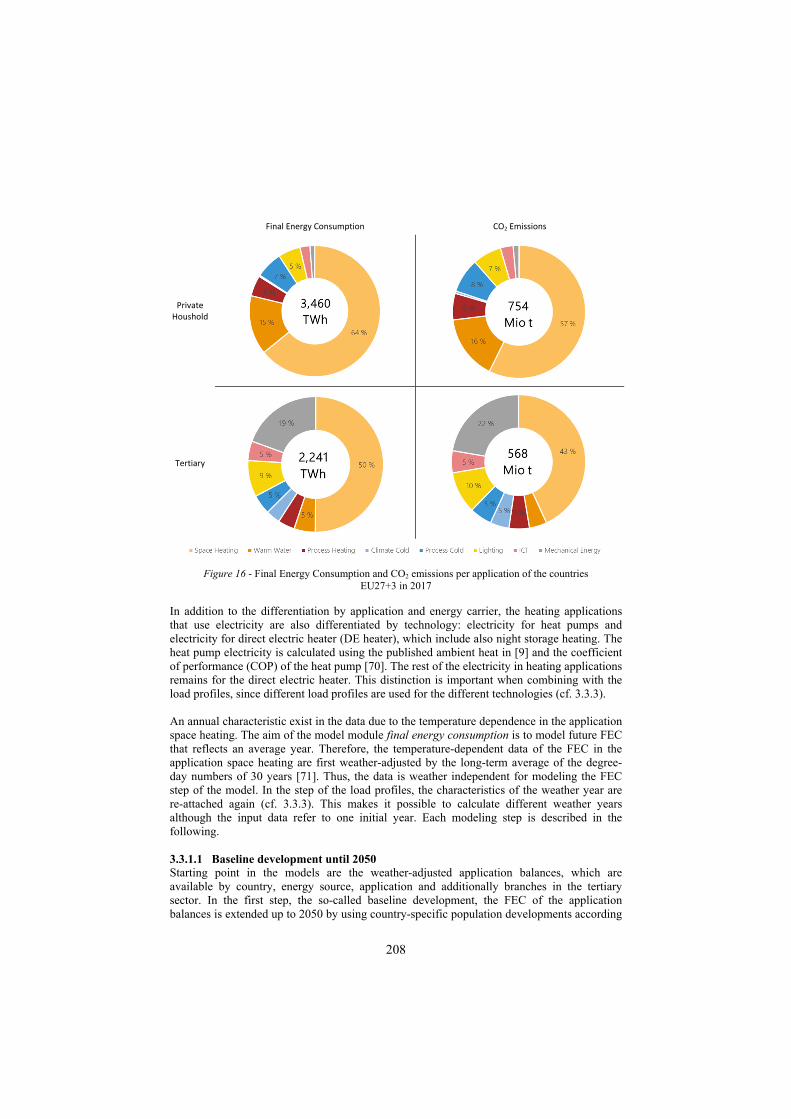
208
Final Energy Consumption CO2 Emissions
Private Houshold
Tertiary
Figure 16 - Final Energy Consumption and CO2 emissions per application of the countries EU27+3 in 2017
In addition to the differentiation by application and energy carrier, the heating applications that use electricity are also differentiated by technology: electricity for heat pumps and electricity for direct electric heater (DE heater), which include also night storage heating. The heat pump electricity is calculated using the published ambient heat in [9] and the coefficient of performance (COP) of the heat pump [70]. The rest of the electricity in heating applications remains for the direct electric heater. This distinction is important when combining with the load profiles, since different load profiles are used for the different technologies (cf. 3.3.3). An annual characteristic exist in the data due to the temperature dependence in the application space heating. The aim of the model module final energy consumption is to model future FEC that reflects an average year. Therefore, the temperature-dependent data of the FEC in the application space heating are first weather-adjusted by the long-term average of the degree-day numbers of 30 years [71]. Thus, the data is weather independent for modeling the FEC step of the model. In the step of the load profiles, the characteristics of the weather year are re-attached again (cf. 3.3.3). This makes it possible to calculate different weather years although the input data refer to one initial year. Each modeling step is described in the following. 3.3.1.1 Baseline development until 2050 Starting point in the models are the weather-adjusted application balances, which are available by country, energy source, application and additionally branches in the tertiary sector. In the first step, the so-called baseline development, the FEC of the application balances is extended up to 2050 by using country-specific population developments according
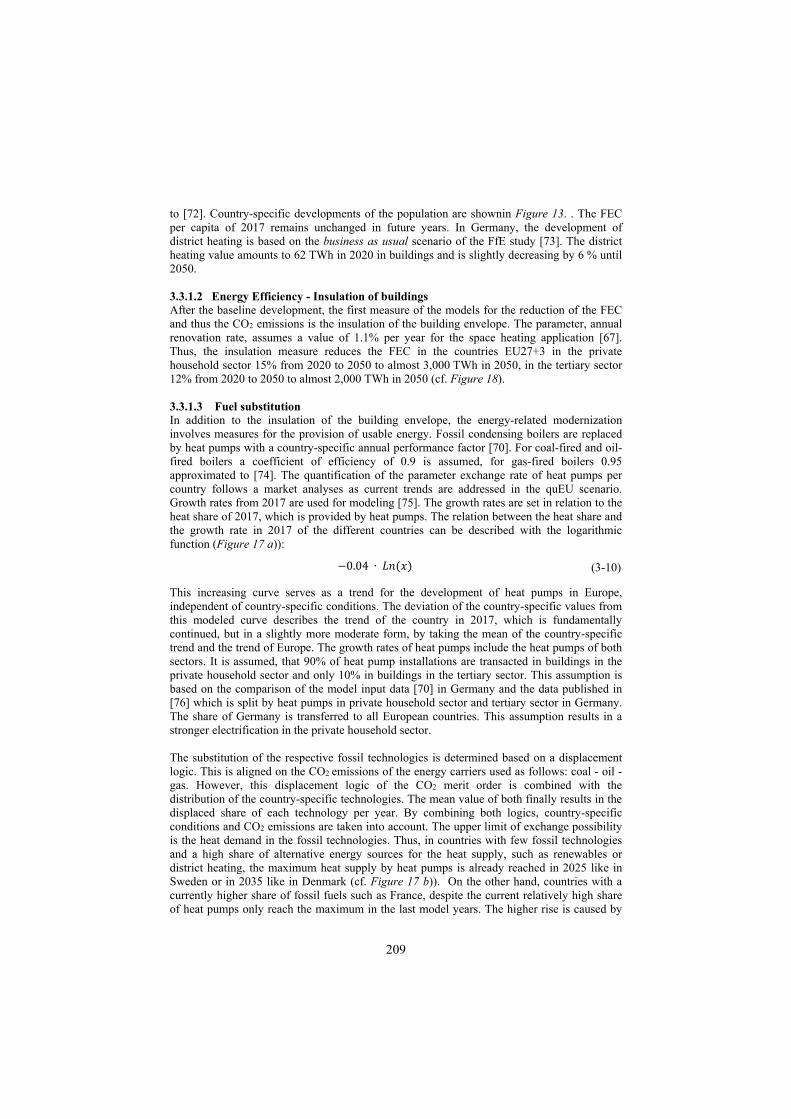
209
to [72]. Country-specific developments of the population are shownin Figure 13. . The FEC per capita of 2017 remains unchanged in future years. In Germany, the development of district heating is based on the business as usual scenario of the FfE study [73]. The district heating value amounts to 62 TWh in 2020 in buildings and is slightly decreasing by 6 % until 2050. 3.3.1.2 Energy Efficiency - Insulation of buildings After the baseline development, the first measure of the models for the reduction of the FEC and thus the CO2 emissions is the insulation of the building envelope. The parameter, annual renovation rate, assumes a value of 1.1% per year for the space heating application [67]. Thus, the insulation measure reduces the FEC in the countries EU27+3 in the private household sector 15% from 2020 to 2050 to almost 3,000 TWh in 2050, in the tertiary sector 12% from 2020 to 2050 to almost 2,000 TWh in 2050 (cf. Figure 18). 3.3.1.3 Fuel substitution In addition to the insulation of the building envelope, the energy-related modernization involves measures for the provision of usable energy. Fossil condensing boilers are replaced by heat pumps with a country-specific annual performance factor [70]. For coal-fired and oil-fired boilers a coefficient of efficiency of 0.9 is assumed, for gas-fired boilers 0.95 approximated to [74]. The quantification of the parameter exchange rate of heat pumps per country follows a market analyses as current trends are addressed in the quEU scenario. Growth rates from 2017 are used for modeling [75]. The growth rates are set in relation to the heat share of 2017, which is provided by heat pumps. The relation between the heat share and the growth rate in 2017 of the different countries can be described with the logarithmic function (Figure 17 a)):
0.04 ∙ 𝐿𝑛 𝑥 (3-10)
This increasing curve serves as a trend for the development of heat pumps in Europe, independent of country-specific conditions. The deviation of the country-specific values from this modeled curve describes the trend of the country in 2017, which is fundamentally continued, but in a slightly more moderate form, by taking the mean of the country-specific trend and the trend of Europe. The growth rates of heat pumps include the heat pumps of both sectors. It is assumed, that 90% of heat pump installations are transacted in buildings in the private household sector and only 10% in buildings in the tertiary sector. This assumption is based on the comparison of the model input data [70] in Germany and the data published in [76] which is split by heat pumps in private household sector and tertiary sector in Germany. The share of Germany is transferred to all European countries. This assumption results in a stronger electrification in the private household sector. The substitution of the respective fossil technologies is determined based on a displacement logic. This is aligned on the CO2 emissions of the energy carriers used as follows: coal - oil - gas. However, this displacement logic of the CO2 merit order is combined with the distribution of the country-specific technologies. The mean value of both finally results in the displaced share of each technology per year. By combining both logics, country-specific conditions and CO2 emissions are taken into account. The upper limit of exchange possibility is the heat demand in the fossil technologies. Thus, in countries with few fossil technologies and a high share of alternative energy sources for the heat supply, such as renewables or district heating, the maximum heat supply by heat pumps is already reached in 2025 like in Sweden or in 2035 like in Denmark (cf. Figure 17 b)). On the other hand, countries with a currently higher share of fossil fuels such as France, despite the current relatively high share of heat pumps only reach the maximum in the last model years. The higher rise is caused by

210
the stronger growth observed in the current market analysis. The electricity required for the heat demand by heat pumps is calculated with a country-specific annual performance factor of the heat pump published in [70].
Figure 17: a) Current relation of heat share of heat pumps and growth rate per country; b) Heat share of heat pumps in future years per country
3.3.1.4 Development of domestic and tertiary final energy consumption in quEU Figure 18 presents the results of the model steps of the sector models PriHM and TerM in the countries EU27+3. Diagrams a) and d) show the FEC of each model step. Diagrams b) and e) present the development of the share of application and diagrams c) and f) display the development of the share of the energy carrier. The values in 2020 exclude effects on FEC due to the Corona crisis.
a)
b)

211
Private household sector
Figure 18: a), d) Development of the FEC of private households and the tertiary sector in the EU27+3 countries until 2050 by model section; share of application (b), e)) and energy carrier (c), f)) refer to the results of the quEU scenario; 2020 excluding corona crisis effects In the private household sector, FEC in 2020 amounts to 3,500 TWh and is reduced to almost 2,400 in the quEU scenario by 2050. Due to the annual insulation rate, the FEC is reduced to 3,000 TWh in 2050. The increase in the baseline development to 3,600 TWh is caused by the positive population trend until 2050 in Europe (cf. Figure 13). From these results, it can be concluded that the insulation and electrification measure with their selected parameters have a similar impact on the reduction of the FEC in the private household sector. The share of
Tertiary sector
a) b) c)
d) e) f)
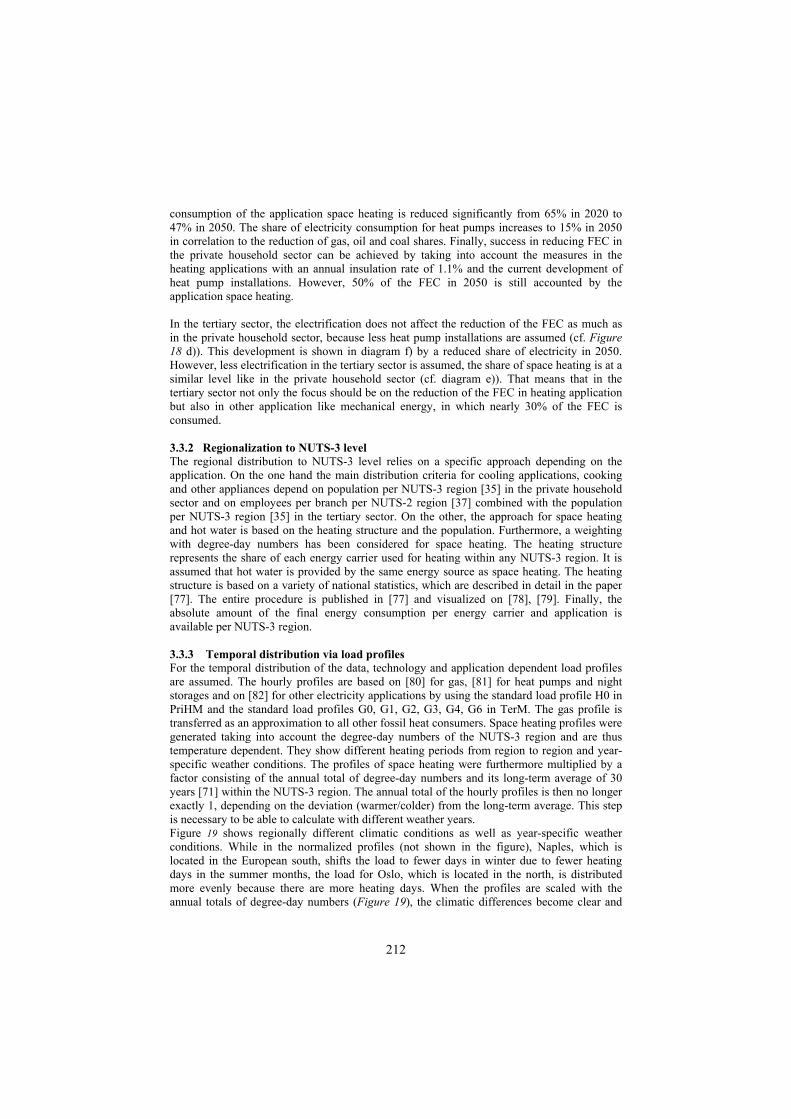
212
consumption of the application space heating is reduced significantly from 65% in 2020 to 47% in 2050. The share of electricity consumption for heat pumps increases to 15% in 2050 in correlation to the reduction of gas, oil and coal shares. Finally, success in reducing FEC in the private household sector can be achieved by taking into account the measures in the heating applications with an annual insulation rate of 1.1% and the current development of heat pump installations. However, 50% of the FEC in 2050 is still accounted by the application space heating. In the tertiary sector, the electrification does not affect the reduction of the FEC as much as in the private household sector, because less heat pump installations are assumed (cf. Figure 18 d)). This development is shown in diagram f) by a reduced share of electricity in 2050. However, less electrification in the tertiary sector is assumed, the share of space heating is at a similar level like in the private household sector (cf. diagram e)). That means that in the tertiary sector not only the focus should be on the reduction of the FEC in heating application but also in other application like mechanical energy, in which nearly 30% of the FEC is consumed. 3.3.2 Regionalization to NUTS-3 level The regional distribution to NUTS-3 level relies on a specific approach depending on the application. On the one hand the main distribution criteria for cooling applications, cooking and other appliances depend on population per NUTS-3 region [35] in the private household sector and on employees per branch per NUTS-2 region [37] combined with the population per NUTS-3 region [35] in the tertiary sector. On the other, the approach for space heating and hot water is based on the heating structure and the population. Furthermore, a weighting with degree-day numbers has been considered for space heating. The heating structure represents the share of each energy carrier used for heating within any NUTS-3 region. It is assumed that hot water is provided by the same energy source as space heating. The heating structure is based on a variety of national statistics, which are described in detail in the paper [77]. The entire procedure is published in [77] and visualized on [78], [79]. Finally, the absolute amount of the final energy consumption per energy carrier and application is available per NUTS-3 region. 3.3.3 Temporal distribution via load profiles For the temporal distribution of the data, technology and application dependent load profiles are assumed. The hourly profiles are based on [80] for gas, [81] for heat pumps and night storages and on [82] for other electricity applications by using the standard load profile H0 in PriHM and the standard load profiles G0, G1, G2, G3, G4, G6 in TerM. The gas profile is transferred as an approximation to all other fossil heat consumers. Space heating profiles were generated taking into account the degree-day numbers of the NUTS-3 region and are thus temperature dependent. They show different heating periods from region to region and year-specific weather conditions. The profiles of space heating were furthermore multiplied by a factor consisting of the annual total of degree-day numbers and its long-term average of 30 years [71] within the NUTS-3 region. The annual total of the hourly profiles is then no longer exactly 1, depending on the deviation (warmer/colder) from the long-term average. This step is necessary to be able to calculate with different weather years. Figure 19 shows regionally different climatic conditions as well as year-specific weather conditions. While in the normalized profiles (not shown in the figure), Naples, which is located in the European south, shifts the load to fewer days in winter due to fewer heating days in the summer months, the load for Oslo, which is located in the north, is distributed more evenly because there are more heating days. When the profiles are scaled with the annual totals of degree-day numbers (Figure 19), the climatic differences become clear and
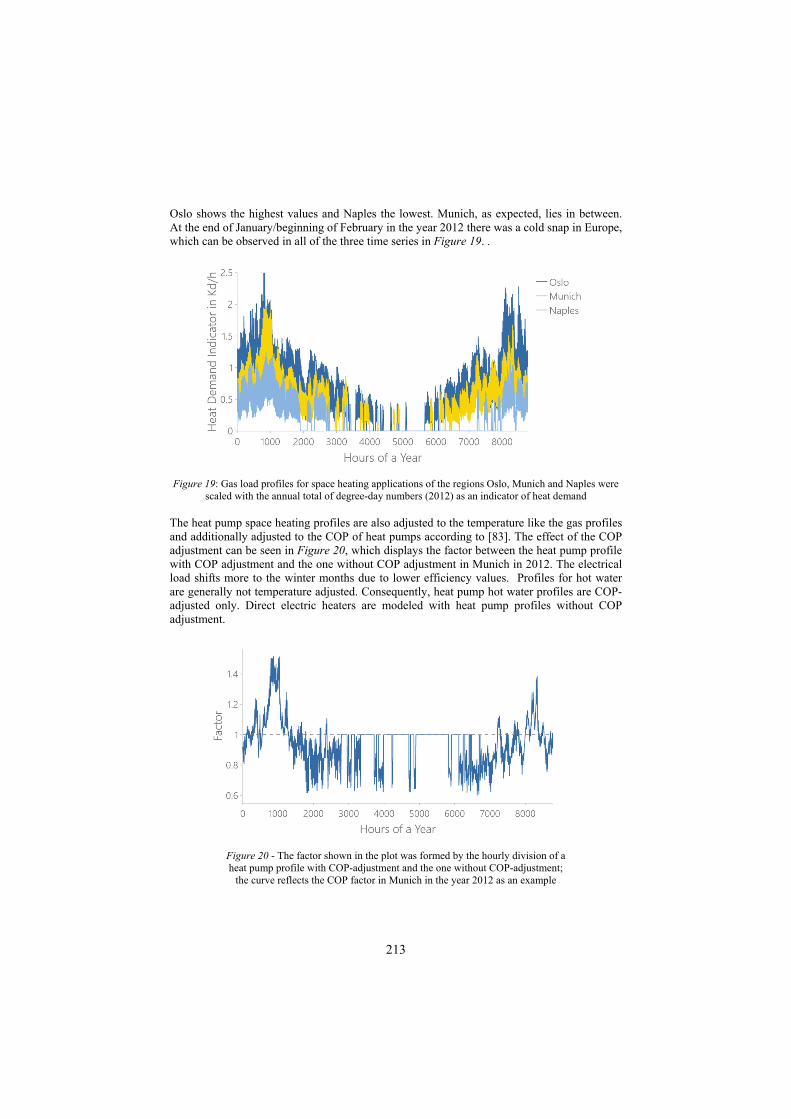
213
Oslo shows the highest values and Naples the lowest. Munich, as expected, lies in between. At the end of January/beginning of February in the year 2012 there was a cold snap in Europe, which can be observed in all of the three time series in Figure 19. .
Figure 19: Gas load profiles for space heating applications of the regions Oslo, Munich and Naples were scaled with the annual total of degree-day numbers (2012) as an indicator of heat demand
The heat pump space heating profiles are also adjusted to the temperature like the gas profiles and additionally adjusted to the COP of heat pumps according to [83]. The effect of the COP adjustment can be seen in Figure 20, which displays the factor between the heat pump profile with COP adjustment and the one without COP adjustment in Munich in 2012. The electrical load shifts more to the winter months due to lower efficiency values. Profiles for hot water are generally not temperature adjusted. Consequently, heat pump hot water profiles are COP-adjusted only. Direct electric heaters are modeled with heat pump profiles without COP adjustment.
Figure 20 - The factor shown in the plot was formed by the hourly division of a heat pump profile with COP-adjustment and the one without COP-adjustment;
the curve reflects the COP factor in Munich in the year 2012 as an example
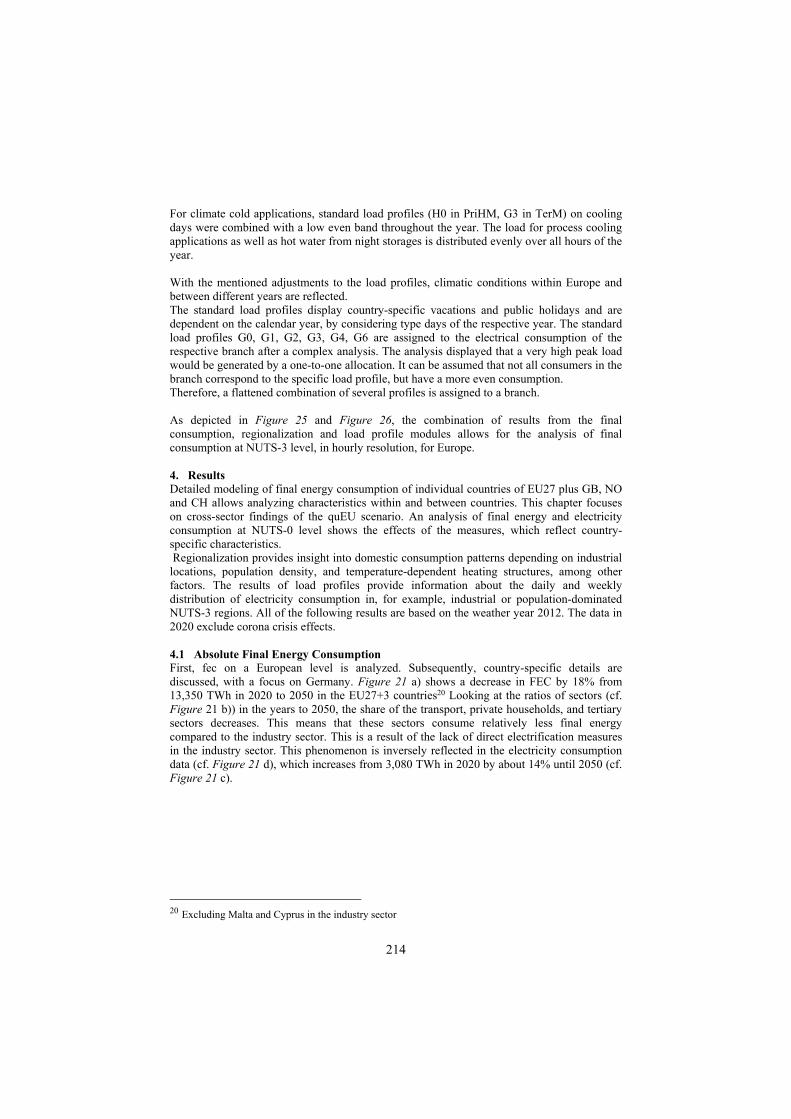
214
For climate cold applications, standard load profiles (H0 in PriHM, G3 in TerM) on cooling days were combined with a low even band throughout the year. The load for process cooling applications as well as hot water from night storages is distributed evenly over all hours of the year. With the mentioned adjustments to the load profiles, climatic conditions within Europe and between different years are reflected. The standard load profiles display country-specific vacations and public holidays and are dependent on the calendar year, by considering type days of the respective year. The standard load profiles G0, G1, G2, G3, G4, G6 are assigned to the electrical consumption of the respective branch after a complex analysis. The analysis displayed that a very high peak load would be generated by a one-to-one allocation. It can be assumed that not all consumers in the branch correspond to the specific load profile, but have a more even consumption. Therefore, a flattened combination of several profiles is assigned to a branch. As depicted in Figure 25 and Figure 26, the combination of results from the final consumption, regionalization and load profile modules allows for the analysis of final consumption at NUTS-3 level, in hourly resolution, for Europe. 4. Results Detailed modeling of final energy consumption of individual countries of EU27 plus GB, NO and CH allows analyzing characteristics within and between countries. This chapter focuses on cross-sector findings of the quEU scenario. An analysis of final energy and electricity consumption at NUTS-0 level shows the effects of the measures, which reflect country-specific characteristics. Regionalization provides insight into domestic consumption patterns depending on industrial locations, population density, and temperature-dependent heating structures, among other factors. The results of load profiles provide information about the daily and weekly distribution of electricity consumption in, for example, industrial or population-dominated NUTS-3 regions. All of the following results are based on the weather year 2012. The data in 2020 exclude corona crisis effects. 4.1 Absolute Final Energy Consumption First, fec on a European level is analyzed. Subsequently, country-specific details are discussed, with a focus on Germany. Figure 21 a) shows a decrease in FEC by 18% from 13,350 TWh in 2020 to 2050 in the EU27+3 countries20 Looking at the ratios of sectors (cf. Figure 21 b)) in the years to 2050, the share of the transport, private households, and tertiary sectors decreases. This means that these sectors consume relatively less final energy compared to the industry sector. This is a result of the lack of direct electrification measures in the industry sector. This phenomenon is inversely reflected in the electricity consumption data (cf. Figure 21 d), which increases from 3,080 TWh in 2020 by about 14% until 2050 (cf. Figure 21 c).
20 Excluding Malta and Cyprus in the industry sector
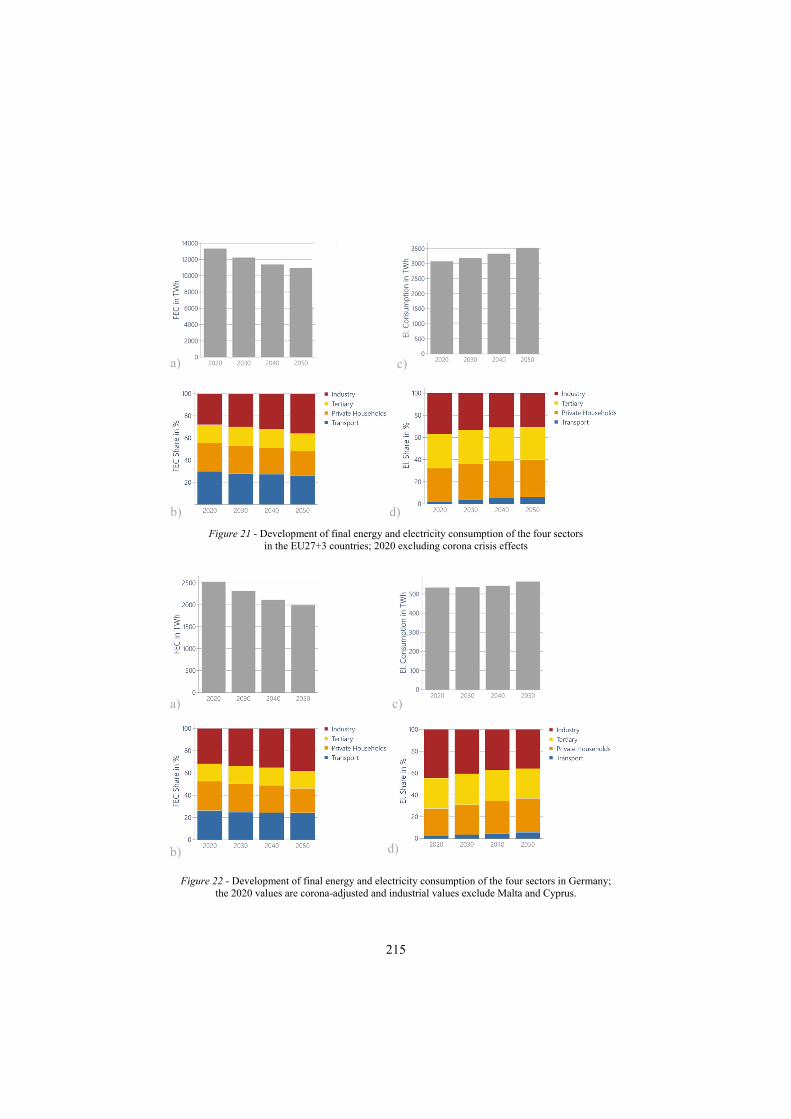
215
Figure 21 - Development of final energy and electricity consumption of the four sectors
in the EU27+3 countries; 2020 excluding corona crisis effects
Figure 22 - Development of final energy and electricity consumption of the four sectors in Germany; the 2020 values are corona-adjusted and industrial values exclude Malta and Cyprus.
b)
c)
d)
a)
a)
b)
c)
d)
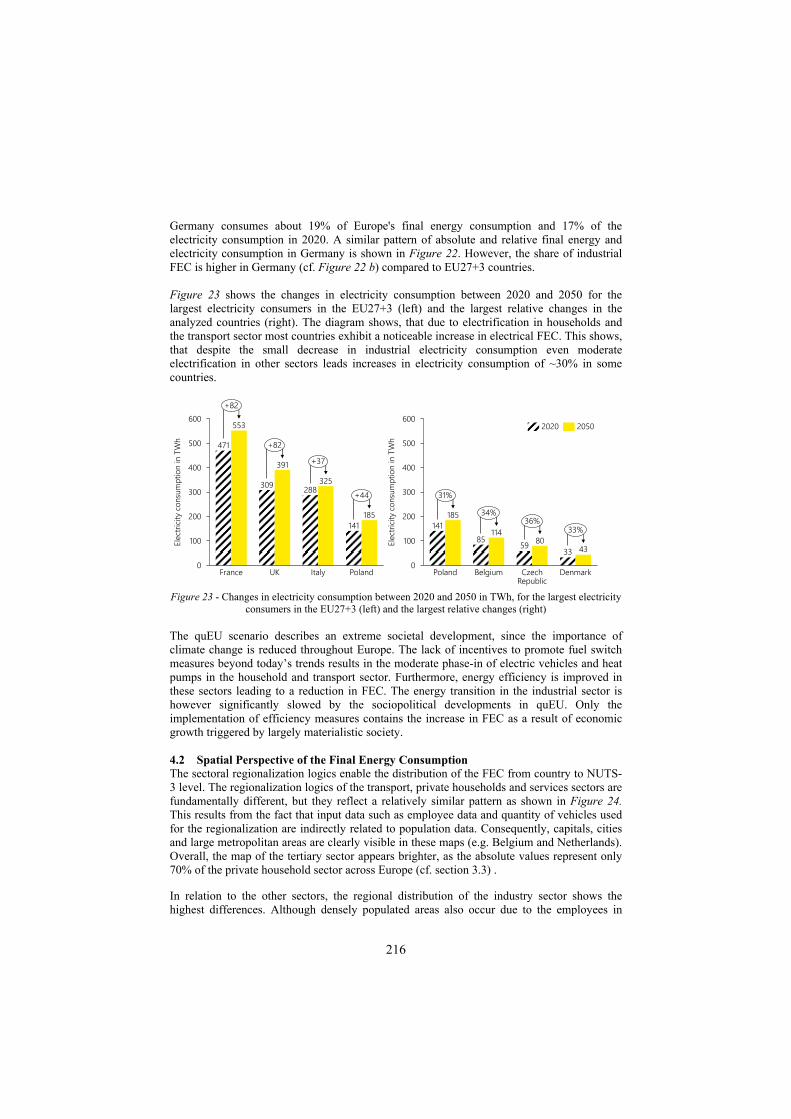
216
Germany consumes about 19% of Europe's final energy consumption and 17% of the electricity consumption in 2020. A similar pattern of absolute and relative final energy and electricity consumption in Germany is shown in Figure 22. However, the share of industrial FEC is higher in Germany (cf. Figure 22 b) compared to EU27+3 countries. Figure 23 shows the changes in electricity consumption between 2020 and 2050 for the largest electricity consumers in the EU27+3 (left) and the largest relative changes in the analyzed countries (right). The diagram shows, that due to electrification in households and the transport sector most countries exhibit a noticeable increase in electrical FEC. This shows, that despite the small decrease in industrial electricity consumption even moderate electrification in other sectors leads increases in electricity consumption of ~30% in some countries.
Figure 23 - Changes in electricity consumption between 2020 and 2050 in TWh, for the largest electricity
consumers in the EU27+3 (left) and the largest relative changes (right) The quEU scenario describes an extreme societal development, since the importance of climate change is reduced throughout Europe. The lack of incentives to promote fuel switch measures beyond today’s trends results in the moderate phase-in of electric vehicles and heat pumps in the household and transport sector. Furthermore, energy efficiency is improved in these sectors leading to a reduction in FEC. The energy transition in the industrial sector is however significantly slowed by the sociopolitical developments in quEU. Only the implementation of efficiency measures contains the increase in FEC as a result of economic growth triggered by largely materialistic society. 4.2 Spatial Perspective of the Final Energy Consumption The sectoral regionalization logics enable the distribution of the FEC from country to NUTS-3 level. The regionalization logics of the transport, private households and services sectors are fundamentally different, but they reflect a relatively similar pattern as shown in Figure 24. This results from the fact that input data such as employee data and quantity of vehicles used for the regionalization are indirectly related to population data. Consequently, capitals, cities and large metropolitan areas are clearly visible in these maps (e.g. Belgium and Netherlands). Overall, the map of the tertiary sector appears brighter, as the absolute values represent only 70% of the private household sector across Europe (cf. section 3.3) . In relation to the other sectors, the regional distribution of the industry sector shows the highest differences. Although densely populated areas also occur due to the employees in
14185 59 33
185
11480
430
100
200
300
400
500
600
Belgium Denmark
Electr
icity
cons
umpt
ionin
TWh
Poland Czech Republic
31%
34%36%
33%
471
309 288
141
553
391325
185
0
100
200
300
400
500
600
UK
Electr
icity
cons
umpt
ionin
TWh
PolandFrance Italy
+82
+82+37
+44
2020 2050
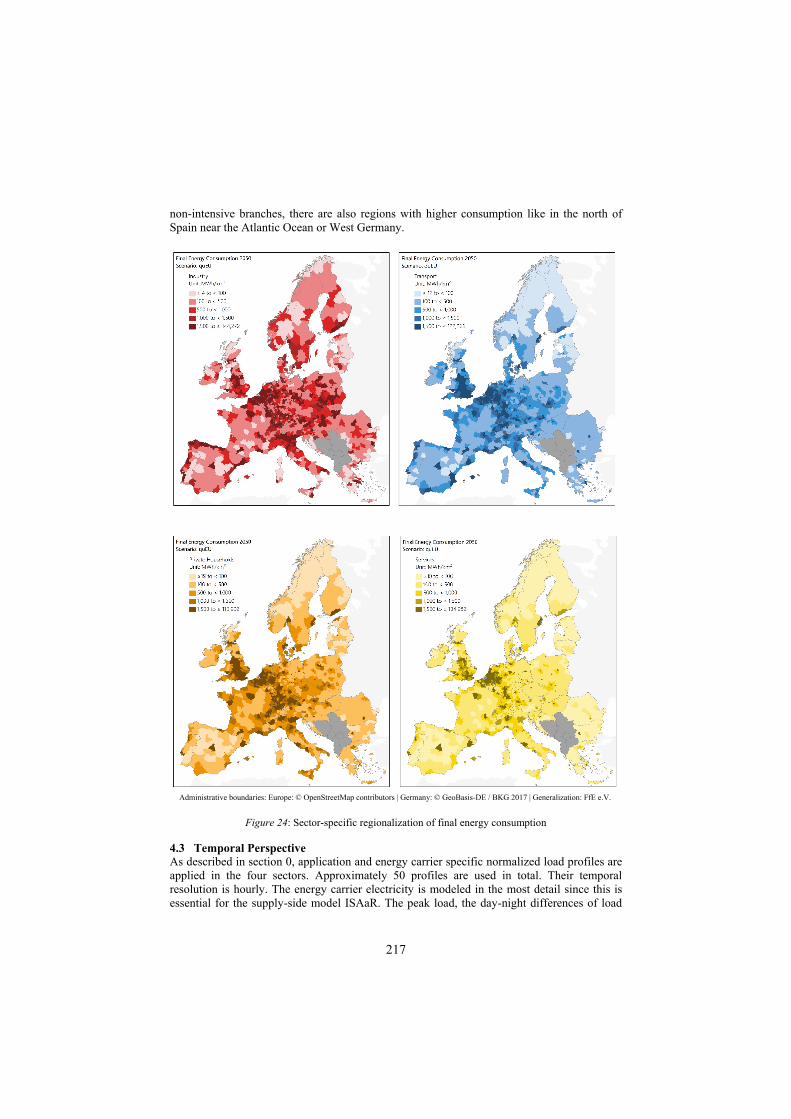
217
non-intensive branches, there are also regions with higher consumption like in the north of Spain near the Atlantic Ocean or West Germany.
Administrative boundaries: Europe: © OpenStreetMap contributors | Germany: © GeoBasis-DE / BKG 2017 | Generalization: FfE e.V.
Figure 24: Sector-specific regionalization of final energy consumption 4.3 Temporal Perspective As described in section 0, application and energy carrier specific normalized load profiles are applied in the four sectors. Approximately 50 profiles are used in total. Their temporal resolution is hourly. The energy carrier electricity is modeled in the most detail since this is essential for the supply-side model ISAaR. The peak load, the day-night differences of load
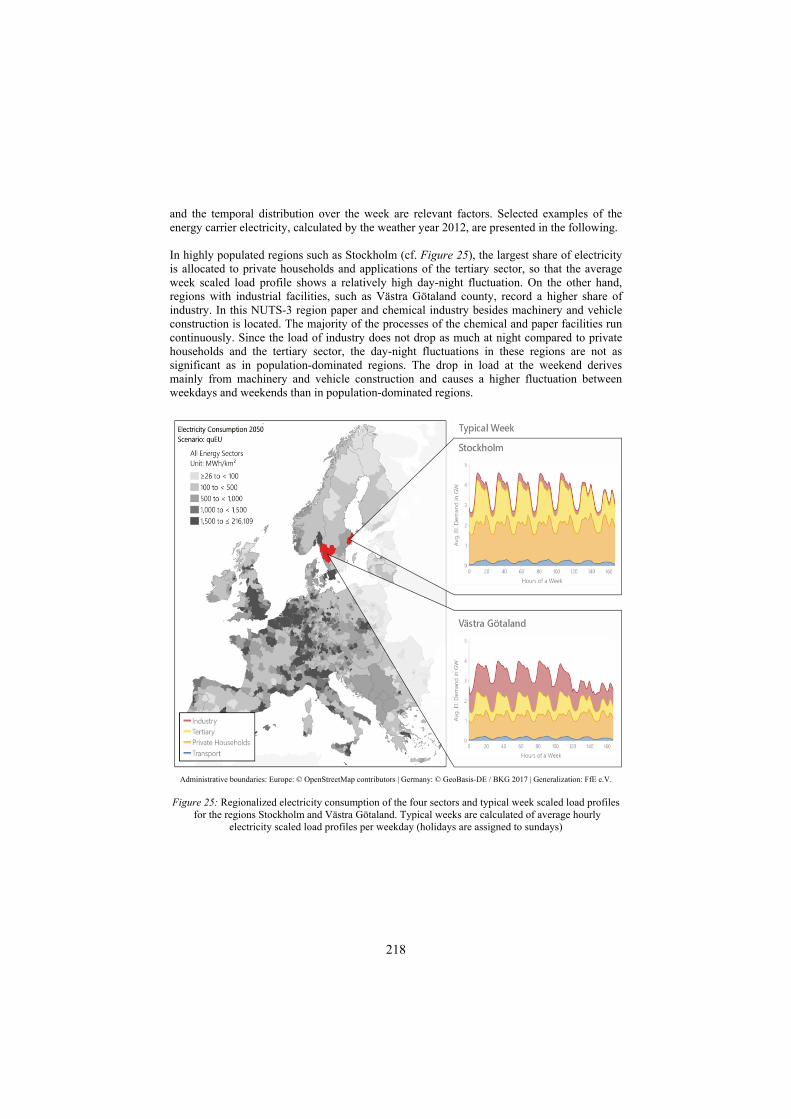
218
and the temporal distribution over the week are relevant factors. Selected examples of the energy carrier electricity, calculated by the weather year 2012, are presented in the following. In highly populated regions such as Stockholm (cf. Figure 25), the largest share of electricity is allocated to private households and applications of the tertiary sector, so that the average week scaled load profile shows a relatively high day-night fluctuation. On the other hand, regions with industrial facilities, such as Västra Götaland county, record a higher share of industry. In this NUTS-3 region paper and chemical industry besides machinery and vehicle construction is located. The majority of the processes of the chemical and paper facilities run continuously. Since the load of industry does not drop as much at night compared to private households and the tertiary sector, the day-night fluctuations in these regions are not as significant as in population-dominated regions. The drop in load at the weekend derives mainly from machinery and vehicle construction and causes a higher fluctuation between weekdays and weekends than in population-dominated regions.
Administrative boundaries: Europe: © OpenStreetMap contributors | Germany: © GeoBasis-DE / BKG 2017 | Generalization: FfE e.V.
Figure 25: Regionalized electricity consumption of the four sectors and typical week scaled load profiles
for the regions Stockholm and Västra Götaland. Typical weeks are calculated of average hourly electricity scaled load profiles per weekday (holidays are assigned to sundays)
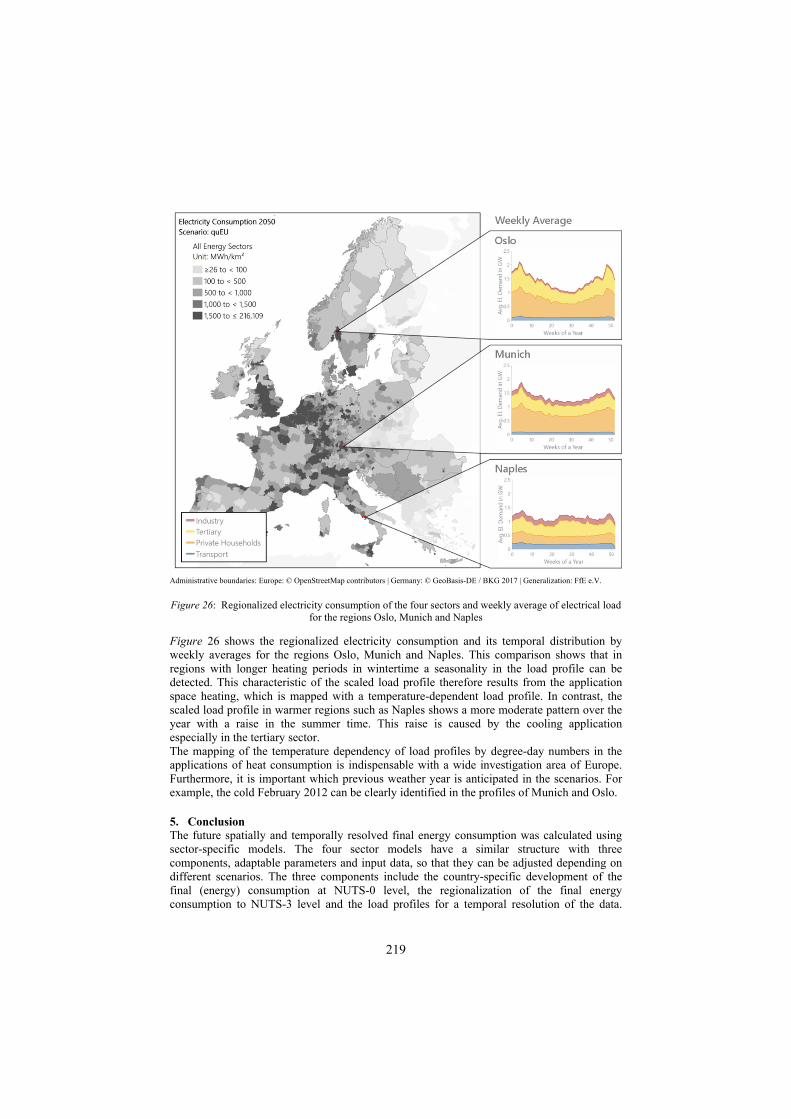
219
Administrative boundaries: Europe: © OpenStreetMap contributors | Germany: © GeoBasis-DE / BKG 2017 | Generalization: FfE e.V.
Figure 26: Regionalized electricity consumption of the four sectors and weekly average of electrical load
for the regions Oslo, Munich and Naples
Figure 26 shows the regionalized electricity consumption and its temporal distribution by weekly averages for the regions Oslo, Munich and Naples. This comparison shows that in regions with longer heating periods in wintertime a seasonality in the load profile can be detected. This characteristic of the scaled load profile therefore results from the application space heating, which is mapped with a temperature-dependent load profile. In contrast, the scaled load profile in warmer regions such as Naples shows a more moderate pattern over the year with a raise in the summer time. This raise is caused by the cooling application especially in the tertiary sector. The mapping of the temperature dependency of load profiles by degree-day numbers in the applications of heat consumption is indispensable with a wide investigation area of Europe. Furthermore, it is important which previous weather year is anticipated in the scenarios. For example, the cold February 2012 can be clearly identified in the profiles of Munich and Oslo. 5. Conclusion The future spatially and temporally resolved final energy consumption was calculated using sector-specific models. The four sector models have a similar structure with three components, adaptable parameters and input data, so that they can be adjusted depending on different scenarios. The three components include the country-specific development of the final (energy) consumption at NUTS-0 level, the regionalization of the final energy consumption to NUTS-3 level and the load profiles for a temporal resolution of the data.
220
Regionalization and load profiles are sector-, energy carrier-, application- and branch-specific. The resolution of the component final energy consumption by application, energy source, branch and vehicles allows detailed modeling of energy efficiency measures and direct or indirect electrification measures. This includes, for example, the replacement of conventional condensing boilers by heat pumps or the replacement of combustion engines by electric vehicles. In this paper, an extreme scenario named quEU is assumed for the development of final energy consumption, which is economically driven and in which national and international climate targets are not achieved. Politically and socially, the situation in Europe is changing for the worse. The many dimensions of final energy consumption modeling make it possible to analyze characteristics within and between countries. The selected results for the EU27 plus GB, NO and CH, countries and districts provide an insight into these evaluation possibilities. In the quEU scenario, the corona adjusted final energy consumption decreases by 18% from 13,350 TWh in 2020 to 2050, whereas the electricity consumption increases by 14% to 3,500 TWh in 2050. The sectoral shares of final energy consumption provide information on the results of the implementation of measures for comparison between the sectors. While final energy consumption in the building sector and the transport sector decreases in the quEU scenario due to fuel substitution and energy efficiency measures, final energy consumption in industry remains at a similar level. This can be explained by the compensation of the increasing gross value added with the implemented energy efficiency measures. Combining the regionalization of final energy and electricity consumption with the load profiles provides information about the amount of demand in each part of the country and at different times. Due to the temperature and weather year dependency, the heat consumption can be modeled in detail across Europe.
Further studies and decisions like international, national and local transmission grid planning can benefit strongly from such highly detailed analyses. In addition to the queEU scenario, a further scenario will be simulated. A scenario named solidEU in which national climate targets are achieved and a solidary European community is assumed [3]. Based on this, a holistic energy system modeling is carried out and extreme scenarios concerning, for example, the price drop of photovoltaics and battery storage or the price drop of electrolyzers are simulated.
References [1] Böing, F., & Regett, A. (2019). Hourly CO2 Emission Factors and Marginal Costs of Energy Carriers
in Future Multi-Energy Systems. Energies, 12(12), 2260. Basel, Switzerland: MDPI AG, 2019. [2] Fiedler, Claudia; Pellinger Christoph: Laufendes Projekt: Verbundprojekt eXtremOS – Wert von
Flexibilität im Kontext der europäischen Strommarktkopplung bei extremen technologischen,regulatorischen und gesellschaftlichen Entwicklungen. In: www.ffe.de/extremos. (Abruf am 2018-05-28); (Archived by WebCite® at http://www.webcitation.org/6zkjLAHjs); München: Forschungsstelle für Energiewirtschaft e.V., 2018.
[3] Ezequiel, Davi et al.: Storylines for extreme context energy scenarios for Germany and neighbouring countries. In: Project workshop eXtremOS; Munich: Institut für Technikfolgenabschätzung und Systemanalyse (ITAS), 2020.
[4] Guminski, Andrej et al.: Vom Wort zum Wert – Leitfaden zur Quantifizierung von Kontextszenarien für komplexe Modelllandschaften. In: et - Energiewirtschaftliche Tagesfragen 04/2020. München: Forschungsgesellschaft für Energiewirtschaft mbH, 2020.
[5] Ezequiel, Davi et al.: Rückblick und Updates von ITAS zum Projekt eXtremOS. In: Project workshop
221
eXtremOS; München: Institut für Technikfolgenabschätzung und Systemanalyse (ITAS), 2019. [6] Fattler, Steffen; Conrad, Jochen; Regett, Anika et al.: Dynamis Hauptbericht - Dynamis - Dynamische
und intersektorale Maßnahmenbewertung zur kosteneffizienten Dekarbonisierung des Energiesystems - Online: https://www.ffe.de/dynamis. München: Forschungsstelle für Energiewirtschaft e.V., 2019. DOI: 10.34805/ffe-144-19
[7] Guminski, Andrej et al.: Demand-side decarbonization options and the role of electrification - FfE discussion paper. München: Forschungsstelle für Energiewirtschaft e.V. (FfE), 2020.
[8] Guminski, Andrej et al.: Model based evaluation of industrial greenhouse gas abatement measures. Wien, Österreich: 11. Internationale Energiewirtschaftstagung an der TU Wien, 2019.
[9] Eurostat Energiebilanzen - Daten 2017 (Ausgabe 2019): https://ec.europa.eu/eurostat/de/web/energy/data/energy-balances; Luxemburg: European Commission - Eurostat, 2019.
[10] Eurostat - Data Explorer - Greenhouse gas emissions by source sector (source: EEA): https://appsso.eurostat.ec.europa.eu/nui/show.do?dataset=env_air_gge&lang=en ; Luxembourg: Eurostat, the Statistical office of the European Union, 2020.
[11] Guminski, Andrej et al.: Energiewende in der Industrie: Methodik zur Identifikation und Quantifizierung von Dekarbonisierungsmaßnahmen. In: et Energiewirtschaftliche Tagesfragen (Ausgabe 12/2017). Essen: etv Energieverlag GmbH, 2017.
[12] Guminski, Andrej et al.: Electrification decarbonization efficiency in Europe - a case study for the industry sector. Munich, Germany: Forschungsgesellschaft für Energiewirtschaft mbH, 2019.
[13] Dossow, Patrick et al.: Anwendungsbasierte Energie- und Emissionsbilanzen für Europa. In: et - Energiewirtschaftliche Tagesfragen - Zeitschrift für Energiewirtschaft, Recht, Technik und Umwelt 12/2020. München: Forschungsgesellschaft für Energiewirtschaft mbH, 2020.
[14] Fleiter, Tobias; Schlomann, Barbara; Eichhammer, Wolfgang: Energieverbrauch und CO2-Emissionen industrieller Prozesstechnologien - Einsparpotentiale, Hemmnisse und Instrumente in: ISI Schriftenreihe "Innovationspotentiale". Stuttgart: Fraunhofer-Institut für Systemtechnik und Innovationsforschung (Fraunhofer ISI), 2013
[15] Hübner, Tobias et al.: Modellgestützte Analyse synthetischer Brennstoffe in der Industrie bei ambitioniertem Klimaschutz. München: Forschungsgesellschaft für Energiewirtschaft (FfE), 2019.
[16] Berichterstattung unter der Klimarahmenkonvention der Vereinten Nationen und dem Kyoto-Protokoll 2019 - Nationaler Inventarbericht zum Deutschen Treibhausgasinventar 1990 – 2017. Dessau-Roßlau: Umweltbundesamt, 2019.
[17] Mapping and analyses of the current and future (2020 - 2030) heating/cooling fuel deployment (fossil/renewables) - Work package 1: Final energy consumption for the year 2012. Luxemburg: Fraunhofer Institute for Systems and Innovation Research (ISI), 2016.
[18] Lucke, Dorothea et al.: International Comparison of Industrial Development in the European Context - the Problems. In: Economic Bulletin 39, 215–220. Berlin: Deutsches Institut für Wirtschaftsforschung, 2002.
[19] Capros, P. et al.: EU Reference Scenario 2016 - Energy, transport and GHG emissions Trends to 2050. Brüssel: Europäische Kommission, 2016.
[20] Fleiter, Tobias et al.: Industrial Innovation: Pathways to deep decarbonisation of Industry - Part 2: Scenario analysis and pathways to deep decarbonisation. Karlsruhe: Fraunhofer-Institut für System-und Innovationsforschung ISI, 2019.
[21] Schlesinger, Michael; Lindenberger, Dietmar; Lutz, Christian: Entwicklung der Energiemärkte -Energiereferenzprognose - Projekt Nr. 57/12 - Studie im Auftrag des Bundesministeriums fürWirtschaft und Technologie. Berlin: Bundesministerium für Wirtschaft und Technologie (BMWi),2014.
[22] Schlomann, Barbara et al.: Energy Efficiency Trends and Policies In Industry - An Analysis Based on the ODYSSEE and MURE Databases. Karlsruhe, Grenoble, France: Fraunhofer Institute for Systems and Innovation Research (ISI), 2015.
[23] Lapillonne, Bruno: Definition of ODEX indicators in ODYSSEE data base. Grenoble, France: Enerdata, 2020.
[24] Bosseboeuf, Didier et al.: Decomposition analysis of the energy demand Methodology and ODYSSEE tool. Riga: ADEME, 2015.
[25] Understanding variation in energy consumption - Methodology. Paris, Grenoble, France: ADEME, 2020.
222
[26] Piegsa, Alexander et al.: Evaluierung der Zielwerte der Vereinbarung zwischen der Regierung derBundesrepublik Deutschland und der deutschen Wirtschaft zur Steigerung der Energieeffizienz vom1.8.2012 für die Bezugsjahre 2017 – 2020. Basel: Prognos, 2018.
[28] Hübner, Tobias: Small-Scale Modelling of Individual Greenhouse Gas Abatement Measures inIndustry. Munich: Forschungsgesellschaft für Energiewirtschaft (FfE), 2020.
[29] Brunke, Jean-Christian: Energieeinsparpotenziale von energieintensiven Produktionsprozessen inDeutschland - Eine Analyse mit Hilfe von Energieeinsparkostenkurven. Dissertation. Herausgegebendurch die Universität Stuttgart - Institut für Energiewirtschaft und Rationelle Energieanwendung,geprüft von Voß, Alfred und Sauer, Alexander: Stuttgart, 2016.
[30] Gebert, Philipp et al.: Klimapfade für Deutschland. München: The Boston Consulting Group (BCG), prognos, 2018.
[31] Fattler, Steffen, Conrad, Jochen, Regett, Anika et al.: Dynamis Datenanhang - Dynamis - Dynamische und intersektorale Maßnahmenbewertung zur kosteneffizienten Dekarbonisierung des Energiesystems - Online: https://www.ffe.de/dynamis . München: Forschungsstelle für Energiewirtschaft e.V., 2019. DOI: 10.34805/ffe-146-19
[32] Guminski, Andrej; von Roon, Serafin: Transition Towards an “All-electric World” - Developing a Merit-Order of Electrification for the German Energy System in: 10. Internationale Energiewirtschaftstagung an der TU Wien. Wien, Österreich: Technische Universität Wien, 2017
[33] Hübner, Tobias et al.: Application-side merit-order-curves for synthetic fuels in the German energysystem. In: 13th International Conference on Energy Economics and Technology Mai/2019. Dresden:TU Dresden, 2019.
[34] Guminski, Andrej et al.: Energiewende in der Industrie: Potenziale und Wechselwirkungen mit dem Energiesektor. München: FfE, 2019.
[35] Bevölkerung am 1. Januar nach NUTS 3 Regionen - 2007-2017 - demo_r_pjangrp3: http://ec.europa.eu/eurostat/de/data/database ; Luxemburg: European Commission - Eurostat, 2018.
[36] Manz, Pia et al.: Developing a georeferenced database of energy-intensive industry plants for estimation of excess heat potentials. Stockholm: ECEEE Industrial summer study proceedings, 2018.
[37] Eurostat: Beschäftigungsdaten im Technologiebereich und in Sektoren mit umfassenden Kenntnissen nach NUTS-2-Regionen und Geschlecht (von 2008, NACE Rev. 2). In: http://appsso.eurostat.ec.europa.eu/nui/show.do?dataset=htec_emp_reg2&lang=de . (Abruf am 2020-05-20); Luxemburg: Eurostat, 2020.
[45] Cracker Capacity. In: https://www.petrochemistry.eu/about-petrochemistry/petrochemicals-facts-and-figures/cracker-capacity/ . (Abruf am 2021-01-05); Brussels, Belgium: Petrochemicals Europe, 2018.
[46] Gobmaier, Thomas: Entwicklung und Anwendung einer Methodik zur Synthese zukünftiger Verbraucherlastgänge - Dissertation. Fakultät für Elektrotechnik und Informationstechnik an der TU München, durchgeführt an der Forschungsstelle für Energiewirtschaft e.V., 2013.
[47] Gruber, Anna-Maria: Zeitlich und regional aufgelöstes industrielles Lastflexibilisierungspotenzial als Beitrag zur Integration Erneuerbarer Energien – Dissertation, eingereicht an der Fakultät für Elektrotechnik und Informationstechnik der TU München, durchgeführt an der Forschungsgesellschaft für Energiewirtschaft mBH: München, 2017
[48] Ganz, Kirstin et al.: Wie können europäische Branchen Lastgänge die Energiewende im Industriesektorunterstützen?. In: et - Energiewirtschaftliche Tagesfragen (submitted to), Ausgabe 1, 2021. München:Forschungsgesellschaft für Energiewirtschaft mbH (FfE), 2021.
[49] Schweizerische Gesamtenergiestatistik 2016 - Tabellen: http://www.bfe.admin.ch/themen/00526/00541/00542/00631/index.html?lang=de&dossier_id=05071 ; Bern: Bundesamt für Energie (BFE), 2017.
[50] Passenger cars, by type of motor energy [road_eqs_carpda]: https://appsso.eurostat.ec.europa.eu/nui/show.do?dataset=road_eqs_carpda&lang=en ; Luxemburg: Eurostat, 2020.
[51] Lorries, by type of motor energy [road_eqs_lormot]: https://appsso.eurostat.ec.europa.eu/nui/show.do?dataset=road_eqs_lormot&lang=en ; Luxemburg: Eurostat, 2020.
[52] Lorries and road tractors, by age [road_eqs_lorroa]: https://appsso.eurostat.ec.europa.eu/nui/show.do?dataset=road_eqs_lorroa&lang=en ; Luxemburg: Eurostat, 2020.
[53] Transport - Data in the EU-28: http://www.odyssee-mure.eu/ ; Angers: Odyssee, 2017. [54] Transport data collection supporting the quantitative analysis of measures relating to transport and
climate change (TRACCS); Thessaloniki: EMISIA SA, 2013.

223
[55] Eurostat: Bestand der Fahrzeuge nach Kategorie und NUTS-2-Regionen - [tran_r_vehst]. In: http://appsso.eurostat.ec.europa.eu/nui/submitViewTableAction.do . (Abruf am 2020-05-20); Luxemburg: Eurostat, 2020.
[56] Population on 1 January by age group, sex and NUTS 3 region: http://appsso.eurostat.ec.europa.eu/nui/submitViewTableAction.do; Luxemburg: European Commission - Eurostat, 2019.
[57] TYNDP 2018 - Input Data: https://tyndp.entsoe.eu/maps-data/; Brüssel: ENTSO-E, 2018. [58] Fattler, Steffen; Böing, Felix; Pellinger, Christoph: Ladesteuerung von Elektrofahrzeugen und deren
Einfluss auf betriebsbedingte Emissionen in: IEWT 2017 - 10 . Internationale Energiewirtschaftstagung Wien. Wien: TU Wien, 2017
[59] Fattler, Steffen et al.: Charge optimization of privately and commercially used electric vehicles and its influence on operational emissions. Munich: Research Center for Energy Economics, 2018.
[60] Follmer, Robert; Gruschwitz, Dana; Jesske, Birgit; Quandt, Sylvia; Lenz, Barbara; Nobis, Claudia; Köhler, Katja; Mehlin, Markus: Mobilität in Deutschland 2008 - Struktur – Aufkommen – Emissionen – Trends. Bonn: infas Institut für angewandte Sozialwissenschaft GmbH, 2010
[61] Deutsches Mobilitätspanel (MOP) - Längsschnittstudie zum Mobilitätsverhalten der Bevölkerung. Karlsruhe: Institut für Verkehrswesen (KIT), 2019.
[62] Gerhardt, Norman; Valov, Boris; Trost, Tobias; Degner, Thomas; Lehnert, Wieland; Rostankowski, Anke: Bahnstrom Regenerativ - Analyse und Konzepte zur Erhöhung des Anteils der Regenerativen Energien des Bahnstrom - Endbericht. Kassel: Fraunhofer-Institut für Windenergie und Energiesystemtechnik (IWES), 2011
[63] Deliverable 3.1: Profile of heating and cooling demand in 2015: http://www.heatroadmap.eu/output.php; Karlsruhe: Fraunhofer Institute for Systems and Innovation Research (ISI), TEP Energy GmbH (TEP), University Utrecht ARMINES, 2017.
[64] Mapping and analyses of the current and future (2020 - 2030) heating/cooling fuel deployment(fossil/renewables) - Work package 1: Final energy consumption for the year 2012; Luxenburg:Fraunhofer Institute for Systems and Innovation Research (ISI), Fraunhofer Institute for Solar EnergySystems (ISE), Institute for Resource Efficiency and Energy Strategies GmbH (IREES), Observ'ERTUWien - Energy Economics Group (EEG), TEP Energy GmbH (TEP), European Commission (EC),2016.
[65] Rohde, Clemens: Erstellung von Anwendungsbilanzen für die Jahre 2013 bis 2017 - Studie für die Arbeitsgemeinschaft Energiebilanzen e.V. (AGEB). Karlsruhe: Fraunhofer-Institut für System- und Innovationsforschung (ISI), 2018.
[66] Energy consumption in households: http://ec.europa.eu/eurostat/statistics-explained/index.php/Energy_consumption_in_households ; Luxenburg: European Commission - Eurostat, 2017.
[67] Fattler, Steffen et al.: Dynamis Hauptbericht - Dynamische und intersektorale Maßnahmenbewertung zur kosteneffizienten Dekarbonisierung des Energiesystems. München: Forschungsstelle für Energiewirtschaft e.V., 2019.
[68] Final Energy Consumption per Sector, Energy Source and Application (Europe NUTS-0): http://opendata.ffe.de/dataset/final-energy-consumption-per-sector-energy-source-and-application-europe-nuts-0/ ; München: Forschungsstelle für Energiewirtschaft e. V. (FfE), 2020.
[69] Final CO2 Emissions per Sector, Energy Source and Application (Europe NUTS-0): http://opendata.ffe.de/dataset/final-co2-emissions-per-sector-energy-source-and-application-europe-nuts-0/ ; München: Forschungsstelle für Energiewirtschaft e. V. (FfE), 2020.
[70] stats.ehpa: EHPA sales data acquisition and processing methodology. In: http://stats.ehpa.org/hp_sales/annex/ . (Abruf am 2020-05-06); 1049 Bruessel: European Commission, 2020.
[71] MERRA-2 - Modern-Era Retrospective analysis for Research and Applications, Version 2: https://gmao.gsfc.nasa.gov/reanalysis/ ; Greenbelt (MD, USA): Global Modeling and Assimilation Office (GMAO), 2018.
[72] Eurostat: Population on 1st January by age, sex and type of projectio - [proj_19np]. In: https://appsso.eurostat.ec.europa.eu/nui/show.do?dataset=proj_18np&lang=en. (Abruf am 2020-05-20); Luxemburg: Eurostat, 2018.
[73] Conrad, Jochen et al.: Flexibilisierung der Kraft-Wärme- Kopplung - Kurzgutachten im Auftrag der ÜNB. München: FfE, 2017.
224
[74] Fleiter, Tobias et al.: Mapping and analyses of the current and future (2020 - 2030) heating/cooling fuel deployment (fossil/renewables) - Work package 2: Assessment of the technologies. Brussels: European Commission Directorate-General for Energy and Transport, 2016
[75] stats.ehpa: Heat pumps by type 2017. In: http://stats.ehpa.org/hp_sales/cockpit/ . (Abruf am 2020-05-06); Bruessel: European Commission, 2020.
[76] Bundesverband Wärmepumpen e. V.: Wärmepumpen in Deutschland . In: https://www.waermepumpe.de/presse/zahlen-daten/ . (Abruf am 2018-03-24); (Archived by WebCite® at http://www.webcitation.org/6yA6XVo9G); Berlin: Bundesverband Wärmepumpen e. V., 2017.
[77] Pellinger, Christoph et al.: Generating energy carrier specific space heating and hot water load profilesat NUTS-3-level in Europe. In: 11. Internationale Energiewirtschaftstagung; Wien: TU Wien, 2019.
[78] Regionalisation of the Final Energy Consumption of the Sector Private Households in Europe. In: http://opendata.ffe.de/regionalisation-of-the-final-energy-consumption-of-private-households-in-europe/ . (Abruf am 2020-12-22); München: Forschungsstelle für Energiewirtschaft e. V. (FfE), 2020.
[79] Regionalisation of the Final Energy Consumption of the Sector Services in Europe. In: http://opendata.ffe.de/regionalisation-of-the-final-energy-consumption-of-services-in-europe/ . (Abruf am 2020-12-22); München: Forschungsstelle für Energiewirtschaft e. V. (FfE), 2020.
[80] Hellwig, Mark: Entwicklung und Anwendung parametrisierter Standard-Lastprofile. Dissertation. Herausgegeben durch Technische Universität München: München, 2003.
[81] Pellinger, Christoph; Schmid, Tobias et al.: Merit Order der Energiespeicherung im Jahr 2030 - Technoökonomische Analyse funktionaler Energiespeicher; laufendes Projekt. München: Forschungsstelle für Energiewirtschaft e.V. (FfE), 2015
[82] Standardlastprofile Strom. Berlin: Bundesverband der Energie- und Wasserwirtschaft e.V. (BDEW), 2014
[83] Ruhnau, Oliver et al.: time series of heat demand and heat pump efficiency for energy system modeling. Aachen: RWTH Aachen University, 2019.
[84] Rossi, Angelo: EU-28: Dairy sector. In: https://www.clal.it/en/index.php?section=quadro_europa . (Abruf am 2021-01); Modena, Italy: clal, 2020.
[85] Amount of milk used for the production of selected dairy products in Norway from 2016 to 2019 (in million liters): https://www.statista.com/statistics/693398/amount-of-milk-used-for-dairy-production-in-norway-by-type/ ; Hamburg: Statista, 2020.
[86] Average production of dairy farms in the Netherlands, Belgium and Luxembourg (Benelux) from 2015 to 2018, by country (in tons): https://www.statista.com/statistics/748007/average-production-of-dairy-farms-in-the-benelux-by-country/ ; Hamburg: Statista, 2020.
[87] FOREST PRODUCTS 2017. Rome: Food and Agriculture Organization of the United Nations, 2017. [88] Total production by PRODCOM list - NACE Rev. 2 - annual data:
http://appsso.eurostat.ec.europa.eu/nui/show.do?dataset=DS-066342&lang=en ; Luxembourg: Eurostat, 2020 (überarbeitet: 2020).
[89] Odyssee: Energy Efficiency Database - European Energy Efficiency and Demand Database: https://www.indicators.odyssee-mure.eu/energy-efficiency-database.html ; Grenoble, France: Enerdata intelligence + consulting, 2001 (überarbeitet: 2020).
[90] Production of Paper and Pulp: Personal corresponence; Brussels, Belgium: Confederation of European Paper Industrie, 2020.
[91] Gérard, Frank et al.: Opportunities for Hydrogen Energy Technologies - Considering the Nationaly Energy & Climate Plans. Rotterdam: Trinomics, 2020.
[92] Chemiewirtschaft in Zahlen 2019. Frankfurt am Main: Verband der chemischen Industrie, 2019. [93] Perez-Fortez, Mar et al.: Techno-economic and environmental evaluation of CO2 production -
Synthesis of methanol and formic acid. Luxembourg: Joint Research Centre, 2016. [94] Egenhofer, Christian et al.: For the Procurement of Studies and Other Supporting Services on
Commission Impact Assessments and Evaluation - Final Report. Brussels, Belgium: Centre for European Policy Studies (CEPS), 2014.
[95] Ammonia Production by Country (Thousand metric tons of contained nitrogen): https://www.indexmundi.com/minerals/?product=ammonia ; Charlotte, USA: indexmundi, 2012.
[96] Chlor-Alkali Industry Review 2018-2019. Brussels: Eurochlor, 2019. [97] Panorama of the EU Glass Industry: https://www.glassallianceeurope.eu/images/cont/panorama-2018-
eu28_file.pdf ; Brussels, Belgium: Glass Alliance Europe, 2020. [98] Statistical Report 2019-2020 - European Glass Industries. Brussels, Belgium: Glass Alliance Europe,
2020.
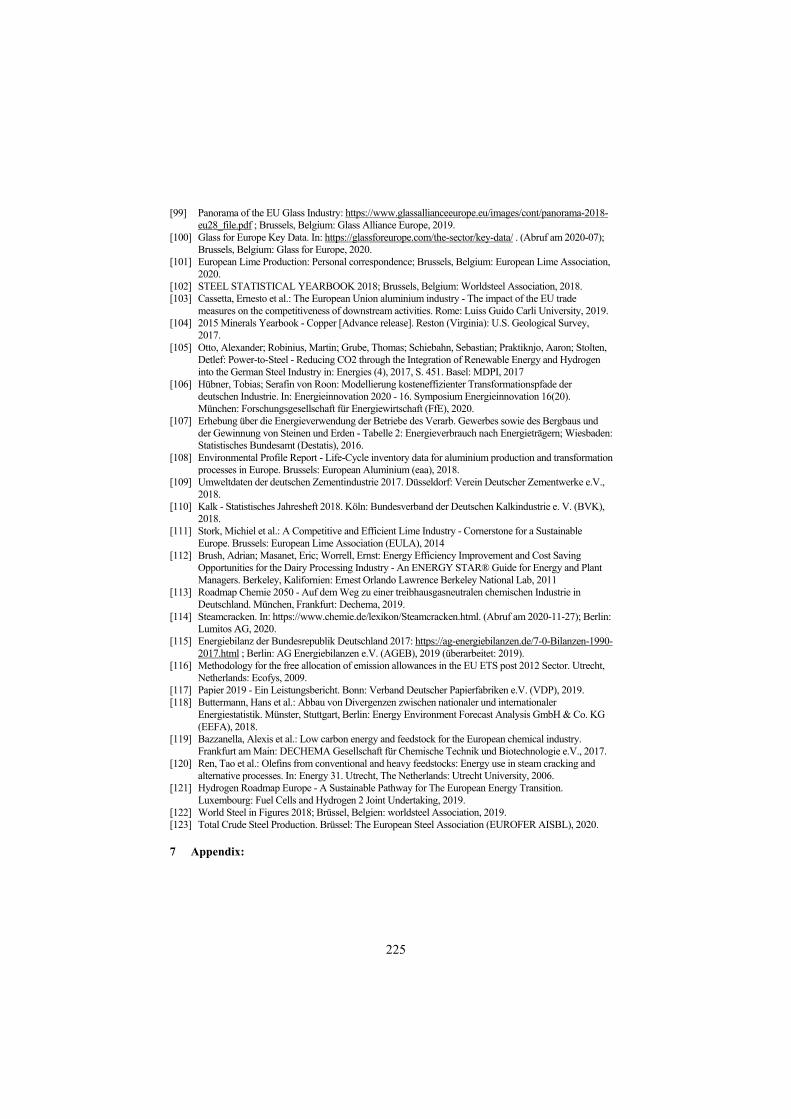
225
[99] Panorama of the EU Glass Industry: https://www.glassallianceeurope.eu/images/cont/panorama-2018-eu28_file.pdf ; Brussels, Belgium: Glass Alliance Europe, 2019.
[100] Glass for Europe Key Data. In: https://glassforeurope.com/the-sector/key-data/ . (Abruf am 2020-07); Brussels, Belgium: Glass for Europe, 2020.
[101] European Lime Production: Personal correspondence; Brussels, Belgium: European Lime Association, 2020.
[102] STEEL STATISTICAL YEARBOOK 2018; Brussels, Belgium: Worldsteel Association, 2018. [103] Cassetta, Ernesto et al.: The European Union aluminium industry - The impact of the EU trade
measures on the competitiveness of downstream activities. Rome: Luiss Guido Carli University, 2019. [104] 2015 Minerals Yearbook - Copper [Advance release]. Reston (Virginia): U.S. Geological Survey,
2017. [105] Otto, Alexander; Robinius, Martin; Grube, Thomas; Schiebahn, Sebastian; Praktiknjo, Aaron; Stolten,
Detlef: Power-to-Steel - Reducing CO2 through the Integration of Renewable Energy and Hydrogen into the German Steel Industry in: Energies (4), 2017, S. 451. Basel: MDPI, 2017
[106] Hübner, Tobias; Serafin von Roon: Modellierung kosteneffizienter Transformationspfade der deutschen Industrie. In: Energieinnovation 2020 - 16. Symposium Energieinnovation 16(20). München: Forschungsgesellschaft für Energiewirtschaft (FfE), 2020.
[107] Erhebung über die Energieverwendung der Betriebe des Verarb. Gewerbes sowie des Bergbaus und der Gewinnung von Steinen und Erden - Tabelle 2: Energieverbrauch nach Energieträgern; Wiesbaden: Statistisches Bundesamt (Destatis), 2016.
[108] Environmental Profile Report - Life-Cycle inventory data for aluminium production and transformation processes in Europe. Brussels: European Aluminium (eaa), 2018.
[109] Umweltdaten der deutschen Zementindustrie 2017. Düsseldorf: Verein Deutscher Zementwerke e.V., 2018.
[110] Kalk - Statistisches Jahresheft 2018. Köln: Bundesverband der Deutschen Kalkindustrie e. V. (BVK), 2018.
[111] Stork, Michiel et al.: A Competitive and Efficient Lime Industry - Cornerstone for a Sustainable Europe. Brussels: European Lime Association (EULA), 2014
[112] Brush, Adrian; Masanet, Eric; Worrell, Ernst: Energy Efficiency Improvement and Cost Saving Opportunities for the Dairy Processing Industry - An ENERGY STAR® Guide for Energy and Plant Managers. Berkeley, Kalifornien: Ernest Orlando Lawrence Berkeley National Lab, 2011
[113] Roadmap Chemie 2050 - Auf dem Weg zu einer treibhausgasneutralen chemischen Industrie in Deutschland. München, Frankfurt: Dechema, 2019.
[114] Steamcracken. In: https://www.chemie.de/lexikon/Steamcracken.html. (Abruf am 2020-11-27); Berlin: Lumitos AG, 2020.
[115] Energiebilanz der Bundesrepublik Deutschland 2017: https://ag-energiebilanzen.de/7-0-Bilanzen-1990-2017.html ; Berlin: AG Energiebilanzen e.V. (AGEB), 2019 (überarbeitet: 2019).
[116] Methodology for the free allocation of emission allowances in the EU ETS post 2012 Sector. Utrecht, Netherlands: Ecofys, 2009.
[117] Papier 2019 - Ein Leistungsbericht. Bonn: Verband Deutscher Papierfabriken e.V. (VDP), 2019. [118] Buttermann, Hans et al.: Abbau von Divergenzen zwischen nationaler und internationaler
Energiestatistik. Münster, Stuttgart, Berlin: Energy Environment Forecast Analysis GmbH & Co. KG (EEFA), 2018.
[119] Bazzanella, Alexis et al.: Low carbon energy and feedstock for the European chemical industry. Frankfurt am Main: DECHEMA Gesellschaft für Chemische Technik und Biotechnologie e.V., 2017.
[120] Ren, Tao et al.: Olefins from conventional and heavy feedstocks: Energy use in steam cracking and alternative processes. In: Energy 31. Utrecht, The Netherlands: Utrecht University, 2006.
[121] Hydrogen Roadmap Europe - A Sustainable Pathway for The European Energy Transition. Luxembourg: Fuel Cells and Hydrogen 2 Joint Undertaking, 2019.
[122] World Steel in Figures 2018; Brüssel, Belgien: worldsteel Association, 2019. [123] Total Crude Steel Production. Brüssel: The European Steel Association (EUROFER AISBL), 2020. 7 Appendix:

226
Cluster Political Societal Economic Energy
Descriptor Climate change policy
World market prices for oil
Innovative capacity
Fuel switching Lifestyle Education Economic development - GDP
Economic order
Consequen- ces of climate change
Energy market regulation
he descriptor addressed by an exogeneous model parameter? yes yes yes yes yes yes yes yes yes yes Parameter Unit Parameter type
Specific electricity consumption kWh / t 1
Specific fuel consumption kWh / t 1
Specific feedstock consumption kWh / t 1
Development specific electricity consumption kWh / t 0
Development specific fuel consumption kWh / t 0
Development specific feedstockconsumption kWh / t 0
Production tonnages 2017 kt 2
Production tonnage development % p.a. 1/0 yes yes yes yes yes yes
Lifetime of process # 1 yes
Energy carrier shares 2017 % p.a. 2
Energy carrier shares development % p.a. 1
Specific process emission factor t CO2 / t 2
Adressed applications per process # 2
Final consumption 2017 TJ 2
Final consumption development TJ 0
Gross value added 2017 bn € 2
Gross value added development % p.a. 1 yes yes yes yes
Energy intensity 2017 bn € / TJ 2
Energy intensity development % p.a. 1
Number of businesses 2017 # 2
Number of businesses development % p.a. 1
Investment process technology € / t 2 yes yes yes Investment cross sectional technology € / business 2 yes yes yes Fixed operating cost process technology € / t 2 yes yes
Fixed operating cost cross-sectional technology € / business 2 yes yes
Technology exchange rate % p.a. 1 yes
Application factor % 2 yes yes
Start of measure implementation # 1 yes yes yes
Ende of measure implementation # 1 yes yes yes yes yes Specific electricity savings kWh / t 2 yes yes yes yes Specific fuel savings kWh / t 2 yes
Utilization factor for heating technologies % 2 yes
Target process # 1 yes
Industry-sites point coordinates Geopoint 2
Employee data # 2
Monthly production index bn. € 2
Real electricity load profiles MW 2
Real fuel load profiles MW 2
Real hot water load profiles MW 2
Outside temperature °C 2
Type days - 1
Weather year - 1 yes
Normalized electricity load profiles - 0
Normalized fuel load profiles - 0
Normalized hot water load profiles - 0
Energy carrier prices ct / kWh 1 / 0 yes
Emission factors kg CO2 / kWh 1 / 0
EU ETS certificate price € / t CO2 1
Interest rate % 1 yes yes
Figure 27: Descriptor-parameter-matrix showing the connection between SmInd EU parameters descriptors The project eXtremOS is supported by the Federal Ministry for Economic Affairs and Energy of Germany (funding id: 03ET4062A/B)

227
Figure 28: Descriptor-parameter-matrix showing the connection between TraM parameters and descriptors
Climate change policy
World market prices for oil
Innovative capacity Fuel switching Lifestyle Demographic
development Education MobilityEconomic
development -GDP
Access to strategic resources
Consequen-ces of climate
change
Energy market
regulation
Household energy costs
Acceptance of renewable energies
yes yes yes yes yes yes yes yes yes yes yes yes yes yesParameter Unit Parameter typeUnits by vehicle class, energy carrier 2017 # 2Units by vehicle class, energy carrier development # 0
Annual mileage by vehicle class 2017 km/a 2Annual mileage by vehicle class development km/a 1 yes yes yes yes yes yes yes yesSpecific consumption by vehicle class, energy carrier 2017 kwh/km 2
Specific consumption by vehicle class, energy carrier development kwh/km 1 yes yes yes
Exchange rate of electric vehicles by vehicle %/a 1 yes yes yes yes yes yes yes yes yes yes yesExchange rate of hydrogen vehicles by vehicle %/a 1 yes yes yes yes yes yes yes yes yes yes yesExchange rate of electric vehicles by category %/a 1 yes yes yes yes yes yes yes yes yes yes yes
Exchange rate of hydrogen vehicles by category %/a 1 yes yes yes yes yes yes yes yes yes yes yes
Useful life a 1 yes yesPopulation 2017 NUTS-3 # 2Population development NUTS-0 % / a 1 yes yes yesUnits by vehicle NUTS-2 # 2Hourly electricity load profile by vehicle, category MW 0
Hourly fuel vehicle load profile by vehicle, category MW 0
Weather year 1Normalized hourly electricity load profile by vehicle, category - 0
Normalized hourly fuel load profile by vehicle, category - 0
Is the descriptor addressed by an exogeneous model parameter?
Cluster Political Societal Economic Energy
Descriptor
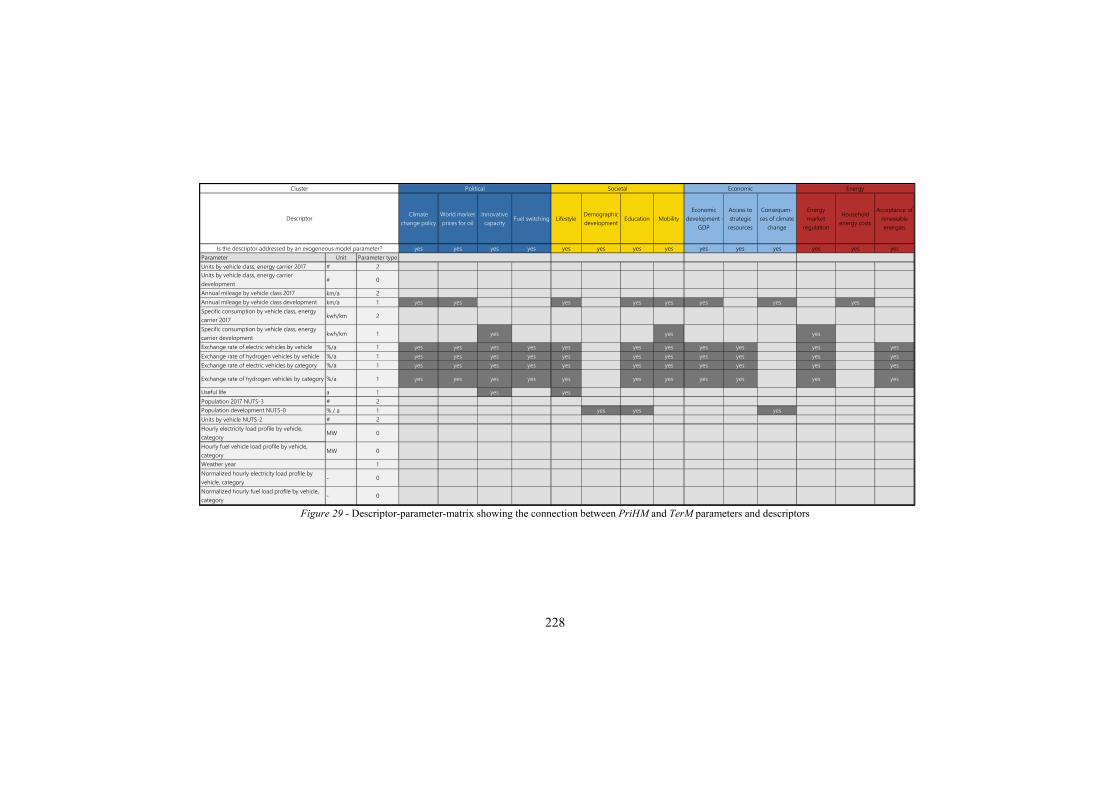
228
Figure 29 - Descriptor-parameter-matrix showing the connection between PriHM and TerM parameters and descriptors
Climate change policy
World market prices for oil
Innovative capacity Fuel switching Lifestyle Demographic
development Education MobilityEconomic
development -GDP
Access to strategic resources
Consequen-ces of climate
change
Energy market
regulation
Household energy costs
Acceptance of renewable energies
yes yes yes yes yes yes yes yes yes yes yes yes yes yesParameter Unit Parameter typeUnits by vehicle class, energy carrier 2017 # 2Units by vehicle class, energy carrier development # 0
Annual mileage by vehicle class 2017 km/a 2Annual mileage by vehicle class development km/a 1 yes yes yes yes yes yes yes yesSpecific consumption by vehicle class, energy carrier 2017 kwh/km 2
Specific consumption by vehicle class, energy carrier development kwh/km 1 yes yes yes
Exchange rate of electric vehicles by vehicle %/a 1 yes yes yes yes yes yes yes yes yes yes yesExchange rate of hydrogen vehicles by vehicle %/a 1 yes yes yes yes yes yes yes yes yes yes yesExchange rate of electric vehicles by category %/a 1 yes yes yes yes yes yes yes yes yes yes yes
Exchange rate of hydrogen vehicles by category %/a 1 yes yes yes yes yes yes yes yes yes yes yes
Useful life a 1 yes yesPopulation 2017 NUTS-3 # 2Population development NUTS-0 % / a 1 yes yes yesUnits by vehicle NUTS-2 # 2Hourly electricity load profile by vehicle, category MW 0
Hourly fuel vehicle load profile by vehicle, category MW 0
Weather year 1Normalized hourly electricity load profile by vehicle, category - 0
Normalized hourly fuel load profile by vehicle, category - 0
Is the descriptor addressed by an exogeneous model parameter?
Cluster Political Societal Economic Energy
Descriptor
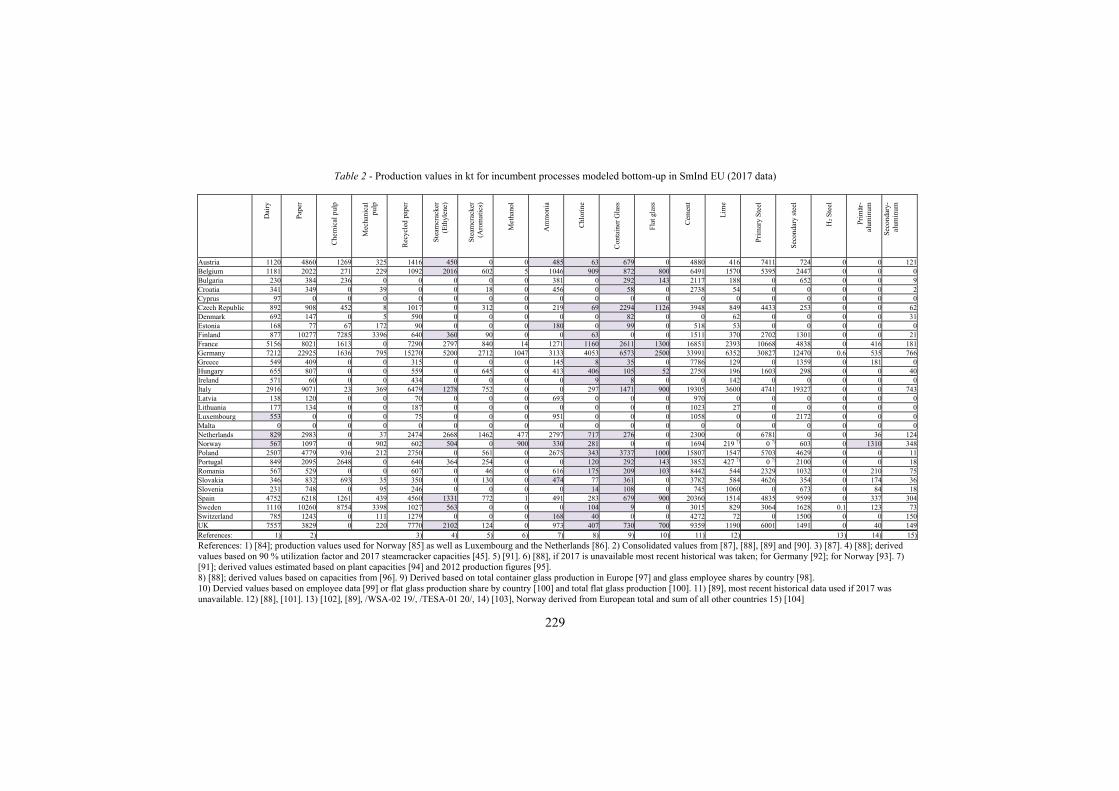
229
Table 2 - Production values in kt for incumbent processes modeled bottom-up in SmInd EU (2017 data)
Dai
ry
Pap
er
Che
mic
al p
ulp
Mec
hani
cal
pulp
Rec
ycle
d pa
per
Ste
amcr
acke
r (E
thyl
ene)
Ste
amcr
acke
r (A
rom
atic
s)
Met
hano
l
Am
mon
ia
Chl
orin
e
Con
tain
er G
lass
Fla
t gla
ss
Cem
ent
Lim
e
Pri
mar
y S
teel
Sec
onda
ry s
teel
H2
Ste
el
Prim
är-
alum
inum
Sec
onda
ry-
alum
inum
Austria 1120 4860 1269 325 1416 450 0 0 485 63 679 0 4880 416 7411 724 0 0 121Belgium 1181 2022 271 229 1092 2016 602 5 1046 909 872 800 6491 1570 5395 2447 0 0 0Bulgaria 230 384 236 0 0 0 0 0 381 0 292 143 2117 188 0 652 0 0 9Croatia 341 349 0 39 0 0 18 0 456 0 58 0 2738 54 0 0 0 0 2Cyprus 97 0 0 0 0 0 0 0 0 0 0 0 0 0 0 0 0 0 0Czech Republic 892 908 452 8 1017 0 312 0 219 69 2294 1126 3948 849 4433 253 0 0 62Denmark 692 147 0 5 590 0 0 0 0 0 82 0 0 62 0 0 0 0 31Estonia 168 77 67 172 90 0 0 0 180 0 99 0 518 53 0 0 0 0 0Finland 877 10277 7285 3396 640 360 90 0 0 63 0 0 1511 370 2702 1301 0 0 21France 5156 8021 1613 0 7290 2797 840 14 1271 1160 2611 1300 16851 2393 10668 4838 0 416 181Germany 7212 22925 1636 795 15270 5200 2712 1047 3133 4053 6573 2500 33991 6352 30827 12470 0.6 535 766Greece 549 409 0 0 315 0 0 0 145 8 35 0 7786 129 0 1359 0 181 0Hungary 655 807 0 0 559 0 645 0 413 406 105 52 2750 196 1603 298 0 0 40Ireland 571 60 0 0 434 0 0 0 0 9 8 0 0 142 0 0 0 0 0Italy 2916 9071 23 369 6479 1278 752 0 0 297 1471 900 19305 3600 4741 19327 0 0 743Latvia 138 120 0 0 70 0 0 0 693 0 0 0 970 0 0 0 0 0 0Lithuania 177 134 0 0 187 0 0 0 0 0 0 0 1023 27 0 0 0 0 0Luxembourg 553 0 0 0 75 0 0 0 951 0 0 0 1058 0 0 2172 0 0 0Malta 0 0 0 0 0 0 0 0 0 0 0 0 0 0 0 0 0 0 0Netherlands 829 2983 0 37 2474 2668 1462 477 2797 717 276 0 2300 0 6781 0 0 36 124Norway 567 1097 0 902 602 504 0 900 330 281 0 0 1694 219 7) 0 7) 603 0 1310 348Poland 2507 4779 936 212 2750 0 561 0 2675 343 3737 1000 15807 1547 5703 4629 0 0 11Portugal 849 2095 2648 0 640 364 254 0 0 120 292 143 3852 427 7) 0 7) 2100 0 0 18Romania 567 529 0 0 607 0 46 0 616 175 209 103 8442 544 2329 1032 0 210 75Slovakia 346 832 693 35 350 0 130 0 474 77 361 0 3782 584 4626 354 0 174 36Slovenia 231 748 0 95 246 0 0 0 0 14 108 0 745 1060 0 673 0 84 18Spain 4752 6218 1261 439 4560 1331 772 1 491 283 679 900 20360 1514 4835 9599 0 337 304Sweden 1110 10260 8754 3398 1027 563 0 0 0 104 9 0 3015 829 3064 1628 0.1 123 73Switzerland 785 1243 0 111 1279 0 0 0 168 40 0 0 4272 72 0 1500 0 0 150UK 7557 3829 0 220 7770 2102 124 0 973 407 730 700 9359 1190 6001 1491 0 40 149References: 1) 2) 3) 4) 5) 6) 7) 8) 9) 10) 11) 12) 13) 14) 15)
References: 1) [84]; production values used for Norway [85] as well as Luxembourg and the Netherlands [86]. 2) Consolidated values from [87], [88], [89] and [90]. 3) [87]. 4) [88]; derived values based on 90 % utilization factor and 2017 steamcracker capacities [45]. 5) [91]. 6) [88], if 2017 is unavailable most recent historical was taken; for Germany [92]; for Norway [93]. 7) [91]; derived values estimated based on plant capacities [94] and 2012 production figures [95]. 8) [88]; derived values based on capacities from [96]. 9) Derived based on total container glass production in Europe [97] and glass employee shares by country [98]. 10) Dervied values based on employee data [99] or flat glass production share by country [100] and total flat glass production [100]. 11) [89], most recent historical data used if 2017 was unavailable. 12) [88], [101]. 13) [102], [89], /WSA‑02 19/, /TESA‑01 20/, 14) [103], Norway derived from European total and sum of all other countries 15) [104]
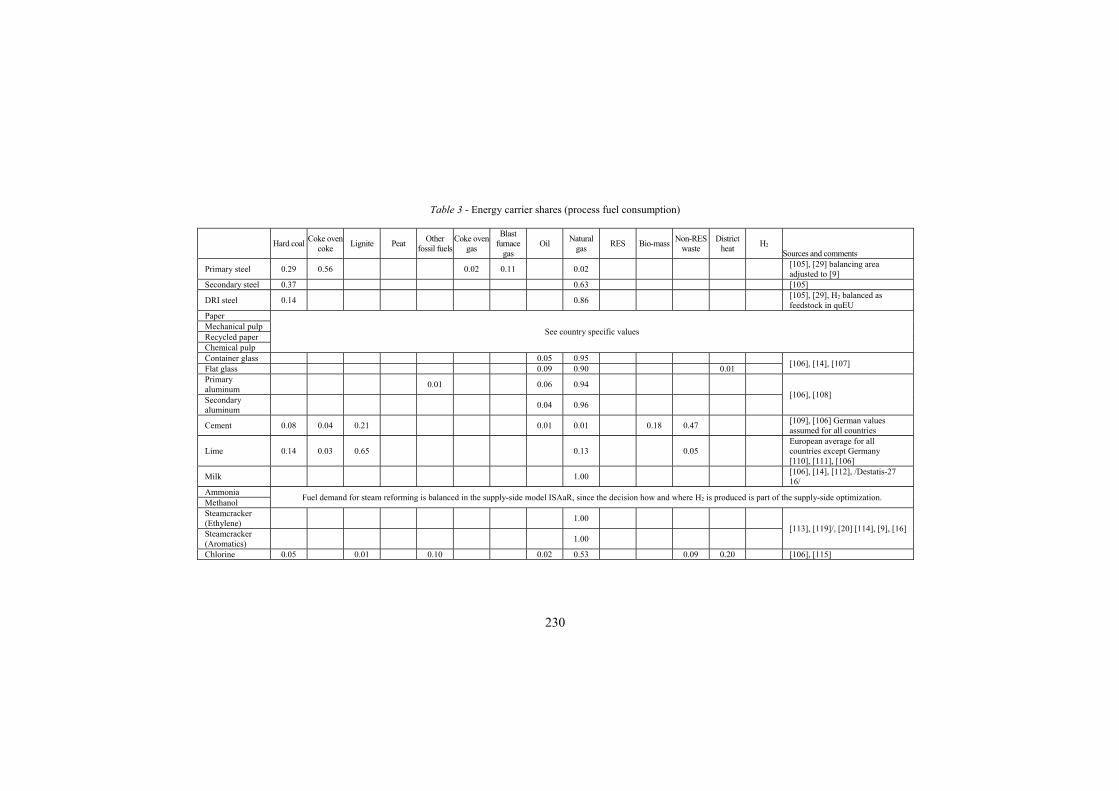
230
Table 3 - Energy carrier shares (process fuel consumption)
Hard coal Coke oven
coke Lignite Peat
Other fossil fuels
Coke oven gas
Blast furnace
gas Oil
Natural gas
RES Bio-mass Non-RES
waste District
heat H2
Sources and comments
Primary steel 0.29 0.56 0.02 0.11 0.02 [105], [29] balancing area adjusted to [9]
Secondary steel 0.37 0.63 [105]
DRI steel 0.14 0.86 [105], [29], H2 balanced as feedstock in quEU
Paper
See country specific values Mechanical pulp Recycled paper Chemical pulp Container glass 0.05 0.95
[106], [14], [107] Flat glass 0.09 0.90 0.01 Primary aluminum
0.01 0.06 0.94 [106], [108]
Secondary aluminum
0.04 0.96
Cement 0.08 0.04 0.21 0.01 0.01 0.18 0.47 [109], [106] German values assumed for all countries
Lime 0.14 0.03 0.65 0.13 0.05 European average for all countries except Germany [110], [111], [106]
Milk 1.00 [106], [14], [112], /Destatis-27 16/
Ammonia Fuel demand for steam reforming is balanced in the supply-side model ISAaR, since the decision how and where H2 is produced is part of the supply-side optimization.
Methanol Steamcracker (Ethylene)
1.00 [113], [119]/, [20] [114], [9], [16]
Steamcracker (Aromatics)
1.00
Chlorine 0.05 0.01 0.10 0.02 0.53 0.09 0.20 [106], [115]

231
Table 4: Country specific energy carrier shares (fuel): Paper, Mechanical pulp. Recycled paper, Chemical pulp [116], [117]
Country
Har
d co
al
Lig
nite
Oth
er f
ossi
l fue
ls
Oil
Nat
ural
gas
Bio
mas
s
Non
-ren
ewab
le
was
te
Dis
tric
t hea
t
Austria & Belgium 0.04 0.03 0.02 0.45 0.46 EU27 average: Bulgaria, Croatia, Denmark, Estonia, Greece, Hungary, Ireland, Latvia,
Lithuania, Luxembourg, Norway, Romania, Slovenia, Switzerland 0.02 0.02 0.02 0.05 0.38 0.51
Czech Republic 0.09 0.07 0.05 0.19 0.60 Finland 0.06 0.05 0.14 0.74 0.01 France 0.03 0.02 0.05 0.05 0.40 0.50
Germany 0.05 0.04 0.49 0.22 0.06 0.14 Italy 0.05 0.95
Netherlands 0.97 0.03 Poland 0.13 0.12 0.04 0.03 0.68
Portugal 0.01 0.10 0.15 0.74 Slovakia 0.10 0.08 0.23 0.59
Spain 0.01 0.05 0.62 0.32 Sweden 0.01 0.09 0.01 0.89
United Kingdom 0.03 0.03 0.01 0.88 0.05
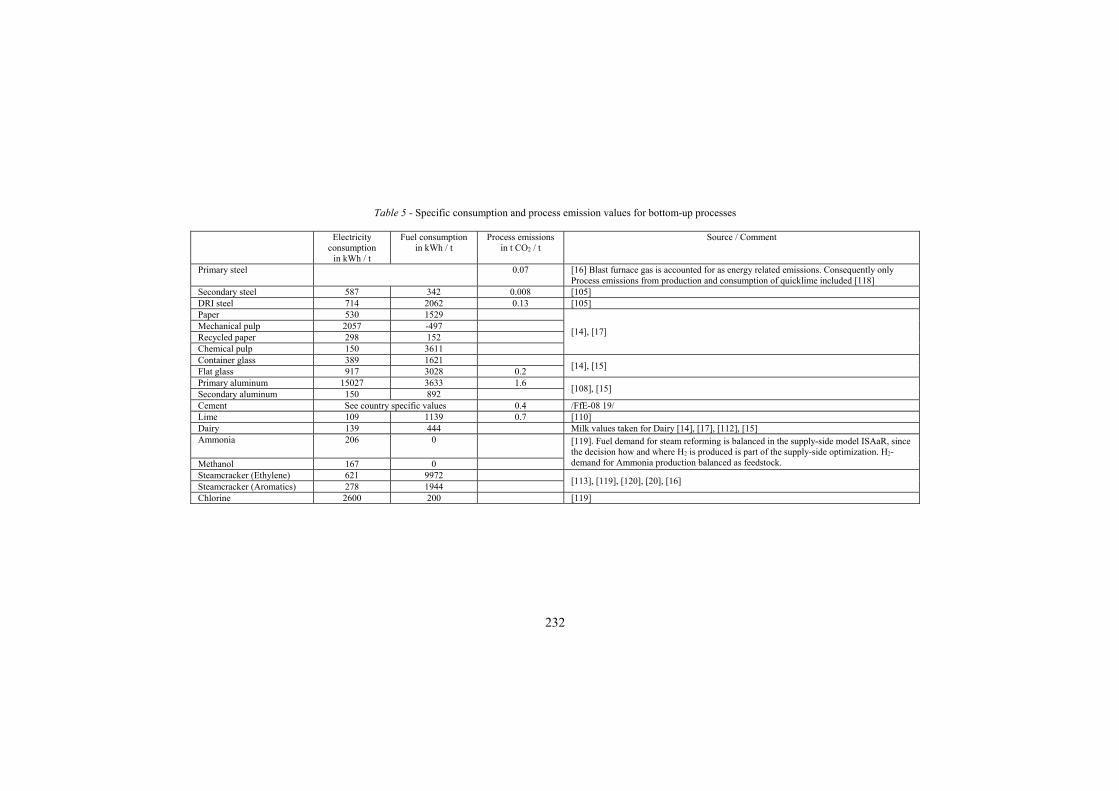
232
Table 5 - Specific consumption and process emission values for bottom-up processes
Electricity consumption
in kWh / t
Fuel consumption in kWh / t
Process emissions in t CO2 / t
Source / Comment
Primary steel 0.07 [16] Blast furnace gas is accounted for as energy related emissions. Consequently only Process emissions from production and consumption of quicklime included [118]
Secondary steel 587 342 0.008 [105] DRI steel 714 2062 0.13 [105] Paper 530 1529
[14], [17] Mechanical pulp 2057 -497 Recycled paper 298 152 Chemical pulp 150 3611 Container glass 389 1621
[14], [15] Flat glass 917 3028 0.2 Primary aluminum 15027 3633 1.6
[108], [15] Secondary aluminum 150 892 Cement See country specific values 0.4 /FfE-08 19/ Lime 109 1139 0.7 [110] Dairy 139 444 Milk values taken for Dairy [14], [17], [112], [15] Ammonia 206 0 [119]. Fuel demand for steam reforming is balanced in the supply-side model ISAaR, since
the decision how and where H2 is produced is part of the supply-side optimization. H2-demand for Ammonia production balanced as feedstock. Methanol 167 0
Steamcracker (Ethylene) 621 9972 [113], [119], [120], [20], [16]
Steamcracker (Aromatics) 278 1944 Chlorine 2600 200 [119]
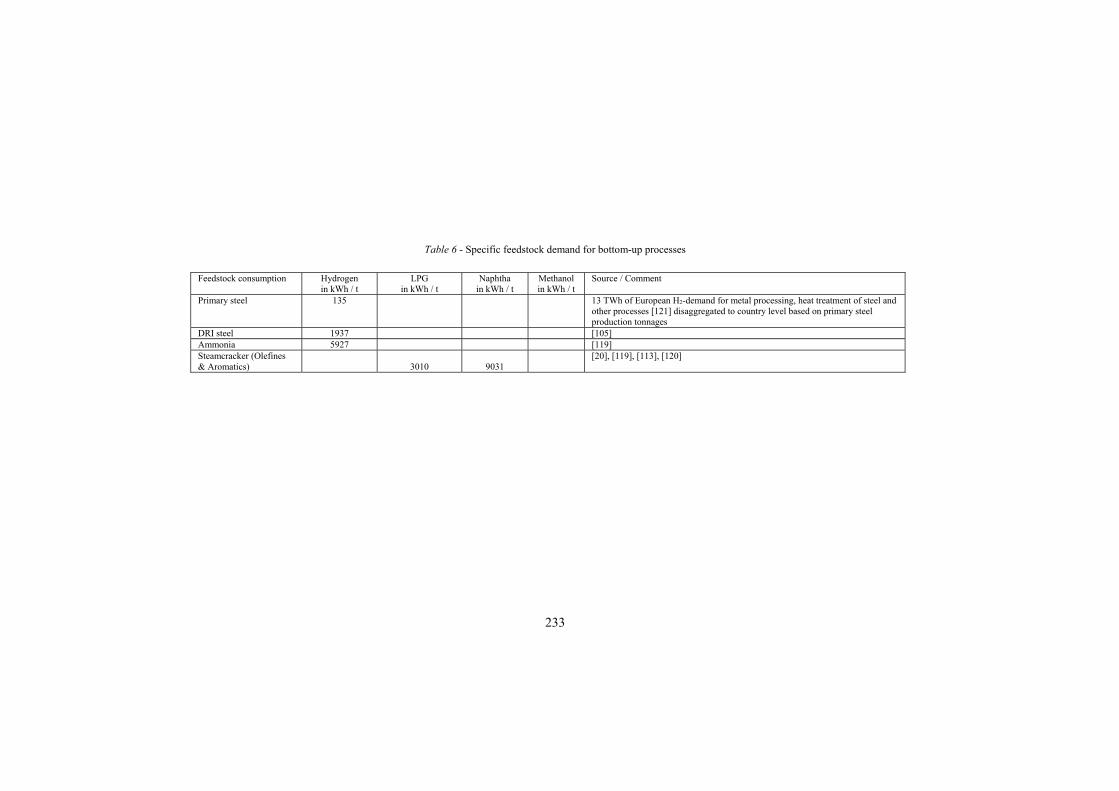
233
Table 6 - Specific feedstock demand for bottom-up processes
Feedstock consumption Hydrogen in kWh / t
LPG in kWh / t
Naphtha in kWh / t
Methanol in kWh / t
Source / Comment
Primary steel 135 13 TWh of European H2-demand for metal processing, heat treatment of steel and other processes [121] disaggregated to country level based on primary steel production tonnages
DRI steel 1937 [105] Ammonia 5927 [119] Steamcracker (Olefines & Aromatics)
3010 9031
[20], [119], [113], [120]
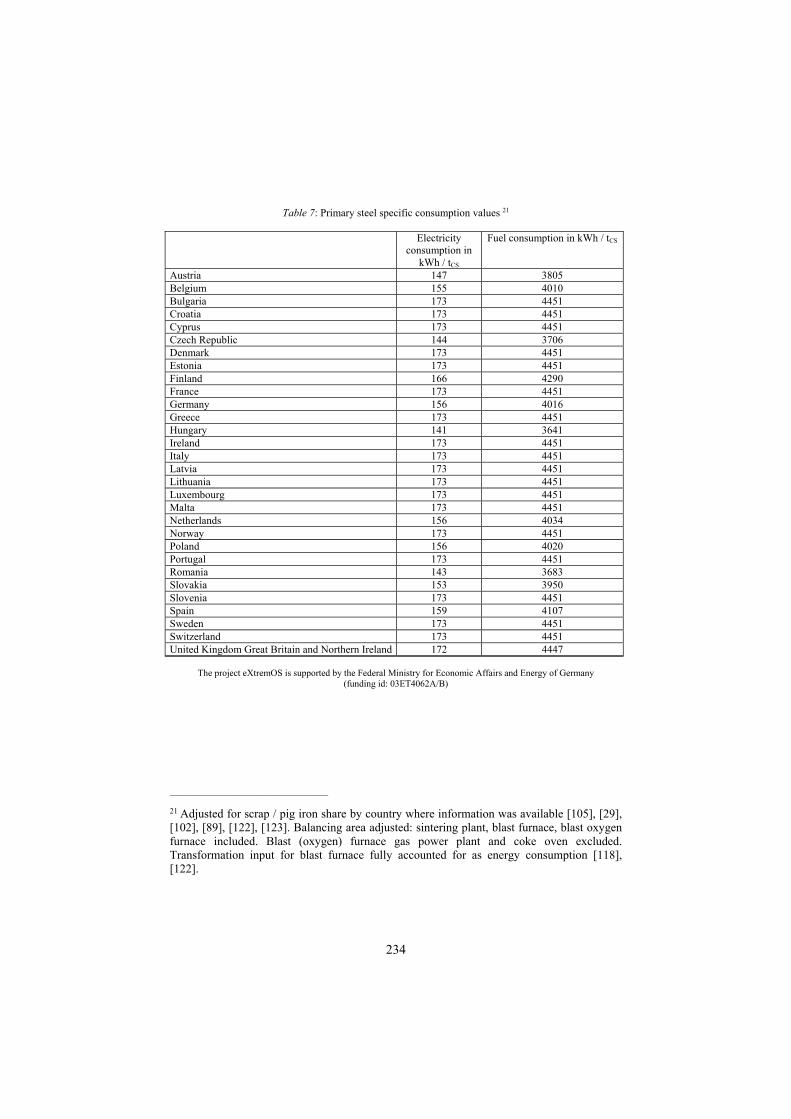
234
Table 7: Primary steel specific consumption values 21
Electricity consumption in
kWh / tCS
Fuel consumption in kWh / tCS
Austria 147 3805 Belgium 155 4010 Bulgaria 173 4451 Croatia 173 4451 Cyprus 173 4451 Czech Republic 144 3706 Denmark 173 4451 Estonia 173 4451 Finland 166 4290 France 173 4451 Germany 156 4016 Greece 173 4451 Hungary 141 3641 Ireland 173 4451 Italy 173 4451 Latvia 173 4451 Lithuania 173 4451 Luxembourg 173 4451 Malta 173 4451 Netherlands 156 4034 Norway 173 4451 Poland 156 4020 Portugal 173 4451 Romania 143 3683 Slovakia 153 3950 Slovenia 173 4451 Spain 159 4107 Sweden 173 4451 Switzerland 173 4451 United Kingdom Great Britain and Northern Ireland 172 4447
The project eXtremOS is supported by the Federal Ministry for Economic Affairs and Energy of Germany (funding id: 03ET4062A/B)
__________________________________ 21 Adjusted for scrap / pig iron share by country where information was available [105], [29], [102], [89], [122], [123]. Balancing area adjusted: sintering plant, blast furnace, blast oxygen furnace included. Blast (oxygen) furnace gas power plant and coke oven excluded. Transformation input for blast furnace fully accounted for as energy consumption [118], [122].
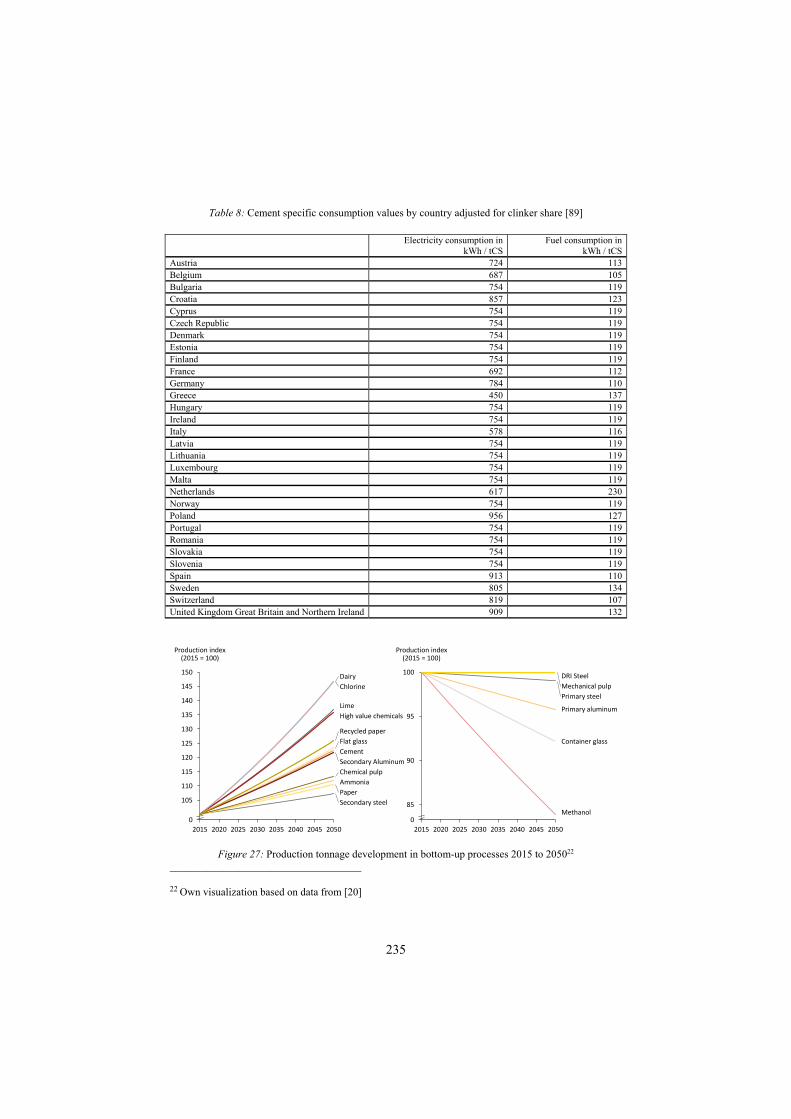
235
Table 8: Cement specific consumption values by country adjusted for clinker share [89]
Electricity consumption in
kWh / tCS Fuel consumption in
kWh / tCS Austria 724 113 Belgium 687 105 Bulgaria 754 119 Croatia 857 123 Cyprus 754 119 Czech Republic 754 119 Denmark 754 119 Estonia 754 119 Finland 754 119 France 692 112 Germany 784 110 Greece 450 137 Hungary 754 119 Ireland 754 119 Italy 578 116 Latvia 754 119 Lithuania 754 119 Luxembourg 754 119 Malta 754 119 Netherlands 617 230 Norway 754 119 Poland 956 127 Portugal 754 119 Romania 754 119 Slovakia 754 119 Slovenia 754 119 Spain 913 110 Sweden 805 134 Switzerland 819 107 United Kingdom Great Britain and Northern Ireland 909 132
Figure 27: Production tonnage development in bottom-up processes 2015 to 205022
____________________________________ 22 Own visualization based on data from [20]
2015 2020 2025 2030 2035 2040 2045 2050
110
105
0
145
150
115
120
125
130
135
140
Production index(2015 = 100)
Secondary steel
Paper
Chlorine
Flat glass
Cement
Chemical pulp
Dairy
Lime
High value chemicals
Secondary Aluminum
Recycled paper
Ammonia
2015 2020 2025 2030 2035 2040 2045 2050
85
0
90
95
100
Mechanical pulp
Production index(2015 = 100)
Primary steel
Container glass
Primary aluminum
DRI Steel
Methanol
236
FORECASTING POWER SYSTEM FLEXIBILITY REQUIREMENTS: A HYBRID DEEP-LEARNING APPROACH Coudray Théotime, University of Montpellier-ART-Dev laboratory and Climate Economics Chair Abstract Variable and Renewable Energies (VRE) are growing fast among power systems all around the world. While they do represent one of the main solutions to decarbonize the electricity sector, VRE’s rapidly increasing capacities also involve significant changes in power systems, many of them being grouped under the term ‘flexibility’. Thus, in future renewable-based power systems, flexibility requirements assessment and forecasting might very well become key tasks for grid operators, market participants as well as producers. Recent developments of highly sophisticated computational intelligence methods such as Artificial Neural Networks (ANN) have shown promising results when it comes to times-series analysis and forecasting. In this paper, we investigate the potential use of a hybrid forecasting framework to predict a given power system Residual Load (RL) curve at different timescales. The numerical application of this framework with French region Occitanie power system data suggests that this forecasting method achieves comparable forecasting error metrics with traditional ARIMA statistical framework for day-ahead hourly RL forecasting. However, this numerical application also illustrates the consistent accuracy of forecasts given by our proposed methodology over time. This is an important result that cannot be achieved without recalibrating ARIMA models every time new data becomes available, and which makes our ANN-based method very suitable for daily practical use, even for non-experts. In a context of energy production decentralization and local energy policy making, this work may be of particular interest for local decision makers and private actors of regions committed in deep decarbonization strategies such as Occitanie.
Section 1: Introduction 1.1 Context Global energy-related CO2 emissions stabilized in 2019, but still represented around 77% of the overall emissions. This stabilization in partially due to the world CO2 emissions of the power sector declining by 1.3% between 2018 and 2019 [1]. Combining energy sobriety and renewable electricity generation has been identified as the most efficient path to cut-off emissions from the sector [2-5]. According to the International Renewable Energy Agency (IRENA), these efforts on the electricity sector only could cover up to 60% of the CO2
emissions cuts needed by 2050 to reach climate goals [6]. Among renewable energies, wind power and solar photovoltaics (PV) are the fastest growing technologies. Between 2000 and 2017, global installed onshore wind capacities have been multiplied by 29, while solar PV capacities have been multiplied by 474 [7]. However, these generation technologies are inherently intermittent and variable with weather conditions. Having a hard-to-predict and no controllable output, Variable and Renewable Energies (VRE) can thus be the source of technical issues on power systems, as well as high volatility on power markets [8-10]. VRE integration also raises uncertainties on the optimal generation fleet and grid sizing of an eventual renewable-based power system. Last but not least, many researchers and energy stakeholders state that power systems incorporating more and more VRE must also be more and more flexible [13-17]. 1.2 Defining power system flexibility Flexibility is a portmanteau word which encompasses many different ideas related to matching load and generation at any time. A general definition of a power system flexibility is
237
its “ability to cope with changes either in electricity generation or consumption” [18]. As a matter of fact, the concept of flexibility implies various temporal aspects, each of one being related to a concrete issue. From real- time to short term (i.e., minutes to hours), flexibility is required mostly for grid balancing [19]. From day-ahead to week-ahead (i.e., mid-term), flexibility will refer to the producers and market participants’ ability to adapt either optimal generation units scheduling or electricity pricing to forecasted load and generation variations [20-21]. Finally, on longer timescales like months or years, matching electricity demand and production will require production units scheduling, building new plants or storage capacities, specific energy policy design as well as grid investments to follow long-term load trends or seasonal variations. This idea can be referred to as long-term flexibility [22-26]. To better illustrate what flexibility refers to, it can be useful to look at existing and future mechanisms designed to ensure a constant matching of electricity production and demand. Following the idea introduced in Lund P. et al. [27], we propose to classify existing and developing flexibility solutions in three main categories, which are simply (i) technology-related solutions, (ii) market-related solutions and (iii) grid-related solutions. Most of technological flexibility solutions like spinning reserves or controllable generation units (e.g., fossil-fueled plants, nuclear plants, or hydropower), are already in use today. Large-scale electricity storage technologies (e.g., Pumped Hydro Storage (PHS), flywheels, supercapacitors, stationary batteries, or Power-to-X) are also part of technological flexibility options, yet the majority of them is still in early development [22, 30-33]. Last, some technological flexibility options are linked to VREs themselves. They can indeed be curtailed [34] or distributed across large territories to benefit from different local weather conditions [35-36]. Improving VRE output forecasting techniques is also identified as a critical way to better integrate them into power grids [26].Within the market solutions category, we find all market mechanisms allowing a faster and more adaptive matching between load and generation (e.g., intra-day contracts on wholesale market, capacity market) and a better demand-side management (e.g., demand-response market) [37-38]. The last category relates to grid developments, either at the transmission or distribution level, that can be implemented to avoid congestions (e.g., grid capacity extensions) or to benefit from different local weather conditions (e.g., interconnections) [39-40]. Table 1 sums up the different flexibility solutions, their activation time, the timescale over they can be used and their current maturity 1.3 Modelling flexibility requirements With the recent growth of VRE’s capacities amongst power systems of various sizes, modeling flexibility has become a flourishing field of science, at the crossroads between engineering and economics. In [15], over 70 flexibility requirements assessment methods are reviewed and categorized in three main groups : technical, economic and market potential evaluation. In most of these methods, a central concept is the Residual Load (RL) curve which is a representation of the amount of electricity consumption that is not covered by VRE generation. In other terms, it represents the amount of load that must be managed by flexible means, such as controllable generation units, storage, or demand-response. Equations (1) and (2) describe the mathematical formulation of the RL function we will use in this paper.
(1) 𝑅𝑒𝑠𝑖𝑑𝑢𝑎𝑙 𝐿𝑜𝑎𝑑 = 𝑇𝑜𝑡𝑎𝑙 𝑙𝑜𝑎𝑑 − 𝑉𝑅𝐸 𝑝𝑟𝑜𝑑𝑢𝑐𝑡𝑖𝑜𝑛 (2) 𝑉𝑅𝐸 𝑝𝑟𝑜𝑑𝑢𝑐𝑡𝑖𝑜𝑛 = 𝑊𝑖𝑛𝑑 𝑝𝑟𝑜𝑑𝑢𝑐𝑡𝑖𝑜𝑛 + 𝑆𝑜𝑙𝑎𝑟 𝑃𝑉 𝑝𝑟𝑜𝑑𝑢𝑐𝑡𝑖𝑜𝑛
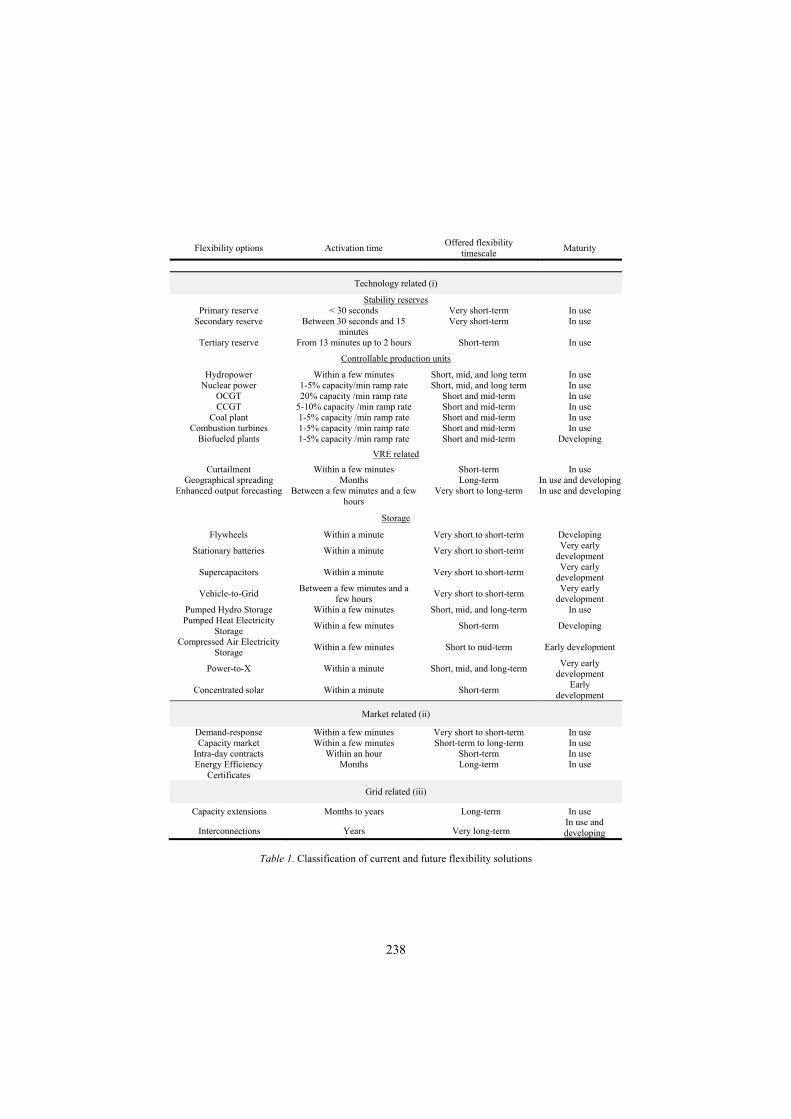
238
Flexibility options Activation time Offered flexibility
timescale Maturity
Technology related (i)
Stability reserves Primary reserve < 30 seconds Very short-term In use
Secondary reserve Between 30 seconds and 15 minutes
Very short-term In use
Tertiary reserve From 13 minutes up to 2 hours Short-term In use
Controllable production units
Hydropower Within a few minutes Short, mid, and long term In use Nuclear power 1-5% capacity/min ramp rate Short, mid, and long term In use
OCGT 20% capacity /min ramp rate Short and mid-term In use CCGT 5-10% capacity /min ramp rate Short and mid-term In use
Coal plant 1-5% capacity /min ramp rate Short and mid-term In use Combustion turbines 1-5% capacity /min ramp rate Short and mid-term In use
Biofueled plants 1-5% capacity /min ramp rate Short and mid-term Developing
VRE related
Curtailment Within a few minutes Short-term In use Geographical spreading Months Long-term In use and developing
Enhanced output forecasting Between a few minutes and a few hours
Very short to long-term In use and developing
Storage
Flywheels Within a minute Very short to short-term Developing
Stationary batteries Within a minute Very short to short-term Very early
development
Supercapacitors Within a minute Very short to short-term Very early
development
Vehicle-to-Grid Between a few minutes and a
few hours Very short to short-term
Very early development
Pumped Hydro Storage Within a few minutes Short, mid, and long-term In use Pumped Heat Electricity
Storage Within a few minutes Short-term Developing
Compressed Air Electricity Storage
Within a few minutes Short to mid-term Early development
Power-to-X Within a minute Short, mid, and long-term Very early
development
Concentrated solar Within a minute Short-term Early
development
Market related (ii)
Demand-response Within a few minutes Very short to short-term In use Capacity market Within a few minutes Short-term to long-term In use
Intra-day contracts Within an hour Short-term In use Energy Efficiency
Certificates Months Long-term In use
Grid related (iii)
Capacity extensions Months to years Long-term In use
Interconnections Years Very long-term In use and developing
Table 1. Classification of current and future flexibility solutions
239
Using load and VRE production time-series, it is possible to build a RL curve that encompasses the various temporal features of flexibility requirements. Indeed, the advantage of working with time series is that they can display both a high temporal granularity (i.e., hours, or even minutes) and a long- time horizon (i.e., months or years). From these RL time-series can be derived diverse flexibility metrics [19, 26, 41], that then can be used to study specific topics related to flexibility, like storage [24, 44], transmission grids [25] or country pathways towards renewable-based power systems [26]. Most of flexibility requirements assessment studies rely on optimization programs [23-26, 41, 42, 44-46], but hybrid methods [20] and game theoretic approaches [47] have been also investigated. Overall, it appears that the generation of RL time-series (or just VRE output in some cases) is a necessary task to empirically explore the impact of increasing VRE shares in power systems. To perform this, two major classes of techniques exist: the ones using deterministic models, and the data-driven ones. Deterministic techniques are most often based on the generation of large amounts of simulated weather data in combination with techno-economic models. Albeit being absolutely transparent and very useful to simulate many possible outcomes, either at short or long-time scales, deterministic simulation techniques show two significant limitations: they usually require huge computational resources and rely on the modeler’s assumptions, which sometimes can be unprecise or non-exhaustive [48]. Oppositely, data-driven techniques only use statistical treatments on recorded data to build purely empirical time-series models. In [49], 483 scientific articles related to data-driven energy forecasting methods are reviewed. In this extensive review, the authors categorize data-driven forecasting techniques into three classes: statistical methods, Computer Intelligence (CI) methods, and hybrid methods. Their findings are quite clear:hybrid methods have better forecasting performances than stand-alone methods, simply because making use of different statistical tools together can effectively overcome stand-alone methods limitations. Notably, decomposition-based hybrid forecasting methods have been increasingly popular over the past years because of their ability to cope with high volatility and non-linearity, two specific features of VRE output time-series. Finally, an important result that seems to emerge from this literature is that the combination of time-series decomposition techniques and deep learning models can produce highly accurate forecasts of alleged hard-to-predict processes [50-59]. However, such hybrid methods have been used to investigate power system flexibility issues only on rare occasions [56-57, 59]. 1.4 Paper contributions and structure In this paper, we propose a novel hybrid approach to forecast the RL curve of any given power system, at different timescales. Precisely, we propose a RL time-series forecasting framework combining two techniques, namely Complete Ensemble Empirical Mode Decomposition with Adaptative Noise (CEEMDAN), and Convolutional and Long Short-Term Memory Artificial Neural Network (ConvLSTM ANN). The resulting models are then trained on empirical data from French region Occitanie power-system, and both one day-ahead and one-year ahead hourly Residual Load forecasts are produced.
To our knowledge, using these two methods together have not been tested and documented yet in the energy forecasting literature [49-51]. Moreover, we want to attract attention on local power systems simply because both load profile and VRE production highly depend on local weather conditions. Providing RL forecasts on such geographical scale can also be useful for policy makers since more and more energy policies are designed and implemented on a local scale [60-61].

240
The paper is organized as follows. In section 2, we briefly introduce the basics of each individual method (CEEMDAN, LSTM and ConvLSTM-2D) before extensively describing the framework used in our study. In section 3, we present a numerical application of the proposed methodology on Occitanie power system and compare its forecasting results with the ones obtained with another more traditional modeling framework, namely ARIMA. Section 5 is dedicated to conclusion and discussion of other research avenues on this topic. Section 2: Methodology 2.1 Empirical Mode Decomposition (EMD) and its extensions EMD is a signal-processing method first introduced in Huang E.N. et al. [62] that can also be useful for time-series analysis. The general purpose of this method is to overcome non-linearity and non-stationarity in time-series to better analyze or predict them. To achieve this, EMD consists in decomposing a non-linear and non-stationary time-series into a set of stationary subseries called Intrinsic Mode Functions (IMFs), plus a residue. The IMFs represent the oscillatory patterns included in the original series, while the residues can be interpreted as the series long term trend. By simply summing all the obtained IMFs and residue, one can recover the original time-series. As opposed to wavelet-based decomposition, EMD is a purely empirical method which is particularly well suited for indeterministic problems analysis. The decomposition algorithm is the following: 1. Identify all local extrema of the original time-series and connect them to obtain the
upper and lower envelopes. 2. Calculate the average envelope and subtract it from the original series to get the first
component. These first two actions are known as the sifting process. 3. This first component becomes the new series to sift. Repeat actions 1. and 2. until
finding an IMF, i.e., a function having the following properties :
The difference between the number of local extrema and zero-crossings is at most 1.
The mean value between upper and lower envelopes is 0. 4. Once the first IMF is extracted, subtract it from the original time-series, and repeat the
sifting process on this new series to identify the next IMF. 5. Once all IMFs have been extracted using the sifting process, it should remain only a
monotonic function in which no more IMF can be extracted. This last function is the residue.
The very advantage of this method is to empirically transform a nonlinear, non-stationary and therefore hard-to-predict time-series into a set of IMFs which are easier to predict, due to their stationary properties. However, EMD itself presents an issue known as the mode-mixing problem, i.e., the fact that inside an IMF two different oscillatory patterns can overlap, or that the same oscillatory pattern can appear in multiple IMFs. To solve this issue, EMD has been improved to become first Ensemble Empirical Mode Decomposition (EEMD) [63] and then Complete Ensemble Empirical Mode Decomposition with Adaptive Noise (CEEMDAN) [64], which both benefit from statistical properties of white-noises to overcome the mode-mixing problem. Basically, CEEMDAN adds a different white- noise series in every step of the sifting process to make sure all extracted IMFs represent a single and specific oscillatory pattern comprised in the original time-series. However, CEEMDAN is a high- consuming computational method which cannot be computed parallelly [50].
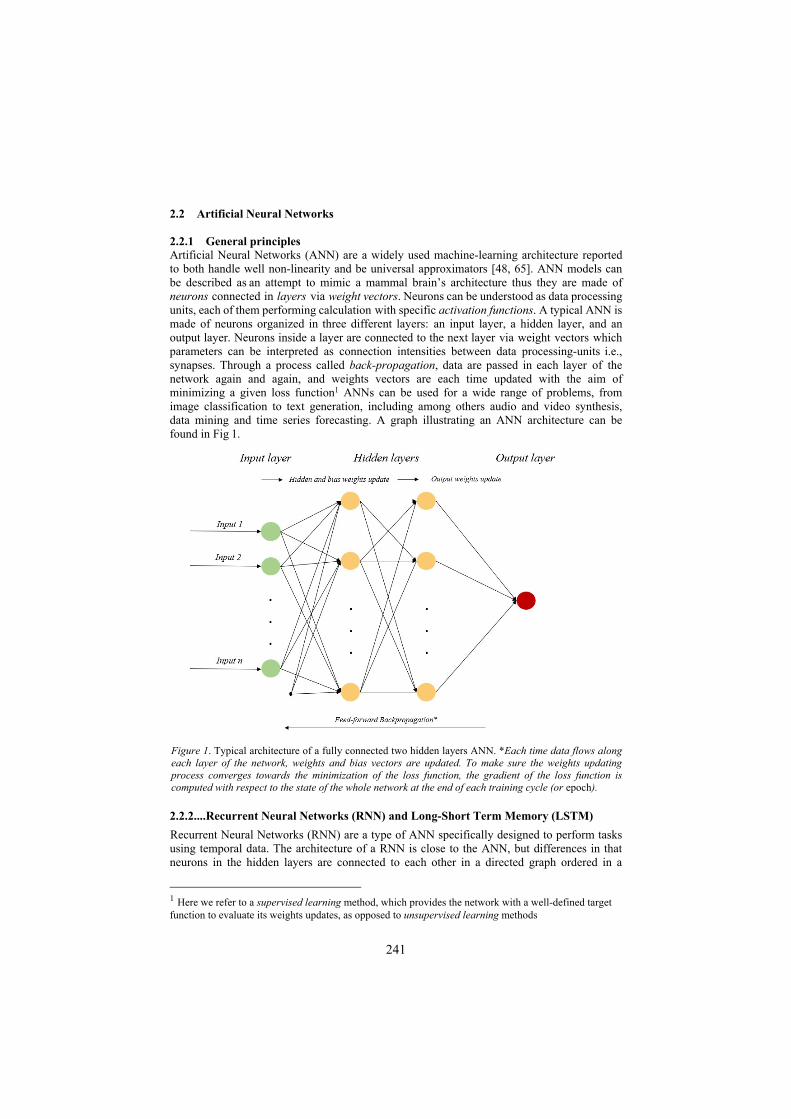
241
2.2 Artificial Neural Networks 2.2.1 General principles Artificial Neural Networks (ANN) are a widely used machine-learning architecture reported to both handle well non-linearity and be universal approximators [48, 65]. ANN models can be described as an attempt to mimic a mammal brain’s architecture thus they are made of neurons connected in layers via weight vectors. Neurons can be understood as data processing units, each of them performing calculation with specific activation functions. A typical ANN is made of neurons organized in three different layers: an input layer, a hidden layer, and an output layer. Neurons inside a layer are connected to the next layer via weight vectors which parameters can be interpreted as connection intensities between data processing-units i.e., synapses. Through a process called back-propagation, data are passed in each layer of the network again and again, and weights vectors are each time updated with the aim of minimizing a given loss function1 ANNs can be used for a wide range of problems, from image classification to text generation, including among others audio and video synthesis, data mining and time series forecasting. A graph illustrating an ANN architecture can be found in Fig 1.
Figure 1. Typical architecture of a fully connected two hidden layers ANN. *Each time data flows along each layer of the network, weights and bias vectors are updated. To make sure the weights updating process converges towards the minimization of the loss function, the gradient of the loss function is computed with respect to the state of the whole network at the end of each training cycle (or epoch).
2.2.2....Recurrent Neural Networks (RNN) and Long-Short Term Memory (LSTM)
Recurrent Neural Networks (RNN) are a type of ANN specifically designed to perform tasks using temporal data. The architecture of a RNN is close to the ANN, but differences in that neurons in the hidden layers are connected to each other in a directed graph ordered in a
1 Here we refer to a supervised learning method, which provides the network with a well-defined target function to evaluate its weights updates, as opposed to unsupervised learning methods
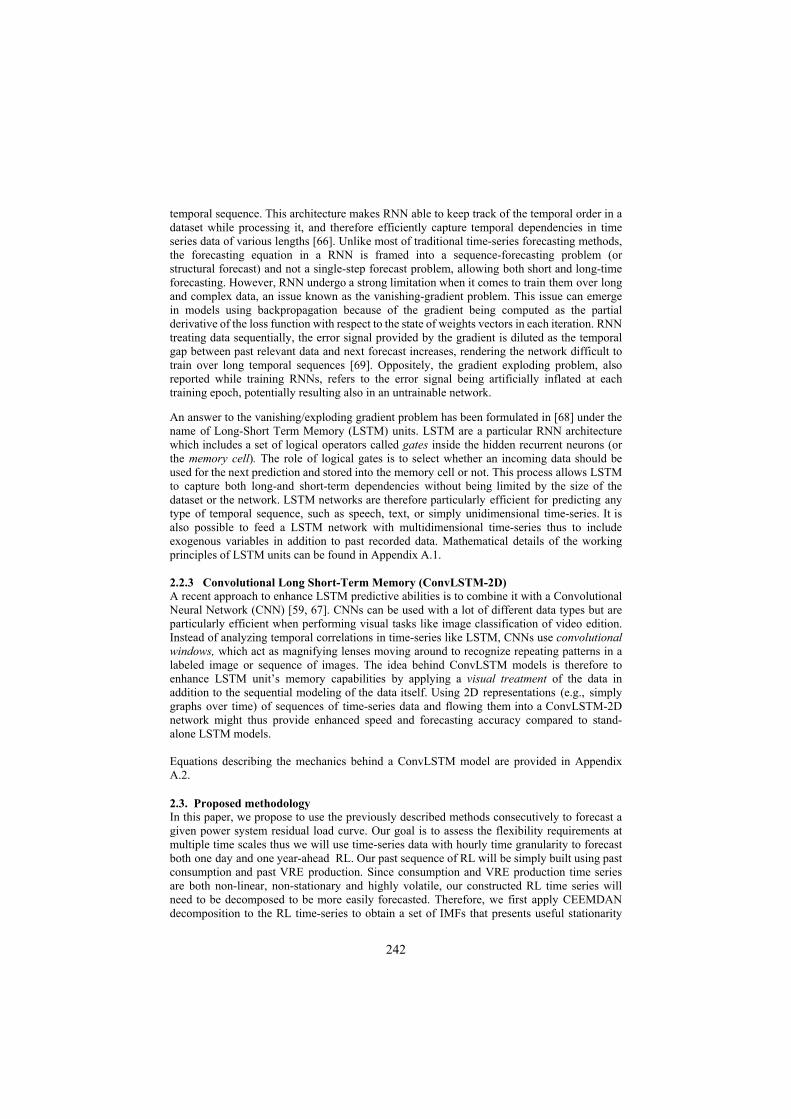
242
temporal sequence. This architecture makes RNN able to keep track of the temporal order in a dataset while processing it, and therefore efficiently capture temporal dependencies in time series data of various lengths [66]. Unlike most of traditional time-series forecasting methods, the forecasting equation in a RNN is framed into a sequence-forecasting problem (or structural forecast) and not a single-step forecast problem, allowing both short and long-time forecasting. However, RNN undergo a strong limitation when it comes to train them over long and complex data, an issue known as the vanishing-gradient problem. This issue can emerge in models using backpropagation because of the gradient being computed as the partial derivative of the loss function with respect to the state of weights vectors in each iteration. RNN treating data sequentially, the error signal provided by the gradient is diluted as the temporal gap between past relevant data and next forecast increases, rendering the network difficult to train over long temporal sequences [69]. Oppositely, the gradient exploding problem, also reported while training RNNs, refers to the error signal being artificially inflated at each training epoch, potentially resulting also in an untrainable network.
An answer to the vanishing/exploding gradient problem has been formulated in [68] under the name of Long-Short Term Memory (LSTM) units. LSTM are a particular RNN architecture which includes a set of logical operators called gates inside the hidden recurrent neurons (or the memory cell). The role of logical gates is to select whether an incoming data should be used for the next prediction and stored into the memory cell or not. This process allows LSTM to capture both long-and short-term dependencies without being limited by the size of the dataset or the network. LSTM networks are therefore particularly efficient for predicting any type of temporal sequence, such as speech, text, or simply unidimensional time-series. It is also possible to feed a LSTM network with multidimensional time-series thus to include exogenous variables in addition to past recorded data. Mathematical details of the working principles of LSTM units can be found in Appendix A.1. 2.2.3 Convolutional Long Short-Term Memory (ConvLSTM-2D) A recent approach to enhance LSTM predictive abilities is to combine it with a Convolutional Neural Network (CNN) [59, 67]. CNNs can be used with a lot of different data types but are particularly efficient when performing visual tasks like image classification of video edition. Instead of analyzing temporal correlations in time-series like LSTM, CNNs use convolutional windows, which act as magnifying lenses moving around to recognize repeating patterns in a labeled image or sequence of images. The idea behind ConvLSTM models is therefore to enhance LSTM unit’s memory capabilities by applying a visual treatment of the data in addition to the sequential modeling of the data itself. Using 2D representations (e.g., simply graphs over time) of sequences of time-series data and flowing them into a ConvLSTM-2D network might thus provide enhanced speed and forecasting accuracy compared to stand-alone LSTM models. Equations describing the mechanics behind a ConvLSTM model are provided in Appendix A.2. 2.3. Proposed methodology In this paper, we propose to use the previously described methods consecutively to forecast a given power system residual load curve. Our goal is to assess the flexibility requirements at multiple time scales thus we will use time-series data with hourly time granularity to forecast both one day and one year-ahead RL. Our past sequence of RL will be simply built using past consumption and past VRE production. Since consumption and VRE production time series are both non-linear, non-stationary and highly volatile, our constructed RL time series will need to be decomposed to be more easily forecasted. Therefore, we first apply CEEMDAN decomposition to the RL time-series to obtain a set of IMFs that presents useful stationarity

243
and oscillatory properties. In this study, precision is privileged over speed, that is why we do not specify any target number of IMFs or maximum sifting operations for the CEEMDAN process. The only stopping criterion used is a 𝑆 𝑛𝑢𝑚𝑏𝑒𝑟 put at 5. The S number is a parameter that represents the number of iterative sifting processes ending with an IMF before switching to the next. The resulting IMFs and the past sequence of RL will then be used as inputs in a multivariate ConvLSTM-2D model. The idea here is to analyze the temporal dependencies between oscillatory patterns contained in the RL time-series itself to enhance the forecasting performance of the model. In traditional one-step ahead forecasting approaches, the error of the first forecasted step is propagated over and over all along the forecasting period, which generally leads to poor forecasting performances as the forecasting horizon becomes more distant. To avoid this issue, we frame our problem as a sequence-to-sequence (or seq2seq) forecasting problem, that can be described by Equation 3: (3) Ŷ𝑡 1|𝑡,…,Ŷ𝑡 𝐿|𝑡 𝑓 𝑌𝑡,𝑌𝑡 1,…,𝐼𝑀𝐹1,𝑡,𝐼𝑀𝐹1,𝑡 1,…,𝐼𝑀𝐹𝑛,𝑡,𝐼𝑀𝐹𝑛,𝑡 1,… Where 𝑌𝑡,𝑌𝑡 1,… is a past sequence of RL observations, 𝐼𝑀𝐹𝑛,𝑡,𝐼𝑀𝐹𝑛,𝑡 1,… is a past sequence of IMF 𝑛 data extracted from the original RL time-series, and Ŷ𝑡 1|𝑡,…,Ŷ𝑡 𝐿|𝑡 is the RL forecasted sequence up to time horizon 𝐿. In our methodology, we choose to produce forecasting sequences of 24 hours to represent full days of RL. Therefore, a full forecasted day of RL can be represented by the following equation:
(4)
To enhance the forecasting performances of our model and to get closer from a real-world situation where daily incoming data can be used to improve forecasts of the following days, we will use walk-froward validation of the model during its training. This means that to calibrate its weights and bias parameters, the model will incorporate actual data to its training history as they become available over time. In other terms, every time the model produces a daily sequence forecast , actual data from that day will be added to the history to perform the next sequence forecast . . It is to be noted that this process requires to first decompose our full time-series into stacks of 24 hours, which can only work if the input time-series lengths are multiple of 24. In addition to the graph proposed in Figure 3., we want to provide here a detailed explanation of the way our model is trained. The decomposed and stacked time-series data are feed to a two layered ANN. The goal of the first ConvLSTM layer is to capture temporal dependencies among data in a visual way. To achieve this, the 24-hours stacks of 1D time-series data are transformed in a time-series of 2D images, in which each image is a 24-hour length frame of RL and RL IMFs curves. Flowing along all the images, the network updates its weights and bias vectors a first time and performs a forecast of the next 24-hour length image. This operation is realized using convolution operators inside LSTM units (see Appendix A.2.), which allows the network to capture both spatial and temporal dependencies between pixels inside consecutive images. In a second time, the forecasted image is then passed through a Flatten layer, which role is to reduce the image dimensionality to re-transform it into a 1D tensor vector of spatiotemporal dependencies between the previously graphed datapoints. Then, temporal correlations within this vector are analyzed in depth by a simple LSTM layer, and weights and bias vectors of the ANN are updated a second time. Finally, a Dense layer, which is the equivalent of an output
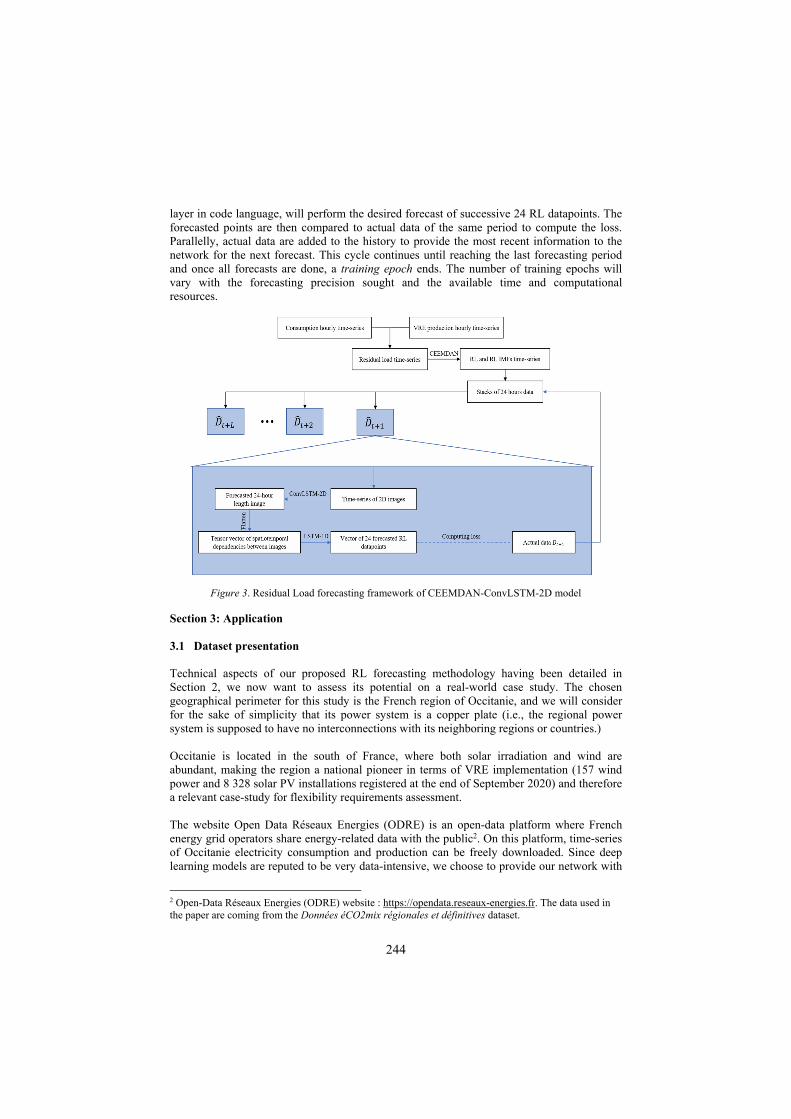
244
layer in code language, will perform the desired forecast of successive 24 RL datapoints. The forecasted points are then compared to actual data of the same period to compute the loss. Parallelly, actual data are added to the history to provide the most recent information to the network for the next forecast. This cycle continues until reaching the last forecasting period and once all forecasts are done, a training epoch ends. The number of training epochs will vary with the forecasting precision sought and the available time and computational resources.
Figure 3. Residual Load forecasting framework of CEEMDAN-ConvLSTM-2D model Section 3: Application 3.1 Dataset presentation Technical aspects of our proposed RL forecasting methodology having been detailed in Section 2, we now want to assess its potential on a real-world case study. The chosen geographical perimeter for this study is the French region of Occitanie, and we will consider for the sake of simplicity that its power system is a copper plate (i.e., the regional power system is supposed to have no interconnections with its neighboring regions or countries.) Occitanie is located in the south of France, where both solar irradiation and wind are abundant, making the region a national pioneer in terms of VRE implementation (157 wind power and 8 328 solar PV installations registered at the end of September 2020) and therefore a relevant case-study for flexibility requirements assessment. The website Open Data Réseaux Energies (ODRE) is an open-data platform where French energy grid operators share energy-related data with the public2. On this platform, time-series of Occitanie electricity consumption and production can be freely downloaded. Since deep learning models are reputed to be very data-intensive, we choose to provide our network with
2 Open-Data Réseaux Energies (ODRE) website : https://opendata.reseaux-energies.fr. The data used in the paper are coming from the Données éCO2mix régionales et définitives dataset.
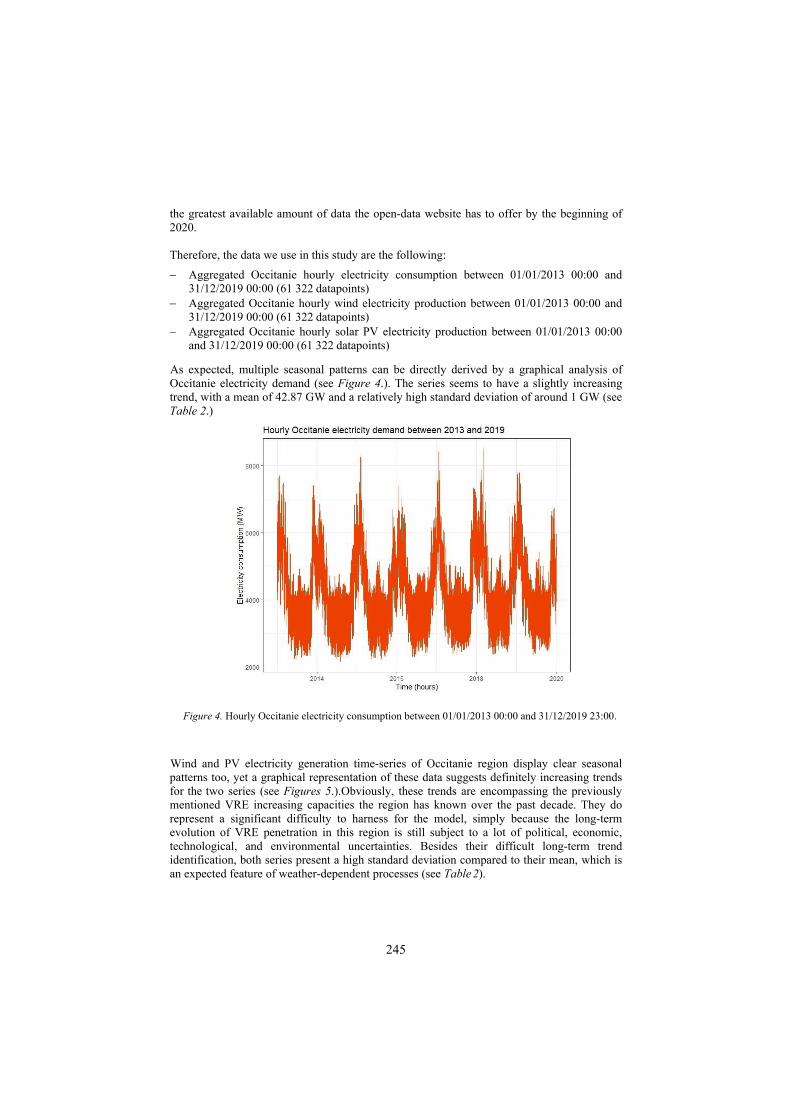
245
the greatest available amount of data the open-data website has to offer by the beginning of 2020. Therefore, the data we use in this study are the following:
Aggregated Occitanie hourly electricity consumption between 01/01/2013 00:00 and 31/12/2019 00:00 (61 322 datapoints)
Aggregated Occitanie hourly wind electricity production between 01/01/2013 00:00 and 31/12/2019 00:00 (61 322 datapoints)
Aggregated Occitanie hourly solar PV electricity production between 01/01/2013 00:00 and 31/12/2019 00:00 (61 322 datapoints)
As expected, multiple seasonal patterns can be directly derived by a graphical analysis of Occitanie electricity demand (see Figure 4.). The series seems to have a slightly increasing trend, with a mean of 42.87 GW and a relatively high standard deviation of around 1 GW (see Table 2.)
Figure 4. Hourly Occitanie electricity consumption between 01/01/2013 00:00 and 31/12/2019 23:00.
Wind and PV electricity generation time-series of Occitanie region display clear seasonal patterns too, yet a graphical representation of these data suggests definitely increasing trends for the two series (see Figures 5.).Obviously, these trends are encompassing the previously mentioned VRE increasing capacities the region has known over the past decade. They do represent a significant difficulty to harness for the model, simply because the long-term evolution of VRE penetration in this region is still subject to a lot of political, economic, technological, and environmental uncertainties. Besides their difficult long-term trend identification, both series present a high standard deviation compared to their mean, which is an expected feature of weather-dependent processes (see Table 2).
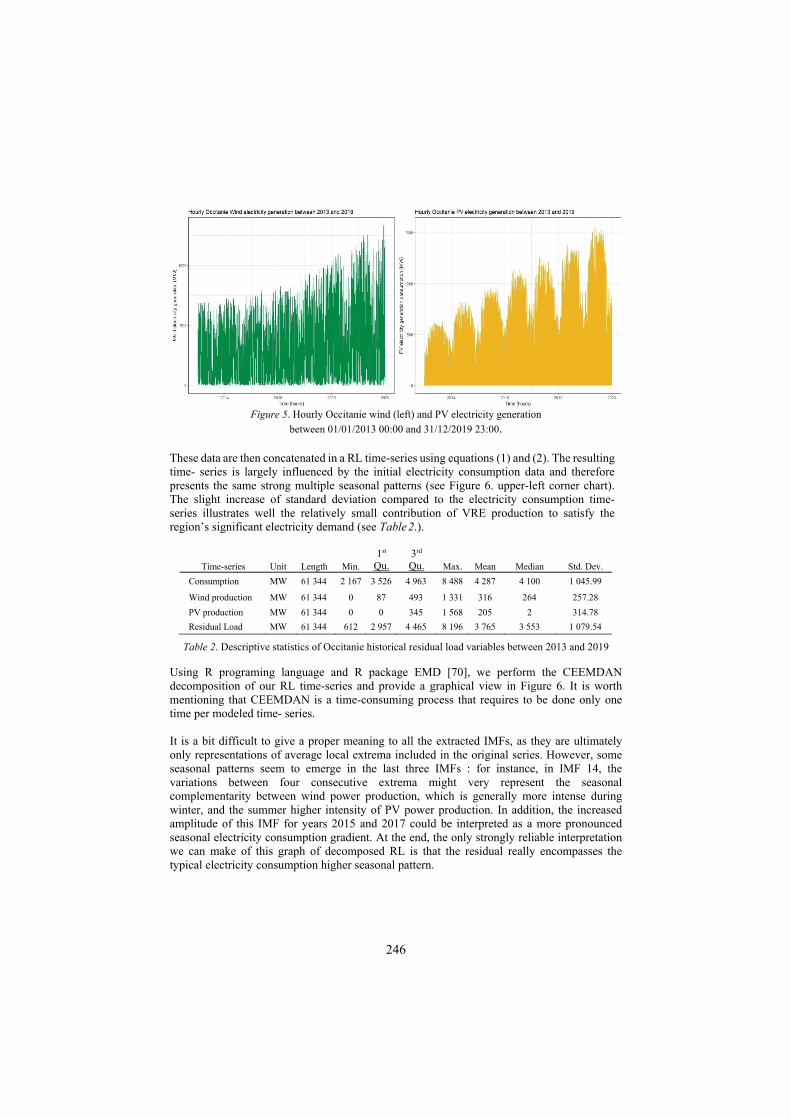
246
Figure 5. Hourly Occitanie wind (left) and PV electricity generation
between 01/01/2013 00:00 and 31/12/2019 23:00. These data are then concatenated in a RL time-series using equations (1) and (2). The resulting time- series is largely influenced by the initial electricity consumption data and therefore presents the same strong multiple seasonal patterns (see Figure 6. upper-left corner chart). The slight increase of standard deviation compared to the electricity consumption time-series illustrates well the relatively small contribution of VRE production to satisfy the region’s significant electricity demand (see Table 2.).
Time-series Unit Length Min. 1st
Qu. 3rd Qu. Max. Mean Median Std. Dev.
Consumption MW 61 344 2 167 3 526 4 963 8 488 4 287 4 100 1 045.99
Wind production MW 61 344 0 87 493 1 331 316 264 257.28
PV production MW 61 344 0 0 345 1 568 205 2 314.78
Residual Load MW 61 344 612 2 957 4 465 8 196 3 765 3 553 1 079.54
Table 2. Descriptive statistics of Occitanie historical residual load variables between 2013 and 2019 Using R programing language and R package EMD [70], we perform the CEEMDAN decomposition of our RL time-series and provide a graphical view in Figure 6. It is worth mentioning that CEEMDAN is a time-consuming process that requires to be done only one time per modeled time- series. It is a bit difficult to give a proper meaning to all the extracted IMFs, as they are ultimately only representations of average local extrema included in the original series. However, some seasonal patterns seem to emerge in the last three IMFs : for instance, in IMF 14, the variations between four consecutive extrema might very represent the seasonal complementarity between wind power production, which is generally more intense during winter, and the summer higher intensity of PV power production. In addition, the increased amplitude of this IMF for years 2015 and 2017 could be interpreted as a more pronounced seasonal electricity consumption gradient. At the end, the only strongly reliable interpretation we can make of this graph of decomposed RL is that the residual really encompasses the typical electricity consumption higher seasonal pattern.

247
Figure 6. Occitanie power system residual load between 01/01/2013 00:00 and 31/12/2019 23:00 and
extracted IMFs and residual from CEEMDAN decomposition
Following the requirements of machine-learning modelling, we finally split this decomposed RL dataset into training and validation sets with an 85%-15% ratio. This means that our model will learn temporal dependencies in the decomposed data from 01/01/2013 00:00 to 31/12/2018 23:00 (841 344 training datapoints) and use them to forecast the Occitanie RL between 01/01/2019 00:00 and 30/12/2019 23:00 (8 736 datapoints to forecast). 3.2 Compared models In the energy industry and more generally in econometrics, AutoRegressive Integrated Moving Average (ARIMA) are a well-known class of time-series forecasting models first introduced by Box G. and Jenkins G. in 1970 [71]. ARIMA models have shown satisfying short-term forecasting results over the past decades but are a strongly limited by their structure for long-term prediction. Indeed, in ARIMA models, the forecasting steps are inevitably performed sequentially, resulting in strong error propagation as the forecasting horizon increases. This can be a particular issue in the electricity field where having accurate forecasts for the entire next day, week or even year can be critical for system operation and planning. To counter this issue, specific ARIMA models can be calibrated to forecast only a single or a few steps ahead. For instance, to predict an entire day ahead of hourly consumption with the ARIMA framework, one can build twenty-four ARIMA models specifically designed to forecast every hour of the day. Although being eventually more precise, this approach is more resource consuming and approaches its limits when it comes to forecast an entire year of hourly time-series. Oppositely, neural network sequence-to-sequence forecasting allows to forecast entire time sequences at once, and thus could be a way to avoid the step-to-step forecasting error propagation issue using only one model. To validate this intuition, we will
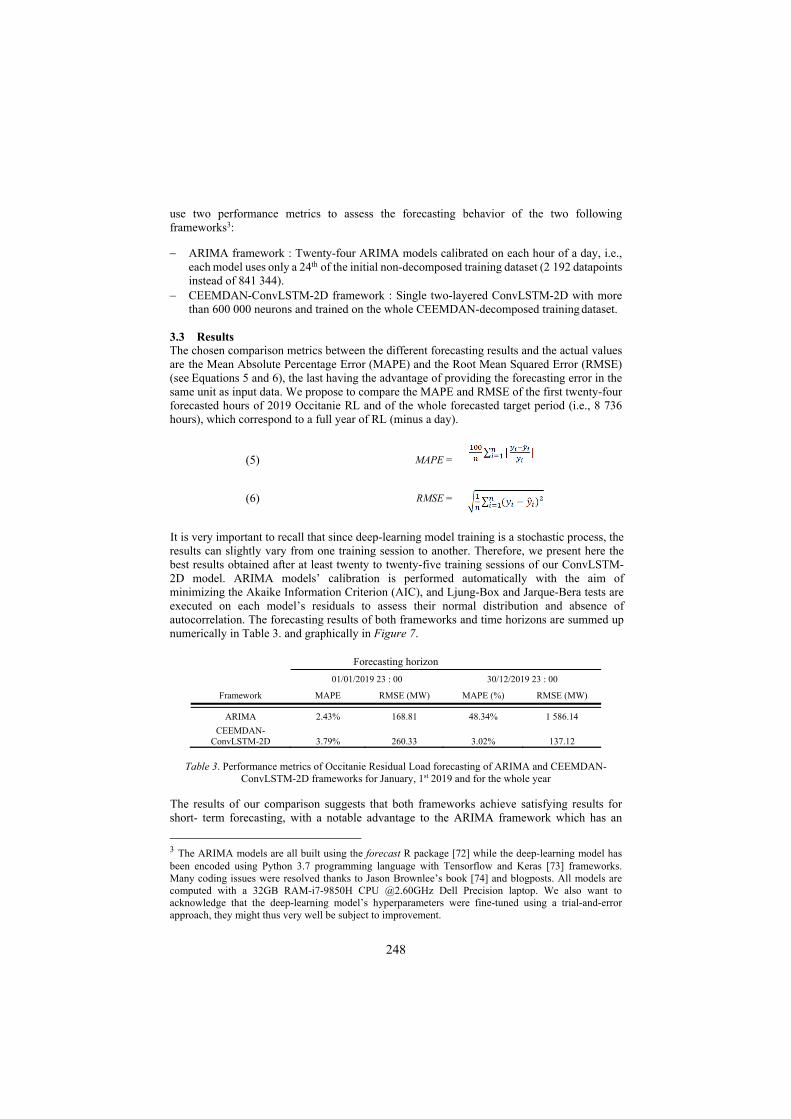
248
use two performance metrics to assess the forecasting behavior of the two following frameworks3:
ARIMA framework : Twenty-four ARIMA models calibrated on each hour of a day, i.e., each model uses only a 24th of the initial non-decomposed training dataset (2 192 datapoints instead of 841 344).
CEEMDAN-ConvLSTM-2D framework : Single two-layered ConvLSTM-2D with more than 600 000 neurons and trained on the whole CEEMDAN-decomposed training dataset.
3.3 Results The chosen comparison metrics between the different forecasting results and the actual values are the Mean Absolute Percentage Error (MAPE) and the Root Mean Squared Error (RMSE) (see Equations 5 and 6), the last having the advantage of providing the forecasting error in the same unit as input data. We propose to compare the MAPE and RMSE of the first twenty-four forecasted hours of 2019 Occitanie RL and of the whole forecasted target period (i.e., 8 736 hours), which correspond to a full year of RL (minus a day).
(5) MAPE =
(6) RMSE =
It is very important to recall that since deep-learning model training is a stochastic process, the results can slightly vary from one training session to another. Therefore, we present here the best results obtained after at least twenty to twenty-five training sessions of our ConvLSTM-2D model. ARIMA models’ calibration is performed automatically with the aim of minimizing the Akaike Information Criterion (AIC), and Ljung-Box and Jarque-Bera tests are executed on each model’s residuals to assess their normal distribution and absence of autocorrelation. The forecasting results of both frameworks and time horizons are summed up numerically in Table 3. and graphically in Figure 7.
Forecasting horizon
01/01/2019 23 : 00 30/12/2019 23 : 00
Framework MAPE RMSE (MW) MAPE (%) RMSE (MW)
ARIMA 2.43% 168.81 48.34% 1 586.14
CEEMDAN- ConvLSTM-2D
3.79%
260.33
3.02%
137.12
Table 3. Performance metrics of Occitanie Residual Load forecasting of ARIMA and CEEMDAN-
ConvLSTM-2D frameworks for January, 1st 2019 and for the whole year The results of our comparison suggests that both frameworks achieve satisfying results for short- term forecasting, with a notable advantage to the ARIMA framework which has an
3 The ARIMA models are all built using the forecast R package [72] while the deep-learning model has been encoded using Python 3.7 programming language with Tensorflow and Keras [73] frameworks. Many coding issues were resolved thanks to Jason Brownlee’s book [74] and blogposts. All models are computed with a 32GB RAM-i7-9850H CPU @2.60GHz Dell Precision laptop. We also want to acknowledge that the deep-learning model’s hyperparameters were fine-tuned using a trial-and-error approach, they might thus very well be subject to improvement.
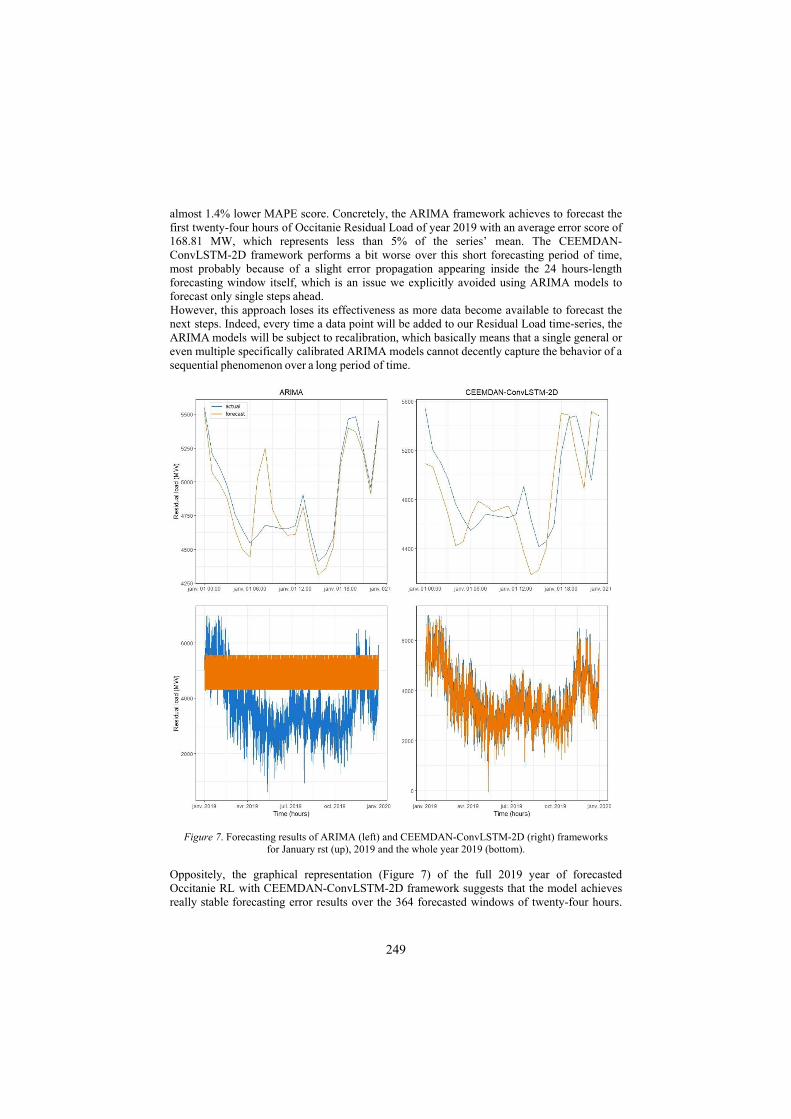
249
almost 1.4% lower MAPE score. Concretely, the ARIMA framework achieves to forecast the first twenty-four hours of Occitanie Residual Load of year 2019 with an average error score of 168.81 MW, which represents less than 5% of the series’ mean. The CEEMDAN-ConvLSTM-2D framework performs a bit worse over this short forecasting period of time, most probably because of a slight error propagation appearing inside the 24 hours-length forecasting window itself, which is an issue we explicitly avoided using ARIMA models to forecast only single steps ahead. However, this approach loses its effectiveness as more data become available to forecast the next steps. Indeed, every time a data point will be added to our Residual Load time-series, the ARIMA models will be subject to recalibration, which basically means that a single general or even multiple specifically calibrated ARIMA models cannot decently capture the behavior of a sequential phenomenon over a long period of time.
Figure 7. Forecasting results of ARIMA (left) and CEEMDAN-ConvLSTM-2D (right) frameworks for January rst (up), 2019 and the whole year 2019 (bottom).
Oppositely, the graphical representation (Figure 7) of the full 2019 year of forecasted Occitanie RL with CEEMDAN-ConvLSTM-2D framework suggests that the model achieves really stable forecasting error results over the 364 forecasted windows of twenty-four hours.

250
Without having to be re-trained every time a full day of RL data becomes accessible, this framework indeed achieves a MAPE score of 3.02% over the whole year 2019, which is far better than the almost-random predictions given by ARIMA models after a certain amount of time. Overall, the results of this comparison thus suggest that if one intends to build realistic expectations of hourly long-term evolutions of a given power system’s flexibility requirements, residual load time-series should be modeled using the CEEMDAN- ConvLSTM-2D framework instead of static ARIMA models. Section 4: Conclusion In this paper, we have shown that forecasting power system flexibility requirements at multiple timescales can be achieved with a low error by using a combination of time-series decomposition (i.e., CEEMDAN) and artificial neural network, namely ConvLSTM-2D. Using this methodology, the hourly Residual Load of French region Occitanie power system can be forecasted during an entire year with MAPE and RMSE scores of respectively 3.02% and 137.12 Megawatts (MW). In the future, we believe that such a forecast could be useful either for electricity producers and grid operators to better schedule unit commitment or avoid grid congestions, or by policy makers when they come to design energy policies. From a methodological point of view, this work proposes a working framework for forecasting flexibility requirements. Using this straightforward data-driven methodology, energy stakeholders can basically forecast load, VRE production and Residual load at any timescale and for any given geographical perimeter. Unlike most traditional deterministic simulation methods, the CEEMDAN-ConvLSTM-2D framework requires no prior knowledge of energy systems or Residual load mechanics, can be run of a personal laptop in reasonable times and can use real-time incoming data to enhance its predictions. However, current technical limitations related to deep-learning models’ training (i.e., computational resources available) still impose to select a rather small forecasting window size, in our case twenty-four hours. This means that our proposed framework can currently only forecast the next day of RL without having access to new data. While the model’s error results remain stable as forecasting steps advance, it would still require expanding the forecasting window size to predict Residual Load tendencies further than twenty-four hours ahead. The very fast pace of developments in the Computational Intelligence field suggests that such limitations will soon to be overcome, allowing then actual long-term hourly forecasting with AI-inspired models. Nonetheless, if one intends to make use of such data-driven forecasting framework, he or she should keep in mind the “Business-As-Usual” nature of the provided forecasts. Indeed, the forecast produced here with our CEEMDAN-ConvLSTM-2D model relies only on past observations, and future shocks on either electricity consumption or production such as a world pandemic or a rapid change in electricity markets regulation cannot be predicted at all since they do not appear in the past data used to train the model. Long-term prediction capabilities of the CEEMDAN-ConvLSTM-2D framework are yet in line with deterministic methods which neither can predict such events. To enhance the predictive performances of the proposed methodology, adding Residual load explanatory variables such as temperatures, economic activity, or heating and/or air-cooling equipment to the training data might very well help. Some future research avenues could be therefore focused on providing such explanatory data (in the form of time-series) for the model training and see if the forecasting results are enhanced. Additionally, combining expert’s knowledge and our modeling framework could lead to the design of scenarios for the
251
future power systems. More generally, the CEEMDAN-ConvLSTM-2D methodology should be tested on other time-series data to assess its forecasting performances on other types of sequential phenomena. References [1] IEA (2020), Global CO2 emissions in 2019, IEA, Paris https://www.iea.org/articles/global-co2-
emissions-in-2019
[2] Freeman, A. Myrick. « Estimating the Environmental Costs of Electricity: An Overview and Review of the Issues ». Resource and Energy Economics 18, no 4 (December 1996): 347-62. https://doi.org/10.1016/S0928-7655(97)00019-5 .
[3] Johansson, Tb, Rh Williams, H Ishitani, et James A Edmonds. « Options for Reducing CO2
Emissions from the Energy Supply Sector ». Energy Policy 24, no 10-11 (October 1996): 985-1003. https://doi.org/10.1016/S0301-4215(96)80362-4.
[4] Vassos, Spyros, et Andriana Vlachou. « Investigating Strategies to Reduce CO2 Emissions from the Electricity Sector: The Case of Greece ». Energy Policy, Model-based policy analysis, 25, n° 3 (February 1st 1997): 327-36. https://doi.org/10.1016/S0301-4215(96)00133-4.
[5] Dincer, Ibrahim. « Environmental Impacts of Energy ». Energy Policy 27, n° 14 (December 1999): 845-54. https://doi.org/10.1016/S0301-4215(99)00068-3.
[6] IRENA (2019), Global energy transformation: A roadmap to 2050 (2019 edition), International Renewable Energy Agency, Abu Dhabi.
[7] IRENA (2019), Renewable Energy Statistics 2019, The International Renewable Energy Agency, Abu Dhabi
[8] Nicolosi, Marco. « Wind Power Integration and Power System Flexibility–An Empirical Analysis of Extreme Events in Germany under the New Negative Price Regime ». Energy Policy 38, n° 11 (November 2010): 7257-68. https://doi.org/10.1016/j.enpol.2010.08.002.
[9] Benhmad, François, et Jacques Percebois. « An Econometric Analysis of the Merit-Order Effect in Electricity Spot Price: The Germany Case ». In Time Series Analysis and Forecasting, édité par Ignacio Rojas, Héctor Pomares, et Olga Valenzuela, 259-71. Contributions to Statistics. Cham: Springer International Publishing, 2018. https://doi.org/10.1007/978-3-319-96944-2_18.
[10] Benhmad, François, et Jacques Percebois. « Photovoltaic and Wind Power Feed-in Impact on Electricity Prices: The Case of Germany ». Energy Policy 119 (August 2018): 317-26. https://doi.org/10.1016/j.enpol.2018.04.042.
[11] Anoune, Kamal, Mohsine Bouya, Abdelali Astito, et Abdellatif Ben Abdellah. « Sizing Methods and Optimization Techniques for PV-Wind Based Hybrid Renewable Energy System: A Review ». Renewable and Sustainable Energy Reviews 93 (October 1st, 2018): 652-73. https://doi.org/10.1016/j.rser.2018.05.032.
[12] Schroeder, Andreas, Pao-Yu Oei, Aram Sander, Lisa Hankel, et Lilian Charlotte Laurisch. «The Integration of Renewable Energies into the German Transmission Grid—A Scenario Comparison Energy Policy 61 (October 1st
2013): 140-50. https://doi.org/10.1016/j.enpol.2013.06.006.
[13] Holttinen, Hannele, Aidan Tuohy, Michael Milligan, Eamonn Lannoye, Vera Silva, Simon Muller, et Lennart Soder. « The Flexibility Workout: Managing Variable Resources and Assessing the Need for Power System Modification ». IEEE Power and Energy Magazine 11, no 6 (November 2013): 53-62. https://doi.org/10.1109/MPE.2013.2278000.
[14] Oleinikova, Irina, et Artjoms Obushevs. « Market Design for Electricity Ensuring Operational Flexibility». In 2015 IEEE 5th International Conference on Power Engineering, Energy and Electrical Drives (POWERENG), 239-43. Riga, Latvia: IEEE, 2015
https://doi.org/10.1109/PowerEng.2015.7266326.
[15] Kondziella, Hendrik, et Thomas Bruckner. « Flexibility Requirements of Renewable Energy Based Electricity Systems – a Review of Research Results and Methodologies ». Renewable and Sustainable Energy Reviews 53 (January 2016): 10-22. https://doi.org/10.1016/j.rser.2015.07.199.
[16] Druce, Richard, Stephen Buryk, et Konrad Borkowski (NERA Consulting) « Making Flexibility Pay: An Emerging Challenge in European Power Market Design » (August 15, 2016). https://www.nera.com/publications/archive/2016/making_flexibility_pay.html
252
[17] Deetjen, Thomas A., Joshua D. Rhodes, et Michael E. Webber. « The Impacts of Wind and Solar on Grid Flexibility Requirements in the Electric Reliability Council of Texas ». Energy 123 (March 2017): 637-54. https://doi.org/10.1016/j.energy.2017.02.021.
[18] Huber, Matthias, Desislava Dimkova, et Thomas Hamacher. « Integration of Wind and Solar Power in Europe: Assessment of Flexibility Requirements ». Energy 69 (May 2014): 236-46. https://doi.org/10.1016/j.energy.2014.02.109 .
[19] Lannoye, Eamonn, Damian Flynn, et Mark O’Malley. « Evaluation of Power System Flexibility».IEEE Transactions on Power Systems 27, n° 2 (May 2012): 922-31.
https://doi.org/10.1109/TPWRS.2011.2177280.
[20] Shaaban, Mohamed, Wen-Shan Tan, et Md. Pauzi Abdullah. « A Multi-Timescale Hybrid Stochastic/Deterministic Generation Scheduling Framework with Flexiramp and Cycliramp Costs ». International Journal of Electrical Power & Energy Systems 99 (July 2018): 585-93.
https://doi.org/10.1016/j.ijepes.2018.02.004.
[21] Martin de Lagarde, Cyril, et Frédéric Lantz. « How Renewable Production Depresses Electricity Prices: Evidence from the German Market ». Energy Policy 117 (June 2018): 263-77.
https://doi.org/10.1016/j.enpol.2018.02.048.
[22] Steinke, Florian, Philipp Wolfrum, et Clemens Hoffmann. « Grid vs. Storage in a 100% Renewable Europe». Renewable Energy 50 (February 2013): 826-32.
https://doi.org/10.1016/j.renene.2012.07.044.
[23] Ma, Juan, Vera Silva, Régine Belhomme, Daniel S. Kirschen, et Luis F. Ochoa. « Evaluating and Planning Flexibility in Sustainable Power Systems ». IEEE Transactions on Sustainable Energy 4, n°
1 (January 2013): 200-209. https://doi.org/10.1109/TSTE.2012.2212471.
[24] Esteban, Miguel, Qi Zhang, et Agya Utama. « Estimation of the Energy Storage Requirement of a Future 100% Renewable Energy System in Japan ». Energy Policy 47 (August 2012): 22-31. https://doi.org/10.1016/j.enpol.2012.03.078.
[25] Heleno, M., R. Soares, J. Sumaili, R.J. Bessa, L. Seca, et Manuel A. Matos. « Estimation of the Flexibility Range in the Transmission-Distribution Boundary ». In 2015 IEEE Eindhoven PowerTech, 1-6. Eindhoven, Netherlands: IEEE, 2015. https://doi.org/10.1109/PTC.2015.7232524.
[26] Holttinen, Hannele, Juha Kiviluoma, Alain Forcione, Michael Milligan, Charles J. Smith, Jody Dillon, Jan Dobschinski, et al. Design and Operation of Power Systems with Large Amounts of Wind Power: Final Summary Report, IEA WIND Task 25, Phase Three 2012-2014. VTT Technical Research Centre of Finland, 2016. https://cris.vtt.fi/en/publications/design-and-operation-of-power-systems- with-large-amounts-of-wind-
[27] Lund, Peter D., Juuso Lindgren, Jani Mikkola, et Jyri Salpakari. « Review of Energy System Flexibility Measures to Enable High Levels of Variable Renewable Electricity ». Renewable and Sustainable Energy Reviews 45 (May 2015): 785-807. https://doi.org/10.1016/j.rser.2015.01.057.
[28] Ortega-Vazquez, Miguel A., et Daniel S. Kirschen. « Optimizing the Spinning Reserve Requirements Using a Cost/Benefit Analysis ». IEEE Transactions on Power Systems 22, n° 1 (February 2007): 24-33. https://doi.org/10.1109/TPWRS.2006.888951.
[29] Jenkins, J.D., Z. Zhou, R. Ponciroli, R.B. Vilim, F. Ganda, F. de Sisternes, et A. Botterud. « The Benefits of Nuclear Flexibility in Power System Operations with Renewable Energy ». Applied Energy 222 (July 2018): 872-84. https://doi.org/10.1016/j.apenergy.2018.03.002.
[30] Schill, Wolf-Peter. « Residual Load, Renewable Surplus Generation and Storage Requirements in Germany ». Energy Policy 73 (octobre 2014): 65-79. https://doi.org/10.1016/j.enpol.2014.05.032.
[31] Fuel Cell and Hydrogen Joint Undertaking (FCHJU), « Commercialisation of Energy Storage in Europe » (March 2015)
https://www.fch.europa.eu/sites/default/files/CommercializationofEnergyStorageFinal_3.pdf
[32] Blanco, Herib, et André Faaij. « A Review at the Role of Storage in Energy Systems with a Focus on Power to Gas and Long-Term Storage ». Renewable and Sustainable Energy Reviews 81 (January 2018): 1049-86. https://doi.org/10.1016/j.rser.2017.07.062.
[33] Percebois, Jacques, et Stanislas Pommeret. « Storage Cost Induced by a Large Substitution of Nuclear by Intermittent Renewable Energies: The French Case ». Energy Policy 135 (December2019): 111067. https://doi.org/10.1016/j.enpol.2019.111067.
253
[34] Bongers, T., J. Kellermann, M. Franz, et A. Moser. « Impact of Curtailment of Renewable Energy Sources on High Voltage Network Expansion Planning ». In 2016 Power Systems Computation Conference (PSCC), 1-8. Genoa, Italy: IEEE, 2016. https://doi.org/10.1109/PSCC.2016.7540971.
[35] Sarafidis, Y., D. Diakoulaki, L. Papayannakis, et A. Zervos. « A Regional Planning Approach for the Promotion of Renewable Energies ». Renewable Energy 18, n° 3 (novembre 1999): 317-30. https://doi.org/10.1016/S0960-1481(98)00808-8.
[36] Krakowski, Vincent, Edi Assoumou, Vincent Mazauric, et Nadia Maïzi. « Feasible Path toward 40–100% Renewable Energy Shares for Power Supply in France by 2050: A Prospective Analysis ». Applied Energy 171 (juin 2016): 501-22. https://doi.org/10.1016/j.apenergy.2016.03.094.
[37] Sharifi, R., S.H. Fathi, et V. Vahidinasab. « A Review on Demand-Side Tools in Electricity Market». Renewable and Sustainable Energy Reviews 72 (May 2017): 565-72. https://doi.org/10.1016/j.rser.2017.01.020.
[38] Villar, José, Ricardo Bessa, et Manuel Matos. « Flexibility Products and Markets: Literature Review ». Electric Power Systems Research 154 (January 2018): 329-40. https://doi.org/10.1016/j.epsr.2017.09.005.
[39] Vito, Helena Gerard, et E. Rivero. « Basic Schemes for TSO-DSO Coordination and Ancillary Services Provision D 1 », 2017. /paper/Basic-schemes-for-TSO-DSO-coordination-and-services-VITO- Rivero/fc1ac4c8e95bb213ad623addf2ff966cfb14edd4.
[40] Karimi-Arpanahi, Sahand, Mohammad Jooshaki, Moein Moeini-Aghtaie, Ali Abbaspour, et Mahmud Fotuhi-Firuzabad. « Incorporating Flexibility Requirements into Distribution System Expansion Planning Studies Based on Regulatory Policies ». International Journal of Electrical Power & Energy Systems 118 (juin 2020): 105769. https://doi.org/10.1016/j.ijepes.2019.105769
[41] Abdin, Islam F., et Enrico Zio. « An Integrated Framework for Operational Flexibility Assessment in Multi-Period Power System Planning with Renewable Energy Production ». Applied Energy 222 (juillet 2018): 898-914. https://doi.org/10.1016/j.apenergy.2018.04.009.
[42] Denholm, Paul, et Maureen Hand. « Grid Flexibility and Storage Required to Achieve Very High Penetration of Variable Renewable Electricity ». Energy Policy 39, n° 3 (March 2011): 1817-30. https://doi.org/10.1016/j.enpol.2011.01.019.
[43] Wagner, Andreas. « Residual Demand Modeling and Application to Electricity Pricing ». SSRN Scholarly Paper. Rochester, NY: Social Science Research Network, March 20, 2012. https://doi.org/10.2139/ssrn.2018908.
[44] Mikkola, Jani, et Peter D. Lund. « Modeling Flexibility and Optimal Use of Existing Power Plants with Large-Scale Variable Renewable Power Schemes ». Energy 112 (October 2016): 364-75. https://doi.org/10.1016/j.energy.2016.06.082.
[45] Heggarty, Thomas, Jean-Yves Bourmaud, Robin Girard, et Georges Kariniotakis. « Multi- Temporal Assessment of Power System Flexibility Requirement ». Applied Energy 238 (March 2019): 1327-36. https://doi.org/10.1016/j.apenergy.2019.01.198.
[46] Kristiansen, Martin, Magnus Korpås, et Harald G. Svendsen. « A Generic Framework for Power System Flexibility Analysis Using Cooperative Game Theory ». Applied Energy 212 (February 2018): 223-32. https://doi.org/10.1016/j.apenergy.2017.12.062.
[47] Deb, Chirag, Fan Zhang, Junjing Yang, Siew Eang Lee, et Kwok Wei Shah. « A Review on Time Series Forecasting Techniques for Building Energy Consumption ». Renewable and Sustainable Energy Reviews 74 (July 2017): 902-24. https://doi.org/10.1016/j.rser.2017.02.085.
[48] Debnath, Kumar Biswajit, et Monjur Mourshed. « Forecasting Methods in Energy Planning Models». Renewable and Sustainable Energy Reviews 88 (May 2018): 297-325. https://doi.org/10.1016/j.rser.2018.02.002.
[49] Qian, Zheng, Yan Pei, Hamidreza Zareipour, et Niya Chen. « A Review and Discussion of Decomposition-Based Hybrid Models for Wind Energy Forecasting Applications ». Applied Energy 235 (February 2019): 939-53. https://doi.org/10.1016/j.apenergy.2018.10.080.
[50] Shi, Jing, Jinmei Guo, et Songtao Zheng. « Evaluation of Hybrid Forecasting Approaches for Wind Speed and Power Generation Time Series ». Renewable and Sustainable Energy Reviews 16, n° 5 (juin 2012): 3471-80. https://doi.org/10.1016/j.rser.2012.02.044.
[51] [52]. Cao, Jian, Zhi Li, et Jian Li. « Financial Time Series Forecasting Model Based on CEEMDAN and LSTM ». Physica A: Statistical Mechanics and Its Applications 519 (April 2019): 127-39.
254
https://doi.org/10.1016/j.physa.2018.11.061.
[52] Yang, Shaomei, Dongjiu Chen, Shengli Li, et Weijun Wang. « Carbon Price Forecasting Based on Modified Ensemble Empirical Mode Decomposition and Long Short-Term Memory Optimized by Improved Whale Optimization Algorithm ». Science of The Total Environment 716 (May 2020): 137117. https://doi.org/10.1016/j.scitotenv.2020.137117.
[53] Lin, Hualing, Qiubi Sun, et Sheng-Qun Chen. « Reducing Exchange Rate Risks in International Trade: A Hybrid Forecasting Approach of CEEMDAN and Multilayer LSTM ». Sustainability 12, n°
6 (March 20 2020): 2451. https://doi.org/10.3390/su12062451.
[54] Lin, Hualing, et Qiubi Sun. « Crude Oil Prices Forecasting: An Approach of Using CEEMDAN- Based Multi-Layer Gated Recurrent Unit Networks ». Energies 13, n° 7 (January 2020): 1543. https://doi.org/10.3390/en13071543.
[55] Ibrahim, Mariam, Ahmad Alsheikh, Qays Al-Hindawi, Sameer Al-Dahidi, et Hisham ElMoaqet. « Short-Time Wind Speed Forecast Using Artificial Learning-Based Algorithms ». Research Article. Computational Intelligence and Neuroscience. Hindawi, April 25, 2020.
https://doi.org/10.1155/2020/8439719.
[56] Wang, Kejun, Xiaoxia Qi, et Hongda Liu. « Photovoltaic Power Forecasting Based LSTM- Convolutional Network ».Energy 189 (December 15, 2019): 116225.
https://doi.org/10.1016/j.energy.2019.116225.
[57] Xiao, Xinyu, Qiuming Kuang, Shiming Xiang, Junnan Hu, et Chunhong Pan. « Precipitation Forecasting via Multi-Scale Deconstructed ConvLSTM ». ArXiv:1912.09425 [Cs, Eess, Math], January 9, 2020. http://arxiv.org/abs/1912.09425.
[58] Coronati, Alex, José R. Andrade, et Ricardo J. Bessa. « A Deep Learning Method for Forecasting Residual Market Curves ». Electric Power Systems Research 190 (January 2021): 106756.
https://doi.org/10.1016/j.epsr.2020.106756.
[59] Direction Régionale de l’Environnement, de l’Aménagement et du Logement – DREAL Occitanie. « PCAET – Plan Climat-Air Energie Territorial : Etat d’avancement de la démarche en Occitanie. » 15/11/2019 http://www.occitanie.developpement-durable.gouv.fr/IMG/pdf/20200512_pcaet- occitanie.pdf
[60] Direction Régionale de l’Environnement, de l’Aménagement et du Logement – DREAL Occitanie. Synthèse du Schéma Régional d’Aménagement, de Développement Durable et d’Egalité des Territoires – SRADDET ». 19/12/2019. https://www.laregion.fr/IMG/pdf/oc-2001-datrm- sraddet_2040_synthese-hd.pdf
[61] Huang, Norden E., Zheng Shen, Steven R. Long, Manli C. Wu, Hsing H. Shih, Quanan Zheng, Nai-Chyuan Yen, Chi Chao Tung, et Henry H. Liu. « The Empirical Mode Decomposition and the Hilbert Spectrum for Nonlinear and Non-Stationary Time Series Analysis ». Proceedings of the Royal Society of London. Series A: Mathematical, Physical and Engineering Sciences 454, n° 1971 (8 mars 1998): 903-95. https://doi.org/10.1098/rspa.1998.0193.
[62] Wu, Zhaohua, et Norden E. Huang. « ENSEMBLE EMPIRICAL MODE DECOMPOSITION: A NOISE-ASSISTED DATA ANALYSIS METHOD ». Advances in Adaptive Data Analysis 01, n° 01 (January 2009): 1-41. https://doi.org/10.1142/S1793536909000047.
[63] Torres, Maria E., Marcelo A. Colominas, Gaston Schlotthauer, et Patrick Flandrin. « A Complete Ensemble Empirical Mode Decomposition with Adaptive Noise ». In 2011 IEEE International Conference on Acoustics, Speech and Signal Processing (ICASSP), 4144-47. Prague, Czech Republic: IEEE, 2011. https://doi.org/10.1109/ICASSP.2011.5947265.
[64] Cai, Mengmeng, Manisa Pipattanasomporn, et Saifur Rahman. « Day-Ahead Building-Level Load Forecasts Using Deep Learning vs. Traditional Time-Series Techniques ». Applied Energy 236 (Februrary 2019): 1078-88. https://doi.org/10.1016/j.apenergy.2018.12.042.
[65] Tealab, Ahmed. « Time Series Forecasting Using Artificial Neural Networks Methodologies: A Systematic Review ». Future Computing and Informatics Journal 3, n° 2 (December 2018): 334-40. https://doi.org/10.1016/j.fcij.2018.10.003.
[66] Bengio, Y., P. Simard, et P. Frasconi. « Learning long-term dependencies with gradient descent is difficult ». IEEE Transactions on Neural Networks 5, n° 2 (March 1994): 157-66.
https://doi.org/10.1109/72.279181.
[67] Hochreiter, Sepp, et Jürgen Schmidhuber. « Long Short-Term Memory ». Neural Computation 9, n°
255
8 (November 1997): 1735-80. https://doi.org/10.1162/neco.1997.9.8.1735.
[68] LeCun, Yann, et Yoshua Bengio. « Convolutional Networks for Images, Speech, and Time Series ». In Handbook of Brain Theory and Neural Networks, édité par Michael A. Arbib, 3361. MIT Press, 1995. https://philpapers.org/rec/LECCNF
[69] Kim, Donghoh, et Hee-Seok Oh. EMD: Empirical Mode Decomposition and Hilbert Spectral Analysis (version 1.5.8), 2018. https://CRAN.R-project.org/package=EMD.
[70] Box, George. « Box and Jenkins: Time Series Analysis, Forecasting and Control ». In A Very British Affair: Six Britons and the Development of Time Series Analysis During the 20th Century, edited by Terence C. Mills, 161-215. Palgrave Advanced Texts in Econometrics. London: Palgrave Macmillan UK, 2013. https://doi.org/10.1057/9781137291264_6.
[71] Hyndman [aut, Rob, cre, cph, George Athanasopoulos, Christoph Bergmeir, Gabriel Caceres, Leanne Chhay, et al. forecast: Forecasting Functions for Time Series and Linear Models (version 8.13), 2020. https://CRAN.R-project.org/package=forecast.
[72] Chollet, F. & others, 2015. Keras. Available at: https://github.com/fchollet/keras.
[73] Machine Learning Mastery. « Deep Learning With Python ». Available at: https://machinelearningmastery.com/deep-learning-with-python/
[74] Graves, Alex. « Generating Sequences With Recurrent Neural Networks ». arXiv:1308.0850 [cs], June 5, 2014. http://arxiv.org/abs/1308.0850.
[75] Shi, Xingjian, Zhourong Chen, Hao Wang, Dit-Yan Yeung, Wai-kin Wong, et Wang-chun Woo. « Convolutional LSTM Network: A Machine Learning Approach for Precipitation Nowcasting ». arXiv:1506.04214 [cs], 19 September 2015. http://arxiv.org/abs/1506.04214.
Appendix A A.1. Long Short-Term Memory (LSTM) LSTM working principles and equations are formulated here following the descriptions made in [59, 75].
In a LSTM network, the input layer contains a number of neurons equal to the size of the dataset. In the hidden layers, neurons are organized to form a memory cell, i.e., a direct sequential graph of neurons able to keep track of temporal dependencies within a dataset . At the end of the network, the output layer comprises a number of neurons equal to the expected output length.
Each time new information passes through the LSTM layers, a forget gate determine if the memory cell state 𝐶𝑡 should be updated or not. To achieve this, the forget gate activation values 𝑓𝑡are computed by taking as inputs the current values of both data and weights connecting it to the input layer -respectively 𝑥𝑡 and 𝑊𝑓,𝑥- but also the previous outputs of the LSTM layer ℎ𝑡−1 and 𝑊𝑓,ℎ, the previous cell state outputs 𝐶𝑡−1 and 𝑊𝑓,𝑐 and the weights of the forget gate term bias term 𝑏𝑓, and applying to them a sigmoid function 𝜎. This way, the output of the forget gate is a value between 0 (completely remove information for the cell state) to 1 (keep full information). (1) 𝑓𝑡= 𝜎(𝑊𝑓,𝑥𝑥𝑡+ 𝑊𝑓,ℎ ℎ𝑡−1+ 𝑊𝑓,𝑐 ∘ 𝐶𝑡−1+ 𝑏𝑓) Where ∘ denotes the Hadamard product. Once the forget gate has determined which incoming information has to be discarded from the cell state, the input gate evaluates if some new
information has to be stored in the cell. Here again, the input gate activation values 𝑖𝑡 are calculated by using a sigmoid function on current inputs and bias and previous outputs. (2) 𝑖𝑡= 𝜎(𝑊𝑖,𝑥𝑥+ 𝑊𝑖,ℎℎ𝑡−1+ 𝑊𝑖,𝑐 ∘ 𝐶𝑡−1+ 𝑏𝑖)

256
While the input gate determines which information needs to be stored in the cell state, candidate values for the cell state �̃�𝑡 are generated using a hyperbolic tangent function on current inputs and bias and past hidden states.
(3) �̃�𝑡 𝑡𝑎𝑛ℎ 𝑊𝑐,𝑥𝑥𝑡 𝑊𝑐,ℎ ∘ ℎ𝑡 1 𝑏𝑖 Merging these previous steps altogether provokes the updating of the current cell state 𝐶𝑡,
using 𝑓𝑡 ∘ 𝐶𝑡 1 to discard incoming information and 𝑖𝑡∘ �̃�𝑡 to store useful information. (4) 𝐶𝑡= 𝑓𝑡∘𝐶𝑡−1+ 𝑖𝑡∘ �̃�𝑡 Finally, an output gate selects information in the cell state that will be useful to perform the forecasting task by applying a sigmoid function to current inputs bias and cell state and previous hidden states.
(5) 𝑜𝑡= 𝜎(𝑊𝑜,𝑥𝑥𝑡 + 𝑊𝑜,ℎ ℎ𝑡−1+ 𝑊𝑜,𝑐 ∘ 𝐶𝑡+ 𝑏𝑜)
By multiplying
To make sure the current hidden states values stay between -1 and 1, a hyperbolic tangent
function of the current cell state is multiplied by the output sigmoid function 𝑜𝑡.
(6) ℎ𝑡 𝑜𝑡 ∘ tanh 𝐶𝑡 A.2. Convolutional Long Short-Term Memory (ConvLSTM) In a ConvLSTM network, inputs 𝑥, cell states 𝐶, hidden states ℎ and gates 𝑖,𝑓 and 𝑜 are 3D tensors and products between weights and values of current inputs and past hidden states are replaced by a convolution operators * [76].
(7) 𝑓𝑡 = 𝜎(𝑊𝑓,𝑥∗𝑥𝑡+ 𝑊𝑓,ℎ∗ℎ𝑡−1+ 𝑊𝑓,𝑐 ∘ 𝐶𝑡−1+ 𝑏𝑓)
(8) 𝑖𝑡= 𝜎(𝑊𝑖,𝑥∗𝑥+ 𝑊𝑖,ℎ∗ℎ𝑡−1+ 𝑊𝑖,𝑐 ∘ 𝐶𝑡−1+ 𝑏𝑖)
(9) �̃�𝑡 𝑡𝑎𝑛ℎ 𝑊𝑐,𝑥∗𝑥𝑡 𝑊𝑐,ℎ∗ℎ𝑡 1 𝑏𝑖
(10) 𝐶𝑡= 𝑓𝑡 ∘ 𝐶𝑡−1+ 𝑖𝑡 ∘ �̃�𝑡
(11) 𝑜𝑡= 𝜎(𝑊𝑜,𝑥∗𝑥𝑡+ 𝑊𝑜,ℎ∗ℎ𝑡−1+ 𝑊𝑜,𝑐 ∘ 𝐶𝑡+ 𝑏𝑜)
(12) ℎ𝑡 𝑜𝑡 ∘ tanh 𝐶𝑡
257
THE FUTURE OF CAPACITY REMUNERATION MECHANISMS IN THE EUROPEAN UNION, REVISITED, WITH A PARTICULAR ATTENTION TO ITALY, POLAND AND SPAIN Giuseppe Franco Ferrari, Professor in Constitutional Law, Università Commerciale Bocconi, Italy Íñigo del Guayo, Professor in Administrative Law, Universidad de Almería, Spain Wojciech Drozdz, Professor of Szczecin University, Vice-president of ENEA. Poland 1. Overview The regulatory framework for electricity must be analyzed and designed in light of the principles governing the European Union's energy policy, that is, economic efficiency, security of supply and environmental sustainability (de-carbonization). This paper analyses how those three components influence the design of capacity remuneration mechanisms (CRMs) in both the European Union and in the different jurisdictions (Italy, Poland and Spain). Those mechanisms try to guarantee security, in a system dominated by renewables (which are intermittent and need back-up) and in the most efficient way (not distorting markets). When the process of liberalization and privatization of the electricity sector began in the last two decades of the twentieth century, promoters of the new regulatory framework thought that the market would always provide signals about where and when to invest. The main investment decisions in this sector are those related to networks (transport and distribution) and those related to new or expanded production units.
The development of liberalization processes led to the conviction that generation and supply must be free activities, subject to free competition between operators. On the contrary, during this liberalization process, the transportation and distribution of electricity have been considered as natural monopolies and, for that reason, they must be subject to economic regulation. However, in a context of decentralization of generation and closed networks, this characterization of networks as natural monopolies is doubtful, especially for distribution. In any case, the regulation of the networks implies a more or less intense degree of public planning of the construction of the networks, particularly of the transport networks, in order to provide a satisfactory service.
The case of electricity generation is special. There is a concern about the 'missing money' problem and its implications for security of supply. This problem arises when the price of electricity in the energy markets does not provide sufficient remuneration to cover the fixed costs of capacity. In this case, investors lack incentives to build new capacity and may want to close capacity. The existence of maximum prices in the markets, fixed by the regulator, was the first justifying argument for the introduction of a regulatory incentive for the construction of new generation capacity or CRM. If the price is not allowed to reflect scarcity situations, then the incentive to build the necessary plants to avoid supply cuts in such scarcity situations disappears. This is the ‘missing money’ problem: the remuneration from the market price in the short term is insufficient to recover the investment in all the plants needed to satisfy the demand efficiently. The ‘missing money’ is due to the artificial limitation of the price in situations of shortage (which should be equal to the price that is willing to pay the demand for not being interrupted). There are other reasons why money may be missing, in particular bad market design that do not enable market prices to reflect the value of flexibility. If market prices did reflect the value of flexibility (not just scarcity), the case for capacity payments would disappear, except for special cases. The debate about the missing money has been going on for 30 years: do we need additional remuneration for conventional power plants, in
258
addition to income from the energy market? The debate is whether there is a need to give the generator of electricity additional compensation. There are arguments in favour of an additional payment (e.g. problems of the design of energy markets, such as price caps, which discourage investment) and others against (e.g., additional costs for related consumers, with planning, intervention and excess capacity)1.
In purity, the price of the wholesale electricity market, known as the "only energy" market, should be sufficient to provide all the investment signals that the generating company needs. However, for very different circumstances (among which the problem of ‘missing money’ stands out), sometimes that wholesale price is unable to provide the necessary signal. This means that in some circumstances there will be the need of a regulatory mechanism that either helps to invest in new generation capacity or rewards those other resources (eg storage, demand management) that provide security (reliability) when some other intermittent technologies (such as renewables) fail. It is not to forget that we are creating distortions with the capacity payments and the result is that the need for these payments is self-reinforcing. The right way forward is to get rid of distortions, not to add to them. Especially because the capacity payments always introduce the potential for political bias that makes European markets open to national restrictions or state aid (hidden).
In light of the above, capacity-building mechanisms have been established in some Member States. The European Union views these mechanisms with suspicion, insofar as it sees them as a real threat to free competition in the market. However, under certain exceptional conditions, provided that the rules on State aid are not violated, the European Commission is prepared to approve some aid schemes in some Member States. Apart from the competition argument (avoidance of state aids), there are two other conditions for allowing a capacity payment: (a) a clear need for the mechanism and (b) that the capacity remuneration is temporary. The evidence of need is the first step. To demonstrate that it is temporary requires identifying why the system has failed and that there is a plan to resolve the distortion that led to the need for extra remuneration.
The criteria to be used by the Commission are the Guidelines on State aid for environmental protection and energy 2014-2020 (EEAG)2. The reform of Regulation 714/2009 of the European Parliament and of the Council of 13 July 2009 on conditions for access to the network for cross-border exchanges in electricity, has led to the approval of Regulation (EU) no 2019/943 of the European Parliament and of the Council, of 5 June 2019 on the internal market for electricity (here-in-after referred as the 2019 Regulation)3. This Regulation incorporates provisions that will affect what is intended to be done in the Member States with regard to capacity mechanisms.
This paper tries to present briefly which role are playing and will pay capacity remuneration mechanisms in the EU. Capacity mechanisms are measures taken by Member States to ensure that electricity supply can match demand in the medium and long term. Capacity mechanisms are designed to support investment to fill the expected capacity gap and ensure security of supply. Typically, capacity mechanisms offer additional rewards to capacity providers, on top of income obtained by selling electricity on the market, in return for maintaining existing capacity or investing in new capacity needed to guarantee security of electricity supplies. Capacity mechanisms have an impact on competition in the internal electricity market. Many of these mechanisms involve State Aids, so they are subject to EU State aids rules. This paper 1 L. Hancher, A. De Houteclocque y M. Sadowska (editors), Capacity Mechanisms in the EU Energy Market. Law, Policy, and Economics, Oxford University Press, Oxford 2015. 2 Communication from the Commission, Guidelines on State aid for environmental protection and energy 2014-2020 (2014/C 200/01), OJ C, 28th June, 2014. 3 OJ 158, of 14th June, 2019.

259
will examine the 2019 Regulation and will compare the situation in Italy, Poland and Spain. The Guidelines on State aid for environmental protection and energy 2014-2020 (EEAG) contain rules to assess capacity mechanisms (Section 3.9 of the EEAG). This is a relatively new field in State aid policy4. 2. Capacity mechanisms in Italy In accordance with Article 108 of the Treaty on the Functioning of the European Union (TFEU), on August 24, 2017 the Italian Authorities notified to the European Commission as a State aid the measure adopted in order to support capacity providers in the electricity market. After examining the Italian measures in detail, with Decision C (2018) 617 adopted on February 7, 2018, the Commission has defined the “State Aid Case SA.42011 (2017/N)” and has approved the Italian capacity mechanisms, declaring the compatibility under the EU State aid Rules of the benefits provided by the Italian government. During the approval process, there has been a close cooperation between the national authorities and the European Commission. The plan has been reviewed and integrated several times in order to ensure its compatibility with EU State aid Rules and in particular with article 107 of The TFEU and with the 2014 Guidelines on State Aid for Environmental Protection and Energy5.
In the European Commission press release of February 7, 2018, Commissioner Margrethe Vestager, in charge of competition policies, referred that “capacity mechanisms can help to safeguard security of electricity supply, but they must be designed so as to avoid distortions of competition in energy markets. I am glad that our close cooperation with national authorities has enabled us today to approve well-designed capacity mechanisms in six EU countries. They will foster competition among all potential capacity providers to the benefit of consumers and our European energy market”. The Italian mechanisms were approved seven years after the Decision of 2011 of the AEEGSI6, the Italian Regulatory Authority for Electricity Gas and Water (as of January 1st, 2018, it became ARERA Regulatory Authority for Energy, Networks and Environment). That Decision defined the criteria and conditions in order to develop a remuneration mechanism for the electricity market, ensuring security of supply. The focus on electricity supply security was in part determined by the severe blackout that struck the entire system in September 2003. After this unexpected event, and in order to minimize the risk of interruption to electricity, Statute No 290/2003 delegated the Ministry of the Environment to adopt specific decrees. They should be aim to speed up the reprogramming of the use of hydroelectric plants, to streamline the timetable of maintenance activities of production installations and the possible reuse of inactive power plants, and to increase uninterruptible electricity capacity in the country. Following the blackout, the legislature decided to reunify the property of network infrastructure with the management of the grid. A decree (DPCM) of May 11, 2004 later set the guidelines for the aforementioned process of reunification and imposed the adoption of the Grid Code on the manager of the
4 Some of the ideas of these introduction are inspired by the work of S. Hesmondalg, J. Pfeifenberger and D. Robinson, “Resource Adequacy and Renewable Energy in Competitive Wholesale Markets”, The Brattle Group, September 2010. 5 Together with the Italian mechanisms, the Commission has also approved the electricity capacity system of other five important European States: the Market-wide capacity mechanism of Poland, the Strategic Reserve of Belgium, the Capacity Reserve of Germany, the Demand Response Scheme of France and the Interruptibility Scheme of Greece. 6 Decision ARG/elt/98/11 of July 21, 2011.

260
grid. They provide objective and non- discriminatory technical rules for the access and use of the national transmission grid and related infrastructures, for the interoperability of networks, along with the provision of dispatching services, together with general criteria for the development of the security of the grid and for its maintenance. In particular, Statute No 379/2003 established the main criteria for a capacity payment system, delegating the adoption of the mechanism to the Italian Energy and Gas Regulatory Authority (AEEGSI).
Article 1, paragraph 2, provides that the system: i) is based on competitive, transparent, non-discriminatory and non-distortive mechanisms, aimed at minimizing the economic impact on consumers; ii) is aimed both at remunerating new plants and infrastructures and at maintaining the efficiency of the existing ones; iii) is based on capacity targets defined by the Transmission System Operator (TSO); and iv) can remunerate consumers that can provide the reserve service.
Moreover, Article 1, paragraph 153 of Statute No 147/2013 provides that the Ministry of Economic Development shall provide the criteria for the definition of a capacity remuneration system. An important role in this process was played by TERNA, which is the Italian transmission system operator (TSO) based in Rome. Following the AEEGSI Decision of 20117, the TSO’s proposal of September 20, 2013 /TE/P20130004704 was approved by a ministerial decree of June 30, 2014. The approval by the European Commission ended a ten-year long regulation process during which the Italian electric System has undergone significant changes, including the revolutionary development of renewable energy.
These changes required the market to fit the objective set by the 2017 National Energy Strategy (SEN), including the full decarbonisation (phase out coal-fire power plants) by the year 2025, and in order to ensure that electricity supply can match demand in the medium and long term with reserve systems for security supply.
With the Final Report of the Sector Inquiry on Capacity Mechanisms8, the European Commission has assessed the compatibility under the EU State aid Rules of the capacity mechanisms of eleven European States in a comparative way and has considered the Italian proposal the most appropriate to market needs. The Italian mechanism is therefore one of the best international practices and is intended to inspire the model of other countries. The mechanism concerns the entire national market and was approved for a period of ten years until December 31, 2018, during which Italy implemented market reforms to address the structural supply risks in the electricity market. After the end of 2018, the capacity market is now regulated by ministerial decree of June 28, 2019, that updated the system without affecting the foundations of its discipline.
New provisions have been issued consistently with Regulation 2019/943/EU, published on June 5, 2019, that defined the conditions for the compatibility of capacity remuneration mechanisms with the European Treaty and set the carbon emission limits that remunerated capacity producers are required to comply with.
Furthermore, implementing the provisions of the European Commission Decision C(2018)617, the aforementioned decree identified the adequacy indicator of the electricity system in terms of LOLE (loss of load expectation), that represents the number of hours per
7 Decision ARG/elt/98/11 of July 21, 2011. 8 Commission’s report. Final report on the sectoral inquiry on capacity mechanisms, C (2016) 752 final, Brussels, 30.11.2016, SWD (2016) 385 final.
261
year in which supply is statistically expected not to meet the demand and is used to determine the amount of capacity that needs to be installed in order to meet the desired reliability target. Article 2 of the decree states that the target value for the LOLE indicator amounts to three hours per year and, with regards to the capacity requirement, the threshold of the system adequacy to six hours per year. The new mechanism will be implemented in two phases. The transitory regime entails a more limited planning horizon compared to the ordinary regime and different demand participation schemes. The ordinary regime will begin as soon as the TSO will assess the technical conditions for a four year planning horizon, active participation of consumption and production, the setting of an elastic demand curve and risk mitigation mechanisms for newcomers.
Capacity providers can obtain a financial compensation for being available to generate electricity or, in case of demand response operators, to reduce their electricity consumption. The European Commission has authorized market-wide capacity mechanisms and stated that: Italy has clearly identified and quantified the security of supply risks, also taking into account possible imports from neighboring countries”.
The Commission has also remarked that “Italy has demonstrated that a significant amount of capacity risks exiting the market and new investments are unlikely to take place because investors cannot earn a sufficient return from their electricity sales”. Brussels has recognized that the Italian mechanism is opened to all types of capacity providers, “including demand response, existing and new capacities, domestic and foreign and the measures will keep costs for consumers in check thanks to the regular, competitive auctions to allocate capacity contracts”. Under the measure approved by the Commission, TERNA is the central buyer of capacity that ensures transparency and provides medium and long term directives in order to lead investment and disinvestment decisions in an efficient way. It also guarantees the maintenance or the construction of new production plants, aiming at the achievement of the established security level. From the viewpoint of the appropriateness of the aid, the Commission concluded that a central-buyer mechanism has the potential to solve a general shortage of capacity, if properly designed.
The security level is identified through a target value of Loss of Load Expectation (LOLE). The LOLE represents the number of hours per year in which, over the long-term, it is statistically expected that supply will not meet demand. Contracts of one year duration can be awarded for existing capacity and fifteen years contracts can be awarded for new capacity. The Italian model provides that the TSO sets the objective of the so-called LOLE. On the basis of LOLE, it is possible to determine generating capacity demand curves for each market area and for each year of the capacity delivery period.
Another key element of the Italian mechanisms approved by the Commission are the auctions in the electricity market. As far as the single buyer of capacity is concerned, the TSO-TERNA organizes the auctions and sets the amount of capacity to be auditioned. The Italian capacity mechanism is a volume-based and market-wide mechanism that allows the participation, on a voluntary basis, of all the operators with the necessary requirements.
Existing and new capacity providers, including storage assets and demand response operators, who can provide evidence of existing or new capacity located on the national territory are admitted to the capacity market, as long as: i) they are not subject to dismantling the measures approved by the competent authorities; ii) they have the necessary building permits and have provided a detailed timetable indicating the main milestones of the plant construction and the expected date in which the new plants will be in operation (if new generators); iii) they have provided specific guarantees; iv) they meet specific minimum asset requirements; v) they
262
pledge to give up any other State aid for the amount of capacity that will be contracted in the mechanism during the delivery period; and vi) demand response must meet the qualification requirements for the so-called Mercato per il servizio di dispacciamento (MSD)9. The definition of new capacity includes not only capacity that has never participated to the so-called Mercato del giorno prima (MGP – day before market) but also installation under renovation of existing plants.
Foreign capacity may participate to the internal market. Italy has submitted that the participation of foreign resources in the mechanism at the same conditions as the Italian ones would require cross-border balancing markets. Only in that case, foreign capacity could react to real-time cross-border price signals. For this reason, Italy commits to negotiate agreements with other relevant TSOs to enable the participation of foreign capacity at the same conditions applied to domestic capacity.
The openness of the mechanism ensures competition between different technologies. This method guarantees that capacity is provided at the lowest cost for consumers and, at the same time, it avoids distortions in the electricity market.
The Italian mechanism also has a special feature to ensure its effectiveness: the so-called “strike price”. As stated by the European Commission, when electricity prices reach a certain level, they trigger an obligation for power plants selected in the auctions to pay back some of the State aid. The power plants can finance this payback obligation from revenues they generate from the sale of electricity. The Italian capacity mechanism therefore not only ensures availability of capacity, but also gives power plants an incentive to use the capacity to offer their electricity on the market when it is needed. The strike price is one of the most important parameters in order to ensure that the participation to the market takes place under sustainable economic conditions, although the operators think that it may limit their profits, discouraging investments.
The Italian capacity mechanism provides that if the production plant is not able to offer energy on the market when needed, it may incur into the payment of penalties. The TSO will take different measures against the capacity provider in case of temporary or permanent breach of the obligations.
Temporary non-fulfilment occurs when the capacity provider is not able to reach 80% of the contracted capacity in a given month over a number of hours at least equal to 25% of the total number of hours in that month. In such a case, TERNA shall suspend the payment of the capacity incentives for the months in which non-fulfilment takes place.
Definitive non-fulfilment occurs when the temporary one lasts for three months. In this case, the capacity provider must reimburse the capacity premiums already received for each month included between the first and the third month of non-fulfilment. TERNA will also reallocate the correspondent contracted capacity in the adjustment auctions or in the secondary market.
The Italian authorities confirmed that the capacity incentives may not be cumulated with other aid measures. In particular, if the generators are subject to any type of investment incentive scheme for the produced energy, they must give up the incentive in order take part in the capacity market, otherwise they will not be admitted to the auction.
Italy is in a stand-by attitude, waiting for the approval from the Ministry of Economic Development and several market reforms.
Italy is planning to upgrade the domestic transmission network, invest in cross-border transmission capacity, and carry out a number of market reforms that will enable electricity markets to send clearer investment signals. However the European Commission declared that
9 European Commission Decision SA.42011 Italian capacity mechanism C(2018) 617 final, 57.
263
these reforms do not ensure the desired level of supply security in the short term, the capacity mechanism is therefore necessary for the time being. 3. Capacity mechanisms in Spain Spain introduced capacity payments in 1997, at the same time the electricity sector was liberalised. The system was replaced by a new one in 2007, which was reduced or abolished by Royal Decree-Law no. 9/2013 and by the 2013 Electricity Sector Act. Finally, at the end of 2018 (to enter into force on January 1, 2019) the payments for capacity were extinguished, by decision of the Spanish Government (however, there might be some old pending capacity payments to be made, to comply with previous the 20 year commitment for newer CCGT plants). Coal plants are subject to other legislation not mentioned here, for instance to support coal power station environmental upgrading to meet EU legislation.
Capacity payments included two types of services: the incentive to invest in capacity and medium-term availability service. The incentive to invest in capacity was considered necessary to ensure the coverage of demand in the long term and was paid as in €/kW installed, for 20 years. This mechanism still applies to the capacity which was built under that legislation, until the end of the 20 year period. In 2012, this mechanism was revised, and in 2013 it was withdrawn. Art. 13 of the 2013 Electricity Sector Act is entitled "economic and financial sustainability of the electrical system". Regulatory powers on the electricity sector are subject to the principle of economic and financial sustainability of the electrical system. The economic and financial sustainability of the electrical system means the capacity to meet all costs of electricity supply. The costs of the electricity system are determined in accordance with the provisions of the 2013 Electricity Act as follows: (...) «d) Remuneration associated with the application of capacity mechanisms, where applicable». In other words, the 2013 Electricity Sector Act states that capacity remuneration mechanisms may exist, but not necessarily.
Regarding the availability service, Ministerial Order TEC/1366/2018, of 20th December 2018, establishing the electricity access tariffs for 2019, withdrew payments for the availability service. The European Commission had analysed different capacity payment mechanism and criticized the Spanish availability payments for not being allocated on a competitive basis.
The Preamble to the Ministerial Order explained their decision in this way. The availability service was regulated in the 2011 Order. The Ministry for Ecological Transition recalled that the legislative package presented by the European Commission on November 30, 2016, entitled "Clean Energy for All Europeans” (including in relation to the electricity sector a complete modification of the law), was pending approval. The new laws would lay down the regulatory framework to advance the achievement of the internal electricity market and to comply with the climate commitments of the Paris Agreement within the framework of the XXI United Nations Conference on Climate Change 2015. This legislative package contemplates a reform of the current capacity mechanisms, to adapt them to EU regulations, whose allocation should be produced through competitive mechanisms, as indicated in the report on the sectoral research on capacity mechanisms, published by the European Commission in November 201610. The Ministry also recalls that the energy system has initiated a process of transition to a new scenario characterized by de-carbonization, the decentralization of generation, the electrification of the economy, the more active participation of consumers and a more sustainable use of resources. In this scenario, with increasing renewable penetration and the approval of the European legislative package 2018-29, an in-depth analysis of the availability service is prudent, in accordance with the
10 Commission’s report. Final report on the sectoral inquiry on capacity mechanisms, C (2016) 752 final, Brussels, 30.11.2016, SWD (2016) 385 final.
264
guidelines resulting from the aforementioned European legislative package as well as with the other objectives. These were the reasons given by the Ministry to suppress the availability service.
Electricity generating companies have criticized, understandably, the Order of 2018 that eliminates availability service payments. They argued that it is a necessary service, because it enables them to keep available the facilities required to ensure the coverage of electricity demand peaks and periods of low renewable production, so that the coverage of the demand is guaranteed at all times. In effect, they argued, it is contradictory that the Order appeals to the greater penetration of renewables and de-carbonization, since both are circumstances that suggest the need for the availability service, rather than measures that could lead to closure of mothballing of stations. It is also contradictory, they argued, that the Order appeals to the European modifications, since in those modifications a payment system by capacity is allowed, insofar it is compatible with competition. The Spanish system has experienced some excess of capacity in the past, and since coal plants are being shut, and so are nuclear plants, the rising renewable output will show the need for capacity mechanisms. The European Commission recognizes that the price of the energy market, in many cases, is an insufficient signal to guarantee the coverage of the electricity supply, but capacity mechanisms are exceptional, temporary, and it is for Member States to demonstrate they need them.
The gas sector is also understandably critical of the Spanish Government’s decision to eliminate remuneration for capacity. The energy sector seems to be aware that the capacity reserve margin is currently quite high and ENTSO-E does not see any problems of meeting peak demand before 2025, so it may appear that there is no need for additional remuneration. The gas industry recognizes that from a competitive point of view, renewables are unbeatable. Sun and wind are the cheapest in terms of their levelized cost of energy (LCOE). However, they do not provide the firm and flexible electricity need to ensure supply security. For the gas industry, there are several arguments in favour of capacity payments. First, combined cycle (natural gas) does guarantee the regularity and quality of the supply. Coal plants are shutting, nuclear plants will begin to shut, renewable penetration is rising, prices are expected to be falling; so the availability of CCGT will become more important as revenues fall. There will be the need for CCGT to be operating for some time to come (maybe not very long) in order to maintain security of supply and to help back up renewables. Second, in a marginalist system of pool price formation, combined cycles do not currently earn any margin above their annual operating and maintenance costs (approximately 6 million euros) . On the contrary, some of them generate large losses. Third, they have the obligation to be available all the time and there are many regulated costs. In these circumstances, shareholders may well wish to shut their plants. The right to close the plant should be defended, if they are not profitable. Forth, they argue that if the Government was trying to design new capacity mechanisms, it should have had them ready before abolishing the existing ones. Previously, capacity payments and long-term investment incentives were received. If Spanish society wants security and quality, it must pay for it. In 2010 combined cycles received about 24,000 or 30,000 euros per plant; today they receive nothing.
In view of the criticism, it seems clear that the wholesale market must be reformed. When the coal plants close, the Spanish electricity market will lose a marginal price signal. The Spanish Market walks towards a situation in which the energy will be extra-marginal. The future park should be similar to the current one. There are 56 combined cycle power plants. According to the gas sector, all are necessary. There are studies that say that 30 more are needed. The CCGT owners are making the case for ensuring that they are still in business when the situation gets critical and they argue that they are already facing financial difficulties justifying staying open. Whether they are natural gas power stations or other sources of
265
capacity, it seems very likely that additional incomes (in the form of capacity payments) will be necessary to the energy market, given how this market is organized today11.
On September 2020, the Spanish Ministry for Ecological Transition opened a public consultation procedure to learn from companies and all interested agents about the opportunity of introducing CRM and of which type. The government is seeking arguments for a mechanism, but they should be credible, which means not obviously biased. The document identifies all of the EU legislation conditions, as we explain in Section 5.
4. Capacity mechanisms in Poland One of the main challenges of the proper functioning of the electricity market in Poland is ensuring continuity of electricity supply to customers in the long-term. To meet this challenge, there is the need of guaranteeing the availability of transmission and distribution networks (the so-called network resources) as well as of production capacity units (so-called generation resources adequacy). These infrastructures must be available several years in advance to the needs of recipients. The goal of the capacity market is to provide customers with long-term stable and secure electricity supply by power plants. The capacity market is to address the so-called missing money problem, which leads to missing capacity problem. The problem is originated by the decreasing time of operation of controllable conventional units against the priority dispatch of subsidized energy from specific technologies (in particular RES). What is more, economic competitiveness of conventional units against subsidized RES decreases, what threatens country’s energy security. This happens firstly due to increasing fixed costs of power plants based on conventional fuels caused by rising needs for their modernization due to their aging (average age of coal-based power plant in Poland is over 45 y.o.). Secondly, prices of electricity, emissions and fuel lead to margin erosion. On top of that electricity market within next couple years will have to face the withdrawal of old inefficient power units, which account for over a third of the total power capacity. In order to provide base capacity that ensures stability of electricity supply and energy security, there is the need to transfer fixed costs in shorter periods of their work, and, consequently, in the absence of coverage of these costs, there is the risk of those units being cancelled. Additional subsidy given to power producers is the main mechanism of capacity market that aims to ensure sufficient electricity supply in the system. A situation in which the electricity market would not be able to meet the peak demand already occurred in Poland in the summer of 2015. This resulted in the reduction of energy supply to many industrial recipients and significant financial consequences. In this context, the Polish authorities committed to reform the Polish electricity market by implementing capacity market, which introduces duality of remuneration of power producers – one for energy production, the new one for readiness of electricity delivery.
Capacity mechanisms related to the Polish power market (as in the case of Italy or Spain) are mainly regulated at the European level by a Decision of the European Commission: Decision on State aid No. SA.46100 (2017/N), of 7 February 2018. The entire process for all regulations for Poland began on 16th November 2016, when the Polish Government drafted its plans of new capacity mechanism. The final Capacity Market Act was published on 8th December 2017 and came into force on 18th January 2018. Later in April 2019 the Polish program to support high-efficiency cogeneration and reduce subsidies to finance the program for energy-intensive users was approved by the European Commission (Decisions of 15 April, 2019: SA 51192 and SA 52530). Originally Polish capacity market was to start its operation on 1st October 2020, however its launch was postponed for 1st January 2021.
11 An issue of Papeles e Energía, no 6 (2019) contains several useful discussions about the future of capacity mechanisms in Spain.
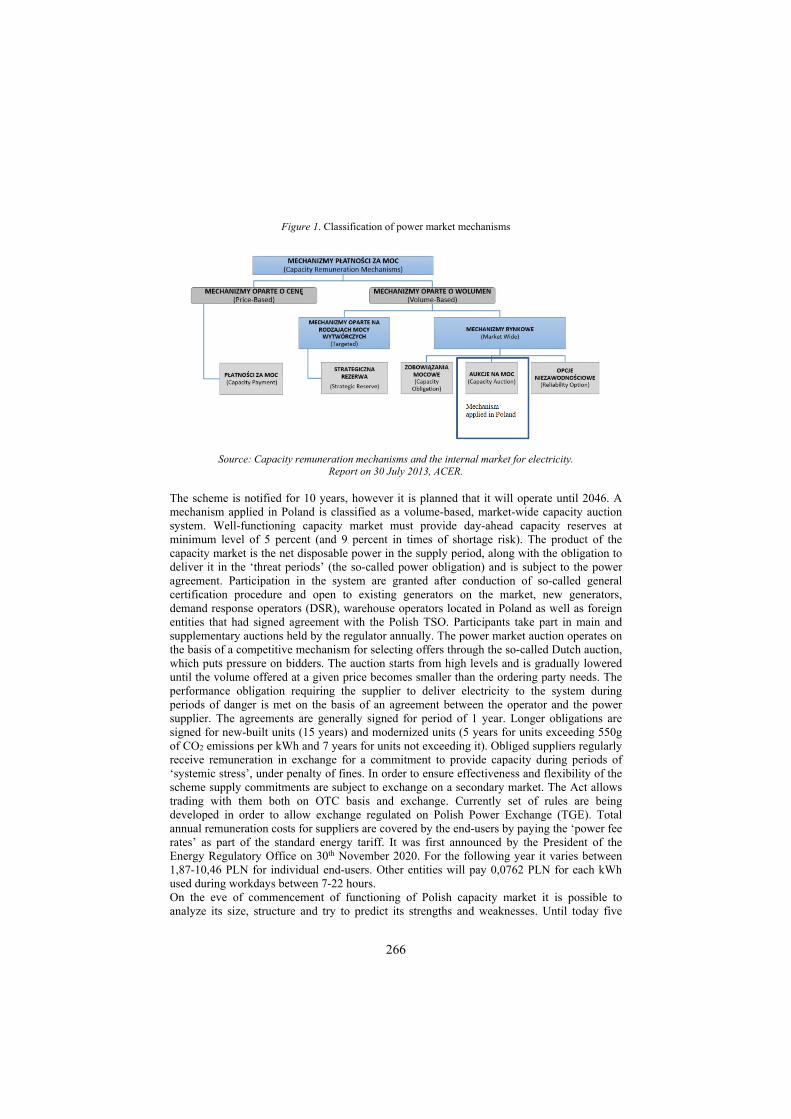
266
Figure 1. Classification of power market mechanisms
Source: Capacity remuneration mechanisms and the internal market for electricity. Report on 30 July 2013, ACER.
The scheme is notified for 10 years, however it is planned that it will operate until 2046. A mechanism applied in Poland is classified as a volume-based, market-wide capacity auction system. Well-functioning capacity market must provide day-ahead capacity reserves at minimum level of 5 percent (and 9 percent in times of shortage risk). The product of the capacity market is the net disposable power in the supply period, along with the obligation to deliver it in the ‘threat periods’ (the so-called power obligation) and is subject to the power agreement. Participation in the system are granted after conduction of so-called general certification procedure and open to existing generators on the market, new generators, demand response operators (DSR), warehouse operators located in Poland as well as foreign entities that had signed agreement with the Polish TSO. Participants take part in main and supplementary auctions held by the regulator annually. The power market auction operates on the basis of a competitive mechanism for selecting offers through the so-called Dutch auction, which puts pressure on bidders. The auction starts from high levels and is gradually lowered until the volume offered at a given price becomes smaller than the ordering party needs. The performance obligation requiring the supplier to deliver electricity to the system during periods of danger is met on the basis of an agreement between the operator and the power supplier. The agreements are generally signed for period of 1 year. Longer obligations are signed for new-built units (15 years) and modernized units (5 years for units exceeding 550g of CO2 emissions per kWh and 7 years for units not exceeding it). Obliged suppliers regularly receive remuneration in exchange for a commitment to provide capacity during periods of ‘systemic stress’, under penalty of fines. In order to ensure effectiveness and flexibility of the scheme supply commitments are subject to exchange on a secondary market. The Act allows trading with them both on OTC basis and exchange. Currently set of rules are being developed in order to allow exchange regulated on Polish Power Exchange (TGE). Total annual remuneration costs for suppliers are covered by the end-users by paying the ‘power fee rates’ as part of the standard energy tariff. It was first announced by the President of the Energy Regulatory Office on 30th November 2020. For the following year it varies between 1,87-10,46 PLN for individual end-users. Other entities will pay 0,0762 PLN for each kWh used during workdays between 7-22 hours. On the eve of commencement of functioning of Polish capacity market it is possible to analyze its size, structure and try to predict its strengths and weaknesses. Until today five
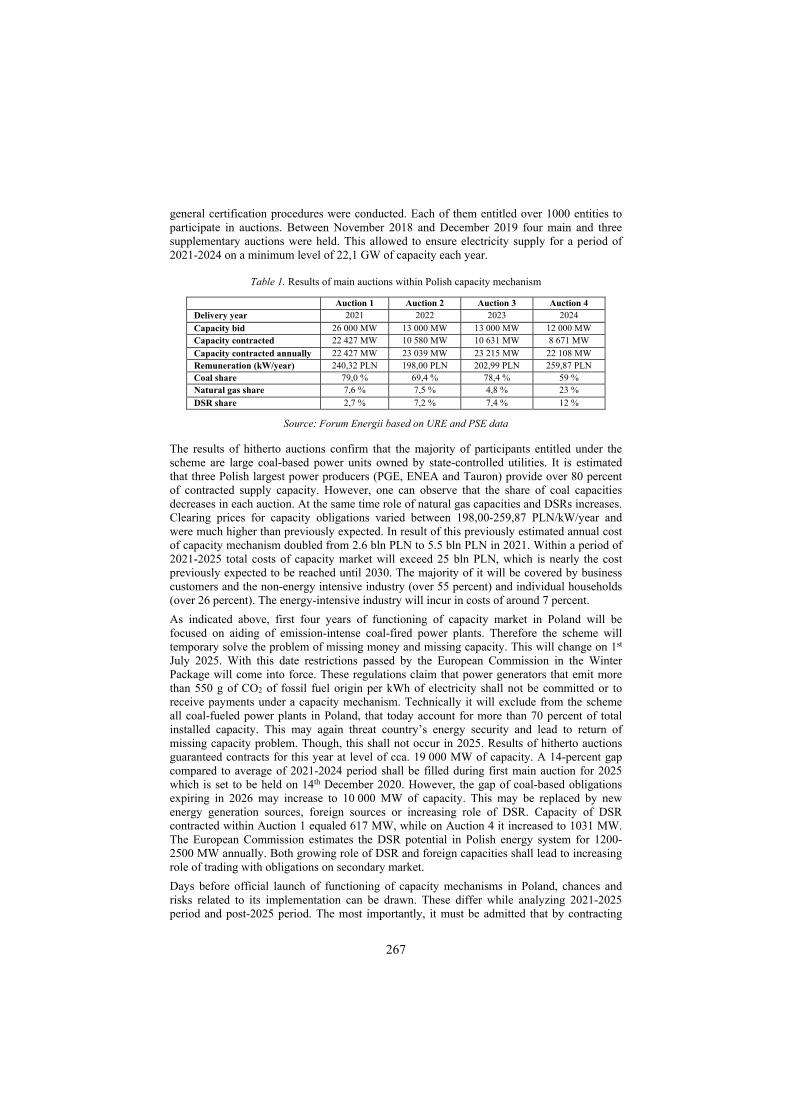
267
general certification procedures were conducted. Each of them entitled over 1000 entities to participate in auctions. Between November 2018 and December 2019 four main and three supplementary auctions were held. This allowed to ensure electricity supply for a period of 2021-2024 on a minimum level of 22,1 GW of capacity each year.
Table 1. Results of main auctions within Polish capacity mechanism
Auction 1 Auction 2 Auction 3 Auction 4 Delivery year 2021 2022 2023 2024
Capacity bid 26 000 MW 13 000 MW 13 000 MW 12 000 MW Capacity contracted 22 427 MW 10 580 MW 10 631 MW 8 671 MW
Capacity contracted annually 22 427 MW 23 039 MW 23 215 MW 22 108 MW Remuneration (kW/year) 240,32 PLN 198,00 PLN 202,99 PLN 259,87 PLN Coal share 79,0 % 69,4 % 78,4 % 59 % Natural gas share 7,6 % 7,5 % 4,8 % 23 %
DSR share 2,7 % 7,2 % 7,4 % 12 %
Source: Forum Energii based on URE and PSE data
The results of hitherto auctions confirm that the majority of participants entitled under the scheme are large coal-based power units owned by state-controlled utilities. It is estimated that three Polish largest power producers (PGE, ENEA and Tauron) provide over 80 percent of contracted supply capacity. However, one can observe that the share of coal capacities decreases in each auction. At the same time role of natural gas capacities and DSRs increases. Clearing prices for capacity obligations varied between 198,00-259,87 PLN/kW/year and were much higher than previously expected. In result of this previously estimated annual cost of capacity mechanism doubled from 2.6 bln PLN to 5.5 bln PLN in 2021. Within a period of 2021-2025 total costs of capacity market will exceed 25 bln PLN, which is nearly the cost previously expected to be reached until 2030. The majority of it will be covered by business customers and the non-energy intensive industry (over 55 percent) and individual households (over 26 percent). The energy-intensive industry will incur in costs of around 7 percent.
As indicated above, first four years of functioning of capacity market in Poland will be focused on aiding of emission-intense coal-fired power plants. Therefore the scheme will temporary solve the problem of missing money and missing capacity. This will change on 1st July 2025. With this date restrictions passed by the European Commission in the Winter Package will come into force. These regulations claim that power generators that emit more than 550 g of CO2 of fossil fuel origin per kWh of electricity shall not be committed or to receive payments under a capacity mechanism. Technically it will exclude from the scheme all coal-fueled power plants in Poland, that today account for more than 70 percent of total installed capacity. This may again threat country’s energy security and lead to return of missing capacity problem. Though, this shall not occur in 2025. Results of hitherto auctions guaranteed contracts for this year at level of cca. 19 000 MW of capacity. A 14-percent gap compared to average of 2021-2024 period shall be filled during first main auction for 2025 which is set to be held on 14th December 2020. However, the gap of coal-based obligations expiring in 2026 may increase to 10 000 MW of capacity. This may be replaced by new energy generation sources, foreign sources or increasing role of DSR. Capacity of DSR contracted within Auction 1 equaled 617 MW, while on Auction 4 it increased to 1031 MW. The European Commission estimates the DSR potential in Polish energy system for 1200-2500 MW annually. Both growing role of DSR and foreign capacities shall lead to increasing role of trading with obligations on secondary market.
Days before official launch of functioning of capacity mechanisms in Poland, chances and risks related to its implementation can be drawn. These differ while analyzing 2021-2025 period and post-2025 period. The most importantly, it must be admitted that by contracting
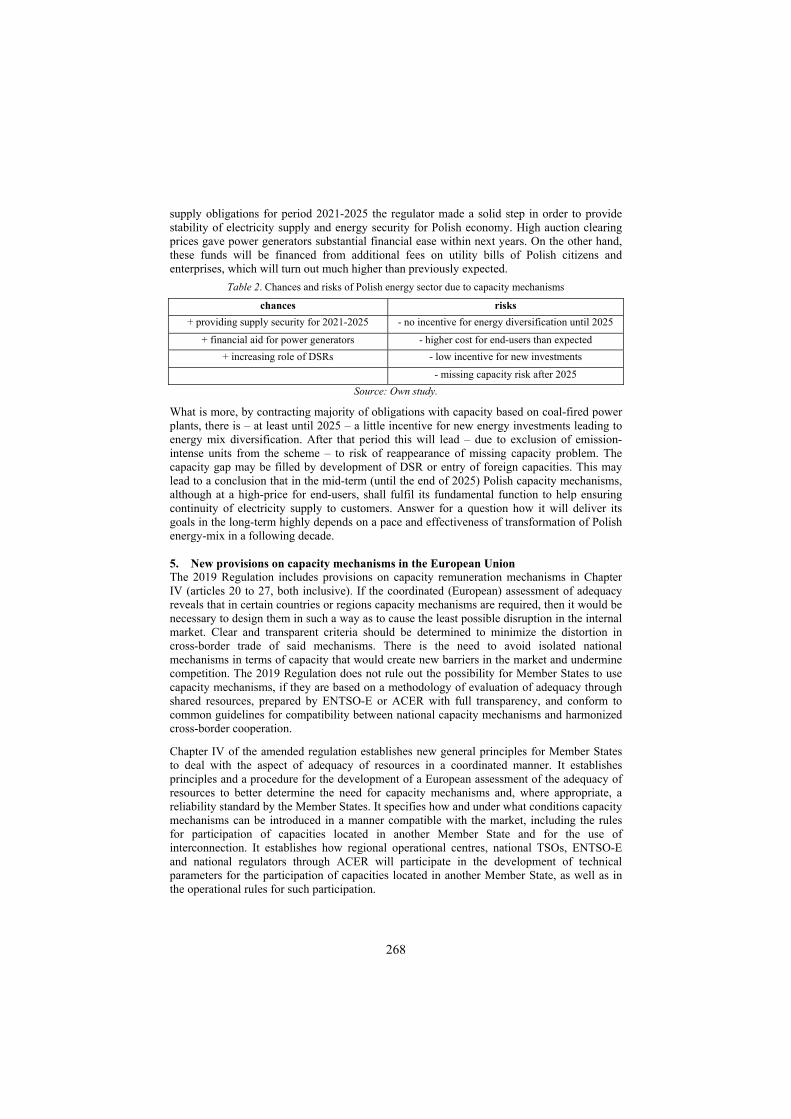
268
supply obligations for period 2021-2025 the regulator made a solid step in order to provide stability of electricity supply and energy security for Polish economy. High auction clearing prices gave power generators substantial financial ease within next years. On the other hand, these funds will be financed from additional fees on utility bills of Polish citizens and enterprises, which will turn out much higher than previously expected.
Table 2. Chances and risks of Polish energy sector due to capacity mechanisms
chances risks
+ providing supply security for 2021-2025 - no incentive for energy diversification until 2025
+ financial aid for power generators - higher cost for end-users than expected
+ increasing role of DSRs - low incentive for new investments
- missing capacity risk after 2025
Source: Own study.
What is more, by contracting majority of obligations with capacity based on coal-fired power plants, there is – at least until 2025 – a little incentive for new energy investments leading to energy mix diversification. After that period this will lead – due to exclusion of emission-intense units from the scheme – to risk of reappearance of missing capacity problem. The capacity gap may be filled by development of DSR or entry of foreign capacities. This may lead to a conclusion that in the mid-term (until the end of 2025) Polish capacity mechanisms, although at a high-price for end-users, shall fulfil its fundamental function to help ensuring continuity of electricity supply to customers. Answer for a question how it will deliver its goals in the long-term highly depends on a pace and effectiveness of transformation of Polish energy-mix in a following decade.
5. New provisions on capacity mechanisms in the European Union The 2019 Regulation includes provisions on capacity remuneration mechanisms in Chapter IV (articles 20 to 27, both inclusive). If the coordinated (European) assessment of adequacy reveals that in certain countries or regions capacity mechanisms are required, then it would be necessary to design them in such a way as to cause the least possible disruption in the internal market. Clear and transparent criteria should be determined to minimize the distortion in cross-border trade of said mechanisms. There is the need to avoid isolated national mechanisms in terms of capacity that would create new barriers in the market and undermine competition. The 2019 Regulation does not rule out the possibility for Member States to use capacity mechanisms, if they are based on a methodology of evaluation of adequacy through shared resources, prepared by ENTSO-E or ACER with full transparency, and conform to common guidelines for compatibility between national capacity mechanisms and harmonized cross-border cooperation.
Chapter IV of the amended regulation establishes new general principles for Member States to deal with the aspect of adequacy of resources in a coordinated manner. It establishes principles and a procedure for the development of a European assessment of the adequacy of resources to better determine the need for capacity mechanisms and, where appropriate, a reliability standard by the Member States. It specifies how and under what conditions capacity mechanisms can be introduced in a manner compatible with the market, including the rules for participation of capacities located in another Member State and for the use of interconnection. It establishes how regional operational centres, national TSOs, ENTSO-E and national regulators through ACER will participate in the development of technical parameters for the participation of capacities located in another Member State, as well as in the operational rules for such participation.
269
Chapter IV is entitled "Adequacy of resources". Art. 20 deals with the resource adequacy problem. It imposes the obligation to carry out a robust medium to long-term European resource adequacy assessment to provide an objective basis for the assessment of adequacy concerns. That assessment is complemented by national assessments. In accordance with Article 21, to eliminate residual resource adequacy concerns, Member States may, as a last resort, in accordance with Article 107, 108 and 109 of the TFEU, introduce capacity mechanisms. Article 22 contains the principles under which capacity mechanisms can be introduced: (a) be temporary; (b) not create undue market distortions and not limit cross-zonal trade; (c) not go beyond what is necessary to address the adequacy concerns; (d) select capacity providers by means of a transparent, non-discriminatory and competitive process; (e) provide incentives for capacity providers to be available in times of expected system stress; (f) ensure that the remuneration is determined through the competitive process; (g) set out the technical conditions for the participation of capacity providers in advance of the selection process; (h) be open to participation of all resources that are capable of providing the required technical performance, including energy storage and demand side management; apply appropriate penalties to capacity providers that are not available in times of system stress. Article 213 does also contain specific requirements when the capacity mechanism has been designed as a strategic reserve, as well as limits for the participation in the mechanisms in polluting generation units (coal).
6. Comparisons and conclusions There is an ongoing debate as to whether some kind of capacity remuneration mechanisms must be in place in the electricity market, to avoid the ‘missing money’ problem. Within those ones in favour of having some mechanisms, the debate is about the form, which those mechanisms should adopt. It is important to stress from the outset in this conclusion, that the European Commission rejects that capacity mechanisms can be a permanent element of the system. The analysis of both the Guidelines on State aid for environmental protection and the content of the 2009 Regulation regarding capacity remuneration can be misleading. To avoid any confusion it is of relevance to underline that CRM are an exception to free market, which should be avoided and only used in extraordinary circumstances and on a temporary basis. Italy and Poland have been negotiating during several years with the European Commission, until a Decision was adopted by the European Commission on the 7th February, 2018. The European Commission authorized Italy and Poland to adopt market-wide capacity mechanisms, since they had clearly identified and quantified the security of supply risks, also taking into account possible imports from neighboring countries. A significant amount of capacity risked exiting the Italian market and new investments were unlikely to take place without the capacity mechanism because investors could not earn a sufficient return from their electricity sales. Poland demonstrated that it was faced with market failures in the electricity market that prevented prices from incentivising power generators to keep existing capacity in the market or to invest in new capacity. The Italian and Polish mechanisms are open to all types of capacity providers, including demand response, existing and new capacities, domestic and foreign. On the contrary, Spain has been progressively diminishing the existing capacity payments, until they were abolished at the end of 2018. There, it will be necessary to debate whether mechanisms will be introduced or not, and to comply with the new EU regulations that require the Member State to demonstrate not only that the impact on competition is minimal, but also that the mechanism is needed, that it is temporary and that reform is underway to eliminate the problems that gave rise to the need for extra payment. In that debate, many options will be on the table, including whether to include new capacity and existing capacity, the duration of capacity payments, the participation of demand, storage and aggregators, and the design of auctions to be considered (with regard to auctions, capacity mechanisms should not be base only in central auctions, but also in contracts of a bilateral
270
nature). When designing future capacity mechanisms for Spain, both the reform of the 2009 Regulation and the Guidelines must be taken into account, in the light of the experience accumulated by the capacity mechanisms approved by the European Commission. The best alternative for Spain would be the "reliability options", which have been adopted by Italy. Energy companies complain about the elimination of capacity mechanisms, since that decision led to an extremely difficult financial situation. The Spanish draft Act on Climate Change and Energy Transition foresees the existence of a capacity remuneration mechanism. When passed, it seems clear that the Spanish Government will be aiming to introduce capacity mechanisms, and could inspired by some of the elements of the Italian example. In September 2020, the Spanish Ministry for Ecological Transition opened a public consultation to learn the views of companies and all interested agents concerning the case for and against introducing capacity mechanisms and, in case they are adopted, what would be the best design. References L. Hancher, A. De Houteclocque y M. Sadowska (editors), Capacity Mechanisms in the EU Energy Market. Law, Policy, and Economics, Oxford University Press, Oxford 2015.
S. Hesmondalg, J. Pfeifenberger and D. Robinson, “Resource Adequacy and Renewable Energy in Competitive Wholesale Markets”, The Brattle Group, September 2010.
Papeles de Energía, no 6 (2018)
271
COINTEGRATION ANALYSIS OF ELECTRICITY DEMAND AND MOBILITY DURING THE FIRST WAVE OF COVID-19 CONTAGION Maria Chiara D’Errico, University of Perugia, Department of Economics.
Abstract The magnitude of the impact of the COVID-19 contagion on key variables, such as electricity demand, mobility of people and number of hospitalization cases is unprecedented. Existing economic models lack historical data to estimate the impact of such events. The nexus among electricity demand, shifting behavior of mobility and COVID-19 contagion is investigated using econometric estimation techniques at high frequency. The three variables are included in a vector autoregressive model and Granger causality tests are performed to investigate potential interactions among lockdown, electricity and COVID-19 contagion intensity. Regional heterogeneity is considered using panel model that highlights differences in the nexus between mobility and contagion respect to the national level. Keywords: Energy-Mobility-Covid nexus; electricity demand, covid pandemia, lockdown effect; Granger causality. JEL codes: D12 D22 I18 Q41 1. Introduction
The impact of the pandemic Covid shock has produced deep consequences and disruptions on the economic life. This study explores the impact on key variables of the Covid pandemic shock in Italy in the period 24 February – 30 June 2020. Italy has been one the first hit countries in Europe since the end of February 2020 and it is an interesting case to analyze the nexus among the economic activity a d the health emergency. Analysis uses three variables at the daily frequency: electricity demand; mobility of people and mobility of workers, which is a proxy for economic activity; health variables related to the Covid contagion, like the number of new cases and the number of hospitalizations with intensive care. This approach is based on classical economic analysis, so a theoretical model is estimated and determined on a daily basis. The period considered ranges between the 23rd of February and the 30th June, the period in which Italy has been hardly hit, from the first relevant cases of contagion to the relaxation of the restrictions. The significant shocks during the Covid pandemic and the lockdown period, which in Italy has been characterized by four events: 23 February – first case of contagion in Italy; 10 March – general lockdown of all activities and mobility (with some exceptions, such as food supermarkets, strategic industries, some public offices); 4 May – gradual relaxation of the lockdown – 3 June - complete relaxation of activity and mobility restrictions, with maintenance of social distance and mask wearing obligations. Many epidemiologist and other mathematical modelers have tried to estimate epidemic curves and the parameters R-zero of contagion diffusion, but scarce attention has been devoted to the short term impact on the economic activity. This study wants to analyze the short-term impact in this period with two novel approaches. First, a daily electric energy demand function is estimated; second, the Energy-Mobility-Covid nexus is analyzed, testing the causality nexus among electricity demand, slowdown of economic activity, contagion diffusion. No one has considered the impact on the economy in real time. There are estimates about the reduction of the economic activity on the quarter which are essentially based on statistical projections considering the type of industries which has been locked down. At the most this methodology should be based input output analysis, albeit it is unknown whether it has been used or not, to consider what are the direct and indirect effects on each sector, given the direct lock down effects or measures implemented by the government. Second, the analysis

272
investigates whether the lockdown measures have been really effective in contrasting the contagion. Specifically, the study analyzes which health variables have been affected by the lockdown measures. This can be summarized by the following 3 hypotheses: H1: Has electricity demand been affected by the lockdown? H2: Has electricity demand been affected by the contagion? H3: Has the contagion been affected by the lockdown measures? All hypotheses been tested considering Granger causality tests among the three variables (Granger, 1969; Shukur and Mantalos, 2000). First, the Granger causality test is performed between electricity demand and mobility at work and mobility at home. These latter are proxies for economic activities so a proxy of the energy demand function of the productive sector and a measure of the energy demand of households respectively Second, the Granger causality test is performed between electricity demand and contagion variables with the maintained hypothesis that contagion is certain exogenous so there shouldn't be any effect of electricity on contagion. Third, the Granger causality test is performed between mobility and contagion. There are two maintained hypotheses that can be advanced: mobility is not influencing contagion if contagion is an exogeneous effect or mobility would have an effect on contagion if the reduction of the social activity (the measures to implement the so-called social distance) can help to reduce the diffusion of the Covid. The opposite direction is whether contagion is influencing mobility, possibly through a demonstration effect or publicity effect so that people get scared when they see contagion reports on the media on a daily basis and they therefore reduce their mobility or respect the social distance measures. Furthermore, the Granger causality procedure is then applied to a panel model in order to investigate possible differences among regions. In this last analysis the physical zones in which Italian electricity market is split constitute the panels and the nexus among electricity, contagion and mobility is analyzed within these panels. The paper is organized as follows. Data and the theoretical model which drives the empirical estimations are presented in Section 2. Section 3 presents and discusses the results. Conclusions are presented in Section 4. 2. Theory and methods A theoretical model considers the electricity demand as a function of both industrial and residential units. The firm’s demand function for energy is the derived from profit maximization problem. The energy demand of households is a function of households’ utility maximization. The background of the model in Figure 2 is the assumption that energy demand of firms depends on economic activity, residential energy demand depends on households’ activity, total energy demand is the sum of firm and residential demand. Moreover, the change in energy demand is affected by the lockdown measures, the Covid contagion is affected by the lockdown measures.
Figure 2 – The background model
efirms = F (economic activity) eresid = F (Household activity) e = efirms + eresid e = F (mobility work, mobility residential) Δe = F (lockdown measures) Covid = F (lockdown measures)

273
Formally model is parametrize using the duality approach to recover the energy demand for both residential and industrial consumers, assuming the existence of a cost function for using electricity as a good “e” and a composite numerary good “x”: c = c(pe, px, y) (1) where pe is the price of electricity, px is the price of the composite numerary good and y is the objective variable. Notice that x is the bundle of other goods for residential consumers and the bundle of capital and labor for firms, respectively. Likewise, y is utility for consumers and output for firms, respectively. In the theoretical specification of eq. (1), “e” is the total amount of electricity used by the unit consumer in a given day. Hence, eq. (1) is a daily cost function, from which it is straightforward to derive a Hicksian daily electricity demand function using Shephard’s Lemma (time subscripts are omitted for simplicity):
e = ∂c/∂pe = h(pe, px, y) (2)
From the Hicksian demand functions (2) the Marshallian demand functions are recovered, inverting eq. (1) into an inverse utility/production function to obtain:
y = y(pe, px, c) (3)
and then apply Roy’s Identity to eq. (3), in order obtain:
e = – ∂x/∂pe /∂x/∂c = e((pe, px, c) (4)
The Marshallian demand functions (4) express the quantity as a function of pe, the daily price of electricity, px price of the composite good and c total cost. Equation (4) holds for each state of nature and for each unit. The demand is function of prices and the scale variable for households and firms. This theoretical demand is parametrized using the Generalized Almost Ideal (GAIDS) system imposing homogeneity and symmetry and without subscripts for clarity:
e = γ + α ln (p /pe) + β c* (5)
where, the real total cost is expressed as c*=c/p (where c is total cost and the price aggregator p is approximated by the general price index), γ is a constant depending on specific effects and α is the parameter of the price sensitivity. In order to characterize the empirical function for estimation, the annual difference of eq. (5) is computed as follows:
Δe = [γ + α ln (p /pe) + β c*]2020 - [γ + α ln (p /pe) + β c*]2019 (6)
Equation (6) can elegantly show the effect of the change in the daily electricity demand in the exceptional period of lockdown and sharp reduction of economic activities and limitation of personal freedom, for both consumers and firms. The change in the scale variable c* can be proxied by a group of relevant variables, labeled as determinants dj, representing the reduction of mobility, during the exceptional period, c* = Σ βjdj. The change in relative prices can be approximated with the change in the price of electricity, so that it is possible to control for the exogenous market conditions. Other structural effect, such as the variation in temperature and the variation in the health conditions registered during the exceptional period can be incorporated in the equation, as a= f(temp, health). With these approximations, the parametric form of eq. (6) can be written as:
Δe = a + b Δln(pe) + Σ fjdj (7)
where a is parameter depending on the structural conditions, b is the price coefficient and fj are the coefficients of several proxies capturing the total scale effect. Notice that eq. (7) is derived explicitly from a theoretical maximizing behavior and, therefore, considering
274
simultaneous effect of prices and scale variables avoids distortions in estimation of the relevant parameters.1 In addition, notice that the difference Δe is computed with respect to the same week day of the previous year2. Data for mobility are sourced from the Google mobility dataset (Google, 2020) which represents the difference with respect to normality of the mobility toward four different categories of places: (i) working places, (ii) residential, (iii) retail and recreation, groceries and pharmacies, parks, (iv) transit stations. This data use as reference for normal situation the period at the beginning of February. In this sense, this data has the characteristic of an index number with base equal to one in February 2020. The monthly industrial production index in 2019 is used to construct a proxy for the daily index of economic activity with base equal to one in February 2019. Then the mobility index is corrected with this latter index to obtain a measure of the proxy for the change in economic activity from 2019 to 2020. The daily data published about the Covid contagion are taken from the Civil Protection dataset (Protezione Civile, 2020). Data report variables on total swabs, total positive cases, number of cases with symptoms, number of hospitalized cases, number of hospitalizations with intensive care and number of total deaths.3 In this study the focus is the number of new positive cases and the number of hospitalized in intensive care.4 3. Results and Discussion The first result concerns the estimation of daily electricity demand of eq. (7) and coefficients are shown in Table 1.
1 Other linear parametric model for estimating aggregate energy demand can be applied. For a review see Xiao et al., (2007), Zarnikau (2003), Karimu and Brannlund (2013), Bigerna and Bollino (2014). 2 After 1 January which is always a national holiday, 2 January 2020 is the first Thursday of the month, so that the difference is taken w.r.t. the 3 January 2019 which is the first Thursday of the month. In this way, difference concerns always the same weekday. In addition, differences have been corrected for the missing hour of the Sunday in which there is the switch to the Daylight saving hour and for the Monday after Eastern and 25 April and 1 May which are national holidays. Electricity demand data are sourced from the Gestore dei Mercati Energetici dataset 3 There has been a debate recently about the first and the last variables, which essentially are not fully representative of the situation, because the total positive cases are a function of the possibility of administering the swabs to the population, but different regions adopted very different practices, so the sample of total cases is not representative of what really has happened for two reasons. First, because of the different practice of screening and second because the epidemiologists have not had a clear understanding of what is the number of the so-called asymptomatic cases, so we don't really know what is the effective spread of contagion as a percentage of the total population. The same critique applied to the number of total deaths, given different reporting procedures. It is a fact that in countries like Germany the number of deaths has been 1/4 with respect to Italy in percentage of the population, which is strange because the number of cases is comparable. The cause can be found in the different practices to statistically record deaths. In Italy every death that has been somehow connected with the contagion has been classified as a death due to COVID-19 while in other countries if the patient had another type of illness that could have been fatal like pneumonia, and then had a positive contagion of Covid, the death is classified as pneumonia. 4 This is crucial, because despite the initial alarm about the possible insufficiency of intensive care beds in the health system, the maximum capacity has never been hit, also due to the immediate construction of additional units. In other words, all patient in critical medical conditions have been recovered in intensive care, which means that the statistics on the number of intensive care cases are not biased or censored.
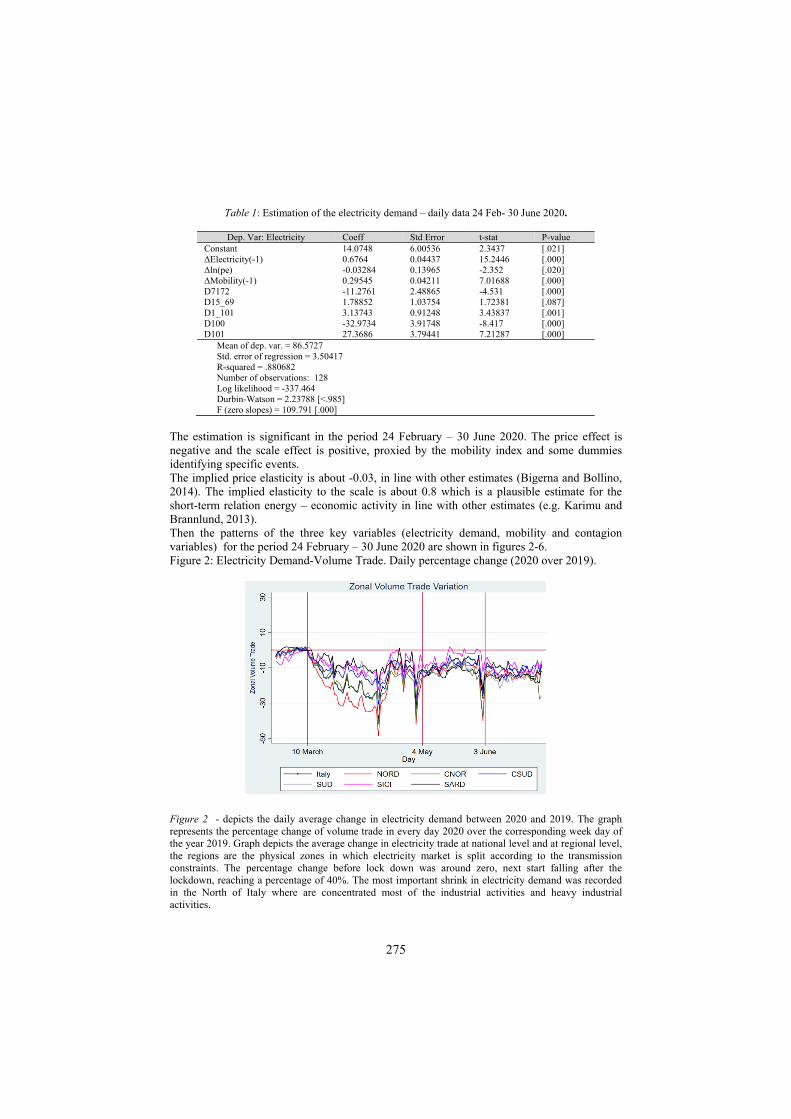
275
Table 1: Estimation of the electricity demand – daily data 24 Feb- 30 June 2020.
Dep. Var: Electricity Coeff Std Error t-stat P-value Constant 14.0748 6.00536 2.3437 [.021] ΔElectricity(-1) 0.6764 0.04437 15.2446 [.000] Δln(pe) -0.03284 0.13965 -2.352 [.020] ΔMobility(-1) 0.29545 0.04211 7.01688 [.000] D7172 -11.2761 2.48865 -4.531 [.000] D15_69 1.78852 1.03754 1.72381 [.087] D1_101 3.13743 0.91248 3.43837 [.001] D100 -32.9734 3.91748 -8.417 [.000] D101 27.3686 3.79441 7.21287 [.000]
Mean of dep. var. = 86.5727 Std. error of regression = 3.50417 R-squared = .880682 Number of observations: 128 Log likelihood = -337.464 Durbin-Watson = 2.23788 [<.985] F (zero slopes) = 109.791 [.000]
The estimation is significant in the period 24 February – 30 June 2020. The price effect is negative and the scale effect is positive, proxied by the mobility index and some dummies identifying specific events. The implied price elasticity is about -0.03, in line with other estimates (Bigerna and Bollino, 2014). The implied elasticity to the scale is about 0.8 which is a plausible estimate for the short-term relation energy – economic activity in line with other estimates (e.g. Karimu and Brannlund, 2013). Then the patterns of the three key variables (electricity demand, mobility and contagion variables) for the period 24 February – 30 June 2020 are shown in figures 2-6. Figure 2: Electricity Demand-Volume Trade. Daily percentage change (2020 over 2019).
Figure 2 - depicts the daily average change in electricity demand between 2020 and 2019. The graph represents the percentage change of volume trade in every day 2020 over the corresponding week day of the year 2019. Graph depicts the average change in electricity trade at national level and at regional level, the regions are the physical zones in which electricity market is split according to the transmission constraints. The percentage change before lock down was around zero, next start falling after the lockdown, reaching a percentage of 40%. The most important shrink in electricity demand was recorded in the North of Italy where are concentrated most of the industrial activities and heavy industrial activities.
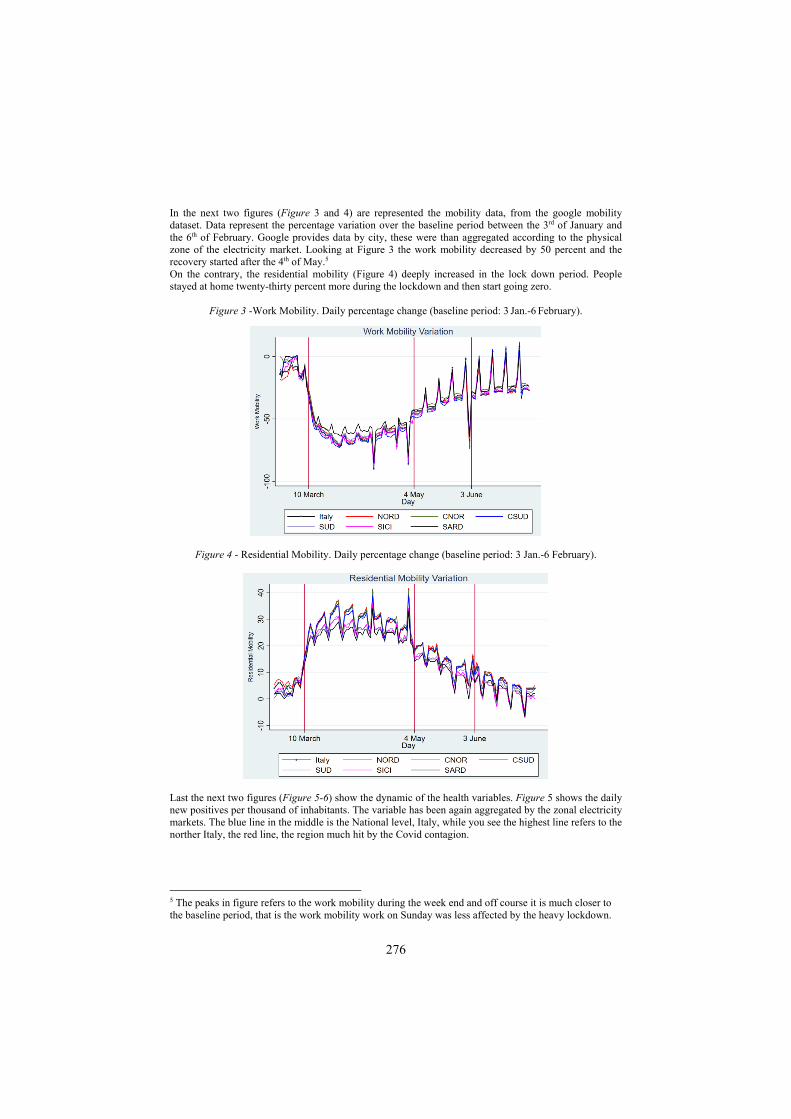
276
In the next two figures (Figure 3 and 4) are represented the mobility data, from the google mobility dataset. Data represent the percentage variation over the baseline period between the 3rd of January and the 6th of February. Google provides data by city, these were than aggregated according to the physical zone of the electricity market. Looking at Figure 3 the work mobility decreased by 50 percent and the recovery started after the 4th of May.5 On the contrary, the residential mobility (Figure 4) deeply increased in the lock down period. People stayed at home twenty-thirty percent more during the lockdown and then start going zero.
Figure 3 -Work Mobility. Daily percentage change (baseline period: 3 Jan.-6 February).
Figure 4 - Residential Mobility. Daily percentage change (baseline period: 3 Jan.-6 February).
Last the next two figures (Figure 5-6) show the dynamic of the health variables. Figure 5 shows the daily new positives per thousand of inhabitants. The variable has been again aggregated by the zonal electricity markets. The blue line in the middle is the National level, Italy, while you see the highest line refers to the norther Italy, the red line, the region much hit by the Covid contagion.
5 The peaks in figure refers to the work mobility during the week end and off course it is much closer to the baseline period, that is the work mobility work on Sunday was less affected by the heavy lockdown.
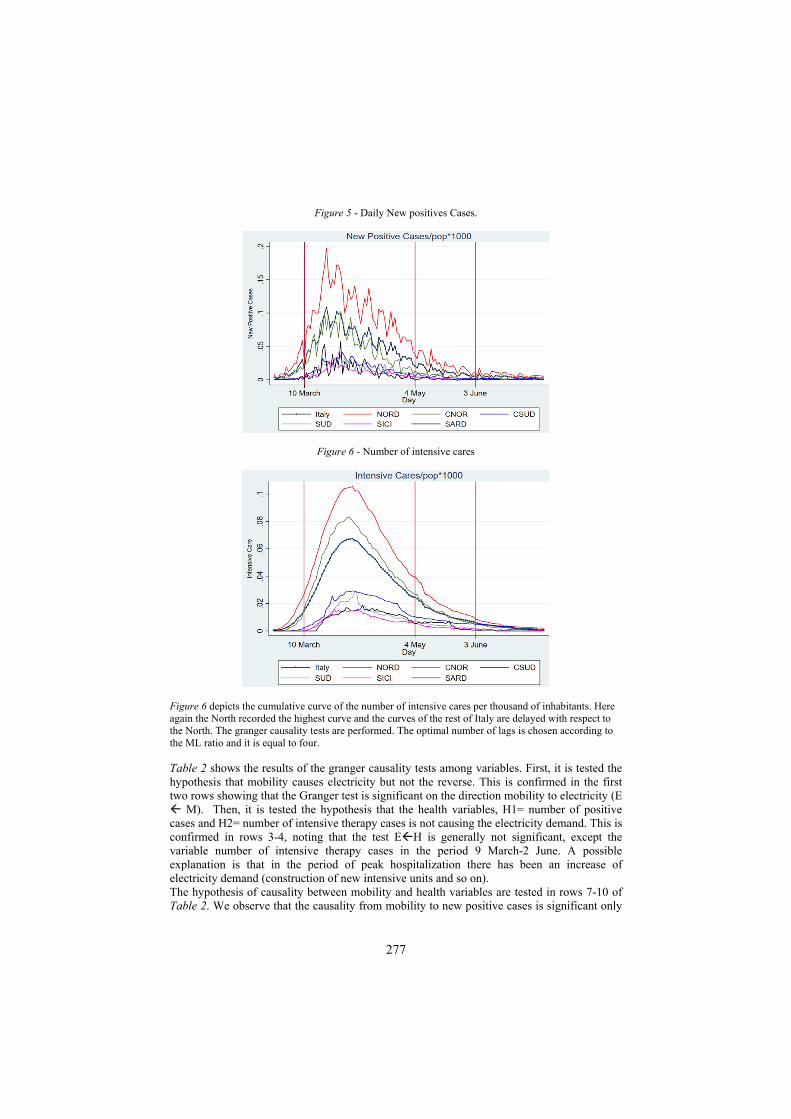
277
Figure 5 - Daily New positives Cases.
Figure 6 - Number of intensive cares
Figure 6 depicts the cumulative curve of the number of intensive cares per thousand of inhabitants. Here again the North recorded the highest curve and the curves of the rest of Italy are delayed with respect to the North. The granger causality tests are performed. The optimal number of lags is chosen according to the ML ratio and it is equal to four. Table 2 shows the results of the granger causality tests among variables. First, it is tested the hypothesis that mobility causes electricity but not the reverse. This is confirmed in the first two rows showing that the Granger test is significant on the direction mobility to electricity (E M). Then, it is tested the hypothesis that the health variables, H1= number of positive cases and H2= number of intensive therapy cases is not causing the electricity demand. This is confirmed in rows 3-4, noting that the test EH is generally not significant, except the variable number of intensive therapy cases in the period 9 March-2 June. A possible explanation is that in the period of peak hospitalization there has been an increase of electricity demand (construction of new intensive units and so on). The hypothesis of causality between mobility and health variables are tested in rows 7-10 of Table 2. We observe that the causality from mobility to new positive cases is significant only
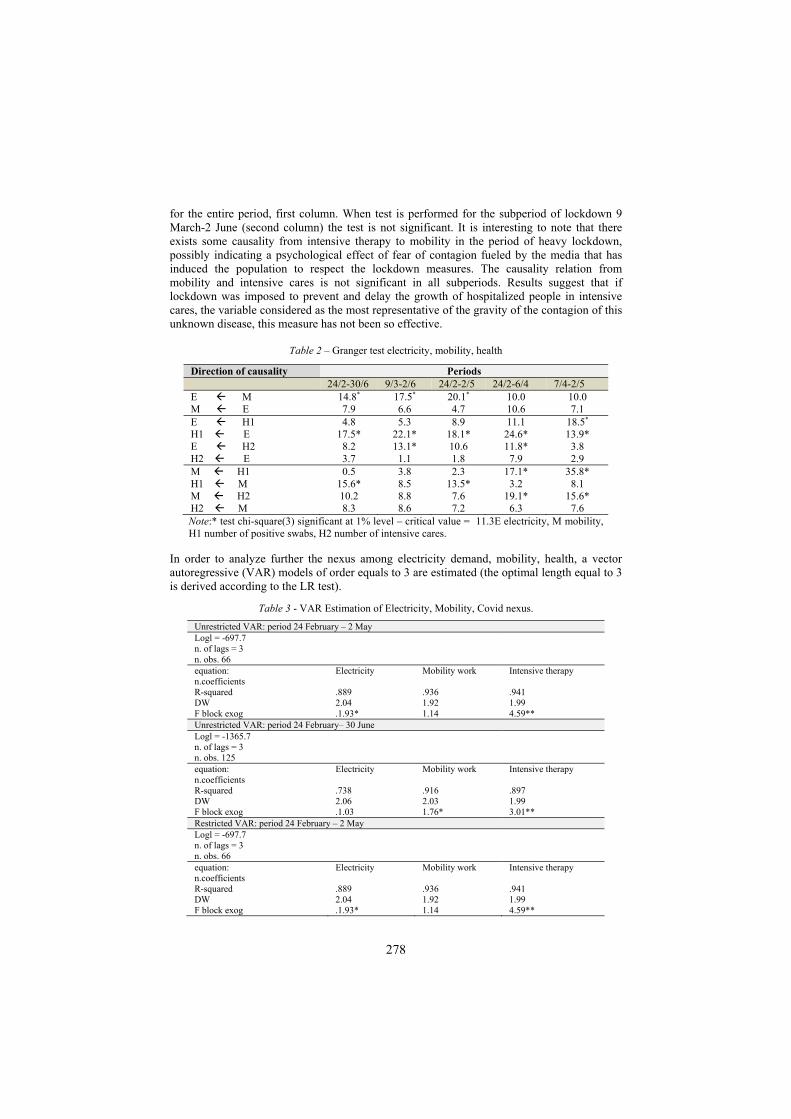
278
for the entire period, first column. When test is performed for the subperiod of lockdown 9 March-2 June (second column) the test is not significant. It is interesting to note that there exists some causality from intensive therapy to mobility in the period of heavy lockdown, possibly indicating a psychological effect of fear of contagion fueled by the media that has induced the population to respect the lockdown measures. The causality relation from mobility and intensive cares is not significant in all subperiods. Results suggest that if lockdown was imposed to prevent and delay the growth of hospitalized people in intensive cares, the variable considered as the most representative of the gravity of the contagion of this unknown disease, this measure has not been so effective.
Table 2 – Granger test electricity, mobility, health
Direction of causality Periods 24/2-30/6 9/3-2/6 24/2-2/5 24/2-6/4 7/4-2/5 E M 14.8* 17.5* 20.1* 10.0 10.0 M E 7.9 6.6 4.7 10.6 7.1 E H1 4.8 5.3 8.9 11.1 18.5* H1 E 17.5* 22.1* 18.1* 24.6* 13.9* E H2 8.2 13.1* 10.6 11.8* 3.8 H2 E 3.7 1.1 1.8 7.9 2.9 M H1 0.5 3.8 2.3 17.1* 35.8* H1 M 15.6* 8.5 13.5* 3.2 8.1 M H2 10.2 8.8 7.6 19.1* 15.6* H2 M 8.3 8.6 7.2 6.3 7.6 Note:* test chi-square(3) significant at 1% level – critical value = 11.3E electricity, M mobility, H1 number of positive swabs, H2 number of intensive cares.
In order to analyze further the nexus among electricity demand, mobility, health, a vector autoregressive (VAR) models of order equals to 3 are estimated (the optimal length equal to 3 is derived according to the LR test).
Table 3 - VAR Estimation of Electricity, Mobility, Covid nexus.
Unrestricted VAR: period 24 February – 2 May Logl = -697.7 n. of lags = 3 n. obs. 66 equation: Electricity Mobility work Intensive therapy n.coefficients R-squared .889 .936 .941 DW 2.04 1.92 1.99 F block exog .1.93* 1.14 4.59** Unrestricted VAR: period 24 February– 30 June Logl = -1365.7 n. of lags = 3 n. obs. 125 equation: Electricity Mobility work Intensive therapy n.coefficients R-squared .738 .916 .897 DW 2.06 2.03 1.99 F block exog .1.03 1.76* 3.01** Restricted VAR: period 24 February – 2 May Logl = -697.7 n. of lags = 3 n. obs. 66 equation: Electricity Mobility work Intensive therapy n.coefficients R-squared .889 .936 .941 DW 2.04 1.92 1.99 F block exog .1.93* 1.14 4.59**
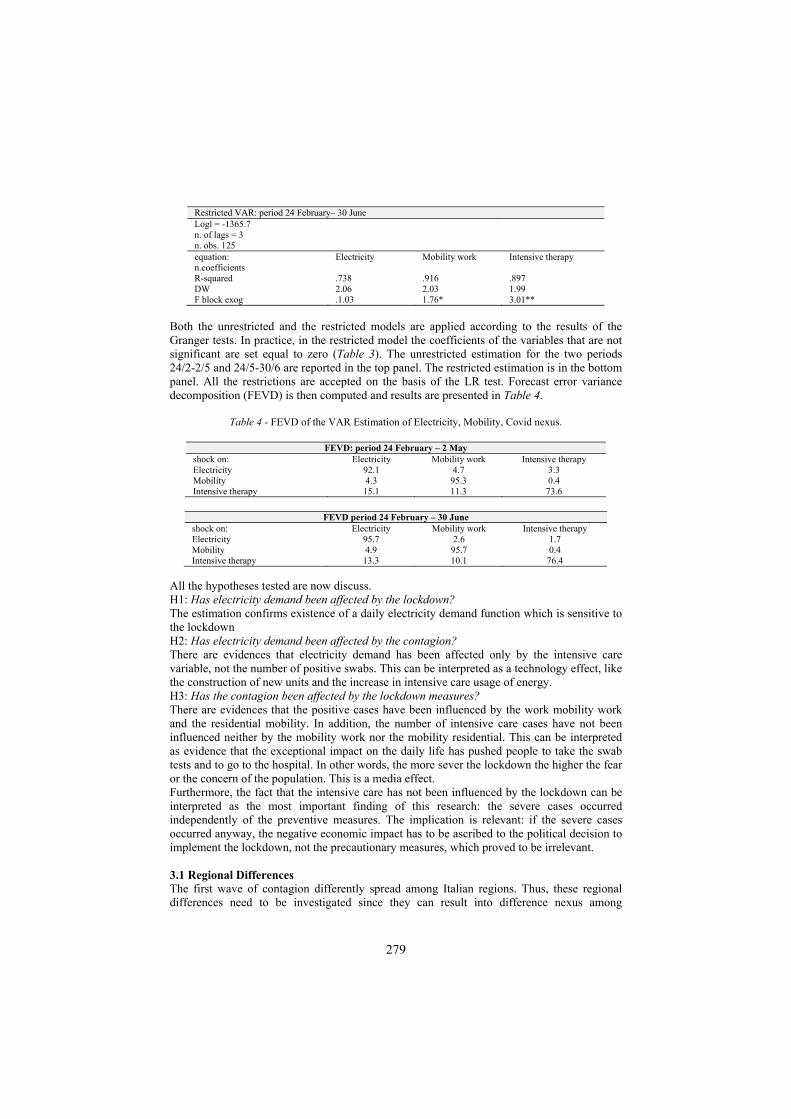
279
Restricted VAR: period 24 February– 30 June Logl = -1365.7 n. of lags = 3 n. obs. 125 equation: Electricity Mobility work Intensive therapy n.coefficients R-squared .738 .916 .897 DW 2.06 2.03 1.99 F block exog .1.03 1.76* 3.01**
Both the unrestricted and the restricted models are applied according to the results of the Granger tests. In practice, in the restricted model the coefficients of the variables that are not significant are set equal to zero (Table 3). The unrestricted estimation for the two periods 24/2-2/5 and 24/5-30/6 are reported in the top panel. The restricted estimation is in the bottom panel. All the restrictions are accepted on the basis of the LR test. Forecast error variance decomposition (FEVD) is then computed and results are presented in Table 4.
Table 4 - FEVD of the VAR Estimation of Electricity, Mobility, Covid nexus.
FEVD: period 24 February – 2 May shock on: Electricity Mobility work Intensive therapy Electricity 92.1 4.7 3.3 Mobility 4.3 95.3 0.4 Intensive therapy 15.1 11.3 73.6
FEVD period 24 February – 30 June
shock on: Electricity Mobility work Intensive therapy Electricity 95.7 2.6 1.7 Mobility 4.9 95.7 0.4 Intensive therapy 13.3 10.1 76.4
All the hypotheses tested are now discuss. H1: Has electricity demand been affected by the lockdown? The estimation confirms existence of a daily electricity demand function which is sensitive to the lockdown H2: Has electricity demand been affected by the contagion? There are evidences that electricity demand has been affected only by the intensive care variable, not the number of positive swabs. This can be interpreted as a technology effect, like the construction of new units and the increase in intensive care usage of energy. H3: Has the contagion been affected by the lockdown measures? There are evidences that the positive cases have been influenced by the work mobility work and the residential mobility. In addition, the number of intensive care cases have not been influenced neither by the mobility work nor the mobility residential. This can be interpreted as evidence that the exceptional impact on the daily life has pushed people to take the swab tests and to go to the hospital. In other words, the more sever the lockdown the higher the fear or the concern of the population. This is a media effect. Furthermore, the fact that the intensive care has not been influenced by the lockdown can be interpreted as the most important finding of this research: the severe cases occurred independently of the preventive measures. The implication is relevant: if the severe cases occurred anyway, the negative economic impact has to be ascribed to the political decision to implement the lockdown, not the precautionary measures, which proved to be irrelevant. 3.1 Regional Differences The first wave of contagion differently spread among Italian regions. Thus, these regional differences need to be investigated since they can result into difference nexus among
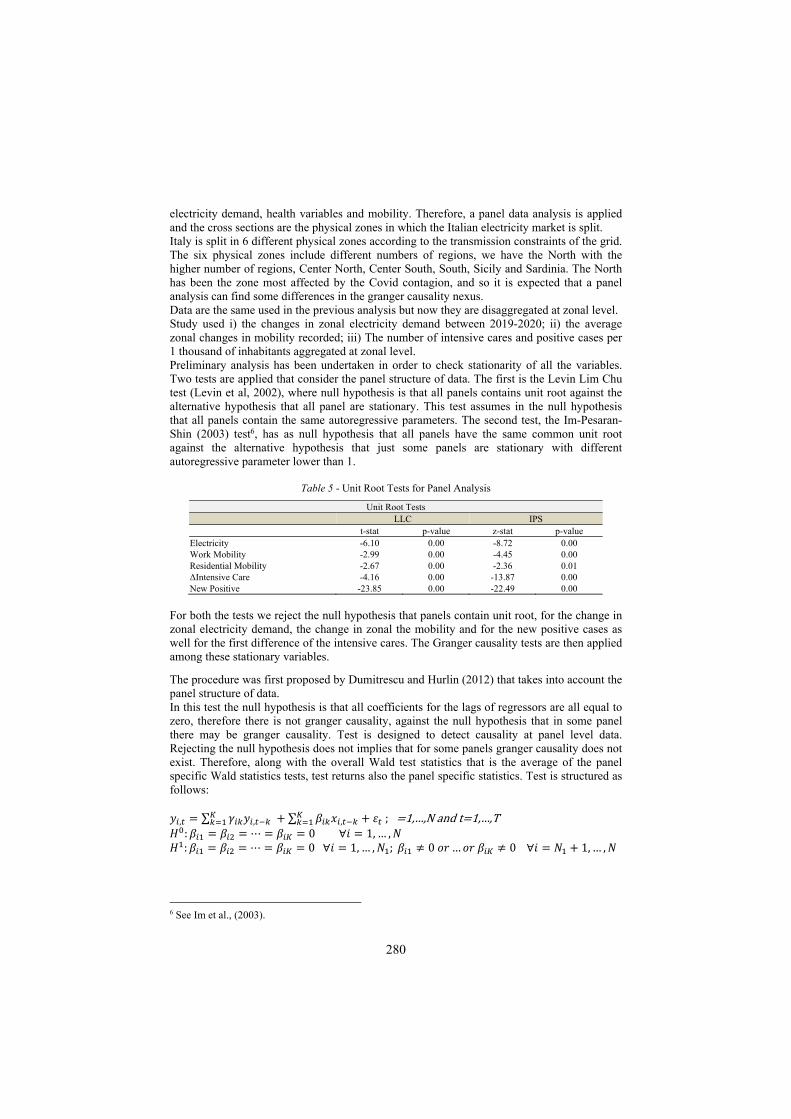
280
electricity demand, health variables and mobility. Therefore, a panel data analysis is applied and the cross sections are the physical zones in which the Italian electricity market is split. Italy is split in 6 different physical zones according to the transmission constraints of the grid. The six physical zones include different numbers of regions, we have the North with the higher number of regions, Center North, Center South, South, Sicily and Sardinia. The North has been the zone most affected by the Covid contagion, and so it is expected that a panel analysis can find some differences in the granger causality nexus. Data are the same used in the previous analysis but now they are disaggregated at zonal level. Study used i) the changes in zonal electricity demand between 2019-2020; ii) the average zonal changes in mobility recorded; iii) The number of intensive cares and positive cases per 1 thousand of inhabitants aggregated at zonal level. Preliminary analysis has been undertaken in order to check stationarity of all the variables. Two tests are applied that consider the panel structure of data. The first is the Levin Lim Chu test (Levin et al, 2002), where null hypothesis is that all panels contains unit root against the alternative hypothesis that all panel are stationary. This test assumes in the null hypothesis that all panels contain the same autoregressive parameters. The second test, the Im-Pesaran-Shin (2003) test6, has as null hypothesis that all panels have the same common unit root against the alternative hypothesis that just some panels are stationary with different autoregressive parameter lower than 1.
Table 5 - Unit Root Tests for Panel Analysis
Unit Root Tests LLC IPS
t-stat p-value z-stat p-value Electricity -6.10 0.00 -8.72 0.00 Work Mobility -2.99 0.00 -4.45 0.00 Residential Mobility -2.67 0.00 -2.36 0.01 ΔIntensive Care -4.16 0.00 -13.87 0.00 New Positive -23.85 0.00 -22.49 0.00
For both the tests we reject the null hypothesis that panels contain unit root, for the change in zonal electricity demand, the change in zonal the mobility and for the new positive cases as well for the first difference of the intensive cares. The Granger causality tests are then applied among these stationary variables.
The procedure was first proposed by Dumitrescu and Hurlin (2012) that takes into account the panel structure of data. In this test the null hypothesis is that all coefficients for the lags of regressors are all equal to zero, therefore there is not granger causality, against the null hypothesis that in some panel there may be granger causality. Test is designed to detect causality at panel level data. Rejecting the null hypothesis does not implies that for some panels granger causality does not exist. Therefore, along with the overall Wald test statistics that is the average of the panel specific Wald statistics tests, test returns also the panel specific statistics. Test is structured as follows: 𝑦 , ∑ 𝛾 𝑦 , ∑ 𝛽 𝑥 , 𝜀 ; 1,…,N and t 1,…,T 𝐻 : 𝛽 𝛽 ⋯ 𝛽 0 ∀𝑖 1, … , 𝑁 𝐻 : 𝛽 𝛽 ⋯ 𝛽 0 ∀𝑖 1, … , 𝑁 ; 𝛽 0 𝑜𝑟 … 𝑜𝑟 𝛽 0 ∀𝑖 𝑁 1, … , 𝑁
6 See Im et al., (2003).
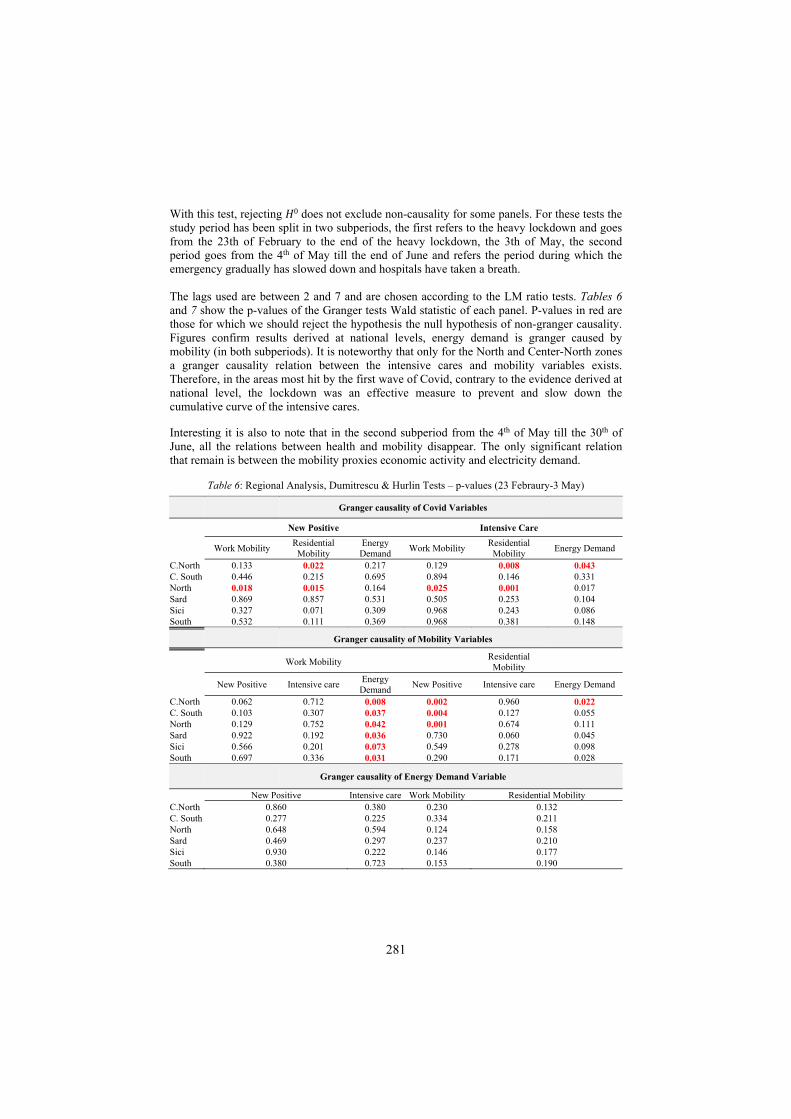
281
With this test, rejecting 𝐻0 does not exclude non-causality for some panels. For these tests the study period has been split in two subperiods, the first refers to the heavy lockdown and goes from the 23th of February to the end of the heavy lockdown, the 3th of May, the second period goes from the 4th of May till the end of June and refers the period during which the emergency gradually has slowed down and hospitals have taken a breath. The lags used are between 2 and 7 and are chosen according to the LM ratio tests. Tables 6 and 7 show the p-values of the Granger tests Wald statistic of each panel. P-values in red are those for which we should reject the hypothesis the null hypothesis of non-granger causality. Figures confirm results derived at national levels, energy demand is granger caused by mobility (in both subperiods). It is noteworthy that only for the North and Center-North zones a granger causality relation between the intensive cares and mobility variables exists. Therefore, in the areas most hit by the first wave of Covid, contrary to the evidence derived at national level, the lockdown was an effective measure to prevent and slow down the cumulative curve of the intensive cares. Interesting it is also to note that in the second subperiod from the 4th of May till the 30th of June, all the relations between health and mobility disappear. The only significant relation that remain is between the mobility proxies economic activity and electricity demand.
Table 6: Regional Analysis, Dumitrescu & Hurlin Tests – p-values (23 Febraury-3 May)
Granger causality of Covid Variables
New Positive
Intensive Care
Work Mobility Residential
Mobility Energy Demand
Work Mobility Residential
Mobility Energy Demand
C.North 0.133 0.022 0.217 0.129 0.008 0.043 C. South 0.446 0.215 0.695 0.894 0.146 0.331 North 0.018 0.015 0.164 0.025 0.001 0.017 Sard 0.869 0.857 0.531 0.505 0.253 0.104 Sici 0.327 0.071 0.309 0.968 0.243 0.086 South 0.532 0.111 0.369 0.968 0.381 0.148
Granger causality of Mobility Variables
Work Mobility
Residential
Mobility
New Positive Intensive care Energy Demand
New Positive Intensive care Energy Demand
C.North 0.062 0.712 0.008 0.002 0.960 0.022 C. South 0.103 0.307 0.037 0.004 0.127 0.055 North 0.129 0.752 0.042 0.001 0.674 0.111 Sard 0.922 0.192 0.036 0.730 0.060 0.045 Sici 0.566 0.201 0.073 0.549 0.278 0.098 South 0.697 0.336 0.031 0.290 0.171 0.028
Granger causality of Energy Demand Variable
New Positive Intensive care Work Mobility Residential Mobility C.North 0.860 0.380 0.230 0.132 C. South 0.277 0.225 0.334 0.211 North 0.648 0.594 0.124 0.158 Sard 0.469 0.297 0.237 0.210 Sici 0.930 0.222 0.146 0.177 South 0.380 0.723 0.153 0.190
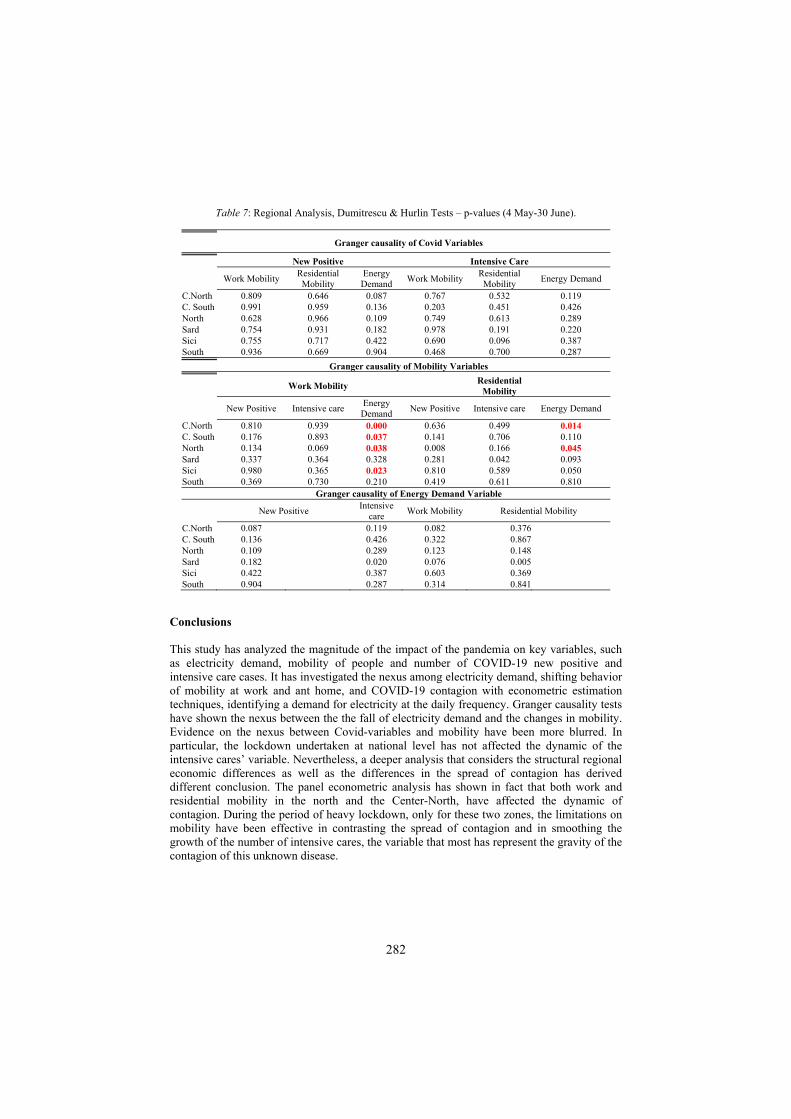
282
Table 7: Regional Analysis, Dumitrescu & Hurlin Tests – p-values (4 May-30 June).
Granger causality of Covid Variables
New Positive Intensive Care
Work Mobility Residential
Mobility Energy Demand
Work Mobility Residential
Mobility Energy Demand
C.North 0.809 0.646 0.087 0.767 0.532 0.119 C. South 0.991 0.959 0.136 0.203 0.451 0.426 North 0.628 0.966 0.109 0.749 0.613 0.289 Sard 0.754 0.931 0.182 0.978 0.191 0.220 Sici 0.755 0.717 0.422 0.690 0.096 0.387 South 0.936 0.669 0.904 0.468 0.700 0.287
Granger causality of Mobility Variables
Work Mobility
Residential
Mobility
New Positive Intensive care Energy Demand
New Positive Intensive care Energy Demand
C.North 0.810 0.939 0.000 0.636 0.499 0.014 C. South 0.176 0.893 0.037 0.141 0.706 0.110 North 0.134 0.069 0.038 0.008 0.166 0.045 Sard 0.337 0.364 0.328 0.281 0.042 0.093 Sici 0.980 0.365 0.023 0.810 0.589 0.050 South 0.369 0.730 0.210 0.419 0.611 0.810
Granger causality of Energy Demand Variable
New Positive Intensive
care Work Mobility Residential Mobility
C.North 0.087 0.119 0.082 0.376 C. South 0.136 0.426 0.322 0.867 North 0.109 0.289 0.123 0.148 Sard 0.182 0.020 0.076 0.005 Sici 0.422 0.387 0.603 0.369 South 0.904 0.287 0.314 0.841
Conclusions This study has analyzed the magnitude of the impact of the pandemia on key variables, such as electricity demand, mobility of people and number of COVID-19 new positive and intensive care cases. It has investigated the nexus among electricity demand, shifting behavior of mobility at work and ant home, and COVID-19 contagion with econometric estimation techniques, identifying a demand for electricity at the daily frequency. Granger causality tests have shown the nexus between the the fall of electricity demand and the changes in mobility. Evidence on the nexus between Covid-variables and mobility have been more blurred. In particular, the lockdown undertaken at national level has not affected the dynamic of the intensive cares’ variable. Nevertheless, a deeper analysis that considers the structural regional economic differences as well as the differences in the spread of contagion has derived different conclusion. The panel econometric analysis has shown in fact that both work and residential mobility in the north and the Center-North, have affected the dynamic of contagion. During the period of heavy lockdown, only for these two zones, the limitations on mobility have been effective in contrasting the spread of contagion and in smoothing the growth of the number of intensive cares, the variable that most has represent the gravity of the contagion of this unknown disease.
283
References Bigerna, S. and C.A. Bollino (2014), Electricity Demand in Wholesale Italian Market”, The Energy
Journal, vol. 35(3), 25-46
Bollino, C.A. (1987). “Gaids: a generalised version of the almost ideal demand system,” Economics Letters. 23(2), 199–202. http://dx.doi.org/10.1016/0165-1765(87)90039-5.
Deaton, M. (1980) “An almost ideal demand system”, American Economics Review, 70, 312-326.
Dumitrescu, E.I. and C. Hurlin (2012), “Testing for Granger Non-Causality in Heterogeneous Panels”, Economic Modelling, 29(4), 1450-1460.
GME (2020). Gestore Mercati Energetici. Results and Statistics, available at:
https://www.mercatoelettrico.org/it
Google, (2020). COVID-19 Community Mobility Reports, Mobility Report CSV Documentation, available at: https://www.google.com/covid19/mobility/
Granger C.W. (1969). Investigating casual relations by economic models and cross-spectral methods. Econometrica 37, 24–36.
Im, K. S., Pesaran, M. H., & Shin, Y. (2003). “Testing for unit roots in heterogeneous panels”. Journal of Econometrics, 115(1), 53-74.
Karimu, A. and R. Brännlund, (2013). Functional form and aggregate energy demand elasticities: A nonparametric panel approach for 17 OECD countries, Energy Economics, Volume 36, 19-27, ISSN 0140-9883, https://doi.org/10.1016/j.eneco.2012.11.026.
Levin, A., C.-F. Lin, and C.-S. J. Chu. 2002. “Unit root tests in panel data: Asymptotic and finite-sample properties”. Journal of Econometrics 108, 1–24.
Protezione Civile, (2020). Dati Covid-19 Itali. Available at: https://github.com/pcm-dpc/COVID-19
Shukur, G. and P. Mantalos (2000) "A simple investigation of the Granger-causality test in integrated-cointegrated VAR systems." Journal of Applied Statistics 27(8), 1021-1031.
Xiao, N., J. Zarnikau, and P. Damien (2007). "Testing functional forms in energy modeling: An application of the Bayesian approach to US electricity demand." Energy Economics 29(2), 158-166.
Zarnikau, J. (2003). Functional forms in energy demand modeling. Energy Economics, 25(6), 603-613.
284
SYNERGIES AND TRADE-OFFS BETWEEN ENERGY ACCESS, CLIMATE CHANGE AND WATER USE IN SUB-SAHARAN AFRICA
Isabella Alloisio, Research Associate Florence School of Regulation, Robert Schuman Centre for Advanced Studies, European University Institute
Abstract Clean and affordable energy is central to the 2030 Agenda for Sustainable Development and in particular to climate change mitigation. On the one hand, SDG 7 calls for ensuring universal access by 2030. On the other hand, SDG 13 invites to take urgent action to combat climate change and its impacts. Energy production and use account for around two thirds of global greenhouse gas emissions and sustainable energy systems are essential in achieving a low-carbon economy and reducing emissions. In order to mitigate the risk of climate change, it is crucial to reduce energy consumption (Target 7.3) and improve the mix of energy sources in favour of renewables (Target 7.2), or in favour of less carbon-intensive fossil fuels. Nevertheless, universal access to energy (Target 7.1) could limit the options for achieving climate mitigation strategies since energy access can be achieved through both renewable and traditional energy generation systems. Indeed, should universal access to energy be achieved by 2030 final energy consumption would increase by 7% (IEA, 2011). Sub-Saharan Africa (SSA), the region with one of the highest energy poverty rates, would contribute to the global share of electricity-related CO2 emissions by only 0.7% by 2030. Moreover, since global energy consumption is projected to grow by one third by 2035 (IEA 2013) this would lead to an increase in the global water use. Sub-Saharan Africa (SSA) is subject to extreme climate variability and it is the region with the highest water stress level, which implies increased water scarcity and serious consequences on energy security and supply. All types of energy generation consume water either through their process of accessing the raw materials or operating and maintaining the power plants. However renewable energies, especially wind and solar, have the lowest water footprint. Therefore, the move towards clean and sustainable energy not only would contribute to climate change mitigation but could also reduce water consumption (biofuels excluded). Understanding the interlinkages between water, energy and climate plays a crucial role in delivering sustainable outcome and assisting communities in their collective efforts to implement the SDGs. The analysis investigates interlinkages among the Goals with a focus on SDG 7, SDG 6 and SDG 13 starting from the perspective of universal access to energy (Target 7.1). Results show that although access to energy may seemingly counteract climate change mitigation, providing universal access to energy is expected to have a small impact on global CO2 emissions. Results also show that if developing nations may overcome technological lock-ins and develop their energy infrastructure based on sustainable and off-grid energy systems, this counter-effect would be minimal compared to the benefits in terms of emissions reduction, water saving, social inclusion and economic development
1. Introduction
The Water-Energy-Food and Climate nexus (WEF nexus) addresses the interrelated nature of our global natural resource systems. The nexus is a key topic in the 2030 Agenda for Sustainable Development launched in 2015 and setting 17 Sustainable Development Goals (SDGs). The 2030 Agenda touches on multiple Goals, namely SDG 6 (Ensure availability and sustainable management of water and sanitation for all); SDG 7 (Ensure access to affordable, reliable, sustainable and modern energy for all); SDG 2 (End hunger, achieve food security and improved nutrition and promote sustainable agriculture); SDG 13 (Take urgent action to
285
combat climate change and its impacts. It aims to tackle simultaneously different issues, such as food and water security, the connection between global warming and water scarcity, and between climate change and food production, as well as energy security, and the connection between energy production and water and land use. For the purpose of this work, which is aimed at analyzing the interlinkages between energy and water and the impact of climate change, the food nexus is outside the scope of this analysis and will not be investigated. Global projections indicate that demand for freshwater and energy will increase significantly over the next decades under the pressure of population growth and mobility, economic development, international trade, urbanization, cultural and technological changes, and climate change.1 Climate change will exacerbate the pressures and risks associated with variations in the availability and distribution of water resources, and consequently of energy supply. Global energy consumption is projected to grow by one third, with the demand for electricity having the lion’s share with a 70 percent increase by 20352. By 2050, global water demand is projected to increase by 55 percent, driven mainly by growing urbanization in developing countries. The issue of water security gained a growing attention after the Johannesburg conference which marked the tenth anniversary after the Rio Conference in 20023. “Water is essential not only for survival but also for the bare necessities of life. It is also a necessity for the realization of each individual’s potential”4 Lack of access to basic service such as water leads to hunger and poverty and is a demonstration of inequality. “Without planetary stewardship for water resilience, it is difficult to see how the world could eradicate poverty and hunger, two of the emerging Sustainable Development Goals to replace the MDGs”.5 Alike the integrated water resources management (IWRM), the WEF nexus approach considers the different dimensions of water, energy (and food) on the same level playing field and recognizes the interdependencies of different resource uses. Water management impact possibilities for energy security and food security, “particularly within an era of globalization under the overarching context of climate change”.6 The paper is organized as follows: section 2 that analyses the WEF nexus from a two-fold perspective, first the interaction between water and energy, with an in-depth analysis of the water renewables interlinkage, and second the interaction between climate change and energy with an in-depth analysis of climate change impact on renewables; section 3 investigates the synergies and trade-offs existing between energy access and climate change mitigation, with a first paragraph on the relation between energy access and growth, and a second one on the interaction between energy access and GHG emissions; section 4 analyses the interaction of energy access and climate change mitigation in Sub-Saharan Africa; section 5 proposes some concrete solutions to energy access, energy and water security and to climate change mitigation challenges; section 6 concludes.
2. Water Energy Climate Nexus
Improving access to water is not trivial. Water is not homogeneously available and the variation in its distribution does not fully explain water scarcity. Shocks associated with water are usually attributed to either scarcity or abundance of water. Climate change exacerbates the magnitude and frequency of such shocks and makes them more unpredictable. Extreme events such as El Nino can impact on both the quantity and quality of available water in a given 1 Hoff, 2011 2 IEA, 2013 3 Schmidt, 2017 4 Henri and Tubiana, 2018: p. 35 5 Rockstrom et al., 2014: p. 165 6 Swatuk and Cash 2018: p. 2

286
region and time, further increasing the negative impacts of natural disasters7. Since climate change adds uncertainty to existing supplies of freshwater, given their interlinkage energy security will inevitably be impacted by water availability, resulting in mutual vulnerability.8 2.1 Water Energy Nexus Water and energy are closely interdependent, as they are major consumers of one another, and choices made in one domain have direct or indirect consequences on the other. Energy is required for the extraction, treatment and distribution of water, and electricity accounts for an estimated 5-30 percent of the total operating cost of water and wastewater utilities. On the other hand, water is required to produce, transport and use nearly all forms of energy. Freshwater withdrawals for energy production accounted in 2010 for 15 percent of the world’s total water use and are expected to increase by 20 percent through 20359.
The power sector’s dependence on water creates vulnerabilities and risks that are exacerbated by extreme weather events induced by climate change. Severe droughts or elevated temperatures may lead to diminishing the performance of thermal power plants - which are high water intensive – or can even hinder the capacity of the power sector to achieve sufficient cooling, thus leading to power outages. Therefore, water constraints are among the most important factors for deciding where to build power plants and what specific cooling system to opt for. Cooling systems without the use of water exist, such as air cooling, but at present these are prohibitively expensive. Conversely, climate change can also benefit electricity production in certain areas exposed to an increase in precipitations. Unlike the water sector, the energy sector can switch to other resources. Water resources required in power generation can be substituted, e.g. by solar and wind energy. The latter not only have a very low carbon footprint, but also consume little water. Nevertheless, wind and solar energy have the important disadvantage of being intermittent and thus needing base load systems such as thermal power or hydropower. Conversely, although other Renewable Energy Sources (RES) such as Concentrated Solar Power (CSP) reduces the carbon footprint and offers a more stable energy system – it has a large water footprint. Among RES a special focus is reserved to geothermal energy power plants, which have the dual advantage of producing base load and clean energy and of having a low water footprint (see a more in-depth analysis of RES and water use in the next paragraph).
As for fossil fuel-based energy, thermal power plants use large quantities of water because of cooling systems that are responsible for around 50 percent of total freshwater withdrawal. In the upstream sector, extraction and production of unconventional energy sources are much more water intensive than conventional oil and gas. Both the hydraulic fracturing technique (better known as fracking) for shale gas extraction, and open-pit mining or in situ drilling techniques for tar sand extraction require a barrel of water for each barrel of gas and oil produced. In the field of climate change mitigation, Carbon Capture and Sequestration (CCS) systems are very important in any national decarbonization pathway. Nevertheless, implementing CCS in an existing power station will have some effect on its water consumption, requiring additional water for cooling. Estimates show that with the addition of a CCS system, the increase in water consumption per megawatt of electrical output can be as high as 90 percent. Having treated water consumption issues in energy production, we will now make one example of energy need for water production. Desalination of salt water and pumping of freshwater supplies over long distances may contribute to reducing water scarcity, but in the
7 Anand, 2007 8 Pittock et al., 2015 9 IEA, 2013
287
process it will increase energy use. Desalinated seawater is very high energy intensive compared to clean water from locally produced surface water and from reclaimed wastewater. Moreover, the two most common techniques for desalination have both an important although different energy need. Indeed, if reverse osmosis plants consume 4-6 kWh to desalinate one cubic metre of treated water, the multistage flash technique consumes much more, up to 21-58 kWh per cubic metre.
In brief, water and energy are closely interlinked, and the use of each resource has an impact on the use of the other. Therefore, interaction between energy and water can be considered as bidirectional, meaning that both A impacts b and B impacts A. This is evident from Target 6.4, which calls for substantially increase water-use efficiency across all sectors, and with Targets 7.1 and 7.2 calling for universal access to affordable, reliable and modern energy services and the substantial increase of the share of renewable energy in the global energy mix, respectively. Against this background, a well-balanced natural resources management should take this interaction into account when tackling the issues of energy poverty and water scarcity. 2.1.1 RES and water footprint This paragraph investigates how a shift towards renewable electricity could positively impact the electricity generation dependence on water resources. If translated into a research question: how can renewable energy improve the reliability of our electricity system while not burdening our water resources?
Life-cycle analysis is used to quantify the full impact of renewable energy technologies on water resources. While the water used to operate power plants presents vulnerability to constraints in local water supplies, water withdrawn for equipment manufacturing can present direct and indirect impacts, depending both on water availability and on the manufacturing locations. “For wind and photovoltaic power, the largest component of life-cycle water withdrawal and consumption is for the manufacturing and construction of power facilities, where the manufacturing facilities are often in a different water basin from the power facility. For geothermal and concentrated solar power, cooling dominates the life-cycle water use, and most of the water withdrawn and consumed is in the same water basin where the production facility is located. Unlike electricity generated by fossil fuels, renewable technologies have few upstream water impacts”.10
In the case of intermittent renewable energies, wind and solar energy, the use of water is negligeable. In wind generation water is mainly used to wash the turbines blades, conversely wind power has been used - especially in the United States - to provide energy for near-surface groundwater extraction for agriculture use. In photovoltaic solar power (PV) water is used in a small amount to manufacture modules, and almost no water is consumed for PV electricity generation, as opposed to most concentrated solar power (CSP) technologies that use a thermal cycle and thus require cooling water. Water withdrawals and consumption in CSP plants whether power towers, linear fresnel or parabolic troughs – can be relevant and reach 1,000 or more gallons per megawatt-hour, whereas Dish Stirling technology uses water only for required periodic cleaning.11
The water requirements of geothermal power plants vary depending on technology and local conditions. At the hottest geothermal resources, it is possible to directly pull steam through the turbine into a condenser where the steam is condensed into water. In ‘flash’ geothermal plants, very hot water is depressurized into steam, which can then be used to drive the turbine. If the water from the geothermal resources is not hot enough for direct or flash designs, a
10 Pittock et al., 2015: p. 70 11 Idem

288
more complex process called binary generation is used.12 In particular, geothermal binary cycle power plants utilize a closed loop system allowing for the re-injection of water back into the geothermal reservoir.
Hydroelectric energy uses the energy of water moving from higher to lower elevations to generate electricity. Hydropower encompasses dam projects with reservoirs, run-of-river and in-stream projects and therefore it has a large water footprint. However, alike geothermal energy which can have an impact on the quality of water and on the safety of drinking water, as the superheated water dissolves solids underground and brings them to the surface, hydroelectric energy does not have an impact on the quality of water. Moreover, hydropower is becoming an important source for energy storage and could contribute to balance electricity systems that have large amounts of variable RE generation13. As of 2017 up to 118,596 MW of pure pumped storage capacity is available globally14. In brief, geothermal and hydropower have the characteristics that could improve the reliability of the electricity system while not burdening water resources. 2.2 Climate Energy Nexus The energy sector is the largest contributor to global Greenhouse Gas (GHG) emissions, representing roughly two-thirds of all anthropogenic GHG. Within the energy sector, electricity generation is the largest single sector emitting fossil fuel CO2 at present and in baseline scenarios of the future. The electricity sector plays, therefore, a major role in mitigation scenarios with deep cuts of GHG emissions. A variety of climate change mitigation options exist in the electricity sector, including renewable energy generation. The lifecycle GHG emissions normalized per unit of electrical output (g CO2eq/kWh) from technologies powered by RE sources are less than from those powered by fossil fuel-based resources.15 Conversely, climate energy nexus can be explained (see paragraph 2.2.1) by the impact of climate change on energy generation, on the reliability of the energy system and in general on the efficiency of the generation systems as a whole. 2.2.1 Climate Change Impact on RES Generation Geothermal energy is not dependent on climate conditions and climate change is not expected to have a significant impact on the resource potential. However, on a local level some effect of climate change on rainfall distribution may have a long-term impact on geothermal potential. With its natural thermal storage capacity, geothermal energy is suitable for supplying base-load electricity and thus useful for the electricity system stability in presence of intermittent renewable resources (wind and solar).
Hydropower is highly dependent on the volume, variability and seasonal distribution of the runoff and, therefore, is vulnerable to climate change effects. A shift in winter precipitation from snow to rain due to increased air temperature may lead to a temporal shift in peak flow and winter conditions in many continental and mountain regions.16 As glaciers retreat due to warming, river flows would be expected to increase in the short term but decline once the glaciers disappear.17 On the other hand, in Sub-Saharan Africa droughts have caused a reduced hydropower production (e.g., in Ghana and Kenya).
12Idem 13 IPCC, 2012 14 IRENA, 2018 15 IPCC, 2012 16 Stickler and Alfredsen, 2009 17 IPCC, 2008
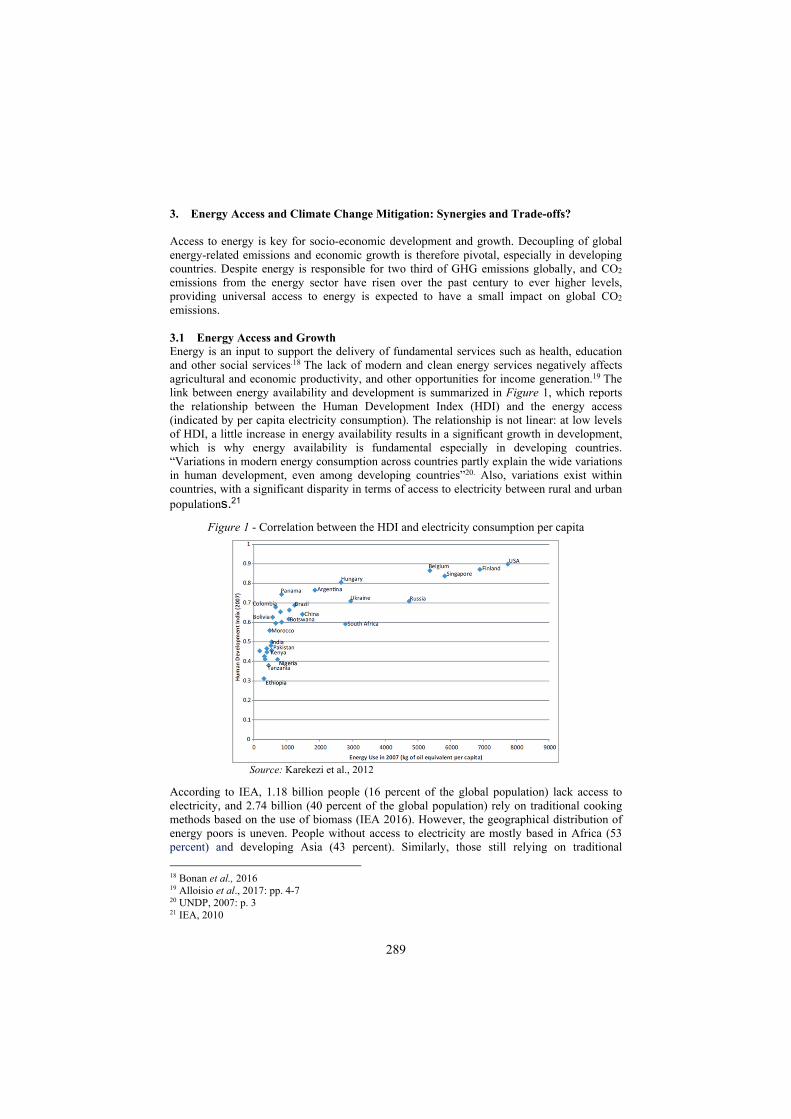
289
3. Energy Access and Climate Change Mitigation: Synergies and Trade-offs? Access to energy is key for socio-economic development and growth. Decoupling of global energy-related emissions and economic growth is therefore pivotal, especially in developing countries. Despite energy is responsible for two third of GHG emissions globally, and CO2
emissions from the energy sector have risen over the past century to ever higher levels, providing universal access to energy is expected to have a small impact on global CO2
emissions. 3.1 Energy Access and Growth Energy is an input to support the delivery of fundamental services such as health, education and other social services.18 The lack of modern and clean energy services negatively affects agricultural and economic productivity, and other opportunities for income generation.19 The link between energy availability and development is summarized in Figure 1, which reports the relationship between the Human Development Index (HDI) and the energy access (indicated by per capita electricity consumption). The relationship is not linear: at low levels of HDI, a little increase in energy availability results in a significant growth in development, which is why energy availability is fundamental especially in developing countries. “Variations in modern energy consumption across countries partly explain the wide variations in human development, even among developing countries”20. Also, variations exist within countries, with a significant disparity in terms of access to electricity between rural and urban populations.21
Figure 1 - Correlation between the HDI and electricity consumption per capita
Source: Karekezi et al., 2012
According to IEA, 1.18 billion people (16 percent of the global population) lack access to electricity, and 2.74 billion (40 percent of the global population) rely on traditional cooking methods based on the use of biomass (IEA 2016). However, the geographical distribution of energy poors is uneven. People without access to electricity are mostly based in Africa (53 percent) and developing Asia (43 percent). Similarly, those still relying on traditional
18 Bonan et al., 2016 19 Alloisio et al., 2017: pp. 4-7 20 UNDP, 2007: p. 3 21 IEA, 2010
290
cookstoves and fuels are concentrated mostly in developing Asia (68 percent) and Africa (29 percent).
Energy poverty is defined as lack, scarcity or difficulty in accessing modern energy services by households, in particular it refers to the access to electricity and to modern and clean cooking facilities. In the 2030 Agenda for Sustainable Development, SDG 7.1 indicators to evaluate access to energy are two: the first one is access to electricity, the second one is referred to the use of solid fuels for households (i.e. heating and cooking).22
Electricity is considered as the most valuable form of energy and the most suitable in the pathway towards the decarbonisation of the energy system. It is clean, it can be converted in to other forms of energy, and it can be delivered over long distances. As already mentioned, access to electricity is an important indicator of development of a country. An analysis covering 26 African countries finds that poor-quality electricity supply infrastructures have strong negative effect on firm’s productivity, especially in lower income African countries such as Eritrea, Ethiopia, Mali, Senegal, Uganda and Zambia.23 Another example of positive correlation between energy access and growth is the positive interaction of energy access with SDG 4 on Education for all, because access to energy allows students to study overnight and to have access to internet and online-education.
The second indicator is relevant because populations which have no or low access to modern forms of energies generally use solid fuels (biomass or charcoal) for heating and cooking. These fuels are very inefficient from an energy standpoint and, above all, have a negative impact on health, as the untreated emissions are responsible for serious respiratory diseases (Martin et al., 2011). Conversely, this does not happen in developed countries where gas or electricity is generally used for cooking purposes, while the use of solid fuels for heating purposes is limited to few complementary biomass-based appliances. In brief, ensuring access to modern energy carriers could not only improve energy efficiency and thus have positive impact on the mitigation of climate change (SDG 13), but also could have important co-benefits on human health. In this framework energy access (SDG 7.1) is closely interlinked with SDG 3 calling for ensuring healthy lives and promote wellbeing for all at all ages.
3.2 Energy Access and GHG Emissions
The energy access goal (SDG7.1) is closely interlinked with other SDGs including climate change mitigation (SDG13). This is acknowledged by the other two targets of SDG7 including targets on renewable energy (SDG 7.2) and energy efficiency (and 7.3). Strategies to mitigate climate change should not limit the ability of least developed countries to meet their basic energy needs for development but rather support access to cleaner energy sources.
The existing literature provides a contradictory picture on the implications of energy poverty alleviation on energy consumption and associated future GHG emissions. Most international organizations estimate this effect as moderate. The International Energy Agency (IEA, 2013) estimates that achieving universal energy access by 2030 would increase electricity consumption by 2.5 percent and fossil fuels use by 0.8 percent.24 A less moderate picture is the one suggested by Chakravarty and Tavoni (2013) that assess an overall increase in global final energy consumption by about 7 percent.25 The bulk of this 7 percent addition would
22 Karekezi et al., 2012 23 Escribano et al., 2009 24 Universal electricity access according to IEA projections assumes a basic level of electricity for every person gaining access. 25 According to Chakravarty and Tavoni, 2013: p. S71. The alleviation policy allows for a higher threshold of consumption compared to IEA (2013) and encompasses both basic and productive uses.
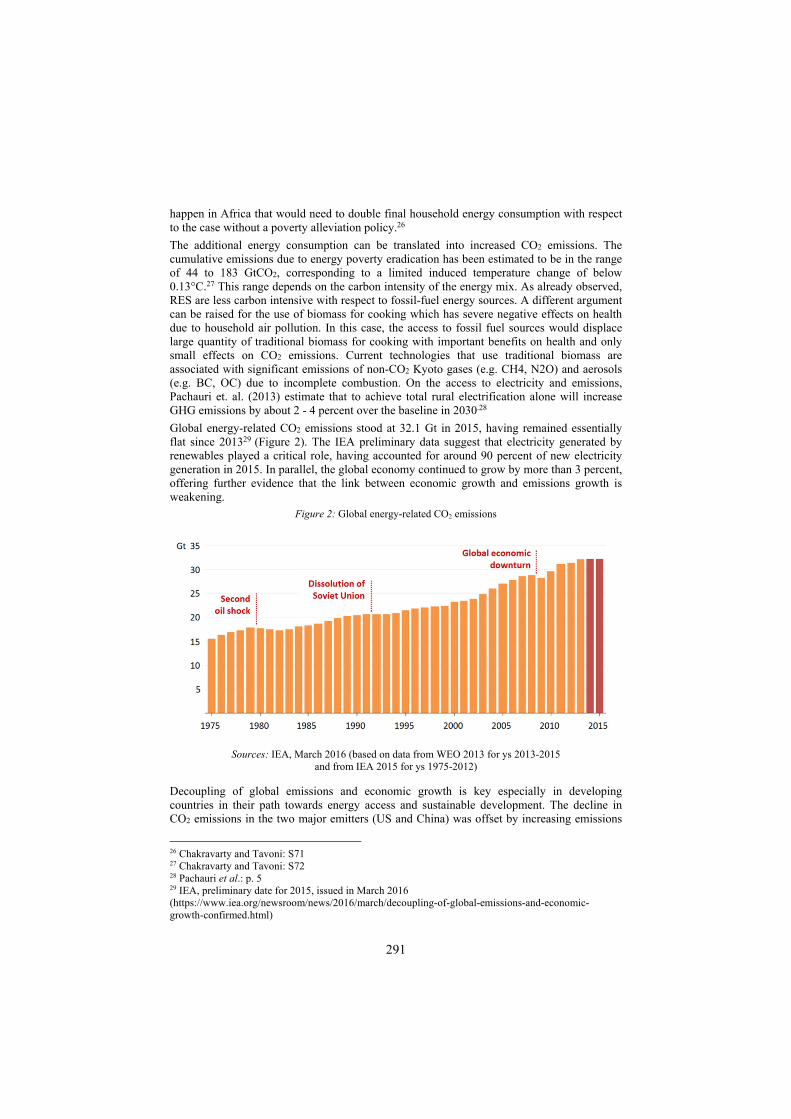
291
happen in Africa that would need to double final household energy consumption with respect to the case without a poverty alleviation policy.26
The additional energy consumption can be translated into increased CO2 emissions. The cumulative emissions due to energy poverty eradication has been estimated to be in the range of 44 to 183 GtCO2, corresponding to a limited induced temperature change of below 0.13°C.27 This range depends on the carbon intensity of the energy mix. As already observed, RES are less carbon intensive with respect to fossil-fuel energy sources. A different argument can be raised for the use of biomass for cooking which has severe negative effects on health due to household air pollution. In this case, the access to fossil fuel sources would displace large quantity of traditional biomass for cooking with important benefits on health and only small effects on CO2 emissions. Current technologies that use traditional biomass are associated with significant emissions of non-CO2 Kyoto gases (e.g. CH4, N2O) and aerosols (e.g. BC, OC) due to incomplete combustion. On the access to electricity and emissions, Pachauri et. al. (2013) estimate that to achieve total rural electrification alone will increase GHG emissions by about 2 - 4 percent over the baseline in 2030.28
Global energy-related CO2 emissions stood at 32.1 Gt in 2015, having remained essentially flat since 201329 (Figure 2). The IEA preliminary data suggest that electricity generated by renewables played a critical role, having accounted for around 90 percent of new electricity generation in 2015. In parallel, the global economy continued to grow by more than 3 percent, offering further evidence that the link between economic growth and emissions growth is weakening.
Figure 2: Global energy-related CO2 emissions
Sources: IEA, March 2016 (based on data from WEO 2013 for ys 2013-2015
and from IEA 2015 for ys 1975-2012)
Decoupling of global emissions and economic growth is key especially in developing countries in their path towards energy access and sustainable development. The decline in CO2 emissions in the two major emitters (US and China) was offset by increasing emissions
26 Chakravarty and Tavoni: S71 27 Chakravarty and Tavoni: S72 28 Pachauri et al.: p. 5 29 IEA, preliminary date for 2015, issued in March 2016 (https://www.iea.org/newsroom/news/2016/march/decoupling-of-global-emissions-and-economic-growth-confirmed.html)
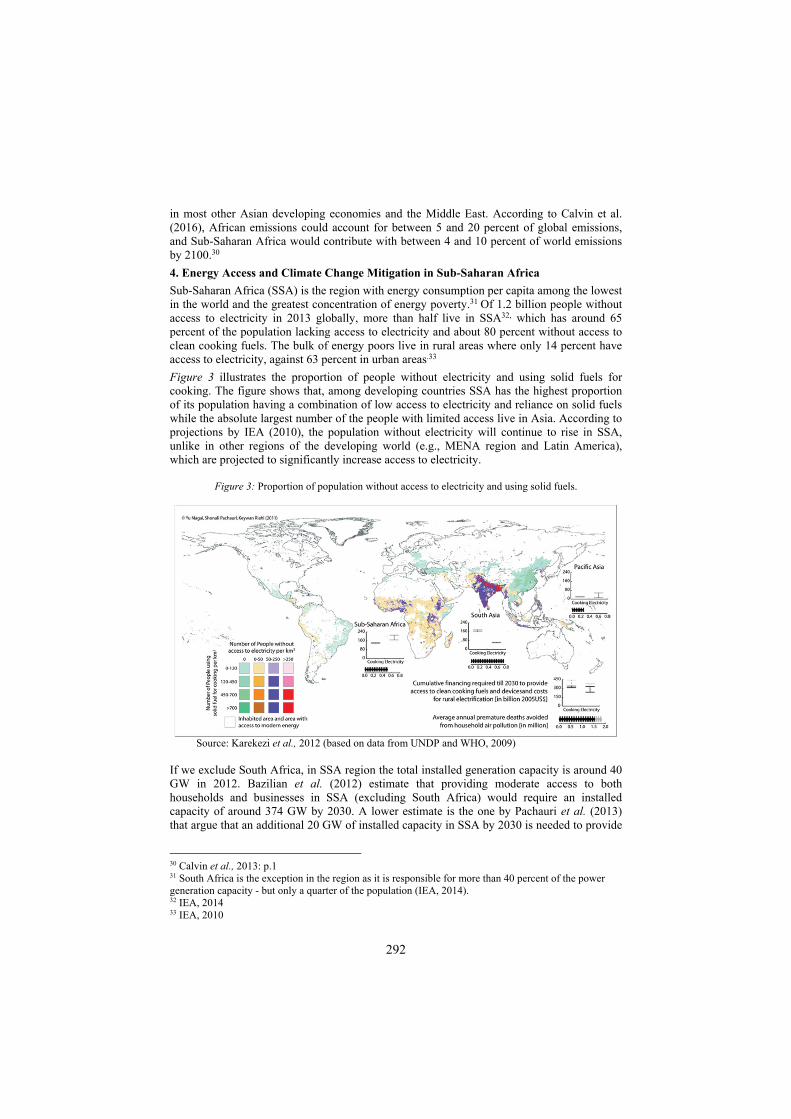
292
in most other Asian developing economies and the Middle East. According to Calvin et al. (2016), African emissions could account for between 5 and 20 percent of global emissions, and Sub-Saharan Africa would contribute with between 4 and 10 percent of world emissions by 2100.30
4. Energy Access and Climate Change Mitigation in Sub-Saharan Africa
Sub-Saharan Africa (SSA) is the region with energy consumption per capita among the lowest in the world and the greatest concentration of energy poverty.31 Of 1.2 billion people without access to electricity in 2013 globally, more than half live in SSA32, which has around 65 percent of the population lacking access to electricity and about 80 percent without access to clean cooking fuels. The bulk of energy poors live in rural areas where only 14 percent have access to electricity, against 63 percent in urban areas.33
Figure 3 illustrates the proportion of people without electricity and using solid fuels for cooking. The figure shows that, among developing countries SSA has the highest proportion of its population having a combination of low access to electricity and reliance on solid fuels while the absolute largest number of the people with limited access live in Asia. According to projections by IEA (2010), the population without electricity will continue to rise in SSA, unlike in other regions of the developing world (e.g., MENA region and Latin America), which are projected to significantly increase access to electricity.
Figure 3: Proportion of population without access to electricity and using solid fuels.
Source: Karekezi et al., 2012 (based on data from UNDP and WHO, 2009) If we exclude South Africa, in SSA region the total installed generation capacity is around 40 GW in 2012. Bazilian et al. (2012) estimate that providing moderate access to both households and businesses in SSA (excluding South Africa) would require an installed capacity of around 374 GW by 2030. A lower estimate is the one by Pachauri et al. (2013) that argue that an additional 20 GW of installed capacity in SSA by 2030 is needed to provide
30 Calvin et al., 2013: p.1 31 South Africa is the exception in the region as it is responsible for more than 40 percent of the power generation capacity - but only a quarter of the population (IEA, 2014). 32 IEA, 2014 33 IEA, 2010
293
basic electricity access although limited to households.34 Against this background, and despite the projection on population growth, SSA is deemed responsible for a small share in global electricity-related emissions: 0.7 percent in 203035. This is mainly due to fuel switch, the use of more efficient coal and gas-powered powered plants and the decrease in carbon intensity, especially in western and central Africa. Conversely, in southern Africa (excluding South Africa) the growing use of coal increases the overall carbon intensity in SSA region36 According to Calvin et al. (2016) - in two of the analyzed scenarios37 - SSA results the African region with the largest rates of energy intensity reduction and of carbon intensity increase.38 Moreover, SSA is one of the regions mostly vulnerable to the impacts of climate change and this has important consequences on its economic growth and the rate of energy access. As observed, climate change poses threats to water availability and energy security due to the water-energy and climate nexus. The magnitude of these impacts varies at different levels of warming, corresponding to 2°C and 4°C above pre-industrial levels. Overall, projections of impacts of climate change on water resources in SSA are associated with large uncertainties.39 According to Serdeczny et al. (2017), “East Africa is at higher risk of flooding and concurrent health impacts and infrastructure damages. West Africa is projected to experience severe impacts on food production, including through declines in oceanic productivity, with severe risks for food security and negative repercussions for human health and employment. South Africa sees the strongest decrease in precipitation with concurrent risks of drought”.40
If we consider both the major impacts of climate change on SSA and the need to achieve energy access whilst mitigating climate change, renewable energies seem the most suitable sources to achieve a sustainable and modern energy access (SDG 7.1). Another possible trade-off after that between energy access and climate mitigation (SDG 13) is the one between climate policy and energy prices. Indeed, climate policies can negatively impact energy access by increasing energy prices. Climate mitigation policies are projected to result in higher electricity prices in all SSA with higher increases in regions with large shares of fossil fuels in their electricity mix.41 Within SSA mitigation policy will increase electricity price by 40 percent in southern Africa, due to natural gas dependency (especially in Angola, Mozambique and Tanzania). In western and central Africa price is projected to increase by 35 percent by 2030 due to a mix of natural gas and hydro in the energy mix. Eastern Africa has the highest share of generation from RES and therefore the lowest price increase.
Against this background and because of the lower carbon intensity of RES, low carbon electricity generation should be further exploited in SSA. This could give a contribution to the achievement of SDG 7.1 with considerable climate co-benefits (SDG 13) and water consumption advantages (SDG 6). Natural gas is among the less carbon intensive fossil fuel sources and is largely available in SSA. The renewable-gas paradigm should therefore be encouraged. Such a paradigm would cut by half SSA utilization of coal in electricity production and would represent a significant step to ensure a sustainable energy access in SSA.42 Alike IEA 2010 projections, under the IEA New Policies Scenario around 70 percent
34 Pachauri et al., 2013 35 Dagnachew, 2018: p. 363; IEA, 2011 36 Dagnachew, 2018: p. 363 37 See the REMIND and WITCH models 38 Calvin et al, 2016: p. 114-115 39 Serdeczny et al., 2017: p. 1591 40 Idem: p. 1596 41 Dagnachew, 2018: p. 363 42 The paradigm would consist in: i) a decrease of coal from 53% to 24% of the mix; ii) an increase of gas from 9% to 25%; iii) an increase of renewables (excluding hydro) from 2% to 16%. Alloisio et al., 2017, p: 11-15

294
of the population in SSA will have access to electricity in 2040, while this rate raises to 83 percent under the African Century Scenario. However, IEA projections in SSA are not in line with SDG 7.1 target of universal energy access, and more investment in technological innovation is needed.43 According to Pachauri et al. (2013) USD 19 – 40 billion44 investment per year will need to occur in SSA.
5. Technological innovation, water saving and energy efficiency
Decision makers in developing countries are examining efficient, environmentally sound, climate-friendly energy options that reduce the climate risk profile of their energy industries and deliver substantial development benefits. There are no blueprint solutions, nevertheless a number of areas of opportunity for sustainably improving water, energy and climate change mitigation exist. These include opportunities for improving water use efficiency in the energy sector, such as for example:
1) Increasing the use of renewable energies for electricity production, e.g. geothermal energy which is unaffected by climate variability and has a limited water footprint.45
2) Shifting from fossil fuels to renewable energy, e.g. photovoltaic for water desalination.46
3) Enhancing off-grid systems (e.g. mini-grids based on hydro, solar, and wind) mostly stand-alone systems (based on solar) in remote and low-density settlements would play an important role in reaching the poorest and isolated populations (the so-called “last-mile” challenge).
4) Switching from kerosene to electric lighting that could reduce related climate impacts due to avoided black carbon emissions.
5) Increasing resource productivity, e.g. water productivity in ethanol production has increased by 30 percent over the past decade.
6) Developing multi-use reservoirs, which could increase the total water use efficiency of hydropower as compared to traditional dams for power generation only.
7) Reducing freshwater demand in energy production by using marginal water, e.g. brackish water.
6. Conclusions
The increase in emissions from providing universal access to electricity is negligible relative to global emissions, and it barely influences global climate change. Moreover, climate mitigation policy could offset the projected increase, due to efficiency improvements and a shift to low-carbon energy sources.47 Furthermore, RES generation technologies based on off-grid systems are becoming increasingly competitive with fossil fuel-based energy systems. This provides an opportunity for developing countries, and in particular SSA - one of the regions with the highest rate of energy poors - to achieve energy access, decarbonize the electricity system and avoid fossil fuel lock-in over the long term.48 The exacerbation of climate change with negative consequences on energy security and water availability can provide new opportunities for overcoming lock-in and facilitating integrated resource planning in SSA. A comprehensive integrated resource planning based on the WEF nexus would help in managing trade-offs and could maximize co-benefits among multiple
43 This estimation rises to more than USD 2 trillion between 2014 and 2040 in the African Century Scenario, which has a focus on energy alleviation vs. a lower cumulative total investment of around USD 1.2 trillion between 2014 and 2040 as projected in the New Policies Scenario. IEA 2014: p 222 44 In 2005 USD 45 See case study on the role of geothermal energy in Kenya. UNESCO 2014: p. 16 46 See case study on desalination in the Gulf Cooperation Countries. UNESCO 2014: p. 147. 47 Dagnachew, 2018: p. 365 48 Idem
295
sectors, guaranteeing a sustainable use of natural resources and contribute to diminishing costs. Technological innovation is needed for increasing resource productivity, and investments that lock development into non-sustainable pathways must be strictly avoided. Ad-hoc solutions for sustainably and affordably improving water, energy and climate change mitigation exist in SSA region. A coherent mitigation policy based on national resource endowments, and an adaptation strategy that balances the risk of inaction with the risk of adapting to climate change in the wrong way, together with careful consideration of all interrelated aspects of the WEF nexus, are pivotal for any suitable energy and climate policy in SSA and all the developing world.49
References
Alloisio, Isabella, Jacopo Bonan, Carlo Carraro, Marinella Davide, Manfred Hafner, Simone Tagliapietra, Massimo Tavoni. “Energy Poverty Alleviation and its Consequences on Climate Change Mitigation and African Economic Development”. Policy Brief 2/2017, Milan, FEEM, 2017
Anand, P.B. (Ed.). “Scarcity, Entitlements and the Economics of Water in Developing Countries”. Northampton: Edward Elgar, 2007 (ISBN 978 1 843767688)
Bazilian, Morgan, Patrick Nussbaumer, Hans-Holger Rogner, Abeeku Brew-Hammond, Vivien Foster, Shonali Pachauri, Eric Williams, et al.. “Energy access scenarios to 2030 for the power sector in sub-Saharan Africa”, Utilities Policies, Vol. 20 (1) (March 2012): 1-16
https://doi.org/10.1016/j.jup.2011.11.002
Bonan, Jacopo, Stefano Pareglio, Massimo Tavoni. “Access to modern energy: a review of barriers, drivers and impacts”. FEEM Working Paper 2016.068, Milan: FEEM, 2016
Bosello, Francesco, Marinella Davide, Isabella Alloisio. “Economic Implications of EU Mitigation Policies: Domestic and International Effects”. FEEM Working Paper 2016.034, Milan: FEEM, 2016
Calvin, Katherine, Shonali Pachauri, Enrica De Cian, Ioanna Mouratiadou. “The effect of African growth on future global energy, emissions, and regional development”. Climatic Change 136 (2016): 109–125 DOI 10.1007/ s10584-013-0964-4
Chakravarty Shoibal and Tavoni Massimo. “Energy poverty alleviation and climate change mitigation: Is there a trade off?”. Energy Economics 40 (1) (2013): S67–S73
Cervigni Guido, et al. (Eds). “Enhancing the Climate Resilience of Africa’s Infrastructure. The Power and Water Sectors”. Washington: World Bank & AFD, 2015
Dagnachew, Anteneh G., Paul L. Lucas, Andries F. Hof, Detlef P. van Vuuren. “Trade-offs and synergies between universal electricity access and climate change mitigation in Sub-Saharan Africa”. Energy Policy 114 (2018): 355-366 https://doi.org/10.1016/j.enpol.2017.12.023
Escribano, Alvaro, J.Luis Guasch, Jorge Pena. “Assessing the Impact of Infrastructure Constraints on Firm Productivity in Africa”. Working Paper 9, Africa Infrastructure Sector Diagnostic, Washington D.C: World Bank, 2009
FAO. The state of the world’s land and water resources for food and agriculture (SOLAW) – Managing systems at risk. Rome, Food and Agriculture Organization of the United Nations and London: Earthscan, 2011
Henri Claude and Laurence Tubiana. Earth at Risk: Natural Capital and the Quest for Sustainability. New York: Columbia University Press, 2018 ISBN 9780231162524
Holger Hoff. “Understanding the Nexus. Background Paper for the Bonn 2011 Conference: The Water, Energy and Food Security Nexus”. Stockholm: Stockholm Environment Institute (SEI), 2011.
International Energy Agency. “Energy Poverty – How to Make Modern Energy Access Universal? World Energy Outlook 2010”. OECD/IEA: Paris, 2010
International Energy Agency. “World Energy Outlook 2011”. OECD/IEA: Paris, 2011
International Energy Agency. “World Energy Outlook 2013”. OECD/IEA: Paris, 2013
49 Cervigni G. et al., 2015
296
International Energy Agency. “Africa Energy Outlook. World Energy Outlook Special Report”, IEA/OECD: Paris, 2014
International Energy Agency. "CO2 Emissions from Fuel Combustion (2015)". OECD/IEA: Paris, 2015 International Energy Agency. “World Energy Outlook 2016”. IEA/OECD: Paris, 2016 International Energy Agency. “World Energy Outlook 2017, Special Report on Energy Access”,
IEA/OECD: Paris, 2017 Intergovernmental Panel on Climate Change. “Climate Change and Water”. Technical Paper VI. Bates B,
Kundzewicz ZW, Wu S, Palutikof J (eds). IPCC, 2008
IPCC. “Special Report of the IPCC on Renewable Energy Sources and Climate Change Mitigation. Prepared by Working Group III of the Intergovernmental Panel on Climate Change”. O. Edenhofer, R. Pichs-Madruga, Y. Sokona, K. Seyboth, P. Matschoss, S. Kadner, T. Zwickel, et al. (eds.). Cambridge University Press, Cambridge, United Kingdom and New York, NY, USA: 2012 (ISBN 978-1-107-02340-6)
International Renewable Energy Agency. “Renewable Capacity Statistics 2018”. IRENA, Abu Dhabi, 2018
Karekezi, Stephan, Susan McDade, Brenda Boardman, John Kimani. “Energy, Poverty and Development”. In Global Energy Assessment (GEA) - Toward a Sustainable Future. pp. 151-190. Cambridge and New York, Cambridge University Press, and the International Institute for Applied Systems Analysis, Laxenburg, 2012
Martin, William J., Roger I. Glass, John M. Balbus, Francis S. Collins. “A Major Environmental Cause of Death”. Science 334, Issue 6053 (October 2011): 180–181 doi: 10.1126/science.1213088
Pachauri, Shonali, Bas J van Ruijven, Yu Nagai, Keywan Riahi, Detlef P van Vuuren, Abeeku Brew-Hammond, Nebojsa Nakicenovic. “Pathways to achieve universal household access to modern energy by 2030”. Environmental Research Letters, Volume 8, Number 2 (May 2013) doi:10.1088/1748-9326/8/2/024015
Pittock, Jamie, Karen Hussey, and Stephen Dovers (Eds.). Climate, Energy and Water: Managing Trade-offs, Seizing Opportunities. Cambridge: Cambridge University Press, 2015. doi: 10.1017/CBO9781139248792.
Rockstrom J., M. Falkenmark, T. Allan, C. Folke, L. Gordon, A. Jägerskog, M. Kummu, M. Lannerstad, M. Meybeck, D. Molden et al. “The unfolding water drama in the Anthropocene: towards a resilience-based perspective on water for global sustainability”. Ecohydrology 7 (2014): 1249–1261. doi: 10.1002/eco.1562
Schmidt, Jeremy. Water: Abundance, Scarcity, and Security in the Age of Humanity. New York: New York University Press, 2017. ISBN: 978-1-4798-4642-9
Serdeczny, Olivia, Sophie Adams, Florent Baarsch, Dim Coumou, Alexander Robinson, William Hare, Michiel Schaeffer, et al. “Climate change impacts in Sub-Saharan Africa: from physical changes to their social repercussions”. Regional Environmental Change. 17 (2017): 1585–1600. doi: 10.1007/s10113-015-0910-2.
Stickler, Morten and Knut T. Alfredsen. “Anchor ice formation in streams: a field study. Hydrological Prosesses”. Vol. 23, Issue 16 (30 July 2009) https://doi.org/10.1002/hyp.7349
Swatuk, Larry A. and Corinne Cash (Eds). Water, Energy, Food and People Across the Global South. ‘The Nexus’ in an Era of Climate Change, International Political Economy Series. London and New York: Palgrave McMillan, 2018. ISBN 978-3-319-64023-5 https://doi.org/10.1007/978-3-319-64024-2
UNDESA. World Population Prospects, the 2012 Revision. New York, Population Division, United Nations Department of Economic and Social Affairs, UNDESA: New York, 2013
UNDP. “Access to Energy and Human Development”. Amie Gaye. Human Development Report 2007/2008. Fighting climate change: Human solidarity in a divided world. Human Development Report Office occasional paper. UNDP 2007/25. UNDP: New York, 2007
UNDP. “UNDP Human Development Indicators Report 2009”. United Nations Development Programme. UNDP: New York, 2009
UNESCO. “The United Nations World Water Development Report 2014. Facing the Challenges”. WWDR 2014, Vol. 2, 2014
World Bank. “Beyond Scarcity. Water Security in the Middle East and North Africa”. World Bank Group: Washington D.C., 2018. ISBN: 978-1-4648-1144-9
World Economic Forum. “Water Security: The Water-Food-Energy-Climate Nexus”. The World Economic Forum Water Initiative. D. Waughray (Ed.). Washington D.C.: Island Press, 2011

297
AN INDICATOR OF ENERGY VULNERABILITY: EVIDENCE FROM ITALIAN REGIONS Alessandro FioriniAlessandro Federici, Corinna Viola ENEA, Unit-Department for Energy Efficiency, Lab. Monitoring Energy Efficiency Policies Overview In the last years, a growing number of studies have explored the influence of climate change on the environment and human beings from different perspectives. The magnitude of the economic impact of climate-related disasters registered worldwide has increased from around USD 500 million in the 1970s to USD 10 billion in the 2010s (Coronese et al. 2019). The consequences of these extreme events as deforestation, loss of biodiversity and increase of the concentration of pollutions are causing depletion of natural resources with irreversible trends in some areas of the planet. There is evidence that the effects of chronic environmental changes have also impact on several aspects of human well-being: job loss, income reduction, increase of social inequalities, mental and physical illness (Simpson et al. 2011, Hanewinkel et al. 2013).
Figure 1 - The doughnut economics framework
Source: Exctract from Raworth (2017)
More generally, it is highlighted that heavily polluted areas have a greater number of patients with chronic pulmonary and heart diseases. Worldwide, in 2016 indoor and outdoor air pollution caused about 7 million deaths, or about one in eight of the deaths globally (EPHA 2020).1 Recently, the COVID-19 pandemic is shifting the focus to the connection between climate change and the spread of new infectious diseases. Rising temperatures, varying rainfall levels and deforestation can lead to the displacement of species in areas with better climatic conditions but populated by human beings, with a consequent increased risk of virus spillover (WWF 2020; WHO 2020).
1 See also data provided by the WHO Global Health Obseravtory (GHO): https://www.who.int/gho/
298
Human life hinges on natural systems. People’s well-being depends on the maintenance of fundamental needs to lead a dignified life (food, water, health, education, income, personal security, etc.) subject to a sustainable exploitation of natural resources. These aspects have been effectively formalised in the "doughnut economics” framework, an economic paradigm developed in the last decade, in attempt to overcome the limitations of the gross domestic product as concept and measure of wealth (Figure 1). According to the scheme in Raworth (2017), the “doughnut of social and planetary boundaries” approach states that a sustainable and inclusive development model reconciles the achievement of minimum standards for social well-being (social foundation), mainly coherent with the Sustainable Development Goals (SDG) of the United Nations Agenda 2030, subject to a maximum level of pressure on the ecological systems, say an “ecological ceiling” (Raworth 2017). A point above the ecological ceiling is characterised by a non-sustainable overshooting that brings the system to a condition of environmental degradation and poor regeneration capacity. Conversely, any point below the social foundation is characterised by critical deprivations for humanity such as poverty, prevalence of social unbalances, lack of civil and political rights, etc. The connection among the building-blocks of the ceiling and the floor are countless. The great acceleration of recent decades has led to exceeding the external limit of the ecological ceiling for several of the aspects considered (Steffen, et al. 2007), while the lower climate-altering emissions recorded in the first months of 2020, because of lockdown measures put in place to curb the effects of COVID-19, have partially reduced the pressure on the ecosystem. At the same time, mortality, and morbidity rates of almost the entire global populations have deteriorated.2 The resulting stagnation of economic activities have spurred unemployment and caused income reduction. The need to support preventive measures have reduced and altered the distribution of public resources among policy subjects related to social protection. These impacts may hit with more severity the groups of population with socio-economic disadvantages, exacerbating social disparities. Energy is a fundamental component of the equilibria within a regenerative and redistributive economy, as long as it is produced and consumed according to the energy sufficiency paradigm. It turns out that people’s ability to access affordable and modern energy services, shortly energy poverty, is the global challenge that bring together several aspects of the inner circle of the doughnut economics. Energy poverty is a worldwide structural problem. The European Union is a frontrunner in undertaking initiatives to alleviate the problem. The 3rd Energy Package, issued in 2009, already called Member States to “take appropriate measures to protect final customers” (in the context of energy market liberalisation) and “define the concept of vulnerable customers which may refer to energy poverty”.3 A critical review of selected works of the growing literature on the topic reveals a focus on setting up a flexible definition of energy poverty and formalise it for the quantification of the share of population involved (Pachauri and Spreng 2011; González-Eguino 2015; Thomson et al. 2017; Sareen et al. 2020). However, is not emerging a prevailing approach. This is also due to the evidence that the phenomenon is highly shaped by context-specific heterogeneities making the analysis hardly replicable (Bhide and Rodríguez-Monroy 2011; Awan et al. 2013; Faiella and Lavecchia 2015; Papada and Kaliampakos 2016; Aristondo and Onaindia 2018a; Aristondo and Onaindia 2018b; Quishpe Sinailin et al. 2019; Selçuk et al. 2019). This leads to describe the multiple aspects of the phenomenon by pinpointing ex-post attributes of households that fall into the perimeter drawn by the specific definition adopted. Conversely, a comparable effort has not been spent so far on building a systematic understanding of the connection between ex-ante energy vulnerability factors and the occurrence of a condition in which “household lacks a socially and materially necessitated level of energy services in the home”
2 See data and analysis provided by the Coronavirus Resource Center of the John Hopkins University and Medicine: https://coronavirus.jhu.edu/data/mortality 3 Directive 2009/72/EC; Directive 2009/73/EC.
299
(Bouzarovski 2014; Bouzarovski and Petrova 2015; Robinson et al. 2018). In this work the latter approach is considered a more correct interpretation of the phenomenon, for two reasons. First, it ascribes to households’ vulnerability determinants the origin of the multifaceted nature of energy poverty. Second, reinforces its interpretation as the occurrence of prevalent risk factors. This is the framework in which the research need is identified, and the contribution of this work is placed. The research question is answered by testing two underlying assumptions,following the rationale behind the methodology proposed by Comboni et al. (2020) and similar analysis proposed in Robinson et al. 2018: (i) a vulnerability metric must be shaped as a function of the risk to fall into energy poverty; (ii) the bridge between vulnerability and energy poverty must be designed as the connection between an ex-ante (potential) risk condition and an ex-post (realised) phenomenon. This study contributes to filling the research gap introducing a new indicator of regional vulnerability towards energy poverty combining a micro (households) and macro (regional context) level of analysis. The novelty is also represented by the specific list of variables considered and the specific application to Italian regions. The indicator synthetises the intensity of risk associated to micro-founded socio-economic factors and macro systemic determinants. Method Along the lines of the research branch on multidimensional analysis of energy poverty (Nussbaumer et al. 2012, Okushima 2017; Castaño-Rosa et al. 2019; Gouveia et al. 2019; Betto et al. 2020), and similarly to Scarpellini et al. (2015), Primc et al. (2019), and Camboni et al. (2020), the empirical method consists of three steps. First, a set of m variables relevant for the assessment of household’s energy vulnerability (X) is identified. Variables do not include expenditure by energy-related classes of good and services to avoid overlaps with the variables used for the construction of the energy poverty indicators and are grouped in seven dimensions: personal characteristics of households’ components; housing characteristics; economic condition; availability of basic home appliances; availability of ICT devices; availability of energy carriers; availability of energy and utilities services. In step two, categories or range of n values assumed by each of the m variables are turned into a risk measure proportional to the estimated parameters in m simple logit models between an energy poverty indicator and each variable:
(1) logit energy poverty 𝛼 𝑋 ⋯ 𝛼 𝑋 𝜖 [Step1-Simple logit]
given 𝑋 , … , 𝑋 the n distinct categories or range of values assumed by the variable Xi, with i=1,…,m. The measure is bounded between 0 and 1, where the extremes are assigned to the categories/range of values associated with the lowest and highest level of energy vulnerability, respectively:
(2) 𝑋 → 𝐻 𝑓 𝛼 ∈ 0,1 given 𝐻 , … , 𝐻 the full set of m variables at household level, rescaled according to formula in (2).
The selected energy poverty measure is the LIHC-type indicator designed for the Italian National Energy and Climate Plan (NECP), developed in Faiella and Lavecchia (2015). In step two, the full set of variables, rescaled according to Formula 2 is regressed against the probability to lie under the energy poverty threshold. Again, the formal model is the logit.
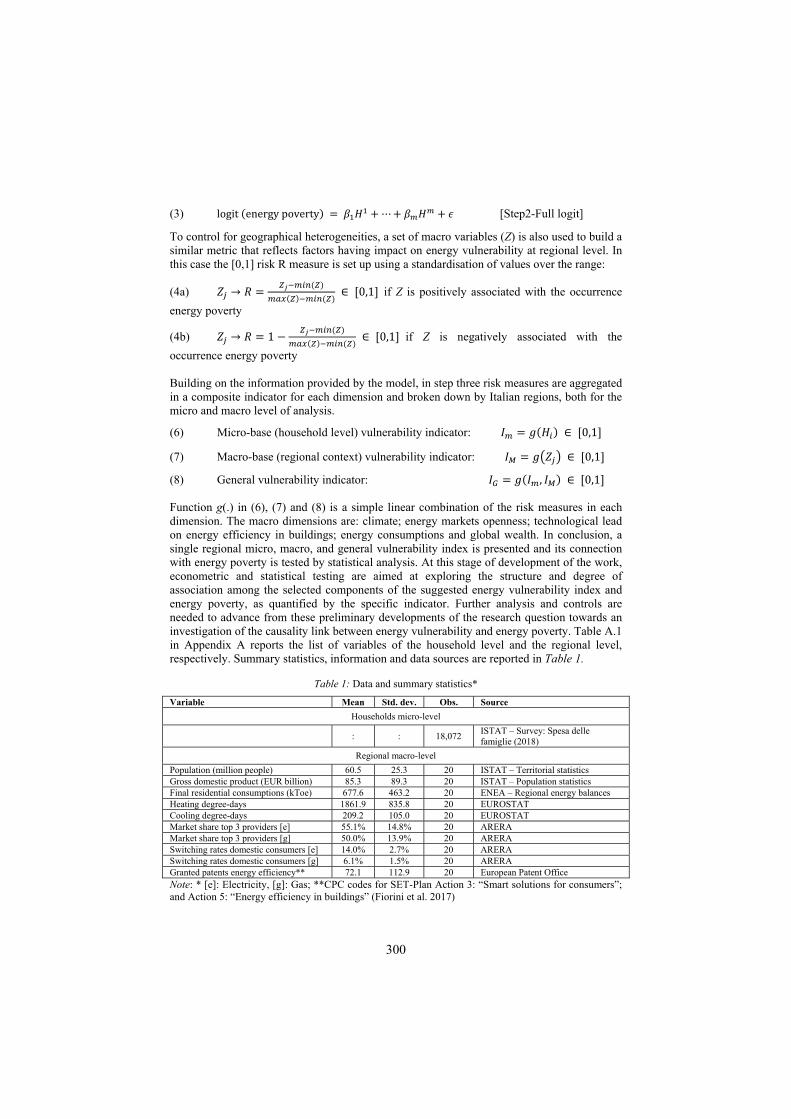
300
(3) logit energy poverty 𝛽 𝐻 ⋯ 𝛽 𝐻 𝜖 [Step2-Full logit]
To control for geographical heterogeneities, a set of macro variables (Z) is also used to build a similar metric that reflects factors having impact on energy vulnerability at regional level. In this case the [0,1] risk R measure is set up using a standardisation of values over the range:
(4a) 𝑍 → 𝑅 ∈ 0,1 if Z is positively associated with the occurrence
energy poverty
(4b) 𝑍 → 𝑅 1 ∈ 0,1 if Z is negatively associated with the
occurrence energy poverty Building on the information provided by the model, in step three risk measures are aggregated in a composite indicator for each dimension and broken down by Italian regions, both for the micro and macro level of analysis.
(6) Micro-base (household level) vulnerability indicator: 𝐼 𝑔 𝐻 ∈ 0,1
(7) Macro-base (regional context) vulnerability indicator: 𝐼 𝑔 𝑍 ∈ 0,1
(8) General vulnerability indicator: 𝐼 𝑔 𝐼 , 𝐼 ∈ 0,1 Function g(.) in (6), (7) and (8) is a simple linear combination of the risk measures in each dimension. The macro dimensions are: climate; energy markets openness; technological lead on energy efficiency in buildings; energy consumptions and global wealth. In conclusion, a single regional micro, macro, and general vulnerability index is presented and its connection with energy poverty is tested by statistical analysis. At this stage of development of the work, econometric and statistical testing are aimed at exploring the structure and degree of association among the selected components of the suggested energy vulnerability index and energy poverty, as quantified by the specific indicator. Further analysis and controls are needed to advance from these preliminary developments of the research question towards an investigation of the causality link between energy vulnerability and energy poverty. Table A.1 in Appendix A reports the list of variables of the household level and the regional level, respectively. Summary statistics, information and data sources are reported in Table 1.
Table 1: Data and summary statistics*
Variable Mean Std. dev. Obs. Source
Households micro-level
: : 18,072 ISTAT – Survey: Spesa delle famiglie (2018)
Regional macro-level
Population (million people) 60.5 25.3 20 ISTAT – Territorial statistics Gross domestic product (EUR billion) 85.3 89.3 20 ISTAT – Population statistics Final residential consumptions (kToe) 677.6 463.2 20 ENEA – Regional energy balances Heating degree-days 1861.9 835.8 20 EUROSTAT Cooling degree-days 209.2 105.0 20 EUROSTAT Market share top 3 providers [e] 55.1% 14.8% 20 ARERA Market share top 3 providers [g] 50.0% 13.9% 20 ARERA Switching rates domestic consumers [e] 14.0% 2.7% 20 ARERA Switching rates domestic consumers [g] 6.1% 1.5% 20 ARERA Granted patents energy efficiency** 72.1 112.9 20 European Patent Office Note: * [e]: Electricity, [g]: Gas; **CPC codes for SET-Plan Action 3: “Smart solutions for consumers”; and Action 5: “Energy efficiency in buildings” (Fiorini et al. 2017)

301
Results Sign and magnitude of the estimated parameters in Step1-Simple logit shown in Table 2 meet the expectations and give comparable results with other works cited in literature review.4 Notice that for some variables the parameters are not significantly different from zero. This is the case of categories 1-3 in the heating type variable (HV3) and 1-3 in year of construction (HS1). This result led to exclude variable HV3 from the Step2-Full logit, since three categories out of four are not significant. Variable HS1 is conversely kept in the model since it is a proxy, although imperfect, of the energy efficiency performance of the building. The output of the Step2-Full logit shows that the (logit of the) probability to fall into energy poverty has a strong positive link with risks associated to all the determinants under the first dimension (Table 2). In case of age of household’s head and her/his nationality the parameter is respectively 0.83 and 0.85. Number of components is also a relevant factor in explaining the exposure to energy poverty. Gender of the household’s head exhibits a weak significance. Differently from the findings in other works (European Parliament 2019), the Step1-Simple logit does not reflect relative advantages for male households’ heads (Table A.2-Appendix A).5 The interaction term between gender and number of underaged children is positive although weakly significant at 10%. The economic condition of the family is also a relevant predictor of the probability to face energy deprivation. Financial soundness plays a preeminent role. The working condition of the household’s head accounts for a 0.74 of a 1% logit probability formalised by the model. Significant deviations are also explained by the income utilisation.
Table 2 - Output of the Step2-Full logit model Variable Estimated
parameter Significance
level (#) Robust standard
error Age of the household’s head 0.8294 *** 0.1922 Number of components 0.7437 * 0.3001 Nationality of the household’s head 0.8515 *** 01399 Interaction term: Sex of the household’s head×Number of underage children 1.0667 - 0.7046 Maximum level of education in household 0.6494 *** 0.171 Tenure type 0.4032 *** 0.098 Working condition of the household’s head 0.7449 *** 0.1736 Income sources in the household 1.6105 *** 0.32 Economic condition of the household 0.523 ** 0.1579 Income utilisation 0.4718 *** 0.1311 Availability of basic devices 0.6373 ** 0.2642 Availability of ICT appliances -0.4029 * 0.2444 Connection to the ICT network 0.6198 *** 0.1208 Availability of electricity and gas 0.4301 * 0.2176 Type of heating fuel 0.8657 *** 0.2052 Availability of ventilation, air conditioning and cooling 0.1809 ** 0.0905 Year of construction of the building 0.4149 ** 0.1598 Square meters per household’s component 1.1463 *** 0.3209
Pseudo R-squared 0.1326 Test-statistics 746.39 *** Log pseudo-likelihood -2587.4421
#***: p-value<0.01; **: p-value∈ [0.01, 0.05); *: p-value∈ [0.05, 0.1); -: p-value=0.1
4 The list of risk weights assigned to each variable considered in the model are reported in Table A.2. in Appendix A 5 According to the rule in formula (2) the highest level of exposure is assigned to the category “male”, despite the parameters in the Step1-Simple logit indicate comparable effects of the two categories on the energy poverty.
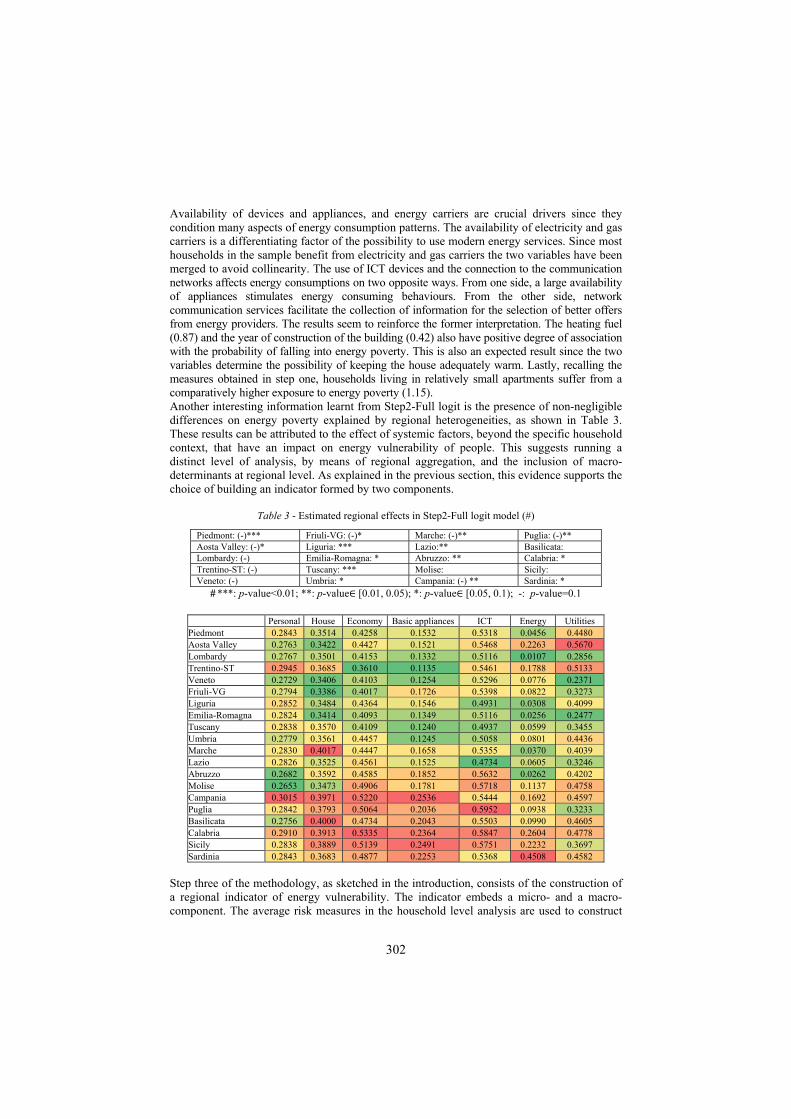
302
Availability of devices and appliances, and energy carriers are crucial drivers since they condition many aspects of energy consumption patterns. The availability of electricity and gas carriers is a differentiating factor of the possibility to use modern energy services. Since most households in the sample benefit from electricity and gas carriers the two variables have been merged to avoid collinearity. The use of ICT devices and the connection to the communication networks affects energy consumptions on two opposite ways. From one side, a large availability of appliances stimulates energy consuming behaviours. From the other side, network communication services facilitate the collection of information for the selection of better offers from energy providers. The results seem to reinforce the former interpretation. The heating fuel (0.87) and the year of construction of the building (0.42) also have positive degree of association with the probability of falling into energy poverty. This is also an expected result since the two variables determine the possibility of keeping the house adequately warm. Lastly, recalling the measures obtained in step one, households living in relatively small apartments suffer from a comparatively higher exposure to energy poverty (1.15). Another interesting information learnt from Step2-Full logit is the presence of non-negligible differences on energy poverty explained by regional heterogeneities, as shown in Table 3. These results can be attributed to the effect of systemic factors, beyond the specific household context, that have an impact on energy vulnerability of people. This suggests running a distinct level of analysis, by means of regional aggregation, and the inclusion of macro-determinants at regional level. As explained in the previous section, this evidence supports the choice of building an indicator formed by two components.
Table 3 - Estimated regional effects in Step2-Full logit model (#)
Piedmont: (-)*** Friuli-VG: (-)* Marche: (-)** Puglia: (-)** Aosta Valley: (-)* Liguria: *** Lazio:** Basilicata: Lombardy: (-) Emilia-Romagna: * Abruzzo: ** Calabria: * Trentino-ST: (-) Tuscany: *** Molise: Sicily: Veneto: (-) Umbria: * Campania: (-) ** Sardinia: *
# ***: p-value<0.01; **: p-value∈ [0.01, 0.05); *: p-value∈ [0.05, 0.1); -: p-value=0.1
Personal House Economy Basic appliances ICT Energy Utilities Piedmont 0.2843 0.3514 0.4258 0.1532 0.5318 0.0456 0.4480 Aosta Valley 0.2763 0.3422 0.4427 0.1521 0.5468 0.2263 0.5670 Lombardy 0.2767 0.3501 0.4153 0.1332 0.5116 0.0107 0.2856 Trentino-ST 0.2945 0.3685 0.3610 0.1135 0.5461 0.1788 0.5133 Veneto 0.2729 0.3406 0.4103 0.1254 0.5296 0.0776 0.2371 Friuli-VG 0.2794 0.3386 0.4017 0.1726 0.5398 0.0822 0.3273 Liguria 0.2852 0.3484 0.4364 0.1546 0.4931 0.0308 0.4099 Emilia-Romagna 0.2824 0.3414 0.4093 0.1349 0.5116 0.0256 0.2477 Tuscany 0.2838 0.3570 0.4109 0.1240 0.4937 0.0599 0.3455 Umbria 0.2779 0.3561 0.4457 0.1245 0.5058 0.0801 0.4436 Marche 0.2830 0.4017 0.4447 0.1658 0.5355 0.0370 0.4039 Lazio 0.2826 0.3525 0.4561 0.1525 0.4734 0.0605 0.3246 Abruzzo 0.2682 0.3592 0.4585 0.1852 0.5632 0.0262 0.4202 Molise 0.2653 0.3473 0.4906 0.1781 0.5718 0.1137 0.4758 Campania 0.3015 0.3971 0.5220 0.2536 0.5444 0.1692 0.4597 Puglia 0.2842 0.3793 0.5064 0.2036 0.5952 0.0938 0.3233 Basilicata 0.2756 0.4000 0.4734 0.2043 0.5503 0.0990 0.4605 Calabria 0.2910 0.3913 0.5335 0.2364 0.5847 0.2604 0.4778 Sicily 0.2838 0.3889 0.5139 0.2491 0.5751 0.2232 0.3697 Sardinia 0.2843 0.3683 0.4877 0.2253 0.5368 0.4508 0.4582
Step three of the methodology, as sketched in the introduction, consists of the construction of a regional indicator of energy vulnerability. The indicator embeds a micro- and a macro-component. The average risk measures in the household level analysis are used to construct
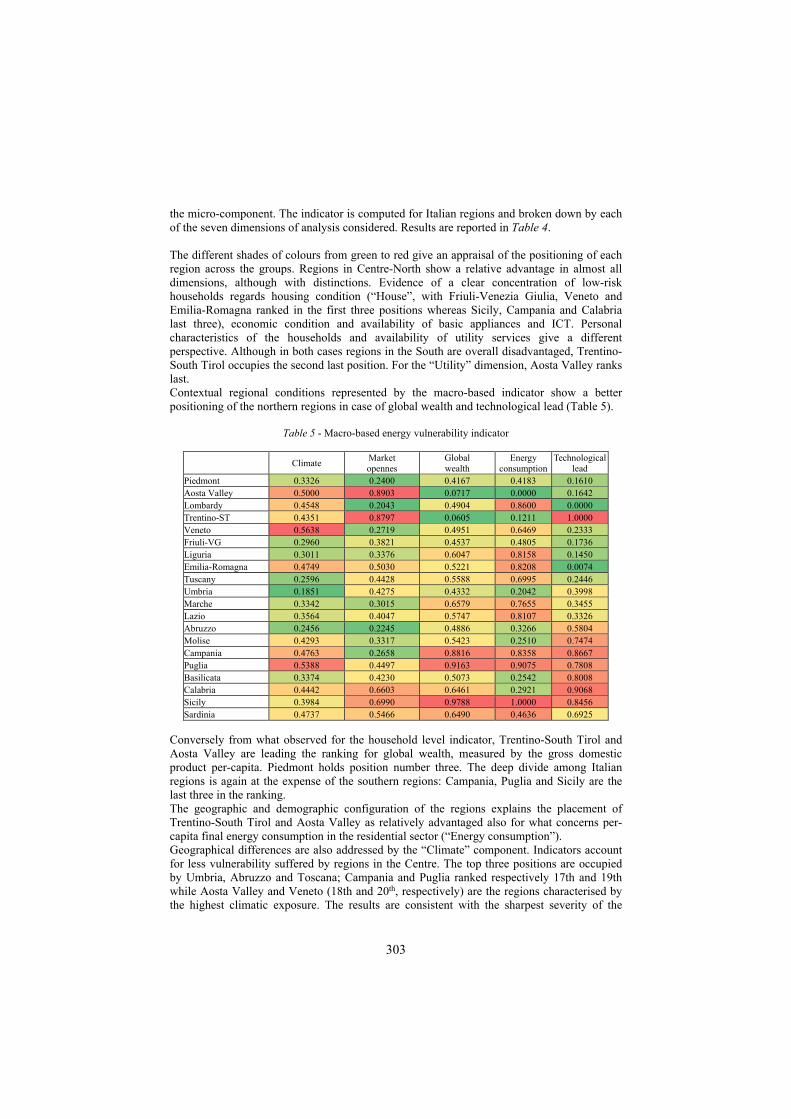
303
the micro-component. The indicator is computed for Italian regions and broken down by each of the seven dimensions of analysis considered. Results are reported in Table 4. The different shades of colours from green to red give an appraisal of the positioning of each region across the groups. Regions in Centre-North show a relative advantage in almost all dimensions, although with distinctions. Evidence of a clear concentration of low-risk households regards housing condition (“House”, with Friuli-Venezia Giulia, Veneto and Emilia-Romagna ranked in the first three positions whereas Sicily, Campania and Calabria last three), economic condition and availability of basic appliances and ICT. Personal characteristics of the households and availability of utility services give a different perspective. Although in both cases regions in the South are overall disadvantaged, Trentino-South Tirol occupies the second last position. For the “Utility” dimension, Aosta Valley ranks last. Contextual regional conditions represented by the macro-based indicator show a better positioning of the northern regions in case of global wealth and technological lead (Table 5).
Table 5 - Macro-based energy vulnerability indicator
Climate
Market opennes
Global wealth
Energy consumption
Technological lead
Piedmont 0.3326 0.2400 0.4167 0.4183 0.1610 Aosta Valley 0.5000 0.8903 0.0717 0.0000 0.1642 Lombardy 0.4548 0.2043 0.4904 0.8600 0.0000 Trentino-ST 0.4351 0.8797 0.0605 0.1211 1.0000 Veneto 0.5638 0.2719 0.4951 0.6469 0.2333 Friuli-VG 0.2960 0.3821 0.4537 0.4805 0.1736 Liguria 0.3011 0.3376 0.6047 0.8158 0.1450 Emilia-Romagna 0.4749 0.5030 0.5221 0.8208 0.0074 Tuscany 0.2596 0.4428 0.5588 0.6995 0.2446 Umbria 0.1851 0.4275 0.4332 0.2042 0.3998 Marche 0.3342 0.3015 0.6579 0.7655 0.3455 Lazio 0.3564 0.4047 0.5747 0.8107 0.3326 Abruzzo 0.2456 0.2245 0.4886 0.3266 0.5804 Molise 0.4293 0.3317 0.5423 0.2510 0.7474 Campania 0.4763 0.2658 0.8816 0.8358 0.8667 Puglia 0.5388 0.4497 0.9163 0.9075 0.7808 Basilicata 0.3374 0.4230 0.5073 0.2542 0.8008 Calabria 0.4442 0.6603 0.6461 0.2921 0.9068 Sicily 0.3984 0.6990 0.9788 1.0000 0.8456 Sardinia 0.4737 0.5466 0.6490 0.4636 0.6925
Conversely from what observed for the household level indicator, Trentino-South Tirol and Aosta Valley are leading the ranking for global wealth, measured by the gross domestic product per-capita. Piedmont holds position number three. The deep divide among Italian regions is again at the expense of the southern regions: Campania, Puglia and Sicily are the last three in the ranking. The geographic and demographic configuration of the regions explains the placement of Trentino-South Tirol and Aosta Valley as relatively advantaged also for what concerns per-capita final energy consumption in the residential sector (“Energy consumption”). Geographical differences are also addressed by the “Climate” component. Indicators account for less vulnerability suffered by regions in the Centre. The top three positions are occupied by Umbria, Abruzzo and Toscana; Campania and Puglia ranked respectively 17th and 19th while Aosta Valley and Veneto (18th and 20th, respectively) are the regions characterised by the highest climatic exposure. The results are consistent with the sharpest severity of the
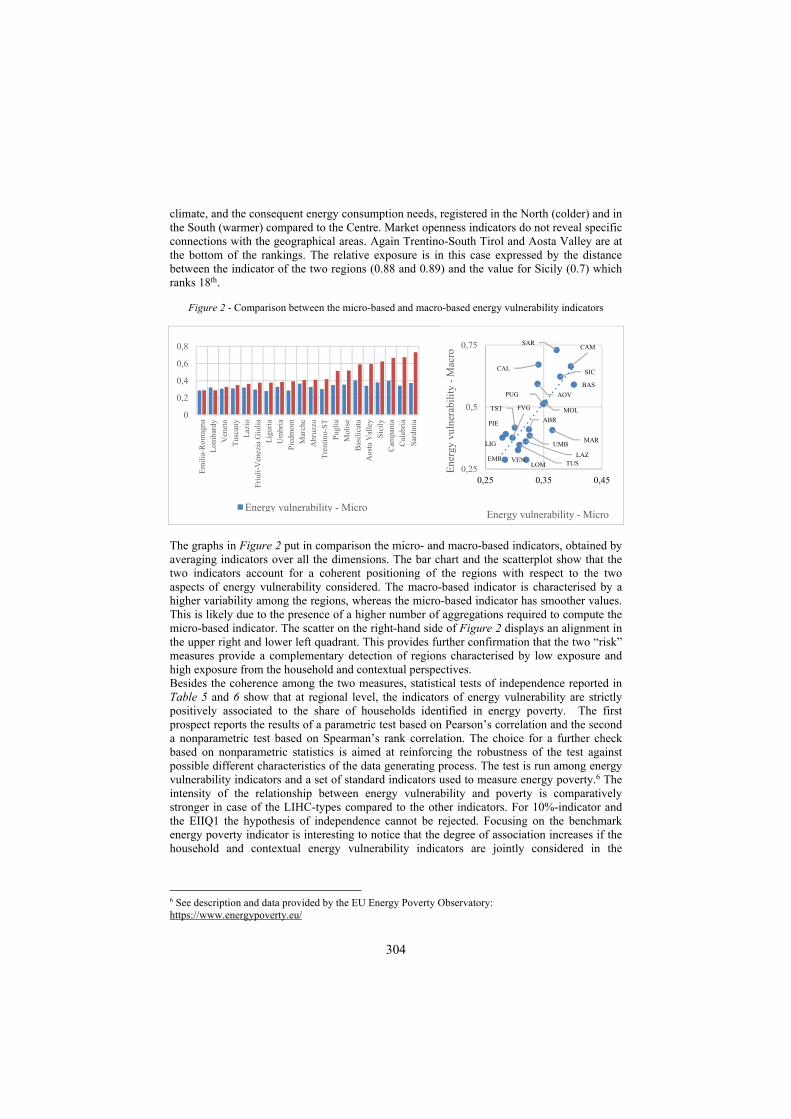
304
climate, and the consequent energy consumption needs, registered in the North (colder) and in the South (warmer) compared to the Centre. Market openness indicators do not reveal specific connections with the geographical areas. Again Trentino-South Tirol and Aosta Valley are at the bottom of the rankings. The relative exposure is in this case expressed by the distance between the indicator of the two regions (0.88 and 0.89) and the value for Sicily (0.7) which ranks 18th.
Figure 2 - Comparison between the micro-based and macro-based energy vulnerability indicators
The graphs in Figure 2 put in comparison the micro- and macro-based indicators, obtained by averaging indicators over all the dimensions. The bar chart and the scatterplot show that the two indicators account for a coherent positioning of the regions with respect to the two aspects of energy vulnerability considered. The macro-based indicator is characterised by a higher variability among the regions, whereas the micro-based indicator has smoother values. This is likely due to the presence of a higher number of aggregations required to compute the micro-based indicator. The scatter on the right-hand side of Figure 2 displays an alignment in the upper right and lower left quadrant. This provides further confirmation that the two “risk” measures provide a complementary detection of regions characterised by low exposure and high exposure from the household and contextual perspectives. Besides the coherence among the two measures, statistical tests of independence reported in Table 5 and 6 show that at regional level, the indicators of energy vulnerability are strictly positively associated to the share of households identified in energy poverty. The first prospect reports the results of a parametric test based on Pearson’s correlation and the second a nonparametric test based on Spearman’s rank correlation. The choice for a further check based on nonparametric statistics is aimed at reinforcing the robustness of the test against possible different characteristics of the data generating process. The test is run among energy vulnerability indicators and a set of standard indicators used to measure energy poverty.6 The intensity of the relationship between energy vulnerability and poverty is comparatively stronger in case of the LIHC-types compared to the other indicators. For 10%-indicator and the EIIQ1 the hypothesis of independence cannot be rejected. Focusing on the benchmark energy poverty indicator is interesting to notice that the degree of association increases if the household and contextual energy vulnerability indicators are jointly considered in the
6 See description and data provided by the EU Energy Poverty Observatory: https://www.energypoverty.eu/
0
0,2
0,4
0,6
0,8
Em
ilia
-Rom
agna
Lom
bard
y
Ven
eto
Tus
cany
Laz
io
Friu
li-V
enez
ia G
iuli
a
Lig
uria
Um
bria
Pie
dmon
t
Mar
che
Abr
uzzo
Tre
ntin
o-S
T
Pug
lia
Mol
ise
Bas
ilic
ata
Aos
ta V
alle
y
Sic
ily
Cam
pani
a
Cal
abri
a
Sar
dini
a
Energy vulnerability - Micro
EMRLOM
VEN TUSLAZ
FVG
LIG UMB
PIE
MAR
ABR
TST
PUG
MOL
BAS
AOV
SIC
CAM
CAL
SAR
0,25
0,5
0,75
0,25 0,35 0,45
Ene
rgy
vuln
erab
ilit
y -
Mac
ro
Energy vulnerability - Micro
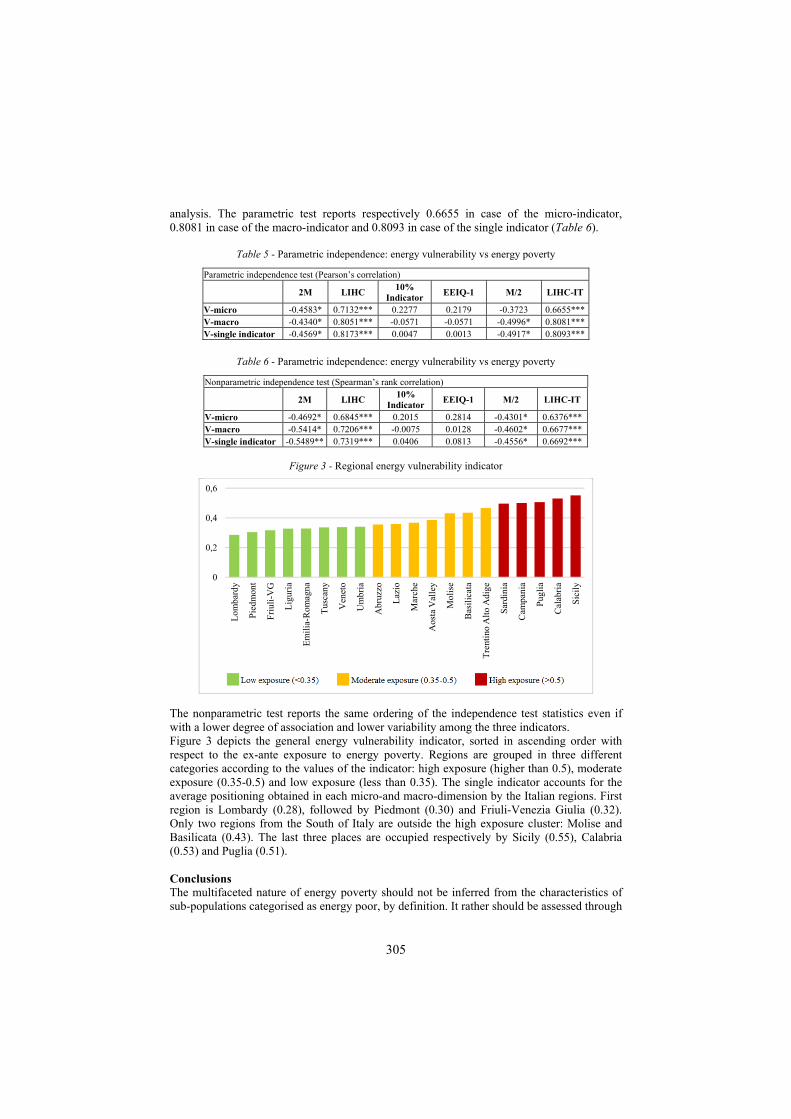
305
analysis. The parametric test reports respectively 0.6655 in case of the micro-indicator, 0.8081 in case of the macro-indicator and 0.8093 in case of the single indicator (Table 6).
Table 5 - Parametric independence: energy vulnerability vs energy poverty
Parametric independence test (Pearson’s correlation)
2M LIHC 10%
Indicator EEIQ-1 M/2 LIHC-IT
V-micro -0.4583* 0.7132*** 0.2277 0.2179 -0.3723 0.6655*** V-macro -0.4340* 0.8051*** -0.0571 -0.0571 -0.4996* 0.8081*** V-single indicator -0.4569* 0.8173*** 0.0047 0.0013 -0.4917* 0.8093***
Table 6 - Parametric independence: energy vulnerability vs energy poverty
Nonparametric independence test (Spearman’s rank correlation)
2M LIHC 10%
Indicator EEIQ-1 M/2 LIHC-IT
V-micro -0.4692* 0.6845*** 0.2015 0.2814 -0.4301* 0.6376*** V-macro -0.5414* 0.7206*** -0.0075 0.0128 -0.4602* 0.6677*** V-single indicator -0.5489** 0.7319*** 0.0406 0.0813 -0.4556* 0.6692***
Figure 3 - Regional energy vulnerability indicator
The nonparametric test reports the same ordering of the independence test statistics even if with a lower degree of association and lower variability among the three indicators. Figure 3 depicts the general energy vulnerability indicator, sorted in ascending order with respect to the ex-ante exposure to energy poverty. Regions are grouped in three different categories according to the values of the indicator: high exposure (higher than 0.5), moderate exposure (0.35-0.5) and low exposure (less than 0.35). The single indicator accounts for the average positioning obtained in each micro-and macro-dimension by the Italian regions. First region is Lombardy (0.28), followed by Piedmont (0.30) and Friuli-Venezia Giulia (0.32). Only two regions from the South of Italy are outside the high exposure cluster: Molise and Basilicata (0.43). The last three places are occupied respectively by Sicily (0.55), Calabria (0.53) and Puglia (0.51). Conclusions The multifaceted nature of energy poverty should not be inferred from the characteristics of sub-populations categorised as energy poor, by definition. It rather should be assessed through
0
0,2
0,4
0,6
Lom
bard
y
Pie
dmon
t
Fri
uli-
VG
Lig
uria
Em
ilia
-Rom
agna
Tus
cany
Ven
eto
Um
bria
Abr
uzzo
Laz
io
Mar
che
Aos
ta V
alle
y
Mol
ise
Bas
ilic
ata
Tre
ntin
o A
lto
Adi
ge
Sar
dini
a
Cam
pani
a
Pug
lia
Cal
abri
a
Sic
ily
306
the complex set of personal, socio-economic, and contextual drivers that define their status. The paper presents a vulnerability index designed to capture this heterogeneity. The methodology is suitable to summarise the ex-ante multifaceted nature of vulnerability with respect to energy needs faced by Italian households and traceable in Italian regions. Vulnerability meaning the combined effect of factors that have impact on the exposure to energy poverty. The results of the analysis suggest important highlights for policy purposes, useful to adjust the target identification problem faced by policy makers in designing tailored measures. First, the impact of some traits of households’ energy vulnerability makes explicit what to address and what is the expected outcome. The exacerbation of economic hardship, inequalities based on gender and nationality, and educational divide likely increase the share of energy poverty, so must be taken as priorities in the identification of target groups and in the selection of measures. Second, the consequences in terms of energy poverty associated with an increased vulnerability concerning the building condition, availability of basic appliances, energy carriers as well as the heating fuel utilised at home suggest that the benefits of an effective deep renovation of the housing stocks and ad hoc incentive schemes would be more than proportional to the cost undertaken. Based on the measure proposed in this study, energy vulnerability is another front in which the substantial divide between North and South of Italy is reflected. In the final ranking, first place (low exposure) is occupied by Lombardy, the first Italian region in terms of economic output. Piedmont, and Friuli-Venezia Giulia follow in the second and third place, whereas at the bottom of the ranking lie Puglia, Calabria and Sicily. The best positioning among the southern regions is obtained by Molise and Basilicata, located in the moderate exposure group. This information coupled with the observed relative importance played by the drivers of the economic condition at household level reinforce the view that the energy poverty phenomenon is a consequence of peculiar features that define people’s energy patterns but is also strictly related to the drivers of poverty in general. It turns out that a focus on energy vulnerability is the cornerstone for designing a long-term strategy that strikes the balance between economic growth and sustainability, from one side, and economic growth and attenuation of social differences from the other side. Avenues for future development of the study are concentrated in the pursuit of a more adequate calculation method for the energy vulnerability indicator. The transformation of the indicator in a multidimensional metric of the risk to fall into energy poverty requires additional analysis. First, the causal link between ex-ante energy vulnerability and energy poverty must explored in depth and with higher level of detail. Digging into these elements allows improving the interpretation of the energy vulnerability indicator as a probability measure and strengthening the relationship with the ex-post occurrence of energy poverty. Moreover, the set of variables must be consolidated trying to check additional solutions that increase the capacity to capture specific aspects of the complexity of the phenomenon. Above all, extending the number and type of interactions among variables, as checked for gender of the household’s head and number of underaged children. References Aristondo, O. and Onaindia, E. (2018a) “Counting energy poverty in Spain between 2004 and 2015”,
Energy Policy, 113(2018): 420-429. Aristondo, O. and Onaindia, E. (2018b) “Inequality of energy poverty between groups in Spain”, Energy,
153(2018): 431-442. Awan, R.U.; Sher, F. and Abbas, A. (2013) “An Investigation of Multidimensional Energy Poverty in
Pakistan”, Pakistan Development Review, 52(4I): 405-419. Betto, F.; Garengo, P. and Lorenzoni, A. (2020) “A new measure of Italian hidden energy poverty”,
Energy Policy, 138(2020): 111237. Bhide, A. and Rodríguez-Monroy, C. (2011) “Energy poverty: A special focus on energy poverty in India
and renewable energy technologies”, Renewable and Sustainable Energy Reviews 15(2): 1057-1066.
307
Bouzarovski, S. (2014) “Energy poverty in the European Union: Landscapes of vulnerability”, WIREs: Energy and Environment, 3(2014): 276-289.
Bouzarovski, S. and Petrova, S. (2015) “A global perspective on domestic energy deprivation: Overcoming the energy poverty-fuel poverty binary”; Energy Research and Social Science, 10(2015): 31-40.
Camboni, R.; Corsini, A.; Miniaci, R. and Valbonesi, P. (2020) “Mapping fuel poverty risk at the municipal level: A Small-Scale Analysis of Italian Energy Performance Certificate, Census and Survey data”, Marco Fanno Working Papers 202, dSEA, University of Padua.
Castaño-Rosa, R.; Solís-Guzmán, J.; Rubio-Bellido, C. and Marrero, M. (2019) “Towards a multiple-indicator approach to energy poverty in the European Union: A review”, Energy and Buildings, 193(2019): 36-48
Coronese, M.; Lamperti, F.; Keller, K.; Chiaromonte, F. and Roventini, A. (2019) “Evidence for sharp increase in the economic damages of extreme natural disasters” PNAS Proceedings of the National Academy of Sciences of the United States of America; 116(43): 21450-21455.
EPHA (2020) “Coronavirus threat greater for polluted cities”, European Public Health Alliance, 1 March 2020: https://epha.org/coronavirus-threat-greater-for-polluted-cities/.
European Parliament (2019) “Women, Gender Equality and the Energy Transition in the EU”, Policy Department for Citizens' Rights and Constitutional Affairs Directorate General for Internal Policies of the Union, PE 608.867, May 2019.
Fiorini A; Georgakaki A; Pasimeni F and Tzimas E. (2017) “Monitoring R&I in Low-Carbon Energy Technologies”, JRC Science for Policy Report, EUR 28446 EN, Publications Office of the European Union, Luxembourg.
Technologies. EUR 28446 EN. doi: 10.2760/447418. Faiella, I. and Lavecchia, L. (2015) “Energy Poverty in Italy”, Politica Economica 31(1): 27-76. González-Eguino, M. (2015) “Energy poverty: An overview”. Renewable and Sustainable Energy
Reviews, 47(2015): 377-385. Gouveia, J.P.; Palma, P. and Simoes, S.G. (2019) “Energy poverty vulnerability index: A
multidimensional tool to identify hotspots for local action”; Energy Reports, 5(2019): 187-201 Hanewinkel, M.; Cullmann, D.A.; Schelhaas, M.-J.; Nabuurs, G.-J. and Zimmermann, N.E. (2012)
“Climate change may cause severe loss in the economic value of European forest land”, Nature Climate Change, 3(2013): 203-207.
Nussbaumer, P.; Bazilianb, M. and Modic, V. (2012) “Measuring energy poverty: Focusing on what matters”, Renewable and Sustainable Energy Reviews, 16(1): 231-243.
Okushima, S (2017) “Gauging energy poverty: a multidimensional approach”, Energy, 137 (2017): 1159-1166.
Pachauri, S. and Spreng, D. (2011) “Measuring and monitoring energy poverty”, Energy Policy, 39(12), 7497-7504.
Papada, L. and Kaliampakos, D. (2016) “Measuring energy poverty in Greece”. Energy Policy, 94(2016): 157-165.
Primc, K., Slabe-Erker, R. and Majcen, B. (2019) “Constructing energy poverty profiles for an effective energy policy”, Energy Policy, 128(2019): 727-734.
Quishpe Sinailin, P.; Taltavull de La Paz, P. and Juárez Tárraga, F. (2019) “Energy poverty in Ecuador”, Sustainability, 11, 6320.
Raworth, K. (2017) “Doughnut economics: Seven ways to think like a 21st century economist”, Chelsea Green Publihing, Windsor, USA.
Robinson, C.; Bouzarovski, S. and Lindley, S. (2018) “Multiple vulnerabilities? Interrogating the spatial distribution of energy poverty measures in England” in Simcock, N.; Thomson, H.; Petrova, S. and Bouzarovski, . (Eds.) “Energy Poverty and Vulnerability: A Global Perspective, Chapter 9, Routledge, London, UK.
Sareen, S.; Thomson, H.; Tirado Herrero, S.; Gouveia, J.P.; Lippert, I.; Lis, A. (2020) “European energy poverty metrics: Scales, prospects and limits”, Global Transitions, 2(2020): 26-36
Scarpellini, S.; Rivera-Torres, P. Suárez-Perales, I. and Aranda-Usón, A. (2015) “Analysis of energy poverty intensity from the perspective of the regional administration: Empirical evidence from households in southern Europe”, Energy Policy, 86(2015), 729-738.
Selçuk, I.Ş.; Gölçek, A.G. and Köktaş, A.M. (2019): “Energy Poverty in Turkey”, Sosyoekonomi, 27(42): 283-299.

308
Simpson, D.M.; Weissbecker, I. and Septhon, S.E. (2011) “Extreme weather-related events: Implications for mental health and well-being”. In Weissbecker, I. (Eds) “Climate Change and Human Well-being: Global Challenges and Opportunities”, Chapter 4, Springer, New York, USA.
Steffen, W.; Crutzen, P.J and McNeill, J.R. (2007) "The Anthropocene: Are humans now overwhelming the great forces of nature", AMBIO: A Journal of the Human Environment, 36(8): 614-621.
Thomson, H.; Bouzarovski, S. and Snell, C. (2017) “Rethinking the measurement of energy poverty in Europe: A critical analysis of indicators and data”, Indoor and Built Environment, 26(7), 879-901.
WHO (2020) “Zoonotic disease: emerging public health threats in the Region”, World Health Organization, Regional Office for the Eastern Mediterranean: http://www.emro.who.int/fr/about-who/rc61/zoonotic-diseases.html
WWF (2020) “Pandemie, effetto boomerang della distruzione degli ecosistemi” Marzo 2020 - https://d24qi7hsckwe9l.cloudfront.net/downloads/biodiversita_e_pandemie_31_3.pdf
Appendix A.
Table A.1 - Variables and values in the micro
Micro dimension 1: Personal characteristics of components [PC]
Age H [PC1]
Components [PC2]
Children (underaged) [PC3]
Maximum level of education in HH [PC4]
Tenure type [PC5]
Sex H [PC6]
Nationality H [PC7]
1: <35 1: 1 1: 0 None Tenant/Sub. Male Italian 2: 35-54 2: 2 2: 1 Primary Owner Female Not italian 3: 55-64 3: 3 3: 2 Second, 1st Usufruct 4: 65-74 4: 4 4: 3 Second, 2nd Free use 5: 75+ 5: 5+ 5: 4 University+ 6: 5+
Micro dimension 2: Economic condition [EC]
Work H [EC1]
Income source HH [EC2]
Current condition HH [EC3]
Income use [EC4]
1: Employed 1: Employer income 1: Good 1: Savings >0 2: In search of first occupation 2: Self-employer income 2: Adequate 2: Savings=0 3: Unemployed/In search of new occupation 3: Pension 3: Inadequate 3: Savings<0 4: House-keeper 4: Allowance 4: Insufficient 5: Student 5: Rent (real estate assets) 6: Retired 6: Rent (financial assets)
Micro dimension 3, 4: Availability of basic appliances and ICT devices [BA], [IC]
Fridge [BA1]
Fixed telephone line [IC1]
Mobile phones/person [IC3]
PC/person [IC4]
TV/person [IC5]
1: Yes 1: Yes 1: <1 1: <1 1: <1 2: No 2: No 2: [1-2) 2: [1-2) 2: [1-2) Washing machine [BA2]: Internet connection [IC2] 3: 2+ 3: 2+ 3: 2+ 1: Yes 1: Yes 2: No 2: No Dishwasher [BA3] 1: Yes 2: No
Micro dimension 5: Heating, cooling and ventilation [HV]
Heating [HV1]
Hot water [HV2]
Heating type [HV3]
Heating fuel [HV4]
Hot water type [HV5]
VAC [[HV6]]
1: Yes 1: Yes 1: Centralised 1: Network gas 1: Electric 1: Yes 2: No 2: No 2: In-home 2: Kerosene 2: Gas 2: No 3: Teleheating 3: Gas tank 3: Heating system 4: Single appliance 4: Biomass 4: Solar panel 5: Electricity 6: Solar panel (continued)

309
Micro dimension 6: Housing
Building’s year of construction [HS1] Square meters/component [HS2] Years since living in the house [HS3] 1: <1900 1: <10 1: <5 2: 1900-1949 2: [10 – 20) 2: [5-10) 3: 1950-1959 3: [20-30) 3: [10-15) 4: 1960-1969 4: [30-40) 4: [15-20) 5: 1970-1979 5: [40-60) 5: 20+ 6: 1980-1989 6: [60-100) 7:1990-1999 7: 100+ 8: 2000-2009 9: After 2009 Macro dimensions: Dimension: Variable: Association with energy poverty Climate Heating degree-days Positive Climate Cooling degree-days Positive Markets openness Market share top 3 electricity and gas providers Positive Markets openness Switching rates domestic electricity and gas consumers Negative Global wealth Gross domestic product per-capita Negative Energy consumption Residential final energy consumption per-capita Negative
Table A.2 - Risk index assigned to each range of values or categories of the households level variables*
Variable Risk index Variable Risk index PC3-1 Risk index Variable Risk index PC1-1 0.PC0000 PC2-1 0.0000 PC3-2 0.0000 PC4-1 0.0000 PC1-2 0.2008 PC2-2 0.4165 PC3-3 0.1948 PC4-2 0.3853 PC1-3 0.3660 PC2-3 0.6085 PC3-4 0.1848 PC4-3 0.7388 PC1-4 0.6177 PC2-4 0.6888 PC3-5 0.3532 PC4-4 0.6179 PC1-5 1.0000 PC2-5 1.0000 PC3-6 0.2642 PC4-5 1.0000 PC3-1 1.0000 Variable Risk index Variable Risk index Variable Risk index Variable Risk index PC5-1 1.0000 PC6-1 1.0000 EC1-1 0.5022 EC2-1 0.5410 PC5-2 0.0000 PC6-2 0.0000 EC1-2 1.0000 EC2-2 0.4895 PC5-3 0.5811 Variable Risk index EC1-3 0.9168 EC2-3 0.4937 PC5-4 0.8642 PC7-1 0.0000 EC1-4 0.7211 EC2-4 0.7815 PC7-2 1.0000 EC1-5 0.8291 EC2-5 0.0000 EC1-6 0.0000 EC2-6 0.4176 EC2-7 0.9780 EC2-8 0.7752 EC2-9 1.0000 Variable Risk index Variable Risk index Variable Risk index Variable Risk index EC3-1 0.0000 EC4-1 0.0000 BA1-1 0.000 BA3-1 0.000 EC3-2 0.1336 EC4-2 0.7200 BA1-2 1.000 BA3-1 1.000 EC3-3 0.5639 EC4-3 1.0000 Variable Risk index Variable Risk index EC3-4 1.0000 BA2-1 0.000 IC1-1 0.000 BA2-2 1.000 IC1-2 1.000 Variable Risk index Variable Risk index Variable Risk index Variable Risk index IC2-1 0.000 IC3-1 1.0000 IC4-1 1.0000 IC5-1 1.0000 IC2-2 1.000 IC3-2 0.5837 IC4-2 0.5072 IC5-2 0.7541 IC3-3 0.0000 IC4-3 0.0000 IC5-3 0.0000 Variable Risk index Variable Risk index Variable Risk index Variable Risk index HV1-1 1.000 HV3-1 0.1038* HV4-1 0.0000 HV5-1 0.1038 HV1-2 0.000 HV3-2 0.0000* HV4-2 0.2637 HV5-2 0.0000 Variable Risk index HV3-3 0.1215* HV4-3 0.2386 HV5-3 0.1214 HV2-1 1.000 HV3-4 1.0000 HV4-4 0.3628 HV5-4 1.0000 HV2-2 0.000 HV4-5 1.0000 Variable Risk index HV4-6 0.6073 HV6-1 0.0000 HV6-2 1.0000 Variable Risk index Variable Risk index Variable Risk index HS1-1 1.0000* HS2-1 1.0000 HS3-1 0.5040 HS1-2 0.9528* HS2-2 0.8667 HS3-2 0.1782 HS1-3 0.8981* HS2-3 0.6788 HS3-3 0.8563 HS1-4 0.8290 HS2-4 0.5997 HS3-4 1.0000 HS1-5 0.4686 HS2-5 0.4885 HS3-5 0.0000 HS1-6 0.2394 HS2-6 0.2582 HS1-7 0.0205 HS2-7 0.0000 HS1-8 0.0000
Note: *Not significant parameter in the logit model
310
ECONOMIC IMPACT OF GHG COSTS ON THE EU INDUSTRY Agime Gerbeti, President of the Scientific Committee of the AIEE - Italian Association of Energy Economists 1. The transformation of economy and local production
In the past, dozens of industries were born and structured around nuclei of local crafts that had progressively expanded. Steel working in Sheffield in South Yorkshire, England, knife production in Solingen in Germany, cars in Turin and fashion in France, yarn production in Scotland, were many examples of local savoir faire that have become recognizable as brands. However, in the past thirty years, the world has changed to an extent that is unprecedented in the history of humanity. In particular, three events that happen in less than three years have changed humanity's economic and environmental rules with revolutionary consequences:
a. On November 9th, 1989, the government of East Germany announced that visits by its citizens to Federal Germany and West Berlin would be allowed: that is, it declared the failure of that "iron curtain", that divided the world in two economic as well as philosophical and cultural systems;
b. On August 6th, 1991, Tim Berners-Lee invented and published the first website. Thus giving birth to the world wide web phenomenon;
c. From June 3rd to 14th, 1992, the first Earth Summit UNCED1 took place in Rio de Janeiro, which would then lead to commitments against GHG emissions and global warming.
With the fall of communism, emerged a single economic and industrial system that would have rule all relations of a negotiating nature and commercial relations. From then on, all will be characterised on an idem sentire, with a common capitalist lex mercatoria. Once the ideological frontier has been defeated, the world has turned into a global market on which opponents are producers or consumers, winners or losers of the economic challenge. In fact, on 11th December 2001 even the Communist China joined the World Trade Organization (WTO)2.
With the development of the World Wide Web, the competition space of these economic players has become without limits or boundaries, not only in geographical terms but also in terms production and supply’ size. This is not only a factor in the alteration of competition between economic entities, as China's imperious monopolization of the world steel market could be, but it has also changed the same market rules for retail.
In 2000, the Web had 360 million users. In December 2018, it was 4 billion3 and 50% of these were Asian. In 2010, online sales covered a 680 billion dollar market and this year4 will reach 4.2 trillion5. Despite or maybe thanks to the recession, it has been a geometric increase in volume, because presumably goods produced in parts of the world with lower labour, administrative, industrial and energy costs will have lower final prices.
1United Nations Conference on Environment and Development (UNCED) Earth Summit Rio de Janeiro,
Brazil 3-14 June 1992. 2Adhesion far from obvious: the cultural resistances of nationalism to this change were based on the
millennial Chinese autarky and were at least as strong as the western perplexities regarding the real opening of the Asian country to the market.
3 https://hostingfacts.com/internet-facts-stats/ 4 Referring to year 2020. 5 https://www.statista.com/statistics/379046/worldwide-retail-e-commerce-sales/
311
If before the Internet, you wanted to buy goods from the United States or another productive country, you would have to wait for an importer interested in dealing with those good, or someone who already bought that good, in the US market, for a client and sent it to you. It looks like prehistory.
2. No fixed abode
It is in the industrial field that the limits of a regulation structured on the national territorial spaces can be seen. It is precisely in this context, that the ineffectiveness of local rules becomes even more apparent and inadequate to the changing world trade and production.
The economy is changing in an epochal way. Globalization has created a sort of industrial nomadism. Companies taking advantage of robotization, which gradually replaces the specialization of workers, instead of growing human capital internally, they acquire in the market managerial skills of financial and managerial nature. Therefore, companies are no longer interested in the local industrial culture. They are far from being anchored to a specific productive fabric and so, choose from time to time the country that guarantees better production and tax conditions. They move in search of incentives, tax exemptions, jumping from a corporate paradise to a fiscal one, and often ending to emissive paradises, i.e. those territories that have no environmental obligations and limits.
Some argue (OECD, 20106) (Wojciech, 20197) that globalization represents a more effective allocation of resources. It is perhaps closer to the truth, that the competition of labour costs, energy costs, taxation and environmental simplifications leads globalization towards a more economically efficient use of resources.
The possibility of paying workers and energy less or having minimal costs for the exploitation of forests for wood and water in agricultural and industrial processes does not lead to uniformity of rights or environmental protection as to a downward in these issues.
In the globalized market, industries move, so does capital. With the progressive robotization of production, it is not necessary to look for the manual skills, the craftsmanship, the savoir faire of the blue collar, that in the past have made the difference in industrial competition; they can differently hire skilled managers directly in the place chosen for production or on the market. Therefore, companies can choose the best legal system for them where to pay taxes and which market to target. Today, Fiat is no longer in Turin: it is somewhere else between Canada, Italy, the United States and the Netherlands; Amazon acts worldwide but is a company incorporated under US law and in Europe pays taxes in Luxembourg8; Apple, one of the leading US technology manufacturers, produces in China and has no physical stores, apart from a few representative boutiques. Nevertheless, you could indefinitely continue. For example, companies operating in the production of energy move between countries according to the incentives recognized for renewables. If the United States puts tariffs on Chinese products, companies like Nike, Samsung and LG go to produce in Vietnam9 by growing its GDP in 2019 to more than 7%10.
6 OECD. (2010). Measuring Globalisation: OECD Economic Globalisation Indicators. OECD. 7 Wojciech, M. (2019). The delocalisation of production to Poland. Production engineering archives 23,
47-52. 8https://www.theguardian.com/technology/2018/apr/25/from-seattle-to-luxembourg-how-tax-schemes-
shaped-amazon 9https://www.corriere.it/economia/finanza/19_giugno_16/vietnam-crescita-record-yacht-perche-nuova-
frontiera-super-ricchi-7b3f80e0-82e9-11e9-9233-14aa8d8cebf9.shtml 10Source Hanoi General Office of Statistics. Hanoitimes - Economic and Urban Newspaper, Anh Hong
“Vietnam remains promising destination for foreign investors”, Jan 02, 2020.
312
In addition, in the near future, with the improvement of the artificial intelligence of robotic machinery, production will probably be completely outsourced, by renting factories in strategic countries and so, completing a process that is already underway.
In the future, factories will be characterized by such an elastic capacity, that they will be able to convert their car production into mobile or tablet production lines in just a few months. For this, it will be sufficient to re-contractualize the suppliers of raw materials, reformulate the processes and update the software. The rest will be done by the specifications imposed by the manufacturer brand.
3. Circumstantial evidence of company relocation
The relocation of industries is not a feared risk or a future phenomenon, but an ongoing one. It is a complex event in its perimeter for an innumerable series of factors. Today in the global market, in a generalized way, companies are all substantially integrated in procuring raw materials and semi-finished products. If a company, while maintaining its fiscal and operational headquarters in Europe, progressively purchases more advanced semi-finished products, it will have implemented a production relocation equal to the percentage of work completed abroad, without these changes being noticeable by statistics as per specific research.
In the same way, it seems unlikely that questionnaires addressed to companies will reveal a clear desire to do environmental dumping or to relocate for cheaper labour or environmental costs. Nonetheless, an attempt was recently made by Eurostat11 (Sunjka, 2019), with a promise of producing a study in 2021. It shows that the main reason why companies outsource activities outside the EU is linked to the "reduction of labour costs" in 85% of the cases and the "reduction of other costs" in 63%, which can also be related to the costs of regulation, administrative, energy. In addition, it is clear that, in the manufacturing sector outsourcing outside the EU represents the most significant share. Italy holds the record with 63% followed by Germany with 55%, which is in line with the EU average of around 50%. However, while Germany outsources the activities considered core business for 68%, Italy uses outsourcing for 70% for the business support functions and for 39% for ICT. There are also a number of "circumstantial evidences" that creak in the European industrial sector without showing visible signs of the impending split. First of all the relationship between production and consumption must be taken into consideration. If the percentages show a progressive separation, it cannot be deducted that an increasing percentage of consumption is actually delocalized in non-European producer countries. Therefore, with an emissions’ content that is with a good approximation in any case higher of which would have been produced with the purchase of European products. This applies regardless of the environmental costs of transport. By way of example, in 2000 the EU trade balance of goods with China had a deficit of 48 billion euros. For this deficit to grow to € 185 billion in 2018.
A second circumstantial consideration can be deduced from the percentages of world production in goods on the international market. For example, in the ceramic sector, Italy between 2000 and 2018 went from 11% to the current 3% of world production, Spain from 10 to 4% and the other European countries cumulatively from 6 to 3% with a loss of 27 percentage points. China has instead grown from 36 to 50% (Table 1).
11Sunjka, N. (2019) International sourcing and relocation of business functions. EUROSTAT.

313
Country\Year 2000 2018 Italy 11% 3% Spain 10% 4% Other EU 6% 3% Other Europe 5% 5% Nafta 4% 3% Other America 10% 7% China 36% 50% Middle-East 5% 7% India 3% 8% Other Asia 9% 9% Others 1% 1% TOTAL 100% 100%
Table 1. Ceramic tiles - percentage of world production in the year 2000-2018. Source,
Confindustria Ceramica. Studies office 2019.
Being able to extract the real data of a phenomenon, that is so impalpable yet but so devastating for the European economy and for global emissions, is an extremely difficult task. While countries try to put "salt on the tail" forcing companies to comply with environmental rules, these large industrial butterflies fly from flower to flower, nation by nation, looking everywhere for the best offers of establishment and taxation.
The reality is that the power relations have overturned: these companies are able, with their turnover, to alter the GDP of a nation, to affect the popularity of a government that has attracted them and, are able to write laws that are most favourable for them. It is now States, which compete to offer the best industrial conditions and lower taxes.
In this situation, how can states impose environmental standards? How can environmental sustainability obligations be regulated by national or EU law (or by contract as in the case of Ilva Italian steel company) if the failure to fulfil commitments by companies becomes the failure of the governments on itself?
Once, industries, in a visceral relationship of mutual growth, were able to drawn from the territory both resources and professional staff (also defined today with little humanistic connotation as resource). It was normal to think about safeguarding work in the local context or that of preventing industries from polluting, because pollution was perceived and regulated as damage to neighbouring waters, air and to the territory in which the industry operated.
Until the adoption of Directive 2004/35/EC12, environmental issues were regulated with the classic command and control tools, which were implemented within a geographical and legal context through authorizations, technical regulations, impositions of maximum limits on emissions, etc.
In nowadays market, it does not matter where the factory is physically located, but only the quality of goods and the production costs, which are related to raw materials rather than labour costs or environmental and energy commitments.
4. Incentives, markets and taxes
In order to limit GHG emissions in Europe, mandatory commitments in this subject have been taken and several legislative measures have been attempted. 12Directive 2004/35/CE on environmental liability with regard to the prevention and remedying of
environmental damage. The purpose of this Directive is to establish a framework of environmental liability based on the "polluter-pays" principle, to prevent and remedy environmental damage.
314
With the directive 2003/87/EC - in transposition of the Kyoto Protocol - a new form of environmental protection, through the market13, was introduced: the emissions reduction passes through the negotiation of pollution rights, which represent the negative externalities of energy production of industrial processes14.
The environmental markets, formally demonstrated by Baumol and Oates (1971), supported by (Tientenberg 201015) and (Brown 201816) were inspired by Coase's theory17 mainly concerned the energy sector. These markets are characterized by the creation of an "artificial" asset, in form of a pollution right. This asset would have not received any spontaneous economic valorisation from the market if it was not supported by an obligation imposed on the companies for the creation of the relative demand.
The problem is that, in the medium term, environmental markets seem to suffer from the artificiality of the goods traded. Born with the idea of leaving on the obliged subject the decision for greater cost efficiency among the interventions in sustainability or purchasing the corresponding certificates on the market, almost all of them have been replaced by more typically administrative actions. The green certificates have been abandoned and replaced by the direct incentives on production. In in an analogous way the EU ETS18 has been the subject of these legal interventions on the side of the availability of the allowances, functionally to the increase in the prices of permits. Today, it is difficult to recognize the free dynamics of supply and demand within the system. This is to say that the price appears “piloted” albeit the adoption of corrective market instruments such as the reserve and the cancellation of allowances.
The difficulties of these systems are due to a plurality of causes including the short-term inelasticity of demand, not very compatible with the typical dynamics of the market as well as the tumultuous increase in objectives. The interventions that obliged subjects should put in place to comply with the objectives require long-term investments. Instead, in the short term, commitments relate to the purchase and management of allowances are a burden rather than a financial opportunity for companies, especially due to the intrinsic characteristics of the ETS. But above all, the lack of similar impositions on all the players operating in the globalized market has led to competitive asymmetries between those subjected to environmental objectives and international competitors without such obligations.
The concept of State and that of the legal system have their own spatial delimitation within which the legal provisions are effective. Therefore, whenever a production activity is regulated, it refers to a more or less wide territorial area where the factory is physically located.
13M. Clarich, Environmental protection through the market, Diritto pubblico, 2007, 1, pp. 219-40 14Similarly, to what was adopted in the United States with Title IV of the Clean air act amendments of
1990. 15 Tientenberg, T. (2010) Cap and trade: The evolution of an economic Idea. Agricultural and Resource
Economics Review 39/3 page 359–367. 16Brow, J. L. “Environmental economics”, The Editors of Encyclopedia Britannica 2018. URL:
https://www.britannica.com/topic/environmental-economics. Access Date: February 17, 2020 (2018). 17Ronald Coase, "The Problem of Social Cost" (1960). 18The EU ETS operates according to the limitation principle, which ensures that the available quotas have
a value, and the exchange of emissions. A ceiling is set on the total quantity of some greenhouse gases that can be emitted by plants that fall within the system and within this limit; companies receive or buy emission allowances, which, if necessary, they can exchange. At the end of each year, companies must return enough allowances to cover their emissions if they do not want to face fines. If a company reduces its emissions, it can keep unused quotas to cover future needs, or sell them to another company that is short of them. The exchange should create flexibility and ensure that emissions reductions occur when they are cheaper. The price of CO2 should encourage investments in clean and low-emission technologies.
315
This is an asymmetrical competition that does not help the environment because every time the EU loses market share, the same production is replaced by an extra-European production that emits more CO2 per unit of product.
Furthermore, the costs of European decarbonisation impact, in terms of bills, on end customers and largely on industrial customers, affecting the final costs per unit of product. Thus, taking a previous example, in 2017 a meter square of ceramic tiles cost production in the EU was about € 9.15 while in Italy it was € 9.55 and in China € 5.8/m2 only. So the difference was between 9.5 and just under 6 € per meter square: an abyss.
The same goes for steel even the fact that the comparison becomes more articulated according to the different production systems, same applies for paper and hundreds of other products.
Third, from 2000 to 2018 the European Union (28-members) reduced fossil emissions by 16%, the US by approximately 10%. The rest of the world increased its net emissions by 87.33%. In other words, the rest of the world has doubled its emissions in 20 years and even if Europe stopped emitting now, at the end of 2020, in 2025 the rest of the world would have completely compensated these missed European emissions.
Environmental commitments on climate-changing emissions have a cost in terms of fuel switches, from coal to gas, for example, costs in renewable production and increasing costs in the purchase of emission allowances in the mandatory ETS scheme.
The carbon border tax is the latest proposed solution to impose environmental sustainability obligations on businesses and to resolve the lack of competitiveness of European industries on energy and environmental costs. The European Commission has indicated it as a possible solution alongside the institutional duties on taxation and the customs union aiming at achieving the objectives of EU sustainable development.
Some limits of the carbon border tax seem to elude the EU. First of all the EU ETS is a tax on production but the carbon border tax will be set on import. This means that, even if this mechanism works, it could defend the competitiveness of European producers only on European territory. However, outside the borders the EU industries would be outclassed by those companies not subject to environmental limits that do not pay any tax or CO2 allowances or be affected by higher European energy and environmental costs entering the Union.
Furthermore, a carbon border tax could lead the EU to believe that it represents a real shield to protect companies from carbon leakage19 or from environmental dumping risk20 and consequently, eliminate the free allowances21 having unpredictable effects on the industry. Another action, with huge repercussions on EU industry, would be if the EU stimulates and raises the price of CO2 up to unsustainable levels with the tools of the stability reserve and the cancellation of the allowances.
19From the website https://ec.europa.eu/clima/policies/ets/allowances/leakage_it "The transfer of CO2
emissions is a phenomenon that can occur if, for reasons of costs due to climate policies, companies intend to transfer the production in countries where emission limits are less stringent. This could lead to an increase in their total emissions. The risk of transferring CO2 emissions may be higher in some energy-intensive industries".
20From the Treccani Encyclopaedia: "there is talk of environmental dumping, when a company can place goods on the market at lower prices because they are produced at lower costs in countries where there is no legislation for environmental protection."
21On the importance of free allowances for carbon leakage sectors see Clò, S. (2011). Emissions Trading Scheme (ETS) tra Mercato e Regolazione: funzionamento e risultati. Presentation at Ministero dell’Economia e delle Finanze. Roma and Joltreau, E., & Sommerfeld, K. (2018). Why does emissions trading under the EU Emissions Trading System (ETS) not affect firms’ competitiveness? Empirical findings from the literature. CLIMATE POLICY, 453–471.
316
5. Quality, price, sustainability
No environmental friendly behaviour will ever be adopted, unless it is perceived to be economically advantageous. The task of the State is to put in place those conditions that allow useful social behaviours, such as the defence of the environment to become a competitive advantage towards those who do not adopt these behaviours.
Incentives, duties and obligations do not represent these conditions. They deploy their effectiveness only in the proximity and in the presence of the State. If the State does not supervise or continue its incentive actions, the assumptions, that have generated these virtuous behaviours, will fall. On the other hand, if the promotion will be placed not on the objective but on competitive efficacy and on profitability, the conditions under which the most sustainable industrial entity is more competitive on the market can be created: an evolutionary approach to economic sustainability where wins the competition the most sustainable producer.
We need today investments and mechanisms that guarantee the competitiveness of recycled materials, virtuous behaviour, environmental sustainable production and not incentives that compensate just for higher costs of production. Hence, if we want producers to act on the basis of values that are considered indispensable for EU, such as the global lowering of GHG emissions, their products must comply with the expectations of the regulated market. Furthermore, the emissions of these products should be exactly calculated and not on the basis of an average of the country of origin. This is because otherwise, the EU carbon boarder adjustment mechanism would not differ from US duties and companies would functionally move from country to country on the basis of the national emission average, thus hiding their emissions.
For example, with the Charge on emissions22 proposal, the real (carefully accounted) CO2 emissions produced during the manufacture of goods are expected to be enhanced within the VAT, regardless of where the goods were produced. In this way, the price of goods would vary according to the emissions released to manufacture them, making the carbon footprint evident on the one hand, and on the other hand allowing the low emissive products to balance the investments made in renewable sources and energy efficiency (individual or national) and recover competitiveness on the final cost of the asset. In other words, sustainability would be added to the price and quality as a parameter of market competition, not only guaranteeing an industrial advantage for sustainable European industries but globally.
The world has changed both economically and technologically. In response to the objections of those who believe it is impossible to accurately account, verify and trace the CO2 emissions on goods imported into Europe, it was answered (Gerbeti & Catino, 201923) that it is possible to trace the "emissive transactions" with the blockchain tool. If macroeconomic processes seem to escape the regulatory forecast, it should not be forgotten that technology also offers recognizable and reliable solutions.
The charge on emissions (Gerbeti, 201424) represents a mechanism for equalizing environmental costs on products placed on the European market but, at the same time, it
22 Charge on Emissions (Imposta sulle Emissioni Aggiunte) based on the book “CO2 nei beni e competitività industriale europea” (2014) was object of a resolution of the joined Commissions X and XIII, approved at the conclusion of the examination of the deal assigned on competitive asymmetries for European industry deriving from the low energy costs and low environmental standards in non-EU countries, 1st August 2017. Doc. XXIV, n. 79 of the Italian Senate's Joint Commissions Productive Activities and Environment. 23 Gerbeti, A., & Catino, F. (2019). Blockchain E Tracciabilità Delle Emissioni Industriali. Energia, 44-49. 24 Gerbeti, A. (2014). CO2 nei beni e competitività industriale europea. Editoriale delfino. Milano.
317
creates a standard and a stimulus because it does not talk to States which, as seen in the various Conference of the Parties (COP) are reluctant about the adoption of restrictive and internationally valid environmental rules, but speaks directly to industries and proposes a parameter of industrial competition for environmental protection.
In the same way, the right remuneration in every field must be recognized, from efficiency to sustainable work, from production to trade so that. the objectives of the competition turn towards sustainability. Industrial interest must be supported by profitability and not by a generic and circumventable ethical and financial responsibility on the producer25, exactly as it already happens for aluminium, steel, glass in the circular economy.
6. Conclusion The research conducted in this article shows that the relocation of businesses is an ongoing and very complex phenomenon. There are many circumstantial evidences, which reveal that "industrial nomadism" remains a multifactorial phenomenon. To this end, environmental regulation and emission reduction should become the driving force of technological and economic development.
Never before as it is now, the need to find solutions to common problems permeates the entire international community, which is confronted with the freedom of establishment and the search for business income with the freedom that only globalization can give them. Solutions can never be effective if they do not take into account that the paths leading to sustainability must be voluntary, advantageous and competitive.
We should transform environment sustainability into an interest and into a competitive need otherwise there will never be an escape from the dichotomy between environment and subtraction, renunciation; a false opposition that is derailing any climate plan.
It is true that, even in this case, the effectiveness of the burden is only within the regulated market, but in this way, the weight of the tax starts from the production and can be avoided only through virtuous behaviour by lowering the specific emissivity by product in the manufacturing phase.
Therefore, if the market is large enough and the cost imposed per unit of pollutant are adequate to stimulate industrial commitments, an environmental-based industrial standard will be created. Of course, the adjustment of industries outside the regulated market will depend on multiple factors such as, the specific interest in the competitive sale on that market, as well as the local costs of efficiency of the factory, the percentage of production dedicated to that regulated market and the relative loss of competitiveness, and so on.
The adoption of "competitive environmental standards" has a series of advantageous repercussions including the shift of environmental objectives from public to private and, specifically to the commercial sphere; not to be affected by the territorial limitation to which the laws are subject but only by the attractiveness of the regulated market26 . Moreover, it is such an elastic approach that it can be used for other environmental needs: for example to create a standard related to the use of water in industrial production, agricultural sector etc.
25 Article 8 e 8a of Directive 2008/98/CE on waste and modified by Directive 2018/851/CE. 26 If such standards, purely by way of example, were adopted at the national level, they would have a
limited impact, if at the Community level quite another efficacy, if, even from the European and US markets, they would immediately set the world standard.
318
Is it this an instrument, an analysis, a solution that can be adapted to any environmental need? Probably not, but a correct application of this methodology will help to recognize in advance those incentives that only represent a tourist attraction for those “nomadic industries”, without there being investment, innovation and jobs for the target nations.
It would probably help to assess correctly if environmental limits penalize only some companies on the globalized market without a real and generalized increase in overall global sustainability.
Reference Tientenberg, T. (2010) Cap and trade: The evolution of an economic Idea. Agricultural and Resource
Economics Review 39/3 page 359–367. Hong, A. (2020) Vietnam remains promising destination for foreign investors, Hanoitimes - Economic
and Urban Newspaper Jan 02, 2020. Treccani, Dizionario di Economia e Finanza (2012). Pigou, A. C. (1920). The Economics of Welfare. London. Clarich, M. (2007) Diritto pubblico, 2007, 1, pp. 219-40 Coase, R. (1960), The Problem of Social Cost. Risoluzione delle Commissioni riunite X e XIII, approvata a conclusione dell'esame dell'affare assegnato
sulle asimmetrie competitive per l'industria europea derivanti dai bassi costi energetici e dai bassi standard ambientali in Paesi extra-UE, 1° agosto 2017. Doc. XXIV, n. 79 delle Commissioni Riunite del Senato Attività produttive e Ambiente.
Brow, J. L. “Environmental economics”, The Editors of Encyclopedia Britannica 2018. URL: https://www.britannica.com/topic/environmental-economics . Access Date: February 17, 2020 (2018).
Clò, S. (2011). Emissions Trading Scheme (ETS) tra Mercato e Regolazione: funzionamento e risultati. “Emissions Trading Scheme (ETS) tra Mercato e Regolazione: funzionamento e risultati” presentazione al Ministeri dell’Economia e delle Finanze. Roma
Gerbeti, A. (2014). CO2 nei beni e competitività industriale europea. Editoriale delfino. Milano. Gerbeti, A., & Catino, F. (2019). Blockchain E Tracciabilità Delle Emissioni Industriali. Energia, 44-49. Joltreau, E., & Sommerfeld, K. (2018). Why does emissions trading under the EU Emissions Trading
System (ETS) not affect firms’ competitiveness? Empirical findings from the literature. CLIMATE POLICY, 453–471.
OECD. (2010). Measuring Globalisation: OECD Economic Globalisation Indicators. OECD. Wojciech, M. (2019). The delocalisation of production to Poland. production engineering archives 23, 47-52. Colombo, M. G., Franzoni, C., & Veugelers, R. (2015). Going radical: producing and transferring
disruptive innovation. The Journal of Technology Transfer, 40(4), 663-669. Sunjka, N. (2019) International sourcing and relocation of business functions. EUROSTAT. Direttiva 2004/35/CE del Parlamento europeo e del Consiglio del 21 aprile 2004 sulla responsabilità
ambientale in materia di prevenzione e e riparazione del danno ambientale. Legge 349/1986 sull’Istituzione del Ministero dell'ambiente e norme in materia di danno ambientale.
(GU n.162 del 15-7-1986 - Suppl. Ordinario n. 59). https://hostingfacts.com/internet-facts-stats/ https://www.statista.com/statistics/379046/worldwide-retail-e-commerce-sales/ https://www.theguardian.com/technology/2018/apr/25/from-seattle-to-luxembourg-how-tax-schemes-
shaped-amazon https://www.corriere.it/economia/finanza/19_giugno_16/vietnam-crescita-record-yacht-perche-nuova-
frontiera-super-ricchi-7b3f80e0-82e9-11e9-9233-14aa8d8cebf9.shtml
319
OPPORTUNITIES TO ENSURE AFFORDABLE PRICES AND SECURITY OF NATURAL GAS SUPPLY IN BULGARIA FOLLOWING THE COMMITMENTS OF GAZPROM EXPORT BEFORE THE EUROPEAN COMMISSION
Lyubomira Gancheva, Sofia University, ‘St. Kliment Ohridski’, Faculty of Economics and Business Administration Summary: This article presents a study on whether the commitments of Gazprom Export after the end of the EC's anti-trust case against it provide opportunities for Bulgaria to ensure affordable prices and security of natural gas supply. The legal framework and strategic documents of the EU on the formation of the single European energy market are examined, international analyses are studied, statistical data on blue fuel prices in the Union is processed. An empirical study on EU gas prices over the last decade is conducted and the individual approach and results in the Member States concerned are analysed. A proposal strategy is developed and presented, containing a road map with the main priorities, based on transparency, expertise, predictability and continuous improvement. Upon its application the gaps identified during the study would be cleared and the chance for Bulgaria to ensure security of natural gas supply and to achieve the lowest possible delivery gas price would be used to the maximum extent. The material is not connected to and does not build on an existing one. This is a pioneering study, which determines its added value. The aim of the author is to provoke a follow-up expert discussion, which will develop the thesis and will give it sustainability. Keywords: energy security, energy supply, енергийна сигурност, енергийни доставки, dependence on energy resource imports, energy transition, European energy market, anti-monopoly legislation, anti-trust case, Bulgaria, European Commission, Gazprom Export JEL Classification System: Q4 Energy: Q41 (Demand and Supply • Prices), Q43 (Energy and the Macroeconomy), Q48 (Government Policy) Introduction 2020 is a key stage in the development of the European natural gas market. On one hand, for over half a century Russia (formerly the USSR) has supplied the Old Continent with blue fuel on the basis of long-term bilateral contracts (with Austria since 1968, with Germany since 1973 and with Finland since 1974). On the other, Europe is currently at a watershed between the current development of gas supply and consumption and the European plans for the complete transformation of energy sources and consumption. At the moment the European Union (EU) and the Russian Federation are irreversibly interconnected in terms of trade of natural gas. Despite the opposing views on how these relations should develop in the future (caused by the contradictions between the European idea of a Single energy gas market of the Union and the Russian practice for long-term bilateral agreements), neither the EU can quickly and easily switch to another supplier, nor can Russia replace its main customer. It is therefore important to analyse how Union policy and legislation affects the main supplier's actions, its commercial conditions and the selling price. Last but not least, natural gas is amongst the key tools for achieving the goals of the so-called "Energy transition" and the Green Deal, by providing solutions that are: cost-effective, climate-friendly, technologically feasible, environmentally efficient, affordable, reliable and universal. And this is especially important in the context of today's conversation about the future of our planet. In recent decades, the EU has been working to reduce any risk associated with natural gas supplies. For this purpose of a number of policies have been developed and concrete actions have been taken on the basis of the idea of a single energy gas market in the Union. All of them inevitably lead to negotiations to change Russia's export policy. One of Russia's main requirements for natural gas exports is bilateral contractual relations, which ensure long-term stability of demand. This is a successful practice imposed in the
320
1970s and a powerful tool for securing funds for investment in infrastructure expansion and modernization. It is also a workable approach to reducing the risk of gas price volatility. A number of analysts believe that these treaties allow the Russian Federation to use the export of its energy resources both as a way to develop its own economy and as a consolidation of power and as a political and geostrategic tool. The most significant change for Bulgaria under the long-term contract for the supply of natural gas between Bulgargaz EAD and Gazprom Export for the domestic market is expressed in a change of the formula for calculating the delivery price of blue fuel. It is a result of the decision of the European Commission (EC), dated 24.05.2018, in the antitrust case, which the Commission has led since September 2012 against the Russian gas concern on suspicion of abuse of a dominant position. Methodology This paper examines a particular case from the main topic of the future partnership between the European Union and the Russian Federation - the natural gas supply, namely the results of the antitrust case of the EC against Gazprom Export and whether they affect the delivery price and security of supply for Bulgaria. It analyzes the possibility for the country to benefit from the agreement in the case. In addition to the analysis, the paper offers concrete recommendations for a future government strategy in the short and medium term. The significance of this article lies in the fact that the issue of managing a long-term partnership with a strategic natural gas supplier is key to the development of energy, the economy and the overall development of Bulgaria. The strong import dependence on the sole supplier brings the topic of security of supply of blue fuel as a leader in the behavior of our country. The unstable economic environment and high energy poverty in the country in combination with the forthcoming legislative changes in the EU through the prism of the Green Deal require maximum flexibility, expertise, consistency and firmness. The present study aims to answer the following research question:
‘Did Gazprom Export's commitments to the EC in the antitrust case provide opportunities for Bulgaria to ensure affordable price and security of natural gas supply?’
The research question is analytical, the method for its answer is "interpretation of theory". Theoretical formulations are used to analyze an empirical case. The theoretical framework provides arguments that reinforce the variables for evaluating the outcome of the case. Empirical evidence serves as data and is related to the expected model. Before the start of the study the author expects the results of the case to have an impact on the two variables: security of natural gas supply and affordable price of natural gas in Bulgaria. Description of the study 1. Theoretical framework Common European Energy policy With the signing of the Energy Charter Treaty1 in 1994, the EU launched a coordinated approach for security and a coherent Union energy policy. Its ultimate goals are: an integrated European internal energy market, diversification of sources of supply, establishment of stable relations with alternative partners and reviewal of the relations with current suppliers. The 1973 oil crisis, in which the price of crude oil quadrupled, highlighted the risk of Europe's dependence on energy sources. That is why since then European leaders have sought ways to reduce the import dependence on energy resources through national energy strategies and
1 Energy Charter Treaty https://www.energycharter.org/fileadmin/DocumentsMedia/Legal/1994_ECT.pdf

321
programs (such as France's ambitious nuclear program) or through supranational alliances. In the late 1990s, the EU began to shape a coherent energy policy. The 1998 Directive 98/30 / EC492 describes the first concrete steps for a liberalized energy market, with the 1999 European Community Treaty3 of Amsterdam energy policy was added to the activities of the European Community (Article 13). A qualitatively new basis has been created with a single free market as the foundation of the Union's energy policy. These efforts are embodied in the Natural Gas Regulation 715/20094 and the Energy Roadmap 20505. Despite the success achieved in this area, it should be explicitly noted that according to an official information document of the European Parliament, updated before the last elections in 2019: ‘Energy policy is a shared competence of the EU and its Member States’6. EU Energy Strategy Policy The 2007 Treaty of Lisbon7 could be considered to set the first, main and specific strategic goal in the field of energy - the completion of the Union's Internal energy market. But against the backdrop of dozens of working groups, discussions and forums in the European institutions, strategic documents in the field of energy have been lacking in the last century. This trend is changing at the beginning of the 21st century, and the last five years have seen an increase in the frequency and scale of strategies adopted. The main objectives of European energy policy are security and sustainable development of the sector, based on three pillars: security of supply, competitiveness and achieving sustainability. At European level, the main strategic documents in the field of energy are:
- The Framework of the Internal Energy Market, outlined by the three energy packages for market liberalization (from the 1990s, 2003 and 20098);
- The Climate and energy framework until 20209, with a focus on climate change, which has set ambitious long-term goals. In May 2014, the European Energy Security Strategy10 outlined short-term goals and measures to achieve them.
- In October 2014, the EU approved the EU Framework for Climate and Energy 203011, which launches the debate on the future of the Union's energy for the period 2020-2030. It focuses on: further reducing emissions and greenhouse gases (up to 80-95% of pre-1990 levels), reduction of dependence on energy imports, improvement and connectivity of energy infrastructure and energy pricing (especially for natural gas and oil). This document is part of
2 Directive 98/30/EC of the European Parliament and of the Council concerning common rules for the internal market in natural gas https://op.europa.eu/en/publication-detail/-/publication/db658716-b025-4cb7-9235-d24f25578b13/language-en 3 Treaty of Amsterdam amending the Treaty on European Union, the Treaties establishing the European Communities and certain related acts 97/C 340/01 https://eur-lex.europa.eu/legal-content/BG/TXT/?uri=CELEX:11997D/TXT 4 Regulation (EC) 715/2009 of the European Parliament and of the Council on conditions for access to the natural gas transmission networks https://eur-lex.europa.eu/legal-content/EN/TXT/HTML/?uri=CELEX:32009R0715&from=EN 5 Energy Roadmap 2050 https://eur-lex.europa.eu/LexUriServ/LexUriServ.do?uri=COM:2011:0885:FIN:EN:PDF 6 EU policies – Delivering for citizens - Energy supply and security https://what-europe-does-for-me.eu/data/pdf/focus/focus11_en.pdf 7 Treaty of Lisbon https://eur-lex.europa.eu/legal-content/EN/TXT/?uri=CELEX%3A12007L%2FTXT 8 Third Energy Package https://ec.europa.eu/energy/topics/markets-and-consumers/market-legislation/third-energy-package_en 9 Climate & Energy Package 2020 https://ec.europa.eu/clima/policies/strategies/2020_bg 10 European Energy Security Strategy https://www.eesc.europa.eu/resources/docs/european-energy-security-strategy.pdf 11 2030 Climate & Energy Policy Framework https://www.consilium.europa.eu/media/24561/145397.pdf
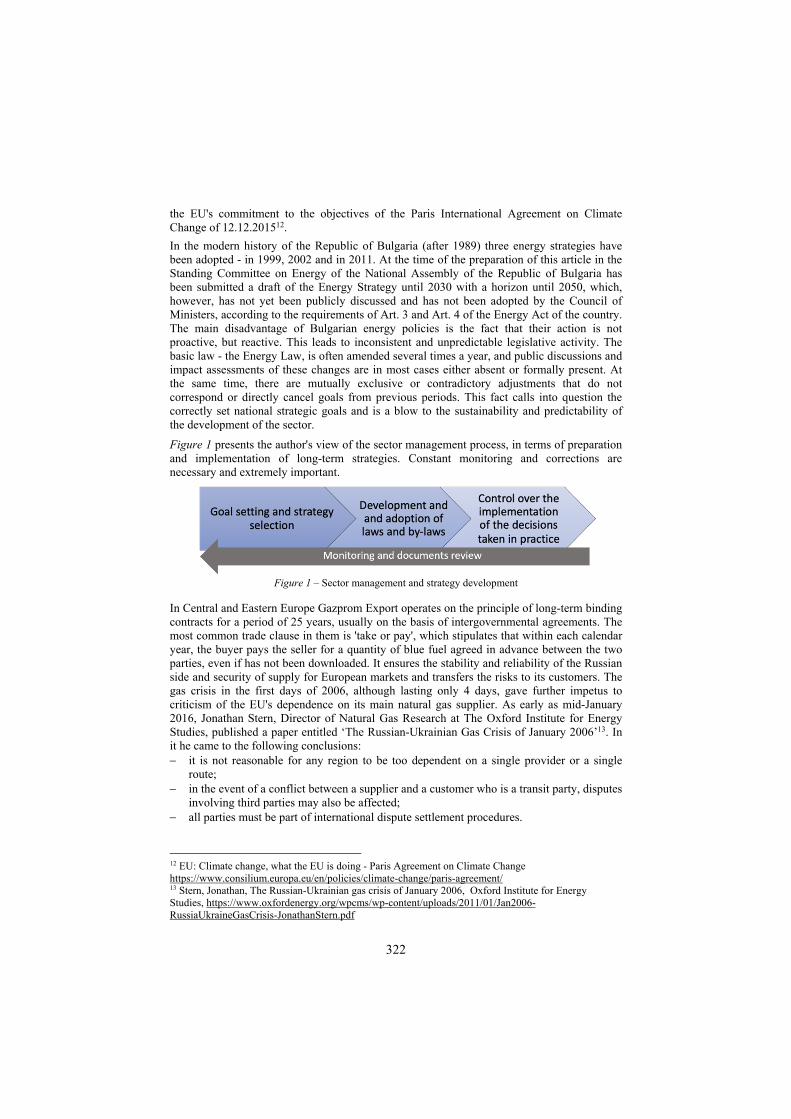
322
the EU's commitment to the objectives of the Paris International Agreement on Climate Change of 12.12.201512.
In the modern history of the Republic of Bulgaria (after 1989) three energy strategies have been adopted - in 1999, 2002 and in 2011. At the time of the preparation of this article in the Standing Committee on Energy of the National Assembly of the Republic of Bulgaria has been submitted a draft of the Energy Strategy until 2030 with a horizon until 2050, which, however, has not yet been publicly discussed and has not been adopted by the Council of Ministers, according to the requirements of Art. 3 and Art. 4 of the Energy Act of the country. The main disadvantage of Bulgarian energy policies is the fact that their action is not proactive, but reactive. This leads to inconsistent and unpredictable legislative activity. The basic law - the Energy Law, is often amended several times a year, and public discussions and impact assessments of these changes are in most cases either absent or formally present. At the same time, there are mutually exclusive or contradictory adjustments that do not correspond or directly cancel goals from previous periods. This fact calls into question the correctly set national strategic goals and is a blow to the sustainability and predictability of the development of the sector.
Figure 1 presents the author's view of the sector management process, in terms of preparation and implementation of long-term strategies. Constant monitoring and corrections are necessary and extremely important.
Figure 1 – Sector management and strategy development
In Central and Eastern Europe Gazprom Export operates on the principle of long-term binding contracts for a period of 25 years, usually on the basis of intergovernmental agreements. The most common trade clause in them is 'take or pay', which stipulates that within each calendar year, the buyer pays the seller for a quantity of blue fuel agreed in advance between the two parties, even if has not been downloaded. It ensures the stability and reliability of the Russian side and security of supply for European markets and transfers the risks to its customers. The gas crisis in the first days of 2006, although lasting only 4 days, gave further impetus to criticism of the EU's dependence on its main natural gas supplier. As early as mid-January 2016, Jonathan Stern, Director of Natural Gas Research at The Oxford Institute for Energy Studies, published a paper entitled ‘The Russian-Ukrainian Gas Crisis of January 2006’13. In it he came to the following conclusions: it is not reasonable for any region to be too dependent on a single provider or a single
route; in the event of a conflict between a supplier and a customer who is a transit party, disputes
involving third parties may also be affected; all parties must be part of international dispute settlement procedures.
12 EU: Climate change, what the EU is doing - Paris Agreement on Climate Change https://www.consilium.europa.eu/en/policies/climate-change/paris-agreement/ 13 Stern, Jonathan, The Russian-Ukrainian gas crisis of January 2006, Oxford Institute for Energy Studies, https://www.oxfordenergy.org/wpcms/wp-content/uploads/2011/01/Jan2006-RussiaUkraineGasCrisis-JonathanStern.pdf

323
In recent decades a number of studies have analyzed whether there is any reason to claim that Gazprom Export is using its monopoly position on the natural gas market in Europe in pricing to its customers. Such are the studies of Oliver Quost and Catherine Locatelli from 199714, Aldo Spanier from 200715, Eirik Lund Zagen and Marina Tsigankova from 200716 to establish a ‘forward-looking policy agenda to achieve the Community's main energy goals for sustainable development, competitiveness and security of energy supply'. Researcher Joris Morbee concludes that buying natural gas from more reliable sources at a price premium can be more attractive to Europe than building strategic fuel storage capacity17. In the spring of 2014, Polish Prime Minister Donald Tusk (President of the European Council for the 2014-2019 term) published his analysis in the pages of the Financial Times under the title ‘United Europe can stop suffocation by Russia’18. In it he argued that Europe should develop a mechanism for joint negotiations on gas supply prices, solidarity in the event of a new supply disruption and develop adequate infrastructure. The Commission's estimates are quoted that in the absence of such decisions by 2035, dependency will increase from 60% to 80%19. According to EC data, by 2014 the EU relied on natural gas from Russia for 39% of natural gas imports and 27% of its consumption, with the Russian Federation being the only supplier of natural gas to six EU member states - Bulgaria, Slovakia, Finland, Lithuania, Latvia and Estonia. Nearly a decade later, the situation has not changed significantly. On the contrary. In June 2017, the Deputy Minister of Energy of the Russian Federation Anatoly Yanovsky participated in the international conference ‘Prospects for energy cooperation between Russia and the EU in terms of natural gas’. In his speech there he said that 150 bcm of natural gas was supplied by Russia to the EU, with the share of Russian supplies in European imports being 31% and the share of the EU in Russian gas exports being 66%. According to Yanowski, this interdependence is unlikely to change significantly in the future due to Russia's existing natural gas reserves. ‘The results for 2016 and the beginning of 2017 show that record volumes of deliveries to Europe have been registered. Markets in Europe are and will remain major for at least a decade20’, he added, concluding that only markets that take into account the interests of all participants can be sustainable.
14 Quast, Oliver and Locatelli, Catherine, Russian natural gas policy and its possible effects on European gas markets, Institute d'Economie et de Politique de l'Energie https://www.sciencedirect.com/science/article/abs/pii/S0301421596001103 15 Spanjer, Aldo, Russian gas price reform and the EU–Russia gas relationship: Incentives, consequences and European security of supply, Leiden University https://www.sciencedirect.com/science/article/abs/pii/S0301421506004101 16 Sagen, Erik Lund and Tsygankova, Marina, Russian natural gas exports—Will Russian gas price reforms improve the European security of supply?, Statistics Norway Research Department https://www.sciencedirect.com/science/article/abs/pii/S0301421507004818 17 Morbee, Joris, Russian Gas Imports in Europe: How Does Gazprom Reliability Change the Game?, The Energy Journal https://www.researchgate.net/publication/273440568_Russian_Gas_Imports_in_Europe_How_Does_Gazprom_Reliability_Change_the_Game 18 Tusk, Donald, A united Europe can end Russia’s energy stranglehold, The Financial Times https://www.ft.com/content/91508464-c661-11e3-ba0e-00144feabdc0 19 European Comission, Communication to the European Parliament and the Council, European Energy Security Strategy https://www.eesc.europa.eu/resources/docs/european-energy-security-strategy.pdf 20 Ministry of Energy of the Russian Federation https://minenergo.gov.ru/node/8451

324
2. Antimonopoly legislation and the antitrust case of the EC against Gazprom Export, 2012-2018 Antimonopoly law of the EU Contrary to the popular notion of the best functioning of the market, where institutions do not intervene and the ‘invisible hand’ is left to operate, countries around the world have developed and implemented a complex network of antitrust legislation to prevent or stop practices of a monopoly or cartel of entire segments of the economy. That is why one of the EU's main tasks in achieving the strategic goal of a single market is to set up a system that allows it to operate on the basis of harmonized national legislation and to prevent any obstacle to competition. The Treaty of Nice21 was signed in 2001, supplementing and amending the Maastricht Treaty and the Treaties establishing the European Communities. Competition rules are based on ensuring that they operate within the EU for all sectors of the economy, even if they are not part of the common market. EU law addresses 4 areas of competition: 1. prohibition of abuse of a dominant position (Article 102 of the Treaty of Lisbon); 2. prohibition of cartel agreements (Article 101 of the Lisbon Treaty); 3. control over mergers of enterprises (EU Regulations on Mergers and the Rules for their
implementation); 4. control over state aid (Articles 107, 108 and 109 of the Lisbon Treaty, Rules for granting
state aid to small and medium-sized enterprises22 and the EC Handbook on state aid rules23). The main body of European antitrust law is the EC, which has wide competences for its implementation, in particular the possibility of antitrust inspections and cases against companies operating in the European Union, even if they are not registered in its Member State.
The main body of European antitrust law is the EC, which has wide competences for its implementation, in particular the possibility of antitrust inspections and cases against companies operating in the European Union, even if they are not registered in its Member State. EC Antitrust case against Gazprom Export On the eve of the antitrust case, the market presence of Russian natural gas in Europe is presented in Table 1: On September 4, 2011, the EC published a commemorative note24 that it had launched a procedure to verify the supply and pricing of natural gas on suspicion that the Russian company was abusing its dominant position in a number of countries and thus violating Art. 101 and 102 of the Treaty on the Functioning of the European Union25. A year later, a formal press release26 made formal allegations: obstructing the free transmission of gas, diversifying its supplies and imposing unfair prices on customers (since the final price is a function of the price of oil and oil derivatives). 21 Nice Treaty https://eur-lex.europa.eu/legal-content/EN/ALL/?uri=CELEX:12002E003 22 European Comission, Handbook On Community State Aid Rules For SMEs https://ec.europa.eu/competition/state_aid/studies_reports/sme_handbook.pdf 23 European Comission, Handbook, Vademecum Community law https://ec.europa.eu/competition/state_aid/studies_reports/vademecum_on_rules_09_2008_en.pdf 24 European Comission, MEMO/11/641, Antitrust: Commission confirms unannounced inspections in the natural gas sector https://ec.europa.eu/commission/presscorner/detail/en/MEMO_11_641 25 The Treaty on European Union https://eur-lex.europa.eu/LexUriServ/LexUriServ.do?uri=OJ:C:2012:326:FULL:EN:PDF 26 European Comission, Press release, Antitrust: Commission opens proceedings against Gazprom https://ec.europa.eu/commission/presscorner/detail/en/IP_12_937
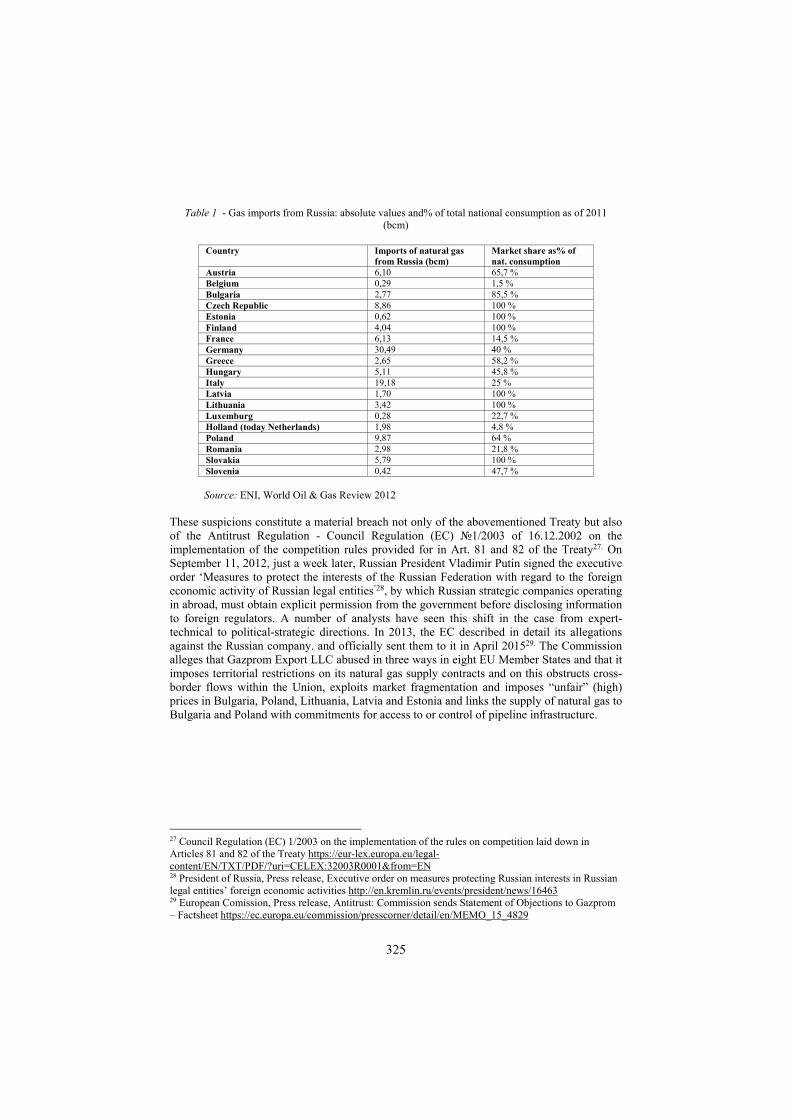
325
Table 1 - Gas imports from Russia: absolute values and% of total national consumption as of 2011 (bcm)
Country Imports of natural gas
from Russia (bcm) Market share as% of nat. consumption
Austria 6,10 65,7 % Belgium 0,29 1,5 % Bulgaria 2,77 85,5 % Czech Republic 8,86 100 % Estonia 0,62 100 % Finland 4,04 100 % France 6,13 14,5 % Germany 30,49 40 % Greece 2,65 58,2 % Hungary 5,11 45,8 % Italy 19,18 25 % Latvia 1,70 100 % Lithuania 3,42 100 % Luxemburg 0,28 22,7 % Holland (today Netherlands) 1,98 4,8 % Poland 9,87 64 % Romania 2,98 21,8 % Slovakia 5,79 100 % Slovenia 0,42 47,7 %
Source: ENI, World Oil & Gas Review 2012 These suspicions constitute a material breach not only of the abovementioned Treaty but also of the Antitrust Regulation - Council Regulation (EC) №1/2003 of 16.12.2002 on the implementation of the competition rules provided for in Art. 81 and 82 of the Treaty27. On September 11, 2012, just a week later, Russian President Vladimir Putin signed the executive order ‘Measures to protect the interests of the Russian Federation with regard to the foreign economic activity of Russian legal entities’28, by which Russian strategic companies operating in abroad, must obtain explicit permission from the government before disclosing information to foreign regulators. A number of analysts have seen this shift in the case from expert-technical to political-strategic directions. In 2013, the EC described in detail its allegations against the Russian company. and officially sent them to it in April 201529. The Commission alleges that Gazprom Export LLC abused in three ways in eight EU Member States and that it imposes territorial restrictions on its natural gas supply contracts and on this obstructs cross-border flows within the Union, exploits market fragmentation and imposes “unfair” (high) prices in Bulgaria, Poland, Lithuania, Latvia and Estonia and links the supply of natural gas to Bulgaria and Poland with commitments for access to or control of pipeline infrastructure.
27 Council Regulation (EC) 1/2003 on the implementation of the rules on competition laid down in Articles 81 and 82 of the Treaty https://eur-lex.europa.eu/legal-content/EN/TXT/PDF/?uri=CELEX:32003R0001&from=EN 28 President of Russia, Press release, Executive order on measures protecting Russian interests in Russian legal entities’ foreign economic activities http://en.kremlin.ru/events/president/news/16463 29 European Comission, Press release, Antitrust: Commission sends Statement of Objections to Gazprom – Factsheet https://ec.europa.eu/commission/presscorner/detail/en/MEMO_15_4829
326
According to the Directive on claims for damages under the antitrust rules of 16.12.200230, the EC has the possibility to impose a fine of up to 10% of the total turnover of the Russian company, which according to Russian experts Salygin and Kaveshnikov could be estimated at $ 1.4 billion annually31. But this is not done. In the course of the case, the Russian supplier pleaded not guilty to the charges, its representatives claimed that the company has always complied with the requirements of EU competition law and is committed to doing so in the future32. Intensive negotiations between the EC and the Russian side are underway between 2015 and 2016, until March 2017, when the Commission announced its proposal33, which makes it clear that it will not impose a fine and is satisfied with the commitment of the Commission. the supplier to review and correct those practices which may be classified as non-competitive. In May 2017, a press release34 officially presented information about the agreement reached with Gazprom Export LLC, and a year later the final commitments were published35 and the official decision36 was made, which contains a number of commitments for the Russian side, presented in Figure 3. The Russian company is committed to introducing competitive indicators, incl. hub and border prices in Western Europe and price revision clauses under its long-term supply contracts when the economic situation on European gas markets, which is not under the control of the parties to the contract, changes significantly, or when the price does not reflect developments on European markets. These commitments create conditions for the formation of more competitive prices. The introduction of the new element ‘weighted average prices at borders or hubs in Western Europe’ shows the intention of the EC to change the traditional formation of the supply price of natural gas in the five countries. In markets where there is still no developed liquid market and hub (such as Bulgaria), in practice it would be difficult to reach an agreement in determining competitive prices. Although rather desirable, the EC decision provided a fundamental understanding that even if a Member State is not bound by a hub, it may require ‘competitive prices’ compared to Western European hub prices or weighted average marginal prices. in continental Europe and this understanding is universally applicable, without the need for proof.
30 Directive 2014/104/EU of the European Parliament and the Council on certain rules governing actions for damages under national law for infringements of the competition law provisions of the Member States and of the European Union https://eur-lex.europa.eu/legal-content/EN/TXT/PDF/?uri=CELEX:32014L0104&from=EN 31 V.I. Salygin, N.Yu. Kaveshnikov, Gazprom in the EU market: a balance of competition and energy security is needed, MGIMO Bulletin https://mgimo.ru/upload/iblock/6fb/gazprom-na-rynke-eu.pdf 32 Gazprom Export, Press release, Statement of Gazprom Export with respect to the adoption of “statement of objections” by the European Commission under the antitrust investigation https://www.gazprom.com/press/news/2015/april/article224444/ 33 European Comission, Press release, Antitrust: Commission sends Statement of Objections to Gazprom – Factsheet https://ec.europa.eu/commission/presscorner/detail/en/MEMO_15_4829 34 European Comission, Press release, Antitrust: Commission imposes binding obligations on Gazprom to enable free flow of gas at competitive prices in Central and Eastern European gas markets https://ec.europa.eu/commission/presscorner/detail/en/IP_18_3921 35 European Comission, Commission proposal, Case AT 39816 https://ec.europa.eu/competition/antitrust/cases/dec_docs/39816/39816_9994_3.pdf 36 European Comission, Antitrust Procedure Council Regulation (EC) 1/2003 https://ec.europa.eu/competition/antitrust/cases/dec_docs/39816/39816_10148_3.pdf
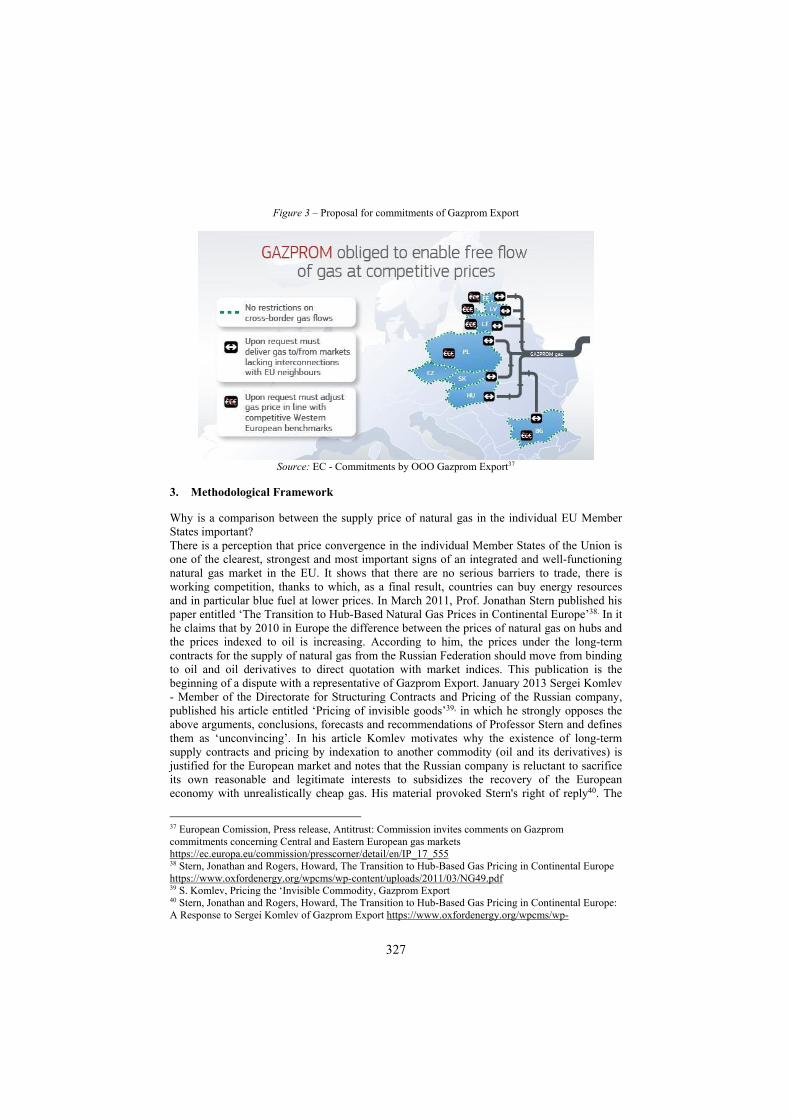
327
Figure 3 – Proposal for commitments of Gazprom Export
Source: EC - Commitments by OOO Gazprom Export37
3. Methodological Framework Why is a comparison between the supply price of natural gas in the individual EU Member States important? There is a perception that price convergence in the individual Member States of the Union is one of the clearest, strongest and most important signs of an integrated and well-functioning natural gas market in the EU. It shows that there are no serious barriers to trade, there is working competition, thanks to which, as a final result, countries can buy energy resources and in particular blue fuel at lower prices. In March 2011, Prof. Jonathan Stern published his paper entitled ‘The Transition to Hub-Based Natural Gas Prices in Continental Europe’38. In it he claims that by 2010 in Europe the difference between the prices of natural gas on hubs and the prices indexed to oil is increasing. According to him, the prices under the long-term contracts for the supply of natural gas from the Russian Federation should move from binding to oil and oil derivatives to direct quotation with market indices. This publication is the beginning of a dispute with a representative of Gazprom Export. January 2013 Sergei Komlev - Member of the Directorate for Structuring Contracts and Pricing of the Russian company, published his article entitled ‘Pricing of invisible goods’39, in which he strongly opposes the above arguments, conclusions, forecasts and recommendations of Professor Stern and defines them as ‘unconvincing’. In his article Komlev motivates why the existence of long-term supply contracts and pricing by indexation to another commodity (oil and its derivatives) is justified for the European market and notes that the Russian company is reluctant to sacrifice its own reasonable and legitimate interests to subsidizes the recovery of the European economy with unrealistically cheap gas. His material provoked Stern's right of reply40. The
37 European Comission, Press release, Antitrust: Commission invites comments on Gazprom commitments concerning Central and Eastern European gas markets https://ec.europa.eu/commission/presscorner/detail/en/IP_17_555 38 Stern, Jonathan and Rogers, Howard, The Transition to Hub-Based Gas Pricing in Continental Europe https://www.oxfordenergy.org/wpcms/wp-content/uploads/2011/03/NG49.pdf 39 S. Komlev, Pricing the ‘Invisible Commodity, Gazprom Export 40 Stern, Jonathan and Rogers, Howard, The Transition to Hub-Based Gas Pricing in Continental Europe: A Response to Sergei Komlev of Gazprom Export https://www.oxfordenergy.org/wpcms/wp-
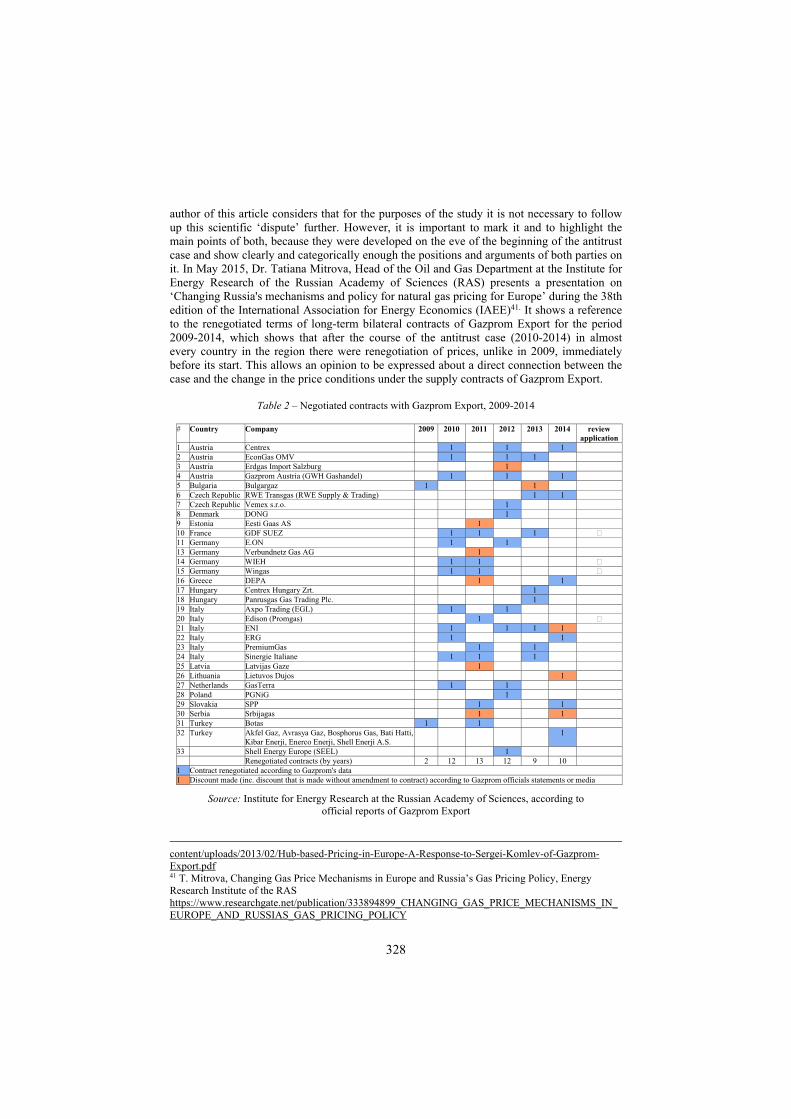
328
author of this article considers that for the purposes of the study it is not necessary to follow up this scientific ‘dispute’ further. However, it is important to mark it and to highlight the main points of both, because they were developed on the eve of the beginning of the antitrust case and show clearly and categorically enough the positions and arguments of both parties on it. In May 2015, Dr. Tatiana Mitrova, Head of the Oil and Gas Department at the Institute for Energy Research of the Russian Academy of Sciences (RAS) presents a presentation on ‘Changing Russia's mechanisms and policy for natural gas pricing for Europe’ during the 38th edition of the International Association for Energy Economics (IAEE)41. It shows a reference to the renegotiated terms of long-term bilateral contracts of Gazprom Export for the period 2009-2014, which shows that after the course of the antitrust case (2010-2014) in almost every country in the region there were renegotiation of prices, unlike in 2009, immediately before its start. This allows an opinion to be expressed about a direct connection between the case and the change in the price conditions under the supply contracts of Gazprom Export.
Table 2 – Negotiated contracts with Gazprom Export, 2009-2014
# Country Company 2009 2010 2011 2012 2013 2014 review application
1 Austria Centrex 1 1 1 2 Austria EconGas OMV 1 1 1 3 Austria Erdgas Import Salzburg 1 4 Austria Gazprom Austria (GWH Gashandel) 1 1 1 5 Bulgaria Bulgargaz 1 1 6 Czech Republic RWE Transgas (RWE Supply & Trading) 1 1 7 Czech Republic Vemex s.r.o. 1 8 Denmark DONG 1 9 Estonia Eesti Gaas AS 1 10 France GDF SUEZ 1 1 1 11 Germany E.ON 1 1 13 Germany Verbundnetz Gas AG 1 14 Germany WIEH 1 1 15 Germany Wingas 1 1 16 Greece DEPA 1 1 17 Hungary Centrex Hungary Zrt. 1 18 Hungary Panrusgas Gas Trading Plc. 1 19 Italy Axpo Trading (EGL) 1 1 20 Italy Edison (Promgas) 1 21 Italy ENI 1 1 1 1 22 Italy ERG 1 1 23 Italy PremiumGas 1 1 24 Italy Sinergie Italiane 1 1 1 25 Latvia Latvijas Gaze 1 26 Lithuania Lietuvos Dujos 1 27 Netherlands GasTerra 1 1 28 Poland PGNiG 1 29 Slovakia SPP 1 1 30 Serbia Srbijagas 1 1 31 Turkey Botas 1 1 32 Turkey Akfel Gaz, Avrasya Gaz, Bosphorus Gas, Bati Hatti,
Kibar Enerji, Enerco Enerji, Shell Enerji A.S. 1
33 Shell Energy Europe (SEEL) 1 Renegotiated contracts (by years) 2 12 13 12 9 10 1 Contract renegotiated according to Gazprom's data 1 Discount made (inc. discount that is made without amendment to contract) according to Gazprom officials statements or media
Source: Institute for Energy Research at the Russian Academy of Sciences, according to official reports of Gazprom Export
content/uploads/2013/02/Hub-based-Pricing-in-Europe-A-Response-to-Sergei-Komlev-of-Gazprom-Export.pdf 41 T. Mitrova, Changing Gas Price Mechanisms in Europe and Russia’s Gas Pricing Policy, Energy Research Institute of the RAS https://www.researchgate.net/publication/333894899_CHANGING_GAS_PRICE_MECHANISMS_IN_EUROPE_AND_RUSSIAS_GAS_PRICING_POLICY
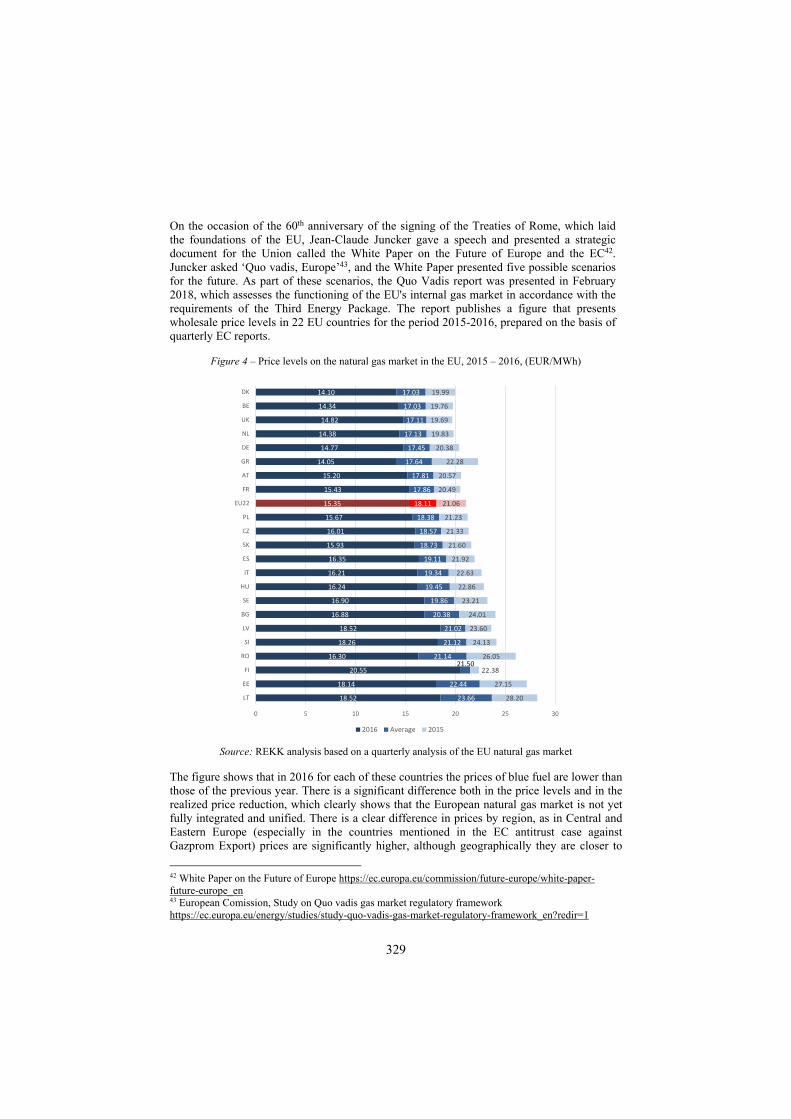
329
On the occasion of the 60th anniversary of the signing of the Treaties of Rome, which laid the foundations of the EU, Jean-Claude Juncker gave a speech and presented a strategic document for the Union called the White Paper on the Future of Europe and the EC42. Juncker asked ‘Quo vadis, Europe’43, and the White Paper presented five possible scenarios for the future. As part of these scenarios, the Quo Vadis report was presented in February 2018, which assesses the functioning of the EU's internal gas market in accordance with the requirements of the Third Energy Package. The report publishes a figure that presents wholesale price levels in 22 EU countries for the period 2015-2016, prepared on the basis of quarterly EC reports.
Figure 4 – Price levels on the natural gas market in the EU, 2015 – 2016, (EUR/MWh)
Source: REKK analysis based on a quarterly analysis of the EU natural gas market
The figure shows that in 2016 for each of these countries the prices of blue fuel are lower than those of the previous year. There is a significant difference both in the price levels and in the realized price reduction, which clearly shows that the European natural gas market is not yet fully integrated and unified. There is a clear difference in prices by region, as in Central and Eastern Europe (especially in the countries mentioned in the EC antitrust case against Gazprom Export) prices are significantly higher, although geographically they are closer to
42 White Paper on the Future of Europe https://ec.europa.eu/commission/future-europe/white-paper-future-europe_en 43 European Comission, Study on Quo vadis gas market regulatory framework https://ec.europa.eu/energy/studies/study-quo-vadis-gas-market-regulatory-framework_en?redir=1
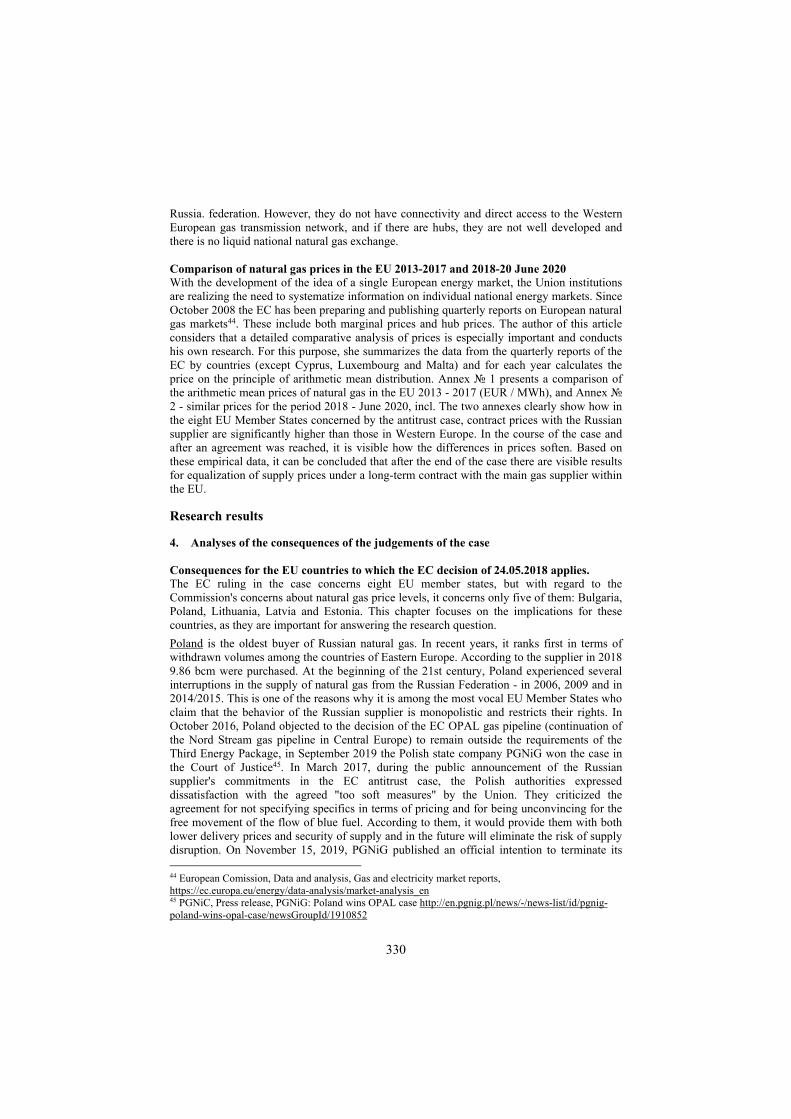
330
Russia. federation. However, they do not have connectivity and direct access to the Western European gas transmission network, and if there are hubs, they are not well developed and there is no liquid national natural gas exchange. Comparison of natural gas prices in the EU 2013-2017 and 2018-20 June 2020 With the development of the idea of a single European energy market, the Union institutions are realizing the need to systematize information on individual national energy markets. Since October 2008 the EC has been preparing and publishing quarterly reports on European natural gas markets44. These include both marginal prices and hub prices. The author of this article considers that a detailed comparative analysis of prices is especially important and conducts his own research. For this purpose, she summarizes the data from the quarterly reports of the EC by countries (except Cyprus, Luxembourg and Malta) and for each year calculates the price on the principle of arithmetic mean distribution. Annex № 1 presents a comparison of the arithmetic mean prices of natural gas in the EU 2013 - 2017 (EUR / MWh), and Annex № 2 - similar prices for the period 2018 - June 2020, incl. The two annexes clearly show how in the eight EU Member States concerned by the antitrust case, contract prices with the Russian supplier are significantly higher than those in Western Europe. In the course of the case and after an agreement was reached, it is visible how the differences in prices soften. Based on these empirical data, it can be concluded that after the end of the case there are visible results for equalization of supply prices under a long-term contract with the main gas supplier within the EU.
Research results 4. Analyses of the consequences of the judgements of the case Consequences for the EU countries to which the EC decision of 24.05.2018 applies. The EC ruling in the case concerns eight EU member states, but with regard to the Commission's concerns about natural gas price levels, it concerns only five of them: Bulgaria, Poland, Lithuania, Latvia and Estonia. This chapter focuses on the implications for these countries, as they are important for answering the research question.
Poland is the oldest buyer of Russian natural gas. In recent years, it ranks first in terms of withdrawn volumes among the countries of Eastern Europe. According to the supplier in 2018 9.86 bcm were purchased. At the beginning of the 21st century, Poland experienced several interruptions in the supply of natural gas from the Russian Federation - in 2006, 2009 and in 2014/2015. This is one of the reasons why it is among the most vocal EU Member States who claim that the behavior of the Russian supplier is monopolistic and restricts their rights. In October 2016, Poland objected to the decision of the EC OPAL gas pipeline (continuation of the Nord Stream gas pipeline in Central Europe) to remain outside the requirements of the Third Energy Package, in September 2019 the Polish state company PGNiG won the case in the Court of Justice45. In March 2017, during the public announcement of the Russian supplier's commitments in the EC antitrust case, the Polish authorities expressed dissatisfaction with the agreed "too soft measures" by the Union. They criticized the agreement for not specifying specifics in terms of pricing and for being unconvincing for the free movement of the flow of blue fuel. According to them, it would provide them with both lower delivery prices and security of supply and in the future will eliminate the risk of supply disruption. On November 15, 2019, PGNiG published an official intention to terminate its 44 European Comission, Data and analysis, Gas and electricity market reports, https://ec.europa.eu/energy/data-analysis/market-analysis_en 45 PGNiC, Press release, PGNiG: Poland wins OPAL case http://en.pgnig.pl/news/-/news-list/id/pgnig-poland-wins-opal-case/newsGroupId/1910852
331
contract with Gazprom Export as of December 31, 202246. In this way, the Polish government has shown in practice that it is not ready to continue trade relations, which it defines as ‘unfavorable’ for its country. Between 2015 and 2020, a lawsuit was pending between the Polish and Russian companies in the Stockholm Arbitration Court over the cost of delivery on a claim for compensation of USD 1.5 billion, filed by the Polish side for overpaid amounts for supplies to blue fuel for a period of 6 years. The case was won by PGNiG47. The Polish company is working hard to replace Russian natural gas with liquefied natural gas (LNG). By January 2020, it declared that compared to the previous year, the share of gas imports from Russia had fallen by 7% to 60% and LNG had increased by 3% to 23%. The company plans to start supplying gas from the Norwegian continental shelf across the North Sea, Denmark and the Baltic Sea by the end of 2022. On June 16, 2020, information appeared on the PGNiG website that an annex had been signed with Gazprom Export LLC to amend the formula for pricing supplies, as required by the arbitration award. As of July 1, 2020, the Russian side will reimburse overpaid amounts of approximately $ 1.5 billion for supplies for the period 2014-2020. The new formula of blue fuel is related to price levels from Western European markets. As a result, PGNiG notes that the price achieved is lower than in Eastern Europe. At the end of August 2020, the financial results of PGNiG were announced and they show that for the first half of 2020 the company has achieved the highest growth of financial results in its history - a profit of over 1.52 billion USD. Net profit and EBIT quadrupled compared to the same period last year, and EBITDA - tripled. The company confirms that this is due to a reduction in the cost of natural gas supply after a change in the formula under the contract with OOO Gazprom Export.
Lithuania, Latvia and Estonia for decades, like Bulgaria and Finland, received natural gas only from the Russian Federation. Until 2014 Gazprom Export owned more than 1/3 of their national energy companies - Lietuvos Dujo, Latvias Gāz and Eesti Gaas. In order to overcome their full energy dependence on Russia, over the past decade all three countries have embarked on the same strategy: diversifying their natural gas supplies. They provided it through investments: in interconnection of their gas transmission networks, in connection with Europe and in storage capacities - through the Baltic connector between Estonia and Finland and the Poland-Lithuania Gas Interconnector (GIPL). Much of the cost of building this infrastructure was provided through EU financial assistance under the Baltic Energy Connectivity Plan (BEMIP)48. At the same time, the three countries made efforts to unbundle their energy companies, which in combination with the terms of the Third Energy Package indirectly forced the Russian side to sell its shares in them. Representatives of the government have repeatedly issued statements against the increased supply prices of Russian blue fuel, with Lithuania being the sharpest and Latvia, which has the highest natural gas consumption of the three, betting on a softer and more moderate approach. In May 2017, when publishing the draft agreement between the EC and Gazprom Export LLC, the Lithuanian Ministry of
46 PGNiC, Press release, Declaration of will to terminate Yamal Contract effective December 31, 2022 http://en.pgnig.pl/news/-/news-list/id/declaration-of-will-to-terminate-yamal-contract-effective-december-31-2022/newsGroupId/1910852 47 PGNiC, Press release, Victory for PGNiG: the Arbitral Tribunal in Stockholm rules to lower the price of the gas sold by Gazprom to PGNiG http://en.pgnig.pl/news/-/news-list/id/victory-for-pgnig-the-arbitral-tribunal-in-stockholm-rules-to-lower-the-price-of-the-gas-sold-by-gazprom-to-pgnig/newsGroupId/1910852 48 European Commission, Baltic energy market interconnection plan, https://ec.europa.eu/energy/topics/infrastructure/high-level-groups/baltic-energy-market-interconnection-plan_en
332
Energy identified the commitments made by the Russian side as insufficient49. The institution was disappointed with the lack of a fine against the Russian side (according to them, it should have amounted to up to 8 billion euros) and the fact that they will not be compensated for the damage caused to them, which is estimated at 1.5 billion. The Lithuanian Ministry announced that it has prepared a package of proposals to the EC, which includes the Russian side to apply an automated mechanism for price revision under its long-term contracts based on levels of Western European gas platforms for natural gas trading. In early 2011 the Ministry announced that the state was paying unreasonably high prices to Russia for the supply of natural gas, and in March of the same year the Republic of Lithuania filed a lawsuit against Gazprom Export in the Vilnius District Court. The claim was for overpaid supplies for the period 2004-2012, valued at 1.45 billion euros at the time. The procedure was long and cumbersome, and it was not until 2016 that the Arbitration Institute of the Stockholm Chamber of Commerce ruled that there was some conflict of interest, but rejected the plaintiffs' claim for effective compensation. The decision was upheld by the Swedish Court of Appeal, and in February 2020 by the Supreme Court of Sweden. In October 2014 at the opening of the liquefied gas terminal in Klaipeda, the Lithuanian president said that ‘From now on, no one will dictate the price of gas or buy our political will’50. According to him, the terminal will be able to provide up to 90% of the natural gas consumption of the three Baltic states and thus will serve as a guarantee for their energy security and independence. In 2016 Latvia adopted a law on the liberalization of the natural gas market. Despite the achieved results and the established interconnection, however, Gazprom Export is still the dominant player in the market. In May 2018 the chairman of the Latvian Regulator Rolands Irklis and the spokesperson of the Ministry of Economy of Latvia Evita Urpena said that the EC decision will lead to some improvement in the Baltic gas market, but not necessarily a rapid or significant reduction in consumer prices51. According to them, the reduction of the dominant position of Gazprom Export, the promotion of competition on the market and the possibility of an arbitration procedure in a dispute over the price of blue fuel will be positive. In April 2017 the Estonian government announced that the Russian supplier's commitments were insufficient and proportionate to the seriousness of the violations committed by it. For the Estonian authorities, the measures were temporary and did not guarantee a long-term solution to the problem of inflated prices52. That is why the government has expressed its intention to continue working to introduce alternative sources for the supply of blue fuel and to build cross-border connections. According to the Tallinn authorities, only diversification and free competition would guarantee reasonable prices for consumers. As of 2014 with 100% natural gas supplies from Russia, the price difference between Estonia and Western Europe was 8 EUR / MWh, ie. gas was 36% more expensive in a country close to the Russian Federation. In 2015 the difference was reduced to 4 EUR / MWh, or 20% in absolute value.
49 Ministry of Energy of the Republic of Lithuania, Press release, Gazprom's proposed commitments are insufficient to address distortions to the gas market https://enmin.lrv.lt/en/news/gazprom-s-proposed-commitments-are-insufficient-to-address-distortions-to-the-gas-market 50 Ministry of Energy of the Republic of Lithuania, Press release, Speech by President Dalia Grybauskaitė at the Klaipėda LNG terminal opening ceremony https://enmin.lrv.lt/uploads/enmin/documents/files/EN_Versija/Dokumentai/Prezidentes_kalba_LNG_Opening_Ceremony_Klaipeda_EN.pdf 51 China-Europe News Agency, EU's ruling on Gazprom not necessarily means lower gas prices at once: Latvia http://www.xinhuanet.com/english/2018-05/26/c_137208349.htm 52 Government of Republic of Estonia, Press release, The Government approved Estonia’s positions on the commitments submitted by Gazprom https://www.valitsus.ee/en/news/government-approved-estonias-positions-commitments-submitted-gazprom
333
The only public information on changes in natural gas supply prices from Russia to Hungary is from November 2013, when it was announced that the price would be reduced by less than 7-10% and the spot component in the pricing formula would remain at 7-8%53.
The EC feared that the natural gas market in Slovakia was isolated from the Russian supplier, which dominated it. In the course of the negotiations, Gazprom Export proposed the abolition of territorial segmentation clauses and enabled its customers to resell gas to Bulgaria or the Baltic States. Hub pricing was also achieved. During the proceedings the Czech Republic liberalized its market and added reverse links, which improved its connectivity and forced the Russian side to link its prices to those of Western European hubs. In practice, at the time of the Agreement with the EC in the case, the territorial restrictions were no longer valid, because on March 1, 2014 the supply contract between Gazprom Export and RWE Transgaz was mutually terminated. In 2012, the Czech company won a legal dispute in a court in Vienna with its Russian supplier over fines for default on the take-or-pay clauses. This is the first such case in a European country and its decision was a precedent, widely commented in the energy circles for its time54. Since 2012, thanks to improved ties with Western Europe, the Czech natural gas market has linked to the Western European market and changes in bilateral agreements with Russia have not been as key to it. The emergence of competition has forced the Russian supplier to index its delivery price to the Czech Republic to that of recognized hubs in Western Europe. The Bulgarian approach According to current data from the website of the Russian supplier55, Bulgaria has been importing natural gas from Russia since 1974, approximately 3 bcm per year or a total of 176 bcm for the entire period of joint activity, calculated at the end of 2018. The domestic supply contract was signed between Bulgargaz EAD and Gazprom Export on 15.11.2012 and is valid for the period 01.01.2013 - 31.12.2022 for estimated quantities up to 2.9 bcm/year. It has already been stated that on the eve of the antitrust case, Bulgaria paid some of the highest prices for natural gas not only in the region but also in the entire EU. The market in the country is currently highly monopolized and non-transparent. The main part of the information on the supply and transit of natural gas (prices, tariffs, taxes, fees and revenues) is not publicly available, it can be judged by statements of various representatives of the government (Prime Minister, Minister, MPs, management of state-owned companies or a regulator, etc.), but these statements are irregular, inconsistent and often contradictory. According to the public supplier, the company satisfies the national consumption of natural gas with supplies from Gazprom Export, as the price at which blue fuel is invoiced changes every quarter and is influenced by the values of alternative fuels on international markets, namely: fuel oil (with 1% sulfur content) and gas oil (with 0.1% sulfur). At the very beginning of the antitrust case, in its press release, Bulgargaz EAD informed about a signed agreement with the Russian side to reduce the delivery price by an average of 11.1%, effective from the third quarter of 201256. There is no information on whether this amendment is relevant to the case. In April 2017 Bulgargaz EAD published a press release on its website, in which it set out information important for the purposes of this study. First of all, in 2015
53 Prime Business News Agency, Russia’s Gazprom cuts prices for Hungary’s Panrusgas, Centrex http://www.1prime.biz/news/0/%7BCF2E72D8-AD8D-4806-BD13-F3B2B3C569B0%7D.uif?layout=print 54 Reuters, UPDATE 2-RWE in landmark win over Gazprom crucial contract clause https://www.reuters.com/article/gazprom-rwe-dispute/update-2-rwe-in-landmark-win-over-gazprom-crucial-contract-clause-idUSL5E8LOAWW20121024 55 Gazprom export, Profile of Bulgaria as a customer, http://www.gazpromexport.ru/en/partners/bulgaria/ 56 Press release Bulgargaz EAD https://www.bulgargaz.bg/index.php?p=6&id=68
334
and 2016, at the height of the antitrust case, ‘natural gas supply prices for Bulgaria under the contract with Gazprom Export decreased by a total of 63.23%’57. Moreover, this is not a one-off reduction, but a recurrent one for almost the entire two-year period under review. In the same press release Bulgargaz EAD noted an important conclusion about the level of supply prices of blue fuel as of 2016: ‘The price of natural gas in Bulgaria is the best in the region and is lower than that of the most liquid gas stock exchanges in Europe’. According to Bulgargaz EAD for its customers, ‘the price of fuel during this two-year period fell by half - from BGN 603.14 / thousand. cubic meters (January - March 2015) at BGN 286.60 / thousand cubic meters (October - December 2016)’. There is no analysis of whether and to what extent this sharp reduction in the price has affected the final prices of goods and services related to natural gas. This is not done by the company or the regulator or scientific and expert circles. In October 2018 the public supplier stated in a press release on the next quarterly report of the European Commission on European gas markets for the second quarter of 2018 that ‘the price indicated in the report of 19.92 EUR / MWh of natural gas supplied by Gazprom to the border for Bulgaria for the second quarter does not correspond to the actual delivery price from Gazprom Export for the specified quarter’. This is an important point because it gives grounds for doubt about the reliability of the information presented in the regular reports of the EC, not only for Bulgaria but also for other countries. There is no comment or analysis of this fact in the public environment, incl. and by experts. It is not mentioned that Bulgargaz EAD informed the EC or insisted on correction of its quarterly report and the conclusions in it. An inspection of the website of Bulgargaz EAD shows that within six months after the end of the EC antitrust case against the Russian side, in four press releases the company informed third parties about its efforts to reduce the delivery price with Gazprom Export.
In the analysis of the Bulgarian approach after the decision of the EC on the antitrust case, several points stand out. First, Bulgaria, the last of the countries concerned, is finalizing the agreement with its Russian partner. On 03.03.2020 at an official press conference with the participation of the Prime Minister, the Minister of Energy and the Executive Director of the public provider in the country it was announced that a price reduction of 40.3% was achieved, with a retroactive date - September 2019. The Russian company undertook to return the overpaid amounts to its counterparty and the Bulgarian public supplier - to its customers on the regulated market. An amendment to the Energy Act of the republic was adopted, whereby gas distribution companies and district heating companies that purchased gas from the public supplier for the given period received a refund of the overpaid amounts. This amendment was proposed by a single MP and lacked detailed reasons and impact assessment. Even taking into account the retroactive date, the prices of blue fuel in the country have decreased at the latest. More than a year earlier, Estonia, the Czech Republic, Hungary, Latvia, Lithuania, Poland and Slovakia agreed on their price reductions. There is no official information on what caused this delay. Secondly, Bulgaria is the only country for which there is information that the price has been reduced retroactively. According to a number of experts, such a practice is controversial as a legal and commercial approach, as noted by the EC itself in an explicit letter from Klaus-Dieter Borchardt, responsible for the Internal Energy Market in DG ENER, in which he expressed concern that the retroactive price change on the regulated market will also affect the free market, as in free market contracts it is often used as a reference measure and its retroactive amendment may lead to bankruptcies of natural gas traders or their customers in the internal market to lose confidence in the system, which will jeopardize the operation of the stock exchange and the Balkan Gas Hub. There was no convincing explanation from the public supplier why the price under the long-term contract was reduced
57 Press release Bulgargaz EAD (in Bulgarian language) https://www.bulgargaz.bg/index.php?p=6&id=160

335
after the end of the heating season Last but not least, even if certain amounts are reimbursed to district heating and gas distribution companies, they would find it very difficult to reach end users. Proposal for strategy of public institutions responsible for the formation of energy policy in the Republic of Bulgaria Energy security, but at an affordable price, is the most serious challenge in the modern world, and the combination of increasing dependence on energy imports and rising energy prices is a serious threat to the security of any country, including its national security. Bulgaria extracts symbolic volumes of natural gas from the local field and is unable to satisfy domestic consumption. This makes it highly dependent on blue fuel imports. In the case of exclusive import dependence, the country must provide options for dealing with a possible supply disruption crisis.
There is a strategic national goal for modernization of Bulgaria's gas transmission network with the addition of a reverse (two-way) connection with neighboring countries. It is one of the most consistent government policies in recent decades, but unfortunately the tools for achieving it (the specific gas pipeline) are changing. The South Stream gas pipeline project was stopped and replaced by the Balkan Stream gas pipeline (continuation of the Turkish Stream on the territory of Bulgaria), which was supposed to be operational on January 1, 2020. As of the end of this article (December 2020), this is not a fact. The change of strategic projects for gas pipelines in the country and the non-compliance with the commitments for their completion in time are serious obstacles to the diversification of both sources and suppliers and routes. transmission of blue fuel and are a danger to energy security.
The introduction of the stock exchange will help to form a liquid gas market and will impose market methods of negotiation instead of the practice of Bulgargaz's annual contracts, for which there are a number of public accusations of lack of transparency. Unfortunately, unlike the stock exchanges in Turkey, Greece, Romania and Hungary, the one in Bulgaria has not yet worked seriously in practice. Its tenders are rather symbolic than in Western Europe, where 80% - 90% of the contracts are hubs, mostly short-term. The lack of a liquid market (free, transparent and competitive) is a significant obstacle to Bulgaria's energy independence.
As a public supplier of natural gas, Bulgargaz EAD buys blue fuel at market prices and sells it to meet the needs of its customers in regulated, approved by the Energy and Water Regulatory Commission (EWRC). The commitments include all commercial activities on behalf of the Bulgarian state to ensure the supply of natural gas. For 2020, there is no indication of alternative supplies, given the growing influence of LNG in Central Europe and the decline in stock market prices in Western Europe. From the above it can be concluded that with its (non)actions the public supplier takes delayed, chaotic, non-market, ambiguous and even unconvincing actions, which in practice does not achieve security of supply and reduce the price of natural gas.
The author of the present study believes that the strategy of public institutions responsible for the formation of energy policy in the Republic of Bulgaria should include a set of actions as follows:
1. Continuous monitoring of natural gas, fuel oil and gas oil prices on the markets in Europe and preparation of monthly short- and medium-term forecasts
2. Continuous forecasting of domestic consumption, in this case the regulated market and forecasts for at least one year ahead
3. Constant optimization of the conditions under the long-term contract for supply of natural gas with Gazprom Export
4. Diversification of sources and routes of natural gas supply, but with a leading end goal -

336
the lowest possible price. 5. Issuance of monthly analyzes and forecasts for the general public 6. Negotiations regarding the ‘take or pay’ clause under the long-term supply contract with
the Russian side 7. Active support for the formation of a liquid market in Bulgaria, including the Balkan
Gas Hub 8. Control over the quality of purchased and sold natural gas 9. Quality completion of the gas transmission network on time 10. Development of the gas storage Results The study examined chronologically the documentary and conceptual development of the concept of a single European energy market and the EC antitrust case against Gazprom Export. Analysis was conducted on the pricing and trading practices of Gazprom Export in the supply of natural gas to European countries. An empiric research was made on the renegotiated contracts between Gazprom Export and European customers for the period 2009-2014 and export prices of Gazprom Export for 2010-2014. An empirical study of EC data on supply prices for the EU in the period 2013 - June 2020. Conclusions The consequences of the antitrust agreement between the EC and Gazprom Export LLC for the eight affected countries was analysed (Poland, Lithuania, Latvia, Estonia, Hungary, Slovakia, the Czech Republic and Bulgaria). In them all results are similar - improvement of trading conditions and lower prices. Even in Member States of the EU, where prices were lower on the eve of the trial than in other European countries, prices were further reduced and trade clauses in the contract were relaxed. The possibilities for ensuring security of supply and affordability in Europe are considered. Forecasts for the development of the sector at regional, European and global level are presented and a strategy for action of the public supplier and the system gas operator in Bulgaria was formulated. Theoretical research on the topic and the author's documentary study showed that Gazprom Export's commitments in connection with the EC antitrust case against it provide Bulgaria with a direct and real opportunity to ensure an affordable price and security of supply of natural gas.

337
RECLAIMING SPACES OF ENERGY CONSUMPTION THROUGH RETHINKING APPROACHES TO RURAL ELECTRIFICATION IN INDIA.
Manashvi Kumar, Secretary to the Government of Punjab, in the department of revenue, relief, rehabilitation and disaster management, Indian Administrative Service (IAS) Abstract
The governance structure of the energy sector in India, is unequivocally titled in favour of the conventional sources. Energy access policies appear to be dictated and dominated by conventional energy sector. Policies negotiating access do not lay due emphasis on a seamless socio-technical transition, recognizing the end user as the single most important element. Thus, the policies appear to be bereft of adopting an ecosystems approach towards access to energy. The energy transition path is littered with various obstacles arising out of current policy design, institutional and regulatory frameworks that exert powerful influence on the current deployment model of energy systems. Decentralized, rural energy systems remain an elusive dream as there are formidable 'barriers' to be transcended for a seamlessly favourable energy system transition that is coherent with larger mandate of service and addressing climate change through integration of renewable energy sources. The 'barriers' can be broadly categorized into such categories as: a) Promotion policy for renewable energy literacy, b) Policy for technological acculturation, c) Policy for self-generation by end users, d) Policy defining role of district, block and village level energy committees and lastly, e) Policy for rural electrification to be nested in the notion of doable and achievable decentralized energy systems (DES).The growing penetration of distributed energy resources is opening up opportunities for local energy management (LEM). This would entail systemic coordination of decentralized energy supply, storage, transport, conversion and consumption within a given geographical area. This paper provides insights into the complexities that revolve around the current institutional framework entrusted with the task of flexibility management to guarantee universal service obligation (USO), but also addresses issues of demand side management (DSM). Keywords: decentralized energy systems, local energy management, barriers, energy transition, universal service obligations and demand side management. 1. Introduction The rural energy landscape of India comprises a plural and complex heterogeneous mix of energy demand. Should there be an ideal case to be- access to modern energy services in rural areas become a perceptible reality in the times to come; the future of power systems shall rest upon twin dogmatic paradigms: 1) comprehensive demand aggregation and profiling of a rural, domestic consumer situated in a geo-cultural, climatic zone/space and a distinct physiographic terrain, and 2) local renewable energy resource assessment. This exercise should emphatically be for a given geographic territory and on a given temporal horizon. It should take into account seasonal variability as well. However, it is always easier said and remains a wishful thinking.
Mega generation systems are not designed to account for local, small and sporadic demands (loads or load centres). The current energy policy framework remains non-cognizant towards the essence of realization of user value of rural electrification. As a result, rural electrification process still remains an unfinished agenda in India, being completely oblivious to the basic needs of the rural societies, and in terms of the effects of quantity and quality of service in their domestic lives. The ability of users to appreciate the intrinsic and extrinsic value of access to energy remains abysmally dismal. The rural, energy consumption ecosystem warrants an in-situ, longitudinal study. The provision of state sponsored subsidies stands on a slippery ground, as there is lack of concurrence on profiling of rural, domestic demand for energy, regressively construed in terms of electricity distribution network extension. The
338
rural, domestic- individual and community clusters (as users), and the productive-sector (energy intensive sector) users should ideally be similarly placed, and considered on principles of equity pricing in lieu of access to energy. As, every society makes an effort towards ‘commodious living’ in space and time, it is extremely important that incremental improvements in quality and reliability of energy services access be given its due in rural areas as well.
The economics of renewable energy-based generation, coupled with innovative technologies, have been growing more favorable, largely due to changing market fundamentals. Realizing the opportunities offered by falling renewable energy (RE) prices, the distribution companies’ (utilities) best consumers have begun drifting away from their traditional suppliers. Today, utilities have little choice but to rethink the way they have been running their business. The key step in this rethinking is resource planning, which allows utilities to absorb more renewable energy into their systems at a lower cost and pass the benefits on to their consumers. Spurred by ambitious national commitments (175 GW of RE by 2022 in the existing 362 GW grid with an ambition to achieve 450 GW by 2030, NITI Aayog report, 2017) and rapid technological progress in the past five years, India has seen an unprecedented addition of renewable capacity (80.5 GW as of June 2019). In 2019, renewable energy (RE) accounted for 75% of the total capacity additions made to India’s system and this trend is expected to continue with the maturity of RE market and falling costs.
However, success of this additions hinges on utilities’ who at the end are the primary off taker of RE. In the present scenario, the utilities are not better equipped to deal with RE dominated portfolio which is variable and does not correspond to the peak demand period and creates excess power situation during the off-peak period. If India must achieve its RE ambition, utilities hold the key, for which they need to be guided and supported for improving their resource planning strategies. At the distribution grid level new challenges shall arise in terms of addressing demand side issues. To respond to these changes in supply and demand, system operators and suppliers must start to develop new strategies for handling a more decentralized system. Among the more radical solutions is local energy management (LEM) the coordination of decentralized energy supply, storage, transport, conversion and consumption within a given (local) geographical area. Combined with automated control and demand-side management strategies, local energy management, especially with the use of local heating production, holds the promise to significantly increase the efficiency of energy use, reduce carbon emissions and enhance energy independence.
As states across India are still gearing up to effectively and efficiently manage the large-scale integration of distributed energy resources, it is important to consider the effect of actor roles and responsibilities for managing the electric flexibility from resources locally in the regulatory context of energy retail competition. Because, the internal market policy process imposes constraints on how the electricity system can be organized, there may be conflicts between these flexibility management approaches and market regulation. The aim of this paper is to give insight into the complexity of the organizational structure that essentially is closed for flexibility management. What is required to be done is- 1) an in-situ analysis of different real-life localized energy integration and management cases, 2) their organizational structures, comparing them to the traditional organizational structures, and 3) evaluate and thereafter consider possibilities for integration of retail consumption to address issues of universal service obligation (USO) and direct benefit transfer (DBT). Lastly, probe the aspect of scalability of those projects.
The paper is structured as follows. Section 2 describes the end use pattern and the variable nature of local load demand across India. Section 3 describes the methods and complexities of the around integration of renewables into mainstream generation and consumption centred
339
around assessment of resource potential and demand forecasting, and Section 4 presents the results of the analysis of the complexities. This is followed by a set of conclusions and policy implication in Sections 5 and 6. 2. The rural load demand variability-
The figures 1.1 and 1.2, at annexure 1, reflect the variability in terms of the load demand across similar socio-economic profiles throughout rural India. These dwelling situated in different parts of rural India, in different politico-administrative units reflect diverse mannerisms of energy end use. These units differ in the manner in which energy is accessed-access to power (electricity) in these units happens to be on account of a variety of mechanisms- a) formal state intervention, b) informal self-intervention by the end-user, and c) energy service being provided by private energy service companies.
The formal state intervention is in terms of-1) access to the central grid, and 2) standalone, off-grid solar power packs, both the services are being paid for by the state, and the beneficiary pays a certain minimum amount commensurate with the supply. The formal intervention of the state in two dwelling units constructed under the erstwhile rural housing scheme, Indira Awas Yojana (known as Pradhan Mantri Awas Yojana [grameen], PMAY [G] now) have been compared. The scheme does not have a provision for access to energy. One of the dwelling units constructed under IAY has a formal, accounted for, connection to the grid. The daily load demand of the unit is 0.525 kWh that is largely a function of usage of such electrical appliances as ceiling fan(s) and tube light(s). The other IAY civil structure also has an access to the grid has a daily load demand of 1.825 kWh. The appliances that contribute towards this load are ceiling fan(s), cooler(s), television and tube light(s) (figure 1.3, annexure 1). This energy usage is not formally accounted for- labelling it as a non-revenue (un-metered) earning energy service. Both these dwelling units constructed under a similar rural housing scheme. The socio-economic structure of the occupants is similar. They are contextually situated in a similar geo-climatic zone and physiographic division, yet have different demands in terms of power consumption.
Coming to another example of state intervention (by two state governments), in terms of providing standalone solar power packs (SPPs), wherein two formats of SPPs are shown (figures 1.4 and 1.5, annexure 1). One of them is provided by the state of Gujarat, and the other by the state of Uttar Pradesh. In the latter case, the standalone system is an inbuilt component of a rural housing scheme, popularly known as Lohia Awas Yojana (LAY). The solar power pack (SPP) of LAY provided by Uttar Pradesh New and renewable energy development agency (UPNEDA) can service a direct current (DC) based appliance load of 0.253 kWh. The appliances that can be run by the SPP comprise ceiling fan, a mobile charging unit and LED lighting devices.
On the other hand, the SPP provided by Gujarat energy development agency (GEDA, SNA for Gujarat) can service a DC load of 0.437 kWh which comprises usage of ceiling fan, portable table fan and LEDs, apart from provision of mobile charging points. An important feature of the SPP in the case of Gujarat is that the institutional responsibility has been entrusted to distribution utilities. The off-grid dwelling units are entitled to this facility. GEDA is too remote to even oversee the objective functioning of the SPP. The SPP in the state of Gujarat is to be provided only in rural areas that cannot be connected to the grid on account of adverse terrain characteristics.
The applications for the SPP are to be moved in the electricity sub-divisional offices in whose jurisdiction the eligible end-user resides (author, 2017). Thus, the off-grid power supply system in Gujarat services almost twice the amount of load as compared to SPPs provided by UPNEDA (SNA for UP). Thus, there are similar institutions performing dis-similar functions.
340
This happens on account of lack of capacity and un-clear mandates, the policy framework does not account for well-defined institutional roles in the action arena. Therefore, GEDA suffers from latent dysfunction on account of institutional capabilities and capacity as well. However, the SPP scheme of UPNEDA was a scheme nested in a clear-cut policy directive linked to a rural housing scheme, Lohia Awas Yojana (LAY). 2.1 Act utilitarianism by self-interested actors- An important feature of the grid based conventional power system in northern India is illegal access to energy supply-non-revenue power. These informal connections are commonly referred to as ‘katiya’ (illegally tapped power service lines). It contributes to huge revenue losses to the local distribution utilities of the state government. The load demands of these informal (illegal) connections are shown as non-electrified dwelling units (NEDUs). The dwelling units have been categorized into three types labelled as NEDU1, NEDU2 and NEDU3 depending upon their load demand and energy use (figures 1.6 and 1.7, annexure 1). These units consume alternating current (AC) loads of 0.515 kWh, 0.525 kWh and 0.725 kWh, respectively (author, 2017). The devices that run on ‘katiya’ connections are largely ceiling fans and bulbs or tube lights, their numbers differ depending upon the income and family size.
The aforesaid events across local energy access arena highlight a plethora of issues that are hinged upon the following aspects of energy provisioning- a) supply akin to systems of production, b) legitimacy of actors in the action arena, c) technical character of energy demand, d) consumer capability, and e) institutional asymmetry. These aspects can be further explicated in terms of experience and evidence-1) different energy production systems (grid-based, conventional and off-grid, non-conventional sources of power supply), 2) the involvement of state actors and the individual, non-state actors, 3) the different nature of loads (AC or DC), 4) the different varieties of demanded loads (in terms of ownership status of various electrical appliances), 5) the different institutional structures of providing access to energy service (s) viz., distribution companies (state utilities) and state nodal agencies (SNAs), 6) regional political moorings, and 7) local power structure reflected through- illegal tapping of service lines to service load(s). 2.2 The static interventions of the non-state actors in providing energy services It is important to highlight the misgivings of the so-called demonstration projects. These interventions were largely driven by a lethal combination of a research funding and fulfilling corporate social responsibilities, which was not desirable for want of time and place knowledge. The private energy service companies run on their own whims and fancies, independent of any obligation towards the energy regulator (meso-level) or the local institutions of self-government (micro-level). The first case of an energy service based on solar energy comes from Tayyabpur village, in Vaishali district of Bihar. The solar grid in Tayyabpur is a demonstration project of TATA power. The grid services DC loads to the tune of 0.042 kWh. This load comprises one LED and a mobile charging point (figure 1.8, annexure 1).
Another private energy service company that is being discussed is MGP. The company provides a pair of LEDs (1W each) and a mobile charging unit. The DC load of the SPP of MGP services comes to about 0.017 kWh (figure 1.9, annexure 1). The quantum of electrical load demand has been calculated by taking into account a usage duration of 6-8 hours in every single case. It is noteworthy to mention that the private operators supply power only for a fixed timeframe of 5-6 hours post sunset from 6.00 pm to 11.00 pm. The aforesaid empirical evidence calls for a re-look into the policy framework that lays down the roles and responsibilities of appropriate regulator’s and the local institutions.
341
2.3 Passive consumerism and the extent policies of rural electrification Understanding passive consumerism is a daunting task in rural, remote and complex cultural settings. The aforesaid data set questions the executional aspiration in terms of the daily consumption of 1 unit (kWh) of electricity. How much is that in terms of the number and type of electrical appliances that it can run? Is that enough? Or, something else warrants attention. Perhaps we do not have a conclusive response at the moment. Even more complex and severe is the conception of the second executional aspiration pertaining to ‘quality and reliability of supply at reasonable rates.’ In the absence of any robust empirical data base for assessing quality and reliability of energy supply, how can reasonable rates be arrived at. And more so, in relation to a rural, domestic category of a consumer, who is too remote to be measured in terms of his usage and preferences. And such low, sporadic load signatures are not accounted for at the level of a majority of designed power sub-stations. It becomes a fatal aspiration existing in a vacuum. The functionality of centralized power generation systems cannot be either definitive or deterministic in terms of the executional aspirations as they operate under complex networks of institutional mechanisms.
Practically speaking, supply-side management (SSM) is dictated by polity and effervescent policy determined by the nature and structure of political engagements at the macro-(centre) and meso- (regional) levels of energy governance. The contemporary policy still favours centralization that entails creation of- mega-size visible infrastructure, and remote generating technologies (Kelly and Pollitt, 2011; Bolton and Foxon, 2015). This policy concentration on remote centralized sources of energy, renewable or non-renewable increases the vulnerability of the rural, remote end users and the local institutions as well. In the process, it distances the end user further from the energy generating process. This adds to the arsenal of information asymmetry already existing, that is minimal in terms of understanding of energy and power systems. The end user remains an indifferent, insensitive, passive consumer of an electricity or energy service. The local institutions also remain inactive and functionally distant from the centrist policy design. 3.0 Demand forecasting and load estimation: issues and challenges Demand forecasting is a science and art of predicting the cause, magnitude and location of electric demand over different period of planning horizon. Demand forecasting assumes a greater importance because, underestimation of demand lead to under capacity, which results in poor quality of service including localized brownouts or even blackouts. An overestimation could lead to authorization and construction of a plant that may not be needed for several years. In the process of making predictions, forecasters bear in mind the feedback effects of pricing and policy changes and therefore, participates in the process of designing ways and means to meet consumer demands (such as developing demand profiles to manage peaks and troughs of electricity demand).
While there is array of methods that are available today for forecasting demand, we have focused on most commonly used approaches to demand forecasting. The first is a trend line, where the historical growth rate is used to extrapolate future demand. While this approach is easy to use, it is not very accurate because it assumes that a historical trend will continue, but often it does not. This approach does not consider econometric, demographic, policy or technological parameters. Compounded average growth rate (CAGR) method practiced by state DISCOMs is one such example. The second is to use econometric parameters such as growth in GDP, income per capita, penetration of appliances and growth in electricity-intensive industries to determine the demand forecast. Econometric models are top-down models (Kumar and Chatterjee, 2012). The third approach is the use of end-use models, which use a bottom-up approach. They use consumption data for each end-use to estimate electricity use for each consumer category. End-use models facilitate an understanding of the factors that affect consumption, and
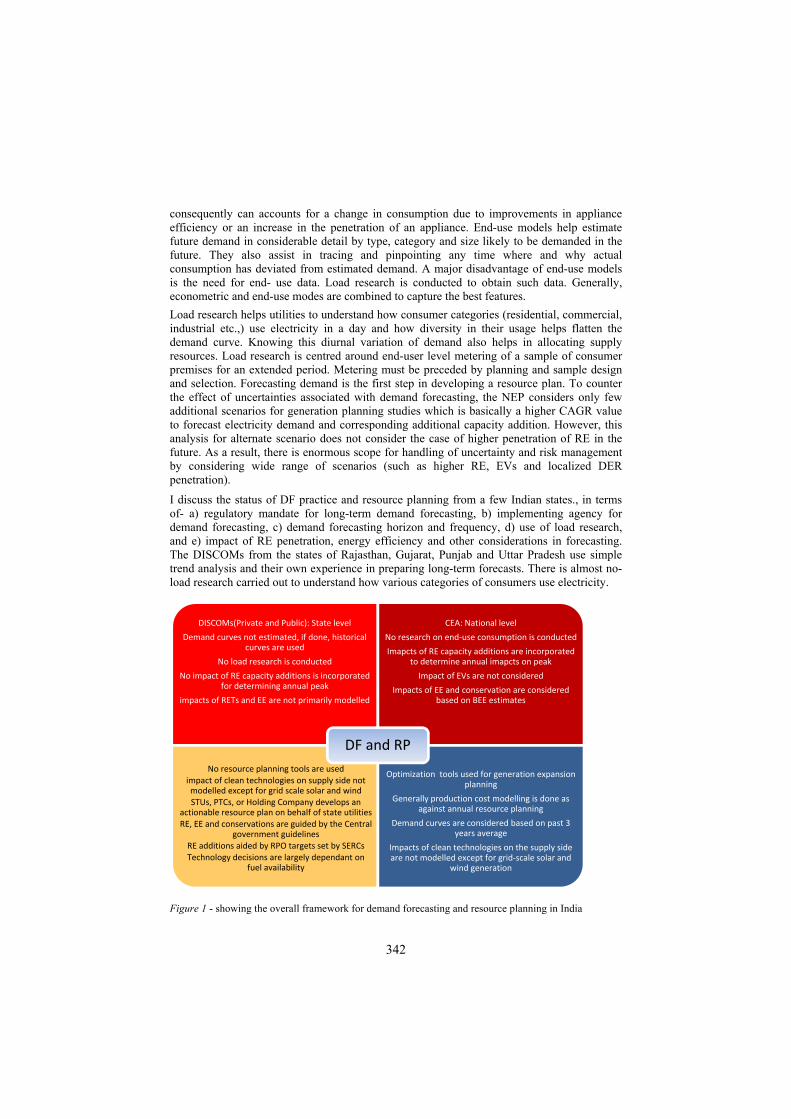
342
consequently can accounts for a change in consumption due to improvements in appliance efficiency or an increase in the penetration of an appliance. End-use models help estimate future demand in considerable detail by type, category and size likely to be demanded in the future. They also assist in tracing and pinpointing any time where and why actual consumption has deviated from estimated demand. A major disadvantage of end-use models is the need for end- use data. Load research is conducted to obtain such data. Generally, econometric and end-use modes are combined to capture the best features.
Load research helps utilities to understand how consumer categories (residential, commercial, industrial etc.,) use electricity in a day and how diversity in their usage helps flatten the demand curve. Knowing this diurnal variation of demand also helps in allocating supply resources. Load research is centred around end-user level metering of a sample of consumer premises for an extended period. Metering must be preceded by planning and sample design and selection. Forecasting demand is the first step in developing a resource plan. To counter the effect of uncertainties associated with demand forecasting, the NEP considers only few additional scenarios for generation planning studies which is basically a higher CAGR value to forecast electricity demand and corresponding additional capacity addition. However, this analysis for alternate scenario does not consider the case of higher penetration of RE in the future. As a result, there is enormous scope for handling of uncertainty and risk management by considering wide range of scenarios (such as higher RE, EVs and localized DER penetration).
I discuss the status of DF practice and resource planning from a few Indian states., in terms of- a) regulatory mandate for long-term demand forecasting, b) implementing agency for demand forecasting, c) demand forecasting horizon and frequency, d) use of load research, and e) impact of RE penetration, energy efficiency and other considerations in forecasting. The DISCOMs from the states of Rajasthan, Gujarat, Punjab and Uttar Pradesh use simple trend analysis and their own experience in preparing long-term forecasts. There is almost no-load research carried out to understand how various categories of consumers use electricity.
Figure 1 - showing the overall framework for demand forecasting and resource planning in India
DISCOMs(Private and Public): State level
Demand curves not estimated, if done, historical curves are used
No load research is conducted
No impact of RE capacity additions is incorporated for determining annual peak
impacts of RETs and EE are not primarily modelled
CEA: National level
No research on end‐use consumption is conducted
Imapcts of RE capacity additions are incorporated to determine annual imapcts on peak
Impact of EVs are not considered
Impacts of EE and conservation are considered based on BEE estimates
No resource planning tools are usedimpact of clean technologies on supply side not modelled except for grid scale solar and windSTUs, PTCs, or Holding Company develops an
actionable resource plan on behalf of state utilitiesRE, EE and conservations are guided by the Central
government guidelinesRE additions aided by RPO targets set by SERCsTechnology decisions are largely dependant on
fuel availability
Optimization tools used for generation expansion planning
Generally production cost modelling is done as against annual resource planning
Demand curves are considered based on past 3 years average
Impacts of clean technologies on the supply side are not modelled except for grid‐scale solar and
wind generation
DF and RP
343
Wherever an attempt was made, it was survey-based and not based on end-use measurements. DISCOMs still lack a focus on long-term planning and mostly juggle day-ahead projections. The reason being there are no well-defined regulatory guidelines on planning. Although, procurement accounts for 60-80 percent of the distribution business costs. Similarly, there is no impetus laid on uncertainties of unexpected integration in terms of OA, EVs, cyber-attacks or climate change. With the justification based on increase in demand on account of the state government’s policy of grid extension to cover up villages and households, the capacity additions are planned mostly based on existing resource availability. There is no assessment of flexibility requirement based on- a) RE share or any alternative portfolios, b) RE capacity, c) uncertainty and risk management (Figure 1).
In majority of the states, the responsibility and ownership of the resource plan is diffused. Taking the case of Punjab, PSPCL (Punjab State Power Corporation Limited) has three cells whose work could be related to long-term resource planning and procurement: 1) power purchase and regulation cell, 2) planning cell, and 3) ARR and tariff regulation. Yet the decisions related to long-term resource planning and procurement are taken by a long-term power purchase committee. Resource planning is linked to the annual revenue requirement (ARR) review as a measure of power procurement, and the associated costs have traditionally been essential components of ARR (interaction with OSD power reforms, PSPCL).
Currently, demand forecasting and resource planning are done in conjunction with the ARR’s approval and tariff determination. Tariff-setting is a short-term exercise and the amount of time needed to examine all components in great detail is limited. In contrast, good resource planning has a long-term horizon, is expansive and comprehensive. It would be useful if regulations specific to resource planning were formulated and a nodal entity be made responsible for submitting the plan to the regulatory commission in a process that is delinked from tariff filings and review proceedings. The approve resource plan would then be used as input to ARR. This would also give the utilities and regulators more time to concentrate on other components of the ARR and tariff setting (CEA, 2003; Annual reports of MoP 2017-18; Planning commission 2013-14). 4. Addressing complexities at different levels: What has been achieved, and where are the short falls? Between fiscals 2006 and 2018, India’s installed capacity for generation of power logged a breezy 8.9% compound annual growth rate (CAGR) to 344 GW, from 124 GW, making it the third-largest electricity generator1 in the world. Indeed, capacity addition was faster than the 5% rate at which peak demand increased, to -160 GW, with the latest draft National Electricity Plan 2016 projecting peak demand of 235 GW at the end of 2021-22. Transmission, too, took rapid strides, to enable evacuation of the generated power with a CAGR of 7.2% over the six-year period FY’12-18 taking the transmission line capacity to 3.9 lac circuit kms (CEA, 2016a and 2016b). However, distribution remained a weak link, despite a raft of reforms mounted over the years to improve the fiscal health of electricity distribution companies (utilities).
Numerous studies undertaken to analyze and recommend measures have focused on critical issues that have hobbled distribution, including poor operational performance and rising accumulated losses of utilities, tremendous pressure on tariffs, and little/ no improvement in cross-subsidy levels. However, several other critical areas have not been addressed as meaningfully so far. These include:
Poor quality of baseline data as well as inadequate capturing of real time data Widening aggregate technical and commercial (AT&C) gaps owing to intensive last
mile connectivity efforts (addition of rural consumers),
344
Under-recovery of fixed costs through fixed charges in tariffs and the fact that the
tariff structure does not reflect the costs, Cross-subsidy levels for most utilities still not within the limits prescribed under the
Electricity Act and the National Tariff Policy, While un-electrified households are being electrified, universal service obligation
(USO) and direct benefit transfer (DBT) remain areas of concern (FoIR 2015 and 2016).
5. Conclusions: Various reforms have been launched to boost the sector’s commercial viability and meet targets, drawing inference from the studies. These reforms can be broadly classified as structural, operational and financial. Major structural reforms undertaken include the Electricity Act, intended to turn the sector around and promote competition, besides the Odisha Electricity Reforms Act, Electricity regulatory commission Act and privatization of Odisha and Delhi distribution entity. However, through privatization of Delhi was successful, the Odisha privatization was not able to achieve the desired result. Similarly, while Electricity Act and subsequent policies have enabled promotion of competition in generation and transmission, however public private partnerships (PPPs) and competition in the distribution sector has not been able to pick up.
Operational reforms introduced to improve power supply and system performance include Rajiv Gandhi Grameen Vidyutikaran Yojana and Deen Dayal Upadhyaya Gram Jyoti Yojana for rural electrification, and Restructured Accelerated Power Development and Reforms Programme and the Integrated Power Development Scheme for urban areas. Household electrification has been achieved, though loss levels continue to remain high for many utilities as well as quality of supply and service remains poor in most of the areas including Urban districts (because of local breakdown of transformers).
The sector has needed financial reforms from time to time, primarily to help utilities compare their mounting losses. The most recent of these is the Ujwal Discom Assurance Yojana (UDAY), aimed at improving performance and reducing losses. While it is too early to access the success of the scheme, however utility data needs to be closely monitored over the span of the scheme. There is a dire need for improvement of data quality and also take into account the possible negative impact of adding and providing 24x7 power to rural consumers/ hugely subsidized consumers on the financial and operational losses of the utilities (CRISIL report, 2019).
5.1 Barriers hinder growth of open access (non-utility consumers) market: Open access (OA) in power distribution, mandated as an operational reform in the Electricity Act, 2003, was expected to allow consumers to choose from among power suppliers on the basis of price and reliability, and also promote competition among distribution licensees to improve their service delivery. This is yet achieve its full potential, although many generators and consumers have been able to opt for it. Another reason why OA has not picked up in many states, and there are limited takers due to commercial viability or operational constraints of such transactions. It has been observed that while overall OA transactions (including the subsidy exempt category) have risen, the share of OA consumers in the exchanges has dipped drastically in the last 1 year from 60% in FY’17 to 33% in FY’18. Financial barriers such as high levels of cross-subsidy surcharge and additional surcharge reduce viability for open access consumers. Cross-subsidy remains higher than 20% of the average cost of supply for industrial and commercial consumers. Most open access consumers are high-tariff ones (industrial and

345
commercial), who cross-subsidize the other consumers. From the utilities’ viewpoint, it becomes critical to reduce their financial losses, which could mount. Financial barriers such as high levels of cross-subsidy surcharge and additional surcharge reduce viability for open access consumers. Cross-subsidy remains higher than 20% of the average cost of supply for industrial and commercial consumers.
Most open access consumers are high-tariff ones (industrial and commercial), who cross-subsidize the other consumers. From the utilities’ viewpoint, it becomes critical to reduce their financial losses, which could mount further in case these high-paying consumers went to the open access (OA) market. This also explains the operational barriers posed by utilities in the form of procedural delays/ rejection on unreasonable grounds, etc. Apart from high open access charges, supply-side constraints on account of limited availability of domestic coal and high cost of imported coal have increased short-term market prices and thus the overall cost of power for generators selling power on the exchange or through bilateral transactions (CEA, 2017 and 2019).
5.2 Separation of content and carriage can change market dynamics, but adoption a challenge: In 2015, the Forum of Indian regulators (FoIR) commissioned a study on ‘Rollout plan for introduction of competition in retail sale of electricity’.
The report envisaged the stages of implementation of separate content and carriage (C&C) starting from functional segregation of utilities, preparation for competition and onset of competition. Among key areas marked for immediate focus were the formation of intermediary companies, transfer of existing power purchase agreements, treatment of existing financial losses, allocation of technical and commercial losses between distribution and supply companies, balance sheet segregation, tariff-setting mechanism for new entities, defining the framework for consumer interface, and phasing of retail supply competition.
Moreover, there is a need for restructuring tariffs i.e. fixed charge in line with fixed costs as well as implementation of direct benefit transfer (DBT) and Universal Service Obligation (USO). This will help in making wheeling and retail supply both viable on a standalone basis. The retail supply tariff comprises two parts: fixed/demand charge and energy/variable charge.
Fixed/demand charge is designed to recover utility costs that are fixed in nature, such as capacity charges payable to power generators, transmission charges, operation and maintenance expenses, depreciation, interest on loans, and return on equity. This is generally recovered on the basis of sanctioned load/ connected load/ contract demand or maximum demand of consumers. Energy/variable charge is designed to recover utility costs that are variable in nature, such as variable cost component of power purchase. This cost is recovered on the basis of the actual consumption of consumers during the billing period (per kWh or per kVAh basis).
However, there is a wide gap between the actual fixed cost paid and the revenue recovered through fixed charge. Data of various state utilities indicates that a large portion of the fixed costs is loaded on energy charges. This raises the proportion of energy charges in total utilities’ revenue. As more consumers move to open access, there is a possible worry of utilities on account of under recovery of fixed costs and therefore exacerbating the utilities poor financial health. Ensuring full recovery of the distribution wires business – which has a major share in the total fixed costs of a utility would obviate levying higher open access charges. In this case, utilities would be able to support competition in the long run, whether it is in the form of open access or content and carriage separation (CERC, 2000 and 2015).

346
Direct Benefit Transfer (DBT), involves transfer of subsidies directly to the beneficiary’s bank account, can help reduce cross-subsidy and keep rural tariffs low as only actual consumption is subsidized, and not power pilferage or losses. State governments give subsidies to power distribution utilities for selling electricity to consumers below the procurement cost. However, subsidy payments by states are not made regularly, adding to the financial misery of the utilities. Implementation of DBT, including full recovery of the costs, will help utilities stay out of the subsidy loop and recover the full price of electricity, thus improving their financial profile. Besides, competition through open access can flourish if tariff rationalization is introduced along with DBT, providing a platform for future reform agenda. Judicious cost recovery will also shield utilities financially from any exodus of consumers and create a conducive environment for other players (planning commission report, 2013-14). 5.3 Regulators haven’t quite succeeded in promoting competition through open access: Despite structural reforms, the tariffs determined for utilities don’t reflect the cost of supply due to high AT&C losses leading to financial losses. State Electricity Regulatory Commissions (SERCs) have tended to create regulatory assets through partial approval of the actual cost. The gap between tariffs and costs, in turn, has forced utilities to take short-term loans to meet the power requirement, while most of the regulators has not penalized the utilities for meeting the loss target levels. The issue has snowballed in the past and the regulator needs to be very cautious going forward (NEP, 2005; NTP 2006 and 2016).
Post UDAY, the SERCs need to regularly change tariffs without any delay, approve adequate tariff hikes to meet the increased cost of supply (including by adding increased rural/subsidized consumers), reduce the cross subsidy going forward, follow AT&C losses as per the UDAY, and implement DBT in alignment with the suggestions of the central regulator (CERC, 2015)
5.4 Utilities unable to tap lowest-cost power: A utility’s ability to buy power from the open market depends on its current tied-up power - higher the capacity tied up, lower the ability, given the fixed-charge liability. Further, a delay in receiving money from consumers has a cascading effect on debtor days, which is higher in case the state has a higher proportion of subsidized consumers. Delays in subsidy realization from the state government also creates a cash crunch. The delays in the cash cycle, in turn, increase the utilities’ dependence on industrial and commercial consumers for providing adequate cushion to their working capital, and make them resist provision of open access to such consumers (Planning commission, 2011). 5.5 Tariffs still too complex: There are numerous categories and sub-categories/slabs in the tariff structures, with no consistency among states, adding to the complexity as indicated in the Table 1 below:
Tariff Structure Haryana Punjab Rajasthan Gujarat Karnataka West Bengal Delhi No of categories 15 17 8 18 12 9 9 No of slabs 45 43 25 34 62 72 14 Complexity Moderate Moderate Simple Moderate Complicated Complicated Simple
(Table 1 shows the complex mix of categories and slabs across different states in India, CRISIL 2019) Besides, states follow a different mechanism to recover costs, apart from a two-part structure such as the concept of monthly minimum charge for domestic consumers which is still prevalent in some states (FoIR, 2015 and 2016).
347
6. Policy Implications and the way forward: A big push aimed at extension of rural electrification infrastructure in rural areas, increases the visibility of rural electricity infrastructure by covering all below poverty line (BPL) families. It involved setting up a uniform village infrastructure at a community development (CD) block level, for catering to non-domestic demand for power. These initiatives, however, were all aimed at pushing through the overlapping extension activities proposed under different flagship programs for rural electrification. Nevertheless, quality and reliability of supply remained a serious un-addressed issue. Rural electrification, as a process, is prohibitively costly given the conditions of terrain and other locale-specific realities which are normally ignored. The process has a lot of scope for recurring revision on account of the fact that 'the context gets missed out' quite often. There is still a dire need for creation of base line energy consumption data including terrain specific modelling.
An empirical approach for demand aggregation shall require creation of robust, autonomous institutions for data capture and analysis. The extension of the central grid for providing access shall remain the sole plausible option, till the time any alternative model for providing on-site generation and consumption of energy is designed. Any switchover to alternate energy systems and technologies that are 'contextually' grounded, and 'smaller in scale' would entail usage of distinctly disparate simulation tools for micro-planning. It is further necessary, that the planning tool must adapt to local complexities and highlight them appropriately, rather than relying on secondary data from different agencies of the state.
These could be the policy options that could be made use of to address issues of aggregating local variability of demand through- a) demand profiling, b) local energy management and c) locally integrating renewable sources of energy through decentralized energy systems approach. However, to make all of this happen there is a need to address the following challenges at the level of state governments and at the centre as well. There is a need for: 1) course correction by the principle by way of changing of organizational structures within the governance architecture for an effective retail electricity market integration, 2) development of a framework for flexibility management at the retail end, 3) clear outlining of responsibilities (who) of as an actor can assume responsibility for managing the flexibility of a specific (set of) appliance(s) being used by a remote, rural end user, 4) developing user friendly devices for picking up local energy consumption signals (how), 5) identifying the nature and the actual number of actors involved in the process of LEM and DSM and 6) an independent rural electricity market regulator who can keep a tab on nature and volume of transactions for an effective DSM.
The aim of rural electrification planning is to fulfil the general objectives defined under the national electricity policy 2005. The overall purpose was to extend access to electricity within a given territory and within a given time horizon. However, this single, sovereign approach missed upon one essential aspect- integration of spatial planning, within the scope of rural electrification to increase the social and economic impact of the process. As a result, this program did not infuse confidence in the private sector. Thought it was visible, but it had no takers apart from the state utilities. As Lahimer et. al (2013) puts it- "rural electrification is a complicated issue because of user affordability, rural in accessibility and remoteness, low population densities and dispersed households, low project profitability, fiscal deficit, scarcity of energy sources, population growth, lack of professionalism and over-dependence on subsidies”.
It is an accepted fact that the development of a sub-sectoral policy on rural electrification is conceived and designed by the 'MACRO' (the union) whereas, the responsibility for effective implementation of the policy lies upon 'MESO' (the state distribution utilities and the power/energy departments of the respective states). There is no involvement of the 'MICRO' (the III tier architecture of local governance) whatsoever. Rural electrification has been since
348
decades, the sole imperative and prerogative of the central government. The electricity act, 2003 has been instrumental in overhauling the 'mega-picture' of the electricity sector, however, a lot remains to be done with regard to the approach towards rural electrification, especially decentralized distributed generation (DDG) based on non-conventional sources of energy including off-grid, stand-alone systems. There is a pressing need for an enabling environment for active community partnership, both as generators and consumers of electrical energy. A greater precision is required in the enabling provisions of regulatory policies and programs of rural electrification as a whole.
The contemporary institutional set up, the central agencies and their functional structures need to adopt a more granular approach in terms of engaging with the MESO in a reciprocal manner-to reduce institutional compartmentalization. This shall involve a closer association with the MICRO- the three-tier local governance structure (the district, the block and the village). Local understanding of the basic needs of any given geo-spatial terrain, in terms of demand aggregation and its subsequent profiling should be effectively through the MICRO- anon-existent entity at present vis-à-vis energy governance framework.
There is a strongly felt need for- a) decentralization, delegation, and devolution at the level of 'MESO' directed towards ‘MICRO' all along the different phases as a sub-sectoral strategy, b) planning and, c) investment programming and execution. Thus, there is a much-desired push in terms of unequivocal sharing of responsibilities between the 'entities’ to be entrusted with this paradigmatic shift. There is even a greater need to build capacities in terms of boosting human capital allowing local communities to have a greater choice in terms of local generation and distribution planning. This ought to be commensurate with, the general 'tendency' at the top towards multi-sector collaboration in terms of energy-mix (renewables and conventional fuels). However, whether the proposed endeavour shall progressively lead to de-compartmentalization in electrification (energy) planning and execution of small projects, at the 'MICRO' level between the key actors and rural development sectors shall primarily depend upon norms of reciprocity amongst the actors, and the networks of civic engagements that evolve later between actors and the enabling agents.
The existing framework is closed for any lateral substitution for accelerating the process of rural integration especially in terms of openings for alternate sources of energy, open access to the distribution network, alternate tariff structure etc. Consequently, in the interest of optimizing the access to electricity for all, the need is to first identify and establish the sufficient and good reasons for this policy dose. What should be the drivers? Electricity has the potential to create user-value by broadening the perception of a 'product experience' rather than just 'object interaction’ (passive consumerism). However, the Indian experience of rural electrification is reflective of the fact that development work typically focuses on economic and physical aspects of development and often neglects the needs of the local communities that are affected by it (Kumar, 2019).
6.1 Key asks
1. Institutional: Sensitization is important on why resource planning is important in renewable energy (RE) dominated environment and how useful resources plan will help in drawing the advantage of cheaper RE power. The sensitization may be different for each of the two important groups. For DISCOM- it should be on methodology for accurate long-term forecast, while for regulators- for examination of the methodology and assessment of its impact. Central Government (Ministry of New and Renewable Energy (MNRE)/Ministry of Power (MoP)/Central Electricity Authority (CEA)/State Governments) need to identify institutions that can develop and can run courses on resource planning.
2. Structural: There are two important aspects which are to be considered from regulatory guidance perspective.
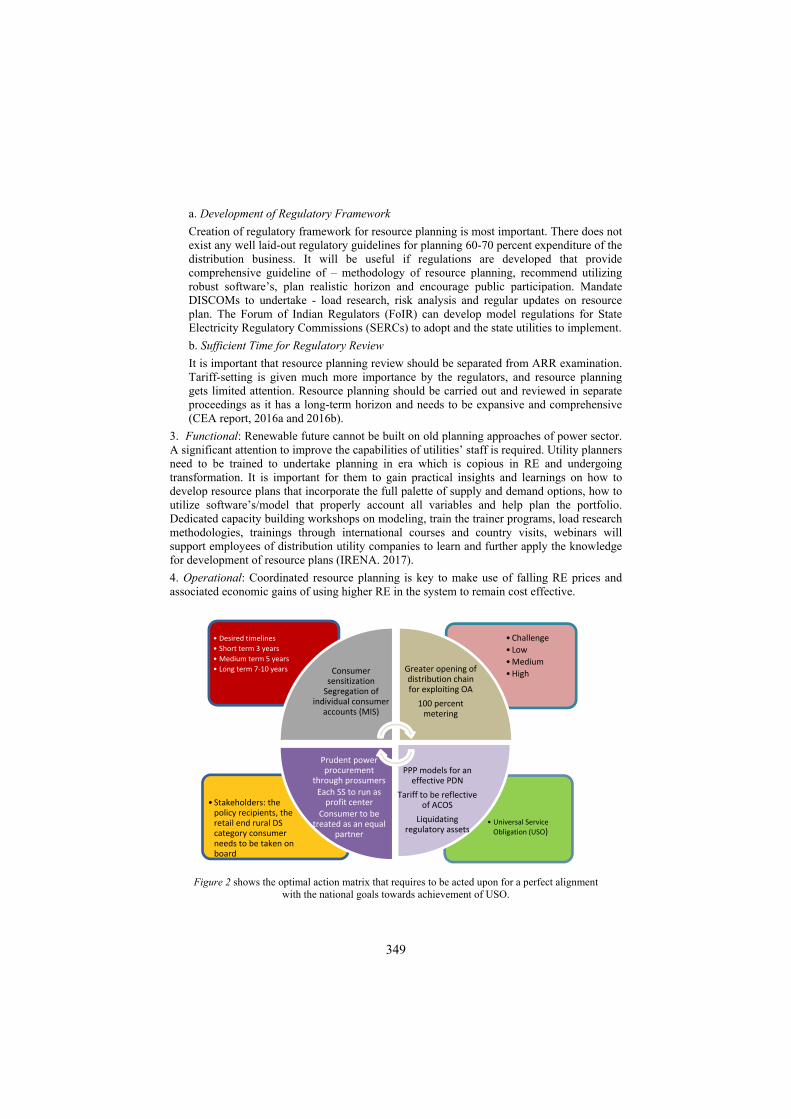
349
a. Development of Regulatory Framework
Creation of regulatory framework for resource planning is most important. There does not exist any well laid-out regulatory guidelines for planning 60-70 percent expenditure of the distribution business. It will be useful if regulations are developed that provide comprehensive guideline of – methodology of resource planning, recommend utilizing robust software’s, plan realistic horizon and encourage public participation. Mandate DISCOMs to undertake - load research, risk analysis and regular updates on resource plan. The Forum of Indian Regulators (FoIR) can develop model regulations for State Electricity Regulatory Commissions (SERCs) to adopt and the state utilities to implement.
b. Sufficient Time for Regulatory Review
It is important that resource planning review should be separated from ARR examination. Tariff-setting is given much more importance by the regulators, and resource planning gets limited attention. Resource planning should be carried out and reviewed in separate proceedings as it has a long-term horizon and needs to be expansive and comprehensive (CEA report, 2016a and 2016b).
3. Functional: Renewable future cannot be built on old planning approaches of power sector. A significant attention to improve the capabilities of utilities’ staff is required. Utility planners need to be trained to undertake planning in era which is copious in RE and undergoing transformation. It is important for them to gain practical insights and learnings on how to develop resource plans that incorporate the full palette of supply and demand options, how to utilize software’s/model that properly account all variables and help plan the portfolio. Dedicated capacity building workshops on modeling, train the trainer programs, load research methodologies, trainings through international courses and country visits, webinars will support employees of distribution utility companies to learn and further apply the knowledge for development of resource plans (IRENA. 2017).
4. Operational: Coordinated resource planning is key to make use of falling RE prices and associated economic gains of using higher RE in the system to remain cost effective.
Figure 2 shows the optimal action matrix that requires to be acted upon for a perfect alignment
with the national goals towards achievement of USO.
• Universal Service Obligation (USO)
• Stakeholders: the policy recipients, the retail end rural DS category consumer needs to be taken on board
•Challenge
• Low
•Medium
•High
• Desired timelines
• Short term 3 years
• Medium term 5 years
• Long term 7‐10 years Consumer sensitizationSegregation of
individual consumer accounts (MIS)
Greater opening of distribution chain for exploiting OA
100 percent metering
PPP models for an effective PDN
Tariff to be reflective of ACOS
Liquidating regulatory assets
Prudent power procurement
through prosumers Each SS to run as profit center
Consumer to be treated as an equal
partner
350
Each utility thus must have a planning department that should be solely responsible for development of the resource plan. Better resource planning offers the possibility of significant reductions in utilities’ power purchase costs which accounts for 60-70% of the total cost of electricity served to end consumers and is therefore, the most critical expenditure head of a DISCOM (Singh, 2016). It will also ensure that demand of electricity is met in the most economical and efficient manner. RE resource require less time in commissioning, they are cheaper and cleaner. Better planning strategies will lead to improvement in environment, prosperous utilities and satisfied consumers (Figure 2).
What is immediately required, is an altogether different 'systems approach’ to convert human (local) energy inaction to local (human) energy in action by tapping/harnessing the local resource base. The focus needs to shift to localized production and consumption, driven by the concept of 'prosumerism' (Toffler,1980). This approach holds the key to an effective system of local energy management at the retail end of the electricity supply chain via integration of locale-specific distributed energy resources. Disclaimer: Dr. Kumar is a serving Indian Administrative Service (IAS) officer of the Punjab cadre. He is currently posted as Secretary, to the government of Punjab in the department of revenue, relief, rehabilitation and disaster management at Chandigarh. The views expressed are personal, and exclusive in character for an academic discourse. There is no clash of interest involved. References: Annual report (2013-14) on the working of state power utilities and electricity departments (power and
energy division), planning commission, government of India, pp.1-225. http://planningcommission.nic.in/
Annual report of the ministry of power, (2017-18), government of India, pp.1-276, http://www.powermin.nic.in .
A study on ‘Performance of distribution utilities’ (2016, FOIR)
A study on ‘Roadmap for reduction in cross-subsidy’ (2015, FOIR)
Best practices and strategies for distribution loss reduction (2016, FOIR)
Bolton, R and Foxon, T.J. (2015). Infrastructure transformation as a socio-technical process-implications for the governance of energy distribution networks in the UK, technological forecasting and social change, volume 90, pp.538-550, ISSN 0040-1625, https://doi.org/10.1016/j.techfore.2014.02.017.
Central electricity act, (2003). The gazette of India, part-II, registered no. DL-33004/2003, dated: 26/5/2003, legislative department, ministry of law and justice, government of India, pp.1-134.
Central Electricity Authority, (2016a). Draft national electricity plan (generation), volume 1, ministry of power, government of India, pp. 1.1 to 6.33.
Central Electricity Authority, (2016b). Draft national electricity plan (transmission), volume 2, ministry of power, government of India, pp. 1.1 to 3.22
Central Electricity Authority, (2017). Growth of electricity sector in India from 1947-2017, ministry of power, government of India, pp.1-86.
Central Electricity Regulatory Commission, (2000). Availability based tariff (ABT), order dated, 4/1/2000, pp.1-69.
Central Electricity Regulatory Commission, (2015). Determination of average power purchase cost (APPC) at the national level, petition no. 15/SM/2015, New Delhi, pp.1-10.
Central Electricity Authority (CEA). Report on growth of the electricity sector in India (1947-2019).
CRISIL (2019). Diagnostic study of the power distribution sector, 2019, pp.1-160.
IRENA (2017). Planning for the Renewable Future: Long-Term Modelling and Tools to Expand Variable Renewable Power in Emerging Economies.

351
Kelly, S and Pollitt, M. (2011). The local dimension of energy, electricity policy research group, EPRG working paper 1103, Cambridge working paper in economics 1114, university of Cambridge, pp.1-34.
Kumar, A and Chatterjee, S (2012). Electricity sector in India- policy and regulation, Oxford university press, New Delhi.
Kumar, M (2019). Doctoral dissertation titled: “Eradicating Energy Poverty: Overcoming ‘barriers’ to Decentralized Energy Systems in India.”
Lahimer, A. A., Razykov, T. M., Sopian, Alghoul, M. A., Amin, N., K. and Yousif, F. (2013). Research and development aspects on decentralized electrification options for rural household, renewable and sustainable energy reviews, volume 24, pp.314-324. https://doi.org/10.1016/j.rser.2013.03.057.
National electricity policy (2005). The gazette of India, resolution no. 23/40/2004- R and R, volume 2, dated 12/2/2005, pp. 1-17.
National tariff policy (2006). The gazette of India, extraordinary, ministry of power, resolution number.23/2/2005-R and R, volume 3, dated 6/1/2006, pp.1-21.
National tariff policy (2016). The gazette of India, extraordinary, ministry of power, resolution number.23/2/2005-R and R, Volume 9, dated 28/02/2016, pp.1-38.
National Institution for Transforming India (NITI) Aayog, Government of India (2017). Draft National Energy Policy, pp. 1-98.
Singh, K. (2016). Business innovation and diffusion of off-grid solar technologies in India. Energy for Sustainable Development, vol.30, pp.1–13. http://dx.doi.org/10.1016/j.esd.2015.10.011.
Study of various power distribution models in India (2011, Planning Commission).
Toffler, A. (1980). The third wave, First published by William Morrow and company, ISBN0688035973, pp.544.

352

353
ANALYTICAL INDEX

354
355
ANALYTICAL INDEX Abstracts index by Presenter Alloisio, Isabella
Isabella Alloisio Synergies and Trade-offs between Energy Access, Climate Change and Water Use in Sub-Saharan Africa
99
Anagnostopoulos, Filippos Filippos Anagnostopoulos, Dimitra Tzani and Vassilis Stavrakas Adaptability of Pay-for-Performance schemes for promoting energy efficiency in the EU
120
Azhgaliyeva, Dina
Dina Azhgaliyeva Renewable energy deployment and energy storage: empirical evidence
168
Badouard, Thierry Thierry Badouard and Morgan Crenes 2020 Energy Consumption Estimates
150
Ball, Christopher Sri Vishnu Teja Josyabhatla, Christopher Ball and Stefan Vögele Assessing stakeholder acceptance of energy transformation pathways: the case of Germany’s net zero strategy
30
Benhmad, François François Benhmad, Jacques Percebois On the impact of wind and solar generation on Nuclear power. The case of France
46
Bertoldi, Paolo
Paolo Bertoldi, EU Energy and Climate Policies to Reach Carbon Neutrality
126
Bertolini, Marina Marco Agostini, Marina Bertolini, Massimiliano Coppo and Fulvio Fontini The Participation of Small-Scale Variable Distributed Renewable Energy Sources to the Balancing Services Market
22
Biancardi, Andrea
Andrea Biancardi What is the European electricity transmission companies approach to innovation? A novel analytical framework
142
Bonaldo, Cinzia Cinzia Bonaldo, Massimiliano Caporin and Fulvio Fontini The relationship between day-ahead and futures prices in electricity market: an empirical analysis on Italy, France, Germany and Switzerland
75
Bourgois, Charles-Henri Charles-Henri Bourgois, Arturo Lapietra and Felice Pandolfo Pay for Performance (P4P) models to foster investment in Energy Efficiency in buildings
116
Broska, Lisa Hanna
Lisa Hanna Broska The Social – A Positive Driver of the Energy Transition? Six Case Studies from Germany
137
Carrino, Gianluca
Gianluca Carrino The circular economy: an essential pillar to achieve the EU energy roadmap to 2050
128
Casati, Paola
Paola Casati The dark side of energy transition: the case of cobalt and the Democratic Republic of Congo
104
Castellani, Francesco Francesco Castellani, Federico Santi, Romano and Alberto Acri Energy efficiency in public historical buildings: an integrated approach. The case of the National Gallery of Modern and Contemporary Art in Rome
21
356
Clerici, Alessandro
Alessandro Clerici Hydrogen era: yes, but when and at what cost of delivered energy?
174
Coudray, Théotime
Théotime Coudray Multistep ahead forecasting of a power system residual load using a hybrid CEEMDAN-ConvLSTM model
67
Crespo Morán, Inmaculada Inmaculada Crespo Morán, María del P. Pablo-Romero, Javier Sánchez-Rivas and Antonio Sánchez-Braza The relationships between tourism energy consumption and emissions
39
Cruz, Nathaly Nathaly Cruz and Marc Baudry Are green value preferences for Energy Quality Stationary ? A Spatio-Temporal Analysis of the Green Energy Value Evolution at Metropolitan Lyon
16
D’Errico, Maria Chiara
Maria Chiara D’Errico Cointegration analysis of electricity demand and mobility during the first wave of COVID19 contagion
82
De Miglio, Rocco Rocco De Miglio, Gabriele Cassetti and Xi Yang The BRIDGE study: “Belt and Road Initiative and the Development of Green Economies” - Challenges and opportunities for a Green BRI
111
del Guayo, Íñigo Íñigo del Guayo, Giuseppe Ferrari and Wojciech Drozdz The future of capacity remuneration mechanisms in the EU, revisited
78
Dell’Olio, Giuseppe
Giuseppe Dell’Olio Assessment of domestic hot water demand: various criteria checked against real life data
18
Della Valle, Nives Paolo Bertoldi and Nives Della Valle How to unlock the human potential for promoting energy efficiency? A review on the barriers and levers
92
Diyun Huang, Diyun Huang and Geert Deconinck Long term transmission rights, a game changer for cross-border electricity market and interconnection governance in Europe?
140
Dufau, Bastien
Bastien Dufau The influence of a carbon tax on cost competitiveness
122
Dumciuviene, Daiva Daiva Dumciuviene and Grazina Startiene Study of factors that influence the price of electricity
71
Durmaz, Tunç Tunç Durmaz, Secil Acar Aytekin and Simay Kizilkaya Electricity market capacity mechanism and strategic capacity withholding in Turkey
80
Facchini, Angelo Angelo Facchini, Francesco Surmonte, Umberto Perna, Antonio Scala and Alessandro Rubino A Data-driven approach to renewable energy source planning at regional level
28
Farimani M., Fazel Fazel M. Farimani and Seyed Reza Mirnezami Iran-China 25 year’s agreement, Energy Implications
131
Federici, Alessandro Alessandro Federici and Corinna Viola Energy poverty: A multifaceted cornerstone for a sustainable and inclusive recovery. Some evidence from Italy
101
357
Fiedler, Claudia Andrej Guminski, Claudia Fiedler and Timo Limmer Modelling transformation pathways for EU27+3 final energy demand using timely and spatially resloved sector models
57
Fotedar, Vanshika Vanshika Fotedar and Alasdair Crawford Energy Load and Price Forecasting: Methods and Variable Treatment
74
Gancheva, Lyubomira
Lyubomira Gancheva Opportunities to ensure affordable prices and security of natural gas supply in Bulgaria following the commitments of Gazprom Export before the European Commission"
135
Garanina, Olga Olga Garanina and Silvana Mima Energy transition in Russia: what implications for natural gas?
132
Gerbeti, Agime
Agime Gerbeti Economic impact of GHG costs on the EU industry
124
Gracceva, Francesco Francesco Gracceva, Chiara Bustreo, Arturs Purvins and Marco Sangiorgi Assessing the implications of high vRES long-term scenarios by integrating energy system and dispatch models
144
Graham, John D. John D. Graham and John A. Rupp Understanding variation in the governance of fracking
134
Janzen, Benedikt Benedikt Janzen and Katharina Drescher Determinants, Persistence and Dynamics of Energy Poverty: An Empirical Assessment Using German Household Survey Data
95
Kaestner, Kathrin Kathrin Kaestner, Manuel Frondel, Stephan Sommer and Colin Vance Photovoltaics and the Solar Rebound: Evidence for Germany
54
Kambe, Kentarou Kentarou Kambe, Ryoichi Komiyama and Yasumasa Fujii Impact assessment for rate design of wheeling charge system on electricity transmission sector and household sector with a technology selection model
109
Lapietra, Arturo Arturo Lapietra, Vincenzo D’Agostino and Luca Petrungaro Devising classes of energy efficiency measure for evaluating pay-4-performance (P4P) rate that energy provider will be willing to offering pay-4-performance scheme
118
Manashvi, Kumar
Kumar Manashvi Reclaiming spaces of energy consumption through rethinking approaches to rural electrification in India
146
Mastropietro, Paolo Paolo Mastropietro, Pablo Rodilla and Carlos Batlle Emergency measures to protect energy consumers during the covid-19 pandemic: a focus on the Italian interventions
37
Milousi, Maria Maria Milousi, Manolis Souliotis and Spiros Papaefthimiou Life Cycle Assessment and eco-design alternatives of Solar Thermal technologies for the promotion of circular economy
107
Nyga-Lukaszewska, Honorata
Honorata Nyga-Lukaszewska Energy security – shift of paradigms
59
Oladosu, Gbadebo Gbadebo Oladosu, Paul Leiby, Rocio Uria-Martinez, David Bowman and Megan Johnson U.S. GDP, Oil Price Shocks and Domestic Oil Production: An ARDL Analysis
156

358
Ondra, Matthias Matthias Ondra and Thomas Dangl Feed-in tariffs and investment in renewable energy technologies under uncertain production volumes
25
Ozgur, Sevkat
Sevkat Ozgur Drivers of merger and acquisition transactions in the U.S upstream oil and gas industry
41
Papadelis, Sotiris
Sotiris Papadelis Towards a performance-based energy economy. The increasing value of Pay for Performance schemes
114
Perico, Giorgio Giorgio Perico, Virginia Canazza and Antonio De Paola Could the Fast Reserve drive the investments in storage in the Italian electricity market?
165
Purica, Ionut
Ionut Purica Switching to full electric transport: future power demand requirements in the EU
155
Romeri, Valentino
Valentino Romeri Hydrogen and fuel cell: looking back to 20 year of professional experience and looking forward beyond ‘Covid-19’ and toward ‘1.5 °C perspective’
170
Rubina Nava, Consuelo Ernesto Cassetta, Consuelo Rubina Nava and Maria Grazia Zoia How far we are from price convergence in the EU energy markets? A two-step procedure to define a composite index of electricity and natural gas prices
33
Sapio, Alessandro Khadija Merzougui, Damiano Fiorillo and Alessandro Sapio How did Italian’s behavior toward energy-consumption change from late 1990s to 2012?
152
Schindler, Markus Markus Schindler and Lukas Gnam An optimization approach for a local electricity market
76
Schwidtal, Jan Marc Jan Marc Schwidtal, Valerio Passarella, Marco Agostino, Fabio Bignucolo, and Arturo Lorenzoni Opening ancillary service markets: investigating emerging opportunities for P2G in Italy
177
Shehzadi, Anam
Anam Shehzadi Firm productivity, energy efficiency and export in Asian emerging and developing countries
84
Sieed, Jubair Jubair Sieed, Ryoichi Komiyama and Yasumasa Fujii Quantitaive analysis of energy security and environmental sustainability using dynamic multi-sector energy economic model
90
Subbotnitskiy, Denis Chirayu Batra and Denis Subbotnitskiy Energy Security Implications of Small Modular Reactors and Microreactors Deployment in Off-Grid Areas in Northern Regions
61
Švec,Martin
Martin Švec Europe Energy road map to 2050: a coal phase-out in the context of international investment law
64
Talipova, Amina Amina Talipova and Sergei Parsegov Exploring Russian Gas Prices to Europe: Empirical Evidence of Price Convergence from Time Series Analysis
44
359
Turdaliev, Salim Salim Turdaliev, Anna Alberini and Milan Scasny Price responsiveness and carbon emissions reductions in the residential sector: evidence from a natural experiment in Russia
19
Uría-Martínez, Rocio Rocio Uría-Martínez, Paul N. Leiby, Gbadebo Oladosu, Megan M. Johnson, and David C. Bowman An Exploration of the Role of Petrochemical Demand on World Oil Demand Elasticity
162
Valeriani, Elisa
Maria Giovanna Bosco, Elisa Valeriani Regional policies to boost firms’ energy efficiency and disaster response: a comparative analysis
88
Wilmot, Neil A.
Neil A. Wilmot Time-Varying Jump Intensities and the Interconnectedness of the North American Crude Oil Complex
159
360
Papers index by Presenter Alloisio, Isabella
Isabella Alloisio Synergies and trade-offs between energy access, climate change and water use in Sub-Saharan Africa
285
Coudray, Théotime
Théotime Coudray Forecasting power system flexibility requirements: a hybrid deep-learning approach
237
del Guayo, Íñigo Giuseppe Franco Ferrari, Íñigo del Guayo, Wojciech Drozdz The future of capacity remuneration mechanisms in the European Union, Revisited, with a particular attention to Italy, Poland and Spain
258
Dell’Olio, Giuseppe
Giuseppe Dell’Olio Assessment of domestic hot water demand: various criteria checked against real life data
185
D'Errico, Maria Chiara
Maria Chiara D'Errico Cointegration Analysis of Electricity Demand and Mobility during the first wave of COVID-19 Contagion
272
Fiedler, Claudia Claudia Fiedler, Andrej Guminski, Timo Limmer, Tobias Wagner, Süheyb Bilici, Christoph Pellinger, Serafin von Roon Modelling transformation pathways for EU27+3 final energy demand using temporally and spatially resolved sector models
188
Fiorini, Alessandro Alessandro Fiorini, Alessandro Federici, Corinna Viola An indicator of energy vulnerability: evidence from Italian regions
298
Gancheva, Lyubomira
Lyubomira Gancheva Opportunities to ensure affordable prices and security of natural gas supply in Bulgaria following the commitments of Gazprom Export before the European Commission
320
Gerbeti, Agime
Agime Gerbeti Economic impact of GHG costs on the EU industry
311
Manashvi, Kumar
Kumar Manashvi Reclaiming spaces of energy consumption through rethinking approaches to rural electrification in India
338