2020 national agriculture symposium
TRANSCRIPT
1
2020 NATIONAL AGRICULTURE SYMPOSIUM
2
2020 NATIONAL AGRICULTURE SYMPOSIUM
FIAS2020National Agriculture Symposium3-4 December 2020The Pearl Resort, Pacific Harbour, Navua, Fiji
“Agriculture Resilience to Calamities - Now and for Future”
Editors:Mr. Shalendra PrasadDr. Salesh KumarMs. Aradhana Deesh
Organiser:Fiji Institute of Agricultural Sciences (FIAS)
Partners:Australian Centre for International Agricultural Research (ACIAR)Ministry of Agriculture (MoA)Fiji National University (FNU)
FIJI INSTITUTE OFAGRICULTURAL SCIENCE
3
2020 NATIONAL AGRICULTURE SYMPOSIUM
All reasonable efforts have been taken in the compilation and editing of the materials presented in this document. The views expressed herein are those of the presenters, panelist and facilitators and not necessarily those of the Fiji Institute of Agricultural Science (FIAS) and its members. Any companies, product from manufacturers and technologies mentioned do not imply the endorsement of recommendation by FIAS.
©FIAS, 2020
This publication may not be reproduced or stored in a retrieval system without the prior written permission of the FIAS. However, FIAS encourages the use and circulation of the information in this document. The information may be copied, downloaded and printed for any non-commercial use as long as FIAS is acknowledged as source and copyright holder, not as an endorser of any products or services.
Published by:
Fiji Institute of Agricultural Sciences
4
2020 NATIONAL AGRICULTURE SYMPOSIUM
TABLE OF CONTENTS
EXECUTIVE SUMMARY 6
LIST OF ABBREVIATIONS 7 - 8
ORGANISING COMMITTEE 9
SCIENTIFIC COMMITTEE 10
SUMMARY OF THE SYMPOSIUM 11 - 14
MESSAGES 15
PRESIDENT - FIAS 15
PERMANENT SECRETARY FOR AGRICULTURE 16 - 17
KEYNOTE PRESENTATIONS 18National Agriculture Symposium to recognize Agriculture Scientists who have positively contributed to the growth of Fiji’s Agriculture Sector with theme “Agriculture Resilience to Calamities – Now and for the Future” Hon. Dr. Mahendra Reddy, Minister for Agriculture, Waterways and Environment, Fiji 18 - 20
SESSION 1: CLIMATE RESILIENT AGRICULTURE 21 Post-Harvest Management - A Strategy to make Agriculture Climate Resilient.Dr Devinder Dhingra, (Indian Council of Agricultural Research, India, & Ministryof Agriculture, Fiji) 22 - 31
The Deployment and Importance of Genetic Resources in Food Security and Agriculture - a Future Perspective to Climate Smart Agriculture in Pacific Island Countries. Dr. Pramod Nair (CAFF, Fiji National University, Fiji) 32 - 40
Spices in Fiji – Perspectives and Prospective for Agriculture Development in the Era of Climate Change Dr. K. Kandiannan (Vivekananda Technical Center, Fiji) 41 - 46
Strengthening Resilience to Fiji’s Taro Diversity through Introduction and Breeding for Taro Leaf Blight (TLB) Disease Mr. Savenaca Cuquma (Research Division, Ministry of Agriculture, Fiji) 47
SESSION 2: PEST & DISEASES 48Comparison of DAS-ELISA and RT-PCR for the detection of Dasheen mosaic virus (DsMV) detection in taro (Colocasia esculenta (L.) Schott) Dr. Amit Sukal (Secretariat of the Pacific Community, Fiji) 49 -56
Biological Studies on the Natural Enemies in Suppression of Coconut Stick Insect, Graeffea crouanii (Le Guillou) in Fiji Ms. Aradhana Deesh (Research Division, Ministry of Agriculture, Fiji) 57 - 69
Mango Anthracnose Disease: the Epidemiology And Management Dr. Mereia Fong (Research Division, Ministry of Agriculture, Fiji) 70
SESSION 3: SOIL FERTILITY 71
Soil Fertility and Productivity Decline Resulting from Twenty Two Years of Intensive Taro Cultivation in Taveuni, Fiji Mr. Ami Chand Sharma (Research Division, Ministry of Agriculture, Fiji) 72 Taro Grower Survey in Taveuni, Fiji Mr Rohit Lal (Research Division, Ministry of Agriculture, Fiji) 73
5
2020 NATIONAL AGRICULTURE SYMPOSIUM
Effects of Composts Integrated Fertilization on GHGs Emissions under Low-input Potato Production in an Andosol Soil Dr. Tekini Nakidakida (Research Division, Ministry of Agriculture) 74
SESSION 4: CROP PRODUCTION 75Importance of Spice and Aromatics Farming in FijiMr. Avin Prasad (CAFF, Fiji National University, Fiji) 76 - 85
A Review of Fiji Basil Production and Exports over Three DecadesKyle Stice (Nadi Bay Herbs, Fiji) 86
SESSION 5: LIVESTOCK AND FISHERIES SECTOR 87Climate Change and Livestock Production 88 - 90
High Cassava Peel Meal-Based Diets with Animal Fat and Enzyme for BroilersMr Avinesh Dayal (Livestock Section, Ministry of Agriculture, Fiji) 91
The Value of Traditional Knowledge (TK) in Ciguatera Fish Poisoning (CFP) and its Treatment in Fiji Dr. Jimaima Lako (CEST, Fiji National University, Fiji) 92
The Implications of COVID-19 Pandemic on the Vegetable Farmers and the Fishermen of Fiji Dr. Ravinesh Ram (CAFF, Fiji National University, Fiji) 93 - 96
SESSION 6: AGRIBUSINESS AND EXTENSION 97Competency-based Training and Assessment in Fijian Agricultural EducationMrs Reshika Kumar (Fiji Higher Education Commission, Fiji) 98 - 103
Digitizing Internal Control Systems within the Kava IndustryMs. Salote Waqairatu (PARDI 2, Fiji) 104
Strengthening the Participation of Producers’ Associations and Farmers Cooperativesin Value Chains Mr. Ritesh Arvind Chand (CAFF, Fiji National University, Fiji) 105 - 107
Contribution of Agriculture and Tourism to Economic Growth: A Case Study Of Fiji 108 - 118
Vote of Thanks 119
LIST OF PRESENTERS 120
LIST OF PARTICIPANTS 121 - 122
Photo Gallery 123 - 125
6
2020 NATIONAL AGRICULTURE SYMPOSIUM
EXECUTIVE SUMMARYThe global pandemic COVID-19 underscores the importance of the agriculture sector, food systems and food security. This is a valuable opportunity for Fiji to reset and reinvigorate its agriculture sector and food systems. This includes a greater focus on being prepared, proactively managing risks and being forward-looking with food security. Fiji’s Ministry of Agriculture (MoA) has compiled a Food Security and Accelerated Agriculture Growth Plan (FSAAGP) to rebuild and accelerate agriculture over the next 18 months in response to COVID-19 and recent tropical cyclones (TC); Sarai and Harold which struck Fiji within the space of three months in 2020. Natural disasters and climate change present major risks for Fiji’s food security and the national economy. In 2016, Tropical Cyclone Winston caused damages amounting to F$2 billion, or 20 % of the GDP.
The World Bank estimates that cyclones and floods push on an average of 25,700 people into poverty every year in Fiji. This is a significant reminder of Fiji’s vulnerability to natural disasters which are likely to increase in future. Increased productivity is essential to the agricultural sector’s contribution to the economy, and thus research for development is crucial towards attaining this increased productivity. Productivity gains may come from the identification of improved varieties/breeds of plants and animals that give higher yields to the inputs. Development and adoption of climate-resilient varieties with improved resistance to biotic stresses are also required for increased productivity. Development of varieties with improved nutritional parameters is needed to better address non-communicable diseases (NCDs).
Productivity increases could also come from precision agriculture techniques as well as practices that support sustainable agriculture development and smallholder farming situation. The expansion in production and trade of commodities, marked by increasing market demand for quality products is often affected by challenges such as reduced productivity, post-harvest losses and pest and disease incidence. Indirect factors influencing this scenario include global climate change, population growth, middleclass expansion and environmental degradation. To address these challenges, research in the country has embarked on programs to improve agricultural productivity and satisfy consumer demands.
The objectives of the symposium are to: 1. Apprise participants of the various current research activities and development initiatives in the field of agriculture
in the country to improve productivity and marketability of local produce. 2. Offer a platform for local scientists to present their research findings and share their knowledge and experiences
with the participants. 3. Provide a way forward for the agriculture sector in implementing sustainable and climate smart agriculture poli-
cies. 4. Provide an opportunity for interaction among all FIAS members from various institutions/ organizations located
in Fiji.
7
2020 NATIONAL AGRICULTURE SYMPOSIUM
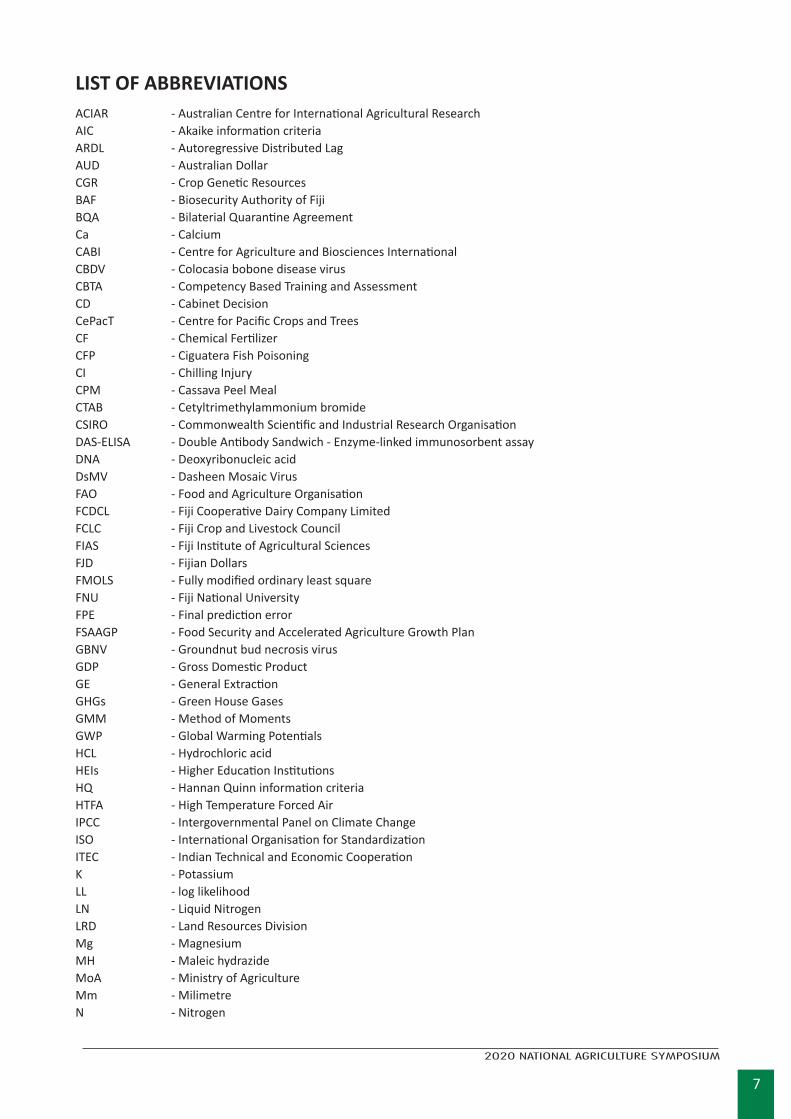
LIST OF ABBREVIATIONSACIAR - Australian Centre for International Agricultural Research AIC - Akaike information criteriaARDL - Autoregressive Distributed LagAUD - Australian DollarCGR - Crop Genetic ResourcesBAF - Biosecurity Authority of FijiBQA - Bilaterial Quarantine Agreement Ca - Calcium CABI - Centre for Agriculture and Biosciences InternationalCBDV - Colocasia bobone disease virusCBTA - Competency Based Training and Assessment CD - Cabinet DecisionCePacT - Centre for Pacific Crops and TreesCF - Chemical FertilizerCFP - Ciguatera Fish PoisoningCI - Chilling InjuryCPM - Cassava Peel MealCTAB - Cetyltrimethylammonium bromideCSIRO - Commonwealth Scientific and Industrial Research OrganisationDAS-ELISA - Double Antibody Sandwich - Enzyme-linked immunosorbent assay DNA - Deoxyribonucleic acidDsMV - Dasheen Mosaic Virus FAO - Food and Agriculture OrganisationFCDCL - Fiji Cooperative Dairy Company Limited FCLC - Fiji Crop and Livestock Council FIAS - Fiji Institute of Agricultural SciencesFJD - Fijian DollarsFMOLS - Fully modified ordinary least squareFNU - Fiji National University FPE - Final prediction error FSAAGP - Food Security and Accelerated Agriculture Growth PlanGBNV - Groundnut bud necrosis virusGDP - Gross Domestic ProductGE - General ExtractionGHGs - Green House GasesGMM - Method of MomentsGWP - Global Warming PotentialsHCL - Hydrochloric acidHEIs - Higher Education Institutions HQ - Hannan Quinn information criteriaHTFA - High Temperature Forced AirIPCC - Intergovernmental Panel on Climate ChangeISO - International Organisation for Standardization ITEC - Indian Technical and Economic CooperationK - PotassiumLL - log likelihoodLN - Liquid Nitrogen LRD - Land Resources DivisionMg - Magnesium MH - Maleic hydrazideMoA - Ministry of Agriculture Mm - MilimetreN - Nitrogen
8
2020 NATIONAL AGRICULTURE SYMPOSIUM
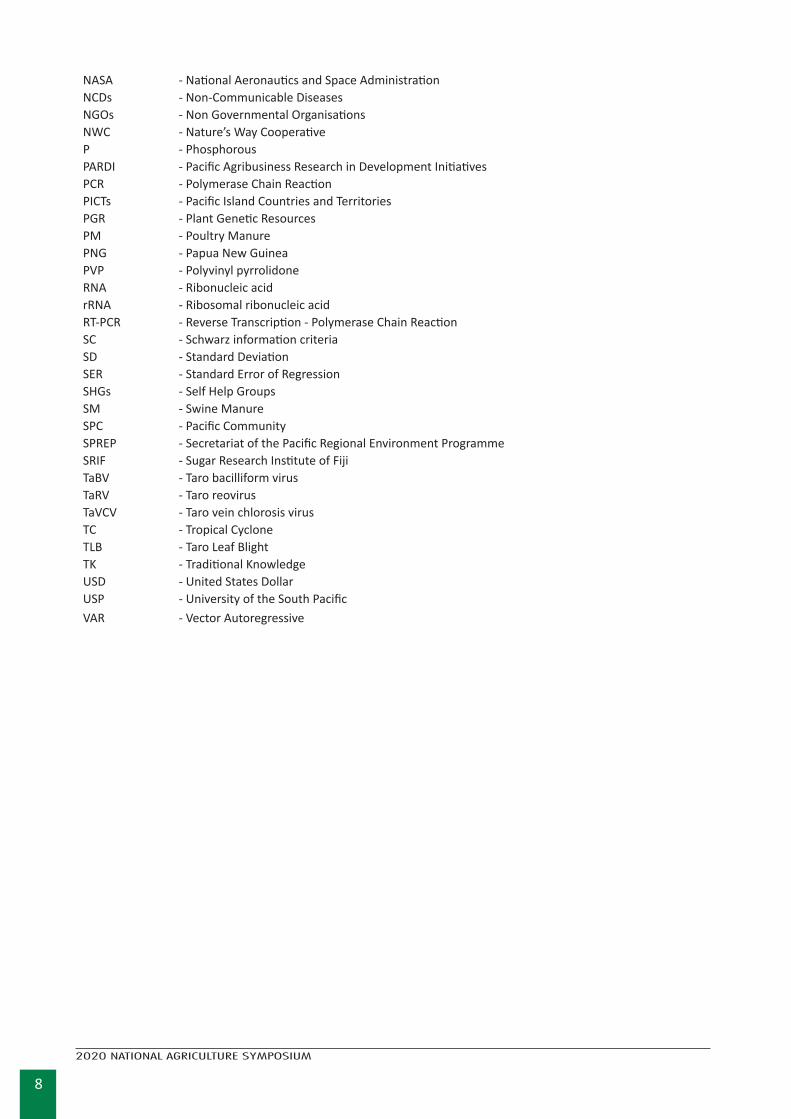
NASA - National Aeronautics and Space Administration NCDs - Non-Communicable DiseasesNGOs - Non Governmental OrganisationsNWC - Nature’s Way CooperativeP - Phosphorous PARDI - Pacific Agribusiness Research in Development InitiativesPCR - Polymerase Chain ReactionPICTs - Pacific Island Countries and TerritoriesPGR - Plant Genetic ResourcesPM - Poultry ManurePNG - Papua New GuineaPVP - Polyvinyl pyrrolidone RNA - Ribonucleic acidrRNA - Ribosomal ribonucleic acidRT-PCR - Reverse Transcription - Polymerase Chain ReactionSC - Schwarz information criteriaSD - Standard Deviation SER - Standard Error of Regression SHGs - Self Help Groups SM - Swine ManureSPC - Pacific CommunitySPREP - Secretariat of the Pacific Regional Environment ProgrammeSRIF - Sugar Research Institute of FijiTaBV - Taro bacilliform virus TaRV - Taro reovirus TaVCV - Taro vein chlorosis virusTC - Tropical Cyclone TLB - Taro Leaf BlightTK - Traditional Knowledge USD - United States DollarUSP - University of the South PacificVAR - Vector Autoregressive
9
2020 NATIONAL AGRICULTURE SYMPOSIUM
ORGANISING COMMITTEE
OrganisersOrganisers: Fiji Institute of Agricultural Sciences (FIAS)
Partners: Australian Centre for International Agricultural Research (ACIAR) Ministry of Agriculture (MoA) Fiji National University (FNU)
Australian Centre for International Agricultural Research (ACIAR)1. Ms. Florence Rahiria The Regional Manager PNG and Pacific
Ministry of Agriculture (MoA)1. Mr. Shalendra Prasad Head of Agriculture Research, Ministry of Agriculture President, Fiji Institute of Agricultural Science Chairman, Symposium Committee
2. Mrs. Aradhana Deesh Research Officer, Ministry of Agriculture Secretary, Symposium Committee
3. Mr. Avinesh Dayal Dass Principal Agriculture Officer, Ministry of Agriculture Member, Symposium Committee
4. Mr. Abishek Chand Research Officer, Ministry of Agriculture Member, Symposium Committee
5. Mrs. Irene Roshika Chand Agriculture Technical Officer, Ministry of Agriculture Member, Symposium Committee Fiji National University (FNU)6. Dr. Salesh Kumar Assistant Professor, Fiji National University Vice President, Fiji Institute of Agricultural Science Co-Chair, Symposium Committee
7. Mr. Atish Chand, Lecturer, Fiji National University Member, Symposium Committee
8. Mr. Ritesh Arvind ChandLecturer, Fiji National University Member, Symposium Committee
9. Ms. Vashnika Narayan Lecturer, Fiji National University Member, Symposium Committee
10
2020 NATIONAL AGRICULTURE SYMPOSIUM
SCIENTIFIC COMMITTEE
Ministry of Agriculture (MoA)1. Mr. Shalendra Prasad
Head of Agriculture Research, Ministry of Agriculture President, Fiji Institute of Agricultural Science Chairman, Symposium Committee
2. Dr. Mereia Fong Principal Research Officer, Ministry of Agriculture Treasurer, FIAS
3. Mr. Avinesh Dayal Dass Principal Agriculture Officer, Ministry of Agriculture Member, Symposium Committee
Fiji National University (FNU) 1. Dr. Salesh Kumar Assistant Professor, Fiji National University Vice President, Fiji Institute of Agricultural Science Co-Chair, Symposium Committee
11
2020 NATIONAL AGRICULTURE SYMPOSIUM
SUMMARY OF THE SYMPOSIUMDAY 1
KEYNOTE ADDRESS
To open the symposium, Minister for Agriculture, Waterways and Environment Hon. Dr. Mahendra Reddy delivered the keynote address titled “NATIONAL AGRICULTURE SCIENCE SYMPOSIUM - FIAS 2020”. Hon. Dr. Reddy reminded the participants that natural disasters and climate change presented major risks to Fiji’s food security and of course the national economy. He emphasised that amidst the impacts of Climate Change and Covid-19 crisis, Fiji needed to reset and reinvigorate its agriculture sector and food systems through greater focus on proactively managing risks. He called for a perfect plan in place to sustain Fiji’s Agriculture Sector, which should include dynamic research findings. He commended the organisation of the symposium, encouraged strong collaboration among the experts and recommended it as one of the best way forward for Agriculture Research. Finally, he looked forward to the research findings to be incorporated in the plan so that it could guide the strategy and implementations going forward.
SESSION 1:
CLIMATE RESILIENT AGRICULTURE
Kickstarting the first technical session was Devinder Dhingra of the Indian Council of Agricultural Research, India and serving as a consultant to the Fijian Ministry of Agriculture. He highlighted that global warm-ing, changes in rain patterns, droughts, floods, cyclones, storms etc. had become a challenge for the food production systems. Post-harvest losses in India have been observed to be quite large. Post-harvest losses among selected fruits and vegetables were observed to be in the range of 6.70 - 15.88 % during the year 2014. Post-harvest losses among cereals, pulses and oilseeds were also observed to be in the range of 3.08 – 9.96 %. Post-Harvest Management of agricultural produce and setting-up of custom hiring centres in rural areas have the potential to reduce post-harvest losses, create employment opportunities in rural areas, en-hance farmers’ income and counter the negative impact of climate change.
Pramod Nair of University of Fiji spoke on the crucial role genetic resources plays in food security, nutrition and livelihoods for agriculture sector. The increasing agriculture yield depends on continuing infusions of plant genetic resources for production stability and development. Crop Genetic Resources (CGR) are valuable for current and future crop improvement programmes. Climate change poses new challenges to sustainable management of the genetic resources for food and agriculture, but it also underlines their importance in island countries. Conservation of existing genetic resources is important to support food security in a growing human population and for development of adaptation in changing climate, as well as for genetic improvement programmes.
K. Kandiannan of Vivekananda Technical Center gave an overview of spices in Fiji. He highlighted that in Fiji people are using around 50 different spices and spice products, but, only few spices are grown in Fiji in a localised homestead to large scale. Fiji has an ideal climate for many spices. Fiji on an average exports 2,730.5 tonnes of spices to the value of 16.6 million FJD, whereas, it imports 1,305.7 tonnes to the value of 5.8 million FJD. There is a strong domestic market exists in Fiji for spice for spices. The spices imported are consumed internally both in households and hotels, part of the imported spices is converted into spice mixtures or value added and re-exported. There is a great scope for expansion of spices cultivation in Fiji.
Savenaca Cuquma of Research Division, Ministry of Agriculture discussed the strengthening resilience to Fiji’s taro diversity through introduction and breeding for Taro Leaf Blight (TLB) disease. Taro Leaf Blight (TLB) is a major disease of taro in the Pacific, caused by the fungus, Phytopthora colocasiae, poses a major threat to Fiji’s thriving taro industry. The narrow gene pool of Fiji’s taro varieties will offer very little resistance to TLB and other climate change effects on taro. Fiji has introduced tolerant breeding taro cultivars from the Pacific region and in addition resistant cultivars from South East Asia for the Fiji taro breeding program from 2013 - 2020. In 2018, Fiji has successfully released two TLB tolerant cultivars and there are future plans of strengthening the resilience in broadening the taro genetic diversity in Fiji.
12
2020 NATIONAL AGRICULTURE SYMPOSIUM
SESSION 2:
PEST & DISEASES
In this session the first speaker, Amit Sukul of Pacific Community, Fiji compared the commercially available DAS-ELISA and RT-PCR to determine the best method for the detection of Dasheen Mosaic Virus (DsMV) genus Potyvirus from taro (C. esculenta). Though the findings revealed that the RT-PCR was highly sensitive but for routine use DAS-ELISA was still considered the important tool considering the cost and availability of the reagents. He indicated that DAS-ELISA is still an important tool that can be used for screening of DsMV at national clean seed systems while, RT-PCR can be used at genebank level, which require the highest level of sensitivity and accuracy, to ensure safe taro germplasm exchange.
Aradhana Deesh of the Fijian Ministry of Agriculture then covered one of the important pest of coconut palms in Fiji, coconut stick insect. From the field surveys presence of several naturally-occurring natural enemies (predators and parasitoids) determined of which two species of egg parasitoids (Paranastatus verticalis and Paranastatus nigriscutellatus) were recorded as the most prevalent natural enemies. Further field and laboratory studies on dominant natural enemy and role in suppressing pest population was discussed.
Finally, Mereia Fong of the Fijian Ministry of Agriculture concluded this session with an overview of the mango production in Fiji and what caused the losses after harvest due to postharvest diseases, for example Anthracnose. She highlighted that effective control of postharvest disease in mango can only be achieved through a combination of appropriate field and postharvest disease management strategies. Furthmore, she emphasised that control strategies should be efficacious and cost effective, as well as be safe for agricultural workers, consumers and the environment.
SESSION 3:
SOIL FERTILITY
Ami Sharma of the Fijian Ministry of Agriculture kickstarted this session covering the soil fertility and pro-ductivity decline due to 22 years continuous cropping of taro on selected soil chemical properties and yields on the island of Taveuni, Fiji. He highlighted that the high native fertility levels and production potential of Taveuni andosols declined rapidly when the forest cover was replaced by the annual crop of taro. This was particularly evident from the trend analyses of the nutrient elements which, altogether with soil pH and taro yields, revealed significant declines. Olsen P and exchangeable Mg were identified to be the most limiting nutrients for the taro soils of Taveuni.
The next speaker was Rohit Lal of the Fijian Ministry of Agriculture, who discussed the findings of a taro grower survey in Taveuni, Fiji. The results of the survey showed that taro yields in Taveuni are low (averaging of 6.9 t/ha) compared to some other taro growing areas where yields >20t/ha are more typical of high yield-ing crops. Survey results showed that average nitrogen (N), phosphorus (P) and potassium (K) fertilizer use by the growers surveyed were below optimum for high yield taro crops, once crop fertilizer use efficiency was accounted for.
Tekini Nakidakida of the Fijian Ministry of Agriculture then dicussed the effects of composts integrated fertilization on GHGs emissions under low-input potato production in an andosol soil. From the viewpoint of global warming mitigation in the construction of low-input crop production systems, it was of interest to assess whether the addition of composts can maintain or increase productivity and reduce GHGs emissions. Global warming potential (GWP) of SM compost plots were higher compared to CF, Zero and PM compost plots. The presence of organic and inorganic N sources in integrated plots resulted in fluctuations of emis-sions. Compared to SM, the PM integration reduced GWP and greenhouse gas intensity and had a higher tuber yield that was not different from 100% CF plot.
13
2020 NATIONAL AGRICULTURE SYMPOSIUM
SESSION 4:
CROP PRODUCTIONAvin Prasad of the Fiji National University spoke on the importance of spice and aromatics farming in Fiji. He mentioned that Fiji had been focusing and has achieved success in minimizing imports and increasing export of ginger as a major exported spice crop. Turmeric with similar growth pattern to ginger has an added advantage to overturn imports and gain export potentials. Apart from ginger and turmeric there are various other spice and aromatics crops, which has a lot economic value to generate revenue and is of substantial benefit to the health industry and improving livelihoods of rural community farmers.
Kyle Stice of the Nadi Bay Herbs reviewed the agronomic and economic variables that allowed this niche industry to survive over three decades. He also explored the challenges faced by one of Fiji’s longest running horticulture export value chains which included pest and diseases, biosecurity, shelf life and freight issues. Recent developments with domestic basil production and processing in New Zealand have put added pressure on the market for Fiji basil, these pressures have been further compounded by Covid 19 which has seen a sharp increase in freight charges and disrup-tion to freight schedules.
DAY 2
KEYNOTE ADDRESS To start the second day of the symposium, Dr Kenneth Cokanasiga from Fiji Veterinary Association delivered the key-note address titled “Livestock and Climate Change”. He gave an overview of the livestock sector in the Pacific and the e ffects of climate change on the livestock. He noted that the Pacific was highly vulnerable and faced direct impact (stress) and indirect impact (pasture) on livestock feed quality. In order to sustain climate change impacts on food security, he recommended studies on heat stress (heat tolerance characteristics), breeds of cattle, livestock pest and diseases (increased temperature leads to increase in vector), pathogens, quality of feed, and greenhouse gases. He indicated the existence of knowledge gap in this area and recommmeded research on quantification of feeds, formula-tions of diets and thermal control of livestock (shelter, etc).
SESSION 5:
LIVESTOCK AND FISHERIES SECTORAvinesh Dayal of the Fijian Ministry of Agriculture discussed the high cost of the feed as the major challenge for poultry production in Fiji. Research on how to use the cassava peal as feed production was highlighted, such as high cassava peel meal-based diets with animal fat and enzyme for broilers. The findings concluded that inclusion of challenzyme and fat reduced the weight of small intestine while caeca weight was increased. He recommended more research into higher levels of CPM, source and concentrations of fat and enzyme products and nutrient utilisation.
Jimaima Lako of the Fiji National University spoke on the value of Traditional Knowledge (TK) in Ciguatera Fish Poisoning (CFP) and its treatment in Fiji. She highlighted that Fijians continue to catch, sell and consume ciguatoxic fish as evident in the incidence reported and there may be various reasons for the continuous catching and selling of ciguatoxic fish in Fiji. Her presenation examined the roles and values of traditional knowledge related to ciguatera fish poisoning and its treatment in Fiji; focusing on the identification of ciguatoxic fish species, iqoliqoli hot spots, seasonality, reporting mechanism and treatment of ciguatoxins.
Ravinesh Ram of the Fiji National University finally concluded the session by highlighting the implications of COVID-19 pandemic on the vegetable farmers and the fishermen of Fiji. From a survey including participants who mostly were doing commercial based farming, linking to tourism, results showed that farmers lost almost 40-50% of income. He fur-ther highlighted that high quantity of goods were discarded due to severe job losses and people grew their own food. Aquatic farmers, supplying to the hotels for incomes were impacted the hardest due to closure of a number of resorts and hotels since the pandemic started. He indicated that COVID-19 has impacted a number of business in the primary industries, however, this has prepared a number of people in Fiji to fight and survive the global pandemic.
SESSION 6:
AGRIBUSINESS AND EXTENSIONReshika Kumar of Fiji Higher Education Commission spoke on the competency-based training and assessment in Fijian agricultural education. She compared CBTA in Agriculture Education in Fiji and the conventional teaching methods
14
2020 NATIONAL AGRICULTURE SYMPOSIUM
that is currently existent in Higher Education Institutions (HEIs) in Fiji. She further discuused the CBTA approach, its advantages and disadvantages and a comparative case study of two institutions. Her finding indicated that (HEIs) were taking up CBTA into its system. She concluded that competency based training and assessment could provide the much needed tool at the lower levels of the Higher Education Framework if they were to move the Agriculture sector forward in Fiji.
The second speaker was Salote Waqairatu of Pacific Agribusiness Research in Development Initiative, who spoke on the digitization of internal control systems within the kava industry. She discussed the feasibility of digitising an internal control system designed to meet third party organic standards for the production and export of kava. In particular, she highlight the importance of proper management of information systems, the effectiveness of mobile apps, the readi-ness of smallholder kava farmers in moving from a manual form of record-keeping to a digital one and a checklist for agribusinesses considering digitizing their own operations.
Ritesh Chand of the Fiji National University presented on strengthening the participation of producers’ associations and farmers cooperatives in value chains. An in-depth investigation on cooperative structure in Fiji revealed that most of these cooperatives are non-sustainable entities and hugely depend on external funding from government and other donor agencies like European Union, Non-Government Organizations and Australian Aid. In order to meet their routine operating expenses, most producer associations levy membership fee on its members and in few cases some of them work entirely on voluntarily basis. He summed up that poor performance of farmer’s cooperatives in Fiji is partly at-tributed to government’s inconsistence development strategies and poor funding opportunities in place.
The final speaker for this session was Ravneel Kumar of Massey University, New Zealand, who gave an overview of the effect of agriculture on economic growth in Fiji comprising 41 annual observations over the period 1975 to 2015. He indicated that in the long run, a 1 percent increase in agriculture would increase real GDP per capita by 0.25 percent whereas a 1 percent increase in tourism would increase real GDP per capita by 0.11 percent pointing to an over 2 fold efficiency of investing in agriculture compared to tourism. He confirmed that the findings have significant implications to boost support for agriculture and tourism in Fiji.
15
2020 NATIONAL AGRICULTURE SYMPOSIUM
Theme: Agriculture Resilience to Calamities – Now and for the Future
Welcome to the 2020 National Agriculture Symposium.
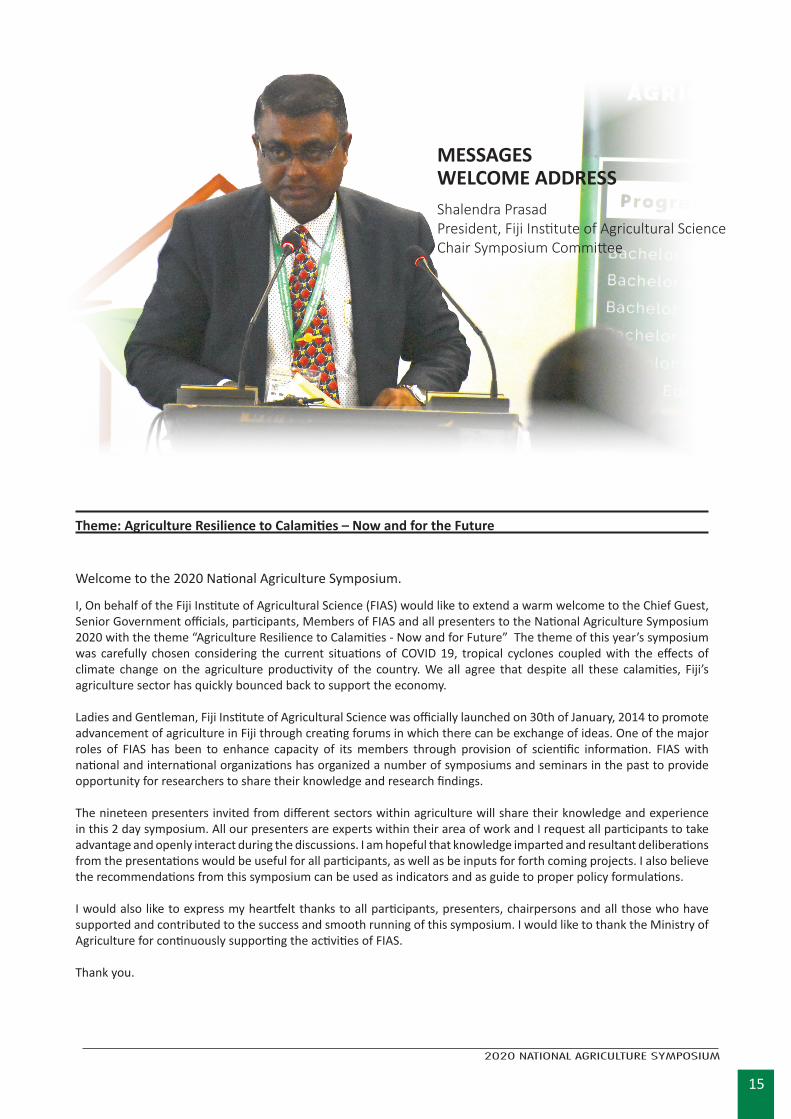
I, On behalf of the Fiji Institute of Agricultural Science (FIAS) would like to extend a warm welcome to the Chief Guest, Senior Government officials, participants, Members of FIAS and all presenters to the National Agriculture Symposium 2020 with the theme “Agriculture Resilience to Calamities - Now and for Future” The theme of this year’s symposium was carefully chosen considering the current situations of COVID 19, tropical cyclones coupled with the effects of climate change on the agriculture productivity of the country. We all agree that despite all these calamities, Fiji’s agriculture sector has quickly bounced back to support the economy.
Ladies and Gentleman, Fiji Institute of Agricultural Science was officially launched on 30th of January, 2014 to promote advancement of agriculture in Fiji through creating forums in which there can be exchange of ideas. One of the major roles of FIAS has been to enhance capacity of its members through provision of scientific information. FIAS with national and international organizations has organized a number of symposiums and seminars in the past to provide opportunity for researchers to share their knowledge and research findings.
The nineteen presenters invited from different sectors within agriculture will share their knowledge and experience in this 2 day symposium. All our presenters are experts within their area of work and I request all participants to take advantage and openly interact during the discussions. I am hopeful that knowledge imparted and resultant deliberations from the presentations would be useful for all participants, as well as be inputs for forth coming projects. I also believe the recommendations from this symposium can be used as indicators and as guide to proper policy formulations.
I would also like to express my heartfelt thanks to all participants, presenters, chairpersons and all those who have supported and contributed to the success and smooth running of this symposium. I would like to thank the Ministry of Agriculture for continuously supporting the activities of FIAS.
Thank you.
MESSAGESWELCOME ADDRESSShalendra Prasad President, Fiji Institute of Agricultural Science Chair Symposium Committee
16
2020 NATIONAL AGRICULTURE SYMPOSIUM
Theme: Agriculture Resilience to Calamities – Now and for the Future
Hon. Minister for Agriculture, Waterways & Environment - Dr Mahendra Reddy
President for Fiji Institute of Agriculture Science - Dr Shalendra Prasad
Regional Manager of ACIAR, Ms. Rahiria Florence
Dean of the College of Agriculture Fisheries and Forests, FNU - Professor Paul Iji
Representatives from Food and Agriculture Organization
Representative from Pacific Agribusiness Research in Development Initiatives
Representative from Biosecurity Authority of Fiji
Representative from Sugar Research Institute of Fiji
Senior Government Officials
Ministry of Agriculture Partners and Stakeholders
Invited Guests
Ladies and Gentlemen
Ni sa bula Vinaka, and a good morning to you all.
Welcome to the 2020 National Agriculture Symposium here at Pearl Resort. I thank you for taking your time out to be here with us today despite your busy schedules. Our presence here this morning signifies the importance of Agriculture Research as the engine for robust agriculture development in Fiji.
Ladies and Gentlemen, Agriculture has always been knowledge intensive. Although there has been some path-breaking research and innovations in the field of agriculture, farmers have primarily depended on their individual or community wisdom to improve production and eradicate farm pests and diseases. Agricultural Research has drastically changed this platform. Together with appropriate Agriculture policies, administration throughout the region have successfully achieved improved food and nutrition security for their country.
After decades in which agriculture and nutrition did not always get the attention they deserved, we are now putting the fight where it should be, which is at the forefront of agricultural development. The global pandemic COVID-19 underscores the importance of Fiji’s agriculture sector and food systems. It creates a valuable opportunity for Fiji to reset and reinvigorate development in the sector which includes a greater focus on being prepared, proactively managing risks and forward-looking on how we can sustain our food systems. It should be rooted in our conviction
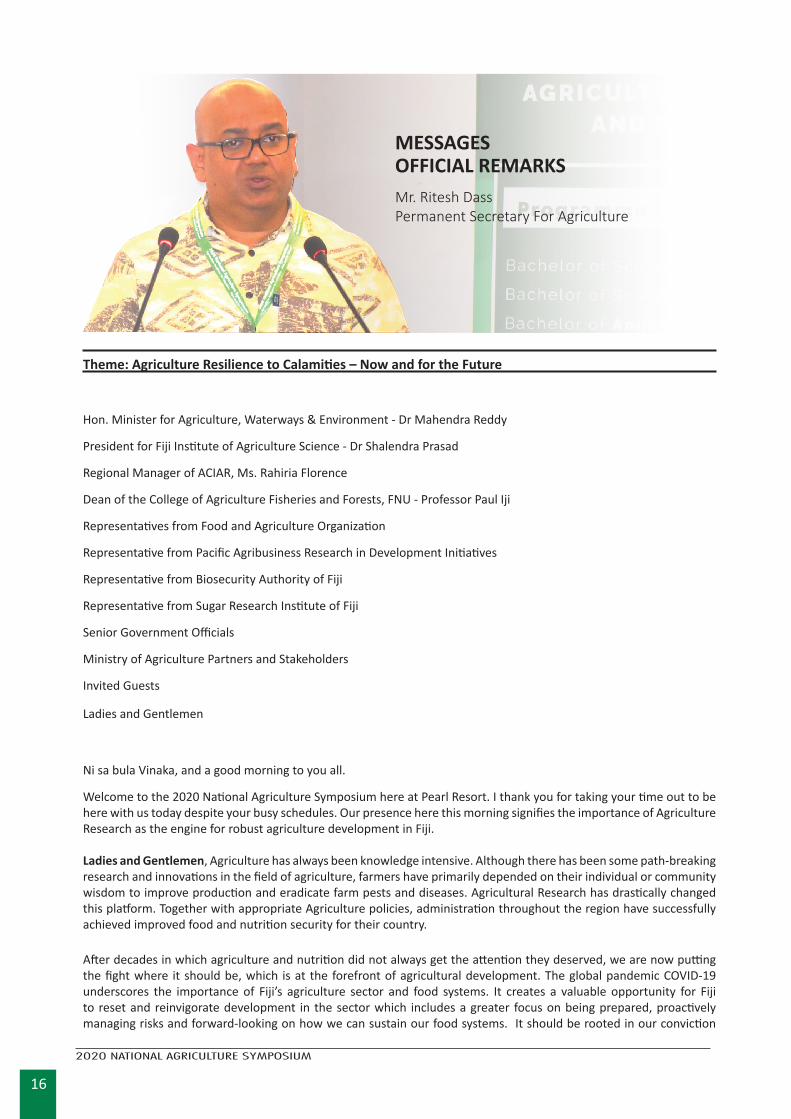
MESSAGESOFFICIAL REMARKSMr. Ritesh DassPermanent Secretary For Agriculture
17
2020 NATIONAL AGRICULTURE SYMPOSIUM
that the much need development in agriculture should not only be done as form of assistance to get on our day to day needs, but also to drive and promote economic growth -- broad-based, inclusive growth that actually helps Fiji develop as a nation and lifts the standard of living for all Fijians. We all should join up to create a sector and create the conditions where day to day assistance is no longer needed, where people have the dignity and the pride of being self-sufficient. Science has a role to play in achieving this outcome, where innovative thinking becomes a way of working in cultivating ideas for growth. Innovation – it must be a mindset, and it is a must!
Ladies and Gentlemen, Increased agricultural productivity is essential to enhancing its contribution to the economy and as such research for development is crucial towards attaining this. Productivity gains may come from the identification of improved varieties/breeds of plants and animals that give higher yields to the inputs. Development and adoption of climate-resilient varieties with improved resistance to biotic stresses are also required for increased productivity. Development of varieties with improved nutritional parameters is needed to better address non-communicable diseases (NCDs). Productivity increases could also come from precision agriculture techniques as well as practices that support sustainable agriculture development and smallholder farming situation.
The expansion in production and trade of commodities, marked by increasing market demand for quality products is often affected by challenges such as reduced productivity, post-harvest losses, pest and disease incidences. Indirect factors influencing this scenario include global climate change, population growth, middle-class expansion and environmental degradation. To address these challenges, research in country has embarked on programs to improve agricultural productivity and satisfy consumer demands.
Ladies and Gentlemen, the objectives of this symposium is to:
1. Inform participants of the various current research activities and development initiatives in the field of agriculture in country to improve productivity and market capability of local produce.
2. Offer a platform for local scientists to present their research findings and share their knowledge and experiences with participants.
3. Provide the best way forward for the implementation of the Ministry’s Strategic Development Plan through dynamic research.
4. Provide an opportunity for interaction among all FIAS members from various institutions/ organizations in Fiji.
I hope that within the next two days we will be able to successfully achieve the objective of this symposium and integrate this scientific findings into the implementation of our strategic plans. ‘
On that note, Ladies and Gentlemen, I must sincerely thank you again for your attendance and to the organizers, Head of Agriculture Research and his team for convening this seminar which I believe has been long overdue and I wish you all the best in your discussions in the next two days.
Thank you, Vinaka vakalevu and Dhaanyavaard.
18
2020 NATIONAL AGRICULTURE SYMPOSIUM
Theme: Agriculture Resilience to Calamities – Now and for the Future
Permanent Secretary for Agriculture, Mr Ritesh Dass
President for Fiji Institute of Agriculture Science – Dr Shalendra Prasad
Dean of the College of Agriculture Fisheries and Forests, FNU – Professor Paul Iji
Representative from Food Agriculture Organization
Representative from PARDI – Pacific Agribusiness Research in Development Initiatives
Representative from BAF – Biosecurity Authority of Fiji
Representative from SRIF – Sugar Research Institute of Fiji
Senior Government Officials
Ministry of Agriculture Partners and Stakeholders
Invited Guests
Ladies and Gentlemen
Bula Vinaka and thank you for the kind invitation and your sincere words of welcome.
I’m grateful to be here with you today at the 2020 National Agriculture Symposium where we recognize our Agriculture Scientists who have positively contributed to the growth of Fiji’s Agriculture Sector.
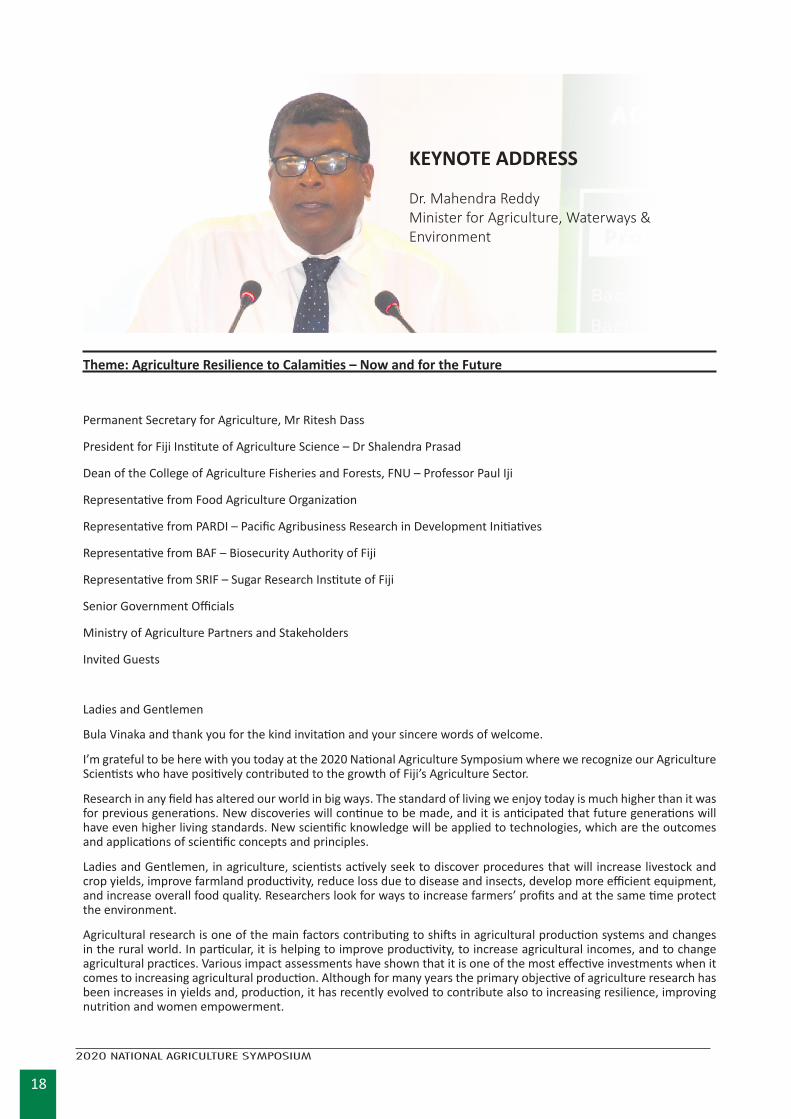
Research in any field has altered our world in big ways. The standard of living we enjoy today is much higher than it was for previous generations. New discoveries will continue to be made, and it is anticipated that future generations will have even higher living standards. New scientific knowledge will be applied to technologies, which are the outcomes and applications of scientific concepts and principles.
Ladies and Gentlemen, in agriculture, scientists actively seek to discover procedures that will increase livestock and crop yields, improve farmland productivity, reduce loss due to disease and insects, develop more efficient equipment, and increase overall food quality. Researchers look for ways to increase farmers’ profits and at the same time protect the environment.
Agricultural research is one of the main factors contributing to shifts in agricultural production systems and changes in the rural world. In particular, it is helping to improve productivity, to increase agricultural incomes, and to change agricultural practices. Various impact assessments have shown that it is one of the most effective investments when it comes to increasing agricultural production. Although for many years the primary objective of agriculture research has been increases in yields and, production, it has recently evolved to contribute also to increasing resilience, improving nutrition and women empowerment.
KEYNOTE ADDRESS
Dr. Mahendra ReddyMinister for Agriculture, Waterways & Environment
19
2020 NATIONAL AGRICULTURE SYMPOSIUM
Climate trends over the last several decades have already been affecting agriculture. For the future, climate projections indicate that agricultural production will be affected through multiple pathways: heat stress via temperature increases; more frequent extreme weather events such as droughts and floods; changing rainfall amounts and patterns; shifts in timing and length of growing seasons; and changing prevalence and severity of pests, weeds and crop and livestock diseases
Ladies and Gentlemen, Fiji’s Agriculture Sector, remains the backbone of Fiji’s Economy, and has been always identified over the years as one of the key drivers of Economic growth. In 2019, the sector contributed $725.8m to National GDP with a growth of 5.7% as compared to 2018. This growth has been influenced by our key commodities such as Yaqona, Taro, Cassava, Ginger etc. which you will agree with me , have been impacted by our continued successful research activities. Value of Domestic export have also continue to grow by 4.7 % since 2013 and this a clear indication of how we have evolved over the years through agriculture research to ensure that we are able to sustain our product position in the external markets.
The demand to come up with new ideas and innovations to respond to the current pandemic and the effects of climate change is more intensive than ever. Especially now when more people are returning to their rural home to toil their land or start their farm where they are located. Covid 19 underscores the importance of agriculture, our food systems and security. Now amidst this crisis, Fiji needs to reset and reinvigorate its agriculture sector and food systems through greater focus on proactively managing risks and ensuring that we have a perfect plan in place to sustain Fiji’s Agriculture Sector. This plan needs to highlight dynamic research findings that will enable us to positively respond to such mishaps and I believe that we are on track convening a forum of this magnitude and theme – AGRICULTURE RESILIENCE TO CALAMITIES – Now and for the Future.
Ladies and Gentlemen, the Fiji Institute of Agriculture Science was launched in 2014, to promote advancement of Agriculture in Fiji through awareness and seminars that will create an opportunity for members to share their knowledge and present their research findings. As such, organinsing this symposium, is one of the best way forward for Agriculture Research, especially now, when Natural disasters and climate change present major risks to Fiji’s food security and of course our national economy.
In 2016, Tropical Cyclone Winston caused damages amounting to 20 % of GDP. The World Bank estimates that cyclones and floods push on an average 25,700 people into poverty every year in Fiji. This is a significant reminder of Fiji’s vulnerability to natural disasters which are likely to increase in future.
The expansion in production and trade of commodities, marked by increasing market demand for quality products is often affected by challenges such as reduced productivity, post-harvest losses and pest and disease incidence. Indirect factors influencing this scenario include global climate change, population growth, middle-class expansion and environmental degradation. To address these challenges, research in the country has embarked on programs to improve agricultural productivity and satisfy consumer demands.
Ladies and Gentlemen, in the next two days you will be introduced to research findings that will pave the way to how we develop our response to catastrophes that can negatively affect Fiji’s Agriculture sector. Findings such as best practices in Post-harvest Management to ensure climate resilient agriculture, a future perspective to climate smart agriculture, strengthening resilient in Fiji’s Taro industry, soil fertility , productivity and decline etc. to name a few.
I look forward that such findings will be incorporated in our plan and guide our strategy and implementations as we move forward amidst risks and changing weather pattern.
Let me end by thanking the organizers, for convening such an event, which is very important to all of us gathered here today especially now when our food system is directly threatened by the current pandemic.
I would like to encourage you all to collaborate and draw from the experts who are here with you today in finding that best way forward for Fiji’s Agriculture Sector.
I wish you all a successful two day seminar and all the best in your deliberations.
Now it gives me great pleasure to declare this symposium OPEN!
Thank you, Vinaka Vakalevu and Dhanyavaad.

20
2020 NATIONAL AGRICULTURE SYMPOSIUM
Fruit Cutting for the Opening of Symposium
Left: Mr. Ritesh Dass [Permenant Secretary for Agriculture], Mr. Shalendra Prasad [President, Fiji Institute of Agricultural Science] Dr. Mahendra Reddy [Minister for Agriculture, Waterways & Environment],
Ms. Florence Rahiria [ACIAR Regional Manager PNG and Pacific] & Prof Paul Iji [Dean FNU Fiji College of Agriculture Fisheries & Forestery]
21
2020 NATIONAL AGRICULTURE SYMPOSIUM
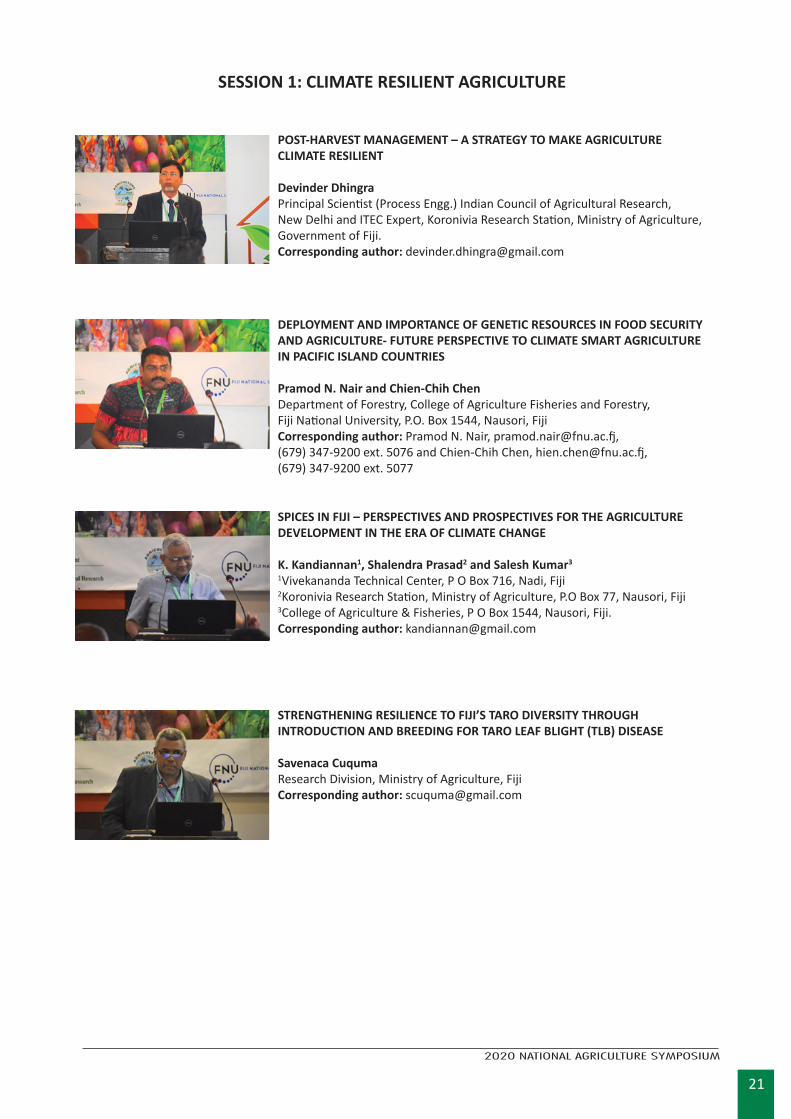
SESSION 1: CLIMATE RESILIENT AGRICULTURE
POST-HARVEST MANAGEMENT – A STRATEGY TO MAKE AGRICULTURE CLIMATE RESILIENT
Devinder Dhingra Principal Scientist (Process Engg.) Indian Council of Agricultural Research, New Delhi and ITEC Expert, Koronivia Research Station, Ministry of Agriculture, Government of Fiji. Corresponding author: [email protected]
DEPLOYMENT AND IMPORTANCE OF GENETIC RESOURCES IN FOOD SECURITY AND AGRICULTURE- FUTURE PERSPECTIVE TO CLIMATE SMART AGRICULTURE IN PACIFIC ISLAND COUNTRIES
Pramod N. Nair and Chien-Chih ChenDepartment of Forestry, College of Agriculture Fisheries and Forestry, Fiji National University, P.O. Box 1544, Nausori, Fiji Corresponding author: Pramod N. Nair, [email protected], (679) 347-9200 ext. 5076 and Chien-Chih Chen, [email protected], (679) 347-9200 ext. 5077
SPICES IN FIJI – PERSPECTIVES AND PROSPECTIVES FOR THE AGRICULTURE DEVELOPMENT IN THE ERA OF CLIMATE CHANGE
K. Kandiannan1, Shalendra Prasad2 and Salesh Kumar3
1Vivekananda Technical Center, P O Box 716, Nadi, Fiji2Koronivia Research Station, Ministry of Agriculture, P.O Box 77, Nausori, Fiji3College of Agriculture & Fisheries, P O Box 1544, Nausori, Fiji.Corresponding author: [email protected]
STRENGTHENING RESILIENCE TO FIJI’S TARO DIVERSITY THROUGH INTRODUCTION AND BREEDING FOR TARO LEAF BLIGHT (TLB) DISEASE
Savenaca CuqumaResearch Division, Ministry of Agriculture, FijiCorresponding author: [email protected]
22
2020 NATIONAL AGRICULTURE SYMPOSIUM
SESSION 1: CLIMATE RESILIENT AGRICULTUREPOST-HARVEST MANAGEMENT – A STRATEGY TO MAKE AGRICULTURE CLIMATE RESILIENT
Devinder Dhingra Principal Scientist (Process Engg.) Indian Council of Agricultural Research, New Delhi and ITEC Expert, Koronivia Research Station, Ministry of Agriculture, Government of Fiji.
Corresponding author: [email protected]
ABSTRACTAgriculture, animal husbandry, fisheries depend largely on climate of the region. Global warming, changes in rain patterns, droughts, floods, cyclones, storms etc. have become a challenge for the food production systems. Various strategies are being explored to counter negative impact of climate change on agriculture and allied activities. Promising crop genotypes and livestock breeds tolerant to climatic stress are being looked into through strategic research. Apart from this, it is also important to develop infrastructure and train manpower to reduce post-harvest losses. Losses at every stage in the food system influence the extent to which nutritional requirements of a growing global population can be sustainably met. Inefficiencies and losses in agricultural production and consumer behavior all play a role. Efforts to reduce post-harvest losses will surely help in mitigating the negative impact on crop production due to climate stress. Post-harvest losses in India have been observed to be quite large. Post-harvest losses among selected fruits and vegetables were observed to be in the range of 6.70 - 15.88 % during the year 2014. Post-harvest losses among cereals, pulses and oilseeds were also observed to be in the range of 3.08 – 9.96 %. Post-harvest Management of agricultural produce and setting-up of custom hiring centres in rural areas have the potential to reduce post-harvest losses, create employment opportunities in rural areas, enhance farmers income and counter the negative impact of climate change. The paper describes the post-harvest losses of selected commodities along the value chain in India and discusses the strategies to reduce post-harvest losses.
INTRODUCTION Farmers produce a diverse range of crops such as fruits, vegetables, tuber crops, plantation crops, spices etc. Apart from this rearing of cattle, fish and honeybees also add valuable food commodities to our kitchens. Post-harvest losses begin as soon as the crops are harvested, eggs are laid, animals are milked/slaughtered & fish is caught. The post-harvest food supply chain involves post-harvest operations, storage, transportation, processing, distribution, retail and consumption. The management of the post-harvest food supply chain has many shortcomings, especially in developing countries. These include inadequate infrastructure, untrained manpower, fragmented supply chain, lack of cold chain, low-levels of processing and value addition, inadequate testing of food commodities etc. It leads to high post-harvest losses due to surplus during the peak production season. Post-harvest losses also happen during the transportation, storage and distribution activities.
POST-HARVEST LOSSESPost-harvest loss is defined as the loss from the stage of harvesting to the stage of retailing of food products. Food wastage at consumers end is generally not included in the post-harvest loss. Post-harvest losses are mainly of two types: qualitative loss and quantitative loss.
Qualitative post-harvest loss: The deterioration in the quality of the product is termed as a qualitative loss. The quality deterioration of the produce may happen during the various unit operations such as aggregation, cleaning, cooling, packaging, storage, handling, transportation, retailing, handling at consumers end etc. Qualitative post-harvest losses are mainly:
(i) The deterioration in organoleptic /sensory quality (appearance and eating quality) of the produce (aroma, flavour, colour, yellowing, taste, firmness, shrivelling, shrinkage, texture etc.) during its storage, transporta-tion, packaging, retailing etc.;
(ii) Loss of nutrition (reduction in the starch/sugar/oil/protein content, vitamins, minerals etc.);
(iii) Development of toxins in the produce (aflatoxins; mycotoxins etc.)
(iv) Inclusion of physical and chemical residues;
23
2020 NATIONAL AGRICULTURE SYMPOSIUM
(v) Physical and biological damage to the product such as snapping, puncturing, tissue damage; rotting, insect infestation, pest damage, rotting due to yeast, mold and fungi etc.
Quantitative post-harvest loss: Reduction in physical quantity (weight) of the product is termed as a quantitative loss. Loss in weight (due to respira-tion of the product and due to loss of water) and loss of product (due to spillage, theft, insect infestation, damage due to microbial organisms etc.) are both included in quantitative losses. Transpiration through stomata is the major way of moisture loss in fresh horticultural commodities. The other paths of water loss are stem scar, lenticels and the cracks resulted from mechanical injury.
Post-harvest losses in quality and quantity are mainly the result of mechanical constraints undergone by the product, the action of pests (insects, rodents) and micro-organisms (moulds), or the chemical changes produced within the product under the effect of environmental conditions (temperature, humidity, duration of storage). Active resumption of growth in harvested produce, such as sprouting and/or rooting of tuberous and bulbous crops, elongation and cur-vature of stem vegetables, and seed germination inside fruits, is undesirable and leads to a great reduction in market quality and accelerated deterioration.
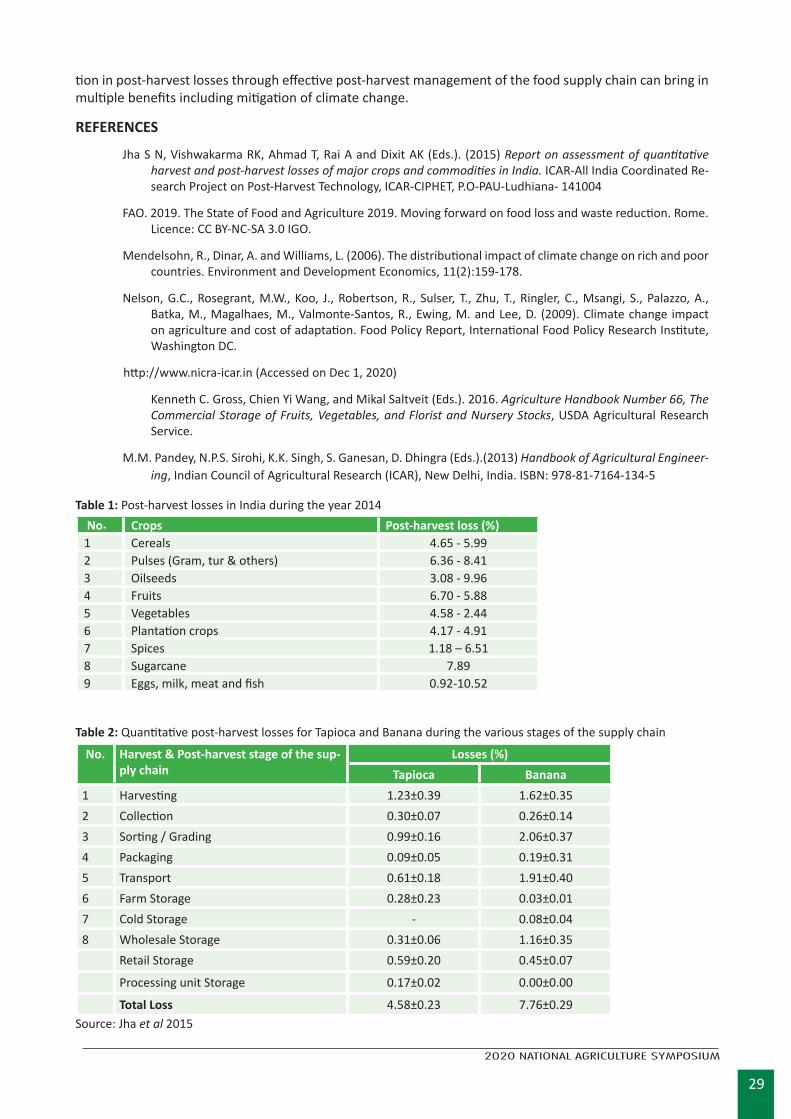
Estimation of post-harvest losses in IndiaIn the recent past two studies were conducted in India to estimate the post-harvest losses during various stages of the food supply chain. The first study on estimation of post-harvest losses was conducted in 106 districts of the country during 2005-07. The survey during the first study was undertaken for 46 crops and commodities comprising of five cereal crops (wheat, rice, maize, pearl millet, sorghum), four legume crops (pigeon-pea, chickpea, black gram, green gram), six oilseed crops (mustard, soybean, safflower, groundnut, sunflower, cottonseed), eight fruit crops (banana, mango, citrus, apple, grapes, guava, papaya, sapota), eight vegetable crops (tomato, potato, onion, cauliflower, green peas, cabbage, tapioca, mushrooms), eight plantation crops/spices, livestock produce and jaggery. A second study (re-peat study) was conducted during the years 2012-2015 (Jha et al 2015). The post-harvest losses according to the study conducted in the years 2012-15 are described in Table 1:
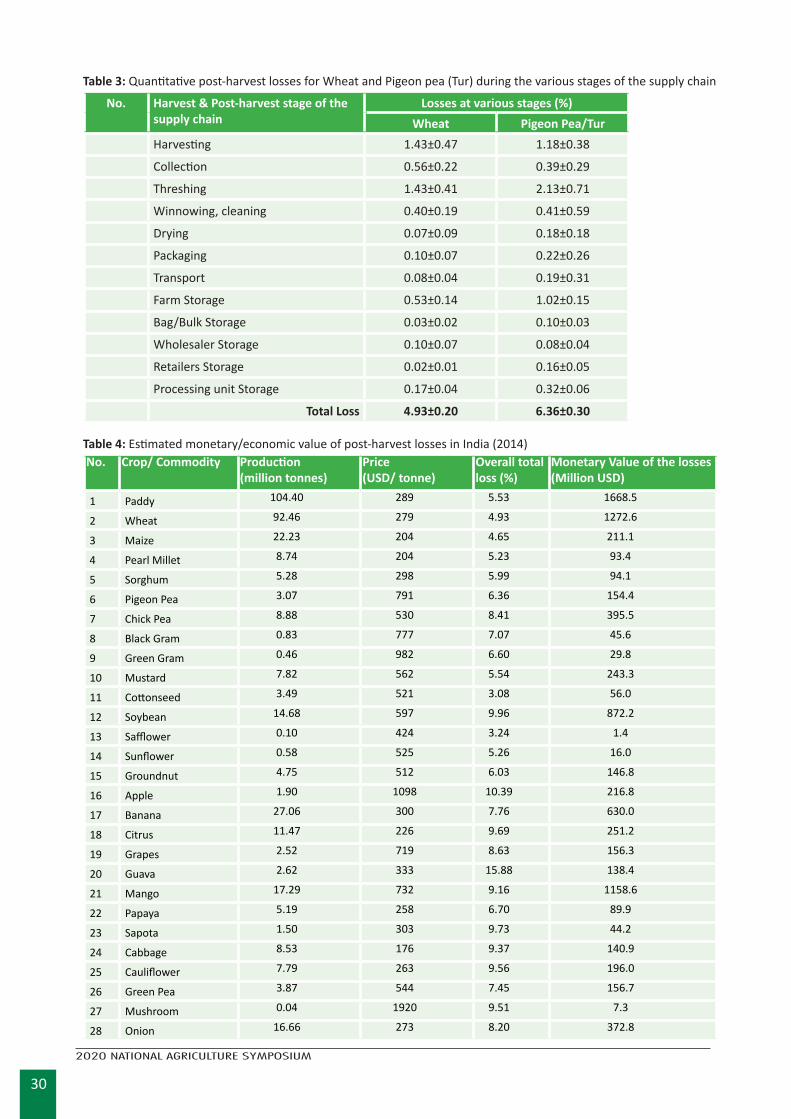
The stages considered for assessment of losses were harvesting, collection, threshing, grading/sorting, winnowing/cleaning, drying, packaging, transportation, and storage depending upon the commodity. Overeating and wastage at the consumer level were not parts of this study. The post-harvest losses observed for few selected crops during the var-ious post-harvest stages are described in table 2 and table 3. These observations pertain to the above-referred study.
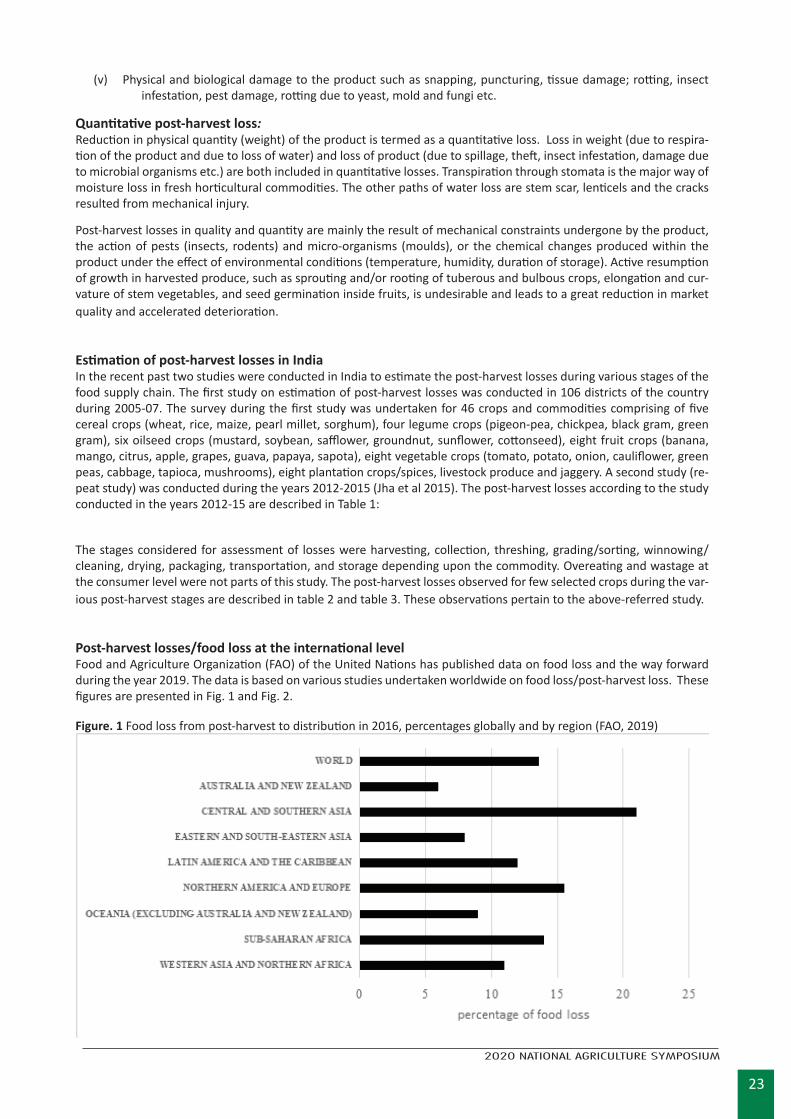
Post-harvest losses/food loss at the international levelFood and Agriculture Organization (FAO) of the United Nations has published data on food loss and the way forward during the year 2019. The data is based on various studies undertaken worldwide on food loss/post-harvest loss. These figures are presented in Fig. 1 and Fig. 2.
Figure. 1 Food loss from post-harvest to distribution in 2016, percentages globally and by region (FAO, 2019)
24
2020 NATIONAL AGRICULTURE SYMPOSIUM
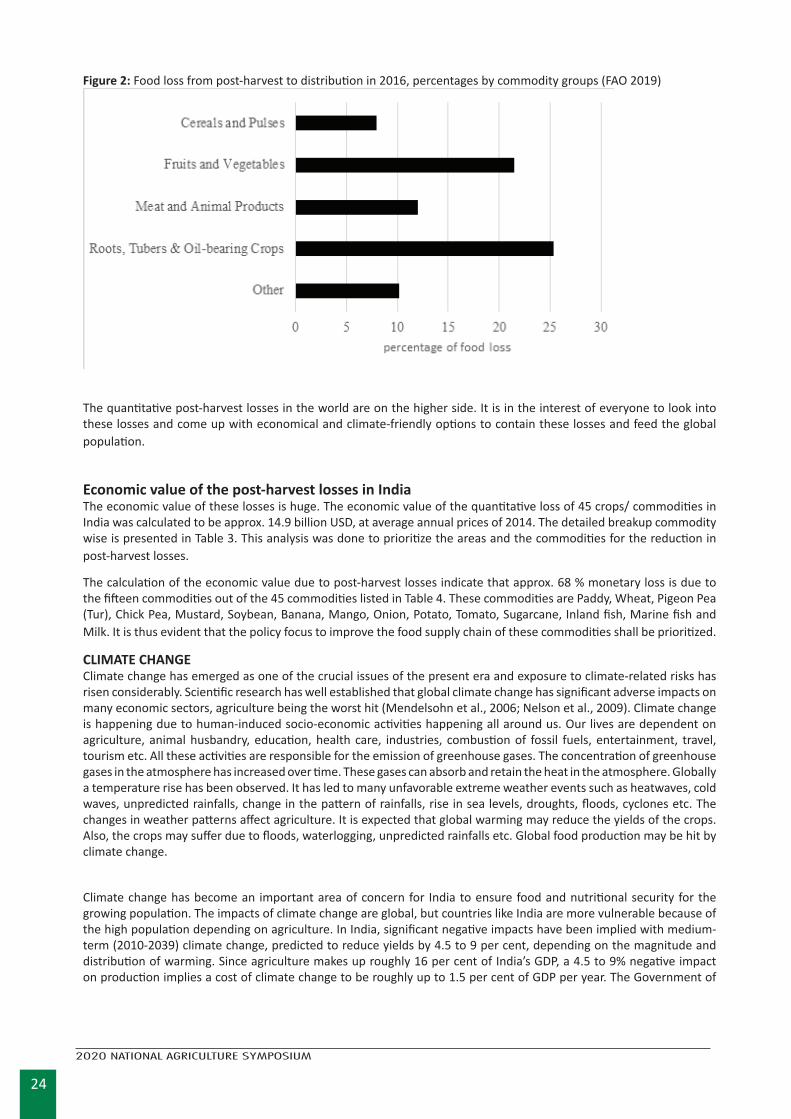
Figure 2: Food loss from post-harvest to distribution in 2016, percentages by commodity groups (FAO 2019)
The quantitative post-harvest losses in the world are on the higher side. It is in the interest of everyone to look into these losses and come up with economical and climate-friendly options to contain these losses and feed the global population.
Economic value of the post-harvest losses in India The economic value of these losses is huge. The economic value of the quantitative loss of 45 crops/ commodities in India was calculated to be approx. 14.9 billion USD, at average annual prices of 2014. The detailed breakup commodity wise is presented in Table 3. This analysis was done to prioritize the areas and the commodities for the reduction in post-harvest losses.
The calculation of the economic value due to post-harvest losses indicate that approx. 68 % monetary loss is due to the fifteen commodities out of the 45 commodities listed in Table 4. These commodities are Paddy, Wheat, Pigeon Pea (Tur), Chick Pea, Mustard, Soybean, Banana, Mango, Onion, Potato, Tomato, Sugarcane, Inland fish, Marine fish and Milk. It is thus evident that the policy focus to improve the food supply chain of these commodities shall be prioritized.
CLIMATE CHANGE Climate change has emerged as one of the crucial issues of the present era and exposure to climate-related risks has risen considerably. Scientific research has well established that global climate change has significant adverse impacts on many economic sectors, agriculture being the worst hit (Mendelsohn et al., 2006; Nelson et al., 2009). Climate change is happening due to human-induced socio-economic activities happening all around us. Our lives are dependent on agriculture, animal husbandry, education, health care, industries, combustion of fossil fuels, entertainment, travel, tourism etc. All these activities are responsible for the emission of greenhouse gases. The concentration of greenhouse gases in the atmosphere has increased over time. These gases can absorb and retain the heat in the atmosphere. Globally a temperature rise has been observed. It has led to many unfavorable extreme weather events such as heatwaves, cold waves, unpredicted rainfalls, change in the pattern of rainfalls, rise in sea levels, droughts, floods, cyclones etc. The changes in weather patterns affect agriculture. It is expected that global warming may reduce the yields of the crops. Also, the crops may suffer due to floods, waterlogging, unpredicted rainfalls etc. Global food production may be hit by climate change.
Climate change has become an important area of concern for India to ensure food and nutritional security for the growing population. The impacts of climate change are global, but countries like India are more vulnerable because of the high population depending on agriculture. In India, significant negative impacts have been implied with medium-term (2010-2039) climate change, predicted to reduce yields by 4.5 to 9 per cent, depending on the magnitude and distribution of warming. Since agriculture makes up roughly 16 per cent of India’s GDP, a 4.5 to 9% negative impact on production implies a cost of climate change to be roughly up to 1.5 per cent of GDP per year. The Government of
25
2020 NATIONAL AGRICULTURE SYMPOSIUM
India has accorded high priority on research and development to cope with climate change in the agriculture sector. The Prime Minister’s National Action Plan on climate change has identified Agriculture as one of the eight national missions. (http://www.nicra-icar.in)
Regular assessment of the scientific basis of climate change, its impact and future risks and options for adaptation and mitigation are being looked into. Some of the adaptation strategies for agriculture include:
• Evolve varieties tolerant to key climatic stresses (drought, heat, frost, flooding, etc.)
• Enhance water and nutrient use efficiency and adopt conservation agriculture/precision agriculture.
• Study changes in pest dynamics, pest/pathogen-crop relationships and emergence of new pests and pathogens under changing climate.
• Improve livestock production through nutritional and environmental manipulations.
• Harness the beneficial effects of temperature in inland and marine fisheries through a better understanding of the spawning behaviour.
• Weather-based agro-advisories to the farmers and contingency planning.
These strategies are required to enhance productivity and augment the production of food. Effective post-harvest management of the food supply chain can reduce the post-harvest losses and thus augment the food supply without additional agriculture. It can thus help in reducing the agricultural activity and help in reducing the emission of the greenhouse gases. Any activity which can help in reducing the emission of the greenhouse gases is considered as the climate change mitigation strategy. Both the mitigation as well as the adaptation strategies are required in the agricul-ture sector.
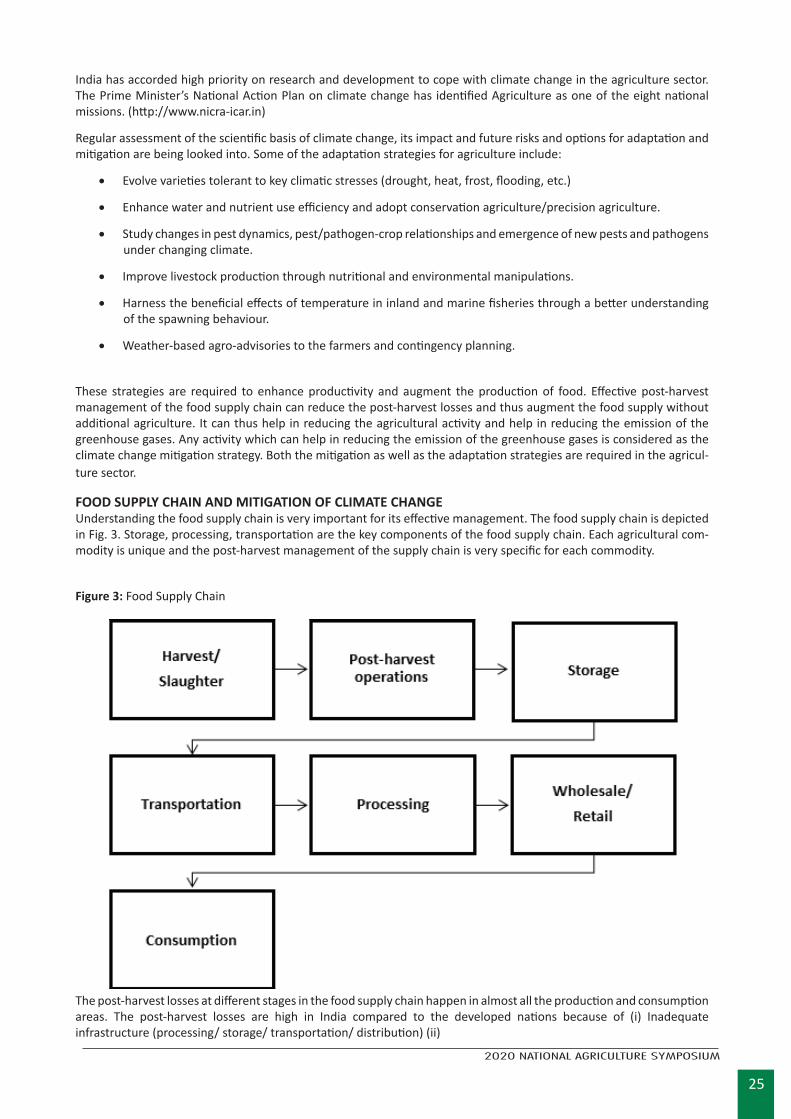
FOOD SUPPLY CHAIN AND MITIGATION OF CLIMATE CHANGEUnderstanding the food supply chain is very important for its effective management. The food supply chain is depicted in Fig. 3. Storage, processing, transportation are the key components of the food supply chain. Each agricultural com-modity is unique and the post-harvest management of the supply chain is very specific for each commodity.
Figure 3: Food Supply Chain
The post-harvest losses at different stages in the food supply chain happen in almost all the production and consumption areas. The post-harvest losses are high in India compared to the developed nations because of (i) Inadequate infrastructure (processing/ storage/ transportation/ distribution) (ii)
26
2020 NATIONAL AGRICULTURE SYMPOSIUM
Untrained manpower (farmers, farmworkers, handlers etc.) (iii) Multiple stages of handling raw produce and (iv) Fragmented supply chain.
Improvements in the food supply chain have lagged food production. The strengthening of the food supply chain involves costs and thus needs proper evaluation of its impact on the reduction in post-harvest losses and mitigation of climate change. The following are the potential costs for improvement and strengthening of the food supply chain:
• Time and effort spent by farmers, consumers and business.
• Investment cost to businesses (e.g. in new buildings, equipment, manpower, electricity, fuel, training, research etc.).
• Public investment costs (e.g. on building infrastructure).
• Time and effort spent by governments (standards/monitoring legislation/enforcement).
• Funds for research and development on technologies for the reduction in post-harvest losses.
Improvement in post-harvest management will lead to reduced post-harvest losses with potential overall societal ben-efits mainly (i) Increased overall income (ii) Improved food security and nutrition and (iii) Reduction of natural resource use and GHG emissions. The reduction of natural resource use and GHG emissions will help in mitigating climate change.
UNIT OPERATIONS INVOLVED IN THE SUPPLY CHAIN FROM HARVEST TO MARKETINGThe various unit operations involved in the supply chain are Aggregation, Curing, Pre-cooling, Cleaning / Washing, Drying, Sorting, Grading, Processing (primary processing, secondary processing), Packaging, Storage, Loading, Transportation, Cold storage, Display, Marketing etc. It is important to perform these operations with proper training, equipment and skills to minimize the post-harvest losses at each step.
Factors responsible for qualitative and quantitative post-harvest lossesIt is important to understand the factors which play a major role in causing losses during the movement of the food from farm to the consumer. Both biotic and abiotic (biological and physical) factors are responsible for post-harvest losses. The physical factors mainly include Temperature, Relative Humidity, Concentration of O2, CO2 and ethylene in the environment surrounding the produce, Load/force/pressure, Mechanical injury/bruising during handling, packaging, transportation and retailing, Wind velocity/air velocity and spillage etc. Inappropriate physical conditions can be very harmful to the quantity and the quality of agricultural products. The biological factors responsible for bringing in an adverse effect on the quality and quantity of the agricultural products are mainly, Insect infestation/pest infestation; Microbial contamination from field/store/packaging material; Diseases caused by fungi and bacteria; and Respiration and transpiration. Proper control of these factors is very helpful in preventing post-harvest losses/food losses.
Temperature affects the respiration of the produce. Respiration is based on the availability of the carbohydrates and other nutrients. Carbohydrates are converted into sugars, carbon dioxide and water. Reduction in respiration can be achieved by lowering the temperature of the products or altering the gaseous atmosphere around the produce (reduction in oxygen concentration; increase in carbon dioxide concentration; scavenging of ethylene etc.)
Temperature and relative humidity around the produce affect the water loss (drying of produce) from the produce. In the case of fruits and vegetables, it leads to irreversible loss in weight, senescence and shriveling of the skin.
Presence of ethylene enhances respiration, senescence and yellowing of tissues.
Excessive load or force on fruits, vegetables, tuber crops etc. causes damage to the tissue. The damage may not appear immediately. But with time it leads to a loss in the quality of the produce. During handling and transportation if proper care is not taken the product in the lower layers may get damaged due to the weight of produce of the top layers.
Measures to reduce post-harvest losses and improve post-harvest managementThere are specific measures for each commodity by which, the post-harvest losses can be controlled. Some of these general measures are listed as under:
- The harvesting of the crop should be done at the correct maturity state. Climacteric fruit is usually harvested at the mature green (unripe) stage since it can ripen normally after harvest. Conversely, non-climacteric fruit must be harvested only when fully ripe.
- For fruits and vegetables, the water should be sanitized with sodium hypochlorite, bleach etc. before usage for washing fruits and vegetables.
27
2020 NATIONAL AGRICULTURE SYMPOSIUM
- If there is any mechanical injury in the food product, it should be discarded early as it can favor the entry of pathogenic microorganisms.
- Harvesting should be done in cooler temperature for the perishable products which are then directly transferred to the storage areas.
- Threshing of grains should be handled properly.
- The grains should be dried completely and cleaned properly before transportation to the storage areas.
- New bags may be used for the storage of fresh grains. Old used bags may be avoided.
- Bins/buckets used for holding grains shall be cleaned and sanitized before use.
- The products shall be monitored regularly during storage.
- The entry of insects, pests, rodents, birds etc. to the storage area shall be controlled properly.
- The storage areas should be highly sanitized and there should be proper ventilation and cleaning.
- The packaging of the product must obey the quality standards on the shape, weight, nutritional value etc.
- The transportation to the market retailers should not be at long distance as there may occur a chance of food spill-age, decay of the food product etc.
- Perishables (fruits/vegetables) shall be kept under shade in a cool place after harvest. These shall never be left under sun and rain.
- Retailing of perishables shall also be done under shade. The shelters shall prevent the product from direct sunlight and rainwater.
- The harvested produce may be aggregated on clean raised surfaces and not dumped on the soil.
- Pre-cooling may be practiced if possible.
- The products shall be shifted to storage maintained at the appropriate temperature at the earliest.
- Perishables shall not be thrown during harvesting and subsequent handling to prevent mechanical injuries.
- The principle of first in and first out shall be used at the time of liquidation of the stored commodities.
- Bags, boxes, baskets, crates used for harvesting and handling shall be cleaned and sanitized regularly.
- Where ever curing is required it may be carried out effectively.
- Fallen fruits may not be mixed with fruits directly harvested from trees/plants.
- Diseased and damaged produce shall be sorted out from healthy produce.
- Produce shall be graded before packaging and storage.
- Requisite storage temperature and humidity may be maintained in the cold stores.
- Ethylene control in the storage environment for both climacteric and non-climacteric fruits helps in reducing post-harvest losses.
- Chilling injury (CI) by low (< 10-13°C) but the non-freezing temperature is observed commonly with tropical and some subtropical origin fruits and vegetables. It is therefore important that storage temperatures may be main-tained accurately.
- Nutritional disorders originate from pre-harvest mineral imbalance and sometimes appear only after harvest in products. Calcium is associated with more postharvest-related deficiency disorders than any other mineral. Bitter pit of apples and blossom-end rot of tomato are well-known calcium deficiency disorders in horticultural crops. Mineral deficiencies in crops shall be addressed during crop growth to prevent post-harvest losses.
- Avoid mechanical damage of fruits and vegetables, as a consequence of inappropriate harvesting and postharvest handling. It affects appearance attributes (skin and flesh lesions and browning) and also creates sites for pathogen infection and water loss. Furthermore, physical injury stimulates ethylene production and respiration in plant tis-
28
2020 NATIONAL AGRICULTURE SYMPOSIUM
sues, which can lead to the acceleration of senescence.
- Use of chemicals to control sprouting, reduce ethylene damage and loss of water in case of perishables. Isopropyl N-(3-chlorophenyl) carbamate (CIPC also referred to as chlorpropham) is the most commonly used sprout sup-pressant on potatoes when stored at 8–12 °C. Ethylene absorbents, such as potassium permanganate on ver-miculite in packages are used to oxidize the ethylene release from fresh products. 1-methyl cyclopropane (1-MCP) is used to prevent the harmful effects of ethylene on horticultural products. Maleic hydrazide (MH) has been successfully used to inhibit sprouting of onions during storage. Users are advised to check country guidelines on the usage of these substances.
- Fumigation of grains to control insect infestation. Fumigation by phosphine gas is commonly practiced worldwide for grains.
- Cooling of grains to control the growth and proliferation of insects is an alternative to the use of chemicals.
- Heat treatments either alone or in combination with other methods. The most commonly used heat treatments include hot water immersion, forced-hot air treatment, and vapor heat treatment. Hot water immersion has been used classically for fungal control and vapour heat treatment was developed specifically for insect control, while forced-hot air treatment is used for both fungal and insect management.
- Modification of the composition of the air surrounding the horticultural produce. CA/MA storage.
- All transportation vehicles must be suitable for the purpose, in good physical condition, dry (no dripping or stand-ing water), well maintained and clean. Inspect all vehicles and containers for debris, soil and odours before load-ing.
- Transport and store produce in vehicles and containers that are dedicated to carrying food products. Do not trans-port fresh produce in a truck that has been used to transport live animals, animal parts, soil or chemicals.
- Do not transport pets in vehicles used to transport fresh produce.
- All transportation vehicles must be pest-free.
- All fresh produce vehicles must be washed with water at 140-160 F and sanitized with a food-grade sanitizer before loading and transporting produce.
- Keep produce refrigerated at temperatures appropriate for the product type during storage and transportation, and during the sale, to minimize the potential for growth of microbial pathogens.
- Refrigerated trucks or containers should be equipped with accurately calibrated thermometers for monitoring temperatures. A thermometer that displays the range of temperatures over a set period, also known as a mini-mum/maximum thermometer, is recommended. Inspect cooling systems before each trip to ensure they are working properly.
- Place produce and/or containers in a manner that allows for proper air circulation.
- All pallets used in the vehicle must be dry, clean and free from damage or visible infestations.
- Fresh-cut or packaged produce must not come into direct contact with the vehicle floor.
- All workers involved in the loading and unloading of fresh produce must be healthy and follow appropriate per-sonal hygiene practices.
- Drivers and other transportation and handling personnel must be educated about established food safety proce-dures.
- Workers should load and unload produce in a manner that minimizes the potential for damage or microbial con-tamination.
CONCLUSIONSEffective post-harvest management of the agricultural products throughout the supply chain can result in a considerable reduction in post-harvest food loss. The prevention of food losses amounts to the availability of more food for human and animal consumption from the same production level. By preventing losses, we need not produce more food, thus leading to a reduction in the use of agricultural inputs. It will directly reduce the emission of greenhouse gases from the agriculture sector. Thus, it can be concluded that reduc-
29
2020 NATIONAL AGRICULTURE SYMPOSIUM
tion in post-harvest losses through effective post-harvest management of the food supply chain can bring in multiple benefits including mitigation of climate change.
REFERENCES
Jha S N, Vishwakarma RK, Ahmad T, Rai A and Dixit AK (Eds.). (2015) Report on assessment of quantitative harvest and post-harvest losses of major crops and commodities in India. ICAR-All India Coordinated Re-search Project on Post-Harvest Technology, ICAR-CIPHET, P.O-PAU-Ludhiana- 141004
FAO. 2019. The State of Food and Agriculture 2019. Moving forward on food loss and waste reduction. Rome. Licence: CC BY-NC-SA 3.0 IGO.
Mendelsohn, R., Dinar, A. and Williams, L. (2006). The distributional impact of climate change on rich and poor countries. Environment and Development Economics, 11(2):159-178.
Nelson, G.C., Rosegrant, M.W., Koo, J., Robertson, R., Sulser, T., Zhu, T., Ringler, C., Msangi, S., Palazzo, A., Batka, M., Magalhaes, M., Valmonte-Santos, R., Ewing, M. and Lee, D. (2009). Climate change impact on agriculture and cost of adaptation. Food Policy Report, International Food Policy Research Institute, Washington DC.
http://www.nicra-icar.in (Accessed on Dec 1, 2020)
Kenneth C. Gross, Chien Yi Wang, and Mikal Saltveit (Eds.). 2016. Agriculture Handbook Number 66, The Commercial Storage of Fruits, Vegetables, and Florist and Nursery Stocks, USDA Agricultural Research Service.
M.M. Pandey, N.P.S. Sirohi, K.K. Singh, S. Ganesan, D. Dhingra (Eds.).(2013) Handbook of Agricultural Engineer-ing, Indian Council of Agricultural Research (ICAR), New Delhi, India. ISBN: 978-81-7164-134-5
Table 1: Post-harvest losses in India during the year 2014 No. Crops Post-harvest loss (%)1 Cereals 4.65 - 5.992 Pulses (Gram, tur & others) 6.36 - 8.413 Oilseeds 3.08 - 9.964 Fruits 6.70 - 5.885 Vegetables 4.58 - 2.446 Plantation crops 4.17 - 4.917 Spices 1.18 – 6.518 Sugarcane 7.899 Eggs, milk, meat and fish 0.92-10.52
Table 2: Quantitative post-harvest losses for Tapioca and Banana during the various stages of the supply chain
No. Harvest & Post-harvest stage of the sup-ply chain
Losses (%)Tapioca Banana
1 Harvesting 1.23±0.39 1.62±0.352 Collection 0.30±0.07 0.26±0.143 Sorting / Grading 0.99±0.16 2.06±0.374 Packaging 0.09±0.05 0.19±0.315 Transport 0.61±0.18 1.91±0.406 Farm Storage 0.28±0.23 0.03±0.017 Cold Storage - 0.08±0.048 Wholesale Storage 0.31±0.06 1.16±0.35
Retail Storage 0.59±0.20 0.45±0.07
Processing unit Storage 0.17±0.02 0.00±0.00
Total Loss 4.58±0.23 7.76±0.29Source: Jha et al 2015
30
2020 NATIONAL AGRICULTURE SYMPOSIUM
Table 3: Quantitative post-harvest losses for Wheat and Pigeon pea (Tur) during the various stages of the supply chain
No. Harvest & Post-harvest stage of the supply chain
Losses at various stages (%)Wheat Pigeon Pea/Tur
Harvesting 1.43±0.47 1.18±0.38
Collection 0.56±0.22 0.39±0.29
Threshing 1.43±0.41 2.13±0.71
Winnowing, cleaning 0.40±0.19 0.41±0.59
Drying 0.07±0.09 0.18±0.18
Packaging 0.10±0.07 0.22±0.26
Transport 0.08±0.04 0.19±0.31
Farm Storage 0.53±0.14 1.02±0.15
Bag/Bulk Storage 0.03±0.02 0.10±0.03
Wholesaler Storage 0.10±0.07 0.08±0.04
Retailers Storage 0.02±0.01 0.16±0.05
Processing unit Storage 0.17±0.04 0.32±0.06
Total Loss 4.93±0.20 6.36±0.30
Table 4: Estimated monetary/economic value of post-harvest losses in India (2014)No. Crop/ Commodity Production
(million tonnes)Price(USD/ tonne)
Overall total loss (%)
Monetary Value of the losses (Million USD)
1 Paddy 104.40 289 5.53 1668.5
2 Wheat 92.46 279 4.93 1272.6
3 Maize 22.23 204 4.65 211.1
4 Pearl Millet 8.74 204 5.23 93.4
5 Sorghum 5.28 298 5.99 94.1
6 Pigeon Pea 3.07 791 6.36 154.4
7 Chick Pea 8.88 530 8.41 395.5
8 Black Gram 0.83 777 7.07 45.6
9 Green Gram 0.46 982 6.60 29.8
10 Mustard 7.82 562 5.54 243.3
11 Cottonseed 3.49 521 3.08 56.0
12 Soybean 14.68 597 9.96 872.2
13 Safflower 0.10 424 3.24 1.4
14 Sunflower 0.58 525 5.26 16.0
15 Groundnut 4.75 512 6.03 146.8
16 Apple 1.90 1098 10.39 216.8
17 Banana 27.06 300 7.76 630.0
18 Citrus 11.47 226 9.69 251.2
19 Grapes 2.52 719 8.63 156.3
20 Guava 2.62 333 15.88 138.4
21 Mango 17.29 732 9.16 1158.6
22 Papaya 5.19 258 6.70 89.9
23 Sapota 1.50 303 9.73 44.2
24 Cabbage 8.53 176 9.37 140.9
25 Cauliflower 7.79 263 9.56 196.0
26 Green Pea 3.87 544 7.45 156.7
27 Mushroom 0.04 1920 9.51 7.3
28 Onion 16.66 273 8.20 372.8
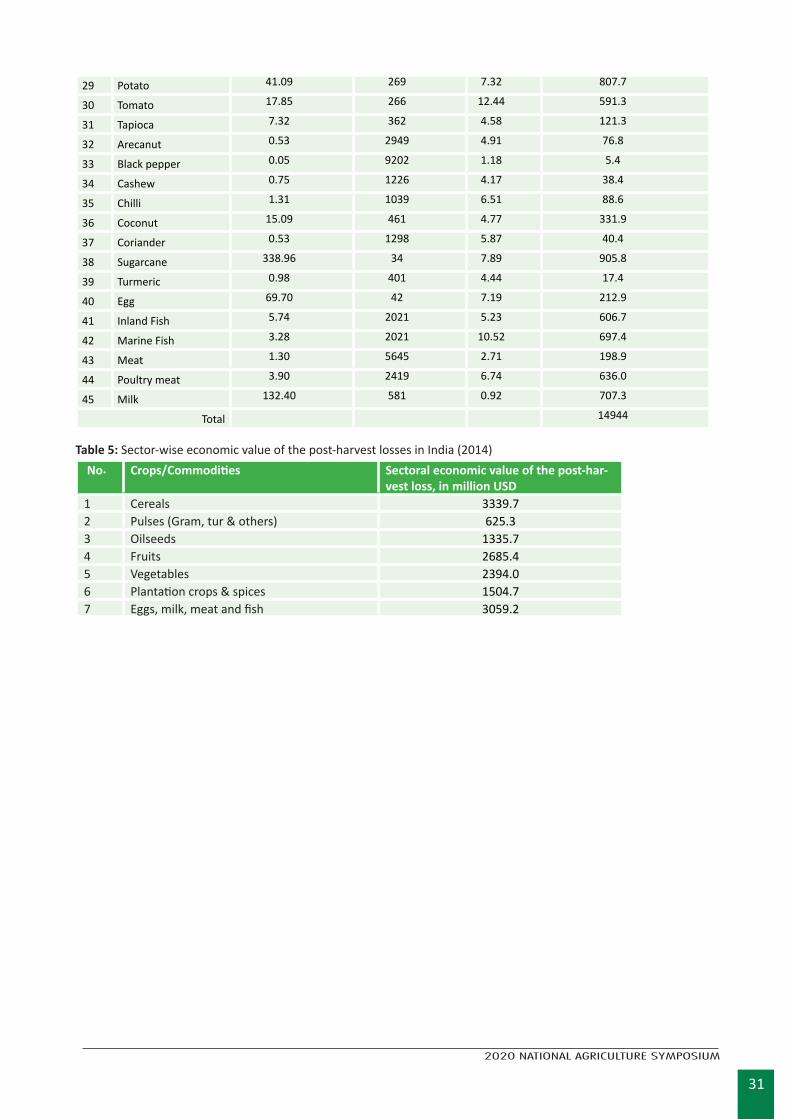
31
2020 NATIONAL AGRICULTURE SYMPOSIUM
29 Potato 41.09 269 7.32 807.7
30 Tomato 17.85 266 12.44 591.3
31 Tapioca 7.32 362 4.58 121.3
32 Arecanut 0.53 2949 4.91 76.8
33 Black pepper 0.05 9202 1.18 5.4
34 Cashew 0.75 1226 4.17 38.4
35 Chilli 1.31 1039 6.51 88.6
36 Coconut 15.09 461 4.77 331.9
37 Coriander 0.53 1298 5.87 40.4
38 Sugarcane 338.96 34 7.89 905.8
39 Turmeric 0.98 401 4.44 17.4
40 Egg 69.70 42 7.19 212.9
41 Inland Fish 5.74 2021 5.23 606.7
42 Marine Fish 3.28 2021 10.52 697.4
43 Meat 1.30 5645 2.71 198.9
44 Poultry meat 3.90 2419 6.74 636.0
45 Milk 132.40 581 0.92 707.3
Total 14944
Table 5: Sector-wise economic value of the post-harvest losses in India (2014) No. Crops/Commodities Sectoral economic value of the post-har-
vest loss, in million USD1 Cereals 3339.72 Pulses (Gram, tur & others) 625.33 Oilseeds 1335.74 Fruits 2685.45 Vegetables 2394.06 Plantation crops & spices 1504.77 Eggs, milk, meat and fish 3059.2
32
2020 NATIONAL AGRICULTURE SYMPOSIUM
DEPLOYMENT AND IMPORTANCE OF GENETIC RESOURCES IN FOOD SECURITY AND AGRICUL-TURE- FUTURE PERSPECTIVE TO CLIMATE SMART AGRICULTURE IN PACIFIC ISLAND COUNTRIES
Pramod N. Nair1 and Chien-Chih ChenDepartment of Forestry, College of Agriculture Fisheries and Forestry, Fiji National University, P.O. Box 1544, Nausori, Fiji.
Corresponding author: Pramod N. Nair, [email protected]
ABSTRACTThe genetic resources play a crucial role in food and nutrition security, and livelihoods of the agriculture sector. In the current situation worldwide, rapidly changing climate poses new threats to the conservation of the existing ge-netic diversity. Loss of genetic diversity equals to loss of valuable gene pool with climate change as the major driver. Modern agriculture and genetic resources are critically interdependent because agricultural commodities are derived and improved from genetic resources around the world. The increasing agriculture production depends on continuing infusions of genetic resources for yield stability and growth. Any plant material can be utilized for developing improved crop varieties for high yield, superior quality and better adaptation to constant changes of environmental conditions. Crop Genetic Resources (CGR) are valuable for current and future crop improvement programmes. It is to be noted that the existing genetic diversity in plants or crops, that plants adapt and survive when their environments changed. Changing Climate poses new challenges to sustainable management of the genetic resources for food and agriculture, but it also underlines their importance in Pacific island countries and territories. Therefore, conservation of existing genetic resources is important to support food and nutrition security in a growing human population and for develop-ment of adaptation in changing climate, as well as for the genetic improvement programmes.
Keywords: Climate change, genetic resources, germplasm, crop improvement, breeding programme
INTRODUCTIONThe genetic resources in food and agriculture are referred as the genetic materials which the world relies to improve the yield and quality not only in agriculture crops, but also in livestock, forestry and fisheries. The genetic resources play a crucial role in food and nutrition security, and it is also useful to maintain healthy populations of crop species. These genetic resources are the key components of sustainability, resilience and adaptability in the agricultural production schemes, and are able to contribute significantly to the scientific efforts to cope with climate change. The changing climate and its severity have now become a tremendous challenge for present and future generations to deal with environmental adaptation in crop species and to enhance food production. The knowledge gained about the impact of climate change on agriculture over the past 20 years are showing that climate change will fundamentally alter global food production patterns (FAO 2015). Like viruses, a small biological infectious agent which are found in almost every ecosystem on earth and causes threat to every living cells, the climate change is an utmost issue on earth which need to be focused for sustainable development of agriculture sector (Bansode et al. 2015; Elbehri et al. 2011). The speed of climate change exceeds our ability to identify, select and reproduce the resilient varieties in agriculture field, especially in the Pacific (Elbehri et al. 2015).
In general, lack of attention had been given to genetic resources in the climate change dome due to lack of awareness. Embark upon the climate change is vital factor in genetic uniformity and genetic erosion are important arguments that underline the need for achieving a sustainable future for the food security, for that the preservation of genetic resources must lie at the core (Hufler and Lefeber 2011). Growing interdependence and climate change as a serious factor globally, research states that there is a hike in agriculture crop production in some regions of the world, but cannot neglect the influence of climate change on global food security (Lipper and Cooper 2009). Although the agricultural sector has a clear understanding to maintain the genetic diversity and its sustainable management, there is an urgent need for greater awareness in Pacific island countries about the roles and values of genetic resources among those engaged in climate change discussions. It is required to enhance the regional and national knowledge base on the climate change issues, potentials, opportunities and constraints relating to crop diversification, covering existing crop and tree genetic resources and resistant/tolerant traits of crops and trees to be identified in Pacific island countries (FAO 2008). The existing civilizations are totally dependent on plants for their livelihood, then genetic resources are valuable for present and future crop improvement programmes. Numbers of the world’s ecosystems have been affected by climate change, where it affects plant biodiversity, pollination in plants, soil biodiversity, microbial biodiversity and other animal diversities. The above valuable gene pools are being lost day-by-day due to various threats and one
33
2020 NATIONAL AGRICULTURE SYMPOSIUM
among of these is climate change, which have a profound impact on losing the genetic resources. Unfortunately, few studies provide detailed analyses of the impacts of climate change on the loss of gene pools. The impacts of climate change and increased carbon dioxide concentrations on plant growth, productivity and the nutrient value of crops commonly grown in Vanuatu is not well understood (FAO 2008) while the other Pacific island countries should also be studied about those impacts in details. These findings could provide us guidelines and perhaps promote awareness in conservation of genetic resources; however, each area and country will have its unique circumstances. Climate affects almost all aspects of life in the Solomon Islands, and due to climate change, a severe damage to agriculture sector had been reported (IPCC 2011).
The Ministry of Agriculture and local farmers have expressed significant interest in improving their understanding of the future climate change and its impacts on farming, as there is limited information currently available in the Solomon Islands (Australian Bureau of Meteorology and CSIRO 2011). Papua New Guinea has a strong effect due to changes in the climate and has undertaken projects for the collection of germplasm in traditional crops and established ex situ gene banks at research stations, even though due to several constraints, they are unable to protect the genetic resources (Ayalew and Kambuou 2008). The Pacific Community’s (SPC) Centre for Pacific Crops and Trees uses in vitro technology to conserve germplasm collections of some of the region’s important staple crops, and such as taro, yam, cassava, banana, vanilla and sweet potato comprising of germplasm from the Pacific and Southeast Asia (SPC 2013). Other than the above studies and collection, based on the massive and adorable vegetation, a systematic and scientific approach will be urgently needed to meet the challenges of climate change and then to protect our genetic resources in Pacific island countries. Funding and collaboration for multidisciplinary researches to be done in Pacific island countries could provide better insights and recommendations for the conservation of genetic resources and to meet the challenges of climate change.
CROP GENETIC RESOURCESBiological resources include the genetic resources of those wild ancestors and closed relatives used to produce agricultural crops. Brockhaus and Oetmann (1996) defined the plant genetic resources (PGR) as the reproductive or vegetative propagating materials of any plant or agriculture varieties (crops) in current use. They also incorporated the newly developed varieties (by breeding), obsolete cultivars, primitive cultivars (landraces), wild and weed varieties, near relatives of cultivated varieties and special genetic stocks such as elite and current breeder’s lines and mutants. In common, agricultural and biological resources includes both crop and livestock genetic resources. Crop genetic resources (CGR) are used by breeders to develop new and improved varieties for farmers, and thereby enhancing substantial economic benefits.
Many reasons could cause a loss of CGR. Industrialization and habitat degradation can destroy the homes of wild species if the resources are not being protected. Another concern would be the consumer preferences. Consumers nowadays would prefer certain varieties. With the addition of various types of resistances, seed companies have been developing improved varieties based on consumer preferences, or even based on their technological and developmental trends. Instead of planting the old landraces with lower production and quality, growers start to abandon the old practices and adopt the new high yield and consumer preferable lines. As a result, these important CGR can gradually disappear if the resources are not being protected. For breeding perspectives, wild species, ancestors, close relatives and special landraces represent as a hidden treasure box containing multi-facet tools in combat with production, pests, diseases and even climate challenges. Once CGR disappeared, the tools neither can be replaced nor be applied in developing new and improved varieties.
A strong CGR base is important for any developing country due to two important reasons, (i) lack of genetic diversity in local fields, and (ii) increase in risk of pest or disease epidemics. Many developing countries are used to consider production more than conservation. Most of the locally adopted species usually do not have a relevant breeding programme for sustainable development. CGR are always important requirement for the continuing process of crop improvement through breeding. CGR in agriculture sector have a prime importance not only in poverty reduction and global food security but also in environmental protection and sustainable development. The Cook Islands, Samoa and Kiribati have limited crop diversity and could be adapted for local needs. Samoa has demonstrated the importance of breeding, having now bred taro varieties, resistant to taro leaf blight (TLB), but still need more awareness on importance of plant genetic resources to public (FAO 2010). Food and Agriculture Organization of the United Nations (FAO) (2010) also reported that existing animal and plant genetic resources are threatened due to sea-level rise, seawater intrusion, drought, and competition for access to land due to population growth and urban drift. In the same report, it is also mentioned that more effort is required at the policy level, and very few countries have any policy, which relates to genetic resources conservation and use. A hypothetical scenario would be if a plant found in any Pacific island countries is known to have healing properties based on the existing traditional knowledge, a research company from overseas analyzes the plant compounds and uses certain compounds for a medicine production and marketing for sale. Then,
34
2020 NATIONAL AGRICULTURE SYMPOSIUM
the existing protocol may not ensure such lawful dividends from the sale of this medicine coming to the actual owners of this plant and its knowledge in Pacific island countries. Collection, preservation, promotion and utilization of existing traditional knowledge of those crop species which have a commercial, medicinal, social and cultural importance, and the potential to provide much enhanced values to be further developed (SPREP 2007). Therefore, the conservation of CGR is important in agricultural production.
LATENT IMPACT OF CLIMATE CHANGE ON CGRThe climate change and its impacts on crop production are already being felt worldwide. The researches have clearly shown that the negative impacts dominate over the positive ones for agriculture, and adaptation is urgently needed (IPCC 2014); especially in Pacific island countries. For revealing the consequences about the conservation and utilization of CGR, it is necessary to understand how climate change is affecting those resources, then in what ways the issues can be resolved and interpreted, and toward identification of a solution for the future. A summary by the Intergovernmental Panel on Climate Change (IPCC) has provided evidences of observed increase in temperature across the globe, and they found it is greater at higher northern latitudes (IPCC 2007b). Furthermore, it is expressed in the instrumental record that for the past three decades, Earth’s surface had become even much warmer than all the previous decades’ (IPCC 2013). In fact, according to National Aeronautics and Space Administration (NASA), global surface average temperature has increased 0.98°C in 2019 compared to 1951-1980 average temperature (NASA 2020).
The introduction of modern hybrid and genetically modified crop varieties has led to the erosion of natural genetic diversity and almost 75% of the genetic diversity of agricultural crops has been lost (FAO 2015). Climate change is an additional threat to agricultural biodiversity, because it leads to the increase in genetic erosion of landraces and crop wild relatives (Jarvis et al. 2008). Current varieties will be lost as farmers replace them with other improved varieties that are healthier and able to adapt the new climate conditions. Weltzien et al. (2006) mentioned in a research study about the Guinea sorghum varieties southern Mali that the range of local varieties grown by families and villages is replaced with modern varieties due to shortened rainy season over the last 20 years as a part of climate change.
Therefore, all countries across the globe that rely on crop genetic diversity has to provide potential consideration to environmental and climatic changes, to maintain agricultural production systems (FAO 2015). Climate change may also increase the importance of otherwise minor or underutilized crops and plant species. Landraces themselves contain the solution to many of the problems of climate change. They contain a wide range of traits for adaptation to abiotic and biotic stresses that may contribute to the adaptation of global agriculture to climate change. The major issues to be identified and solved such as: i) increased need for crop wild relatives, ii) novel and increased demands on germplasm in gene banks for adapting agriculture to climate change, iii) review of breeding strategies in each country for each crop to release improved varieties, and iv) review and strengthen policies for promoting seed and seed exchange between the farmers and its availability (FAO 2003). Folland et al. (2018) reconstructed a time series of monthly global mean surface temperature from 1891 till date. Based on their analyses, two historically strong warming periods (1911-1940 and 1976-1997) were found, and increasing greenhouse gases and anthropogenic aerosols were the two main reasons that can be attributed to the causes of most warming incidences found from 1891. The speed and complexity of the ongoing climate change worldwide, makes adaptation for agriculture crops more challenging when compare to earlier stages of climate change (Ramirez-Villegas et al. 2013). Some research studies have indicated that high-elevation CGR are more vulnerable than lower elevation crops to the effects of climate change (Mercer and Perales 2010).
Three factors are majorly relevant for crops to fight against the changed climate and these are plasticity, evolution and gene flow. From this plasticity, it allows the plants to endure extreme climate conditions without considering changes in genotypic characters. Climate change can cause alterations in the physical form of plants and affects its survival ability. In plant breeding practices, artificial crossing is introducing a higher pace of gene flow and speeding up the natural process of evolution. Through careful selection, one would be able to reveal plasticity and identify traits and phenotypes of particular interests. Plant breeding can be an applicable tool to overcome the consequences brought by climate change and increase phenotypic plasticity (Haussmann et al. 2012). Climate change is not only expected to bring directional changes (e.g. higher average temperatures at a given location in the future), but also to increase the variability of the climate. Farmers usually address directional changes either by drawing on adapted material from among the genetic resources already present locally or by seeking material from neighboring areas. However, as the cli-mate becomes more variable, and extreme events become more extreme, new strategies may be needed. Greater intra varietal diversity may be needed in order to cope with unpredictable extreme climate events. Traits that contribute to phenotypic plasticity (the capacity to cope with a wide range of environmental conditions) may become increasingly important. Climate change may increase the importance of plant species that have previously been underutilized or considered to be of minor importance (Jarvis et al. 2008).Microevolution or short term changes may provide leverage for crops to survive climate change through selection.
35
2020 NATIONAL AGRICULTURE SYMPOSIUM
There might be correlations between the traits needed that serve as constraints to their simultaneous development (Jump and Penuelas 2005). Variation as well as evolution in traits according to change in climate constitutes can be an advantage for crops because that evolution in traits may help the crop to adapt to rapid influences brought by climate change. Higher the evolution, higher the proportion of crops that are adapted to the changed environment. Evolutionary adaptation actually has the potential to reduce future adverse consequences brought to the plants (Jump et al. 2008). The gene flow is taking place through pollen or seed movement, thereby new and potentially adaptive genetic variation can be delivered into a population. This is the natural way for spreading the adaptive capacity, but these may be affected due the climate change by increase in temperature. The pollen-mediated gene flow depends on overlapping flowering times, but due to increase in temperature, original pollen production or transfer patterns may be affected and resulted in altered gene flow patterns (Mercer and Perales 2010). Landraces, which often contain considerable phenotypic variability, still dominate agriculture in many areas especially against the effects of climate change, and possess all the above mentioned factors. The landraces tend to be more diverse than genetically improved varieties, but it is still not able to meet several climatic variations. Single landrace never fulfils farmer’s utility criteria will usually be replaced by another, either it may be a new landrace or else it may be an improved variety.
As a result of climate change, the CGR require a greater need for conservation and maintenance. This may lead to sustain the crop genetic diversity as well as food security. Adaptation will depend not only on conservation, including further collecting and characterization efforts, but also on broad utilization and exchange of CGR. There are many un-derutilized species which are not only the great contributors to agricultural adaptation but also have high food security potential (Sthapit et al. 2009; Padulosi et al. 2011). According to the changes in climate conditions, some crops adapt to the particular area and its grains become an integral part of the food system (Lane and Jarvis 2007a; Lane and Jarvis 2007b). The extreme changes in temperature and weather patterns are affecting CGR and crop genetic diversity, where the scenario will continuously create new chapters and episodes (Turner and Meyer 2011).
Therefore, it is necessary to ensure that human interventions such as ex situ and in situ conservation efforts will be taken to maintain crop genetic diversity, including potentially climate relevant traits, landraces and other locally adapt-ed varieties. Climate drivers of significance over the industrial era include both those associated with anthropogenic activity and, to a lesser extent, those of natural origin. The only significant natural climate drivers in the industrial era are changes in solar irradiance, volcanic eruptions, and the El Niño–Southern Oscillation. Changes in solar irradiance directly impact the climate system because the irradiance is Earth’s primary energy source. Most volcanic eruptions are minor events with the effects of emissions confined to the troposphere and only lasting for weeks to months. Cloud feedbacks also influence natural variability within the climate system and may amplify atmospheric circulation patterns and the El Niño–Southern Oscillation (Fahey et al. 2017). Another climate change parameter is changes in precipitation patterns and it affects and increase the frequency of drought events (IPCC 2007a). The IPCC issued a global climate assessment in 2013 clearly mentioned that major reason for climate change is accumulation of carbon dioxide in the atmosphere and that influence the existing food and agriculture systems (IPCC 2007a).
BRIDGING THE TECHNOLOGY GAP/SUSTAINABLE MANAGEMENT STEPS TO PROTECT THE GENETIC RESOURCESThe PGR are the most valuable source of plant genetic diversity, and are considered as essential materials for the crop improvement programmes, for developing crops to mitigate the far run climate change challenges. The plants are unique of their individual genotypes which may not be useful currently, but they may become useful in the future due to climate change (Campbell et al. 2009). Due to the concealed responses of previous underutilized plants against climate change, they may be far better than the useful plants that we considered, and they may become essential for crop improvement in meeting climate challenges. If a particular genotype is lost, then it is difficult to rebuild the same genetic combinations. Subsequently, it should be the primary goal for any scientific community to collect and conserve this diversity in a systematic manner, and then undertake a sustainable management, which including procedures to protect the PGR.
The scientific community need to establish initiatives in order to support farmers in mitigating agricultural adversity in climate change epoch. One of the approaches can be the development of crop varieties with better traits. Such new genetic traits in crops need to be focused mainly on biotic and abiotic stress that are expected to combat with the consequences brought by climate change. Traits to boost crop adaptation may be found in genetic resources such as landraces or wild relatives of domestic crops; therefore, there is an urgency to conserve these genetic resources before it is too late. In light of their likely social and economic benefits, such resources have probably been underused and required further investigation in the developing nations of Pacific island countries.
36
2020 NATIONAL AGRICULTURE SYMPOSIUM
LOCAL CROP VARIETIES SHOULD BE GENETICALLY ANALYZEDHistorically, anthropogenic factor determines crop utilization in many areas. This is particularly true in Pacific island countries, which had undergone different colonization eras. Various types of exotic species had been brought in for production, where adaptation and variation could exist through years of cultivation. If the pedigree record of a crop is well kept, then breeding efforts can follow its trace in attempts to bring improvement. If the pedigree record of a crop is partial or even unknown, this would make breeding efforts very difficult. In order to solve the puzzle and provide better understanding, molecular tool sets may offer insights for breeding purposes.
Natural plant populations routinely and consistently show small-scale genetic differentiation (more than 100 species demonstrated) although important exceptions are known (Linhart and Grant 1996). Most molecular variation observed is presumed to be neutral or nearly neutral characters. Regardless of that, a minority of evolutionary biologists argues that genetic differentiation has been typically produced by natural selection in response to environmental heterogeneity. It has been shown that beneficial mutations are more common than assumed and methods have been developed to screen them (Schlotterer 2002). Neutral theory of molecular evolution predicts that the majority of evolutionary changes and variability within species are caused by random genetic drift of alleles, which are selectively neutral. Selection may operate but the intensity is weak when compared to neutral processes (Graur and Li 2000). Most molecular markers are presumed to be neutral and these can be used to analyze problems in evolution. Molecular markers possess many advantages, which make them superior to morphological markers. Molecular markers offer a great scope for improving the efficiency of conventional plant breeding by carrying out selection not directly on the trait of interest but on molecular markers linked to that trait (Buu and Lang 2003).
Furthermore, these markers are used in mapping of specific genes, cultivar identification and biodiversity studies (Rana and Bhat 2004). Molecular markers are not environmentally influenced and are detected in all plant growth stages (Rungis et al. 2000). DNA based markers are considered as the most suitable markers for genetic distance estimates because of potentially large number of polymorphisms. There are various types of DNA markers presently available to evaluate polymorphism in sample genomes.
The genetic resources could be collected through geographic information systems for predicting adaptation based on spatial information, then evaluated and characterized by molecular marker analyses. It may be helpful to increase the efficiency in incorporating valuable genetic traits into commercial crop varieties, based on spatial specificities. In this development of modern molecular tools, the researchers may be able to reduce the time spent and cost in collection and analysis of genetic resources. Such development can also assist in conservation of PGR and thus increase their use for climate change adaptation.
COLLECTION OF WILD SPECIES, EX SITU CONSERVATION OF GERMPLASMThe goal of ex situ conservation as stated by Marshall and Brown (1975) is to conserve, “95% of existing genes” or gene pools in local. For the above, a first requirement is to classify and identify the prioritized species and regions already affected or will be affected by climate change. Many earlier studies suggested that wild species are mostly exposed to climate change, and in addition to the wild species of currently utilized crops, crop relatives or cultivated crops, biological control species and underutilized species such as tree species should be considered at a high priority. Collections of crop wild relatives and all taxonomic species of relevance will be needed for future crop improvement. In some cases, fairly distant wild relatives will be needed. Collections are also needed to cover the full geographic distribution of the species, and especially populations on the extremes of the distribution where novel traits of interests in combating climate change may be found.
The subsistence and salable agriculture on small islands would be adversely affected by climate change significantly. It should be seriously considered, and the precautionary steps should be taken to prevent the heavy lose and damage in the near future (Smith et al. 2003). With the increase of adverse effects in climate change, many studies also suggested the evidences of increased introductions and enhanced colonization of alien species in island ecosystems, therefore its impacts are also increasing simultaneously (Frenot et al. 2005). Climate change threatens the wild relatives of cultivated crops and potential landraces, while exotic and invasive species conquer their original habitats, thereby these strengthen the needs for conservation of diverse germplasms to bolster crop resistance and enhancement of abiotic and biotic stresses. These factors represent both a challenge for gene banks to ensure that important gene pools are adequately conserved and an opportunity for stimulating greater use of germplasm holdings. Efforts to conserve crop diversity by the scientific community can lead to the collection and conservation of seeds in ex situ gene banks, which all Pacific island countries can be benefitted from.
GENE BANK COLLECTION, IN SITU CONSERVATION OF GERMPLASMThe climate change knowingly looms the diversity in crops as previously mentioned in their wild relatives. A significant portion of the crop diversity is already conserved in gene banks across several areas of the world, but more will be
37
2020 NATIONAL AGRICULTURE SYMPOSIUM
needed for future safety. When considering the in situ conservation strategies, the limitations of certain crop varieties for adaptation and acclimatization are quite unknown, due to the uncertainty in intensity of climate change. Improved monitoring will help Pacific island countries to pinpoint sites or species most in need of attention, then coordinated researches are required to make it clear about what levels of in situ conservation required in Pacific island countries.
The in situ conservation refers to the persistence of genetic resources in their natural habitats. It should start with farmers maintaining genetic diversity on daily basis in their farms. This can also be visible in regions where farmers maintain local crops, their landraces, or their high yielding modern varieties. In situ conservation programmes majorly designed to influence farmers in the direction of maintaining local crops. This type of conservation may come across with continual social, technological, and biological change. When preserving these evolved crop varieties, it should be based on genetic diversity, farmers’ knowledge and selection, and exchange of crop varieties. Therefore, in situ conservation practices and projects are concerned with the wide spectrum of genetic resources related to crops such as wild and weedy relatives of crops.
One reason for our focus on diversity within cultivated crops is that science of in situ conservation of cultivated resources is relatively less developed than the science of conserving wild resources such as wild and weedy crop relatives. Another reason is that in situ conservation of cultivated plants requires novel approaches, while in situ conservation of wild crop relatives can draw on theories and methods developed for conserving many different species in their natural habitats. Finally, focusing on variation within cultivated species is warranted by the fact that this type of diversity is arguably the most important one for the future viability of agricultural evolution, as it has been in the past.
BREEDING STRATEGIES FOR CROP IMPROVEMENT TO ADAPT TO CLIMATE CHANGEThe climate change is considered as one among the major causative of abiotic stress for agricultural crops. The changes in temperature and rainfall patterns have a direct impact on the cultivation of agricultural crops. In future, it is very much important for Pacific island countries to carry out and invest major researches for developing crop varieties that are more resilient to climate change, and then the focus can be directed toward genome based breeding, i.e. genetic engineering and marker-assisted selection methods to assist conventional breeding. Genetics and genomic based researches may focus more on the understanding of genetic mechanisms and for strengthening stress tolerance in crops, especially against drought, salinity and temperature stress to agriculture crops.
The frequent changes in the climate over a long period may leads to several new problems such as development of new insect pests, new diseases, and new weeds. Life cycles of many wild plants and agriculture crops may be affected severely as in successful pollination and yield due to the increase in temperature, intensity of drought, and changes in rainfall pattern. Water scarcity and drought may affect severely to agriculture crops especially in seasonal crops. The genetic changes may occur in the agriculture crops due to change in the intensity of sunlight and total day length i.e. photoperiod. Thus, it is important to study the change in adaptation of crops in the areas of climate change, as well as making suitable adjustments in crop improvement and cropping pattern in the region. Although developing stress tolerance can have a high priority, to understand the interactions between plant and newly evolved stress elements can provide breeding guidelines for better crop improvement.
The germplasm collections are the important potential sources, which can be utilized for developing suitable crop cultivars for areas of climate change. By using appropriate genetics and genomic based breeding techniques, it is able to develop new resistant cultivar and solve the specific problems in the region. If the resistant traits are not able to borrow from existing germplasms or incompatibility exits, genetic engineering could assist in introduction of the resistant traits from suitable donors. Evidences from various commercial crop varieties have been shown to carry multiple traits of resistance against pests and herbicide application or with additive nutritional values in crop species. Another approach (mutation breeding) is to induce mutations for developing resistant cultivars suitable for climate change. Such approach mimics natural selection process but with a much higher speed in finding out the stress tolerant traits. Numerous early studies demonstrated successful usage of induced mutation technique for developing crop varieties resistant to diseases and insect pests.
While doing the breeding researches, Pacific island countries should give importance to develop crop cultivars with multiple-resistance in adversities, such as resistance to insects, diseases and drought. It is to be noted that plenty plants in nature and several agriculture crops are resistant to multiple diseases. In addition, some components of plant defense are relatively nonspecific, therefore with modern breeding technologies we can now produce multiple resistance crop varieties which may withstand the climate change effects. From a grower’s perspective, growing one crop equipped with multiple weaponries would save the production costs and deliver the most benefits to them. On the other hand, farmer’s participation in breeding development can be important as well since previous mentioned interactions between crops and stress agents are best known at the production sites. Trails and demonstration sites
38
2020 NATIONAL AGRICULTURE SYMPOSIUM
should also be developed along development timelines in a breeding programme. Research and education can work side-by-side to improve livelihoods which may suffer from the consequences in climate change. In this development, the capacity in research and resilience can be gradually built up in Pacific island countries.
CONCLUSIONGermplasm is considered as a basic tool to crop improvement or breeding programmes for sustainable agriculture. The trait-specific genetic or genomic modification or naturally diverse plants are considered as primary need of the plant breeding programme in a country. As an island country which have adverse effects from climate change, it is to be primarily focus its research on collections, conservation and identification of new elite germplasm in and around the islands, which can ultimately use in breeding programmes of country to produce locally adopted and genetically superior cultivars with a capability to survive against the climate change threats. The crop genetic conservation programmes should be based on the importance of climate change and its threats to food and nutrition. Land races and local varieties should be given a high priority for genetic conservation. Maintaining the existing genetic diversity by in situ and ex situ reserves should give much importance in developing crops with more adaptation to new changed environments. These reserves should be actively managed to increase the resistance of crops to biotic and abiotic stress. The threats to CGR due to climate change should be given the first priority and then take precautions for the maintenance and utilization of these resources. Germplasm or genetic resources to be kept as a prominent agenda of all Pacific island countries.
REFERENCESAustralian Bureau of Meteorology and CSIRO. (2011). Climate Change in the Pacific: Scientific Assessment and New
Research. Volume 1: Regional Overview. Volume 2: Country Reports.
Ayalew, W. and Kambuou, R. (2008). Status and Management of plant and animal genetic resources in Papua New Guinea Capacity building for risk management systems on genetic resources. APEC- ATCWG Workshop: 159-172
Bansode, R., Kumar, S., Mol, S.A., Malav, L., Malav, M.K. and Kharia, K.S. (2015). Impact of Climate Change on Plant Genetic Resources. International journal of extensive research. 3:6-9.
Brockhaus, R., and Oetmann, A. (1996). Aspects of the documentation of in situ conservation measures of genetic re-sources. Plant Genetic Resources Newsletter 108, 1-16.
Buu, B.C. and Lang, N.T. (2003). Application of molecular markers in rice breeding in the Mekong Delta 216 of Vietnam. In ‘Advances in rice genetics’ (Eds G.S. Khush, D.S. Brar, and B. Hardy), pp. 216-220. International Rice Research Institute, Los Baños, Philippines.
Campbell, A., Kapos, V., Scharlemann, J. P.W., Bubb, P., Chenery, A., Coad, L., Dickson, B., Doswald, N., Khan, M. S. I., Kershaw, F. and Rashid, M. (2009). Review of the literature on the links between biodiversity and climate change: impacts, adaptation and mitigation. Secretariat of the Convention on Biological Diversity, Montreal. Technical Series No. 42.
Elbehri, A., Genest, A., and Burfishe, M. (2011). Global action on climate change in agriculture: linkages to food secu-rity, markets and trade policies in developing countries. Food and Agriculture Organization of the United Nations, Rome.
Elbehri, A., Elliott, J. and Wheeler, T. (2015). “Climate Change, Food Security and Trade: An Overview of Global Assess-ments and Policy Insights.” In Climate Change and Food Systems: Global Assessments and Implications for Food Security and Trade. Rome: Food and Agriculture Organization of the United Nations.
Fahey, D.W., Doherty, S.J., Hibbard, K.A., Romanou, A. and Taylor, P.C. (2017). Physical drivers of climate change. In: Climate Science Special Report: Fourth National Climate Assessment, Volume I (Eds D.J. Wuebbles, D.W. Fahey, K.A. Hibbard, D.J. Dokken, B.C. Stewart and T.K. Maycock), U.S. Global Change Research Program, Washington, DC, USA, pp. 73-113, doi: 10.7930/J0513WCR.
FAO. (2003). Climate Change and its Effect on Conservation and Use of Plant Genetic Resources for Food and Agricul-ture and Associated Biodiversity for Food Security. Food and Agriculture Organization of the United Nations
FAO. (2008). Climate change and Food security in Pacific island countries. Food and Agriculture Organization of the United Nations
FAO. (2010). Country report on the state of plant genetic resources for food and agriculture; the status of plant genetic resources; country report- Samoa http://www.fao.org/3/i1500e/Samoa.pdf
39
2020 NATIONAL AGRICULTURE SYMPOSIUM
FAO. (2015). Climate change and food systems: global assessments and implications for food security and trade. Food Agriculture Organization of the United Nations (FAO)
Folland, C.K., Boucher, O., Colman, A., and Parker, D.E. (2018). Causes of irregularities in trends of global mean surface temperature since the late 19th century. Science Advances 4(6), eaao5297.
Frenot, Y., Chown, S.L., Whinam, J., Selkirk, P.M., Convey, P., Skotnicki, M., and Bergstrom, D.M. (2005). Biological inva-sions in the Antarctic: extent, impacts and implications. Biological Reviews 80, 45-72.
Graur, D. and Li, W.-H. (2000). ‘Fundamentals of Molecular Evolution’. Sinauer Associates, Inc, USA.
Haussmann, B.I.G., Fred Rattunde, H., Weltzien-Rattunde, E., Traore, P.S.C., vom Brocke, K., and Parzies, H.K. (2012). Breeding strategies for adaptation of pearl millet and sorghum to climate variability and change in West Africa. Journal of Agronomy and Crop Science 198, 327-339.
Hufler, C. and Lefeber, R. (2011). Our Heritage is Our Future-Humankind’s Responsibility for Food Security: Book Chap-ter 18; Plant Genetic Resources and Food Security; Stakeholder Perspectives on the International Treaty on Plant Genetic Resources for Food and Agriculture (Edited by Frison, C., Lopez, F. and Esquinas-Alcazar J.T.) The Food and Agriculture Organization of the United Nations and Bioversity International with Earthscan.
IPCC (Intergovernmental Panel on Climate Change). (2007a). Climate change: The physical science basis. Contribution of Working Group I to the Fourth Assessment Report of the Intergovernmental Panel on Climate Change. Cam-bridge.
IPCC (Intergovernmental Panel on Climate Change). (2007b). Climate change 2007: synthesis report. Contribution of working groups I, II and III to the fourth assessment report of the Intergovernmental Panel on Climate Change. (Eds R.K. Pachauri and A. Reisinger), Intergovernmental Panel on Climate Change, Geneva.
IPCC (Intergovernmental Panel on Climate Change). (2013). Climate change 2013: the physical science basis. Contribu-tion of working group 1 to the fifth assessment report of the Intergovernmental Panel on Climate Change. (Eds T.F Stocker et al.), Cambridge University Press, Cambridge.
IPCC (Intergovernmental Panel on Climate Change). (2014). Food security and food production systems. In ‘Climate change 2014: impacts, adaptation and vulnerability. IPCC working group II contribution to AR5. Accepted final draft released online in unedited form. (Retrieved on March 31, 2014; http://ipcc-wg2.gov/AR5/images/uploads/WGIIAR5-Chap7_ FGDall.pdf).
Jarvis, A., Lane, A. and Hijmans, R. (2008). The effect of climate change on crop wild relatives. Agriculture, Ecosystems and Environment, 126: 13–23.
Jump, A.S. and Penuelas, J. (2005). Running to stand still: adaptation and the response of plants to rapid climate change. Ecology Letters 8, 1010-1020.
Jump, A.S., Marchant, R., and Pen˜uelas, J. (2008). Environmental change and the option value of genetic diversity. Trends in Plant Science 14, 51-58.
Lane, A. and Jarvis, A. (2007a). Changes in climate will modify the geography of crop suitability: agricultural biodiversity can help with adaptation. Paper presented at ICRISAT/CGIAR 35th Anniversary Symposium, Climate-Proofing In-novation for Poverty Reduction and Food Security, 22–24 November 2007, ICRISAT, Patancheru, India (available at http://www.icrisat.org/Journal/SpecialProject/ sp2.pdf).
Lane, A. and Jarvis, A. (2007b). Changes in climate will modify the geography of crop suitability: agricultural biodiversity can help with adaptation. SAT eJournal 4(1), 1-12.
Linhart, Y.B. and Grant, M.C. (1996). Evolutionary significance of local genetic differentiation in plants. Annual Review of Ecology and Systematics 27, 237-277.
Lipper, L. and Cooper, D. (2009). Managing plant genetic resources for sustainable use in food and agriculture: balanc-ing the benefits in the field. In ‘Agrobiodiversity, conservation and economic development’ (Eds A. Kontoleon, U. Pascual, and M. Smale). pp. 27-39. Routledge, New York.
Marshall, D.R. and Brown, A.H.D. (1975). Optimum sampling strategies in genetic conservation. In ‘Crop genetic re-sources for today and tomorrow’ (Eds O.H. Frankel and J.G. Hawkes). pp. 53-80. Cambridge University Press, Cambridge.
Mercer, K.L. and Perales, H.R. (2010). Evolutionary response of landraces to climate change in centers of crop diversity. Evolutionary Applications 3, 480-493.
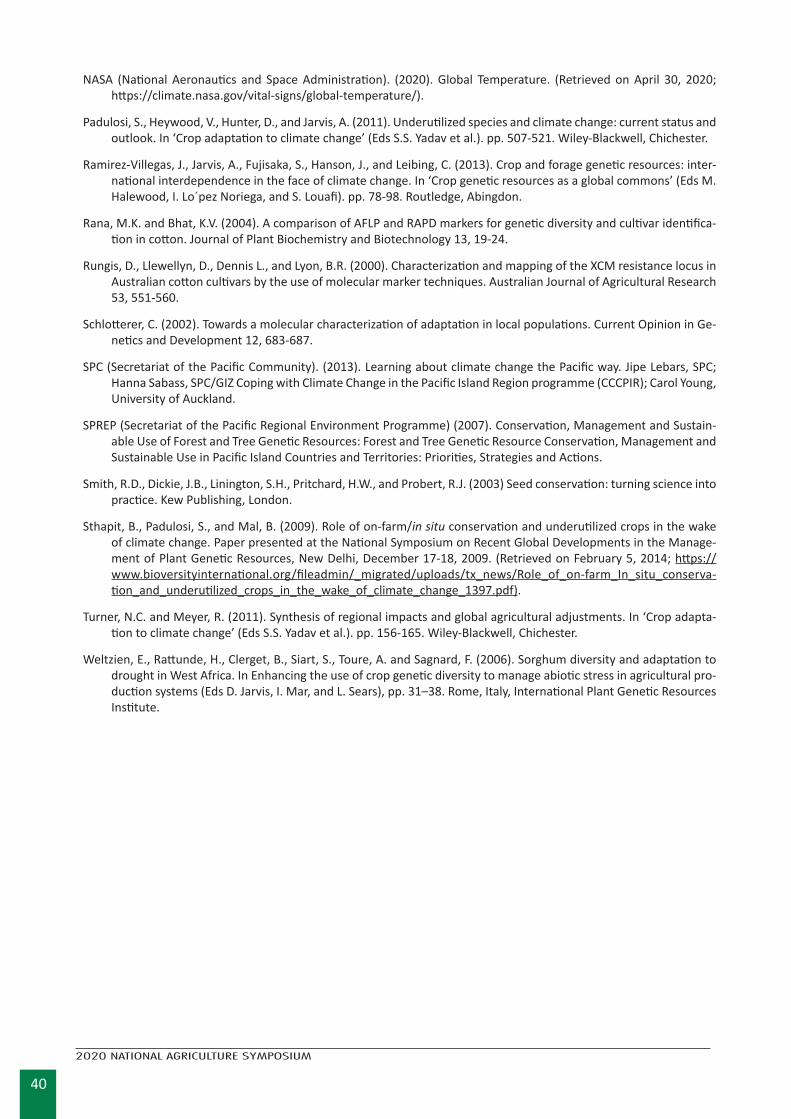
40
2020 NATIONAL AGRICULTURE SYMPOSIUM
NASA (National Aeronautics and Space Administration). (2020). Global Temperature. (Retrieved on April 30, 2020; https://climate.nasa.gov/vital-signs/global-temperature/).
Padulosi, S., Heywood, V., Hunter, D., and Jarvis, A. (2011). Underutilized species and climate change: current status and outlook. In ‘Crop adaptation to climate change’ (Eds S.S. Yadav et al.). pp. 507-521. Wiley-Blackwell, Chichester.
Ramirez-Villegas, J., Jarvis, A., Fujisaka, S., Hanson, J., and Leibing, C. (2013). Crop and forage genetic resources: inter-national interdependence in the face of climate change. In ‘Crop genetic resources as a global commons’ (Eds M. Halewood, I. Lo´pez Noriega, and S. Louafi). pp. 78-98. Routledge, Abingdon.
Rana, M.K. and Bhat, K.V. (2004). A comparison of AFLP and RAPD markers for genetic diversity and cultivar identifica-tion in cotton. Journal of Plant Biochemistry and Biotechnology 13, 19-24.
Rungis, D., Llewellyn, D., Dennis L., and Lyon, B.R. (2000). Characterization and mapping of the XCM resistance locus in Australian cotton cultivars by the use of molecular marker techniques. Australian Journal of Agricultural Research 53, 551-560.
Schlotterer, C. (2002). Towards a molecular characterization of adaptation in local populations. Current Opinion in Ge-netics and Development 12, 683-687.
SPC (Secretariat of the Pacific Community). (2013). Learning about climate change the Pacific way. Jipe Lebars, SPC; Hanna Sabass, SPC/GIZ Coping with Climate Change in the Pacific Island Region programme (CCCPIR); Carol Young, University of Auckland.
SPREP (Secretariat of the Pacific Regional Environment Programme) (2007). Conservation, Management and Sustain-able Use of Forest and Tree Genetic Resources: Forest and Tree Genetic Resource Conservation, Management and Sustainable Use in Pacific Island Countries and Territories: Priorities, Strategies and Actions.
Smith, R.D., Dickie, J.B., Linington, S.H., Pritchard, H.W., and Probert, R.J. (2003) Seed conservation: turning science into practice. Kew Publishing, London.
Sthapit, B., Padulosi, S., and Mal, B. (2009). Role of on-farm/in situ conservation and underutilized crops in the wake of climate change. Paper presented at the National Symposium on Recent Global Developments in the Manage-ment of Plant Genetic Resources, New Delhi, December 17-18, 2009. (Retrieved on February 5, 2014; https://www.bioversityinternational.org/fileadmin/_migrated/uploads/tx_news/Role_of_on-farm_In_situ_conserva-tion_and_underutilized_crops_in_the_wake_of_climate_change_1397.pdf).
Turner, N.C. and Meyer, R. (2011). Synthesis of regional impacts and global agricultural adjustments. In ‘Crop adapta-tion to climate change’ (Eds S.S. Yadav et al.). pp. 156-165. Wiley-Blackwell, Chichester.
Weltzien, E., Rattunde, H., Clerget, B., Siart, S., Toure, A. and Sagnard, F. (2006). Sorghum diversity and adaptation to drought in West Africa. In Enhancing the use of crop genetic diversity to manage abiotic stress in agricultural pro-duction systems (Eds D. Jarvis, I. Mar, and L. Sears), pp. 31–38. Rome, Italy, International Plant Genetic Resources Institute.
41
2020 NATIONAL AGRICULTURE SYMPOSIUM
SPICES IN FIJI – PERSPECTIVES AND PROSPECTIVES FOR THE AGRICULTURE DEVELOPMENT IN THE ERA OF CLIMATE CHANGE
K. Kandiannan1, Shalendra Prasad2 and Salesh Kumar3
1Vivekananda Technical Center, P O Box 716, Nadi, Fiji2Koronivia Research Station, Ministry of Agriculture, P.O Box 77, Nausori, Fiji3College of Agriculture & Fisheries, P O Box 1544, Nausori, FijiCorresponding author: [email protected]
ABSTRACTSpices are important group of horticultural crops and considered as high value and low volume crops. In fact human civilization revolved around spices, the historical voyages of Vasco da Gama, Christopher Columbus, Ferdinand Magellan, etc.., are mainly in search of spices. Possession of spices was considered as royals. Many countries economy depends mainly on spices production. Every house hold use one or other spice in their kitchen. The demand for spices and spice products are ever increasing owing to their increased use in culinary, pharmaceutical, confectionary, beverages and perfume industries, aroma therapy etc..,. The International Organization for Standardization (ISO) recognised 108 plants as spice crops. In Fiji, people are using around 50 different spices and spice products, but, only few spices are grown in Fiji in a localised homestead to large scale. Spices are classified in many ways, tropical and temperate spices, tree spices, herbal spices, seed spices, rhizomatous spices, annuals, perennials etc.., depends on convenience and need. Fiji has an ideal climate for many spices. Fiji on an average exports 2,730.5 tonnes of spices to the value of 16.6 million FJD, whereas, it imports 1,305.7 tonnes to the value of 5.8 million FJD. There is a strong domestic market exists in Fiji for spices. The spices imported are consumed internally both in households and hotels, part of the imported spices is converted into spice mixtures or value added and re-exported. There is a great scope for expansion of spices cultivation in Fiji. It is worth to mention about the efforts of Mr Ronald Gatty, who introduced many spices for the benefit of the Fijian farmers. There are many success stories particularly in ginger by Kaiming Agro Processors Ltd, Frespac Ltd etc., are well documented. Nadi Bay Herbs (Fiji) Ltd is another firm exclusively works on herbal spices and exports. They grow basil, pepper basil, mint, rosemary, dil, thyme, parsley, etc.., successfully in Fiji soil. These are the evidences that spices can be very well grown successfully in Fiji.
A survey was conducted on spices consumption, in which sample population belong to Fijian (49.0%), Fiji-Indian (38.0%), Chinese (5.0%), European (3.0%) and others (Indian, PNG, Rotuman, Tongan) (5.0%) with average family size of 6, 5, 6, 5 and 6, respectively, the mean number spices used among the group is 9, 15, 9, 4 and 9, respectively. The result indicated that number of spices used by Fiji-Indian is maximum (15) and minimum by European (4). The maximum quantity of spice used was onion around (3.0 kg per month) followed by garlic 1.6kg per month. Further the result showed that mean usage of fresh ginger (416g), green chilli (322g), coriander leaf (259g), dry turmeric powder (229g), masala powder (214g), mustard seed (146g), tamarind (144g), cumin seed (138g), and fresh turmeric and fenugreek seed each 100g per month. The rest of the spices are used < 100g per month. In general, Fiji-Indian use more spices both number and quantity and less by European, others use moderate level. Fresh ginger usage was maximum (498 g/month) by Fijian family followed by Fiji-Indian family (474 g/month).
The advantage of spices crop is that it can fit into several cropping systems and suitable for climate resilient and crop diversification in Fiji. The efforts should focus on multiplication of quality planting materials by rapid multiplication techniques, popularisation of spices by demonstrations by Government agencies, encouraging and supporting self-help groups (SHG’s) and non-governmental organizations (NGO’s) in all possible ways to start spice production and on-farm processing and value addition. Providing trainings to youths and women entrepreneurs in spices production and processing for self-sustenance. These efforts would help the agriculture development in Fiji. The crops such as turmeric, black pepper, cardamom, cinnamon, nutmeg, vanilla, herbal spices can be targeted and may be extended to other crops in a phased manner. These holistic efforts would make Fiji to become one of the major spice exporters in future.
INTRODUCTIONSpices are plant products either fresh or dried forms or any other forms such as powder, oil, oleoresin etc., used mainly in food preparation for seasoning purposes which add aroma, pungency, taste, colour to the food. In addition, their industrial applications are increasing day by day in bakery, confectionary, aroma therapy, pharmaceuticals, beverages etc.,. The history of spice is almost as old as human civilisation. It is a history of lands discovered, empires built and brought down, wars won and lost, treaties signed and flouted, flavours sought and offered, and the rise and fall of different religious practices and beliefs. Spices were among the most valuable items of trade in ancient and medieval times.As long ago as 3500 BC the ancient Egyptians were using various spices for flavouring food, in cosmetics, and for
42
2020 NATIONAL AGRICULTURE SYMPOSIUM
embalming their dead. The use of spices spread through the Middle East to the eastern Mediterranean and Europe. Spices from China, Indonesia, India, and Ceylon (now Sri Lanka) were originally transported overland by donkey or camel caravans. For almost 5000 years, Arab middlemen controlled the spice trade, until European explorers discovered a sea route to India and other spice producing countries in the East.
The spice is one of the earliest traded commodities in the world, the history of the cultivation and use of spices is per-haps the most romantic story of any vegetable product. From the earliest known eras of civilization spices were eagerly sought in all parts of the world. It must be noted that the greater part of the spices that have been valued by man are derived from the Asiatic tropics, while the other quarters of the globe have produced comparatively few.Spices played an important role in the evolution of human civilizations. The great navigations by Christopher Columbus, Vasco de Gama, Ferdinand Magellanare in search of spice producing lands, as a result ‘Spice route’ connecting Asia and Europe were established. Every household in the world irrespective of the ethnicity usesone or other spice every day. At pres-ent, there are 109 spices listed by ISO, whereas, Seidemann (2005) listed 1400 plants for similar uses and mentioned that some of them relevant to certain regions of the world.
Freedman (2020) pointed out that spices had an important place in ancient and medieval cooking. Medical theories about diet and health overlapped with taste preferences. The recipes of classical Greece and Rome favor sharp flavors, while those of the Middle Ages result in dishes that are sweeter and more perfumed. Spanish and Portuguese colonization of the Americas circulated the chili pepper whose acceptance was considerably greater in Asia and Africa than in Europe. The origins of modern European cuisine can be identified in changes led by France during the seventeenth century. Among the key shifts was the displacement of spices in sauces and their general decline in all manner of recipes. Britain and North America retained a certain affection for spices through the cuisine of foreigners – Indian and Mexican restaurants, for example. Some of this love of the piquant has now spread through culinary globalization.
SPICES IN FIJIEach spice has their own origins, black pepper (King of Spices) and small cardamom (Queen of Spices) from Western Ghats of India; ginger and turmeric Indo-China region; Tree spices like clove, nutmeg, cassia are from Indonesia and nearby regions; true cinnamon from Sri Lanka and India; herbal spices from Europe regions; Seed spices from Mediterranean, Allspice and Chilies from America, onion and garlic from China; Basil from Australia, etc., (Duke 2003). European colonization helped to spread the spices across the globe. Many spices are naturalized and performs better in the newly introduced locations.
Spices are essential for every culture, Seemann (1862)has noted four different spices in Fiji, he mentioned turmeric (Cago)(Curcuma longa Linn.), Zingiber zerumbet Roscoe, (Beta), Bird’s eye pepper (Capsicum frutescens Linn.) and Myristica castaneifolia A.Gray (Male), he also made a mention about tamarind but he might have not considered it as spice at that time. Another aromatic plant he mentioned was ‘Cevuga’ (Amomum sp.). In his subsequent book : Flora of VitianIslands (Seemann 1869) he mentioned about Cinnamon (Cinnamomumpedatinervium Meisn). Many spices were introduced to Fiji, black pepper and vanilla during 1880’s; ginger introduced before 1890, cardamom, nutmeg and clove during 1930’s and some became naturalized. Few species of nutmeg and cinnamon are indigenous to Fiji.
The monumental work of Albert C Smith on Flora Vitiensis Nova – A New Flora of Fiji (Smith 1979, 1981, 1985, 1988 and 1991)documented the full list of plants available at Fiji, from that following list of spices (Table 1) are identifed, few herbal spices are later introduction. Fiji is suitable for cultivation of important spices. As such there is no statistics on area and production of spices in the country except for ginger, but, a well-documented statistic is available on import and export of spices in Fiji. Vinning (1990) has given comprehensive account on spices development in Fiji and found out that black pepper and turmeric has bright prospectus in Pacific. However, not much headway in this direction. Lim and Fleming (2000) documented the published information on spices in Fiji.
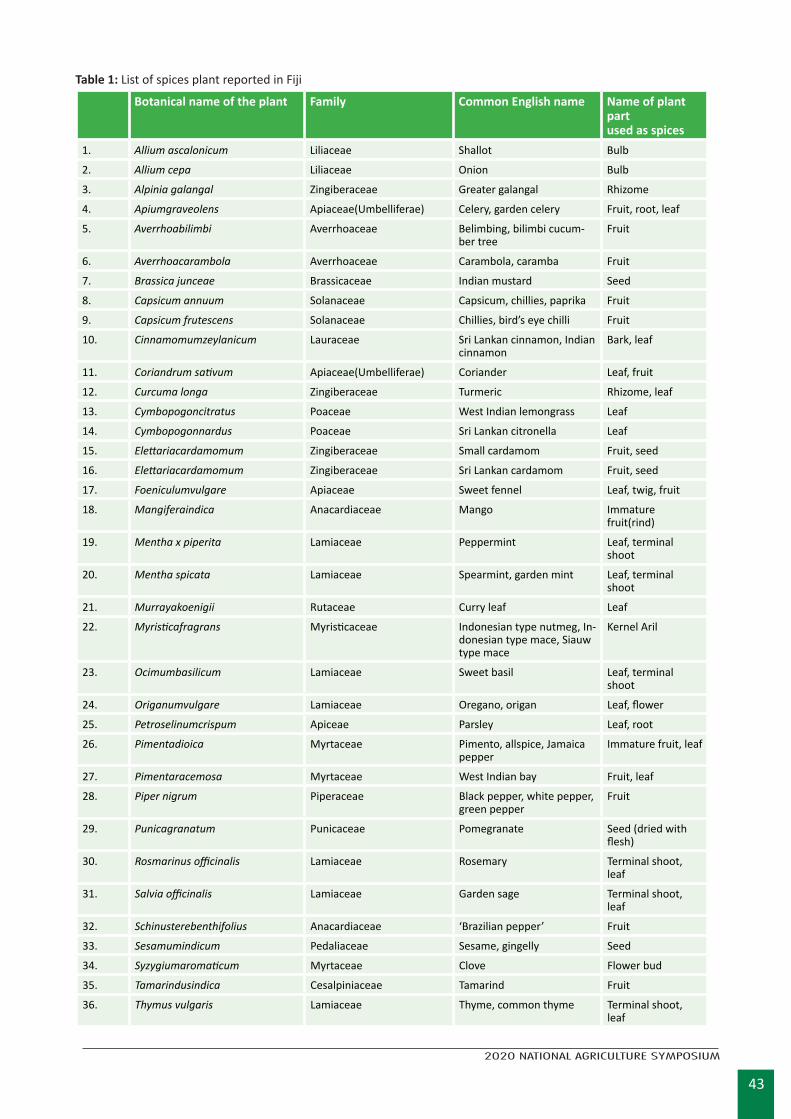
43
2020 NATIONAL AGRICULTURE SYMPOSIUM
Table 1: List of spices plant reported in Fiji
Botanical name of the plant Family Common English name Name of plant part used as spices
1. Allium ascalonicum Liliaceae Shallot Bulb
2. Allium cepa Liliaceae Onion Bulb
3. Alpinia galangal Zingiberaceae Greater galangal Rhizome
4. Apiumgraveolens Apiaceae(Umbelliferae) Celery, garden celery Fruit, root, leaf
5. Averrhoabilimbi Averrhoaceae Belimbing, bilimbi cucum-ber tree
Fruit
6. Averrhoacarambola Averrhoaceae Carambola, caramba Fruit
7. Brassica junceae Brassicaceae Indian mustard Seed
8. Capsicum annuum Solanaceae Capsicum, chillies, paprika Fruit
9. Capsicum frutescens Solanaceae Chillies, bird’s eye chilli Fruit
10. Cinnamomumzeylanicum Lauraceae Sri Lankan cinnamon, Indian cinnamon
Bark, leaf
11. Coriandrum sativum Apiaceae(Umbelliferae) Coriander Leaf, fruit
12. Curcuma longa Zingiberaceae Turmeric Rhizome, leaf
13. Cymbopogoncitratus Poaceae West Indian lemongrass Leaf
14. Cymbopogonnardus Poaceae Sri Lankan citronella Leaf
15. Elettariacardamomum Zingiberaceae Small cardamom Fruit, seed
16. Elettariacardamomum Zingiberaceae Sri Lankan cardamom Fruit, seed
17. Foeniculumvulgare Apiaceae Sweet fennel Leaf, twig, fruit
18. Mangiferaindica Anacardiaceae Mango Immature fruit(rind)
19. Mentha x piperita Lamiaceae Peppermint Leaf, terminal shoot
20. Mentha spicata Lamiaceae Spearmint, garden mint Leaf, terminal shoot
21. Murrayakoenigii Rutaceae Curry leaf Leaf
22. Myristicafragrans Myristicaceae Indonesian type nutmeg, In-donesian type mace, Siauw type mace
Kernel Aril
23. Ocimumbasilicum Lamiaceae Sweet basil Leaf, terminal shoot
24. Origanumvulgare Lamiaceae Oregano, origan Leaf, flower
25. Petroselinumcrispum Apiceae Parsley Leaf, root
26. Pimentadioica Myrtaceae Pimento, allspice, Jamaica pepper
Immature fruit, leaf
27. Pimentaracemosa Myrtaceae West Indian bay Fruit, leaf
28. Piper nigrum Piperaceae Black pepper, white pepper, green pepper
Fruit
29. Punicagranatum Punicaceae Pomegranate Seed (dried with flesh)
30. Rosmarinus officinalis Lamiaceae Rosemary Terminal shoot, leaf
31. Salvia officinalis Lamiaceae Garden sage Terminal shoot, leaf
32. Schinusterebenthifolius Anacardiaceae ‘Brazilian pepper’ Fruit
33. Sesamumindicum Pedaliaceae Sesame, gingelly Seed
34. Syzygiumaromaticum Myrtaceae Clove Flower bud
35. Tamarindusindica Cesalpiniaceae Tamarind Fruit
36. Thymus vulgaris Lamiaceae Thyme, common thyme Terminal shoot, leaf
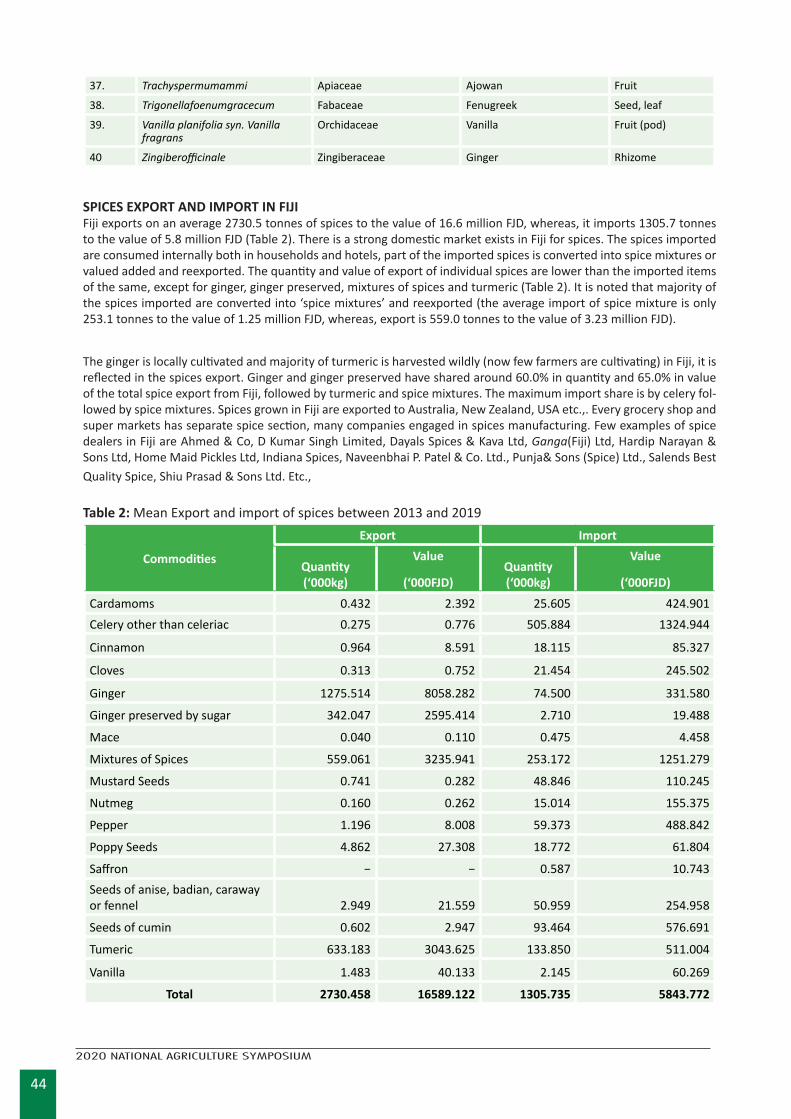
44
2020 NATIONAL AGRICULTURE SYMPOSIUM
37. Trachyspermumammi Apiaceae Ajowan Fruit
38. Trigonellafoenumgracecum Fabaceae Fenugreek Seed, leaf
39. Vanilla planifolia syn. Vanilla fragrans
Orchidaceae Vanilla Fruit (pod)
40 Zingiberofficinale Zingiberaceae Ginger Rhizome
SPICES EXPORT AND IMPORT IN FIJIFiji exports on an average 2730.5 tonnes of spices to the value of 16.6 million FJD, whereas, it imports 1305.7 tonnes to the value of 5.8 million FJD (Table 2). There is a strong domestic market exists in Fiji for spices. The spices imported are consumed internally both in households and hotels, part of the imported spices is converted into spice mixtures or valued added and reexported. The quantity and value of export of individual spices are lower than the imported items of the same, except for ginger, ginger preserved, mixtures of spices and turmeric (Table 2). It is noted that majority of the spices imported are converted into ‘spice mixtures’ and reexported (the average import of spice mixture is only 253.1 tonnes to the value of 1.25 million FJD, whereas, export is 559.0 tonnes to the value of 3.23 million FJD).
The ginger is locally cultivated and majority of turmeric is harvested wildly (now few farmers are cultivating) in Fiji, it is reflected in the spices export. Ginger and ginger preserved have shared around 60.0% in quantity and 65.0% in value of the total spice export from Fiji, followed by turmeric and spice mixtures. The maximum import share is by celery fol-lowed by spice mixtures. Spices grown in Fiji are exported to Australia, New Zealand, USA etc.,. Every grocery shop and super markets has separate spice section, many companies engaged in spices manufacturing. Few examples of spice dealers in Fiji are Ahmed & Co, D Kumar Singh Limited, Dayals Spices & Kava Ltd, Ganga(Fiji) Ltd, Hardip Narayan & Sons Ltd, Home Maid Pickles Ltd, Indiana Spices, Naveenbhai P. Patel & Co. Ltd., Punja& Sons (Spice) Ltd., Salends Best Quality Spice, Shiu Prasad & Sons Ltd. Etc.,
Table 2: Mean Export and import of spices between 2013 and 2019
Commodities
Export Import
Quantity (‘000kg)
Value
(‘000FJD)Quantity (‘000kg)
Value
(‘000FJD)Cardamoms 0.432 2.392 25.605 424.901Celery other than celeriac 0.275 0.776 505.884 1324.944
Cinnamon 0.964 8.591 18.115 85.327
Cloves 0.313 0.752 21.454 245.502
Ginger 1275.514 8058.282 74.500 331.580
Ginger preserved by sugar 342.047 2595.414 2.710 19.488
Mace 0.040 0.110 0.475 4.458
Mixtures of Spices 559.061 3235.941 253.172 1251.279
Mustard Seeds 0.741 0.282 48.846 110.245
Nutmeg 0.160 0.262 15.014 155.375
Pepper 1.196 8.008 59.373 488.842
Poppy Seeds 4.862 27.308 18.772 61.804
Saffron − − 0.587 10.743Seeds of anise, badian, caraway or fennel 2.949 21.559 50.959 254.958
Seeds of cumin 0.602 2.947 93.464 576.691
Tumeric 633.183 3043.625 133.850 511.004
Vanilla 1.483 40.133 2.145 60.269
Total 2730.458 16589.122 1305.735 5843.772
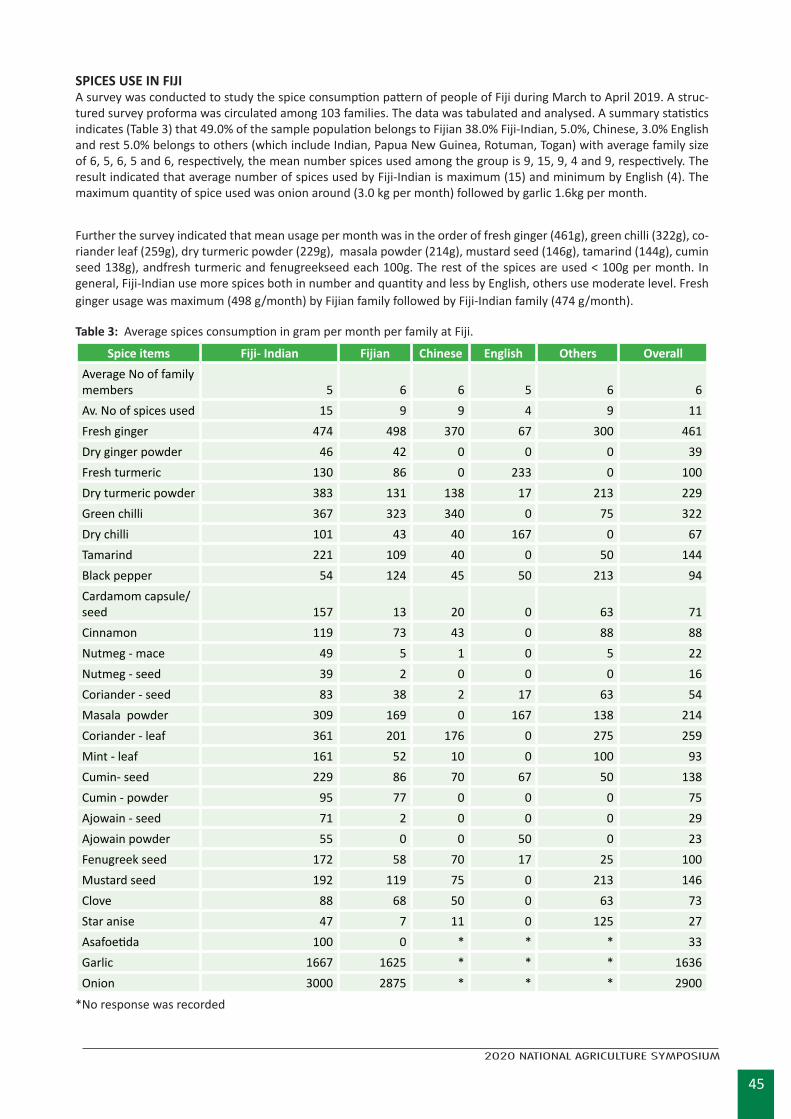
45
2020 NATIONAL AGRICULTURE SYMPOSIUM
SPICES USE IN FIJIA survey was conducted to study the spice consumption pattern of people of Fiji during March to April 2019. A struc-tured survey proforma was circulated among 103 families. The data was tabulated and analysed. A summary statistics indicates (Table 3) that 49.0% of the sample population belongs to Fijian 38.0% Fiji-Indian, 5.0%, Chinese, 3.0% English and rest 5.0% belongs to others (which include Indian, Papua New Guinea, Rotuman, Togan) with average family size of 6, 5, 6, 5 and 6, respectively, the mean number spices used among the group is 9, 15, 9, 4 and 9, respectively. The result indicated that average number of spices used by Fiji-Indian is maximum (15) and minimum by English (4). The maximum quantity of spice used was onion around (3.0 kg per month) followed by garlic 1.6kg per month.
Further the survey indicated that mean usage per month was in the order of fresh ginger (461g), green chilli (322g), co-riander leaf (259g), dry turmeric powder (229g), masala powder (214g), mustard seed (146g), tamarind (144g), cumin seed 138g), andfresh turmeric and fenugreekseed each 100g. The rest of the spices are used < 100g per month. In general, Fiji-Indian use more spices both in number and quantity and less by English, others use moderate level. Fresh ginger usage was maximum (498 g/month) by Fijian family followed by Fiji-Indian family (474 g/month).
Table 3: Average spices consumption in gram per month per family at Fiji.
Spice items Fiji- Indian Fijian Chinese English Others OverallAverage No of family members 5 6 6 5 6 6Av. No of spices used 15 9 9 4 9 11Fresh ginger 474 498 370 67 300 461Dry ginger powder 46 42 0 0 0 39Fresh turmeric 130 86 0 233 0 100Dry turmeric powder 383 131 138 17 213 229Green chilli 367 323 340 0 75 322Dry chilli 101 43 40 167 0 67Tamarind 221 109 40 0 50 144Black pepper 54 124 45 50 213 94Cardamom capsule/ seed 157 13 20 0 63 71Cinnamon 119 73 43 0 88 88Nutmeg - mace 49 5 1 0 5 22Nutmeg - seed 39 2 0 0 0 16Coriander - seed 83 38 2 17 63 54Masala powder 309 169 0 167 138 214Coriander - leaf 361 201 176 0 275 259Mint - leaf 161 52 10 0 100 93Cumin- seed 229 86 70 67 50 138Cumin - powder 95 77 0 0 0 75Ajowain - seed 71 2 0 0 0 29Ajowain powder 55 0 0 50 0 23Fenugreek seed 172 58 70 17 25 100Mustard seed 192 119 75 0 213 146Clove 88 68 50 0 63 73Star anise 47 7 11 0 125 27Asafoetida 100 0 * * * 33Garlic 1667 1625 * * * 1636Onion 3000 2875 * * * 2900
*No response was recorded
46
2020 NATIONAL AGRICULTURE SYMPOSIUM
CONCLUSION AND SCOPE OF SPICES IN FIJISpices are introduced to the pacific region and used in culinary and traditional medicines. There is a new usage in pharmaceutical, cosmetic, perfume and flavor, confectionary and beverage industries and aroma therapy. There is great demand for organically produced spices. The agro-climate of Fiji is very well suitable to grow different spices. It is worth to mention about the efforts of Mr Ronald Gatty, who promoted many spices for the benefit of the Fijian farmers. There are many success stories particularly in ginger by Kaiming Agro Processors Ltd, Frespac Ltd etc., are well documented. Nadi Bay Herbs (Fiji) Ltd is another firm exclusively works on herbal spices and exports. These are few evidences that spices can be grown successfully in Fiji.
The advantage of spices is that it can fit into several cropping systems and suitable for climate resilient and crop diversification in Fiji. The efforts should focus on multiplication of quality planting materials by rapid multiplication techniques, popularization of spices by demonstrations by Government agencies, encouraging and supporting self help groups (SHG’s) and non-governmental organizations (NGO’s) in all possible ways to start spice production and on-farm processing and value addition. Providing trainings to youths and women entrepreneurs in spices production and processing. These efforts would help the agriculture development in Fiji. A systematic cultivation of ginger is existing in Fiji. There is Fiji Ginger Farmers Association and Ginger Council of Fiji Act 1996 are helps to promote ginger.
Similar associations and set ups are required for other spices. The crops such as turmeric, black pepper, cardamom, cinnamon, nutmeg, clove, allspice, vanilla, tamarind, curry leaf, herbal spices can be targeted and may be extended to other crops in a phased manner. There is a great scope for identification of spice plants available with different people around Fiji and collection, conservation and improvement are the paramount importance in the era of climate change. Once in 1900, Fiji was the major producer of vanilla in the world, now it is not in the world map, Papua New Guinea(PNG), Tonga and French Polynesia together contribute 9.0% world vanilla production from pacific. Many NGO’s and Private are engaged in vanilla production but they are small scale and scattered, there need to be a earnest efforts to promote this crop in Fiji. Herbal spices like Rosemary, lemon grass are very much suitable throughout Fiji, they can be grown and essential oil can be extracted for industrial use. Similarly, true cinnamon available both in Viti Levu and Vanua Levu can be commercially utilized that would help augmenting the farmers income. These holistic efforts would make Fiji to become one of the major spice exporters in future from pacific region.
REFERENCESFreedman P. 2020.History of Spices. In: Meiselman H. (eds) Handbook of Eating and Drinking. Springer, Cham.
https://doi.org/10.1007/978-3-030-14504-0_9
Lim T K and Fleming EM 2000.Food and other crops in Fiji: an annotated bibliography. ACIAR Monograph No. 55, 378 pp.Australian Centre for International Agricultural Research, Canberra, Australia.
Ravindran P N 2017. The Encyclopedia of Herbs and Spices. Commonwealth Agricultural Bureau International, London, UK.
Seemann B1862. Viti: an account of a government mission to the Vitian or Fijian Islands in the years 1860-61. Macmillan Co., London, UK.
Seemann B 1869. Flora Vitiensis: A Description of the Plants of the Viti Or Fiji Islands, with an Account of Their History, Uses, and Properties. L. Reeve and Co., London, UK.
Seidemann J 2005. World Spice Plants – Economic Usage, Botany, Taxonomy. Springer-Verlag Berlin Heidelberg
Smith A C 1979, 1981, 1985, 1988, 1991. Flora Vitiensis Nova: A New Flora of Fiji(Vol I to V). Pacific Tropical Botanical Garden, Hawaii, USA.
Vinning G 1990. Marketing Perspectives on a Potential Pacific Spice Industry. Australian Center for International Ag
47
2020 NATIONAL AGRICULTURE SYMPOSIUM
STRENGTHENING RESILIENCE TO FIJI’S TARO DIVERSITY THROUGH INTRODUCTION AND BREEDING FOR TARO LEAF BLIGHT (TLB) DISEASE
Savenaca CuqumaResearch Division, Ministry of Agriculture, FijiCorresponding author: [email protected]
ABSTRACTTaro Leaf Blight (TLB) is a major disease of taro in the Pacific, caused by the fungus, Phytopthora colocasiae, poses a major threat to Fiji’s thriving taro industry. Currently Fiji is free of the disease and contingencies plans with proactive approach must be put in place for any near future introduction of the disease in Fiji. TLB is present in the Pacific region in countries such as Hawaii, Palau, and Federated State of Micronesia, Guam, Papua New Guinea, Solomon Islands, Northern Marianas, American Samoa and Samoa. Fiji and the Pacific have learnt the lessons these countries encountered during the introduction of TLB in their shores. In addition, the narrow gene pool of Fiji’s taro varieties will offer very little resistance to TLB and other climate change effects on taro. The most devastating effect was an epidemic in Samoa from 1993 – 1994, the disease was so catastrophic for taro production. If affected food security, loss of genetic resources, farmer’s livelihood and a total ban in taro export. This paper highlights the measures being undertaken in Fiji as an important taro producer in the Pacific. The Ministry of Agriculture research and development has worked with Pacific Island Countries with regional and international institutions through capacity building, information and genetic resources exchange from 2012 to 2020. Fiji has introduced tolerant breeding taro cultivars from the Pacific region and in addition resistant cultivars from South East Asia for the Fiji taro breeding program from 2013 - 2020. In 2018, Fiji has successfully released two TLB tolerant cultivars and the paper further highlights the future plans of strengthening the resilience in broadening the taro genetic diversity in Fiji.
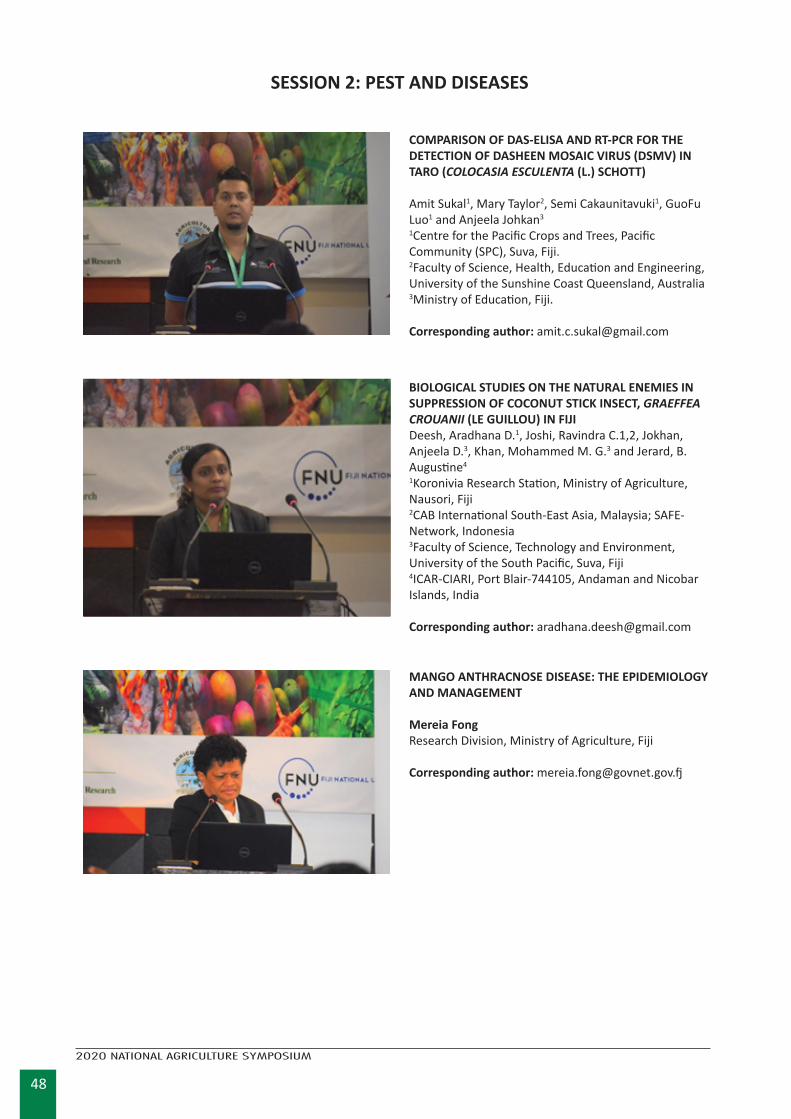
48
2020 NATIONAL AGRICULTURE SYMPOSIUM
SESSION 2: PEST AND DISEASES
COMPARISON OF DAS-ELISA AND RT-PCR FOR THE DETECTION OF DASHEEN MOSAIC VIRUS (DSMV) IN TARO (COLOCASIA ESCULENTA (L.) SCHOTT)
Amit Sukal1, Mary Taylor2, Semi Cakaunitavuki1, GuoFu Luo1 and Anjeela Johkan3 1Centre for the Pacific Crops and Trees, Pacific Community (SPC), Suva, Fiji.2Faculty of Science, Health, Education and Engineering, University of the Sunshine Coast Queensland, Australia3Ministry of Education, Fiji.
Corresponding author: [email protected]
BIOLOGICAL STUDIES ON THE NATURAL ENEMIES IN SUPPRESSION OF COCONUT STICK INSECT, GRAEFFEA CROUANII (LE GUILLOU) IN FIJIDeesh, Aradhana D.1, Joshi, Ravindra C.1,2, Jokhan, Anjeela D.3, Khan, Mohammed M. G.3 and Jerard, B. Augustine4
1Koronivia Research Station, Ministry of Agriculture, Nausori, Fiji2CAB International South-East Asia, Malaysia; SAFE-Network, Indonesia3Faculty of Science, Technology and Environment, University of the South Pacific, Suva, Fiji4ICAR-CIARI, Port Blair-744105, Andaman and Nicobar Islands, India
Corresponding author: [email protected]
MANGO ANTHRACNOSE DISEASE: THE EPIDEMIOLOGY AND MANAGEMENT
Mereia FongResearch Division, Ministry of Agriculture, Fiji
Corresponding author: [email protected]
49
2020 NATIONAL AGRICULTURE SYMPOSIUM
SESSION 2: PEST & DISEASESCOMPARISON OF DAS-ELISA AND RT-PCR FOR THE DETECTION OF DASHEEN MOSAIC VIRUS (DSMV) IN TARO (COLOCASIA ESCULENTA (L.) SCHOTT)
Amit Sukal1*, Mary Taylor2, Semi Cakaunitavuki1, GuoFu Luo1 and Anjeela Johkan3 1Centre for the Pacific Crops and Trees, Pacific Community (SPC), Suva, Fiji.2Faculty of Science, Health, Education and Engineering, University of the Sunshine Coast Queensland, Australia3Ministry of Education, Fiji.*Corresponding author: [email protected]
ABSTRACTCommercially available DAS-ELISA and RT-PCR were compared to determine the best method for the detection of Dasheen Mosaic Virus (DsMV), genus Potyvirus, from taro (C. esculenta). Fifty taro plants were randomly selected from the Koronivia Research Station (KRS) field germplasm collection and were tested for DsMV with DAS-ELISA and RT-PCR. 36% of the field samples were tested DsMV-positive using RT-PCR. In contrast, only 20% were determined as DsMV-positive using DAS-ELISA. Sensitivity in DsMV detection was 10 times higher (up to 10-3 dilutions) using RT_PCR compared to that of DAS-ELISA (up to 10-2 dilutions). Despite the high sensitivity of RT-PCR, routine analysis is not feasible as the reagents are expensive, require more technical expertise and require purpose-built infrastructures compared to DAS-ELISA. Therefore, DAS-ELISA is still an important tool that can be used for routine screening of DsMV at national clean seed systems while, RT-PCR can be used at genebank level, which require the highest level of sensitivity and accuracy, to ensure safe taro germplasm exchange.
Key words: DsMV, DAS-ELISA, RT-PCR, Colocasia esculenta
INTRODUCTIONTaro, Colocasia esculenta (L.) Schott, of the family Araceae, is widely cultivated in many parts of the humid tropics and subtropics. It is an important staple food in the Pacific Island Countries and Territories (PICTs) (Jianchu et al., 2001; Sardos et al., 2012). Taro is a vegetatively propagated crop species and is mainly cultivated for its corm which is a very important source of carbohydrates and potassium. The leaves and petioles (sources of vitamin A and C) are also utilized, often by boiling and serving as a kind of spinach (Manner & Taylor, 2010; Yokoyama et al., 1989). Once grown purely as a subsistence crop, it is now a major export commodity for some countries in the Pacific, particularly for Fiji. Between 2005 and 2009 taro exports from the Pacific Island countries have been around 10,000-12,000 tonnes annually with Fiji accounting for 95% of that export market (McGregor., 2011).
Taro is an important export crop, mainly because of the demand from Pacific Islanders living in Australia, New Zealand and west coast of America; its potential as a base for gluten-free flour remains a market to be explored. However, the demand is not reflected in the production that occurs across the Pacific region partly due to significant losses to pest and diseases. Taro leaf blight (TLB) caused by the fungus-like Oomycete Phytophthora colocasiae Raciborski (P. colocasiae) alone has resulted in corm yield losses of 50% (Jackson, 1999; Singh et al., 2006; Trujillo, 1967; Trujillo and Aragaki, 1964; Singh et al, 2013) and leaf yield losses in susceptible varieties of 95% (Nelson, 2011; Singh et al, 2013). There are at least 10 major pests and diseases of taro (Kohler et al., 1997; Singh et al., 2012). Of these pest and diseases, viruses are considered as one of the most important with some infections resulting in severe yield reductions and plant mortality (Revill et al., 2005; Singh et al., 2012). Four viruses have been reported to infect taro in the Pacific; Dasheen mosaic virus (DsMV), Colocasia bobone disease virus, (CBDV), Taro bacilliform virus (TaBV) and Taro vein chlorosis virus (TaVCV) (Brunt et al., 1990; Pearson et al., 1999.; Revill et al., 2005; Yang et al., 2003a, b). A reovirus with greatest similarity to Oryzavirus in the family Reoviridae has also been reported from Pacific taro (Devitt et al., 2001). The reovirus has been tentatively named as the Taro reovirus (TaRV). TaRV has only been recorded in mixed infections from PNG, Solomon Islands and Vanuatu Revill et al., 2005; Singh et al., 2012). Recently, natural infection of taro by Groundnut bud necrosis virus (GBNV) has been reported from India (Sivaprasad et al., 2011) but this has not been recorded in the Pacific.
Dasheen mosaic virus (DsMV) is one of the important viral infections of taro. DsMV was first detected in taro (Zettler et al., 1970) but it also infects a variety of cultivated aroids and ornamental plants worldwide (Revill et al., 2005; Shaw et al., 1979; Zettler & Hartman, 1987). DsMV has flexuous, filamentous particles c. 750nm long. It is transmitted by aphids in a non-persistent manner and is sap-transmissible (Adams & Antoniw, 1978). A conspicuous feathery mosaic
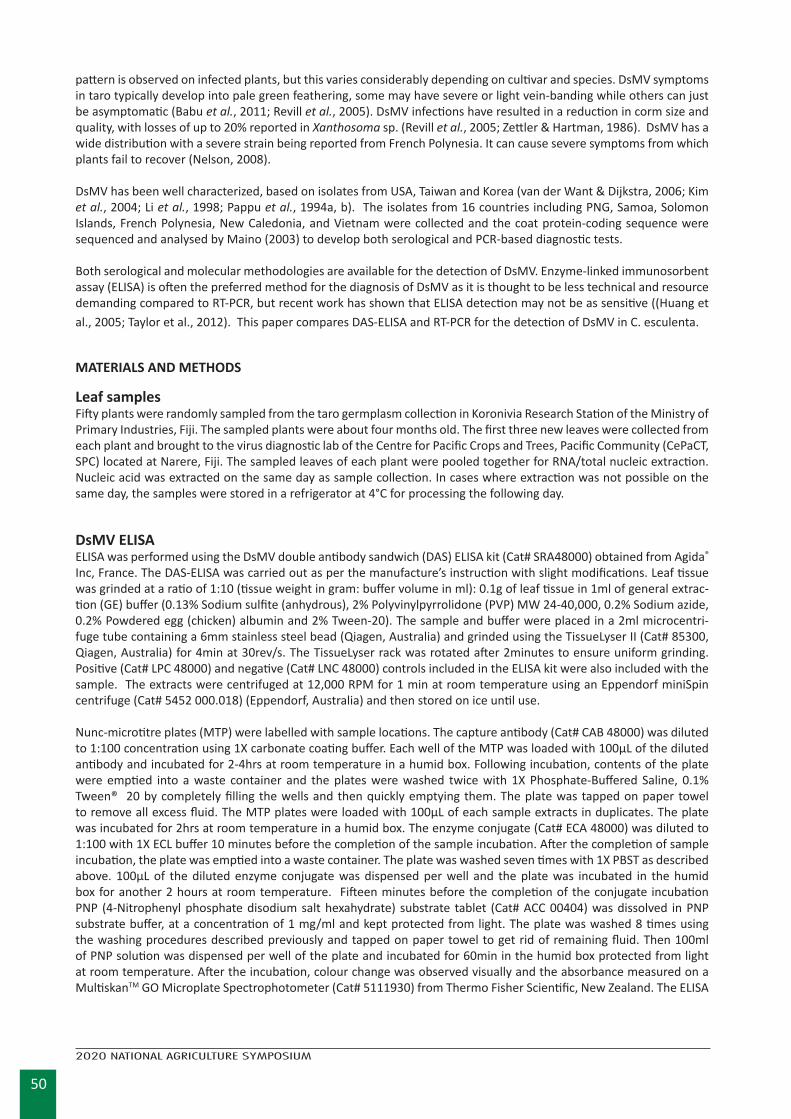
50
2020 NATIONAL AGRICULTURE SYMPOSIUM
pattern is observed on infected plants, but this varies considerably depending on cultivar and species. DsMV symptoms in taro typically develop into pale green feathering, some may have severe or light vein-banding while others can just be asymptomatic (Babu et al., 2011; Revill et al., 2005). DsMV infections have resulted in a reduction in corm size and quality, with losses of up to 20% reported in Xanthosoma sp. (Revill et al., 2005; Zettler & Hartman, 1986). DsMV has a wide distribution with a severe strain being reported from French Polynesia. It can cause severe symptoms from which plants fail to recover (Nelson, 2008).
DsMV has been well characterized, based on isolates from USA, Taiwan and Korea (van der Want & Dijkstra, 2006; Kim et al., 2004; Li et al., 1998; Pappu et al., 1994a, b). The isolates from 16 countries including PNG, Samoa, Solomon Islands, French Polynesia, New Caledonia, and Vietnam were collected and the coat protein-coding sequence were sequenced and analysed by Maino (2003) to develop both serological and PCR-based diagnostic tests.
Both serological and molecular methodologies are available for the detection of DsMV. Enzyme-linked immunosorbent assay (ELISA) is often the preferred method for the diagnosis of DsMV as it is thought to be less technical and resource demanding compared to RT-PCR, but recent work has shown that ELISA detection may not be as sensitive ((Huang et al., 2005; Taylor et al., 2012). This paper compares DAS-ELISA and RT-PCR for the detection of DsMV in C. esculenta.
MATERIALS AND METHODS
Leaf samplesFifty plants were randomly sampled from the taro germplasm collection in Koronivia Research Station of the Ministry of Primary Industries, Fiji. The sampled plants were about four months old. The first three new leaves were collected from each plant and brought to the virus diagnostic lab of the Centre for Pacific Crops and Trees, Pacific Community (CePaCT, SPC) located at Narere, Fiji. The sampled leaves of each plant were pooled together for RNA/total nucleic extraction. Nucleic acid was extracted on the same day as sample collection. In cases where extraction was not possible on the same day, the samples were stored in a refrigerator at 4°C for processing the following day.
DsMV ELISAELISA was performed using the DsMV double antibody sandwich (DAS) ELISA kit (Cat# SRA48000) obtained from Agida® Inc, France. The DAS-ELISA was carried out as per the manufacture’s instruction with slight modifications. Leaf tissue was grinded at a ratio of 1:10 (tissue weight in gram: buffer volume in ml): 0.1g of leaf tissue in 1ml of general extrac-tion (GE) buffer (0.13% Sodium sulfite (anhydrous), 2% Polyvinylpyrrolidone (PVP) MW 24-40,000, 0.2% Sodium azide, 0.2% Powdered egg (chicken) albumin and 2% Tween-20). The sample and buffer were placed in a 2ml microcentri-fuge tube containing a 6mm stainless steel bead (Qiagen, Australia) and grinded using the TissueLyser II (Cat# 85300, Qiagen, Australia) for 4min at 30rev/s. The TissueLyser rack was rotated after 2minutes to ensure uniform grinding. Positive (Cat# LPC 48000) and negative (Cat# LNC 48000) controls included in the ELISA kit were also included with the sample. The extracts were centrifuged at 12,000 RPM for 1 min at room temperature using an Eppendorf miniSpin centrifuge (Cat# 5452 000.018) (Eppendorf, Australia) and then stored on ice until use.
Nunc-microtitre plates (MTP) were labelled with sample locations. The capture antibody (Cat# CAB 48000) was diluted to 1:100 concentration using 1X carbonate coating buffer. Each well of the MTP was loaded with 100μL of the diluted antibody and incubated for 2-4hrs at room temperature in a humid box. Following incubation, contents of the plate were emptied into a waste container and the plates were washed twice with 1X Phosphate-Buffered Saline, 0.1% Tween® 20 by completely filling the wells and then quickly emptying them. The plate was tapped on paper towel to remove all excess fluid. The MTP plates were loaded with 100μL of each sample extracts in duplicates. The plate was incubated for 2hrs at room temperature in a humid box. The enzyme conjugate (Cat# ECA 48000) was diluted to 1:100 with 1X ECL buffer 10 minutes before the completion of the sample incubation. After the completion of sample incubation, the plate was emptied into a waste container. The plate was washed seven times with 1X PBST as described above. 100μL of the diluted enzyme conjugate was dispensed per well and the plate was incubated in the humid box for another 2 hours at room temperature. Fifteen minutes before the completion of the conjugate incubation PNP (4-Nitrophenyl phosphate disodium salt hexahydrate) substrate tablet (Cat# ACC 00404) was dissolved in PNP substrate buffer, at a concentration of 1 mg/ml and kept protected from light. The plate was washed 8 times using the washing procedures described previously and tapped on paper towel to get rid of remaining fluid. Then 100ml of PNP solution was dispensed per well of the plate and incubated for 60min in the humid box protected from light at room temperature. After the incubation, colour change was observed visually and the absorbance measured on a MultiskanTM GO Microplate Spectrophotometer (Cat# 5111930) from Thermo Fisher Scientific, New Zealand. The ELISA
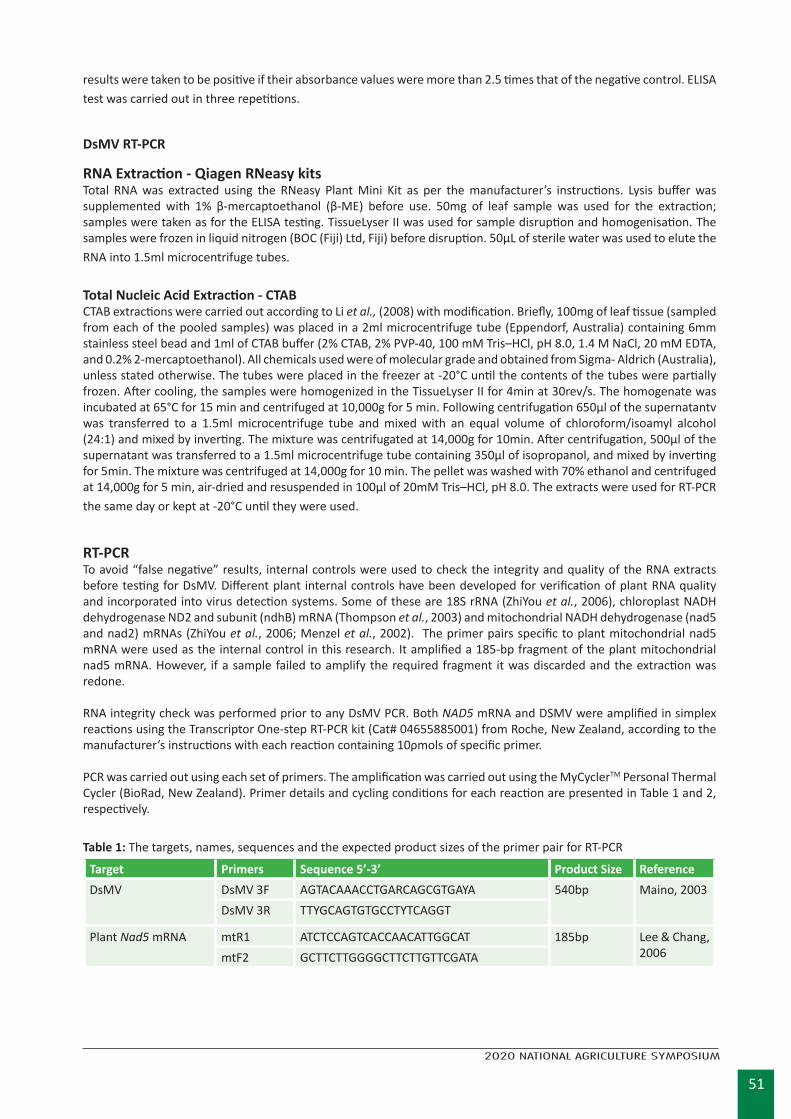
51
2020 NATIONAL AGRICULTURE SYMPOSIUM
results were taken to be positive if their absorbance values were more than 2.5 times that of the negative control. ELISA test was carried out in three repetitions.
DsMV RT-PCR
RNA Extraction - Qiagen RNeasy kitsTotal RNA was extracted using the RNeasy Plant Mini Kit as per the manufacturer’s instructions. Lysis buffer was supplemented with 1% β-mercaptoethanol (β-ME) before use. 50mg of leaf sample was used for the extraction; samples were taken as for the ELISA testing. TissueLyser II was used for sample disruption and homogenisation. The samples were frozen in liquid nitrogen (BOC (Fiji) Ltd, Fiji) before disruption. 50μL of sterile water was used to elute the RNA into 1.5ml microcentrifuge tubes.
Total Nucleic Acid Extraction - CTABCTAB extractions were carried out according to Li et al., (2008) with modification. Briefly, 100mg of leaf tissue (sampled from each of the pooled samples) was placed in a 2ml microcentrifuge tube (Eppendorf, Australia) containing 6mm stainless steel bead and 1ml of CTAB buffer (2% CTAB, 2% PVP-40, 100 mM Tris–HCl, pH 8.0, 1.4 M NaCl, 20 mM EDTA, and 0.2% 2-mercaptoethanol). All chemicals used were of molecular grade and obtained from Sigma- Aldrich (Australia), unless stated otherwise. The tubes were placed in the freezer at -20°C until the contents of the tubes were partially frozen. After cooling, the samples were homogenized in the TissueLyser II for 4min at 30rev/s. The homogenate was incubated at 65°C for 15 min and centrifuged at 10,000g for 5 min. Following centrifugation 650μl of the supernatantv was transferred to a 1.5ml microcentrifuge tube and mixed with an equal volume of chloroform/isoamyl alcohol (24:1) and mixed by inverting. The mixture was centrifugated at 14,000g for 10min. After centrifugation, 500μl of the supernatant was transferred to a 1.5ml microcentrifuge tube containing 350μl of isopropanol, and mixed by inverting for 5min. The mixture was centrifuged at 14,000g for 10 min. The pellet was washed with 70% ethanol and centrifuged at 14,000g for 5 min, air-dried and resuspended in 100μl of 20mM Tris–HCl, pH 8.0. The extracts were used for RT-PCR the same day or kept at -20°C until they were used.
RT-PCR To avoid “false negative” results, internal controls were used to check the integrity and quality of the RNA extracts before testing for DsMV. Different plant internal controls have been developed for verification of plant RNA quality and incorporated into virus detection systems. Some of these are 18S rRNA (ZhiYou et al., 2006), chloroplast NADH dehydrogenase ND2 and subunit (ndhB) mRNA (Thompson et al., 2003) and mitochondrial NADH dehydrogenase (nad5 and nad2) mRNAs (ZhiYou et al., 2006; Menzel et al., 2002). The primer pairs specific to plant mitochondrial nad5 mRNA were used as the internal control in this research. It amplified a 185-bp fragment of the plant mitochondrial nad5 mRNA. However, if a sample failed to amplify the required fragment it was discarded and the extraction was redone.
RNA integrity check was performed prior to any DsMV PCR. Both NAD5 mRNA and DSMV were amplified in simplex reactions using the Transcriptor One-step RT-PCR kit (Cat# 04655885001) from Roche, New Zealand, according to the manufacturer’s instructions with each reaction containing 10ρmols of specific primer.
PCR was carried out using each set of primers. The amplification was carried out using the MyCyclerTM Personal Thermal Cycler (BioRad, New Zealand). Primer details and cycling conditions for each reaction are presented in Table 1 and 2, respectively.
Table 1: The targets, names, sequences and the expected product sizes of the primer pair for RT-PCR
Target Primers Sequence 5’-3’ Product Size ReferenceDsMV DsMV 3F AGTACAAACCTGARCAGCGTGAYA 540bp
Maino, 2003DsMV 3R TTYGCAGTGTGCCTYTCAGGT
Plant Nad5 mRNA mtR1 ATCTCCAGTCACCAACATTGGCAT 185bp Lee & Chang, 2006mtF2 GCTTCTTGGGGCTTCTTGTTCGATA
52
2020 NATIONAL AGRICULTURE SYMPOSIUM
Table 2: The cycling parameters of each target under RT-PCRTarget Cycling Parameters
DsMV 25min at 50°C, 2 min denaturation step at 94°C, followed by 30 cycles of 94°C for 30 sec, 55°C for 30 sec, 68°C for 30 sec, and a final extension step at 68°C for 10 min
Plant Nad5 mRNA 25min at 50°C, 5min denaturation step at 94°C, followed by 30 cycles of 94°C for 30 sec, 52 for 30 sec, 72 for 30 sec, and a final extension step at 72 for 10 min
Following PCR, products were analysed by electrophoresis in 2% agarose gels in Tris-borate-EDTA (TBE) buffer (Qiagen, Australia) containing 1ppm of SYBRTM Safe Dye (Cat # S33102, Life Technologies, Australia). The PCR products were mixed with 5X nucleic acid sample loading buffer (50 mM Tris-HCl, pH 8.0, 25% Glycerol, 5 mM EDTA, 0.2% Bromophe-nol Blue, 0.2% Xylene Cyanole FF) (Cat # 161- 0767, Bio-Rad Laboratories Pty Ltd, Australia) and loaded on the gel. DNA ladder (100bp) from BioRad (Cat #170-8202) was also included in the gel for size determination. The gels were visual-ized and photographed using the Gel DocTM System (Bio-Rad Laboratories Pty Ltd, Australia).
Statistical analysisComparison of DsMV infection rates as detected by ELISA and RT-PCR was carried out using chi-square contingency test (with Yate’s correction) so as to determine an association between the two diagnostic tests, ELISA versus PCR and the frequency of positive versus negative diagnosis.
3. RESULTS
3.1. Detection of DsMV using ELISAThe sensitivity of ELISA was determined by using a tenfold serial dilution (down to 10-3) of infected taro leaf extract. The absorbance values are presented in Figure 1. The graph shows that the undiluted sample gave the highest absorbance with 1/10 also giving significantly higher absorbance values positioned higher than the positive threshold. The absorb-ance at 1/100 was very close to the positive threshold and was taken as a suspect result while the absorbance beyond this point was taken as unreliable.
Figure 1: Graphical representation of absorbance values of taro leaf samples tested by ELISA
3.3. Nucleic acid extraction and RT-PCRTwo extraction methods were compared to determine which one would be most efficient. The RNeasy kit required a small amount of sample and produced low yields of total RNA. In addition, on several occasions, the nucleic acid failed to amplify NAD5 gene with RT-PCR. However, CTAB method was found to be very effective. The CTAB extracts amplified the NAD5 gene on every occasion of 50 replicates except one. However, RNeasy extracts would fail with 5 out of every 50 attempts. Furthermore, CTAB extraction did not require the use of liquid nitrogen. Liquid nitrogen (LN) is hazardous and only one company, BOC Fiji Ltd, supplies LN in Fiji. The supply is also very sporadic. CTAB extraction was much cheaper compared to the RNeasy kits, with RNeasy kits costing around AUD7 for an extract while CTAB
53
2020 NATIONAL AGRICULTURE SYMPOSIUM
extracts would cost around AUD2 per sample. The TissueLyser allows for the effective homogenization of 48 samples at one time and avoids the laborious task of sample grinding. It also avoids possible contamination that can be introduced when grinding samples in LN using mortar and pestle, and it is time efficient RT-PCR amplification of nucleic acid extracted using the DsMV 3F and DsMV 3R primer pair produced a specific DNA band of about 540bp while the RT-PCR using the mt-R1 and mt-R2 primer pair amplified an 185bp sized band confirming the presence of DsMV and NAD5 gene RNA (Figure 2).
Figure 2: Gel picture showing the NAD5 and DsMV RT-PCR products
Comparison of ELISA and RT-PCR The sensitivity of ELISA and RT-PCR was compared using a tenfold serial dilution of the nucleic acid extracts. Samples containing DsMV were ELISA-positive in undiluted preparations or in preparations diluted not more than 100 times while RT-PCR was able to amplify the viral RNA from 1/1000 dilution. The results showed that RT-PCR is capable of detecting the virus titre up to 10-3 as depicted by the weak band (Figure 3). RT-PCR was more sensitive than ELISA for the detection of DsMV. Eighteen (36%) out of 50 samples collected from KRS tested positive for DsMV by RT- PCR and 10 (20%) by ELISA.
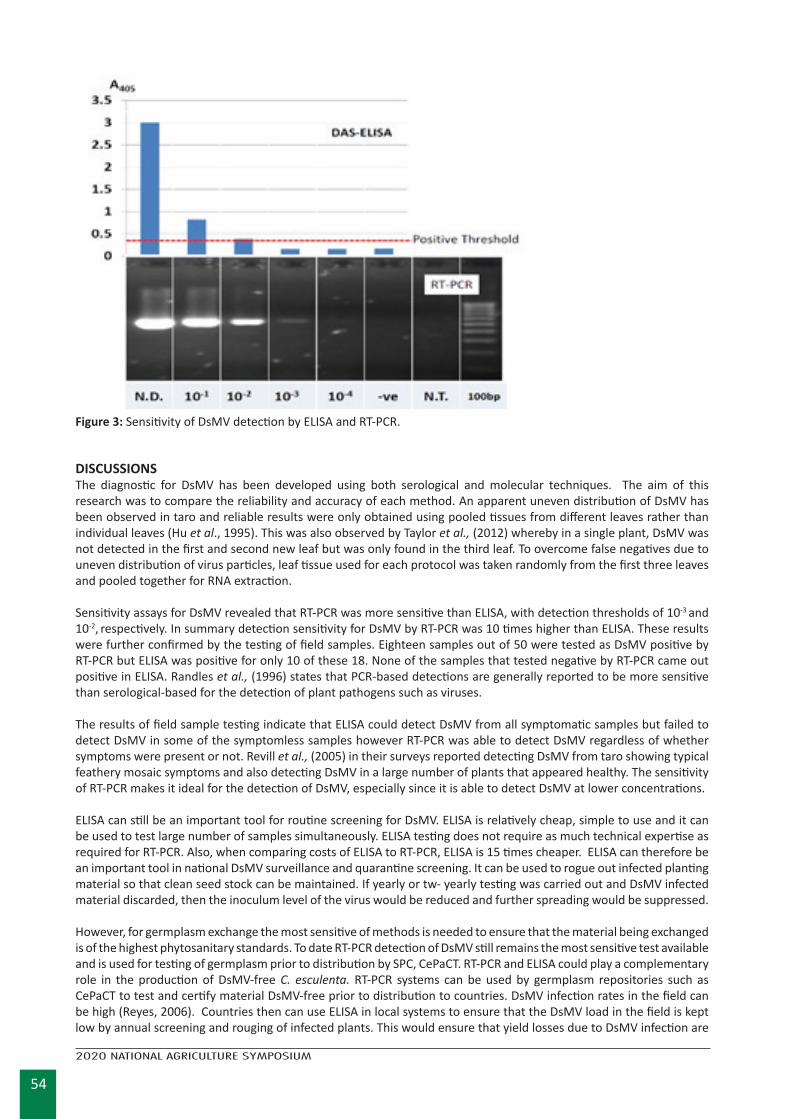
54
2020 NATIONAL AGRICULTURE SYMPOSIUM
Figure 3: Sensitivity of DsMV detection by ELISA and RT-PCR.
DISCUSSIONSThe diagnostic for DsMV has been developed using both serological and molecular techniques. The aim of this research was to compare the reliability and accuracy of each method. An apparent uneven distribution of DsMV has been observed in taro and reliable results were only obtained using pooled tissues from different leaves rather than individual leaves (Hu et al., 1995). This was also observed by Taylor et al., (2012) whereby in a single plant, DsMV was not detected in the first and second new leaf but was only found in the third leaf. To overcome false negatives due to uneven distribution of virus particles, leaf tissue used for each protocol was taken randomly from the first three leaves and pooled together for RNA extraction.
Sensitivity assays for DsMV revealed that RT-PCR was more sensitive than ELISA, with detection thresholds of 10-3 and 10-2, respectively. In summary detection sensitivity for DsMV by RT-PCR was 10 times higher than ELISA. These results were further confirmed by the testing of field samples. Eighteen samples out of 50 were tested as DsMV positive by RT-PCR but ELISA was positive for only 10 of these 18. None of the samples that tested negative by RT-PCR came out positive in ELISA. Randles et al., (1996) states that PCR-based detections are generally reported to be more sensitive than serological-based for the detection of plant pathogens such as viruses.
The results of field sample testing indicate that ELISA could detect DsMV from all symptomatic samples but failed to detect DsMV in some of the symptomless samples however RT-PCR was able to detect DsMV regardless of whether symptoms were present or not. Revill et al., (2005) in their surveys reported detecting DsMV from taro showing typical feathery mosaic symptoms and also detecting DsMV in a large number of plants that appeared healthy. The sensitivity of RT-PCR makes it ideal for the detection of DsMV, especially since it is able to detect DsMV at lower concentrations.
ELISA can still be an important tool for routine screening for DsMV. ELISA is relatively cheap, simple to use and it can be used to test large number of samples simultaneously. ELISA testing does not require as much technical expertise as required for RT-PCR. Also, when comparing costs of ELISA to RT-PCR, ELISA is 15 times cheaper. ELISA can therefore be an important tool in national DsMV surveillance and quarantine screening. It can be used to rogue out infected planting material so that clean seed stock can be maintained. If yearly or tw- yearly testing was carried out and DsMV infected material discarded, then the inoculum level of the virus would be reduced and further spreading would be suppressed.
However, for germplasm exchange the most sensitive of methods is needed to ensure that the material being exchanged is of the highest phytosanitary standards. To date RT-PCR detection of DsMV still remains the most sensitive test available and is used for testing of germplasm prior to distribution by SPC, CePaCT. RT-PCR and ELISA could play a complementary role in the production of DsMV-free C. esculenta. RT-PCR systems can be used by germplasm repositories such as CePaCT to test and certify material DsMV-free prior to distribution to countries. DsMV infection rates in the field can be high (Reyes, 2006). Countries then can use ELISA in local systems to ensure that the DsMV load in the field is kept low by annual screening and rouging of infected plants. This would ensure that yield losses due to DsMV infection are
55
2020 NATIONAL AGRICULTURE SYMPOSIUM
minimized. This is very relevant for many Pacific countries, as they do not have infrastructure required for molecular diagnostics, yet at the same time need to maintain good production of taro to meet the local and export demands. As reported by Reyes et al., (2006) DsMV is linked to yield losses.
ACKNOWLEDGMENTThe authors would like to acknowledge the funding kindly provided by the International Foundation of Sci-ence (IFS), Pacific Community (SPC) and University of the South Pacific (USP) for the work carried
REFERENCESAdams, M. J. & Antoniw, J. F. 1978. DPV Web - Descriptions of Plant Viruses. http://www.dpvweb.net, Dasheen mosaic
virus.
Babu, B., Hegde, V., Makeshkumar, T. & Jeeva, M. L. 2011. Detection and identification of Dasheen mosaic virus infect-ing Colocasia esculenta in India. Indian Journal of Virology 22, 59-62.
Brunt, A. A., Crabtree, K. & Gibbs, A. J. 1990. Viruses of tropical plants. Wallingford, UK: CABI.
Kim, M. K., Soon Bae Kwon, S. B., Yoon, J. Y., Ryu, K. H., Heo, S. J., Hong, J. K., Kim, K. H. & Choi, J. K. 2004. Characteriza-tion of a Korean isolate of Dasheen mosaic virus isolated from taro (Colocasia esculenta (L.) Schott) in Korea. The Plant Pathology Journal 20, 135-141.
Devitt, L. C., Hafner, G., Dale, J. L. & Harding, R. M. 2001. Partial characterization of a new dsRNA virus infecting taro. 1st Australian Virology Group Meeting. Fraser Island.
Hu, J. S., Meleisea, S., Wang, M., Shaarawy, M. A. & Zettler, F. W. 1995. Dasheen mosaic potyvirus in Hawaiian taro. Australasian Plant 24, 112-117.
Huang, W. Z., Chung, F. C., Chen, Y. L., Huang, C. H. & Chang, Y. C. 2005. Development and comparison of three detec-tion methods for calla lily-infecting Dasheen mosaic virus. Plant Pathology Bulletin 14, 239-250.
Jianchu, X., Yongping, Y., Yingdong, P. & Ayad, W. 2001. Genetic diversity in taro (Colocasia esculenta (L.) Schott, Ara-ceae) in China: An ethnobotanical and genetic approach. Economic Botany 55, 14-31.
Kohler, F., Pellegrin, F., Jackson, G. V. & MacKenzie, E. 1997. Taro., Diseases of Cultivated Crops in Pacific Island Coun-tries. Noumea, New Caledonia: Secretariat of the Pacific Community.
Lee, S. C. & Chang, Y. C. 2006. Multiplex RT-PCR detection of two orchid viruses with an internal control of plant nad5 mRNA. Plant Pathology Bulletin 15, 187-196.
Li, R., Mock, R., Huang, Q., Abad, J., Hartung, J. & Kinard, G. 2008. A reliable and inexpensive method of nucleic acid extraction for the PCR-based detection of diverse plant pathogens. Journal of Virological Methods 154, 48-55.
Li, R., Zettler, F., Purcifull, D. & Hiebert, E. 1998. The nucleotide sequence of the 3’-terminal region of Dasheen mosaic virus (Caladium isolate) and expression of its coat protein in Escherichia coli for antiserum production. Archives of Virology 143, 2461-2469.
Maino, M. K. 2003. The development of a serological-based diagnostic test for Dasheen mosaic potyvirus (DsMV). PhD Thesis. Queensland University of Technology, Brisbane Australia.
Manner, H. I. & Taylor, M. 2010. Farm and Forestry Production and Marketing Profile for Taro (Colocasia esculenta). In Specialty Crops for the Pacific Islands, pp. 1-32C. R. Elevitch. Tran. Holualoa, Hawaii: Permanent Agriculture Resources (PAR).
McGregor, A., Afeaki, P., Armstrong, J., Hamilton, A., Hollyer, J., Masamdu, R. & Nalder, K. 2011. Pacific island taro mar-ket access scoping study. Suva, Fiji: Facilitating Agricultural Commodity Trade (FACT) Project, Secretariat of the Pacific Community (SPC).
Menzel, W., Jelkmann, W. & Maiss, E. 2002. Detection of four apple viruses by multiplex RT-PCR assays with co-amplifi-cation of plant mRNA as internal control. Journal of Virological Methods 99, 81-92.
Pappu, S., Pappu, H., Rybicki, E. & Niblett, C. 1994a. Variability in the length of the amino terminal sequence contributes to the capsid protein diversity among dasheen mosaic potyvirus isolates. Archives of Virology 136, 407-413.
56
2020 NATIONAL AGRICULTURE SYMPOSIUM
Pappu, S., Pappu, H., Rybicki, E. & Niblett, C. 1994b. Unusual amino-terminal sequence repeat characterizes the capsid protein of dasheen mosaic potyvirus. Journal of General Virology 75, 239- 242.
Pearson, M. N., Jackson, G. V., Saelea, J. & Morar, S. G. 1999. Evidence for two rhabdoviruses in taro (Colocasia escu-lenta) in the Pacific region. Australasian Plant Pathology 28, 248-253.
Revill, P. A., Jackson, G. V. H., Hafner, G. J., Yang, I., Maino, M. K., Dowling, M. L., Devitt, L. C., Dale, J. L. & Harding, R. M. 2005. Incidence and distribution of viruses of Taro (Colocasia esculenta) in Pacific Island countries. Australasian Plant Pathology 34, 327.
Reyes, G., Rönnberg-Wästljung, A. C. & Nyman, M. 2006. Comparison of field performance between Dasheen mosaic virus-free and virus-infected in vitro plants of cocoyam (Xanthosoma spp.) in Nicaragua. Experimental Agricul-ture 42, 301-310.
Sardos, J., Noyer, J., Malapa, R., Bouchet, S. & Lebot, V. 2012. Genetic diversity of taro (Colocasia esculenta (L.) Schott) in Vanuatu (Oceania): an appraisal of the distribution of allelic diversity (DAD) with SSR markers. Genetic Re-sources and Crop Evolution 59, 805-820.
Shaw, D., Plumb, R. & Jackson, G. 1979. Virus diseases of taro (Colocasia esculenta) and Xanthosoma sp. in Papua New Guinea. Papua New Guinea Agricultural Journal 30, 71-97.
Singh, D., Jackson, G., Hunter, D., Fullerton, R., Lebot, V., Taylor, M., Iosefa, T., Okpul, T. & Tyson, J. 2012. Taro leaf blight—A Threat to food security. Agriculture 2, 182-203.
Sivaprasad, Y., Reddy, B. V., Kumar, C. V., Reddy, K. R. & Gopal, D. V. 2011. First report of groundnut bud necrosis virus infecting taro (Colocasia esculenta). Australian Plant Disease Notes 6, 30-32.
Taylor, M., Iosefa, T. & Sukal, A. 2012. Evaluation of the impact of Dasheen mosaic virus and other viruses on taro yield, Final Report. Australian Center for International Agricultural Research (ACIAR).
Thompson, J. R., Wetzel, S., Klerks, M. M., Vašková, D., Schoen, C. D., Špak, J. & Jelkmann, W. 2003. Multiplex RT-PCR detection of four aphid-borne strawberry viruses in Fragaria spp. in combination with a plant mRNA specific internal control. Journal of Virological Methods 111, 85-93.
Van der Want, J. P. H. & Dijkstra, J. 2006. A history of plant virology. Archives of Virology 151, 1467-1498.
Yang, I. C., Hafner, G. J., Dale, J. L. & Harding, R. M. 2003a. Genomic characterization of taro bacilliform virus. Archives of Virology 148, 937-949.
Yang, I. C., Hafner, G. J., Dale, J. L. & Harding, R. M. 2003b. Sequence diversity of South Pacific isolates of taro bacilliform virus and the development of a PCR-based diagnostic test. Archives of Virology 148, 1957-1968.
Yokoyama, K. M., Hollyer, J. R., Nakamoto, S. T. & Wanitprapha, K. 1989. Taro. Economic Fact Sheet #1. Honolulu, Ha-waii: Dept. of Agricultural and Resource Economics, CTAHR, University of Hawai‘i.
ZhiYou, du, Chen, J. & Hiruki, C. 2006. Optimization and application of a multiplex RT-PCR system for simultaneous de-tection of five potato viruses using 18S rRNA as an internal control. Plant Disease 90, 185-189.
Zettler, F. W. & Hartman, R. D. 1986. Dasheen mosaic virus and its control in cultivated aroids. Extension Bulletin, ASPAC Food and Fertilizer Technology Centre for the Asian and Pacific region, Taipei 101-112.
Zettler, F. W. & Hartman, R. D. 1987. Dasheen mosaic virus as a pathogen of cultivated aroids and control of the virus by tissue culture. Plant Disease 71, 958-963.
Zettler, F., Foxe, M., Hartman, R. & Edwardson, J. 1970. Filamentous viruses infecting dasheen and other araceous plants. Phytopathology 983-987.
57
2020 NATIONAL AGRICULTURE SYMPOSIUM
BIOLOGICAL STUDIES ON THE NATURAL ENEMIES IN SUPPRESSION OF COCONUT STICK INSECT, GRAEFFEA CROUANII (LE GUILLOU) IN FIJI
Deesh, Aradhana D.1, Joshi, Ravindra C.1,2, Jokhan, Anjeela D.3, Khan, Mohammed M. G.3 and Jerard, B. Augustine4
1Koronivia Research Station, Ministry of Agriculture, Nausori, Fiji2CAB International South-East Asia, Malaysia; SAFE-Network, Indonesia3Faculty of Science, Technology and Environment, University of the South Pacific, Suva, Fiji4 ICAR-CIARI, Port Blair-744105, Andaman and Nicobar Islands, India
Corresponding author: [email protected]
ABSTRACTCoconut stick insect, Graeffea crouanii (Le Guillou) is one of the important pests of coconut palms in Fiji. It causes extensive leaf damage resulting to production losses. The field surveys revealed the presence of several naturally-occurring natural enemies (predators and parasitoids) on G. crouanii in the major coconut growing regions in the Fiji Islands viz., Viti Levu, Vanua Levu and Taveuni. Two species of egg parasitoids, Paranastatus verticalis Eady and Paranastatus nigriscutellatus Eady were recorded as the most prevalent natural enemies, of which P. verticalis was the dominant species. This paper presents information from field and laboratory studies on the pest and dominant natural enemy and role of P. verticalis on the population suppression of G. crouanii in Fiji. The release of P. verticalis and field sanitation were the two best management practices identified that contributed to the improvement of plant health toward the management of G. crouanii.
Keywords: Cocos nucifera L., Coconut stick insect pest, Graeffea crouanii, natural enemies, Paranastatus verticalis, Fiji.
INTRODUCTIONCoconut palm, Cocos nucifera L., is widely regarded as “The Tree of Life” due to the use of all its parts in supporting livelihood supporting in the South Pacific. The coconut palms provide environment services, support food security and livelihood of most people in the South Pacific region. Besides, the food, nutrition, and income securities, C. nucifera is also considered as more important component for tourism industry in the South Pacific Islands Countries and Territories (Luigi, 2005). In Fiji, coconut palm is one of the most economically important crops occupying the coastal areas supporting livelihood in terms of providing food, fuel and shelter, and adding value to the tourism industry by way of beautifying the beaches. Coconuts and copra (the dried meat of the coconut) are important agricultural products that are widely used and exported from Fiji.
The coconut plantations are affected by various categories of plant pests in different growing regions, few of them are fatal to the palms. Child (1974) has reported 751 species of insects as pest of coconuts around the world. In Fiji, the coconut stick insect, Graeffea crouanii (Le Guillou) is the one of the principal insect pests causing severe losses to the coconut industry (Deesh et al. 2020). They cause severe defoliation resulting to crop losses, and even death of trees. Knowledge on the natural enemies is of paramount importance towards the development of ecologically sustainable integrated pest management approach against this chronic pest in coconut plantations.
This paper provides information from field and laboratory studies on the diversity of the naturally-occurring natural enemies, their spatial and temporal population dynamics, biology and role of the dominant egg parasitoid, Paranastatus verticalis Eady, on the population suppression of G. crouanii in Fiji. It also provides guidance on the practical integration of IPM options against G. crouanii for smallholders.
MATERIALS AND METHODS
Field Survey of Natural EnemiesField surveys for natural enemies of the coconut stick insect, Graeffea crouanii (Le Guillou) were carried out in the major coconut growing areas of three main islands of Fiji group viz., Viti Levu, Vanua Levu and Taveuni (Figure 1). The survey was confined to the wet zones of the major coconut plantations since preliminary studies between 2009 -2012 on pest status showed that the pest was localized mostly in wet areas compared to dry zone, where the incidence was at lower level (Deesh et al., 2013). The geo-positional coordinates of the surveyed area lay between 17.4057(S),
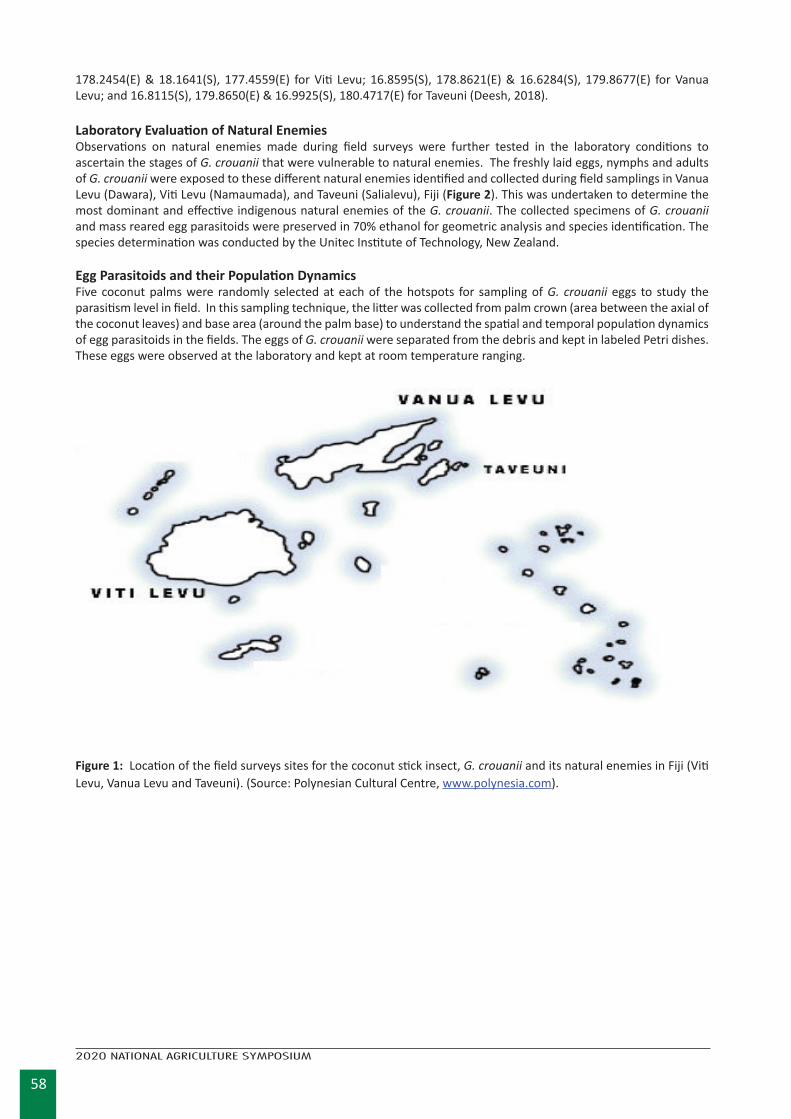
58
2020 NATIONAL AGRICULTURE SYMPOSIUM
178.2454(E) & 18.1641(S), 177.4559(E) for Viti Levu; 16.8595(S), 178.8621(E) & 16.6284(S), 179.8677(E) for Vanua Levu; and 16.8115(S), 179.8650(E) & 16.9925(S), 180.4717(E) for Taveuni (Deesh, 2018).
Laboratory Evaluation of Natural EnemiesObservations on natural enemies made during field surveys were further tested in the laboratory conditions to ascertain the stages of G. crouanii that were vulnerable to natural enemies. The freshly laid eggs, nymphs and adults of G. crouanii were exposed to these different natural enemies identified and collected during field samplings in Vanua Levu (Dawara), Viti Levu (Namaumada), and Taveuni (Salialevu), Fiji (Figure 2). This was undertaken to determine the most dominant and effective indigenous natural enemies of the G. crouanii. The collected specimens of G. crouanii and mass reared egg parasitoids were preserved in 70% ethanol for geometric analysis and species identification. The species determination was conducted by the Unitec Institute of Technology, New Zealand.
Egg Parasitoids and their Population DynamicsFive coconut palms were randomly selected at each of the hotspots for sampling of G. crouanii eggs to study the parasitism level in field. In this sampling technique, the litter was collected from palm crown (area between the axial of the coconut leaves) and base area (around the palm base) to understand the spatial and temporal population dynamics of egg parasitoids in the fields. The eggs of G. crouanii were separated from the debris and kept in labeled Petri dishes. These eggs were observed at the laboratory and kept at room temperature ranging.
Figure 1: Location of the field surveys sites for the coconut stick insect, G. crouanii and its natural enemies in Fiji (Viti Levu, Vanua Levu and Taveuni). (Source: Polynesian Cultural Centre, www.polynesia.com).
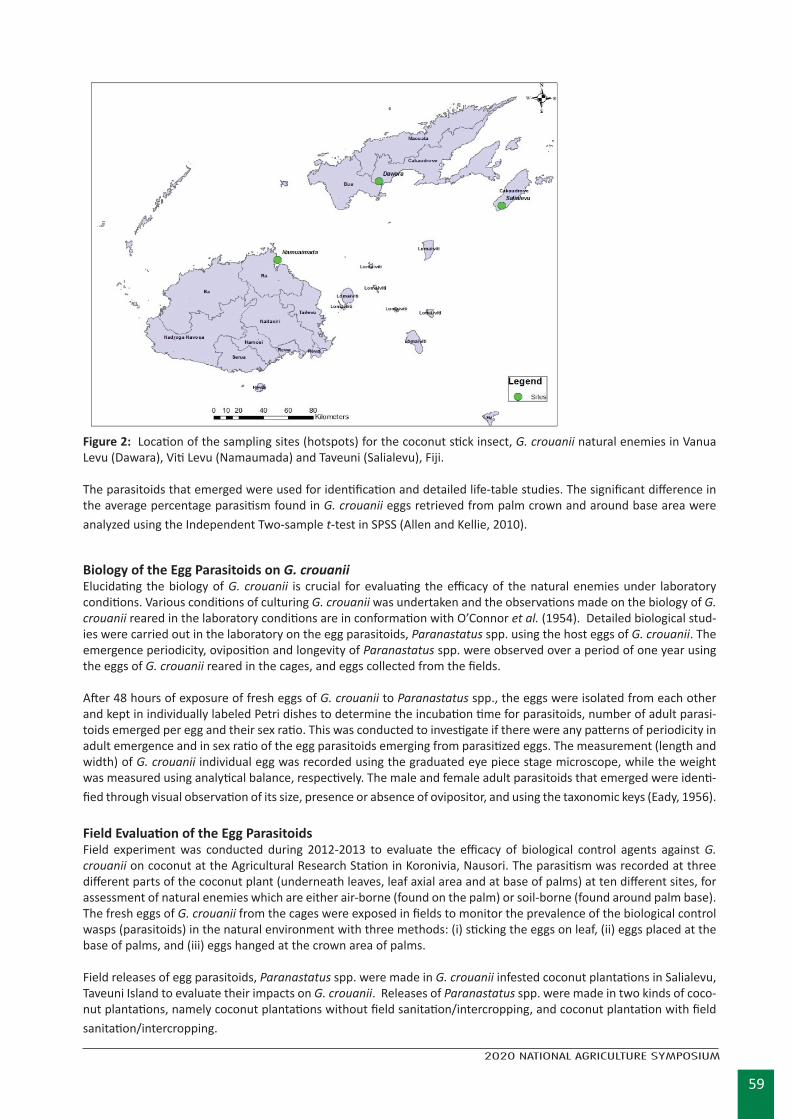
59
2020 NATIONAL AGRICULTURE SYMPOSIUM
Figure 2: Location of the sampling sites (hotspots) for the coconut stick insect, G. crouanii natural enemies in Vanua Levu (Dawara), Viti Levu (Namaumada) and Taveuni (Salialevu), Fiji.
The parasitoids that emerged were used for identification and detailed life-table studies. The significant difference in the average percentage parasitism found in G. crouanii eggs retrieved from palm crown and around base area were analyzed using the Independent Two-sample t-test in SPSS (Allen and Kellie, 2010).
Biology of the Egg Parasitoids on G. crouaniiElucidating the biology of G. crouanii is crucial for evaluating the efficacy of the natural enemies under laboratory conditions. Various conditions of culturing G. crouanii was undertaken and the observations made on the biology of G. crouanii reared in the laboratory conditions are in conformation with O’Connor et al. (1954). Detailed biological stud-ies were carried out in the laboratory on the egg parasitoids, Paranastatus spp. using the host eggs of G. crouanii. The emergence periodicity, oviposition and longevity of Paranastatus spp. were observed over a period of one year using the eggs of G. crouanii reared in the cages, and eggs collected from the fields.
After 48 hours of exposure of fresh eggs of G. crouanii to Paranastatus spp., the eggs were isolated from each other and kept in individually labeled Petri dishes to determine the incubation time for parasitoids, number of adult parasi-toids emerged per egg and their sex ratio. This was conducted to investigate if there were any patterns of periodicity in adult emergence and in sex ratio of the egg parasitoids emerging from parasitized eggs. The measurement (length and width) of G. crouanii individual egg was recorded using the graduated eye piece stage microscope, while the weight was measured using analytical balance, respectively. The male and female adult parasitoids that emerged were identi-fied through visual observation of its size, presence or absence of ovipositor, and using the taxonomic keys (Eady, 1956).
Field Evaluation of the Egg ParasitoidsField experiment was conducted during 2012-2013 to evaluate the efficacy of biological control agents against G. crouanii on coconut at the Agricultural Research Station in Koronivia, Nausori. The parasitism was recorded at three different parts of the coconut plant (underneath leaves, leaf axial area and at base of palms) at ten different sites, for assessment of natural enemies which are either air-borne (found on the palm) or soil-borne (found around palm base). The fresh eggs of G. crouanii from the cages were exposed in fields to monitor the prevalence of the biological control wasps (parasitoids) in the natural environment with three methods: (i) sticking the eggs on leaf, (ii) eggs placed at the base of palms, and (iii) eggs hanged at the crown area of palms.
Field releases of egg parasitoids, Paranastatus spp. were made in G. crouanii infested coconut plantations in Salialevu, Taveuni Island to evaluate their impacts on G. crouanii. Releases of Paranastatus spp. were made in two kinds of coco-nut plantations, namely coconut plantations without field sanitation/intercropping, and coconut plantation with field sanitation/intercropping.
60
2020 NATIONAL AGRICULTURE SYMPOSIUM
RESULTS AND DISCUSSIONS
Field Survey of Natural Enemies During the field surveys, several kinds of natural enemies were observed with different functional feeding guilds. Gen-eral predators like Indian myna (Acridotheres tristis), chicken (Gallus gallus domesticus), spiders, lizards, cattle and ants were encountered feeding on eggs, nymphs, and adults of G. crouanii in coconut plantations. Their abundance varied across sites and sampling dates. The populations of lizards and ants were highest followed by A. tristis and spiders, while the cattle and G. domesticus were very low (Table 1). Similar observations on predation by G. domesticus were reported from Tokelau Island (Dharmaraju, 1978), where they were found picking up the eggs of G. crouanii under coconut and pandanus canopies. However, in Western Samoa, Fiji and some other countries G. domesticus consumed the nymphs and adults of G. crouanii that fell on ground when palms fronds were burnt beneath the palm on a still day (Lever 1946; Lever 1947). G. domesticus managed to find all eggs on bare soil, whereas the eggs escaped predation in grassy areas. However, in our field surveys, the G. domesticus and cattle populations ranged from not present to few where the severe infestation of G. crouanii was also recorded (Deesh and Swamy, 2012). They observed that the eggs of G. crouanii were damaged by the cattle stamping eggs and nymphs in areas where cattle were allowed to graze. Hence, recommended establishing free range poultry and controlled grazing of cattle in coconut plantations as one of the ecofriendly strategies to contain the G. crouanii infestations.
Eggs of G. crouanii consumed by several predatory ant species, Pheidole megacephala and Tapinoma melanocephalum in Fiji and Tonga (O’ Connor, 1949; Bedford, 1976; Bedford, 1978; Crooker, 1979 and Singh, 1979), Solenopsis geminata (Crooker, 1979) (Mariau, 2001), and Pheidole caldwelli (Singh, 1972) have been reported. In Fiji, Singh (1977, 1979 & 1981) obtained up to 76% of predation, and highlighted major role of predators in controlling the stick insect. In Australia, eggs and young nymphs of the Phasmid Dydimuria were found in the nests of Iridomyrmex spp. (Readshaw, 1965). Dharmaraju (1978) observed the blue-tailed skink lizard (also referred to as western skink), commonly found on palm groves and the vicinity of building, predating on the eggs of G. crouanii.
Though we have good information on the diversity of predators on G. crouanii developmental stages in Fiji and across the infested Pacific Islands Countries, we currently lack data on their impacts on G. crouanii population regulation, and also on approaches to enhance their populations and predatory actions. In future more research is needed on the influence of habitat manipulation and natural enemy and pest interactions. Two species of parasitoids belonging to the Order Hymenoptera under Family Eupelmidae and Genus Paranastatus were recorded from the eggs of G. crouanii that were collected from palm crown and palm basal areas in three selected hotspots in Vanua Levu, Viti Levu and Taveuni Islands. The two egg parasitoids species were Paranastatus verticalis Eady and Paranastatus nigriscutellatus Eady (Lal, 2009), of which P. verticalis was the most dominant species. These parasitoids were described earlier by Eady (1956). In Fiji, Singh (1977, 1979 & 1981) has reported 0% to 11% parasitization by P. verticalis, while the parasitization by P. nigriscutellatus was close to nil.
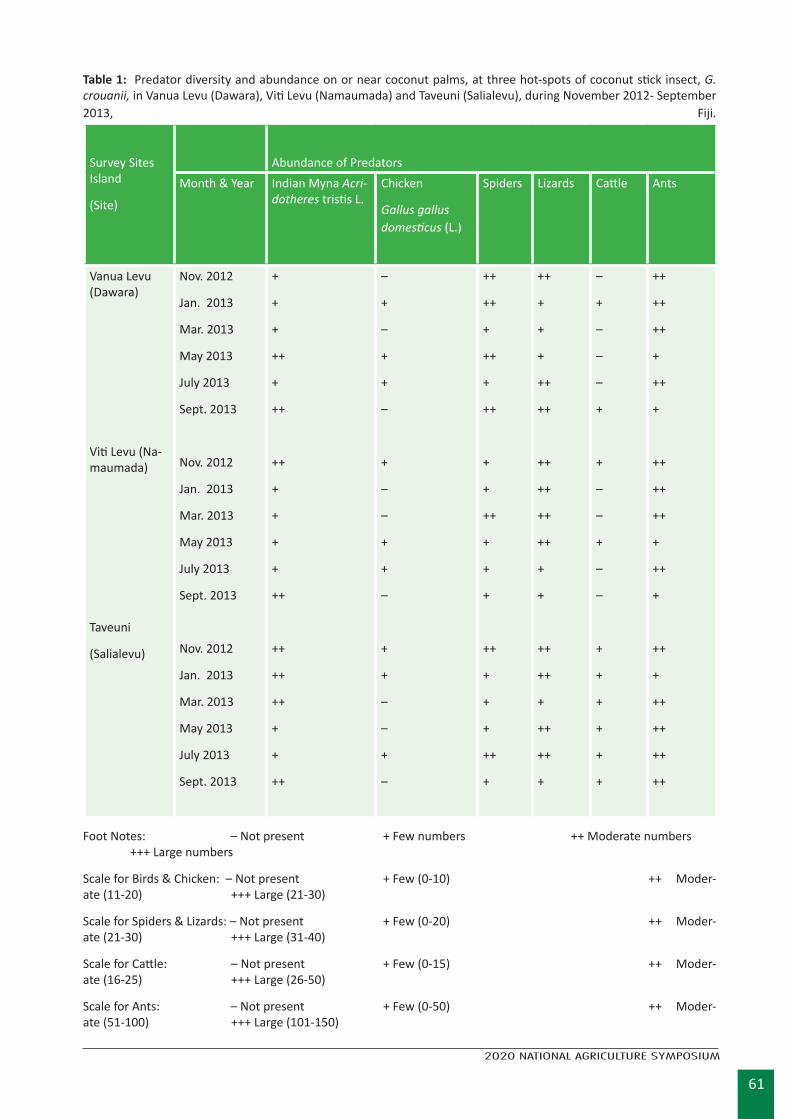
61
2020 NATIONAL AGRICULTURE SYMPOSIUM
Table 1: Predator diversity and abundance on or near coconut palms, at three hot-spots of coconut stick insect, G. crouanii, in Vanua Levu (Dawara), Viti Levu (Namaumada) and Taveuni (Salialevu), during November 2012- September 2013, Fiji.
Survey Sites Island
(Site)
Abundance of PredatorsMonth & Year Indian Myna Acri-
dotheres tristis L.Chicken
Gallus gallus domesticus (L.)
Spiders Lizards Cattle Ants
Vanua Levu (Dawara)
Viti Levu (Na-maumada)
Taveuni
(Salialevu)
Nov. 2012
Jan. 2013
Mar. 2013
May 2013
July 2013
Sept. 2013
Nov. 2012
Jan. 2013
Mar. 2013
May 2013
July 2013
Sept. 2013
Nov. 2012
Jan. 2013
Mar. 2013
May 2013
July 2013
Sept. 2013
+
+
+
++
+
++
++
+
+
+
+
++
++
++
++
+
+
++
–
+
–
+
+
–
+
–
–
+
+
–
+
+
–
–
+
–
++
++
+
++
+
++
+
+
++
+
+
+
++
+
+
+
++
+
++
+
+
+
++
++
++
++
++
++
+
+
++
++
+
++
++
+
–
+
–
–
–
+
+
–
–
+
–
–
+
+
+
+
+
+
++
++
++
+
++
+
++
++
++
+
++
+
++
+
++
++
++
++
Foot Notes: – Not present + Few numbers ++ Moderate numbers +++ Large numbers
Scale for Birds & Chicken: – Not present + Few (0-10) ++ Moder-ate (11-20) +++ Large (21-30)
Scale for Spiders & Lizards: – Not present + Few (0-20) ++ Moder-ate (21-30) +++ Large (31-40)
Scale for Cattle: – Not present + Few (0-15) ++ Moder-ate (16-25) +++ Large (26-50)
Scale for Ants: – Not present + Few (0-50) ++ Moder-ate (51-100) +++ Large (101-150)
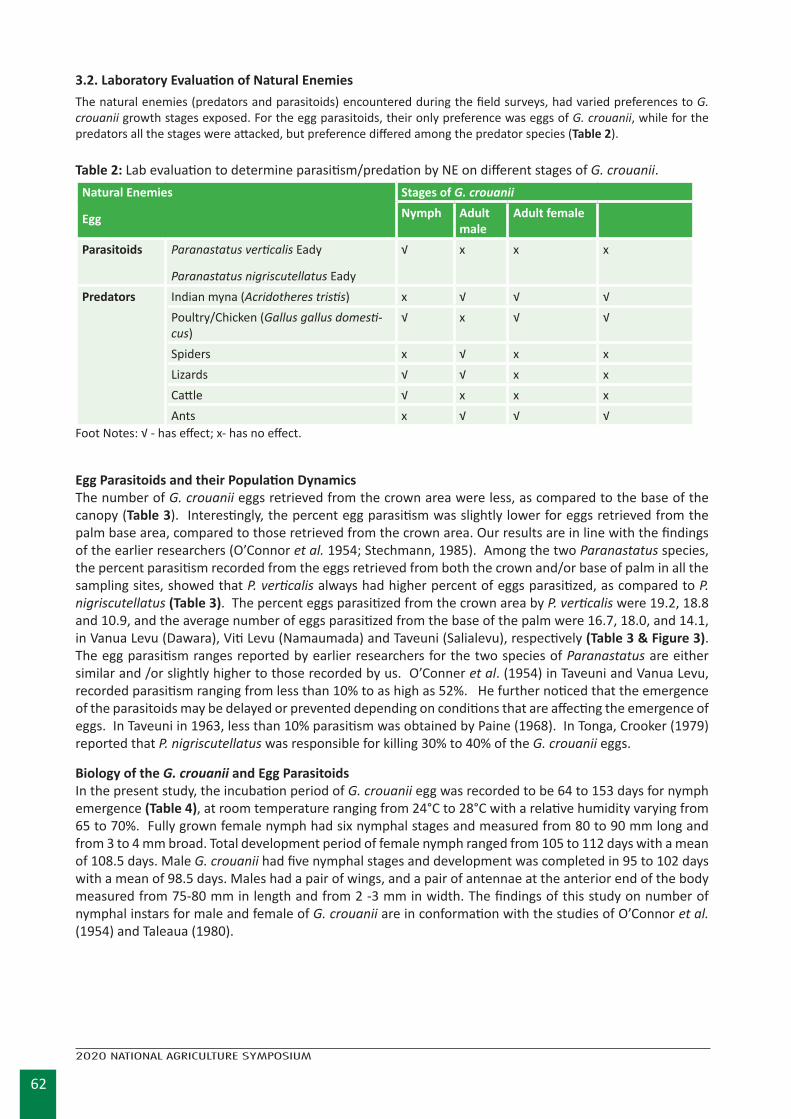
62
2020 NATIONAL AGRICULTURE SYMPOSIUM
3.2. Laboratory Evaluation of Natural Enemies The natural enemies (predators and parasitoids) encountered during the field surveys, had varied preferences to G. crouanii growth stages exposed. For the egg parasitoids, their only preference was eggs of G. crouanii, while for the predators all the stages were attacked, but preference differed among the predator species (Table 2).
Table 2: Lab evaluation to determine parasitism/predation by NE on different stages of G. crouanii. Natural Enemies
Egg
Stages of G. crouaniiNymph Adult
maleAdult female
Parasitoids Paranastatus verticalis Eady
Paranastatus nigriscutellatus Eady
√ x x x
Predators Indian myna (Acridotheres tristis) x √ √ √Poultry/Chicken (Gallus gallus domesti-cus)
√ x √ √
Spiders x √ x xLizards √ √ x x Cattle √ x x xAnts x √ √ √
Foot Notes: √ - has effect; x- has no effect.
Egg Parasitoids and their Population Dynamics The number of G. crouanii eggs retrieved from the crown area were less, as compared to the base of the canopy (Table 3). Interestingly, the percent egg parasitism was slightly lower for eggs retrieved from the palm base area, compared to those retrieved from the crown area. Our results are in line with the findings of the earlier researchers (O’Connor et al. 1954; Stechmann, 1985). Among the two Paranastatus species, the percent parasitism recorded from the eggs retrieved from both the crown and/or base of palm in all the sampling sites, showed that P. verticalis always had higher percent of eggs parasitized, as compared to P. nigriscutellatus (Table 3). The percent eggs parasitized from the crown area by P. verticalis were 19.2, 18.8 and 10.9, and the average number of eggs parasitized from the base of the palm were 16.7, 18.0, and 14.1, in Vanua Levu (Dawara), Viti Levu (Namaumada) and Taveuni (Salialevu), respectively (Table 3 & Figure 3). The egg parasitism ranges reported by earlier researchers for the two species of Paranastatus are either similar and /or slightly higher to those recorded by us. O’Conner et al. (1954) in Taveuni and Vanua Levu, recorded parasitism ranging from less than 10% to as high as 52%. He further noticed that the emergence of the parasitoids may be delayed or prevented depending on conditions that are affecting the emergence of eggs. In Taveuni in 1963, less than 10% parasitism was obtained by Paine (1968). In Tonga, Crooker (1979) reported that P. nigriscutellatus was responsible for killing 30% to 40% of the G. crouanii eggs.
Biology of the G. crouanii and Egg Parasitoids In the present study, the incubation period of G. crouanii egg was recorded to be 64 to 153 days for nymph emergence (Table 4), at room temperature ranging from 24°C to 28°C with a relative humidity varying from 65 to 70%. Fully grown female nymph had six nymphal stages and measured from 80 to 90 mm long and from 3 to 4 mm broad. Total development period of female nymph ranged from 105 to 112 days with a mean of 108.5 days. Male G. crouanii had five nymphal stages and development was completed in 95 to 102 days with a mean of 98.5 days. Males had a pair of wings, and a pair of antennae at the anterior end of the body measured from 75-80 mm in length and from 2 -3 mm in width. The findings of this study on number of nymphal instars for male and female of G. crouanii are in conformation with the studies of O’Connor et al. (1954) and Taleaua (1980).
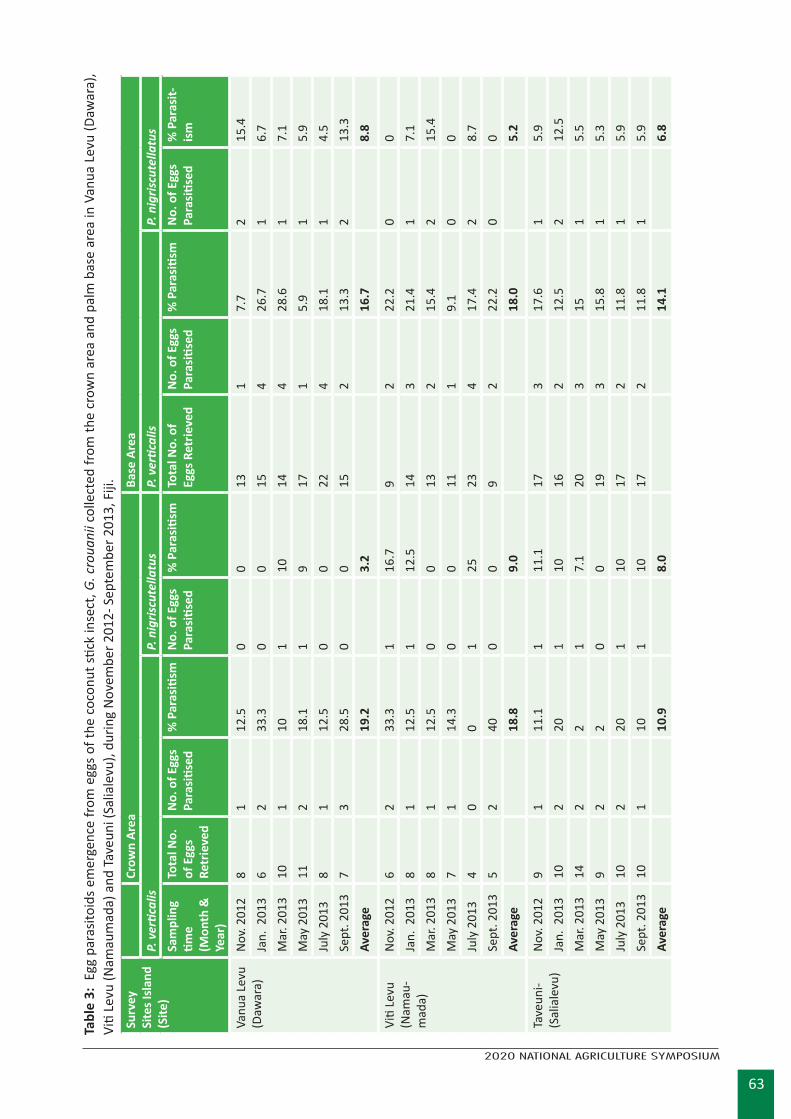
63
2020 NATIONAL AGRICULTURE SYMPOSIUM
Tabl
e 3:
Egg
par
asito
ids
emer
genc
e fr
om e
ggs
of th
e co
conu
t stic
k in
sect
, G. c
roua
nii c
olle
cted
from
the
crow
n ar
ea a
nd p
alm
bas
e ar
ea in
Van
ua L
evu
(Daw
ara)
, Vi
ti Le
vu (N
amau
mad
a) a
nd T
aveu
ni (S
alia
levu
), du
ring
Nov
embe
r 201
2- S
epte
mbe
r 201
3, F
iji.
Surv
ey
Site
s Isl
and
(Site
)
Cr
own
Area
Base
Are
aP.
ver
tical
isP.
nig
riscu
tella
tus
P. v
ertic
alis
P. n
igris
cute
llatu
sSa
mpl
ing
time
(Mon
th &
Year
)
Tota
l No.
of
Egg
s Re
trie
ved
No.
of E
ggs
Para
sitis
ed
% P
aras
itism
N
o. o
f Egg
s Pa
rasi
tised
% P
aras
itism
Tota
l No.
of
Eggs
Ret
rieve
dN
o. o
f Egg
s Pa
rasi
tised
% P
aras
itism
No.
of E
ggs
Para
sitis
ed%
Par
asit-
ism
Vanu
a Le
vu
(Daw
ara)
Nov
. 201
28
112
.50
013
17.
72
15.4
Jan.
201
36
233
.30
015
426
.71
6.7
Mar
. 201
310
110
110
144
28.6
17.
1M
ay 2
013
112
18.1
19
171
5.9
15.
9Ju
ly 2
013
81
12.5
00
224
18.1
14.
5Se
pt. 2
013
73
28.5
00
152
13.3
213
.3Av
erag
e19
.23.
216
.78.
8
Viti
Levu
(Nam
au-
mad
a)
Nov
. 201
26
233
.31
16.7
92
22.2
00
Jan.
201
38
112
.51
12.5
143
21.4
17.
1M
ar. 2
013
81
12.5
00
132
15.4
215
.4M
ay 2
013
71
14.3
00
111
9.1
00
July
201
34
00
125
234
17.4
28.
7Se
pt. 2
013
52
400
09
222
.20
0Av
erag
e18
.89.
018
.05.
2
Tave
uni-
(Sal
iale
vu)
Nov
. 201
29
111
.11
11.1
173
17.6
15.
9Ja
n. 2
013
102
201
1016
212
.52
12.5
Mar
. 201
314
22
17.
120
315
15.
5M
ay 2
013
92
20
019
315
.81
5.3
July
201
310
220
110
172
11.8
15.
9Se
pt. 2
013
101
101
1017
211
.81
5.9
Aver
age
10.9
8.0
14.1
6.8
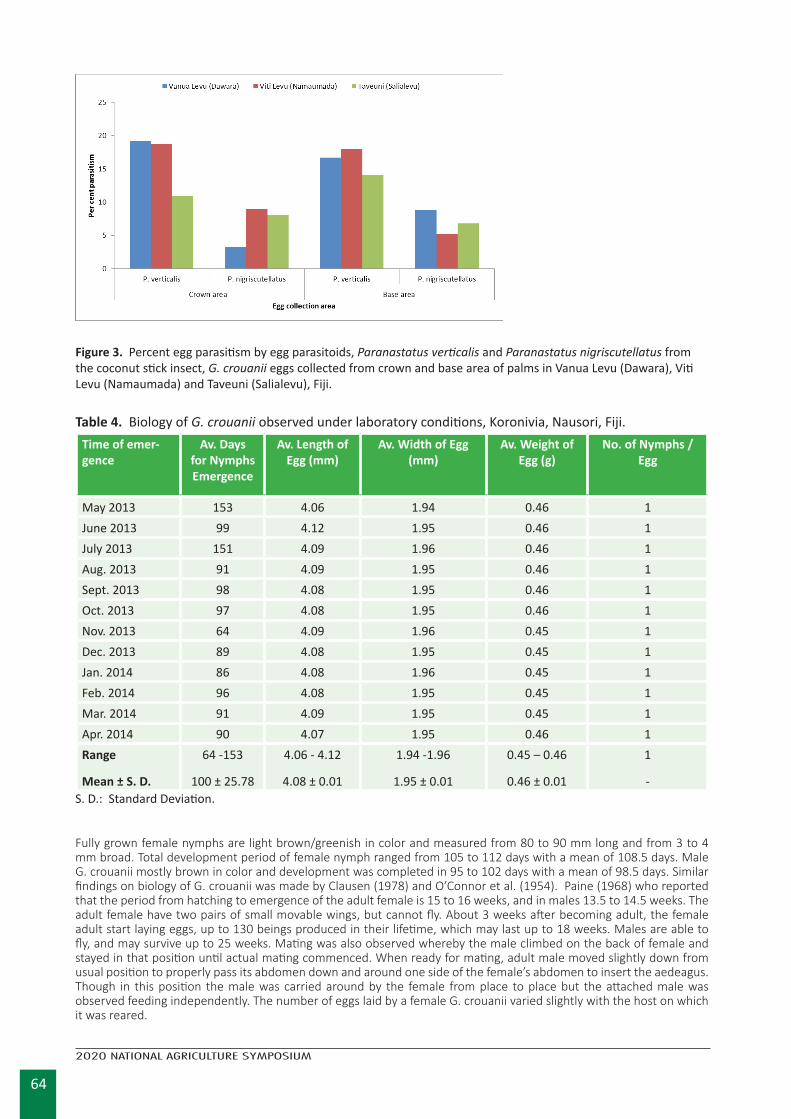
64
2020 NATIONAL AGRICULTURE SYMPOSIUM
Figure 3. Percent egg parasitism by egg parasitoids, Paranastatus verticalis and Paranastatus nigriscutellatus from the coconut stick insect, G. crouanii eggs collected from crown and base area of palms in Vanua Levu (Dawara), Viti Levu (Namaumada) and Taveuni (Salialevu), Fiji.
Table 4. Biology of G. crouanii observed under laboratory conditions, Koronivia, Nausori, Fiji.Time of emer-gence
Av. Days for Nymphs Emergence
Av. Length of Egg (mm)
Av. Width of Egg (mm)
Av. Weight of Egg (g)
No. of Nymphs /Egg
May 2013 153 4.06 1.94 0.46 1June 2013 99 4.12 1.95 0.46 1July 2013 151 4.09 1.96 0.46 1Aug. 2013 91 4.09 1.95 0.46 1Sept. 2013 98 4.08 1.95 0.46 1Oct. 2013 97 4.08 1.95 0.46 1Nov. 2013 64 4.09 1.96 0.45 1Dec. 2013 89 4.08 1.95 0.45 1Jan. 2014 86 4.08 1.96 0.45 1Feb. 2014 96 4.08 1.95 0.45 1Mar. 2014 91 4.09 1.95 0.45 1Apr. 2014 90 4.07 1.95 0.46 1Range
Mean ± S. D.
64 -153
100 ± 25.78
4.06 - 4.12
4.08 ± 0.01
1.94 -1.96
1.95 ± 0.01
0.45 – 0.46
0.46 ± 0.01
1
-S. D.: Standard Deviation.
Fully grown female nymphs are light brown/greenish in color and measured from 80 to 90 mm long and from 3 to 4 mm broad. Total development period of female nymph ranged from 105 to 112 days with a mean of 108.5 days. Male G. crouanii mostly brown in color and development was completed in 95 to 102 days with a mean of 98.5 days. Similar findings on biology of G. crouanii was made by Clausen (1978) and O’Connor et al. (1954). Paine (1968) who reported that the period from hatching to emergence of the adult female is 15 to 16 weeks, and in males 13.5 to 14.5 weeks. The adult female have two pairs of small movable wings, but cannot fly. About 3 weeks after becoming adult, the female adult start laying eggs, up to 130 beings produced in their lifetime, which may last up to 18 weeks. Males are able to fly, and may survive up to 25 weeks. Mating was also observed whereby the male climbed on the back of female and stayed in that position until actual mating commenced. When ready for mating, adult male moved slightly down from usual position to properly pass its abdomen down and around one side of the female’s abdomen to insert the aedeagus. Though in this position the male was carried around by the female from place to place but the attached male was observed feeding independently. The number of eggs laid by a female G. crouanii varied slightly with the host on which it was reared.
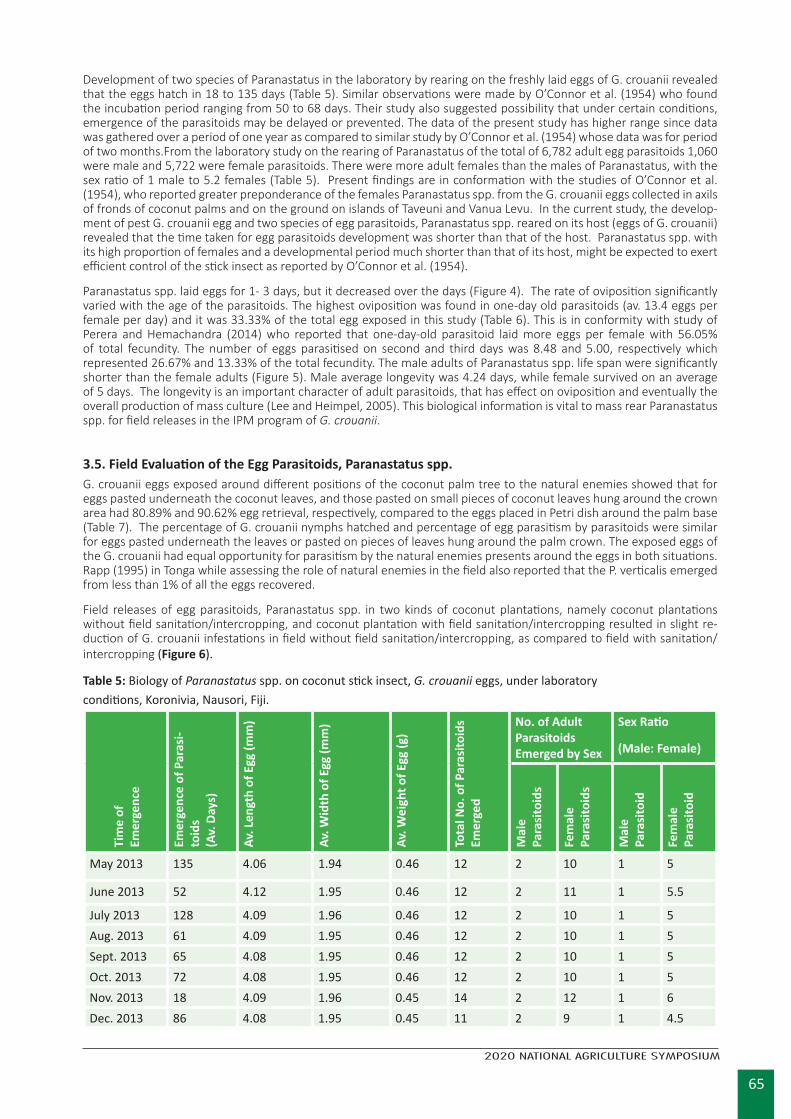
65
2020 NATIONAL AGRICULTURE SYMPOSIUM
Development of two species of Paranastatus in the laboratory by rearing on the freshly laid eggs of G. crouanii revealed that the eggs hatch in 18 to 135 days (Table 5). Similar observations were made by O’Connor et al. (1954) who found the incubation period ranging from 50 to 68 days. Their study also suggested possibility that under certain conditions, emergence of the parasitoids may be delayed or prevented. The data of the present study has higher range since data was gathered over a period of one year as compared to similar study by O’Connor et al. (1954) whose data was for period of two months.From the laboratory study on the rearing of Paranastatus of the total of 6,782 adult egg parasitoids 1,060 were male and 5,722 were female parasitoids. There were more adult females than the males of Paranastatus, with the sex ratio of 1 male to 5.2 females (Table 5). Present findings are in conformation with the studies of O’Connor et al. (1954), who reported greater preponderance of the females Paranastatus spp. from the G. crouanii eggs collected in axils of fronds of coconut palms and on the ground on islands of Taveuni and Vanua Levu. In the current study, the develop-ment of pest G. crouanii egg and two species of egg parasitoids, Paranastatus spp. reared on its host (eggs of G. crouanii) revealed that the time taken for egg parasitoids development was shorter than that of the host. Paranastatus spp. with its high proportion of females and a developmental period much shorter than that of its host, might be expected to exert efficient control of the stick insect as reported by O’Connor et al. (1954).
Paranastatus spp. laid eggs for 1- 3 days, but it decreased over the days (Figure 4). The rate of oviposition significantly varied with the age of the parasitoids. The highest oviposition was found in one-day old parasitoids (av. 13.4 eggs per female per day) and it was 33.33% of the total egg exposed in this study (Table 6). This is in conformity with study of Perera and Hemachandra (2014) who reported that one-day-old parasitoid laid more eggs per female with 56.05% of total fecundity. The number of eggs parasitised on second and third days was 8.48 and 5.00, respectively which represented 26.67% and 13.33% of the total fecundity. The male adults of Paranastatus spp. life span were significantly shorter than the female adults (Figure 5). Male average longevity was 4.24 days, while female survived on an average of 5 days. The longevity is an important character of adult parasitoids, that has effect on oviposition and eventually the overall production of mass culture (Lee and Heimpel, 2005). This biological information is vital to mass rear Paranastatus spp. for field releases in the IPM program of G. crouanii.
3.5. Field Evaluation of the Egg Parasitoids, Paranastatus spp. G. crouanii eggs exposed around different positions of the coconut palm tree to the natural enemies showed that for eggs pasted underneath the coconut leaves, and those pasted on small pieces of coconut leaves hung around the crown area had 80.89% and 90.62% egg retrieval, respectively, compared to the eggs placed in Petri dish around the palm base (Table 7). The percentage of G. crouanii nymphs hatched and percentage of egg parasitism by parasitoids were similar for eggs pasted underneath the leaves or pasted on pieces of leaves hung around the palm crown. The exposed eggs of the G. crouanii had equal opportunity for parasitism by the natural enemies presents around the eggs in both situations. Rapp (1995) in Tonga while assessing the role of natural enemies in the field also reported that the P. verticalis emerged from less than 1% of all the eggs recovered.
Field releases of egg parasitoids, Paranastatus spp. in two kinds of coconut plantations, namely coconut plantations without field sanitation/intercropping, and coconut plantation with field sanitation/intercropping resulted in slight re-duction of G. crouanii infestations in field without field sanitation/intercropping, as compared to field with sanitation/intercropping (Figure 6).
Table 5: Biology of Paranastatus spp. on coconut stick insect, G. crouanii eggs, under laboratory conditions, Koronivia, Nausori, Fiji.
Tim
e of
Em
erge
nce
Emer
genc
e of
Par
asi-
toid
s (A
v. D
ays)
Av. L
engt
h of
Egg
(mm
)
Av. W
idth
of E
gg (m
m)
Av. W
eigh
t of E
gg (g
)
Tota
l No.
of P
aras
itoid
s Em
erge
d
No. of Adult Parasitoids Emerged by Sex
Sex Ratio
(Male: Female)
Mal
e Pa
rasi
toid
s
Fem
ale
Para
sito
ids
Mal
e Pa
rasi
toid
Fem
ale
Para
sito
id
May 2013 135 4.06 1.94 0.46 12 2 10 1 5
June 2013 52 4.12 1.95 0.46 12 2 11 1 5.5
July 2013 128 4.09 1.96 0.46 12 2 10 1 5Aug. 2013 61 4.09 1.95 0.46 12 2 10 1 5Sept. 2013 65 4.08 1.95 0.46 12 2 10 1 5Oct. 2013 72 4.08 1.95 0.46 12 2 10 1 5Nov. 2013 18 4.09 1.96 0.45 14 2 12 1 6Dec. 2013 86 4.08 1.95 0.45 11 2 9 1 4.5
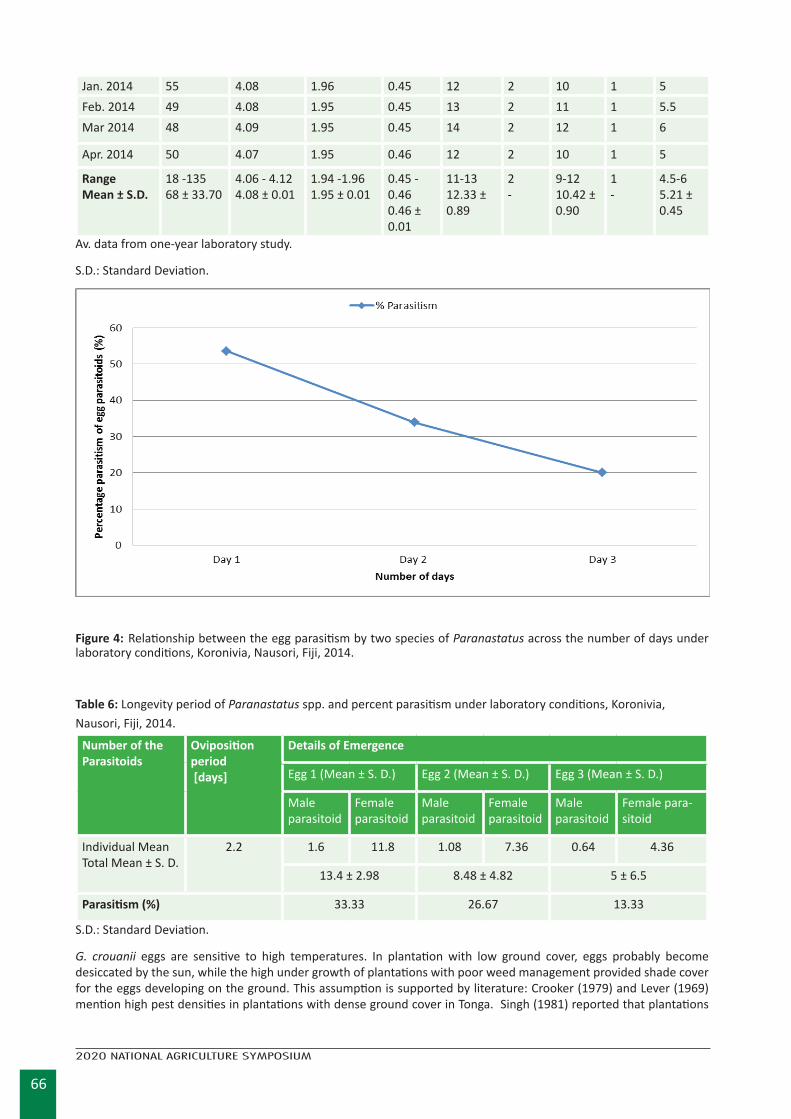
66
2020 NATIONAL AGRICULTURE SYMPOSIUM
Jan. 2014 55 4.08 1.96 0.45 12 2 10 1 5Feb. 2014 49 4.08 1.95 0.45 13 2 11 1 5.5Mar 2014 48 4.09 1.95 0.45 14 2 12 1 6
Apr. 2014 50 4.07 1.95 0.46 12 2 10 1 5
RangeMean ± S.D.
18 -13568 ± 33.70
4.06 - 4.124.08 ± 0.01
1.94 -1.961.95 ± 0.01
0.45 - 0.460.46 ± 0.01
11-1312.33 ± 0.89
2-
9-1210.42 ± 0.90
1 -
4.5-65.21 ± 0.45
Av. data from one-year laboratory study.
S.D.: Standard Deviation.
Figure 4: Relationship between the egg parasitism by two species of Paranastatus across the number of days under laboratory conditions, Koronivia, Nausori, Fiji, 2014.
Table 6: Longevity period of Paranastatus spp. and percent parasitism under laboratory conditions, Koronivia, Nausori, Fiji, 2014.
Number of the Parasitoids
Oviposition period [days]
Details of Emergence
Egg 1 (Mean ± S. D.) Egg 2 (Mean ± S. D.) Egg 3 (Mean ± S. D.)
Male parasitoid
Female parasitoid
Male parasitoid
Female parasitoid
Male parasitoid
Female para-sitoid
Individual MeanTotal Mean ± S. D.
2.2 1.6 11.8 1.08 7.36 0.64 4.36
13.4 ± 2.98 8.48 ± 4.82 5 ± 6.5
Parasitism (%) 33.33 26.67 13.33
S.D.: Standard Deviation.
G. crouanii eggs are sensitive to high temperatures. In plantation with low ground cover, eggs probably become desiccated by the sun, while the high under growth of plantations with poor weed management provided shade cover for the eggs developing on the ground. This assumption is supported by literature: Crooker (1979) and Lever (1969) mention high pest densities in plantations with dense ground cover in Tonga. Singh (1981) reported that plantations
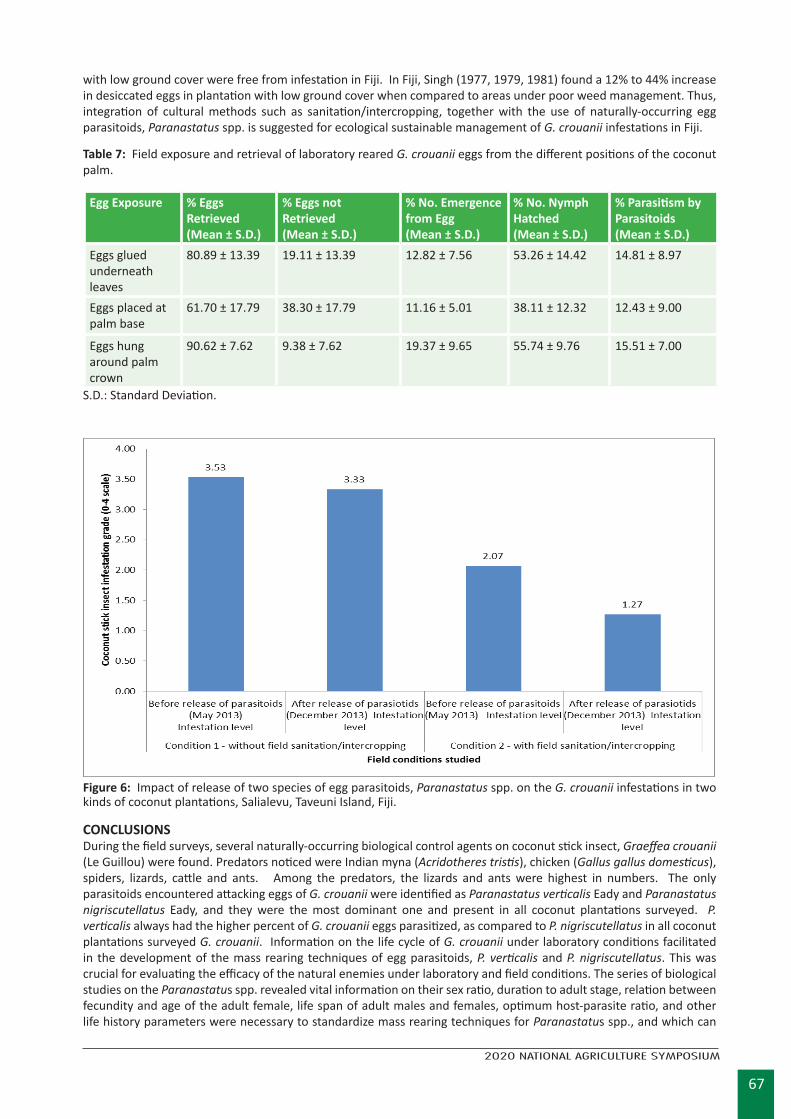
67
2020 NATIONAL AGRICULTURE SYMPOSIUM
with low ground cover were free from infestation in Fiji. In Fiji, Singh (1977, 1979, 1981) found a 12% to 44% increase in desiccated eggs in plantation with low ground cover when compared to areas under poor weed management. Thus, integration of cultural methods such as sanitation/intercropping, together with the use of naturally-occurring egg parasitoids, Paranastatus spp. is suggested for ecological sustainable management of G. crouanii infestations in Fiji.
Table 7: Field exposure and retrieval of laboratory reared G. crouanii eggs from the different positions of the coconut palm.
Egg Exposure % Eggs Retrieved(Mean ± S.D.)
% Eggs not Retrieved(Mean ± S.D.)
% No. Emergence from Egg(Mean ± S.D.)
% No. Nymph Hatched(Mean ± S.D.)
% Parasitism by Parasitoids(Mean ± S.D.)
Eggs glued underneath leaves
80.89 ± 13.39 19.11 ± 13.39 12.82 ± 7.56 53.26 ± 14.42 14.81 ± 8.97
Eggs placed at palm base
61.70 ± 17.79 38.30 ± 17.79 11.16 ± 5.01 38.11 ± 12.32 12.43 ± 9.00
Eggs hung around palm crown
90.62 ± 7.62 9.38 ± 7.62 19.37 ± 9.65 55.74 ± 9.76 15.51 ± 7.00
S.D.: Standard Deviation.
Figure 6: Impact of release of two species of egg parasitoids, Paranastatus spp. on the G. crouanii infestations in two kinds of coconut plantations, Salialevu, Taveuni Island, Fiji.
CONCLUSIONSDuring the field surveys, several naturally-occurring biological control agents on coconut stick insect, Graeffea crouanii (Le Guillou) were found. Predators noticed were Indian myna (Acridotheres tristis), chicken (Gallus gallus domesticus), spiders, lizards, cattle and ants. Among the predators, the lizards and ants were highest in numbers. The only parasitoids encountered attacking eggs of G. crouanii were identified as Paranastatus verticalis Eady and Paranastatus nigriscutellatus Eady, and they were the most dominant one and present in all coconut plantations surveyed. P. verticalis always had the higher percent of G. crouanii eggs parasitized, as compared to P. nigriscutellatus in all coconut plantations surveyed G. crouanii. Information on the life cycle of G. crouanii under laboratory conditions facilitated in the development of the mass rearing techniques of egg parasitoids, P. verticalis and P. nigriscutellatus. This was crucial for evaluating the efficacy of the natural enemies under laboratory and field conditions. The series of biological studies on the Paranastatus spp. revealed vital information on their sex ratio, duration to adult stage, relation between fecundity and age of the adult female, life span of adult males and females, optimum host-parasite ratio, and other life history parameters were necessary to standardize mass rearing techniques for Paranastatus spp., and which can
68
2020 NATIONAL AGRICULTURE SYMPOSIUM
be used in future to manage G. crouanii infestations. More ecological engineering research is needed in future across various agroecological zones in Fiji, where the integration of cultural and biological methods are fine-tuned for the development of the integrated pest management package against G. crouanii in Fiji Islands.
ACKNOWLEDGEMENT The senior author (A.D. Deesh) thank the University of the South Pacific (USP), Suva Fiji for the research grant, to the Unitec Institute of Technology, New Zealand for species identification of the egg parasitoids, and to the Ministry of Agriculture, Fiji for providing resources and expertise.
REFERENCESAllen, P. and Kellie, B. 2010. PASW Statistics by SPSS: A Practical Guide, Version 18.0. Cengage Learning Australia Pty
Limited.
Bedford, G. O. 1976. Description and development of the eggs of two stick insects (Phasmatodea: Phasmatidae) from New Britain. Journal of Australian Entomological Society 15: 389-393.
Bedford, G. O. 1978. Biology and Ecology of the Phasmatodea. Annual Review of Entomology 23: 125-149.
Child, R. 1974. Coconuts (Vol. 2nd). England: Longmans, Green and Co., London. pp 335.
Clausen, C.P. 1978. Introduced Parasites and Predators of Arthropod Pests and Weeds: A World Review. USDA Agricul-ture Handbook No 480, Washington.
Crooker, P. S. 1979. Final report of the research officer entomologist, Government Experimental Farm, Vaini, Tonga.
Deesh, A. D. 2018. Studies on biological control of the Coconut stick insect (Graeffea crouanii Le Guillou) pest in Fiji. School of Biological and Chemical Sciences, Faculty of Science, Technology and Environment, The University of the South Pacific, Suva Fiji. 126pp.
Deesh, A.D. and Swamy, B.N. 2012. Management of coconut stick insect (Graeffea crouanii) in Fiji. Technical Bulletin No. 1, Ministry of Primary Industries, Fiji.
Deesh, A. D., Swamy, B. N. and Khan, M.G.M. 2013. Distribution of coconut stick insect, Graeffea crouanii and its para-sitoids in selected islands of Fiji. Fiji Agricultural Journal 53 (1): 18-24.
Deesh, A.D., Jokhan, A.D., Joshi, R.C., Khan M.G.M. and Jerard, B.A. 2020. Seasonal abundance and host plants of co-conut stick insect (Graeffea crouanii Le Guillou) in coconut plantations of Fiji Islands. Journal of Plantation Crops 48 (1): 1-10.
https://updatepublishing.com/journal/index.php/JPC/article/view/6211
Dharmaraju, E. 1978. Coconut Pest Control in the Tokelau Islands. Alafua Agricultural Bulletin 3: 9-12.
Eady, R. D. 1956. Two new species of the genus Paranastatus Masi (Hymenoptera: Eupelmidae) from Fiji. Bulletin of Entomological Research 47 (1): 61-67. doi: https://doi.org/10.1017/S0007485300046514
Lal, S. N. 2009. Biological Control of Arthropods in the Pacific Island Countries-An Overview, Pacific Biological Control Workshop, Waipuna Hotel, Auckland. http://www.issg.org/cii/Electronic%20references/pii/biocontrol_work-shop_nov09/pacific_arthropods_lal.pdf
Lee, J.C. and Heimpel, G.E. 2005. Impact of flowering buckwheat on Lepidopteron cabbage pests and their parasitoids at two spatial scales. Biological Control 34: 290-301. DOI: 10.1016/j.biocontrol.2005.06.002
Lever, R. J. A. W. 1946. Insect pests in Fiji. Fiji Department of Agriculture, Fiji. https://www.amazon.com/Insect-pests-Fiji-Agriculture-Bulletin/dp/B0007JKE4Q
Lever, R. J. A. W. 1947. Insects pests of some economic crops in Fiji, Bulletin of Entomological Research 38 (1): 137-143.
Lever, R. J. A. W. 1969. Pest of coconut palm. Food and Agriculture Organization, Rome, Italy. Pages???
Luigi, G. 2005. Saving coconuts in Southeast Asia and Pacific Islands. Retrieved on 6th May 2017, from Plant Genetic Resources News from the Pacific: http://papgren.blogspot.com
Mariau, D. 2001. The fauna of oil palm and coconut: insect and mites pests and their natural enemies. Translated from the French by Peter Biggins. Montpellier, France, CIRAD, 264pp. http://agritrop.cirad.fr/488607/
69
2020 NATIONAL AGRICULTURE SYMPOSIUM
O’Connor, B. A., Pillai, J. S. and Singh, S. R. 1954. Notes on the coconut stick insect, Graeffea crouanii Le Guillou. Agri-cultural Journal 25 (3&4): 89-92.
O’Connor, B. A. 1949. Some insect pests of Tonga. Fiji Agriculture Journal 20 (2): 47-57.
Paine, R. 1968. Investigations for the biological control in Fiji of the Coconut Stick-insect Graeffea crouanii (Le Guillou). Bulletin of Entomological Research 57 (4): 567-604.
Perera, M. C. and Hemachandra, K. S. 2014. Study of Longevity, Fecundity and Oviposition of Trichogrammatoidea bactrae Nagaraja (Hymenoptera: Trichogrammatidae) to Facilitate Mass Rearing. Tropical Agricultural Research 25 (4): 602-609.
https://www.pgia.ac.lk/files/Annual_congress/journel/Journal-No%204/Journal-No%204/Poster/14.%20M.C.D.%20Perera%20-%2040%20%20%20-OK.pdf
Rapp, G. 1995. Eggs of the stick insect Graeffea crouanii Le Guillou (Orthoptera, Phasmidae). Mortality after expo-sure to natural enemies and high temperature. Journal of Applied Entomology 119 (1-5): 89-91. https://doi.org/10.1111/j.1439-0418.1995.tb01249.x
Readshaw, J. L. 1965. A theory of phasmatid outbreak release. Australian Journal of Zoology 13: 475-490.
Singh, S. R. 1972. Coconut stick insect Graeffea crouanii Le Guillou. Report to Chairman on Coconut Pest and Disease, Fiji.
Singh, S. R. 1977. Control of the coconut stick insect Graeffea crouanii Le Guillou (Phasmatida: Phasmatidae). Annual Research Report 1977. Department of Agriculture, Fiji.
Singh, S. R. 1979. Control of the coconut stick insect Graeffea crouanii Le Guillou (Phasmatidea: Phasmatidae). Annual Research Report 1979. Department of Agriculture, Fiji.
Singh, S. R. 1981. Ecological studies on coconut stick insect Graeffea crouanii Le Guillou (Phasmatidea: Phasmatidae). Annual Research Report 1981, Department of Agriculture, Fiji.
Stechmann, D.H. 1985. Research Report. Ministry of Agriculture, Research Division, Tonga.
Taleaua, S. 1980. Pest and diseases of coconut in the South Pacific - Prepared as a partial requirement for the course AG313 Crop Protection. Project, The University of the South Pacific, Suva, Fiji.
70
2020 NATIONAL AGRICULTURE SYMPOSIUM
MANGO ANTHRACNOSE DISEASE: THE EPIDEMIOLOGY AND MANAGEMENT
Mereia FongResearch Division, Ministry of Agriculture, Fiji
Corresponding author: [email protected]
ABSTRACTMango production in Fiji incurs high losses after harvest due to postharvest diseases. Such losses not only undermine industry profitability, but also create tangible disincentives for wider smallholder participation in the industry. Recently key pathogens causing postharvest disease of mango grown in Fiji has been identified, studies on the susceptibility of local and exotic cultivars to postharvest disease and the geographical differences in the incidence of postharvest diseases. Anthracnose was first documented as a disease of mango in Fiji in 1956 and its importance as a postharvest disease of mango has been widely reported.
Anthracnose is a very common disease of mango that occurs throughout tropical regions of the world where the crop is grown. It is the most important pre- and postharvest disease of mango worldwide, and under very wet and humid conditions, anthracnose incidence can reach up to 100% of the harvested crop. Anthracnose not only makes the fruit unattractive, but also reduces fruit quality and subsequent market value. Colletotrichum gloeosporioides has been the most commonly reported causal agent of mango anthracnose throughout the world, whereas C. acutatum has been reported as a minor postharvest pathogen of mango fruit in Australia, Taiwan and India. C. gloeosporioides var. minor is a specialised form of C. gloeosporioides described by Simmonds in Australia, rarely reported, most likely due to the difficulty in distinguishing it from C. gloeosporioides on the basis of morphology.
The effective control of postharvest disease in mango can only be achieved through a combination of appropriate field and postharvest disease management strategies. Control strategies should be efficacious and cost effective, as well as be safe for agricultural workers, consumers and the environment. Anthracnose control methods reported in the literature for mango include the use of resistant cultivars, maintenance of orchard hygiene, field and postharvest fungicide application, postharvest temperature and ripening management, and the use of postharvest heat treatments.
71
2020 NATIONAL AGRICULTURE SYMPOSIUM
SESSION 3: SOIL FERTILITY
SOIL FERTILITY AND PRODUCTIVITY DECLINE RESULTING FROM TWENTY TWO YEARS OF INTENSIVE TARO CULTIVATION IN TAVEUNI, FIJI.
Ami SharmaResearch Division, Ministry of Agriculture, Fiji
Corresponding author: [email protected]
TARO GROWER SURVEY IN TAVEUNI, FIJI
Rohit Lal1, Nicholas R. Roskruge, James A. Hanly, James P. MillnerResearch Division, Ministry of Agriculture, Fiji
Corresponding author: [email protected]
EFFECTS OF COMPOSTS INTEGRATED FERTILIZATION ON GHGS EMISSIONS UNDER LOW-INPUT POTATO PRODUCTION IN AN ANDOSOL SOIL
Tekini G. Nakidakida1, Kazunori Minamikawa2 and Hisayoshi Hayashi3
1Graduate School of Life and Environmental Sciences, University of Tsukuba,Tennodai 2-1, Tsukuba, Ibaraki 305-8572, Japan.2 National Institute for Agro-Environmental Sciences (NIAES), Kannondai 3-1-1, Tsukuba, Ibaraki 305-8604, Japan.3Faculty of Life and Environmental Sciences, University of Tsukuba, Tsukuba,Tennodai 1-1-1, Ibaraki 305- 8572, Japan.
Corresponding author: [email protected]
72
2020 NATIONAL AGRICULTURE SYMPOSIUM
SESSION 3: SOIL FERTILITY
SOIL FERTILITY AND PRODUCTIVITY DECLINE RESULTING FROM TWENTY TWO YEARS OF INTENSIVE TARO CULTIVATION IN TAVEUNI, FIJI
Ami SharmaResearch Division, Ministry of Agriculture, FijiCorresponding author: [email protected]
ABSTRACTSoil degradation is the loss of actual or potential productivity and utility of the soil and it implies a decline in the soil’s inherent capacity to produce economic goods and perform environmental regulatory functions. With short-term ob-servations, the transient phenomena can be missed or misinterpreted. In general, observations made over a long pe-riod allow more rigorous conclusions with regards to decline in soil fertility. Soil data for “22-year period” was retrieved from the archival files at the Koronivia Research Station while other important information was gathered through survey questionnaire and ministry officials based on the Island. The effects of 22 years continuous cropping of taro on selected soil chemical properties and yields were studied on the island of Taveuni, Fiji.
The high native fertility levels and production potential of Taveuni andosols declined rapidly when the forest cover was replaced by the annual crop of taro. This was particularly evident from the trend analyses of the nutrient elements which, altogether with soil pH and taro yields, revealed significant declines, with the exception of exchangeable K.
Significant associations between and dependence of taro yields on soil pH, Olsen P, exchangeable Ca and exchangeable Mg were also observed. In addition, significant changes in these four chemical parameters were observed when the pre and the post cultivation levels were compared. Olsen P and exchangeable Mg were identified to be the most limiting nutrients for the taro soils of Taveuni. The archival database provides an important tool for looking at soil test trends over time on taro commercial sites.
73
2020 NATIONAL AGRICULTURE SYMPOSIUM
TARO GROWER SURVEY IN TAVEUNI, FIJI
Rohit Lal1, Nicholas R. Roskruge, James A. Hanly, James P. MillnerResearch Division, Ministry of Agriculture, Fiji
Corresponding author: [email protected]
ABSTRACTTaro (Colocasia esculenta) is a major component of socio-cultural, dietary and economic livelihood of Pacific Island countries (Onwueme, 1999; He et al., 2008). Taro is third most important economic crop in Fiji, after sugar cane and coconuts. Fiji’s total taro exports reached a peak in 2007 of approximately 12,000 tonnes, but declined over subsequent years to about half this level.
A field survey was conducted to identify the causes of declining taro exports from Taveuni, Fiji. A list frame and stratified random sampling technique was used to select the taro growers and face-to-face farmer interviews were conducted using a semi-structured research questionnaire. The results of the survey showed that taro yields in Taveuni are low (averaging of 6.9 t/ha) compared to some other taro growing areas where yields >20t/ha are more typical of high yielding crops.
Survey results showed that average nitrogen (N), phosphorus (P) and potassium (K) fertilizer use by the growers surveyed were below optimum for high yield taro crops, once crop fertilizer use efficiency was accounted for. Composite topsoil samples (0-20 cm soil depth) were collected from selected taro exporting farms on Taveuni. About three-quarters of the growers had soil Olsen P levels below 10 mg P/kg soil, which implicated Olsen P as a key yield limiting factor.
About half of growers surveyed placed fertilizers at the bottom/base of their planting hole (20 cm below soil surface), which may also influence availability of fertilizer nutrients, especially less mobile nutrients like phosphorus. About two-thirds of growers also had low soil exchangeable K levels on their farms (<0.4 me/100g).
74
2020 NATIONAL AGRICULTURE SYMPOSIUM
EFFECTS OF COMPOSTS INTEGRATED FERTILIZATION ON GHGS EMISSIONS UNDER LOW-INPUT POTATO PRODUCTION IN AN ANDOSOL SOIL
Tekini G Nakidakida1, Kazunori Minamikawa2 and Hisayoshi Hayashi3
1Graduate School of Life and Environmental Sciences, University of Tsukuba,Tennodai 2-1, Tsukuba, Ibaraki 305-8572, Japan.2 National Institute for Agro-Environmental Sciences (NIAES), Kannondai 3-1-1, Tsukuba, Ibaraki 305-8604, Japan.3Faculty of Life and Environmental Sciences, University of Tsukuba, Tsukuba,Tennodai 1-1-1, Ibaraki 305- 8572, Japan.
Corresponding author: [email protected]
ABSTRACTThe emission of greenhouse gases (GHGs) by compost in an integrated fertilization potato production system was studied. The gas measurement was carried out for a one year period within a continuous potato production study. Due to the high costs of chemical fertilizers (CF), composts were used not only as a soil amendment but as a source of nitrogen (N) to supplement the intentionally reduced N from the applied CF.
Composts used in the study are swine manure (SM) and poultry manure (PM).From the viewpoint of global warming mitigation in the construction of low-input crop production systems, it was of interest to assess whether the addition of composts can maintain or increase productivity and reduce GHGs emissions. Important agriculture GHGs measured here includes N2O, CH4 and CO2. All GHGs had peak fluxes immediately after fertilization. Carbon dioxide equivalence emission of nitrous oxide and methane were higher in SM compost.
Results were within range of previous GHG studies on Andosol soils. Global warming potential (GWP) of SM compost plots were higher compared to CF, Zero and PM compost plots. The presence of organic and inorganic N sources in integrated plots resulted in fluctuations of emissions. Compared to SM, the PM integration reduced GWP and greenhouse gas intensity and had a higher tuber yield that was not different from 100% CF plot.
75
2020 NATIONAL AGRICULTURE SYMPOSIUM
SESSION 4: CROP PRODUCTION
IMPORTANCE OF SPICE AND AROMATICS FARMING IN FIJI
Avin. A. Prasad1, Salesh Kumar1, Hirdesh. K. Sachan1 and Rishal. D. Chand1
1College of Agriculture, Fisheries and Forestry, Fiji National University, Fiji Islands
Corresponding author: [email protected]
A REVIEW OF FIJI BASIL PRODUCTION AND EXPORTS OVER THREE DECADES
Stice, KyleNadi Bay Herbs, Fiji
Corresponding author: [email protected]
76
2020 NATIONAL AGRICULTURE SYMPOSIUM
SESSION 4: CROP PRODUCTION
IMPORTANCE OF SPICE AND AROMATICS FARMING IN FIJI
Avin. A. Prasad1, Salesh Kumar1, Hirdesh. K. Sachan1 and Rishal. D. Chand1
1College of Agriculture, Fisheries and Forestry, Fiji National University, Fiji Islands
Corresponding author: [email protected]
ABSTRACTFiji being one the tropical islands in the south pacific has being experiencing vast effects of climate change. Changing climate has been affecting major agricultural production of the country, which is regarded as the backbone of Fiji. Agriculture is an important sector on which many local populations rely to sustain livelihood. Fiji has a long history of growing spice crops, however, have been given diminutive attention for local production. Spice crop not only season our food and add taste to food delicacy, but are also a source of various chemical nutraceuticals which are now widely utilized in modern medicines. Globally, various spice and aromatic plants have proven utility in curing some of very se-rious non- communicable diseases (NCD’s) affecting the country. Spice crops have shown potentials in fighting against diseases, giving immunity boost and improving general health of the country’s population. A number of aromatic crops including citronella derived from lemon grass has huge economic value, having a number of aromatic volatile oil used in perfume industry, medicine, soap making, incense sticks, and insect repellent. Additionally, import of spices is on rise and indicates the opportunity to expand local production. Fiji has been focusing and have achieved success in minimiz-ing imports and increasing export of ginger as a major exported spice crop. Turmeric with similar growth pattern to ginger has an added advantage to overturn imports and gain export potentials. Apart from ginger and turmeric there are various other spice and aromatics crops, which has a lot economic value to generate revenue and is of substantial benefit to the health industry and improving livelihoods of rural community farmers.
Key words: Spice, climate, farm, crop, aromatics, agriculture.
INTRODUCTIONSpices and aromatics plants has been integral part of every house hold culinary for centuries (Jiang, 2019). Spices as believed not only enhance aroma, flavor and color in food and beverages but is also utilized for medicinal purpose in providing protection against many acute and chronic diseases (Jiang, 2019). As being a tropical island nation, Fiji has the capacity to expand its spice and aromatic farming sector and rely the importance of practicing spice growing to decrease Fiji’s spice import status. Traditionally, people have used lemon grass (Cymbopogon citratus) for tea and plant parts have been used in preparation of volatile oils used in perfume industry, anti-inflammatory, antiseptic, antifever and pest’s industry (Chand et al, 2018). Similarly, various spice and aromatic crop with likes of ginger, turmeric, garlic, onion and to name few has been used in preparation of various traditional medicine as immunity boost supplement.
Spice and aromatics plants have also shown positive results in acquiring majority of the antioxidants needed by the hu-man body (Rubio et al, 2013). Aroma compounds excreted from spices play a very important role in flavourant produc-tion, which is a very vital ingredient for majority of the food industries in Fiji. They are classified by various functional groups, e.g. aldehydes, amines, alcohols, ethers, esters, ketones, thiols and other miscellaneous compounds (Par-thasarathy et al, 2008). Fiji’s spice and aromatic area of production has been limited if compared to other important horticultural fruits and vegetables. Ginger own majority of organoleptic properties of two constituent classes: flavor and odour, which is determined by constituents of steam- volatile oil. Whereas its pungency is determined by non- steam volatile components chemically known as gingerols (Parthasarathy et al, 2008). In cardamom major aroma com-pound is dominated through oxygenated compounds, which is determined by very little sesquiterpenic hydrocarbons (Parthasarathy et al, 2008). Cinnamon, attributed through volatile oil has potential delicate and spicy aroma. Which is a vital ingredient in masala and curry powder. Turmeric on a contrary note has a number of antibacterial properties with major active compound curcumin responsible for improving cardiovascular, gastrointestinal, joint and muscle health. Garlic with presence of allicin as the major bio active component play a very important role in endothelial functions of cardiovascular health. Also regarded as an important component in lowering blood cholesterol and improving brain health (Jiang, 2019). Black pepper is regarded as the king of all the spices (Thangaselvabal et al. 2008).
Similarly, main aromatic plants of Fiji have equal potentials to sustain local needs and minimize import of herbs in the
77
2020 NATIONAL AGRICULTURE SYMPOSIUM
country. Main aromatic plants include basil, parsley, rosemary, oregano, dill, thyme, spear mint and vanilla. This paper will discuss on importance of spice and aromatic farming in Fiji with statistics reflection and application of spice and aromatic plants in Fiji.
METHODOLOGYResearch method used was qualitative, as various books, journal articles and other forms of online resources were cited in complication of this review paper. Majority of data collected were referred to Fiji Agriculture context, as all the crops mentioned has potentials to be established in Fiji. Major focus area was importance of spice and aromatic farming in Fiji. Major focus of study was common spice and aromatic crops. All information’s used in compilation of this paper were cited and mentioned in the reference section.
HistoryFiji has a long history of spice and aromatic plants. Initiatives on were brought in by Dr. Ronald Gatty on development of spice crops in Fiji. He started experimenting on spices and aromatic plants at his land namely Spices of Fiji limited, Wainadoi, Navua; critically analyzing the agricultural situation in Fiji (Luzius, 2006). Dr. Gatty’s objective was not to replace sugarcane or rice crops, which were grown on large scale but to cultivate root crops and sustain subsistence farming, which eventually did not solve the problem of migration from rural to urban areas as root crops had fewer market. He was interested in retaining people locally and finally came to conclusion that promotion of horticultural crops especially spices viz. vanilla, cinnamon, pepper and nutmeg can change rural life in Fiji (Luzius, 2006). He founded the spices of Fiji Limited and took the responsibility of packaging, marketing and exporting.
Dr. Gatty exhorted people to go for cultivation of spice crops and started purchasing them upon which it enabled the farmers to go out of their village by keeping purity and innovation in his products like vanilla extract, vanilla paste, cin-namon powder etc. Approximately 97 % of the spice products of Spices of Fiji is exported, while remaining 3 % is sold in the local market. To sustain local spice and aromatics need, majority of the spice is imported in the country through major industrial importers such as Punja’s Fiji Limited and other local importers after which it is distributed to local super markets.
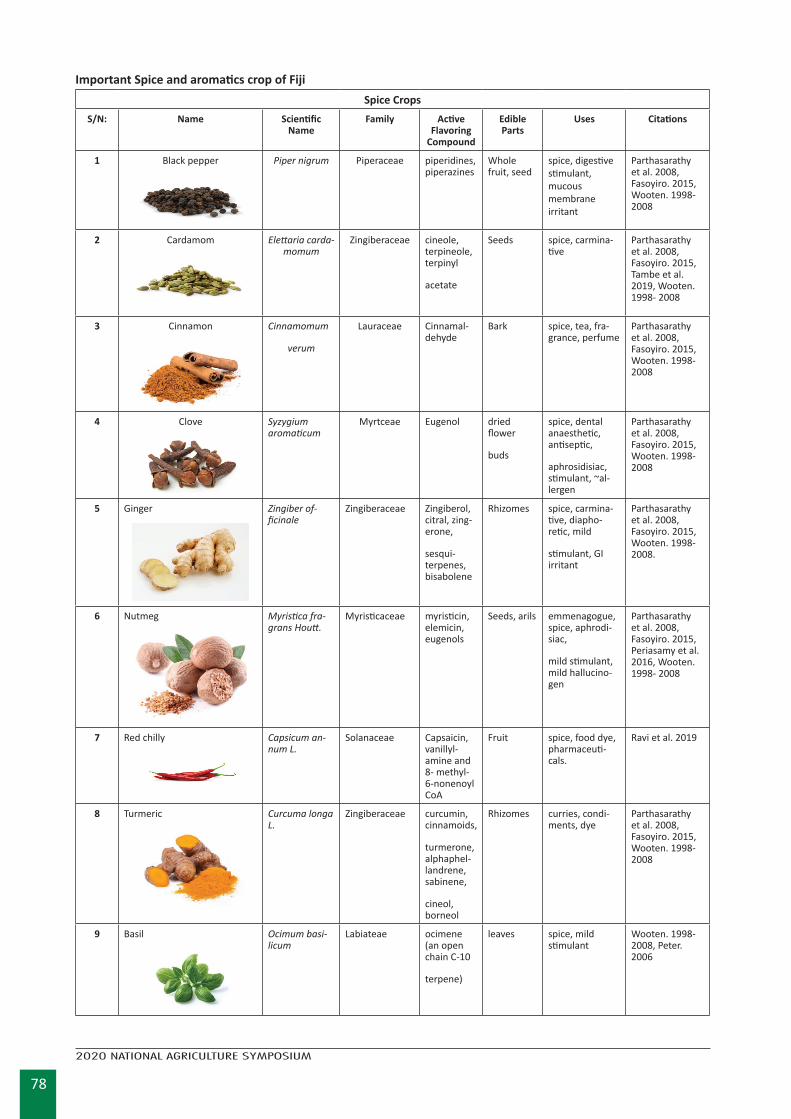
78
2020 NATIONAL AGRICULTURE SYMPOSIUM
Important Spice and aromatics crop of FijiSpice Crops
S/N: Name Scientific Name
Family Active Flavoring
Compound
Edible Parts
Uses Citations
1 Black pepper Piper nigrum Piperaceae piperidines, piperazines
Whole fruit, seed
spice, digestive stimulant, mucousmembrane irritant
Parthasarathy et al. 2008, Fasoyiro. 2015, Wooten. 1998- 2008
2 Cardamom Elettaria carda-momum
Zingiberaceae cineole, terpineole, terpinyl
acetate
Seeds spice, carmina-tive
Parthasarathy et al. 2008, Fasoyiro. 2015, Tambe et al. 2019, Wooten. 1998- 2008
3 Cinnamon Cinnamomum
verum
Lauraceae Cinnamal-dehyde
Bark spice, tea, fra-grance, perfume
Parthasarathy et al. 2008, Fasoyiro. 2015, Wooten. 1998- 2008
4 Clove Syzygium aromaticum
Myrtceae Eugenol dried flower
buds
spice, dental anaesthetic, antiseptic,
aphrosidisiac, stimulant, ~al-lergen
Parthasarathy et al. 2008, Fasoyiro. 2015, Wooten. 1998- 2008
5 Ginger Zingiber of-ficinale
Zingiberaceae Zingiberol, citral, zing-erone,
sesqui-terpenes, bisabolene
Rhizomes spice, carmina-tive, diapho-retic, mild
stimulant, GI irritant
Parthasarathy et al. 2008, Fasoyiro. 2015, Wooten. 1998- 2008.
6 Nutmeg Myristica fra-grans Houtt.
Myristicaceae myristicin, elemicin, eugenols
Seeds, arils emmenagogue, spice, aphrodi-siac,
mild stimulant, mild hallucino-gen
Parthasarathy et al. 2008, Fasoyiro. 2015, Periasamy et al. 2016, Wooten. 1998- 2008
7 Red chilly Capsicum an-num L.
Solanaceae Capsaicin, vanillyl-amine and 8- methyl-6-nonenoyl CoA
Fruit spice, food dye, pharmaceuti-cals.
Ravi et al. 2019
8 Turmeric Curcuma longa L.
Zingiberaceae curcumin, cinnamoids,
turmerone, alphaphel-landrene, sabinene,
cineol, borneol
Rhizomes curries, condi-ments, dye
Parthasarathy et al. 2008, Fasoyiro. 2015, Wooten. 1998- 2008
9 Basil Ocimum basi-licum
Labiateae ocimene (an open chain C-10
terpene)
leaves spice, mild stimulant
Wooten. 1998- 2008, Peter. 2006
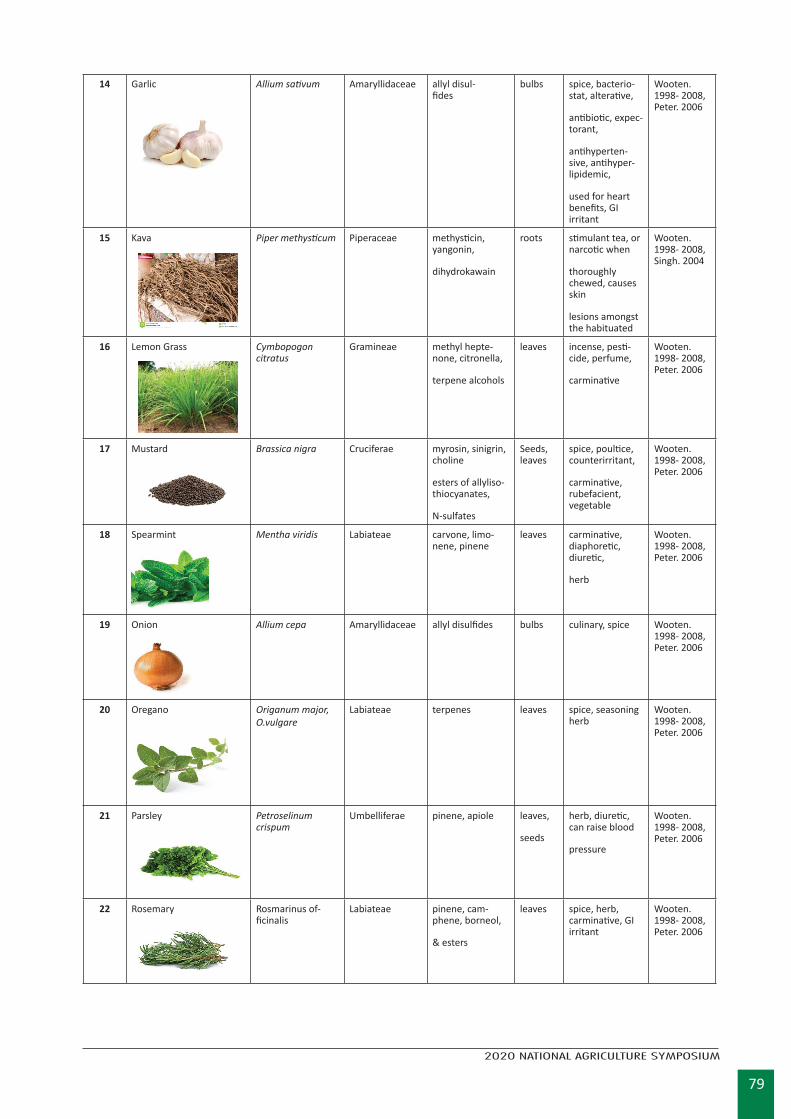
79
2020 NATIONAL AGRICULTURE SYMPOSIUM
14 Garlic Allium sativum Amaryllidaceae allyl disul-fides
bulbs spice, bacterio-stat, alterative,
antibiotic, expec-torant,
antihyperten-sive, antihyper-lipidemic,
used for heart benefits, GI irritant
Wooten. 1998- 2008, Peter. 2006
15 Kava Piper methysticum Piperaceae methysticin, yangonin,
dihydrokawain
roots stimulant tea, or narcotic when
thoroughly chewed, causes skin
lesions amongst the habituated
Wooten. 1998- 2008, Singh. 2004
16 Lemon Grass Cymbopogon citratus
Gramineae methyl hepte-none, citronella,
terpene alcohols
leaves incense, pesti-cide, perfume,
carminative
Wooten. 1998- 2008, Peter. 2006
17 Mustard Brassica nigra Cruciferae myrosin, sinigrin, choline
esters of allyliso-thiocyanates,
N-sulfates
Seeds, leaves
spice, poultice, counterirritant,
carminative, rubefacient, vegetable
Wooten. 1998- 2008, Peter. 2006
18 Spearmint Mentha viridis Labiateae carvone, limo-nene, pinene
leaves carminative, diaphoretic, diuretic,
herb
Wooten. 1998- 2008, Peter. 2006
19 Onion Allium cepa Amaryllidaceae allyl disulfides bulbs culinary, spice Wooten. 1998- 2008, Peter. 2006
20 Oregano Origanum major, O.vulgare
Labiateae terpenes leaves spice, seasoning herb
Wooten. 1998- 2008, Peter. 2006
21 Parsley Petroselinum crispum
Umbelliferae pinene, apiole leaves,
seeds
herb, diuretic, can raise blood
pressure
Wooten. 1998- 2008, Peter. 2006
22 Rosemary Rosmarinus of-ficinalis
Labiateae pinene, cam-phene, borneol,
& esters
leaves spice, herb, carminative, GI irritant
Wooten. 1998- 2008, Peter. 2006
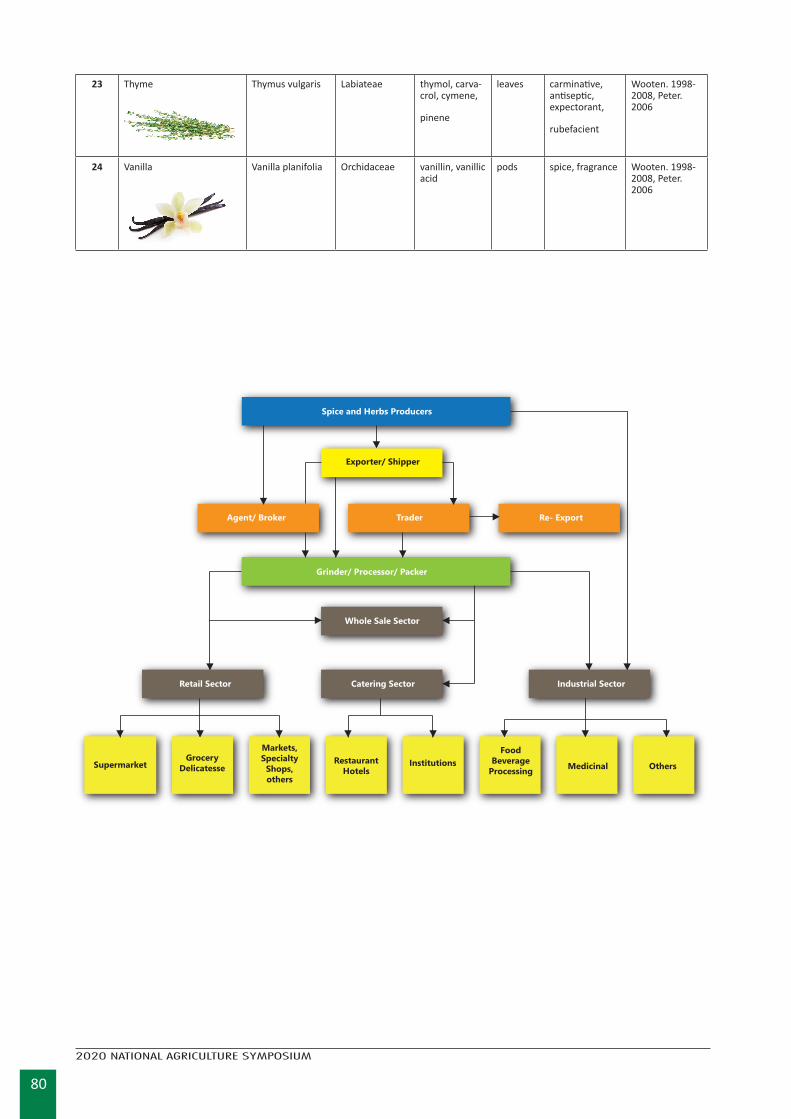
80
2020 NATIONAL AGRICULTURE SYMPOSIUM
23 Thyme Thymus vulgaris Labiateae thymol, carva-crol, cymene,
pinene
leaves carminative, antiseptic, expectorant,
rubefacient
Wooten. 1998- 2008, Peter. 2006
24 Vanilla Vanilla planifolia Orchidaceae vanillin, vanillic acid
pods spice, fragrance Wooten. 1998- 2008, Peter. 2006
SupermarketGrocery
Delicatesse
Markets,Specialty
Shops,others
FoodBeverage
Processing Medicinal OthersRestaurantHotels
Institutions
Grinder/ Processor/ Packer
Whole Sale Sector
Retail Sector Catering Sector
Agent/ Broker Trader Re- Export
Exporter/ Shipper
Spice and Herbs Producers
Industrial Sector
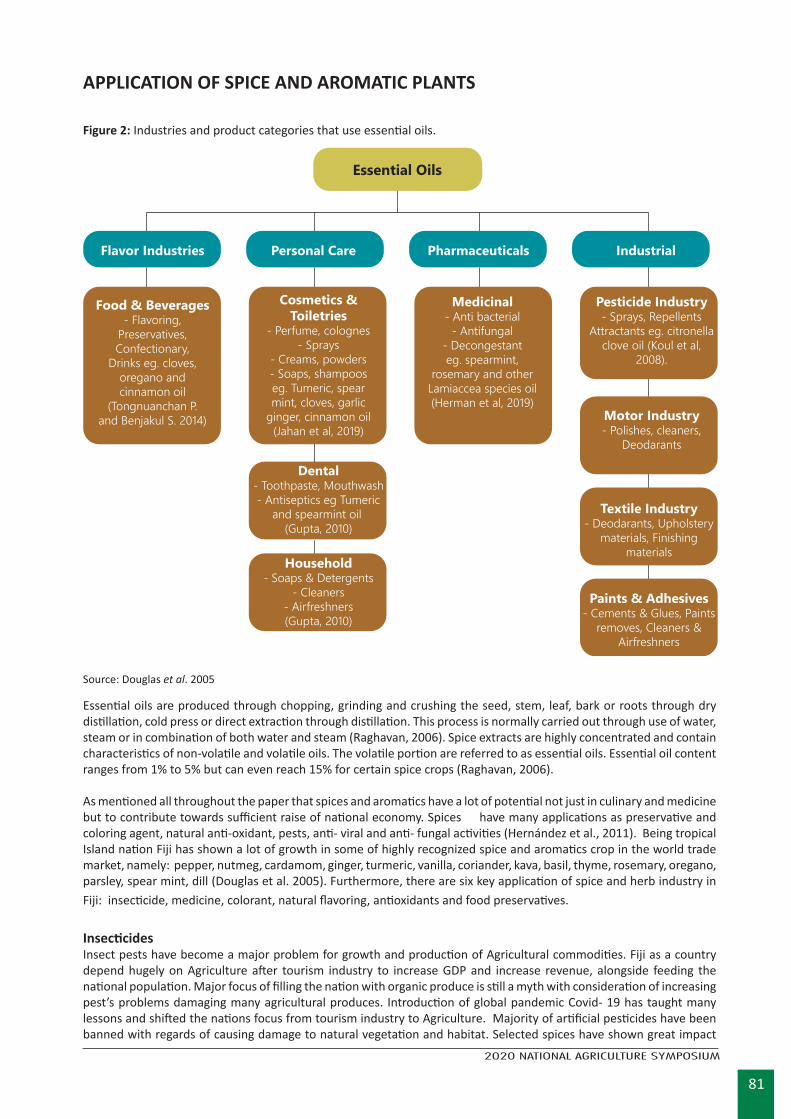
81
2020 NATIONAL AGRICULTURE SYMPOSIUM
APPLICATION OF SPICE AND AROMATIC PLANTS
Figure 2: Industries and product categories that use essential oils.
Essential Oils
Flavor Industries
Food & Beverages- Flavoring,
Preservatives,Confectionary,
Drinks eg. cloves,oregano andcinnamon oil
(Tongnuanchan P.and Benjakul S. 2014)
Cosmetics &Toiletries
- Perfume, colognes- Sprays
- Creams, powders- Soaps, shampooseg. Tumeric, spearmint, cloves, garlic
ginger, cinnamon oil(Jahan et al, 2019)
Medicinal- Anti bacterial
- Antifungal- Decongestanteg. spearmint,
rosemary and otherLamiaccea species oil(Herman et al, 2019)
Pesticide Industry- Sprays, Repellents
Attractants eg. citronellaclove oil (Koul et al,
2008).
Motor Industry- Polishes, cleaners,
Deodarants
Textile Industry- Deodarants, Upholstery
materials, Finishingmaterials
Paints & Adhesives- Cements & Glues, Paints
removes, Cleaners &Airfreshners
Dental- Toothpaste, Mouthwash- Antiseptics eg Tumeric
and spearmint oil (Gupta, 2010)
Household- Soaps & Detergents
- Cleaners- Airfreshners(Gupta, 2010)
Personal Care Pharmaceuticals Industrial
Source: Douglas et al. 2005
Essential oils are produced through chopping, grinding and crushing the seed, stem, leaf, bark or roots through dry distillation, cold press or direct extraction through distillation. This process is normally carried out through use of water, steam or in combination of both water and steam (Raghavan, 2006). Spice extracts are highly concentrated and contain characteristics of non-volatile and volatile oils. The volatile portion are referred to as essential oils. Essential oil content ranges from 1% to 5% but can even reach 15% for certain spice crops (Raghavan, 2006).
As mentioned all throughout the paper that spices and aromatics have a lot of potential not just in culinary and medicine but to contribute towards sufficient raise of national economy. Spices have many applications as preservative and coloring agent, natural anti-oxidant, pests, anti- viral and anti- fungal activities (Hernández et al., 2011). Being tropical Island nation Fiji has shown a lot of growth in some of highly recognized spice and aromatics crop in the world trade market, namely: pepper, nutmeg, cardamom, ginger, turmeric, vanilla, coriander, kava, basil, thyme, rosemary, oregano, parsley, spear mint, dill (Douglas et al. 2005). Furthermore, there are six key application of spice and herb industry in Fiji: insecticide, medicine, colorant, natural flavoring, antioxidants and food preservatives.
InsecticidesInsect pests have become a major problem for growth and production of Agricultural commodities. Fiji as a country depend hugely on Agriculture after tourism industry to increase GDP and increase revenue, alongside feeding the national population. Major focus of filling the nation with organic produce is still a myth with consideration of increasing pest’s problems damaging many agricultural produces. Introduction of global pandemic Covid- 19 has taught many lessons and shifted the nations focus from tourism industry to Agriculture. Majority of artificial pesticides have been banned with regards of causing damage to natural vegetation and habitat. Selected spices have shown great impact
82
2020 NATIONAL AGRICULTURE SYMPOSIUM
on controlling insect pests in agricultural. Plants are an alternate source of bio- agents for insect control as it contains vast range of bioactive chemical compound. Many of this chemical compound have very little rather selective effects on insect pests (Ravi et al, 2019). Volatile oil extracted from cardamom has shown potential effects in destroying various stages of insect infestation in wheat crop, e.g. Black spruce beetle (Tetropium castaneum). Cinnamaldehyde found in cinnamon has proved to be very beneficial in controlling major insect pests of fruit crops. e.g. Bean weevil (Acanthoscelides obtectus). Moreover, nutmeg oil possesses a strong antifungal, antibacterial and insecticidal properties. Myristicin found in nutmeg imparts hallucinogenic properties, which has proved out to be very beneficial in controlling agricultural pests (Parthasarathy et al, 2008). Citronella derived from lemon grass has shown significant effects as a major active ingredient in insect repellents and was also a very famous traditional insect repellent used as part of Fijian culture, prepared in conjunction with coconut oil.
Medicinal and antioxidantsSpices and aromatics plants contribute hugely towards medical health and wellbeing. Different parts of spice exhibit different medicinal properties in form of flowers, roots, leaves, stem and seeds (Fasoyiro, 2015). Phytochemicals present in selective spice crops have the ability to suppress active oxygen species and prevent it from getting damaged. Oxidative play an important pathological role in controlling human diseases (Fasoyiro, 2015). Diseases such as arthrosclerosis, cancer and arthritis have been linked with oxidative damage. Remedy ingredient found in spices is used for numerous local medicines in treatment of gastro- intestinal problems, dysentery, fever, tapeworms, tonsils and inflammation of throat (Fasoyiro, 2015). Spices used in foods also play an important role in fighting against toxins created by modern world activities (Raghavan, 2006). Tobacco smoke, heat, UV light, radiation and alcohol initiates free radical growth and formation in human body. Free radicals are responsible for damage of human cells and limits its ability to fight cancer, memory loss and aging. Components present in spices acts as antioxidants and have the ability to protect cells from radicals (Raghavan, 2006).
Natural flavoring and colorantsFlavor consists combination of aroma, taste and texture. It contains sensation of piney, sour, bitter, sweet, spicy, earthy, sulfury and pungent zests derived from overall combination of taste (due to non-volatile compounds) and aroma (mainly due to volatile composites) in a spice (Raghavan, 2006). Spices and aromatics are consumed in three main categories: Fresh whole spice, dried spice and spice extractives. Spice and aromatics consumed fresh include: cilantro, ginger, basil, chili pepper, onions, mints and garlics, which are famous due to its distinctive aroma, flavor and texture (Raghavan, 2006). Dried spice is mostly used after grounding them in mills into various particle sizes. Grinding generates rapid heat and air movement amongst spice that dissipates certain volatile oils and changes the natural flavor through oxidation process (Raghavan, 2006). Most spices such as coriander, cumin and cardamom tend to release more aroma and flavor, when grounded freshly compared to brought as a preground spice (Raghavan, 2006). Flavors released by spices are due to chemical compound family: phenylpropanoids, monoterpenes and phenol compounds (Torres et al, 2015). Some of the major flavoring compounds include: apiol, sufranol, eugenol, vanillin, beta caryophylenen, piperine, sabinene, alfa pinene, carvacol, cinnamaldehyde gingerol and thymol (Peter and Shylaja, 2012).
Furthermore, spices have natural colorant properties and consist of different tints in colors from orange, yellow and different variations of red (Torres et al, 2015). Spices used for coloring include: red pepper, paprika, ginger, turmeric, mustard, saffron and parsley. Coloring properties in spice is due to presence of several chemical compounds. Carotenoids are principal compound responsible for color in spice (Torres et al, 2015). Common coloring components in spices include; crocin in saffron, capsanthiin in chile pepper, carotenoids in paprika and curcumin in turmeric (Raghavan, 2006).
Food preservativeFoods are very susceptible to contamination resulted through microbes, this includes: processed meat and dairy products, which are common vector of pathogens such as: Salmonella, E. coli, Listeria monocytogenes, Clostridrium perfrigen, Straphylococcus aurens and Toxoplasma Gondi, which have been present in meat (Reuben et al, 2003). Spice such as: cumin, clove, oregano and cinnamon has shown some effective results against inoculated microorganisms on meat products, especially against gram positive and negative bacteria (Torres et al, 2015).
Cumin is traditionally used as antiseptic and possesses high anti-microbial activity in different kinds of pathogenic and non- pathogenic fungus growth and bacteria found in humans. Main component responsible for cumin essential oil and provides anti-microbial properties in cumin is cuminaldehyde. Clove also poses potential preservative properties with active ingredient eugenol, which is found in essential oil generated from cloves (Torres et al, 2015). Cinnamon contains potential preservative properties due to effective antibacterial and antimicrobial activity which inhibits bacterial growth on foods. (Winias et al, 2011).
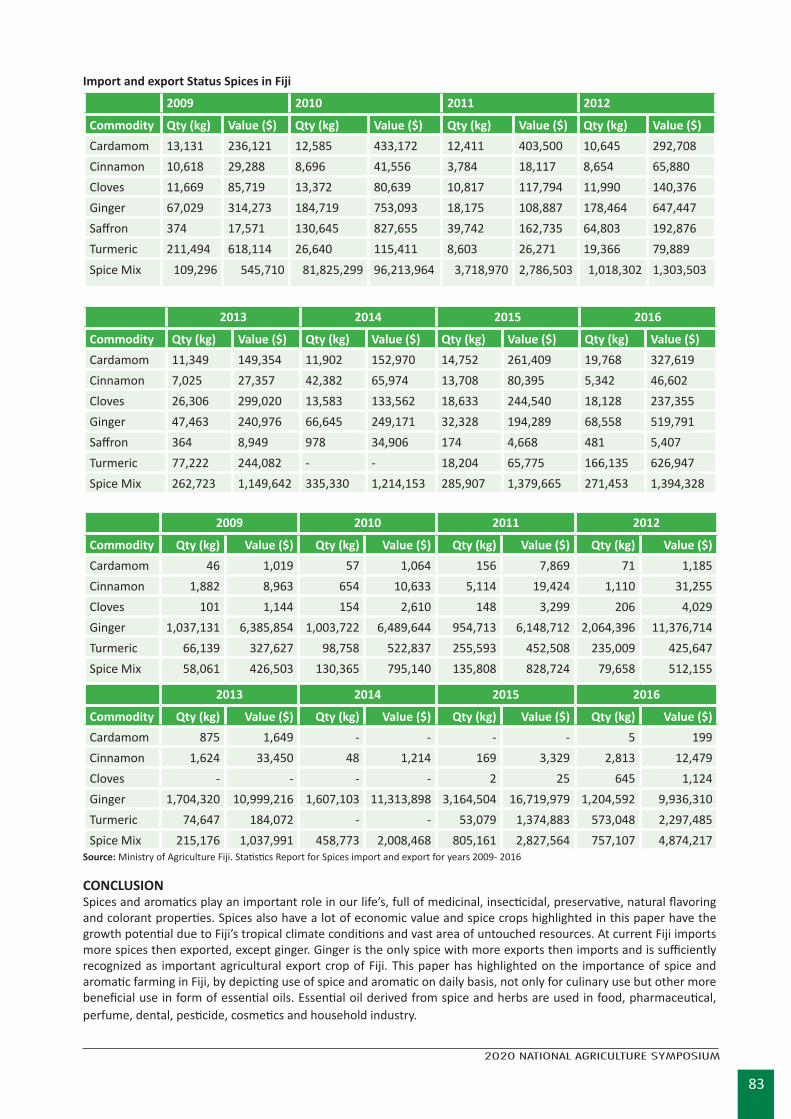
83
2020 NATIONAL AGRICULTURE SYMPOSIUM
Import and export Status Spices in Fiji
2009 2010 2011 2012
Commodity Qty (kg) Value ($) Qty (kg) Value ($) Qty (kg) Value ($) Qty (kg) Value ($)Cardamom 13,131 236,121 12,585 433,172 12,411 403,500 10,645 292,708Cinnamon 10,618 29,288 8,696 41,556 3,784 18,117 8,654 65,880Cloves 11,669 85,719 13,372 80,639 10,817 117,794 11,990 140,376Ginger 67,029 314,273 184,719 753,093 18,175 108,887 178,464 647,447Saffron 374 17,571 130,645 827,655 39,742 162,735 64,803 192,876Turmeric 211,494 618,114 26,640 115,411 8,603 26,271 19,366 79,889Spice Mix 109,296 545,710 81,825,299 96,213,964 3,718,970 2,786,503 1,018,302 1,303,503
2013 2014 2015 2016
Commodity Qty (kg) Value ($) Qty (kg) Value ($) Qty (kg) Value ($) Qty (kg) Value ($)Cardamom 11,349 149,354 11,902 152,970 14,752 261,409 19,768 327,619Cinnamon 7,025 27,357 42,382 65,974 13,708 80,395 5,342 46,602Cloves 26,306 299,020 13,583 133,562 18,633 244,540 18,128 237,355Ginger 47,463 240,976 66,645 249,171 32,328 194,289 68,558 519,791Saffron 364 8,949 978 34,906 174 4,668 481 5,407Turmeric 77,222 244,082 - - 18,204 65,775 166,135 626,947Spice Mix 262,723 1,149,642 335,330 1,214,153 285,907 1,379,665 271,453 1,394,328
2009 2010 2011 2012
Commodity Qty (kg) Value ($) Qty (kg) Value ($) Qty (kg) Value ($) Qty (kg) Value ($)Cardamom 46 1,019 57 1,064 156 7,869 71 1,185Cinnamon 1,882 8,963 654 10,633 5,114 19,424 1,110 31,255Cloves 101 1,144 154 2,610 148 3,299 206 4,029Ginger 1,037,131 6,385,854 1,003,722 6,489,644 954,713 6,148,712 2,064,396 11,376,714Turmeric 66,139 327,627 98,758 522,837 255,593 452,508 235,009 425,647Spice Mix 58,061 426,503 130,365 795,140 135,808 828,724 79,658 512,155
2013 2014 2015 2016
Commodity Qty (kg) Value ($) Qty (kg) Value ($) Qty (kg) Value ($) Qty (kg) Value ($)Cardamom 875 1,649 - - - - 5 199Cinnamon 1,624 33,450 48 1,214 169 3,329 2,813 12,479Cloves - - - - 2 25 645 1,124Ginger 1,704,320 10,999,216 1,607,103 11,313,898 3,164,504 16,719,979 1,204,592 9,936,310Turmeric 74,647 184,072 - - 53,079 1,374,883 573,048 2,297,485Spice Mix 215,176 1,037,991 458,773 2,008,468 805,161 2,827,564 757,107 4,874,217
Source: Ministry of Agriculture Fiji. Statistics Report for Spices import and export for years 2009- 2016
CONCLUSIONSpices and aromatics play an important role in our life’s, full of medicinal, insecticidal, preservative, natural flavoring and colorant properties. Spices also have a lot of economic value and spice crops highlighted in this paper have the growth potential due to Fiji’s tropical climate conditions and vast area of untouched resources. At current Fiji imports more spices then exported, except ginger. Ginger is the only spice with more exports then imports and is sufficiently recognized as important agricultural export crop of Fiji. This paper has highlighted on the importance of spice and aromatic farming in Fiji, by depicting use of spice and aromatic on daily basis, not only for culinary use but other more beneficial use in form of essential oils. Essential oil derived from spice and herbs are used in food, pharmaceutical, perfume, dental, pesticide, cosmetics and household industry.
84
2020 NATIONAL AGRICULTURE SYMPOSIUM
REFERENCES
Chand. R. R, Devi. S. S, Kumari. S.S, Kumar. S. S, Goundar. N. N, Naranyan. N and Chandra. P. (2018). TRADITIONAL USE OF MEDICINAL PLANTS AMONG SELECTED VILLAGES IN FIJI ISLANDS: A REVIEW PERSPECTIVE. Pacific Medical Student Journal, University of Fiji. Pdf.
Douglas. M, Heyes. J and Smallfield. B. (2005). Herbs, spices and essential oils. Post-harvest operations in developing countries. Food and Agriculture Organization of the United Nations. Pdf.
Fasoyiro. S (2015). The Value of Spices; Uses, Nutritional and Health Benefits. LAP LAMBERT Academic Publishing. Germany. 66 pp. Pdf.
Fiji: Cloves (whole fruit, cloves and stems), import value (US $). Retrieved from: https://www.tilasto.com/en/country/fiji/handel/cloves-import-value
Gupta. M (2010) Pharmacological Properties and Traditional Therapeutic Uses of Important Indian Spices: A Review, International Journal of Food Properties, 13:5, 1092-1116, DOI: 10.1080/10942910902963271
Herman. R. A, Ayepa. E, Shittu. S, Fometu. S. S and Wang. J (2019). Essential Oils and Their Applications -A Mini Review. Advances in Nutrition & Food Science. Volume 4, Issue 4. Retrieved from: http://www.opastonline.com/stor-age/2019/10/essential-oils-and-their-applications-a-mini-review-anfs-19.pdf
Hernández. L, Aguirre Y.B, Nevárez. G.V, Gutierrez. N. and Salas. E. (2011). Use of essential oils and extracts from spices in meat protection. Journal of Food Science and Technology.
Jahan. F, Happy. A. F, Chowdhury. M.M. H, Hossain. M. (2019). A Natural Herbs and Spices: A Great Resource for Skin Care Cosmetics. Journal of Plant Sciences. Vol. 7, No. 4, pp. 86-99. doi: 10.11648/j.jps.20190704.13
Jiang. T. A. (2019). Health Benefits of Culinary Herbs and Spices. Jiang: Journal of AOAC International Vol. 102, No. 2. Nouritek International LLC, Timonium, MD 21093. Pdf.
KOUL. O, WALIA. S AND DHALIWAL. G. S (2008). Essential Oils as Green Pesticides: Potential and Constraints. Biopesti-cides International Vol. 4, no. 1. Insect Biopesticide Research Centre, 30 Parkash Nagar, Jalandhar 144003, India; 1. Division of Agricultural Chemicals, Indian Agricultural Research Institute, New Delhi 110012, India. Pdf.
Kunnumakkara, Ajaikumar & Koca, Cemile & Dey, Sanjit & Danda, Divya & Sung, Bokyung & Aggarwal, Bharat. (2009). Traditional Uses of Spices: An Overview. Molecular Targets and Therapeutic Uses of Spices. 10.1142/9789812837912_0001.
Luzius. M. J. (2006). Agricultural firm export strategies in Fiji. Pacific Economic Bulletin Volume 21 Number 2. Asia Pa-cific Press. Pdf.
Medicinal Properties of Spices. Retrieved from: http://www.indianspices.com/sites/default/files/medicinal%20_oth-er_values_spices.pdf.
Ministry of Agriculture Fiji. Statistics Report for Spices import and export for years 2009- 2016.
Parthasarathy. V. A, Chempakam. B and Zachariah. T. J. (2008). Chemistry of Spices. Indian Institute of Spices Research Calicut, Kerala, India. 455 pp. Pdf.
Periasamy. G, Karim. A, Gibrelibanos. M, Gebremedhin. G and Gilani. A. (2016). Nutmeg (Myristica fragrans Houtt.) Oils. Essential Oils in Food Preservation, Flavor and Safety. Retrieved from: http://dx.doi.org/10.1016/B978-0-12-416641-7.00069-9
Peter, K.V. and Shylaja, M.R. (2012). Introduction to herbs and spices: definitions, trade and applications. In: The Hand-book of herbs and spices Second edition, volume 1, pp. 1-24. Woodhead Publishing.
Peter. K. V (2006). Handbook of herbs and spices. Vol 3. WOODHEAD PUBLISHING LIMITED, Cambridge, England. pp. 560. Pdf.
Raghavan. S (2006). Forms, Functions, and Applications of Spices from: Handbook of Spices, Seasonings, and Flavorings CRC Press Accessed on: 29 Oct 2020 https://www.routledgehandbooks.com/doi/10.1201/9781420004366-4
Ravi. Y, Meena. N. K and Lal. G (2019). Spices: A novel source for insect-pest management. Journal of Entomology and Zo-ology Studies. Retrieved from: https://www.entomoljournal.com/archives/2019/vol7issue2/PartL/7-1-69-627.pdf
85
2020 NATIONAL AGRICULTURE SYMPOSIUM
Reuben, A., Treminio, H., Arias, M. L., and Chaves, C. (2003) Presencia de Escherichia coli O157:H7, Listeria monocyto-genes y Salmonella spp. en alimentos de origen animal. Costa Rica. Arch Latinoam Nutr 53:389–392
RUBI ´ O. L, MOTILVA. M and ROMERO. M. (2013). Recent Advances in Biologically Active Compounds in Herbs and Spices: A Review of the Most Effective Antioxidant and Anti-Inflammatory Active Principles. Critical Reviews in Food Science and Nutrition, 53:9, 943-953, DOI: 10.1080/10408398.2011.574802. Pdf
Saleh. B. K, Omer. A, Teweldemedhin. B (2018). Medicinal uses and health benefits of chili pepper (Capsicum spp.): a re-view. MOJ Food Process Technol. 6(4):325‒328. DOI: 10.15406/mojfpt.2018.06.00183. Retrieved from: http://medcraveonline.com/MOJFPT/MOJFPT-06-00183.pdf
Singh. Y. N (2004). Kava from Ethnology to Pharmacology. Medicinal and Aromatic Plants — Industrial Profiles. CRC PRESS Boca Raton London New York Washington, D.C. pp. 178 pdf.
Tambe, Esha & Gotmare, Sulekha & Scholar. (2019). CHEMICAL CHARACTERIZATION OF THREE CARDAMOM OILS (ELET-TARIA CARDAMOMUM) BY GCMS. WORLD JOURNAL OF PHARMACY AND PHARMACEUTICAL SCIENCES. 08. 876 - 885. 10.20959/wjpps201911-14879.
Thangaselvabal. T, Gailce Leo Justin. C and Leelamathi. M (2008). BLACK PEPPER (PIPER NIGRUM L.) ‘THE KING OF SPICES’ - A REVIEW. AGRICUTURAL REVIEWS. 29 (2): 89 - 98, Pdf. Retrieved from: https://www.arccjournals.com/uploads/articles/ar292002.pdf
Tongnuanchan. P and Benjakul. S. (2014). Essential Oils: Extraction, Bioactivities, and Their Uses for Food Preservation. Journal of Food Science. Vol. 79, Nr. 7. Pdf.
Torres. J. E. D. L. T, Gassara. F, Kouassi. A. P, Brar. S. K & Belkacemi. K. (2015). Spice Use in Food: Properties and Benefits, Critical Reviews in Food Science and Nutrition, DOI: 10.1080/10408398.2013.858235
Winias, S., Retno, A., Magfiroh, R., Nasrulloh, M, R. and Rahayu R. (2011). Effect of cynammyldehyde from cinnamon extract as a natural preservative alternative to the growth of Staphylococcus aureus bacteria. J. Trop. Infect. Dis. 2:38-41.
Wooten. G (1998- 2008). The Herbal Database A listing of herbs, spices, and medicinal plants & some clues to their uses. Retrieved from: http://okanogan1.com/botany/herbal/herbal-db.pd
86
2020 NATIONAL AGRICULTURE SYMPOSIUM
A REVIEW OF FIJI BASIL PRODUCTION AND EXPORTS OVER THREE DECADES
Stice, KyleNadi Bay Herbs, FijiCorresponding author: [email protected]
ABSTRACTFiji has had a thriving fresh basil export industry since the late 1980’s based around one primary value chain. The production and export of fresh basil to New Zealand has evolved over the past 30 years and brought with it a range of innovations to Fiji’s horticulture industry.
This paper reviews the agronomic and economic variables that allowed this niche industry to survive over three decades. This paper also explores the challenges faced by one of Fiji’s longest running horticulture export value chains which include pest and diseases, biosecurity, shelf life and freight issues.
Recent developments with domestic basil production and processing in New Zealand have put added pressure on the market for Fiji basil, these pressures have been further compounded by Covid 19 which has seen a sharp increase in freight charges and disruption to freight schedules.
87
2020 NATIONAL AGRICULTURE SYMPOSIUM
CLIMATE CHANGE AND LIVESTOCK PRODUCTION
Dr. Ken CokanasigaAnimal Health Specialist
Corresponding author: [email protected]
HIGH CASSAVA PEEL MEAL-BASED DIETS WITH ANIMAL FAT AND ENZYME FOR BROILERS
Avinesh DayalAnimal Health and Production, Ministry of Agriculture, Fiji
Corresponding author:[email protected]
THE VALUE OF TRADITIONAL KNOWLEDGE (TK) IN CIGUATERA FISH POISONING (CFP) AND ITS TREATMENT IN FIJI
Lako, J, Naisilisili1, S; Kuridrani, N and Sharma, S1College of Agriculture, Fisheries and Forestry, Fiji National University, Fiji
Corresponding author: [email protected]
THE IMPLICATIONS OF COVID-19 PANDEMIC ON THE VEGETABLE FARMERS AND THE FISHERMEN OF FIJI.
Ravinesh Ram1; Roveena Vandana Chand2, Ateca Radinibau1, Bruce Kirkham Vesetaki Tavaga1, Ilai Kuli1, Isikeli Odrovakavula1, Litiana Lily Lomani Taoi1, Mateo Salevuwai1, Miriama Vualikeu Nataucoko1, Mohammed Altaf1, Sairusi Senilawalawa1, Semi Colaivalu Raiova1, Vani Kutu Cobilevu1, Virisila Likutua Biukoro1 and Vivina Seruvono Baukari1
1Department of Fisheries, School of Veterinary, Animal Husbandry and Fisheries, College of Agriculture, Fisheries and Forestry. Fiji National University. P. O. Box 1544, Nausori, Fiji2School of Marine Studies, Faculty of Science, Technology and Environment. University of the South Pacific, Laucala Campus. Private Mail Suva, Fiji
Corresponding author: [email protected]
SESSION 5: LIVESTOCK AND FISHERIES SECTOR
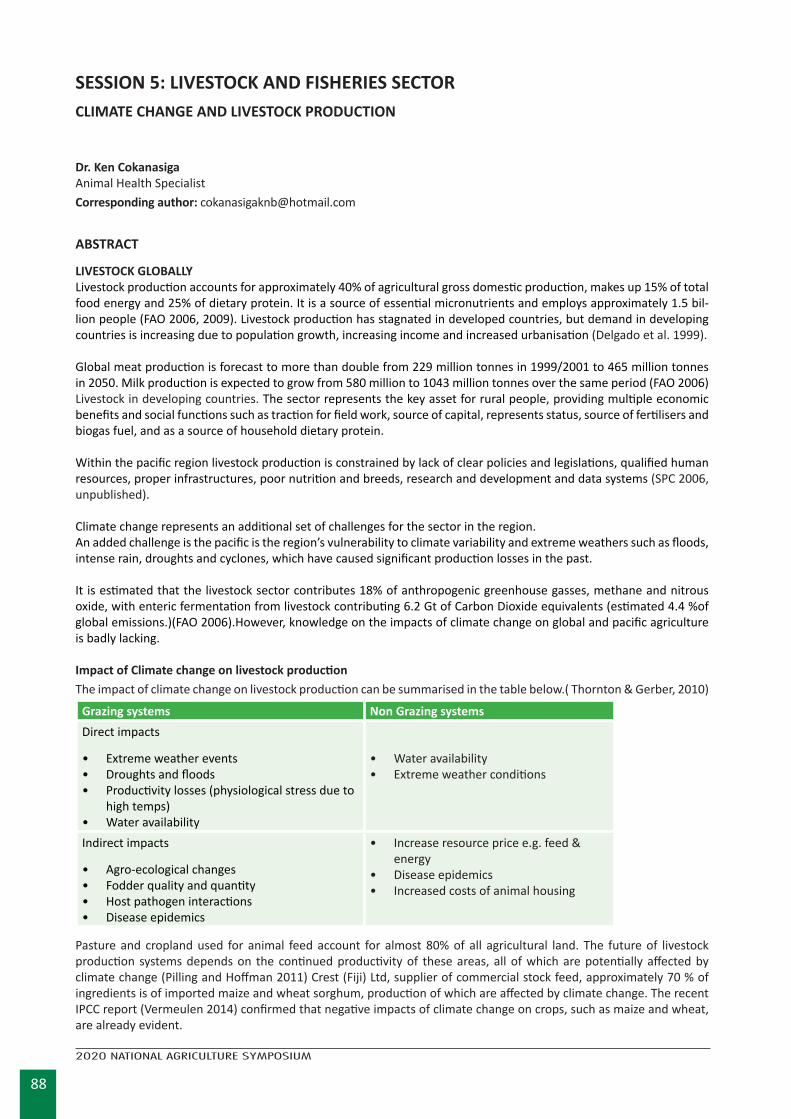
88
2020 NATIONAL AGRICULTURE SYMPOSIUM
SESSION 5: LIVESTOCK AND FISHERIES SECTOR CLIMATE CHANGE AND LIVESTOCK PRODUCTION
Dr. Ken CokanasigaAnimal Health SpecialistCorresponding author: [email protected]
ABSTRACT
LIVESTOCK GLOBALLYLivestock production accounts for approximately 40% of agricultural gross domestic production, makes up 15% of total food energy and 25% of dietary protein. It is a source of essential micronutrients and employs approximately 1.5 bil-lion people (FAO 2006, 2009). Livestock production has stagnated in developed countries, but demand in developing countries is increasing due to population growth, increasing income and increased urbanisation (Delgado et al. 1999).
Global meat production is forecast to more than double from 229 million tonnes in 1999/2001 to 465 million tonnes in 2050. Milk production is expected to grow from 580 million to 1043 million tonnes over the same period (FAO 2006)Livestock in developing countries. The sector represents the key asset for rural people, providing multiple economic benefits and social functions such as traction for field work, source of capital, represents status, source of fertilisers and biogas fuel, and as a source of household dietary protein.
Within the pacific region livestock production is constrained by lack of clear policies and legislations, qualified human resources, proper infrastructures, poor nutrition and breeds, research and development and data systems (SPC 2006, unpublished).
Climate change represents an additional set of challenges for the sector in the region.An added challenge is the pacific is the region’s vulnerability to climate variability and extreme weathers such as floods, intense rain, droughts and cyclones, which have caused significant production losses in the past.
It is estimated that the livestock sector contributes 18% of anthropogenic greenhouse gasses, methane and nitrous oxide, with enteric fermentation from livestock contributing 6.2 Gt of Carbon Dioxide equivalents (estimated 4.4 %of global emissions.)(FAO 2006).However, knowledge on the impacts of climate change on global and pacific agriculture is badly lacking.
Impact of Climate change on livestock productionThe impact of climate change on livestock production can be summarised in the table below.( Thornton & Gerber, 2010)
Grazing systems Non Grazing systemsDirect impacts
• Extreme weather events• Droughts and floods• Productivity losses (physiological stress due to
high temps)• Water availability
• Water availability• Extreme weather conditions
Indirect impacts
• Agro-ecological changes• Fodder quality and quantity• Host pathogen interactions• Disease epidemics
• Increase resource price e.g. feed & energy
• Disease epidemics• Increased costs of animal housing
Pasture and cropland used for animal feed account for almost 80% of all agricultural land. The future of livestock production systems depends on the continued productivity of these areas, all of which are potentially affected by climate change (Pilling and Hoffman 2011) Crest (Fiji) Ltd, supplier of commercial stock feed, approximately 70 % of ingredients is of imported maize and wheat sorghum, production of which are affected by climate change. The recent IPCC report (Vermeulen 2014) confirmed that negative impacts of climate change on crops, such as maize and wheat, are already evident.
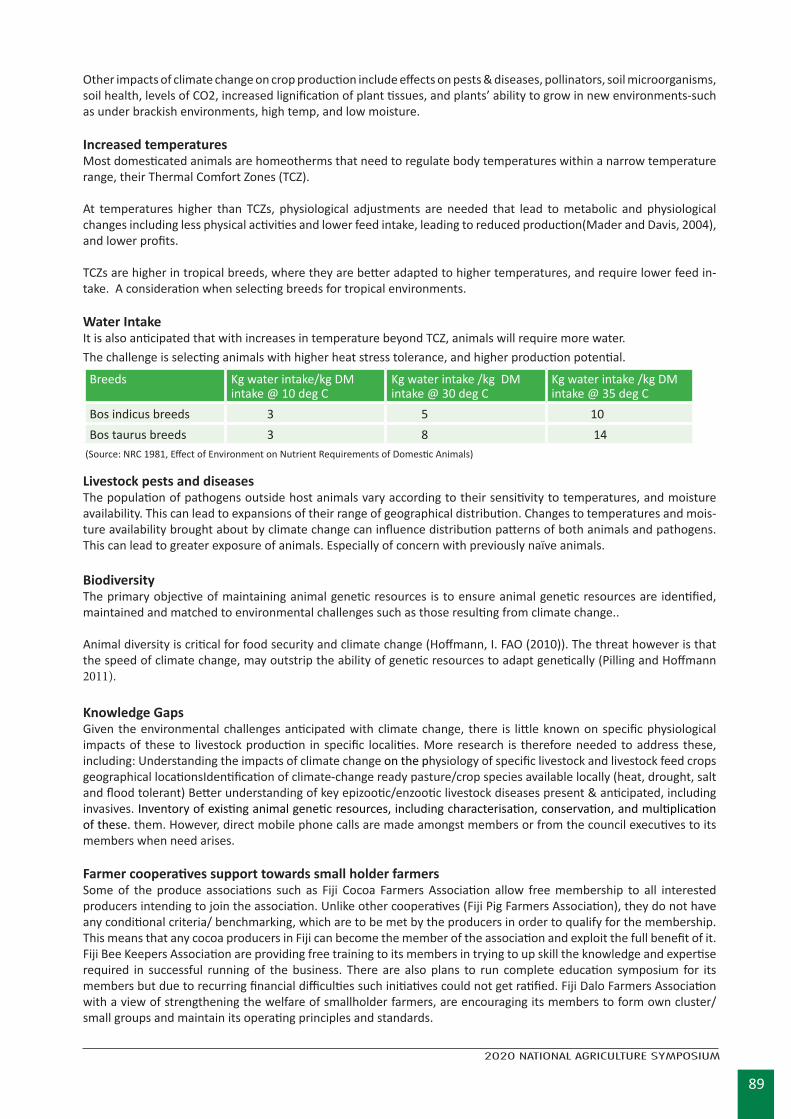
89
2020 NATIONAL AGRICULTURE SYMPOSIUM
Other impacts of climate change on crop production include effects on pests & diseases, pollinators, soil microorganisms, soil health, levels of CO2, increased lignification of plant tissues, and plants’ ability to grow in new environments-such as under brackish environments, high temp, and low moisture.
Increased temperaturesMost domesticated animals are homeotherms that need to regulate body temperatures within a narrow temperature range, their Thermal Comfort Zones (TCZ).
At temperatures higher than TCZs, physiological adjustments are needed that lead to metabolic and physiological changes including less physical activities and lower feed intake, leading to reduced production(Mader and Davis, 2004), and lower profits.
TCZs are higher in tropical breeds, where they are better adapted to higher temperatures, and require lower feed in-take. A consideration when selecting breeds for tropical environments.
Water IntakeIt is also anticipated that with increases in temperature beyond TCZ, animals will require more water. The challenge is selecting animals with higher heat stress tolerance, and higher production potential.
Breeds Kg water intake/kg DM intake @ 10 deg C
Kg water intake /kg DM intake @ 30 deg C
Kg water intake /kg DM intake @ 35 deg C
Bos indicus breeds 3 5 10Bos taurus breeds 3 8 14
(Source: NRC 1981, Effect of Environment on Nutrient Requirements of Domestic Animals)
Livestock pests and diseasesThe population of pathogens outside host animals vary according to their sensitivity to temperatures, and moisture availability. This can lead to expansions of their range of geographical distribution. Changes to temperatures and mois-ture availability brought about by climate change can influence distribution patterns of both animals and pathogens. This can lead to greater exposure of animals. Especially of concern with previously naïve animals.
BiodiversityThe primary objective of maintaining animal genetic resources is to ensure animal genetic resources are identified, maintained and matched to environmental challenges such as those resulting from climate change..
Animal diversity is critical for food security and climate change (Hoffmann, I. FAO (2010)). The threat however is that the speed of climate change, may outstrip the ability of genetic resources to adapt genetically (Pilling and Hoffmann 2011).
Knowledge GapsGiven the environmental challenges anticipated with climate change, there is little known on specific physiological impacts of these to livestock production in specific localities. More research is therefore needed to address these, including: Understanding the impacts of climate change on the physiology of specific livestock and livestock feed crops geographical locationsIdentification of climate-change ready pasture/crop species available locally (heat, drought, salt and flood tolerant) Better understanding of key epizootic/enzootic livestock diseases present & anticipated, including invasives. Inventory of existing animal genetic resources, including characterisation, conservation, and multiplication of these. them. However, direct mobile phone calls are made amongst members or from the council executives to its members when need arises.
Farmer cooperatives support towards small holder farmersSome of the produce associations such as Fiji Cocoa Farmers Association allow free membership to all interested producers intending to join the association. Unlike other cooperatives (Fiji Pig Farmers Association), they do not have any conditional criteria/ benchmarking, which are to be met by the producers in order to qualify for the membership. This means that any cocoa producers in Fiji can become the member of the association and exploit the full benefit of it. Fiji Bee Keepers Association are providing free training to its members in trying to up skill the knowledge and expertise required in successful running of the business. There are also plans to run complete education symposium for its members but due to recurring financial difficulties such initiatives could not get ratified. Fiji Dalo Farmers Association with a view of strengthening the welfare of smallholder farmers, are encouraging its members to form own cluster/small groups and maintain its operating principles and standards.
90
2020 NATIONAL AGRICULTURE SYMPOSIUM
1. Success of farmer cooperative business model
I. Pooling of resources that is not easily accessed by individual farmers.
II. Risk sharing – farmers do not become not vulnerable to total loss.
III. More opportunities to exploit novel business ventures such as value addition.
IV. More bargaining power for inputs and reaching lucrative markets.
V. Better financial accessibility and consideration for grants.
VI. More cooperation and learning amongst members.
CONCLUSIONResearch studies have revealed that poor performance of farmer’s cooperatives in Fiji is partly attributed to its inconsis-tence development strategies and poor funding opportunities in place. This study highlights that NWC (Fiji) and FCDCL are the only 2 producer associations had the capacity to administer its operational matters at its own cost. Most of the cooperatives mentioned had been recently formalized and are still into its developing stage with no clear legislative structure or constitution in place to mentor its operational matters. And because there are very little funding prospects available for these organizations, most of these associations are lying as idle units.
RECOMMENDATIONS
I. Fijian government have some very specific agricultural developments plans in place. All they need to do is to include farmer’s cooperatives in their development plan, facilitate funding, monitor progress and evaluate outcome.
II. Government should initiate some specific tailor made agricultural development projects exclusively aligned towards existing producer associations interest, facilitate initial funding, let the council run these project(s) and later, it to become an income generating entity for the association/members.
III. Every producer association should register with relevant statutory body which should have a well-defined legislative structure in place to govern its operating principles.
IV. FCLC should organize seminars/workshops/field days to facilitate information exchange forum amongst its af-filiated members and identify key concepts of successfully running a cooperative business.
V. FCLC as the parent body of producer’s associations in Fiji are to work closely with government and be able to secure funds from potential donors such as European Union, NGO’s, AUSAID to name a few.
REFERENCES
D. Mukesh, personal communication, June 11, 2018.
FAO. (2000). Asia and the Pacific National Forestry Programmes: Update 34. Retrieved from Food and Agriculture Or-ganisation: http://www.fao.org/3/X6900E/x6900e0b.htm#8.%20Fiji
G. Anil, personal communication, June 11, 2018.
Natures Way. (2020). About us. Retrieved from Natures Way Cooperative Fiji Limited: http://nwcfiji.com/about-us/
R. Nilesh, personal communication, June 10, 2018.
Pacific Agriculture Poilcy Project. (2020). Retrieved from Pacific Agriculture Poilcy Project: https://pafpnet.spc.int/helping-smallholder-markets/fclc
V. Osea, personal communication, June 10, 2018
91
2020 NATIONAL AGRICULTURE SYMPOSIUM
HIGH CASSAVA PEEL MEAL-BASED DIETS WITH ANIMAL FAT AND ENZYME FOR BROILERS
Avinesh DayalAnimal Health and Production, Ministry of Agriculture, FijiCorresponding author: [email protected]
ABSTRACTThe study investigated the effect of fat and enzyme on utilisation of cassava peel meal by broiler. Total of 250 Ross 308 broiler chicks, 10 d-old, were allotted to five diets consisting of a control and 4 diets containing CPM with fat and enzyme singly or in combination.
Feed intake, feed: gain, relative weights of carcass, thigh and drumstick were not affected (10-41 d). Weight gain was reduced (P<0.05) on CPM but addition of fat, enzyme or fat plus enzyme markedly improved weight gain. Breast mus-cle deposition was depressed on the groups fed CPM alone but this was corrected by fat or enzyme addition with the maximum deposition in the fat and enzyme supplemented groups.
Enzyme supplementation resulted in a heavier liver while the weights of crop and pancreas were increased on CPM alone. There were no treatment effects on the relative weight of proventriculus and gizzard. Feeding CPM with chal-lenzyme or fat plus enzyme reduced the weight of small intestine while caeca weight was increased on CPM fed alone.
Replacement of 40% maize with CPM adversely affects broiler performance but enzyme and tallow supplementation restores performance. More research is recommended into higher levels of CPM, source and concentrations of fat and enzyme products and nutrient utilisation.
92
2020 NATIONAL AGRICULTURE SYMPOSIUM
THE VALUE OF TRADITIONAL KNOWLEDGE (TK) IN CIGUATERA FISH POISONING (CFP) AND ITS TREATMENT IN FIJI
Lako, J, Naisilisili1, S; Kuridrani, N and Sharma, S1College of Agriculture, Fisheries and Forestry, Fiji National University, Fiji *Corresponding author: [email protected]
ABSTRACTEven though Ciguatera Fish Poisoning (CFP) or ciguatoxin is a threat to health, trade and livelihood, it appears that Fijians continue to catch, sell and consume ciguatoxic fish as evident in the incidence reported. There may be various reasons for the continuous catching and selling of ciguatoxic fish in Fiji. These may include heavy reliance on fish for food security and major source of proteins, trade and livelihood; absence of any ciguatera regulatory framework and the effective and valuable use of traditional and herbal treatment of fish poisoning.
This paper examined the roles and values of traditional knowledge related to ciguatera fish poisoning and its treatment in Fiji; focusing on the identification of ciguatoxic fish species, iqoliqoli hot spots, seasonality, reporting mechanism and treatment of ciguatoxins. Various methods were used to gather the necessary information for this paper. These included a 2-day participatory stakeholder workshop, face-face interviews, in-depth interviews and field observations. Results showed that about 11 major species of fish were identified as poisonous by stakeholders, together with their associated fishing grounds and seasonality.
Comparatively, the Ministry of Fisheries survey data gathered in 2010-2015 revealed a total of 33 toxic species of fish that implicated about 466 fish poisoning incidence in 43 districts or 140 villages. Of the 33 toxic fish species identi-fied, Red snapper (Lutjanus argentimaculatu) appeared to be the most implicated species. It appears that seasonality of ciguatoxin is closely associated with the rise of the Balolo (Palola viridis – an edible sea worm), and the growth of certain types of soft corals or Bulewa, however, without any scientific evidence. It was also noted that there are cigua-toxin-localized reefs such as in Senimuna in Kadavu and Kabara reef in Lau, where most fish are apparently poisonous. Furthermore, various herbal medicines had been identified to be effective in the treatment of ciguatoxin.
This paper highlights and recognizes the importance of local and traditional knowledge (TK) of the native fishers and traditional healers in the management of ciguatoxin, which may warrant development of formal documentation.
93
2020 NATIONAL AGRICULTURE SYMPOSIUM
THE IMPLICATIONS OF COVID-19 PANDEMIC ON THE VEGETABLE FARMERS AND THE FISHERMEN OF FIJI.
Ravinesh Ram1*; Roveena Vandana Chand2, Ateca Radinibau1, Bruce Kirkham Vesetaki Tavaga1, Ilai Kuli1, Isikeli Odro-vakavula1, Litiana Lily Lomani Taoi1, Mateo Salevuwai1, Miriama Vualikeu Nataucoko1, Mohammed Altaf1, Sairusi Senilawalawa1, Semi Colaivalu Raiova1, Vani Kutu Cobilevu1, Virisila Likutua Biukoro1 and Vivina Seruvono Baukari1
1Department of Fisheries, School of Veterinary, Animal Husbandry and Fisheries, College of Agriculture, Fisheries and Forestry. Fiji National University. P. O. Box 1544, Nausori, Fiji
2School of Marine Studies, Faculty of Science, Technology and Environment. University of the South Pacific, Laucala Campus. Private Mail Suva, Fiji
*Corresponding author: [email protected]
ABSTRACT Farmers are regarded as the backbone of Fiji, who work tirelessly ensuring that the supply of food is in large quantities for the people. The majority of the farmers sell their produce on Saturday’s, when a significant number of consumers purchase the produce which either is the land or the aquatic based food source. Farmers (including the aquaculture farmers/fishermen) were satisfied with the weekly income (ranging from $100.00 - $2,000) depending on the type of business each farmer was engaged in. However, with the sudden emergence of COVID-19 pandemic, the people in the primary industries were highly impacted. The data for the present study was collected through a cross-sectional questionnaire, qualitative design approach in Fiji. The target participants were from, Rewa, greater Suva-Nausori corridor, Nadroga, Natewa, Kadavu, Lau, Ovalau, Labasa and Savusavu. The participants were chosen, who mostly were doing commercial based farming, linking to tourism. Results showed that, farmers lost almost 40-50% of income as well as high quantity of goods were discard due to severe job losses and people grew their own food, who could not afford to purchase food. Aquatic farmers, supplying to the hotels for incomes were impacted the hardest due to closure of a number of resorts and hotels since the pandemic started. COVID-19 has impacted a number of business in the primary industries, however, this has prepared a number of people in Fiji to fight and survive the global pandemic.
Key words: Agriculture, Fisheries, Farmers, COVID-19, Fiji
INTRODUCTION Our globe has seen a number of pandemics over time such as from the Spanish flu of 1918, to AIDS that still has no definitive cure and there is a risk of developing a new infectious disease over time (Siche, 2020; Burnet and White, 1972). From past pandemics that the world has experienced, it has been shown that quarantines and panic have an impact on human activities and economic growth (Hanashima and Tomobe, 2012; Bermejo, 2004; Arndt and Lewis, 2001); but, the effect also occurs in agricultural and fisheries activities. When there is an outbreak of infectious disease, there is also an increase in hunger and malnutrition (Burgui, 2020; Sar et al., 2010).
Covid-19 is the contagious disease that threatens and disturbs humanity and arrived in Fiji I on 20 March 2020, thus affecting the entire production cycle in Fiji (FAO, 2020b). With closure of international borders and restrictions to the movement of people, trade was also affected (FAO, 2020b). Since China represe2nts an important market in world trade and where the COVID-19 disease started (Siche, 2020), this experience shows an increase in online demand in the food and beverage sector, due to quarantine policies (FAO, 2020a). In situations like these, where a virus spreads on contact, contactless delivery services become preferred by consumers. Fiji is comprised of approximately 700 Islands of which around 300 is habited which is actively used for residential, commercial, industrial and agriculture purpose. There are around 497,787 hectares or 28% of land available for agricultural purpose and about 495,361 sq mi EEZ for fishing activities (Anonymous, undated). Agricultural land use is broken down into temporary farm land, fallow land permanent crop land, pastures, coconuts, natural forest, cultivated forest and non-agricultural land. The highest proportion of total land use (37%) is for permanent crops followed by pastures (19%) and natural forests (17%). Agricultural industry has become major contribution in Fiji economy because it contributes 16.5% of the country’s GDP and employ’s almost 2000 Fijians.
Over the last two decades the government was importing products outside the country and cost of imported products was high. The fisheries and the agriculture sectors were in neglect over time and more development was given to the tourist sector (Chand, 2020). COVID-19 however, had the greatest impact on the tourism industry leading grounding of
94
2020 NATIONAL AGRICULTURE SYMPOSIUM
airplanes, hospitality losses and a collapse in the Fijian economy (Vula, 2020). Apart from the tourism sector, agriculture and fisheries were impacted due to the travel restrictions. The aim for this research The main aim of the research was to outline the impacts of COVID-19 on the agro-fisheries sector in Fiji.
MATERIALS AND METHODS Data collection for this study was conducted in Fiji from September – December 2020. A descriptive study design with a cross-sectional research questionnaire was developed and the farmers and the fishermen were targeted (N=200) as the key people for information. The questionnaire comprised of the questions relating to income generated from the produce generated by the farmers and the fishermen over a week. Since the arrival of COVID-19 the impact of the border closure locally and internationally was felt by a number of people in the primary industry (agri-fisheries). The differences in the income before and after the COVID-19 pandemic was included in the data collection survey.
An information sheet for participants was included and given to the participants to better facilitate data collection. Human ethics approval was sought from Fiji National University Research Office). All information was kept confidential.
2.1. Data analysisSince this was a descriptive study, the data generated from this study was presented as percentage and number responded for a question.
RESULTS AND DISCUSSION The data from this study was collected from Dalo farmers, vegetable farmers, artisanal fishermen, Bivalve fishermen and sweet potatoe farmers who resided in the areas between Serua, Fiji to Tailevu, Nadroga and Levuka. From the in-formation gathered, it showed that almost 90% were land based farmers, while the remaining 10% were aquatic based (bivalve and aquaculture). The results showed that all respondents (100%) were severely impacted by the arrival of the global pandemic COVID-19.
On average, each land based farmers was able to generate approximately, 60 – 100 kg of vegetable for weekly sale at the markets or for distribution to the hotels or restaurants. 40 out of the 200 respondents (20%) were growing for personal consumption and another 20% of the respondents switched from fishing to land based agriculture due to the higher cost to travel to sea for fishing and owned a land to farm. 2% of the farmers were from the hospitality industry due to job losses. The remaining 80% farmers/fishermen were in the business from a minimum of 2 years to 15 years and have generated income as high as $15,000.00 per month from sales of their produce before the COVID-19 pan-demic.
On average, the respondents (Dalo farmers (40% of the respondents); vegetable farmers (20% of the respondents); sweet potatoe farmers (20% of the respondents) and fishermen (20% of the respondents)) earned an income of $2000 - $10,000 per week; $500 - $2500 per week; $200 - $1000 per week and $700 - $5000 per week respectively. Since the arrival of the COVID-19 pandmic, the income was slashed by almost 40 – 60% and resulted in the farmers and fishermen earning an average income of $300 - $4000 per week. Five percent of the respondents were satisfied with the weekly income. This reduction impacted the farmers greatly since most of the farmers had invested through government/bank loan in their business and started to struggle in paying the mortgage off and eventually was seized by the bank due to non-payments. As of September 2020, the poverty rate in Fiji increased to 24.2% (210, 963) of the population (Kumar, 2020; Chand, 2020). The people who lost jobs due to COVID-19 pandemic, who belonged to the Aviation industry, Tourism sector, and businesses in Fiji which struggled to survive.
Two percent of the respondents, who were Tilapia farmers, supplied the fish to hotels around the Serua and Nadroga areas, were without buyers. Two Tilapia farmers interviewed were forced to changed their farming strategy into something else for income in order to support their families. These findings are in concurrent with the finding of Vula (2020), who also reported that people were forced to do backyard gardening for survival. Because the job losses were severe, a number of Fijians were forced to take the initiative for backyard gardening. Since a number of people took the initiative for backyard gardening, the produce for a number of farmers accumulated and was not sold in time and resulted in spoilage and discard. The data from the present study revealed that on average, each farmer discarded approximately 10 – 100kg of the harvest which amounted to $200 - $6000. One of the fishermen respondents (bivalve fishermen) indicated that, the produce which was not sold on the day of the harvest, usually was combined to a larger heap and sold for the same amount such as $5.00/ heap and if it was still not sold, the fishermen would cook and then sell the produce for $7.00/ plastic (1 – 2kg).
The loss of urban jobs due to the COVID-19 pandemic has pushed some people back to their villages in rural areas and
95
2020 NATIONAL AGRICULTURE SYMPOSIUM
small islands, shining a light on the lack of public services and income-generating opportunities outside of the cities (Chand, 2020; Vula, 2020). Enhancing rural livelihoods through new income-earning opportunities both on and off-farm activities could be an important strategy for weathering future crises. There is a need for greater investment in infrastructure and basic services to underpin the development of rural economies with attractive prospects for young people. Fiji tourism should also be highly promoted at the national level and more promotions created for domestic people. Currently the Western Division is the tourism hub for Fiji, where most touring activities originate at the Fiji’s international airport in Nadi (FAO, 2020b). The government may need to consider developing additional tourism hubs in the Northern, Eastern and Central Divisions, as well as promoting income-generating tourism opportunities throughout the country.
This study found that farmers were forced to adapt to new market dynamics due to disruptions along the supply chain and to allocate more resources to local food security. This study acknowledges major opportunities in the agricultural sector to boost the Pacific economy, and the need to work with the government on exploring ways to promote the generation of better livelihoods in agriculture (FAO, 2020b). The government and policy makers need to revise the strategy for income generation through fisheries and agriculture. Fiji had a total of approximately 18,000 sq km of the farming spaces which needs to be properly utilized and advanced agri-farming techniques initiated to utilize the lands where faming is difficult such as aquaponics and a more cohesive and collaborative approach taken by all industries to overcome the immediate threat of COVID-19. There have not yet been any studies on the cost of disruptions to the agrifood system in Fiji, although global and regional reports have pointed out some of the costs of the COVID-19 crisis, including the cost of inaction. A recent finding from the United Nations Office for the Coordination of Humanitarian Affairs (OCHA) states that “waiting and then reacting when the full impacts are already visible would be a more expensive proposition (Omtzigt and Pople, 2020).”
CONCLUSION The findings from this study have shown that the COVID-19 pandemic has impacted the income for a number of Fijians in the agriculture and the fisheries sector in Fiji. With the income reduced by almost 60% for the farmers and fishermen, has made them to think alternatives for income while majority, opted to be classified under poverty which stands at 24.2% in Fiji. The government and the policy makers need to address quicker and more strategic actions to overcome the pandemic once things normalize. Fijians have greatly learnt from the pandemic and have also learnt from the last tropical cyclone (Cyclone Winston) that struck Fiji in 2016 to be prepared which has given everyone a lesson to be learnt.
ACKNOWLEDGEMENT The authors wish to acknowledge all the respondents (fishermen and farmers) for actively participating on this project. The authors also wish to thank the Fiji National University for providing the necessary funds and administrative support to successfully complete this project. The support and technical staff are thankfully acknowledged.
REFERENCES Anonymous, undated. Methodology for the creation of the Maritime Boundaries. Available in: https://www.marinere-
gions.org/eezmethodology.php . Accessed 15 February 2021.
Arndt, C; Lewis, J.D. 2001. The HIV/AIDS pandemic in South Africa: Sectoral impacts and unemployment. Journal of International Development 13(4): 427-449.
Bermejo, A. 2004. HIV/AIDS in Africa: International responses to the pandemic. New Economy 11(3): 164-169.
Burgui, D. 2020. Coronavirus: How action against hunger is responding to the pandemic. Available in: https://www.actionagainsthunger.org/story/coronavirus-how-action-against-hunger-responding-pandemic. Accessed 15 February 2021.
Burnet, M; White, D.O. 1972. Natural history of infectious disease. 4th ed. Cambridge, United Kingdom: Cambridge University Press. 279 pp.
Chand, A. 2020. GDP expected to contract. The Fiji Times. Accessed online 15 February 2021.
FAO - Food and Agriculture Organization. 2020a. Q&A: COVID-19 pandemic - impact on food and agriculture. Available in: http://www.fao.org/2019-ncov/q-and-a/en/. Accessed 12 February 2021.
FAO. 2020. National agrifood systems and COVID-19 in Fiji. Effects, policy responses and long term implications. Rome https://doi.org/10.4060/cb1349en
96
2020 NATIONAL AGRICULTURE SYMPOSIUM
Kumar, V. 2020. 210,963 live in poverty. The Fiji Times. Accessed online 15 February 2020.
Omtzigt, D.J. and Pople, A. 2020. The cost of doing nothing: The price of inaction in response to the COVID-19 crisis. In: United Nations Office for the Coordination of Humanitarian Affairs [online]. New York and Geneva. https://www.unocha.org/sites/unocha/files/Cost of inaction 10.07.20.pdf Accessed on 15 February 2021.
Sar, T.T; Aernan, P.T; Houmsou, R.S. 2010. H1N1 Influenza Epidemic: Public Health Implications for Nigeria. International Journal of Virology 6: 1-6.
Siche, R. 2020. What is the impact of COVID-19 disease on agriculture? Scientia Agropecuaria vol.11 no.1 Trujillo ene./mar 2020. http://dx.doi.org/10.17268/sci.agropecu.2020.01.00
Vula, T. 2020. COVID-19: People forced to change lifestyles; many turn to backyard gardening. The Fiji Times. Accessed online 15 February 2021.
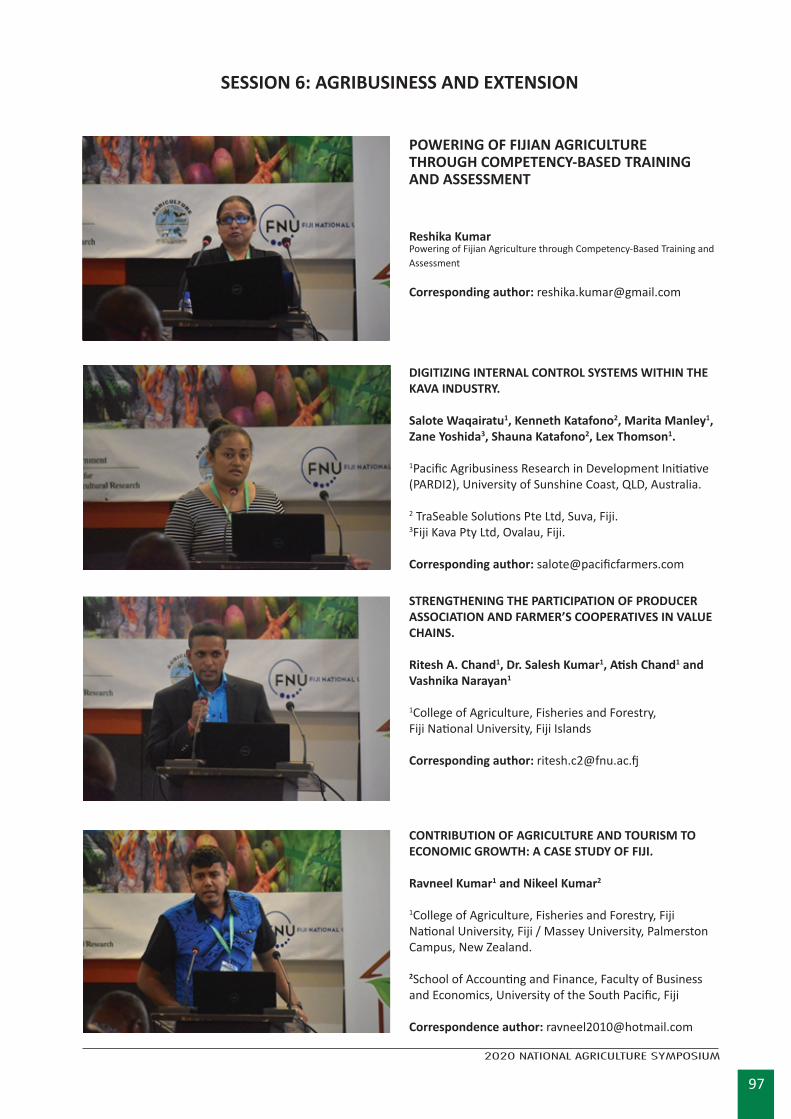
97
2020 NATIONAL AGRICULTURE SYMPOSIUM
POWERING OF FIJIAN AGRICULTURE THROUGH COMPETENCY-BASED TRAINING AND ASSESSMENT
Reshika KumarPowering of Fijian Agriculture through Competency-Based Training and Assessment
Corresponding author: [email protected]
DIGITIZING INTERNAL CONTROL SYSTEMS WITHIN THE KAVA INDUSTRY.
Salote Waqairatu1, Kenneth Katafono2, Marita Manley1, Zane Yoshida3, Shauna Katafono2, Lex Thomson1.
1Pacific Agribusiness Research in Development Initiative (PARDI2), University of Sunshine Coast, QLD, Australia.
2 TraSeable Solutions Pte Ltd, Suva, Fiji.3Fiji Kava Pty Ltd, Ovalau, Fiji.
Corresponding author: [email protected]
STRENGTHENING THE PARTICIPATION OF PRODUCER ASSOCIATION AND FARMER’S COOPERATIVES IN VALUE CHAINS.
Ritesh A. Chand1, Dr. Salesh Kumar1, Atish Chand1 and Vashnika Narayan1
1College of Agriculture, Fisheries and Forestry, Fiji National University, Fiji Islands
Corresponding author: [email protected]
CONTRIBUTION OF AGRICULTURE AND TOURISM TO ECONOMIC GROWTH: A CASE STUDY OF FIJI.
Ravneel Kumar1 and Nikeel Kumar2
1College of Agriculture, Fisheries and Forestry, Fiji National University, Fiji / Massey University, Palmerston Campus, New Zealand.
2School of Accounting and Finance, Faculty of Business and Economics, University of the South Pacific, Fiji
Correspondence author: [email protected]
SESSION 6: AGRIBUSINESS AND EXTENSION
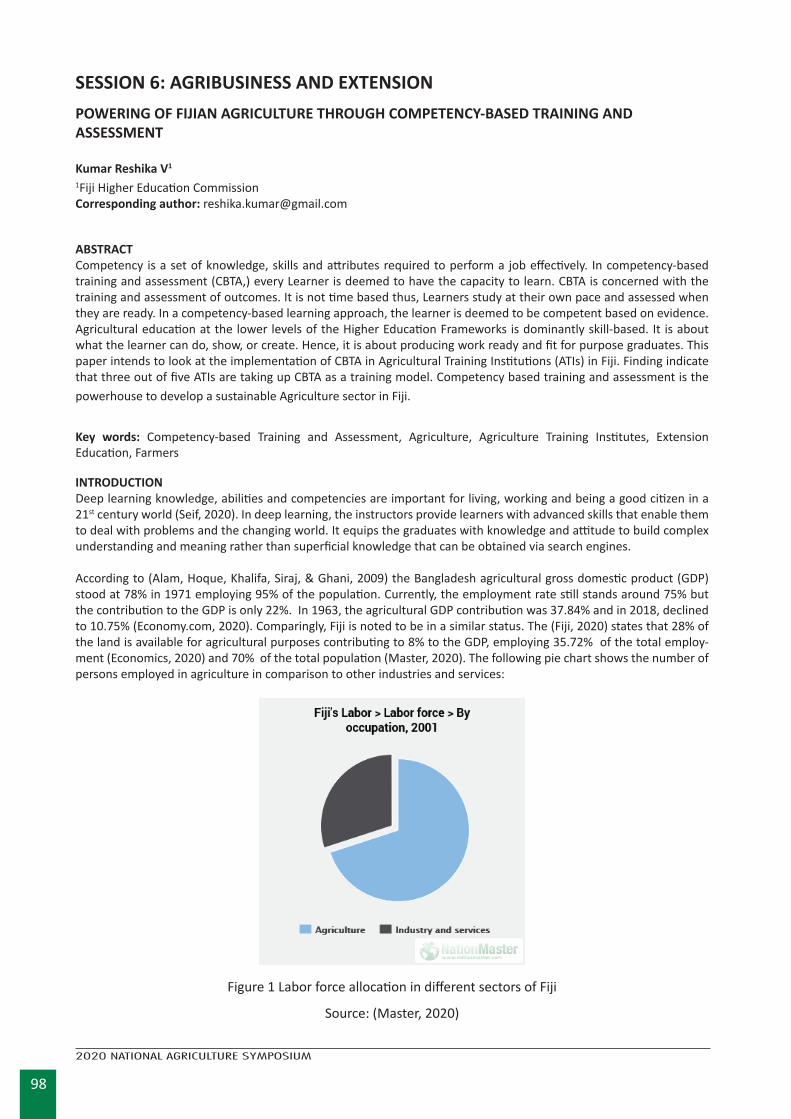
98
2020 NATIONAL AGRICULTURE SYMPOSIUM
SESSION 6: AGRIBUSINESS AND EXTENSION POWERING OF FIJIAN AGRICULTURE THROUGH COMPETENCY-BASED TRAINING ANDASSESSMENT
Kumar Reshika V1 1Fiji Higher Education CommissionCorresponding author: [email protected]
ABSTRACTCompetency is a set of knowledge, skills and attributes required to perform a job effectively. In competency-based training and assessment (CBTA,) every Learner is deemed to have the capacity to learn. CBTA is concerned with the training and assessment of outcomes. It is not time based thus, Learners study at their own pace and assessed when they are ready. In a competency-based learning approach, the learner is deemed to be competent based on evidence. Agricultural education at the lower levels of the Higher Education Frameworks is dominantly skill-based. It is about what the learner can do, show, or create. Hence, it is about producing work ready and fit for purpose graduates. This paper intends to look at the implementation of CBTA in Agricultural Training Institutions (ATIs) in Fiji. Finding indicate that three out of five ATIs are taking up CBTA as a training model. Competency based training and assessment is the powerhouse to develop a sustainable Agriculture sector in Fiji.
Key words: Competency-based Training and Assessment, Agriculture, Agriculture Training Institutes, Extension Education, Farmers
INTRODUCTIONDeep learning knowledge, abilities and competencies are important for living, working and being a good citizen in a 21st century world (Seif, 2020). In deep learning, the instructors provide learners with advanced skills that enable them to deal with problems and the changing world. It equips the graduates with knowledge and attitude to build complex understanding and meaning rather than superficial knowledge that can be obtained via search engines.
According to (Alam, Hoque, Khalifa, Siraj, & Ghani, 2009) the Bangladesh agricultural gross domestic product (GDP) stood at 78% in 1971 employing 95% of the population. Currently, the employment rate still stands around 75% but the contribution to the GDP is only 22%. In 1963, the agricultural GDP contribution was 37.84% and in 2018, declined to 10.75% (Economy.com, 2020). Comparingly, Fiji is noted to be in a similar status. The (Fiji, 2020) states that 28% of the land is available for agricultural purposes contributing to 8% to the GDP, employing 35.72% of the total employ-ment (Economics, 2020) and 70% of the total population (Master, 2020). The following pie chart shows the number of persons employed in agriculture in comparison to other industries and services:
Figure 1 Labor force allocation in different sectors of Fiji
Source: (Master, 2020)
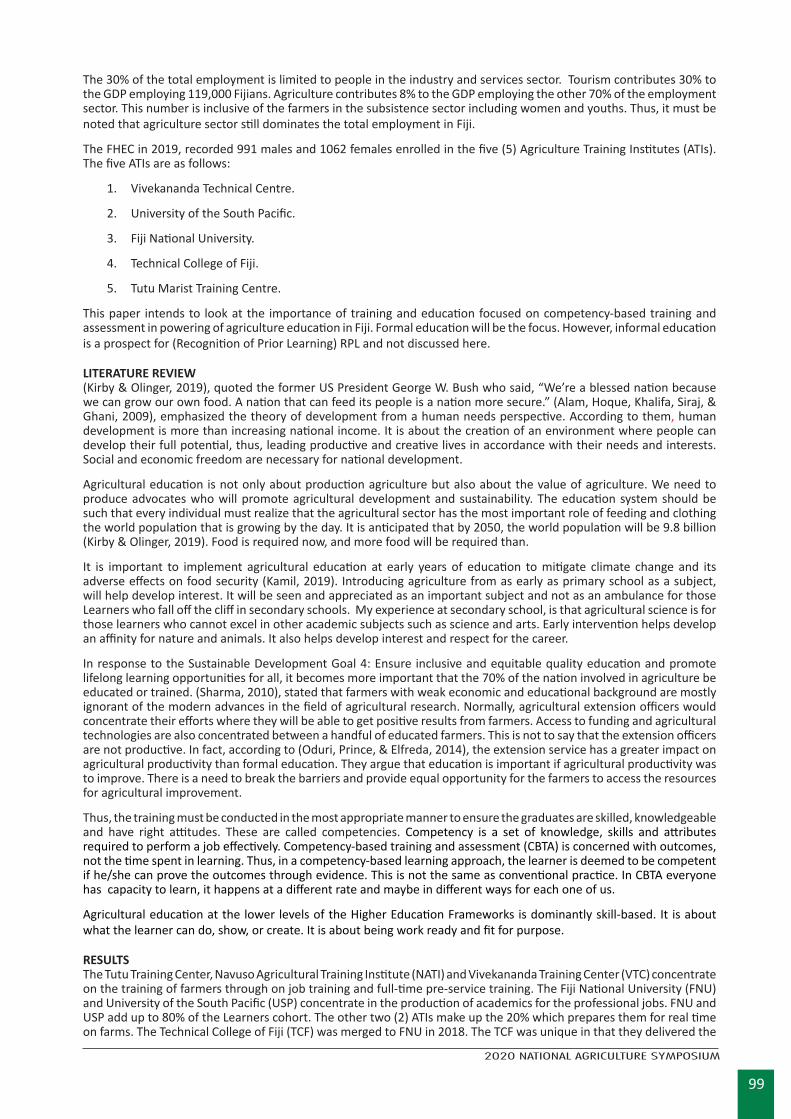
99
2020 NATIONAL AGRICULTURE SYMPOSIUM
The 30% of the total employment is limited to people in the industry and services sector. Tourism contributes 30% to the GDP employing 119,000 Fijians. Agriculture contributes 8% to the GDP employing the other 70% of the employment sector. This number is inclusive of the farmers in the subsistence sector including women and youths. Thus, it must be noted that agriculture sector still dominates the total employment in Fiji.
The FHEC in 2019, recorded 991 males and 1062 females enrolled in the five (5) Agriculture Training Institutes (ATIs). The five ATIs are as follows:
1. Vivekananda Technical Centre.
2. University of the South Pacific.
3. Fiji National University.
4. Technical College of Fiji.
5. Tutu Marist Training Centre.
This paper intends to look at the importance of training and education focused on competency-based training and assessment in powering of agriculture education in Fiji. Formal education will be the focus. However, informal education is a prospect for (Recognition of Prior Learning) RPL and not discussed here.
LITERATURE REVIEW(Kirby & Olinger, 2019), quoted the former US President George W. Bush who said, “We’re a blessed nation because we can grow our own food. A nation that can feed its people is a nation more secure.” (Alam, Hoque, Khalifa, Siraj, & Ghani, 2009), emphasized the theory of development from a human needs perspective. According to them, human development is more than increasing national income. It is about the creation of an environment where people can develop their full potential, thus, leading productive and creative lives in accordance with their needs and interests. Social and economic freedom are necessary for national development.
Agricultural education is not only about production agriculture but also about the value of agriculture. We need to produce advocates who will promote agricultural development and sustainability. The education system should be such that every individual must realize that the agricultural sector has the most important role of feeding and clothing the world population that is growing by the day. It is anticipated that by 2050, the world population will be 9.8 billion (Kirby & Olinger, 2019). Food is required now, and more food will be required than.
It is important to implement agricultural education at early years of education to mitigate climate change and its adverse effects on food security (Kamil, 2019). Introducing agriculture from as early as primary school as a subject, will help develop interest. It will be seen and appreciated as an important subject and not as an ambulance for those Learners who fall off the cliff in secondary schools. My experience at secondary school, is that agricultural science is for those learners who cannot excel in other academic subjects such as science and arts. Early intervention helps develop an affinity for nature and animals. It also helps develop interest and respect for the career.
In response to the Sustainable Development Goal 4: Ensure inclusive and equitable quality education and promote lifelong learning opportunities for all, it becomes more important that the 70% of the nation involved in agriculture be educated or trained. (Sharma, 2010), stated that farmers with weak economic and educational background are mostly ignorant of the modern advances in the field of agricultural research. Normally, agricultural extension officers would concentrate their efforts where they will be able to get positive results from farmers. Access to funding and agricultural technologies are also concentrated between a handful of educated farmers. This is not to say that the extension officers are not productive. In fact, according to (Oduri, Prince, & Elfreda, 2014), the extension service has a greater impact on agricultural productivity than formal education. They argue that education is important if agricultural productivity was to improve. There is a need to break the barriers and provide equal opportunity for the farmers to access the resources for agricultural improvement.
Thus, the training must be conducted in the most appropriate manner to ensure the graduates are skilled, knowledgeable and have right attitudes. These are called competencies. Competency is a set of knowledge, skills and attributes required to perform a job effectively. Competency-based training and assessment (CBTA) is concerned with outcomes, not the time spent in learning. Thus, in a competency-based learning approach, the learner is deemed to be competent if he/she can prove the outcomes through evidence. This is not the same as conventional practice. In CBTA everyone has capacity to learn, it happens at a different rate and maybe in different ways for each one of us.
Agricultural education at the lower levels of the Higher Education Frameworks is dominantly skill-based. It is about what the learner can do, show, or create. It is about being work ready and fit for purpose.
RESULTSThe Tutu Training Center, Navuso Agricultural Training Institute (NATI) and Vivekananda Training Center (VTC) concentrate on the training of farmers through on job training and full-time pre-service training. The Fiji National University (FNU) and University of the South Pacific (USP) concentrate in the production of academics for the professional jobs. FNU and USP add up to 80% of the Learners cohort. The other two (2) ATIs make up the 20% which prepares them for real time on farms. The Technical College of Fiji (TCF) was merged to FNU in 2018. The TCF was unique in that they delivered the
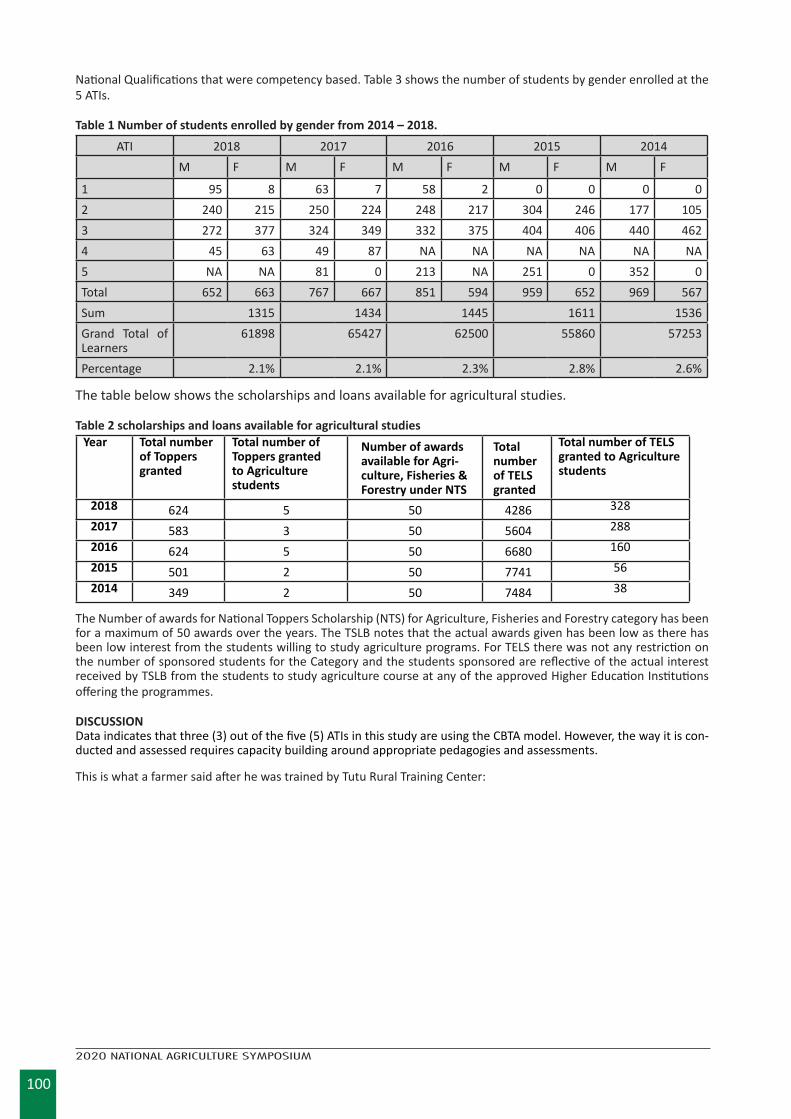
100
2020 NATIONAL AGRICULTURE SYMPOSIUM
National Qualifications that were competency based. Table 3 shows the number of students by gender enrolled at the 5 ATIs.
Table 1 Number of students enrolled by gender from 2014 – 2018.
ATI 2018 2017 2016 2015 2014M F M F M F M F M F
1 95 8 63 7 58 2 0 0 0 02 240 215 250 224 248 217 304 246 177 1053 272 377 324 349 332 375 404 406 440 4624 45 63 49 87 NA NA NA NA NA NA5 NA NA 81 0 213 NA 251 0 352 0Total 652 663 767 667 851 594 959 652 969 567Sum 1315 1434 1445 1611 1536Grand Total of Learners
61898 65427 62500 55860 57253
Percentage 2.1% 2.1% 2.3% 2.8% 2.6%
The table below shows the scholarships and loans available for agricultural studies.
Table 2 scholarships and loans available for agricultural studiesYear Total number
of Toppers granted
Total number of Toppers granted to Agriculture students
Number of awards available for Agri-culture, Fisheries & Forestry under NTS
Total number of TELS granted
Total number of TELS granted to Agriculture students
2018 624 5 50 4286 3282017 583 3 50 5604 2882016 624 5 50 6680 1602015 501 2 50 7741 562014 349 2 50 7484 38
The Number of awards for National Toppers Scholarship (NTS) for Agriculture, Fisheries and Forestry category has been for a maximum of 50 awards over the years. The TSLB notes that the actual awards given has been low as there has been low interest from the students willing to study agriculture programs. For TELS there was not any restriction on the number of sponsored students for the Category and the students sponsored are reflective of the actual interest received by TSLB from the students to study agriculture course at any of the approved Higher Education Institutions offering the programmes.
DISCUSSIONData indicates that three (3) out of the five (5) ATIs in this study are using the CBTA model. However, the way it is con-ducted and assessed requires capacity building around appropriate pedagogies and assessments.
This is what a farmer said after he was trained by Tutu Rural Training Center:
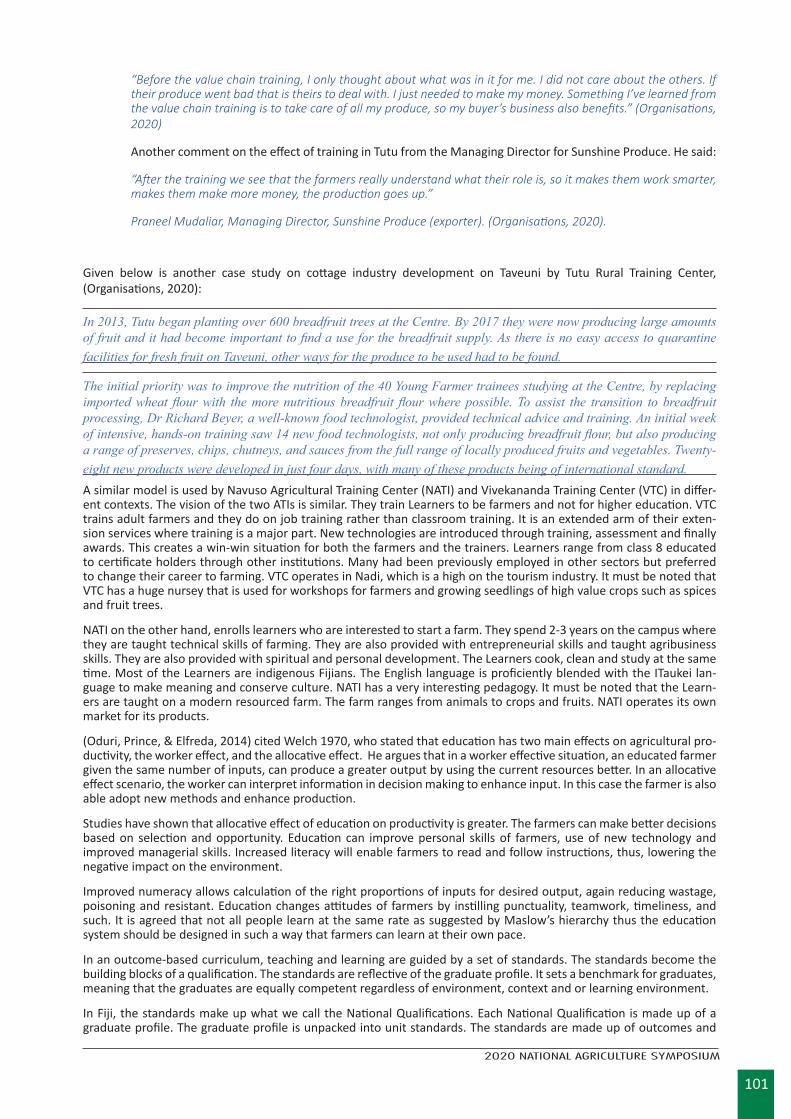
101
2020 NATIONAL AGRICULTURE SYMPOSIUM
“Before the value chain training, I only thought about what was in it for me. I did not care about the others. If their produce went bad that is theirs to deal with. I just needed to make my money. Something I’ve learned from the value chain training is to take care of all my produce, so my buyer’s business also benefits.” (Organisations, 2020)
Another comment on the effect of training in Tutu from the Managing Director for Sunshine Produce. He said:
“After the training we see that the farmers really understand what their role is, so it makes them work smarter, makes them make more money, the production goes up.”
Praneel Mudaliar, Managing Director, Sunshine Produce (exporter). (Organisations, 2020).
Given below is another case study on cottage industry development on Taveuni by Tutu Rural Training Center, (Organisations, 2020):
In 2013, Tutu began planting over 600 breadfruit trees at the Centre. By 2017 they were now producing large amounts of fruit and it had become important to find a use for the breadfruit supply. As there is no easy access to quarantine facilities for fresh fruit on Taveuni, other ways for the produce to be used had to be found.
The initial priority was to improve the nutrition of the 40 Young Farmer trainees studying at the Centre, by replacing imported wheat flour with the more nutritious breadfruit flour where possible. To assist the transition to breadfruit processing, Dr Richard Beyer, a well-known food technologist, provided technical advice and training. An initial week of intensive, hands-on training saw 14 new food technologists, not only producing breadfruit flour, but also producing a range of preserves, chips, chutneys, and sauces from the full range of locally produced fruits and vegetables. Twenty-eight new products were developed in just four days, with many of these products being of international standard.A similar model is used by Navuso Agricultural Training Center (NATI) and Vivekananda Training Center (VTC) in differ-ent contexts. The vision of the two ATIs is similar. They train Learners to be farmers and not for higher education. VTC trains adult farmers and they do on job training rather than classroom training. It is an extended arm of their exten-sion services where training is a major part. New technologies are introduced through training, assessment and finally awards. This creates a win-win situation for both the farmers and the trainers. Learners range from class 8 educated to certificate holders through other institutions. Many had been previously employed in other sectors but preferred to change their career to farming. VTC operates in Nadi, which is a high on the tourism industry. It must be noted that VTC has a huge nursey that is used for workshops for farmers and growing seedlings of high value crops such as spices and fruit trees.
NATI on the other hand, enrolls learners who are interested to start a farm. They spend 2-3 years on the campus where they are taught technical skills of farming. They are also provided with entrepreneurial skills and taught agribusiness skills. They are also provided with spiritual and personal development. The Learners cook, clean and study at the same time. Most of the Learners are indigenous Fijians. The English language is proficiently blended with the ITaukei lan-guage to make meaning and conserve culture. NATI has a very interesting pedagogy. It must be noted that the Learn-ers are taught on a modern resourced farm. The farm ranges from animals to crops and fruits. NATI operates its own market for its products.
(Oduri, Prince, & Elfreda, 2014) cited Welch 1970, who stated that education has two main effects on agricultural pro-ductivity, the worker effect, and the allocative effect. He argues that in a worker effective situation, an educated farmer given the same number of inputs, can produce a greater output by using the current resources better. In an allocative effect scenario, the worker can interpret information in decision making to enhance input. In this case the farmer is also able adopt new methods and enhance production.
Studies have shown that allocative effect of education on productivity is greater. The farmers can make better decisions based on selection and opportunity. Education can improve personal skills of farmers, use of new technology and improved managerial skills. Increased literacy will enable farmers to read and follow instructions, thus, lowering the negative impact on the environment.
Improved numeracy allows calculation of the right proportions of inputs for desired output, again reducing wastage, poisoning and resistant. Education changes attitudes of farmers by instilling punctuality, teamwork, timeliness, and such. It is agreed that not all people learn at the same rate as suggested by Maslow’s hierarchy thus the education system should be designed in such a way that farmers can learn at their own pace.
In an outcome-based curriculum, teaching and learning are guided by a set of standards. The standards become the building blocks of a qualification. The standards are reflective of the graduate profile. It sets a benchmark for graduates, meaning that the graduates are equally competent regardless of environment, context and or learning environment.
In Fiji, the standards make up what we call the National Qualifications. Each National Qualification is made up of a graduate profile. The graduate profile is unpacked into unit standards. The standards are made up of outcomes and
102
2020 NATIONAL AGRICULTURE SYMPOSIUM
evidence. Each outcome has set of evidence to define its achievements. Thus, to get an award, a learner must first meet all the evidence to achieve an outcome. To become competent, the learner must then achieve all the outcomes of the unit standard. Finally, an award is given if the learner becomes competent in all the unit standards.
Competency based assessments are conducted to meet the evidence requirement for each outcome in the unit standard. In the assessments, learners could be asked to create, say, show or do something. CBA is not only about exams. Assessment tools are developed to meet the outcome. In the development of assessment tools, the verb becomes the primary determinant of the method for choosing assessments. Assessments can be conducted on the job site; it can be conducted in a simulated environment or it can be role played. The idea is for the Learner to demonstrate that he/she is competent in each skill. They are also given the opportunity to either say or write to provide evidence of their knowledge. Another advantage is that the previous knowledge or skill can be recognized and used for grading purposes.
In CBT, learners are not graded but deemed competent or not yet competent. This gives a chance for the Learner to be assessed and reassessed. The Learners also have the right to appeal, thus, ensuring that they are not harassed or disadvantaged. The four principles of assessment are very closely followed. Assessments must be flexible, reliable, valid, and fair. CBT assessments also provide an opportunity to Learners to determine how they would like to determine their competencies. Thus, allowing Learners to be actively involved in the designing of assessments. This works very well in the Pacific, as people are culturally shyer and speaking up is considered rude.
According to many Pacific writers such as Konai Helu Thaman, cultural competency is an important attribute for Teach-ers in the Pacific. Teachers must consider the cultural background of the Learners, while making decisions on how to prepare lessons. The Learners ways of doing, learning and being (Nabobo-Baba, 2006) differs not only communally but also individually. Thus, teachers must be better prepared to harness this difference in the most productive way.
Similarly, assessments also need to be prepared in much the same way. The differences in the individual’s thoughts, perceptions, and ways of doing must be considered when preparing for assessments. For a while, assessments have been considered as a tool for differentiation, culling and removal process. But recent literature says otherwise, such as (Boud, 2010), who argues that assessments is a learning tool. It is about competent graduates who are safe and capable practitioners.
So how do we define safe and competent or capable practitioners in the field of agriculture. Firstly, the qualifications must be bench marked against standards that is applicable to the industry and these standards must be set by the in-dustry. This will not only determine safe and capable fit for the industry but also ensure that the ATIs are current with the needs of the industry and vice-versa.
Whilst we can claim that the Fijian agriculture industry is not as fast as the academia, we also need to ask the reason/s for the delays. So much research has been conducted on the ways that agricultural productivity could be increased in Fiji. However, the information is not reaching the grassroots. So, where is the gap. One of the gaps is the extension officers not prepared for the transfer of knowledge and skills to the farmers where it will be processed. The extension service is another form of passing knowledge which is comparable to teaching because there is an exchange of new and old knowledge.
Thus, the extension officers also need to be prepared to use appropriate pedagogies and assessment methods like the teachers. They also should be in the position to award farmers where it is due such that we can grow our farmers to become more skilled and knowledgeable. This knowledge and skill will boost the agricultural sector with improved agricultural practices. It will also allow the farmers to become entrepreneurs and become confident to take risks, adopt new technologies, take loans, and reduce wastage through proper handling and value addition. We also need to pro-duce educated farmers who understand the correct use of fertilizers and chemicals to reduce environmental degrada-tion, decrease pollution and reduce effects of climate change.
CONCLUSIONThe case studies confirm that competency-based training and assessment model is the powerhouse required at the lower levels of the Higher Education Framework for sustainable agricultural development.
RECOMMENDATION The Competency-based Training and assessment model could be replicated to all the training institutions and the ex-tension service of the Ministry of Agriculture.
REFERENCESAlam, G. M., Hoque, K. E., Khalifa, M. T., Siraj, S. B., & Ghani, M. F. (2009). The role of agriculture education and
training on agriculture economics and national development of Bangladesh . African Journal of Agricultural Research Vol. 4 (12),, 1334-1350.
Boud, D. (2010). Assessment for Developing Practice. Researchgate.
Economics, T. (2020). Fiji - Employment In Agriculture (% Of Total Employment). https://tradingeconomics.com/fiji/employment-in-agriculture-percent-of-total-employment-wb-data.html.
103
2020 NATIONAL AGRICULTURE SYMPOSIUM
Economy.com, T. G. (2020). Business and economic data for 200 countries. https://www.theglobaleconomy.com/Fiji/share_of_agriculture/.
Fiji, I. (2020). Investment Fiji. https://www.investmentfiji.org.fj/pages.cfm/for-investors/sector-industry-profiles/tour-ism.html.
Kamil, Y. A. (2019, July 24). Shutterstock. Retrieved from Back to basics: Is agricultural education the way forward?: https://www.studyinternational.com/news/back-to-basics-is-agricultural-education-the-way-forward/
Kirby, T., & Olinger, G. (2019, February 8). Pilot and Today. Retrieved from Community Agriculture Alliance: The im-portance of agricultural education: https://www.steamboatpilot.com/news/community-agriculture-alliance-the-importance-of-agricultural-education/
Master, N. (2020). Fiji Labour Stats. https://www.nationmaster.com/country-info/profiles/Fiji/Labor.
Nabobo-Baba, U. (2006). Teacher Education in the Pacific Islands: New Landscapes and Challenges-Where are we go-ing? . APERA. Hong Kong.
Oduri, O. E., Prince, A. A., & Elfreda, A. N. (2014). Effects of education on the agricultural productivity of farmers in the offinso municipality. International Journal of Development ResearchVol. 4, Issue, 9,, pp. 1951-1960,.
Organisations, P. F. (2020). Farmer Organisations bring Farmers Together. Retrieved from 2020 Pacific Island Farmers Organisation Network: https://pacificfarmers.com/
Seif, E. (2020, October 13). ASCD in Service. Retrieved from Mozilla Firefox: https://inservice.ascd.org/what-is-deep-learning-who-are-the-deep-learning-teachers/
Sharma, P. (2010). Necessity of education and awareness in farmers: the basis of agricultural progress in developing and underdeveloped nations . AGRICULTURE AND BIOLOGY JOURNAL OF NORTH AMERICA ISSN Print: 2151-7517, ISSN Online: 2151-7525 © 2010, ScienceHuβ, http://www.scihub.org/ABJNA , NA.
104
2020 NATIONAL AGRICULTURE SYMPOSIUM
DIGITIZING INTERNAL CONTROL SYSTEMS WITHIN THE KAVA INDUSTRY
Salote Waqairatu1, Kenneth Katafono2, Marita Manley1, Zane Yoshida3, Shauna Katafono2 and Lex Thomson1
1Pacific Agribusiness Research in Development Initiative (PARDI2), University of Sunshine Coast, QLD, Australia.2 TraSeable Solutions Pte Ltd, Suva, Fiji.3Fiji Kava Pty Ltd, Ovalau, Fiji.
Corresponding author: [email protected]
ABSTRACTKava is one of Fiji’s most significant commodities, predominantly traded domestically and growing steadily in the export market. Although there have been recent fluctuations in market prices post-COVID19, kava demand is estimated to continue to increase progressively. Kava has long been considered a drug, however the Codex Alimentarius Commission’s recent recognition of kava as a food and beverage, may also be a compounding factor in raising the demand for kava globally.
Despite this, a majority of the kava that is supplied to kava exporters come from smallholder kava farmers, usually farming less than a hectare of land. Meeting the global demand for kava, will also mean sustainably producing and supplying kava to meet production and export standards. Here, we discuss the feasibility of digitizing an internal control system designed to meet third party organic standards for the production and export of kava.
In particular, we highlight the importance of proper management of information systems, the effectiveness of mobile apps, the readiness of smallholder kava farmers in moving from a manual form of record-keeping to a digital one and a checklist for agribusinesses considering digitizing their own operations.
105
2020 NATIONAL AGRICULTURE SYMPOSIUM
STRENGTHENING THE PARTICIPATION OF PRODUCER ASSOCIATION AND FARMER’S COOPERATIVES IN VALUE CHAINS.
Ritesh A. Chand1, Dr. Salesh Kumar1, Atish Chand1 and Vashnika Narayan1
1College of Agriculture, Fisheries and Forestry, Fiji National University, Fiji IslandsCorresponding author: [email protected]
ABSTRACTThis study highlights that Fiji Crop and Livestock Council (FCLC) is the parent body under which most farmer cooperatives in Fiji are currently registered with. At present there are 12 registered entities with this organization. Previously, most these associations existed on its own either formally or informally and following cabinets endorsement on July 20th, 2010, FCLC became official entity and began its full operation from February, 2013. Apart from this, there are two other farmer cooperatives in Fiji operating independently. These are Nature’s Way Cooperative (NWC) Fiji and Fiji Cooperative Dairy Company Limited (FCDCL). An in-depth investigation on cooperative structure in Fiji revealed that most of these cooperatives are non-sustainable entities and hugely depend on external funding from government and other donor agencies like European Union, Non-Government Organizations and Australian Aid. The study further highlights that only two producer associations that is Fiji Ginger Farmers’ Association and Fiji Cocoa Producers Association have recently received some funding from government, to cater their operational costs and ratify their development plans while remaining ten producer associations are yet to receive any funding from any external source. In order to meet their routine operating expenses, most producer associations levy membership fee on its members and in few cases some of them work entirely on voluntarily basis. In addition, the study further reveals that NWC Fiji and FCDCL are the only two cooperative organizations which have the capacity to run its affairs on its own without any reliance from outside. In conclusion it can be summed up that poor performance of farmer’s cooperatives in Fiji is partly attributed to government’s inconsistence development strategies and poor funding opportunities in place.
INTRODUCTION A cooperative is an independent association of women and men, united voluntary to meet their common, social, cultural needs and aspirations through a jointly owned and democratically controlled enterprise. An agricultural or farmer cooperative is a formal form of farmer collective action for the marketing and processing of farm produce and or for the purchase and production of farm inputs. They aim to increase member’s production and income by helping better link them with finance, agricultural inputs, information and output markets.
Collective action is the core resource of agricultural cooperatives. Cooperatives create social relations that enable individuals to achieve goals that they may not be otherwise be able to achieve by themselves. For example, cooperatives can help farmers benefit from economies of scale to lower their cost of acquiring inputs or hiring services such as storage and transport. Farmer cooperatives also enable farmers to improve product and service quality and reduce risks. They may also empower their members economically and socially by involving them in decision making process that create additional rural employment opportunities or enable them to become more resilient to economic and environmental shocks.
FIJI’S BACKGROUNDFiji covers about 1.3 million km2 of the South Pacific Ocean, with a total land area of 18,333 km2. The two major islands Viti Levu and Vanua Levu have areas of 10,429 km2 and 5,556 km2, respectively. (FAO, 2000). Most of this productive land is situated along the coastal plains, river deltas, and valleys. Currently Fiji has a population of 850,000. Fiji enjoys a tropical South Sea maritime climate with neither extremes of heat nor cold. The islands lie in an area which is occasionally traversed by tropical cyclones, during the period November to April. Temperatures average around 15°c during the cooler months (May to October) while during November to April, temperatures are relatively higher with heavy downpours. Although rainfall is highly variable, the average rainfall increases steadily inland from coastal areas.
OVERVIEW OF FARMER COOPERATIVES/PRODUCER ASSOCIATIONS.Fiji Crop and Livestock Council (FCLC) is the parent body under which most farmer cooperatives and producer associations in Fiji are registered with. FCLF became an official entity in February, 2013 when its secretariat (Fiji Crops Livestock Trust) was established following Cabinet’s endorsement in its meeting on 20th July, 2010, Cabinet Decision CP (10) 215 (Pacific Agriculture Poilcy Project, 2020). FCLC’s main objective is to act as an apex forum for advocacy to better represent the needs of the farmers to government and stakeholders including financiers, aid, rehabilitation agencies and potential new investors. It is geared towards raising the profile of Fiji’s farmers involve in crop and livestock production. FCLC was established in conjunction with agricultural associations to improve agri. food productivity. It
106
2020 NATIONAL AGRICULTURE SYMPOSIUM
works closely with Ministry of Agriculture in addressing issues that affects its members. The core of FCLC is 12 commodity associations that represent almost 60,000 farmers in non-sugar sector of the agricultural industry. This includes:
1. Fiji Bee keepers Association.
2. Fiji Ginger Farmers Association.
3. Fiji Cocoa Farmers Association.
4. Fiji Grazing Livestock Association.
5. Fiji Dalo Farmers Association.
6. Fiji Pig Farmers Association
7. Fiji Food Exporters Association.
8. Fiji Fruits and Vegetable Farmers association.
9. Fiji Rice Growers Association.
10. Fiji National Yaqona Farmers’ Association.
11. Fiji Coconut Growers Association.
12. Fiji Organic Farmers Association.
In view of the fact that FCLC is a recently formed entity, it is quite evident there lies lot of work ahead which needs to be done to develop a good data base of its affiliated members. An insight in FCLC’s website has revealed that most of its core commodity associates do not have adequate information outlined on their webpage detailing the developments taking place within their association. There is also a need to create vibrant legislative framework/structure to ensure all its affiliated member’s voice are taken on board while developing polices for the association.
Further to this, there are two other cooperative organizations in Fiji which are not associated with FCLC. They are Nature’s Way Cooperative (NWC) Fiji Limited and Fiji Cooperative Dairy Company Limited (FCDCL). Nature’s Way Cooperative (NWC) was established in 1995 to carry out mandatory quarantine treatment on Fijian fruit and vegetables under the Bilateral Quarantine Agreement (BQA) established with importing countries. After over 20 years, NWC is now a thriving agribusiness providing treatment, grading, packing and technical services to both its exporter and grower members (Natures Way, 2020).
Fiji Cooperative Dairy Limited was created under dairy restructure decree 2010 when the industry was restructured in two companies, FCDCL and Fiji Dairy Company Limited (FDL).
FCDCL owns 20 percent of FDL on behalf of its shareholders, the FCDCL dairy farmers. The Co-operative is owned by the dairy farmers of Fiji and is operated as a commercial company with its own Board of Directors and Chief Executive Officer. The Board sets policy, implemented by the CEO. The full Board consists of eight active dairy farmers, elected by the shareholders, and three Government representatives appointed by the Minister of Agriculture.
FCDCL is the principle supplier of raw milk for processing in Fiji. FCDCL buys milk as per the quality grades and sells it to FDL. The aggregate cost of each grade milk varies according to its quality. They have Quality Assurance expertise that assures farmers are maintaining clean milking environment, farm hygiene, and water reticulation.
BUSINESS MODEL OF FARMER COOPERATIVESMost farmer cooperatives or producer association’s in Fiji are recently formed entities with no proper legislative struc-ture in place to govern their operating principles. Majority of them are budding organizations which currently are struggling to put their footing on ground. They are non-profit making organizations and the council members elected/representing is on voluntary basis since they do not get paid for the duties discharged. The source of the funding for some comes from government for example Fiji Ginger Farmers Association while the others depend entirely only on membership fee for example Fiji Bee Keepers Association. Most of these associations offer free membership to its clients and for funding they largely depend on non-governmental organizations (NGO’s) and other potential donor agencies. This however, is very rare in most cases.
Nature’s Way Cooperative (Fiji) and Fiji Cooperative Dairy Company Limited are the only corporate bodies which
107
2020 NATIONAL AGRICULTURE SYMPOSIUM
are well established and financially stable. They have a well-defined legislative structure in place which governs their operational activities.
The core business of NWC (Fiji) is the operation of its four High Temperature Forced Air (HTFA) Chambers which provide the mandatory quarantine treatment for fresh exports of papaya, eggplant, breadfruit and mango. This HTFA quarantine treatment was developed solely for the control of fruit flies in selected tropical fruits. Apart from this they also offer packaging services to their clients (exporters). For both of these service delivery, they are charging the exporters at the rate of $0.72 per kg.
In regards to FCDCL approximately 40% of their total funding comes from the 8.7 cents per liter makeup on all milk sold to FDL. The remaining 60% comes from the other commercial ventures that FCDCL is now involved in. The commercial ventures are but not limited to Feed Sales and feed mill, machinery hire, equipment sales and hire, specialized dairy chemical sales, dairy consumable sale and chargeable farm activities. FCDCL continues to explore other commercial ventures in order to reduce the reliance on the markup on the milk sales and ultimately offering its suppliers (farmers) the factory price of raw milk.
The products sold by these associations are (unique) consumable food items and there is a ready market available for these products. For NWC (Fiji) which exports tropical fruits, target markets are some of our neighboring Pacific Island Countries (PIC) and in particular Australia and New Zealand. FCDCL and remaining 12 producer associations most of their produce are sold locally while others like ginger and dalo are exported.
SPECIAL/INNOVATIVE SCHEMES OF PRODUCER ASSOCIATIONSAll producer associations affiliated with FCLC together with NWC Fiji and FCDCL have common intend on ground. That is to promote the economic interest of their clients to secure sustainable operation platform. Some of key areas these associations are working onto are:
i. Help organize educational symposium for the producers.
ii. To represent the interest of the members to the Fiji Government.
iii. Engage with Biosecurity Authority of Fiji to curb problems related to product diseases and illegal importation of related products.
iv. Fostered communication amongst producers, buyers and equipment sellers to facilitate their businesses.
v. Deal with all marketing, production and input related supplies required to run the industry successfully.
Fiji Dalo farmers’ association are negotiating towards regularizing the dalo prices so that every producer receives the same price of their product they sell. In addition, there are also plans in place to negotiate and enter into contract farming system binded by legal framework to be agreed by all parties involved, that is sellers and buyers/exporters. In this way, there is a hope that buyers will be restrained in exploiting their usual buying tactics which is always to the discomfort of producers? This however, is only confined to “a few” mentioned cooperatives. Most of them are yet to begin their full operational. And this delay is due to lack of funding opportunities available to them.
DIGITALIZED METHODOLOGY USED IN PLANNING, OPERATING AND MANAGEMENTThere is no specific tailor made software developed to assist in planning, management or in operating of these cooperatives. However, some well-established farmer cooperatives such as FCDCL and NWC Fiji Limited have proper recoding keeping mechanisms in place to assist in planning, organizing and decision making process. As stated, that most of our cooperatives are still budding associations (previously informally existed) and had just formalized recently, are yet to exploit full opportunity which could give them the edge of exploring digital media platform that can be used in planning, management and for operational matters of the organization. It was however, gathered that of 12 listed cooperatives under FCLC, only 6 of them have partly developed web page(s), which displays few relevant information related to the organization. The remaining 6 cooperative bodies are yet to find this milestone. Social media website is very common interactive platform in Fiji and some of these associations resort to this medium in trying to reach out to their target customers. There is a vast opportunity for producer associations to form mobile (viber, watsup or messenger) groups but cross interviews via telephone calls had revealed that no such medium of communication exists
108
2020 NATIONAL AGRICULTURE SYMPOSIUM
2 0 2 0 F I A S N a t i o n a l A g r i c u l t u r e S y m p o s i u m 1 0 4
CONTRIBUTION OF AGRICULTURE AND TOURISM TO ECONOMIC GROWTH: A CASE STUDY OF FIJI
Ravneel Kumar1 and Nikeel Kumar2 1College of Agriculture, Fisheries and Forestry, Fiji National University, Fiji / Massey University, Palmerston Campus, New Zealand. 2School of Accounting and Finance, Faculty of Business and Economics, University of the South Pacific, Fiji Correspondence author: [email protected]
ABSTRACT In this study, we examine the effect of agriculture on economic growth in Fiji over the period 1975 to 2015 which amounts to 41 annual observations. Agricultural output has been consistently declining overtime and the current study would provide new evidence to boost support for the sector. We apply the autoregressive distributed lags bounds approach to estimate the long run and short run parameters, identify structural breaks using the Bai-Perron break test, and examine causality using Toda and Yamamoto’s augmented VAR model. Real GDP per capita is regressed on per-capita agricultural output, with the per-capita capital stock and per-capita visitor arrivals as control variables. Our results indicate that in the long run, the contribution of agriculture exceeds that of tourism whereas in the short run, the opposite is observed. We find a unidirectional causality from tourism and agriculture to output. The findings have significant implications for agricultural and developmental policy in Fiji. Keywords: agriculture; tourism; economic growth; long run; short run; structural breaks INTRODUCTION Global trends have shown that all economies progress from an agrarian to service-based as a country develops over time with the proportion of final agricultural contribution to GDP being dependent on government taxation on other sectors, government funding for other sectors and the overall posture of government and the public when related to education (Johnston & Mellor, 1961; Pingali, 2007). However, it is also prudent to state that most economies must have a foundation of raw material provision before any significant development can take place. This is in line with the decline of agricultural contribution to the economy of a country as development progresses (Gollin et. al., 2002; Pingali, 2007). The degree to which agriculture influences the economy depends upon the size of the workforce that it employs, value of commodities that it produces and the presence of other competing industries in the economy (Johnston & Mellor, 1961; Cervantes-Godoy & Dewbre, 2010). Notwithstanding, it is imperative for countries to ensure that those commodities that can be produced efficiently locally should be exploited to their fullest extent. In doing so, unnecessary expenditure is minimized thus reducing trade deficits that plague smaller economies. This ensures exogenous price increases due to global market forces do not impact local prices to extreme extents (Anderson and Nelgen, 2012). In this study we attempt to determine the effects agriculture in controlling for the effects of the tourism sector in Fiji. The government’s current policy stance is based wholly on improving both industries simultaneously, however, agriculture has taken a back seat in the mindset of both the public and policy makers alike due to its traditional portrayal almost universally as a ‘second class’ occupation (Pohoski, 2017; Took, 2015; Zhan, 2015). The problem is further aggravated by differing estimates on its contribution to the GDP (Chand, 2015; Shah et.al., 2018; Singh-Peterson & Iranacolaivalu, 2018). Here we will attempt to provide a more transparent estimate of the agriculture sector’s contribution to GDP while also determining the relative change to GDP per percentage increase in the sector. The importance of such studies cannot be stressed enough as our current agricultural policy has goals that focus only up until the year 2010 (Karim et. Al., 2016). We do not yet have data on the success rates of deliverables outlined in the original policy document. By reflecting on our findings, the next policy document could include tools for measuring of outcomes. A resilient agricultural sector is important for Fiji due to its geographic isolation
109
2020 NATIONAL AGRICULTURE SYMPOSIUM2 0 2 0 F I A S N a t i o n a l A g r i c u l t u r e S y m p o s i u m 1 0 5
which makes rapid relief provision difficult in the case of major natural disasters e.g. the effects of tropical cyclone Winston. Notably, our findings indicate that the long run contribution of the agricultural sector is about 21%. The long run effect of the tourism sector is noted at about 12% which is similar to Kumar, Kumar, Patel and Stauvermann (2018). Moreover, the capital share is estimated at about 0.50. The current study is timely because it provides updated information on the agricultural sector which can be useful in developing sustainable agricultural policy in Fiji. The rest of the paper is set out as follows: In section 2, we provide a brief review of agriculture-growth interaction and contribution literature, in section 3, we discuss the model and framework, followed by the results in section 4 and concludes with findings and policy remarks in section 5. LITERATURE REVIEW Agriculture had long been the backbone of Fiji with numerous agricultural commodities having been established and then given way to more promising ventures. Stokes (1968) notes that cotton may have initially been introduced in the 1830s and was already growing wild by the 1860s, however, the natives saw little use for the commodity. The cotton boom of the 1860s was driven by explosive global prices but a sudden crash in global market demand due to a supply glut caused the bankruptcy of numerous businesses involved in the cotton industry (Stokes, 1968; Saxonhouse & Wright, 2010). Sugarcane was the primary agricultural commodity in Fiji after cotton. However, the industry’s contribution to the economy has been decreasing steadily due to numerous external pressures (figure 1) (Gounder, 2001; Narayan & Prasad, 2005). Once the highest foreign exchange earner and described as the backbone of the economy, it now contributes less than ten percent to GDP (Bijay & Singh, 2016; Chandra & Hemstock, 2016; Narayan & Prasad, 2005). Cash crops and root crop production has taken the stead of sugarcane although scope exists for improvement in all sectors of agriculture in the country (Raj & Chand, 2017). It is imperative that policy be designed and implemented correctly with Gounder (2013) reporting the implications for proper agricultural policy implementation highlighting its positive effects in facilitating development in the country while reducing rural poverty. The impact of agriculture and its contribution to the economy has remained vague in the country. No two reference sources have ever provided the same output or contribution value for any single commodity (Chandra & Hemstock, 2015; Raj & Chand, 2017; Narayan & Prasad, 2005). Further complications arise when one considers that agriculture would play an important role in the largest contributor to the economy recently-tourism. Policy currently has agriculture taking a back seat and it is important to determine an accurate measurement of the short term and long-term impact of investing in the sector to ensure that money is diverted to the right places hence fast-tracking economic growth. Additionally, knowledge gaps exist in the threshold value of agricultural production which this study will address. The findings and methodology of this study can be used in most developing countries in the south pacific region that are faced with similar problems. METHODS AND DATA COINTEGRATION, LONG RUN, AND SHORT RUN Cointegration and the long-run and short-run estimates were computed with the ARDL-bounds procedure (Pesaran, Shin, & Smith, 2001). The benefits of this approach include the ability to examine cointegration when the series is stationary at levels, stationary at the first difference, or a combination of the two. The method provides unbiased estimates in small samples, avoids the endogeneity bias because it has a dynamic structure supported by lagged explanatory variables that act as instruments in the estimates. Additionally, the lags do not need to be symmetrical, and cointegration in multivariate systems can be examined (Al-Mulali, Saboori & Ozturk, 2015; Kumar, Kumar, Patel, & Stauvermann, 2018).
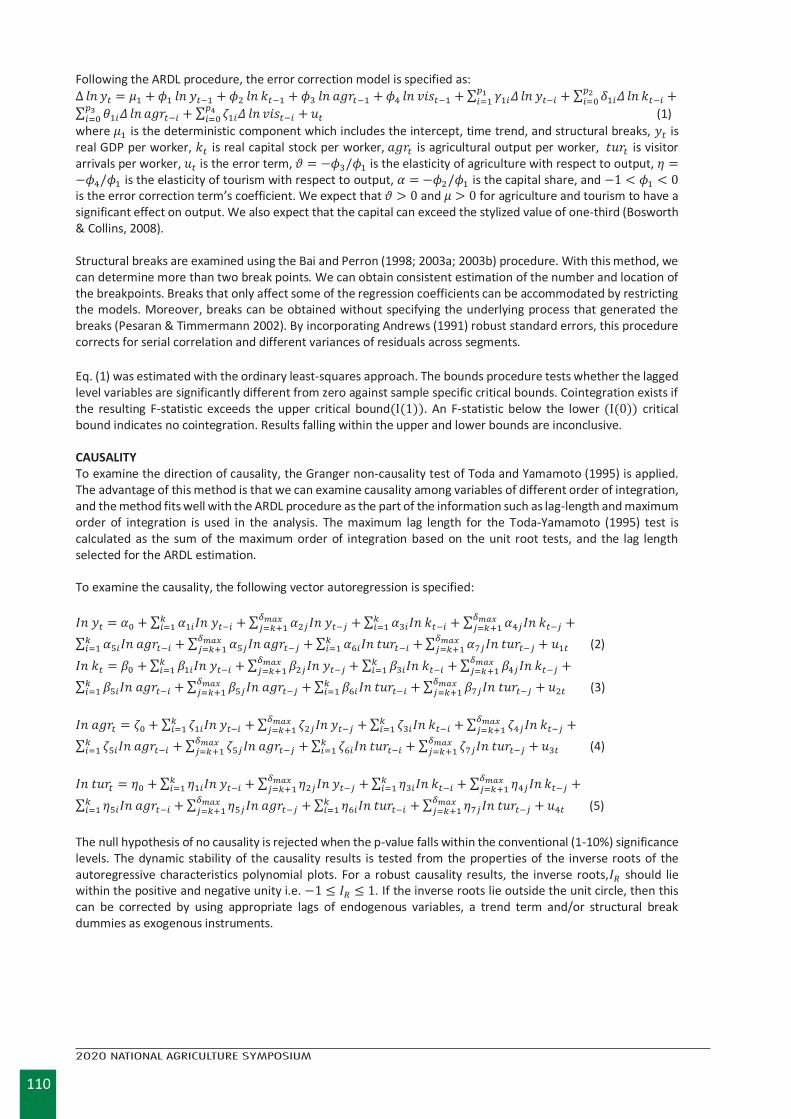
110
2020 NATIONAL AGRICULTURE SYMPOSIUM2 0 2 0 F I A S N a t i o n a l A g r i c u l t u r e S y m p o s i u m 1 0 6
Following the ARDL procedure, the error correction model is specified as: ∆ 𝑙𝑙𝑙𝑙 𝑦𝑦𝑡𝑡 = 𝜇𝜇1 + 𝜙𝜙1 𝑙𝑙𝑙𝑙 𝑦𝑦𝑡𝑡−1 + 𝜙𝜙2 𝑙𝑙𝑙𝑙 𝑘𝑘𝑡𝑡−1 + 𝜙𝜙3 𝑙𝑙𝑙𝑙 𝑎𝑎𝑎𝑎𝑎𝑎𝑡𝑡−1 + 𝜙𝜙4 𝑙𝑙𝑙𝑙 𝑣𝑣𝑣𝑣𝑣𝑣𝑡𝑡−1 + ∑ 𝛾𝛾1𝑖𝑖𝛥𝛥𝑝𝑝1
𝑖𝑖=1 𝑙𝑙𝑙𝑙 𝑦𝑦𝑡𝑡−𝑖𝑖 + ∑ 𝛿𝛿1𝑖𝑖𝛥𝛥𝑝𝑝2𝑖𝑖=0 𝑙𝑙𝑙𝑙 𝑘𝑘𝑡𝑡−𝑖𝑖 +
∑ 𝜃𝜃1𝑖𝑖𝛥𝛥𝑝𝑝3𝑖𝑖=0 𝑙𝑙𝑙𝑙 𝑎𝑎𝑎𝑎𝑎𝑎𝑡𝑡−𝑖𝑖 + ∑ 𝜁𝜁1𝑖𝑖𝛥𝛥𝑝𝑝4
𝑖𝑖=0 𝑙𝑙𝑙𝑙 𝑣𝑣𝑣𝑣𝑣𝑣𝑡𝑡−𝑖𝑖 + 𝑢𝑢𝑡𝑡 (1) where 𝜇𝜇1 is the deterministic component which includes the intercept, time trend, and structural breaks, 𝑦𝑦𝑡𝑡 is real GDP per worker, 𝑘𝑘𝑡𝑡 is real capital stock per worker, 𝑎𝑎𝑎𝑎𝑎𝑎𝑡𝑡 is agricultural output per worker, 𝑡𝑡𝑢𝑢𝑎𝑎𝑡𝑡 is visitor arrivals per worker, 𝑢𝑢𝑡𝑡 is the error term, 𝜗𝜗 = −𝜙𝜙3/𝜙𝜙1 is the elasticity of agriculture with respect to output, 𝜂𝜂 =−𝜙𝜙4/𝜙𝜙1 is the elasticity of tourism with respect to output, 𝛼𝛼 = −𝜙𝜙2/𝜙𝜙1 is the capital share, and −1 < 𝜙𝜙1 < 0 is the error correction term’s coefficient. We expect that 𝜗𝜗 > 0 and 𝜇𝜇 > 0 for agriculture and tourism to have a significant effect on output. We also expect that the capital can exceed the stylized value of one-third (Bosworth & Collins, 2008). Structural breaks are examined using the Bai and Perron (1998; 2003a; 2003b) procedure. With this method, we can determine more than two break points. We can obtain consistent estimation of the number and location of the breakpoints. Breaks that only affect some of the regression coefficients can be accommodated by restricting the models. Moreover, breaks can be obtained without specifying the underlying process that generated the breaks (Pesaran & Timmermann 2002). By incorporating Andrews (1991) robust standard errors, this procedure corrects for serial correlation and different variances of residuals across segments. Eq. (1) was estimated with the ordinary least-squares approach. The bounds procedure tests whether the lagged level variables are significantly different from zero against sample specific critical bounds. Cointegration exists if the resulting F-statistic exceeds the upper critical bound(I(1)). An F-statistic below the lower (I(0)) critical bound indicates no cointegration. Results falling within the upper and lower bounds are inconclusive. CAUSALITY To examine the direction of causality, the Granger non-causality test of Toda and Yamamoto (1995) is applied. The advantage of this method is that we can examine causality among variables of different order of integration, and the method fits well with the ARDL procedure as the part of the information such as lag-length and maximum order of integration is used in the analysis. The maximum lag length for the Toda-Yamamoto (1995) test is calculated as the sum of the maximum order of integration based on the unit root tests, and the lag length selected for the ARDL estimation. To examine the causality, the following vector autoregression is specified: 𝐼𝐼𝑙𝑙 𝑦𝑦𝑡𝑡 = 𝛼𝛼0 + ∑ 𝛼𝛼1𝑖𝑖𝐼𝐼𝑙𝑙 𝑦𝑦𝑡𝑡−𝑖𝑖𝑘𝑘
𝑖𝑖=1 + ∑ 𝛼𝛼2𝑗𝑗𝐼𝐼𝑙𝑙 𝑦𝑦𝑡𝑡−𝑗𝑗𝛿𝛿𝑚𝑚𝑚𝑚𝑚𝑚𝑗𝑗=𝑘𝑘+1 + ∑ 𝛼𝛼3𝑖𝑖𝐼𝐼𝑙𝑙 𝑘𝑘𝑡𝑡−𝑖𝑖𝑘𝑘
𝑖𝑖=1 + ∑ 𝛼𝛼4𝑗𝑗𝐼𝐼𝑙𝑙 𝑘𝑘𝑡𝑡−𝑗𝑗𝛿𝛿𝑚𝑚𝑚𝑚𝑚𝑚𝑗𝑗=𝑘𝑘+1 +
∑ 𝛼𝛼5𝑖𝑖𝐼𝐼𝑙𝑙 𝑎𝑎𝑎𝑎𝑎𝑎𝑡𝑡−𝑖𝑖𝑘𝑘𝑖𝑖=1 + ∑ 𝛼𝛼5𝑗𝑗𝐼𝐼𝑙𝑙 𝑎𝑎𝑎𝑎𝑎𝑎𝑡𝑡−𝑗𝑗𝛿𝛿𝑚𝑚𝑚𝑚𝑚𝑚
𝑗𝑗=𝑘𝑘+1 + ∑ 𝛼𝛼6𝑖𝑖𝐼𝐼𝑙𝑙 𝑡𝑡𝑢𝑢𝑎𝑎𝑡𝑡−𝑖𝑖𝑘𝑘𝑖𝑖=1 + ∑ 𝛼𝛼7𝑗𝑗𝐼𝐼𝑙𝑙 𝑡𝑡𝑢𝑢𝑎𝑎𝑡𝑡−𝑗𝑗𝛿𝛿𝑚𝑚𝑚𝑚𝑚𝑚
𝑗𝑗=𝑘𝑘+1 + 𝑢𝑢1𝑡𝑡 (2) 𝐼𝐼𝑙𝑙 𝑘𝑘𝑡𝑡 = 𝛽𝛽0 + ∑ 𝛽𝛽1𝑖𝑖𝐼𝐼𝑙𝑙 𝑦𝑦𝑡𝑡−𝑖𝑖𝑘𝑘
𝑖𝑖=1 + ∑ 𝛽𝛽2𝑗𝑗𝐼𝐼𝑙𝑙 𝑦𝑦𝑡𝑡−𝑗𝑗𝛿𝛿𝑚𝑚𝑚𝑚𝑚𝑚𝑗𝑗=𝑘𝑘+1 + ∑ 𝛽𝛽3𝑖𝑖𝐼𝐼𝑙𝑙 𝑘𝑘𝑡𝑡−𝑖𝑖𝑘𝑘
𝑖𝑖=1 + ∑ 𝛽𝛽4𝑗𝑗𝐼𝐼𝑙𝑙 𝑘𝑘𝑡𝑡−𝑗𝑗𝛿𝛿𝑚𝑚𝑚𝑚𝑚𝑚𝑗𝑗=𝑘𝑘+1 +
∑ 𝛽𝛽5𝑖𝑖𝐼𝐼𝑙𝑙 𝑎𝑎𝑎𝑎𝑎𝑎𝑡𝑡−𝑖𝑖𝑘𝑘𝑖𝑖=1 + ∑ 𝛽𝛽5𝑗𝑗𝐼𝐼𝑙𝑙 𝑎𝑎𝑎𝑎𝑎𝑎𝑡𝑡−𝑗𝑗𝛿𝛿𝑚𝑚𝑚𝑚𝑚𝑚
𝑗𝑗=𝑘𝑘+1 + ∑ 𝛽𝛽6𝑖𝑖𝐼𝐼𝑙𝑙 𝑡𝑡𝑢𝑢𝑎𝑎𝑡𝑡−𝑖𝑖𝑘𝑘𝑖𝑖=1 + ∑ 𝛽𝛽7𝑗𝑗𝐼𝐼𝑙𝑙 𝑡𝑡𝑢𝑢𝑎𝑎𝑡𝑡−𝑗𝑗𝛿𝛿𝑚𝑚𝑚𝑚𝑚𝑚
𝑗𝑗=𝑘𝑘+1 + 𝑢𝑢2𝑡𝑡 (3) 𝐼𝐼𝑙𝑙 𝑎𝑎𝑎𝑎𝑎𝑎𝑡𝑡 = 𝜁𝜁0 + ∑ 𝜁𝜁1𝑖𝑖𝐼𝐼𝑙𝑙 𝑦𝑦𝑡𝑡−𝑖𝑖𝑘𝑘
𝑖𝑖=1 + ∑ 𝜁𝜁2𝑗𝑗𝐼𝐼𝑙𝑙 𝑦𝑦𝑡𝑡−𝑗𝑗𝛿𝛿𝑚𝑚𝑚𝑚𝑚𝑚𝑗𝑗=𝑘𝑘+1 + ∑ 𝜁𝜁3𝑖𝑖𝐼𝐼𝑙𝑙 𝑘𝑘𝑡𝑡−𝑖𝑖𝑘𝑘
𝑖𝑖=1 + ∑ 𝜁𝜁4𝑗𝑗𝐼𝐼𝑙𝑙 𝑘𝑘𝑡𝑡−𝑗𝑗𝛿𝛿𝑚𝑚𝑚𝑚𝑚𝑚𝑗𝑗=𝑘𝑘+1 +
∑ 𝜁𝜁5𝑖𝑖𝐼𝐼𝑙𝑙 𝑎𝑎𝑎𝑎𝑎𝑎𝑡𝑡−𝑖𝑖𝑘𝑘𝑖𝑖=1 + ∑ 𝜁𝜁5𝑗𝑗𝐼𝐼𝑙𝑙 𝑎𝑎𝑎𝑎𝑎𝑎𝑡𝑡−𝑗𝑗𝛿𝛿𝑚𝑚𝑚𝑚𝑚𝑚
𝑗𝑗=𝑘𝑘+1 + ∑ 𝜁𝜁6𝑖𝑖𝐼𝐼𝑙𝑙 𝑡𝑡𝑢𝑢𝑎𝑎𝑡𝑡−𝑖𝑖𝑘𝑘𝑖𝑖=1 + ∑ 𝜁𝜁7𝑗𝑗𝐼𝐼𝑙𝑙 𝑡𝑡𝑢𝑢𝑎𝑎𝑡𝑡−𝑗𝑗𝛿𝛿𝑚𝑚𝑚𝑚𝑚𝑚
𝑗𝑗=𝑘𝑘+1 + 𝑢𝑢3𝑡𝑡 (4) 𝐼𝐼𝑙𝑙 𝑡𝑡𝑢𝑢𝑎𝑎𝑡𝑡 = 𝜂𝜂0 + ∑ 𝜂𝜂1𝑖𝑖𝐼𝐼𝑙𝑙 𝑦𝑦𝑡𝑡−𝑖𝑖𝑘𝑘
𝑖𝑖=1 + ∑ 𝜂𝜂2𝑗𝑗𝐼𝐼𝑙𝑙 𝑦𝑦𝑡𝑡−𝑗𝑗𝛿𝛿𝑚𝑚𝑚𝑚𝑚𝑚𝑗𝑗=𝑘𝑘+1 + ∑ 𝜂𝜂3𝑖𝑖𝐼𝐼𝑙𝑙 𝑘𝑘𝑡𝑡−𝑖𝑖𝑘𝑘
𝑖𝑖=1 + ∑ 𝜂𝜂4𝑗𝑗𝐼𝐼𝑙𝑙 𝑘𝑘𝑡𝑡−𝑗𝑗𝛿𝛿𝑚𝑚𝑚𝑚𝑚𝑚𝑗𝑗=𝑘𝑘+1 +
∑ 𝜂𝜂5𝑖𝑖𝐼𝐼𝑙𝑙 𝑎𝑎𝑎𝑎𝑎𝑎𝑡𝑡−𝑖𝑖𝑘𝑘𝑖𝑖=1 + ∑ 𝜂𝜂5𝑗𝑗𝐼𝐼𝑙𝑙 𝑎𝑎𝑎𝑎𝑎𝑎𝑡𝑡−𝑗𝑗𝛿𝛿𝑚𝑚𝑚𝑚𝑚𝑚
𝑗𝑗=𝑘𝑘+1 + ∑ 𝜂𝜂6𝑖𝑖𝐼𝐼𝑙𝑙 𝑡𝑡𝑢𝑢𝑎𝑎𝑡𝑡−𝑖𝑖𝑘𝑘𝑖𝑖=1 + ∑ 𝜂𝜂7𝑗𝑗𝐼𝐼𝑙𝑙 𝑡𝑡𝑢𝑢𝑎𝑎𝑡𝑡−𝑗𝑗𝛿𝛿𝑚𝑚𝑚𝑚𝑚𝑚
𝑗𝑗=𝑘𝑘+1 + 𝑢𝑢4𝑡𝑡 (5) The null hypothesis of no causality is rejected when the p-value falls within the conventional (1-10%) significance levels. The dynamic stability of the causality results is tested from the properties of the inverse roots of the autoregressive characteristics polynomial plots. For a robust causality results, the inverse roots,𝐼𝐼𝑅𝑅 should lie within the positive and negative unity i.e. −1 ≤ 𝐼𝐼𝑅𝑅 ≤ 1. If the inverse roots lie outside the unit circle, then this can be corrected by using appropriate lags of endogenous variables, a trend term and/or structural break dummies as exogenous instruments.
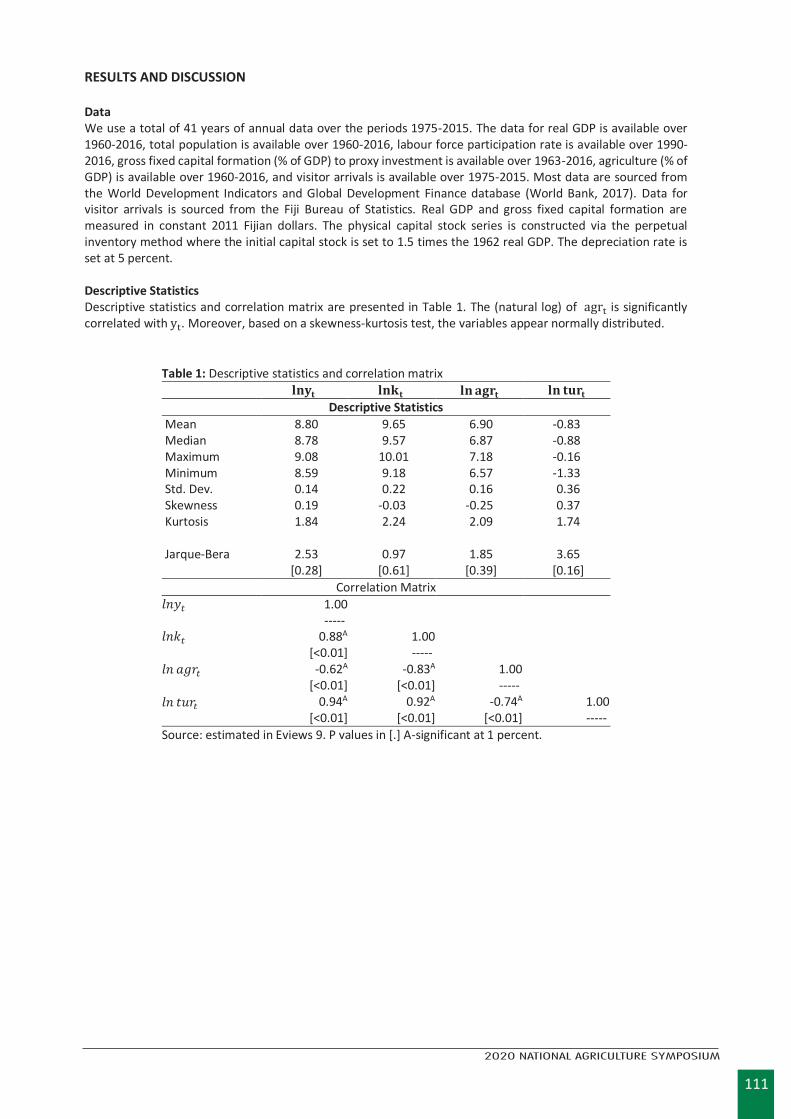
111
2020 NATIONAL AGRICULTURE SYMPOSIUM
RESULTS AND DISCUSSION Data We use a total of 41 years of annual data over the periods 1975-2015. The data for real GDP is available over 1960-2016, total population is available over 1960-2016, labour force participation rate is available over 1990-2016, gross fixed capital formation (% of GDP) to proxy investment is available over 1963-2016, agriculture (% of GDP) is available over 1960-2016, and visitor arrivals is available over 1975-2015. Most data are sourced from the World Development Indicators and Global Development Finance database (World Bank, 2017). Data for visitor arrivals is sourced from the Fiji Bureau of Statistics. Real GDP and gross fixed capital formation are measured in constant 2011 Fijian dollars. The physical capital stock series is constructed via the perpetual inventory method where the initial capital stock is set to 1.5 times the 1962 real GDP. The depreciation rate is set at 5 percent. Descriptive Statistics Descriptive statistics and correlation matrix are presented in Table 1. The (natural log) of agrt is significantly correlated with yt. Moreover, based on a skewness-kurtosis test, the variables appear normally distributed.
Table 1: Descriptive statistics and correlation matrix
𝐥𝐥𝐥𝐥𝐥𝐥𝐭𝐭 𝐥𝐥𝐥𝐥𝐥𝐥𝐭𝐭 𝐥𝐥𝐥𝐥𝐚𝐚𝐚𝐚𝐚𝐚𝐭𝐭 𝐥𝐥𝐥𝐥 𝐭𝐭𝐭𝐭𝐚𝐚𝐭𝐭 Descriptive Statistics
Mean 8.80 9.65 6.90 -0.83 Median 8.78 9.57 6.87 -0.88 Maximum 9.08 10.01 7.18 -0.16 Minimum 8.59 9.18 6.57 -1.33 Std. Dev. 0.14 0.22 0.16 0.36 Skewness 0.19 -0.03 -0.25 0.37 Kurtosis 1.84 2.24 2.09 1.74
Jarque-Bera 2.53 0.97 1.85 3.65 [0.28] [0.61] [0.39] [0.16]
Correlation Matrix 𝑙𝑙𝑙𝑙𝑙𝑙𝑡𝑡 1.00
----- 𝑙𝑙𝑙𝑙𝑙𝑙𝑡𝑡 0.88A 1.00
[<0.01] ----- 𝑙𝑙𝑙𝑙 𝑎𝑎𝑎𝑎𝑎𝑎𝑡𝑡 -0.62A -0.83A 1.00
[<0.01] [<0.01] ----- 𝑙𝑙𝑙𝑙 𝑡𝑡𝑡𝑡𝑎𝑎𝑡𝑡 0.94A 0.92A -0.74A 1.00
[<0.01] [<0.01] [<0.01] ----- Source: estimated in Eviews 9. P values in [.] A-significant at 1 percent.
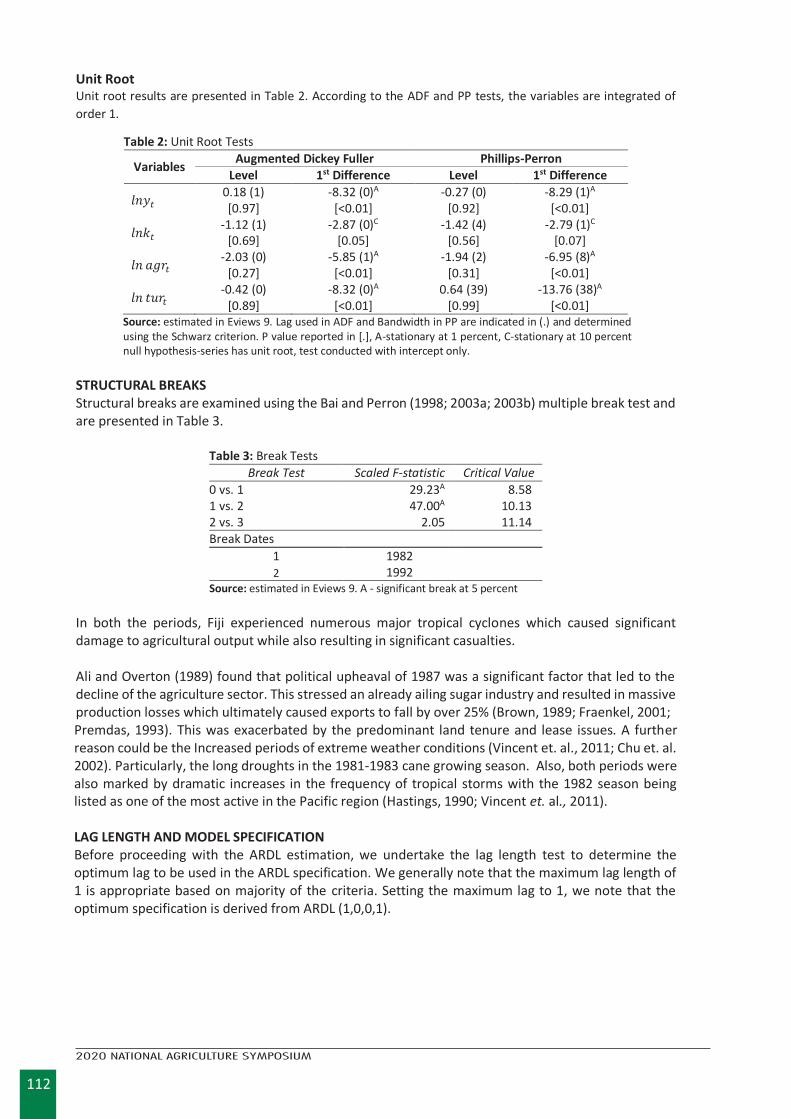
112
2020 NATIONAL AGRICULTURE SYMPOSIUM
2 0 2 0 F I A S N a t i o n a l A g r i c u l t u r e S y m p o s i u m 1 0 8
Unit Root Unit root results are presented in Table 2. According to the ADF and PP tests, the variables are integrated of order 1.
Table 2: Unit Root Tests
Variables Augmented Dickey Fuller Phillips-Perron Level 1st Difference Level 1st Difference
𝑙𝑙𝑙𝑙𝑙𝑙𝑡𝑡 0.18 (1) [0.97]
-8.32 (0)A
[<0.01] -0.27 (0)
[0.92] -8.29 (1)A
[<0.01]
𝑙𝑙𝑙𝑙𝑙𝑙𝑡𝑡 -1.12 (1)
[0.69] -2.87 (0)C
[0.05] -1.42 (4)
[0.56] -2.79 (1)C
[0.07]
𝑙𝑙𝑙𝑙 𝑎𝑎𝑎𝑎𝑎𝑎𝑡𝑡 -2.03 (0) [0.27]
-5.85 (1)A
[<0.01] -1.94 (2)
[0.31] -6.95 (8)A
[<0.01]
𝑙𝑙𝑙𝑙 𝑡𝑡𝑡𝑡𝑎𝑎𝑡𝑡 -0.42 (0) [0.89]
-8.32 (0)A
[<0.01] 0.64 (39)
[0.99] -13.76 (38)A
[<0.01] Source: estimated in Eviews 9. Lag used in ADF and Bandwidth in PP are indicated in (.) and determined using the Schwarz criterion. P value reported in [.], A-stationary at 1 percent, C-stationary at 10 percent null hypothesis-series has unit root, test conducted with intercept only.
STRUCTURAL BREAKS Structural breaks are examined using the Bai and Perron (1998; 2003a; 2003b) multiple break test and are presented in Table 3.
Table 3: Break Tests Break Test Scaled F-statistic Critical Value
0 vs. 1 29.23A 8.58 1 vs. 2 47.00A 10.13 2 vs. 3 2.05 11.14 Break Dates
1 1982 2 1992
Source: estimated in Eviews 9. A - significant break at 5 percent In both the periods, Fiji experienced numerous major tropical cyclones which caused significant damage to agricultural output while also resulting in significant casualties. Ali and Overton (1989) found that political upheaval of 1987 was a significant factor that led to the decline of the agriculture sector. This stressed an already ailing sugar industry and resulted in massive production losses which ultimately caused exports to fall by over 25% (Brown, 1989; Fraenkel, 2001; Premdas, 1993). This was exacerbated by the predominant land tenure and lease issues. A further reason could be the Increased periods of extreme weather conditions (Vincent et. al., 2011; Chu et. al. 2002). Particularly, the long droughts in the 1981-1983 cane growing season. Also, both periods were also marked by dramatic increases in the frequency of tropical storms with the 1982 season being listed as one of the most active in the Pacific region (Hastings, 1990; Vincent et. al., 2011). LAG LENGTH AND MODEL SPECIFICATION Before proceeding with the ARDL estimation, we undertake the lag length test to determine the optimum lag to be used in the ARDL specification. We generally note that the maximum lag length of 1 is appropriate based on majority of the criteria. Setting the maximum lag to 1, we note that the optimum specification is derived from ARDL (1,0,0,1).
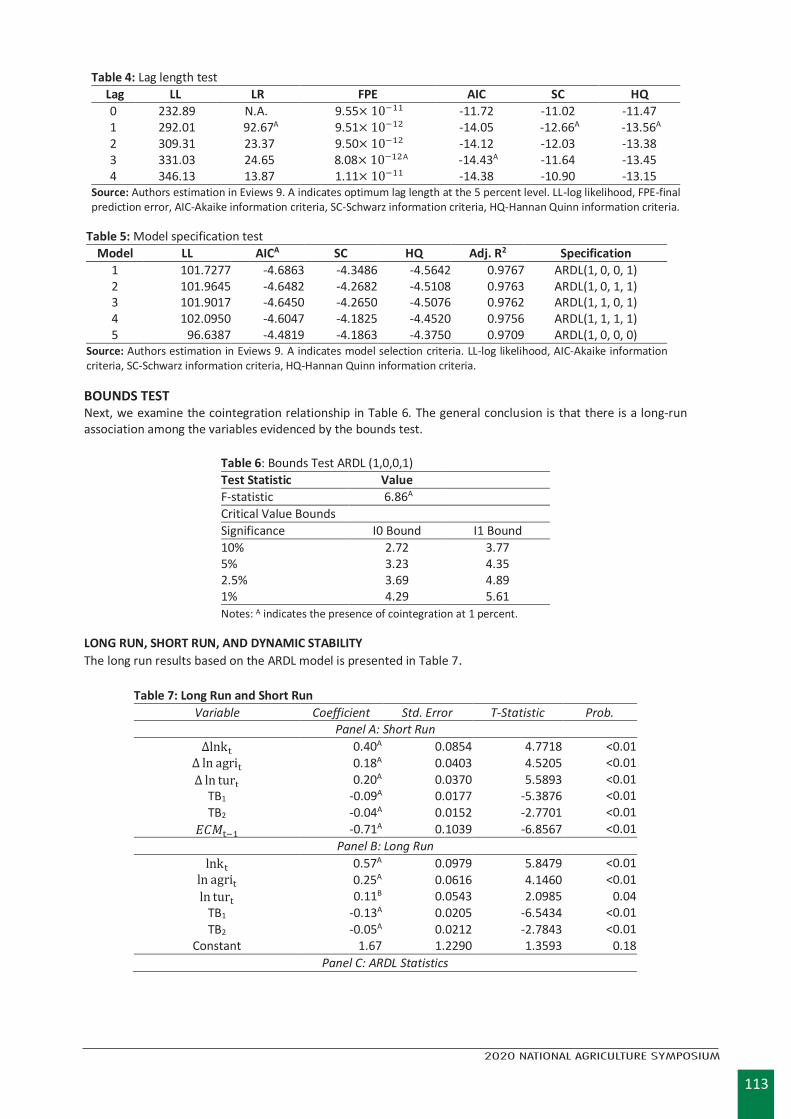
113
2020 NATIONAL AGRICULTURE SYMPOSIUM
2 0 2 0 F I A S N a t i o n a l A g r i c u l t u r e S y m p o s i u m 1 0 9
Table 4: Lag length test Lag LL LR FPE AIC SC HQ
0 232.89 N.A. 9.55× 10⁻¹¹ -11.72 -11.02 -11.47 1 292.01 92.67A 9.51× 10⁻¹² -14.05 -12.66A -13.56A
2 309.31 23.37 9.50× 10⁻¹² -14.12 -12.03 -13.38 3 331.03 24.65 8.08× 10⁻¹²A -14.43A -11.64 -13.45 4 346.13 13.87 1.11× 10⁻¹¹ -14.38 -10.90 -13.15
Source: Authors estimation in Eviews 9. A indicates optimum lag length at the 5 percent level. LL-log likelihood, FPE-final prediction error, AIC-Akaike information criteria, SC-Schwarz information criteria, HQ-Hannan Quinn information criteria.
Table 5: Model specification test
Model LL AICA SC HQ Adj. R2 Specification 1 101.7277 -4.6863 -4.3486 -4.5642 0.9767 ARDL(1, 0, 0, 1) 2 101.9645 -4.6482 -4.2682 -4.5108 0.9763 ARDL(1, 0, 1, 1) 3 101.9017 -4.6450 -4.2650 -4.5076 0.9762 ARDL(1, 1, 0, 1) 4 102.0950 -4.6047 -4.1825 -4.4520 0.9756 ARDL(1, 1, 1, 1) 5 96.6387 -4.4819 -4.1863 -4.3750 0.9709 ARDL(1, 0, 0, 0)
Source: Authors estimation in Eviews 9. A indicates model selection criteria. LL-log likelihood, AIC-Akaike information criteria, SC-Schwarz information criteria, HQ-Hannan Quinn information criteria. BOUNDS TEST Next, we examine the cointegration relationship in Table 6. The general conclusion is that there is a long-run association among the variables evidenced by the bounds test.
Table 6: Bounds Test ARDL (1,0,0,1) Test Statistic Value F-statistic 6.86A Critical Value Bounds Significance I0 Bound I1 Bound 10% 2.72 3.77 5% 3.23 4.35 2.5% 3.69 4.89 1% 4.29 5.61 Notes: A indicates the presence of cointegration at 1 percent.
LONG RUN, SHORT RUN, AND DYNAMIC STABILITY The long run results based on the ARDL model is presented in Table 7.
Table 7: Long Run and Short Run Variable Coefficient Std. Error T-Statistic Prob.
Panel A: Short Run Δlnkt 0.40A 0.0854 4.7718 <0.01
Δ ln agrit 0.18A 0.0403 4.5205 <0.01 Δ ln turt 0.20A 0.0370 5.5893 <0.01
TB1 -0.09A 0.0177 -5.3876 <0.01 TB2 -0.04A 0.0152 -2.7701 <0.01
𝐸𝐸𝐸𝐸𝐸𝐸t−1 -0.71A 0.1039 -6.8567 <0.01 Panel B: Long Run
lnkt 0.57A 0.0979 5.8479 <0.01 ln agrit 0.25A 0.0616 4.1460 <0.01 ln turt 0.11B 0.0543 2.0985 0.04
TB1 -0.13A 0.0205 -6.5434 <0.01 TB2 -0.05A 0.0212 -2.7843 <0.01
Constant 1.67 1.2290 1.3593 0.18 Panel C: ARDL Statistics
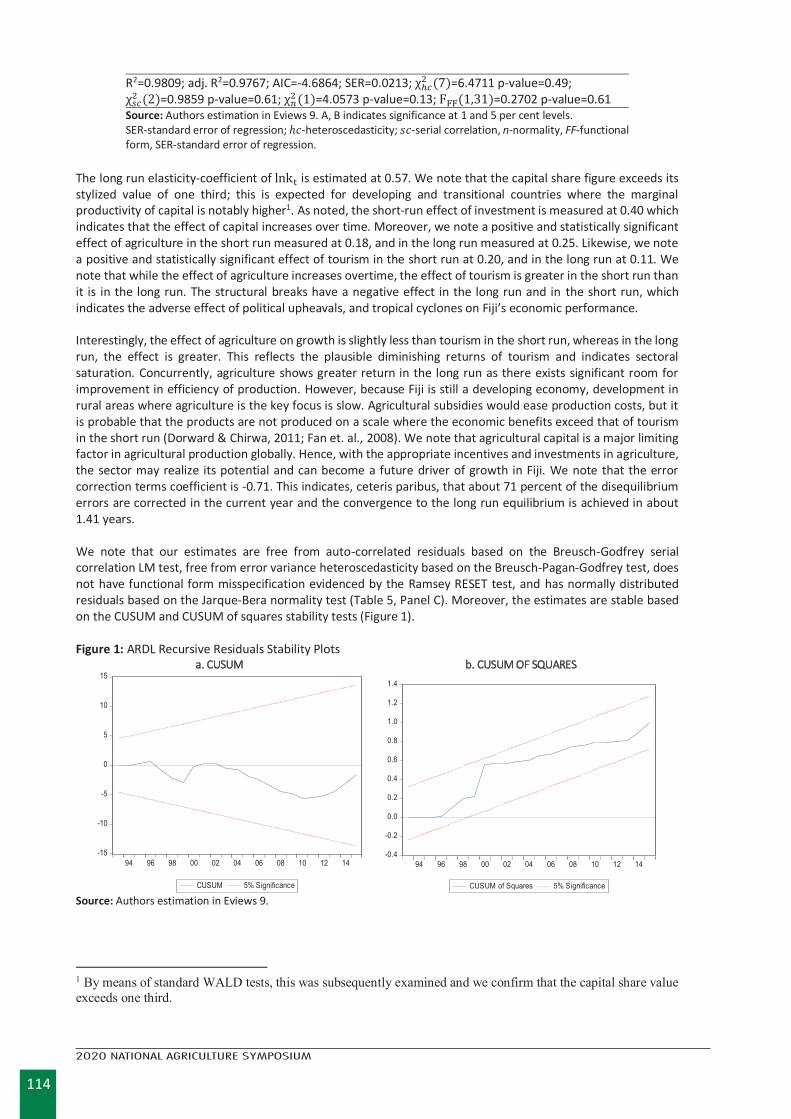
114
2020 NATIONAL AGRICULTURE SYMPOSIUM2 0 2 0 F I A S N a t i o n a l A g r i c u l t u r e S y m p o s i u m 1 1 2
R2=0.9809; adj. R2=0.9767; AIC=-4.6864; SER=0.0213; χℎ𝑐𝑐2 (7)=6.4711 p-value=0.49; χ𝑠𝑠𝑐𝑐2 (2)=0.9859 p-value=0.61; χ𝑛𝑛2(1)=4.0573 p-value=0.13; FFF(1,31)=0.2702 p-value=0.61 Source: Authors estimation in Eviews 9. A, B indicates significance at 1 and 5 per cent levels. SER-standard error of regression; ℎ𝑐𝑐-heteroscedasticity; 𝑠𝑠𝑐𝑐-serial correlation, n-normality, FF-functional form, SER-standard error of regression.
The long run elasticity-coefficient of lnkt is estimated at 0.57. We note that the capital share figure exceeds its stylized value of one third; this is expected for developing and transitional countries where the marginal productivity of capital is notably higher1. As noted, the short-run effect of investment is measured at 0.40 which indicates that the effect of capital increases over time. Moreover, we note a positive and statistically significant effect of agriculture in the short run measured at 0.18, and in the long run measured at 0.25. Likewise, we note a positive and statistically significant effect of tourism in the short run at 0.20, and in the long run at 0.11. We note that while the effect of agriculture increases overtime, the effect of tourism is greater in the short run than it is in the long run. The structural breaks have a negative effect in the long run and in the short run, which indicates the adverse effect of political upheavals, and tropical cyclones on Fiji’s economic performance. Interestingly, the effect of agriculture on growth is slightly less than tourism in the short run, whereas in the long run, the effect is greater. This reflects the plausible diminishing returns of tourism and indicates sectoral saturation. Concurrently, agriculture shows greater return in the long run as there exists significant room for improvement in efficiency of production. However, because Fiji is still a developing economy, development in rural areas where agriculture is the key focus is slow. Agricultural subsidies would ease production costs, but it is probable that the products are not produced on a scale where the economic benefits exceed that of tourism in the short run (Dorward & Chirwa, 2011; Fan et. al., 2008). We note that agricultural capital is a major limiting factor in agricultural production globally. Hence, with the appropriate incentives and investments in agriculture, the sector may realize its potential and can become a future driver of growth in Fiji. We note that the error correction terms coefficient is -0.71. This indicates, ceteris paribus, that about 71 percent of the disequilibrium errors are corrected in the current year and the convergence to the long run equilibrium is achieved in about 1.41 years. We note that our estimates are free from auto-correlated residuals based on the Breusch-Godfrey serial correlation LM test, free from error variance heteroscedasticity based on the Breusch-Pagan-Godfrey test, does not have functional form misspecification evidenced by the Ramsey RESET test, and has normally distributed residuals based on the Jarque-Bera normality test (Table 5, Panel C). Moreover, the estimates are stable based on the CUSUM and CUSUM of squares stability tests (Figure 1). Figure 1: ARDL Recursive Residuals Stability Plots
a. CUSUM b. CUSUM OF SQUARES
-15
-10
-5
0
5
10
15
94 96 98 00 02 04 06 08 10 12 14
CUSUM 5%Significance
-0.4
-0.2
0.0
0.2
0.4
0.6
0.8
1.0
1.2
1.4
94 96 98 00 02 04 06 08 10 12 14
CUSUMofSquares 5%Significance Source: Authors estimation in Eviews 9.
1 By means of standard WALD tests, this was subsequently examined and we confirm that the capital share value exceeds one third.
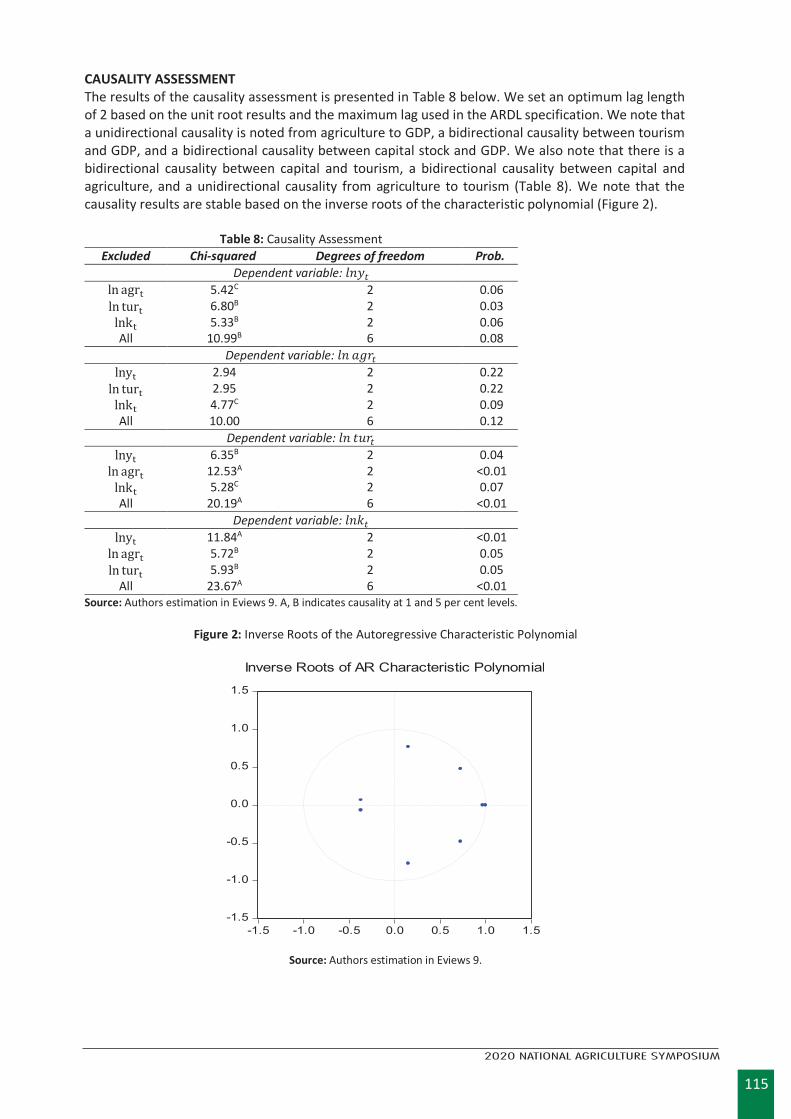
115
2020 NATIONAL AGRICULTURE SYMPOSIUM
2 0 2 0 F I A S N a t i o n a l A g r i c u l t u r e S y m p o s i u m 1 1 2
CAUSALITY ASSESSMENT The results of the causality assessment is presented in Table 8 below. We set an optimum lag length of 2 based on the unit root results and the maximum lag used in the ARDL specification. We note that a unidirectional causality is noted from agriculture to GDP, a bidirectional causality between tourism and GDP, and a bidirectional causality between capital stock and GDP. We also note that there is a bidirectional causality between capital and tourism, a bidirectional causality between capital and agriculture, and a unidirectional causality from agriculture to tourism (Table 8). We note that the causality results are stable based on the inverse roots of the characteristic polynomial (Figure 2).
Table 8: Causality Assessment Excluded Chi-squared Degrees of freedom Prob.
Dependent variable: 𝑙𝑙𝑙𝑙𝑙𝑙𝑡𝑡 ln agrt 5.42C 2 0.06 ln turt 6.80B 2 0.03
lnkt 5.33B 2 0.06 All 10.99B 6 0.08
Dependent variable: 𝑙𝑙𝑙𝑙 𝑎𝑎𝑎𝑎𝑎𝑎𝑡𝑡 lnyt 2.94 2 0.22
ln turt 2.95 2 0.22 lnkt 4.77C 2 0.09 All 10.00 6 0.12
Dependent variable: 𝑙𝑙𝑙𝑙 𝑡𝑡𝑡𝑡𝑎𝑎𝑡𝑡 lnyt 6.35B 2 0.04
ln agrt 12.53A 2 <0.01 lnkt 5.28C 2 0.07 All 20.19A 6 <0.01
Dependent variable: 𝑙𝑙𝑙𝑙𝑙𝑙𝑡𝑡 lnyt 11.84A 2 <0.01
ln agrt 5.72B 2 0.05 ln turt 5.93B 2 0.05
All 23.67A 6 <0.01 Source: Authors estimation in Eviews 9. A, B indicates causality at 1 and 5 per cent levels.
Figure 2: Inverse Roots of the Autoregressive Characteristic Polynomial
-1.5
-1.0
-0.5
0.0
0.5
1.0
1.5
-1.5 -1.0 -0.5 0.0 0.5 1.0 1.5
InverseRootsofARCharacteristicPolynomial
Source: Authors estimation in Eviews 9.
116
2020 NATIONAL AGRICULTURE SYMPOSIUM
2 0 2 0 F I A S N a t i o n a l A g r i c u l t u r e S y m p o s i u m 1 1 2
ROBUSTNESS TESTS We re-estimated the models using the generalised method of moments (GMM) and fully modified ordinary least squares (FMOLS) techniques in Tables 9 and 10. The Durbin-Wu-Hausman test indicates that the GMM estimates do not suffer from the endogeneity bias. The long run estimates from both methods generally agree with the ARDL estimates.
Table 9: GMM estimates Variable Coefficient Std. Error T-Statistic Prob.
lnkt 0.57A 0.0856 6.6517 <0.01 ln agrit 0.28A 0.0734 3.8897 <0.01 ln turt 0.13A 0.0531 2.4794 <0.01
TB1 -0.12A 0.0150 -8.1257 <0.01 TB2 -0.05A 0.0117 -4.7802 <0.01
Constant 1.50 1.1850 1.2695 0.21 R2=0.9693; adj. R2=0.9648; χ𝑒𝑒𝑒𝑒2 (4)=3.8928 p-value=0.42; SER=0.0262 Source: Authors estimation in Eviews 9. A, B indicates significance at 1 and 5 per cent levels. SER-standard error of regression; 𝑒𝑒𝑒𝑒-Durbin-Wu-Hausman endogeneity test.
CONCLUSIONS AND POLICY IMPLICATIONS In this study, we examined the effect of agriculture and tourism on the economic growth of Fiji over the period 1975 to 2015 (41 observations) using the fully modified least squares estimator and structural breaks identified by the Bai-Perron sequential break methodology. The results indicate that the long run capital elasticity is estimated at 0.50, the long run tourism elasticity is estimated at 0.12 and the long run agriculture elasticity is estimated at 0.20. Importantly, we note that the contribution of agriculture exceeds the contribution of tourism in the long run. The short run effect of agriculture and tourism are noted at 0.17 and 0.20, respectively. Against the findings, we note there are some limitations with our study. Although the FMOLS produces unbiased and robust results, the study could have benefitted with other methods that may be more suitable in small samples. Moreover, the study could have considered the non-linear and hidden cointegration properties and examined the causality nexus to further improve the predictive power of the model. Nevertheless, the findings have some significant policy implications. These are the need to ensure policies have a means to measure outcomes. A major critique of the current policy is that despite its well formulated end goals, it is difficult to derive accurate measurements for the various objectives outlines. Further, we recommend analysis be conducted using a similar technique to determine which subsector of the agriculture sector would benefit the country the most. It is important to consider the implications for monetary investment should returns not be justify initial input.
Table 10: FMOLS estimates Variable Coefficient Std. Error T-Statistic Prob.
lnkt 0.50A 0.0764 6.5793 <0.01 ln agrit 0.21A 0.0505 4.0963 <0.01 ln turt 0.13A 0.0414 3.1049 <0.01
Constant 2.68A 0.9651 2.7775 <0.01 TB1 -0.12A 0.0175 -6.9980 <0.01 TB2 -0.05B 0.0191 -2.5305 0.01
R2=0.9728; adj. R2=0.9688; SER=0.0246 Source: Authors estimation in Eviews 9. A, B indicates significance at 1 and 5 per cent levels. SER-standard error of regression.
117
2020 NATIONAL AGRICULTURE SYMPOSIUM
2 0 2 0 F I A S N a t i o n a l A g r i c u l t u r e S y m p o s i u m 1 1 3
DECLARATIONS Authors Contribution RK is the main author of the article and was responsible for outlining the idea, developing the parts of the introduction, parts of the literature review, and parts of the discussion and conclusion. NK was a co-author with responsibility for experimental design, methodology development, result presentation, discussion, parts of the introduction, and parts of the literature review. Availability of Data and Materials Data is sourced from the World Development Indicators (https://datacatalog.worldbank.org/dataset/world-development-indicators), Global Development Finance database (https://www.worldbank.org/en/publication/gfdr/data/global-financial-development-database) and World Bank Database for agricultural data (https://data.worldbank.org/country/Fiji). Data for visitor arrivals is sourced from the Fiji Bureau of Statistics and can be provided upon request. Competing Interests The authors declare that they have no competing interests. ACKNOWLEDGEMENTS The authors would like to thank their families for the support that was provided during the writing of the manuscript. Further thanks is provided to Dr. Salesh Kumar and the team at FIAS for providing a platform by which the research can reach the broader public. REFERENCES Ali, I., & Overton, J. (1989). Agriculture: crisis and recovery. Pacific Viewpoint, 30(2), 179-191. Anderson, K., & Nelgen, S. (2012). Trade barrier volatility and agricultural price stabilization. World Development,
40(1), 36-48. Bijay, P., & Singh, A. (2015). Progress Towards Low Carbon Fuels in the Pacific: Prospects and Challenges. In
Climate Change in the Asia-Pacific Region (pp. 335-356). Springer, Cham. Bosworth, B., & Collins, S. M. (2008). Accounting for growth: comparing China and India. Journal of Economic
Perspectives, 22(1), 45-66. Brown, C. H. (1989). The Social Background of Fiji’s 1987 Coup. Sociological Bulletin, 38(1), 95-117. Cervantes-Godoy, D., & Dewbre, J. (2010). Economic importance of agriculture for poverty reduction. Chand, S. (2015). The Political Economy of Fiji: Past, Present, and Prospects. The Round Table, 104(2), 199-208. Chandra, V. V., & Hemstock, S. L. (2016). The Potential of Sugarcane Bioenergy in Fiji. Sugar Tech, 18(3), 229-235. Chu, J. H., Sampson, C. R., Levine, A. S., & Fukada, E. (2002). The joint typhoon warning center tropical cyclone
best-tracks, 1945–2000. Ref. NRL/MR/7540‐02, 16. Dorward, A., & Chirwa, E. (2011). The Malawi agricultural input subsidy programme: 2005/06 to 2008/09.
International journal of agricultural sustainability, 9(1), 232-247. Engle, R. F., & Granger, C. W. (1987). Co-integration and error correction: representation, estimation, and
testing. Econometrica: journal of the Econometric Society, 251-276. Fan, S., Gulati, A., & Thorat, S. (2008). Investment, subsidies, and pro‐poor growth in rural India. Agricultural
Economics, 39(2), 163-170. Fraenkel, J. (2001). The alternative vote system in Fiji: electoral engineering or ballot-rigging?. Commonwealth
and comparative politics, 39(2), 1-31. Fraenkel, J. (2015). The remorseless power of incumbency in Fiji’s September 2014 election. The Round Table,
104(2), 151-164. Gollin, D., Parente, S., & Rogerson, R. (2002). The role of agriculture in development. American Economic Review,
92(2), 160-164. Gounder, N. (2013). Correlates of poverty in Fiji: An analysis of individual, household and community factors
related to poverty. International Journal of Social Economics, 40(10), 923-938. Gounder, R. (2001). Aid-growth nexus: empirical evidence from Fiji. Applied Economics, 33(8), 1009-1019. Hastings, P. A. (1990). Southern Oscillation influences on tropical cyclone activity in the Australian/south‐west
Pacific region. International Journal of Climatology, 10(3), 291-298.
118
2020 NATIONAL AGRICULTURE SYMPOSIUM2 0 2 0 F I A S N a t i o n a l A g r i c u l t u r e S y m p o s i u m 1 1 4
Johnston, B. F., & Mellor, J. W. (1961). The role of agriculture in economic development. The American Economic Review, 51(4), 566-593.
Karim, S., Button-Sloan, A., Lagataki, S., Bulai, S., Kete, T., & Alauddin, M. (2016). Policy and legal framework for promoting sustainable agroforestry in Fiji. In Promoting sustainable agriculture and agroforestry to replace unproductive land use in Fiji and Vanuatu (pp. 171-181). Australian Centre for International Agricultural Research (ACIAR).
Kumar, N., Kumar, R. R., Patel, A., & Stauvermann, P. J. (2018). Exploring the effects of tourism and economic growth in Fiji: accounting for capital, labor, and structural breaks. Tourism Analysis, 23(3), 391-407.
Kumar, R. R., & Kumar, R. (2012). Exploring the nexus between information and communications technology, tourism and growth in Fiji. Tourism Economics, 18(2), 359-371.
Narayan, P. K., & Prasad, B. C. (2005, July). Economic importance of the sugar industry for Fiji. In Review of Urban & Regional Development Studies: Journal of the Applied Regional Science Conference (Vol. 17, No. 2, pp. 104-114). Oxford, UK and Boston, USA: Blackwell Publishing, Inc.
Phillips, P. C., & Hansen, B. E. (1990). Statistical inference in instrumental variables regression with I (1) processes. The Review of Economic Studies, 57(1), 99-125.
Phillips, P. C., & Ouliaris, S. (1990). Asymptotic properties of residual based tests for cointegration. Econometrica:
Journal of the Econometric Society, 165-193. Pingali, P. (2007). Agricultural growth and economic development: a view through the globalization lens.
Agricultural Economics, 37, 1-12. Pohoski, M. (2017). Social inequality and social mobility. In Social Stratification in Poland: Eight Empirical Studies
(pp. 42-71). Routledge. Premdas, R. (1993). General Rabuka and the Fiji elections of 1992. Asian Survey, 33(10), 997-1009. Raj, S. K., & Chand, P. P. (2017). Analysis of Fiji’s Export and Its Impact on Economic Growth. International Journal
of Business and Social Research, 7(4), 01-14. Rao, B. B., & Hassan, G. (2011). Determinants of the long-run growth rate of Bangladesh. Applied Economics
Letters, 18(7), 655-658. Ratuva, S. (2015). Protectionism versus Reformism: The Battle for Taukei Ascendancy in Fiji’s 2014 General
Election. The Round Table, 104(2), 137-149. Saxonhouse, G., & Wright, G. (2010). New evidence on the stubborn English mule and the cotton industry, 1878-
1920. In The Japanese Economy in Retrospect: Selected Papers by Gary R Saxonhouse Volume 1 (pp. 209-221).
Shah, S., Moroca, A., & Bhat, J. A. (2018). Neo-traditional approaches for ensuring food security in Fiji Islands. Environmental development.
Singh-Peterson, L., & Iranacolaivalu, M. (2018). Barriers to market for subsistence farmers in Fiji–A gendered perspective. Journal of Rural Studies, 60, 11-20.
Solow, R. M. (1956). A contribution to the theory of economic growth. The quarterly journal of economics, 70(1), 65-94.
Stokes, E. (1968). The Fiji cotton boom in the eighteen-sixties'. New Zealand Journal of History, 2(2), 165-167. Took, L. (2015). Land tenure, return migration and rural change in the Italian province of Chieti. Return Migration
and Regional Economic Problems (Routledge Library Editions: Economic Geography), 79. Vincent, E. M., Lengaigne, M., Menkes, C. E., Jourdain, N. C., Marchesiello, P., & Madec, G. (2011). Interannual
variability of the South Pacific Convergence Zone and implications for tropical cyclone genesis. Climate Dynamics, 36(9-10), 1881-1896.
Weller, S. (2006). The embeddedness of global production networks: the impact of crisis in Fiji's garment export sector. Environment and Planning A, 38(7), 1249-1267.
Zhan, C. (2015). Money vs prestige: Cultural attitudes and occupational choices. Labour Economics, 32, 44-56.

119
2020 NATIONAL AGRICULTURE SYMPOSIUM
MESSAGE VOTE OF THANKSDr. Salesh KumarVice PresidentFiji Institute of Agriculture ScienceCo-Chair 2020 National Agriculture Symposium
Theme: Agriculture Resilience to Calamities – Now and for the Future
Honourable guest speakers, invited guests, ladies and gentlemen and friends.
I am privileged to do the honours of delivering the Vote of Thanks for the one and half day 2020 National Agriculture Symposium organised by Fiji Institute of Agricultural Science (FIAS) in collaboration with Australian Centre for Interna-tional Agricultural Research, Ministry of Agriculture and Fiji National University.
On behalf of the Fiji Institute of Agricultural Science Council, firstly, I would like to extend our sincere gratitude to the Chief Guest for taking out his time to bless the occasion and deliver his enlightening speech. Secondly, I would like to convey our sincere appreciation to ACIAR for being the major sponsor of this event. I would like to acknowledge the assistance of ACIAR regional manager for Pacific and PNG, her team and ACIAR capacity building team from Canberra for engaging with FIAS.
A sincere vote of thanks to the speakers for gracing the symposium and sharing your knowledge, experiences and professionalism to the audience that are gathered here. The theme of “agriculture resilience to calamities – now and for future” has been professionally discussed by the presenters. Your contribution has been heard and all will agree with me that they have learnt something new. We wish to sincerely thank you for the hard work and willingness to participate.
A hearty thanks to all the chairs of the sessions. Please accept our sincere gratitude for supporting the sessions with your experience and valuable knowledge. Vinaka.
I also take this opportunity to extend our most sincere thanks to all our guest invitees who have accepted our invita-tions and came to support the course for national agriculture development. Thank you so much for availing yourself and giving your contributions and supporting our researchers.
An event of this dimension cannot happen overnight. The wheels start rolling months in advance. It requires meticulous planning and execution and an eye for details. This occasion has simply provided the opportunity for exposure to a wide range of key disciplines that are relevant and important to our world today in the time of COVID19 pandemic and climate change. I would like to take this opportunity to thank the FIAS organising members of this event, who have dedicated their leisure time to this. Thank you and may the almighty bless you for your future endeavours.
We have been fortunate enough to be backed by a team of very motivated and dedicated professionals, who know their job and are result oriented. I extend my sincere gratitude to the Permanent Secretary of Agriculture for helping us out whenever and wherever possible. I cannot thank everyone enough for the involvement they have shown and the willingness they have expressed to take on the completion of tasks beyond their comfort zones. To the wonderful members and audience who have turned up in such overwhelming numbers. We thank you very much for your pa-tience and cooperation.
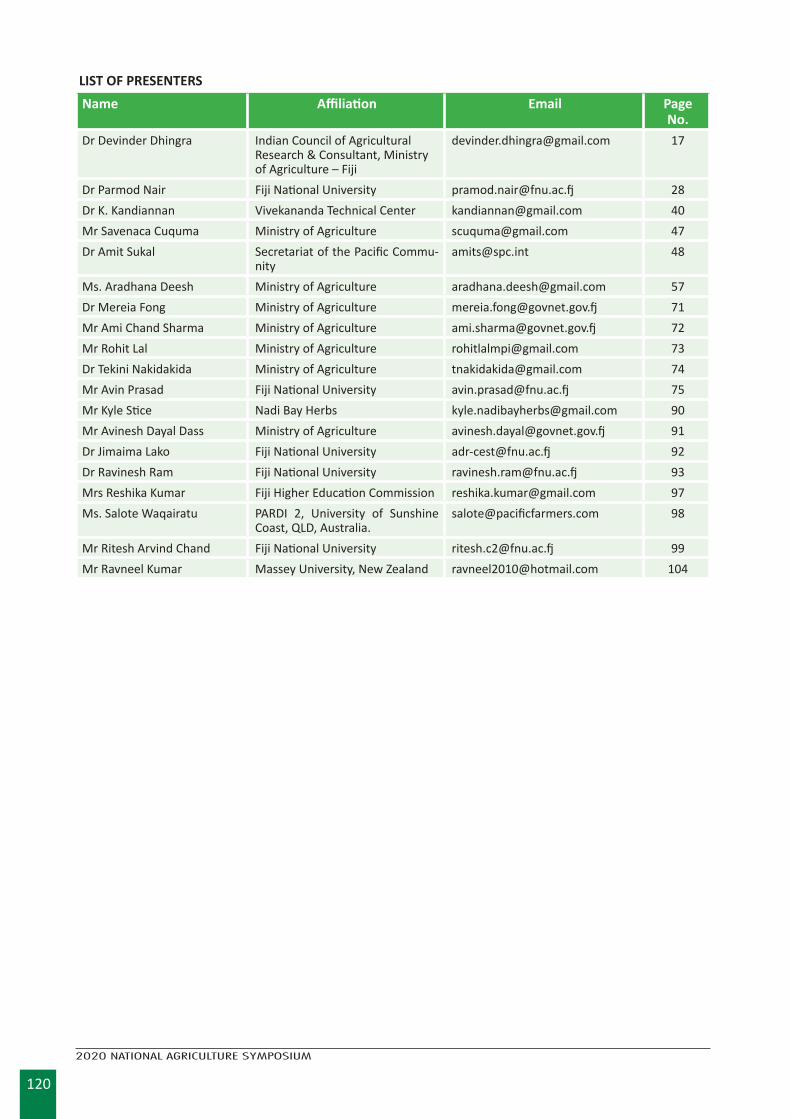
120
2020 NATIONAL AGRICULTURE SYMPOSIUM
LIST OF PRESENTERSName Affiliation Email Page
No.Dr Devinder Dhingra Indian Council of Agricultural
Research & Consultant, Ministry of Agriculture – Fiji
Dr Parmod Nair Fiji National University [email protected] 28Dr K. Kandiannan Vivekananda Technical Center [email protected] 40Mr Savenaca Cuquma Ministry of Agriculture [email protected] 47Dr Amit Sukal Secretariat of the Pacific Commu-
Ms. Aradhana Deesh Ministry of Agriculture [email protected] 57Dr Mereia Fong Ministry of Agriculture [email protected] 71Mr Ami Chand Sharma Ministry of Agriculture [email protected] 72Mr Rohit Lal Ministry of Agriculture [email protected] 73Dr Tekini Nakidakida Ministry of Agriculture [email protected] 74Mr Avin Prasad Fiji National University [email protected] 75Mr Kyle Stice Nadi Bay Herbs [email protected] 90Mr Avinesh Dayal Dass Ministry of Agriculture [email protected] 91Dr Jimaima Lako Fiji National University [email protected] 92Dr Ravinesh Ram Fiji National University [email protected] 93Mrs Reshika Kumar Fiji Higher Education Commission [email protected] 97Ms. Salote Waqairatu PARDI 2, University of Sunshine
Coast, QLD, [email protected] 98
Mr Ritesh Arvind Chand Fiji National University [email protected] 99Mr Ravneel Kumar Massey University, New Zealand [email protected] 104
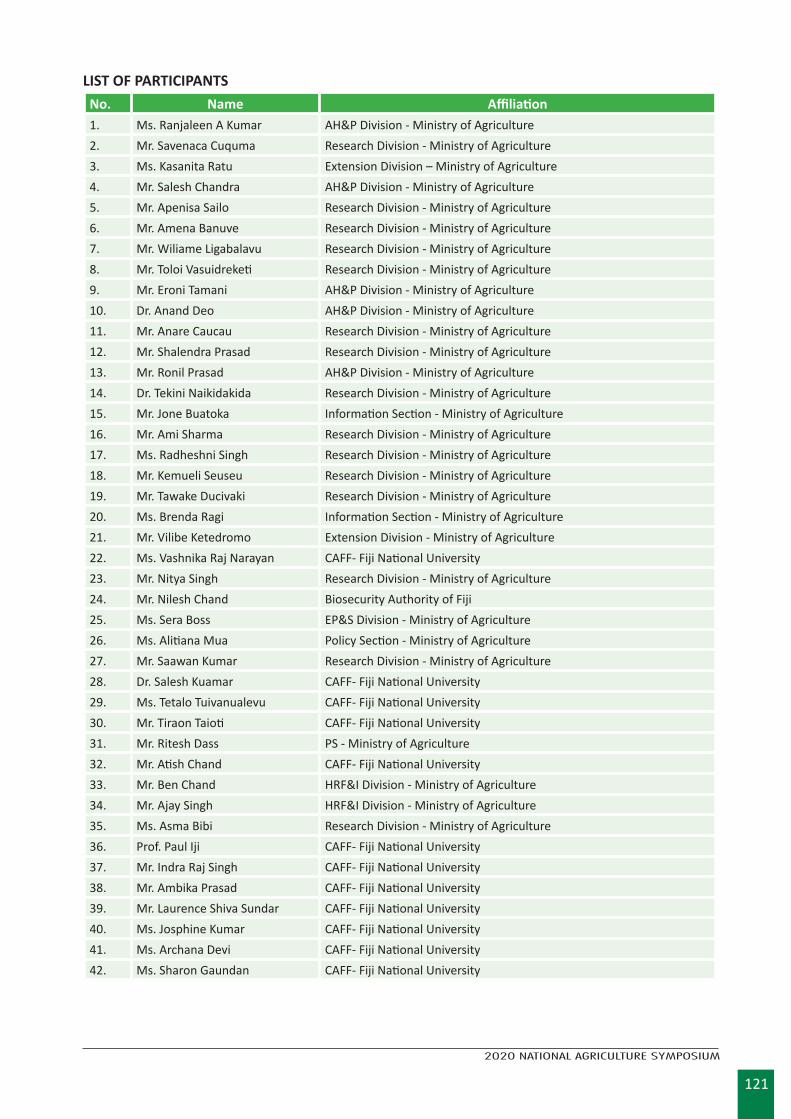
121
2020 NATIONAL AGRICULTURE SYMPOSIUM
LIST OF PARTICIPANTSNo. Name Affiliation 1. Ms. Ranjaleen A Kumar AH&P Division - Ministry of Agriculture2. Mr. Savenaca Cuquma Research Division - Ministry of Agriculture3. Ms. Kasanita Ratu Extension Division – Ministry of Agriculture4. Mr. Salesh Chandra AH&P Division - Ministry of Agriculture5. Mr. Apenisa Sailo Research Division - Ministry of Agriculture6. Mr. Amena Banuve Research Division - Ministry of Agriculture7. Mr. Wiliame Ligabalavu Research Division - Ministry of Agriculture8. Mr. Toloi Vasuidreketi Research Division - Ministry of Agriculture9. Mr. Eroni Tamani AH&P Division - Ministry of Agriculture10. Dr. Anand Deo AH&P Division - Ministry of Agriculture11. Mr. Anare Caucau Research Division - Ministry of Agriculture12. Mr. Shalendra Prasad Research Division - Ministry of Agriculture13. Mr. Ronil Prasad AH&P Division - Ministry of Agriculture14. Dr. Tekini Naikidakida Research Division - Ministry of Agriculture15. Mr. Jone Buatoka Information Section - Ministry of Agriculture16. Mr. Ami Sharma Research Division - Ministry of Agriculture17. Ms. Radheshni Singh Research Division - Ministry of Agriculture18. Mr. Kemueli Seuseu Research Division - Ministry of Agriculture19. Mr. Tawake Ducivaki Research Division - Ministry of Agriculture20. Ms. Brenda Ragi Information Section - Ministry of Agriculture21. Mr. Vilibe Ketedromo Extension Division - Ministry of Agriculture22. Ms. Vashnika Raj Narayan CAFF- Fiji National University23. Mr. Nitya Singh Research Division - Ministry of Agriculture24. Mr. Nilesh Chand Biosecurity Authority of Fiji25. Ms. Sera Boss EP&S Division - Ministry of Agriculture26. Ms. Alitiana Mua Policy Section - Ministry of Agriculture 27. Mr. Saawan Kumar Research Division - Ministry of Agriculture28. Dr. Salesh Kuamar CAFF- Fiji National University29. Ms. Tetalo Tuivanualevu CAFF- Fiji National University30. Mr. Tiraon Taioti CAFF- Fiji National University31. Mr. Ritesh Dass PS - Ministry of Agriculture 32. Mr. Atish Chand CAFF- Fiji National University33. Mr. Ben Chand HRF&I Division - Ministry of Agriculture34. Mr. Ajay Singh HRF&I Division - Ministry of Agriculture35. Ms. Asma Bibi Research Division - Ministry of Agriculture36. Prof. Paul Iji CAFF- Fiji National University37. Mr. Indra Raj Singh CAFF- Fiji National University38. Mr. Ambika Prasad CAFF- Fiji National University39. Mr. Laurence Shiva Sundar CAFF- Fiji National University40. Ms. Josphine Kumar CAFF- Fiji National University41. Ms. Archana Devi CAFF- Fiji National University42. Ms. Sharon Gaundan CAFF- Fiji National University
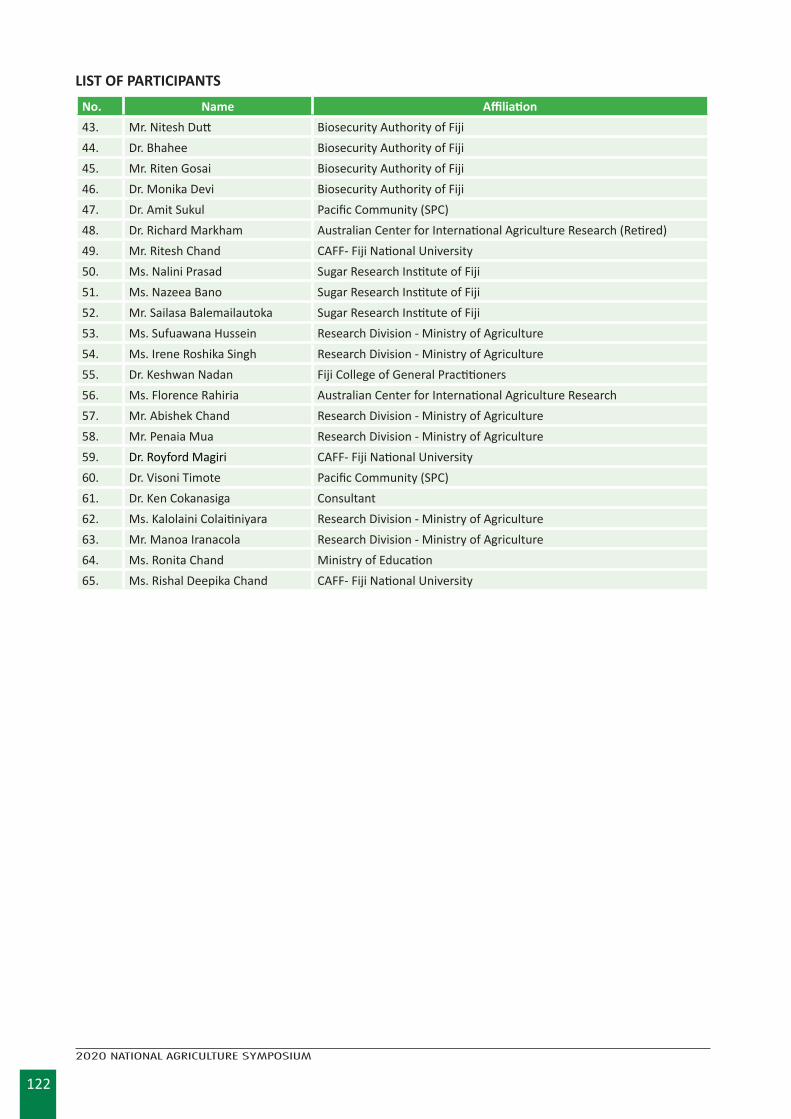
122
2020 NATIONAL AGRICULTURE SYMPOSIUM
No. Name Affiliation 43. Mr. Nitesh Dutt Biosecurity Authority of Fiji44. Dr. Bhahee Biosecurity Authority of Fiji45. Mr. Riten Gosai Biosecurity Authority of Fiji46. Dr. Monika Devi Biosecurity Authority of Fiji47. Dr. Amit Sukul Pacific Community (SPC)48. Dr. Richard Markham Australian Center for International Agriculture Research (Retired) 49. Mr. Ritesh Chand CAFF- Fiji National University50. Ms. Nalini Prasad Sugar Research Institute of Fiji51. Ms. Nazeea Bano Sugar Research Institute of Fiji52. Mr. Sailasa Balemailautoka Sugar Research Institute of Fiji53. Ms. Sufuawana Hussein Research Division - Ministry of Agriculture54. Ms. Irene Roshika Singh Research Division - Ministry of Agriculture55. Dr. Keshwan Nadan Fiji College of General Practitioners 56. Ms. Florence Rahiria Australian Center for International Agriculture Research57. Mr. Abishek Chand Research Division - Ministry of Agriculture58. Mr. Penaia Mua Research Division - Ministry of Agriculture59. Dr. Royford Magiri CAFF- Fiji National University60. Dr. Visoni Timote Pacific Community (SPC)61. Dr. Ken Cokanasiga Consultant 62. Ms. Kalolaini Colaitiniyara Research Division - Ministry of Agriculture63. Mr. Manoa Iranacola Research Division - Ministry of Agriculture64. Ms. Ronita Chand Ministry of Education65. Ms. Rishal Deepika Chand CAFF- Fiji National University
LIST OF PARTICIPANTS
123
2020 NATIONAL AGRICULTURE SYMPOSIUM
Photo Gallery
124
2020 NATIONAL AGRICULTURE SYMPOSIUM
125
2020 NATIONAL AGRICULTURE SYMPOSIUM

126
2020 NATIONAL AGRICULTURE SYMPOSIUM
Fiji Institute of Agriculture ScienceKoronivia Research Station
P O Box 77, NausoriEmail: [email protected]
FIJI INSTITUTE OFAGRICULTURAL SCIENCE