farm machinery and processes management in sustainable agriculture. vi international scientific...
TRANSCRIPT
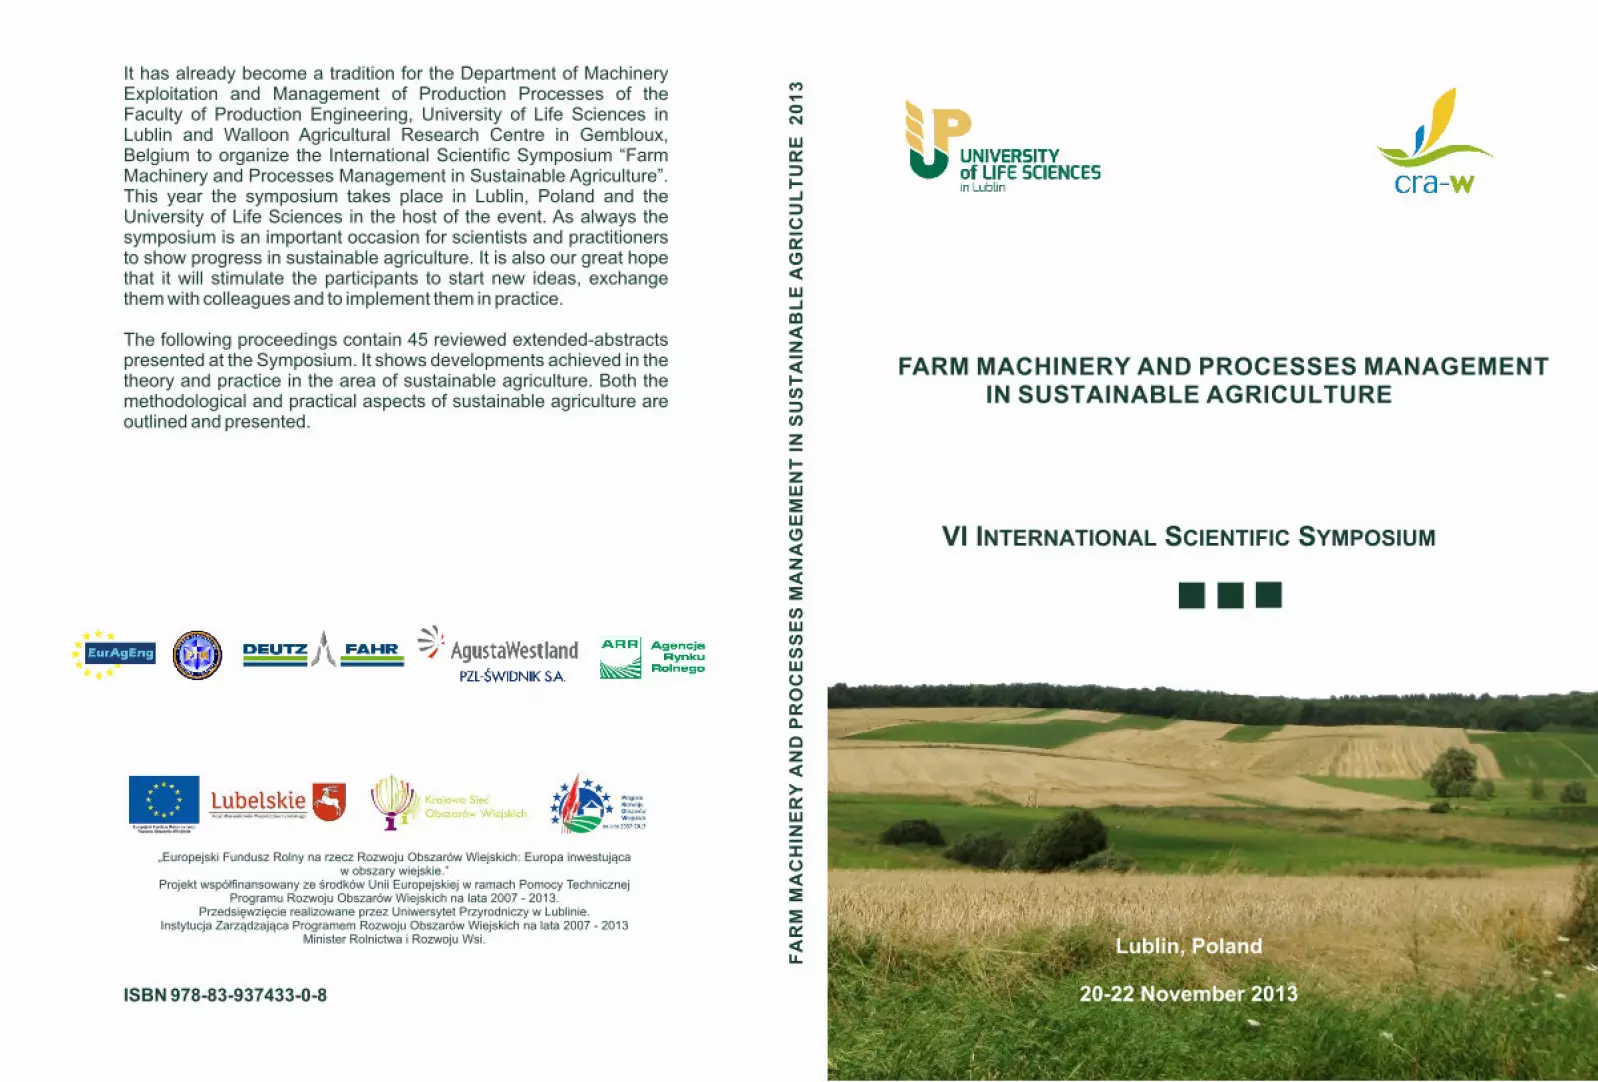
VI International Scientific Symposium
FARM MACHINERY AND PROCESSES MANAGEMENT IN SUSTAINABLE AGRICULTURE
Symposium Proceedings
Edited by Edmund Lorencowicz, Jacek Uziak, Bruno Huyghebaert
Published by Department of Machinery Exploitation
and Management of Production Processes University of Life Sciences in Lublin, POLAND
The symposium is organized in the research project „Optimization of composition and pressure agglomeration of plant biomass in terms of combustion
parameters in heating installations of low power ” NN 313 7575 40
Lublin, Poland 2013
Organizers
University of Life Sciences in Lublin, Department of Machinery Exploitation and Management of Production Processes, Lublin, POLAND Walloon Agricultural Research Centre, Gembloux, BELGIUM
Programmes & Organizing Committee Chairmen
Prof. dr hab. Józef Sawa, University of Life Sciences in Lublin, Poland Prof. dr Yves Schenkel, Walloon Agricultural Research Centre, Belgium
Members
Ir. Bruno Huyghebaert CRA-W Gembloux/BELGIUM Dr. Gerhard Moitzi BOKU - University of Natural Resources and
Life Sciences, Vienna/AUSTRIA Prof. dr hab. Edmund Lorencowicz University of Life Sciences in Lublin/POLAND Prof. dr hab. Janusz Nowak University of Life Sciences in Lublin/POLAND Prof. Dr. Taskin Oztas Atatürk University, Erzurum/TURKEY Prof. Athanassios Papageorgiou Technological Educational Institute of
Kalamata/GREECE Prof. Ing. Giacomo Scarascia-Mugnozza University of Bari Aldo Moro /ITALY Prof. dr hab. Mieczysław Szpryngiel University of Life Sciences in Lublin/POLAND Prof. dr Jacek Uziak University of Botswana/BOTSWANA
Cover page: Jarosław Figurski Cover page photo: Sławomir Kocira
All papers are published on the responsibility of authors and after the positive reviewing by the Symposium Organizing Committee.
ISBN 978-83-937433-0-8
Printed by: Reprographic Centre, University of Life Sciences in Lublin

The organizers wish to acknowledge with gratitude
the sponsorship and support of
Rector of the University of Life Sciences in Lublin
Marshal of Lubelskie
European Society of Agricultural Engineers
Polish Society of Agricultural Engineers Branch Lublin
Wytwórnia Sprzętu Komunikacyjnego „PZL-Świdnik”,
an AgustaWestland company
Same Deutz-Fahr Polska
Sp. z o.o.
Agencja Rynku Rolnego Oddział Lublin
Agricultural Market Agency Lublin Branch

VI International Scientific Symposium "Farm Machinery and Processes Management in Sustainable Agriculture", Lublin, Poland, 2013
5
CONTENTS INTRODUCTION 9 Valerii ADAMCHUK, Volodymyr BULGAKOV, Hryhorij KALETNIK, Andrii BORYS, Janusz NOWAK THE THEORY OF WORKING BODY FOR PROCESS OF DIVISION OF TOPS OF A SUGAR BEET
11
Valerii ADAMCHUK, Volodymyr BULGAKOV, Hryhorij KALETNIK THE THEORY OF VIBRATING EXCAVATION OF ROOT CROPS OF A SUGAR BEET
17
Arlindo ALMEIDA APPROPRIATE MECHANICAL HARVESTING SYSTEMS FOR DIFFERENT TYPES OF OLIVE ORCHARDS
23
Rafał BAUM, Karol WAJSZCZUK, Jacek WAWRZYNOWICZ, Jarosław WAŃKOWICZ SHAPING AN ORGANIZATIONAL CULTURE IN AGRICULTURE ENTERPRISE – A CASE STUDY
29
Tomasz BERBEKA, Tomasz SZUK, Tomasz WICIAK MODERNIZATION OF FARMS IN LOWER SILESIA
33
Robert BOREK AGROFORESTRY – A SUSTAINABLE LAND USE FOR THE FUTURE OF EUROPEAN AGRICULTURE
39
Philippe BURNY, François Terrones GAVIRA, Maxime HABRAN IMPACT OF DIFFERENT SCENARIOS RELATED TO THE NEW COMMON AGRICULTURAL POLICY ON FARM INCOME IN WALLONIA
41
Philippe BURNY, Maxime HABRAN, François Terrones GAVIRA THE COMMON AGRICULTURAL POLICY TOWARDS 2020
45
Philippe BURNY, Frederic DEBODE DEVELOPMENT OF ORGANIC FARMING IN WALLONIA: PAST, PRESENT AND PERSPECTIVES
49
Małgorzata BZOWSKA-BAKALARZ, Michał PNIAK, Martin BAGAR, Andrzej WILCZAŃSKI BIOLOGICAL CROP PROTECTION USING AUTOGYRO - MOUNTED SPRAYING SYSTEMS
53
Maria Lisa CLODOVEO, Simone PASCUZZI, Giacomo SCARASCIA MUGNOZZA, Riccardo AMIRANTE APPLICABILITY OF EXPERIENCE FROM LABORATORY SCALE EXPE RIMENTS TO DEVELOP A MORE SUSTAINABLE VIRGIN OLIVE OIL INDUSTRIAL PLANT
57
Renata CZECZKO INFLUENCE OF AGROECOLOGICAL FACTORS ON THE BIOLOGICAL VALUE OF SELECTED VEGETABLE SPECIES
65
Artur GODYŃ, Ryszard HOŁOWNICKI, Grzegorz DORUCHOWSKI, Waldemar ŚWIECHOWSKI THE COMPARISON OF THE NOZZLE INSPECTION METHODS: NOZZLE FLOW VS. SPRAY TRANSVERSE DISTRIBUTION - THE METHODOLOGY AND THE FIRST RESULTS
67
VI International Scientific Symposium "Farm Machinery and Processes Management in Sustainable Agriculture", Lublin, Poland, 2013
6
Krzysztof GOŁACKI, Bożena GŁADYSZEWSKA, Paweł KOŁODZIEJ, Zbigniew STROPEK TENSILE AND IMPACT PROPERTIES OF THIN FILM MADE FROM THERMOPLASTIC STARCH
71
Jerzy GRUDZIŃSKI, Monika GRUSZECKA ANALYSIS OF STUDENTS’ MOTIVATION AND PREDISPOSITION FOR INTRODUCING INFORMATION TECHNOLOGY TOOLS FOR TEACHING MATERIALS SCIENCE
75
Mieczysław GRZESIK, Zdzisława ROMANOWSKA-DUDA, Regina JANAS APPLICATION OF GREEN ALGAE AND CYANOBACTERIA SECONDARY METABOLITES IN CORN BIOMASS FOR ECO - ENERGY PRODUCTION
79
Jacek HOŁAJ, Hanna HOŁAJ OPERATING COSTS OF FIXED ASSETS USED IN THE HOP PRODUCTION
83
Ryszard HOŁOWNICKI, Grzegorz DORUCHOWSKI, Waldemar ŚWIECHOWSKI, Artur GODYŃ BEST MANAGEMENT PRACT ICE TO REDUCE SPRAY DRIFT IN FIELD CROPS
85
Bruno HUYGHEBAERT, Gaëtan DUBOIS, Guillaume DEFAYS STUDY OF THE PRECISI ON OF THE GUIDANCE SYSTEM AUTOTRAC FROM JOHN DEERE – PART 1: MATERIAL AND METHOD
89
Bruno HUYGHEBAERT, Gaëtan DUBOIS, Guillaume DEFAYS STUDY OF THE PRECISI ON OF THE GUIDANCE SYSTEM AUTOTRAC FROM JOHN DEERE – PART 2: RESULTS AND DICUSSIONS
93
Magdalena JAKUBOWSKA THE USE OF INTEGRATED PLANT PROTECTION AGAINST ELATERIDAE IN POTATO FOR REDUCING LOSS OF QUALITY TUBERS
99
Regina JANAS, Mieczysław GRZESIK, Zdzisława ROMANOWSKA–DUDA THE EFFECTIVENESS OF SELECTED BIOLOGICAL COMPOUNDS IN THE CARROTS AND PARSLEY SEED PRODUCTION
105
Magdalena KACHEL-JAKUBOWSKA , Agnieszka SUJAK, Siemowit MUSZYŃSKI ANALYSIS OF PHYSICOCHEMICAL PROPERTIES OF RAW MATERIALS OF AGRICULTURAL AND INDUSTRIAL ORIGIN
109
Alaa KAMEL SUBR ORGANIZATION AND TECHNIQUE OF AGRICULTURAL CROP PROTECTION IN IRAQ
113
Józef KOWALCZUK, Janusz ZARAJCZYK, Norbert LESZCZYŃSKI, Agnieszka STAREK, Jacek MAZUR, Alicja WIECZORKOWSKA, Piotr MARKOWSKI COMPARISON OF THE QUALITY OF SEEDING THE HERMAPHRODITA RUSBY SEEDS BY S071 KRUK SEEDER IN LABORATORY AND FIELD CONDITIONS
117
Józef KOWALCZUK, Kazimierz ZAWIŚLAK, Janusz ZARAJCZYK, Paweł SOBCZAK, Agnieszka STAREK, Jacek MAZUR ANALYSIS OF DURABILITY FEATURES OF PELLETS USED IN POWER GENERATION
121
VI International Scientific Symposium "Farm Machinery and Processes Management in Sustainable Agriculture", Lublin, Poland, 2013
7
Witold KOWALIK THE DEFINING OF THE LIQUID DECOMPOSITION IN A FLAT - FAN NOZZLE
125
Artur KRASZKIEWICZ, Magdalena KACHEL–JAKUBOWSKA, Mieczysław SZPRYNGIEL, Ignacy NIEDZIÓŁKA INFLUENCE OF THE CHEMICAL PROPERTIES OF THE PLANT BIOMASS OF AGRICULTURAL ORIGIN ON ENERGY INTENSITY OF ITS COMPACTION
129
Dariusz KWAŚNIEWSKI, Urszula MALAGA-TOBOŁA, Maciej KUBOŃ COMMODITY PRODUCTION AND LABOUR INPUTS IN ECOLOGICAL FARMS
133
Miran LAKOTA, Mario LEŠNIK DRIFT REDUCTION RATE OF THREE ANTIDRIFT NOZZLES USED FOR SPRAY APPLICATION IN BARLEY
137
Edmund LORENCOWICZ, Jacek UZIAK FARMERS COLLABORATION - A FACTOR IN THE DEVELOPMENT OF SUSTAINABLE AGRICULTURE
139
Ivan A. LOUKANOV, Jacek UZIAK RESONANCE PUMP FOR APPLICATION IN DESERT AREAS
143
Ewa MATYJASZCZYK PREVENTION OF HARMFUL ORGANISMS DEVELOPMENT IN POLAND IN THE LIGHT OF INTEGRATED PLANT PROTECTION REQUIREMENTS
149
Gerhard MOITZI, Rudolf GRUBAUER, Helmut WAGENTRISTL, Josef BOXBERGER, Andreas GRONAUER EFFECT OF A PLOUGH WITH FURROW SLICE CRACKER ON THE CRUSHING DEGREE IN THE SEEDBED USING A NEW APPROACH OF IN - SITU AIR PERMEABILITY ME ASUREMENT
153
Aleksander MUZALEWSKI POLISH AGRICULTURAL MACHINERY MARKET 2000 - 2012
157
Artur PRZYWARA, Janusz NOWAK, Wojciech PRZYSTUPA MATHEMATICAL MODEL OF TOTAL STATIC DISTRIBUTION OF MINERAL FERTILIZERS
163
Wacław ROMANIUK, Jan BARWICKI SUSTAINABLE DEVELOPMENT OF TECHNOLOGY IN AGRICULTURE TAKING INTO ACCOUNT RESTRICTIONS CONCERNING ENVIRONMENT CONDITIONS IN CATTLE BREEDING SYSTEMS
167
Grzegorz SOLECKI, Andrzej WILCZEK, Agnieszka SZYPŁOWSKA, Anna NAKONIECZNA, Bartosz PASZKOWSKI, Wojciech SKIERUCHA SELECTED ISSUES OF THE TDR BASED MEASUREMENT OF THE SOIL APPARENT DIELECTRIC PERMITTIVITY ORIENTED TO THE EVALUATION OF SOIL MOISTURE
169
Andrej ULIČNÝ, Tomáš DURANÍK, Milan KOSZEL TECHNOLOGY OF SOIL BIOREMEDIATION AND CONVERSION OF CONTAMINATED PHYTOMASS INTO USABLE ENERGY FORMS
175
Jacek UZIAK, Magdalena WALCZAK, M. Tunde OLADIRAN LIFELONG LEARNING – AN ESSENTIAL ATTRIBUTE FOR ENGINEERING GRADUATES
177
VI International Scientific Symposium "Farm Machinery and Processes Management in Sustainable Agriculture", Lublin, Poland, 2013
8
Maria WALCZYKOVA, Mirosław ZAGÓRDA POSSIBLE TECHNICAL SOLUTIONS AND COST OF SPATIALLY VARIABLE MINERAL FERTILIZATION AVAILABLE TO POLISH FARMERS
183
Zbigniew WASĄG MAINTENANCE COSTS OF TECHNICAL RESOURCES IN FAMILY FARMS RECEIVING EUROPEAN UNION SUBSIDIES
187
Jacek WAWRZYNOWICZ A SHEET AUDIT MODEL FOR THE LOGISTICS PROCESSES OF THE SUPPLY SPHERE OF A COMPANY
191
Andrzej WILCZEK, Agnieszka SZYPŁOWSKA, Artur NOSALEWICZ, Wojciech SKIERUCHA, Waldemar WILCZEK PROJECT OF AN AUTOMATIC SYSTEM FOR SOIL MOISTURE REGULATION USING TDR TECHNIQUE
197
Wioletta ŻUKIEWICZ-SOBCZAK, Grażyna CHOLEWA, Ewelina KRASOWSKA, Jacek ZWOLIŃSKI CONVENTIONAL AND ORGANIC CROP PRODUCTION - RISKS FOR FARMERS HEALTH
201
Ignacy NIEDZIÓŁKA, Beata ZAKLIKA, Magdalena KACHEL-JAKUBOWSKA, Artur KRASZKIEWICZ, Mieczysław SZPRYNGIEL EVALUATION OF ENERGY CONSUMPTION AND QUALITY OF SOLID BIOFUELS PRODUCTION FROM PLANT RAW MATERIALS
205
Tomasz SZUK, Tomasz BERBEKA
REPRODUCTION OF MECHANIZATION MEANS ON FARMS IN LOWER SILESIA
209
KEYWORDS INDEX 213 AUTHORS INDEX 215
VI International Scientific Symposium
"Farm Machinery and Processes Management in Sustainable Agriculture", Lublin, Poland, 2013
9
INTRODUCTION
The VI International Scientific Symposium on “Farm Machinery and Process
Management in Sustainable Agriculture” is taking place in Lublin, Poland.
Once again the Symposium is the result of a successful and rewarding
collaboration between the Lublin University of Life Sciences and the
Walloon Agricultural Research Centre.
The aim of the Symposium is to present the on-going and also concluded
research on the sustainability of agriculture. Sustainable Agriculture may
create solutions to ever growing concerns related to production maximization
achieved by mechanization increased chemical use.
We understand ‘sustainability’ in its broadest meaning as meeting needs
without compromising future generations. In terms of agriculture it entails a
commitment to satisfy human food needs and to enhance the quality of life
for farmers and society as a whole, now and into the future. Agriculture is
often considered as composed of three different systems: economic, ecologic
and social. Therefore, the sustainable agriculture must be based on
interlocking of three spheres; farm profitability, environmental responsibility
and quality of life for farm families and rural communities. In simple terms
that translates to economic profitability, environmental health and social
equity.
There is however a global context to sustainability; these are size and growth
of population, conservation and restoration of biological base, optimization
of energy output and economic efficiency. Sustainable agriculture can be the
solution to those global issues by integrating all these components into a solid
production system that benefits all participants.
We hope that once again this Symposium will be the platform for an
international synergy and cooperation between experts from different
countries who are working on specific areas related to sustainable agriculture.
The Organizing Committee

VI International Scientific Symposium "Farm Machinery and Processes Management in Sustainable Agriculture", Lublin, Poland, 2013
10
VI International Scientific Symposium
"Farm Machinery and Processes Management in Sustainable Agriculture", Lublin, Poland, 2013
11
THE THEORY OF WORKING BODY
FOR PROCESS OF DIVISION OF TOPS OF A SUGAR BEET
Valerii ADAMCHUK1, Volodymyr BULGAKOV2, Hryhorij KALETNIK3, Andrii BORYS1,
Janusz NOWAK4 1NSC “Institute for Agricultural Engineering and Electrification”, Glevaкha-1, Vasylkiv
district, Kiev region, UKRAINE 2National University of Life and Environmental Sciences of Ukraine, Kyiv, UKRAINE 3Vinnytsia National Agrarian University, Vinnytsia, UKRAINE 4University of Life Sciences in Lublin, POLAND
e-mail: [email protected]; [email protected]; [email protected]
Keywords: sugar beets, mathematical model, statistical characteristics of crops, sugar-
bearing mass loss, tops residues
1. Introduction
Increase in pollution of a root heap with green mass by 1% decreases
sucrose yield by 0.1%, and storage of root crops in piles with a content of
tops about 4% causes the daily loss of sugar on average of 0.012%
[Pohorilyi, 2004]. Along with the modern machines for removing foliage are
operating with significant losses of sugar-bearing mass. Therefore, a relevant
search of technical solutions which allows avoiding these losses is a current
issue.
Analyses of numerous designs of working members for removing foliage
are considered enough in detail in works of L. Pogorilyi, V. Bulgakov, M.
Tatianko, R. Gevko, V.Martynenko M.Helemendyk, F. Kozibrody, S. Synii,
M. Berezovyi, etc. However, at present there are no machine designs for
removing foliage that meet agro-technical requirements concerning losses of
sugar-bearing mass [Helemendyk 1996, Bulgakov 2010, Kepe 1996, Vilde
1998].
As in [Borys, 2009] it is found that cutting without a template is mainly
used in modern machines, so it is necessary to identify the main factors of
sugar-bearing mass losses and determine key ways to reduce them.
2. Material and methods
The study was carried out using the methods of probability theory and
mathematical simulation. It is suggested that the height of the heads of root
crops is distributed by the normal law. The algorithm of process of cutting
without a template is used. The material from experimental studies of
protrusion height of heads of root crops was used in the research.
3. Results
As a result of the application of cutting without a template the quality of
removing beet tops is not good enough and sugar-bearing mass losses in tops
VI International Scientific Symposium
"Farm Machinery and Processes Management in Sustainable Agriculture", Lublin, Poland, 2013
12
exceeding agro-technical requirements are possible. Due to an increase in the
thickness of the cut part of a root head, the content of tops residues on sugar
beet roots will decrease, but the loss of sugar-bearing mass will increase.
According to the test results [Agricultural Technology, 2007], the number
of sugar beet roots with tops height more than 2 cm was 2% on average for
the machines of the flow sheet; for highly cut tops (with tops height less than
2 cm but equal or more 0 cm) ‒ 26.6%; for low cut tops (below of green
leaves) ‒ 7.5%; and satisfactorily cut roots ‒ 60.1%. This statistics indicates
the presence of sugar-bearing mass loss and significant residues of tops on
roots. These results are given for an average operating speed of the machine
of 6 km/h, which is a low speed, and it was chosen due to a desire to obtain
satisfactory quality of work of passive knives. Digging up bodies can operate
at significantly higher speeds.
In the article [Borys, 2009] it was found that the main factor contributing
to the loss of sugar-bearing mass under cutting without a template is the
distribution of heights of heads above the soil, in particular, its statistical
properties of the mean and standard deviation.
It is also known that these factors may vary within wide limits and be
different for various crops of sugar beet. Most of these factors are formed by
sugar beet cultivation techniques, soil and climate conditions. Along with the
statistical characteristics of the distribution of the height of root heads above
the soil, the sugar-bearing mass loss is greatly influenced by their number
per hectare. Therefore it is important to examine the degree of integrated
effects of these factors on the loss of sugar-bearing mass.
The well-known parametric model of the root head and foliage is used for
this modeling [Borys, 2009].
Relationships between the parameters of the root head and foliage are as
follows:
1
1
;
; ,
2
зл
зл зл
h ah b
d mh n
d d h tg
(1)
where hзл– a distance from the top of the head to the base of green leaves;
h–height of the projection of the root head above the soil;
d1–the diameter of the top of the root head;
dзл–the diameter of a bunch of tops;
α–a half cone angle of the root head;
a, b, m, n–are constants.
VI International Scientific Symposium
"Farm Machinery and Processes Management in Sustainable Agriculture", Lublin, Poland, 2013
13
The loss of sugar-bearing mass and the residues of tops on heads for roots
of a preprogrammed range of heights of root heads projection over the soil
are determined by the equation:
3 1 ,; ;i i i i iM F h h P h h N (2)
where, F (hi; hz ) – sugar-bearing mass losses or residues of tops on roots;
F(hi;hз) = Vк∙ρ, for tops Fс(hi;hзг) = Vг∙ρг, where Vк, ρ and Vг, ρг –
respectively the volume of the root and density foliage; Ni – number of roots
of a set range per unit area, P(hi;hi+1) – the probability of occurrence of the
range of the projection height of heads over the soil is estimated as follows:
21
1 2
1; exp
22
i
i
h
i i
h
h mP h h dh
(3)
The integral in the equation 3 is not defined in quadrature, so the
probability of occurrence of roots of a specified interval of the roots
projection height is defined by a numerical integration by Simpson's rule.
Summing up the residues of tops and loss of sugar-bearing mass for all
intervals of the projection height, we obtain the total residues of tops and
losses of sugar-bearing mass per unit area:
1 1
0
; ( )2 3
b mi i i i
ç j
i a j
h h h hBM N F h c f h
m
, (4)
1 1
0
; ( )2 3
b mi i i i
c ç j
i a j
h h h hGM N F h c f h
m
, (5)
where, m – the number of intervals: m = 2U; U = 1,2,3,4,...;
cj – the coefficient under the values of the integrand at the appropriate points,
cj = 1,2,3,4,2,4,…,2,4,1.
Losses of sugar-bearing mass and the residues of tops on root crops
depending on the standard deviation and the density of plants per hectare are
calculated. The method [Borys, 2009] was used, a program in the
environment of VBA MS Excel 2010 was developed, and the graphs of these
relationships were built.
VI International Scientific Symposium
"Farm Machinery and Processes Management in Sustainable Agriculture", Lublin, Poland, 2013
14
The calculation of sugar-bearing mass loss was performed in the operating
range 60-80 mm of the height of cutting root heads without a template
[Zuiev, Toporovskyi, 1988].
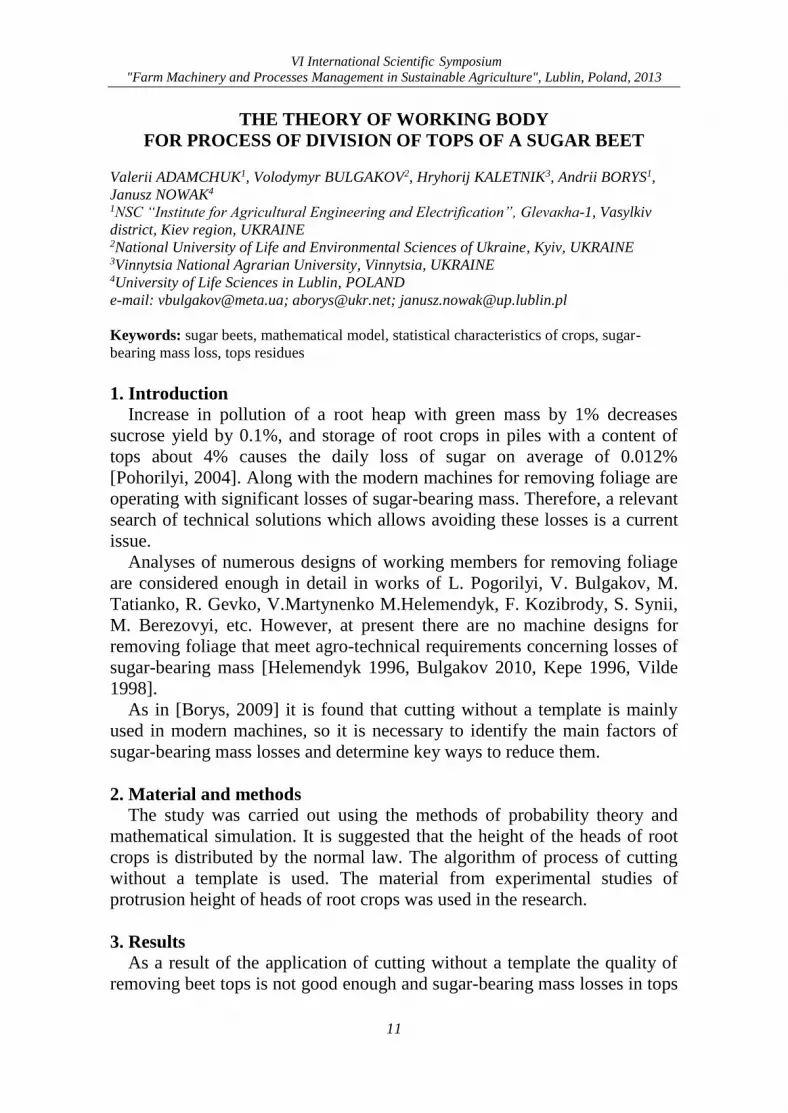
Figure 1. Graphs of sugar-bearing mass loss under the height of cutting without a template
of 60 mm (a ) and 80 mm (b); two-dimensional cross sections of these graphs under the
height of cutting without a template of 60 mm (c) and 80 mm (d)
Based on the plots of Fig. 1, it can be stated that the loss of sugar-bearing
mass increases sharply under an increase of both the standard deviation and
density of roots per hectare. It should be noted that in the case of the lower
limit of the operating range of the height of cutting root heads without a
template (Fig. 1, b, d) agronomic requirements concerning sugar-bearing
mass loss are met, but in this case we should expect the excessive pollution
of piles with tops and therefore it is advantageous to reduce the specified
height of cutting. In the case of the upper limit of height of cutting without a
template, an unacceptable zone exists concerning agronomic requirements on
sugar-bearing mass loss (more than 2% of the total mass of roots) (Fig. 1 a,
VI International Scientific Symposium
"Farm Machinery and Processes Management in Sustainable Agriculture", Lublin, Poland, 2013
15
c), and in this case it is advisable to increase the height of cutting without a
template to prevent losses of sugar-bearing mass.
There arises a necessity of creation of an automatic control system of
cutting height of heads of root crops given the above features of separation
of sugar beet tops using cutting without a template. The functions of this
system are the constant monitoring of the dimensional characteristics of root
crops, determination of their statistical characteristics and the continuous
optimization of the cutting height to prevent the loss of sugar-bearing mass.
4. Conclusions
Results of the study show that the sugar-bearing mass loss depends on
statistical characteristics of the height of the root head projection above the
soil and thickness of the head roots per hectare that in turn can vary within
wide limits. It is established that under the extreme values of the statistical
characteristics of the root head projection above the soil and their thickness
per hectare the losses of sugar-bearing mass exceed agronomic requirements
twofold. The necessity of creating an automatic control system of the height
of root heads cutting is substantiated.
5. References [1] Boris N. 2009. Substantiation of the process and the parameters of the working body for
the separation of sugar beet tops: Abstract of a thesis on competition of the scientific
Ph.D. degree of Eng. Science, specialty 05.05.11 “Machines and tools fur - organization
of agricultural production” – Vinnitsa, 20 p. (in Russian).
[2] Bulgakov V. , Ivanovs S. 2010. Matematical Simulation of Beet Vibrational
Exstraction. 9th International Scientific Conference “Engineering for Rural
Development”, Procedings, Volume 9. Jelgava, pp. 25-31 (in Russian).
[3] Bulgakov V.M. 2005. Theory of beet harvesting machinery. – K.: Publishing Center
NAU, 245 p. (in Russian).
[4] Kepe O., Viba J. 1996.Teorētiskā mehānika. Dinamika II., Riga, RTU, g. 173 pp. (in
Latvian).
[5] Pogorilyi L., Tatianko M. 2004. Beet Machines: History, Design, prognosis. – K.:
Phoenix, 232 p. (in Russian).
[6] The results of independent tests [electronic resource] /Agricultural machinery.-2007. -
№. ‒ Mode of access to journals - nel: http: // russia.profi.com.(in Russian).
[7] Vilde A. 1998. Cukurbiešu un lopbarības biešu mehanizēta audzēšana (lekciju
konspekts). Ulbroka, LVLMEZPI., 16 pp. (in Latvian).
[8] Zuev, N.M. 1988. Cutting heads of root crops without a template / N.M Zuev, S.A
Toporovsky // Sugar beet. № 6, p. 42-45. (in Russian).

VI International Scientific Symposium
"Farm Machinery and Processes Management in Sustainable Agriculture", Lublin, Poland, 2013
16
VI International Scientific Symposium
"Farm Machinery and Processes Management in Sustainable Agriculture", Lublin, Poland, 2013
17
THE THEORY OF VIBRATING EXCAVATION
OF ROOT CROPS OF A SUGAR BEET
Valerii ADAMCHUK1, Volodymyr BULGAKOV2, Hryhorij KALETNIK3 1NSC “Institute for Agricultural Engineering and Electrification”, Glevaкha-1, Vasylkiv
district, Kiev region, UKRAINE 2National University of Life and Environmental Sciences of Ukraine, Kyiv, UKRAINE 3Vinnytsia National Agrarian University, Vinnytsia, UKRAINE
e-mail: [email protected]
Keywords: sugar beet, root crop, vibrating digging up tool, the spring environment, the
differential equations of movement, fluctuation, amplitude, frequency
1. Introduction
Use of vibrating excavation of a sugar beet root from a ground has a
number of essential advantages in comparison with other ways. It is
characterized by less damage of root, decrease in losses of a crop at
harvesting, more intensive clarification of root crops from the stuck ground,
less smaller blocking up of a digger working channel from a ground and
residues of weeds. Therefore this technological process requires detailed
analytical research, further development and wide introduction of advanced
vibrating digging tools.
2. Material and methods
Thorough theoretical and experimental researches of vibrating excavation
of sugar beet root were rather widely described in works [1–6]. So, in work
[6] the process of a root crop withdrawal from the ground is considered in
most general case – at asymmetrical claw of a root crop by vibrating digging
up working body. The given process is described by means of kinematic and
dynamic equations of Aler. System of the differential equations received in
work [6] describes spatial oscillatory process of the root crop fixed in the
ground, as in the spring environment, with one point of fastening. In the
given work the process of vibrating withdrawal of a root crop of a ground is
considered at symmetric claw of a root crop by both shares of vibrating
digging up body.
At such claw of a root crop by digging up shares the process of the further
full withdrawal of a root crop of a ground is possible. Therefore we
investigate process of direct withdrawal of a root crop of a ground at its
symmetric claw by vibrating digging up working body.
To construct mathematical model of direct withdrawal of a sugar beet root
crop from the ground, which is carried out under the action of vertical
troubling forces which it is given to a root crop from vibrating digging up
working body, and traction effort owing to translational movement of digger.
VI International Scientific Symposium
"Farm Machinery and Processes Management in Sustainable Agriculture", Lublin, Poland, 2013
18
3. Results
At first let's make the necessary formalization of technological process
which will be considered. Despite of that process of withdrawal of a ground
of a sugar beet a root crop will take place for a short time interval (as
translational speed of a root crop machines can reach 2 m/s) it is possible to
divide technological process into separate interconnected, consecutive
operations conditionally. As, it was marked above the withdrawal is possible,
only at symmetric claw of a root crop by working body and simultaneously
with translational fluctuations of a root crop occurs angular fluctuations of a
root crop around of a conditional point of fastening on some angle. At the
first stage of withdrawal, and especially at the first fluctuations, renew force
at angular fluctuations, and so, and its moment concerning a conditional
point of fastening, will be maximal. That is why the angle of inclination of a
root crop will be insignificant enough and a full (or partial) restoration of its
vertical position owing to translational movement of the digger will be
possible. Nevertheless, owing to action of forward translational fluctuations
of a root crop together with a ground surrounding it, the compaction of the
specified ground will decrease, and renewing force at angular fluctuations
will be decrease too. So, with each following fluctuation the angle of an
inclination of a root crop will increase, and restoration of the previous
position – to decrease. The root crop will be loosened around of a conditional
point of fastening with gradual increase of an inclination angle of a root crop
forward on a digger course. It will lead to the break of a root crop
connections with a ground in the direction of digger`s movement, beginning
from the top part of a conic surface of a root crop in unloosened ground,
gradually approaching to a conditional point of its fastening. So as it was
stated above it follows, that the destruction of connections of a root crop with
a ground occurs simultaneously in two directions – along the translational
digger’s movement and in the direction perpendicularly to specified (on
depth of a root crop arrangement in the ground). Thus the force of
connections of a root crop with a ground and the forces of a ground spring
will gradually decrease to such minimal size when oscillatory processes will
pass into the processes of continuous moving of a root crop upwards and
forward – along the translational digger movement, and also continuous turn
of a root crop around its mass center on some angle to full withdrawal of a
root crop from a ground. Forces of a ground spring will simply pass into the
force of resistance of the loosened ground at a root crop movement in a
digger working channel. After that the stage of direct withdrawal of a sugar
beet root crop from a ground is begun.
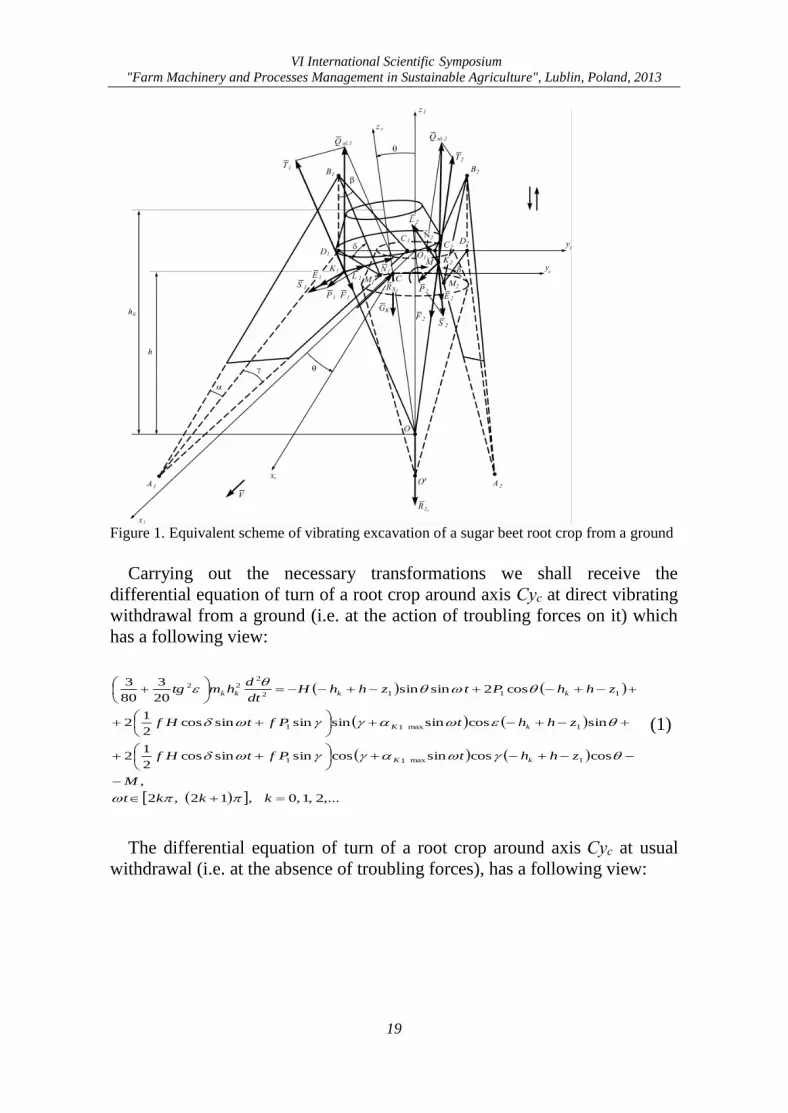
For construction of mathematical model first of all we shall make the
equivalent scheme of a root crop interaction with working surfaces of
vibrating digging up working body at its direct withdrawal (fig.).
VI International Scientific Symposium
"Farm Machinery and Processes Management in Sustainable Agriculture", Lublin, Poland, 2013
19
Figure 1. Equivalent scheme of vibrating excavation of a sugar beet root crop from a ground
Carrying out the necessary transformations we shall receive the
differential equation of turn of a root crop around axis Сус at direct vibrating
withdrawal from a ground (i.e. at the action of troubling forces on it) which
has a following view:
,...2,1,0,12,2
,
coscossincossinsincos2
12
sincossinsinsinsincos2
12
cos2sinsin20
3
80
3
1max11
1max11
1112
222
kkkt
M
zhhtPftHf
zhhtPftHf
zhhPtzhhHdt
dhmtg
kK
kK
kkkk
(1)
The differential equation of turn of a root crop around axis Сус at usual
withdrawal (i.e. at the absence of troubling forces), has a following view:
VI International Scientific Symposium
"Farm Machinery and Processes Management in Sustainable Agriculture", Lublin, Poland, 2013
20
,...2,1,2,12
,coscos2sinsincos
sin2cos220
3
80
3
111
2
1112
222
kkkt
MzhhPfzhh
PfzhhPdt
dhmtg
kk
kkk
(2)
The differential equation (1) is nonlinear. It is possible to solve it by the
application numerical methods and for each step of application of numerical
algorithm of mean z1 is necessary to find from the second equation of system
for the corresponding moment of time tk. The differential equation (2) which
includes the magnitude z1 which is replaceable and, is also nonlinear, and for
each moment of time tk the mentioned magnitude z1 is necessary for defining
from the second equation of system.
Thus, it is finally possible to consider, that the constructed mathematical
model of direct withdrawal process of a sugar beet root crop from a ground
at its vibrating excavation. The received results enable to define kinematic
modes of vibrating excavation root crops at the conditions of inviolate and
constructive parameters of vibrating digging up bodies.
4. Conclusions
1. Two systems of the differential equations which describe plane-parallel
movement of a root crop in a ground at its direct withdrawal which is carried
out under action of vertical troubling forces which is given to a root crop
from vibrating digging up body, and traction effort which arises owing to
translational movement of digger.
2. Solution the given differential equations gives an opportunity to find out
the law of movement of a root crop in longitudinal-vertical plane at direct
withdrawal from a ground.
3. Results received enable also to define kinematic modes of vibrating
excavation of root crops from their conditions of inviolate not damage and to
find rational constructive parameters of vibrating digging up working bodies.
5. References [1] Vasylenco P.M., Pogorelyj L.V, Bray V.V. 1970. Vibrating way of root crops harvesting //
Mechanization and electrification of a socialist agriculture, , №2, p. 9.
[2] Beet-harvesting machines (designing and calculation) // L.V. Pogorelyj, N.V. Tatyanko,
V.V. Bray, etc.: under gener. red. Pogorelyj L.V. 1983. Kiev: Technics, pp.168.
[3] Bulgakov V.M., Golovach I.V., Vojtyuk D.G. 2003. The Theory of vibrating excavation of the
root crops – Collection of scientific works of National agrarian university “Mechanization of an
agricultural production”. Volume XIV, p. 34-86.
[4] Bulgakov V.M., Golovach I.V., Vojtyuk D.G. 2004. The Theory of cross-section fluctuations of a
root crop at vibrating excavation. - Works of Tavriysky state agrotechnical academy. Issue 18.
Melitopol, p. 8-24.

VI International Scientific Symposium
"Farm Machinery and Processes Management in Sustainable Agriculture", Lublin, Poland, 2013
21
[5] Bulgakov V.M., Golovach I.V. 2005. About the compelled cross-section fluctuations of a root
crop at vibrating excavation. Bulletin of the Kharkov national technical university of an
agriculture of Peter Vasylenko: Collection of scientific works. Issue 39. Kharkov, p. 23-39.
[6] Bulgakov V.M., Golovach I.V. Development of mathematical model of withdrawal of a root crop
from a ground // Technics of agrarian and industrial complex, 2006, №6-7. – p. 36-38; №8. – p.
25-28; №9-10. – p. 47-49.
[7] Bulgakov V.M., Golovach I.V. Specified theory of digging up working body of share
type // Bulletin of an agrarian science of Black Sea Coast. Special issue 4 (18). Volume –
Nikolaev, 2002. – p. 37-63.
[8] Butenin N.V., Lunts I.L., Merkin D.R. A rate of theoretical mechanics. Volume II. Dynamics. –
M.: Science, 1985. – pp.496.

VI International Scientific Symposium
"Farm Machinery and Processes Management in Sustainable Agriculture", Lublin, Poland, 2013
22
VI International Scientific Symposium
"Farm Machinery and Processes Management in Sustainable Agriculture", Lublin, Poland, 2013
23
APPROPRIATE MECHANICAL HARVESTING SYSTEMS
FOR DIFFERENT TYPES OF OLIVE ORCHARDS
Arlindo ALMEIDA
School of Agriculture, Polytechnic Institute of Bragança – Mountain Research Centre
(CIMO) – Campus de Sta. Apolónia - Apartado 1172 – 5301-855 Bragança, PORTUGAL
e-mail: [email protected]
Keywords: olive harvesting, mechanical harvesting
1. Introduction
In the last decades olive growers spent a substantial part of their gross
return to face high costs of manually cultural practices, due to shortage of
manpower.
Olive crop is in a critical situation due to low product price and high
production costs.
In order to face the problem it is mandatory to increase competitiveness on
the global market, reducing costs and improving fruit quality. Low
mechanization level penalizes the sector.
Olive harvesting mechanization systems allow achieving these goals
[Amirante, Tamborino 2012]: costs – reducing manpower needs and quality
– better work rates make possible to harvest in the optimal harvest timing.
For mechanical harvesting, different types of olive orchards must be
considered: (a) traditional (<150 trees per hectare), (b) high density olive
orchards (300 to 400 trees per hectare) and (c) hedgerow olive orchards
(1000 to 2000 trees per hectare). For each olive orchard type, an appropriate
harvesting system is required.
2. Material and methods
2.1 Traditional olive orchards
First experiments took place in Northeast of Portugal (Trás-os-Montes) in
Verdeal, Cobrançosa and Madural cultivars and in the South of the country
(Alentejo) mainly with Galega and Picual cultivars.
Three treatments were compared: trunk shakers mounted on the front
loader of a tractor was used to detach olives, collected by manually moved
canvas (system I) or by mechanical rolling canvas (system II) or by an
inverted umbrella (system III) mounted on the front loader of a tractor
(combined with the shaker) [Almeida, 2007a].
Trees with large canopies (volume superior than 100 m3 / 200 m3 and
trunk perimeter superior than 2 m / 3.5 m) are not suitable for trunk shakers.
So other experiments took place in Northeast of Portugal (Trás-os-
Montes) in Verdeal, Cobrançosa and Madural cultivars to evaluate the
performance and operational conditions of a spike rotor able to turn around
VI International Scientific Symposium
"Farm Machinery and Processes Management in Sustainable Agriculture", Lublin, Poland, 2013
24
its axle providing the brushing action to detach olives [Almeida, 2007b].
This equipment work in conjunction with hand held shakers concentrated in
lower branches.
Trees are harvested one by one in this type of olive orchard.
2.2 High density olive orchards
Experiments took place in Northeast and South of Portugal mainly with,
Cobrançosa and Picual cultivars. Specific mechanical rolling canvas
equipment has been designed to collect olives detached by trunk shakers.
Trees are harvested one by one.
2.3 Hedgerow olive orchards
This kind of olive orchard is becoming usual in some olive producers
regions. Observations in order to evaluate equipment performance and
operational conditions took place in central region of Portugal.
An over row equipment is an appropriate equipment. Olives are detached
and collected simultaneously row by row, not tree by tree.
3. Results
3.1 Traditional olive orchards
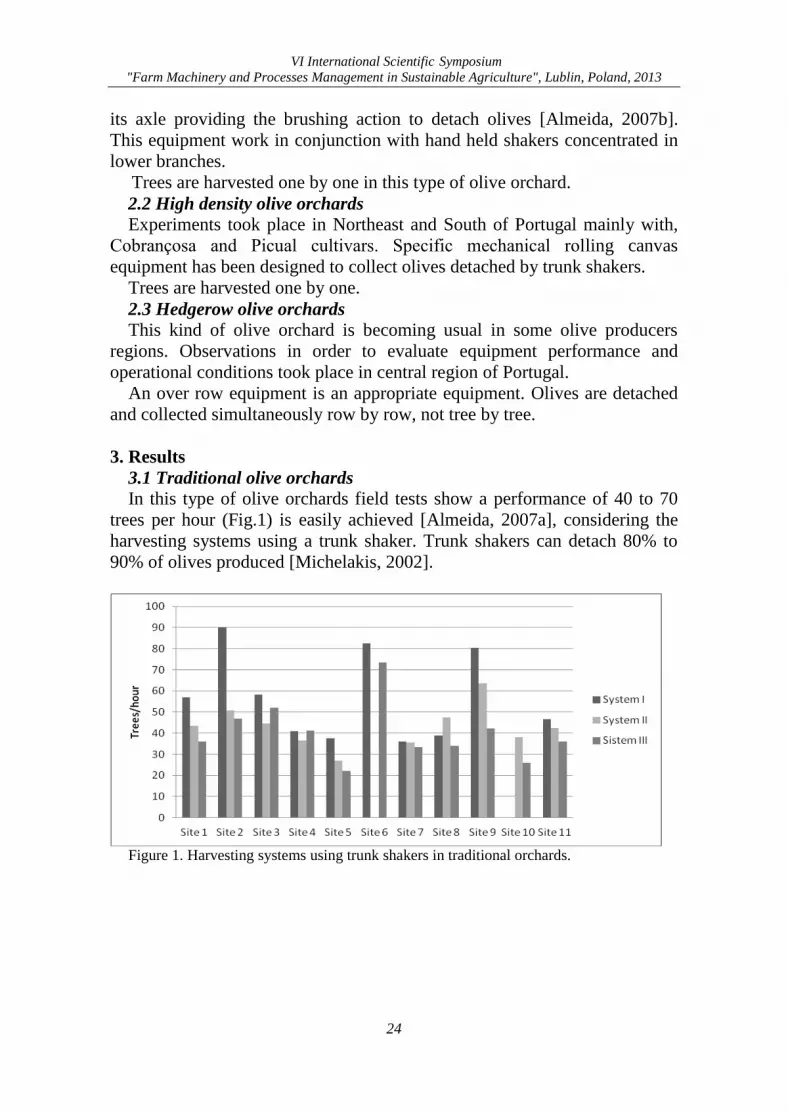
In this type of olive orchards field tests show a performance of 40 to 70
trees per hour (Fig.1) is easily achieved [Almeida, 2007a], considering the
harvesting systems using a trunk shaker. Trunk shakers can detach 80% to
90% of olives produced [Michelakis, 2002].
Figure 1. Harvesting systems using trunk shakers in traditional orchards.
VI International Scientific Symposium
"Farm Machinery and Processes Management in Sustainable Agriculture", Lublin, Poland, 2013
25
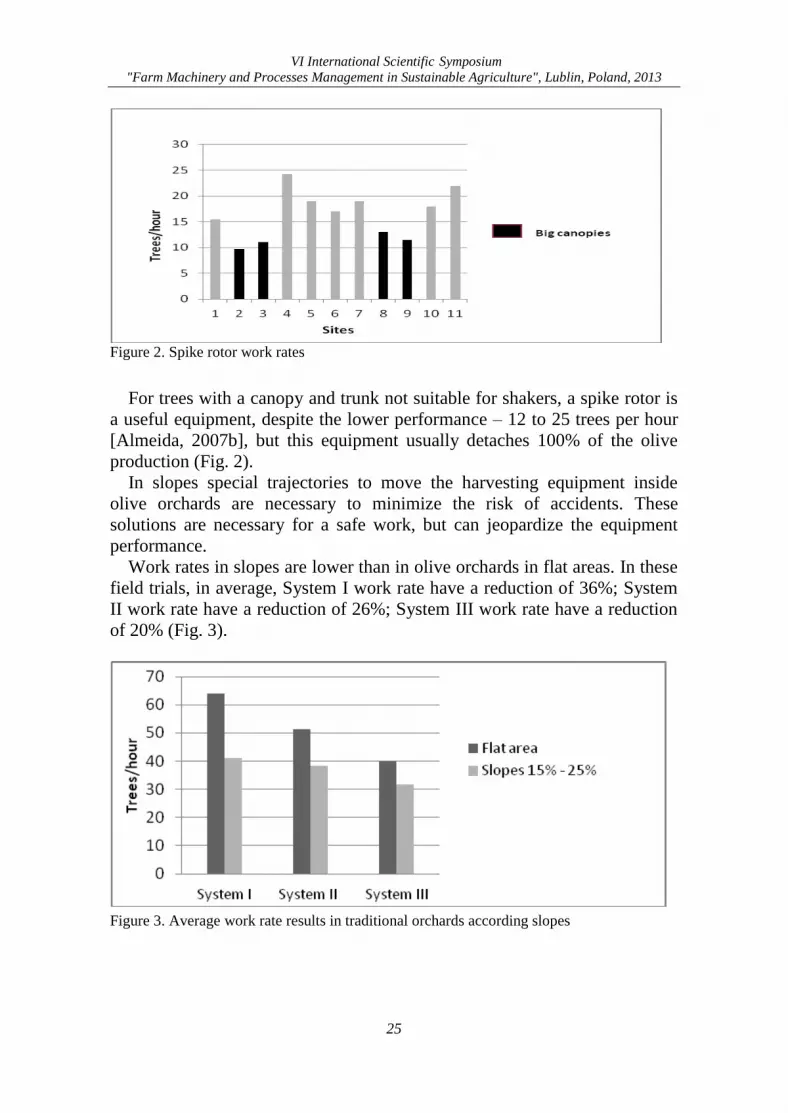
Figure 2. Spike rotor work rates
For trees with a canopy and trunk not suitable for shakers, a spike rotor is
a useful equipment, despite the lower performance – 12 to 25 trees per hour
[Almeida, 2007b], but this equipment usually detaches 100% of the olive
production (Fig. 2).
In slopes special trajectories to move the harvesting equipment inside
olive orchards are necessary to minimize the risk of accidents. These
solutions are necessary for a safe work, but can jeopardize the equipment
performance.
Work rates in slopes are lower than in olive orchards in flat areas. In these
field trials, in average, System I work rate have a reduction of 36%; System
II work rate have a reduction of 26%; System III work rate have a reduction
of 20% (Fig. 3).
Figure 3. Average work rate results in traditional orchards according slopes
VI International Scientific Symposium
"Farm Machinery and Processes Management in Sustainable Agriculture", Lublin, Poland, 2013
26
3.2 High density olive orchards
The reduced space between trees along lines does not allow the inverted
umbrella work or a satisfactory work of conventional mechanical rolling
canvas.
A specific mechanical rolling canvas has been designed to collect olives
detached by trunk shakers. The performance achieved is 40 to 50 trees per
hour [Peça, 2008].
3.3 Hedgerow olive orchards
In this kind of olive orchards, harvesting is a continuous work, row by
row.
Olives are harvested and collected simultaneously, using an overrow
equipment. In this case, expected performance is 3 to 3.5 hours per hectare.
4. Conclusions
4.1 Traditional olive orchards
Experiments and their evaluation show that the most suitable system is the
trunk shaker (to detach olives) combined with the inverted umbrella (to
collect detached olives) [Almeida, 2007a]. Despite the performance is not the
best, it needs the minimum of manpower and the costs by production
harvested are lower.
The system using the spike rotor in conjunction with hand shakers may be
regarded as a useful tool for olive harvesting of trees with large canopies
(volume between 100 m3 and 200 m3 and the trunk diameter between 2 m
and 3.5 m), bearing in mind that values close to 100% of detachment can be
reached and that for such trees trunk shakers are inadequate. However, to
make operational costs competitive it is important to improve work
organization and above all to increase olive production on these traditional
olive orchards. In the former aspect, the increase in the number of hand held
shakers concentrated in lower branches should be envisaged in the near
future.
Some of these old traditional olive orchards with autochthonous cultivars
with large canopies are able to produce high quality olive oil, factor of a
great importance in a so competitive market.
4.2 High density olive orchards
In this case the most suitable harvesting system includes a trunk shaker
with the specific mechanical rolling canvas referred. The performance can be
greatly improved if two rows are harvested simultaneously, using one trunk
shaker and two mechanical rolling canvas.
In these two types of olives orchards - traditional olive orchards and high
density olive orchards, trees are harvest one by one - the most important
factor affecting performance is the operational time to move equipment from
VI International Scientific Symposium
"Farm Machinery and Processes Management in Sustainable Agriculture", Lublin, Poland, 2013
27
one tree to the next. In order to get a better performance a good trafficability
conditions for equipment is needed. This objective can be achieved by an
adequate soil management that reduces the soil water content in harvesting
season.
4.3 Hedgerow olive orchards
The continuous harvesting system with an overrow equipment is by now
the recommended procedure. This harvesting system requires a tree below a
certain height, width, and with trunk access or clearance below the canopy
for the fruit catching frame. It is not been fully demonstrated that the
topping, hedging and hand pruning required to maintain the adequate tree
size will produce annual economic crops [Ferguson, 2006].
5. References [1] Almeida, Arlindo; Peça, José; Pinheiro, Anacleto; Dias, António; Santos, Luís S.S.
dos; Reynolds, Domingos; Lopes, João. 2007a. Performance of three mechanical
harvesting systems for olives in Portugal. 35th International Symposium on
Agricultural Engineering. Opatija. Actual Tasks on Agricultural Engineering: 461-466.
[2] Almeida, Arlindo; Peça, José; Pinheiro, Anacleto; Dias, António. 2007b. Performance
of the “Oli-Picker” olive harvester in Trás-os-Montes region of Portugal. CIOSTA
Congress: Advances in labour and machinery management for a profitable agriculture
and forestry. Nitra: 44-51.
[3] Amirante, P., Tamborino, A. Olive Harvesting Systems in High Density Orchards. Acta
Horticulturae nº 949: 351-358.
[4] Ferguson, Louise. 2006. Trends in Olive Harvesting in Trends in olive fruit handling
previous to its industrial transformation. Grasas y Aceites, 57 (1): 9-15.
[5] Michelakis, J, 2002. Olive Orchards Management: Advances and Problems. Acta
Horticulare nº 586: 239-245.
[6] Peça, José; Almeida, Arlindo; Pinheiro, Anacleto; Dias, António; Santos, Luís S.S.dos;
Lopes, João; Reynolds, Domingos. 2008. Mechanical harvesting of 400 trees per
hectare olive orchards based on a rolling canvas prototype. Acta Horticulturae nº 79:
363-367.

VI International Scientific Symposium
"Farm Machinery and Processes Management in Sustainable Agriculture", Lublin, Poland, 2013
28
VI International Scientific Symposium
"Farm Machinery and Processes Management in Sustainable Agriculture", Lublin, Poland, 2013
29
SHAPING AN ORGANIZATIONAL CULTURE IN AGRICULTURE
ENTERPRISE – A CASE STUDY
Rafał BAUM1, Karol WAJSZCZUK1, Jacek WAWRZYNOWICZ1 , Jarosław WAŃKOWICZ2
1 Poznań University of Life Sciences, Department of Management and Law, Poznań,
POLAND 2 Farm Frites Poland Dwa Sp. z o.o., Bobrowniki, POLAND
e-mail: [email protected]; [email protected]; [email protected];
Keywords: organizational culture, corporate image, agricultural enterprise
1. Introduction
In the literature, organizational culture is defined generally as social norms
and value systems to stimulate workers, appropriate organizational climate,
governance, shared meanings and symbols, patterns of cognition, behavior
requirements. Deshapande and Parasurman state that organizational culture
is unwritten and often unconscious set of principles which fill the space
between rules and reality hence [Zbiegień - Maciag 1999]. The most famous
definition to determine Edgar Schein [1986], according to which
organizational culture is a set of core values and standards of behavior,
dominant in the organization, encouraged by the spirit and manifesting itself
through artifacts.
Organizational culture is variable and depends on many external and internal
factors, that affect the company (type of environment and type of
organization, the characteristics of the organization and characteristics of
participants) [Aniszewska, Gielnicka 1999].
Looking outward to the achievements of economic thought, organizational
culture is - besides strategies of the company, its organizational structure and
procedures for the execution of tasks - forming part of the so-called
organizational resource companies. Thus, organizational culture affects the
effectiveness of the company [Bagieński 2010].
2. Material and methods
The aim of this study was to identify and analyze the basic principles of the
firm operation – values, that are the main points of reference in the shaping
image and culture of the agriculture company. The following areas of
research were distinguished:
a/ subject scope: Farm Frites Poland Two Ltd. ( FFPD ) – the agricultural
company is actively engaged in business activities (crop production – about
3200 hectares of arable land);
VI International Scientific Symposium
"Farm Machinery and Processes Management in Sustainable Agriculture", Lublin, Poland, 2013
30
b/ scope of the study: the characteristics of the operation conditions of the
selected company according to the second level of Schein's model [Peszko
2013];
c/ time range: the years 2009 - 2011 according to statistical and economic
data, and 2012 according to empirical research;
d/ spatial scope: the area of the Company operations: municipalities
Damnica and Główczyce, Pomorskie province.
Applied research methods were as follows:
a/ method of analysis of the literature, especially in the first stage of research
and logical inference method to isolate the internal and external conditions of
activity of the test subject;
b/ stakeholders analysis method to distinguish entities of the enterprise
environment, which directly or indirectly affect the Company's operations;
c/ case study method.
3. Results Starting the FFPD business was associated with the construction by a Dutch
investor a modern factory fries in Lęborg in 1994 (sister company of Farm
Frites Poland Joint-stock Company).
Potato cultivation and reproduction are based on the best seed material
imported from Holland, Scotland and Germany.
Currently about 1,000 hectares of potatoes is grown at Farm Frites Poland
Two yearly. The farm uses a four-year crop rotation. Within the structure of
sowing areas can be distinguish other cultivations like rape and cereals
(wheat, rye) (around 700-800 ha), and a range of complementary crops like
corn, grass and radish .
To meet the annual demand for raw materials (more than 200 thousand tons),
factory of potato products in Lęborg, cooperates very closely with FFPD and
70 smaller potato producers mainly from the Zachodniopomorskie,
Pomorskie and Wielkopolska provinces within the vertical integration. It
should be noted that FFPD and other producers cooperating with the Lęborg
factory generate more than 2% of the harvested potatoes in Poland annually.
As mentioned earlier, the aim of the research was to identify and analyze the
basic principles of the company, the values and norms which are the main
points of reference in shaping the image and culture. Based on research
conducted in the reporting company and the information contained in the
available documents of the company, such elements would definitely
include:
• care of the highest quality and food safety,
• innovation and progress implementation in agriculture,
• dialogue with stakeholders,
• integrity and traditions of cooperation,
VI International Scientific Symposium
"Farm Machinery and Processes Management in Sustainable Agriculture", Lublin, Poland, 2013
31
• production and other activities in accordance with the concept of
sustainable development.
As each of food supply chain, end consumer and his requirements for quality
and safety of the product produced are playing a major role. FFPD produced
by well-known international and national standards, following above-average
recommendations for farming and crops.
One of the consequences involved in ensuring food safety is to have a so-
called certificate of product quality - GlobalGAP (GAP - Good Agricultural
Practice). FFPD was the first farm in Poland which obtained such certificate
in the production of potatoes. In addition, the farm is audited annually by an
independent certification organization for the agricultural sector in Europe -
ECAS MPS (MPS is an international organization dedicated to the
implementation of sustainable development and corporate social
responsibility). Since 2001, the company is also included in the McDonald's
Agricultural Assurance Programme (MAAP). The McDonald's standards
apply to all links in the supply chain.
The FFPD is also a member of SAI Platform (called the Sustainable
Agriculture Initiative Platform) uniting the world's largest food producers.
The main aim of the association is to guarantee food safety and sustainable
development.
In the FFPD , at every stage of production quality is the most important thing
- to maintain quality all employees are involved. Develop the habit of
employees continuously monitor individual processes, next to the
technological advancement, is recognized as a priority action for the
improvement of quality in the company. Quality control and supervision of
the production process facilitates its own laboratory, which allows the
monitoring of basic parameters of derived plant products.
Meeting the higher standards of potato cultivation the Farm Frites Poland
Two was nominated by a worldwide network of McDonald's to the role of
Flagship Farm (holding flag - business cards). Thus, the company has
become a model of good agricultural practices for other suppliers of potatoes
for McDonald's. The aim of the Flagship Farms programme is to share
experiences and promote sustainable farming practices that are not only good
for the environment, but also cost-effective and ethically unproblematic. The
FFPD as a model producer of potatoes using its own specialists, shares their
knowledge with cooperating farms.
In the dialogue with stakeholders, the company is involved in many different
initiatives (especially for their crew) and is strongly committed to social
issues (a variety of activities for the local community).
Authenticity and tradition of cooperation is another important value taken
into account in shaping the organizational culture of the FFPD. The flagship
product of the farm - potatoes are the raw material for the production of

VI International Scientific Symposium
"Farm Machinery and Processes Management in Sustainable Agriculture", Lublin, Poland, 2013
32
frozen potato products which, through the factory in Lęborg, it provides the
most known brands: Farm Frites, Aviko and McDonald's.
The last basic principle of the company functioning, which also makes its
corporate culture and image, is the action in accordance with the concept of
sustainable development. Among the unwritten company management
instruments it should be mentioned the basic principles applicable to all
employees, such as a policy of continuous improvement of the production
process, innovation, quality improvement and care about environmental
protection and efforts to reduce costs.
Annual plans like technical and financial budget and capital budget which
are performed in the farm favor the implementation of the idea of SD.
Financial and technical budget refers to the theory of organic farming and is
based on the creation of the internal balance of the company, connecting the
production and inputs.
4. Conclusions
Included synthetically selected issues related to the organization's culture in
the agricultural company FFPD, demonstrated the importance of the
multidimensionality of the concept, and how much impact it can have on the
company functioning.
Results of this study confirmed that organizational culture has an impact on
improving competitiveness and increasing the efficiency of the company.
Based on example of the analyzed entity can be concluded that significantly
improves the functioning of the organization and helps to achieve financial
success. Organizational culture pursues the seemingly contradictory tasks:
provides both durability and stability of the company and great flexibility,
i.e. the ability to adapt to changing external conditions.
5. References [1] Aniszewska G., Gielnicka I. 1999. Firma to ja, firma to my. Poradnik kultury
organizacyjnej firmy. Ośrodek Doradztwa Doskonalenia Kadr, Gdańsk.
[2] Bagieński St. 2010. Zasób organizacyjny rolniczej spółdzielni produkcyjnej -
studium przypadku. Roczniki Nauk Rolniczych Seria G, T. 97, z. 3:20-29.
[3] Cameron K.S., Quinn R.E. 2003. Kultura organizacyjna - diagnoza i zmiana:
model wartości konkurujących. Oficyna Ekonomiczna, Kraków.
[4] Kroeber A., Kluckhohn C. 1952. A Critical Review of Concepts Definitions.
Papers of the Peabody Museum of Archaeology and Ethnology, Harvard
University, Vol. 47, No 1: 56-57.
[5] Peszko P. 2013.Kultura organizacyjna firmy. http://artelis.pl/artykuly/489/kultura-
organizacyjna-firmy [access: 2.02.2013]
[6] Schein E.H. 1986. Organizational Culture and Leadership. Jossey-Bass, San-
Francisco.
[7] Sikorski Cz. 2002. Kultura organizacyjna, C. H. Beck, Warszawa.
[8] Zbiegień-Maciąg L. 1999. Kultura w organizacji, PWN, Warszawa.
VI International Scientific Symposium
"Farm Machinery and Processes Management in Sustainable Agriculture", Lublin, Poland, 2013
33
MODERNIZATION OF FARMS IN LOWER SILESIA
Tomasz BERBEKA, Tomasz SZUK, Tomasz WICIAK
Wroclaw University of Environmental and Life Sciences, Institute of Economics and Social
Sciences, Wrocław, POLAND
e-mail: [email protected], [email protected]; [email protected]
Keywords: modernization, investments, individual farm
1. Introduction
Investment processes in agriculture is the basis of the development and
the competitiveness of farms on European market. The new possibilities of
investment funding in this sector of national economy already appeared in
the short period before Poland entering to UE structures. Investments
decisions are dependent on many factors where the level of farm income
seems to be the most important [Kusz, 2009]. Moreover one of the most
import and economic reason of long term investment development is willing
to invest [Woś, 2000]. These processes become more intensive after
implementation in Poland the system of direct payments and more visible in
larger farms [Poczta, 2006].
In financial perspectives PROW 2004-2006 and PROW 2007-2013 the
part of the cash designated on the modernization grew up significantly. The
numbers of farmers applications testify several times higher number of
potential beneficiaries than established limit. For over last 10 years the
essential growth of machines prices for agriculture purposes has been
noticed. There is a straight dependency between own capital participation
and possibility of co-financing from public budget what cause a real income
[Rowiński, 2008].
Participation in investments programmes became the only chance to
modernize the machine’s park for many farms. However in the report to the
whole population of agricultural farms the part of individuals which
participated in modernization did not cross 2%. Undertaken investments in
larger area groups were covered from own canters and with co-financing by
credit bank. Exceptionally profitable situation in agriculture in years 2011
and 2012 caused intensification of investment processes in individual farms.
The analysis of the investment process was the aim of the present study in
studied community of farms.
2. Material and methods
Investigations were conducted in years 2012/2013. The purposeful
selection of farms lay within 3 administrative districts of the Lower -Silesian
province. Source data base materials came from agricultural farms, which
VI International Scientific Symposium
"Farm Machinery and Processes Management in Sustainable Agriculture", Lublin, Poland, 2013
34
received refinance to the investment for “Modernization of agricultural
farms” within PROW 2007-2013. Investigations covered 229 individual
farms where applications were accepted by regional division of ARMA in
Wrocław. For the research purposes farms has been divided into five area
groups: 1.00 -14.99 ha; 15.00-29.99 ha; 30.00-49.99 ha; 50.00-99.99 ha; over
100 ha.
The largest part of farms made up located in Wrocław Poviat - 41%, then
Średzki Poviat - 34% and Kłodzki Poviat - 25%. The aim of the study was
indication the main directions of modernization changes and the qualification
of the scale of modernization processes (the category of investment
expenditures). The detailed analysis of origin and size of modernization
undertakings with regard to the groups of fixed assets and its use were
executed.
3. Results
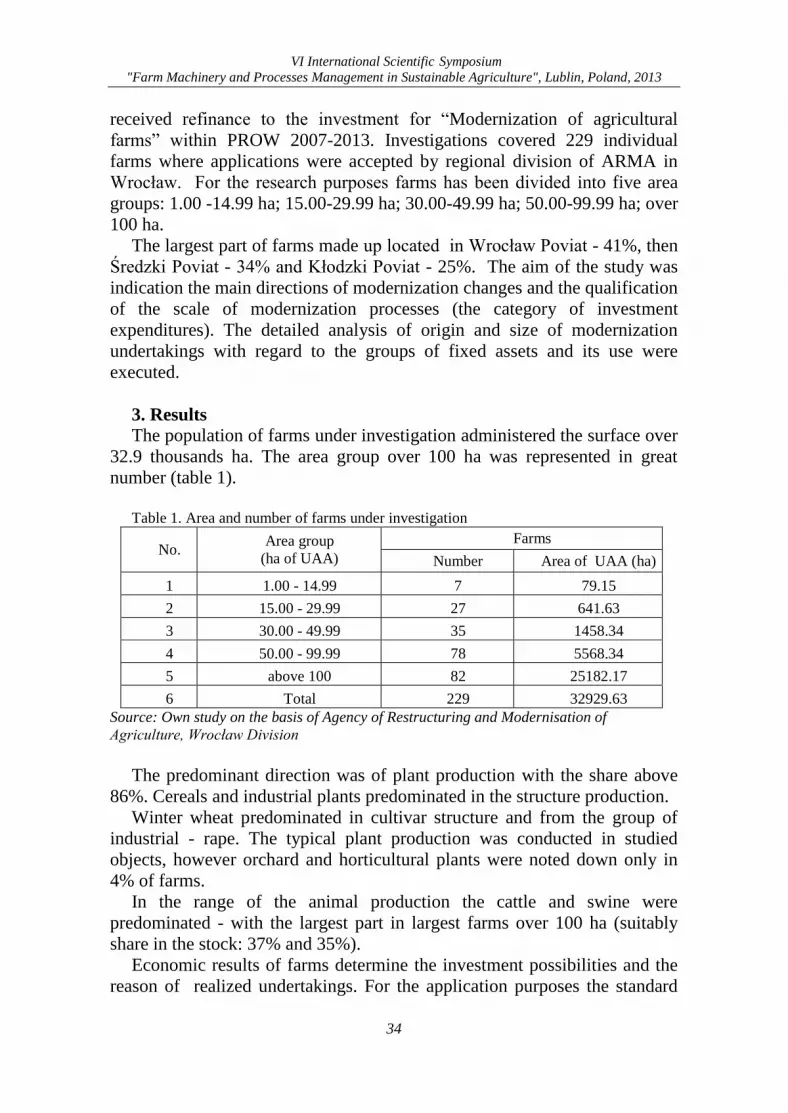
The population of farms under investigation administered the surface over
32.9 thousands ha. The area group over 100 ha was represented in great
number (table 1).
Table 1. Area and number of farms under investigation
No. Area group
(ha of UAA)
Farms
Number Area of UAA (ha)
1 1.00 - 14.99 7 79.15
2 15.00 - 29.99 27 641.63
3 30.00 - 49.99 35 1458.34
4 50.00 - 99.99 78 5568.34
5 above 100 82 25182.17
6 Total 229 32929.63
Source: Own study on the basis of Agency of Restructuring and Modernisation of
Agriculture, Wrocław Division
The predominant direction was of plant production with the share above
86%. Cereals and industrial plants predominated in the structure production.
Winter wheat predominated in cultivar structure and from the group of
industrial - rape. The typical plant production was conducted in studied
objects, however orchard and horticultural plants were noted down only in
4% of farms.
In the range of the animal production the cattle and swine were
predominated - with the largest part in largest farms over 100 ha (suitably
share in the stock: 37% and 35%).
Economic results of farms determine the investment possibilities and the
reason of realized undertakings. For the application purposes the standard
VI International Scientific Symposium
"Farm Machinery and Processes Management in Sustainable Agriculture", Lublin, Poland, 2013
35
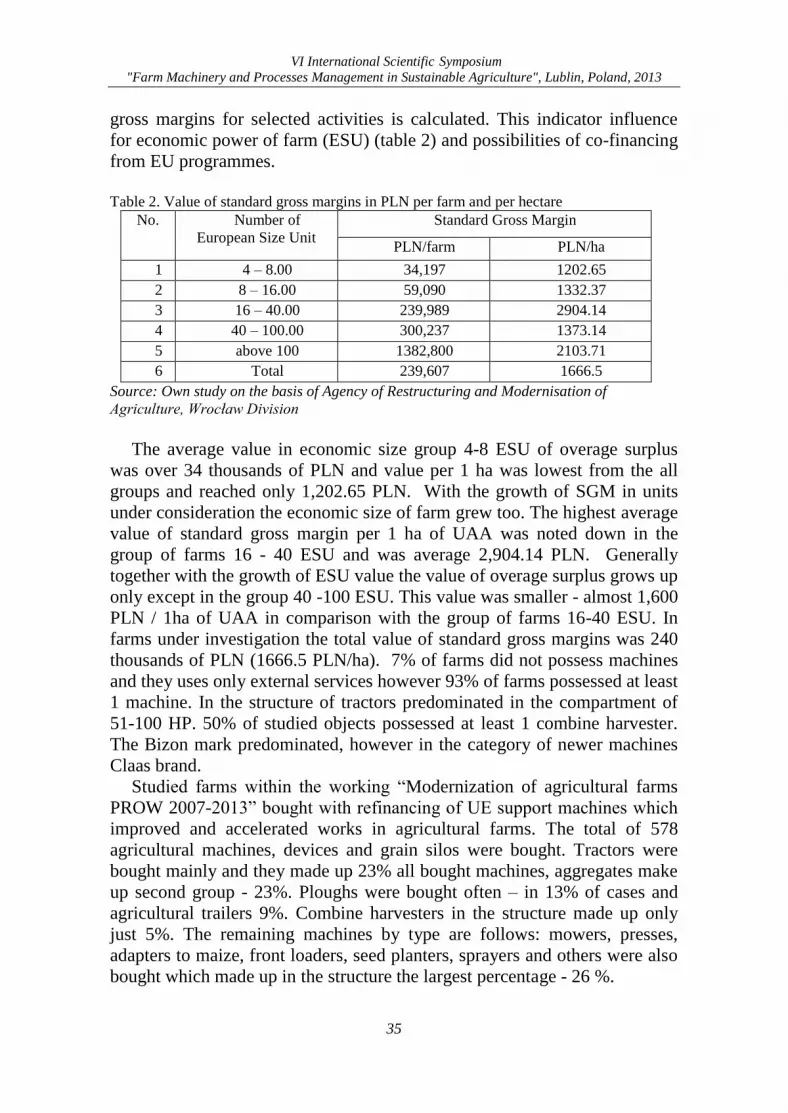
gross margins for selected activities is calculated. This indicator influence
for economic power of farm (ESU) (table 2) and possibilities of co-financing
from EU programmes.
Table 2. Value of standard gross margins in PLN per farm and per hectare
No. Number of
European Size Unit
Standard Gross Margin
PLN/farm PLN/ha
1 4 – 8.00 34,197 1202.65
2 8 – 16.00 59,090 1332.37
3 16 – 40.00 239,989 2904.14
4 40 – 100.00 300,237 1373.14
5 above 100 1382,800 2103.71
6 Total 239,607 1666.5
Source: Own study on the basis of Agency of Restructuring and Modernisation of
Agriculture, Wrocław Division
The average value in economic size group 4-8 ESU of overage surplus
was over 34 thousands of PLN and value per 1 ha was lowest from the all
groups and reached only 1,202.65 PLN. With the growth of SGM in units
under consideration the economic size of farm grew too. The highest average
value of standard gross margin per 1 ha of UAA was noted down in the
group of farms 16 - 40 ESU and was average 2,904.14 PLN. Generally
together with the growth of ESU value the value of overage surplus grows up
only except in the group 40 -100 ESU. This value was smaller - almost 1,600
PLN / 1ha of UAA in comparison with the group of farms 16-40 ESU. In
farms under investigation the total value of standard gross margins was 240
thousands of PLN (1666.5 PLN/ha). 7% of farms did not possess machines
and they uses only external services however 93% of farms possessed at least
1 machine. In the structure of tractors predominated in the compartment of
51-100 HP. 50% of studied objects possessed at least 1 combine harvester.
The Bizon mark predominated, however in the category of newer machines
Claas brand.
Studied farms within the working “Modernization of agricultural farms
PROW 2007-2013” bought with refinancing of UE support machines which
improved and accelerated works in agricultural farms. The total of 578
agricultural machines, devices and grain silos were bought. Tractors were
bought mainly and they made up 23% all bought machines, aggregates make
up second group - 23%. Ploughs were bought often – in 13% of cases and
agricultural trailers 9%. Combine harvesters in the structure made up only
just 5%. The remaining machines by type are follows: mowers, presses,
adapters to maize, front loaders, seed planters, sprayers and others were also
bought which made up in the structure the largest percentage - 26 %.

VI International Scientific Symposium
"Farm Machinery and Processes Management in Sustainable Agriculture", Lublin, Poland, 2013
36
In the structure of bought tractors in three poviats above the half of
machines possessed power from 101 to 151 HP. No one tractor below power
51 HP was bought. The number of tractors with power above 201 HP, 51-
101 HP and 151-201 HP was on the approximate same level. It results from
the largest demands on the tractors with average power engine and was
connected with the area structure of agricultural farms under consideration.
Tractors with power 101-151 HP were bought mainly by farms with surface
from 50 ha to 200 ha.
The farmers purchased mainly the tractors of New Holland and John
Deere brand - above 20 % in both marks. The large interest were pleased to
the tractors of Deutz Fahr and made up above 10 % in the structure of bought
tractors. Tractors Valtra, Class and Pronar were bought the least - more less
than 2 %. In 33 % of farms the machine mark wasn’t identified.
The highest number of combine harvesters was bought in Wrocław and
Środa Śląska Poviats (14 and 20 pieces). The highest percentage of bought
combines constituted New Holland mark (43%) and Claas mark (25 %) the
lowest share of combine harvesters were Case and Deutz Fahr (7%).
From studied agricultural farms agricultural machines were purchased in
amount of 90 pieces of tillage aggregates, secondly above 70 of ploughs
were bought. So the large quantity of bought these two machines was
connected with the function of basic agricultural, indispensable in every farm
leading plant production. Also bought in smaller quantity were: grubers and
disk harrows, chisel – plowers, and power harrows.
Table 3. Average value of investment in area groups in selected poviats.
No. Area group
Average value of investment per ha in area
groups in selected poviats in PLN
kłodzki średzki wrocławski
1 1,00 – 15,00 27 062.35 12 198.5 16 079.24
2 15,00 – 30,00 10 095.61 7166.72 10 790.3
3 30,00 – 50,00 5 592.8 9224.2 5539.21
4 50,00 – 100,00 4 878.11 6173.2 6640.26
5 over 100 2 269.23 2 454.28 1861.48
6 Total 3 692.78 3 508.4 2808.83
Source: Own study on the basis of Agency of Restructuring and Modernisation of
Agriculture, Wrocław Division
Average value of the investments was the highest per hectare in Kłodzko
Poviat and constituted above 27 thous. of PLN where in Wrocław Poviat
was lower almost 11 thousand PLN, and in Środa Śląska Poviat down
almost 15 tys. of PLN (table 3). The the lowest value of investments was
noted in Wrocław Poviat in are group over 100 ha (1,861.48 PLN/ha).
VI International Scientific Symposium
"Farm Machinery and Processes Management in Sustainable Agriculture", Lublin, Poland, 2013
37
Together with in the growth of the area of farm average value of investment
in count on 1 ha falls – but the area group 30-50 ha was exception Środa
Śląska Poviat, where the value of investment per 1 ha was over 2 thousands
of PLN. Average value of investments per 1 ha in selected poviats were
comparable – the highest in Kłodzko Poviat – 3,692 PLN, than Środa Śląska
Poviat 3,508 PLN and Wrocław Poviat 2,808 PLN.
4. Conclusions
The majority of farms before modernization programme possessed at least
one machine to the agricultural production. Farm producers were equipped
first of all in basic machines to the plant production purposes. The significant
quantity of farms was forced in agricultural tractor from average power
compartment. The tractors of Polish and Czech production were dominated.
The majority of studied farms were equipped in cereal combine harvester
both national and foreign. Farms from the region of intensive agriculture, in
the larger scale undertook modernization workings than farms from the
Kłodzko region. The directions of modernization transformations were
determined by: direction of led activity, the size of farm, location and the
size of standard gross margins. The average value of investment per one
farm was higher in the region of intensive agriculture, than in the Kłodzko
region. However the value of investment per 1 ha in Kłodzko Poviat was
higher than both in Wrocław Poviat and in Średzki Poviat.
5. References [1] Kusz D. 2009. Nakłady inwestycyjne w rolnictwie polskim w latach 1990-2007,
Roczniki Naukowe SERiA, t. XI, z. 2.
[2] Poczta W. 2006. Przemiany w rolnictwie. Polska wieś 2006, Raport o stanie wsi,
FDPA, Warszawa
[3] Rowiński J. 2008, Program Rozwoju Obszarów Wiejskich na lata 2007 – 2013 na tle
wcześniejszych programów wiejskich, współfinansowanych ze środków unijnych
(analiza struktury programu), Wieś i Rolnictwo nr 3, Wyd. IRWiR PAN, Warszawa, s.
67 – 84.
[4] Woś A. 2000. Inwestycje i akumulacja w rolnictwie chłopskim w latach 1988-1998,
Komunikaty Raporty, Ekspertyzy, IERiGŻ, Warszawa. z. 466.

VI International Scientific Symposium
"Farm Machinery and Processes Management in Sustainable Agriculture", Lublin, Poland, 2013
38
VI International Scientific Symposium
"Farm Machinery and Processes Management in Sustainable Agriculture", Lublin, Poland, 2013
39
AGROFORESTRY – A SUSTAINABLE LAND USE
FOR THE FUTURE OF EUROPEAN AGRICULTURE
Robert BOREK
Institute of Soil Science and Plant Cultivation – State Research Institute, Puławy, POLAND
Keywords: agroforestry, sustainable agriculture, multifunctional agriculture, intercropping
Summary
Agroforestry means land-use systems and practices, where woody
perennials are deliberately integrated with crops and/or animals on the same
land management unit. The trees may be single or in groups inside parcels
(silvoarable agroforestry, silvopastoralism, grazed or intercropped orchards)
or on the limits between parcels (hedges, tree lines) (EURAF 2012).
Decline of traditional agroforestry systems in Europe was caused mainly
by increased mechanization leading to removal of trees, maximising
productivity through monocultures, a reduction in the agricultural work force
limiting viability of labour-intensive systems, farms consolidation, favouring
single crop systems by CAP Policy, wooded area were ineligible for subsidy
payments (Eichhorn et al. 2006).
Possible functions of traditional as well as modern agroforestry systems
for Europe under temperate climate conditions may include: soil protection
against erosion, sustainable utilization of marginal lands, reduction of
nutrients and pesticides leaching losses, biodiversity regulation,
microclimate modification and climate resilience, carbon sequestration,
products diversification, enhancement of agricultural landscapes.
Agroforestry plays important role in both mitigation and adaptation to
climate change (EURAF 2012, Mosquera-Losada et al. 2012).
Systems incorporating belts of biomass crops like short rotation willow
coppice can be the source of energy every 2nd-4th year, while other systems
with trees growing slower may deliver wood as a by-product of management
practices including thinning and pruning.
The key issue for optimal production in agroforestry systems is
optimization resource capture by maximizing positive interactions and
minimizing negative ones (Smith et al. 2012). The recommended measure of
productivity of intercropping systems is the Land Equivalent Ratio (Federer
et al. 1982) that has been defined as a measure of efficiency of an
intercropping. The LER compares land areas required under single cropping
to give the yields obtained from the component crops of the mixture. Values
greater than one indicate intercropping to be more efficient than sole
cropping in terms of land use, while values less than one indicate a loss in
efficiency due to intercropping.

VI International Scientific Symposium
"Farm Machinery and Processes Management in Sustainable Agriculture", Lublin, Poland, 2013
40
Productivity of agricultural crops and trees is affected by appropriate
choice of tree genotype, spatial design of the system (distribution of trees,
orientating tree rows in north-south direction to optimize light availability for
crops) and management practices (for example thinning and pruning of
branches and roots controlling trees density influence on light penetration
and quality of timber). Distances between the tree rows should be adapted to
facilitate use of machines. Wide planting distances between trees within row
allows higher diameter increment and better quality of wood. It is possible
also to use free space within the row to sow plants attracting pollinating
insects or herbs, fruits, vegetables etc.
Long-term studies are needed to optimize agroforestry systems design and
maximize positive interactions under different conditions. Particular
attention should be paid to nutrient use of neighbouring crops and water
uptake. Due to complexity of the system, multidisciplinary approach is
needed. Close cooperation between forestry and agriculture specialists may
be necessary. Adoption of agroforestry is affected severely by farmers’
awareness, high initial investment and a lack of financial incentives.
Moreover, intercropping is excessively labour-intensive. However,
appropriate management of these systems, supported financially by EU and
regional policies may increase crop growth and yield and diversify
agricultural production in a sustainable manner.
References [1] Eichhorn M. P., Paris P., Herzog F., Incoll L. D., Liagre F., Mantzanas K., Mayus M.,
Moreno G., Papanastis V.P., Pilbeam D.J., Pisanelli A., Dupraz C. 2006. Silvoarable
systems in Europe – past, present and future prospects. Agroforestry Systems, 67(1),
pp. 29-50.
[2] EURAF webpage. http://www.agroforestry.eu
[3] Federer W.T., Schwager S.J. 1982. On the Distribution of Land Equivalent Ratios.
Biometrics Unit Technical Reports: Number BU-777-M, pp. 9.
http://hdl.handle.net/1813/32880
[4] Mosquera-Losada M. R., Moreno G., Pardini A., McAdam J. H., Papanastasis V.,
Burgess P. J., Lamersdorf N., Castro M., Liagre F., Rigueiro-Rodríguez A. 2012. Past,
present, and future of agroforestry systems in Europe in agroforestry: the future of
global land use. In: Nair, P.K. R., Garrity D. (Ed.) Agroforestry - The Future of Global
Land Use. Springer, Berlin 2012
[5] Smith J., Pearce D., Wolfe M. S. 2012. A European perspective for developing modern
multifunctional agroforestry systems for sustainable intensification. Renewable
Agriculture and Food Systems, Volume 27, Issue 4, pp. 323-332.
VI International Scientific Symposium
"Farm Machinery and Processes Management in Sustainable Agriculture", Lublin, Poland, 2013
41
IMPACT OF DIFFERENT SCENARIOS
RELATED TO THE NEW COMMON AGRICULTURAL POLICY
ON FARM INCOME IN WALLONIA
Philippe BURNY1, François Terrones GAVIRA2, Maxime HABRAN3 1 Walloon Center for Agricultural Research, Gembloux, BELGIUM 2 University of Liege, Department of Economics and Rural Development, Gembloux,
BELGIUM 3 University of Liege, Department of Political Science, Liege, BELGIUM
Keywords : Wallonia, Common Agricultural Policy, scenarios, farm income.
1. Introduction
The Common Agricultural Policy (CAP) has been reformed several times
since the treaty of Rome in 1958 [Ledent, Burny 2002]. For the period 2014-
2020 at the European level, a new CAP had to be agreed upon by the 27
Member States and the EU parliament. Discussions were launched in 2010
and several proposals were made.
In Belgium, as agricultural policy is regionalized, the Walloon Minister
for Agriculture decided to support academic research in order to assess the
possible impact of different scenarios on farm income, and so to help the
regional authorities to take decisions when the EU legislation would be
adopted, giving a large set of possibilities to the Member States/regions.
So, different scenarios were defined with the partners of the
administration, including farmers' unions, and their impacts on farm income
were calculated.
2. Material and methods
The data used to calculate the impact of different scenarios come from the
Integrated Management and Control System [Service public de Wallonie
2013] implemented by the regional administration of agriculture and from
the Farm Accounting Data Network.
The scenarios are based on the different options proposed by different
actors - the Commission [EU Commission 2011], the EU Parliament [EU
Parliament 2013] and Member States.
The calculations are made on several hypotheses. To estimate the
available amount for direct payments in Wallonia in 2020, it was supposed
a) that the share of Wallonia within the Belgian envelope remains the same,
so 54%, and b) that the amount available in 2013 is reduced by 11.2%,
according to the proposal of the EU Commission. So, the amount available
for direct payments in Wallonia is supposed to reach €270 million.
In order to estimate the eligible area, the area declared by farmers who
have direct payments rights in 2011 was added to the area of farmers who

VI International Scientific Symposium
"Farm Machinery and Processes Management in Sustainable Agriculture", Lublin, Poland, 2013
42
produce only fruits and vegetables and/or had vineyards, with no direct
payment right in 2011.
The proposition of the EU Parliament concerning direct payments ceilings
is implemented: a reduction of 20% between €150,000 and €200,000, 40%
between €200,000 and €250,000, 70% between €250,000 and €300,000 and
100% over €300,000 .
The different scenarios are compared to a Scenario 0, status quo 2013.
In the reference scenario, the amount of the direct payments is calculated
for each farm in 2013, before the implementation of the reform. The single
payment is granted on an historical basis and the suckling cows premiums
remain coupled.
The scenarios integrate the following alternatives [Terrones Gavira,
Burny, Lebailly 2013]:
- with the maintenance of the coupled premiums for suckling cows or their
incorporation into the decoupled payment;
- with an additional payment for the 30 first hectares or for the 50 first
hectares;
- with an additional payment being equal to 25% of the basic payment or to
50% of the basic payment.
3. Results
The results are presented in table 1.
Table 1. Impact of different scenarios on the amount of direct payments granted to Walloon
farmers in 2020 compared to the references scenario (2013) Scenario 1 2 3 4 5 6 7 8 9 10
Suckling cow
premium
witch premium
(12 % of direct payments) without premium
Number of ha
witth
additional
payment
0 30 50 0 30 50
Amount of the
additional
payment
0 25%
*DP
50%
*DP
25%*
DP
50%
*DP 0
25%*
DP
50%*
DP
25%*
DP
50%*
DP
LOSSES
50 % or more 4% 3% 3% 3% 3% 4% 5% 4% 5% 4%
From 30 to 50 % 16% 15% 14% 15% 14% 16% 14% 13% 14% 14%
From 20 to 30 % 16% 15% 14% 15% 15% 14% 14% 13% 14% 13%
From 15 to 20 % 8% 8% 7% 8% 7% 7% 7% 7% 7% 7%
From 10 to 15 % 7% 7% 7% 7% 7% 7% 6% 6% 6% 6%
From 5 to 10 % 7% 6% 6% 6% 6% 6% 6% 6% 6% 6%
From 0 % to 5 % 5% 5% 6% 6% 6% 5% 5% 5% 5% 6%
TOTAL 62% 60% 58% 60% 59% 60% 57% 54% 58% 56%
STATU QUO 0% 0% 0% 0% 0% 0% 0% 0% 0% 0%
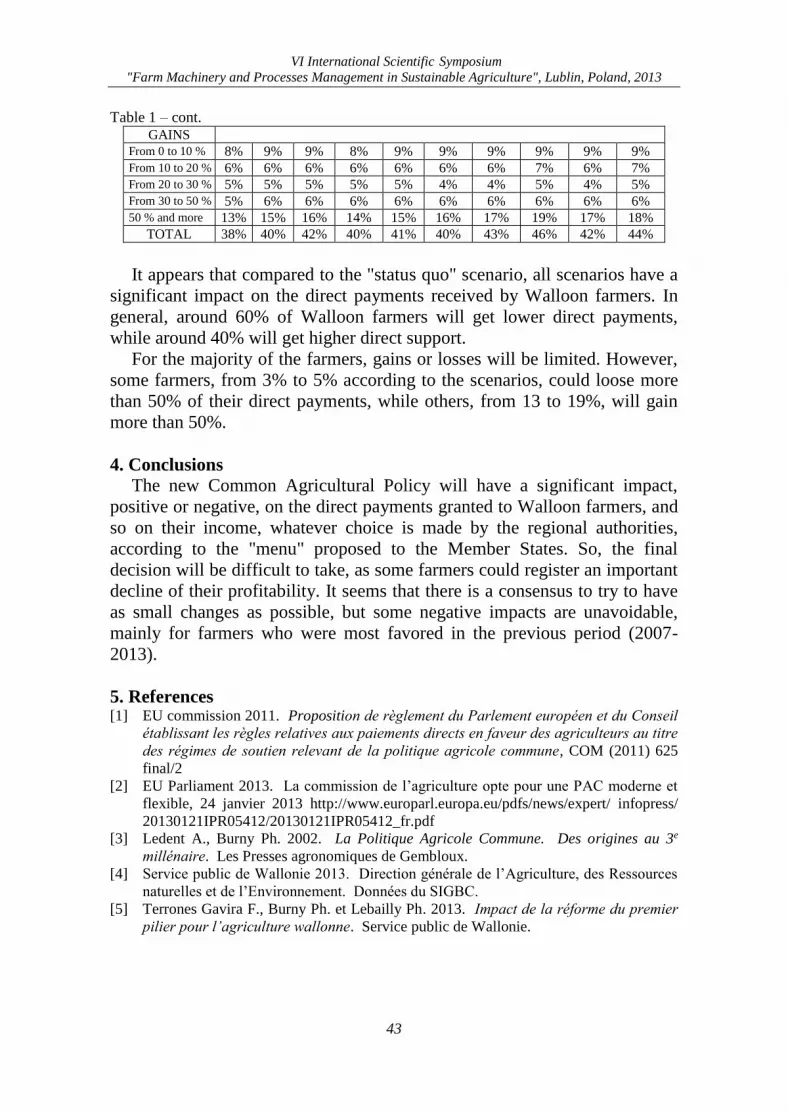
VI International Scientific Symposium
"Farm Machinery and Processes Management in Sustainable Agriculture", Lublin, Poland, 2013
43
Table 1 – cont. GAINS
From 0 to 10 % 8% 9% 9% 8% 9% 9% 9% 9% 9% 9%
From 10 to 20 % 6% 6% 6% 6% 6% 6% 6% 7% 6% 7%
From 20 to 30 % 5% 5% 5% 5% 5% 4% 4% 5% 4% 5%
From 30 to 50 % 5% 6% 6% 6% 6% 6% 6% 6% 6% 6%
50 % and more 13% 15% 16% 14% 15% 16% 17% 19% 17% 18%
TOTAL 38% 40% 42% 40% 41% 40% 43% 46% 42% 44%
It appears that compared to the "status quo" scenario, all scenarios have a
significant impact on the direct payments received by Walloon farmers. In
general, around 60% of Walloon farmers will get lower direct payments,
while around 40% will get higher direct support.
For the majority of the farmers, gains or losses will be limited. However,
some farmers, from 3% to 5% according to the scenarios, could loose more
than 50% of their direct payments, while others, from 13 to 19%, will gain
more than 50%.
4. Conclusions
The new Common Agricultural Policy will have a significant impact,
positive or negative, on the direct payments granted to Walloon farmers, and
so on their income, whatever choice is made by the regional authorities,
according to the "menu" proposed to the Member States. So, the final
decision will be difficult to take, as some farmers could register an important
decline of their profitability. It seems that there is a consensus to try to have
as small changes as possible, but some negative impacts are unavoidable,
mainly for farmers who were most favored in the previous period (2007-
2013).
5. References [1] EU commission 2011. Proposition de règlement du Parlement européen et du Conseil
établissant les règles relatives aux paiements directs en faveur des agriculteurs au titre
des régimes de soutien relevant de la politique agricole commune, COM (2011) 625
final/2
[2] EU Parliament 2013. La commission de l’agriculture opte pour une PAC moderne et
flexible, 24 janvier 2013 http://www.europarl.europa.eu/pdfs/news/expert/ infopress/
20130121IPR05412/20130121IPR05412_fr.pdf
[3] Ledent A., Burny Ph. 2002. La Politique Agricole Commune. Des origines au 3e
millénaire. Les Presses agronomiques de Gembloux.
[4] Service public de Wallonie 2013. Direction générale de l’Agriculture, des Ressources
naturelles et de l’Environnement. Données du SIGBC.
[5] Terrones Gavira F., Burny Ph. et Lebailly Ph. 2013. Impact de la réforme du premier
pilier pour l’agriculture wallonne. Service public de Wallonie.

VI International Scientific Symposium
"Farm Machinery and Processes Management in Sustainable Agriculture", Lublin, Poland, 2013
44
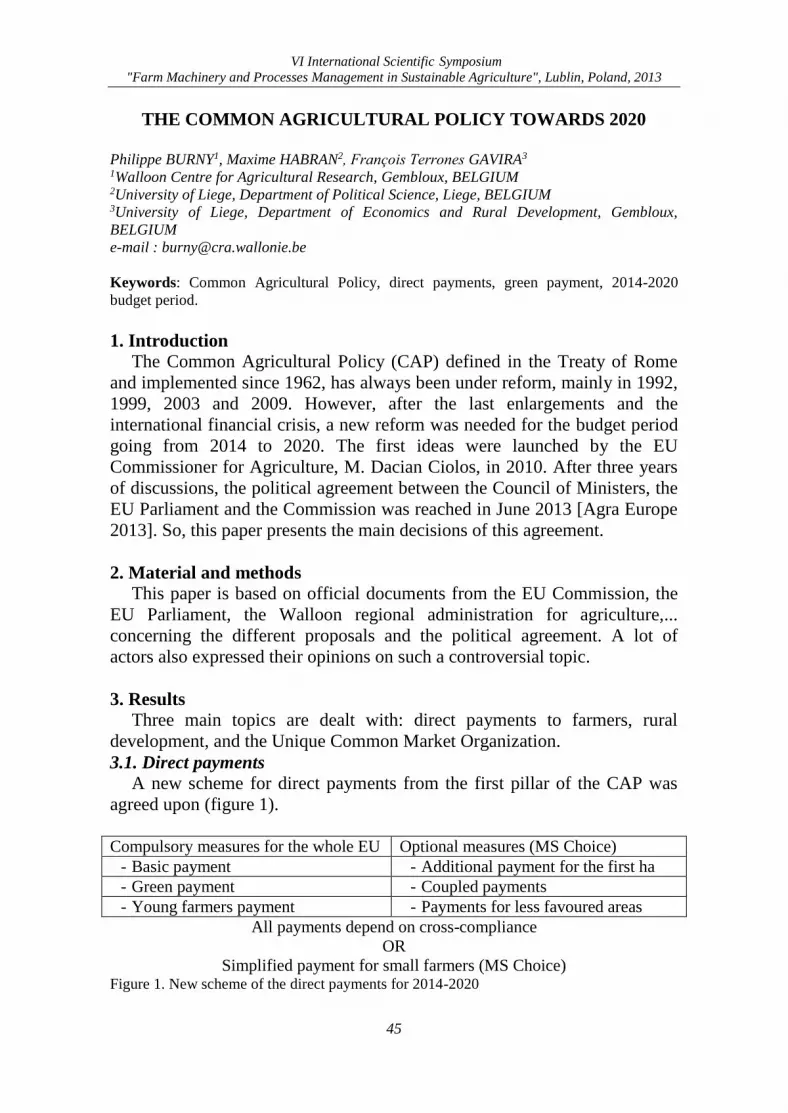
VI International Scientific Symposium
"Farm Machinery and Processes Management in Sustainable Agriculture", Lublin, Poland, 2013
45
THE COMMON AGRICULTURAL POLICY TOWARDS 2020
Philippe BURNY1, Maxime HABRAN2, François Terrones GAVIRA3 1Walloon Centre for Agricultural Research, Gembloux, BELGIUM 2University of Liege, Department of Political Science, Liege, BELGIUM 3University of Liege, Department of Economics and Rural Development, Gembloux,
BELGIUM
e-mail : [email protected]
Keywords: Common Agricultural Policy, direct payments, green payment, 2014-2020
budget period.
1. Introduction
The Common Agricultural Policy (CAP) defined in the Treaty of Rome
and implemented since 1962, has always been under reform, mainly in 1992,
1999, 2003 and 2009. However, after the last enlargements and the
international financial crisis, a new reform was needed for the budget period
going from 2014 to 2020. The first ideas were launched by the EU
Commissioner for Agriculture, M. Dacian Ciolos, in 2010. After three years
of discussions, the political agreement between the Council of Ministers, the
EU Parliament and the Commission was reached in June 2013 [Agra Europe
2013]. So, this paper presents the main decisions of this agreement.
2. Material and methods
This paper is based on official documents from the EU Commission, the
EU Parliament, the Walloon regional administration for agriculture,...
concerning the different proposals and the political agreement. A lot of
actors also expressed their opinions on such a controversial topic.
3. Results
Three main topics are dealt with: direct payments to farmers, rural
development, and the Unique Common Market Organization.
3.1. Direct payments
A new scheme for direct payments from the first pillar of the CAP was
agreed upon (figure 1).
Compulsory measures for the whole EU Optional measures (MS Choice)
- Basic payment - Additional payment for the first ha
- Green payment - Coupled payments
- Young farmers payment - Payments for less favoured areas
All payments depend on cross-compliance
OR
Simplified payment for small farmers (MS Choice) Figure 1. New scheme of the direct payments for 2014-2020
VI International Scientific Symposium
"Farm Machinery and Processes Management in Sustainable Agriculture", Lublin, Poland, 2013
46
For all Member States (MS) or regions within them, the direct payments
paid to the farmers from the first pillar must include at least three parts: the
"green" payment, a payment to young farmers (in addition to the financial
support for young farmers from the second pillar of the CAP) and the basic
payment (the amount available for the basic payment is equal to the "national
envelope" for direct payments reduced by the other payments in the new
scheme). In addition the MS (or the regions within them) have also the
possibility, if they choose so, to include:
- an additional payment for the first hectares of each farm (in order to
support the smaller farms):
- to maintain some coupled payments (like the premium for suckling cows);
- a payment for less favoured areas (in addition to the financial support from
the second pillar).
Of course, the amounts spent for these optional payments reduce equally
the basic payment, as the "national/regional envelopes" have to be respected.
With this new scheme, the CAP becomes friendlier to the environment:
the "green payment" will represent 30% of the national/regional maximum
amount for direct payments in each MS/region [Département des Politiques
Européennes et des Accords Internationaux du Service public de Wallonie
2013]. In order to get the green payment, farmers will have to prove that they
respect some conditions additional to cross-compliance: crop diversification,
maintenance of permanent pastures and to manage a minimal area of
ecological interest. There are several ways of implementation and the
MS/regions have the choice among several options.
Organic farming automatically gives the right to the green payment [EU
Commission 2013]. Where NATURA 2000 is implemented, its measures
have the priority. The MS can also consider some measures as equivalent to
the "greening" measures, like environmental certification and agro-
environmental measures (no double payment!).
The payments for young farmers [Clisson 2013] can represent a
maximum of 2% of the maximum amount for direct payments at the
national/regional level. Young farmers are farmers under 40, and the
financial support can be granted for five years. There are several ways to
calculate this payment, the choice being let to the MS/regions. So, the total
expenses can vary according to the method.
The basic payments will be granted to farmers who applied for direct
payments in 2013 and the number of eligible hectares in 2015. The mean
value is the amount available for basic payments at the MS/regional level
divided by the number of eligible hectares.
In order to support smaller farms, an additional payment can be granted to
a given limited number of hectares. Up to 30% of the total amount of direct
payments can be used for this purpose. The MS/regions are free to

VI International Scientific Symposium
"Farm Machinery and Processes Management in Sustainable Agriculture", Lublin, Poland, 2013
47
implement this payment or not, and to implement it according to the method
they have chosen.
Another optional payment is the additional payment for the less favoured
areas. If the MS/Regions decide to implement it, they can use as much as 5%
of the total amount for direct payments.
The last option for the MS/regions is to keep some coupled payments. in
such a case, they can use as much as 2% of the total amount of direct
payments for proteaginous crops and 13% for other productions. It is even
possible to use a larger share of direct payments, with the agreement of the
Commission. In Wallonia for example, the premiums for suckling cows
represent 20% of the direct payments.
Between 2014 and 2020, the EU budget for the CAP will decline by 11%
in constant terms (EURO 2011) [EU Commission 2013]. In addition, as large
differences are observed, concerning the mean level of direct payments per
hectare, not only between the MS, but also within the MS (when historical
references are used), a measure of convergence has been decided : when a
country has a mean direct payment below 90% of the EU mean, or when a
farmer has a mean basic payment per ha lower than 90% of the MS/regional
mean, one third of the difference will have to be compensated and supported
by the countries (between MS) or the farmers (within MS/regions) who are
above the mean.
The MS/regions also have the possibility to implement a special regime
for small farms [EU Parliament 2013]. All direct payments can be replaced
by an amount from 500 to 1,250 €. The total expenses cannot exceed 10% of
the national/regional amount for direct payments.
3.2. Rural development
Six priorities and measures are proposed to the MS/regions:
- knowledge transfer and innovation;
- competitivity improvement;
- promotion of market chain organization and risk management;
- to protect agricultural and forestry agrosystems;
- to reduce the production of CO2;
- to promote social integration and economic development.
In addition, agro-environmental measures must represent at least 30% of the
total budget for rural development, and LEADER at least 5%.
Measures are implemented within a multi-fund strategic scheme.
3.3. The Unique Common Market Organization
The disappearance of the milk quotas is confirmed for 2015, while the
disappearance of sugar quotas is foreseen for 2017. However, intervention
measures will be maintained.

VI International Scientific Symposium
"Farm Machinery and Processes Management in Sustainable Agriculture", Lublin, Poland, 2013
48
The producers' organizations and inter-professional organizations are
encouraged, as they have to play a more important role in the management of
the market.
A financial reserve is created from the direct payments amount in order to
face eventual crises, like price collapse.
4. Conclusion
The new CAP leads to a better equity between the MS and within the MS
(convergence of direct payments). It is also "greener" than before, as 30% of
the direct payments are linked to the respect of additional measures in favour
of the environment. It could also be simplified with the implementation of
the regime for small farmers, though the new scheme for direct payments is
more complex than before. The stress is also put on young farmers, as they
are less and less numerous.
It is also observed that many important choices are let to the Member
States/regions, so that the "Common" Agricultural Policy is less "Common"
than before.
5. References [1] Aga Europe 2013. Réforme de la PAC. N°3405, pp 3-11.
[2] Clisson N. 2013. The CAP towards 2020. Political agreement and implementation. DG
Agriculture and rural Development. EU Commission.
[3] Département des Politiques Européennes et des Accords Internationaux du Service
public de Wallonie 2013. La PAC à l’horizon 2020 – Accord politique au niveau de
l’Union européenne.
[4] EU Commission 2011. Proposition de règlement du Parlement européen et du Conseil
établissant les règles relatives aux paiements directs en faveur des agriculteurs au titre
des régimes de soutien relevant de la politique agricole commune, COM (2011) 625
final/2.
[5] EU Commission 2013. Multiannual Financial Framework 2014-2020.
http://ec.europa.eu/budget/mff/index_fr.cfm
[6] EU Parliament 2013. La commission de l’agriculture opte pour une PAC moderne et
flexible, 24 janvier 2013. http://www.europarl.europa.eu/pdfs/news/expert/infopress/
20130121IPR05412/20130121IPR05412_fr.pdf
VI International Scientific Symposium
"Farm Machinery and Processes Management in Sustainable Agriculture", Lublin, Poland, 2013
49
DEVELOPMENT OF ORGANIC FARMING IN WALLONIA:
PAST, PRESENT AND PERSPECTIVES
Philippe BURNY, Frederic DEBODE
Walloon Center for Agricultural Research, Gembloux, BELGIUM
e-mail : [email protected]
Keywords : Wallonia, organic farming, development plan.
1. Introduction
Organic farming is today fully recognized as an alternative to
conventional agriculture and its problems (water and air pollution, large use
of pesticides and possible impacts on human health, vegetal and animal
diseases, overproduction, etc.) and is clearly supported by the Common
Agricultural Policy and its "greening".
Belgian (and Walloon) agriculture is an intensive one, with a high "labour
force/agricultural area" ratio and high yields thanks to good soils, but also
the use of large quantities of inputs like fertilizers and pesticides.
However, organic farming increased in importance during the last years
and the Walloon regional government has just launched a development plan
in June 2013. So, this paper aims to analyse the evolution of organic farming
in Wallonia and to present the goals and the measures of the new
development plan.
2. Material and methods
The data concerning organic farming and its products come from the
national farm census organized every year on May 15, from statistics
delivered by the regional Walloon administration, from consumer surveys, a
survey among organic cereals producers, and the interprofessional
organization "Bioforum Walloniei".
The official development plan for organic farming decided by the
Walloon government is also taken into consideration.
3. Results
3.1. Production
The number of organic farmers in Wallonia (figure 1) and the agricultural
area devoted to organic farming (figure 2) sharply increased during the
recent past [Bioforum 2013]; In 2012, there are nearly 1,100 organic farmers,
managing nearly 55,000 ha. Both represent around 8% of the total in
Wallonia.
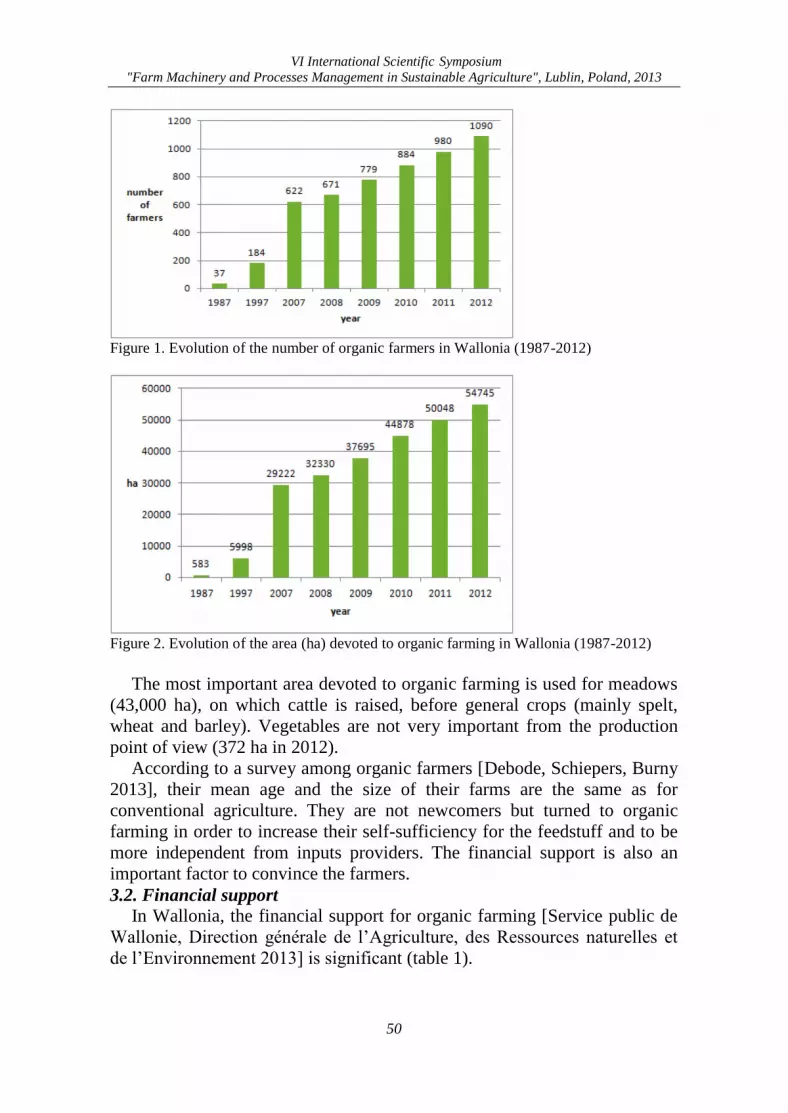
VI International Scientific Symposium
"Farm Machinery and Processes Management in Sustainable Agriculture", Lublin, Poland, 2013
50
Figure 1. Evolution of the number of organic farmers in Wallonia (1987-2012)
Figure 2. Evolution of the area (ha) devoted to organic farming in Wallonia (1987-2012)
The most important area devoted to organic farming is used for meadows
(43,000 ha), on which cattle is raised, before general crops (mainly spelt,
wheat and barley). Vegetables are not very important from the production
point of view (372 ha in 2012).
According to a survey among organic farmers [Debode, Schiepers, Burny
2013], their mean age and the size of their farms are the same as for
conventional agriculture. They are not newcomers but turned to organic
farming in order to increase their self-sufficiency for the feedstuff and to be
more independent from inputs providers. The financial support is also an
important factor to convince the farmers.
3.2. Financial support
In Wallonia, the financial support for organic farming [Service public de
Wallonie, Direction générale de l’Agriculture, des Ressources naturelles et
de l’Environnement 2013] is significant (table 1).
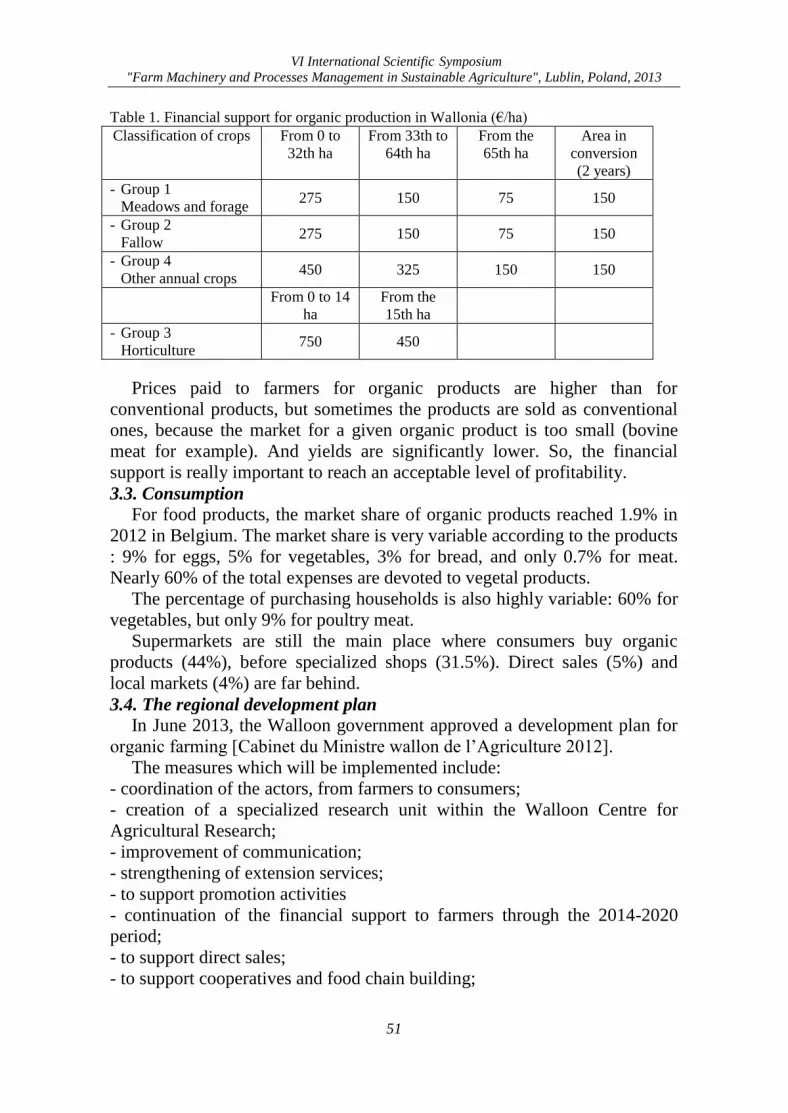
VI International Scientific Symposium
"Farm Machinery and Processes Management in Sustainable Agriculture", Lublin, Poland, 2013
51
Table 1. Financial support for organic production in Wallonia (€/ha)
Classification of crops From 0 to
32th ha
From 33th to
64th ha
From the
65th ha
Area in
conversion
(2 years)
- Group 1
Meadows and forage 275 150 75 150
- Group 2
Fallow 275 150 75 150
- Group 4
Other annual crops 450 325 150 150
From 0 to 14
ha
From the
15th ha
- Group 3
Horticulture 750 450
Prices paid to farmers for organic products are higher than for
conventional products, but sometimes the products are sold as conventional
ones, because the market for a given organic product is too small (bovine
meat for example). And yields are significantly lower. So, the financial
support is really important to reach an acceptable level of profitability.
3.3. Consumption
For food products, the market share of organic products reached 1.9% in
2012 in Belgium. The market share is very variable according to the products
: 9% for eggs, 5% for vegetables, 3% for bread, and only 0.7% for meat.
Nearly 60% of the total expenses are devoted to vegetal products.
The percentage of purchasing households is also highly variable: 60% for
vegetables, but only 9% for poultry meat.
Supermarkets are still the main place where consumers buy organic
products (44%), before specialized shops (31.5%). Direct sales (5%) and
local markets (4%) are far behind.
3.4. The regional development plan
In June 2013, the Walloon government approved a development plan for
organic farming [Cabinet du Ministre wallon de l’Agriculture 2012].
The measures which will be implemented include:
- coordination of the actors, from farmers to consumers;
- creation of a specialized research unit within the Walloon Centre for
Agricultural Research;
- improvement of communication;
- strengthening of extension services;
- to support promotion activities
- continuation of the financial support to farmers through the 2014-2020
period;
- to support direct sales;
- to support cooperatives and food chain building;
VI International Scientific Symposium
"Farm Machinery and Processes Management in Sustainable Agriculture", Lublin, Poland, 2013
52
- to build up teaching activities.
The development plan precise quantities targets for 2020:
- to reach 14% of the agricultural area
- to increase the number of organic farmers to 1,750:
- to double the number of organic products processing enterprises and so
reach 500 units;
- to increase the value of organic products sales of the processing enterprises
from 222 million € in 2009 to 500 million €;
- to increase the share of organic products in the households food expenses to
3.0%.
4. Conclusions
Organic farming has significantly developed during the last years in
Wallonia, notably thanks to the financial support from the public authorities.
In 2013, the regional government decided to even strengthen the public
support through a series of specific measures which will be implemented in
order to reach quantitative targets in 2020. The market for organic products
has increased and will probably continue to expand. So, organic farming will
probably play a more important role in Walloon agriculture, though there are
economical (prices for consumers, profitability for farmers) and technical
(lower yields, pests, etc.) limits.
5. References [1] Bioforum 2013. Le Bio en chiffres (2013)[http://www.biowallonie.be/pdf/37-
Le_Bio_en_chiffres_2012.pdf]
[2] Cabinet du Ministre wallon de l’Agriculture 2012. Note au Gouvernement wallon
relative au Plan stratégique pour le développement de l’agriculture biologique à
l’horizon 2020.
[3] Debode F., Schiepers H. et Burny Ph. 2013. La production céréalière en Wallonie. In
Livre Blanc - Céréales - Edition Février 2013, 11e Perspectives, pp. 11/2 à 11/10.
Gembloux, Belgium.
[4] Service public de Wallonie, Direction générale de l’Agriculture, des Ressources
Naturelles et de l’Environnement 2013. Statistiques sur l’agriculture biologique en
Wallonie.
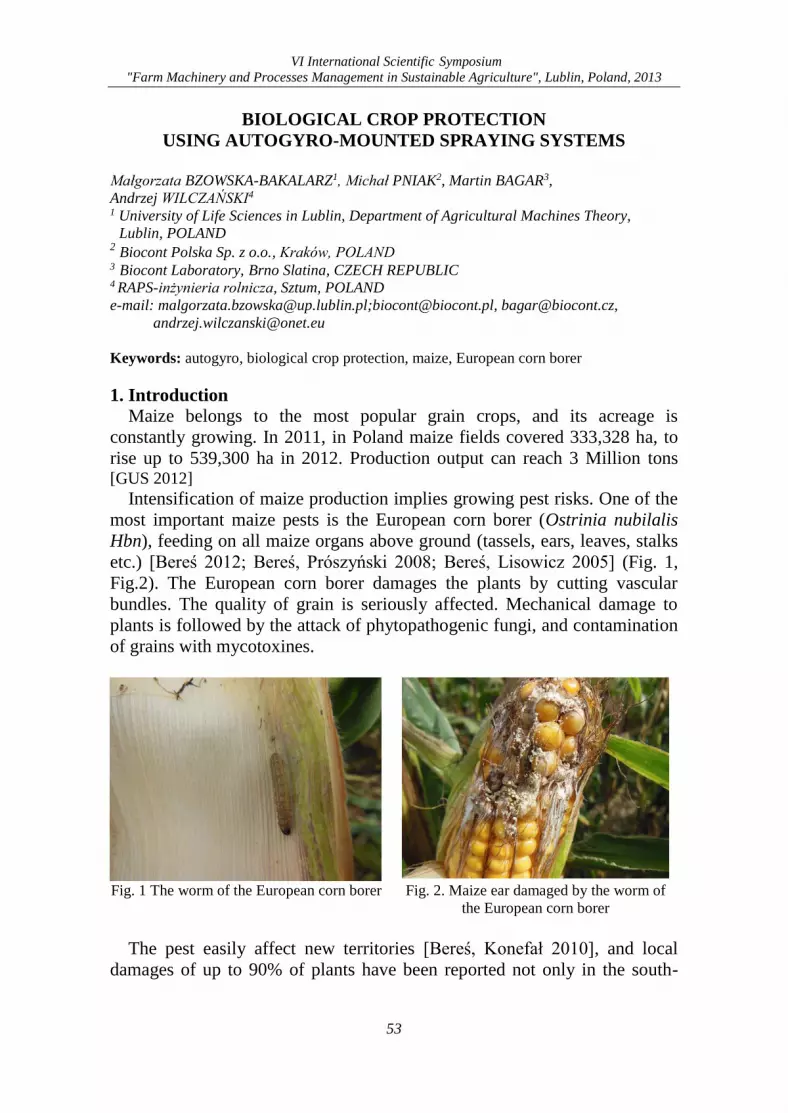
VI International Scientific Symposium
"Farm Machinery and Processes Management in Sustainable Agriculture", Lublin, Poland, 2013
53
BIOLOGICAL CROP PROTECTION
USING AUTOGYRO-MOUNTED SPRAYING SYSTEMS
Małgorzata BZOWSKA-BAKALARZ1, Michał PNIAK2, Martin BAGAR3,
Andrzej WILCZAŃSKI4
1 University of Life Sciences in Lublin, Department of Agricultural Machines Theory,
Lublin, POLAND 2 Biocont Polska Sp. z o.o., Kraków, POLAND 3 Biocont Laboratory, Brno Slatina, CZECH REPUBLIC 4 RAPS-inżynieria rolnicza, Sztum, POLAND
e-mail: [email protected];[email protected], [email protected],
Keywords: autogyro, biological crop protection, maize, European corn borer
1. Introduction
Maize belongs to the most popular grain crops, and its acreage is
constantly growing. In 2011, in Poland maize fields covered 333,328 ha, to
rise up to 539,300 ha in 2012. Production output can reach 3 Million tons [GUS 2012]
Intensification of maize production implies growing pest risks. One of the
most important maize pests is the European corn borer (Ostrinia nubilalis
Hbn), feeding on all maize organs above ground (tassels, ears, leaves, stalks
etc.) [Bereś 2012; Bereś, Prószyński 2008; Bereś, Lisowicz 2005] (Fig. 1,
Fig.2). The European corn borer damages the plants by cutting vascular
bundles. The quality of grain is seriously affected. Mechanical damage to
plants is followed by the attack of phytopathogenic fungi, and contamination
of grains with mycotoxines.
Fig. 1 The worm of the European corn borer Fig. 2. Maize ear damaged by the worm of
the European corn borer
The pest easily affect new territories [Bereś, Konefał 2010], and local
damages of up to 90% of plants have been reported not only in the south-
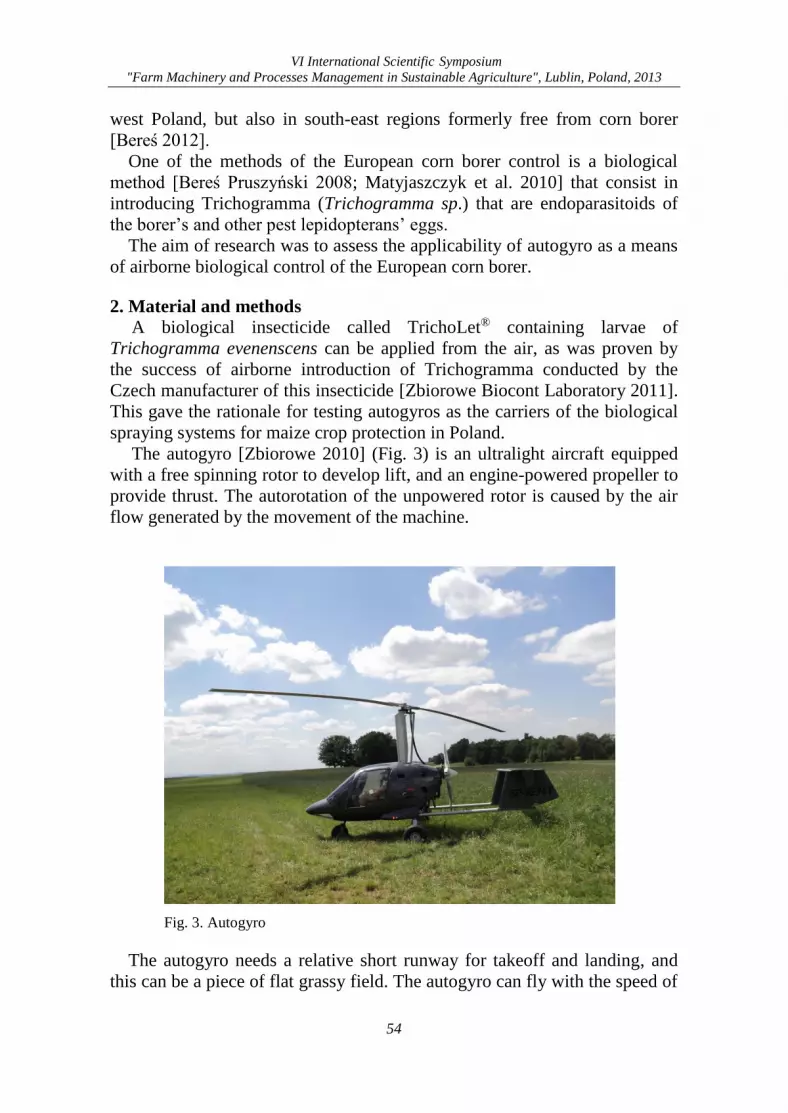
VI International Scientific Symposium
"Farm Machinery and Processes Management in Sustainable Agriculture", Lublin, Poland, 2013
54
west Poland, but also in south-east regions formerly free from corn borer
[Bereś 2012].
One of the methods of the European corn borer control is a biological
method [Bereś Pruszyński 2008; Matyjaszczyk et al. 2010] that consist in
introducing Trichogramma (Trichogramma sp.) that are endoparasitoids of
the borer’s and other pest lepidopterans’ eggs.
The aim of research was to assess the applicability of autogyro as a means
of airborne biological control of the European corn borer.
2. Material and methods
A biological insecticide called TrichoLet® containing larvae of
Trichogramma evenenscens can be applied from the air, as was proven by
the success of airborne introduction of Trichogramma conducted by the
Czech manufacturer of this insecticide [Zbiorowe Biocont Laboratory 2011].
This gave the rationale for testing autogyros as the carriers of the biological
spraying systems for maize crop protection in Poland.
The autogyro [Zbiorowe 2010] (Fig. 3) is an ultralight aircraft equipped
with a free spinning rotor to develop lift, and an engine-powered propeller to
provide thrust. The autorotation of the unpowered rotor is caused by the air
flow generated by the movement of the machine.
Fig. 3. Autogyro
The autogyro needs a relative short runway for takeoff and landing, and
this can be a piece of flat grassy field. The autogyro can fly with the speed of
VI International Scientific Symposium
"Farm Machinery and Processes Management in Sustainable Agriculture", Lublin, Poland, 2013
55
100km/h and is easily maneuverable; which is an asset if compared with the
tractor.
The tested autogyro was equipped with the insecticide applicators –
containers mounted on the ends of the boom in the distance of 7 m from each
other (Fig. 4). The applicators were filled with the larvae of Trichogramma
in parasitized eggs of moths and the vehicle substance.
To define the settings for the application (height of flight and swath width
to provide adequate distribution of the larvae), preliminary tests were
conducted above the runway: the containers filled solely with the vehicle
substance were emptied over rows 25 collector boards covered with glue.
The boards’ size was 15 by 21 cm, and they were placed on the ground in
row with 1 m spacing. The test was repeated eight times for two dosing
speeds. Additionally, there were three tests with different autogyro flight
speed, each repeated twice. The volume reaching the target and the
uniformity of distribution were estimated on the basis of the amount and
distribution of the material glued to the collector boards.
Fig.4. Autogyro equipped with Trichogramma application system
3. Results
Maize plantations are usually large, which justifies using airborne
treatments and the autogyro is an option worth considering – with its modest
needs towards runway length and quality (compared with airplanes) and ease
of operation (compared with helicopters). Due to relatively low flight speed
and maneuverability, it seems also applicable in the case of precision
treatments on small areas.
Another practical asset of the autogyro as a spraying system carrier is its
efficiency - compared with wheeled machines. For instance, a tractor with a
spraying system can treat 10 ha per hour (assuming swath width of 20 m).
VI International Scientific Symposium
"Farm Machinery and Processes Management in Sustainable Agriculture", Lublin, Poland, 2013
56
The autogyro set of the same swath width could spray about 100 ha per hour,
including the time for refueling and loading the pesticide, maneuvers over
the field, and flight to the field and back.
The flight height established during test flights was 18 m, and the optimal
flight speed was found to be 100 km/h with the efficiency of 80 ha/h. Two
containers were enough to treat 80 ha with the right amount of the pesticide.
4. Conclusions The proposed method of corn borer control, if compared to traditional
treatments, is considered an improvement as it uses a biological pesticide
instead of chemicals, and a quick and efficient application method by means
of an autogyro. The short time of application is not without meaning as this
pest appears suddenly, and its eggs hatch time is short.
5. References [1] Bereś P. 2012. Damage caused by Ostrinia nubilalis Hbn. to fodder maize (Zea mays
L.), sweet maize (Zea mays var. saccharata [Sturtev.] L.H. Bailey) and sweet sorghum
(Sorghum bicolor[L.] Moench) near Rzeszów (south-eastern Poland) in 2008-2010.
Acta Sci. Pol., Agricultura 11(3): 3-16
[2] Bereś P., Konefał T. 2010. Distribution range of the European Corn Borer (Ostrinia
Nubilalis Hbn.) on maize in 2004–2008 in Poland. Journal of Plant Protection Research
Vol. 50, No. 3: 326-334.
[3] Bereś P., Pruszyński G. 2008. Ochrona kukurydzy przed szkodnikami w produkcji
integrowanej. Acta Sci. Pol., Agricultura 7(4):19-32
[4] Bereś P., Lisowicz K. 2005. Przydatność kruszynka (Trichogramma spp) w ochronie
kukurydzy przed omacnica prosowianką (Ostrinia nubilalis) w gospodarstwach
ekologicznych. Prog. Plant Protaction.Post.Ochr, Roślin 45, 47-51.
[5] GUS 2012.
http://www.stat.gov.pl/cps/rde/xbcr/gus/nsp_psr_2012_wyn_wstepne_konf_280111.pdf
[6] Matyjaszczyk E., Tratwal A., Walczak F. 2010. Wybrane zagadnienia ochrony roślin w
rolnictwie ekologicznym i integrowanej ochronie roślin. Instytut Ochrony Roślin,
Poznań, 103 pp.
[7] Rowiński R. S. 1994. Agrolotnictwo. T.1, 2 Wyd. ART. Olsztyn
[8] Zbiorowe. 2010. Rotorcraft flying handbook. U.S. Department of Transportation
Federalaviation Administration Flight Standards Service.
http://www.pra.org/default.aspx?p=EZinePage&i=5 [access 5.09.13]
[9] Zbiorowe 2011. Materiały szkoleniowe Biocont Laboratory, Brno-Slatina, Czech
Republic

VI International Scientific Symposium
"Farm Machinery and Processes Management in Sustainable Agriculture", Lublin, Poland, 2013
57
APPLICABILITY OF EXPERIENCE FROM LABORATORY SCALE
EXPERIMENTS TO DEVELOP A MORE SUSTAINABLE VIRGIN
OLIVE OIL INDUSTRIAL PLANT
Maria Lisa CLODOVEO 1, Simone PASCUZZI 1, Giacomo SCARASCIA MUGNOZZA 1,
Riccardo AMIRANTE 2
1 University of Bari, Department of Agro-Environmental and Territorial Sciences, Bari,
ITALY 2 Polytechnic University of Bari, Department of Mechanical, Mathematical and
Management, Bari, ITALY
e-mail: [email protected]; [email protected];
[email protected]; [email protected]
Keywords: virgin olive oil extraction process, emerging technology, ultrasound, sustainable
plant engineering solutions, scale up techniques.
1. Introduction
The European Union through the “Integrated pollution prevention and
control” directive defines the obligations with which industrial and
agricultural activities with a high pollution potential must comply. The aim is
to prevent or reduce pollution of the atmosphere, water and soil, as well as
the quantities of waste arising from industrial and agricultural installations,
to ensure a high level of environmental protection. Moreover, within the last
decade, the public's demands for adequate quantities of good-quality food
and for sustainability throughout the food chains stimulated the study and
application of promising new and emerging food technologies [Clodoveo,
Hachicha, 2013]. In this scenario, ultrasound (US) is an emerging technology
that has already found application in the food industry or related sectors.
Industrial applications in the virgin olive oil extraction process (VOO) are
not still developed. At the same time, energy costs have risen considerably,
rendering a lot of conventional processes more expensive and time
consuming. The entire VOO process, which has changed very little over the
last 20 years [Clodoveo, 2013 a], is subject to strict environmental
regulations. These regulations and the changes in the VOO worldwide
market determined higher production costs in the developed countries such
as the European ones, pressing the VOO producers to improve both the
product quality and the extraction process in order to increase their incomes.
One of the essential challenges of VOO industrial plant manufacturing sector
is to design and build advanced machines in order to transform the
discontinuous malaxing step in a continuous phase and improve the working
capacity of the industrial plants [Clodoveo, Durante, La Notte, 2013]. In fact,
the current uninterrupted extraction system is not totally so structured.
Considering the current continuous extraction system, it is composed by a
series of apparatuses able to work in continuous mode [Clodoveo, 2012;

VI International Scientific Symposium
"Farm Machinery and Processes Management in Sustainable Agriculture", Lublin, Poland, 2013
58
Amirante, Catalano, 2000]. However, it is clear that the weakest link of the
chain in the VOO extraction process to perform a continuous process is the
malaxation [Amirante, Cini, Montel, Pasqualone, 2001; Clodoveo, 2013 b].
So actually, the malaxation represents the bottleneck of the continuous
extraction process. In fact, a bottleneck is a stage in a process that causes the
entire process to slow down [Clodoveo, 2012].Currently the system used to
guarantee continuity to the process, without interrupting the activity of the
machines upstream and downstream of the malaxer, consists in placing
several malaxing machines in parallel, with an heavy economic investment.
Oil mills not equipped with plural malaxers arranged in parallel actually
operate discontinuously and do not fully exploit the working capacity of the
metal crusher and of the decanter. One of the crucial factors causing such
lengthy malaxing times is the time period needed for the freshly crushed
olive paste to reach the process temperature (27-32°C). This period has a
length on average equal to at least one-third of the total malaxing time, as the
olive paste outlet from the crusher may have temperatures comprised
between 18 and 26°C, depending on the temperature of the working
environment and the type of crusher employed [Amirante, Cini, Montel,
Pasqualone, 2001; Clodoveo, 2012]. The malaxer is a heat exchanger
characterized by a low overall heat transfer coefficient [Clodoveo, 2012]
because the ratio (r) between machine surface area (S) and its volume (V) is
very disadvantageous (r = S/V). So, it is important to find an innovative
technology able to improve heat-exchange reducing the duration of this batch
process and the investment costs due to the numerous malaxers usually
placed in parallel. Recent researches at laboratory scale demonstrated that
US is an emerging technology able to increase the environmental
sustainability, improving VOO extraction yields and quality. US are
characterized by thermal and mechanical effects: The mechanical effect of
ultrasounds is mainly due to cavitation phenomena [Clodoveo, 2013 b].
Cavitation phenomenon is the formation, growth and implosion of gas
bubbles at high negative pressure, which promotes the release of minor
compounds from the plant tissue by disrupting the cells. The thermal effect
of ultrasound occurs as kinetic energy from the ultrasound waves is absorbed
by a medium. Absorption is a mechanism that represents that portion of
ultrasonic wave that is converted into heat. During malaxation, the
conventional heating method required about 25 minutes to warm up the olive
paste until the process temperature. Instead, US treatment (35 kHz–150 W)
reduced the pre-heating time until about 10 minutes [Clodoveo, Durante, La
Notte, Punzi, Gambacorta, 2013]. This result demonstrated that US is a time
saving technology. US reduced significantly the pre-heating stage of the
malaxation: the industrial application of this technology could represent the
first step toward a continuous malaxing phase. However before developing
VI International Scientific Symposium
"Farm Machinery and Processes Management in Sustainable Agriculture", Lublin, Poland, 2013
59
an innovative device we should consider the effects of the merging
technology on the product quality and on the process sustainability.
Analytical data [Clodoveo, Durante, La Notte, Punzi, Gambacorta, 2013]
demonstrated that the main parameters legally established (acidity, peroxide
value, and specific extinction coefficients (K232 and K270)) to evaluate VOO
quality were not affected by the US treatment. Moreover, as previously
mentioned, cavitation phenomena are responsible for the disruption of cell
tissues releasing minor compounds. In fact the increasing of sonication time
determined the increment of tocopherols, carotenoids and chlorophylls. The
mechanical effect on olive paste is clear also observing the oil yields that
improved as sonication time increased. The present paper analyses the
strategy to develop an industrial and industrial plant starting from the
laboratory scale experiment. The reduction of the duration of malaxation
could be the first step towards the development of a sustainable and
continuous process. In fact, over the advantages that could arise from a
continuous process, it is important underline that the US technology of the
process is characterized by a high energetic efficiency. So, the aim of this
paper is to propose a series of technical ideas to design an innovative device
placeable in an already existent VOO extraction plant, in order to increase
the performance of the industrial plant, increasing the quality and the
quantity of VOO guaranteeing a higher sustainability of the process.
Moreover a swot analysis will be developed in order to stimulate the VOO
plant manufacture sector to invest time and money in the scaling up of the
tested technology. Some principles that should be considered during the
design project to build a prototype of the innovative plant are also suggested.
In the next future, it would be of great interest to assess the effects of the
ultrasound technology in a full scale VOO extraction process. The aim of
this study is to objectively and rationally uncover the strengths and
weaknesses of the application of US in the VOO extraction process,
opportunities and threats present in the environment, the resources required
to carry through, and ultimately the prospects for success. The two criteria
applied to judge feasibility are cost required and value to be attained.
2. Material and methods
SWOT analysis
Lozano and Valles [2007] state that “SWOT analysis” is widely
recognized and it constitutes an important basis for learning about the
situation and for designing future procedures which can be seen necessary
for thinking in a strategic way. This useful method is very simple and
everybody can use it without having advanced knowledge or external
technical support. This study draws information from the previous research
activity and from the information collected interviewing the managers of the

VI International Scientific Symposium
"Farm Machinery and Processes Management in Sustainable Agriculture", Lublin, Poland, 2013
60
five main VOO industrial plant manufacturers in order to evaluate the
commercial appeal of the new product. This method identifies the strengths,
weaknesses, opportunities and threats of the introduction of an innovation in
a well-known process. Firstly, the strengths of an innovation may be the
advantages and the benefits arising from a new choice. Secondly, the
weaknesses of the innovation could be obstacles that should be avoided in
order for the innovation can respond sufficiently to designed goals. Thirdly,
it seeks to identify the opportunities associated with the introduction of the
innovation and finally, the method detects the threats that will be faced by
the implemented plan from external factors.
3. Results
Is it easy to scale-up this technology? Ultrasonic liquid processing can be described by the following parameters:
pressure, temperature, viscosity, concentration of solids and US signal
waveform [Patist, Bates, 2008]. The result, or outcome, (e.g., percentage
improved extraction yield and/or rate) is a function of:
1) specific energy, the energy input per volume treated material (in
kWh/m3);
2) power intensity - the actual power output per surface area of the US probe
(in W/cm2),
where, the specific energy input is the product of power output (here
measured in kW) and the time of exposure (here measured in hours). Both
specific energy and power intensity are independent of scale and thus any
ultrasonic process will be scalable using these two parameters.
Figure 1. Hypothesis for the US technology scaling up in a VOO industrial plant.
VI International Scientific Symposium
"Farm Machinery and Processes Management in Sustainable Agriculture", Lublin, Poland, 2013
61
At the light of this observation that ultrasound is an easy scalable
technology, the full scale innovative ultrasound equipment for the VOO
extraction plant should guarantee:
- high work capacity;
- high energetic efficiency and high oil yield;
- low costs;
- easy adjustability;
- sustainability.
These conditions seem to be well satisfactory by the US technology.
The scaling up of this technology can be realized following to hypothesis:
retrofitting the existing malaxer introducing an ultrasound probe or
developing a new ultrasound device placeable between the crusher and the
malaxer [Clodoveo, 2013 b]. The new ultrasound device (Fig. 1) could be an
ultrasonic reactor that consists of a holding tank and a sonotrode (US probe).
In order to reduce the duration of sonication treatment it is also possible to
combine a heat exchanger with the ultrasonic reactor [Clodoveo, Durante, La
Notte, 2013; Clodoveo, 2013 a]. The heat exchanger can give rise to the
faster attainment of the malaxation temperature. Ultrasound can enhance the
effects of the heat exchanger by inducing acoustic cavitation, acoustic
streaming, and fluid particles oscillations that are responsible for improving
heat transfer [Legay, Gondrexon, Le Person, Boldo, Bontemps, 2011].
Figure 2. Sectional view of an innovative ultrasonic heat exchanger named “sono-
exchanger”, consisting of concentric tubes coupled with an US probe.
The sono-exchanger can consist of same concentric tubes (Fig. 2). The olive
paste can flows in between two service channels, and is heated from the
inside and outside at the same time. This heat exchanger can be coupled with
a ultrasonic probe to treat the olive paste.
Is it convenient to scale-up this technology?
The opportunity to scale up the US in the VOO process is described using
the SWOT analysis as reported in table 1.
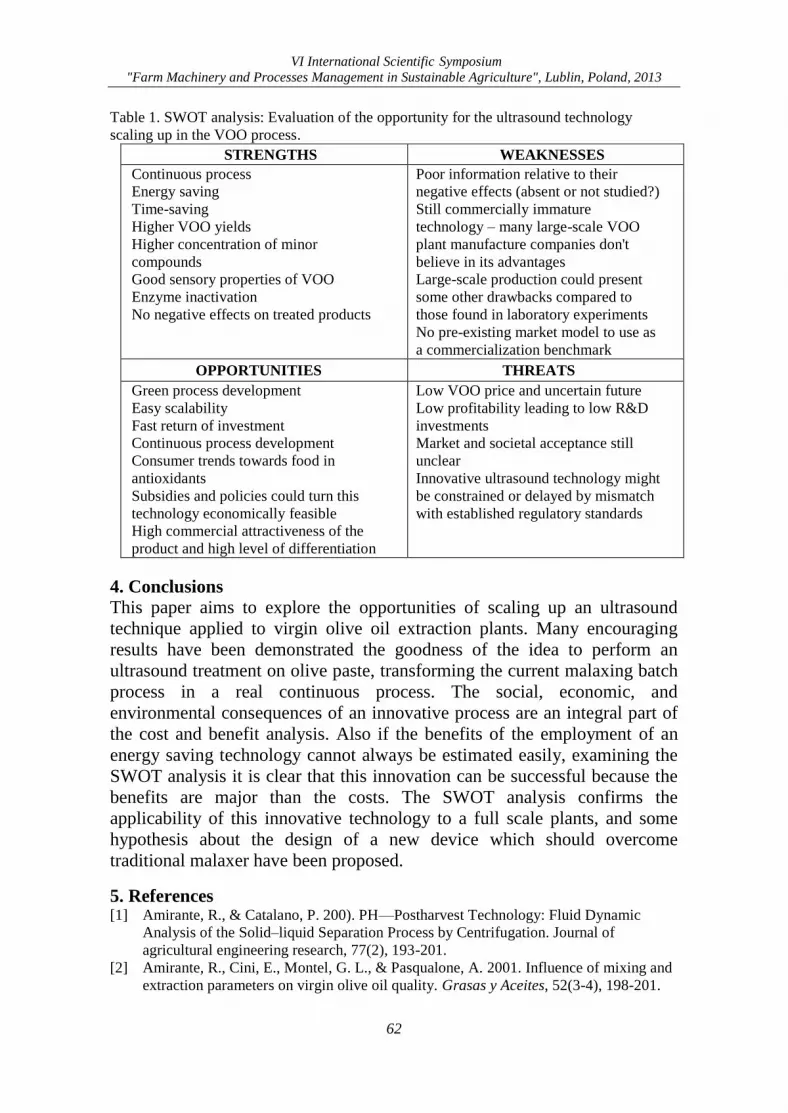
VI International Scientific Symposium
"Farm Machinery and Processes Management in Sustainable Agriculture", Lublin, Poland, 2013
62
Table 1. SWOT analysis: Evaluation of the opportunity for the ultrasound technology
scaling up in the VOO process.
STRENGTHS WEAKNESSES
Continuous process
Energy saving
Time-saving
Higher VOO yields
Higher concentration of minor
compounds
Good sensory properties of VOO
Enzyme inactivation
No negative effects on treated products
Poor information relative to their
negative effects (absent or not studied?)
Still commercially immature
technology – many large-scale VOO
plant manufacture companies don't
believe in its advantages
Large-scale production could present
some other drawbacks compared to
those found in laboratory experiments
No pre-existing market model to use as
a commercialization benchmark
OPPORTUNITIES THREATS
Green process development
Easy scalability
Fast return of investment
Continuous process development
Consumer trends towards food in
antioxidants
Subsidies and policies could turn this
technology economically feasible
High commercial attractiveness of the
product and high level of differentiation
Low VOO price and uncertain future
Low profitability leading to low R&D
investments
Market and societal acceptance still
unclear
Innovative ultrasound technology might
be constrained or delayed by mismatch
with established regulatory standards
4. Conclusions
This paper aims to explore the opportunities of scaling up an ultrasound
technique applied to virgin olive oil extraction plants. Many encouraging
results have been demonstrated the goodness of the idea to perform an
ultrasound treatment on olive paste, transforming the current malaxing batch
process in a real continuous process. The social, economic, and
environmental consequences of an innovative process are an integral part of
the cost and benefit analysis. Also if the benefits of the employment of an
energy saving technology cannot always be estimated easily, examining the
SWOT analysis it is clear that this innovation can be successful because the
benefits are major than the costs. The SWOT analysis confirms the
applicability of this innovative technology to a full scale plants, and some
hypothesis about the design of a new device which should overcome
traditional malaxer have been proposed.
5. References [1] Amirante, R., & Catalano, P. 200). PH—Postharvest Technology: Fluid Dynamic
Analysis of the Solid–liquid Separation Process by Centrifugation. Journal of
agricultural engineering research, 77(2), 193-201.
[2] Amirante, R., Cini, E., Montel, G. L., & Pasqualone, A. 2001. Influence of mixing and
extraction parameters on virgin olive oil quality. Grasas y Aceites, 52(3-4), 198-201.
VI International Scientific Symposium
"Farm Machinery and Processes Management in Sustainable Agriculture", Lublin, Poland, 2013
63
[3] Clodoveo M.L. 2013a. New advances in the development of innovative virgin olive oil
extraction plants: looking back to see the future. Food Research International. 54(1),
726-729.
[4] Clodoveo M.L., Durante V., La Notte D. 2013. Working towards the development of
innovative ultrasound equipment for the extraction of virgin olive oil. Ultrasonics
Sonochemistry, 20 (5) ,. 1261-1270.
[5] Clodoveo M.L., Durante, V., La Notte, D., Punzi, R. & Gambacorta, G. 2013.
Ultrasound-assisted extraction of virgin olive oil to improve the process efficiency.
European Journal of Lipid Science and Technology. 115 (9) , pp. 1062-1069.
[6] Clodoveo ML. 2012. Malaxation: influence on virgin olive oil quality. Past, present
and future – an overview. Trends In Food Science & Technology,. 25,. 13-23.
[7] Clodoveo ML, Hachicha R. 2013.Beyond the traditional virgin olive oil extraction
systems: earching innovative and sustainable plant engineering solutions. Food
Research International. DOI: 10.1016/j.foodres.2013.06.014.
[8] Clodoveo, M.L. 2013b. An overview of emerging techniques in virgin olive oil
extraction process: Strategies in the development of innovative plants. Proceedings of
10th AIIA Conference: “AIIA13—Horizons in agricultural, forestry and biosystems
engineering.. Viterbo, Settembre 2013. Journal of Agricultural Engineering. vol. XLIV,
297-305.
[9] Legay, M., Gondrexon, N., Le Person, S., Boldo, P., & Bontemps, A. 2011.
Enhancement of heat transfer by ultrasound: review and recent advances. International journal of Chemical Engineering Volume 2011, Article ID 670108, 17 pages http://dx.doi.org/10.1155/2011/670108.
[10] Lozano, M., & Vallés, J. 2007. An analysis of the implementation of an environmental
management system in a local public administration. Journal of environmental
management, 82(4), 495-511.
[11] Patist, A., & Bates, D. 2008. Ultrasonic innovations in the food industry: from the
laboratory to commercial production. Innovative food science & emerging
technologies, 9(2), 147-154.

VI International Scientific Symposium
"Farm Machinery and Processes Management in Sustainable Agriculture", Lublin, Poland, 2013
64
VI International Scientific Symposium
"Farm Machinery and Processes Management in Sustainable Agriculture", Lublin, Poland, 2013
65
INFLUENCE OF AGROECOLOGICAL FACTORS ON THE
BIOLOGICAL VALUE OF SELECTED VEGETABLE SPECIES
Renata CZECZKO
University of Life Sciences in Lublin, Department of Chemistry, Lublin, POLAND
e-mail: [email protected]
Keywords: vegetable, agronomic factors
1. Introduction
Agronomic factors, environmental conditions and genetic features of
species affect the structure and yields of vegetable crops as well as their
biological value. One of the key factors influencing the amount and quality
of the crop is a soil, its type, acidity, and richness in macro-and
micronutrients. The production of vegetables should be located on soils of
high microbial culture. Temperature and precipitation during the growing
season are the climatic factors, the variability of which has the greatest
impact on yield of vegetables and their biological quality. For the growth of
a plant, the proper temperatures at certain stages of its development are also
required [Poniedziałek, Stokowski 1997]. Important issues in the cultivation
of vegetables are pests and diseases. When they are not controlled they
destroy on average 30% of vegetable crops and impair their quality. Plants
infected by pathogens and pests contain substances harmful to the health
especially mycotoxins secreted by fungi. A proper protection of plants can
significantly improve the biological value of crops. Intensive research on the
protection of vegetables is carried out [Mrówczyński, Wachowiak 2006].
Another problem is the contamination of soils. In industrial areas elevated
concentrations of heavy metals, mostly zinc, copper, iron, lead and cadmium,
have been observed. Heavy metal concentrations exceeding their permissible
limits are found in vegetables coming from crops located near the emitters of
these metals. Heavy metals present at excessive concentrations in the
nutrient medium have destructive impact on plant organisms at various
levels. Water stress caused by an excess of metals is the beginning of all
other abnormalities observed in plant physiological processes and
metabolism. Water stress and hence reduced transpiration may indirectly
affect the photosynthesis by reducing the level of CO2, which is available for
this process. Plant photosynthetic system is particularly sensitive to heavy
metals. The light is one of the most important environmental factors
determining the processes of morphogenesis and influencing the crop yield
and quality. It affects both the plant growth and photosynthesis process. The
reduction in light intensity causes the etiolation of shoots, weak or lack of
flowering, which consequently leads to the decrease in crop yield. The
amount and intensity of the light at the end of the ripening period has a
VI International Scientific Symposium
"Farm Machinery and Processes Management in Sustainable Agriculture", Lublin, Poland, 2013
66
considerable effect on the content of ascorbic acid. The cultivation of
vegetables creates a need for continuous enrichment of the soil with micro
and macroelements [Ociepa-Kubicka, Ociepa 2012; Sady, Smoleń 2004].
Their availability determines the yield and quality of crops, is responsible for
vegetable health and resistance to pests and diseases, and their normal
development. Nitrogen fertilization induces an increase in nitrate
concentration, and consequently an increase in the content of very harmful
nitrite in vegetables. However, this effect is clearly dependent on the species
and harvest time. Increased doses of nitrogen fertilizer reduce the level of
vitamin C in potato tubers. At extremely high doses of nitrogen (200 kg N /
ha) the decrease in vitamin C content by 30 % in the comparison to the
control tubers is observed. High doses of potassium may also reduce the
vitamin C content. Phosphorus fertilizer does not affect ascorbic acid level.
Of all nutrients plants take the largest quantities of potassium. It plays three
main functions in the plant: it regulates water balance, is an activator of more
than 60 enzymatic reactions and increases the resistance of plants to various
abiotic and biotic stresses. Potassium deficiency leads to the increase in the
content of nitrogen, calcium and magnesium, and potassium excess results in
phosphorus content increase and significant reduction of the content of
calcium and magnesium. Potassium ions play a balancing role in the
transport of NO3- ions, and activate protein synthesis. In the absence of
potassium simple nitrogen compounds, including toxic nitrosamines,
accumulate in plants [Rożek 2000].
2. Conclusions
The content of macro- and micronutrients is dependent on the amount of
rainfall, soil conditions, applied agricultural technology and plant variety.
3. References [1] Mrówczyński M., Wachowiak H., Pruszyński G. 2006. Zagrożenie upraw rolniczych
przez szkodniki glebowe. Prog. Plant Protection/Post. Ochr. Roślin 46 (1): 300–304.
[2] Ociepa-Kubicka A., Ociepa E. 2012. Toksyczne oddziaływanie metali ciężkich na
rośliny zwierzęta i ludzi. Inżynieria i Ochrona Środowiska. T 12, nr 2, p. 169-180.
[3] Poniedziałek M., Stokowski E. 1997. Przyrodnicze i techniczne możliwości
doskonalenia produkcji polowej warzyw. Materiały Konferencji Warzywniczej, ART.
Olsztyn
[4] Rożek S. 2000. Czynniki wpływające na akumulacje azotanów w plonie warzyw.
Zeszyty Naukowe Akademii Rolniczej w Krakowie, 364, (71), 19-31.
[5] Sady W., Smoleń S. 2004. Wpływ czynników glebowo-nawozowych na akumulację
metali ciężkich w roślinach. Roczniki Akademii Rolniczej w Poznaniu, Ogrodnictwo,
XXXCLVI, (37), 269-277.
VI International Scientific Symposium
"Farm Machinery and Processes Management in Sustainable Agriculture", Lublin, Poland, 2013
67
THE COMPARISON OF THE NOZZLE INSPECTION METHODS:
NOZZLE FLOW VS. SPRAY TRANSVERSE DISTRIBUTION -
THE METHODOLOGY AND THE FIRST RESULTS Artur GODYŃ, Ryszard HOŁOWNICKI, Grzegorz DORUCHOWSKI,
Waldemar ŚWIECHOWSKI
Research Institute of Horticulture, Skierniewice, POLAND
e-mail: [email protected]; [email protected];
[email protected]; [email protected]
Keywords: nozzle inspection, nozzle flow, transverse distribution, methodology
1. Introduction
Polish national procedure for the inspection of field crop sprayers in use
allows two methods of evaluation of the nozzles working during the
inspection of the field crop sprayers. Only three countries (Poland, Portugal
and Sweden) use both methods (measurement of nozzle flow and transverse
distribution) [Wehmann 2012]. Measuring only nozzle flow is carried out in
four countries, and in the majority of countries only measurements of the
transverse distribution of the spray are carried out, with the coefficient of
variation CV% as a measure of accuracy.
The comparison of the nozzle inspection methods have not been carried
out in a direct way. Therefore, it is not known which of these methods is
more rigorous, and if both methods could achieve the same results. In order
to compare the stringency and time-consuming of both inspection methods,
the methodology of comparative tests have been elaborated.
2. Materials and methods
The elaborated methodology [Godyń 2013] describes how to compare and
criteria for the evaluation of methods of inspection nozzles in field crop
sprayers.
In all studies, three types of Lechler nozzles were used (utilized before for
less than one hour) flat fan standard (LU 120-03) at 3 bar, flat fan air-injector
(ID 120-03) and Twin flat spray air-injector compact nozzles (IDKT 120-03)
at 4.5 bar. During the tests the electronic spray patternator SPRAYER TEST
1000 (PESSL Instruments, Austria) have been used. The trials on the groove
patternator (STABEN - “mechanical”) are planned to be done soon. The
nozzle flow has been measured by SCHACHTNER (set of 20 scaled burets
of nominal capacity 2000 ml and accuracy 20 ml) and ball flow-meter
LURMARK.
For each of the method the time of removing and assembling nozzles or
changing positions of nozzle bodies was measured and assumed as a
common time for further calculations. For each of the evaluated method the

VI International Scientific Symposium
"Farm Machinery and Processes Management in Sustainable Agriculture", Lublin, Poland, 2013
68
time of each action was measured and the results of the study during the test
were noted (CV%, mean nozzle flow rate, the number of the burets with 15%
deviation from the mean and each nozzle flow rate). The gathered data
allows the calculation of average time of the inspection of one nozzle
depending on the type of the nozzle and the method used as well as binary
and linear assessment of the test result.
The binary assessment expressed if the sprayer/nozzle inspection would be
passed or not. The linear assessment expressed a percentage of fulfill the
inspection criteria (e.g. CV% or the maximum deviation from the nominal
value of nozzle flow rate).
Example: For limit value of CV% or flow rate deviation = 10% (linear
assessment = 100%):
- if measured CV% / deviation = 5% - the binary assessment is 1
(passed), the linear assessment is 50%
- if measured CV% / deviation = 15% – the binary assessment is 0 (not
passed / failed), linear assessment is 150%.
The comparison of the means for the linear assessments obtained for each
nozzle type or inspection method answers whether the compared methods are
equally "rigorous".
The repeatability of measurements was evaluated using the coefficient of
variation for repetitions and by the statistical analysis (the “weight” of the
factor "Repetition").
3. Results
The measurements of the transverse distribution uniformity were done by
means of the electronic patternator SPRAYER TEST 1000 for the field crop
sprayer Krukowiak with the 12 m long boom. The most uneven transverse
distribution of the spray was measured for standard nozzles LU-120-03
(mean binary assessment = 0, all repetition failed; mean linear assessment =
104.55%) and the most equal for the air-injector ID-120-03 nozzles (binary =
1; linear = 64.08%). The CV% value for the first repetition of the IDKT
nozzles (10.74%) clearly differed from three others (< 8.8%), therefore
binary assessment achieved 0.75 (one failed) and linear one = 92.00%. A
possible reason for such a difference was elimination of the spraying on to
the spray line by one of the nozzles, noticed after the first measurement.
The average time of a single measurement (one position of a scanner) for
standard nozzles was 36.5 seconds in comparison to 32.6 seconds for the air-
injector nozzles. The mean test time of a single nozzle depended on the flow
rate of the nozzle and the flow was pressure dependent. In this study, the 3.0
bar pressure was used for the standard and 4.5 bar for the air-injector nozzles
(acc. to the Regulation of Ministry of Agriculture concerning sprayers
inspection).
VI International Scientific Symposium
"Farm Machinery and Processes Management in Sustainable Agriculture", Lublin, Poland, 2013
69
Average time of the assembling one nozzle was 29.06, 12.53 for
disassembling and 1.53 seconds for rotating a nozzle body. The results of
measurements will be used to simulate full inspection time for the method
with all nozzles removed from the boom and/or for booms longer than 12 m
or equipped with more than one set of the nozzles.
4. Conclusions
When the study will be finished it will be possible to answer which
inspection method is more time-consuming or more restrictive. Preliminary
analysis of the data obtained for a single measurement method shows the
significance of a nozzle type in the final assessment of the evaluated method.
Research goes on.
5. References [1] Godyń A. 2013. Metodyka - badania porównawcze okresowej oceny rozpylaczy za
pomocą pomiaru natężenia wypływu cieczy z pojedynczych rozpylaczy i pomiaru
rozkładu poprzecznego. Opracowanie w ramach realizacji Programu Wieloletniego
Instytutu Ogrodnictwa na lata 2008-2014.
http://www.inhort.pl/files/program_wieloletni/wykaz_publikacji/obszar1/Metodyka%20
ocena%20rozpylaczy.pdf (accessed 16 October 2013)
[2] Wehmann H.-J. 2012. Survey on the actions of the MS to implement the inspection
system of sprayers concerning the EU Directive 2009/128/EC. Fourth European
Workshop on Standarized Procedure for the Inspection of Sprayers in Europe – SPISE
4, 27 to 29 March 2012 – Lana (Italy).
http://spise.jki.bund.de/dokumente/upload/fadd6_09_wehmann_.pdf (accessed 16
October 2013)
Acknowledgements This work was performed in the frame of Multi-annual Programme "Development of
sustainable methods of horticultural production to ensure high biological and nutritional
quality of horticultural products and to preserve the biodiversity of the environment and to
protect its resources", financed by the Polish Ministry of Agriculture and Rural
Development.

VI International Scientific Symposium
"Farm Machinery and Processes Management in Sustainable Agriculture", Lublin, Poland, 2013
70
VI International Scientific Symposium
"Farm Machinery and Processes Management in Sustainable Agriculture", Lublin, Poland, 2013
71
TENSILE AND IMPACT PROPERTIES OF THIN FILM
MADE FROM THERMOPLASTIC STARCH
Krzysztof GOŁACKI1, Bożena GŁADYSZEWSKA2, Paweł KOŁODZIEJ1,
Zbigniew STROPEK1 1 University of Life Sciences in Lublin, Department of Mechanical Engineering and
Automatic Control, Lublin, POLAND 2 University of Life Sciences in Lublin, Department of Physics, Lublin, POLAND
Keywords: thermoplastic starch, tension, impact properties
1. Introduction
The serious environment pollution due to the usage of packaging
materials encourages producers to look for environmental friendly solutions.
Most of researches are focused on oil substitute – based plastics by
biodegradable materials. Starch is completely biodegradable in soil and
water. It is also very cheap and possible to extract from many natural sources
like potatoes, corn, rice or rye.
The thermoplastic starch is obtained after disruption of crystal structure of
macromolecules by using high temperature and pressure [1].
These features testified that starch is one of the most promising raw materials
for production of elastic and rigid packaging.
In order to use this material, it must meet the requirements of clients and
producers with regards to static, dynamic, creep and stress relaxation
strengths and other material properties.
Starch can be processed to mouldable thermoplastic form at high
temperatures under shearing force loading. During processing the
semicristaline structure is lost and molecules partly depolymerized. To
improve elasticity and other mechanical properties, some cold plasticizers,
like glycerol, alcohol, glucose and others, could be add during processing
[2]. The aim of this work is to study different thin film strength parameters
obtained from tensile and impact test.
2. Material and methods
Thermoplastic starch foils were prepared by the extrusion method with the
film by blowing method from starch granulates. The main component of
starch granulate was potato starch mixed with glycerol. It was done by the
extrusion cooking process. Additionally, two kinds of additives were used:
polyvinyl alcohol and keratin. Four different extruder screw rotation, ranging
from 40 rpm to 70 rpm, were used. Samples were stored for two days in
room at solar light, temperature 21o C and three values of relative air
humidity: 55%, 91% and 99%. Fresh and stored samples were tested under
tensile and impact loading conditions.
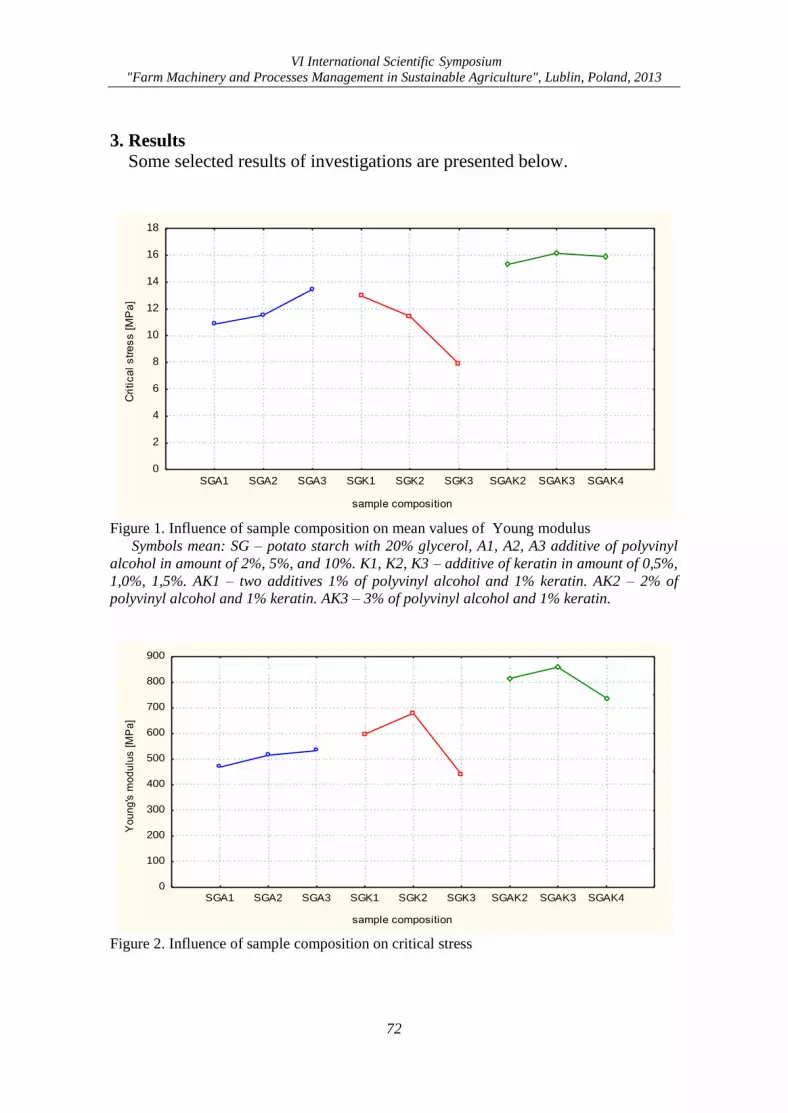
VI International Scientific Symposium
"Farm Machinery and Processes Management in Sustainable Agriculture", Lublin, Poland, 2013
72
3. Results
Some selected results of investigations are presented below.
sample composition
Cri
tic
al
str
es
s [
MP
a]
0
2
4
6
8
10
12
14
16
18
SGA1 SGA2 SGA3 SGK1 SGK2 SGK3 SGAK2 SGAK3 SGAK4
Figure 1. Influence of sample composition on mean values of Young modulus
Symbols mean: SG – potato starch with 20% glycerol, A1, A2, A3 additive of polyvinyl
alcohol in amount of 2%, 5%, and 10%. K1, K2, K3 – additive of keratin in amount of 0,5%,
1,0%, 1,5%. AK1 – two additives 1% of polyvinyl alcohol and 1% keratin. AK2 – 2% of
polyvinyl alcohol and 1% keratin. AK3 – 3% of polyvinyl alcohol and 1% keratin.
sample composition
Yo
un
g's
mo
du
lus
[M
Pa
]
0
100
200
300
400
500
600
700
800
900
SGA1 SGA2 SGA3 SGK1 SGK2 SGK3 SGAK2 SGAK3 SGAK4
Figure 2. Influence of sample composition on critical stress
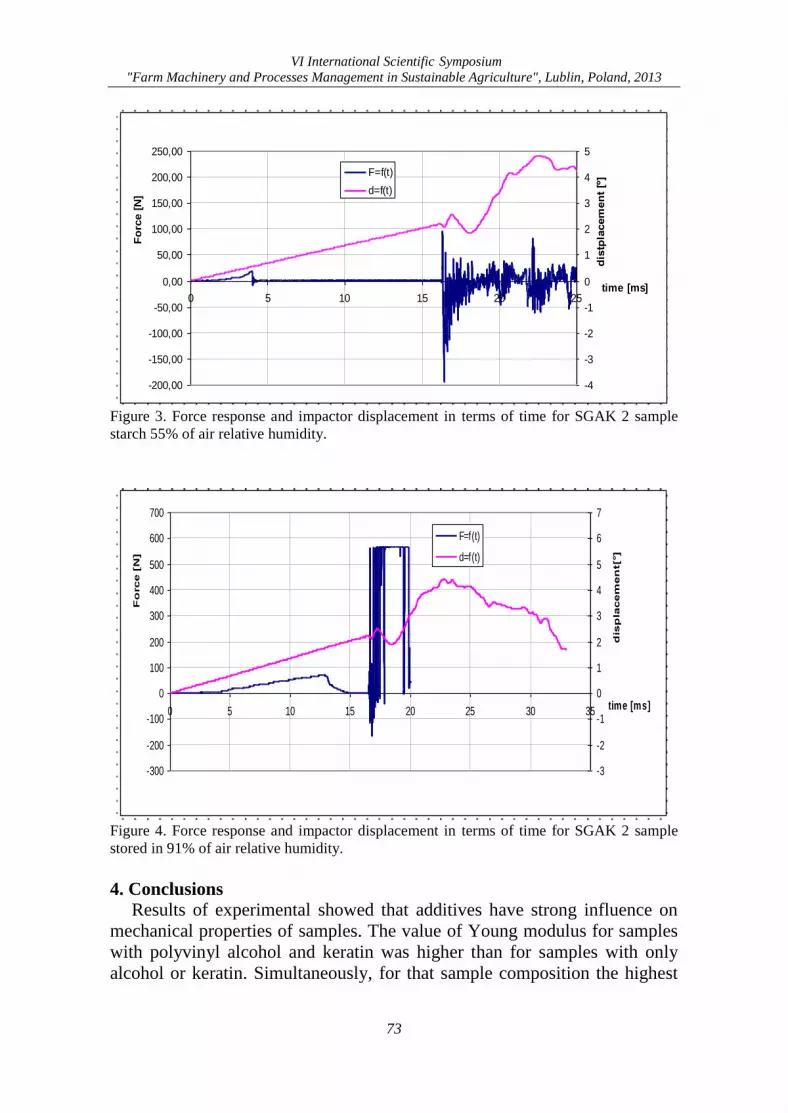
VI International Scientific Symposium
"Farm Machinery and Processes Management in Sustainable Agriculture", Lublin, Poland, 2013
73
-200,00
-150,00
-100,00
-50,00
0,00
50,00
100,00
150,00
200,00
250,00
0 5 10 15 20 25
Fo
rce [
N]
-4
-3
-2
-1
0
1
2
3
4
5
time [ms]
dis
tpla
cem
en
t [º
]F=f(t)
d=f(t)
Figure 3. Force response and impactor displacement in terms of time for SGAK 2 sample
starch 55% of air relative humidity.
-300
-200
-100
0
100
200
300
400
500
600
700
0 5 10 15 20 25 30 35 time [ms]
Fo
rce [
N]
-3
-2
-1
0
1
2
3
4
5
6
7
dis
pla
cem
en
t[°]
F=f(t)
d=f(t)
Figure 4. Force response and impactor displacement in terms of time for SGAK 2 sample
stored in 91% of air relative humidity.
4. Conclusions
Results of experimental showed that additives have strong influence on
mechanical properties of samples. The value of Young modulus for samples
with polyvinyl alcohol and keratin was higher than for samples with only
alcohol or keratin. Simultaneously, for that sample composition the highest
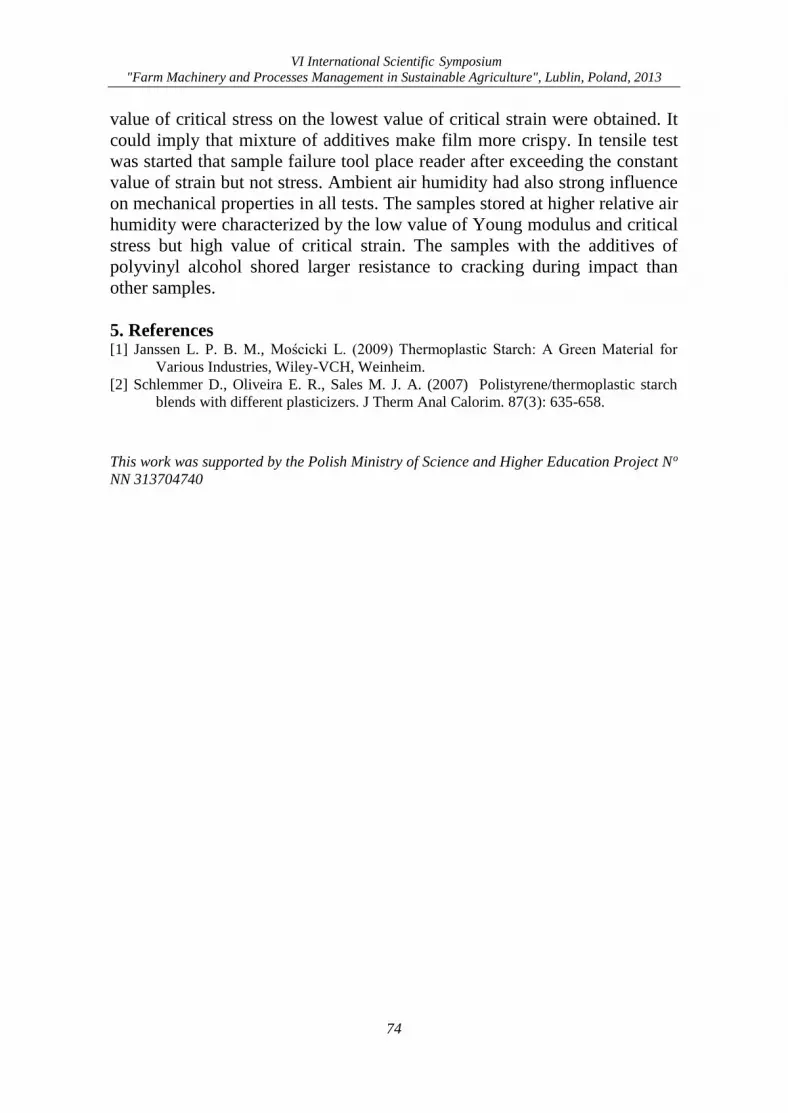
VI International Scientific Symposium
"Farm Machinery and Processes Management in Sustainable Agriculture", Lublin, Poland, 2013
74
value of critical stress on the lowest value of critical strain were obtained. It
could imply that mixture of additives make film more crispy. In tensile test
was started that sample failure tool place reader after exceeding the constant
value of strain but not stress. Ambient air humidity had also strong influence
on mechanical properties in all tests. The samples stored at higher relative air
humidity were characterized by the low value of Young modulus and critical
stress but high value of critical strain. The samples with the additives of
polyvinyl alcohol shored larger resistance to cracking during impact than
other samples.
5. References [1] Janssen L. P. B. M., Mościcki L. (2009) Thermoplastic Starch: A Green Material for
Various Industries, Wiley-VCH, Weinheim.
[2] Schlemmer D., Oliveira E. R., Sales M. J. A. (2007) Polistyrene/thermoplastic starch
blends with different plasticizers. J Therm Anal Calorim. 87(3): 635-658.
This work was supported by the Polish Ministry of Science and Higher Education Project No
NN 313704740
VI International Scientific Symposium
"Farm Machinery and Processes Management in Sustainable Agriculture", Lublin, Poland, 2013
75
ANALYSIS OF STUDENTS’ MOTIVATION AND PREDISPOSITION
FOR INTRODUCING INFORMATION TECHNOLOGY TOOLS
FOR TEACHING MATERIALS SCIENCE
Jerzy GRUDZIŃSKI, Monika GRUSZECKA
University of Life Sciences in Lublin, Department of Fundamentals of Technology, Lublin,
POLAND
e-mail: [email protected]; monika.gruszecka@ up.lublin.pl
Keywords: materials teaching, educational software, CES EduPack
1. Introduction
The phenomenon of systematic worsening of learning outcomes of
Materials Science among students of Agricultural and Forestry Engineering,
Management and Production Engineering, Transport, Environmental
Engineering and Safety Engineering at the University of Life Sciences in
Lublin, became the motivation to implement the computer methods in
materials selection. The best educational software applied to different levels
of education is Cambridge Engineering Selector - CES EduPack developed
at the University of Cambridge. Previous studies on the use of IT by students
of Agriculture show their good IT skills and widespread use to search for
information on the internet [Lorencowicz, Kocira 2009, 2010, 2012],
[Sołowiej, Nalepa, Neugebauer 2007]. Teachers doubt about the computer
skills of students and their knowledge of English.
2. Material and methods
The purpose of the analysis was to check the motivation and
predispositions of students for learning Materials Science with application of
computer software in English. Surveys were carried out in a group of 221
students of Agricultural and Forestry Engineering, Management and
Production Engineering, Transport, Environment Engineering and Safety
Engineering at the University of Life Sciences in Lublin. The survey
included 17 questions about the level of English, computer skills, motivation
to learn Materials Engineering, use of IT in the classroom, access to
computer at home and personal questions.
3. Results
The analysis shows that 56% of the students assessed their computer skills
as good or very good (Fig. 1) and 62% of them correctly answered the
survey questions about computer skills (Fig. 2).
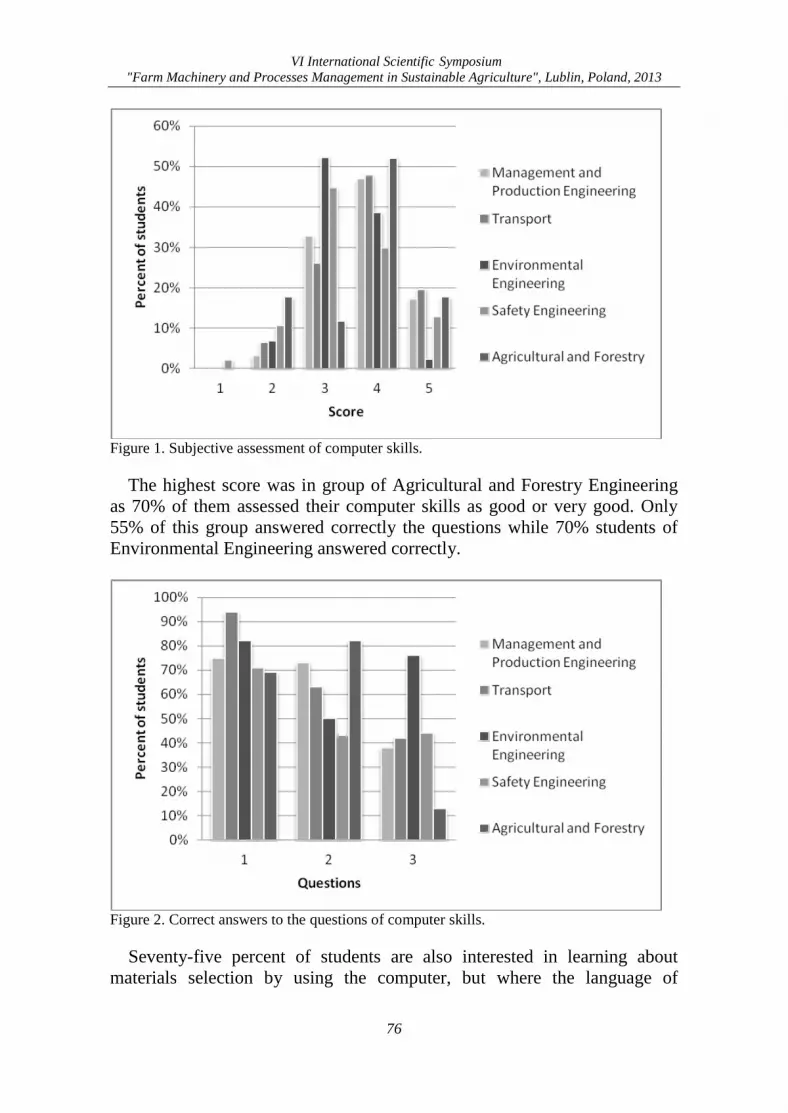
VI International Scientific Symposium
"Farm Machinery and Processes Management in Sustainable Agriculture", Lublin, Poland, 2013
76
Figure 1. Subjective assessment of computer skills.
The highest score was in group of Agricultural and Forestry Engineering
as 70% of them assessed their computer skills as good or very good. Only
55% of this group answered correctly the questions while 70% students of
Environmental Engineering answered correctly.
Figure 2. Correct answers to the questions of computer skills.
Seventy-five percent of students are also interested in learning about
materials selection by using the computer, but where the language of
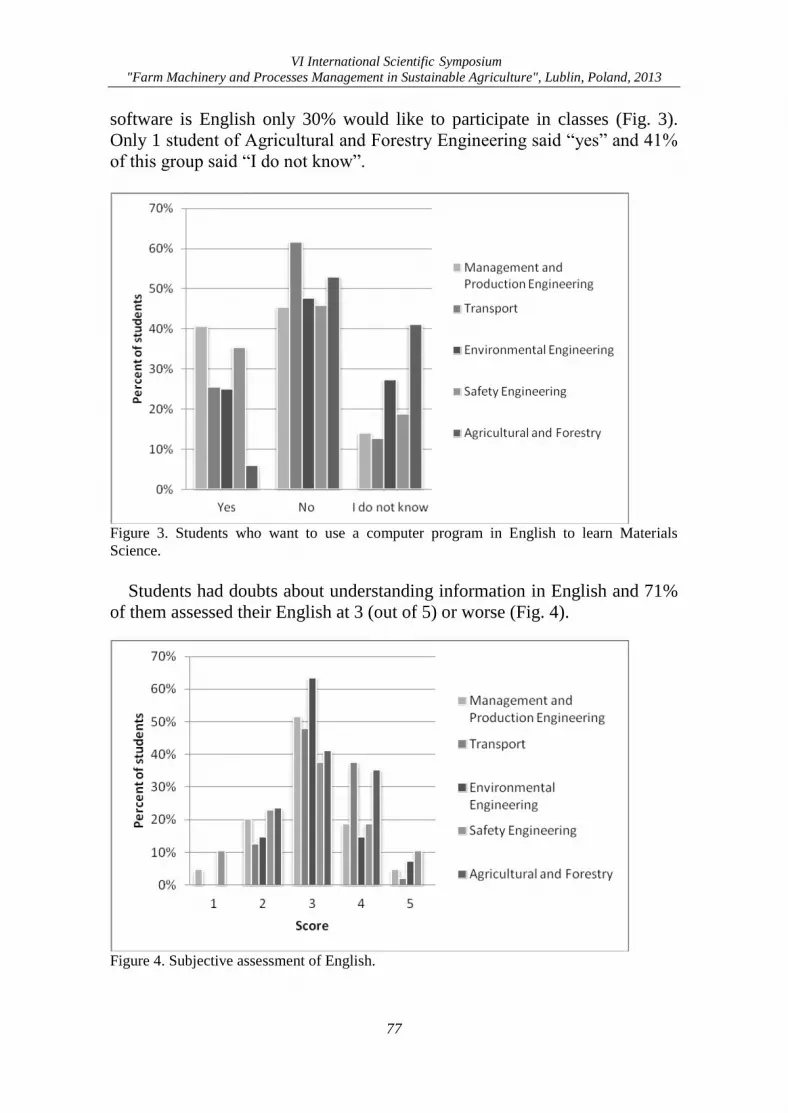
VI International Scientific Symposium
"Farm Machinery and Processes Management in Sustainable Agriculture", Lublin, Poland, 2013
77
software is English only 30% would like to participate in classes (Fig. 3).
Only 1 student of Agricultural and Forestry Engineering said “yes” and 41%
of this group said “I do not know”.
Figure 3. Students who want to use a computer program in English to learn Materials
Science.
Students had doubts about understanding information in English and 71%
of them assessed their English at 3 (out of 5) or worse (Fig. 4).
Figure 4. Subjective assessment of English.
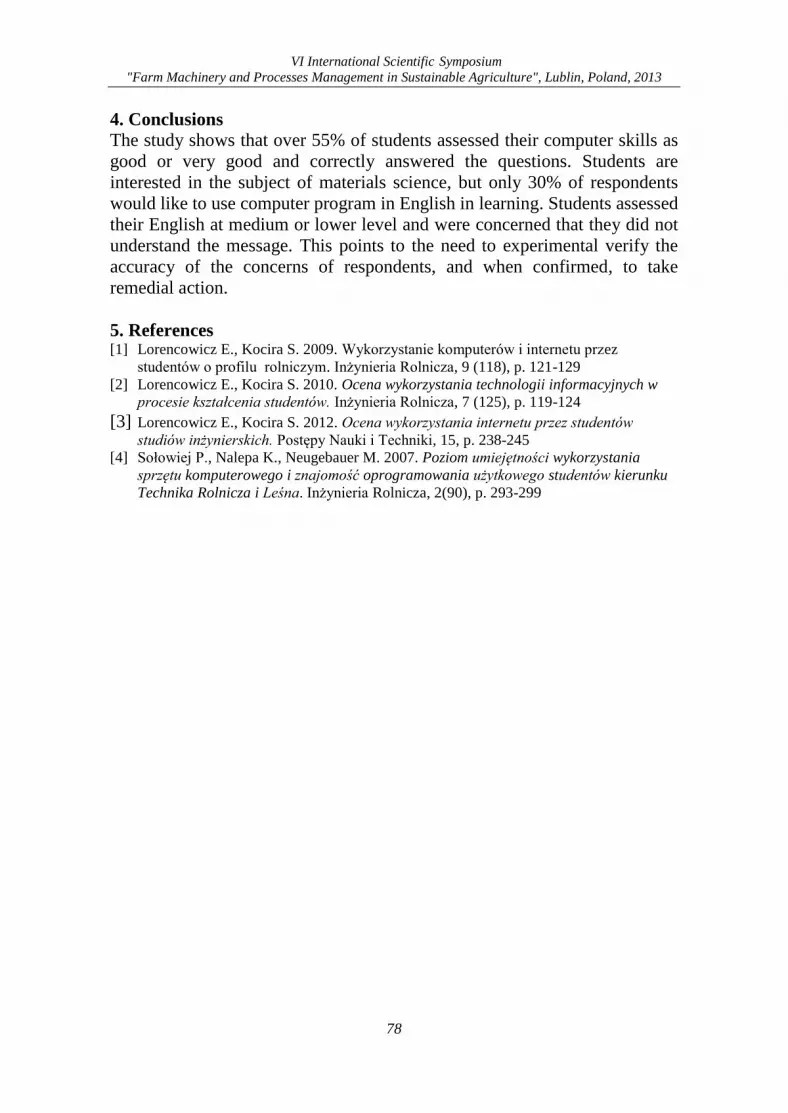
VI International Scientific Symposium
"Farm Machinery and Processes Management in Sustainable Agriculture", Lublin, Poland, 2013
78
4. Conclusions
The study shows that over 55% of students assessed their computer skills as
good or very good and correctly answered the questions. Students are
interested in the subject of materials science, but only 30% of respondents
would like to use computer program in English in learning. Students assessed
their English at medium or lower level and were concerned that they did not
understand the message. This points to the need to experimental verify the
accuracy of the concerns of respondents, and when confirmed, to take
remedial action.
5. References [1] Lorencowicz E., Kocira S. 2009. Wykorzystanie komputerów i internetu przez
studentów o profilu rolniczym. Inżynieria Rolnicza, 9 (118), p. 121-129
[2] Lorencowicz E., Kocira S. 2010. Ocena wykorzystania technologii informacyjnych w
procesie kształcenia studentów. Inżynieria Rolnicza, 7 (125), p. 119-124
[3] Lorencowicz E., Kocira S. 2012. Ocena wykorzystania internetu przez studentów
studiów inżynierskich. Postępy Nauki i Techniki, 15, p. 238-245 [4] Sołowiej P., Nalepa K., Neugebauer M. 2007. Poziom umiejętności wykorzystania
sprzętu komputerowego i znajomość oprogramowania użytkowego studentów kierunku
Technika Rolnicza i Leśna. Inżynieria Rolnicza, 2(90), p. 293-299
VI International Scientific Symposium
"Farm Machinery and Processes Management in Sustainable Agriculture", Lublin, Poland, 2013
79
APPLICATION OF GREEN ALGAE AND CYANOBACTERIA
SECONDARY METABOLITES IN CORN BIOMASS
FOR ECO-ENERGY PRODUCTION
Mieczysław GRZESIK1, Zdzisława ROMANOWSKA-DUDA2, Regina JANAS1
1Research Institute of Horticulture, Skierniewice, POLAND 2Department of Ecophysiology and Plant Development, University of Lodz, Łódź, POLAND;
e-mail: [email protected]
Keywords: microalgae, Cyanobacteria, corn, plant growth, metabolic activity
1. Introduction
Literature data indicate that diazotrophic Cyanobacteria and microalgae
can have beneficial influence on higher plants growth and development.
Plant growth can be stimulated not only due to additional dose of
atmospheric nitrogen supplied by diazotrophic Cyanobacteria, but also by a
wide spectrum of organic compounds, including plants hormones, amino
acids, extracellular polysaccharides, proteins and others, which are
synthesized by these organisms. Microalgal and cyanobacterial strains
affected the several physical and physiological properties of soil and plants
and also influence on number and composition of other microorganisms.
There is an increasing worldwide interest in the use of Cyanobacteria and
microalgae for improving plant development, although there is only a small
amount of data on this subject [Karthikeyanb et al. 2007; Grzesik,
Romanowska-Duda 2009; Tan et al. 2010].
The aim of the presented research was to test the influence of green algae
Chlorella sp., and Cyanobacteria: Anabaena sp. PCC7120 and Microcystis
aeruginosa MKR0105 strains, applied to leaves, on growth and some
physiological properties of corn plants.
2. Material and methods
Influence of three preselected monocultures: Anabaena sp. PCC7120,
Microcystis aeruginosa MKR0105 (Cyanobacteria) and Chlorella sp. (green
algae) on growth of corn (Zea mays L.) plants, cultivated in pots, was tested
in the presented research. The plants were cultivated outside in container
area, in 3 liter pots filled with the low quality soil and fertilized once with
1.0; 0.5 and 0.0 g/pot of YaraMila Complex (Yara International ASA),
consisting all the micro and macro elements necessary for growth. The
mentioned above green algae and Cyanobacteria strains were applied to corn
plants three times, in three week interval during vegetation, as the cells re-
suspended in water (500 000 cells x ml-1). The first spray was made when the
plant were 15 cm in height. The method of plant spraying with no damaged
cells and re-suspended in water was chosen on the base of previous
VI International Scientific Symposium
"Farm Machinery and Processes Management in Sustainable Agriculture", Lublin, Poland, 2013
80
experiments. They indicated that plant treatment with not damaged
monocultures were slightly more beneficial than spraying of plants with the
cells water homogenates and solutions (at doses of 1, 10 and 100 ppm) made
from lyophilized, not homogenate cells [Grzesik et al. 2013; Pszczółkowska
et al. 2013; Romanowska-Duda et al. 2013].
Height of plants, total shoot length, index of chlorophyll content SPAD
and photosynthesis activity (net photosynthesis, stomatal conductance,
intercellular CO2 concentration, transpiration), were evaluated every four
weeks during the vegetation. Activity of acid (pH 6.0) and alkaline (pH 7,5)
phosphatase, total dehydrogenase, nitrogen reductase and electrolyte leakage
from leaves were measured once during growing season.
3. Results and discussion
All three monocultures: Microcystis aeruginosa MKR0105, Chlorella
sp. and Anabaena sp. PCC7120, applied as triple foliar sprays, significantly
stimulated the growth and development of corn plants and also intensified
selected metabolic processes. Effects of applications varied slightly
depending on green algae and Cyanobacteria species and considerably on
level of plant fertilization.
All the treatments significantly increased growth and biomass of corn
plants, as to compare to control. Spraying the plants with monoculture of
Microcystis aeruginosa MKR0105 was slightly more beneficial in increasing
growth than with Anabaena sp. PCC7120 and Chlorella sp.. The more
intensive growth was associated with the increased physiological activity in
plants. The used green algae and Cyanobacteria increased activity of acid
(pH 6,0) and alkaline (pH 7,5) phosphatase, total dehydrogenase,
photosynthesis (net photosynthesis, stomatal conductance, intercellular CO2
concentration, transpiration), index of chlorophyll a+b content in leaves and
decreased cytomembrane permeability (electrolyte leakage).
The applied doses of complex fertilizer YaraMila greatly influenced the
plant growth and its biomass production. Corn fertilized with a dose of
1g/pot was the highest, and the lowering fertilizer dosages down to 0.5g and
0.0g/pot decreased plant height and their biomass respectively. Applied
monocultures of green algae and Cyanobacteria caused the intensification of
plant growth, independently of level of fertilization. Although, the higher
increase in biomass production was in case of plant fertilized with 0.5g
YaraMila/pot, slightly lower with 1g and much lower when the fertilization
was not used.
The results show a great potential of Microcystis aeruginosa MKR0105,
Chlorella sp. and Anabaena sp. PCC7120 as a new source of bio-fertilizers
and bio-stimulating chemicals for growth stimulation of corn plants under
condition of optimal fertilization and also in case of lower content of macro
VI International Scientific Symposium
"Farm Machinery and Processes Management in Sustainable Agriculture", Lublin, Poland, 2013
81
and micro elements in soil. This indicate that ecological application of the
evaluated monocultures of green algae and Cyanobacteria can reduce the
amount of the used synthetic fertilizers, helping to minimize contamination
of the environment and simultaneously it improves the corn plant growth and
their biomass for eco-energy production.
4. Conclusions
Suspended in water monocultures of Microcystis aeruginosa MKR0105,
Anabaena sp. PCC7120 (Cyanobacteria) and Chlorella sp. (green algae),
applied as triple foliar sprays, significantly stimulated the growth and
development of corn plants, and also intensified selected metabolic
processes, independently of the level of used synthetic fertilizers. Ecological
application of the evaluated monocultures of green algae and Cyanobacteria
can stimulate corn biomass for eco-energy production and reduce the
contamination by synthetic fertilizers in the environment.
5. References [1] Chojnacka A., Grzesik M., Pszczółkowski W., Romanowska-Duda Z., Janas R. 2013.
Microalgal and cyanobacterial candidates for ecological plant growth stimulating
chemicals. XII Międzynarodowa Konferencja Fykologiczna 20.05-23.05.2013
Mikorzyn. Book of Abstracts
[2] Grzesik M., Romanowska-Duda Z. 2009. The effect of potential climatic changes,
Cyanobacteria, Biojodis and Asahi SL on development of the Virginia fanpetals (Sida
hermaphrodita) plants. Pamiętnik Puławski Z. 151. 483-491.
[3] Grzesik M., Romanowska-Duda Z., Pszczółkowska A., Pszczółkowski W., Janas R.
2013. Microalgal candidate for ecological stimulation of willow (Salix viminalis l.)
growth. ESNA 3-8.09.2013 The Saloniki. Greece. Book of abstracts.
[4] Karthikeyanb N, Prasannaa R, Nainb L, Kaushik BD, 2007. Evaluating the potential of
plant growth promoting cyanobacteria as inoculants for wheat. European Journal of
Soil Biology. 43 (1), 23-30
[5] Pszczółkowska A., Romanowska-Duda Z., Grzesik M., Pszczółkowski W. 2013.
Cyanobacteria stimulates energetic plants growth. Konferencja MICROBIOT Łódź.
Book of abstracts (in print).
[6] Romanowska-Duda Z., Grzesik M., Pszczółkowska A., Pszczółkowski W. 2013.
Usefulness of Microcistis aeruginosa secondary metabolites in Sida hermaphrodita
plants cultivation. ESNA 3-8.09.2013 TheSaloniki. Greece. Book of abstracts.
[7] Tan LT, Goh BP, Tripathi A, Lim MG, Dickinson GH, Lee SS, Teo SL, 2010 Natural
antifoulants from the marine cyanobacterium Lyngbya majuscula. Biofouling. 26 (6),
685-95
Research where sponsored by the National Science Center in Poland, Grant No. N304
102940.

VI International Scientific Symposium
"Farm Machinery and Processes Management in Sustainable Agriculture", Lublin, Poland, 2013
82
VI International Scientific Symposium
"Farm Machinery and Processes Management in Sustainable Agriculture", Lublin, Poland, 2013
83
OPERATING COSTS OF FIXED ASSETS
USED IN THE HOP PRODUCTION
Jacek HOŁAJ1, Hanna HOŁAJ2
1 Institute of Soil Science and Plant Cultivation – State Research Institute, Department of
Agrometeorology and Applied Informatics, Puławy, POLAND 2 Agricultural Experimental Unit in Jastków, POLAND
Keywords: hop production, fixed assets, operating costs
1. Introduction
By the end of the twentieth century, Poland was the fifth largest in the
world and the third largest in Europe hop producer and the situation on the
hop market was developing fairly favourably [Zaorski 2002]. Since 2001 the
position of Poland as a hop producer has been falling, and the hop area has
been constantly decreasing. In addition, frequent difficulties with selling the
raw hop material have been occurring. Even those growers who own high-
yielding plantations and sell the raw hop material without much difficulty,
rarely decide to increase the acreage.
2. Material and methods
Hop production is a specialized production and requires the layout of
substantial financial resources for the infrastructure that consists, among
others, of the hop field, hop dryer and heater, humidifier of dried hop and a
hop storehouse. In hop growing specialized machines are used, such as:
stationary hop harvester, hop platform, bine cutter, hop cultivator,
specialized sprayer and a packing press [Migdal, Zaorski 1996]. Hop farmers
incur direct costs and indirect costs such as: depreciation, interest on capital,
insurance and storage costs that translate into high annual costs borne by the
hop grower to maintain in operation the fixed assets on the farm. Hop
production is also very labour-intensive, especially in times of workload
such as spring work on the plantation and hop harvesting.
The aim of this work is to isolate groups of the fixed assets used in hop
production, conduct an economic analysis and assess the cost of exploitation
of fixed assets on the hop farm [Hołaj, Zaliwski 1999].
3. Results
Fixed assets are property production elements and are directly involved in
the processes of hop production. In the current hop market situation in
Poland, hop growers rarely make farm investments to modernize the existing
capital assets and those investments that are made have a limited scope. In
accordance with the financial requirements fixed assets can be divided into
the following groups [Hołaj 2008]:

VI International Scientific Symposium
"Farm Machinery and Processes Management in Sustainable Agriculture", Lublin, Poland, 2013
84
- arable lands, along with the hop field construction,
- farm buildings and facilities,
- machinery and technical devices,
- means of transport,
- other fixed assets.
It is assumed that as fixed assets the property production elements of value
exceeding 3 500 PLN are considered.
4. Conclusion
Over recent years the unit prices of the hop-production fixed assets
mentioned above have been increasing systematically, while the prices of
raw hop material have been stagnating. This led to a general decrease of the
profitability of hop production.
Prices of selected fixed assets were acquired from the documentation of
the Agricultural Experimental Station "JASTKÓW" Ltd. – a hop farm with
60 years of tradition, counted among the largest hop producers in the
country.
5. References [1] Hołaj J. 2008. Modelowanie potrzeb informacyjnych producentów chmielu. Inżynieria
Rolnicza, 11(109), p. 91-97
[2] Hołaj J., Zaliwski A. 1999. Zastosowanie programu “Agroefekt” do modelowania
technologii uprawy chmielu. Inżynieria Rolnicza, 1(7), p. 17-22
[3] Migdal J., Zaorski T. 1996. Poradnik plantatora chmielu. IUNG Puławy
[4] Zaorski T. 2002. Zarys dziejów chmielarstwa polskiego. IUNG Puławy
VI International Scientific Symposium
"Farm Machinery and Processes Management in Sustainable Agriculture", Lublin, Poland, 2013
85
BEST MANAGEMENT PRACTICE TO REDUCE SPRAY DRIFT
IN FIELD CROPS
Ryszard HOLOWNICKI1, Grzegorz DORUCHOWSKI1, Waldemar SWIECHOWSKI1,
Artur GODYŃ1
Research Institute of Horticulture, Horticulture Engineering Department, Skierniewice,
POLAND
e-mail: [email protected]
Keywords: spray drift, field crops, spray boom, liquid pressure, boom height
1. Introduction
Spray drift is a major environmental problem when applying pesticides in
agriculture. It poses risk of environmental contamination, may damage
neighboring crops, reduce control efficacy and hence lead to economical loss
for the farmer [Nuyttens et al, 2011; Holownicki et al., 2006; D., Van de
Zande et al., 2005]. In recent years many different spray drift reducing
techniques (SDRT) were developed and implemented in practice. The
implementation of the SDRTs requiring investment in new equipment may
be very costly; however, there are also available low-cost methods of drift
mitigation based on application of coarse spray, less prone to drift. Use of
air-inclusion nozzles is one of the most effective ones, though it still costs
money. Meanwhile a great potential of drift reduction, very often ignored by
the applicators, is still in sprayer adjustment as recommended by best
management practice (BMP), including lowering the boom height,
decreasing spray pressure, slowing down travel velocity or increasing nozzle
size.
The objective of the presented study was to determine the effect of spray
application parameters of field crop sprayer, adjusted according to BMP
rules, on spray drift. The obtained results may be used for classification of
such adjustments as SDRTs.
2. Material and methods
In the field experiment a reference field crop sprayer was used (12 m
boom; flat-fan nozzles 120-03). The effect of boom height and liquid
pressure during spray application in field crops were evaluated according to
the ISO Standard 22866 [ISO, 2005]. The sedimentation drift was measured
30 m downwind from the grass field sprayed with water solution of
fluorescent tracer Brilliant Sulfo Flavine (BSF) at a concentration 0.3%
(Fig. 1). The treatments were carried out at travel velocity 6.0 km∙h-1 as
combination of three boom heights (0.35; 0.5; 0.75 m) over the field and
three spray pressures (0.15; 0.3; 0.5 MPa). Ground deposit was measured on
horizontal collectors made of synthetic filter cloths, of 0.1x1.0 m, placed on
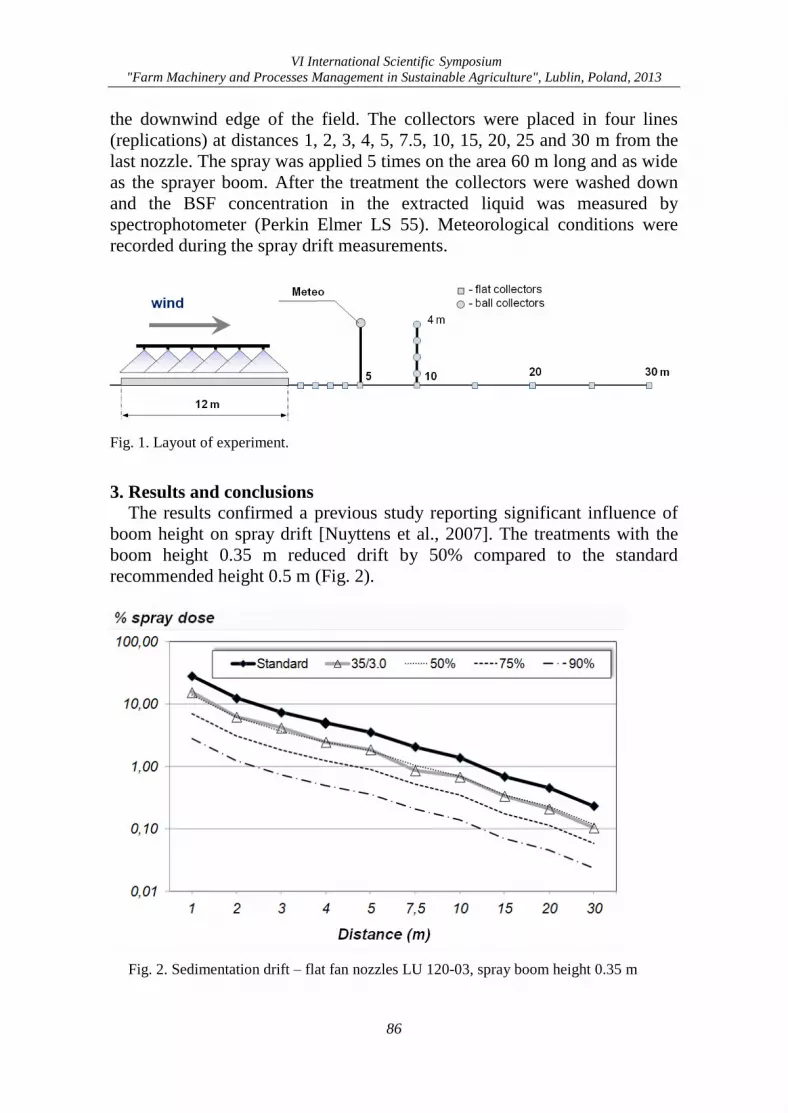
VI International Scientific Symposium
"Farm Machinery and Processes Management in Sustainable Agriculture", Lublin, Poland, 2013
86
the downwind edge of the field. The collectors were placed in four lines
(replications) at distances 1, 2, 3, 4, 5, 7.5, 10, 15, 20, 25 and 30 m from the
last nozzle. The spray was applied 5 times on the area 60 m long and as wide
as the sprayer boom. After the treatment the collectors were washed down
and the BSF concentration in the extracted liquid was measured by
spectrophotometer (Perkin Elmer LS 55). Meteorological conditions were
recorded during the spray drift measurements.
Fig. 1. Layout of experiment.
3. Results and conclusions
The results confirmed a previous study reporting significant influence of
boom height on spray drift [Nuyttens et al., 2007]. The treatments with the
boom height 0.35 m reduced drift by 50% compared to the standard
recommended height 0.5 m (Fig. 2).
Fig. 2. Sedimentation drift – flat fan nozzles LU 120-03, spray boom height 0.35 m
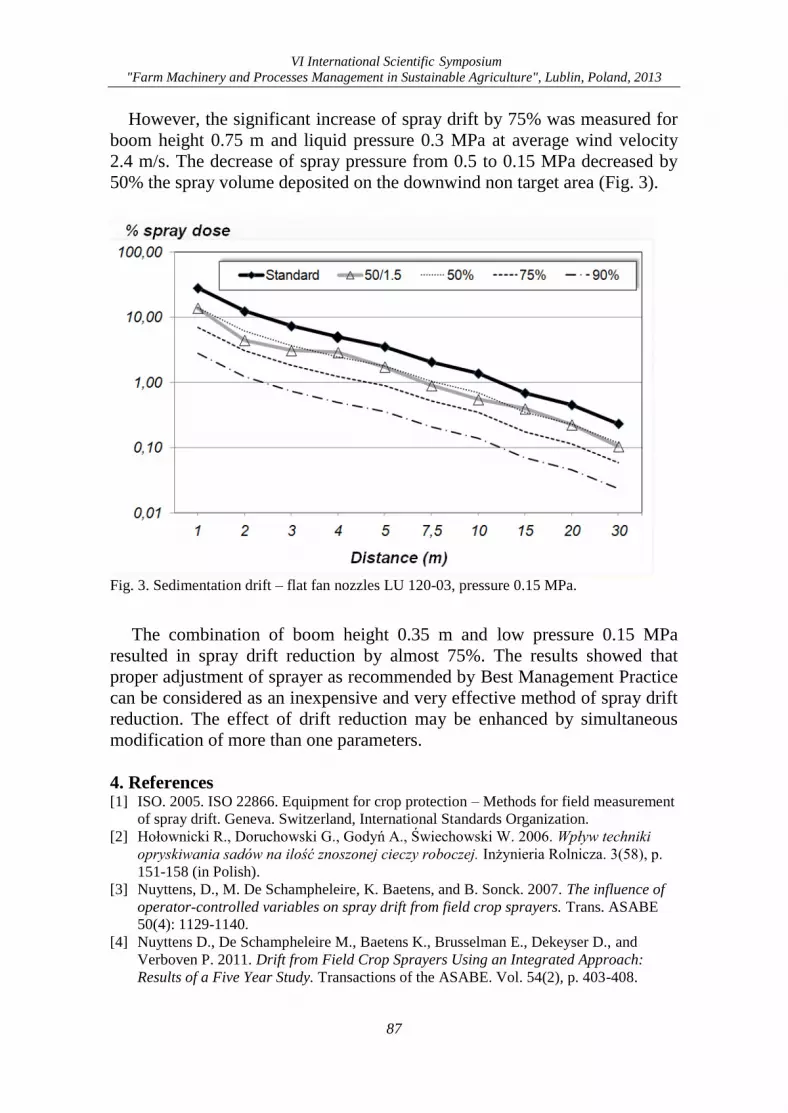
VI International Scientific Symposium
"Farm Machinery and Processes Management in Sustainable Agriculture", Lublin, Poland, 2013
87
However, the significant increase of spray drift by 75% was measured for
boom height 0.75 m and liquid pressure 0.3 MPa at average wind velocity
2.4 m/s. The decrease of spray pressure from 0.5 to 0.15 MPa decreased by
50% the spray volume deposited on the downwind non target area (Fig. 3).
Fig. 3. Sedimentation drift – flat fan nozzles LU 120-03, pressure 0.15 MPa.
The combination of boom height 0.35 m and low pressure 0.15 MPa
resulted in spray drift reduction by almost 75%. The results showed that
proper adjustment of sprayer as recommended by Best Management Practice
can be considered as an inexpensive and very effective method of spray drift
reduction. The effect of drift reduction may be enhanced by simultaneous
modification of more than one parameters.
4. References [1] ISO. 2005. ISO 22866. Equipment for crop protection – Methods for field measurement
of spray drift. Geneva. Switzerland, International Standards Organization.
[2] Hołownicki R., Doruchowski G., Godyń A., Świechowski W. 2006. Wpływ techniki
opryskiwania sadów na ilość znoszonej cieczy roboczej. Inżynieria Rolnicza. 3(58), p.
151-158 (in Polish).
[3] Nuyttens, D., M. De Schampheleire, K. Baetens, and B. Sonck. 2007. The influence of
operator-controlled variables on spray drift from field crop sprayers. Trans. ASABE
50(4): 1129-1140.
[4] Nuyttens D., De Schampheleire M., Baetens K., Brusselman E., Dekeyser D., and
Verboven P. 2011. Drift from Field Crop Sprayers Using an Integrated Approach:
Results of a Five Year Study. Transactions of the ASABE. Vol. 54(2), p. 403-408.
VI International Scientific Symposium
"Farm Machinery and Processes Management in Sustainable Agriculture", Lublin, Poland, 2013
88
[5] Van de Zande J. C., Stallinga H., Michielsen J. M. G. P., and van Velde P. 2005. Effect
of sprayer speed on spray drift. Ann. Rev. Agric. Eng. 4(1), p. 129-142.
Acknowledgements This work was performed in the frame of Multi-annual Programme "Development of
sustainable methods of horticultural production to ensure high biological and nutritional
quality of horticultural products and to preserve the biodiversity of the environment and to
protect its resources", financed by the Polish Ministry of Agriculture and Rural
Development.
VI International Scientific Symposium
"Farm Machinery and Processes Management in Sustainable Agriculture", Lublin, Poland, 2013
89
STUDY OF THE PRECISION OF THE GUIDANCE SYSTEM
AUTOTRAC FROM JOHN DEERE – PART 1:
MATERIAL AND METHOD
Bruno HUYGHEBAERT, Gaëtan DUBOIS, Guillaume DEFAYS
Centre wallon de Recherches agronomiques(CRA-W), Production and Sectors Department,
Gembloux, BELGIUM
e-mail: [email protected], [email protected],
ABSTRACT
The main objective of the study was to determine the actual precision of the AutoTrac
Guidance System according to different correction signals proposed in Belgium by John
Deere: StarFire 1 (SF1), StarFire 2 (SF2) and RTK. The second objective was to observe the
evolution of this precision in function of the return time between two passes in the field.
Finally, the study aimed at fixing the limits of use of each correction signal. A theoretical
case (specific tool especially designed for the trials) and a practical case (precision seeder
for sugar beet) were studied on fully equipped tractor John Deere 6830. The observed
precision of the correction signals was equal or better than the one announced by the
manufacturer.
Keywords: GNSS, guidance system, tractor, actual precision, Belgium
1. Introduction
The use of guidance systems by satellites experiences an increasing
demand from farmers. Automated steering also interests farmers more and
more because it largely facilitates control on field and improves comfort of
the operator as well as the precision of work.
Principal works for which automated steering is strongly required are the
sowing and the plantation of traditional cultures like cereals, corn, beets and
potatoes (Freycon, 1996). The precision sought for this work varies from 1 to
10 centimeters pass to pass according to the culture but also according to the
working width of the tool. The possibility of increasing the daily working
period by carrying out work in night condition plays a considerable part in
the choice of this system (Dana, 2000).
The Research Unit Agricultural Machines and Facilities underwent a
study in collaboration with Cofabel, the Belgian importer of John Deere, on
the Guidance System AutoTrac.
The main objective of the study was to determine the actual precision of
the Guidance System AutoTrac in function of the different correction signals
proposed in Belgium by John Deere: StarFire 1 (SF1), StarFire 2 (SF2) and
RTK. By actual precision of the Guidance System, we understand, the
working precision of the machine measured directly in the field. Therefore
VI International Scientific Symposium
"Farm Machinery and Processes Management in Sustainable Agriculture", Lublin, Poland, 2013
90
the actual precision can be considered as the global driving precision of the
combination tractor-machine that the user could obtain (Huyghebaert et al,
2007). The second objective was to observe the evolution of this precision in
function of the return time between two passes in the field. The return time
was the necessary time to go from one point in a parcel to the edge of the
field and come back. This time was a function of the field length and could
influence the driving precision of the guidance system (Adamchuk and al,
2008; Beguyot et al, 2004). Finally, the study aimed at fixing the limits of
use of each correction signal with the AutoTrac.
2. Material and methods
2.1 Vehicle and Correction Systems
The equipment used during the trials are one tractor John Deere 6830
equipped with an integrated Guidance System AutoTrac, the new receptor
STARFIRE 3000 and the interface GREENSTAR 2630. AutoTrac is a
system of power-assisted steering allowing the operators to release the wheel
while the machine (tractor, motorized vehicle…) follows the virtual guidance
line. The new receiver STARFIRE 3000 is able to collect the signals from
GPS and GLONASS constellations of satellites. The receiver accepts all the
correction signals proposed by John Deere: SF1, SF2 and RTK. The tractor
is mounted with “650/65” and “540/65” tires.
The 3 correction signals StarFire 1 (SF1), Star Fire 2 (SF2) and RTK,
proposed by John Deere in Belgium, have been used and tested during the
trials:
Star Fire 1 (SF1) is a dGPS correction signal which has an announced
precision of ± 30 cm pass to pass for 95% of the working time.
Star Fire (SF2) is also a dGPS correction signal with an announced
precision of ± 10 cm for 95% of the working time. This signal is
subjected to a paying subscription.
RTK correction signal has an announced precision of ± 2 cm. This
system requires to invest in base station positioned near the field
(< to 10 km).
2.2 Protocol and Method of Measurement
All the trials have been realized in the field in actual conditions. However,
they can be divided in two parts: the “theoretical part” realized without
machine and the “practical part” realized with a precision seeder for sugar
beet.
For the “theoretical part”, a specific tool especially designed for the trials
(Huyghebaert et al, 2008) has been mounted on the three-point linkage of the
tractor (Figure 1). This tool consists of a mono-disc of great diameter
maintained in contact with soil by means of a spring system. The work of the
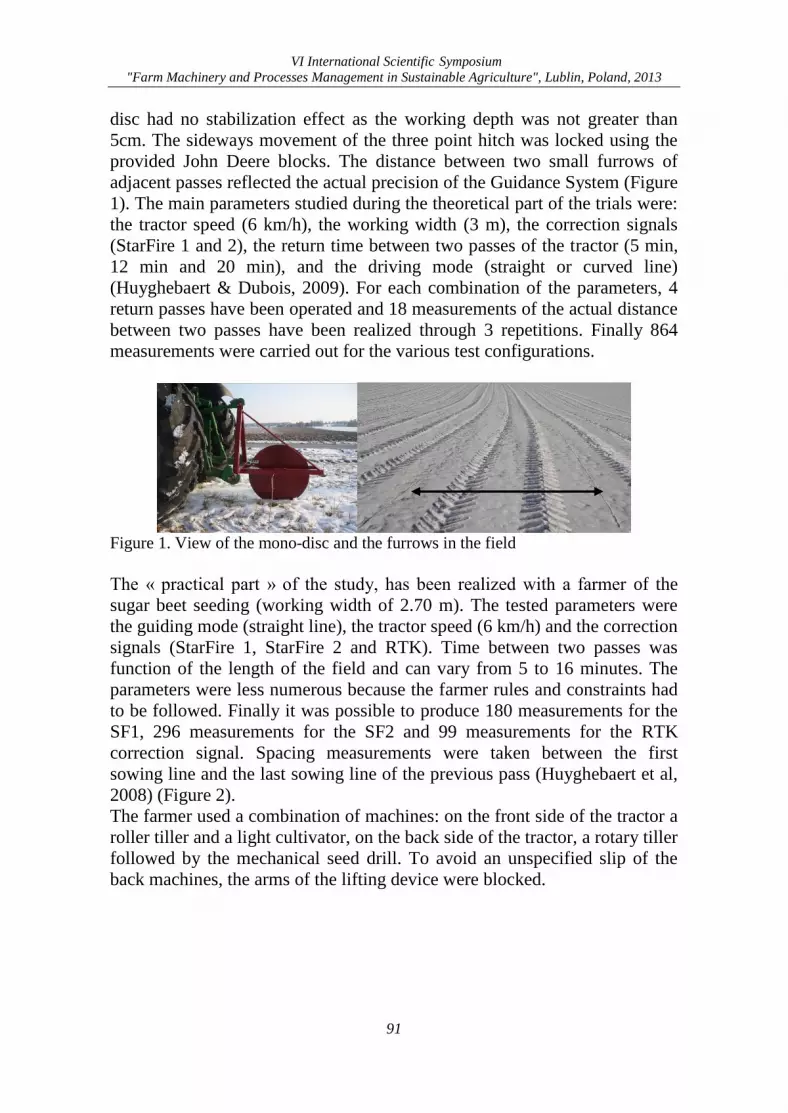
VI International Scientific Symposium
"Farm Machinery and Processes Management in Sustainable Agriculture", Lublin, Poland, 2013
91
disc had no stabilization effect as the working depth was not greater than
5cm. The sideways movement of the three point hitch was locked using the
provided John Deere blocks. The distance between two small furrows of
adjacent passes reflected the actual precision of the Guidance System (Figure
1). The main parameters studied during the theoretical part of the trials were:
the tractor speed (6 km/h), the working width (3 m), the correction signals
(StarFire 1 and 2), the return time between two passes of the tractor (5 min,
12 min and 20 min), and the driving mode (straight or curved line)
(Huyghebaert & Dubois, 2009). For each combination of the parameters, 4
return passes have been operated and 18 measurements of the actual distance
between two passes have been realized through 3 repetitions. Finally 864
measurements were carried out for the various test configurations.
Figure 1. View of the mono-disc and the furrows in the field
The « practical part » of the study, has been realized with a farmer of the
sugar beet seeding (working width of 2.70 m). The tested parameters were
the guiding mode (straight line), the tractor speed (6 km/h) and the correction
signals (StarFire 1, StarFire 2 and RTK). Time between two passes was
function of the length of the field and can vary from 5 to 16 minutes. The
parameters were less numerous because the farmer rules and constraints had
to be followed. Finally it was possible to produce 180 measurements for the
SF1, 296 measurements for the SF2 and 99 measurements for the RTK
correction signal. Spacing measurements were taken between the first
sowing line and the last sowing line of the previous pass (Huyghebaert et al,
2008) (Figure 2).
The farmer used a combination of machines: on the front side of the tractor a
roller tiller and a light cultivator, on the back side of the tractor, a rotary tiller
followed by the mechanical seed drill. To avoid an unspecified slip of the
back machines, the arms of the lifting device were blocked.
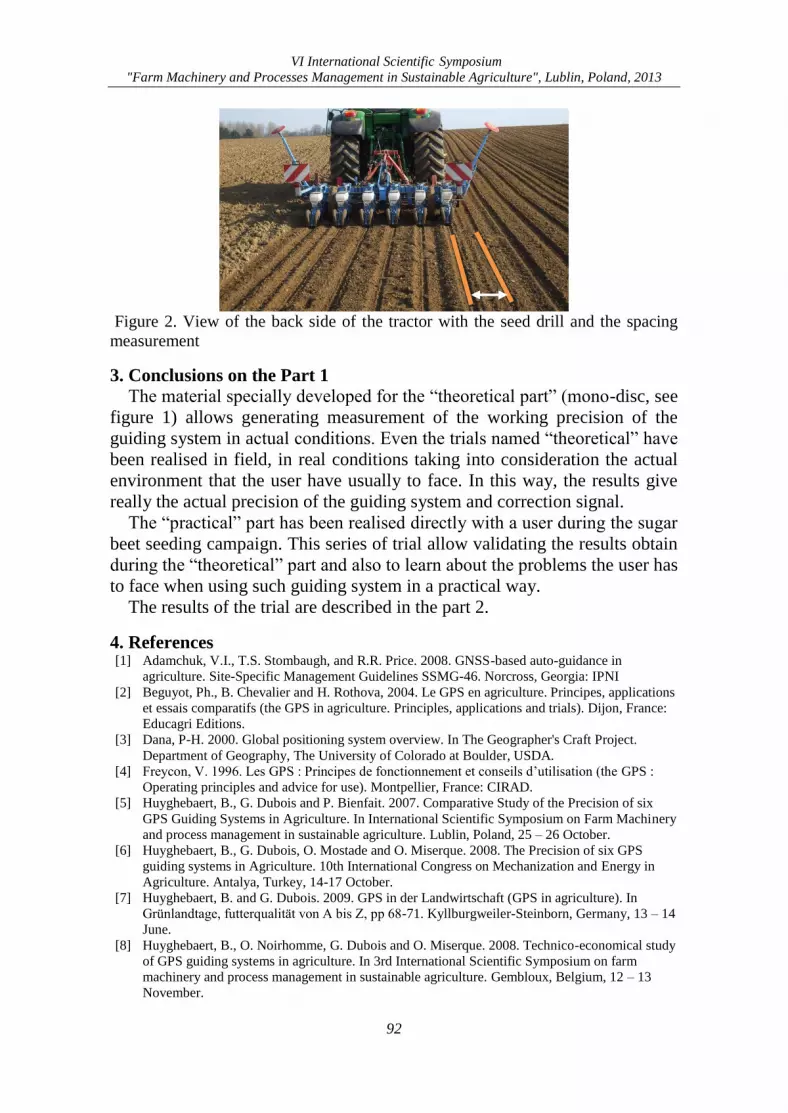
VI International Scientific Symposium
"Farm Machinery and Processes Management in Sustainable Agriculture", Lublin, Poland, 2013
92
Figure 2. View of the back side of the tractor with the seed drill and the spacing
measurement
3. Conclusions on the Part 1
The material specially developed for the “theoretical part” (mono-disc, see
figure 1) allows generating measurement of the working precision of the
guiding system in actual conditions. Even the trials named “theoretical” have
been realised in field, in real conditions taking into consideration the actual
environment that the user have usually to face. In this way, the results give
really the actual precision of the guiding system and correction signal.
The “practical” part has been realised directly with a user during the sugar
beet seeding campaign. This series of trial allow validating the results obtain
during the “theoretical” part and also to learn about the problems the user has
to face when using such guiding system in a practical way.
The results of the trial are described in the part 2.
4. References [1] Adamchuk, V.I., T.S. Stombaugh, and R.R. Price. 2008. GNSS-based auto-guidance in
agriculture. Site-Specific Management Guidelines SSMG-46. Norcross, Georgia: IPNI
[2] Beguyot, Ph., B. Chevalier and H. Rothova, 2004. Le GPS en agriculture. Principes, applications
et essais comparatifs (the GPS in agriculture. Principles, applications and trials). Dijon, France:
Educagri Editions.
[3] Dana, P-H. 2000. Global positioning system overview. In The Geographer's Craft Project.
Department of Geography, The University of Colorado at Boulder, USDA.
[4] Freycon, V. 1996. Les GPS : Principes de fonctionnement et conseils d’utilisation (the GPS :
Operating principles and advice for use). Montpellier, France: CIRAD.
[5] Huyghebaert, B., G. Dubois and P. Bienfait. 2007. Comparative Study of the Precision of six
GPS Guiding Systems in Agriculture. In International Scientific Symposium on Farm Machinery
and process management in sustainable agriculture. Lublin, Poland, 25 – 26 October.
[6] Huyghebaert, B., G. Dubois, O. Mostade and O. Miserque. 2008. The Precision of six GPS
guiding systems in Agriculture. 10th International Congress on Mechanization and Energy in
Agriculture. Antalya, Turkey, 14-17 October.
[7] Huyghebaert, B. and G. Dubois. 2009. GPS in der Landwirtschaft (GPS in agriculture). In
Grünlandtage, futterqualität von A bis Z, pp 68-71. Kyllburgweiler-Steinborn, Germany, 13 – 14
June.
[8] Huyghebaert, B., O. Noirhomme, G. Dubois and O. Miserque. 2008. Technico-economical study
of GPS guiding systems in agriculture. In 3rd International Scientific Symposium on farm
machinery and process management in sustainable agriculture. Gembloux, Belgium, 12 – 13
November.
VI International Scientific Symposium
"Farm Machinery and Processes Management in Sustainable Agriculture", Lublin, Poland, 2013
93
STUDY OF THE PRECISION OF THE GUIDANCE SYSTEM
AUTOTRAC FROM JOHN DEERE – PART 2:
RESULTS AND DICUSSIONS
Bruno HUYGHEBAERT, Gaëtan DUBOIS, Guillaume DEFAYS
Centre wallon de Recherches agronomiques(CRA-W), Production and Sectors Department,
Gembloux, BELGIUM
e-mail: [email protected], [email protected],
ABSTRACT
The main objective of the study was to determine the actual precision of the AutoTrac
Guidance System according to different correction signals proposed in Belgium by John
Deere: StarFire 1 (SF1), StarFire 2 (SF2) and RTK. The second objective was to observe the
evolution of this precision in function of the return time between two passes in the field.
Finally, the study aimed at fixing the limits of use of each correction signal. A theoretical
case (specific tool especially designed for the trials) and a practical case (precision seeder
for sugar beet) were studied on a tractor John Deere 6830 fully equipped. The observed
precision of the correction signals was equal or better than the one announced by the
manufacturer.
Keywords: GNSS, guidance system, tractor, actual precision, Belgium
1. Introduction
The problem has been introduced in the part 1. The material and the
methods developed for the realization of the trials have been also described
in the part 1.
All the trials have been realized in the field in actual conditions. However,
they can be divided in two parts: the “theoretical part” realized without
machine and the “practical part” realized with a precision seeder for sugar
beet.
2. Results
The overall precision of a Guidance System depends on several factors as
the precision of the signal, the configuration of the vehicle and the machines,
the field and ground conditions. During the trials, these factors have been
taken into consideration and optimized where possible.
3.1 Theoretical Trials with the mono-disc
The distance between each pass has been measured and compared to the
theoretical width (3 m). The distribution of the distance between two passes
permitted to characterize the precision of the AutoTrac system used in
different ways.

VI International Scientific Symposium
"Farm Machinery and Processes Management in Sustainable Agriculture", Lublin, Poland, 2013
94
The Table 1 gives the characteristics of the driving precision of the
AutoTrack guidance system used in straight line mode of functioning. Each
result corresponds to 72 observations.
Table 1. Characteristics of the straight line driving precision of the AutoTrack used with the
correction signal SF1 and SF2, in function of the return time.
Return time (min) 5 12 20
Correction signal SF1 SF2 SF1 SF2 SF1 SF2
Average distance between two passes (m) 3.00 3.02 3.01 3.01 3.01 3.00
Mean of the absolute deviations from the
theoretical distance (m) 0.04 0.04 0.06 0.04 0.09 0.03
Maximum observed deviation (m) 0.18 0.14 0.22 0.10 0.33 0.12
Maximum deviation for 95 % of the time
(m) 0.13 0.11 0.13 0.09 0.24 0.07
The global precision of the guidance system was better or in accordance
with the precision announced by the manufacturer. The maximum observed
deviation for 95 % of the working time was lower than 30 cm for the
correction signal SF1 and was around 10 cm for the SF2.
On average the results don’t show a significant difference between the two
signals of correction (SF1 and SF2). The average distance between two
passes is practically the same for both signals whatever are the return times.
However the mean of the absolute deviations, the maximum observed
deviation and the maximum deviation for 95% of the working time increase
with the return time for the correction signal SF1 and remain constant for
SF2.
Figure 1. Evolution of the average deviation of the AutoTrack guidance system used with
the correction signal SF1 and SF2, in function of the mode of functioning and the return
time.
VI International Scientific Symposium
"Farm Machinery and Processes Management in Sustainable Agriculture", Lublin, Poland, 2013
95
The results obtained in curved line mode of functioning underwent the same
analysis and shows the same trends. However, the mean of the absolute
deviations increases more in function of the return time for the curved line
mode than the straight line mode (Figure 1).
3.2 Practical Trials during Sugar Beet Sowing
The working width of the drill seeder was 2.70 m. The three correction
signals (SF1, SF2 and RTK) have been tested. As the trials have been
realized in practical conditions, the return times differ from one correction
signal to another.
As the precision of the SF1 correction signal was lower, the farmer used
the tracers of the seeder to visualize when the AutoTrack guidance system
left the right trajectory. When the tractor deviated more than 10 cm from the
right trajectory, the farmer took back manually the control, replaced the
tractor in the right track and recalibrated the guidance system. Two parcels
of different length (350 m and 600 m) have been sowed using SF1 as
correction signal. It allowed generating on average two different return times
(10 min and 16 min). The results of the precision given by the guidance
system using SF1 correction signal during sugar beet sowing are given in the
table 2.
Table 2. Guidance precision of the AutoTrack used with the correction signal SF1, in
function of the return time (practical trials – sugar beet sowing).
Average return time (min) 10 16
Mean of the absolute deviations from the theoretical
distance (m) 0.05 0.08
Maximum observed deviation (m) 0.15 0.20
Maximum deviation for 95 % of the time (m) 0.12 0.16
As observed during the “theoretical trials”, the deviations tend to increase
with the return time. The maximum observed deviation and the maximum
deviation for 95 % of the time seem to be lower, but these results are non-
comparable to SF1 results of the “Theorical trials”, due to the regular
recalibration that the farmer had to proceed during this work. These
interventions are supposed to produce a too optimistic pass to pass accuracy
for SF1.
The trials realized with the correction signal SF2 didn’t ask to recalibrate
the system. Also two parcels of different length have been sowed permitting
to generate on average two different return times (12 mm and 16 min). The
results of the precision given by the guidance system using SF2 correction
signal during sugar beet sowing are given in the Table 3.
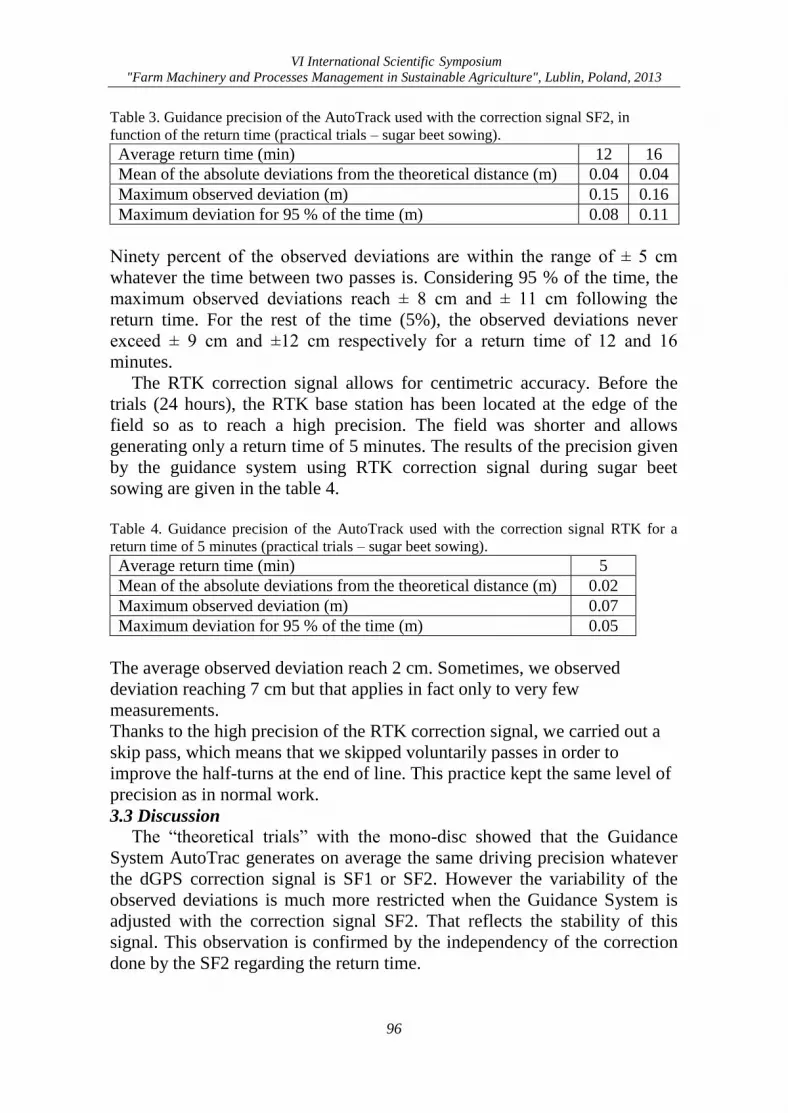
VI International Scientific Symposium
"Farm Machinery and Processes Management in Sustainable Agriculture", Lublin, Poland, 2013
96
Table 3. Guidance precision of the AutoTrack used with the correction signal SF2, in
function of the return time (practical trials – sugar beet sowing).
Average return time (min) 12 16
Mean of the absolute deviations from the theoretical distance (m) 0.04 0.04
Maximum observed deviation (m) 0.15 0.16
Maximum deviation for 95 % of the time (m) 0.08 0.11
Ninety percent of the observed deviations are within the range of ± 5 cm
whatever the time between two passes is. Considering 95 % of the time, the
maximum observed deviations reach ± 8 cm and ± 11 cm following the
return time. For the rest of the time (5%), the observed deviations never
exceed ± 9 cm and ±12 cm respectively for a return time of 12 and 16
minutes.
The RTK correction signal allows for centimetric accuracy. Before the
trials (24 hours), the RTK base station has been located at the edge of the
field so as to reach a high precision. The field was shorter and allows
generating only a return time of 5 minutes. The results of the precision given
by the guidance system using RTK correction signal during sugar beet
sowing are given in the table 4.
Table 4. Guidance precision of the AutoTrack used with the correction signal RTK for a
return time of 5 minutes (practical trials – sugar beet sowing).
Average return time (min) 5
Mean of the absolute deviations from the theoretical distance (m) 0.02
Maximum observed deviation (m) 0.07
Maximum deviation for 95 % of the time (m) 0.05
The average observed deviation reach 2 cm. Sometimes, we observed
deviation reaching 7 cm but that applies in fact only to very few
measurements.
Thanks to the high precision of the RTK correction signal, we carried out a
skip pass, which means that we skipped voluntarily passes in order to
improve the half-turns at the end of line. This practice kept the same level of
precision as in normal work.
3.3 Discussion
The “theoretical trials” with the mono-disc showed that the Guidance
System AutoTrac generates on average the same driving precision whatever
the dGPS correction signal is SF1 or SF2. However the variability of the
observed deviations is much more restricted when the Guidance System is
adjusted with the correction signal SF2. That reflects the stability of this
signal. This observation is confirmed by the independency of the correction
done by the SF2 regarding the return time.
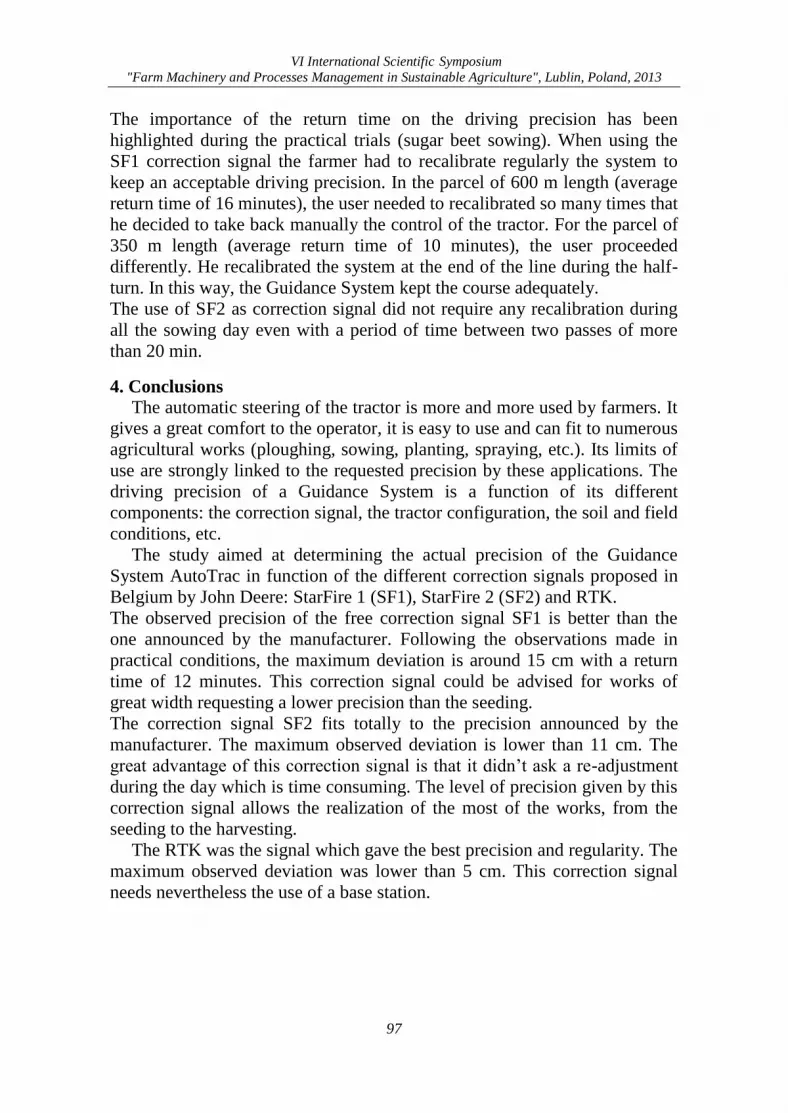
VI International Scientific Symposium
"Farm Machinery and Processes Management in Sustainable Agriculture", Lublin, Poland, 2013
97
The importance of the return time on the driving precision has been
highlighted during the practical trials (sugar beet sowing). When using the
SF1 correction signal the farmer had to recalibrate regularly the system to
keep an acceptable driving precision. In the parcel of 600 m length (average
return time of 16 minutes), the user needed to recalibrated so many times that
he decided to take back manually the control of the tractor. For the parcel of
350 m length (average return time of 10 minutes), the user proceeded
differently. He recalibrated the system at the end of the line during the half-
turn. In this way, the Guidance System kept the course adequately.
The use of SF2 as correction signal did not require any recalibration during
all the sowing day even with a period of time between two passes of more
than 20 min.
4. Conclusions
The automatic steering of the tractor is more and more used by farmers. It
gives a great comfort to the operator, it is easy to use and can fit to numerous
agricultural works (ploughing, sowing, planting, spraying, etc.). Its limits of
use are strongly linked to the requested precision by these applications. The
driving precision of a Guidance System is a function of its different
components: the correction signal, the tractor configuration, the soil and field
conditions, etc.
The study aimed at determining the actual precision of the Guidance
System AutoTrac in function of the different correction signals proposed in
Belgium by John Deere: StarFire 1 (SF1), StarFire 2 (SF2) and RTK.
The observed precision of the free correction signal SF1 is better than the
one announced by the manufacturer. Following the observations made in
practical conditions, the maximum deviation is around 15 cm with a return
time of 12 minutes. This correction signal could be advised for works of
great width requesting a lower precision than the seeding.
The correction signal SF2 fits totally to the precision announced by the
manufacturer. The maximum observed deviation is lower than 11 cm. The
great advantage of this correction signal is that it didn’t ask a re-adjustment
during the day which is time consuming. The level of precision given by this
correction signal allows the realization of the most of the works, from the
seeding to the harvesting.
The RTK was the signal which gave the best precision and regularity. The
maximum observed deviation was lower than 5 cm. This correction signal
needs nevertheless the use of a base station.

VI International Scientific Symposium
"Farm Machinery and Processes Management in Sustainable Agriculture", Lublin, Poland, 2013
98

VI International Scientific Symposium
"Farm Machinery and Processes Management in Sustainable Agriculture", Lublin, Poland, 2013
99
THE USE OF INTEGRATED PLANT PROTECTION
AGAINST ELATERIDAE IN POTATO
FOR REDUCING LOSS OF QUALITY TUBERS
Magdalena JAKUBOWSKA
Institute of Plant Protection – National Research Institute, Department Method of Pest
Forecasting and Economic Plant Protection, Poznań, POLAND
e-mail: [email protected];
Keywords: click beetle, effectiveness, forecasting, monitoring, pheromone traps,
wireworms
1. Introduction
In the recent years, a locally growing population size of wireworm in
agricultural fields with various plants such as vegetables, horticultural and
ornamental plants has been observed [Erlichowski 2007, 2009; Pusz et al.
2013]. The scope of the research covered observation of four species of click
beetles: Agriotes lineatus (L.), A. obscurus (L.), A. sputator (L.) and A.
ustulatus (L.), which are the most dominant species in Poland. Click beetles
were monitored in years 2010-2012 by YATLORf or VARb3 pheromone
traps with synthetic sexual pheromone. The purpose of the research was
determining the dependence between the catches dynamics and the location
of traps in fields with potatoes, sugar beet, corn and grasses in eight
municipalities in three voivodships (zachodniopomorskie, warmińsko-
mazurskie and wielkopolskie).
2. Material and methods
The experiment was conducted in Poland, in the Wielkopolska Region, in
Winna Góra (52°12’N, 17°27’E) and Słupia Wielka (52º13’N, 17°13’E)
(municipality of Środa Wlkp.), during the 2011-2012 time period; in the
Zachodniopomorskie Region, in Bonin (53°36’95’’N, 15°39’71’’E)
(municipality of Łobez) and Laski Koszalińskie (54°08’25’’N, 16°04’57’’E)
(municipality of Biesiekierz) during years 2010-2012; and in Warmia and
Mazury Region in Barczewko (53°50’12’’N, 20°41’43’’E), in Łęgajny
(53°49’N, 20°38’E) (municipality of Barczewo) and Garzewko
(53°50’45’’N, 20°16’49’’E) (municipality of Jonkowo). Observations were
provided on sugar beet, corn, potatoes and perennial grasses. Hungarian
pheromone traps YATLORf or VARb3 type with Hungarian pheromone
dispensers for catching males of Agriotes lineatus L., A. obscurus L., A.
ustulatus.L. [Tóth et al. 2002] we used for Agroties spp. (click beetles)
presence. Traps were placed on plantations in the third decade of April in a
distance of approximately 3-5 m from the field edge - 1 trap per plantation.
The average size of the field was from 1 hectare (corn, potato, grass, and
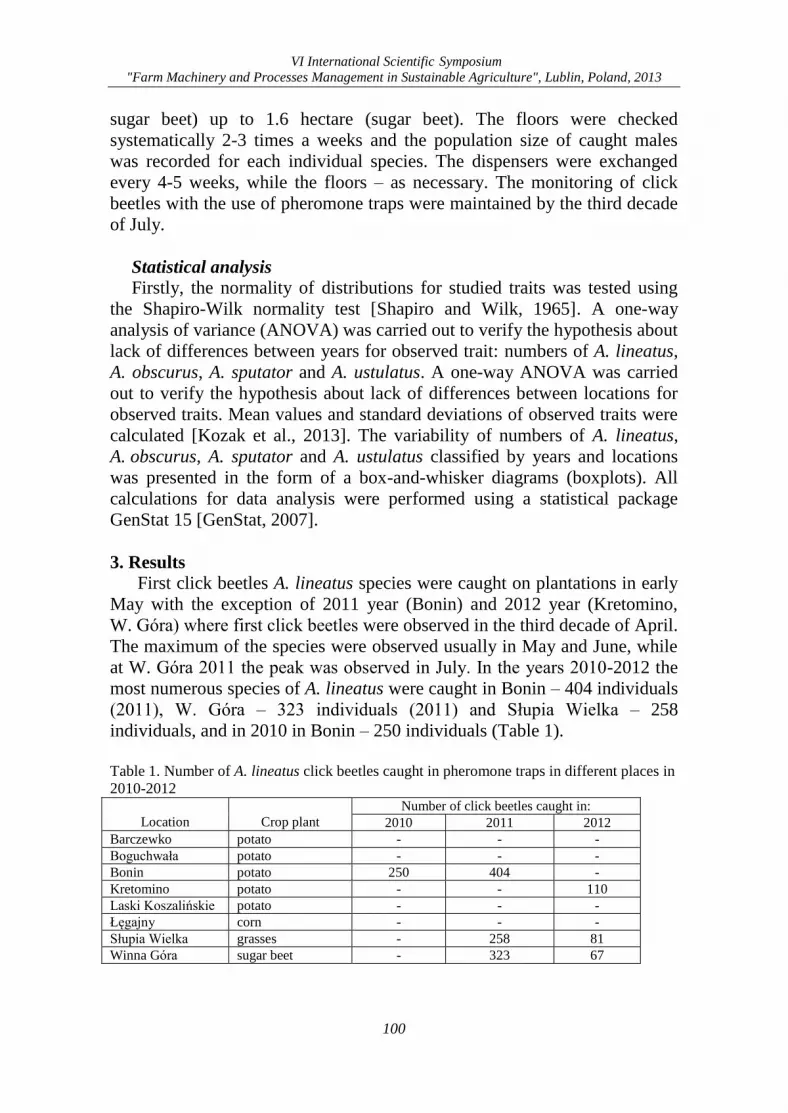
VI International Scientific Symposium
"Farm Machinery and Processes Management in Sustainable Agriculture", Lublin, Poland, 2013
100
sugar beet) up to 1.6 hectare (sugar beet). The floors were checked
systematically 2-3 times a weeks and the population size of caught males
was recorded for each individual species. The dispensers were exchanged
every 4-5 weeks, while the floors – as necessary. The monitoring of click
beetles with the use of pheromone traps were maintained by the third decade
of July.
Statistical analysis
Firstly, the normality of distributions for studied traits was tested using
the Shapiro-Wilk normality test [Shapiro and Wilk, 1965]. A one-way
analysis of variance (ANOVA) was carried out to verify the hypothesis about
lack of differences between years for observed trait: numbers of A. lineatus,
A. obscurus, A. sputator and A. ustulatus. A one-way ANOVA was carried
out to verify the hypothesis about lack of differences between locations for
observed traits. Mean values and standard deviations of observed traits were
calculated [Kozak et al., 2013]. The variability of numbers of A. lineatus,
A. obscurus, A. sputator and A. ustulatus classified by years and locations
was presented in the form of a box-and-whisker diagrams (boxplots). All
calculations for data analysis were performed using a statistical package
GenStat 15 [GenStat, 2007].
3. Results
First click beetles A. lineatus species were caught on plantations in early
May with the exception of 2011 year (Bonin) and 2012 year (Kretomino,
W. Góra) where first click beetles were observed in the third decade of April.
The maximum of the species were observed usually in May and June, while
at W. Góra 2011 the peak was observed in July. In the years 2010-2012 the
most numerous species of A. lineatus were caught in Bonin – 404 individuals
(2011), W. Góra – 323 individuals (2011) and Słupia Wielka – 258
individuals, and in 2010 in Bonin – 250 individuals (Table 1).
Table 1. Number of A. lineatus click beetles caught in pheromone traps in different places in
2010-2012
Location
Crop plant
Number of click beetles caught in:
2010 2011 2012
Barczewko potato - - -
Boguchwała potato - - -
Bonin potato 250 404 -
Kretomino potato - - 110
Laski Koszalińskie potato - - -
Łęgajny corn - - -
Słupia Wielka grasses - 258 81
Winna Góra sugar beet - 323 67
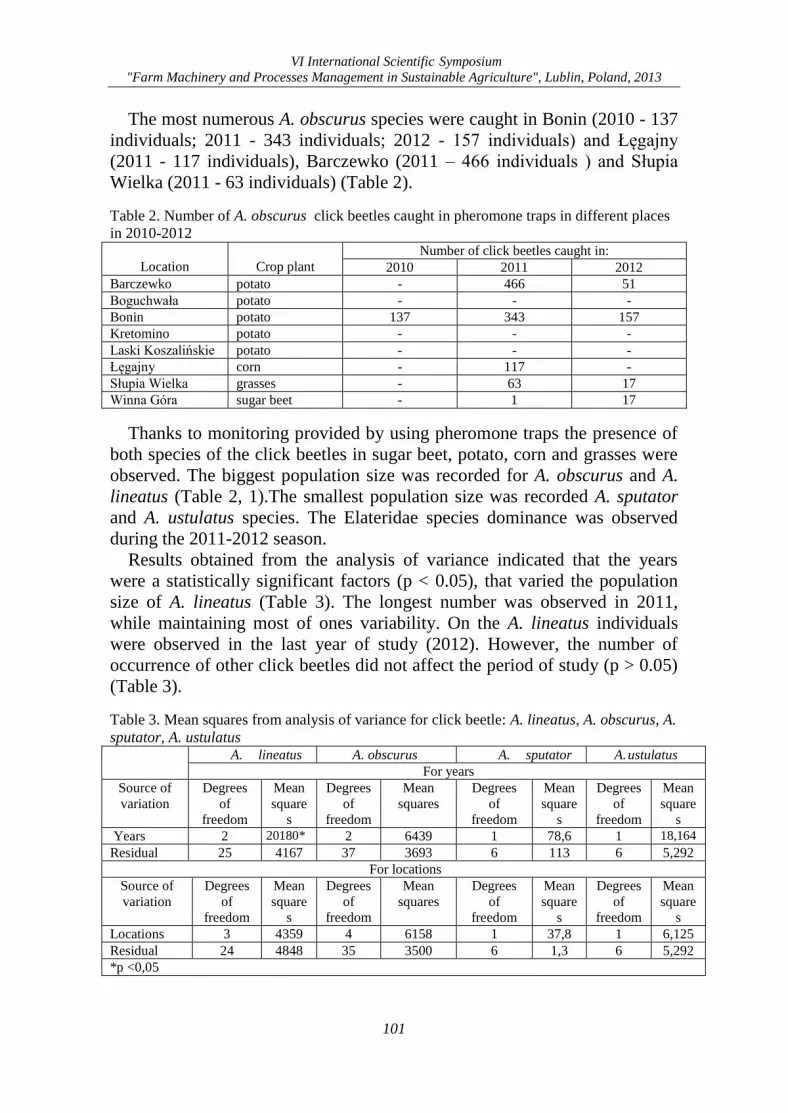
VI International Scientific Symposium
"Farm Machinery and Processes Management in Sustainable Agriculture", Lublin, Poland, 2013
101
The most numerous A. obscurus species were caught in Bonin (2010 - 137
individuals; 2011 - 343 individuals; 2012 - 157 individuals) and Łęgajny
(2011 - 117 individuals), Barczewko (2011 – 466 individuals ) and Słupia
Wielka (2011 - 63 individuals) (Table 2).
Table 2. Number of A. obscurus click beetles caught in pheromone traps in different places
in 2010-2012
Location
Crop plant
Number of click beetles caught in:
2010 2011 2012
Barczewko potato - 466 51
Boguchwała potato - - -
Bonin potato 137 343 157
Kretomino potato - - -
Laski Koszalińskie potato - - -
Łęgajny corn - 117 -
Słupia Wielka grasses - 63 17
Winna Góra sugar beet - 1 17
Thanks to monitoring provided by using pheromone traps the presence of
both species of the click beetles in sugar beet, potato, corn and grasses were
observed. The biggest population size was recorded for A. obscurus and A.
lineatus (Table 2, 1).The smallest population size was recorded A. sputator
and A. ustulatus species. The Elateridae species dominance was observed
during the 2011-2012 season.
Results obtained from the analysis of variance indicated that the years
were a statistically significant factors (p < 0.05), that varied the population
size of A. lineatus (Table 3). The longest number was observed in 2011,
while maintaining most of ones variability. On the A. lineatus individuals
were observed in the last year of study (2012). However, the number of
occurrence of other click beetles did not affect the period of study (p > 0.05)
(Table 3).
Table 3. Mean squares from analysis of variance for click beetle: A. lineatus, A. obscurus, A.
sputator, A. ustulatus
A. lineatus A. obscurus A. sputator A. ustulatus
For years
Source of
variation
Degrees
of
freedom
Mean
square
s
Degrees
of
freedom
Mean
squares
Degrees
of
freedom
Mean
square
s
Degrees
of
freedom
Mean
square
s
Years 2 20180* 2 6439 1 78,6 1 18,164
Residual 25 4167 37 3693 6 113 6 5,292
For locations
Source of
variation
Degrees
of
freedom
Mean
square
s
Degrees
of
freedom
Mean
squares
Degrees
of
freedom
Mean
square
s
Degrees
of
freedom
Mean
square
s
Locations 3 4359 4 6158 1 37,8 1 6,125
Residual 24 4848 35 3500 6 1,3 6 5,292
*p <0,05
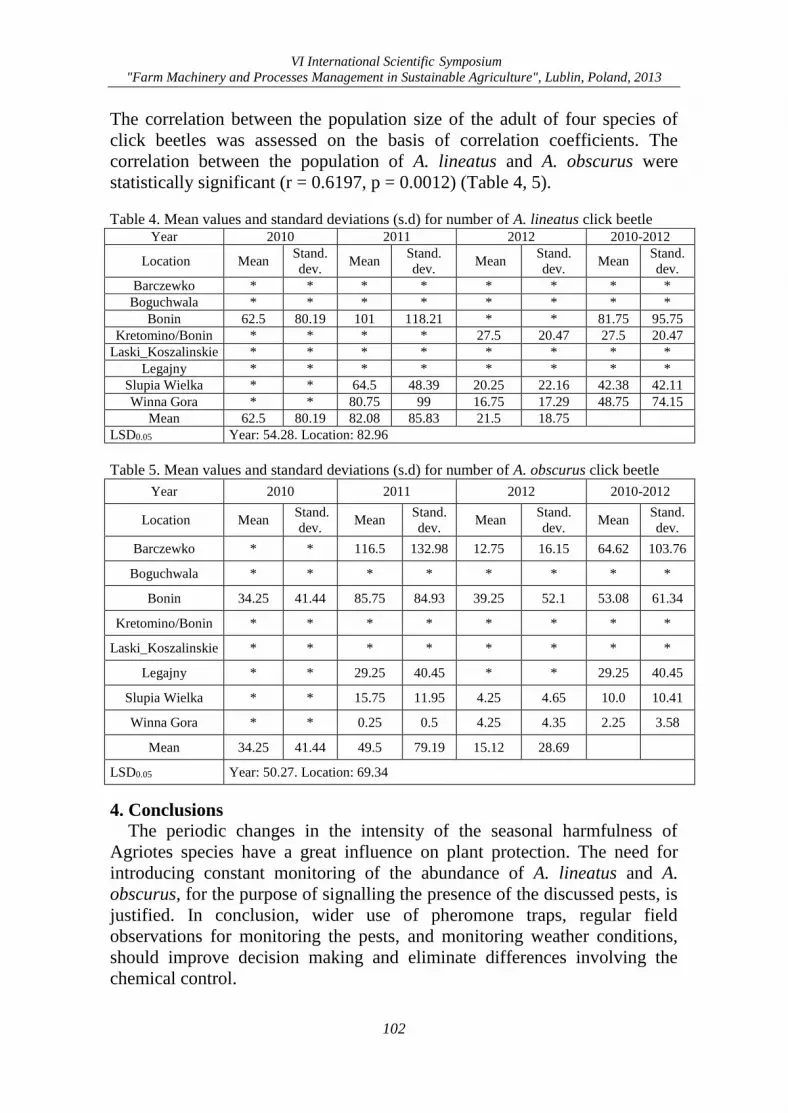
VI International Scientific Symposium
"Farm Machinery and Processes Management in Sustainable Agriculture", Lublin, Poland, 2013
102
The correlation between the population size of the adult of four species of
click beetles was assessed on the basis of correlation coefficients. The
correlation between the population of A. lineatus and A. obscurus were
statistically significant (r = 0.6197, p = 0.0012) (Table 4, 5).
Table 4. Mean values and standard deviations (s.d) for number of A. lineatus click beetle Year 2010 2011 2012 2010-2012
Location Mean Stand.
dev. Mean
Stand.
dev. Mean
Stand.
dev. Mean
Stand.
dev.
Barczewko * * * * * * * *
Boguchwala * * * * * * * *
Bonin 62.5 80.19 101 118.21 * * 81.75 95.75
Kretomino/Bonin * * * * 27.5 20.47 27.5 20.47
Laski_Koszalinskie * * * * * * * *
Legajny * * * * * * * *
Slupia Wielka * * 64.5 48.39 20.25 22.16 42.38 42.11
Winna Gora * * 80.75 99 16.75 17.29 48.75 74.15
Mean 62.5 80.19 82.08 85.83 21.5 18.75
LSD0.05 Year: 54.28. Location: 82.96
Table 5. Mean values and standard deviations (s.d) for number of A. obscurus click beetle
Year 2010 2011 2012 2010-2012
Location Mean Stand.
dev. Mean
Stand.
dev. Mean
Stand.
dev. Mean
Stand.
dev.
Barczewko * * 116.5 132.98 12.75 16.15 64.62 103.76
Boguchwala * * * * * * * *
Bonin 34.25 41.44 85.75 84.93 39.25 52.1 53.08 61.34
Kretomino/Bonin * * * * * * * *
Laski_Koszalinskie * * * * * * * *
Legajny * * 29.25 40.45 * * 29.25 40.45
Slupia Wielka * * 15.75 11.95 4.25 4.65 10.0 10.41
Winna Gora * * 0.25 0.5 4.25 4.35 2.25 3.58
Mean 34.25 41.44 49.5 79.19 15.12 28.69
LSD0.05 Year: 50.27. Location: 69.34
4. Conclusions
The periodic changes in the intensity of the seasonal harmfulness of
Agriotes species have a great influence on plant protection. The need for
introducing constant monitoring of the abundance of A. lineatus and A.
obscurus, for the purpose of signalling the presence of the discussed pests, is
justified. In conclusion, wider use of pheromone traps, regular field
observations for monitoring the pests, and monitoring weather conditions,
should improve decision making and eliminate differences involving the
chemical control.
VI International Scientific Symposium
"Farm Machinery and Processes Management in Sustainable Agriculture", Lublin, Poland, 2013
103
5. References [1] Erlichowski T. 2007. Nowe metody monitorowania i zwalczania szkodników
glebowych (ze szczególnym uwzględnieniem drutowców – Elateridae) w uprawach
ziemniaka. Wieś Jutra 2 (103): 1-3.
[2] Erlichowski T. 2009. Nowe metody wykrywania obecności sprężykowatych
(Koleoptera: Elateridae) w uprawach ziemniaka z wykorzystaniem pułapek
przynetowych i feromonowych. Prog. Plant Protection/Post. Ochr Roślin 49(4): 1691-
1696.
[3] GenStat. 2007 GenStat Release 10 Reference Manual. Lawes Agricultural Trust,
Rothamsted, UK.
[4] Kozak M., Bocianowski J., Rybiński W. 2013. Note on the use of coefficient of
variation for data from Agricultural experiments. Bulgarian Journal of Agricultural
Science 19 (4): 644-646.
[5] Pusz M., Bawoł S., Jakubowska M. 2013. Efektywność odłowów gatunków z rodzin
Noctuidae i Elateridae za pomocą pułapek feromonowych w powiecie olsztyńskim w
latach 2011-2012. Prog. Plant Protection/Post. Ochr Roślin 53 (4) – in print.
[6] Shapiro S.S., Wilk M.B. 1965. An analysis of variance test for normality (complete
samples). Biometrika 52: 591-611.
[7] Tóth M., Furlan L., Szarukan I., Ujvary I. 2002. Geranyl hexanoate atracting male click
beetle A. rufipalpis (B) and A. sordidus (Ill.). J.Appl. Ent. 126: 312-314.

VI International Scientific Symposium
"Farm Machinery and Processes Management in Sustainable Agriculture", Lublin, Poland, 2013
104
VI International Scientific Symposium
"Farm Machinery and Processes Management in Sustainable Agriculture", Lublin, Poland, 2013
105
THE EFFECTIVENESS OF SELECTED BIOLOGICAL
COMPOUNDS IN THE CARROTS AND PARSLEY SEED
PRODUCTION
Regina JANAS1, Mieczysław GRZESIK1, Zdzisława ROMANOWSKA-DUDA2 1Research Institute of Horticulture in Skierniewice, POLAND 2University of Lodz, Department of Ecophysiology and Plant Development, Łódź, POLAND
e-mail: [email protected]
Keywords: seeds, biological compounds, carrots, parsley
1. Introduction
The effective, from January 2014, rules concerning the protection of
plants by integrated methods oblige to reduce chemical compounds and
replace them by biological preparations. In the production of horticultural
crops, especially vegetable seed production, a major problem is the lack of
biological agents, as well as the limited number of research indicating the
phytotoxic effects of this compounds on forming, aging, health and quality
of reproduced seeds. It concerns particularly the economically important
plant species, including carrots and parsley [Gruszecki 2006, Dorna 2007,
Dorna et al. 2008, Janas 2013].
Seed production of carrots and parsley is difficult and creates a lot of
problems. The seeds of these species, and especially parsley, generally
exhibit low germination caused by the high occupation of pathogenic
microflora. Most of pathogens of the mentioned vegetable species seeds
move from seeds to plants, causing difficulties in controlling infectious
diseases. Poor germination results in low and uneven plant emergence and in
reduced yield of crops and seeds, in the first year of cultivation [Tylkowska,
Binek 1996, Nowicki 2002, 2002a, Wagner et al. 2003, Farrar et al. 2004,
Irzykowska et al. 2007].
The used seed dressings and fungicides for plant protection are not
always effective and many of them will be withdrawn and not allowed in
protection of integrated or organic crops. Therefore, the efficient biological
agents and methods are sought to improve the health and quality of seeds or
plants.
2. Material and methods
The study was performed in 2010-2012 in the experimental field of
the Institute of Horticulture in Skierniewice. The material for the study were
plants and seeds of carrot (Daucus carota L.) and parsley root (Petroselinum
sativum L.), obtained from plants grown organically. In the cultivation of the
mentioned species, the biological agents with different mechanisms of action
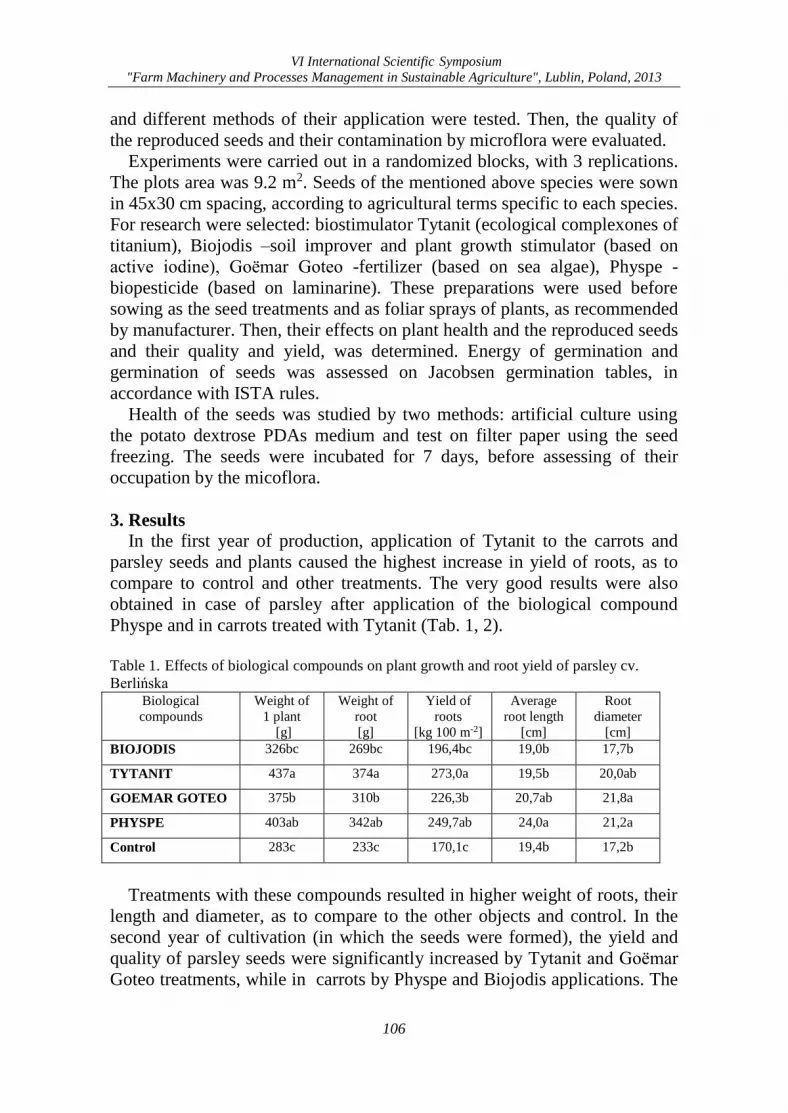
VI International Scientific Symposium
"Farm Machinery and Processes Management in Sustainable Agriculture", Lublin, Poland, 2013
106
and different methods of their application were tested. Then, the quality of
the reproduced seeds and their contamination by microflora were evaluated.
Experiments were carried out in a randomized blocks, with 3 replications.
The plots area was 9.2 m2. Seeds of the mentioned above species were sown
in 45x30 cm spacing, according to agricultural terms specific to each species.
For research were selected: biostimulator Tytanit (ecological complexones of
titanium), Biojodis –soil improver and plant growth stimulator (based on
active iodine), Goëmar Goteo -fertilizer (based on sea algae), Physpe -
biopesticide (based on laminarine). These preparations were used before
sowing as the seed treatments and as foliar sprays of plants, as recommended
by manufacturer. Then, their effects on plant health and the reproduced seeds
and their quality and yield, was determined. Energy of germination and
germination of seeds was assessed on Jacobsen germination tables, in
accordance with ISTA rules.
Health of the seeds was studied by two methods: artificial culture using
the potato dextrose PDAs medium and test on filter paper using the seed
freezing. The seeds were incubated for 7 days, before assessing of their
occupation by the micoflora.
3. Results
In the first year of production, application of Tytanit to the carrots and
parsley seeds and plants caused the highest increase in yield of roots, as to
compare to control and other treatments. The very good results were also
obtained in case of parsley after application of the biological compound
Physpe and in carrots treated with Tytanit (Tab. 1, 2).
Table 1. Effects of biological compounds on plant growth and root yield of parsley cv.
Berlińska Biological
compounds
Weight of
1 plant
[g]
Weight of
root
[g]
Yield of
roots
[kg 100 m-2]
Average
root length
[cm]
Root
diameter
[cm]
BIOJODIS 326bc 269bc 196,4bc 19,0b 17,7b
TYTANIT 437a 374a 273,0a 19,5b 20,0ab
GOEMAR GOTEO 375b 310b 226,3b 20,7ab 21,8a
PHYSPE 403ab 342ab 249,7ab 24,0a 21,2a
Control 283c 233c 170,1c 19,4b 17,2b
Treatments with these compounds resulted in higher weight of roots, their
length and diameter, as to compare to the other objects and control. In the
second year of cultivation (in which the seeds were formed), the yield and
quality of parsley seeds were significantly increased by Tytanit and Goëmar
Goteo treatments, while in carrots by Physpe and Biojodis applications. The
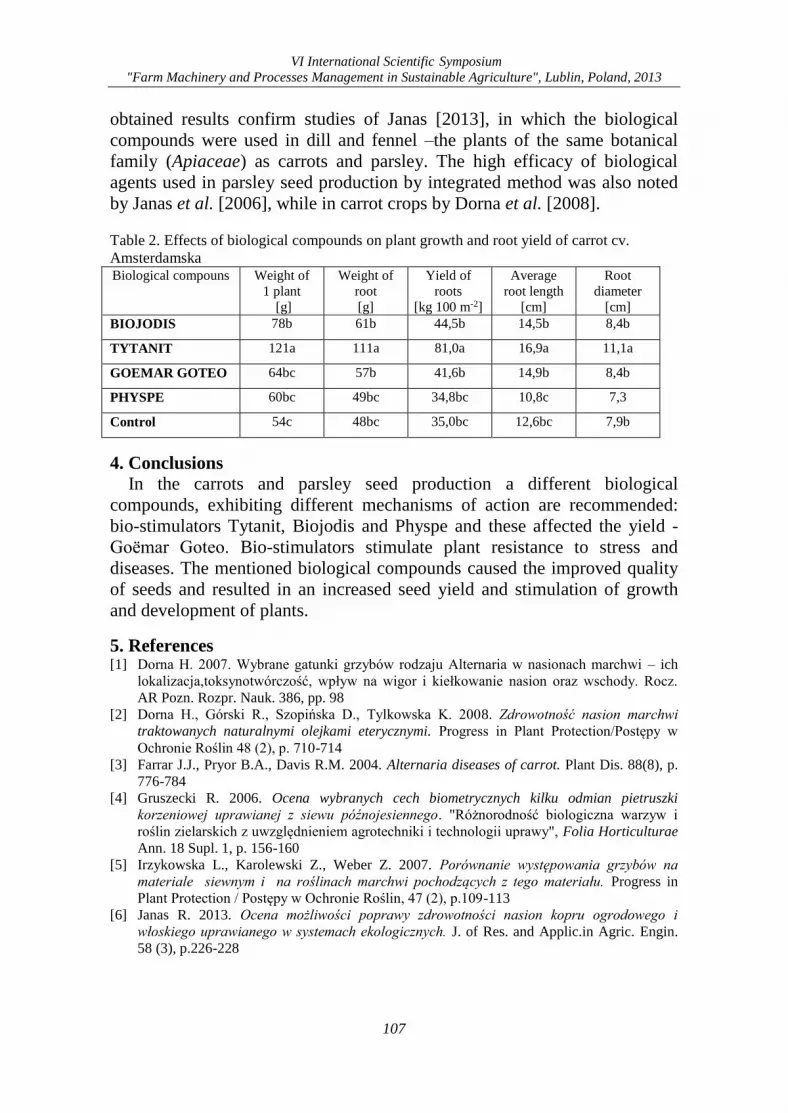
VI International Scientific Symposium
"Farm Machinery and Processes Management in Sustainable Agriculture", Lublin, Poland, 2013
107
obtained results confirm studies of Janas [2013], in which the biological
compounds were used in dill and fennel –the plants of the same botanical
family (Apiaceae) as carrots and parsley. The high efficacy of biological
agents used in parsley seed production by integrated method was also noted
by Janas et al. [2006], while in carrot crops by Dorna et al. [2008].
Table 2. Effects of biological compounds on plant growth and root yield of carrot cv.
Amsterdamska Biological compouns Weight of
1 plant
[g]
Weight of
root
[g]
Yield of
roots
[kg 100 m-2]
Average
root length
[cm]
Root
diameter
[cm]
BIOJODIS 78b 61b 44,5b 14,5b 8,4b
TYTANIT 121a 111a 81,0a 16,9a 11,1a
GOEMAR GOTEO 64bc 57b 41,6b 14,9b 8,4b
PHYSPE 60bc 49bc 34,8bc 10,8c 7,3
Control 54c 48bc 35,0bc 12,6bc 7,9b
4. Conclusions
In the carrots and parsley seed production a different biological
compounds, exhibiting different mechanisms of action are recommended:
bio-stimulators Tytanit, Biojodis and Physpe and these affected the yield -
Goëmar Goteo. Bio-stimulators stimulate plant resistance to stress and
diseases. The mentioned biological compounds caused the improved quality
of seeds and resulted in an increased seed yield and stimulation of growth
and development of plants.
5. References [1] Dorna H. 2007. Wybrane gatunki grzybów rodzaju Alternaria w nasionach marchwi – ich
lokalizacja,toksynotwórczość, wpływ na wigor i kiełkowanie nasion oraz wschody. Rocz.
AR Pozn. Rozpr. Nauk. 386, pp. 98
[2] Dorna H., Górski R., Szopińska D., Tylkowska K. 2008. Zdrowotność nasion marchwi
traktowanych naturalnymi olejkami eterycznymi. Progress in Plant Protection/Postępy w
Ochronie Roślin 48 (2), p. 710-714
[3] Farrar J.J., Pryor B.A., Davis R.M. 2004. Alternaria diseases of carrot. Plant Dis. 88(8), p.
776-784
[4] Gruszecki R. 2006. Ocena wybranych cech biometrycznych kilku odmian pietruszki
korzeniowej uprawianej z siewu późnojesiennego. "Różnorodność biologiczna warzyw i
roślin zielarskich z uwzględnieniem agrotechniki i technologii uprawy", Folia Horticulturae
Ann. 18 Supl. 1, p. 156-160
[5] Irzykowska L., Karolewski Z., Weber Z. 2007. Porównanie występowania grzybów na
materiale siewnym i na roślinach marchwi pochodzących z tego materiału. Progress in
Plant Protection / Postępy w Ochronie Roślin, 47 (2), p.109-113
[6] Janas R. 2013. Ocena możliwości poprawy zdrowotności nasion kopru ogrodowego i
włoskiego uprawianego w systemach ekologicznych. J. of Res. and Applic.in Agric. Engin.
58 (3), p.226-228
VI International Scientific Symposium
"Farm Machinery and Processes Management in Sustainable Agriculture", Lublin, Poland, 2013
108
[7] Janas R., Robak J., Sobolewski J. 2006. Wpływ integrowanej metody ochrony upraw
pietruszki nasiennej na jakość i zdrowotność materiału siewnego. Progress in Plant Prot/
Postępy w Ochronie Roślin, 46(1) p. 1229-1234
[8] Nowicki B. 2002. Carrot protection against complex of pathogens causing damping-off.
Vegetable Crops Res. Bull. 57 p. 83–94
[9] Nowicki B. 2002a. Ochrona pietruszki korzeniowej przed zgorzelą siewek. Acta Agrob. Vol.
55 (1) pp.255-263
[10] Tylkowska K., Biniek A. 1996. Fungi and germination of carrot and parsley seeds under
osmoconditioning and fungicide treatment. Phytopathologia-Polonica (12) p. 51-61
[11] Wagner A., Strudzińska A., Struszczyk H. 2003. Effect of some natural compounds on
Alternaria alternata Keiss. and Botrytis cinerea Pers. Bull. Pol. Acad. Sci. Biol. Scien. 51
(3) p. 287-290
VI International Scientific Symposium
"Farm Machinery and Processes Management in Sustainable Agriculture", Lublin, Poland, 2013
109
ANALYSIS OF PHYSICOCHEMICAL PROPERTIES OF RAW
MATERIALS OF AGRICULTURAL AND INDUSTRIAL ORIGIN
Magdalena KACHEL-JAKUBOWSKA 1, Agnieszka SUJAK 2, Siemowit MUSZYŃSKI2
1 University of Life Sciences in Lublin, Department of Machinery Exploitation and
Management of Production Processes, Lublin, POLAND 2
University of Life Sciences in Lublin, Department of Physics, Lublin, POLAND
e-mail: [email protected], [email protected],
Keywords: rape oil, glycerin, chlorophyll, lipids, fatty acids, MONG
Abbreviations: MONG - monoglyceri des/diglycerides/triglycerides/methyl ester/other
organics
1. Introduction
Proper management of the resources of a country should follow the
fundamental motto “Nothing can be wasted”, therefore all products created
as a result of human activity should be utilised to the maximum possible
extent, without causing any negative effect on the natural environment.
Among the great variety of raw materials with a broad spectrum of
applications we can distinguish rape seeds and all kinds of products of their
processing, namely oils, technical glycerine, distilled glycerine, or MONG
which is a by-product of its purification. Rapeseed (Brassica napus L) is one
of the most important crop plants used for the production of both edible and
industrial oils and glycerine in Poland as well as in Europe [Kachel-
Jakubowska et al. 2011, Gupta et al. 2007; Casséus 2009; Bhattacharjee
1991; Singh et al. 2007; Brauer, Röbbelen 1989]. Due to its high levels of
essential linoleic acids (ω-3 fatty acids), monounsaturated fatty acids,
polyphenols, phytosterols, that oil contains tocopherols having excellent
nutritional value and thus becomes indispensable in human diet. Due to its
mild aroma and its typical characteristic taste, it is used primarily as salad
oil, in margarines and other edible fats [Guderjan 2007].
The elimination of dyestuffs from the oil causes not only an improvement
of its colouring but also an increase in the stability of the product obtained,
especially in the case of cold pressing of oil [Krygier et al. 1996, 2000;
Dąbrowski et al. 1987]. However, the removal of chlorophyll accumulated in
the seeds is important as – under the effect of temperature and other factors –
it undergoes oxidation and hydrolysis, which causes the loss of proper
colouring of the seeds, affecting the final colour quality of refined oil [Daun
1987; Gruszecki 1999; Jerzewska et al. 1986; Strobel et al. 2005].
As a result of increased production of bioesters, the biocomponent added
to diesel fuel, excess amounts of glycerine are produced, classified as a by-
VI International Scientific Symposium
"Farm Machinery and Processes Management in Sustainable Agriculture", Lublin, Poland, 2013
110
product. The producers and importers of fuels, obligated by the biofuel laws,
must add them both to petrol and diesel fuels. The production of every 10kg
of biodiesel generates about 1kg of glycerine (so-called glycerol) [Sabourin-
Provost 2009]. Glycerine is non-toxic and non-irritant, biodegradable and
suitable for recycling, and it is very stable under typical storage conditions
and compatible with numerous chemical substances. These properties permit
its use as a desiccant, a plasticiser, as an agent softening the skin, as a
thickener, lubricant, a sweetener, and an antifreeze. Thus it is used as a
component in cosmetics, personal hygiene cosmetology, medical products,
and food products [Ash and Ash, 2004]. However, all of those branches are
not capable of utilising all the glycerine produced, and therefore both in
Poland and abroad (Brazil, Great Britain) research has been initiated on the
possibility of using glycerol as a fuel for engines. Such a fuel could be used
in diesel engines.
2. Objective of the study
The objective of the study was to examine physico-chemical properties of
selected rape oils and rape oil by-products.
The following parameters of rape oils delivered by different providers
were evaluated: lipid content, fatty acids profile and chlorophyll content.
Calorific value was evaluated for rape oil by-products such as distilled
glycerine, technical glycerine and MONG fraction.
3. Materials and methods
Experimental material originated from Trzebinia Refinery S.A
(Bodaczów). The 30mL samples of industrial rape oil as well as five-liter
samples of distilled glycerine, technical glycerine and MONG fraction were
used. Rape seeds were collected at random from the resources provided by
17 different contractors from Lublin area according to the PN-EN ISO
542/1997 standard and stored under laboratory condition at the temperatures
between 19-220C and the humidity between 60-70%. All the rape seed
samples consisted of a mixture of different varieties of winter seeds collected
by individual supplier. Samples of rape oil-by products such as distilled
glycerine, technical glycerine and MONG fraction were obtained from the
Trzebinia Refinery S.A, Orlen Group.
Rapeseed oil was pressed on laboratory pressing stand using a HYBREN
6 worm extruder equipped with micrometric mesh strainers. The process of
pressing started after stabilization of the press temperature. After pressing of
c.a. 1.5 kg of raw material the temperature of extruder reached 70oC (TP6
laser pyrometer).
Chlorophylls a and b as well as carotenoids were determined
spectrophotometrically in the freshly pressed oil using a double-beam Varian
VI International Scientific Symposium
"Farm Machinery and Processes Management in Sustainable Agriculture", Lublin, Poland, 2013
111
Model Cary 300Bio spectrophotometer. Samples of oil were diluted 5 times
in acetone and the spectrum measured between 350 and 700 nm.
Concentrations of chlorophylls and total carotenoids from 3 independent
measurements were calculated according to the procedure of Lichtenthaler
and Buschmann [Lichtenthaler and Buschmann, 2001].
The values of heat of combustion of the oil was evaluated with means of
LECO AC 600 type calorimeter.
The measurement consisted in the perfect combustion of the 1 g
(+/- 0.0002 g) standardised samples in bomb calorimeter pressurised with
3 MPa oxygen. The internal atmosphere was saturated with water. The
measurements were conveyed in three independent repetitions, and the
reading was done after ca. 5 min. after the process stabilized (according
PN-86/C-04062).
Fatty acids content was determined with means of gas chromatograph
Varian 450-GC, supplied with Galaxie™ Chromatography Data System.
Statistical analysis included mean values, standard deviations (S.D.) as well
as the data correlation matrices. All the calculations were done with means
of Statistica 6.0 by Statsoft.
4. Results and discussion
Preliminary analysis of selected results revealed that the calorific value of
rapeseed oil varied within the range from 9194 to 9847 kJ/kg, the calorific
value of technical glycerine was 1806 kJ/kg, that of distilled glycerine was
1703 kJ/kg, and of MONG - 1134 kJ/kg.
The content of the particular saturated fatty acids in samples of oil was in
the range from 5.20% to 7.70% of the total acids content. The level of
unsaturated acids was in the range from 92.32% to 95.08% of total acids
content. In technical glycerine the presence of saturated fatty acids was noted
at the level of 59.5%, while in distilled glycerine the whole, i.e. 100% of the
total acids content, was constituted by saturated fatty acids. The content of
83.92% of the total acids content was noted for MONG.
On the basis of the research performed it can be concluded that the raw
materials under analysis are characterised by all the parameters that make
them interesting from the viewpoint of both the agriculture and the industry.
5. Literature [1] Ash, M., Ash, I., 2004. Handbook of Preservatives. Synapse Info. Resources, USA.
[2] Bhattacharjee, J.B., 1991. Social and Polity Formations in Pre-Colonial North-East
India: the Barak Valley Experience. Har-Anand & Vikas House, New Delhi, 180 pp.
[3] Bocheński C., Bocheńska A., 2008. Olej rzepakowy paliwem do silników diesla.
Czasopismo techniczne M. Wydawnictwo Politechniki Krakowskiej, 134-142.
[4] Brauer, V.D., Röbbelen, G., 1989. Development and future of rapeseed production in the
Federal Republic of Germany. Fat. Sci. Technol. 91, 158–164 (in German).
VI International Scientific Symposium
"Farm Machinery and Processes Management in Sustainable Agriculture", Lublin, Poland, 2013
112
[5] Casséus, L., 2009. Canola: a Canadian success story. Component of Statistics Canada
Catalogue, pp. 96–325, http://www.statcan.gc.ca/ (accessed 12.09.13).
[6] Cieślikowski B., Juliszewski T., Łapczyńska-Kordon B. 2006. Utylizacja na cele
energetyczne produktów ubocznych technologii biopaliwowej. Inż. Rol. 12, 51-57.
[7] Dąbrowski K., Peć K., Rutkowski A., Kopczyński. 1987. Zmiany zawartości substancji
niepożądanych w trakcie dojrzewania nasion uszlachetnionych odmian rzepaku. Wyniki badań
nad rzepakiem ozimym IHAR, 121 – 129.
[8] Daun J.K. 1987. Chlorophyll in Canadian Canda snd Rapeseed and its role In grading. 7th
International Rapeseed Congress, Poznań, Poland, 1451-1456.
[9] Gruszecki, W.I. 1999. Carotenoids in membranes. w: "The Photochemistry of Carotenoids",
Frank, H.A., Young, A.J., Britton, G, Cogdell, R.J. eds., Kluwer Acad. Publ., pp. 363-379.
[10] Guderjan M., Elez-Martínez P., Knorr D. 2007. Application of pulsed electric fields at
oil yield and content of functional food ingredients at the production of rapeseed oil.
Innovative Food Science and Emerging Technologies 8, 55–62.
[11] Gupta, S.K., Pratap, A., 2007. History, origin, and evolution. In: Gupta, S.K.
(Ed.),Advances in Botanical Research: Incorporating Advances in Plant Pathology, vol.
45. Academic Press/Elsevier, San Diego, pp. 1–20.
[12] Jerzewska M., Płatek T. 1986. Instrumentalna metoda oznaczania barwników olejów roślinnych
z wykorzystaniem aparatu Spekol – 11. Tłuszcze Jadalne, XXIV (2), 10 – 21.
[13] Kachel-Jakubowska M., Kraszkiewicz A, Szpryngiel M., Niedziółka I. 2011.
Możliwości wykorzystania odpadów poprodukcyjnych z rzepaku ozimego na cele
energetyczne. Inż. Roln. 6 (131), 61-68.
[14] Krygier K., Obiedziński M., Ratusz K. 1996. Wpływ procesu bielenia na jakość oleju
rzepakowego tłoczonego na zimno. Rośliny Oleiste, 455 – 459.
[15] Krygier K., Wroniak M., Grześkiewicz S. 2000. Badania wpływu zawartości nasion
uszkodzonych na jakość oleju rzepakowego tłoczonego na zimno. Rośliny Oleiste IHAR, 587 –
596.
[16] Singh, R., Sharma, S.K., 2007. Evaluation, maintenance, and conservation of
germoplasm. In: Gupta, S.K. (Ed.), Advances in Botanical Research: Incorporating
Advances in Plant Pathology, vol. 45. Academic Press/Elsevier, San Diego, pp. 466–
481.
[17] Strobel W., Tys J., Sujak A., Gagoś M., Żak W., Kotlarz A., Rybacki R. 2005. Wpływ
technologii zbioru na zawartość chlorofili i karotenoidów w nasionach rzepaku, wytłokach i
oleju. Rośliny Oleiste, XXVI (2), 479-487.
[18] Sabourin-Provost G, Hallenbeck PC., 2009. High yield conversion of a crude glycerol
fractionfrombiodiesel productiontohydrogen by photofermentation. Bioresour Technol;
100:3513e7.
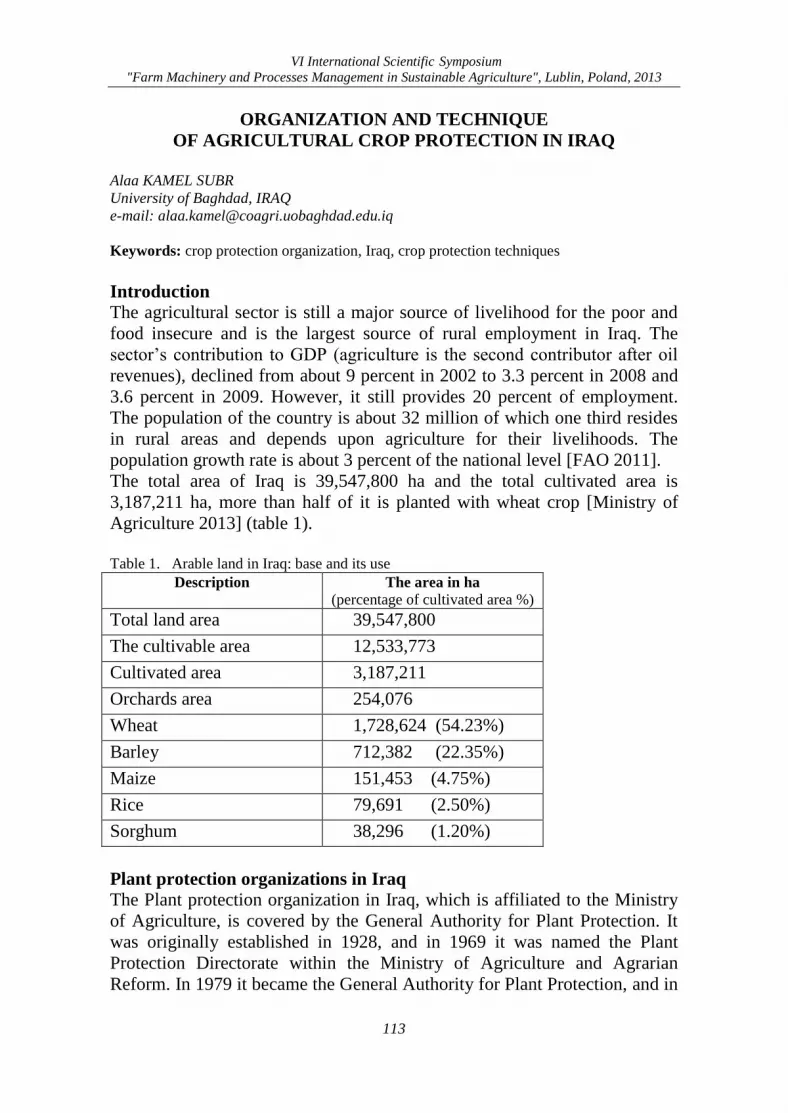
VI International Scientific Symposium
"Farm Machinery and Processes Management in Sustainable Agriculture", Lublin, Poland, 2013
113
ORGANIZATION AND TECHNIQUE
OF AGRICULTURAL CROP PROTECTION IN IRAQ
Alaa KAMEL SUBR
University of Baghdad, IRAQ
e-mail: [email protected]
Keywords: crop protection organization, Iraq, crop protection techniques
Introduction
The agricultural sector is still a major source of livelihood for the poor and
food insecure and is the largest source of rural employment in Iraq. The
sector’s contribution to GDP (agriculture is the second contributor after oil
revenues), declined from about 9 percent in 2002 to 3.3 percent in 2008 and
3.6 percent in 2009. However, it still provides 20 percent of employment.
The population of the country is about 32 million of which one third resides
in rural areas and depends upon agriculture for their livelihoods. The
population growth rate is about 3 percent of the national level [FAO 2011].
The total area of Iraq is 39,547,800 ha and the total cultivated area is
3,187,211 ha, more than half of it is planted with wheat crop [Ministry of
Agriculture 2013] (table 1).
Table 1. Arable land in Iraq: base and its use
Description The area in ha
(percentage of cultivated area %)
Total land area 39,547,800
The cultivable area 12,533,773
Cultivated area 3,187,211
Orchards area 254,076
Wheat 1,728,624 (54.23%)
Barley 712,382 (22.35%)
Maize 151,453 (4.75%)
Rice 79,691 (2.50%)
Sorghum 38,296 (1.20%)
Plant protection organizations in Iraq
The Plant protection organization in Iraq, which is affiliated to the Ministry
of Agriculture, is covered by the General Authority for Plant Protection. It
was originally established in 1928, and in 1969 it was named the Plant
Protection Directorate within the Ministry of Agriculture and Agrarian
Reform. In 1979 it became the General Authority for Plant Protection, and in
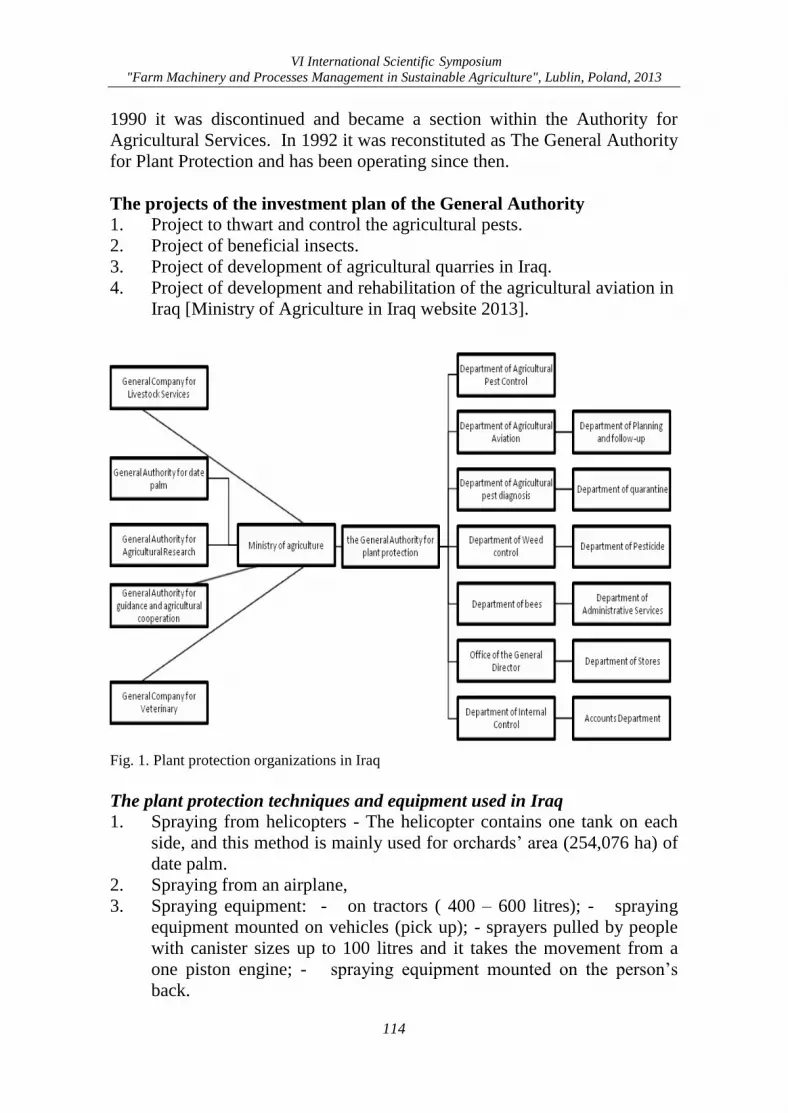
VI International Scientific Symposium
"Farm Machinery and Processes Management in Sustainable Agriculture", Lublin, Poland, 2013
114
1990 it was discontinued and became a section within the Authority for
Agricultural Services. In 1992 it was reconstituted as The General Authority
for Plant Protection and has been operating since then.
The projects of the investment plan of the General Authority
1. Project to thwart and control the agricultural pests.
2. Project of beneficial insects.
3. Project of development of agricultural quarries in Iraq.
4. Project of development and rehabilitation of the agricultural aviation in
Iraq [Ministry of Agriculture in Iraq website 2013].
Fig. 1. Plant protection organizations in Iraq
The plant protection techniques and equipment used in Iraq
1. Spraying from helicopters - The helicopter contains one tank on each
side, and this method is mainly used for orchards’ area (254,076 ha) of
date palm.
2. Spraying from an airplane,
3. Spraying equipment: - on tractors ( 400 – 600 litres); - spraying
equipment mounted on vehicles (pick up); - sprayers pulled by people
with canister sizes up to 100 litres and it takes the movement from a
one piston engine; - spraying equipment mounted on the person’s
back.
VI International Scientific Symposium
"Farm Machinery and Processes Management in Sustainable Agriculture", Lublin, Poland, 2013
115
There are different types of sprayers used to protect the crop. Most of the
protection process is done by the General Authority for Plant Protection.
The national campaign
Date palm control campaign: The government of Iraq organizes a free
national campaign carried out by the Ministry of Agriculture - General
Authority for Plant Protection - Department of Agricultural Aviation to
combat the lesser date moth (Batrachedra amydraula) and dubas bug
(Ommatissus lybicus) on the date palm every year .It usually takes
place at the beginning of April or May for the Spring generation and in
September for Autumnal generation in every year.
Wheat weeds control campaign: The process of controlling wheat
weeds starts at the beginning of October, the control process starts with
conducting field trips to the wheat fields and doing the necessary
surveys for the fields using the wooden box to calculate the density of
the weeds to see what kinds of weed is spreading, this is done through
special forms prepared for this purpose [General Authority for Plant
Protection 2012].
Pesticide registration procedure
In Iraq a new pesticide should be registered before being used. To register a
new pesticide the person or the company who imports the pesticide needs to
fill in the pesticide registration form and provide some documents and
certificates. The pesticide registration procedure requires the following:
1. Provide a required document, for example the certificate of pesticide
registration in the country in which this pesticide was produced and
certificates of chemical and physical analyses.
2. Provide general information about the pesticide and the company
which produced it.
3. Provide data about the active ingredient.
4. Provide data on formulated products.
5. The toxicity of the active ingredient and end use product.
6. Fate in plants and residues in target crops.
7. The assessment of consumer risk.
8. Environmental fate and ecotoxicology.
9. Biological properties and target pests and crops.
10. Mode of action (how the pesticide influences on the disease).
11. Uses and recommendations.
12. Crop tolerance and compatibility.
13. Safety handling.
14. Storage and disposal.
15. Type of container and packaging materials.
VI International Scientific Symposium
"Farm Machinery and Processes Management in Sustainable Agriculture", Lublin, Poland, 2013
116
16. Fill in the form of pesticide producer company which contains general
information about the company, information about the research and
production divisions in the company and control laboratories.
17. All the forms, documents and certificates should be provided to the
national committee for pesticide registration and approval – Ministry of
Agriculture [Ministry of Agriculture in Iraq website 2013].
Conclusions
The General Authority for Plant Protection continues to secure the provision
of pesticides for control campaigns and give support to state-owned
companies that produce pesticides, and continue to provide free control
campaigns as well as the database of all diseases that infect plants and the
results of each campaign and its efficiency.
References [1] Annual statistical data for agricultural activity for the year 2012. Ministry of
Agriculture/Department of Planning /Department of Statistics. Baghdad, Iraq , p. 3-16.
[2] FAO investment centre 2011. Agriculture sector note /Iraq. Rome, Italy, pp.16.
[3] General Authority for Plant Protection 2012. Protection letter, issue 1,3,4,6,7,9,10 .
Baghdad, Iraq.
[4] Ministry of Agriculture in Iraq website 2013,
http://www.zeraa.gov.iq/ar/index.php?name=Pages&op=page&pid=160
VI International Scientific Symposium
"Farm Machinery and Processes Management in Sustainable Agriculture", Lublin, Poland, 2013
117
COMPARISON OF THE QUALITY OF SEEDING
THE HERMAPHRODITA RUSBY SEEDS BY S071 KRUK SEEDER
IN LABORATORY AND FIELD CONDITIONS
Józef KOWALCZUK1, Janusz ZARAJCZYK1, Norbert LESZCZYŃSKI1, Agnieszka STAREK2,
Jacek MAZUR2, Alicja WIECZORKOWSKA3, Piotr MARKOWSKI4
University of Life Science in Lublin, POLAND 1Department of Horticultural and Forest Machinery, 2Department of Food Engineering and Machinery, 3Polish-Japanese Institute of Information Technology, Warszawa, POLAND 4University of Warmia and Mazury, Department of Heavy Duty Machines and Research
Methodology, Olsztyn, POLAND
Keywords: precision seeding, seeding quality
1. Introduction Properly performed act of seeding is one of the major factors determining
the volume and quality of the yield. Economic justification behind the
application of this seeding method is based on the fact that it allows to
reduce to a minimum the amount of the sown seeds and thus lower the
seeding costs.
Hermaphrodita Rusby, in America commonly known as Virginia
fanpetals, was brought to Poland in the fifties of the previous century and
since then has been used as a raw material providing energy. This plant
belongs to the family of Malvaceae. Virginia fanpetals can be reproduced
generatively through sowing seeds but also vegetatively. The growth and
development of this plant is basically undisturbed in our climate. Prior to
establishing a plantation of this plant, the most advantageous reproduction
method should be chosen. It was observed that 1 or 2 year old seeds
germinate easily in humid and not crusty soil but the initial growth of
seedlings is very slow and the plantation requires intensive weed control.
Most frequently applied method of Virginia fanpetals reproduction is
sowing seeds while which it is crucial to properly and carefully arrange
individual seeds on a specified unit of surface and keep the same sowing
depth for all of them.
2. Material and methods
In the laboratory conditions the Virginia fanpetals seeds were sown onto a
sticky tape of the research stand. Then distances between them were
measured on 1-meter measurement sections in 5 repetitions and percentage
of single, duplicate and skipped plants was calculated. Single plants were
considered those between which the distance was bigger than half of the
average real distance and smaller or equal to 1.5 of the average real distance.
Duplicated plants were considered those which grew at distances smaller or
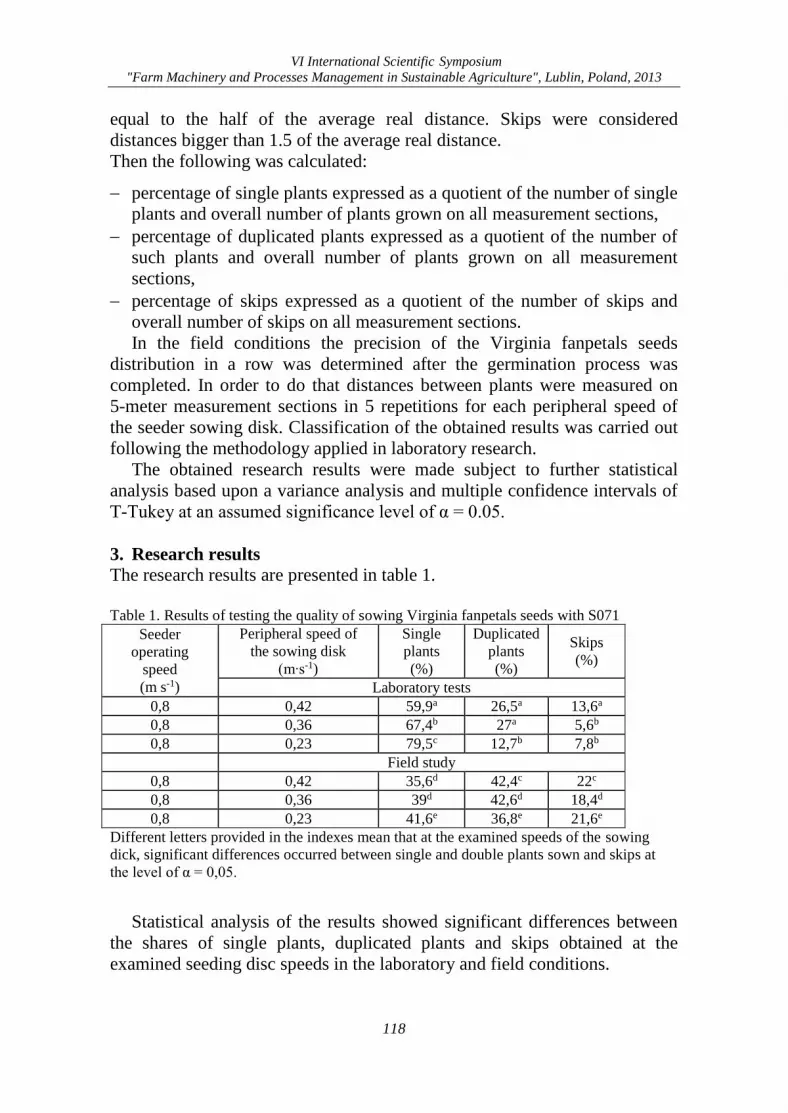
VI International Scientific Symposium
"Farm Machinery and Processes Management in Sustainable Agriculture", Lublin, Poland, 2013
118
equal to the half of the average real distance. Skips were considered
distances bigger than 1.5 of the average real distance.
Then the following was calculated:
percentage of single plants expressed as a quotient of the number of single
plants and overall number of plants grown on all measurement sections,
percentage of duplicated plants expressed as a quotient of the number of
such plants and overall number of plants grown on all measurement
sections,
percentage of skips expressed as a quotient of the number of skips and
overall number of skips on all measurement sections.
In the field conditions the precision of the Virginia fanpetals seeds
distribution in a row was determined after the germination process was
completed. In order to do that distances between plants were measured on
5-meter measurement sections in 5 repetitions for each peripheral speed of
the seeder sowing disk. Classification of the obtained results was carried out
following the methodology applied in laboratory research.
The obtained research results were made subject to further statistical
analysis based upon a variance analysis and multiple confidence intervals of
T-Tukey at an assumed significance level of α = 0.05.
3. Research results
The research results are presented in table 1.
Table 1. Results of testing the quality of sowing Virginia fanpetals seeds with S071
Seeder
operating
speed
(m s-1)
Peripheral speed of
the sowing disk
(m∙s-1)
Single
plants
(%)
Duplicated
plants
(%)
Skips
(%)
Laboratory tests
0,8 0,42 59,9a 26,5a 13,6a
0,8 0,36 67,4b 27a 5,6b
0,8 0,23 79,5c 12,7b 7,8b
Field study
0,8 0,42 35,6d 42,4c 22c
0,8 0,36 39d 42,6d 18,4d
0,8 0,23 41,6e 36,8e 21,6e
Different letters provided in the indexes mean that at the examined speeds of the sowing
dick, significant differences occurred between single and double plants sown and skips at
the level of α = 0,05.
Statistical analysis of the results showed significant differences between
the shares of single plants, duplicated plants and skips obtained at the
examined seeding disc speeds in the laboratory and field conditions.
VI International Scientific Symposium
"Farm Machinery and Processes Management in Sustainable Agriculture", Lublin, Poland, 2013
119
4. Conclusions
1. Significant influence of peripheral speed of the seeder’s sowing disk on
percentages of single, duplicate and skipped plants was observed.
2. Negative correlation of simple regression of shares of single, duplicated
and skipped seedlings shows that the shares decreased as the peripheral
speed of the S071 Kruk seeder sowing disk increased.
3. Most advantageous ratios related to the distribution of the seeds in a row
were obtained at the peripheral speed of the sowing disk of 0.23 m∙s-1.
4. At the examined peripheral speeds of the seeder sowing disk, the ratios
indicating the distribution of the seeds in a row obtained in laboratory
conditions were better than the ones obtained in the field conditions.
5. References [1] Banasiak J., Michalak J. 2000. Research on the quality of spotseeding. Problemy
Inżynierii Rolniczej [Problems of Agricultural Engineering], no. 4, pp. 21-28.
[2] Borkowska H., Styk B. 2003. Virginia fanpetals. Energy plants – collective work under
supervision of Kościska B Issued by Agricultural University in Lublin (in Polish), 79-93.
[3] Gaworski M. 1998. Seeders for vegetables – precision and modernity. Fruit, vegetables,
flowers, no. 17-18, 27, pp. 27-28.
[4] Kowalczuk J., Leszczyński N., Zarajczyk J., 2002. Assessment of the quality of work of
seeders: S011 Alex and Drop 1 while sowing carrot seeds. Zbirnik naukowich prac
Nacionalnogo Agrarnogo Uniwersitetu. Mechanizacia silskogospodarskogo
wirobnictwa. Kijów, t. 13, 311-315.
[5] Przybył J., Błażczak P. 2000. Assessment of work quality of precision seeders (in
Polish). Materials from Jubilee International Scientific Conference at 30th Anniversary of
Agricultural Technology Faculty at the Agricultural University in Lublin entitled:
“Current problems encountered in agricultural engineering in the light of Poland’s EU
accession”, Issued by Agricultural University in Lublin, Lublin 13-14 September, 154-
155.
[6] Walczyk J., 1992. Analysis of the possibilities to supplement skips in spot seeders.
Zeszyty Probl. Post. Nauk Rol., 404, 273-279.
[7] International standard ISO 7256/1-1884 (E). 1984. Sowing equipment – test methods
Part 1: Single seed drills.

VI International Scientific Symposium
"Farm Machinery and Processes Management in Sustainable Agriculture", Lublin, Poland, 2013
120
VI International Scientific Symposium
"Farm Machinery and Processes Management in Sustainable Agriculture", Lublin, Poland, 2013
121
ANALYSIS OF DURABILITY FEATURES OF PELLETS
USED IN POWER GENERATION
Józef KOWALCZUK1, Kazimierz ZAWIŚLAK2, Janusz ZARAJCZYK1, Paweł SOBCZAK2,
Agnieszka STAREK2 Jacek MAZUR2
University of Life Sciences in Lublin, POLAND 1Department of Horticultural and Forest Machinery, 2Department of Food Engineering and Machinery,
e-mail: [email protected]; [email protected]
Keywords: pellet, straw crushing
1. Introduction
One of the most modern and ecological fuels is pellet composed of
cylinder-shaped granules 10-50 mm long and 4-25 mm in diameter. Its
production involves the usage of waste materials such as: sawdust,
woodchips, corn straw, rape straw and other energy-related plants. It is made
through crushing and compressing of half-products under very high pressure.
The process also causes the calorific value of the product to condense and
thus we obtain a fuel of very good physical and chemical properties.
Pellet shows very low humidity of 8-12% only. In the combustion process
we obtain neutral balance of CO2 emission – the same as in the case of wood.
Besides the ash generated in the wood granulate combustion process may be
used as fertiliser. The calorific value of pellet, according to DIN 51731
ranges between 4.9 to 5.4 kWh·kg-1. When pellet combustion properties are
compared to the analogical parameters obtained in the process of coal or
various oil fraction combustion, significantly lower emission of harmful dust
and gas is observed.
2. Research material and methodology
The research material was obtained from URSUS S.A. Company situated
in Dobre Miasto. Examined were pellets made of various kinds of straw such
as: wheat, rye, maize, rape and olive. In order to determine the humidity of
the examined pellets, gravimetric method was applied, compliant with the
procedures described in norm [PN-93Z-15008/02].
After agglomeration, a durability test was conducted to check a pellet’s
resistance to crushing by INSTRON 4302 apparatus connected to a computer
and equipped with a load cell strain gauge of the pressure force of F=1kN;
the sweep speed was 25 mm·min-1. The pellet samples of every pellet type
were subject to uniaxial crushing. The samples were selected at random
(6 repetitions for each rotation speed of the gauge) during the process of their
condensation on the ring granulator at different gauge speeds, such as: 25, 38
and 45 revs·min-1.
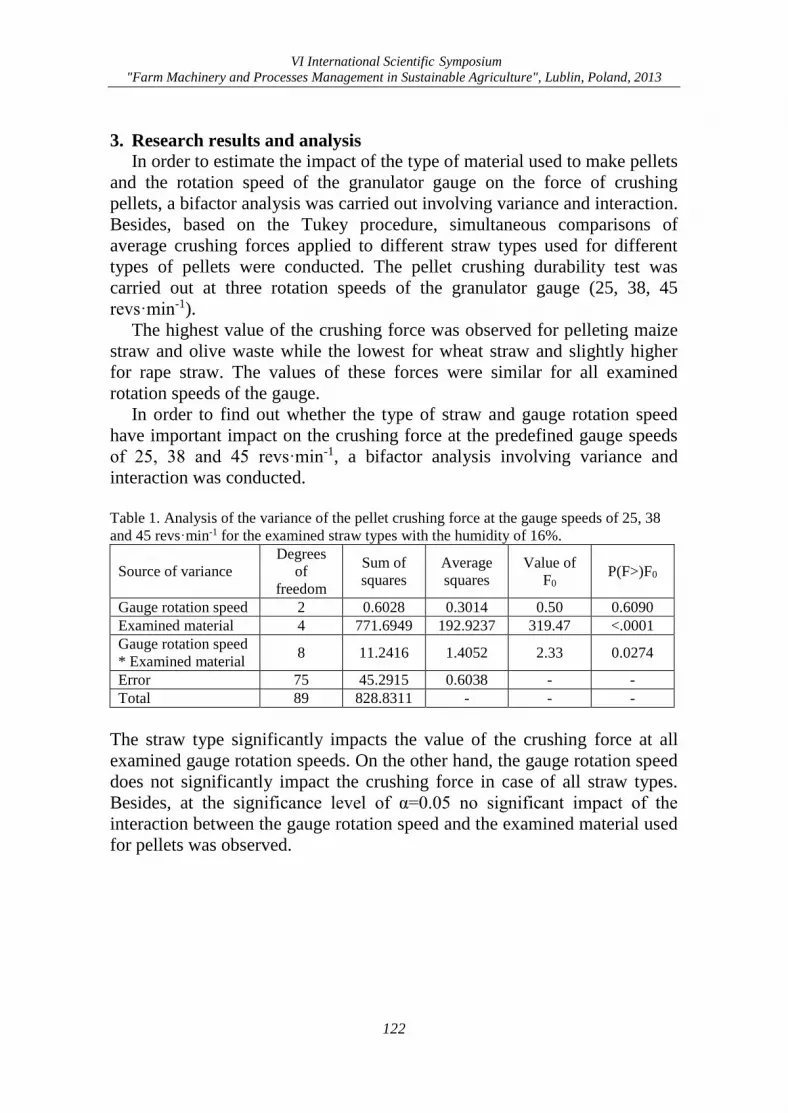
VI International Scientific Symposium
"Farm Machinery and Processes Management in Sustainable Agriculture", Lublin, Poland, 2013
122
3. Research results and analysis
In order to estimate the impact of the type of material used to make pellets
and the rotation speed of the granulator gauge on the force of crushing
pellets, a bifactor analysis was carried out involving variance and interaction.
Besides, based on the Tukey procedure, simultaneous comparisons of
average crushing forces applied to different straw types used for different
types of pellets were conducted. The pellet crushing durability test was
carried out at three rotation speeds of the granulator gauge (25, 38, 45
revs·min-1).
The highest value of the crushing force was observed for pelleting maize
straw and olive waste while the lowest for wheat straw and slightly higher
for rape straw. The values of these forces were similar for all examined
rotation speeds of the gauge.
In order to find out whether the type of straw and gauge rotation speed
have important impact on the crushing force at the predefined gauge speeds
of 25, 38 and 45 revs·min-1, a bifactor analysis involving variance and
interaction was conducted.
Table 1. Analysis of the variance of the pellet crushing force at the gauge speeds of 25, 38
and 45 revs·min-1 for the examined straw types with the humidity of 16%.
Source of variance
Degrees
of
freedom
Sum of
squares
Average
squares
Value of
F0 P(F>)F0
Gauge rotation speed 2 0.6028 0.3014 0.50 0.6090
Examined material 4 771.6949 192.9237 319.47 <.0001
Gauge rotation speed
* Examined material 8 11.2416 1.4052 2.33 0.0274
Error 75 45.2915 0.6038 - -
Total 89 828.8311 - - -
The straw type significantly impacts the value of the crushing force at all
examined gauge rotation speeds. On the other hand, the gauge rotation speed
does not significantly impact the crushing force in case of all straw types.
Besides, at the significance level of α=0.05 no significant impact of the
interaction between the gauge rotation speed and the examined material used
for pellets was observed.
VI International Scientific Symposium
"Farm Machinery and Processes Management in Sustainable Agriculture", Lublin, Poland, 2013
123
4. Conclusions
1. The research showed that the value of the crushing force depends on the
type of material used for pellet production.
2. Based on the conducted research, it can be stated that the granulator gauge
rotation speed, at the level of α=0.05 did not significantly impact the
value of the crushing force for the obtained pellets.
5. References [1] Jakubiak M., Kortylewski W 2008. Pelety podstawowym paliwem dla energetyki.
[Pellets as basic fuel for energy industry], Archiwum spalania 3-4(8), 1-12.
[2] Kraszkiewicz A., Kachel-Jakubowska M., Szpryngiel M., Niedziółka I. 2013. Analiza
wybranych cech jakościowych peletów wytworzonych z surowców roślinnych. [Analysis
of selected quality features of pellets made of plant materials] Inżynieria Rolnicza,
2(143), 167-173.
[3] Kornacki A., Maj G. 2011. Wybrane właściwości peletów wytworzonych z trawy
pozyskanej z trawnika przydomowego [Selected properties of pellets made of grass
obtained from a house-adjacent lawn]. Inżynieria Rolnicza, 1(126), 103-108.
[4] Skonecki S., Kulig R., Potręć M. 2011. Ciśnieniowe zagęszczanie trocin sosnowych i
topolowych – parametry procesu i jakość aglomeratu [Pressure condensation of pine and
poplar sawdust – process parameters and agglomerate quality]. Acta Agrophysica, 18(1),
149-160.
[5] Wiśniewski G. 2010. Analiza możliwości rozwoju produkcji urządzeń dla energetyki
odnawialnej w Polsce dla potrzeb krajowych i eksportu [Analysis of the possibilities to
develop production of devices for renewable energy in Poland for domestic and
exporting needs]. Instytut Energetyki Odnawialnej EC BREC IEO, Warszawa.
[6] Witt J., Kaltschmitt M. 2007. Mass pellets for the power plant section, VGB Powertech,
9(101).

VI International Scientific Symposium
"Farm Machinery and Processes Management in Sustainable Agriculture", Lublin, Poland, 2013
124
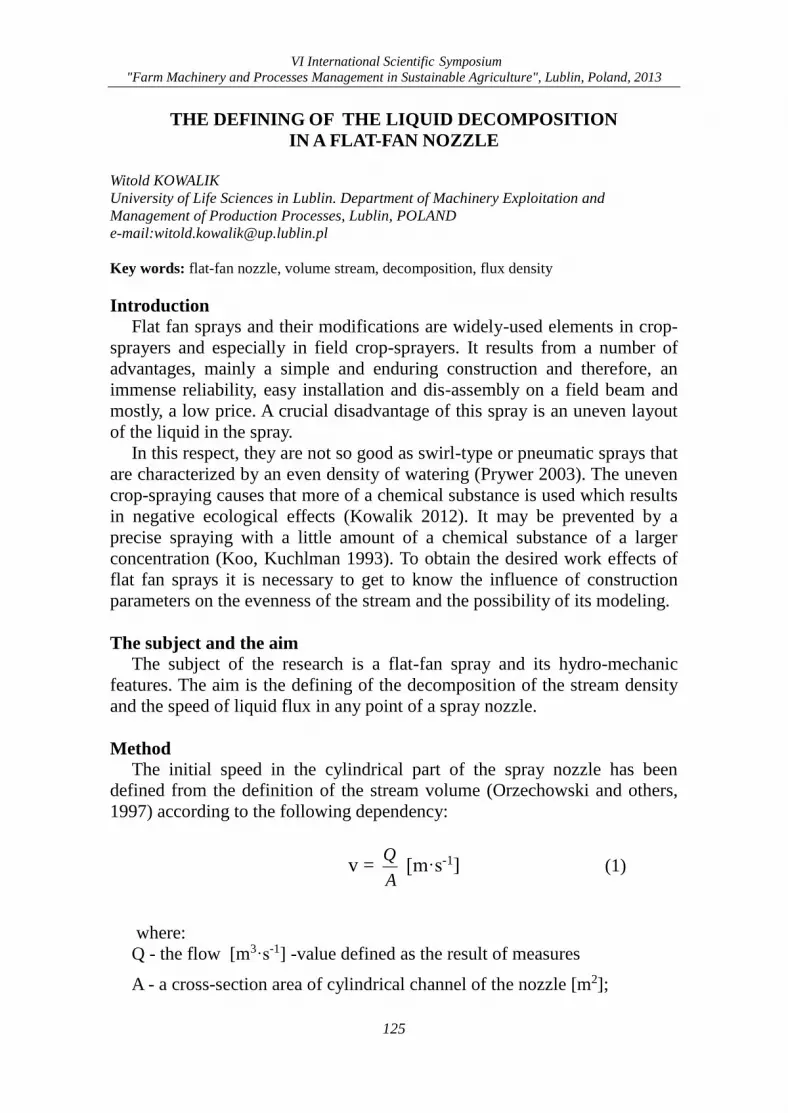
VI International Scientific Symposium
"Farm Machinery and Processes Management in Sustainable Agriculture", Lublin, Poland, 2013
125
THE DEFINING OF THE LIQUID DECOMPOSITION
IN A FLAT-FAN NOZZLE
Witold KOWALIK
University of Life Sciences in Lublin. Department of Machinery Exploitation and
Management of Production Processes, Lublin, POLAND
e-mail:[email protected]
Key words: flat-fan nozzle, volume stream, decomposition, flux density
Introduction
Flat fan sprays and their modifications are widely-used elements in crop-
sprayers and especially in field crop-sprayers. It results from a number of
advantages, mainly a simple and enduring construction and therefore, an
immense reliability, easy installation and dis-assembly on a field beam and
mostly, a low price. A crucial disadvantage of this spray is an uneven layout
of the liquid in the spray.
In this respect, they are not so good as swirl-type or pneumatic sprays that
are characterized by an even density of watering (Prywer 2003). The uneven
crop-spraying causes that more of a chemical substance is used which results
in negative ecological effects (Kowalik 2012). It may be prevented by a
precise spraying with a little amount of a chemical substance of a larger
concentration (Koo, Kuchlman 1993). To obtain the desired work effects of
flat fan sprays it is necessary to get to know the influence of construction
parameters on the evenness of the stream and the possibility of its modeling.
The subject and the aim
The subject of the research is a flat-fan spray and its hydro-mechanic
features. The aim is the defining of the decomposition of the stream density
and the speed of liquid flux in any point of a spray nozzle.
Method
The initial speed in the cylindrical part of the spray nozzle has been
defined from the definition of the stream volume (Orzechowski and others,
1997) according to the following dependency:
v = A
Q [m·s-1] (1)
where:
Q - the flow [m3·s-1] -value defined as the result of measures
A - a cross-section area of cylindrical channel of the nozzle [m2];
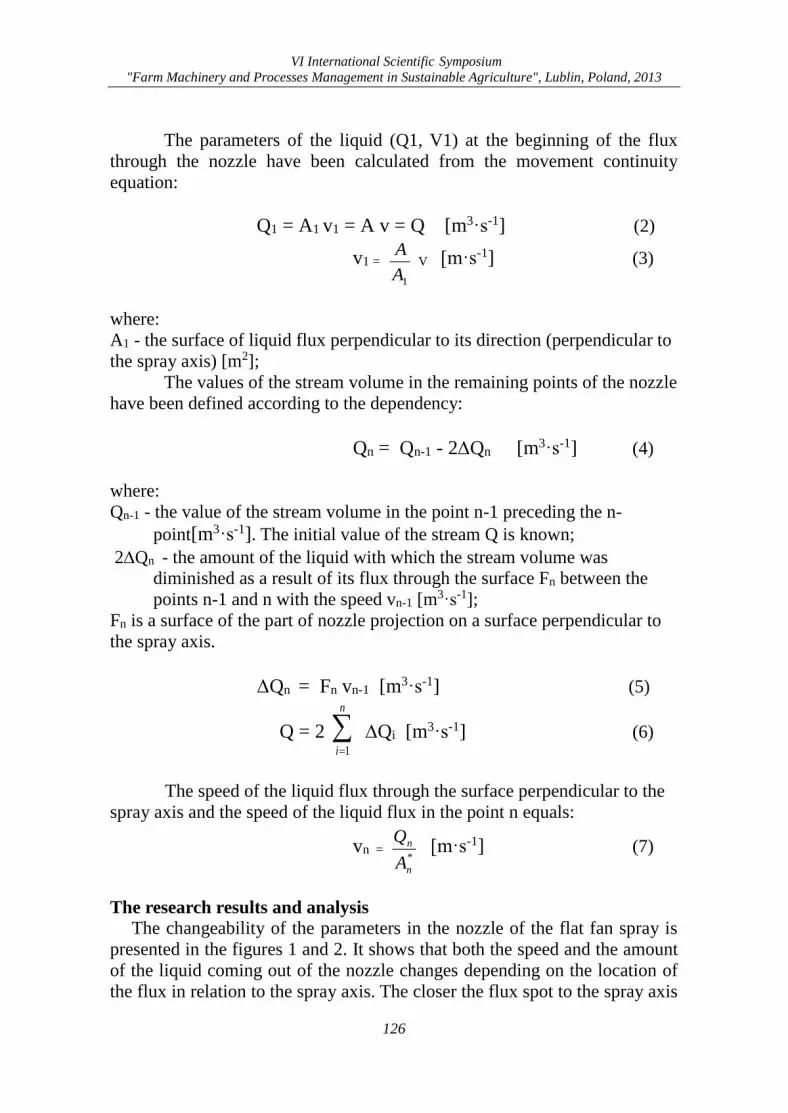
VI International Scientific Symposium
"Farm Machinery and Processes Management in Sustainable Agriculture", Lublin, Poland, 2013
126
The parameters of the liquid (Q1, V1) at the beginning of the flux
through the nozzle have been calculated from the movement continuity
equation:
Q1 = A1 v1 = A v = Q [m3·s-1] (2)
v1 =
1A
A V [m·s-1] (3)
where:
A1 - the surface of liquid flux perpendicular to its direction (perpendicular to
the spray axis) [m2];
The values of the stream volume in the remaining points of the nozzle
have been defined according to the dependency:
Qn = Qn-1 - 2Qn [m3·s-1] (4)
where:
Qn-1 - the value of the stream volume in the point n-1 preceding the n-
point[m3·s-1]. The initial value of the stream Q is known;
2Qn - the amount of the liquid with which the stream volume was
diminished as a result of its flux through the surface Fn between the
points n-1 and n with the speed vn-1 [m3·s-1];
Fn is a surface of the part of nozzle projection on a surface perpendicular to
the spray axis.
Qn = Fn vn-1 [m3·s-1] (5)
Q = 2
n
i 1
Qi [m3·s-1] (6)
The speed of the liquid flux through the surface perpendicular to the
spray axis and the speed of the liquid flux in the point n equals:
vn = *
n
n
A
Q [m·s-1] (7)
The research results and analysis
The changeability of the parameters in the nozzle of the flat fan spray is
presented in the figures 1 and 2. It shows that both the speed and the amount
of the liquid coming out of the nozzle changes depending on the location of
the flux in relation to the spray axis. The closer the flux spot to the spray axis
VI International Scientific Symposium
"Farm Machinery and Processes Management in Sustainable Agriculture", Lublin, Poland, 2013
127
is, the more of the liquid Qn appears. It is caused by a greater speed with
which the liquid comes out and the bigger surface of the flux.
0
4
8
12
16
20
-0,0012 -0,0008 -0,0004 0 0,0004 0,0008 0,0012xn(m)
v
(m/s)
Fig. 1. The layout of the flux liquid speed from a flat-fan nozzle
0
0,0000001
0,0000002
0,0000003
0,0000004
0,0000005
0,0000006
0,0000007
0,0000008
0,0000009
-0,0012 -0,0008 -0,0004 0 0,0004 0,0008 0,0012xn (m)
Q
(m3/s)
Fig. 2. The layout of the stream volume density in a nozzle
Analyzing pattern no 5 it must be stated that changing the values of its
components we can change the amount of the liquid coming out in any point
of the nozzle, that is, we may alter the flux density.
Conclusions
1. The speed of the liquid flux from the flat-fan spray is different and
changes from a minimal value at the end of the nozzle to the maximal
value in its central part.
2. The amount of the liquid coming out of the flat-fan spray depends on
VI International Scientific Symposium
"Farm Machinery and Processes Management in Sustainable Agriculture", Lublin, Poland, 2013
128
the flux point. In the center of the nozzle a large part of the liquid
comes out while in the extreme external parts the flux is minimal.
3. Modeling the shape of the nozzle we may alter the layout of the
density of the liquid flux, and thus, we may affect the evenness of the
spraying.
References [1] Koo Y.M., Kuhlman D.K. 1993. Theoretical spray performance of swirl – type nozzles.
Transactions of the ASAE. 36(3) .671 – 678.
[2] Kowalik W. 2012. Określenie dynamiki znoszenia rozpylonej cieczy za pomocą
równania Rosina – Ramlera. Acta Scient. Polon. 11(1 – 2) , 3 – 11.
[3] Orzechowski Z., Prywer J., Zarzycki R. 1997. Mechanika płynów w inżynierii
środowiska. WNT Warszawa.
[4] Prywer J. 2003. Wpływ parametrów konstrukcyjnych rozpylaczy strumieniowo-
wirowych na ich właściwości. Zesz. Nauk. Rozpr. Nauk. Polit. Łódzka. 317,. 5 – 235.
VI International Scientific Symposium
"Farm Machinery and Processes Management in Sustainable Agriculture", Lublin, Poland, 2013
129
INFLUENCE OF THE CHEMICAL PROPERTIES
OF THE PLANT BIOMASS OF AGRICULTURAL ORIGIN
ON ENERGY INTENSITY OF ITS COMPACTION
Artur KRASZKIEWICZ1, Magdalena KACHEL-JAKUBOWSKA1,
Mieczysław SZPRYNGIEL1, Ignacy NIEDZIÓŁKA2 1 University of Life Sciences in Lublin, Department of Machinery Exploitation and
Management of Production Processes, Lublin, POLAND 2 University of Life Sciences in Lublin, Department of Agricultural Machines Theory,
Lublin, POLAND
e-mail: [email protected]
Keywords: chemical properties of the biomass, compaction energy consumption, plant
biomass
1. Introduction Plant biomass as a renewable, environmentally friendly energy source has
a constant interest. It is recommended for energy use of biomass of waste
and surplus from conventional agricultural crops, such as cereal straw and
other plants and grasses of permanent grassland and wasteland
[Świętochowski et al. 2011].
These raw materials, in its original condition, unprocessed, are diverse not
only in terms of physical characteristics (moisture, density) but also chemical
characteristics [Denisiuk 2009; Rybak 2006; Wandrasz and Wandrasz 2006].
Shares of individual chemical elements in solid fuels, which include
biomass, are different and depend on the type of fuel and its degree of
coalification. With the increase in the degree of metamorphism increases
significantly the carbon content, and a decrease in the oxygen and hydrogen
content decreases slightly. The quantities of nitrogen and sulfur in practice
depend on the carbon content of the fuel, and the other elements present in
minor amounts of biomass in the form of a mineral substance [Kowalczyk-
Juśko 2009; Rybak 2006; Wandrasz and Wandrasz 2006]. It should also be
noted that the quantitative differences in chemical composition occur not
only in the biomass of different species, but also can occur inside a single
species. This causes the quality of the habitat and agricultural practices
carried out [Świętochowski et al. 2011]. Hence, plant biomass is a difficult
material to energy use in the unprocessed and it is difficult when compacted.
Based on literature data you can get information on range of parameters of
the compaction process of biomass, including energy intensity and, as well
as its chemical composition [Denisiuk 2009; Rybak 2006; Wandrasz and
Wandrasz 2006]. There are no elaborations which take into account the
relationships between energy intensive compaction plant biomass of
agricultural origin and her chemical properties.
VI International Scientific Symposium
"Farm Machinery and Processes Management in Sustainable Agriculture", Lublin, Poland, 2013
130
2. Material and methods
The following types of straw were selected for the study; winter wheat,
triticale, rye, buckwheat, cereal mixed.
Acquired material shredded device H-111, which is equipped with a sieves
with openings of 3 mm. Then, samples were taken for further laboratory tests
that define the content of:
water - gravimetric method according to PN-EN 14774-2:2010;
carbon, hydrogen - IR absorption method according to CEN / TS
15104:2006;
nitrogen - measuring automatic analyzer according to CEN / TS
15104:2006;
sulfur - automatic measurement of IR analyzer according to PN-G-
04584: 2001;
chlorine - Eschki method according to PN-ISO 587:2000 p.7.2.1.
The agglomeration of particulate materials so proceeded with the
compactor with a fixed flat-sided matrix with a thickness of 25 mm and a
diameter of 8 mm holes. The rotational speed roller compaction was
11.67 rads-1, and was transferred to the drive roller of an electric motor with
a capacity of 7.5 kW for team toothed gears.
The research on energy intensive process of compaction test plant
materials used measuring system, which included a measure of Lumel N14,
coupled with computer recording, which was determined using energy
expenditures.
The statistical analysis of test results acquired to determine average
values, standard deviations, and Pearson correlation coefficients was
performed, as well as ANOVA test. The significance of differences between
mean values determined using Tukey's test. The level of significance α=0.05.
3. Results Selected results are presented in Table 1.
In terms of research, statistical analysis showed significant differences
between the averages in each group of raw materials. The test Tukey most
often pointed to following homogeneous groups: grain and straw mixture of
winter wheat as well as winter wheat and rye (Table 1).

VI International Scientific Symposium
"Farm Machinery and Processes Management in Sustainable Agriculture", Lublin, Poland, 2013
131
Table 1. Selected chemical properties of the material subjected to compaction and energy
expenditures
(a-c homogeneous groups; α = 0.05)
Para-
meter
The straw
species
Mois-
ture
[%]
Car-
bon
[%]
Hydro-
gen
[%]
Nitro-
gen
[%]
Sulfur
[%]
Chlo-
rine
[%]
Energy
expendi-
tures
[kWh∙kg-1]
Ave-
rage
triticale 15.35 46.64 5.83 a 1.07 0.12 a 0.093 0.275 a
cereal
mixed 14.09 a 46.98 a 5.85 a, b 0.59 0.06 b 0.028 0.275 a, b
winter
wheat 14.03 a, b 47.00 a 5.79 a, b 1.19 0.12 a, c 0.082 0.270 a, b, c
buckwheat 14.49 44.40 5.56 0.88 a 0.13 a, c 0.123 0.190
rye 13.85 b 47.94 5.92 0.85 a 0.07 b 0.018 0.265 c
Stan-
dard
devia-
tion
triticale 0.06 0.06 0.03 0.02 0.02 0.001 0.002
cereal
mixed 0,07 0,04 0,03 0,01 0,03 0,002 0.003
winter
wheat 0.02 0.07 0.02 0.01 0.02 0.001 0.002
buckwheat 0.07 0.02 0.02 0.02 0.02 0.002 0.002
rye 0.05 0.03 0.03 0.02 0.01 0.001 0.004
For the examined raw materials statistical analysis results showed negative
linear trend between energy expenditures and: water content, total sulfur and
chlorine. Positive linear trend between energy expenditures and: contents of
carbon, hydrogen, and nitrogen. Wherein the coefficients of correlation
expenditures energy and: carbon, hydrogen and chlorine are significant
p<0.05.
4. Conclusions
Under the test conditions the lowest power consumption occurred during
compaction buckwheat straw was determined for the least amount of carbon
and hydrogen, and the largest chlorine-and sulfur. This parameter for other
raw materials was about 45% higher. Cross-shareholdings between the
considered chemical composition meant that among the examined species of
straw, buckwheat straw biomass was the most favorable material properties
to agglomeration.
Comparing the results with literature data it can be concluded that, at the
test conditions of participation was comparable [Denisiuk 2009; Rybak
2006; Wandrasz and Wandrasz 2006].
The content of the test material under consideration of water, carbon,
hydrogen, nitrogen, sulfur, and chlorine is a factor in determining its
suitability for energy purposes. Nevertheless, the large variation in the
elemental composition of organic matter, as well as their impact on the
process of compaction of individual fuels of agricultural origin, indicates a
need for further research in this area and to make them public.
VI International Scientific Symposium
"Farm Machinery and Processes Management in Sustainable Agriculture", Lublin, Poland, 2013
132
5. References [1] Denisiuk W. 2009. Słoma jako paliwo. Inżynieria Rolnicza, 1(110), Kraków. pp. 83-89
[2] Kowalczyk-Juśko A. 2009. Popiół z różnych roślin energetycznych. Proceedings of
ECOpole, Vol.3, No.1, Opole. p. 159-164
[3] Rybak W. 2006. Spalanie i współspalanie biopaliw stałych. Wyd. Politechniki
Wrocławskiej. Wrocław, pp. 411
[4] Świętochowski A., Grzybek A., Gutry P. 2011. Wpływ czynników agrotechnicznych na
właściwości energetyczne słomy. Problemy Inżynierii Rolniczej, 1, Warszawa. p. 41-47
[5] Wandrasz J.W., Wandrasz A.J. 2006. Paliwa Formowane. Wyd. Seidel-Przywecki.
Warszawa. pp. 466
The scientific work funded from resources of National Science Centre in years 2011-2014 as
the research project N N 313 757540
VI International Scientific Symposium
"Farm Machinery and Processes Management in Sustainable Agriculture", Lublin, Poland, 2013
133
COMMODITY PRODUCTION AND LABOUR INPUTS
IN ECOLOGICAL FARMS
Dariusz KWAŚNIEWSKI, Urszula MALAGA-TOBOŁA, Maciej KUBOŃ
University of Agriculture in Kraków, Institute of Agricultural Engineering and Informatics,
Kraków, POLAND
e-mail: [email protected]; [email protected];
Keywords: ecological farm, commodity production, labour inputs
1. Introduction
In Poland, as in other EU Member States, intensive development of
ecological farming has been observed since the end of the 90's of the
previous century [Tryburski, Żakowska-Biemas 2007].
Dynamic development of ecological farming in Poland, after EU
accession in 2004, gave rise to the need of carrying out research and analysis
concerning the agriculture branch. Getting information on production and
economic situation of ecological farms and their competitiveness has become
crucial, especially because the number of agricultural producers interested in
the production of ecological methods raises systematically [Kowalska 2010;
Nachtman, Żekało 2011]. Huge diversity of factors shaping the functioning
of such farms should be taken into consideration when assessing activity of
agricultural farms [Kowalski et al 2012]. Effective use of human labour
resources and obtained production results constitute these factors.
2. Material and methods
The objective of the paper was to assess commodity production in the
global production of the researched ecological farms in the aspect of incurred
labour inputs. The scope of the study covered research carried out in 50
ecological farms with a certificate, located in the Southern Poland. The study
was carried out within the development grant No 12 016510 'Innovative
impact of technology and IT support of management on of production
efficiency in organic farms".
The collected information was obtained on the basis of a guided survey
carried out with farm owners. Information concerned 2011 and the collected
data allowed, inter alia, determination of the sowing structure, the obtained
crops and the incurred labour inputs in the researched farms. Farms were
divided into four area groups on account of the size of the agricultural land
area: I group - to 5.00 ha (12 farms), II group - from 5.01 to 10.00 ha (17),
III - from 10.01 to 20.00 ha (12), IV - above 20.00 ha (9).
VI International Scientific Symposium
"Farm Machinery and Processes Management in Sustainable Agriculture", Lublin, Poland, 2013
134
3. Results
Participation of commodity production in the global plant and animal
production (with division into plant and agricultural land groups) was
presented in tables 1 and 2; whereas, labour inputs were presented in table 3.
Table 1. Participation of commodity production in the plant global production (at the
average for plant and agricultural land groups) [%]*
Group
Area of
agricultural
land [ha]
Plant and agricultural land group
Grain Root Fodder
crops Vegetables Herbs
Orchards
and
plantations
I 3.33 53.3 60.8 97.5 77.1 100.0 92.7
II 6.90 36.5 54.2 57.3 88.6
55.9
III 15.05 88.5 67.1 80.0 97.1 100.0 66.7
IV 31.80 24.2 62.5 0.3 25.0
Total 12.48 55.5 58.6 68.7 84.5 100.0 75.1 *- for facilities, where a specific product occurs
Table 2. Participation of commodity production in the animal global production in the
product assortment *
Group Parameter
Milk Meat Eggs
PG** PT** PG PT PG PT
ths ltr % tons % ths %
I average 4.6 58.5 0.8 44.4 5.1 41.3
standard deviation 3.1
0.7
6.5
II average 11.5 62.4 1.5 63.9 6.3 66.4
standard deviation 14.6
1.2
7.4
III average 37.1 80.2 4.2 62.7
standard deviation 26.6
3.2
IV average 78.3 93.7 5.0 58.6
standard deviation 36.6
1.8
Total average 29.8 71.8 2.6 58.4 5.8 55.3
standard deviation 36.0
2.4
6.8 *- for facilities, where a specific product occurs;
** - PG – global production, PT – commodity production
Table 3. Labour inputs in plant and animal production (plant and agricultural land groups)
[manhour·ha1]
Gro
up Parameter Grain Root
Fodder
crops
Vegeta-
bles Herbs
Grass-
lands
Orchards
and
planta-
tions
Animal
produc-
tion
I
average 41.9 287.0 58.2 1107.5 30.9 35.4 654.9 262.7
standard
deviation 23.2 388.6 127.3 2079.7 107.1 44.8 828.0 222.5
II
average 27.4 272.6 71.3 462.7 - 31.5 439.6 195.3
standard
deviation 23.2 355.6 119.5 1131.7 - 49.6 1326.9 137.6
VI International Scientific Symposium
"Farm Machinery and Processes Management in Sustainable Agriculture", Lublin, Poland, 2013
135
Table 3 - cont.
III
average 23.6 107.1 28.9 269.6 9.4 8.1 105.8 74.8
standard
deviation 24.6 116.1 31.1 621.6 32.7 7.8 155.4 88.2
IV
average 31.7 104.4 24.0 43.6 - 13.7 - 70.5
standard
deviation 20.2 81.1 11.8 130.8 - 6.1 - 44.6
To-
tal
average 30.8 206.1 49.4 495.7 9.7 23.6 332.0 160.1
standard
deviation 23.4 294.5 94.6 1273.1 54.5 37.5 892.5 160.1
4. Conclusions
Participation of commodity production in total plant production was varied
and was within 55.5% for grains to as much as 100% for specialistic crops
such as herbs. Whereas, in animal production, participation of commodity
production for milk is at the average of 71.8%, 58.4% for meat and 55.3%
for eggs.
Labour inputs for plant production were high and amounted to respectively:
30.8 manhour·ha-1 grains, 206.1 manhour·ha-1 root plants (potatoes) and
495.7 manhour·ha-1 vegetables. Organization of field works related to
manual loading and unloading of pressed straw, manual harvesting of
potatoes after a potato spinner and manual harvesting of vegetables
decisively influenced such a high level of labour inputs. Labour inputs in
animal production were at the average of 160.1 manhour·ha-1.
5. References [1] Kowalska A. 2010. Jakość i konkurencyjność w rolnictwie ekologicznym. Wyd. Difin
S.A. Warszawa, ISBN 978-83-7641-322-8.
[2] Kowalski J. i inni 2012. Założenia, program oraz metodyka badań, analiza badań
wstępnych, założenia do projektowania systemu, robocza wersja programu
komputerowego. Monografia. Wyd. PTIR Kraków, ISBN 978-83-930818-7-5.
[3] Nachtman G., Żekało M. 2011. Wyniki ekonomiczne wybranych ekologicznych
produktów rolniczych w latach 2005-2009. Dział Wydawnictw IERiGŻ-PIB Warszawa,
ISBN 978-83-7658-117-0.
[4] Tyburski J. Żakowska-Biemas S. 2007. Wprowadzenie do rolnictwa ekologicznego.
Wydawnictwo SGGW. Warszawa.
The paper was carried out within the research and development project no. NR 12 016510
financed by the Ministry of Science and Higher Education.

VI International Scientific Symposium
"Farm Machinery and Processes Management in Sustainable Agriculture", Lublin, Poland, 2013
136
VI International Scientific Symposium
"Farm Machinery and Processes Management in Sustainable Agriculture", Lublin, Poland, 2013
137
DRIFT REDUCTION RATE OF THREE ANTIDRIFT NOZZLES
USED FOR SPRAY APPLICATION IN BARLEY
Miran LAKOTA, Mario LEŠNIK
University of Maribor, Faculty of Agriculture and Life Sciences, Department of Biosystems
Engineering, Pivola 10, 2311 Hoče, SLOVENIA
e-mail: [email protected]
Key words: barley, reduction rate, drift-reducing nozzles, standard nozzles, drift
Abstract
We have done experiments on a field of barley where we have studied a
possibility of lowering the drift FFS with using the antidrift nozzles. After
applying, we have measured a share of spray deposit on the distance of 0, 1,
2, 5 and 10 meters away from the edge of the field using the fluorescent
tracker. All measurements have been done in four repetitions. We have
compared a perimeter of skidding with standard nozzle (Lechler LU 120-03)
and three antidrift nozzles (Lechler ID 120-03, Albuz AVI – TWIN 110-03,
and AGROTOP Turbodrop HiSpeed 110-03) with a deposit of 250 liters of
spray deposit on hectare. A share of spray deposit that was skid lowered with
the distance from the edge of the field with all measured distances. The
smallest drift was achieved with the nozzle HS. The size of the droplets
significantly influenced the part of the drift where the drift was the biggest
with the nozzle LU (VMD = 185). When using different types of nozzles
with similar sizes of droplets and approximately same speeds of wind in the
time of deposit the drift is the same. Antidrift nozzles lowered the drift for
70–85% on all measured distances.

VI International Scientific Symposium
"Farm Machinery and Processes Management in Sustainable Agriculture", Lublin, Poland, 2013
138
VI International Scientific Symposium
"Farm Machinery and Processes Management in Sustainable Agriculture", Lublin, Poland, 2013
139
FARMERS COLLABORATION – A FACTOR IN THE
DEVELOPMENT OF SUSTAINABLE AGRICULTURE
Edmund LORENCOWICZ1, Jacek UZIAK2
1 University of Life Sciences in Lublin, Department of Machinery Exploitation and
Management of Production Processes, Lublin, POLAND 2 University of Botswana, Department of Mechanical Engineering, Gaborone, BOTSWANA
e-mail: [email protected]; [email protected]
Keywords: farmers collaboration, machinery costs, labour management
Introduction
The definition of the sustainable agriculture covers not only the
ecological and technological aspects but also economic and social. As one of
many definitions of sustainable agriculture [SAI] states: “Sustainable
agriculture is the efficient production of safe, high quality agricultural
products, in a way that protects and improves the natural environment, the
social and economic conditions of farmers, their employees and local
communities, and safeguards the health and welfare of all farmed species.”
Those aspects are especially important in case of small, family farms with
area of a few hectares and economic value of a few ESU. Without doubt,
farmers’ collaboration, in terms of planning and realization of work
activities, would improve the economic results of farms as well as quality of
life for farm families.
Forms of collaboration in mechanization
Proper realization of many agricultural activities requires access to many
machines and equipment, which in general is very expensive. It is quite
normal that in case of small farms with small areas and low income it is not
possible to keep own machinery. One of the possible solutions is
collaboration between farmers. In most cases, farmers collaborate with each
other both formally and informally, using a variety of methods for work
organization and to settle costs and efforts. It is typical in countries with
majority of small, few hectares, farms but also in case of bigger farms, even
with areas of hundreds of hectares [de Toro and Hansson 2004, Lorencowicz
2005].
The possible solutions for farmers’ cooperation can be classified as
follows [Landers 2000, Theunissen 2002, Wesche 2004, Witney 1988]:
machinery syndicates - both formal and informal groups,
machinery rings,
machinery co-operatives,
neighbours’ cooperation – both in terms of contract work and work
exchange.
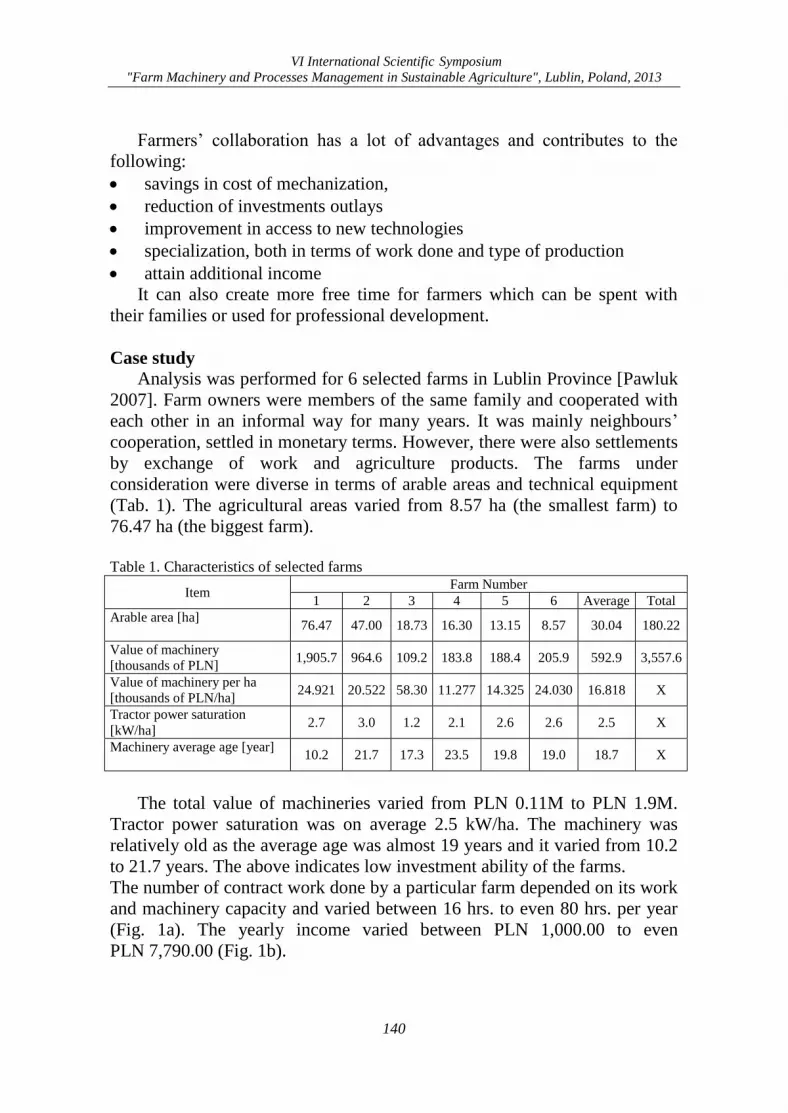
VI International Scientific Symposium
"Farm Machinery and Processes Management in Sustainable Agriculture", Lublin, Poland, 2013
140
Farmers’ collaboration has a lot of advantages and contributes to the
following:
savings in cost of mechanization,
reduction of investments outlays
improvement in access to new technologies
specialization, both in terms of work done and type of production
attain additional income
It can also create more free time for farmers which can be spent with
their families or used for professional development.
Case study
Analysis was performed for 6 selected farms in Lublin Province [Pawluk
2007]. Farm owners were members of the same family and cooperated with
each other in an informal way for many years. It was mainly neighbours’
cooperation, settled in monetary terms. However, there were also settlements
by exchange of work and agriculture products. The farms under
consideration were diverse in terms of arable areas and technical equipment
(Tab. 1). The agricultural areas varied from 8.57 ha (the smallest farm) to
76.47 ha (the biggest farm).
Table 1. Characteristics of selected farms
Item Farm Number
1 2 3 4 5 6 Average Total
Arable area [ha]
76.47 47.00 18.73 16.30 13.15 8.57 30.04 180.22
Value of machinery
[thousands of PLN] 1,905.7 964.6 109.2 183.8 188.4 205.9 592.9 3,557.6
Value of machinery per ha
[thousands of PLN/ha] 24.921 20.522 58.30 11.277 14.325 24.030 16.818 X
Tractor power saturation
[kW/ha] 2.7 3.0 1.2 2.1 2.6 2.6 2.5 X
Machinery average age [year]
10.2 21.7 17.3 23.5 19.8 19.0 18.7 X
The total value of machineries varied from PLN 0.11M to PLN 1.9M.
Tractor power saturation was on average 2.5 kW/ha. The machinery was
relatively old as the average age was almost 19 years and it varied from 10.2
to 21.7 years. The above indicates low investment ability of the farms.
The number of contract work done by a particular farm depended on its work
and machinery capacity and varied between 16 hrs. to even 80 hrs. per year
(Fig. 1a). The yearly income varied between PLN 1,000.00 to even
PLN 7,790.00 (Fig. 1b).
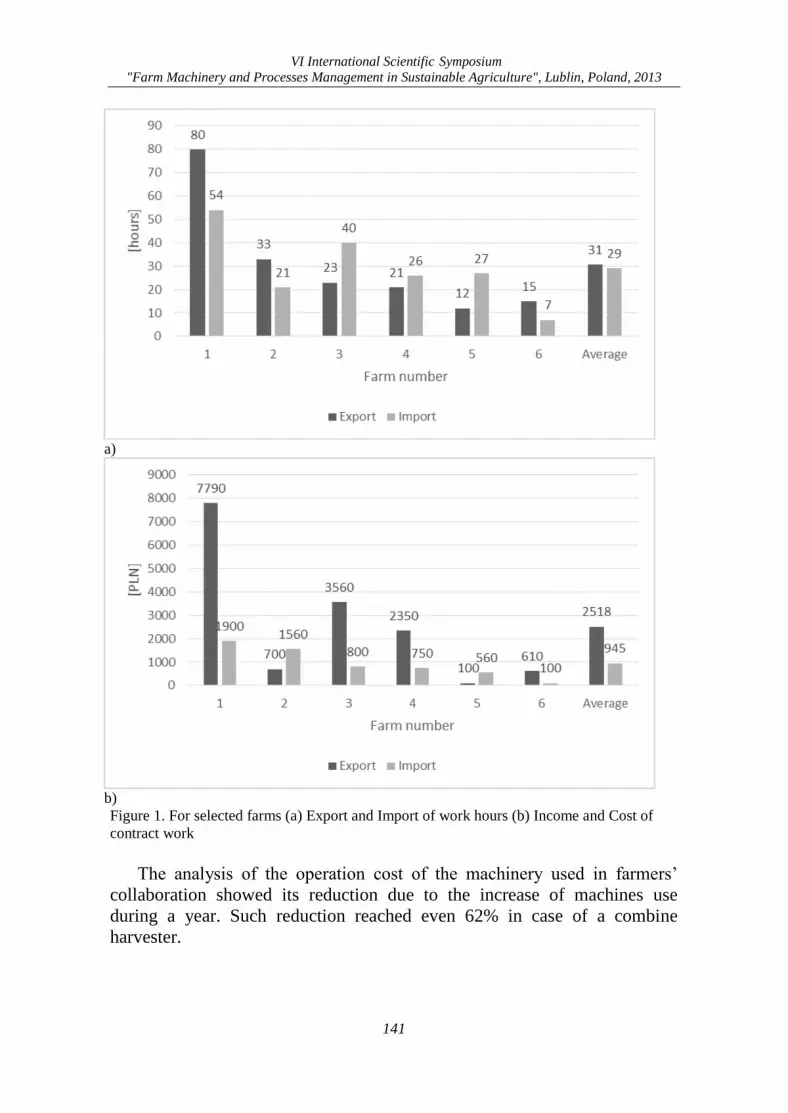
VI International Scientific Symposium
"Farm Machinery and Processes Management in Sustainable Agriculture", Lublin, Poland, 2013
141
a)
b)
Figure 1. For selected farms (a) Export and Import of work hours (b) Income and Cost of
contract work
The analysis of the operation cost of the machinery used in farmers’
collaboration showed its reduction due to the increase of machines use
during a year. Such reduction reached even 62% in case of a combine
harvester.
VI International Scientific Symposium
"Farm Machinery and Processes Management in Sustainable Agriculture", Lublin, Poland, 2013
142
Conclusions
Farmers’ collaboration is an important form of satisfying technological
needs in case of fragmented agriculture; at the same time it reduces the costs
and outlays. It allows the farms to fulfil the requirements for sustainable
agriculture improving, at the same time, the quality of life for farm families.
According to farmers under investigation, the most important factor in
favour of collaboration was lack of own equipment and, in case of elderly
farmers, limited possibility of own work. Despite relatively low economic
gain and frequent use of non-monetary forms of settlements, the farmers’
collaboration practised throughout the years afforded proper operation of the
farms and protected their owners in case of lack of technical means.
References [1] de Toro A., Hansson P.-A. 2004. Machinery Co-operatives – a case study in Sweden.
Biosystem Eng., nr 87 (1), 13-15.
[2] Landers A. 2000. Farm machinery selection, investment and management. Farming
Press, Kent, pp. 152.
[3] Lorencowicz E. 2005. Mechanizacja w procesie przemian strukturalnych gospodarstw
rodzinnych. Problemy Inżynierii Rolniczej, nr 3 (49), 5-14.
[4] Pawluk B. 2007. Kooperacja rolników jako sposób na redukcję nakładów i kosztów
mechanizacji. Typescript, WIP AR Lublin, pp. 44
[5] SAI – Sustainable Agriculture Initiative. Definition.
http://www.saiplatform.org/sustainable-agriculture/definition (accessed 23 Oct. 2013)
[6] Sustainable Agriculture. http://www.csrees.usda.gov/nea/ag_systems/in_focus/
sustain_ag_if_legal.html (accessed 23 Oct. 2013)
[7] Theunissen P. 2002. An Economical Approach to Agricultural Machinery Management.
Computus Management Information (Pty) Ltd, Betlehem, pp.256
[8] Weshe R. 2004 Formen der Zusamenarbeit landwirtschaftlichen Betriebe.
www.ktbl.de/betrieb/leitfaden (accessed 18 Jan. 2005)
[9] Witney. 1988. Choosing and Using Farm Machines. Longman Scientific and Technical
Essex, pp. 412
VI International Scientific Symposium
"Farm Machinery and Processes Management in Sustainable Agriculture", Lublin, Poland, 2013
143
RESONANCE PUMP FOR APPLICATION IN DESERT AREAS
Ivan A. LOUKANOV, Jacek UZIAK
University of Botswana, Department of Mechanical Engineering, Gaborone, BOTSWANA
e-mail: [email protected], [email protected]
Keywords: resonance vibrating pumps; spring suspension system; solar power
Introduction
Pumping water in the desert and remote countryside in the absence of
electricity has always been a great engineering challenge. A cheaper and
easy means for solving this problem is to use a resonance vibrating pump.
Although these pumps were primarily invented and used for many decades in
oil industry they could be used for pumping ground water from deep wells
for agricultural applications.
Resonance Pump
Resonance pumps, known formerly as sonic pumps, were invented in the
early fifties of the 20 t h century and since then were used for pumping
crude oil from as deep as 2000 m, as well as water from 30 to 150 m [1].
Unfortunately these pumps are almost unknown today as they have been
superseded by submersible centrifugal, screw, and rod-pumps. However,
the current generation of pumps is electrically powered, which restricts
their use in the non-electrified regions in the desert and semiarid areas of
Africa, Middle East, and central Asia.
Resonance pump utilizes the resonance vibrations of one degree-of-
freedom oscillating system. The pump is powered by a mechanical shaker
consisting of two counter rotating offset masses and as the name
suggests operates in resonance [2].
Fig. 1,a shows the dynamic model of a low frequency sonic pump
furnished with a spring loaded poppet valve whereas Fig. 1,b shows the
physical model of the pump [3]. Apart from the mechanical shaker, the pump
entails a valve which is attached to the bottom end of the oscillating pipe and
submersed at a depth of hs under the water level in the well. The pump is
modelled as one degree-of-freedom oscillating system and for simplicity of
the analysis it is assumed that both the pipe and the water column (WC) in
the pipe are solid bodies.
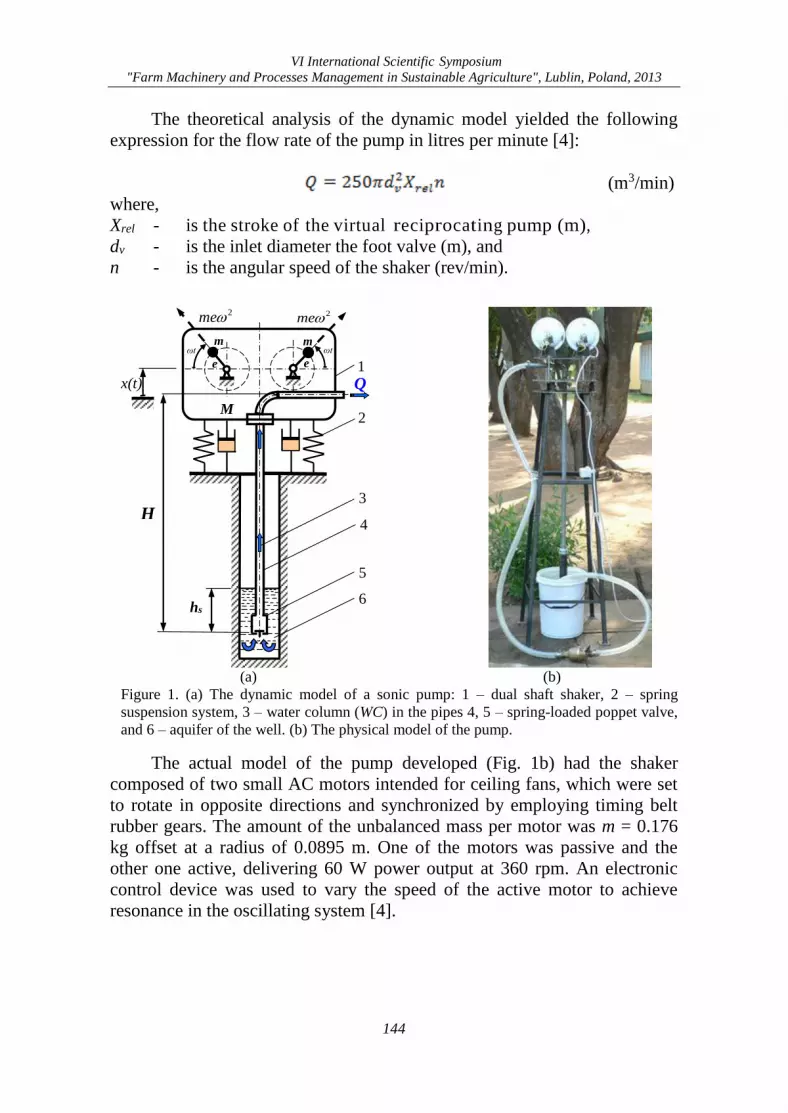
VI International Scientific Symposium
"Farm Machinery and Processes Management in Sustainable Agriculture", Lublin, Poland, 2013
144
The theoretical analysis of the dynamic model yielded the following
expression for the flow rate of the pump in litres per minute [4]:
(m3/min)
where,
Xrel - is the stroke of the virtual reciprocating pump (m),
dv - is the inlet diameter the foot valve (m), and
n - is the angular speed of the shaker (rev/min).
(a) (b)
Figure 1. (a) The dynamic model of a sonic pump: 1 – dual shaft shaker, 2 – spring
suspension system, 3 – water column (WC) in the pipes 4, 5 – spring-loaded poppet valve,
and 6 – aquifer of the well. (b) The physical model of the pump.
The actual model of the pump developed (Fig. 1b) had the shaker
composed of two small AC motors intended for ceiling fans, which were set
to rotate in opposite directions and synchronized by employing timing belt
rubber gears. The amount of the unbalanced mass per motor was m = 0.176
kg offset at a radius of 0.0895 m. One of the motors was passive and the
other one active, delivering 60 W power output at 360 rpm. An electronic
control device was used to vary the speed of the active motor to achieve
resonance in the oscillating system [4].
hs
M
m
x(t)
m
e
ωt
e
ωt
Q 1
2
5
6
3 H
4
2me 2me
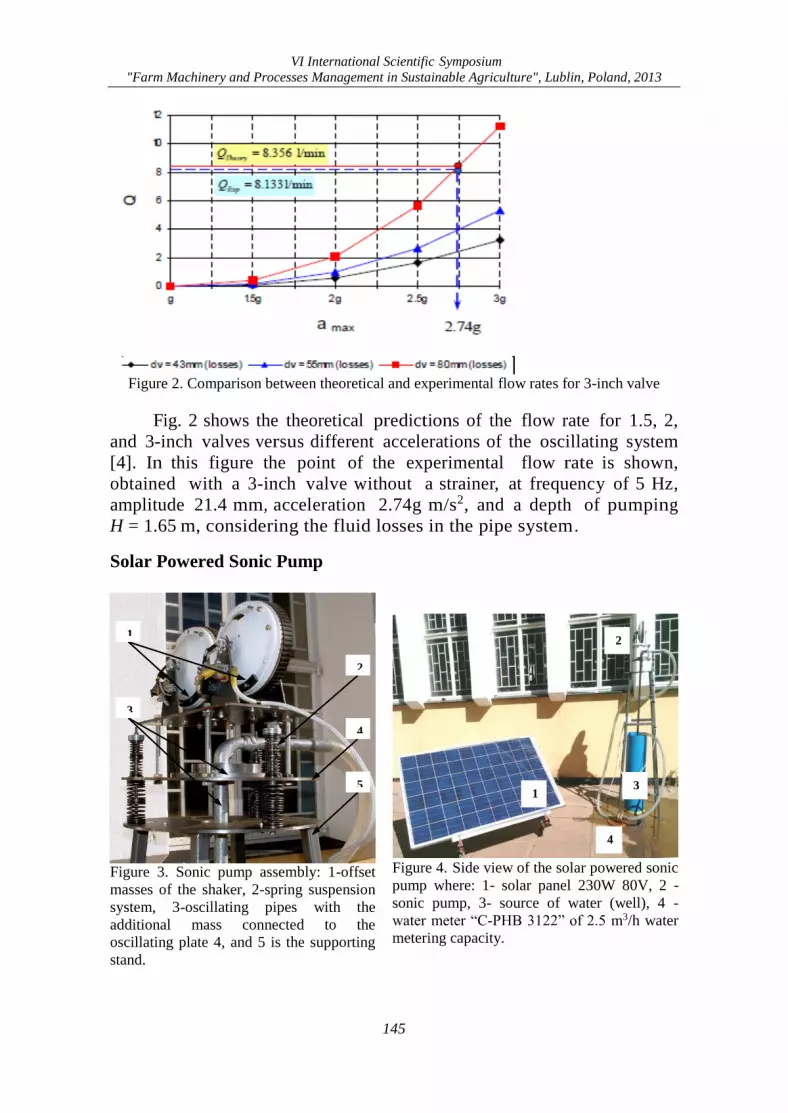
VI International Scientific Symposium
"Farm Machinery and Processes Management in Sustainable Agriculture", Lublin, Poland, 2013
145
Figure 2. Comparison between theoretical and experimental flow rates for 3-inch valve
Fig. 2 shows the theoretical predictions of the flow rate for 1.5, 2,
and 3-inch valves versus different accelerations of the oscillating system
[4]. In this figure the point of the experimental flow rate is shown,
obtained with a 3-inch valve without a strainer, at frequency of 5 Hz,
amplitude 21.4 mm, acceleration 2.74g m/s2, and a depth of pumping
H = 1.65 m, considering the fluid losses in the pipe system.
Solar Powered Sonic Pump
Figure 3. Sonic pump assembly: 1-offset
masses of the shaker, 2-spring suspension
system, 3-oscillating pipes with the
additional mass connected to the
oscillating plate 4, and 5 is the supporting
stand.
Figure 4. Side view of the solar powered sonic
pump where: 1- solar panel 230W 80V, 2 -
sonic pump, 3- source of water (well), 4 -
water meter “C-PHB 3122” of 2.5 m3/h water
metering capacity.
4
3 1
2
2
4
5
3
1
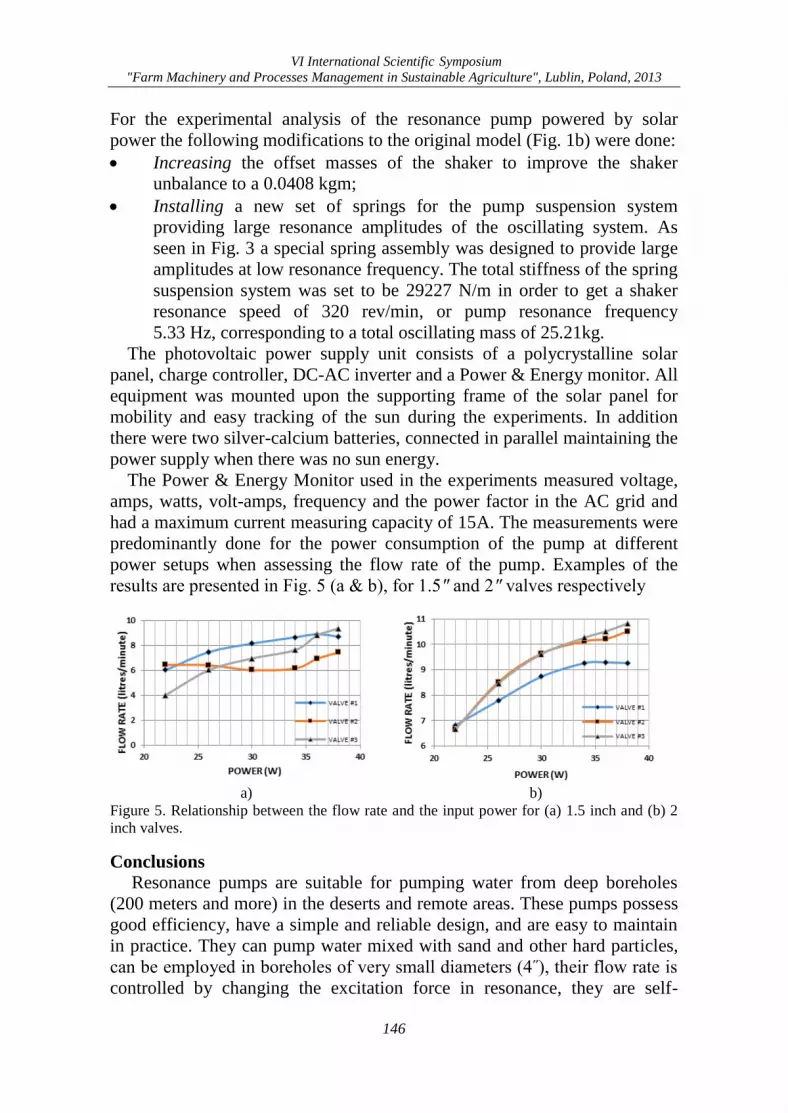
VI International Scientific Symposium
"Farm Machinery and Processes Management in Sustainable Agriculture", Lublin, Poland, 2013
146
For the experimental analysis of the resonance pump powered by solar
power the following modifications to the original model (Fig. 1b) were done:
Increasing the offset masses of the shaker to improve the shaker
unbalance to a 0.0408 kgm;
Installing a new set of springs for the pump suspension system
providing large resonance amplitudes of the oscillating system. As
seen in Fig. 3 a special spring assembly was designed to provide large
amplitudes at low resonance frequency. The total stiffness of the spring
suspension system was set to be 29227 N/m in order to get a shaker
resonance speed of 320 rev/min, or pump resonance frequency
5.33 Hz, corresponding to a total oscillating mass of 25.21kg.
The photovoltaic power supply unit consists of a polycrystalline solar
panel, charge controller, DC-AC inverter and a Power & Energy monitor. All
equipment was mounted upon the supporting frame of the solar panel for
mobility and easy tracking of the sun during the experiments. In addition
there were two silver-calcium batteries, connected in parallel maintaining the
power supply when there was no sun energy.
The Power & Energy Monitor used in the experiments measured voltage,
amps, watts, volt-amps, frequency and the power factor in the AC grid and
had a maximum current measuring capacity of 15A. The measurements were
predominantly done for the power consumption of the pump at different
power setups when assessing the flow rate of the pump. Examples of the
results are presented in Fig. 5 (a & b), for 1.5″ and 2″ valves respectively
a)
b)
Figure 5. Relationship between the flow rate and the input power for (a) 1.5 inch and (b) 2
inch valves.
Conclusions
Resonance pumps are suitable for pumping water from deep boreholes
(200 meters and more) in the deserts and remote areas. These pumps possess
good efficiency, have a simple and reliable design, and are easy to maintain
in practice. They can pump water mixed with sand and other hard particles,
can be employed in boreholes of very small diameters (4˝), their flow rate is
controlled by changing the excitation force in resonance, they are self-
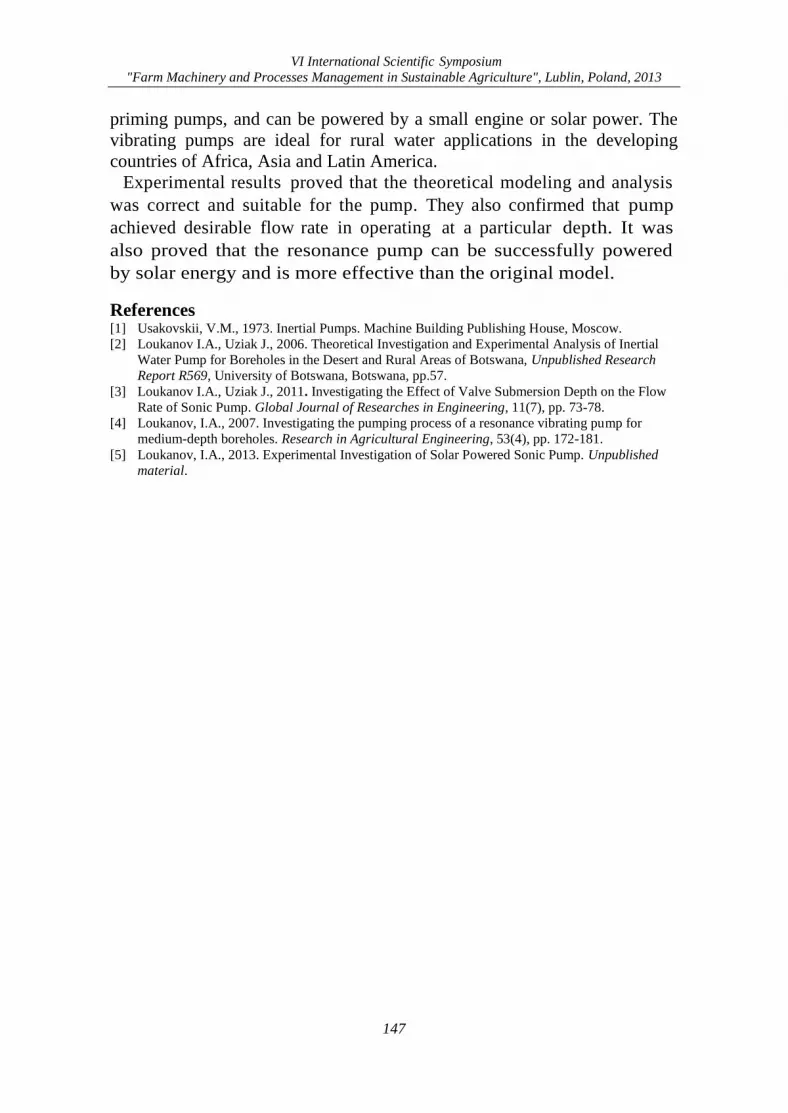
VI International Scientific Symposium
"Farm Machinery and Processes Management in Sustainable Agriculture", Lublin, Poland, 2013
147
priming pumps, and can be powered by a small engine or solar power. The
vibrating pumps are ideal for rural water applications in the developing
countries of Africa, Asia and Latin America.
Experimental results proved that the theoretical modeling and analysis
was correct and suitable for the pump. They also confirmed that pump
achieved desirable flow rate in operating at a particular depth. It was
also proved that the resonance pump can be successfully powered
by solar energy and is more effective than the original model.
References [1] Usakovskii, V.M., 1973. Inertial Pumps. Machine Building Publishing House, Moscow.
[2] Loukanov I.A., Uziak J., 2006. Theoretical Investigation and Experimental Analysis of Inertial
Water Pump for Boreholes in the Desert and Rural Areas of Botswana, Unpublished Research
Report R569, University of Botswana, Botswana, pp.57.
[3] Loukanov I.A., Uziak J., 2011. Investigating the Effect of Valve Submersion Depth on the Flow
Rate of Sonic Pump. Global Journal of Researches in Engineering, 11(7), pp. 73-78.
[4] Loukanov, I.A., 2007. Investigating the pumping process of a resonance vibrating pump for
medium-depth boreholes. Research in Agricultural Engineering, 53(4), pp. 172-181.
[5] Loukanov, I.A., 2013. Experimental Investigation of Solar Powered Sonic Pump. Unpublished
material.

VI International Scientific Symposium
"Farm Machinery and Processes Management in Sustainable Agriculture", Lublin, Poland, 2013
148
VI International Scientific Symposium
"Farm Machinery and Processes Management in Sustainable Agriculture", Lublin, Poland, 2013
149
PREVENTION OF HARMFUL ORGANISMS DEVELOPMENT
IN POLAND IN THE LIGHT OF INTEGRATED PLANT
PROTECTION REQUIREMENTS
Ewa MATYJASZCZYK
Plant Protection Institute – National Research Institute, Poznań, POLAND
e-mail: [email protected]
Keywords: integrated plant protection, prevention methods, Poland
1. Introduction
Integrated Plant Protection will be obligatory in Poland, as well as in all
European Union member states, from the 1st of January 2014. According to
the general principles of Integrated Plant Protection laid down in the
Directive 128/2009 of 21 October 2009 establishing a framework for
Community action to achieve the sustainable use of pesticides, non-chemical
methods should have priority over chemical plant protection. Among non-
chemical methods of pest control particularly important is prevention.
2. Material and methods
The main purpose of the analysis was to assess the importance and scale
of use of individual prevention methods in Polish agriculture with the regard
to the most important agricultural crops.
The analysis was based on the data of Polish Central Statistical Office,
Ministry of Agriculture and Rural Development and literature.
3. Results
The prevention of harmful organisms can be achieved especially by:
— crop rotation,
— use of adequate cultivation techniques (e.g. stale seedbed technique,
sowing dates and densities, under-sowing, conservation tillage, pruning
and direct sowing),
— use, where appropriate, of resistant/tolerant cultivars and
standard/certified seed and planting material,
— use of balanced fertilisation, liming and irrigation/drainage practices,
— preventing the spreading of harmful organisms by hygiene measures (e.g.
by regular cleansing of machinery and equipment),
— protection and enhancement of important beneficial organisms, e.g. by
adequate plant protection measures or the utilisation of ecological
infrastructures inside and outside production sites.
Polish agriculture is not homogenous. It is characterized by small average
farm area which amounts to about 10.5 ha of agricultural land [1], however
more than half of the farms produce exclusively or mainly for their own
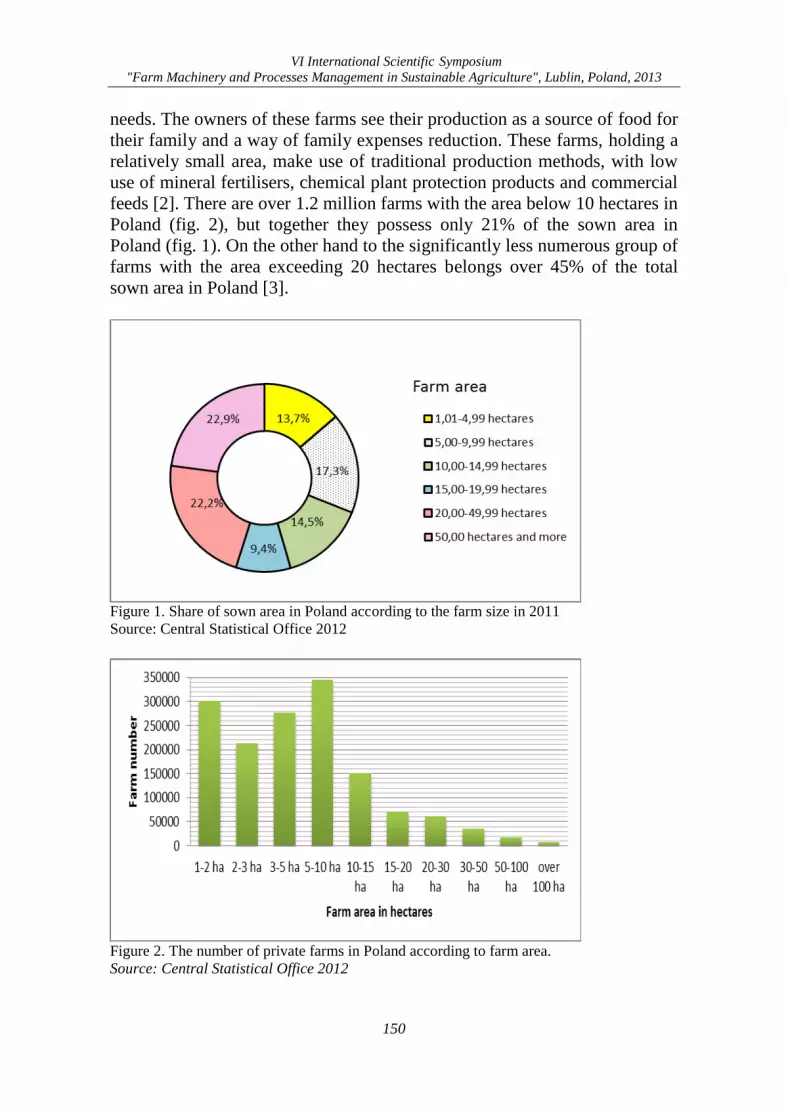
VI International Scientific Symposium
"Farm Machinery and Processes Management in Sustainable Agriculture", Lublin, Poland, 2013
150
needs. The owners of these farms see their production as a source of food for
their family and a way of family expenses reduction. These farms, holding a
relatively small area, make use of traditional production methods, with low
use of mineral fertilisers, chemical plant protection products and commercial
feeds [2]. There are over 1.2 million farms with the area below 10 hectares in
Poland (fig. 2), but together they possess only 21% of the sown area in
Poland (fig. 1). On the other hand to the significantly less numerous group of
farms with the area exceeding 20 hectares belongs over 45% of the total
sown area in Poland [3].
Figure 1. Share of sown area in Poland according to the farm size in 2011
Source: Central Statistical Office 2012
Figure 2. The number of private farms in Poland according to farm area.
Source: Central Statistical Office 2012
VI International Scientific Symposium
"Farm Machinery and Processes Management in Sustainable Agriculture", Lublin, Poland, 2013
151
The farmers themselves are also diversified group. About 20% of farmers
have elementary education only, but mainly the owners of the smallest farms
belong to this group. Over ¼ of heads of farms with the area over 100
hectares has higher agricultural education [4]. The highest share of farms
with commodity production is located in Kujawsko-Pomorskie and
Wielkopolskie provinces while the lowest in Podkarpackie and Małopolsie
provinces.
4. Conclusions
From the point of view of fulfilling the requirements of Integrated Plant
Protection the small farms belonging to poorly educated farmers are often
forward the big farms with specialised production run by farmers with higher
education [5]. It is not the result of the farmers’ special efforts, but rather of
making use of traditional cropping systems. Probably some of the farmers
are even not aware that following the methods used by their parents and
grandparents they successfully fulfil the most recent European Union
requirements.
5. References [1] Ogłoszenie prezesa Agencji Restrukturyzacji i Modernizacji Rolnictwa z dnia 20
września 2013 r. w sprawie wielkości średniej powierzchni gruntów rolnych w
gospodarstwie rolnym w poszczególnych województwach oraz średniej powierzchni
gruntów rolnych w gospodarstwie rolnym w kraju w 2013 roku
http://www.arimr.gov.pl/dla-beneficjenta/srednia-powierzchnia-gospodarstwa.html
[accessed 1 October 2013]
[2] Goraj L. 2010. Przestrzenne zróżnicowanie produkcji towarowej gospodarstw rolnych
w Polsce. Opinie i Ekspertyzy Kancelarii Senatu OE – 149. Warszawa 12 pp.
[3] Główny Urząd Statystyczny 2012. Concise Statistical Yearbook of Poland 2012,
Warszawa
[4] Główny Urząd Statystyczny 2012 Charakterystyka gospodarstw rolnych. Warszawa
468 pp.
[5] Matyjaszczyk E. 2013. Plant protection in Poland on the eve of obligatory Integrated
Pest Management implementation. Pest Management Science DOI 10.1002/ps.3578

VI International Scientific Symposium
"Farm Machinery and Processes Management in Sustainable Agriculture", Lublin, Poland, 2013
152
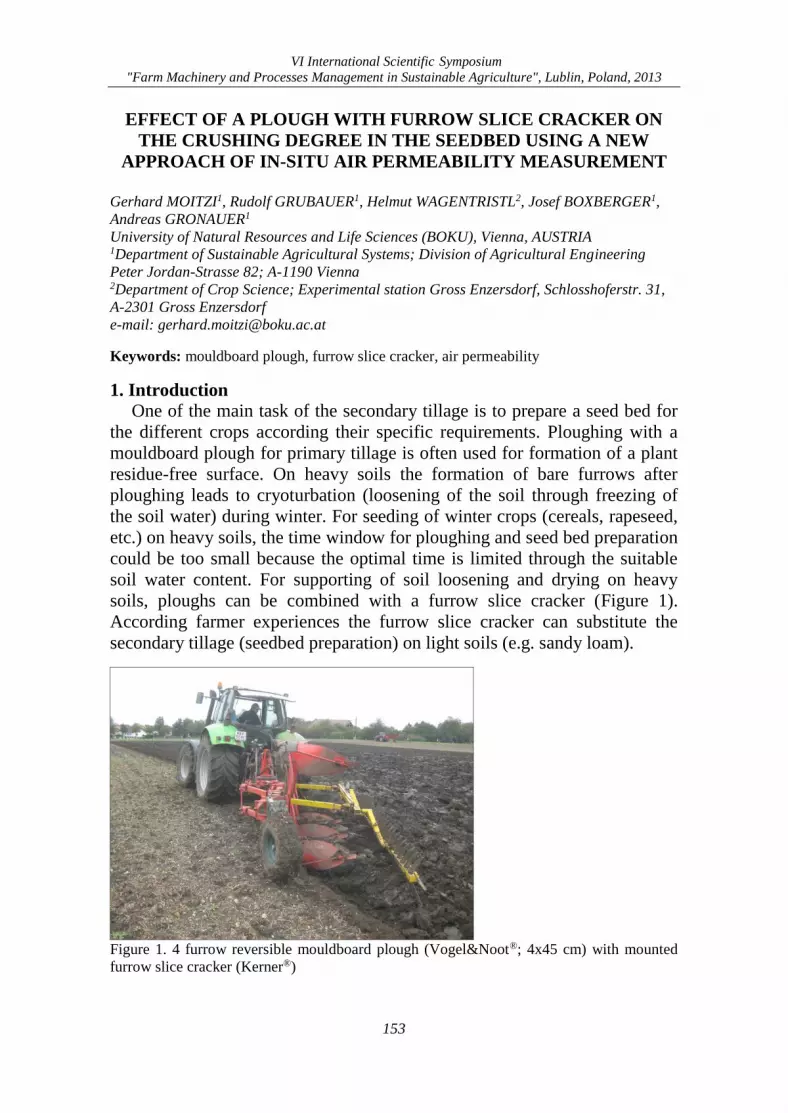
VI International Scientific Symposium
"Farm Machinery and Processes Management in Sustainable Agriculture", Lublin, Poland, 2013
153
EFFECT OF A PLOUGH WITH FURROW SLICE CRACKER ON
THE CRUSHING DEGREE IN THE SEEDBED USING A NEW
APPROACH OF IN-SITU AIR PERMEABILITY MEASUREMENT
Gerhard MOITZI1, Rudolf GRUBAUER1, Helmut WAGENTRISTL2, Josef BOXBERGER1,
Andreas GRONAUER1
University of Natural Resources and Life Sciences (BOKU), Vienna, AUSTRIA 1Department of Sustainable Agricultural Systems; Division of Agricultural Engineering
Peter Jordan-Strasse 82; A-1190 Vienna 2Department of Crop Science; Experimental station Gross Enzersdorf, Schlosshoferstr. 31,
A-2301 Gross Enzersdorf
e-mail: [email protected]
Keywords: mouldboard plough, furrow slice cracker, air permeability
1. Introduction
One of the main task of the secondary tillage is to prepare a seed bed for
the different crops according their specific requirements. Ploughing with a
mouldboard plough for primary tillage is often used for formation of a plant
residue-free surface. On heavy soils the formation of bare furrows after
ploughing leads to cryoturbation (loosening of the soil through freezing of
the soil water) during winter. For seeding of winter crops (cereals, rapeseed,
etc.) on heavy soils, the time window for ploughing and seed bed preparation
could be too small because the optimal time is limited through the suitable
soil water content. For supporting of soil loosening and drying on heavy
soils, ploughs can be combined with a furrow slice cracker (Figure 1).
According farmer experiences the furrow slice cracker can substitute the
secondary tillage (seedbed preparation) on light soils (e.g. sandy loam).
Figure 1. 4 furrow reversible mouldboard plough (Vogel&Noot®; 4x45 cm) with mounted
furrow slice cracker (Kerner®)
VI International Scientific Symposium
"Farm Machinery and Processes Management in Sustainable Agriculture", Lublin, Poland, 2013
154
The aim of the investigation was to analyze the effect of the furrow slice
cracker (Figure 1) in heavy soils on the loosening and compaction degree in
the seedbed. For measuring the loosening and compaction degree of the
seedbed a new approach (in-situ air permeability) was used. Additional the
moisture situation after the seedbed preparation was measured.
2. Material and methods
The investigations were carried out on 2. and 3. October 2012 on a arable
farm in Kleinfrauenhaid (Province of Burgenland; mean precipitation of
600 mm) on a sandy clay soil [1]. The used tractor for ploughing was Deutz
Agroton 135 MK3 (130 kW). The field (length 327 m) with the previous
crop (winter cereal) was separated in stripes with a width of each 5 m. Three
long plots where ploughed (25 cm) on 2 October with the furrow slice
cracker and three without the furrow slice cracker. On 3 October the seedbed
preparation and seeding was done with a combined power harrow-seeding
machine (Vogel&Noot/Gaspardo, 3 m). Three soil parameters (pneumatic
conductivity, water tension and moisture content) are measured immediately
after the seedbed preparation and seeding process. This was done with a
combined field measurement PL-300 ([2], figure 2). The pneumatic
conductivity describes the waterfree pore space of the soil and is a function
of water content. A defined air flow is generated using a measurement
chamber in the soil volume investigated. The rate of flow is determined from
the drop in pressure through a calibrated two stage measurement throttle in
the PL instrument. The pressure difference above the soil volume is recorded
by a further pressure sensor and supplies the pressure gradient of this flow.
The pneumatic conductivity is calculated from these test parameters using
the DARCY equation and shown in the instrument display. The PL-300 also
has connections for an electronic soil tensiometer and a moisture probe so
that soil moisture tension and/or soil moisture may be recorded parallel to
each other. The data of all connected sensors as well as the calibration data
of the measurement chambers and a marking of the measurement point are
saved and managed by a microcomputer within the instrument (UGT, 2012).
The measurement of the soil conductivity was done with the ring-camber
(height: 6.1 cm, diameter: 7.2 cm). Before the field measurement was started,
the calibration was done with a calibration throttle. The measurements were
done with the measuring throttle 2, which is suitable for soils with low
permeability (1.5....0.03 cm/s). From each variant (mouldboard plough
without mounted furrow slice cracker; mouldboard plough with mounted
furrow slice cracker) 16 randomly measurements were carried out. One
measurement of the three parameters took about 10 min.
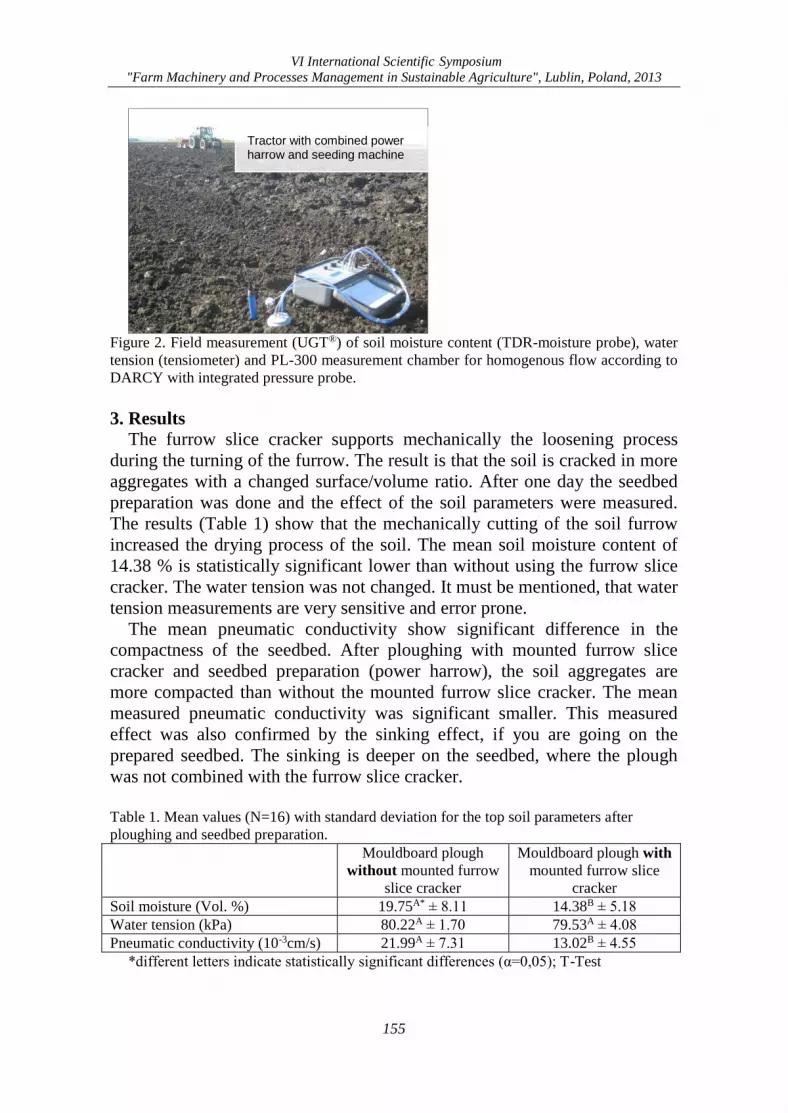
VI International Scientific Symposium
"Farm Machinery and Processes Management in Sustainable Agriculture", Lublin, Poland, 2013
155
Figure 2. Field measurement (UGT®) of soil moisture content (TDR-moisture probe), water
tension (tensiometer) and PL-300 measurement chamber for homogenous flow according to
DARCY with integrated pressure probe.
3. Results
The furrow slice cracker supports mechanically the loosening process
during the turning of the furrow. The result is that the soil is cracked in more
aggregates with a changed surface/volume ratio. After one day the seedbed
preparation was done and the effect of the soil parameters were measured.
The results (Table 1) show that the mechanically cutting of the soil furrow
increased the drying process of the soil. The mean soil moisture content of
14.38 % is statistically significant lower than without using the furrow slice
cracker. The water tension was not changed. It must be mentioned, that water
tension measurements are very sensitive and error prone.
The mean pneumatic conductivity show significant difference in the
compactness of the seedbed. After ploughing with mounted furrow slice
cracker and seedbed preparation (power harrow), the soil aggregates are
more compacted than without the mounted furrow slice cracker. The mean
measured pneumatic conductivity was significant smaller. This measured
effect was also confirmed by the sinking effect, if you are going on the
prepared seedbed. The sinking is deeper on the seedbed, where the plough
was not combined with the furrow slice cracker.
Table 1. Mean values (N=16) with standard deviation for the top soil parameters after
ploughing and seedbed preparation.
Mouldboard plough
without mounted furrow
slice cracker
Mouldboard plough with
mounted furrow slice
cracker
Soil moisture (Vol. %) 19.75A* ± 8.11 14.38B ± 5.18
Water tension (kPa) 80.22A ± 1.70 79.53A ± 4.08
Pneumatic conductivity (10-3cm/s) 21.99A ± 7.31 13.02B ± 4.55
*different letters indicate statistically significant differences (α=0,05); T-Test
Tractor with combined power harrow and seeding machine
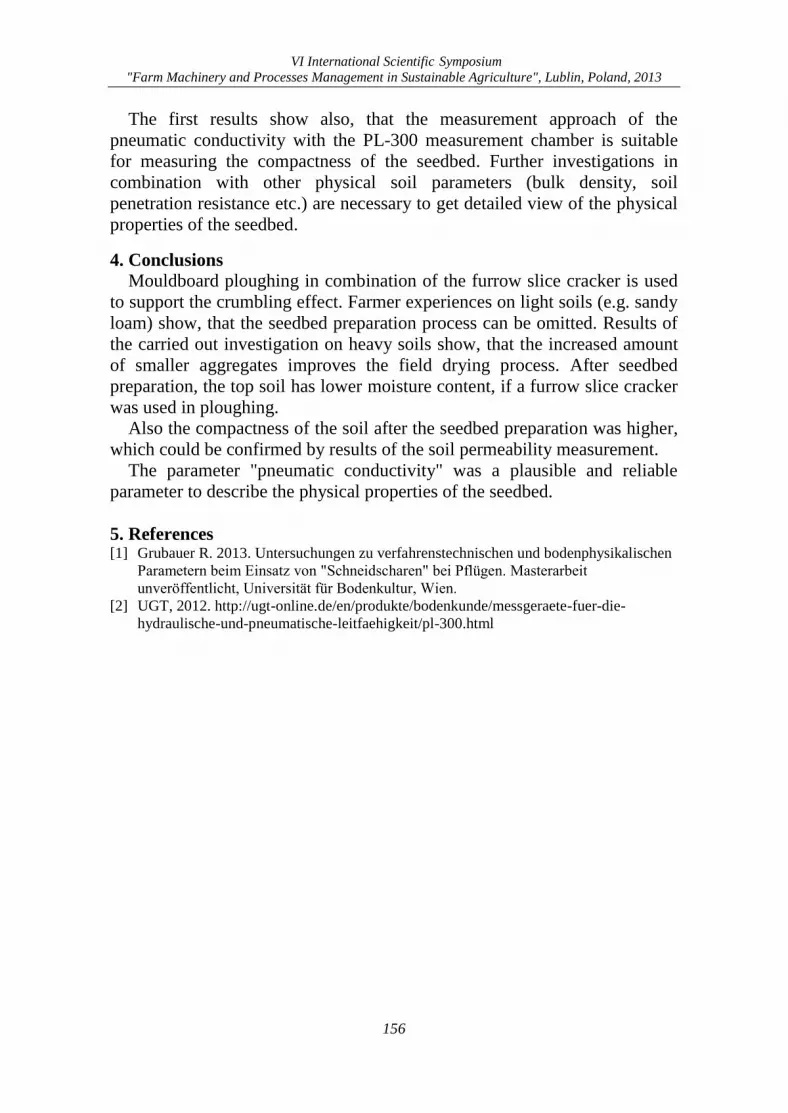
VI International Scientific Symposium
"Farm Machinery and Processes Management in Sustainable Agriculture", Lublin, Poland, 2013
156
The first results show also, that the measurement approach of the
pneumatic conductivity with the PL-300 measurement chamber is suitable
for measuring the compactness of the seedbed. Further investigations in
combination with other physical soil parameters (bulk density, soil
penetration resistance etc.) are necessary to get detailed view of the physical
properties of the seedbed.
4. Conclusions
Mouldboard ploughing in combination of the furrow slice cracker is used
to support the crumbling effect. Farmer experiences on light soils (e.g. sandy
loam) show, that the seedbed preparation process can be omitted. Results of
the carried out investigation on heavy soils show, that the increased amount
of smaller aggregates improves the field drying process. After seedbed
preparation, the top soil has lower moisture content, if a furrow slice cracker
was used in ploughing.
Also the compactness of the soil after the seedbed preparation was higher,
which could be confirmed by results of the soil permeability measurement.
The parameter "pneumatic conductivity" was a plausible and reliable
parameter to describe the physical properties of the seedbed.
5. References [1] Grubauer R. 2013. Untersuchungen zu verfahrenstechnischen und bodenphysikalischen
Parametern beim Einsatz von "Schneidscharen" bei Pflügen. Masterarbeit
unveröffentlicht, Universität für Bodenkultur, Wien.
[2] UGT, 2012. http://ugt-online.de/en/produkte/bodenkunde/messgeraete-fuer-die-
hydraulische-und-pneumatische-leitfaehigkeit/pl-300.html
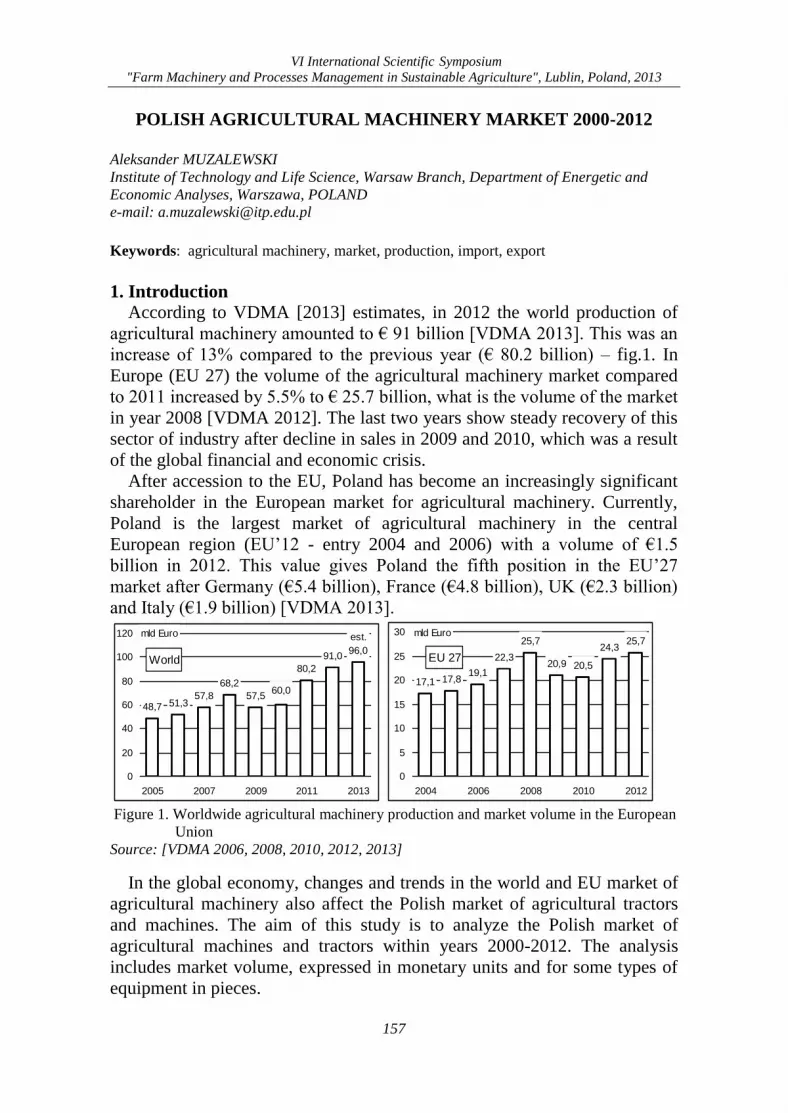
VI International Scientific Symposium
"Farm Machinery and Processes Management in Sustainable Agriculture", Lublin, Poland, 2013
157
POLISH AGRICULTURAL MACHINERY MARKET 2000-2012
Aleksander MUZALEWSKI
Institute of Technology and Life Science, Warsaw Branch, Department of Energetic and
Economic Analyses, Warszawa, POLAND
e-mail: [email protected]
Keywords: agricultural machinery, market, production, import, export
1. Introduction
According to VDMA [2013] estimates, in 2012 the world production of
agricultural machinery amounted to € 91 billion [VDMA 2013]. This was an
increase of 13% compared to the previous year (€ 80.2 billion) – fig.1. In
Europe (EU 27) the volume of the agricultural machinery market compared
to 2011 increased by 5.5% to € 25.7 billion, what is the volume of the market
in year 2008 [VDMA 2012]. The last two years show steady recovery of this
sector of industry after decline in sales in 2009 and 2010, which was a result
of the global financial and economic crisis.
After accession to the EU, Poland has become an increasingly significant
shareholder in the European market for agricultural machinery. Currently,
Poland is the largest market of agricultural machinery in the central
European region (EU’12 - entry 2004 and 2006) with a volume of €1.5
billion in 2012. This value gives Poland the fifth position in the EU’27
market after Germany (€5.4 billion), France (€4.8 billion), UK (€2.3 billion)
and Italy (€1.9 billion) [VDMA 2013].
World
48,7 51,357,8
68,2
57,5
80,2
91,0
est.
96,0
60,0
0
20
40
60
80
100
120
2005 2007 2009 2011 2013
mld Euro
EU 27
17,1 17,819,1
22,3
25,7
20,9 20,5
24,325,7
0
5
10
15
20
25
30
2004 2006 2008 2010 2012
mld Euro
Figure 1. Worldwide agricultural machinery production and market volume in the European
Union
Source: [VDMA 2006, 2008, 2010, 2012, 2013]
In the global economy, changes and trends in the world and EU market of
agricultural machinery also affect the Polish market of agricultural tractors
and machines. The aim of this study is to analyze the Polish market of
agricultural machines and tractors within years 2000-2012. The analysis
includes market volume, expressed in monetary units and for some types of
equipment in pieces.

VI International Scientific Symposium
"Farm Machinery and Processes Management in Sustainable Agriculture", Lublin, Poland, 2013
158
2. Material and methods
The market of agricultural machinery is determined as the sum of supplies
from domestic production and imports, less export (Market = Production +
Import – Export). Such defined volume indicates a change in the value of
domestic agricultural resources of mechanization means and is slightly
smaller than the actual demand (purchase of equipment) by the value of
exports of used equipment. The analysis does not include the market value of
trade between farmers.
The analysis was based on the following data:
Central Statistics Office (Production of industrial products - years 2000-
2012, Bank of foreign trade data), Agency for Restructuring and
Modernisation of Agriculture (Reports on the activities), publications of
IERiGZ concerning the market of production means for agriculture,
estimations of VDMA (German Association of Machinery and Equipment
Manufacturers), own market unpublished data.
3. Results
In the years 2000-2012 the market of the agricultural machines and
tractors in Poland increased at current prices more than three times, reaching
in 2012 PLN 7.03 billion (€1.67 billion) - Figure 1 and 2. The breakdown of
sales of agricultural equipment in 2009 by 23%, compared to 2008, was due
to the global financial crisis, affecting the purchasing power and willingness
to invest in agriculture. In real terms, taking into account the annual price
index of agricultural machinery, the domestic market for agricultural
equipment increased in the period 2000-2012 nearly 2-fold.
Market volume
2,1
4,3
7,05,7
4,7
5,6
-3,3-4
-2
0
2
4
6
8
2000 2002 2004 2006 2008 2010 2012
mld PLN
Market
Production
Import
Export
Production
4,74
4,52
0,220
1
2
3
4
5
2000 2002 2004 2006 2008 2010 2012
mld PLN
Total production
MachinesTractors
Figure 2. Volume of Polish market and production of agricultural machinery
Source: Own estimations based on data of GUS [2000-2012, 2001-2013]
The main sources of funding for investment in modernizing farms were
EU development programs, including SAPARD and also rural (2004-2006)
and scrotal (2004-2006) development programs. In the last years the demand
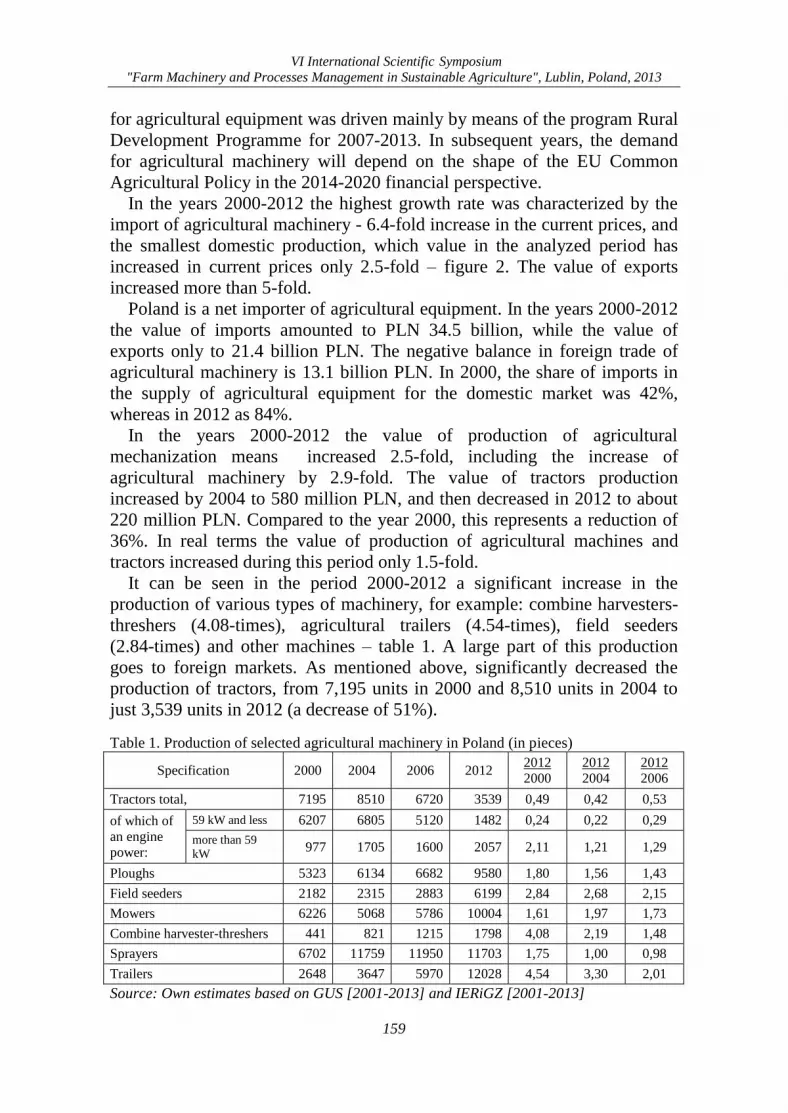
VI International Scientific Symposium
"Farm Machinery and Processes Management in Sustainable Agriculture", Lublin, Poland, 2013
159
for agricultural equipment was driven mainly by means of the program Rural
Development Programme for 2007-2013. In subsequent years, the demand
for agricultural machinery will depend on the shape of the EU Common
Agricultural Policy in the 2014-2020 financial perspective.
In the years 2000-2012 the highest growth rate was characterized by the
import of agricultural machinery - 6.4-fold increase in the current prices, and
the smallest domestic production, which value in the analyzed period has
increased in current prices only 2.5-fold – figure 2. The value of exports
increased more than 5-fold.
Poland is a net importer of agricultural equipment. In the years 2000-2012
the value of imports amounted to PLN 34.5 billion, while the value of
exports only to 21.4 billion PLN. The negative balance in foreign trade of
agricultural machinery is 13.1 billion PLN. In 2000, the share of imports in
the supply of agricultural equipment for the domestic market was 42%,
whereas in 2012 as 84%.
In the years 2000-2012 the value of production of agricultural
mechanization means increased 2.5-fold, including the increase of
agricultural machinery by 2.9-fold. The value of tractors production
increased by 2004 to 580 million PLN, and then decreased in 2012 to about
220 million PLN. Compared to the year 2000, this represents a reduction of
36%. In real terms the value of production of agricultural machines and
tractors increased during this period only 1.5-fold.
It can be seen in the period 2000-2012 a significant increase in the
production of various types of machinery, for example: combine harvesters-
threshers (4.08-times), agricultural trailers (4.54-times), field seeders
(2.84-times) and other machines – table 1. A large part of this production
goes to foreign markets. As mentioned above, significantly decreased the
production of tractors, from 7,195 units in 2000 and 8,510 units in 2004 to
just 3,539 units in 2012 (a decrease of 51%).
Table 1. Production of selected agricultural machinery in Poland (in pieces)
Specification 2000 2004 2006 2012 2012
2000
2012
2004
2012
2006
Tractors total, 7195 8510 6720 3539 0,49 0,42 0,53
of which of
an engine
power:
59 kW and less 6207 6805 5120 1482 0,24 0,22 0,29
more than 59
kW 977 1705 1600 2057 2,11 1,21 1,29
Ploughs 5323 6134 6682 9580 1,80 1,56 1,43
Field seeders 2182 2315 2883 6199 2,84 2,68 2,15
Mowers 6226 5068 5786 10004 1,61 1,97 1,73
Combine harvester-threshers 441 821 1215 1798 4,08 2,19 1,48
Sprayers 6702 11759 11950 11703 1,75 1,00 0,98
Trailers 2648 3647 5970 12028 4,54 3,30 2,01
Source: Own estimates based on GUS [2001-2013] and IERiGZ [2001-2013]
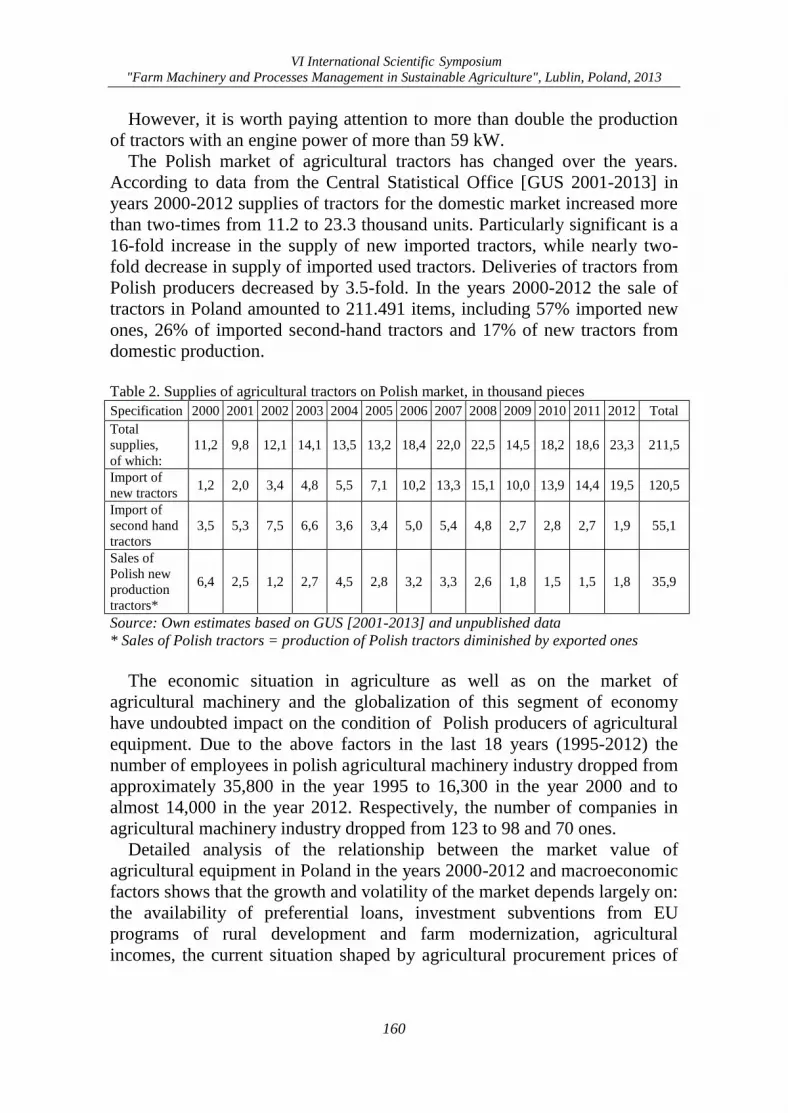
VI International Scientific Symposium
"Farm Machinery and Processes Management in Sustainable Agriculture", Lublin, Poland, 2013
160
However, it is worth paying attention to more than double the production
of tractors with an engine power of more than 59 kW.
The Polish market of agricultural tractors has changed over the years.
According to data from the Central Statistical Office [GUS 2001-2013] in
years 2000-2012 supplies of tractors for the domestic market increased more
than two-times from 11.2 to 23.3 thousand units. Particularly significant is a
16-fold increase in the supply of new imported tractors, while nearly two-
fold decrease in supply of imported used tractors. Deliveries of tractors from
Polish producers decreased by 3.5-fold. In the years 2000-2012 the sale of
tractors in Poland amounted to 211.491 items, including 57% imported new
ones, 26% of imported second-hand tractors and 17% of new tractors from
domestic production.
Table 2. Supplies of agricultural tractors on Polish market, in thousand pieces
Specification 2000 2001 2002 2003 2004 2005 2006 2007 2008 2009 2010 2011 2012 Total
Total
supplies,
of which:
11,2 9,8 12,1 14,1 13,5 13,2 18,4 22,0 22,5 14,5 18,2 18,6 23,3 211,5
Import of
new tractors 1,2 2,0 3,4 4,8 5,5 7,1 10,2 13,3 15,1 10,0 13,9 14,4 19,5 120,5
Import of
second hand
tractors
3,5 5,3 7,5 6,6 3,6 3,4 5,0 5,4 4,8 2,7 2,8 2,7 1,9 55,1
Sales of
Polish new
production
tractors*
6,4 2,5 1,2 2,7 4,5 2,8 3,2 3,3 2,6 1,8 1,5 1,5 1,8 35,9
Source: Own estimates based on GUS [2001-2013] and unpublished data
* Sales of Polish tractors = production of Polish tractors diminished by exported ones
The economic situation in agriculture as well as on the market of
agricultural machinery and the globalization of this segment of economy
have undoubted impact on the condition of Polish producers of agricultural
equipment. Due to the above factors in the last 18 years (1995-2012) the
number of employees in polish agricultural machinery industry dropped from
approximately 35,800 in the year 1995 to 16,300 in the year 2000 and to
almost 14,000 in the year 2012. Respectively, the number of companies in
agricultural machinery industry dropped from 123 to 98 and 70 ones.
Detailed analysis of the relationship between the market value of
agricultural equipment in Poland in the years 2000-2012 and macroeconomic
factors shows that the growth and volatility of the market depends largely on:
the availability of preferential loans, investment subventions from EU
programs of rural development and farm modernization, agricultural
incomes, the current situation shaped by agricultural procurement prices of
VI International Scientific Symposium
"Farm Machinery and Processes Management in Sustainable Agriculture", Lublin, Poland, 2013
161
cereals, maize, rapeseed, milk. In-depth analysis of this issue will be the
subject of a separate publication.
4. Conclusions
In years 2000-2012 Polish market of agricultural machinery has increased
above three-times to 7.03 billion PLN. This value gives Poland the fifth
position in the EU’27 market and the first position in the EU’12. Since 2000,
gradually increases the share of imports in the supply of agricultural
machinery and currently stands at 84%.
Domestic production of various types of agricultural machines is also
increasing, but at a slower rate than the market of mechanization means of
agriculture. It was found a significant increase in a production of combine
harvesters-threshers, agricultural trailers, field seeders and other machines.
On the other hand production of tractors has diminished above 2-times.
These changes have an impact on the improvement of agricultural
equipment with modern mechanization means (see results of the National
Agricultural Census 2010) as well as on a state of Polish industry of
agricultural machines and tractors.
5. References [1] ARiMR 2003-2013. Sprawozdania z działalności Agencji Restrukturyzacji i
Modernizacji Rolnictwa z lat 2002-2012. (Reports on the activities of the Agency for
Restructuring and Modernisation of Agriculture, years 2002-2012). Warsaw.
[2] GUS 2000-2012. Bank of foreign trade data. GUS Warsaw.
[3] GUS 2001-2013. Produkcja wyrobów przemysłowych – za lata 2000-2012. (Production
of industrial products - years 2000-2012). GUS Warsaw.
[4] IERiGZ 2001-2013. Rynek środków produkcji dla rolnictwa. (The market of production
means for agriculture). IERiGZ. Warsaw.
[5] VDMA 2013. Wirtschaftsbericht - Landtechnik 2013. VDMA Frankfurt.
[6] VDMA 2006 - 2012. Agricultural machinery – Economic report (years 2006, 2008,
2010, 2012). VDMA Frankfurt.
[7] Unpublished market data.

VI International Scientific Symposium
"Farm Machinery and Processes Management in Sustainable Agriculture", Lublin, Poland, 2013
162
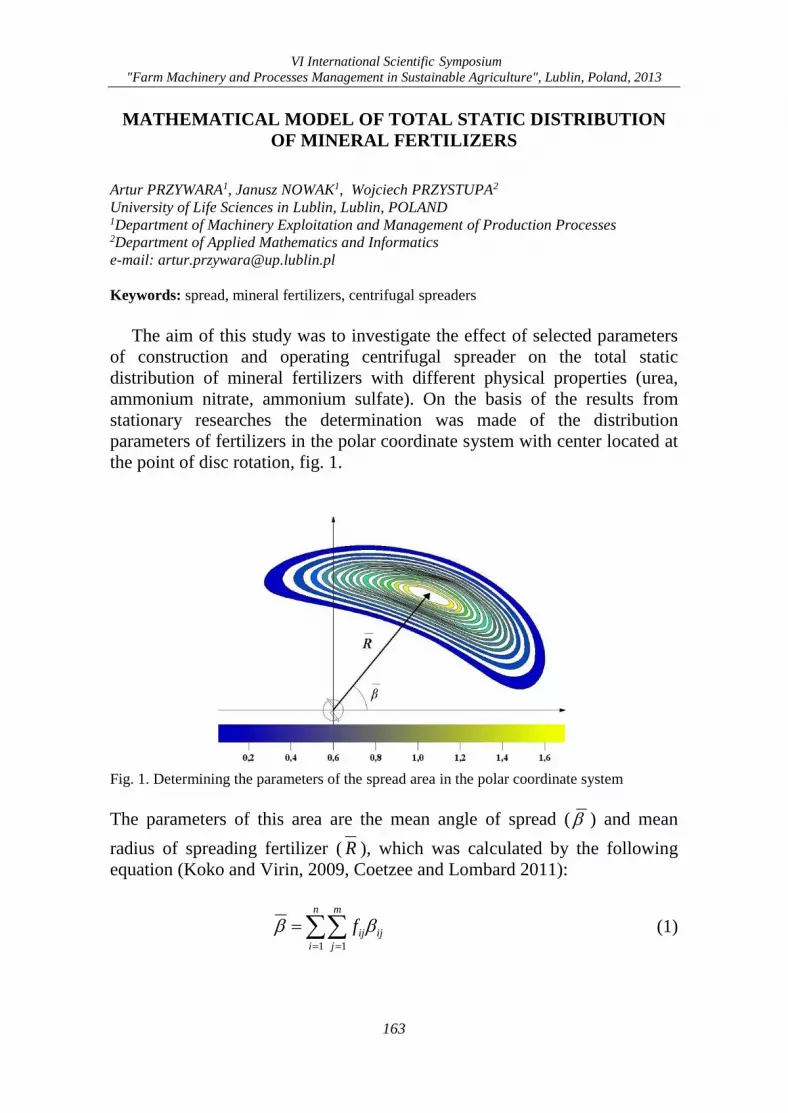
VI International Scientific Symposium
"Farm Machinery and Processes Management in Sustainable Agriculture", Lublin, Poland, 2013
163
MATHEMATICAL MODEL OF TOTAL STATIC DISTRIBUTION
OF MINERAL FERTILIZERS
Artur PRZYWARA1, Janusz NOWAK1, Wojciech PRZYSTUPA2
University of Life Sciences in Lublin, Lublin, POLAND 1Department of Machinery Exploitation and Management of Production Processes 2Department of Applied Mathematics and Informatics
e-mail: [email protected]
Keywords: spread, mineral fertilizers, centrifugal spreaders
The aim of this study was to investigate the effect of selected parameters
of construction and operating centrifugal spreader on the total static
distribution of mineral fertilizers with different physical properties (urea,
ammonium nitrate, ammonium sulfate). On the basis of the results from
stationary researches the determination was made of the distribution
parameters of fertilizers in the polar coordinate system with center located at
the point of disc rotation, fig. 1.
Fig. 1. Determining the parameters of the spread area in the polar coordinate system
The parameters of this area are the mean angle of spread ( ) and mean
radius of spreading fertilizer ( R ), which was calculated by the following
equation (Koko and Virin, 2009, Coetzee and Lombard 2011):
ij
n
i
m
j
ijf
1 1
(1)
VI International Scientific Symposium
"Farm Machinery and Processes Management in Sustainable Agriculture", Lublin, Poland, 2013
164
ij
n
i
m
j
ijrfR
1 1
(2)
where:
ijf − mass fraction of particles in the collector tray, g
ij − angle of the ij-th collector of particles in the collector tray, °
n − number of rows of trays,
m − number of columns of trays,
ijr − radius of the ij-th collector of particles in the collector tray, m.
Based on the calculated parameters of the tested fertilizers spread area and
statistical analysis of the results (mean, standard deviation) a probability
density was proposed of the normal distribution of two variables (in the
absence of traffic centrifugal spreader). It can be a useful function for
modeling mineral fertilizer spread process by centrifugal spreaders. The form
of this function is as follows:
2
2
2
2
2
)()(
2
)()(exp
2
)(
tttrtrtmQ
m
i
r
m
i
r
i
i (3)
2
2
2
2
2
)(
2
)(exp
2
)(),,,(
LLL
LL
R
LL
LR
LLLLL
RRtmtRmQ
(4)
2
2
2
2
2
)(
2
)(exp
2
)(),,,(
PPP
PP
R
PP
PR
PPPPP
RRtmtRmQ
(5)
),,,(),,,( tRmQtRmQQ PPPPLLLLtotal (6)
where:
PL QQ , – total static distribution spread for left and right disc, kg·s-1·m-1·()-1
Qtotal – total static distribution spread for two discs, kg·s-1·m-1·()-1
)(),( tmtm PL – mass flow rate for left and right disc, kg·s-1
PL RR , – mean radius for left and right disc, m
PL , – mean angle for left and right disc,
PL RR , – standard deviation of radius of spread area for left and right disc, m
PL , – standard deviation of angle of spread area for left and right disc, .
Experimental studies made it possible to develop a model of the
interactions between parameters of the total static distribution (spread of

VI International Scientific Symposium
"Farm Machinery and Processes Management in Sustainable Agriculture", Lublin, Poland, 2013
165
fertilizer) and some of the operating parameters that can be the basis for
carrying out computer simulations. Sample test results and regression based
on the studied traits (S – angle setting of the vanes, V – rotational speed of
the disc, G - density of the fertilizer, FP - powdery fraction) for ammonium
sulfate are shown in figures 2-4.
Fig. 2. Total static distribution of ammonium sulfate and the calculated mean values of
radius ( R ) and angle ( ) of the spread area
Fig. 3. Relationship of mean angle versus rotational speed of the disc and vanes setting for
ammonium sulfate
VI International Scientific Symposium
"Farm Machinery and Processes Management in Sustainable Agriculture", Lublin, Poland, 2013
166
Fig. 4. Relationship of mean radius versus rotational speed of the disc and vanes setting for
ammonium sulfate
Based on the developed mathematical model of mineral fertilizers total
static distribution, the optimization can be achieved of the construction and
setup work elements of centrifugal spreaders. Knowledge of the physical
properties of mineral fertilizers and construction and operating parameters of
fertilizer spreaders also allows for the development of spread tables.
References
[1] Coetzee C.J., Lombard S.G., 2011. Discrete element method modeling of a centrifugal
fertilizer spreader, Biosystems Engineering, 109 (4): 308-325.
[2] Koko J., Virin T. 2009. Optimization of a fertilizer spreading process. Mathematic and
Computers in Simulation, 79(10): 3099-3109.
VI International Scientific Symposium
"Farm Machinery and Processes Management in Sustainable Agriculture", Lublin, Poland, 2013
167
SUSTAINABLE DEVELOPMENT OF TECHNOLOGY
IN AGRICULTURE TAKING INTO ACCOUNT RESTRICTIONS
CONCERNING ENVIRONMENT CONDITIONS
IN CATTLE BREEDING SYSTEMS
Wacław ROMANIUK, Jan BARWICKI
Institute of Technology and Life Sciences in Falenty, Branch in Warsaw, POLAND
e-mail: [email protected]; j.barwicki@ itep.edu.pl
Keywords: sustainable development, renewable energy, cattle breeding, manure disposal,
harmful gases, biogas production
1. Introduction
Rational development of technology in agriculture connected with animal
production is very close to some vastly important parameters as: genetic
progress, EU requirements for well-being of animals living in restricted area,
existing limitations of environment protection and general expectations for
the quality of a final product. It is proved that exhausted air from cattle barns
contains quite harmful components as: ammonia, methane, hydrogen sulfide,
nitrous oxide, germs and dust.
The goal of the present research is to evaluate the influence of different
factors on sustainable development of agriculture technology based on the
manure and odor management in cattle barns. Moreover the utilization of
manure as a raw material for energy production was also taken into
consideration.
2. Material and methods
The scope of research is technical and economic analysis of two cattle
barns located on family farms with high – V level of mechanization. Both
barns had loose housing systems, but one of them had litter on the cattle
stalls, but another one had no litter at all and rubber mats used. To utilize
natural manure and also biomass residue on the farms, it was proposed
development of biogas installation to obtain additional energy production
directly on the farm [Romaniuk et al 2012].
Besides that some tests concerning harmful gases concentration inside the
barn according to EU regulations were provided.
3. Results
Principal objective of this study was to determine the influence of
environment condition elements on the inputs and animal welfare.
In both of the cattle barns relative humidity of air exceeded the optimum.
Average relative air humidity inside the cattle barns tested, ranged from 60.1
to 77.12%, whereas the particular readings oscillated within 26.4–99.9%.
VI International Scientific Symposium
"Farm Machinery and Processes Management in Sustainable Agriculture", Lublin, Poland, 2013
168
Average concentration of carbon dioxide in all the cattle barns did not
exceed 1000 p.p.m., what is recognized as the comfortable conditions.
Particular CO2 concentrations, varying from 280 to 2900 p.p.m., were
comprised within standard accepted limits. Average ammonia concentration
in tested objects was situated in the range from 3.39 to 8.72 p.p.m., what
does not exceed allowable limits.
Generation and usage of agricultural origin energy, give some chances to
diversify and increase the agricultural incomes and rural energetic security,
as well as to improving the environment protection in the country side.
Considering the needs to diversification of energy sources, the agricultural
biogas plants give the chance to ensure energetic security. Agricultural
biogas plants of the power 100–500 kW, when using 50–70% of natural
manure from the own farm, are economically feasible.
4. Conclusions
Average ammonia concentration in tested objects was situated in the range
from 3.39 to 8.72 p.p.m., what does not exceed allowable limits.
Also particular CO2 concentrations, varying from 280 to 2900 p.p.m.,
were comprised within standard accepted limits.
Generation and usage of agricultural origin energy, give some chances to
diversify and increase the agricultural incomes and rural energetic security,
as well as to improving the environment protection of agriculture land.
Provided experiments have proved that it is possible to obtain the following
results:
• Reduction of greenhouse gases by about 20 percent
• Improvement of effectiveness of energy utilization by about
20 percent (lower usage of original energy),
• Increase of usage renewable energy sources in a total energetic
energy balance on a country scale by about 20 percent.
5. References [1] CIGR Handbook of Agricultural Engineering.1999. Volume II: Animal Production and
Aquacultural Engineering. Part I Livestock Housing and Environment. Volume Editors: Bartali
E.H., Wheaton F.W., Singh S. pp. 395.
[2] Romaniuk W., Głaszczka A., Biskupska K. 2012. Analiza rozwiązań instalacji biogazowych dla
gospodarstw rodzinnych i farmerskich. Seria wyd. „Inżynieria w Rolnictwie. Monografie”. ITP
Falenty, pp. 94.
[3] Wardal W.J. 2012. Wpływ systemu chowu bydła na nakłady usuwania
i magazynowania nawozu naturalnego. Rozprawa doktorska. Instytut Technologiczno-
Przyrodniczy. Falenty-Warszawa, pp. 131.
[4] Fiedorowicz G., Romaniuk W., Wardal W.J. 2011. Metoda oceny ekonomiczno-technologicznej
rozwiązań ciągu funkcjonalnego usuwania i magazynowania nawozu naturalnego z obór.
Problemy Inżynierii Rolniczej, wyd. ITP, nr 4, p. 105-116.
[5] Mazur K. 2012. Emisja szkodliwych gazów z obór dla krów mlecznych. Monografia, Problemy
intensyfikacji produkcji zwierzęcej z uwzględnieniem ochrony środowiska
i produkcji energii alternatywnej, wyd. IPT, p.100-105

VI International Scientific Symposium
"Farm Machinery and Processes Management in Sustainable Agriculture", Lublin, Poland, 2013
169
SELECTED ISSUES OF THE TDR BASED MEASUREMENT
OF THE SOIL APPARENT DIELECTRIC PERMITTIVITY
ORIENTED TO THE EVALUATION OF SOIL MOISTURE
Grzegorz SOLECKI, Andrzej WILCZEK, Agnieszka SZYPŁOWSKA, Anna NAKONIECZNA,
Bartosz PASZKOWSKI, Wojciech SKIERUCHA
Institute of Agrophysics PAS, Lublin, POLAND
e-mail: [email protected], [email protected], [email protected],
[email protected], [email protected], [email protected]
Keywords: TDR, soil water content, dielectric permittivity
1. Introduction
Water status monitoring defined as the spatial and temporal registration of
the water properties that decide about the processes under consideration, is
the basic instrument in natural research (in industrial processes, too).
Increasing demands of water management result in the continuous
development of its tools. Monitoring of water status is accomplished using
digital systems.
The most difficult are the electric measurement of soil water potential and
soil water content; therefore they are the subject of permanent research. The
method successfully verified for soils can be also applicable for other porous
agricultural materials because their structure is usually not as complex as
soil.
In majority of practical situations the status of water is described only by
one variable – water content. Soil water content seems to be the most
difficult water status variable to determine because the response of available
moisture sensors is not dependent only on soil water content, but also on soil
salinity, temperature and texture. Thermogravimetric methods enable to
determine the amount of water in the soil sample on the mass or volume
basis in the direct way and they are the most popular. These methods are
very laborious, time consuming and require the laboratory equipment. Time
Domain Reflectometry (TDR) technique for soil water content and electrical
conductivity [1, 2] has become popular since the publication of Topp et al.
[5].
The key feature of the applied measurement method is its selectivity, i.e.
the lack of sensitivity of the conversion function (calibration) on the
influence from the factors other than the measured one. Proper selectivity
liberates the user from frequent, specific for each soil, in situ calibration
measurements.
A water molecule has a permanent dipole moment of 1.87 D, which is
extremely big value as compared to other molecules in natural world. This
polarity is the reason that dielectric permittivity of water is much higher than

VI International Scientific Symposium
"Farm Machinery and Processes Management in Sustainable Agriculture", Lublin, Poland, 2013
170
permittivity of soil solid phase (the relative dielectric permittivity of pure
water in the electric field of frequency below about 20 GHz and 18ºC
temperature is 81, while the relative dielectric permittivity of solid phase is
45 at the same conditions). The dielectric permittivity of soil strongly
depends on its water content, therefore it may be concluded that electric
measurement of soil moisture should be based on the measurement of its
dielectric permittivity.
In the case of materials conducting electric current, such as moist soil, the
selective electric measurement of moisture on the base of dielectric
permittivity is complicated because soil has features of dielectric and
conductor simultaneously. The soil dielectric permittivity, , is a complex
quantity:
0
"'
dj , (1)
where: ε’ is the real part of the relative complex dielectric permittivity of the
soil, εd’’ is negligible contribution from the soil dielectric loss connected with
dielectric polarization (mutual friction of permanent and induced dipoles),
(g cm-3) is dry bulk density of soil, (S m-1) is the electrical conductivity
of electrolyte, (s-1) is electric pulsation of external field stimulating the
sensor, equal to 2f, f (Hz) is frequency of electric field, 0 (Fm-1) is
dielectric permittivity of vacuum and j= 1 . Practically ’ depends solely
on soil moisture, , and soil dry bulk density, . The imaginary part depends
on electrical conductivity of the soil, , as well as the frequency of electric
field, f. The bigger the value of the imaginary part (practically the bigger the
value of soil electrical conductivity), the more visible are conductive features
of the soil. Considering that the electrical conductivity of soils reaches values
of 1 Sm-1, the electric method of moisture measurement should apply the
electric field of frequency not lower than 1 GHz.
2. Time domain reflectometry application in dielectric moisture
measurement
The principle of measurement of electromagnetic wave propagation
velocity in soil (or other porous materials) is presented in Fig. 1.
A section of transmission line, called the sensor, is constructed from two
parallel, non-isolated metal rods. Another transmission line (for example
coaxial line), called the feeder, connects the ending of the sensor with an
electric voltage pulse generator. The voltage step traveling along the feeder
reaches at instant t1 the beginning of the sensor and propagates further in the
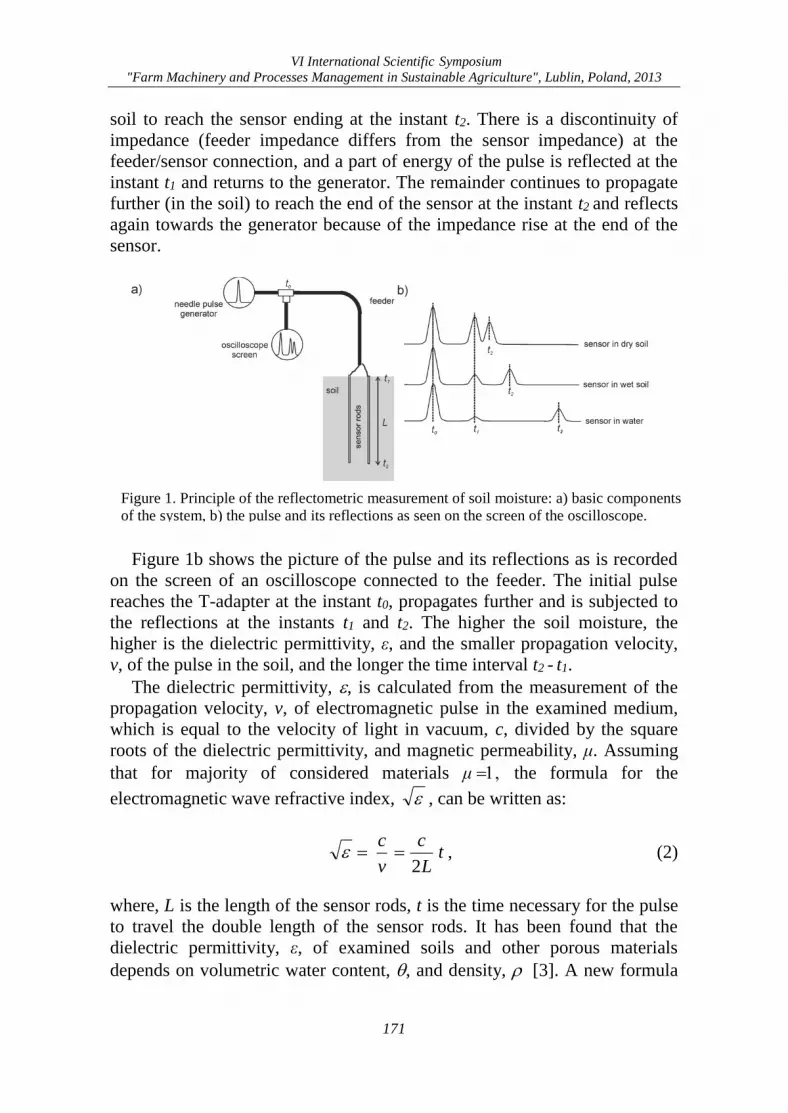
VI International Scientific Symposium
"Farm Machinery and Processes Management in Sustainable Agriculture", Lublin, Poland, 2013
171
soil to reach the sensor ending at the instant t2. There is a discontinuity of
impedance (feeder impedance differs from the sensor impedance) at the
feeder/sensor connection, and a part of energy of the pulse is reflected at the
instant t1 and returns to the generator. The remainder continues to propagate
further (in the soil) to reach the end of the sensor at the instant t2 and reflects
again towards the generator because of the impedance rise at the end of the
sensor.
Figure 1b shows the picture of the pulse and its reflections as is recorded
on the screen of an oscilloscope connected to the feeder. The initial pulse
reaches the T-adapter at the instant t0, propagates further and is subjected to
the reflections at the instants t1 and t2. The higher the soil moisture, the
higher is the dielectric permittivity, ε, and the smaller propagation velocity,
v, of the pulse in the soil, and the longer the time interval t2 - t1.
The dielectric permittivity, , is calculated from the measurement of the
propagation velocity, v, of electromagnetic pulse in the examined medium,
which is equal to the velocity of light in vacuum, c, divided by the square
roots of the dielectric permittivity, and magnetic permeability, μ. Assuming
that for majority of considered materials μ the formula for the
electromagnetic wave refractive index, , can be written as:
tL
c
v
c
2 , (2)
where, L is the length of the sensor rods, t is the time necessary for the pulse
to travel the double length of the sensor rods. It has been found that the
dielectric permittivity, ε, of examined soils and other porous materials
depends on volumetric water content, , and density, [3]. A new formula
Figure 1. Principle of the reflectometric measurement of soil moisture: a) basic components
of the system, b) the pulse and its reflections as seen on the screen of the oscilloscope.
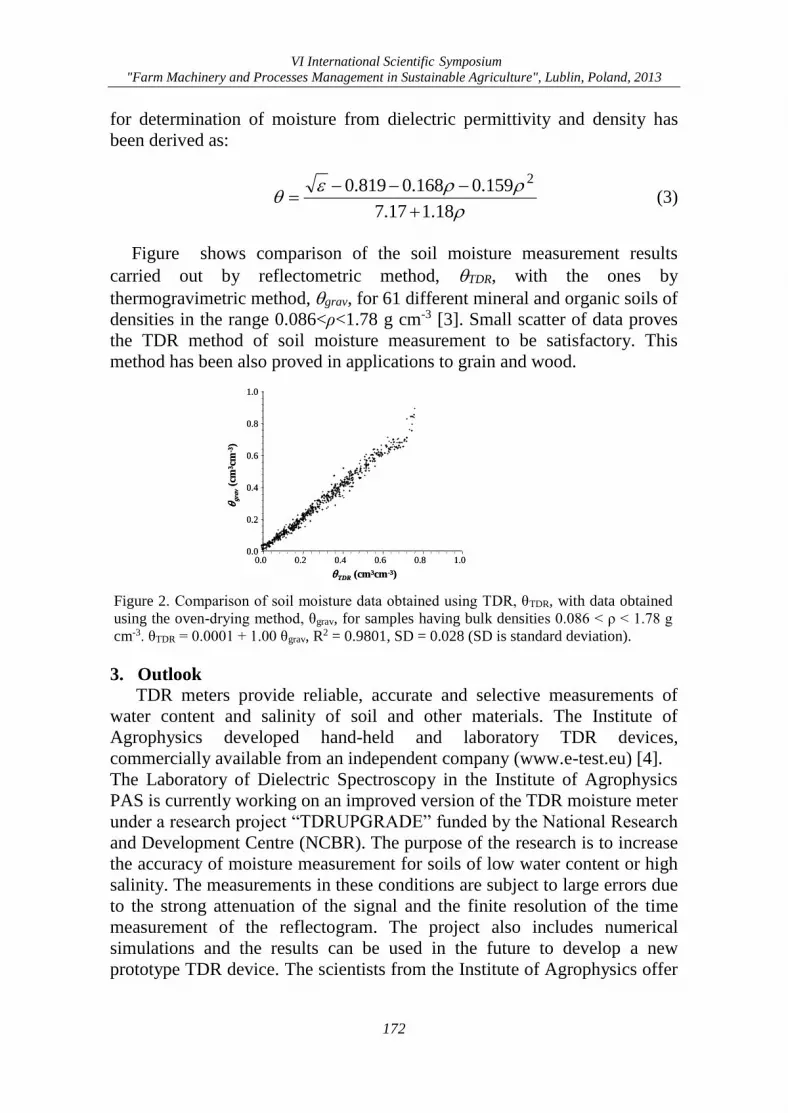
VI International Scientific Symposium
"Farm Machinery and Processes Management in Sustainable Agriculture", Lublin, Poland, 2013
172
for determination of moisture from dielectric permittivity and density has
been derived as:
18.117.7
159.0168.00.819 2
(3)
Figure shows comparison of the soil moisture measurement results
carried out by reflectometric method, TDR, with the ones by
thermogravimetric method, grav, for 61 different mineral and organic soils of
densities in the range 0.086<ρ<1.78 g cm-3 [3]. Small scatter of data proves
the TDR method of soil moisture measurement to be satisfactory. This
method has been also proved in applications to grain and wood.
0.0
0.2
0.4
0.6
0.8
1.0
0.0 0.2 0.4 0.6 0.8 1.0
TDR (cm3cm-3)
gra
v(c
m3cm
-3)
0.0
0.2
0.4
0.6
0.8
1.0
0.0 0.2 0.4 0.6 0.8 1.0
TDR (cm3cm-3)
gra
v(c
m3cm
-3)
3. Outlook
TDR meters provide reliable, accurate and selective measurements of
water content and salinity of soil and other materials. The Institute of
Agrophysics developed hand-held and laboratory TDR devices,
commercially available from an independent company (www.e-test.eu) [4].
The Laboratory of Dielectric Spectroscopy in the Institute of Agrophysics
PAS is currently working on an improved version of the TDR moisture meter
under a research project “TDRUPGRADE” funded by the National Research
and Development Centre (NCBR). The purpose of the research is to increase
the accuracy of moisture measurement for soils of low water content or high
salinity. The measurements in these conditions are subject to large errors due
to the strong attenuation of the signal and the finite resolution of the time
measurement of the reflectogram. The project also includes numerical
simulations and the results can be used in the future to develop a new
prototype TDR device. The scientists from the Institute of Agrophysics offer
Figure 2. Comparison of soil moisture data obtained using TDR, θTDR, with data obtained
using the oven-drying method, θgrav, for samples having bulk densities 0.086 < ρ < 1.78 g
cm-3. θTDR = 0.0001 + 1.00 θgrav, R2 = 0.9801, SD = 0.028 (SD is standard deviation).
VI International Scientific Symposium
"Farm Machinery and Processes Management in Sustainable Agriculture", Lublin, Poland, 2013
173
their expertise and the measurement TDR equipment that can be tailored to
specific applications in agriculture engineering.
4. References [1] Dasberg, S., Dalton, F.N. 1985. Time domain reflectometry measurements of soil water
content and electrical conductivity. Soil Science Society of America Journal, 49, p.
293-297.
[2] Malicki, M.A., Plagge, R., Renger, M., Walczak, R.T. 1992. Application of time-
domain reflectometry (TDR) soil water content miniprobe for the determination of
unsaturated soil water characteristics from undisturbed soil cores. Irrigation Science,
13, p. 65-72.
[3] Malicki M.A, Plagge R., Roth C.H. 1996. Reduction of soil matrix effect on TDR
dielectric moisture determination by accounting for bulk density or porosity. European
Journal of Soil Science, 47, p. 357-366.
[4] Skierucha W., Wilczek A., Szypłowska A., Sławiński C., Lamorski K. 2012. A TDR-
Based Soil Moisture Monitoring System with Simultaneous Measurement of Soil
Temperature and Electrical Conductivity. Sensors, 12, p. 13545-13566.
[5] Topp G.C., Davis J.L., Annan A.P. 1980. Electromagnetic determination of soil water
content: measurements in coaxial transmission lines. Water Resources Research, 16, p.
574-582.

VI International Scientific Symposium
"Farm Machinery and Processes Management in Sustainable Agriculture", Lublin, Poland, 2013
174
VI International Scientific Symposium
"Farm Machinery and Processes Management in Sustainable Agriculture", Lublin, Poland, 2013
175
TECHNOLOGY OF SOIL BIOREMEDIATION
AND CONVERSION OF CONTAMINATED PHYTOMASS
INTO USABLE ENERGY FORMS
Andrej ULIČNÝ1, Tomáš DURANÍK1, Milan KOSZEL2
1 Faculty of Manufacturing Technologies, Technical University of Kosice with seat in
Presov, SLOVAKIA 2 University of Life Sciences in Lublin, Department of Machinery Exploitation and
Management of Production Processes, Lublin, POLAND
e-mail: [email protected]
Keywords: ash, biomass, decontaminate, energy, heavy metals, phytomass
1. Introduction
One of the places characterized by soil pollution in Slovakia is Ružín dam
on the River Hornád. Heavy metals get into the soil as a result of water
erosion and also from factories.
According to the data from 2002 (Brehuv, et al. 2002) the amount of
deposited silt on Ružín dam was 7 000 000 m3. The annual deposit of silt is
approximately 225 000 m3.
The examinations of pollutants content (Brehuv, et al. 2002) showed that
as a result of sedimentation the soil on the river bottom was contaminated
with heavy metals beyond the limits (Bouček 2005). Therefore, it is
advisable to search for the ways of soil disinfection in the interest of
environment protection.
2. Material and methods
The aim of the study was soil remediation by means of amaranthus
cultivation with the possibility of using thus produced phytomass for energy
production.
The research on soil remediation is justified since the extraction of
sedimentary soil increases the capacity of a water reservoir. The repeated
cultivation of amaranthus should decrease the soil contamination to the
permissible limit.
The first stage was the examination of the soil contamination level and
possibilities of its disinfection. A decision was taken to use the biological
method for soil remediation. The plant used in the examination was
amaranthus.
3. Results
The analysis of heavy metals content in the soil before sowing and after
harvesting of amaranthus is presented in Table 1.
The examination results indicate the increased level of heavy metals in the
soil before sowing of amaranthus. The data shown in Table 1 imply a
decrease in the soil contamination after harvesting of amaranthus.

VI International Scientific Symposium
"Farm Machinery and Processes Management in Sustainable Agriculture", Lublin, Poland, 2013
176
Table 1. The content of heavy metals in the soil before sowing and after harvesting of
amaranthus
Examined
element
Heavy metals content [mg*kg-1]
Difference [%]
Limit values of
detrimental
elements Before sowing
of amaranthus
After harvesting of
amaranthus
As 50,00 25,90 48,20 25,00
Cu 321,00 300,00 6,54 60,00
Hg 1,24 1,18 5,08 0,50
Pb 66,00 30,10 54,39 70,00
The comparison of the examination results showed that the content of
heavy metals in the plants grown in the contaminated substrate was higher
than in the plants from the disinfected substrate, which proves that
amaranthus has the ability to accumulate heavy metals. The analysis of the
examination results implied that if the plants are harvested for energetic
purposes, they need to be harvested together with the roots. Otherwise, if
only the aerial parts of the plants were harvested, the roots would die and
recontaminate the soil.
The content of heavy metals in ash is the evidence of the transportation of
pollutants from the soil through a plant as a transitory material, and
eventually the contamination of ash – the product of biomass burning.
4. Conclusions
The examinations proved that amaranthus is a plant which is capable of
accumulating heavy metals. It was also found that a considerable amount of
heavy metals was accumulated in the plants roots, which implies that the
plants need to be harvested together with the roots.
Contaminated plants can be processed into power engineering fuel. The
energy potential is comparable to the one of cereal straw or wood. The
technology of processing of the aerial parts of plants is comparable to the
technology of processing of fodder plants (Duraník 2010).
5. References [1] Brehuv J., Bobro M., Hančuľák J. 2002. Hodnotenie výsledkov prieskumu nánosov v nádrži
Vodného diela Ružín I v roku 2001. In: F. Jenčík, Ľ, Bindas, S. Hredzák (eds.) XI. Vedecké
sympózium s medzinárodnou účasťou O ekológii vo vybraných aglomeráciach Jelšavy –
Lubeníka a stredného Spiša : zborník. Hrádok pri Jelšave, 21.-22. november 2002, Košice :
Slovenská banícka spoločnosť ZSVTS, 92 – 95.
[2] Bouček P. 2005. Návrh dekontaminácie pôdy prostredníctvom výsadby láskavca (Amaranthus) a
jeho spracovanie ako paliva z fytoenergetickej suroviny. Diplomová práca. Technická Univerzita
Košice.
[3] Duraník T. 2010. Alternatívne možnosti využitia kontaminovanej biomasy vo výrobnom procese
Technickej Univerzity Košice, Fakulty výrobných technológii so sídlom v Prešove v roku 2010.
Diplomová práca. Technická Univerzita Košice.
VI International Scientific Symposium
"Farm Machinery and Processes Management in Sustainable Agriculture", Lublin, Poland, 2013
177
LIFELONG LEARNING – AN ESSENTIAL ATTRIBUTE
FOR ENGINEERING GRADUATES
Jacek UZIAK1, Magdalena WALCZAK2, M. Tunde OLADIRAN3
1 Department of Mechanical Engineering, University of Botswana, Gaborone, BOTSWANA 2 Department of Mechanical and Metallurgical Engineering, School of Engineering,
Pontificia Universidad Católica de Chile, CHILE 3 Department of Mining, Energy and Geological Engineering, Botswana International
University of Science & Technology, Gaborone, BOTSWANA
e-mail:; [email protected], [email protected], [email protected]
Keywords: lifelong learning, self-directed learning, graduate attributes
Introduction
Lifelong education which is precursor of lifelong learning (LLL) grew out
of the notion that education is a continuous aspect of life. That aspect of
education is especially important in science and engineering as their
boundaries are continuously shifting by advances of science and its
technological implications. The pace of progress seems faster with true
revolutions occurring in less than a generation forcing engineers to evolve in
both technical and non-technical knowledge if they are to keep abreast with
the actual requirements posed on them by the society.
There are attempts to formulate learning policies taking into consideration
the importance of ‘skills and knowledge for life’. One of such very
influential examples may be Organization for Economic Cooperation and
Development (OECD)-based lifelong learning policy [1].
LLL started as an idea in Denmark 150 years ago when Grundtvig, the
Danish scholar and priest, introduced the concept of liberal education and the
folk high schools [2]. The concept was political as the aim was to improve
the general knowledge of all citizens, in order to equip them to participate
fully in public life [2].
It is impossible to find one, universally accepted, definition of LLL. In
fact, there are several definitions depending on the framework set by the
author, the audience, objective and circumstances in which the definition is
given. Some definitions consider LLL as a process required for an employee
to change areas of employment in order to advance in a career or adapt to a
new setting of employment; whereas other definitions view LLL as
continuing or distance learning. However, for the purpose of engineering
education at the university level, it is convenient to consider LLL skills as
the ability to acquire new knowledge throughout graduate life, i.e., learning
beyond conventional schooling resulting in both professional and personal
development. Because engineering education is often based on a set of
VI International Scientific Symposium
"Farm Machinery and Processes Management in Sustainable Agriculture", Lublin, Poland, 2013
178
competences required by the profession, it is the responsibility of university
curricula and academic staff to develop LLL skills in their graduates.
Lifelong learning in engineering
The mutual recognition of engineering qualifications and professional
competence by various countries [3] has brought the concept of LLL to
foreground. All three international accords, the Washington Accord – for
engineering degree programmes, the Sydney Accord – for engineering
technologists and the Dublin Accord – for engineering technicians, recognize
the need and importance of LLL for graduates. In case of engineering degree
programmes the attribute is formulated as follows [3]:
Recognize the need for, and have the preparation and ability to
engage in independent and life-long learning in the broadest
context of technological change.
The requirement of LLL skills is also embedded in the graduate knowledge
profile [3], which requires ‘engagement with selected knowledge in the
research literature of the discipline’ in the context of depth of knowledge
required for solving complex engineering problems.
On the other hand, the cognitive perspective of engineering education
considers LLL as a form of self-directed learning. The process of self-
directed learning refers to the ability of students to identify goals for
learning, access relevant information, assess their learning and make
necessary modifications to improve their progress by own initiative rather
than something controlled outside the learner by a teacher, trainer, or
instructional designer such as in a formal educational arrangement [4].
In view of the importance of new technologies and growing demands on
the engineering profession, the capacity to undertake lifelong learning should
be considered as the most important aspect of the professional (soft) skills
for graduate engineers. The lifelong learning concept is no longer some
additional, i.e. optional, training after graduation but these are all activities
covering the entire active life of a graduate [5,6].
Need to re-engineer curricula
In the last few decades the university education has gone through
enormous transition. It is due to two major factors; one of them is the fact
that university education has now become a norm rather than exception and
has finally stopped being the privilege of only elite group of people. That
dramatically increased the student population and also the diversity of
students. The second factor is the aspiration of countries to create or to
transit towards ‘knowledge society’ [7]. That created a general movement
towards the society in which the ability to learn tomorrow is as important as
the ability to learn today. Those two factors fit perfectly the concept of LLL

VI International Scientific Symposium
"Farm Machinery and Processes Management in Sustainable Agriculture", Lublin, Poland, 2013
179
which has main pillars, namely, widening participation and learning
throughout life.
The traditional engineering (or science) curricula, still used in their
original form at many universities, do not support lifelong learning skills.
The academics see engineering curricula as highly structured and linked in
sequential serial courses [8]. However, are they really linked and connected?
Academics see those courses as ‘building blocks’ to successfully deliver
everything an engineer should know. How do we know that the curriculum is
not a set of separate and unrelated stumbling blocks? Also, since there is no
block dedicated to LLL how do we then ensure that it makes a part of the
curriculum?
The paradigm shift from traditional curricula based on teaching toward
curricula based on learning and acquisition of particular skills, or
competences (including LLL), is an on-going response of programmes to the
demands posed by globalization of economy, advancement of information
and communication technologies and the associated social and cultural
changes. It is now recognized that the new curricula should be driven by
clear learning objectives rather than material to be covered. The goal of
university education should be attaining higher level skills and knowledge,
as well as generic skills and knowledge, lifelong learning skills included.
Furthermore, the OECD’s framework of key competences for ‘knowledge
society’ define teaching and learning as a process in which not only skills
and knowledge are acquired but also particular values, motivations, attitudes
and dispositions that are deemed necessary for continuous, reflecting and
autonomous learning are to be nurtured [1]. Therefore the design of new
curricula requires change in the teaching philosophy and teaching strategies
in order to meet these expectations.
Need to change teaching philosophy and teaching approach
In order to boost and encourage LLL skills, teaching and learning
philosophy should change from teaching students to facilitating student
learning. The shift towards student-centred learning can be regarded as the
single most important step towards transforming universities to ‘lifelong
learning universities’.
Student-centred learning refers to pedagogies focused on the learner and
what is learned, rather than on the teacher and what is taught [9]. The
primary reason for project-based learning (PBL) is a need to adapt to a
changing world. The argument is that students should strive in an
environment centred on learning instead of on teaching. Student-centred
learning offers an attractive alternative to traditional education by shifting
the focus of education from ‘what staff teaches’ to ‘what students learn’. The
emphasis moves from the result to the process and the lecturer transforms

VI International Scientific Symposium
"Farm Machinery and Processes Management in Sustainable Agriculture", Lublin, Poland, 2013
180
from the classroom main actor and a dictator to an advisor and mentor. It is
pictorially described as a shift of a lecturer from a ‘sage on the stage to a
guide on the side’ [10]. The other element of the "student-centred" feature of
PBL is that the student, at least partially, determines the goals. It creates an
environment of self-directed learner thus contributing to the development of
LLL skills.
Student-centred instructional methods which emphasise the student’s
responsibility for learning include all active learning approaches. Methods
are mainly based on the concept that students learn by creating their own
version of reality rather than following the versions delivered to them by the
instructor. Such approaches include peer learning (both cooperative and
collaborative learning), as well as project and problem based learning.
Several activities within a course can also help in developing LLL skills
[11]. Those include the following:
use new technologies - incorporate extensive online resources to support
students in all aspects of their learning;
create independent study resources – that can include both virtual and real
facility for independent study;
employ assignments that require initiative in search of information and
encourage the student to assess the quality of information;
enhance communication skills – encourage, develop and maintain
communication between staff and students and also between students
themselves’;
develop teamwork activities - emphasise small group learning, especially
for laboratory experiments and project work.
Conclusions
The ever changing reality of engineering practice requires that graduates
of engineering are equipped with professional skills and are committed to
lifelong learning in order to face the new challenges both in terms of
knowledge and possible changes in job profile. LLL skills provide engineers
with the ability to acquire those elements of knowledge that were omitted in
the course of their formal education and keep updating their knowledge
through concern for acquiring other relevant skills.
Lifelong learning is the continuous building of skills and knowledge
throughout the life of an individual. It should start as early as possible in the
learning process and such skills should be introduced and initiated during
teaching. Lecturers should not be mere instructors who deliver knowledge
but rather guides and encourages students to acquire knowledge and reflect
on their learning. The reflection on the learning process is an important part
of the learning experience.
VI International Scientific Symposium
"Farm Machinery and Processes Management in Sustainable Agriculture", Lublin, Poland, 2013
181
The emphasis and successful attaining of LLL skills during university
education has two imperatives; curriculum and staff. The curriculum should
be flexible and not restrictive in terms of mode of delivery and time of study.
The staff should be involved, motivated and committed to teaching with
readiness to experiment with non-traditional methods of teaching.
Although structure (curriculum) is an important factor, it is human aspect
(staff) which is the key factor in the successful development of students’
lifelong skills.
References [1] Takayama K. 2013. OECD, ‘Key competencies’ and the new challenges of educational
inequality. Journal of Curriculum Studies, 45(1), 67-80.
[2] Corl S.S. III 1981. The Danish Folk High Schools Adapts to a New World. Educational
Leadership, 38 (4), 338-341.
[3] International Engineering Alliance 2013. Graduate Attributes and Professional
Competencies. Accessed on 2 Nov 2013: http://www.ieagreements.org.
[4] Dunlop J.C., Grabinger S. 2003. Preparing Students for Lifelong Learning: A Review of
Instructional Features and Teaching Methodologies. Performance Improvement
Quarterly, 16 (2), 6-25.
[5] Walczak M, Uziak J., Oladiran M.T., Baeza C.C., Paez P.T. 2013. Industry
Expectations of Mechanical Engineering Graduates: A Case Study in Chile.
International Journal of Engineering Education, 29(1), 181-192.
[6] Uziak J., Oladiran M.T., Walczak M, Gizejowski M. 2013. Accreditation - Opportunity
for Positive Change or a Mirage? Journal of Professional Issues in Engineering
Education & Practice (accepted for publication – early view: 10.1061/(ASCE)EI.1943-
5541.0000172 , 02513001).
[7] Vallima, J., Hoffman, D. 2008. Knowledge society discourse and higher education.
Higher Education, 56 (3), 265-285.
[8] Dym C.L. 1999. Learning Engineering: Design, Languages, and Experiences. Journal
of Engineering Education, 88 (2), 145–148.
[9] Prince, M. 2004. Does Active Learning Work? A Review of the Research. Journal of
Engineering Education, 93 (3), 223–231.
[10] King A. 1993. From Sage on the Stage to Guide on the Side. College Teaching, 4(1),
30-35.
[11] Peat M., Taylor C. E., Franklin S. 2005. Re‐engineering of Undergraduate Science
Curricula to Emphasise Development of Lifelong Learning Skills. Innovations in
Education and Teaching International, 42(2), 135-146.

VI International Scientific Symposium
"Farm Machinery and Processes Management in Sustainable Agriculture", Lublin, Poland, 2013
182
VI International Scientific Symposium
"Farm Machinery and Processes Management in Sustainable Agriculture", Lublin, Poland, 2013
183
POSSIBLE TECHNICAL SOLUTIONS AND COST
OF SPATIALLY VARIABLE MINERAL FERTILIZATION
AVAILABLE TO POLISH FARMERS
Maria WALCZYKOVA, Mirosław ZAGÓRDA
University of Agriculture in Krakow, Institute of Machinery Management, Ergonomics and
Production Processes, Krakow, POLAND
e-mail: [email protected]; [email protected]
Keywords: variable mineral fertilization, costs, breakeven area
1. Introduction
Application of spatially variable fertilization should be preceded by
economic analysis as the economic benefits have to be offset against the cost
of specialist equipment for introducing precision farming techniques
[Godwin et al., 2003]. Introduction of the site specific management
technologies involves not only considerable expenses, as the necessary
equipment is concerned, but also costly acquisition of information on the
field conditions, inevitable for performing the field operations in spatially
variable mode. It is than fully justified to ask a question on what conditions it
is profitable, especially in relation to the farm size. The farm breakeven area
depends on many factors, among them on used technologies, cultivated
plants and also on the prices of agricultural products and machines.
2. Material and methods
The presentation includes available technical solutions of spatially
variable mineral fertilization that can currently be used by Polish farmers and
the related costs. Some systems for precision farming, comprising hardware,
software and available (possible) custom services offered to the Polish
farmers, were set up and for each of them the breakeven area for spatially
variable mineral fertilization was determined. Calculations were made on the
basis of annual costs of maintenance per hectare, considering the range of
areas between 50 and 500 hectares, and on the savings of fertilizers,
obtained as a result of using variable rate application (VRA) in wheat, rape
and corn production.
Calculating the annual costs of maintenance it was assumed that the price
of the fertilizer spreader equals to the difference between conventional one
and adapted to VRA performance, and also that the farmer owns already a
computer (either desktop or laptop). The determined costs are net costs
expressed in euro (EUR).
Calculation of the annual costs was made according to the generally
accepted method [Goć i in. 1992; Rataj 2005].
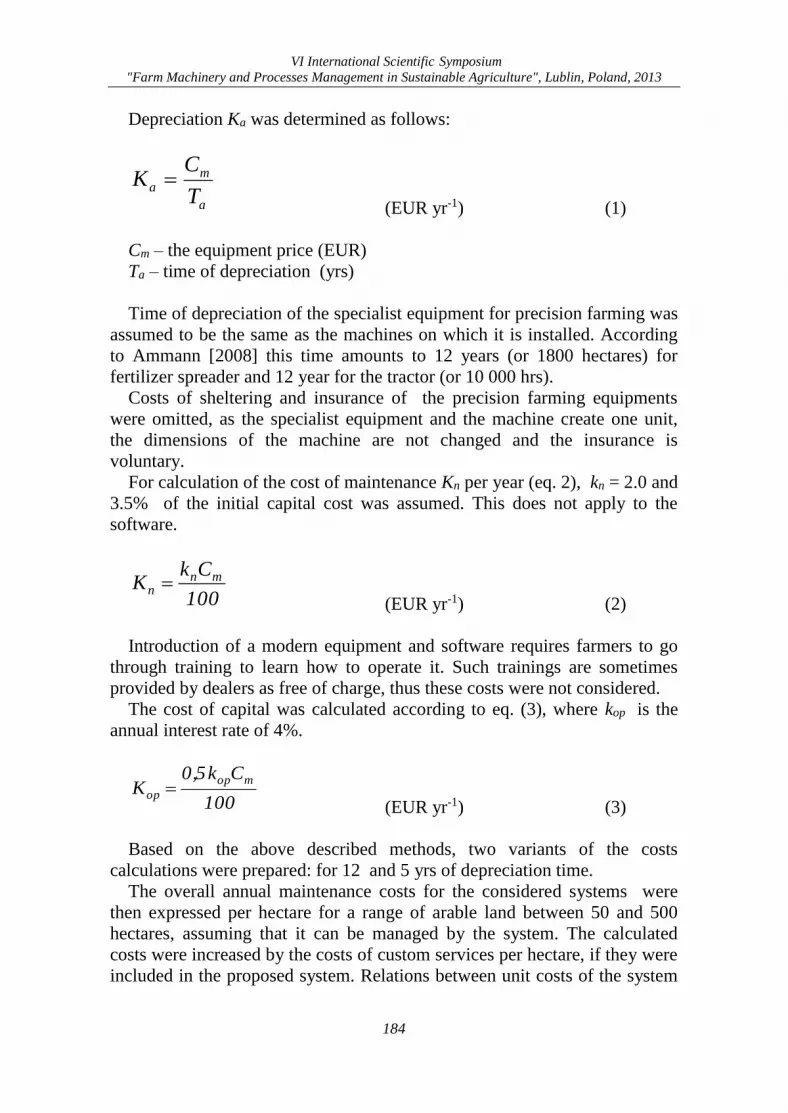
VI International Scientific Symposium
"Farm Machinery and Processes Management in Sustainable Agriculture", Lublin, Poland, 2013
184
Depreciation Ka was determined as follows:
a
ma
T
CK
(EUR yr-1) (1)
Cm – the equipment price (EUR)
Ta – time of depreciation (yrs)
Time of depreciation of the specialist equipment for precision farming was
assumed to be the same as the machines on which it is installed. According
to Ammann [2008] this time amounts to 12 years (or 1800 hectares) for
fertilizer spreader and 12 year for the tractor (or 10 000 hrs).
Costs of sheltering and insurance of the precision farming equipments
were omitted, as the specialist equipment and the machine create one unit,
the dimensions of the machine are not changed and the insurance is
voluntary.
For calculation of the cost of maintenance Kn per year (eq. 2), kn = 2.0 and
3.5% of the initial capital cost was assumed. This does not apply to the
software.
100
CkK mn
n (EUR yr-1) (2)
Introduction of a modern equipment and software requires farmers to go
through training to learn how to operate it. Such trainings are sometimes
provided by dealers as free of charge, thus these costs were not considered.
The cost of capital was calculated according to eq. (3), where kop is the
annual interest rate of 4%.
100
Ck5,0K
mop
op (EUR yr-1) (3)
Based on the above described methods, two variants of the costs
calculations were prepared: for 12 and 5 yrs of depreciation time.
The overall annual maintenance costs for the considered systems were
then expressed per hectare for a range of arable land between 50 and 500
hectares, assuming that it can be managed by the system. The calculated
costs were increased by the costs of custom services per hectare, if they were
included in the proposed system. Relations between unit costs of the system
VI International Scientific Symposium
"Farm Machinery and Processes Management in Sustainable Agriculture", Lublin, Poland, 2013
185
overall maintenance in EUR∙ha-1 and the land area in hectares, were
presented on the chart.
3. Results
Determination of the breakeven areas was made graphically. They
represent the points where curves of the annual cost per unit area intersect
the lines representing the obtained benefits per unit area, arising from
spatially variable spreading of nitrogen, phosphorus and potassium, in rape,
wheat and corn production (Fig. 1 a, b).
a)
b)
Figure 1. Determination of the breakeven areas for six different systems of precision
farming, assuming: a) 12 years of depreciation b) 5 years of depreciation
VI International Scientific Symposium
"Farm Machinery and Processes Management in Sustainable Agriculture", Lublin, Poland, 2013
186
The average benefits amounted to 16,14 EUR∙ha-1. It must be stressed that
the costs of depreciation and maintenance were calculated in accordance to
the assumed yearly use, thus with the increasing area the time of utilization
in years shortened and the depreciation costs increased adequately. The
systems I, II and III included costs of soil examination on macro elements
contents and preparing the application maps, carried out as custom service.
As a result, the overall maintenance costs of those systems did not fall below
12 EUR∙ha-1 even at 500 hectares of the arable land (Fig. 1 a, b).
At the average savings on fertilizers, the breakeven area in the case of
systems I and II amounted to 125 and 175 hectares (Fig. 1 a) for 12 and 5
years of exploitation respectively (Fig. 1 b). The biggest breakeven area was
obtained for the system III – 210 and 280 hectares for 12 and 5 years of use
respectively. According to the carried out calculations, the best results would
be achieved by using the systems IV and V, with 90 and 130 hectares as
economically justified area. Results for the system VI are similar as those
obtained for systems I and II.
4. Conclusions
Application of variable fertilization based on maps prepared by the
custom service is profitable in the case of having high benefits from using
VRA. When the average savings, as a result of using VRA, amounts to net
16 EUR∙ha-1, then it justifies introduction of the VRA equipment on farms
having above 90 hectares of arable land (Fig. 1 a). On farms of more than
300 hectares of area, each of the presented system for variable fertilization
will be profitable.
5. References [1] Ammann H. 2008. Maschinenkosten 2008. Kostenansätze Gebäudeteile und
mechanische Einrichtungen. ART-Berichte, Nr. 688/2008.
[2] Goć E. i in. 1992. Wskaźniki eksploatacyjno-ekonomiczne maszyn stosowanych w
gospodarstwach indywidualnych. IBMER, Warszawa. pp. 17.
[3] Godwin, R.J., Richards T.E., Wood G.A., Welsh J.P., Knight S.M., 2003. An economic
analysis of the potential for precision farming in UK cereal production. Biosystems
Engineering, Vol. 84 (4), 533-545.
[4] Rataj V. 2005. Projektovanie výrobných systémov. Výpočty a analýzy. Nitra. SPU.120
pp. 120.
VI International Scientific Symposium
"Farm Machinery and Processes Management in Sustainable Agriculture", Lublin, Poland, 2013
187
MAINTENANCE COSTS OF TECHNICAL RESOURCES
IN FAMILY FARMS RECEIVING EUROPEAN UNION SUBSIDIES
Zbigniew WASĄG
Social Insurance Institution, Branch in Biłgoraj, POLAND
e-mail: [email protected]
Keywords: family farm, maintenance costs, usage costs
1. Introduction
Scientific and technological development as well as the development of
farms is connected with an increase in the investment expenditure and also
an increase in the maintenance costs of technical resources resulting from the
tear and wear of machines and appliances. In the process of making
decisions concerning each type of production, costs constitute one of the
main factors as they decide not only the quantity of production but also its
range or structure. Malaga-Toboła and Tabor [2004] as well as Karmowska
[2008] stated that the use of machines has a considerable influence on the
value of changeable costs and their share in the structure of maintenance
costs. The level of usage costs of means of mechanisation can serve as an
indicator of a current engagement of agricultural technology in the
production process. The economic condition of agricultural farms does not
always allow investment from their own resources. Therefore, there arises
the need to use available support sources, which nonetheless is connected
with contributing one’s own financial resources [Wasąg 2011]. A profitable
farm generating profits from its business activity can provide such
opportunities,
2. Material and methods In the years 2004–2009 70 agricultural farms were studies in the Biłgoraj
County which used EU subsidies for technical modernisation. In order to
determine maintenance costs of technical resources, the group of farms under
study was divided according to the amount of subsidy, to the area of the
arable land, to the economic size unit (ESU) and to the income of the farm.
The level of maintenance costs of means of agricultural mechanisation
was calculated by means of the calculation method taking into account actual
investment inputs made by the farms under the study. The costs of
maintenance of mechanical resources include usage costs (variable costs)
and maintenance costs (fixed costs). Maintenance costs (depreciation, taxes,
garage costs, farmers’ TPL insurance for machines, crops and buildings and
farmer Insurance at KRUS was determined by calculation [Muzalewski
2008].
VI International Scientific Symposium
"Farm Machinery and Processes Management in Sustainable Agriculture", Lublin, Poland, 2013
188
The structure of maintenance costs includes the usage costs of
technical resources, which includes petrol and grease costs, electricity
charges, spare parts, repair materials, repair charges, etc. The presented
cost group enables the evaluation of the current engagement of technology
in the agricultural production process. Usage costs were included into the
analysis as a turnover resources factor with respect to agricultural
technology. The input side also includes the level of engagement of
production turnover resources. Labour costs are not included in the input
part because in individual farm sit is impossible to determine it once and
for all.
3. Results
The group of farms based on the amount of subsidies, the highest
maintenance costs were found in the category of farms up to 50 thousand
PLN (2.82 103 PLN · ha-1 AL) and 50–100 thousand PLN (2.72 103 PLN ·
ha-1 AL). Growth of subsidy, AL area, and economical size unit meant
decreased maintenance costs per one hectare of AL. Though, an increase
in the income of a farm resulted also in an increase in the maintenance
costs. Intensity of the organisation of production was high in the
economically largest farms and also with respect to their size (from 510 to
950 pts).
Usage costs in the farms under study were over 20% of maintenance costs
and with an increase in the amount of subsidy, size of arable land,
economical size unit and the income of a farm they decreased gradually.
Investment purchases of means of mechanisation per one ha of AL were the
highest in farms with the smallest area. The calculating method of
determining maintenance costs can lead to high tax deductions for
depreciation and to agricultural technology to be treated as a renewable
resource of production on a farm. The study found that the relation of usage
costs to the replacement value of technical resources increased with an
increase of the area (1.7–3.8%) and the economic size of farms (2.1–3.3%).
A low level of relation of these costs is another argument confirming the
existence of a high burden on the studied farms by the value of technical
machines when they are rarely used. In studied farms with a rate of
mechanisation costs against replacement value 32.8 thousand PLN · ha-1 AL.
and the assumed annual investment input at about 5% (1.64 103 PLN · ha-1
AL) of this value, replacement time for a set of machines is 20 years (32.8 :
1.64 = 20 years).
4. Conclusions
The analysis showed that investment purchases constitute on average
24.8% of the replacement value of means of mechanisation, and their largest
VI International Scientific Symposium
"Farm Machinery and Processes Management in Sustainable Agriculture", Lublin, Poland, 2013
189
share us in farms with an area of 50–70 ha AL (58.2%) and amount of
subsidy 100–150 thousand PLN (48.9%). These indicators are especially
important as the mean replacement time of some agricultural machines in
Poland in family farms is 25 years and more [Wójcicki 2001]. The group
ordered according to the amount of subsidies showed that greatest
maintenance costs in the category of 50 thousand PLN and 50–100 thousand
PLN. With a growth of the amount of subsidy, area of AL and the economic
size unit saw a simultaneous increase in the maintenance costs.
One of the prerequisites for EU subsidies is making one’s own
contributions (ca. 50 %), which undoubtedly is an obstacle for some
agricultural farms. In such cases there is the need for some of them to obtain
a commercial or bridge loan (public support excluded) for agricultural
investment. Following the studies, it was found that especially farms with
small areas do not have sufficient income to obtain invest. A more profitable
solution would be to give advance payments towards the realisation of
undertakings or to provide state guarantees to bank loans.
5. References [1] Karmowska G. 2008. Koszty jako element badania konkurencyjności indywidualnych
gospodarstw rolnych. Roczn. Nauk. SERiA, X, 1. Warszawa – Poznań – Lublin, 139–
143.
[2] Malaga-Toboła U., Tabor S. 2004. Wartość odtworzeniowa parku maszynowego a
efektywność postępu w rolnictwie. Inż. Roln. II, 4 (59), 77–84.
[3] Muzalewski A. 2008. Zasady doboru maszyn rolniczych. IBMER, Warszawa.
[4] Wasąg Z. 2011. Wyposażenie techniczne wybranych gospodarstw rolnych
korzystających z funduszy Unii Europejskiej. Inż. Roln. 1(126), 265–271.
[5] Wójcicki Z. 2001. Metody badania i ocena przemian w rozwojowych gospodarstwach
rodzinnych. PTIR, Kraków.

VI International Scientific Symposium
"Farm Machinery and Processes Management in Sustainable Agriculture", Lublin, Poland, 2013
190
VI International Scientific Symposium
"Farm Machinery and Processes Management in Sustainable Agriculture", Lublin, Poland, 2013
191
A SHEET AUDIT MODEL FOR THE LOGISTICS PROCESSES OF
THE SUPPLY SPHERE OF A COMPANY
Jacek WAWRZYNOWICZ
Poznan University of Life Sciences, Department of Management and Law, Poznań,
POLAND
e-mail: [email protected]
Keywords: logistics audit, procurement process, farms
1. Introduction
The logistics audit is a method of verification of the discrepancy between
the declared state of a real implementation or functioning of logistics
systems and to assess their effectiveness [Twaróg 1998]. The logistics audit
is a systematic and independent examination to determine whether activities
related to the quality of the logistics system and their results comply with
planned findings and whether these findings are implemented effectively and
allow the achievement of the objectives particularly in terms of cost, use
resource and customer service [Twaróg 1996]. The organization of the
supply process is designed to minimize costs while maintaining the proper
levels of supply and inventory. The purpose of the supply process is
therefore the maximum protection for any material requirements for farms at
a minimum cost of logistics services. It is about ensuring the availability of
raw materials, materials and means of production which maintains the
company in the production readiness [Wojciechowski 1999]. A procurement
logistics is a system of management of the flow of materials from suppliers
to production area on an acceptable price, in the right quantity, at the right
time, quality and location.
The purpose of this study was to develop a model of the auditory sheet for
the evaluation of logistics processes in the sphere of supplying agricultural
enterprises. The development of a sheet audit model in supply sphere is part
of an integrated audit methodology of logistic processes in agricultural
enterprises which includes outside the sphere of supply other spheres such
as: storage, production and distribution. Developed sheet will be a tool used
in the audit methodology of logistic processes in relation to the all means of
production and services purchased by company. The sheet will allow to
verify and evaluated and express of recommendations to improve the
efficiency of logistics processes in supply sphere. The advantage of the
model is that possibility of registration of all activities and procedures in the
procurement process, while of the analysis, evaluation and recommendations
shall be subject only of logistics activities. As the main criterion in divide of
activities for logistics and non-logistics activities the purpose
implementation of actions was selected. In the logistics of agricultural
VI International Scientific Symposium
"Farm Machinery and Processes Management in Sustainable Agriculture", Lublin, Poland, 2013
192
production the purpose of the tasks typically logistic is the implementation of
logistics function for handling operational processes, e.g. to provide all the
means of production, means of supporting the storage area or directly from
the supplier to the manufacturing process such as supplier selection, the
implementation of the orders, loading, transporting and unloading for sowing
seed, fertilizer, etc. However non logistics tasks are directly related to the
achievement of the objectives of production such as sowing seeds into the
soil.
The need to develop tools useful for the implementation of audits of
logistics is due to a significant share of logistics costs in total costs of
activity in farms. Results of a pilot study carried out in a number of selected
agricultural enterprises showed that the share of logistics costs in total costs
of production remained at a relatively high level compared to other industries
and businesses in the range of 35% - 42% [Wajszczuk, 2005]. In addition,
there are no tools for evaluation and control of logistics processes
implementation in the sphere of supplying agricultural enterprises, the lack
of improvement systems in the sphere of procurement the means of
production, waste of the means of production, inflated production costs
resulting from poorly planned supply, unreliable supplier causing overdue
deliveries.
2. Material and methods
The study was conducted in 10 agricultural enterprises. To the study was
used deliberately chosen multibody enterprises, leading production of mixed,
about varying shape of field and area of more than 500 ha of arable land
(criterion important because of the complexity of the logistics processes).
The deliberately choice will let for the knowledge of supply systems of
agricultural enterprises of various production profiles, supplying various
types of production. Collecting information takes place through direct
interviews with those responsible for the sphere of enterprise supply. In
addition, we examined documentation orders and purchases. Interview
include a description of all the procedures for the procurement process on the
individual means of agricultural production and the purchase of services. To
applied the studies of the technique of mapping processes. Process mapping
is a analysis technique allows shows the process by means of map of
processes. Resulting from the use of this technique, the organization's
business process maps are models reflect reality [Ciesielski 2009]. Maps of
processes visualized make it possible to assess processes, the extent of
losses, errors and situations that need improvement. The main purpose of
creating these maps is to describe business processes in order to simplify,
eliminate and improve in such a way that products and services are cheaper,
VI International Scientific Symposium
"Farm Machinery and Processes Management in Sustainable Agriculture", Lublin, Poland, 2013
193
better and faster achievable [Christopher, 2000; Hunt, 1996]. Benefits
include process maps [Peppard and Rowland, 1997]:
• maps of processes often further explain the process better than words,
therefore, should be widely used in the organization, which gives the
opportunity to evaluate processes, losses and situations that need
improvement,
• when mapping, the workers begin to better understand the tasks and
problems of others as well as their contribution to the processes,
• often during the mapping process are evident imperfections, that by
finding ways to improve the business, are eliminated.
The scope of research concerned the mapping procedures in the area of
procurement, verification of existing procedures and their evaluation. In
order to identify specific changes in supply has been made to map the entire
process including all means of production and services purchased in the
process. For this purpose, has been inspected all procurement processes for
both livestock, crop and other activities within the agricultural enterprises.
Furthermore, in order to develop of sheets detailed analysis made including:
• methods of market analysis of suppliers,
• procurement system,
• suppliers, delivery terms, payment terms,
• negotiating with suppliers,
• the supply contracts,
• transport conditions.
3. Results
The developed sheet model contains the main areas of the supply process,
material requirements planning, supplier selection, ordering and purchasing,
organizing supplies supply (transport), warehousing, inventory and
assessment of the structure of waste management. The purpose of the sheet is
to obtain information about all the activities and practices implemented in
the supply process. The data contained in the sheet are all purchased
production inputs.
The first element is a sheet audit description of the actions of the process.
Deliberately chosen set of questions is designed to accurately describe each
action carried out in the process. Description of the measure allows for the
development of criteria for evaluating the success of the action. On this
basis, using the ID of the supply process are analyzed in terms of specific
tasks relevant set of evaluation criteria. The criteria are qualitative or
quantitative. To assess the audit sheet model is shown in Table 1.
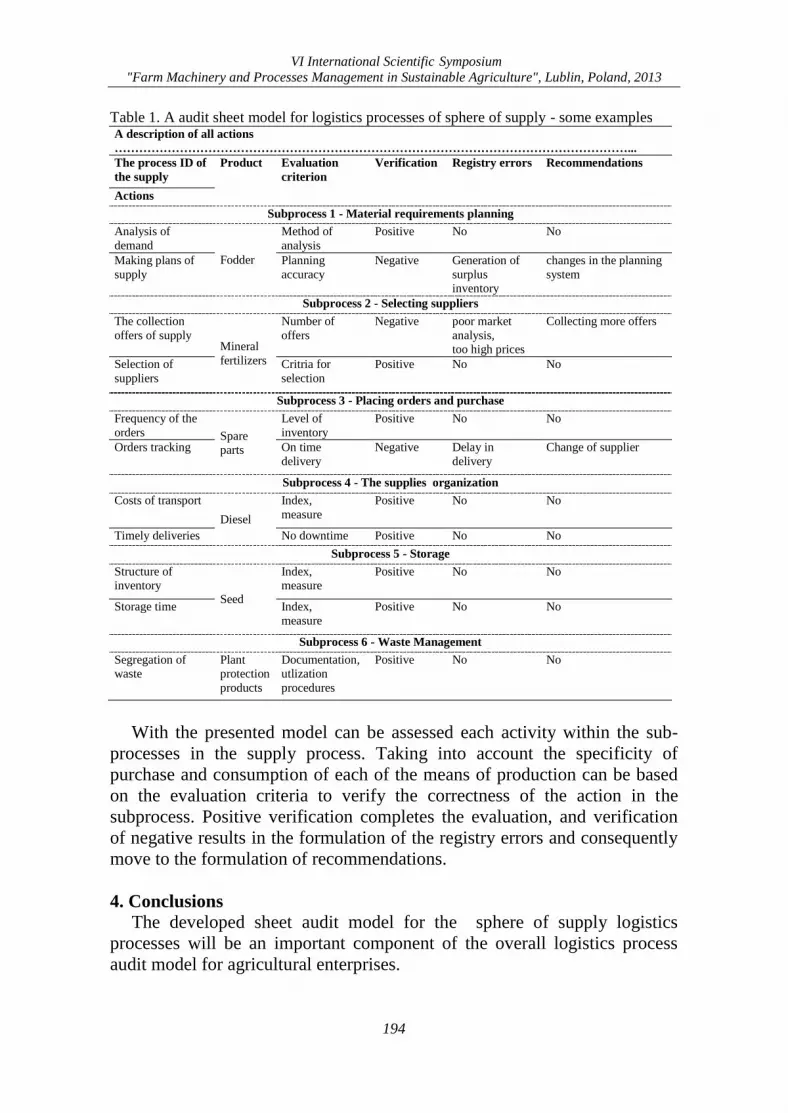
VI International Scientific Symposium
"Farm Machinery and Processes Management in Sustainable Agriculture", Lublin, Poland, 2013
194
Table 1. A audit sheet model for logistics processes of sphere of supply - some examples A description of all actions
………………………………………………………………………………………………………………...
The process ID of
the supply
Product Evaluation
criterion
Verification Registry errors Recommendations
Actions
Subprocess 1 - Material requirements planning
Analysis of
demand
Fodder
Method of
analysis
Positive No No
Making plans of
supply
Planning
accuracy
Negative Generation of
surplus inventory
changes in the planning
system
Subprocess 2 - Selecting suppliers
The collection
offers of supply Mineral
fertilizers
Number of
offers
Negative poor market
analysis, too high prices
Collecting more offers
Selection of
suppliers
Critria for
selection
Positive No No
Subprocess 3 - Placing orders and purchase
Frequency of the
orders Spare parts
Level of
inventory
Positive No No
Orders tracking On time
delivery
Negative Delay in
delivery
Change of supplier
Subprocess 4 - The supplies organization
Costs of transport
Diesel
Index,
measure
Positive No No
Timely deliveries No downtime Positive No No
Subprocess 5 - Storage
Structure of inventory
Seed
Index, measure
Positive No No
Storage time Index,
measure
Positive No No
Subprocess 6 - Waste Management
Segregation of waste
Plant protection
products
Documentation, utlization
procedures
Positive No No
With the presented model can be assessed each activity within the sub-
processes in the supply process. Taking into account the specificity of
purchase and consumption of each of the means of production can be based
on the evaluation criteria to verify the correctness of the action in the
subprocess. Positive verification completes the evaluation, and verification
of negative results in the formulation of the registry errors and consequently
move to the formulation of recommendations.
4. Conclusions
The developed sheet audit model for the sphere of supply logistics
processes will be an important component of the overall logistics process
audit model for agricultural enterprises.
VI International Scientific Symposium
"Farm Machinery and Processes Management in Sustainable Agriculture", Lublin, Poland, 2013
195
The potential benefits from the use of tools in the form of a sheet audit in the
methodology of the audit logistics processes include:
- identify errors and omissions in purchasing procedures,
- assess the effectiveness of negotiating the terms of delivery,
- possible savings in the consumption, storage, transport means of
production,
- increase the timeliness of delivery,
- favorable discounts and loyalty programs,
- lower storage costs by planning and implementation of on-time delivery,
- avoid downtime caused by e.g. equipment failure,
- obtaining the optimal purchase price,
- evaluation of the optimal batch size.
In further studies, after the development of a comprehensive audit model of
logistics processes will be verified sheets audit sphere of supply.
5. References [1] Wajszczuk K. 2005. Logistics costs analysis as an assisting tool to achieve competitive
advantage for agricultural enterprises. XIth International Congress of the EAAE “The
Future of Rural Europe in the Global Agri-Food System” Copenhagen, Denmark:
August 24-27, 2005 www.eaae2005.dk/scientificprogramme.htm
[2] Ciesielski M. 2009. Instrumenty zarządzania łańcuchami dostaw. PWE, Warszawa.
[3] Hunt V.D. 1996. Process Mapping, How to Reengineer Your Business Processes. John
Wiley & Sons, New York.
[4] Peppard J., Rowland P. 1997. Re-enginneering. Gebethner & Ska, Warszawa,1997.
[5] Twaróg J., Koncepcja zastosowania audytu logistycznego w przedsiębiorstwie
przemysłowym, Gospodarka Materiałowa i Logistyka, nr 7 i 8/, Poznań 1998.
[6] Twaróg J., Opracowanie koncepcji prowadzenia audytu logistycznego w
przedsiębiorstwie produkcyjnym., ILiM, Poznań 1996.
[7] Wojciechowski T. 1999. Zarządzanie sprzedażą i zakupem materiałów. PWE.
Warszawa. s. 23-25.

VI International Scientific Symposium
"Farm Machinery and Processes Management in Sustainable Agriculture", Lublin, Poland, 2013
196
VI International Scientific Symposium
"Farm Machinery and Processes Management in Sustainable Agriculture", Lublin, Poland, 2013
197
PROJECT OF AN AUTOMATIC SYSTEM FOR SOIL MOISTURE
REGULATION USING TDR TECHNIQUE
Andrzej WILCZEK1, Agnieszka SZYPŁOWSKA1, Artur NOSALEWICZ1,
Wojciech SKIERUCHA1, Waldemar WILCZEK2 1 Institute of Agrophysics, Polish Academy of Sciences, Lublin, POLAND
e-mail:[email protected] 2 E-Test Sp. z o.o., Stasin, POLAND
e-mail: [email protected]
Keywords: irrigation system, moisture stabilization, time-domain reflectometry
1. Introduction
Soil moisture is one of the most important factors determining the energy
consumption of applied agrotechnical measures as well as agricultural output
(Abayomi et al., 2012, Farooq et al., 2012).
Even small decrease of soil moisture may increase mechanical impedance
of soil reducing root growth rate and increase soil resistance to agricultural
machinery (Whalley and Clark, 2011).
Plant water use, which is almost proportional to crop yield (Dmowski and
Chmura, 2006), is strongly dependent on soil moisture. The knowledge of
the effect of soil moisture deficit on photosynthesis rate is important in face
of increased growing season droughts predicted by climate-change scenarios
(Vico and Porporato, 2008). New deficit and partial root zone irrigation
techniques may help to improve efficiency of plant water use (Nardella et al.,
2012). However, these techniques require precision in watering level both in
time and on the spatial scale. The drought induces a chain of plant reactions
including non-linear changes in root hydraulic conductance. Depending on
drought duration root hydraulic conductance initially decreases as an effect
of water channels activity and later increases due to the increased
suberization of the root endodermis (Lipiec et al., 2013). The proper
evaluation of physiological plant reaction on water deficit should be made on
the level and duration of water shortage. Studies on the impact of precisely
controlled water deficit on plant growth and functioning is important due to a
high potential of irrigation in increasing crop yields and the cost of typical
irrigation techniques. The growth chamber experiments with the controlled
plant environment include the regulation of the soil water availability for
plants. This allows for precision measurements of the biomass distribution
between the root and shoots that is strongly dependent on the availability of
soil water (Mann et al. 2013).
VI International Scientific Symposium
"Farm Machinery and Processes Management in Sustainable Agriculture", Lublin, Poland, 2013
198
2. Materials and methods
The project of an automatic soil moisture regulation system was based on
laboratory multichannel reflectometric TDR/MUX E-Test moisture meters
(Skierucha et al., 2006, Skierucha et al., 2012). These devices enable
selective measurements of soil volumetric water content with the accuracy of
±2% of the measuring range. The moisture regulation system consists of a
PLC (programmable logic controller) connected to a personal computer and
a precision flowmeter with the water dosing resolution of 0.013 mL and the
flow range from 5 to 250 mL/min (Fig. 1). The PC controls the electrovalves
according to the moisture readings from the TDR meters. This enables
dosing of given amounts of water with a frequency set by the user or a
selected algorithm. The feedback allows to maintain chosen soil moisture for
any length of time independently of diurnal variations or the long-term water
intake by the root system of a studied plant. It is also possible for the user to
simulate drought of the chosen intensity or excessive moisture conditions for
a given period of time. The designed system can regulate moisture in up to
128 objects, providing that the total dose of the irrigation water for all
objects does not exceed 15 litres per hour.
The system is able to record the dosages of the irrigation water, moisture
content and electrical conductivity of the soil. It is also possible to upgrade
the system by adding additional sensors for soil temperature and matrix
potential. The designed system provides immediate notifications in the case
of malfunctions occurring because of water shortages or excessive leakage
from the studied object (text message or email).
Computer PC PLC Flowmeter
Waterdistribution
electrovalveelectrovalve
electrovalveelectrovalve
electrovalveelectrovalve
electrovalve
Up to 128
TDR/MUX8 channel
electrovalve
TDR/MUX8 channel
Up to 16
RS-485
soil
Up to 128 objects
TDR probe
irrigation
Channel 1
Figure 1. The scheme of the automatic system for soil moisture regulation
VI International Scientific Symposium
"Farm Machinery and Processes Management in Sustainable Agriculture", Lublin, Poland, 2013
199
3. Strengths and weaknesses of the project
The described project of the moisture control system uses the time-domain
reflectometry (TDR) to measure soil moisture content. This technique is the
most popular nowadays because of its selectivity and high measurement
speed. The TDR probes consist of two parallel acid resistant steel rods which
are inserted into the soil. This method is very reliable and easy to use.
Thanks to the time-domain signal analysis and the usage of the internal
frequency references, the soil moisture stabilization uncertainty can be as
low as 0.1%. The application of a flowmeter with extremely low flow rates
and high resolution allows precise dosage of water, which would lessen the
sensitivity of the system to any possible overshoot or oscillations of the
controlled value.
The system can be also used in research requiring control of soil matrix
potential, as well as in the cases where the temperature corrections of
measured parameters of a tested object are necessary. However, such
versatility requires substantial financial resources because of the high cost of
the TDR system elements and the flowmeter. The adjustment of the control
algorithms (PID – proportional-integral-derivative controller) to the stability
and accuracy demands of the user could also be a problem. It is possible to
average the measured quantity over several probes at the expense of reducing
the number of the objects. However, controlling the system by the PC allows
for flexible modifications of the software according to the specific demands
of a given experiment.
4. Summary
The proposed system will facilitate research requiring soil moisture
stabilization and control. There is a possibility of further development of the
control algorithms which are essential to the control accuracy, e.g. predictive
algorithms.
5. References [1] Abayomi Y.A., Awokola C.D. and Lawal Z.O. 2012. Comparative evaluation of water
deficit tolerance capacity of extra-early and early maize genotypes under controlled
conditions. Journal of Agricultural Sciences, 4, p. 54-71.
[2] Dmowski Z., Chmura K. 2006. Plant water relations. In: Plant Irrigation. Eds.
Kaczmarczyk S, Nowak L. PWRiL. (in Polish).
[3] Farooq, M., Hussain, M., Wahid, A. and Siddique K.H.M. 2012. Drought Stress in
Plants: An Overview. In: Plant Responses to Drought Stress. Ed. Aroca R. Springer-
Verlag Berlin Heidelberg.
[4] Lipiec J, Doussan C., Nosalewicz A., Kondracka K. 2013. Effect of drought and heat
stresses on plant growth and yield: a review. International Agrophysics (in print).
[5] Mann J.J., Barney J.N., Kyser G.B. and DiTomaso J.M. 2013. Root system dynamics of
miscanthus × giganteus and panicum virgatum in response to rainfed and irrigated
conditions in California. Bioenergy Research, 6, p. 678–687.
VI International Scientific Symposium
"Farm Machinery and Processes Management in Sustainable Agriculture", Lublin, Poland, 2013
200
[6] Nardella E., Giuliani M.M., Gatta G. and De Caro A. 2012. Yield Response to Deficit
Irrigation and Partial Root-Zone Drying in Processing Tomato (Lycopersicon
esculentum Mill.). Journal of Agricultural Science and Technology A, 2, p. 209-219.
[7] Skierucha W., Wilczek A. and Walczak R.T. 2006. Recent software improvements in
moisture (TDR method), matric pressure, electrical conductivity and temperature
meters of porous media. International Agrophysics, 20, p. 229–235.
[8] Skierucha W., Wilczek A., Szypłowska A., Sławiński C., and Lamorski K. 2012. A
TDR-based soil moisture monitoring system with simultaneous measurement of soil
temperature and electrical conductivity. Sensors, 12, p. 13545–13566.
[9] Vico G., Porporato A. 2008. Modelling C3 and C4 photosynthesis under water-stressed
conditions. Plant Soil, 313, p. 187-203.
[10] Whalley W.R., Clark, L.J. 2011. Drought stress, effect on soil mechanical impedance
and root (crop) growth. In: Encyclopedia of Agrophysics, Eds. J. Gliński, J. Horabik,
and J. Lipiec, p. 228-231, Springer Dordrecht, Heidelberg, London, New York.

VI International Scientific Symposium
"Farm Machinery and Processes Management in Sustainable Agriculture", Lublin, Poland, 2013
201
CONVENTIONAL AND ORGANIC CROP PRODUCTION
- RISKS FOR FARMERS HEALTH
Wioletta ŻUKIEWICZ-SOBCZAK, Grażyna CHOLEWA, Ewelina KRASOWSKA,
Jacek ZWOLIŃSKI
Department of Allergology and Environmental Hazards, Institute of Rural Health, Lublin,
POLAND
e-mail: [email protected]
Keywords: organic dusts, organic and conventional crops, health
1. Introduction
Farmers in relation to the specific of their work are exposed to a variety of
factors harmful to their health. It is divided into: physical, chemical and
biological factors. Among the physical factors may be mentioned: noise,
vibration, high physical stress related to work, climate and UV radiation.
Among chemical agents should be replaced pesticides. The occupational
biohazard agents include inorganic and organic dusts. Organic dust contains
macro-and micro-organisms and their metabolites such as toxins, allergenic
substances in its composition. Biological occupational risk factors can be
divided in terms of the nature of their harmful effects on the human body to:
pathogens, allergens, biological toxins, carcinogens and biological vectors
carrying infectious diseases. According to the Directive 2000/54/EC of the
European Parliament and of the Council biological occupational hazard
classified into four groups depending on the degree of risk. Biological agents
from first group are the least harmful and unlikely there is to cause human
disease. However in the fourth group there are biological agents that causes
severe human diseases and is a serious hazard to workers, is present a high
risk of spreading to the community. There is no available effective
prevention and therapy.
Among the sources of occupational biohazard factors include: dust, human
and animal excreta, sewage, waste and animal and vegetable products. These
factors can be transmitted in many different ways such as: air-dust, airborne
droplets, oral, skin and mucous membranes, and the sting e.g. ticks.
Conventional farming uses measures of industrial production, including
fertilizers and chemical pesticides while organic farming rejects any
chemical fertilizers for organic fertilizers. According to data the Inspection
of Agricultural and Food Quality in recent years, organic farming in Poland
is growing rapidly. Continued support of the European Union in this area and
the growing interest in organic products are the factors that determine the
development. In the first half of 2012, the increase in the number of organic
producers was reported in all 16 provinces.
VI International Scientific Symposium
"Farm Machinery and Processes Management in Sustainable Agriculture", Lublin, Poland, 2013
202
The aim of this research project was to assess the exposure of farmers to
organic dusts in organic and conventional cereal crops. It was evaluated
potential ability of fungi and their metabolites of inhaled organic dust to
cause respiratory diseases
2. Material and methods
In 2012, as part of the project assessed the degree of colonization by fungi
samples taken from grain rye, settled dust collected during threshing
combine harvester and soil taken from the crop of rye, coming from organic
and conventional farms in the Province of Lublin. That assessment was made
used the method of plate dilution on media Malt Agar (MA) and Potato
Dextrose Agar (PDA). Selected isolates were classified according to the
BioSafety Level classification.
3. Results
Less contaminated with mold, thereby constituting a lower risk to the health
of farmers are organic crops. Organic dust is the most contaminated
microbiologically. The greatest difference for microbial contamination was
observed in soil samples. In general, reported higher levels of fungi was in
samples from conventional farms compared to organic farms about: 7.5% for
samples of dust, 1.5% for samples of grain, 58.9% for soil samples. These
results are presented in Table 1.
Table 1. Mean values of CFU/g (Colony Formin Unit per gram) for molds isolated from
samples of dust, grains of rye and soil for two different strategies for agriculture
Dust Grains of rye Soil
Organic
Farming
Conventional
Farming
Organic
Farming
Conventional
Farming
Organic
Farming
Conventional
Farming
Average:
3065 x 103
CFU/g
Average:
3313 x 103
CFU/g
Average:
27,475 x 103
CFU/g
Average:
27,9 x 10³
CFU/g
Average:
50,075 x
103 CFU/g
Average:
121,975 x103
CFU/g
In organic farming does not apply to common antifungal preparations
and plant protection products, which are the basis of conventional farming in
the fight against weeds and pests, however, correctly sized for this type of
cultivation of cereals better deal with threats such as mould.
Most commonly isolated fungi from samples (regardless of the strategy
of agriculture) were: Alternaria alternata, Aspergillus versicolor,
Aureobasidium pullulans, Cladosporium macrocarpum, C. oxysporum, C.
herbarium, Fusarium poae, F. tricinctum, Paecilomyces variotii, Penicillium
citreo-viride, P. expansum, P. glabrum, P. lilacinum, Gonatobotrys sp.
Classification of Biosafety Level (BSL) is the scale of potentially
pathogenic fungi for humans and animals, and distinguishes three hazard
classes represented by different species of fungi. Most frequently occurring
fungi mostly belong to the BSL-1 class causing a non-invasive or mild

VI International Scientific Symposium
"Farm Machinery and Processes Management in Sustainable Agriculture", Lublin, Poland, 2013
203
danger. Some fungal isolates has been included in BSL-II class that is
particularly dangerous for people with immune deficiency, in whom can
cause opportunistic infections.
4. Conclusions
Years of research conducted at the Institute of Rural Health have shown
that exposure to organic dust can lead to many respiratory syndromes, such
as diseases of allergic (extrinsic allergic alveolitis - EAA - alveolitis
allergica, bronchial asthma, allergic rhinitis, allergic conjunctivitis, allergic
dermatitis), immunotoxic related diseases (organic dust toxic syndrome -
ODTS, “sick building syndrome”), nonspecific diseases, chronic bronchitis.
Health statistics show that the most of occupational diseases reported by
Polish farmers is caused by pathogens present in organic dusts. In Poland,
lung diseases are more common in farmers than in the rest of the population,
just as in other countries.
Results of this study indicate that organic farming is less contaminated
by mould, and therefore are less hazardous to the health of farmers. In
addition, organic products have better nutritional values.
5. References [1] De Hoog GS. 1996. Risk assessment of fungi reported from humans and animals. Mycoses. 39, p.
407-417
[2] Dutkiewicz J., Skórska C., Mackiewicz B., Cholewa G. 2000. Zapobieganie chorobom
wywołanym przez pyły organiczne w rolnictwie i przemyśle rolnym. Instytut Medycyny Wsi,
Lublin, p. 24-27
[3] Gang G., Miedaner U., Schuhmacher U., Schollenberger M., Geiger HH. 1998. Deoxynivalenol
and nivalenol production by Fusarium culmorum isolates differing in aggressiveness towards
winter rye. Phytopathology. 88, p. 879-884
[4] Głowacka A., Przychodzień A., Szwedek A. 2007. Grzyby glebowe potencjalnie chorobotwórcze
dla człowieka i zwierząt z leśnych terenów rekreacyjnych Łodzi. Mikologia Lekarska. 14(2), p.
89-94
[5] Govi V. 1992. Aerial diffusion of phytopathogenic fungi. Aerobiologia. 8, p. 84-93
[6] Lipiec A. 2002. Grzyby w etiologii chorób alergicznych. Alergol. Współcz., 1, p. 10-14
[7] Nolard N. 2001. Mold allergy: 25 years of indoor and outdoor studies in Belgium. Allergy
Immunol. Paris, 33, p. 101-102
[8] Pałczyński C., Kieć-Świerczyńska M. 2000. Alergologia i toksykologia kliniczna. Kliniczna
Medycyna Pracy, Łódź, 47 p.73-74
[9] Pokrzywa P., Cieślik E., Topolska K. 2007. Ocena zawartości mikotoksyn w wybranych
produktach spożywczych. Żywność Nauka Technologia Jakość. 3, p. 139-146
[10] Rapiejko P., Lipiec A., Modrzyński M. 2004. Treshold pollen concentration necessary to evoke
allergic symptoms. Int. Rev. Allergol. Clin. Immunol. 10, p. 91-94
[11] Socha K., Waszewska M. 2012. Producenci ekologiczni w 2012 r. In: Wiedza i Jakość. Inspekcja
Jakości Handlowej Artykułów Rolno-Spożywczych. 3(26), p. 14-15
[12] Wittczak T. 2012. Choroby alergiczne i zagrożenia toksykologiczne w środowisku pracy
rolników. Alergia, 1, p. 12-14.
[13] Ziółkowska G., Tokarzewski S. 2007. Occurrence of moulds in reproductive goose flocks in
southern-eastern Poland. Bull. Vet. Inst. Pulawy, 51, p. 553-561
[14] Żukiewicz-Sobczak W., Cholewa G., Krasowska E., Zwoliński J., Sobczak P., Zawiślak K,
Chmielewska-Badora J., Piątek J., Wojtyła A. 2012. Pathogenic fungi in the work environment of
organic and conventional farmers. Postep. Derm. Alergol.; 29(4), p. 256-262

VI International Scientific Symposium "Farm Machinery and Processes Management in Sustainable Agriculture", Lublin, Poland, 2013
204
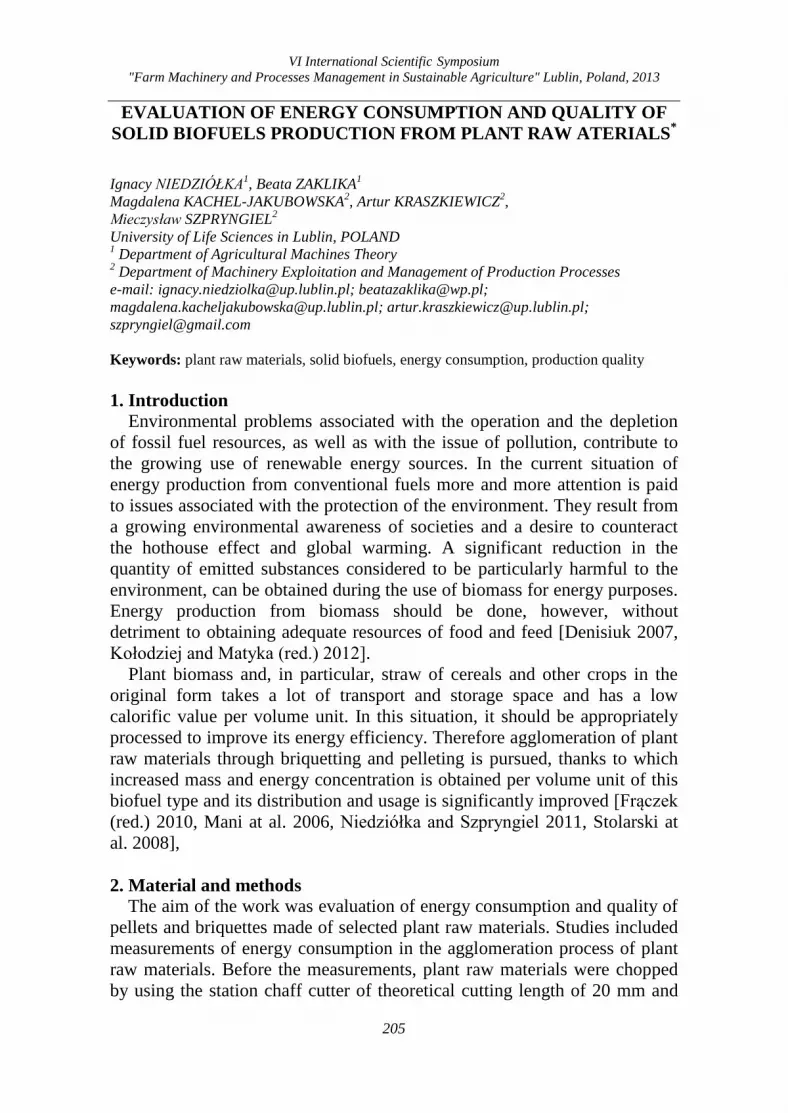
VI International Scientific Symposium "Farm Machinery and Processes Management in Sustainable Agriculture" Lublin, Poland, 2013
205
EVALUATION OF ENERGY CONSUMPTION AND QUALITY OF SOLID BIOFUELS PRODUCTION FROM PLANT RAW ATERIALS*
Ignacy NIEDZIÓŁKA1, Beata ZAKLIKA1
Magdalena KACHEL-JAKUBOWSKA2, Artur KRASZKIEWICZ2, Mieczysław SZPRYNGIEL2 University of Life Sciences in Lublin, POLAND 1 Department of Agricultural Machines Theory 2 Department of Machinery Exploitation and Management of Production Processes e-mail: [email protected]; [email protected]; [email protected]; [email protected]; [email protected] Keywords: plant raw materials, solid biofuels, energy consumption, production quality 1. Introduction
Environmental problems associated with the operation and the depletion of fossil fuel resources, as well as with the issue of pollution, contribute to the growing use of renewable energy sources. In the current situation of energy production from conventional fuels more and more attention is paid to issues associated with the protection of the environment. They result from a growing environmental awareness of societies and a desire to counteract the hothouse effect and global warming. A significant reduction in the quantity of emitted substances considered to be particularly harmful to the environment, can be obtained during the use of biomass for energy purposes. Energy production from biomass should be done, however, without detriment to obtaining adequate resources of food and feed [Denisiuk 2007, Kołodziej and Matyka (red.) 2012].
Plant biomass and, in particular, straw of cereals and other crops in the original form takes a lot of transport and storage space and has a low calorific value per volume unit. In this situation, it should be appropriately processed to improve its energy efficiency. Therefore agglomeration of plant raw materials through briquetting and pelleting is pursued, thanks to which increased mass and energy concentration is obtained per volume unit of this biofuel type and its distribution and usage is significantly improved [Frączek (red.) 2010, Mani at al. 2006, Niedziółka and Szpryngiel 2011, Stolarski at al. 2008], 2. Material and methods
The aim of the work was evaluation of energy consumption and quality of pellets and briquettes made of selected plant raw materials. Studies included measurements of energy consumption in the agglomeration process of plant raw materials. Before the measurements, plant raw materials were chopped by using the station chaff cutter of theoretical cutting length of 20 mm and
VI International Scientific Symposium "Farm Machinery and Processes Management in Sustainable Agriculture" Lublin, Poland, 2013
206
then on the chopper equipped with sieves of 6 mm holes. Relative humidity of plant raw materials was determined by weight-dryer methods according to standard PN-EN 15414-3:2011.
In the process of compacting the chopped plant raw materials used was a pelleting machine with a fixed one-sided flat matrix and rollers powered by a 7.5 kW electric engine and a screw briquetting press. The power of the compacting screw came from a 4.5 kW electric engine, and the heating of the compacting chamber from the electric heaters of 3 kW.
The volume of energy outlays was set using the converter of power, time and Lumel 3000 electricity type working with the computer. The converter- recorded data included: instantaneous and idling power consumption of devices and compaction process, as well as the duration of the compaction process. Energy consumption measurements were carried out after the adopted temperature by the compaction. Measurements of the total electricity consumption in the heating chamber and during the compaction process there are also using the three-phase linear meter.
The obtained power results converted per unit mass of produced pellets or briquettes. The obtained results have been testing statistical analysis based on an analysis of variance and Tukey test, with 95% confidence interval in STATISTICA 6.0. 3. Results
Figure 1 shows the results of tests of mechanical durability of pellets produced from the various raw materials. The pellets of lowest mechanical durability are made of wheat straw (82.6%) while slightly higher mechanical durability present those of rape straw (87.8%) and meadow hay (90.7%).
Figure 1. Mechanical durability of pellets produced from plant raw materials
Figure 2 shows the results of tests of briquettes mechanical durability, depending on the kind of used plant raw materials and the temperature in the

VI International Scientific Symposium "Farm Machinery and Processes Management in Sustainable Agriculture" Lublin, Poland, 2013
207
compacting chamber of briquetting press. The lowest mechanical durability is that of the rape straw briquettes (52-75%) while that of meadow hay and wheat straw briquettes is slightly higher, 55-75% and 60-80% respectively.
Figure 2. Mechanical durability of briquettes depending on the compaction temperature
An analysis of variance showed that plant raw materials used in studies of significantly affect energy consumption during the process of pelleting. Statistically significant differences were found in the case of energy consumption in the production of pellets for all agglomerated plant raw materials (table 1).
Table 1. The average values of the energy consumption during the pelleting process
Kind of raw material Wheat straw Rape straw Hay meadow
Energy consumption [kWh·kg-1] 0,153A 0,145B 0,176C
Standard deviation 0,0068 0,0035 0,0032
Statistically significant differences were found in the case of energy consumption of briquetting process for all agglomerated plant raw materials. Also, statistically significant differences were found in the case of energy consumption during production of briquettes at the temperature of 200, 225 and 250°C (table 2).
Table 2. The average values of the energy consumption during the briquetting process
Kind of raw material Wheat straw Rape straw Hay meadow
Energy consumption [kWh·kg-1] 0,137A 0,159B 0,168C
Temperature [°C] 200 225 250
Energy consumption [kWh·kg-1] 0,162A 0,151B 0,140C

VI International Scientific Symposium "Farm Machinery and Processes Management in Sustainable Agriculture" Lublin, Poland, 2013
208
4. Conclusions 1. Statistical analysis showed significant differences in the case of
mechanical durability of pellets produced from tested plant raw materials. Best results in terms of mechanical durability of pellets were obtained when meadow hay was used to produce them while in case of wheat straw the results were a bit worse.
2. Analysis of variance showed that both the plant raw material and the temperature have a statistically significant influence on briquettes mechanical durability. The lowest durability briquettes have been reported in the case of compacting rape straw at a temperature of 200°C (52%) and highest when compacting wheat straw at a temperature of 250°C (83%).
3. By analyzing the results of the study it was found out that the energy consumption of the production process of both pellets and briquettes depends on the kind of the agglomerated plant raw materials and adopted temperature in the compacting chamber of briquetting press.
4. The smallest energy consumption during pelleting occurred for rape straw, while larger for wheat straw about 5.5% and of meadow hay about 21.4%. In turn during briquetting the smallest energy consumption occurred for wheat straw, and larger for rape straw about 16.0% and hay meadow about 22.6%.
5. The unit energy consumption during the briquetting process was reduced with increasing temperature in the compacting chamber. With increasing temperature from 200 to 250°C, the reduction in energy consumption ranged from 13 to 15% for wheat and rape straw and about 20% for hay meadow.
5. References [1] Denisiuk W. 2007. Brykiety/pelety ze słomy w energetyce. Inżynieria Rolnicza, No.
9(97), p. 41-47. [2] Frączek J. (red.). 2010. Przetwarzanie biomasy na cele energetyczne. Wyd. PTIR,
Kraków, ISBN 978-83-917053-9-1, pp. 268. [3] Kołodziej B., Matyka M. (red.). 2012. Odnawialne źródła energii. Rolnicze surowce
energetyczne. PWRiL Sp. z o.o. Poznań, ISBN 978-83-09-01139-2, pp. 595. [4] Mani S., Tabil L., Sokhansanj S. 2006. Effects of compressive force, particle size and
moisture content on mechanical properties of biomass pellets from grasses. Biomass and Bioenergy, No. 30, p. 648-654.
[5] Niedziółka I., Szpryngiel M. 2011. Ocena energetyczna procesu zagęszczania wybranych surowców roślinnych w brykieciarce ślimakowej. Inżynieria Rolnicza, No. 9(134), p. 153-159.
[6] Stolarski M., Szczukowski S., Tworkowski J. 2008. Biopaliwa z biomasy wieloletnich roślin energetycznych. Energetyka, No. 1, p. 77-80.
*Scientific work funded by the National Center for Science in the years 2011-2014 as a research project N N 313 757540
VI International Scientific Symposium "Farm Machinery and Processes Management in Sustainable Agriculture" Lublin, Poland, 2013
209
REPRODUCTION OF MECHANIZATION MEANS ON FARMS IN LOWER SILESIA
Tomasz SZUK, Tomasz BERBEKA
Wroclaw University of Environmental and Life Sciences, Institute of Economics and Social Sciences, Wrocław, POLAND e-mail: [email protected]; e-mail: [email protected] Keywords: mechanization, farms, 1. Introduction One of the most essential questions in the area of agriculture farm management is technical armament of the work that means it’s mechanization. This irreversible in present-day times process of the substitute of the alive work for work objectivizes except many advantage connected mainly with the improvement of efficiency, the quality and economic threat resulting from the high capital absorption of mechanization processes decrease of the difficulty of work carries especially in individual farms [Muzalewski et al. 1997, Pawlak 2010]. This is highly connected in the report to received products with the price of mechanization means, and also the costs of their exploitation whose level determines first of all the degree of their utilization. The rationality of the reproduction process of these centres gathers in relationship with this essential meaning. Having this on the attention, the analysis of the reproduction of the mechanization means in the studied population of farms was the aim introduced in the study. 2. Material and methods The investigation was conducted in the period of 3 years – since 2008 till 2010. Source materials came from individual farms laid in the most farm intensive subregions of Lower Silesia. The investigations were conducted in 100 farms with plant production profile chosen in the purposeful way. In this farms the accounting processes was introduced with special advisory AG persons for book – keeping in purpose to count final economic efficiency for whole farm and identify mechanization costs. Moreover, the detailed stock-taking of possessed assets was executed and conducted interviews with owners relating to activity investment. The average surface of studied farm carried out 46.65 ha of which 46.24 ha was utilised agricultural area. This surface was about four times larger in comparison with average surface of the individual farm on Lower Silesia passed by Main Statistical Office and three the times larger in the relation to
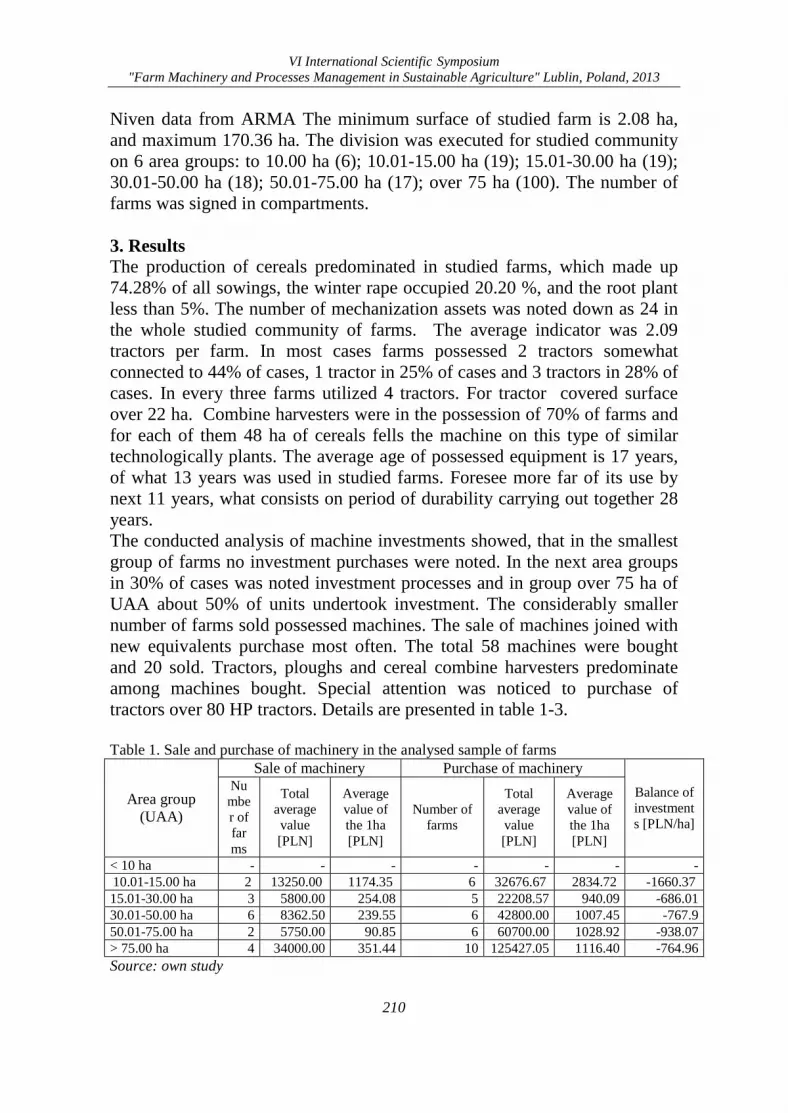
VI International Scientific Symposium "Farm Machinery and Processes Management in Sustainable Agriculture" Lublin, Poland, 2013
210
Niven data from ARMA The minimum surface of studied farm is 2.08 ha, and maximum 170.36 ha. The division was executed for studied community on 6 area groups: to 10.00 ha (6); 10.01-15.00 ha (19); 15.01-30.00 ha (19); 30.01-50.00 ha (18); 50.01-75.00 ha (17); over 75 ha (100). The number of farms was signed in compartments. 3. Results The production of cereals predominated in studied farms, which made up 74.28% of all sowings, the winter rape occupied 20.20 %, and the root plant less than 5%. The number of mechanization assets was noted down as 24 in the whole studied community of farms. The average indicator was 2.09 tractors per farm. In most cases farms possessed 2 tractors somewhat connected to 44% of cases, 1 tractor in 25% of cases and 3 tractors in 28% of cases. In every three farms utilized 4 tractors. For tractor covered surface over 22 ha. Combine harvesters were in the possession of 70% of farms and for each of them 48 ha of cereals fells the machine on this type of similar technologically plants. The average age of possessed equipment is 17 years, of what 13 years was used in studied farms. Foresee more far of its use by next 11 years, what consists on period of durability carrying out together 28 years. The conducted analysis of machine investments showed, that in the smallest group of farms no investment purchases were noted. In the next area groups in 30% of cases was noted investment processes and in group over 75 ha of UAA about 50% of units undertook investment. The considerably smaller number of farms sold possessed machines. The sale of machines joined with new equivalents purchase most often. The total 58 machines were bought and 20 sold. Tractors, ploughs and cereal combine harvesters predominate among machines bought. Special attention was noticed to purchase of tractors over 80 HP tractors. Details are presented in table 1-3. Table 1. Sale and purchase of machinery in the analysed sample of farms
Area group (UAA)
Sale of machinery Purchase of machinery Balance of investments [PLN/ha]
Number of farms
Total average value [PLN]
Average value of the 1ha [PLN]
Number of farms
Total average value [PLN]
Average value of the 1ha [PLN]
< 10 ha - - - - - - - 10.01-15.00 ha 2 13250.00 1174.35 6 32676.67 2834.72 -1660.37 15.01-30.00 ha 3 5800.00 254.08 5 22208.57 940.09 -686.01 30.01-50.00 ha 6 8362.50 239.55 6 42800.00 1007.45 -767.9 50.01-75.00 ha 2 5750.00 90.85 6 60700.00 1028.92 -938.07 > 75.00 ha 4 34000.00 351.44 10 125427.05 1116.40 -764.96 Source: own study
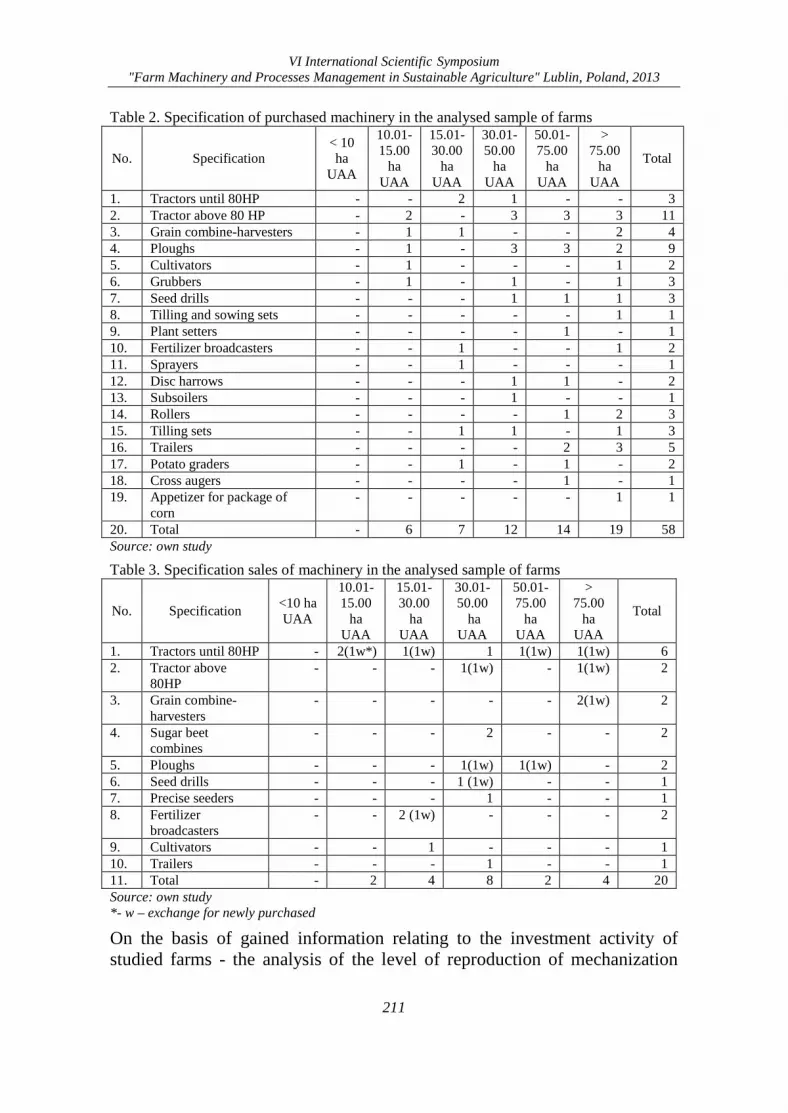
VI International Scientific Symposium "Farm Machinery and Processes Management in Sustainable Agriculture" Lublin, Poland, 2013
211
Table 2. Specification of purchased machinery in the analysed sample of farms
No. Specification < 10 ha
UAA
10.01-15.00
ha UAA
15.01-30.00
ha UAA
30.01-50.00
ha UAA
50.01-75.00
ha UAA
> 75.00
ha UAA
Total
1. Tractors until 80HP - - 2 1 - - 3 2. Tractor above 80 HP - 2 - 3 3 3 11 3. Grain combine-harvesters - 1 1 - - 2 4 4. Ploughs - 1 - 3 3 2 9 5. Cultivators - 1 - - - 1 2 6. Grubbers - 1 - 1 - 1 3 7. Seed drills - - - 1 1 1 3 8. Tilling and sowing sets - - - - - 1 1 9. Plant setters - - - - 1 - 1 10. Fertilizer broadcasters - - 1 - - 1 2 11. Sprayers - - 1 - - - 1 12. Disc harrows - - - 1 1 - 2 13. Subsoilers - - - 1 - - 1 14. Rollers - - - - 1 2 3 15. Tilling sets - - 1 1 - 1 3 16. Trailers - - - - 2 3 5 17. Potato graders - - 1 - 1 - 2 18. Cross augers - - - - 1 - 1 19. Appetizer for package of
corn - - - - - 1 1
20. Total - 6 7 12 14 19 58 Source: own study
Table 3. Specification sales of machinery in the analysed sample of farms
No. Specification <10 ha UAA
10.01-15.00
ha UAA
15.01-30.00
ha UAA
30.01-50.00
ha UAA
50.01-75.00
ha UAA
> 75.00
ha UAA
Total
1. Tractors until 80HP - 2(1w*) 1(1w) 1 1(1w) 1(1w) 6 2. Tractor above
80HP - - - 1(1w) - 1(1w) 2
3. Grain combine-harvesters
- - - - - 2(1w) 2
4. Sugar beet combines
- - - 2 - - 2
5. Ploughs - - - 1(1w) 1(1w) - 2 6. Seed drills - - - 1 (1w) - - 1 7. Precise seeders - - - 1 - - 1 8. Fertilizer
broadcasters - - 2 (1w) - - - 2
9. Cultivators - - 1 - - - 1 10. Trailers - - - 1 - - 1 11. Total - 2 4 8 2 4 20 Source: own study *- w – exchange for newly purchased
On the basis of gained information relating to the investment activity of studied farms - the analysis of the level of reproduction of mechanization
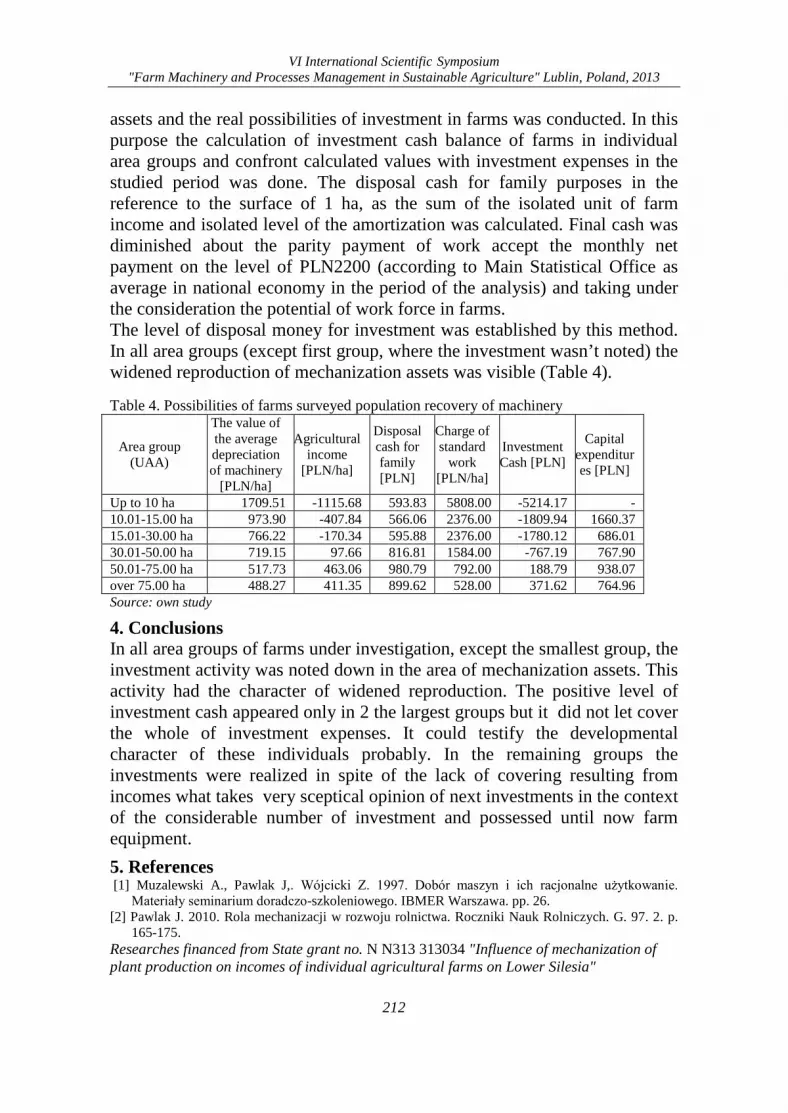
VI International Scientific Symposium "Farm Machinery and Processes Management in Sustainable Agriculture" Lublin, Poland, 2013
212
assets and the real possibilities of investment in farms was conducted. In this purpose the calculation of investment cash balance of farms in individual area groups and confront calculated values with investment expenses in the studied period was done. The disposal cash for family purposes in the reference to the surface of 1 ha, as the sum of the isolated unit of farm income and isolated level of the amortization was calculated. Final cash was diminished about the parity payment of work accept the monthly net payment on the level of PLN2200 (according to Main Statistical Office as average in national economy in the period of the analysis) and taking under the consideration the potential of work force in farms. The level of disposal money for investment was established by this method. In all area groups (except first group, where the investment wasn’t noted) the widened reproduction of mechanization assets was visible (Table 4). Table 4. Possibilities of farms surveyed population recovery of machinery
Area group (UAA)
The value of the average depreciation of machinery
[PLN/ha]
Agricultural income
[PLN/ha]
Disposal cash for family [PLN]
Charge of standard
work [PLN/ha]
Investment Cash [PLN]
Capital expenditures [PLN]
Up to 10 ha 1709.51 -1115.68 593.83 5808.00 -5214.17 - 10.01-15.00 ha 973.90 -407.84 566.06 2376.00 -1809.94 1660.37 15.01-30.00 ha 766.22 -170.34 595.88 2376.00 -1780.12 686.01 30.01-50.00 ha 719.15 97.66 816.81 1584.00 -767.19 767.90 50.01-75.00 ha 517.73 463.06 980.79 792.00 188.79 938.07 over 75.00 ha 488.27 411.35 899.62 528.00 371.62 764.96 Source: own study
4. Conclusions In all area groups of farms under investigation, except the smallest group, the investment activity was noted down in the area of mechanization assets. This activity had the character of widened reproduction. The positive level of investment cash appeared only in 2 the largest groups but it did not let cover the whole of investment expenses. It could testify the developmental character of these individuals probably. In the remaining groups the investments were realized in spite of the lack of covering resulting from incomes what takes very sceptical opinion of next investments in the context of the considerable number of investment and possessed until now farm equipment.
5. References [1] Muzalewski A., Pawlak J,. Wójcicki Z. 1997. Dobór maszyn i ich racjonalne użytkowanie.
Materiały seminarium doradczo-szkoleniowego. IBMER Warszawa. pp. 26. [2] Pawlak J. 2010. Rola mechanizacji w rozwoju rolnictwa. Roczniki Nauk Rolniczych. G. 97. 2. p.
165-175. Researches financed from State grant no. N N313 313034 "Influence of mechanization of plant production on incomes of individual agricultural farms on Lower Silesia"
VI International Scientific Symposium "Farm Machinery and Processes Management in Sustainable Agriculture", Lublin, Poland, 2013
213
KEYWORDS INDEX
Keyword Page actual precision 89, 93 agricultural enterprise 29 agricultural machinery 157 agroforestry 39 agronomic factors 65 air permeability 153 amplitude 17 ash 175 autogyro 53 barley 136 Belgium 89,93 biogas production 167 biological compounds 105 biological crop protection 53 biomass 175 boom height 85 breakeven area 183 budget period 2014-2020 45 carrots 105 cattle breeding 167 centrifugal spreaders 163 CES EduPack 75 chemical properties of the biomass 129 chlorophyll 109 click beetle 99 commodity production 133 Common Agricultural Policy 41,45 compaction energy consumption 129 corn 79 corporate image 29 costs 183 crop protection organization 113 crop protection techniques 113 Cyanobacteria 79 decomposition 125 decontaminate 175 development plan 49 dielectric permittivity 169 direct payments 45
drift 136 drift-reducing nozzles 136 ecological farm 133 educational software 75 effectiveness 99 emerging technology 57 energy 175 energy consumption 205 European corn borer 53 export 157 family farm 187 farm income 41 farmers collaboration 139 farms 191,209 fatty acids 109 field crops 85 fixed assets 83 flat-fan nozzle 125 fluctuation 17 flux density 125 forecasting 99 frequency 17 furrow slice cracker 153 glycerin 109 GNSS 89,93 graduate attributes 177 green payment 45 guidance system 89,93 harmful gases 167 health 201 heavy metals 175 hop production 83 impact properties 71 import 157 individual farm 33 integrated plant protection 149 intercropping 39 investments 33 Iraq 113 irrigation system 197 labour inputs 133 labour management 139 lifelong learning 177 lipids 109 liquid pressure 85 logistics audit 191
VI International Scientific Symposium "Farm Machinery and Processes Management in Sustainable Agriculture", Lublin, Poland, 2013
214
machinery costs 139 maintenance costs 187 maize, 53 manure disposal 167 market 157 materials teaching 75 mathematical model 10 mechanical harvesting 23 mechanization 209 metabolic activity 79 methodology 67 microalgae 79 mineral fertilizers 163 modernization 33 moisture stabilization 197 MONG 109 monitoring 99 mouldboard plough 153 multifunctional agriculture 39 nozzle flow 67 nozzle inspection 67 olive harvesting 23 operating costs 83 organic and conventional crops 201 organic dusts 201 organic farming 49 organizational culture 29 parsley 105 pellet 121 pheromone traps 99 phytomass 175 plant biomass 129 plant growth 79 plant raw materials 205 Poland 149 precision seeding 117 prevention methods 149 procurement process 191 production 157 production quality 205 rape oil 109 reduction rate 136 renewable energy 167 resonance vibrating pumps 143 root crop 17
scale up techniques 57 scenarios 41 seeding quality 117 seeds 105 self-directed learning 177 soil water content 169 solar power 143 solid biofuels 205 spray boom 85 spray drift 85 spread 163 spring suspension system 143 standard nozzles 136 statistical characteristics of crops 10 straw crushing 121 sugar beet 17 sugar beets 10 Sugarbearing mass loss 10 sustainable agriculture 39 sustainable development 167 sustainable plant engineering solutions 57 TDR 169 tension 71 the differential equations of movement 17 the spring environment 17 thermoplastic starch 71 time-domain reflectometry 197 tops residues 10 tractor 89,93 transverse distribution 67 ultrasound 57 usage costs 187 variable mineral fertilization 183 vegetable 65 vibrating digging up tool 17 virgin olive oil extraction process 57 volume stream 125 Wallonia 41,49 wireworms 99
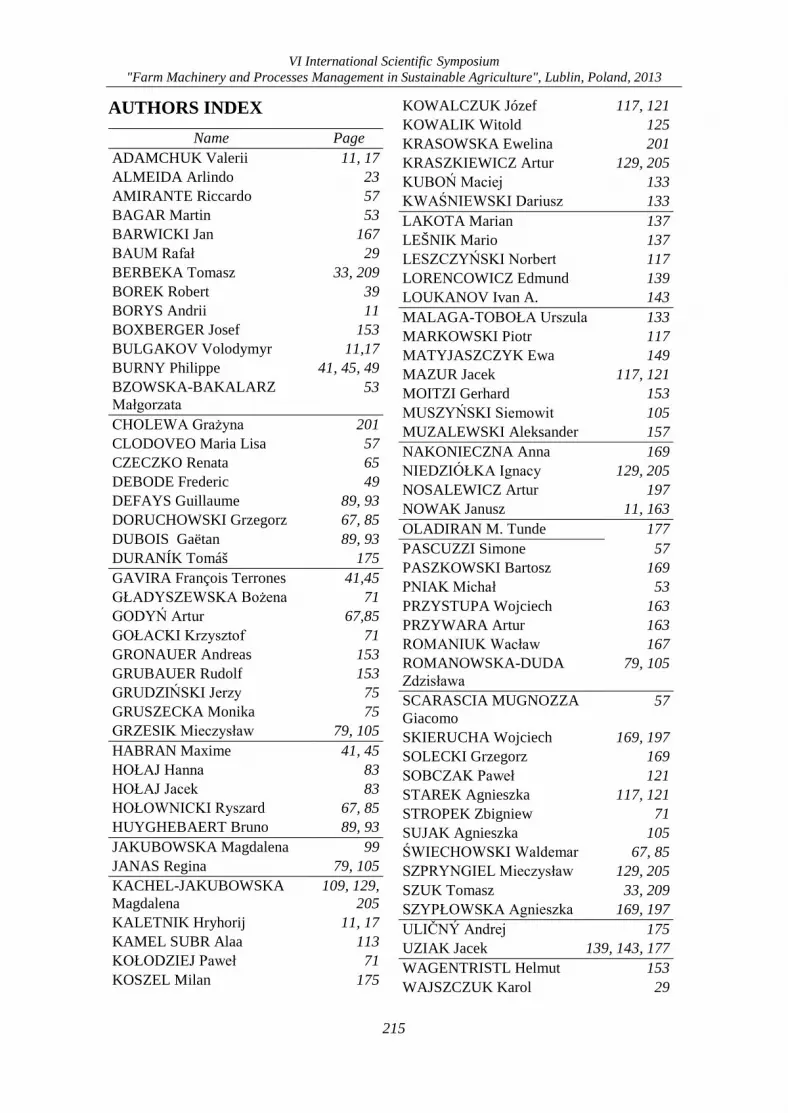
VI International Scientific Symposium "Farm Machinery and Processes Management in Sustainable Agriculture", Lublin, Poland, 2013
215
AUTHORS INDEX Name Page
ADAMCHUK Valerii 11, 17 ALMEIDA Arlindo 23 AMIRANTE Riccardo 57 BAGAR Martin 53 BARWICKI Jan 167 BAUM Rafał 29 BERBEKA Tomasz 33, 209 BOREK Robert 39 BORYS Andrii 11 BOXBERGER Josef 153 BULGAKOV Volodymyr 11,17 BURNY Philippe 41, 45, 49 BZOWSKA-BAKALARZ Małgorzata
53
CHOLEWA Grażyna 201 CLODOVEO Maria Lisa 57 CZECZKO Renata 65 DEBODE Frederic 49 DEFAYS Guillaume 89, 93 DORUCHOWSKI Grzegorz 67, 85 DUBOIS Gaëtan 89, 93 DURANÍK Tomáš 175 GAVIRA François Terrones 41,45 GŁADYSZEWSKA Bożena 71 GODYŃ Artur 67,85 GOŁACKI Krzysztof 71 GRONAUER Andreas 153 GRUBAUER Rudolf 153 GRUDZIŃSKI Jerzy 75 GRUSZECKA Monika 75 GRZESIK Mieczysław 79, 105 HABRAN Maxime 41, 45 HOŁAJ Hanna 83 HOŁAJ Jacek 83 HOŁOWNICKI Ryszard 67, 85 HUYGHEBAERT Bruno 89, 93 JAKUBOWSKA Magdalena 99 JANAS Regina 79, 105 KACHEL-JAKUBOWSKA Magdalena
109, 129, 205
KALETNIK Hryhorij 11, 17 KAMEL SUBR Alaa 113 KOŁODZIEJ Paweł 71 KOSZEL Milan 175
KOWALCZUK Józef 117, 121 KOWALIK Witold 125 KRASOWSKA Ewelina 201 KRASZKIEWICZ Artur 129, 205 KUBOŃ Maciej 133 KWAŚNIEWSKI Dariusz 133 LAKOTA Marian 137 LEŠNIK Mario 137 LESZCZYŃSKI Norbert 117 LORENCOWICZ Edmund 139 LOUKANOV Ivan A. 143 MALAGA-TOBOŁA Urszula 133 MARKOWSKI Piotr 117 MATYJASZCZYK Ewa 149 MAZUR Jacek 117, 121 MOITZI Gerhard 153 MUSZYŃSKI Siemowit 105 MUZALEWSKI Aleksander 157 NAKONIECZNA Anna 169 NIEDZIÓŁKA Ignacy 129, 205 NOSALEWICZ Artur 197 NOWAK Janusz 11, 163 OLADIRAN M. Tunde 177 PASCUZZI Simone 57 PASZKOWSKI Bartosz 169 PNIAK Michał 53 PRZYSTUPA Wojciech 163 PRZYWARA Artur 163 ROMANIUK Wacław 167 ROMANOWSKA-DUDA Zdzisława
79, 105
SCARASCIA MUGNOZZA Giacomo
57
SKIERUCHA Wojciech 169, 197 SOLECKI Grzegorz 169 SOBCZAK Paweł 121 STAREK Agnieszka 117, 121 STROPEK Zbigniew 71 SUJAK Agnieszka 105 ŚWIECHOWSKI Waldemar 67, 85 SZPRYNGIEL Mieczysław 129, 205 SZUK Tomasz 33, 209 SZYPŁOWSKA Agnieszka 169, 197 ULIČNÝ Andrej 175 UZIAK Jacek 139, 143, 177 WAGENTRISTL Helmut 153 WAJSZCZUK Karol 29
VI International Scientific Symposium "Farm Machinery and Processes Management in Sustainable Agriculture", Lublin, Poland, 2013
216
WALCZAK Magdalena 177 WALCZYKOVA Maria 183 WAŃKOWICZ Jarosław 29 WASĄG Zbigniew 187 WAWRZYNOWICZ Jacek 29, 191 WICIAK Tomasz 33 WIECZORKOWSKA Alicja 117 WILCZAŃSKI Andrzej 53 WILCZEK Andrzej 169, 197 WILCZEK Waldemar 197 ZAGÓRDA Mirosław 183 ZAKLIKA Beata 205 ZARAJCZYK Janusz 117, 121 ZAWIŚLAK Kazimierz 121 ZWOLIŃSKI Jacek 201 ŻUKIEWICZ-SOBCZAK Wioletta
201