4.0 what are the implications of climate change and variability for gulf coast transportation?
TRANSCRIPT

Impacts of Climate Change and Variability on Transportation Systems and Infrastructure: Gulf Coast Study, Phase I Chapter 4: What are the Implications of Climate Change and Variability for Gulf Coast Transportation?
4-1
4.0 What Are the Implications of Climate Change and Variability for Gulf Coast Transportation?
Lead Authors: Robert S. Kafalenos, Kenneth J. Leonard
Contributing Authors: Daniel M. Beagan, Virginia R. Burkett, Barry D. Keim, Alan Meyers, David T. Hunt, Robert C. Hyman, Michael K. Maynard, Barbara Fritsche, Russell H. Henk, Edward J. Seymour, Leslie E. Olson, Joanne R. Potter, Michael J. Savonis
The major climate drivers discussed in chapter 3.0 have significant implications for the transportation system in the Gulf Coast region. This chapter provides an overview, in section 4.1, of the impacts of climate change on the region’s transportation infrastructure. It starts with a summary organized around the primary climate effects addressed in chapter 3.0 (temperature, precipitation, sea level rise, and storm activity) and continues with a discussion of freight and private sector concerns. In section 4.2, it shifts to a more detailed discussion organized by transportation mode; this subsection ends by summarizing and discussing freight and private sector concerns involving multiple modes. Finally, we use a series of case studies in section 4.3 to illustrate some of the effects of the 2005 hurricanes on transportation.
Based on the analysis of the climate scenarios relayed in chapter 3.0, climate change is likely to have the largest impact on highways, ports, and rail, particularly through sea level rise and storm surge. Temperature increases, particularly temperature extremes, are likely to increase energy consumption for refrigerated storage as well as rail and highway maintenance. Bridges, included in multiple modes, also could be affected by changes in precipitation, particularly through changes in peak stream flow. Changes in severe weather patterns (thunderstorms) or cloud cover could affect flight operations. See tables 4.3 through 4.6 for summary statistics.

Impacts of Climate Change and Variability on Transportation Systems and Infrastructure: Gulf Coast Study, Phase I Chapter 4: What are the Implications of Climate Change and Variability for Gulf Coast Transportation?
4-2
4.1 Climate Drivers and Their Impacts on the Transportation System
This section focuses on the main impacts on transportation facilities and features (e.g., bridges) resulting from the primary climate drivers: temperature, precipitation, sea level rise, and storm activity, and summarizes some of the issues that affect multiple modes.1 While each climate factor has implications for the transportation network, relative sea level rise (RSLR) and storm activity have the potential to cause the most serious damage to transportation infrastructure in this study region. The relative significance of different climate factors will vary from region to region. The section closes with a look at key cross-modal issues, particularly private sector involvement and the potential for climate impacts in the Gulf Coast region to disrupt freight movements outside the study region.
As noted in Chapter 3.0, the climate impacts on transportation infrastructure assessed in this study rely on the combination of an understanding of historical climate trends and future projections from general circulation models (GCM). While model results imply that change will be gradual and linear, it should be noted that regional “surprises” are increasingly possible in the complex, nonlinear Earth climate system (Groisman et al., 2004), which is characterized by thresholds in physical processes that are not completely understood or incorporated into climate model simulations; e.g., interactive chemistry, interactive land and ocean carbon emissions, etc. While there is still considerable uncertainty about the rates of change that can be expected (Karl and Trenberth, 2003), there is a fairly strong consensus concerning the direction of change for most of the climate variables that affect transportation in the Gulf Coast region.
4.1.1 Effects of Warming Temperatures
Based on the results presented in chapter 3.0 for the Gulf Coast subset of the GCM runs performed for the IPCC Fourth Assessment Report (2007), the average temperature in the Gulf Coast region appears likely to increase by at least 1.5 °C ± 1 °C (2.7 °F ± 1.8 °F) during the next 50 years. While changes in average temperatures have some implications for transportation infrastructure and services, the more significant consideration is the potential change in temperature extremes. As the number of days that the temperature is above 32 °C (90 °F) increases – rising in the next century to as much as 115 days (plus or minus 16 days) per year from the current level of 77 days – stress will increase on both the infrastructure itself and on the people who use and provide transportation services. Temperature extremes are most likely to cause the greatest maintenance problems. The greater frequency of very hot days will lead to greater need for maintenance of roads and
1 Aside from introductory and summary sections, the climate drivers are not addressed in order of relative
importance but rather are discussed in the same order throughout this chapter for purposes of consistency: temperature, precipitation, sea level rise, and storm activity.

Impacts of Climate Change and Variability on Transportation Systems and Infrastructure: Gulf Coast Study, Phase I Chapter 4: What are the Implications of Climate Change and Variability for Gulf Coast Transportation?
4-3
asphalt pavement (although some paving materials may handle temperature extremes better than others), rail tracks and freight facilities, some vehicles, and facility buildings and structures due to degradation in materials. Further, construction and maintenance schedules may be affected, as work crews may be unable to work during extreme heat events. For aviation, longer runways may be required, although this will probably be offset by advancements in engine technology and airframe materials.
Increases in temperatures also are likely to increase energy consumption for cooling. This applies particularly to freight operations, including ports where energy is required to provide for refrigeration, as well as to trains and truck operations. Air conditioning requirements for passengers also can be expected to increase, which may lead to a need for additional infrastructure at terminal facilities. This has both environmental and economic costs and may pose a public health concern to vulnerable populations during emergency situations.
4.1.2 Effects of Precipitation Levels and Patterns
Precipitation and Runoff
In this study, annual and monthly (January and July) precipitation totals are examined. Changes in mean precipitation levels appear to have a less significant effect on transportation than do sea level rise, storm surge, and temperature extremes. However, the potential exists for increased intensity in individual precipitation events, which would likely affect transportation network operations, safety, and storm water management infrastructure. Runoff resulting from such events could lead to increased peak streamflow, which could affect the sizing requirement for bridges and culverts.
As reported in chapter 3.0, the climate models show relatively wide variance in average precipitation projections, with plausible scenarios showing annual rainfall potentially increasing or decreasing by as much as 13 percent by 2050 and by ± 15 percent by 2100. However, regardless of whether average precipitation rises or falls, higher temperatures are expected to result in more rapid evaporation. This would result in declining soil moisture and decreased runoff to rivers and streams. The size and extent of natural habitats adjacent to highways may be altered, resulting in changes in some plant and animal communities. These ecological changes may have implications for environmental mitigation strategies and commitments.
While changes in annual average precipitation may have some effects, change in the intensity of individual rainfall events is likely to be the more significant implication for the transportation system. An increase in the intensity or frequency of heavy downpours may require redesign of storm water management facilities for highway, bridges and culverts, ports, aviation, and rail. Severe weather events are correlated to higher incidence of crashes and delays, affecting both safety and mobility. Further, aviation services can be disrupted by intense rainfall events as well as an increase in the probability of severe convective weather. No attempt is made in this study to quantify potential changes in intensity under the climate scenarios presented in chapter 3.0.

Impacts of Climate Change and Variability on Transportation Systems and Infrastructure: Gulf Coast Study, Phase I Chapter 4: What are the Implications of Climate Change and Variability for Gulf Coast Transportation?
4-4
4.1.3 Relative Sea Level Rise
Background
Scenarios of 61 cm and 122 cm (2 and 4 ft) of relative sea level rise were selected as inputs to our analysis of potential transportation impacts in the study area. These scenarios were selected based on the range of projected relative sea level rise (discussed in chapter 3.0) of 24-199 cm (about 1-7 ft, depending on location, GCM, and a given emission scenario from the Special Report on Emissions Scenarios (SRES). Even the lowest end of the range of increase in relative sea level has the potential to threaten a considerable proportion of the transportation infrastructure in the region. Future planning, construction, and maintenance activities should be informed by an understanding of the potential vulnerabilities. This subsection begins with a summary of the relative sea level rise analysis conducted for this study (see chapter 3.0 for the full discussion) and continues by summarizing the potential effects of relative sea level rise on the transportation modes.
As noted in chapter 3.0, RSLR is the combined effect of the projected increase in the volume of the world’s oceans (eustatic sea level change), which results from increases in temperature and melting of ice, and the projected changes in land surface elevation at a given location. In the Gulf Coast region, change in land surface elevation change is dominated by subsidence, or sinking, of the land surface. While sea level may continue to rise incrementally, the potential for abrupt increases in relative levels cannot be dismissed. Gradual and relatively consistent rates of sea level increases will be more easily addressed by transportation planners and designers than would more abrupt or discontinuous changes in water levels. No analysis is conducted regarding the implications of a catastrophic degree of sea level change that would result from major changes in the rate of land ice decline (e.g., a rapid collapse of the Greenland Ice Sheet).
Two different sea level rise models were used to estimate potential RSLR in the study area. Both models were used to estimate relative sea level rise by 2050 and 2100 under the greenhouse gas emissions scenarios considered in this study (see chapter 3.0 for more on the scenarios). Both models account for eustatic sea level change and land subsidence in the region based on the historical record. One model, CoastClim, produces results that approximate future change in RSLR under the climate scenarios. A similar model, SLRRP, also incorporates values for high and low tidal variation attributed to astronomical and meteorological causes, which are pulled from the historical record. The tide data used is based on a monthly average of the mean high tide (mean higher high water) for each day of the month. The SLRRP results presented in the study are the highest predicted monthly sea level elevations by 2050 and 2100. Thus, the SLRRP results capture seasonal variability and interannual trends in sea level change, while the CoastClim results do not.
Results for the low- and high-range RSLR cases are summarized in tables 4.1 and 4.2. (See tables 3.14 and 3.16 for the full range of results.) Analysis was conducted for three long-term tide gage locations, as subsidence rates vary substantially across the region: regional subsidence rates are 4.7 mm/year (0.19 in/year) for Galveston, TX, and the chenier plain; 8.05 mm/year (0.32 in/year) for Grand Isle, LA, and the Mississippi River deltaic plain; and 0.34 mm/year (0.013 in/year) for Pensacola, FL, and the Mississippi/Alabama

Impacts of Climate Change and Variability on Transportation Systems and Infrastructure: Gulf Coast Study, Phase I Chapter 4: What are the Implications of Climate Change and Variability for Gulf Coast Transportation?
4-5
Sound of the central Gulf Coast. Results generated using CoastClim range from 24 cm (0.8 ft) in Pensacola to 167 cm (5.5 ft) in Grand Isle. Results from SLRRP, which as noted above accounts for historical tidal variation, are somewhat higher, with predicted sea level ranging from 70 cm (2.3 ft) in Pensacola to 199 cm (6.5 ft) in Grand Isle (North American Vertical Datum 88 [NAVD88]).
[INSERT Table 4.1: Relative sea level rise (RSLR) modeled using SLRRP]
[INSERT Table 4.2: Relative sea level rise (RSLR) modeled using CoastClim]
This phase I analysis broadly examines the potential effects of sea level rise on the region as a whole; the results related in this study should not be used to predict specific impacts on any single location at a specific point in time. Impacts were analyzed assuming two different levels of relative sea level rise; 61 cm (2 ft) and 122 cm (4 ft). From a regional perspective, the selection of this range for analysis is clearly supported by the model results. In fact, given that the results range from 24 cm to 199 cm (0.8 to 6.5 ft), analyzing for 61- and 122-cm (2- and 4-ft) increases in RSLR may be overly conservative from a regional perspective. For both Galveston and especially Grand Isle, analyzing at the 122-cm (4-ft)level is conservative, given that the high-range scenario results modeled to the year 2100 range from 130 cm (4.3 ft) to 199 cm (6.5 ft) for these two areas. In the case of Pensacola, given that three of the four values that define the range of the results are above 61 cm (2 ft), this level should be considered a conservative input value. The 122-cm (4-ft) level, however, is representative of the high-range scenario results (114 cm or 3.8 ft) for Pensacola.
The effect of existing flood control works has not been addressed in this study. Many existing facilities at lower elevations are protected by levees and other physical structures, which are intended to provide resistance to storm surge. The present land-based elevation data allows us to identify general geographic zones of potential risk and to identify areas that merit further study. More detailed future assessments of specific sites and facilities should consider the presence and viability of protective structures as part of an analysis of risk and vulnerability at those locations.
As discussed in chapter 3.0, RSLR will not be uniform across the region. This study’s results are meant to give a broad indication of where relative sea levels could be by the year 2100 and what infrastructure could be affected as a result of the analysis under the 61- and 122-cm (2- and 4-ft) RSLR scenarios. This analysis provides a first approximation of potential vulnerabilities and provides insights for transportation planners; more detailed analyses can then be conducted to further assess specific locations and facilities that may be at risk. Phase II of this study will examine specific sublocations within the region and incorporate location-specific projections of future RSLR.
Impact on Transportation
Relative sea level rise poses the greatest danger to the dense network of ports, highways, and rail lines across the region. An increase in relative sea level of 61 cm (2 ft) has the potential to affect 64 percent of the region’s port facilities, while a 122-cm (4-ft) rise in

Impacts of Climate Change and Variability on Transportation Systems and Infrastructure: Gulf Coast Study, Phase I Chapter 4: What are the Implications of Climate Change and Variability for Gulf Coast Transportation?
4-6
relative sea level would affect nearly three-quarters of port facilities. This is not surprising given that port facilities are adjacent to a navigable water body. For highways and rail, while the percentages are lower, the effect also is quite large. About a quarter of arterials and interstates, nearly half of the region’s intermodal connector miles, and 10 percent of its rail miles would be affected by a 122-cm (4-ft) rise. Because goods are transferred to and from ports by both trucks and rail, service interruptions on selected segments of infrastructure are likely to affect much more than these percentages imply due to the disruption to network connectivity. For example, an increase in relative sea level of 61 cm (2 ft) would affect 220 km (137 mi) of I-10 east of New Orleans, which could affect on-road transport of both people and goods into and out of New Orleans and, to a lesser extent, Houston. Similarly, while less than 10 percent of rail miles would be affected, most of the rail lines linking New Orleans to the rail system could be affected. This could hinder freight movements in the region, especially since New Orleans is the main east-west link for rail located in the region, one of four in the United States. While airports in the region are less directly vulnerable to sea level rise, the vulnerability of roads and rail lines serving them affects the passenger and freight services these facilities provide as well. See table 4.3 for a summary of this information.
[INSERT TABLE 4.3 – Relative sea level rise impacts on Gulf Coast transportation modes: percentage of facilities vulnerable.]
Relative sea level rise is likely to have an impact on the other modes as well. While bus routes can be adjusted over time should facilities no longer be of use, light rail facilities are not so easily moved; some of the light rail routes in Galveston and New Orleans would be affected by a 61-cm (2-ft) rise. Airports would not escape the direct and indirect effects of relative sea level rise; New Orleans International airport, at 122-cm (4 ft), and two other smaller airports could be affected directly by higher sea levels. Others could be affected indirectly if the roads and connectors leading to them are flooded.
The data and analysis for both relative sea level rise and storm surge are based on land area elevations, rather than facility elevations. Facility elevations generally were not readily available for this phase of the study in a consolidated and geospatial format. The elevation of land areas was determined from the National Elevation Dataset (NED) maintained by the United States Geological Survey (USGS) (USGS, 2004). Mapping data for transportation infrastructure was obtained from the U.S Department of Ttransportation’s (DOT) Bureau of Transportation Statistics (BTS, 2004).
The NED has a horizontal resolution of 30 m (98 ft). Since the positional accuracy of the transportation facilities is plus or minus 80 m (262 ft), the elevation data is sufficient only to make general conclusions about transportation facilities that are vulnerable to flooding. While some sections of the transportation network – particularly roads and rail lines – may be elevated, it is important to note that inundation of even short segments of the system can shut down significant portions of the broader network due to the essential connectivity provided by these segments. Furthermore, such inundation can undermine infrastructure’s foundations and substructures.

Impacts of Climate Change and Variability on Transportation Systems and Infrastructure: Gulf Coast Study, Phase I Chapter 4: What are the Implications of Climate Change and Variability for Gulf Coast Transportation?
4-7
4.1.4 Storm Activity
As discussed in chapter 3.0, the intensity of hurricanes making landfall in the Gulf Coast study area is likely to increase. In addition, the climate analysis indicates that the number of hurricanes may increase as the temperature of the sea surface continues to warm. Simulated storm surge from model runs across the central Gulf Coast at today’s elevations and sea levels demonstrated a 6.7- to 7.3-m (22- to 24-ft) potential surge for major hurricanes of Category 3 or greater. Based on recent experience, even these levels may be conservative; surge levels during Hurricane Katrina (rated a Category 3 at landfall) exceeded these heights in some locations.
Many of the region’s major roads, railroads, and airports have been constructed on land surfaces at elevations below 5 m (16.4 ft). Storm surge poses significant risk to transportation facilities2 due to the immediate flooding of infrastructure, the damage caused by the force of the water, and secondary damage caused by collisions with debris. While surges at varying heights may disrupt operations and damage infrastructure, the effects of storm surges of 5.5 and 7 m (18 and 23 ft) were assessed for the purposes of this analysis.
This assessment does not take into account the possible dampening of surge effects due to distance inland from coastal areas and the buffering qualities of both ecological systems (barrier islands, wetlands, marshes) and the built environment. The analysis identifies portions of the transportation network that are at land elevations below 5.5 and 7 m (18 and 23 ft) as an initial indication of areas and facilities that may be at risk and warrant more detailed analysis. Areas significantly inland from the coast or protected by buffering systems may be less vulnerable, depending on site-specific coastal geomorphology and the characteristics of individual storm events.
As shown clearly by Hurricanes Katrina and Rita, storm surge has the potential to cause serious damage and loss of life in low-lying areas. As considered in this study, much of the region’s infrastructure is vulnerable to storm surges on the order of 5.5 to 7 m (18 to 23 ft), though the specific infrastructure that would be flooded depends on the characteristics of a given storm, including its landfall location, wind speed, direction, and tidal conditions.
As in the case of relative sea level rise, ports, highway, and rail are the transportation facilities that would be most directly affected by storm surge. Ports have the most exposure, because 98 percent of port facilities are vulnerable to a storm surge of 5.5 m (18 ft). Fifty-one percent of arterials and 56 percent of interstates are located in areas that are vulnerable to a surge of 5.5 m (18 ft), and the proportions rise to 57 and 64 percent, respectively, for a surge of 7 m (23 ft). Some 73 percent of intermodal connector miles are vulnerable to surges of 5.5 or 7 m (18 ft or 23 ft). Thirty-three percent of rail lines are
2 Bridges may be of particular interest in this regard. Phase II of this study, which will include an in-depth
analysis of a single location within the study region, is expected to include a systematic analysis of the potential impacts of climate change on bridges, because bridges play a key role across multiple modes, and their failures can produce bottlenecks.

Impacts of Climate Change and Variability on Transportation Systems and Infrastructure: Gulf Coast Study, Phase I Chapter 4: What are the Implications of Climate Change and Variability for Gulf Coast Transportation?
4-8
vulnerable to a storm surge of 5.5 m (18 ft); this proportion climbs to 41 percent vulnerable at 7 m (23 ft). Twenty-nine airports are vulnerable to a surge of 7 m (23 ft), and one major commercial service facility – New Orleans International – also is vulnerable to a 5.5-m (18-ft) surge. Vulnerability of the region’s infrastructure to storm surge is summarized in table 4.4.
[INSERT TABLE 4.4. Storm surge impacts on Gulf Coast transportation modes: percentage of facilities vulnerable]
The effects of storms on the transportation network go beyond the impacts of storm surge. Severe winds and rainfall events throughout the study region can cause damage and flooding, disrupting system performance. Wind damage risk contours were not mapped as part of this project. Experience shows that the highest hurricane velocities are experienced along the coasts, diminishing as storms move inland, but that severe damaging winds can be sustained well inland. Hurricanes also spawn tornados, which can have substantially higher velocities over much smaller areas. The entire study area is within 100 mi of the Gulf of Mexico shoreline, and all of it could be considered potentially vulnerable to significant wind damage. As noted in chapter 3.0, while historical and projected increases in summer minimum temperatures for the study area suggest an increase in the probability of severe convective weather (Dessens, 1995; Groisman et al., 2004), GCMs currently lack the capacity for simulating small-scale phenomena such as thunderstorms, tornadoes, hail, and lightning.
One factor that complicates the effects of both storm surge and relative sea level rise is the condition of the barrier islands. As noted in section 3.5.1, wave heights in coastal bays will tend to increase due to the combined erosional effects of sea level rise and storms on coastal barrier islands and wetlands. As the barrier islands erode, their role in shielding Gulf Coast waterways and infrastructure from the effects of waves will diminish, which means their ability to protect coastal infrastructure from waves at current sea levels and future sea levels, as well as from storm surge, will likely diminish.
Any facility subject to flooding may incur structural damage or be rendered inoperable due to debris or other obstructions. Restoring facility and system performance necessitates considerable time and investment on the part of facility owners. The secondary economic costs to both businesses and communities who rely on these transportation networks could be considerable as well, depending on the time required to restore system performance.
This report does not attempt to estimate the total costs of protecting, maintaining, and replacing Gulf Coast transportation infrastructure due to damage caused by climate change. It does, however, include a case study on Hurricane Katrina in section 4.3.1 that provides examples of the efforts associated with addressing the impacts of the hurricane.
4.1.5 Climate Impacts on Freight Transport
The private sector has made massive investments in transportation infrastructure in the Gulf Coast study area, a large portion of which revolves around moving freight. Almost all

Impacts of Climate Change and Variability on Transportation Systems and Infrastructure: Gulf Coast Study, Phase I Chapter 4: What are the Implications of Climate Change and Variability for Gulf Coast Transportation?
4-9
of the roads and major airports are publicly owned, but the vehicles that operate over them, and the commercial and freight services that they accommodate, are private. Many of the ports are private, and the vessels and commercial services using them are private. Almost all of the Nation’s rail infrastructure is privately owned and operated.
Disruption of privately owned infrastructure can have huge costs for the owners and users of these facilities. Repair costs for the more than 65-km (40-mi) CSX railroad segment damaged in Hurricane Katrina, $250 million, could be dwarfed by the costs of moving the line if the company chose to relocate the line further inland; Congressional proposals have considered authorizing $700 million in Federal funding to help relocate the damaged portion of the CSX segment. This is just a small share of the 1,915 km (1,190 mi) of rail line in the study area that are vulnerable to sea level rise and storm surge. Critical transportation-dependent industries – petroleum, chemical, agricultural production and transportation, etc. – are heavily concentrated in the study area. The private sector, therefore, has a significant interest in the impacts of climate change on transportation infrastructure, because it potentially affects hundreds of billions of dollars annually in commercial activity over study area roads, railroads, airports, seaports, and pipelines.
One of the key issues that draws the private sector into the discussion of climate impacts on transportation is the movement of freight. The private sector has proven adept at using intermodal freight systems – involving ports, highways, rail, and aviation – to transport goods as inexpensively as possible. However, this lean and efficient system is vulnerable: a disruption that seemingly affects a limited area or a single mode can have a ripple effect throughout the supply chain.
The loss of direct freight transportation service or connectivity in the Gulf Coast would likely have a substantial impact beyond the transportation provider and the local economy. The interruption of freight transportation service in the Gulf Coast could impact the distribution of goods nationally and, therefore, impact the national economy. Costs of raw materials or products that have to be rerouted or transported by an alternate mode would likely increase to absorb higher transportation costs. Further, most businesses and industries that once held large inventories of products have shifted to low inventory, just-in-time delivery business models, managing much of their inventories in transit. Therefore, they have lower tolerance for delays in shipment and receipt of goods and now demand greater reliability and visibility from their freight carriers. This system is very cost effective, but it leaves shippers with little cushion when the freight transportation system fails. A large failure such as that caused by a hurricane can quickly disrupt thousands of supply chains, undermining the operations and profitability of many shippers, carriers, and customers. For example, after Hurricane Katrina, CSX rerouted trains and experienced an increase in operating costs of the railroad through increased fuel usage, crew costs, equipment delays, and a loss of overall system capacity. Other freight transportation impacts included the disruption in the distribution of petroleum by pipelines and the failure of ships being able to make port along the Gulf Coast. An increase in transportation costs such as these is likely to increase the price of the final product and could jeopardize the national and global competitiveness of affected businesses.

Impacts of Climate Change and Variability on Transportation Systems and Infrastructure: Gulf Coast Study, Phase I Chapter 4: What are the Implications of Climate Change and Variability for Gulf Coast Transportation?
4-10
4.2 Climate Impacts on Transportation Modes
This section begins with an in depth examination of the impacts of climate change on each individual mode. It continues by looking at how these impacts could affect emergency management and evacuation and closes with a look at key cross-modal issues.
4.2.1 Highways
As in most parts of the nation, roads are the backbone of the transportation network in the Gulf Coast. Highways3 are the chief mode for transporting people across the region, and together with rail, highways are essential for moving freight throughout the region and to other parts of the United States. Thus, impacts to the highway network could serve as choke points to both passenger and freight traffic that emanates in or flows through the region. While temperature and precipitation changes have some implications for highway design and maintenance, the key impacts to the highway network result from relative sea level rise and storm surge.
Temperature
Impacts related to projected changes in average temperatures appear to have moderate implications for highways, while increases in extreme heat may be significant. Maintenance and construction costs for roads and bridges are likely to increase as temperatures increase. Further, higher temperatures cause some pavement materials to degrade faster, requiring earlier replacement. Such costs will likely grow as the number of days above 32 °C (90 °F) – projected to grow from the current average of 77 days to a range of 99 to 131 days over the next century – increases and as the projected maximum record temperatures increase in the region.
While maintenance and construction costs are expected to rise as the number of very hot days increase, the incremental costs have not been calculated as part of this analysis. These additional, excessive temperature-related costs are incorporated into the total maintenance and construction costs for all pavements and bridges. Changes in materials used may help reduce future temperature-induced maintenance costs. For example, Louisiana Department of Transportation and Development (DOTD) has begun to use asphalts with a higher polymer content, which helps pavement better handle higher temperatures, though at a higher initial cost than standard asphalt.
There are measures that could be taken to mitigate the loss in productivity associated with maintenance and construction, such as evening work hours, but these measures also would
3 As noted in chapter 2.0, this report focuses on interstates, arterials, and collectors, but not local roads.

Impacts of Climate Change and Variability on Transportation Systems and Infrastructure: Gulf Coast Study, Phase I Chapter 4: What are the Implications of Climate Change and Variability for Gulf Coast Transportation?
4-11
increase costs. In subsequent phases of this study, the implications on construction, maintenance, and operation budgets in specific sublocations should be examined.
The designs of steel and concrete bridges and of pavements in the study area typically are based on a maximum design temperature of 46 °C (115 °F) to 53 °C (125 °F). The increase in maximum record temperatures implied by the climate model projections are less than these values, although under the climate scenarios they would approach those values over the next century. It may be prudent for future designers of highway facilities to ensure that joints in steel and concrete bridge superstructures and concrete road surfaces can adequately accommodate thermal expansion resulting from these temperatures. The State DOT design manuals generally establish the maximum design temperature at a value near 53 °C (125 °F), well above the current maximum recorded temperatures in the study area, but as temperatures increase there may well be more failures of aging infrastructure. Consideration should be given to designing for higher maximum temperatures in replacement or new construction.
Precipitation
As previously noted, the analysis generally indicates little change in mean annual precipitation (152 cm or 60 inches per year) through either 2050 or 2100, but the range of possible futures includes both reductions and increases in seasonal precipitation. In either case, the analysis points to potential reductions in soil moisture and runoff as temperatures and the number of days between rainfall events increase. The research team analyzed average annual precipitation separately from potential changes in intensity of rain events.
Under a scenario of insignificant change or a reduction in average precipitation, coupled with drier soils and less runoff, there would be decreases in soil moisture, which may result in a decline of slides in slopes adjacent to highways. It also would mean less settling under pavements, with a decrease in cracking and undermining of pavement base courses. While uniform decreases in runoff could reduce scouring of bridge piers in rivers and streams, greater frequency of high-intensity events could result in more scour. Stresses on animal and plant populations brought about by higher temperatures and changes in rainfall patterns could make it more difficult and expensive to mitigate the impacts of highway development on the natural environment.
Pavement settling, bridge scour, and ecosystem impacts may not be significantly impacted by modest increases in average annual rainfall because of the effects of increasing temperature on evaporation rates. However, while potential changes in average annual precipitation are likely to have minor impacts, an increase in the intensity of individual rainfall events may have significant implications for highways. An increase in the frequency of extreme precipitation events – as discussed in chapter 3.0 – would increase accident rates, result in more frequent short-term flooding and bridge scour, as well as more culvert washouts, and exceed the capacity of stormwater management infrastructure. More instances of intense rainfall also may contribute to more frequent slides, requiring increased maintenance. However, some states, such as Louisiana, already address precipitation through pavement grooving and sloping and thus may have adequate capacity to handle some increase in precipitation.

Impacts of Climate Change and Variability on Transportation Systems and Infrastructure: Gulf Coast Study, Phase I Chapter 4: What are the Implications of Climate Change and Variability for Gulf Coast Transportation?
4-12
Relative Sea Level Rise
As discussed above, the effects of 61- and 122-cm (2- and 4-ft) RSLRs were analyzed to assess their implications on highways. The presence or absence of protective structures was not considered in this baseline analysis but would be an important factor in subsequent sublocation assessments.
As shown in figure 4.1, the majority of the highways at risk from a 61-cm (2-ft) increase in relative sea level are located in the Mississippi River delta near New Orleans. The most notable highways at risk are I-10 and U.S. 90, with 220 km (137 miles) and 235 km (146 miles), respectively, passing through areas that will be below sea level if sea levels rise by 61 cm (2 ft). Overall, 20 percent of the arterial miles and 19 percent of the interstate miles in the study area are at elevations below 61 cm (2 ft) and thus are at risk from sea level rise unless elevated or protected by levees (table 4.5).
The majority of the highways at risk from a 122-cm (4-ft) increase in relative sea level are similarly located in the Mississippi River Delta near New Orleans (figure 4.2). The most notable highways at risk remain I-10 and U.S. Highway 90, with the number of miles increasing to 684 km (425 mi) and 628 km (390 mi) passing through areas below sea level, respectively. Overall, 28 percent of the arterial miles and 24 percent of the interstate miles are at elevations below 122 cm (4 ft). Currently, about 130 mi (209 km) or about 1 percent of major highways (interstates and arterials) in the study region are located on land that is at or below sea level.
As shown in figure 4.3, many of the National Highway System (NHS) intermodal (IM) connectors pass through low-lying areas concentrated in the Mississippi River Delta, where sea level rise is expected to have the most pervasive impact. Intermodal connectors are primarily necessary to provide highway access for various transportation facilities, such as rail, ports, and airports, some of which will be below sea level with a relative sea level rise of 61 to 122 cm (2 to 4 ft). Of the 1,041 km (647 mi) of IM connectors, 238 km (148 mi), or 23 percent, are at risk to a 61-cm (2-ft) increase in relative sea levels; and a total of 444 km (276 mi), or 43 percent, are at risk to a 122-cm (4-ft) increase. In addition to the terminals at risk under the 61-cm (2 ft) RSLR scenario (the New Orleans International Airport, Port Fourchon, most rail terminals in New Orleans, ferry terminals in New Orleans, and ferry terminals outside of the Mississippi River Delta in Galveston and Houston), additional terminals at risk under the 122 cm (4 ft) RSLR scenario include port facilities in Lake Charles, Galveston, Pascagoula, and Gulfport.
The cost of various adaptation options – including relocating, elevating, or protecting highways and IM connectors – is not addressed by this study. Additionally, the costs of right-of-way and environmental mitigation for relocating or elevating such facilities are unknown at this time. The adaptation and investment plans for specific facilities will be determined by local and regional decision makers.
As discussed in section 4.2.1, the available elevation data for the study area is sufficient to make first order conclusions about roads that are at risk of flooding; it does not indicate the elevation of specific highways. However, it is worth noting that the loss of use of a small
Impacts of Climate Change and Variability on Transportation Systems and Infrastructure: Gulf Coast Study, Phase I Chapter 4: What are the Implications of Climate Change and Variability for Gulf Coast Transportation?
4-13
individual segment of a given highway may make significant portions of that road network impassable. Further, even if a particular interstate or arterial is passable, if the feeder roads are flooded, then the larger road becomes less usable.
[INSERT FIGURE 4.1: Highways at risk from a relative sea level rise of 61 cm (2 ft)]
[INSERT [FIGURE 4.2.: Highways at risk from a relative sea level rise of 122 cm (4 ft)]
[INSERT FIGURE 4.3: NHS Intermodal Connectors at risk from a relative sea level rise of 122 cm (4 ft)]
[INSERT TABLE 4.5: Relative sea level rise impacts on highways: percentage of facilities vulnerable]
Storm Activity
As discussed in chapter 3.0, the intensity of hurricanes making landfall or striking in the Gulf Coast study area can be expected to increase. About half of the region’s arterial miles and about three-quarters of the IM connectors are vulnerable to a storm surge of 5.5 m (18 ft), and these proportions are even higher for a 7-m (23-ft) storm surge.
Surge Wave Crests and Effects on Bridges The wave energy during storm surge events is greatest at the crest of the wave. The facilities most at risk are bridge decks and supports that are constructed at the wave heights reached during a storm. The impact of the 2005 hurricanes vividly illustrated some of the factors involved in infrastructure vulnerability (see section 4.3.1.) While only a small percentage of the study area’s bridges are located at the shore and have bridge decks or structures at these heights, when storm waves meet those bridges the effect is devastating; spans weighing 300 tons were dislodged during Hurricane Katrina. Although these bridges are few in number compared to the over 8,000 bridges on the functionally classified system, over two dozen bridges were hit by wave surges resulting from Hurricane Katrina and experienced serious damage.
An example is shown in figure 4.4. In perhaps the most spectacular example, the Bay St. Louis Bridge on U.S. Highway 90, which links Bay St. Louis and Henderson Point, MS, was destroyed by Hurricane Katrina’s storm surge. The 3.2-km- (2-mi-) long bridge was recently replaced at a cost of $267 million, with two lanes in each direction and a shared-use path. At it highest point, the new bridge reaches 26 m (85 ft) above the bay, 17 m (55 ft) higher than its predecessor (Nossiter, 2007; Sloan, 2007).
Design features such as lack of venting along the length of the span, solid railings (preventing water from flowing through), and lack of connectors anchoring the spans to the pilings or corrosion in existing connectors made some bridges more susceptible than others to the force of the water during Katrina. In the absence of standard American Association of State Highway and Transportation Officials (AASHTO) design factors for storm surge, both the Louisiana DOTD and Mississippi DOT have developed their own approaches to

Impacts of Climate Change and Variability on Transportation Systems and Infrastructure: Gulf Coast Study, Phase I Chapter 4: What are the Implications of Climate Change and Variability for Gulf Coast Transportation?
4-14
designing for future storms. For instance, Louisiana DOTD is developing standards calling for new bridges to be elevated beyond a 500-year event for the main span (9.1-11.6 m, or 30-38 ft) and a 100-year event for transition spans close to shore. In addition, new bridges will be designed with open railings to reduce the impact of pounding water (Paul, 2007). Mississippi also has adopted more stringent design standards and is rebuilding the Biloxi Bay and St. Louis Bay bridges as high-rise structures, to keep the bridge decks above future storm surges.
As the sea level rises, the coastline will change. Bridges that were not previously at risk may be exposed in the future. Additionally, bridges with decks at an elevation below the likely crest of storm surges, based on experience from previous storms, will be below water during the storm event and not subject to wave damage. Only data regarding the height of bridges above navigable channels was available to this study – a small portion of all bridges in the region. Therefore, a full analysis of the possible impacts of wave crests on bridges was not feasible.
[INSERT FIGURE 4.4 Hurricane Katrina damage to Highway 90 at Bay St. Louis, MS]
Surge Inundation Figures 4.5 and 4.6 show areas potentially vulnerable to surge inundation at the 5.5- and 7- m (18- and 23-ft) levels and identifies interstate and arterial highways that pass through these risk areas. As illustrated, a substantial portion of the highway system across the study area is vulnerable to surge inundation: 51 percent of all arterials and 56 percent of the interstates are in the 5.5-m (18-ft) surge risk areas. At the 7-m (23-ft) level, these percentages increase only slightly: 57 percent of all arterials and 64 percent of the interstates are in 7-m (23-ft) surge risk areas (table 4.6).
The risk from surge inundation for NHS IM connectors is even greater than that for all highways. Seventy-three percent of IM connector miles are located in areas that would be inundated by a 5.5-m (18-ft) surge, and the proportion of IM connectors that is vulnerable at the 7-m (23-ft) level is only slightly higher (see figure 4.7).
As noted above, the elevation data is sufficient to make only general conclusions about roads that are at risk of inundation. Local conditions for specific segments and facilities may be important, and individual roads that may be vulnerable should be studied in detail.
While inundation from storm surges is a temporary event, during each period of inundation the highway is not passable, and after the surge dissipates, highways must be cleared of debris before they can function properly. Of particular concern is that a substantial portion of all of the major east-west highways in the study area, particularly I-10/I-12, are at risk to storm surge inundation in some areas, and during storm events and the recovery from these events, all long-distance highway travel through the study area is likely to be disrupted.
The expense of these poststorm cleanups can be considerable and is often not included in State DOT budgets. For instance, the Louisiana DOTD spent $74 million on debris removal alone following Hurricanes Katrina and Rita (Paul, 2007). In the 14 months following the hurricanes, the Mississippi DOT spent $672 million on debris removal,

Impacts of Climate Change and Variability on Transportation Systems and Infrastructure: Gulf Coast Study, Phase I Chapter 4: What are the Implications of Climate Change and Variability for Gulf Coast Transportation?
4-15
highway and bridge repair, and rebuilding the Biloxi and Bay St. Louis bridges (Mississippi DOT, 2007). See section 4.3.1 for a fuller discussion of poststorm cleanup costs.
Moreover, data from the Louisiana DOTD suggests that prolonged inundation can lead to long-term weakening of roadways. A study of pavements submerged longer than three days during Katrina (some were submerged several weeks) found that asphalt concrete pavements and subgrades suffered a strength loss equivalent to two inches of pavement. Portland concrete cement pavements suffered little damage, while composite pavements showed weakening primarily in the subgrade (equivalent to one inch of asphalt concrete). The study estimated a $50 million price tag for rehabilitating the 320 km (200 mi) of submerged state highway pavements and noted that an additional 2,900 km (1,800 mi) of nonstate roads were submerged in the New Orleans area. The data was collected several months after the waters had receded; there has not been a subsequent analysis to test whether any strength was restored over time (Gaspard et al., 2007).
[INSERT FIGURE 4.5 Highways at risk from storm surge at elevations currently below 5.5 m (18 ft)]
[INSERT FIGURE 4.6 Highways currently at risk from storm surge at elevations currently below 7.0 m (23 ft)]
[INSERT FIGURE 4.7 NHS Intermodal Connectors at risk from storm surge at elevations currently below 7.0 m (23 ft)]
[INSERT TABLE 4.6: Storm surge impacts on highways: percentage of facilities vulnerable]
Wind Wind from storms may impact the highway signs, traffic signals, and luminaries throughout the study area. The wind design speed for signs and supports in the study area is typically 160 to 200 km/h (100 to 125 mi/h). These designs should accommodate all but the most severe storm events. More significant safety and operational impacts are likely from debris blown onto roadways and from crashes precipitated by debris or severe winds.
4.2.2 Transit
Transit in the region consists of bus systems as well as light rail in New Orleans, Houston, and Galveston. While bus routes could be affected by relative sea level rise, transit operators can presumably adjust their routes as needed, particularly since the location of transit users and routes also might change. Storm surge could be a more serious, if temporary, issue. For the light rail systems in New Orleans and Galveston, an increase in relative sea level of 61 or 122 cm (2 or 4 ft) would affect at least some of the routes, especially in New Orleans; storm surge of 5.5 or 7.0 m (18 or 23 ft) would have an even greater impact. The light rail system in Houston would not likely be affected. Projected rises in temperature could lead to greater maintenance and air conditioning costs and an
Impacts of Climate Change and Variability on Transportation Systems and Infrastructure: Gulf Coast Study, Phase I Chapter 4: What are the Implications of Climate Change and Variability for Gulf Coast Transportation?
4-16
increased likelihood of rail buckling for the light rail systems. If the intensity of precipitation increases, accident rates could be expected to increase. If total average annual precipitation increases, it could lead to higher accident rates.
Temperature
Given the temperature projections noted in chapter 3.0, temperature stresses on engines and air conditioning systems could possibly affect vehicle availability rates, disrupting overall scheduled service. Since these additional, excessive temperature-related costs are included in the total maintenance and construction costs of transit agencies, it is possible that those amounts will at a minimum increase by an amount proportional to the increase in the number of days above 32 °C (90 °F).
Furthermore, temperature increases, especially increases in extremely high temperatures, will cause increases in the use of air conditioning on buses to maintain passenger comfort. This will exacerbate the issue of vehicle availability rates and raise costs due to increased fuel consumption.
Increases in (record maximum) temperatures are likely to only impact fixed guideway rail networks and have little or no impact on bus or paratransit systems, aside from the vehicle maintenance issues noted above. As discussed in greater detail in section 4.2.3, rail networks are subject to “sun kinks” (the buckling of sections of rail) at higher temperatures; sun kinks are likely to occur more frequently as (record maximum) temperatures increase. The possibility of rail buckling can lead to speed restrictions to avoid derailments. The track used by the trolley systems in Galveston and New Orleans have expansion joints that generally are not significantly affected by sun kinks, while Houston’s METRORail uses continuously welded rail (CWR) track. CWR track lacks expansion joints and thus is more prone to sun kinks.
Precipitation
The climate model results point to potential increases or decreases in average annual precipitation. If precipitation increases, it very likely would lead to an increase in accidents involving buses, as well as increased costs and disruptions associated with such accidents. The same also is likely if the intensity of precipitation increases. Even an increase in roadway accidents not involving buses will lead to congestion that could disrupt bus schedules.
Relative Sea Level Rise
If relative sea level increases to an extent that transit service would pass through areas under water in the future, either the connectivity provided by that transit would be lost or corrective actions to reroute the transit would be needed. Since the vast majority of transit service is provided by buses, schedules and routes can be modified easily, though the same is not true for terminals and maintenance facilities. Therefore, minimal impact on bus systems is expected from RSLR. For light rail systems in the region, however, RSLR

Impacts of Climate Change and Variability on Transportation Systems and Infrastructure: Gulf Coast Study, Phase I Chapter 4: What are the Implications of Climate Change and Variability for Gulf Coast Transportation?
4-17
could potentially be a much more serious issue. Moving tracks and permanent facilities is a major undertaking; tracks would need to be protected or moved to higher ground.
With the exception of the RTA and St. Bernard buses in New Orleans and a small portion of the routes traveled in Galveston, bus and paratransit service is not expected to be affected by either a 61- or 122-cm (2- or 4-ft) increase in relative sea levels. If bus routes are not affected, ancillary facilities such as terminals and maintenance facilities may not be affected either. Figure 4.8 shows the effect of a 122-cm (4-ft) rise in relative sea level on fixed bus routes in New Orleans. This clearly illustrates the vulnerability of the transit network in New Orleans without levees or other protection.
[INSERT FIGURE 4.8 Fixed bus routes at risk from a relative sea level rise of 122 cm (4 ft), New Orleans]
The New Orleans streetcars system operated by the RTA and some small portions of the streetcar system operated by Island Transit in Galveston are similarly at risk of inundation at either the 61- or 122-cm (2- or 4-ft) sea level rise scenarios. Like the city itself, portions of many of the streetcar routes in New Orleans currently are below sea level, and it is only the levee system that maintains the ability of these streetcars to function. In contrast, the fixed transit system in Houston is not at risk at these levels, as show in figure 4.9.
[INSERT FIGURE 4.9 Fixed transit guideways at risk from a relative sea level rise of 122 cm (4 ft), Houston and Galveston]
Storm Activity
Transit facilities passing through areas at elevations at or below 5.5 and 7.0 m (18 and 23 ft) were identified. As shown in figures 4.10 and 4.11, the fixed transit systems in New Orleans and Galveston are very likely to be affected by any storms that generate surges of 5.5 m (18 ft) or more. This inundation would affect service during and immediately after a storm, though it would not likely result in long-term disruptions.
[[INSERT FIGURE 4.10: Fixed transit guideways at risk from storm surge at elevations currently below 5.5 m (18 ft), New Orleans]
[INSERT FIGURE 4.11: Fixed transit guideways at risk from storm surge at elevations currently below 5.5 m (18 ft), Houston and Galveston]
Fixed bus route systems also are at risk to storm surges. The bus route systems that are vulnerable to storm surges of 5.5 m (18 ft) include all the systems except those in Baton Rouge, Beaumont, and Houston (figure 4.12 and 4.13). At 7.0 m (23 ft), the risk of storm surge inundation also extends to the fixed bus routes in Beaumont.
The risk of inundation by storm surge is that the bus routes could not operate on flooded or obstructed roads. It also should be noted that in low surge events, even if the buses can operate, their utility would be influenced by whether pedestrian facilities are passable and

Impacts of Climate Change and Variability on Transportation Systems and Infrastructure: Gulf Coast Study, Phase I Chapter 4: What are the Implications of Climate Change and Variability for Gulf Coast Transportation?
4-18
riders can walk to bus stops. Consideration should be given to developing contingency plans for alternative routes during storms.
[INSERT FIGURE 4.12: Fixed bus routes at risk from storm surge at elevations currently below 5.5 m (18 ft), New Orleans]
[INSERT FIGURE 4.13: Fixed bus routes at risk from storm surge at elevations currently below 5.5 m (18 ft), Houston and Galveston]
Storm Winds The transit infrastructure that is most vulnerable to impacts by the winds associated with increases in the number of intense storms are the overhead catenary lines that power street cars in New Orleans and Houston. Transit signs and control devices also are subject to wind damage.
However, rather than wind damage to transit facilities, the most widespread impact may be from fallen trees and property debris blocking the streets on which transit routes operate. This impact would occur during and immediately after storm events and should be addressed by highway clean up operations.
Storm Waves With the exception of light rail and Bus Raid Transit (BRT) systems, transit equipment can be moved away from areas subject to wave impacts, and therefore, storm wave impacts during surge events are not expected to impact most transit systems. Even in the case of fixed guideways, storm waves will mostly affect areas immediately on the shoreline, which is not where fixed guideway facilities in the New Orleans and Houston systems are located. However, the trolley tracks in Galveston are at risk to these impacts.
4.2.3 Freight and Passenger Rail
Rail lines in the region play a key role in transporting freight and a minor role in intercity passenger traffic. Much of the traffic on class I rail lines in the region is for transshipments as opposed to freight originating or terminating in the region (figure 2.12). Rail connectivity and service also is vital to the functioning of many, if not most, of the marine freight facilities in the study area.
Of the four main climate drivers examined in this study, storm surge could be the most significant for rail. One-third of the rail lines in the study region are vulnerable to a storm surge of 5.5 m (18 ft), and 41 percent are vulnerable to a storm surge of 7.0 m (23 ft). Fifty-one freight facilities and 12 passenger facilities are vulnerable to storm surges of 7.0 m (23 ft). Sea level rise is of less concern for rail; a 122-cm (4-ft) RSLR would affect less than 10 percent of rail miles, as well as 19 freight facilities and no rail passenger facilities. Temperature increases could raise the danger of rail buckling, but would be unlikely to

Impacts of Climate Change and Variability on Transportation Systems and Infrastructure: Gulf Coast Study, Phase I Chapter 4: What are the Implications of Climate Change and Variability for Gulf Coast Transportation?
4-19
necessitate design changes. Projected precipitation patterns do not indicate that design changes are warranted to prevent increased erosion or moisture damage to railroad track.
Temperature
The level of average temperature increases discussed in chapter 3.0 is unlikely to require immediate design changes to track or other rail infrastructure, as these ranges generally fall within the current standards for existing rail track and facilities. However, the increase in temperature extremes – very hot days – could increase the incidence of buckling or “sun kinks” on all the rail tracks in the study area. This occurs when compressive forces in the rail, due to restrained expansion during hot weather, exceed the lateral stiffness of the track, causing the track to become displaced laterally. The amplitude of track buckles can reach 75 cm (30 inches) or more.
Track buckling occurs predominately on continuously welded track, though it also can occur on older jointed track when the ends of the track become frozen in place. Track buckling is most prevalent on an isolated hot day in the springtime or early summer, rather than mid to late summer when temperatures are more uniformly hot. Buckling also is more likely to occur in alternating sun/shade regions and in curves.
The most serious problem associated with track buckling is derailments. A derailment can occur when a buckled section of track is not observed in time for the train to safely stop. One way to overcome this is through blanket slow orders. In hot weather (more than 35 °C, or 95 °F), railroads issue blanket slow orders (generally to reduce all train speeds by 16 km/h or 10 mi/h) to help prevent derailments caused by buckling. This has several negative consequences, such as longer transit times, higher operating costs, shipment delays, reduced track capacity, and increased equipment cycle time leading to larger fleet sizes and costs. Reduced train speeds similarly affect passenger rail schedules, causing delays in travel schedules.
Research into improved track design and installation has greatly reduced the derailments attributable to buckling. For example, concrete crossties with improved fasteners can withstand greater track stress than wooden ties with spikes. During installation, the rail is prestressed to a target neutral temperature. Since the track is more stable when the rail is in tension at temperatures below the neutral temperature, the target neutral temperature is generally 75 percent of the expected maximum temperature of the region. In the Gulf Coast region, the neutral temperature is typically 38 °C (100 °F), while 32 °C (90 °F) is used in more northern climates. Prestressing can occur either thermally (by actually heating the steel during installation) or mechanically by stretching the steel to introduce the desired stress prior to fastening it to the crossties.
A temperature change of 1.5 °C (2.7 °F) over the next 50 years may slightly raise the neutral temperature used for installation but would have little impact on track design otherwise. A temperature increase in this range would not necessitate replacing existing track. It would most likely be replaced as part of normal maintenance, upgrades to handle increased traffic volumes, or replacement due to storm surge or other catastrophic events. The typical cost to upgrade track can vary greatly depending upon the type of upgrade, the

Impacts of Climate Change and Variability on Transportation Systems and Infrastructure: Gulf Coast Study, Phase I Chapter 4: What are the Implications of Climate Change and Variability for Gulf Coast Transportation?
4-20
slope and curvature, and the number of bridges and tunnels. Costs to replace track range from $0.3 million to $1.9 million per kilometer ($0.5 million to $3 million per mile), excluding any additional right-of-way expenses.
If incidences of buckling rise it will be increasingly important to develop improved methods of detection. It is relatively easy to detect a broken rail by running a light electric current through track, but manual observation remains the best method for identifying track buckling. Research is underway to develop improved methods that measure temperature and stress of the track.4
The projected increases in average temperature and number of hot days, coupled with possible increases in humidity, would create serious safety concerns for workers in rail yards and other rail facilities and would require investments to protect rail workers. This might include increases in crew size to allow for more frequent recovery breaks or greater use of climate-controlled facilities for loading and unloading the railcars. Regardless of the solution, providing the necessary relief for workers will lead to increased operating or capital expenses, which will be reflected in higher transportation costs.
Precipitation
The primary impacts on rail infrastructure from precipitation are erosion of the track subgrade and rotting of wooden crossties. Erosion of the subgrade can wash away ballast and weaken the foundation, making the track unstable for passage of heavy locomotives and railcars. Ballast is typically granite or other hard stone used to provide a flat, stable bed for the track, and also to drain moisture from the track and ties. Without ballast, wooden crossties would rot at a faster rate, leading to more buckling and unstable track. As with buckling, subgrade erosion and rotting crossties are difficult to detect using methods other than visual inspection. This situation is improving, though, through remote sensing advances that detect standing water and air pockets.
The precipitation projections do not indicate that design changes are warranted to prevent increased erosion or moisture damage to railroad track, even with a potential change of 13 percent in precipitation levels. The runoff projections point to even fewer problems with erosion over the next century than are present today, due to possibly less precipitation and slightly higher temperatures. However, if the frequency and/or the intensity of extreme rainfall events increases, it could lead to higher rates of erosion and railroad bridge scour, as well as higher safety risks and increased maintenance requirements.
4 Much of the material in this section was developed through personal communication with David Read,
Principal Investigator, Transportation Technology Center, Inc., an Association of American Railroads subsidiary located in Pueblo, CO.

Impacts of Climate Change and Variability on Transportation Systems and Infrastructure: Gulf Coast Study, Phase I Chapter 4: What are the Implications of Climate Change and Variability for Gulf Coast Transportation?
4-21
Relative Sea Level Rise
The effects on rail lines and facilities of relative sea level of 61 and 122 cm (2 and 4 ft) over the next 50 to 100 years were analyzed. The obvious impacts for both of these sea level rise scenarios are water damage or complete submersion of existing rail track and facilities. These ground elevations affect the vulnerability of rail segments to storm surge as well.5 Table 4.7 indicates the percent of rail lines and facilities vulnerable to sea level rise at 6-1 and 122-cm (2- and 4-ft) levels. Currently, about 50 miles or about 2 percent of rail lines in the study region are located on land that is at or below sea level.
[INSERT Table 4.7: Relative sea level rise impacts on rail: percentage of facilities vulnerable]
Figure 4.14 displays the rail network, used by both freight trains and Amtrak, with the RSLR elevation projections. Rail lines located in areas with a ground elevation of 0 to 61 cm (0 to 2 ft) are vulnerable to a relative sea level rise of 61 cm (2 ft) or more. Lines located in slightly higher areas, with a ground elevation of 61 to 122 cm (2 to 4 ft), are vulnerable to a relative sea level rise of 122 cm (4 ft).
Most of the rail lines in and around New Orleans would likely be impacted by RSLR. The heavily traveled CSX line between Mobile and New Orleans, which was damaged during Hurricane Katrina, also is at risk, as are several area short lines. A listing of the rail lines impacted if relative sea level rises 61 cm (2 ft) includes the following:
• Most rail lines in and around New Orleans;
• Burlington Northern Santa Fe (BNSF) line between Lafayette and New Orleans;
• Canadian Nation (CN) line into New Orleans;
• CSX line between Mobile and New Orleans;
• CSX line north of Mobile;
• Louisiana and Delta Railroad west of New Orleans;
• Portions of the Mississippi Export (MSE) rail line in Mississippi;
• The New Orleans and Gulf Coast Railway line between New Orleans and Myrtle Grove, LA;
• Norfolk Station (NS) line into New Orleans;
• Portions of the Port Bienville Railroad;
5 It should be noted that many existing facilities at low elevations are protected by levees and other physical
structures, which provide some resistance to gradual changes in sea level and the impacts of storm surge. The effects of existing or planned protections were not addressed by this study. Even with this protection, the infrastructure described in this study is potentially still at risk.

Impacts of Climate Change and Variability on Transportation Systems and Infrastructure: Gulf Coast Study, Phase I Chapter 4: What are the Implications of Climate Change and Variability for Gulf Coast Transportation?
4-22
• Segments of the Union Pacific (UP) line west of New Orleans; and
• Various segments of track around Lake Charles and Galveston.
[INSERT FIGURE 4.14: Rail lines at risk due to relative sea level rise of 61 and 122 cm (2 and 4 ft)]
Further degradation of these lines is very likely to occur should relative sea level increase by 122 cm (4 ft), with additional problems on the Kansas City Southern (KCS) route into New Orleans, the NS line north of Mobile, and selected track segments around Beaumont and Houston.
Figure 4.15 shows the potential impacts of RSLR on railroad-owned and served facilities in the study region. Facilities located at less than 61 cm (2 ft) of elevation are very likely to be affected by a rise in relative sea level of 61 cm (2 ft). These include the KCS, NS, and UP rail yards in the New Orleans area. Facilities between 61 and 122 cm (2 and 4 ft) of elevation are very likely to be affected by a rise in relative sea level of 122 cm (4 ft). A listing of facilities with elevation 122 cm (4 ft) or less is contained in table 4.8. A listing of all freight rail facilities in the Gulf Coast study region, along with their elevation grid codes, is provided in appendix C.
[INSERT FIGURE 4.15: Freight railroad-owned and served facilities at risk due to relative sea level rise of 61 and 122 cm (2 and 4 ft)]
[INSERT TABLE 4.8 Freight railroad-owned and served facilities in the Gulf Coast study region at elevation of 122 cm (4 ft) or less]
A related issue is how railroad customers will respond to these rising relative sea levels and storm surge, and how these decisions will affect the demand for rail services. For example, to what extent will customers choose to relocate or modify their shipping and production patterns? Some industries, most notably the ports, need to remain at or near the water’s edge to send and receive shipments. There will be a continued need for rail service into these locations. Other rail customers, however, may begin to relocate to higher ground or to different regions entirely. This will in turn affect the type and scale of rail network needed to meet the demand for inbound and outbound freight shipments. While it is difficult to predict the future choices of rail customers, it seems likely that climate change will negatively impact growth in goods movement at the lower elevations, and thus could lead to significantly reduced, and costlier, rail service in the region.
Turning to passenger rail service, none of the Amtrak passenger rail stations are at a high risk of impact due to a 122-cm (4-ft) increase in relative sea level. However, the rail lines used by Amtrak are at risk. These include the Sunset Limited routes between Mobile and New Orleans on the CSX-owned track and between New Orleans and Houston on the UP-owned track.
Table 4.9 summarizes the impacts of RSLR and storm surge on the freight and passenger rail lines and facilities in the region. These calculations are based on ground-level elevations of the rail facilities. All facilities and lines at low elevations are included, even

Impacts of Climate Change and Variability on Transportation Systems and Infrastructure: Gulf Coast Study, Phase I Chapter 4: What are the Implications of Climate Change and Variability for Gulf Coast Transportation?
4-23
though some are surrounded by higher land that may block rising sea levels. The actual inland flow of water due to higher relative sea levels was not available for this study.
[INSERT TABLE 4.9: Vulnerability from sea level rise and storm surge by rail distance and number of facilities]
One final factor, not directly addressed by the maps and tables discussed in this section, is the extent to which rising relative sea levels create a higher water table that leads to additional flooding during periods of normal precipitation. As the water table rises, the ground is less able to absorb normal rainfall. This could cause frequent flooding of rail track and facilities beyond the levels identified in the maps and tables.
Storm Activity
Hurricane Katrina provided a vivid example of the devastating impacts of severe storm events to the rail system in the Gulf Coast study area. Making landfall on August 29, 2005, Katrina caused damage to all of the major railroads in the region. BNSF, CN, KCS, and UP all suffered damage, mostly to yards in and around New Orleans. CSX track and bridges also were damaged. NS had nearly 8 km (5 mi) of track washed away from the 9.3-km- (5.8-mi-) long Lake Pontchartrain Bridge. By September 13, 2005, most of these railroads had resumed operations into New Orleans, at least on a partial basis. There were still yards that had not fully opened, though this was due to a mixture of storm damage to the yard and customers not being fully operational. By October 8, 2005 most rail service on these carriers had been restored, except CSX (Association of American Railroads, 2005). (See section 4.3.1 for more on the impacts of the 2005 hurricanes.)
Figure 4.16 illustrates the rail lines most at risk from storm surge at the 5.5- and 7.0-meter (18- and 23-ft) marks. One-third of the rail lines in the study region are vulnerable to a storm surge of 5.5 m (18 ft), and 41 percent are vulnerable to a storm surge of 7.0 m (23 ft) (table 4.10). This includes the heavily traveled CSX line from New Orleans to Mobile and the UP and BNSF lines from New Orleans to Houston. Cities at risk include Mobile, Gulfport, Biloxi, New Orleans, Baton Rouge, Lafayette, Lake Charles, Beaumont, Port Arthur, and Galveston.
Similarly, figure 4.17 shows the potential impacts of storm surge on railroad-owned and served facilities in the study region. Facilities at less than 5.5 m (18 ft) of elevation have the highest risk of 5.5-m (18-ft) storm surge impacts. These include 43 percent of the rail facilities in the study region. An additional 11 facilities are between 5.5 and 7.0 m (18 and 23 ft) of elevation and are very likely to be affected by a 7.0-m (23-ft) storm surge. A listing of all freight rail facilities in the Gulf Coast study region, along with their elevation grid codes, is provided in appendix C.
Figure 4.18 shows the risks for Amtrak passenger rail stations due to storm surge at 5.5 and 7.0 m (18 and 23 ft). The data indicates that there is low risk overall to Amtrak stations from storm surge, but the nine stations listed in table 4.11 are very likely to be affected by a storm surge of 5.5 m (18 ft). Two of the stations, Galveston and La Marque, TX, do not have direct passenger rail service but are connected to the Amtrak services by bus. At the
Impacts of Climate Change and Variability on Transportation Systems and Infrastructure: Gulf Coast Study, Phase I Chapter 4: What are the Implications of Climate Change and Variability for Gulf Coast Transportation?
4-24
7.0-m (23-ft) storm surge level, an additional three stations are likely to be affected: New Iberia, LA, and Bay St. Louis and Biloxi, MS. A listing of all Amtrak stations in the Gulf Coast study region, along with their elevation grid codes, is provided in appendix C.
[INSERT FIGURE 4.16 Rail lines at risk due to storm surge of 5.5 and 7.0 m (18 and 23 ft)]
[INSERT Figure 4.17 Freight railroad-owned and served facilities at risk due to storm surge of 5.5 and 7.0 m (18 and 23 ft)]
[INSERT TABLE 4.10: Storm surge impacts on rail: percentage of facilities vulnerable]
[INSERT FIGURE 4.18 Amtrak facilities at risk due to storm surge of 5.5 and 7.0 m (18 and 23 ft)]
[INSERT TABLE 4.11: Amtrak stations projected to be impacted by storm surge of 5.5 and 7.0 m (18 and 23 ft)]
Railroad Response to Hurricane Damage
In the immediate aftermath of a hurricane, one of the largest problems facing railroad operators who are trying to restore service is safety issues at road-rail, at-grade crossings. Without power to operate the crossing gates, the railroads either need to manually flag each crossing or not run the trains. The larger railroads purchase electric generators that can be deployed after a hurricane to operate the gates, thus allowing trains to offer emergency response services and resume economic activity. For prolonged outages, as was the case with Hurricane Katrina, the railroads need to reeducate the public on the dangers of at-grade crossings once train service resumes.
Other short-term responses are directed at protecting revenues and controlling costs. Business customers within a region impacted by a hurricane are likely facing the same difficulties as the railroads and may not be fully operational. Once a company is fully operational, though, a railroad needs to be ready to offer service or risk losing business to other railroads, trucks, or barges. Delays in rail service availability can lead to a long-term loss of revenue. The other issue is continued long-haul service to businesses outside of the impacted area. After Hurricane Katrina, CSX rerouted trains that previously passed through the New Orleans gateway to junctions at St. Louis and Memphis. This extra routing increases the operating costs of the railroad through increased fuel usage, crew costs, equipment delays, and a loss of overall system capacity. There is a strong financial incentive to return to normal operations as soon as possible after a catastrophic event.
The long-term response of the railroads to increased storm intensity currently is being evaluated. The railroads are participating with both public and private groups to identify the best ways to serve the Gulf Coast region in the future. CSX Chief Operating Officer Tony Ingram stated, “We are open to ideas that are in the best interests of CSX, its customers, and its communities.” Mr. Ingram further stated, “Our recent rebuild of the Gulf Coast line restores vital service and underscores our commitment, but does not foreclose other long-term alternatives for the rail line.” (CSX, 2006a).

Impacts of Climate Change and Variability on Transportation Systems and Infrastructure: Gulf Coast Study, Phase I Chapter 4: What are the Implications of Climate Change and Variability for Gulf Coast Transportation?
4-25
One obvious response is to begin relocating rail track and facilities further away from coastal areas and making expanded use of intermodal shipping. For example, CSX recently announced a new 1,250-acre integrated logistics center (ILC) in Winter Haven, FL, to serve the Tampa and Orlando markets. This ILC will include truck, rail, and warehousing for the storage and transfer of consumer goods to these two urban markets (CSX, 2006b). Although this ILC location was driven by proximity to the expanding Tampa and Orlando markets and the availability of affordable land – rather than as a risk reduction strategy – it does provide an interesting model for redesigned approaches to long-haul shipping by using inland locations and trucks to serve sensitive coastal markets.
Other proposals have included the relocation of CSX rail lines in Mississippi. As proposed, the rail relocation would occur in the Gulfport area and would bypass the Bay St. Louis Bridge that was damaged by Hurricane Katrina. However, much of the rail line on this CSX route might remain in storm surge danger, as illustrated in figure 4.16.
Another issue related to moving rail lines further away from coastal areas is that it will, in most cases, move passenger rail service further from population centers. The highest density populations tend to occur along coastal regions, making it the most desirable location for passenger rail stations. If the rail track is moved further inland to areas with lower population density, it would have a negative impact on intercity service and the potential of any future commuter passenger rail service that might be warranted by population growth along the coast. On the other hand, this effect could be obviated if rail facilities and passenger centers migrate inland in tandem, but coordinated responses cannot be assumed, in part because the entities involved – private rail companies, citizens, and governments – face different decisions related to the impacts of climate change, and their decision making processes are also necessarily different.
The temperature and precipitation changes projected under the climate scenarios and models used in this study likely would not necessitate any rebuilding of rail facilities or any significant design changes in the Gulf Coast study area rail network. The larger issue is damage due to RSLR, storm surge, and hurricanes. Rail lines totaling 1,915 km (1,190 mi) and 40 rail facilities are at risk from storm surge as examined above. (See figures 4.16 and 4.17.) Railroads may begin slowly relocating track and facilities further away from coastal areas, though this will be largely driven by customer location and needs. Increased use of rail-truck transloading from ILCs further from the coast might be an alternative. Any effort to move rail lines from the higher density coastal areas will have a negative impact on intercity passenger rail ridership and the potential utility of the line for commuter rail service as the population along the coast increases.
4.2.4 Marine Facilities and Waterways
Due to their location, marine facilities are most vulnerable to storm surge and relative sea level rise. Marine facilities include both freight and nonfreight facilities: ports, marinas, and industry-support facilities. Virtually all of the region’s port facilities, or 98 percent, have the potential to be inundated by a storm surge of 5.5 m (18 ft), and 99 percent would be affected by a surge of 7.0 m (23 ft). A RSLR of 61 cm (2 ft) has the potential to affect

Impacts of Climate Change and Variability on Transportation Systems and Infrastructure: Gulf Coast Study, Phase I Chapter 4: What are the Implications of Climate Change and Variability for Gulf Coast Transportation?
4-26
64 percent of the region’s port facilities, while a 122-cm (4-ft) rise in relative sea level would affect nearly three-quarters of the port facilities. Impacts related to increased temperatures and changes in precipitation are expected to include increased costs related to maintenance as rising temperatures place greater stress on facilities, higher energy costs for refrigeration, and changes in the quantity and type of products shipped through the region as production and consumption patterns change both in and outside the region due to climate change.
Marine facilities and waterways are vital to the region and to the Nation as a whole. As noted in chapter 2.0, the study area is one of the Nation’s leading centers of marine activity. Much of the region’s economy is directly linked to waterborne commerce. and in turn, this waterborne commerce supports a substantial portion of the U.S. economy.
While some of these functions could be considered “replaceable” by facilities and waterways elsewhere, many of them – by virtue of geography, connections to particular industries and markets, historical investments, or other factors – represent unique and essentially irreplaceable assets. It might be possible to provide capacity equivalent to the Gulf Intracoastal Waterway or the Mississippi River on land, via highway and/or rail. It might even be possible to provide landside connections to, and sufficient capacity at, alternative international seaports, but the capital costs to provide such “replacement capacity” would undoubtedly be huge, and the costs to system users would be dramatically higher, if not prohibitively higher.
Higher Temperatures
Higher temperatures may affect port facilities in three key ways. First, higher temperatures will increase costs of terminal construction and maintenance, particularly of any paved surfaces that will deteriorate more quickly if the frequency of high temperatures increases. Many terminals – especially container and automobile handling terminals – have very large and open paved surfaces for storing cargo that in some cases can range up to hundreds of paved acres, while most others have at least some open paved area for storage. Nearly all provide on-terminal circulation space for trucks and wheeled terminal equipment. All such areas would be vulnerable to higher temperatures. Second, higher temperatures will lead to higher energy consumption and costs for refrigerated warehouses or “reefer slots” (electrical plug-ins for containers with on-board cooling units). Third, higher temperatures would likely lead to increased stress on temperature-sensitive structures. Container handling cranes, warehouses, and other marine terminal assets are made of metals. With increasing record temperatures and days over 32 °C (90 °F), it may be necessary to design for higher maximum temperatures in replacement or new construction. On the other hand, most dock and wharf facilities are made of concrete and lumber, which are generally less sensitive to temperature fluctuations. It is possible that lock and dam structures could be affected, although this will require further investigation. While this analysis examines existing facilities, it should be noted that development of new types of surfaces and structures that can better tolerate high temperatures, for example, would counteract some adverse impacts.
Impacts of Climate Change and Variability on Transportation Systems and Infrastructure: Gulf Coast Study, Phase I Chapter 4: What are the Implications of Climate Change and Variability for Gulf Coast Transportation?
4-27
Temperature changes in other parts of the country may prompt some changes in consumption and production patterns in the United States that in turn would affect shipping patterns in the study region. Compared to the freight movement patterns of today, increases in temperature in the southeast or other regions could possibly lead to increases in shipments of coal or other energy supplies that pass through the region’s ports. (This assumes that the current mix of power plants and fuels remains the same; however, changes in energy consumption patterns and improvements in energy efficiency are certainly possible, which could lead to changes in demand for fossil fuels.) Additionally, temperature changes in other regions could possibly lead to changes in the quantity and location of grain production, thus changing shipping patterns involving Gulf Coast ports; such changes could have economic ramifications for the Nation as a whole as well as for regional ports.
Precipitation
As noted previously, projections of future annual average rainfall suggest a slight increase or decrease in average annual precipitation depending on choice of GCM and emissions scenario. The prospect of more intense precipitation events, as indicated in chapter 3.0, could require the capacity of some stormwater retention and treatment facilities to be increased. The handling of stormwater can be a significant expense for container terminals, auto terminals, and other terminals with large areas of impervious surface. Increasing environmental regulatory requirements also may add to costs of adapting stormwater handling infrastructure.
Relative Sea Level Rise
Typically, the highest portion of the marine terminal is the wharf or pier structure, where a vessel actually berths. Structures and open storage areas behind the wharf or pier may be at the same level or may be lower. The highway and rail connections serving the terminal will be at land level, unless they are on bridge structures. Depending on their design, different terminals will have different areas of particular vulnerability with respect to RSLR.
It is important to note that many existing facilities at low elevations are protected by levees and other physical structures, which should provide resistance to gradual changes in sea levels. The specific effects of existing protections have not been considered in this study. For facilities that are not appropriately protected, either by elevation or by structures, rising water levels pose an increased risk of chronic flooding, leading in the worst case to permanent inundation of marine terminal facilities, either completely or in part, and rendering them inoperable.
Of freight facilities in the study area, about 72 percent are vulnerable to a 122-cm (4-ft) rise in relative sea level. Of the 994 freight facilities in the United States Army Corps of Engineers (USACE) database, 638 (64 percent) are in areas with elevations between 0 and 61 cm (2 ft) above sea level, and another 80 (8 percent) are in areas with elevations between 61 and 122 cm (2 and 4 ft). More than 75 percent of facilities are potentially

Impacts of Climate Change and Variability on Transportation Systems and Infrastructure: Gulf Coast Study, Phase I Chapter 4: What are the Implications of Climate Change and Variability for Gulf Coast Transportation?
4-28
vulnerable in Beaumont, Chocolate Bayou, Freeport, Galveston, New Orleans, Pascagoula, Plaquemines, Port Arthur, Port Bienville, and Texas City; between 50 percent and 75 percent of facilities are potentially vulnerable in Gulfport, Houston, Lake Charles, Mobile, South Louisiana, and the Tenn-Tom. Only Baton Rouge, with 6 percent of facilities potentially at risk, appears to be well-positioned to avoid impacts of sea level rise (see figure 4.19).
A similar situation faces nonfreight facilities. Seventy-three percent of study area marine, nonfreight facilities in the study area are potentially vulnerable to a 122-cm (4-ft) increase in relative sea level. Of the 810 nonfreight facilities in the USACE database, 547 (68 percent) are in areas with elevations between 0 and 61 cm (2 ft) above sea level, and another 47 (6 percent) are in areas with elevations between 61 and 122 cm (2 and 4 ft). More than 75 percent of facilities are potentially vulnerable in Beaumont, Chocolate Bayou, Freeport, Galveston, New Orleans, Pascagoula, Plaquemines, Port Arthur, the Tenn-Tom, and Texas City; between 50 percent and 75 percent of facilities are potentially vulnerable in Houston, Lake Charles, Mobile, and South Louisiana. Twenty-seven percent of Gulfport facilities and no Baton Rouge facilities are potentially at risk (see table 4.10).
Navigable depths are likely to increase in many harbors and navigation channels as a result of rising sea levels. This could lead to reduced dredging costs, but higher costs where rising water levels require changes to terminals. The functionality and/or protections of lock and dam structures controlling the inland waterway system also may be impacted by relative sea level rise.
Various indirect impacts could potentially affect operations and need for ports. As discussed in earlier sections, impacts on highways and rail connections could affect the ability to utilize and transport goods to and from affected ports. Rail connections to the Ports of New Orleans, Mobile, Pascagoula, and Gulfport/Biloxi are at greatest risk.
Production and consumption patterns within the study area are likely to be significantly affected by changes in sea level, which could lead to increased demand for certain types of shipments and reduced demand for others. As residential populations relocate from affected areas, demand for transported goods would decline. Similarly, as commercial activities relocate, transportation services would shift with them. Further, shifts in population could cause labor shortages for transportation and commercial facilities.
[INSERT TABLE 4.12: Relative sea level rise impacts on ports: percentage of facilities vulnerable]
[INSERT FIGURE 4.19: Freight handling ports facilities at risk from relative sea level rise of 61 and 122 cm (2 and 4 ft)]
Storm Activity: Water and Wind Damage
While the actual facilities that would be flooded depend on the particulars of a given storm – the landfall location, direction, tidal conditions, etc. – fully 99 percent of all study area facilities are vulnerable to temporary and permanent impacts resulting from a 7.0-m

Impacts of Climate Change and Variability on Transportation Systems and Infrastructure: Gulf Coast Study, Phase I Chapter 4: What are the Implications of Climate Change and Variability for Gulf Coast Transportation?
4-29
(23-ft) storm surge, while almost 98 percent are vulnerable to temporary and permanent impacts resulting from an 5.5-m (18-ft) storm surge (figure 4.20 and table 4.13). All facilities are vulnerable to wind impacts. Similar to sea level rise, storm surge impacts on highway and rail connections could affect the ability to utilize ports for transport of goods to and from affected ports.
As evidenced by Katrina, fast moving water can be incredibly damaging to marine facilities. Water can physically dislodge containers and other cargo from open storage areas, knock down terminal buildings, damage or destroy specialized terminal equipment, damage wharf and pier structures, temporarily inundate and submerge large areas, and undermine or damage pavement and foundations. Wind has its most damaging effects on unreinforced terminal structures, such as metal warehouses that feature large surface areas and relatively light construction. Much of Katrina’s damage to the Port of New Orleans – which mostly escaped water damage – was due to wind tearing off warehouse roofs and doors.
Wind and water can result in navigation channels becoming inoperable due to blockages and/or loss of markers. One of the first recovery tasks following Katrina was locating and clearing the channel in the Mississippi River, allowing it to reopen to barge and vessel traffic. Wind and water also can affect the location and protection afforded by the barrier islands that help define the Gulf Intracoastal Waterway.
[INSERT FIGURE 4.20: Freight handling ports facilities at risk from storm surge of 5.5 and 7.0 m (18 and 23 ft)]
[INSERT TABLE 4.13: Storm surge impacts on ports: percentage of facilities vulnerable]
Further, as mentioned earlier, highway and rail connectivity is vital to the functioning of nearly all port facilities in the study area. The road and rail facilities that are potentially at risk of surge at 5.5 and 7.0 m (18 and 23 ft) are shown in figures 4.5, 4.6, 4.7, 4.16, and 4.17. While the actual highways that would be flooded depends on the particulars of a given storm, a substantial portion of the highway system is at risk of surge inundation, including roads in all four states in the study area. The resulting potential loss of access to ports is obviously a critical vulnerability to reliable intermodal operations.
Secondary Impacts
Water levels in navigable rivers, and thus the ability to move freight, would be affected by higher or lower levels of precipitation, evapotranspiration, and runoff occurring outside the region. Such changes in the Mississippi River Basin could affect the ability to use the upper Mississippi River and its tributaries to export grain and other commodities from the Midwest and Great Plains States through Gulf Coast ports. Dredging operations and changes in water control facilities and marine terminals at up-river ports could be needed to maintain access to them. Freight transport by truck and rail outside the study region could increase if river transport is curtailed. Estimation of these effects would require the application of models and data from outside of the study area to incorporate up-river hydrology.
Impacts of Climate Change and Variability on Transportation Systems and Infrastructure: Gulf Coast Study, Phase I Chapter 4: What are the Implications of Climate Change and Variability for Gulf Coast Transportation?
4-30
Demand for freight services that include use of Gulf Coast ports also could be influenced by changes in precipitation and temperature outside the study region. For example, changes in the amount and frequency of precipitation as well as temperature levels could affect demand for U.S. grain products overseas, just as changes in the same climate drivers in the United States could affect the ability of U.S. grain producers to supply export markets and domestic consumers. Such changes could have implications for Gulf Coast ports in particular, as well as for national highway and rail systems.
Similarly, transport of energy supplies through Gulf Coast ports could be influenced by changes in temperature across the globe. Increases in temperature in the United States could affect the demand for energy products transported through Gulf Coast ports; demand for natural gas and coal to power electricity plants in the southeast, for example, could lead to greater production and/or importation of natural gas and liquefied natural gas (LNG) LNG through the ports and could put downward pressure on coal exports through the Gulf in favor of domestic consumption. On the other hand, coal exports through Gulf Coast ports could increase as export demand increased. Of course, climate mitigation policies could lead to significant shifts in preferred energy resources, leading to changes in energy transport demand. Such changes would have implications for pipelines (natural gas, petroleum), as well as rail (coal) and ports (coal). These secondary effects may prove to be important in the future, and such changes need to be monitored closely to track and adapt to changing demand levels.
4.2.5 Aviation
It is possible that existing patterns and intensity of severe weather events could be adversely affected by climate change, and such events could have the greatest impacts on aviation. These changes in severe weather may be widespread geographically such that they could profoundly affect the operational aspects of aviation and overall air traffic and air space management. If the climate becomes wetter, more general aviation pilots would need to learn to fly by instruments or avoid flying during inclement weather. Increased precipitation also could affect commercial service operations, particularly by raising the potential for delays. However, it should be noted that predicting how severe weather patterns would change as a result of climate change is extremely difficult and uncertain. Ultimately, the impact on the operational aspects of aviation could potentially supersede the overall magnitude of combined effects on aviation due to other factors discussed below
A total of 29 airports could be vulnerable to a storm surge of 7.0 m (23 ft). The analysis suggests that 3 airports may be vulnerable to an increase in RLSR of 1.2 m (4 ft). Temperature increases considered by this report would indicate a small increase in baseline runway length requirements, assuming other relevant factors are held constant; however, the changes will very likely not be sufficient, especially accounting for ongoing technological change in commercial aircraft, to have any substantial impact on runway length requirements. Nevertheless, aircraft manufacturers may want to determine whether the generic hot day temperatures used in their specifications for civilian aviation aircraft are sufficiently high.
Impacts of Climate Change and Variability on Transportation Systems and Infrastructure: Gulf Coast Study, Phase I Chapter 4: What are the Implications of Climate Change and Variability for Gulf Coast Transportation?
4-31
Temperature
Runway Design and Utilization
Required runway length is a function of many variables, including airport elevation, air temperature, wing design, aircraft takeoff weight and engine performance, runway gradient, and runway surface conditions.6 Runways are designed to accommodate the most stringent conditions aircraft can experience. Climate model simulations as discussed in chapter 3.0 have conclusively noted that future change in climate will be accompanied by increases in temperature. Generally speaking, the higher the temperature the longer the runway that is required. In fact, initial runway construction planning takes into account, as a matter of course, a range of temperatures that can very well capture the extent of the increase in mean maximum temperature derived from the model results. If increases in temperature exceed the range initially expected, then considerations for additional adjustment in runway length may be necessary, depending on other relevant considerations such as payload and elevation. However, this is considered unlikely.
With rising temperatures, it is possible that there could be an impact on aircraft performance that would warrant aircraft manufacturers considering field length requirements in their design specifications. However, current trends in aircraft design point to shorter takeoff distances as airframes become lighter and engines become more powerful. Thus, due to technological innovation, runway length requirements may actually decrease even if temperatures increase.
Forecasting aircraft manufacturer’s product offerings beyond 20 to 30 years is speculative, but trends toward increased fuel efficiency, more powerful engines, and lighter weight aircraft are anticipated to continue, which could offset the need for longer runway length as temperatures rise. Analysis of passenger jet aircraft performance indicates that newer aircraft entering the market over the last 50 years use less runway length per pound of aircraft. A comparison of two similar Boeing aircraft illustrates this point: the Boeing 737-200 aircraft entered commercial service in 1968 with an engine thrust of 6,580 kg (14,500 lb) and a per passenger seat thrust ratio of 53 kg (117 lb). In 2008, the company’s first 787-800 “Dreamliner,” made of up to 50 percent light weight composite products, will enter service. Compared to its predecessor, the 737-200, the GE Aircraft Engines on the 787 will provide more than four times as much thrust and twice as much engine thrust per passenger seat. This design, paired with more fuel efficient engines, translates into increased fuel efficiency, producing fuel savings up to 20 percent versus similar sized aircraft as well as shorter takeoff distances.
In order to better understand how changes in temperature could affect the current generation of aircraft, we looked at both general aviation and civil aviation applications.
6 These variables affect the performance of departing aircraft in particular; landing aircraft use less runway
because of decreased landing weight (from fuel usage), as compared to take-off weight, and the use of flap settings.

Impacts of Climate Change and Variability on Transportation Systems and Infrastructure: Gulf Coast Study, Phase I Chapter 4: What are the Implications of Climate Change and Variability for Gulf Coast Transportation?
4-32
Generally, assessments of required runway length are conducted along two tracks for general aviation and civil aviation airports, and our analysis below reflects this difference:7
• Using the procedures outlined in the Federal Aviation Administration (FAA) Advisory Circulars (AC) (for general aviation aircraft); and
• Using the manufacturer’s performance curves, published by aircraft manufacturers8 (primarily large commercial service aircraft).
General Aviation While planning for runway design generally accounts for a range of temperatures, this analysis of general aviation airports looks solely at how changes in assumptions about temperature would affect the baseline analysis of runway length requirements for a hypothetical general aviation airport by using the FAA’s Airport Design for Microcomputers software.9 The software allows for four variable inputs: airport elevation; runway slope measured in difference in elevations at each end of the runway; mean maximum temperature for the hottest day of the month; and runway conditions. Aircraft performance during takeoff varies significantly based on runway elevation, although generally speaking, there is only moderate difference in runway length needed between an airport at sea level and one at 91 m (300 ft) above sea level. Runways located in mountainous areas, however, have significantly longer runways than those at sea level. Mean maximum temperature is used by airport planners to identify the average hottest temperature during the hottest month of the year. Generally speaking, longer runways are required at hotter temperatures. Requirements for wet runways, which have less friction for braking or slowing the aircraft, are set out in regulation.
Table 4.14 lists the FAA design standards for a hypothetical general aviation airport and shows that all small airplanes (defined as having a maximum takeoff weight of less than 5,670 kg or 12,500 lb) could operate in the study area with a 1,308-m (4,290-ft) runway on days as hot as 33 °C (91.5 ºF). On cooler days, less runway length is required. Large aircraft with maximum takeoff weights greater than 5,670 kg (12,500 lb) require longer runways. As noted in table 4.14, 1,637 m (5,370 ft) of runway is recommended to accommodate 75 percent of large airplanes up to 27,200 kg (60,000 lb) at up to a 60 percent useful load when runway surfaces are wet. Wet runway conditions require more length, and these conditions are typically used when calculating runway length.
7 The approach is not completely different. The FAA AC provides design guidance for both small aircraft
and large aircraft by using the charts within the AC or directing the reader to obtain manufacturer performance charts for small or large aircraft. The FAA AC also stipulates what design procedure to apply, based on whether or not Federal dollars are involved, e.g., funding through the Airport Improvement Program (AIP).
8 Runways at military airports are designed to military aircraft specifications. 9 It should be noted that the FAA Airport Design for Microcomputer software is solely for planning
purposes and not for design, since the software generates roughly estimated lengths.

Impacts of Climate Change and Variability on Transportation Systems and Infrastructure: Gulf Coast Study, Phase I Chapter 4: What are the Implications of Climate Change and Variability for Gulf Coast Transportation?
4-33
[INSERT Table 4.14 FAA recommended runway lengths for hypothetical general aviation airport]
While planning for airport construction generally accounts for a range of temperatures, this analysis looks solely at how changes in assumptions about temperature would affect the baseline results generated using the FAA’s Airport Design for Microcomputers. The research team analyzed the effect of changes in mean maximum temperature for the hottest month of the year on runway length requirements as indicated by the climate scenarios reviewed in chapter 3.0. Mean maximum temperature was the only variable changed; airport elevation, centerline elevation, and runway surface conditions (wet) were held constant.10 The 5th, 50th, and 95th percentile temperature increases demonstrated in scenarios A1B, B1, and A2 were applied to the FAA design standards for the hypothetical airport presented. The increases in runway length based on the increase in temperature associated with each scenario are discussed below. Mean maximum monthly temperature is derived by averaging the daily high temperature for the month with the highest average maximum temperature, which for the Gulf Coast is August. The projected temperature increases used were then added to the base year’s mean maximum monthly temperature. The current average mean maximum temperature is estimated to be 33 °C (91.4 °F), based on 1972-2002 data from 12 research stations from the Carbon Dioxide Information Analysis Center (CDIAC) located in the region. For example, for scenario A1B the 50th percentile temperature increase of 2.5 °C (4.5 °F) was added to the 33 °C (91.4 °F) base year mean maximum temperature, indicating that in 2050 the mean maximum temperature is projected to be 35.5 °C (95.9 °F).
Below is a brief discussion of the results of this analysis that indicates the range of potential changes in baseline runway length requirements under the climate scenarios, conveying the full range of results based on the models and scenarios. For 2100, we point out the lowest and highest results. These results indicate the change in baseline runway length requirements for this hypothetical airport by using the FAA’s airport design software, given a specific change in mean max temperature.
The analysis confirms that generally speaking, the possible increases are quite small. Given the long lead times and ongoing changes in aircraft technology, this means that possible temperature increases most probably will have little effect on runway length for commercial aircraft.
The potential temperature increases for the month of August are summarized in chapter 3.0, table 3.11. Over the longer term (to 2100), the analysis indicates an increase of between 1.8 °C (3.2 °F) (B1, 5th percentile) and 6 °C (10.8 °F) (A2, 95th percentile). An increase at the lower end would indicate a potential need to increase runway length by 9 m (30 ft) for small aircraft and by 12 to 15 m (40 to 50 ft) for large general aviation aircraft. At the 95th percentile, an increase of 6 °C (10.8 °F) could require lengthening the runway
10 One hundred percent of all large aircraft category is seldom used in runway design since very few airports
experience the entire spectrum of large general aviation aircraft operations.

Impacts of Climate Change and Variability on Transportation Systems and Infrastructure: Gulf Coast Study, Phase I Chapter 4: What are the Implications of Climate Change and Variability for Gulf Coast Transportation?
4-34
by 30 to 46 m (100 to 150 ft) for small airplanes and by 40 to 219 m (130 to 720 ft) for large aircraft.
Generally speaking, the possible increases in baseline runway length requirements are very low, especially for small aircraft (see table 4.15). The scale of these runway length requirement increases range from 8 to 16 percent for corporate jets to 2 to 3 percent for light general aviation aircraft. While these limited analyses are illustrative of the potential influence of temperature increase on runway length based on existing aircraft technology, whether more detailed analyses would need to be conducted would be decided by airport managers on a case by case basis in order to determine possible investment considerations.
[INSERT Table 4.15: Summary of impacts of temperature change to runway length (general aviation) under three climate scenarios (SRES Scenarios A2, B1, and A1B)]
Commercial Service Airports Commercial service, military airfields, and industrial airport master plans determine the size of “critical” aircraft anticipated to operate at an airport in the future, then design the runway system to accommodate the critical aircraft. Runways at commercial airports are designed by using aircraft manufacturer’s specifications. Figure 4.21 is a table showing runway lengths for airport design issued by Boeing for the 757-200 aircraft. These specifications provide length of runway required for aircraft based on payload, temperature, and elevation. In general, the higher the temperature, elevation, and payload weight, the longer the runway needs to be to accommodate the aircraft (figure 4.21).
[INSERT FIGURE 4.21 B757-200 takeoff runway requirements for design purposes]
Commercial airliners offer versatility in their ability to operate at a wide assortment of airports throughout the world. Large wide-body aircraft such as the Boeing 747 are designed to seat over 300 passengers and operate at international gateway airports such as Houston, whereas narrow-body aircraft designed for medium-sized markets seat 100 to 200 passengers and serve markets such as Tallahassee, FL, and Baton Rouge, LA. Regional jets seat 34 to 70 passengers and serve markets such as Lake Charles Regional Airport in Louisiana.
Airport master plans determine the size of “critical” aircraft anticipated to operate at an airport in the future, then design the runway system to accommodate these critical aircraft. Unlike general aviation airports that rely on the FAA airport design software to calculate runway length requirements, runways at commercial airports are designed by using aircraft manufacturer’s specifications. Once airports go into service, it is the pilot’s responsibility to calculate aircraft performance on a given day prior to takeoff based on the following: ambient temperature, aircraft gross takeoff weight (GTW), airfield elevation, wind velocity and direction, and runway surface slope and drag. Thus, on hot days the pilot can make adjustments in cargo or passenger loads in order to takeoff on a runway, given its length. On days when the temperature is higher than the aircraft specs contemplate, the airliner would need to lower its weight to accommodate the higher temperatures.

Impacts of Climate Change and Variability on Transportation Systems and Infrastructure: Gulf Coast Study, Phase I Chapter 4: What are the Implications of Climate Change and Variability for Gulf Coast Transportation?
4-35
Table 4.16 lists the required runway lengths for three groups of aircraft, fully loaded, for a generic hot day (a standard day temperature of 15 °C (59 °F) plus 15 °C (27 °F), for a total of 30 °C (86 °F)) and compares the manufacturer’s specifications with the primary runway lengths of the 11 commercial service airports in the study area. Shortfalls in runway length for specific aircraft are presented in italics. Houston Bush Intercontinental (IAH) is the fourth largest market in the United States and is the only international gateway airport in the study area. Other airports in the study area do not require the same runway lengths since wide-body aircraft do not operate at these airports on a scheduled basis. On the opposite end of the spectrum, regional jets typically operate at Lake Charles Regional (LCH), Hattiesburg (HBG), and Beaumont/Port Arthur (BPT). These airports are designed to accommodate regional jets and turboprop aircraft and have shorter runway lengths. The other commercial airports in the study area are designed to accommodate medium-haul, narrow-body jets.
As shown in the discussion above, the maximum temperature contemplated by this study is 39 °C (102.2 °F), which is 33 °C (91.4 °F) plus 6 °C (10.8 °F), based on scenario A2 for the year 2100. This maximum temperature is 9 °C (16.2 °F) higher than the generic hot day. Therefore, aircraft manufacturers may want to consider the extent to which the use of a standard day temperature of 15°C (59°F) plus 15°C (27°F) as a measure of a typical hot day will continue to be applicable for aircraft design or whether to increase this temperature based on any projected temperature increase associated with a change in climate.
[INSERT TABLE 4.16: Commercial aircraft runway length takeoff requirements]
Temperature Conclusions As is the case today, pilots will need to address how temperature increases may affect aircraft takeoff performance capabilities and payload requirements, and airports will need to address any such increases in the context of current runway utilization and future runway design. Given past trends, it is likely that future aircraft will be able to operate on shorter runways. Airports serving large commercial aircraft in the future, however, are anticipated to continue to utilize aircraft manufacturer’s specifications to determine runway lengths.
Precipitation
In general, airlines, airports, and aircraft operate more efficiently in dry weather conditions than wet. Weather is a critical influence on aircraft performance and the outcome of the flight operations while taking off, landing, and while aloft. Precipitation affects aircraft and airports in several ways such as decreasing visibility, slowing air traffic by requiring greater separation between aircraft, and decreasing braking effectiveness. On the ground, effects include creating turbulence, increasing the risk of icing of wings, and affecting engine thrust.
The climate scenarios for the years 2050 and 2100 developed as part of this research generally indicate that the Gulf Coast study area could become a warmer but drier climate. However, the models do indicate the possibility that the climate could be warmer with

Impacts of Climate Change and Variability on Transportation Systems and Infrastructure: Gulf Coast Study, Phase I Chapter 4: What are the Implications of Climate Change and Variability for Gulf Coast Transportation?
4-36
increased annual precipitation. In either scenario, the increased intensity of individual rainfall events is likely.
Implications of a drier climate to airport and aircraft operations may include positive and negative effects. Less precipitation would most likely reduce aircraft and air traffic delays; reduce periods of wet surfaces on runways, taxiways, and aprons; and in the winter months, reduce the risk of wing icing. A drier climate also may increase the number of days of visual flight rules11 (VFR) operations. A warmer climate with less precipitation may, however, increase convective weather (turbulence), as well as increase the number and severity of thunderstorms. In addition, increased water vapor in the atmosphere, particularly during the summer months, may increase haze and reduce pilot visibility, thereby reducing the number of VFR days.
A wetter climate would reduce the number of VFR-operating time periods and would impact the general aviation sector. General aviation pilots would either learn to fly in instrument flight rules (IFR) conditions by becoming “instrument rated” or not fly during periods of reduced visibility and precipitation. In order for pilots to fly in IFR conditions, aircraft flight decks must be equipped with complex navigation instruments, which is a significant investment for aircraft owners.
Increased extreme precipitation events also would impact commercial service aircraft operations. During severe thunderstorm activity it is not unusual for an airline to cancel flights or at a minimum experience delays in operations. Navigation in heavy precipitation is possible and currently occurs on a daily basis in the national air system. However, precipitation almost always creates delays, particularly at the most congested airports.
If the Gulf Coast study area climate proves to have more intense precipitation events, airport planners and engineers would need to consider the implications of periods of increased heavy rainfall in airport design and engineering. This is particularly true of airports located on floodplains in the study area since they are more susceptible to flash flood events. Eight of the 61 airports in the study area are located on 100-year floodplains. These airports are identified in table 4.17.
[INSERT TABLE 4.17: Airports located on 100-year flood plains]
Relative Sea Level Rise
As indicated in chapter 3.0, RSLR scenarios developed as part of this research indicate that coastal zones in the Gulf Coast study area are very likely to be inundated by rising sea level combined with geologic subsidence. As a result, some airport infrastructure would most likely be susceptible to erosion and flooding.
11 Visual flight rules (VFR) are a set of aviation regulations under which a pilot may operate an aircraft, if
weather conditions are sufficient to allow the pilot to visually control the aircraft’s attitude, navigate, and maintain separation with obstacles such as terrain and other aircraft.

Impacts of Climate Change and Variability on Transportation Systems and Infrastructure: Gulf Coast Study, Phase I Chapter 4: What are the Implications of Climate Change and Variability for Gulf Coast Transportation?
4-37
Geographic information system (GIS) analysis indicates three airports in the study area would be below mean sea level (MSL) if relative sea level increases by 122 cm (4 ft). Each of these airports currently is protected by preventive infrastructure such as dikes and levees, which will need to be maintained. If feeder roads in the area are inundated, however, access to these airports may be disrupted. Table 4.18 lists these airports and their elevations. All three airports are located in Louisiana and range from New Orleans International (122 cm or 4 ft elevation), one of the study area’s large commercial service airports, to South LaFourche (30 cm or 1 ft), a very small general aviation facility. The third is a military airport, New Orleans Naval Air Station Joint Reserve Base (NASJRB New Orleans) (91 cm or 3 ft).
[INSERT Table 4.18 Gulf Coast study area airports vulnerable to submersion by relative sea level rise of 61 to 122 cm (2-4 ft)]
Storm Activity
Both storm surge and hurricane force winds can damage airport facilities. As indicated in chapter 3.0, the study team analyzed the vulnerability of facilities to storm surge heights of 5.5 and 7.0 m (18 and 23 ft). At these elevations a variety of airports in the region would be vulnerable to the impacts of storm surge, though this depends on the specific characteristics of each individual storm event, including landfall location, wind speed, wind direction, tidal conditions, etc.
Figure 4.22 depicts airports within the study that are vulnerable to storm surges of 5.5 or 7 m (18 or 23 ft). Table 4.19 lists these airports by location, type, and elevation. There are 22 airports in the 0- to 5.5-m (18-ft) MSL category and seven airports in the 5.8- to 7-m (19- to 23-ft) MSL category. This list includes some major airports in the region, such as New Orleans International. Also, the commercial service airport in Lake Charles, LA, would be vulnerable. See section 4.3.1 for a discussion of the wind impacts of the 2005 hurricanes on airport facilities.
[INSERT FIGURE 4.22: Gulf Coast study area airports at risk from storm surge]
[INSERT TABLE 4.19: Gulf Coast study area airports vulnerable to storm surge]
4.2.6 Pipelines
There is a combined total of 42,520 km (26,427 mi) of onshore liquid (oil and petroleum product) transmission and natural gas transmission pipelines in the Gulf Coast area of study, as shown in figure 4.23.12 This includes 22,913 km (14,241 mi) of onshore natural gas transmission pipelines and 19,607 km or 12,186 mi of onshore hazardous liquid 12 This includes some extended pipeline sections beyond the boundaries of the study, because GIS coding of
links included segments that spanned both inside and outside the study area.

Impacts of Climate Change and Variability on Transportation Systems and Infrastructure: Gulf Coast Study, Phase I Chapter 4: What are the Implications of Climate Change and Variability for Gulf Coast Transportation?
4-38
pipelines (Pipeline and Hazardous Materials Safety Administration [PHMSA], 2007). This region is essential to the distribution of the Nation’s energy supply through pipeline transportation, and historically the landside pipelines have been relatively secure from disruption by increased storm activity and intensity. A number of risks and vulnerabilities to climate-related impacts have been revealed, however, particularly for submerged or very low elevation pipelines. PHMSA of the U.S. DOT has jurisdiction over onshore pipeline facilities and some offshore pipeline facilities. PHMSA has jurisdiction over offshore pipeline facilities that are exposed or are hazards to navigation when the offshore pipeline facilities are between the mean watermark and the point where the subsurface is under 4.6 m (15 ft) of water as measured from mean low water. The U.S. Department of the Interior Minerals Management Service (MMS) has jurisdiction over about 36,000 miles of offshore pipelines in the Gulf of Mexico.
[INSERT FIGURE 4.23 – Landside pipelines having at least one GIS link located in an area of elevation zero to 91 cm (3 ft) above sea level in the study area]
Some historical weather events have resulted in only minor impacts on pipelines, with the notable exceptions of Hurricanes Andrew, Ivan, Katrina and Rita, which caused fairly extensive damage to underwater pipelines, and flooded distribution lines in areas where houses were destroyed. Storm surge and high winds historically have not had much impact on pipelines – either onshore transmission lines or offshore pipelines – since they are strong structures, well-stabilized, and/or buried underground. Yet offshore pipelines have been damaged in relatively large numbers on occasion, as during Hurricanes Andrew and Ivan. Temperature shifts resulting from climate scenario projections are not expected to have much direct or indirect impact on pipelines. Increases or decreases in precipitation – either long-term or in the frequency or extent of droughts or inundation – could impact soil structure. Sea level rise would likely have little direct effect but could affect water tables, soil stability, and the vulnerability of pipelines to normal wave action as well as sea surge.
Changes in soil structure, stability, and subsidence – whether undersea, landside, or in wetlands or transition elevations – could play an important role in pipeline-related risks. However, there is little information on this topic outside of earthquake risks. There has recently been concern about how wave action could affect the seabed, either by liquefying/destabilizing the sand or silt surface above a buried pipeline or by gradually eroding away seabed that had been covering the pipeline. It is unclear at present whether a changing climate might lead to conditions that exacerbate these effects and cause additional damage.
The possible effects on pipelines from climate change – storm surge and extreme winds, temperature shifts, precipitation changes, and sea level rise – were considered in this analysis. Both pipeline companies and governmental agencies have considered pipeline risks, vulnerability, and safety and have well-developed inspection, maintenance, and response plans. However, these plans do not appear to address a number of risks that may be arising. This study did not examine the adequacy of those plans. While some issues regarding impacts have been addressed here, there is still significant uncertainty about the overall risk to pipelines from climate change.

Impacts of Climate Change and Variability on Transportation Systems and Infrastructure: Gulf Coast Study, Phase I Chapter 4: What are the Implications of Climate Change and Variability for Gulf Coast Transportation?
4-39
Importance of Pipeline Operations in the Study Area
Onshore natural gas transmission pipelines are primarily located in Louisiana. Approximately 49 percent of natural gas wellhead production either occurs near the Henry Hub, which is the centralized point for natural gas futures trading in the United States or passes close to the Henry Hub as it moves to downstream consumption markets. The Henry Hub – located near the town of Erath in Vermillion Parish, north central Louisiana – interconnects nine interstate and four intrastate pipelines, including: Acadian, Columbia Gulf, Dow, Equitable (Jefferson Island), Koch Gateway, Louisiana Resources Company (LRC), Natural Gas Pipe Line, Sea Robin, Southern Natural, Texas Gas, Transco, Trunkline, and Sabine’s mainline.
Temperature
Pipelines are more protected than other types of infrastructure from the effects of temperature changes projected for the region due to the moderating and insulating effects of soil and water. The great majority of the transmission pipeline system is buried under at least 91 cm (3 ft) of soil cover, both onshore and offshore. Federal regulations require that all pipelines in navigable waters be buried. Moreover, pipelines are designed to carry product at significant temperature variations (natural gas is pressurized in their system, while petroleum products are heated considerably above ambient temperatures). There is extensive experience with pipelines in much more extreme ambient temperature conditions (Alaska, Saudi Arabia, West Africa) than would be expected in the Gulf States region. Sea temperatures will vary even less than land temperatures. Thus, there is not expected to be any significant effect on pipelines due to direct effects from increased (or decreased) temperatures.
Precipitation Changes
Sustained periods of increases or decreases in precipitation, whether over months or the cumulative effect across years, can cause substantial soil changes due to drought or saturation. Changes in water tables may occur both from local climate changes as well as from global effects such as sea level rise. An increase in water table level or increased surface water runoff can cause erosion or slumping (collapse) of the soil surface, thereby leading to potential for pipeline exposure.
In the lowland and marsh areas particularly associated with the coastal regions of Louisiana, the soil is being washed away due to storm activity. With the disappearance of the soil, the pipelines in these regions are losing cover.
Detailed analysis of geology and pipeline-specific conditions are required to draw more precise conclusions regarding the potential for serious disruption of the transmission pipeline system from climate-related soil changes. Nonetheless, this is an area of concern, because a considerable and unpredictable portion of the pipeline system could be vulnerable to these climate change and sea level induced impacts.
Impacts of Climate Change and Variability on Transportation Systems and Infrastructure: Gulf Coast Study, Phase I Chapter 4: What are the Implications of Climate Change and Variability for Gulf Coast Transportation?
4-40
Another vulnerability is from expected short-term changes (such as torrents and floods), where significant change in water flow rate and water flow energy are a result of increased precipitation. Risk analysis of the impacts of extreme events is required to determine appropriate adaptation or mitigation actions.
Storm Impact Preparation, Mitigation, and Response
Wave action during storms may impact pipelines. For offshore pipelines, in instances where significant subsidence occurs and the pipeline segment is exposed, that section is exposed to wave action. High-energy waves may subject a pipeline to stress levels it was not designed to withstand, causing a fracture. An exposed offshore pipeline also could be vulnerable to lateral and vertical displacement, exposure to vessel traffic and fishing trawls, or rupture by currents, which may be very important in this context.
Pipeline operating companies are required to have an emergency plan in place to cover all known or expected situations that may require response to repair the pipeline system due to damage, including, storms, excavation, and even sabotage or terrorist attack. Pipeline systems are segregated by sections between valves in order to allow isolation and shutdown of segments for routine maintenance, malfunctions, or response to emergency incidents. During shutdowns, pipelines are pressurized at the value given in the emergency plan design, and all valves are closed to prevent flow problems during the rest of the event and to facilitate repair. The operating portion of the emergency plan generally presumes that operations will be interrupted for a period of only up to 10 days.
As soon as a storm or other event dissipates in the pipeline area of concern, the pipeline response team initiates their response plan. An inspection begins as a visual flyover the pipeline in the affected region to examine it for exposure or other obvious indications of damage. Some damage also can be detected through sensors measuring pressure in different pipeline segments or through other physical indicators, although these approaches may miss some damage (e.g., structural damage not yet causing a leak) or not be able to isolate damage location more precisely. If damage is apparent, then a thorough closeup inspection will take place, including divers if necessary. After damage has been identified, a repair team initiates repairs.
The damages caused to pipelines by Hurricanes Andrew and Ivan were severe and fairly widespread throughout the storm front region, as documented by the MMS study discussed below (Skinner, 2006). After Ivan, oil refineries had ample products to supply, but the pipelines could not deliver due to damages. In contrast, damage to pipelines from Katrina and Rita was relatively minor; most pipelines were ready to take product but were hampered by the lack of available product due to refinery damage and/or power shortages.
One representative of a hazardous liquid pipeline company stated that, prior to Ivan, obtaining pipeline maintenance and repair contract commitments was relatively easy, “a foregone conclusion of commitment,” but after Katrina and Rita, it has become increasingly difficult to obtain solid commitments from suppliers to respond to emergency calls. While suppliers are still offering contracts, the commitment is now only an offering to put the customer on a response list for a front-end fee. There is no longer a guarantee

Impacts of Climate Change and Variability on Transportation Systems and Infrastructure: Gulf Coast Study, Phase I Chapter 4: What are the Implications of Climate Change and Variability for Gulf Coast Transportation?
4-41
that the supplier will respond to an emergency call within a fixed time period or otherwise provide service, because all their assets and personnel may be engaged in a prior commitment.
Response capabilities and reliability have thus declined, even while the acknowledged storm threat has increased due to Ivan’s illustration of a previously unknown level of damage. Furthermore, while there were emergency operating plans before Ivan that matched the committed response time, we now know that responses may take longer, and operating plans will need to be adapted to meet these eventualities.
Hurricane Damage Studies
One of the more substantial studies of hurricane damage to pipelines in the Gulf of Mexico was done by Det Norske Veritas (DNV) Technology Services upon a request from the MMS (Skinner, 2006). This was an assessment of damage to the Gulf of Mexico offshore pipelines resulting from the passage of Hurricane Ivan in September 2004. The DNV study also summarized the impacts of Hurricanes Andrew, Lili, Katrina, and Rita.
Hurricane Ivan reached Category 5 strength three times and was a Category 3 hurricane when it made landfall. Hurricane Ivan resulted in approximately 168 pipeline damage reports, although the vast majority of Gulf of Mexico offshore pipelines performed well during its passage. According to the MMS DNV report, the impact on the environment from pipeline spills was minimal. The majority of pipeline damage occurred at or near platform interfaces, in areas of mudflows, or as a result of an indirect hurricane impact, such as platform failure or anchor dragging. Localized failures at pipeline crossings and excessive movements in shallow water depths indicate that more hurricane-resistant design considerations might be needed on a site-specific basis but do not warrant industry-wide design or construction code revisions. The report suggests that design assumptions used for shallow water pipelines need to be evaluated in areas dominated by silty soils, particularly where self-burial is intended as the method of installation.
Hurricane Andrew passed through the Gulf of Mexico in August 1992 as a Category 4 storm. It damaged more than 480 pipelines and flow lines. Prior to Hurricane Andrew, minimal damage to pipelines had been experienced as a result of passing hurricanes, with combined pipeline failures from hurricanes for the period of 1971 through 1988 resulting in about 100 damage reports. Most of the pipeline failures were in depths less than 30 m (100 ft) of water.
Hurricane Lili was a Category 4 storm offshore in the Gulf of Mexico and was downgraded to a Category 2 hurricane at landfall in October 2002. There were 120 pipeline damage reports to the MMS following Hurricane Lili. The majority of the pipeline failures in Lili occurred in small diameter pipelines with no apparent correlation for age, which also was true for damages reported from Andrew.
According to the MMS, there were 457 offshore oil and gas pipelines that were damaged as a result of Hurricanes Katrina and Rita (MMS Press Release, 2006). Most of the damage was relatively minor. Disruptions also occurred due to power outages, and pipeline

Impacts of Climate Change and Variability on Transportation Systems and Infrastructure: Gulf Coast Study, Phase I Chapter 4: What are the Implications of Climate Change and Variability for Gulf Coast Transportation?
4-42
operators procured portable electric power generators necessary to resume operations. The closure of major pipelines originating in the Gulf of Mexico region in the wake of both storms served to exacerbate the petroleum product supply situation (EIA, 2005).
Storm Activity: Erosion
The above information and an interview with a hazardous liquids (mostly petroleum products) pipeline company revealed that damage from erosion and soil stability due to storm wave action has focused new interest on this phenomenon. The results of Hurricane Ivan, when erosion occurred in waters up to 76 m (250 ft) in depth, demonstrated that this effect can occur at depths previously considered impervious. The problem and solution is still being investigated in joint industry programs, along with Office of Pipeline Safety and MMS.
Erosion typically has been found to occur in what the industry has termed “ultra shallow waters.” This phenomenon was prevalent from Hurricane Ivan (Skinner, 2006) but almost completely lacking from Hurricanes Katrina and Rita. This indicates that risk is not only due to storm intensity but also may be based on more complex meteorological and fluid dynamics factors, making the risk less predictable than assumed.
In ultra shallow waters where erosion occurs, the general concurrence of industry specialists is that the seabed is “liquefying” (when the sand or silt shifts from a wet solid to a suspended state) in certain wave-action conditions. Pipeline design incorporates negative buoyancy (a present regulatory requirement and previously considered good design practice), but, if the sands are liquefying, the negative buoyancy may become positive and the pipeline ends up on the seabed surface. Documentation shows that the seabed level has not changed in these occurrences, but the pipeline has changed its elevation from 0.9 m (3 ft) below the seabed surface to resting on the surface. While possible solutions are being developed, impacts from more frequent or severe storms currently can be considered a vulnerability of the pipeline system (EIA, 2005).
Storm Activity: Increased Storm Severity
In the Gulf Coast area of study, transmission pipelines have been designed to maintain their integrity for a (historical) 100-year storm event. Interviews with natural gas transmission pipeline company representatives indicate that the potential of pipeline damage due to increased storm activity or increased severity of storms is considered to be of marginal concern. They framed the issue as: to what extent can increased weather damage be effectively planned for, and what level of risk exposure should be assumed, beyond regulatory requirements? While there is an extensive regular inspection process that may identify weaknesses that could be expanded by a storm or by more gradual soil structure changes, it only partially prepares for and mitigates potential storm damage.
Discussions regarding the potential for transmission pipeline damage consistently centered on the issue that nearly all the transmission lines are buried with 0.9 m (3 ft) of top cover, more in urban and populated areas, and they are regularly inspected for integrity. There is a need to better understand issues regarding damage to exposed pipeline portions (which

Impacts of Climate Change and Variability on Transportation Systems and Infrastructure: Gulf Coast Study, Phase I Chapter 4: What are the Implications of Climate Change and Variability for Gulf Coast Transportation?
4-43
may be the most vital), such as valves, pumping stations, etc., and damage to underground portions from previously unconsidered factors, such as changing water tables and soil subsidence due to sea level changes..
Researchers interviewed MMS regulatory officials in the New Orleans, LA, office regarding the effects they see concerning climate change. The offshore pipelines are regulated by MMS regarding design, construction, operations, and maintenance requirements. MMS representatives indicated that they do not anticipate increased storm severity and frequency will appreciably affect the pipelines under their regulatory authority in the Gulf of Mexico. (Note that MMS’ authority ends at the State/Federal boundary offshore.13) It is unclear whether their comments took into account the changing soil structure and shoreline in the region. They based their comments on the fact that the subject pipelines are at substantial depth, and the pipelines are buried 0.9 m (3 ft) below sea floor level or anchored to piers designed to prevent pipeline movement on the sea floor. It is not certain how this accounts for the results of Hurricane Ivan and the findings of the DNV study.
Secondary Impacts
The level of oil and natural gas products moved via pipelines could be influenced by changes in temperature across the globe. Increases in temperature in the United States could affect the demand for energy products transported through the Gulf Coast; demand for natural gas (and coal) to power electricity plants in the southeast, for example, could lead to greater production and/or importation of natural gas through study region pipelines. Furthermore, climate mitigation policies designed to reduce carbon emissions could favor natural gas over other fossil fuels, thus promoting greater exploration and production of natural gas and importation of LNG, with clear implications for pipelines.
Further study is necessary before firm conclusions can be drawn regarding the vulnerability of onshore and offshore pipelines. Relatively significant damage has occasionally occurred, yet other storms have produced only minor damage. Recent investigations have raised concerns about seabed conditions under which pipelines exhibit some vulnerability. It is a matter of further research whether climate change will exacerbate those conditions or whether the interface between onshore and offshore pipelines might be affected.
4.2.7 Implications for Transportation Emergency Management
Without proactive planning, climate change could complicate evacuation efforts in the region. As noted above, some highways, the chief mode for evacuation, are very likely to be inundated permanently as relative sea level rises and periodically when areas are flooded by storms. Further, higher temperatures could make evacuations more problematic, particularly in situations where there is severe congestion; higher 13 The State/Federal boundary is 3 mi offshore in the study area except in Texas, where it is 10 mi offshore.

Impacts of Climate Change and Variability on Transportation Systems and Infrastructure: Gulf Coast Study, Phase I Chapter 4: What are the Implications of Climate Change and Variability for Gulf Coast Transportation?
4-44
temperatures lead to greater air conditioning usage, making it more likely that vehicles will run out of fuel and block traffic. Large-scale emergency management is further challenged by the changing demographics of the region: an increasing percentage of residents are older and/or have special needs. Also, recent experience with evacuations suggests that congestion on key evacuation routes poses serious challenges to evacuating residents quickly. The need for interoperable communications systems across the region, currently lacking, will be heightened as the number of emergencies increases with climate change.
A robust emergency management system is highly dependent on the viability of the region’s transportation infrastructure. Ensuring the capability to both evacuate residents, and move emergency responders and services into affected areas will require purposeful adaptation and, thus, focused investment in the transportation system. This section examines the implications for transportation emergency management of the potential impacts to highways and to transit and passenger rail that were presented earlier in this report. Many of these routes are expected to become increasingly vulnerable to higher sea levels and storm surge.
This section also highlights some of the lessons learned from recent hurricane evacuation experiences and examines some of the issues related to the varied – and often incompatible – communications system found across the region.
Further analysis and development of institutional consensus is necessary to more fully understand the implications of climate change on transportation emergency management. However, the preliminary vulnerability issues raised here are illustrative of the kinds of interactions that climate change and variability may cause for emergency management planning and operations. These issues are compounded by the changing demographics in the region.
There are two key types of emergency management/climate change scenarios. The first involves complications for emergency response activities given climate impacts. For example, unusable roads caused by higher sea levels could disrupt road connectivity, increasing the time needed for emergency response vehicles to reach fires, medical emergencies, etc. The second involves situations where the climate impact itself causes the emergency; e.g., where hurricane induced flooding or a sudden rise in relative sea levels forces people to evacuate a particular area.
Temperature
As discussed in chapter 3.0, both mean and extreme temperatures are very likely to increase in the Gulf Coast region over the next 50 to 100 years. The increase in temperatures could cause more air conditioning usage during some evacuations and could further diminish mobility. Vehicles using air conditioning during storm evacuations, particularly on congested roads, would contribute to roadside blockages as fuel is depleted and vehicles are abandoned. Furthermore, an increase in temperatures, especially maximum temperatures, coupled with a growing number of special needs residents in the Gulf Coast study area means that more lives could be vulnerable in the absence of electrical power and air conditioning in the aftermath of a storm.

Impacts of Climate Change and Variability on Transportation Systems and Infrastructure: Gulf Coast Study, Phase I Chapter 4: What are the Implications of Climate Change and Variability for Gulf Coast Transportation?
4-45
Relative Sea Level Rise
As noted above, interstates and arterials tend to serve as the major evacuation routes for emergencies in the Gulf Coast study area. This substantial reliance on a single mode of transportation may endanger many people if the highway infrastructure is damaged or made inaccessible because of relative sea level rise. If the relative sea level increases such that portions of evacuation routes are under water then the essential connectivity and evacuation provided by those highways would be lost. This will be particularly important for large-scale evacuations dependent on east-west routes. Of course, as sea levels rise over time population centers may shift to higher elevations; the segments of evacuation routes that will be most critical are likely to change with these shifts in community locations. Furthermore, if the increase in relative sea level is gradual, infrastructure development would likely follow the movement of population centers.
As discussed in section 4.2.1, the majority of the highways vulnerable to a 61- and 122-cm (2- and 4-ft) rise in relative sea level are located in the Mississippi River Delta region near New Orleans. The most prominent vulnerable highways are I-10, with 220 km (137 miles) and U.S. Highway 90 with 235 km (146 mi) passing through areas likely to be below sea level with a 61-cm (2-ft) rise in relative sea level. Overall, 19 percent of the interstate miles and 20 percent of the arterial miles are at elevations below 61 cm (2 ft). With a 122 cm (4-ft) rise, the miles affected increase to 684 km (425 mi) of I-10 and 628 km (390 mi) of U.S. Highway 90. Overall, 24 percent of the interstate miles and 28 percent of the arterial miles currently are at elevations below 122 cm (4 ft).
Storm Activity
As noted in chapter 3.0, studies suggest that as radiative forcing (that is, greenhouse gas [GHG] concentrations) and sea surface temperatures continue to increase, hurricanes may be more likely to form in the Atlantic and Pacific and more likely to intensify in their destructive capacity. Storm surge disperses debris that blocks highways and makes many roads, including evacuation routes, impassable. In addition, storm surge may damage bridges and other structures, potentially compromising mobility for extended periods. While the actual highways that would be flooded and impacted by debris depends on the specific characteristics of any given storm, a substantial portion of the highway system is vulnerable to surge inundation, including roads in all four States in the study area. The areas that are potentially vulnerable to 5.5- and 7.0-m (18- and 23-ft) storm surge levels are shown in section 4.2.1 above. At the 5.5-m (18-ft) level, 51 percent of all arterial highways and 56 percent of the interstates in the study area are affected (figure 4.24). At 7.0 m (23 ft), these percentages rise to 57 percent of all highways and 64 percent of the interstates.
[INSERT FIGURE 4.24 Potential evacuation route highways vulnerable from storm surge of 5.5 meters (18 ft)]
Although not traditionally used for evacuation and emergency management purposes, railroads also could provide a transportation choice, especially for evacuees with special needs. Figure 4.25 illustrates the impacts on Amtrak facilities due to relative sea level rise

Impacts of Climate Change and Variability on Transportation Systems and Infrastructure: Gulf Coast Study, Phase I Chapter 4: What are the Implications of Climate Change and Variability for Gulf Coast Transportation?
4-46
and storm surge and identifies the Amtrak stations that are vulnerable to storm surge at the 5.5-m (18-ft) level.
[INSERT FIGURE 4.25 Risks to Amtrak Facilities due to relative sea level rise and storm surge]
Other Considerations Affecting the Success of Emergency Management
The issues below are important from the perspective of managing emergencies and protecting people. Highlighting these issues is important because they are relevant to preparing for potential emergencies, some of which could be related to the impacts of climate change.
Adapting Emergency Management Plans Effective emergency evacuation plans must be living documents that incorporate current and anticipated conditions, procedures, and resources. Climate change will likely exacerbate the need to update these plans and procedures. The 2005 hurricane season highlighted the need to reassess the appropriate level of investment for emergency management planning. As discussed, the climate analysis indicates a rise in temperature and relative sea level for the Gulf Coast region. These changes – coupled with continued increases in overall population, and of particular concern, major increases in the elderly and special needs populations – translate into a difficult situation for emergency evacuations in the Gulf Coast region without thoughtful and proactive planning.
The requirement to transport those with special needs is especially challenging along the Gulf Coast, where many elderly people live in rural areas. Figure 4.26 illustrates the State and county/parish boundaries and the population over 65 that were impacted by Hurricane Katrina.
[INSERT FIGURE 4.26 Population over age 65 impacted by Hurricane Katrina]
Interdependent Communications Infrastructure Successful emergency management depends not only on the transportation infrastructure but also on interdependent communications infrastructure that allows emergency management personnel and responders to dynamically accommodate changing needs and infrastructure availability. Lessons learned from recent events indicate that significant breakdowns in communication can occur across multiple jurisdictions and agencies during major emergencies. Although not linked to or caused by changes in climate characteristics directly, cell phones and land lines quickly become unreliable both before and after major regional emergencies. Changes in climate may exacerbate this dynamic as greater penetration of storm surge and wind fields may disable the “day-to-day” communications infrastructure.
A recent study released by First Response Coalition, a public safety group, suggests that many wireless communications systems in hurricane-prone states are still unlikely to function well during major regional emergencies. Communication plans and infrastructure

Impacts of Climate Change and Variability on Transportation Systems and Infrastructure: Gulf Coast Study, Phase I Chapter 4: What are the Implications of Climate Change and Variability for Gulf Coast Transportation?
4-47
remain largely uncoordinated, even after concerted efforts to improve these dynamics following the 2005 hurricane season (First Response Coalition, 2006).
The use of new surveillance technologies such as unmanned aerial vehicles (UAV) may help ameliorate problems with existing communications systems that would be exacerbated by future storm events. These relatively new, but increasingly efficient and more affordable devices, could be effective new tools in the critical 72-hour period leading up to evacuations, as well as postevent recovery and response operations. These and other strategies may serve as a new means of acquiring and relaying real-time information when existing infrastructure is disabled during a storm.
Traffic Management Traffic management related to emergency evacuations will become increasingly critical as the population in the Gulf Coast region grows. This may lead to increased instances such as that experienced during Hurricane Rita in 2005, when Galveston’s long-standing plan to evacuate to Houston was complicated by the evacuation of Houston itself. Many Galveston (and other) residents tried to evacuate “through Houston,” only to encounter hours of gridlock in the oversaturated transportation system that already was filled with Houston residents evacuating from the approaching storm. Other coastal communities in the region could fare similar evacuation problems in future storms. Also, as storm impacts and the resulting evacuations do not follow State lines, it is important that States not only plan for evacuations of their own residents but also account and allow for potential multistate evacuations that cross multiple State boundaries.
Critical Care Facilities and Shelters for Those with Special Needs The predicted changes in climate over the next century will make the care of those with special needs more complex and problematic. In the instance of “sheltering in place,” increased attention and planning will need to be given to auxiliary power and backup communication systems to sustain critical health services and to maintain acceptable quality of life (air conditioning, water supply, etc.).
The 2005 hurricane season also produced numerous instances of evacuees with special needs arriving at their “designated shelters,” only to be turned away due to lack of capacity or the facility not even being open. Many of these shelters that denied evacuees shelter received funding from the U.S. Department of Homeland Security to support the facility infrastructure and operation. With evacuee demands only expected to increase in the future, the need to ensure reliable shelter services becomes increasingly important.
Local Development Policies As it relates to the ability to support regional evacuations during emergencies, the potential for climate impacts – particularly storm surge and wind field during major hurricanes – should be mapped (and otherwise illustrated) to determine probable zones of risk. This information can inform local development policies and guide the location of new housing and critical care facilities to areas of lower vulnerability.

Impacts of Climate Change and Variability on Transportation Systems and Infrastructure: Gulf Coast Study, Phase I Chapter 4: What are the Implications of Climate Change and Variability for Gulf Coast Transportation?
4-48
Fiscal Impacts Revenue data collected by the State of Florida indicates that hurricane weather events reduce toll collection and increase toll system costs. As shown in table 4.20 below, the Florida 2004 hurricane season cost the State’s tolled facilities $62,600,000 (Ely, 2005). These financial impacts could negatively impact the fiscal viability of toll projects that are used for evacuation routes in emergencies. The toll operating agencies in Florida recognize their toll facilities as evacuation routes and are working to suspend payment of tolls in the event of a hurricane (Warren, 2005).
[INSERT TABLE 4.20 Hurricane impacts on toll revenue in Florida]
Increased frequency and severity of hurricanes might pose a challenge to the fiscal strategies of toll facilities, may discourage the trend to finance future infrastructure with tolls, and may thereby reduce infrastructure that can be used for emergency evacuation. If too much of an area is inundated for an extended period there may be a reduction in vehicle trips below the threshold needed to support repayment of bonds. For example, beaches that had served as a destination for toll bridges could be flooded by rising sea levels and no longer support tourism. This could in turn affect toll revenues and ultimately undermine the financial viability of key segments of evacuation routes. Bridge tolls in the northwestern Florida region (Garcon Point and Mid-Bay Bridges) offer one illustration of this potential impact.
Highways provide the majority of transportation infrastructure for emergency operations. There are limited public transportation capabilities that operate on separate rights-of-way. This substantial reliance on a single mode of transportation could endanger many residents if the highway infrastructure is damaged or made inaccessible.
The prospect of climate change may require more frequent changes to emergency management plans and procedures. After the 2005 hurricane season, many public agencies are reassessing the appropriate level of investment for this activity. Recent events, as well as the climate change projections discussed in this report, highlight the need to develop action plans for worst-case scenarios. With predictions of a warmer Gulf Coast climate, more intense storms and hurricanes, and rising relative sea levels, the future design of critical infrastructure and emergency evacuation plans will need to incorporate increased challenges to our emergency management system.

Impacts of Climate Change and Variability on Transportation Systems and Infrastructure: Gulf Coast Study, Phase I Chapter 4: What are the Implications of Climate Change and Variability for Gulf Coast Transportation?
4-49
4.3 Impacts and Adaptation: Case Examples in the Study Region
While sections 4.1 and 4.2 analyze the potential future impacts of climate change on the region, this section focuses on the impacts associated with Hurricanes Katrina and Rita. The challenges of responding to severe weather events are all too familiar to transportation managers in the Gulf Coast. The hurricane season of 2005 was devastating for many communities in the study area. As the region rebuilds, some areas are incorporating changes to infrastructure design to help systems better withstand flooding and storm surge. The lessons learned from the costs of clean up and repair can help managers assess the implications of infrastructure damage as they consider future adaptation options. The following case examples illustrate the issues confronting managers working to ensure a safe and reliable transportation system.
4.3.1 Impacts of Hurricanes Katrina and Rita on Transportation Infrastructure
Hurricane Katrina, which made landfall on August 29, 2005, was the most destructive and costliest natural disaster in the history of the United States and the deadliest hurricane since the 1928 Okeechobee Hurricane. Over 1,800 people lost their lives during Hurricane Katrina, and the economic losses totaled more than $100 billion (Graumann et al., 2006). More than 233,000 km² (90,000 mi2) were declared disaster areas. While a single storm cannot be attributed to climate change, the impacts of Hurricanes Katrina and Rita in 2005 illustrate the types of impacts that would occur more frequently if the Gulf Coast were to experience more Category 4 and 5 hurricanes in the future.
The storm had a devastating impact on much of the transportation infrastructure of coastal Mississippi, Louisiana, and Alabama, causing major damage to highways, railroads, ports, and airports. Damage was caused by flooding, pounding waves, and high winds. In addition, when the floodwaters subsided, an enormous amount of debris still had to be removed before transportation networks could function. Forty-six million yd3 of debris were removed from Mississippi alone (from all locations, not just transportation facilities). Louisiana DOTD spent $74 million on debris removal following Hurricanes Katrina and Rita (Paul, 2007).
Through aggressive action by public and private transportation managers, many major transportation facilities were reopened relatively quickly considering the level of damage. Most of the study area highways, rail lines, pipelines, ports, and airports were back in service within weeks to a month. Limited access across the I-10 Twin Span Bridge was available within two months and nearly full access achieved within five months. The heavily damaged CSX Gulf Coast mainline and its bridges were reopened six months after being washed out by Hurricane Katrina. The worst damaged facilities were the river and bay bridges that carry U.S. Highway 90 along the edge of the Gulf Coast. Though much of the roadway and three of the six badly damaged crossings were repaired within about three
Impacts of Climate Change and Variability on Transportation Systems and Infrastructure: Gulf Coast Study, Phase I Chapter 4: What are the Implications of Climate Change and Variability for Gulf Coast Transportation?
4-50
months, the three remaining bridges took considerably longer to repair or replace. The last of these bridges, the Biloxi-Ocean Springs Bridge, is scheduled to reopen in November 2007, more than two years after Katrina. In all, the price tag of cleanup and reconstruction effort will run into the billions of dollars: the Louisiana Recovery Authority estimated costs exceeding $15 billion for Louisiana alone (Louisiana Recovery Authority, 2006). Mississippi spent more than $1 billion on cleanup and bridge replacement. (Mississippi DOT, 2007).
By most accounts, the impact of Hurricanes Katrina and Rita on national-level freight flows was modest because of redundancy in the national transportation system and timing. Truck traffic was able to divert to parallel east-west interstate routes that avoided the collapsed bridges and other barriers. Railroad operators were able to reroute intermodal and carload traffic that was not bound directly for New Orleans through Memphis and other Midwest rail hubs. Most of the Mississippi river ports and the Mississippi inland waterway were back in service in time to handle the peak export demand later in the fall of 2005. Major pipelines suffered relatively little damage and were able to open within days as electrical power was restored (Grenzeback and Lukmann, 2006).
The following text outlines some of the key impacts by mode.
Roads
The most significant impacts to roads were to the numerous bay and river crossings throughout the region. While the effects were limited in some locations and damage was repaired within days, in some coastal sections prominent elements of the transportation network remained closed many months after the storm. The worst damage was focused in the area along and to the south of the I-10/I-12 corridor, including U.S. Highway 90, State Highway 1, and the Lake Pontchartrain Causeway in Louisiana, as well as I-110 in Mississippi. Three major bridge crossings along the route were destroyed and two more sustained significant damage. The damage was largely caused by the immense force of wave action on the bridge spans, many of which were not sufficiently tied down to the bridge pilings to resist movement (figure 4.4). Spans weighing 300 tons were dislodged by the hurricane.
Inundation also caused structural problems along many miles of roadway. More than 50 km (30 mi) of coastal U.S. Highway 90, which runs through the beachfront communities of Mississippi, were completely inundated by the storm. At a cost of $267 million, the 3.2-km (2-mi), four-lane Bay St. Louis Bridge (U.S. Highway 90) reopened on May 17, 2007. The total request for emergency repairs to Mississippi highways alone after Katrina is $580 million (Mississippi Gulf Coast Regional Planning Commission, 2006). Much of the paved surface between Pass Christian and Biloxi buckled or dropped into sinkholes; in places it took weeks to repair washouts and to remove many feet of sand from the road surface: More than 3,200 km (2,000 mi) of roads were submerged in Louisiana, and the Louisiana DOTD found indications that prolonged inundation can lead to long-term weakening of roadways. A study of pavements submerged longer than three days (some were submerged several weeks) found that asphalt concrete pavements and subgrades

Impacts of Climate Change and Variability on Transportation Systems and Infrastructure: Gulf Coast Study, Phase I Chapter 4: What are the Implications of Climate Change and Variability for Gulf Coast Transportation?
4-51
suffered a strength loss equivalent to 5 cm (2 in) of pavement (Gaspard et al., 2007). The estimate for rehabilitating a portion of these roads, 320 km (200 mi) of submerged State highway pavements, amounted to $50 million.
The expense of poststorm cleanup and repair can be considerable. The Louisiana Recovery Authority estimated that the cost of rebuilding infrastructure (defined as roads, bridges, utilities and debris removal) damaged by the hurricanes would cost $15-18 billion. Louisiana DOTD spent $74 million on debris removal; as of June 2007, Mississippi DOT had spent $672 million on debris removal, highway and bridge repair, and rebuilding the Biloxi and Bay St. Louis bridges; it expects to spend an additional $330 million in the subsequent 18 months (Mississippi DOT, 2007; Louisiana Recovery Authority, 2006). Also, debris removal is not completely benign in terms of further impact; heavy trucks removing debris in Louisiana also damaged some roadways (Paul, 2007).
Rail
The rail infrastructure in coastal Mississippi and Louisiana suffered major damage that took weeks or months to repair. The worst storm damage was focused on a 160-km (100-mi) section of CSX’s Gulf Coast line between New Orleans and Pascagoula, Mississippi. CSX had to restore six major bridges and more than 65 km (40 mi) of track, much of which was washed out or undermined. Damage was so extensive on the line that CSX required more than 5 months and $250 million to complete repairs and to reopen the line. It would take many times that if the company wanted to relocate the line further inland. In addition, New Orleans is a major rail freight interchange point for east-west rail traffic, and the railroads needed to reroute intermodal and carload traffic that was not bound directly for New Orleans through other rail hubs in Memphis and St. Louis, which increased operating expenses (Grenzeback and Lukmann, 2006).
Ports
Due to their low-lying locations, the ports were susceptible to damage from all effects of Hurricane Katrina– high winds, heavy rains, and especially the storm surge. Container cranes were knocked down, storage sheds blown apart, and navigational aids lost. In Gulfport, MS, the storm surge pushed barges hundreds of feet inland and scattered 40-ft containers throughout downtown Gulfport. The storm sank nearly 175 barges near New Orleans, disrupting navigation on the river; however, almost all ports in the central Gulf Coast were able to reopen within a month of Katrina’s landfall. Nonetheless, damage was costly: more than $250 million has been allocated to repair, rebuild, and expand the Port of Gulfport in the wake of Hurricane Katrina (Grenzeback and Lukmann, 2006).
Fortunately, the timing of the storm prevented a catastrophic impact on U.S. agricultural exports. Gulf Coast ports typically handle 55 percent to 65 percent of U.S. raw corn, soybean, and wheat exports. Since the bulk of U.S. corn and soybean harvest moves down the Mississippi River from October to February, the ports were generally able to restore operations in preparation for this critical season, although agriculture still faced increased

Impacts of Climate Change and Variability on Transportation Systems and Infrastructure: Gulf Coast Study, Phase I Chapter 4: What are the Implications of Climate Change and Variability for Gulf Coast Transportation?
4-52
shipping costs due to a shortage of barges. The severe damage to Gulfport (which specializes in importing containerized bananas and winter fruits from Central and South America) did result in a regional shortage of tropical fruits, because major fruit importers such as Dole, Chiquita, and Crowley were forced to reroute shipments to Port Everglades, FL, or Freeport, TX, at extra expense (Grenzeback and Lukmann, 2006).
Airports
A number of airports in the study area received significant damage from the strong winds, flooding rains and embedded tornadoes associated with Hurricane Katrina. Airports sustained damage to passenger terminals, maintenance facilities, and navigational devices. Power outages also took air traffic control facilities offline and darkened nighttime runway lights. As a result, some airports were closed for days and weeks while necessary repairs could be made, but relief flights were flown in before the airport facilities were fully reopened.
Louis Armstrong New Orleans International Airport, the third largest airport in the Central Gulf Coast, sustained damage to its roofs, hangars, and fencing, but had no significant airfield damage despite sitting only 122 cm (4 ft) above sea level (making it the second lowest lying international airport in the world, after Schiphol International in The Netherlands). For the first few weeks of September, the airport was open only to military aircraft and humanitarian flights, but reopened to commercial flights on September 13, 2005. On the other hand, Lakefront Airport, one of the busiest general aviation facilities in the Gulf Coast and located directly on Lake Pontchartrain to the north of the New Orleans city center, suffered extensive damage, with a number of terminals and hangars destroyed. It took 7 weeks before it could even reopen for daytime operations. Gulfport-Biloxi International, the fifth busiest commercial airport in the central Gulf Coast, was also hard hit by the storm. Located less than a mile inland, between U.S. Highway 90 and I-10 in Gulfport, the airport’s terminal building, taxiways, cargo facility, general aviation facility, and rental car facility sustained an estimated $50 million to $60 million in damage. The airport reopened to commercial flights on September 8 and returned to its normal volume of traffic in February 2006 (Grenzeback and Lukmann, 2006).
Fifty-eight airports were surveyed on how they were affected by Hurricanes Katrina and Rita – the extent of damage either hurricane caused, the ability of the airports to cope with the damage, and the use of the airports for emergency management. Twenty-nine airports, or 50 percent, responded to the survey. Forty-eight percent of respondents pointed to the following as some of the main reasons for closure: electrical outage (19 percent), wind damage (16 percent), and debris on runways (12 percent) were the top three reasons identified. Civil, military, and passenger airline operations were affected by the hurricanes. Figure 4.23 identifies airports affected by Hurricane Katrina’s winds. GIS analysis indicates 16 airports experienced winds exceeding 161 km/h (100 mi/h) during Hurricane Katrina, including New Orleans International, Gulfport-Biloxi, and Hattiesburg commercial service airports. These airports are located in southeastern Louisiana and south-central Mississippi. USGS data also indicates that nine airports impacted by Hurricane Rita experienced winds exceeding 161 km/h (100 mi/h), including two

Impacts of Climate Change and Variability on Transportation Systems and Infrastructure: Gulf Coast Study, Phase I Chapter 4: What are the Implications of Climate Change and Variability for Gulf Coast Transportation?
4-53
commercial service airports: Beaumont-Port Arthur in Texas and Lake Charles Regional in southwestern Louisiana. Survey responses indicated additional implications to aircraft operations as follows:
• Civil aircraft operations were closed at 12 airports. The average length of closure to civil aircraft operations was 209 hours, and the maximum observed closure was 1,152 hours. Lakefront Airport in New Orleans, an outlier, was closed for 48 days and skews the data. When removing this airport from the data field, the average length of time closed to civil aircraft operations is 35 hours. It is noteworthy that although many airports “opened” soon after the hurricanes passed, many were without electricity and were only open during daylight hours.
• Military aircraft operations were closed at eight airports. The average length of closure to military aircraft operations at civil airports was 33 hours, and the maximum observed closure was 96 hours.
• Two commercial service airports, Lake Charles Regional and Houston’s William P. Hobby, reported passenger airline operations were suspended at their airport.
[INSERT FIGURE 4.27 Airports affected by Hurricane Katrina winds]
Hangar facilities also were damaged by Hurricanes Katrina and Rita. Thirty-eight percent of responding airports suffered damage to T-hangars, which are long rectangular structures with 12 to 20 “bays” that store single-engine and small twin-engine aircraft. Forty-five percent of responding airports experienced damage to conventional hangars, which are designed to store large aircraft and are 18 by 18 m (60 by 60 ft) to 30 by 30 m (100 by 100 ft) in size. Conventional hangars are also 6 to 9 m (20 to 30 ft) in height to accommodate large aircraft with high tails.
Pipelines
The major petroleum and petroleum-product pipelines servicing the study area received relatively little physical damage from the effects of Hurricanes Katrina and Rita, but could not operate reliably due to massive power outages in the wake of the storms and by interruptions to the supply of fresh product to transport due to refinery shutdowns, causing shortages of petroleum products in parts of the Nation. Even so, most of these systems were able to resume partial service within days of the storm and full service within a week. At the peak of the disruption caused by Hurricane Katrina, 11 petroleum refineries were shut down, representing 2.5 million barrels per day or 15 percent of U.S. refining capacity, and all major pipelines in the area were inoperable due to power outages. By September 4, 5 days after the storm, eight major petroleum refineries remained shut down (representing 1.5 million barrels per day or nine percent of U.S. refining capacity); however, all of the major crude or petroleum product pipelines had resumed operation at either full or near-full capacity (Grenzeback and Lukmann, 2006).
Impacts of Climate Change and Variability on Transportation Systems and Infrastructure: Gulf Coast Study, Phase I Chapter 4: What are the Implications of Climate Change and Variability for Gulf Coast Transportation?
4-54
4.3.2 Evacuation During Hurricane Rita
Emergency evacuation is a key strategy to cope with hurricanes in the low-lying Gulf Coast study region. The evacuation of Houston/Galveston, the largest metropolitan area in the study region, prior to Hurricane Rita presents a case study of the difficulties of evacuating large urban areas and some lessons learned for future emergency planning.
Unlike New Orleans, much of Houston is high enough to be out of the storm surge zone; thus, Galveston and the low-lying eastern areas are generally supposed to evacuate first. However, Houstonians learned during Tropical Storm Allison (2001) that precipitation alone can cause massive flooding in the city from overflowing bayous and lack of drainage. With images of the devastation wrought by Hurricane Katrina fresh on their minds, up to 2.5 million people attempted to evacuate the Houston/Galveston area in the days before Rita’s projected landfall (Mack, 2005) – twice as many people as the area’s evacuation planning was developed for (Durham, 2006). In fact, only about half of these people lived in evacuation zones (Feldstein and Stiles, 2005).
Evacuees faced massive congestion, with 160-km (100-mi) traffic jams reported (Breckinridge et al., 2006). One fifth of the evacuees spent more than 20 hours on the road to leave the area; only half completed the trip in less than 10 hours (Mack, 2005). Worsening the congestion, households traveled in multiple cars in order to get valuable property out of harm’s way: the Texas Transportation Institute (TTI) estimated that on average there were 1.2 occupants per vehicle, versus the 2.1 occupants generally assumed in evacuation planning (Durham, 2006). In an effort to ease congestion, officials improvised a last-minute contraflow system on some highways, which was not part of their original evacuation plan. Fuel shortages plagued travelers as gasoline stations on the evacuation routes were overwhelmed by demand. Tragically, 23 nursing home evacuees died when their bus caught fire on the road.
Following the storm, the Houston-Galveston Area Evacuation and Response Task Force identified several lessons learned from the experience and recommendations for the future (Durham, 2006):
• Evacuation plans should be practiced extensively prior to the hurricane season to reveal problems ahead of time.
• Plans should include a system for removing disabled vehicles – during Rita, an effective incident management service was available only within the Houston city limits. As a result, vehicle breakdowns caused significant bottlenecks along the evacuation routes.
• Contraflow plans should be developed well in advance, but operations are not a panacea. Emergency planners will need to consider the numerous drawbacks of implementing contraflow strategies: They require intensive use of law enforcement and other personnel, disrupt day-to-day operations in areas not evacuating, and make it more difficult to move emergency vehicles and supplies back into the area.

Impacts of Climate Change and Variability on Transportation Systems and Infrastructure: Gulf Coast Study, Phase I Chapter 4: What are the Implications of Climate Change and Variability for Gulf Coast Transportation?
4-55
• Thorough planning is necessary for evacuees with special needs, including ensuring an adequate supply of vehicles, identifying destination(s) capable of supporting their needs, and providing personnel sufficient training to ensure a safe trip.
The Rita evacuation also demonstrated the importance of accounting for human behavior. “Too few” people evacuated New Orleans before Katrina, but “too many” evacuated the Houston-Galveston area (Breckinridge et al., 2006). Evacuation orders are meant to reinforce the fundamental strategy of “run from the water, hide from the wind”; however, in the case of Rita it seems many evacuees ran from the wind. Similarly, the tendency of households to take as many vehicles with them as possible is a logical way to protect property but counterproductive during a mass evacuation. This illustrates the need to better understand the range of potential reactions by residents during a crisis and how best to communicate with the public to facilitate effective emergency management.
4.3.3 Elevating Louisiana Highway 1
Louisiana currently is in the process of upgrading and elevating portions of Louisiana Highway 1, a road that is very important both locally and nationally. It connects Fourchon and Port Fourchon to Leeville and Golden Meadow to the north. The project is broken into multiple phases and includes a four-lane elevated highway between Golden Meadow, Leeville, and Fourchon to be elevated above the 500-year flood level; and a bridge at Leeville with 22.3-m (73-ft) clearance over Bayou LaFourche and Boudreaux Canal. Construction has begun on both the $161 million bridge project and a segment of the road south of Leeville to Port Fourchon (Wilbur Smith, 2007).
Hurricane Katrina’s impact on the energy infrastructure helped raise the profile of the dangers facing and the importance of Louisiana Highway 1. The highway floods even in low-level storms, and in addition to the effects of storm surge, the existing infrastructure also faces threats from very high rates of coastal erosion and subsidence (Smith, 2006).
The importance of this part of the Gulf Coast, and thus Highway 1, to the Nation’s energy supply and infrastructure cannot be overstated. It is the only roadway linking Port Fourchon and the Louisiana Offshore Oil Port (LOOP) to the Nation. Port Fourchon supports 75 percent of deepwater oil and gas production in the Gulf of Mexico, and its role in supporting oil production in the region is increasing. The LOOP, located about 32 km (20 mi) offshore, plays a key role in U.S. petroleum importation, production, and refining as it links daily imports of 1 million barrels and production of 300,000 barrels of oil in the Gulf of Mexico to 50 percent of U.S. refining capacity. Locally, the road is the key route for transporting machinery and supplies to Port Fourchon and offshore oil workers and also for exporting seafood from the region. Perhaps most importantly, it is the evacuation route for south Lafourche and Grand Isle, as well as some 5,000 offshore oil workers (LA 1 Coalition, 2007a and b).

Impacts of Climate Change and Variability on Transportation Systems and Infrastructure: Gulf Coast Study, Phase I Chapter 4: What are the Implications of Climate Change and Variability for Gulf Coast Transportation?
4-56
4.4 Conclusions
The results of this investigation shows a wide range of possible impacts on transportation infrastructure and services across the Gulf Coast study area. Given the uncertainties inherent in modeling and the complexities of the natural processes involved, this analysis does not attempt to pinpoint the precise timing of climate effects but rather provides a broad assessment of potential impacts during the coming decades. These findings provide a critical overview for transportation planners and managers of the potential implications of climate factors and indicate areas of vulnerability that warrant consideration by decision makers. Future investment decisions should be informed by the potential risks identified in this study.
Some of the most evident impacts are related to RSLR and storm surge. A 122-cm (4-ft) increase in relative sea level could inundate a substantial portion of the transportation infrastructure in the region: 28 percent of the arterials, 43 percent of the IM connectors, and 20 percent of the rail miles. Nearly three quarters of ports could be affected, as well as three airports, including Louis Armstrong International in New Orleans. Impacts associated with storm activity are more acute, although confined to the specific locations of individual storm events. Some 51 percent of arterials and 56 percent of interstates, along with almost all ports, a third of rail lines, and 22 airports are vulnerable to a storm surge of 5.5 m (18 ft), should such a surge occur. As the potential of higher-intensity storms increases and sea level rises, the vulnerability of infrastructure to storm surge becomes increasingly significant.
The direct impacts of climate factors on specific facilities can have much broader implications than implied by the percentages and maps contained in this chapter. Damage to critical links in the intermodal network can disrupt connectivity throughout the region. These disruptions can be relatively short term, as in the case of precipitation and some storm surge and weather events; moderate, as in the case of shut-downs to conduct maintenance required to repair pavement surfaces caused by higher temperatures or storm surges; or long-term interruptions of service caused by inundation and damage to entire segments of infrastructure due to storm surge or permanent sea level rise.
The safety impacts associated with climate impacts deserve further in-depth analysis beyond this effort. Storm activity and storm surge in particular have the most direct implications for safety. These include accidents caused by: debris caused by storms, washed-out roads during or after storms, or evacuations before storms. Furthermore, the other key climate drivers, including changes in precipitation patterns, temperature, and relative sea level rise, could have important safety impacts as well.
In addition to these regional impacts, the vulnerabilities of Gulf Coast transportation will have nationwide significance that merit further investigation. The resilience of Gulf Coast transportation infrastructure capabilities has implications for the country’s ability to transport many key commodities into and out of the United States, including petroleum and natural gas, agricultural products, and other bulk goods.

Impacts of Climate Change and Variability on Transportation Systems and Infrastructure: Gulf Coast Study, Phase I Chapter 4: What are the Implications of Climate Change and Variability for Gulf Coast Transportation?
4-57
Data and Research Opportunities
This study identified needs for additional data and research that would further advance understanding of the implications of climate change for transportation. These include information and investigation in the following areas:
• Integration of site-specific data – The integration of site-specific elevation and location data in a GIS-compatible format would greatly facilitate investigation of the impacts of climate change and the natural environment on transportation. This data should include information on transportation facilities as well as on protective structures such as levees and dikes
• Additional and refined climate data and projections – Further development of environmental trend data and climate model projections tailored to transportation decision makers is needed to facilitate integration of climate information into transportation decisions. In addition, specific data on other climate factors not fully addressed in this study would be valuable. These factors include wind speeds, isolated hot days, and fog.
• Effects of climate change on freight transport demand – Research is needed on the perspectives, investment considerations, relocation plans, and adaptation strategies of private sector shippers and freight transportation providers and how their requirements may evolve due to climate change and shifts in market demand.
• Demographic response to climate change – High-population density creates increased need for both passenger transport and movement of consumer goods. Population change will be driven by multiple factors, possibly including changing environmental conditions. Projections of population density along coastal regions and their impact on the demand for freight and passenger services need to be explored.
• Design standards and reconstruction and adaptation costs – Additional case information would be valuable regarding the costs of rebuilding transportation facilities following severe storms. Research is needed on how local agencies are adapting design standards during reconstruction (or construction of new facilities) to increase the resilience of their facilities, such as changes in bridge height or construction, use of new materials, and changes in design criteria. Analysis of the range of adaptation options available and the costs and benefits of specific strategies would help inform State and local transportation planners and decision makers.
• New materials and technologies – Research is needed to develop materials that can better withstand higher temperatures and drier or wetter conditions and technologies that can help us better adapt to the effects of climate change.
• Pipelines – A more complete examination of pipeline impacts from climate change and adaptation strategies is warranted.
• Land use and climate change interactions – Research is required to investigate how
Impacts of Climate Change and Variability on Transportation Systems and Infrastructure: Gulf Coast Study, Phase I Chapter 4: What are the Implications of Climate Change and Variability for Gulf Coast Transportation?
4-58
various land use development and environmental management strategies in vulnerable areas affect the magnitude of climate change impacts on communities and transportation infrastructure. A comparative analysis of current, international best practices in land use and building codes, particularly in coastal regions, could provide useful information to U.S. transportation and planning agencies.
• Emergency management planning/coordination/modeling – Additional study on successful approaches in coordinating emergency management planning among public agencies and major private sector entities in at-risk areas could identify opportunities for improved coordination, public-private partnering, and risk reduction. Development and application of simulation modeling should be considered to illustrate the increasing challenges of evacuating major urban areas and evaluate mitigation strategies. Collection and evaluation of real-time data gathered during emergencies is needed to determine its possible use to first responders, operating agencies, the media, and the general public. Changes in communication and information technology infrastructure also should be explored.
• Secondary and national economic impacts – More in-depth research into the secondary economic impacts to the region and Nation of freight disruption would benefit understanding of national trends and vulnerabilities and inform development of appropriate policies.
• Site-specific impacts – This assessment considers scenarios of change for the counties that comprise the central Gulf Coast. More detailed analysis is desirable since specific transportation facilities will ultimately be affected by climate change. This will require development of climate data and information that is specific to much smaller geographic areas, in addition to detailed analyses of specific facilities.
4.5 Sources
4.5.1 References
Administration on Aging, 2006: Aging into the 21st Century. Department of Health and Human Services. Available on-line at: <http://www.aoa.gov/prof/Statistics/future_growth/aging21/demography.asp>, viewed June 2006.
Ballard, A., 2006: Recommended Practices for Hurricane Evacuation Traffic Operations, Product 0-4962-P2. Available on-line at: <http://tti.tamu.edu/documents/0-4962-P2.pdf>.
Breckinridge, W.L., F.T. Najafi, M. Rouleau, J. Ekberg, and E. Mamaghanizadeh, 2006: A Summary Review on the Importance of Transportation Planning, Preparation, and Execution during a Mass Evacuation. TRB 2007 Annual Meeting CD-ROM, Washington, D.C., 17 pages.

Impacts of Climate Change and Variability on Transportation Systems and Infrastructure: Gulf Coast Study, Phase I Chapter 4: What are the Implications of Climate Change and Variability for Gulf Coast Transportation?
4-59
Bureau of Transportation Statistics (BTS), 2004: National Transportation Atlas Database (NTAD) 2004. U.S. Department of Transportation, Washington, D.C., CD-ROM. [Available on-line at http://www.bts.gov/publications/national_transportation_atlas_database/]
Budzik, Phillip, 2003: Energy Information Administration (EIA), U.S. Natural Gas Markets: Relationship Between Henry Hub Spot Prices and U.S. Wellhead Prices. Available on-line at: <http://www.eia.doe.gov/oiaf/analysispaper/henryhub/index.html>.
City of Biloxi, August 2005: Storm & Flood Preparedness. Available on-line at: <http://www.biloxi.ms.us/PDF/Storm_Flood_2005.pdf>, viewed December 2006.
City of New Orleans, 2006 Emergency Preparedness Plan: July 2006. Available on-line at: <http://www.cityofno.com/Portals/Portal46/portal.aspx?portal=46&tabid=38>, viewed December 2006.
City of Houston, Office of Emergency Management, 2006: Evacuation Information. Available on-line at: <http://www.houstontx.gov/oem/hcra.html>, viewed December 2006.
City of Houston, Office of Emergency Management, 2006: The City of Houston Emergency Plan. Available on-line at: <http://www.houstontx.gov/oem/plan.html>, viewed December 2006.
City of Houston, Office of Emergency Management, 2006: Annex E Evacuation. Available on-line at: <http://www.houstontx.gov/oem/plan.html>, viewed December 2006.
City-Parish of Lafayette, Office of Emergency Preparedness, What To Do In Case of an EVACUATION. Available on-line at: <http://brgov.com/dept/oep/plan.asp#Search%20the%20Plan>, viewed December 2006.
City-Parish of Lafayette, Office of Emergency Preparedness, Lafayette Hurricane Evacuation Routes. Available on-line at: <http://info.louisiana.edu/mahler/oep/sug-rout.html>, viewed December 2006.
Code of Federal Regulations, 2007: Title 49, Section 192.705, Transportation of Natural and other gas by pipeline: Minimum Federal safety standards, transmission lines: patrolling.
Code of Federal Regulations, 2007: Title 49, Section 195.412, Transportation of Hazardous Liquids by pipeline: Inspection of rights-of-way and crossings under navigable waters.
Dessens, J., 1995: Severe convective weather in the context of a nighttime global warming. Geophysical Research Letters., 22, 1,241–1,244.

Impacts of Climate Change and Variability on Transportation Systems and Infrastructure: Gulf Coast Study, Phase I Chapter 4: What are the Implications of Climate Change and Variability for Gulf Coast Transportation?
4-60
Durham, C., 2006: Hurricane Evacuation. TRB 2007 Annual Meeting CD-ROM, Washington, D.C., 19 pages.
East Baton Rouge, Parish of, 2006: Emergency Operations Plan. February 2006. Available on-line at: <http://brgov.com/dept/oep/plan.asp#Search%20the%20Plan>, viewed December 2006.
Ely, J.L., 2005: 2004 Hurricane Season – Florida’s Toll Agencies’ Rise to the Challenge. Presented at the International Bridge, Tunnel, and Turnpike Association 73rd Annual Meeting and Exhibition. Cleveland, Ohio. Available on-line at: <http://www.ibtta.org/files/PDFs/Ely_Jim.pdf>, viewed December 2005.
Energy Information Administration (EIA), 2005: Special Report – Hurricane Katrina’s Impact on U.S. Energy. Department of Energy, Washington, D.C., September 2, 2005. http://tonto.eia.doe.gov/oog/special/eia1_katrina_090205.html.
First Response Coalition, April 2006: The Imminent Storm 2006: Vulnerable Emergency Communications in Eight Hurricane Prone States.
Gaspard, K., M. Martinez, Z. Zhang, and Z. Wu., 2007: Impact of Hurricane Katrina on Roadways in the New Orleans Area. Technical Assistance Report No. 07-2TA, LTRC Pavement Research Group, Louisiana Department of Transportation and Development, Louisiana Transportation Research Center, March 2007, 73 pages.
Graumann, A., T. Houston, J. Lawrimore, D. Levinson, N. Lott, S. McCown, S. Stephens and D. Wuertz, 2005: Hurricane Katrina – a climatological perspective. October 2005, Updated August 2006. Technical Report 2005-01 page 28. NOAA National Climate Data Center, available at http://www.ncdc.noaa.gov/oa/reports/tech-report-200501z.pdf.
Groisman, P.Y., R.W. Knight, T.R. Karl, D.R. Easterling, B. Sun, and J.H. Lawrimore, 2004: Contemporary changes of the hydrological cycle over the contiguous United States: Trends derived from in situ observations. J. Hydrometeorol., 5, 64-85.
Guillet, Jaime, 2007: 2: LA 1: $1.4 billion. New Orleans City Business, February 26, 2007. Available on-line at: <http://www.neworleanscitybusiness.com/viewstory.cfm?recID=18279>, viewed June 2007.
Hitchcock, C., M. Angell, R. Givler, and J. Hooper, 2006: A Pilot Study for Regionally Consistent Hazard Susceptibility Mapping of Submarine Mudslides, Offshore Gulf of Mexico. Minerals Management Service, Engineering & Research Branch, Herndon, Virginia, April 5, 2006.
Hooper, James R. 2005: Hurricane-Induced Seafloor Failures in the Mississippi Delta. Presented to 2005 Offshore Hurricane Readiness and Recovery Conference, Houston, Texas, July 26-27, 2005.

Impacts of Climate Change and Variability on Transportation Systems and Infrastructure: Gulf Coast Study, Phase I Chapter 4: What are the Implications of Climate Change and Variability for Gulf Coast Transportation?
4-61
Karl, T.R., and K.E. Trenberth, 2003. Modern global climate change. Science, 302 (5651), 1,719-1,723.
Louis Berger Group, Inc., 2004: OCS-Related Infrastructure in the Gulf of Mexico Fact Book, OCS Study MMS 2004-027, June 2004. The reported value is believed by the author to represent only in-service oil pipelines in the MMS jurisdiction of the GOM.
Louisiana Recovery Authority, 2006: Press Release: LRA Releases Estimates of Hurricane Impact: Magnitude of Disaster to Factor into Block Grant Discussion Friday, Jan 12, 2006. Available on-line at: <www.lra.louisiana.gov/pr_1_12_impact.html>, viewed 10 July 2007.
Louisiana State Police, 2006: Louisiana Citizen Awareness and Disaster Evacuation Guide, Emergency Evacuation Guide. Available on-line at: <http://www.lsp.org/evacguide.html>, viewed December 2006.
Mississippi Gulf Coast Regional Planning Commission, 2006: Transportation Improvement Program FY 2007-2012, amended 9-28-06. Gulfport, Mississippi.
Mississippi DOT, 2007: Gulf Coast Transportation Recovery Update. 22 June 2007. Mississippi Department of Transportation.
Mississippi DOT, 2005: Hurricane Evacuation Guide. Available on-line at: <http://www.mdot.state.ms.us/cetrp/ms_coastal_hurricane.pdf>, viewed December 2006.
Mobile County Alabama, 2006: Evacuation Procedures. Available on-line at: <http://www.mcema.net/sa_procs.html>, viewed December 2006.
National Assessment Synthesis Team (U.S.). Climate Change Impacts on the United States: The Potential Consequences of Climate Variability and Change. Cambridge University Press, Cambridge, 2001. Available on-line at: <http://www.usgcrp.gov/usgcrp/Library/nationalassessment/foundation.htm>, viewed December 2005.>
Paul, H., 2007: Impacts of Climate Change and Variability on Transportation Systems and Infrastructure: Gulf Coast Study. Presented at Impacts of Climate Change and Variability on Transportation Systems and Infrastructure: Gulf Coast Study, Phase I Federal Advisory Committee Meeting, May 16-17, 2007.
Pipeline and Hazardous Materials Safety Administration (PHMSA), 2007: Annual Reports: National Pipeline Mapping System. PHMSA, U.S. Department of Transportation, Washington, D.C.
Plans Branch, Louisiana Office of Homeland Security and Emergency Preparedness, 2006: Pelican Parish Planning Guidance and Crosswalk for Parish Multi-Hazard Emergency Operations Plans. March 2006. Available on-line at: <http://www.ohsep.louisiana.gov/plans/PELICAN%20CROSSWALK06F.doc>, viewed December 2006.
Impacts of Climate Change and Variability on Transportation Systems and Infrastructure: Gulf Coast Study, Phase I Chapter 4: What are the Implications of Climate Change and Variability for Gulf Coast Transportation?
4-62
Skinner, John, 2006: Pipeline Damage Assessment from Hurricane Ivan. Det Norske Veritas Technology Services, Department of Interior, Minerals Management Services report. Available on-line at: <http://www.mms.gov/tarprojects/553.htm>.
Sloan, Kim, 2007: Bay St. Louis Bridge Open. Mississippi DOT Public Affairs. 17 May 2007. Available on-line at: <http://www.gomdot.com/newsapp/newsDetail.aspx?referrer=list&id=529200710349>, viewed 10 July 2007.
State of Alabama, Emergency Operations Plan, April 20, 2006: Available on-line at: <http://ema.alabama.gov/Misc/Alabama%20EOP%202006.pdf>, viewed December 2006.
State of Louisiana, Office of Homeland Security and Emergency Preparedness, Emergency Operations Plan. April 2005. Available on-line at: <http://www.lsuhsc.edu/hcsd/loep.pdf>, viewed December 2006.
Transportation Research Board, Special Report 281, Transportation Pipelines and Land Use, Washington, D.C., 2004, page 47.
U.S. Census Bureau: Areas Affected by Hurricane Katrina (Revised). Available on-line at: <http://ftp2.census.gov/geo/maps/special/HurKat/Katrina_Pop_65+_v2.pdf>, viewed May 2006.
U.S. Department of Transportation (DOT) in Cooperation with U.S. Department of Homeland Security, 2006: Catastrophic Hurricane Evacuation Plan Evaluation: A Report to Congress. Available on-line at: <http://www.fhwa.dot.gov/reports/hurricanevacuation/index.htm>.
U.S. Geological Survey (USGS), 2004: National Elevation Dataset (NED). U.S. Geological Survey, EROS Data Center, Sioux Falls, South Dakota. [Available on-line at http://ned.usgs.gov/]
Warren, C.L., et al., 2005: Toll Suspension Plan during Hurricanes. Transportation and Expressway Authority Membership of Florida (TEAMFL).
Wilbur Smith Associates, 2007: LA 1 Improvements. Available on-line at: <http://www.la1project.com/index.cfm>, viewed 3 July 2007.
4.5.2 Background Sources
Association of American Railroads, 2005: Back on Track, Issue 2, September 16, 2005, and, Back on Track, Issue 5, October 7, 2005. Available at: <www.aar.org>.
CSX, Press Release: January 19, 2006. CSX Takes First Steps Toward New Logistics Center. Available at: <www.csx.com>.

Impacts of Climate Change and Variability on Transportation Systems and Infrastructure: Gulf Coast Study, Phase I Chapter 4: What are the Implications of Climate Change and Variability for Gulf Coast Transportation?
4-63
CSX, Press Release: January 18, 2006. CSX Transportation to Reopen Vital Gulf Coast Rail Line. Available at: <www.csx.com>.
Feldstein, D. and M. Stiles, 2005: Too Many People and No Way Out. Houston Chronicle, Houston, Texas, September 25.
Grenzeback, L. R., A. T. Lukmann, 2008: Case Study of the Transportation Sector’s Response to and Recovery from Hurricanes Katrina and Rita. In: The Potential Impacts of Climate Change on U.S. Transportation. The National Research Council, National Academy of Science, Transportation Research Board and Department of Earth and Life Sciences, Washington, D.C.
LA 1 Coalition, 2007: Highway Challenge, LA Highway 1: Gateway to the Gulf. Available on-line at: <http://www.la1coalition.org/highway.html, viewed June 2007.
LA 1 Coalition, 2007: The Importance of LA Highway 1 to our Region and our Nation. Available on-line at: <http://www.la1coalition.org/highway_02.html>, viewed June 2007.
Mack, K., 2005: Most Say They’d Evacuate Again. Houston Chronicle, Houston, Texas, November 10.
Nossiter, Adam, “A Bridge Restores a Lifeline to a Battered Town,” The New York Times, May 24, 2007. Available at: <http://www.nytimes.com/2007/05/29/us/nationalspecial/29bridge.html?ex=1338091200&en=24a98c1c1216af01&ei=5088&partner=rssnyt&emc=rss>, viewed 10 July 2007.
Smith, Elliot Blair, 2006: Road to Recovery Sinking into Gulf. USA Today, 18 July 2006. Available on-line at: <http://www.usatoday.com/money/2006-07-17-new-orleans-usat_x.htm>, viewed 3 July 2007.


Impacts of Climate Change and Variability on Transportation Systems and Infrastructure: Gulf Coast Study, Phase I Chapter 4: What are the Implications of Climate Change and Variability for Gulf Coast Transportation?: Tables
4T-1
Table 4.1 Relative sea level rise modeled by using SLRRP.
Low Range High Range
Galveston, TX 117 cm (3.8 ft) 161 cm (5.3 ft)
Grand Isle, LA 160 cm (5.2 ft) 199 cm (6.5 ft)
Pensacola, FL 70 cm (2.3 ft) 114 cm (3.8 ft)
Table 4.2 Relative sea level rise modeled by using CoastClim.
Projected Subsidence
by 2100 RSLR, B1- Low Range
Subsidence, Percent of
Low Range RSLR, A1F1-High Range
Subsidence, Percent of High
Range
Galveston, TX 51.7 cm (1.7 ft) 72 cm (2.4 ft) 71.8% 130 cm (4.3 ft) 39.7%
Grand Isle, LA 88.6 cm (2.9 ft) 109 cm (3.5 ft) 81.3% 167 cm (5.5 ft) 53.0%
Pensacola, FL 3.7 cm (0.12 ft) 24 cm (0.8 ft) 15.4% 82 cm (2.7 ft) 4.5%
Table 4.3 Relative sea level rise impacts on Gulf Coast transportation modes: percentage of facilities vulnerable.
Relative Sea Level Rise
Interstate Highways Ports (Freight) Rail Lines Airports
61 cm (2 ft) 19% 64% 5% 1 airport
122 cm (4 ft) 24% 72% 9% 3 airports

Impacts of Climate Change and Variability on Transportation Systems and Infrastructure: Gulf Coast Study, Phase I Chapter 4: What are the Implications of Climate Change and Variability for Gulf Coast Transportation?: Tables
4T-2
Table 4.4 Storm surge impacts on Gulf Coast transportation modes: percentage of facilities vulnerable.
Storm Surge Height
Interstate Highways
Ports (Freight and Nonfreight) Rail Lines Airports
5.5 m (18 ft) 56% 98% 33% 22 airports
7.0 m (23 ft) 64% 99% 41% 29 airports
Table 4.5 Relative sea level rise impacts on highways: percentage of facilities vulnerable.
Relative Sea Level Rise Arterials Interstates Intermodal Connectors
61 cm (2 ft) 20% 19% 23%
122 cm (4 ft) 28% 24% 43%
Table 4.6 Storm surge impacts on highways: percentage of facilities vulnerable.
Storm Surge Height Arterials Interstates Intermodal Connectors
5.5 m (18 ft) 51% 56% 73%
7.0 m (23 ft) 57% 64% 73%
Table 4.7 Relative sea level rise impacts on rail: percentage of facilities vulnerable.
Relative Sea Level Rise Rail Lines
(track miles) Rail Freight
Facilities (94) Rail Passenger Stations (21)
61 cm (2 ft) 5% 12% 0
122 cm (4 ft) 9% 20% 0

Impacts of Climate Change and Variability on Transportation Systems and Infrastructure: Gulf Coast Study, Phase I Chapter 4: What are the Implications of Climate Change and Variability for Gulf Coast Transportation?: Tables
4T-3
Table 4.8 Railroad-owned and -served freight facilities in the Gulf Coast study region at elevation of 122 cm (4 ft) or less.
Name Modal Access City State Elevation
cm (ft)
KCS Rail and truck Metairie LA < 0
Larsen Intermodal, Inc. Rail and truck Metairie LA < 0
New Orleans Cold Storage and Warehouse, Ltd. Rail and truck Metairie LA < 0
Port of Gulfport Truck, port, rail Gulfport MS < 0
Port of Galveston Truck, port, rail Galveston TX < 0
NS – New Orleans, Louisiana Rail and truck New Orleans LA 0-30 (0-1)
UP Intermodal Facility Rail and truck Avondale LA 0-30 (0-1)
Port of Freeport Truck, port, rail Freeport TX 0-30 (0-1)
Dry Storage Corporation of Louisiana Rail and truck Kenner LA 30-61 (1-2)
DSC Logistics Rail and truck Kenner LA 30-61 (1-2)
Yellow Terminal Rail and truck New Orleans LA 30-61 (1-2)
BNSF – New Orleans, Louisiana Rail and truck Westwego LA 61-91 (2-3)
BNSF 539 Bridge Rail and truck Westwego LA 61-91 (2-3)
BNSF Intermodal Facility Rail and truck New Orleans LA 61-91 (2-3)
Intermodal Cartage Company Truck, port, rail New Orleans LA 61-91 (2-3)
Transflo Rail and truck New Orleans LA 61-91 (2-3)
BNSF 101 Avonda Rail and truck Avondale LA 91-122 (3-4)
Downtown Transfer, Inc. Rail and truck Avondale LA 91-122 (3-4)
Port of New Orleans Truck, port, rail New Orleans LA 91-122 (3-4)

Impacts of Climate Change and Variability on Transportation Systems and Infrastructure: Gulf Coast Study, Phase I Chapter 4: What are the Implications of Climate Change and Variability for Gulf Coast Transportation?: Tables
4T-4
Table 4.9 Vulnerability from sea level rise and storm surge by rail distance and number of facilities.
Cumulative
Elevation Risk Gridcode
Ground Elevation m (Ft)
Length of Railway Segments Vulnerable
km (mi) Freight Facilities
Vulnerable Passenger Facilities
Vulnerable
0 and 1 <0.3 (<1) 26 (86) 8 0
2 0.3-0.6 (1-2) 45 (146) 11 0
3 0.6-0.9 (2-3) 58 (191) 16 0
4 0.9-1.2 (3-4) 81 (267) 19 0
5 1.2-1.5 (4-5) 126 (412) 22 0
6 1.5-5.5 (5-18) 294 (966) 40 9
7 5.5-7.0 (18-23) 363 (1,190) 51 12
8 >7.0 (>23) 894 (2,934) 94 21
Table 4.10 Storm surge impacts on rail: percentage of facilities vulnerable.
Storm Surge Height Rail Lines
(Track Miles) Rail Freight
Facilities (total of 94) Rail Passenger
Stations (total of 21)
5.5 m (18 ft) 33% 43% 43%
7.0 m (23 ft) 41% 54% 57%

Impacts of Climate Change and Variability on Transportation Systems and Infrastructure: Gulf Coast Study, Phase I Chapter 4: What are the Implications of Climate Change and Variability for Gulf Coast Transportation?: Tables
4T-5
Table 4.11 Amtrak stations projected to be impacted by storm surge of 5.5 and 7.0 m (18 and 23 ft).
Station State Amtrak Services
5.5-m (18-ft) Storm Surge Mobile AL Sunset Limited1 Pascagoula MS Sunset Limited1 Lake Charles LA Sunset Limited New Orleans LA City of New Orleans, Crescent, Sunset Limited Schriever LA Sunset Limited Slidell LA Crescent Beaumont TX Sunset Limited Galveston TX Service by bus La Marque TX Service by bus
7.0-m (23-ft) Storm Surge
New Iberia LA Sunset Limited
Bay St. Louis MS Sunset Limited1
Biloxi MS Sunset Limited1
1 Stations are currently inactive due to Hurricane Katrina.
Table 4.12 Relative sea level rise impacts on ports: percentage of facilities vulnerable.
Ports Relative Sea Level Rise Freight Nonfreight
61 cm (2 ft) 64% 68% 122 cm (4 ft) 72% 73%
Table 4.13 Storm surge impacts on ports: percentage of facilities vulnerable.
Storm Surge Height Ports
(Freight and Nonfreight)
5.5 m (18 ft) 98%
7.0 m (23 ft) 99%

Impacts of Climate Change and Variability on Transportation Systems and Infrastructure: Gulf Coast Study, Phase I Chapter 4: What are the Implications of Climate Change and Variability for Gulf Coast Transportation?: Tables
4T-6
Table 4.14 FAA recommended runway lengths for hypothetical general aviation airport. (Source: U.S. DOT Federal Aviation Administration, Airport Design Version 4.2D)
Airport Data
Airport Elevation 30
Maximum Difference in Runway Centerline Elevation (feet) 1
Temperature (°F) 91.5
Runway Condition Wet
Small Airplanes
Small Airplanes with Approach Speeds of Less than 30 Knots 330
Small Airplanes with Approach Speeds of Less than 50 Knots 870
Small Airplanes with Less than 10 Passenger Seats
75 Percent of these Small Airplanes 2,530
95 Percent of these Small Airplanes 3,100
100 Percent of these Small Airplanes 3,660
Small Airplanes with 10 or More Passenger Seats 4,290
Large Airplanes
Large Airplanes of 60,000 Pounds1 or Less
75 Percent of these Large Airplanes at 60 Percent Useful Load 5,370
75 Percent of these Large Airplanes at 90 Percent Useful Load 7,000
100 Percent of these Large Airplanes at 60 Percent Useful Load 5,500
100 Percent of these Large Airplanes at 90 Percent Useful Load 8,520
1 Maximum takeoff weight.
.

Impacts of Climate Change and Variability on Transportation Systems and Infrastructure: Gulf Coast Study, Phase I Chapter 4: What are the Implications of Climate Change and Variability for Gulf Coast Transportation?: Tables
4T-7
Table 4.15 Summary of impacts of temperature change to runway length (general aviation) under three climate scenarios (SRES scenarios A2, B1, and A1B). (Source: U.S. DOT Federal Aviation Administration (FAA) Airport Design Version 4.2D)
50th Percentile 2050 Climate Scenarios 2100 Climate Scenarios Analysis Category Base Year A2 B1 A1B A2 B1 A1B
Possible Mean Maximum Temperature of Hottest Month, °C (°F) 33.0 (91.4) 35.2
(95.5) 34.8
(94.6) 35.5
(95.9) 37.7
(99.9) 35.7
(96.3) 36.9
(98.4)
Runway Length Analysis by Aircraft Type Runway Length
m (Ft) Runway Length Percent Increase Small Airplanes with Less than 10 Passenger Seats
75 Percent of these Small Airplanes 771 (2,530) 1.6% 1.2% 1.6% 3.2% 1.6% 2.8%
95 Percent of these Small Airplanes 945 (3,100) 1.3% 1.0% 1.6% 2.9% 1.6% 2.6%
100 Percent of these Small Airplanes 1,116 (3,660) 1.6% 1.1% 1.6% 3.3% 1.6% 2.7%
Small Airplanes with 10 or More Passenger Seats 1,308 (4,290) 1.6% 1.2% 1.9% 3.3% 1.9% 2.8%
Large Airplanes of 60,000 Pounds or Less
75 Percent of these Large Airplanes at 60 Percent Useful Load 1,637 (5,370) 0.9% 0.7% 1.1% 2.4% 1.1% 2.0%
75 Percent of these Large Airplanes at 90 Percent Useful Load 2,134 (7,000) 2.1% 0.9% 2.7% 7.9% 2.7% 6.0%
100 Percent of these Large Airplanes at 60 Percent Useful Load 1,676 (5,500) 2.5% 1.6% 3.3% 8.0% 3.3% 6.2%
100 Percent of these Large Airplanes at 90 Percent Useful Load 2,597 (8,520) 6.8% 4.9% 7.9% 16.3% 7.9% 13.1%

Impacts of Climate Change and Variability on Transportation Systems and Infrastructure: Gulf Coast Study, Phase I Chapter 4: What are the Implications of Climate Change and Variability for Gulf Coast Transportation?: Tables
4T-8
Table 4.16 Commercial aircraft runway length takeoff requirements.
Commercial Service Airport Primary Runway Lengths (m) EFD IAH HOU BPT MSY LFT BTR LCH MOB GPT HBG
Aircraft Group Aircraft
Type1 Required
Runway Length2 2,744 3,658 2,317 2,057 3,080 2,332 2,135 1,981 2,597 2,744 1,859
A. Measured in Meters
747-400 3,170 -426 488 -853 -1,113 -90 -838 -1,035 -1,189 -573 -426 -1,311 MD 11 3,597 -853 61 -1,280 -1,539 -517 -1,265 -1,462 -1,615 -999 -853 -1,738
Wide-Body
777-200LR 3,505 -762 153 -1,188 -1,448 -426 -1,173 -1,370 -1,524 -908 -761 -1,646 737-900 2,652 92 1,006 -335 -594 428 -320 -517 -671 -55 92 -793 DC-9-15 2,499 244 1,159 -182 -442 580 -167 -365 -518 98 244 -640 737-800 2,225 518 1,433 92 -168 855 107 -90 -244 372 519 -366 MD-80 2,195 549 1,463 123 -137 885 137 -60 -213 403 549 -336 737-300 2,012 732 1,646 305 46 1,068 320 123 -30 586 732 -153 A300-600 1,981 762 1,677 336 76 1,098 351 154 0 616 763 -122 737-500 1,920 823 1,738 397 137 1,159 412 215 61 677 824 -61 A319 1,859 884 1,799 458 198 1,220 473 276 122 738 885 -0.3757-200 1,829 915 1,829 488 229 1,251 503 306 152 768 915 30
Medium-Haul3 Narrow Body
737-600 1,768 976 1,890 549 290 1,312 564 367 213 829 976 91 ERJ 145 1,951 793 1,707 366 107 1,129 381 184 30 646 793 -92 Regional Jets and
Turboprops ERJ 135 1,951 793 1,707 366 107 1,129 381 184 30 646 793 -92 CRJ 1,829 915 1,829 488 229 1,251 503 306 152 768 915 30 DASH8-300 1,554 1,189 2,103 763 503 1,525 778 580 427 1,043 1,189 304

Impacts of Climate Change and Variability on Transportation Systems and Infrastructure: Gulf Coast Study, Phase I Chapter 4: What are the Implications of Climate Change and Variability for Gulf Coast Transportation?: Tables
4T-9
Table 4.16 Commercial aircraft runway length takeoff requirements. (continued)
Commercial Service Airport Primary Runway Lengths (Ft) EFD IAH HOU BPT MSY LFT BTR LCH MOB GPT HBG
Aircraft Group Aircraft
Type1 Required
Runway Length2 9,001 12,001 7,602 6,750 10,104 7,651 7,004 6,500 8,521 9,002 6,099
B. Measured in Feet
747-400 10,400 -1,399 1,601 -2,798 -3,650 -296 -2,749 -3,396 -3,900 -1,879 -1,398 -4,301 MD 11 11,800 -2,799 201 -4,198 -5,050 -1,696 -4,149 -4,796 -5,300 -3,279 -2,798 -5,701
Wide-Body
777-200LR 11,500 -2,499 501 -3,898 -4,750 -1,396 -3,849 -4,496 -5,000 -2,979 -2,498 -5,401 737-900 8,700 302 3,301 -1,098 -1,950 1,404 -1,049 -1,696 -2,200 -179 302 -2,601 DC-9-15 8,200 801 3,801 -598 -1,450 1,904 -549 -1,196 -1,700 321 802 -2,101 737-800 7,300 1,701 4,701 302 -550 2,804 351 -296 -800 1,221 1,702 -1,201 MD-80 7,200 1,801 4,801 402 -450 2,904 451 -196 -700 1,321 1,802 -1,101 737-300 6,600 2,401 5,401 1,002 150 3,504 1,051 404 -100 1,921 2,402 -501 A300-600 6,500 2,501 5,501 1,102 250 3,604 1,151 504 0 2,021 2,502 -401 737-500 6,300 2,701 5,701 1,302 450 3,804 1,351 704 200 2,221 2,702 -201 A319 6,100 2,901 5,901 1,502 650 4,004 1,551 904 400 2,421 2,902 -1 757-200 6,000 3,001 6,001 1,602 750 4,104 1,651 1,004 500 2,521 3,002 99
Medium-Haul3 Narrow Body
737-600 5,800 3,201 6,201 1,802 950 4,304 1,851 1,204 700 2,721 3,202 299 ERJ 145 6,400 2,601 5,601 1,202 350 3,704 1,251 604 100 2,121 2,602 -301 Regional Jets and
Turboprops ERJ 135 6,400 2,601 5,601 1,202 350 3,704 1,251 604 100 2,121 2,602 -301 CRJ 6,000 3,001 6,001 1,602 750 4,104 1,651 1,004 500 2,521 3,002 99 DASH8-300 5,100 3,901 6,901 2,502 1,650 5,004 2,551 1,904 1,400 3,421 3,902 999
1 MD 11 aircraft runway length based on standard day +18°C (33°F). All other aircraft based on standard day +15°C (27°F). 2 Assumes all elevations at sea level. 3 Medium-Haul are aircraft weights for 800 miles of fuel on-board.
EFD Houston Ellington Field MSY New Orleans International MOB Mobile Regional
IAH Houston Intercontinental LFT Lafayette Regional GPT Gulfport Biloxi
HOU Houston Hobby BTR Baton Rouge Metropolitan HBG Hattiesburg Regional
BPT Beaumont/Port Arthur Regional LCH Lake Charles Regional

Impacts of Climate Change and Variability on Transportation Systems and Infrastructure: Gulf Coast Study, Phase I Chapter 4: What are the Implications of Climate Change and Variability for Gulf Coast Transportation?: Tables
4T-10
Table 4.17 Airports located on 100-year flood plains. (Sources: Wilbur Smith Associates; USGS)
Associated City State Airport Name
Gonzales LA Louisiana Regional
Sulphur LA Southland Field
Galliano LA South Lafourche
New Orleans LA Lakefront
Reserve LA St. John The Baptist Parish
Thibodaux LA Thibodaux Municipal
Winnie/Stowell TX Chambers County-Winnie Stowell
Galveston TX Scholes International at Galveston
Table 4.18 Gulf Coast study area airports vulnerable to submersion by relative sea level rise of 61 to 122 cm (2 to 4 ft).
State Associated City Airport Name Airport
Type Elevation
in Feet
Louisiana Galliano South LaFourche GA 1
Louisiana New Orleans New Orleans NAS JRB MIL 3
Louisiana New Orleans Louis Armstrong-New Orleans International CS 4

Impacts of Climate Change and Variability on Transportation Systems and Infrastructure: Gulf Coast Study, Phase I Chapter 4: What are the Implications of Climate Change and Variability for Gulf Coast Transportation?: Tables
4T-11
Table 4.19 Gulf Coast study area airports vulnerable to storm surge. (Sources: U.S. DOT FAA Records, April 2006; FEMA Storm Inundation Data)
State Associated City Airport Name Airport Type
Elevation
m (ft)
Airports 0 to 5.5 m (18 ft) Elevation
Alabama Gulf Shores Jack Edwards General Aviation 4.9 (16)
Alabama Mobile Dauphin Island Airport General Aviation 1.5 (5)
Louisiana Abbeville Abbeville Chris Crusta Memorial General Aviation 4.6 (15)
Louisiana Crowley Le Gros Memorial General Aviation 5.2 (17)
Louisiana Galliano South LaFourche General Aviation 0.3 (1)
Louisiana Gonzales Louisiana Regional General Aviation 4.6 (15)
Louisiana Houma Houma-Terrebonne General Aviation 3.0 (10)
Louisiana Jeanerette Le Maire Memorial General Aviation 4.3 (14)
Louisiana Lake Charles Lake Charles Regional Commercial Services 4.6 (15)
Louisiana Lake Charles Chennault International Industrial 5.2 (17)
Louisiana New Orleans New Orleans NAS JRB Military 0.9 (3)
Louisiana New Orleans Louis Armstrong-New Orleans International Commercial Services 1.2 (4)
Louisiana New Orleans Lakefront General Aviation 2.4 (8)
Louisiana Patterson Harry P. Williams Memorial General Aviation 2.7 (9)
Louisiana Reserve St. John The Baptist Parish General Aviation 2.1 (7)
Louisiana Sulphur Southland Field General Aviation 3.4 (11)
Louisiana Thibodaux Thibodaux Municipal General Aviation 2.7 (9)
Louisiana Welsh Welsh General Aviation 5.5 (18)
Mississippi Pascagoula Trent Lott International General Aviation 5.2 (17)
Texas Beaumont/Port Arthur Southeast Texas Regional General Aviation 4.6 (15)
Texas Galveston Scholes International at Galveston General Aviation 1.8 (6)
Texas Orange Orange County General Aviation 4.0 (13)
Airports 5.6 – 7.0 m (19 to 23 ft) Elevation
Alabama Mobile Mobile Downtown Industrial 5.8 (19)
Louisiana Iberia Acadiana Regional Industrial 6.1 (20)
Louisiana Jefferson Davis Jennings General Aviation 6.1 (20)
Mississippi Hancock Stennis International Industrial 7.0 (23)
Mississippi Harrison Keesler AFB Military 6.1 (20)
Texas Brazoria Brazoria County General Aviation 6.7 (22)
Texas Chambers Chambers County-Winnie Stowell General Aviation 6.4 (21)

Impacts of Climate Change and Variability on Transportation Systems and Infrastructure: Gulf Coast Study, Phase I Chapter 4: Impacts on Climate Variability and Change of Transportation in the Gulf Coast: Tables
4T-12
Table 4.20 Hurricane impacts on toll revenue in Florida. (Source: Ely, 2005)
Hurricane Season 2004 Millions Entity Estimated Revenue Loss Estimated Damage Costs Estimated Total Loss
Turnpike System $32.21 $8.50 $40.71
FDOT-Owned (5) 2.48 1.33 3.81
Garcon Point 0.27 0.22 0.49
Mid-Bay 0.52 0.25 0.77
MDX 1.03 0.00 1.03
Bob Sikes 0.30 1.76 2.06
THCEA 1.44 0.00 1.44
OOCEA 9.07 1.50 10.57
Lee County 0.70 0.87 1.57
Miami-Dade County 0.11 0.00 0.11
Monroe (Card Sound) 0.04 0.00 0.04
Total $48.17 $14.43 $62.60

Impacts of Climate Change and Variability on Transportation Systems and Infrastructure: Gulf Coast Study, Phase I Chapter 4: What are the Implications of Climate Change and Variability for Gulf Coast Transportation?: Figures
Figure 4.1 Highways at risk from a relative sea level rise of 61 cm (2 ft). (Source: Cambridge Systematics analysis of U.S. DOT data)
4F-1

Impacts of Climate Change and Variability on Transportation Systems and Infrastructure: Gulf Coast Study, Phase I Chapter 4: What are the Implications of Climate Change and Variability for Gulf Coast Transportation?: Figures
Figure 4.2 Highways at risk from a relative sea level rise of 122 cm (4 ft). (Source: Cambridge Systematics analysis of U.S. DOT data)
4F-2

Impacts of Climate Change and Variability on Transportation Systems and Infrastructure: Gulf Coast Study, Phase I Chapter 4: What are the Implications of Climate Change and Variability for Gulf Coast Transportation?: Figures
4F-3
Figure 4.3 National Highway System (NHS) intermodal connectors at risk from a relative sea level rise of 122 cm (4 ft). (Source: CambridgSystematics
e analysis of U.S. DOT data)

Impacts of Climate Change and Variability on Transportation Systems and Infrastructure: Gulf Coast Study, Phase I Chapter 4: What are the Implications of Climate Change and Variability for Gulf Coast Transportation?: Figures
Figure 4.4 Hurricane Katrina damage to U.S. Highway 90 at Bay St. Louis, MS. (Source: NASA Remote Sensing Tutorial)
4F-4
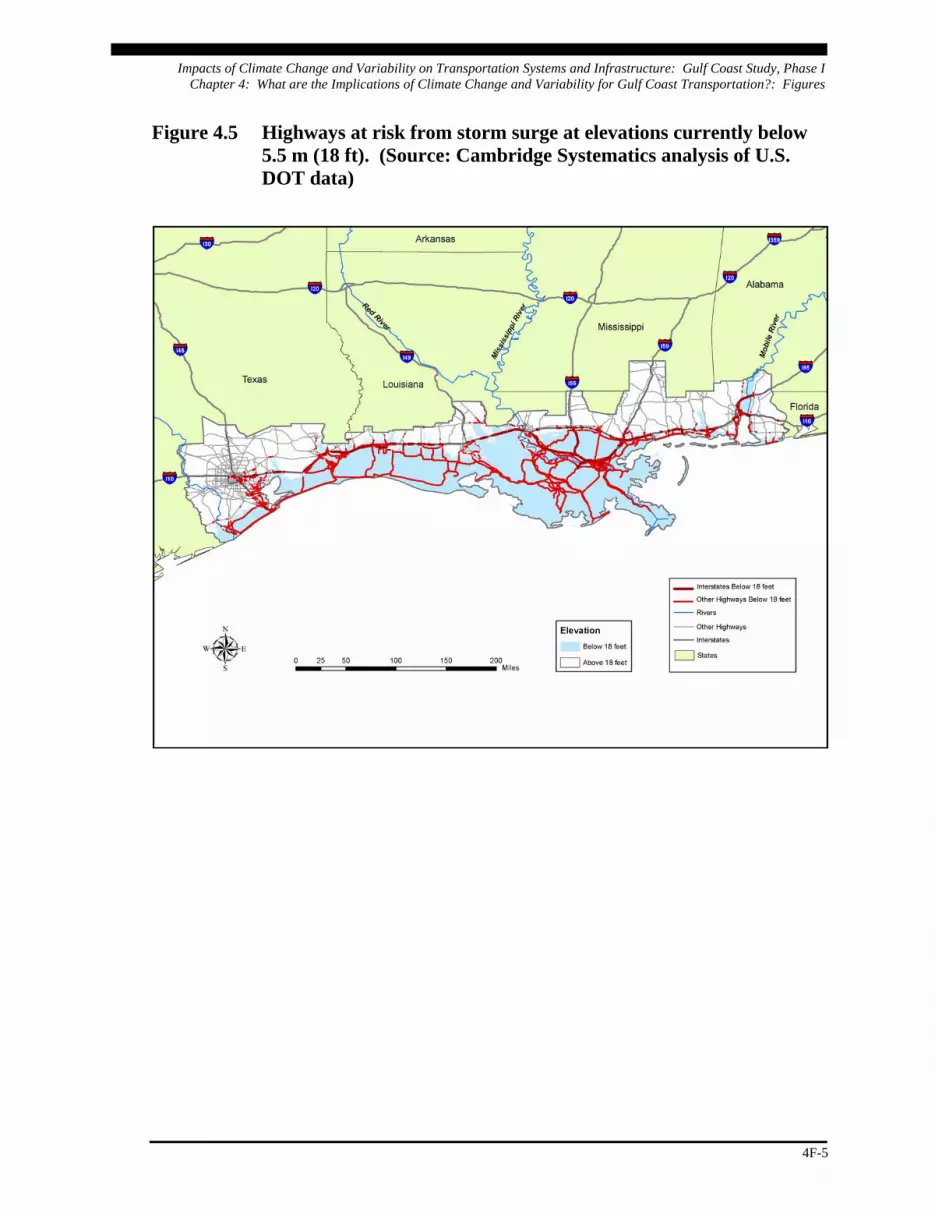
Impacts of Climate Change and Variability on Transportation Systems and Infrastructure: Gulf Coast Study, Phase I Chapter 4: What are the Implications of Climate Change and Variability for Gulf Coast Transportation?: Figures
Figure 4.5 Highways at risk from storm surge at elevations currently below 5.5 m (18 ft). (Source: Cambridge Systematics analysis of U.S. DOT data)
4F-5

Impacts of Climate Change and Variability on Transportation Systems and Infrastructure: Gulf Coast Study, Phase I Chapter 4: What are the Implications of Climate Change and Variability for Gulf Coast Transportation?: Figures
Figure 4.6 Highways currently at risk from storm surge at elevations currently below 7.0 m (23 ft). (Source: Cambridge Systematics analysis of U.S. DOT data)
4F-6

Impacts of Climate Change and Variability on Transportation Systems and Infrastructure: Gulf Coast Study, Phase I Chapter 4: What are the Implications of Climate Change and Variability for Gulf Coast Transportation?: Figures
Figure 4.7 National Highway System (NHS) intermodal connectors at risk from storm surge at elevations currently below 7.0 m (23 ft). (Source: Cambridge Systematics analysis of U.S. DOT data)
4F-7

Impacts of Climate Change and Variability on Transportation Systems and Infrastructure: Gulf Coast Study, Phase I Chapter 4: What are the Implications of Climate Change and Variability for Gulf Coast Transportation?: Figures
Figure 4.8 Fixed bus routes at risk from a relative sea level rise of 122 cm (4 ft), New Orleans, LA. (Source: Cambridge Systematics analysis of U.S. DOT data)
4F-8

Impacts of Climate Change and Variability on Transportation Systems and Infrastructure: Gulf Coast Study, Phase I Chapter 4: What are the Implications of Climate Change and Variability for Gulf Coast Transportation?: Figures
Figure 4.9 Fixed transit guideways at risk from a relative sea level rise of 122 cm (4 ft), Houston and Galveston, TX. (Source: Cambridge Systematics analysis of U.S. DOT data)
4F-9

Impacts of Climate Change and Variability on Transportation Systems and Infrastructure: Gulf Coast Study, Phase I Chapter 4: What are the Implications of Climate Change and Variability for Gulf Coast Transportation?: Figures
Figure 4.10 Fixed transit guideways at risk from storm surge at elevations currently below 5.5 m (18 ft), New Orleans, LA. (Source: Cambridge Systematics analysis of U.S. DOT data)
4F-10

Impacts of Climate Change and Variability on Transportation Systems and Infrastructure: Gulf Coast Study, Phase I Chapter 4: What are the Implications of Climate Change and Variability for Gulf Coast Transportation?: Figures
Figure 4.11 Fixed transit guideways at risk from storm surge at elevations currently below 5.5 m (18 ft), Houston and Galveston, TX. (Source: Cambridge Systematics analysis of U.S. DOT data)
4F-11

Impacts of Climate Change and Variability on Transportation Systems and Infrastructure: Gulf Coast Study, Phase I Chapter 4: What are the Implications of Climate Change and Variability for Gulf Coast Transportation?: Figures
Figure 4.12 Fixed bus routes at risk from storm surge at elevations currently below 5.5 m (18 ft), New Orleans, LA. (Source: Cambridge Systematics analysis of U.S. DOT data)
4F-12
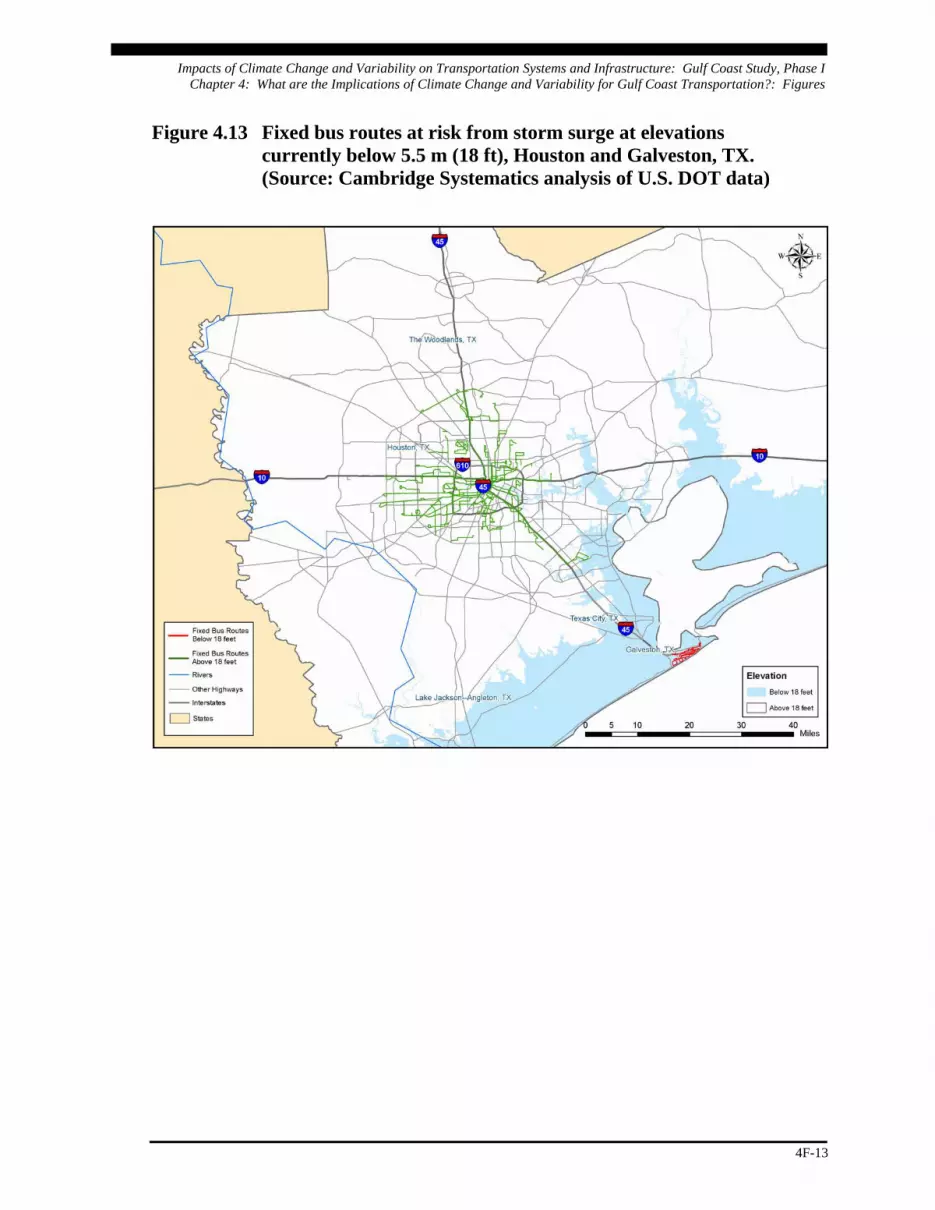
Impacts of Climate Change and Variability on Transportation Systems and Infrastructure: Gulf Coast Study, Phase I Chapter 4: What are the Implications of Climate Change and Variability for Gulf Coast Transportation?: Figures
Figure 4.13 Fixed bus routes at risk from storm surge at elevations currently below 5.5 m (18 ft), Houston and Galveston, TX. (Source: Cambridge Systematics analysis of U.S. DOT data)
4F-13

Impacts of Climate Change and Variability on Transportation Systems and Infrastructure: Gulf Coast Study, Phase I Chapter 4: What are the Implications of Climate Change and Variability for Gulf Coast Transportation?: Figures
Figure 4.14 Rail lines at risk due to relative sea level rise of 61 and 122 cm (2 and 4 ft). Of the 4,722 km (2,934 mi) of rail lines in the region, 235 km (146 mi), or 5 percent, are at risk from a relative sea level rise of 61 cm (2 ft) or less. An additional 195 km (121 mi), for a total of nine percent, are at risk from an increase of 61 to 122 cm (2 to 4 ft). (Source: Cambridge Systematics analysis of U.S. DOT data)
4F-14

Impacts of Climate Change and Variability on Transportation Systems and Infrastructure: Gulf Coast Study, Phase I Chapter 4: What are the Implications of Climate Change and Variability for Gulf Coast Transportation?: Figures
Figure 4.15 Railroad-owned and -served freight facilities at risk due to relative sea level rise of 61 and 122 cm (2 and 4 ft). Of the 94 facilities in the region, 11 are at risk from a 61-cm (2-ft) increase in relative sea level, and an additional 8 facilities are at risk from a 122-cm (4-ft) increase. (Source: Cambridge Systematics analysis of U.S. DOT data)
4F-15

Impacts of Climate Change and Variability on Transportation Systems and Infrastructure: Gulf Coast Study, Phase I Chapter 4: What are the Implications of Climate Change and Variability for Gulf Coast Transportation?: Figures
Figure 4.16 Rail lines at risk due to storm surge of 5.5 and 7.0 m (18 and 23 ft). Of the 4,722 km (2,934 mi) of rail lines in the region, 1,555 km (966 mi) are potentially at risk from a storm surge of 5.5 m (18 ft), and an additional 360 km (224 mi) are potentially at risk from a storm surge of 7.0 m (23 ft). (Source: Cambridge Systematics analysis of U.S. DOT data)
4F-16

Impacts of Climate Change and Variability on Transportation Systems and Infrastructure: Gulf Coast Study, Phase I Chapter 4: What are the Implications of Climate Change and Variability for Gulf Coast Transportation?: Figures
Figure 4.17 Railroad-owned and -served freight facilities at risk due to storm surge of 5.5 and 7.0 m (18 and 23 ft). Of the 94 facilities in the region, 40 are at risk from a storm surge of 5.5 m (18 ft) or less, and an additional 11 facilities are at risk from storm surge of 5.5 to 7.0 m (18 to 23 ft). (Source: Cambridge Systematics analysis of U.S. DOT data)
4F-17

Impacts of Climate Change and Variability on Transportation Systems and Infrastructure: Gulf Coast Study, Phase I Chapter 4: What are the Implications of Climate Change and Variability for Gulf Coast Transportation?: Figures
Figure 4.18 Amtrak facilities at risk due to storm surge of 5.5 and 7.0 m (18 and 23 ft). Of the 21 Amtrak facilities in the region, 9 are at risk from a storm surge of 7.0 m (18 ft) or less, and an additional 3 facilities are at risk from storm surge of 5.5 to 7.0 m (18 to 23 ft). (Source: Cambridge Systematics analysis of U.S. DOT data)
4F-18

Impacts of Climate Change and Variability on Transportation Systems and Infrastructure: Gulf Coast Study, Phase I Chapter 4: What are the Implications of Climate Change and Variability for Gulf Coast Transportation?: Figures
Figure 4.19 Freight handling port facilities at risk from relative sea level rise of 61 and 122 cm (2 and 4 ft). (Source: Cambridge Systematics analysis of U.S. Army Corps of Engineers data)
4F-19

Impacts of Climate Change and Variability on Transportation Systems and Infrastructure: Gulf Coast Study, Phase I Chapter 4: What are the Implications of Climate Change and Variability for Gulf Coast Transportation?: Figures
Figure 4.20 Freight handling port facilities at risk from storm surge of 5.5 and 7.0 m (18 and 23 ft). (Source: Cambridge Systematics analysis of U.S. Army Corps of Engineers data)
4F-20

Impacts of Climate Change and Variability on Transportation Systems and Infrastructure: Gulf Coast Study, Phase I Chapter 4: What are the Implications of Climate Change and Variability for Gulf Coast Transportation?: Figures
Figure 4.21 Boeing 757-200 takeoff runway requirements for design purposes. (Source: The Boeing Company, 2002)
4F-21

Impacts of Climate Change and Variability on Transportation Systems and Infrastructure: Gulf Coast Study, Phase I Chapter 4: What are the Implications of Climate Change and Variability for Gulf Coast Transportation?: Figures
Figure 4.22 Gulf Coast study area airports at risk from storm surge. (Source: Cambridge Systematics analysis of U.S. DOT and USGS data)
4F-22

Impacts of Climate Change and Variability on Transportation Systems and Infrastructure: Gulf Coast Study, Phase I Chapter 4: What are the Implications of Climate Change and Variability for Gulf Coast Transportation?: Figures
Figure 4.23 Landside pipelines having at least one GIS link located in an area of elevation 0 to 91 cm (3 ft) above sea level in the study area. (Source: Texas Transportation Institute)
4F-23

Impacts of Climate Change and Variability on Transportation Systems and Infrastructure: Gulf Coast Study, Phase I Chapter 4: What are the Implications of Climate Change and Variability for Gulf Coast Transportation?: Figures
Figure 4.24 Evacuation route highways potentially vulnerable from storm surge of 5.5 m (18 ft). (Source: Cambridge Systematics analysis of U.S. DOT data)
4F-24

Impacts of Climate Change and Variability on Transportation Systems and Infrastructure: Gulf Coast Study, Phase I Chapter 4: What are the Implications of Climate Change and Variability for Gulf Coast Transportation?: Figures
Figure 4.25 Risks to Amtrak facilities due to relative sea level rise and storm surge. (Source: Cambridge Systematics analysis of U.S. DOT data)
4F-25

Impacts of Climate Change and Variability on Transportation Systems and Infrastructure: Gulf Coast Study, Phase I Chapter 4: What are the Implications of Climate Change and Variability for Gulf Coast Transportation?: Figures
Figure 4.26 Population over age 65 impacted by Hurricane Katrina. (Source: U.S. Census Bureau)
4F-26

Impacts of Climate Change and Variability on Transportation Systems and Infrastructure: Gulf Coast Study, Phase I Chapter 4: What are the Implications of Climate Change and Variability for Gulf Coast Transportation?: Figures
4F-27
Figure 4.27 Airports affected by Hurricane Katrina winds. (Source: USGS)
