2015 client satisfaction survey - stanford university
TRANSCRIPT

University IT2015 Client Satisfaction Survey
May 2015

AcknowledgementsThe 2015 Client Satisfaction Survey Team Sponsors:
Randy Livingston, OCIOBill Clebsch, IT Services
Michael Duff, ISOGanesh Karkala, AS
Sam Steinhardt, Shared Services
The 2015 Client Satisfaction Survey Team: Jim Knox, University IT, Lead Project Manager
Julie Simmons, IT Services, Project Manager Claudia Dencker, AS
Tricia Richter, AS Alvin Chew, IT Services
Christina Zuffinetti, IT Services Liz Goesseringer, IT Services
David Hoffman, ISOJan Cicero, IT Services
Brian McDonald, MOR AssociatesChris Paquette, MOR Associates
Rob Smyser, MOR AssociatesAlicia Jurus, MOR Associates
MOR Associates, an external consulting firm, acted as project manager for this effort, analyzing the data and preparing this report. MOR Associates specializes in continu-ous improvement, strategic thinking and leadership development. MOR Associates has conducted a number of large-scale satisfaction surveys for IT organizations in higher education, including Yale, MIT, Northeastern University, the University of Chicago, and others.
MOR Associates, Inc.462 Main Street, Suite 300
Watertown, MA 02472tel: 617.924.4501morassociates.com
Brian McDonald, [email protected]
Contents
Introduction . . . . . . . . . . . . . . . . . . . . . . . . . . . . . . . . . . . . . . . . . . . . . . . . . . . . . . a1
Stanford’s 2015 Sample Size and Response Rates . . . . . . . . . . . . . . . . . . . . . . . a3
Overview of the Results . . . . . . . . . . . . . . . . . . . . . . . . . . . . . . . . . . . . . . . . . . ES-1
Reading the Charts . . . . . . . . . . . . . . . . . . . . . . . . . . . . . . . . . . . . . . . . . . . . . . . . . 1
University IT Service Attributes . . . . . . . . . . . . . . . . . . . . . . . . . . . . . . . . . . . . . . . 3
General Support . . . . . . . . . . . . . . . . . . . . . . . . . . . . . . . . . . . . . . . . . . . . . . . . . . . . 7
University IT Communications . . . . . . . . . . . . . . . . . . . . . . . . . . . . . . . . . . . . . . . 19
Network Services . . . . . . . . . . . . . . . . . . . . . . . . . . . . . . . . . . . . . . . . . . . . . . . . . . 27
Collaboration Tools . . . . . . . . . . . . . . . . . . . . . . . . . . . . . . . . . . . . . . . . . . . . . . . . 31
Research Computing . . . . . . . . . . . . . . . . . . . . . . . . . . . . . . . . . . . . . . . . . . . . . . . 41
Central Data Storage Services . . . . . . . . . . . . . . . . . . . . . . . . . . . . . . . . . . . . . . . 49
Telecommunications . . . . . . . . . . . . . . . . . . . . . . . . . . . . . . . . . . . . . . . . . . . . . . . 57
Services . . . . . . . . . . . . . . . . . . . . . . . . . . . . . . . . . . . . . . . . . . . . . . . . . . . . . . . . . . 57
Information Security Office . . . . . . . . . . . . . . . . . . . . . . . . . . . . . . . . . . . . . . . . . 61
Web-Related Services . . . . . . . . . . . . . . . . . . . . . . . . . . . . . . . . . . . . . . . . . . . . . . 67
Administrative Systems . . . . . . . . . . . . . . . . . . . . . . . . . . . . . . . . . . . . . . . . . . . . . 73
Appendix A: The Full Text of Written Comments . . . . . . . . . . . . . . . . . . . . . . . A-1
Appendix B: The Survey Instruments . . . . . . . . . . . . . . . . . . . . . . . . . . . . . . . . . B-1University IT Survey � � � � � � � � � � � � � � � � � � � � � � � � � � � � � � � � � � B1
Administrative Systems Survey � � � � � � � � � � � � � � � � � � � � � � � � B29

Stanford University IT 2015 Client Satisfaction Survey • Introduction | a1
MOR Associates, Inc.
IntroductionThis report provides a summary of the purposes, the methodology and the results of the client satisfaction survey sponsored by University IT in May, 2015. The survey is one means through which University IT can give a voice to its clients. It is a systematic way to identify what is working and what needs to be improved from the clients’ vantage point. This survey was undertaken for the following purposes all of which helped guide the construct and design of the survey.
§ To document where clients are satisfied and dissatisfied, and to identify what gaps cause any disappointment in the client experience.
§ To find out what improvements are important to clients.
§ To use this data to prioritize the continuous improvement initiatives that will make it easier for University IT’s clients to do their work.
The ultimate goal is to provide an excellent client IT experience that supports the teaching, learning, research and busi-ness needs of the Stanford community. In the near term the goal is to improve the clients’ ability to use IT to get their work done. The survey findings on the following pages provide a sound basis for determining how University IT can focus its efforts to enhance the quality of the client experience at Stanford University.
Brian McDonald President, MOR Associates
a2 | Introduction • Stanford University IT 2015 Client Satisfaction Survey
MOR Associates, Inc.
Survey Methodology
Survey PopulationThe survey solicited feedback from two client communities: faculty and administrative staff. Most of the survey data will be presented based on these two categories.
A supplementary survey was administered as a census to clients of Administrative Systems who work with AS in devel-oping and deploying applications.
Selection Criteria - All Communities § Had to have a full-service SUNet ID.
§ Hospital employees were excluded.
§ SLAC employees were excluded.
§ University IT staff were excluded.
§ Bargaining units were excluded.
§ Visiting faculty were excluded.
Selection Criteria - Faculty § Tenured, Tenure Line, Appointment Line are included.
Selection Criteria - Administrative Systems Supplementary Survey § Included business owners and associated staff member who collaborate with AS in developing and/or deploying applications for the business owners and their communities.
The following table presents a summary of the population and sample size estimates that result from applying the above criteria.

Stanford University IT 2015 Client Satisfaction Survey • Introduction | a3
MOR Associates, Inc.
Stanford’s 2015 Sample Size and Response RatesThe Target Sample Size for “All” was derived assuming a Confidence Interval of .20 and a Confidence Level of 95%.
Stanford received a 43% response rate from the randomly selected population that was asked to complete the survey. This robust response rate increases the likelihood that these results accurately represent the views of the Stanford community.
Group Initial Sample Size
Target No. Responses
Actual No. Responses
Projected Response
Rate
Actual Response
RateFaculty 550 150 172 27% 31%Admin Staff 700 300 364 43% 52%Total 1250 450 536 36% 43%
AS Applications Clients 426 - 151 - 35%
For any cumulative statistics there will be relative over and under weighting of the specific groups (faculty and staff) because each groups representation of the population is not equal to their target sample representation.
Stanford’s 2012 Sample Size and Response Rates
Group Initial Sample Size
Target No. Responses
Actual No. Responses
Projected Response
Rate
Actual Response
RateFaculty 550 150 182 27% 33%Graduate Students* 200 75 118 38% 59%Undergraduate Students* 250 75 104 30% 42%
Admin Staff 300 150 182 50% 61%Total 1300 450 586 35% 45%
*Graduate and undergraduate students were not included in the survey because they were already being targeted by an unrelated university-wide survey.


Stanford University IT 2015 Client Satisfaction Survey • Overview | ES-1
MOR Associates, Inc.
Overview of the Results

ES-2 | Overview • Stanford University IT 2015 Client Satisfaction Survey
MOR Associates, Inc.
Executive SummaryIn a random sampling of 1,250 faculty and staff members of the Stanford community, 536, or 43%, responded to the sur-vey. Unlike all previous IT Services surveys, students were not included in the sample because of a conflict with another university-wide survey. With the exception of the table on page ES-17, any comparisons between this year’s survey and previous surveys look only at faculty and staff data.
Some Perspective on the Ratings
The Satisfaction Scale
A large proportion of the survey consisted of satisfaction questions that employed the following six-point scale. In addition to these selections, respondents had the option of selecting “N/A - Don’t Know” or skipping the question.
VeryDissatisfied
1Dissatisfied
2
SomewhatDissatisfied
3
Somewhat Satisfied
4Satisfied
5
Very Satisfied
6
The Range of Ratings for Individual Question and Average Ratings for All Questions
The table below illustrates the range of ratings. This is useful for understanding the practical range of the scale that was used and what constitutes an excellent rating and what constitutes a poor rating. It should be noted that some questions are more likely to receive either higher or lower ratings. For example, based on MOR’s experience with other institutions, excellent ratings for courteousness and friendliness, while no doubt earned, are much easier to attain than excellent ratings for keeping clients informed.
Figures for “All” reflect questions with 100 or more responses; figures for faculty and staff reflect questions with 30 or more responses.
Cohort Question Mean Tot Neg** Tot Pos**
Highest Individual Question Ratings from the Survey
ALL* Q3c. 5-HELP staff are courteous and friendly 5.37 4% 96%Faculty* Q3c. 5-HELP staff are courteous and friendly 5.45 1% 99%Staff* Q3c. 5-HELP staff are courteous and friendly 5.33 1% 94%
Averages of All Question Ratings
ALL* Average of All Questions 4.77 11% 89%Faculty* Average All Questions 4.56 17% 83%Staff* Average All Questions 4.81 9% 91%
Lowest Individual Question Ratings from the Survey
ALL* Q13c. UIT keeping clients informed about new centrally-provided services that are introduced 4.23 24% 76%
Faculty* Q13c. UIT keeping clients informed about new centrally-provided services that are introduced 3.82 38% 62%
Staff* Q92k. SeRA (Stanford electronic Research Admin-istration) efficiency in completing needed tasks 4.32 27% 63%
* Minimum number of respondents for “ALL” was 100; minimum number os respondents for faculty and staff was 30.
**Tot Pos represents the percent of respondents who selected Very Satisfied, Satisfied or Somewhat Satisfied; Tot Neg represents the percent of respondents who selected either Very Dissatisfied, Dissatisfied or Somewhat Dissatisfied.

Stanford University IT 2015 Client Satisfaction Survey • Overview | ES-3
MOR Associates, Inc.
Major Findings and ThemesRatings for Two Out of Twenty-Six Measures Repeated from the 2012 Survey Saw Statistically
Significant Decreases; None Saw Statistically Significant Increases
In the 2012 survey, about two thirds of all repeated measures increased and about one third decreased. In this year’s survey the ratio was reversed; seventeen measures decreased, ten increased. Counting measures with 30 or more re-sponses, the average of all changes was -0.09 on a six-point scale. Changes in the seventeen measures with 30 or more responses in both 2012 and 2015 are shown in the table below. Statistically significant changes are flagged in yellow.
Questions with 30 or More Responses in Both 2012 and 2015 2012 2015 ChangeQ4b. HelpSU staff are knowledgeable 4.94 5.01 0.07Q70c. Secure File Storage (individual or group) 4.81 4.87 0.06Q70b. File Storage (individual and group) 4.81 4.83 0.03Q3a. 5-HELP staff are available when needed 5.03 5.04 0.02Q3b. 5-HELP staff are knowledgeable 4.97 4.96 -0.01Q4a. HelpSU staff are available when needed 4.95 4.92 -0.03Q4d. HelpSU staff resolve problems in a timely manner 4.82 4.78 -0.04Q50a. Wired (Ethernet) network performance 5.13 5.06 -0.07Q50b. Wireless (Wi-Fi) network performance 4.75 4.69 -0.07Q50c. Wireless (Wi-Fi) network access 4.80 4.71 -0.09Q79b. Traditional voicemail 4.81 4.70 -0.11Q3d. 5-HELP staff resolve problems in a timely manner 4.92 4.80 -0.12Q91q. Web Authentication ease of use 4.87 4.71 -0.16Q83d. Qualtrics 5.03 4.85 -0.18Q70g. AFS 4.62 4.41 -0.21Q50d. Stanford Visitor - short-term wireless access for visitors, no sponsor required 4.90 4.63 -0.27Q56a. Stanford Box 4.87 4.49 -0.38
Overall Measures for University IT Services Were Mixed
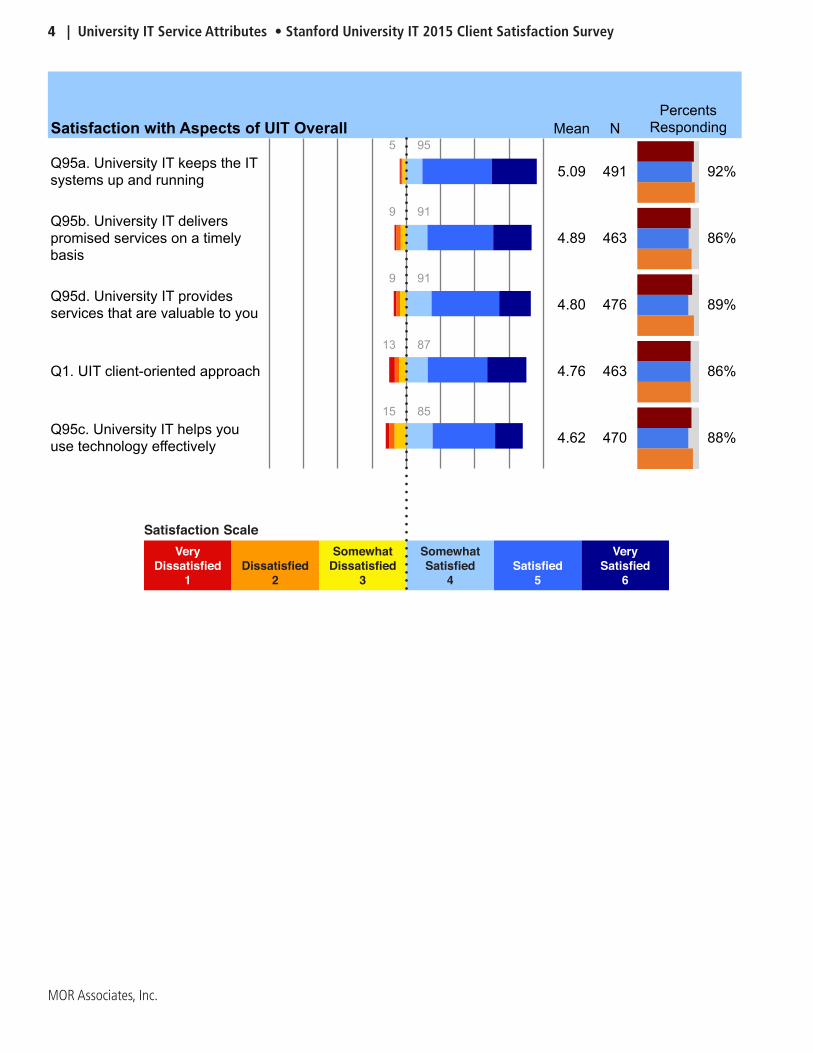
The question “University IT keeps the IT systems up and running,” a key measure of reliability, received the sixth highest rating in the survey. Two other overall measures, “University IT delivers promised services on a timely basis” and “University IT provides services that are valuable to you,” received above average ratings. Another measure, “UIT client-oriented approach” received average ratings. The lowest rated overall measure, “University IT helps you use technology effectively” scored in the bottom quartile of all satisfaction questions with 100 or more responses, though in MOR’s experience, questions that ask about an IT organization’s ability to help people use technology effectively tend to be lower than other overall measures.
Question Mean Tot Neg** Tot Pos** CountQ95a. University IT keeps the IT systems up and running 5.09 5% 95% 491Q95b. University IT delivers promised services on a timely basis 4.89 9% 91% 463Q95d. University IT provides services that are valuable to you 4.80 9% 91% 476Q1. UIT client-oriented approach 4.76 13% 87% 463Q95c. University IT helps you use technology effectively 4.62 15% 85% 470
ES-4 | Overview • Stanford University IT 2015 Client Satisfaction Survey
MOR Associates, Inc.
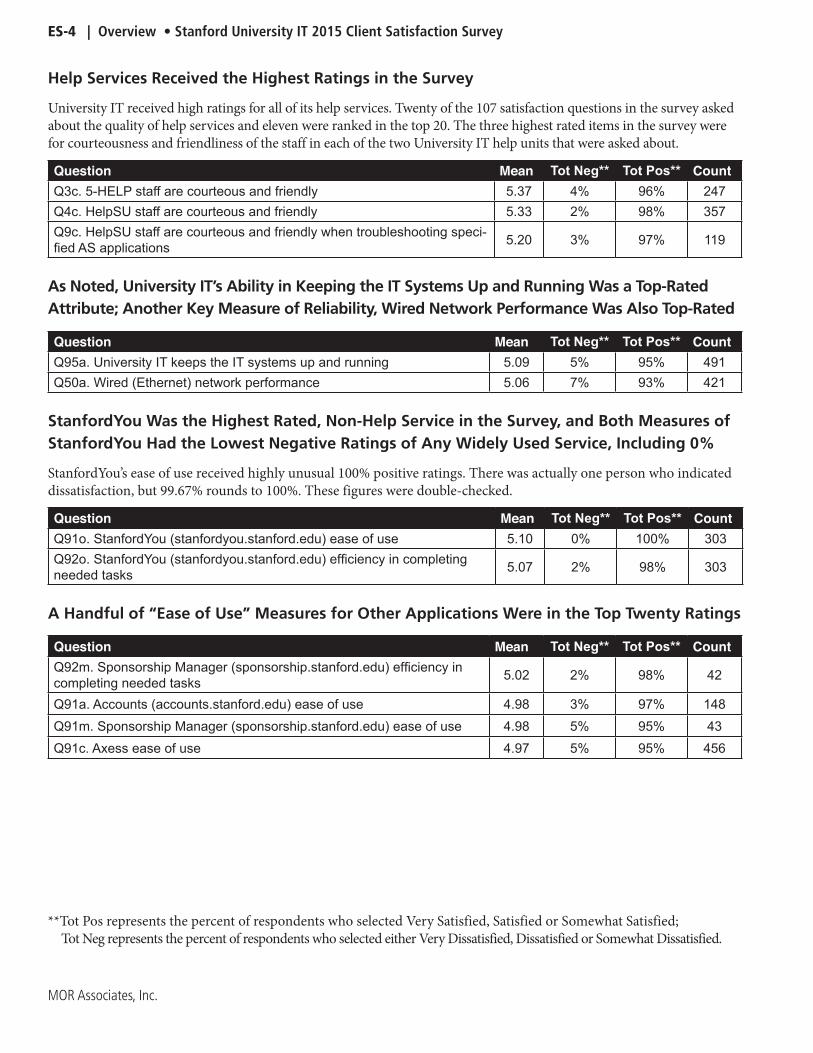
Help Services Received the Highest Ratings in the Survey
University IT received high ratings for all of its help services. Twenty of the 107 satisfaction questions in the survey asked about the quality of help services and eleven were ranked in the top 20. The three highest rated items in the survey were for courteousness and friendliness of the staff in each of the two University IT help units that were asked about.
Question Mean Tot Neg** Tot Pos** CountQ3c. 5-HELP staff are courteous and friendly 5.37 4% 96% 247Q4c. HelpSU staff are courteous and friendly 5.33 2% 98% 357Q9c. HelpSU staff are courteous and friendly when troubleshooting speci-fied AS applications 5.20 3% 97% 119
As Noted, University IT’s Ability in Keeping the IT Systems Up and Running Was a Top-Rated Attribute; Another Key Measure of Reliability, Wired Network Performance Was Also Top-Rated
Question Mean Tot Neg** Tot Pos** CountQ95a. University IT keeps the IT systems up and running 5.09 5% 95% 491Q50a. Wired (Ethernet) network performance 5.06 7% 93% 421
StanfordYou Was the Highest Rated, Non-Help Service in the Survey, and Both Measures of StanfordYou Had the Lowest Negative Ratings of Any Widely Used Service, Including 0%
StanfordYou’s ease of use received highly unusual 100% positive ratings. There was actually one person who indicated dissatisfaction, but 99.67% rounds to 100%. These figures were double-checked.
Question Mean Tot Neg** Tot Pos** CountQ91o. StanfordYou (stanfordyou.stanford.edu) ease of use 5.10 0% 100% 303Q92o. StanfordYou (stanfordyou.stanford.edu) efficiency in completing needed tasks 5.07 2% 98% 303
A Handful of “Ease of Use” Measures for Other Applications Were in the Top Twenty Ratings
Question Mean Tot Neg** Tot Pos** CountQ92m. Sponsorship Manager (sponsorship.stanford.edu) efficiency in completing needed tasks 5.02 2% 98% 42
Q91a. Accounts (accounts.stanford.edu) ease of use 4.98 3% 97% 148Q91m. Sponsorship Manager (sponsorship.stanford.edu) ease of use 4.98 5% 95% 43Q91c. Axess ease of use 4.97 5% 95% 456
**Tot Pos represents the percent of respondents who selected Very Satisfied, Satisfied or Somewhat Satisfied; Tot Neg represents the percent of respondents who selected either Very Dissatisfied, Dissatisfied or Somewhat Dissatisfied.
Stanford University IT 2015 Client Satisfaction Survey • Overview | ES-5
MOR Associates, Inc.
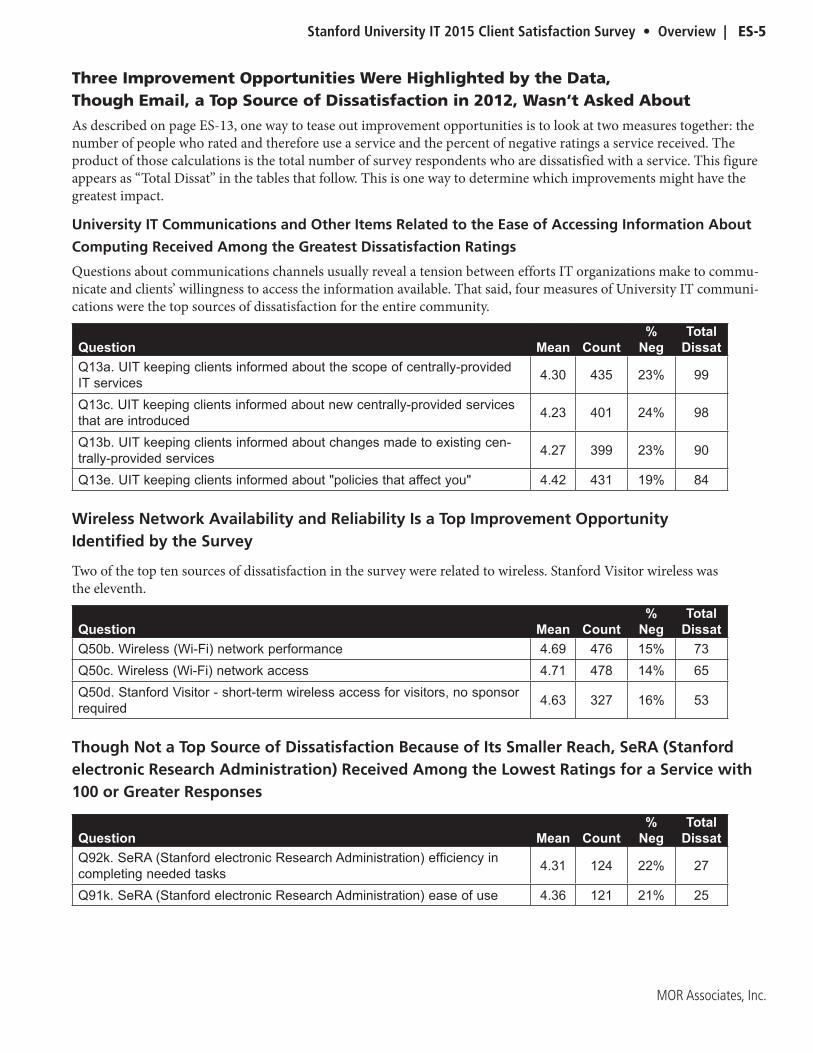
Three Improvement Opportunities Were Highlighted by the Data, Though Email, a Top Source of Dissatisfaction in 2012, Wasn’t Asked About
As described on page ES-13, one way to tease out improvement opportunities is to look at two measures together: the number of people who rated and therefore use a service and the percent of negative ratings a service received. The product of those calculations is the total number of survey respondents who are dissatisfied with a service. This figure appears as “Total Dissat” in the tables that follow. This is one way to determine which improvements might have the greatest impact.
University IT Communications and Other Items Related to the Ease of Accessing Information About
Computing Received Among the Greatest Dissatisfaction Ratings
Questions about communications channels usually reveal a tension between efforts IT organizations make to commu-nicate and clients’ willingness to access the information available. That said, four measures of University IT communi-cations were the top sources of dissatisfaction for the entire community.
Question Mean Count%
NegTotal
DissatQ13a. UIT keeping clients informed about the scope of centrally-provided IT services 4.30 435 23% 99
Q13c. UIT keeping clients informed about new centrally-provided services that are introduced 4.23 401 24% 98
Q13b. UIT keeping clients informed about changes made to existing cen-trally-provided services 4.27 399 23% 90
Q13e. UIT keeping clients informed about "policies that affect you" 4.42 431 19% 84
Wireless Network Availability and Reliability Is a Top Improvement Opportunity Identified by the Survey
Two of the top ten sources of dissatisfaction in the survey were related to wireless. Stanford Visitor wireless was the eleventh.
Question Mean Count%
NegTotal
DissatQ50b. Wireless (Wi-Fi) network performance 4.69 476 15% 73Q50c. Wireless (Wi-Fi) network access 4.71 478 14% 65Q50d. Stanford Visitor - short-term wireless access for visitors, no sponsor required 4.63 327 16% 53
Though Not a Top Source of Dissatisfaction Because of Its Smaller Reach, SeRA (Stanford electronic Research Administration) Received Among the Lowest Ratings for a Service with 100 or Greater Responses
Question Mean Count%
NegTotal
DissatQ92k. SeRA (Stanford electronic Research Administration) efficiency in completing needed tasks 4.31 124 22% 27
Q91k. SeRA (Stanford electronic Research Administration) ease of use 4.36 121 21% 25
ES-6 | Overview • Stanford University IT 2015 Client Satisfaction Survey
MOR Associates, Inc.
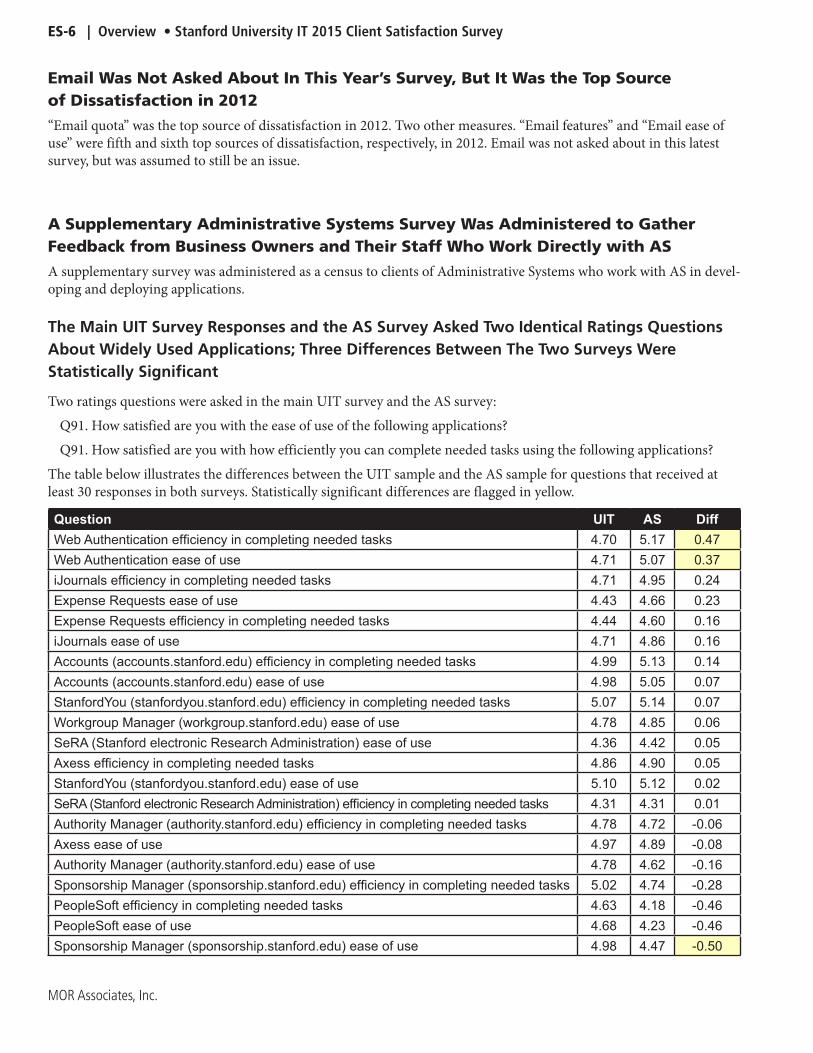
Email Was Not Asked About In This Year’s Survey, But It Was the Top Source of Dissatisfaction in 2012
“Email quota” was the top source of dissatisfaction in 2012. Two other measures. “Email features” and “Email ease of use” were fifth and sixth top sources of dissatisfaction, respectively, in 2012. Email was not asked about in this latest survey, but was assumed to still be an issue.
A Supplementary Administrative Systems Survey Was Administered to Gather Feedback from Business Owners and Their Staff Who Work Directly with AS
A supplementary survey was administered as a census to clients of Administrative Systems who work with AS in devel-oping and deploying applications.
The Main UIT Survey Responses and the AS Survey Asked Two Identical Ratings Questions About Widely Used Applications; Three Differences Between The Two Surveys Were Statistically Significant
Two ratings questions were asked in the main UIT survey and the AS survey:
Q91. How satisfied are you with the ease of use of the following applications?
Q91. How satisfied are you with how efficiently you can complete needed tasks using the following applications?
The table below illustrates the differences between the UIT sample and the AS sample for questions that received at least 30 responses in both surveys. Statistically significant differences are flagged in yellow.
Question UIT AS DiffWeb Authentication efficiency in completing needed tasks 4.70 5.17 0.47Web Authentication ease of use 4.71 5.07 0.37iJournals efficiency in completing needed tasks 4.71 4.95 0.24Expense Requests ease of use 4.43 4.66 0.23Expense Requests efficiency in completing needed tasks 4.44 4.60 0.16iJournals ease of use 4.71 4.86 0.16Accounts (accounts.stanford.edu) efficiency in completing needed tasks 4.99 5.13 0.14Accounts (accounts.stanford.edu) ease of use 4.98 5.05 0.07StanfordYou (stanfordyou.stanford.edu) efficiency in completing needed tasks 5.07 5.14 0.07Workgroup Manager (workgroup.stanford.edu) ease of use 4.78 4.85 0.06SeRA (Stanford electronic Research Administration) ease of use 4.36 4.42 0.05Axess efficiency in completing needed tasks 4.86 4.90 0.05StanfordYou (stanfordyou.stanford.edu) ease of use 5.10 5.12 0.02SeRA (Stanford electronic Research Administration) efficiency in completing needed tasks 4.31 4.31 0.01Authority Manager (authority.stanford.edu) efficiency in completing needed tasks 4.78 4.72 -0.06Axess ease of use 4.97 4.89 -0.08Authority Manager (authority.stanford.edu) ease of use 4.78 4.62 -0.16Sponsorship Manager (sponsorship.stanford.edu) efficiency in completing needed tasks 5.02 4.74 -0.28PeopleSoft efficiency in completing needed tasks 4.63 4.18 -0.46PeopleSoft ease of use 4.68 4.23 -0.46Sponsorship Manager (sponsorship.stanford.edu) ease of use 4.98 4.47 -0.50

Stanford University IT 2015 Client Satisfaction Survey • Overview | ES-7
MOR Associates, Inc.
Unlike the Main UIT Survey, Which Asked About Products and Services, the AS Survey Also Asked About Their Processes, Which Are by Definition More Complex
The AS survey addressed a variety of aspects of doing projects with Administrative Systems:
§ Initiating a project
§ Planning a project
§ Executing a project
§ End results of the service solutions AS delivers
§ The support AS provides for the products it delivers
§ Specific aspects of AS staff
The Range of Ratings for AS Process Questions Was Narrower and More Negative Than the Range in the Main UIT Survey
For the main UIT survey, ratings ranged from a low of 4.20 to a high of 5.37 (for questions with 30 or more responses). For the AS survey, the range was 3.98 to 4.64. Looking at percents of negative ratings, the range in the main UIT survey was 0% to 24% and in the AS survey it was 13% to 34%.
ES-8 | Overview • Stanford University IT 2015 Client Satisfaction Survey
MOR Associates, Inc.
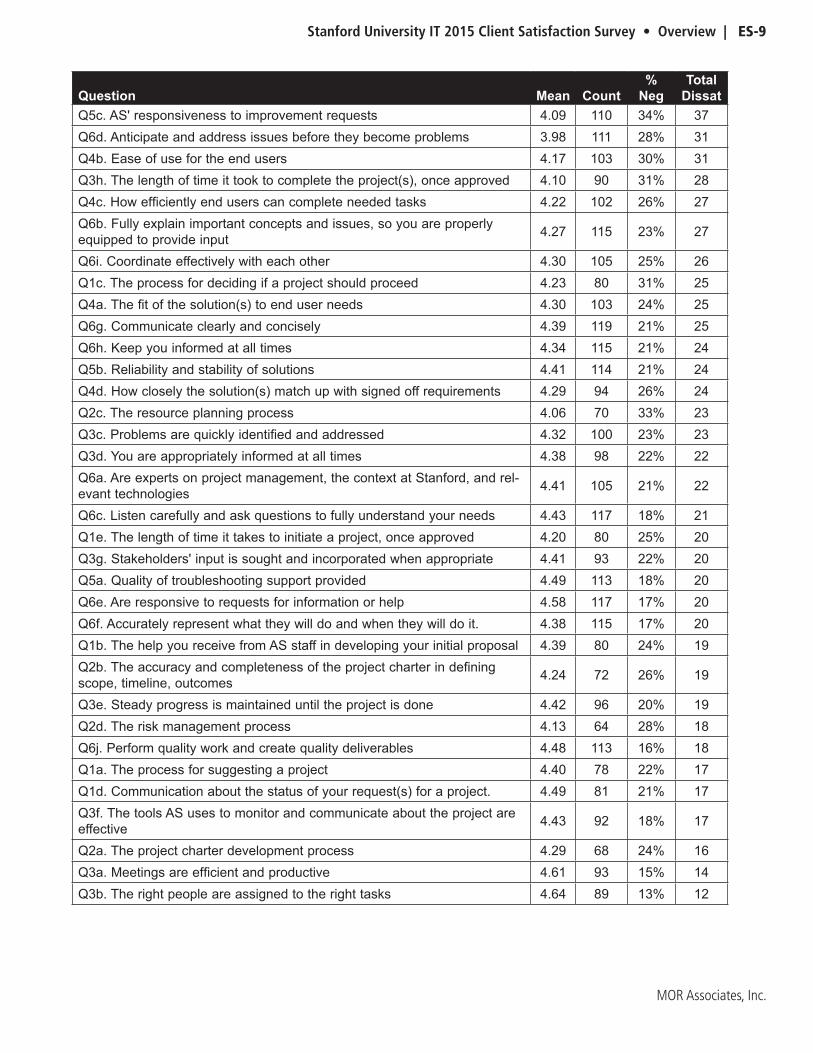
The Ordered List of Sources of Dissatisfaction with AS Processes
As described on page ES-13, one way to tease out improvement opportunities is to look at two measures together: the number of people who rated and therefore use a service and the percent of negative ratings a service received. The product of those calculations is the total number of survey respondents who are dissatisfied with a service. This figure appears as “Total Dissat” in the table on the opposite page. This is one way to determine which improvements might have the greatest impact.
In the case of AS process questions, the top sources of dissatisfaction are hard to categorize, which suggests that a proper answer may lie in a case-by-case investigation.
Stanford University IT 2015 Client Satisfaction Survey • Overview | ES-9
MOR Associates, Inc.
Question Mean Count%
NegTotal
DissatQ5c. AS' responsiveness to improvement requests 4.09 110 34% 37Q6d. Anticipate and address issues before they become problems 3.98 111 28% 31Q4b. Ease of use for the end users 4.17 103 30% 31Q3h. The length of time it took to complete the project(s), once approved 4.10 90 31% 28Q4c. How efficiently end users can complete needed tasks 4.22 102 26% 27Q6b. Fully explain important concepts and issues, so you are properly equipped to provide input 4.27 115 23% 27
Q6i. Coordinate effectively with each other 4.30 105 25% 26Q1c. The process for deciding if a project should proceed 4.23 80 31% 25Q4a. The fit of the solution(s) to end user needs 4.30 103 24% 25Q6g. Communicate clearly and concisely 4.39 119 21% 25Q6h. Keep you informed at all times 4.34 115 21% 24Q5b. Reliability and stability of solutions 4.41 114 21% 24Q4d. How closely the solution(s) match up with signed off requirements 4.29 94 26% 24Q2c. The resource planning process 4.06 70 33% 23Q3c. Problems are quickly identified and addressed 4.32 100 23% 23Q3d. You are appropriately informed at all times 4.38 98 22% 22Q6a. Are experts on project management, the context at Stanford, and rel-evant technologies 4.41 105 21% 22
Q6c. Listen carefully and ask questions to fully understand your needs 4.43 117 18% 21Q1e. The length of time it takes to initiate a project, once approved 4.20 80 25% 20Q3g. Stakeholders' input is sought and incorporated when appropriate 4.41 93 22% 20Q5a. Quality of troubleshooting support provided 4.49 113 18% 20Q6e. Are responsive to requests for information or help 4.58 117 17% 20Q6f. Accurately represent what they will do and when they will do it. 4.38 115 17% 20Q1b. The help you receive from AS staff in developing your initial proposal 4.39 80 24% 19Q2b. The accuracy and completeness of the project charter in defining scope, timeline, outcomes 4.24 72 26% 19
Q3e. Steady progress is maintained until the project is done 4.42 96 20% 19Q2d. The risk management process 4.13 64 28% 18Q6j. Perform quality work and create quality deliverables 4.48 113 16% 18Q1a. The process for suggesting a project 4.40 78 22% 17Q1d. Communication about the status of your request(s) for a project. 4.49 81 21% 17Q3f. The tools AS uses to monitor and communicate about the project are effective 4.43 92 18% 17
Q2a. The project charter development process 4.29 68 24% 16Q3a. Meetings are efficient and productive 4.61 93 15% 14Q3b. The right people are assigned to the right tasks 4.64 89 13% 12

ES-10 | Overview • Stanford University IT 2015 Client Satisfaction Survey
MOR Associates, Inc.
Ten Highest Satisfaction Ratings from the General Survey Ratings Sorted by Mean*Question Mean Tot Neg** Tot Pos** CountQ3c. 5-HELP staff are courteous and friendly 5.37 4% 96% 247Q4c. HelpSU staff are courteous and friendly 5.33 2% 98% 357Q9c. HelpSU staff are courteous and friendly when troubleshooting speci-fied AS applications 5.20 3% 97% 119
Q3e. 5-HELP staff speak clearly and concisely 5.17 6% 94% 246Q91o. StanfordYou (stanfordyou.stanford.edu) ease of use 5.10 0% 100% 303Q95a. University IT keeps the IT systems up and running 5.09 5% 95% 491Q4e. HelpSU staff write clearly and concisely 5.08 5% 95% 337Q92o. StanfordYou (stanfordyou.stanford.edu) efficiency in completing needed tasks 5.07 2% 98% 303
Q50a. Wired (Ethernet) network performance 5.06 7% 93% 421Q3a. 5-HELP staff are available when needed 5.04 7% 93% 249
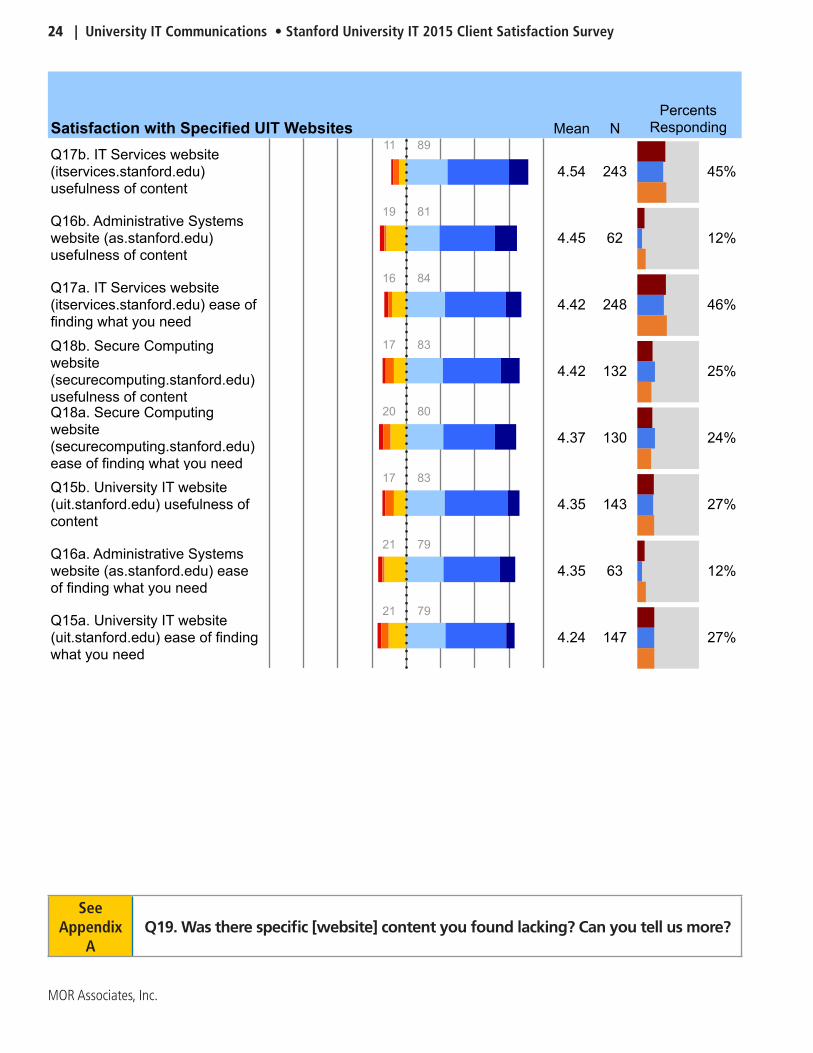
Ten Lowest Satisfaction Ratings from the General Survey Ratings Sorted by Mean*Question Mean Tot Neg** Tot Pos** CountQ13e. UIT keeping clients informed about "policies that affect you" 4.42 19% 81% 431Q18b. Secure Computing website (securecomputing.stanford.edu) useful-ness of content 4.42 17% 83% 132
Q18a. Secure Computing website (securecomputing.stanford.edu) ease of finding what you need 4.37 20% 80% 130
Q91k. SeRA (Stanford electronic Research Administration) ease of use 4.36 21% 79% 121Q15b. University IT website (uit.stanford.edu) usefulness of content 4.35 17% 83% 143Q92k. SeRA (Stanford electronic Research Administration) efficiency in completing needed tasks 4.31 22% 78% 124
Q13a. UIT keeping clients informed about the scope of centrally-provided IT services 4.30 23% 77% 435
Q13b. UIT keeping clients informed about changes made to existing centrally-provided services 4.27 23% 77% 399
Q15a. University IT website (uit.stanford.edu) ease of finding what you need 4.24 21% 79% 147
Q13c. UIT keeping clients informed about new centrally-provided services that are introduced 4.23 24% 76% 401
* Minimum number of respondents was 100.
**Tot Pos represents the percent of respondents who selected Very Satisfied, Satisfied or Somewhat Satisfied; Tot Neg represents the percent of respondents who selected either Very Dissatisfied, Dissatisfied or Somewhat Dissatisfied.
Stanford University IT 2015 Client Satisfaction Survey • Overview | ES-11
MOR Associates, Inc.
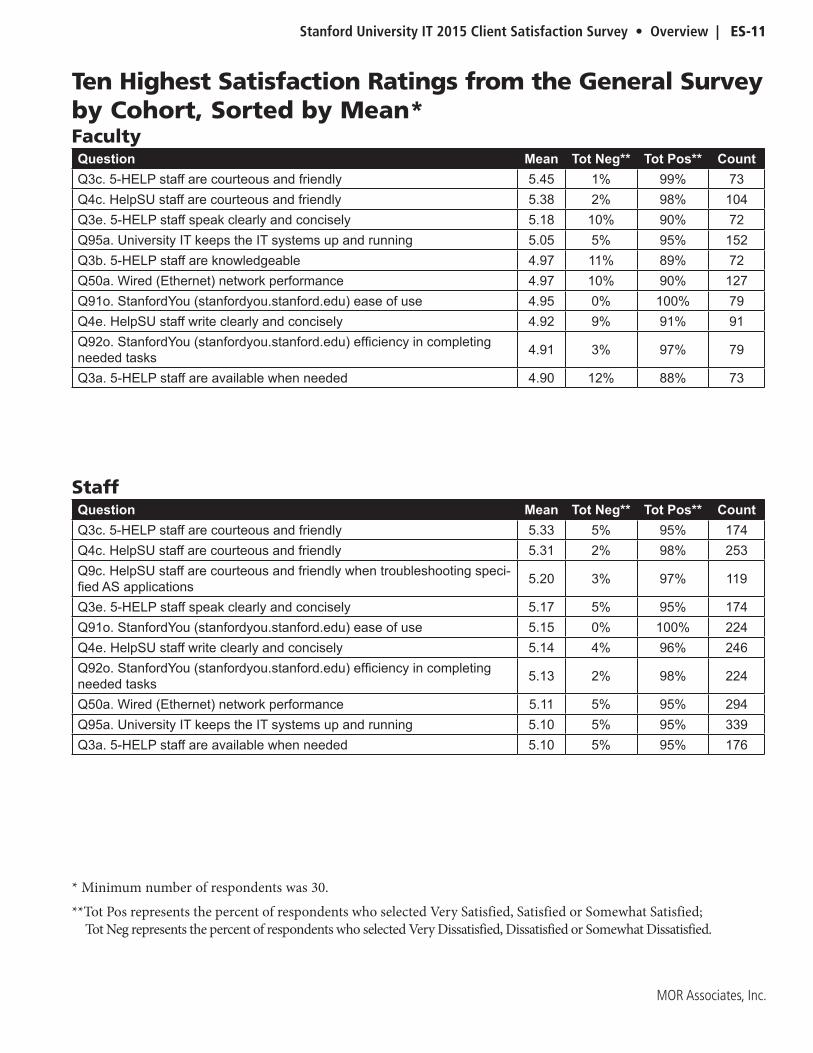
Ten Highest Satisfaction Ratings from the General Survey by Cohort, Sorted by Mean*FacultyQuestion Mean Tot Neg** Tot Pos** CountQ3c. 5-HELP staff are courteous and friendly 5.45 1% 99% 73Q4c. HelpSU staff are courteous and friendly 5.38 2% 98% 104Q3e. 5-HELP staff speak clearly and concisely 5.18 10% 90% 72Q95a. University IT keeps the IT systems up and running 5.05 5% 95% 152Q3b. 5-HELP staff are knowledgeable 4.97 11% 89% 72Q50a. Wired (Ethernet) network performance 4.97 10% 90% 127Q91o. StanfordYou (stanfordyou.stanford.edu) ease of use 4.95 0% 100% 79Q4e. HelpSU staff write clearly and concisely 4.92 9% 91% 91Q92o. StanfordYou (stanfordyou.stanford.edu) efficiency in completing needed tasks 4.91 3% 97% 79
Q3a. 5-HELP staff are available when needed 4.90 12% 88% 73
StaffQuestion Mean Tot Neg** Tot Pos** CountQ3c. 5-HELP staff are courteous and friendly 5.33 5% 95% 174Q4c. HelpSU staff are courteous and friendly 5.31 2% 98% 253Q9c. HelpSU staff are courteous and friendly when troubleshooting speci-fied AS applications 5.20 3% 97% 119
Q3e. 5-HELP staff speak clearly and concisely 5.17 5% 95% 174Q91o. StanfordYou (stanfordyou.stanford.edu) ease of use 5.15 0% 100% 224Q4e. HelpSU staff write clearly and concisely 5.14 4% 96% 246Q92o. StanfordYou (stanfordyou.stanford.edu) efficiency in completing needed tasks 5.13 2% 98% 224
Q50a. Wired (Ethernet) network performance 5.11 5% 95% 294Q95a. University IT keeps the IT systems up and running 5.10 5% 95% 339Q3a. 5-HELP staff are available when needed 5.10 5% 95% 176
* Minimum number of respondents was 30.
**Tot Pos represents the percent of respondents who selected Very Satisfied, Satisfied or Somewhat Satisfied; Tot Neg represents the percent of respondents who selected Very Dissatisfied, Dissatisfied or Somewhat Dissatisfied.
ES-12 | Overview • Stanford University IT 2015 Client Satisfaction Survey
MOR Associates, Inc.
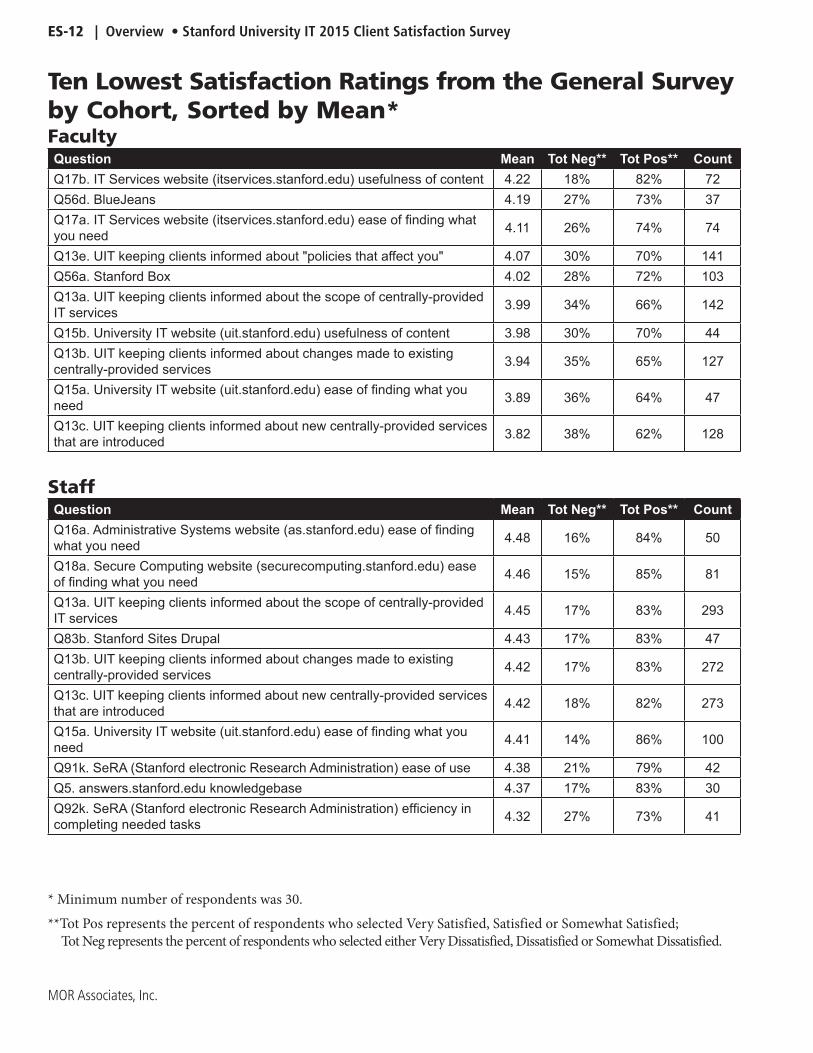
Ten Lowest Satisfaction Ratings from the General Survey by Cohort, Sorted by Mean*FacultyQuestion Mean Tot Neg** Tot Pos** CountQ17b. IT Services website (itservices.stanford.edu) usefulness of content 4.22 18% 82% 72Q56d. BlueJeans 4.19 27% 73% 37Q17a. IT Services website (itservices.stanford.edu) ease of finding what you need 4.11 26% 74% 74
Q13e. UIT keeping clients informed about "policies that affect you" 4.07 30% 70% 141Q56a. Stanford Box 4.02 28% 72% 103Q13a. UIT keeping clients informed about the scope of centrally-provided IT services 3.99 34% 66% 142
Q15b. University IT website (uit.stanford.edu) usefulness of content 3.98 30% 70% 44Q13b. UIT keeping clients informed about changes made to existing centrally-provided services 3.94 35% 65% 127
Q15a. University IT website (uit.stanford.edu) ease of finding what you need 3.89 36% 64% 47
Q13c. UIT keeping clients informed about new centrally-provided services that are introduced 3.82 38% 62% 128
StaffQuestion Mean Tot Neg** Tot Pos** CountQ16a. Administrative Systems website (as.stanford.edu) ease of finding what you need 4.48 16% 84% 50
Q18a. Secure Computing website (securecomputing.stanford.edu) ease of finding what you need 4.46 15% 85% 81
Q13a. UIT keeping clients informed about the scope of centrally-provided IT services 4.45 17% 83% 293
Q83b. Stanford Sites Drupal 4.43 17% 83% 47Q13b. UIT keeping clients informed about changes made to existing centrally-provided services 4.42 17% 83% 272
Q13c. UIT keeping clients informed about new centrally-provided services that are introduced 4.42 18% 82% 273
Q15a. University IT website (uit.stanford.edu) ease of finding what you need 4.41 14% 86% 100
Q91k. SeRA (Stanford electronic Research Administration) ease of use 4.38 21% 79% 42Q5. answers.stanford.edu knowledgebase 4.37 17% 83% 30Q92k. SeRA (Stanford electronic Research Administration) efficiency in completing needed tasks 4.32 27% 73% 41
* Minimum number of respondents was 30.
**Tot Pos represents the percent of respondents who selected Very Satisfied, Satisfied or Somewhat Satisfied; Tot Neg represents the percent of respondents who selected either Very Dissatisfied, Dissatisfied or Somewhat Dissatisfied.

Stanford University IT 2015 Client Satisfaction Survey • Overview | ES-13
MOR Associates, Inc.
Counts of Clients Expressing Dissatisfaction for Satisfaction Questions, Sorted by Total DissatisfiedOne method of interpreting the results of satisfaction questions and prioritizing possible improvement is to sort the results into a matrix with two axes, satisfaction and importance. The illustration below elaborates on the concept.
Typically, when these matrices are used, it presupposes that for any given satisfaction question, a parallel question was asked about the importance that respondents placed on the item being rated for satisfaction. This was not practical for this survey, given its length and breadth. However, in lieu of a question asking specifically about importance, we can infer some measure of importance by looking at the total number of respondents to each question. In this survey the number of responses for questions ranged from a low of 3 (Q11. Friday Open Labs) to a high of 491 (Q95a. University IT keeps the IT systems up and running). The following tables quantify the number of people who registered dissat-isfaction with each of the services or service attributes with response counts of 30 or more that respondents were asked to rate for satisfaction. It is one way to get at the same type of information provided by the matrix, and to think about what service improvements might have the most impact. The tables also feature color coding to indicate how highly each item correlates with respondents’ average satisfaction with the five overall UIT measures asked in the survey. This is another data point to consider when deciding which services to prioritize.
Satisfaction
Impo
rtan
ce
HIGH IMPORTANCELOW SATISFACTION
HIGH IMPORTANCEHIGH SATISFACTION
LOW IMPORTANCELOW SATISFACTION
LOW IMPORTANCEHIGH SATISFACTION
• Prioritize for immediate improvement
• Maintain excellence• Be on the lookout for possible improvements
• Not currently a priority• Consider eliminating or deemphasizing
• Not a priority• Consider redeploying resources
LOW HIGH
HIGH

ES-14 | Overview • Stanford University IT 2015 Client Satisfaction Survey
MOR Associates, Inc.
Counts of Customers Expressing Dissatisfaction for All Satisfaction Questions, Sorted by Total Dissatisfied, Plus Correlations with University IT Services Overall
Question Mean Count%
NegTotal
Dissat R2
Q13a. UIT keeping clients informed about the scope of centrally-provided IT services 4.30 435 23% 99
Q13c. UIT keeping clients informed about new centrally-provided services that are introduced 4.23 401 24% 98
Q13b. UIT keeping clients informed about changes made to existing cen-trally-provided services 4.27 399 23% 90
Q13e. UIT keeping clients informed about "policies that affect you" 4.42 431 19% 84Q50b. Wireless (Wi-Fi) network performance 4.69 476 15% 73Q95c. University IT helps you use technology effectively 4.62 470 15% 71Q13d. UIT keeping clients informed about service outages 4.65 455 15% 69Q50c. Wireless (Wi-Fi) network access 4.71 478 14% 65Q1. UIT client-oriented approach 4.76 463 13% 58Q56a. Stanford Box 4.49 317 17% 53Q50d. Stanford Visitor - short-term wireless access for visitors, no sponsor required 4.63 327 16% 53
Q4d. HelpSU staff resolve problems in a timely manner 4.78 364 13% 48Q79b. Traditional voicemail 4.70 385 12% 45Q95d. University IT provides services that are valuable to you 4.80 476 9% 44Q4f. HelpSU staff keep you informed about your issue(s) 4.79 348 12% 43Q95b. University IT delivers promised services on a timely basis 4.89 463 9% 40Q17a. IT Services website (itservices.stanford.edu) ease of finding what you need 4.42 248 16% 40
Q79a. Desk phone service 4.80 432 9% 39Q92c. Axess efficiency in completing needed tasks 4.86 458 8% 36Q3d. 5-HELP staff resolve problems in a timely manner 4.80 247 13% 32Q4a. HelpSU staff are available when needed 4.92 368 8% 31Q15a. University IT website (uit.stanford.edu) ease of finding what you need 4.24 147 21% 31
Color Coding of Text Strength of Correlation with Average of All Overall Measures of University IT Services (Pearson’s R2)
Communications / Channels Very Strong =>70%Wireless Network Strong 40%-69%Help Services Moderate 30-39%Telecommunications Weak 20-29%StanfordYou No or negligible 0-19%
Minimum number of responses was 30.

Stanford University IT 2015 Client Satisfaction Survey • Overview | ES-15
MOR Associates, Inc.
Question Mean Count%
NegTotal
Dissat R2
Q50a. Wired (Ethernet) network performance 5.06 421 7% 29Q4b. HelpSU staff are knowledgeable 5.01 363 8% 28Q17b. IT Services website (itservices.stanford.edu) usefulness of content 4.54 243 11% 27Q92k. SeRA (Stanford electronic Research Administration) efficiency in completing needed tasks 4.31 124 22% 27
Q92q. Web Authentication efficiency in completing needed tasks 4.70 227 11% 26Q18a. Secure Computing website (securecomputing.stanford.edu) ease of finding what you need 4.37 130 20% 26
Q15b. University IT website (uit.stanford.edu) usefulness of content 4.35 143 17% 25Q91q. Web Authentication ease of use 4.71 231 11% 25Q91k. SeRA (Stanford electronic Research Administration) ease of use 4.36 121 21% 25Q95a. University IT keeps the IT systems up and running 5.09 491 5% 24Q56d. BlueJeans 4.49 160 15% 24Q18b. Secure Computing website (securecomputing.stanford.edu) useful-ness of content 4.42 132 17% 23
Q3b. 5-HELP staff are knowledgeable 4.96 245 9% 23Q91c. Axess ease of use 4.97 456 5% 21Q3f. 5-HELP staff keep you informed about your issue(s) 4.94 228 9% 21Q56b. Stanford Google Apps (e.g., Google Docs, Google Drive) 4.75 200 10% 19Q70a. CrashPlan PROe 4.74 199 10% 19Q3a. 5-HELP staff are available when needed 5.04 249 7% 18Q4e. HelpSU staff write clearly and concisely 5.08 337 5% 18Q92d. Expense Requests efficiency in completing needed tasks 4.44 86 19% 16Q3e. 5-HELP staff speak clearly and concisely 5.17 246 6% 15Q91d. Expense Requests ease of use 4.43 86 15% 13Q16a. Administrative Systems website (as.stanford.edu) ease of finding what you need 4.35 63 21% 13
Q16b. Administrative Systems website (as.stanford.edu) usefulness of con-tent 4.45 62 19% 12
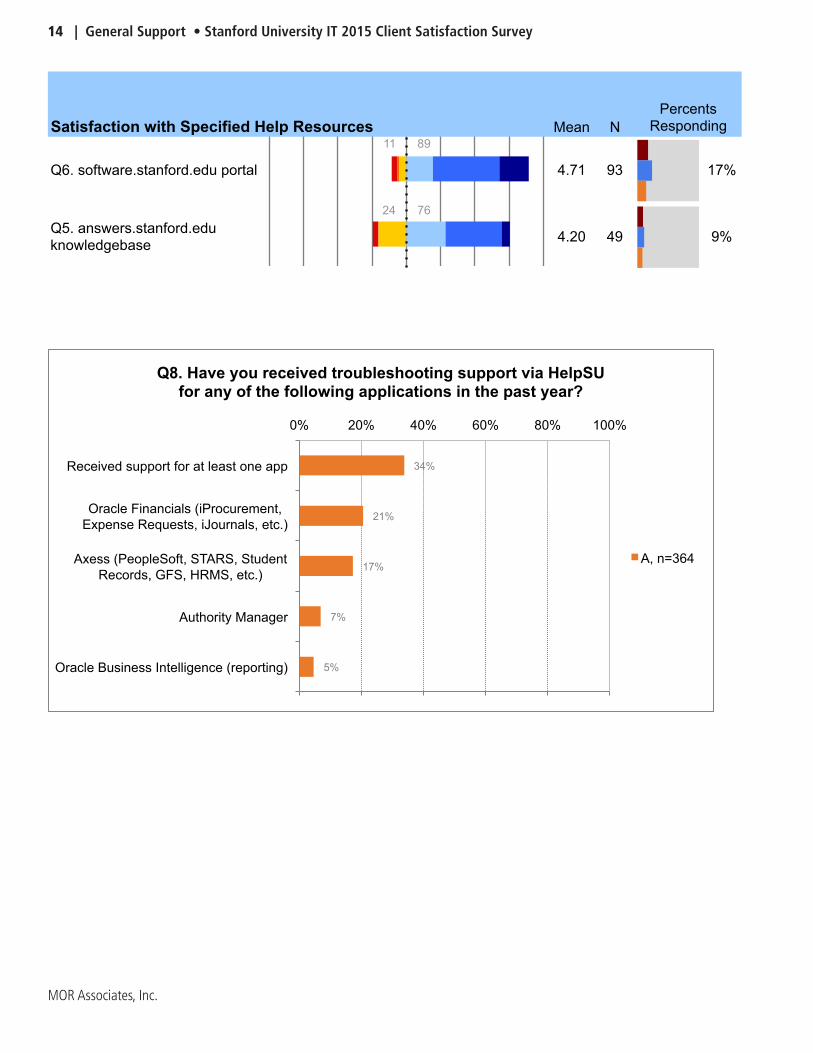
Q5. answers.stanford.edu knowledgebase 4.20 49 24% 12Q9d. HelpSU staff resolve problems in a timely manner when troubleshoot-ing specified AS applications 4.81 118 9% 11
Q6. software.stanford.edu portal 4.71 93 11% 10
Table continued on next page.

ES-16 | Overview • Stanford University IT 2015 Client Satisfaction Survey
MOR Associates, Inc.
Question Mean Count%
NegTotal
Dissat R2
Q9a. HelpSU staff are available when needed when troubleshooting speci-fied AS applications 4.96 120 8% 9
Q83b. Stanford Sites Drupal 4.42 53 17% 9Q3c. 5-HELP staff are courteous and friendly 5.37 247 4% 9Q56g. Mailing lists (Mailman) 4.85 239 4% 9Q83d. Qualtrics 4.85 98 9% 9Q9e. HelpSU staff write clearly and concisely when troubleshooting speci-fied AS applications 5.01 113 7% 8
Q9f. HelpSU staff keep you informed about your issue(s) when trouble-shooting specified AS applications 4.86 111 7% 8
Q4c. HelpSU staff are courteous and friendly 5.33 357 2% 7Q9b. HelpSU staff are knowledgeable when troubleshooting specified AS applications 4.96 120 6% 7
Q92b. Authority Manager (authority.stanford.edu) efficiency in completing needed tasks 4.78 77 9% 7
Q92e. iJournals efficiency in completing needed tasks 4.71 73 10% 7Q91e. iJournals ease of use 4.71 72 10% 7Q92o. StanfordYou (stanfordyou.stanford.edu) efficiency in completing needed tasks 5.07 303 2% 6
Q92a. Accounts (accounts.stanford.edu) efficiency in completing needed tasks 4.99 149 4% 6Q92h. PeopleSoft efficiency in completing needed tasks 4.63 46 13% 6Q91a. Accounts (accounts.stanford.edu) ease of use 4.98 148 3% 5Q92j. Secure Portal efficiency in completing needed tasks 4.86 57 9% 5Q91h. PeopleSoft ease of use 4.68 47 11% 5Q91b. Authority Manager (authority.stanford.edu) ease of use 4.78 77 6% 5Q9c. HelpSU staff are courteous and friendly when troubleshooting speci-fied AS applications 5.20 119 3% 4
Q91j. Secure Portal ease of use 4.93 57 7% 4Q56c. Confluence 4.56 34 12% 4Q70g. AFS 4.41 34 12% 4Q91s. Workgroup Manager (workgroup.stanford.edu) ease of use 4.78 32 9% 3Q70d. Server Storage 4.81 48 4% 2
Color Coding of Text Strength of Correlation with Overall Measures of University IT Services(Pearson’s R2)
Communications Very Strong =>70%Wireless Network Strong 40%-69%Help Services Moderate 30-39%Telecommunications Weak 20-29%StanfordYou No or negligible 0-19%
Minimum number of responses was 30.
Table continued from previous page.
Stanford University IT 2015 Client Satisfaction Survey • Overview | ES-17
MOR Associates, Inc.
Question Mean Count%
NegTotal
Dissat R2
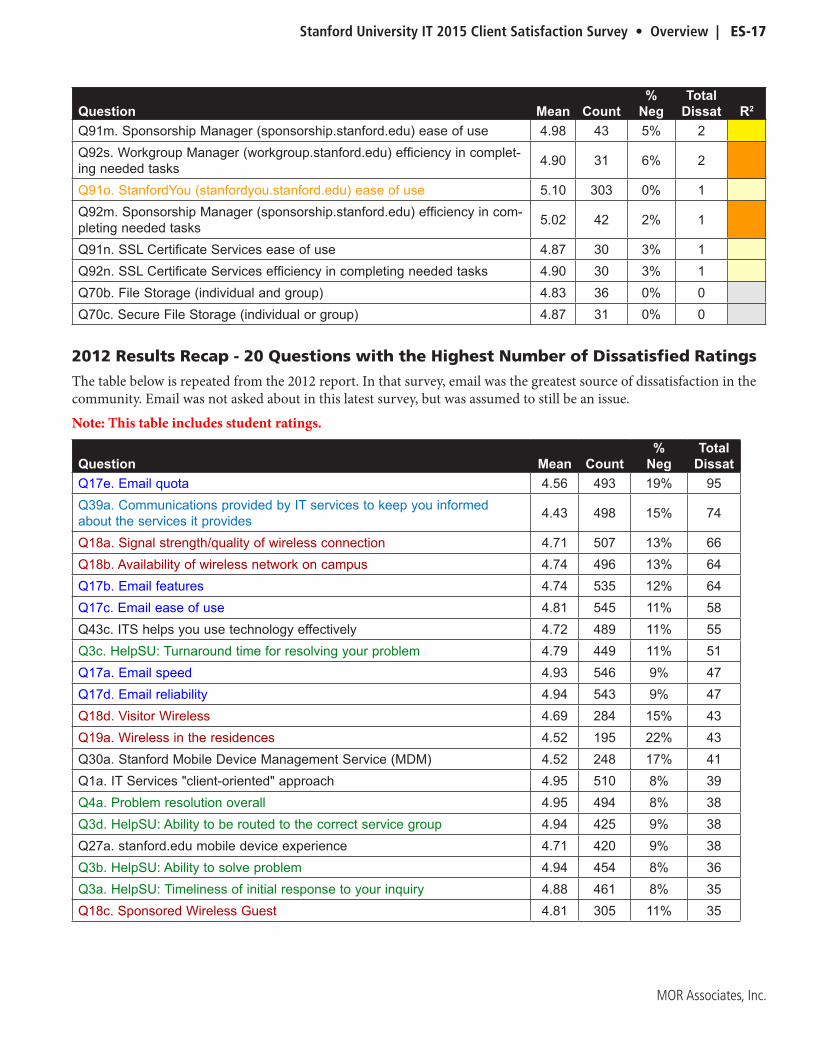
Q91m. Sponsorship Manager (sponsorship.stanford.edu) ease of use 4.98 43 5% 2Q92s. Workgroup Manager (workgroup.stanford.edu) efficiency in complet-ing needed tasks 4.90 31 6% 2
Q91o. StanfordYou (stanfordyou.stanford.edu) ease of use 5.10 303 0% 1Q92m. Sponsorship Manager (sponsorship.stanford.edu) efficiency in com-pleting needed tasks 5.02 42 2% 1
Q91n. SSL Certificate Services ease of use 4.87 30 3% 1Q92n. SSL Certificate Services efficiency in completing needed tasks 4.90 30 3% 1Q70b. File Storage (individual and group) 4.83 36 0% 0Q70c. Secure File Storage (individual or group) 4.87 31 0% 0
2012 Results Recap - 20 Questions with the Highest Number of Dissatisfied Ratings
The table below is repeated from the 2012 report. In that survey, email was the greatest source of dissatisfaction in the community. Email was not asked about in this latest survey, but was assumed to still be an issue.
Note: This table includes student ratings.
Question Mean Count%
NegTotal
DissatQ17e. Email quota 4.56 493 19% 95Q39a. Communications provided by IT services to keep you informed about the services it provides 4.43 498 15% 74
Q18a. Signal strength/quality of wireless connection 4.71 507 13% 66Q18b. Availability of wireless network on campus 4.74 496 13% 64Q17b. Email features 4.74 535 12% 64Q17c. Email ease of use 4.81 545 11% 58Q43c. ITS helps you use technology effectively 4.72 489 11% 55Q3c. HelpSU: Turnaround time for resolving your problem 4.79 449 11% 51Q17a. Email speed 4.93 546 9% 47Q17d. Email reliability 4.94 543 9% 47Q18d. Visitor Wireless 4.69 284 15% 43Q19a. Wireless in the residences 4.52 195 22% 43Q30a. Stanford Mobile Device Management Service (MDM) 4.52 248 17% 41Q1a. IT Services "client-oriented" approach 4.95 510 8% 39Q4a. Problem resolution overall 4.95 494 8% 38Q3d. HelpSU: Ability to be routed to the correct service group 4.94 425 9% 38Q27a. stanford.edu mobile device experience 4.71 420 9% 38Q3b. HelpSU: Ability to solve problem 4.94 454 8% 36Q3a. HelpSU: Timeliness of initial response to your inquiry 4.88 461 8% 35Q18c. Sponsored Wireless Guest 4.81 305 11% 35

ES-18 | Overview • Stanford University IT 2015 Client Satisfaction Survey
MOR Associates, Inc.
All Satisfaction Ratings Sorted from High to Low by MeanQuestion Mean Tot Neg** Tot Pos** CountQ3c. 5-HELP staff are courteous and friendly 5.37 4% 96% 247Q4c. HelpSU staff are courteous and friendly 5.33 2% 98% 357Q9c. HelpSU staff are courteous and friendly when troubleshooting speci-fied AS applications 5.20 3% 97% 119
Q3e. 5-HELP staff speak clearly and concisely 5.17 6% 94% 246Q91o. StanfordYou (stanfordyou.stanford.edu) ease of use 5.10 0% 100% 303Q95a. University IT keeps the IT systems up and running 5.09 5% 95% 491Q4e. HelpSU staff write clearly and concisely 5.08 5% 95% 337Q92o. StanfordYou (stanfordyou.stanford.edu) efficiency in completing needed tasks 5.07 2% 98% 303
Q50a. Wired (Ethernet) network performance 5.06 7% 93% 421Q3a. 5-HELP staff are available when needed 5.04 7% 93% 249Q92m. Sponsorship Manager (sponsorship.stanford.edu) efficiency in completing needed tasks 5.02 2% 98% 42
Q4b. HelpSU staff are knowledgeable 5.01 8% 92% 363Q9e. HelpSU staff write clearly and concisely when troubleshooting speci-fied AS applications 5.01 7% 93% 113
Q92a. Accounts (accounts.stanford.edu) efficiency in completing needed tasks 4.99 4% 96% 149
Q91a. Accounts (accounts.stanford.edu) ease of use 4.98 3% 97% 148Q91m. Sponsorship Manager (sponsorship.stanford.edu) ease of use 4.98 5% 95% 43Q91c. Axess ease of use 4.97 5% 95% 456Q9a. HelpSU staff are available when needed when troubleshooting specified AS applications 4.96 8% 93% 120
Q9b. HelpSU staff are knowledgeable when troubleshooting specified AS applications 4.96 6% 94% 120
Q3b. 5-HELP staff are knowledgeable 4.96 9% 91% 245Q3f. 5-HELP staff keep you informed about your issue(s) 4.94 9% 91% 228Q91j. Secure Portal ease of use 4.93 7% 93% 57Q4a. HelpSU staff are available when needed 4.92 8% 92% 368Q92s. Workgroup Manager (workgroup.stanford.edu) efficiency in com-pleting needed tasks 4.90 6% 94% 31
Q92n. SSL Certificate Services efficiency in completing needed tasks 4.90 3% 97% 30Q95b. University IT delivers promised services on a timely basis 4.89 9% 91% 463Q70c. Secure File Storage (individual or group) 4.87 0% 100% 31Q91n. SSL Certificate Services ease of use 4.87 3% 97% 30Q92j. Secure Portal efficiency in completing needed tasks 4.86 9% 91% 57Q92c. Axess efficiency in completing needed tasks 4.86 8% 92% 458
**Tot Pos represents the percent of respondents who selected Very Satisfied, Satisfied or Somewhat Satisfied; Tot Neg represents the percent of respondents who selected either Very Dissatisfied, Dissatisfied or Somewhat Dissatisfied.

Stanford University IT 2015 Client Satisfaction Survey • Overview | ES-19
MOR Associates, Inc.
Question Mean Tot Neg** Tot Pos** CountQ9f. HelpSU staff keep you informed about your issue(s) when trouble-shooting specified AS applications 4.86 7% 93% 111
Q56g. Mailing lists (Mailman) 4.85 4% 96% 239Q83d. Qualtrics 4.85 9% 91% 98Q70b. File Storage (individual and group) 4.83 0% 100% 36Q70d. Server Storage 4.81 4% 96% 48Q9d. HelpSU staff resolve problems in a timely manner when trouble-shooting specified AS applications 4.81 9% 91% 118
Q3d. 5-HELP staff resolve problems in a timely manner 4.80 13% 87% 247Q79a. Desk phone service 4.80 9% 91% 432Q95d. University IT provides services that are valuable to you 4.80 9% 91% 476Q4f. HelpSU staff keep you informed about your issue(s) 4.79 12% 88% 348Q4d. HelpSU staff resolve problems in a timely manner 4.78 13% 87% 364Q91s. Workgroup Manager (workgroup.stanford.edu) ease of use 4.78 9% 91% 32Q92b. Authority Manager (authority.stanford.edu) efficiency in completing needed tasks 4.78 9% 91% 77
Q91b. Authority Manager (authority.stanford.edu) ease of use 4.78 6% 94% 77Q1. UIT client-oriented approach 4.76 13% 87% 463Q56b. Stanford Google Apps (e.g., Google Docs, Google Drive) 4.75 10% 91% 200Q70a. CrashPlan PROe 4.74 10% 90% 199Q92e. iJournals efficiency in completing needed tasks 4.71 10% 90% 73Q50c. Wireless (Wi-Fi) network access 4.71 14% 86% 478Q6. software.stanford.edu portal 4.71 11% 89% 93Q91e. iJournals ease of use 4.71 10% 90% 72Q91q. Web Authentication ease of use 4.71 11% 89% 231Q92q. Web Authentication efficiency in completing needed tasks 4.70 11% 89% 227Q79b. Traditional voicemail 4.70 12% 88% 385Q50b. Wireless (Wi-Fi) network performance 4.69 15% 85% 476Q91h. PeopleSoft ease of use 4.68 11% 89% 47Q13d. UIT keeping clients informed about service outages 4.65 15% 85% 455Q50d. Stanford Visitor - short-term wireless access for visitors, no spon-sor required 4.63 16% 84% 327
Q92h. PeopleSoft efficiency in completing needed tasks 4.63 13% 87% 46Q95c. University IT helps you use technology effectively 4.62 15% 85% 470Q56c. Confluence 4.56 12% 88% 34Q17b. IT Services website (itservices.stanford.edu) usefulness of content 4.54 11% 89% 243
Table continued on next page.

ES-20 | Overview • Stanford University IT 2015 Client Satisfaction Survey
MOR Associates, Inc.
Question Mean Tot Neg** Tot Pos** CountQ56d. BlueJeans 4.49 15% 85% 160Q56a. Stanford Box 4.49 17% 83% 317Q16b. Administrative Systems website (as.stanford.edu) usefulness of content 4.45 19% 81% 62
Q92d. Expense Requests efficiency in completing needed tasks 4.44 19% 81% 86Q91d. Expense Requests ease of use 4.43 15% 85% 86Q17a. IT Services website (itservices.stanford.edu) ease of finding what you need 4.42 16% 84% 248
Q13e. UIT keeping clients informed about "policies that affect you" 4.42 19% 81% 431Q18b. Secure Computing website (securecomputing.stanford.edu) useful-ness of content 4.42 17% 83% 132
Q83b. Stanford Sites Drupal 4.42 17% 83% 53Q70g. AFS 4.41 12% 88% 34Q18a. Secure Computing website (securecomputing.stanford.edu) ease of finding what you need 4.37 20% 80% 130
Q91k. SeRA (Stanford electronic Research Administration) ease of use 4.36 21% 79% 121Q15b. University IT website (uit.stanford.edu) usefulness of content 4.35 17% 83% 143Q16a. Administrative Systems website (as.stanford.edu) ease of finding what you need 4.35 21% 79% 63
Q92k. SeRA (Stanford electronic Research Administration) efficiency in completing needed tasks 4.31 22% 78% 124
Q13a. UIT keeping clients informed about the scope of centrally-provided IT services 4.30 23% 77% 435
Q13b. UIT keeping clients informed about changes made to existing centrally-provided services 4.27 23% 77% 399
Q15a. University IT website (uit.stanford.edu) ease of finding what you need 4.24 21% 79% 147
Q13c. UIT keeping clients informed about new centrally-provided services that are introduced 4.23 24% 76% 401
Q5. answers.stanford.edu knowledgebase 4.20 24% 76% 49
**Tot Pos represents the percent of respondents who selected Very Satisfied, Satisfied or Somewhat Satisfied; Tot Neg represents the percent of respondents who selected either Very Dissatisfied, Dissatisfied or Somewhat Dissatisfied.
Table continued from previous page.
Stanford University IT 2015 Client Satisfaction Survey • Overview | ES-21
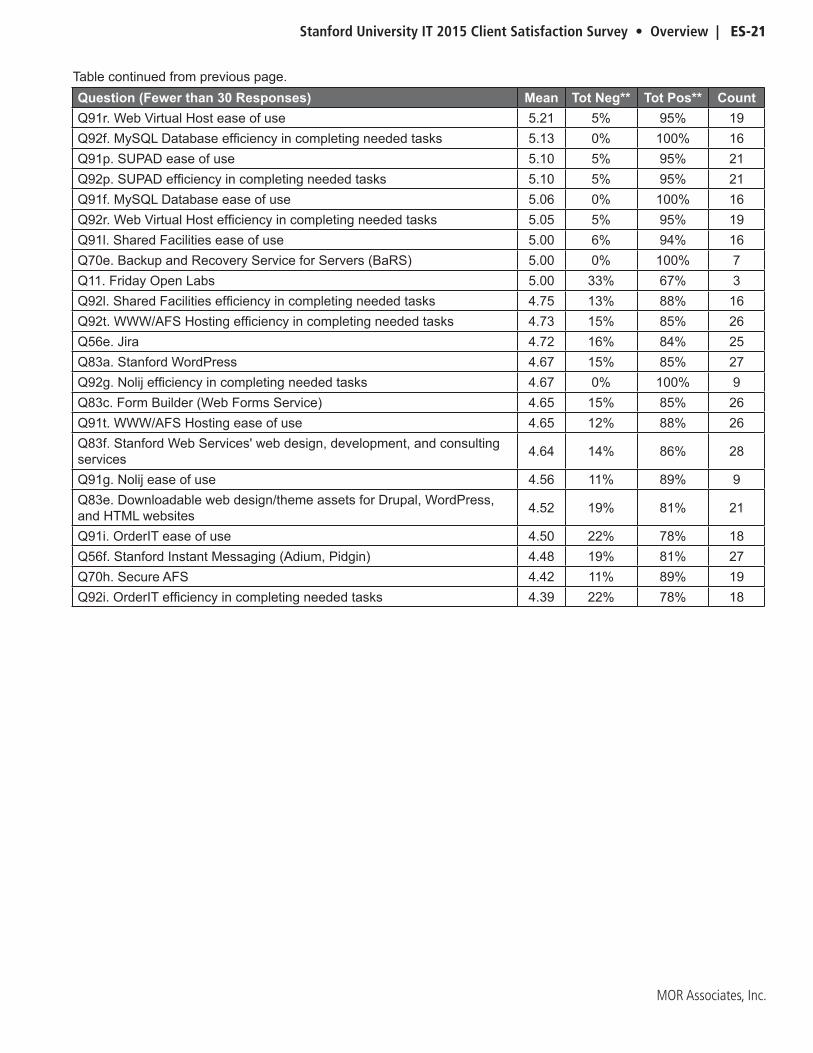
MOR Associates, Inc.
Question (Fewer than 30 Responses) Mean Tot Neg** Tot Pos** CountQ91r. Web Virtual Host ease of use 5.21 5% 95% 19Q92f. MySQL Database efficiency in completing needed tasks 5.13 0% 100% 16Q91p. SUPAD ease of use 5.10 5% 95% 21Q92p. SUPAD efficiency in completing needed tasks 5.10 5% 95% 21Q91f. MySQL Database ease of use 5.06 0% 100% 16Q92r. Web Virtual Host efficiency in completing needed tasks 5.05 5% 95% 19Q91l. Shared Facilities ease of use 5.00 6% 94% 16Q70e. Backup and Recovery Service for Servers (BaRS) 5.00 0% 100% 7Q11. Friday Open Labs 5.00 33% 67% 3Q92l. Shared Facilities efficiency in completing needed tasks 4.75 13% 88% 16Q92t. WWW/AFS Hosting efficiency in completing needed tasks 4.73 15% 85% 26Q56e. Jira 4.72 16% 84% 25Q83a. Stanford WordPress 4.67 15% 85% 27Q92g. Nolij efficiency in completing needed tasks 4.67 0% 100% 9Q83c. Form Builder (Web Forms Service) 4.65 15% 85% 26Q91t. WWW/AFS Hosting ease of use 4.65 12% 88% 26Q83f. Stanford Web Services' web design, development, and consulting services 4.64 14% 86% 28
Q91g. Nolij ease of use 4.56 11% 89% 9Q83e. Downloadable web design/theme assets for Drupal, WordPress, and HTML websites 4.52 19% 81% 21
Q91i. OrderIT ease of use 4.50 22% 78% 18Q56f. Stanford Instant Messaging (Adium, Pidgin) 4.48 19% 81% 27Q70h. Secure AFS 4.42 11% 89% 19Q92i. OrderIT efficiency in completing needed tasks 4.39 22% 78% 18
Table continued from previous page.

ES-22 | Overview • Stanford University IT 2015 Client Satisfaction Survey
MOR Associates, Inc.
This page intentionally left blank�

Stanford University IT 2015 Client Satisfaction Survey • Reading the Charts | 1
MOR Associates, Inc.
Reading the Charts

2 | Reading the Charts • Stanford University IT 2015 Client Satisfaction Survey
MOR Associates, Inc.
Mean N
Q3c. 5-HELP staff are courteous and friendly
4 96
5.37 247 46%
Q3e. 5-HELP staff speak clearly and concisely
6 94
5.17 246 46%
Q3a. 5-HELP staff are available when needed
7 93
5.04 249 46%
Q3b. 5-HELP staff are knowledgeable
9 91
4.96 245 46%
Q3f. 5-HELP staff keep you informed about your issue(s)
9 91
4.94 228 43%
Q3d. 5-HELP staff resolve problems in a timely manner
13 87
4.80 247 46%
Satisfaction with Aspects of 5-HELP StaffPercents
Responding
Reading the ChartsThroughout this report there are charts that show the percent responding for a given point in the scales depicted below. The diagram below illustrates the structure of these charts.
All charts for the scales shown above feature a dotted line that indicates the
midpoint of all possible responses.
25% 100%
Satisfaction ScaleVery
Dissatisfied1
Dissatisfied2
SomewhatDissatisfied
3
Somewhat Satisfied
4Satisfied
5
Very Satisfied
6
Willingness Scale
Not Willing
Willing, But with Some Reluctance
Quite Willing
Already Doing It
Percent of each cohort responding, based on all respondentsThe total percents on either side
of the midpoint are represented as whole numbers. All
FacultyStaff (All)
Stanford University IT 2015 Client Satisfaction Survey • University IT Service Attributes | 3
MOR Associates, Inc.
University IT Service Attributes
4 | University IT Service Attributes • Stanford University IT 2015 Client Satisfaction Survey
MOR Associates, Inc.
Satisfaction ScaleVery
Dissatisfied1
Dissatisfied2
SomewhatDissatisfied
3
Somewhat Satisfied
4Satisfied
5
Very Satisfied
6
Mean N
Q95a. University IT keeps the IT systems up and running
5 95
5.09 491 92%
Q95b. University IT delivers promised services on a timely basis
9 91
4.89 463 86%
Q95d. University IT provides services that are valuable to you
9 91
4.80 476 89%
Q1. UIT client-oriented approach
13 87
4.76 463 86%
Q95c. University IT helps you use technology effectively
15 85
4.62 470 88%
Satisfaction with Aspects of UIT OverallPercents
Responding
Stanford University IT 2015 Client Satisfaction Survey • University IT Service Attributes | 5
MOR Associates, Inc.
Q92r Web Virtual Host efficiency in completing needed tasks
Mean VD D SD SS S VS Count Std. Dev. 95% CI+-All 5.05 0% 0% 5% 11% 58% 26% 19 0.78 0.35Faculty 5.00 0% 0% 0% 0% 100% 0% 1 - -Staff 5.06 0% 0% 6% 11% 56% 28% 18 0.80 0.37
Q92s
Mean VD D SD SS S VS Count Std. Dev. 95% CI+-All 4.90 0% 3% 3% 16% 55% 23% 31 0.91 0.32Faculty 2.00 0% 100% 0% 0% 0% 0% 1 - -Staff 5.00 0% 0% 3% 17% 57% 23% 30 0.74 0.27
Q92t WWW/AFS Hosting efficiency in completing needed tasks
Mean VD D SD SS S VS Count Std. Dev. 95% CI+-All 4.73 0% 4% 12% 12% 54% 19% 26 1.04 0.40Faculty 4.63 0% 0% 13% 25% 50% 13% 8 0.92 0.63Staff 4.78 0% 6% 11% 6% 56% 22% 18 1.11 0.51
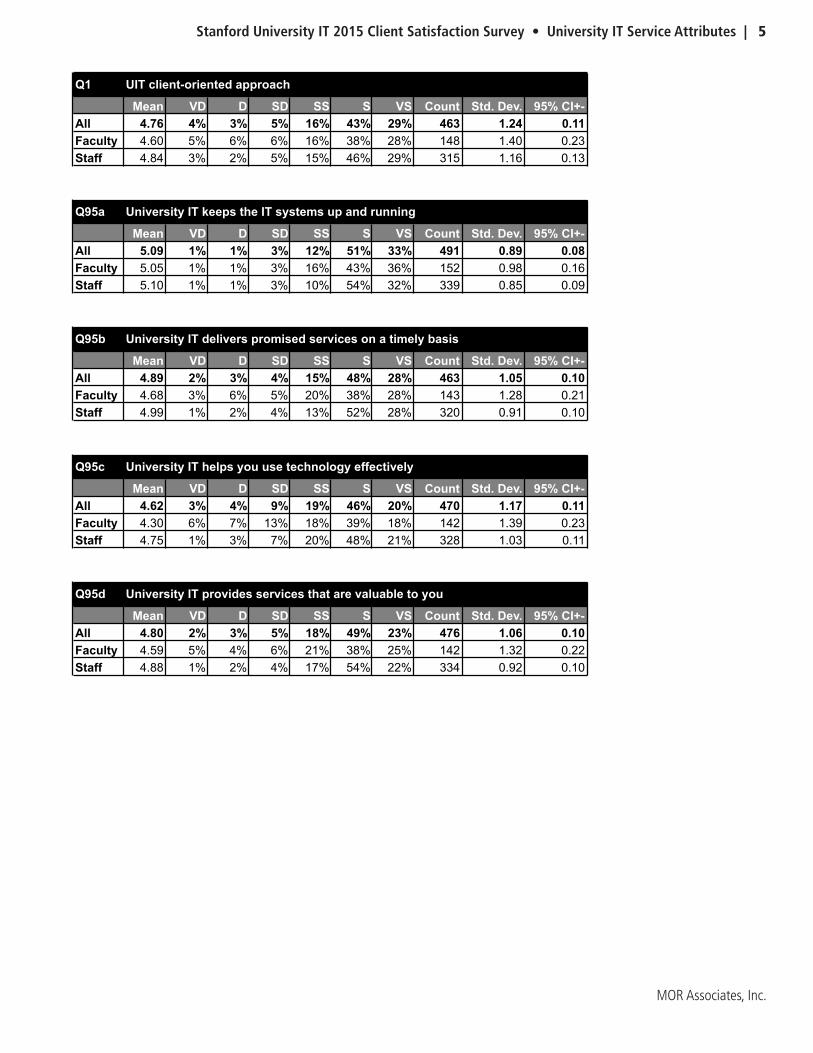
Q1 UIT client-oriented approach
Mean VD D SD SS S VS Count Std. Dev. 95% CI+-All 4.76 4% 3% 5% 16% 43% 29% 463 1.24 0.11Faculty 4.60 5% 6% 6% 16% 38% 28% 148 1.40 0.23Staff 4.84 3% 2% 5% 15% 46% 29% 315 1.16 0.13
Q95a University IT keeps the IT systems up and running
Mean VD D SD SS S VS Count Std. Dev. 95% CI+-All 5.09 1% 1% 3% 12% 51% 33% 491 0.89 0.08Faculty 5.05 1% 1% 3% 16% 43% 36% 152 0.98 0.16Staff 5.10 1% 1% 3% 10% 54% 32% 339 0.85 0.09
Q95b University IT delivers promised services on a timely basis
Mean VD D SD SS S VS Count Std. Dev. 95% CI+-All 4.89 2% 3% 4% 15% 48% 28% 463 1.05 0.10Faculty 4.68 3% 6% 5% 20% 38% 28% 143 1.28 0.21Staff 4.99 1% 2% 4% 13% 52% 28% 320 0.91 0.10
Workgroup Manager (workgroup.stanford.edu) efficiency in completing needed tasks
Q95c University IT helps you use technology effectively
Mean VD D SD SS S VS Count Std. Dev. 95% CI+-All 4.62 3% 4% 9% 19% 46% 20% 470 1.17 0.11Faculty 4.30 6% 7% 13% 18% 39% 18% 142 1.39 0.23Staff 4.75 1% 3% 7% 20% 48% 21% 328 1.03 0.11
Q95d University IT provides services that are valuable to you
Mean VD D SD SS S VS Count Std. Dev. 95% CI+-All 4.80 2% 3% 5% 18% 49% 23% 476 1.06 0.10Faculty 4.59 5% 4% 6% 21% 38% 25% 142 1.32 0.22Staff 4.88 1% 2% 4% 17% 54% 22% 334 0.92 0.10
Q1/95 University IT rounded overall average
Mean VD D SD SS S VS Count Std. Dev. 95% CI+-All 4.81 1% 2% 6% 19% 50% 23% 525 1.00 0.09Faculty 4.62 2% 5% 6% 24% 41% 22% 167 1.17 0.18Staff 4.90 1% 1% 6% 16% 53% 23% 358 0.89 0.09
Q1/95 University IT AVERAGE
Mean - - - - - - Count Std. Dev. 95% CI+-All 4.79 1% 1% 2% 7% 28% 13% 525 0.97 0.08Faculty 4.60 2% 1% 2% 10% 21% 13% 167 1.15 0.17Staff 4.88 1% 1% 2% 6% 31% 13% 358 0.85 0.09

6 | University IT Service Attributes • Stanford University IT 2015 Client Satisfaction Survey
MOR Associates, Inc.
This page intentionally left blank�

Stanford University IT 2015 Client Satisfaction Survey • General Support | 7
MOR Associates, Inc.
General Support
8 | General Support • Stanford University IT 2015 Client Satisfaction Survey
MOR Associates, Inc.
See Appendix
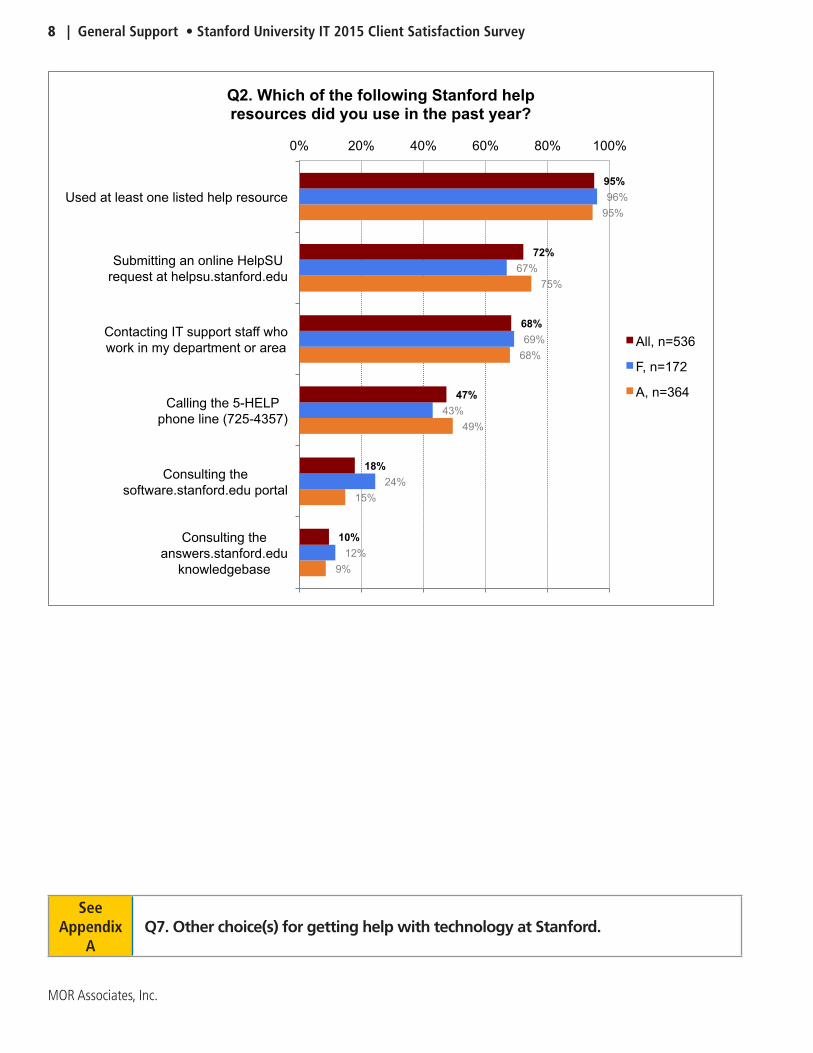
AQ7 . Other choice(s) for getting help with technology at Stanford .
9%
15%
49%
68%
75%
95%
12%
24%
43%
69%
67%
96%
10%
18%
47%
68%
72%
95%
0% 20% 40% 60% 80% 100%
Consulting the answers.stanford.edu
knowledgebase
Consulting the software.stanford.edu portal
Calling the 5-HELP phone line (725-4357)
Contacting IT support staff who work in my department or area
Submitting an online HelpSU request at helpsu.stanford.edu
Used at least one listed help resource
Q2. Which of the following Stanford help resources did you use in the past year?
All, n=536
F, n=172
A, n=364
Stanford University IT 2015 Client Satisfaction Survey • General Support | 9
MOR Associates, Inc.
0% 20% 40% 60% 80% 100%
Q7b. Consult the answers.stanford.edu
Q7i. Visit a drop-in counter for in-person help
Q7h. Ask a peer
Q7a. Conduct a Google, Yahoo, Bing, etc. search
Q7e. Send an email to [email protected]
Q7c. Call 5-HELP
Q7f. Online chat with a technical support representative
Q7d. Submit a HelpSU request
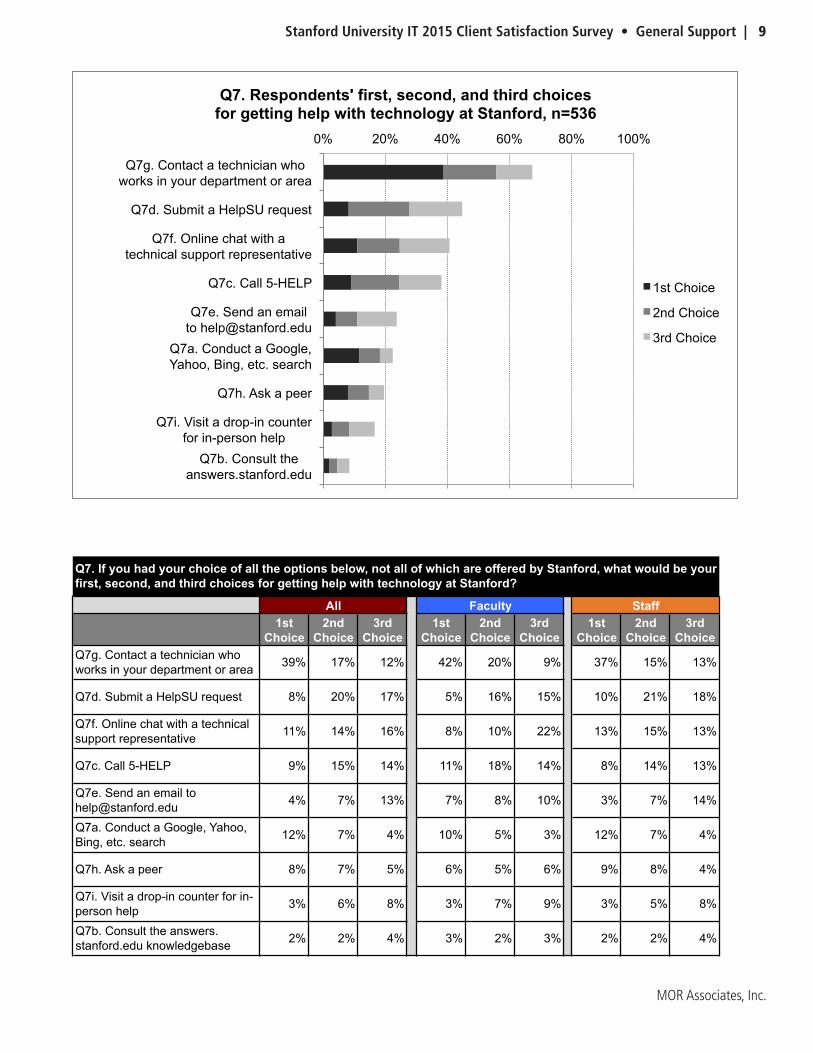
Q7g. Contact a technician who works in your department or area
Q7. Respondents' first, second, and third choices for getting help with technology at Stanford, n=536
1st Choice
2nd Choice
3rd Choice
1st Choice
2nd Choice
3rd Choice
1st Choice
2nd Choice
3rd Choice
1st Choice
2nd Choice
3rd Choice
Q7g. Contact a technician who works in your department or area 39% 17% 12% 42% 20% 9% 37% 15% 13%
Q7d. Submit a HelpSU request 8% 20% 17% 5% 16% 15% 10% 21% 18%
Q7f. Online chat with a technical support representative 11% 14% 16% 8% 10% 22% 13% 15% 13%
Q7c. Call 5-HELP 9% 15% 14% 11% 18% 14% 8% 14% 13%
Q7e. Send an email to [email protected] 4% 7% 13% 7% 8% 10% 3% 7% 14%
Q7a. Conduct a Google, Yahoo, Bing, etc. search 12% 7% 4% 10% 5% 3% 12% 7% 4%
Q7h. Ask a peer 8% 7% 5% 6% 5% 6% 9% 8% 4%
Q7i. Visit a drop-in counter for in-person help 3% 6% 8% 3% 7% 9% 3% 5% 8%
Q7b. Consult the answers. stanford.edu knowledgebase 2% 2% 4% 3% 2% 3% 2% 2% 4%
All Faculty Staff
Q7. If you had your choice of all the options below, not all of which are offered by Stanford, what would be your first, second, and third choices for getting help with technology at Stanford?
10 | General Support • Stanford University IT 2015 Client Satisfaction Survey
MOR Associates, Inc.
Mean N
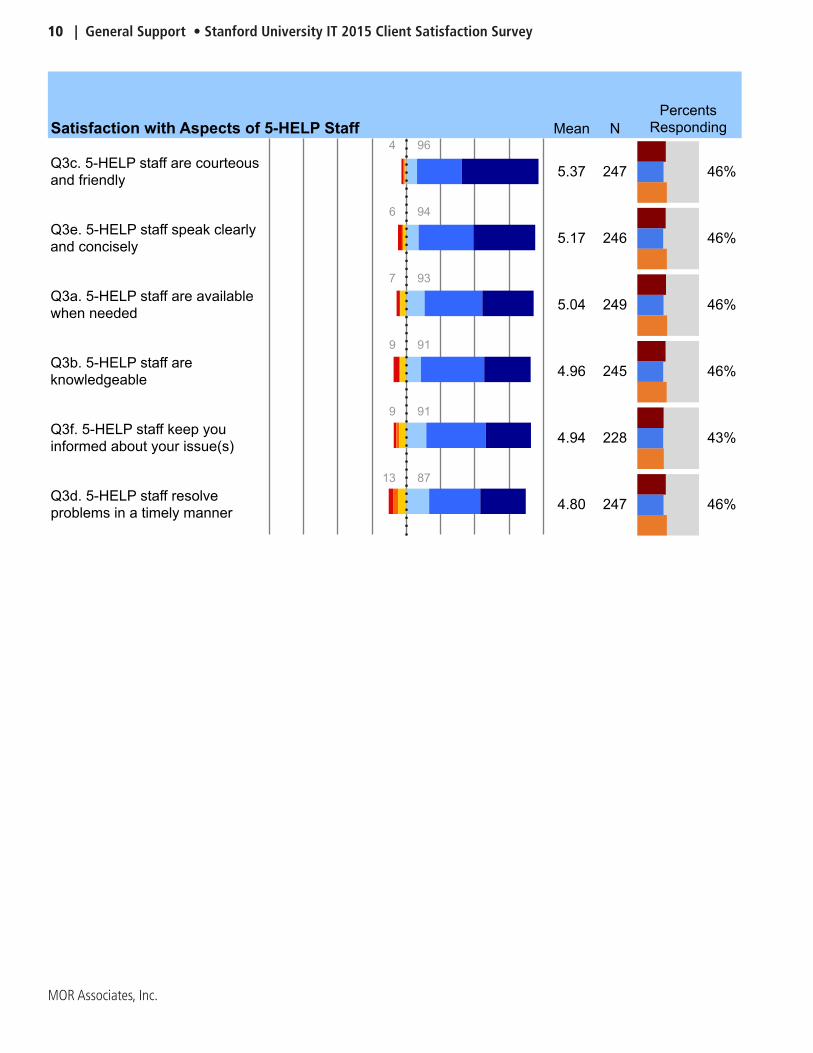
Q3c. 5-HELP staff are courteous and friendly
4 96
5.37 247 46%
Q3e. 5-HELP staff speak clearly and concisely
6 94
5.17 246 46%
Q3a. 5-HELP staff are available when needed
7 93
5.04 249 46%
Q3b. 5-HELP staff are knowledgeable
9 91
4.96 245 46%
Q3f. 5-HELP staff keep you informed about your issue(s)
9 91
4.94 228 43%
Q3d. 5-HELP staff resolve problems in a timely manner
13 87
4.80 247 46%
Satisfaction with Aspects of 5-HELP StaffPercents
Responding

Stanford University IT 2015 Client Satisfaction Survey • General Support | 11
MOR Associates, Inc.
Q3a 5-HELP staff are available when needed
Mean VD D SD SS S VS Count Std. Dev. 95% CI+-All 5.04 2% 0% 4% 13% 42% 37% 249 1.05 0.13Faculty 4.90 3% 0% 10% 16% 34% 37% 73 1.17 0.27Staff 5.10 2% 1% 2% 12% 45% 38% 176 1.00 0.15
Q3b 5-HELP staff are knowledgeable
Mean VD D SD SS S VS Count Std. Dev. 95% CI+-All 4.96 4% 1% 4% 11% 46% 34% 245 1.16 0.15Faculty 4.97 3% 1% 7% 10% 43% 36% 72 1.15 0.27Staff 4.95 5% 1% 3% 11% 47% 33% 173 1.17 0.17
Q3c 5-HELP staff are courteous and friendly
Mean VD D SD SS S VS Count Std. Dev. 95% CI+-All 5.37 2% 1% 1% 8% 33% 56% 247 0.94 0.12Faculty 5.45 0% 0% 1% 10% 32% 58% 73 0.73 0.17Staff 5.33 2% 1% 1% 7% 33% 55% 174 1.02 0.15
Q3d 5-HELP staff resolve problems in a timely manner
Mean VD D SD SS S VS Count Std. Dev. 95% CI+-All 4.80 4% 3% 6% 17% 37% 33% 247 1.26 0.16Faculty 4.82 3% 3% 11% 18% 25% 41% 73 1.31 0.30Staff 4.79 4% 3% 4% 16% 43% 30% 174 1.24 0.18
Q3e 5-HELP staff speak clearly and concisely
Mean VD D SD SS S VS Count Std. Dev. 95% CI+-All 5.17 3% 1% 2% 9% 40% 45% 246 1.07 0.13Faculty 5.18 1% 0% 8% 11% 28% 51% 72 1.08 0.25Staff 5.17 3% 1% 0% 8% 45% 43% 174 1.07 0.16
Q3f 5-HELP staff keep you informed about your issue(s)
Mean VD D SD SS S VS Count Std. Dev. 95% CI+-All 4.94 2% 2% 5% 14% 43% 33% 228 1.08 0.14Faculty 4.90 1% 1% 13% 14% 32% 39% 72 1.18 0.27Staff 4.96 2% 3% 2% 15% 49% 30% 156 1.03 0.16
12 | General Support • Stanford University IT 2015 Client Satisfaction Survey
MOR Associates, Inc.
Mean N
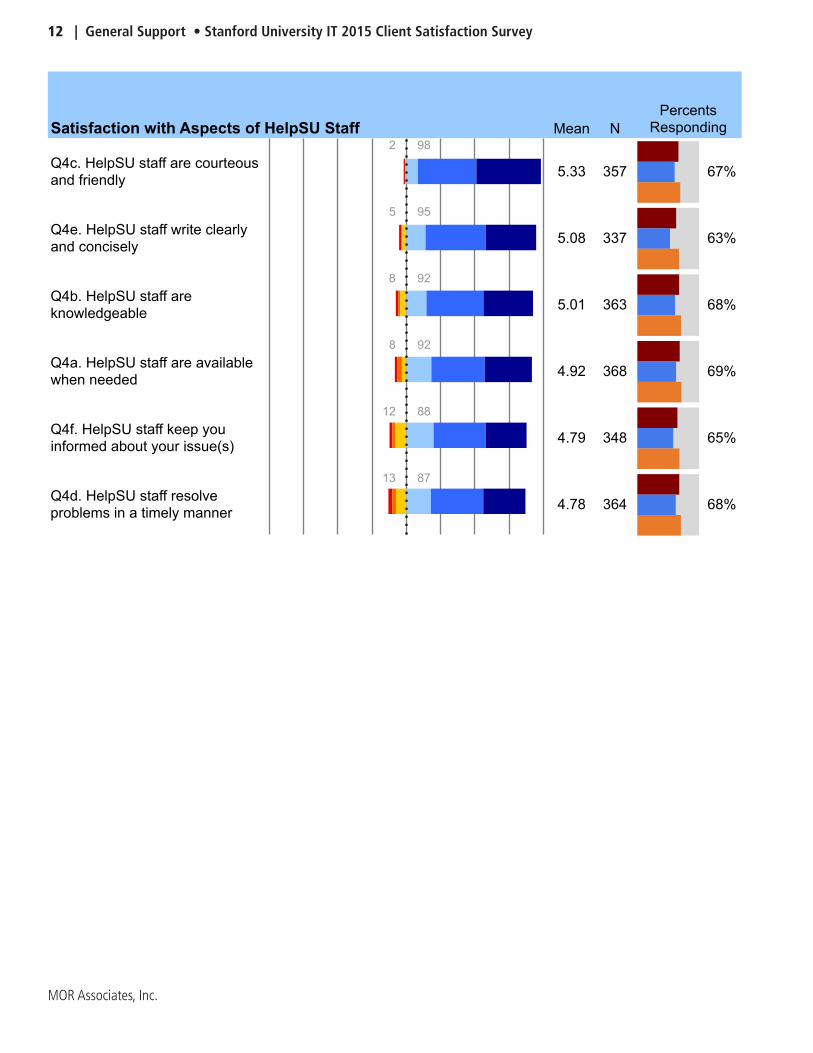
Q4c. HelpSU staff are courteous and friendly
2 98
5.33 357 67%
Q4e. HelpSU staff write clearly and concisely
5 95
5.08 337 63%
Q4b. HelpSU staff are knowledgeable
8 92
5.01 363 68%
Q4a. HelpSU staff are available when needed
8 92
4.92 368 69%
Q4f. HelpSU staff keep you informed about your issue(s)
12 88
4.79 348 65%
Q4d. HelpSU staff resolve problems in a timely manner
13 87
4.78 364 68%
Mean N
Q6. software.stanford.edu portal
11 89
4.71 93 17%
Q5. answers.stanford.edu knowledgebase
24 76
4.20 49 9%
Satisfaction with Aspects of HelpSU Staff
Satisfaction with Specified Help Resources
Percents Responding
Percents Responding
Stanford University IT 2015 Client Satisfaction Survey • General Support | 13
MOR Associates, Inc.
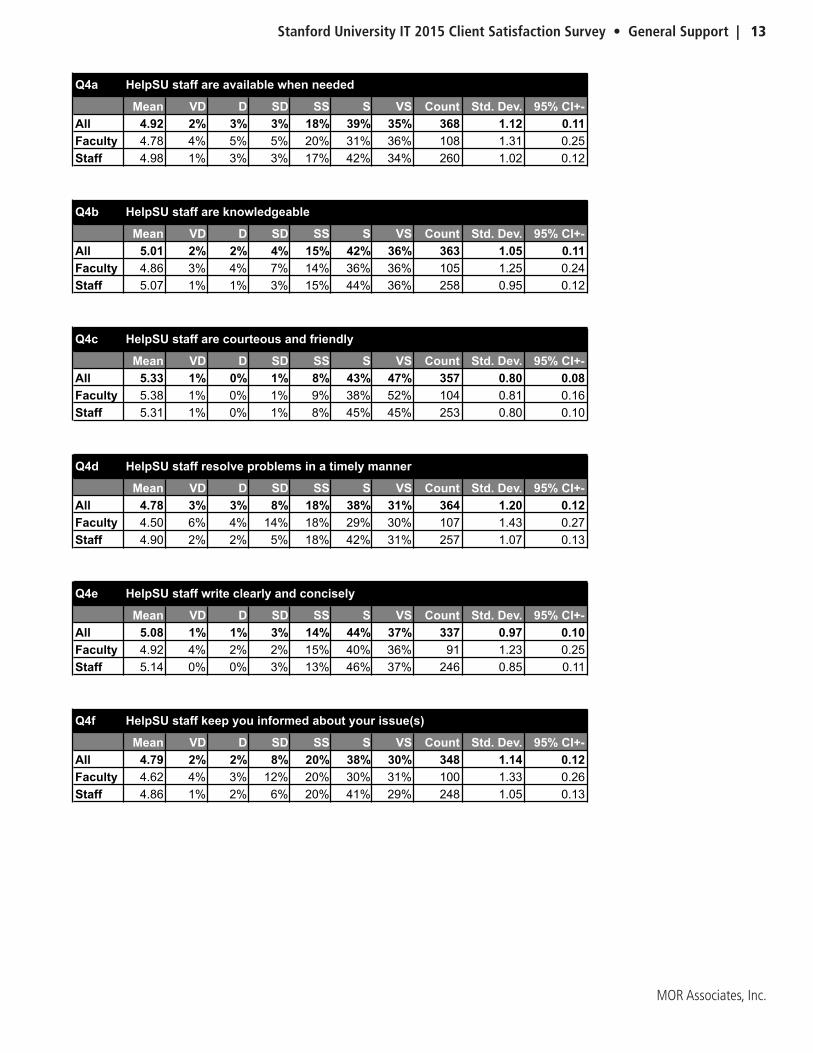
Q4a HelpSU staff are available when needed
Mean VD D SD SS S VS Count Std. Dev. 95% CI+-All 4.92 2% 3% 3% 18% 39% 35% 368 1.12 0.11Faculty 4.78 4% 5% 5% 20% 31% 36% 108 1.31 0.25Staff 4.98 1% 3% 3% 17% 42% 34% 260 1.02 0.12
Q4b HelpSU staff are knowledgeable
Mean VD D SD SS S VS Count Std. Dev. 95% CI+-All 5.01 2% 2% 4% 15% 42% 36% 363 1.05 0.11Faculty 4.86 3% 4% 7% 14% 36% 36% 105 1.25 0.24Staff 5.07 1% 1% 3% 15% 44% 36% 258 0.95 0.12
Q4c HelpSU staff are courteous and friendly
Mean VD D SD SS S VS Count Std. Dev. 95% CI+-All 5.33 1% 0% 1% 8% 43% 47% 357 0.80 0.08Faculty 5.38 1% 0% 1% 9% 38% 52% 104 0.81 0.16Staff 5.31 1% 0% 1% 8% 45% 45% 253 0.80 0.10
Q4d HelpSU staff resolve problems in a timely manner
Mean VD D SD SS S VS Count Std. Dev. 95% CI+-All 4.78 3% 3% 8% 18% 38% 31% 364 1.20 0.12Faculty 4.50 6% 4% 14% 18% 29% 30% 107 1.43 0.27Staff 4.90 2% 2% 5% 18% 42% 31% 257 1.07 0.13
Q4e HelpSU staff write clearly and concisely
Mean VD D SD SS S VS Count Std. Dev. 95% CI+-All 5.08 1% 1% 3% 14% 44% 37% 337 0.97 0.10Faculty 4.92 4% 2% 2% 15% 40% 36% 91 1.23 0.25Staff 5.14 0% 0% 3% 13% 46% 37% 246 0.85 0.11
Q4f HelpSU staff keep you informed about your issue(s)
Mean VD D SD SS S VS Count Std. Dev. 95% CI+-All 4.79 2% 2% 8% 20% 38% 30% 348 1.14 0.12Faculty 4.62 4% 3% 12% 20% 30% 31% 100 1.33 0.26Staff 4.86 1% 2% 6% 20% 41% 29% 248 1.05 0.13
14 | General Support • Stanford University IT 2015 Client Satisfaction Survey
MOR Associates, Inc.
Mean N
Q4c. HelpSU staff are courteous and friendly
2 98
5.33 357 67%
Q4e. HelpSU staff write clearly and concisely
5 95
5.08 337 63%
Q4b. HelpSU staff are knowledgeable
8 92
5.01 363 68%
Q4a. HelpSU staff are available when needed
8 92
4.92 368 69%
Q4f. HelpSU staff keep you informed about your issue(s)
12 88
4.79 348 65%
Q4d. HelpSU staff resolve problems in a timely manner
13 87
4.78 364 68%
Mean N
Q6. software.stanford.edu portal
11 89
4.71 93 17%
Q5. answers.stanford.edu knowledgebase
24 76
4.20 49 9%
Satisfaction with Aspects of HelpSU Staff
Satisfaction with Specified Help Resources
Percents Responding
Percents Responding
5%
7%
17%
21%
34%
0% 20% 40% 60% 80% 100%
Oracle Business Intelligence (reporting)
Authority Manager
Axess (PeopleSoft, STARS, Student Records, GFS, HRMS, etc.)
Oracle Financials (iProcurement, Expense Requests, iJournals, etc.)
Received support for at least one app
Q8. Have you received troubleshooting support via HelpSU for any of the following applications in the past year?
A, n=364
Stanford University IT 2015 Client Satisfaction Survey • General Support | 15
MOR Associates, Inc.
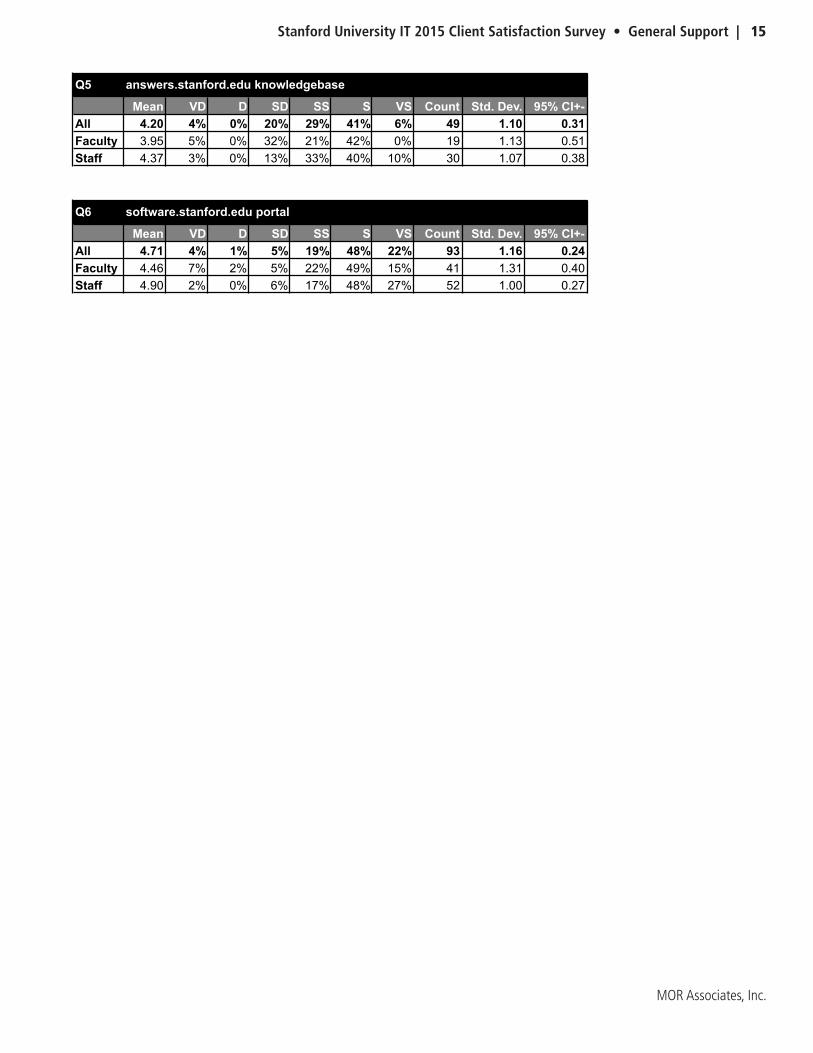
Q5 answers.stanford.edu knowledgebase
Mean VD D SD SS S VS Count Std. Dev. 95% CI+-All 4.20 4% 0% 20% 29% 41% 6% 49 1.10 0.31Faculty 3.95 5% 0% 32% 21% 42% 0% 19 1.13 0.51Staff 4.37 3% 0% 13% 33% 40% 10% 30 1.07 0.38
Q6 software.stanford.edu portal
Mean VD D SD SS S VS Count Std. Dev. 95% CI+-All 4.71 4% 1% 5% 19% 48% 22% 93 1.16 0.24Faculty 4.46 7% 2% 5% 22% 49% 15% 41 1.31 0.40Staff 4.90 2% 0% 6% 17% 48% 27% 52 1.00 0.27
Q11 Friday Open Labs
Mean VD D SD SS S VS Count Std. Dev. 95% CI+-Staff 5.00 0% 0% 33% 0% 0% 67% 3 1.73 1.96

16 | General Support • Stanford University IT 2015 Client Satisfaction Survey
MOR Associates, Inc.
Mean NQ9c. HelpSU staff are courteous and friendly when troubleshooting specified AS applications
3 97
5.20 119 22%
Q9e. HelpSU staff write clearly and concisely when troubleshooting specified AS applications
7 93
5.01 113 21%
Q9a. HelpSU staff are available when needed when troubleshooting specified AS applications
8 93
4.96 120 22%
Q9b. HelpSU staff are knowledgeable when troubleshooting specified AS applications
6 94
4.96 120 22%
Q9f. HelpSU staff keep you informed about your issue(s) when troubleshooting specified AS applications
7 93
4.86 111 21%
Q9d. HelpSU staff resolve problems in a timely manner when troubleshooting specified AS applications
9 91
4.81 118 22%
Mean N
Q11. Friday Open Labs
33 67
5.00 3 1%
Satisfaction with HelpSU Staff Troubleshooting Specified AS AppsPercents
Responding
Satisfaction with Friday Open LabsPercents
Responding
Q7f Online chat with a technical support representative
1st Choice 2nd Choice 3rd Choice CountAll 27% 33% 39% 218Faculty 19% 25% 55% 67Staff 30% 37% 32% 151
Q7g Contact a technician who works in your department or area
1st Choice 2nd Choice 3rd Choice CountAll 58% 25% 17% 361Faculty 59% 29% 12% 122Staff 57% 23% 20% 239
Q7h Ask a peer
1st Choice 2nd Choice 3rd Choice CountAll 41% 34% 25% 105Faculty 36% 29% 36% 28Staff 43% 36% 21% 77
Q7i Visit a drop-in counter for in-person help
1st Choice 2nd Choice 3rd Choice CountAll 17% 34% 49% 89Faculty 16% 38% 47% 32Staff 18% 32% 51% 57
Q10
Yes No CountStaff 1% 99% 315
Q21
Yes No CountAll 24% 76% 508Faculty 15% 85% 158Staff 28% 72% 350
Have you attended any of the Friday Open Labs available for obtaining one-on-one assistance with Administrative Systems?
Are you subscribed to the University IT email newsletter?
See Appendix
AQ12 . What would increase your satisfaction with Friday Open Labs?

Stanford University IT 2015 Client Satisfaction Survey • General Support | 17
MOR Associates, Inc.
Q9 Aspects of HelpSU staff troubleshooting specified AS applications - asked of staff only
Staff Mean VD D SD SS S VS Count Std. Dev. 95% CI+-Q9a. Are available when needed 4.96 3% 2% 3% 17% 42% 34% 120 1.10 0.20Q9b. Are knowledgeable 4.96 3% 2% 2% 19% 42% 33% 120 1.07 0.19Q9c. Are courteous and friendly 5.20 1% 1% 2% 14% 39% 44% 119 0.91 0.16Q9d. Resolve problems in a timely manner 4.81 4% 3% 3% 21% 38% 31% 118 1.23 0.22Q9e. Write clearly and concisely 5.01 2% 1% 4% 15% 43% 35% 113 1.02 0.19Q9f. Keep you informed about your issue(s) 4.86 3% 1% 4% 20% 47% 26% 111 1.05 0.20
Q5 answers.stanford.edu knowledgebase
Mean VD D SD SS S VS Count Std. Dev. 95% CI+-All 4.20 4% 0% 20% 29% 41% 6% 49 1.10 0.31Faculty 3.95 5% 0% 32% 21% 42% 0% 19 1.13 0.51Staff 4.37 3% 0% 13% 33% 40% 10% 30 1.07 0.38
Q6 software.stanford.edu portal
Mean VD D SD SS S VS Count Std. Dev. 95% CI+-All 4.71 4% 1% 5% 19% 48% 22% 93 1.16 0.24Faculty 4.46 7% 2% 5% 22% 49% 15% 41 1.31 0.40Staff 4.90 2% 0% 6% 17% 48% 27% 52 1.00 0.27
Q11 Friday Open Labs
Mean VD D SD SS S VS Count Std. Dev. 95% CI+-Staff 5.00 0% 0% 33% 0% 0% 67% 3 1.73 1.96
18 | General Support • Stanford University IT 2015 Client Satisfaction Survey
MOR Associates, Inc.
This page intentionally left blank�

Stanford University IT 2015 Client Satisfaction Survey • University IT Communications | 19
MOR Associates, Inc.
University IT Communications
20 | University IT Communications • Stanford University IT 2015 Client Satisfaction Survey
MOR Associates, Inc.
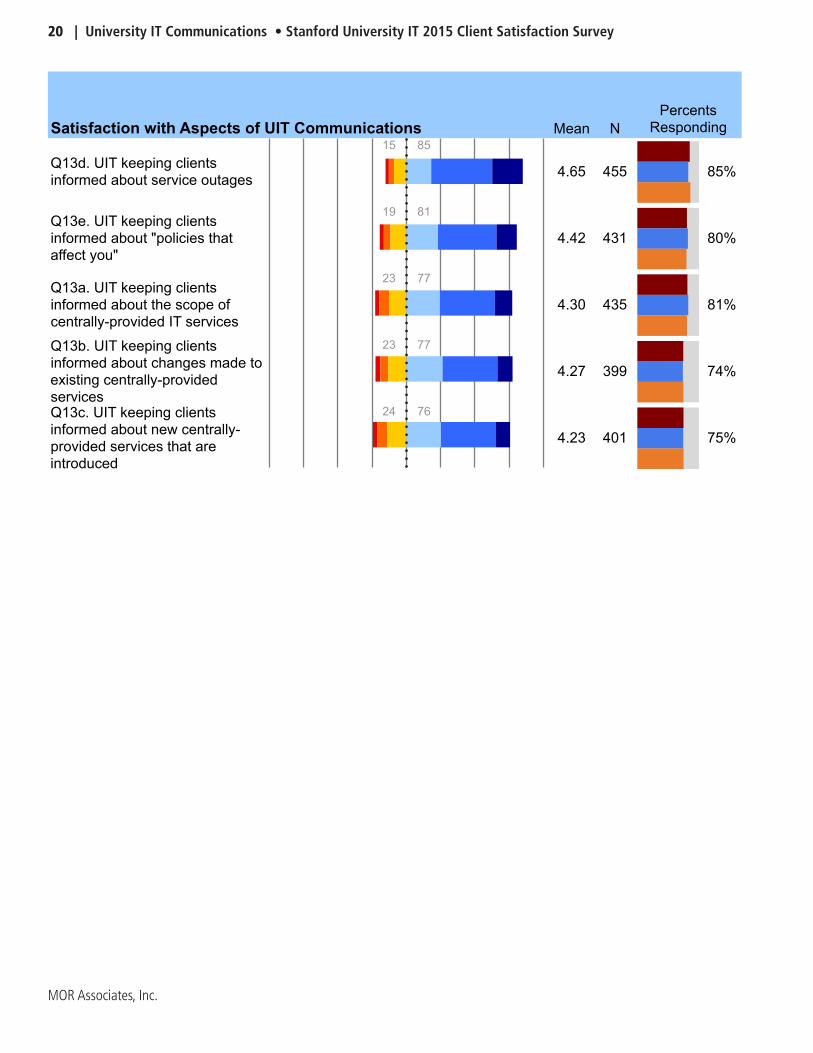
Mean N
Q13d. UIT keeping clients informed about service outages
15 85
4.65 455 85%
Q13e. UIT keeping clients informed about "policies that affect you"
19 81
4.42 431 80%
Q13a. UIT keeping clients informed about the scope of centrally-provided IT services
23 77
4.30 435 81%
Q13b. UIT keeping clients informed about changes made to existing centrally-provided services
23 77
4.27 399 74%
Q13c. UIT keeping clients informed about new centrally-provided services that are introduced
24 76
4.23 401 75%
Satisfaction with Aspects of UIT CommunicationsPercents
Responding
Stanford University IT 2015 Client Satisfaction Survey • University IT Communications | 21
MOR Associates, Inc.
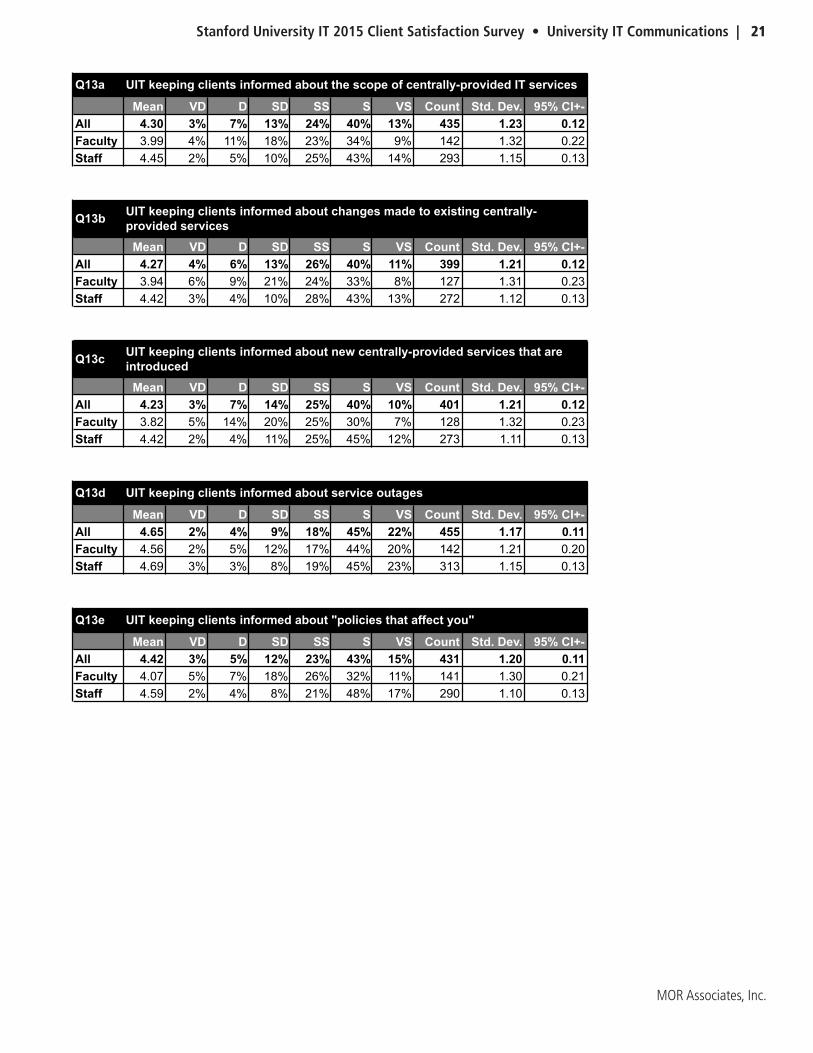
Q13a UIT keeping clients informed about the scope of centrally-provided IT services
Mean VD D SD SS S VS Count Std. Dev. 95% CI+-All 4.30 3% 7% 13% 24% 40% 13% 435 1.23 0.12Faculty 3.99 4% 11% 18% 23% 34% 9% 142 1.32 0.22Staff 4.45 2% 5% 10% 25% 43% 14% 293 1.15 0.13
Q13b
Mean VD D SD SS S VS Count Std. Dev. 95% CI+-All 4.27 4% 6% 13% 26% 40% 11% 399 1.21 0.12Faculty 3.94 6% 9% 21% 24% 33% 8% 127 1.31 0.23Staff 4.42 3% 4% 10% 28% 43% 13% 272 1.12 0.13
Q13c
Mean VD D SD SS S VS Count Std. Dev. 95% CI+-All 4.23 3% 7% 14% 25% 40% 10% 401 1.21 0.12Faculty 3.82 5% 14% 20% 25% 30% 7% 128 1.32 0.23Staff 4.42 2% 4% 11% 25% 45% 12% 273 1.11 0.13
Q13d UIT keeping clients informed about service outages
Mean VD D SD SS S VS Count Std. Dev. 95% CI+-All 4.65 2% 4% 9% 18% 45% 22% 455 1.17 0.11Faculty 4.56 2% 5% 12% 17% 44% 20% 142 1.21 0.20Staff 4.69 3% 3% 8% 19% 45% 23% 313 1.15 0.13
Q13e UIT keeping clients informed about "policies that affect you"
Mean VD D SD SS S VS Count Std. Dev. 95% CI+-All 4.42 3% 5% 12% 23% 43% 15% 431 1.20 0.11Faculty 4.07 5% 7% 18% 26% 32% 11% 141 1.30 0.21Staff 4.59 2% 4% 8% 21% 48% 17% 290 1.10 0.13
UIT keeping clients informed about changes made to existing centrally-provided services
UIT keeping clients informed about new centrally-provided services that are introduced

22 | University IT Communications • Stanford University IT 2015 Client Satisfaction Survey
MOR Associates, Inc.
15%
24%
29%
50%
64%
8%
32%
28%
45%
60%
13%
27%
29%
48%
63%
0% 20% 40% 60% 80% 100%
Administrative Systems website (as.stanford.edu)
Secure Computing website (securecomputing.stanford.edu)
University IT website (uit.stanford.edu)
IT Services website (itservices.stanford.edu)
Visited at least one listed website
Q14. Which of the following University IT websites have you visited in the past year?
All, n=536
F, n=172
A, n=364
See Appendix
A
Q20a . Other top three preferred channel(s) for being informed about available Stanford centrally provided services .
Q22 . How can University IT better communicate about planned maintenance down time and service outages?
Q23 . What is the single most important thing University IT could do to keep you better informed about Stanford Centrally-provided IT services?
50%
67%
67%
0% 20% 40% 60% 80% 100%
Q22. Which social media platforms would you prefer to use for getting information about Stanford centrally-provided
IT services provided by University IT? n=6
A, n=6
Stanford University IT 2015 Client Satisfaction Survey • University IT Communications | 23
MOR Associates, Inc.
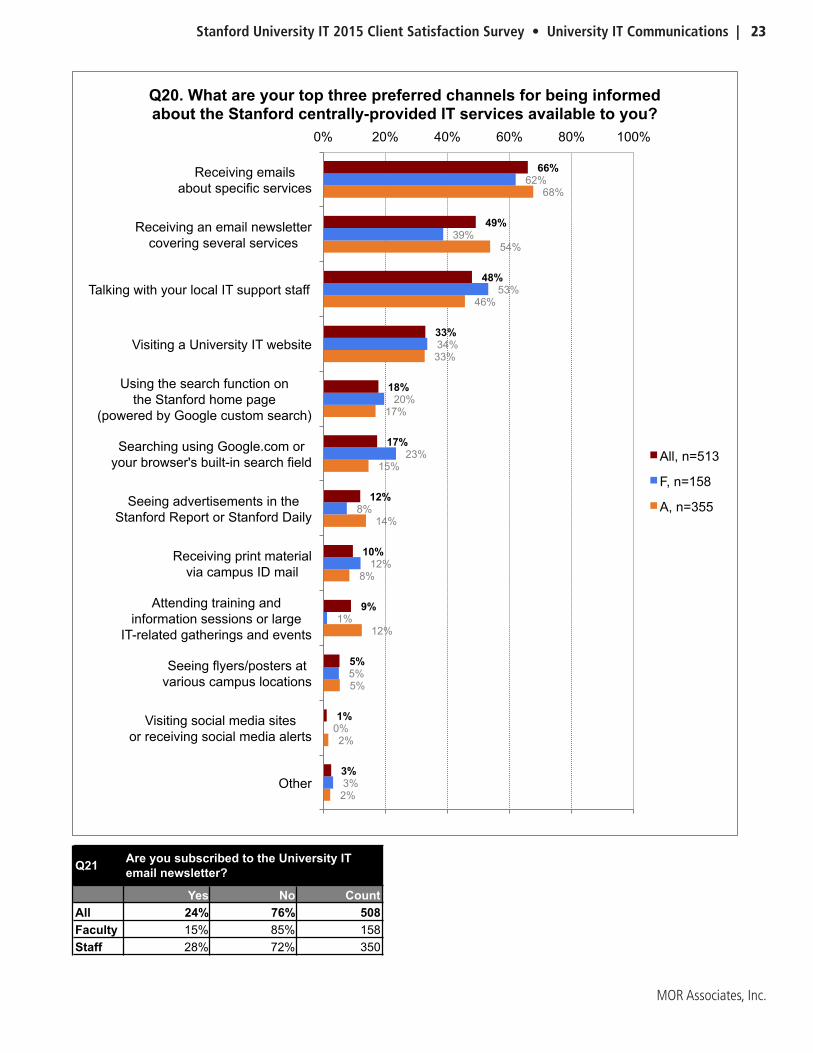
2%
2%
5%
12%
8%
14%
15%
17%
33%
46%
54%
68%
3%
0%
5%
1%
12%
8%
23%
20%
34%
53%
39%
62%
3%
1%
5%
9%
10%
12%
17%
18%
33%
48%
49%
66%
0% 20% 40% 60% 80% 100%
Other
Visiting social media sites or receiving social media alerts
Seeing flyers/posters at various campus locations
Attending training and information sessions or large
IT-related gatherings and events
Receiving print material via campus ID mail
Seeing advertisements in the Stanford Report or Stanford Daily
Searching using Google.com or your browser's built-in search field
Using the search function on the Stanford home page
(powered by Google custom search)
Visiting a University IT website
Talking with your local IT support staff
Receiving an email newsletter covering several services
Receiving emails about specific services
Q20. What are your top three preferred channels for being informed about the Stanford centrally-provided IT services available to you?
All, n=513
F, n=158
A, n=355
Q7f Online chat with a technical support representative
1st Choice 2nd Choice 3rd Choice CountAll 27% 33% 39% 218Faculty 19% 25% 55% 67Staff 30% 37% 32% 151
Q7g Contact a technician who works in your department or area
1st Choice 2nd Choice 3rd Choice CountAll 58% 25% 17% 361Faculty 59% 29% 12% 122Staff 57% 23% 20% 239
Q7h Ask a peer
1st Choice 2nd Choice 3rd Choice CountAll 41% 34% 25% 105Faculty 36% 29% 36% 28Staff 43% 36% 21% 77
Q7i Visit a drop-in counter for in-person help
1st Choice 2nd Choice 3rd Choice CountAll 17% 34% 49% 89Faculty 16% 38% 47% 32Staff 18% 32% 51% 57
Q10
Yes No CountStaff 1% 99% 315
Q21
Yes No CountAll 24% 76% 508Faculty 15% 85% 158Staff 28% 72% 350
Have you attended any of the Friday Open Labs available for obtaining one-on-one assistance with Administrative Systems?
Are you subscribed to the University IT email newsletter?
24 | University IT Communications • Stanford University IT 2015 Client Satisfaction Survey
MOR Associates, Inc.
Mean N
Q17b. IT Services website (itservices.stanford.edu) usefulness of content
11 89
4.54 243 45%
Q16b. Administrative Systems website (as.stanford.edu) usefulness of content
19 81
4.45 62 12%
Q17a. IT Services website (itservices.stanford.edu) ease of finding what you need
16 84
4.42 248 46%
Q18b. Secure Computing website (securecomputing.stanford.edu) usefulness of content
17 83
4.42 132 25%
Q18a. Secure Computing website (securecomputing.stanford.edu) ease of finding what you need
20 80
4.37 130 24%
Q15b. University IT website (uit.stanford.edu) usefulness of content
17 83
4.35 143 27%
Q16a. Administrative Systems website (as.stanford.edu) ease of finding what you need
21 79
4.35 63 12%
Q15a. University IT website (uit.stanford.edu) ease of finding what you need
21 79
4.24 147 27%
Satisfaction with Specified UIT WebsitesPercents
Responding
See Appendix
AQ19 . Was there specific [website] content you found lacking? Can you tell us more?

Stanford University IT 2015 Client Satisfaction Survey • University IT Communications | 25
MOR Associates, Inc.
Q15a University IT website (uit.stanford.edu) ease of finding what you need
Mean VD D SD SS S VS Count Std. Dev. 95% CI+-All 4.24 3% 5% 13% 29% 44% 6% 147 1.11 0.18Faculty 3.89 4% 9% 23% 23% 38% 2% 47 1.20 0.34Staff 4.41 2% 4% 8% 31% 47% 8% 100 1.03 0.20
Q15b University IT website (uit.stanford.edu) usefulness of content
Mean VD D SD SS S VS Count Std. Dev. 95% CI+-All 4.35 2% 6% 9% 28% 46% 8% 143 1.10 0.18Faculty 3.98 2% 11% 16% 30% 39% 2% 44 1.15 0.34Staff 4.52 2% 4% 6% 27% 49% 11% 99 1.04 0.21
Q16a
Mean VD D SD SS S VS Count Std. Dev. 95% CI+-All 4.35 3% 2% 16% 27% 41% 11% 63 1.12 0.28Faculty 3.85 8% 8% 23% 23% 31% 8% 13 1.41 0.76Staff 4.48 2% 0% 14% 28% 44% 12% 50 1.01 0.28
Q16b Administrative Systems website (as.stanford.edu) usefulness of content
Mean VD D SD SS S VS Count Std. Dev. 95% CI+-All 4.45 3% 2% 15% 24% 40% 16% 62 1.17 0.29Faculty 4.00 8% 8% 15% 23% 38% 8% 13 1.41 0.77Staff 4.57 2% 0% 14% 24% 41% 18% 49 1.08 0.30
Q17a IT Services website (itservices.stanford.edu) ease of finding what you need
Mean VD D SD SS S VS Count Std. Dev. 95% CI+-All 4.42 3% 3% 10% 28% 44% 11% 248 1.09 0.14Faculty 4.11 4% 4% 18% 31% 38% 5% 74 1.14 0.26Staff 4.56 2% 2% 7% 27% 47% 14% 174 1.05 0.16
Q17b IT Services website (itservices.stanford.edu) usefulness of content
Mean VD D SD SS S VS Count Std. Dev. 95% CI+-All 4.54 2% 4% 5% 30% 45% 14% 243 1.04 0.13Faculty 4.22 1% 7% 10% 38% 39% 6% 72 1.04 0.24Staff 4.68 2% 3% 4% 27% 47% 18% 171 1.02 0.15
Administrative Systems website (as.stanford.edu) ease of finding what you need
Q18a
Mean VD D SD SS S VS Count Std. Dev. 95% CI+-All 4.37 3% 5% 12% 27% 38% 15% 130 1.21 0.21Faculty 4.22 6% 6% 16% 20% 33% 18% 49 1.42 0.40Staff 4.46 1% 5% 9% 31% 41% 14% 81 1.07 0.23
Q18b
Mean VD D SD SS S VS Count Std. Dev. 95% CI+-All 4.42 2% 6% 9% 27% 42% 14% 132 1.16 0.20Faculty 4.27 4% 8% 12% 24% 35% 16% 49 1.34 0.37Staff 4.51 1% 5% 7% 28% 47% 12% 83 1.04 0.22
Q50a Wired (Ethernet) network performance
Mean VD D SD SS S VS Count Std. Dev. 95% CI+-All 5.06 1% 2% 3% 11% 46% 36% 421 1.00 0.10Faculty 4.97 2% 4% 5% 10% 45% 35% 127 1.12 0.19Staff 5.11 1% 2% 3% 11% 47% 36% 294 0.95 0.11
Q50b Wireless (Wi-Fi) network performance
Mean VD D SD SS S VS Count Std. Dev. 95% CI+-All 4.69 2% 3% 10% 18% 41% 26% 476 1.18 0.11Faculty 4.63 3% 5% 9% 19% 39% 25% 146 1.24 0.20Staff 4.71 2% 3% 10% 18% 42% 26% 330 1.16 0.13
Q50c Wireless (Wi-Fi) network access
Mean VD D SD SS S VS Count Std. Dev. 95% CI+-All 4.71 3% 3% 8% 19% 42% 25% 478 1.16 0.10Faculty 4.66 3% 3% 10% 17% 38% 28% 149 1.26 0.20Staff 4.73 2% 3% 7% 19% 44% 24% 329 1.12 0.12
Q50d Stanford Visitor - short-term wireless access for visitors, no sponsor required
Mean VD D SD SS S VS Count Std. Dev. 95% CI+-All 4.63 2% 7% 7% 19% 40% 25% 327 1.25 0.14Faculty 4.77 1% 7% 5% 14% 45% 27% 95 1.19 0.24Staff 4.58 3% 6% 8% 21% 38% 25% 232 1.27 0.16
Secure Computing website (securecomputing.stanford.edu) ease of finding what you need
Secure Computing website (securecomputing.stanford.edu) usefulness of content
26 | University IT Communications • Stanford University IT 2015 Client Satisfaction Survey
MOR Associates, Inc.
This page intentionally left blank�

Stanford University IT 2015 Client Satisfaction Survey • Network Services | 27
MOR Associates, Inc.
Network Services

28 | Network Services • Stanford University IT 2015 Client Satisfaction Survey
MOR Associates, Inc.
Mean N
Q50a. Wired (Ethernet) network performance
7 93
5.06 421 79%
Q50c. Wireless (Wi-Fi) network access
14 86
4.71 478 89%
Q50b. Wireless (Wi-Fi) network performance
15 85
4.69 476 89%
Q50d. Stanford Visitor - short-term wireless access for visitors, no sponsor required
16 84
4.63 327 61%
Satisfaction with Aspects of Stanford's Computer NetworkPercents
Responding
Q53 Do you ever use Stanford hospitals' computer networks?
Yes No I don't know. CountAll 21% 74% 5% 496Faculty 34% 60% 5% 151Staff 15% 80% 5% 345
Q68
Yes No I don't know. CountAll 71% 8% 21% 500Faculty 75% 12% 13% 153Staff 69% 6% 24% 347
Q80
Yes No I don't know. CountAll 24% 71% 5% 489Faculty 21% 74% 5% 148Staff 25% 70% 4% 341
Q93
Yes No I don't know. CountAll 24% 41% 35% 17Faculty 0% 60% 40% 5Staff 33% 33% 33% 12
Q97
Yes No CountAll 47% 53% 369Faculty 39% 61% 123Staff 51% 49% 246
Q98
Yes No CountFaculty 11% 89% 18
May research computing staff contact you to discuss your anticipated HPC and/or large data storage needs?
Are all of the computing devices you use for Stanford work backed up?
Do you use Stanford's voicemail to email service in which voicemails appear in your email inbox?
OrderIT was revamped in 2013. Did you use the previous version?
Would you like to subscribe to the University IT email newsletter?
16%
10%
10%
19%
45%
23%
18%
19%
24%
16%
18%
13%
13%
20%
36%
0% 20% 40% 60% 80% 100%
0%
1-25%
26-50%
51-75%
76-100%
Q54. What percentage of your network time is spent plugged into the Stanford WIRED (Ethernet) network?
All, n=494
F, n=152
A, n=342

Stanford University IT 2015 Client Satisfaction Survey • Network Services | 29
MOR Associates, Inc.
Q18a
Mean VD D SD SS S VS Count Std. Dev. 95% CI+-All 4.37 3% 5% 12% 27% 38% 15% 130 1.21 0.21Faculty 4.22 6% 6% 16% 20% 33% 18% 49 1.42 0.40Staff 4.46 1% 5% 9% 31% 41% 14% 81 1.07 0.23
Q18b
Mean VD D SD SS S VS Count Std. Dev. 95% CI+-All 4.42 2% 6% 9% 27% 42% 14% 132 1.16 0.20Faculty 4.27 4% 8% 12% 24% 35% 16% 49 1.34 0.37Staff 4.51 1% 5% 7% 28% 47% 12% 83 1.04 0.22
Q50a Wired (Ethernet) network performance
Mean VD D SD SS S VS Count Std. Dev. 95% CI+-All 5.06 1% 2% 3% 11% 46% 36% 421 1.00 0.10Faculty 4.97 2% 4% 5% 10% 45% 35% 127 1.12 0.19Staff 5.11 1% 2% 3% 11% 47% 36% 294 0.95 0.11
Q50b Wireless (Wi-Fi) network performance
Mean VD D SD SS S VS Count Std. Dev. 95% CI+-All 4.69 2% 3% 10% 18% 41% 26% 476 1.18 0.11Faculty 4.63 3% 5% 9% 19% 39% 25% 146 1.24 0.20Staff 4.71 2% 3% 10% 18% 42% 26% 330 1.16 0.13
Q50c Wireless (Wi-Fi) network access
Mean VD D SD SS S VS Count Std. Dev. 95% CI+-All 4.71 3% 3% 8% 19% 42% 25% 478 1.16 0.10Faculty 4.66 3% 3% 10% 17% 38% 28% 149 1.26 0.20Staff 4.73 2% 3% 7% 19% 44% 24% 329 1.12 0.12
Q50d Stanford Visitor - short-term wireless access for visitors, no sponsor required
Mean VD D SD SS S VS Count Std. Dev. 95% CI+-All 4.63 2% 7% 7% 19% 40% 25% 327 1.25 0.14Faculty 4.77 1% 7% 5% 14% 45% 27% 95 1.19 0.24Staff 4.58 3% 6% 8% 21% 38% 25% 232 1.27 0.16
Secure Computing website (securecomputing.stanford.edu) ease of finding what you need
Secure Computing website (securecomputing.stanford.edu) usefulness of content
See Appendix
A
Q51 . Why are you dissatisfied with Stanford Visitor network?
Are there locations on campus where improved wired or wireless connectivity is needed? Please list the locations and be as specific as possible .

30 | Network Services • Stanford University IT 2015 Client Satisfaction Survey
MOR Associates, Inc.
This page intentionally left blank�
Stanford University IT 2015 Client Satisfaction Survey • Collaboration Tools | 31
MOR Associates, Inc.
Collaboration Tools
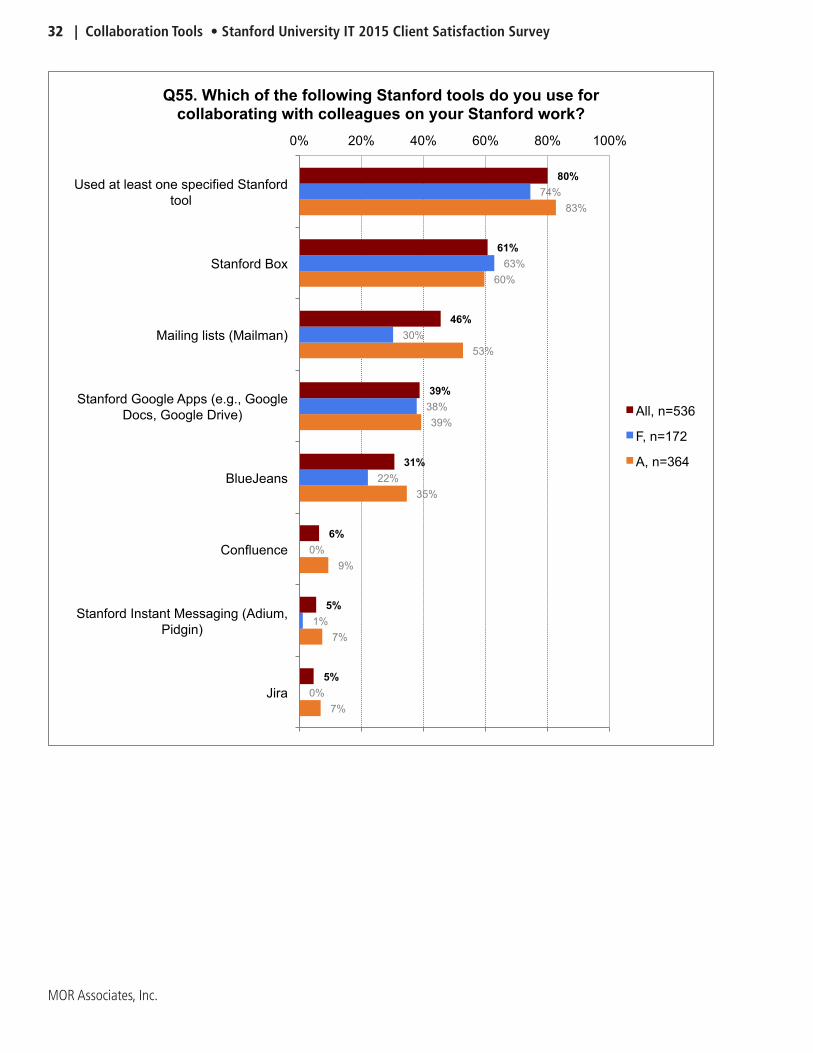
32 | Collaboration Tools • Stanford University IT 2015 Client Satisfaction Survey
MOR Associates, Inc.
7%
7%
9%
35%
39%
53%
60%
83%
0%
1%
0%
22%
38%
30%
63%
74%
5%
5%
6%
31%
39%
46%
61%
80%
0% 20% 40% 60% 80% 100%
Jira
Stanford Instant Messaging (Adium, Pidgin)
Confluence
BlueJeans
Stanford Google Apps (e.g., Google Docs, Google Drive)
Mailing lists (Mailman)
Stanford Box
Used at least one specified Stanford tool
Q55. Which of the following Stanford tools do you use for collaborating with colleagues on your Stanford work?
All, n=536
F, n=172
A, n=364

Stanford University IT 2015 Client Satisfaction Survey • Collaboration Tools | 33
MOR Associates, Inc.
This page intentionally left blank�

34 | Collaboration Tools • Stanford University IT 2015 Client Satisfaction Survey
MOR Associates, Inc.
Mean N
Q56g. Mailing lists (Mailman)
4 96
4.85 239 45%
Q56b. Stanford Google Apps (e.g., Google Docs, Google Drive)
10 91
4.75 200 37%
Q56c. Confluence
12 88
4.56 34 6%
Q56d. BlueJeans
15 85
4.49 160 30%
Q56a. Stanford Box
17 83
4.49 317 59%
Q56e. Jira
16 84
4.72 25 5%
Q56f. Stanford Instant Messaging (Adium, Pidgin)
19 81
4.48 27 5%
Satisfaction with Specified Stanford Tools for Collaborating with Others on Stanford Work
Percents Responding
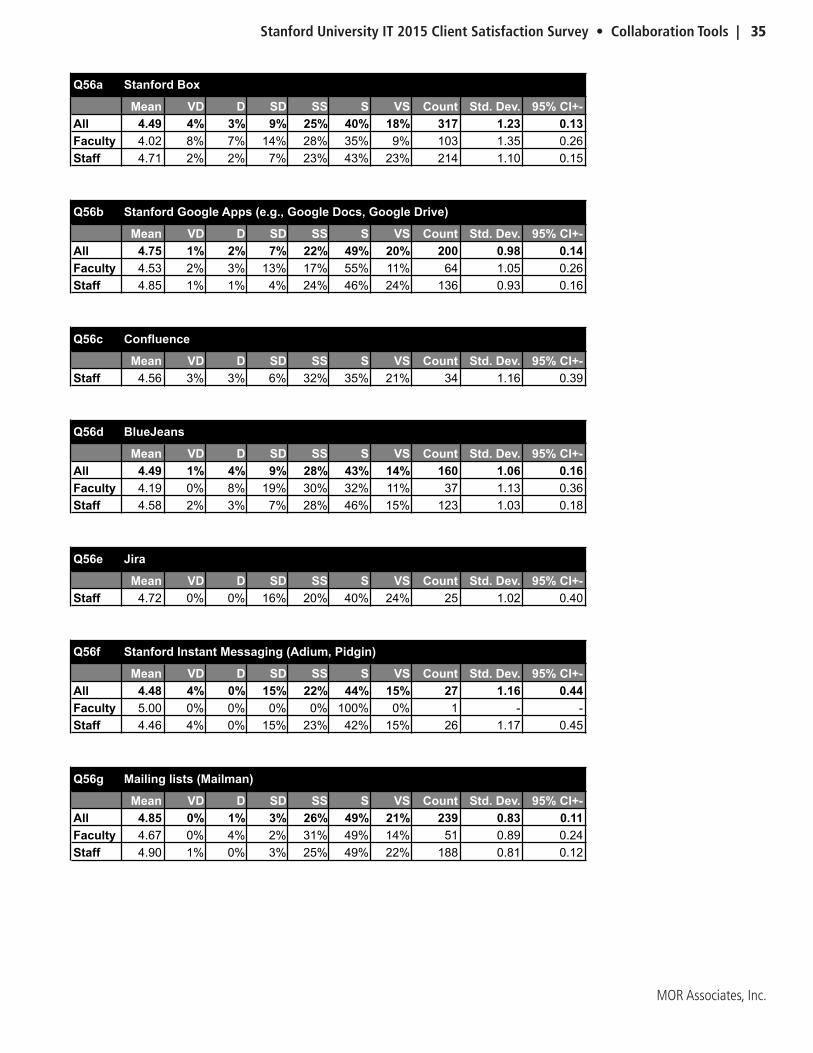
Stanford University IT 2015 Client Satisfaction Survey • Collaboration Tools | 35
MOR Associates, Inc.
Q56a Stanford Box
Mean VD D SD SS S VS Count Std. Dev. 95% CI+-All 4.49 4% 3% 9% 25% 40% 18% 317 1.23 0.13Faculty 4.02 8% 7% 14% 28% 35% 9% 103 1.35 0.26Staff 4.71 2% 2% 7% 23% 43% 23% 214 1.10 0.15
Q56b Stanford Google Apps (e.g., Google Docs, Google Drive)
Mean VD D SD SS S VS Count Std. Dev. 95% CI+-All 4.75 1% 2% 7% 22% 49% 20% 200 0.98 0.14Faculty 4.53 2% 3% 13% 17% 55% 11% 64 1.05 0.26Staff 4.85 1% 1% 4% 24% 46% 24% 136 0.93 0.16
Q56c Confluence
Mean VD D SD SS S VS Count Std. Dev. 95% CI+-Staff 4.56 3% 3% 6% 32% 35% 21% 34 1.16 0.39
Q56d BlueJeans
Mean VD D SD SS S VS Count Std. Dev. 95% CI+-All 4.49 1% 4% 9% 28% 43% 14% 160 1.06 0.16Faculty 4.19 0% 8% 19% 30% 32% 11% 37 1.13 0.36Staff 4.58 2% 3% 7% 28% 46% 15% 123 1.03 0.18
Q56e Jira
Mean VD D SD SS S VS Count Std. Dev. 95% CI+-Staff 4.72 0% 0% 16% 20% 40% 24% 25 1.02 0.40
Q56f Stanford Instant Messaging (Adium, Pidgin)
Mean VD D SD SS S VS Count Std. Dev. 95% CI+-All 4.48 4% 0% 15% 22% 44% 15% 27 1.16 0.44Faculty 5.00 0% 0% 0% 0% 100% 0% 1 - -Staff 4.46 4% 0% 15% 23% 42% 15% 26 1.17 0.45
Q56g Mailing lists (Mailman)
Mean VD D SD SS S VS Count Std. Dev. 95% CI+-All 4.85 0% 1% 3% 26% 49% 21% 239 0.83 0.11Faculty 4.67 0% 4% 2% 31% 49% 14% 51 0.89 0.24Staff 4.90 1% 0% 3% 25% 49% 22% 188 0.81 0.12

36 | Collaboration Tools • Stanford University IT 2015 Client Satisfaction Survey
MOR Associates, Inc.
21%
38%
88%
36%
32%
84%
29%
35%
86%
0% 20% 40% 60% 80% 100%
Reliability
Features
Ease of use
Q57. Which of the following items factor into your dissatisfaction with Stanford Box?
All, n=49
F, n=25
A, n=24
0%
40%
80%
40%
50%
70%
27%
47%
73%
0% 20% 40% 60% 80% 100%
Reliability
Features
Ease of use
Q58. Which of the following items factor into your dissatisfaction with Stanford Google Apps (e.g., Google Docs, Google Drive)? n=15
All, n=15
F, n=10
A, n=5
See Appendix
A
Q57a . Other item factoring into dissatisfaction with Stanford Box
Q58a . Other item factoring into dissatisfaction with Stanford Google Apps
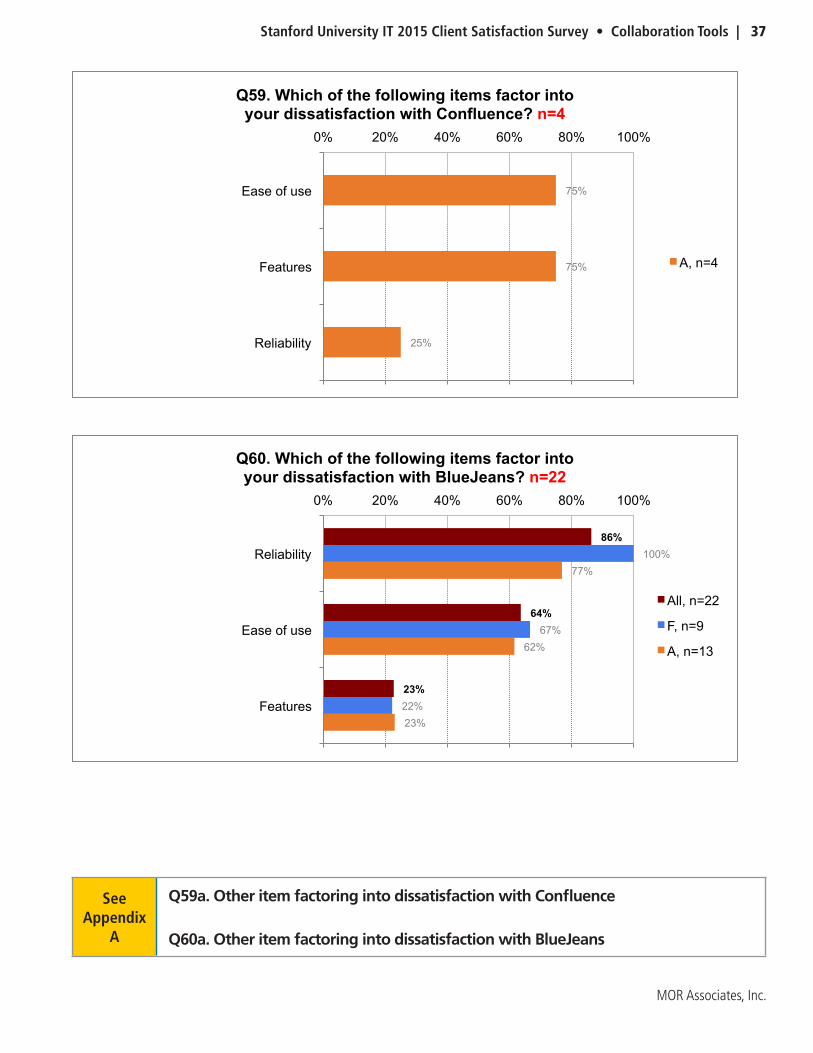
Stanford University IT 2015 Client Satisfaction Survey • Collaboration Tools | 37
MOR Associates, Inc.
25%
75%
75%
0% 20% 40% 60% 80% 100%
Reliability
Features
Ease of use
Q59. Which of the following items factor into your dissatisfaction with Confluence? n=4
A, n=4
23%
62%
77%
22%
67%
100%
23%
64%
86%
0% 20% 40% 60% 80% 100%
Features
Ease of use
Reliability
Q60. Which of the following items factor into your dissatisfaction with BlueJeans? n=22
All, n=22
F, n=9
A, n=13
See Appendix
A
Q59a . Other item factoring into dissatisfaction with Confluence
Q60a . Other item factoring into dissatisfaction with BlueJeans
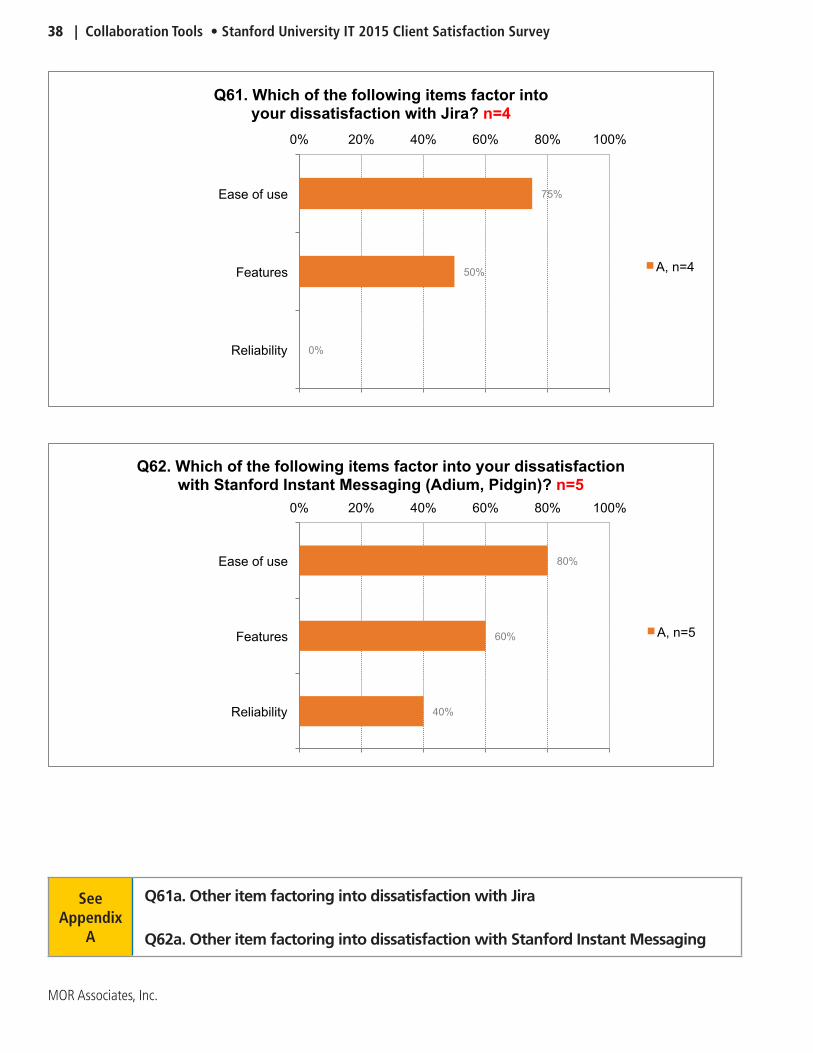
38 | Collaboration Tools • Stanford University IT 2015 Client Satisfaction Survey
MOR Associates, Inc.
0%
50%
75%
0% 20% 40% 60% 80% 100%
Reliability
Features
Ease of use
Q61. Which of the following items factor into your dissatisfaction with Jira? n=4
A, n=4
40%
60%
80%
0% 20% 40% 60% 80% 100%
Reliability
Features
Ease of use
Q62. Which of the following items factor into your dissatisfaction with Stanford Instant Messaging (Adium, Pidgin)? n=5
A, n=5
See Appendix
A
Q61a . Other item factoring into dissatisfaction with Jira
Q62a . Other item factoring into dissatisfaction with Stanford Instant Messaging

Stanford University IT 2015 Client Satisfaction Survey • Collaboration Tools | 39
MOR Associates, Inc.
See Appendix
AQ63a . Other item factoring into dissatisfaction with Mailing lists (Mailman)
50%
67%
100%
67%
33%
100%
56%
56%
100%
0% 20% 40% 60% 80% 100%
Features
Reliability
Ease of use
Q63. Which of the following items factor into your dissatisfaction with Mailing lists (Mailman)? n=9
All, n=9
F, n=3
A, n=6
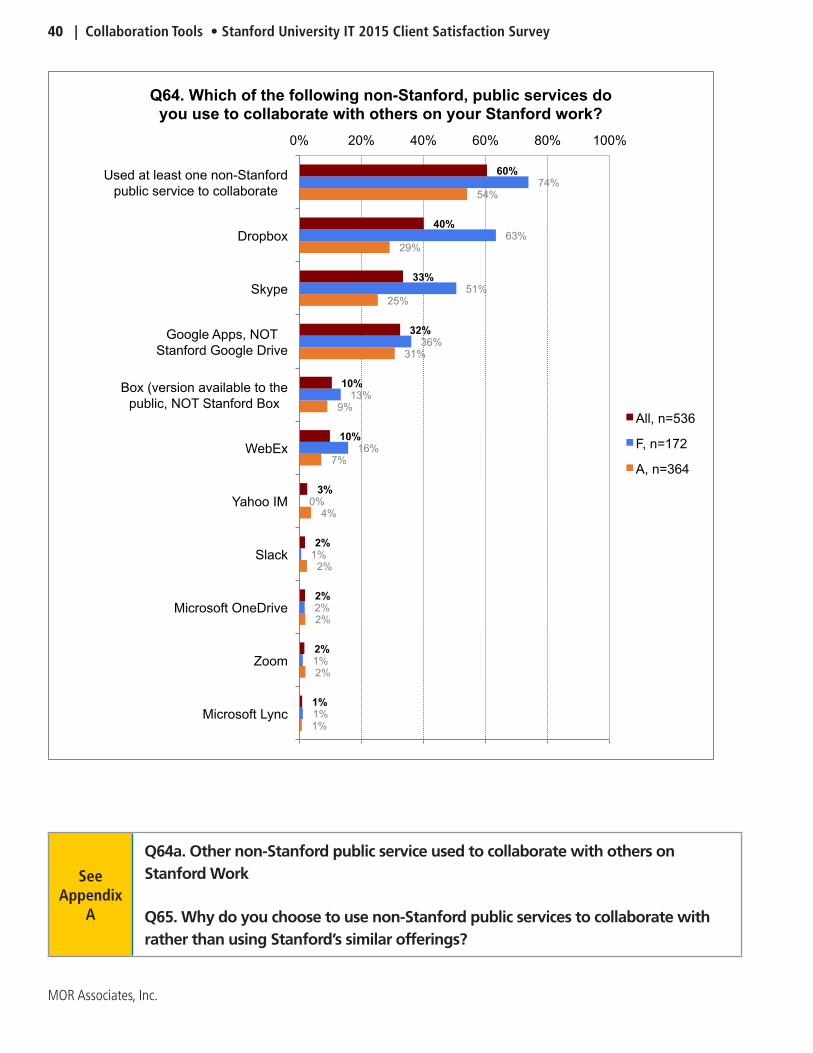
40 | Collaboration Tools • Stanford University IT 2015 Client Satisfaction Survey
MOR Associates, Inc.
1%
2%
2%
2%
4%
7%
9%
31%
25%
29%
54%
1%
1%
2%
1%
0%
16%
13%
36%
51%
63%
74%
1%
2%
2%
2%
3%
10%
10%
32%
33%
40%
60%
0% 20% 40% 60% 80% 100%
Microsoft Lync
Zoom
Microsoft OneDrive
Slack
Yahoo IM
WebEx
Box (version available to the public, NOT Stanford Box
Google Apps, NOT Stanford Google Drive
Skype
Dropbox
Used at least one non-Stanford public service to collaborate
Q64. Which of the following non-Stanford, public services do you use to collaborate with others on your Stanford work?
All, n=536
F, n=172
A, n=364
See Appendix
A
Q64a . Other non-Stanford public service used to collaborate with others on Stanford Work
Q65 . Why do you choose to use non-Stanford public services to collaborate with rather than using Stanford’s similar offerings?
Stanford University IT 2015 Client Satisfaction Survey • Research Computing | 41
MOR Associates, Inc.
Research Computing
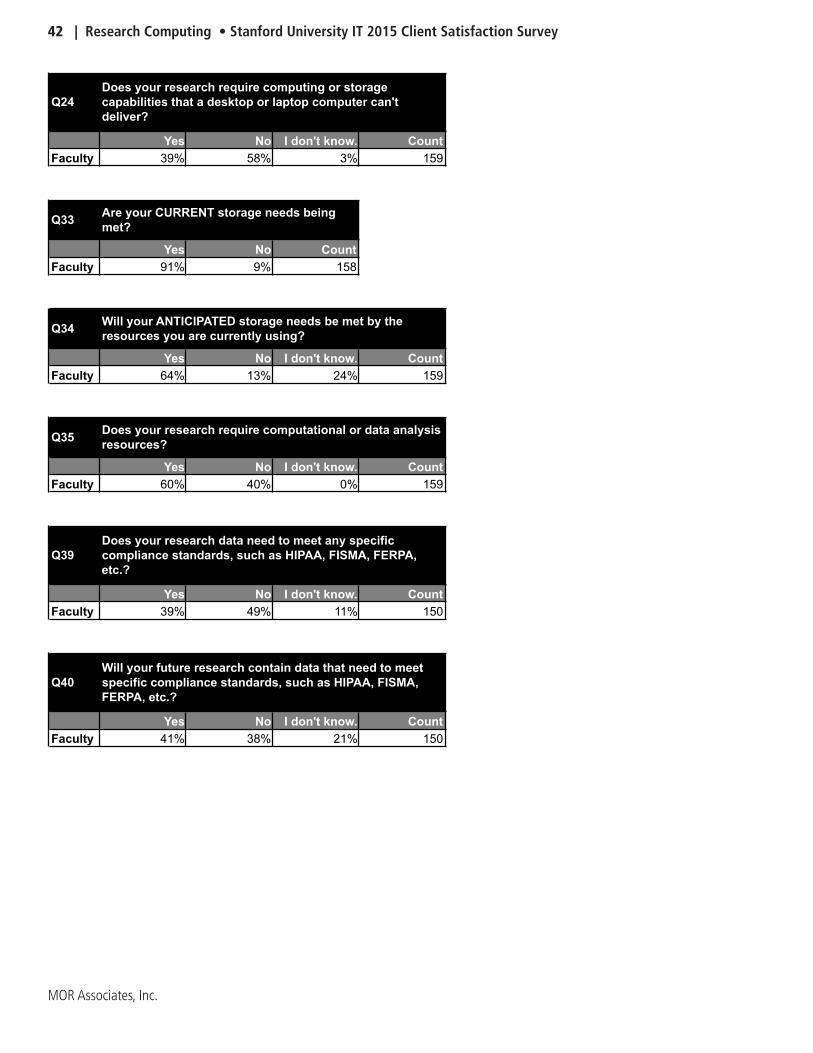
42 | Research Computing • Stanford University IT 2015 Client Satisfaction Survey
MOR Associates, Inc.
Q24
Yes No I don't know. CountFaculty 39% 58% 3% 159
Q33
Yes No CountFaculty 91% 9% 158
Q34
Yes No I don't know. CountFaculty 64% 13% 24% 159
Q35
Yes No I don't know. CountFaculty 60% 40% 0% 159
Q39
Yes No I don't know. CountFaculty 39% 49% 11% 150
Q40
Yes No I don't know. CountFaculty 41% 38% 21% 150
Q47
Yes No I don't know. CountAll 42% 39% 18% 485Faculty 48% 30% 22% 150Staff 40% 44% 16% 335
Does your research require computing or storage capabilities that a desktop or laptop computer can't deliver?
Are your CURRENT storage needs being met?
Will your ANTICIPATED storage needs be met by the resources you are currently using?
Does your research require computational or data analysis resources?
Does your research data need to meet any specific compliance standards, such as HIPAA, FISMA, FERPA, etc.?
Will your future research contain data that need to meet specific compliance standards, such as HIPAA, FISMA, FERPA, etc.?
Do you run Stanford Mobile Device Management (AirWatch) on your mobile device?

Stanford University IT 2015 Client Satisfaction Survey • Research Computing | 43
MOR Associates, Inc.
5%
14%
19%
35%
3%
4%
5%
12%
0% 20% 40% 60% 80% 100%
High performance computing (HPC)
Both HPC and large data storage
Large data storage
Requires at least one special capability
Q26/27. Which special (research computing) capabilities do you or will you require?, n=172
Currently require Will require
2%
3%
7%
11%
77%
0% 20% 40% 60% 80% 100%
Within three months
Within six months
Within one year
Within two years
I don't expect to need them.
Q25. [For faculty who don't currently need them], When, if ever, do you expect to need special capabilities for your research?, n=91
Faculty
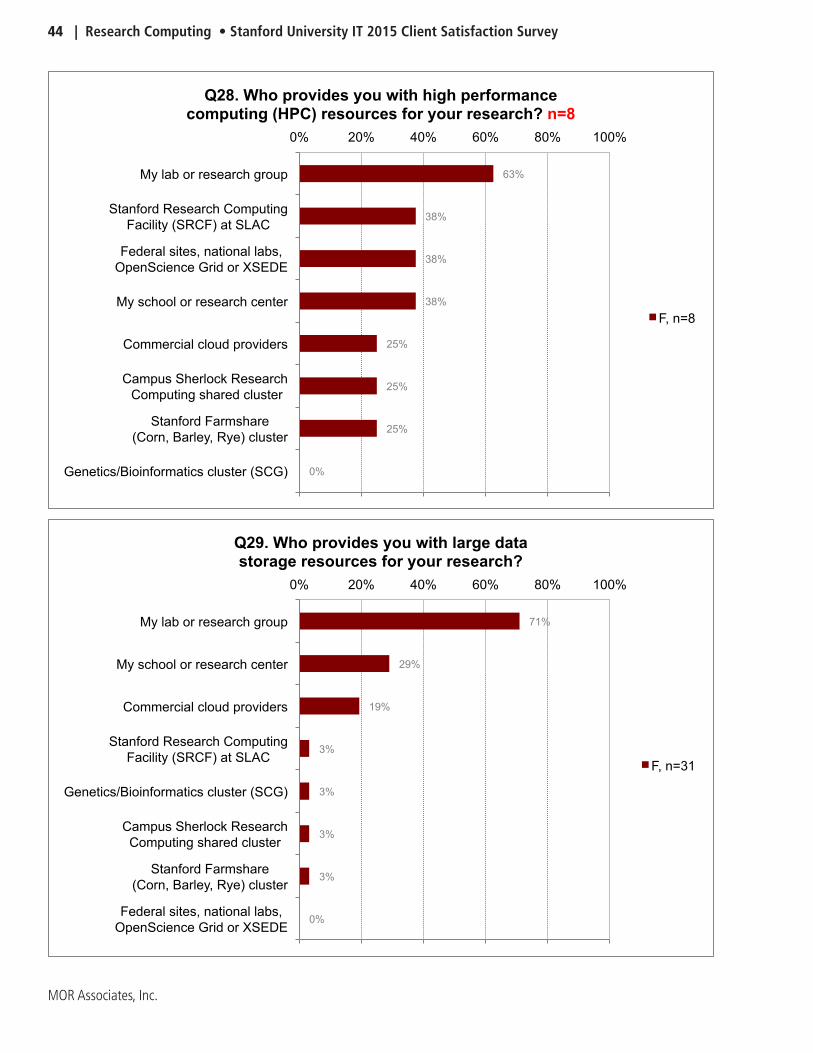
44 | Research Computing • Stanford University IT 2015 Client Satisfaction Survey
MOR Associates, Inc.
0%
25%
25%
25%
38%
38%
38%
63%
0% 20% 40% 60% 80% 100%
Genetics/Bioinformatics cluster (SCG)
Stanford Farmshare (Corn, Barley, Rye) cluster
Campus Sherlock Research Computing shared cluster
Commercial cloud providers
My school or research center
Federal sites, national labs, OpenScience Grid or XSEDE
Stanford Research Computing Facility (SRCF) at SLAC
My lab or research group
Q28. Who provides you with high performance computing (HPC) resources for your research? n=8
F, n=8
0%
3%
3%
3%
3%
19%
29%
71%
0% 20% 40% 60% 80% 100%
Federal sites, national labs, OpenScience Grid or XSEDE
Stanford Farmshare (Corn, Barley, Rye) cluster
Campus Sherlock Research Computing shared cluster
Genetics/Bioinformatics cluster (SCG)
Stanford Research Computing Facility (SRCF) at SLAC
Commercial cloud providers
My school or research center
My lab or research group
Q29. Who provides you with large data storage resources for your research?
F, n=31

Stanford University IT 2015 Client Satisfaction Survey • Research Computing | 45
MOR Associates, Inc.
17%
33%
50%
0% 20% 40% 60% 80% 100%
Cloud vendor credits or collaborations - no charges accrue to me
Written into grants as direct charges
Personal funds / Pcard
Q31. How are you paying for commercial cloud offerings? n=6
F, n=6
0%
0%
32%
44%
60%
64%
0% 20% 40% 60% 80% 100%
AFS/Secure AFS
SCG cluster
Central IT File Storage /Secure File Storage
USB drives
Hard drive of my computer/laptop
External drive or shared departmental drive
Q32. Where else do you store your active research data? n=25
F, n=25
See Appendix
A
Q28a . Other provider(s) of high performance computing resources .
Q29a . Other provider(s) of large data storage resources .
Q30 . Which commercial cloud provider(s) do you receive HPC and/or large data storage services from?
Q31a . Other means of paying for commercial cloud offerings
Q32a . Other place storing active research data .
17%
33%
50%
0% 20% 40% 60% 80% 100%
Cloud vendor credits or collaborations - no charges accrue to me
Written into grants as direct charges
Personal funds / Pcard
Q31. How are you paying for commercial cloud offerings? n=6
F, n=6
0%
0%
32%
44%
60%
64%
0% 20% 40% 60% 80% 100%
AFS/Secure AFS
SCG cluster
Central IT File Storage /Secure File Storage
USB drives
Hard drive of my computer/laptop
External drive or shared departmental drive
Q32. Where else do you store your active research data? n=25
F, n=25

46 | Research Computing • Stanford University IT 2015 Client Satisfaction Survey
MOR Associates, Inc.
3%
3%
6%
6%
8%
10%
10%
12%
13%
13%
14%
15%
20%
24%
30%
31%
49%
0% 20% 40% 60% 80% 100%
GPU or other accelerator-based computing (for example, Xeon Phi)
Campus code repository /revision control system (GitHub)
Large scratch storage for temporary data
Computing and storage resources for data-intensive distributed apps...
Consulting/support for access to external computing resources...
Consulting/support for high performance computing...
Training classes and workshops for specific computational methods...
High-speed networking to move data between locations on campus
Consulting/support for storage solutions and data access/data sharing
High-speed networking to move data between campus and other sites
High-throughput computing to run many simultaneous codes or jobs
Consulting/support to transition from desktop computing to larger-scale...
Computing resources beyond what I can do on my desktop, although not...
Site licenses for standard computational tools, libraries and software
Backed up storage space for research data while computing and working on...
Long-term storage of research data after publication
Requires at least one option
Q36. Which of the following computational or data analysis options do you require?
F, n=172

Stanford University IT 2015 Client Satisfaction Survey • Research Computing | 47
MOR Associates, Inc.
See Appendix
A
Q36a . Other computational or data analysis options required .
Q37 . How much memory do you need on a single node for your simulation or analysis?
Q38 . How much total memory is required for a single job?
Q41 . What one thing could be done to make it easier for you to do your research computing on campus?
Q53 Do you ever use Stanford hospitals' computer networks?
Yes No I don't know. CountAll 21% 74% 5% 496Faculty 34% 60% 5% 151Staff 15% 80% 5% 345
Q68
Yes No I don't know. CountAll 71% 8% 21% 500Faculty 75% 12% 13% 153Staff 69% 6% 24% 347
Q80
Yes No I don't know. CountAll 24% 71% 5% 489Faculty 21% 74% 5% 148Staff 25% 70% 4% 341
Q93
Yes No I don't know. CountAll 24% 41% 35% 17Faculty 0% 60% 40% 5Staff 33% 33% 33% 12
Q97
Yes No CountAll 47% 53% 369Faculty 39% 61% 123Staff 51% 49% 246
Q98
Yes No CountFaculty 11% 89% 18
May research computing staff contact you to discuss your anticipated HPC and/or large data storage needs?
Are all of the computing devices you use for Stanford work backed up?
Do you use Stanford's voicemail to email service in which voicemails appear in your email inbox?
OrderIT was revamped in 2013. Did you use the previous version?
Would you like to subscribe to the University IT email newsletter?

48 | Research Computing • Stanford University IT 2015 Client Satisfaction Survey
MOR Associates, Inc.
This page intentionally left blank�
Stanford University IT 2015 Client Satisfaction Survey • Central Data Storage Services | 49
MOR Associates, Inc.
Central Data Storage Services

50 | Central Data Storage Services • Stanford University IT 2015 Client Satisfaction Survey
MOR Associates, Inc.
0%
1%
2%
3%
3%
4%
7%
8%
8%
11%
14%
26%
42%
64%
1%
2%
2%
1%
0%
3%
4%
6%
8%
9%
9%
24%
46%
63%
0%
1%
2%
2%
2%
4%
6%
7%
8%
10%
13%
26%
43%
64%
0% 20% 40% 60% 80% 100%
Disk-Based Replication
MOZY
Backup and Recovery Service for Servers (BaRS)
Iron Mountain
Confluence
Secure AFS
AFS
Secure File Storage (individual or group)
File Storage (individual and group)
Server Storage
Stanford Google Drive
Stanford Box
CrashPlan PROe
Used at least one Stanford-provided solution
Q66. Which of the following Stanford-provided data storage and backup solutions do you use?
All, n=536
F, n=172
A, n=364
See Appendix
AQ66a . Other Stanford-provided data storage and backup solution used
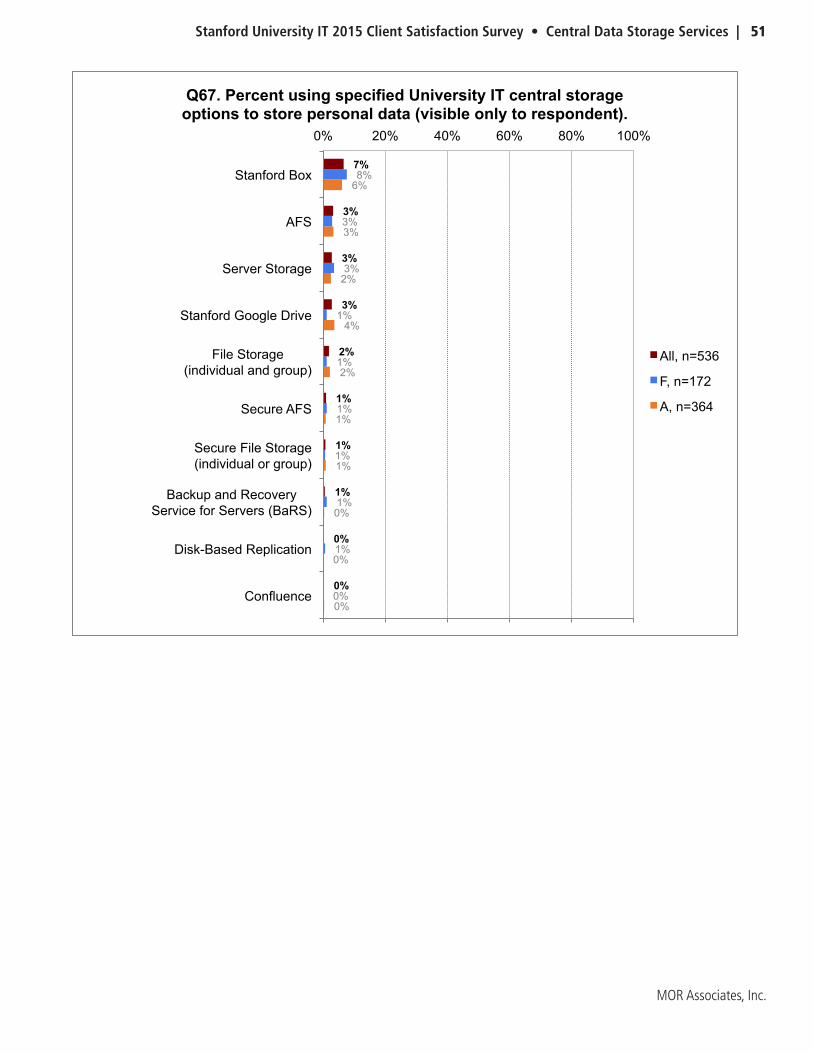
Stanford University IT 2015 Client Satisfaction Survey • Central Data Storage Services | 51
MOR Associates, Inc.
0%
0%
0%
1%
1%
2%
4%
2%
3%
6%
0%
1%
1%
1%
1%
1%
1%
3%
3%
8%
0%
0%
1%
1%
1%
2%
3%
3%
3%
7%
0% 20% 40% 60% 80% 100%
Confluence
Disk-Based Replication
Backup and Recovery Service for Servers (BaRS)
Secure File Storage (individual or group)
Secure AFS
File Storage (individual and group)
Stanford Google Drive
Server Storage
AFS
Stanford Box
Q67. Percent using specified University IT central storage options to store personal data (visible only to respondent).
All, n=536
F, n=172
A, n=364

52 | Central Data Storage Services • Stanford University IT 2015 Client Satisfaction Survey
MOR Associates, Inc.
0%
1%
3%
3%
5%
5%
5%
9%
12%
23%
0%
1%
0%
1%
2%
4%
5%
4%
6%
19%
0%
1%
2%
2%
4%
5%
5%
7%
10%
22%
0% 20% 40% 60% 80% 100%
Disk-Based Replication
Backup and Recovery Service for Servers (BaRS)
Confluence
Secure AFS
AFS
Secure File Storage (individual or group)
File Storage (individual and group)
Server Storage
Stanford Google Drive
Stanford Box
Q67. Percent using specified University IT central storage options to store group data (visible to respondent and others).
All, n=536
F, n=172
A, n=364

Stanford University IT 2015 Client Satisfaction Survey • Central Data Storage Services | 53
MOR Associates, Inc.
0%
1%
1%
1%
1%
2%
2%
2%
3%
7%
1%
0%
0%
0%
0%
1%
2%
2%
3%
6%
0%
0%
0%
1%
1%
2%
2%
2%
3%
6%
0% 20% 40% 60% 80% 100%
Disk-Based Replication
Confluence
Secure AFS
Backup and Recovery Service for Servers (BaRS)
AFS
Stanford Google Drive
Secure File Storage (individual or group)
File Storage (individual and group)
Server Storage
Stanford Box
Q67. Percent using specified University IT central storage options to store backup copies.
All, n=536
F, n=172
A, n=364
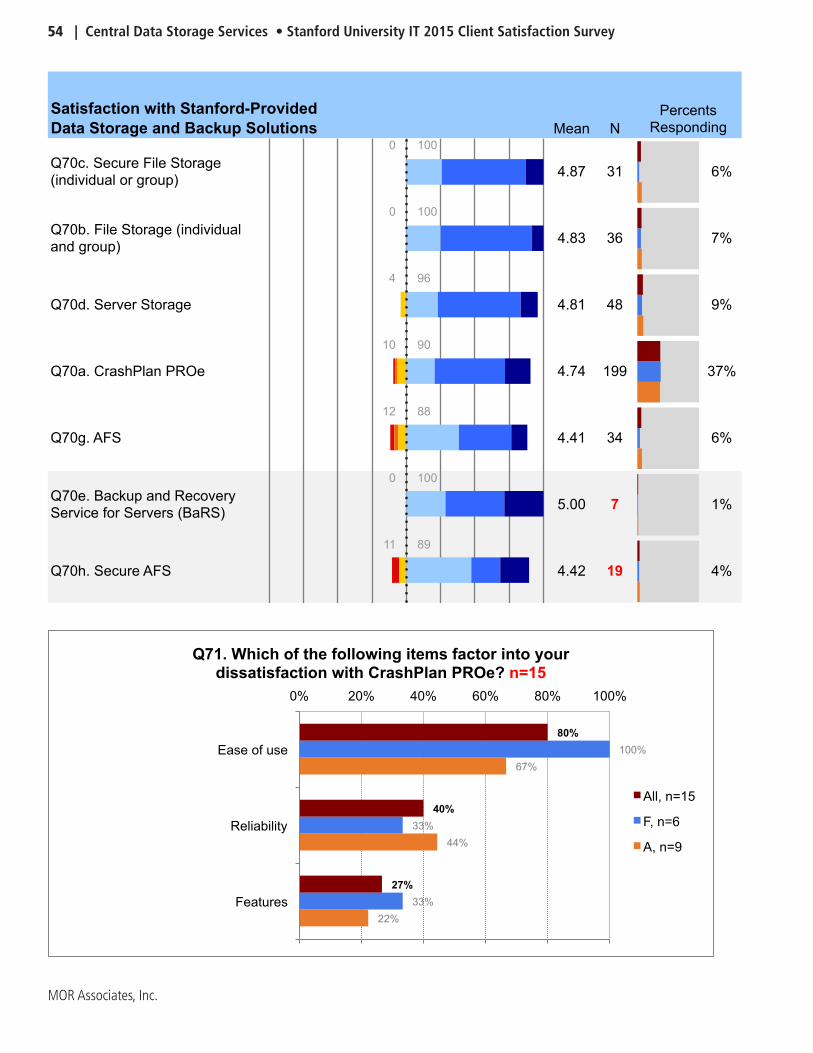
54 | Central Data Storage Services • Stanford University IT 2015 Client Satisfaction Survey
MOR Associates, Inc.
Mean N
Q70c. Secure File Storage (individual or group)
0 100
4.87 31 6%
Q70b. File Storage (individual and group)
0 100
4.83 36 7%
Q70d. Server Storage
4 96
4.81 48 9%
Q70a. CrashPlan PROe
10 90
4.74 199 37%
Q70g. AFS
12 88
4.41 34 6%
Q70e. Backup and Recovery Service for Servers (BaRS)
0 100
5.00 7 1%
Q70h. Secure AFS
11 89
4.42 19 4%
Mean N
Q79a. Desk phone service
9 91
4.80 432 81%
Q79b. Traditional voicemail
12 88
4.70 385 72%
Satisfaction with Stanford-Provided Data Storage and Backup Solutions
Percents Responding
Satisfaction with Aspects of Stanford's Telecommunications Service
Percents Responding
22%
44%
67%
33%
33%
100%
27%
40%
80%
0% 20% 40% 60% 80% 100%
Features
Reliability
Ease of use
Q71. Which of the following items factor into your dissatisfaction with CrashPlan PROe? n=15
All, n=15
F, n=6
A, n=9
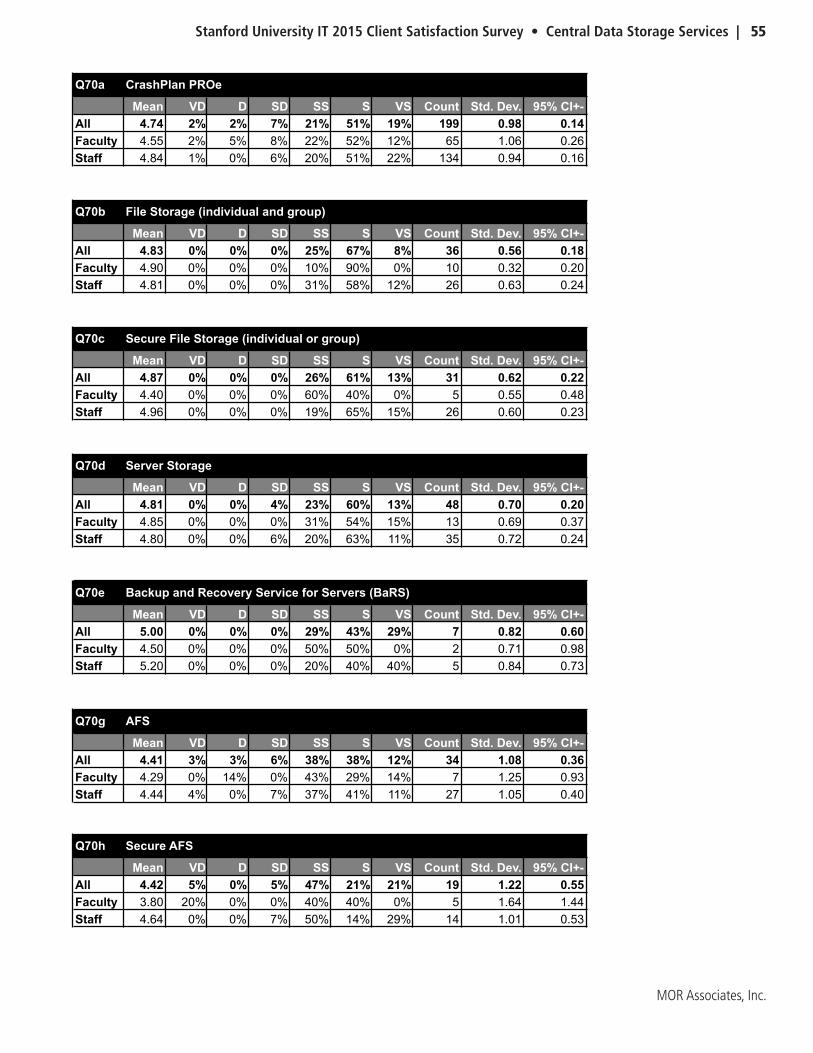
Stanford University IT 2015 Client Satisfaction Survey • Central Data Storage Services | 55
MOR Associates, Inc.
Q70a CrashPlan PROe
Mean VD D SD SS S VS Count Std. Dev. 95% CI+-All 4.74 2% 2% 7% 21% 51% 19% 199 0.98 0.14Faculty 4.55 2% 5% 8% 22% 52% 12% 65 1.06 0.26Staff 4.84 1% 0% 6% 20% 51% 22% 134 0.94 0.16
Q70b File Storage (individual and group)
Mean VD D SD SS S VS Count Std. Dev. 95% CI+-All 4.83 0% 0% 0% 25% 67% 8% 36 0.56 0.18Faculty 4.90 0% 0% 0% 10% 90% 0% 10 0.32 0.20Staff 4.81 0% 0% 0% 31% 58% 12% 26 0.63 0.24
Q70c Secure File Storage (individual or group)
Mean VD D SD SS S VS Count Std. Dev. 95% CI+-All 4.87 0% 0% 0% 26% 61% 13% 31 0.62 0.22Faculty 4.40 0% 0% 0% 60% 40% 0% 5 0.55 0.48Staff 4.96 0% 0% 0% 19% 65% 15% 26 0.60 0.23
Q70d Server Storage
Mean VD D SD SS S VS Count Std. Dev. 95% CI+-All 4.81 0% 0% 4% 23% 60% 13% 48 0.70 0.20Faculty 4.85 0% 0% 0% 31% 54% 15% 13 0.69 0.37Staff 4.80 0% 0% 6% 20% 63% 11% 35 0.72 0.24
Q70e Backup and Recovery Service for Servers (BaRS)
Mean VD D SD SS S VS Count Std. Dev. 95% CI+-All 5.00 0% 0% 0% 29% 43% 29% 7 0.82 0.60Faculty 4.50 0% 0% 0% 50% 50% 0% 2 0.71 0.98Staff 5.20 0% 0% 0% 20% 40% 40% 5 0.84 0.73
Q70f Disk-Based Replication
Mean VD D SD SS S VS Count Std. Dev. 95% CI+-All
Q70g AFS
Mean VD D SD SS S VS Count Std. Dev. 95% CI+-All 4.41 3% 3% 6% 38% 38% 12% 34 1.08 0.36Faculty 4.29 0% 14% 0% 43% 29% 14% 7 1.25 0.93Staff 4.44 4% 0% 7% 37% 41% 11% 27 1.05 0.40
Q70h Secure AFS
Mean VD D SD SS S VS Count Std. Dev. 95% CI+-All 4.42 5% 0% 5% 47% 21% 21% 19 1.22 0.55Faculty 3.80 20% 0% 0% 40% 40% 0% 5 1.64 1.44Staff 4.64 0% 0% 7% 50% 14% 29% 14 1.01 0.53
Q79a Desk phone service
Mean VD D SD SS S VS Count Std. Dev. 95% CI+-All 4.80 3% 1% 4% 16% 52% 22% 432 1.08 0.10Faculty 4.49 4% 4% 10% 20% 45% 17% 140 1.24 0.21Staff 4.95 3% 0% 2% 15% 56% 25% 292 0.97 0.11
Q79b Traditional voicemail
Mean VD D SD SS S VS Count Std. Dev. 95% CI+-All 4.70 3% 2% 6% 17% 53% 19% 385 1.11 0.11Faculty 4.36 6% 5% 11% 18% 46% 14% 119 1.33 0.24Staff 4.86 2% 1% 4% 16% 56% 21% 266 0.96 0.12
Q70a CrashPlan PROe
Mean VD D SD SS S VS Count Std. Dev. 95% CI+-All 4.74 2% 2% 7% 21% 51% 19% 199 0.98 0.14Faculty 4.55 2% 5% 8% 22% 52% 12% 65 1.06 0.26Staff 4.84 1% 0% 6% 20% 51% 22% 134 0.94 0.16
Q70b File Storage (individual and group)
Mean VD D SD SS S VS Count Std. Dev. 95% CI+-All 4.83 0% 0% 0% 25% 67% 8% 36 0.56 0.18Faculty 4.90 0% 0% 0% 10% 90% 0% 10 0.32 0.20Staff 4.81 0% 0% 0% 31% 58% 12% 26 0.63 0.24
Q70c Secure File Storage (individual or group)
Mean VD D SD SS S VS Count Std. Dev. 95% CI+-All 4.87 0% 0% 0% 26% 61% 13% 31 0.62 0.22Faculty 4.40 0% 0% 0% 60% 40% 0% 5 0.55 0.48Staff 4.96 0% 0% 0% 19% 65% 15% 26 0.60 0.23
Q70d Server Storage
Mean VD D SD SS S VS Count Std. Dev. 95% CI+-All 4.81 0% 0% 4% 23% 60% 13% 48 0.70 0.20Faculty 4.85 0% 0% 0% 31% 54% 15% 13 0.69 0.37Staff 4.80 0% 0% 6% 20% 63% 11% 35 0.72 0.24
Q70e Backup and Recovery Service for Servers (BaRS)
Mean VD D SD SS S VS Count Std. Dev. 95% CI+-All 5.00 0% 0% 0% 29% 43% 29% 7 0.82 0.60Faculty 4.50 0% 0% 0% 50% 50% 0% 2 0.71 0.98Staff 5.20 0% 0% 0% 20% 40% 40% 5 0.84 0.73
Q70f Disk-Based Replication
Mean VD D SD SS S VS Count Std. Dev. 95% CI+-All
Q70g AFS
Mean VD D SD SS S VS Count Std. Dev. 95% CI+-All 4.41 3% 3% 6% 38% 38% 12% 34 1.08 0.36Faculty 4.29 0% 14% 0% 43% 29% 14% 7 1.25 0.93Staff 4.44 4% 0% 7% 37% 41% 11% 27 1.05 0.40

56 | Central Data Storage Services • Stanford University IT 2015 Client Satisfaction Survey
MOR Associates, Inc.
Q53 Do you ever use Stanford hospitals' computer networks?
Yes No I don't know. CountAll 21% 74% 5% 496Faculty 34% 60% 5% 151Staff 15% 80% 5% 345
Q68
Yes No I don't know. CountAll 71% 8% 21% 500Faculty 75% 12% 13% 153Staff 69% 6% 24% 347
Q80
Yes No I don't know. CountAll 24% 71% 5% 489Faculty 21% 74% 5% 148Staff 25% 70% 4% 341
Q93
Yes No I don't know. CountAll 24% 41% 35% 17Faculty 0% 60% 40% 5Staff 33% 33% 33% 12
Q97
Yes No CountAll 47% 53% 369Faculty 39% 61% 123Staff 51% 49% 246
Q98
Yes No CountFaculty 11% 89% 18
May research computing staff contact you to discuss your anticipated HPC and/or large data storage needs?
Are all of the computing devices you use for Stanford work backed up?
Do you use Stanford's voicemail to email service in which voicemails appear in your email inbox?
OrderIT was revamped in 2013. Did you use the previous version?
Would you like to subscribe to the University IT email newsletter?
5%
16%
37%
21%
26%
8%
0%
0%
33%
67%
6%
10%
23%
26%
42%
0% 20% 40% 60% 80% 100%
Cost
It's not my responsibility.
I don't know how.
It doesn't matter to me.
I haven't set it up on my machine(s).
Q69. Why aren't all of the computers you use for your Stanford work being backed up?
All, n=31
F, n=12
A, n=19
See Appendix
A
Q69a . Other reason why all computers used for Stanford work aren’t being backed up
Stanford University IT 2015 Client Satisfaction Survey • Telecommunications Services | 57
MOR Associates, Inc.
TelecommunicationsServices
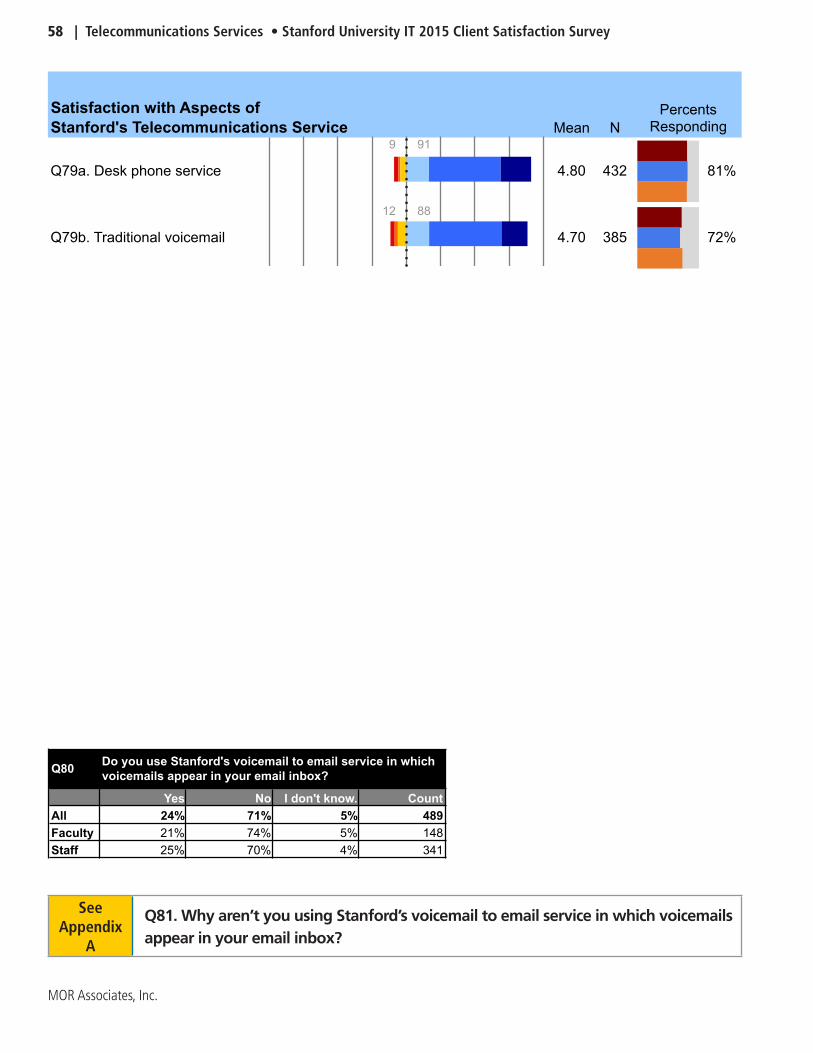
58 | Telecommunications Services • Stanford University IT 2015 Client Satisfaction Survey
MOR Associates, Inc.
Q53 Do you ever use Stanford hospitals' computer networks?
Yes No I don't know. CountAll 21% 74% 5% 496Faculty 34% 60% 5% 151Staff 15% 80% 5% 345
Q68
Yes No I don't know. CountAll 71% 8% 21% 500Faculty 75% 12% 13% 153Staff 69% 6% 24% 347
Q80
Yes No I don't know. CountAll 24% 71% 5% 489Faculty 21% 74% 5% 148Staff 25% 70% 4% 341
Q93
Yes No I don't know. CountAll 24% 41% 35% 17Faculty 0% 60% 40% 5Staff 33% 33% 33% 12
Q97
Yes No CountAll 47% 53% 369Faculty 39% 61% 123Staff 51% 49% 246
Q98
Yes No CountFaculty 11% 89% 18
May research computing staff contact you to discuss your anticipated HPC and/or large data storage needs?
Are all of the computing devices you use for Stanford work backed up?
Do you use Stanford's voicemail to email service in which voicemails appear in your email inbox?
OrderIT was revamped in 2013. Did you use the previous version?
Would you like to subscribe to the University IT email newsletter?
Mean N
Q70c. Secure File Storage (individual or group)
0 100
4.87 31 6%
Q70b. File Storage (individual and group)
0 100
4.83 36 7%
Q70d. Server Storage
4 96
4.81 48 9%
Q70a. CrashPlan PROe
10 90
4.74 199 37%
Q70g. AFS
12 88
4.41 34 6%
Q70e. Backup and Recovery Service for Servers (BaRS)
0 100
5.00 7 1%
Q70h. Secure AFS
11 89
4.42 19 4%
Mean N
Q79a. Desk phone service
9 91
4.80 432 81%
Q79b. Traditional voicemail
12 88
4.70 385 72%
Satisfaction with Stanford-Provided Data Storage and Backup Solutions
Percents Responding
Satisfaction with Aspects of Stanford's Telecommunications Service
Percents Responding
See Appendix
A
Q81 . Why aren’t you using Stanford’s voicemail to email service in which voicemails appear in your email inbox?
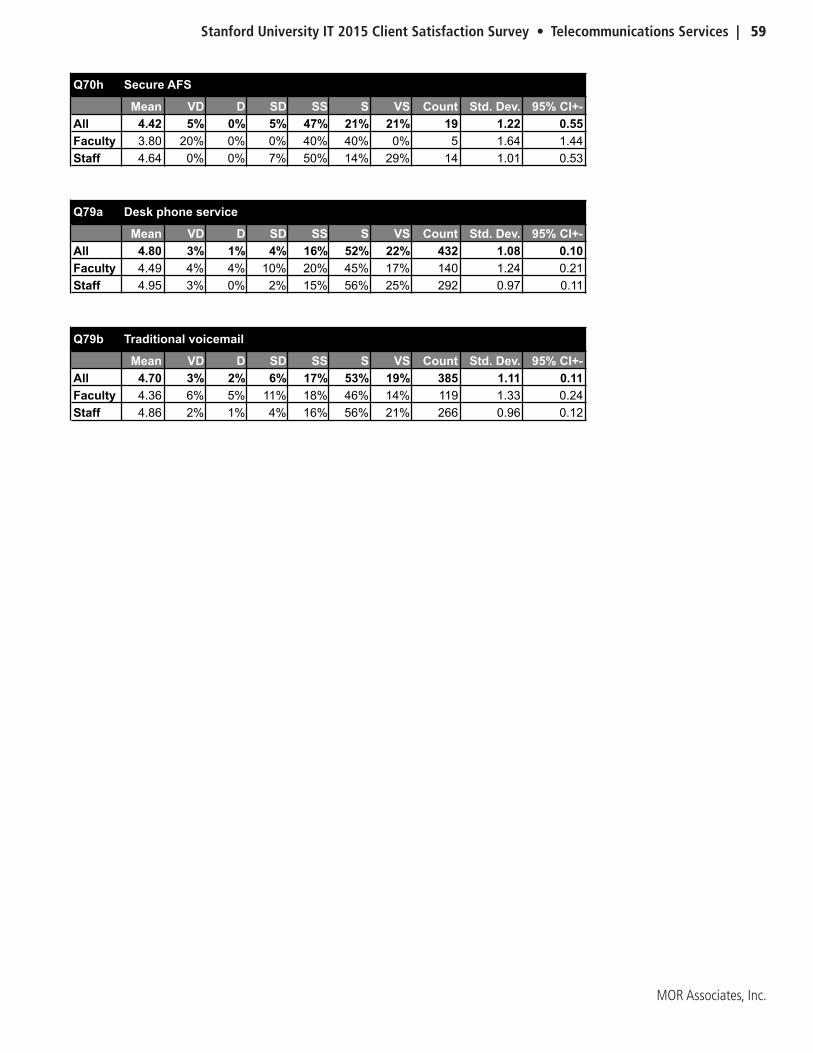
Stanford University IT 2015 Client Satisfaction Survey • Telecommunications Services | 59
MOR Associates, Inc.
Q70h Secure AFS
Mean VD D SD SS S VS Count Std. Dev. 95% CI+-All 4.42 5% 0% 5% 47% 21% 21% 19 1.22 0.55Faculty 3.80 20% 0% 0% 40% 40% 0% 5 1.64 1.44Staff 4.64 0% 0% 7% 50% 14% 29% 14 1.01 0.53
Q79a Desk phone service
Mean VD D SD SS S VS Count Std. Dev. 95% CI+-All 4.80 3% 1% 4% 16% 52% 22% 432 1.08 0.10Faculty 4.49 4% 4% 10% 20% 45% 17% 140 1.24 0.21Staff 4.95 3% 0% 2% 15% 56% 25% 292 0.97 0.11
Q79b Traditional voicemail
Mean VD D SD SS S VS Count Std. Dev. 95% CI+-All 4.70 3% 2% 6% 17% 53% 19% 385 1.11 0.11Faculty 4.36 6% 5% 11% 18% 46% 14% 119 1.33 0.24Staff 4.86 2% 1% 4% 16% 56% 21% 266 0.96 0.12

60 | Telecommunications Services • Stanford University IT 2015 Client Satisfaction Survey
MOR Associates, Inc.
This page intentionally left blank�

Stanford University IT 2015 Client Satisfaction Survey • Information Security Office | 61
MOR Associates, Inc.
Information Security Office
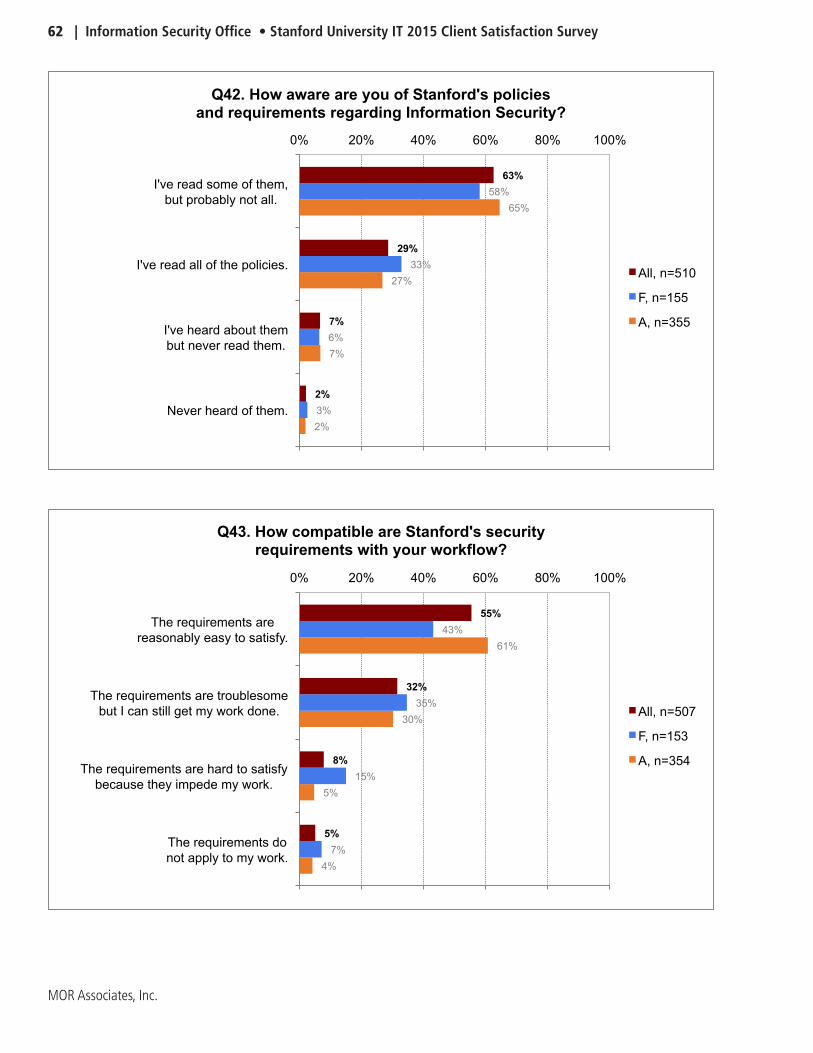
62 | Information Security Office • Stanford University IT 2015 Client Satisfaction Survey
MOR Associates, Inc.
4%
5%
30%
61%
7%
15%
35%
43%
5%
8%
32%
55%
0% 20% 40% 60% 80% 100%
The requirements do not apply to my work.
The requirements are hard to satisfy because they impede my work.
The requirements are troublesome but I can still get my work done.
The requirements are reasonably easy to satisfy.
Q43. How compatible are Stanford's security requirements with your workflow?
All, n=507
F, n=153
A, n=354
2%
7%
27%
65%
3%
6%
33%
58%
2%
7%
29%
63%
0% 20% 40% 60% 80% 100%
Never heard of them.
I've heard about them but never read them.
I've read all of the policies.
I've read some of them, but probably not all.
Q42. How aware are you of Stanford's policies and requirements regarding Information Security?
All, n=510
F, n=155
A, n=355
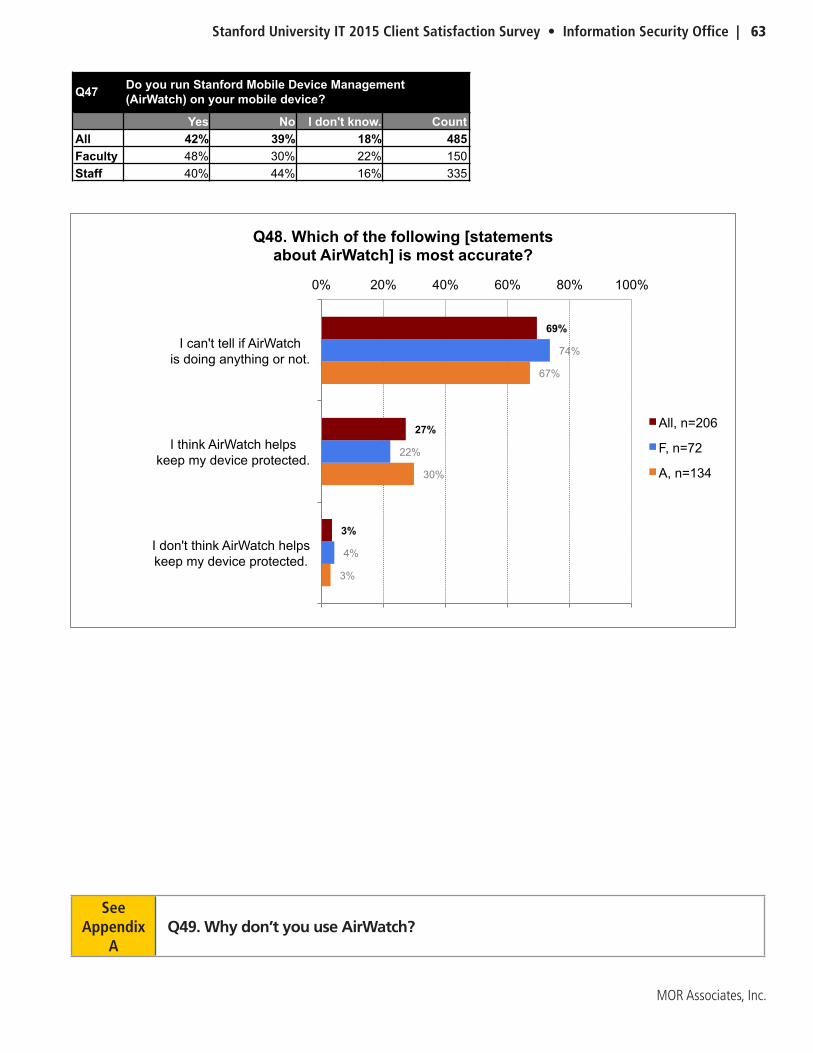
Stanford University IT 2015 Client Satisfaction Survey • Information Security Office | 63
MOR Associates, Inc.
Q24
Yes No I don't know. CountFaculty 39% 58% 3% 159
Q33
Yes No CountFaculty 91% 9% 158
Q34
Yes No I don't know. CountFaculty 64% 13% 24% 159
Q35
Yes No I don't know. CountFaculty 60% 40% 0% 159
Q39
Yes No I don't know. CountFaculty 39% 49% 11% 150
Q40
Yes No I don't know. CountFaculty 41% 38% 21% 150
Q47
Yes No I don't know. CountAll 42% 39% 18% 485Faculty 48% 30% 22% 150Staff 40% 44% 16% 335
Does your research require computing or storage capabilities that a desktop or laptop computer can't deliver?
Are your CURRENT storage needs being met?
Will your ANTICIPATED storage needs be met by the resources you are currently using?
Does your research require computational or data analysis resources?
Does your research data need to meet any specific compliance standards, such as HIPAA, FISMA, FERPA, etc.?
Will your future research contain data that need to meet specific compliance standards, such as HIPAA, FISMA, FERPA, etc.?
Do you run Stanford Mobile Device Management (AirWatch) on your mobile device?
3%
30%
67%
4%
22%
74%
3%
27%
69%
0% 20% 40% 60% 80% 100%
I don't think AirWatch helps keep my device protected.
I think AirWatch helps keep my device protected.
I can't tell if AirWatch is doing anything or not.
Q48. Which of the following [statements about AirWatch] is most accurate?
All, n=206
F, n=72
A, n=134
See Appendix
AQ49 . Why don’t you use AirWatch?

64 | Information Security Office • Stanford University IT 2015 Client Satisfaction Survey
MOR Associates, Inc.
Q45a. Automatically configure computer security settings
10 90
487 91%
Q45b. Automatically perform software updates
10 90
486 91%
Q45c. Automatically block suspected suspicious software from running
8 92
487 91%
Q45d. Install all your software to prevent suspicious software from being installed
20 80
484 90%
N
Q46c. Automatically block suspected suspicious software from running
34 66
397 74%
Q46b. Automatically perform software updates
37 63
395 74%
Q46a. Automatically configure computer security settings
37 63
401 75%
Q46d. Install all software to ensure that suspicious software isn't installed
45 55
391 73%
Willingness to Allow IT Staff to Perform Specified Actions on Personally-Owned Computer
Percents Responding
Mean N
Q83d. Qualtrics
9 91
4.85 98 18%
Q83b. Stanford Sites Drupal
17 83
4.42 53 10%
Q83a. Stanford WordPress
15 85
4.67 27 5%
Q83c. Form Builder (Web Forms Service)
15 85
4.65 26 5%
Q83f. Stanford Web Services' web design, development, and consulting services
14 86
4.64 28 5%
Q83e. Downloadable web design/theme assets for Drupal, WordPress, and HTML websites
19 81
4.52 21 4%
N
Q44b. Change your SUNet password every year
10 90
491 92%
Q44d. Use a Stanford-owned, password-protected USB drive to transport data instead of your own USB drive
19 81
445 83%
Q44a. Use a password manager to help create and maintain unique passwords for all your accounts
21 79
474 88%
Q44c. Change your SUNet password every 6 months
26 74
492 92%
N
Satisfaction with Specified Web-Related ServicesPercents
Responding
Willingness to Engage in Specified Behaviors
Willingness to Allow IT Staff to Perform Specified Actions on Stanford-Owned Computer
Percents Responding
Percents Responding
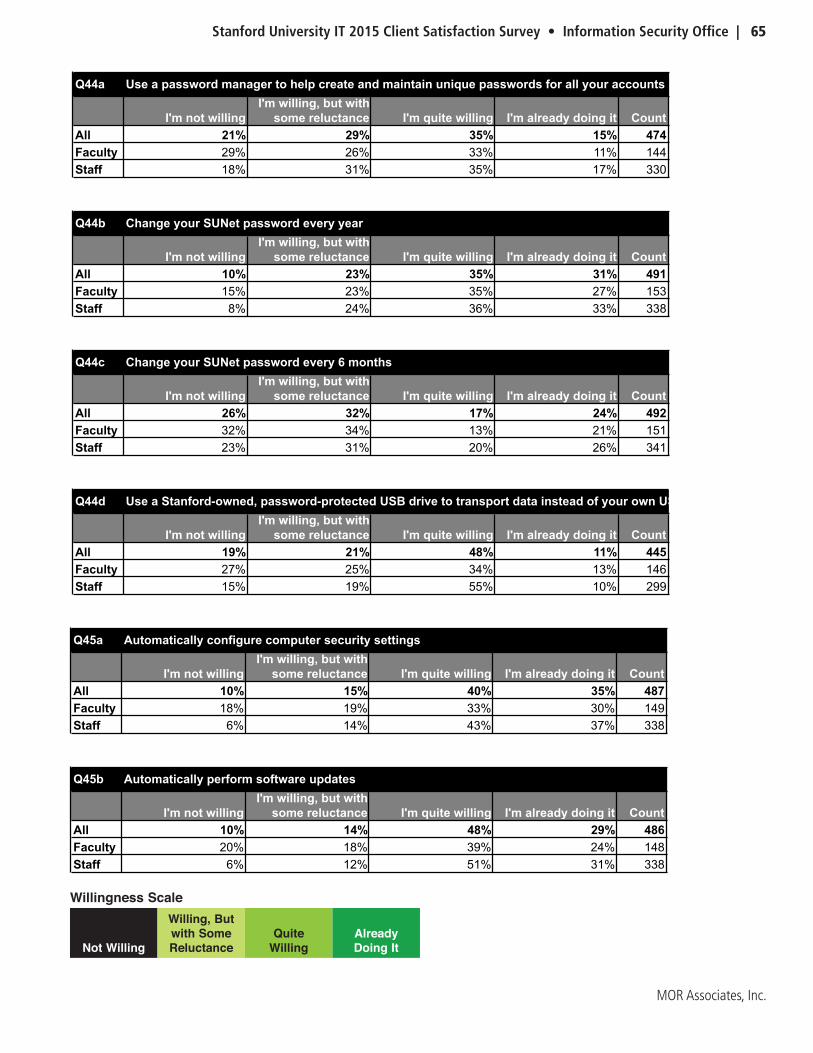
Stanford University IT 2015 Client Satisfaction Survey • Information Security Office | 65
MOR Associates, Inc.
Q42 How aware are you of Stanford's policies and requirements regarding Information Security?
Never heard of them.
I've heard about them but never read
them.
I've read some of them, but probably
not all.I've read all of the
policies. CountAll 2% 7% 63% 29% 510Faculty 3% 6% 58% 33% 155Staff 2% 7% 65% 27% 355
Q44a Use a password manager to help create and maintain unique passwords for all your accounts
I'm not willing I'm willing, but with
some reluctance I'm quite willing I'm already doing it CountAll 21% 29% 35% 15% 474Faculty 29% 26% 33% 11% 144Staff 18% 31% 35% 17% 330
Q44b Change your SUNet password every year
I'm not willing I'm willing, but with
some reluctance I'm quite willing I'm already doing it CountAll 10% 23% 35% 31% 491Faculty 15% 23% 35% 27% 153Staff 8% 24% 36% 33% 338
Q44c Change your SUNet password every 6 months
I'm not willing I'm willing, but with
some reluctance I'm quite willing I'm already doing it CountAll 26% 32% 17% 24% 492Faculty 32% 34% 13% 21% 151Staff 23% 31% 20% 26% 341
Q44d Use a Stanford-owned, password-protected USB drive to transport data instead of your own USB drive
I'm not willing I'm willing, but with
some reluctance I'm quite willing I'm already doing it CountAll 19% 21% 48% 11% 445Faculty 27% 25% 34% 13% 146Staff 15% 19% 55% 10% 299
Q45a Automatically configure computer security settings
I'm not willing I'm willing, but with
some reluctance I'm quite willing I'm already doing it CountAll 10% 15% 40% 35% 487Faculty 18% 19% 33% 30% 149Staff 6% 14% 43% 37% 338
Q45b Automatically perform software updates
I'm not willing I'm willing, but with
some reluctance I'm quite willing I'm already doing it CountAll 10% 14% 48% 29% 486Faculty 20% 18% 39% 24% 148Staff 6% 12% 51% 31% 338
Q45c Automatically block suspected suspicious software from running
I'm not willing I'm willing, but with
some reluctance I'm quite willing I'm already doing it CountAll 8% 16% 50% 25% 487Faculty 11% 19% 49% 22% 151Staff 7% 15% 50% 27% 336
Q45d Install all your software to prevent suspicious software from being installed
I'm not willing I'm willing, but with
some reluctance I'm quite willing I'm already doing it CountAll 20% 18% 42% 20% 484Faculty 28% 20% 40% 13% 149Staff 16% 16% 43% 24% 335
Willingness Scale
Not Willing
Willing, But with Some Reluctance
Quite Willing
Already Doing It

66 | Information Security Office • Stanford University IT 2015 Client Satisfaction Survey
MOR Associates, Inc.
Q45a Automatically configure computer security settings
I'm not willing I'm willing, but with
some reluctance I'm quite willing I'm already doing it CountAll 10% 15% 40% 35% 487Faculty 18% 19% 33% 30% 149Staff 6% 14% 43% 37% 338
Q45b Automatically perform software updates
I'm not willing I'm willing, but with
some reluctance I'm quite willing I'm already doing it CountAll 10% 14% 48% 29% 486Faculty 20% 18% 39% 24% 148Staff 6% 12% 51% 31% 338
Q45c Automatically block suspected suspicious software from running
I'm not willing I'm willing, but with
some reluctance I'm quite willing I'm already doing it CountAll 8% 16% 50% 25% 487Faculty 11% 19% 49% 22% 151Staff 7% 15% 50% 27% 336
Q45d Install all your software to prevent suspicious software from being installed
I'm not willing I'm willing, but with
some reluctance I'm quite willing I'm already doing it CountAll 20% 18% 42% 20% 484Faculty 28% 20% 40% 13% 149Staff 16% 16% 43% 24% 335
Q46a Automatically configure computer security settings
I'm not willing I'm willing, but with
some reluctance I'm quite willing I'm already doing it CountAll 37% 21% 29% 12% 401Faculty 32% 21% 32% 15% 136Staff 40% 22% 28% 11% 265
Q46b Automatically perform software updates
I'm not willing I'm willing, but with
some reluctance I'm quite willing I'm already doing it CountAll 37% 20% 33% 11% 395Faculty 34% 18% 35% 13% 136Staff 38% 21% 31% 10% 259
Q46c Automatically block suspected suspicious software from running
I'm not willing I'm willing, but with
some reluctance I'm quite willing I'm already doing it CountAll 34% 22% 34% 11% 397Faculty 28% 20% 39% 12% 137Staff 37% 23% 30% 10% 260
Q46d Install all software to ensure that suspicious software isn't installed
I'm not willing I'm willing, but with
some reluctance I'm quite willing I'm already doing it CountAll 45% 18% 29% 8% 391Faculty 44% 16% 33% 7% 132Staff 45% 19% 27% 9% 259
Q43 How compatible are Stanford's security requirements with your workflow?
The requirements are reasonably easy
to satisfy.
The requirements are troublesome but
I can still get my work done.
The requirements are hard to satisfy
because they impede my work.
The requirements do not apply to my
work. CountAll 55% 32% 8% 5% 507Faculty 43% 35% 15% 7% 153Staff 61% 30% 5% 4% 354

Stanford University IT 2015 Client Satisfaction Survey • Web-Related Services | 67
MOR Associates, Inc.
Web-Related Services

68 | Web-Related Services • Stanford University IT 2015 Client Satisfaction Survey
MOR Associates, Inc.
5%
6%
5%
6%
13%
21%
35%
2%
2%
4%
5%
3%
13%
23%
4%
5%
5%
6%
10%
19%
31%
0% 20% 40% 60% 80% 100%
Downloadable web design/ theme assets for Drupal,
WordPress, and HTML websites
Form Builder (Web Forms Service)
Stanford WordPress
Stanford Web Services' web design, development, and consulting services
Stanford Sites Drupal
Qualtrics
Used at least one web-related service
Q82. Which of the following web-related services have you used in the past year?
All, n=536
F, n=172
A, n=364
Stanford University IT 2015 Client Satisfaction Survey • Web-Related Services | 69
MOR Associates, Inc.
This page intentionally left blank�

70 | Web-Related Services • Stanford University IT 2015 Client Satisfaction Survey
MOR Associates, Inc.
Mean N
Q83d. Qualtrics
9 91
4.85 98 18%
Q83b. Stanford Sites Drupal
17 83
4.42 53 10%
Q83a. Stanford WordPress
15 85
4.67 27 5%
Q83c. Form Builder (Web Forms Service)
15 85
4.65 26 5%
Q83f. Stanford Web Services' web design, development, and consulting services
14 86
4.64 28 5%
Q83e. Downloadable web design/theme assets for Drupal, WordPress, and HTML websites
19 81
4.52 21 4%
N
Q44b. Change your SUNet password every year
10 90
491 92%
Q44d. Use a Stanford-owned, password-protected USB drive to transport data instead of your own USB drive
19 81
445 83%
Q44a. Use a password manager to help create and maintain unique passwords for all your accounts
21 79
474 88%
Q44c. Change your SUNet password every 6 months
26 74
492 92%
Satisfaction with Specified Web-Related ServicesPercents
Responding
Willingness to Engage in Specified BehaviorsPercents
Responding
See Appendix
A
Q84 . What would increase your satisfaction with Stanford WordPress?
Q85 . What would increase your satisfaction with Stanford Sites Drupal?
Q86 . What would increase your satisfaction with Form Builder?
Q87 . What would increase your satisfaction with Qualtrics?
Q88 . What would increase your satisfaction with Downloadable web design/theme assets for Drupal, WordPress, and HTML websites?
Q89 . What would increase your satisfaction with Stanford Web Services’ web design, development, and consulting services?

Stanford University IT 2015 Client Satisfaction Survey • Web-Related Services | 71
MOR Associates, Inc.
Q83a Stanford WordPress
Mean VD D SD SS S VS Count Std. Dev. 95% CI+-All 4.67 4% 0% 11% 22% 37% 26% 27 1.21 0.46Faculty 4.29 0% 0% 29% 29% 29% 14% 7 1.11 0.82Staff 4.80 5% 0% 5% 20% 40% 30% 20 1.24 0.54
Q83b Stanford Sites Drupal
Mean VD D SD SS S VS Count Std. Dev. 95% CI+-All 4.42 6% 2% 9% 25% 45% 13% 53 1.23 0.33Faculty 4.33 0% 0% 17% 33% 50% 0% 6 0.82 0.65Staff 4.43 6% 2% 9% 23% 45% 15% 47 1.28 0.37
Q83c Form Builder (Web Forms Service)
Mean VD D SD SS S VS Count Std. Dev. 95% CI+-All 4.65 0% 4% 12% 15% 54% 15% 26 1.02 0.39Faculty 4.33 0% 0% 33% 0% 67% 0% 3 1.15 1.31Staff 4.70 0% 4% 9% 17% 52% 17% 23 1.02 0.42
Q83d Qualtrics
Mean VD D SD SS S VS Count Std. Dev. 95% CI+-All 4.85 0% 1% 8% 18% 50% 22% 98 0.90 0.18Faculty 4.78 0% 0% 9% 17% 61% 13% 23 0.80 0.33Staff 4.87 0% 1% 8% 19% 47% 25% 75 0.93 0.21
Q83e
Mean VD D SD SS S VS Count Std. Dev. 95% CI+-All 4.52 0% 10% 10% 24% 33% 24% 21 1.25 0.53Faculty 3.00 0% 50% 0% 50% 0% 0% 4 1.15 1.13Staff 4.88 0% 0% 12% 18% 41% 29% 17 0.99 0.47
Q83f Stanford Web Services' web design, development, and consulting services
Mean VD D SD SS S VS Count Std. Dev. 95% CI+-All 4.64 4% 4% 7% 25% 32% 29% 28 1.28 0.48Faculty 4.14 0% 14% 14% 29% 29% 14% 7 1.35 1.00Staff 4.81 5% 0% 5% 24% 33% 33% 21 1.25 0.53
Downloadable web design/theme assets for Drupal, WordPress, and HTML websites

72 | Web-Related Services • Stanford University IT 2015 Client Satisfaction Survey
MOR Associates, Inc.
This page intentionally left blank�
Stanford University IT 2015 Client Satisfaction Survey • Administrative Systems | 73
MOR Associates, Inc.
Administrative Systems
74 | Administrative Systems • Stanford University IT 2015 Client Satisfaction Survey
MOR Associates, Inc.
Introduction to Administrative Systems ResultsIn addition to the community-wide survey that is the focus of this report, a separate survey was administered to busi-ness owners and the people who work with or for them in the development and deployment of applications developed and maintained by Administrative Systems on behalf of the business owners.
There are three categories of questions reported out in this section:
A . Questions that appeared in both surveys
Q90. Which of the following applications have you used in the past year? (Check all that apply.)
Q91. How satisfied are you with the ease of use of the following applications?
Q91. How satisfied are you how efficiently you can complete needed tasks using the following applications?
B . Questions that were only asked in the main UIT survey
Q93. OrderIT was revamped in 2013. Did you use the previous version?
Q94. Since OrderIT was revamped, how has the overall day-to-day experience (features, ease of use, efficiency in com-pleting needed tasks) of using it changed, if at all?
C . Questions that were only asked in the Administrative Systems survey
AS-Q10. How satisfied are you with the quality of the learning support you’ve received for the following applications?
AS-Q11. How satisfied are you with the quality of the troubleshooting support you’ve received for the following ap-plications?
AS-Q12. How satisfied are you with AS’ responsiveness to improvement requests for the following applications?
AS-Q1 through AS-Q9 addressed a variety of aspects of doing projects with Administrative Systems, from initiation to execution to support for completed projects.
Throughout this section and report, all table or chart references to “All” only reflect responses to the main UIT survey, excluding responses to the Administrative Systems Survey. Administrative Systems Survey data are identified as “AS.”
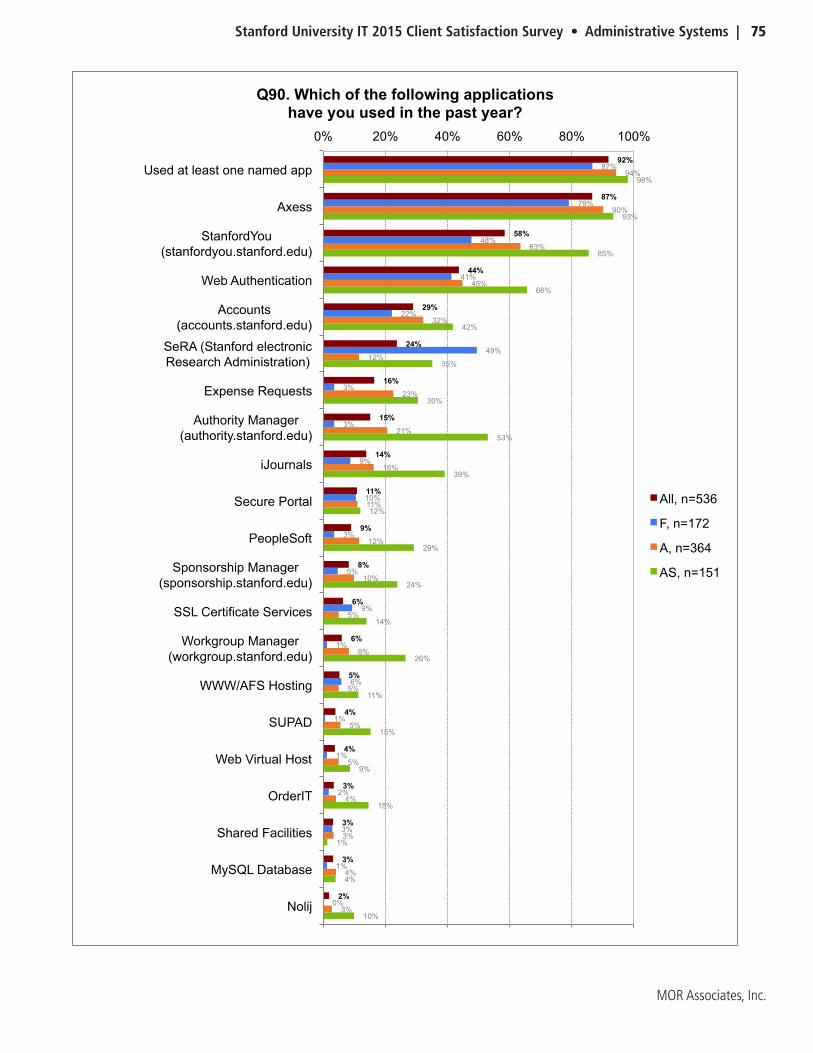
Stanford University IT 2015 Client Satisfaction Survey • Administrative Systems | 75
MOR Associates, Inc.
10%
4%
1%
15%
9%
15%
11%
26%
14%
24%
29%
12%
39%
53%
30%
35%
42%
66%
85%
93%
98%
3%
4%
3%
4%
5%
5%
5%
8%
5%
10%
12%
11%
16%
21%
23%
12%
32%
45%
63%
90%
94%
0%
1%
3%
2%
1%
1%
6%
1%
9%
5%
3%
10%
9%
3%
3%
49%
22%
41%
48%
79%
87%
2%
3%
3%
3%
4%
4%
5%
6%
6%
8%
9%
11%
14%
15%
16%
24%
29%
44%
58%
87%
92%
0% 20% 40% 60% 80% 100%
Nolij
MySQL Database
Shared Facilities
OrderIT
Web Virtual Host
SUPAD
WWW/AFS Hosting
Workgroup Manager (workgroup.stanford.edu)
SSL Certificate Services
Sponsorship Manager (sponsorship.stanford.edu)
PeopleSoft
Secure Portal
iJournals
Authority Manager (authority.stanford.edu)
Expense Requests
SeRA (Stanford electronic Research Administration)
Accounts (accounts.stanford.edu)
Web Authentication
StanfordYou (stanfordyou.stanford.edu)
Axess
Used at least one named app
Q90. Which of the following applications have you used in the past year?
All, n=536
F, n=172
A, n=364
AS, n=151

76 | Administrative Systems • Stanford University IT 2015 Client Satisfaction Survey
MOR Associates, Inc.
Mea
n-
+n
Mea
n-
+n
Mea
n-
+n
Mea
n-
+n
Mea
n-
+n
Q91
o. S
tanf
ordY
ou (s
tanf
ordy
ou.s
tanf
ord.
edu)
5.10
0%10
0%30
35.
072%
98%
303
4.91
8%92
%78
5.10
2%98
%51
4.93
5%95
%42
Q91
a. A
ccou
nts
(acc
ount
s.st
anfo
rd.e
du)
4.98
3%97
%14
84.
994%
96%
149
4.91
9%91
%47
4.86
7%93
%28
4.70
11%
89%
27
Q91
m. S
pons
orsh
ip M
anag
er (s
pons
orsh
ip.s
tanf
ord.
edu)
4.98
5%95
%43
5.02
2%98
%42
4.26
30%
70%
234.
3317
%83
%12
4.09
27%
73%
11
Q91
c. A
xess
4.97
5%95
%45
64.
868%
92%
458
4.92
9%91
%91
4.96
10%
90%
684.
6615
%85
%61
Q91
j. S
ecur
e P
orta
l4.
937%
93%
574.
869%
91%
575.
250%
100%
125.
000%
100%
95.
000%
100%
8
Q91
n. S
SL
Cer
tific
ate
Ser
vice
s4.
873%
97%
304.
903%
97%
304.
928%
92%
135.
100%
100%
104.
6722
%78
%9
Q91
s. W
orkg
roup
Man
ager
(wor
kgro
up.s
tanf
ord.
edu)
4.78
9%91
%32
4.90
6%94
%31
4.54
19%
81%
264.
8113
%88
%16
3.92
42%
58%
12
Q91
b. A
utho
rity
Man
ager
(aut
horit
y.st
anfo
rd.e
du)
4.78
6%94
%77
4.78
9%91
%77
4.52
17%
83%
524.
8011
%89
%35
4.46
25%
75%
28
Q91
e. iJ
ourn
als
4.71
10%
90%
724.
7110
%90
%73
4.87
7%93
%45
5.12
3%97
%33
5.13
0%10
0%24
Q91
q. W
eb A
uthe
ntic
atio
n4.
7111
%89
%23
14.
7011
%89
%22
74.
973%
97%
715.
160%
100%
494.
893%
97%
35
Q91
h. P
eopl
eSof
t4.
6811
%89
%47
4.63
13%
87%
464.
6519
%81
%31
4.25
28%
72%
324.
1926
%74
%27
Q91
d. E
xpen
se R
eque
sts
4.43
15%
85%
864.
4419
%81
%86
4.90
5%95
%40
4.83
14%
86%
294.
879%
91%
23
Q91
k. S
eRA
(Sta
nfor
d el
ectro
nic
Res
earc
h A
dmin
istra
tion)
4.36
21%
79%
121
4.31
22%
78%
124
4.60
15%
85%
484.
8810
%90
%40
4.08
24%
76%
37
Q91
r. W
eb V
irtua
l Hos
t5.
215%
95%
195.
055%
95%
195.
0014
%86
%7
5.40
0%10
0%5
5.25
0%10
0%4
Q91
p. S
UPA
D5.
105%
95%
215.
105%
95%
215.
270%
100%
155.
290%
100%
145.
090%
100%
11
Q91
f. M
ySQ
L D
atab
ase
5.06
0%10
0%16
5.13
0%10
0%16
4.80
0%10
0%5
4.67
0%10
0%3
5.00
0%10
0%2
Q91
l. S
hare
d Fa
cilit
ies
5.00
6%94
%16
4.75
13%
88%
16-
--
0-
--
0-
--
0
Q91
t. W
WW
/AFS
Hos
ting
4.65
12%
88%
264.
7315
%85
%26
4.18
36%
64%
114.
0040
%60
%5
3.50
50%
50%
4
Q91
g. N
olij
4.56
11%
89%
94.
670%
100%
94.
2727
%73
%11
4.57
29%
71%
74.
2929
%71
%7
Q91
i. O
rder
IT4.
5022
%78
%18
4.39
22%
78%
184.
1331
%69
%16
4.00
36%
64%
143.
9238
%62
%13
Adm
inis
trat
ive
Syst
ems
App
sEa
se o
f use
(prim
ary
sort
)Ef
ficie
ncy
Qua
lity
of le
arni
ng s
uppo
rtQ
ualit
y of
trou
bles
hoot
ing
supp
ort
Impr
ovem
ent r
eque
st re
spon
sive
ness
All
AS
Thes
e q
ues
tio
ns
wer
e as
ked
in b
oth
th
e m
ain
UIT
su
rvey
an
d t
he
Ad
min
istr
ativ
e Sy
stem
s Su
rvey
.
App
licat
ions
with
few
er th
an30
resp
onse
s fro
m “A
ll”
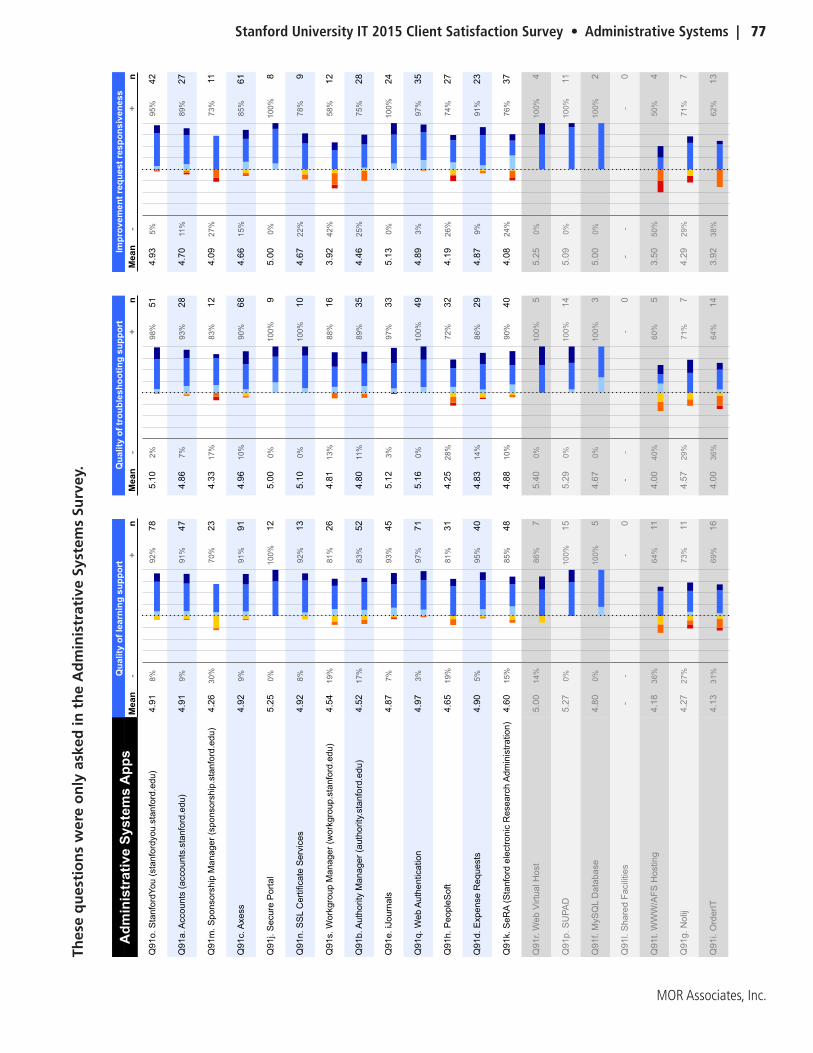
Stanford University IT 2015 Client Satisfaction Survey • Administrative Systems | 77
MOR Associates, Inc.
Mea
n-
+n
Mea
n-
+n
Mea
n-
+n
Mea
n-
+n
Mea
n-
+n
Q91
o. S
tanf
ordY
ou (s
tanf
ordy
ou.s
tanf
ord.
edu)
5.10
0%10
0%30
35.
072%
98%
303
4.91
8%92
%78
5.10
2%98
%51
4.93
5%95
%42
Q91
a. A
ccou
nts
(acc
ount
s.st
anfo
rd.e
du)
4.98
3%97
%14
84.
994%
96%
149
4.91
9%91
%47
4.86
7%93
%28
4.70
11%
89%
27
Q91
m. S
pons
orsh
ip M
anag
er (s
pons
orsh
ip.s
tanf
ord.
edu)
4.98
5%95
%43
5.02
2%98
%42
4.26
30%
70%
234.
3317
%83
%12
4.09
27%
73%
11
Q91
c. A
xess
4.97
5%95
%45
64.
868%
92%
458
4.92
9%91
%91
4.96
10%
90%
684.
6615
%85
%61
Q91
j. S
ecur
e P
orta
l4.
937%
93%
574.
869%
91%
575.
250%
100%
125.
000%
100%
95.
000%
100%
8
Q91
n. S
SL
Cer
tific
ate
Ser
vice
s4.
873%
97%
304.
903%
97%
304.
928%
92%
135.
100%
100%
104.
6722
%78
%9
Q91
s. W
orkg
roup
Man
ager
(wor
kgro
up.s
tanf
ord.
edu)
4.78
9%91
%32
4.90
6%94
%31
4.54
19%
81%
264.
8113
%88
%16
3.92
42%
58%
12
Q91
b. A
utho
rity
Man
ager
(aut
horit
y.st
anfo
rd.e
du)
4.78
6%94
%77
4.78
9%91
%77
4.52
17%
83%
524.
8011
%89
%35
4.46
25%
75%
28
Q91
e. iJ
ourn
als
4.71
10%
90%
724.
7110
%90
%73
4.87
7%93
%45
5.12
3%97
%33
5.13
0%10
0%24
Q91
q. W
eb A
uthe
ntic
atio
n4.
7111
%89
%23
14.
7011
%89
%22
74.
973%
97%
715.
160%
100%
494.
893%
97%
35
Q91
h. P
eopl
eSof
t4.
6811
%89
%47
4.63
13%
87%
464.
6519
%81
%31
4.25
28%
72%
324.
1926
%74
%27
Q91
d. E
xpen
se R
eque
sts
4.43
15%
85%
864.
4419
%81
%86
4.90
5%95
%40
4.83
14%
86%
294.
879%
91%
23
Q91
k. S
eRA
(Sta
nfor
d el
ectro
nic
Res
earc
h A
dmin
istra
tion)
4.36
21%
79%
121
4.31
22%
78%
124
4.60
15%
85%
484.
8810
%90
%40
4.08
24%
76%
37
Q91
r. W
eb V
irtua
l Hos
t5.
215%
95%
195.
055%
95%
195.
0014
%86
%7
5.40
0%10
0%5
5.25
0%10
0%4
Q91
p. S
UPA
D5.
105%
95%
215.
105%
95%
215.
270%
100%
155.
290%
100%
145.
090%
100%
11
Q91
f. M
ySQ
L D
atab
ase
5.06
0%10
0%16
5.13
0%10
0%16
4.80
0%10
0%5
4.67
0%10
0%3
5.00
0%10
0%2
Q91
l. S
hare
d Fa
cilit
ies
5.00
6%94
%16
4.75
13%
88%
16-
--
0-
--
0-
--
0
Q91
t. W
WW
/AFS
Hos
ting
4.65
12%
88%
264.
7315
%85
%26
4.18
36%
64%
114.
0040
%60
%5
3.50
50%
50%
4
Q91
g. N
olij
4.56
11%
89%
94.
670%
100%
94.
2727
%73
%11
4.57
29%
71%
74.
2929
%71
%7
Q91
i. O
rder
IT4.
5022
%78
%18
4.39
22%
78%
184.
1331
%69
%16
4.00
36%
64%
143.
9238
%62
%13
Adm
inis
trat
ive
Syst
ems
App
sEa
se o
f use
(prim
ary
sort
)Ef
ficie
ncy
Qua
lity
of le
arni
ng s
uppo
rtQ
ualit
y of
trou
bles
hoot
ing
supp
ort
Impr
ovem
ent r
eque
st re
spon
sive
ness
Mea
n-
+n
Mea
n-
+n
Mea
n-
+n
Mea
n-
+n
Mea
n-
+n
Q91
o. S
tanf
ordY
ou (s
tanf
ordy
ou.s
tanf
ord.
edu)
5.10
0%10
0%30
35.
072%
98%
303
4.91
8%92
%78
5.10
2%98
%51
4.93
5%95
%42
Q91
a. A
ccou
nts
(acc
ount
s.st
anfo
rd.e
du)
4.98
3%97
%14
84.
994%
96%
149
4.91
9%91
%47
4.86
7%93
%28
4.70
11%
89%
27
Q91
m. S
pons
orsh
ip M
anag
er (s
pons
orsh
ip.s
tanf
ord.
edu)
4.98
5%95
%43
5.02
2%98
%42
4.26
30%
70%
234.
3317
%83
%12
4.09
27%
73%
11
Q91
c. A
xess
4.97
5%95
%45
64.
868%
92%
458
4.92
9%91
%91
4.96
10%
90%
684.
6615
%85
%61
Q91
j. S
ecur
e P
orta
l4.
937%
93%
574.
869%
91%
575.
250%
100%
125.
000%
100%
95.
000%
100%
8
Q91
n. S
SL
Cer
tific
ate
Ser
vice
s4.
873%
97%
304.
903%
97%
304.
928%
92%
135.
100%
100%
104.
6722
%78
%9
Q91
s. W
orkg
roup
Man
ager
(wor
kgro
up.s
tanf
ord.
edu)
4.78
9%91
%32
4.90
6%94
%31
4.54
19%
81%
264.
8113
%88
%16
3.92
42%
58%
12
Q91
b. A
utho
rity
Man
ager
(aut
horit
y.st
anfo
rd.e
du)
4.78
6%94
%77
4.78
9%91
%77
4.52
17%
83%
524.
8011
%89
%35
4.46
25%
75%
28
Q91
e. iJ
ourn
als
4.71
10%
90%
724.
7110
%90
%73
4.87
7%93
%45
5.12
3%97
%33
5.13
0%10
0%24
Q91
q. W
eb A
uthe
ntic
atio
n4.
7111
%89
%23
14.
7011
%89
%22
74.
973%
97%
715.
160%
100%
494.
893%
97%
35
Q91
h. P
eopl
eSof
t4.
6811
%89
%47
4.63
13%
87%
464.
6519
%81
%31
4.25
28%
72%
324.
1926
%74
%27
Q91
d. E
xpen
se R
eque
sts
4.43
15%
85%
864.
4419
%81
%86
4.90
5%95
%40
4.83
14%
86%
294.
879%
91%
23
Q91
k. S
eRA
(Sta
nfor
d el
ectro
nic
Res
earc
h A
dmin
istra
tion)
4.36
21%
79%
121
4.31
22%
78%
124
4.60
15%
85%
484.
8810
%90
%40
4.08
24%
76%
37
Q91
r. W
eb V
irtua
l Hos
t5.
215%
95%
195.
055%
95%
195.
0014
%86
%7
5.40
0%10
0%5
5.25
0%10
0%4
Q91
p. S
UPA
D5.
105%
95%
215.
105%
95%
215.
270%
100%
155.
290%
100%
145.
090%
100%
11
Q91
f. M
ySQ
L D
atab
ase
5.06
0%10
0%16
5.13
0%10
0%16
4.80
0%10
0%5
4.67
0%10
0%3
5.00
0%10
0%2
Q91
l. S
hare
d Fa
cilit
ies
5.00
6%94
%16
4.75
13%
88%
16-
--
0-
--
0-
--
0
Q91
t. W
WW
/AFS
Hos
ting
4.65
12%
88%
264.
7315
%85
%26
4.18
36%
64%
114.
0040
%60
%5
3.50
50%
50%
4
Q91
g. N
olij
4.56
11%
89%
94.
670%
100%
94.
2727
%73
%11
4.57
29%
71%
74.
2929
%71
%7
Q91
i. O
rder
IT4.
5022
%78
%18
4.39
22%
78%
184.
1331
%69
%16
4.00
36%
64%
143.
9238
%62
%13
Adm
inis
trat
ive
Syst
ems
App
sEa
se o
f use
(prim
ary
sort
)Ef
ficie
ncy
Qua
lity
of le
arni
ng s
uppo
rtQ
ualit
y of
trou
bles
hoot
ing
supp
ort
Impr
ovem
ent r
eque
st re
spon
sive
ness
Thes
e q
ues
tio
ns
wer
e o
nly
ask
ed in
th
e A
dm
inis
trat
ive
Syst
ems
Surv
ey .

78 | Administrative Systems • Stanford University IT 2015 Client Satisfaction Survey
MOR Associates, Inc.
Q91a Accounts (accounts.stanford.edu) ease of use
Mean VD D SD SS S VS Count Std. Dev. 95% CI+-All 4.98 0% 1% 3% 11% 70% 16% 148 0.66 0.11Faculty 4.79 0% 3% 3% 18% 65% 12% 34 0.81 0.27Staff 5.04 0% 0% 3% 9% 71% 18% 114 0.61 0.11AS Clients 5.05 0% 0% 0% 18% 59% 23% 61 0.64 0.16
Q91b Authority Manager (authority.stanford.edu) ease of use
Mean VD D SD SS S VS Count Std. Dev. 95% CI+-All 4.78 3% 0% 4% 21% 56% 17% 77 0.95 0.21Faculty 4.75 0% 0% 0% 50% 25% 25% 4 0.96 0.94Staff 4.78 3% 0% 4% 19% 58% 16% 73 0.96 0.22AS Clients 4.62 3% 4% 6% 21% 48% 18% 77 1.14 0.25
Q91c Axess ease of use
Mean VD D SD SS S VS Count Std. Dev. 95% CI+-All 4.97 2% 0% 3% 15% 55% 25% 456 0.89 0.08Faculty 4.80 3% 2% 3% 17% 56% 20% 132 1.04 0.18Staff 5.04 1% 0% 2% 15% 54% 27% 324 0.82 0.09AS Clients 4.89 1% 1% 6% 15% 50% 26% 137 1.00 0.17
Q91d Expense Requests ease of use
Mean VD D SD SS S VS Count Std. Dev. 95% CI+-All 4.43 3% 2% 9% 31% 40% 14% 86 1.13 0.24Faculty 3.50 17% 0% 17% 50% 17% 0% 6 1.38 1.10Staff 4.50 3% 3% 9% 30% 41% 15% 80 1.09 0.24AS Clients 4.66 0% 5% 7% 23% 50% 16% 44 0.99 0.29
Q91e iJournals ease of use
Mean VD D SD SS S VS Count Std. Dev. 95% CI+-All 4.71 1% 3% 6% 22% 50% 18% 72 1.01 0.23Faculty 4.87 0% 0% 0% 33% 47% 20% 15 0.74 0.38Staff 4.67 2% 4% 7% 19% 51% 18% 57 1.07 0.28AS Clients 4.86 3% 0% 7% 8% 59% 22% 59 1.06 0.27
Q91f MySQL Database ease of use
Mean VD D SD SS S VS Count Std. Dev. 95% CI+-All 5.06 0% 0% 0% 6% 81% 13% 16 0.44 0.22Faculty 5.00 0% 0% 0% 0% 100% 0% 1 - -Staff 5.07 0% 0% 0% 7% 80% 13% 15 0.46 0.23AS Clients 4.80 0% 0% 0% 20% 80% 0% 5 0.45 0.39
Q91g Nolij ease of use
Mean VD D SD SS S VS Count Std. Dev. 95% CI+-Staff 4.56 0% 0% 11% 33% 44% 11% 9 0.88 0.58AS Clients 4.13 7% 7% 7% 27% 53% 0% 15 1.25 0.63
Q91h PeopleSoft ease of use
Mean VD D SD SS S VS Count Std. Dev. 95% CI+-All 4.68 0% 2% 9% 23% 51% 15% 47 0.91 0.26Faculty 4.33 0% 0% 33% 17% 33% 17% 6 1.21 0.97Staff 4.73 0% 2% 5% 24% 54% 15% 41 0.87 0.27AS Clients 4.23 3% 10% 13% 23% 43% 10% 40 1.25 0.39
Q91i OrderIT ease of use
Mean VD D SD SS S VS Count Std. Dev. 95% CI+-All 4.50 11% 0% 11% 17% 28% 33% 18 1.62 0.75Faculty 2.33 67% 0% 0% 0% 33% 0% 3 2.31 2.61Staff 4.93 0% 0% 13% 20% 27% 40% 15 1.10 0.56AS Clients 4.05 5% 18% 9% 18% 36% 14% 22 1.50 0.62
Q91j Secure Portal ease of use
Mean VD D SD SS S VS Count Std. Dev. 95% CI+-All 4.93 0% 2% 5% 14% 56% 23% 57 0.86 0.22Faculty 5.12 0% 0% 6% 12% 47% 35% 17 0.86 0.41Staff 4.85 0% 3% 5% 15% 60% 18% 40 0.86 0.27AS Clients 5.06 0% 0% 6% 12% 53% 29% 17 0.83 0.39
Q91k SeRA (Stanford electronic Research Administration) ease of use
Mean VD D SD SS S VS Count Std. Dev. 95% CI+-All 4.36 4% 2% 14% 23% 45% 12% 121 1.18 0.21Faculty 4.35 3% 4% 14% 25% 44% 10% 79 1.12 0.25Staff 4.38 7% 0% 14% 19% 45% 14% 42 1.31 0.39AS Clients 4.42 0% 9% 13% 23% 36% 19% 53 1.22 0.33

Stanford University IT 2015 Client Satisfaction Survey • Administrative Systems | 79
MOR Associates, Inc.
Q91f MySQL Database ease of use
Mean VD D SD SS S VS Count Std. Dev. 95% CI+-All 5.06 0% 0% 0% 6% 81% 13% 16 0.44 0.22Faculty 5.00 0% 0% 0% 0% 100% 0% 1 - -Staff 5.07 0% 0% 0% 7% 80% 13% 15 0.46 0.23AS Clients 4.80 0% 0% 0% 20% 80% 0% 5 0.45 0.39
Q91g Nolij ease of use
Mean VD D SD SS S VS Count Std. Dev. 95% CI+-Staff 4.56 0% 0% 11% 33% 44% 11% 9 0.88 0.58AS Clients 4.13 7% 7% 7% 27% 53% 0% 15 1.25 0.63
Q91h PeopleSoft ease of use
Mean VD D SD SS S VS Count Std. Dev. 95% CI+-All 4.68 0% 2% 9% 23% 51% 15% 47 0.91 0.26Faculty 4.33 0% 0% 33% 17% 33% 17% 6 1.21 0.97Staff 4.73 0% 2% 5% 24% 54% 15% 41 0.87 0.27AS Clients 4.23 3% 10% 13% 23% 43% 10% 40 1.25 0.39
Q91i OrderIT ease of use
Mean VD D SD SS S VS Count Std. Dev. 95% CI+-All 4.50 11% 0% 11% 17% 28% 33% 18 1.62 0.75Faculty 2.33 67% 0% 0% 0% 33% 0% 3 2.31 2.61Staff 4.93 0% 0% 13% 20% 27% 40% 15 1.10 0.56AS Clients 4.05 5% 18% 9% 18% 36% 14% 22 1.50 0.62
Q91j Secure Portal ease of use
Mean VD D SD SS S VS Count Std. Dev. 95% CI+-All 4.93 0% 2% 5% 14% 56% 23% 57 0.86 0.22Faculty 5.12 0% 0% 6% 12% 47% 35% 17 0.86 0.41Staff 4.85 0% 3% 5% 15% 60% 18% 40 0.86 0.27AS Clients 5.06 0% 0% 6% 12% 53% 29% 17 0.83 0.39
Q91k SeRA (Stanford electronic Research Administration) ease of use
Mean VD D SD SS S VS Count Std. Dev. 95% CI+-All 4.36 4% 2% 14% 23% 45% 12% 121 1.18 0.21Faculty 4.35 3% 4% 14% 25% 44% 10% 79 1.12 0.25Staff 4.38 7% 0% 14% 19% 45% 14% 42 1.31 0.39AS Clients 4.42 0% 9% 13% 23% 36% 19% 53 1.22 0.33
Q91l Shared Facilities ease of use
Mean VD D SD SS S VS Count Std. Dev. 95% CI+-All 5.00 0% 0% 6% 19% 44% 31% 16 0.89 0.44Faculty 4.75 0% 0% 0% 25% 75% 0% 4 0.50 0.49Staff 5.08 0% 0% 8% 17% 33% 42% 12 1.00 0.56AS Clients 3.50 0% 0% 50% 50% 0% 0% 2 0.71 0.98
Q91m Sponsorship Manager (sponsorship.stanford.edu) ease of use
Mean VD D SD SS S VS Count Std. Dev. 95% CI+-All 4.98 0% 0% 5% 19% 51% 26% 43 0.80 0.24Faculty 4.71 0% 0% 0% 29% 71% 0% 7 0.49 0.36Staff 5.03 0% 0% 6% 17% 47% 31% 36 0.84 0.28AS Clients 4.47 3% 0% 14% 17% 64% 3% 36 0.97 0.32
Q91n SSL Certificate Services ease of use
Mean VD D SD SS S VS Count Std. Dev. 95% CI+-All 4.87 0% 3% 0% 20% 60% 17% 30 0.82 0.29Faculty 4.83 0% 0% 0% 33% 50% 17% 12 0.72 0.41Staff 4.89 0% 6% 0% 11% 67% 17% 18 0.90 0.42AS Clients 4.94 0% 0% 6% 11% 67% 17% 18 0.73 0.34
Q91o StanfordYou (stanfordyou.stanford.edu) ease of use
Mean VD D SD SS S VS Count Std. Dev. 95% CI+-All 5.10 0% 0% 0% 16% 57% 27% 303 0.68 0.08Faculty 4.95 0% 0% 0% 25% 54% 20% 79 0.68 0.15Staff 5.15 0% 0% 0% 12% 58% 29% 224 0.68 0.09AS Clients 5.12 0% 1% 1% 13% 58% 28% 128 0.71 0.12
Q91p SUPAD ease of use
Mean VD D SD SS S VS Count Std. Dev. 95% CI+-All 5.10 0% 0% 5% 19% 38% 38% 21 0.89 0.38Faculty 5.00 0% 0% 0% 0% 100% 0% 1 - -Staff 5.10 0% 0% 5% 20% 35% 40% 20 0.91 0.40AS Clients 5.09 0% 0% 0% 17% 57% 26% 23 0.67 0.27
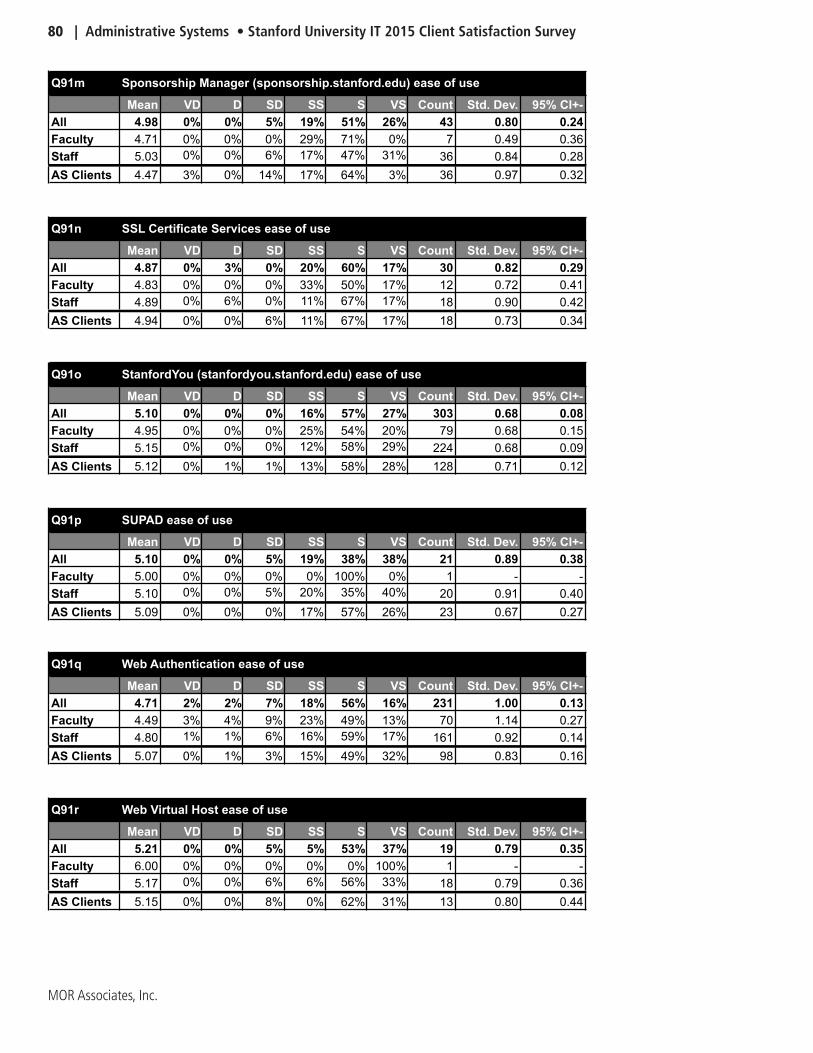
80 | Administrative Systems • Stanford University IT 2015 Client Satisfaction Survey
MOR Associates, Inc.
Q91l Shared Facilities ease of use
Mean VD D SD SS S VS Count Std. Dev. 95% CI+-All 5.00 0% 0% 6% 19% 44% 31% 16 0.89 0.44Faculty 4.75 0% 0% 0% 25% 75% 0% 4 0.50 0.49Staff 5.08 0% 0% 8% 17% 33% 42% 12 1.00 0.56AS Clients 3.50 0% 0% 50% 50% 0% 0% 2 0.71 0.98
Q91m Sponsorship Manager (sponsorship.stanford.edu) ease of use
Mean VD D SD SS S VS Count Std. Dev. 95% CI+-All 4.98 0% 0% 5% 19% 51% 26% 43 0.80 0.24Faculty 4.71 0% 0% 0% 29% 71% 0% 7 0.49 0.36Staff 5.03 0% 0% 6% 17% 47% 31% 36 0.84 0.28AS Clients 4.47 3% 0% 14% 17% 64% 3% 36 0.97 0.32
Q91n SSL Certificate Services ease of use
Mean VD D SD SS S VS Count Std. Dev. 95% CI+-All 4.87 0% 3% 0% 20% 60% 17% 30 0.82 0.29Faculty 4.83 0% 0% 0% 33% 50% 17% 12 0.72 0.41Staff 4.89 0% 6% 0% 11% 67% 17% 18 0.90 0.42AS Clients 4.94 0% 0% 6% 11% 67% 17% 18 0.73 0.34
Q91o StanfordYou (stanfordyou.stanford.edu) ease of use
Mean VD D SD SS S VS Count Std. Dev. 95% CI+-All 5.10 0% 0% 0% 16% 57% 27% 303 0.68 0.08Faculty 4.95 0% 0% 0% 25% 54% 20% 79 0.68 0.15Staff 5.15 0% 0% 0% 12% 58% 29% 224 0.68 0.09AS Clients 5.12 0% 1% 1% 13% 58% 28% 128 0.71 0.12
Q91p SUPAD ease of use
Mean VD D SD SS S VS Count Std. Dev. 95% CI+-All 5.10 0% 0% 5% 19% 38% 38% 21 0.89 0.38Faculty 5.00 0% 0% 0% 0% 100% 0% 1 - -Staff 5.10 0% 0% 5% 20% 35% 40% 20 0.91 0.40AS Clients 5.09 0% 0% 0% 17% 57% 26% 23 0.67 0.27
Q91q Web Authentication ease of use
Mean VD D SD SS S VS Count Std. Dev. 95% CI+-All 4.71 2% 2% 7% 18% 56% 16% 231 1.00 0.13Faculty 4.49 3% 4% 9% 23% 49% 13% 70 1.14 0.27Staff 4.80 1% 1% 6% 16% 59% 17% 161 0.92 0.14AS Clients 5.07 0% 1% 3% 15% 49% 32% 98 0.83 0.16
Q91r Web Virtual Host ease of use
Mean VD D SD SS S VS Count Std. Dev. 95% CI+-All 5.21 0% 0% 5% 5% 53% 37% 19 0.79 0.35Faculty 6.00 0% 0% 0% 0% 0% 100% 1 - -Staff 5.17 0% 0% 6% 6% 56% 33% 18 0.79 0.36AS Clients 5.15 0% 0% 8% 0% 62% 31% 13 0.80 0.44
Q91s Workgroup Manager (workgroup.stanford.edu) ease of use
Mean VD D SD SS S VS Count Std. Dev. 95% CI+-All 4.78 0% 3% 6% 22% 47% 22% 32 0.97 0.34Faculty 3.50 0% 50% 0% 0% 50% 0% 2 2.12 2.94Staff 4.87 0% 0% 7% 23% 47% 23% 30 0.86 0.31AS Clients 4.85 0% 3% 8% 15% 51% 23% 39 0.96 0.30
Q91t WWW/AFS Hosting ease of use
Mean VD D SD SS S VS Count Std. Dev. 95% CI+-All 4.65 0% 4% 8% 27% 42% 19% 26 1.02 0.39Faculty 4.67 0% 0% 0% 44% 44% 11% 9 0.71 0.46Staff 4.65 0% 6% 12% 18% 41% 24% 17 1.17 0.56AS Clients 4.71 0% 6% 12% 12% 47% 24% 17 1.16 0.55
Q92a Accounts (accounts.stanford.edu) efficiency in completing needed tasks
Mean VD D SD SS S VS Count Std. Dev. 95% CI+-All 4.99 0% 1% 3% 9% 69% 17% 149 0.68 0.11Faculty 4.77 0% 0% 9% 17% 63% 11% 35 0.77 0.26Staff 5.06 0% 1% 2% 7% 71% 19% 114 0.64 0.12AS Clients 5.13 0% 0% 2% 11% 60% 27% 62 0.66 0.17

Stanford University IT 2015 Client Satisfaction Survey • Administrative Systems | 81
MOR Associates, Inc.
Q92b
Mean VD D SD SS S VS Count Std. Dev. 95% CI+-All 4.78 3% 0% 6% 17% 56% 18% 77 1.00 0.22Faculty 4.75 0% 0% 0% 50% 25% 25% 4 0.96 0.94Staff 4.78 3% 0% 7% 15% 58% 18% 73 1.00 0.23AS Clients 4.72 3% 3% 10% 10% 54% 21% 72 1.15 0.27
Q92c Axess efficiency in completing needed tasks
Mean VD D SD SS S VS Count Std. Dev. 95% CI+-All 4.86 2% 2% 4% 17% 52% 24% 458 1.01 0.09Faculty 4.58 4% 4% 5% 24% 44% 19% 133 1.19 0.20Staff 4.97 1% 1% 4% 14% 54% 26% 325 0.91 0.10AS Clients 4.90 1% 3% 7% 11% 52% 27% 135 1.01 0.17
Q92d Expense Requests efficiency in completing needed tasks
Mean VD D SD SS S VS Count Std. Dev. 95% CI+-All 4.44 3% 1% 14% 26% 41% 15% 86 1.15 0.24Faculty 3.40 20% 0% 20% 40% 20% 0% 5 1.52 1.33Staff 4.51 2% 1% 14% 25% 42% 16% 81 1.11 0.24AS Clients 4.60 2% 2% 12% 14% 56% 14% 43 1.09 0.33
Q92e iJournals efficiency in completing needed tasks
Mean VD D SD SS S VS Count Std. Dev. 95% CI+-All 4.71 1% 3% 5% 21% 53% 16% 73 0.99 0.23Faculty 4.80 0% 0% 0% 33% 53% 13% 15 0.68 0.34Staff 4.69 2% 3% 7% 17% 53% 17% 58 1.06 0.27AS Clients 4.95 2% 0% 9% 7% 56% 26% 57 0.99 0.26
Q92f MySQL Database efficiency in completing needed tasks
Mean VD D SD SS S VS Count Std. Dev. 95% CI+-All 5.13 0% 0% 0% 0% 88% 13% 16 0.34 0.17Faculty 5.00 0% 0% 0% 0% 100% 0% 1 - -Staff 5.13 0% 0% 0% 0% 87% 13% 15 0.35 0.18AS Clients 5.00 0% 0% 0% 0% 100% 0% 5 0.00 -
Q92g Nolij efficiency in completing needed tasks
Mean VD D SD SS S VS Count Std. Dev. 95% CI+-Staff 4.67 0% 0% 0% 44% 44% 11% 9 0.71 0.46AS Clients 4.57 0% 7% 0% 21% 71% 0% 14 0.85 0.45
Authority Manager (authority.stanford.edu) efficiency in completing needed tasks
Q91q Web Authentication ease of use
Mean VD D SD SS S VS Count Std. Dev. 95% CI+-All 4.71 2% 2% 7% 18% 56% 16% 231 1.00 0.13Faculty 4.49 3% 4% 9% 23% 49% 13% 70 1.14 0.27Staff 4.80 1% 1% 6% 16% 59% 17% 161 0.92 0.14AS Clients 5.07 0% 1% 3% 15% 49% 32% 98 0.83 0.16
Q91r Web Virtual Host ease of use
Mean VD D SD SS S VS Count Std. Dev. 95% CI+-All 5.21 0% 0% 5% 5% 53% 37% 19 0.79 0.35Faculty 6.00 0% 0% 0% 0% 0% 100% 1 - -Staff 5.17 0% 0% 6% 6% 56% 33% 18 0.79 0.36AS Clients 5.15 0% 0% 8% 0% 62% 31% 13 0.80 0.44
Q91s Workgroup Manager (workgroup.stanford.edu) ease of use
Mean VD D SD SS S VS Count Std. Dev. 95% CI+-All 4.78 0% 3% 6% 22% 47% 22% 32 0.97 0.34Faculty 3.50 0% 50% 0% 0% 50% 0% 2 2.12 2.94Staff 4.87 0% 0% 7% 23% 47% 23% 30 0.86 0.31AS Clients 4.85 0% 3% 8% 15% 51% 23% 39 0.96 0.30
Q91t WWW/AFS Hosting ease of use
Mean VD D SD SS S VS Count Std. Dev. 95% CI+-All 4.65 0% 4% 8% 27% 42% 19% 26 1.02 0.39Faculty 4.67 0% 0% 0% 44% 44% 11% 9 0.71 0.46Staff 4.65 0% 6% 12% 18% 41% 24% 17 1.17 0.56AS Clients 4.71 0% 6% 12% 12% 47% 24% 17 1.16 0.55
Q92a Accounts (accounts.stanford.edu) efficiency in completing needed tasks
Mean VD D SD SS S VS Count Std. Dev. 95% CI+-All 4.99 0% 1% 3% 9% 69% 17% 149 0.68 0.11Faculty 4.77 0% 0% 9% 17% 63% 11% 35 0.77 0.26Staff 5.06 0% 1% 2% 7% 71% 19% 114 0.64 0.12AS Clients 5.13 0% 0% 2% 11% 60% 27% 62 0.66 0.17

82 | Administrative Systems • Stanford University IT 2015 Client Satisfaction Survey
MOR Associates, Inc.
Q92b
Mean VD D SD SS S VS Count Std. Dev. 95% CI+-All 4.78 3% 0% 6% 17% 56% 18% 77 1.00 0.22Faculty 4.75 0% 0% 0% 50% 25% 25% 4 0.96 0.94Staff 4.78 3% 0% 7% 15% 58% 18% 73 1.00 0.23AS Clients 4.72 3% 3% 10% 10% 54% 21% 72 1.15 0.27
Q92c Axess efficiency in completing needed tasks
Mean VD D SD SS S VS Count Std. Dev. 95% CI+-All 4.86 2% 2% 4% 17% 52% 24% 458 1.01 0.09Faculty 4.58 4% 4% 5% 24% 44% 19% 133 1.19 0.20Staff 4.97 1% 1% 4% 14% 54% 26% 325 0.91 0.10AS Clients 4.90 1% 3% 7% 11% 52% 27% 135 1.01 0.17
Q92d Expense Requests efficiency in completing needed tasks
Mean VD D SD SS S VS Count Std. Dev. 95% CI+-All 4.44 3% 1% 14% 26% 41% 15% 86 1.15 0.24Faculty 3.40 20% 0% 20% 40% 20% 0% 5 1.52 1.33Staff 4.51 2% 1% 14% 25% 42% 16% 81 1.11 0.24AS Clients 4.60 2% 2% 12% 14% 56% 14% 43 1.09 0.33
Q92e iJournals efficiency in completing needed tasks
Mean VD D SD SS S VS Count Std. Dev. 95% CI+-All 4.71 1% 3% 5% 21% 53% 16% 73 0.99 0.23Faculty 4.80 0% 0% 0% 33% 53% 13% 15 0.68 0.34Staff 4.69 2% 3% 7% 17% 53% 17% 58 1.06 0.27AS Clients 4.95 2% 0% 9% 7% 56% 26% 57 0.99 0.26
Q92f MySQL Database efficiency in completing needed tasks
Mean VD D SD SS S VS Count Std. Dev. 95% CI+-All 5.13 0% 0% 0% 0% 88% 13% 16 0.34 0.17Faculty 5.00 0% 0% 0% 0% 100% 0% 1 - -Staff 5.13 0% 0% 0% 0% 87% 13% 15 0.35 0.18AS Clients 5.00 0% 0% 0% 0% 100% 0% 5 0.00 -
Q92g Nolij efficiency in completing needed tasks
Mean VD D SD SS S VS Count Std. Dev. 95% CI+-Staff 4.67 0% 0% 0% 44% 44% 11% 9 0.71 0.46AS Clients 4.57 0% 7% 0% 21% 71% 0% 14 0.85 0.45
Authority Manager (authority.stanford.edu) efficiency in completing needed tasks
Q92h PeopleSoft efficiency in completing needed tasks
Mean VD D SD SS S VS Count Std. Dev. 95% CI+-All 4.63 0% 0% 13% 24% 50% 13% 46 0.88 0.25Faculty 4.60 0% 0% 20% 20% 40% 20% 5 1.14 1.00Staff 4.63 0% 0% 12% 24% 51% 12% 41 0.86 0.26AS Clients 4.18 8% 8% 18% 8% 48% 13% 40 1.47 0.45
Q92i OrderIT efficiency in completing needed tasks
Mean VD D SD SS S VS Count Std. Dev. 95% CI+-All 4.39 11% 0% 11% 22% 28% 28% 18 1.58 0.73Faculty 2.00 67% 0% 0% 33% 0% 0% 3 1.73 1.96Staff 4.87 0% 0% 13% 20% 33% 33% 15 1.06 0.54AS Clients 4.05 5% 15% 10% 25% 30% 15% 20 1.47 0.64
Q92j Secure Portal efficiency in completing needed tasks
Mean VD D SD SS S VS Count Std. Dev. 95% CI+-All 4.86 0% 4% 5% 18% 49% 25% 57 0.97 0.25Faculty 5.00 0% 0% 12% 12% 41% 35% 17 1.00 0.48Staff 4.80 0% 5% 3% 20% 53% 20% 40 0.97 0.30AS Clients 5.18 0% 0% 0% 12% 59% 29% 17 0.64 0.30
Q92k
Mean VD D SD SS S VS Count Std. Dev. 95% CI+-All 4.31 4% 5% 13% 27% 36% 15% 124 1.24 0.22Faculty 4.30 2% 6% 11% 34% 34% 13% 83 1.17 0.25Staff 4.32 7% 2% 17% 15% 41% 17% 41 1.40 0.43AS Clients 4.31 2% 12% 14% 16% 39% 18% 51 1.35 0.37
Q92l Shared Facilities efficiency in completing needed tasks
Mean VD D SD SS S VS Count Std. Dev. 95% CI+-All 4.75 0% 6% 6% 19% 44% 25% 16 1.13 0.55Faculty 4.25 0% 0% 25% 25% 50% 0% 4 0.96 0.94Staff 4.92 0% 8% 0% 17% 42% 33% 12 1.16 0.66AS Clients 4.00 0% 0% 0% 100% 0% 0% 2 0.00 -
SeRA (Stanford electronic Research Administration) efficiency in completing needed tasks

Stanford University IT 2015 Client Satisfaction Survey • Administrative Systems | 83
MOR Associates, Inc.
Q92h PeopleSoft efficiency in completing needed tasks
Mean VD D SD SS S VS Count Std. Dev. 95% CI+-All 4.63 0% 0% 13% 24% 50% 13% 46 0.88 0.25Faculty 4.60 0% 0% 20% 20% 40% 20% 5 1.14 1.00Staff 4.63 0% 0% 12% 24% 51% 12% 41 0.86 0.26AS Clients 4.18 8% 8% 18% 8% 48% 13% 40 1.47 0.45
Q92i OrderIT efficiency in completing needed tasks
Mean VD D SD SS S VS Count Std. Dev. 95% CI+-All 4.39 11% 0% 11% 22% 28% 28% 18 1.58 0.73Faculty 2.00 67% 0% 0% 33% 0% 0% 3 1.73 1.96Staff 4.87 0% 0% 13% 20% 33% 33% 15 1.06 0.54AS Clients 4.05 5% 15% 10% 25% 30% 15% 20 1.47 0.64
Q92j Secure Portal efficiency in completing needed tasks
Mean VD D SD SS S VS Count Std. Dev. 95% CI+-All 4.86 0% 4% 5% 18% 49% 25% 57 0.97 0.25Faculty 5.00 0% 0% 12% 12% 41% 35% 17 1.00 0.48Staff 4.80 0% 5% 3% 20% 53% 20% 40 0.97 0.30AS Clients 5.18 0% 0% 0% 12% 59% 29% 17 0.64 0.30
Q92k
Mean VD D SD SS S VS Count Std. Dev. 95% CI+-All 4.31 4% 5% 13% 27% 36% 15% 124 1.24 0.22Faculty 4.30 2% 6% 11% 34% 34% 13% 83 1.17 0.25Staff 4.32 7% 2% 17% 15% 41% 17% 41 1.40 0.43AS Clients 4.31 2% 12% 14% 16% 39% 18% 51 1.35 0.37
Q92l Shared Facilities efficiency in completing needed tasks
Mean VD D SD SS S VS Count Std. Dev. 95% CI+-All 4.75 0% 6% 6% 19% 44% 25% 16 1.13 0.55Faculty 4.25 0% 0% 25% 25% 50% 0% 4 0.96 0.94Staff 4.92 0% 8% 0% 17% 42% 33% 12 1.16 0.66AS Clients 4.00 0% 0% 0% 100% 0% 0% 2 0.00 -
SeRA (Stanford electronic Research Administration) efficiency in completing needed tasks
Q92m
Mean VD D SD SS S VS Count Std. Dev. 95% CI+-All 5.02 0% 0% 2% 21% 48% 29% 42 0.78 0.24Faculty 4.71 0% 0% 0% 29% 71% 0% 7 0.49 0.36Staff 5.09 0% 0% 3% 20% 43% 34% 35 0.82 0.27AS Clients 4.74 0% 6% 6% 11% 63% 14% 35 0.98 0.32
Q92n SSL Certificate Services efficiency in completing needed tasks
Mean VD D SD SS S VS Count Std. Dev. 95% CI+-All 4.90 0% 3% 0% 20% 57% 20% 30 0.84 0.30Faculty 4.92 0% 0% 0% 31% 46% 23% 13 0.76 0.41Staff 4.88 0% 6% 0% 12% 65% 18% 17 0.93 0.44AS Clients 5.00 0% 0% 11% 5% 58% 26% 19 0.88 0.40
Q92o StanfordYou (stanfordyou.stanford.edu) efficiency in completing needed tasks
Mean VD D SD SS S VS Count Std. Dev. 95% CI+-All 5.07 1% 0% 1% 14% 59% 26% 303 0.74 0.08Faculty 4.91 0% 0% 3% 25% 51% 22% 79 0.75 0.17Staff 5.13 1% 0% 1% 9% 62% 27% 224 0.73 0.10AS Clients 5.14 0% 1% 2% 11% 56% 31% 124 0.74 0.13
Q92p SUPAD efficiency in completing needed tasks
Mean VD D SD SS S VS Count Std. Dev. 95% CI+-All 5.10 0% 0% 5% 19% 38% 38% 21 0.89 0.38Faculty 5.00 0% 0% 0% 0% 100% 0% 1 - -Staff 5.10 0% 0% 5% 20% 35% 40% 20 0.91 0.40AS Clients 5.18 0% 0% 0% 9% 64% 27% 22 0.59 0.25
Q92q Web Authentication efficiency in completing needed tasks
Mean VD D SD SS S VS Count Std. Dev. 95% CI+-All 4.70 2% 3% 7% 17% 56% 16% 227 1.02 0.13Faculty 4.40 3% 7% 9% 19% 49% 12% 67 1.22 0.29Staff 4.83 1% 1% 6% 16% 58% 18% 160 0.91 0.14AS Clients 5.17 1% 0% 1% 11% 52% 35% 98 0.80 0.16
Sponsorship Manager (sponsorship.stanford.edu) efficiency in completing needed tasks

84 | Administrative Systems • Stanford University IT 2015 Client Satisfaction Survey
MOR Associates, Inc.
Q92m
Mean VD D SD SS S VS Count Std. Dev. 95% CI+-All 5.02 0% 0% 2% 21% 48% 29% 42 0.78 0.24Faculty 4.71 0% 0% 0% 29% 71% 0% 7 0.49 0.36Staff 5.09 0% 0% 3% 20% 43% 34% 35 0.82 0.27AS Clients 4.74 0% 6% 6% 11% 63% 14% 35 0.98 0.32
Q92n SSL Certificate Services efficiency in completing needed tasks
Mean VD D SD SS S VS Count Std. Dev. 95% CI+-All 4.90 0% 3% 0% 20% 57% 20% 30 0.84 0.30Faculty 4.92 0% 0% 0% 31% 46% 23% 13 0.76 0.41Staff 4.88 0% 6% 0% 12% 65% 18% 17 0.93 0.44AS Clients 5.00 0% 0% 11% 5% 58% 26% 19 0.88 0.40
Q92o StanfordYou (stanfordyou.stanford.edu) efficiency in completing needed tasks
Mean VD D SD SS S VS Count Std. Dev. 95% CI+-All 5.07 1% 0% 1% 14% 59% 26% 303 0.74 0.08Faculty 4.91 0% 0% 3% 25% 51% 22% 79 0.75 0.17Staff 5.13 1% 0% 1% 9% 62% 27% 224 0.73 0.10AS Clients 5.14 0% 1% 2% 11% 56% 31% 124 0.74 0.13
Q92p SUPAD efficiency in completing needed tasks
Mean VD D SD SS S VS Count Std. Dev. 95% CI+-All 5.10 0% 0% 5% 19% 38% 38% 21 0.89 0.38Faculty 5.00 0% 0% 0% 0% 100% 0% 1 - -Staff 5.10 0% 0% 5% 20% 35% 40% 20 0.91 0.40AS Clients 5.18 0% 0% 0% 9% 64% 27% 22 0.59 0.25
Q92q Web Authentication efficiency in completing needed tasks
Mean VD D SD SS S VS Count Std. Dev. 95% CI+-All 4.70 2% 3% 7% 17% 56% 16% 227 1.02 0.13Faculty 4.40 3% 7% 9% 19% 49% 12% 67 1.22 0.29Staff 4.83 1% 1% 6% 16% 58% 18% 160 0.91 0.14AS Clients 5.17 1% 0% 1% 11% 52% 35% 98 0.80 0.16
Sponsorship Manager (sponsorship.stanford.edu) efficiency in completing needed tasks
Q92r Web Virtual Host efficiency in completing needed tasks
Mean VD D SD SS S VS Count Std. Dev. 95% CI+-All 5.05 0% 0% 5% 11% 58% 26% 19 0.78 0.35Faculty 5.00 0% 0% 0% 0% 100% 0% 1 - -Staff 5.06 0% 0% 6% 11% 56% 28% 18 0.80 0.37AS Clients 5.15 0% 0% 8% 8% 46% 38% 13 0.90 0.49
Q92s
Mean VD D SD SS S VS Count Std. Dev. 95% CI+-All 4.90 0% 3% 3% 16% 55% 23% 31 0.91 0.32Faculty 2.00 0% 100% 0% 0% 0% 0% 1 - -Staff 5.00 0% 0% 3% 17% 57% 23% 30 0.74 0.27AS Clients 4.84 0% 5% 8% 14% 43% 30% 37 1.12 0.36
Q92t WWW/AFS Hosting efficiency in completing needed tasks
Mean VD D SD SS S VS Count Std. Dev. 95% CI+-All 4.73 0% 4% 12% 12% 54% 19% 26 1.04 0.40Faculty 4.63 0% 0% 13% 25% 50% 13% 8 0.92 0.63Staff 4.78 0% 6% 11% 6% 56% 22% 18 1.11 0.51AS Clients 4.56 0% 0% 19% 31% 25% 25% 16 1.09 0.54
Workgroup Manager (workgroup.stanford.edu) efficiency in completing needed tasks
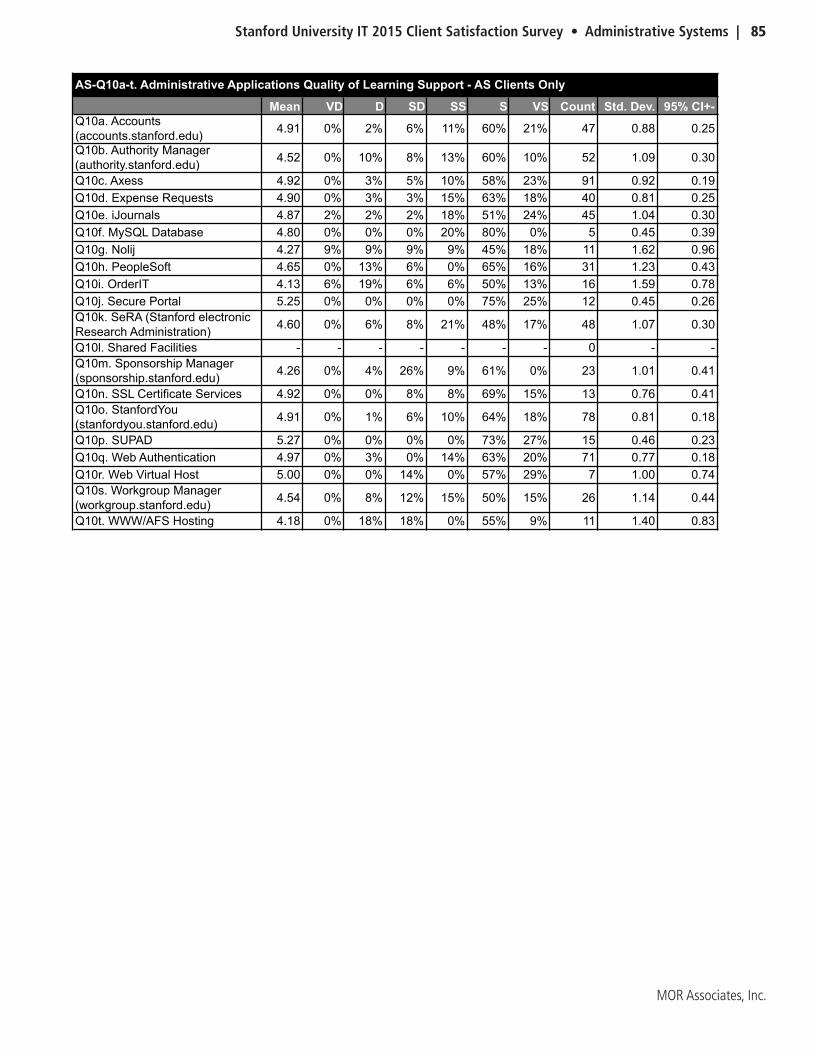
Stanford University IT 2015 Client Satisfaction Survey • Administrative Systems | 85
MOR Associates, Inc.
AS-Q10a-t. Administrative Applications Quality of Learning Support - AS Clients Only
Mean VD D SD SS S VS Count Std. Dev. 95% CI+-Q10a. Accounts (accounts.stanford.edu) 4.91 0% 2% 6% 11% 60% 21% 47 0.88 0.25
Q10b. Authority Manager (authority.stanford.edu) 4.52 0% 10% 8% 13% 60% 10% 52 1.09 0.30
Q10c. Axess 4.92 0% 3% 5% 10% 58% 23% 91 0.92 0.19Q10d. Expense Requests 4.90 0% 3% 3% 15% 63% 18% 40 0.81 0.25Q10e. iJournals 4.87 2% 2% 2% 18% 51% 24% 45 1.04 0.30Q10f. MySQL Database 4.80 0% 0% 0% 20% 80% 0% 5 0.45 0.39Q10g. Nolij 4.27 9% 9% 9% 9% 45% 18% 11 1.62 0.96Q10h. PeopleSoft 4.65 0% 13% 6% 0% 65% 16% 31 1.23 0.43Q10i. OrderIT 4.13 6% 19% 6% 6% 50% 13% 16 1.59 0.78Q10j. Secure Portal 5.25 0% 0% 0% 0% 75% 25% 12 0.45 0.26Q10k. SeRA (Stanford electronic Research Administration) 4.60 0% 6% 8% 21% 48% 17% 48 1.07 0.30
Q10l. Shared Facilities - - - - - - - 0 - -Q10m. Sponsorship Manager (sponsorship.stanford.edu) 4.26 0% 4% 26% 9% 61% 0% 23 1.01 0.41
Q10n. SSL Certificate Services 4.92 0% 0% 8% 8% 69% 15% 13 0.76 0.41Q10o. StanfordYou (stanfordyou.stanford.edu) 4.91 0% 1% 6% 10% 64% 18% 78 0.81 0.18
Q10p. SUPAD 5.27 0% 0% 0% 0% 73% 27% 15 0.46 0.23Q10q. Web Authentication 4.97 0% 3% 0% 14% 63% 20% 71 0.77 0.18Q10r. Web Virtual Host 5.00 0% 0% 14% 0% 57% 29% 7 1.00 0.74Q10s. Workgroup Manager (workgroup.stanford.edu) 4.54 0% 8% 12% 15% 50% 15% 26 1.14 0.44
Q10t. WWW/AFS Hosting 4.18 0% 18% 18% 0% 55% 9% 11 1.40 0.83

86 | Administrative Systems • Stanford University IT 2015 Client Satisfaction Survey
MOR Associates, Inc.
AS-Q11a-t. Administrative Applications Quality of Troubleshooting Support - AS Clients Only
Mean VD D SD SS S VS Count Std. Dev. 95% CI+-AS-Q11a. Accounts (accounts.stanford.edu) 4.86 0% 4% 4% 14% 61% 18% 28 0.89 0.33
AS-Q11b. Authority Manager (authority.stanford.edu) 4.80 0% 9% 3% 14% 49% 26% 35 1.13 0.38
AS-Q11c. Axess 4.96 1% 1% 7% 7% 54% 28% 68 1.01 0.24AS-Q11d. Expense ReAS-Quests 4.83 3% 0% 10% 7% 55% 24% 29 1.14 0.41AS-Q11e. iJournals 5.12 3% 0% 0% 9% 55% 33% 33 0.96 0.33AS-Q11f. MySAS-QL Database 4.67 0% 0% 0% 33% 67% 0% 3 0.58 0.65AS-Q11g. Nolij 4.57 0% 14% 14% 0% 43% 29% 7 1.51 1.12AS-Q11h. PeopleSoft 4.25 6% 13% 9% 13% 41% 19% 32 1.52 0.53AS-Q11i. OrderIT 4.00 7% 21% 7% 7% 43% 14% 14 1.66 0.87AS-Q11j. Secure Portal 5.00 0% 0% 0% 22% 56% 22% 9 0.71 0.46AS-Q11k. SeRA (Stanford electronic 4.88 0% 5% 5% 18% 43% 30% 40 1.07 0.33
AS-Q11l. Shared Facilities - - - - - - - 0 - -AS-Q11m. Sponsorship Manager (sponsorship.stanford.edu) 4.33 8% 8% 0% 17% 58% 8% 12 1.44 0.81
AS-Q11n. SSL Certificate Services 5.10 0% 0% 0% 10% 70% 20% 10 0.57 0.35AS-Q11o. StanfordYou (stanfordyou.stanford.edu) 5.10 2% 0% 0% 8% 65% 25% 51 0.81 0.22
AS-Q11p. SUPAD 5.29 0% 0% 0% 7% 57% 36% 14 0.61 0.32AS-Q11AS-Q. Web Authentication 5.16 0% 0% 0% 12% 59% 29% 49 0.62 0.17AS-Q11r. Web Virtual Host 5.40 0% 0% 0% 0% 60% 40% 5 0.55 0.48AS-Q11s. Workgroup Manager (workgroup.stanford.edu) 4.81 0% 13% 0% 13% 44% 31% 16 1.28 0.63
AS-Q11t. WWW/AFS Hosting 4.00 0% 20% 20% 20% 20% 20% 5 1.58 1.39

Stanford University IT 2015 Client Satisfaction Survey • Administrative Systems | 87
MOR Associates, Inc.
Mean VD D SD SS S VS Count Std. Dev. 95% CI+-AS-Q12a. Accounts (accounts.stanford.edu) 4.70 4% 4% 4% 11% 63% 15% 27 1.14 0.43
AS-Q12b. Authority Manager (authority.stanford.edu) 4.46 0% 21% 4% 4% 50% 21% 28 1.45 0.54
AS-Q12c. Axess 4.66 2% 5% 8% 16% 49% 20% 61 1.14 0.29AS-Q12d. Expense ReAS-Quests 4.87 0% 4% 4% 9% 65% 17% 23 0.92 0.38AS-Q12e. iJournals 5.13 0% 0% 0% 13% 63% 25% 24 0.61 0.24AS-Q12f. MySAS-QL Database 5.00 0% 0% 0% 0% 100% 0% 2 0.00 -AS-Q12g. Nolij 4.29 14% 0% 14% 0% 57% 14% 7 1.70 1.26AS-Q12h. PeopleSoft 4.19 11% 4% 11% 15% 48% 11% 27 1.49 0.56AS-Q12i. OrderIT 3.92 0% 38% 0% 0% 54% 8% 13 1.61 0.87AS-Q12j. Secure Portal 5.00 0% 0% 0% 13% 75% 13% 8 0.53 0.37AS-Q12k. SeRA (Stanford electronic 4.08 5% 16% 3% 30% 32% 14% 37 1.44 0.46
AS-Q12l. Shared Facilities - - - - - - - 0 - -AS-Q12m. Sponsorship Manager (sponsorship.stanford.edu) 4.09 9% 18% 0% 0% 73% 0% 11 1.58 0.93
AS-Q12n. SSL Certificate Services 4.67 0% 11% 11% 0% 56% 22% 9 1.32 0.86AS-Q12o. StanfordYou (stanfordyou.stanford.edu) 4.93 2% 2% 0% 7% 71% 17% 42 0.92 0.28
AS-Q12p. SUPAD 5.09 0% 0% 0% 0% 91% 9% 11 0.30 0.18AS-Q12AS-Q. Web Authentication 4.89 0% 3% 0% 20% 60% 17% 35 0.80 0.26AS-Q12r. Web Virtual Host 5.25 0% 0% 0% 0% 75% 25% 4 0.50 0.49AS-Q12s. Workgroup Manager (workgroup.stanford.edu) 3.92 8% 25% 8% 0% 42% 17% 12 1.78 1.01
AS-Q12t. WWW/AFS Hosting 3.50 25% 25% 0% 0% 25% 25% 4 2.38 2.33
AS-Q12a-t. Administrative Systems Applications Responsiveness to Improvement ReAS-Quests- AS Clients Only
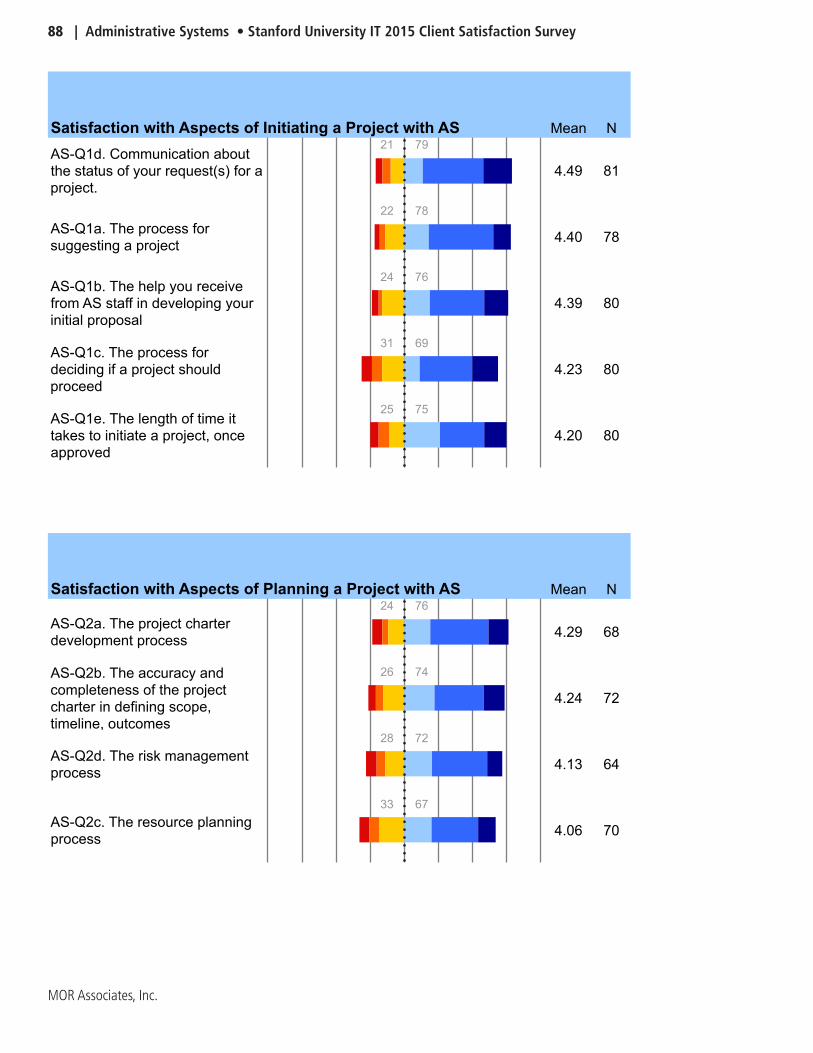
88 | Administrative Systems • Stanford University IT 2015 Client Satisfaction Survey
MOR Associates, Inc.
Mean N
AS-Q1d. Communication about the status of your request(s) for a project.
21 79
4.49 81
AS-Q1a. The process for suggesting a project
22 78
4.40 78
AS-Q1b. The help you receive from AS staff in developing your initial proposal
24 76
4.39 80
AS-Q1c. The process for deciding if a project should proceed
31 69
4.23 80
AS-Q1e. The length of time it takes to initiate a project, once approved
25 75
4.20 80
Mean N
AS-Q2a. The project charter development process
24 76
4.29 68
AS-Q2b. The accuracy and completeness of the project charter in defining scope, timeline, outcomes
26 74
4.24 72
AS-Q2d. The risk management process
28 72
4.13 64
AS-Q2c. The resource planning process
33 67
4.06 70
Satisfaction with Aspects of Initiating a Project with AS
Satisfaction with Aspects of Planning a Project with AS
Mean N
AS-Q1d. Communication about the status of your request(s) for a project.
21 79
4.49 81
AS-Q1a. The process for suggesting a project
22 78
4.40 78
AS-Q1b. The help you receive from AS staff in developing your initial proposal
24 76
4.39 80
AS-Q1c. The process for deciding if a project should proceed
31 69
4.23 80
AS-Q1e. The length of time it takes to initiate a project, once approved
25 75
4.20 80
Mean N
AS-Q2a. The project charter development process
24 76
4.29 68
AS-Q2b. The accuracy and completeness of the project charter in defining scope, timeline, outcomes
26 74
4.24 72
AS-Q2d. The risk management process
28 72
4.13 64
AS-Q2c. The resource planning process
33 67
4.06 70
Satisfaction with Aspects of Initiating a Project with AS
Satisfaction with Aspects of Planning a Project with AS
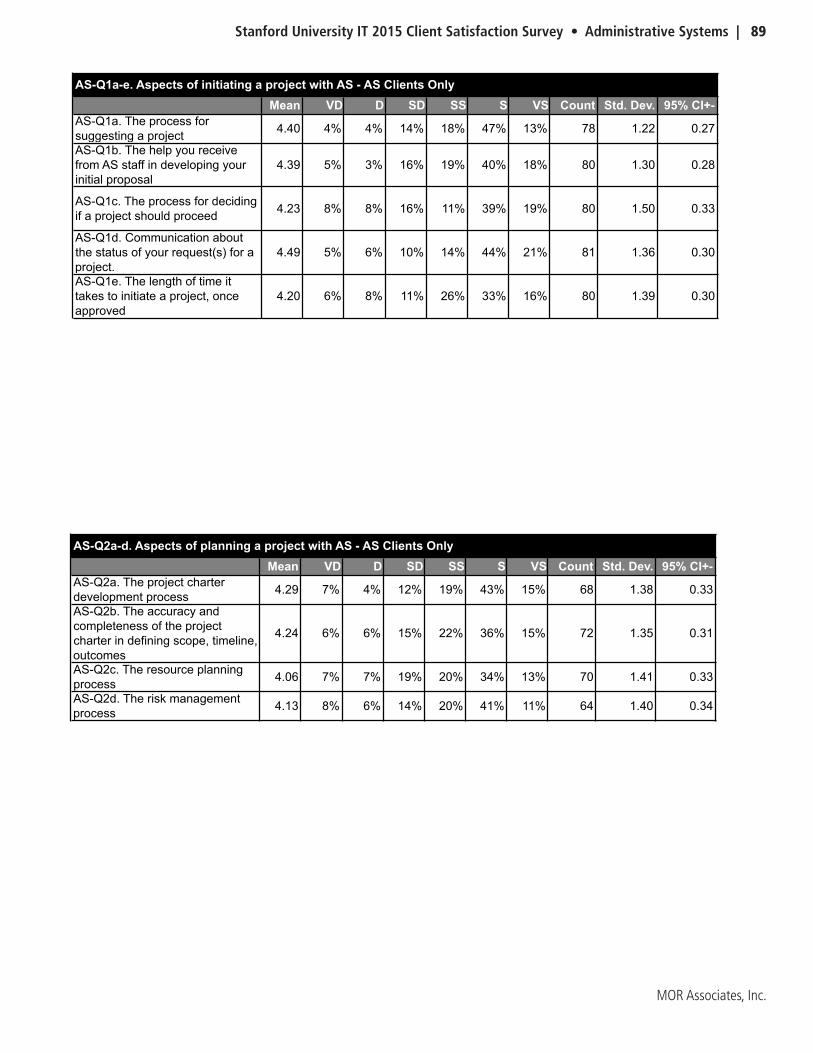
Stanford University IT 2015 Client Satisfaction Survey • Administrative Systems | 89
MOR Associates, Inc.
AS-Q1a-e. Aspects of initiating a project with AS - AS Clients OnlyMean VD D SD SS S VS Count Std. Dev. 95% CI+-
AS-Q1a. The process for suggesting a project 4.40 4% 4% 14% 18% 47% 13% 78 1.22 0.27
AS-Q1b. The help you receive from AS staff in developing your initial proposal
4.39 5% 3% 16% 19% 40% 18% 80 1.30 0.28
AS-Q1c. The process for deciding if a project should proceed 4.23 8% 8% 16% 11% 39% 19% 80 1.50 0.33
AS-Q1d. Communication about the status of your request(s) for a project.
4.49 5% 6% 10% 14% 44% 21% 81 1.36 0.30
AS-Q1e. The length of time it takes to initiate a project, once approved
4.20 6% 8% 11% 26% 33% 16% 80 1.39 0.30
AS-Q2a-d. Aspects of planning a project with AS - AS Clients OnlyMean VD D SD SS S VS Count Std. Dev. 95% CI+-
AS-Q2a. The project charter development process 4.29 7% 4% 12% 19% 43% 15% 68 1.38 0.33
AS-Q2b. The accuracy and completeness of the project charter in defining scope, timeline, outcomes
4.24 6% 6% 15% 22% 36% 15% 72 1.35 0.31
AS-Q2c. The resource planning process 4.06 7% 7% 19% 20% 34% 13% 70 1.41 0.33
AS-Q2d. The risk management process 4.13 8% 6% 14% 20% 41% 11% 64 1.40 0.34

90 | Administrative Systems • Stanford University IT 2015 Client Satisfaction Survey
MOR Associates, Inc.
Mean N
AS-Q3b. The right people are assigned to the right tasks
13 87
4.64 89
AS-Q3a. Meetings are efficient and productive
15 85
4.61 93
AS-Q3f. The tools AS uses to monitor and communicate about the project are effective
18 82
4.43 92
AS-Q3e. Steady progress is maintained until the project is done
20 80
4.42 96
AS-Q3g. Stakeholders' input is sought and incorporated when appropriate
22 78
4.41 93
AS-Q3d. You are appropriately informed at all times
22 78
4.38 98
AS-Q3c. Problems are quickly identified and addressed
23 77
4.32 100
AS-Q3h. The length of time it took to complete the project(s), once approved
31 69
4.10 90
Satisfaction with Aspects of Executing a Project with AS

Stanford University IT 2015 Client Satisfaction Survey • Administrative Systems | 91
MOR Associates, Inc.
AS-Q3a-h. Aspects of executing a project with AS - AS Clients OnlyMean VD D SD SS S VS Count Std. Dev. 95% CI+-
AS-Q3a. Meetings are efficient and productive 4.61 2% 2% 11% 17% 53% 15% 93 1.07 0.22
AS-Q3b. The right people are assigned to the right tasks 4.64 2% 6% 6% 17% 52% 18% 89 1.15 0.24
AS-Q3c. Problems are quickly identified and addressed 4.32 6% 5% 12% 21% 40% 16% 100 1.35 0.26
AS-Q3d. You are appropriately informed at all times 4.38 3% 7% 12% 22% 37% 18% 98 1.29 0.26
AS-Q3e. Steady progress is maintained until the project is done
4.42 2% 9% 8% 24% 38% 19% 96 1.27 0.25
AS-Q3f. The tools AS uses to monitor and communicate about the project are effective
4.43 3% 5% 10% 22% 46% 14% 92 1.21 0.25
AS-Q3g. Stakeholders' input is sought and incorporated when appropriate
4.41 3% 6% 12% 20% 41% 17% 93 1.27 0.26
AS-Q3h. The length of time it took to complete the project(s), once approved
4.10 2% 14% 14% 21% 36% 12% 90 1.33 0.28
AS-Q4a-d. Aspects of the service solutions AS delivers - AS Clients OnlyMean VD D SD SS S VS Count Std. Dev. 95% CI+-
AS-Q4a. The fit of the solution(s) to end user needs 4.30 3% 8% 14% 23% 37% 16% 103 1.27 0.25
AS-Q4b. Ease of use for the end users 4.17 5% 7% 18% 20% 36% 14% 103 1.34 0.26
AS-Q4c. How efficiently end users can complete needed tasks 4.22 6% 6% 15% 21% 40% 13% 102 1.34 0.26
AS-Q4d. How closely the solution(s) match up with signed off requirements
4.29 3% 5% 17% 23% 36% 15% 94 1.25 0.25
AS-Q5a-c. Aspects of the support AS provides for the projects it delivers - AS Clients OnlyMean VD D SD SS S VS Count Std. Dev. 95% CI+-
AS-Q5a. Quality of troubleshooting support provided 4.49 4% 4% 11% 27% 33% 22% 113 1.25 0.23
AS-Q5b. Reliability and stability of solutions 4.41 4% 4% 13% 20% 44% 15% 114 1.23 0.22
AS-Q5c. AS' responsiveness to improvement requests 4.09 5% 11% 17% 19% 30% 17% 110 1.45 0.27
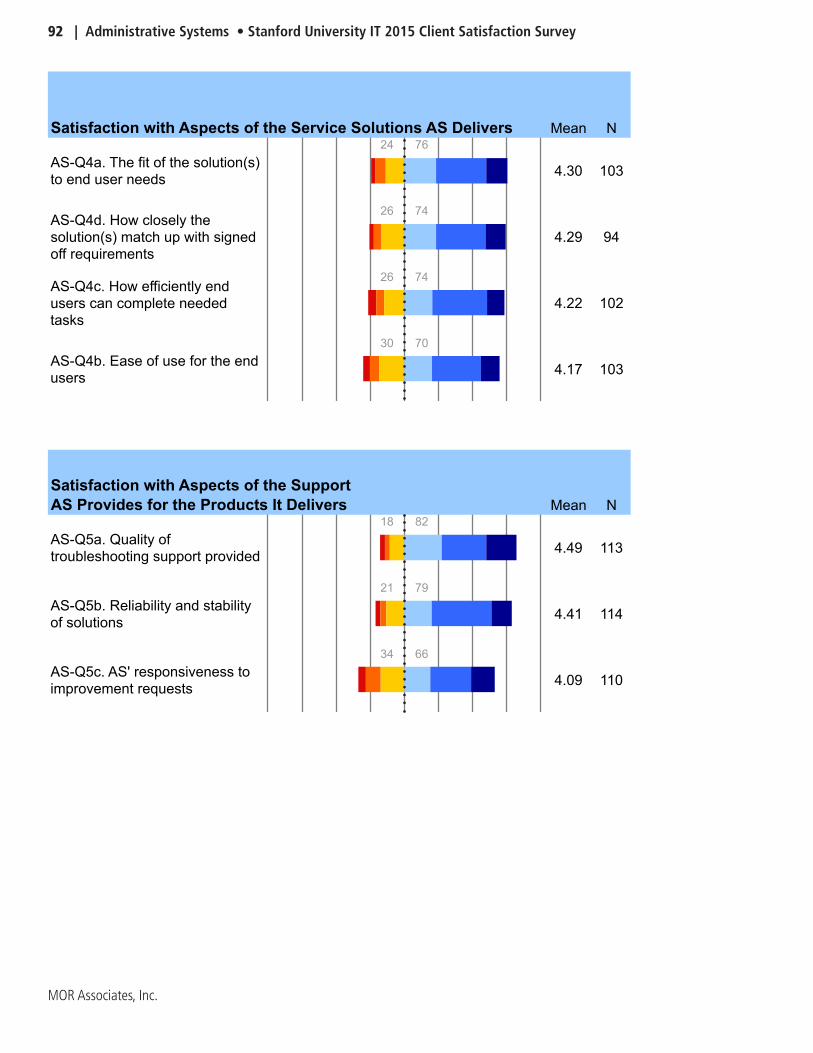
92 | Administrative Systems • Stanford University IT 2015 Client Satisfaction Survey
MOR Associates, Inc.
Mean N
AS-Q4a. The fit of the solution(s) to end user needs
24 76
4.30 103
AS-Q4d. How closely the solution(s) match up with signed off requirements
26 74
4.29 94
AS-Q4c. How efficiently end users can complete needed tasks
26 74
4.22 102
AS-Q4b. Ease of use for the end users
30 70
4.17 103
Mean N
AS-Q5a. Quality of troubleshooting support provided
18 82
4.49 113
AS-Q5b. Reliability and stability of solutions
21 79
4.41 114
AS-Q5c. AS' responsiveness to improvement requests
34 66
4.09 110
Satisfaction with Aspects of the Service Solutions AS Delivers
Satisfaction with Aspects of the Support AS Provides for the Products It Delivers
Mean N
AS-Q4a. The fit of the solution(s) to end user needs
24 76
4.30 103
AS-Q4d. How closely the solution(s) match up with signed off requirements
26 74
4.29 94
AS-Q4c. How efficiently end users can complete needed tasks
26 74
4.22 102
AS-Q4b. Ease of use for the end users
30 70
4.17 103
Mean N
AS-Q5a. Quality of troubleshooting support provided
18 82
4.49 113
AS-Q5b. Reliability and stability of solutions
21 79
4.41 114
AS-Q5c. AS' responsiveness to improvement requests
34 66
4.09 110
Satisfaction with Aspects of the Service Solutions AS Delivers
Satisfaction with Aspects of the Support AS Provides for the Products It Delivers
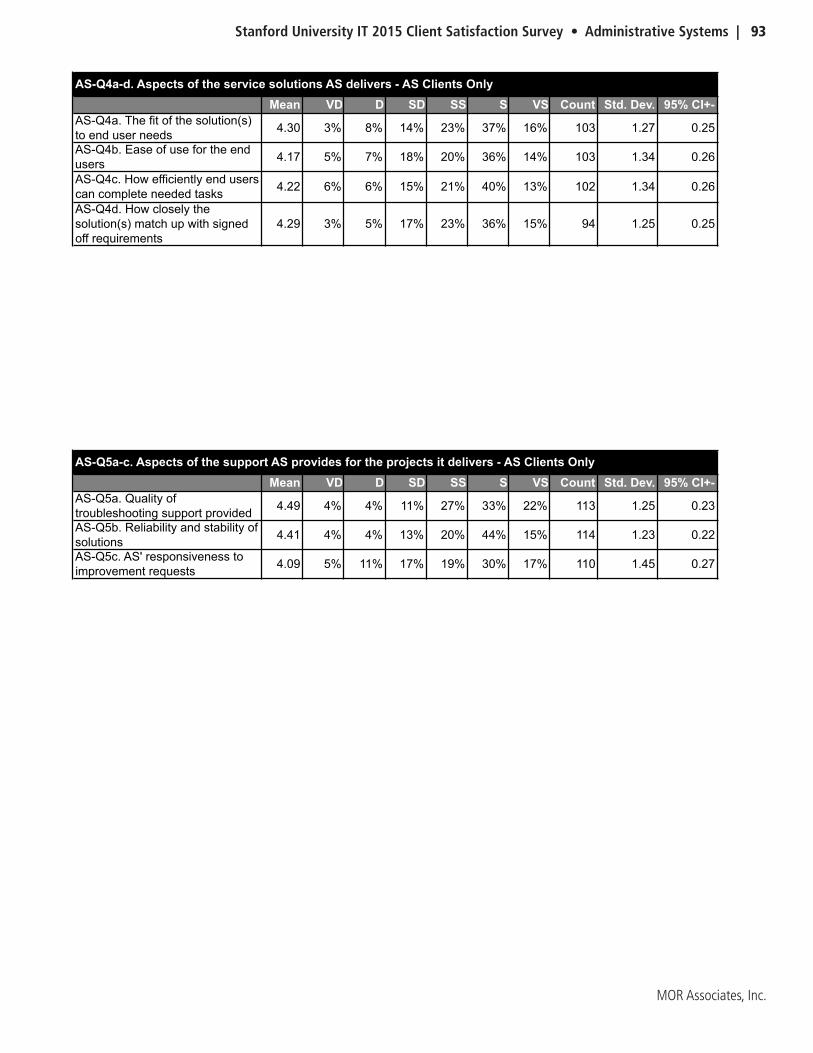
Stanford University IT 2015 Client Satisfaction Survey • Administrative Systems | 93
MOR Associates, Inc.
AS-Q3a-h. Aspects of executing a project with AS - AS Clients OnlyMean VD D SD SS S VS Count Std. Dev. 95% CI+-
AS-Q3a. Meetings are efficient and productive 4.61 2% 2% 11% 17% 53% 15% 93 1.07 0.22
AS-Q3b. The right people are assigned to the right tasks 4.64 2% 6% 6% 17% 52% 18% 89 1.15 0.24
AS-Q3c. Problems are quickly identified and addressed 4.32 6% 5% 12% 21% 40% 16% 100 1.35 0.26
AS-Q3d. You are appropriately informed at all times 4.38 3% 7% 12% 22% 37% 18% 98 1.29 0.26
AS-Q3e. Steady progress is maintained until the project is done
4.42 2% 9% 8% 24% 38% 19% 96 1.27 0.25
AS-Q3f. The tools AS uses to monitor and communicate about the project are effective
4.43 3% 5% 10% 22% 46% 14% 92 1.21 0.25
AS-Q3g. Stakeholders' input is sought and incorporated when appropriate
4.41 3% 6% 12% 20% 41% 17% 93 1.27 0.26
AS-Q3h. The length of time it took to complete the project(s), once approved
4.10 2% 14% 14% 21% 36% 12% 90 1.33 0.28
AS-Q4a-d. Aspects of the service solutions AS delivers - AS Clients OnlyMean VD D SD SS S VS Count Std. Dev. 95% CI+-
AS-Q4a. The fit of the solution(s) to end user needs 4.30 3% 8% 14% 23% 37% 16% 103 1.27 0.25
AS-Q4b. Ease of use for the end users 4.17 5% 7% 18% 20% 36% 14% 103 1.34 0.26
AS-Q4c. How efficiently end users can complete needed tasks 4.22 6% 6% 15% 21% 40% 13% 102 1.34 0.26
AS-Q4d. How closely the solution(s) match up with signed off requirements
4.29 3% 5% 17% 23% 36% 15% 94 1.25 0.25
AS-Q5a-c. Aspects of the support AS provides for the projects it delivers - AS Clients OnlyMean VD D SD SS S VS Count Std. Dev. 95% CI+-
AS-Q5a. Quality of troubleshooting support provided 4.49 4% 4% 11% 27% 33% 22% 113 1.25 0.23
AS-Q5b. Reliability and stability of solutions 4.41 4% 4% 13% 20% 44% 15% 114 1.23 0.22
AS-Q5c. AS' responsiveness to improvement requests 4.09 5% 11% 17% 19% 30% 17% 110 1.45 0.27

94 | Administrative Systems • Stanford University IT 2015 Client Satisfaction Survey
MOR Associates, Inc.
Mean N
AS-Q6e. Are responsive to requests for information or help
17 83
4.58 117
AS-Q6j. Perform quality work and create quality deliverables
16 84
4.48 113
AS-Q6c. Listen carefully and ask questions to fully understand your needs
18 82
4.43 117
AS-Q6a. Are experts on project management, the context at Stanford, and relevant technologies
21 79
4.41 105
AS-Q6g. Communicate clearly and concisely
21 79
4.39 119
AS-Q6f. Accurately represent what they will do and when they will do it.
17 83
4.38 115
AS-Q6h. Keep you informed at all times
21 79
4.34 115
AS-Q6i. Coordinate effectively with each other
25 75
4.30 105
AS-Q6b. Fully explain important concepts and issues, so you are properly equipped to provide input
23 77
4.27 115
AS-Q6d. Anticipate and address issues before they become problems
28 72
3.98 111
Satisfaction with Aspects of AS Staff

Stanford University IT 2015 Client Satisfaction Survey • Administrative Systems | 95
MOR Associates, Inc.
AS-Q6a-j. Aspects of AS staff - AS Clients OnlyMean VD D SD SS S VS Count Std. Dev. 95% CI+-
AS-Q6a. Are experts on project management, the context at Stanford, and relevant technologies
4.41 6% 5% 10% 19% 42% 18% 105 1.34 0.26
AS-Q6b. Fully explain important concepts and issues, so you are properly equipped to provide input
4.27 5% 4% 14% 25% 37% 14% 115 1.29 0.24
AS-Q6c. Listen carefully and ask questions to fully understand your needs
4.43 5% 4% 9% 24% 41% 17% 117 1.28 0.23
AS-Q6d. Anticipate and address issues before they become problems
3.98 6% 8% 14% 34% 29% 9% 111 1.30 0.24
AS-Q6e. Are responsive to requests for information or help 4.58 3% 8% 6% 16% 44% 23% 117 1.31 0.24
AS-Q6f. Accurately represent what they will do and when they will do it.
4.38 3% 4% 10% 29% 41% 13% 115 1.17 0.21
AS-Q6g. Communicate clearly and concisely 4.39 4% 4% 13% 23% 40% 16% 119 1.26 0.23
AS-Q6h. Keep you informed at all times 4.34 3% 7% 11% 26% 39% 14% 115 1.21 0.22
AS-Q6i. Coordinate effectively with each other 4.30 4% 7% 14% 19% 43% 13% 105 1.28 0.24
AS-Q6j. Perform quality work and create Quality deliverables 4.48 4% 5% 7% 23% 46% 15% 113 1.20 0.22
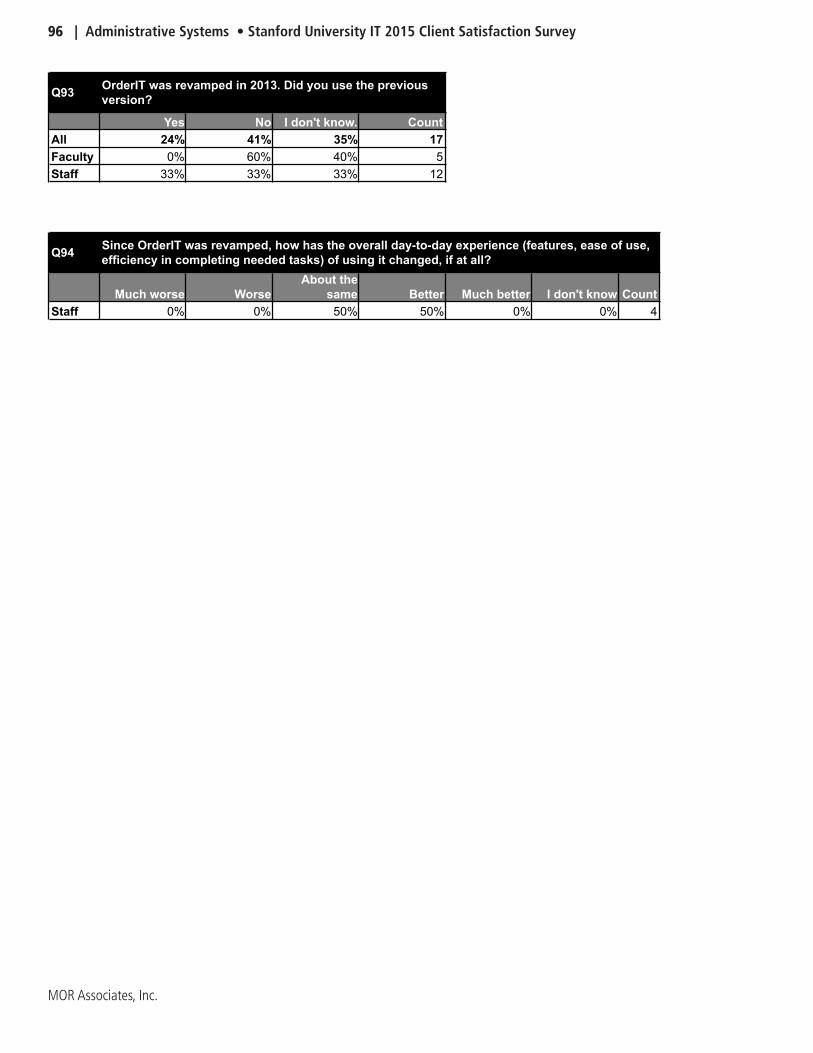
96 | Administrative Systems • Stanford University IT 2015 Client Satisfaction Survey
MOR Associates, Inc.
Q53 Do you ever use Stanford hospitals' computer networks?
Yes No I don't know. CountAll 21% 74% 5% 496Faculty 34% 60% 5% 151Staff 15% 80% 5% 345
Q68
Yes No I don't know. CountAll 71% 8% 21% 500Faculty 75% 12% 13% 153Staff 69% 6% 24% 347
Q80
Yes No I don't know. CountAll 24% 71% 5% 489Faculty 21% 74% 5% 148Staff 25% 70% 4% 341
Q93
Yes No I don't know. CountAll 24% 41% 35% 17Faculty 0% 60% 40% 5Staff 33% 33% 33% 12
Q97
Yes No CountAll 47% 53% 369Faculty 39% 61% 123Staff 51% 49% 246
Q98
Yes No CountFaculty 11% 89% 18
May research computing staff contact you to discuss your anticipated HPC and/or large data storage needs?
Are all of the computing devices you use for Stanford work backed up?
Do you use Stanford's voicemail to email service in which voicemails appear in your email inbox?
OrderIT was revamped in 2013. Did you use the previous version?
Would you like to subscribe to the University IT email newsletter?
Q94
Much worse WorseAbout the
same Better Much better I don't know CountStaff 0% 0% 50% 50% 0% 0% 4
Since OrderIT was revamped, how has the overall day-to-day experience (features, ease of use, efficiency in completing needed tasks) of using it changed, if at all?
Stanford University IT 2015 Client Satisfaction Survey • Appendix A - Full Comments | A-1
MOR Associates, Inc.
Appendix AThe Full Text of
Written Comments

A-2 | Appendix A - Full Comments • Stanford University IT 2015 Client Satisfaction Survey
MOR Associates, Inc.
Q7j. Other first, second, or third choices for getting help with technology at Stanford.
Responses to this question have been sorted by cohort and then alphabetically .
F: Having someone at GSE IT who is available for emergency phone calls, etc.
F: I prefer human contact rather than leaving a message as that creates uncertainty as to whether anyone will under-stand my problem and respond in a timely manner.
F: I would like to be able to get help during the weekends, not only during the week.
F: I would prefer contacting a technician in my department or area, however a technician needs to understand PCs not just Macs!
F: It always seems best for someone to come to my office and examine the machine itself. But I realize that this is not necessarily efficient for everyone except me :)
F: Let our administrative associate know, and she contacts IT because she is available when they come to my computer. I’m usually in clinic.
F: live person is always best
F: The get immediate help and satisfaction. I find the help from IT to slow. I also ask a lot of “personal” questions about problems with iPhone, whether to upgrade etcetera.
F: The HelpSU request system is also fine with me.
F: The IT staff for the Department of Pediatrics are in the office next door to me and are incredibly responsive, knowl-edgeable and helpful. As a new faculty member, I have had countless questions and problems getting set up and would be completely lost without them
F: When I submitted a HelpSU request, the response was unhelpful. No one really tried to get to terms with the prob-lem. Stanford’s IT services are abysmal!
A: ask my sons, my boss, my colleagues, or Goggle it.
A: Call a personal friend who works in Stanford IT (first choice, frequently used to triage my options)
A: Consult one of SUP’s inhouse IT support staff. 1st choice.
A: Depending on the situation and problem on hand and also how quickly I need to find the solution, I will take differ-ent approaches. I don’t think one single approach fits all the problems/issues.
A: Depends on how complicated and time sensitive the problem is, but online chat seems like a good, immediate way to triage.
A: FIRST - Be given quality programs with unchanging user interfaces with which to do my work, instead of being forced to Beta-test this low-bid *&%$#@!
A: I generally can solve most problems myself. It is only Stanford-specific set-ups that sometimes stymie me
A: It really depend from nature of the task/problem/trouble. If it related with managing/creating web sites for Depart-ment and faculty - HelpSU and IRT ticket is first choice. If I know, but want to find better programming code block - Google will be first choice. If Stanford-related web site located on other web host, Bluehost.com for example, - first choice is contact with their technical support.
A: Rank #1. Interacting with a technician who is proactively scheduled to complete a standard checklist of actions that would likely prevent problems for me as a technology user. This routinely scheduled contact, even if occurs only annu-ally, could also at that time see if there are other issues/questions that they can address
A: Results from HelpSU vary. Some tickets are resolved quickly, others are lost and never resolved. It would be good to monitor the status of outstanding tickets. I would also monitor the relative satisfaction with different types of queries and different responders.

Stanford University IT 2015 Client Satisfaction Survey • Appendix A - Full Comments | A-3
MOR Associates, Inc.
Q12. What would increase your satisfaction with Friday Open Labs?
Responses to this question have been sorted by cohort and then by respondents’ ratings for Q11 .
Friday Open Labs .
A: (SD) I was hoping for help with how to get the information I needed, easily, out of ReportMart3, but the people on-site weren’t very knowledgeable on the individual reports, and while a lady there promised to follow up with me, she never did. I’m left to conclude that ReportMart is just cumbersome, and that there is no help to be had.
A-4 | Appendix A - Full Comments • Stanford University IT 2015 Client Satisfaction Survey
MOR Associates, Inc.
Q19. Was there specific website content you found lacking? If so, can you tell us more?
Responses to this question have been sorted by cohort and then alphabetically .
F: I have had trouble figuring out who to call with problems related to my IT needs through the Children’s Hospital. Sometime, their help desk refers me to the main Stanford help desk, and sometimes its the other way around
F: Listing a large range of services and options does not help. The presentation should be focused on the kind of person you are or job you have, and then recommendations about which tools are useful given who you are and your likely needs.
F: policies on what kind of computer/mobile devices are covered for faculty, coverage for mobile device (seems separate from computer).

Stanford University IT 2015 Client Satisfaction Survey • Appendix A - Full Comments | A-5
MOR Associates, Inc.
Q20a. Other top three preferred channels for being informed about the Stanford centrally-provided IT services available.
Responses to this question have been sorted by cohort and then alphabetically .
F: Direct contact from IT expert. I mainly just want to use my computer securely and efficiently. I want to be able to drive, but don’t have the bandwidth to understand a lot of details.
F: I find the search engine on the Stanford home page totally useless. When you enter a search item, you wind up get-ting tons of departmental web sites using that term and a lot of non-relevant information. That search function needs to be improved.
F: if it’s important, having it discussed in a faculty meeting with an IT person presenting
F: Many of my problems/questions pertain to software issues and there does not seem to be an easy way to access resources/answers at Stanford--But i also understand that Stanford It can’t know everything there is to know about specific software apps
F: Receiving emails that are clear and not so long.
F: These are all nuisances
A: Although local IT is very knowledgeable and helpful, unless there is a problem, there is no communication mecha-nism for them to share their knowledge about services.
A: Email from my school IT team
A: I did not choose posters, but I noticed the encryption posters around campus and received positive feedback from clients regarding them.
A: I should not HAVE to receive information outside of a user-friendly interface. EVERYTHING ELSE should happen behind the scenes without me having to be aware of it at all besides a warning light saying to take my car to the shop for it’s tuneup!!!!! (And that shouldn’t happen very often.)
A: I wish you had something like the old “Speaking of Computers” newsletter.
A: I’ve not used any of the tech services.
A: Learning more about SOM specific platforms from HelpSU tech such as AEM, Drupal equivalent for web editing
A: Online training resources
A: Receiving print materials via campus ID mail also will be good since I don’t carry my laptop and other electronic de-vices everywhere I go. Receiving emails about specific services will also be good. Visiting a University IT website is also something that I can do but I usually do that anyway when the other options don’t provide the answers we are looking for.
A: Talking with local non-IT staff.
A: You may want to be aware that the search function on the stanford home page doesn’t work on some browsers, for example Chrome.

A-6 | Appendix A - Full Comments • Stanford University IT 2015 Client Satisfaction Survey
MOR Associates, Inc.
Q22a. Other social media platforms preferred for getting information about Stan-ford centrally-provided IT services provided by University IT
No responses received .

Stanford University IT 2015 Client Satisfaction Survey • Appendix A - Full Comments | A-7
MOR Associates, Inc.
Q22.5. How can University IT better communicate about planned maintenance down time and system outages?
Responses to this question have been sorted by cohort, then by respondents’ ratings for Q13d . The
job University IT is doing to keep people informed about service outages, and then alphabetically .
F: (SD) Email is fine
F: (SD) Email is fine.
F: (SD) Emails
F: (SD) Fine
F: (SD) I am mostly annoyed by Zimbra outages or times when it runs like a snail. Would be helpful to have some way of messaging that there is a current issue (maybe on the sign-in page), as sending an email about an outage doesn’t help when Zimbra is down.
F: (SD) lead time is the most critical
F: (SD) Let us know in advance!
F: (SD) text alert
F: (D) e-mail ahead of time
F: (D) email
F: (D) emails ahead of time and on the day it happenes
F: (D) It does help when emails are sent in advance.
F: (VD) Email
A: (SD) An opt-in email alert would be very useful (although this probably exists?)
A: (SD) email
A: (SD) emails and updates to better advertised websites
A: (SD) Emails are pretty effective. Not sure I’m getting them though.
A: (SD) emails from University IT alerting upcoming outages are best internal departmental IT person follows up with another email
A: (SD) good enough
A: (SD) I get frequent notification about OBIEE planned maintenance which I appreciate so that I can plan around the downtime. I usually get information about eAM or Oracle financials downtime from weekly eAM meetings but email notifications would be appreciated.
A: (SD) I think the communication on planned down time is fine. It is the unplanned problems that are not communi-cated so we spend lots of time trying to find out what is going on.
A: (SD) I think they do a decent job of notifying people via email about upcoming outages and down time. I think if a person can’t manage to read their emails it’s a sign of a problem in their job or ability not the fault of UIT.
A: (SD) I would recommend using mechanisms similar to the emergency notification systems. If you chose you could send text or emails.
A: (SD) I’ve noticed you send out notices early, but they aren’t repeated closer to the actual outages
A: (SD) More timely notifications of outages (in person, via text)
A: (SD) Planned maintenance downtime is communicated well, but my office is often left wondering when there’s a system outage, especially around how long it will be out.
A-8 | Appendix A - Full Comments • Stanford University IT 2015 Client Satisfaction Survey
MOR Associates, Inc.
A: (SD) Put them on the helpsu page. I go there for outages, but often don’t see the issue that I’m having. Then after calling in, I find out my issue, is actually an issue. But you could post as many things as possible on helpsu. I would think that if you can put in a helpsu request for it, that should be part of what’s posted on the helpsu home for outages.
A: (SD) Send emails and have our local IT staff let us know as well.
A: (SD) timely email
A: (SD) Update helpsu’s service alert area sooner for system outages. Typically there is an outage and it isn’t posted anywhere. We’re never 100% sure there is an outage vs having a problem with our computer until we call the help line.
A: (D) An email would be suffice.
A: (D) better email blasts
A: (D) communication regarding scheduled outages is pretty good; communication regarding unscheduled outages is not good (especially when email messages are sent regarding server issues (maybe a blast phone message would be better).
A: (D) email or text
A: (D) Email with header that informs
A: (D) Give people more notice and explain how things will effect them better.
A: (D) Multiple channels of distribution. Use channels directly available plus channels available to partners + clients, so they can rebroadcast the communication.
A: (D) Text me regarding outages; email regarding planned downtime
A: (VD) email
A: (VD) I believe the email sent for planned outages works fine. I have difficulty with the times when the wireless ser-vices are slow or down in unplanned times and I cannot get information about whether or not IT knows about it.
A: (VD) Please send out an e-mail notice of system outages. We usually get a ping from our IT guy, but that doesn’t notify us as quickly as from you guys.
A: (VD) Via text message

Stanford University IT 2015 Client Satisfaction Survey • Appendix A - Full Comments | A-9
MOR Associates, Inc.
Q23. What is the single most important thing University IT could do to keep you better informed about Stanford centrally-provided IT services?
Responses to this question have been sorted by cohort and then alphabetically .
F: 1) have information coming from one place only. It is totally unclear to me what are the different policies of medical school vs university and who is implementing them. 2) have a knowledgeable person in each department
F: A clear well organized website that is available for general searching, i.e. I do not need to go to Stanford site to search.
F: A website where I could actually find what I am looking for
F: Advance announcements of changes, and simple explanations for why they are necessary.
107 229
0 50 100 150 200 250 300 350
Other
Chat, sms texts, push notices that aren't email
Clarify what's central it vs dept
Visit our group with a road show pitch
Too many emails, too many sources, too much to read
Things are fine
Clarify core offerings in each domain
Timely human contact
Good it-specific web site and search
Periodic update (monthly, quarterly, annual), newsletter
Use decentralized, dept local experts
Email announcements
Commented at all
Q23. What is the single most important thing University IT could do to keep you better informed about Stanford centrally-provided IT services? n=336
F, n=107
A, n=229
A-10 | Appendix A - Full Comments • Stanford University IT 2015 Client Satisfaction Survey
MOR Associates, Inc.
F: annual summary
F: Better articulate core services and use that opportunity to channel users toward university support solutions (such as calendar free-busy, email lists, file server, etc.), but first there would have to be clarity about which systems to support and which systems NOT to support.
F: brief monthly emails highlighting services, especially new ones
F: Come make an annual or semi-annual presentation to our organization - Division-level.
F: Communicate through departmental IT
F: communication through department IT
F: concise updates by email
F: Decentralize: more in-house one-on-one help by a competent human
F: Decentralize! The previous system was much better, as our in-house IT staff understood our issues much better and were highly responsive to providing help.
F: Decentralize.
F: Discuss what services will be provided in the future, and if we can keep our current IT experts who will be working under the centrally-provided IT services.
F: Disseminate information for specific services.
F: e-mail me
F: e-mail with changes
F: Easy access to a friendly human.
F: Email
F: email
F: Email
F: email
F: email communication
F: email complete information on the IT services provided
F: email information in LAY TERMS - pls understand that some of us are technically challenged.
F: Email newlsetter
F: email us.
F: Email with simple explanation of what new is being provided
F: Emails
F: emails
F: Emails or texting to my cell phone
F: Fix the main Stanford web search engine. There are too many non-relevant items that pop up in the first ten hits.
F: Follow-up email.
F: forward only pertinent information. We have too many emails to process which aspects of hew policies are impor-tant to us.
F: Good (concise, informative, high information density, low image density) newsletter
F: have a departmental representative
Stanford University IT 2015 Client Satisfaction Survey • Appendix A - Full Comments | A-11
MOR Associates, Inc.
F: Have IT people at the GSB proactively provide new services
F: Have local IT staff available. Or have somebody answer the phone in a timely way (leaving a message and calling back a few days later is not timely)
F: have local support staff inform us
F: Have lunchtime discussions in departments to discuss what sorts of services might be useful to us.
F: Have simple list and actually have competent help to follow through
F: Have the Law School IT folks (who are superb) communicate that information to us.
F: I am concerned at emails explaining that all campus computers must very soon use encrypted files. I have no idea how to implement this on my office iMac, or whether Mac OSX is designed to make it easy. I don’t feel able to make the change myself, and I’m not conscious of any IT help in making it. Hence, a clear statement would be welcome on how the change will be implemented on each machine.
F: I am satisfied that I get all necessary information from my terrific local IT colleagues
F: I consult 5-help frequently when I suspect phishing. Sometimes these are legit requests from IT. The staff has been informed and helpful.
F: I don’t know. Bombarded by emails already. Info overload. Let me just call HELP line when I need it. Excellent ser-vice.
F: I have appreciated the fairly good response time especially when I am in a helpless situation and facing imminent deadlines for teaching, research and lectures of all kinds. The computing and IT world is increasingly complex; we cannot function at Stanford without the very best support to back up our academic and administrative endeavors and mandates. Thanks for your help. What I am not amused by is the fact that many encrypted computers cannot run anymore yet our departments and schools often do not provide funds for new machines for students and faculty (only administration). This does not seem reasonable to me. Support on this front should be at the school level.
F: I only started at Stanford last year. A small leaflet explaining how to get IT help would have been great! Best not to distribute this at the orientation. I got so many documents on that day I still haven’t properly filed them all.
F: I really like the drop-in hours with the IT specialist in our department.
F: Information with email.
F: invitation to sign up for choosing the types of things that I would like to know about. Focused information dispersal would be better than a universal newsletter.
F: IT expert perform updates as needed.
F: It has long been apparent to me that, as a humanist who knows very little about IT issues, I would benefit most from having a regularly scheduled, e.g. every-winter, routine “check up” appointment with a knowledgeable IT staff mem-ber. At this appointment, the staff member could clue me in to important new software, capacities, and services while checking to see that my computers have all the latest updates needed to perform at top capability. I’ve mentioned this to IT staff whenever I had a new computer that needed to be serviced, and they all agree it is a great idea, but evidently nothing has been done with this idea. Perhaps now is the time. It would be VERY helpful if the IT office took the ini-tiative to make such personalized check-up appointments available to faculty. This seems like basic preventive medi-cine. Why wait until there is a crisis for us to get to know our IT doctors?? Thanks for asking.
F: It is not always clear to me which office I need to go to for support. Specifically for support in building websites or other related technological issues. For repair I know where to go, and I have been very satisfied with the service.
F: It is not an information problem
F: just keep it simple and let us know when there are major areas of improvement that we are not accessing already
F: keep a link on pages for IT help
A-12 | Appendix A - Full Comments • Stanford University IT 2015 Client Satisfaction Survey
MOR Associates, Inc.
F: Keep the emails shorter - or do it on paper. I know - that’s not good for the environment. I have too many emails though and can’t stand to look at them all.
F: Keep the information on the websites complete and up to date with links etc.
F: keep users in the loop regarding policy changes. things have been very confusing during the last year regarding encryption/windows 7, etc
F: Keep your websites up to date and easy to use
F: Let us know the difference between local and university.
F: Make certain that department IT personal are kept in the department. They are the best source of information and service help/needs.
F: make notification computer platform-specific (e.g., PC vs Mac) changes and updates more obvious
F: New services available.
F: newsletter
F: newsletter and a link that uses a google search--also an online forum for the stanford community to share knowl-edge and experiences would be very valuable where one could post questions/search the forum database that would be moderated by one of Stanford IT experts
F: not keep changing the policies
F: not too many emails but the most important options linked to the web for more info
F: Nothing new. The information transmission process is sufficient as is.
F: Notify department management who in turn can notify us (faculty) of the RELEVANT services when we meet in person at regularly scheduled faculty meetings
F: Occasionally I get help in a timely manner. More often it takes forever--like a week--to get simple answers to simple questions. It feels more like we’re in a third world country than a world-class university in the heart of Silicon Valley. By comparison, the service I receive from Apple (if there is something wrong with my computer), AT&T (if there is something wrong with my home internet), or various software sources is infinitely better.
F: one-stop shopping that helps you navigate to answers you need more efficiently
F: Post updates clearly on a single online portal. It seems there are too many online portals.
F: Present key updates and feature at Dept faculty meetings
F: Probably a newsletter. I am unaware of this
F: quarterly emails that are succinctly written to deliver infomation
F: Repeat information
F: Segment your customer base and provide specific advice: Faculty according to school or phenotype, staff according to nature of their job; administrative people according to their service unit. Listing services and asking me to search for the right one is too challenging.
F: Send a concise email with links to important features.
F: send a personal email about what needs to be done and then provide a personal contact person who can help make the change or whatever is required in my office
F: Send e-mails
F: Send email updates.
F: Send information in print form.
F: Send IT emails

Stanford University IT 2015 Client Satisfaction Survey • Appendix A - Full Comments | A-13
MOR Associates, Inc.
F: Send me and email with a list of all services and have my local provider tell me in person.
F: Send occasional emails
F: Send out email notices as you currently do.
F: Send updates
F: Short frequent emails
F: Short to the point emails.
F: shorten the emails you send---they are too long and too detailed.
F: Simple pointed email newsletters where I don’t have to read a lot of text. Often we get incredibly long dense mes-sages about upcoming changes - ugh!
F: simple quarterly newsletter that’s SPECIFICALLY designed for busy faculty --maybe a short online webinar that can be watched anytime that shows something like the top 10 (top 5?) most used (appreciated?) IT features/services pro-vided by Stanford IT (again, geared at faculty)--I think that different groups at Stanford (faculty, staff, students) have different needs ...
F: Software info and updates
F: The (Google-powered?) SU search function is completely useless except for people searches. If it were as functional as Google search is for the Web generally, I think it would solve all my problems with SU IT.
F: The existing information seems adequate.
F: The problem is that IT related resources keep changing a lot. It is important to stabilize this so people pay attention when new changes are offered. If there are few changes, email works best. Otherwise, not sure.
F: through my department IT person
F: timely response
F: To help us understand who is available when a real problem occurs that impeded getting our work done
F: Warnings of changes to occur which affect my specific needs with IT
F: Well informed local department staff and email circulations.
F: When assisting faculty with a specific problem, IT employees could review a checklist of 3-4 items that faculty should be aware of (perhaps update that regularly)? “Did you know about this”, etc?
A: 1. Why is Stanford IT using an outside 3rd party to administer an IT survey? 2. The survey does not indicate it is anonymous until one gets to the end of the survey. 3. The survey is far too long. I’m guessing you have a low response rate for these reasons.
A: a biannual issue recapping significant changes to systems.
A: a dedicated technician
A: Actually be knowledgeable in their field
A: Add information about IT services to new employee orientation so that checking the resource becomes a habit.
A: Add the information to an already scheduled in person meeting we have (like the All-Staff meeting once a month).
A: All I really need is someone available for me to talk with when I have a computer problem.
A: Allow me to create a personal webpage wherein I can keep relevant things and history
A: announcements
A: Ask me what information I need/IT functions I use and then send me emails specifically tailored to those needs.
A: Automatically enroll everyone in the IT newsletter, and ask people to opt out if they don’t want to receive it.

A-14 | Appendix A - Full Comments • Stanford University IT 2015 Client Satisfaction Survey
MOR Associates, Inc.
A: Be certain that major announcements get communicated through IT specialists within departments.
A: Be more quick-to-respond to my local EH&S IT department when we use one of their services
A: Be more transparent as to the purpose of the service. If it is new or changed, what caused the change and how is it better or the reason it was implemented if new.
A: Be more visible. Provide more than links to IT services websites, I would also like to know what types of services and resources are available so that I WANT to visit the websites for information. Include descriptions of IT Services resources in general publications such as Stanford Report and print flyers.
A: Better organize IT website on mygsb.
A: Better understanding of our work unit interests/needs/constraints to have targeted and timely communication about issues that impact us
A: better web site
A: brief email updates -
A: clarity on why certain services routinely break down. E.g., MS Outlook is very slow and regularly gets stuck
A: Clearly differentiate those communications from other IT related communications.
A: Communicate more frequently
A: Communicate news with departmental IT specialists for them to share with us.
A: Communicate only what is needed and keep it simple
A: Communicate via email
A: Communicate with departments for scheduling various services, such as the recnt installation of CISCO phones, and discussing the options the current phones and if the new phones will be programmed the same, such as intercom features that were established and then not properly set-up. They were set-up to teh whisper feature which allowed you to begin to talk to a faculty member (or they hear you), Prior to them accepting the call.
A: Communicate, communicate, communicate -- we receive so many emails on a daily basis, information tends to get lost or ignored. Continue having forums, training, etc. Thanks!!!
A: communication
A: communication - either via email or through our local IT group.
A: Communication via our IT staff - not just emails
A: Concise emails.
A: Continue sending information by email
A: Continue the newsletter
A: Continue to provide informational newsletter
A: Continue to refine email notifications of services.
A: Continue to send emails
A: Continue to send emails regarding important information, updates and changes.
A: Create a more human-centered help system. The current systems favor technology and data over the satisfaction and interaction of people to determine the problem, assist people, and follow up about the solutions.
A: Create better transparency about how processes work & who to go to with which questions.
A: Direct and timely contact (best through email) of changes, issues, and services. There is just so much information whizzing around the university that it is hard to be pro-active and seek out information - I just don’t have the time. It makes my life so much easier when important information comes to me directly!
Stanford University IT 2015 Client Satisfaction Survey • Appendix A - Full Comments | A-15
MOR Associates, Inc.
A: E-mail
A: E-mail and brown bags
A: e-mail that might be more interactive
A: easier to navigate web site with more comprehensive up-to-date information.
A: Easy to browse and read.
A: email
A: email
A: Email
A: email
A: email
A: email
A: email
A: email
A: email
A: email
A: email
A: Email blast
A: Email list subscription
A: email me
A: Email me about the services
A: Email me links to what services are available if a problem arises.
A: Email me.
A: Email notices work fine
A: email the info
A: Email updates
A: email updates
A: email updates
A: Email updates
A: Email updates via newsletters or have key IT people make announcements within department staff meetings
A: Email with header that informs
A: Email/mail newsletter updated
A: Emailed information
A: Emails
A: emails
A: Emails
A: emails
A: emails
A-16 | Appendix A - Full Comments • Stanford University IT 2015 Client Satisfaction Survey
MOR Associates, Inc.
A: emails
A: Emails from local department IT staff with announcements about new and existing services.
A: Explain when we should be calling our local IT guy vs. when we need to submit a Help SU ticket.
A: Finding answers to problems can be confusing. Whether to call or try to find an answer on a website and which website. Particularly since I am in the School of Medicine which may have different IT. . I would appreciate a clearer/simplified path to finding a answer, i.e. ask a question--look here to find the answer.
A: First of all, I need to understand the difference between Stanford centrally-provided IT services and the services that (I suppose) are only provided within my specific department/School.
A: For me (don’t get a ton of emails), send an email for a specific change NOT in the newsletter
A: For Services: Open site in Find Services (icons on front page that allows user to go into that area to learn more about what’s available or how to do something). Also note if there are any recent changes here. Maybe color code things that might be new, or add a short paragraph above letting everyone know if there’s something new. For Alerts: Is it feasible to put an alert on the front screen of SmartMart for problems? Prior to us making an attempt to complete an applica-tion, or contacting HelpSU, or going to a site to learn of the problem. This could be done on other systems too, an alert banner across the top.
A: Get word out by email, newsletter and social media (is there an IT facebook page?) when updates are made to mandatory data security policies. Word is that this policy is still being tweaked. My program handles restricted and prohibited information and we are making strong efforts to comply, but I don’t receive updates or know whether and when they are even available. Periodic reminder emails on the importance of this policy and the specifics would also be helpful. Also, please offer laminated resource cards on data classifications and allowable services for end users. We need tools, reminders and updates in order to effectively comply.
A: hand out bookmarks with urls at various points at campus and put interesting notes that people might actually read in the Stanford Daily.
A: Have a comprehensive, easy to browse site cataloging all services and making sure that site is advertised heavily.
A: HAVE A DEPARTMENT APPOINTED PERSON TO RELAY FIRST HAND INFORMATION.
A: Have a news and policy webpage documenting the recent changes.
A: Have a single-page “cheat sheet” with information about services and who to contact/where to go to access those services. This could be emailed, printed out, turned into a poster, etc.
A: I am not aware what they could do; my needs are met by Stanford Engineering IT staff
A: I appreciate the annual IT fair - I often learn things there that I hadn’t known about
A: I didn’t even know there was a University IT newsletter. I think that there should be an automatic enrollment for this for all new employees. As a new employee, I never received any orientation to UIT; I heard about various services and sources from co-workers when I’ve had an issue. Or I stumble upon it when searching the stanford.edu website. I would greatly encourage an intro into the UIT “sphere” to be a mandatory component of the campus on boarding pro-gram. I sort of stumbled upon AFS (and still don’t really have a good understanding of it; how its administered who we contact if we need more space; what are the policies, etc. around using it; requesting secure afs space, etc.)
A: I didn’t know there was a University IT newsletter. I would subscribe.
A: i don’t know if it’s possible to send a push update regarding new services when you log on to email, but that might be a way to go. not getting an actual email but a notification that you have a message or update waiting and then you could click an icon and go to the webpage. i think that would be helpful since i don’t regularly go to the IT website to check for updates.
A: I don’t know. I’m pretty simple. If I have computer issues I call IT and they come over and fix it. Apologies, that’s my main interaction with IT and I am completely satisfied.

Stanford University IT 2015 Client Satisfaction Survey • Appendix A - Full Comments | A-17
MOR Associates, Inc.
A: I don’t think there is to much more that can be done. I feel that they do cover all bases in my area.
A: I don’t want to be “better informed”, I would rather be informed only about policies that directly affect ME, rather than about every single new policy that comes out.
A: I enjoy reading the newsletter.
A: I found that the IT newsletter has been giving me a single point of contact to find out about future projects, progress on current ones and gives me a sense of being part of the big picture.
A: I guess email
A: I hadn’t heard about the newsletter before taking this survey. While I don’t know if it would be relevant to me in my daily work, I would like to take a look at it. Is it easy to find on your website? Or, is it something you’ve been sending me and I’ve been ignoring? Sorry if that’s the case!
A: I handle all the IT support in my group so IT services does not affect me much.
A: I have realized with this survey that I don’t know about some of the services. I would read an email listing the ser-vices.
A: I love our IT help, provide them more support and keep them happy!
A: I really like our GSB IT Tips, Tricks, Scheduled Work, and Announcements email. Simple and easy to read!
A: I think email communication is most effective, anything that would draw attention to an email communication.
A: I think that IT services are provided in my local area (school of education) so I think that I do not access centrally provided services.
A: I typically deal with out in house IT person
A: I worked on Oracle eAM and need to know about unplanned downtime. One of our application connects to eAM database and sometimes it fails because of unplanned downtime but we are not informed until much later. The AS eAM group informs us as soon as they get news of it but it seems that they are not informed as well?
A: I would be happy to receive more emails with specific information on select services, or simply promoting certain services. If the service is irrelevant to me, I can delete the email, but chances are I’ll learn something new about these centrally-provided services. Essentially, frequent, short emails are the best communication method for me.
A: I would like to get an email about important updates or mandatory issues (compliance, security) that includes infor-mation about what’s new, what I need to do, and how to do it.
A: I would like to see some staff come by and tell people about what’s new, similar to haw the occupational health and safety people come by to inform people about ergonomic problems. This could be augmented by individual visits when needed.
A: I’m not sure. Honestly, I don’t need to use the services very often.
A: I’m pretty happy with IT services, in the sense that I’ve been able to do everything I’ve wanted to do. I think specific emails are important, but if they are not relevant, after several emails I will filter them into a lower-priority inbox and will stop looking at the really important ones.
A: I’m really not sure
A: Improve the quality of those services. Make them more user friendly
A: Improved information distribution, which IT does a pretty good job already, but there’s always more opportunities to do better.
A: incentives
A: inform via Email
A: Informing people about IT services at the New staff orientation.

A-18 | Appendix A - Full Comments • Stanford University IT 2015 Client Satisfaction Survey
MOR Associates, Inc.
A: Introduction at New Employees Orientation
A: It is difficult when University and SOM are different and not universal for different web based services such as Qualtrics, Drupal/AEM, etc.
A: It might be interesting to flag financial records for services being paid for that are offered by UIT. Targeting those individuals paying for services offered by UIT for less/free could be an interesting way to inform people about services offered.
A: It would be great if annual maintenance was kept up for us... I need a tech who can meet me at a set time. I am so busy, they will show up when I am away from my desk working on events.
A: It would be nice if our departmental IT guy was better informed of IT services. He hadn’t even heard of CMGM.
A: It’s fine as it is.
A: It’s fine as it is.
A: keep doing what you are doing.
A: Keep the website updated and interesting. (Mostly, I just look up stuff when something goes wrong.)
A: keep up the good work
A: keep website up to date
A: Keep with emails
A: Let us know any significant changes in advance
A: Local
A: Make flyers/ emails direct and to the point.
A: Make sure everything is communicated extremely well to management - especially the leaders of each unit’s admin-istration team - so that these individuals can educate people in person and be the go-to person to answer questions within the unit. Usually for me, if a google search / website search doesn’t answer my question, the next step is to ask our head of administration, because I know her personally and she often knows the answers. Having in person ambas-sadors is the best!
A: make sure the Dept IT person(s) are communicating the updates/services to the dept. staff
A: Make the messaging seem relevant to my needs
A: Make things easily searchable and locatable on the web
A: Meet with our Dept (in person) (have a dept meeting about updates). I work in a department where we don’t know who works on the other side of the building, let alone down the hall. Not the fault of IT, but gives you an idea of the lack of cohesiveness.
A: monthly (+ occasional extra for some significant news/info) newsletter - bulleted (for brevity) w links to add’l info for the topics that are relevant
A: Monthly/quarterly newsletter about what’s happening. I get both the Tech Training & HR newsletters, but didn’t know about the IT one. And I’ve in doing IT work the entire time I’ve been here. When did I miss that? Maybe it was me, but just didn’t know there was one. I know not everyone opens these, but I find them the best source of new info. Either that or talking to colleagues or the IT conferences on campus. I always find something new and interesting that I didn’t know about at these. But these conferences are only once a year, so it wouldn’t be enough considering IT changes every day and you are constantly looking ahead to new technologies. For example, I heard (from colleagues) about everyone moving to Outlook for mail instead of Zimbra. But no official “This is coming in the future” type of email to let anyone know. I still know virtually nothing about it, timing, implementation, how it will effect our stall, etc. Might be too soon to tell, but I’ve heard nothing other than rumors.
Stanford University IT 2015 Client Satisfaction Survey • Appendix A - Full Comments | A-19
MOR Associates, Inc.
A: More and more effective announcements -- changes happen and despite being on a department IT staff, I only catch wind of things second- or third-hand.
A: more frequent comunication
A: More frequent reminders of services that are underutilized. I think they just fall off my radar if I don’t see any im-mediate application to my current work flow.
A: More transparency, less bureaucracy
A: newsletter emails
A: Newsletter or website updated regularly
A: Not sure. They do a great job already.
A: Occasional E-mails
A: Offer classes at various levels and when a class is advertised as a basic workshop or meant for beginners, please keep ti that way. Discourage conversations meant for intermediate or advanced levels from creeping into basic workshops/classes.
A: one-click webpage
A: Online chat
A: online information
A: Periodic email and newsletter
A: periodic updates via email
A: Probably an introductory training session of what all the centrally-provided IT services are, and how to find them or get help with them. For example, when I was hired would have been a good time. Mostly I am introduced to it piece-meal, when I have a problem. I usually find what I need by starting with a google search.
A: Provide clear and succinct emails; I guess I need to sign up for the newsletter!
A: Provide just one website for all information/updates/news/links to specific areas. And to make sure that website is heavily promoted to current employees and in new employee training sessions. My main issue is that I just can’t keep straight all the different possible places/ways to get help or find info.
A: provide more staff to answer the helpdesk phone. I have been waiting for 24 minutes and counting for someone to pick up the phone while I’m completing this survey. . .
A: Provide more, and smaller/bite-sized pieces of information
A: Provide updates via email on changes in services.
A: Providing a “how-to-webinar” in which one can see/hear and ask questions if need be.
A: Quarterly e-mail updates?
A: Regular email updates
A: Regular emails relevant to my department and related.
A: remain the email function operating well
A: Require 15-30 minute training on “Common Technical & Software Issues” for all new employees.
A: Responsiveness. Always get back quickly once a help order has been filed.
A: Screen savers in the hospital
A: Send a direct email. I work in R&DE so I get all of my IT related information through that team.
A: Send an e-mail with important announcements.

A-20 | Appendix A - Full Comments • Stanford University IT 2015 Client Satisfaction Survey
MOR Associates, Inc.
A: send an email
A: Send an email newsletter
A: Send an email to the campus community.
A: Send an email when there are changes or new services that would affect my job.
A: send an email with a link to a central page that has a summary and more links.
A: Send announcements via email. repetitiveness is good.
A: Send detailed emails on services that can be covered for specific occasions.
A: send effective communication
A: send email
A: Send email
A: Send email newsletters
A: Send emails about important *changes*, while having all information all easily available on a website.
A: Send emails about useful and pertinent information.
A: send emails for notifications
A: Send emails or Txt messages
A: send me an email
A: Send me notifications by email.
A: Send me something, yearly or half-yearly, letting me know what specific services are available to me.
A: send more emails
A: send out campus-wide emails (not listserv only), post about it on AXESS so people see it when they are submitting timesheets, etc.
A: Send out in a daily university wide email
A: Send out regular email newsletters or communications.
A: Send out updates via email
A: Send short emails
A: Send us email general reports.
A: Send us emails.
A: sending alerts: i.e. availability of updated version of free Stanford IT-software and other recent IT-related informa-tion
A: Sending out information on what tools are available and the latest technical information.
A: Sending small postcards via mailbox.
A: Short and sweet emails
A: Short emails with links to more info
A: Since I am in the GSE, I need to know services one at a time so that I can see if I have a need independent of my internal providers.
A: software update
A: Some courses that aren’t so expensive in terms of STAP funds
Stanford University IT 2015 Client Satisfaction Survey • Appendix A - Full Comments | A-21
MOR Associates, Inc.
A: specific emails about changes/new programs
A: Status updates
A: suggest they provide information session which they can come to various departmental staff meetings to give a brief overview will be great!!
A: SUP has its own IT support in-house, and they keep us informed about whatever applies to us. I have no opinion about what central IT could or should be doing.
A: Techs listen to client; stop reciting scripts or platitudes.
A: tell me how to sign up for the newsletter
A: tell where up to date and easily accessible info can be found
A: The announcement section on Axess.
A: The entire computer-based system needs to be redesigned from scratch. All this retraining and communication and down time is a waste of our time. It is indicative of a poorly planned system. The information is flowing in entirely the wrong direction. Whoever is planning and programing obviously has NO IDEA what we are trying to accomplish with the programs we are being forced to work with. The so-called ‘enhancements’ are impediments to effectively doing the job the programs are supposed to be helping us do.
A: This is a tough question to answer but perhaps a IT highlights newsletter once a quarter to serve as a reminder of the services and resources since beyond fixing a problem, IT services can provide improvements which I may not know of. I am not a fan of frequent email newsletters, I prefer to go to a resource ie webpage when I need it but an occasional newsletter would be welcome. Perhaps including a few stories of problems solved, etc..
A: Through email
A: Through email
A: timely dissemination of important information....only what we REALLY need to know. Other information can be on the website.
A: Transparency
A: Treat everyone as if they were a new employee who didn’t know anything and structure orientation and ongoing communication packages accordingly.
A: Unified email newsletter combining a large range of services.
A: updates
A: visit to staff meeting for key changes/updates/service, otherwise email
A: We are fortunate to still have a dedicated IT staff who is very familiar with our systems and procedures. I find that extremely helpful!
A: website posts
A: When updates are rolled out.
A: you are doing great so keep doing what you are doing and send emails to us.
A: You do a good job keeping me informed already (via email).
A-22 | Appendix A - Full Comments • Stanford University IT 2015 Client Satisfaction Survey
MOR Associates, Inc.
Q28a. Other provider of high performance computing (HPC) resources for research
No responses received .
Q29a. Other provider of large data resources for research
F: Large scale storage help at Stanford is extremely expensive and not useful
F: My Department and the SOM servers?
F: Stanford library
Q30. Which commercial cloud provider(s) do you receive HPC and...
F: Amazon Cloud
F: Dropbox
F: DropBox
F: Dropbox
Q31a. Other means of payting for commercial cloud offerings
F: Box.com account with unlimited storage-free
Q32a. Other place storing active research data
F: BOX
F: box.com
F: Dropbox
Q36a. Other computational or data analysis options needed
F: Easy communications with my co-authors: exchange of papers, drafts, and other critical documents rejected by the Stanford system as potentially harmful, or something to that effect. So no more possibility of attachment. We are bound to the heavy clumsy, unfriendly Box system. It is really an impediment.
F: Increasingly difficult to share large data with persons on outside and inside Stanford. Have not streamlined this process for our whole research group or found the easiest ways of doing so.
F: no immediate needs
F: Spatial analysis, mapping
Stanford University IT 2015 Client Satisfaction Survey • Appendix A - Full Comments | A-23
MOR Associates, Inc.
Q37. How much memory do you need on a single node for your simulations or analyses?
F: 10 GB
F: 100 gb
F: 10s-100s of GB
F: 128G
F: 16GB
F: 2 GB
F: 2 GB
F: 32GB
F: 4 GB per core, at least 32 cores per node
F: 500 GB to 1 TB
F: 500Mb
F: 64GB for my main desktop.
F: DK
F: do not know
F: don’t know
F: don’t know
F: don’t know
F: Don’t know
F: I am clueless...
F: I do not know
F: I don’t know
F: I don’t know
F: i don’t know
F: I don’t know yet
F: IDK
F: most31 4-8 G, some jobs however require200G
F: My informatics counterpart does this - I don’t know.
F: no idea
F: Not clear
F: not sure
F: not sure
F: Not sure
F: Not sure
F: This is a really silly question. It is a good example of the hardware oriented rather than the process oriented ap-proach. I do work that is doable. If I have different configurations available, I modulate to fit those .
A-24 | Appendix A - Full Comments • Stanford University IT 2015 Client Satisfaction Survey
MOR Associates, Inc.
Q38. How much total memory is required for a typical job?
F: ~60-100 GB
F: 10 GB
F: 10Gb
F: 10MB
F: 128G
F: 12GB
F: 2 GB
F: 4-8G
F: 500 GB to 1 TB
F: 64 G RAM would be helpful ... sometimes need more... Need to run on parallel processors - I have six which is sometimes not enough
F: 64GB
F: 64GB
F: can approach 1TB in some simulations we are considering
F: couple GB
F: DK
F: do not know
F: don’t know
F: don’t know
F: don’t know
F: Don’t know
F: I do not know
F: I don’t know
F: I don’t know
F: I don’t know
F: I don’t know right now
F: IDK
F: no idea
F: not sure
F: not sure
F: Not sure
F: Not sure
F: Stop it. Anyway, we routinely run on a system with 384G and use that up. I configured my SRCF virtual machines with 256G.
F: terrabyte
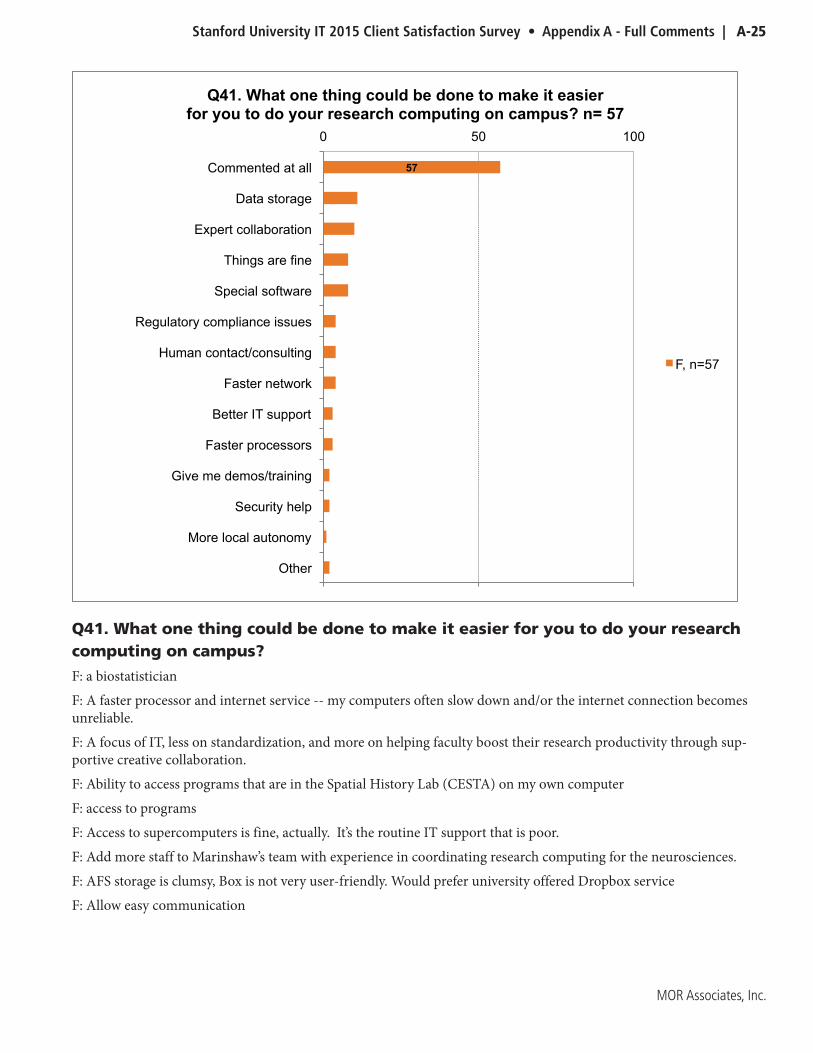
Stanford University IT 2015 Client Satisfaction Survey • Appendix A - Full Comments | A-25
MOR Associates, Inc.
Q41. What one thing could be done to make it easier for you to do your research computing on campus?
F: a biostatistician
F: A faster processor and internet service -- my computers often slow down and/or the internet connection becomes unreliable.
F: A focus of IT, less on standardization, and more on helping faculty boost their research productivity through sup-portive creative collaboration.
F: Ability to access programs that are in the Spatial History Lab (CESTA) on my own computer
F: access to programs
F: Access to supercomputers is fine, actually. It’s the routine IT support that is poor.
F: Add more staff to Marinshaw’s team with experience in coordinating research computing for the neurosciences.
F: AFS storage is clumsy, Box is not very user-friendly. Would prefer university offered Dropbox service
F: Allow easy communication
57
0 50 100
Other
More local autonomy
Security help
Give me demos/training
Faster processors
Better IT support
Faster network
Human contact/consulting
Regulatory compliance issues
Special software
Things are fine
Expert collaboration
Data storage
Commented at all
Q41. What one thing could be done to make it easier for you to do your research computing on campus? n= 57
F, n=57
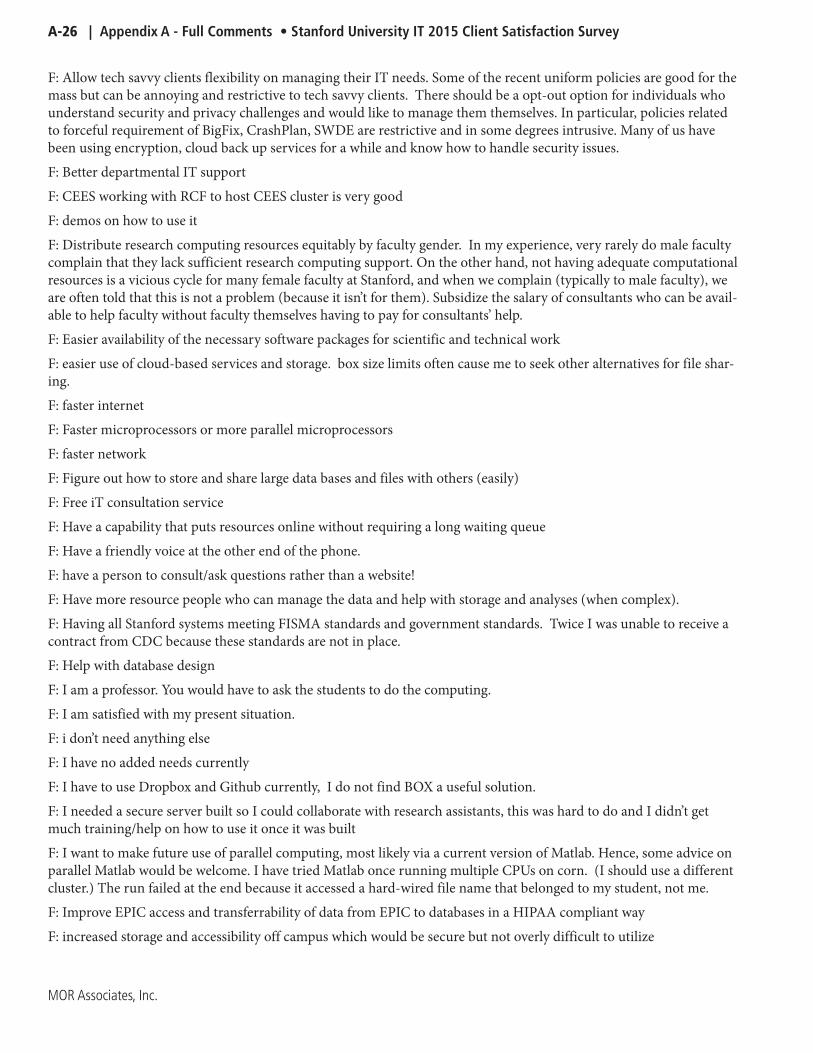
A-26 | Appendix A - Full Comments • Stanford University IT 2015 Client Satisfaction Survey
MOR Associates, Inc.
F: Allow tech savvy clients flexibility on managing their IT needs. Some of the recent uniform policies are good for the mass but can be annoying and restrictive to tech savvy clients. There should be a opt-out option for individuals who understand security and privacy challenges and would like to manage them themselves. In particular, policies related to forceful requirement of BigFix, CrashPlan, SWDE are restrictive and in some degrees intrusive. Many of us have been using encryption, cloud back up services for a while and know how to handle security issues.
F: Better departmental IT support
F: CEES working with RCF to host CEES cluster is very good
F: demos on how to use it
F: Distribute research computing resources equitably by faculty gender. In my experience, very rarely do male faculty complain that they lack sufficient research computing support. On the other hand, not having adequate computational resources is a vicious cycle for many female faculty at Stanford, and when we complain (typically to male faculty), we are often told that this is not a problem (because it isn’t for them). Subsidize the salary of consultants who can be avail-able to help faculty without faculty themselves having to pay for consultants’ help.
F: Easier availability of the necessary software packages for scientific and technical work
F: easier use of cloud-based services and storage. box size limits often cause me to seek other alternatives for file shar-ing.
F: faster internet
F: Faster microprocessors or more parallel microprocessors
F: faster network
F: Figure out how to store and share large data bases and files with others (easily)
F: Free iT consultation service
F: Have a capability that puts resources online without requiring a long waiting queue
F: Have a friendly voice at the other end of the phone.
F: have a person to consult/ask questions rather than a website!
F: Have more resource people who can manage the data and help with storage and analyses (when complex).
F: Having all Stanford systems meeting FISMA standards and government standards. Twice I was unable to receive a contract from CDC because these standards are not in place.
F: Help with database design
F: I am a professor. You would have to ask the students to do the computing.
F: I am satisfied with my present situation.
F: i don’t need anything else
F: I have no added needs currently
F: I have to use Dropbox and Github currently, I do not find BOX a useful solution.
F: I needed a secure server built so I could collaborate with research assistants, this was hard to do and I didn’t get much training/help on how to use it once it was built
F: I want to make future use of parallel computing, most likely via a current version of Matlab. Hence, some advice on parallel Matlab would be welcome. I have tried Matlab once running multiple CPUs on corn. (I should use a different cluster.) The run failed at the end because it accessed a hard-wired file name that belonged to my student, not me.
F: Improve EPIC access and transferrability of data from EPIC to databases in a HIPAA compliant way
F: increased storage and accessibility off campus which would be secure but not overly difficult to utilize
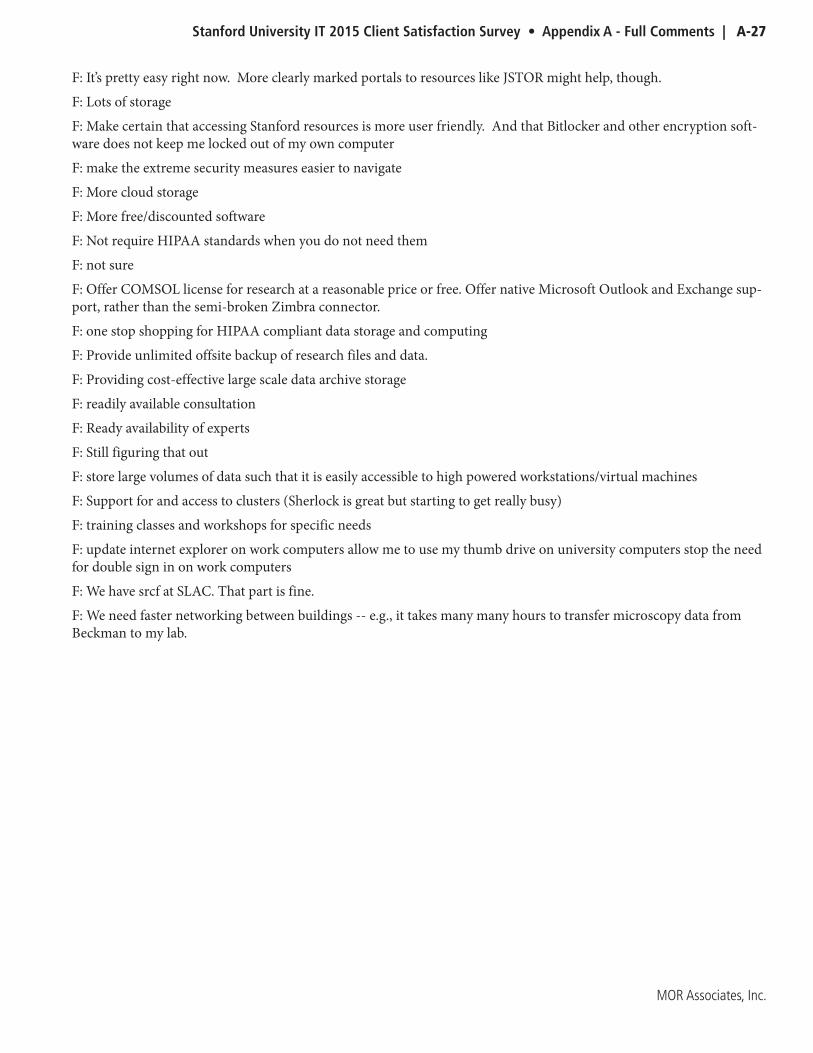
Stanford University IT 2015 Client Satisfaction Survey • Appendix A - Full Comments | A-27
MOR Associates, Inc.
F: It’s pretty easy right now. More clearly marked portals to resources like JSTOR might help, though.
F: Lots of storage
F: Make certain that accessing Stanford resources is more user friendly. And that Bitlocker and other encryption soft-ware does not keep me locked out of my own computer
F: make the extreme security measures easier to navigate
F: More cloud storage
F: More free/discounted software
F: Not require HIPAA standards when you do not need them
F: not sure
F: Offer COMSOL license for research at a reasonable price or free. Offer native Microsoft Outlook and Exchange sup-port, rather than the semi-broken Zimbra connector.
F: one stop shopping for HIPAA compliant data storage and computing
F: Provide unlimited offsite backup of research files and data.
F: Providing cost-effective large scale data archive storage
F: readily available consultation
F: Ready availability of experts
F: Still figuring that out
F: store large volumes of data such that it is easily accessible to high powered workstations/virtual machines
F: Support for and access to clusters (Sherlock is great but starting to get really busy)
F: training classes and workshops for specific needs
F: update internet explorer on work computers allow me to use my thumb drive on university computers stop the need for double sign in on work computers
F: We have srcf at SLAC. That part is fine.
F: We need faster networking between buildings -- e.g., it takes many many hours to transfer microscopy data from Beckman to my lab.
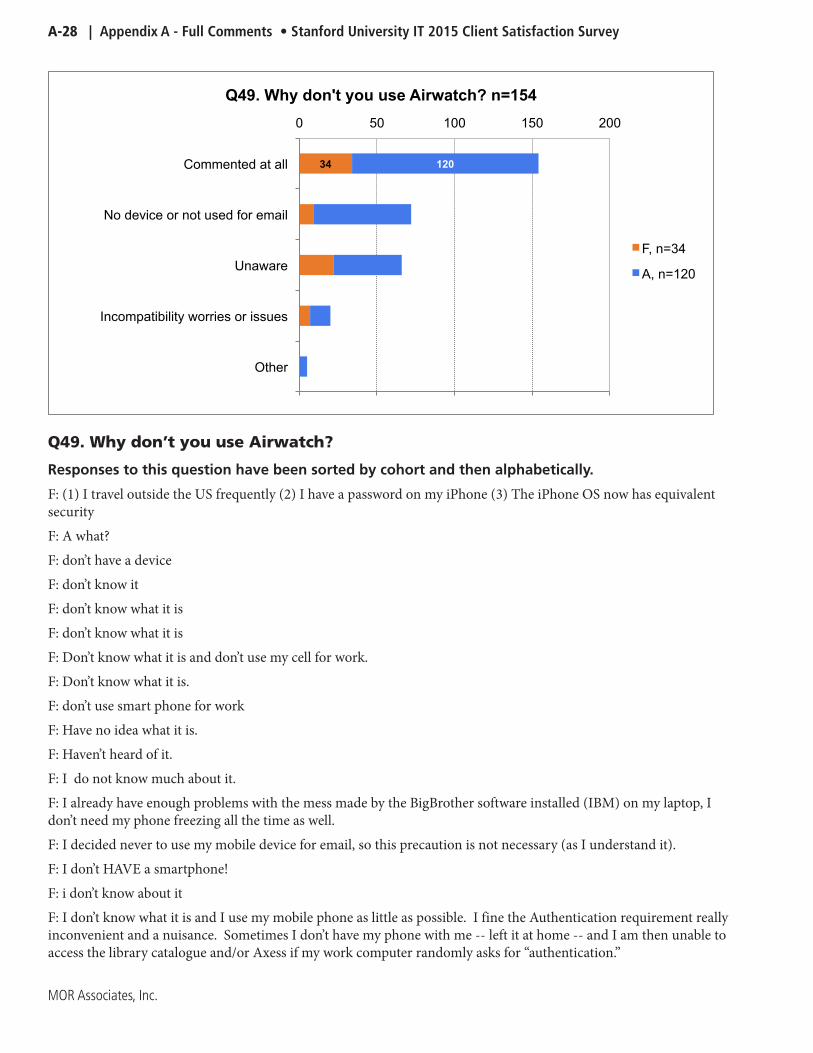
A-28 | Appendix A - Full Comments • Stanford University IT 2015 Client Satisfaction Survey
MOR Associates, Inc.
Q49. Why don’t you use Airwatch?
Responses to this question have been sorted by cohort and then alphabetically .
F: (1) I travel outside the US frequently (2) I have a password on my iPhone (3) The iPhone OS now has equivalent security
F: A what?
F: don’t have a device
F: don’t know it
F: don’t know what it is
F: don’t know what it is
F: Don’t know what it is and don’t use my cell for work.
F: Don’t know what it is.
F: don’t use smart phone for work
F: Have no idea what it is.
F: Haven’t heard of it.
F: I do not know much about it.
F: I already have enough problems with the mess made by the BigBrother software installed (IBM) on my laptop, I don’t need my phone freezing all the time as well.
F: I decided never to use my mobile device for email, so this precaution is not necessary (as I understand it).
F: I don’t HAVE a smartphone!
F: i don’t know about it
F: I don’t know what it is and I use my mobile phone as little as possible. I fine the Authentication requirement really inconvenient and a nuisance. Sometimes I don’t have my phone with me -- left it at home -- and I am then unable to access the library catalogue and/or Axess if my work computer randomly asks for “authentication.”
34 120
0 50 100 150 200
Other
Incompatibility worries or issues
Unaware
No device or not used for email
Commented at all
Q49. Why don't you use Airwatch? n=154
F, n=34
A, n=120

Stanford University IT 2015 Client Satisfaction Survey • Appendix A - Full Comments | A-29
MOR Associates, Inc.
F: I don’t know what it is.
F: I don’t recall hearing about it, so I’m not sure what it is.
F: I don’t think it works with my Windows phone
F: I don’t use a mobile device.
F: I don’t use my mobile device for work-related issues.
F: I have Verison I-phone.
F: I want my devices to be extremely easy to use. I do not want to be inconvenienced in any way whatsoever. I am not even slightly concerned about security.
F: I’ve never heard of it.
F: Intrusive. Jeopardizes privacy. Can’t allow a chance of access to my contacts. Hackers that break into University sys-tems then have access to my phone’s content.
F: never heard of it
F: Never heard of it
F: never heard of it
F: Never heard of it, and I don’t like installing unnecessary software.
F: never heard of it!
F: never heard of it...
F: What is AirWatch, another waste of time?
F: What is it?
A: apple, find my devices app
A: Because I don’t do Stanford work on my mobile device. But also, I wouldn’t want to give Stanford or anyone else ac-cess to my personal device.
A: because I try not to use my mobile device for work. Also, I already have my phone password protected.
A: Currently I am using my personal iPhone only to access my Stanford email and calendar only; and do not want to configure my phone using MDM -- as I have it set up with other software to do these operations. I have requested a Stanford supplied iPhone and will put AirWatch on this device if/when i get it.
A: didn’t know such thing existed.
A: Didn’t know there was one. What is it? Why would I wear it?
A: Didn’t work
A: Do not like Google...
A: do not need to.
A: Don’t even know what it is.
A: Don’t have a Stanford owned mobile device.
A: don’t have it
A: Don’t know enough about it.
A: don’t know what it is
A: Don’t know what it is.
A: Don’t know what it is.....plus, I don’t use my personal phone for anything Stanford.
A-30 | Appendix A - Full Comments • Stanford University IT 2015 Client Satisfaction Survey
MOR Associates, Inc.
A: Don’t see a need for it; hasn’t been mandated for me
A: Don’t think I know about it.
A: don’t use my mobile phone to access any stanford-related services (email, etc).
A: Dont use my phone for work
A: expensive
A: Far, far to many permissions I am not comfortable with it having. (I use my own phone)
A: Haven’t felt the need for it
A: i am not ready to have my phone security locked down by the university
A: I am not sure
A: I am not using my mobile device for Stanford related work. I experienced first hand that the airwatch also compro-mises the battery life of the phone which I am not willing to trade. So, I stopped using my mobile for work, and also uninstalled the airwatch.
A: I assume that this is the encryption program for smart phones. I do not use this because I consider my phone to be my private property and I resent my employer expecting me to use my own device. Therefore, because there is no way I can possibly NOT use my own phone for work-related activities, I adapt my use of my personal iphone to allow me not to have to encrypt it. Essentially for me, this means never checking my email on the phone and not sending PHI in any texts.
A: I could never access the program.
A: I didn’t know about it! Am going to install it now.
A: i do not use mobile device
A: I do not use my mobile device for Stanford work AT ALL.
A: I do not use my mobile device for work purposes.
A: I do not use my personal mobile phone for Stanford work
A: i do not wish to
A: I don’t access anything Stanford-related on my personal phone.
A: I don’t conduct Stanford work outside of the office.
A: I don’t have a mobile device
A: I don’t have a mobile device
A: I don’t have a mobile device
A: I don’t have a mobile device.
A: I don’t have a Stanford-issued mobile device, and I don’t use my personal device for work.
A: I don’t have a suitable mobile device.
A: I don’t have a take home computer
A: I don’t know about it.
A: I don’t know about it.
A: I don’t know what AirWatch is. Is that the same as MDM?
A: I don’t know what it is.
A: I don’t know what it is.
A: I don’t know what it is.
Stanford University IT 2015 Client Satisfaction Survey • Appendix A - Full Comments | A-31
MOR Associates, Inc.
A: I don’t know what it is.
A: I don’t know what it is.
A: I don’t know what it is.
A: I don’t know what it is. I have a person mobile phone that I only rarely use for work, for email only.
A: I don’t know what that is.
A: I don’t think I know what it is!
A: I don’t think I know what it is.
A: I don’t use a mobile device for anything work related.
A: I don’t use a personal mobile device, only a hospital owned and updated one.
A: I don’t use mobile devices for work
A: I don’t use mobile devices for work.
A: I don’t use my cell phone for stanford
A: I don’t use my device for work.
A: i don’t use my mobile device for any stanford business.
A: I don’t use my mobile device for work
A: I don’t use my mobile device for work.
A: I don’t use my personal devices for work-related activities.
A: I don’t use my personal mobile device for Stanford business and don’t wish to. Also, I don’t know what AirWatch is, never heard of it. I assume it’s encryption.
A: I don’t use my personal mobile device to access Stanford applications since the new regulations were announced because I don’t want it to be password protected.
A: I don’t use my personal phone for Stanford business other than phone calls.
A: I don’t use my personal phone for work purposes, nor do I have a SU owned phone.
A: I don’t want Stanford monitoring on my personal device that I take with me everywhere. It’s creepy and intrusive.
A: I don’t want to use my personal device.
A: i dont know what it is
A: I have to upgrade
A: I haven’t really heard much about it, and don’t want that app on my personal cell phone.
A: I heard it slows the phone down, prevents apps from being easily installed, and spies on your personal information.
A: I installed and it ate my battery up, so I uninstalled it.
A: I maintain my own personal device and don’t want/need Stanford’s assistance
A: I tried to, but there I receive an error stating that I am an unknown user.
A: I use my mobile device rarely, and never for Stanford-related business.
A: I’m not aware of what it is and I don’t really want to put Stanford software on my personal electronics.
A: I’m not aware of what it is and that it is available and recommeneded.
A: I’m not aware of what it is or what it does
A: I’m not familiar with AirWatch and therefore I have not used it.

A-32 | Appendix A - Full Comments • Stanford University IT 2015 Client Satisfaction Survey
MOR Associates, Inc.
A: If by mobile device you mean smart phone, or cell phone, or tablet that I carry with me, I don’t have one.
A: it is incredibly confusing to configure, and I could not get it to work on my phone.
A: It is my personal device, not provided by Stanford.
A: it seems too invasive.
A: Just needs to get configured.
A: Mobile is only personal use
A: My Apple ID is somehow messed up (Invalid, incompletely set up, etc) and it seems to be needed to set up AirWatch.
A: My cell phone it is basic one. It is not smartphone.
A: My mobile device is personal; I don’t have Stanford data on it.
A: Never hear of it.
A: Never heard of it
A: Never heard of it, so I don’t know.
A: Never heard of it.
A: Never heard of it.
A: Never heard of it.
A: no idea what it is
A: No need
A: no need
A: no need to for my work
A: No reason to
A: not applicable
A: not applicable
A: not familiar
A: not sure
A: not sure what it is, texting codes works for me.
A: Not used for work
A: Not using my phone for Stanford work
A: Only use mobil phone for communication.
A: Only use work email / calendar on phone.
A: Personal device already setup.
A: Personal device that I do not use for work.
A: what is it?
A: what is it????
A: why should I?
A: Why should I?
A: WTH is AirWatch?
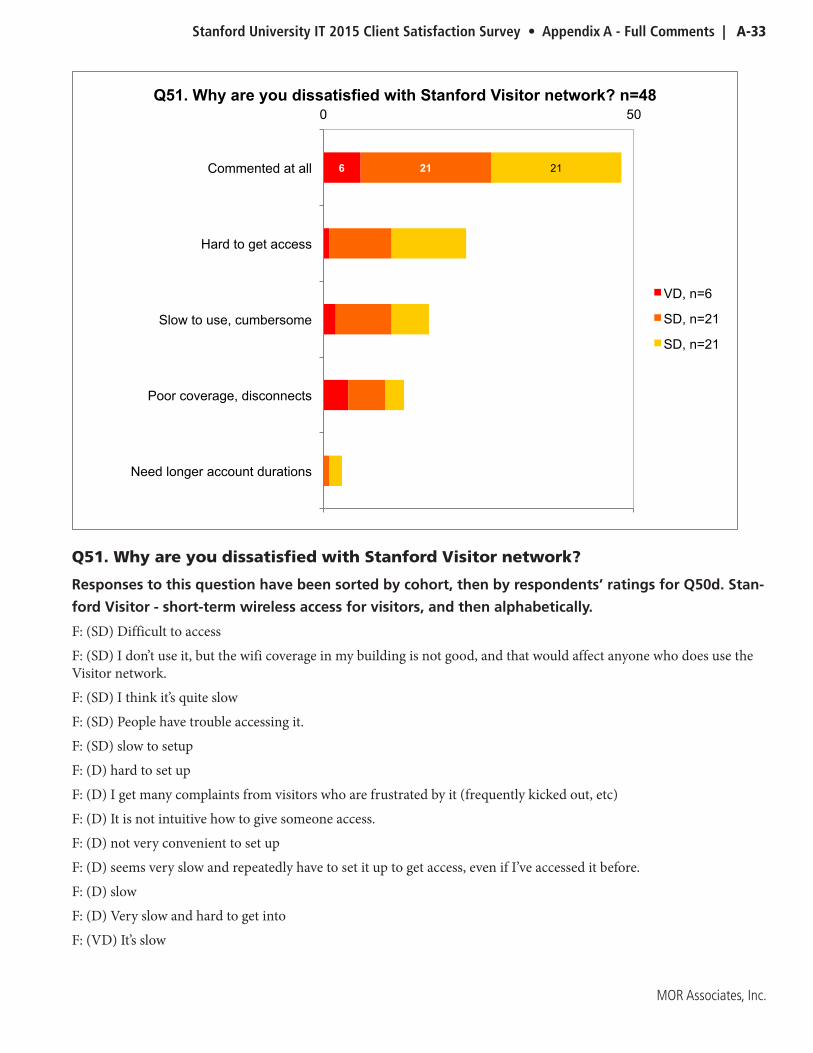
Stanford University IT 2015 Client Satisfaction Survey • Appendix A - Full Comments | A-33
MOR Associates, Inc.
Q51. Why are you dissatisfied with Stanford Visitor network?
Responses to this question have been sorted by cohort, then by respondents’ ratings for Q50d . Stan-
ford Visitor - short-term wireless access for visitors, and then alphabetically .
F: (SD) Difficult to access
F: (SD) I don’t use it, but the wifi coverage in my building is not good, and that would affect anyone who does use the Visitor network.
F: (SD) I think it’s quite slow
F: (SD) People have trouble accessing it.
F: (SD) slow to setup
F: (D) hard to set up
F: (D) I get many complaints from visitors who are frustrated by it (frequently kicked out, etc)
F: (D) It is not intuitive how to give someone access.
F: (D) not very convenient to set up
F: (D) seems very slow and repeatedly have to set it up to get access, even if I’ve accessed it before.
F: (D) slow
F: (D) Very slow and hard to get into
F: (VD) It’s slow
6 21 21
0 50
Need longer account durations
Poor coverage, disconnects
Slow to use, cumbersome
Hard to get access
Commented at all
Q51. Why are you dissatisfied with Stanford Visitor network? n=48
VD, n=6
SD, n=21
SD, n=21
A-34 | Appendix A - Full Comments • Stanford University IT 2015 Client Satisfaction Survey
MOR Associates, Inc.
A: (SD) Applicants who were applying to our program during interview season could not access the internet.A: (SD) bumps you off too quicklyA: (SD) cumbersomeA: (SD) Drops connections frequentlyA: (SD) hard to connect sometimesA: (SD) I run programs on campus that last longer than 2 weeks, and to renew the guest wireless access every two weeks is a pain in the neck. I think there should be some flexibility there for some programs on campus that last longer than two weeksA: (SD) It doesn’t always work. For instance, when I have visitors at a conference and they have their iPads or other tablets, they are not able to reach the Stanford Visitor network. It doesn’t show up at all as an option to connect to wifi.A: (SD) It is mainly an awareness thing on my part - I don’t know how to get visitors set up quickly.A: (SD) It times out at different locations.A: (SD) Not easy to configureA: (SD) Not great performance when connectedA: (SD) On the occasion when I had guests, it was difficult to log on.A: (SD) SlowA: (SD) Sometimes the network connects and there’s no problem, and other times, it blocks access to the network.A: (SD) Speed is slow and difficult to connectA: (SD) Wish I could set up a longer access time period for vendor work.A: (D) hard to connect; crappy bandwidthA: (D) Having used it, it is incredibly slow and cuts out a lot.A: (D) I have never been able to make it work. I tried to access it once on my phone and now I can never get Wifi on/near campus on my phone. This is probably more user error than a serious network issue though.A: (D) it doesn’t always connect.A: (D) It is really complicated to get people signed in to use itA: (D) It resets very frequently which is very annoying.A: (D) Its limits.A: (D) Multiple sign ups required and unable to resign quicklyA: (D) not enough coverageA: (D) problems for visitors logging in and disconnects repeatedlyA: (D) slowA: (D) So slow! Have problems downloading things on tablet for work when walking around campus/med center.A: (D) too slowA: (D) why do you have to register? seems nosy.A: (VD) Doesn’t connect wellA: (VD) it is EXTREMELY slow and often disconnects.A: (VD) It is not available in all locations where it is needed.A: (VD) My visitors always have trouble connecting to the wifiA: (VD) Not reliable

Stanford University IT 2015 Client Satisfaction Survey • Appendix A - Full Comments | A-35
MOR Associates, Inc.
Q52. Are there locations on campus where improved wired or wireless network connectivity is needed? Please list the locations and be as specific as possible.
Responses to this question have been sorted by cohort, then by respondents’ ratings for Q50c . Wire-
less (Wi-Fi) network access, and then alphabetically .
F: (VS) coupa café /outside of Green library
F: (VS) My office. There is HORRIBLE reception here.
F: (VS) need more in asc physicians room
F: (S) Basements of Mitchell and Green buildings… no cell phone reception, I don’t know about wifi
F: (S) G306
F: (S) Inside the animal facility that is underground
F: (S) Schwab and GSB
F: (S) The wireless connection in my office (Bldg. 260) is poor.
F: (S) Walkways between buidlings on Blake Wilbur Dr, Welch Rd, parking lots
F: (SS) CCSR - 4th floor
F: (SS) grant
F: (SS) hrp redwood bulding
F: (SS) My Office
F: (SS) outdoor coverage -- around Bio, Gates, between campus Bio buildings and Med school
F: (SS) Packard building in EE department has a terrible wifi connectivity.
F: (SS) The hospital H2110
F: (SS) Underground in RAF1 and RAF2
F: (SD) Blg 120
F: (SD) CCSR Building has poor wifi coverage.
F: (SD) Edwards R213
F: (SD) Grant building
F: (SD) I lose the network when I’m on Mayfield, near the Clayman Institute and FloMo.
F: (SD) Lane History Corner - entire building
F: (SD) Stanford wireless within LPCH is spotty
F: (SD) The hospitals still have areas with poor wireless coverage. Also, when walking from a hospital-covered zone to a Stanford-covered zone, my iPhone gets confused, resulting in websites or email not loading.
F: (SD) Wifi on campus, outside buildings, is not reliable and the Stanford connection gets lost frequently on mobile devices. There is no support for the usage of eduroam, especially for Stanford faculty when they are at other institu-tions in the US and abroad.
F: (D) Hospital, Grant Building, many sites across the medical school.
F: (D) Quad classrooms
F: (D) School of Medicine
F: (VD) 520
A-36 | Appendix A - Full Comments • Stanford University IT 2015 Client Satisfaction Survey
MOR Associates, Inc.
F: (VD) Huang building, cell phone communications. We cannot call and our desk phones acnnot be transferred. That’s progress!!!
F: (VD) LKSC conference center in basement.
F: (VD) McCullough Building (3rd floor at least). Much faster to set up my own wifi hotspot than try to connect to Stanford or eduroam (both have same slow speed and poor signal strength).
F: (VD) Welch Road area
F: (NR) All of my work life on campus is spent in my office or the classroom and connectivity is fine in those locations.
A: (VS) at the Oval areas
A: (VS) Building basements seem to be an issue in general. I’ve noticed this especially in Main Quad buildings and School of Medicine buildings. Also, many of the Marguerite buses contain signs that say the wireless connectivity has recently been improved, but I still have issues connecting to wireless on the buses.
A: (VS) FCTR (it often boots me off because another device, probably a printer, hiijacks my IP address)
A: (VS) I attend a lecture in Lathrop library and I do not have any connectivity in the large lecture room.
A: (VS) I was having a lot of problems the last few months, but then IT reinstalled my wifi driver and now it works well the places I use. I have heard staff say they have trouble with wifi at James Clark Center.
A: (VS) In the dorms for people who do not live in the dorms. I would still like to be able to access wireless networks using my stanford computer when I am at a meeting in the dorms. Right now a RCC has to put your computer on the network, but I think there should be an override for staff/faculty who are in the dorms. I am a pre major advisor, but I cannot go online there.
A: (VS) Indirectly related, the Neukom building does not get cell phone reception for either Verizon or At&T which makes it difficult to receive texts and push notifications when prompted.
A: (VS) Lathrop 180
A: (VS) On the Marguerite shuttles.
A: (VS) Sometimes on Santa Theresa by Roble there are dead spots, generally very accessible.
A: (VS) The Arrillaga Outdoor Education and Recreation Center (AOERC); I sometimes get poor wireless connectivity in the gym, which is located on the basement level.
A: (VS) The Dish Trail.
A: (VS) Wireless networks out by palm drive
A: (S) 3000 El Camino Real, 94306
A: (S) 750 Welch Road #319 and 750 Welch Road #104 (University personnel only)
A: (S) 800 Welch Road. The wifi connectivity is not stable all the times. There are incidents where wifi connectivity is limited/unavailable before 8AM.
A: (S) All meeting spaces for major events. PS I’ve now been on hold for 28 minutes. . .
A: (S) Arrillaga Family Dining Commons
A: (S) At my desk at Porter drive, wifi is iffy. It has been reported via tickets. It was fixed, but it breaks from time to time.
A: (S) basement conference room in Building 170
A: (S) basement of Edwards, Beckman Bldgs
A: (S) Branner Earth Sciences Library. Particularly in the teaching area
A: (S) bus stop

Stanford University IT 2015 Client Satisfaction Survey • Appendix A - Full Comments | A-37
MOR Associates, Inc.
A: (S) Coupa cafe on the engineering quad, parking structures
A: (S) Escondido village?
A: (S) I seem to get pretty good wifi connectivity wherever I’m at on campus; no other suggestions for ethernet connec-tivity.
A: (S) I sometimes have trouble with wifi in the Track Lot at Galvez and Campus.
A: (S) Locker rooms inside of Maples Pavilion
A: (S) Main quad towards oval park.
A: (S) My ethernet never works.
A: (S) My office had been somewhat iffy but that seems to have been pretty much fixed (HRP).
A: (S) our office wireless connection often goes out.
A: (S) Parking lots and outdoor locations
A: (S) Perhaps the Oval could use a boost.
A: (S) Poor network connection at times (not often) in the Alway Building of the School of Medicine.
A: (S) The oval
A: (S) Wilbur and Toyon residential area.
A: (S) y2e2 service seems to be less reliable and less fast that, for example, my old office in the main quad . . .
A: (S) yes, our offices are in the basement (quad 01, bldg. 170) and wifi is spotty
A: (SS) 770 welch suite 100 conference room-- have to try to connect to Surf Central multiple times
A: (SS) areas within Green Library
A: (SS) Basement stack area of East Asia Library
A: (SS) Bing Concert Hall, Maples Parking Lot
A: (SS) Could not get wifi sitting in chair outside the bookstore.
A: (SS) Encina hall did not have a good connection for Stanford Visitor.
A: (SS) Everywhere, parking lots, just all over campus, not necessarily just inside buildings.
A: (SS) Fourth Floor Wallenberg Hall
A: (SS) Green East Room 251 Wifi is very weak
A: (SS) I frequently use wifi in the basement of Y2E2 and sometimes it’s either not available or extremely slow.
A: (SS) in grant building
A: (SS) Inside the libraries (wired).
A: (SS) Knight Management Center, Encina Hall, Serra Street
A: (SS) LKSC
A-38 | Appendix A - Full Comments • Stanford University IT 2015 Client Satisfaction Survey
MOR Associates, Inc.
A: (SS) main quad
A: (SS) My office in Herrin Hall in the hallways in Herrin Hall
A: (SS) Near the athletic facilites. Often I have no access there.
A: (SS) Parking Lot at Bonair Siding, 315 Bonair Siding
A: (SS) Right outside of buildings and open spaces like the main quad or the path between Lathrop, Littlefield and His-tory Corner.
A: (SS) The campus should be universally covered
A: (SS) Toward downtown Palo Alto in the trees it might be nice to get some wifi.
A: (SS) Verizon access is spotty in the med school.
A: (SS) Via Ortega and Campus drive.
A: (SS) when walking between buildings, sometimes service can be lost (not a big deal).
A: (SS) Wired performance is low in CERAS and Cubberley
A: (SS) Wireless network access is extremely limited in the tunnels especially in RAF areas and also in Clark basement
A: (SS) Yes! Munger Bldg 5 (all offices have poor wireless connectivity), Arrillaga Family Dining Commons conference room and offices.
A: (SS) Yes. For some reason, during lunch (sometimes), the wireless network will be down for a few seconds and up again and again; it’s not stable.
A: (SD) Around Wilber Field and between Stern and Munger
A: (SD) Can’t get good connection to the Stanford Wi-Fi netwwork on my Mobile Device at 1841 Page Mill Road.
A: (SD) Cantor Arts Center: Scholtz Conference Room, Auditorium, Classroom, Galleries, my office.
A: (SD) everywhere!
A: (SD) I cannot use wifi on my phone on campus at all. It is horribly slow.
A: (SD) I couldn’t get wireless service in the parking lot at the intersection of Santa Teresa Street and Campus Drive West this morning.
A: (SD) I have tried to use wifi in Sweet Hall conference rooms on the first floor and in a Law School meeting on the 2nd floor (sorry can’t remember where exactly) and each time I’ve had the wifi suddenly stop working for no apparent reason. Possibly this is because of my (Stanford-owned) laptop and not the wifi as such.
A: (SD) Marguerite shuttle and area near Cancer Center- internet is extremely slow.
A: (SD) R&DE Dining - Pampas Lane
A: (SD) Redwood City 425 Broadway campus.
A: (SD) RWC
A: (SD) Sometime wifi at 1070 is spotty
A: (SD) sometimes the wifi gets very slow near the hospital in the Grant building.
A: (SD) The courtyard outside Munger Market & Russo is a dead zone.
A: (SD) Yes--I still have trouble accessing internet in some areas
A: (D) Definitely Packard
A: (D) El Camino Hospital
A: (D) Lagunita dining room, Lagunita dining office, Lagunita basement.

Stanford University IT 2015 Client Satisfaction Survey • Appendix A - Full Comments | A-39
MOR Associates, Inc.
A: (D) LKSC CCSR
A: (D) Medical school campus between buildings
A: (D) MSOB
A: (VD) 800 Welch Road, outdoor areas of the medical campus, including SHC and LPCH, in general
A: (VD) Wireless access in the School of Medicine is atrocious. If you look in your records, you will see that I have lodged at least 10 complaints about this over the last 7 years. I have given up!
A: (NR) After moving from Arastradero to MSOB, stable connectivity in MSOB seems less stable with slower speeds.
A: (NR) Don’t know.
A: (NR) Dropped mobile calls and slow wireless for other users in Gilbert Building on campus.
A: (NR) Yes, but at the moment I can’t recall.
A-40 | Appendix A - Full Comments • Stanford University IT 2015 Client Satisfaction Survey
MOR Associates, Inc.
Q57a. Other item factoring into dissatisfaction with Stanford Box
Responses to this question have been sorted by cohort, then by respondents’ ratings for Q56a . Stan-
ford Box, and then alphabetically .
F: (SD) Clunky
F: (SD) I am not sure how to get there, how to put stuff on, what the space limits are, what the sharing abilities are (inside and outside Stanford).
F: (SD) It has problem with syncing files and this can have negative consequences when I am collaborating on a paper or proposal close to a deadline. Sometimes even small files take forever. I have also used Google Drive and Dropbox. Dropbox is the most reliable one.
F: (SD) it’s not as easy to use and intuitive as Dropbox, which I’ve used for years
F: (SD) Mateirals are hard to read and scroll through. There’s no reason documents can’t look just as good as they would in Adobe Acrobat, even if you can’t print or copy them.
F: (SD) not easy to find
F: (SD) Slow, clunky interface.
F: (SD) Unlike dropbox, its hard to access it directly from my desktop. Additionally, not all files are accessible from “my computer” setting. Just a pain
F: (D) access problems
F: (D) Don’t sync properly
F: (D) Very hard to get access - very confusing. Hate it.
F: (D) Very slow to upload and download large amounts of data. Essentially impossible to upload any data larger than 9 GB (quite a small size).
F: (VD) do not know how to use it, can’t figure out password, need to double sign in
F: (VD) It is the worst “upgrade” I have experienced at Stanford. It is heavy, clumsy and simply gets in my way of com-municating with people.
F: (VD) Just compare Stanford Box to Dropbox which I also use. Box has horrible sync and upload capabilities. You cannot easily upload lots of small files as we often need for scientific collaboration (Dropbox has no problems, but Box has file number limits and sometimes requires web interface, which is horrible and buggy). Also the new version (4.0) no longer allows one to switch between private and corporate accounts without a complete re-sync, which 3.0 allowed. Box seems to have no timeline to add this feature back.
F: (VD) Not stanfordmedicine box is still not working on my desktop, still working on a fix.
F: (VD) They have configured a couple times. The configuration never holds. I cannot use it reliably. I find it frustrat-ing that my productive time is consistently impaired on what seems to me should be a standard function.
F: (VD) This is terrible - it doesn’t work half the time and I seem to get in cycles. It is not logical.
A: (SD) Half the time something is stored on Box and the other half of the time it’s on Google. I spend way too much time trying to figure out where someone put something. Would be easiest to have just one option so everything is in one place.
A: (SD) No clean process for uploading large quantities of files. Large groups of subdirectories import around 1mbps. Viewing content is frustrating with things being organized haphazardly by recent usage or name but not by most used.
A: (SD) Trying to keep straight which box StanfordBox or StanfordMedicine Box is ridiculous. Could you guys not have worked together on this and just used one Box application?
A: (D) Sync speed is ridiculously slow. I use my personal DropBox for most things because of this.

Stanford University IT 2015 Client Satisfaction Survey • Appendix A - Full Comments | A-41
MOR Associates, Inc.
A: (VD) I can’t even LOG IN, nor can I find FACs that give me the LOG IN location. And I hear from coworkers who’ve managed that features make it a pain to share use.
A: (VD) I have contacted many different people on campus, and no one can figure out why my Stanford Box doesn’t work. This failure prevents me from accessing shared files and impedes my work flow.
A: (VD) What a piece of bloatware! I hate having to click through so many things and installing that stupid opswat gears cert everytime
A-42 | Appendix A - Full Comments • Stanford University IT 2015 Client Satisfaction Survey
MOR Associates, Inc.
Q58a. Other item factoring into dissatisfaction with Stanford Google Apps (e.g., Google Docs, Google Drive)
Responses to this question have been sorted by cohort, then by respondents’ ratings for Q56b . Stan-
ford Google Apps (e .g ., Google Docs, Google Drive), and then alphabetically .
F: (SD) I find Google docs to be really clunky! I ‘m not sure how the Stanford version is different ...
F: (SD) I like google docs, but I am confused about my gmail version and my stanford version - there are two, they aren’t the same. I would like them to be integrated into one.
F: (D) I experience a lot of bugs with Google Apps such as random languages appearing when opening spreadsheets, and also
F: (VD) I don’t trust Google. I find Google docs difficult to work with, especially because multiple users can work with scientific documents when they have different reference managers.
A: (SD) Half the time something is stored on Box and the other half of the time it’s on Google. I spend way too much time trying to figure out where someone put something. Would be easiest to have just one option so everything is in one place.
A: (SD) Not everyone knows how to use these applications, so the majority of the work time is spent teaching.
A: (SD) Overuse of Google Docs for things that can be in email or tickets.
A: (D) difficult to find documents; hard to track who has access; these apps seem more geared toward socializing and having fun as opposed to working in an organized and confidential manner. PPS I’ve now been waiting on the phone for 33 minutes. . .
A: (D) Passwords. Always changing passwords.

Stanford University IT 2015 Client Satisfaction Survey • Appendix A - Full Comments | A-43
MOR Associates, Inc.
Q59a. Other item factoring into dissatisfaction with Confluence
A: (SD) I prefer using Google products. The login process takes too long.
A: (SD) Lots of redundancies and piles of notifications about small changes by default.
Q60a. Other item factoring into dissatisfaction with BlueJeans
Responses to this question have been sorted by cohort, then by respondents’ ratings for Q56d . Blue-
Jeans, and then alphabetically .
F: (SD) Cuts out, poor video performance
F: (SD) Poor quality picture and experience compared to skype or facetime. Confusing user interface. Just basically does not work well -- end up switching to skype, facetime or just phone conference because quality so poor.
F: (SD) We have had some calls where there is a very bizarre echo that has forced us to stop using it. We now use We-bEx as it is more reliable.
F: (D) It is another level of complexity, another thing that takes time to learn, and it doesn’t seem to work very well. I suppose it’s like everything else in IT. You require users to spend hours learning how to use it, then You push out an upgrade. The features change, and the time that you’ve invested to learn this system is squandered.
F: (D) Poor quality. It seems Webex was better.
F: (D) We have had repeated problems with participants getting disconnected or not being able to show their screen. We set up an appointment with tech support and they couldn’t figure out what was wrong. We think it helped to have participants use google chrome rather than internet explorer but that has not been 100% reliable either. The interfact is not as user friendly or intuitive as webex. We never had these problems with webex and really miss it.
A: (SD) audio drops in and out, video degrades
A: (SD) Person at Columbia could not set herself up for meeting, we had to use alternative means. Interface not as friendly as WebEx.
A: (SD) There is a feedback issue when using a laptop speaker vs calling in so there are additional steps if I want to use my computer microphone rather than call in.
A: (VD) Can’t see who is on the call, difficult to download recordings, can’t change the pin/passcode, spotty sound quality
Q61a. Other item factoring into dissatisfaction with Jira
A: (SD) They are unnecessary mandatory fields that added to my time in creating Jira tickets
Q62a. Other item factoring into dissatisfaction with Stanford Instant Messaging (Adium, Pidgin)
A: (SD) I hate logging into kerberos before I log in. It’s a barrier to entry that sometimes stops me from asking a quick question via IM.
A: (SD) It’s difficult to add people and using kerberos ticketing is difficult on mac 10.7+
A: (SD) No mobile client = not so useful. I’m going to test slack. Cisco Jabber is coming and that might fix it.
A-44 | Appendix A - Full Comments • Stanford University IT 2015 Client Satisfaction Survey
MOR Associates, Inc.
Q63a. Other item factoring into dissatisfaction with Mailing lists (Mailman)
Responses to this question have been sorted by cohort, then by respondents’ ratings for Q56g . Mail-
ing lists (Mailman), and then alphabetically .
F: (SD) Clunky interface. Need to have 8+ characters in a mailing list name is absurd.
F: (D) Clunky web interface, hard to tell what the options are and what to do for simple results. For example, how come when I set up a mailing list, not everyone on the list can post without my intervention?
A: (SD) It is confusing to figure out how to set up the lists
A: (SD) The secure mailing lists are especially problematic when going between stanford.edu and stanfordhealthcare.org. We’ve had multiple issues where stanford.edu and stanfordhealthcare.org recipients are asked to create a login and password to access a secure e-mail, even though that’s impossible. We’ve also had a separate issue where, when you reply all to an e-mail that includes a mailing list, recipients that are not on the mailing list get dropped. So for example, if you send an e-mail To Mailing List A, Person A, Person B, and copy Person C, if someone replies-all, Person A and Person B drop off. Neither issue was resolved to my knowledge. And as such, we don’t trust the mailing lists to behave the way we need them to.

Stanford University IT 2015 Client Satisfaction Survey • Appendix A - Full Comments | A-45
MOR Associates, Inc.
Q64a. Other non-Stanford public service used to collaborate with others on Stanford work
Responses to this question have been sorted by cohort and then alphabetically .
F: Dropbox is far more convenient than Box
F: email attachments
F: evernote
F: Evernote
F: facetime
F: I am going to have to escape the Stanford system one way or another.
A: Adobe Connect
A: Although a Stanford tool, I have to use Stanford Medicine Box
A: Apple shared photo albums, Face Time
A: Asana.com
A: Blackboard Collaborate, GoToMeeting, Google+
A: FaceTime
A: GitHub. Stanford should have an internal Github instance. I actually can’t believe we don’.t Yale does. That’s a little embarrassing, actually, with the amount of code this place produces.
A: Google hangout
A: HipChat, GitHub
A: I am careful never to mix my Stanford tasks with other things.
A: I do not like that I have to switch log ins for google, so I usually log in with my google gmail account instead of my stanford account. I do not find it easy to swtich.
A: I use Stanford Medicine Box, we have our own confluence. These are Stanford School of Medicine instances.
A: iContact for mailings (we use both mailman + icontact for mailing depending on nature of the info, whether we need attachments, etc.), regonline for event registration. We used to use WebExOne to share documents with non-Stanford people, but that has been discontinued and we have started using stanford.box.com. One of our external sponsors in not allowed to use stanford.box.com (or anything other than what their IT has approved & vetted), so we usually send them a CD with documents if needed.
A: My research with the MS mouse model doesn’t require any of this.
A: Screenhero
A: Stanford Medicine Box
A: texting
A: Wrike
A: Wunderlist

A-46 | Appendix A - Full Comments • Stanford University IT 2015 Client Satisfaction Survey
MOR Associates, Inc.
Q65. Why do you choose to use non-Stanford, public services to collaborate rather than using Stanford’s similar offerings?
Responses to this question have been sorted by cohort and then alphabetically .
F: 1) Didn’t know Stanford had some of these 2) I am not keen to have Stanford between me and public services. E.g., ITSS has a portentous link requiring that I sign off on some “agreement” before I can use Stanford Google apps -- but I can use Google anyway. 3) I am generally concerned about privacy and am very skeptical about Stanford’s commitment to privacy versus security
F: asked to do so by colleagues
F: Because collaborators elsewhere expect that I use them
F: Because collaborators use them
F: Because I collaborate with others who use these tools and it is not a fair request ask them to learn new software and procedures for something that’s otherwise fairly straightforward.
F: because I work with people outside of stanford
F: Because others have chosen them
F: because stanford similar offering do not allow sharing with people that are not stanford affiliates
F: Because the Stanford offerings are redundant and difficult to use for collaborators that are not on campus and unfa-miliar with them.
106 159
0 50 100 150 200 250 300
I don't use non-Stanford offerings or promise not to
Burdensome policies
Features / storage
Unaware
Habit
Better/easier
Others collaborating with me
Commented at all
Q65. Why do you choose to use non-Stanford, public services to collaborate rather than using Stanford's similar offerings? n=265
F, n=106
A, n=159

Stanford University IT 2015 Client Satisfaction Survey • Appendix A - Full Comments | A-47
MOR Associates, Inc.
F: Because those are the ones that I know how to use. And when collaborators are not Stanford folks.
F: Better documentation and don’t need pesky SU security procedures--instead use 1Password.
F: better quality. easier to use.
F: collaborators outside of stanford can use those services.
F: Colleagues are not Stanford affiliated and I se the systems they use.
F: convenient, easier if non risky
F: Don’t anymore
F: Don’t know about it.
F: Don’t know Stanford’s offerings
F: Dropbox is a LOT easier to use.
F: Dropbox is the easiest to use and is very user friendly. Box is not.
F: Dropbox works better than Stanford’s offerings.
F: Ease of access.
F: ease of use
F: Ease of use
F: easier
F: easier & others do it
F: Easier and more convenient
F: Easier for me and others to get in and out
F: easier to communicate with colleagues at other universities around the world
F: easier to use
F: Easier to use
F: easy to find, embedded in the Mac OS
F: Easy to use.
F: familiarity and convenience
F: Familiarity, and some (like Dropbox) are easier to use.
F: faster, easier, available to others
F: for greater than 50 MB files
F: For non-Stanford related issues.
F: Habit.
F: Have been using for a while. Collaborate with others
F: Historical use
F: I am unaware of the Stanford versions, and I already have the non-Stanford versions installed and running.
F: I believe these public services to be easier to use. If I had an orientation to the Stanford services from IT, I might learn otherwise.
F: I do what takes the least amount of my time.
F: I don’t know about Stanford’s

A-48 | Appendix A - Full Comments • Stanford University IT 2015 Client Satisfaction Survey
MOR Associates, Inc.
F: I don’t know how and it is unclear how non stanford collaborators can acess it without a lot of hassles
F: I don’t know how to use Box or Stanford’s Google docs. I’ve been told that Box doesn’t work great.
F: I don’t know what the stanford version of Skype is- if I know I would use it!
F: I don’t know which is which..
F: I don’t make the decisions. I just use whatever other people ask me to use.
F: I find Dropbox to be easier, more intuitive than Box; also I’ve been using it longer, so perhaps it’s just habit! I LOVE Evernote; love the ease of it.
F: I had a dropbox account prior to coming to Stanford. More Europeans have dropbox than box.
F: I had Dropbox before Stanford provided anything similar, and I’ve continued it, since it has always worked well, and it doesn’t cost much.
F: I had them before Stanford provided Box.
F: I like dropbox more than box. Google docs too
F: I like to keep my private files on a non-Stanford network, and in case I ever leave the University I don’t want to have to transfer large amounts of data to my own personal service.
F: I like widely used tools that are likely to remain supported, and I don’t think the university should be expending resources duplicating these.
F: I might buy a personal prescription to webex since Bluejeans has not worked well for me
F: I need to collaborate with people who are not Stanford affiliated,
F: I only use them when other present them for my use;
F: I use those when collaborating with people outside Stanford -- usually at their request. Also, when Stanford took over Google accounts, a lot of confusion has ensued. It sometimes happen that when I try to make changes to Google accounts (gmail, youtube) that I set up independently of Stanford, it now tells me that I need to contact a Stanford administrator to make changes. I really dislike the way that Stanford hijacked these pre-existing Stanford accounts and I’m not sure why that happened.
F: I was invited to use them by collaborators who are non-Stanford employees or students.
F: I was not aware of a Stanford alternative to Skype. I only use it rarely for Stanford business anyway.
F: i’m not informed about the others
F: I’m not sure. Perhaps I wasn’t aware of the Stanford offerings.
F: I’ve been using DropBox and Google services for years.
F: If I do, it will be because Stanford has put so many obstacles to communication that it will be easier to get around it.
F: It depends on availability by collaborators and sometimes they have access to Skype quicker than say learning to use bluejeans
F: It depends on the way I get an invitation to collaborate. I don’t choose to use non-Stanford services but simply go with whatever is being used.
F: it is driven by choice from collaborator
F: It is easier and better
F: It was easier to load and more intuitive to use.
F: It’s for work with colleagues in other locations. For example, they initiate Google docs or call in via Skype or Google chat.
F: just disorganized
Stanford University IT 2015 Client Satisfaction Survey • Appendix A - Full Comments | A-49
MOR Associates, Inc.
F: long term familiarity
F: Mainly determined by other collaborators.
F: more convenient - familiarity with them
F: my collaborators are not at stanford; we have been using those services well before any of them were available through Stanford, so what switch?
F: no idea
F: no oversight by Stanford
F: no particular reason
F: No use Stanford
F: Non-Stanford applications seem to be more reliable!
F: Once already using and familiar with it, hard to switch.
F: Others can access them
F: Privacy, ease of use
F: See earlier comments. Dropbox very solid, reliable, robust sync. Only problem is storage limitations. Stanford should negotiate site license with Dropbox rather than use unwieldy products like Box.
F: Several reasons: 1) Dropbox is much more reliable than Box and Google Apps 2) Microsoft Lync and WebEx since some collaborators are in companies that only use those software.
F: Some work better, like Skype I use others sometimes because my collaborators are using them.
F: Sometimes it is because the non-Stanford person initiates
F: sometimes share personal, none stanford stuff with family
F: Sometimes the public offerings are available and known to me before the Stanford ones.
F: Stanford Box is very hard to use. It doesn’t let me get set up. Hate it.
F: Stanford makes everything more difficult, I even use email from google instead of Stanford webmail which is awful. Dropbox and GitHub are much better than anything Stanford has to offer.
F: Started that way and it’s easier now
F: Started using them early and they worked, so never changed.
F: suggested by outside colleagues
F: support to other people
F: That is what I get asked to use for virtual meetings
F: they are better, and GSE IT told me to
F: They are easier (especially Dropbox)
F: They are easier or better.
F: They are more user friend, better documented, and reliable.
F: To work with colleagues at other institutions.
F: Whatever is easy.
F: when they’re easier to use (for example Dropbox has an easier interface than Box b/c I can see all the files in the folders just like a regular folder) if my collaborators are already using them if I’m already using them
A: Already familiar with those services.
A-50 | Appendix A - Full Comments • Stanford University IT 2015 Client Satisfaction Survey
MOR Associates, Inc.
A: As far as I know there is not a Stanford offering that has the capabilities of Wunderlist. This is also only amounts to a tiny portion of my workload.
A: Because I am used to it
A: Because in some cases there aren’t similar offerings (github) and in others the Stanford Services don’t perform as well (Box vs Dropbox)
A: Because many of my colleagues and collaborators do not have access to the stanford services
A: Because person chairing the group at another university uses drop box
A: Because the guest does not have it ready to use.
A: because the other party initiated the exchange
A: Because the other party prefers to use skype at times.
A: Because the Stanford offerings have poor user interface design, or do not perform the functions I am looking for.
A: been using them before Stanford offered the similar ones.
A: Blue Jeans does not have access yet to do webinars for large groups, and I would love to finally have that functional-ity complete as we conduct many webinars.
A: can’t do google hangouts with stanford account
A: Cause they work well and are established
A: Collaborators sometimes make the choices
A: Convenience
A: Depends on what email accounts I am on.
A: Did not know there was a Stanford alternative.
A: didn’t know stanford offered google apps
A: Does Stanford provide video messaging, similar to Skype? If they do, we don’t use it because we don’t know it exists.
A: Don’t know about the similar offerings.
A: Driven by Faculty usage decisions.
A: Drop is legacy. No good chat app available yet.
A: Dropbox integrates seamlessly with MacOS. Webex is a very standard tool used by many companies that I deal with.
A: Dropbox is easier to use than the Stanford box
A: Dropbox is far easier to use than Stanford BOX
A: Ease of access to sign in. I already have my google drive account and I like using it and not switching between.
A: Ease of use
A: Ease of use
A: Ease of use for non-stanford collaborators not familiar with certain services
A: Ease of use, scriptability, cross-platform availability. These days everyone seems to make the assumption that one is on a Mac or a PC. But as a technical researcher, I need Unix capabilities.
A: Ease of use.
A: ease of use.
A: easier

Stanford University IT 2015 Client Satisfaction Survey • Appendix A - Full Comments | A-51
MOR Associates, Inc.
A: easier
A: Easier
A: easier than having to 2 step authenticate to do something
A: Easier to use
A: easier to use
A: Easier to use, better functionality, other parties know how to use them
A: Easier to use, used by more people - easy to share/collaborate
A: easy
A: Easy and intuitive
A: Easy to use, familiar, have been using these for years; do not use them for secure or confidential information
A: Either the features are easier to use or our current Stanford services just don’t meet the type needs we have. For example, it’s much easier to figure out regonline’s registration interface, than set up something similar in Qualtrics. It’s something we can do ourselves as well without having to pay a Stanford on campus service and it may or may-not be less expensive, but we can set it up without having to ask someone else to do it.
A: Example: Google web forms is superior to Stanford Forms, but Stanford forms looks more professional. I would like to see more in-house development that competes with non-Stanford products.
A: Faculty have been using for a while and they’re not ready to use G-Drive
A: folks outside of stanford use those for collaboration with me
A: Google drive is the best when it comes to live docs for revisions etc.
A: group decision - no longer use these
A: Habit
A: Habit and long-term use of GoogleDocs outside of Stanford. No PHI-related activities done there, of course.
A: had it set up already and the information is not sensitive.
A: Have been using it a long time. Works on personal devices, too.
A: Honestly I was not aware that Stanford offered all the services listed on the past couple of pages.
A: I already have personal accounts set up.
A: I already know them; already using them.
A: I am already using them for personal reasons and have familiarity with the software.
A: I am not aware of Google apps being available to us here in MCD. I would LOVE to be on the Google platform and be able to use these features through Stanford. Again, I am not aware of any messaging system within Stanford. We have found it easiest to use Yahoo IM or Google Chat.
A: I am not sure
A: I am told to by my group
A: I am unaware of a Stanford sponsored service for web/video conferencing. Our Team use zoom.us
A: I can’t figure out how to get the google apps through my stanford email (I would love to use the Stanford google chat, docs and calendar but don’t know how)
A: I did not know the presence of Stanford’s offerings for the services...
A: I don’t collaborate with other Stanford users. I send files to authors and freelancers. Dropbox is the easiest for all parties.

A-52 | Appendix A - Full Comments • Stanford University IT 2015 Client Satisfaction Survey
MOR Associates, Inc.
A: I don’t think Stanford offers this.
A: I don’t use any of this in my work.
A: I enjoy Google products and find that Dropbox is easier to use than Box.
A: I guess because these services come to me from outside users who are using the public services for their work, on which they are asking me to collaborate
A: I haven’t been informed about Stanford services for transferring large files to colleagues. Would love to know about them!
A: I just started with Google Stanford, didn’t know about it til a few days ago. Zoom is preferred by my organization for web conferences due to too many glitches with BlueJeans.
A: I need to collaborate with people in China and with people outside of the Stanford network, making use of Stanford offerings impractical.
A: I should use Stanford’s, I will from now on
A: I use google docs extremely infrequently for work, usually just to fill in my information in a spreadsheet, so I use my existing Google account to sign in.
A: I use these apps : google docs, dropbox, skype for my personal life as well, and so don’t have to know two different sets of software. Life is complicated enough.
A: I used Dropbox to share large files with colleagues before being informed about Stanford Box.
A: I was by R&DE to install Skype on my Stanford laptop for a job interview I was applying for within R&DE
A: I was told upon arrival that many people on my team use this tool.
A: I wasn’t aware that there was a Stanford version.
A: I work with a graphic design team (external to Stanford) and we set up the files on dropbox. It has worked well for us, and I haven’t thought about changing.
A: I work with other colleagues from other institutions that have different programs used by their institutions. It is more convenient to use a more general/public form to collaborate.
A: I’m more familiar with the other technology
A: I’m using both because different colleagues have shared files through both media.
A: I’ve been using Skype for years--prior to Blue Jeans being available. I find it more reliable than Blue Jeans.
A: I’ve been using these services for longer than I’ve been employed by Stanford; I’ve kept using my older accounts.
A: If I’m collaborating with a partner institution who doesn’t have BlueJeans/initiates a call in webex
A: Individuals that I work with out of country occasionally use Skyp. Blue Jeans can be a real pain.
A: Institutional inertia on using Google Hangout and Skype. Our one bluejeans conversation had some reliability prob-lems, but that is not very good data. I should give it a try again. With respect to Google apps, I’m unsure of Stanford’s privacy policy with respect to overseeing materials on Google Apps - that might be a concern. I’m not interested in maintaining two separate google accounts, so I’ve stuck with my personal one for now.
A: It depends on the others. If they are using the other services to collaborate, I go with that service.
A: It has already been established as a method of communication by my team.
A: It is an old account that one of my lecturers has and asks me to use with them.
A: it is what other departments use currently and it works well for the department
A: It originates on their end, and does not involve PHI or HIPPA info.
A: it was setup for me like that before I was full time
Stanford University IT 2015 Client Satisfaction Survey • Appendix A - Full Comments | A-53
MOR Associates, Inc.
A: It’s an extra step to go through Stanford’s version of that when I already have it opened on my google account. Also the things I’m working on in collaboration with others have 0 informational risk.
A: It’s easier to use than using Stanford’s similar offerings.
A: It’s the only tool that’s provided to me.
A: its faster to use google, but not sure if admins are allowed to use it
A: Just out of habit.
A: Legacy -- I already have a Dropbox account that I’m familiar with and use regularly.
A: mix of personal and work related activities, it was historical artifact (I used google apps prior to box and didn’t mi-grate everything over)
A: More choices. Everyone is using something different so I just have to find the one that works with the person I am dealing with
A: More familiar with the non-Stanford services and not aware that Stanford offers equivalent services
A: Most of the people I need to collaborate with are from outside the Stanford community.
A: Much of my work is with non-Stanford affiliates who are not university employees, and who cannot use the Stanford versions, or can only do so with difficulty.
A: My work involves talking to international partners regularly. Skype is necessary.
A: Never gave it any thought.
A: no good reason
A: non attached to my stanford affiliation.
A: non-Stanford initiated collaborations
A: Not aware of a collaboration tool similar to Skype.
A: not aware of Stanford similar services
A: NOT FAMILIAR WITH THEM.
A: not family with it.
A: Not only communicating with on campus people, but also off campus people. Therefore, those services are more familiar with off campus people.
A: occasional, depending on who I am working with, and if it is just an “easier” way to do things - for all parties
A: often work off campus
A: One of the labs I work with has a lab Google account so I update their calendar occasionally. They set up the ac-count, not me.
A: Other co works are using them.
A: Our vendor users Zoom, and they schedule the meetings. Slack is all the rage right now. Screenhero (now owned by Slack) has the killer feature of shared control with individual mouse cursors, and it’s just way easier to use than a Bluejeans screen share.
A: personal family use
A: Personal use or was using it BEFORE Stanford Box came on line
A: security blockades to application
A: Simply to consolidate my work products

A-54 | Appendix A - Full Comments • Stanford University IT 2015 Client Satisfaction Survey
MOR Associates, Inc.
A: Since I deal with some PHI all of my Stanford box is encrypted and cannot access it on my laptop. The data I want to access does not contain any PHI and is not related to the projects that do have PHI. I mostly use the Google drive to store files that are too large to send via email or excel files that I collaborate on - I want these to be updated and the most recent version to be saved rather than sending back and forth with collaborators.
A: Skype
A: Skype allows especially quick, efficient communication on non-sensitive matters.
A: Skype is more familiar and easier than BlueJeans. Don’t need to set up a session, just get on the call. Use dropbox when collaborating with external people or when others use it.
A: slack - because it is amazing and stanford jabber does not have mobile capabilities. Frankly, the integration of Adium with kerberos is weird.
A: Sometimes I collaborate with non-Stanford individuals who don’t have an SU ID
A: sometimes my Stanford email always bounce back other’s email
A: Sometimes we don’t have a choice to work with a vendor.
A: Space.
A: Stanford doesn’t have a similar, easy to use platform like Skype that I am aware of at this time for one on one video conferencing.
A: The person sharing files chose to share them with Dropbox.
A: The vendor just used different tools.
A: These are services that others are using for collaboration - so in order to work with them (and they are typically non-Stanford people) I need to utilize these services. Thankfully, more universities are using BlueJeans so we can col-laborate with the same platform. But most of my other collaborations use a wide variety of tools/services -- and they are often the ones initiating the collaboration.
A: They are better
A: They are easier to use for outsiders or an outsider is already using them.
A: They have features that we want, we can update to newer version on our schedule, we have more fine-grained con-trols over the configuration
A: They were the first tools we used, so transitioning out of them must wait for future projects.
A: To engage with partners who don’t have Stanford identities.
A: To facilitate my workflow.
A: typically do not use non-Stanford services
A: Unfamiliar with Stanford services.
A: Unsure if Stanford offers anything similar. Some systems work better, and allow more flexibility.
A: used to Skype, many people around the world use Skype, so great compatibility
A: Usually it’s chosen by the other party. Adobe Connect offers more functionality than other tools.
A: Was not aware of all the options available at Stanford.
A: was not aware that Stanford had a google doc option.
A: Wasn’t aware of the Stanford offerings.
A: We collaborate with non-Stanford organizations, and Dropbox is the easiest way we’ve found to share documents.
A: We started using Dropbox a long time ago and we never switched to Stanford Box. I’m not sure what the exact rea-son is for us not switching over.

Stanford University IT 2015 Client Satisfaction Survey • Appendix A - Full Comments | A-55
MOR Associates, Inc.
A: whatever my colleagues send
A: When an external group has organized a meeting, created content, etc, and they choose to share it with me via a non-Stanford supported avenue, such as Dropbox (for sharing content) or WebEx (for hosting meetings/webinars). With Google Apps, I often find that as long as I’m using my Stanford computer and email address, I’m able to auto-matically access the material via the Stanford-supported Google Apps platform, so it is rare that I use non-Stanford supported Google Apps.
A: When I created new web sites for people from Stanford AND other institution, I need some public services available for faculty outside Stanford.
A: When working with vendors, we use their tools to collaborate with their team. Our Stanford Box account does not have enough space to store large graphics files.
A-56 | Appendix A - Full Comments • Stanford University IT 2015 Client Satisfaction Survey
MOR Associates, Inc.
Q66a. Other Stanford-provided data storage and backup solution used
Responses to this question have been sorted by cohort and then alphabetically .
F: A tech person installed mine so I know I have one just don’t recall the name of it.
F: external back up drive
F: I do use the crashplan from H&S but do not know which of the above is it.
F: I maintain http://stanford.edu/group/SOL/ and need Stanford’s server storage for that. I also use http://stanford.edu/~saunders/tmp/ to share large files with colleagues (instead of filling up email).
F: I think Crashplan is on my computer (at least from the automated messages that pop up), but I’m not sure. I rely on Dropbox for my off-site saving solutions.
F: icloud
F: Multiple external drives and Time Machine on my home computer
F: not sure, it’s the one IT installed
F: Our own (Drobo storage units).
F: Whatever the default is, that’s what I use.
A: BaRS! ha! is it still around?
A: git
A: I back up with a hard disk that sits on my desk. I do not know about these other options.
A: I really don’t know if I use any or all of these.
A: in FMS...rely on Dept IT to manage and take care of.
A: Isn’t Bitlocker a back-up system? I know that it is installed on my desktop computer...
A: might be others that i don’t know about - rely on IT tech in dept. for his expertise.
A: my own backup
A: SoM Crashplan, Stanford Medicine Box, School of Medicine Confluence, School of Medicine server storage
A: Time Machine
A: Time Machine backup to external drive
A: used to use Iron Mountain. WE have now migrated to CarshPlan Pro at SOM

Stanford University IT 2015 Client Satisfaction Survey • Appendix A - Full Comments | A-57
MOR Associates, Inc.
Q69a. Other reason why all computers used for Stanford work aren’t being backed up
Responses to this question have been sorted by cohort and then alphabetically .
F: Because there is no local IT person to help me with this.
F: does not work - get error message from crash plan backup
F: mostly use dropbox on laptop.
F: Only limited number of my computers are allowed to be backed up, but I have more computers than the limited number.
F: traveling with laptop, Time Machine backup drive stays home.
A: I’m in the process of enrolling my personal cell phone on MDM. Everything else is either backed up or enrolled on MDM.
A: Its my personal device and I only use it when I work from home. It doesn’t make a lot of sense to back-up my photos, pictures and other personal material to save a few items that I may work on occasionally. Plus, I am pretty sure using Stanford’s resources to back up my personal life is a no-go.
A: Stanford is not very supportive of my personal laptop. It is difficult to set a time to meet with techs to get set up in the way that is required.
A: The important stuff is backed up manually or is stored in the cloud. An automated solution is probably better, but I’m happy with the system in place.
A-58 | Appendix A - Full Comments • Stanford University IT 2015 Client Satisfaction Survey
MOR Associates, Inc.
Q71a. Other item factoring into dissatisfaction with CrashPlan PROe
Responses to this question have been sorted by cohort, then by respondents’ ratings for Q70a .
CrashPlan PROe, and then alphabetically .
F: (SD) I really have not got much idea where this backup is going and how I would ever use it to restore any thing. It’s pretty opaque.
F: (SD) Need a way to quickly have disk image-level backups, too. VERY VERY slow.
F: (SD) When I restored a laptop that died, 2X the number of files were present., with one copy of each starting with the word “original. . .” Restoring files is not intuitively easy. I’ve done it once but am still not sure how I did it.
F: (D) First, IT services keeps changing the server on me. This has happened at least twice, requiring complete and lengthy backups to restart, and preventing me from accessing any previous backups. Lack of historical backups renders the entire concept limited. Also, as far as I can tell, they were unable to move me to new servers without a lot of work on my part, and seemed not to know why my computers were giving errors. Also, there is now a limit on number of computers I can add, which naturally leaves some not backed up (answer to previous question also). Also, backup is incredibly slow. I have one backup that has been going on continuously for over half a year without finishing. There seems to be a bandwidth cap on server end (not on client software) that prevents large backups from every completing in reasonable time, especially a problem for laptops which are not plugged in to network continuously. Also, Crash-Plan has very poor options for configuring backup away from campus.
F: (D) Very slow to upload files. Very slow to do backups. Slows my computer down considerably, especially on startup.
A: (SD) it disappears for no reason of which I am aware and then I receive stern emails to correct the problem
A: (SD) System very slow when processing back-up
A: (SD) takes bandwidth to perform backups
A: (SD) The darned thing comes on too often and the choice to restrict it from sucking up the bandwith is limited to a max of one day! More choices are needed.
A: (VD) Drains my laptop battery. Went from 6hrs to 2 hrs. unacceptable.

Stanford University IT 2015 Client Satisfaction Survey • Appendix A - Full Comments | A-59
MOR Associates, Inc.
Q72a. Other item factoring into dissatisfaction with File Storage (individual and group)
No responses received .
Q73a. Other item factoring into dissatisfaction with Secure File Storage (individual or group)
No responses received .
Q74a. Other item factoring into dissatisfaction with Server Storage
A: (SD) We have a lot of issues gaining access and providing others with access to shared drives between departments with our division. New employees have taken weeks to secure regular access, which makes getting mundane work very difficult - not sure if this is a problem with the infrastructure, or human error on the part of the programmers.
Q75a. Other item factoring into dissatisfaction with Backup and Recovery Service for Servers (BaRS)
No responses received .
Q76a. Other item factoring into dissatisfaction with Disk-Based Replication
No responses received .
Q77a. Other item factoring into dissatisfaction with AFS
A: (VD) We vitally need mountable file storage such as AFS, which I’ve used since 1990. The AFS space allocation has not kept pace with file sizes. It apparently does not work with backup services such as CrashPlan. When a file is saved or transferred to AFS from OS X, a hidden file is created that prevents the file from being opened. It takes a sophis-ticated Unix user to find and remove the hidden file. A fix for this problem, called extended attributes, is not in the works anytime soon, even with YFS. Finally, there is a problem that causes clients to not be able to find volumes. The only current fix for this is to have the volume moved. I’ve had this happen several times, and each time lost hours of work.
Q78a. Other item factoring into dissatisfaction with Secure AFS
A: (SD) We have a lot of issues gaining access and providing others with access to shared drives between departments with our division. New employees have taken weeks to secure regular access, which makes getting mundane work very difficult - not sure if this is a problem with the infrastructure, or human error on the part of the programmers.

A-60 | Appendix A - Full Comments • Stanford University IT 2015 Client Satisfaction Survey
MOR Associates, Inc.
Q81. Why aren’t you using Stanford’s voicemail to email service in which voice-mails appear in your email inbox?
Responses to this question have been sorted by cohort and then alphabetically .
F: Because I don’t want my voicemails to show up in my email inbox.
F: Because there is no local IT person to tell me about it. I did not know it existed.
F: Cellphone is my primary device. I don’t have voice mail on my deskphone since I am rarely next to my phone
F: Did not know about it
F: did not know about it.
F: Did not know about it.
F: did not know existed
F: Did not know I could
F: did not know I could do that
F: did not know it exists
F: Didn’t know
F: didn’t know about it
F: didn’t know about it
94 206
0 50 100 150 200 250 300 350
Other
I use cell phone
Prefer a different way
Good idea now that I know about it
Don't want to / haven't needed it
Unaware
Commented at all
Q81. Why aren't you using Stanford's voicemail to email service in which voicemails appear in your email inbox? n=300
F, n=94
A, n=206
Stanford University IT 2015 Client Satisfaction Survey • Appendix A - Full Comments | A-61
MOR Associates, Inc.
F: didn’t know about it
F: Didn’t know about it
F: didn’t know about it
F: Didn’t know about it - that would be great, especially when traveling
F: didn’t know about it ... and I get very few voice mails anyway. Most people email.
F: didn’t know about it--but it sounds GREAT! I sometimes go weeks without checking my voice mail because I travel often. this sounds like a wonderful solution!!
F: Didn’t know about it.
F: didn’t know about it.
F: didn’t know about it.
F: Didn’t know about it.
F: didn’t know it existed
F: didn’t know stanford had voicemail
F: didn’t know they exist
F: do not know what you are talking about
F: Do not need it.
F: Don’t get enough voicemail to bother.
F: Don’t have a voicemail box configured - don’t encourage others to leave voicemail messages for me. Prefer that mes-sages are left and evaluated by our office staff.
F: don’t know
F: don’t know about it don’t encourage use of my voicemail at all people get in touch with me through email and cell phone or via staff in office
F: don’t know about it.
F: don’t know how
F: Don’t know how
F: don’t know how to set it up
F: Don’t know how to set up
F: don’t need it, don’t want to learn how. Have a cell phone for critical communications. I prefer phone calls.
F: don’t think necessary
F: hasn’t been necessary
F: Haven’t bothered
F: Haven’t got around to it.
F: haven’t needed it
F: I am not sure I understand the question!
F: I did not I could
F: I did not know this service existed
F: I did not know.
A-62 | Appendix A - Full Comments • Stanford University IT 2015 Client Satisfaction Survey
MOR Associates, Inc.
F: I didn’t know about it.
F: I didn’t know about it. I don’t know how to activate it.
F: I do not have a Stanford phone number. I work mainly at the VA. You haven’t asked any questions about the LAN from Stanford to the VA
F: I do not like to encourage use of the telephone as a way to reach me.
F: I don’t care to check voicemail; if somebody needs to reach me, they should e-mail.
F: I don’t get enough voicemail to justify learning how to do that.
F: I don’t have a Stanford phone.
F: I don’t know about it.
F: I don’t know anything about it
F: I don’t know how to do this.
F: I don’t know how to set it up.
F: I don’t know how to set it up.
F: I don’t know how to use it, never heard about it
F: I don’t know how.
F: I don’t receive very many voicemails.
F: I don’t use Stanford voicemail
F: I don’t use voicemail
F: I don’t use voicemail at all
F: I don’t use voicemail.
F: I don’t want to use it.
F: I get so much spam voicemail, Cruises, Medical devices, whatever, I just don’t want all this junk in my inbox as well.
F: I get too much email as it is. I see no advantage to converting a phone message to a print message for my inbox.
F: I haven’t set it up and I don’t know how
F: I haven’t studied how to do it yet.
F: I just have never set it up.
F: I wasn’t aware the service was available
F: I’d love to. I didn’t know it was available.
F: i’m lazy
F: Need it set up...
F: never heard of it, but do not want even more emails
F: Never heard of it.
F: Never knew it existed
F: Never tried it. I have a secretary to take messages and anything important goes to my cellphone
F: no need
F: no time to setup
F: not aware of how to set this up
Stanford University IT 2015 Client Satisfaction Survey • Appendix A - Full Comments | A-63
MOR Associates, Inc.
F: not been shown
F: Not that aware of this service
F: The sound on IP phone is terrible.
F: There are NO DATES and TIMES attached to voicemail. This is really annoying.
F: These is nothing that urgent that comes as a voice mail. Must we be tied in to every device all the time?
F: Too busy with other tasks, not a high enough priority.
F: too confusing
F: too many emails
F: Very complicated
F: We have separate answering machines for messages.
F: Why should I?
A: Because I have 2 jobs on campus and I only have a phone at one of them. I don’t want to have messages from the one job distracting me from my other job.
A: Because I have not heard of that function before.
A: Because I moved positions and my old # is still coming to my email. I tried to call IT to fix it and I don’t think they understood the problem. I haven’t had time to call again to ask.
A: because I support 8 faculty
A: Because we just changed phones and I don’t know how to set this up
A: Did not know about it
A: Did not know about it.
A: Did not know about it.
A: did not know about voicemail to eamil service
A: Did not know it existed
A: Did not know it existed.
A: Did not know the service was available.
A: did not realize it was available
A: Didn’t have it set-up initially. I plan to do that soon.
A: Didn’t know about it
A: Didn’t know about it
A: Didn’t know about it
A: didn’t know about it
A: didn’t know about it
A: Didn’t know about it till just now; may well start. But not sure about having to delete messages in two places, or if I want all my phone messages to play on my computer for everyone to hear.
A: Didn’t know about it.
A: Didn’t know about it.
A: Didn’t know about it. Also, I don’t really get voicemails, although maybe I would if I knew about it.
A-64 | Appendix A - Full Comments • Stanford University IT 2015 Client Satisfaction Survey
MOR Associates, Inc.
A: Didn’t know it existed
A: Didn’t know it existed - but I will ask around now about how to set it up.
A: didn’t know it existed, also not really necessary.
A: Didn’t know it existed.
A: Didn’t know it existed.
A: Didn’t know it existed. I would like to know how to do that know that I know about it.
A: Didn’t know of that option. How do you do it?
A: Didn’t know that I could ---
A: didn’t know that there was such a service.
A: didn’t know this existed.
A: Didn’t know we had that option. Even still...not sure why I would use. I would most likely just send the email and use the voicemail to email option.
A: didn’t know we had the option
A: Didn’t’ know about it
A: didnt know that could happen
A: Disclosure: I used to design phones for Bell Labs for a living. 1. The phone interface sucks (If a human has to per-sonally train you to use a phone, it sucks.) 2. I prefer to have all phone traffic go to one number, my cell. 3. The handset design sucks. It doesn’t securely nest in the holder. It feels cheap and hollow. The cord is too short. 3. The wireless head phone design sucks.
A: do not know how to
A: do not know there is voicemail in my email box
A: Do not want to play the voice messages on my computer (need a headphone) and also need to look up the instruc-tion to set up.
A: Don’t know about it
A: Don’t know anything about it.
A: don’t know how
A: Don’t know how
A: Don’t know how to activate this.
A: don’t know how to do it
A: Don’t know how to do it.
A: Don’t know how to set it up.
A: Don’t know the service.
A: Don’t know we have this feature
A: Don’t need it.
A: Don’t need to.
A: Don’t want to cross platforms too much. Like having to be physically at my desk.
A: dont care to
A: dont know about it

Stanford University IT 2015 Client Satisfaction Survey • Appendix A - Full Comments | A-65
MOR Associates, Inc.
A: dont know how to
A: dont want to have to see them in two places
A: Had not thought of doing this. Also laziness: have so few voice mails.
A: Have no voice phone
A: Have not made the time to set it up...
A: have not setup
A: Haven’t been introduced on how to use it.
A: Haven’t had the opportunity to use for my work.
A: Haven’t looked into it, but now I will!
A: Haven’t taken the time to set it up
A: havent bothered to set it up 38 minutes
A: Heard of it but don’t know how to set up and haven’t had time to figure it out
A: How?
A: I am not familiar with the service.
A: I am not sure how to set it up. I would love to.
A: I am not used to
A: I am unaware of the feature.
A: I did not know about it.
A: I did not know about it...but would like to!
A: I did not know I had that option
A: I did not know this function existed.
A: I didn’t even know that was an option.
A: I didn’t even know there was such a service.
A: I didn’t know about it and I very rarely get voicemail.
A: I didn’t know about it! I wish I had known earlier!
A: I didn’t know about it.
A: I didn’t know about it.
A: I didn’t know about it. I work on an inpatient setting and I rarely get phone calls. I mostly get secure emails.
A: I didn’t know about it. How do I get access to this?
A: I didn’t know it existed
A: I didn’t know it existed until now. It would be great to use.
A: I didn’t know it existed.
A: I didn’t know it existed. Perhaps it’s not offered to me because of my position here in R&DE
A: I didn’t know it was a thing - I would love to use it!!
A: I didn’t know it was an option.
A: I didn’t know it was an option.
A: i didn’t know it was available

A-66 | Appendix A - Full Comments • Stanford University IT 2015 Client Satisfaction Survey
MOR Associates, Inc.
A: I didn’t know that I could or how to configure
A: I didn’t know that that was available.
A: I didn’t know we had that option.
A: I didn’t know.
A: I didnt know about it
A: i didnt know this exists
A: I do not have a stanford phone? I am not sure.
A: I do not need it.
A: I don’t get many voice mails.
A: I don’t get phone calls
A: I don’t get that many calls and often forward my desk phone to my cell phone when involved in larger event coordi-nation to ensure people can reach me.
A: i don’t get that many phone calls/messages so it seems unnecessary
A: I don’t get that many voicemails.
A: I don’t have a dedicated office phone line.
A: I don’t have a desk phone. I only use a cellphone.
A: I don’t have a need for it at this time.
A: I don’t have a need for it.
A: I don’t have a personal voicemail.
A: I don’t have a phone at my desk or ana assigned work phone; I receive phone calls on my private phone.
A: I don’t have a Stanford phone or voicemail.
A: I don’t have a Stanford phone.
A: I don’t have a voicemail at stanford.
A: I don’t have voicemails account.
A: I don’t know about this service
A: I don’t know how to do that.
A: I don’t know how to use
A: I don’t know how to use it
A: I don’t know how to use it
A: I don’t know how to use it.
A: I don’t know how to use it. Never occurred to me
A: I don’t know how to use that.
A: I don’t know how.
A: I don’t know what this means.
A: i don’t receive very many voicemails so there isn’t a need
A: I don’t use a computer at work. My Stanford messages are forwarded to my home computer.
A: I don’t want to see my voicemails in my email; I’ll respond once I’m back in the office.

Stanford University IT 2015 Client Satisfaction Survey • Appendix A - Full Comments | A-67
MOR Associates, Inc.
A: I forward calls to my mobile. I find the voicemail system annoying to navigate.
A: I get too much email.
A: I get voicemails on my phone. That’s fine for me.
A: I have a Stanford Cellphone
A: I have no idea what you’re talking about! Though it sounds like it would be useful, even though I rarely receive phone calls. Most of my correspondence with Stanford employees is done through email. I discovered that is their pre-ferred method when I arrived here about 8 years ago.
A: I have no interest in this service
A: I have no use for this. I get no phone calls.
A: I have not had a chance to set it up and don’t know how.
A: I have not had any reason to do that.
A: I haven’t had the need to use this option. I have received forwarded voicemail messages via email though.
A: I haven’t heard of this service
A: I haven’t let my desk for any period of time that would necessitate it.
A: I just haven’t set it up, but I should because I always forget my voicemail password. I think I will sign up for it.
A: I need to set it up and I haven’t because it didn’t seem easy to me. I would like to set it up.
A: I never know when there is a voicemail. Most people text these days.
A: I receive very few voice mails.
A: I still need to set it up. It would help if instructions were given when I started at the GSB.
A: I use skype
A: I usually don’t go away (on vacation or leave) much so I have no need for this. Plus, some of my colleagues have had little glitches where messages disappeared.
A: I was not aware of such a service being available at Stanford. Since I already use Comcast’s service similar to this for my personal e-mails, it would be nice to know more about Stanford’s voicemail to email service.
A: I wasn’t aware of the service. I don’t get many voicemails.
A: I work from home.
A: I work remotely and use my own landline.
A: I’m not aware of the service.
A: I’m not familiar with this option
A: I’m not sure how to do it.
A: I’m not sure how to set this up
A: I’m offsite.
A: It is not a need I have.
A: It is not necessary in my line of work to have this function.
A: Just didn’t know about this
A: Keep forgetting to turn it on....
A: My department removed my voicemail feature.
A: Need time to figure out how to set it up and then set it up.
A-68 | Appendix A - Full Comments • Stanford University IT 2015 Client Satisfaction Survey
MOR Associates, Inc.
A: Never got shown to me.
A: never heard of it
A: Never used it.
A: never work
A: no good reason
A: No knowledge that it existed or how to set that up
A: no need
A: no need for it
A: no need for that
A: no need to for my work
A: no one ever asked me to do so, but I would be interested.
A: No one has ever showed me how to set this up. First time hearing about this...
A: no one told me about it
A: no particular reason, I think
A: No personal work phone, phone is shared between multiple colleagues
A: No phone
A: No Reason. I will look into setting this up.
A: Not aware of it
A: Not aware of this feature
A: Not aware such service exists
A: Not familiar with it.
A: not familiar with this program; also do not receive many voicemail messages
A: not needed for my work
A: Not really a need for it.
A: not set up
A: Not sure how to set it up.
A: Not sure how to set it up. Also, rarely get phone calls.
A: Not sure how to use it
A: Not sure how to use it.
A: Rarely get voice mail and wouldn’t know how to do this
A: Requires configuration. I have not had it set up.
A: seriously?
A: Simply haven’t set it up.
A: The phone is a lab phone so many of the calls are not directed toward me.
A: The website was annoying to use in setting up, and I receive very few voicemails.
A: too busy to set up!!
A: Too many steps to get to your voice mail
Stanford University IT 2015 Client Satisfaction Survey • Appendix A - Full Comments | A-69
MOR Associates, Inc.
A: too much email already
A: tried to set it up but ran into problems and just haven’t tried it again
A: Vaguely aware this was an option, but not sure how to set it up, although this would be great as I find it cumbersome to have to access vmail over phone. Will look into it.
A: Want to use it, did not set it up yet
A: Why would I want to do that? At least my voicemail works! Email...who knows from one day to the next if my com-puter is even going to boot up, never mind let me do work.
A-70 | Appendix A - Full Comments • Stanford University IT 2015 Client Satisfaction Survey
MOR Associates, Inc.
Q84. What would increase your satisfaction with Stanford WordPress?
Responses to this question have been sorted by cohort, then by respondents’ ratings for Q83a . Stan-
ford WordPress, and then alphabetically .
F: (SD) Slow.
F: (SD) Take longer time for resolution of the problem
A: (SD) We have issues with versioning - I am not able to update, so there is a lot of functionality that I cannot make use of.
Q85. What would increase your satisfaction with Stanford Sites Drupal?
Responses to this question have been sorted by by respondents’ ratings for Q83b . Stanford Sites
drupal, and then alphabetically .
A: (SD) A WYSIWIG interface.
A: (SD) I think if it was made more user friendly it would be great.
A: (VD) I don’t know if there is anything. I think it’s a really bad program. Cumbersome to use, not intuitive, and the graphics are bad.
A: (VD) I prefer WordPress
A: (VD) If it had useful features, worked faster, and if its WYSIWYG feature actually worked.
Q86. What would increase your satisfaction with Formbuilder?
Responses to this question have been sorted by cohort, then by respondents’ ratings for Q83c . Form
Builder, and then alphabetically .
F: (SD) modular easy use with templates i can choose
A: (SD) better sophisticated tool and more accessible support
A: (SD) It needs more development. It would be nice if we could attach downloadable files to the form and not just up-load them. The ability to insert data validation. The ability for submissions to dump into a collaborative spreadsheet like you can do with Google forms. That’s my number one need.
Stanford University IT 2015 Client Satisfaction Survey • Appendix A - Full Comments | A-71
MOR Associates, Inc.
Q87. What would increase your satisfaction with Qualtrics?
Responses to this question have been sorted by cohort, then by respondents’ ratings for Q83d . Qual-
trics, and then alphabetically .
F: (SD) Better tech support and tech capability from Qualtrics
A: (SD) better sophisticated tool and more accessible support
A: (SD) make more user friendly
A: (SD) not user friendly for the occasional user
A: (SD) the last “next” button should indicate that it is the LAST “next” button and that clicking it will SUBMIT the form. A lot of people get tricked by this and submit forms with out completion
A: (D) It needs to be more user friendly.
Q88. What would increase your satisfaction with Downloadable web design/theme assets for Drupal, WordPress, and HTML websites?
F: (D) Better support for Dreamweaver. Better looking templates.
F: (D) Drupal is VERY slow
Q89. What would increase your satisfaction with Stanford Web Services’ web de-sign, development, and consulting services?
Responses to this question have been sorted by cohort, then by respondents’ ratings for Q83f . Stan-
ford Web Services’ web design, development, and consulting services, and then alphabetically .
F: (SD) If they were not so backlogged that you could get help with updates and redesign more quickly.
F: (D) The only redeeming feature of the whole thing is the extremely competent technician of the department. With-out his help, the whole thing would be paralyzed (and paralyzing).
A: (VD) If they had responded to their email/voicemail like professionals. We wound up going with an outside vendor.

A-72 | Appendix A - Full Comments • Stanford University IT 2015 Client Satisfaction Survey
MOR Associates, Inc.
This page intentionally left blank�

Stanford University IT 2015 Client Satisfaction Survey • Appendix B - The Survey Instruments | B-1
MOR Associates, Inc.
Appendix B The Survey Instruments
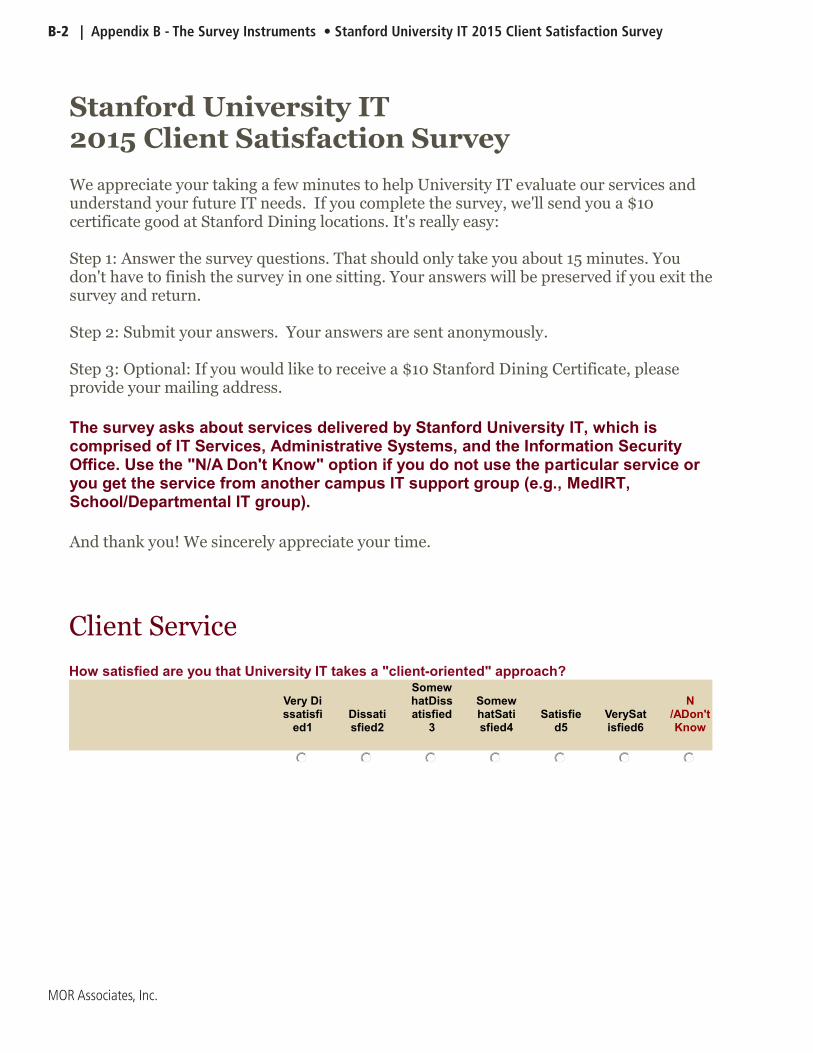
B-2 | Appendix B - The Survey Instruments • Stanford University IT 2015 Client Satisfaction Survey
MOR Associates, Inc.

Stanford University IT 2015 Client Satisfaction Survey • Appendix B - The Survey Instruments | B-3
MOR Associates, Inc.

B-4 | Appendix B - The Survey Instruments • Stanford University IT 2015 Client Satisfaction Survey
MOR Associates, Inc.

Stanford University IT 2015 Client Satisfaction Survey • Appendix B - The Survey Instruments | B-5
MOR Associates, Inc.

B-6 | Appendix B - The Survey Instruments • Stanford University IT 2015 Client Satisfaction Survey
MOR Associates, Inc.

Stanford University IT 2015 Client Satisfaction Survey • Appendix B - The Survey Instruments | B-7
MOR Associates, Inc.

B-8 | Appendix B - The Survey Instruments • Stanford University IT 2015 Client Satisfaction Survey
MOR Associates, Inc.

Stanford University IT 2015 Client Satisfaction Survey • Appendix B - The Survey Instruments | B-9
MOR Associates, Inc.

B-10 | Appendix B - The Survey Instruments • Stanford University IT 2015 Client Satisfaction Survey
MOR Associates, Inc.

Stanford University IT 2015 Client Satisfaction Survey • Appendix B - The Survey Instruments | B-11
MOR Associates, Inc.
B-12 | Appendix B - The Survey Instruments • Stanford University IT 2015 Client Satisfaction Survey
MOR Associates, Inc.
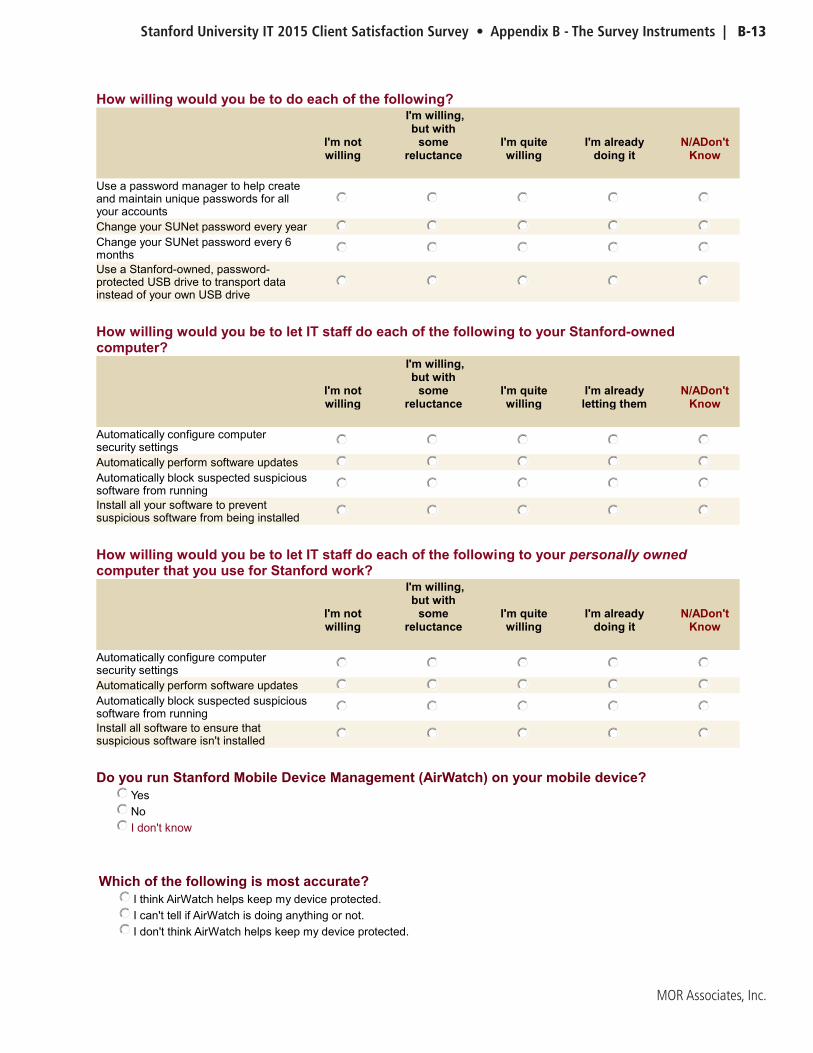
Stanford University IT 2015 Client Satisfaction Survey • Appendix B - The Survey Instruments | B-13
MOR Associates, Inc.
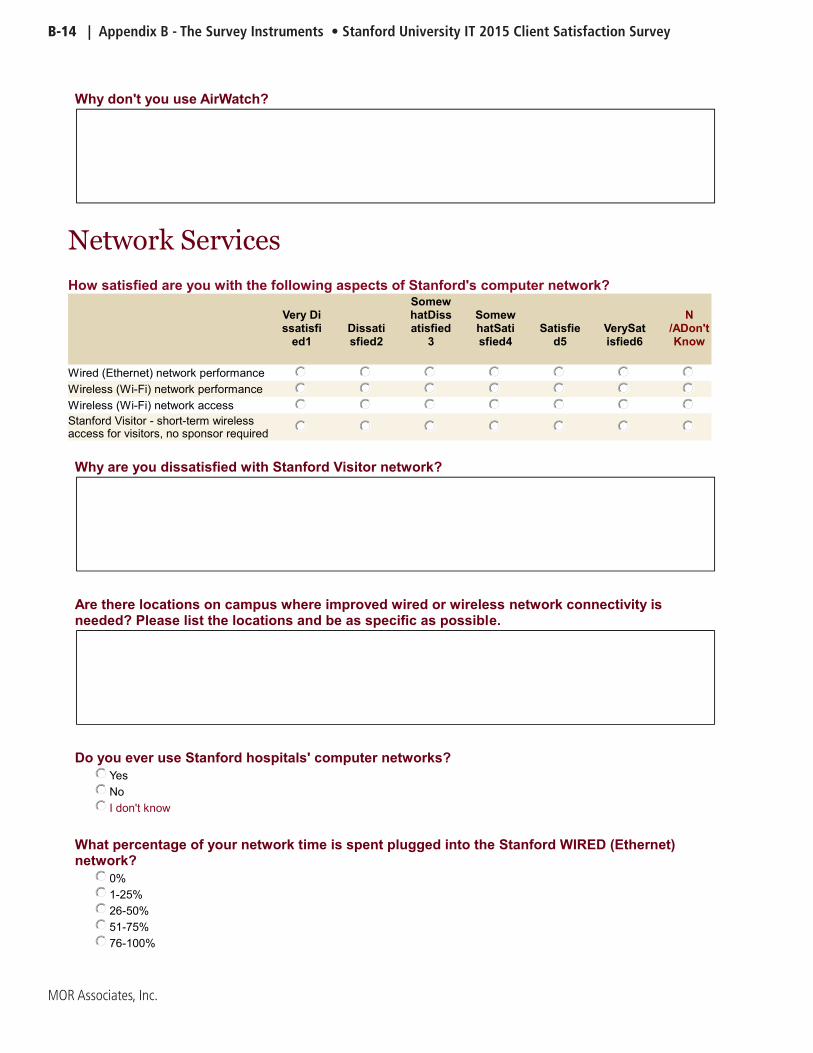
B-14 | Appendix B - The Survey Instruments • Stanford University IT 2015 Client Satisfaction Survey
MOR Associates, Inc.
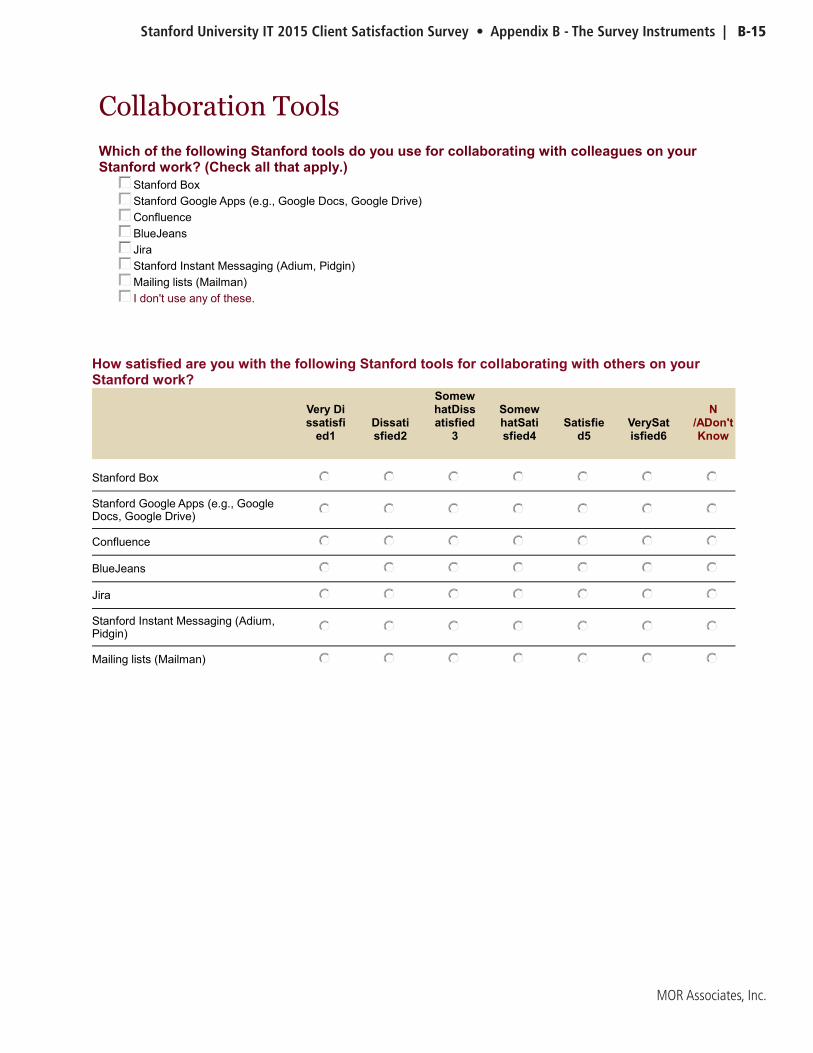
Stanford University IT 2015 Client Satisfaction Survey • Appendix B - The Survey Instruments | B-15
MOR Associates, Inc.
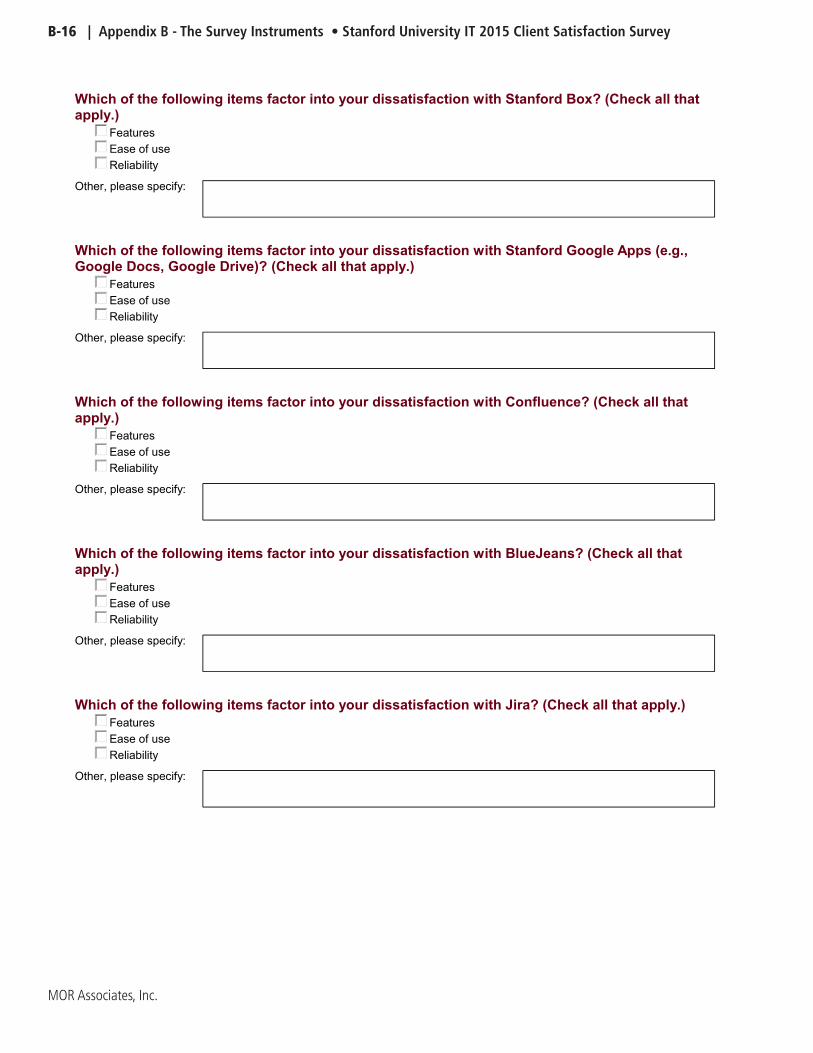
B-16 | Appendix B - The Survey Instruments • Stanford University IT 2015 Client Satisfaction Survey
MOR Associates, Inc.

Stanford University IT 2015 Client Satisfaction Survey • Appendix B - The Survey Instruments | B-17
MOR Associates, Inc.

B-18 | Appendix B - The Survey Instruments • Stanford University IT 2015 Client Satisfaction Survey
MOR Associates, Inc.

Stanford University IT 2015 Client Satisfaction Survey • Appendix B - The Survey Instruments | B-19
MOR Associates, Inc.

B-20 | Appendix B - The Survey Instruments • Stanford University IT 2015 Client Satisfaction Survey
MOR Associates, Inc.

Stanford University IT 2015 Client Satisfaction Survey • Appendix B - The Survey Instruments | B-21
MOR Associates, Inc.

B-22 | Appendix B - The Survey Instruments • Stanford University IT 2015 Client Satisfaction Survey
MOR Associates, Inc.

Stanford University IT 2015 Client Satisfaction Survey • Appendix B - The Survey Instruments | B-23
MOR Associates, Inc.

B-24 | Appendix B - The Survey Instruments • Stanford University IT 2015 Client Satisfaction Survey
MOR Associates, Inc.

Stanford University IT 2015 Client Satisfaction Survey • Appendix B - The Survey Instruments | B-25
MOR Associates, Inc.
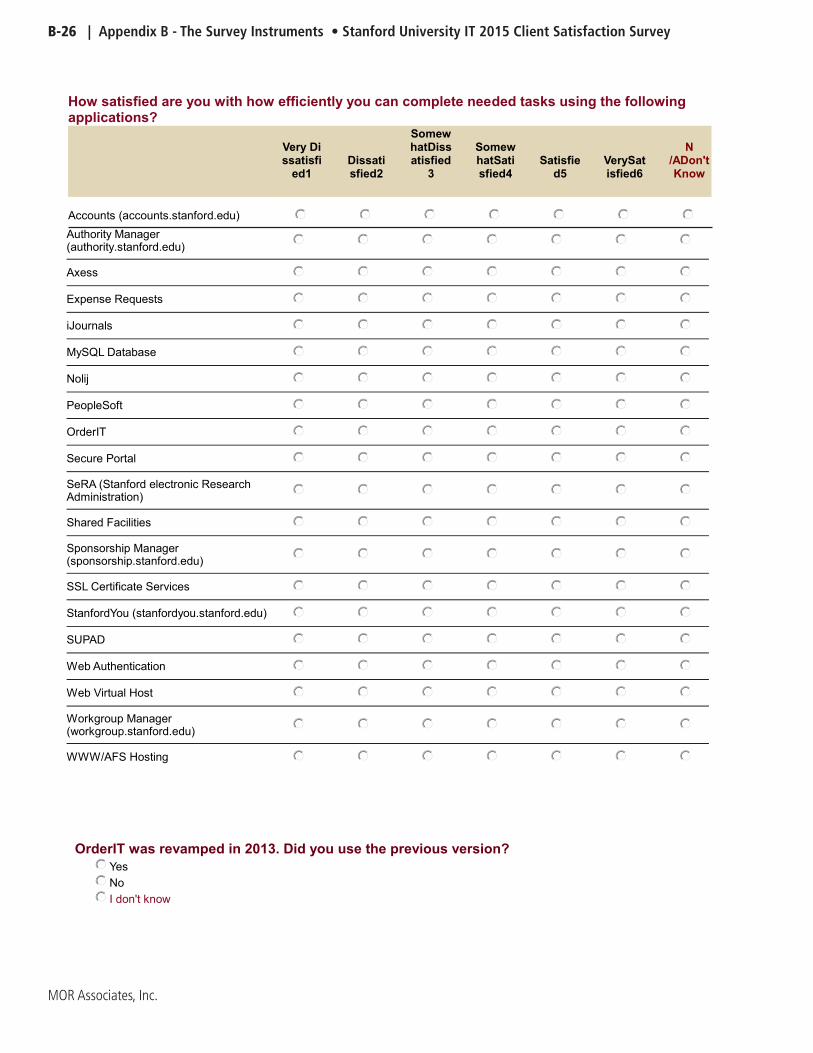
B-26 | Appendix B - The Survey Instruments • Stanford University IT 2015 Client Satisfaction Survey
MOR Associates, Inc.
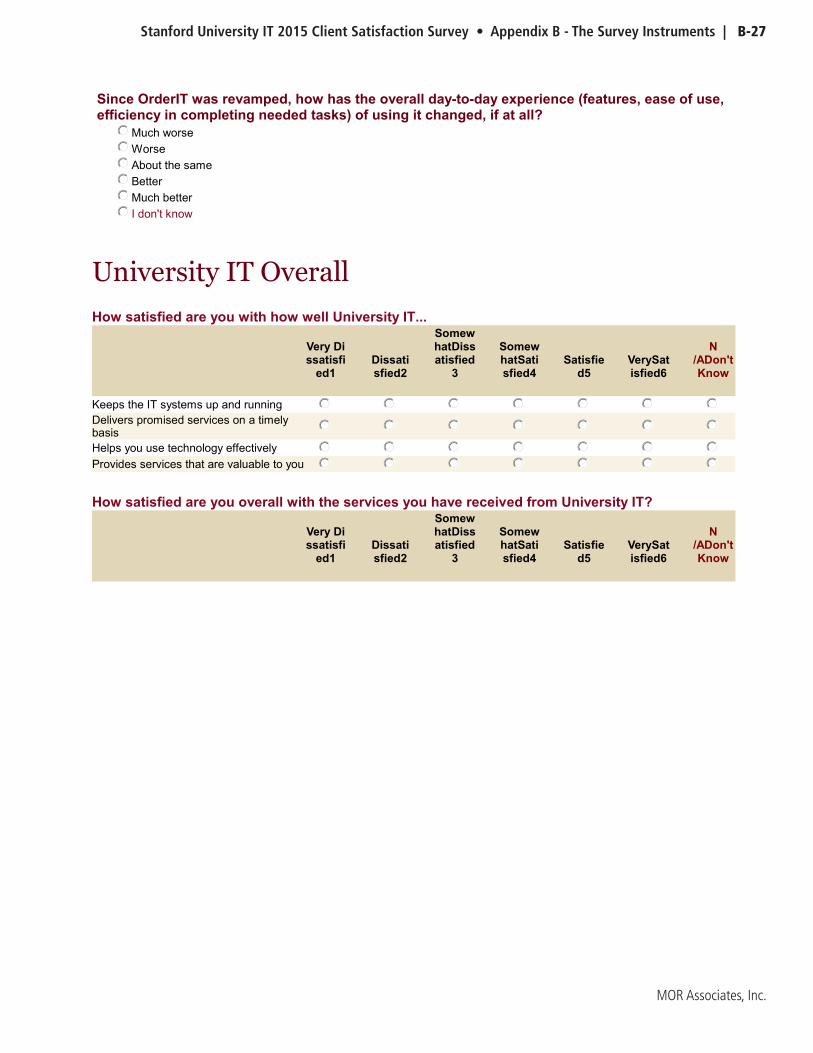
Stanford University IT 2015 Client Satisfaction Survey • Appendix B - The Survey Instruments | B-27
MOR Associates, Inc.
B-28 | Appendix B - The Survey Instruments • Stanford University IT 2015 Client Satisfaction Survey
MOR Associates, Inc.

Stanford University IT 2015 Client Satisfaction Survey • Appendix B - The Survey Instruments | B-29
MOR Associates, Inc.

B-30 | Appendix B - The Survey Instruments • Stanford University IT 2015 Client Satisfaction Survey
MOR Associates, Inc.

Stanford University IT 2015 Client Satisfaction Survey • Appendix B - The Survey Instruments | B-31
MOR Associates, Inc.
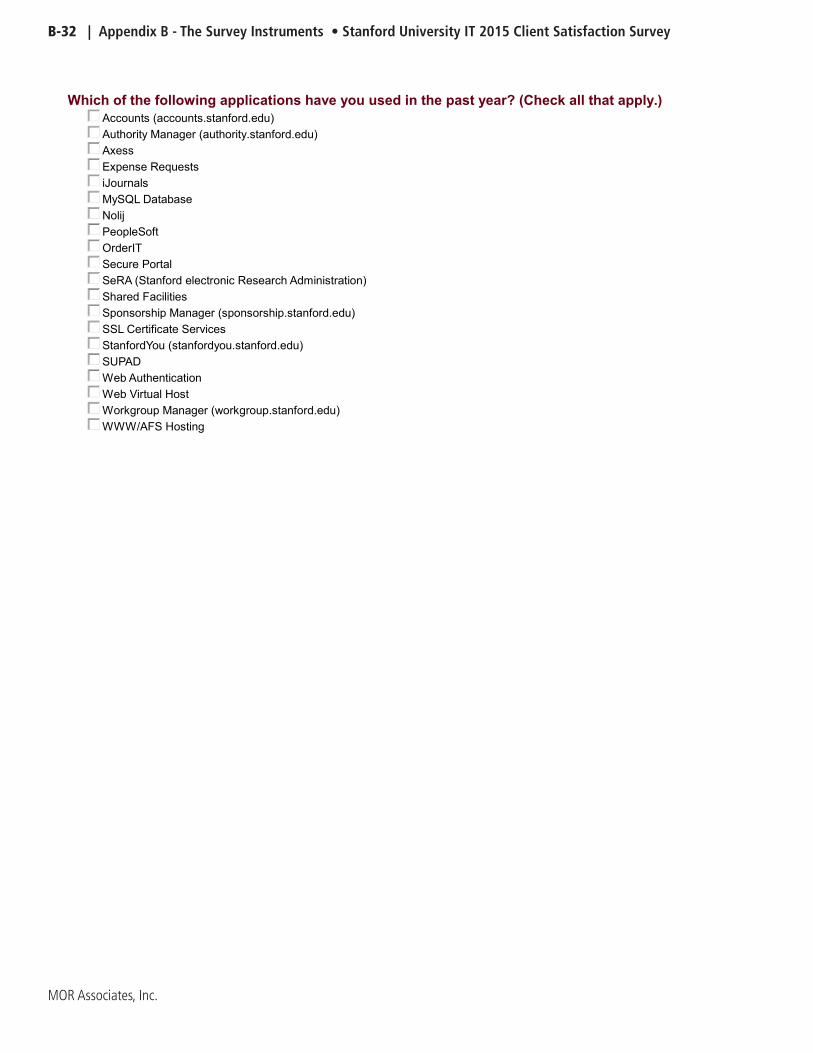
B-32 | Appendix B - The Survey Instruments • Stanford University IT 2015 Client Satisfaction Survey
MOR Associates, Inc.

Stanford University IT 2015 Client Satisfaction Survey • Appendix B - The Survey Instruments | B-33
MOR Associates, Inc.
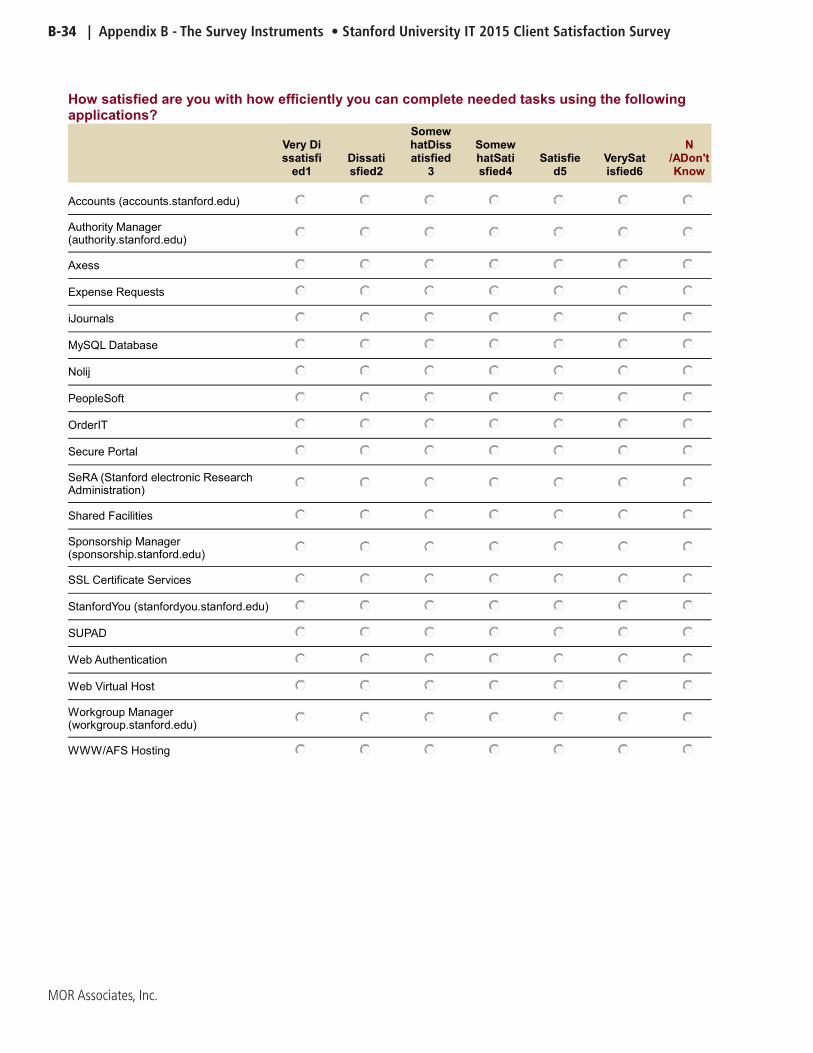
B-34 | Appendix B - The Survey Instruments • Stanford University IT 2015 Client Satisfaction Survey
MOR Associates, Inc.
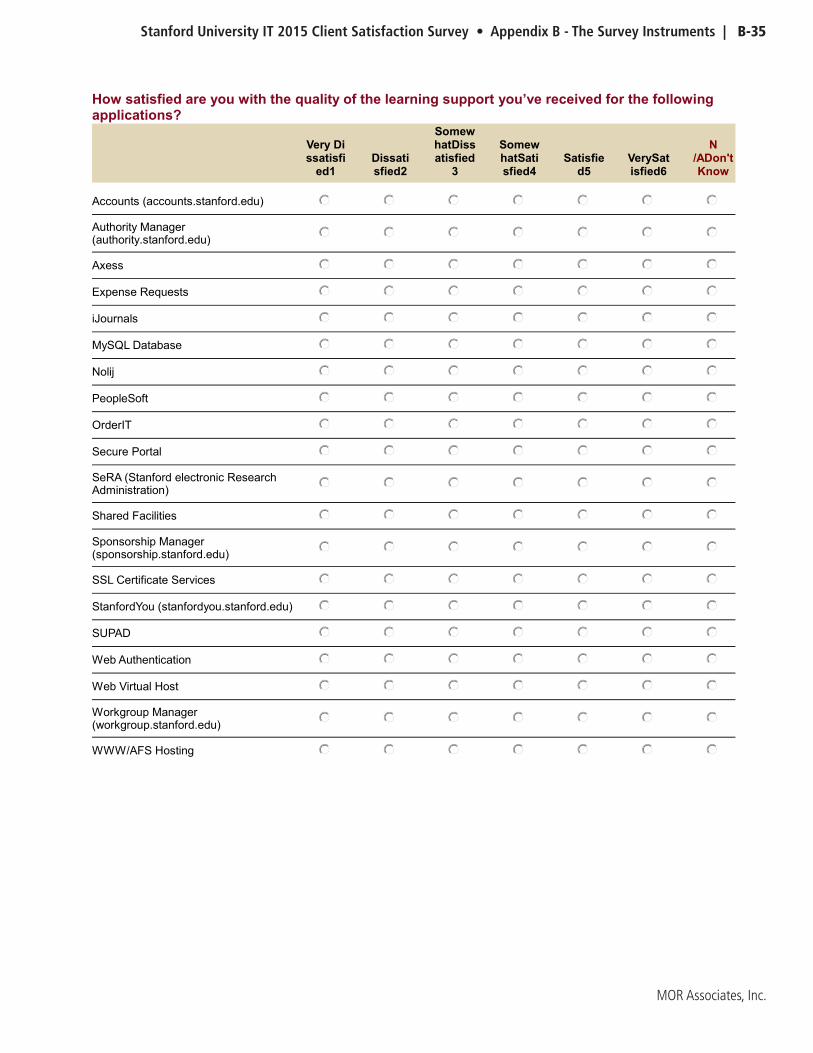
Stanford University IT 2015 Client Satisfaction Survey • Appendix B - The Survey Instruments | B-35
MOR Associates, Inc.

B-36 | Appendix B - The Survey Instruments • Stanford University IT 2015 Client Satisfaction Survey
MOR Associates, Inc.

Stanford University IT 2015 Client Satisfaction Survey • Appendix B - The Survey Instruments | B-37
MOR Associates, Inc.
B-38 | Appendix B - The Survey Instruments • Stanford University IT 2015 Client Satisfaction Survey
MOR Associates, Inc.
Stanford University IT 2015 Client Satisfaction Survey • Appendix B - The Survey Instruments | B-39
MOR Associates, Inc.
This page intentionally left blank�
