2013 my obd-ii system operation summary for fiesta
TRANSCRIPT
CONTINENTAL REVISED: MARCH 29, 2012 PAGE 1 OF 112
2013 MY OBD System Operation
Summary for Fiesta
Table of Contents
Catalyst Efficiency Monitor ................................................................... 4
Misfire Monitor ...................................................................................... 8
EVAP System Monitor – Natural Vacuum Leak Detection ............... 14
NVLD II Overview ...................................................................................... 16
Small leak (0.020") detection algorithm: ................................................... 18
Canister Purge Solenoid, switch and large-leak (0.090") test algorithm: 21
Canister Purge Solenoid CPS - Flow-check ............................................ 22
EVAP System Monitor Component Checks ...................................... 26
Fuel System Monitor .......................................................................... 30
HO2S Monitor .................................................................................... 36
Upstream Oxygen Sensor Monitoring - Switching Sensor ...................... 36
Upstream Oxygen Sensor Slow Response Monitor - Switching Sensor 40
Upstream Oxygen Sensor Heater Circuit Monitor ................................... 45
Downstream Oxygen Sensor Monitoring ................................................. 48
Downstream Oxygen Sensor Slow Response Monitor ........................... 51
Downstream Oxygen Sensor Heater Circuit Monitor .............................. 56
Thermostat Monitor ............................................................................ 59
CONTINENTAL REVISED: MARCH 29, 2012 PAGE 2 OF 112
Cold Start Emission Reduction Component Monitor ......................... 62
Low Idle RPM Test .................................................................................... 62
Spark Timing Monitor ................................................................................ 63
Cold Start Variable Cam Timing Monitor .................................................. 64
Cold Start Emission Reduction System Monitor ............................... 65
Temperatures Used ................................................................................... 65
Ratio Calculation ........................................................................................ 65
General CSER Monitor Operation ............................................................ 65
Variable Valve Timing System Monitor.............................................. 68
Variable Cam Timing Target Error ............................................................ 68
Variable Cam Timing Slow Response ..................................................... 70
Camshaft/Crankshaft Position Correlation ............................................... 74
Electronic Throttle Control ................................................................. 77
Electronic Throttle Control (ETC) Motor Control Circuit .......................... 79
Spring check (start routine) ....................................................................... 79
ETC adaptation diagnostic ........................................................................ 79
Electronic Throttle Control (ETC) Motor Control Performance ............... 81
Accelerator and Throttle Position Sensor Inputs ..................................... 83
Comprehensive Component Monitor - Engine .................................. 84
Engine Temperature Sensor Input ........................................................... 84
Intake Air Temperature Sensor Input ....................................................... 86
IAT Rationality Test ................................................................................... 87
Ambient Air Temperature Sensor Input .................................................... 89
Mass Air Flow Sensor ............................................................................... 90
Mass Air Flow Range Performance ......................................................... 91
TPS Load Test ........................................................................................... 92
Engine Off Timer Monitor .......................................................................... 94
Idle Speed Control Monitor ....................................................................... 95
CONTINENTAL REVISED: MARCH 29, 2012 PAGE 3 OF 112
Knock Sensor ............................................................................................ 97
Barometric Pressure Sensor ..................................................................... 98
Ignition Coil................................................................................................. 99
Camshaft Position Sensor Monitor ......................................................... 100
Crankshaft Position Sensor Monitor ....................................................... 101
Miscellaneous CPU Tests ....................................................................... 102
DPS6 (FWD) Transmission ............................................................. 103
The Gearbox & Dual-Clutch System Physical Architecture .................. 103
Transmission Inputs ................................................................................ 105
Speed Sensors ........................................................................................ 105
Transmission Outputs ............................................................................. 105
Transmission Control Module (TCM) ..................................................... 106
CAN Communications error .................................................................... 106
On Board Diagnostic Executive ....................................................... 107
Exponentially Weighted Moving Average ........................................ 109
I/M Readiness .................................................................................. 111
Serial Data Link MIL Illumination ..................................................... 111
Closed Loop Fuel Control Enable Conditions ................................. 112
Calculated Load Value ..................................................................... 112
CONTINENTAL REVISED: MARCH 29, 2012 PAGE 4 OF 112
Catalyst Efficiency Monitor
The Catalyst Efficiency Monitor uses an oxygen sensor after the catalyst to infer the hydrocarbon efficiency based on
oxygen storage capacity of the ceria and precious metals in the wash coat. Under normal, closed-loop fuel conditions,
high efficiency catalysts have significant oxygen storage. This makes the switching frequency of the rear HO2S very
slow and reduces the amplitude of those. As catalyst efficiency deteriorates due to thermal and/or chemical deterioration,
its ability to store oxygen declines and the post-catalyst HO2S signal begins to switch more rapidly with increasing
amplitude. The predominant failure mode for high mileage catalysts is chemical deterioration (phosphorus deposition on
the front brick of the catalyst), not thermal deterioration.
Integrated Air/Fuel Method
The Integrated Air/Fuel Catalyst Monitor assesses the oxygen storage capacity of a catalyst after a fuel cut event. The
monitor integrates how much excess fuel is needed to drive the monitored catalyst to a rich condition starting from an
oxygen-saturated, lean condition. Therefore, the monitor is a measure of how much fuel is required to force catalyst
breakthrough from lean to rich. To accomplish this, the monitor runs during fuel reactivation following a Decel Fuel Shut
Off (DFSO) event. The monitor completes after a calibrated number of DFSO monitoring events have occurred. The IAF
catalyst monitor can be used with either a wide range O2 sensor (UEGO) or a conventional switching sensor (HEGO).
Functionally, the equation is:
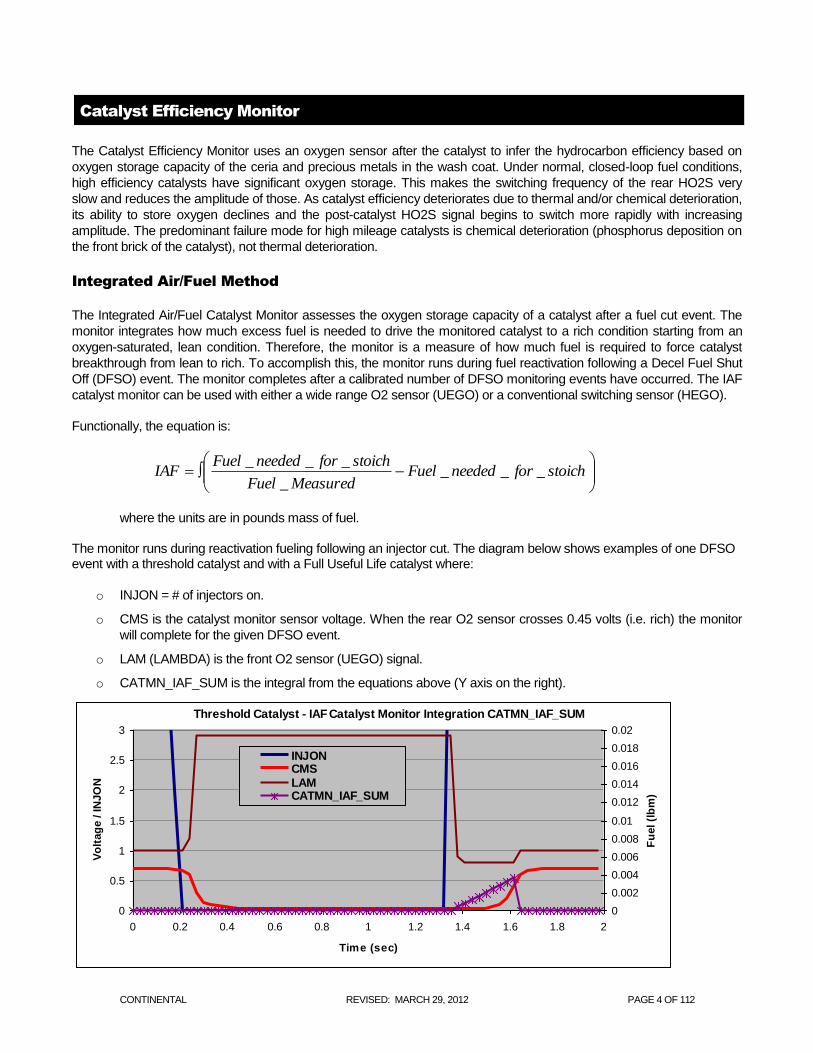
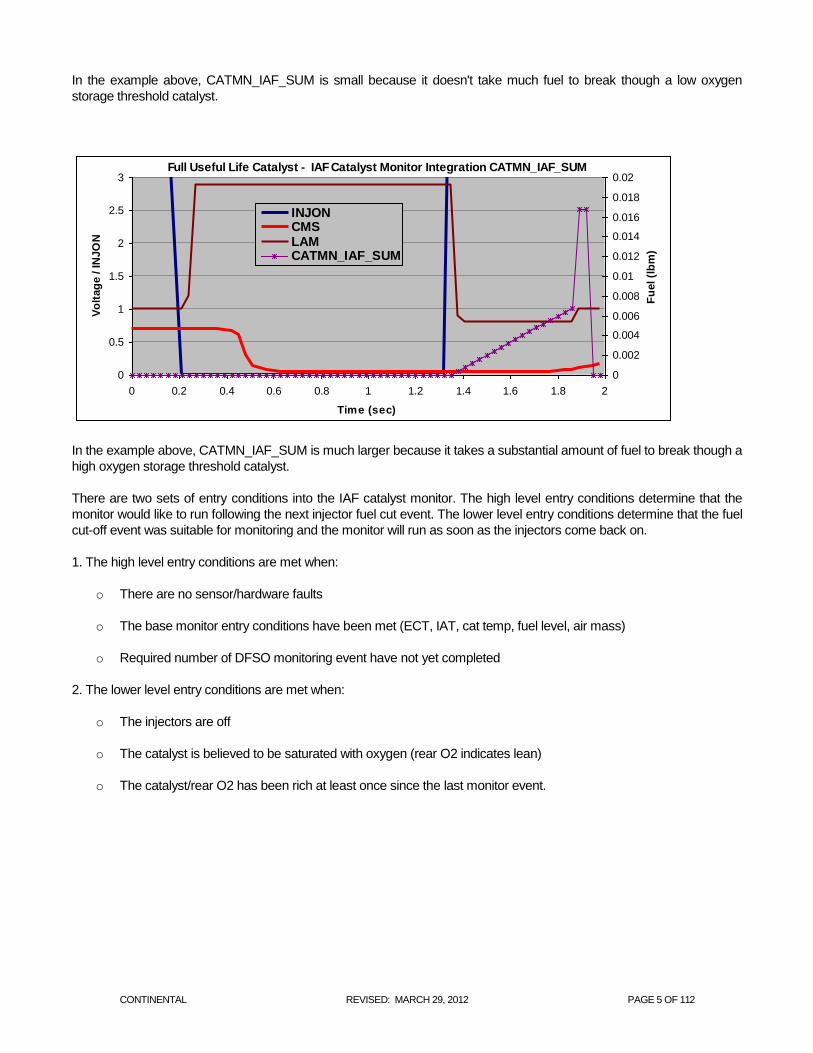
where the units are in pounds mass of fuel. The monitor runs during reactivation fueling following an injector cut. The diagram below shows examples of one DFSO event with a threshold catalyst and with a Full Useful Life catalyst where:
o INJON = # of injectors on.
o CMS is the catalyst monitor sensor voltage. When the rear O2 sensor crosses 0.45 volts (i.e. rich) the monitor
will complete for the given DFSO event.
o LAM (LAMBDA) is the front O2 sensor (UEGO) signal.
o CATMN_IAF_SUM is the integral from the equations above (Y axis on the right).
Threshold Catalyst - IAF Catalyst Monitor Integration CATMN_IAF_SUM
0
0.5
1
1.5
2
2.5
3
0 0.2 0.4 0.6 0.8 1 1.2 1.4 1.6 1.8 2
Time (sec)
Vo
ltag
e / IN
JO
N
0
0.002
0.004
0.006
0.008
0.01
0.012
0.014
0.016
0.018
0.02
Fu
el (l
bm
)
INJONCMSLAMCATMN_IAF_SUM
stoichforneededFuel
MeasuredFuel
stoichforneededFuelIAF ___
_
___
CONTINENTAL REVISED: MARCH 29, 2012 PAGE 5 OF 112
In the example above, CATMN_IAF_SUM is small because it doesn't take much fuel to break though a low oxygen
storage threshold catalyst.
Full Useful Life Catalyst - IAF Catalyst Monitor Integration CATMN_IAF_SUM
0
0.5
1
1.5
2
2.5
3
0 0.2 0.4 0.6 0.8 1 1.2 1.4 1.6 1.8 2
Time (sec)
Vo
ltag
e / IN
JO
N
0
0.002
0.004
0.006
0.008
0.01
0.012
0.014
0.016
0.018
0.02
Fu
el (l
bm
)
INJONCMSLAMCATMN_IAF_SUM
In the example above, CATMN_IAF_SUM is much larger because it takes a substantial amount of fuel to break though a
high oxygen storage threshold catalyst.
There are two sets of entry conditions into the IAF catalyst monitor. The high level entry conditions determine that the
monitor would like to run following the next injector fuel cut event. The lower level entry conditions determine that the fuel
cut-off event was suitable for monitoring and the monitor will run as soon as the injectors come back on.
1. The high level entry conditions are met when:
o There are no sensor/hardware faults
o The base monitor entry conditions have been met (ECT, IAT, cat temp, fuel level, air mass)
o Required number of DFSO monitoring event have not yet completed
2. The lower level entry conditions are met when:
o The injectors are off
o The catalyst is believed to be saturated with oxygen (rear O2 indicates lean)
o The catalyst/rear O2 has been rich at least once since the last monitor event.
CONTINENTAL REVISED: MARCH 29, 2012 PAGE 6 OF 112
General Catalyst Monitor Operation
Rear HO2S sensors can be located in various ways to monitor different kinds of exhaust systems. In-line engines and
many V-engines are monitored by individual bank. A rear HO2S sensor is used along with the front, fuel-control HO2S
sensor for each bank. Two sensors are used on an in-line engine; four sensors are used on a V-engine. Some V-
engines have exhaust banks that combine into a single underbody catalyst. These systems are referred to as Y-pipe
systems. They use only one rear HO2S sensor along with the two front, fuel-control HO2S sensors. Y-pipe system
systems use three sensors in all. For Y-pipe systems which utilize switching front O2 sensors, the two front HO2S
sensor signals are combined by the software to infer what the HO2S signal would have been in front of the monitored
catalyst. The inferred front HO2S signal and the actual single, rear HO2S signal is then used to calculate the switch ratio.
Most vehicles monitor less than 100% of the catalyst volume – often the first catalyst brick of the catalyst system. Partial
volume monitoring is done on LEV and LEV-II vehicles in order to meet the 1.75 * emission-standard threshold for
NMHC and NOx. The rationale for this practice is that the catalysts nearest the engine deteriorate first, allowing the
catalyst monitor to be more sensitive and illuminate the MIL properly at lower emission standards.
Many applications that utilize partial-volume monitoring place the rear HO2S sensor after the first light-off catalyst can or,
after the second catalyst can in a three-can per bank system. (A few applications placed the HO2S in the middle of the
catalyst can, between the first and second bricks.)
The Integrated A/F catalyst monitor was designed to allow monitoring 100% of the catalyst volume. It can be used for
both partial and full volume monitoring.
Vehicles with the Integrated Air/Fuel catalyst monitor employ an improved version of the EWMA algorithm.
The EWMA logic incorporates several important CARB requirements. These are:
Fast Initial Response (FIR): The first 4 tests after a code clear will process unfiltered data to quickly
indicate a fault. The FIR will use a 2-trip MIL. This will help the service technician determine that a
fault has been fixed.
Step-change Logic (SCL): The logic will detect an abrupt change from a no-fault condition to a fault
condition. The SCL will be active after the 4th catalyst monitor cycle and will also use a 2-trip MIL.
This will illuminate the MIL when a fault is instantaneously induced.
Normal EWMA (NORM): This is the normal mode of operation and uses an Exponentially
Weighted Moving Average (EWMA) to filter the catalyst monitor test data. It is employed after the
4th catalyst test and will illuminate a MIL during the drive cycle where the EWMA value exceeds the
fault threshold. (1 trip MIL).
Catalyst Monitor Operation:
DTCs P0420
Monitor execution once per driving cycle
Monitor Sequence HO2S response test complete and no DTCs prior to calculating switch ratio, no
evap leak check or fuel monitor DTCs,
Sensors OK ECT (P0118, P0117, P0119, P0116), IAT (P0111, P0112, P0113, P009A),:
MAF,( P0102, P0103), front and rear O2 (P0132, P0131, P0134, P0130,
P2A00, P2297, P0133, P0136, P0138, P0137, P0140, P2A01, P0139), front
and rear O2 heaters (P0036, P0037, P0038, P0030, P0031, P0032) fuel
monitor (P0171, P0172)
Monitoring Duration 3 Decel Fuel Cutoff events for IAF catalyst monitor (approx 90 sec)
CONTINENTAL REVISED: MARCH 29, 2012 PAGE 7 OF 112
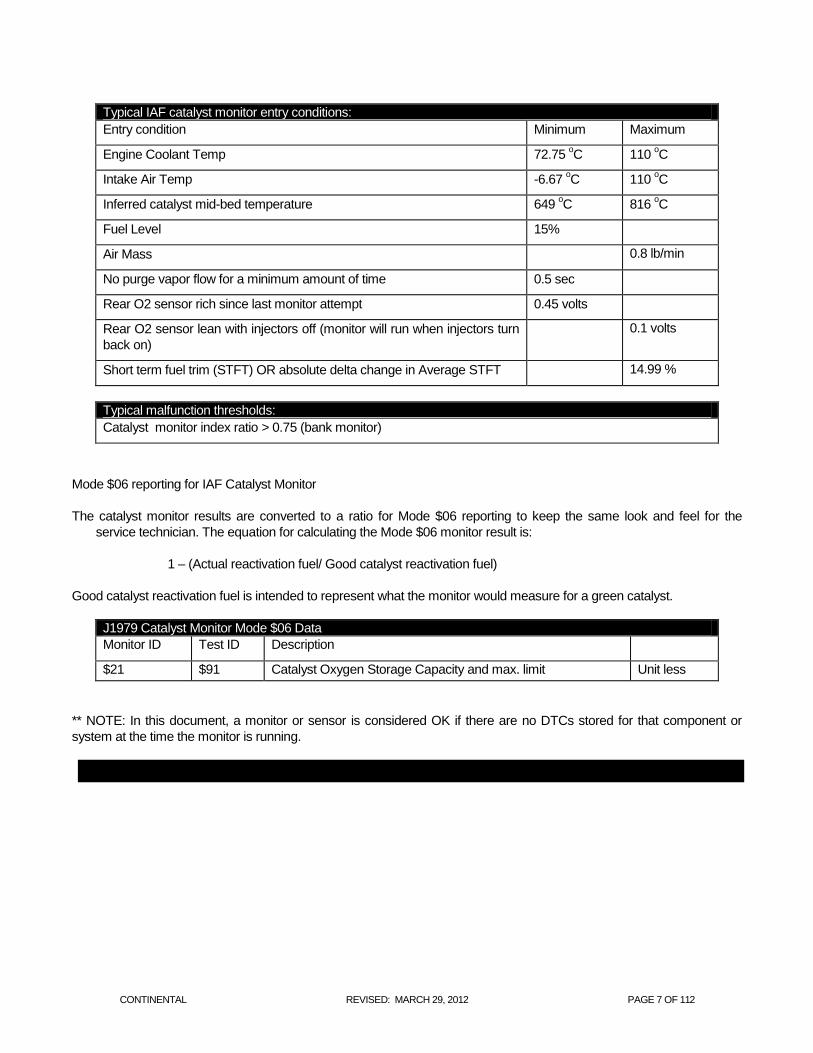
Typical IAF catalyst monitor entry conditions:
Entry condition Minimum Maximum
Engine Coolant Temp 72.75 oC 110
oC
Intake Air Temp -6.67 oC 110
oC
Inferred catalyst mid-bed temperature 649 oC 816
oC
Fuel Level 15%
Air Mass 0.8 lb/min
No purge vapor flow for a minimum amount of time 0.5 sec
Rear O2 sensor rich since last monitor attempt 0.45 volts
Rear O2 sensor lean with injectors off (monitor will run when injectors turn
back on)
0.1 volts
Short term fuel trim (STFT) OR absolute delta change in Average STFT 14.99 %
Typical malfunction thresholds:
Catalyst monitor index ratio > 0.75 (bank monitor)
Mode $06 reporting for IAF Catalyst Monitor
The catalyst monitor results are converted to a ratio for Mode $06 reporting to keep the same look and feel for the
service technician. The equation for calculating the Mode $06 monitor result is:
1 – (Actual reactivation fuel/ Good catalyst reactivation fuel)
Good catalyst reactivation fuel is intended to represent what the monitor would measure for a green catalyst.
J1979 Catalyst Monitor Mode $06 Data
Monitor ID Test ID Description
$21 $91 Catalyst Oxygen Storage Capacity and max. limit Unit less
** NOTE: In this document, a monitor or sensor is considered OK if there are no DTCs stored for that component or
system at the time the monitor is running.
CONTINENTAL REVISED: MARCH 29, 2012 PAGE 8 OF 112
Misfire Monitor
The method used for engine misfire detection is based on evaluating the engine speed fluctuations; it is commonly
referred to as Engine Roughness. Engine torque is a function of engine speed, engine load, and the moment of inertia.
In order to detect a misfiring cylinder, the torque of each cylinder is evaluated by using the crankshaft position signal to
measure the time between sensor wheel teeth for each ignition event. This time is a measure of the mean value of the
speed of this angular segment. A change in engine torque also results in a change in engine speed. In addition, different
road surfaces, pot holes etc. will affect engine speed. Because mean engine speed is used to detect misfire, the effects
caused by road surfaces have to be eliminated. The misfire monitor consists of following main parts:
Data acquisition:
The duration of the crankshaft segment for each cylinder is measured continuously, every combustion cycle.
Sensor wheel adaptation:
Crankshaft sensor wheel adaptation software is used to "learn" and correct for mechanical inaccuracies in the crankshaft
position wheel tooth spacing. To prevent any fueling or combustion differences from affecting the correction factors,
learning is done during decel-fuel cutout. When operating in decel-fuel cutout within a defined engine speed range,
misfire monitoring is suspended and adaptation of the sensor wheel tolerances takes place. The adaptation values are
stored in memory and used as correction factors for the calculation of the engine roughness.
Calculation of the engine roughness:
The engine roughness is derived from the differences of the segment durations. Different statistical methods are used to
distinguish between normal changes of the segment duration and the changes due to misfiring.
Misfire Determination:
Misfire detection is performed by comparing the calculated engine roughness value for each cylinder to the engine
roughness threshold (a table value). If the threshold is exceeded, a misfire is detected and the counter is incremented.
This counter counts the number of misfires for all cylinders. In addition, a cylinder specific counter is also incremented.
The engine roughness threshold can be adjusted to account for the following factors to prevent false misfire indications:
If engine coolant temperature is very cold, the engine roughness threshold is adjusted by a coolant temperature
dependent factor.
If cold start emission reduction actions are active for improved catalyst warm-up (elevated idle speed, spark
retard, VVT timing, etc), the engine roughness threshold is adjusted by a catalyst warm-up dependent factor.
Rough road conditions can induce crankshaft speed changes via the drive train and result in false misfire
indications. When these conditions are detected, misfire detection is temporarily suspended for a calibratable
time period. After this time, with no rough road conditions present, misfire monitoring will resume.
CONTINENTAL REVISED: MARCH 29, 2012 PAGE 9 OF 112
Fault processing - Emission Threshold
The sum of the cylinder misfire counters is evaluated every 1000 rev period and compared to a single threshold value to
indicate an emission-threshold malfunction, which can be either a single 1000 rev exceedence from startup or four
subsequent 1000 rev exceedences on a drive cycle after start-up.
The cylinders with the highest misfire rate are flagged. If the misfire occurs again on a subsequent driving cycle, the MIL
is illuminated and a cylinder specific fault is stored.
Fault processing - Catalyst Damage Threshold
The weighted sum of the cylinder misfire counters is evaluated every 200 revolution period and compared to a table of
threshold values to indicate a catalyst-damaging malfunction. The MIL is illuminated immediately. (The MIL blinks at a 1
Hz rate.)
The cylinders with the highest misfire rate are flagged. If one of the cylinder-specific counters is exceeding the catalyst
damage threshold the following actions take place:
1. Closed loop fuel control is set to open loop.
2. Downstream O2 sensor fuel trim is suspended
3. A cylinder-specific fault code is stored.
4. The fuel injector to the misfiring cylinder is turned off (a maximum of one cylinder)
All misfire counters are reset after each interval.
Similar Conditions
When the engine management system recognizes a failure in the misfire or fuel systems, the engine management
system is required to record the conditions present when the fault occurred. These conditions recorded include engine
speed, engine load (MAF), and warm up status of the first event that resulted in the storage of a code. These conditions
stored are referred to as similar conditions.
Once the similar conditions are met without a failure in the misfire or fuel system, the flag is set to 1. Once this flag is set
the driving cycle counter for that failure can be decrement.
The code and stored freeze frame conditions may be erased if similar conditions are not encountered during the next 80
driving cycles immediately following the initial detection of the malfunction.
The MIL is extinguished after three consecutive cycles in which similar conditions have been encountered without
exceeding the fuel system diagnostic thresholds.
CONTINENTAL REVISED: MARCH 29, 2012 PAGE 10 OF 112
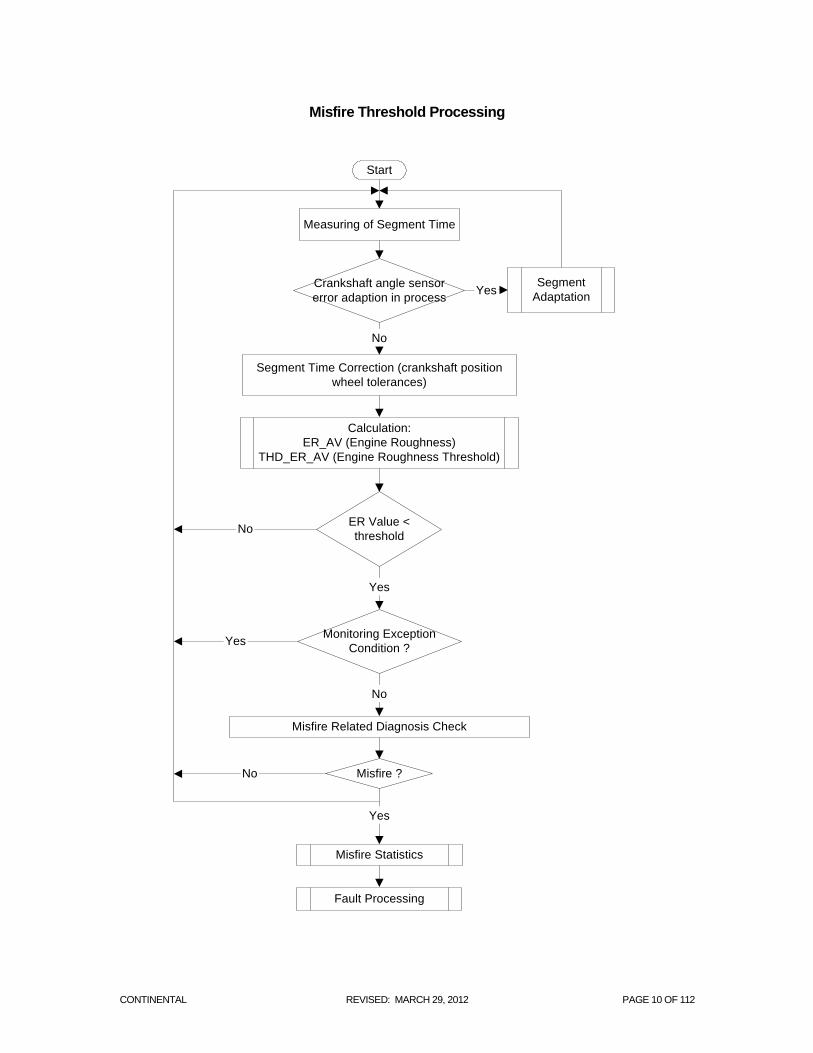
Misfire Threshold Processing
Start
Measuring of Segment Time
Crankshaft angle sensor
error adaption in process
Segment
AdaptationYes
No
Segment Time Correction (crankshaft position
wheel tolerances)
Calculation:
ER_AV (Engine Roughness)
THD_ER_AV (Engine Roughness Threshold)
ER Value <
threshold
Yes
Monitoring Exception
Condition ?
No
Misfire Related Diagnosis Check
Misfire ?
Misfire Statistics
Fault Processing
Yes
No
Yes
No
CONTINENTAL REVISED: MARCH 29, 2012 PAGE 11 OF 112
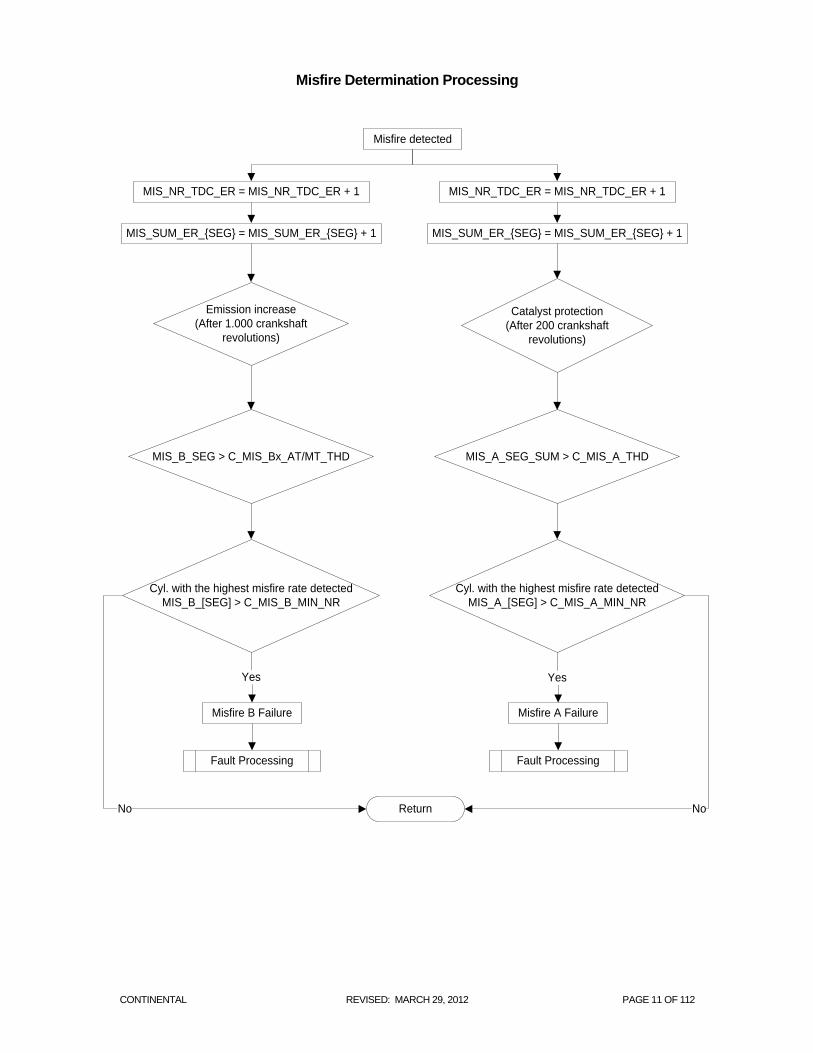
Misfire Determination Processing
Misfire detected
MIS_NR_TDC_ER = MIS_NR_TDC_ER + 1 MIS_NR_TDC_ER = MIS_NR_TDC_ER + 1
MIS_SUM_ER_{SEG} = MIS_SUM_ER_{SEG} + 1 MIS_SUM_ER_{SEG} = MIS_SUM_ER_{SEG} + 1
Emission increase
(After 1.000 crankshaft
revolutions)
Catalyst protection
(After 200 crankshaft
revolutions)
Cyl. with the highest misfire rate detected
MIS_B_[SEG] > C_MIS_B_MIN_NR
Cyl. with the highest misfire rate detected
MIS_A_[SEG] > C_MIS_A_MIN_NR
Misfire B Failure
Return
Misfire A Failure
Yes
No
Yes
No
Fault Processing Fault Processing
MIS_A_SEG_SUM > C_MIS_A_THDMIS_B_SEG > C_MIS_Bx_AT/MT_THD
CONTINENTAL REVISED: MARCH 29, 2012 PAGE 12 OF 112
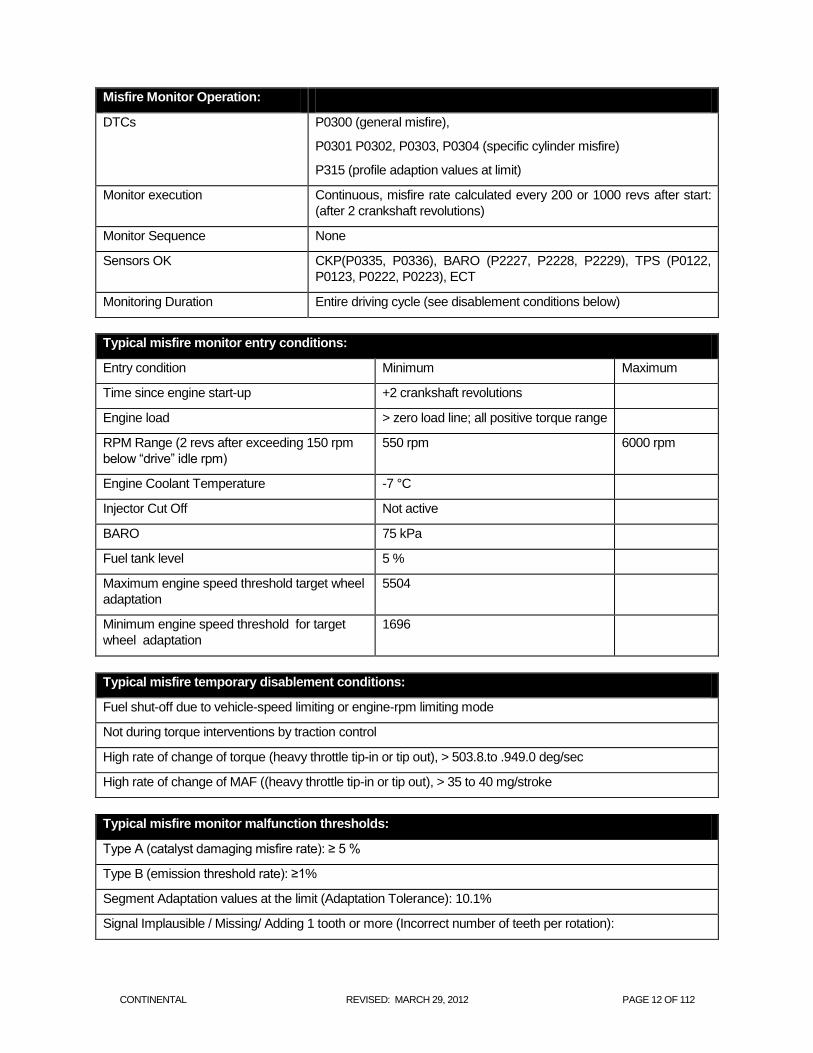
Misfire Monitor Operation:
DTCs P0300 (general misfire),
P0301 P0302, P0303, P0304 (specific cylinder misfire)
P315 (profile adaption values at limit)
Monitor execution Continuous, misfire rate calculated every 200 or 1000 revs after start:
(after 2 crankshaft revolutions)
Monitor Sequence None
Sensors OK CKP(P0335, P0336), BARO (P2227, P2228, P2229), TPS (P0122,
P0123, P0222, P0223), ECT
Monitoring Duration Entire driving cycle (see disablement conditions below)
Typical misfire monitor entry conditions:
Entry condition Minimum Maximum
Time since engine start-up +2 crankshaft revolutions
Engine load > zero load line; all positive torque range
RPM Range (2 revs after exceeding 150 rpm
below “drive” idle rpm)
550 rpm 6000 rpm
Engine Coolant Temperature -7 °C
Injector Cut Off Not active
BARO 75 kPa
Fuel tank level 5 %
Maximum engine speed threshold target wheel
adaptation
5504
Minimum engine speed threshold for target
wheel adaptation
1696
Typical misfire temporary disablement conditions:
Fuel shut-off due to vehicle-speed limiting or engine-rpm limiting mode
Not during torque interventions by traction control
High rate of change of torque (heavy throttle tip-in or tip out), > 503.8.to .949.0 deg/sec
High rate of change of MAF ((heavy throttle tip-in or tip out), > 35 to 40 mg/stroke
Typical misfire monitor malfunction thresholds:
Type A (catalyst damaging misfire rate): ≥ 5 %
Type B (emission threshold rate): ≥1%
Segment Adaptation values at the limit (Adaptation Tolerance): 10.1%
Signal Implausible / Missing/ Adding 1 tooth or more (Incorrect number of teeth per rotation):
CONTINENTAL REVISED: MARCH 29, 2012 PAGE 13 OF 112
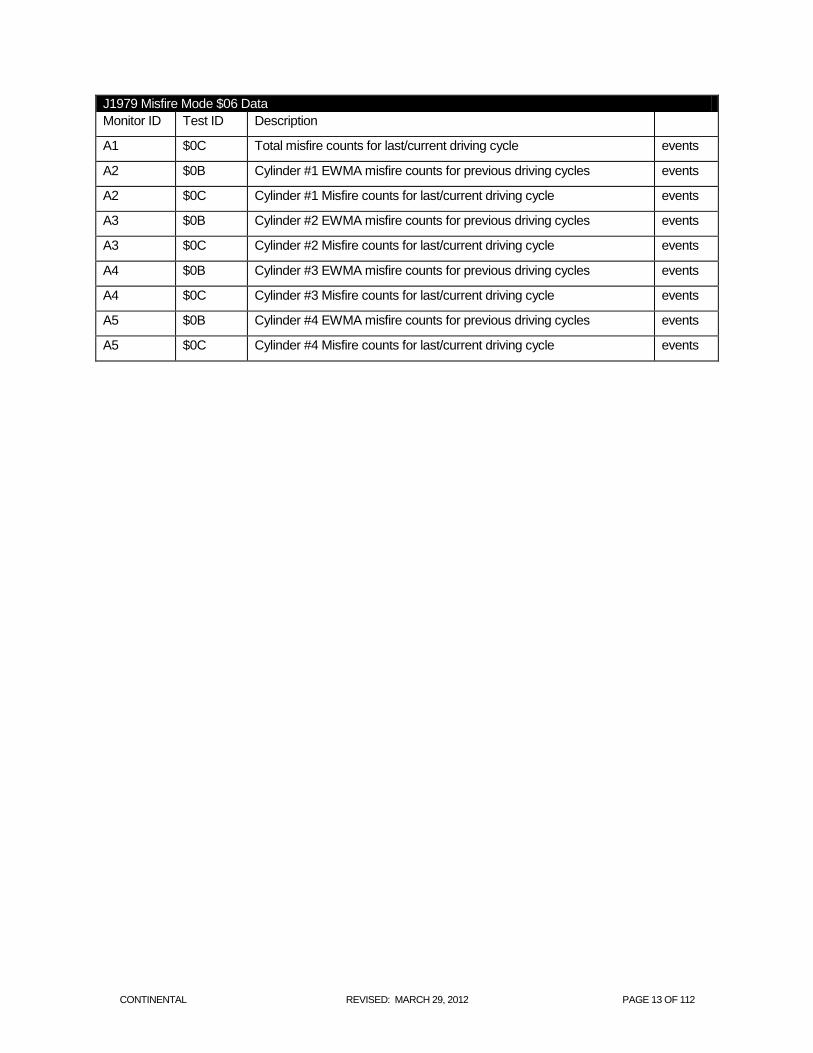
J1979 Misfire Mode $06 Data
Monitor ID Test ID Description
A1 $0C Total misfire counts for last/current driving cycle events
A2 $0B Cylinder #1 EWMA misfire counts for previous driving cycles events
A2 $0C Cylinder #1 Misfire counts for last/current driving cycle events
A3 $0B Cylinder #2 EWMA misfire counts for previous driving cycles events
A3 $0C Cylinder #2 Misfire counts for last/current driving cycle events
A4 $0B Cylinder #3 EWMA misfire counts for previous driving cycles events
A4 $0C Cylinder #3 Misfire counts for last/current driving cycle events
A5 $0B Cylinder #4 EWMA misfire counts for previous driving cycles events
A5 $0C Cylinder #4 Misfire counts for last/current driving cycle events
CONTINENTAL REVISED: MARCH 29, 2012 PAGE 14 OF 112
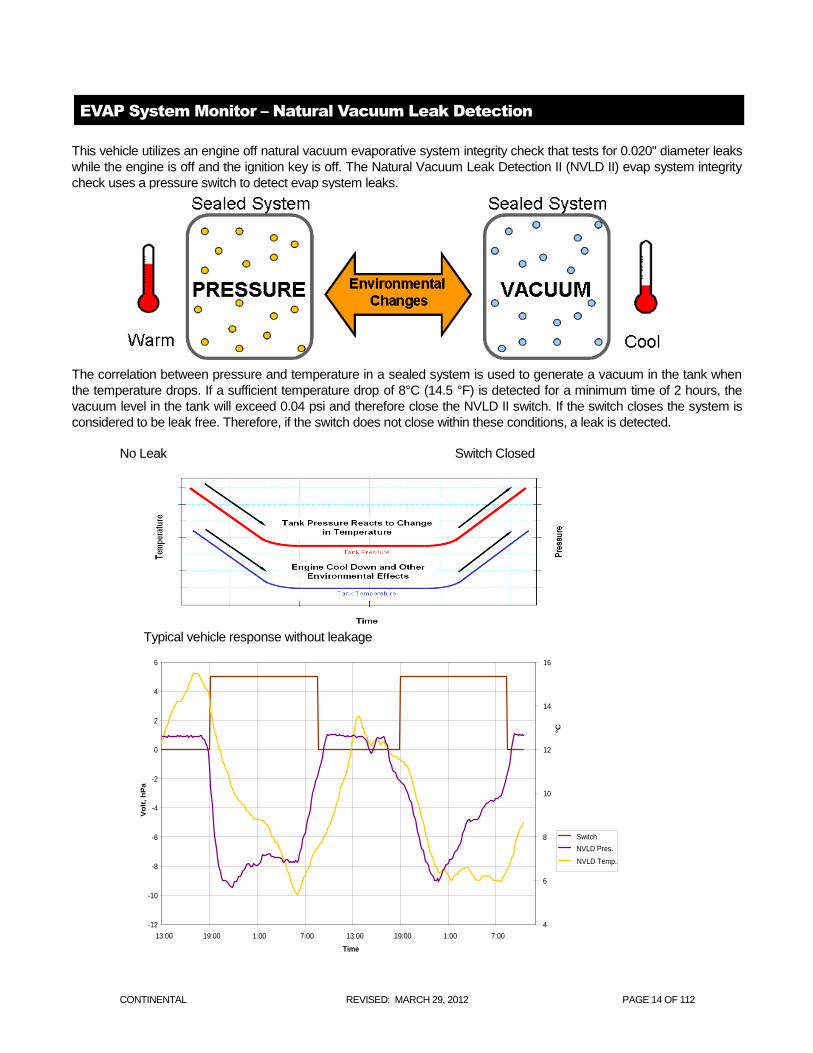
EVAP System Monitor – Natural Vacuum Leak Detection
This vehicle utilizes an engine off natural vacuum evaporative system integrity check that tests for 0.020" diameter leaks
while the engine is off and the ignition key is off. The Natural Vacuum Leak Detection II (NVLD II) evap system integrity
check uses a pressure switch to detect evap system leaks.
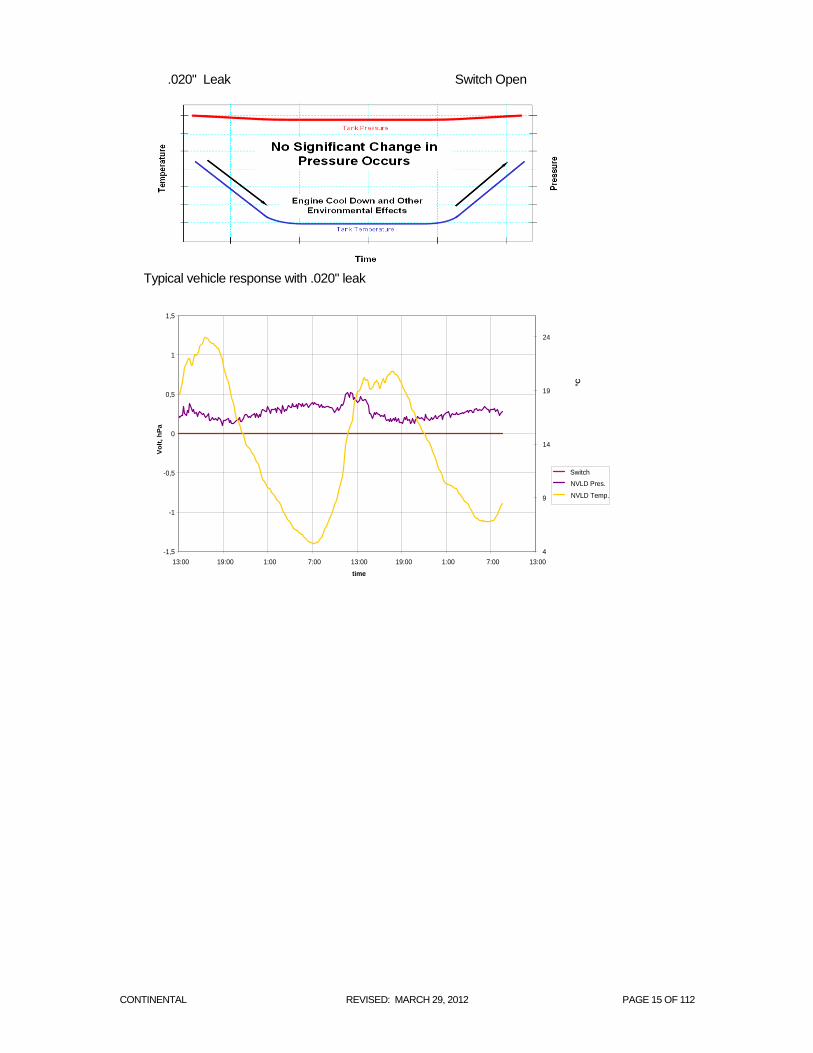
The correlation between pressure and temperature in a sealed system is used to generate a vacuum in the tank when
the temperature drops. If a sufficient temperature drop of 8°C (14.5 °F) is detected for a minimum time of 2 hours, the
vacuum level in the tank will exceed 0.04 psi and therefore close the NVLD II switch. If the switch closes the system is
considered to be leak free. Therefore, if the switch does not close within these conditions, a leak is detected.
No Leak Switch Closed Typical vehicle response without leakage
-12
-10
-8
-6
-4
-2
0
2
4
6
13:00 19:00 1:00 7:00 13:00 19:00 1:00 7:00
Time
4
6
8
10
12
14
16
Switch
NVLD Pres.
NVLD Temp.
Vo
lt,
hP
a
°C
CONTINENTAL REVISED: MARCH 29, 2012 PAGE 15 OF 112
.020" Leak Switch Open Typical vehicle response with .020" leak
-1,5
-1
-0,5
0
0,5
1
1,5
13:00 19:00 1:00 7:00 13:00 19:00 1:00 7:00 13:00
time
4
9
14
19
24
Switch
NVLD Pres.
NVLD Temp.
Vo
lt, h
Pa
°C
CONTINENTAL REVISED: MARCH 29, 2012 PAGE 16 OF 112
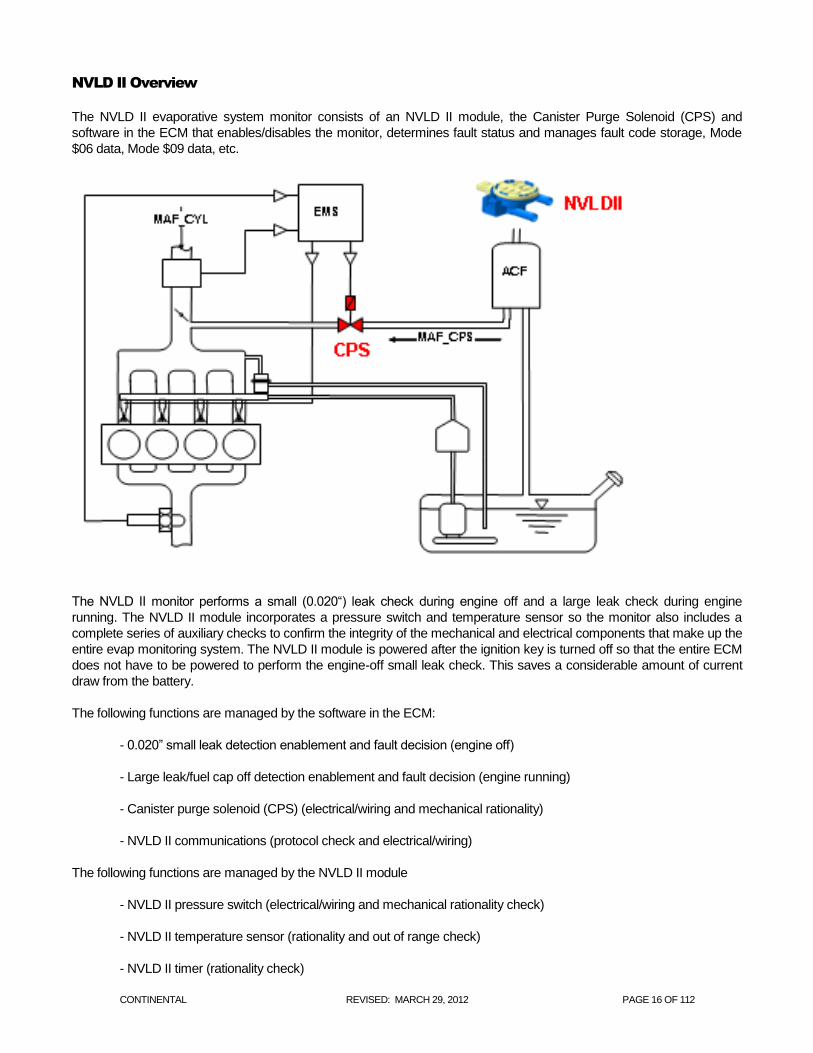
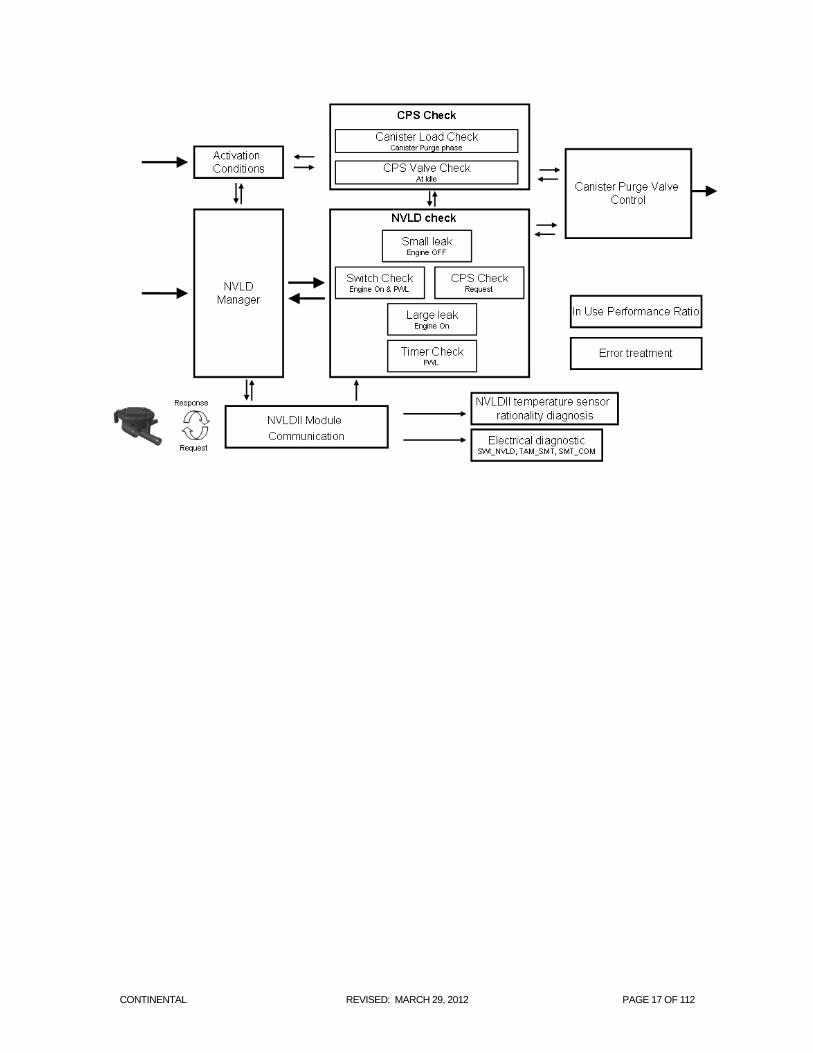
NVLD II Overview
The NVLD II evaporative system monitor consists of an NVLD II module, the Canister Purge Solenoid (CPS) and
software in the ECM that enables/disables the monitor, determines fault status and manages fault code storage, Mode
$06 data, Mode $09 data, etc.
The NVLD II monitor performs a small (0.020“) leak check during engine off and a large leak check during engine
running. The NVLD II module incorporates a pressure switch and temperature sensor so the monitor also includes a
complete series of auxiliary checks to confirm the integrity of the mechanical and electrical components that make up the
entire evap monitoring system. The NVLD II module is powered after the ignition key is turned off so that the entire ECM
does not have to be powered to perform the engine-off small leak check. This saves a considerable amount of current
draw from the battery.
The following functions are managed by the software in the ECM:
- 0.020” small leak detection enablement and fault decision (engine off)
- Large leak/fuel cap off detection enablement and fault decision (engine running)
- Canister purge solenoid (CPS) (electrical/wiring and mechanical rationality)
- NVLD II communications (protocol check and electrical/wiring)
The following functions are managed by the NVLD II module
- NVLD II pressure switch (electrical/wiring and mechanical rationality check)
- NVLD II temperature sensor (rationality and out of range check)
- NVLD II timer (rationality check)
CONTINENTAL REVISED: MARCH 29, 2012 PAGE 17 OF 112
CONTINENTAL REVISED: MARCH 29, 2012 PAGE 18 OF 112
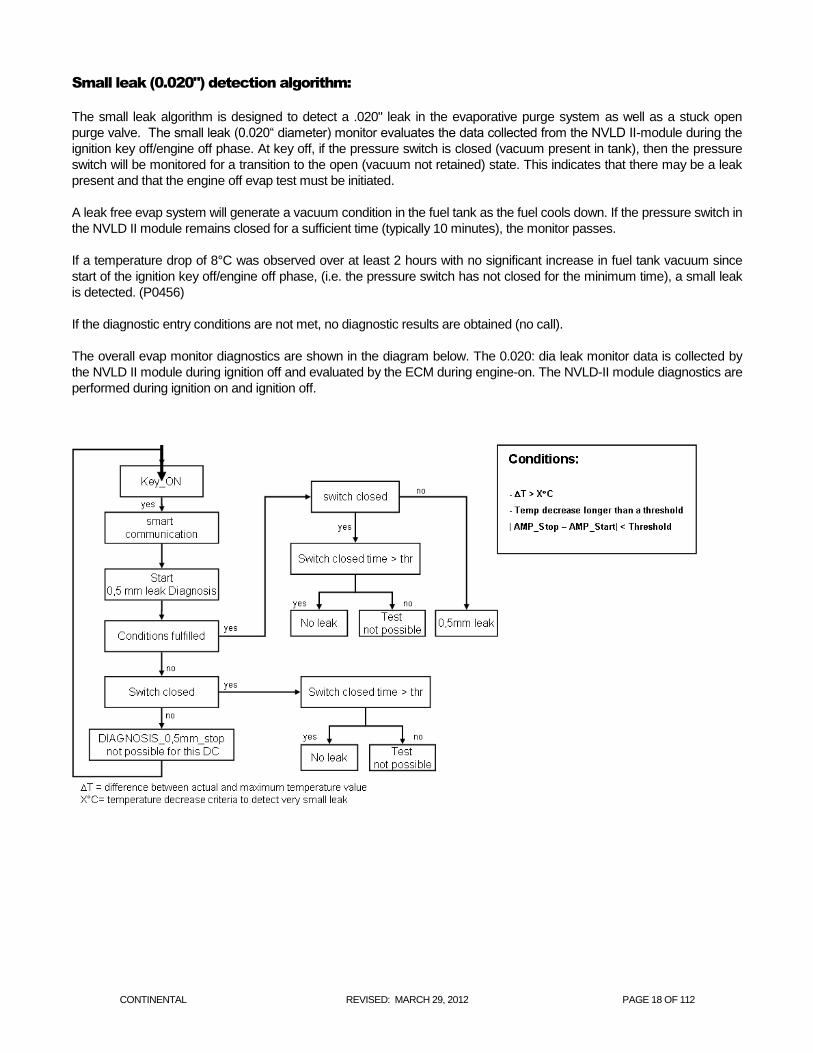
Small leak (0.020") detection algorithm:
The small leak algorithm is designed to detect a .020" leak in the evaporative purge system as well as a stuck open
purge valve. The small leak (0.020“ diameter) monitor evaluates the data collected from the NVLD II-module during the
ignition key off/engine off phase. At key off, if the pressure switch is closed (vacuum present in tank), then the pressure
switch will be monitored for a transition to the open (vacuum not retained) state. This indicates that there may be a leak
present and that the engine off evap test must be initiated.
A leak free evap system will generate a vacuum condition in the fuel tank as the fuel cools down. If the pressure switch in
the NVLD II module remains closed for a sufficient time (typically 10 minutes), the monitor passes.
If a temperature drop of 8°C was observed over at least 2 hours with no significant increase in fuel tank vacuum since
start of the ignition key off/engine off phase, (i.e. the pressure switch has not closed for the minimum time), a small leak
is detected. (P0456)
If the diagnostic entry conditions are not met, no diagnostic results are obtained (no call).
The overall evap monitor diagnostics are shown in the diagram below. The 0.020: dia leak monitor data is collected by
the NVLD II module during ignition off and evaluated by the ECM during engine-on. The NVLD-II module diagnostics are
performed during ignition on and ignition off.
CONTINENTAL REVISED: MARCH 29, 2012 PAGE 19 OF 112
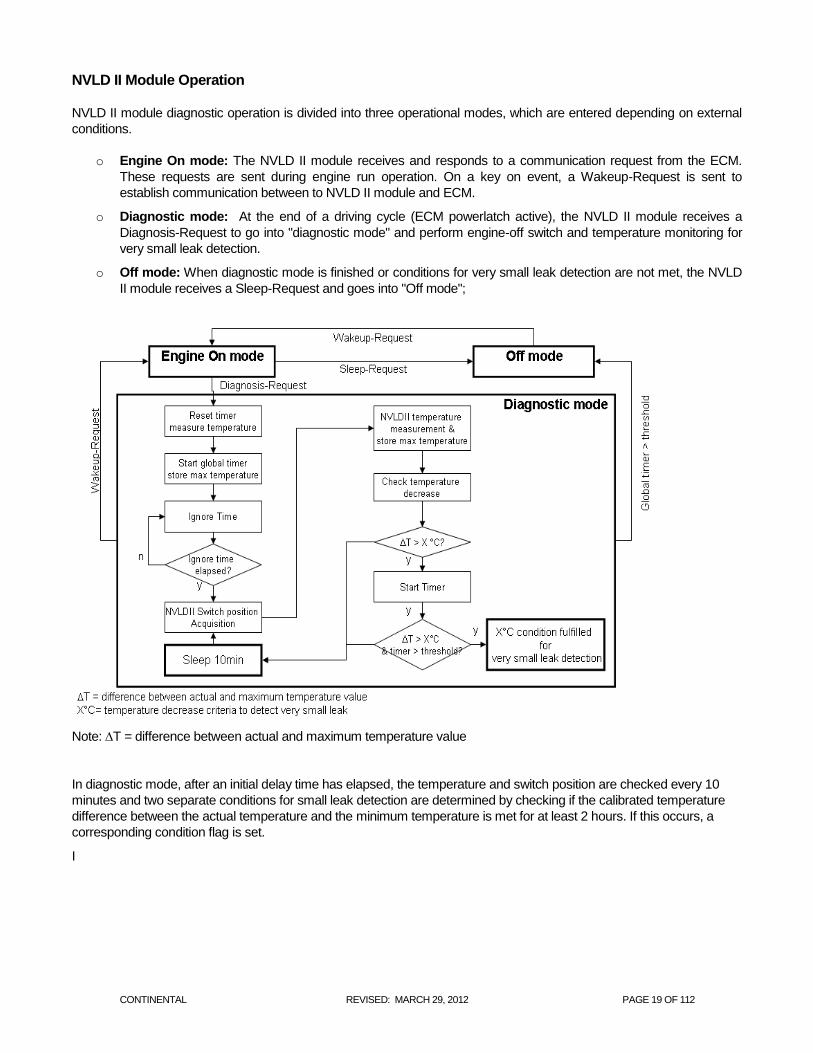
NVLD II Module Operation
NVLD II module diagnostic operation is divided into three operational modes, which are entered depending on external
conditions.
o Engine On mode: The NVLD II module receives and responds to a communication request from the ECM.
These requests are sent during engine run operation. On a key on event, a Wakeup-Request is sent to
establish communication between to NVLD II module and ECM.
o Diagnostic mode: At the end of a driving cycle (ECM powerlatch active), the NVLD II module receives a
Diagnosis-Request to go into "diagnostic mode" and perform engine-off switch and temperature monitoring for
very small leak detection.
o Off mode: When diagnostic mode is finished or conditions for very small leak detection are not met, the NVLD
II module receives a Sleep-Request and goes into "Off mode";
Note: T = difference between actual and maximum temperature value
In diagnostic mode, after an initial delay time has elapsed, the temperature and switch position are checked every 10
minutes and two separate conditions for small leak detection are determined by checking if the calibrated temperature
difference between the actual temperature and the minimum temperature is met for at least 2 hours. If this occurs, a
corresponding condition flag is set.
I
CONTINENTAL REVISED: MARCH 29, 2012 PAGE 20 OF 112
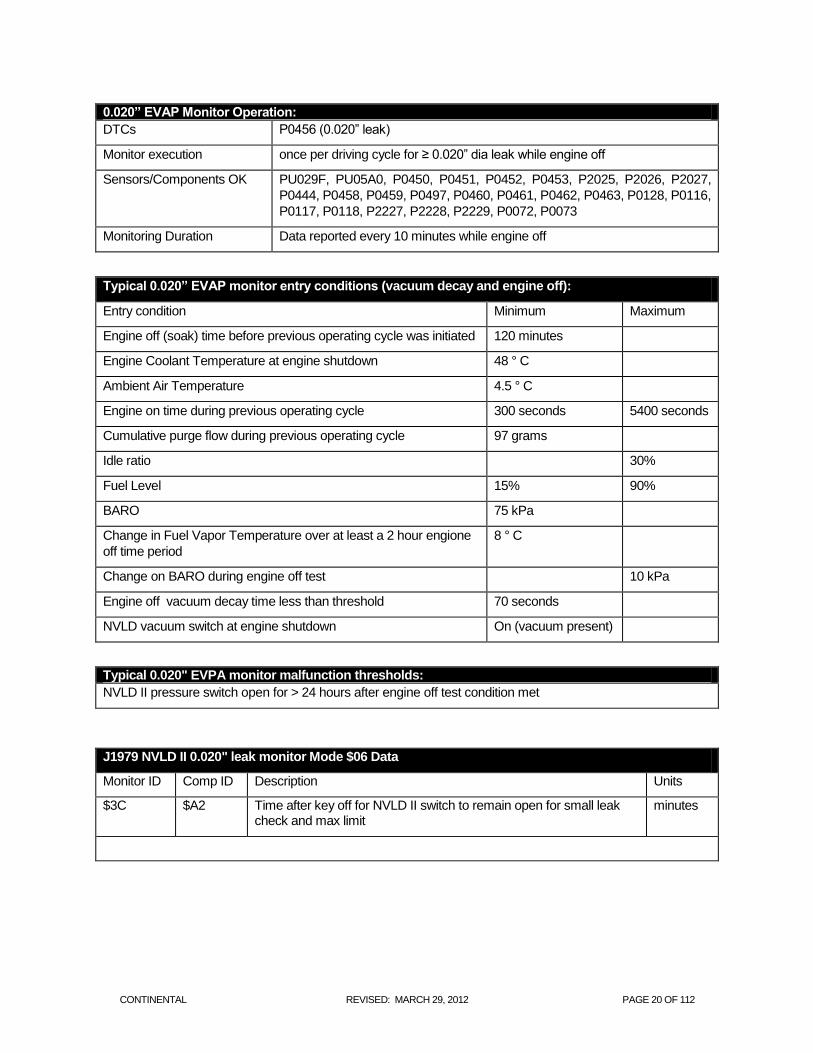
0.020” EVAP Monitor Operation:
DTCs P0456 (0.020” leak)
Monitor execution once per driving cycle for ≥ 0.020” dia leak while engine off
Sensors/Components OK PU029F, PU05A0, P0450, P0451, P0452, P0453, P2025, P2026, P2027,
P0444, P0458, P0459, P0497, P0460, P0461, P0462, P0463, P0128, P0116,
P0117, P0118, P2227, P2228, P2229, P0072, P0073
Monitoring Duration Data reported every 10 minutes while engine off
Typical 0.020” EVAP monitor entry conditions (vacuum decay and engine off):
Entry condition Minimum Maximum
Engine off (soak) time before previous operating cycle was initiated 120 minutes
Engine Coolant Temperature at engine shutdown 48 ° C
Ambient Air Temperature 4.5 ° C
Engine on time during previous operating cycle 300 seconds 5400 seconds
Cumulative purge flow during previous operating cycle 97 grams
Idle ratio 30%
Fuel Level 15% 90%
BARO 75 kPa
Change in Fuel Vapor Temperature over at least a 2 hour engione
off time period
8 ° C
Change on BARO during engine off test 10 kPa
Engine off vacuum decay time less than threshold 70 seconds
NVLD vacuum switch at engine shutdown On (vacuum present)
Typical 0.020" EVPA monitor malfunction thresholds:
NVLD II pressure switch open for > 24 hours after engine off test condition met
J1979 NVLD II 0.020" leak monitor Mode $06 Data
Monitor ID Comp ID Description Units
$3C $A2 Time after key off for NVLD II switch to remain open for small leak check and max limit
minutes
CONTINENTAL REVISED: MARCH 29, 2012 PAGE 21 OF 112
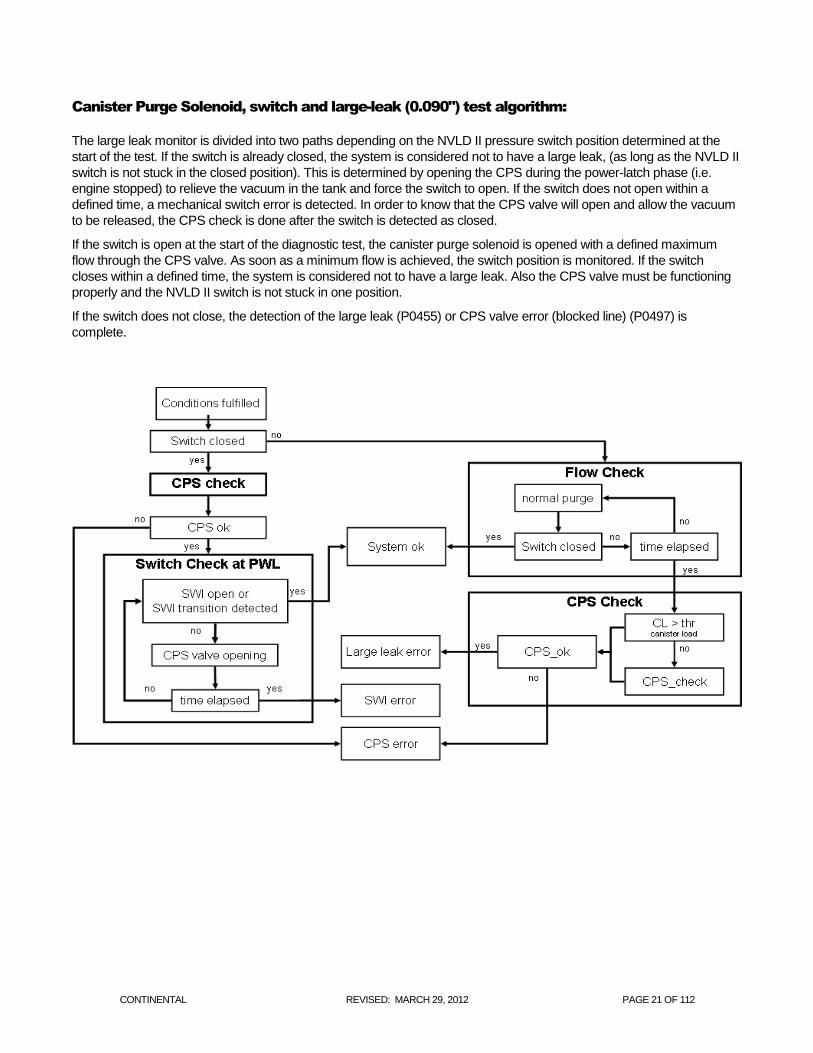
Canister Purge Solenoid, switch and large-leak (0.090") test algorithm:
The large leak monitor is divided into two paths depending on the NVLD II pressure switch position determined at the
start of the test. If the switch is already closed, the system is considered not to have a large leak, (as long as the NVLD II
switch is not stuck in the closed position). This is determined by opening the CPS during the power-latch phase (i.e.
engine stopped) to relieve the vacuum in the tank and force the switch to open. If the switch does not open within a
defined time, a mechanical switch error is detected. In order to know that the CPS valve will open and allow the vacuum
to be released, the CPS check is done after the switch is detected as closed.
If the switch is open at the start of the diagnostic test, the canister purge solenoid is opened with a defined maximum
flow through the CPS valve. As soon as a minimum flow is achieved, the switch position is monitored. If the switch
closes within a defined time, the system is considered not to have a large leak. Also the CPS valve must be functioning
properly and the NVLD II switch is not stuck in one position.
If the switch does not close, the detection of the large leak (P0455) or CPS valve error (blocked line) (P0497) is
complete.
CONTINENTAL REVISED: MARCH 29, 2012 PAGE 22 OF 112
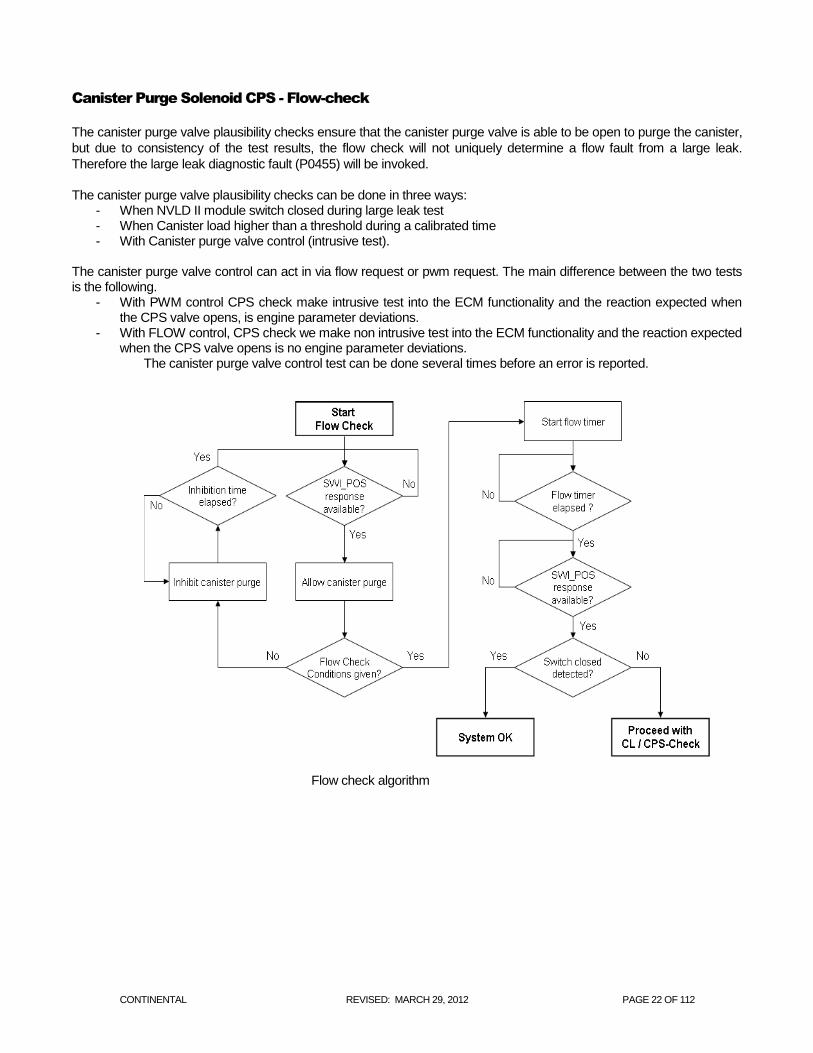
Canister Purge Solenoid CPS - Flow-check
The canister purge valve plausibility checks ensure that the canister purge valve is able to be open to purge the canister,
but due to consistency of the test results, the flow check will not uniquely determine a flow fault from a large leak.
Therefore the large leak diagnostic fault (P0455) will be invoked.
The canister purge valve plausibility checks can be done in three ways: - When NVLD II module switch closed during large leak test - When Canister load higher than a threshold during a calibrated time - With Canister purge valve control (intrusive test).
The canister purge valve control can act in via flow request or pwm request. The main difference between the two tests is the following.
- With PWM control CPS check make intrusive test into the ECM functionality and the reaction expected when the CPS valve opens, is engine parameter deviations.
- With FLOW control, CPS check we make non intrusive test into the ECM functionality and the reaction expected when the CPS valve opens is no engine parameter deviations.
The canister purge valve control test can be done several times before an error is reported.
Flow check algorithm
CONTINENTAL REVISED: MARCH 29, 2012 PAGE 23 OF 112
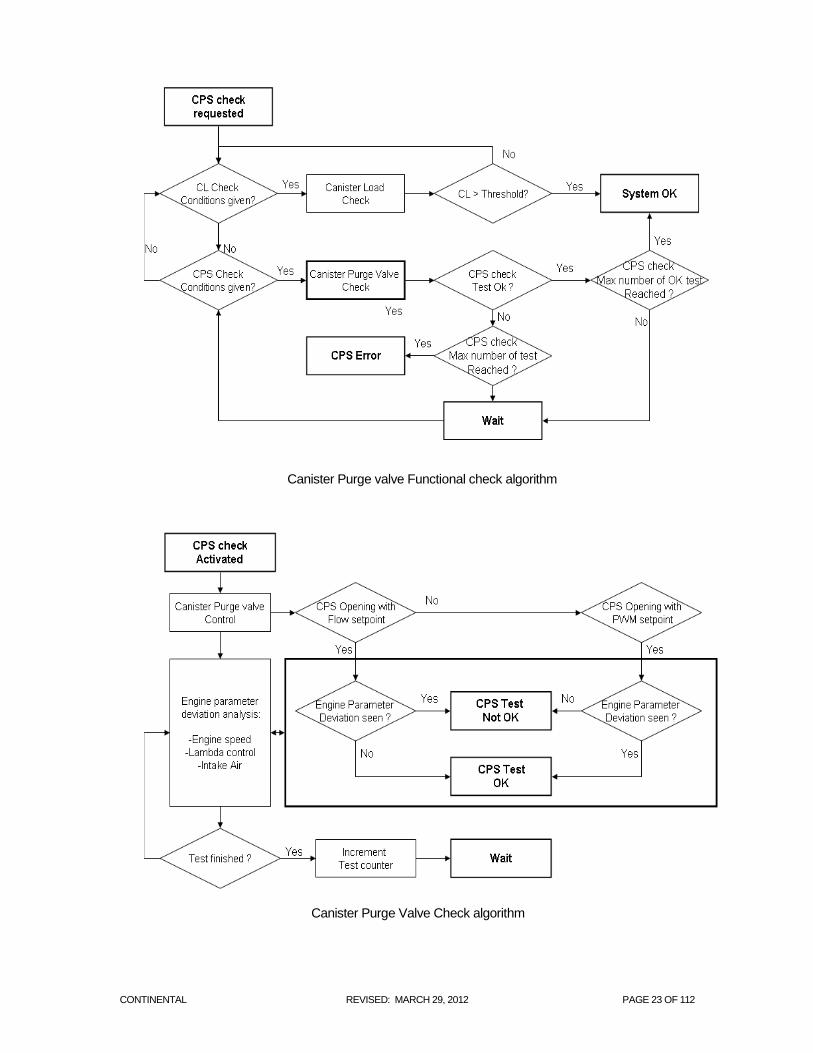
Canister Purge valve Functional check algorithm
Canister Purge Valve Check algorithm
CONTINENTAL REVISED: MARCH 29, 2012 PAGE 24 OF 112
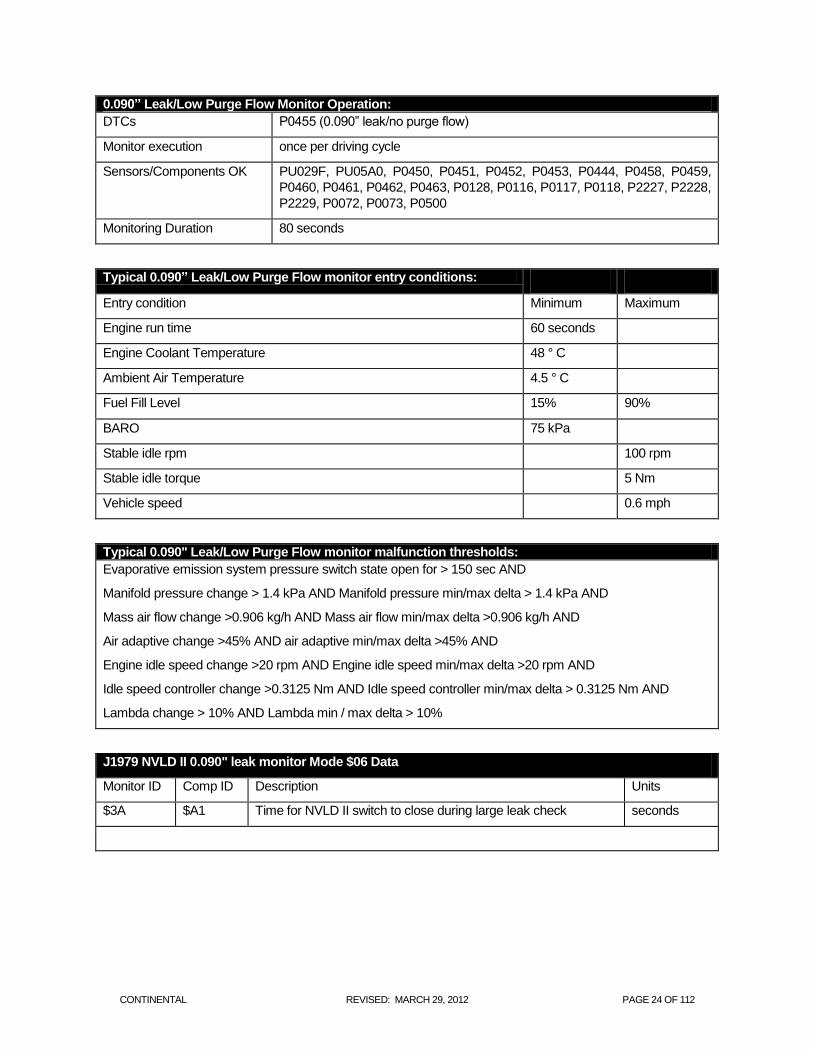
0.090” Leak/Low Purge Flow Monitor Operation:
DTCs P0455 (0.090” leak/no purge flow)
Monitor execution once per driving cycle
Sensors/Components OK PU029F, PU05A0, P0450, P0451, P0452, P0453, P0444, P0458, P0459,
P0460, P0461, P0462, P0463, P0128, P0116, P0117, P0118, P2227, P2228,
P2229, P0072, P0073, P0500
Monitoring Duration 80 seconds
Typical 0.090” Leak/Low Purge Flow monitor entry conditions:
Entry condition Minimum Maximum
Engine run time 60 seconds
Engine Coolant Temperature 48 ° C
Ambient Air Temperature 4.5 ° C
Fuel Fill Level 15% 90%
BARO 75 kPa
Stable idle rpm 100 rpm
Stable idle torque 5 Nm
Vehicle speed 0.6 mph
Typical 0.090" Leak/Low Purge Flow monitor malfunction thresholds:
Evaporative emission system pressure switch state open for > 150 sec AND
Manifold pressure change > 1.4 kPa AND Manifold pressure min/max delta > 1.4 kPa AND
Mass air flow change >0.906 kg/h AND Mass air flow min/max delta >0.906 kg/h AND
Air adaptive change >45% AND air adaptive min/max delta >45% AND
Engine idle speed change >20 rpm AND Engine idle speed min/max delta >20 rpm AND
Idle speed controller change >0.3125 Nm AND Idle speed controller min/max delta > 0.3125 Nm AND
Lambda change > 10% AND Lambda min / max delta > 10%
J1979 NVLD II 0.090" leak monitor Mode $06 Data
Monitor ID Comp ID Description Units
$3A $A1 Time for NVLD II switch to close during large leak check seconds
CONTINENTAL REVISED: MARCH 29, 2012 PAGE 25 OF 112
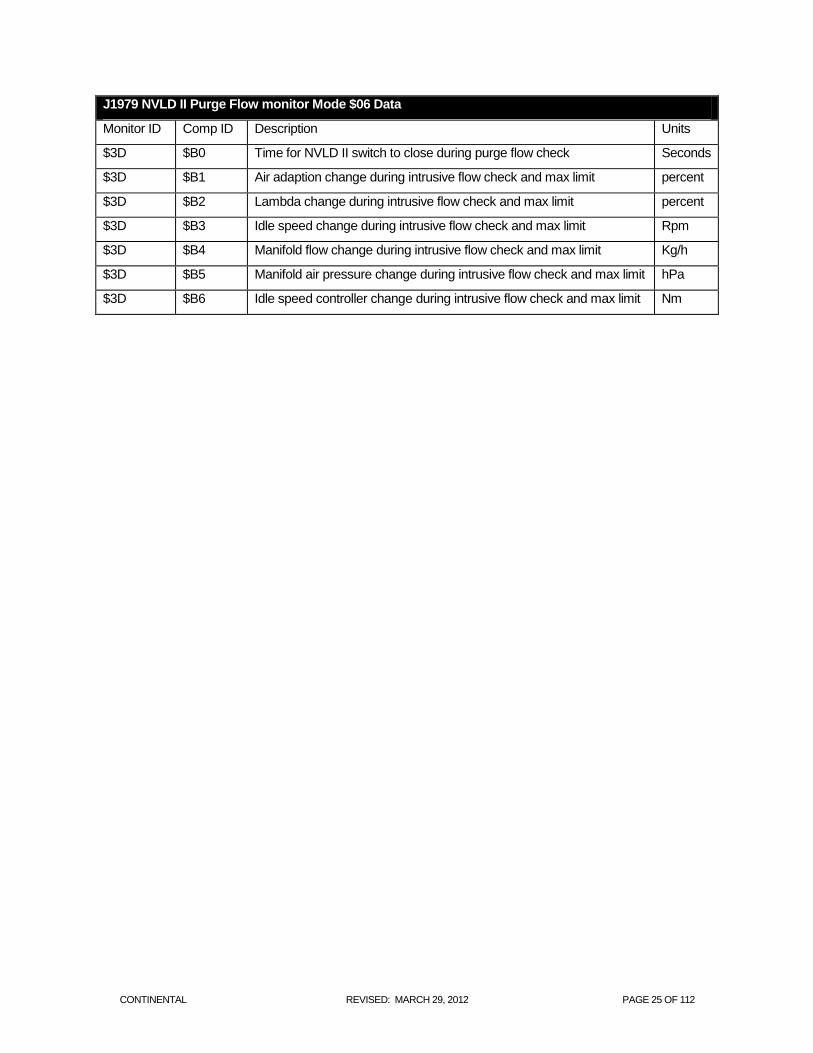
J1979 NVLD II Purge Flow monitor Mode $06 Data
Monitor ID Comp ID Description Units
$3D $B0 Time for NVLD II switch to close during purge flow check Seconds
$3D $B1 Air adaption change during intrusive flow check and max limit percent
$3D $B2 Lambda change during intrusive flow check and max limit percent
$3D $B3 Idle speed change during intrusive flow check and max limit Rpm
$3D $B4 Manifold flow change during intrusive flow check and max limit Kg/h
$3D $B5 Manifold air pressure change during intrusive flow check and max limit hPa
$3D $B6 Idle speed controller change during intrusive flow check and max limit Nm
CONTINENTAL REVISED: MARCH 29, 2012 PAGE 26 OF 112
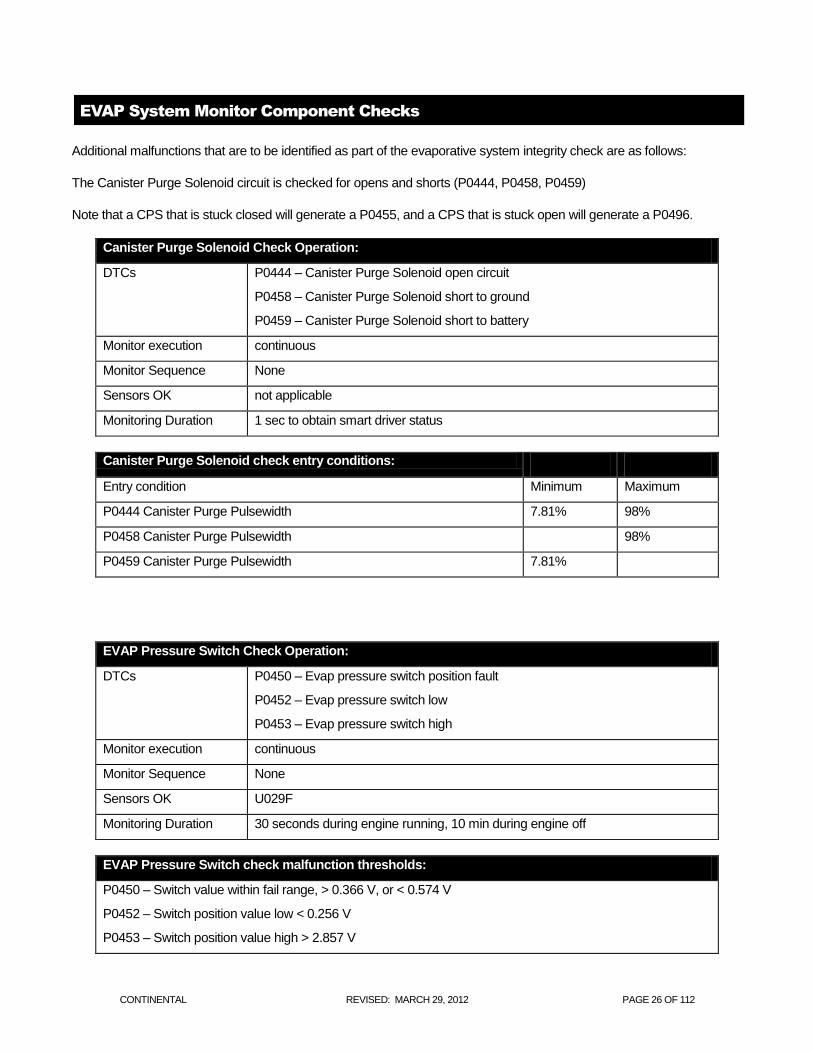
EVAP System Monitor Component Checks
Additional malfunctions that are to be identified as part of the evaporative system integrity check are as follows:
The Canister Purge Solenoid circuit is checked for opens and shorts (P0444, P0458, P0459)
Note that a CPS that is stuck closed will generate a P0455, and a CPS that is stuck open will generate a P0496.
Canister Purge Solenoid Check Operation:
DTCs P0444 – Canister Purge Solenoid open circuit
P0458 – Canister Purge Solenoid short to ground
P0459 – Canister Purge Solenoid short to battery
Monitor execution continuous
Monitor Sequence None
Sensors OK not applicable
Monitoring Duration 1 sec to obtain smart driver status
Canister Purge Solenoid check entry conditions:
Entry condition Minimum Maximum
P0444 Canister Purge Pulsewidth 7.81% 98%
P0458 Canister Purge Pulsewidth 98%
P0459 Canister Purge Pulsewidth 7.81%
EVAP Pressure Switch Check Operation:
DTCs P0450 – Evap pressure switch position fault
P0452 – Evap pressure switch low
P0453 – Evap pressure switch high
Monitor execution continuous
Monitor Sequence None
Sensors OK U029F
Monitoring Duration 30 seconds during engine running, 10 min during engine off
EVAP Pressure Switch check malfunction thresholds:
P0450 – Switch value within fail range, > 0.366 V, or < 0.574 V
P0452 – Switch position value low < 0.256 V
P0453 – Switch position value high > 2.857 V
CONTINENTAL REVISED: MARCH 29, 2012 PAGE 27 OF 112
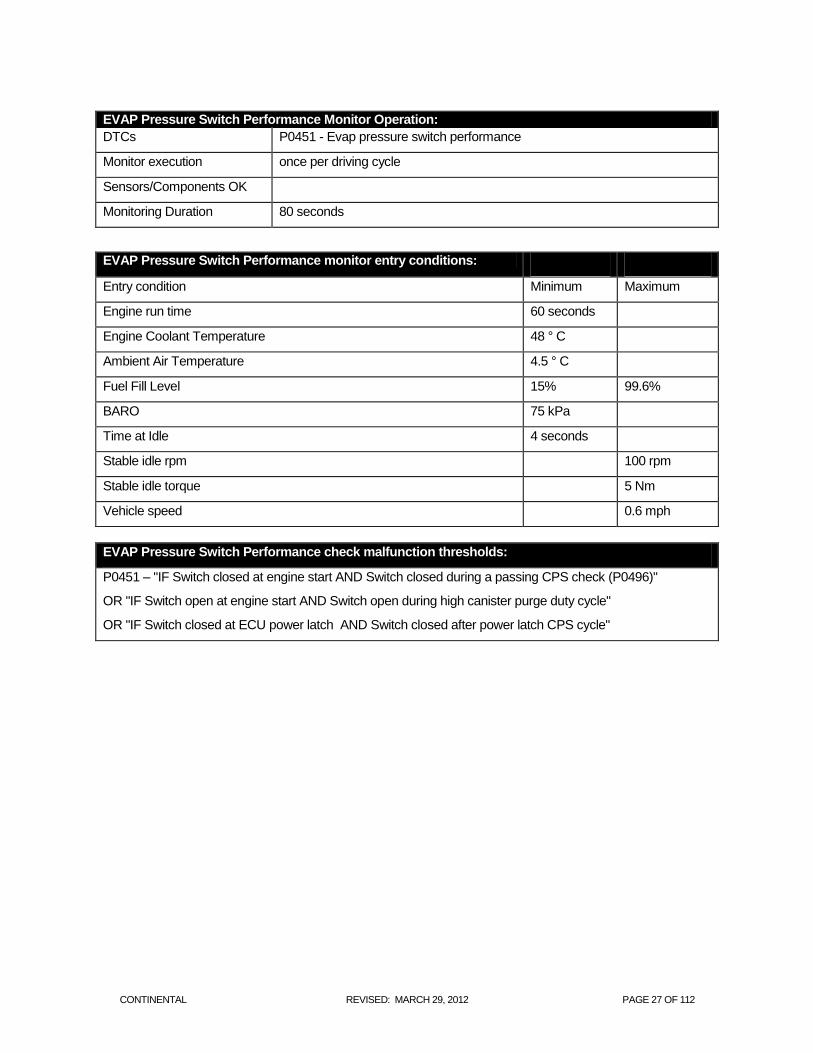
EVAP Pressure Switch Performance Monitor Operation:
DTCs P0451 - Evap pressure switch performance
Monitor execution once per driving cycle
Sensors/Components OK
Monitoring Duration 80 seconds
EVAP Pressure Switch Performance monitor entry conditions:
Entry condition Minimum Maximum
Engine run time 60 seconds
Engine Coolant Temperature 48 ° C
Ambient Air Temperature 4.5 ° C
Fuel Fill Level 15% 99.6%
BARO 75 kPa
Time at Idle 4 seconds
Stable idle rpm 100 rpm
Stable idle torque 5 Nm
Vehicle speed 0.6 mph
EVAP Pressure Switch Performance check malfunction thresholds:
P0451 – "IF Switch closed at engine start AND Switch closed during a passing CPS check (P0496)"
OR "IF Switch open at engine start AND Switch open during high canister purge duty cycle"
OR "IF Switch closed at ECU power latch AND Switch closed after power latch CPS cycle"
CONTINENTAL REVISED: MARCH 29, 2012 PAGE 28 OF 112
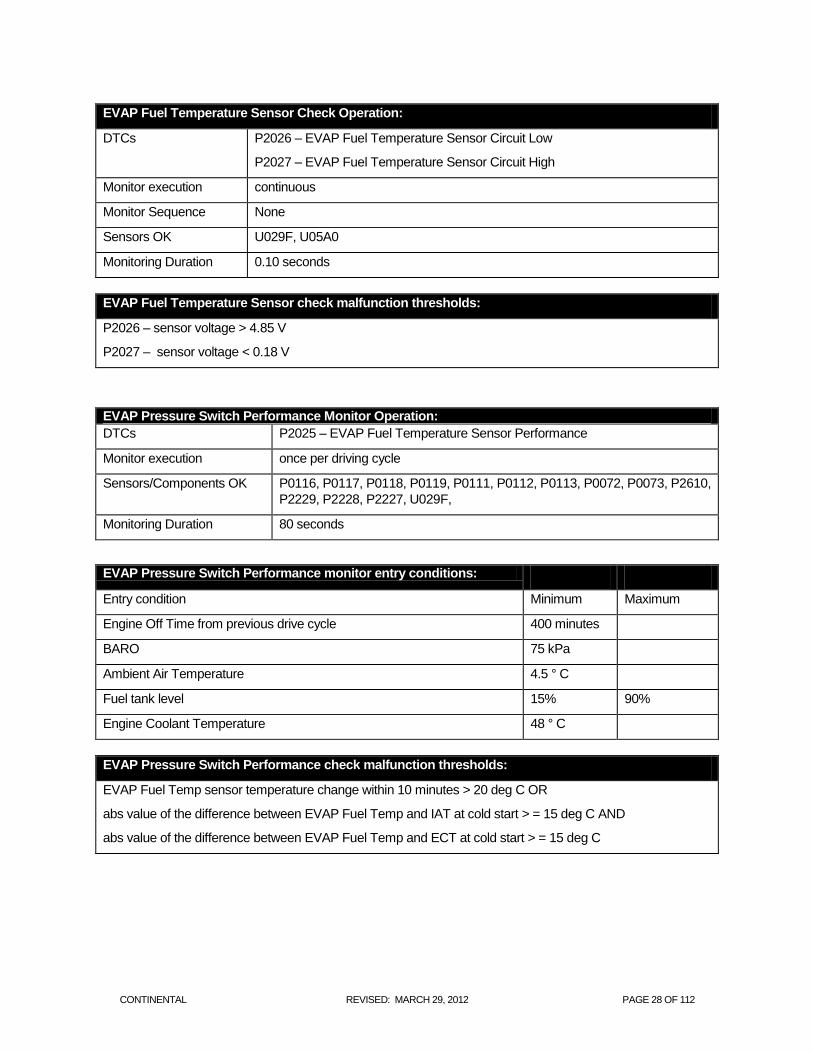
EVAP Fuel Temperature Sensor Check Operation:
DTCs P2026 – EVAP Fuel Temperature Sensor Circuit Low
P2027 – EVAP Fuel Temperature Sensor Circuit High
Monitor execution continuous
Monitor Sequence None
Sensors OK U029F, U05A0
Monitoring Duration 0.10 seconds
EVAP Fuel Temperature Sensor check malfunction thresholds:
P2026 – sensor voltage > 4.85 V
P2027 – sensor voltage < 0.18 V
EVAP Pressure Switch Performance Monitor Operation:
DTCs P2025 – EVAP Fuel Temperature Sensor Performance
Monitor execution once per driving cycle
Sensors/Components OK P0116, P0117, P0118, P0119, P0111, P0112, P0113, P0072, P0073, P2610,
P2229, P2228, P2227, U029F,
Monitoring Duration 80 seconds
EVAP Pressure Switch Performance monitor entry conditions:
Entry condition Minimum Maximum
Engine Off Time from previous drive cycle 400 minutes
BARO 75 kPa
Ambient Air Temperature 4.5 ° C
Fuel tank level 15% 90%
Engine Coolant Temperature 48 ° C
EVAP Pressure Switch Performance check malfunction thresholds:
EVAP Fuel Temp sensor temperature change within 10 minutes > 20 deg C OR
abs value of the difference between EVAP Fuel Temp and IAT at cold start > = 15 deg C AND
abs value of the difference between EVAP Fuel Temp and ECT at cold start > = 15 deg C
CONTINENTAL REVISED: MARCH 29, 2012 PAGE 29 OF 112
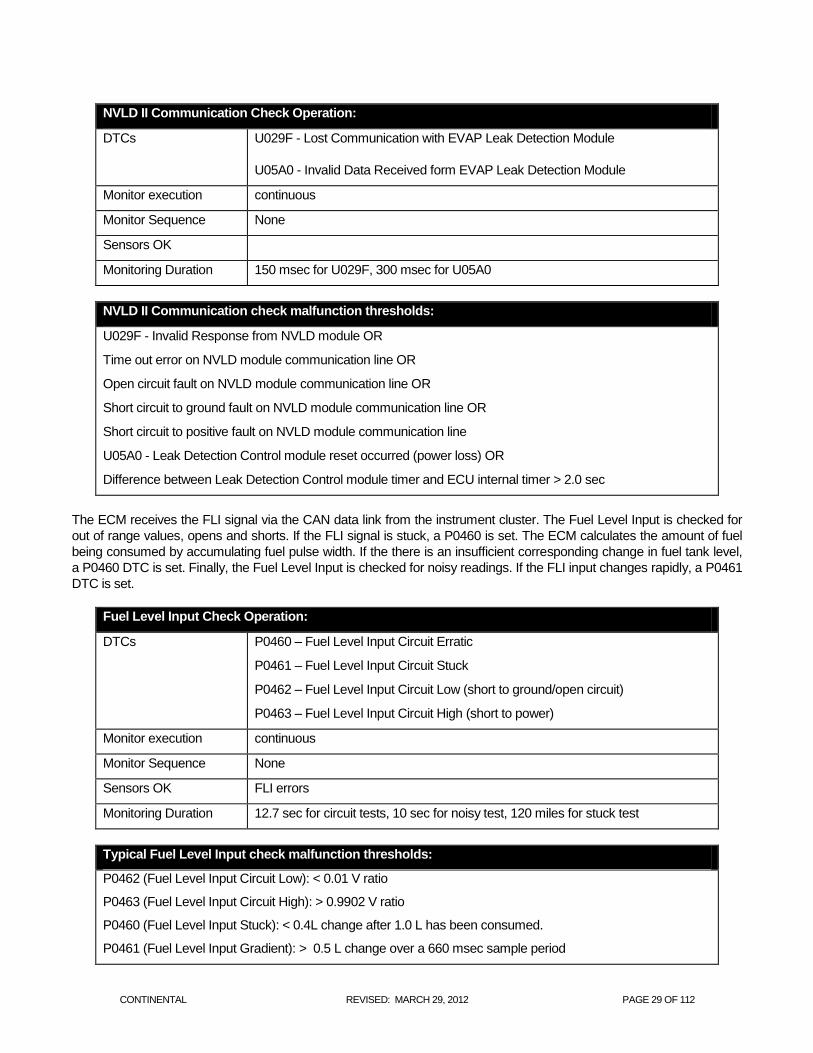
NVLD II Communication Check Operation:
DTCs U029F - Lost Communication with EVAP Leak Detection Module
U05A0 - Invalid Data Received form EVAP Leak Detection Module
Monitor execution continuous
Monitor Sequence None
Sensors OK
Monitoring Duration 150 msec for U029F, 300 msec for U05A0
NVLD II Communication check malfunction thresholds:
U029F - Invalid Response from NVLD module OR
Time out error on NVLD module communication line OR
Open circuit fault on NVLD module communication line OR
Short circuit to ground fault on NVLD module communication line OR
Short circuit to positive fault on NVLD module communication line
U05A0 - Leak Detection Control module reset occurred (power loss) OR
Difference between Leak Detection Control module timer and ECU internal timer > 2.0 sec
The ECM receives the FLI signal via the CAN data link from the instrument cluster. The Fuel Level Input is checked for
out of range values, opens and shorts. If the FLI signal is stuck, a P0460 is set. The ECM calculates the amount of fuel
being consumed by accumulating fuel pulse width. If the there is an insufficient corresponding change in fuel tank level,
a P0460 DTC is set. Finally, the Fuel Level Input is checked for noisy readings. If the FLI input changes rapidly, a P0461
DTC is set.
Fuel Level Input Check Operation:
DTCs P0460 – Fuel Level Input Circuit Erratic
P0461 – Fuel Level Input Circuit Stuck
P0462 – Fuel Level Input Circuit Low (short to ground/open circuit)
P0463 – Fuel Level Input Circuit High (short to power)
Monitor execution continuous
Monitor Sequence None
Sensors OK FLI errors
Monitoring Duration 12.7 sec for circuit tests, 10 sec for noisy test, 120 miles for stuck test
Typical Fuel Level Input check malfunction thresholds:
P0462 (Fuel Level Input Circuit Low): < 0.01 V ratio
P0463 (Fuel Level Input Circuit High): > 0.9902 V ratio
P0460 (Fuel Level Input Stuck): < 0.4L change after 1.0 L has been consumed.
P0461 (Fuel Level Input Gradient): > 0.5 L change over a 660 msec sample period
CONTINENTAL REVISED: MARCH 29, 2012 PAGE 30 OF 112
Fuel System Monitor
The closed loop fuel strategy uses O2 sensors for feedback. The fuel equation includes short and long term fuel trim
modifiers:
A conventional O2 sensor (not a wide-range sensor) can only indicate if the mixture is richer or leaner than
stoichiometric. During closed loop operation, short term fuel trim values are calculated by the ECM using oxygen sensor
inputs in order to maintain a stoichiometric air/fuel ratio. The ECM is constantly making adjustments to the short term fuel
trim, which causes the oxygen sensor voltage to switch from rich to lean around the stoichiometric point. As long as the
short term fuel trim is able to cause the oxygen sensor voltage to switch, a stoichiometric air/fuel ratio is maintained.
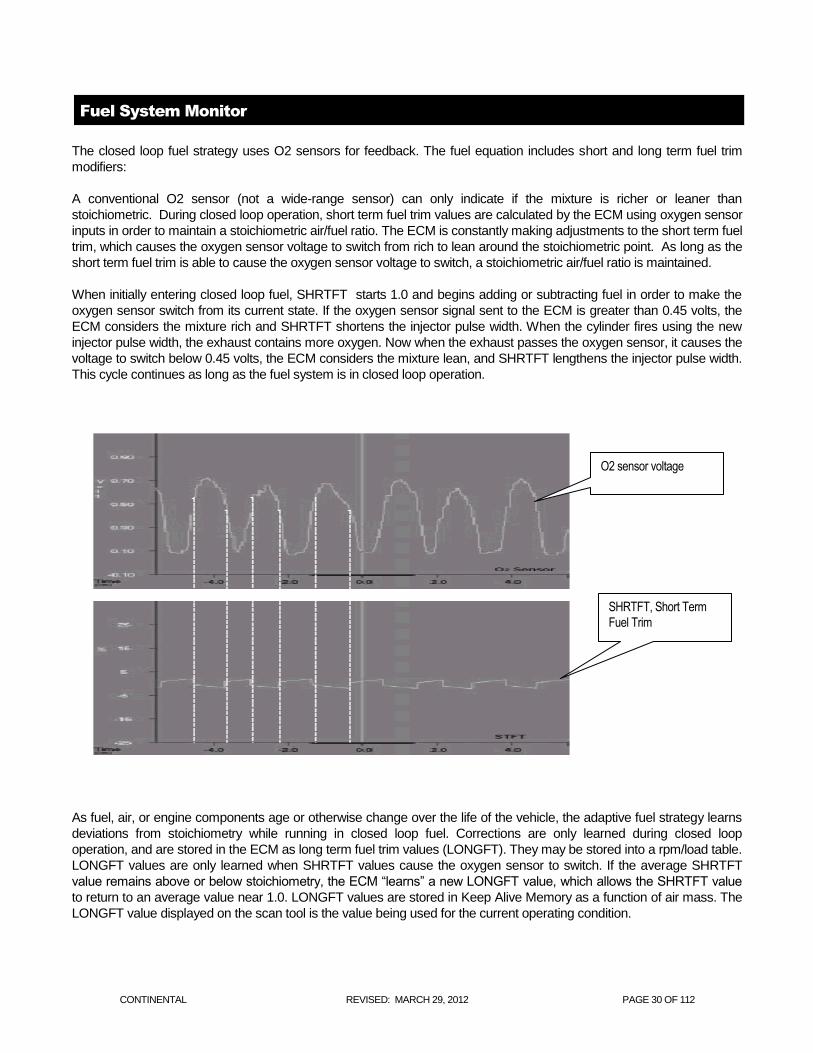
When initially entering closed loop fuel, SHRTFT starts 1.0 and begins adding or subtracting fuel in order to make the
oxygen sensor switch from its current state. If the oxygen sensor signal sent to the ECM is greater than 0.45 volts, the
ECM considers the mixture rich and SHRTFT shortens the injector pulse width. When the cylinder fires using the new
injector pulse width, the exhaust contains more oxygen. Now when the exhaust passes the oxygen sensor, it causes the
voltage to switch below 0.45 volts, the ECM considers the mixture lean, and SHRTFT lengthens the injector pulse width.
This cycle continues as long as the fuel system is in closed loop operation.
As fuel, air, or engine components age or otherwise change over the life of the vehicle, the adaptive fuel strategy learns
deviations from stoichiometry while running in closed loop fuel. Corrections are only learned during closed loop
operation, and are stored in the ECM as long term fuel trim values (LONGFT). They may be stored into a rpm/load table.
LONGFT values are only learned when SHRTFT values cause the oxygen sensor to switch. If the average SHRTFT
value remains above or below stoichiometry, the ECM “learns” a new LONGFT value, which allows the SHRTFT value
to return to an average value near 1.0. LONGFT values are stored in Keep Alive Memory as a function of air mass. The
LONGFT value displayed on the scan tool is the value being used for the current operating condition.
O2 sensor voltage
SHRTFT, Short Term
Fuel Trim
CONTINENTAL REVISED: MARCH 29, 2012 PAGE 31 OF 112
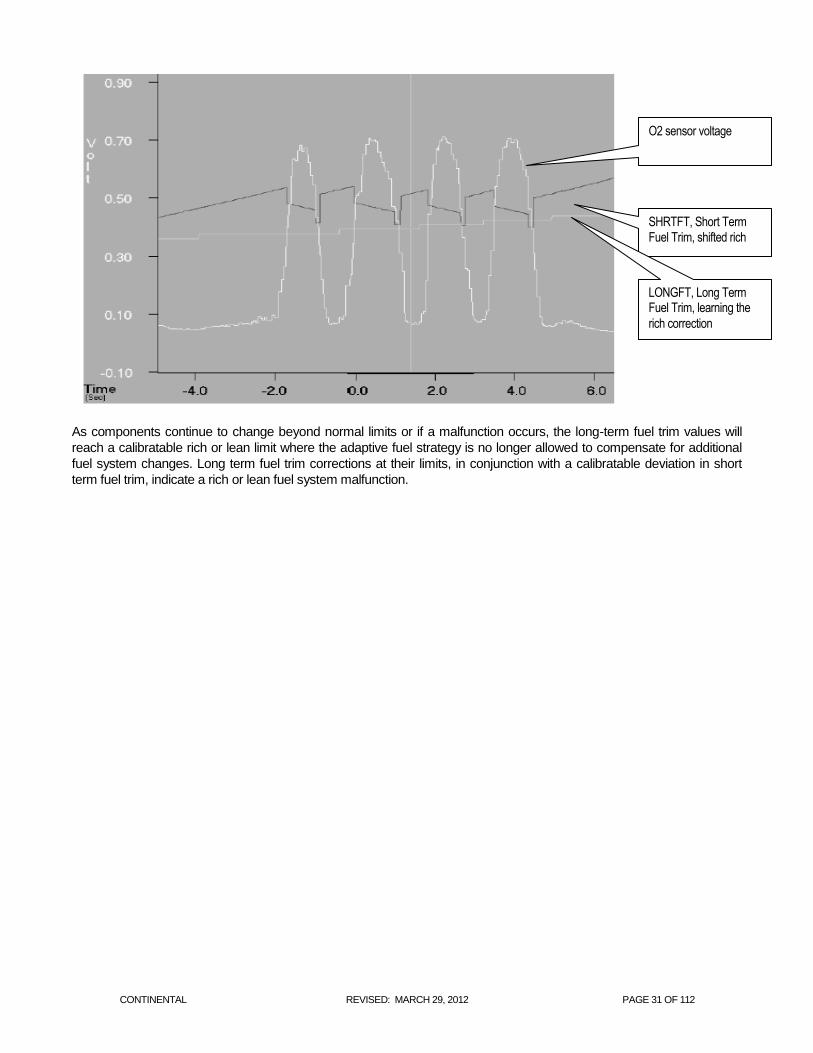
As components continue to change beyond normal limits or if a malfunction occurs, the long-term fuel trim values will
reach a calibratable rich or lean limit where the adaptive fuel strategy is no longer allowed to compensate for additional
fuel system changes. Long term fuel trim corrections at their limits, in conjunction with a calibratable deviation in short
term fuel trim, indicate a rich or lean fuel system malfunction.
O2 sensor voltage
SHRTFT, Short Term Fuel Trim, shifted rich
LONGFT, Long Term Fuel Trim, learning the
rich correction
CONTINENTAL REVISED: MARCH 29, 2012 PAGE 32 OF 112
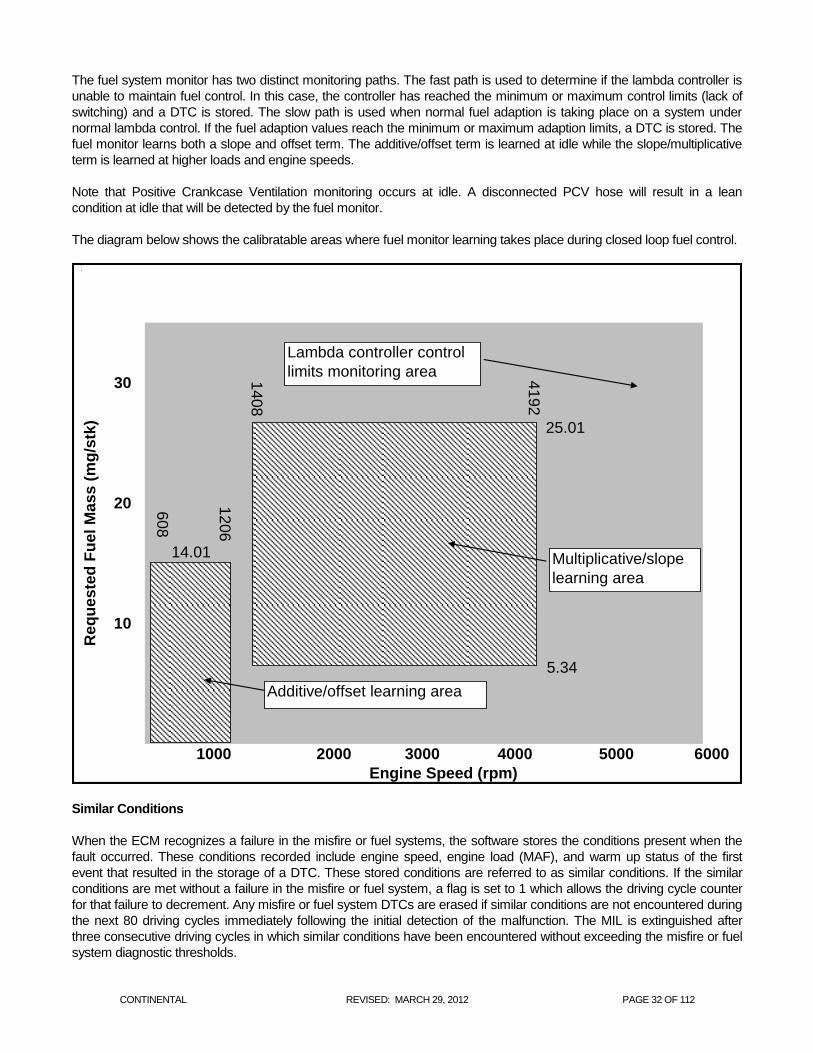
The fuel system monitor has two distinct monitoring paths. The fast path is used to determine if the lambda controller is
unable to maintain fuel control. In this case, the controller has reached the minimum or maximum control limits (lack of
switching) and a DTC is stored. The slow path is used when normal fuel adaption is taking place on a system under
normal lambda control. If the fuel adaption values reach the minimum or maximum adaption limits, a DTC is stored. The
fuel monitor learns both a slope and offset term. The additive/offset term is learned at idle while the slope/multiplicative
term is learned at higher loads and engine speeds.
Note that Positive Crankcase Ventilation monitoring occurs at idle. A disconnected PCV hose will result in a lean
condition at idle that will be detected by the fuel monitor.
The diagram below shows the calibratable areas where fuel monitor learning takes place during closed loop fuel control.
1000 2000 3000 4000 5000 6000
Engine Speed (rpm)
Req
ueste
d F
uel
Mass (
mg
/stk
)
10
20
30
25.01
5.34
1408
4192
1206
608
Additive/offset learning area
Multiplicative/slope
learning area
Lambda controller control
limits monitoring area
14.01
Similar Conditions
When the ECM recognizes a failure in the misfire or fuel systems, the software stores the conditions present when the
fault occurred. These conditions recorded include engine speed, engine load (MAF), and warm up status of the first
event that resulted in the storage of a DTC. These stored conditions are referred to as similar conditions. If the similar
conditions are met without a failure in the misfire or fuel system, a flag is set to 1 which allows the driving cycle counter
for that failure to decrement. Any misfire or fuel system DTCs are erased if similar conditions are not encountered during
the next 80 driving cycles immediately following the initial detection of the malfunction. The MIL is extinguished after
three consecutive driving cycles in which similar conditions have been encountered without exceeding the misfire or fuel
system diagnostic thresholds.
CONTINENTAL REVISED: MARCH 29, 2012 PAGE 33 OF 112
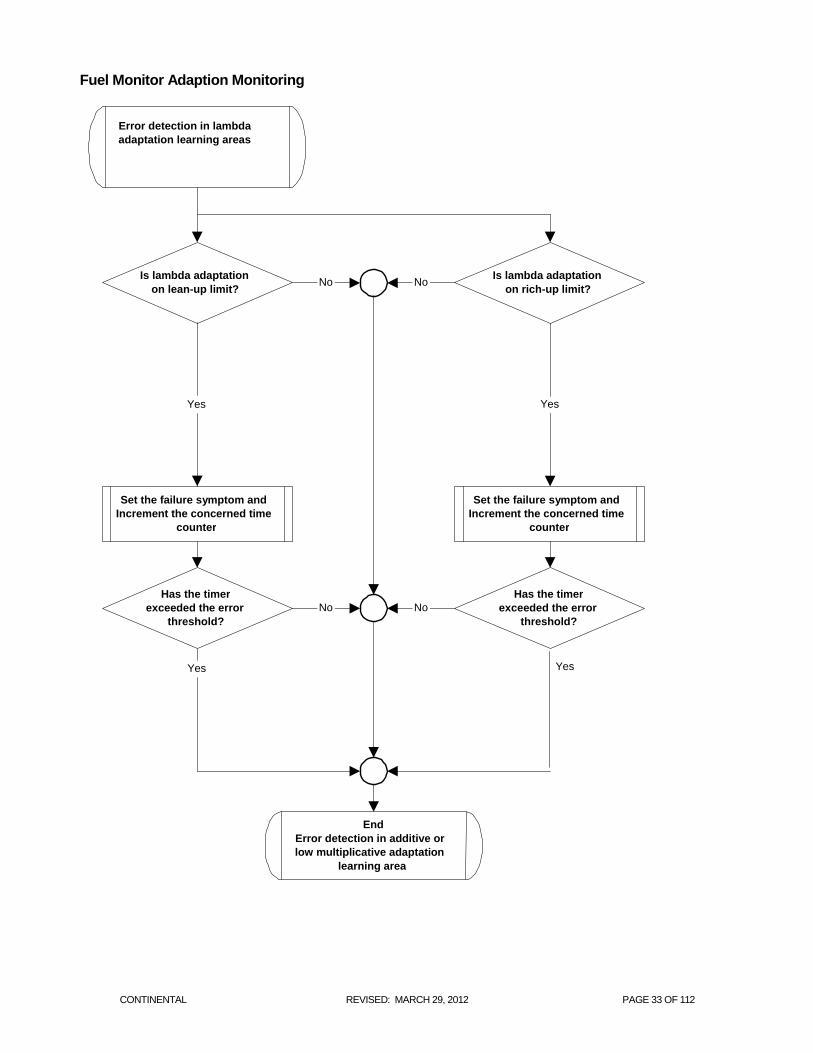
Fuel Monitor Adaption Monitoring
Error detection in lambda adaptation learning areas
Is lambda adaptation on lean-up limit?
Set the failure symptom and Increment the concerned time
counter
Is lambda adaptation on rich-up limit?
No No
Set the failure symptom and Increment the concerned time
counter
Yes
End Error detection in additive or low multiplicative adaptation
learning area
Has the timer exceeded the error
threshold?
Yes
No Has the timer
exceeded the error threshold?
Yes
No
Yes
CONTINENTAL REVISED: MARCH 29, 2012 PAGE 34 OF 112
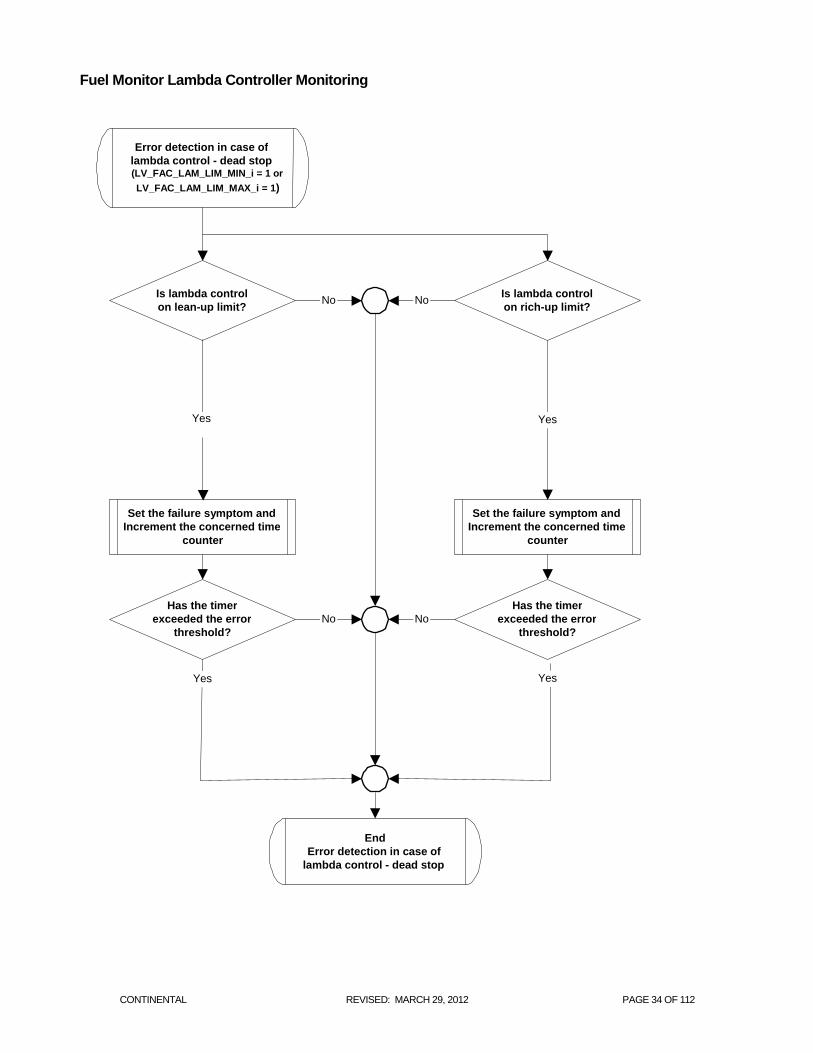
Fuel Monitor Lambda Controller Monitoring
Error detection in case of
lambda control - dead stop (LV_FAC_LAM_LIM_MIN_i = 1 or
LV_FAC_LAM_LIM_MAX_i = 1)
Is lambda control on lean-up limit?
Set the failure symptom and Increment the concerned time
counter
Is lambda control on rich-up limit?
No No
Set the failure symptom and Increment the concerned time
counter
Yes
End Error detection in case of
lambda control - dead stop
Has the timer exceeded the error
threshold?
Yes
No Has the timer
exceeded the error threshold?
Yes
No
Yes
CONTINENTAL REVISED: MARCH 29, 2012 PAGE 35 OF 112
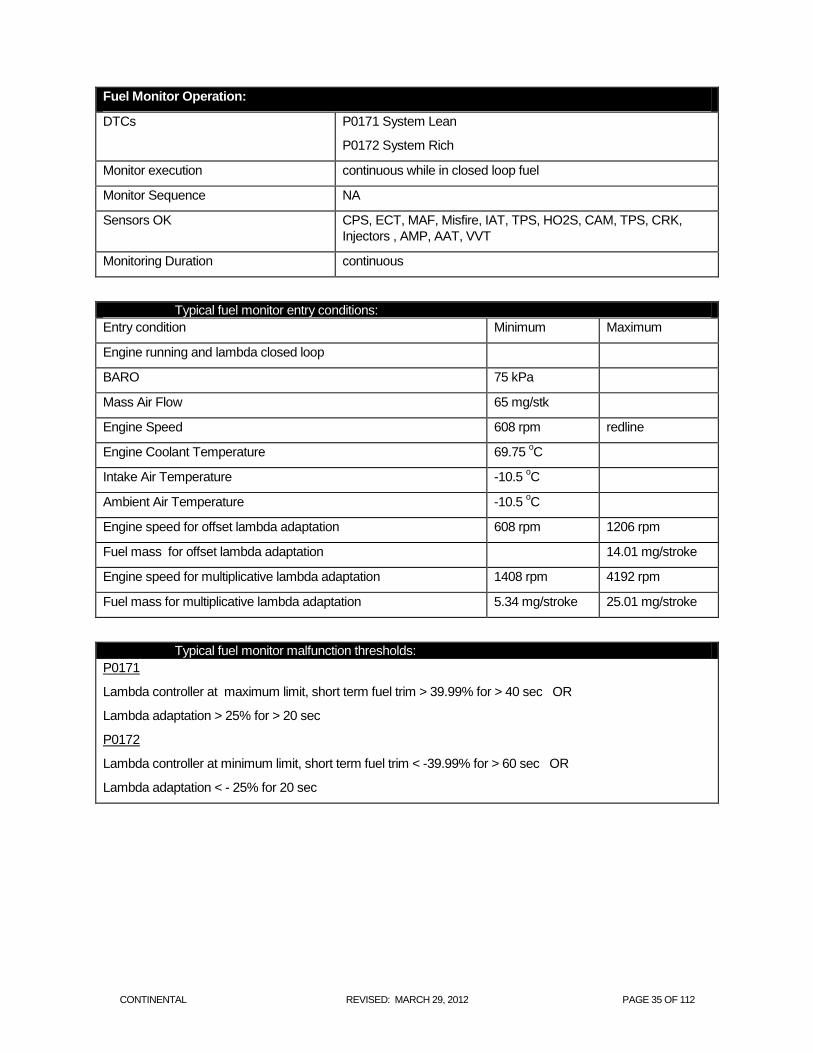
Fuel Monitor Operation:
DTCs P0171 System Lean
P0172 System Rich
Monitor execution continuous while in closed loop fuel
Monitor Sequence NA
Sensors OK CPS, ECT, MAF, Misfire, IAT, TPS, HO2S, CAM, TPS, CRK,
Injectors , AMP, AAT, VVT
Monitoring Duration continuous
Typical fuel monitor entry conditions:
Entry condition Minimum Maximum
Engine running and lambda closed loop
BARO 75 kPa
Mass Air Flow 65 mg/stk
Engine Speed 608 rpm redline
Engine Coolant Temperature 69.75 oC
Intake Air Temperature -10.5 oC
Ambient Air Temperature -10.5 oC
Engine speed for offset lambda adaptation 608 rpm 1206 rpm
Fuel mass for offset lambda adaptation 14.01 mg/stroke
Engine speed for multiplicative lambda adaptation 1408 rpm 4192 rpm
Fuel mass for multiplicative lambda adaptation 5.34 mg/stroke 25.01 mg/stroke
Typical fuel monitor malfunction thresholds:
P0171
Lambda controller at maximum limit, short term fuel trim > 39.99% for > 40 sec OR
Lambda adaptation > 25% for > 20 sec
P0172
Lambda controller at minimum limit, short term fuel trim < -39.99% for > 60 sec OR
Lambda adaptation < - 25% for 20 sec
CONTINENTAL REVISED: MARCH 29, 2012 PAGE 36 OF 112
HO2S Monitor
Upstream Oxygen Sensor Monitoring - Switching Sensor
The upstream oxygen sensor circuit monitor detects if the HO2S sensor voltage is above or below a calibratable
threshold or if it is not active, (lack of switching) or stuck at the bias voltage.
The upstream oxygen sensor monitor detects if the HO2S signal circuit voltage is:
Shorted to ground or an air leak is present (low signal),
Signal circuit voltage is high (high signal),
Open circuit causing the signal circuit voltage to be inactive or stuck at the bias voltage.
The open circuit detection strategy is described below
Open Circuit Check
This check detects if the HO2S signal circuit is not active (lack of switching) or stuck at the bias voltage at the beginning
of the driving cycle. This check allows the service technician to find the root cause of the upstream HO2S sensor "not
ready for closed loop”. If the "open circuit check" stores a DTC (P0130) then an additional DTC is also stored
automatically (P016A ) - O2 Sensor Not Ready (Bank 1 Sensor 1)).
This additional check is performed because there are two different possible root causes for this symptom at engine start.
The upstream signal voltage can be inactive (stuck at the bias voltage) because of an open circuit, or because of a weak
HO2S heater. These cases are described below:
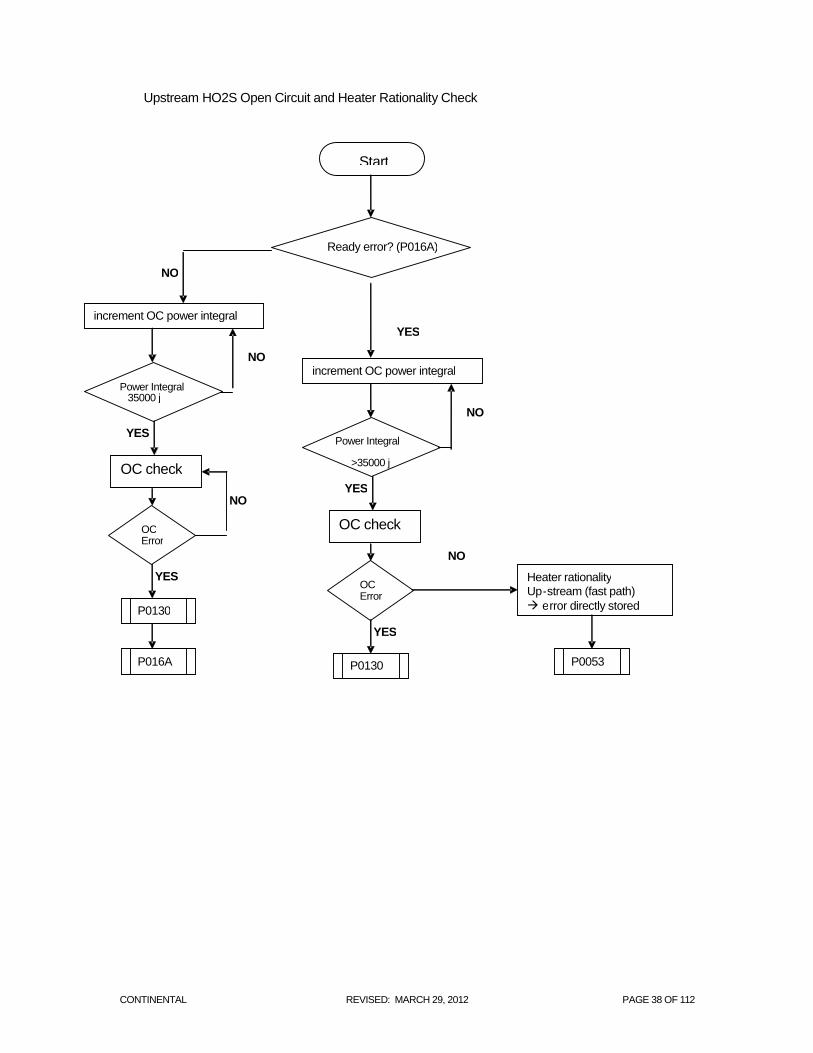
Case 1: HO2S Open Circuit at engine start
An open circuit power integral starts and activates the open circuit diagnosis to check if a real open circuit is present or if
the P016A was set because of a weak O2 sensor heater.
If the power integral exceed its limit, the signal is checked again. If the signal voltage is still stuck at the bias voltage and
the internal resistance is above a calibrated limit, a P0130 is stored for an open circuit.
Case 2: HO2S heater low performance at engine start
The open circuit power integral starts and the signal is checked again. The power integral is calibrated based on low
activity of the signal voltage with a weak heater. After the power integral exceeds its limit, and the upstream voltage is
outside the open circuit limits, if no real open circuit present, the P0053 for the heater rationality upstream is stored.
CONTINENTAL REVISED: MARCH 29, 2012 PAGE 37 OF 112
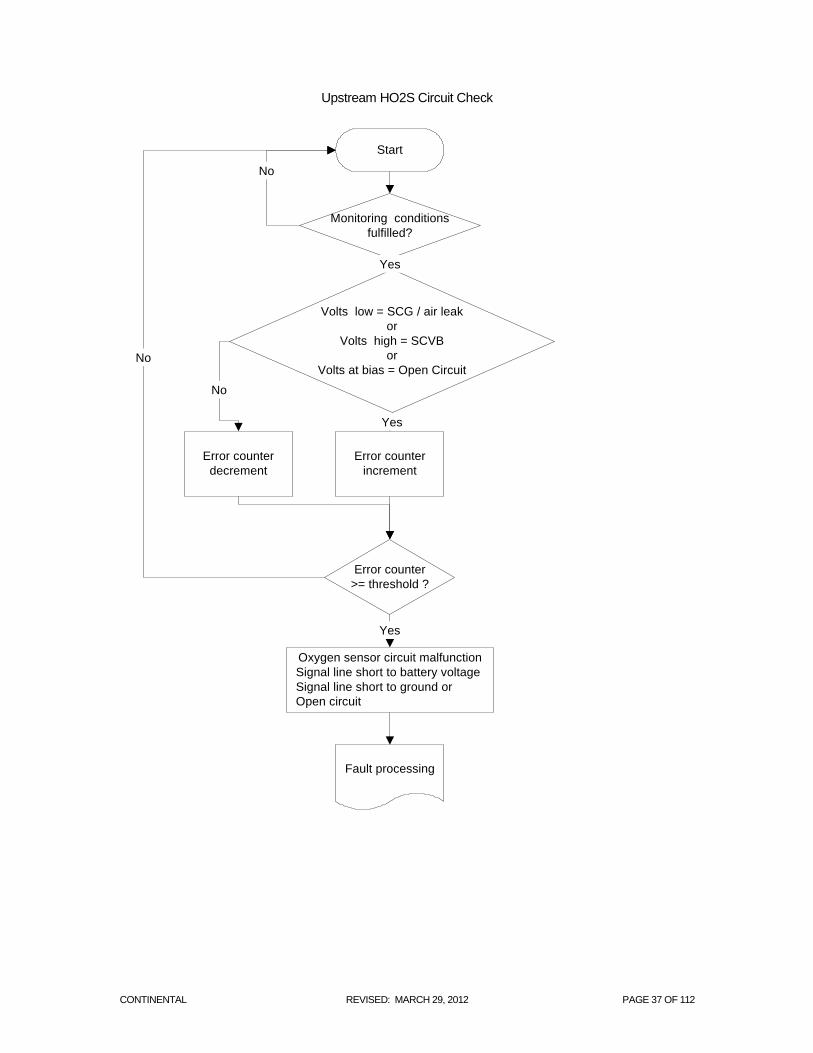
Upstream HO2S Circuit Check
Start
Error counter
increment
Error counter
decrement
Oxygen sensor circuit malfunction
Signal line short to battery voltage
Signal line short to ground or
Open circuit
Fault processing
Volts low = SCG / air leak
or
Volts high = SCVB
or
Volts at bias = Open Circuit
Yes
Monitoring conditions
fulfilled?
Yes
No
No
Error counter
>= threshold ?
No
Yes
CONTINENTAL REVISED: MARCH 29, 2012 PAGE 38 OF 112
Upstream HO2S Open Circuit and Heater Rationality Check
Start
Ready error? (P016A)
Power Integral 35000 j
NO
OC check
increment OC power integral
NO
YES
YES
OC Error
P0130
P016A
NO
YES
Power Integral
>35000 j
OC check
increment OC power integral
NO
YES
OC Error
NO
YES
Heater rationality Up - stream (fast path) e rror directly stored
P0053 P0130
CONTINENTAL REVISED: MARCH 29, 2012 PAGE 39 OF 112
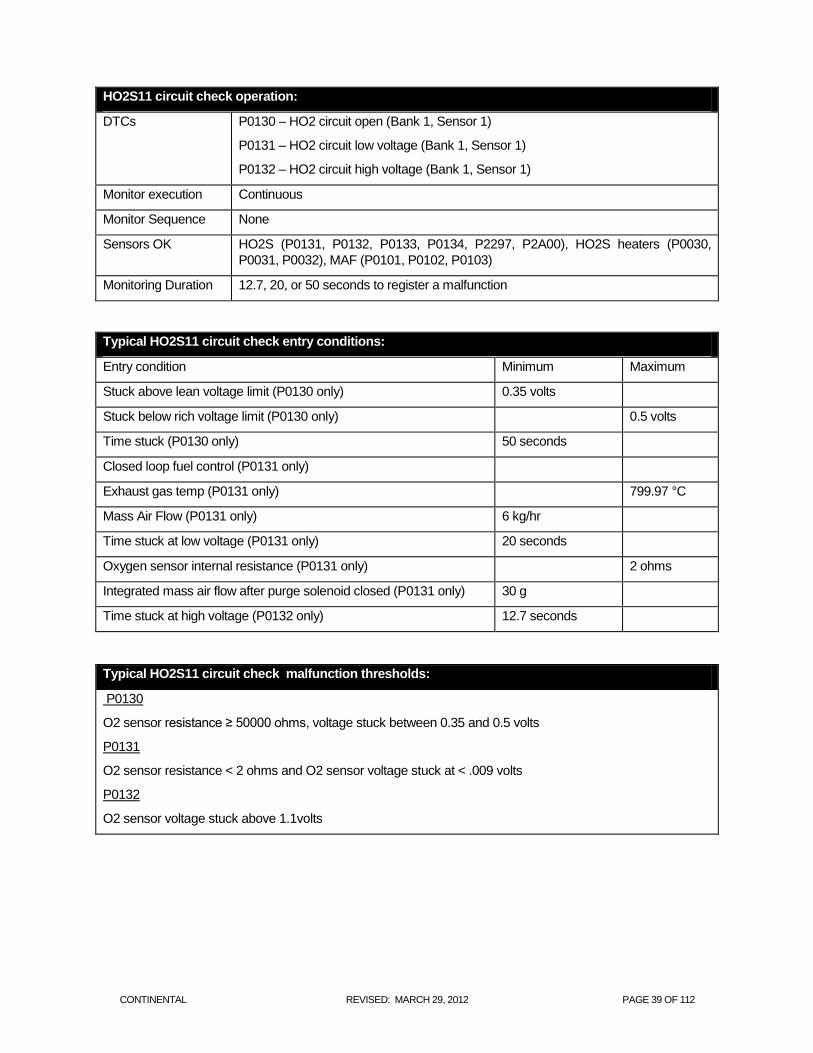
HO2S11 circuit check operation:
DTCs P0130 – HO2 circuit open (Bank 1, Sensor 1)
P0131 – HO2 circuit low voltage (Bank 1, Sensor 1)
P0132 – HO2 circuit high voltage (Bank 1, Sensor 1)
Monitor execution Continuous
Monitor Sequence None
Sensors OK HO2S (P0131, P0132, P0133, P0134, P2297, P2A00), HO2S heaters (P0030,
P0031, P0032), MAF (P0101, P0102, P0103)
Monitoring Duration 12.7, 20, or 50 seconds to register a malfunction
Typical HO2S11 circuit check entry conditions:
Entry condition Minimum Maximum
Stuck above lean voltage limit (P0130 only) 0.35 volts
Stuck below rich voltage limit (P0130 only) 0.5 volts
Time stuck (P0130 only) 50 seconds
Closed loop fuel control (P0131 only)
Exhaust gas temp (P0131 only) 799.97 °C
Mass Air Flow (P0131 only) 6 kg/hr
Time stuck at low voltage (P0131 only) 20 seconds
Oxygen sensor internal resistance (P0131 only) 2 ohms
Integrated mass air flow after purge solenoid closed (P0131 only) 30 g
Time stuck at high voltage (P0132 only) 12.7 seconds
Typical HO2S11 circuit check malfunction thresholds:
P0130
O2 sensor resistance ≥ 50000 ohms, voltage stuck between 0.35 and 0.5 volts
P0131
O2 sensor resistance < 2 ohms and O2 sensor voltage stuck at < .009 volts
P0132
O2 sensor voltage stuck above 1.1volts
CONTINENTAL REVISED: MARCH 29, 2012 PAGE 40 OF 112
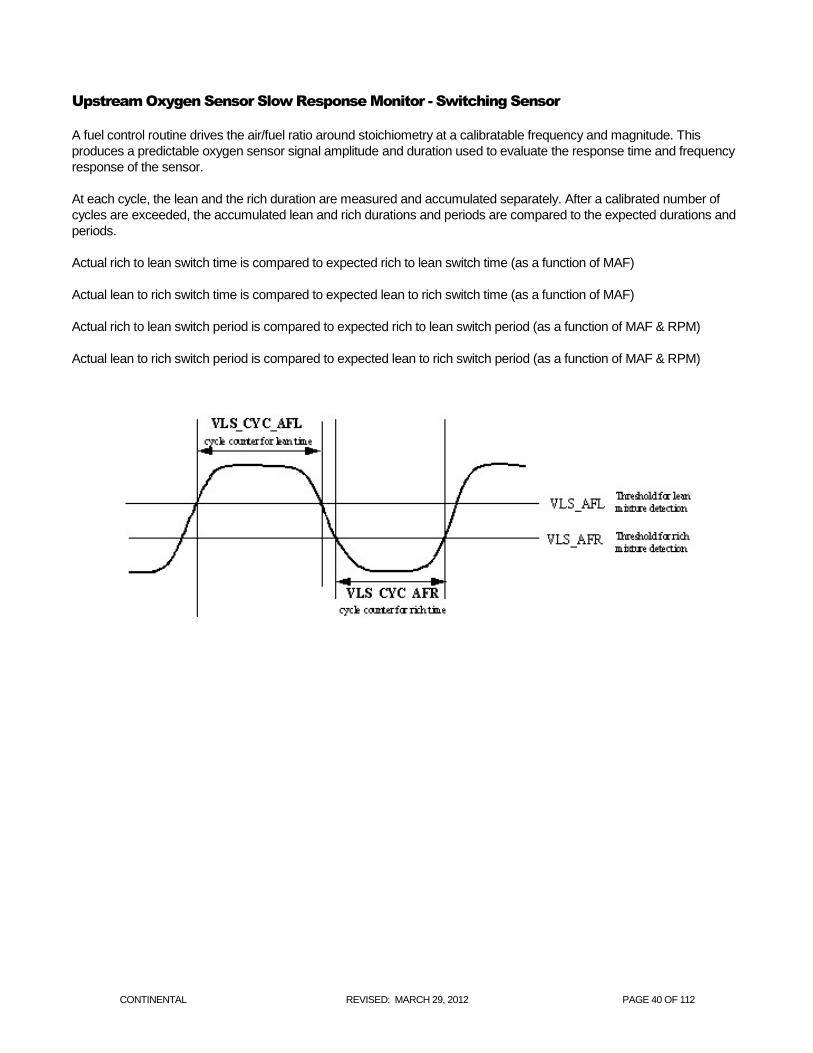
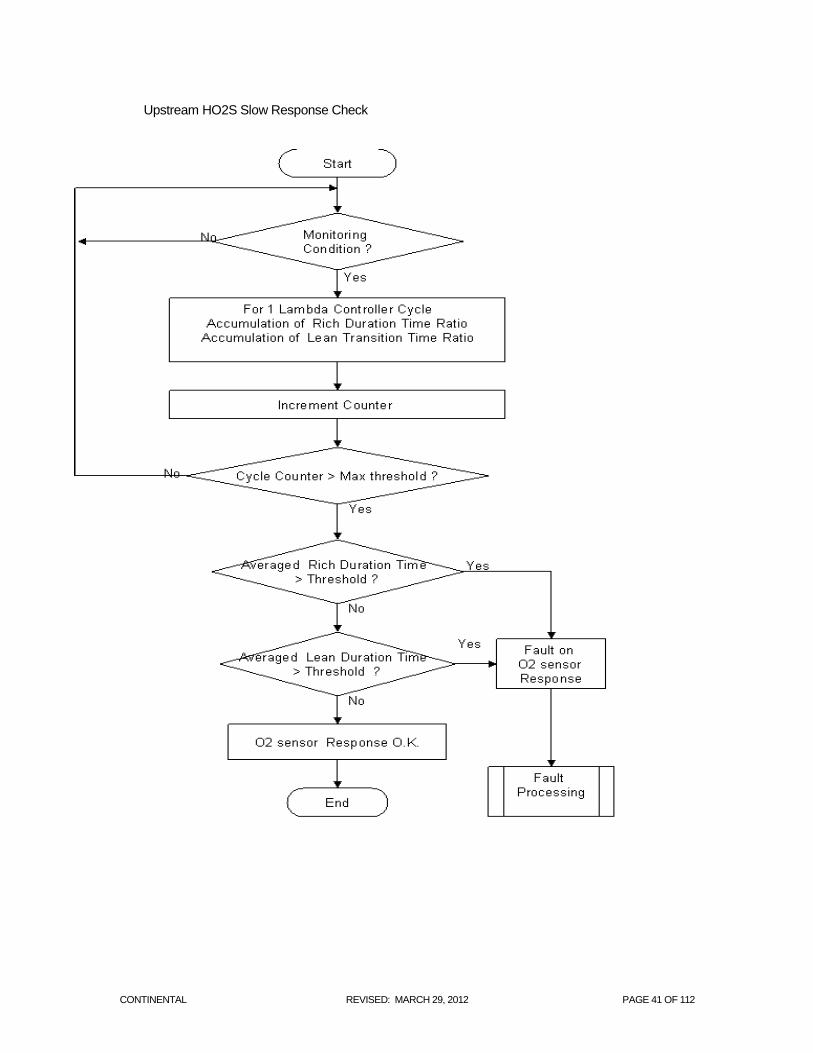
Upstream Oxygen Sensor Slow Response Monitor - Switching Sensor
A fuel control routine drives the air/fuel ratio around stoichiometry at a calibratable frequency and magnitude. This
produces a predictable oxygen sensor signal amplitude and duration used to evaluate the response time and frequency
response of the sensor.
At each cycle, the lean and the rich duration are measured and accumulated separately. After a calibrated number of
cycles are exceeded, the accumulated lean and rich durations and periods are compared to the expected durations and
periods.
Actual rich to lean switch time is compared to expected rich to lean switch time (as a function of MAF)
Actual lean to rich switch time is compared to expected lean to rich switch time (as a function of MAF)
Actual rich to lean switch period is compared to expected rich to lean switch period (as a function of MAF & RPM)
Actual lean to rich switch period is compared to expected lean to rich switch period (as a function of MAF & RPM)
CONTINENTAL REVISED: MARCH 29, 2012 PAGE 41 OF 112
Upstream HO2S Slow Response Check
CONTINENTAL REVISED: MARCH 29, 2012 PAGE 42 OF 112
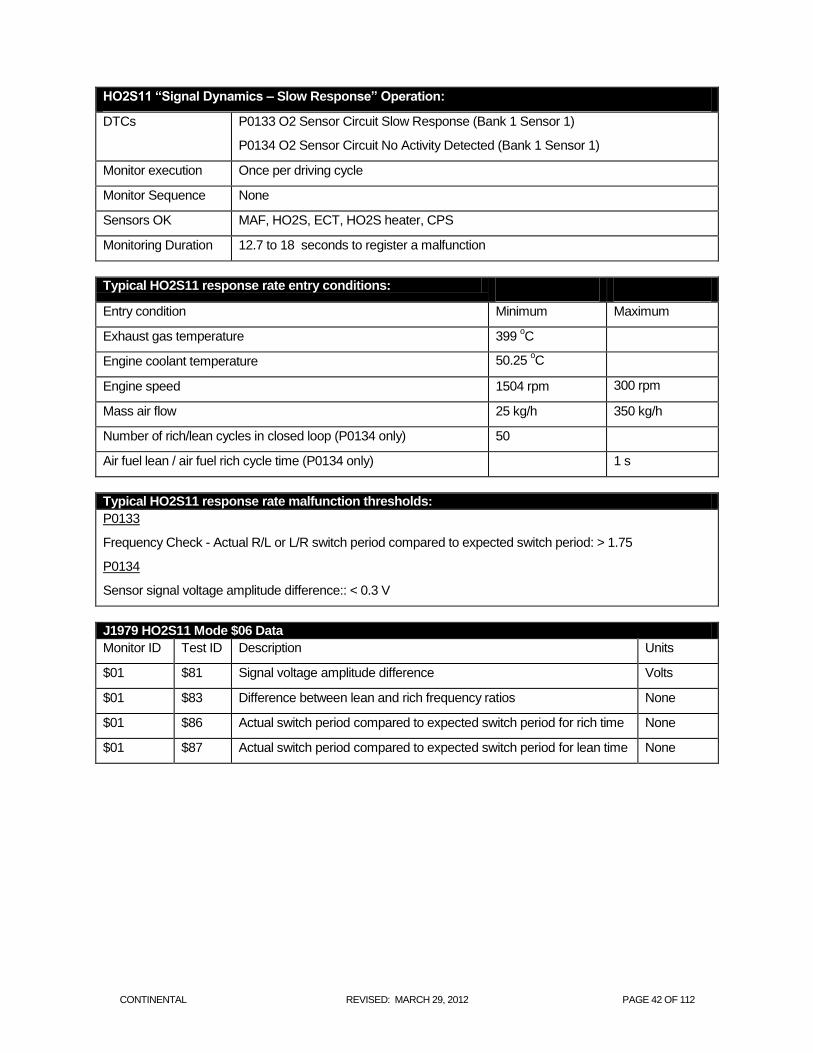
HO2S11 “Signal Dynamics – Slow Response” Operation:
DTCs P0133 O2 Sensor Circuit Slow Response (Bank 1 Sensor 1)
P0134 O2 Sensor Circuit No Activity Detected (Bank 1 Sensor 1)
Monitor execution Once per driving cycle
Monitor Sequence None
Sensors OK MAF, HO2S, ECT, HO2S heater, CPS
Monitoring Duration 12.7 to 18 seconds to register a malfunction
Typical HO2S11 response rate entry conditions:
Entry condition Minimum Maximum
Exhaust gas temperature 399 oC
Engine coolant temperature 50.25 oC
Engine speed 1504 rpm 300 rpm
Mass air flow 25 kg/h 350 kg/h
Number of rich/lean cycles in closed loop (P0134 only) 50
Air fuel lean / air fuel rich cycle time (P0134 only) 1 s
Typical HO2S11 response rate malfunction thresholds:
P0133
Frequency Check - Actual R/L or L/R switch period compared to expected switch period: > 1.75
P0134
Sensor signal voltage amplitude difference:: < 0.3 V
J1979 HO2S11 Mode $06 Data
Monitor ID Test ID Description Units
$01 $81 Signal voltage amplitude difference Volts
$01 $83 Difference between lean and rich frequency ratios None
$01 $86 Actual switch period compared to expected switch period for rich time None
$01 $87 Actual switch period compared to expected switch period for lean time None
CONTINENTAL REVISED: MARCH 29, 2012 PAGE 43 OF 112
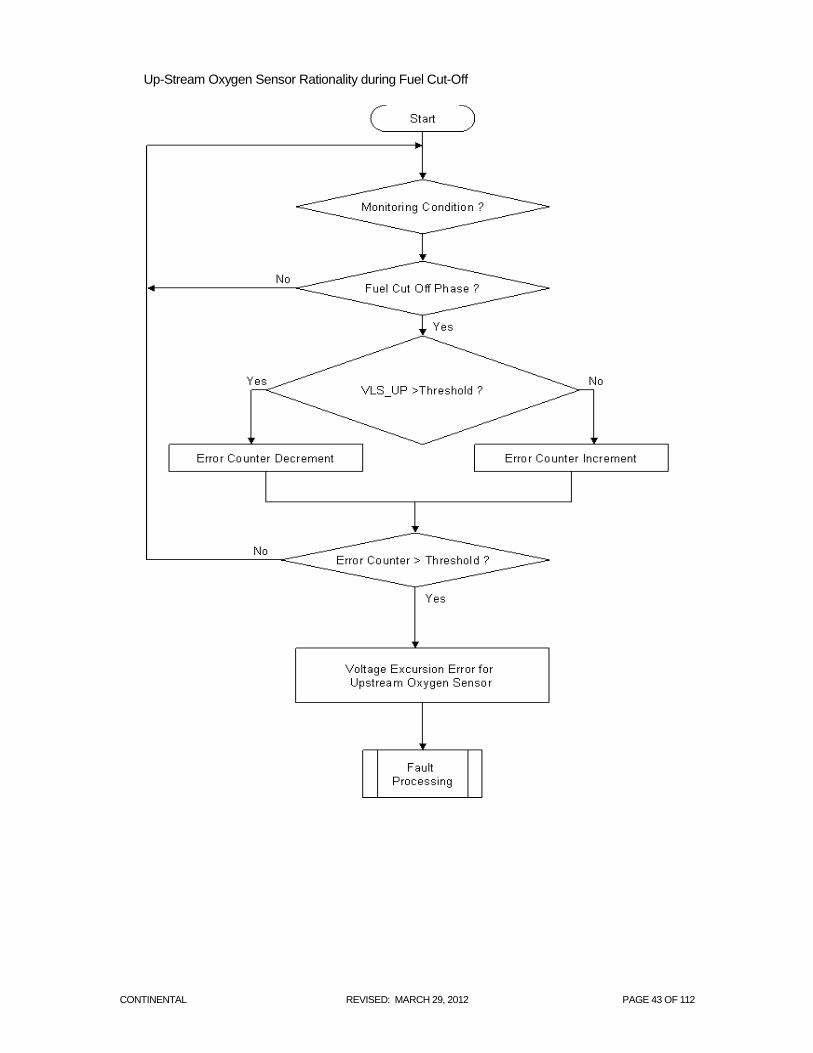
Up-Stream Oxygen Sensor Rationality during Fuel Cut-Off
CONTINENTAL REVISED: MARCH 29, 2012 PAGE 44 OF 112
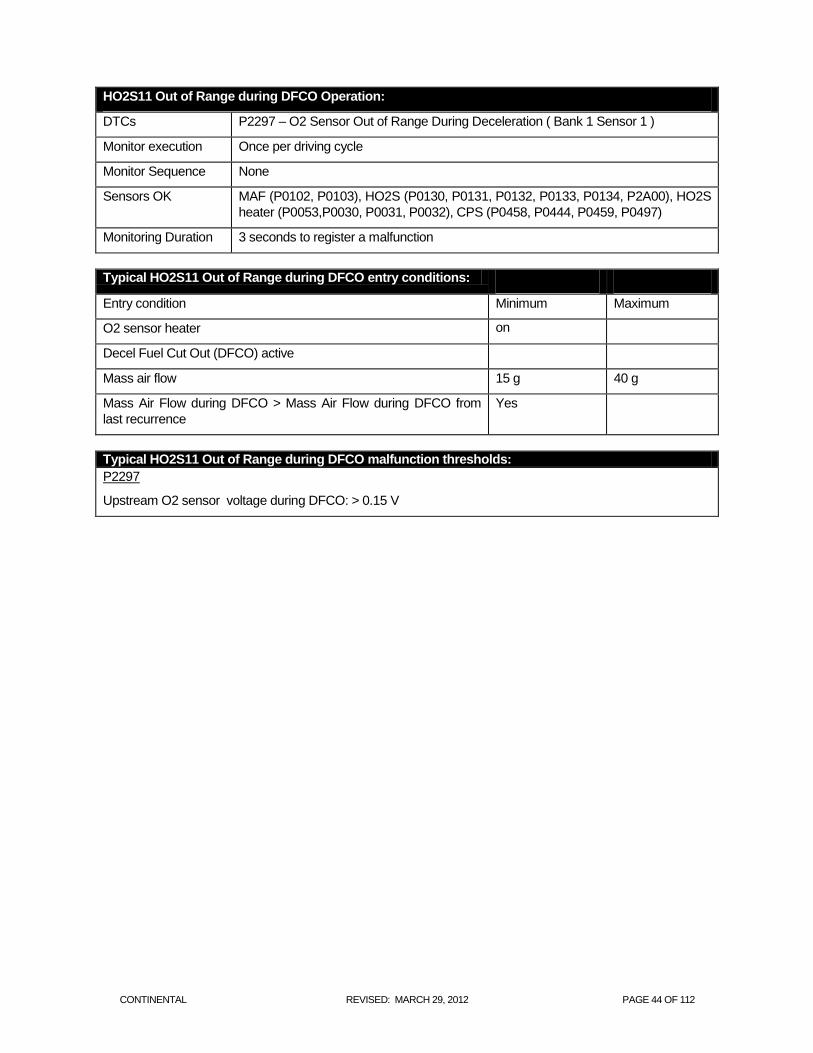
HO2S11 Out of Range during DFCO Operation:
DTCs P2297 – O2 Sensor Out of Range During Deceleration ( Bank 1 Sensor 1 )
Monitor execution Once per driving cycle
Monitor Sequence None
Sensors OK MAF (P0102, P0103), HO2S (P0130, P0131, P0132, P0133, P0134, P2A00), HO2S
heater (P0053,P0030, P0031, P0032), CPS (P0458, P0444, P0459, P0497)
Monitoring Duration 3 seconds to register a malfunction
Typical HO2S11 Out of Range during DFCO entry conditions:
Entry condition Minimum Maximum
O2 sensor heater on
Decel Fuel Cut Out (DFCO) active
Mass air flow 15 g 40 g
Mass Air Flow during DFCO > Mass Air Flow during DFCO from
last recurrence
Yes
Typical HO2S11 Out of Range during DFCO malfunction thresholds:
P2297
Upstream O2 sensor voltage during DFCO: > 0.15 V
CONTINENTAL REVISED: MARCH 29, 2012 PAGE 45 OF 112
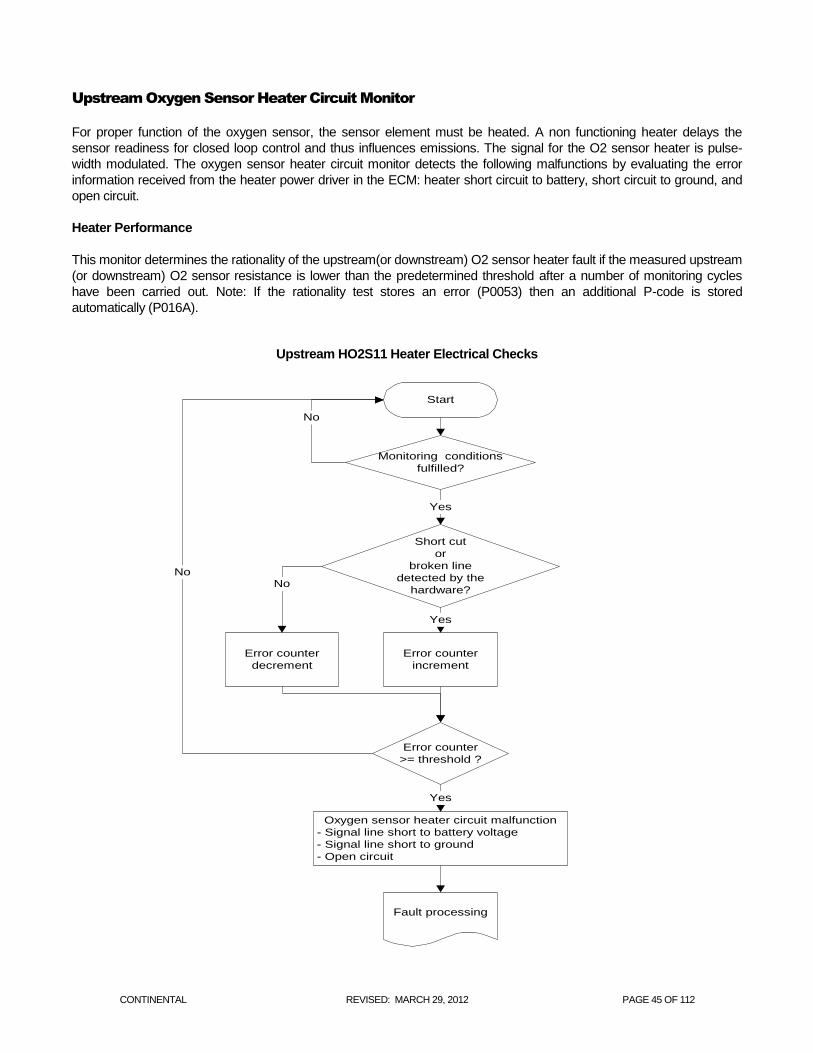
Upstream Oxygen Sensor Heater Circuit Monitor
For proper function of the oxygen sensor, the sensor element must be heated. A non functioning heater delays the
sensor readiness for closed loop control and thus influences emissions. The signal for the O2 sensor heater is pulse-
width modulated. The oxygen sensor heater circuit monitor detects the following malfunctions by evaluating the error
information received from the heater power driver in the ECM: heater short circuit to battery, short circuit to ground, and
open circuit.
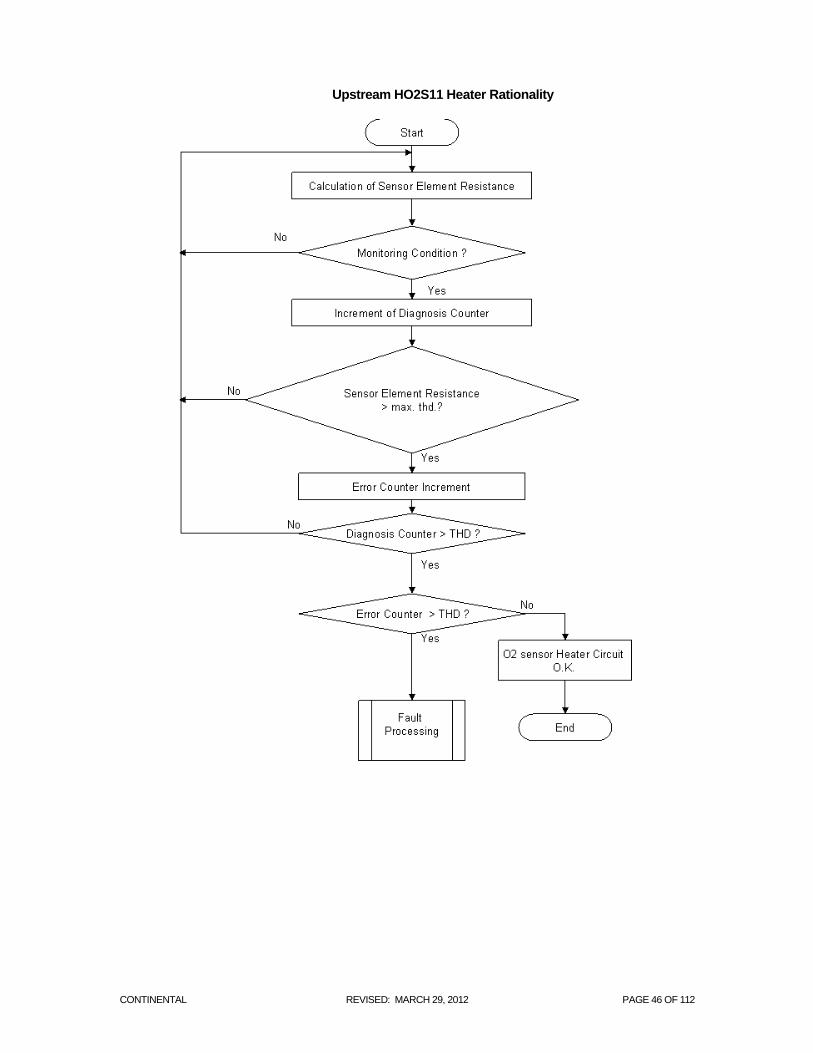
Heater Performance
This monitor determines the rationality of the upstream(or downstream) O2 sensor heater fault if the measured upstream
(or downstream) O2 sensor resistance is lower than the predetermined threshold after a number of monitoring cycles
have been carried out. Note: If the rationality test stores an error (P0053) then an additional P-code is stored
automatically (P016A).
Upstream HO2S11 Heater Electrical Checks
Start
Error counter
increment
Error counter
decrement
Oxygen sensor heater circuit malfunction
- Signal line short to battery voltage
- Signal line short to ground
- Open circuit
Fault processing
Short cut
or
broken line
detected by the
hardware?
Yes
Monitoring conditions
fulfilled?
Yes
No
No
Error counter
>= threshold ?
No
Yes
CONTINENTAL REVISED: MARCH 29, 2012 PAGE 46 OF 112
Upstream HO2S11 Heater Rationality
CONTINENTAL REVISED: MARCH 29, 2012 PAGE 47 OF 112
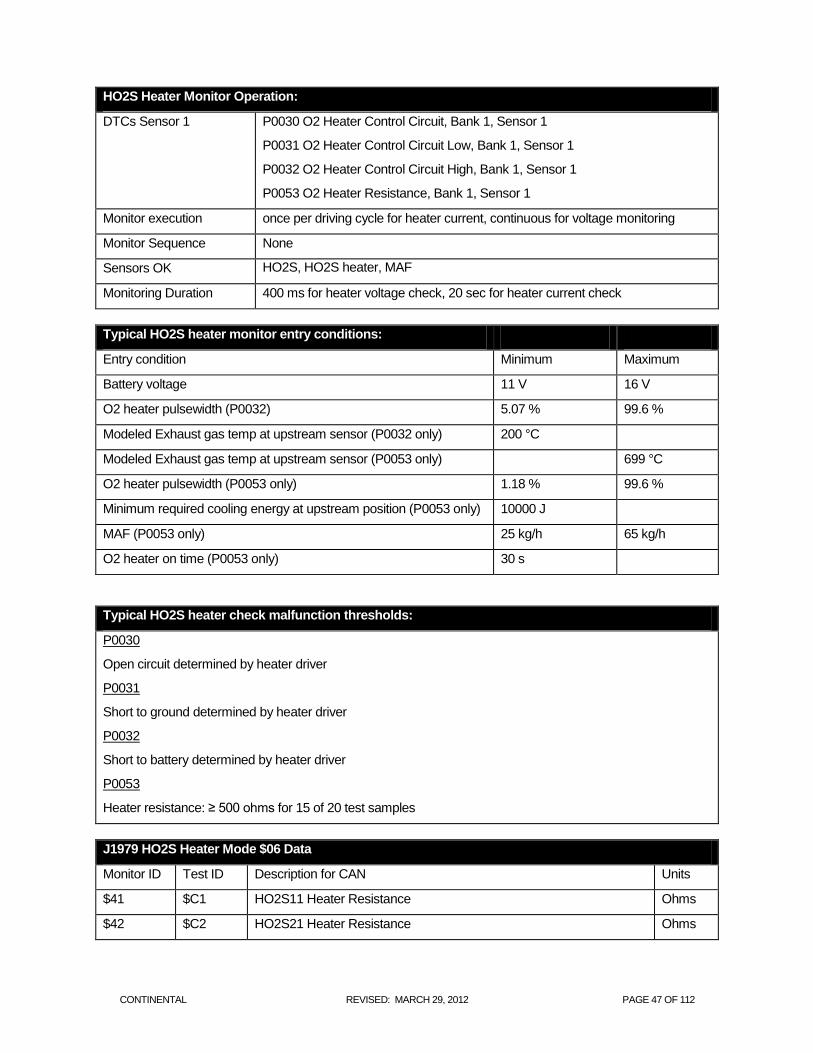
HO2S Heater Monitor Operation:
DTCs Sensor 1 P0030 O2 Heater Control Circuit, Bank 1, Sensor 1
P0031 O2 Heater Control Circuit Low, Bank 1, Sensor 1
P0032 O2 Heater Control Circuit High, Bank 1, Sensor 1
P0053 O2 Heater Resistance, Bank 1, Sensor 1
Monitor execution once per driving cycle for heater current, continuous for voltage monitoring
Monitor Sequence None
Sensors OK HO2S, HO2S heater, MAF
Monitoring Duration 400 ms for heater voltage check, 20 sec for heater current check
Typical HO2S heater monitor entry conditions:
Entry condition Minimum Maximum
Battery voltage 11 V 16 V
O2 heater pulsewidth (P0032) 5.07 % 99.6 %
Modeled Exhaust gas temp at upstream sensor (P0032 only) 200 °C
Modeled Exhaust gas temp at upstream sensor (P0053 only) 699 °C
O2 heater pulsewidth (P0053 only) 1.18 % 99.6 %
Minimum required cooling energy at upstream position (P0053 only) 10000 J
MAF (P0053 only) 25 kg/h 65 kg/h
O2 heater on time (P0053 only) 30 s
Typical HO2S heater check malfunction thresholds:
P0030
Open circuit determined by heater driver
P0031
Short to ground determined by heater driver
P0032
Short to battery determined by heater driver
P0053
Heater resistance: ≥ 500 ohms for 15 of 20 test samples
J1979 HO2S Heater Mode $06 Data
Monitor ID Test ID Description for CAN Units
$41 $C1 HO2S11 Heater Resistance Ohms
$42 $C2 HO2S21 Heater Resistance Ohms
CONTINENTAL REVISED: MARCH 29, 2012 PAGE 48 OF 112
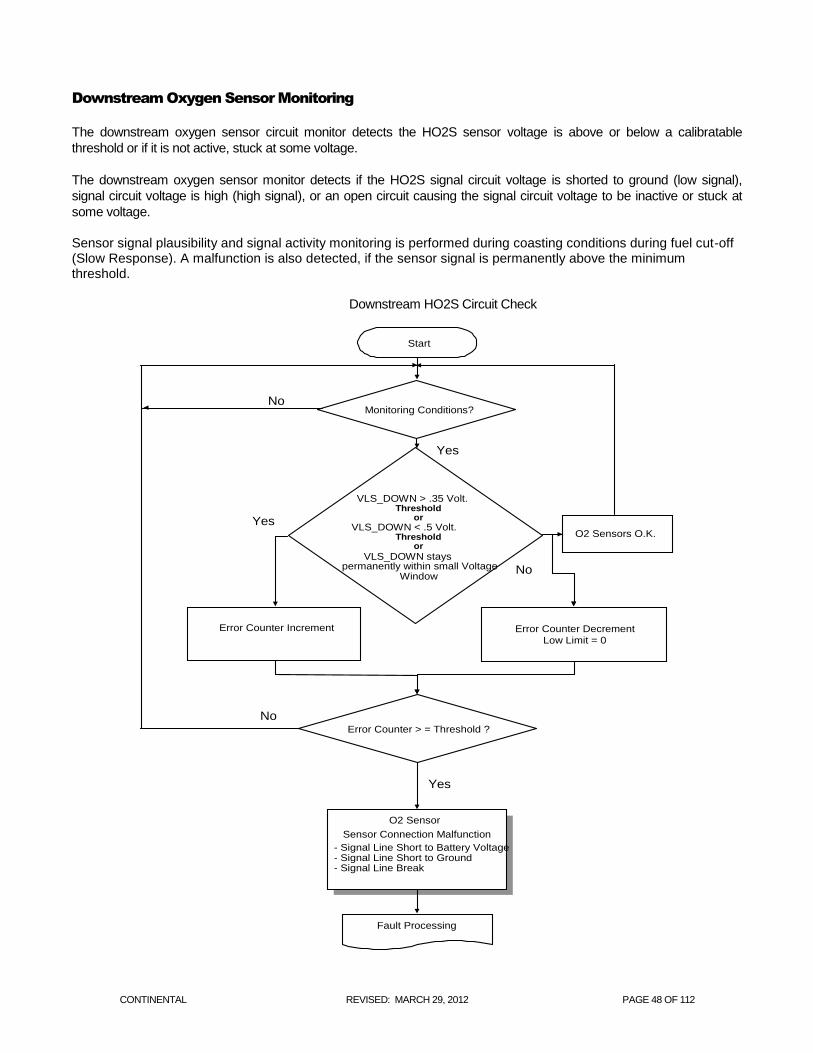
Downstream Oxygen Sensor Monitoring
The downstream oxygen sensor circuit monitor detects the HO2S sensor voltage is above or below a calibratable
threshold or if it is not active, stuck at some voltage.
The downstream oxygen sensor monitor detects if the HO2S signal circuit voltage is shorted to ground (low signal),
signal circuit voltage is high (high signal), or an open circuit causing the signal circuit voltage to be inactive or stuck at
some voltage.
Sensor signal plausibility and signal activity monitoring is performed during coasting conditions during fuel cut-off (Slow Response). A malfunction is also detected, if the sensor signal is permanently above the minimum threshold.
Downstream HO2S Circuit Check
Start
Monitoring Conditions? No
Yes
VLS_DOWN > .35 Volt. Threshold
or VLS_DOWN < .5 Volt.
Threshold or
VLS_DOWN stays permanently within small Voltage
Window
Error Counter Decrement Low Limit = 0
Error Counter > = Threshold ?
O2 Sensor
- Signal Line Short to Battery Voltage - Signal Line Short to Ground - Signal Line Break
Fault Processing
No
Yes
Yes
Sensor Connection Malfunction
Error Counter Increment
No
O2 Sensors O.K.
CONTINENTAL REVISED: MARCH 29, 2012 PAGE 49 OF 112
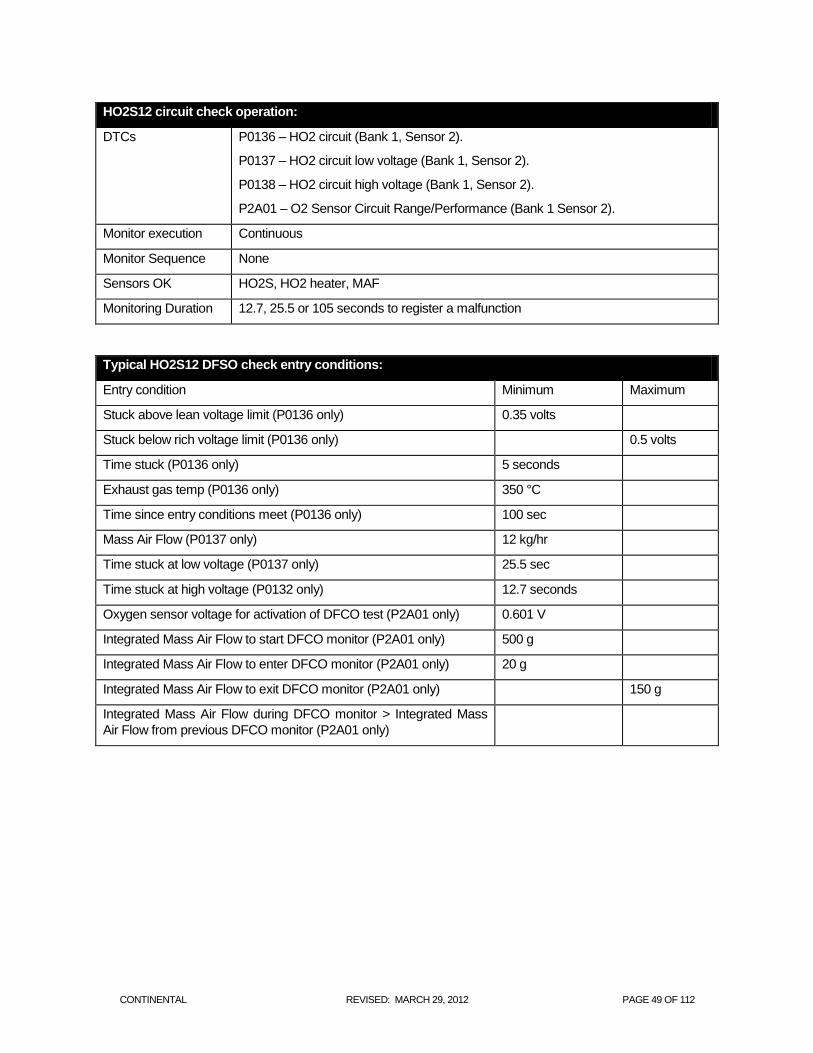
HO2S12 circuit check operation:
DTCs P0136 – HO2 circuit (Bank 1, Sensor 2).
P0137 – HO2 circuit low voltage (Bank 1, Sensor 2).
P0138 – HO2 circuit high voltage (Bank 1, Sensor 2).
P2A01 – O2 Sensor Circuit Range/Performance (Bank 1 Sensor 2).
Monitor execution Continuous
Monitor Sequence None
Sensors OK HO2S, HO2 heater, MAF
Monitoring Duration 12.7, 25.5 or 105 seconds to register a malfunction
Typical HO2S12 DFSO check entry conditions:
Entry condition Minimum Maximum
Stuck above lean voltage limit (P0136 only) 0.35 volts
Stuck below rich voltage limit (P0136 only) 0.5 volts
Time stuck (P0136 only) 5 seconds
Exhaust gas temp (P0136 only) 350 °C
Time since entry conditions meet (P0136 only) 100 sec
Mass Air Flow (P0137 only) 12 kg/hr
Time stuck at low voltage (P0137 only) 25.5 sec
Time stuck at high voltage (P0132 only) 12.7 seconds
Oxygen sensor voltage for activation of DFCO test (P2A01 only) 0.601 V
Integrated Mass Air Flow to start DFCO monitor (P2A01 only) 500 g
Integrated Mass Air Flow to enter DFCO monitor (P2A01 only) 20 g
Integrated Mass Air Flow to exit DFCO monitor (P2A01 only) 150 g
Integrated Mass Air Flow during DFCO monitor > Integrated Mass
Air Flow from previous DFCO monitor (P2A01 only)
CONTINENTAL REVISED: MARCH 29, 2012 PAGE 50 OF 112
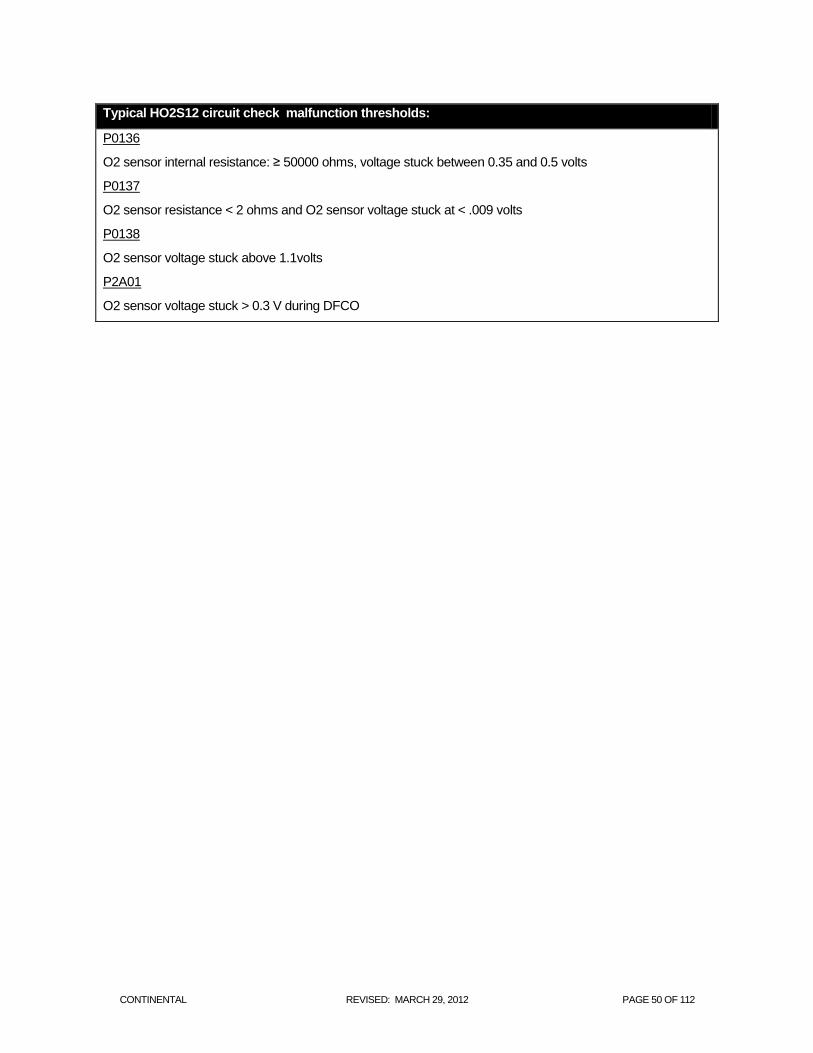
Typical HO2S12 circuit check malfunction thresholds:
P0136
O2 sensor internal resistance: ≥ 50000 ohms, voltage stuck between 0.35 and 0.5 volts
P0137
O2 sensor resistance < 2 ohms and O2 sensor voltage stuck at < .009 volts
P0138
O2 sensor voltage stuck above 1.1volts
P2A01
O2 sensor voltage stuck > 0.3 V during DFCO
CONTINENTAL REVISED: MARCH 29, 2012 PAGE 51 OF 112
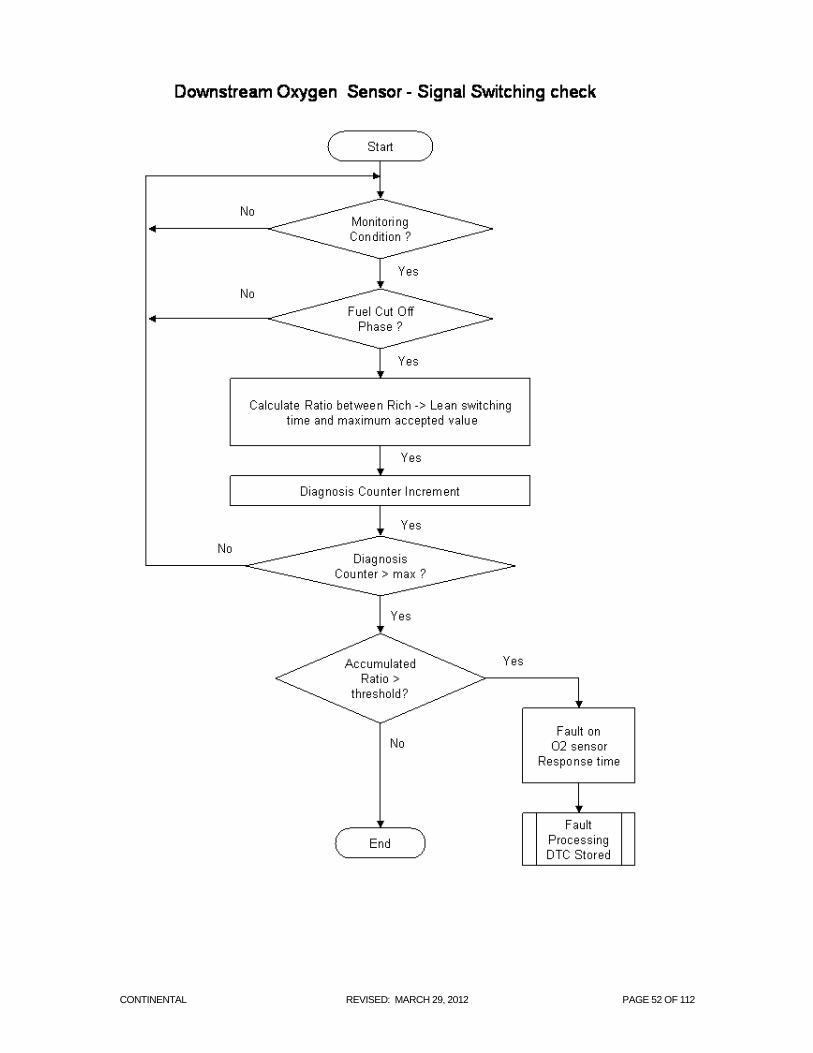
Downstream Oxygen Sensor Slow Response Monitor
This non intrusive diagnosis can detect the sluggish behavior of the rich/lean switch times during the transition to decel
fuel cut-off. The malfunction thresholds are a function of MAF and signal band limits.
Monitoring function:
After the enable conditions are met and DFCO is determined to be active, the current downstream O2 voltage is
monitored and stored. If the stored value is above a calibratable threshold, and MAF is within a calibratable window, the
test is started.
Once the sensor voltage drops a calibratable percentage of the stored value, a timer is started. This timer is then
stopped when the voltage drops a calibratable percentage of that stored value. At this point the test is determined to be
valid and the diagnostic counter is incremented by one.
The switching time value is then converted to a weighted value. This process is repeated for a calibratable number of
DFCO events. Each time the diagnostic counter is incremented the weighted value is added to a total value. At the end
of the maximum number of DFCO events, the total value is divided by the number of DFCO events and another value is
developed. This value is then compared to a threshold. If the value exceeds the threshold the sensor is determine to be
slow and the corresponding fault code is stored.
CONTINENTAL REVISED: MARCH 29, 2012 PAGE 52 OF 112
Signal activity / Plausibility check during fuel cut-off
CONTINENTAL REVISED: MARCH 29, 2012 PAGE 53 OF 112
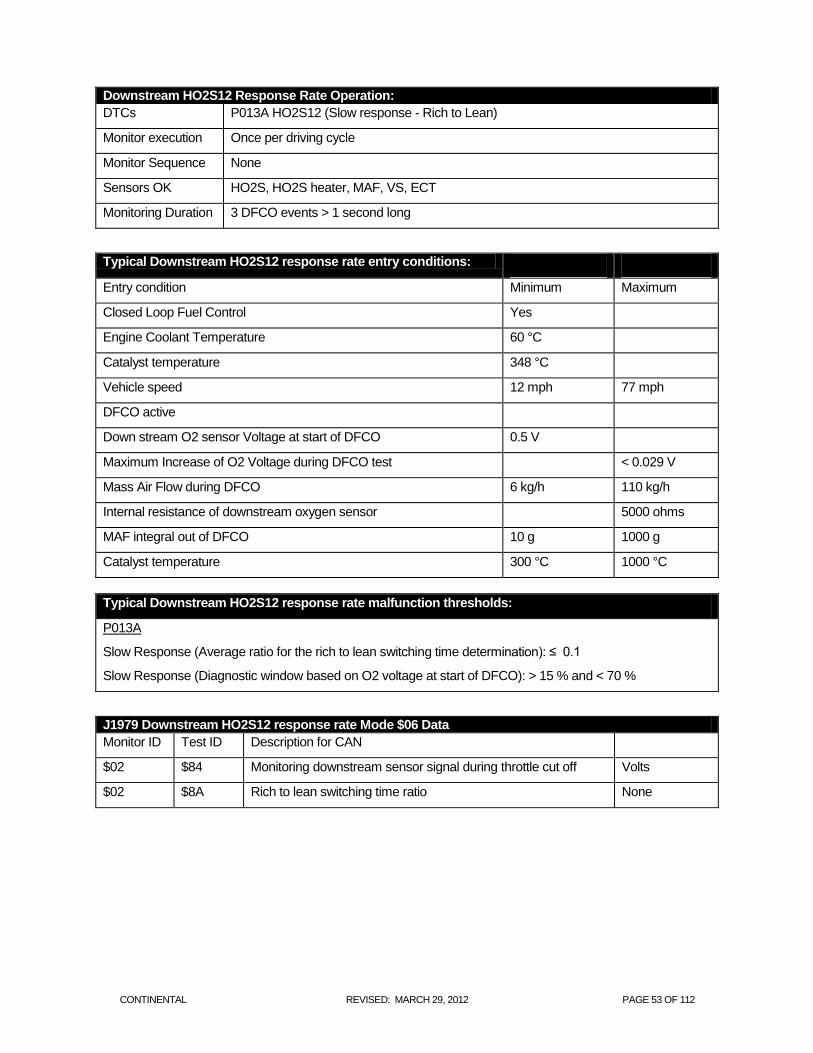
Downstream HO2S12 Response Rate Operation:
DTCs P013A HO2S12 (Slow response - Rich to Lean)
Monitor execution Once per driving cycle
Monitor Sequence None
Sensors OK HO2S, HO2S heater, MAF, VS, ECT
Monitoring Duration 3 DFCO events > 1 second long
Typical Downstream HO2S12 response rate entry conditions:
Entry condition Minimum Maximum
Closed Loop Fuel Control Yes
Engine Coolant Temperature 60 °C
Catalyst temperature 348 °C
Vehicle speed 12 mph 77 mph
DFCO active
Down stream O2 sensor Voltage at start of DFCO 0.5 V
Maximum Increase of O2 Voltage during DFCO test < 0.029 V
Mass Air Flow during DFCO 6 kg/h 110 kg/h
Internal resistance of downstream oxygen sensor 5000 ohms
MAF integral out of DFCO 10 g 1000 g
Catalyst temperature 300 °C 1000 °C
Typical Downstream HO2S12 response rate malfunction thresholds:
P013A
Slow Response (Average ratio for the rich to lean switching time determination): ≤ 0.1
Slow Response (Diagnostic window based on O2 voltage at start of DFCO): > 15 % and < 70 %
J1979 Downstream HO2S12 response rate Mode $06 Data
Monitor ID Test ID Description for CAN
$02 $84 Monitoring downstream sensor signal during throttle cut off Volts
$02 $8A Rich to lean switching time ratio None
CONTINENTAL REVISED: MARCH 29, 2012 PAGE 54 OF 112
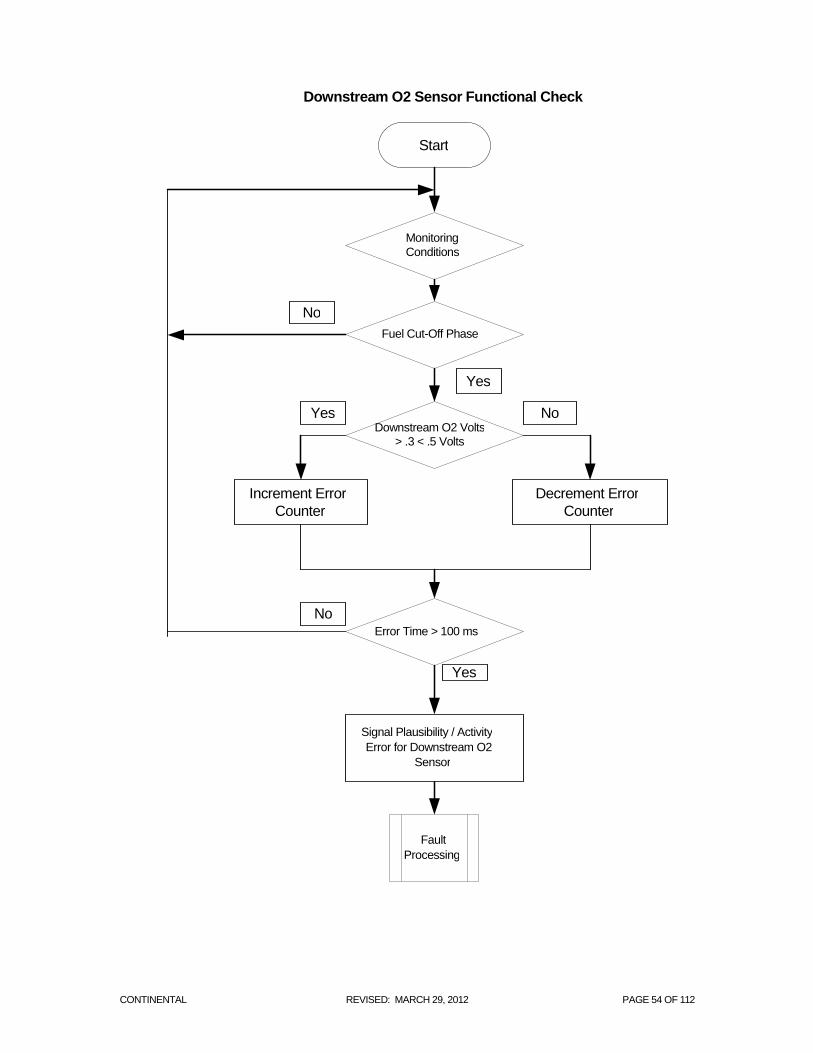
Downstream O2 Sensor Functional Check
Start
Monitoring Conditions
Fuel Cut-Off Phase
Downstream O2 Volts > .3 < .5 Volts
Increment Error
Counter
Decrement Error
Counter
Error Time > 100 ms
Signal Plausibility / Activity Error for Downstream O2
Sensor
Fault Processing
Yes
Yes No
No
No
Yes
CONTINENTAL REVISED: MARCH 29, 2012 PAGE 55 OF 112
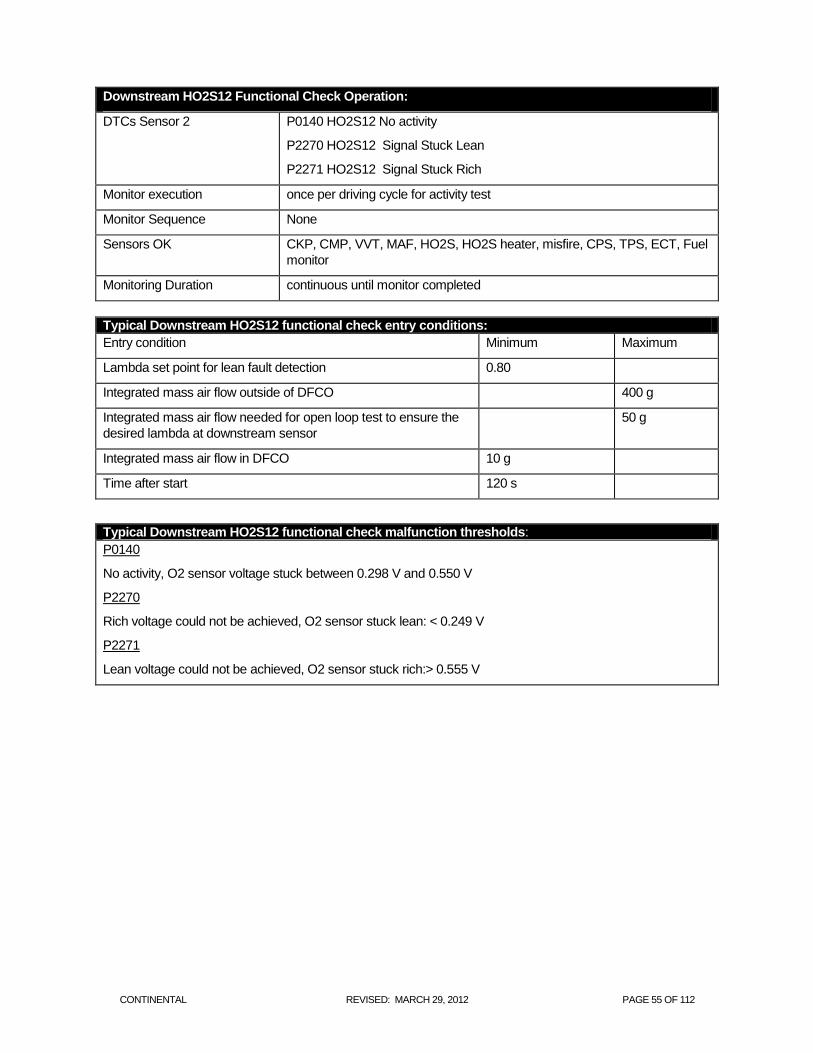
Downstream HO2S12 Functional Check Operation:
DTCs Sensor 2
P0140 HO2S12 No activity
P2270 HO2S12 Signal Stuck Lean
P2271 HO2S12 Signal Stuck Rich
Monitor execution once per driving cycle for activity test
Monitor Sequence None
Sensors OK CKP, CMP, VVT, MAF, HO2S, HO2S heater, misfire, CPS, TPS, ECT, Fuel
monitor
Monitoring Duration continuous until monitor completed
Typical Downstream HO2S12 functional check entry conditions:
Entry condition Minimum Maximum
Lambda set point for lean fault detection 0.80
Integrated mass air flow outside of DFCO 400 g
Integrated mass air flow needed for open loop test to ensure the
desired lambda at downstream sensor
50 g
Integrated mass air flow in DFCO 10 g
Time after start 120 s
Typical Downstream HO2S12 functional check malfunction thresholds:
P0140
No activity, O2 sensor voltage stuck between 0.298 V and 0.550 V
P2270
Rich voltage could not be achieved, O2 sensor stuck lean: < 0.249 V
P2271
Lean voltage could not be achieved, O2 sensor stuck rich:> 0.555 V
CONTINENTAL REVISED: MARCH 29, 2012 PAGE 56 OF 112
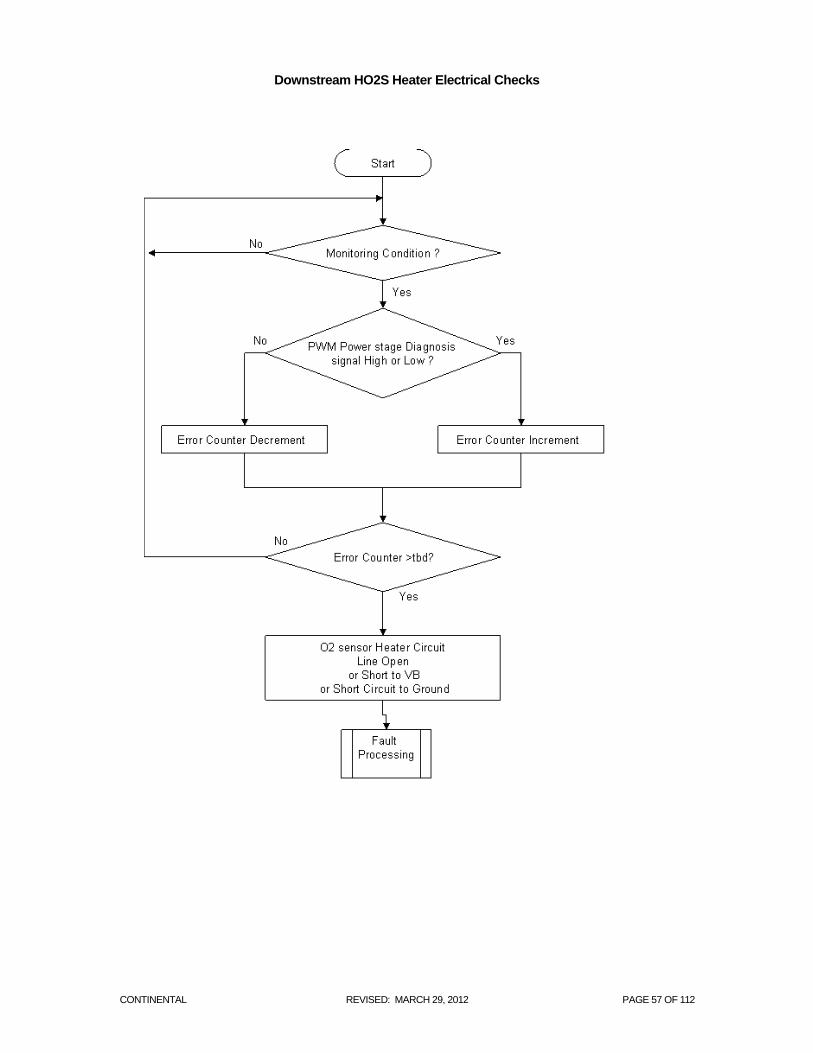
Downstream Oxygen Sensor Heater Circuit Monitor
For proper function of the oxygen sensor, the sensor element must be heated. A non functioning heater delays the
sensor readiness for closed loop control and thus influences emissions. The signal for the O2 sensor heater is pulse-
width modulated. The oxygen sensor heater circuit monitor detects the following malfunctions by evaluating the error
information received from the heater power driver in the ECM: heater short circuit to battery, short circuit to ground, and
open circuit.
Heater Performance
The monitoring strategy is based on the comparison of the O2 sensor heater resistance to an absolute threshold during
deceleration conditions where the exhaust temperature is sufficiently low as to cause the sensor ceramic temperature to
fall outside normal operating levels in cases where the heating power is insufficient.
The cooling energy of the exhaust gas is calculated and compared to a calibrated threshold. The heater monitor is active
if the calculated energy is equal or exceeds the threshold. Then the O2 sensor heater is compared to a calibrated
threshold. If the heater resistance is equal or exceeds the threshold, an O2 sensor heater malfunction is detected.
CONTINENTAL REVISED: MARCH 29, 2012 PAGE 57 OF 112
Downstream HO2S Heater Electrical Checks
CONTINENTAL REVISED: MARCH 29, 2012 PAGE 58 OF 112
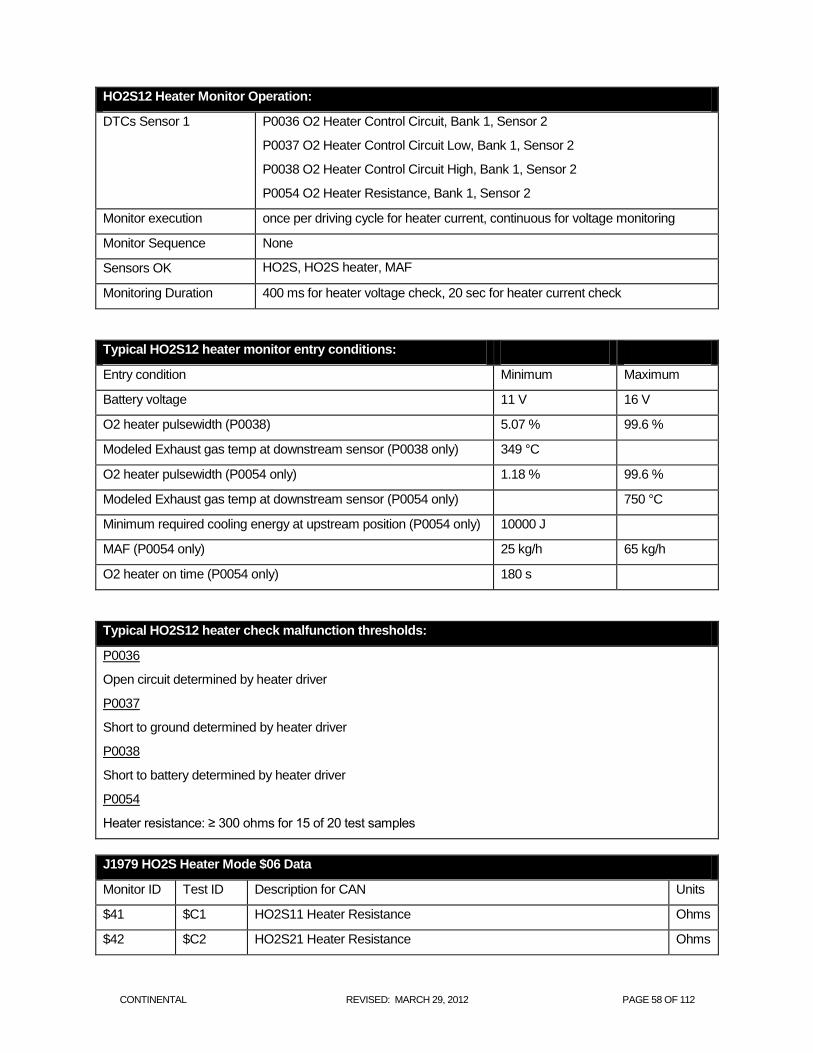
HO2S12 Heater Monitor Operation:
DTCs Sensor 1 P0036 O2 Heater Control Circuit, Bank 1, Sensor 2
P0037 O2 Heater Control Circuit Low, Bank 1, Sensor 2
P0038 O2 Heater Control Circuit High, Bank 1, Sensor 2
P0054 O2 Heater Resistance, Bank 1, Sensor 2
Monitor execution once per driving cycle for heater current, continuous for voltage monitoring
Monitor Sequence None
Sensors OK HO2S, HO2S heater, MAF
Monitoring Duration 400 ms for heater voltage check, 20 sec for heater current check
Typical HO2S12 heater monitor entry conditions:
Entry condition Minimum Maximum
Battery voltage 11 V 16 V
O2 heater pulsewidth (P0038) 5.07 % 99.6 %
Modeled Exhaust gas temp at downstream sensor (P0038 only) 349 °C
O2 heater pulsewidth (P0054 only) 1.18 % 99.6 %
Modeled Exhaust gas temp at downstream sensor (P0054 only) 750 °C
Minimum required cooling energy at upstream position (P0054 only) 10000 J
MAF (P0054 only) 25 kg/h 65 kg/h
O2 heater on time (P0054 only) 180 s
Typical HO2S12 heater check malfunction thresholds:
P0036
Open circuit determined by heater driver
P0037
Short to ground determined by heater driver
P0038
Short to battery determined by heater driver
P0054
Heater resistance: ≥ 300 ohms for 15 of 20 test samples
J1979 HO2S Heater Mode $06 Data
Monitor ID Test ID Description for CAN Units
$41 $C1 HO2S11 Heater Resistance Ohms
$42 $C2 HO2S21 Heater Resistance Ohms
CONTINENTAL REVISED: MARCH 29, 2012 PAGE 59 OF 112
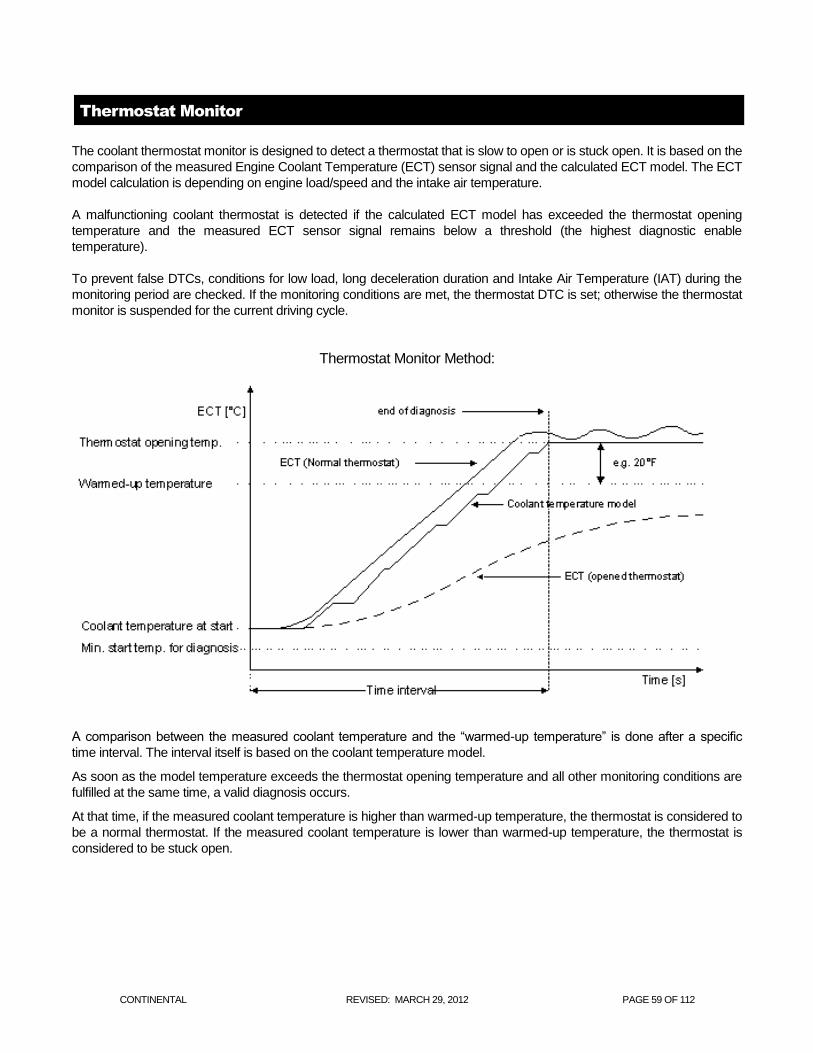
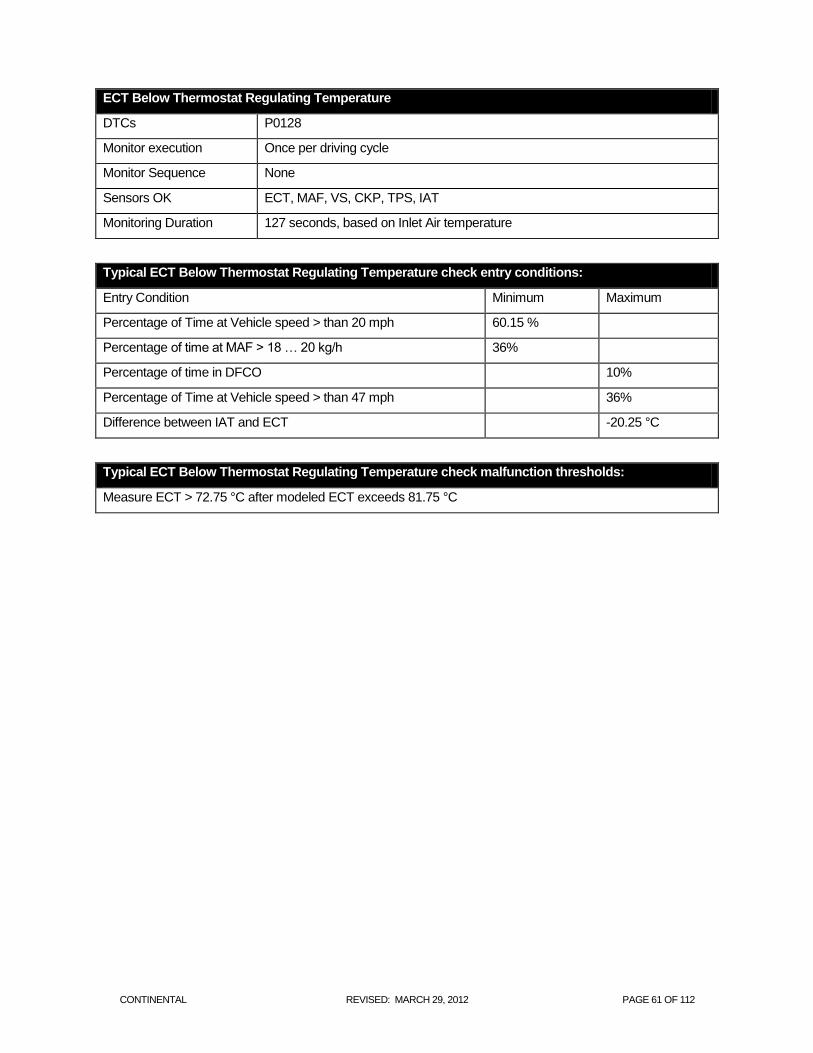
Thermostat Monitor
The coolant thermostat monitor is designed to detect a thermostat that is slow to open or is stuck open. It is based on the
comparison of the measured Engine Coolant Temperature (ECT) sensor signal and the calculated ECT model. The ECT
model calculation is depending on engine load/speed and the intake air temperature.
A malfunctioning coolant thermostat is detected if the calculated ECT model has exceeded the thermostat opening
temperature and the measured ECT sensor signal remains below a threshold (the highest diagnostic enable
temperature).
To prevent false DTCs, conditions for low load, long deceleration duration and Intake Air Temperature (IAT) during the
monitoring period are checked. If the monitoring conditions are met, the thermostat DTC is set; otherwise the thermostat
monitor is suspended for the current driving cycle.
Thermostat Monitor Method:
A comparison between the measured coolant temperature and the “warmed-up temperature” is done after a specific
time interval. The interval itself is based on the coolant temperature model.
As soon as the model temperature exceeds the thermostat opening temperature and all other monitoring conditions are
fulfilled at the same time, a valid diagnosis occurs.
At that time, if the measured coolant temperature is higher than warmed-up temperature, the thermostat is considered to
be a normal thermostat. If the measured coolant temperature is lower than warmed-up temperature, the thermostat is
considered to be stuck open.
CONTINENTAL REVISED: MARCH 29, 2012 PAGE 60 OF 112
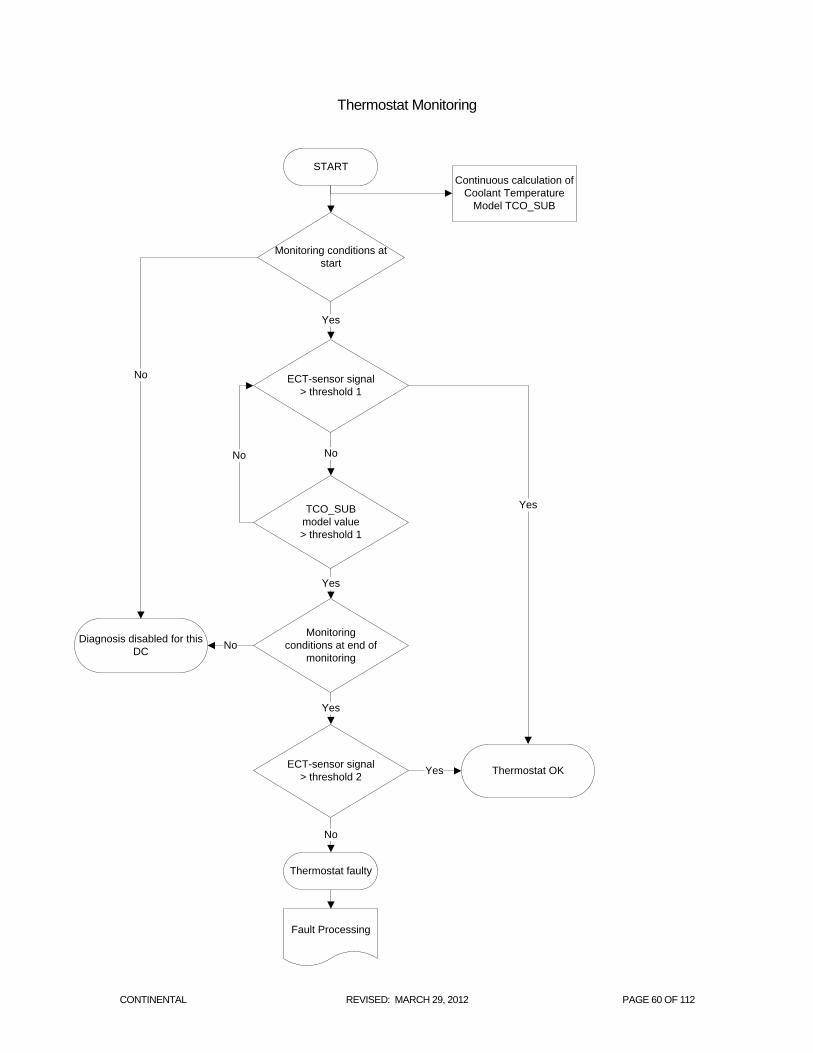
Thermostat Monitoring
START
Thermostat faulty
Continuous calculation of
Coolant Temperature
Model TCO_SUB
Monitoring conditions at
start
Diagnosis disabled for this
DC
No ECT-sensor signal
> threshold 1
TCO_SUB
model value
> threshold 1
Monitoring
conditions at end of
monitoring
Thermostat OK
Yes
Yes
Yes
No
No
ECT-sensor signal
> threshold 2
No
Yes
Yes
No
Fault Processing
CONTINENTAL REVISED: MARCH 29, 2012 PAGE 61 OF 112
ECT Below Thermostat Regulating Temperature
DTCs P0128
Monitor execution Once per driving cycle
Monitor Sequence None
Sensors OK ECT, MAF, VS, CKP, TPS, IAT
Monitoring Duration 127 seconds, based on Inlet Air temperature
Typical ECT Below Thermostat Regulating Temperature check entry conditions:
Entry Condition Minimum Maximum
Percentage of Time at Vehicle speed > than 20 mph 60.15 %
Percentage of time at MAF > 18 … 20 kg/h 36%
Percentage of time in DFCO 10%
Percentage of Time at Vehicle speed > than 47 mph 36%
Difference between IAT and ECT -20.25 °C
Typical ECT Below Thermostat Regulating Temperature check malfunction thresholds:
Measure ECT > 72.75 °C after modeled ECT exceeds 81.75 °C
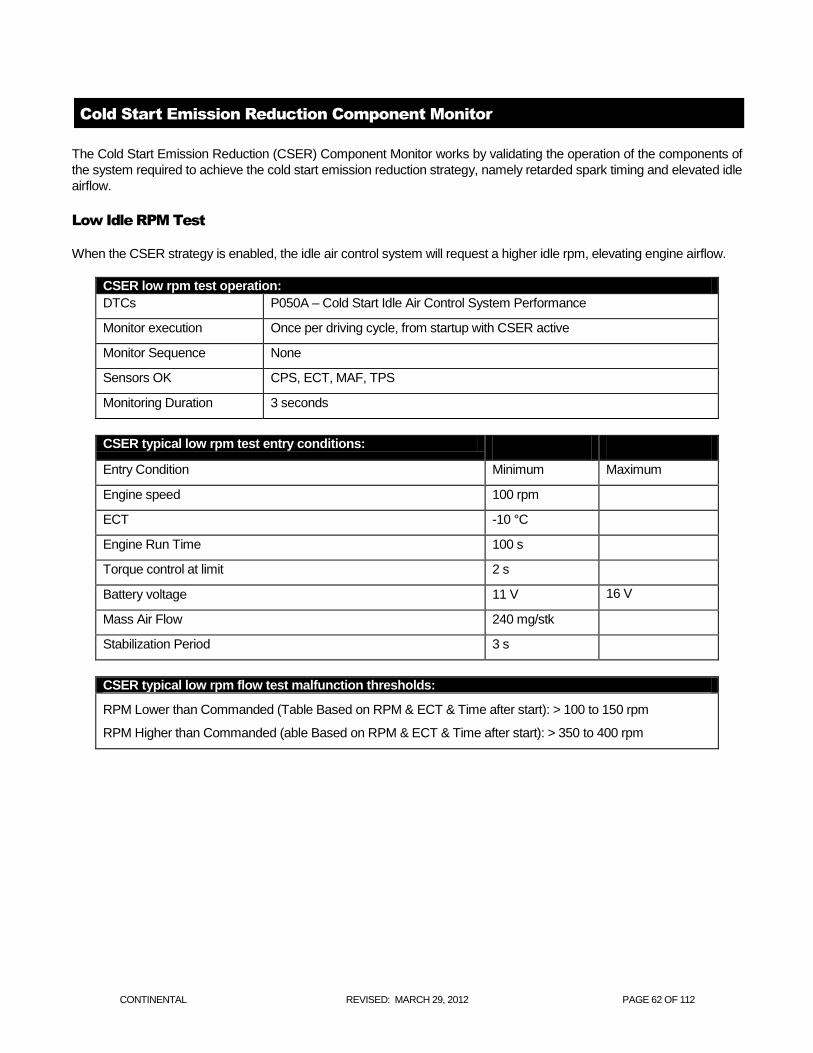
CONTINENTAL REVISED: MARCH 29, 2012 PAGE 62 OF 112
Cold Start Emission Reduction Component Monitor
The Cold Start Emission Reduction (CSER) Component Monitor works by validating the operation of the components of
the system required to achieve the cold start emission reduction strategy, namely retarded spark timing and elevated idle
airflow.
Low Idle RPM Test
When the CSER strategy is enabled, the idle air control system will request a higher idle rpm, elevating engine airflow.
CSER low rpm test operation:
DTCs P050A – Cold Start Idle Air Control System Performance
Monitor execution Once per driving cycle, from startup with CSER active
Monitor Sequence None
Sensors OK CPS, ECT, MAF, TPS
Monitoring Duration 3 seconds
CSER typical low rpm test entry conditions:
Entry Condition Minimum Maximum
Engine speed 100 rpm
ECT -10 °C
Engine Run Time 100 s
Torque control at limit 2 s
Battery voltage 11 V 16 V
Mass Air Flow 240 mg/stk
Stabilization Period 3 s
CSER typical low rpm flow test malfunction thresholds:
RPM Lower than Commanded (Table Based on RPM & ECT & Time after start): > 100 to 150 rpm
RPM Higher than Commanded (able Based on RPM & ECT & Time after start): > 350 to 400 rpm
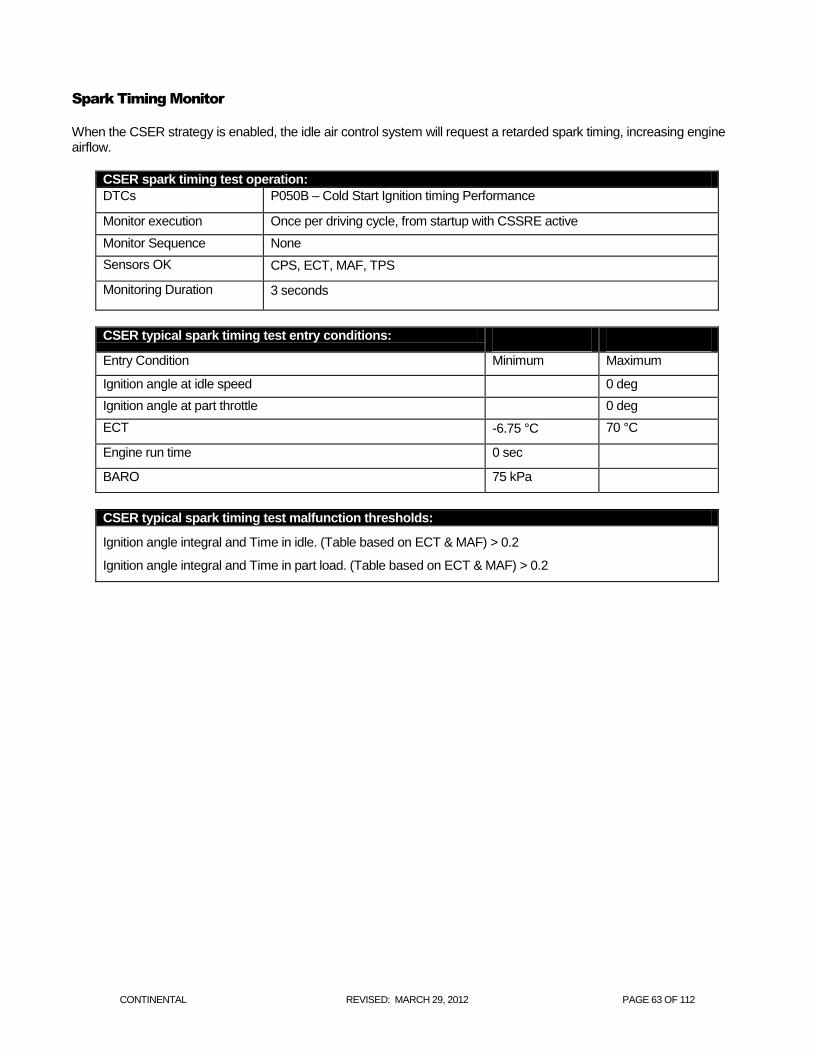
CONTINENTAL REVISED: MARCH 29, 2012 PAGE 63 OF 112
Spark Timing Monitor
When the CSER strategy is enabled, the idle air control system will request a retarded spark timing, increasing engine airflow.
CSER spark timing test operation:
DTCs P050B – Cold Start Ignition timing Performance
Monitor execution Once per driving cycle, from startup with CSSRE active
Monitor Sequence None
Sensors OK CPS, ECT, MAF, TPS
Monitoring Duration 3 seconds
CSER typical spark timing test entry conditions:
Entry Condition Minimum Maximum
Ignition angle at idle speed 0 deg
Ignition angle at part throttle 0 deg
ECT -6.75 °C 70 °C
Engine run time 0 sec
BARO 75 kPa
CSER typical spark timing test malfunction thresholds:
Ignition angle integral and Time in idle. (Table based on ECT & MAF) > 0.2
Ignition angle integral and Time in part load. (Table based on ECT & MAF) > 0.2
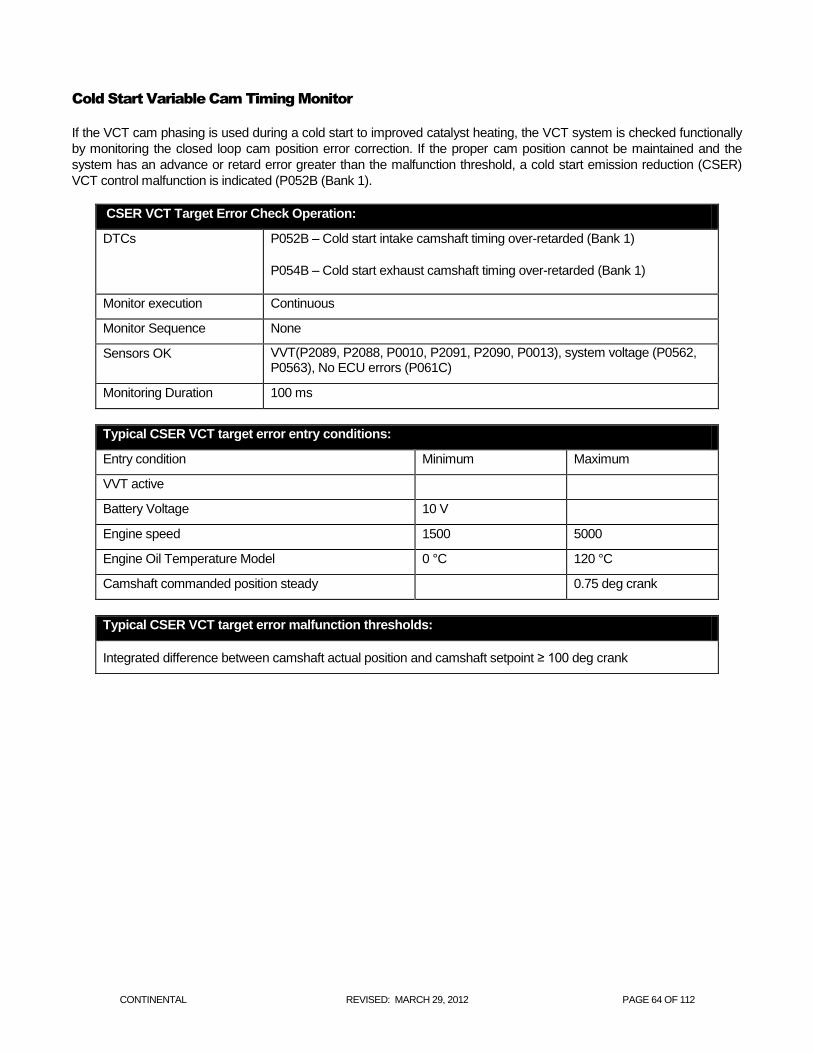
CONTINENTAL REVISED: MARCH 29, 2012 PAGE 64 OF 112
Cold Start Variable Cam Timing Monitor
If the VCT cam phasing is used during a cold start to improved catalyst heating, the VCT system is checked functionally
by monitoring the closed loop cam position error correction. If the proper cam position cannot be maintained and the
system has an advance or retard error greater than the malfunction threshold, a cold start emission reduction (CSER)
VCT control malfunction is indicated (P052B (Bank 1).
CSER VCT Target Error Check Operation:
DTCs P052B – Cold start intake camshaft timing over-retarded (Bank 1)
P054B – Cold start exhaust camshaft timing over-retarded (Bank 1)
Monitor execution Continuous
Monitor Sequence None
Sensors OK VVT(P2089, P2088, P0010, P2091, P2090, P0013), system voltage (P0562, P0563), No ECU errors (P061C)
Monitoring Duration 100 ms
Typical CSER VCT target error entry conditions:
Entry condition Minimum Maximum
VVT active
Battery Voltage 10 V
Engine speed 1500 5000
Engine Oil Temperature Model 0 °C 120 °C
Camshaft commanded position steady 0.75 deg crank
Typical CSER VCT target error malfunction thresholds:
Integrated difference between camshaft actual position and camshaft setpoint ≥ 100 deg crank
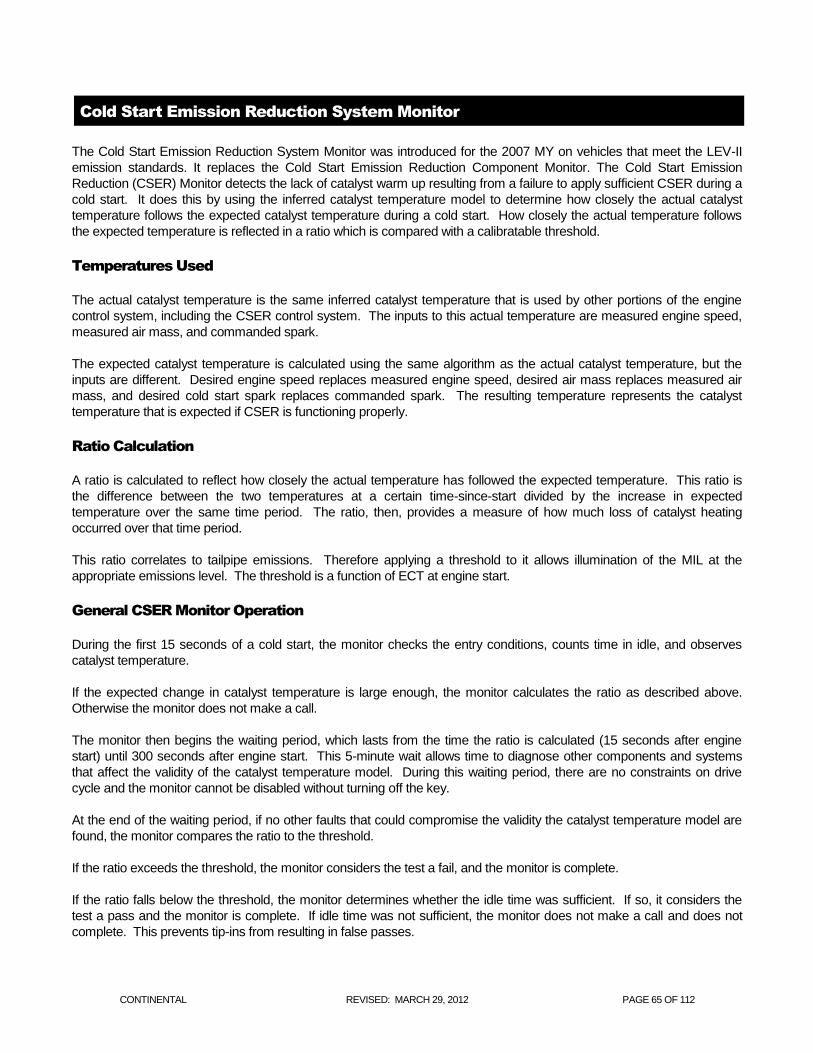
CONTINENTAL REVISED: MARCH 29, 2012 PAGE 65 OF 112
Cold Start Emission Reduction System Monitor
The Cold Start Emission Reduction System Monitor was introduced for the 2007 MY on vehicles that meet the LEV-II
emission standards. It replaces the Cold Start Emission Reduction Component Monitor. The Cold Start Emission
Reduction (CSER) Monitor detects the lack of catalyst warm up resulting from a failure to apply sufficient CSER during a
cold start. It does this by using the inferred catalyst temperature model to determine how closely the actual catalyst
temperature follows the expected catalyst temperature during a cold start. How closely the actual temperature follows
the expected temperature is reflected in a ratio which is compared with a calibratable threshold.
Temperatures Used
The actual catalyst temperature is the same inferred catalyst temperature that is used by other portions of the engine
control system, including the CSER control system. The inputs to this actual temperature are measured engine speed,
measured air mass, and commanded spark.
The expected catalyst temperature is calculated using the same algorithm as the actual catalyst temperature, but the
inputs are different. Desired engine speed replaces measured engine speed, desired air mass replaces measured air
mass, and desired cold start spark replaces commanded spark. The resulting temperature represents the catalyst
temperature that is expected if CSER is functioning properly.
Ratio Calculation
A ratio is calculated to reflect how closely the actual temperature has followed the expected temperature. This ratio is
the difference between the two temperatures at a certain time-since-start divided by the increase in expected
temperature over the same time period. The ratio, then, provides a measure of how much loss of catalyst heating
occurred over that time period.
This ratio correlates to tailpipe emissions. Therefore applying a threshold to it allows illumination of the MIL at the
appropriate emissions level. The threshold is a function of ECT at engine start.
General CSER Monitor Operation
During the first 15 seconds of a cold start, the monitor checks the entry conditions, counts time in idle, and observes
catalyst temperature.
If the expected change in catalyst temperature is large enough, the monitor calculates the ratio as described above.
Otherwise the monitor does not make a call.
The monitor then begins the waiting period, which lasts from the time the ratio is calculated (15 seconds after engine
start) until 300 seconds after engine start. This 5-minute wait allows time to diagnose other components and systems
that affect the validity of the catalyst temperature model. During this waiting period, there are no constraints on drive
cycle and the monitor cannot be disabled without turning off the key.
At the end of the waiting period, if no other faults that could compromise the validity the catalyst temperature model are
found, the monitor compares the ratio to the threshold.
If the ratio exceeds the threshold, the monitor considers the test a fail, and the monitor is complete.
If the ratio falls below the threshold, the monitor determines whether the idle time was sufficient. If so, it considers the
test a pass and the monitor is complete. If idle time was not sufficient, the monitor does not make a call and does not
complete. This prevents tip-ins from resulting in false passes.
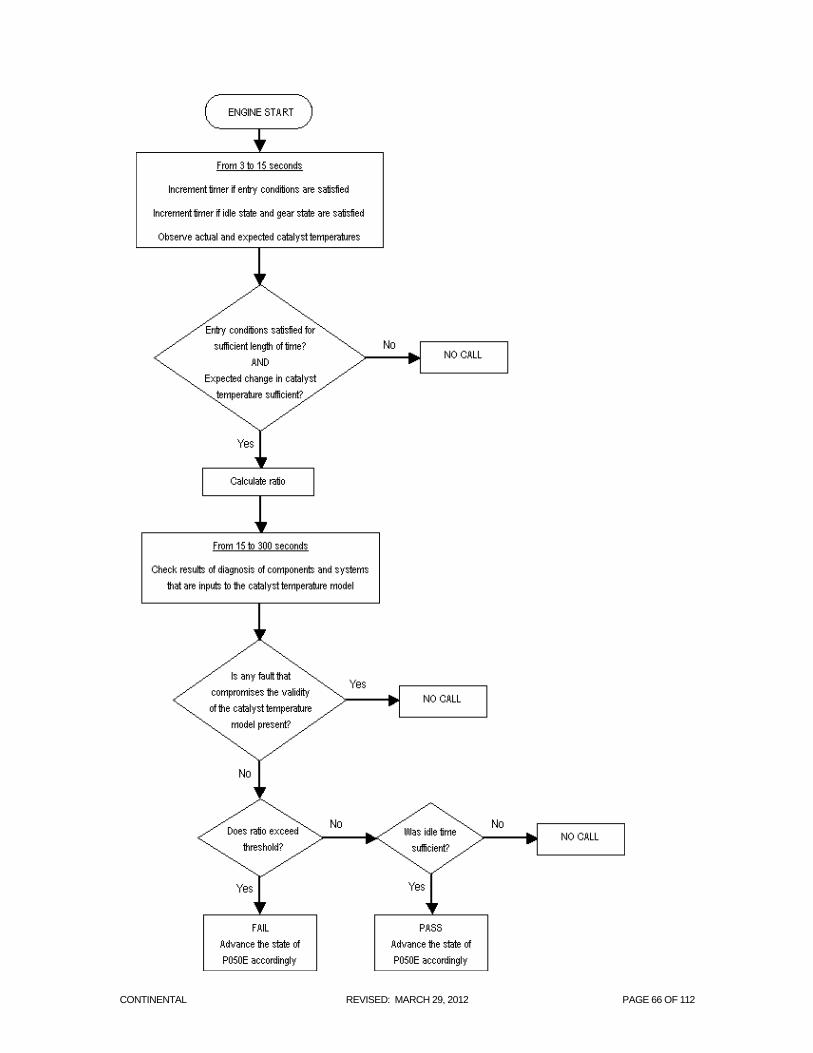
CONTINENTAL REVISED: MARCH 29, 2012 PAGE 66 OF 112
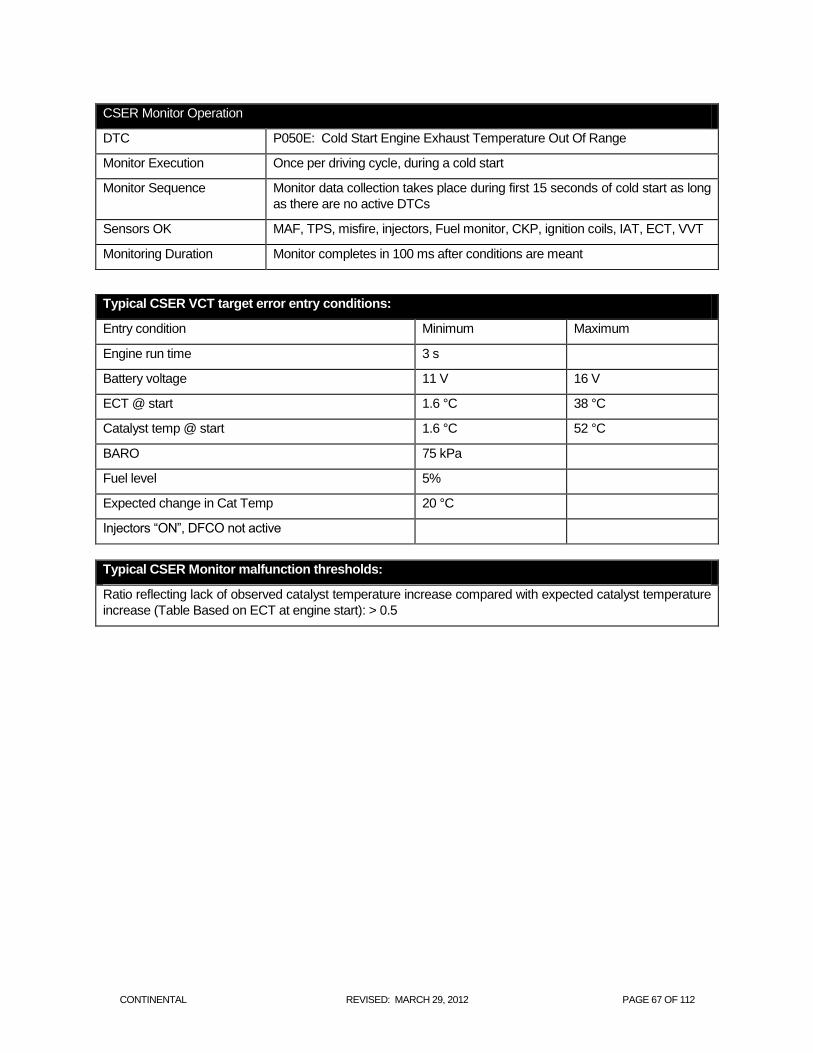
CONTINENTAL REVISED: MARCH 29, 2012 PAGE 67 OF 112
CSER Monitor Operation
DTC P050E: Cold Start Engine Exhaust Temperature Out Of Range
Monitor Execution Once per driving cycle, during a cold start
Monitor Sequence Monitor data collection takes place during first 15 seconds of cold start as long
as there are no active DTCs
Sensors OK MAF, TPS, misfire, injectors, Fuel monitor, CKP, ignition coils, IAT, ECT, VVT
Monitoring Duration Monitor completes in 100 ms after conditions are meant
Typical CSER VCT target error entry conditions:
Entry condition Minimum Maximum
Engine run time 3 s
Battery voltage 11 V 16 V
ECT @ start 1.6 °C 38 °C
Catalyst temp @ start 1.6 °C 52 °C
BARO 75 kPa
Fuel level 5%
Expected change in Cat Temp 20 °C
Injectors “ON”, DFCO not active
Typical CSER Monitor malfunction thresholds:
Ratio reflecting lack of observed catalyst temperature increase compared with expected catalyst temperature
increase (Table Based on ECT at engine start): > 0.5
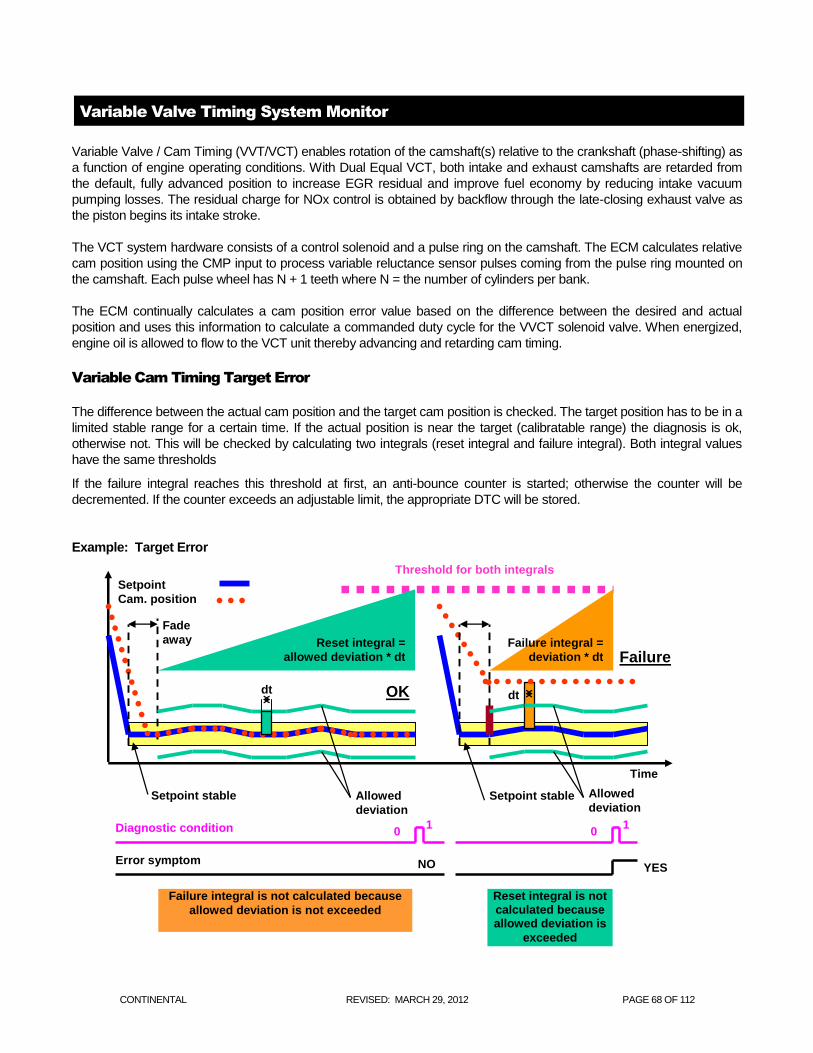
CONTINENTAL REVISED: MARCH 29, 2012 PAGE 68 OF 112
Variable Valve Timing System Monitor
Variable Valve / Cam Timing (VVT/VCT) enables rotation of the camshaft(s) relative to the crankshaft (phase-shifting) as
a function of engine operating conditions. With Dual Equal VCT, both intake and exhaust camshafts are retarded from
the default, fully advanced position to increase EGR residual and improve fuel economy by reducing intake vacuum
pumping losses. The residual charge for NOx control is obtained by backflow through the late-closing exhaust valve as
the piston begins its intake stroke.
The VCT system hardware consists of a control solenoid and a pulse ring on the camshaft. The ECM calculates relative
cam position using the CMP input to process variable reluctance sensor pulses coming from the pulse ring mounted on
the camshaft. Each pulse wheel has N + 1 teeth where N = the number of cylinders per bank.
The ECM continually calculates a cam position error value based on the difference between the desired and actual
position and uses this information to calculate a commanded duty cycle for the VVCT solenoid valve. When energized,
engine oil is allowed to flow to the VCT unit thereby advancing and retarding cam timing.
Variable Cam Timing Target Error
The difference between the actual cam position and the target cam position is checked. The target position has to be in a
limited stable range for a certain time. If the actual position is near the target (calibratable range) the diagnosis is ok,
otherwise not. This will be checked by calculating two integrals (reset integral and failure integral). Both integral values
have the same thresholds
If the failure integral reaches this threshold at first, an anti-bounce counter is started; otherwise the counter will be
decremented. If the counter exceeds an adjustable limit, the appropriate DTC will be stored.
Example: Target Error
Setpoint
Cam. position
Time
Threshold for both integrals
OK
Fade
away Reset integral =
allowed deviation * dt
Failure integral =
deviation * dt Failure
dt dt
Setpoint stable Allowed
deviation Setpoint stable Allowed
deviation
Diagnostic condition 0 1
0 1
Error symptom NO YES
Failure integral is not calculated because
allowed deviation is not exceeded
Reset integral is not calculated because allowed deviation is
exceeded
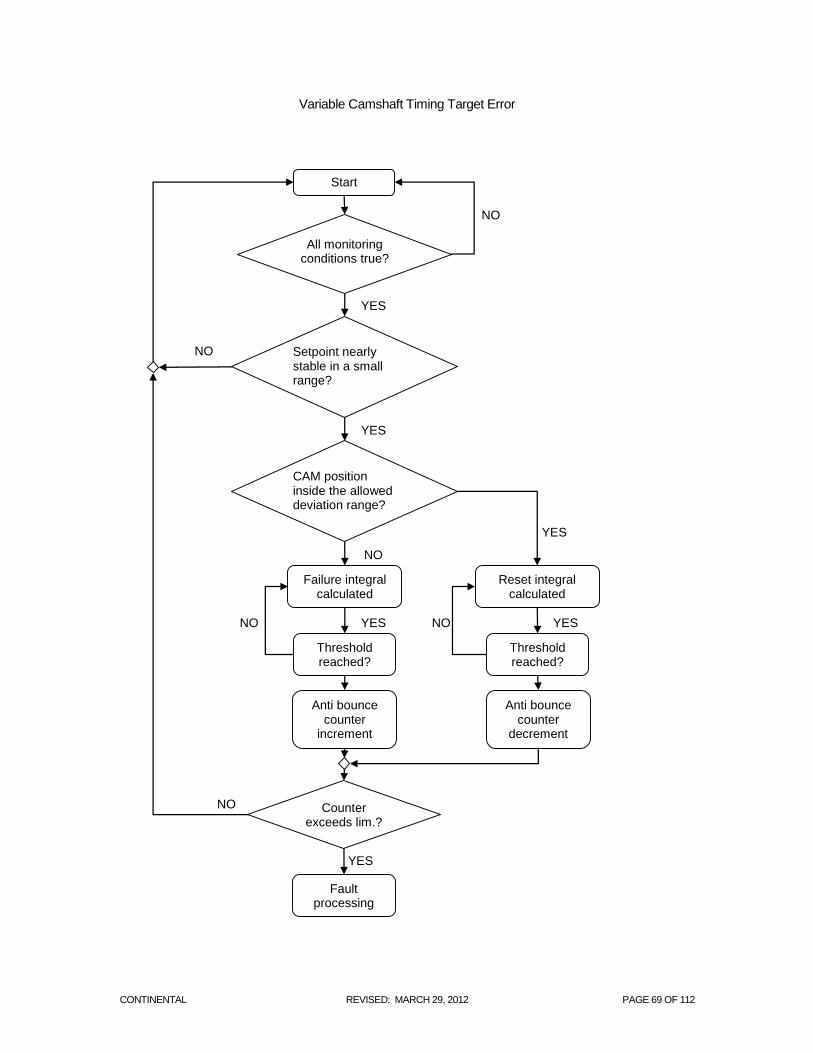
CONTINENTAL REVISED: MARCH 29, 2012 PAGE 69 OF 112
Variable Camshaft Timing Target Error
Start
All monitoring conditions true?
YES
Failure integral calculated
Counter exceeds lim.?
Fault processing
Reset integral calculated
NO
NO
YES
Setpoint nearly stable in a small range?
NO
CAM position inside the allowed deviation range?
YES
NO
Anti bounce counter
increment
Anti bounce counter
decrement
Threshold reached?
Threshold reached?
YES
NO
NO YES YES
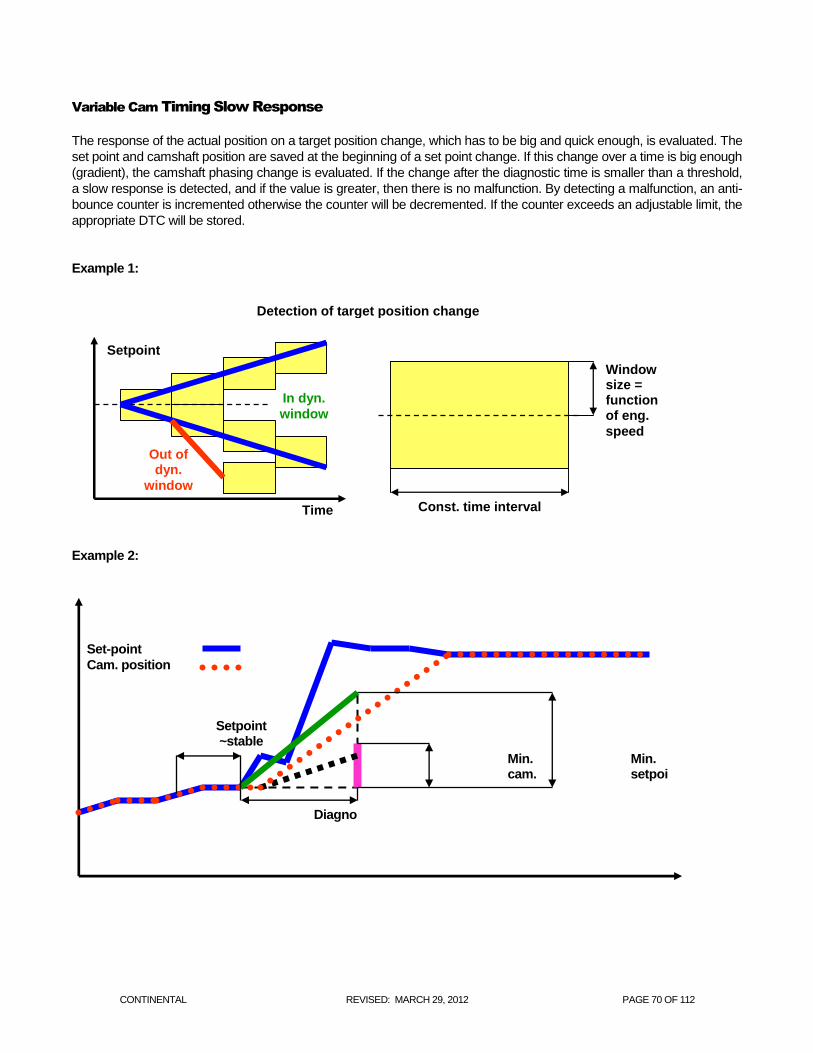
CONTINENTAL REVISED: MARCH 29, 2012 PAGE 70 OF 112
Variable Cam Timing Slow Response
The response of the actual position on a target position change, which has to be big and quick enough, is evaluated. The
set point and camshaft position are saved at the beginning of a set point change. If this change over a time is big enough
(gradient), the camshaft phasing change is evaluated. If the change after the diagnostic time is smaller than a threshold,
a slow response is detected, and if the value is greater, then there is no malfunction. By detecting a malfunction, an anti-
bounce counter is incremented otherwise the counter will be decremented. If the counter exceeds an adjustable limit, the
appropriate DTC will be stored.
Example 1:
Example 2:
Set-point
Cam. position
Time
Setpoint ~stable
for certain time
Min. setpoint change required
Min. cam. pos. change required
Failure
OK
Diagnostic time
Setpoint
Time
In dyn.
window
Out of dyn.
window
Const. time interval
Window size = function of eng.
speed
Detection of target position change
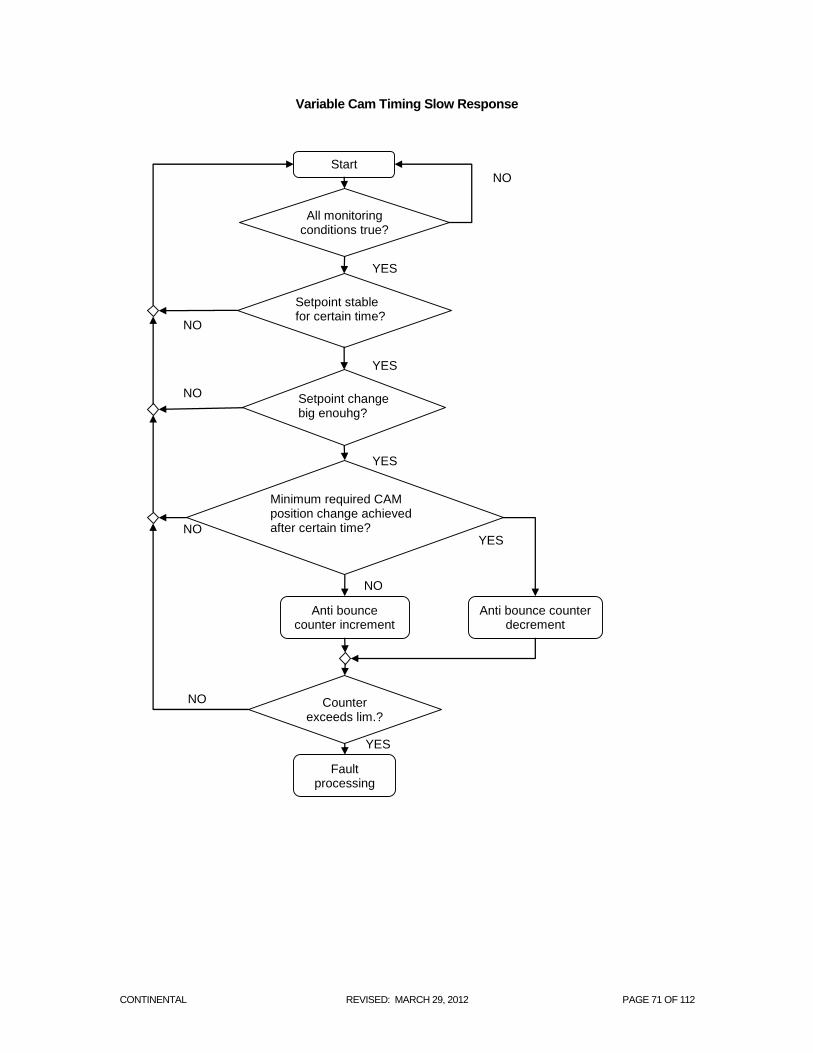
CONTINENTAL REVISED: MARCH 29, 2012 PAGE 71 OF 112
Variable Cam Timing Slow Response
Start
All monitoring conditions true?
Minimum required CAM position change achieved after certain time?
YES
YES
Anti bounce counter increment
Counter exceeds lim.?
Fault processing
Anti bounce counter decrement
NO
NO
NO
YES
Setpoint stable for certain time?
NO
Setpoint change big enouhg?
YES
YES
NO
NO
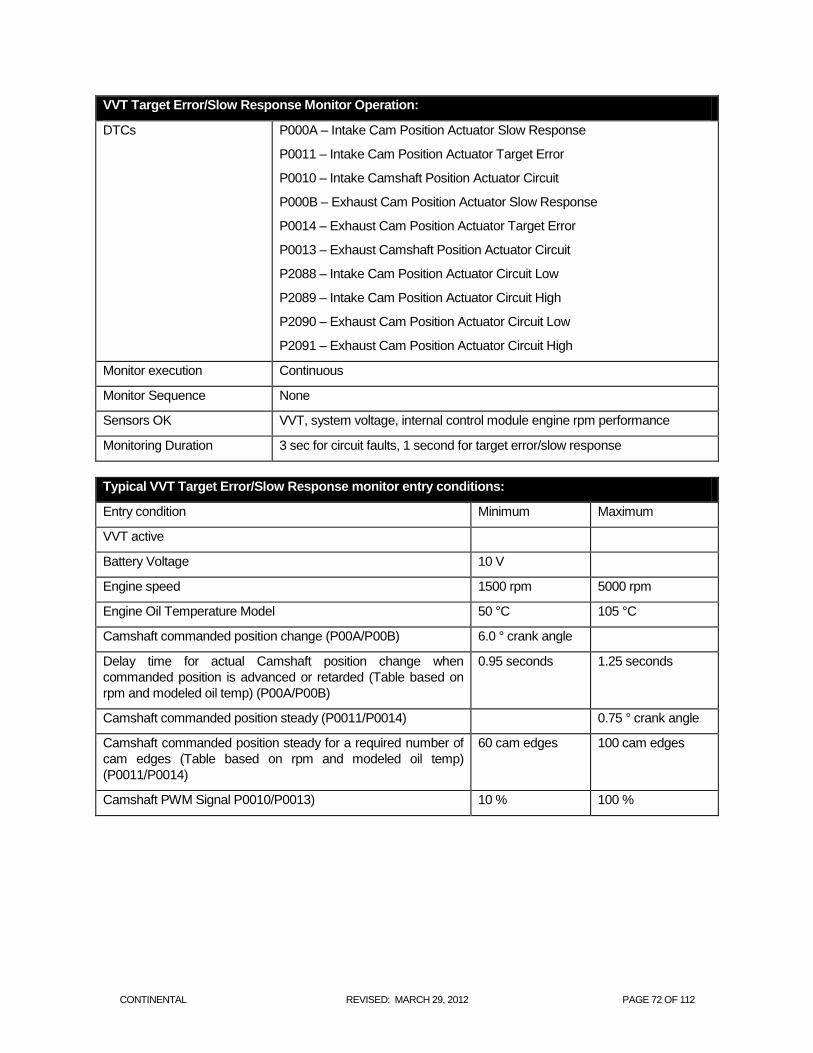
CONTINENTAL REVISED: MARCH 29, 2012 PAGE 72 OF 112
VVT Target Error/Slow Response Monitor Operation:
DTCs P000A – Intake Cam Position Actuator Slow Response
P0011 – Intake Cam Position Actuator Target Error
P0010 – Intake Camshaft Position Actuator Circuit
P000B – Exhaust Cam Position Actuator Slow Response
P0014 – Exhaust Cam Position Actuator Target Error
P0013 – Exhaust Camshaft Position Actuator Circuit
P2088 – Intake Cam Position Actuator Circuit Low
P2089 – Intake Cam Position Actuator Circuit High
P2090 – Exhaust Cam Position Actuator Circuit Low
P2091 – Exhaust Cam Position Actuator Circuit High
Monitor execution Continuous
Monitor Sequence None
Sensors OK VVT, system voltage, internal control module engine rpm performance
Monitoring Duration 3 sec for circuit faults, 1 second for target error/slow response
Typical VVT Target Error/Slow Response monitor entry conditions:
Entry condition Minimum Maximum
VVT active
Battery Voltage 10 V
Engine speed 1500 rpm 5000 rpm
Engine Oil Temperature Model 50 °C 105 °C
Camshaft commanded position change (P00A/P00B) 6.0 ° crank angle
Delay time for actual Camshaft position change when
commanded position is advanced or retarded (Table based on
rpm and modeled oil temp) (P00A/P00B)
0.95 seconds 1.25 seconds
Camshaft commanded position steady (P0011/P0014) 0.75 ° crank angle
Camshaft commanded position steady for a required number of
cam edges (Table based on rpm and modeled oil temp)
(P0011/P0014)
60 cam edges 100 cam edges
Camshaft PWM Signal P0010/P0013) 10 % 100 %
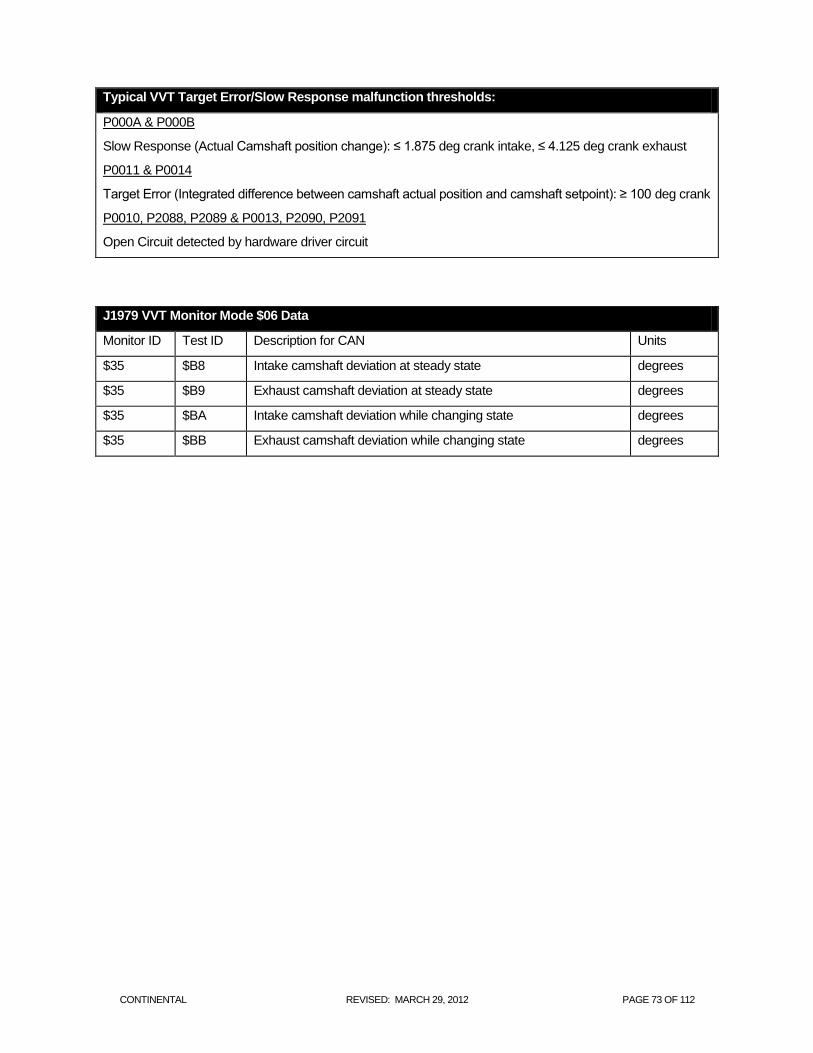
CONTINENTAL REVISED: MARCH 29, 2012 PAGE 73 OF 112
Typical VVT Target Error/Slow Response malfunction thresholds:
P000A & P000B
Slow Response (Actual Camshaft position change): ≤ 1.875 deg crank intake, ≤ 4.125 deg crank exhaust
P0011 & P0014
Target Error (Integrated difference between camshaft actual position and camshaft setpoint): ≥ 100 deg crank
P0010, P2088, P2089 & P0013, P2090, P2091
Open Circuit detected by hardware driver circuit
J1979 VVT Monitor Mode $06 Data
Monitor ID Test ID Description for CAN Units
$35 $B8 Intake camshaft deviation at steady state degrees
$35 $B9 Exhaust camshaft deviation at steady state degrees
$35 $BA Intake camshaft deviation while changing state degrees
$35 $BB Exhaust camshaft deviation while changing state degrees
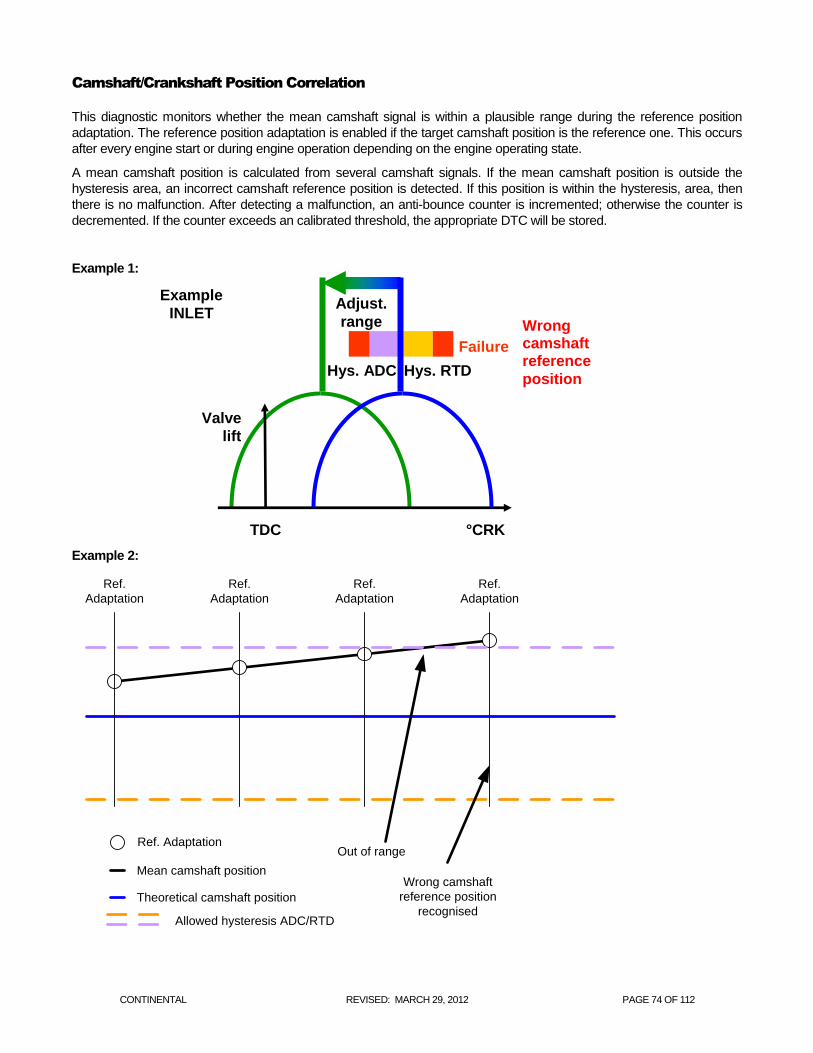
CONTINENTAL REVISED: MARCH 29, 2012 PAGE 74 OF 112
Camshaft/Crankshaft Position Correlation
This diagnostic monitors whether the mean camshaft signal is within a plausible range during the reference position
adaptation. The reference position adaptation is enabled if the target camshaft position is the reference one. This occurs
after every engine start or during engine operation depending on the engine operating state.
A mean camshaft position is calculated from several camshaft signals. If the mean camshaft position is outside the
hysteresis area, an incorrect camshaft reference position is detected. If this position is within the hysteresis, area, then
there is no malfunction. After detecting a malfunction, an anti-bounce counter is incremented; otherwise the counter is
decremented. If the counter exceeds an calibrated threshold, the appropriate DTC will be stored.
Example 1:
Example 2:
Ref.
Adaptation
Ref.
Adaptation
Ref.
Adaptation
Ref.
Adaptation
Out of range
Wrong camshaft
reference position
recognised
Ref. Adaptation
Allowed hysteresis ADC/RTD
Mean camshaft position
Theoretical camshaft position
Valve
lift
°CRK TDC
Hys. ADC Hys. RTD
Adjust.
range
Example
INLET
Failure
Wrong camshaft reference
position
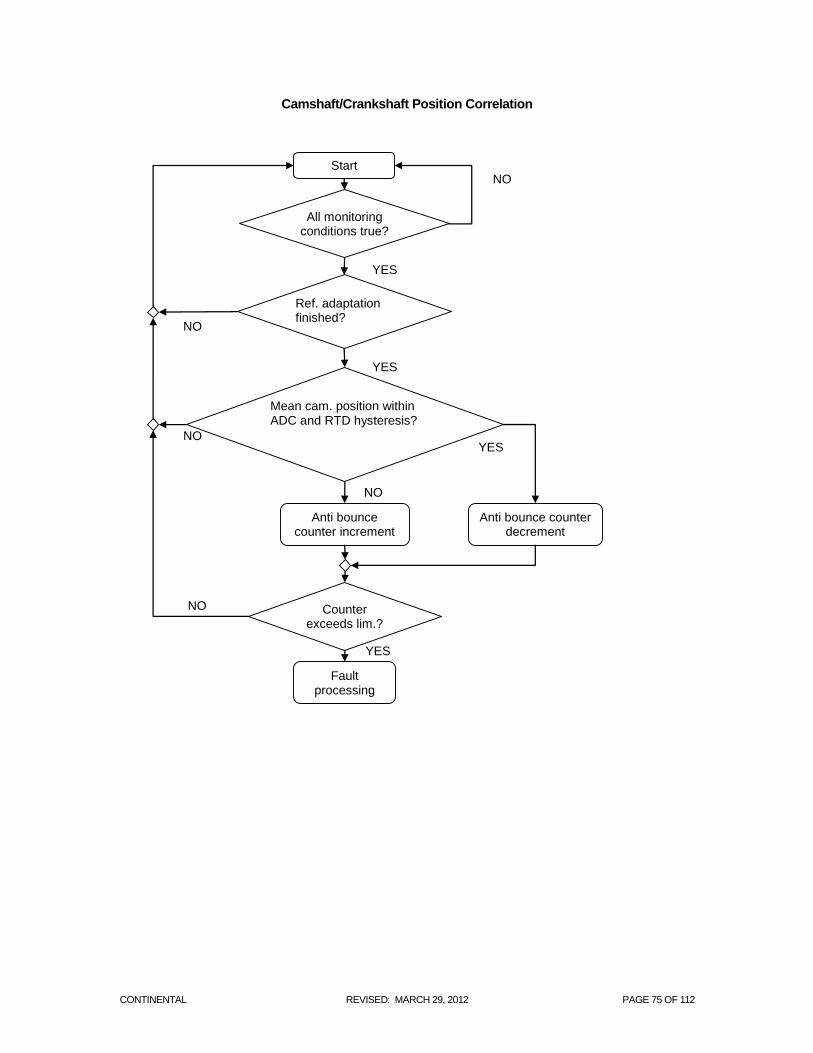
CONTINENTAL REVISED: MARCH 29, 2012 PAGE 75 OF 112
Camshaft/Crankshaft Position Correlation
Start
All monitoring conditions true?
Mean cam. position within ADC and RTD hysteresis?
YES
YES
Anti bounce counter increment
Counter exceeds lim.?
Fault processing
Anti bounce counter decrement
NO
NO
NO
YES
Ref. adaptation finished?
NO
YES
NO
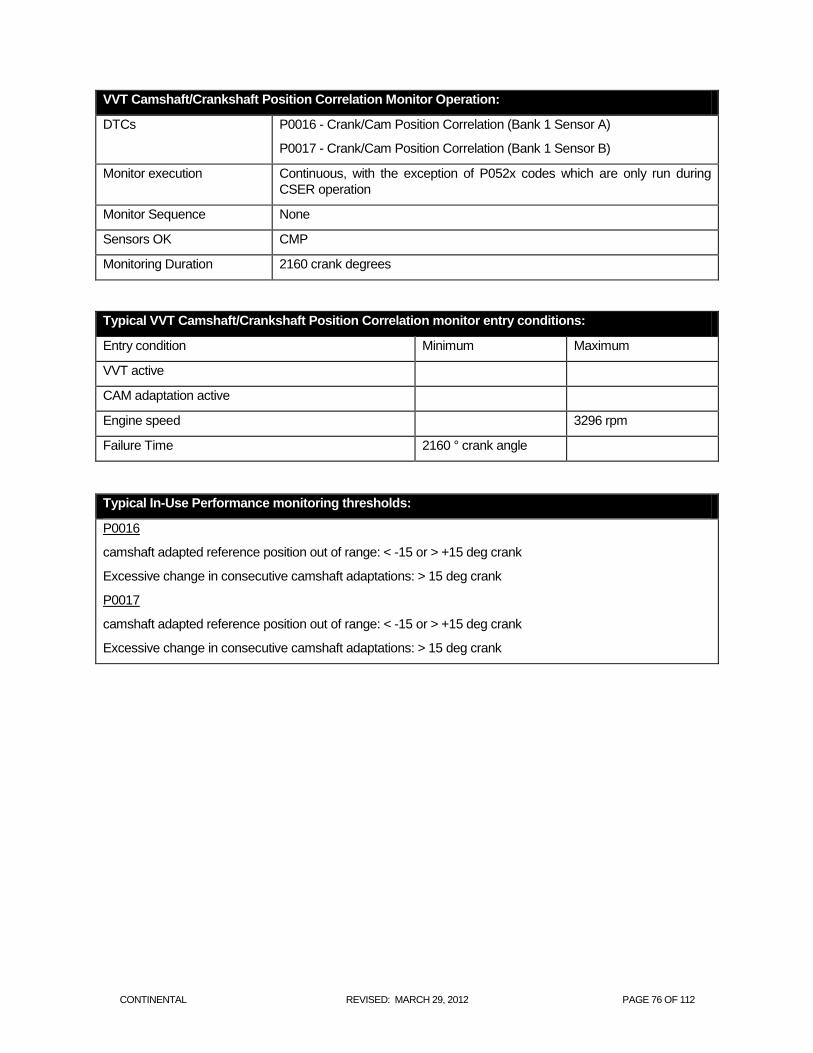
CONTINENTAL REVISED: MARCH 29, 2012 PAGE 76 OF 112
VVT Camshaft/Crankshaft Position Correlation Monitor Operation:
DTCs P0016 - Crank/Cam Position Correlation (Bank 1 Sensor A)
P0017 - Crank/Cam Position Correlation (Bank 1 Sensor B)
Monitor execution Continuous, with the exception of P052x codes which are only run during
CSER operation
Monitor Sequence None
Sensors OK CMP
Monitoring Duration 2160 crank degrees
Typical VVT Camshaft/Crankshaft Position Correlation monitor entry conditions:
Entry condition Minimum Maximum
VVT active
CAM adaptation active
Engine speed 3296 rpm
Failure Time 2160 ° crank angle
Typical In-Use Performance monitoring thresholds:
P0016
camshaft adapted reference position out of range: < -15 or > +15 deg crank
Excessive change in consecutive camshaft adaptations: > 15 deg crank
P0017
camshaft adapted reference position out of range: < -15 or > +15 deg crank
Excessive change in consecutive camshaft adaptations: > 15 deg crank
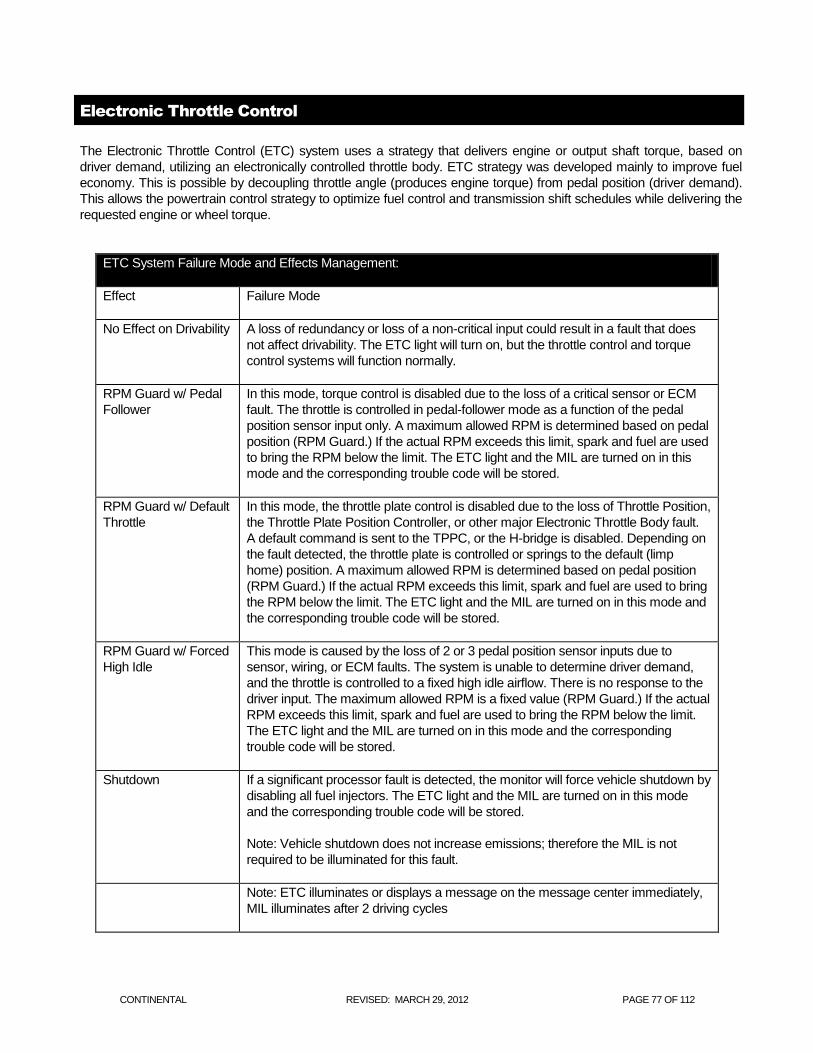
CONTINENTAL REVISED: MARCH 29, 2012 PAGE 77 OF 112
Electronic Throttle Control
The Electronic Throttle Control (ETC) system uses a strategy that delivers engine or output shaft torque, based on
driver demand, utilizing an electronically controlled throttle body. ETC strategy was developed mainly to improve fuel
economy. This is possible by decoupling throttle angle (produces engine torque) from pedal position (driver demand).
This allows the powertrain control strategy to optimize fuel control and transmission shift schedules while delivering the
requested engine or wheel torque.
ETC System Failure Mode and Effects Management:
Effect Failure Mode
No Effect on Drivability A loss of redundancy or loss of a non-critical input could result in a fault that does
not affect drivability. The ETC light will turn on, but the throttle control and torque
control systems will function normally.
RPM Guard w/ Pedal
Follower
In this mode, torque control is disabled due to the loss of a critical sensor or ECM
fault. The throttle is controlled in pedal-follower mode as a function of the pedal
position sensor input only. A maximum allowed RPM is determined based on pedal
position (RPM Guard.) If the actual RPM exceeds this limit, spark and fuel are used
to bring the RPM below the limit. The ETC light and the MIL are turned on in this
mode and the corresponding trouble code will be stored.
RPM Guard w/ Default
Throttle
In this mode, the throttle plate control is disabled due to the loss of Throttle Position,
the Throttle Plate Position Controller, or other major Electronic Throttle Body fault.
A default command is sent to the TPPC, or the H-bridge is disabled. Depending on
the fault detected, the throttle plate is controlled or springs to the default (limp
home) position. A maximum allowed RPM is determined based on pedal position
(RPM Guard.) If the actual RPM exceeds this limit, spark and fuel are used to bring
the RPM below the limit. The ETC light and the MIL are turned on in this mode and
the corresponding trouble code will be stored.
RPM Guard w/ Forced
High Idle
This mode is caused by the loss of 2 or 3 pedal position sensor inputs due to
sensor, wiring, or ECM faults. The system is unable to determine driver demand,
and the throttle is controlled to a fixed high idle airflow. There is no response to the
driver input. The maximum allowed RPM is a fixed value (RPM Guard.) If the actual
RPM exceeds this limit, spark and fuel are used to bring the RPM below the limit.
The ETC light and the MIL are turned on in this mode and the corresponding
trouble code will be stored.
Shutdown If a significant processor fault is detected, the monitor will force vehicle shutdown by
disabling all fuel injectors. The ETC light and the MIL are turned on in this mode
and the corresponding trouble code will be stored.
Note: Vehicle shutdown does not increase emissions; therefore the MIL is not
required to be illuminated for this fault.
Note: ETC illuminates or displays a message on the message center immediately,
MIL illuminates after 2 driving cycles
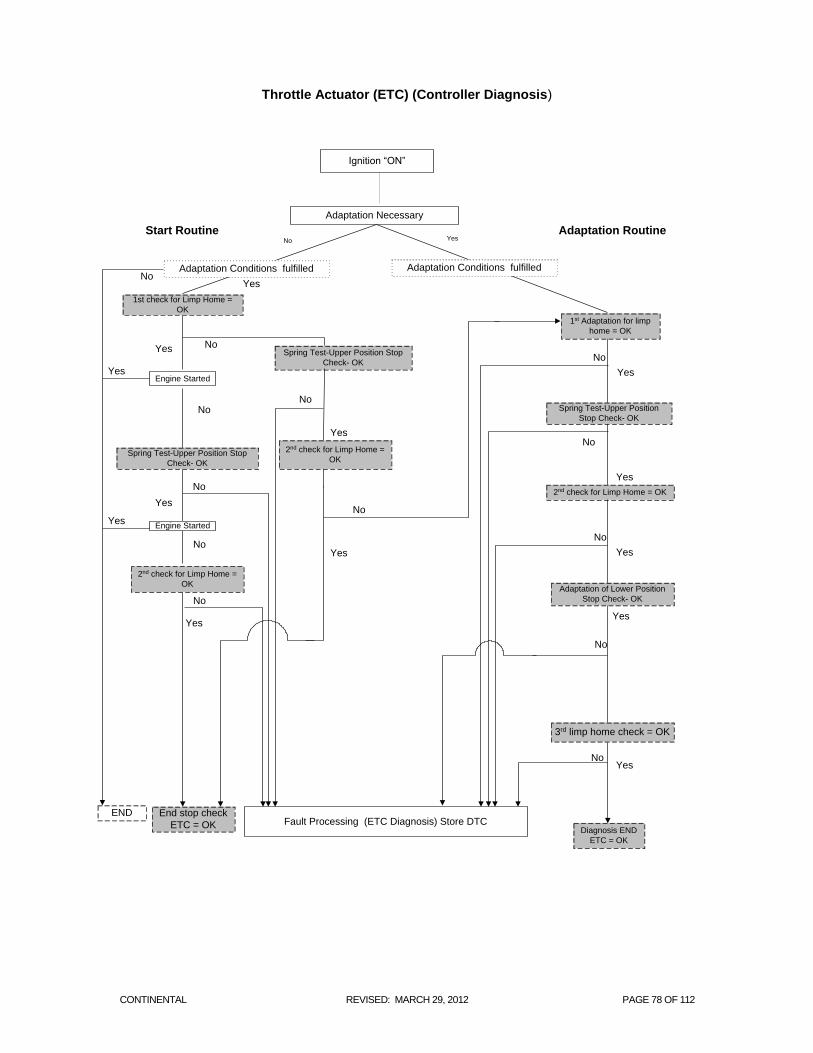
CONTINENTAL REVISED: MARCH 29, 2012 PAGE 78 OF 112
Throttle Actuator (ETC) (Controller Diagnosis)
Ignition “ON”
Adaptation Necessary
Start Routine Adaptation Routine
NoYes
Engine Started
Yes
Yes
No
Diagnosis END
ETC = OK
1st check for Limp Home =
OK
Spring Test-Upper Position Stop
Check- OK
2nd check for Limp Home =
OK
Yes
Fault Processing (ETC Diagnosis) Store DTC
No
Yes
No
Yes
No
2nd check for Limp Home =
OK
Yes
1st Adaptation for limp
home = OK
Spring Test-Upper Position
Stop Check- OK
No
Yes
No
2nd check for Limp Home = OK
No
Yes
Adaptation of Lower Position
Stop Check- OK
No
Yes
3rd limp home check = OK
YesNo
End stop check
ETC = OK
No
Spring Test-Upper Position Stop
Check- OK
Adaptation Conditions fulfilled
YesNo
Engine StartedYes
No
END
Adaptation Conditions fulfilled
No Yes
CONTINENTAL REVISED: MARCH 29, 2012 PAGE 79 OF 112
Electronic Throttle Control (ETC) Motor Control Circuit
The ETC Motor Control Circuit diagnostics are able to detect a short circuit to power, a short circuit to ground and an
open circuit. The diagnostic is initialized after a module reset or a “Key ON”. After initialization (Key "ON"), the following
are all reset: The diagnostic conditions, the symptom, the counter, and the failure stored in the Error Management.
The circuit diagnostics execute every 10 milliseconds and are continuous. A short circuit can only be detected when the
H-bridge switches are open, so the condition for the each short circuit is calculated during all ranges of the PWM.
The ETC motor control circuit diagnostic is activated between a battery voltage range. This is to eliminate false low limit
voltage detection. The deactivation threshold for the ETC motor control circuit diagnostic is typically calibrated to a low
voltage.
Spring check (start routine)
This diagnostic checks if the throttle spring is working correctly and if the throttle limp home position can be achieved.
The diagnostic is performed at the beginning of every driving cycle at ignition "Key ON" position. The throttle body spring
check is executed as part of the start routine and is carried out with every “Key ON” of the engine control unit. More
specifically the spring check is run during the TPS adaptation routine. The routine includes the following:
Limp-home position check
Adaptation of the limp-home position
Upper return spring check
The start routine is only carried out when the adaptation conditions are maintained, (Key "ON" / Engine Running). The
diagnostic will report when a spring-check error occurs, which includes the upper or lower return spring limits.
There is a throttle position set-point, calibratable, used for the upper return spring check. The TPS set-point should be
approximately 10 ° greater than the limp-home position.
After the adaptation of the lower mechanical stop, the set point is used for the lower return spring check. The objective is
to adjust the throttle in a position between the lower limit and limp-home. Without this set point, the throttle could stick in
the lower mechanical stop after the adaptation. A typical value of 2 ° is recommended.
ETC adaptation diagnostic
After the initial engine start and / or component change, the characteristic Potentiometer values for the limp home
position and the lower mechanical stop are learned within an adaptation routine. The values are stored at the end of the
driving cycle in the non-volatile memory. If the conditions are not fulfilled, the malfunction errors (DTC's) are stored.
Due to the electrical and mechanical tolerances of the ETC system, the sensor characteristic has to be learned and the
ETC system controller must adapt. The TPS adaptation is executed as part of the start routine and is carried out the very
first time there is a “Key ON” of the engine control unit at the vehicle assembly plant or when the engine control unit is
changed in service.
CONTINENTAL REVISED: MARCH 29, 2012 PAGE 80 OF 112
The TPS adaptation includes the following functions:
Adaptation and check of the limp-home position
Adaptation and check of the lower mechanical stop
Lower return spring check
Adaptation of the amplifier amplification (TPS 1 channel)
Upper return spring check
Due to the electrical and the mechanical tolerances of the throttle position system, the sensor characteristic has to be
learned. The adaptation and diagnosis of the lower mechanical stop and limp-home position occurs within the adaptation
routines. The adapted lower mechanical stop and the upper check position are used for the calculation of TPS channel
1. The upper mechanical stop is not learned. During the TPS adaptation no limitation of the throttle position set-point is
active. The learned value for the limp-home position, the lower mechanical stop and the TPS channel1 values are stored
at the end of each driving cycle as „non-volatile“.
The first step is the adaptation of the limp-home position. The actuator is without current and is forced by spring power to
the limp home position. During the adaptation all the voltage values must be in the adaptation windows. A hysteresis is
set up around each of the first recorded values (TPS 1 and 2). If all the TPS values are with in this hysteresis during a
calibrated time, then the adaptation values are determined from the first and last value for each TPS. If a TPS value is
outside the hysteresis, then the process is started over for both TPS channels. The learning function is limited by a
calibratable time. An adaptation error is detected if the adaptation could not be carried out during the maximum time.
The next step is the adaptation of the lower mechanical stop. The throttle is driven into the lower mechanical stop by
switching on the position controller and gradually decreasing the set point. As soon as the mechanical stop is reached,
the adaptation of the lower mechanical stop for all TPS input channels is started. The adaptation procedure is the same
as the limp-home position except the calibration values are different. As with the limp-home position, if the maximum
adaptation time is exceeded, an adaptation error is indicated.
Now the lower return spring is checked. The throttle is positioned between lower mechanical stop and limp-home by
switching on the position controller and increasing the set point gradually until a calibrated set point for testing the lower
return spring is reached. An adaptation error is indicated if the throttle does not reach the requested position in a defined
time limit. Then the ETC power stage is switched off and the throttle has to return by spring power to the limp-home
position or a return spring error is indicated.
Next is the adaptation of the amplification from the TPS measuring amplifier (TPS 1 channel). The controller is switched
on and the set point is gradually increased and the throttle is moved to a position above limp-home until the calibrated
set point for the adaptation of the measuring amplifier is reached. An adaptation error is indicated if the throttle does not
reach the requested position in a defined time limit.
The final step is the check of the upper return spring. The throttle is gradually driven further away from limp home
position until a calibrated set point for the upper spring check is reached. An adaptation error will be indicated if the
throttle does not reach the requested position in a defined time limit. The ETC power stage is switched-off and the
throttle has to return by spring power to the limp-home position, or an upper return spring error is indicated.
If all of the adaptations and checks pass, the learned value for the limp-home position, the lower mechanical stop and
the TPS channel 1 values are stored at the end of each driving cycle in non-volatile memory. This provides the initial
control settings for the next “Key ON”.
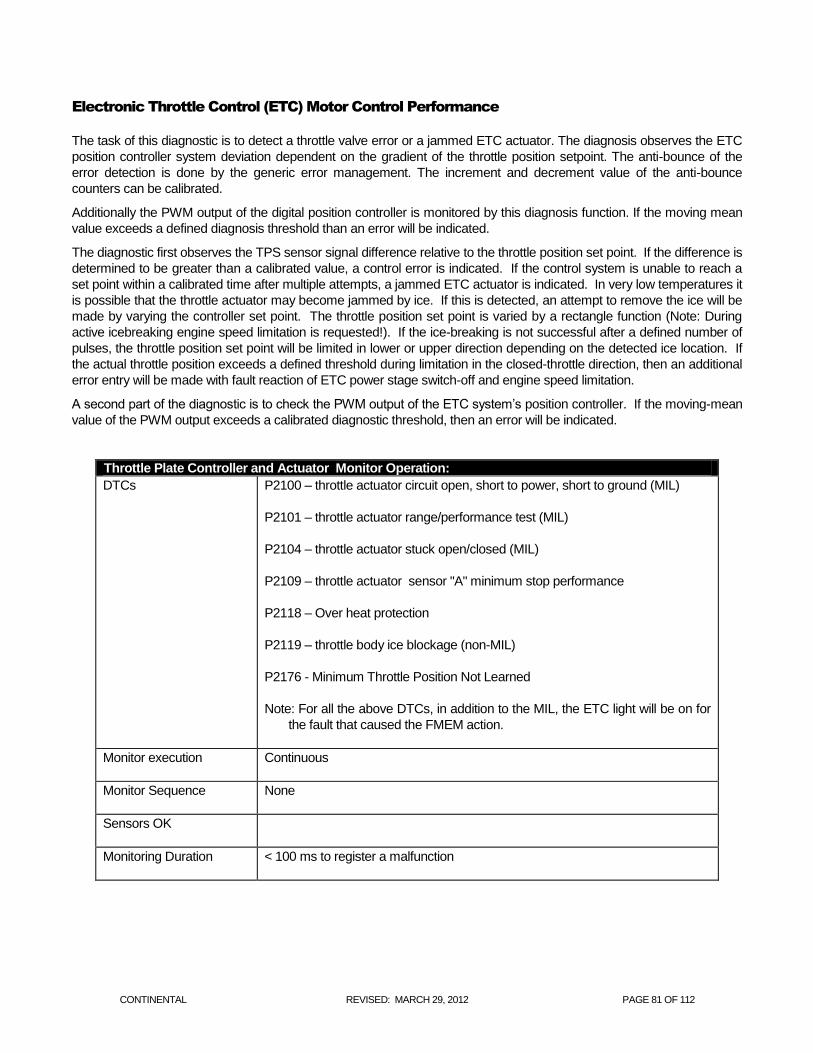
CONTINENTAL REVISED: MARCH 29, 2012 PAGE 81 OF 112
Electronic Throttle Control (ETC) Motor Control Performance
The task of this diagnostic is to detect a throttle valve error or a jammed ETC actuator. The diagnosis observes the ETC
position controller system deviation dependent on the gradient of the throttle position setpoint. The anti-bounce of the
error detection is done by the generic error management. The increment and decrement value of the anti-bounce
counters can be calibrated.
Additionally the PWM output of the digital position controller is monitored by this diagnosis function. If the moving mean
value exceeds a defined diagnosis threshold than an error will be indicated.
The diagnostic first observes the TPS sensor signal difference relative to the throttle position set point. If the difference is
determined to be greater than a calibrated value, a control error is indicated. If the control system is unable to reach a
set point within a calibrated time after multiple attempts, a jammed ETC actuator is indicated. In very low temperatures it
is possible that the throttle actuator may become jammed by ice. If this is detected, an attempt to remove the ice will be
made by varying the controller set point. The throttle position set point is varied by a rectangle function (Note: During
active icebreaking engine speed limitation is requested!). If the ice-breaking is not successful after a defined number of
pulses, the throttle position set point will be limited in lower or upper direction depending on the detected ice location. If
the actual throttle position exceeds a defined threshold during limitation in the closed-throttle direction, then an additional
error entry will be made with fault reaction of ETC power stage switch-off and engine speed limitation.
A second part of the diagnostic is to check the PWM output of the ETC system’s position controller. If the moving-mean
value of the PWM output exceeds a calibrated diagnostic threshold, then an error will be indicated.
Throttle Plate Controller and Actuator Monitor Operation:
DTCs P2100 – throttle actuator circuit open, short to power, short to ground (MIL)
P2101 – throttle actuator range/performance test (MIL)
P2104 – throttle actuator stuck open/closed (MIL)
P2109 – throttle actuator sensor "A" minimum stop performance
P2118 – Over heat protection
P2119 – throttle body ice blockage (non-MIL)
P2176 - Minimum Throttle Position Not Learned
Note: For all the above DTCs, in addition to the MIL, the ETC light will be on for
the fault that caused the FMEM action.
Monitor execution Continuous
Monitor Sequence None
Sensors OK
Monitoring Duration < 100 ms to register a malfunction
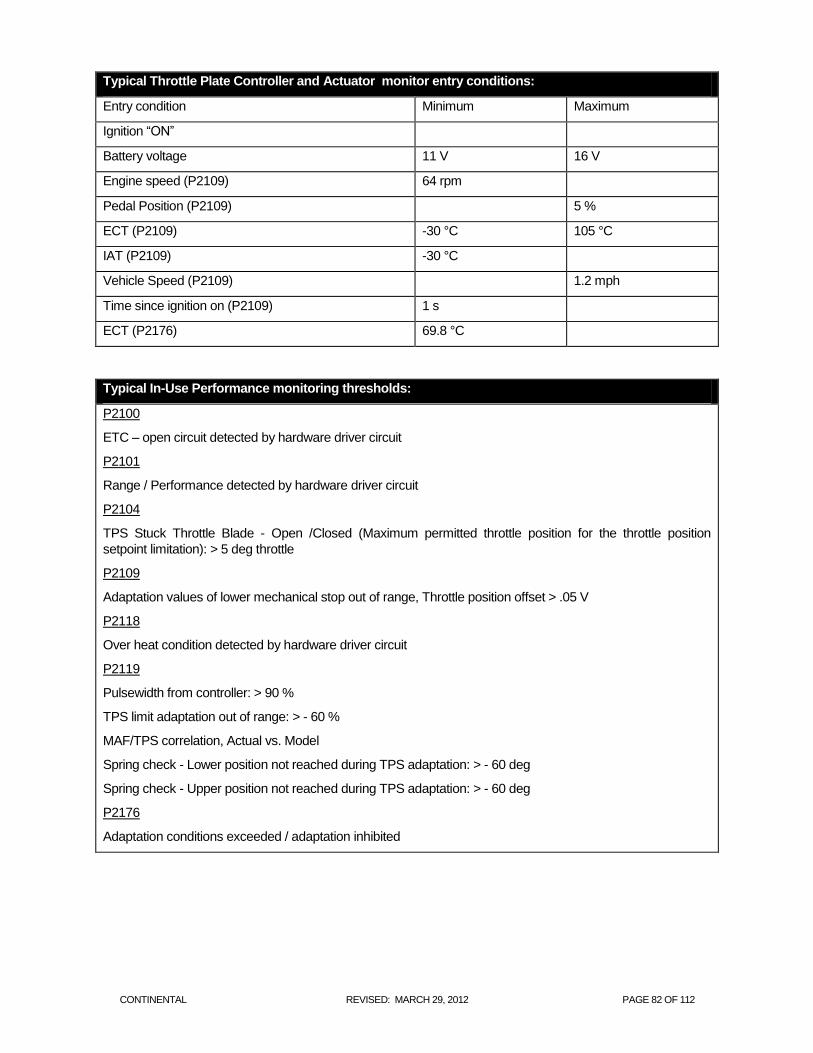
CONTINENTAL REVISED: MARCH 29, 2012 PAGE 82 OF 112
Typical Throttle Plate Controller and Actuator monitor entry conditions:
Entry condition Minimum Maximum
Ignition “ON”
Battery voltage 11 V 16 V
Engine speed (P2109) 64 rpm
Pedal Position (P2109) 5 %
ECT (P2109) -30 °C 105 °C
IAT (P2109) -30 °C
Vehicle Speed (P2109) 1.2 mph
Time since ignition on (P2109) 1 s
ECT (P2176) 69.8 °C
Typical In-Use Performance monitoring thresholds:
P2100
ETC – open circuit detected by hardware driver circuit
P2101
Range / Performance detected by hardware driver circuit
P2104
TPS Stuck Throttle Blade - Open /Closed (Maximum permitted throttle position for the throttle position
setpoint limitation): > 5 deg throttle
P2109
Adaptation values of lower mechanical stop out of range, Throttle position offset > .05 V
P2118
Over heat condition detected by hardware driver circuit
P2119
Pulsewidth from controller: > 90 %
TPS limit adaptation out of range: > - 60 %
MAF/TPS correlation, Actual vs. Model
Spring check - Lower position not reached during TPS adaptation: > - 60 deg
Spring check - Upper position not reached during TPS adaptation: > - 60 deg
P2176
Adaptation conditions exceeded / adaptation inhibited
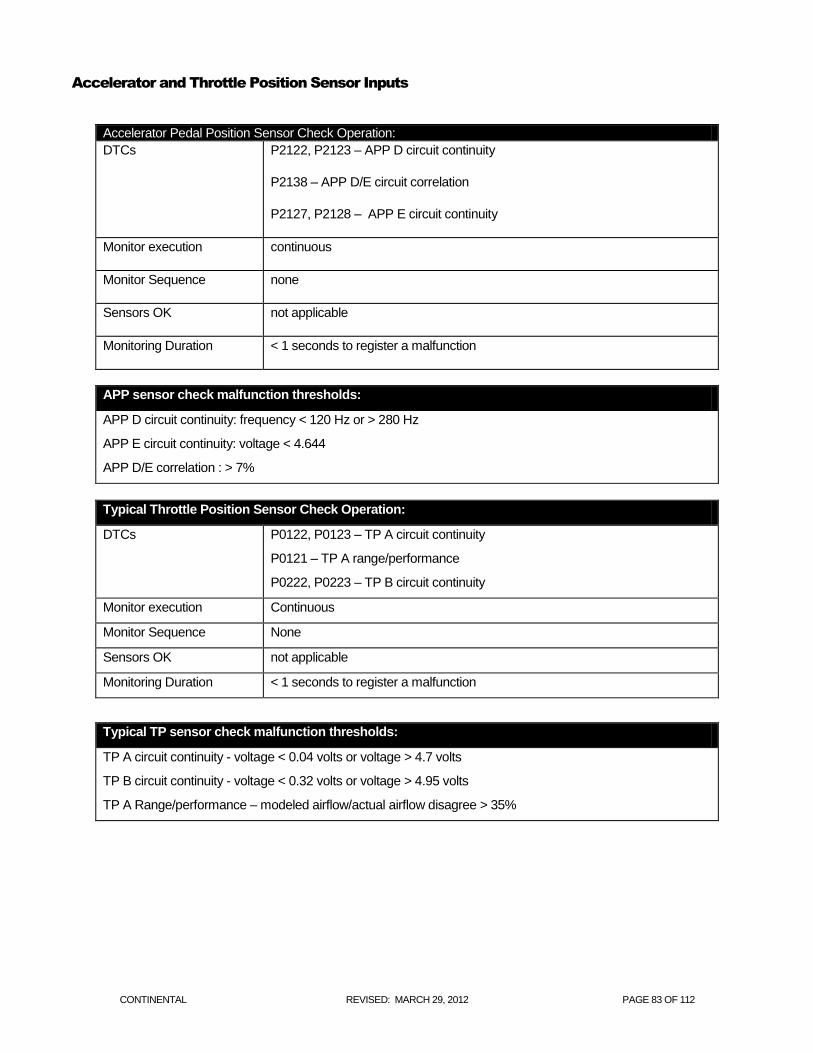
CONTINENTAL REVISED: MARCH 29, 2012 PAGE 83 OF 112
Accelerator and Throttle Position Sensor Inputs
Accelerator Pedal Position Sensor Check Operation:
DTCs P2122, P2123 – APP D circuit continuity
P2138 – APP D/E circuit correlation
P2127, P2128 – APP E circuit continuity
Monitor execution continuous
Monitor Sequence none
Sensors OK not applicable
Monitoring Duration < 1 seconds to register a malfunction
APP sensor check malfunction thresholds:
APP D circuit continuity: frequency < 120 Hz or > 280 Hz
APP E circuit continuity: voltage < 4.644
APP D/E correlation : > 7%
Typical Throttle Position Sensor Check Operation:
DTCs P0122, P0123 – TP A circuit continuity
P0121 – TP A range/performance
P0222, P0223 – TP B circuit continuity
Monitor execution Continuous
Monitor Sequence None
Sensors OK not applicable
Monitoring Duration < 1 seconds to register a malfunction
Typical TP sensor check malfunction thresholds:
TP A circuit continuity - voltage < 0.04 volts or voltage > 4.7 volts
TP B circuit continuity - voltage < 0.32 volts or voltage > 4.95 volts
TP A Range/performance – modeled airflow/actual airflow disagree > 35%
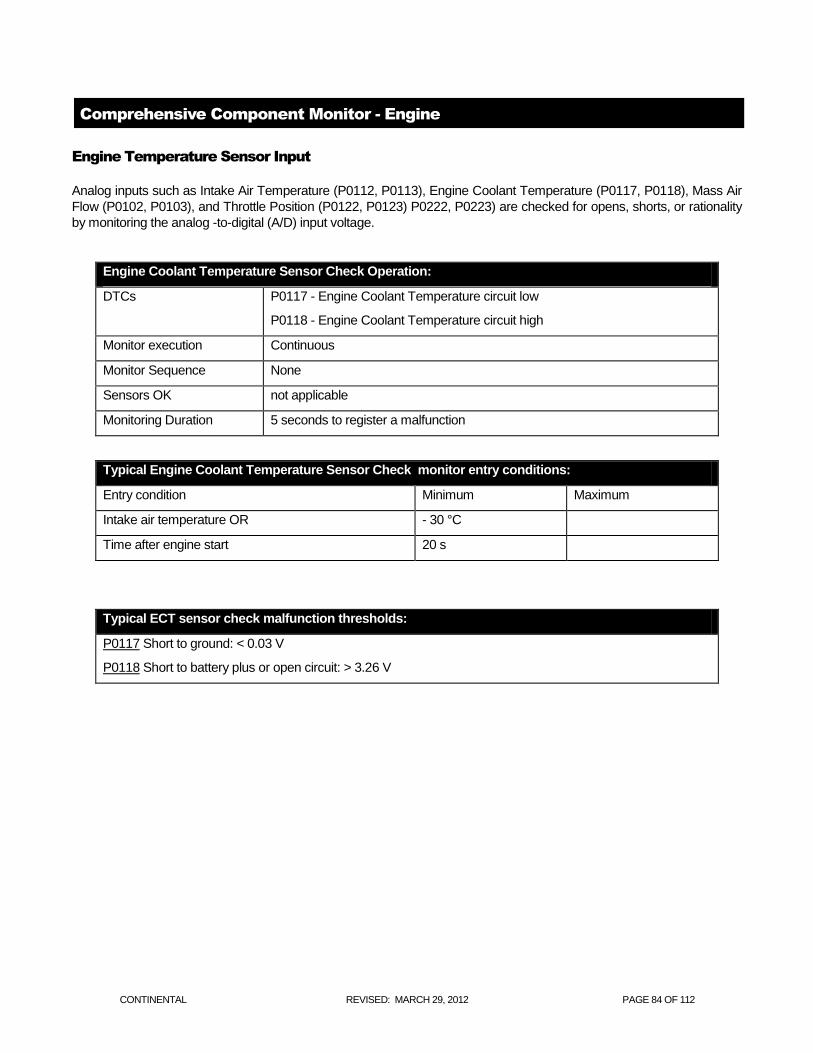
CONTINENTAL REVISED: MARCH 29, 2012 PAGE 84 OF 112
Comprehensive Component Monitor - Engine
Engine Temperature Sensor Input
Analog inputs such as Intake Air Temperature (P0112, P0113), Engine Coolant Temperature (P0117, P0118), Mass Air
Flow (P0102, P0103), and Throttle Position (P0122, P0123) P0222, P0223) are checked for opens, shorts, or rationality
by monitoring the analog -to-digital (A/D) input voltage.
Engine Coolant Temperature Sensor Check Operation:
DTCs P0117 - Engine Coolant Temperature circuit low
P0118 - Engine Coolant Temperature circuit high
Monitor execution Continuous
Monitor Sequence None
Sensors OK not applicable
Monitoring Duration 5 seconds to register a malfunction
Typical Engine Coolant Temperature Sensor Check monitor entry conditions:
Entry condition Minimum Maximum
Intake air temperature OR - 30 °C
Time after engine start 20 s
Typical ECT sensor check malfunction thresholds:
P0117 Short to ground: < 0.03 V
P0118 Short to battery plus or open circuit: > 3.26 V
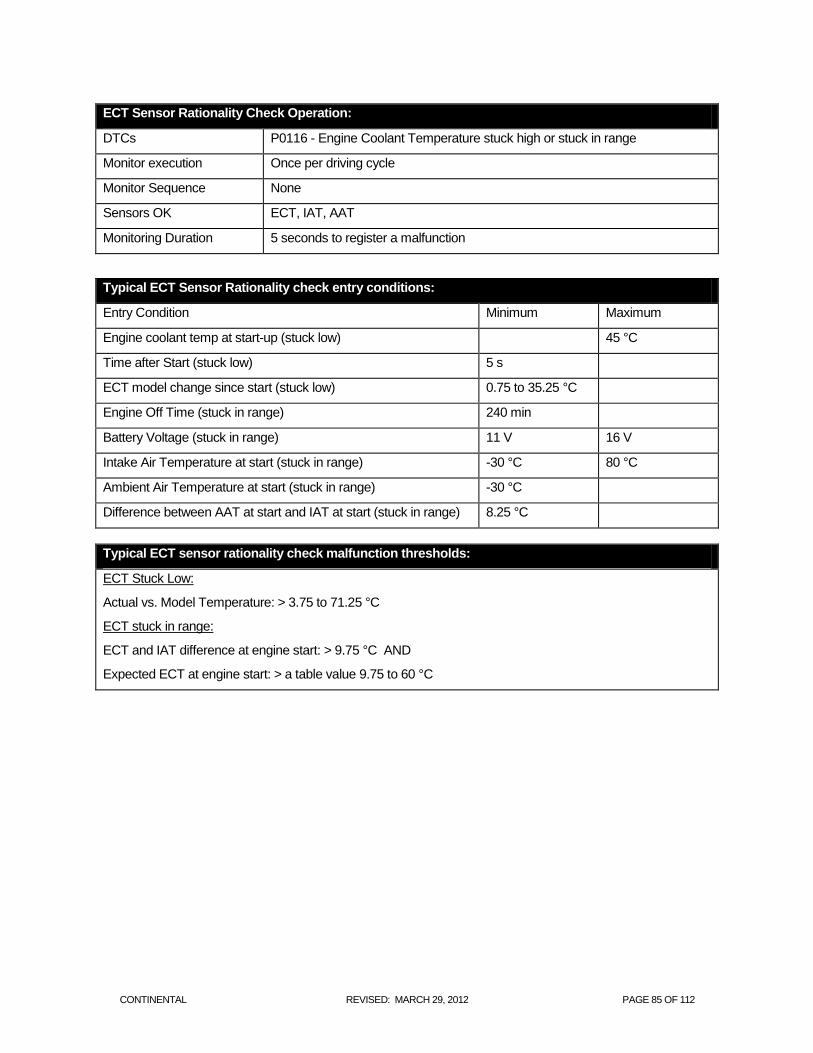
CONTINENTAL REVISED: MARCH 29, 2012 PAGE 85 OF 112
ECT Sensor Rationality Check Operation:
DTCs P0116 - Engine Coolant Temperature stuck high or stuck in range
Monitor execution Once per driving cycle
Monitor Sequence None
Sensors OK ECT, IAT, AAT
Monitoring Duration 5 seconds to register a malfunction
Typical ECT Sensor Rationality check entry conditions:
Entry Condition Minimum Maximum
Engine coolant temp at start-up (stuck low) 45 °C
Time after Start (stuck low) 5 s
ECT model change since start (stuck low) 0.75 to 35.25 °C
Engine Off Time (stuck in range) 240 min
Battery Voltage (stuck in range) 11 V 16 V
Intake Air Temperature at start (stuck in range) -30 °C 80 °C
Ambient Air Temperature at start (stuck in range) -30 °C
Difference between AAT at start and IAT at start (stuck in range) 8.25 °C
Typical ECT sensor rationality check malfunction thresholds:
ECT Stuck Low:
Actual vs. Model Temperature: > 3.75 to 71.25 °C
ECT stuck in range:
ECT and IAT difference at engine start: > 9.75 °C AND
Expected ECT at engine start: > a table value 9.75 to 60 °C
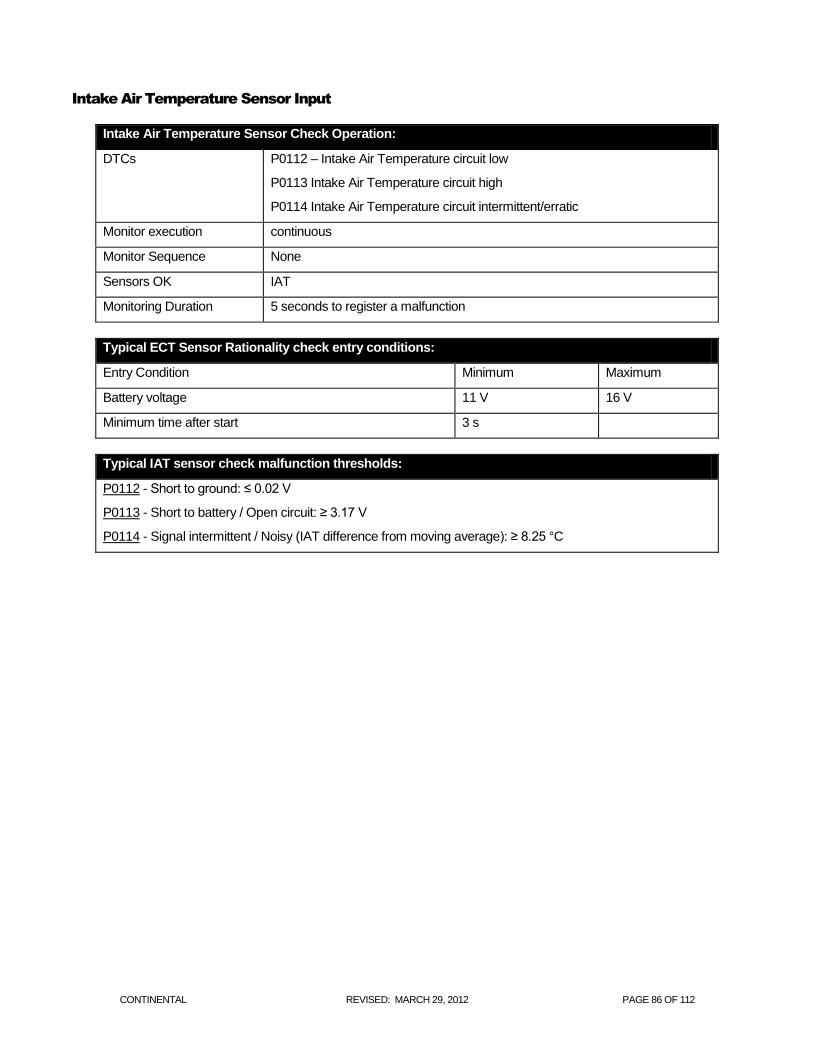
CONTINENTAL REVISED: MARCH 29, 2012 PAGE 86 OF 112
Intake Air Temperature Sensor Input
Intake Air Temperature Sensor Check Operation:
DTCs P0112 – Intake Air Temperature circuit low
P0113 Intake Air Temperature circuit high
P0114 Intake Air Temperature circuit intermittent/erratic
Monitor execution continuous
Monitor Sequence None
Sensors OK IAT
Monitoring Duration 5 seconds to register a malfunction
Typical ECT Sensor Rationality check entry conditions:
Entry Condition Minimum Maximum
Battery voltage 11 V 16 V
Minimum time after start 3 s
Typical IAT sensor check malfunction thresholds:
P0112 - Short to ground: ≤ 0.02 V
P0113 - Short to battery / Open circuit: ≥ 3.17 V
P0114 - Signal intermittent / Noisy (IAT difference from moving average): ≥ 8.25 °C
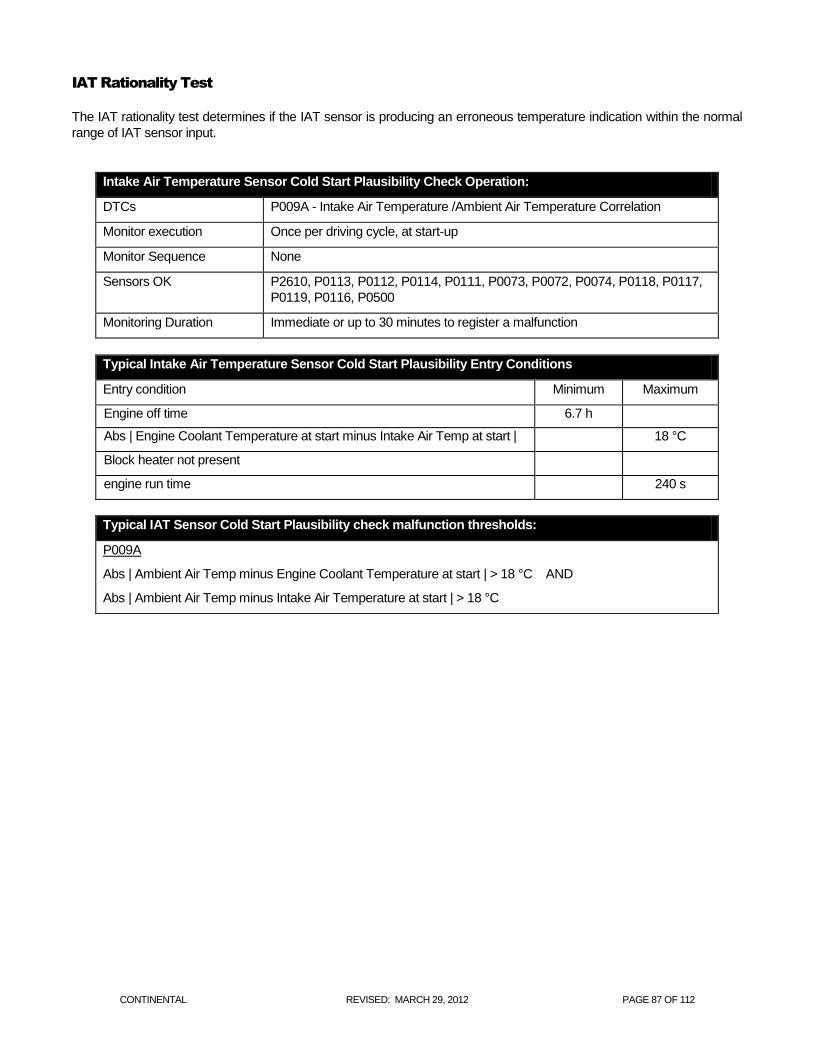
CONTINENTAL REVISED: MARCH 29, 2012 PAGE 87 OF 112
IAT Rationality Test
The IAT rationality test determines if the IAT sensor is producing an erroneous temperature indication within the normal
range of IAT sensor input.
Intake Air Temperature Sensor Cold Start Plausibility Check Operation:
DTCs P009A - Intake Air Temperature /Ambient Air Temperature Correlation
Monitor execution Once per driving cycle, at start-up
Monitor Sequence None
Sensors OK P2610, P0113, P0112, P0114, P0111, P0073, P0072, P0074, P0118, P0117,
P0119, P0116, P0500
Monitoring Duration Immediate or up to 30 minutes to register a malfunction
Typical Intake Air Temperature Sensor Cold Start Plausibility Entry Conditions
Entry condition Minimum Maximum
Engine off time 6.7 h
Abs | Engine Coolant Temperature at start minus Intake Air Temp at start | 18 °C
Block heater not present
engine run time 240 s
Typical IAT Sensor Cold Start Plausibility check malfunction thresholds:
P009A
Abs | Ambient Air Temp minus Engine Coolant Temperature at start | > 18 °C AND
Abs | Ambient Air Temp minus Intake Air Temperature at start | > 18 °C
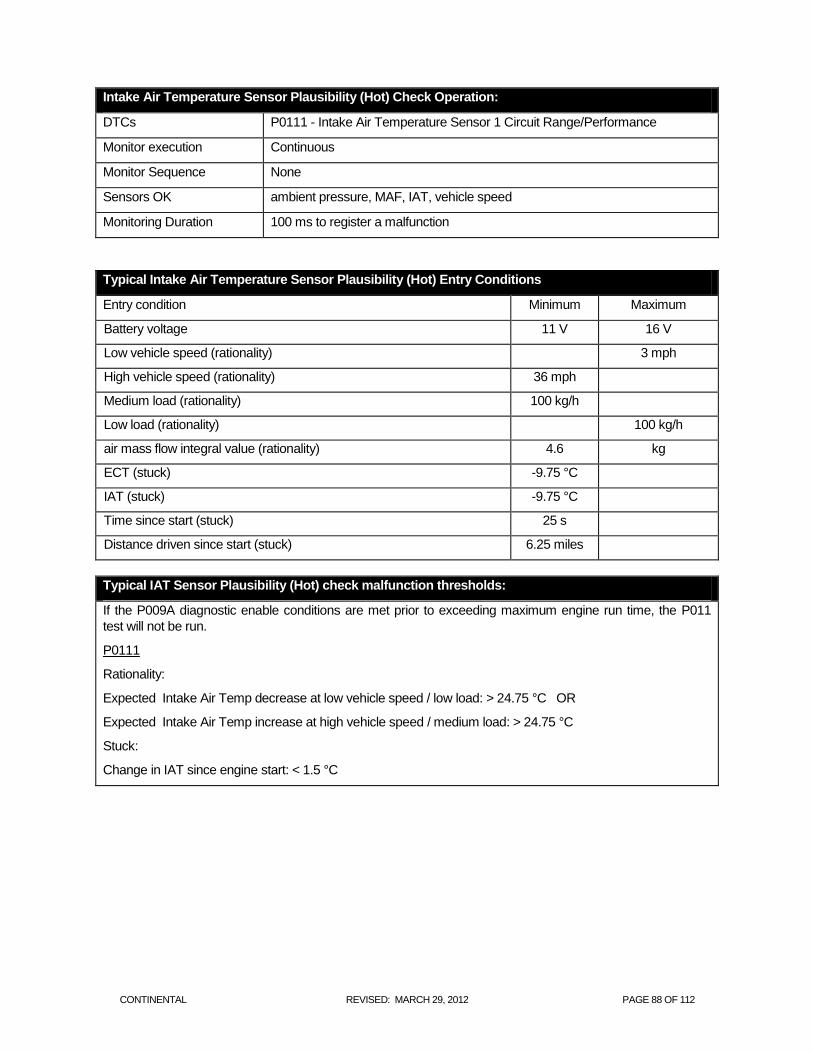
CONTINENTAL REVISED: MARCH 29, 2012 PAGE 88 OF 112
Intake Air Temperature Sensor Plausibility (Hot) Check Operation:
DTCs P0111 - Intake Air Temperature Sensor 1 Circuit Range/Performance
Monitor execution Continuous
Monitor Sequence None
Sensors OK ambient pressure, MAF, IAT, vehicle speed
Monitoring Duration 100 ms to register a malfunction
Typical Intake Air Temperature Sensor Plausibility (Hot) Entry Conditions
Entry condition Minimum Maximum
Battery voltage 11 V 16 V
Low vehicle speed (rationality) 3 mph
High vehicle speed (rationality) 36 mph
Medium load (rationality) 100 kg/h
Low load (rationality) 100 kg/h
air mass flow integral value (rationality) 4.6 kg
ECT (stuck) -9.75 °C
IAT (stuck) -9.75 °C
Time since start (stuck) 25 s
Distance driven since start (stuck) 6.25 miles
Typical IAT Sensor Plausibility (Hot) check malfunction thresholds:
If the P009A diagnostic enable conditions are met prior to exceeding maximum engine run time, the P011
test will not be run.
P0111
Rationality:
Expected Intake Air Temp decrease at low vehicle speed / low load: > 24.75 °C OR
Expected Intake Air Temp increase at high vehicle speed / medium load: > 24.75 °C
Stuck:
Change in IAT since engine start: < 1.5 °C
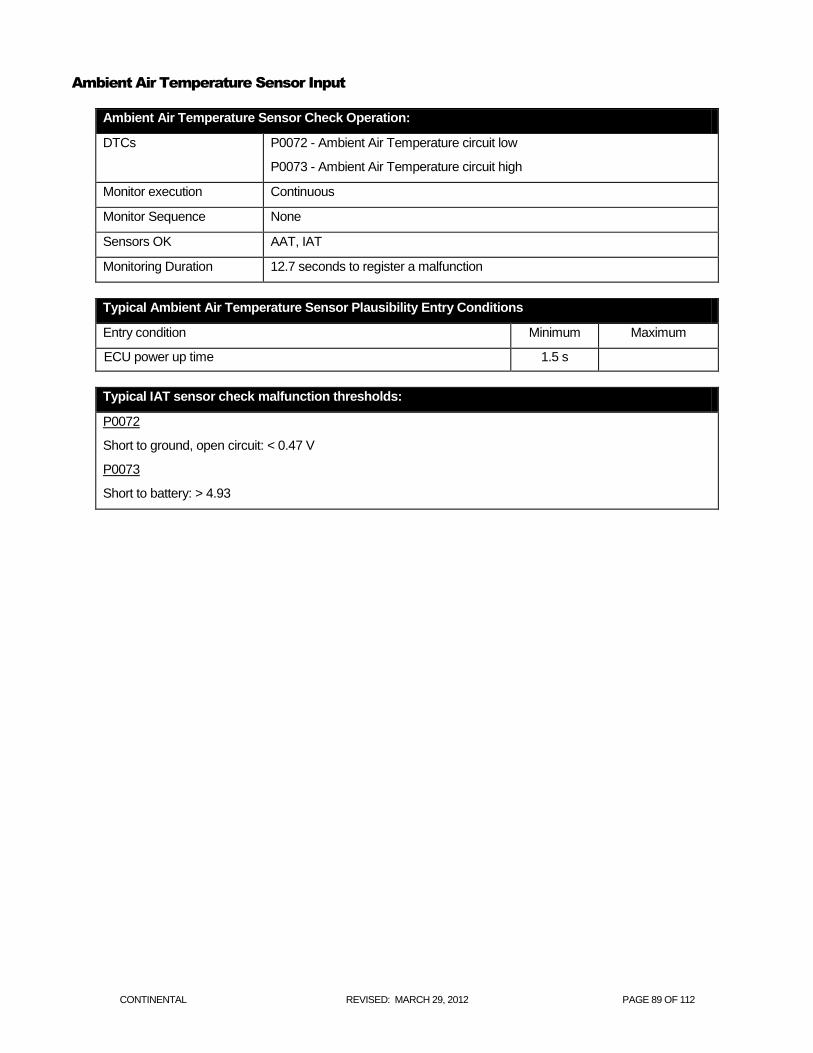
CONTINENTAL REVISED: MARCH 29, 2012 PAGE 89 OF 112
Ambient Air Temperature Sensor Input
Ambient Air Temperature Sensor Check Operation:
DTCs P0072 - Ambient Air Temperature circuit low
P0073 - Ambient Air Temperature circuit high
Monitor execution Continuous
Monitor Sequence None
Sensors OK AAT, IAT
Monitoring Duration 12.7 seconds to register a malfunction
Typical Ambient Air Temperature Sensor Plausibility Entry Conditions
Entry condition Minimum Maximum
ECU power up time 1.5 s
Typical IAT sensor check malfunction thresholds:
P0072
Short to ground, open circuit: < 0.47 V
P0073
Short to battery: > 4.93
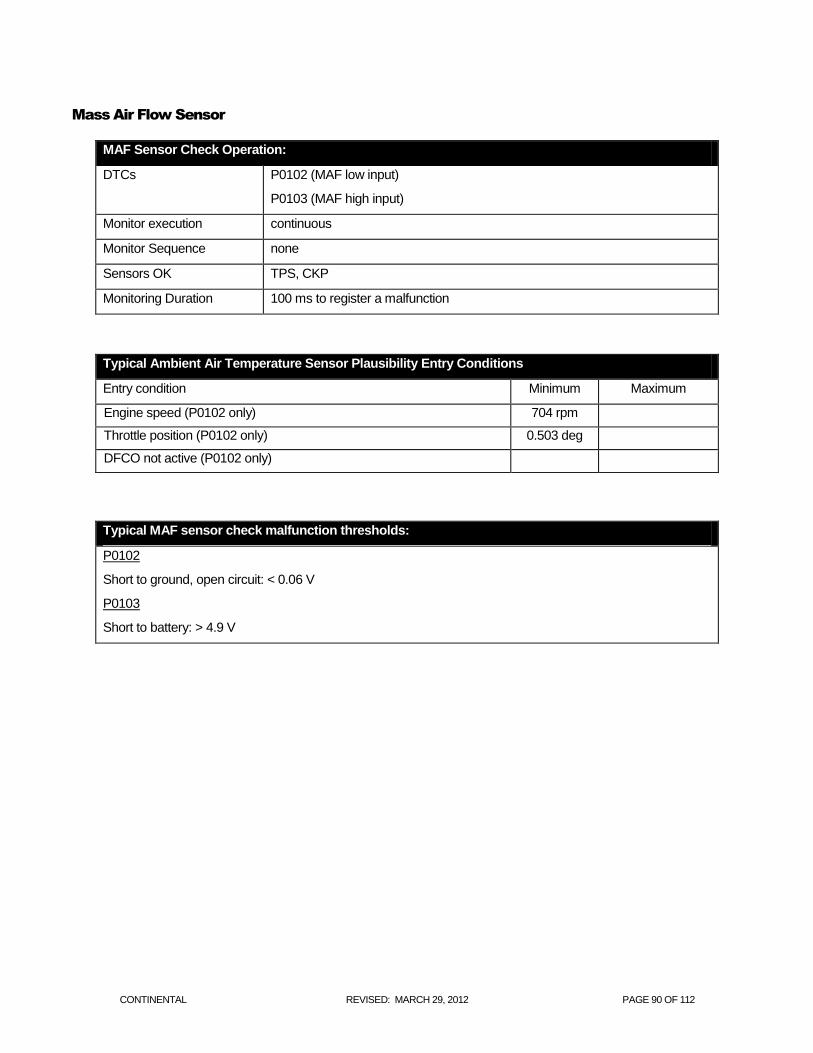
CONTINENTAL REVISED: MARCH 29, 2012 PAGE 90 OF 112
Mass Air Flow Sensor
MAF Sensor Check Operation:
DTCs P0102 (MAF low input)
P0103 (MAF high input)
Monitor execution continuous
Monitor Sequence none
Sensors OK TPS, CKP
Monitoring Duration 100 ms to register a malfunction
Typical Ambient Air Temperature Sensor Plausibility Entry Conditions
Entry condition Minimum Maximum
Engine speed (P0102 only) 704 rpm
Throttle position (P0102 only) 0.503 deg
DFCO not active (P0102 only)
Typical MAF sensor check malfunction thresholds:
P0102
Short to ground, open circuit: < 0.06 V
P0103
Short to battery: > 4.9 V
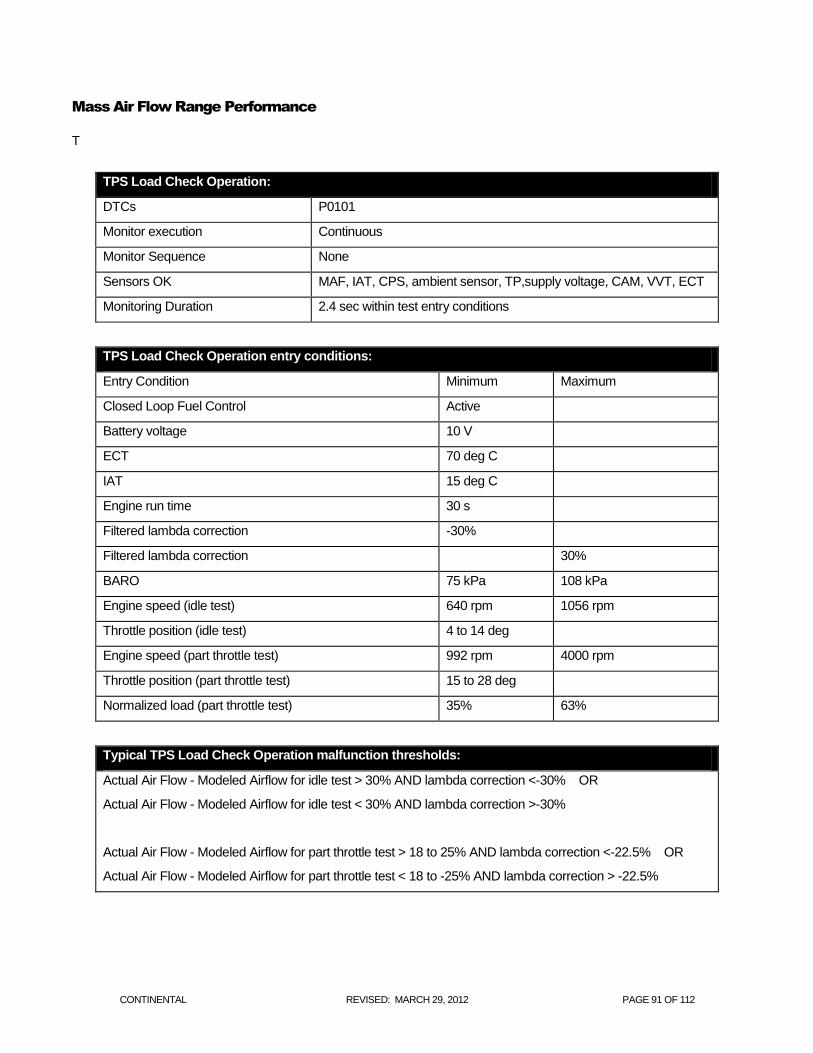
CONTINENTAL REVISED: MARCH 29, 2012 PAGE 91 OF 112
Mass Air Flow Range Performance
T
TPS Load Check Operation:
DTCs P0101
Monitor execution Continuous
Monitor Sequence None
Sensors OK MAF, IAT, CPS, ambient sensor, TP,supply voltage, CAM, VVT, ECT
Monitoring Duration 2.4 sec within test entry conditions
TPS Load Check Operation entry conditions:
Entry Condition Minimum Maximum
Closed Loop Fuel Control Active
Battery voltage 10 V
ECT 70 deg C
IAT 15 deg C
Engine run time 30 s
Filtered lambda correction -30%
Filtered lambda correction 30%
BARO 75 kPa 108 kPa
Engine speed (idle test) 640 rpm 1056 rpm
Throttle position (idle test) 4 to 14 deg
Engine speed (part throttle test) 992 rpm 4000 rpm
Throttle position (part throttle test) 15 to 28 deg
Normalized load (part throttle test) 35% 63%
Typical TPS Load Check Operation malfunction thresholds:
Actual Air Flow - Modeled Airflow for idle test > 30% AND lambda correction <-30% OR
Actual Air Flow - Modeled Airflow for idle test < 30% AND lambda correction >-30%
Actual Air Flow - Modeled Airflow for part throttle test > 18 to 25% AND lambda correction <-22.5% OR
Actual Air Flow - Modeled Airflow for part throttle test < 18 to -25% AND lambda correction > -22.5%
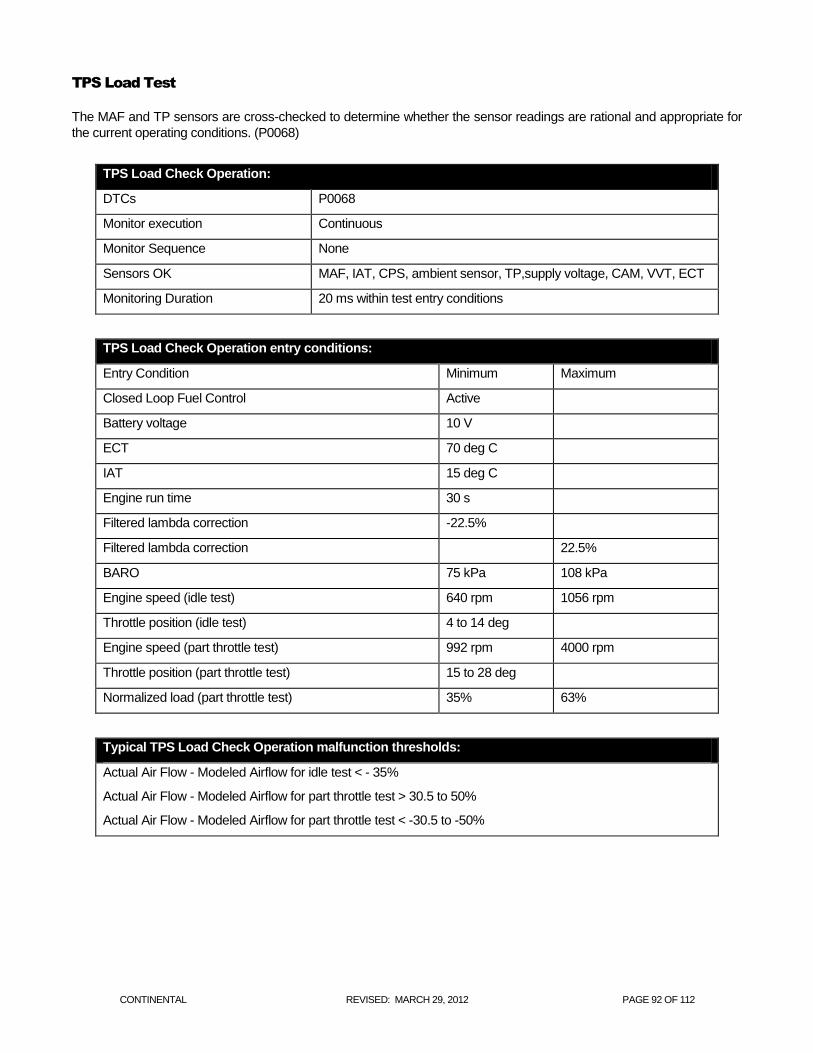
CONTINENTAL REVISED: MARCH 29, 2012 PAGE 92 OF 112
TPS Load Test
The MAF and TP sensors are cross-checked to determine whether the sensor readings are rational and appropriate for
the current operating conditions. (P0068)
TPS Load Check Operation:
DTCs P0068
Monitor execution Continuous
Monitor Sequence None
Sensors OK MAF, IAT, CPS, ambient sensor, TP,supply voltage, CAM, VVT, ECT
Monitoring Duration 20 ms within test entry conditions
TPS Load Check Operation entry conditions:
Entry Condition Minimum Maximum
Closed Loop Fuel Control Active
Battery voltage 10 V
ECT 70 deg C
IAT 15 deg C
Engine run time 30 s
Filtered lambda correction -22.5%
Filtered lambda correction 22.5%
BARO 75 kPa 108 kPa
Engine speed (idle test) 640 rpm 1056 rpm
Throttle position (idle test) 4 to 14 deg
Engine speed (part throttle test) 992 rpm 4000 rpm
Throttle position (part throttle test) 15 to 28 deg
Normalized load (part throttle test) 35% 63%
Typical TPS Load Check Operation malfunction thresholds:
Actual Air Flow - Modeled Airflow for idle test < - 35%
Actual Air Flow - Modeled Airflow for part throttle test > 30.5 to 50%
Actual Air Flow - Modeled Airflow for part throttle test < -30.5 to -50%
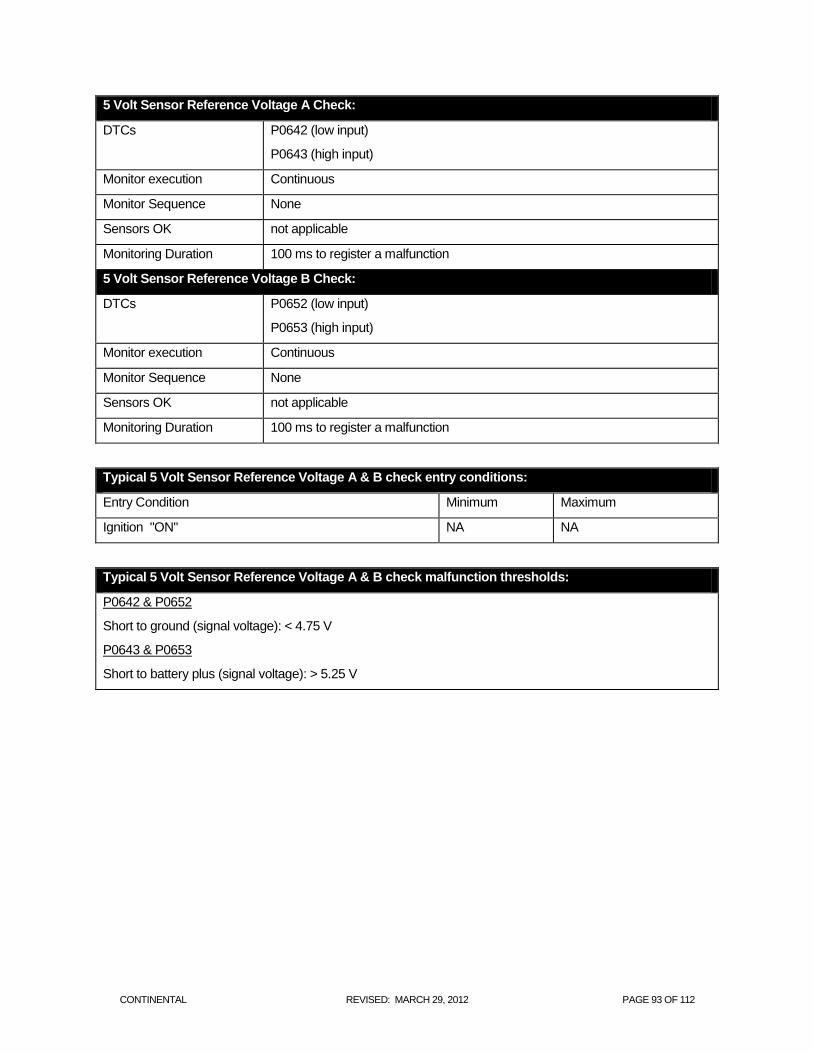
CONTINENTAL REVISED: MARCH 29, 2012 PAGE 93 OF 112
5 Volt Sensor Reference Voltage A Check:
DTCs P0642 (low input)
P0643 (high input)
Monitor execution Continuous
Monitor Sequence None
Sensors OK not applicable
Monitoring Duration 100 ms to register a malfunction
5 Volt Sensor Reference Voltage B Check:
DTCs P0652 (low input)
P0653 (high input)
Monitor execution Continuous
Monitor Sequence None
Sensors OK not applicable
Monitoring Duration 100 ms to register a malfunction
Typical 5 Volt Sensor Reference Voltage A & B check entry conditions:
Entry Condition Minimum Maximum
Ignition "ON" NA NA
Typical 5 Volt Sensor Reference Voltage A & B check malfunction thresholds:
P0642 & P0652
Short to ground (signal voltage): < 4.75 V
P0643 & P0653
Short to battery plus (signal voltage): > 5.25 V
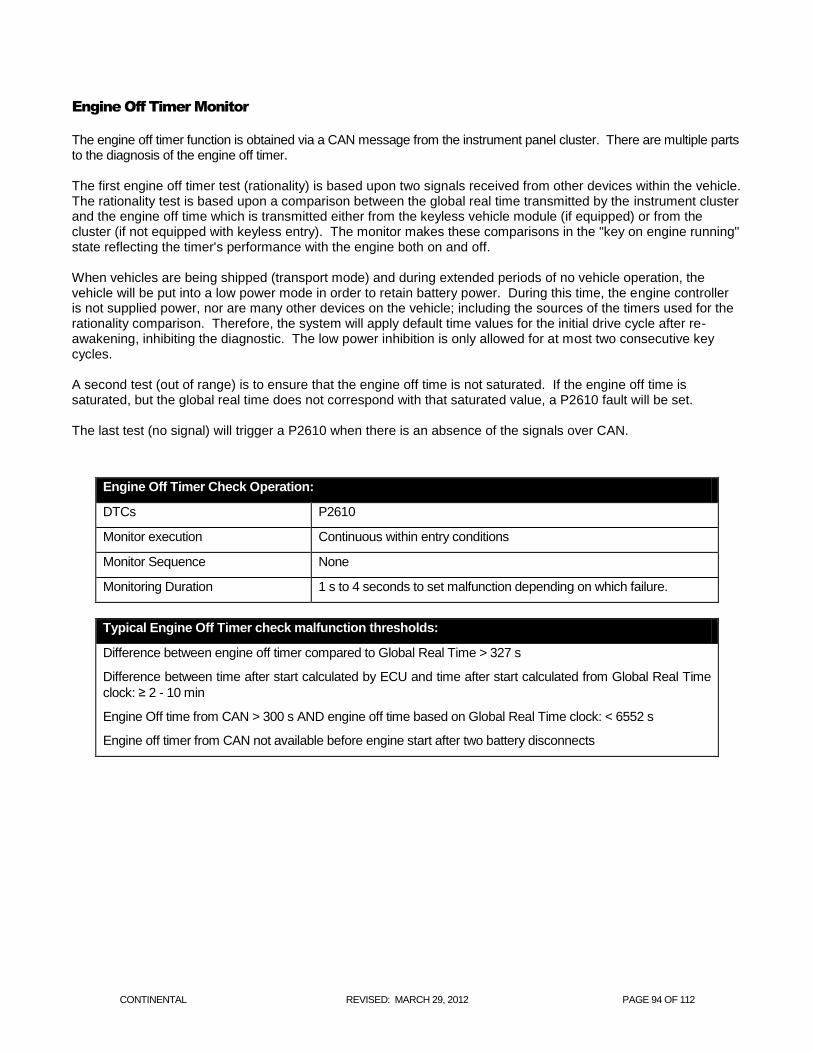
CONTINENTAL REVISED: MARCH 29, 2012 PAGE 94 OF 112
Engine Off Timer Monitor
The engine off timer function is obtained via a CAN message from the instrument panel cluster. There are multiple parts to the diagnosis of the engine off timer. The first engine off timer test (rationality) is based upon two signals received from other devices within the vehicle. The rationality test is based upon a comparison between the global real time transmitted by the instrument cluster and the engine off time which is transmitted either from the keyless vehicle module (if equipped) or from the cluster (if not equipped with keyless entry). The monitor makes these comparisons in the "key on engine running" state reflecting the timer's performance with the engine both on and off. When vehicles are being shipped (transport mode) and during extended periods of no vehicle operation, the vehicle will be put into a low power mode in order to retain battery power. During this time, the engine controller is not supplied power, nor are many other devices on the vehicle; including the sources of the timers used for the rationality comparison. Therefore, the system will apply default time values for the initial drive cycle after re-awakening, inhibiting the diagnostic. The low power inhibition is only allowed for at most two consecutive key cycles. A second test (out of range) is to ensure that the engine off time is not saturated. If the engine off time is saturated, but the global real time does not correspond with that saturated value, a P2610 fault will be set. The last test (no signal) will trigger a P2610 when there is an absence of the signals over CAN.
Engine Off Timer Check Operation:
DTCs P2610
Monitor execution Continuous within entry conditions
Monitor Sequence None
Monitoring Duration 1 s to 4 seconds to set malfunction depending on which failure.
Typical Engine Off Timer check malfunction thresholds:
Difference between engine off timer compared to Global Real Time > 327 s
Difference between time after start calculated by ECU and time after start calculated from Global Real Time
clock: ≥ 2 - 10 min
Engine Off time from CAN > 300 s AND engine off time based on Global Real Time clock: < 6552 s
Engine off timer from CAN not available before engine start after two battery disconnects
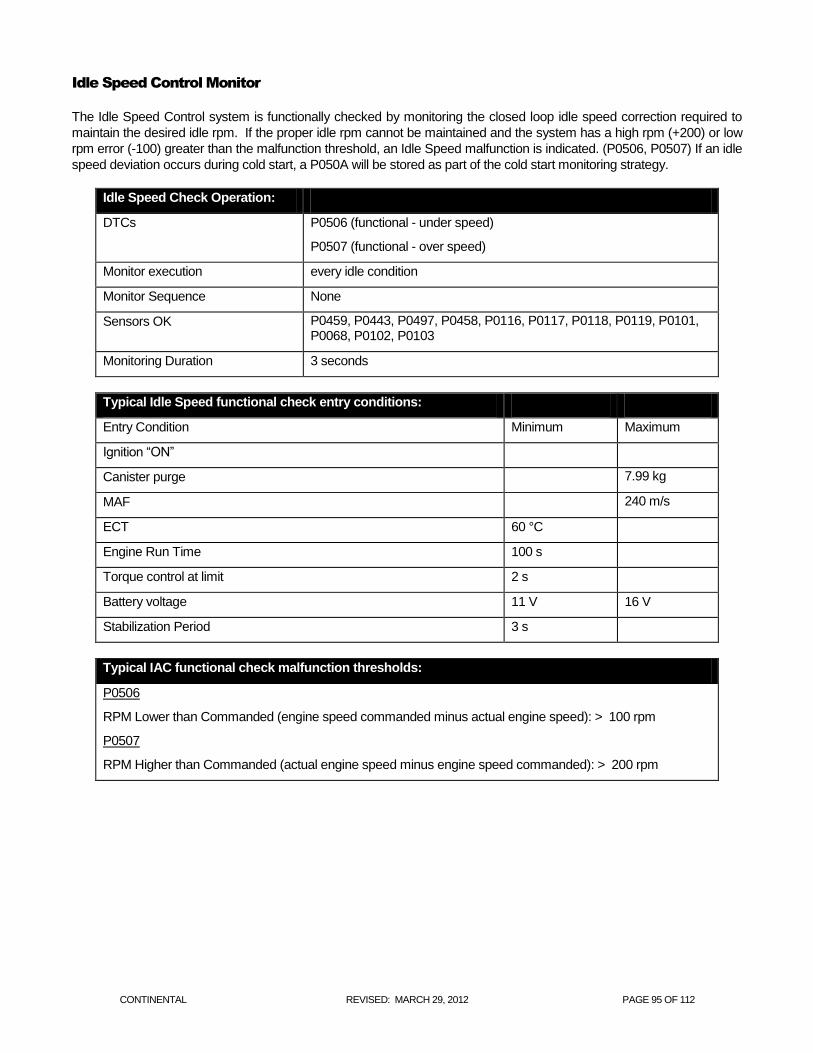
CONTINENTAL REVISED: MARCH 29, 2012 PAGE 95 OF 112
Idle Speed Control Monitor
The Idle Speed Control system is functionally checked by monitoring the closed loop idle speed correction required to
maintain the desired idle rpm. If the proper idle rpm cannot be maintained and the system has a high rpm (+200) or low
rpm error (-100) greater than the malfunction threshold, an Idle Speed malfunction is indicated. (P0506, P0507) If an idle
speed deviation occurs during cold start, a P050A will be stored as part of the cold start monitoring strategy.
Idle Speed Check Operation:
DTCs P0506 (functional - under speed)
P0507 (functional - over speed)
Monitor execution every idle condition
Monitor Sequence None
Sensors OK P0459, P0443, P0497, P0458, P0116, P0117, P0118, P0119, P0101, P0068, P0102, P0103
Monitoring Duration 3 seconds
Typical Idle Speed functional check entry conditions:
Entry Condition Minimum Maximum
Ignition “ON”
Canister purge 7.99 kg
MAF 240 m/s
ECT 60 °C
Engine Run Time 100 s
Torque control at limit 2 s
Battery voltage 11 V 16 V
Stabilization Period 3 s
Typical IAC functional check malfunction thresholds:
P0506
RPM Lower than Commanded (engine speed commanded minus actual engine speed): > 100 rpm
P0507
RPM Higher than Commanded (actual engine speed minus engine speed commanded): > 200 rpm
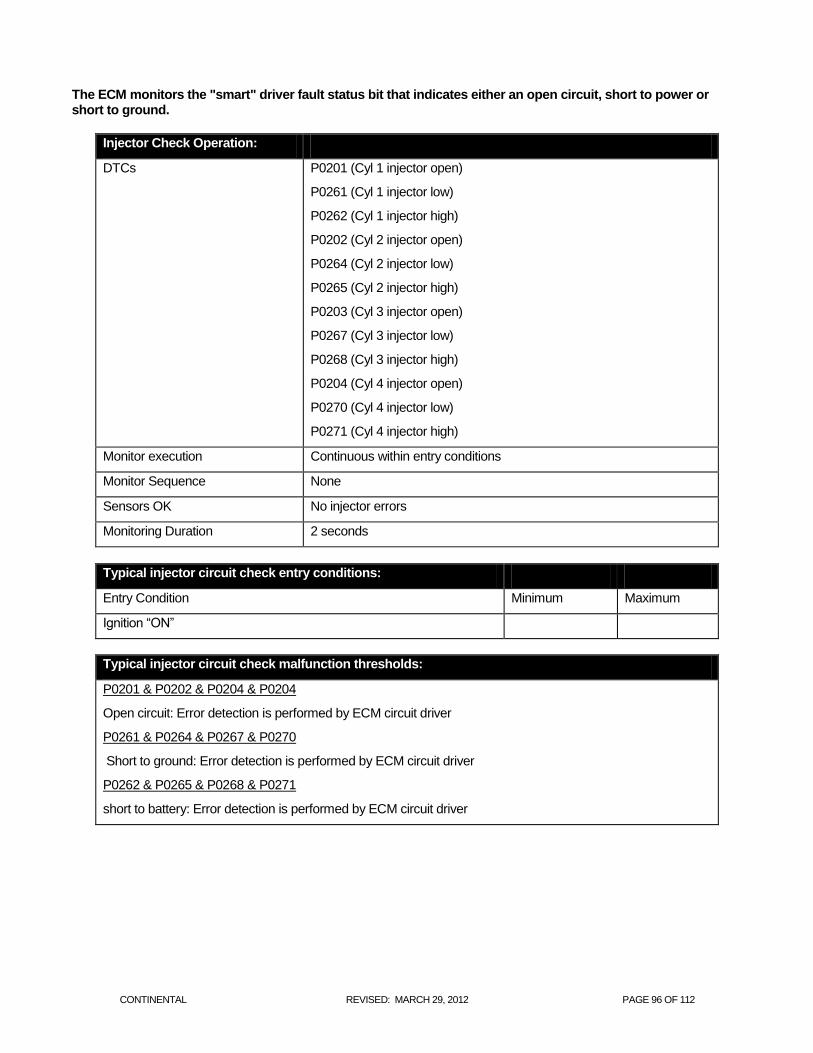
CONTINENTAL REVISED: MARCH 29, 2012 PAGE 96 OF 112
The ECM monitors the "smart" driver fault status bit that indicates either an open circuit, short to power or short to ground.
Injector Check Operation:
DTCs P0201 (Cyl 1 injector open)
P0261 (Cyl 1 injector low)
P0262 (Cyl 1 injector high)
P0202 (Cyl 2 injector open)
P0264 (Cyl 2 injector low)
P0265 (Cyl 2 injector high)
P0203 (Cyl 3 injector open)
P0267 (Cyl 3 injector low)
P0268 (Cyl 3 injector high)
P0204 (Cyl 4 injector open)
P0270 (Cyl 4 injector low)
P0271 (Cyl 4 injector high)
Monitor execution Continuous within entry conditions
Monitor Sequence None
Sensors OK No injector errors
Monitoring Duration 2 seconds
Typical injector circuit check entry conditions:
Entry Condition Minimum Maximum
Ignition “ON”
Typical injector circuit check malfunction thresholds:
P0201 & P0202 & P0204 & P0204
Open circuit: Error detection is performed by ECM circuit driver
P0261 & P0264 & P0267 & P0270
Short to ground: Error detection is performed by ECM circuit driver
P0262 & P0265 & P0268 & P0271
short to battery: Error detection is performed by ECM circuit driver
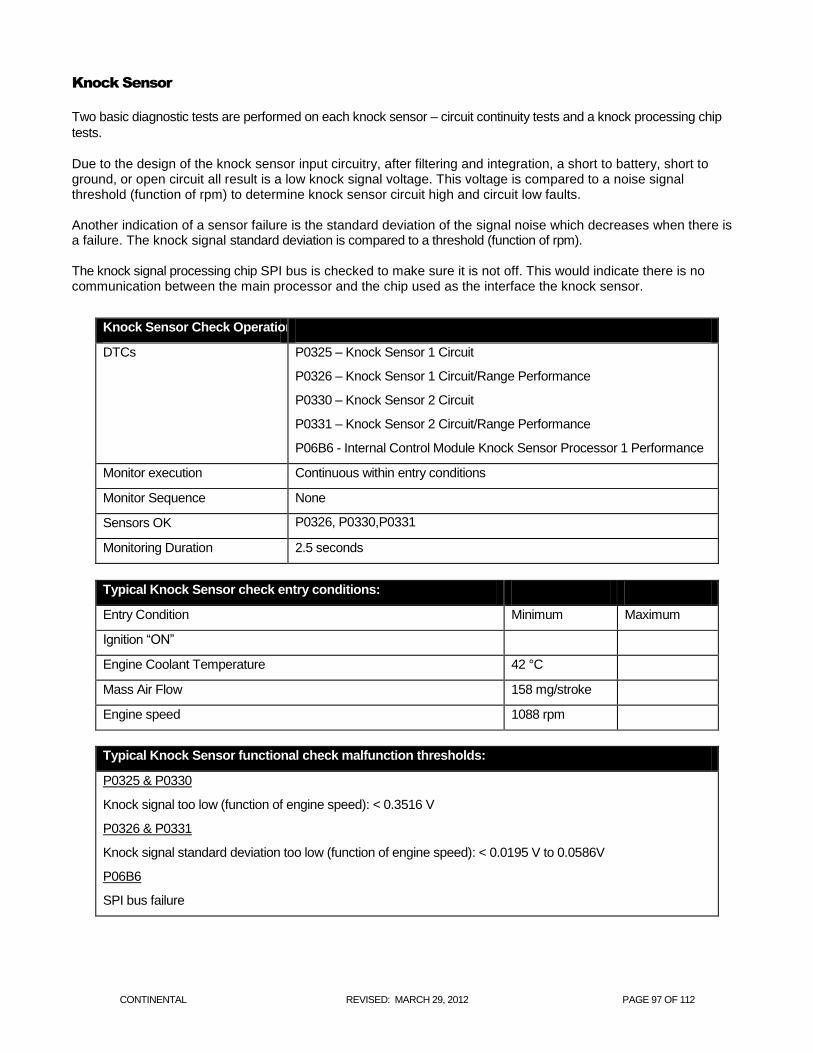
CONTINENTAL REVISED: MARCH 29, 2012 PAGE 97 OF 112
Knock Sensor
Two basic diagnostic tests are performed on each knock sensor – circuit continuity tests and a knock processing chip
tests.
Due to the design of the knock sensor input circuitry, after filtering and integration, a short to battery, short to ground, or open circuit all result is a low knock signal voltage. This voltage is compared to a noise signal threshold (function of rpm) to determine knock sensor circuit high and circuit low faults. Another indication of a sensor failure is the standard deviation of the signal noise which decreases when there is a failure. The knock signal standard deviation is compared to a threshold (function of rpm). The knock signal processing chip SPI bus is checked to make sure it is not off. This would indicate there is no communication between the main processor and the chip used as the interface the knock sensor.
Knock Sensor Check Operation:
DTCs P0325 – Knock Sensor 1 Circuit
P0326 – Knock Sensor 1 Circuit/Range Performance
P0330 – Knock Sensor 2 Circuit
P0331 – Knock Sensor 2 Circuit/Range Performance
P06B6 - Internal Control Module Knock Sensor Processor 1 Performance
Monitor execution Continuous within entry conditions
Monitor Sequence None
Sensors OK P0326, P0330,P0331
Monitoring Duration 2.5 seconds
Typical Knock Sensor check entry conditions:
Entry Condition Minimum Maximum
Ignition “ON”
Engine Coolant Temperature 42 °C
Mass Air Flow 158 mg/stroke
Engine speed 1088 rpm
Typical Knock Sensor functional check malfunction thresholds:
P0325 & P0330
Knock signal too low (function of engine speed): < 0.3516 V
P0326 & P0331
Knock signal standard deviation too low (function of engine speed): < 0.0195 V to 0.0586V
P06B6
SPI bus failure
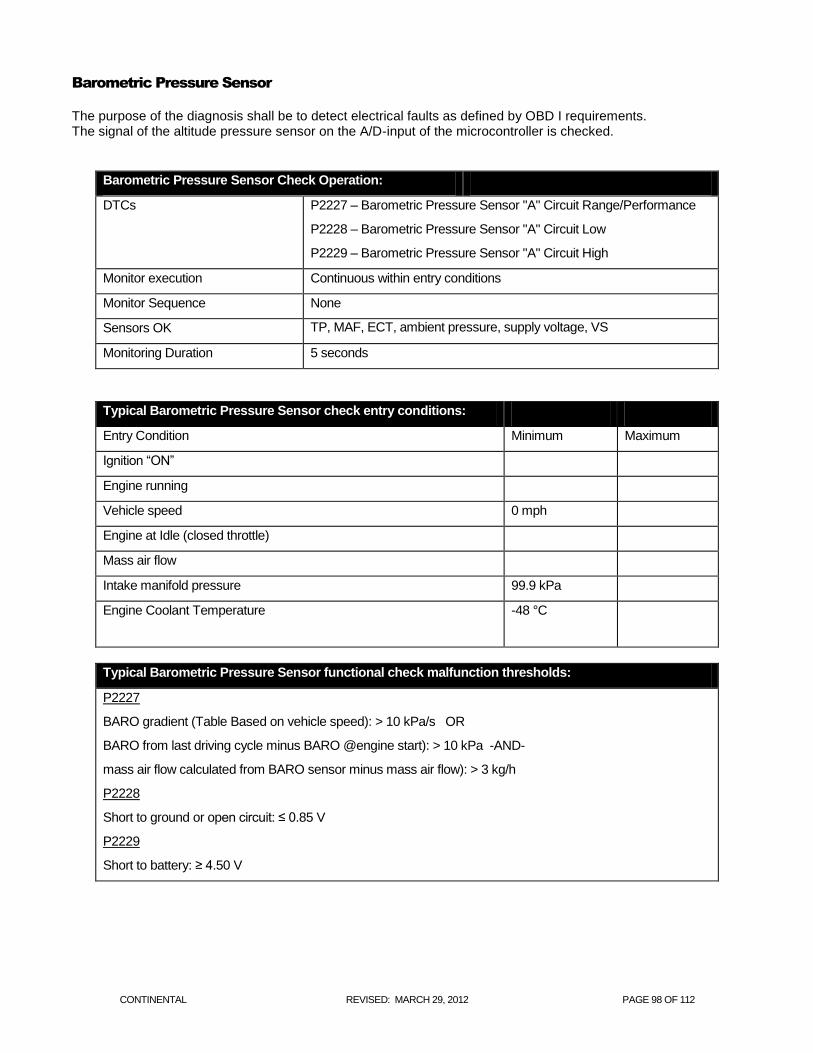
CONTINENTAL REVISED: MARCH 29, 2012 PAGE 98 OF 112
Barometric Pressure Sensor
The purpose of the diagnosis shall be to detect electrical faults as defined by OBD I requirements. The signal of the altitude pressure sensor on the A/D-input of the microcontroller is checked.
Barometric Pressure Sensor Check Operation:
DTCs P2227 – Barometric Pressure Sensor "A" Circuit Range/Performance
P2228 – Barometric Pressure Sensor "A" Circuit Low
P2229 – Barometric Pressure Sensor "A" Circuit High
Monitor execution Continuous within entry conditions
Monitor Sequence None
Sensors OK TP, MAF, ECT, ambient pressure, supply voltage, VS
Monitoring Duration 5 seconds
Typical Barometric Pressure Sensor check entry conditions:
Entry Condition Minimum Maximum
Ignition “ON”
Engine running
Vehicle speed 0 mph
Engine at Idle (closed throttle)
Mass air flow
Intake manifold pressure 99.9 kPa
Engine Coolant Temperature -48 °C
Typical Barometric Pressure Sensor functional check malfunction thresholds:
P2227
BARO gradient (Table Based on vehicle speed): > 10 kPa/s OR
BARO from last driving cycle minus BARO @engine start): > 10 kPa -AND-
mass air flow calculated from BARO sensor minus mass air flow): > 3 kg/h
P2228
Short to ground or open circuit: ≤ 0.85 V
P2229
Short to battery: ≥ 4.50 V
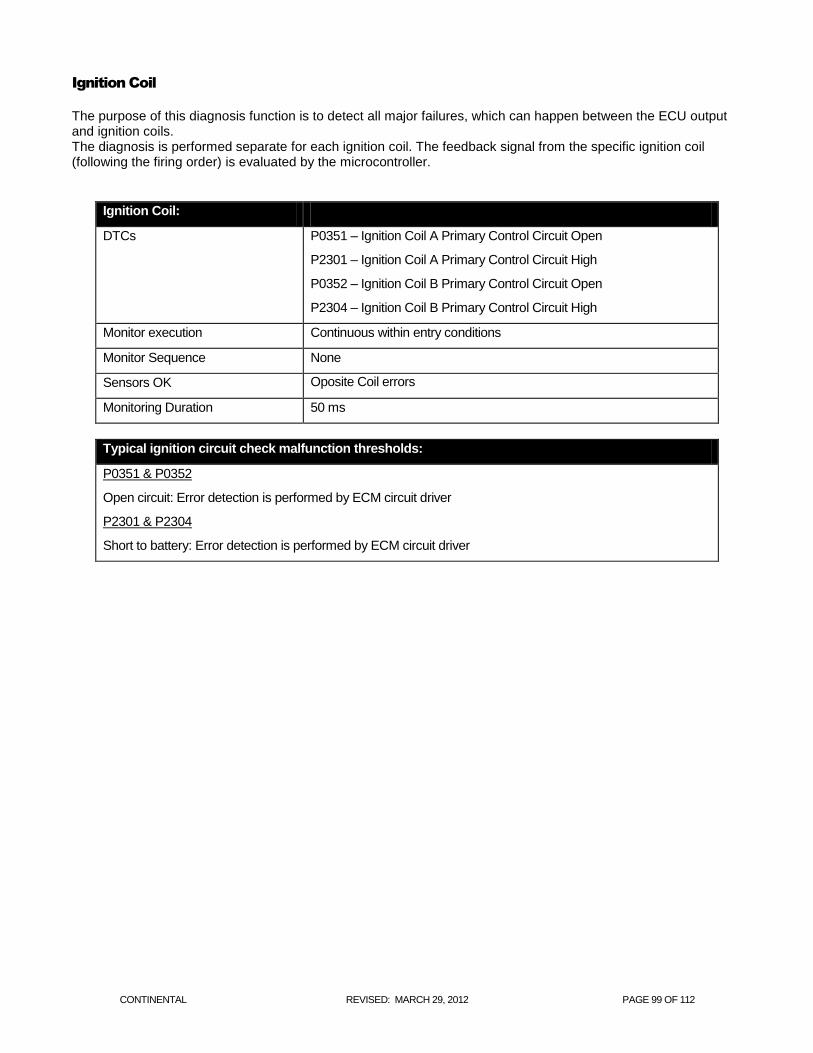
CONTINENTAL REVISED: MARCH 29, 2012 PAGE 99 OF 112
Ignition Coil
The purpose of this diagnosis function is to detect all major failures, which can happen between the ECU output and ignition coils. The diagnosis is performed separate for each ignition coil. The feedback signal from the specific ignition coil (following the firing order) is evaluated by the microcontroller.
Ignition Coil:
DTCs P0351 – Ignition Coil A Primary Control Circuit Open
P2301 – Ignition Coil A Primary Control Circuit High
P0352 – Ignition Coil B Primary Control Circuit Open
P2304 – Ignition Coil B Primary Control Circuit High
Monitor execution Continuous within entry conditions
Monitor Sequence None
Sensors OK Oposite Coil errors
Monitoring Duration 50 ms
Typical ignition circuit check malfunction thresholds:
P0351 & P0352
Open circuit: Error detection is performed by ECM circuit driver
P2301 & P2304
Short to battery: Error detection is performed by ECM circuit driver
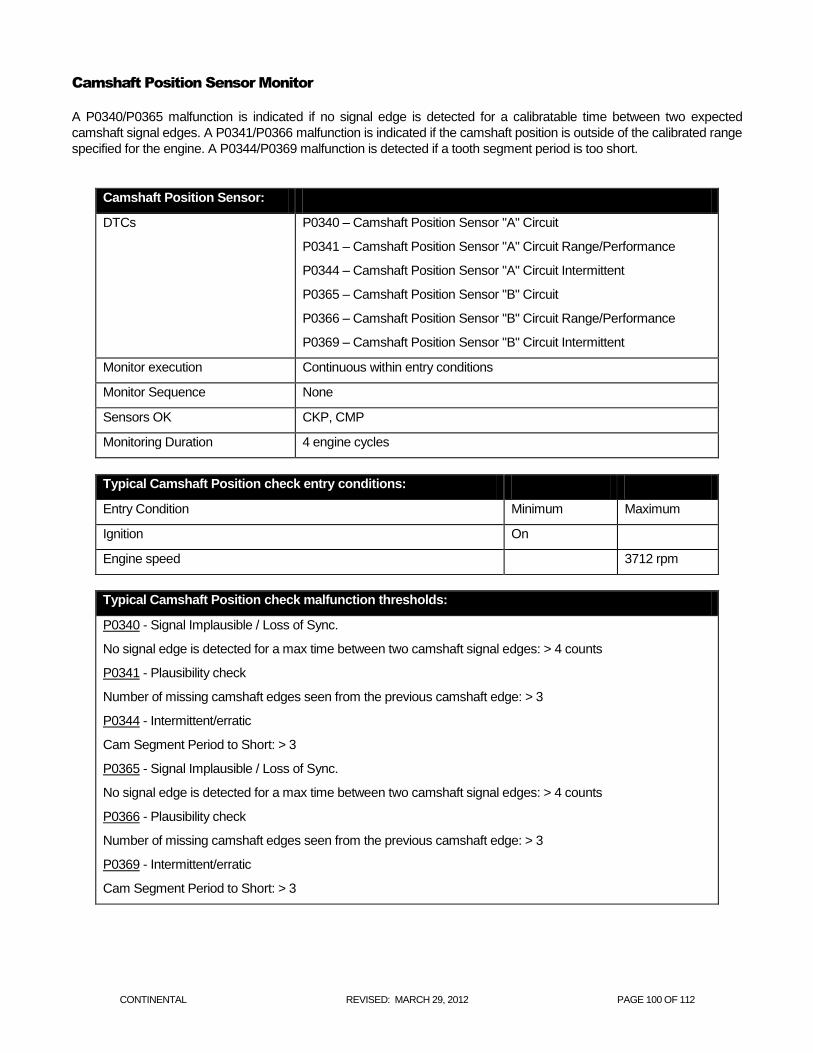
CONTINENTAL REVISED: MARCH 29, 2012 PAGE 100 OF 112
Camshaft Position Sensor Monitor
A P0340/P0365 malfunction is indicated if no signal edge is detected for a calibratable time between two expected
camshaft signal edges. A P0341/P0366 malfunction is indicated if the camshaft position is outside of the calibrated range
specified for the engine. A P0344/P0369 malfunction is detected if a tooth segment period is too short.
Camshaft Position Sensor:
DTCs P0340 – Camshaft Position Sensor "A" Circuit
P0341 – Camshaft Position Sensor "A" Circuit Range/Performance
P0344 – Camshaft Position Sensor "A" Circuit Intermittent
P0365 – Camshaft Position Sensor "B" Circuit
P0366 – Camshaft Position Sensor "B" Circuit Range/Performance
P0369 – Camshaft Position Sensor "B" Circuit Intermittent
Monitor execution Continuous within entry conditions
Monitor Sequence None
Sensors OK CKP, CMP
Monitoring Duration 4 engine cycles
Typical Camshaft Position check entry conditions:
Entry Condition Minimum Maximum
Ignition On
Engine speed 3712 rpm
Typical Camshaft Position check malfunction thresholds:
P0340 - Signal Implausible / Loss of Sync.
No signal edge is detected for a max time between two camshaft signal edges: > 4 counts
P0341 - Plausibility check
Number of missing camshaft edges seen from the previous camshaft edge: > 3
P0344 - Intermittent/erratic
Cam Segment Period to Short: > 3
P0365 - Signal Implausible / Loss of Sync.
No signal edge is detected for a max time between two camshaft signal edges: > 4 counts
P0366 - Plausibility check
Number of missing camshaft edges seen from the previous camshaft edge: > 3
P0369 - Intermittent/erratic
Cam Segment Period to Short: > 3
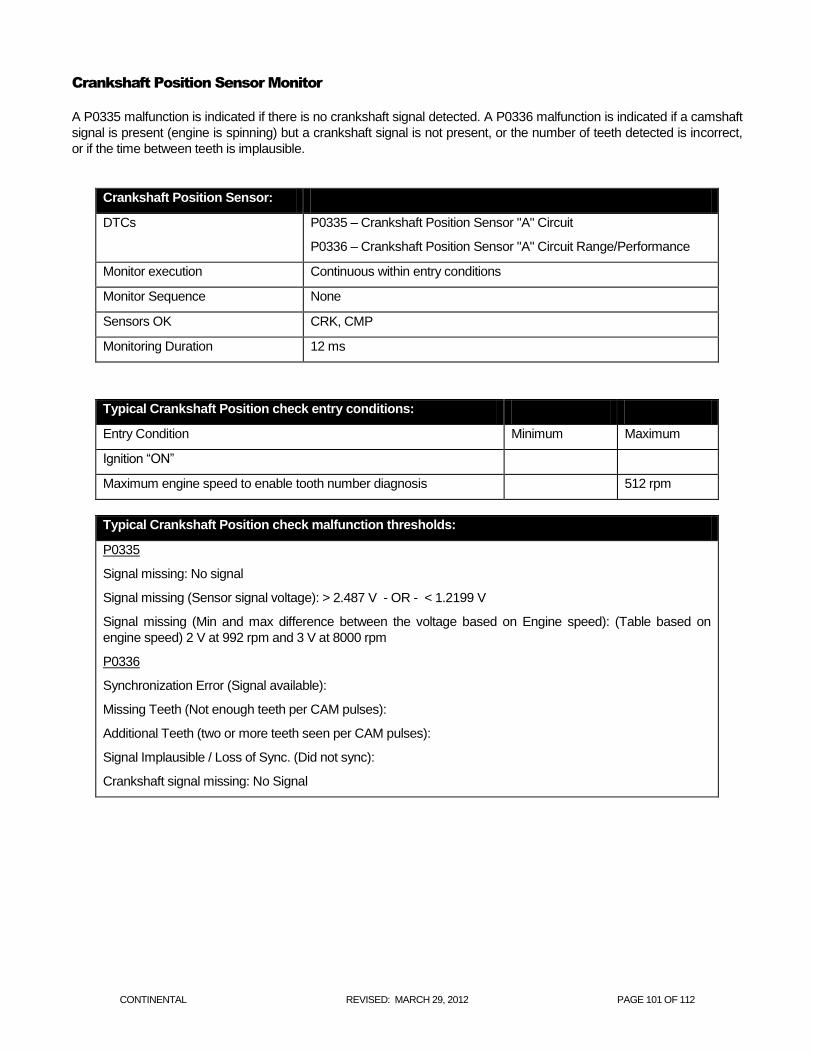
CONTINENTAL REVISED: MARCH 29, 2012 PAGE 101 OF 112
Crankshaft Position Sensor Monitor
A P0335 malfunction is indicated if there is no crankshaft signal detected. A P0336 malfunction is indicated if a camshaft
signal is present (engine is spinning) but a crankshaft signal is not present, or the number of teeth detected is incorrect,
or if the time between teeth is implausible.
Crankshaft Position Sensor:
DTCs P0335 – Crankshaft Position Sensor "A" Circuit
P0336 – Crankshaft Position Sensor "A" Circuit Range/Performance
Monitor execution Continuous within entry conditions
Monitor Sequence None
Sensors OK CRK, CMP
Monitoring Duration 12 ms
Typical Crankshaft Position check entry conditions:
Entry Condition Minimum Maximum
Ignition “ON”
Maximum engine speed to enable tooth number diagnosis 512 rpm
Typical Crankshaft Position check malfunction thresholds:
P0335
Signal missing: No signal
Signal missing (Sensor signal voltage): > 2.487 V - OR - < 1.2199 V
Signal missing (Min and max difference between the voltage based on Engine speed): (Table based on
engine speed) 2 V at 992 rpm and 3 V at 8000 rpm
P0336
Synchronization Error (Signal available):
Missing Teeth (Not enough teeth per CAM pulses):
Additional Teeth (two or more teeth seen per CAM pulses):
Signal Implausible / Loss of Sync. (Did not sync):
Crankshaft signal missing: No Signal

CONTINENTAL REVISED: MARCH 29, 2012 PAGE 102 OF 112
Miscellaneous CPU Tests
U0101 - Lost Communications With Transmission Control System (for vehicles with standalone TCM)
U0121 - Lost Communication With Anti-Lock Brake System (ABS) Control Module (for vehicles with manual trans)
U0423 - Invalid Data Received from Instrument Panel Cluster Control Module
U2012 - Car Configuration Parameter(s) - vehicle configuration not plausible
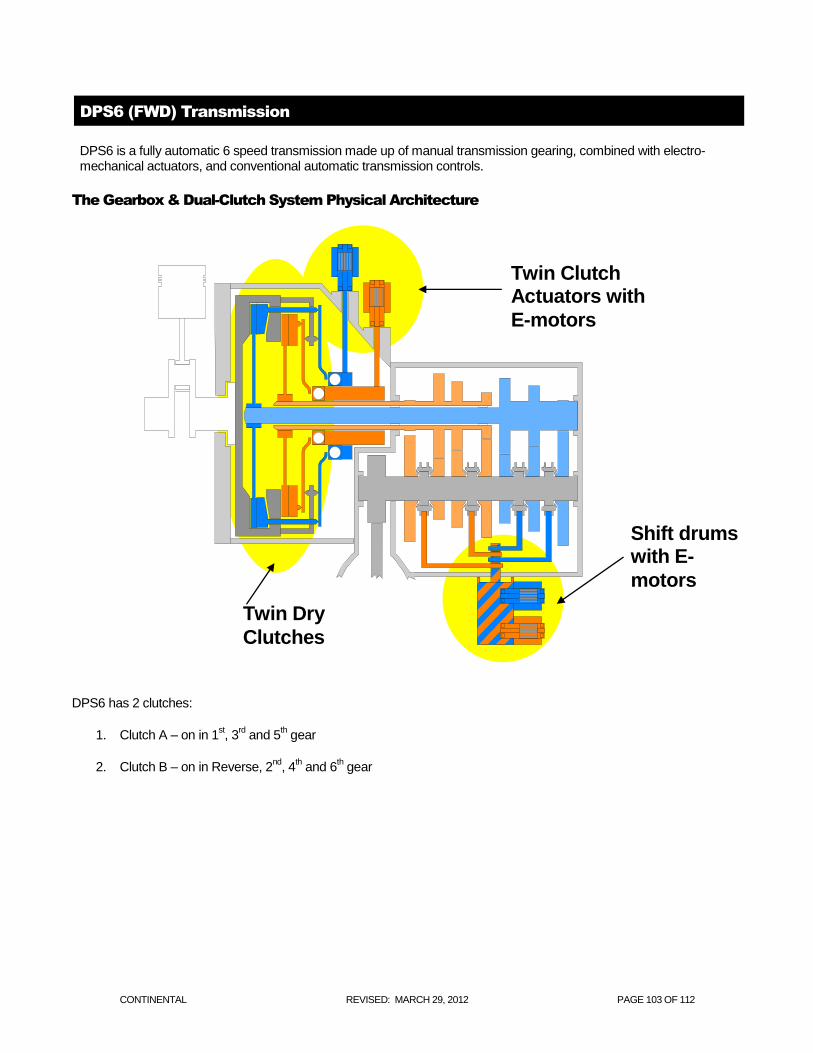
CONTINENTAL REVISED: MARCH 29, 2012 PAGE 103 OF 112
DPS6 (FWD) Transmission
DPS6 is a fully automatic 6 speed transmission made up of manual transmission gearing, combined with electro-mechanical actuators, and conventional automatic transmission controls.
The Gearbox & Dual-Clutch System Physical Architecture
DPS6 has 2 clutches:
1. Clutch A – on in 1st, 3
rd and 5
th gear
2. Clutch B – on in Reverse, 2nd
, 4th and 6
th gear
Twin Clutch Actuators with
E-motors
Twin Dry
Clutches
Shift drums with E-
motors
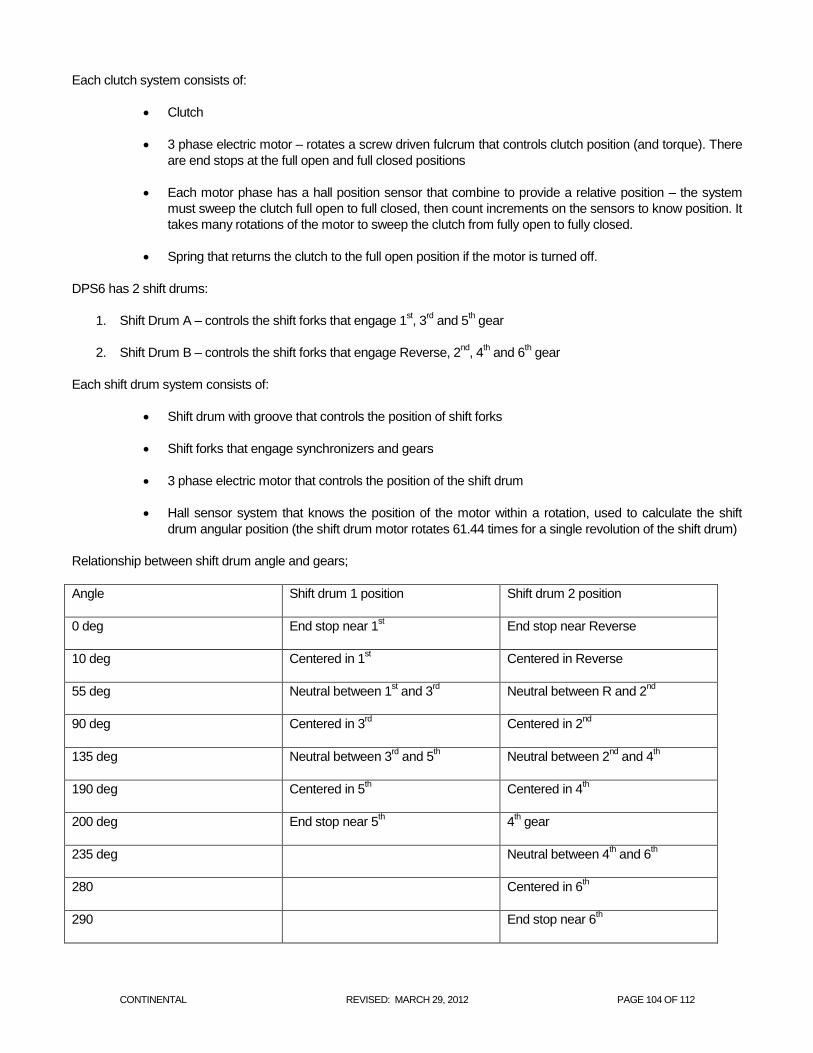
CONTINENTAL REVISED: MARCH 29, 2012 PAGE 104 OF 112
Each clutch system consists of:
Clutch
3 phase electric motor – rotates a screw driven fulcrum that controls clutch position (and torque). There
are end stops at the full open and full closed positions
Each motor phase has a hall position sensor that combine to provide a relative position – the system
must sweep the clutch full open to full closed, then count increments on the sensors to know position. It
takes many rotations of the motor to sweep the clutch from fully open to fully closed.
Spring that returns the clutch to the full open position if the motor is turned off.
DPS6 has 2 shift drums:
1. Shift Drum A – controls the shift forks that engage 1st, 3
rd and 5
th gear
2. Shift Drum B – controls the shift forks that engage Reverse, 2nd
, 4th and 6
th gear
Each shift drum system consists of:
Shift drum with groove that controls the position of shift forks
Shift forks that engage synchronizers and gears
3 phase electric motor that controls the position of the shift drum
Hall sensor system that knows the position of the motor within a rotation, used to calculate the shift
drum angular position (the shift drum motor rotates 61.44 times for a single revolution of the shift drum)
Relationship between shift drum angle and gears;
Angle Shift drum 1 position Shift drum 2 position
0 deg End stop near 1st End stop near Reverse
10 deg Centered in 1st Centered in Reverse
55 deg Neutral between 1st and 3
rd Neutral between R and 2
nd
90 deg Centered in 3rd Centered in 2
nd
135 deg Neutral between 3rd and 5
th Neutral between 2
nd and 4
th
190 deg Centered in 5th Centered in 4
th
200 deg End stop near 5th 4
th gear
235 deg Neutral between 4th and 6
th
280 Centered in 6th
290 End stop near 6th
CONTINENTAL REVISED: MARCH 29, 2012 PAGE 105 OF 112
Transmission Inputs
Transmission Range Sensor
DPS6 is range by wire with mechanical Park. DPS6 uses a dual PWM output (at 250 Hz) TRS where one signal is the inverse of the other and the sum of the two signals add up to 100%. Each signal is tested for frequency errors (P0706 / P2801), duty cycle out of range low (P0707 / P2802) and duty cycle out of range high (P0708 / P2803). There is also a correlation error (P2805) if the two signals do not add up to 100%.
Speed Sensors
Input 1 Speed Sensor (I1SS) – detects input shaft 1 speed, connected to clutch 1 and the odd gears (1st, 3
rd and 5
th).
I1SS is tested for power supply faults (P06A6), circuit failures detected by the TCM hardware (P0715), erratic signal
(P0716), and lack of signal (P0717).
Input 2 Speed Sensor (I2SS) – detects input shaft 2 speed, connected to clutch 2 and the even gears (R, 2nd
, 4th and
6th). I2SS is tested for power supply faults (P06A7), circuit failures detected by the TCM hardware (P2765), erratic signal
(P2766), and lack of signal (P2767).
Output Speed Sensor (OSS) – detects output speed. OSS is tested for power supply faults (P06A8), circuit failures
detected by the TCM hardware (P0720), erratic signal (P0721), and lack of signal (P0722).
Note: because DPS6 is "Dry clutch" the only transmission fluid is for splash lube (no pump, no pressure control
solenoids), so DPS6 does not have a temperature sensor.
Transmission Outputs
DPS6 has four 3-phase electric motors: 1. Clutch A motor – controls clutch A torque capacity. The Clutch A system is tested for:
a. ATIC faults (P0805) – the ATIC is an internal TCM component that controls motor current. b. Hall sensor faults (P0806) – each phase has a hall sensor that provides motor position information c. Sequence faults (P0809) – as the motor rotates it generates an defined pattern from the 3 hall sensors,
if the sequence of hall sensor patterns is off this code sets. d. Open circuit (P0900) e. Short to ground (P0902) f. Short to power (P0903) g. Clutch functionally stuck off (P07A2) h. Clutch functionally stuck on (P07A3)
2. Clutch B motor – controls clutch B torque capacity. The Clutch B system is tested for: a. ATIC faults (P087A) – the ATIC is an internal TCM component that controls motor current. b. Hall sensor faults (P087B) – each phase has a hall sensor that provides motor position information c. Sequence faults (P087E) – as the motor rotates it generates an defined pattern from the 3 hall sensors,
if the sequence of hall sensor patterns is off this code sets. d. Open circuit (P090A) e. Short to ground (P090C) f. Short to power (P090D) g. Clutch functionally stuck off (P07A4) h. Clutch functionally stuck on (P07A5)
CONTINENTAL REVISED: MARCH 29, 2012 PAGE 106 OF 112
3. Shift drum A motor – controls the shift forks that engage 1
st, 3
rd and 5
th gear. The system is tested for:
a. ATIC faults (P2831) – the ATIC is an internal TCM component that controls motor current. b. Sequence faults (P2835) – as the motor rotates it generates an defined pattern from the 3 hall sensors,
if the sequence of hall sensor patterns is off this code sets. c. Open circuit (P285B) d. Short to ground (P285D) e. Short to power (P285E) f. Stuck in gear (P072C, P072E, P073A) g. Position error (P2832) – includes blocked motor, or any failure that results in the TCM losing confidence
in the relative position of the shift drum.
4. Shift drum A motor – controls the shift forks that engage 1st, 3
rd and 5
th gear. The system is tested for:
a. ATIC faults (P2836) – the ATIC is an internal TCM component that controls motor current. b. Sequence faults (P283A) – as the motor rotates it generates an defined pattern from the 3 hall sensors,
if the sequence of hall sensor patterns is off this code sets. c. Open circuit (P285F) d. Short to ground (P2861) e. Short to power (P2862) f. Stuck in gear (P072B, P072D, P072F, P073B) g. Position error (P2837) – includes blocked motor, or any failure that results in the TCM losing confidence
in the relative position of the shift drum.
Transmission Control Module (TCM)
The TCM monitors itself by using various software monitoring functions. The TCM is monitored for:
a. If a RAM Read/Write error is detected during initialization, a P0604 fault code will be stored
b. the flash ROM is checked using a checksum calculation. If the checksum is incorrect during a P0605 fault
will be stored
c. CPU performance is monitored for incorrect instructions or resets, if detected a P0607 fault code is set
d. If an error is found with NVRAM a P06B8 fault code will be stored
CAN Communications error
The TCM receives information from the ECM via CAN. If the CAN link fails the TCM no longer has torque or engine
speed information available. The TCM will store a U0073 fault code if the CAN Bus is off. The TCM will store a U0100
fault code if it doesn’t receive any more CAN messages from the ECM. A U0401 fault codes will be stored if the ECM
received invalid/faulted information for the following CAN message items: engine torque, pedal position.
System voltage:
the TCM monitors system voltage and stores fault codes if it is out of range low (P0882) or out of range high (P0883). These thresholds are set based on hardware capability.
CONTINENTAL REVISED: MARCH 29, 2012 PAGE 107 OF 112
On Board Diagnostic Executive
The On-Board Diagnostic (OBD) Executive is a portion of the PCM strategy that manages the diagnostic trouble codes and operating modes for all diagnostic tests. It is the "traffic cop" of the diagnostic system. The Diagnostic Executive performs the following functions:
Sequence the OBD monitors such that when a test runs, each input that it relies upon has already been tested. For 2008 MY and beyond ISO 14229 programs, the OBD monitors are no longer sequenced by the diagnostic executive.
Controls and co-ordinates the execution of the individual OBD system monitors: Catalyst, Misfire, EGR, O2, Fuel, AIR, EVAP and, Comprehensive Component Monitor (CCM). For 2008 MY and beyond ISO 14229 programs, the execution of the OBD monitors is no longer controlled and coordinated by the diagnostic executive.
Stores freeze frame and "similar condition" data.
Manages storage and erasure of Diagnostic Trouble Codes as well as MIL illumination.
Controls and co-ordinates the execution of the On-Demand tests: Key On Engine Off (KOEO) Key On Engine Running (KOER).
Performs transitions between various states of the diagnostic and powertrain control system to minimize the effects on vehicle operation.
Interfaces with the diagnostic test tools to provide diagnostic information (I/M readiness, various J1979 test modes) and responses to special diagnostic requests (J1979 Mode 08 and 09).
Tracks and manages indication of the driving cycle which includes the time between two key on events that include an engine start and key off.
The diagnostic executive also controls several overall, global OBD entry conditions. The battery voltage must fall between 11.0 and 18.0 volts to initiate monitoring cycles. The engine must be started to initiate the engine started, engine running, and engine off monitoring cycles. The Diagnostic Executive suspends OBD monitoring when battery voltage falls below 11.0 volts. The Diagnostic Executive suspends monitoring of fuel-system related monitors (catalyst, misfire, evap, O2, AIR and fuel system) when fuel level falls below 15%. For 2005 MY and beyond, the execution of the fuel related OBD monitors is no longer suspended for fuel level by the diagnostic executive.
The diagnostic executive controls the setting and clearing of pending and confirmed DTCs.
A pending DTC and freeze frame data is stored after a fault is confirmed on the first monitoring cycle. If the fault recurs on the next driving cycle, a confirmed DTC is stored, freeze frame data is updated, and the MIL is illuminated. If confirmed fault free on the next driving cycle, the pending DTC and freeze frame data is erased on the next power-up. Pending DTCs will be displayed as long as the fault is present. Note that OBD-II regulations required a complete fault-free monitoring cycle to occur before erasing a pending DTC. In practice, this means that a pending DTC is erased on the next power-up after a fault-free monitoring cycle. After a confirmed DTC is stored and the MIL has been illuminated, three consecutive confirmed fault-free monitoring cycles must occur before the MIL can be extinguished on the next (fourth) power-up. After 40 engine warm-ups, the DTC and freeze frame data is erased.
CONTINENTAL REVISED: MARCH 29, 2012 PAGE 108 OF 112
The diagnostic executive controls the setting and clearing of permanent DTCs.
A permanent DTC is stored when a confirmed DTC is stored, the MIL has been illuminated, and there are not yet six permanent DTCs stored. After a permanent DTC is stored, three consecutive confirmed fault-free monitoring cycles must occur before the permanent DTC can be erased. After a permanent DTC is stored, one confirmed fault-free monitoring cycle must occur, following a DTC reset request, before the permanent DTC can be erased. For 2010MY and beyond ISO 14229 programs a driving cycle including the following criteria must also occur, following the DTC reset request, before a permanent DTC can be erased: o Cumulative time since engine start is greater than or equal to 600 seconds; o Cumulative vehicle operation at or above 25 miles per hour occurs for greater than or equal to
300 seconds (medium-duty vehicles with diesel engines certified on an engine dynamometer may use cumulative operation at or above 15% calculated load in lieu of at or above 25 miles per hour for purposes of this criteria); and
o Continuous vehicle operation at idle (i.e., accelerator pedal released by driver and vehicle speed less than or equal to one mile per hour) for greater than or equal to 30 seconds.
A permanent DTC can not be erased by a battery disconnect. Additionally, its confirmed DTC counterpart will be restored after completion of the system reset (battery reconnect).
CONTINENTAL REVISED: MARCH 29, 2012 PAGE 109 OF 112
Exponentially Weighted Moving Average
Exponentially Weighted Moving Averaging is a well-documented statistical data processing technique that is used to
reduce the variability on an incoming stream of data. Use of EWMA does not affect the mean of the data; however, it
does affect the distribution of the data. Use of EWMA serves to “filter out” data points that exhibit excessive and
unusual variability and could otherwise erroneously light the MIL.
The simplified mathematical equation for EWMA implemented in software is as follows:
New Average = [New data point * “filter constant”] + [( 1 - “filter constant” ) * Old Average]
This equation produces an exponential response to a step-change in the input data. The "Filter Constant" determines
the time constant of the response. A large filter constant (i.e. 0.90) means that 90% of the new data point is averaged in
with 10% of the old average. This produces a very fast response to a step change. Conversely, a small filter constant
(i.e. 0.10) means that only 10% of the new data point is averaged in with 90% of the old average. This produces a
slower response to a step change.
When EWMA is applied to a monitor, the new data point is the result from the latest monitor evaluation. A new average
is calculated each time the monitor is evaluated and stored in Non Volatile Memory (NVRAM). This normally occurs
each driving cycle. The MIL is illuminated and a DTC is stored based on the New Average store in NVRAM.
In order to facilitate repair verification and DDV demonstration, 2 different filter constants are used. A “fast filter
constant” is used after are erased and a “normal filter constant” is used for normal customer driving. The “fast filter” is
used for 2 driving cycles after DTCs are erased, and then the “normal filter” is used. The “fast filter” allows for easy
repair verification and monitor demonstration in 2 driving cycles, while the normal filter is used to allow up to 6 driving
cycles, on average, to properly identify a malfunction and illuminate the MIL. This feature is called Fast Initial Response
(FIR). The fast filter is always calibrated to 1.0 which means that the EWMA is effectively disabled because the new
average is 100% of the new data point. Since the EWMA is effectively disabled, it takes twp driving cycles to set the
MIL. The first driving cycle with a fault will set a pending DTC; the second driving cycle will set a confirmed code and
illuminate the MIL. This feature is called Fast Initial Response (FIR). The fast filter is always calibrated to 1.0 which
means that the EWMA is effectively disabled because the new average is 100% of the new data point. Since the
EWMA is effectively disabled, it takes twp driving cycles to set the MIL. The first driving cycle with a fault will set a
pending DTC; the second driving cycle will set a confirmed code and illuminate the MIL.
The other unique feature used with EWMA is called Step Change Logic (SCL). This logic detects an abrupt change
from a no-fault condition to a fault condition. This is done by comparing the new data point to the EWMA old average. If
the two points differ by more than a calibrated amount (i.e. the new data point is outside the normal distribution), it
means that a catastrophic failure has occurred. The fast filter is then used in the same manner as for the FIR feature
above. Since the EWMA is effectively disabled, it takes twp driving cycles to set the MIL. The first driving cycle with a
fault will set a pending DTC; the second driving cycle will set a confirmed code and illuminate the MIL. The SCL
becomes active after the 4th "normal" monitoring cycle to give the EWMA a chance to stabilize.
During "normal" EWMA operation, a slower filter constant is used. The "normal filer" allows the MIL to be illuminated in
1 to 6 driving cycles. A confirmed code is set and the MIL is illuminated as soon as the EWMA crosses the malfunction
threshold. There is no pending DTC because EWMA uses a 1-trip MIL.
In order to relate filter constants to driving cycles for MIL illumination, filter constants must be converted to time
constants. The mathematical relationship is described below:
Time constant = [ ( 1 / filter constant ) - 1 ] * evaluation period
The evaluation period is a driving cycle. The time constant is the time it takes to achieve 68% of a step-change to an
input. Two time constants achieve 95% of a step change input.
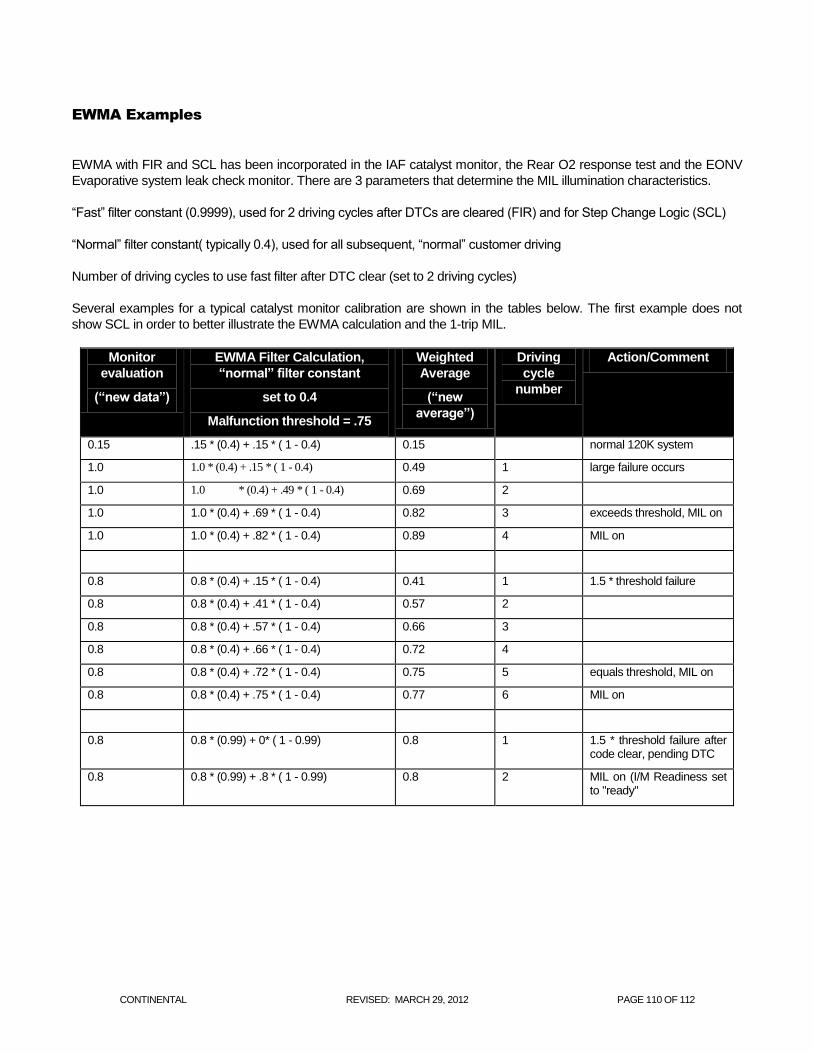
CONTINENTAL REVISED: MARCH 29, 2012 PAGE 110 OF 112
EWMA Examples
EWMA with FIR and SCL has been incorporated in the IAF catalyst monitor, the Rear O2 response test and the EONV
Evaporative system leak check monitor. There are 3 parameters that determine the MIL illumination characteristics.
“Fast” filter constant (0.9999), used for 2 driving cycles after DTCs are cleared (FIR) and for Step Change Logic (SCL)
“Normal” filter constant( typically 0.4), used for all subsequent, “normal” customer driving
Number of driving cycles to use fast filter after DTC clear (set to 2 driving cycles)
Several examples for a typical catalyst monitor calibration are shown in the tables below. The first example does not
show SCL in order to better illustrate the EWMA calculation and the 1-trip MIL.
Monitor
evaluation
(“new data”)
EWMA Filter Calculation,
“normal” filter constant
set to 0.4
Malfunction threshold = .75
Weighted
Average
(“new
average”)
Driving
cycle
number
Action/Comment
0.15 .15 * (0.4) + .15 * ( 1 - 0.4) 0.15 normal 120K system
1.0 1.0 * (0.4) + .15 * ( 1 - 0.4) 0.49 1 large failure occurs
1.0 1.0 * (0.4) + .49 * ( 1 - 0.4) 0.69 2
1.0 1.0 * (0.4) + .69 * ( 1 - 0.4) 0.82 3 exceeds threshold, MIL on
1.0 1.0 * (0.4) + .82 * ( 1 - 0.4) 0.89 4 MIL on
0.8 0.8 * (0.4) + .15 * ( 1 - 0.4) 0.41 1 1.5 * threshold failure
0.8 0.8 * (0.4) + .41 * ( 1 - 0.4) 0.57 2
0.8 0.8 * (0.4) + .57 * ( 1 - 0.4) 0.66 3
0.8 0.8 * (0.4) + .66 * ( 1 - 0.4) 0.72 4
0.8 0.8 * (0.4) + .72 * ( 1 - 0.4) 0.75 5 equals threshold, MIL on
0.8 0.8 * (0.4) + .75 * ( 1 - 0.4) 0.77 6 MIL on
0.8 0.8 * (0.99) + 0* ( 1 - 0.99) 0.8 1 1.5 * threshold failure after code clear, pending DTC
0.8 0.8 * (0.99) + .8 * ( 1 - 0.99) 0.8 2 MIL on (I/M Readiness set to "ready"
CONTINENTAL REVISED: MARCH 29, 2012 PAGE 111 OF 112
I/M Readiness
The readiness function is implemented based on the J1979 format. A battery disconnection or clearing codes using a
scan tool results in the various I/M readiness bits being set to a “not-ready” condition. As each non-continuous monitor
completes a full diagnostic check, the I/M readiness bit associated with that monitor is set to a “ready” condition. This
may take one or two driving cycles based on whether malfunctions are detected or not. The readiness bits for
comprehensive component monitoring, misfire and fuel system monitoring are immediately considered complete since
they are continuous monitors.
Serial Data Link MIL Illumination
The OBD-II diagnostic communication messages utilize an industry standard 500 kbps CAN communication link.
The instrument cluster on some vehicles uses the same CAN data link to receive and display various types of
information from the ECM. For example, the engine coolant temperature information displayed on the instrument cluster
comes from the same ECT sensor used by the ECM for all its internal calculations.
These same vehicles use the CAN data link to illuminate the MIL rather than a circuit, hard-wired to the ECM. The ECM
periodically sends the instrument cluster a message that tells it to turn on the MIL, turn off the MIL or blink the MIL. If the
instrument cluster fails to receive a message within a 5-second timeout period, the instrument cluster itself illuminates the
MIL. If communication is restored, the instrument cluster turns off the MIL after 5 seconds. Due to its limited capabilities,
the instrument cluster does not generate or store Diagnostic Trouble Codes.
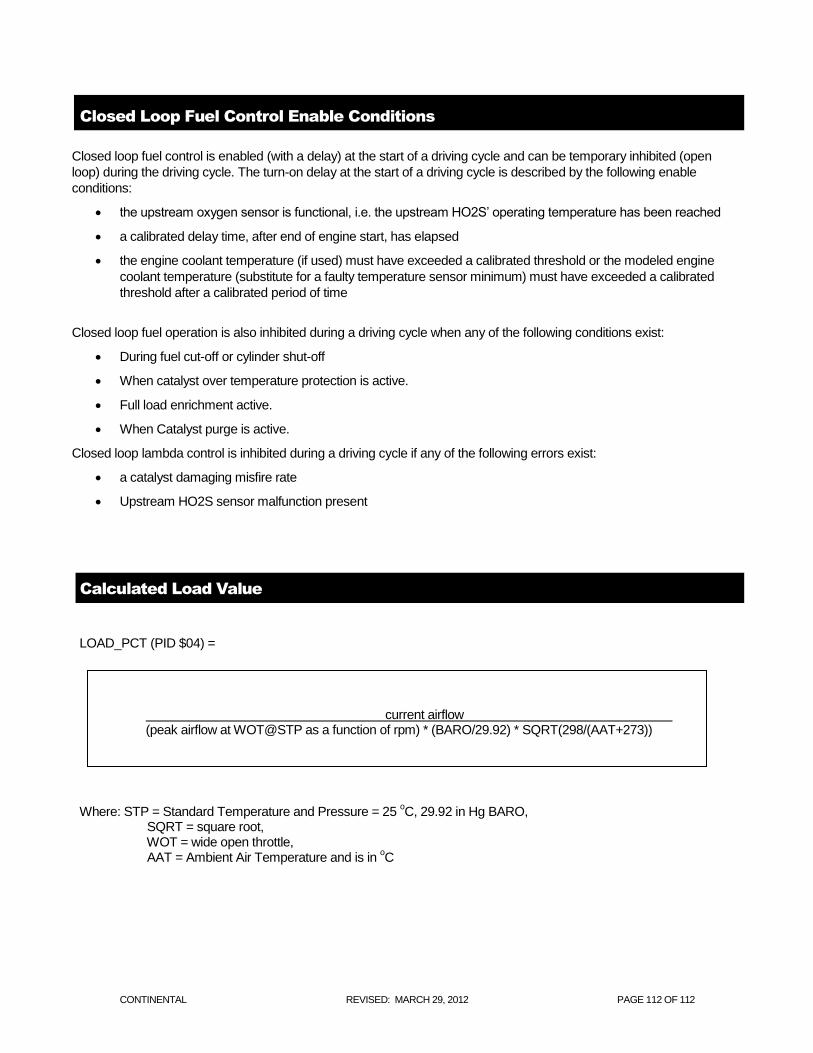
CONTINENTAL REVISED: MARCH 29, 2012 PAGE 112 OF 112
Closed Loop Fuel Control Enable Conditions
Closed loop fuel control is enabled (with a delay) at the start of a driving cycle and can be temporary inhibited (open
loop) during the driving cycle. The turn-on delay at the start of a driving cycle is described by the following enable
conditions:
the upstream oxygen sensor is functional, i.e. the upstream HO2S’ operating temperature has been reached
a calibrated delay time, after end of engine start, has elapsed
the engine coolant temperature (if used) must have exceeded a calibrated threshold or the modeled engine
coolant temperature (substitute for a faulty temperature sensor minimum) must have exceeded a calibrated
threshold after a calibrated period of time
Closed loop fuel operation is also inhibited during a driving cycle when any of the following conditions exist:
During fuel cut-off or cylinder shut-off
When catalyst over temperature protection is active.
Full load enrichment active.
When Catalyst purge is active.
Closed loop lambda control is inhibited during a driving cycle if any of the following errors exist:
a catalyst damaging misfire rate
Upstream HO2S sensor malfunction present
Calculated Load Value
LOAD_PCT (PID $04) = Where: STP = Standard Temperature and Pressure = 25
oC, 29.92 in Hg BARO,
SQRT = square root, WOT = wide open throttle, AAT = Ambient Air Temperature and is in
oC
current airflow (peak airflow at WOT@STP as a function of rpm) * (BARO/29.92) * SQRT(298/(AAT+273))