∈ + − x x x x ,14 :g ↦ - the student room
TRANSCRIPT

1. The function f is defined by
,52:f −xx x ∈
(a) Sketch the graph with equation y = f(x), showing the coordinates of the points where the graph cuts or meets the axes.
(2)
(b) Solve f = (x) = 15 + x. (3)
The function g is defined by
∈+− xxxx ,14:g 2 , 0 ≤ x ≤ 5
(c) Find fg(2). (2)
(d) Find the range of g. (3)
(Total 10 marks)
2.
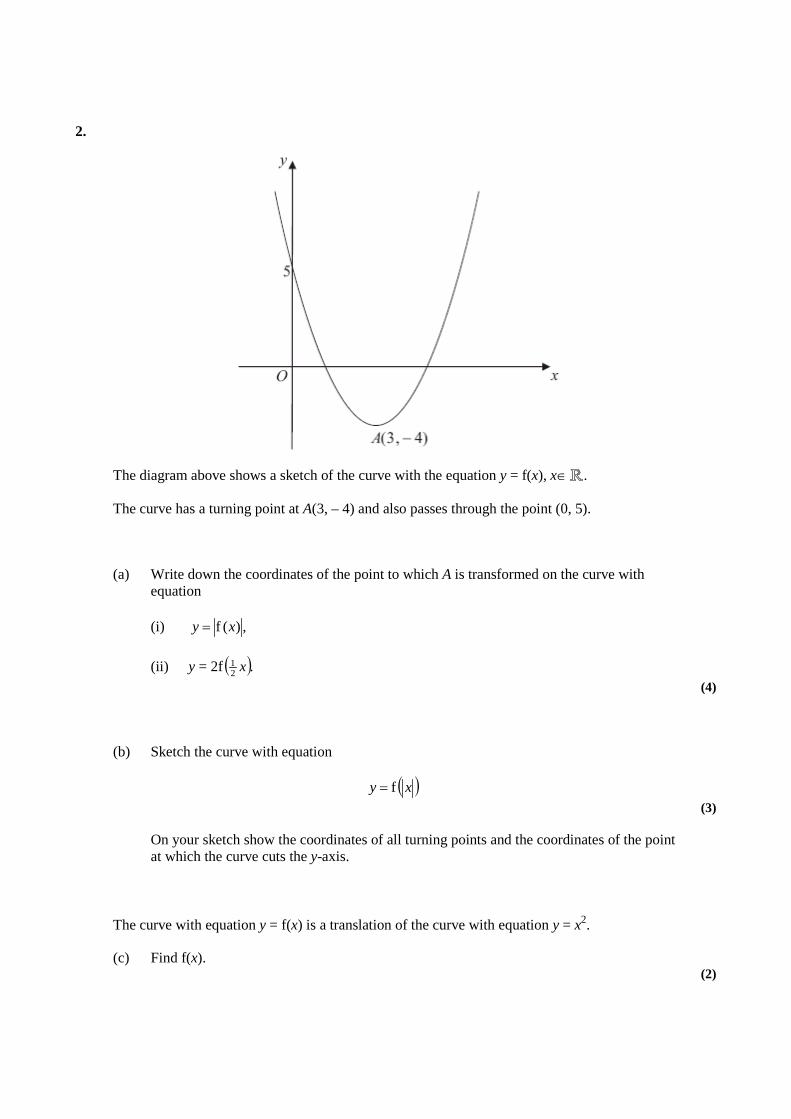
The diagram above shows a sketch of the curve with the equation y = f(x), x∈ .
The curve has a turning point at A(3, – 4) and also passes through the point (0, 5).
(a) Write down the coordinates of the point to which A is transformed on the curve with equation
(i) ,)(f xy =
(ii) y = 2f ( ).21 x
(4)
(b) Sketch the curve with equation
( )xy f= (3)
On your sketch show the coordinates of all turning points and the coordinates of the point at which the curve cuts the y-axis.
The curve with equation y = f(x) is a translation of the curve with equation y = x2.
(c) Find f(x). (2)

(d) Explain why the function f does not have an inverse. (1)
(Total 10 marks)
3. Sketch the graph of y = ln x , stating the coordinates of any points of intersection with the axes. (Total 3 marks)
4.
The diagram above shows a sketch of the graph of y = f(x).
The graph intersects the y-axis at the point (0, 1) and the point A(2, 3) is the maximum turning point.
Sketch, on separate axes, the graphs of
(i) y = f(-x) + 1,
(ii) y = f(x + 2) + 3,
(iii) y = 2f(2x).
On each sketch, show the coordinates of the point at which your graph intersects the y-axis and the coordinates of the point to which A is transformed.
(Total 9 marks)
5. (i) Find the exact solutions to the equations
(a) ln (3x – 7) = 5 (3)
(b) 3xe7x + 2 = 15 (5)
(ii) The functions f and g are defined by
f (x) = e2x + 3, x ∈
g(x) = ln (x – 1), x ∈ , x > 1
(a) Find f–1 and state its domain. (4)
(b) Find fg and state its range. (3)
(Total 15 marks)

6.
The figure above shows a sketch of part of the curve with equation y = f(x), x ∈
The curve meets the coordinate axes at the points A(0, 1 – k) and 1 B ( )0,121 kn ,
where k is a constant and k >1, as shown in the diagram above.
On separate diagrams, sketch the curve with equation
(a) y = ,)(f x (3)
(b) y = f–1(x) (2)
Show on each sketch the coordinates, in terms of k, of each point at which the curve meets or cuts the axes.
Given that f(x) = e2x – k,
(c) state the range of f, (1)
(d) find f–1(x), (3)
(e) write down the domain of f–1. (1)
(Total 10 marks)
7.
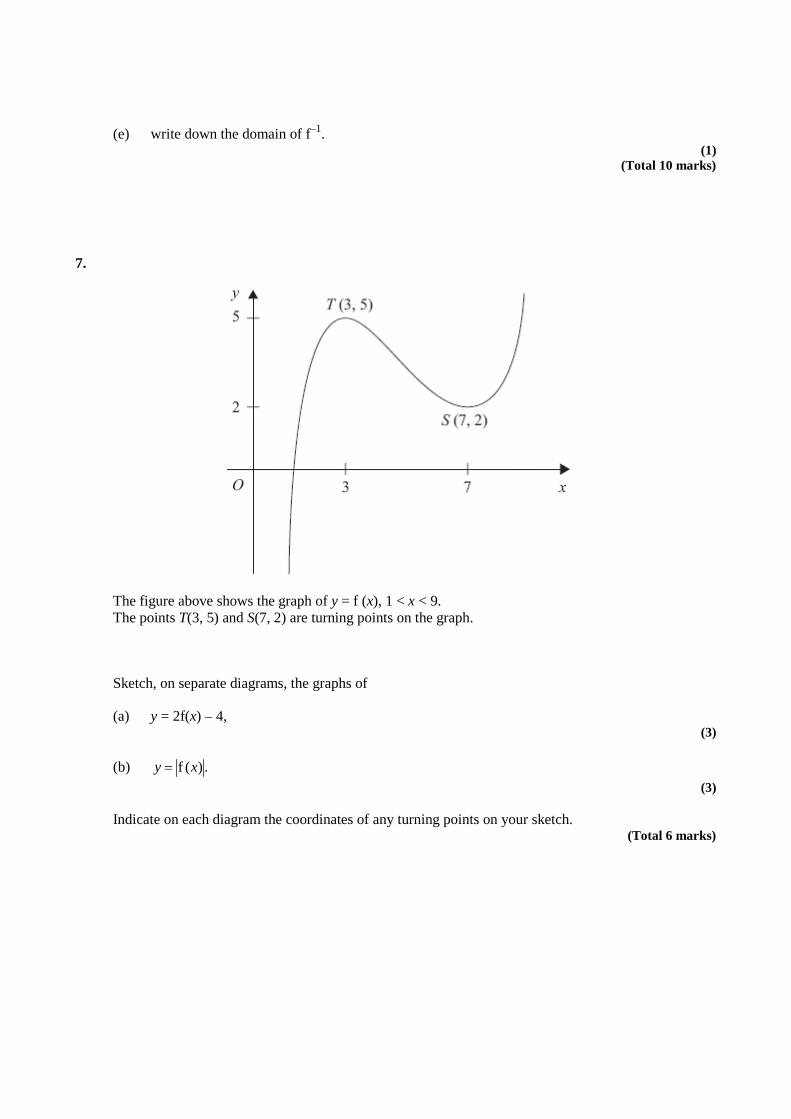
The figure above shows the graph of y = f (x), 1 < x < 9. The points T(3, 5) and S(7, 2) are turning points on the graph.
Sketch, on separate diagrams, the graphs of
(a) y = 2f(x) – 4, (3)
(b) .)(f xy = (3)
Indicate on each diagram the coordinates of any turning points on your sketch. (Total 6 marks)
8. The functions f and g are defined by
∈>+ xxxxx ,0,ln3:f
∈xexg x ,:2
(a) Write down the range of g. (1)
(b) Show that the composite function fg is defined by
∈+ xxxg x ,3:f22
(2)
(c) Write down the range of fg. (1)
(d) Solve the equation [ ] ).2e()(fgdd 2
== xxxxx
(6) (Total 10 marks)
9.
xR
P
Q
y
–3
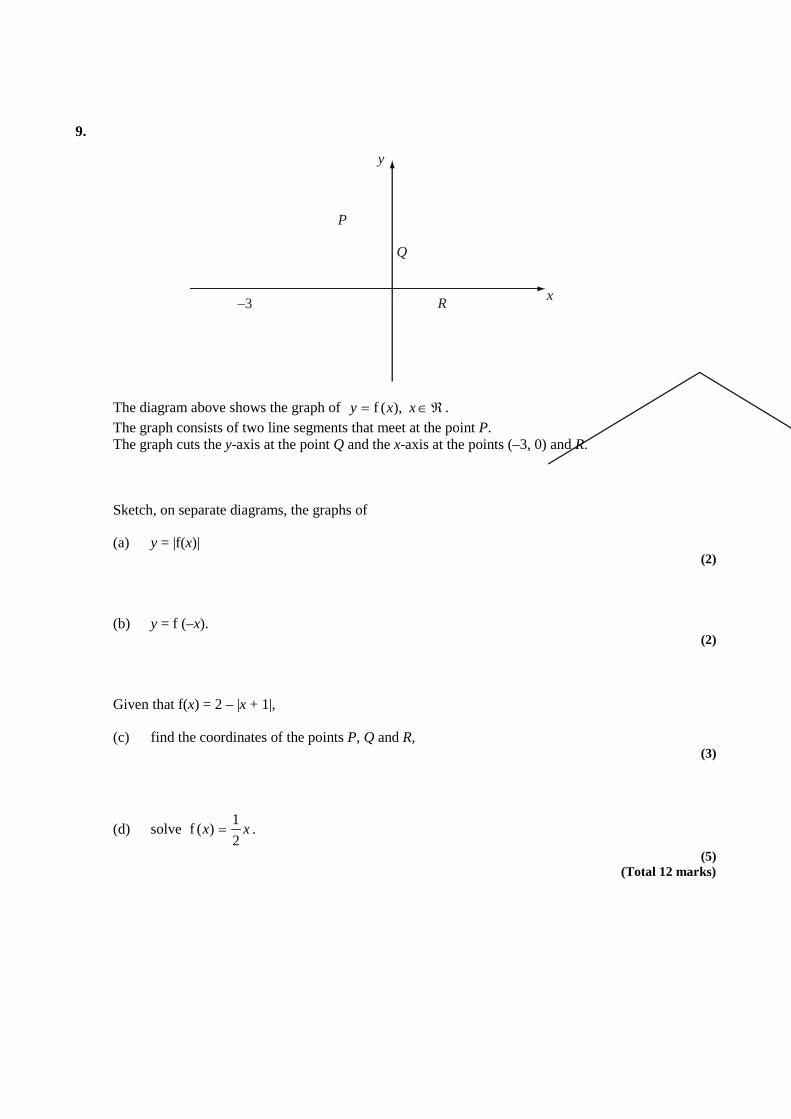
The diagram above shows the graph of ℜ∈= xxy ),(f . The graph consists of two line segments that meet at the point P. The graph cuts the y-axis at the point Q and the x-axis at the points (–3, 0) and R.
Sketch, on separate diagrams, the graphs of
(a) y = |f(x)| (2)
(b) y = f (–x). (2)
Given that f(x) = 2 – |x + 1|,
(c) find the coordinates of the points P, Q and R, (3)
(d) solve xx21)(f = .
(5) (Total 12 marks)

10. The function f is defined by
3,3
132
)1(2:f 2 >−
−−−
− xxxx
xx
(a) Show that 3,1
1)(f >+
= xx
x
(4)
(b) Find the range of f. (2)
(c) Find f–1 (x). State the domain of this inverse function. (3)
The function g is defined by
ℜ∈− xxxg ,32: 2 .
(d) Solve 81)(fg =x .
(3) (Total 12 marks)
11.
y
x
A (5, 4)
B (– 5, – 4)
O
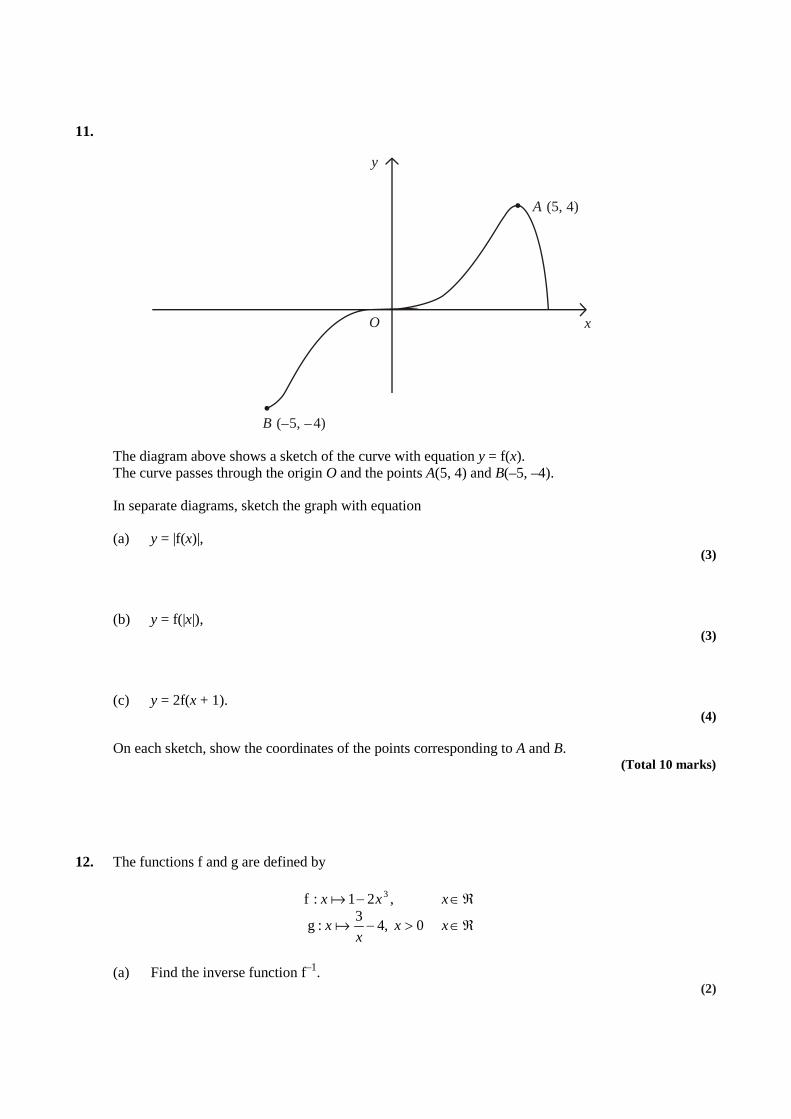
The diagram above shows a sketch of the curve with equation y = f(x). The curve passes through the origin O and the points A(5, 4) and B(–5, –4).
In separate diagrams, sketch the graph with equation
(a) y = |f(x)|, (3)
(b) y = f(|x|), (3)
(c) y = 2f(x + 1). (4)
On each sketch, show the coordinates of the points corresponding to A and B. (Total 10 marks)
12. The functions f and g are defined by
ℜ∈>−
ℜ∈−
xxx
x
xxx
0,43:g
,21:f 3
(a) Find the inverse function f–1. (2)

(b) Show that the composite function gf is
3
3
2118:gf
xxx−
−
(4)
(c) Solve gf(x) = 0. (2)
(d) Use calculus to find the coordinates of the stationary point on the graph of y = gf(x). (5)
(Total 13 marks)
13. The functions f and g are defined by
( )
.3,,3
2:
.21,,12ln:f
≠ℜ∈−
>ℜ∈−
xxx
xg
xxxx
(a) Find the exact value of fg(4). (2)
(b) Find the inverse function f–1(x), stating its domain. (4)
(c) Sketch the graph of y = g(x). Indicate clearly the equation of the vertical asymptote and the coordinates of the point at which the graph crosses the y-axis.
(3)
(d) Find the exact values of x for which .33
2=
−x
(3) (Total 12 marks)
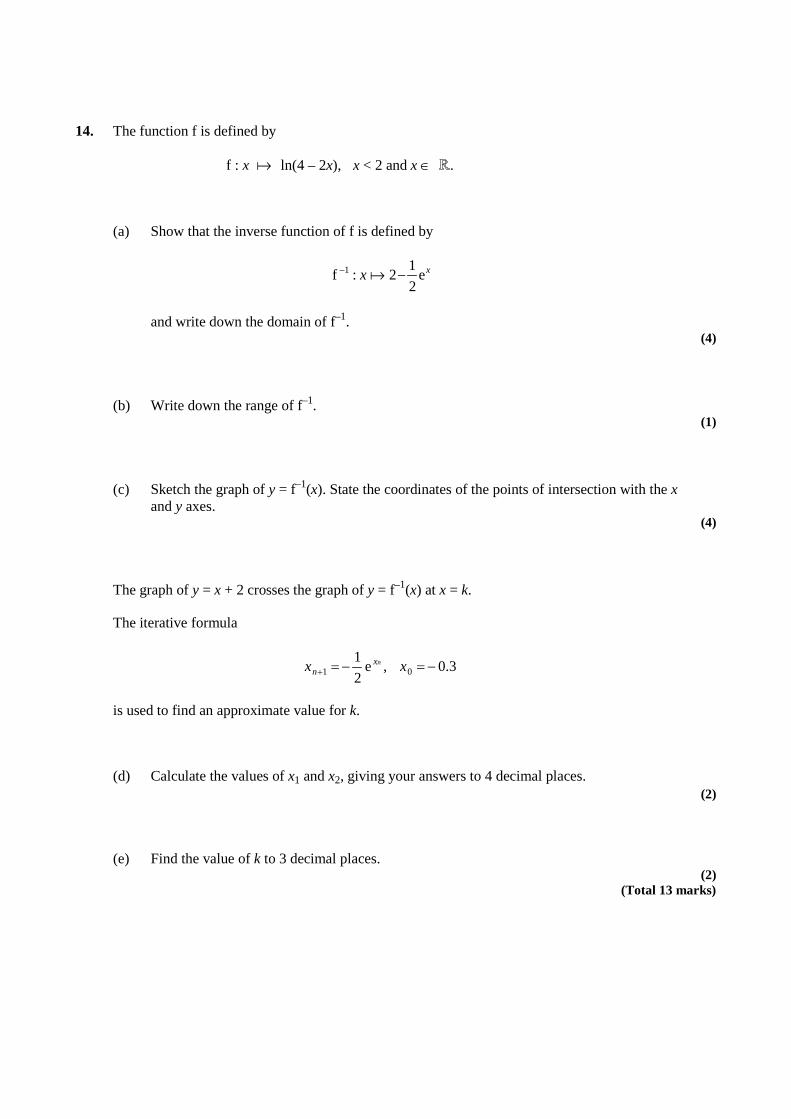
14. The function f is defined by
f : x ln(4 – 2x), x < 2 and x ∈ .
(a) Show that the inverse function of f is defined by
xx e212:f 1 −−
and write down the domain of f–1. (4)
(b) Write down the range of f–1. (1)
(c) Sketch the graph of y = f–1(x). State the coordinates of the points of intersection with the x and y axes.
(4)
The graph of y = x + 2 crosses the graph of y = f–1(x) at x = k.
The iterative formula
3.0,e21
01 −=−=+ xx nxn
is used to find an approximate value for k.
(d) Calculate the values of x1 and x2, giving your answers to 4 decimal places. (2)
(e) Find the value of k to 3 decimal places. (2)
(Total 13 marks)

15.
y
xO
y x = f( )
Q (3, 0)
(0, –2)P
The figure above shows part of the curve with equation y = f(x), x ∈ , where f is an increasing function of x. The curve passes through the points P(0, –2) and Q(3, 0) as shown.
In separate diagrams, sketch the curve with equation
(a) y = |f(x)|, (3)
(b) y = f –1(x), (3)
(c) y = 21 f(3x).
(3)
Indicate clearly on each sketch the coordinates of the points at which the curve crosses or meets the axes.
(Total 9 marks)
16. For the constant k, where k > 1, the functions f and g are defined by
f: x ln (x + k), x > –k,
g: x |2x – k |, x ∈.
(a) On separate axes, sketch the graph of f and the graph of g.
On each sketch state, in terms of k, the coordinates of points where the graph meets the coordinate axes.
(5)
(b) Write down the range of f. (1)
(c) Find
4fg k in terms of k, giving your answer in its simplest form.
(2)
The curve C has equation y = f(x). The tangent to C at the point with x-coordinate 3 is parallel to the line with equation 9y = 2x + 1.
(d) Find the value of k. (4)
(Total 12 marks)
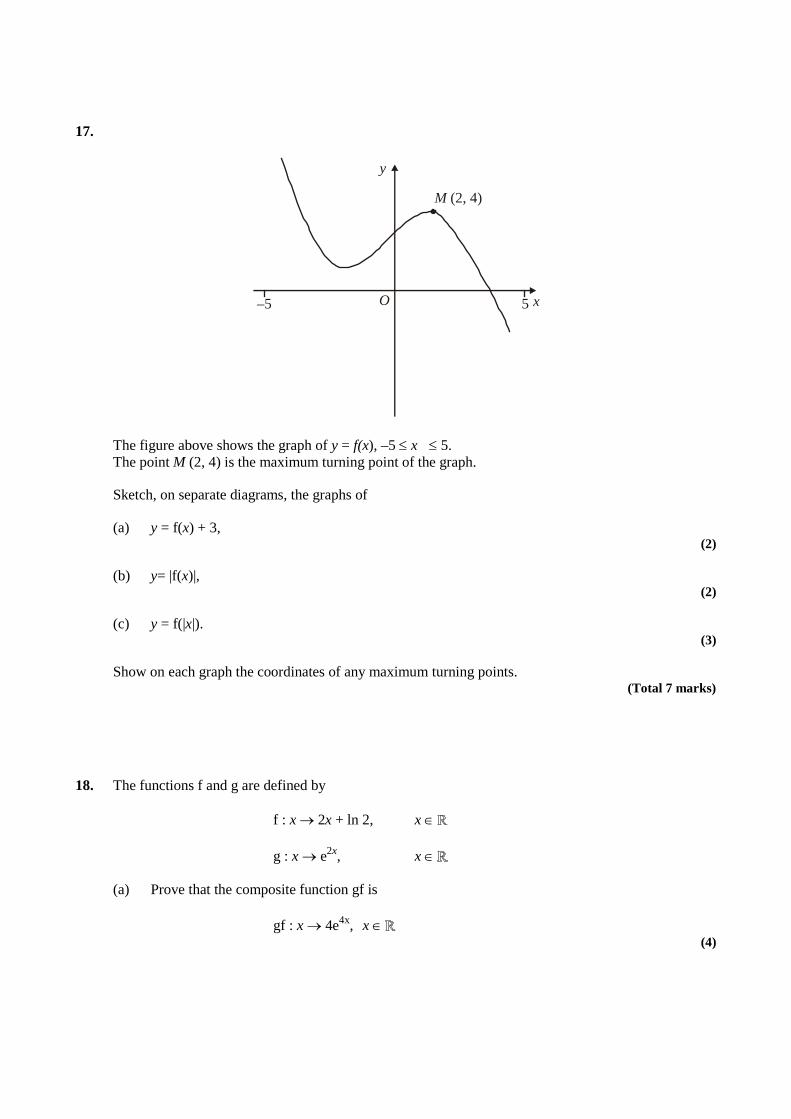
17.
–5 5 x
y
O
M (2, 4)
The figure above shows the graph of y = f(x), –5 ≤ x ≤ 5. The point M (2, 4) is the maximum turning point of the graph.
Sketch, on separate diagrams, the graphs of
(a) y = f(x) + 3, (2)
(b) y= |f(x)|, (2)
(c) y = f(|x|). (3)
Show on each graph the coordinates of any maximum turning points. (Total 7 marks)
18. The functions f and g are defined by
f : x → 2x + ln 2, x ∈
g : x → e2x, x ∈
(a) Prove that the composite function gf is
gf : x → 4e4x, x ∈ (4)
(b) In the space provided below, sketch the curve with equation y = gf(x), and show the coordinates of the point where the curve cuts the y-axis.
(1)
(c) Write down the range of gf. (1)
(d) Find the value of x for which ( )[ ] 3gfdd
=xx
, giving your answer to 3 significant figures.
(4) (Total 10 marks)
19. The function f is defined by
f: x → 2
152 −+
+xx
x –
23+x
, x > 1.
(a) Show that f(x) = 1
2−x
, x > 1.
(4)
(b) Find f –1(x). (3)
The function g is defined by
g: x → x2 + 5, x ∈ ℝ.
(c) Solve fg(x) = 41 .
(3) (Total 10 marks)
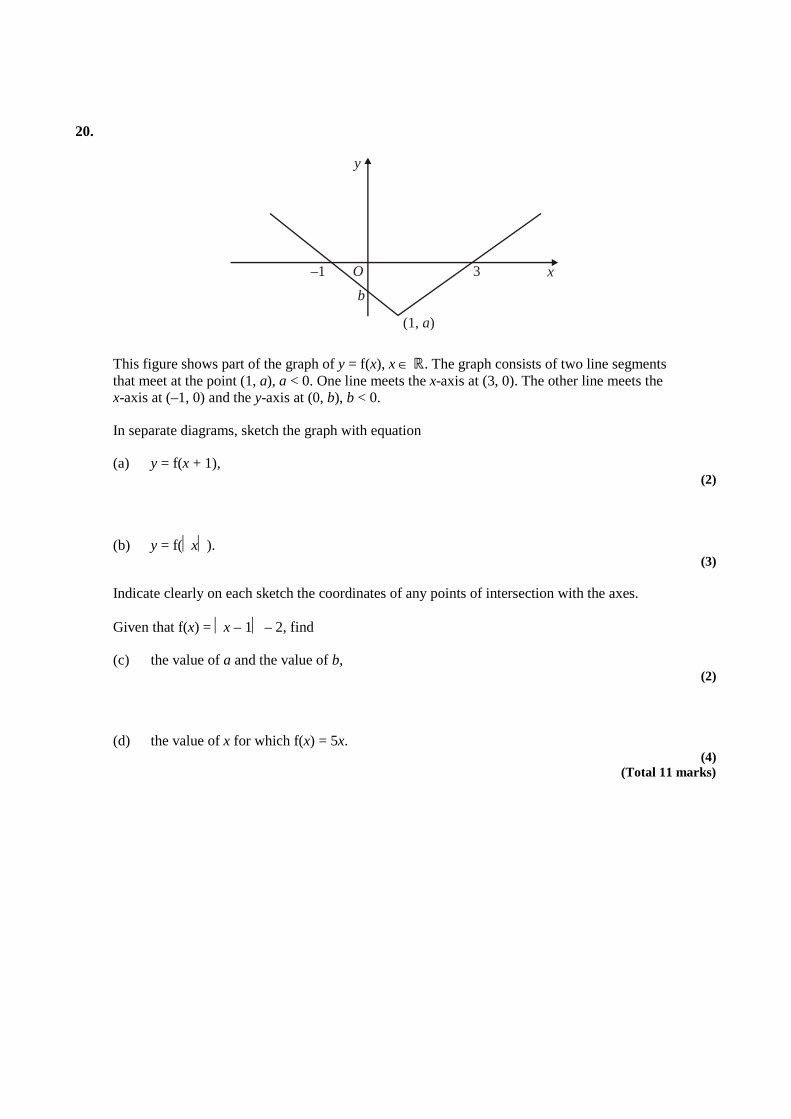
20.
–1 3O x
y
(1, )a
b
This figure shows part of the graph of y = f(x), x ∈ ℝ. The graph consists of two line segments that meet at the point (1, a), a < 0. One line meets the x-axis at (3, 0). The other line meets the x-axis at (–1, 0) and the y-axis at (0, b), b < 0.
In separate diagrams, sketch the graph with equation
(a) y = f(x + 1), (2)
(b) y = f(x). (3)
Indicate clearly on each sketch the coordinates of any points of intersection with the axes.
Given that f(x) = x – 1 – 2, find
(c) the value of a and the value of b, (2)
(d) the value of x for which f(x) = 5x. (4)
(Total 11 marks)
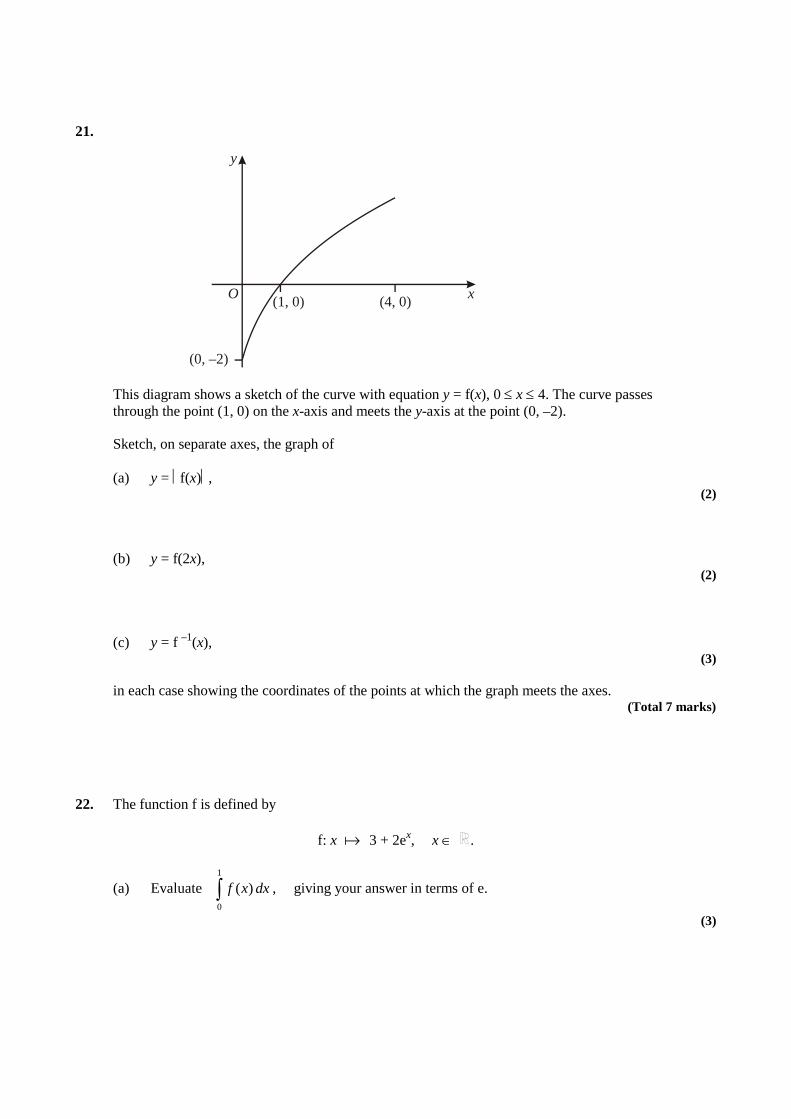
21.
y
xO
(0, –2)
(1, 0) (4, 0)
This diagram shows a sketch of the curve with equation y = f(x), 0 ≤ x ≤ 4. The curve passes through the point (1, 0) on the x-axis and meets the y-axis at the point (0, –2).
Sketch, on separate axes, the graph of
(a) y = f(x), (2)
(b) y = f(2x), (2)
(c) y = f –1(x), (3)
in each case showing the coordinates of the points at which the graph meets the axes. (Total 7 marks)
22. The function f is defined by
f: x 3 + 2ex, x ∈ .
(a) Evaluate ∫1
0
)( dxxf , giving your answer in terms of e.
(3)
The curve C, with equation y = f(x), passes through the y-axis at the point A. The tangent to C at A meets the x-axis at the point (c, 0).
(b) Find the value of c. (4)
The function g is defined by
g: x 425
++
xx
, x ∈ , x > –4.
(c) Find an expression for g–1(x). (3)
(d) Find gf(0). (2)
(Total 12 marks)
23.
f(x) = 352
++
xx
– )2)(3(
1++ xx
, x > –2.
(a) Express f(x) as a single fraction in its simplest form. (5)
(b) Hence show that f(x) = 2 – 2
1+x
, x > –2.
(2)
The curve y = x1
, x > 0, is mapped onto the curve y = f(x), using three successive
transformations T1, T2 and T3, where T1 and T3 are translations.
(c) Describe fully T1, T2 and T3. (4)
(Total 11 marks)
24. The function f is defined by
f: x 2x – 5, x ∈ .
(a) Sketch the graph of y = f(x), showing the coordinates of points at which the graph meets or crosses the axes.
(3)
(b) Find the values of x for which f(x) = x. (4)
The function g is defined by
g: x x(x – 6), x ∈ .
(c) Find the range of g(x). (3)
(d) Find fg(1). (2)
(Total 12 marks)
25. The function f is given by
f : x 2 + 2
3+x
, x ∈ , x ≠ –2.
(a) Express 2 + 2
3+x
as a single fraction.
(1)
(b) Find an expression for f –1(x). (3)
(c) Write down the domain of f –1. (1)
(Total 5 marks)
26. The function f is even and has domain . For x ≥ 0, f(x) = x2 – 4ax, where a is a positive constant.
(a) In the space below, sketch the curve with equation y = f(x), showing the coordinates of all the points at which the curve meets the axes.
(3)
(b) Find, in terms of a, the value of f(2a) and the value of f(–2a). (2)
Given that a = 3,
(c) use algebra to find the values of x for which f(x) = 45. (4)
(Total 9 marks)
27. The functions f and g are defined by
f: x | x – a | + a, x ∈ R,
g: x 4x + a, x ∈ R.
where a is a positive constant.
(a) On the same diagram, sketch the graphs of f and g, showing clearly the coordinates of any points at which your graphs meet the axes.
(5)
(b) Use algebra to find, in terms of a, the coordinates of the point at which the graphs of f and g intersect.
(3)
(c) Find an expression for fg(x). (2)
(d) Solve, for x in terms of a, the equation
fg(x) = 3a. (3)
(Total 13 marks)
28. The functions f and g are defined by
f: x x2 – 2x + 3, x ∈ , 0 ≤ x ≤ 4,
g: x λx + 1, where λ is a constant, x ∈ .
(a) Find the range of f. (3)
(b) Given that gf(2) = 16, find the value of λ. (3)
(Total 6 marks)

29.
–1 O 3 x
y
A(2, 0)
B( , 1)43
The diagram above shows a sketch of the curve with equation y = f(x), −1 ≤ x ≤ 3. The curve touches the x-axis at the origin O, crosses the x-axis at the point A(2, 0) and has a maximum at the point B( 3
4 , 1).
In separate diagrams, show a sketch of the curve with equation
(a) y = f(x + 1), (3)
(b) y = |f(x)|, (3)
(c) y = f(|x|), (4)
marking on each sketch the coordinates of points at which the curve
(i) has a turning point,
(ii) meets the x-axis. (Total 10 marks)
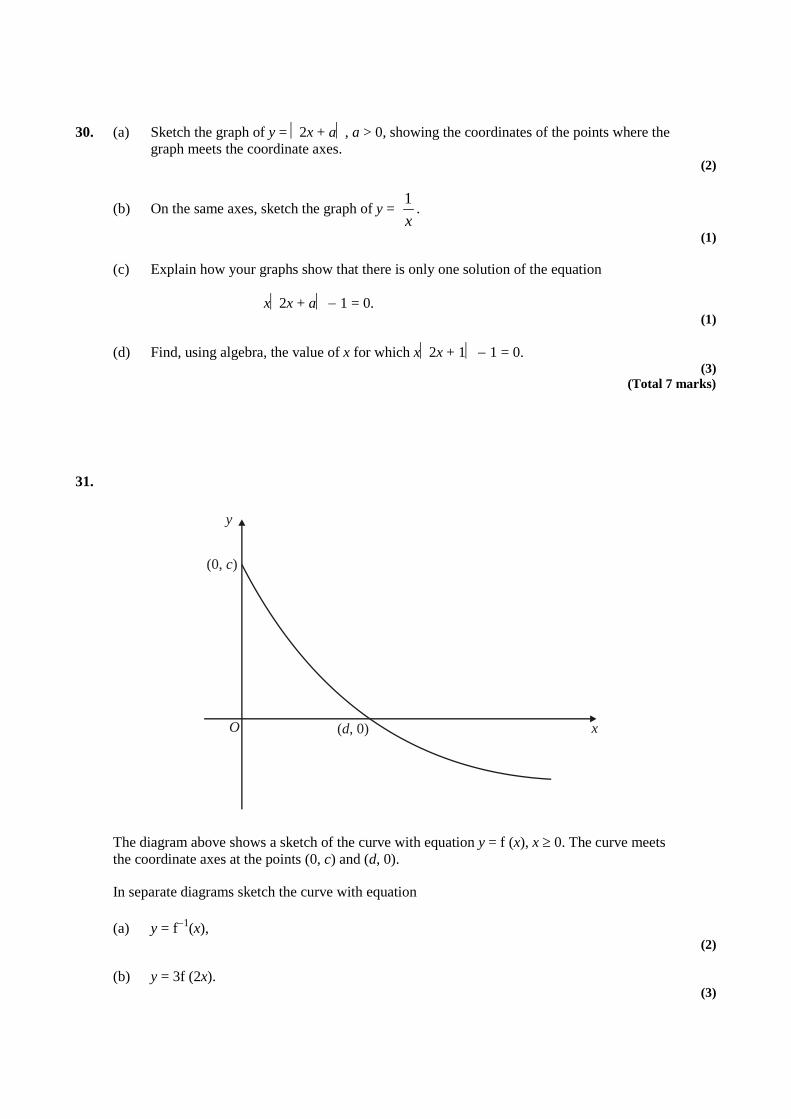
30. (a) Sketch the graph of y = 2x + a, a > 0, showing the coordinates of the points where the graph meets the coordinate axes.
(2)
(b) On the same axes, sketch the graph of y = x1
.
(1)
(c) Explain how your graphs show that there is only one solution of the equation
x2x + a − 1 = 0. (1)
(d) Find, using algebra, the value of x for which x2x + 1 − 1 = 0. (3)
(Total 7 marks)
31.
y
O x
(0, )c
( , 0)d
The diagram above shows a sketch of the curve with equation y = f (x), x ≥ 0. The curve meets the coordinate axes at the points (0, c) and (d, 0).
In separate diagrams sketch the curve with equation
(a) y = f−1(x), (2)
(b) y = 3f (2x). (3)
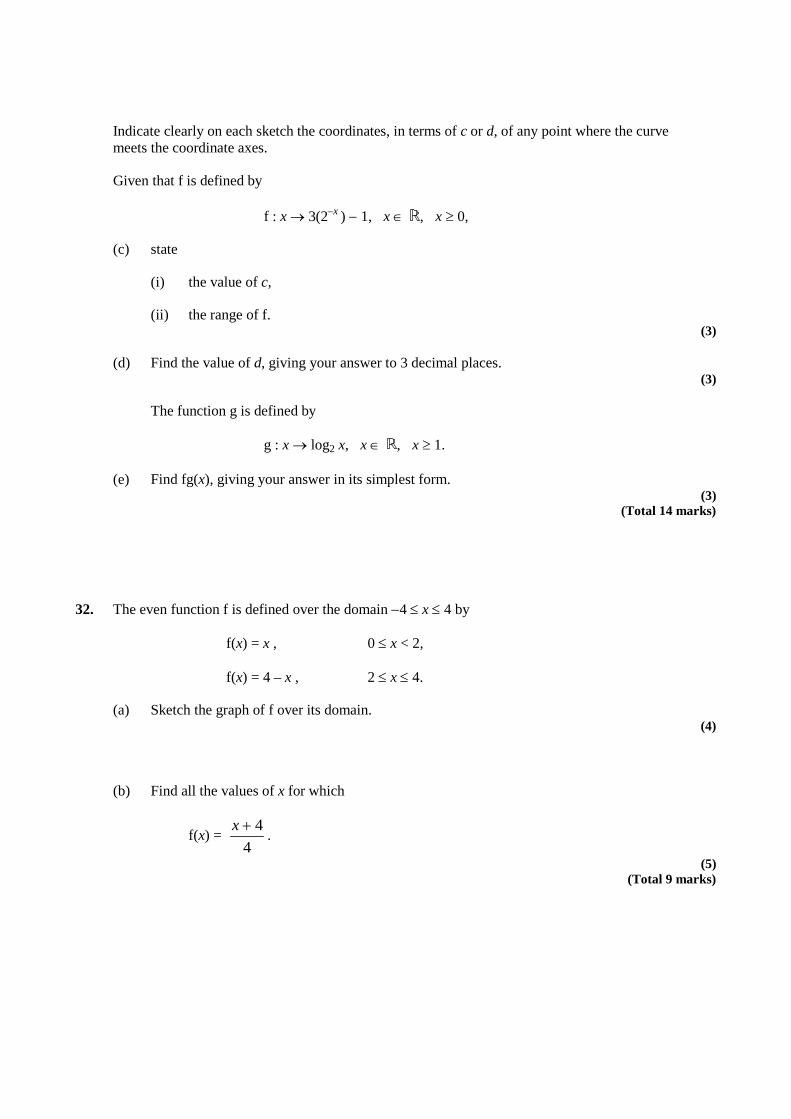
Indicate clearly on each sketch the coordinates, in terms of c or d, of any point where the curve meets the coordinate axes.
Given that f is defined by
f : x → 3(2–x ) − 1, x ∈ , x ≥ 0,
(c) state
(i) the value of c,
(ii) the range of f. (3)
(d) Find the value of d, giving your answer to 3 decimal places. (3)
The function g is defined by
g : x → log2 x, x ∈ , x ≥ 1.
(e) Find fg(x), giving your answer in its simplest form. (3)
(Total 14 marks)
32. The even function f is defined over the domain −4 ≤ x ≤ 4 by
f(x) = x , 0 ≤ x < 2,
f(x) = 4 – x , 2 ≤ x ≤ 4.
(a) Sketch the graph of f over its domain. (4)
(b) Find all the values of x for which
f(x) = 4
4+x.
(5) (Total 9 marks)

33.
x
y
O A
B
The diagram above shows a sketch of the curve with equation y = f(x) where the function f is given by
f: x ex −2 – 1, x ∈ .
The curve meets the x-axis at the point A and the y-axis at the point B.
(a) Write down the coordinates of A and B. (2)
(b) Find, in the form f −1(x): x . . ., the inverse function of f and state its domain. (5)
(c) Prove that the equation f(x) = x has a root α in the interval [3, 4]. (2)
(d) Use the iterative formula
xn + 1 = f −1(xn), with x1 = 3.5,
to find α to 3 decimal places. Prove that your answer is correct to 3 decimal places. (5)
(Total 14 marks)
34. The function f is defined by
f : x 2x, x ∈ .
(a) Find f –1(x) and state the domain of f –1. (2)
The function g is defined by
g : x 3x2 + 2, x ∈ .
(b) Find gf –1(x). (2)
(c) State the range of gf –1(x). (1)
(Total 5 marks)
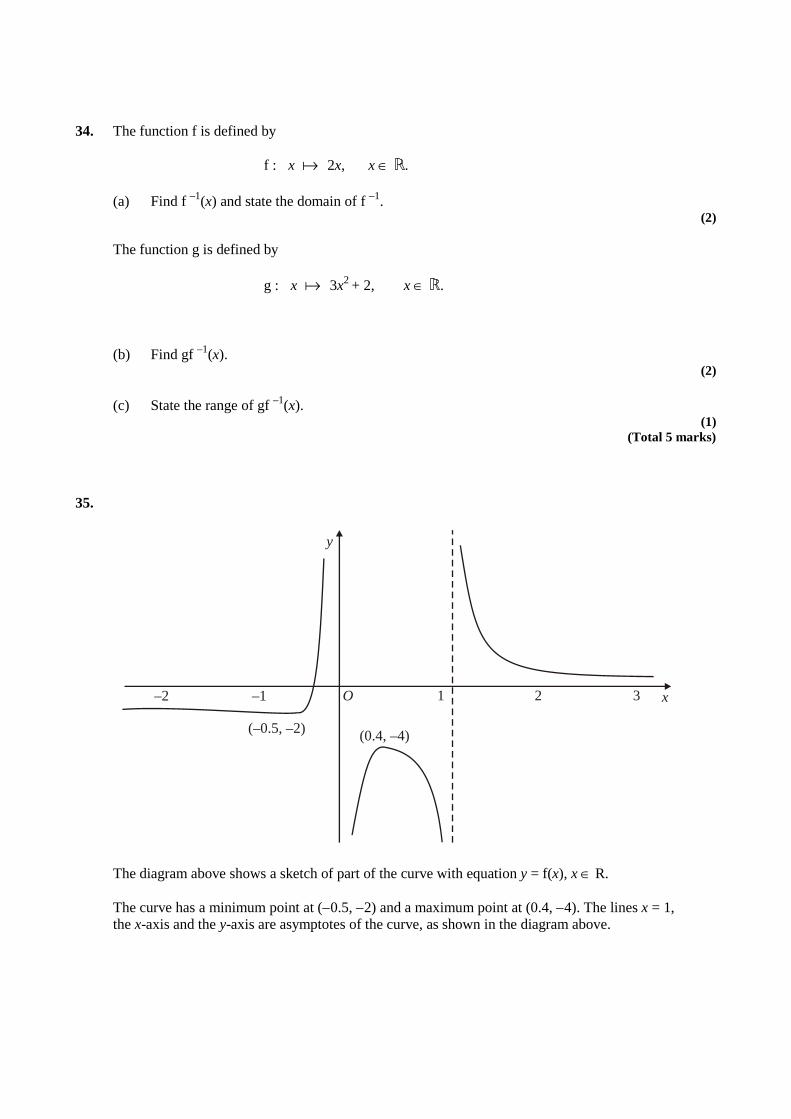
35.
O 1 2 3–1–2 x
y
(0.4, –4)(–0.5, –2)
The diagram above shows a sketch of part of the curve with equation y = f(x), x ∈ R.
The curve has a minimum point at (−0.5, −2) and a maximum point at (0.4, −4). The lines x = 1, the x-axis and the y-axis are asymptotes of the curve, as shown in the diagram above.
On a separate diagram sketch the graphs of
(a) y = f(x), (4)
(b) y = f(x – 3), (4)
(c) y = f(x). (4)
In each case show clearly
(i) the coordinates of any points at which the curve has a maximum or minimum point,
(ii) how the curve approaches the asymptotes of the curve. (Total 12 marks)