""" '-0 - austintexas.gov
TRANSCRIPT
AUSTIN ENERGY'S TARIFF PACKAGE: § 2015 COST OF SERVICE § BEFORE THE CITY OF AUSTIN
IMPARTIAL HEARING EXAMINER STUDY AND PROPOSAL TO CHANGE § BASE ELECTRIC RATES §
AUSTIN ENERGY'S RESPONSE TO AE LOW INCOME CUSTOMERS' SEVENTH REQUEST FOR INFORMATION
Austin Energy CAE") files this Response to AE Low Income Customers' ("AELIC")
Seventh Request for Information submitted on March 30, 2016. Pursuant to the City of Austin
Procedural Rules for the Initial Review of Austin Energy ' s Rates § 7.3(c)(l), this Response is
timely filed.
Respectfully submitted,
LLOYD GOSSELINK ROCHELLE & TOWNSEND, P.c. 8 I 6 Congress Avenue, Suite 1900 Austin, Texas 78701
)-0 t.r;) (512) 322-5800
~ IY. \.;~
l..L,i -<
1--~
<n
:l!:: 'OX
N
Ck 0...
""" '-0
= ""
(512) 472-0532,,+ ax) tbrocato@lgla,*firm com
w' char c glaY} '!t'm com
HANNAH M. WILCHAR State Bar No. 24088631
ATTORNEYS FOR AUSTIN ENERGY
CERTIFICATE OF SERVICE
I hereby certify that a true and correct copy of this plea'diig has been served on all parties and the Impm1ial Hearing Examiner on this I th day of April ~ 20 16, in accordance with the City of Austin Procedural Rules for the Initial Revie,· fAus ' Ene ID s Rates.
7~9/ 1117068322
1
Austin Energy’s Response to AELIC’s 7th RFI
749/11/7068322
AELIC 7-1 In your response to AELIC 3rd RFI, No. 3-7, AE responded that it “does notsupport bonds with bonds.” By this answer are you stating that AE has incurreddebt financed by bonds to fund its non-utility operations; in other words, “DebtIssues by Series” referenced in your response to AELIC No. 3-7(A) refers tobonds used, in whole or in part, to fund non-utility operations, correct?
ANSWER:
No. Austin Energy does not use debt to support any of its operating expenses. Austin Energyhas incurred debt financed by bonds to fund non-utility capital improvements.
Prepared by: BESponsored by: Mark Dombroski
2
Austin Energy’s Response to AELIC’s 7th RFI
749/11/7068322
AELIC 7-2 If the answer to RFI No. 7-1 is yes, has AE pledged its revenues, including itsregulated revenues, to payment of the bonds issued, in whole or in part, to fundnon-utility operations?
ANSWER:
Not applicable.
Prepared by: RMSponsored by: Mark Dombroski
3
Austin Energy’s Response to AELIC’s 7th RFI
749/11/7068322
AELIC 7-3 Does AE report its revenues realized and expenses incurred for its non-utilityoperations to members of the financial community such as Moody’s InvestorsService?
ANSWER:
Yes. Please see AE’s Response to AELIC RFI No. 3-7 (D).
Prepared by: RMSponsored by: Mark Dombroski
4
Austin Energy’s Response to AELIC’s 7th RFI
749/11/7068322
AELIC 7-4 If the answer to RFI No. 7-3 is yes, does AE identify these revenues and expenses(including expenses related to its debt incurred to fund non-utility operations suchas debt service) as non-utility operation revenues and expenses in its reporting ofits operations to members of the financial community such as Moody’s InvestorsService?
ANSWER:
Yes.
Prepared by: RMSponsored by: Mark Dombroski
5
Austin Energy’s Response to AELIC’s 7th RFI
749/11/7068322
AELIC 7-5 What is the amount of non-utility debt AE excluded from its TY 2014 COS?Please identify where that adjustment can be found in AE’s COS.
ANSWER:
Please see AE’s Response to AELIC RFI No. 3-7 (E) and (F).
Prepared by: RMSponsored by: Mark Dombroski
6
Austin Energy’s Response to AELIC’s 7th RFI
749/11/7068322
AELIC 7-6 For each bond issuance identified in your response to AELIC 3rd RFI, No. 3-7,please provide the associated interest rate, the sinking fund requirement for thecurrent and any future sinking fund requirement.
ANSWER:
2012BAverage interest/cost rate 3.226769%Principal and Interest requirements for FY16 - 21,298,404.10 (current sinking fund requirement)Principal and Interest Requirements for FY17-FY27 - $110,887,211.75 (future sinking fundrequirement)
2015BAverage interest/cost rate 2.247936%Principal and Interest requirements for FY16 - $2,263,753.27 (current sinking fund requirement)Principal and Interest Requirements for FY17-FY38 - $109,296,574.58 (future sinking fundrequirement)
Prepared by: MGSponsored by: Mark Dombroski
7
Austin Energy’s Response to AELIC’s 7th RFI
749/11/7068322
AELIC 7-7 Other than the issuances referred to in your response to AELIC RFI No. 3-7 toyou, has AE incurred any other type of debt related to its non-utility operationssince TY 2009 up to FY 2015?
ANSWER:
No.
Prepared by: MGSponsored by: Mark Dombroski
8
Austin Energy’s Response to AELIC’s 7th RFI
749/11/7068322
AELIC 7-8 If the answer to RFI No. 7-7 is yes, please list each type of debt and for each debtstate:
A. The amount of interest; andB. The amount of time to repay (i.e. the term of the debt instrument).
ANSWER:
Not applicable.
Prepared by: MGSponsored by: Mark Dombroski
9
Austin Energy’s Response to AELIC’s 7th RFI
749/11/7068322
AELIC 7-9 Does any of the residential base rate revenue amounts identified at WP G-10.2,Column (B), Bates Stamp p. 1005 include revenues AE realized from the CAPcharge (See “Outflow of CAP Funds”, line 24, Schedule H-5.2, Bates Stamp p.1070)? Please provide workpapers supporting your answer. If the answer is yes,please identify where in the COS the adjustment to the base rate revenues weremade to add in the CAP rate-funded revenues.
ANSWER:
No. Please see WP H-5.1 in the RFP.
Prepared by: GRSponsored by: Mark Dombroski
10
Austin Energy’s Response to AELIC’s 7th RFI
749/11/7068322
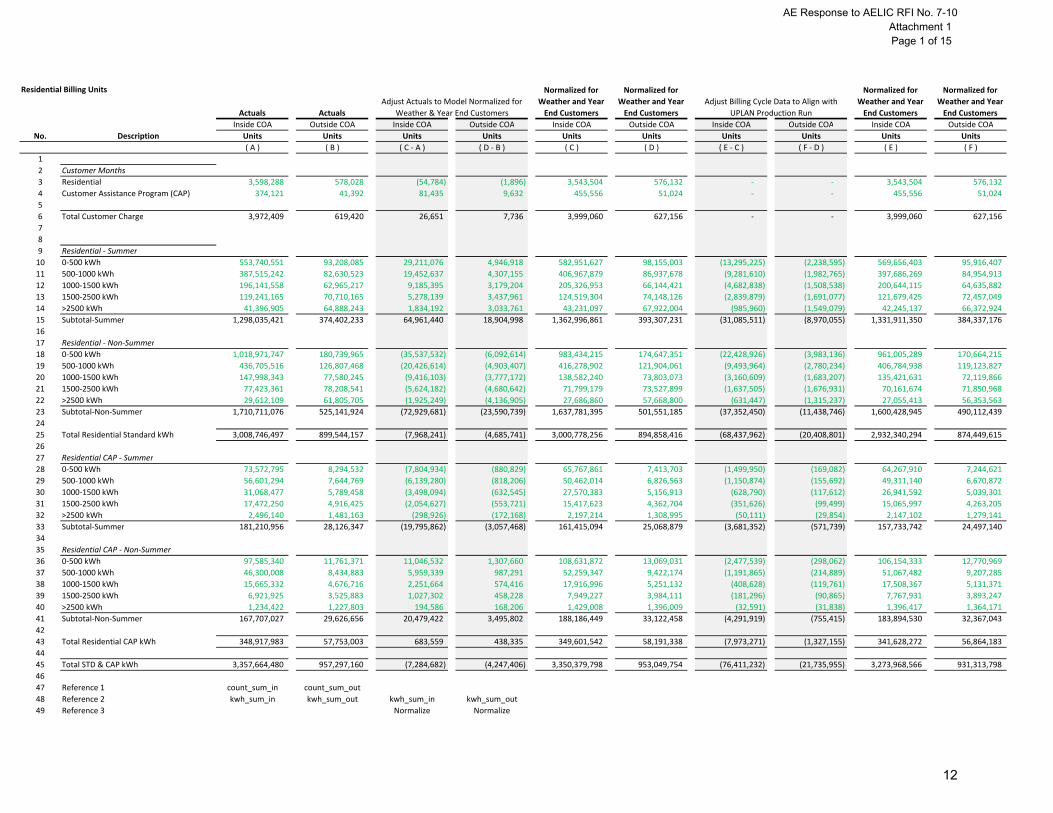
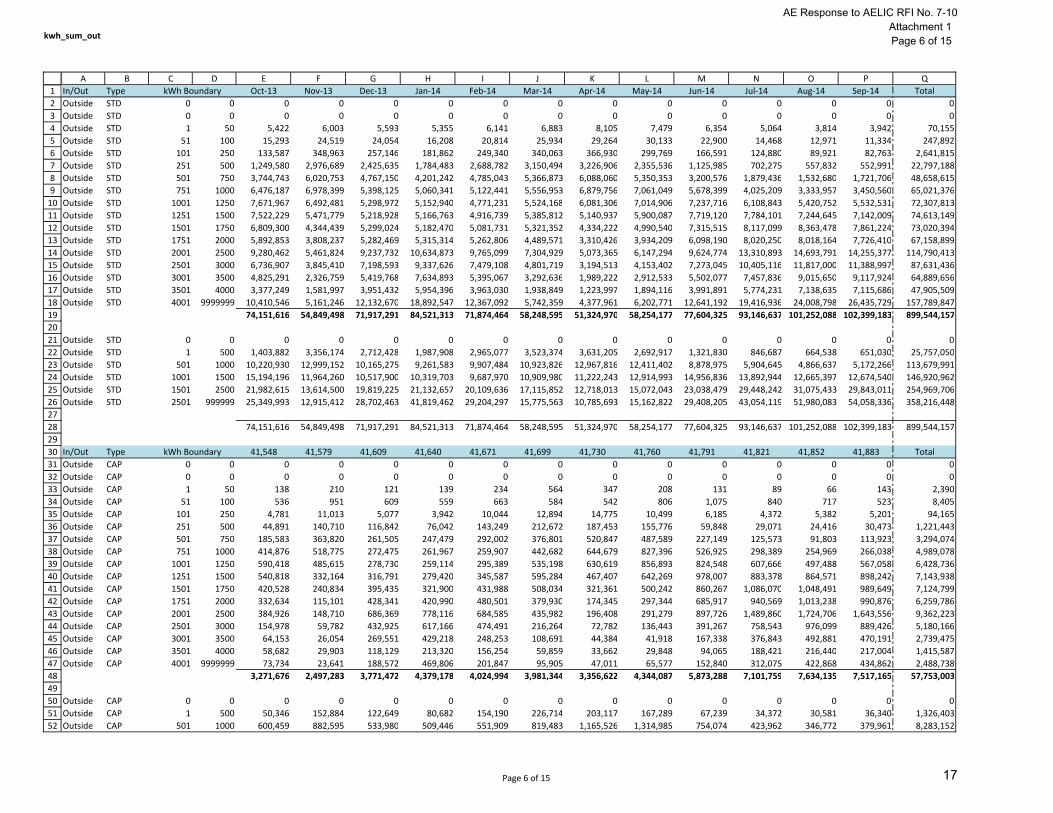
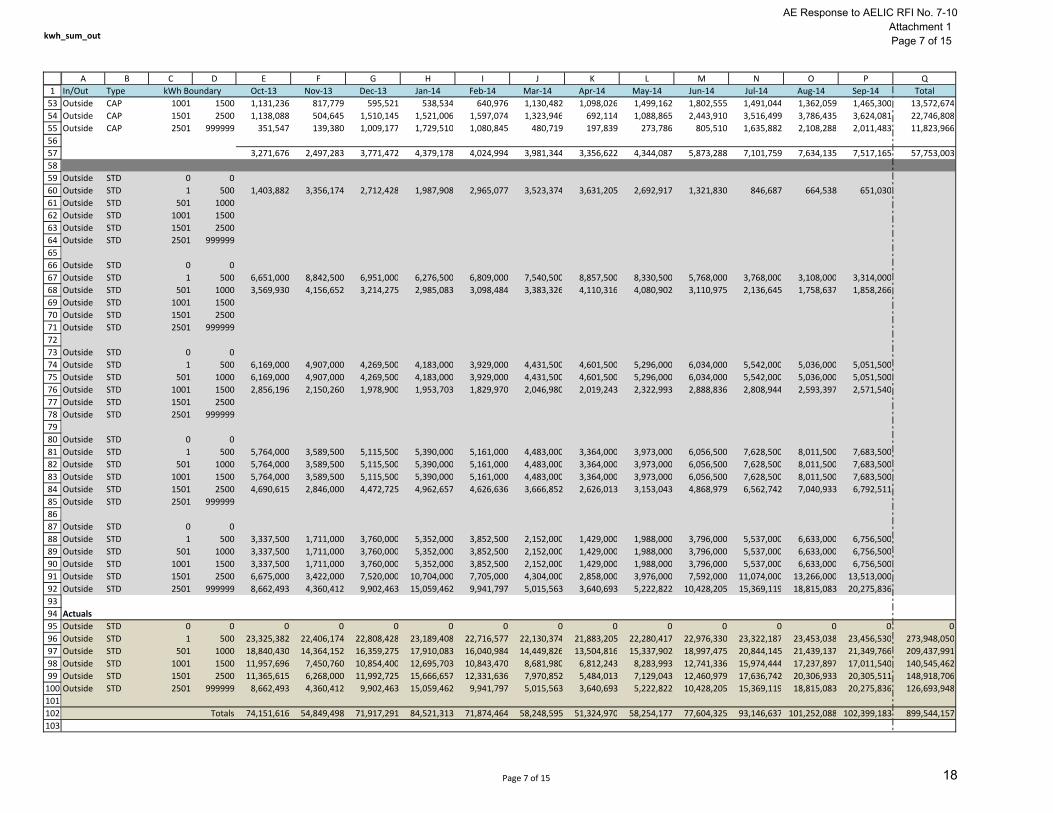
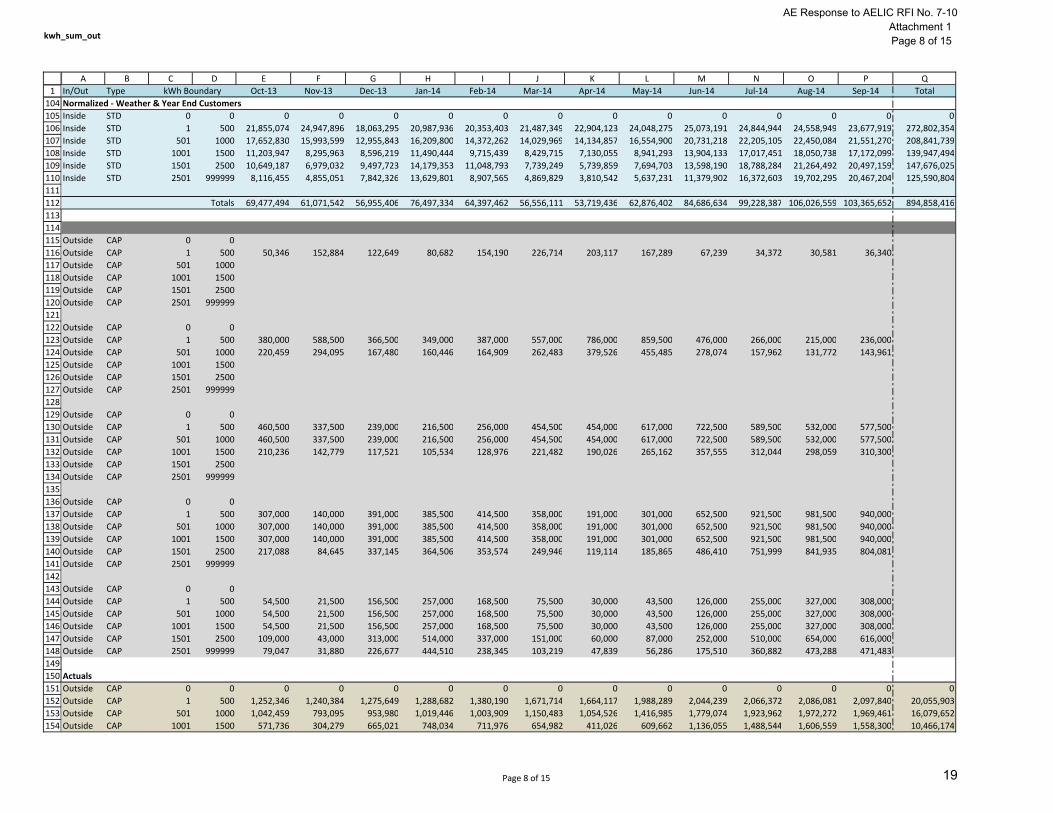
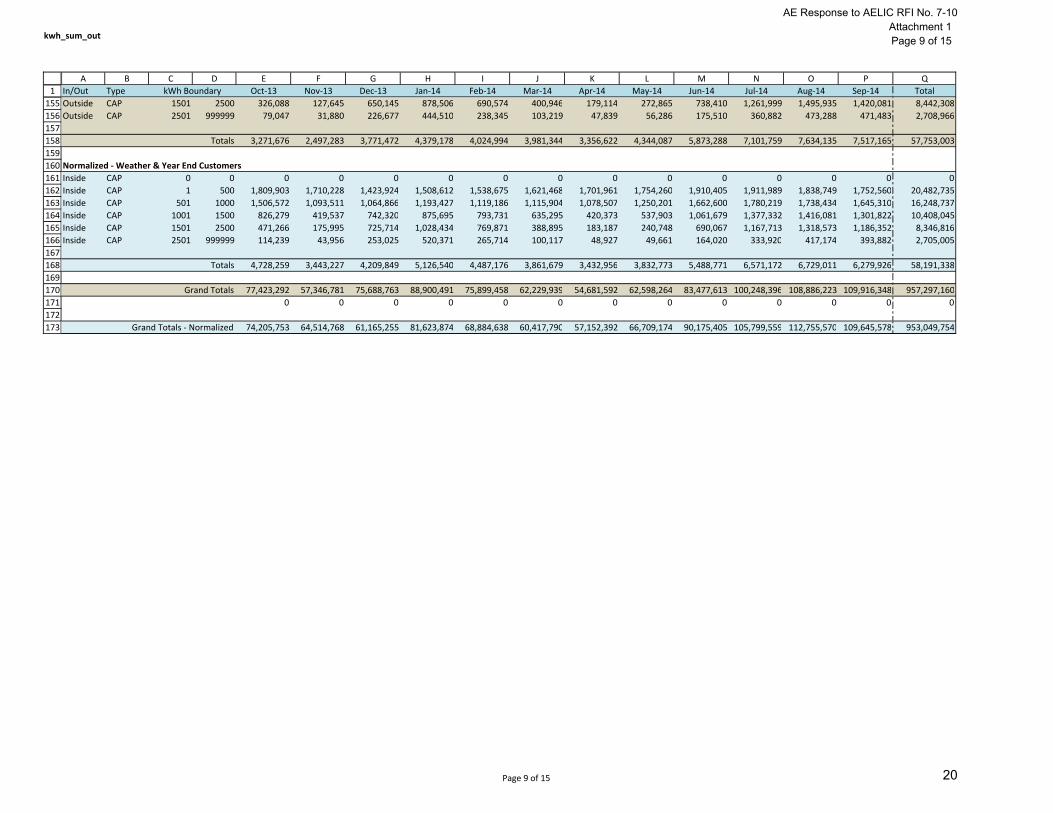
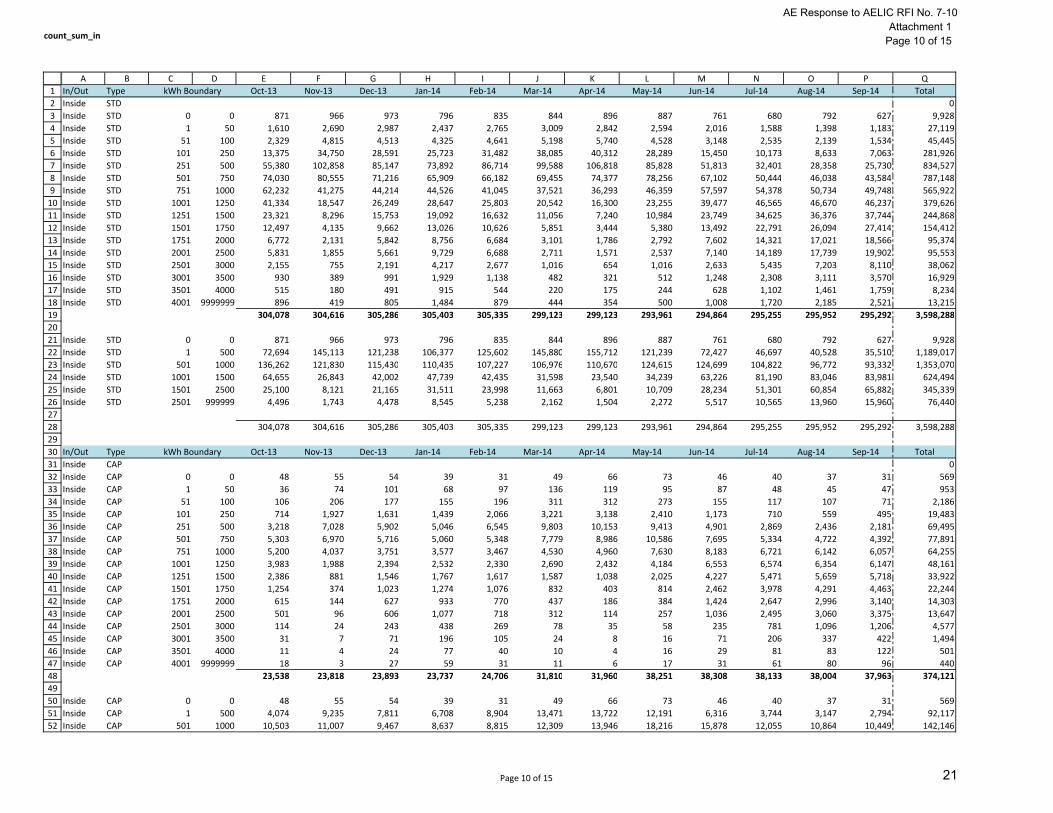
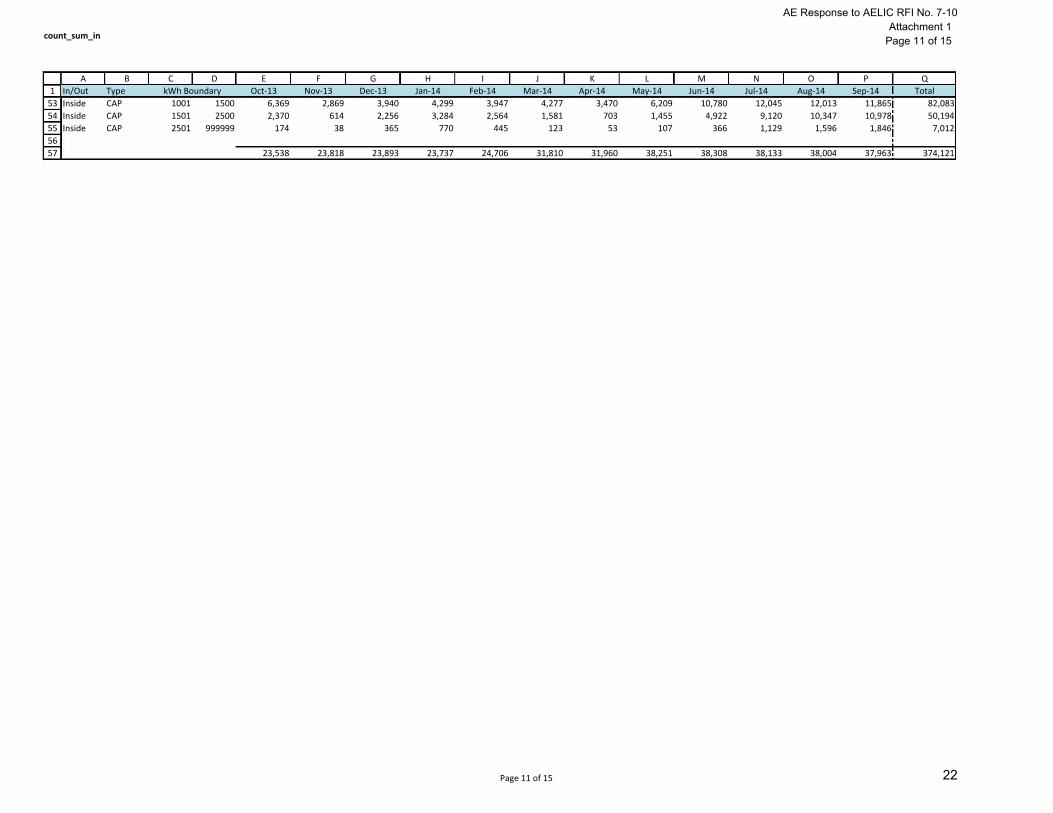
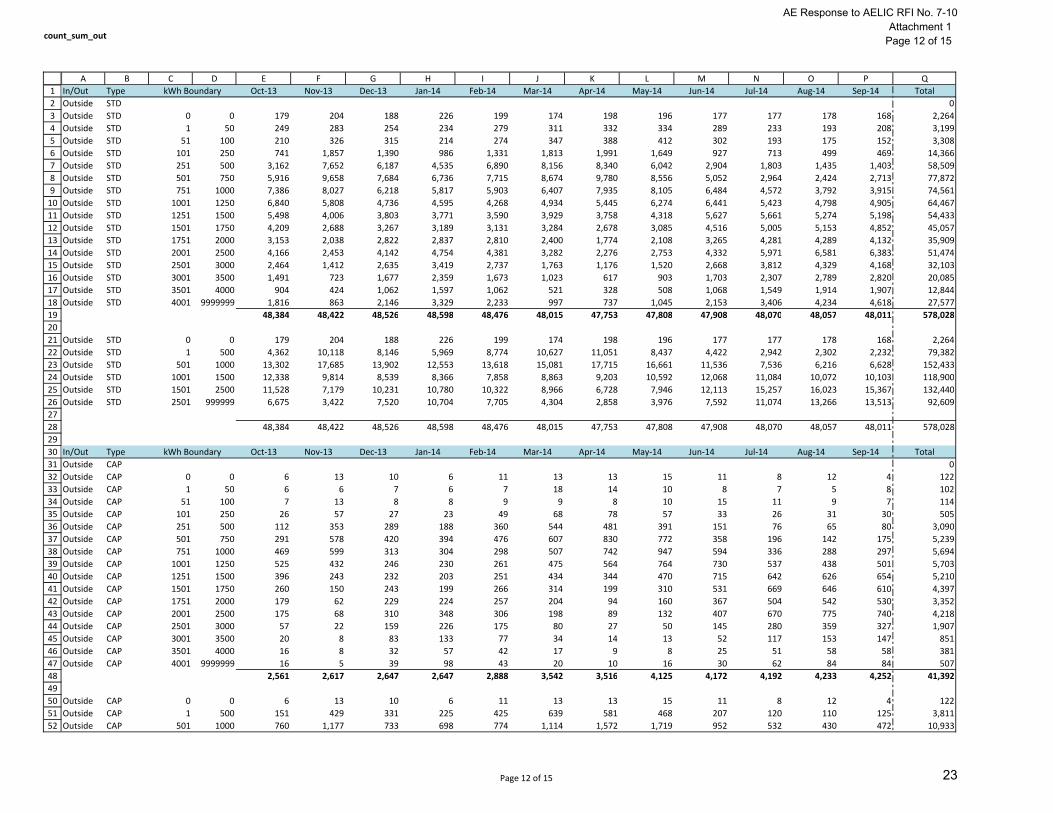
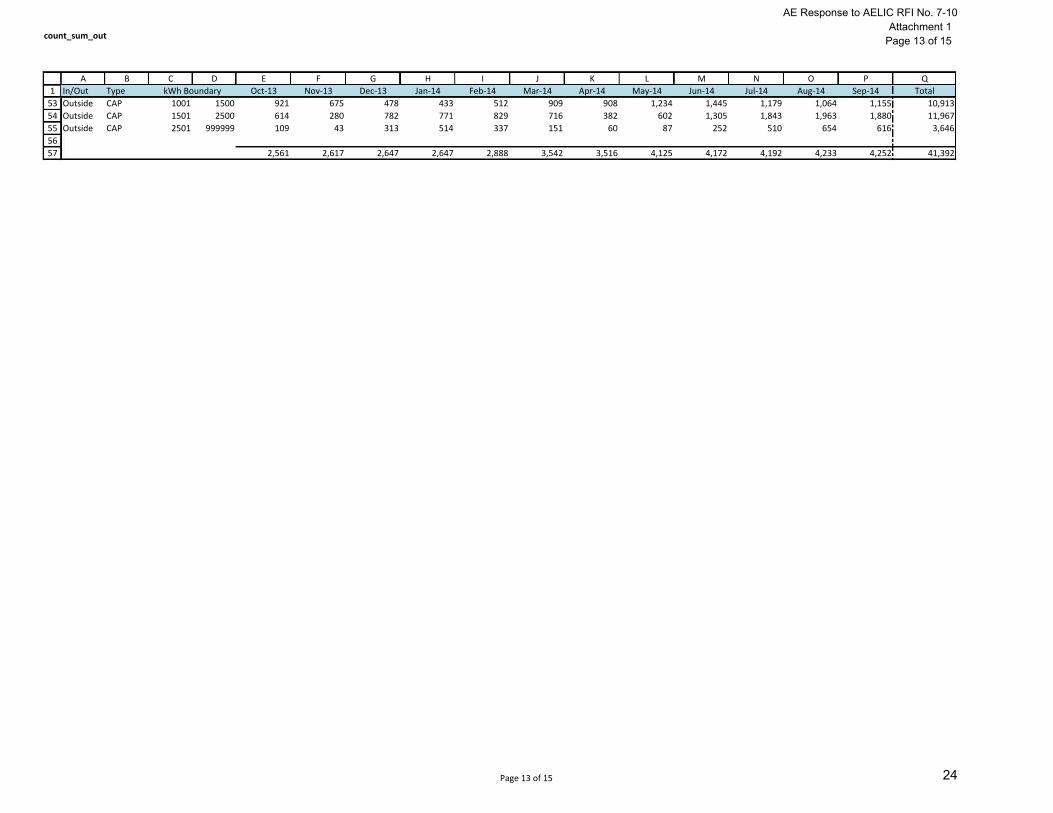
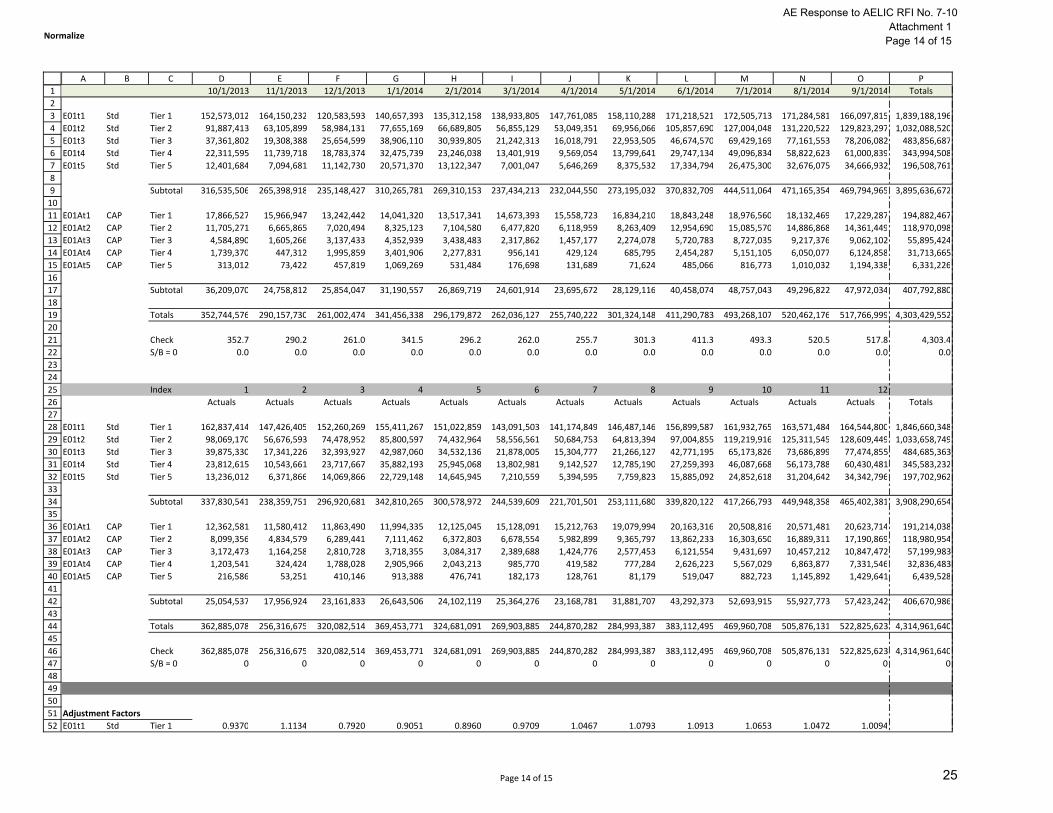
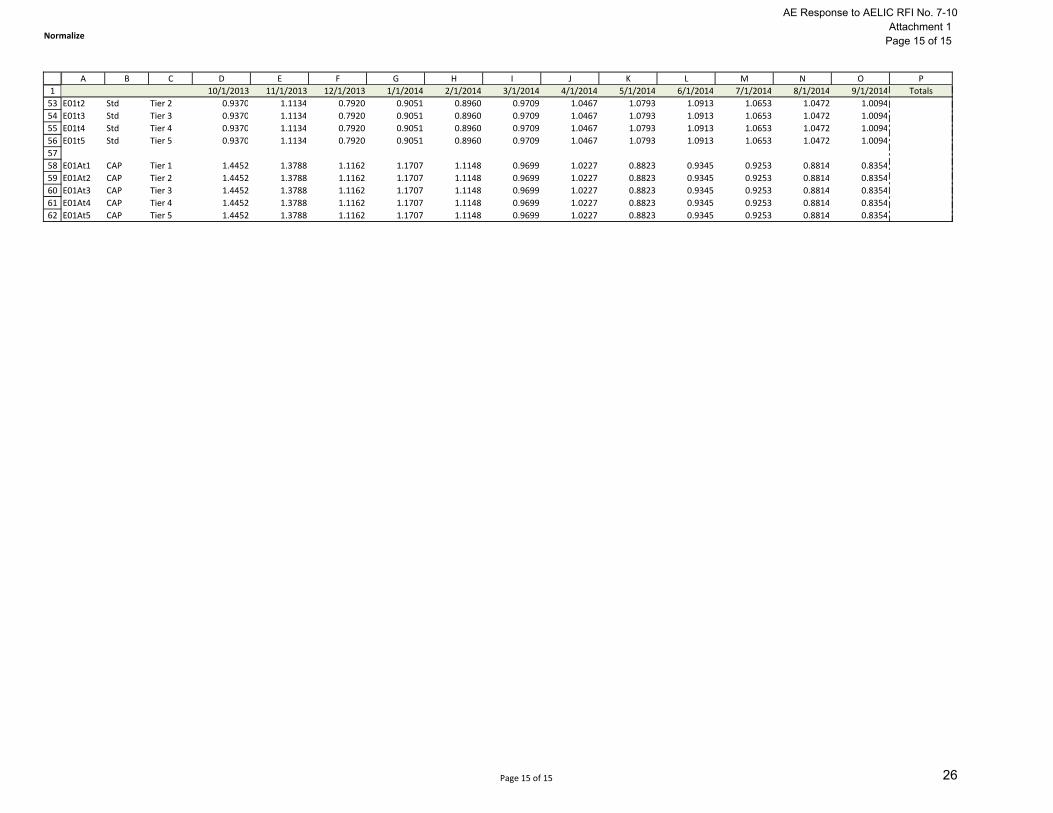
AELIC 7-10 Please provide all of the workpapers supporting the calculation of the$257,323,175 amount of residential base rates identified at WP G-10.2, BatesStamp p. 1005, including workpapers for all of the billing adjustments AE madeand such other adjustments to residential kWh usage in the TY2014 and/or torevenues that were utilized to derive its TY 2014 base rate revenues.
ANSWER:
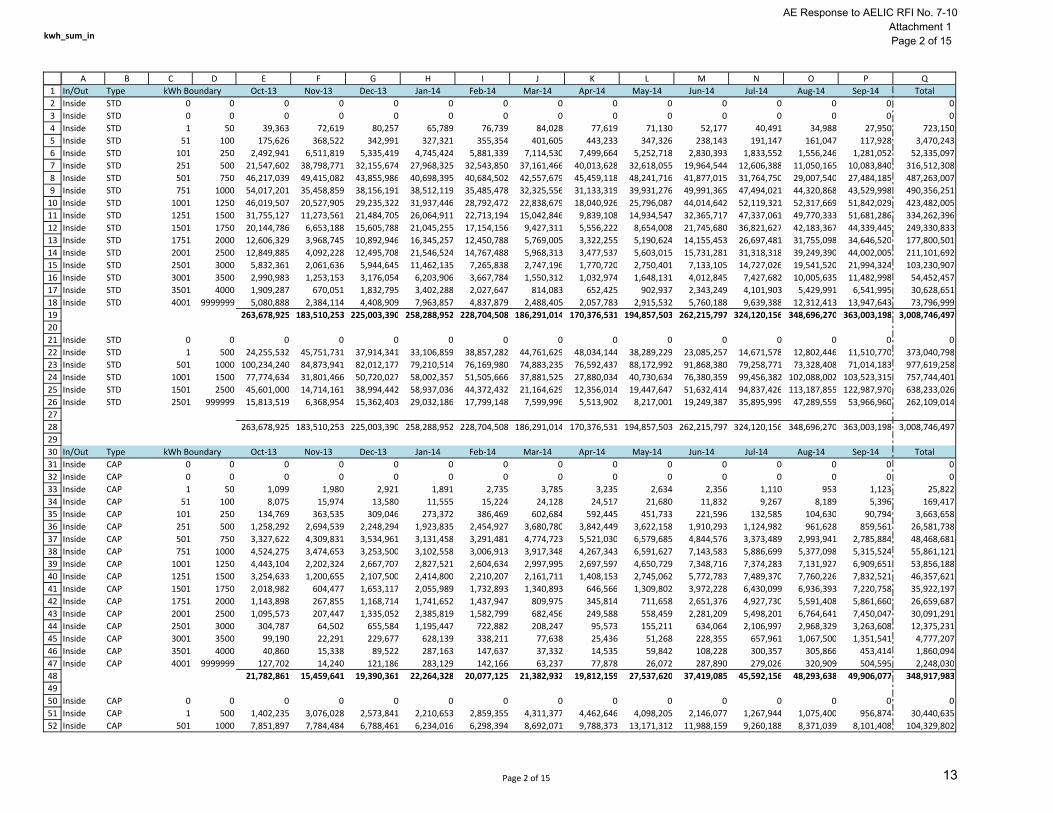
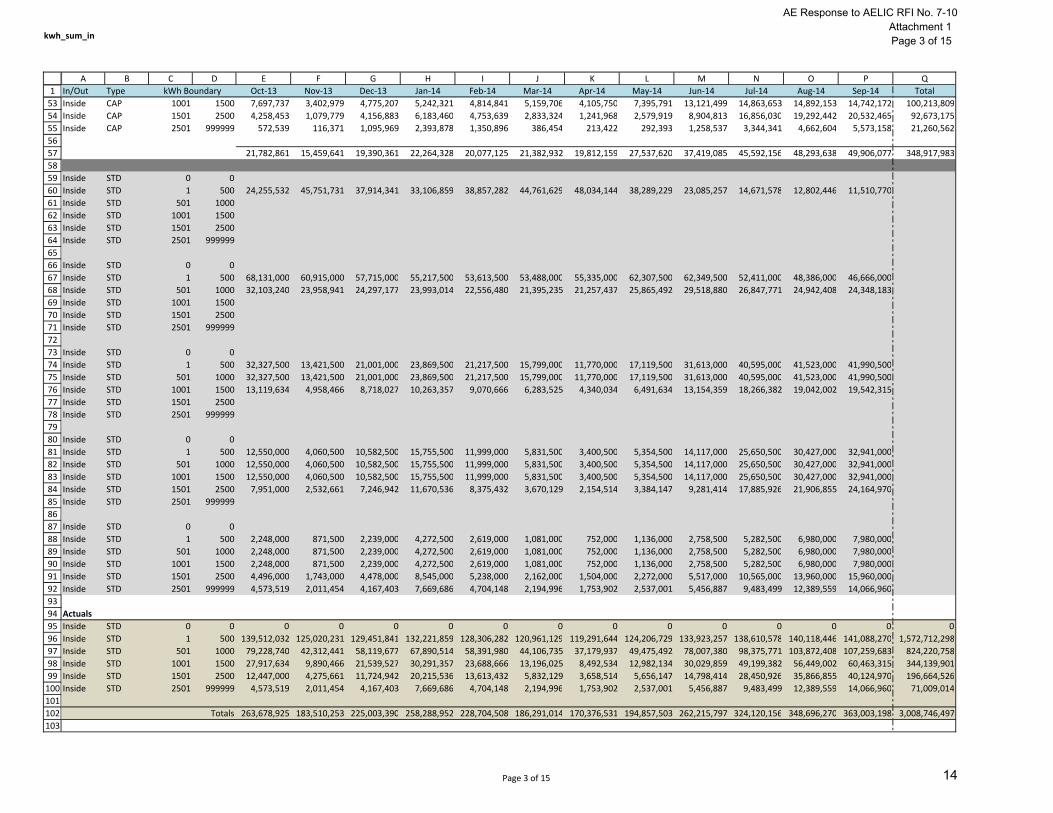
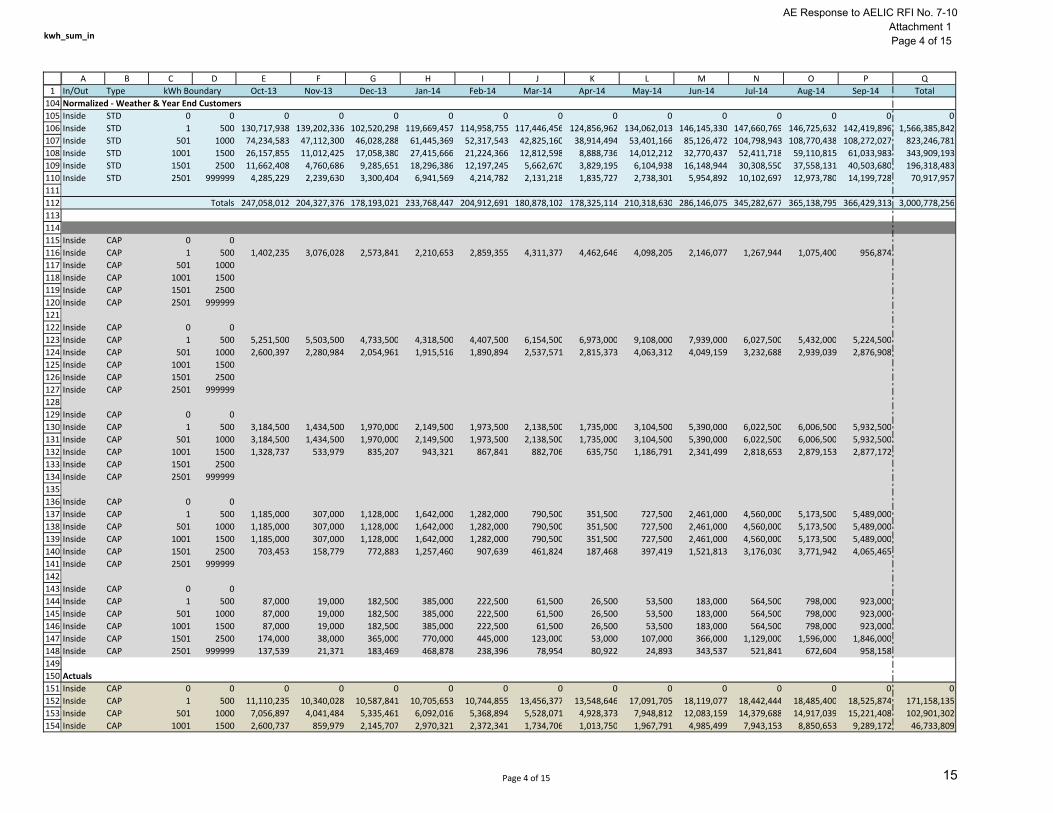
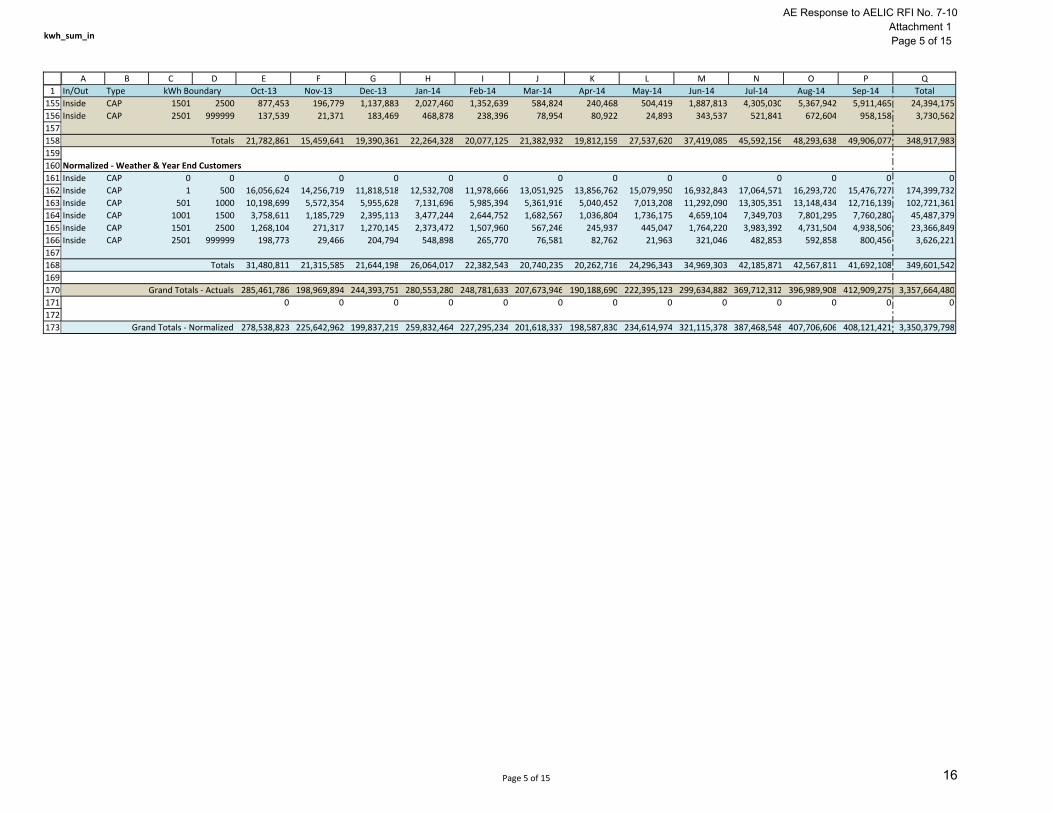
The $257,323,175 in base rate revenue under current rates shown on WP G-10.2 can becalculated by adding line number 14 and 57 in columns C and F on WP H-5.1 and thenmultiplying that result by (1-0.47%). Amounts on line number 14 and 57 reflect the customercharges and energy charges for residential customers inside and outside the City Limits and the -0.47% reflects the billing adjustment factor developed on WP G-10.1.1.
The billing units shown in columns A and D on WP H-5.1 for customers inside and outside theCity Limits are normalized for weather and customer count. Attachment 1 shows theadjustments from FY 2014 Actual billing data to normalized Test Year 2014 billing data.
Attachment 1: Residential Billing Units
Prepared by: GRSponsored by: Mark Dombroski
11
Residential Billing Units
Inside COA Outside COA Inside COA Outside COA Inside COA Outside COA Inside COA Outside COA Inside COA Outside COANo. Description Units Units Units Units Units Units Units Units Units Units
( A ) ( B ) ( C ‐ A ) ( D ‐ B ) ( C ) ( D ) ( E ‐ C ) ( F ‐ D ) ( E ) ( F )12 Customer Months3 Residential 3,598,288 578,028 (54,784) (1,896) 3,543,504 576,132 ‐ ‐ 3,543,504 576,132 4 Customer Assistance Program (CAP) 374,121 41,392 81,435 9,632 455,556 51,024 ‐ ‐ 455,556 51,024 56 Total Customer Charge 3,972,409 619,420 26,651 7,736 3,999,060 627,156 ‐ ‐ 3,999,060 627,156 789 Residential ‐ Summer10 0‐500 kWh 553,740,551 93,208,085 29,211,076 4,946,918 582,951,627 98,155,003 (13,295,225) (2,238,595) 569,656,403 95,916,407 11 500‐1000 kWh 387,515,242 82,630,523 19,452,637 4,307,155 406,967,879 86,937,678 (9,281,610) (1,982,765) 397,686,269 84,954,913 12 1000‐1500 kWh 196,141,558 62,965,217 9,185,395 3,179,204 205,326,953 66,144,421 (4,682,838) (1,508,538) 200,644,115 64,635,882 13 1500‐2500 kWh 119,241,165 70,710,165 5,278,139 3,437,961 124,519,304 74,148,126 (2,839,879) (1,691,077) 121,679,425 72,457,049 14 >2500 kWh 41,396,905 64,888,243 1,834,192 3,033,761 43,231,097 67,922,004 (985,960) (1,549,079) 42,245,137 66,372,924 15 Subtotal‐Summer 1,298,035,421 374,402,233 64,961,440 18,904,998 1,362,996,861 393,307,231 (31,085,511) (8,970,055) 1,331,911,350 384,337,176 1617 Residential ‐ Non‐Summer18 0‐500 kWh 1,018,971,747 180,739,965 (35,537,532) (6,092,614) 983,434,215 174,647,351 (22,428,926) (3,983,136) 961,005,289 170,664,215 19 500‐1000 kWh 436,705,516 126,807,468 (20,426,614) (4,903,407) 416,278,902 121,904,061 (9,493,964) (2,780,234) 406,784,938 119,123,827 20 1000‐1500 kWh 147,998,343 77,580,245 (9,416,103) (3,777,172) 138,582,240 73,803,073 (3,160,609) (1,683,207) 135,421,631 72,119,866 21 1500‐2500 kWh 77,423,361 78,208,541 (5,624,182) (4,680,642) 71,799,179 73,527,899 (1,637,505) (1,676,931) 70,161,674 71,850,968 22 >2500 kWh 29,612,109 61,805,705 (1,925,249) (4,136,905) 27,686,860 57,668,800 (631,447) (1,315,237) 27,055,413 56,353,563 23 Subtotal‐Non‐Summer 1,710,711,076 525,141,924 (72,929,681) (23,590,739) 1,637,781,395 501,551,185 (37,352,450) (11,438,746) 1,600,428,945 490,112,439 2425 Total Residential Standard kWh 3,008,746,497 899,544,157 (7,968,241) (4,685,741) 3,000,778,256 894,858,416 (68,437,962) (20,408,801) 2,932,340,294 874,449,615 2627 Residential CAP ‐ Summer28 0‐500 kWh 73,572,795 8,294,532 (7,804,934) (880,829) 65,767,861 7,413,703 (1,499,950) (169,082) 64,267,910 7,244,621 29 500‐1000 kWh 56,601,294 7,644,769 (6,139,280) (818,206) 50,462,014 6,826,563 (1,150,874) (155,692) 49,311,140 6,670,872 30 1000‐1500 kWh 31,068,477 5,789,458 (3,498,094) (632,545) 27,570,383 5,156,913 (628,790) (117,612) 26,941,592 5,039,301 31 1500‐2500 kWh 17,472,250 4,916,425 (2,054,627) (553,721) 15,417,623 4,362,704 (351,626) (99,499) 15,065,997 4,263,205 32 >2500 kWh 2,496,140 1,481,163 (298,926) (172,168) 2,197,214 1,308,995 (50,111) (29,854) 2,147,102 1,279,141 33 Subtotal‐Summer 181,210,956 28,126,347 (19,795,862) (3,057,468) 161,415,094 25,068,879 (3,681,352) (571,739) 157,733,742 24,497,140 3435 Residential CAP ‐ Non‐Summer36 0‐500 kWh 97,585,340 11,761,371 11,046,532 1,307,660 108,631,872 13,069,031 (2,477,539) (298,062) 106,154,333 12,770,969 37 500‐1000 kWh 46,300,008 8,434,883 5,959,339 987,291 52,259,347 9,422,174 (1,191,865) (214,889) 51,067,482 9,207,285 38 1000‐1500 kWh 15,665,332 4,676,716 2,251,664 574,416 17,916,996 5,251,132 (408,628) (119,761) 17,508,367 5,131,371 39 1500‐2500 kWh 6,921,925 3,525,883 1,027,302 458,228 7,949,227 3,984,111 (181,296) (90,865) 7,767,931 3,893,247 40 >2500 kWh 1,234,422 1,227,803 194,586 168,206 1,429,008 1,396,009 (32,591) (31,838) 1,396,417 1,364,171 41 Subtotal‐Non‐Summer 167,707,027 29,626,656 20,479,422 3,495,802 188,186,449 33,122,458 (4,291,919) (755,415) 183,894,530 32,367,043 4243 Total Residential CAP kWh 348,917,983 57,753,003 683,559 438,335 349,601,542 58,191,338 (7,973,271) (1,327,155) 341,628,272 56,864,183 4445 Total STD & CAP kWh 3,357,664,480 957,297,160 (7,284,682) (4,247,406) 3,350,379,798 953,049,754 (76,411,232) (21,735,955) 3,273,968,566 931,313,798 4647 Reference 1 count_sum_in count_sum_out48 Reference 2 kwh_sum_in kwh_sum_out kwh_sum_in kwh_sum_out49 Reference 3 Normalize Normalize
Normalized for Weather and Year End Customers
Normalized for Weather and Year End CustomersActuals Actuals
Normalized for Weather and Year End Customers
Adjust Billing Cycle Data to Align with UPLAN Production Run
Adjust Actuals to Model Normalized for Weather & Year End Customers
Normalized for Weather and Year End Customers
AE Response to AELIC RFI No. 7-10Attachment 1Page 1 of 15
12
kwh_sum_in
12345678910111213141516171819202122232425262728293031323334353637383940414243444546474849505152
A B C D E F G H I J K L M N O P QIn/Out Type Oct‐13 Nov‐13 Dec‐13 Jan‐14 Feb‐14 Mar‐14 Apr‐14 May‐14 Jun‐14 Jul‐14 Aug‐14 Sep‐14 TotalInside STD 0 0 0 0 0 0 0 0 0 0 0 0 0 0 0Inside STD 0 0 0 0 0 0 0 0 0 0 0 0 0 0 0Inside STD 1 50 39,363 72,619 80,257 65,789 76,739 84,028 77,619 71,130 52,177 40,491 34,988 27,950 723,150Inside STD 51 100 175,626 368,522 342,991 327,321 355,354 401,605 443,233 347,326 238,143 191,147 161,047 117,928 3,470,243Inside STD 101 250 2,492,941 6,511,819 5,335,419 4,745,424 5,881,339 7,114,530 7,499,664 5,252,718 2,830,393 1,833,552 1,556,246 1,281,052 52,335,097Inside STD 251 500 21,547,602 38,798,771 32,155,674 27,968,325 32,543,850 37,161,466 40,013,628 32,618,055 19,964,544 12,606,388 11,050,165 10,083,840 316,512,308Inside STD 501 750 46,217,039 49,415,082 43,855,986 40,698,395 40,684,502 42,557,679 45,459,118 48,241,716 41,877,015 31,764,750 29,007,540 27,484,185 487,263,007Inside STD 751 1000 54,017,201 35,458,859 38,156,191 38,512,119 35,485,478 32,325,556 31,133,319 39,931,276 49,991,365 47,494,021 44,320,868 43,529,998 490,356,251Inside STD 1001 1250 46,019,507 20,527,905 29,235,322 31,937,446 28,792,472 22,838,679 18,040,926 25,796,087 44,014,642 52,119,321 52,317,669 51,842,029 423,482,005Inside STD 1251 1500 31,755,127 11,273,561 21,484,705 26,064,911 22,713,194 15,042,846 9,839,108 14,934,547 32,365,717 47,337,061 49,770,333 51,681,286 334,262,396Inside STD 1501 1750 20,144,786 6,653,188 15,605,788 21,045,255 17,154,156 9,427,311 5,556,222 8,654,008 21,745,680 36,821,627 42,183,367 44,339,445 249,330,833Inside STD 1751 2000 12,606,329 3,968,745 10,892,946 16,345,257 12,450,788 5,769,005 3,322,255 5,190,624 14,155,453 26,697,481 31,755,098 34,646,520 177,800,501Inside STD 2001 2500 12,849,885 4,092,228 12,495,708 21,546,524 14,767,488 5,968,313 3,477,537 5,603,015 15,731,281 31,318,318 39,249,390 44,002,005 211,101,692Inside STD 2501 3000 5,832,361 2,061,636 5,944,645 11,462,135 7,265,838 2,747,196 1,770,720 2,750,401 7,133,105 14,727,026 19,541,520 21,994,324 103,230,907Inside STD 3001 3500 2,990,983 1,253,153 3,176,054 6,203,906 3,667,784 1,550,312 1,032,974 1,648,131 4,012,845 7,427,682 10,005,635 11,482,998 54,452,457Inside STD 3501 4000 1,909,287 670,051 1,832,795 3,402,288 2,027,647 814,083 652,425 902,937 2,343,249 4,101,903 5,429,991 6,541,995 30,628,651Inside STD 4001 9999999 5,080,888 2,384,114 4,408,909 7,963,857 4,837,879 2,488,405 2,057,783 2,915,532 5,760,188 9,639,388 12,312,413 13,947,643 73,796,999
263,678,925 183,510,253 225,003,390 258,288,952 228,704,508 186,291,014 170,376,531 194,857,503 262,215,797 324,120,156 348,696,270 363,003,198 3,008,746,497
Inside STD 0 0 0 0 0 0 0 0 0 0 0 0 0 0 0Inside STD 1 500 24,255,532 45,751,731 37,914,341 33,106,859 38,857,282 44,761,629 48,034,144 38,289,229 23,085,257 14,671,578 12,802,446 11,510,770 373,040,798Inside STD 501 1000 100,234,240 84,873,941 82,012,177 79,210,514 76,169,980 74,883,235 76,592,437 88,172,992 91,868,380 79,258,771 73,328,408 71,014,183 977,619,258Inside STD 1001 1500 77,774,634 31,801,466 50,720,027 58,002,357 51,505,666 37,881,525 27,880,034 40,730,634 76,380,359 99,456,382 102,088,002 103,523,315 757,744,401Inside STD 1501 2500 45,601,000 14,714,161 38,994,442 58,937,036 44,372,432 21,164,629 12,356,014 19,447,647 51,632,414 94,837,426 113,187,855 122,987,970 638,233,026Inside STD 2501 999999 15,813,519 6,368,954 15,362,403 29,032,186 17,799,148 7,599,996 5,513,902 8,217,001 19,249,387 35,895,999 47,289,559 53,966,960 262,109,014
263,678,925 183,510,253 225,003,390 258,288,952 228,704,508 186,291,014 170,376,531 194,857,503 262,215,797 324,120,156 348,696,270 363,003,198 3,008,746,497
In/Out Type Oct‐13 Nov‐13 Dec‐13 Jan‐14 Feb‐14 Mar‐14 Apr‐14 May‐14 Jun‐14 Jul‐14 Aug‐14 Sep‐14 TotalInside CAP 0 0 0 0 0 0 0 0 0 0 0 0 0 0 0Inside CAP 0 0 0 0 0 0 0 0 0 0 0 0 0 0 0Inside CAP 1 50 1,099 1,980 2,921 1,891 2,735 3,785 3,235 2,634 2,356 1,110 953 1,123 25,822Inside CAP 51 100 8,075 15,974 13,580 11,555 15,224 24,128 24,517 21,680 11,832 9,267 8,189 5,396 169,417Inside CAP 101 250 134,769 363,535 309,046 273,372 386,469 602,684 592,445 451,733 221,596 132,585 104,630 90,794 3,663,658Inside CAP 251 500 1,258,292 2,694,539 2,248,294 1,923,835 2,454,927 3,680,780 3,842,449 3,622,158 1,910,293 1,124,982 961,628 859,561 26,581,738Inside CAP 501 750 3,327,622 4,309,831 3,534,961 3,131,458 3,291,481 4,774,723 5,521,030 6,579,685 4,844,576 3,373,489 2,993,941 2,785,884 48,468,681Inside CAP 751 1000 4,524,275 3,474,653 3,253,500 3,102,558 3,006,913 3,917,348 4,267,343 6,591,627 7,143,583 5,886,699 5,377,098 5,315,524 55,861,121Inside CAP 1001 1250 4,443,104 2,202,324 2,667,707 2,827,521 2,604,634 2,997,995 2,697,597 4,650,729 7,348,716 7,374,283 7,131,927 6,909,651 53,856,188Inside CAP 1251 1500 3,254,633 1,200,655 2,107,500 2,414,800 2,210,207 2,161,711 1,408,153 2,745,062 5,772,783 7,489,370 7,760,226 7,832,521 46,357,621Inside CAP 1501 1750 2,018,982 604,477 1,653,117 2,055,989 1,732,893 1,340,893 646,566 1,309,802 3,972,228 6,430,099 6,936,393 7,220,758 35,922,197Inside CAP 1751 2000 1,143,898 267,855 1,168,714 1,741,652 1,437,947 809,975 345,814 711,658 2,651,376 4,927,730 5,591,408 5,861,660 26,659,687Inside CAP 2001 2500 1,095,573 207,447 1,335,052 2,385,819 1,582,799 682,456 249,588 558,459 2,281,209 5,498,201 6,764,641 7,450,047 30,091,291Inside CAP 2501 3000 304,787 64,502 655,584 1,195,447 722,882 208,247 95,573 155,211 634,064 2,106,997 2,968,329 3,263,608 12,375,231Inside CAP 3001 3500 99,190 22,291 229,677 628,139 338,211 77,638 25,436 51,268 228,355 657,961 1,067,500 1,351,541 4,777,207Inside CAP 3501 4000 40,860 15,338 89,522 287,163 147,637 37,332 14,535 59,842 108,228 300,357 305,866 453,414 1,860,094Inside CAP 4001 9999999 127,702 14,240 121,186 283,129 142,166 63,237 77,878 26,072 287,890 279,026 320,909 504,595 2,248,030
21,782,861 15,459,641 19,390,361 22,264,328 20,077,125 21,382,932 19,812,159 27,537,620 37,419,085 45,592,156 48,293,638 49,906,077 348,917,983
Inside CAP 0 0 0 0 0 0 0 0 0 0 0 0 0 0 0Inside CAP 1 500 1,402,235 3,076,028 2,573,841 2,210,653 2,859,355 4,311,377 4,462,646 4,098,205 2,146,077 1,267,944 1,075,400 956,874 30,440,635Inside CAP 501 1000 7,851,897 7,784,484 6,788,461 6,234,016 6,298,394 8,692,071 9,788,373 13,171,312 11,988,159 9,260,188 8,371,039 8,101,408 104,329,802
kWh Boundary
kWh Boundary
Page 2 of 15
AE Response to AELIC RFI No. 7-10Attachment 1Page 2 of 15
13
kwh_sum_in
1A B C D E F G H I J K L M N O P Q
In/Out Type Oct‐13 Nov‐13 Dec‐13 Jan‐14 Feb‐14 Mar‐14 Apr‐14 May‐14 Jun‐14 Jul‐14 Aug‐14 Sep‐14 TotalkWh Boundary5354555657585960616263646566676869707172737475767778798081828384858687888990919293949596979899100101102103
Inside CAP 1001 1500 7,697,737 3,402,979 4,775,207 5,242,321 4,814,841 5,159,706 4,105,750 7,395,791 13,121,499 14,863,653 14,892,153 14,742,172 100,213,809Inside CAP 1501 2500 4,258,453 1,079,779 4,156,883 6,183,460 4,753,639 2,833,324 1,241,968 2,579,919 8,904,813 16,856,030 19,292,442 20,532,465 92,673,175Inside CAP 2501 999999 572,539 116,371 1,095,969 2,393,878 1,350,896 386,454 213,422 292,393 1,258,537 3,344,341 4,662,604 5,573,158 21,260,562
21,782,861 15,459,641 19,390,361 22,264,328 20,077,125 21,382,932 19,812,159 27,537,620 37,419,085 45,592,156 48,293,638 49,906,077 348,917,983
Inside STD 0 0Inside STD 1 500 24,255,532 45,751,731 37,914,341 33,106,859 38,857,282 44,761,629 48,034,144 38,289,229 23,085,257 14,671,578 12,802,446 11,510,770Inside STD 501 1000Inside STD 1001 1500Inside STD 1501 2500Inside STD 2501 999999
Inside STD 0 0Inside STD 1 500 68,131,000 60,915,000 57,715,000 55,217,500 53,613,500 53,488,000 55,335,000 62,307,500 62,349,500 52,411,000 48,386,000 46,666,000Inside STD 501 1000 32,103,240 23,958,941 24,297,177 23,993,014 22,556,480 21,395,235 21,257,437 25,865,492 29,518,880 26,847,771 24,942,408 24,348,183Inside STD 1001 1500Inside STD 1501 2500Inside STD 2501 999999
Inside STD 0 0Inside STD 1 500 32,327,500 13,421,500 21,001,000 23,869,500 21,217,500 15,799,000 11,770,000 17,119,500 31,613,000 40,595,000 41,523,000 41,990,500Inside STD 501 1000 32,327,500 13,421,500 21,001,000 23,869,500 21,217,500 15,799,000 11,770,000 17,119,500 31,613,000 40,595,000 41,523,000 41,990,500Inside STD 1001 1500 13,119,634 4,958,466 8,718,027 10,263,357 9,070,666 6,283,525 4,340,034 6,491,634 13,154,359 18,266,382 19,042,002 19,542,315Inside STD 1501 2500Inside STD 2501 999999
Inside STD 0 0Inside STD 1 500 12,550,000 4,060,500 10,582,500 15,755,500 11,999,000 5,831,500 3,400,500 5,354,500 14,117,000 25,650,500 30,427,000 32,941,000Inside STD 501 1000 12,550,000 4,060,500 10,582,500 15,755,500 11,999,000 5,831,500 3,400,500 5,354,500 14,117,000 25,650,500 30,427,000 32,941,000Inside STD 1001 1500 12,550,000 4,060,500 10,582,500 15,755,500 11,999,000 5,831,500 3,400,500 5,354,500 14,117,000 25,650,500 30,427,000 32,941,000Inside STD 1501 2500 7,951,000 2,532,661 7,246,942 11,670,536 8,375,432 3,670,129 2,154,514 3,384,147 9,281,414 17,885,926 21,906,855 24,164,970Inside STD 2501 999999
Inside STD 0 0Inside STD 1 500 2,248,000 871,500 2,239,000 4,272,500 2,619,000 1,081,000 752,000 1,136,000 2,758,500 5,282,500 6,980,000 7,980,000Inside STD 501 1000 2,248,000 871,500 2,239,000 4,272,500 2,619,000 1,081,000 752,000 1,136,000 2,758,500 5,282,500 6,980,000 7,980,000Inside STD 1001 1500 2,248,000 871,500 2,239,000 4,272,500 2,619,000 1,081,000 752,000 1,136,000 2,758,500 5,282,500 6,980,000 7,980,000Inside STD 1501 2500 4,496,000 1,743,000 4,478,000 8,545,000 5,238,000 2,162,000 1,504,000 2,272,000 5,517,000 10,565,000 13,960,000 15,960,000Inside STD 2501 999999 4,573,519 2,011,454 4,167,403 7,669,686 4,704,148 2,194,996 1,753,902 2,537,001 5,456,887 9,483,499 12,389,559 14,066,960
ActualsInside STD 0 0 0 0 0 0 0 0 0 0 0 0 0 0 0Inside STD 1 500 139,512,032 125,020,231 129,451,841 132,221,859 128,306,282 120,961,129 119,291,644 124,206,729 133,923,257 138,610,578 140,118,446 141,088,270 1,572,712,298Inside STD 501 1000 79,228,740 42,312,441 58,119,677 67,890,514 58,391,980 44,106,735 37,179,937 49,475,492 78,007,380 98,375,771 103,872,408 107,259,683 824,220,758Inside STD 1001 1500 27,917,634 9,890,466 21,539,527 30,291,357 23,688,666 13,196,025 8,492,534 12,982,134 30,029,859 49,199,382 56,449,002 60,463,315 344,139,901Inside STD 1501 2500 12,447,000 4,275,661 11,724,942 20,215,536 13,613,432 5,832,129 3,658,514 5,656,147 14,798,414 28,450,926 35,866,855 40,124,970 196,664,526Inside STD 2501 999999 4,573,519 2,011,454 4,167,403 7,669,686 4,704,148 2,194,996 1,753,902 2,537,001 5,456,887 9,483,499 12,389,559 14,066,960 71,009,014
Totals 263,678,925 183,510,253 225,003,390 258,288,952 228,704,508 186,291,014 170,376,531 194,857,503 262,215,797 324,120,156 348,696,270 363,003,198 3,008,746,497
Page 3 of 15
AE Response to AELIC RFI No. 7-10Attachment 1Page 3 of 15
14
kwh_sum_in
1A B C D E F G H I J K L M N O P Q
In/Out Type Oct‐13 Nov‐13 Dec‐13 Jan‐14 Feb‐14 Mar‐14 Apr‐14 May‐14 Jun‐14 Jul‐14 Aug‐14 Sep‐14 TotalkWh Boundary104105106107108109110111112113114115116117118119120121122123124125126127128129130131132133134135136137138139140141142143144145146147148149150151152153154
Normalized ‐ Weather & Year End CustomersInside STD 0 0 0 0 0 0 0 0 0 0 0 0 0 0 0Inside STD 1 500 130,717,938 139,202,336 102,520,298 119,669,457 114,958,755 117,446,456 124,856,962 134,062,013 146,145,330 147,660,769 146,725,632 142,419,896 1,566,385,842Inside STD 501 1000 74,234,583 47,112,300 46,028,288 61,445,369 52,317,543 42,825,160 38,914,494 53,401,166 85,126,472 104,798,943 108,770,438 108,272,027 823,246,781Inside STD 1001 1500 26,157,855 11,012,425 17,058,380 27,415,666 21,224,366 12,812,598 8,888,736 14,012,212 32,770,437 52,411,718 59,110,815 61,033,983 343,909,193Inside STD 1501 2500 11,662,408 4,760,686 9,285,651 18,296,386 12,197,245 5,662,670 3,829,195 6,104,938 16,148,944 30,308,550 37,558,131 40,503,680 196,318,483Inside STD 2501 999999 4,285,229 2,239,630 3,300,404 6,941,569 4,214,782 2,131,218 1,835,727 2,738,301 5,954,892 10,102,697 12,973,780 14,199,728 70,917,957
Totals 247,058,012 204,327,376 178,193,021 233,768,447 204,912,691 180,878,102 178,325,114 210,318,630 286,146,075 345,282,677 365,138,795 366,429,313 3,000,778,256
Inside CAP 0 0Inside CAP 1 500 1,402,235 3,076,028 2,573,841 2,210,653 2,859,355 4,311,377 4,462,646 4,098,205 2,146,077 1,267,944 1,075,400 956,874Inside CAP 501 1000Inside CAP 1001 1500Inside CAP 1501 2500Inside CAP 2501 999999
Inside CAP 0 0Inside CAP 1 500 5,251,500 5,503,500 4,733,500 4,318,500 4,407,500 6,154,500 6,973,000 9,108,000 7,939,000 6,027,500 5,432,000 5,224,500Inside CAP 501 1000 2,600,397 2,280,984 2,054,961 1,915,516 1,890,894 2,537,571 2,815,373 4,063,312 4,049,159 3,232,688 2,939,039 2,876,908Inside CAP 1001 1500Inside CAP 1501 2500Inside CAP 2501 999999
Inside CAP 0 0Inside CAP 1 500 3,184,500 1,434,500 1,970,000 2,149,500 1,973,500 2,138,500 1,735,000 3,104,500 5,390,000 6,022,500 6,006,500 5,932,500Inside CAP 501 1000 3,184,500 1,434,500 1,970,000 2,149,500 1,973,500 2,138,500 1,735,000 3,104,500 5,390,000 6,022,500 6,006,500 5,932,500Inside CAP 1001 1500 1,328,737 533,979 835,207 943,321 867,841 882,706 635,750 1,186,791 2,341,499 2,818,653 2,879,153 2,877,172Inside CAP 1501 2500Inside CAP 2501 999999
Inside CAP 0 0Inside CAP 1 500 1,185,000 307,000 1,128,000 1,642,000 1,282,000 790,500 351,500 727,500 2,461,000 4,560,000 5,173,500 5,489,000Inside CAP 501 1000 1,185,000 307,000 1,128,000 1,642,000 1,282,000 790,500 351,500 727,500 2,461,000 4,560,000 5,173,500 5,489,000Inside CAP 1001 1500 1,185,000 307,000 1,128,000 1,642,000 1,282,000 790,500 351,500 727,500 2,461,000 4,560,000 5,173,500 5,489,000Inside CAP 1501 2500 703,453 158,779 772,883 1,257,460 907,639 461,824 187,468 397,419 1,521,813 3,176,030 3,771,942 4,065,465Inside CAP 2501 999999
Inside CAP 0 0Inside CAP 1 500 87,000 19,000 182,500 385,000 222,500 61,500 26,500 53,500 183,000 564,500 798,000 923,000Inside CAP 501 1000 87,000 19,000 182,500 385,000 222,500 61,500 26,500 53,500 183,000 564,500 798,000 923,000Inside CAP 1001 1500 87,000 19,000 182,500 385,000 222,500 61,500 26,500 53,500 183,000 564,500 798,000 923,000Inside CAP 1501 2500 174,000 38,000 365,000 770,000 445,000 123,000 53,000 107,000 366,000 1,129,000 1,596,000 1,846,000Inside CAP 2501 999999 137,539 21,371 183,469 468,878 238,396 78,954 80,922 24,893 343,537 521,841 672,604 958,158
ActualsInside CAP 0 0 0 0 0 0 0 0 0 0 0 0 0 0 0Inside CAP 1 500 11,110,235 10,340,028 10,587,841 10,705,653 10,744,855 13,456,377 13,548,646 17,091,705 18,119,077 18,442,444 18,485,400 18,525,874 171,158,135Inside CAP 501 1000 7,056,897 4,041,484 5,335,461 6,092,016 5,368,894 5,528,071 4,928,373 7,948,812 12,083,159 14,379,688 14,917,039 15,221,408 102,901,302Inside CAP 1001 1500 2,600,737 859,979 2,145,707 2,970,321 2,372,341 1,734,706 1,013,750 1,967,791 4,985,499 7,943,153 8,850,653 9,289,172 46,733,809
Page 4 of 15
AE Response to AELIC RFI No. 7-10Attachment 1Page 4 of 15
15
kwh_sum_in
1A B C D E F G H I J K L M N O P Q
In/Out Type Oct‐13 Nov‐13 Dec‐13 Jan‐14 Feb‐14 Mar‐14 Apr‐14 May‐14 Jun‐14 Jul‐14 Aug‐14 Sep‐14 TotalkWh Boundary155156157158159160161162163164165166167168169170171172173
Inside CAP 1501 2500 877,453 196,779 1,137,883 2,027,460 1,352,639 584,824 240,468 504,419 1,887,813 4,305,030 5,367,942 5,911,465 24,394,175Inside CAP 2501 999999 137,539 21,371 183,469 468,878 238,396 78,954 80,922 24,893 343,537 521,841 672,604 958,158 3,730,562
Totals 21,782,861 15,459,641 19,390,361 22,264,328 20,077,125 21,382,932 19,812,159 27,537,620 37,419,085 45,592,156 48,293,638 49,906,077 348,917,983
Normalized ‐ Weather & Year End CustomersInside CAP 0 0 0 0 0 0 0 0 0 0 0 0 0 0 0Inside CAP 1 500 16,056,624 14,256,719 11,818,518 12,532,708 11,978,666 13,051,925 13,856,762 15,079,950 16,932,843 17,064,571 16,293,720 15,476,727 174,399,732Inside CAP 501 1000 10,198,699 5,572,354 5,955,628 7,131,696 5,985,394 5,361,916 5,040,452 7,013,208 11,292,090 13,305,351 13,148,434 12,716,139 102,721,361Inside CAP 1001 1500 3,758,611 1,185,729 2,395,113 3,477,244 2,644,752 1,682,567 1,036,804 1,736,175 4,659,104 7,349,703 7,801,295 7,760,280 45,487,379Inside CAP 1501 2500 1,268,104 271,317 1,270,145 2,373,472 1,507,960 567,246 245,937 445,047 1,764,220 3,983,392 4,731,504 4,938,506 23,366,849Inside CAP 2501 999999 198,773 29,466 204,794 548,898 265,770 76,581 82,762 21,963 321,046 482,853 592,858 800,456 3,626,221
Totals 31,480,811 21,315,585 21,644,198 26,064,017 22,382,543 20,740,235 20,262,716 24,296,343 34,969,303 42,185,871 42,567,811 41,692,108 349,601,542
Grand Totals ‐ Actuals 285,461,786 198,969,894 244,393,751 280,553,280 248,781,633 207,673,946 190,188,690 222,395,123 299,634,882 369,712,312 396,989,908 412,909,275 3,357,664,4800 0 0 0 0 0 0 0 0 0 0 0 0
Grand Totals ‐ Normalized 278,538,823 225,642,962 199,837,219 259,832,464 227,295,234 201,618,337 198,587,830 234,614,974 321,115,378 387,468,548 407,706,606 408,121,421 3,350,379,798
Page 5 of 15
AE Response to AELIC RFI No. 7-10Attachment 1Page 5 of 15
16
kwh_sum_out
12345678910111213141516171819202122232425262728293031323334353637383940414243444546474849505152
A B C D E F G H I J K L M N O P QIn/Out Type Oct‐13 Nov‐13 Dec‐13 Jan‐14 Feb‐14 Mar‐14 Apr‐14 May‐14 Jun‐14 Jul‐14 Aug‐14 Sep‐14 TotalOutside STD 0 0 0 0 0 0 0 0 0 0 0 0 0 0 0Outside STD 0 0 0 0 0 0 0 0 0 0 0 0 0 0 0Outside STD 1 50 5,422 6,003 5,593 5,355 6,141 6,883 8,105 7,479 6,354 5,064 3,814 3,942 70,155Outside STD 51 100 15,293 24,519 24,054 16,208 20,814 25,934 29,264 30,133 22,900 14,468 12,971 11,334 247,892Outside STD 101 250 133,587 348,963 257,146 181,862 249,340 340,063 366,930 299,769 166,591 124,880 89,921 82,763 2,641,815Outside STD 251 500 1,249,580 2,976,689 2,425,635 1,784,483 2,688,782 3,150,494 3,226,906 2,355,536 1,125,985 702,275 557,832 552,991 22,797,188Outside STD 501 750 3,744,743 6,020,753 4,767,150 4,201,242 4,785,043 5,366,873 6,088,060 5,350,353 3,200,576 1,879,436 1,532,680 1,721,706 48,658,615Outside STD 751 1000 6,476,187 6,978,399 5,398,125 5,060,341 5,122,441 5,556,953 6,879,756 7,061,049 5,678,399 4,025,209 3,333,957 3,450,560 65,021,376Outside STD 1001 1250 7,671,967 6,492,481 5,298,972 5,152,940 4,771,231 5,524,168 6,081,306 7,014,906 7,237,716 6,108,843 5,420,752 5,532,531 72,307,813Outside STD 1251 1500 7,522,229 5,471,779 5,218,928 5,166,763 4,916,739 5,385,812 5,140,937 5,900,087 7,719,120 7,784,101 7,244,645 7,142,009 74,613,149Outside STD 1501 1750 6,809,300 4,344,439 5,299,024 5,182,470 5,081,731 5,321,352 4,334,222 4,990,540 7,315,515 8,117,099 8,363,478 7,861,224 73,020,394Outside STD 1751 2000 5,892,853 3,808,237 5,282,469 5,315,314 5,262,806 4,489,571 3,310,426 3,934,209 6,098,190 8,020,250 8,018,164 7,726,410 67,158,899Outside STD 2001 2500 9,280,462 5,461,824 9,237,732 10,634,873 9,765,099 7,304,929 5,073,365 6,147,294 9,624,774 13,310,893 14,693,791 14,255,377 114,790,413Outside STD 2501 3000 6,736,907 3,845,410 7,198,593 9,337,626 7,479,108 4,801,719 3,194,513 4,153,402 7,273,045 10,405,116 11,817,000 11,388,997 87,631,436Outside STD 3001 3500 4,825,291 2,326,759 5,419,768 7,634,893 5,395,067 3,292,636 1,989,222 2,912,533 5,502,077 7,457,836 9,015,650 9,117,924 64,889,656Outside STD 3501 4000 3,377,249 1,581,997 3,951,432 5,954,396 3,963,030 1,938,849 1,223,997 1,894,116 3,991,891 5,774,231 7,138,635 7,115,686 47,905,509Outside STD 4001 9999999 10,410,546 5,161,246 12,132,670 18,892,547 12,367,092 5,742,359 4,377,961 6,202,771 12,641,192 19,416,936 24,008,798 26,435,729 157,789,847
74,151,616 54,849,498 71,917,291 84,521,313 71,874,464 58,248,595 51,324,970 58,254,177 77,604,325 93,146,637 101,252,088 102,399,183 899,544,157
Outside STD 0 0 0 0 0 0 0 0 0 0 0 0 0 0 0Outside STD 1 500 1,403,882 3,356,174 2,712,428 1,987,908 2,965,077 3,523,374 3,631,205 2,692,917 1,321,830 846,687 664,538 651,030 25,757,050Outside STD 501 1000 10,220,930 12,999,152 10,165,275 9,261,583 9,907,484 10,923,826 12,967,816 12,411,402 8,878,975 5,904,645 4,866,637 5,172,266 113,679,991Outside STD 1001 1500 15,194,196 11,964,260 10,517,900 10,319,703 9,687,970 10,909,980 11,222,243 12,914,993 14,956,836 13,892,944 12,665,397 12,674,540 146,920,962Outside STD 1501 2500 21,982,615 13,614,500 19,819,225 21,132,657 20,109,636 17,115,852 12,718,013 15,072,043 23,038,479 29,448,242 31,075,433 29,843,011 254,969,706Outside STD 2501 999999 25,349,993 12,915,412 28,702,463 41,819,462 29,204,297 15,775,563 10,785,693 15,162,822 29,408,205 43,054,119 51,980,083 54,058,336 358,216,448
74,151,616 54,849,498 71,917,291 84,521,313 71,874,464 58,248,595 51,324,970 58,254,177 77,604,325 93,146,637 101,252,088 102,399,183 899,544,157
In/Out Type 41,548 41,579 41,609 41,640 41,671 41,699 41,730 41,760 41,791 41,821 41,852 41,883 TotalOutside CAP 0 0 0 0 0 0 0 0 0 0 0 0 0 0 0Outside CAP 0 0 0 0 0 0 0 0 0 0 0 0 0 0 0Outside CAP 1 50 138 210 121 139 234 564 347 208 131 89 66 143 2,390Outside CAP 51 100 536 951 609 559 663 584 542 806 1,075 840 717 523 8,405Outside CAP 101 250 4,781 11,013 5,077 3,942 10,044 12,894 14,775 10,499 6,185 4,372 5,382 5,201 94,165Outside CAP 251 500 44,891 140,710 116,842 76,042 143,249 212,672 187,453 155,776 59,848 29,071 24,416 30,473 1,221,443Outside CAP 501 750 185,583 363,820 261,505 247,479 292,002 376,801 520,847 487,589 227,149 125,573 91,803 113,923 3,294,074Outside CAP 751 1000 414,876 518,775 272,475 261,967 259,907 442,682 644,679 827,396 526,925 298,389 254,969 266,038 4,989,078Outside CAP 1001 1250 590,418 485,615 278,730 259,114 295,389 535,198 630,619 856,893 824,548 607,666 497,488 567,058 6,428,736Outside CAP 1251 1500 540,818 332,164 316,791 279,420 345,587 595,284 467,407 642,269 978,007 883,378 864,571 898,242 7,143,938Outside CAP 1501 1750 420,528 240,834 395,435 321,900 431,988 508,034 321,361 500,242 860,267 1,086,070 1,048,491 989,649 7,124,799Outside CAP 1751 2000 332,634 115,101 428,341 420,990 480,501 379,930 174,345 297,344 685,917 940,569 1,013,238 990,876 6,259,786Outside CAP 2001 2500 384,926 148,710 686,369 778,116 684,585 435,982 196,408 291,279 897,726 1,489,860 1,724,706 1,643,556 9,362,223Outside CAP 2501 3000 154,978 59,782 432,925 617,166 474,491 216,264 72,782 136,443 391,267 758,543 976,099 889,426 5,180,166Outside CAP 3001 3500 64,153 26,054 269,551 429,218 248,253 108,691 44,384 41,918 167,338 376,843 492,881 470,191 2,739,475Outside CAP 3501 4000 58,682 29,903 118,129 213,320 156,254 59,859 33,662 29,848 94,065 188,421 216,440 217,004 1,415,587Outside CAP 4001 9999999 73,734 23,641 188,572 469,806 201,847 95,905 47,011 65,577 152,840 312,075 422,868 434,862 2,488,738
3,271,676 2,497,283 3,771,472 4,379,178 4,024,994 3,981,344 3,356,622 4,344,087 5,873,288 7,101,759 7,634,135 7,517,165 57,753,003
Outside CAP 0 0 0 0 0 0 0 0 0 0 0 0 0 0 0Outside CAP 1 500 50,346 152,884 122,649 80,682 154,190 226,714 203,117 167,289 67,239 34,372 30,581 36,340 1,326,403Outside CAP 501 1000 600,459 882,595 533,980 509,446 551,909 819,483 1,165,526 1,314,985 754,074 423,962 346,772 379,961 8,283,152
kWh Boundary
kWh Boundary
Page 6 of 15
AE Response to AELIC RFI No. 7-10Attachment 1Page 6 of 15
17
kwh_sum_out
1A B C D E F G H I J K L M N O P Q
In/Out Type Oct‐13 Nov‐13 Dec‐13 Jan‐14 Feb‐14 Mar‐14 Apr‐14 May‐14 Jun‐14 Jul‐14 Aug‐14 Sep‐14 TotalkWh Boundary5354555657585960616263646566676869707172737475767778798081828384858687888990919293949596979899100101102103
Outside CAP 1001 1500 1,131,236 817,779 595,521 538,534 640,976 1,130,482 1,098,026 1,499,162 1,802,555 1,491,044 1,362,059 1,465,300 13,572,674Outside CAP 1501 2500 1,138,088 504,645 1,510,145 1,521,006 1,597,074 1,323,946 692,114 1,088,865 2,443,910 3,516,499 3,786,435 3,624,081 22,746,808Outside CAP 2501 999999 351,547 139,380 1,009,177 1,729,510 1,080,845 480,719 197,839 273,786 805,510 1,635,882 2,108,288 2,011,483 11,823,966
3,271,676 2,497,283 3,771,472 4,379,178 4,024,994 3,981,344 3,356,622 4,344,087 5,873,288 7,101,759 7,634,135 7,517,165 57,753,003
Outside STD 0 0Outside STD 1 500 1,403,882 3,356,174 2,712,428 1,987,908 2,965,077 3,523,374 3,631,205 2,692,917 1,321,830 846,687 664,538 651,030Outside STD 501 1000Outside STD 1001 1500Outside STD 1501 2500Outside STD 2501 999999
Outside STD 0 0Outside STD 1 500 6,651,000 8,842,500 6,951,000 6,276,500 6,809,000 7,540,500 8,857,500 8,330,500 5,768,000 3,768,000 3,108,000 3,314,000Outside STD 501 1000 3,569,930 4,156,652 3,214,275 2,985,083 3,098,484 3,383,326 4,110,316 4,080,902 3,110,975 2,136,645 1,758,637 1,858,266Outside STD 1001 1500Outside STD 1501 2500Outside STD 2501 999999
Outside STD 0 0Outside STD 1 500 6,169,000 4,907,000 4,269,500 4,183,000 3,929,000 4,431,500 4,601,500 5,296,000 6,034,000 5,542,000 5,036,000 5,051,500Outside STD 501 1000 6,169,000 4,907,000 4,269,500 4,183,000 3,929,000 4,431,500 4,601,500 5,296,000 6,034,000 5,542,000 5,036,000 5,051,500Outside STD 1001 1500 2,856,196 2,150,260 1,978,900 1,953,703 1,829,970 2,046,980 2,019,243 2,322,993 2,888,836 2,808,944 2,593,397 2,571,540Outside STD 1501 2500Outside STD 2501 999999
Outside STD 0 0Outside STD 1 500 5,764,000 3,589,500 5,115,500 5,390,000 5,161,000 4,483,000 3,364,000 3,973,000 6,056,500 7,628,500 8,011,500 7,683,500Outside STD 501 1000 5,764,000 3,589,500 5,115,500 5,390,000 5,161,000 4,483,000 3,364,000 3,973,000 6,056,500 7,628,500 8,011,500 7,683,500Outside STD 1001 1500 5,764,000 3,589,500 5,115,500 5,390,000 5,161,000 4,483,000 3,364,000 3,973,000 6,056,500 7,628,500 8,011,500 7,683,500Outside STD 1501 2500 4,690,615 2,846,000 4,472,725 4,962,657 4,626,636 3,666,852 2,626,013 3,153,043 4,868,979 6,562,742 7,040,933 6,792,511Outside STD 2501 999999
Outside STD 0 0Outside STD 1 500 3,337,500 1,711,000 3,760,000 5,352,000 3,852,500 2,152,000 1,429,000 1,988,000 3,796,000 5,537,000 6,633,000 6,756,500Outside STD 501 1000 3,337,500 1,711,000 3,760,000 5,352,000 3,852,500 2,152,000 1,429,000 1,988,000 3,796,000 5,537,000 6,633,000 6,756,500Outside STD 1001 1500 3,337,500 1,711,000 3,760,000 5,352,000 3,852,500 2,152,000 1,429,000 1,988,000 3,796,000 5,537,000 6,633,000 6,756,500Outside STD 1501 2500 6,675,000 3,422,000 7,520,000 10,704,000 7,705,000 4,304,000 2,858,000 3,976,000 7,592,000 11,074,000 13,266,000 13,513,000Outside STD 2501 999999 8,662,493 4,360,412 9,902,463 15,059,462 9,941,797 5,015,563 3,640,693 5,222,822 10,428,205 15,369,119 18,815,083 20,275,836
ActualsOutside STD 0 0 0 0 0 0 0 0 0 0 0 0 0 0 0Outside STD 1 500 23,325,382 22,406,174 22,808,428 23,189,408 22,716,577 22,130,374 21,883,205 22,280,417 22,976,330 23,322,187 23,453,038 23,456,530 273,948,050Outside STD 501 1000 18,840,430 14,364,152 16,359,275 17,910,083 16,040,984 14,449,826 13,504,816 15,337,902 18,997,475 20,844,145 21,439,137 21,349,766 209,437,991Outside STD 1001 1500 11,957,696 7,450,760 10,854,400 12,695,703 10,843,470 8,681,980 6,812,243 8,283,993 12,741,336 15,974,444 17,237,897 17,011,540 140,545,462Outside STD 1501 2500 11,365,615 6,268,000 11,992,725 15,666,657 12,331,636 7,970,852 5,484,013 7,129,043 12,460,979 17,636,742 20,306,933 20,305,511 148,918,706Outside STD 2501 999999 8,662,493 4,360,412 9,902,463 15,059,462 9,941,797 5,015,563 3,640,693 5,222,822 10,428,205 15,369,119 18,815,083 20,275,836 126,693,948
Totals 74,151,616 54,849,498 71,917,291 84,521,313 71,874,464 58,248,595 51,324,970 58,254,177 77,604,325 93,146,637 101,252,088 102,399,183 899,544,157
Page 7 of 15
AE Response to AELIC RFI No. 7-10Attachment 1Page 7 of 15
18
kwh_sum_out
1A B C D E F G H I J K L M N O P Q
In/Out Type Oct‐13 Nov‐13 Dec‐13 Jan‐14 Feb‐14 Mar‐14 Apr‐14 May‐14 Jun‐14 Jul‐14 Aug‐14 Sep‐14 TotalkWh Boundary104105106107108109110111112113114115116117118119120121122123124125126127128129130131132133134135136137138139140141142143144145146147148149150151152153154
Normalized ‐ Weather & Year End CustomersInside STD 0 0 0 0 0 0 0 0 0 0 0 0 0 0 0Inside STD 1 500 21,855,074 24,947,896 18,063,295 20,987,936 20,353,403 21,487,349 22,904,123 24,048,275 25,073,191 24,844,944 24,558,949 23,677,919 272,802,354Inside STD 501 1000 17,652,830 15,993,599 12,955,843 16,209,800 14,372,262 14,029,969 14,134,857 16,554,900 20,731,218 22,205,105 22,450,084 21,551,270 208,841,739Inside STD 1001 1500 11,203,947 8,295,963 8,596,219 11,490,444 9,715,439 8,429,715 7,130,055 8,941,293 13,904,133 17,017,451 18,050,738 17,172,099 139,947,494Inside STD 1501 2500 10,649,187 6,979,032 9,497,723 14,179,353 11,048,793 7,739,249 5,739,859 7,694,703 13,598,190 18,788,284 21,264,492 20,497,159 147,676,025Inside STD 2501 999999 8,116,455 4,855,051 7,842,326 13,629,801 8,907,565 4,869,829 3,810,542 5,637,231 11,379,902 16,372,603 19,702,295 20,467,204 125,590,804
Totals 69,477,494 61,071,542 56,955,406 76,497,334 64,397,462 56,556,111 53,719,436 62,876,402 84,686,634 99,228,387 106,026,559 103,365,652 894,858,416
Outside CAP 0 0Outside CAP 1 500 50,346 152,884 122,649 80,682 154,190 226,714 203,117 167,289 67,239 34,372 30,581 36,340Outside CAP 501 1000Outside CAP 1001 1500Outside CAP 1501 2500Outside CAP 2501 999999
Outside CAP 0 0Outside CAP 1 500 380,000 588,500 366,500 349,000 387,000 557,000 786,000 859,500 476,000 266,000 215,000 236,000Outside CAP 501 1000 220,459 294,095 167,480 160,446 164,909 262,483 379,526 455,485 278,074 157,962 131,772 143,961Outside CAP 1001 1500Outside CAP 1501 2500Outside CAP 2501 999999
Outside CAP 0 0Outside CAP 1 500 460,500 337,500 239,000 216,500 256,000 454,500 454,000 617,000 722,500 589,500 532,000 577,500Outside CAP 501 1000 460,500 337,500 239,000 216,500 256,000 454,500 454,000 617,000 722,500 589,500 532,000 577,500Outside CAP 1001 1500 210,236 142,779 117,521 105,534 128,976 221,482 190,026 265,162 357,555 312,044 298,059 310,300Outside CAP 1501 2500Outside CAP 2501 999999
Outside CAP 0 0Outside CAP 1 500 307,000 140,000 391,000 385,500 414,500 358,000 191,000 301,000 652,500 921,500 981,500 940,000Outside CAP 501 1000 307,000 140,000 391,000 385,500 414,500 358,000 191,000 301,000 652,500 921,500 981,500 940,000Outside CAP 1001 1500 307,000 140,000 391,000 385,500 414,500 358,000 191,000 301,000 652,500 921,500 981,500 940,000Outside CAP 1501 2500 217,088 84,645 337,145 364,506 353,574 249,946 119,114 185,865 486,410 751,999 841,935 804,081Outside CAP 2501 999999
Outside CAP 0 0Outside CAP 1 500 54,500 21,500 156,500 257,000 168,500 75,500 30,000 43,500 126,000 255,000 327,000 308,000Outside CAP 501 1000 54,500 21,500 156,500 257,000 168,500 75,500 30,000 43,500 126,000 255,000 327,000 308,000Outside CAP 1001 1500 54,500 21,500 156,500 257,000 168,500 75,500 30,000 43,500 126,000 255,000 327,000 308,000Outside CAP 1501 2500 109,000 43,000 313,000 514,000 337,000 151,000 60,000 87,000 252,000 510,000 654,000 616,000Outside CAP 2501 999999 79,047 31,880 226,677 444,510 238,345 103,219 47,839 56,286 175,510 360,882 473,288 471,483
ActualsOutside CAP 0 0 0 0 0 0 0 0 0 0 0 0 0 0 0Outside CAP 1 500 1,252,346 1,240,384 1,275,649 1,288,682 1,380,190 1,671,714 1,664,117 1,988,289 2,044,239 2,066,372 2,086,081 2,097,840 20,055,903Outside CAP 501 1000 1,042,459 793,095 953,980 1,019,446 1,003,909 1,150,483 1,054,526 1,416,985 1,779,074 1,923,962 1,972,272 1,969,461 16,079,652Outside CAP 1001 1500 571,736 304,279 665,021 748,034 711,976 654,982 411,026 609,662 1,136,055 1,488,544 1,606,559 1,558,300 10,466,174
Page 8 of 15
AE Response to AELIC RFI No. 7-10Attachment 1Page 8 of 15
19
kwh_sum_out
1A B C D E F G H I J K L M N O P Q
In/Out Type Oct‐13 Nov‐13 Dec‐13 Jan‐14 Feb‐14 Mar‐14 Apr‐14 May‐14 Jun‐14 Jul‐14 Aug‐14 Sep‐14 TotalkWh Boundary155156157158159160161162163164165166167168169170171172173
Outside CAP 1501 2500 326,088 127,645 650,145 878,506 690,574 400,946 179,114 272,865 738,410 1,261,999 1,495,935 1,420,081 8,442,308Outside CAP 2501 999999 79,047 31,880 226,677 444,510 238,345 103,219 47,839 56,286 175,510 360,882 473,288 471,483 2,708,966
Totals 3,271,676 2,497,283 3,771,472 4,379,178 4,024,994 3,981,344 3,356,622 4,344,087 5,873,288 7,101,759 7,634,135 7,517,165 57,753,003
Normalized ‐ Weather & Year End CustomersInside CAP 0 0 0 0 0 0 0 0 0 0 0 0 0 0 0Inside CAP 1 500 1,809,903 1,710,228 1,423,924 1,508,612 1,538,675 1,621,468 1,701,961 1,754,260 1,910,405 1,911,989 1,838,749 1,752,560 20,482,735Inside CAP 501 1000 1,506,572 1,093,511 1,064,866 1,193,427 1,119,186 1,115,904 1,078,507 1,250,201 1,662,600 1,780,219 1,738,434 1,645,310 16,248,737Inside CAP 1001 1500 826,279 419,537 742,320 875,695 793,731 635,295 420,373 537,903 1,061,679 1,377,332 1,416,081 1,301,822 10,408,045Inside CAP 1501 2500 471,266 175,995 725,714 1,028,434 769,871 388,895 183,187 240,748 690,067 1,167,713 1,318,573 1,186,352 8,346,816Inside CAP 2501 999999 114,239 43,956 253,025 520,371 265,714 100,117 48,927 49,661 164,020 333,920 417,174 393,882 2,705,005
Totals 4,728,259 3,443,227 4,209,849 5,126,540 4,487,176 3,861,679 3,432,956 3,832,773 5,488,771 6,571,172 6,729,011 6,279,926 58,191,338
Grand Totals 77,423,292 57,346,781 75,688,763 88,900,491 75,899,458 62,229,939 54,681,592 62,598,264 83,477,613 100,248,396 108,886,223 109,916,348 957,297,1600 0 0 0 0 0 0 0 0 0 0 0 0
Grand Totals ‐ Normalized 74,205,753 64,514,768 61,165,255 81,623,874 68,884,638 60,417,790 57,152,392 66,709,174 90,175,405 105,799,559 112,755,570 109,645,578 953,049,754
Page 9 of 15
AE Response to AELIC RFI No. 7-10Attachment 1Page 9 of 15
20
count_sum_in
12345678910111213141516171819202122232425262728293031323334353637383940414243444546474849505152
A B C D E F G H I J K L M N O P QIn/Out Type Oct‐13 Nov‐13 Dec‐13 Jan‐14 Feb‐14 Mar‐14 Apr‐14 May‐14 Jun‐14 Jul‐14 Aug‐14 Sep‐14 TotalInside STD 0Inside STD 0 0 871 966 973 796 835 844 896 887 761 680 792 627 9,928Inside STD 1 50 1,610 2,690 2,987 2,437 2,765 3,009 2,842 2,594 2,016 1,588 1,398 1,183 27,119Inside STD 51 100 2,329 4,815 4,513 4,325 4,641 5,198 5,740 4,528 3,148 2,535 2,139 1,534 45,445Inside STD 101 250 13,375 34,750 28,591 25,723 31,482 38,085 40,312 28,289 15,450 10,173 8,633 7,063 281,926Inside STD 251 500 55,380 102,858 85,147 73,892 86,714 99,588 106,818 85,828 51,813 32,401 28,358 25,730 834,527Inside STD 501 750 74,030 80,555 71,216 65,909 66,182 69,455 74,377 78,256 67,102 50,444 46,038 43,584 787,148Inside STD 751 1000 62,232 41,275 44,214 44,526 41,045 37,521 36,293 46,359 57,597 54,378 50,734 49,748 565,922Inside STD 1001 1250 41,334 18,547 26,249 28,647 25,803 20,542 16,300 23,255 39,477 46,565 46,670 46,237 379,626Inside STD 1251 1500 23,321 8,296 15,753 19,092 16,632 11,056 7,240 10,984 23,749 34,625 36,376 37,744 244,868Inside STD 1501 1750 12,497 4,135 9,662 13,026 10,626 5,851 3,444 5,380 13,492 22,791 26,094 27,414 154,412Inside STD 1751 2000 6,772 2,131 5,842 8,756 6,684 3,101 1,786 2,792 7,602 14,321 17,021 18,566 95,374Inside STD 2001 2500 5,831 1,855 5,661 9,729 6,688 2,711 1,571 2,537 7,140 14,189 17,739 19,902 95,553Inside STD 2501 3000 2,155 755 2,191 4,217 2,677 1,016 654 1,016 2,633 5,435 7,203 8,110 38,062Inside STD 3001 3500 930 389 991 1,929 1,138 482 321 512 1,248 2,308 3,111 3,570 16,929Inside STD 3501 4000 515 180 491 915 544 220 175 244 628 1,102 1,461 1,759 8,234Inside STD 4001 9999999 896 419 805 1,484 879 444 354 500 1,008 1,720 2,185 2,521 13,215
304,078 304,616 305,286 305,403 305,335 299,123 299,123 293,961 294,864 295,255 295,952 295,292 3,598,288
Inside STD 0 0 871 966 973 796 835 844 896 887 761 680 792 627 9,928Inside STD 1 500 72,694 145,113 121,238 106,377 125,602 145,880 155,712 121,239 72,427 46,697 40,528 35,510 1,189,017Inside STD 501 1000 136,262 121,830 115,430 110,435 107,227 106,976 110,670 124,615 124,699 104,822 96,772 93,332 1,353,070Inside STD 1001 1500 64,655 26,843 42,002 47,739 42,435 31,598 23,540 34,239 63,226 81,190 83,046 83,981 624,494Inside STD 1501 2500 25,100 8,121 21,165 31,511 23,998 11,663 6,801 10,709 28,234 51,301 60,854 65,882 345,339Inside STD 2501 999999 4,496 1,743 4,478 8,545 5,238 2,162 1,504 2,272 5,517 10,565 13,960 15,960 76,440
304,078 304,616 305,286 305,403 305,335 299,123 299,123 293,961 294,864 295,255 295,952 295,292 3,598,288
In/Out Type Oct‐13 Nov‐13 Dec‐13 Jan‐14 Feb‐14 Mar‐14 Apr‐14 May‐14 Jun‐14 Jul‐14 Aug‐14 Sep‐14 TotalInside CAP 0Inside CAP 0 0 48 55 54 39 31 49 66 73 46 40 37 31 569Inside CAP 1 50 36 74 101 68 97 136 119 95 87 48 45 47 953Inside CAP 51 100 106 206 177 155 196 311 312 273 155 117 107 71 2,186Inside CAP 101 250 714 1,927 1,631 1,439 2,066 3,221 3,138 2,410 1,173 710 559 495 19,483Inside CAP 251 500 3,218 7,028 5,902 5,046 6,545 9,803 10,153 9,413 4,901 2,869 2,436 2,181 69,495Inside CAP 501 750 5,303 6,970 5,716 5,060 5,348 7,779 8,986 10,586 7,695 5,334 4,722 4,392 77,891Inside CAP 751 1000 5,200 4,037 3,751 3,577 3,467 4,530 4,960 7,630 8,183 6,721 6,142 6,057 64,255Inside CAP 1001 1250 3,983 1,988 2,394 2,532 2,330 2,690 2,432 4,184 6,553 6,574 6,354 6,147 48,161Inside CAP 1251 1500 2,386 881 1,546 1,767 1,617 1,587 1,038 2,025 4,227 5,471 5,659 5,718 33,922Inside CAP 1501 1750 1,254 374 1,023 1,274 1,076 832 403 814 2,462 3,978 4,291 4,463 22,244Inside CAP 1751 2000 615 144 627 933 770 437 186 384 1,424 2,647 2,996 3,140 14,303Inside CAP 2001 2500 501 96 606 1,077 718 312 114 257 1,036 2,495 3,060 3,375 13,647Inside CAP 2501 3000 114 24 243 438 269 78 35 58 235 781 1,096 1,206 4,577Inside CAP 3001 3500 31 7 71 196 105 24 8 16 71 206 337 422 1,494Inside CAP 3501 4000 11 4 24 77 40 10 4 16 29 81 83 122 501Inside CAP 4001 9999999 18 3 27 59 31 11 6 17 31 61 80 96 440
23,538 23,818 23,893 23,737 24,706 31,810 31,960 38,251 38,308 38,133 38,004 37,963 374,121
Inside CAP 0 0 48 55 54 39 31 49 66 73 46 40 37 31 569Inside CAP 1 500 4,074 9,235 7,811 6,708 8,904 13,471 13,722 12,191 6,316 3,744 3,147 2,794 92,117Inside CAP 501 1000 10,503 11,007 9,467 8,637 8,815 12,309 13,946 18,216 15,878 12,055 10,864 10,449 142,146
kWh Boundary
kWh Boundary
Page 10 of 15
AE Response to AELIC RFI No. 7-10Attachment 1
Page 10 of 15
21
count_sum_in
1A B C D E F G H I J K L M N O P Q
In/Out Type Oct‐13 Nov‐13 Dec‐13 Jan‐14 Feb‐14 Mar‐14 Apr‐14 May‐14 Jun‐14 Jul‐14 Aug‐14 Sep‐14 TotalkWh Boundary5354555657
Inside CAP 1001 1500 6,369 2,869 3,940 4,299 3,947 4,277 3,470 6,209 10,780 12,045 12,013 11,865 82,083Inside CAP 1501 2500 2,370 614 2,256 3,284 2,564 1,581 703 1,455 4,922 9,120 10,347 10,978 50,194Inside CAP 2501 999999 174 38 365 770 445 123 53 107 366 1,129 1,596 1,846 7,012
23,538 23,818 23,893 23,737 24,706 31,810 31,960 38,251 38,308 38,133 38,004 37,963 374,121
Page 11 of 15
AE Response to AELIC RFI No. 7-10Attachment 1
Page 11 of 15
22
I I I I I I I
f- I
r- I
f- I r-
I I I I I I I
f- I
r- I
f- I r-
count_sum_out
12345678910111213141516171819202122232425262728293031323334353637383940414243444546474849505152
A B C D E F G H I J K L M N O P QIn/Out Type Oct‐13 Nov‐13 Dec‐13 Jan‐14 Feb‐14 Mar‐14 Apr‐14 May‐14 Jun‐14 Jul‐14 Aug‐14 Sep‐14 TotalOutside STD 0Outside STD 0 0 179 204 188 226 199 174 198 196 177 177 178 168 2,264Outside STD 1 50 249 283 254 234 279 311 332 334 289 233 193 208 3,199Outside STD 51 100 210 326 315 214 274 347 388 412 302 193 175 152 3,308Outside STD 101 250 741 1,857 1,390 986 1,331 1,813 1,991 1,649 927 713 499 469 14,366Outside STD 251 500 3,162 7,652 6,187 4,535 6,890 8,156 8,340 6,042 2,904 1,803 1,435 1,403 58,509Outside STD 501 750 5,916 9,658 7,684 6,736 7,715 8,674 9,780 8,556 5,052 2,964 2,424 2,713 77,872Outside STD 751 1000 7,386 8,027 6,218 5,817 5,903 6,407 7,935 8,105 6,484 4,572 3,792 3,915 74,561Outside STD 1001 1250 6,840 5,808 4,736 4,595 4,268 4,934 5,445 6,274 6,441 5,423 4,798 4,905 64,467Outside STD 1251 1500 5,498 4,006 3,803 3,771 3,590 3,929 3,758 4,318 5,627 5,661 5,274 5,198 54,433Outside STD 1501 1750 4,209 2,688 3,267 3,189 3,131 3,284 2,678 3,085 4,516 5,005 5,153 4,852 45,057Outside STD 1751 2000 3,153 2,038 2,822 2,837 2,810 2,400 1,774 2,108 3,265 4,281 4,289 4,132 35,909Outside STD 2001 2500 4,166 2,453 4,142 4,754 4,381 3,282 2,276 2,753 4,332 5,971 6,581 6,383 51,474Outside STD 2501 3000 2,464 1,412 2,635 3,419 2,737 1,763 1,176 1,520 2,668 3,812 4,329 4,168 32,103Outside STD 3001 3500 1,491 723 1,677 2,359 1,673 1,023 617 903 1,703 2,307 2,789 2,820 20,085Outside STD 3501 4000 904 424 1,062 1,597 1,062 521 328 508 1,068 1,549 1,914 1,907 12,844Outside STD 4001 9999999 1,816 863 2,146 3,329 2,233 997 737 1,045 2,153 3,406 4,234 4,618 27,577
48,384 48,422 48,526 48,598 48,476 48,015 47,753 47,808 47,908 48,070 48,057 48,011 578,028
Outside STD 0 0 179 204 188 226 199 174 198 196 177 177 178 168 2,264Outside STD 1 500 4,362 10,118 8,146 5,969 8,774 10,627 11,051 8,437 4,422 2,942 2,302 2,232 79,382Outside STD 501 1000 13,302 17,685 13,902 12,553 13,618 15,081 17,715 16,661 11,536 7,536 6,216 6,628 152,433Outside STD 1001 1500 12,338 9,814 8,539 8,366 7,858 8,863 9,203 10,592 12,068 11,084 10,072 10,103 118,900Outside STD 1501 2500 11,528 7,179 10,231 10,780 10,322 8,966 6,728 7,946 12,113 15,257 16,023 15,367 132,440Outside STD 2501 999999 6,675 3,422 7,520 10,704 7,705 4,304 2,858 3,976 7,592 11,074 13,266 13,513 92,609
48,384 48,422 48,526 48,598 48,476 48,015 47,753 47,808 47,908 48,070 48,057 48,011 578,028
In/Out Type Oct‐13 Nov‐13 Dec‐13 Jan‐14 Feb‐14 Mar‐14 Apr‐14 May‐14 Jun‐14 Jul‐14 Aug‐14 Sep‐14 TotalOutside CAP 0Outside CAP 0 0 6 13 10 6 11 13 13 15 11 8 12 4 122Outside CAP 1 50 6 6 7 6 7 18 14 10 8 7 5 8 102Outside CAP 51 100 7 13 8 8 9 9 8 10 15 11 9 7 114Outside CAP 101 250 26 57 27 23 49 68 78 57 33 26 31 30 505Outside CAP 251 500 112 353 289 188 360 544 481 391 151 76 65 80 3,090Outside CAP 501 750 291 578 420 394 476 607 830 772 358 196 142 175 5,239Outside CAP 751 1000 469 599 313 304 298 507 742 947 594 336 288 297 5,694Outside CAP 1001 1250 525 432 246 230 261 475 564 764 730 537 438 501 5,703Outside CAP 1251 1500 396 243 232 203 251 434 344 470 715 642 626 654 5,210Outside CAP 1501 1750 260 150 243 199 266 314 199 310 531 669 646 610 4,397Outside CAP 1751 2000 179 62 229 224 257 204 94 160 367 504 542 530 3,352Outside CAP 2001 2500 175 68 310 348 306 198 89 132 407 670 775 740 4,218Outside CAP 2501 3000 57 22 159 226 175 80 27 50 145 280 359 327 1,907Outside CAP 3001 3500 20 8 83 133 77 34 14 13 52 117 153 147 851Outside CAP 3501 4000 16 8 32 57 42 17 9 8 25 51 58 58 381Outside CAP 4001 9999999 16 5 39 98 43 20 10 16 30 62 84 84 507
2,561 2,617 2,647 2,647 2,888 3,542 3,516 4,125 4,172 4,192 4,233 4,252 41,392
Outside CAP 0 0 6 13 10 6 11 13 13 15 11 8 12 4 122Outside CAP 1 500 151 429 331 225 425 639 581 468 207 120 110 125 3,811Outside CAP 501 1000 760 1,177 733 698 774 1,114 1,572 1,719 952 532 430 472 10,933
kWh Boundary
kWh Boundary
Page 12 of 15
AE Response to AELIC RFI No. 7-10Attachment 1
Page 12 of 15
23
count_sum_out
1A B C D E F G H I J K L M N O P Q
In/Out Type Oct‐13 Nov‐13 Dec‐13 Jan‐14 Feb‐14 Mar‐14 Apr‐14 May‐14 Jun‐14 Jul‐14 Aug‐14 Sep‐14 TotalkWh Boundary5354555657
Outside CAP 1001 1500 921 675 478 433 512 909 908 1,234 1,445 1,179 1,064 1,155 10,913Outside CAP 1501 2500 614 280 782 771 829 716 382 602 1,305 1,843 1,963 1,880 11,967Outside CAP 2501 999999 109 43 313 514 337 151 60 87 252 510 654 616 3,646
2,561 2,617 2,647 2,647 2,888 3,542 3,516 4,125 4,172 4,192 4,233 4,252 41,392
Page 13 of 15
AE Response to AELIC RFI No. 7-10Attachment 1
Page 13 of 15
24
I I I I I I I
f- I
r- I
f- I r-
I I I I I I I
f- I
r- I
f- I r-
Normalize
12345678910111213141516171819202122232425262728293031323334353637383940414243444546474849505152
A B C D E F G H I J K L M N O P10/1/2013 11/1/2013 12/1/2013 1/1/2014 2/1/2014 3/1/2014 4/1/2014 5/1/2014 6/1/2014 7/1/2014 8/1/2014 9/1/2014 Totals
E01t1 Std Tier 1 152,573,012 164,150,232 120,583,593 140,657,393 135,312,158 138,933,805 147,761,085 158,110,288 171,218,521 172,505,713 171,284,581 166,097,815 1,839,188,196E01t2 Std Tier 2 91,887,413 63,105,899 58,984,131 77,655,169 66,689,805 56,855,129 53,049,351 69,956,066 105,857,690 127,004,048 131,220,522 129,823,297 1,032,088,520E01t3 Std Tier 3 37,361,802 19,308,388 25,654,599 38,906,110 30,939,805 21,242,313 16,018,791 22,953,505 46,674,570 69,429,169 77,161,553 78,206,082 483,856,687E01t4 Std Tier 4 22,311,595 11,739,718 18,783,374 32,475,739 23,246,038 13,401,919 9,569,054 13,799,641 29,747,134 49,096,834 58,822,623 61,000,839 343,994,508E01t5 Std Tier 5 12,401,684 7,094,681 11,142,730 20,571,370 13,122,347 7,001,047 5,646,269 8,375,532 17,334,794 26,475,300 32,676,075 34,666,932 196,508,761
Subtotal 316,535,506 265,398,918 235,148,427 310,265,781 269,310,153 237,434,213 232,044,550 273,195,032 370,832,709 444,511,064 471,165,354 469,794,965 3,895,636,672
E01At1 CAP Tier 1 17,866,527 15,966,947 13,242,442 14,041,320 13,517,341 14,673,393 15,558,723 16,834,210 18,843,248 18,976,560 18,132,469 17,229,287 194,882,467E01At2 CAP Tier 2 11,705,271 6,665,865 7,020,494 8,325,123 7,104,580 6,477,820 6,118,959 8,263,409 12,954,690 15,085,570 14,886,868 14,361,449 118,970,098E01At3 CAP Tier 3 4,584,890 1,605,266 3,137,433 4,352,939 3,438,483 2,317,862 1,457,177 2,274,078 5,720,783 8,727,035 9,217,376 9,062,102 55,895,424E01At4 CAP Tier 4 1,739,370 447,312 1,995,859 3,401,906 2,277,831 956,141 429,124 685,795 2,454,287 5,151,105 6,050,077 6,124,858 31,713,665E01At5 CAP Tier 5 313,012 73,422 457,819 1,069,269 531,484 176,698 131,689 71,624 485,066 816,773 1,010,032 1,194,338 6,331,226
Subtotal 36,209,070 24,758,812 25,854,047 31,190,557 26,869,719 24,601,914 23,695,672 28,129,116 40,458,074 48,757,043 49,296,822 47,972,034 407,792,880
Totals 352,744,576 290,157,730 261,002,474 341,456,338 296,179,872 262,036,127 255,740,222 301,324,148 411,290,783 493,268,107 520,462,176 517,766,999 4,303,429,552
Check 352.7 290.2 261.0 341.5 296.2 262.0 255.7 301.3 411.3 493.3 520.5 517.8 4,303.4S/B = 0 0.0 0.0 0.0 0.0 0.0 0.0 0.0 0.0 0.0 0.0 0.0 0.0 0.0
Index 1 2 3 4 5 6 7 8 9 10 11 12Actuals Actuals Actuals Actuals Actuals Actuals Actuals Actuals Actuals Actuals Actuals Actuals Totals
E01t1 Std Tier 1 162,837,414 147,426,405 152,260,269 155,411,267 151,022,859 143,091,503 141,174,849 146,487,146 156,899,587 161,932,765 163,571,484 164,544,800 1,846,660,348E01t2 Std Tier 2 98,069,170 56,676,593 74,478,952 85,800,597 74,432,964 58,556,561 50,684,753 64,813,394 97,004,855 119,219,916 125,311,545 128,609,449 1,033,658,749E01t3 Std Tier 3 39,875,330 17,341,226 32,393,927 42,987,060 34,532,136 21,878,005 15,304,777 21,266,127 42,771,195 65,173,826 73,686,899 77,474,855 484,685,363E01t4 Std Tier 4 23,812,615 10,543,661 23,717,667 35,882,193 25,945,068 13,802,981 9,142,527 12,785,190 27,259,393 46,087,668 56,173,788 60,430,481 345,583,232E01t5 Std Tier 5 13,236,012 6,371,866 14,069,866 22,729,148 14,645,945 7,210,559 5,394,595 7,759,823 15,885,092 24,852,618 31,204,642 34,342,796 197,702,962
Subtotal 337,830,541 238,359,751 296,920,681 342,810,265 300,578,972 244,539,609 221,701,501 253,111,680 339,820,122 417,266,793 449,948,358 465,402,381 3,908,290,654
E01At1 CAP Tier 1 12,362,581 11,580,412 11,863,490 11,994,335 12,125,045 15,128,091 15,212,763 19,079,994 20,163,316 20,508,816 20,571,481 20,623,714 191,214,038E01At2 CAP Tier 2 8,099,356 4,834,579 6,289,441 7,111,462 6,372,803 6,678,554 5,982,899 9,365,797 13,862,233 16,303,650 16,889,311 17,190,869 118,980,954E01At3 CAP Tier 3 3,172,473 1,164,258 2,810,728 3,718,355 3,084,317 2,389,688 1,424,776 2,577,453 6,121,554 9,431,697 10,457,212 10,847,472 57,199,983E01At4 CAP Tier 4 1,203,541 324,424 1,788,028 2,905,966 2,043,213 985,770 419,582 777,284 2,626,223 5,567,029 6,863,877 7,331,546 32,836,483E01At5 CAP Tier 5 216,586 53,251 410,146 913,388 476,741 182,173 128,761 81,179 519,047 882,723 1,145,892 1,429,641 6,439,528
Subtotal 25,054,537 17,956,924 23,161,833 26,643,506 24,102,119 25,364,276 23,168,781 31,881,707 43,292,373 52,693,915 55,927,773 57,423,242 406,670,986
Totals 362,885,078 256,316,675 320,082,514 369,453,771 324,681,091 269,903,885 244,870,282 284,993,387 383,112,495 469,960,708 505,876,131 522,825,623 4,314,961,640
Check 362,885,078 256,316,675 320,082,514 369,453,771 324,681,091 269,903,885 244,870,282 284,993,387 383,112,495 469,960,708 505,876,131 522,825,623 4,314,961,640S/B = 0 0 0 0 0 0 0 0 0 0 0 0 0 0
Adjustment FactorsE01t1 Std Tier 1 0.9370 1.1134 0.7920 0.9051 0.8960 0.9709 1.0467 1.0793 1.0913 1.0653 1.0472 1.0094
Page 14 of 15
AE Response to AELIC RFI No. 7-10Attachment 1
Page 14 of 15
25
Normalize
1A B C D E F G H I J K L M N O P
10/1/2013 11/1/2013 12/1/2013 1/1/2014 2/1/2014 3/1/2014 4/1/2014 5/1/2014 6/1/2014 7/1/2014 8/1/2014 9/1/2014 Totals53545556575859606162
E01t2 Std Tier 2 0.9370 1.1134 0.7920 0.9051 0.8960 0.9709 1.0467 1.0793 1.0913 1.0653 1.0472 1.0094E01t3 Std Tier 3 0.9370 1.1134 0.7920 0.9051 0.8960 0.9709 1.0467 1.0793 1.0913 1.0653 1.0472 1.0094E01t4 Std Tier 4 0.9370 1.1134 0.7920 0.9051 0.8960 0.9709 1.0467 1.0793 1.0913 1.0653 1.0472 1.0094E01t5 Std Tier 5 0.9370 1.1134 0.7920 0.9051 0.8960 0.9709 1.0467 1.0793 1.0913 1.0653 1.0472 1.0094
E01At1 CAP Tier 1 1.4452 1.3788 1.1162 1.1707 1.1148 0.9699 1.0227 0.8823 0.9345 0.9253 0.8814 0.8354E01At2 CAP Tier 2 1.4452 1.3788 1.1162 1.1707 1.1148 0.9699 1.0227 0.8823 0.9345 0.9253 0.8814 0.8354E01At3 CAP Tier 3 1.4452 1.3788 1.1162 1.1707 1.1148 0.9699 1.0227 0.8823 0.9345 0.9253 0.8814 0.8354E01At4 CAP Tier 4 1.4452 1.3788 1.1162 1.1707 1.1148 0.9699 1.0227 0.8823 0.9345 0.9253 0.8814 0.8354E01At5 CAP Tier 5 1.4452 1.3788 1.1162 1.1707 1.1148 0.9699 1.0227 0.8823 0.9345 0.9253 0.8814 0.8354
Page 15 of 15
AE Response to AELIC RFI No. 7-10Attachment 1
Page 15 of 15
26
Austin Energy’s Response to AELIC’s 7th RFI
749/11/7068322
AELIC 7-11 AE responded to AELIC 3rd RFI to AE, RFI No. 3-23 stating that “[r]esidentialcustomers are not eligible to qualify as Key Account customers.” If this is so,why did AE allocate some of the costs for its Key Accounts to the residentialclass? (Reference: Schedule G-6, line no.61, Bates Stamp p. 991).
ANSWER:
One Key Account Manager is assigned to qualifying master-metered multi-family and retirementcommunities. While the Key Account Manager’s responsibility is to be a resource for theassigned commercial customers, sometimes the manager is asked to assist in resolving tenantissues in those communities. For that reason, 5% of one Key Account Manager’s time wasallocated to the Residential class.
Prepared by: KDSponsored by: Mark Dombroski
27
Austin Energy’s Response to AELIC’s 7th RFI
749/11/7068322
AELIC 7-12 Since no residential customers are eligible to qualify as Key Account customers,then why did AE state at p. 3-48 and 3-49 (Bates Stamp, p. 077-78) “Additionally,two Key Account representatives are dedicated to serving AE’s remainingcommercial and residential customers.” In your explanation, please address howthe Key Account representatives “serve” the residential customers and at whatpoint a residential customer is “served” by a Key Account representative.
ANSWER:
The statement in Austin Energy’s Tariff Package is an editing error because Key Accounts doesnot directly serve residential customers. It should have said, “… two Key Accountrepresentatives are dedicated to serving AE’s remaining non-residential customers.”
With that said, one Key Account Manager is assigned to qualifying master-metered multi-familyand retirement communities. While the Key Account Manager’s responsibility is to be aresource for the assigned commercial customers, sometimes the manager is asked to assist inresolving tenant issues in those communities. For that reason, 5% of one Key AccountManager’s time was allocated to the Residential class.
Prepared by: KDSponsored by: Debbie Kimberly
28
Austin Energy’s Response to AELIC’s 7th RFI
749/11/7068322
AELIC 7-13 For any of AE’s FYs since AE’s TY 2009 underlying its last base rate case, hasAE’s non-utility operations resulted in revenue amounts realized from its non-utility operations exceeding the amounts it incurred in expenses from its non-utility operations? In other words, did AE realize net operating income from itsnon-utility operations for any of its FYs subsequent to the TY 2009?
ANSWER:
Yes. Austin Energy does not prepare audited GAAP based financial reporting specific to its non-utility operations. However, based on cost components, non-utility operations did generate netoperating income in years subsequent to 2009.
Prepared by: SSSponsored by: Elaina Ball
29
Austin Energy’s Response to AELIC’s 7th RFI
749/11/7068322
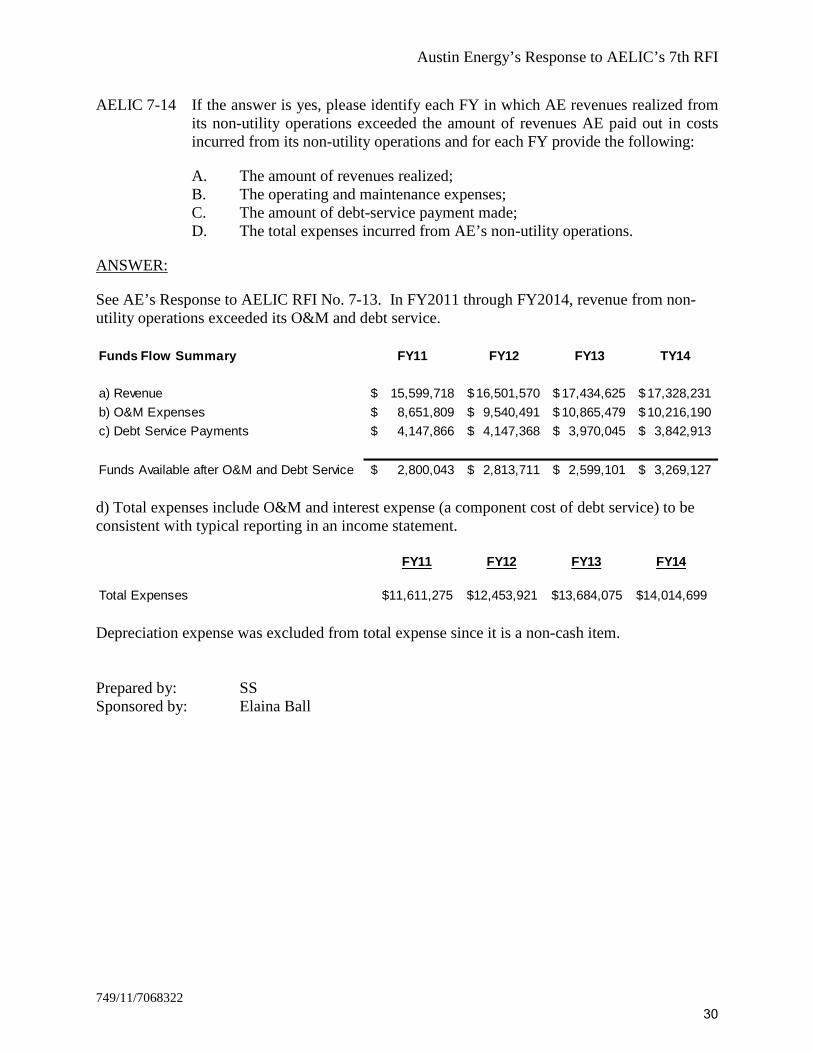
AELIC 7-14 If the answer is yes, please identify each FY in which AE revenues realized fromits non-utility operations exceeded the amount of revenues AE paid out in costsincurred from its non-utility operations and for each FY provide the following:
A. The amount of revenues realized;B. The operating and maintenance expenses;C. The amount of debt-service payment made;D. The total expenses incurred from AE’s non-utility operations.
ANSWER:
See AE’s Response to AELIC RFI No. 7-13. In FY2011 through FY2014, revenue from non-utility operations exceeded its O&M and debt service.
d) Total expenses include O&M and interest expense (a component cost of debt service) to beconsistent with typical reporting in an income statement.
Depreciation expense was excluded from total expense since it is a non-cash item.
Prepared by: SSSponsored by: Elaina Ball
Funds Flow Summary FY11 FY12 FY13 TY14
a) Revenue 15,599,718$ 16,501,570$ 17,434,625$ 17,328,231$
b) O&M Expenses 8,651,809$ 9,540,491$ 10,865,479$ 10,216,190$
c) Debt Service Payments 4,147,866$ 4,147,368$ 3,970,045$ 3,842,913$
Funds Available after O&M and Debt Service 2,800,043$ 2,813,711$ 2,599,101$ 3,269,127$
FY11 FY12 FY13 FY14
Total Expenses $11,611,275 $12,453,921 $13,684,075 $14,014,699
30
Austin Energy’s Response to AELIC’s 7th RFI
749/11/7068322
AELIC 7-15 What additional installation and infrastructure costs are incurred to serve aresidential value of solar customer versus a non-value of solar residentialcustomer? In your response, please address how if at all additional costs areincurred relating to meters; what elements/components of the distribution systemare impacted and how each element/component is impacted; and how, if at allAE’s operating software for billing, distribution, and interactions with the grid areimpacted, including both the embedded costs and the marginal operating costs.(Reference: AE Response to AELIC RFI No. 3-16(C))
ANSWER:
The additional installation and infrastructure costs Austin Energy incurs for serving a Value ofSolar customer versus a non-Value of Solar customer are approximately $322 in one-timeexpenses and $1.03 in on-going monthly costs.
Of the $322 in estimated one-time additional costs, $241 is related to the cost of purchasing andinstalling the requisite VOS meters. This estimated expense includes the cost of the meters aswell as staff salary and benefit expenses. $81 is associated with programming the meter readingsystem to pull data from the VOS meters. This estimated expense includes staff salary andbenefit expenses. The $1.03 of on-going monthly additional expenses is related to monthlymeter reads of the VOS meters.
Components of the distribution system are normally positively impacted by distributedresidential solar because the generation resource can offset load on the distribution componentsand thereby reduce overall distribution system losses. Only in cases of high concentrations ofdistributed solar — such that the localized capacity of distributed solar exceeds the capacity ofexisting distribution components — is the system impacted negatively. In these cases, the VOScustomer is responsible for 100% of the cost to upgrade the component so that the system is notimpacted.
Other costs for maintenance and billing are de minimis because meter maintenance orreplacements are rare and the billing system applies VOS credits to an existing residentialaccount and generates a credit on a bill which exists regardless of whether solar has beenconnected or not.
Prepared by: DSSponsored by: Elaina Ball
31
Austin Energy’s Response to AELIC’s 7th RFI
749/11/7068322
AELIC 7-16 In response to AELIC RFI No. 3-18 AE responded without explaining how eachconsideration impacted AE’s load making the response unclear. Moreover, AEfailed to address the cost considerations requested to be addressed. Pleaseprovide what cost considerations are involved in AE’s design of a distributionsystem for each consideration identified in AELIC RFI No. 3-17 to AE. Forinstance, AE responded in AELIC RFI. No. 3-18 A saying the “size of theresidential structure typically relates to the size of the load.” What does thismean? Does this mean the larger the house, the greater the demand. How doesthis factor impact costs of the distribution system?
ANSWER:
A. With regard to the size of a residential structure, AE takes into accountmany factors when designing a distribution system for a residentialdevelopment, including:
• The number of structures on a property (e.g., main house,guesthouse, guard house, etc.);
• The size of each structure (in square feet);• The use type of the structures (e.g., single family, multifamily,
garage workshop, guest house, pool house, etc.);• The fuel types used on the property (e.g., all electric or dual fuel –
electric & gas); and• Whether there are any specialty loads on site (e.g., large workshop
equipment).
For example, a 5,000 square foot home typically uses more power than a2,000 square foot home. All other variables being equal (fuel type, usetype, etc.), the difference can typically be attributed to air conditioningload; thus, a larger building requires more electricity to cool the largervolume of air as compared to a smaller building. In such instances, alarger home may require higher rated infrastructure — such as a 320 ampmeter (vs. a 200 amp meter), larger service wire, larger transformer, etc.— to meet the demand of the larger infrastructure. This higher ratedinfrastructure can lead to increased cost; however, under the CityCouncil’s current line extension policy, 100% of these costs are paidupfront by the customer requesting this service.
B. With regard to the size of the property on which the structures are located,the location of the residential structures compared with the location of theservice feed is used in determining the amount of infrastructure that isrequired to provide service. For example, buildings erected further awayfrom the source of electricity typically require longer power lines toprovide power to the meter at the structure. This increases the cost toprovide power because more wire and/or poles are required due to thelonger distance between source and meter; however, under the CityCouncil’s current line extension policy, 100% of these costs are paidupfront by the customer requesting this service.
32
Austin Energy’s Response to AELIC’s 7th RFI
749/11/7068322
C. With regard to the demand of the structures, AE must take intoconsideration the electrical demand of the residential structures andwhether there have been any improvements made on the property — suchas swimming pools, hot tubs, and landscaping — when sizing electricalinfrastructure. These higher demand loads often increase theinfrastructure required to serve the customer (such as wire, poles,transformers, meter, etc.) and therefore, increase installation cost.However, under the City Council’s current line extension policy, 100% ofthis cost is paid upfront by the customer requesting this service.
D. With regard to the geology of the subdivision, Austin Energy considersvarious geological factors when designing the facilities that are required toserve new customers. Infrastructure, such as pole heights, framing, andother equipment as well as the locations of the infrastructure may all beimpacted by the geology of the subdivision. In cases, where there is alarge grade change — i.e., a hill or valley — more poles may be requiredthan normal in order to maintain National Electric Safety Code clearances.The additional infrastructure may increase the installation costs; however,under the City Council’s current line extension policy, 100% of this cost ispaid upfront by the customer requesting this service.
Prepared by: DSSponsored by: Elaina Ball
33
Austin Energy’s Response to AELIC’s 7th RFI
749/11/7068322
AELIC 7-17 Please provide the aggregate kWh usage by residential customers whose service islocated outside the Austin City limits for each of the following tiers broken out bythe summer surcharge months and the winter months:
A. Summer1. 0-500kWh2. 501-1000kWh3. 1001-1500kWh4. 1501-2500kWh5. 2501kWh and over
B. Winter1. 0-500kWh2. 501-1000kWh3. 1001-1500kWh4. 1501-2500kWh5. 2501kWh and over
(If the kWh data using these tiers is not available, then AE may utilize the usage blocks it reliedupon in deriving bill impacts. See WPH-3.1.2 and WP H-3.1.2.1, Bates Stamp pp. 1028and1029)
ANSWER:
The aggregate data for residential customer class can be found within the ‘AE RFP’ model onWP H-5.1 under column ‘D’ for outside city limits, lines 25-29 for summer and lines 33-37 forwinter.
Prepared by: CMSponsored by: Mark Dombroski
34
Austin Energy’s Response to AELIC’s 7th RFI
749/11/7068322
AELIC 7-18 Please provide the aggregate kWh usage by residential customers whose service islocated within the Austin City limits for each of the following tiers broken out bythe summer surcharge months and the winter months:
A. Summer1. 0-500kWh2. 501-1000kWh3. 1001-1500kWh4. 1501-2500kWh5. 2501kWh and over
B. Winter1. 0-500kWh2. 501-1000kWh3. 1001-1500kWh4. 1501-2500kWh5. 2501kWh and over
(If the kWh data using these tiers is not available, then AE may utilize the usage blocks it reliedupon in deriving bill impacts. See WP H-3.1.1 and WP H-3.1.1.1, Bates Stamp pp. 1026 and1027)
ANSWER:
The aggregate data for residential customer class can be found within ‘AE RFP’ model on WPH-5.1 under column ‘A’ for inside city limits, lines 25-29 for summer and lines 33-37 for winter.
Prepared by: CMSponsored by: Mark Dombroski
35
Austin Energy’s Response to AELIC’s 7th RFI
749/11/7068322
AELIC 7-19 In AE’s response to AELIC RFI No.3-3 to AE, a “Demand meter” and an “S-Netmeter” were identified as in service to residential customers receiving three-phaseelectric service. In its response to AELIC RFI No. 1-14 AE did not identify a“demand meter” as a meter maintained and operated by AE for residentialcustomers. Also, in that same response, AE identified a Net meter, not a S-Netmeter. Please explain how the “demand meter” for residential customersreceiving three-phase electric service is used by AE to provide service to thesecustomers. In your explanation, please explain why this meter was not identifiedin your response to AELIC RFI No. 1-14 and what the average cost of this meteris. Please also identify where this meter is located in AE’s COS.
ANSWER:
The Demand meter type was inadvertently omitted from the response to AELIC 1-14 and AELIC1-15; please see Austin Energy’s Supplemental Response to AELIC’s RFI No. 1-14 and 1-5.The average cost for the Demand meter type used for residential service ranges from $226 to$396. Demand meters are a meter make and model that is capable of registering energy at ahigher voltage. A residential Demand meter type collects the same meter register data as theSimple meter type. Demand meters are installed on a residential premise based on the size oftheir service and load.
The Cost of Service does not distinguish between meter types by customer class. The COS usesthe average cost of the most common meter. The average cost of meters is shown in Work PaperF-6.3, line 6. The supporting document for the meter cost during the Test Year has beenprovided in AE’s Response to NXP/Samsung RFI No. 5-15.
Prepared by: JLSponsored by: Elaina Ball
36
Austin Energy’s Response to AELIC’s 7th RFI
749/11/7068322
AELIC 7-20 The S-Net meter identified by AE in its response to AELIC RFI No. 3-3 was notspecifically identified in AE in its response to AELIC RFI No. 1-14 that requestedAE to identify all meters used to serve residential customers. Please explain whyit was not. Also, please briefly explain how AE uses this meter to provide serviceto these residential customers receiving three-phase electric service. Pleaseprovide the average cost for this meter. Please also identify where this meter islocated in the COS.
ANSWER:
The Net meter identified in Austin Energy’s Response to AELIC’s RFI No. 1-14 is the samemeter as the S-Net (Simple Net) meter listed in Austin Energy’s Response to AELIC RFI No. 3-3. Austin Energy used the abbreviated name for this type of meter in its Response to AELIC RFINo. 1-14. Simple Net meters are used to measure kWh delivered to the distribution grid from acustomer’s premise and kWh received by the customers from the distribution grid. The data readfrom Simple Net meters do not differ by the phase of electric service. The average cost ofSimple Net meters is $160 as shown in Austin Energy’s Response to AELIC RFI No. 1-14 andshown in Work Paper F-6.3, line 6.
The Cost of Service does not distinguish between meter types by customer class. The COS usesthe average cost of the most common meter. The average cost of meters is shown in Work PaperF-6.3, line 6. The supporting document for the meter cost during the Test Year has beenprovided in AE’s Response to NXP/Samsung RFI No. 5-15.
Prepared by: JLSponsored by: Elaina Ball
37
Austin Energy’s Response to AELIC’s 7th RFI
749/11/7068322
AELIC 7-21 For each meter type identified in your response to AELIC RFI No. 1-14 to AE,please provide the following:
A. A brief explanation of how AE uses the meter to provide service toresidential customers;
B. How the meter is different from the other types of meters identified
ANSWER:
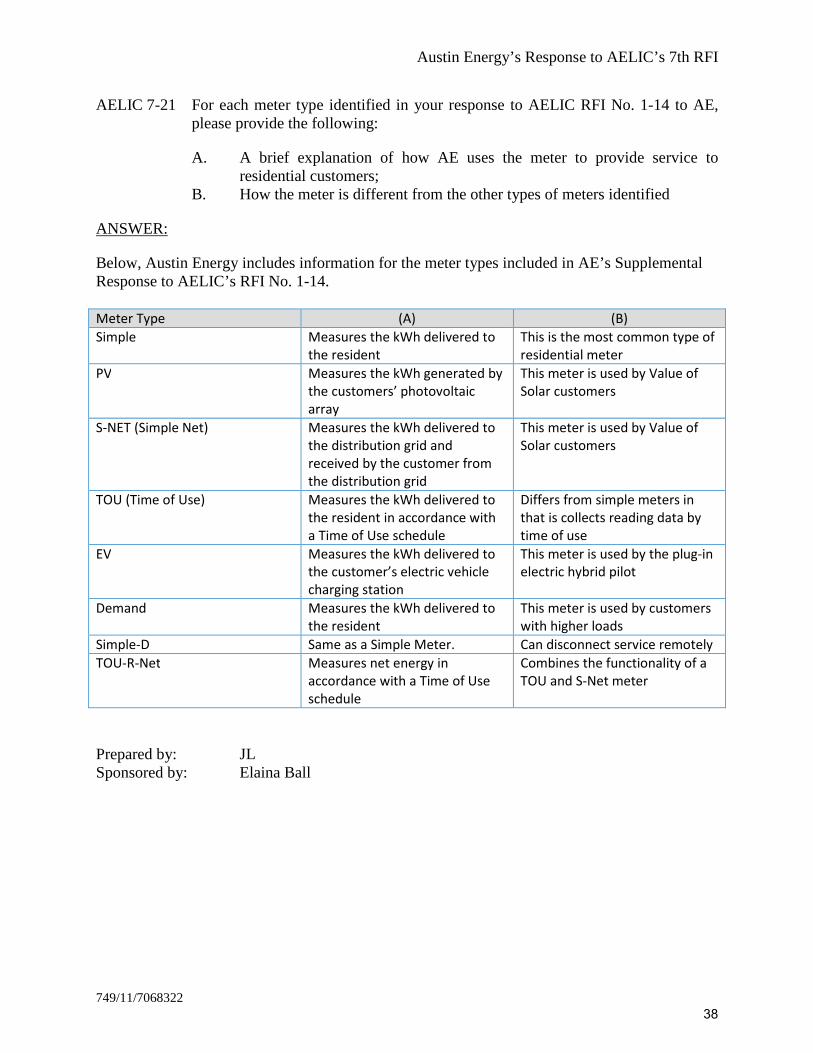
Below, Austin Energy includes information for the meter types included in AE’s SupplementalResponse to AELIC’s RFI No. 1-14.
Meter Type (A) (B)
Simple Measures the kWh delivered tothe resident
This is the most common type ofresidential meter
PV Measures the kWh generated bythe customers’ photovoltaicarray
This meter is used by Value ofSolar customers
S-NET (Simple Net) Measures the kWh delivered tothe distribution grid andreceived by the customer fromthe distribution grid
This meter is used by Value ofSolar customers
TOU (Time of Use) Measures the kWh delivered tothe resident in accordance witha Time of Use schedule
Differs from simple meters inthat is collects reading data bytime of use
EV Measures the kWh delivered tothe customer’s electric vehiclecharging station
This meter is used by the plug-inelectric hybrid pilot
Demand Measures the kWh delivered tothe resident
This meter is used by customerswith higher loads
Simple-D Same as a Simple Meter. Can disconnect service remotely
TOU-R-Net Measures net energy inaccordance with a Time of Useschedule
Combines the functionality of aTOU and S-Net meter
Prepared by: JLSponsored by: Elaina Ball
38
Austin Energy’s Response to AELIC’s 7th RFI
749/11/7068322
AELIC 7-22 Does AE maintain and operate any other meters for residential customers thanthose identified in AELIC RFI Nos.3-3 and 1-14. If so, please list each suchmeter; provide a brief explanation of how AE uses the meter to provide service toresidential customers; the average cost for the meter; and how the meter isdifferent from the other types of meters identified in responding to the AELICRFIs referred to in the previous sentence. Please also identify where the meter islocated in AE’s COS.
ANSWER:
Please refer AE’s Supplemental Response to AELIC 1-14. In addition to those meter typesoriginally identified in AE’s Response to AELIC RFI Nos. 1-14 and 3-3, AE operates Simple-Dand TOU-R-NET meter types for residential customers. These meter types are variants of theSimple and TOU meters previously identified.
The Simple meter types are currently being replaced with a Simple-D meter type. The Simple-Dmeter types perform the same functions as Simple meters. Simple-D meters have the addedfunctionality of a remote disconnect. The average cost of the Simple-D meter is the same asshown for the Simple meter type in AE’s Response to AELIC RFI No. 1-15.
The TOU-R-Net meter type is a variant of the TOU meter listed in AE’s Response to AELICRFI No. 1-14. There is no difference in cost between the TOU-R-Net and TOU residentialmeters. The TOU-R-Net meter measures the kWh delivered to the distribution grid by thecustomer and received by the customer from the distribution grid. Additionally, the TOU-R-Netmeter also collects the meter read by the time of use schedule. This new meter type has not beenwidely deployed.
The Simple-D and TOU-R-Net meter types were not use during the test year. Therefore, they arenot in the COS.
Prepared by: JLSponsored by: Elaina Ball
39
Austin Energy’s Response to AELIC’s 7th RFI
749/11/7068322
AELIC 7-23 When did AE cease operating the Holly Power Plant to produce electric energy?In your response please also address when AE commenced Holly Power plantdecommissioning activities as that term is used by AE at p. 4-71, Bates Stamp p.100 of its rate filing package.
ANSWER:
By agreement of the parties, this request has been withdrawn.
Prepared by: -Sponsored by: -
40
Austin Energy’s Response to AELIC’s 7th RFI
749/11/7068322
AELIC 7-24 What are the termination dates for each of the coal supply contracts to which AEis a joint signatory with LCRA that are either in operation now or were inoperation during the TY 2014. (Reference: AE response to AELIC RFINo. 4-15.)
ANSWER:
This request is subject to a pending objection. Austin Energy has determined the request seeksinformation that is related to competitive matters and, thus, not subject to disclosure pursuant toTex. Gov't Code § 552.133, Confidentiality of Public Power Utility Competitive Matters.
Prepared by: EBSponsored by: Elaina Ball
41
Austin Energy’s Response to AELIC’s 7th RFI
749/11/7068322
AELIC 7-25 For each of the coal supply contracts whose termination dates are identified inRFI No. 7-24, please identify and quantify any costs such as financing penalty forearly termination or for liquidated damages AE may incur as a signatory to thecontract for early termination of the contract.
ANSWER:
This request is subject to a pending objection. Austin Energy has determined the request seeksinformation that is related to competitive matters and, thus, not subject to disclosure pursuant toTex. Gov't Code § 552.133, Confidentiality of Public Power Utility Competitive Matters.
Prepared by: EBSponsored by: Elaina Ball
42
Austin Energy’s Response to AELIC’s 7th RFI
749/11/7068322
AELIC 7-26 Does AE agree that AE’s business operations must be consistent with its financialpolicy to maintain a debt service coverage ratio of not less than 2.0x on electricutility revenue bonds? (Reference: p. 4-58, Bates Stamp, p. 087).
ANSWER:
This question refers to Austin Energy’s financial policy #6. As such, Austin Energy agrees thatit should comply with Financial Policy 6, found in Appendix D, Bates Stamp 368, in AustinEnergy’s Tariff Package and which states:
“Debt service coverage of a minimum of 2.0x shall be targeted for the Electric Utility Bonds.All short term debt, including commercial paper, and non-revenue obligations will be included at1.0x.”
Austin Energy sets retail rates in compliance with Financial Policy 17 also found in Appendix D,starting on Bates Stamp 370, which states in essence that rates will be set using a cash flowmethod. Once electric rates are designed using the cash flow method, they should producerevenues that ensure a minimum debt service coverage of 2.0x on electric utility revenue bonds.
Prepared by: RMSponsored by: Mark Dombroski
43
Austin Energy’s Response to AELIC’s 7th RFI
749/11/7068322
AELIC 7-27 Please identify each of the cost components AE included in deriving its $21.68cost of service customer charge. (Reference: AE response to Rourke RFINo. 1-5).
ANSWER:
$3.90 is the customer related revenue requirement found on schedule G-4 ($23 million) allocatedto the classes on schedule G-6 ($18 million) then divided by the number of customer months onschedule G-8 (4.6 Million)
17.78 is the customer related revenue requirement found on schedule G-5 ($95 million) allocatedto the classes on schedule G-6 ($82 million) then divided by the number of customer months onschedule G-8 (4.6 Million)
Prepared by: MMSponsored by: Mark Dombroski
44
Austin Energy’s Response to AELIC’s 7th RFI
749/11/7068322
AELIC 7-28 For each cost component identified in RFI No. 7-27, please provide the following:
A. The aggregated cost of that component for the residential customer classthat was included in deriving the cost of service customer charge;
B. The amount included in the $21.68 cost of service customer charge.C. A brief explanation of how that cost was used to derive the cost of service
customer charge. In your explanation, please provide the underlyingcalculation(s) used to derive the cost of service customer charge. (Forinstance, the cost of the “X” component was divided by the number of TY2014 residential customers)
D. Where that cost component is located in the COS.
ANSWER:
A. The aggregate cost of the components that derived the customer chargeand the amounts can be found within ‘AE RFP’ model on Schedule G-8under column ‘C’ or Schedule H-5.4 under column ‘B’.
B. The aggregate cost of the components that derived the customer chargeand the amounts can be found within ‘AE RFP’ model on Schedule G-8under column ‘C’ or Schedule H-5.4 under column ‘B’.
C. The underlying calculations used to derive the customer charge can befound within ‘AE RFP’ model on Schedule G-8 under column ‘C’ orSchedule H-5.4 under column ‘B’. Please refer to ‘Austin Energy’s TariffPackage: 2015 Cost of Service Study and Proposal to Change BaseElectric Rates,’ under Chapters 5 and 6 for an explanation of how the costwas used to derive the cost of service customer charge.
D. All of the individual cost components are derived in Schedules G-1through G-7 within ‘AE RFP’ model.
Prepared by: CMSponsored by: Mark Dombroski
45
Austin Energy’s Response to AELIC’s 7th RFI
749/11/7068322
AELIC 7-29 Please identify each of the cost components AE included in deriving its $17.59 forits cost of service electric delivery charge.
ANSWER:
$17.59 is the demand related revenue requirement found on schedule G-4 ($177 million)allocated to the classes on schedule G-6 ($81 million) then divided by the number of customermonths on schedule G-8 (4.6 Million).
Prepared by: MMSponsored by: Mark Dombroski
46
Austin Energy’s Response to AELIC’s 7th RFI
749/11/7068322
AELIC 7-30 For each component identified in RFI No. 7-29, please provide the following:
A. The aggregated cost of that component for the residential customer classthat was included in deriving the cost of service electric delivery charge.
B. The amount included in the $17.59 cost of service electric delivery charge.C. A brief explanation of how that cost was used to derive the cost of service
electric delivery charge. In your explanation, please provide theunderlying calculation(s) used to derive the cost of service electricdelivery charge. (For instance, the cost of “X” component was divided bythe number of TY 2014 residential customers)
D. Where that cost component is located in the COS.
ANSWER:
A. The aggregate cost of the components that derived the customer chargeand the amounts can be found within ‘AE RFP’ model on Schedule G-8under column ‘C’.
B. The aggregate cost of the components that derived the customer chargeand the amounts can be found within ‘AE RFP’ model on Schedule G-8under column ‘C’.
C. The underlying calculations used to derive the customer charge can befound within ‘AE RFP’ model on Schedule G-8 under column ‘C’. Pleaserefer to ‘Austin Energy’s Tariff Package: 2015 Cost of Service Study andProposal to Change Base Electric Rates,’ under Chapters 5 and 6 for anexplanation of how the cost was used to derive the cost of service electricdelivery charge.
D. All of the individual cost components are derived in Schedules G-1through G-7 within ‘AE RFP’ model.
Prepared by: CMSponsored by: Mark Dombroski
47
Austin Energy’s Response to AELIC’s 7th RFI
749/11/7068322
AELIC 7-31 Please explain how AE derived the $.03069 cost of service energy charge. Inyour explanation, please provide the underlying calculations used to derive thecost of service energy charge. (Reference: AE Response to Rourke’s 1st RFINo. 1-5).
ANSWER:
The .0369 represents the sum of the production costs allocated on demand on schedule G-6($143 million) less the amount to be recovered in the energy efficiency charge on schedule G-7($14 million) divided by the annual billed energy kWh on schedule G-8 (4.2 billion).
Prepared by: MMSponsored by: Mark Dombroski
48
Austin Energy’s Response to AELIC’s 7th RFI
749/11/7068322
AELIC 7-32 Please explain how AE’s transmission O&M expenses went from a Texas PublicUtility Commission finding of $10,884,465 in 2006 (Reference: PUC Docket No.31462, Final Order, FOF No. 12A) to $145,698,897 (characterized as nonfuelO&M) in this rate filing? (Reference: Schedule A, Bates Stamp p. 767). In yourexplanation please identify cost elements that were not included in both thetransmission O&M expenses determined in PUC Docket No. 31462 and theamount included as nonfuel transmission O&M expenses in this rate filing.
ANSWER:
This request is subject to a pending objection.
Prepared by: CGSponsored by: Mark Dombroski
49
Austin Energy’s Response to AELIC’s 7th RFI
749/11/7068322
AELIC 7-33 For each cost element identified in RFI No. 7-32, please explain why it was notincluded in both O&M amounts.
ANSWER:
This request is subject to a pending objection.
Prepared by: CGSponsored by: Mark Dombroski
50
Austin Energy’s Response to AELIC’s 7th RFI
749/11/7068322
AELIC 7-34 For each reserve where AE uses its nonfuel O&M as it base to calculate thereserve amount (i.e. working capital reserve equals 45 days of nonfuel (alsoreferred to as “non-power supply”) O&M), what was the dollar amount of nonfuelO&M AE used as a base to calculate the reserve.
ANSWER:
Please see WP C-3.2.1, Line 9, Columns (A) and (B) in the RFP.
Prepared by: RMSponsored by: Mark Dombroski
51
Austin Energy’s Response to AELIC’s 7th RFI
749/11/7068322
AELIC 7-35 In Attachment 1, p.1 of 89, AE’s response to AELIC (referred to as “TLSC”) RFINo. 1-32, there are two vertical columns entitled Austin Energy Calculation andPUCT. Please explain what those two columns represent. In your explanation,please explain what is meant by “Austin Energy Calculation” and what is meantby “PUCT”. Also, please address why the working capital amount set out under“PUCT” is less than the working capital amount set out under Austin EnergyCalculation. Lastly, please address why reductions for Materials and supplies andfor Pre-paid expenses were made under “PUCT” but not under “Austin EnergyCalculation.”
ANSWER:
As part of evaluating Austin Energy’s reserves, NewGen compared — for informationalpurposes — the cash working capital calculation under AE’s financial policies (the “AustinEnergy Calculation”) to what is allowed at the Public Utility Commission of Texas as part ofdeveloping a utility’s rate base (the “PUCT” calculation).
Reductions for materials and supplies for pre-paid expenses were not made under the “AustinEnergy Calculation” because AE’s Financial Policy No. 11 indicates operating cash should beevaluated based on 45 days of operations and maintenance expense, less fuel and purchasedpower.
When calculating rate base, P.U.C Subst. R. 25.231(c)(2)(B)(iii)(I) states:
Cash working capital for electric utilities shall in no event begreater than one-eighth of total annual operations and maintenanceexpense, excluding amounts charged to operations andmaintenance expense for materials, supplies, fuel, andprepayments.
Materials, supplies and prepayments are excluded from the cash working capital element of ratebase at the PUCT because these items are, themselves, separately identified elements of ratebase. Thus, removing them from the cash working capital calculation prevents them from beingdouble counted.
The exclusion of materials, supplies and prepayments from the cash working capital calculationis what results in the difference in the calculated working capital amounts under “Austin EnergyCalculation” and “PUCT” on the cited worksheet.
Again, this comparison was performed for informational purposes only and had no direct impacton the overall financial reserves analysis.
Prepared by: GRSponsored by: Elaina Ball
52
Austin Energy’s Response to AELIC’s 7th RFI
749/11/7068322
AELIC 7-36 For each expense item identified below, please state whether you included thatexpense into your calculation of working capital reserve.
A. PrepaymentsB. MaterialsC. SuppliesD. DepreciationE. Other taxesF. Non-nuclear reserve
ANSWER:
Prepayments, materials, and supplies along with non-nuclear decommissioning expense whichwould fund non-nuclear reserves were included in the calculation of the working capital reserve.Depreciation and other taxes were not included.
Prepared by: RMSponsored by: Mark Dombroski
53
Austin Energy’s Response to AELIC’s 7th RFI
749/11/7068322
AELIC 7-37 Please provide the amount for each expense item identified below that wasincluded in AE’s COS.
A. PrepaymentsB. MaterialsC. SuppliesD. DepreciationE. Other taxesF. Non-nuclear reserve
ANSWER:
A. Prepayments - $16,562,661B. Materials - $11,017,068C. Supplies – Supplies expensed to O&M are included in the response to (b)
aboveD. Depreciation - $145,651,759E. Other taxes - $1,407,353F. Non-nuclear decommissioning expense which would fund non-nuclear
reserves - $19,442,308
Prepared by: RMSponsored by: Mark Dombroski
54
Austin Energy’s Response to AELIC’s 7th RFI
749/11/7068322
AELIC 7-38 Did AE calculate its cash working capital in this rate filing the same way itcalculated its cash working capital requirements in its TCOS filing in PUCDocket No. 31462? (This question is calling for a “formula” response.).
ANSWER:
Yes. The cash working capital in both this rate filing and Docket No. 31462 was calculatedusing the 1/8th rule as shown on Schedule B-9, Bates Stamp 797, in the RFP.
Prepared by: RMSponsored by: Mark Dombroski
55
Austin Energy’s Response to AELIC’s 7th RFI
749/11/7068322
AELIC 7-39 If the answer to RFI No. 7-38 is no, please explain the differences in AE’scalculations.
ANSWER:
Not applicable.
Prepared by: RMSponsored by: Mark Dombroski
56
Austin Energy’s Response to AELIC’s 7th RFI
749/11/7068322
AELIC 7-40 Please provide the formula relied upon by rating agencies to measure a publicpower’s number of days of cash on hand. In providing the formula, please brieflyidentify and define the components of the formula. (Reference: footnote No.1,p. 4-72, Bates Stamp p. 101).
ANSWER:
Austin Energy is not responsible for the rating agencies’ calculations and, therefore, cannotspeak to their methodologies.
Prepared by: RMSponsored by: Mark Dombroski
57
Austin Energy’s Response to AELIC’s 7th RFI
749/11/7068322
AELIC 7-41 Please explain what operating expenses 150 days “cash on hand” is supposed tocover.
ANSWER:
One hundred fifty (150) days cash on hand is a measure of a level of cash reserves. Please seethe discussion on reserves and their purposes at Section 4.4 starting on 4-65 (Bates Stamp 094)in Austin Energy’s Tariff Package.
Prepared by: RMSponsored by: Mark Dombroski
58
Austin Energy’s Response to AELIC’s 7th RFI
749/11/7068322
AELIC 7-42 Please identify each of the cost components AE included in deriving its $.03069cost of service energy charge. (Reference: AE Response to Rourke 1st RFI toAE, RFI No. 1-5).
ANSWER:
Please see AE’s Response to AELIC RFI No. 7-31.
Prepared by: MMSponsored by: Mark Dombroski
59
Austin Energy’s Response to AELIC’s 7th RFI
749/11/7068322
AELIC 7-43 For each cost component identified in RFI No. 7-42, please provide the following:
A. The aggregated cost of that component for the residential customer classthat was included in deriving the cost of service energy charge;
B. A brief explanation of how that cost was used to derive the of serviceenergy charge. In your explanation, please provide the underlyingcalculation(s) used to derive the cost of service energy charge; (Forinstance, the cost of the “X” component was divided by the number ofkWh at the meter)
C. Where that cost component is located in the COS.
ANSWER:
A. The aggregate cost of the components that derived the customer chargeand the amounts can be found within ‘AE RFP’ model on Schedule G-8under column ‘C’.
B. The underlying calculations used to derive the customer charge can befound within ‘AE RFP’ model on Schedule G-8 under column ‘C’. Pleaserefer to ‘Austin Energy’s Tariff Package: 2015 Cost of Service Study andProposal to Change Base Electric Rates,’ under Chapters 5 and 6 for anexplanation of how the cost was used to derive the cost of service energycharges.
C. All of the individual cost components are derived in Schedules G-1through G-7 within ‘AE RFP’ model.
Prepared by: CMSponsored by: Mark Dombroski
60
Austin Energy’s Response to AELIC’s 7th RFI
749/11/7068322
AELIC 7-44 Please identify, including horizontal and vertical column references, where thekWh usage AE relied upon in deriving its cost of service is located in its COS.
ANSWER:
Please refer to Work Paper F-6.1, columns (A) through (M), line numbers 63 through 74. WorkPaper F-6-1 is utilized for class cost of service allocators.
Additionally, please refer to Work Papers H-5.1 through H-5.14, columns (A) and (D). The linesvary by work paper. These work papers are used for rate design.
Prepared by: JLSponsored by: Mark Dombroski
61