c 0 0 5 – 2 0 3 0
TRANSCRIPT
CEMENTING OUR FUTURE 2005–2030 T E C H N O L O G Y PAT H W AY F O R T H E A U S T R A L I A N C E M E N T I N D U S T R Y
ContentsPreface 1
Executive summary 2The purpose of the report 2How cement is made 2Snapshot of the Australian cement industry in 2004 3Impact of technology on the cement industry 2005–2012 4Opportunities 2012 to 2030 and beyond 6Drivers to adopting new technology 6
1 Introduction 7Cement and its uses 7The cement manufacturing process 7Where technology can make a difference 8Participants in the Australian cement industry 9Aims of the study and structure of the report 9
2 The Australian Cement Industry in 2004 11Production 11Growth and technological change 11Sustainability 15
3 Modelling the Australian Cement Industry 2005 to 2012 18The review process 18Uptake of world best technology 19Industry performance measures 19Market trend predictions 22Caveats and limitations of the model and forecasts 25
4 Forecast profile of Australian Cement Industry in 2012 27Profile based on business as usual (BAU) conditions 28Profile based on best available technology (BAT) conditions 33
5 Opportunities 2012 to 2030 and beyond 38Existing technologies 38Emerging technologies from the cement and other industries 41Drivers to adopting new technology 44
APPENDIX A Acronyms and abbreviations 46
APPENDIX B Glossary 47
APPENDIX C References 49
ATTACHMENT A Sustainability in the Cement Industry 51
ATTACHMENT B Industry performance measures 54
ATTACHMENT C Industry technology to 2012 58
C E M E N T I N G O U R F U T U R E
ii
T E C H N O L O G Y P A T H W A Y F O R T H E A U S T R A L I A N C E M E N T I N D U S T R Y 2 0 0 5 – 2 0 3 0
1
PrefaceThe Cement Industry Federation (CIF) is the national body representing the Australian cement
industry. It aims to promote and sustain a competitive Australian cement industry that is
committed to best practice in its activities. Since 1989, the CIF has been gathering extensive data
from its members. Analysis of these data has allowed the cement industry to accurately articulate
movements in the industry that have an impact on the Australian community.
We fully appreciate our need to engage with government and other decision-makers to keep them
fully informed of how our industry is travelling and to provide our best estimates of how it will
perform in the future, and how that performance can be optimised. We are conscious that many
changes to current practices, particularly those pertaining to environmental protection, will require
support from the government to eventuate.
To this end, we have produced this report, Cementing our Future, which benchmarks the Australian
cement industry’s current technologies against the world’s best, and ascertains what the industry is
likely to do under current and forecast economic circumstances. It analyses what new technologies
the industry could implement that would contribute to reduced energy consumption, reduced
greenhouse-gas emission, and environmental enhancement of the community at large, at the same
time as sustaining the industry as commercially viable. The report also speculates on the possible
impact of emerging technologies that may arise out to 2030 that could be linked into cement-
making processes. The report addresses issues inherent in current policy frameworks set out by the
three tiers of government—federal, state and local. Of course, if the policy parameters change, then
the assumptions made here will change accordingly.
The CIF wishes to thank and acknowledge the following people who assisted in the production of
this report:
■ Technology Taskforce, chaired by David Cusack of Cement Australia Pty Ltd and assisted by
Michael Jones of Adelaide Brighton Ltd, Kathryn Turner of Blue Circle Southern Cement Ltd,
and Ros DeGaris of the CIF, who were the authors, modellers and researchers
■ company site personnel who provided the data to forecast technology plans.
Robyn Bain
Chief Executive
Cement Industry Federation
June 2005
C E M E N T I N G O U R F U T U R E
2
Executive summaryCement is the ‘glue’ that binds concrete and as such has been intrinsic to the built environment
of modern society. Few of us could imagine a world without concrete in its many shapes and
forms, and the global demand for it is not likely to diminish. However, cement manufacture is a
process that requires accurate chemical and physical control that is energy-intensive and produces
high levels of greenhouse-gas emissions—features which make it a prime target for embracing
technological innovation.
The cement industry in Australia is very conscious of its responsibility and obligations to act to
conserve electrical and fuel energy and minimise emissions. It is also keen to conserve natural raw
materials used to make cement by increasing the use of alternative materials and use of wastes and
by-products from other industries to reduce overall industry waste, reduce costs, and ensure the
sustainability of the industry for future generations.
The purpose of the report
For these reasons, the Cement Industry Federation (CIF) put together a Technology Taskforce
to examine the cement industry in Australia. The first role of the taskforce was to document the
current status of the Australian cement industry and the extent to which best available technologies
are currently in use. The taskforce then developed a model to assess the opportunities for uptake
of new technology and, with certain assumptions, used this model to forecast the effect of new
technology on industry performance parameters in the near term (2005–2012) and identify the
impediments to adoption of best available technology.
Further trends in technology uptake, from 2012 to 2030 and beyond, were then considered. The
likelihood of the industry adopting these technologies in the future is therefore more speculative,
but nevertheless this review provides valuable insight into the direction the industry is taking.
The CIF is well placed to undertake this study as it represents all the major cement producers in
Australia and has access to all relevant data collated through its annual surveys of the industry. The
report analyses the national industry performance and compares it to world best practice achieved
by nominated plants.
How cement is made
The first step in making cement is to combine the calcium from limestone in accurate proportions
with silica and aluminium (from sands, clays or shales) and iron (from iron ore or other ore-
bearing minerals) to form a raw mix. Raw mix is then ground to a fine powder called raw meal
which is then chemically transformed by intensive heating to form an intermediate product called
clinker (a calcium silicate matrix). Clinker is then ground with gypsum and small proportions
of additional materials, to produce the grey powder commonly recognised as cement. Basic
cement can then be blended with other materials, such as fly ash and slag, to make blended
cements to support a wide range of construction applications. Appropriate chemical, physical
and environmental testing is carried out at every stage of the process to ensure that all applicable
standards are met.
T E C H N O L O G Y P A T H W A Y F O R T H E A U S T R A L I A N C E M E N T I N D U S T R Y 2 0 0 5 – 2 0 3 0
3
Snapshot of the Australian cement industry in 2004
There are three major Australian cement producers: Adelaide Brighton Ltd, Blue Circle Southern
Cement Ltd, and Cement Australia Pty Ltd. Together, these companies account for all the integrated
production of clinker and cement manufactured in Australia. Operations are located regionally,
with 15 manufacturing sites, seven mines and 74 distribution terminals. In 2004, the industry
manufactured over nine million tonnes of cementitious materials, directly employed 1840 people
and had an annual turnover of more than $1.25 billion.
The Australian industry supplies almost all the cementitious material requirements of the
Australian market from local manufacturing plants. Cementitious materials include all types of
cement and other materials sold for use as a supplement for cement in concrete. Over 74 per cent
of the industry’s production uses the fuel-efficient pre-calciner kiln technology, considered to be
the most advanced commercial technology for making cement clinker. In the past 15 years, over
$1 billion has been invested in new, technologically advanced capacity.
Sustainability and environmental concerns have been key considerations for the cement industry
in recent years. In response, changes to cement manufacturing have included:
■ recycling other industry waste while conserving natural materials in the manufacturing process
■ managing utilised waste to the end of its life-cycle
■ reducing emissions from the cement-manufacturing process, including greenhouse gases,
landfill, dust, and oxides of nitrogen
■ increasing efficiency in manufacturing—requiring less power and fuel
■ rehabilitating quarries and sites—returning the land to a better-than-before or equivalent
condition
■ creating superior construction materials for a wider range of uses
■ improving the durability of concrete through cement quality.
From 1990 to 2004, the Australian industry improved its electrical efficiency per tonne of product
by 18 per cent. This reduction in power demand can mainly be attributed to the commissioning of
new, larger, manufacturing plants and, to a lesser extent, to improvements such as upgraded liners
and classifiers on cement mills, variable speed drives, replacement of materials pumping technology
with low-energy transport systems, and power-optimising control to manage the charge in large
electrostatic filters.
In the same period, it has improved fuel efficiency in the kiln per tonne of cement by 32 per cent.
This reduction is mainly attributable to the commissioning of new dry-process precalciner plants,
and to a lesser extent, improvements such as the greater control of the clinkering process and better
preparation of raw materials. The conversion to dry-process technology is very significant as it
avoids the need to evaporate water from the slurry of wet-process kilns.
Alternative fuels and materials—in 2004, 5 per cent of fuel used in the Australian cement industry
came from alternative sources, such as industrial waste, used tyres and the like, compared to
none in 1990. In addition, there was a substantial increase in use of supplementary cementitious
materials (SCMs) and mineral additions over this period.
From 2000 to 2004, emissions of both dust and oxides of nitrogen were reduced by approximately
40 per cent by installing high-efficiency dust filters in clinker plants, and upgrading kiln burners
and using alternative fuels, respectively. Reduction in the emission of greenhouse gases (carbon
dioxide) since 1990 has been significant, at 21 per cent per tonne of cementitious material sold.
C E M E N T I N G O U R F U T U R E
4
In 2005, the industry is expected to exceed the target for reduced greenhouse-gas (GHG) emissions
set by the Australian Greenhouse Challenge Program by an impressive 70 per cent.
The Australian cement industry continually seeks ways to reduce its own waste. Cleaner production
measures are employed on all sites, minimising waste at the source, returning materials to the
process where possible, and finding alternative uses such as recycling (e.g. of used oil) before
landfill or incineration are considered. Cement kiln dust (CKD) is the only solid process waste
from cement production. From 2000 to 2004, the amount of CKD reaching landfill was reduced
by approximately 20 per cent through process modifications and development of markets (e.g.
using it as a neutralising and stabilising material).
Impact of technology on the cement industry 2005–2012
The CIF Technology Taskforce examined the prospects for technological change during this period
under two different sets of conditions:
■ business as usual (BAU), where the drivers for investment are those that prevail under the
present set of government fiscal, monetary and other policies
■ best available technology (BAT), where there are additional mechanisms for permitting
investments in new technology to be made where the financial returns would currently not
be acceptable.
Demand forecasts suggest no major requirement for increased clinker capacity before 2012.
In the absence of such an increase, the main opportunities for technological improvement are:
■ increased use of alternative fuels and raw materials in clinker-manufacturing plants, driven
by the need to reduce the cost of production
■ continuous incremental improvements in systems and equipment (e.g. more efficient motors,
fan designs, maintenance practices) to provide small reductions in fuel and electrical energy
consumption
■ investment in cement-grinding capacity to address customer needs and to reduce electricity
consumption
■ development of market opportunities to reduce the amount of CKD going to landfill
■ further use of SCMs and mineral additions in cement and concrete.
Where BAT differs from BAU is the assumption that certain technologies which are not
commercially viable for some cement plants under BAU would become viable given: government
intervention to allow investment; application of appropriate and transparent environmental
compliance processes; and community acceptance for sustainable practices.
It would cost approximately $150 million to introduce the technology required for the BAU
scenario, and $500 million on top of that to install the BAT proposal. The proposed BAU plan
will invest most heavily in cement-milling operations. The BAT plan would add to this the types
of technology that allow:
■ further increase in the use of alternative fuels and raw materials in the clinker-manufacturing
plant
■ upgrade of other specific plant processes to further improve efficiencies
■ environmental performance improvement beyond the requirements of operating
licence conditions.
T E C H N O L O G Y P A T H W A Y F O R T H E A U S T R A L I A N C E M E N T I N D U S T R Y 2 0 0 5 – 2 0 3 0
5
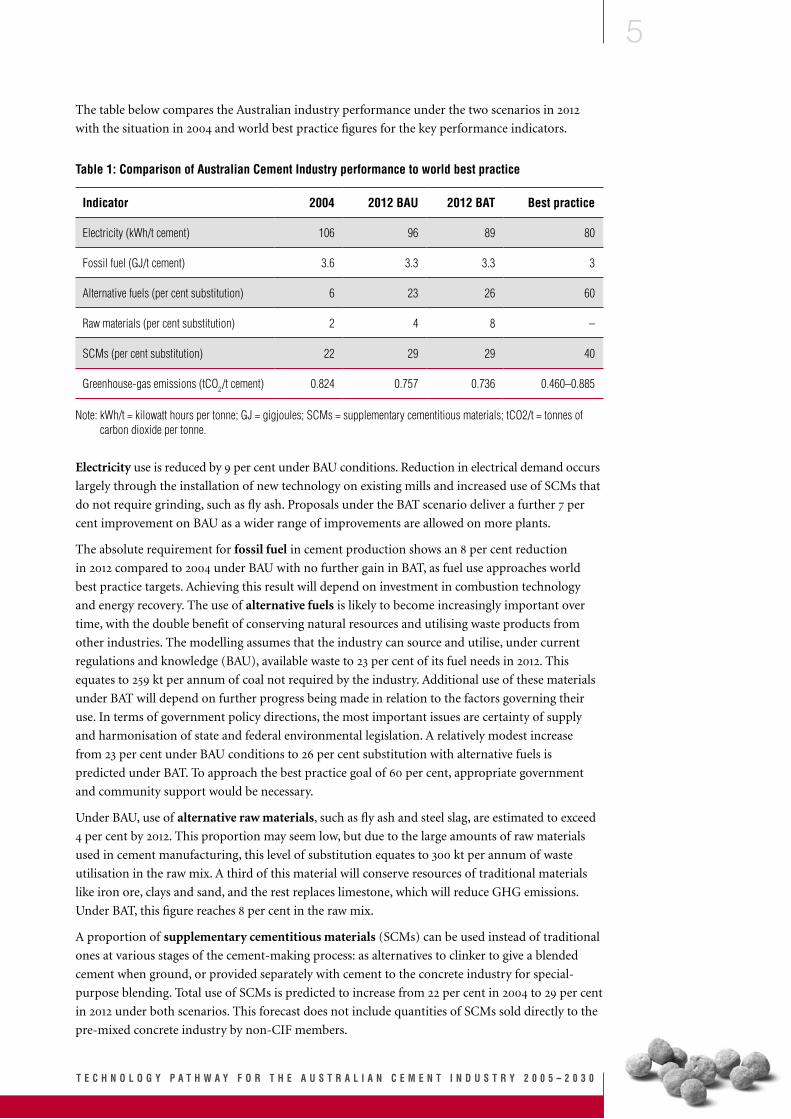
The table below compares the Australian industry performance under the two scenarios in 2012
with the situation in 2004 and world best practice figures for the key performance indicators.
Table 1: Comparison of Australian Cement Industry performance to world best practice
Indicator 2004 2012 BAU 2012 BAT Best practice
Electricity (kWh/t cement) 106 96 89 80
Fossil fuel (GJ/t cement) 3.6 3.3 3.3 3
Alternative fuels (per cent substitution) 6 23 26 60
Raw materials (per cent substitution) 2 4 8 –
SCMs (per cent substitution) 22 29 29 40
Greenhouse-gas emissions (tCO2/t cement) 0.824 0.757 0.736 0.460–0.885
Note: kWh/t = kilowatt hours per tonne; GJ = gigjoules; SCMs = supplementary cementitious materials; tCO2/t = tonnes of carbon dioxide per tonne.
Electricity use is reduced by 9 per cent under BAU conditions. Reduction in electrical demand occurs
largely through the installation of new technology on existing mills and increased use of SCMs that
do not require grinding, such as fly ash. Proposals under the BAT scenario deliver a further 7 per
cent improvement on BAU as a wider range of improvements are allowed on more plants.
The absolute requirement for fossil fuel in cement production shows an 8 per cent reduction
in 2012 compared to 2004 under BAU with no further gain in BAT, as fuel use approaches world
best practice targets. Achieving this result will depend on investment in combustion technology
and energy recovery. The use of alternative fuels is likely to become increasingly important over
time, with the double benefit of conserving natural resources and utilising waste products from
other industries. The modelling assumes that the industry can source and utilise, under current
regulations and knowledge (BAU), available waste to 23 per cent of its fuel needs in 2012. This
equates to 259 kt per annum of coal not required by the industry. Additional use of these materials
under BAT will depend on further progress being made in relation to the factors governing their
use. In terms of government policy directions, the most important issues are certainty of supply
and harmonisation of state and federal environmental legislation. A relatively modest increase
from 23 per cent under BAU conditions to 26 per cent substitution with alternative fuels is
predicted under BAT. To approach the best practice goal of 60 per cent, appropriate government
and community support would be necessary.
Under BAU, use of alternative raw materials, such as fly ash and steel slag, are estimated to exceed
4 per cent by 2012. This proportion may seem low, but due to the large amounts of raw materials
used in cement manufacturing, this level of substitution equates to 300 kt per annum of waste
utilisation in the raw mix. A third of this material will conserve resources of traditional materials
like iron ore, clays and sand, and the rest replaces limestone, which will reduce GHG emissions.
Under BAT, this figure reaches 8 per cent in the raw mix.
A proportion of supplementary cementitious materials (SCMs) can be used instead of traditional
ones at various stages of the cement-making process: as alternatives to clinker to give a blended
cement when ground, or provided separately with cement to the concrete industry for special-
purpose blending. Total use of SCMs is predicted to increase from 22 per cent in 2004 to 29 per cent
in 2012 under both scenarios. This forecast does not include quantities of SCMs sold directly to the
pre-mixed concrete industry by non-CIF members.

C E M E N T I N G O U R F U T U R E
6
Overall emissions of both dust and oxides of nitrogen are reduced over the study period, as are
those of greenhouse gas, namely carbon dioxide (CO2)—a crucial factor in climate protection.
Under BAU, CO2 emissions are forecast to diminish by 8 per cent per tonne of cement, while using
BAT, this figure could be increased to 11 per cent. This would be achieved in a variety of ways:
■ using biomass as an alternative fuel, which is a zero emitter when diverted from landfill
■ substituting calcined material for limestone in raw mix
■ introducing more energy-efficient equipment and practices
■ increasing use of fuels with a lower specific CO2 emission rate
■ extending use of SCMs in cement and concrete.
Opportunities 2012 to 2030 and beyondBeyond 2012, new technology will be introduced through production-cost efficiencies, changes to
standards in quality and environmental performance and, to a lesser extent, the replacement of
old equipment. As a result, emissions of CO2 will continue to reduce, based on 2012 production
estimates, as a result of:
■ improvements in electrical power generation which could yield a further 6 per cent reduction
■ further substitution of fossil fuels with alternatives, especially increased use of biomass which
could yield a further 10 per cent reduction
■ use of alternative raw materials which have been precalcined, as the major source of CO2
emissions in the cement industry is the calcination of limestone (52 per cent) during the clinker-
making process. It is technically feasible for the use of precalcined raw materials to increase from
2 per cent in 2012 to 10 per cent or possibly more. Such an increase would cut emissions by a
further 6 per cent
■ increased use of SCMs—CO2 emission reduction is directly proportional to the amount used;
for instance, a further increase of 10 per cent will save 500 kt CO2 per annum
Post 2012, continuing pressures to eliminate landfill will require industries which produce
unavoidable waste to explore further opportunities for re-use of their waste. Because the cement
industry is able to use a wide range of these waste materials, it is reasonable to expect that it will use
increasing quantities in the period 2012 to 2030.
Emerging technologies have the potential to impact on all areas of industry performance from 2012.
Research and development is under way internationally in areas of interest such as fluidised-bed
systems, alternative building materials, low-emission technologies, carbon capture and storage,
electrical energy related technologies, and use of non-carbon fuels.
Drivers to adopting new technologyThe cement industry recognises that adopting new processes and practices is essential to the
sustainability of the industry, both economically and environmentally. Although the BAU
scenario sees significant improvements in these areas, enabling BAT to be installed is certainly
desirable, particularly for the waste management and climate protection gains which are crucial
considerations for environmental protection.
However, introducing these processes and practices will require a series of technical, legislative,
commercial, risk reduction and community issues to be addressed. To capitalise on the early-action
benefit that cement manufacturing can offer to utilise waste materials, decisions need to be made
quickly and frequently using flexible regulatory frameworks enabled by government.
T E C H N O L O G Y P A T H W A Y F O R T H E A U S T R A L I A N C E M E N T I N D U S T R Y 2 0 0 5 – 2 0 3 0
7
1 Introduction
Cement and its uses
Cement is the ‘glue’ that binds concrete, and as such it has provided the infrastructure for the
development of modern civilisation. The use of cementitious material in construction is extremely
widespread and varied.
The pre-mixed concrete industry uses the greatest volumes of cement in applications such as:
■ concrete slabs and foundations for buildings, roads and bridges
■ pre-cast panels, renders, blocks, bricks and roofing tiles
■ fence posts and railway sleepers
■ construction of stormwater channels, reservoirs, dams and tanks.
Cement is also used in bulk quantities in other diverse applications such as:
■ stabilisation of roads and open-cut rocky surfaces
■ backfill mining operations
■ casings in oil and gas wells.
Cement can be adapted for specific conditions; for example, to resist sulfate attack, or to meet specific
performance needs, such as high early strength or low heat evolution, and architectural needs.
The cement manufacturing process
The main raw materials used for making cement are limestone, shale, clay, iron ore and sand.
These materials are primarily obtained from mines. A proportion of this traditional raw material
requirement can be replaced with alternative raw materials such as by-products from other
industries, including fly ash and slag. Raw materials are transported to the cement plant by
conveyors, road, rail or sea transport.
The first step in manufacturing cement is to make a raw mix by accurately combining the raw
materials. Raw mix is then ground to a fine powder called raw meal. A typical analysis of raw meal
includes calcium oxide (CaCO3; 71 per cent), silicon oxide (SiO
2; 21 per cent), aluminium oxide
(Al2O
3; 3 per cent) and iron oxide (Fe
2O
3; 2 per cent), with limits on minor elements.
Raw meal is fed into a pre-heater/rotary kiln where it is calcined, driving off carbon dioxide (CO2).
Inside the kiln, the high temperature of the flame (2000°C) and kiln feed (1450°C), and the long
retention times of the process (greater than five seconds), allow for complete combustion of the fuel and
enable the raw materials to reform into new minerals in an intermediate product called clinker.
Temperatures, pressures, gas and feed flows are strictly monitored in the continuous operation of
the pre-heater and kiln as the raw meal is converted to clinker through a changing temperature
profile. Finally, the clinker is rapidly cooled to ensure the desired mineralogy is formed in the final
product. The heat recovered from the kiln and cooler is recycled into the process to reduce fuel
requirements.
These controls are necessary to produce cement clinker of high quality, with a mineralogical
structure that is reactive with water. No ash is produced. Materials fed into the process become
part of the calcium silicate matrix of the clinker, ultimately forming part of the intrinsic matrix of
cement and concrete product from which no deleterious materials can leach.
C E M E N T I N G O U R F U T U R E
8
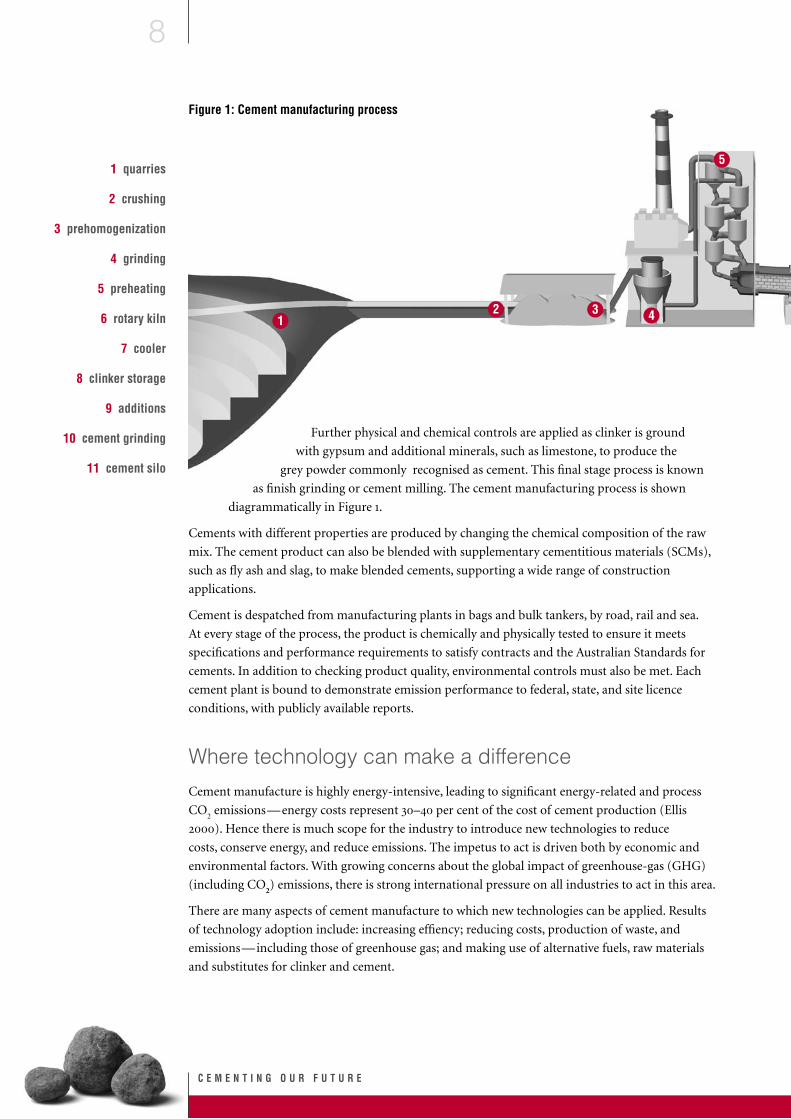
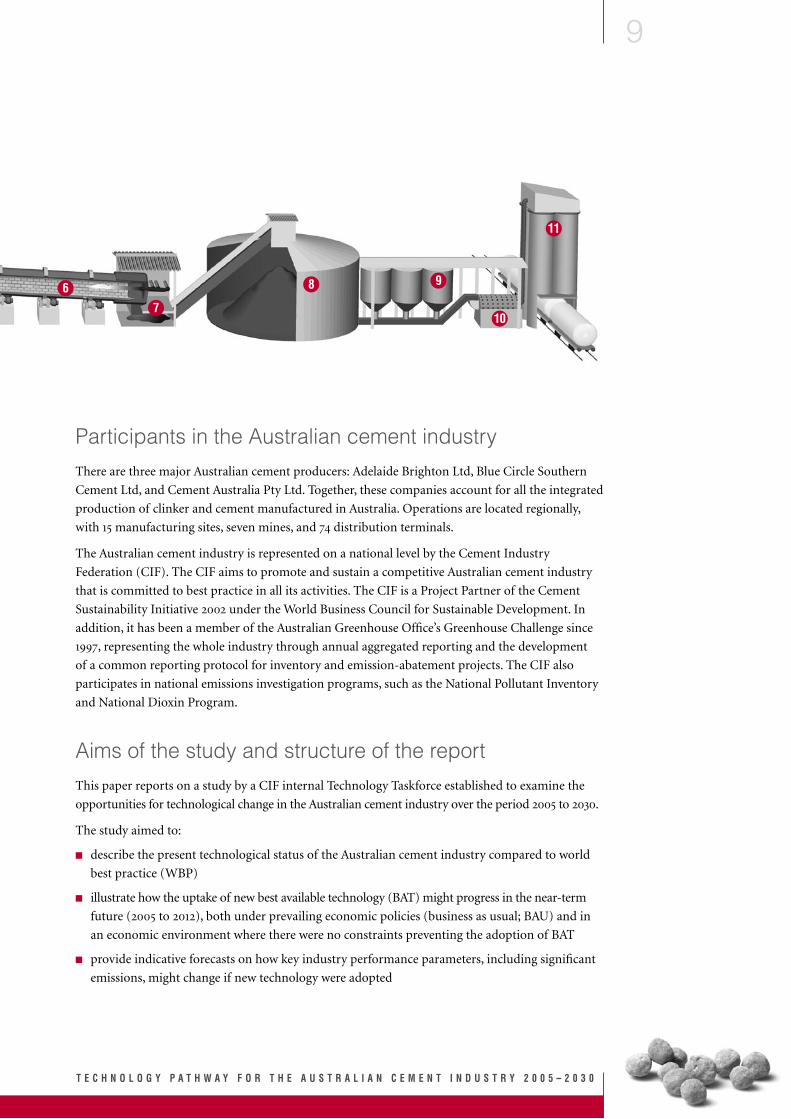
Figure 1: Cement manufacturing process
Further physical and chemical controls are applied as clinker is ground
with gypsum and additional minerals, such as limestone, to produce the
grey powder commonly recognised as cement. This final stage process is known
as finish grinding or cement milling. The cement manufacturing process is shown
diagrammatically in Figure 1.
Cements with different properties are produced by changing the chemical composition of the raw
mix. The cement product can also be blended with supplementary cementitious materials (SCMs),
such as fly ash and slag, to make blended cements, supporting a wide range of construction
applications.
Cement is despatched from manufacturing plants in bags and bulk tankers, by road, rail and sea.
At every stage of the process, the product is chemically and physically tested to ensure it meets
specifications and performance requirements to satisfy contracts and the Australian Standards for
cements. In addition to checking product quality, environmental controls must also be met. Each
cement plant is bound to demonstrate emission performance to federal, state, and site licence
conditions, with publicly available reports.
Where technology can make a difference
Cement manufacture is highly energy-intensive, leading to significant energy-related and process
CO2 emissions—energy costs represent 30–40 per cent of the cost of cement production (Ellis
2000). Hence there is much scope for the industry to introduce new technologies to reduce
costs, conserve energy, and reduce emissions. The impetus to act is driven both by economic and
environmental factors. With growing concerns about the global impact of greenhouse-gas (GHG)
(including CO2) emissions, there is strong international pressure on all industries to act in this area.
There are many aspects of cement manufacture to which new technologies can be applied. Results
of technology adoption include: increasing effiency; reducing costs, production of waste, and
emissions—including those of greenhouse gas; and making use of alternative fuels, raw materials
and substitutes for clinker and cement.
12 3 4
51 quarries
2 crushing
3 prehomogenization
4 grinding
5 preheating
6 rotary kiln
7 cooler
8 clinker storage
9 additions
10 cement grinding
11 cement silo
T E C H N O L O G Y P A T H W A Y F O R T H E A U S T R A L I A N C E M E N T I N D U S T R Y 2 0 0 5 – 2 0 3 0
9
Participants in the Australian cement industry
There are three major Australian cement producers: Adelaide Brighton Ltd, Blue Circle Southern
Cement Ltd, and Cement Australia Pty Ltd. Together, these companies account for all the integrated
production of clinker and cement manufactured in Australia. Operations are located regionally,
with 15 manufacturing sites, seven mines, and 74 distribution terminals.
The Australian cement industry is represented on a national level by the Cement Industry
Federation (CIF). The CIF aims to promote and sustain a competitive Australian cement industry
that is committed to best practice in all its activities. The CIF is a Project Partner of the Cement
Sustainability Initiative 2002 under the World Business Council for Sustainable Development. In
addition, it has been a member of the Australian Greenhouse Office’s Greenhouse Challenge since
1997, representing the whole industry through annual aggregated reporting and the development
of a common reporting protocol for inventory and emission-abatement projects. The CIF also
participates in national emissions investigation programs, such as the National Pollutant Inventory
and National Dioxin Program.
Aims of the study and structure of the report
This paper reports on a study by a CIF internal Technology Taskforce established to examine the
opportunities for technological change in the Australian cement industry over the period 2005 to 2030.
The study aimed to:
■ describe the present technological status of the Australian cement industry compared to world
best practice (WBP)
■ illustrate how the uptake of new best available technology (BAT) might progress in the near-term
future (2005 to 2012), both under prevailing economic policies (business as usual; BAU) and in
an economic environment where there were no constraints preventing the adoption of BAT
■ provide indicative forecasts on how key industry performance parameters, including significant
emissions, might change if new technology were adopted
6
7
8 9
10
11
C E M E N T I N G O U R F U T U R E
10
■ note the possibilities for further technological change over the period 2012 to 2030 and beyond
■ identify those factors that currently impede the adoption of reasonable BAT in the Australian
cement industry.
This report is intended to provide expert resource material to assist the cement industry,
government and other stakeholders in developing direction and policy in relation to the promotion
of technological change in the cement industry and the achievement of advances in emissions
reduction and greater industry sustainability.
The report is structured in the following way:
■ section 2, The Australian Cement Industry in 2004, describes the current state of technology in
the Australian industry
■ section 3, Modelling the Australian Cement Industry 2005 to 2012, describes the methods used to
assess the opportunities for uptake of new technology in the Australian cement industry and the
assumptions used to forecast the effect of new technology on industry performance parameters
■ section 4, Forecast profile of the Australian Cement Industry in 2012, assesses technology uptake
and the effect on industry performance parameters under two scenarios—BAU and BAT
■ section 5, Opportunities 2012 to 2030 and beyond, reviews the potential for further technology
changes in the industry from developments within the cement industry and elsewhere.
T E C H N O L O G Y P A T H W A Y F O R T H E A U S T R A L I A N C E M E N T I N D U S T R Y 2 0 0 5 – 2 0 3 0
11
2 The Australian Cement Industry in 2004
Production
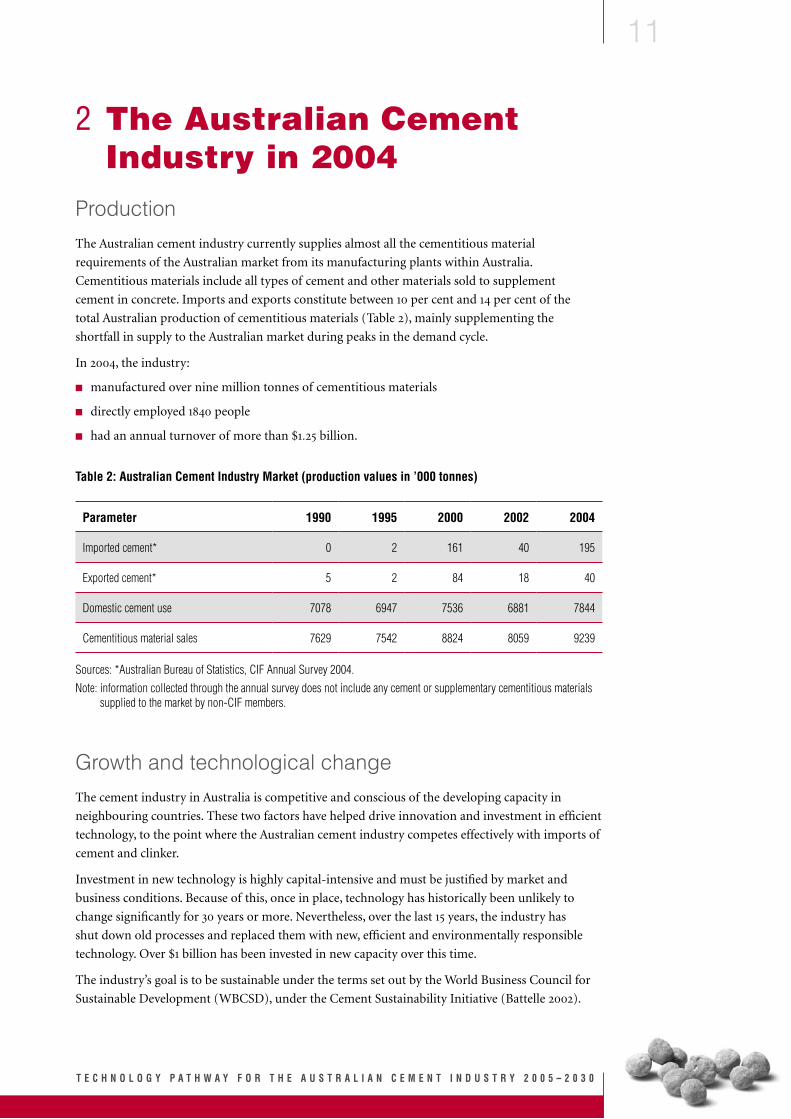
The Australian cement industry currently supplies almost all the cementitious material
requirements of the Australian market from its manufacturing plants within Australia.
Cementitious materials include all types of cement and other materials sold to supplement
cement in concrete. Imports and exports constitute between 10 per cent and 14 per cent of the
total Australian production of cementitious materials (Table 2), mainly supplementing the
shortfall in supply to the Australian market during peaks in the demand cycle.
In 2004, the industry:
■ manufactured over nine million tonnes of cementitious materials
■ directly employed 1840 people
■ had an annual turnover of more than $1.25 billion.
Table 2: Australian Cement Industry Market (production values in ’000 tonnes)
Parameter 1990 1995 2000 2002 2004
Imported cement* 0 2 161 40 195
Exported cement* 5 2 84 18 40
Domestic cement use 7078 6947 7536 6881 7844
Cementitious material sales 7629 7542 8824 8059 9239
Sources: *Australian Bureau of Statistics, CIF Annual Survey 2004.Note: information collected through the annual survey does not include any cement or supplementary cementitious materials
supplied to the market by non-CIF members.
Growth and technological change
The cement industry in Australia is competitive and conscious of the developing capacity in
neighbouring countries. These two factors have helped drive innovation and investment in efficient
technology, to the point where the Australian cement industry competes effectively with imports of
cement and clinker.
Investment in new technology is highly capital-intensive and must be justified by market and
business conditions. Because of this, once in place, technology has historically been unlikely to
change significantly for 30 years or more. Nevertheless, over the last 15 years, the industry has
shut down old processes and replaced them with new, efficient and environmentally responsible
technology. Over $1 billion has been invested in new capacity over this time.
The industry’s goal is to be sustainable under the terms set out by the World Business Council for
Sustainable Development (WBCSD), under the Cement Sustainability Initiative (Battelle 2002).
C E M E N T I N G O U R F U T U R E
12
The industry has made major improvements in environmental performance:
■ emissions of greenhouse gases (GHGs), dust and oxides of nitrogen have been significantly
reduced
■ utilisation of alternative raw materials and fuels (wastes from other industries) has grown
strongly, leading to the conservation of natural materials.
Production plant processes
Over the past 15 years, substantial capital investments in new and upgraded capacity have been
undertaken. As a result, the technological profile of the industry is similar to that of other
developed countries, such as Germany and Japan, as shown in Table 3 (for clinker production).
Over 84 per cent of Australian clinker is produced using dry-process technology, with most plants
using the world’s best technology, the precalciner kiln (Table 3).
Table 3: World Clinker Production Data for 2004
Parameter Japan Germany USA Australia
Number of kilns 62 70 192 15
Precalciner dry process (per cent) 88 88 43 *74
Other dry process (per cent) 12 – 37 10
Wet process (per cent) – 12 20 16
Design capacity (Mt/annum) 78.5 42.0 89.2 8.4
* Includes upgrades of pre-heater kilns in progress, scheduled completion 2005.Source: Japan Cement Association (2004) and CIF Annual Survey 2004.
The other area of significant technology in the manufacture of cement is cement milling.
Improvements in cement manufacturing technology since 1990 have included changes in mill
component design and the installation of mineral-addition equipment to meet the changes to the
Australian Standard in 1994. This change allowed the limited addition of minerals to substitute for
clinker content in cement, and reduced the associated energy and raw materials required per tonne
of cement by up to 5 per cent. The introduction of larger mills to capture improvements in power
and productivity has supported the move to clinker kilns of larger capacity.
New opportunities exist for the Australian industry to achieve further productivity gains with the
installation of emerging cement-milling technologies, such as pre-crushing operations.
Electricity
Electrical energy is used in cement manufacture to power motors for fans, drives, and damper
controls, and to transport material around the production site. The most significant power demand
is for the grinding of materials in large mills. During the manufacturing process, there are two
grinding stages:
■ preparation of the raw materials as raw meal for the kiln
■ grinding clinker, gypsum, and added minerals together to make cement.
T E C H N O L O G Y P A T H W A Y F O R T H E A U S T R A L I A N C E M E N T I N D U S T R Y 2 0 0 5 – 2 0 3 0
13
Since 1990, the Australian cement industry has improved its electricity efficiency per tonne of
product by 18 per cent (Table 4).
Table 4: Electrical Efficiency (kilowatt hours per tonne)
1990 1995 2000 2002 2004
kWh/t cement 132 121 110 111 108
Source: CIF Annual Survey 2004.
This reduction in power demand can mainly be attributed to the commissioning of new, larger,
manufacturing plants and, to a lesser extent, to improvements such as upgraded liners and
classifiers on cement mills, variable speed drives, replacement of materials pumping technology
with low-energy transport systems, and power-optimising control to manage the charge in large
electrostatic filters..
Fuel
Cement manufacturing traditionally uses fossil fuels to fire the rotary kiln that converts the raw-
meal feed to clinker. In Australia, the traditional fuels used are coal and/or natural gas. Small
quantities of oil are used from time to time.
This reduction is mainly attributable to the commissioning of new dry-process precalciner plants,
and to a lesser extent, improvements such as the greater control of the clinkering process and better
preparation of raw materials. The conversion to dry-process technology is very significant as it
avoids the need to evaporate water from the slurry of wet-process kilns..
Industry fuel efficiency can be expressed in terms of tonnes of clinker when it relates directly to the
performance of the kiln, or in tonnes of cementitious material when it is related to the whole of
production, including the benefits of SCM addition in blended cements and the concrete industry.
However, international benchmarks often compare fuel efficiency to the cement production of the
site. Since 1990, the Australian industry has improved its fuel efficiency in the kiln per tonne of
cement by 32 per cent (Table 5).
Table 5: Fuel efficiency (gigajoules per tonne)
Material produced 1990 1995 2000 2002 2004
Clinker 5.6 5.0 4.7 4.5 4.4
Cement 5.1 4.3 3.9 3.8 3.5
Cementitious material 4.6 4.0 3.5 3.5 3.1
Source: CIF Annual Survey 2004.
Alternative fuels and materials
The cement industry has actively sought to substitute traditional fuels with suitable wastes and
raw materials to drive down costs and ensure the long-term sustainability of the industry.
C E M E N T I N G O U R F U T U R E
14
Alternative raw materials— Traditional raw materials such as limestone and clay can be replaced
with certain wastes and by-products that provide the required elements used in the manufacture
of clinker. By-products commonly used by the industry are slags from the metal industry, mill scale
from the iron industry, and casting sands.
From the point of view of the cement industry, the most attractive waste raw materials are those which
have been precalcined. The major source of CO2 emissions in the cement industry comes from the
calcination of limestone (52 per cent) during the clinker-making process. The use of precalcined
materials as sources of calcium oxide can therefore greatly reduce GHG emissions. Small amounts
of such materials, like blast-furnace slag, are used now as raw material at some plants.
The extent to which alternative raw materials have been adopted has depended on the availability
of the materials, their chemical composition, and how the material can be received, stored and fed
to the process.
Other materials can be substituted at other stages of processing. For example, synthetic gypsum
produced elsewhere (e.g. fertiliser and zinc-making industries) can be used as a substitute for
natural gypsum in cement milling.
Alternative fuels—The cement industry’s reliance on traditional sources of fuel, such as coal and
natural gas, can be reduced by utilising waste products of other industries that still contain energy
(calorific value) and release heat in the kiln operation. Examples of materials in present or recent
use in Australia as alternative fuels include vehicle tyres, demolition timber, tallow, carbon or anode
fines, spent cell-lining waste, waste oils, breeze coke and blended solvents.
The selection of alternative fuels depends on:
■ suitability for the specific process—both physical and chemical properties
■ compatibility of combinations of fuels and raw materials
■ site emission limits set by both regulations and corporate governance
■ storage and feed equipment
■ supply arrangements.
Table 6 illustrates the increasing use of alternative fuels since 1990.
Table 6: Alternative Fuel Use
Parameter 1990 1995 2000 2002 2004
Percentage substitution for traditional fuels (per cent) – 4 5 5 5
Fuel type
Liquid fuel (’000 tonnes) – 25.3 27.4 27.9 31.3
Tyres (’000 tonnes) – 8.1 15.0 10.6 8.1
Carbon dust/coke (’000 tonnes) – – 4.8 1.8 7.7
Source: CIF Annual Survey 2004.
Alternatives to clinker—Provided the properties needed for cement as a construction material
are not compromised, the use of other materials instead of clinker is possible. Such materials with
inherent cementitious qualities are classified into two types: mineral additions and supplementary
T E C H N O L O G Y P A T H W A Y F O R T H E A U S T R A L I A N C E M E N T I N D U S T R Y 2 0 0 5 – 2 0 3 0
15
cementitious materials (SCMs). The advantage of using these is to reduce the amount of clinker
that needs to be produced, with consequent savings in raw materials, electricity, fuel, and emissions.
Cements using these materials are called blended cements.
Mineral additions, such as ground limestone, can be added in small amounts (up to 5 per cent,
according to the Australian Standard for cement quality) at the final grinding stage of cement
manufacturing.
Supplementary cementitious materials include fly ash (from coal-burning power stations), ground
granulated blast-furnace slag (from the steel industry) and silica fume. The use of SCMs reduces
the quantity of clinker or cement required. They are added to cement either through intergrinding
with cement clinker or by blending with cement after grinding; or can be added during concrete
batching to supplement the cement. Because of differences in chemistry, SCMs affect the
performance of cement in concrete to suit different applications. Each approved SCM has been
the subject of numerous scientific and engineering studies linking performance characteristics
with chemical and physical properties.
The growth in the use of alternatives for clinker is shown in Table 7. The Australian market demand
for cement both by type and quantity has changed little since 1990—the biggest movement being
in the use of SCMs in concrete and in the use of mineral additions in cement.
Table 7: Alternative Clinker Materials (’000 tonnes)
Material 1990 1995 2000 2002 2004
Mineral addition (in cement) – 33 226 241 369
SCMs (in cement) 462 514 609 394 328
SCMs (in concrete) 578 772 1288 1198 1402
Source: CIF Annual Survey 2004.
Note: SCMs = supplementary cementitious materials.
Sustainability
Recognising that manufacturing cement has a negative impact on the environment, the industry has
sought to implement mitigating actions through higher standards of technology, while continuing to
supply a cheap, versatile, quality construction material and a range of employment opportunities.
Sustainable advantages implemented by changes to cement manufacturing include:
■ recycling wastes from other industries while conserving natural materials in the manufacturing
process
■ managing utilised waste to the end of its life-cycle
■ reducing emissions from the cement manufacturing process, including GHGs, landfill, dust and
oxides of nitrogen
■ increasing efficiency in manufacturing—requiring less power and fuel
■ rehabilitating quarries and sites—returning the land to a better-than-before or equivalent condition
■ creating superior construction materials for a wider range of uses
■ improving the durability of concrete through cement quality.
C E M E N T I N G O U R F U T U R E
16
The Cement Sustainability Initiative (CSI) (Battelle 2002), Agenda for Action is a commitment
by the international cement industry, supported by the World Business Council for Sustainable
Development (WBCSD). This action has united the international cement industry to establish
industry protocols for setting guidelines and practices to ensure the ideals of sustainability form
the basis on which the industry conducts its business. The full extent of Australia’s commitment
to this endeavour is outlined in Attachment A.
Emissions
Emissions from cement manufacturing are primarily airborne. Emissions to water have been
minimised with the move to using dry-process technology and recirculating cooling water.
The cement industry is committed to understanding and controlling emissions to within safe
levels identified in international codes for health and the environment. To support this, the
industry has invested time and capital into developing direct measurement procedures to monitor
environmental effects.
Emissions from cement-manufacturing facilities in Australia are monitored regularly to:
■ maintain the manufacturing process at optimal conditions for product quality and the
protection of equipment
■ meet operating licence conditions set specifically for each site
■ meet national reporting requirements such as the National Pollutant Inventory, National Dioxin
Program, Stockholm Convention, National Environmental Performance Measures (NEMP)
Air Quality
■ monitor specific local effects of interest to local communities
■ investigate the outcome of changes in process operations.
Table 8 illustrates the substantial reduction in emissions that has occurred in the industry in recent
years. The reduction in dust emissions from chimney stacks have been achieved by installing high-
efficiency dust filters in clinker plants. Oxides of nitrogen have been reduced by upgrading kiln
burners and using alternative fuels.
Table 8: Emissions Reduction from manufacturing (tonnes)
Emissions 2000 2002 2004
Dust 1150 1016 694
Oxides of nitrogen 23 784 20 635 14 687
Source: CIF Annual Survey 2004.
Climate protection
The cement industry is a member of the Australian Greenhouse Challenge Program (GCP), with
goals for the reduction of GHG emissions which are set out in the Cooperative Agreement (AGO 1997).
The industry reports aggregated GHG performance annually, including the specific achievements
of individual sites’ abatement projects involving the installation of more efficient equipment and
practices. To encourage the industry to share experiences and successful solutions to managing
GHG emissions, the CIF runs industry-wide awards for innovative projects in climate protection.
T E C H N O L O G Y P A T H W A Y F O R T H E A U S T R A L I A N C E M E N T I N D U S T R Y 2 0 0 5 – 2 0 3 0
17
The reduction in carbon dioxide (CO2) emissions since 1990 has been significant, at 21 per cent
per tonne of cementitious material sold. This is illustrated in Table 9. The quantity of CO2 abated
in 2005, through a register of over 100 projects operating in the industry, is expected to be 1.6 Mt,
exceeding the target set in the GCP (AGO 1997) by 70 per cent.
Table 9: Climate protection
1990 1995 2000 2002 2004
*ktCO2 abated – – 513 1408 1502
tCO2/t cementitious material 0.871 0.805 0.723 0.755 0.692
Source: *CIF Cement Industry Challenge Report; CIF Annual Survey 2004.
Waste minimisation
The industry continually seeks ways to reduce its own waste. Cleaner production measures are employed
on all sites, minimising waste at the source, returning materials to the process when possible, and
finding alternative uses, such as recycling (e.g. of used oil), before landfill or incineration are
considered. Cement kiln dust is the only solid process waste from cement production. Process
modifications and the development of markets that can use the dust have come with greater
awareness of sustainability opportunities. Table 10 illustrates the scale and variation of solid waste
generation in the industry.
Table 10: Waste minimisation (tonnes)
2000 2002 2004
Cement kiln dust to landfill 46 661 33 026 37 379
Source: CIF Annual Survey 2004.
C E M E N T I N G O U R F U T U R E
18
3 Modelling the Australian Cement Industry 2005 to 2012
This section outlines the model and assumptions used by the Technology Taskforce to describe the
present state of technology and to forecast the likely extent and direction of future technological
change and the subsequent impact of this on the cement industry’s performance.
The review process
The Technology Taskforce established a process to assess the current status of technology in
Australia, forecast expected industry investment to 2012, and estimate the expected efficiency and
environmental gains arising from this investment.
The process followed these stages:
■ identify world best technology (WBT) and performance
■ identify the current use of WBT in Australia
■ assess the extent of further installation of WBT expected by the industry before 2012 under
business-as-usual (BAU) conditions
■ assess the extent of additional reasonable adoption of WBT that could be achieved without
economic constraints (best available technology (BAT))
■ assess the change in plant performance measures resulting from technology uptake under both
BAU and BAT scenarios
■ compare the proposed outcomes and world best practice (WBP) plants
■ estimate the market demands in Australia for cementitious materials
evaluate the effect and extent of technology uptake on key performance parameters, including
emissions, under both economic scenarios (BAU and BAT), bearing in mind the influence of the
size of market demand for cementitious products on the likely uptake of new WBT.
The Technology Taskforce also reviewed the progress of more ambitious technologies (both within
the industry and in other areas) which are expected to become commercial beyond 2012. These
technologies are discussed in section 5.
The BAU and BAT scenarios were studied under four conditions:
■ ‘high’, ‘best’ and ‘low’ market demand based on the predicted demand for cementitious product
■ ‘maximum industry capacity’ which runs the industry model without market influences. This
allows the effect of technology change alone to be appreciated.
The Technology Taskforce has focused more on technologies of cement manufacturing and less on
the external product development.
Modelling and forecasting were kept to an industry-aggregated approach affected by developments
in technology. This enabled information required from each company to be collected openly.
T E C H N O L O G Y P A T H W A Y F O R T H E A U S T R A L I A N C E M E N T I N D U S T R Y 2 0 0 5 – 2 0 3 0
19
Uptake of world best technology
New technology will be introduced into three primary areas of operations:
■ clinker production, including raw-material preparation and kiln operation
■ cement milling or finish grinding—the last stage of the manufacturing process
■ environmental control equipment.
From the review of proposed WBT, assessments were made under the BAU and BAT scenarios of
the opportunities in the operational areas noted above to:
■ reduce fuel and electricity use
■ increase production
■ accept a wider variety of alternative materials and fuels
■ improve environmental performance in the main areas of airborne emissions of dust, GHGs and
other substances from the combustion and production process and waste minimisation.
Each of these performance parameters is measured and monitored regularly by cement plants in
Australia.
The capital investment required to adopt WBT was estimated using typical budget factors normally
used to evaluate a project concept prior to design. The estimates are therefore related to the
technology alone, and are independent of site-specific installation costs. To further simplify the
cost estimates, some technology installations were classified as either ‘small’ or ‘large’ projects and
valued accordingly. The actual costs of technology under BAU or BAT are likely to be larger than
estimated and so these estimates should be viewed as relative indicators rather than absolute values.
Detailed evaluation of the possibilities for WBT to 2012 is provided in section 4, supported by
Attachments B and C.
Forecasts of Australian performance have been compared to WBP data to check that the proposed
benefits have not been over or understated, so ensuring that the forecast for Australian performance
is within realistic parameters.
General efficiency improvement opportunities, enabling better management of maintenance and
process control without significant capital investment, were compiled from GHG reduction strategies
contained in the Greenhouse Energy Management System (GEMS) Guidelines (CIF 2002) and
recent industry technical articles (Martin et al. 1999; Choate 2003; Worrell and Galitsky 2004).
These opportunities have been assumed to deliver a flat-rate reduction of 1 per cent per annum on
the estimated annual electrical and fuel requirement under BAU and 1.5 per cent per annum under BAT.
Industry performance measures
Through the cooperation of the cement industry reporting annual performance data to
PricewaterhouseCoopers for aggregation into industry statistics, a robust body of reliable industry
information is available for analysis from 1989 to June 2004 (CIF Annual Surveys). However,
production costs and market data were considered confidential and unavailable.
The ‘working boundaries’ of the CIF, and therefore this study, are upstream mines supplying
the primary raw material for clinker production and cement-manufacturing process to the bulk
despatching point. Excluded from the study have been the use of transportation by road, rail or sea
between the mines and the manufacturing plant, and the delivery of product from the plant.
C E M E N T I N G O U R F U T U R E
20
The estimates of the reductions in electrical energy and fuel consumption are typical benefits
publicised by the manufacturers using field experience in the cement industry.
Plant capacity was taken to be the design capacity of the plant, with allowance for lost production
due to regular maintenance. Regional market downturns, which could not be predicted with
confidence over the period of interest, were not part of this assessment. No major increase in
clinker plant capacity is expected before 2012.
To project the demand for electricity, fuel, and raw materials to 2012, the usage in 2004 became
the base industry inventory reference. Changes in efficiency were predicted relative to the baseline,
year by year to 2012 as installations changed according to the proposed introduction of significant
technology. The total demands for electricity, fuel and raw materials were calculated on the
required plant capacity. Plant capacity was adjusted to supply only what had been estimated in the
market demand forecasts under each of three conditions, ‘low’, ‘best’ and ‘high’ market estimates,
and compared to WBP.
Plant performance before and after the adoption of new technology was evaluated across four
categories:
■ electricity
■ fuel
■ alternative fuels and materials
■ sustainability—emissions, climate protection and waste minimisation.
Changes in the demand for materials to produce cement are expected to follow the influence of
business or commercial initiatives. The parameters which vary in this way are:
■ incremental improvements in electrical consumption (kWh/t product) and in fuel consumption
(GJ/t product) as forecast in business plans
■ use of alternative fuels and materials
■ use of precalcined raw materials.
Electricity
The calculated demand for electricity used in this evaluation covered the process from the mining
of raw materials through clinker manufacturing to cement grinding plant. It included storage and
distribution of cement from the site. The reported demand for electricity by the industry is the total
power, from any source, required to operate the manufacturing processes. The calculations estimated
the quantity of power that may be generated by a manufacturing site for its own use through
cogeneration plants from the clinker cooler’s waste heat. Ancillary electricity demands were not
considered to include a significant amount of energy in comparison to that required by the operations.
Fuel
It is assumed that the industry will not adopt primary fuel switching, i.e. coal to natural gas or visa
versa, before 2012. This would involve substantial changes in equipment and expense, and loss of
production. Rather than switching between primary fossil fuels, the industry’s focus is to replace
fossil fuels with alternative fuels. When calculating the industry’s need for energy from fuels, each
fuel’s use was converted to energy (joules) and the rate and total demand were calculated from the data.
T E C H N O L O G Y P A T H W A Y F O R T H E A U S T R A L I A N C E M E N T I N D U S T R Y 2 0 0 5 – 2 0 3 0
21
Alternative fuels and materials
Estimations of the potential for substitution of alternative fuels and raw materials were assessed
by representatives of the Technology Taskforce based on experience with the types of materials
regionally available, the specific issues related to each material and manufacturing plants’ technical
capability.
Changes to fuel mixes and the raw-mix composition were calculated to determine, where possible,
the effect on:
■ GHG emissions—both absolute and the intensity of
■ quantities of waste materials recycled
■ substitution rate for traditional materials
■ quantities of natural materials conserved.
Alternative raw materials—The adoption of alternative raw materials can have environmental
benefits for the cement manufacturing process, e.g. GHG reductions, if the material is calcined.
Otherwise, these materials substitute for the minerals provided by limestone or other raw
materials that are sourced from mining operations. The model aggregates the industry’s expected
substitution rate, and reports in tonnes of waste utilised as a waste-recycling initiative, reduction in
process GHG emissions and reductions in the fuel demand according to the type of material used.
Environmental benefits that were unable to be calculated were reduced dust and oxides of nitrogen
emissions, changes in electricity demand, and the reduced environmental effect of mining.
The use of calcined material, e.g. slags in raw mix instead of limestone, was calculated assuming
clinker contains 64 per cent calcium oxide. This is a typical large-volume clinker chemical
composition. The slag composition was the average of the industry’s latest analytical data, since
the chemical composition of slags can vary depending on the source of the material.
Alternative fuels—Wastes suitable for use can be sourced from chemical industries that produce
and use hydrocarbon-based products, such as paints, cosmetics, fertilisers, pesticides and
herbicides, lubricants and oils, and pharmaceuticals. Other possibilities include timber from the
demolition of buildings, the trimmings of packaging and paper-product manufacture, non-metallic
components from scrap-metal recycling, spent cell liners from aluminium smelting and used
tyres. Each was assessed for its GHG impact by assuming it to be one of the following types: tyres/
plastics; solvent/waste oil; metallurgical or petroleum coke/carbon dust; or sewage sludge/timber
(biomass). The conversion factors used for these fuel types were as provided by the Australian
Greenhouse Office (AGO 2004), where biomass is assumed to be greenhouse neutral.
Benefits from alternative fuels were calculated as the percentage substitution rate for traditional
fuels, or reported as the equivalent tonnes of coal saved, and calculated for their contribution
to changing GHG emissions. Unassessed definitively was the benefit in emissions of oxides of
nitrogen, reductions in dust, the quantity and nature of the waste recycled or the environmental
benefit of reduced mining activity for fossil fuels.
Alternatives to clinker—Materials to substitute for clinker that have cementitious properties
(SCMs), or are mineral additions when mixed in cement, have specifically been forecast in the
market demand process as they are influenced by market acceptance. Materials that can reduce the
clinker required for the production of cement also give benefits in reduced fuel, electricity and raw
material needs per tonne of cement. The industry model calculates the degree of substitution that
is being achieved by these materials and adjusts the clinker required in the market accordingly.
C E M E N T I N G O U R F U T U R E
22
Alternatives to cement—supplementary cementitious materials can also be added to concrete
to substitute for some of the cement requirement. Since the industry supplies and assists in the
development of concrete mix design with these materials, this study has forecast the demand for
this practice. To be comparable with WBP data, it has been included with the reported SCM usage
in cement (alternatives to clinker).
Sustainability
When alternative materials are used in the manufacturing process, they contribute to the industry’s
overall role in waste management, conservation of natural materials and improved environmental
performance. These options have been taken into account when compiling industry data in the
form of a total tonnes of waste that can be used per year and, where appropriate, the effect on the
environmental performance of the process.
Emissions—Reductions in emissions of dust and oxides of nitrogen due to improvements in
technology have been considered; however it is difficult to gain accurate emission levels without
specific design and in-operation measurements. It has been noted that improvements in these
emissions are part of the adoption of the new technology.
Climate protection—Calculations of carbon dioxide (CO2) emissions in the model are included
with the use of electricity, fuel and raw materials, covering both direct and indirect sources.
The calculations take into account power generation from ‘co-generation’ and the varied use of
alternative fuels and materials. The AGO (2004) factors were used to convert the contribution of
each material to an overall CO2 measure for the industry.
Waste minimisation—Through cleaner production initiatives, the industry strives to reduce
wastes that occur from the clinker and cement manufacturing process. Traditionally these have
included off-specification materials, waste from mining operations, and cement kiln dust (CKD).
Further reduction of CKD remains as a challenge for the industry. The technology model tracks the
expected trends in this area to 2012, by means of reporting the reduction in tonnes of the material
going to landfill.
Market trend predictions
The capital cost of investment in cement manufacturing equipment is very high. Such investments
are generally maintained and run for many decades. New technology is introduced into the cement
industry only on occasions when there is a need to upgrade capacity because of an increase in
market demand for additional cementitious product. Thus, an important part of this study was
to examine likely future demand to assess the opportunities for significant new technology arising
from capacity-increase requirements.
After consideration of various ways to forecast cementitious demand to 2012, the methodology
of Jubb (2003) was chosen. Jubb’s work in this area is used by the Australian Government in the
preparation and assessment of data for the prediction of performance of the cement industry GHG
management strategies for the National Greenhouse Gas Inventory.
Linear regression of demand over time was determined using data from the last 15 years (CIF annual
survey data) and then projected at the same gradient into the future. The projected regression line
was used as the ‘best’ estimate of future market demand for cementitious product. The base for the
projection of the line was taken as 2004 modelled data. These modelled data were close to actual
2004 data and so, for ease of use in calculations, 2004 modelled data were chosen as the base for all
projections.
T E C H N O L O G Y P A T H W A Y F O R T H E A U S T R A L I A N C E M E N T I N D U S T R Y 2 0 0 5 – 2 0 3 0
23
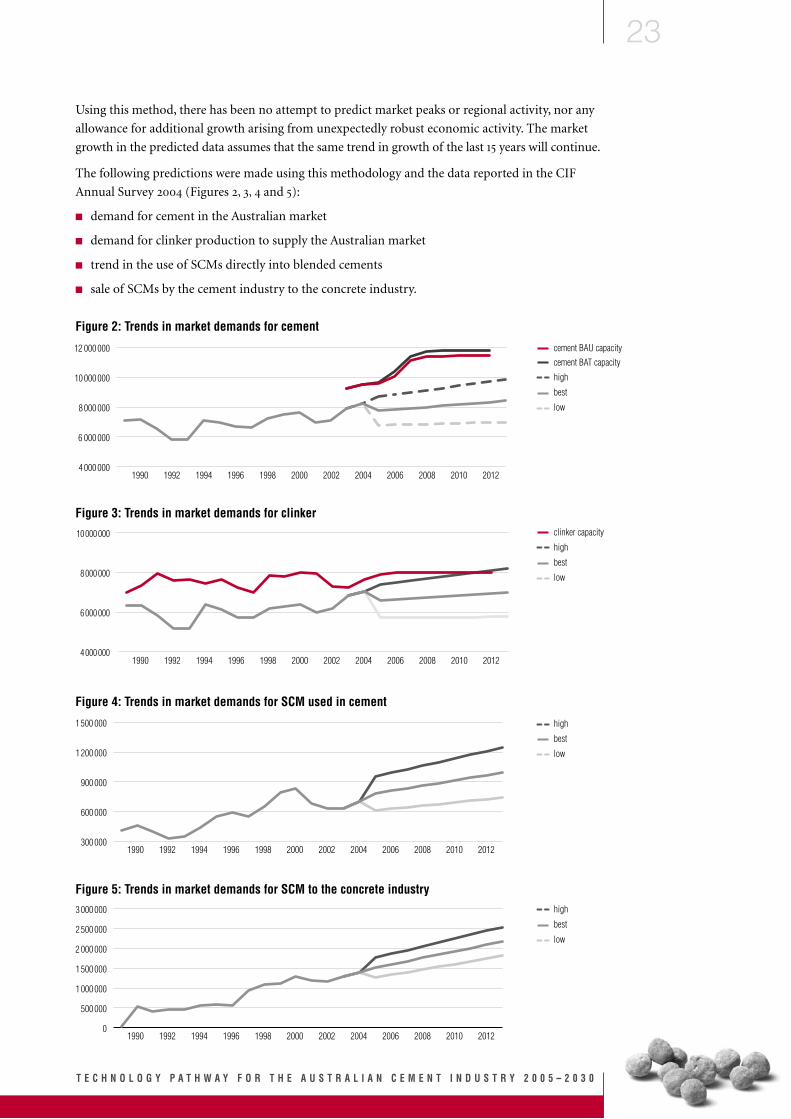
Using this method, there has been no attempt to predict market peaks or regional activity, nor any
allowance for additional growth arising from unexpectedly robust economic activity. The market
growth in the predicted data assumes that the same trend in growth of the last 15 years will continue.
The following predictions were made using this methodology and the data reported in the CIF
Annual Survey 2004 (Figures 2, 3, 4 and 5):
■ demand for cement in the Australian market
■ demand for clinker production to supply the Australian market
■ trend in the use of SCMs directly into blended cements
■ sale of SCMs by the cement industry to the concrete industry.
Figure 3: Trends in market demands for clinker
1990 1992 1994 1996 1998 2000 2002 2004 2006 2008 2010 20124 000 000
6 000 000
8 000 000
10 000 000
Figure 2: Trends in market demands for cement
4 000 000
6 000 000
8 000 000
10 000 000
12 000 000
1990 1992 1994 1996 1998 2000 2002 2004 2006 2008 2010 2012
Figure 4: Trends in market demands for SCM used in cement
1990 1992 1994 1996 1998 2000 2002 2004 2006 2008 2010 2012300 000
600 000
900 000
1 200 000
1 500 000
Figure 5: Trends in market demands for SCM to the concrete industry
1990 1992 1994 1996 1998 2000 2002 2004 2006 2008 2010 20120
500 000
1 000 000
1 500 000
2 000 000
2 500 000
3 000 000
clinker capacity
high
best
low
high
best
low
high
best
low
cement BAU capacity
high
best
low
cement BAT capacity
C E M E N T I N G O U R F U T U R E
24
Cement demand in the Australian market was determined from production data for all cement
types, including imported and excluding exported cement. Clinker demand in the Australian
market was calculated from the sum of indigenous clinker production and imported clinker
and cement (adjusted to clinker) less clinker exported as clinker or cement. The use of SCMs in
blended cements was available directly from the survey, and it has been assumed that exported and
imported cements are general purpose cements without SCM additions. The demand for SCMs
as direct sales to concrete plants or exported material was modelled on data available from sales
information. It is also recognised that this quantity reflects the SCMs sold only by the CIF members
into the concrete industry.
Imported clinker and cement is expected to provide for any shortfall in the Australian market
demand until construction of a new Australian facility is justifiable. Exports of clinker and cement
from Australia are assumed not to increase between 2004 and 2012.
Predicting an industry performance range
In order to predict the most likely range of performance in the industry, in light of unavoidable
uncertainty about future cement demand, a 95 per cent confidence range was placed on market
predictions for clinker and cementitious materials in the Australian market. This was used to
generate production data for ‘high’, ‘best’, and ‘low’ market conditions.
Required production for both clinker and cement at the ‘high’ market condition was set by either
plant capacity or ‘high’ market demand (whichever was the lesser) and at the ‘low’ market condition
by the ‘low’ market demand prediction.
Disposition of clinker production under different market demand scenarios was managed by shutting
down less-efficient plants or ‘swing’ plants that can most easily be turned on and off. For instance, under
‘low’ market conditions, the five modern dry processes at Gladstone, Berrima K6, Waurn Ponds,
Railton and Birkenhead were assumed to operate, giving improved efficiencies in performance
parameters. Angaston, Maldon, Rockhampton and Cockburn (K2) were identified as dedicated to
special cement production and expected to continue to supply their portion of niche market.
Cement-milling operations tend to be located close to regional markets and can be turned on and
off as demand requires. In the case of ‘low’, ‘best’ and ‘high’ market conditions, the operations of all
mills were considered to be ramped up or down to the same degree as required.
In order to compare the contribution of technology on a relative scale, excluding the effect of
market demand, a model condition was run in which the industry operated at ‘maximum industry
capacity’. This result can be used to compare the Australian national industry performance to WBP
due solely to the forecast implementation of technology.
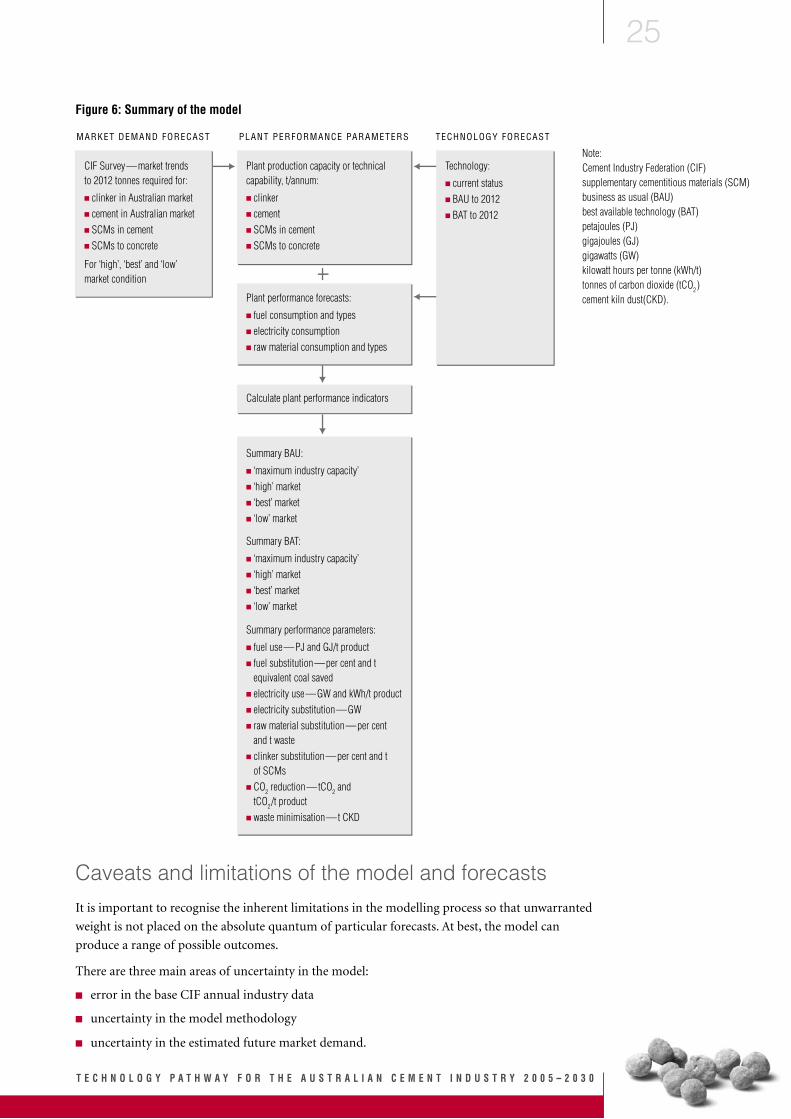
The relationships of data used in the model are summarised in Figure 6.
T E C H N O L O G Y P A T H W A Y F O R T H E A U S T R A L I A N C E M E N T I N D U S T R Y 2 0 0 5 – 2 0 3 0
25
Figure 6: Summary of the model
Caveats and limitations of the model and forecasts
It is important to recognise the inherent limitations in the modelling process so that unwarranted
weight is not placed on the absolute quantum of particular forecasts. At best, the model can
produce a range of possible outcomes.
There are three main areas of uncertainty in the model:
■ error in the base CIF annual industry data
■ uncertainty in the model methodology
■ uncertainty in the estimated future market demand.
CIF Survey—market trends to 2012 tonnes required for:
� clinker in Australian market� cement in Australian market� SCMs in cement� SCMs to concrete
For ‘high’, ‘best’ and ‘low’ market condition
Plant production capacity or technical capability, t/annum:
� clinker� cement� SCMs in cement� SCMs to concrete
Summary BAU:
� ‘maximum industry capacity’� ‘high’ market� ‘best’ market� ‘low’ market
Summary BAT:
� ‘maximum industry capacity’� ‘high’ market� ‘best’ market� ‘low’ market
Summary performance parameters:
� fuel use—PJ and GJ/t product� fuel substitution—per cent and t equivalent coal saved� electricity use—GW and kWh/t product� electricity substitution—GW� raw material substitution—per cent and t waste� clinker substitution—per cent and t of SCMs� CO2 reduction—tCO2 and tCO2/t product� waste minimisation—t CKD
Plant performance forecasts:
� fuel consumption and types� electricity consumption� raw material consumption and types
Calculate plant performance indicators
Technology:
� current status� BAU to 2012� BAT to 2012
MARKET DEMAND FORECAST PLANT PERFORMANCE PARAMETERS TECHNOLOGY FORECAST
Note: Cement Industry Federation (CIF) supplementary cementitious materials (SCM) business as usual (BAU) best available technology (BAT) petajoules (PJ) gigajoules (GJ) gigawatts (GW) kilowatt hours per tonne (kWh/t) tonnes of carbon dioxide (tCO2 ) cement kiln dust(CKD).
C E M E N T I N G O U R F U T U R E
26
Error in the base CIF annual industry data
The error in the CIF survey was assessed by comparing cement sales data with production data.
Over 14 annual data sets, the discrepancy was found to be typically 4 per cent, with the production
data higher than sales data. Production data were used to establish the historical trends for
predicting the 2012 market conditions as this data set most closely matched production records
and the stated capacities of the clinker and cement processes.
Uncertainty in the model methodology
An error assessment of the modelling was conducted by comparing the model calculations to the
2003 and 2004 actual data of the CIF survey. The relative error across primary data, such as kilowatt
hours (kWh), petajoules (PJ) and tonnes of carbon dioxide (tCO2), was calculated to be in the
range of 3 per cent to 7 per cent. The calculation of alternative fuel substitution carried the greatest
error, with the model predicting a higher usage than the actual data supported.
Reasons for model uncertainty:
■ The model uses predicted ‘typical’ performance values for various parameters (e.g. usage of
alternative fuels) while actual performance tends to be affected by operational upsets and
‘unsteady’ conditions.
■ The estimates of ‘typical’ performance values for improvement and reduction in fuel and
electrical energy are based on nominal quantum that can be achieved with the generic types of
technology that have been assumed to be adopted.
■ The model assumes the total Australian market is not affected by regional demand, and that
demand anywhere can be serviced by Australian-produced clinker and cement. This is not
necessarily the case as the economics and logistics of transporting cementitious product are
complicated. Regional demands cannot always be serviced by Australian-made product.
The standard default factors from the Australian Greenhouse Office were used to calculate the
effects of GHG emissions from fuel and electricity, and the industry default of 0.518 tCO2/t clinker
for emissions from the calcination of limestone. Should the standard factors change in the future,
then all emissions estimates will be affected.
Altogether, error in the base data and uncertainty in the model methodology are estimated to sum
to a +/–5 per cent error in any forecasts from the model.
Uncertainty in future demand forecasts
Using the 95 per cent confidence interval to estimate the range of possible market demand
conditions for cementitious product in 2012, a further range of uncertainty is introduced into
forecasts by made the model. The size of this uncertainty is estimated to be +/–16 per cent from the
‘best’ market estimate line in 2012.
Total uncertainty in 2012 forecasts
The magnitude of the calculated errors and uncertainties in the modelling process is estimated to
be +/– 20 per cent in the 2012 ‘best’ estimate.
Therefore, all projections and forecasts should be viewed with this level of uncertainty and given a
probative weight in line with the uncertainty inherent in the process of derivation of these forecasts
and projections.
T E C H N O L O G Y P A T H W A Y F O R T H E A U S T R A L I A N C E M E N T I N D U S T R Y 2 0 0 5 – 2 0 3 0
27
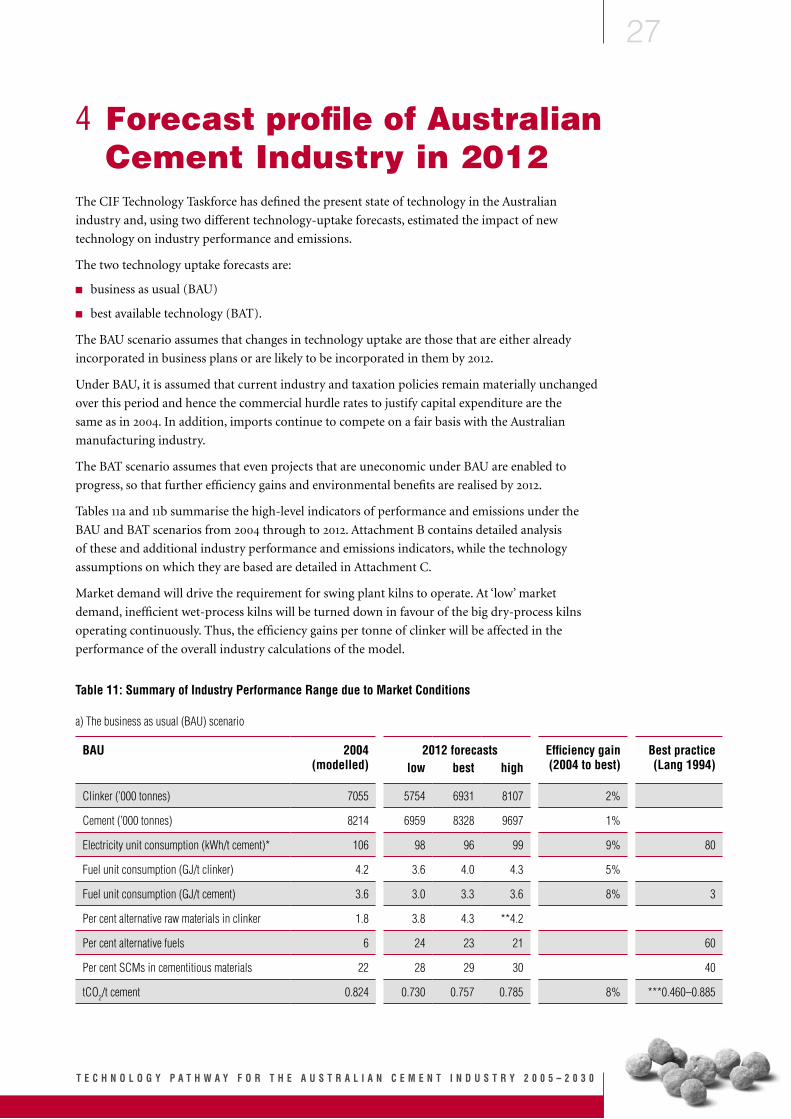
4 Forecast profile of Australian Cement Industry in 2012
The CIF Technology Taskforce has defined the present state of technology in the Australian
industry and, using two different technology-uptake forecasts, estimated the impact of new
technology on industry performance and emissions.
The two technology uptake forecasts are:
■ business as usual (BAU)
■ best available technology (BAT).
The BAU scenario assumes that changes in technology uptake are those that are either already
incorporated in business plans or are likely to be incorporated in them by 2012.
Under BAU, it is assumed that current industry and taxation policies remain materially unchanged
over this period and hence the commercial hurdle rates to justify capital expenditure are the
same as in 2004. In addition, imports continue to compete on a fair basis with the Australian
manufacturing industry.
The BAT scenario assumes that even projects that are uneconomic under BAU are enabled to
progress, so that further efficiency gains and environmental benefits are realised by 2012.
Tables 11a and 11b summarise the high-level indicators of performance and emissions under the
BAU and BAT scenarios from 2004 through to 2012. Attachment B contains detailed analysis
of these and additional industry performance and emissions indicators, while the technology
assumptions on which they are based are detailed in Attachment C.
Market demand will drive the requirement for swing plant kilns to operate. At ‘low’ market
demand, inefficient wet-process kilns will be turned down in favour of the big dry-process kilns
operating continuously. Thus, the efficiency gains per tonne of clinker will be affected in the
performance of the overall industry calculations of the model.
Table 11: Summary of Industry Performance Range due to Market Conditions
a) The business as usual (BAU) scenario
BAU 2004 (modelled)
2012 forecasts Efficiency gain (2004 to best)
Best practice (Lang 1994)low best high
Clinker (’000 tonnes) 7055 5754 6931 8107 2%
Cement (’000 tonnes) 8214 6959 8328 9697 1%
Electricity unit consumption (kWh/t cement)* 106 98 96 99 9% 80
Fuel unit consumption (GJ/t clinker) 4.2 3.6 4.0 4.3 5%
Fuel unit consumption (GJ/t cement) 3.6 3.0 3.3 3.6 8% 3
Per cent alternative raw materials in clinker 1.8 3.8 4.3 **4.2
Per cent alternative fuels 6 24 23 21 60
Per cent SCMs in cementitious materials 22 28 29 30 40
tCO2/t cement 0.824 0.730 0.757 0.785 8% ***0.460–0.885
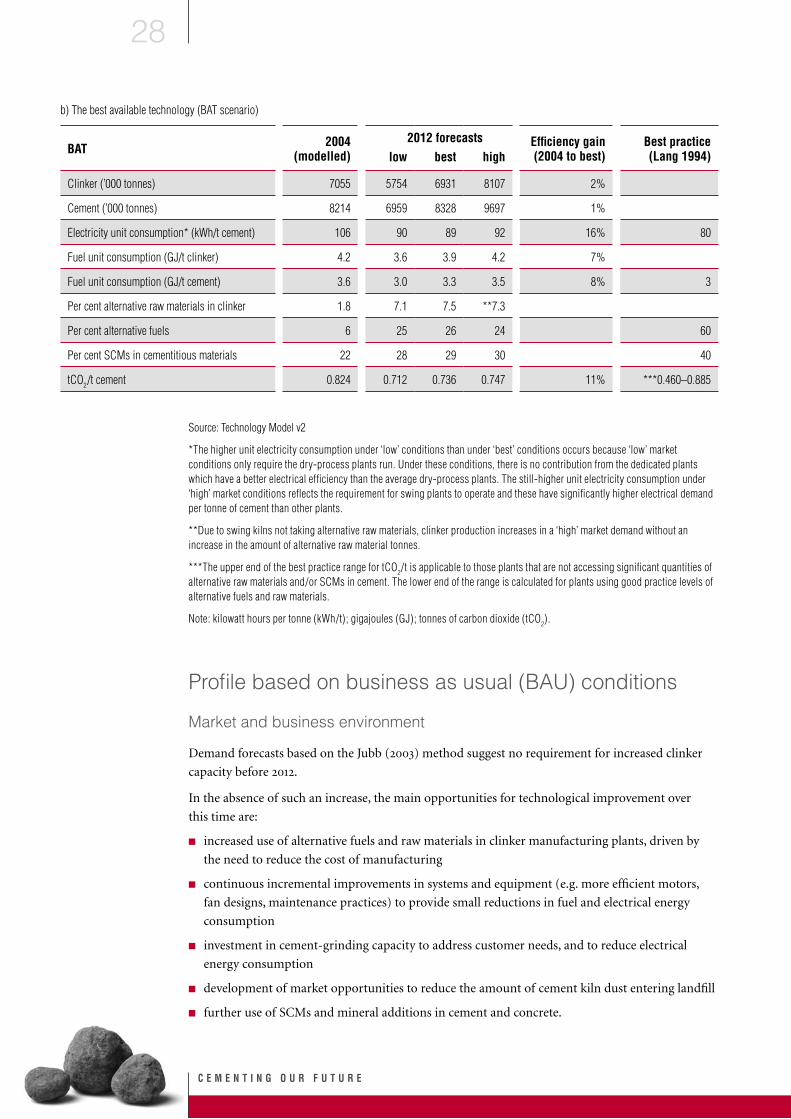
C E M E N T I N G O U R F U T U R E
28
b) The best available technology (BAT scenario)
BAT 2004 (modelled)
2012 forecasts Efficiency gain (2004 to best)
Best practice (Lang 1994)low best high
Clinker (’000 tonnes) 7055 5754 6931 8107 2%
Cement (’000 tonnes) 8214 6959 8328 9697 1%
Electricity unit consumption* (kWh/t cement) 106 90 89 92 16% 80
Fuel unit consumption (GJ/t clinker) 4.2 3.6 3.9 4.2 7%
Fuel unit consumption (GJ/t cement) 3.6 3.0 3.3 3.5 8% 3
Per cent alternative raw materials in clinker 1.8 7.1 7.5 **7.3
Per cent alternative fuels 6 25 26 24 60
Per cent SCMs in cementitious materials 22 28 29 30 40
tCO2/t cement 0.824 0.712 0.736 0.747 11% ***0.460–0.885
Source: Technology Model v2
*The higher unit electricity consumption under ‘low’ conditions than under ‘best’ conditions occurs because ‘low’ market conditions only require the dry-process plants run. Under these conditions, there is no contribution from the dedicated plants which have a better electrical efficiency than the average dry-process plants. The still-higher unit electricity consumption under ‘high’ market conditions reflects the requirement for swing plants to operate and these have significantly higher electrical demand per tonne of cement than other plants.
**Due to swing kilns not taking alternative raw materials, clinker production increases in a ‘high’ market demand without an increase in the amount of alternative raw material tonnes.
***The upper end of the best practice range for tCO2/t is applicable to those plants that are not accessing significant quantities of alternative raw materials and/or SCMs in cement. The lower end of the range is calculated for plants using good practice levels of alternative fuels and raw materials.
Note: kilowatt hours per tonne (kWh/t); gigajoules (GJ); tonnes of carbon dioxide (tCO2).
Profile based on business as usual (BAU) conditions
Market and business environment
Demand forecasts based on the Jubb (2003) method suggest no requirement for increased clinker
capacity before 2012.
In the absence of such an increase, the main opportunities for technological improvement over
this time are:
■ increased use of alternative fuels and raw materials in clinker manufacturing plants, driven by
the need to reduce the cost of manufacturing
■ continuous incremental improvements in systems and equipment (e.g. more efficient motors,
fan designs, maintenance practices) to provide small reductions in fuel and electrical energy
consumption
■ investment in cement-grinding capacity to address customer needs, and to reduce electrical
energy consumption
■ development of market opportunities to reduce the amount of cement kiln dust entering landfill
■ further use of SCMs and mineral additions in cement and concrete.
T E C H N O L O G Y P A T H W A Y F O R T H E A U S T R A L I A N C E M E N T I N D U S T R Y 2 0 0 5 – 2 0 3 0
29
Technology
Attachment C summarises the main opportunities for significant new technologies that are likely
to be adopted by the Australian cement industry and have, as part of their benefits, the capacity
to reduce direct and indirect emissions, particularly those of carbon dioxide. Attachment C also
provides a brief commentary on whether or not the adoption of the technology is likely in a BAU
environment, given the current hurdle rates for capital justification and the likely demand for
cementitious products over the period 2005 to 2012. More detailed analyses of the actual quanta
of reductions have been carried out for the calculations underlying the industry aggregate figures
on fuel and electricity consumption and the corresponding emission calculations.
Note that the more detailed estimations of change in industry performance parameters are only
approximate. The determination of more precise values requires a detailed analysis involving
considerable investment in engineering studies by the owners and operators of each Australian plant.
Based on this analysis, it is estimated that new technology which may be introduced under the BAU
scenario would cost approximately $150 million.
The impact of adopting such technology on key industry performance parameters and emissions
is discussed below. The proposed BAU technology plan will invest most heavily in cement-milling
operations to extend the capacity of existing equipment.
Electricity
Under BAU, in the ‘best’ market scenario, electrical energy efficiency is estimated to decrease between
2005 and 2012 from 106 kWh per tonne of cement to 96 kWh per tonne of cement, a reduction of 9
per cent (Table 11a). There will be an estimated 9 per cent reduction in the industry’s total gigawatt
demand for electricity, even with increased production of the ‘best’ market estimate. In the event of
a ‘high’ market, total annual demand would be 8 per cent above the power requirement in 2004.
The reduction in electrical demand occurs largely through the installation of new technology to
existing cement mills. Such technology includes high-pressure rollers to pre-crush clinker before
final milling, further upgrades to high-efficiency separators, and dense-phase pumping for transfer
of cement between the milling operations and storage. Increasing use of clinker-substituting
materials would also contribute to a reduction in electricity demand as certain SCMs, such as fly
ash, do not need to be ground.
Other areas of new power-efficient technologies are raw-mill high-efficiency classifiers to control
the particle size of raw meal, and improvements in blending-silo efficiencies. Electrostatic air-filter
controls are improved to optimise power requirements, and expert control systems yield electrical
savings through better process management.
Fuel
Under BAU, in a ‘best’ market scenario, it is forecast that the Australian industry average annual
performance by 2012 will be 3.3 GJ/t cement (Table 11a), a movement of 8 per cent since 2004.
This can be compared to a WBP plant of 3 GJ/t cement. The movement in this indicator is a
consequence of the majority of Australian clinker being produced through kiln technology installed
since the early 1990s, without further expectation of the industry expanding under BAU between
2005 and 2012. The absolute requirement for fuel shows a 7 per cent reduction in the ‘best’ market
estimate in 2012 against 2004 data.
The demand for fossil fuel will decrease under all circumstances, given the expected increase in the
use of alternative fuels (see below).
C E M E N T I N G O U R F U T U R E
30
The projected fuel-efficiency gains will result from installation of improved combustion technology
and energy recovery, which will arise from installations of new burners and improved clinker
coolers, respectively.
Alternative fuels and materials
The use of alternative materials is dependent on these factors:
■ availability of technically suitable waste materials from other industries
■ being able to fit new waste-processing technologies to existing cement-plant processes
■ satisfactory commercial justification
■ no detrimental environmental, health or safety effects
■ strong regulatory framework that does not permit landfill solutions and requires waste
segregation and collection
■ recognition of the true cost of landfill
■ effective environmental approval processes that
● provide an efficient licencing approval process that is timely with reasonable conditions
● harmonise environmental legislation between the states and the Commonwealth Government
to reduce reporting and justification processes and to simplify transport of waste for
utilisation across state boundaries
● support government policies recognising the cement industry’s role in recycling
● have transparent regulatory requirements that require solutions for waste to include a viable
business and a life-cycle management plan
■ certainty of supply quality and quantity
■ community acceptance of opportunities for waste re-use.
The use of alternative materials in the cement industry is steadily increasing, and further growth
is expected as solutions are found to technical, commercial, environmental and legislative issues.
Specifically, nationally recognised waste-management schemes and greater community acceptance
of the opportunities in the cement industry to utilise alternative fuels and raw materials will
facilitate their use.
Alternative raw materials—Use of these will increase as commercial opportunities arise, product
stewardship programs are introduced, or as national recycling initiatives are supported. Under
BAU, raw materials sourced from non-traditional supplies are estimated to reach 4.3 per cent
substitution by 2012 in a ‘best’ market condition (Table 11a). While this quantity of substitution
may appear small, because of the large amounts of raw materials used in cement manufacturing,
it equates to 300 kt per annum of waste utilisation in the raw mix. A third of this material will
conserve resources of traditional materials like iron ore, clays and sand, and the rest replaces
limestone, which will reduce GHG emissions.
Alternative fuels—The best practice target for the use of alternative fuels in kilns is considered in
the industry to be substitution of 60 per cent of traditional fuel requirements. This usage rate is
particularly sensitive to plant technology, regional availability of alternative fuels, and community
acceptance of the technology.
The modelling of alternative fuel use assumes the industry can source and utilise, under current
regulations and knowledge, available waste to 23 per cent of its fuel needs in 2012 at ‘best’ market
conditions (Table 11a). This equates to 259 kt per annum of coal not required by the industry. The
T E C H N O L O G Y P A T H W A Y F O R T H E A U S T R A L I A N C E M E N T I N D U S T R Y 2 0 0 5 – 2 0 3 0
31
industry is working closely with relevant industries to locate viable resources. Key issues are the cost
of compatible storage and feeding mechanisms on site, transport and collection costs, preparation
of the materials for cement-industry use, and the assurance of supply.
Alternatives to clinker—The use of the SCMs fly ash and slag in the Australian market varies
in different market areas, depending on the availability of chemically suitable materials and
satisfactory transport and preparation costs. Future opportunities for the use of fly ash and slag
depend on commercial considerations, primarily logistical costs.
Queensland and New South Wales already use fly ash at very high rates. Victoria and Western
Australia have local fly ashes of poor quality. Further use in these latter states depends on the
commercial viability of transporting good-quality fly ash to the markets. Tasmania and Northern
Territory, both small markets for cementitious products, have no local fly ash and use is limited by
transport costs. South Australia has limited good-quality local fly ash. Further opportunities for
greater use are limited by the small size of the total market for cementitious products and transport
costs in bringing ash from other markets.
Blast-furnace slag is available from Whyalla, Port Kembla and overseas, but further use is subject to
commercial justification because of the requirement for investment in granulation, grinding, storage
and transport facilities. Dedicated slag-grinding facilities currently exist in New South Wales and
Victoria and some grinding is carried out at cement plants from time to time for their own use.
Silica fume is a relatively high-cost material used in specialised applications where the properties
it provides to the cement (high strength and dense microstructure) are specifically sought for
engineering reasons. The rate of growth in use is expected to be in line with historical use.
It is generally agreed that a best practice target for substitution by cementitious materials in cement
and concrete is 40 per cent. For technical reasons, this target is difficult to apply to all markets
and cement types because substitution ratios and the type of SCM used affect the performance
of the cement and concrete. The BAU projection expects a rise to 29 per cent substitution of
cementitious materials in cement and concrete by 2012. This forecast is against the expected ‘best’
case market demand. Under the same conditions, the amount of SCMs supplied directly by cement
manufacturers to pre-mixed concrete plants is forecast to increase by 50 per cent.
In total, this represents 3056 kt of SCMs utilised in the industry and a rise in the substitution rate
from 22 per cent (2004) to 29 per cent of SCMs per tonne of cementitious materials produced by
the cement industry in 2012 (Table 11a). This forecast does not include quantities of SCMs sold
directly to the pre-mixed concrete industry by non-CIF members. The industry believes that there
are sufficient quantities of SCMs available to achieve this level of substitution.
Sustainability
With the strategies in place to extend technology to utilise waste and minimise waste generation
from the process, the role of cement manufacturing and community waste recycling becomes more
significant.
Overall emissions from cement manufacturing are also decreasing and the industry has developed
better means of testing emissions from chimney stacks and atmospheric modelling to measure
and estimate the effects of operations on the environment. These developments to predict
environmental effects have given the industry confidence in making changes to operations.
Under BAU conditions, the wider use of bypass technology on the clinker process will allow greater
flexibility for plants to accept alternative raw materials and fuels, particularly those with chloride,
sulfate or alkali content. With the increase in bypass technologies, a marginal increase in fuel
consumption and the generation of cement kiln dust may occur.
C E M E N T I N G O U R F U T U R E
32
Reductions in GHG emissions are expected due to the wide range of opportunities to utilise waste
through alternative fuels, raw materials and SCMs, thus reducing the need for limestone and the
use of fossil fuels.
Emissions. Under the BAU scenario, by 2012 emissions will be reduced in the following areas:
■ High-efficiency dust-filter technology will be installed on nearly all large production plants
and most of the smaller plants—this will reduce dust emissions to <30 mg/m3 and give greater
process control in upset conditions.
■ Upgrades to kiln burners and burner management systems and the use of certain alternative
fuels may reduce the release of oxides of nitrogen (NOx) in some circumstances. It is not
possible to quantify a reduction in NOx without knowing details of the fuel changes and
equipment. However, under suitable conditions, these types of changes can achieve reductions
in NOx emissions of up to 30 per cent.
Climate protection. Greenhouse-gas emissions will continue to reduce as the industry:
■ uses biomass as an alternative fuel, which is greenhouse neutral when diverted from landfill
■ substitutes calcined material for limestone in raw mix
■ introduces more energy-efficient equipment and practices
■ increases use of fuels with a lower specific CO2 emission rate
■ extends use of SCMs in cement and concrete.
Under the ‘best’ market condition, a reduction in CO2 emissions by 8 per cent per tonne of cement
and 7 per cent in absolute emissions is forecast. This change is driven by the combination of
utilising as much dry-process production as possible, the quantity of clinker production required,
and the increased use of SCMs. The Australian industry with BAU in place is within the best
practice range (Table 11a) for emission rates of CO2 from calcination and power sources.
Waste minimisation. Cleaner production measures used in the industry cover all areas of waste
minimisation from production. These measures include reducing:
■ airborne dust, by enclosing materials-handling operations, reducing stockpiles and encouraging
‘just in time’ delivery schedules, and the installation and upgrading of dust-collection units at
material-transfer points
■ waste entering landfill, by recirculating suitable waste into on-site processes or to other recycling
initiatives (e.g. waste oil re-use), reconditioned parts programs, and scrap-metal recycling
■ waste water by harvesting run-off water and utilising other waste water to substitute for mains
supply to the process or to the maintenance of green areas in the vicinity of the cement plant site.
Data from the CIF Annual Survey 2004 show cement kiln dust (CKD) going to landfill was 37 kt. It
is expected that by 2012 this figure will have reduced to less than 25 kt per year. By comparison, the
utilisation of waste by the process as raw materials and SCMs is expected to increase to be 140 times
greater than the amount of CKD put into landfill. Developing markets for CKD and improving
the operations of bypasses will reduce CKD emissions, however the possible installation of bypass
technology to manage a wider range of alternative fuels and materials may create more CKD to
market or landfill.
T E C H N O L O G Y P A T H W A Y F O R T H E A U S T R A L I A N C E M E N T I N D U S T R Y 2 0 0 5 – 2 0 3 0
33
Profile based on best available technology (BAT) conditions
Market and business environment
Market demand for cementitious material under the BAT scenario uses the same estimates as
those used in the BAU situation. Where BAT differs from BAU is in the assumption that certain
technologies, which are not commercially viable for some cement plants under BAU, would become
viable given:
■ appropriate government fiscal, monetary or regulatory intervention to ensure hurdle rates are
satisfied for investment
■ appropriate and transparent environmental compliance processes are applied
■ community acceptance for sustainable practices.
Technology
The types of technology available for adoption under the BAT scenario are the same as those
discussed in the section on BAU and outlined in Attachment C. The estimated capital cost to install
the BAT proposal is $500 million. This is in addition to the cost of the BAU changes.
The BAT analysis does not assume that all new technology would be applied without reference to
all plants—it has been applied to plants that would give a commercial benefit and to which it can
practically be installed.
The most obvious ‘reality check’ is to assume that the small wet-process plants are not changed to
dry-process technology. Such change is likely only in conjunction with a major capacity increase.
Conversion of a small wet plant to a small dry plant would be unrealistic and certainly sub-economic.
Some wet plants are identified as ‘dedicated’—being ideally suited to batch processes of specialty
cements for niche markets, e.g. off-white cement. These plants are unlikely to change their operations as
they are usually located close to specific raw-material supplies and because their scale of operation is
suited to the quantities required.
Similarly, new technologies such as precalciner kilns, vertical roller mills for raw meal, and high-
pressure rolls for cement grinding have been applied to the technology plan only if they make
reasonable technical and economic sense for the individual site.
Small plants cannot justify the high cost of upgrade to BAT but will nevertheless provide
opportunities for incremental improvement in performance across key indicators.
Given adequate commercial justification and regulatory support for changes in operations and
sourcing, the types of technology that are expected to be adopted under the BAT scenario are:
■ further increasing the use of alternative fuels and raw materials in clinker-manufacturing plants
■ upgrading specific plant processes such as pre-grinders, grinding mill separators, intra-plant
material transport systems, plant control systems, kiln fuel burners and clinker coolers
■ improving environmental performance beyond the requirements of some operating licence
conditions.
The proposed BAT plan requires capital expenditure in both the clinker plant and the cement-milling
plant. In clinker manufacturing, the introduction of technology would occur more widely across the
industry. New designs of clinker coolers and hot-air recirculation would be installed, modern kiln
burners with facilities to control a wide range of different types of fuels would be introduced, and
access for alternative raw materials would develop. Likewise, the cement-milling technology focused
on in the BAU scenario would extend to smaller, more regional operations.
C E M E N T I N G O U R F U T U R E
34
Technologies specifically addressing environmental performance would also progress more quickly,
particularly co-generation for power projects and bypass installations to kilns. Remaining clinker
processes without high-efficiency dust filters would be upgraded and NOx-reduction technology
would be installed, although this could vary significantly from plant to plant, depending on fuels
and plant configuration. Cleaner production initiatives could also be implemented. Process control
measures would continue to be refined, driven by the need for better environmental monitoring
and control.
Electricity
There are significant electricity-efficiency benefits to be gained from the implementation of WBT
at the smaller less-efficient plants, where the current return on investment for such technology
is insufficient for it to be commercially viable. The key area of technology upgrade continues to
be in cement milling, with high-pressure roller mills being installed with existing cement mills
to increase grinding efficiency. The adoption of low-energy transport systems for movement of
product around the site is another area that, under assisted-capital means, could yield benefits both
to supply grids and the national environmental signature.
Co-generation of power is technically feasible for modern kilns, and can generate up to 10 per cent
of the power need from waste heat. However, the economics are highly unfavourable at this time.
Subject to resolution of the commercial justification issue, additional benefits in reduced electricity
consumption may be available. Estimates of the possible benefits of co-generation have been made
and an industry contribution of 8 MW, based on 1 MW per 1 Mt per annum of clinker production
could consistently be saved from the grid supply with the proposed BAT plan (Claus and Kolbe
2002). However, without experience of adoption of this technology, each site’s case needs to be
reviewed on its merits.
Current BAT, such as low-efficiency drop cyclones, high-efficiency clinker-cooler designs, and high-
efficiency separators for raw mills will continue to give further incremental electrical efficiencies
to all areas of production. Emerging technologies, such as ceramic filters and sintered-metal heat
exchangers, may give benefits as the technologies are proven.
The calculated annual aggregate electrical energy consumption for the industry shows a 16 per cent
reduction between 2004 and 2012 in the ‘best’ market estimate condition (Table 11b). The described
industry efficiency gains are the sum of BAU and BAT plans together—BAT delivering a further 7
per cent improvement on BAU.
In comparison to WBP, the Australian cement-industry performance is forecast to a national
average of 89 kWh/t of cement, within the range identified by other reports (VDZ 2002, 2004) for
plants achieving WBP.
Fuel
Contributions to the reduced need for energy provided by fossil fuels under BAT include the
further installation of high-efficiency clinker coolers and better and more versatile burner
technology to allow for increased use of alternative fuels.
A projected decrease of 8 per cent in the required total energy from fuels under the ‘best’ market
condition is estimated by 2012 under both BAU and BAT. There is little change in this parameter
as justifiable kiln upgrades have been completed. The dependency on fossil-fuel resources will be
reduced further as alternative fuels become more established.
Aggregated Australian industry fuel efficiency under ‘best’ market conditions is forecast to be 3.3
GJ/t cement, compared to WBP of 3 GJ/t cement.
T E C H N O L O G Y P A T H W A Y F O R T H E A U S T R A L I A N C E M E N T I N D U S T R Y 2 0 0 5 – 2 0 3 0
35
Alternative fuels and materials
Additional use of alternative fuels and materials under BAT compared to BAU will depend on
further progress being made in relation to the factors governing their use. In terms of government
policy directions, the most important issues are certainty of supply and harmonisation of state
and federal environmental legislation. The awareness and cooperation of communities with regard
to strategies for segregation of waste and linking waste-management strategies to sustainable
operations is vital to progressing the opportunities for industries such as cement to utilise waste as
alternatives to natural resources.
The range of alternative fuels and raw materials available to the industry under the BAT scenario is
the same as that discussed under BAU. Any further increase in the use of alternative raw materials
depends less on technology and more on financial considerations, as well as discovering and
having access to other resources. Should compatible materials be available in greater quantities, the
opportunity to increase the substitution rate is much greater.
Alternative raw materials—There is an expectation that the industry by 2012, under ‘best’ market
conditions, will utilise 520 kt of waste, representing 8 per cent substitution in raw mix (Table 11b).
Six per cent of this material would be precalcined, reducing the need for limestone.
Alternative fuel—The model predicts 26 per cent substitution for fossil fuels by 2012 under ‘best’
market conditions (Table 10b). This is equivalent to conservation of 287 kt of coal through the
utilisation of waste as a fuel. Best practice for a plant is considered to be 60 per cent substitution.
Some Australian kilns could achieve this practice, however not all plants have access to suitable
materials. This shortfall between best practice and the 2012 forecast is an area where significant
work is warranted to overcome the hurdles to greater utilisation of waste materials by the industry
that were discussed above.
Alternatives to clinker—The range of SCMs available to the industry under a BAT scenario is the
same as that discussed under BAU. As noted in that section, any further increase in the use of SCMs
depends less on technology and more on financial considerations, such as the cost of transporting
the materials.
Under the BAT scenario in ‘best’ market conditions, SCMs would increase to 29 per cent per tonne
of cementitious material sold (Table 11b). This would fall short of best industry practice of 40 per
cent and there is opportunity for this to be explored as an option for improving the performance of
broader industry. It should be considered that some SCMs are sold directly to the concrete industry
and are not part of the CIF data collection.
Sustainability
The BAT scenario furthers the objectives of sustainability by supporting opportunities in waste
recycling to reduce emissions and to promote climate protection and cleaner production measures.
Emissions. Under BAT, with greater opportunities to install technology, there is an expectation that
the industry’s environmental performance would improve in all areas.
Available technologies that have not been able to attract capital investment because of low internal
rates of return include:
■ improving heat-recuperation equipment
■ introducing greater versatility to manage alternative materials and fuels with bypass technology
■ reducing dust emissions with use of high-efficiency dust filters
C E M E N T I N G O U R F U T U R E
36
■ introducing burner technology to reduce NOx emissions
■ implementing co-generation plants to reduce site demand for grid power.
Under BAT, dust emissions across all cement plants could be less than 30 mg/m3, equivalent to the
tightest world standard for new plants.
Climate protection—The opportunities to further reduce GHG emissions given commercially
viable technologies revolve around the extended use of alternative fuels, raw materials and use of
SCMs. Under the ‘best’ market estimate, CO2 emissions by 2012 would be reduced by 11 per cent
(Table 11b) to 0.736 tCO2 per tonne of cementitious material. This is within the best practice range
of the comparative international data.
In terms of absolute emissions under ‘best’ market estimates of the model, the industry would emit
10 per cent less CO2 in 2012 than in 2004.
Waste minimisation—Under BAT, the opportunities to reduce waste from the cement-manufacturing
process are similar to those previously proposed under BAU. However, under BAT, cleaner
production technologies may be enhanced, such as methods to return process waste to the system.
In relation to CKD, BAT predictions estimate that by 2012, 41 per cent of the CKD going to landfill
in 2004 will be either eliminated through plant improvements or diverted to a market.
Drivers to adopting best available technology
Under the BAU scenario, it is assumed that current industry and taxation policies remain materially
unchanged over the period 2005 to 2012 and hence the commercial hurdle rates to justify capital
expenditure are the same as in 2004. The discussion under BAU identified a number of other
impediments to achieving greater levels of technology improvement over the forecast period,
particularly in the area of alternative fuels and raw materials.
The BAT scenario assumes that even projects that are uneconomic under BAU are enabled to
progress, so that further efficiency gains and environmental benefits are realised by 2012. The
achievement of BAT forecasts also requires successful resolution of those other impediments to
achievement of greater levels of technology identified under BAU. In summary, over and above
the issue of commercial rate of return, the achievement of BAT will require solutions to satisfy the
following concerns.
Technical issues, including:
■ availability of new technology, in particular for increased use of alternative fuels and raw
materials
■ availability of sufficient quantities of alternative fuels and raw materials of suitable technical
quality for cement production
■ implementation of emissions-monitoring programs that demonstrate there are no detrimental
environmental, health or safety effects resulting from the use of alternative fuels and raw
materials
■ changes to the Australian Standard for Portland and blended cement to support criteria based
on performance rather than prescription to support investigation into the use of other mineral
additions, SCMs or cement technologies.
Legislative issues, including:
■ clear legislative requirements in relation to environmental and public-health criteria
T E C H N O L O G Y P A T H W A Y F O R T H E A U S T R A L I A N C E M E N T I N D U S T R Y 2 0 0 5 – 2 0 3 0
37
■ harmonisation of environmental legislation between the states and the Commonwealth that
supports the efforts of industry’s recycling and life-cycle management plans
■ a strong regulatory framework that does not permit landfill solutions and instead requires
solutions involving waste segregation and collection.
Commercial issues, including:
■ appropriate depreciation schedules for new technology, in particular for investment with no
benefit in relation to product quantity or quality
■ appropriateness and effectiveness of grants for new technology
■ recognition of the true cost of landfill.
Risk reduction issues, including:
■ certainty of supply quality and quantity for waste-derived alternative fuels and raw materials
■ support from government and the community for the role of the cement industry in waste
utilisation.
Community issues, including:
■ community acceptance of opportunities for waste re-use
■ a positive community attitude towards the cement industry.
Increasing the utilisation of waste materials is significant to the achievement of energy efficiencies
and emission reductions. The industry’s experience is that waste streams are dynamic resources,
changing in supply, composition and location as advances occur in cleaner production methods
and new opportunities develop for re-uses of higher value. To capitalise on the early-action benefit
that cement manufacturing can offer to utilise waste materials, decisions need to be made quickly
and frequently using flexible regulatory frameworks. Government support is required to recognise
cement kilns as a responsible means of waste use or recycling.
C E M E N T I N G O U R F U T U R E
38
5 Opportunities 2012 to 2030 and beyond
This section reviews the potential for further technology developments in the cement industry
in the period 2012 to 2030 and beyond and provides commentary on the likely effect on industry
performance. This evaluation draws on the recent experience in a number of areas, such as the
Australian coal and power industry, the worldwide search for low-emission technologies and the
research being undertaken by the cement industry, particularly in Europe.
Existing technologies
Beyond 2012, there will be opportunities for further technological improvements arising from
capacity increases to meet domestic demand need for clinker and cement. Any new clinker and
cement manufacturing capacity will utilise the latest technology, lowering the industry’s average
consumption of fuel and electrical energy.
New technology will be introduced through production-cost efficiencies, changes to standards in
quality and environmental performance and, to a lesser extent, the replacement of old equipment.
As a result of the adoption of new technology for new capacity, unit emissions of carbon dioxide
will continue to reduce after 2012. The extent to which new technology is adopted will depend on
its commercial viability, taking into account market demand, and changing health, safety, environmental
and quality standards. Where commercial factors might constrain the uptake of new technology,
assistance would be required to enable investment, such as intervention with government policy,
and the development of cheaper and more accessible Australian-made technology.
Technology in the cement industry has traditionally had a long lead time of 20 to 30 years. World
best practice cement plants operating in Australia are expected to continue to be able to utilise the
types of alternative fuels and raw materials that have been described in previous sections until 2020.
Leading-edge technical developments after 2012 will therefore continue to be adapted and fitted to
existing rotary kilns and cement mills.
Electricity
Greenfield cement plants (plants on previously undeveloped sites) constructed after 2004 will
be constructed to WBT with typical efficiencies, i.e. have a typical electrical energy consumption
of around 85 kWh per tonne of cement and in some cases even lower (75 kWh/t), if there are
favourable raw materials and site conditions. Based on an average figure of 80 kWh/t, for every
million tonnes of new capacity constructed in Australia, there will be a reduction in the Australian
industry average consumption of 1.7 kWh/t. Such a reduction in power consumption would lead
to a reduction in specific CO2 emissions of 1.5 kg of CO
2 for every tonne of cement produced. This
gives a very small reduction of 0.3 per cent in overall CO2 emission based on 2012 production.
Future greenfield plants would incorporate known low-energy technology, such as vertical-roller mills,
high-efficiency classifiers, rolls presses, low pressure-drop cyclones, high-efficiency coolers and
low-energy material-transport systems. These technologies, already proven, will continue to stand
as best practice technology at least for the early part of the period 2012 to 2030. Internationally,
the cement industry and its equipment suppliers and consultants are continuing to develop new
process technologies which may lead to further reductions. As yet, little public information is
available about new process technology under development.
T E C H N O L O G Y P A T H W A Y F O R T H E A U S T R A L I A N C E M E N T I N D U S T R Y 2 0 0 5 – 2 0 3 0
39
To the extent that the power industry is successful in reducing its CO2 emissions, so will the
cement industry indirectly reduce emissions, e.g. Coal21 (2004) has set a 2020 target of a 40 per
cent reduction in power-station GHG emissions, equating to the cement industry as a 6 per cent
reduction in addition to the technology-derived efficiency gains made by the cement industry.
Fuel
Greenfield cement plants constructed from 2004 have a typical fuel consumption of approximately
3 GJ per tonne of cement, lower if there are favourable raw materials and site conditions. Future
greenfield kilns would be fitted with known BAT, such as high-efficiency coolers, expert control
systems and modern burners that may use mineralisers and oxygen enrichment. Modifications to
the raw-meal chemistry and raw-material selection may give further environmental savings but it is
unlikely that there will be dramatic change in overall performance as such modifications can have a
negative influence on product quality.
Reducing fuel consumption from the 2012 industry performance of 3.3 GJ per tonne of cement to
the good practice benchmark of 3 GJ/t would reduce consumption by 0.03 GJ/t for every million
tonnes of new capacity constructed in Australia. Such a reduction in fuel consumption would
lead to a reduction in specific CO2 emissions of 2.9 kg of CO
2 for every tonne of cement produced
(using black coal as the basis for CO2 generation). This is a further 0.5 per cent reduction based on
2012 production. However, it is important to note that increased and widespread use of alternative
fuels and raw materials will require, in some cases, the installation of kiln bypass systems. This
will have a negative effect on kiln fuel consumption, so overall industry fuel consumption could
increase marginally.
Significant reductions in CO2 emissions could result if fossil fuels were replaced with biomass.
The carbon cycle of biomass is almost net zero in GHG emission terms; hence, the use of biomass
as fuel provides an offset for CO2 emissions associated with the use of traditional fuels. However,
such biomass fuels are often low in calorific value relative to traditional fuels used in the industry,
and this can limit their use to around 30 per cent of the total fuel requirement. Large-scale firing of
biomass is more readily adopted in the calciner technology.
This potential substitution of biomass for fossil fuels could reduce overall tonnes of CO2 emissions
by 745kt based on 2012 production figures and assuming black coal CO2 production equivalence.
This is a substantially higher biomass usage than the 9.6 per cent which has been included in the
modelling to 2012 and would lead to a further 10 per cent reduction per tonne of product based on
2012 production.
Alternative fuels and materials
Assuming the barriers to technology uptake discussed in section 4 are adequately addressed, uptake
of alternative fuels and raw materials will increase over time. Post-2012, continuing pressures
to minimise landfill will require industries that produce unavoidable waste to explore further
opportunities for re-use of their waste and to conduct product stewardship programs. Because the
cement industry is able to use a wide range of waste materials, it is reasonable to expect that it will
use increasing quantities in the period 2012 to 2030.
It is not possible to predict which wastes will be available and suitable for use in the cement industry
at a time eight or more years from the present. Wastes available now may no longer be so, as
alternative uses or cleaner production initiatives for these materials are put into practice.
Alternative raw materials. It is technically feasible for the use of precalcined alternative raw
materials to increase from 2 per cent of the demand (in 2012) to approximately 10 per cent or
C E M E N T I N G O U R F U T U R E
40
possibly more. Such an increase in substitution would cut CO2 emissions by a further 280 kt or 6
per cent if applied at 2012 production levels across the industry. Technical limitations may arise
from the content of various elements in slag, which can have an adverse impact on product quality
above certain limits. These materials can be used extensively, but the primary barrier is the cost of
transporting them to the plant.
Non precalcined wastes are less attractive to the industry. Their acceptance comes from the
opportunities they present to save costs compared to other raw material sources.
Alternative fuels—For similar reasons, a range of new alternative fuels can be expected to become
available in future years and that increasing quantities of waste materials will be used as substitute
fuels by the Australian cement industry in the period 2012 to 2030. It is not possible to predict
which wastes will be available and suitable for use in cement manufacturing, but the industry’s
requirement for energy release will remain. Wastes which are now available may no longer be
available as cleaner production methods, new technologies or other waste management methods
are discovered.
Alternatives to clinker. Post-2012, it can be expected that increased use of SCMs will reduce the
average clinker content of cement. It is technically possible to increase significantly the use of SCMs
beyond the 2012 estimate of 10 per cent in cement manufacturing (and a combined 30 per cent in
cement and concrete use) if, for instance, blends with 35 per cent or more ground granulated blast-
furnace slag are used. However, increased use of higher blends in concrete will occur only if the
physical properties can match the performance of Portland cement. There are technical solutions to
achieve this, but they involve additional expense or costly changes in concrete work practices.
The reduction in emissions that can be expected for an increase in SCM consumption is directly
proportional to the amount of SCMs used. For instance, a further increase of 10 per cent in SCM
usage will save 500 kt CO2 per annum based on 2012 estimates.
Important to developments in this area are the requirements of Australian Standards and federal
and state regulations governing the supply and use of building materials and systems. The further
development and promulgation of standards based on performance rather than prescription is
a necessary step to facilitate the development of innovative alternative materials and building
systems. These types of innovations may utilise a wider range and higher proportion of new and
existing materials, allowing further substitution for clinker in cementitious products.
New SCMs are identified only infrequently. Some recent examples include metakaolin and other
very fine silica materials. Generally expensive (similar in order of magnitude to silica fume), further
use of these materials will depend on their pricing structure, a demand for the concrete properties
they provide, and the development of specific Australian Standards to facilitate their use.
It is difficult to predict the additional emissions benefits that further developments in this area
might provide without greater certainty about the chemistry of the new materials. Emissions
reduction and other environmental benefits will continue to be implemented with the advances in
high-efficiency dust filters and controls on emission-reduction technologies such as burner design.
Development of these technologies will be driven by tighter emission limits, better process controls,
and more knowledge about environmental effects.
Summary
In summary, further adoption of BAT, incremental efficiency improvements, and increased use of
alternative raw materials and fuels may see the industry’s average CO2 emissions reduce by some
6 per cent from the 2012 ‘best’ market scenario forecast value of 0.605 to 0.567 tCO2 per tonne of
T E C H N O L O G Y P A T H W A Y F O R T H E A U S T R A L I A N C E M E N T I N D U S T R Y 2 0 0 5 – 2 0 3 0
41
cementitious materials, in line with WBP. A further 10 per cent reduction is possible with large-
scale usage of biomass materials. Offsetting some of these gains may be a relatively small adverse
effect on emissions of higher electricity and fuel consumption if the installation of kiln bypass
systems is required to maximise the use of waste materials. Further substantial reductions, up to 10
per cent of CO2 emissions, are possible as the market’s acceptance of blended cements increases.
Emerging technologies from the cement and other industries
This subsection reviews, from a technical position, emerging technologies with the potential to
provide efficiencies and environmental benefits in the manufacture of cement for the period 2012
to 2030. Many identified technologies are in the research and development (R&D) stage but are
receiving significant investment and have possible applications in the cement industry.
The Australian cement industry is small by world standards, and new technologies will most likely
emerge from large United States and European process technology specialists. These emerging
technologies have the potential to impact on all areas of industry performance—electricity, fuel
and alternative raw materials use, as well as emissions reduction. However, there are also several
GHG-related programs and initiatives in Australia which in the future will produce new technology
that can be adapted and effectively used in the manufacture of cement (AIGN 2003).
Fluidised-bed kilns
Development of fluidised-bed kiln (FBK) technology for producing clinker started in the early
1950s (Worrell and Galitsky 2004). The concept of the FBK involves a stationary, vertical, cylindrical
vessel in which raw materials are clinkered in a fluidised bed. Large pilot-scale FBKs were
demonstrated in 1996, producing 200 tonnes of clinker per day. To reach full commercial scale,
an FBK would need to produce at least 3000 tonnes of clinker per day.
Fluidised-bed systems are estimated to cost the equivalent of 88 per cent of the capital costs of a
modern cement facility, and to have operating costs equivalent to 75 per cent of a modern cement
facility’s operating costs (Choate 2003).
The expected advantages of FBK technology compared to rotary kilns include:
■ lower capital costs because of smaller equipment requirements
■ lower operating temperatures, resulting in lower NOx emissions
■ ability to use a wide range of alternative fuels for firing
■ lower energy (15–20 per cent) use than traditional rotary kilns
■ smaller footprint on site
■ higher flexibility with regard to raw material feed.
The FBK technology has to overcome technical hurdles, including a high clinker-recycling rate
and capacity constraints for alkali dust return. The technology has not yet been demonstrated
on a commercial basis. The risks associated with building a commercial-scale plant, based on the
successful demonstration of a one-tenth scale facility, are considered high.
Alternative building materials
Alternatives to Portland cement and Portland cement-based concrete are continually being
researched. Market acceptance of alternatives has been low and limited to special applications.
C E M E N T I N G O U R F U T U R E
42
Alternative cementitious products currently under development or commercially available on a
limited scale include:
■ geopolymers or mineral polymers (amorphous alumino-silicates) formed from industrial waste
materials, such as fly ash and slag or a range of natural clays—intensive research into mineral
polymers was conducted in eastern Europe and United States of America in the early 1980s and,
while the technology has not yet been successfully commercialised for cement applications,
significant research continues into its potential
● sulfate activated slag and fly ash
● alkali-activated slag and fly ash
● sialite (limestone-treated molten slag)
● magnesium oxide cement.
Most of these innovative building materials are aimed at making hydraulic binders with little or no
clinker constituents. Magnesium oxide-based cements are the exception, using high proportions of
cement, up to 95 per cent.
In the majority of cases, the drivers of these developments are stated as environmental benefits
and improve performance properties of the materials, such as strength and setting time. The
environmental benefits claimed with alternative building systems are low energy requirements for
their production, and the nil calcination emission associated with their manufacture when using
industrial wastes as the feed stock.
There is a cost barrier to their introduction to the normal construction materials register. The
development of an alternative to traditional cement must be able to offer clear superiority in the
marketplace to warrant the investment in its manufacture.
The uptake of these technologies has been slow. Barriers to their use in the building and construction
industry are both technical and commercial. Many of the technical benefits attributed to alternative
building materials are based on results from laboratory-scale testing. The lack of sufficient and
verified data on long-term field performance is a major obstacle to the market success of these
products and restricts their acceptance in local standards, building codes and regulations.
Electrical energy related technologies
Many of Australia’s industrial manufacturing industries rely heavily on the cost of electricity
staying low to remain competitive. As the price of electricity continues to rise, technologies that
reduce their reliance on traditional power-generation sources and improve energy efficiency will
begin to emerge over the longer term. Energy-efficiency technologies will provide an important
opportunity for the Australian cement industry to continue to reduce its fuel and power consumption.
Consequently, the cement industry would reduce indirect electricity and direct fuel emissions.
Non-carbon fuels
The transport sector is conducting significant R&D of fuel cells and hydrogen fuels. These represent
potentially important longer-term technologies, albeit with significant cost and supply barriers.
Hydrogen will be viable only if it proves cost-competitive against other energy sources.
Other technologies, such as low-cost CO2 sequestration, are likely to be required to be associated
with the production of hydrogen. However, beyond 2030, hydrogen and fuel cells could provide
new opportunities for the cement industry for transportation of cement to the customer and
alternative power-supply options in the manufacture of cement. Fuel cells are developing with
T E C H N O L O G Y P A T H W A Y F O R T H E A U S T R A L I A N C E M E N T I N D U S T R Y 2 0 0 5 – 2 0 3 0
43
interest and finding viable markets in commercial buildings and transport. Barriers to fuel cells are
their inefficiencies in the power cycle.
Low-emission technologies
The development of low-emission technologies adapted from other manufacturing industries can
provide new opportunities for the cement industry to further reduce GHG emissions and improve
environmental performance. Technologies may be sourced for the cement industry from power
generation and the chemical and mineral processing sectors. Developments are likely in the areas of
combustion technologies, more efficient methods of comminution, and improved heat transfer and
lower heat losses in vessels and reactors.
Oxy-fuel combustion technology
Oxy-fuel combustion is developing with post-combustion CO2 capture techniques as a means of
increasing the concentration of CO2 in flue gas from 17 per cent to the 70 per cent level that makes
capture achievable. It can be used with conventional pulverised coal technology but this has not yet been
demonstrated in a full-scale plant. The operation requires flue gas to be recycled with relatively
purer oxygen, reducing the emission of nitrogen (no air) and increasing the concentration of CO2.
Carbon capture and storage
Carbon capture and storage technology is being developed for use in power generation. Once
developed, this technology could be adapted to cement manufacturing but the cost of capture and
storage of CO2 today is estimated at more than $27 per tonne—a cost which, if added to the price
of cement, would make Australian product uncompetitive against imports.
Flue gas CO2 capture—Of the numerous approaches to CO
2 capture, the flue gas approach has
the highest potential applicability to the cement industry. The CO2 is separated and captured from
the combustion products in the flue gas stream. The technology is well known, using scrubbers
or cooling and condensing, and membranes and absorption techniques, or combinations thereof.
There are, however, efficiency and capital barriers.
Technical challenges include removal of contaminants such as particulates, and oxides of sulfur and
nitrogen. The efficiency of the cycle, which includes the associated emissions from energy needed
to run the capture plant, is equivalent to 85 per cent removal of the CO2 in the flue (International
Panel on Climate Change, unpublished data). The flue gas from clinker manufacture typically
contains a slightly higher concentration of CO2 (18–20 per cent) than coal-fired power station
flues. This encourages such technology to be developed at cement-manufacturing sites. Applying
technology in this way enables the capture, in one step, of both process and fuel CO2 emissions
from cement production, representing 87 per cent of emissions per tonne of cement.
Post-combustion capture of CO2 for the cement industry, given the efficiencies of the technology,
can be expected to address 74 per cent of the total GHG emissions associated with each tonne of
cementitious product. A further 10 per cent could be reduced by the power-generation industry
adopting the same technology. The high economic cost of CO2 separation is a major obstacle for
the application in cement plants. However, as the technology develops and economic costs reduce,
this may be a viable avenue for cement plants to reduce CO2 emissions before 2030.
Geological sequestration—Australian researchers have identified saline geological formations
as the most promising CO2 storage option in Australia. The geographical distribution of available
formations may limit the potential for CO2 storage in some areas. Cement plants near viable
C E M E N T I N G O U R F U T U R E
44
formations could participate in demonstration projects of CO2 capture and storage technology.
The cost of transporting captured CO2 is another consideration in applying this technology.
While capture and geological storage of CO2 has not been demonstrated for the specific purpose
of abating emissions from cement plants, CO2 separation and re-injection is common in natural-
gas production and in gasification processes at petrochemical refineries. The injection of CO2 into
geological formations is being carried out routinely at more than 70 sites in enhanced recovery
operations, primarily in North America, North Africa and Europe (Coal21 2004).
Biological sequestration. Emerging technology in this area is associated with biological CO2 fixation
using a photobioreactor system. There are two key areas of research: speeding up the rate of CO2
fixation, and successful conversion into fuels and other products (Usui and Ikenouchi 1997).
Research in this area has been undertaken in Japan throughout the 1990s.
Markets for CO2—The development of markets for CO
2 would increase the viability of capture
from flues. Horticulture has several small commercially viable markets. Markets that have limited
application but are well developed include enhanced oil and gas recovery, and a developing
opportunity in enhanced coal-bed recovery which is at a pilot-plant stage.
Drivers to adopting new technology
The drivers to adopt new technology in the period after 2012 are expected to be the same as in the
period 2005 to 2012, although it is expected that environmental issues will play a more significant role.
As discussed in section 4, subsection Drivers to adopting best available technology, the principal
issues that need to be addressed can be categorised as technical, legislative, commercial, risk, and
community. The types of issues that will require successful resolution in these areas will require
identification at the appropriate time in the future. Research and development is a pre-cursor to
the development of commercially viable new technology and some discussion on this point is
warranted.
Australia has been an active participant in R&D into properties and uses of cementitious materials.
However, it has not developed a strong R&D capability in the area of cement manufacturing.
Among reasons for this are:
■ the quantum of R&D funding required is very large
■ Australia’s cement producers have generally had strong ownership or technical relationships
with international cement companies and equipment suppliers.
Australian cement companies continue to have strong links to large international cement
companies and to industry or business groups. These relationships provide access to emerging
technologies for production improvement, cost and quality efficiencies, emissions abatement,
energy-efficiency improvements, improved material conservation and for other environmental
issues. Where there are ownership links, these provide capital for investment in new technology.
Partnerships involving international business groups, such as the World Business Council for
Sustainable Development (WBCSD), offer avenues for coordinated R&D activities into new
technologies within the global cement industry. Local initiatives are sometimes required to assist
and accelerate the adaptation and adoption of new technologies to local Australian conditions.
Cross-over technologies—the application of technology developed in one industry to another
industry—require collaboration across industry sectors. Typical examples in the cement industry
include the adoption of improved comminution techniques and heat-transfer modelling. In
principle, the opening up of opportunities for the cement industry to participate in alliances
T E C H N O L O G Y P A T H W A Y F O R T H E A U S T R A L I A N C E M E N T I N D U S T R Y 2 0 0 5 – 2 0 3 0
45
and common working parties between industry sectors would assist in the development of the
technologies and in the acceptance of such leads in the Australian cement industry and should
be encouraged.
Cooperative Research Centres provide a practical central organising point for alliances, but the
nature of emerging technologies is often that they are not sufficiently advanced for trial in various
different commercial circumstances. Other ways the cement industry can tie into new technology
development is by participation in demonstration or pilot projects.
Australian cement companies have demonstrated their readiness to implement commercially viable
new technology. Provided future competitiveness is secure, Australian-based cement producers are
well placed to continue to implement world’s best practice in technology.
C E M E N T I N G O U R F U T U R E
46
APPENDIX A Acronyms and abbreviations
BAT best available technology
BAU business as usual
CIF Cement Industry Federation
CKD cement kiln dust
CO2 carbon dioxide
CSI Cement Sustainability Initiative
GCP Greenhouse Challenge Program
GHG greenhouse gas
GJ gigajoule
GW gigawatt
kt kilotonnes
kWh/t kilowatt hours per tonne
MW megawatt
Mt megatonne
NOx oxides of nitrogen
PJ petajoule
R&D research and development
SCMs supplementary cementitious materials
tCO2 tonnes of carbon dioxide
WBCSD World Business Council for Sustainable Development
WBP world best practice
WBT world best technology
T E C H N O L O G Y P A T H W A Y F O R T H E A U S T R A L I A N C E M E N T I N D U S T R Y 2 0 0 5 – 2 0 3 0
47
APPENDIX B Glossary
Aggregate Gravel, sand, crushed stone, and possibly other materials used in making concrete
Alternative fuels Energy-containing wastes used to substitute for conventional thermal energy sources
Alternative fuels and raw materials
Inputs to cement production derived from non-traditional sources such as industrial, municipal, and agricultural waste streams
Alternative raw materials Materials with suitable chemical composition used to replace the traditional virgin raw materials used to make clinker
‘best’ The most likely estimate of market demand
Biomass Organic material from vegetation and animal waste used as a source of fuel
By-product Secondary product from an industrial process
Cement, Portland cement Final product from a manufacturing process involving the production and grinding of clinker and addition of minerals and cementitious materials to achieve specified performance criteria—used in the production of concrete as the binding (glue) material
Cementitious materials Materials with similar hydration properties as cement—able to be blended with cement to reduce the proportion of clinker required to make the final binder
Cement Industry Federation Industry association representing the integrated cement manufacturers in Australia
Cement Sustainability Initiative A sub-group of the World Business Council for Sustainable Development specially focused on cement manufacturing and a sustainable industry
Clinker The intermediate product in cement manufacturing formed in the rotary kiln
Concrete A material produced by mixing binder, water and aggregate
Fly ash By-product from the combustion of coal
Fossil fuel A general term for combustible geological deposits of carbon in reduced (organic) form and of biological origin, including coal, oil natural gas, and oil shale
Greenhouse gas Gases in the Earth’s lower atmosphere that may contribute to
global warming, including the major component, carbon dioxide
C E M E N T I N G O U R F U T U R E
48
Greenhouse neutral A term used for biomass waste diverted from landfill for use
as a fuel.
General blended cement Cement with a percentage of slag and/or fly ash greater than 5 per cent and blended by a cement manufacturer rather than a ready-mix supplier — made in accordance with as3972, the Australian Standard for cement
General purpose cement Cement made from Portland cement clinker and gypsum with the optional addition of up to 5 per cent slag, fly ash and/or limestone—made in accordance with as3972, the Australian Standard for cement
‘high’ The highest market demand for product, two standard deviations more then the ‘best’ estimate
Kiln Large, inclined rotary industrial oven for producing clinker used in the manufacture of cement
‘low’ The lowest market demand for product, two standard deviations below the ‘best’ estimate
‘maximum industry capacity’ The theoretical performance of the cement industry, calculating only the effect of technology
Mineral addition Any slag, fly ash and/or limestone that may be added to general purpose cement to a maximum of 5 per cent in accordance with as3972, the Australian Standard for cement
Ordinary Portland cement Cement that consists of approximately 95 per cent ground clinker and 5 per cent gypsum
Precalcined Material that has undergone a decarbonising process to remove carbon dioxide
Stakeholder A person or group that has an investment, share, or interest in something, as a business or industry
Supplementary cementitious materials
Materials that have similar properties to cement and can be used to supplement clinker or cement, e.g. slags and fly ash
Sustainable business A business that is able to anticipate and meet the economic, environmental, and social needs of present and future generations of customers and other stakeholders
Sustainable development Ability to continually meet the needs of the present without compromising the ability of future generations to meet their own needs
Technology The way in which traditional raw materials are, by the Portland cement process, changed to meet the specification required to be the cementitious component in concretes and mortars— this includes process equipment and materials selection
Waste A by-product material having no or little value derived from a process of activity, not the product of a process
T E C H N O L O G Y P A T H W A Y F O R T H E A U S T R A L I A N C E M E N T I N D U S T R Y 2 0 0 5 – 2 0 3 0
49
APPENDIX C References
AGO (Australian Greenhouse Office) 1997, Greenhouse challenge cooperative agreement between companies of the cement industry through the Cement Industry Federation and the Commonwealth of Australia.
AGO (Australian Greenhouse Office) 2004, Factors and methodology workbook. Australian Government, Department of Environment and Heritage, AGO, August 2004, <www.greenhouse.gov.au/workbook/pubs/workbook.pdf>.
AIGN (Australian Industry Greenhouse Network) 2003, Greenhouse-related research and development activities and initiatives in Australian industry, <www.aign.net>.
Battelle 2002, Towards a sustainable cement industry, report commissioned by the World Business Council for Sustainable Development.
CIF (Cement Industry Federation) 1989–2004, Cement industry annual surveys, commissioned by the CIF and prepared by Pricewaterhouse Coopers.
CIF (Cement Industry Federation) 2002, Greenhouse Energy Management System (GEMS) guidelines, July 2002.
Choate, WT 2003, Energy and emissions reduction opportunities for the cement industry, Industrial Technologies Program, US Department of Energy, Energy Efficiency and Renewable Energy, December 2003, <www.eere.energy.gov/industry/imf/pdfs/eeroci_dec03a.pdf>.
Claus, W and Kolbe, T 2002, Long-term operating experience with the ORC plant for low-temperature power generation at the Lengfurt works, Zement-Kalk-Gips (ZKP) International, October 2002, p. 78.
Coal21 2004, National action plan: a plan of action for Australia, March 2004, <www.coal21.com.au>.
Ellis, J 2000, An initial view on methodologies for emission baselines: cement case study, Organisation for Economic Cooperation and Development (OECD) and International Energy Agency (IEA) Information Paper, Paris, June 2000, <www.ghgprotocol.org/docs/baseline-cement.pdf>.
Japan Cement Association 2004, Cement in Japan 2004 (September).
Jubb, C 2003, Cement clinker. National Greenhouse Gas Inventory 2003. Australian Government, Department of Environment and Heritage, Australian Greenhouse Office.
Lang, TA 1994, ‘Energy saving potential in the cement industry and special activities of the ‘Holderbank’ group’, in Industrial energy efficiency: policies and programmes conference proceedings, 26–27 May 1994, Paris, International Energy Agency and US Department of Energy.
Martin, N, Worrell, E and Price, L 1999, Energy efficiency and carbon dioxide emissions reductions opportunities in the US cement industry, Ernest Orlando Lawrence Berkeley National
Laboratory, September 1999.
Usui, N and Ikenouchi, M 1997, The biological CO2 fixation and utilization by RITE(1)—
highly-effective photobioreactor system, Energy Conversion Management, Volume 38 supplement, p. S487–S497.
C E M E N T I N G O U R F U T U R E
50
VDZ (Verein Deutscher Zementwerke e.V.; German Cement Works Association) 2001, Trace elements in German standard cements 2001.
VDZ (Verein Deutscher Zementwerke e.V.; German Cement Works Association) 2002, Environmental data on the German cement industry 2001. Dusseldorf, VDZ.
VDZ (Verein Deutscher Zementwerke e.V.; German Cement Works Association) 2004, Activity report 2001–2003. Dusseldorf, VDZ, <www.vdz-online.de/engl/pub.htm>.
Worrell, E and Galitsky, C 2004, Energy efficiency improvement opportunities for cement making: an energy star guide for energy and plant managers. University of California, Ernest Orlando Lawrence Berkeley National Laboratory, sponsored by the US Environmental Protection Agency, January 2004, <http://www.climatevision.gov/sectors/cement/pdfs/final_lbnl.pdf>.
T E C H N O L O G Y P A T H W A Y F O R T H E A U S T R A L I A N C E M E N T I N D U S T R Y 2 0 0 5 – 2 0 3 0
51
ATTACHMENT A Sustainability in the Cement IndustryThe World Business Council for Sustainable Development (WBCSD) defines sustainable
development as ‘forms of progress which meet the needs of the present without compromising the
ability of future generations to meet their own needs’.
The Australian cement industry is committed to a sustainable future and strives to ensure the best
solution is found to manage the needs of industry and the community.
Cement manufacturing impacts on the environment in the following main areas:
■ emissions of greenhouse gas (GHG)
■ visual impact (a modern cement plant can have a tower as high as 100 m)
■ airborne emissions from combustion of fuels and handling of materials
■ dust due to the handling of large tonnes of material
■ operation of mines for the provision of limestone and other raw materials
■ traffic due to transport of raw materials and product.
However, the industry is able to mitigate its impact by:
■ providing opportunities to recycle other industry waste while conserving natural materials
■ rehabilitating quarries once operations have ceased
■ creating the capacity to provide solutions for a wide range of broader national environmental
issues, through superior construction solutions
■ improving the durability of concrete through improvements in cement quality
■ adopting cleaner production measures with technology, better practices and innovation.
The Cement Sustainability Initiative (CSI) (Battelle 2002), Agenda for Action is a commitment by
the international cement industry, supported by the WBCSD, to reduce the effect of the industry on
the environment and integrate industry operations with the needs of the community.
The Agenda for Action covers six areas of cement-manufacturing operations:
■ climate protection, GHG emissions, reductions and adaptation
■ fuels and raw materials selection
■ employee health and safety
■ emissions reduction
■ local impacts and community consultation
■ internal procedures to set sustainability as part of the industry culture.
The Cement Industry Federation (CIF) participates in the initiative as a communications
partner by assisting in the development of documentation and progress reporting on the Australian
industry’s position. This involves regular discussion and progression of all items on the CSI agenda
through the CIF’s Sustainable Development Taskforce, a committee supported by each of the
CIF members. Involvement with the initiative has kept the Australian industry aligned with, and
participating in, international developments in all areas of sustainability. This technology taskforce
report will fulfil the CSI agenda item six requirements to review technology beyond 2012.
C E M E N T I N G O U R F U T U R E
52
Other initiatives of the industry to promote sustainability include running industry-wide awards
to recognise innovative projects, and publishing an industry sustainability report.
Key items of the CSI Agenda for Action addressed by the technical report include climate
protection, fuels and raw materials, and emissions reduction. Other items indirectly supported
by new technology are:
■ employee health and safety through the review and installation of new equipment that
introduces more sophisticated interlock and access systems, and provides the opportunity
to review and modernise to updated standards the operating procedures of the process
■ local impacts, as significant technology changes require site operating licence reviews and the
introduction of conditions with greater accountability for monitoring and reporting.
Acceptable alternative materials for cement manufacturing contribute to sustainability through
responsible waste recycling by:
■ managing an end to the life-cycle of the material
■ conserving natural resources through utilisation of both their energy and mineral content
■ reducing process emissions of the cement industry, including GHGs
■ leaving no additional waste stream.
Internationally, the substitution of traditional fuels and materials has been an acceptable practice
for more than 25 years.
Emissions
Emissions from cement manufacturing are primarily airborne. The use of water has been
minimised with the move to dry-process technology and recirculating cooling water.
Parameters commonly monitored as airborne emissions include dust, carbon dioxide, oxygen,
heavy metals, oxides of nitrogen, sulfur dioxide, volatile organic compounds, poly-aromatic
hydrocarbons, dioxins (polychlorinated dibenzo-dioxins and polychlorinated dibenzo-furans),
moisture, and energy lost in the form of heat.
The cement industry is committed to understanding and controlling emissions to within safe levels
identified in international codes for health and the environment. Each cement plant operates under
both Australian Government and state policy for the environment, health and safety, and also has
specific licence conditions with operating and reporting requirements.
The cement industry has invested time and capital in developing direct measurement procedures
to sample and test emissions from the kiln stacks. Protocols have been established and modelling
of the measured data has developed a relationship between ‘end-of-pipe’ emissions and ground-
level concentrations that can be related to environmental and health standards.
Emissions from cement-manufacturing facilities in Australia are monitored regularly to:
■ control the manufacturing process to optimal conditions for product quality and the protection
of equipment
■ meet operating licence conditions set specifically for each site
■ meet national reporting requirements such as the National Pollutant Inventory, National
Dioxin Program, Stockholm Convention, National Environmental Performance Measures
(NEPM) Air Quality
■ monitor specific local effects of interest to local communities
■ investigate the outcome of changes in process operations.
T E C H N O L O G Y P A T H W A Y F O R T H E A U S T R A L I A N C E M E N T I N D U S T R Y 2 0 0 5 – 2 0 3 0
53
Climate protection
The industry is a member of the Australian Greenhouse Challenge Program (GCP), with goals
for the reduction of GHG emissions which are set out in the Cooperative Agreement of 1997
(AGO 1997). The industry has reported aggregated GHG performance annually to the Australian
Greenhouse Office since that time. The annual report also notes the specific achievements of
individual sites, reporting the top five abatement projects of the year. To encourage the industry
to share experiences and successful solutions to GHG management, the CIF runs industry-wide
awards for innovative projects in climate protection.
The industry has actively contributed to the global, national and state debate on climate change
through international Australian Government delegations, local strategy development forums and
industry discussion groups. The formation of common reporting protocols for CIF members in
1997 has expanded to a global level for the cement industry in 2005.
The reduction in carbon dioxide (CO2) emissions since 1990 has been significant, at 21 per cent per
tonne of cementitious material sold. This is illustrated in Table 9 of the main report. The quantity
of CO2 abated in 2005, through a register of over 100 projects in operation in the industry, is
expected to be 1.6 Mt, exceeding the target set in the GCP (AGO 1997) by 70 per cent.
Waste minimisation
The industry continually seeks ways to reduce its own waste. Cleaner production measures
are employed on all sites, minimising waste at the source, returning materials to the process
when possible, and finding alternative uses such as recycling, e.g. of used oil, before landfill or
incineration are considered.
Cement kiln dust is the only solid process waste from cement production. Process modifications
and the development of markets using the dust have come with greater awareness of sustainability
opportunities.
Conclusion
Cement manufacture adds significantly to the lifestyle of the community by supplying the vital
ingredient for the most common construction material in the world—concrete. The manufacturing
process is a source of substantial employment in a wide range of occupations, and the importer
of new world-class technology. The cement-manufacturing process utilises a diverse range of
community wastes otherwise difficult to manage, and brings to Australia proven advances in
international sustainability practices.
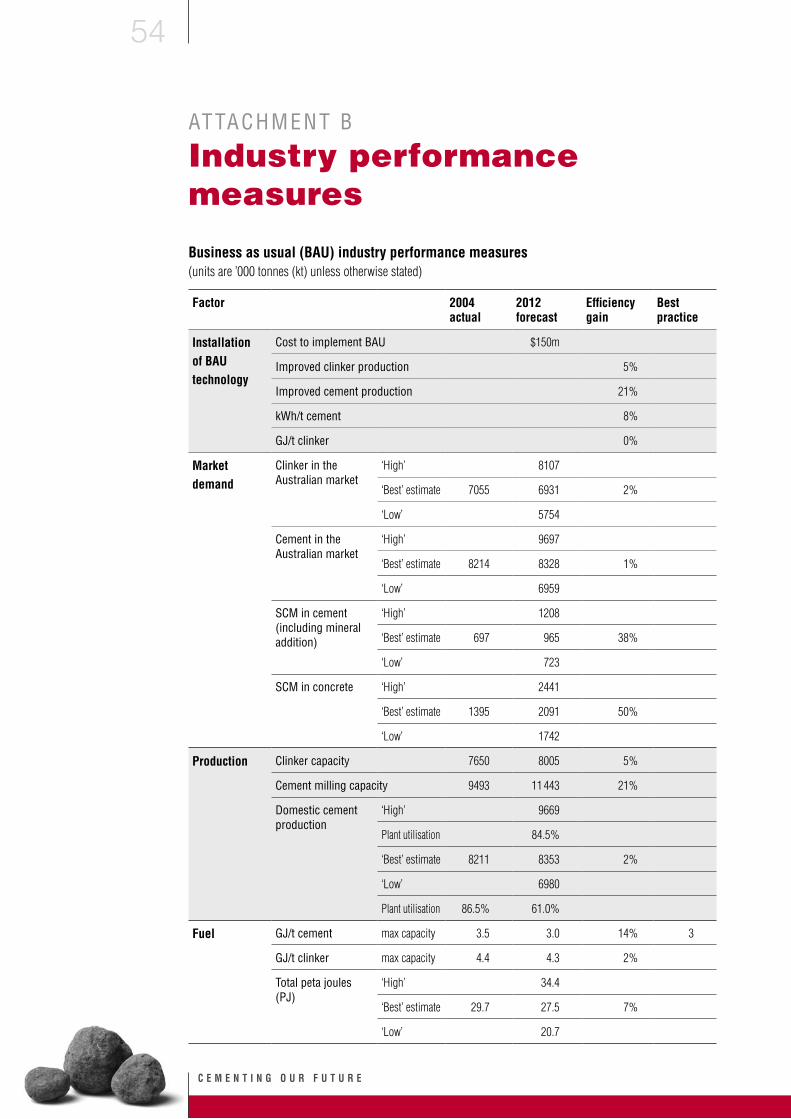
C E M E N T I N G O U R F U T U R E
54
ATTACHMENT B Industry performance measures
Business as usual (BAU) industry performance measures (units are ’000 tonnes (kt) unless otherwise stated)
Factor 2004 actual
2012 forecast
Efficiency gain
Best practice
Installation of BAU technology
Cost to implement BAU $150m
Improved clinker production 5%
Improved cement production 21%
kWh/t cement 8%
GJ/t clinker 0%
Market demand
Clinker in the Australian market
‘High’ 8107
‘Best’ estimate 7055 6931 2%
‘Low’ 5754
Cement in the Australian market
‘High’ 9697
‘Best’ estimate 8214 8328 1%
‘Low’ 6959
SCM in cement (including mineral addition)
‘High’ 1208
‘Best’ estimate 697 965 38%
‘Low’ 723
SCM in concrete ‘High’ 2441
‘Best’ estimate 1395 2091 50%
‘Low’ 1742
Production Clinker capacity 7650 8005 5%
Cement milling capacity 9493 11 443 21%
Domestic cement production
‘High’ 9669
Plant utilisation 84.5%
‘Best’ estimate 8211 8353 2%
‘Low’ 6980
Plant utilisation 86.5% 61.0%
Fuel GJ/t cement max capacity 3.5 3.0 14% 3
GJ/t clinker max capacity 4.4 4.3 2%
Total peta joules (PJ)
‘High’ 34.4
‘Best’ estimate 29.7 27.5 7%
‘Low’ 20.7
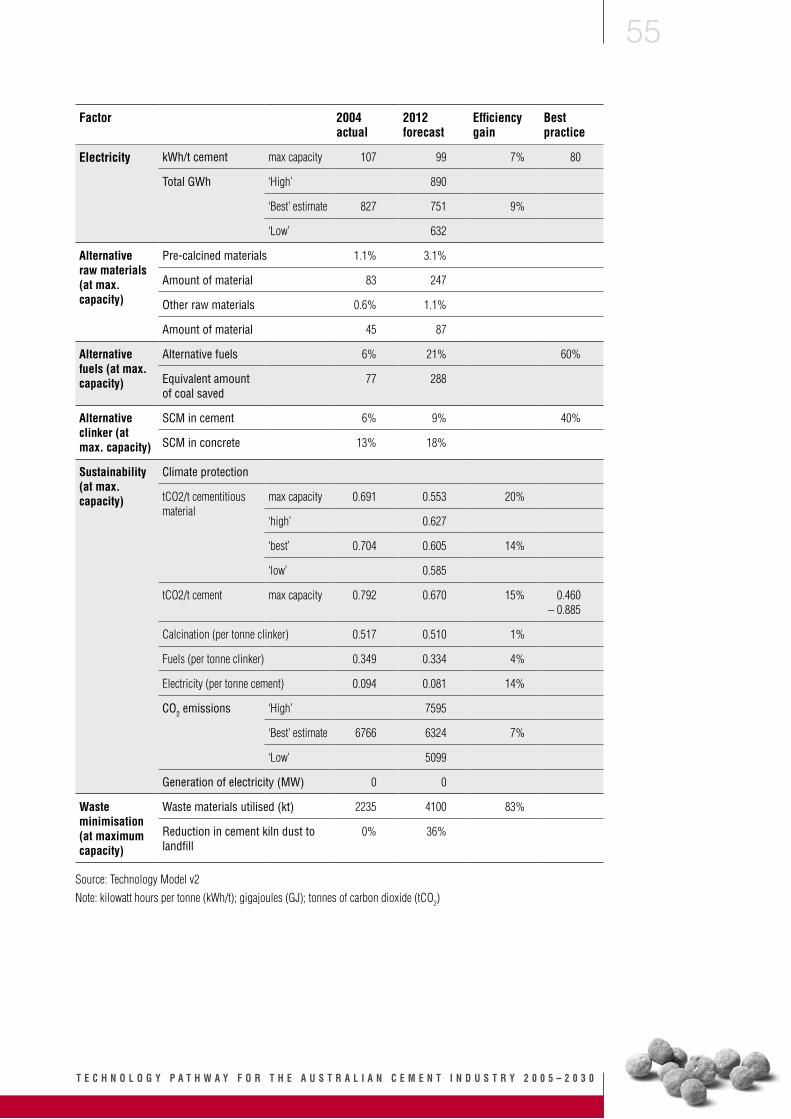
T E C H N O L O G Y P A T H W A Y F O R T H E A U S T R A L I A N C E M E N T I N D U S T R Y 2 0 0 5 – 2 0 3 0
55
Factor 2004 actual
2012 forecast
Efficiency gain
Best practice
Electricity kWh/t cement max capacity 107 99 7% 80
Total GWh ‘High’ 890
‘Best’ estimate 827 751 9%
‘Low’ 632
Alternative raw materials (at max. capacity)
Pre-calcined materials 1.1% 3.1%
Amount of material 83 247
Other raw materials 0.6% 1.1%
Amount of material 45 87
Alternative fuels (at max. capacity)
Alternative fuels 6% 21% 60%
Equivalent amount of coal saved
77 288
Alternative clinker (at max. capacity)
SCM in cement 6% 9% 40%
SCM in concrete 13% 18%
Sustainability (at max. capacity)
Climate protection
tCO2/t cementitious material
max capacity 0.691 0.553 20%
‘high’ 0.627
‘best’ 0.704 0.605 14%
‘low’ 0.585
tCO2/t cement max capacity 0.792 0.670 15% 0.460 – 0.885
Calcination (per tonne clinker) 0.517 0.510 1%
Fuels (per tonne clinker) 0.349 0.334 4%
Electricity (per tonne cement) 0.094 0.081 14%
CO2 emissions
‘High’ 7595
‘Best’ estimate 6766 6324 7%
‘Low’ 5099
Generation of electricity (MW) 0 0
Waste minimisation (at maximum capacity)
Waste materials utilised (kt) 2235 4100 83%
Reduction in cement kiln dust to landfill
0% 36%
Source: Technology Model v2Note: kilowatt hours per tonne (kWh/t); gigajoules (GJ); tonnes of carbon dioxide (tCO2)
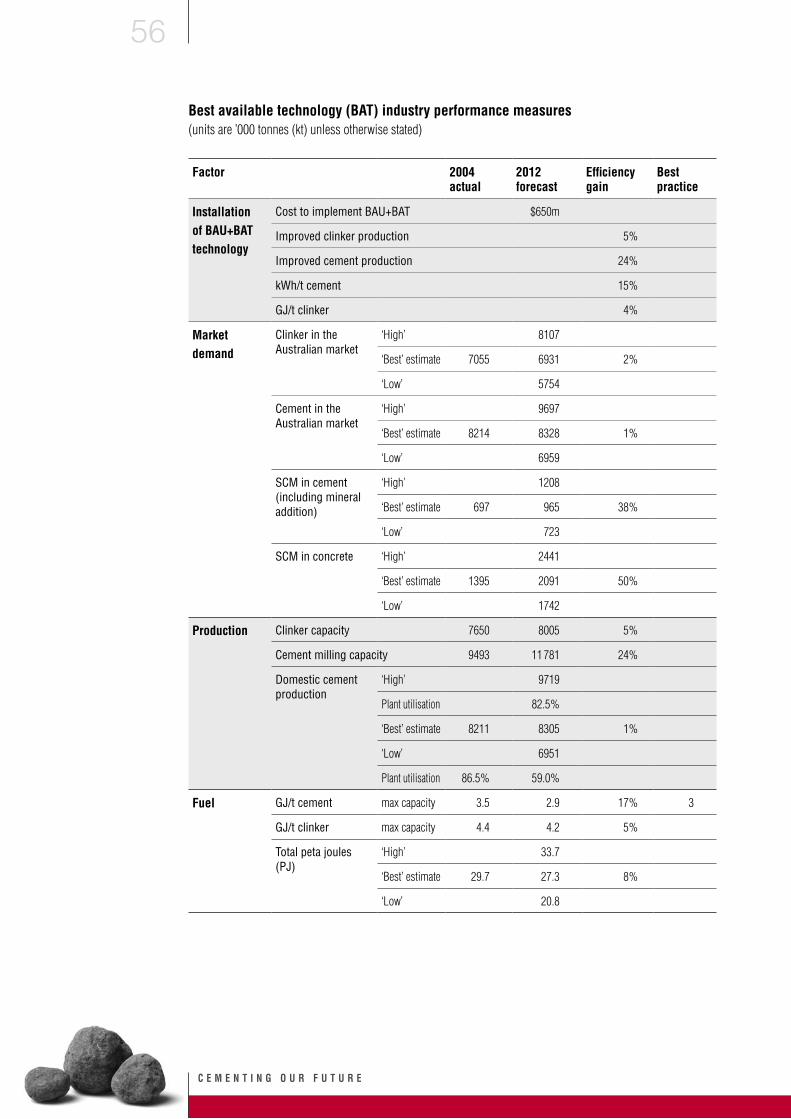
C E M E N T I N G O U R F U T U R E
56
Best available technology (BAT) industry performance measures (units are ’000 tonnes (kt) unless otherwise stated)
Factor 2004 actual
2012 forecast
Efficiency gain
Best practice
Installation of BAU+BAT technology
Cost to implement BAU+BAT $650m
Improved clinker production 5%
Improved cement production 24%
kWh/t cement 15%
GJ/t clinker 4%
Market demand
Clinker in the Australian market
‘High’ 8107
‘Best’ estimate 7055 6931 2%
‘Low’ 5754
Cement in the Australian market
‘High’ 9697
‘Best’ estimate 8214 8328 1%
‘Low’ 6959
SCM in cement (including mineral addition)
‘High’ 1208
‘Best’ estimate 697 965 38%
‘Low’ 723
SCM in concrete ‘High’ 2441
‘Best’ estimate 1395 2091 50%
‘Low’ 1742
Production Clinker capacity 7650 8005 5%
Cement milling capacity 9493 11 781 24%
Domestic cement production
‘High’ 9719
Plant utilisation 82.5%
‘Best’ estimate 8211 8305 1%
‘Low’ 6951
Plant utilisation 86.5% 59.0%
Fuel GJ/t cement max capacity 3.5 2.9 17% 3
GJ/t clinker max capacity 4.4 4.2 5%
Total peta joules (PJ)
‘High’ 33.7
‘Best’ estimate 29.7 27.3 8%
‘Low’ 20.8

T E C H N O L O G Y P A T H W A Y F O R T H E A U S T R A L I A N C E M E N T I N D U S T R Y 2 0 0 5 – 2 0 3 0
57
Factor 2004 actual
2012 forecast
Efficiency gain
Best practice
Electricity kWh/t cement max capacity 107 92 14% 80
Total GWh ‘High’ 823
‘Best’ estimate 827 691 16%
‘Low’ 582
Alternative raw materials (at max. capacity)
Pre-calcined materials 1.1% 5.7%
Amount of material 83 453
Other raw materials 0.6% 1.7%
Amount of material 45 134
Alternative fuels (at max. capacity)
Alternative fuels 6% 24% 60%
Equivalent amount of coal saved
77 331
Alternative clinker (at max. capacity)
SCM in cement 6% 9% 40%
SCM in concrete 13% 17%
Sustainability (at max. capacity)
Climate protection
tCO2/t cementitious material
max capacity 0.691 0.516 25%
‘high’ 0.597
‘best’ 0.704 0.588 16%
‘low’ 0.570
tCO2/t cement max capacity 0.792 0.623 21% 0.460 – 0.885
Calcination (per tonne clinker) 0.517 0.499 3%
Fuels (per tonne clinker) 0.349 0.311 11%
Electricity (per tonne cement) 0.094 0.073 22%
CO2 emissions
‘High’ 7260
‘Best’ estimate 6766 6110 10%
‘Low’ 4951
Generation of electricity (MW) 0 8
Waste minimisation (at maximum capacity)
Waste materials utilised (kt) 2235 4465 100%
Reduction in cement kiln dust to landfill
0% 41%
Source: Technology Model v2Note: kilowatt hours per tonne (kWh/t); gigajoules (GJ); tonnes of carbon dioxide (tCO2)
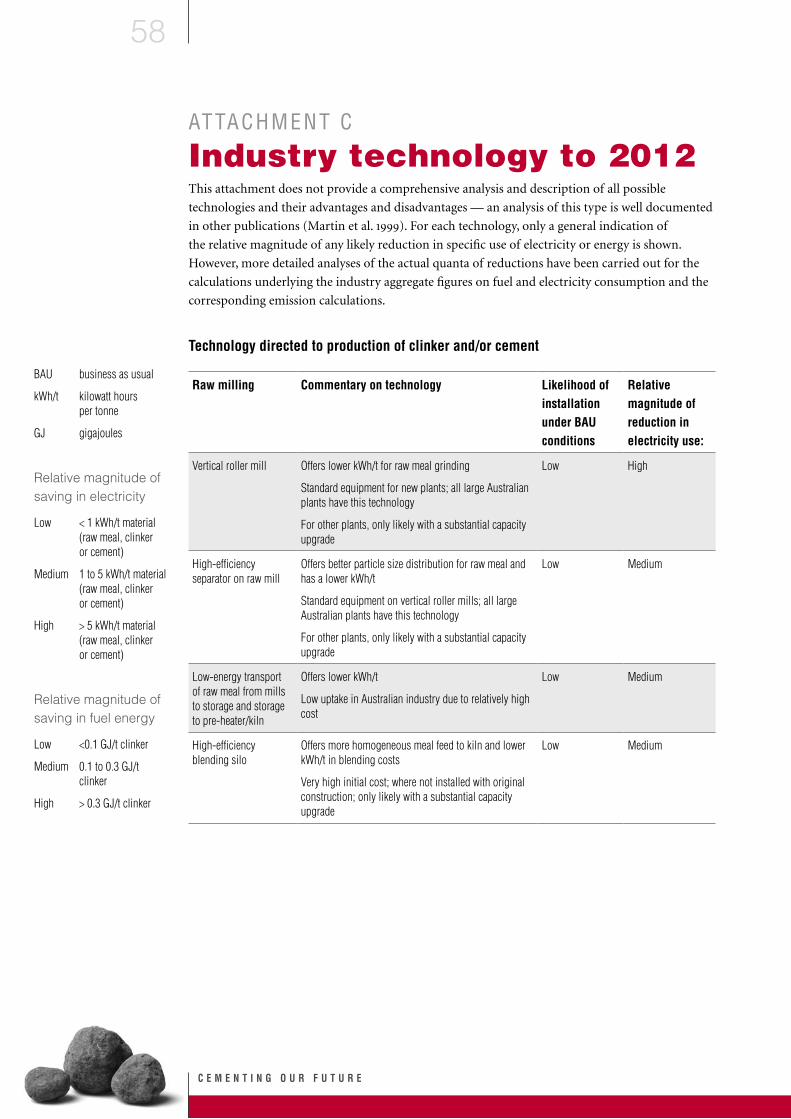
C E M E N T I N G O U R F U T U R E
58
ATTACHMENT C Industry technology to 2012This attachment does not provide a comprehensive analysis and description of all possible
technologies and their advantages and disadvantages — an analysis of this type is well documented
in other publications (Martin et al. 1999). For each technology, only a general indication of
the relative magnitude of any likely reduction in specific use of electricity or energy is shown.
However, more detailed analyses of the actual quanta of reductions have been carried out for the
calculations underlying the industry aggregate figures on fuel and electricity consumption and the
corresponding emission calculations.
BAU business as usual
kWh/t kilowatt hours per tonne
GJ gigajoules
Relative magnitude of saving in electricity
Low < 1 kWh/t material (raw meal, clinker or cement)
Medium 1 to 5 kWh/t material (raw meal, clinker or cement)
High > 5 kWh/t material (raw meal, clinker or cement)
Relative magnitude of saving in fuel energy
Low <0.1 GJ/t clinker
Medium 0.1 to 0.3 GJ/t clinker
High > 0.3 GJ/t clinker
Technology directed to production of clinker and/or cement
Raw milling Commentary on technology Likelihood of installation under BAU conditions
Relative magnitude of reduction in electricity use:
Vertical roller mill Offers lower kWh/t for raw meal grinding
Standard equipment for new plants; all large Australian plants have this technology
For other plants, only likely with a substantial capacity upgrade
Low High
High-efficiency separator on raw mill
Offers better particle size distribution for raw meal and has a lower kWh/t
Standard equipment on vertical roller mills; all large Australian plants have this technology
For other plants, only likely with a substantial capacity upgrade
Low Medium
Low-energy transport of raw meal from mills to storage and storage to pre-heater/kiln
Offers lower kWh/t
Low uptake in Australian industry due to relatively high cost
Low Medium
High-efficiency blending silo
Offers more homogeneous meal feed to kiln and lower kWh/t in blending costs
Very high initial cost; where not installed with original construction; only likely with a substantial capacity upgrade
Low Medium
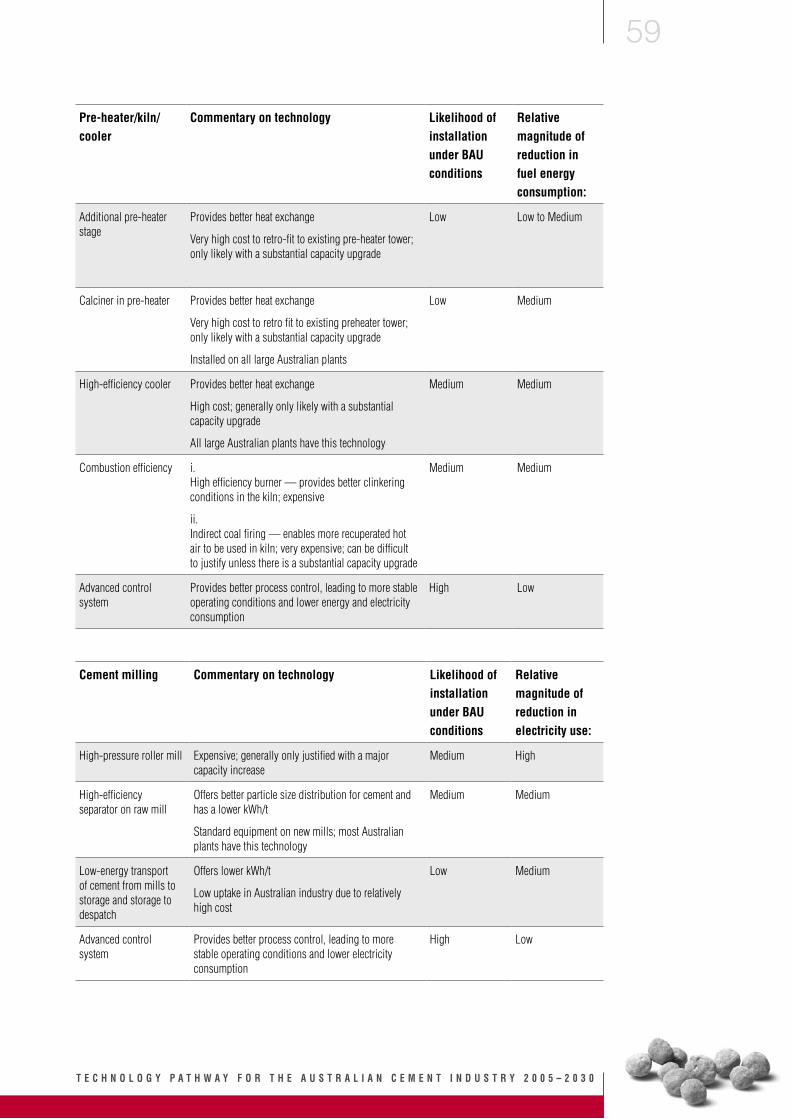
T E C H N O L O G Y P A T H W A Y F O R T H E A U S T R A L I A N C E M E N T I N D U S T R Y 2 0 0 5 – 2 0 3 0
59
Pre-heater/kiln/cooler
Commentary on technology Likelihood of installation under BAU conditions
Relative magnitude of reduction in fuel energy consumption:
Additional pre-heater stage
Provides better heat exchange
Very high cost to retro-fit to existing pre-heater tower; only likely with a substantial capacity upgrade
Low Low to Medium
Calciner in pre-heater Provides better heat exchange
Very high cost to retro fit to existing preheater tower; only likely with a substantial capacity upgrade
Installed on all large Australian plants
Low Medium
High-efficiency cooler Provides better heat exchange
High cost; generally only likely with a substantial capacity upgrade
All large Australian plants have this technology
Medium Medium
Combustion efficiency i. High efficiency burner — provides better clinkering conditions in the kiln; expensive
ii. Indirect coal firing — enables more recuperated hot air to be used in kiln; very expensive; can be difficult to justify unless there is a substantial capacity upgrade
Medium Medium
Advanced control system
Provides better process control, leading to more stable operating conditions and lower energy and electricity consumption
High Low
Cement milling Commentary on technology Likelihood of installation under BAU conditions
Relative magnitude of reduction in electricity use:
High-pressure roller mill Expensive; generally only justified with a major capacity increase
Medium High
High-efficiency separator on raw mill
Offers better particle size distribution for cement and has a lower kWh/t
Standard equipment on new mills; most Australian plants have this technology
Medium Medium
Low-energy transport of cement from mills to storage and storage to despatch
Offers lower kWh/t
Low uptake in Australian industry due to relatively high cost
Low Medium
Advanced control system
Provides better process control, leading to more stable operating conditions and lower electricity consumption
High Low
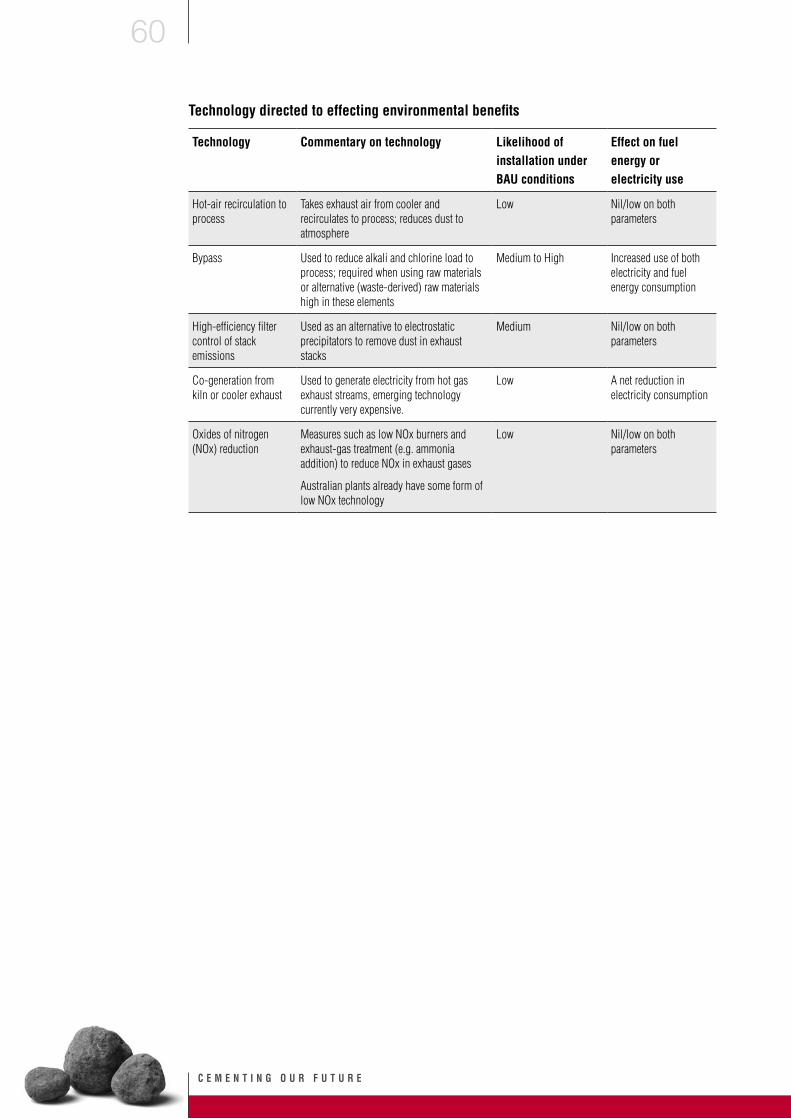
C E M E N T I N G O U R F U T U R E
60
Technology directed to effecting environmental benefits
Technology Commentary on technology Likelihood of installation under BAU conditions
Effect on fuel energy or electricity use
Hot-air recirculation to process
Takes exhaust air from cooler and recirculates to process; reduces dust to atmosphere
Low Nil/low on both parameters
Bypass Used to reduce alkali and chlorine load to process; required when using raw materials or alternative (waste-derived) raw materials high in these elements
Medium to High Increased use of both electricity and fuel energy consumption
High-efficiency filter control of stack emissions
Used as an alternative to electrostatic precipitators to remove dust in exhaust stacks
Medium Nil/low on both parameters
Co-generation from kiln or cooler exhaust
Used to generate electricity from hot gas exhaust streams, emerging technology currently very expensive.
Low A net reduction in electricity consumption
Oxides of nitrogen (NOx) reduction
Measures such as low NOx burners and exhaust-gas treatment (e.g. ammonia addition) to reduce NOx in exhaust gases
Australian plants already have some form of low NOx technology
Low Nil/low on both parameters
For further information about this report contact:
Robyn BainChief Executive
CEMENT INDUSTRY FEDERATION Suite 3, 16 Bougainville St PO Box 4178 Manuka act 2603
telephone +61 2 6260 7222 facsimile +61 2 6260 7333 mobile 0408 557 449 email [email protected] web www.cement.org.au
pdf version amended august 2005