distinct wind convergence patterns due to thermal and
TRANSCRIPT

HAL Id: hal-00301895https://hal.archives-ouvertes.fr/hal-00301895
Submitted on 1 Nov 2005
HAL is a multi-disciplinary open accessarchive for the deposit and dissemination of sci-entific research documents, whether they are pub-lished or not. The documents may come fromteaching and research institutions in France orabroad, or from public or private research centers.
L’archive ouverte pluridisciplinaire HAL, estdestinée au dépôt et à la diffusion de documentsscientifiques de niveau recherche, publiés ou non,émanant des établissements d’enseignement et derecherche français ou étrangers, des laboratoirespublics ou privés.
Distinct wind convergence patterns due to thermal andmomentum forcing of the low level jet into the Mexico
City basinB. de Foy, A. Clappier, L. T. Molina, M. J. Molina
To cite this version:B. de Foy, A. Clappier, L. T. Molina, M. J. Molina. Distinct wind convergence patterns due to thermaland momentum forcing of the low level jet into the Mexico City basin. Atmospheric Chemistry andPhysics Discussions, European Geosciences Union, 2005, 5 (6), pp.11055-11090. �hal-00301895�

ACPD5, 11055–11090, 2005
Basin convergencepatterns due to low
level jets
B. de Foy et al.
Title Page
Abstract Introduction
Conclusions References
Tables Figures
J I
J I
Back Close
Full Screen / Esc
Print Version
Interactive Discussion
EGU
Atmos. Chem. Phys. Discuss., 5, 11055–11090, 2005www.atmos-chem-phys.org/acpd/5/11055/SRef-ID: 1680-7375/acpd/2005-5-11055European Geosciences Union
AtmosphericChemistry
and PhysicsDiscussions
Distinct wind convergence patterns dueto thermal and momentum forcing of thelow level jet into the Mexico City basinB. de Foy1, A. Clappier2, L. T. Molina1, and M. J. Molina1
1Department of Earth, Atmospheric and Planetary Sciences, Massachusetts Institute ofTechnology, USA2Air and Soil Pollution Laboratory, Swiss Federal Institute of Technology, Lausanne (EPFL),Switzerland
Received: 7 October 2005 – Accepted: 17 October 2005 – Published: 1 November 2005
Correspondence to: B. de Foy ([email protected])
© 2005 Author(s). This work is licensed under a Creative Commons License.
11055

ACPD5, 11055–11090, 2005
Basin convergencepatterns due to low
level jets
B. de Foy et al.
Title Page
Abstract Introduction
Conclusions References
Tables Figures
J I
J I
Back Close
Full Screen / Esc
Print Version
Interactive Discussion
EGU
Abstract
Mexico City lies in a high altitude basin where air quality and pollutant fate is stronglyinfluenced by local winds. The combination of high terrain with weak synoptic forcingleads to weak and variable winds with complex circulation patterns. A low level jetentering the basin in the afternoon leads to very different wind convergence lines over5
the city depending on the meteorological conditions. Surface and upper-air meteoro-logical observations are analysed during the MCMA-2003 field campaign to establishthe meteorological conditions and obtain an index of the strength and timing of the jet.A mesoscale meteorological model (MM5) is used in combination with high-resolutionsatellite data for the land surface parameters and soil moisture maps derived from diur-10
nal ground temperature range. A simple method to map the lines of wind convergenceboth in the basin and on the regional scale is used to show the different convergencepatterns according to episode types. The low level jet is found to occur on most daysof the campaign and is primarily due to thermal forcing which is very similar from dayto day. Momentum mixing from winds aloft into the surface layer is much more vari-15
able and can determine both the strength of the jet and the pattern of the convergencezones. Northerly flows aloft lead to a weak jet with an east-west convergence line thatprogresses northwards in the late afternoon and early evening. Westerlies aloft lead tostronger jets and a north-south convergence line through the middle of the basin start-ing in the early afternoon. Improved understanding of basin meteorology will lead to20
better air quality forecasts for the city and better understanding of the chemical regimesin the urban atmosphere.
1. Introduction
The interaction of a low level jet with regional air flows into the Mexico City basin leadsto complex convergence patterns that determine the concentration and fate of air pollu-25
tants, with strong associated health effects. Stensrud (1996) reviews the climatological
11056

ACPD5, 11055–11090, 2005
Basin convergencepatterns due to low
level jets
B. de Foy et al.
Title Page
Abstract Introduction
Conclusions References
Tables Figures
J I
J I
Back Close
Full Screen / Esc
Print Version
Interactive Discussion
EGU
importance of low level jets, summarising research on several categories of jets includ-ing those due to terrain effects. Kimura and Kuwagata (1993) study in greater detailthe thermal forcing in an elevated basin, leading to low pressures and a strong flowover from neighbouring valleys over mountain ridges. Optimum conditions are a basinless than 100 km and mountain ranges slightly lower than the mixing height, both of5
which are satisfied by the Mexico City basin. Banta and Cotton (1981) analysed thestructure of the local wind systems in a broad mountain basin and found that in additionto night-time drainage and day-time up-slope flows, there were afternoon winds due todown-mixing of momentum aloft into the boundary layer.
A number of recent field campaigns have taken place in mountain valleys and basins.10
The Vertical Transport and Mixing (VTMX, Doran et al., 2002) field campaign studiedthe meteorological processes in Salt Lake city in October 2002. Banta et al. (2004)found that cold drainage flows from the surrounding mountains could lead to conver-gence in the basin and vertical motion within a cold stable atmosphere. Rife et al.(2004) looked at the performance of a range of mesoscale meteorological models for15
the complex local flows measured during VTMX. They found that by standard verifi-cation measures, high resolution models did not perform significantly better than theregional models. This was traced to the high fraction of spectral power in the sub-diurnal range which the models cannot simulate exactly. Accounting for this howeversuggests that the high resolution models do perform better.20
The Mesoscale Alpine Programme (MAP, Mayr et al., 2004) provided extensive mea-surements in a gap through the Alps. The aim of the study is to study the interaction ofthe gap flow with the flow aloft, develop local forecasting methods and improve modelverification. Zangl et al. (2004) developed the MM5 model to use true horizontal dif-fusion. This lead to improved simulations of the progression of the Foehn down the25
valley and its impact on the cold air pool at Lake Constance due in part to the improvedmodelling of the vertical turbulent mixing. Liu et al. (2000) describe a different low leveljet in Iran where a synoptic surface high leads to an outflow of cold air down valley.The strength of the jet is determined by the balance of the pressure, momentum and
11057

ACPD5, 11055–11090, 2005
Basin convergencepatterns due to low
level jets
B. de Foy et al.
Title Page
Abstract Introduction
Conclusions References
Tables Figures
J I
J I
Back Close
Full Screen / Esc
Print Version
Interactive Discussion
EGU
friction forces.Kossmann and Fiedler (2000) analysed the diurnal momentum budget of thermally
induced slope winds. The balance between the buoyancy and pressure gradient forceswith the friction forces was found to determine the strength of the slope flows. Thesewere also found to react to changes of forcing within 120 s. The formation of a5
mesoscale heat low was described by Kossmann et al. (2002) in an alpine lake basin.This is similar to Kimura and Kuwagata (1993) and leads to an intrusion of cold airinto the basin in the late afternoon. Regmi et al. (2003) find a similar situation in Kath-mandu, Nepal. Shallow surface influx of cool south-westerly air from the Indian plateauforms a stable layer beneath north-westerly valley flow. The resulting layers suppress10
vertical mixing and lead to high air pollution events.As reviewed in Molina and Molina (2002), the Mexico City Metropolitan Area (MCMA)
lies in a dry lake bed surrounded by high mountains and suffers from high levels of airpollution. Bossert (1997) modelled the local wind circulation and showed distinct pollu-tion venting patterns depending on the interaction of the synoptic and local winds. Jaz-15
cilevich et al. (2003) examine cases of convective transport of pollutants in the basinand the flushing of pollutants through the passage to the south-east. The IMADA-AVERfield campaign (Doran et al., 1998) made extensive meteorological observations in thebasin and found large day-to-day variation in the wind patterns. Fast and Zhong (1998)describe in detail some of the wind patterns leading to high surface ozone concentra-20
tions, including the presence of a convergence zone that moves through the MCMAfrom south to north. Whiteman et al. (2000) analyse the heat budget in the basin tohighlight the importance of an influx of cool moist air through the Chalco gap in thesouth-east of the basin, similar to the flows described by Kimura and Kuwagata (1993).Doran and Zhong (2000) analyse this gap flow in terms of the heat balance on the25
regional scale and across the basin rim to find that the jet strength is a function of thethermal forcing.
de Foy et al. (2005a) analyse the meteorological conditions during the MCMA-2003field campaign. Three different wind circulation episode types are proposed for the
11058

ACPD5, 11055–11090, 2005
Basin convergencepatterns due to low
level jets
B. de Foy et al.
Title Page
Abstract Introduction
Conclusions References
Tables Figures
J I
J I
Back Close
Full Screen / Esc
Print Version
Interactive Discussion
EGU
duration of the campaign. O3-South are days when ozone is high in the south and aweak late afternoon jet flow forms. O3-North days are when the ozone peak is in thenorth due to the combination of a strong jet and flow over the south and west edgesof the basin. Cold Surge days are when cold northerlies sweep the basin atmosphereclean.5
This paper adopts the analysis of Doran and Zhong (2000) for the wind jets occur-ring during MCMA-2003, classifying the results according to the three episode types.Convergence zones suggested by Fast and Zhong (1998) are shown explicitly therebyillustrating the interaction of synoptic and local scales proposed by Bossert (1997).
After describing the observations and model used in Sect. 2, the synoptic conditions10
during MCMA-2003 will be reviewed in Sect. 3 and the model results will be evaluatedin Sect. 4. Sections 5 and 6 will describe the low level jet and the convergence pat-terns. Section 7 will discuss how the circulation patterns relate to the local and synopticforcings.
2. Observations and model description15
The observations described in de Foy et al. (2005a) are used, in particular the sur-face meteorological observation network and the radiosondes of the Mexican NationalWeather Service (Servicio Meteorologico Nacional, SMN) and the monitoring data fromthe campaign super-site at the National Centre for Environmental Research and Train-ing (Centro Nacional de Investigacion y Capacitacion Ambiental, CENICA) as well as20
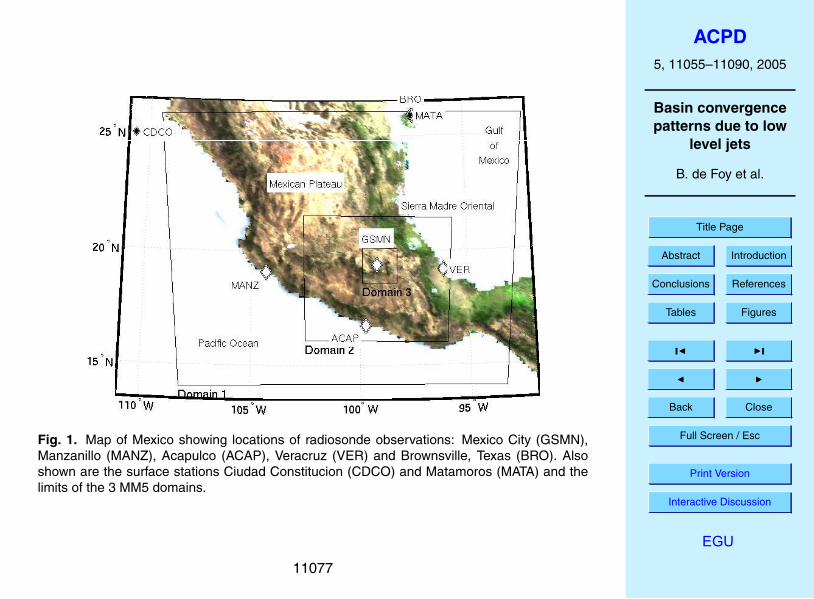
the surface ozone measurements from the Ambient Air Monitoring Network (Red Au-tomatica de Monitoreo Atmosferico, RAMA). Figure 1 shows the radiosonde and sur-face stations along with geographical reference points. Figure 2 shows the basin to-pography and the urban area along with the stations in the MCMA. All times in thispaper are stated as local time, per field campaign guidelines, which is Central Daylight25
savings Time (CDT=UTC–5 h).The basin circulation is simulated using the Pennsylvania State University/National
11059

ACPD5, 11055–11090, 2005
Basin convergencepatterns due to low
level jets
B. de Foy et al.
Title Page
Abstract Introduction
Conclusions References
Tables Figures
J I
J I
Back Close
Full Screen / Esc
Print Version
Interactive Discussion
EGU
Center for Atmospheric Research Mesoscale Model (MM5, Grell et al., 1995) version3.7.2 using three nested grids with one-way nesting. The grid resolution used is 36,12 and 3 km, with 40×50, 55×64 and 61×61 grid cells for domains 1, 2 and 3, re-spectively. The simulation procedure is described in detail in de Foy et al. (2005b) andmakes use of high resolution satellite remote sensing for initialising the land surface5
parameters. Nine simulations of 4 days were used to cover the entire field campaign,with the following two modifications. The initialisation period was increased from 18 to42 h, yielding better results for the first simulation day.
Due to an unverified moistening of the soil in the AGRMET model half-way during thecampaign, the previous modelling study made use of averaged AGRMET soil moisture10
during the first part of the month which were held constant during the simulation. Thismethod fails to capture the variation of the soil moisture during the field campaign. Soilmoisture products are available from AMSR-E. These are valid for a very thin surfacelayer. In this case, the top layer is very dry and does not reflect the moisture belowthe soil. An alternative was therefore obtained by relating the soil moisture to the diur-15
nal range of the skin temperature measured by MODIS on the AQUA platform. 8-dayaverage values were used for the months of March–May 2003. An empirical relation-ship was devised to produce fields of similar magnitudes to those from AGRMET. Soiltemperature differences in the range of 15 K to 45 K were linearly mapped to soil mois-tures of 0.18 to 0.08 m3/m3 for the surface layer, 0.22 to 0.12 for layer 2 and 3 and20
0.3 to 0.2 for layer 4 (i.e. points with the largest diurnal temperature range have thedriest soils). Gaussian smoothing was applied to all the fields; one pass for layers 1and 2, two passes for layers 3 and 4. Initial fields were interpolated in time from the8-day estimated values, and were held constant in the MM5 simulation. This schemeimproves the simulation of the diurnal temperature range and also captures some soil25
moisture variation during the campaign. The eight day smoothing on the soil temper-ature however leads to an under estimation of the soil moisture variability. This couldbe an important factor in the simulation of the Cold Surge episodes which would meritfurther analysis.
11060
ACPD5, 11055–11090, 2005
Basin convergencepatterns due to low
level jets
B. de Foy et al.
Title Page
Abstract Introduction
Conclusions References
Tables Figures
J I
J I
Back Close
Full Screen / Esc
Print Version
Interactive Discussion
EGU
3. Synoptic conditions
Synoptic weather charts for the 3 episode types were shown in de Foy et al. (2005a).Cold Surge episodes are due to a surface high over Texas with a low pressure systemaloft. O3-South episodes occur when a anti-cyclone is over Mexico and O3-North whenlow pressure systems move north of the MCMA forcing the sub-tropical jet southward.5
In order to compare all the days of the campaign with the synoptic charts, Fig. 3 showsthe evolution of the 500 hPa height and temperature at radiosonde locations on thecoasts and in Mexico City.
The most variability occurs at Brownsville where the high pressure for O3-South dayscan be clearly seen. O3-North episodes are characterised by a north-south pressure10
gradient which drives the westerlies aloft and Cold Surge episodes by falling pressureat most of the stations. The temperature at 500 hPa is high and rising for O3-Southdays, constant with a stronger north-south gradient for O3-North days and decreasingfor Cold Surge days.
Daily average surface pressure and temperature are shown in Fig. 4. High surface15
pressures at Matamoros and Veracruz during Cold Surge episodes force cold northerlysurface flows. O3-South days have minimal pressure gradients between the two coastswith increasing surface temperatures. On O3-North days the pressure on the Gulfcoast tends to be lower than on the Pacific Coast.
From this, it is clear that the three Cold Surge episodes follow the pattern described20
by Schultz et al. (1998), with varying intensities. Both the O3-South and O3-Northepisodes, with the exception of the transition periods, have well defined synoptic char-acteristics that vary little across the different days.
4. Model results
Model statistics were calculated for each simulation for the SMN weather stations in the25
basin. Figure 5 shows the centred root mean square error (RMSEc) versus the bias
11061

ACPD5, 11055–11090, 2005
Basin convergencepatterns due to low
level jets
B. de Foy et al.
Title Page
Abstract Introduction
Conclusions References
Tables Figures
J I
J I
Back Close
Full Screen / Esc
Print Version
Interactive Discussion
EGU
along side the model versus observed standard deviation of the data for temperature,humidity and wind speed, as described in de Foy et al. (2005b). Temperature biasesare less than 1 K with the exception of the first Cold Surge episode. RMSEc are within2 K with the exception of the first two Cold Surge episodes. For water mixing ratio, thebiases are within 1.5 g/kg and the RMSEc in the range of 1 to 2 g/kg, although the first5
Cold Surge episode is too moist and has larger errors than the other simulations. Windspeed performance is similar for all the simulations with the exception of the secondCold Surge episode when the winds are too strong and the errors largest. Overall, thissuggests that the simulation performance for the whole campaign is similar to that ofthe O3-South episode described in de Foy et al. (2005b). The Cold Surge episodes10
are an exception to this however and would need further refinement, probably in thesoil moisture field.
Continuous time series for the field campaign were obtained by collating the resultsfrom the nine simulations. Figure 6 shows the diurnal variation of the model windsat CENICA by episode. For each episode, the median is shown by a bold line, the15
inter-quartile range by thin lines and the total range by dotted lines. The winds aresouth-easterly and below 2 m/s in the early morning turning to northerly during theday and then back to southerly in the range of 4 to 6 m/s by sunrise. Comparison withFig. 8 in de Foy et al. (2005a) shows that the main features are well represented bythe model. O3-North episodes have a stronger and earlier wind speed peak whereas20
Cold Surge winds are slightly weaker. The main difference between the model andthe observations is the delay in the increase in wind speeds. Whereas the observedwinds increase linearly starting at 09:00, the model increase starts after 12:00 and ismuch steeper. In terms of wind directions, the main feature of the observations is theafternoon wind shift which takes place around 15:00 for O3-North, around 20:00 for25
O3-South and around 04:00 for Cold Surge. The model simulates this although thedifference between O3-North and O3-South is not as stark. In the morning there is asharp transition from south-easterly to north-westerly whereas the observations showa more gradual turning via the east. In the afternoon there is a large variability in the
11062

ACPD5, 11055–11090, 2005
Basin convergencepatterns due to low
level jets
B. de Foy et al.
Title Page
Abstract Introduction
Conclusions References
Tables Figures
J I
J I
Back Close
Full Screen / Esc
Print Version
Interactive Discussion
EGU
Cold Surge winds with a southerly component which the observations do not show.The Cold Surge episode type contains the greatest variation of circulation patterns andin addition is the least well simulated of the three types. Nevertheless, the afternoonwind direction is better simulated at stations further from the Chalco gap in the south-east – both in the city and to the east of the basin at Chapingo – suggesting that this is5
due to the gap flow intensity.
5. Low level jet
The wind shifts observed at CENICA are part of the low level jet that passes through theChalco passage, as described in Whiteman et al. (2000). Figure 7 shows the surfacewinds in the basin for selected days of the three episode types at 16:00 and 19:00.10
O3-South days such as 16 April have weaker northerly winds and a gap flow influ-encing the south-east of the city in the early evening. 23 April, an O3-North day, hasa gap flow that is already influencing the whole eastern half of the basin by 16:00. Itmeets with westerly winds coming over the basin rim leading to a convergence line inthe middle of the city. This is pushed further north as the afternoon progresses. On this15
particular day, the convergence leads to strong convection and cloud formation causinghighly variable surface winds. On 9 April, a Cold Surge day, strong northerly flows areforced into the gap and are followed by a shift to westerly winds throughout the basin.
North-south cross-sections through the Chalco gap in Fig. 8 show the horizontalwinds and contours of potential temperature. On O3-South days the winds aloft are20
weaker. Westerlies above 6000 m give way to northerly winds below. A strong temper-ature gradient forms between the basin and the Cuautla valley to the south. The asso-ciated pressure difference drives a low level jet less than 1000 m thick which brings incold air. The jet progresses gradually through the basin turning to easterly as it meetsthe northerly flow in the basin. On O3-North days, the winds aloft are still from the west,25
but stronger and with no layer of northerlies below. The potential temperature differ-ence between the basin and the valley to the south, at 6 K, is the same as 16 April.
11063

ACPD5, 11055–11090, 2005
Basin convergencepatterns due to low
level jets
B. de Foy et al.
Title Page
Abstract Introduction
Conclusions References
Tables Figures
J I
J I
Back Close
Full Screen / Esc
Print Version
Interactive Discussion
EGU
The low level jet however is much stronger and deeper. By 16:00 it is nearly 2000 mthick and extends all the way to the northern edge of the basin. By 19:00, horizontalconvergence of winds leads to strong convective activity and the formation of cumulusclouds in the north of the basin. Cold Surge days have strong westerly winds aloft withnorth-easterlies entering the basin from the Gulf coast. At 16:00 the model simulates5
a limited low level jet which meets the moist Gulf air leading to westerly winds into theearly evening.
6. Wind convergence
6.1. Convergence patterns from model simulations
The formation of low level jet winds and of terrain induced circulations leads to conver-10
gence zones in the basin. On the regional scale, convergence zones are also formeddue to the opposite flows from the sea breezes of the Pacific Ocean and of the Gulf ofMexico. These can be diagnosed by looking at vertical velocities above a given thresh-old, chosen to be 0.5 m/s. For each column, the values at sigma level 17 were chosenas this corresponds to roughly 1300 m above ground level which is either above or15
towards the top of the surface layer.Figure 11 shows such a plot for the medium and fine domains, with convergence
zones for a whole day coloured by time of day. O3-South days have weak synopticforcing and a much clearer signature of terrain induced flow. On the regional scale,convergence lines are formed from the meeting of the sea breezes from the Pacific20
and the Gulf. These are relatively stationary moving south-west only slightly during theafternoon. The combination of terrain blocking from the east-west range of volcanoesforming the south of the basin and the flat mexican plateau to the north of the basinleads to an advance of the convergence line which now passes through the MCMA. Onthe basin scale, the low level jet coming from the Chalco passage forms a very clear25
signature, starting at 15:00 and sweeping through the whole city by 22:00. Similar jets
11064
ACPD5, 11055–11090, 2005
Basin convergencepatterns due to low
level jets
B. de Foy et al.
Title Page
Abstract Introduction
Conclusions References
Tables Figures
J I
J I
Back Close
Full Screen / Esc
Print Version
Interactive Discussion
EGU
can be seen through Toluca to the west and past Puebla on the east, due to the sameterrain elevation differential between the plateaus to the north and the low-lying Cuautlavalley to the south.
On O3-North days, the regional convergence line is now at the edge of the SierraMadre Oriental, due to the strength of the westerlies. In the basin, the low level jet is5
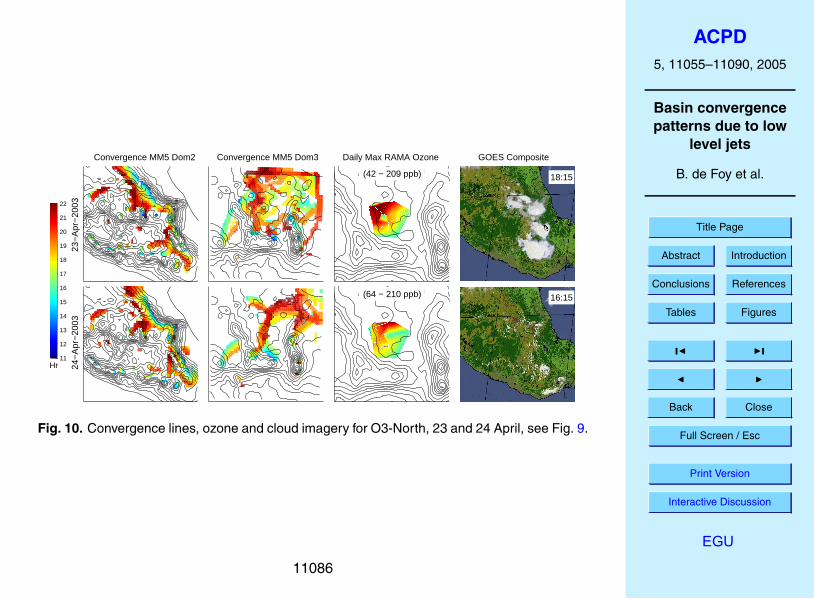
much stronger and leads to an early convergence zone that runs north-south throughthe centre of the city. On 23 April, the meeting point of the gap flow and the windscoming over the basin rim exhibits some meandering in the north-west of the basin. Inaddition, later afternoon convection can be seen as east-west lines across the basin.For 24 April however there were no clouds and the convergence line is quite stationary.10
Three air masses can be seen pushing into the basin: the gap flow from Chalco, thewesterlies over the Toluca pass to the west and the flow over the Ajusco mountain tothe south.
For 8 April, strong cold northerly winds from the Gulf lead to up-slope flows on theedge of the Sierra Madre Oriental. The winds then continue over the Mexican plateau15
and highlands meeting in a convergence zone nearer to the Pacific coast. In the basin,the situation is complicated with strong convective activity in the basin and slope flowson the basin edge. On 9 April, drier conditions lead to reduced convection and a clearerconvergence zone along the south-west of the country. In the basin, we now see theconvergence lines due to the low level jet radiating from the Chalco passage. These20
are limited in both time and space however, with late afternoon convergence above themountains.
6.2. Verification with surface ozone and cloud imagery
Verification of the convergence lines is difficult to achieve by comparisons with instan-taneous observed winds. Their impact on the basin circulation can be seen however by25
looking at the transport of pollutants and water vapour. The maximum daily ozone mea-sured by RAMA in the MCMA along with a GOES visible image taken in the afternoonare shown alongside the convergence patterns in Fig. 11.
11065

ACPD5, 11055–11090, 2005
Basin convergencepatterns due to low
level jets
B. de Foy et al.
Title Page
Abstract Introduction
Conclusions References
Tables Figures
J I
J I
Back Close
Full Screen / Esc
Print Version
Interactive Discussion
EGU
O3-South days have high ozone peaks in the south-west, as would be predicted fromthe convergence patterns. In particular, ozone is higher on 16 April than on 15 Aprildue to the delayed gap flow. The Goes image shows very clearly the low level cloudson the Gulf coast plains due to the sea breeze. Scattered cloud formation is limited tothe high volcanoes due to the dry prevailing conditions.5
On O3-North days the ozone peak is in the north-west of the city, due to the gapflow pushing all the pollutants back through the basin to the north-west. The peaks areequivalent for 23 and 24 April, but on the 23 the spatial extent is larger and on the 24the peak is further to the east. This is in accordance with the convergence lines thatare meandering over the north-west on the first day, and oriented towards the north-10
east with stronger westerlies flushing the basin on the second day. There is much lesscloudiness on the plains from gulf breezes, but there is convection on the edge of theSierra Madre Oriental, as suggested by the convergence lines that are very sharplylocated over the ridge. Afternoon convection in the basin can be clearly see on 23April, whereas 24 April has clear skies.15
Cold Surge days have low ozone levels with maxima in the south of the basin, con-firming wind transport to the south. On 8 April, ozone peaks are in the south-westin accordance with early afternoon convergence resulting from northerly flow meetingthe Ajusco mountain. On 9 April, the peak is to the south-east which is where a smallgap flow is forming owing to the clearer sky conditions on this day. Cloud transport to20
the eastern flanks of the Sierra Madre Oriental shows the northerly flows, followed bystrong convection over the Mexican plateau and above the basin once the winds passover the mountain edge.
7. Discussion
The Froude number determines the impact of complex terrain on wind circulation. The25
Brunt-Vaisala frequency was calculated from model output and found to be in the rangeof 0.005 to 0.015 s−1 over the basin. Taking a mean free velocity of 10 m/s as repre-
11066

ACPD5, 11055–11090, 2005
Basin convergencepatterns due to low
level jets
B. de Foy et al.
Title Page
Abstract Introduction
Conclusions References
Tables Figures
J I
J I
Back Close
Full Screen / Esc
Print Version
Interactive Discussion
EGU
sentative of the conditions near the mountain tops, and distances of 1000 and 1500 mas representative of the mountain ridge heights above basin level on the eastern andwestern side yielded Froude numbers in the range of 2.8 to 12.5, see Table 1. Becausethese are always greater than one, the wind flow can be expected to be over the moun-tain tops with limited mountain waves. The primary effect of the mountains is therefore5
due more to the generation of up-slope and drainage flows rather than to the disruptionof the mean tropospheric flow.
During the IMADA campaign, the jet strength through the Chalco passage was diag-nosed from wind profiler data (Doran and Zhong, 2000). As no such data is availableduring the MCMA-2003, an alternative was sought that would be based on routine10
surface observations in the basin. A simple metric was devised based on southerlycomponent of velocity in the basin above a threshold of 1 m/s. The excess velocityabove the threshold was summed between 12:00 and 24:00 and divided by an averageestimated jet length of 6 hours. The average was then taken over the 5 SMN stationsto yield a number that can be roughly interpreted as an excess meridional wind speed15
due to the jet flow. The average time of the jet was obtained by averaging the time ofday weighted by the jet strength for every hour at each station. Figure 12 shows thejet strength versus the jet time for the observations and for the model simulations foreach day of the campaign. The three episode types are clearly segregated into threeseparate categories. Weak and early jets for Cold Surge days, weak and later jets for20
O3-South days and strong jets peaking around 18:00 for O3-North. The model repro-duced this pattern although the O3-North days tend to be weaker and the O3-Southand Cold Surge days too strong. Individual timing of the jet can be off by up to 3 hoursor more, but overall, the simulations are within 1 to 2 hours of the observations.
The Mexico City basin has surface wind speeds below 1 m/s during the early morn-25
ing leading to very stagnant air masses. Because the basin is at low latitude and highaltitude, solar heating is intense and develops rapidly after sunrise, leading to a rapidgrowth of the boundary layer. The valley to the south of the basin, at an elevation of1000 m a.s.l., is 1200 m below the basin level. The first effect of this is that in the bot-
11067

ACPD5, 11055–11090, 2005
Basin convergencepatterns due to low
level jets
B. de Foy et al.
Title Page
Abstract Introduction
Conclusions References
Tables Figures
J I
J I
Back Close
Full Screen / Esc
Print Version
Interactive Discussion
EGU
tom 2000 m layer of the atmosphere there are roughly 1400 kg/m2 of air at CENICAbut 1720 kg/m2 at Cuautla. For equivalent surface heating, this leads to an averagediurnal temperature variation at CENICA of 5 K and at Cuautla of 3.5 K. Becausethis leads to lower mixing heights at Cuautla, the temperature at equivalent heights ishigher at CENICA, leading to temperature gradients between CENICA and Cuautla in5
the 2250 to 3250 m a.s.l. range of around 5 K.Doran and Zhong (2000) analysed jet strength as a function of two different tem-
perature differentials. The first was the average temperature difference in the rangeof 2800 to 3200 m a.s.l. between the Tres Marias site on the southern basin rim andthe average of 3 radiosondes in the basin at 13:30 CST. The second was the average10
difference in temperature in the range of 2250 to 3150 m a.s.l. between the Mexico Cityand Acapulco radiosondes at 18:00 CST. A correlation was found between strong jetsand large temperature gradients suggesting thermal forcing as the main cause of thejets.
During MCMA-2003, there were no Acapulco soundings at 19:00. Analysing previ-15
ous soundings shows however that there is little difference in temperature at that heightrange between the 07:00 and 19:00 soundings. Furthermore, there is little differencebetween the Acapulco and Mexico City soundings for this same height range at 07:00.The temperature difference is therefore a proxy for the heating at the Mexico City ra-diosonde site during the day. Figure 13 plots the jet strength versus the temperature20
difference in the bottom 1000 m layer above ground level at GSMN between the 07:00and 19:00 soundings. Substantial heating takes place on nearly all of the days. Thereis a clear difference between the Cold Surge days with small temperature differencesand the O3-South days with larger differences. Overall however there is no clear cor-relation between jet strength and temperature difference.25
The temperature difference between Tres Marias and the basin during IMADA servedas a more direct measure of possible thermal forcings. As this was unavailable, thesimulated temperature difference was calculated between CENICA, which is near thegeographic centre of the basin, and Cuautla just to the south of the Chalco passage for
11068
ACPD5, 11055–11090, 2005
Basin convergencepatterns due to low
level jets
B. de Foy et al.
Title Page
Abstract Introduction
Conclusions References
Tables Figures
J I
J I
Back Close
Full Screen / Esc
Print Version
Interactive Discussion
EGU
the same vertical interval (2250 to 3250 m a.s.l.) at 15:00, as shown in Fig. 13. Table 2shows the parameters for a linear fit to the data by episode. For O3-South episodesthere is a positive correlation of temperature gradient and jet strength that explains16% of the variance. For O3-North days however, there is zero correlation.
Episode types in the basin were found to correlate with wind direction aloft. The jet5
strength was therefore plotted versus average wind direction at the top of the bound-ary layer (4250 to 6250 m a.s.l.) for the 07:00 sounding, shown in Fig. 14. For the4 cases where the 07:00 sounding was missing, data was taken from the 13:00 or19:00 sounding depending on availability. For O3-South days, this shows a clear neg-ative correlation with northerly winds aloft causing weaker jets and westerlies causing10
stronger jets. The linear fit explains 84% of the variation. For O3-North days there islittle variation in the wind direction and a slight negative correlation that explains only5% of the variation. The correlation between the jet strength and the wind directionaloft is in accordance with Banta and Cotton (1981). They describe the influence ofwind direction aloft on basin winds in South Park, Colorado as the mixing layer causes15
momentum exchange with the surface layer leading to “afternoon westerlies” in thebasin. This suggests that the winds aloft and the location of the regional convergencezone will have a predictable impact on the balance between the different flows into theMexico City basin.
On O3-South days, the regional convergence line passes through the basin starting20
on the east side and moving to the west side in the afternoon. This leads to air massesfrom the Mexican plateau entering the basin in the morning giving way to Gulf air as theconvergence line moves west. The weak westerlies aloft give way to an intermediatelayer of northerly flow. As the basin air heats up relative to surrounding air masses,the low level jet from the Cuautla valley enters the basin pushing back the northerlies,25
with the location of the convergence line between the two determined by the balancebetween the momentum down-mixing and the thermally-induced pressure low.
On O3-North days, the regional convergence is to the east of the basin on the edge ofthe Sierra Madre Oriental. This leads to stronger westerlies aloft and surface norther-
11069

ACPD5, 11055–11090, 2005
Basin convergencepatterns due to low
level jets
B. de Foy et al.
Title Page
Abstract Introduction
Conclusions References
Tables Figures
J I
J I
Back Close
Full Screen / Esc
Print Version
Interactive Discussion
EGU
lies from the Mexican plateau in the morning. In the afternoon, the low level jet comingfrom the south-east meets with air masses that are pushed over the southern andwestern edges of the basin rim by the westerlies aloft. Together, these 3 fluxes into thebasin flush out the basin to the north-west.
Cold Surge days are characterised by high surface pressures to the north and strong5
westerlies aloft. This leads to strong, cold, surface northerlies which are held backearly in the day behind the Sierra Madre Oriental and then move through the Mexicanplateau leading to regional convergence lines south-west of the basin. In the basin, thenortherlies sweep through the MCMA and move south into the Chalco gap. Despitethe cold temperatures and increased cloudiness, a weak afternoon low level jet still10
develops on most days. It does not progress through the basin however, turning westinstead at east-west convergence lines. Convection develops along these lines withassociated afternoon rainfall.
8. Conclusions
Wind circulation in the Mexico City basin is characterised by a low level jet coming15
through the mountain pass in the south-east and extending into the basin. This takesplace nearly every day, with varying strength and depth. The main mechanism behindthis is the thermal imbalance between the hot air in the basin and the cooler air in thelow-lying valley to the south. This does not vary much from day to day however, andwas shown to be a poor predictor of the jet strength. Wind direction aloft was shown20
to explain most of the jet strength for O3-South days. Both temperature gradients andwind directions are very similar for all O3-North days and are therefore not able toaccount for the jet strength. Identifying determining factors will require further analysisof the synoptic conditions and vertical mixing in the basin.
MM5 simulations were carried out for the whole campaign using high resolution satel-25
lite remote sensing of the land surface. Soil moisture fields were derived from the diur-nal range of the ground temperature, leading to a spatially and temporally varying field.
11070

ACPD5, 11055–11090, 2005
Basin convergencepatterns due to low
level jets
B. de Foy et al.
Title Page
Abstract Introduction
Conclusions References
Tables Figures
J I
J I
Back Close
Full Screen / Esc
Print Version
Interactive Discussion
EGU
Statistically, the model simulations were found to have low biases in surface tempera-ture, humidity and wind speeds and errors in accordance with the episode discussedin de Foy et al. (2005b).
Wind convergence patterns over Mexico can be clearly identified by plotting the ver-tical velocity above a given threshold near the top of the surface layer. Combining5
these for every hour of the afternoon into a single map shows the development ofthe convergence zones. The Mexico City basin circulation was shown to depend onthe interaction of two convergence zones: those resulting from the sea breezes fromthe Pacific Ocean and the Gulf of Mexico, and those formed from the interaction ofa low level jet with northerly day-time winds in the basin. The resulting basin con-10
vergence patterns fit into the three episode types proposed in de Foy et al. (2005a).O3-South days have a convergence lines radiating northwards from the Chalco gap,moving through the basin in the late afternoon and early evening. O3-North days havenorth-south convergence lines through the middle of the MCMA due to the meeting ofthe gap flow with surface westerlies over the southern and western edges of the basin.15
Cold Surge days have east-west convergence line across the basin leading to cumulusconvection and rainfall.
Verification of the convergence patterns was made possible by analysing surfaceozone patterns in the basin and cloud formation observed by satellite. The spatialdistribution of surface ozone can be clearly linked to the location of the afternoon con-20
vergence lines. Cloud patterns act as clear indicators of sea-breeze fronts and moistair movements over the mountains as well as convection lines in the basin. Thesewere shown to correspond to the model simulated convergence lines on both the re-gional and local scale. An improved understanding of the transport processes in theMexico City basin will improve air quality forecasts in the MCMA and the facilitate the25
evaluation of the regional impact of the MCMA plume. The increased understanding ofthe chemical regimes of the urban atmosphere will improve the evaluation of pollutioncontrol policies and the mitigation of health effects suffered by the people of the MCMA.
Acknowledgements. The analysis contained in this paper was made possible by the collabo-
11071

ACPD5, 11055–11090, 2005
Basin convergencepatterns due to low
level jets
B. de Foy et al.
Title Page
Abstract Introduction
Conclusions References
Tables Figures
J I
J I
Back Close
Full Screen / Esc
Print Version
Interactive Discussion
EGU
rative efforts of many people involved in field measurements, both during the campaign andover longer periods of time. We are indebted to the staff of CENICA who hosted the cam-paign and would like to thank B. Cardenas, S. Blanco, A. Sanchez, O. Fentanes, J. Zaragoza,A. P. Ocampo, C. Cruz, C. Aguirre, R. Romo, A. Pino, R. Castaneda, R. Rodrıguez, P. Es-camilla as well as R. Ramos, A. Retama and the operators and analyst personnel of the “Red5
Automatica de Monitoreo Atmosferico del Gobierno del Distrito Federal” for their contributionin administering and gathering the data used in this manuscript. We are grateful to M. Rosen-gaus, J. L. Razo, J. Olalde and P. Garcıa of the Mexican National Meteorological Service forproviding the EHCA and Radiosonde data.
MM5 is made publicly available and supported by the Mesoscale and Microscale Meteorology10
division at the National Center for Atmospheric Research. Their dedication and hard work isgratefully acknowledged. The satellite data used in this study were acquired as part of theNASA’s Earth Science Enterprise. The algorithms were developed by the MODIS ScienceTeams. The data were processed by the MODIS Adaptive Processing System (MODAPS) andGoddard Distributed Active Archive Center (DAAC), and are archived and distributed by the15
Goddard DAAC.
We thank A. Garcıa and A. Jazcilevich of the Universidad Nacional Autonoma de Mexico,A. Soler and F. Hernandez of the Secretarıa del Medio Ambiente, Gobierno del Distrito Fed-eral, Mexico and J. Fast of Pacific Northwest National Laboratory for helpful discussions. Thefinancial support from the US National Science Foundation (Award ATM-0511803), the US De-20
partment of Energy (Award DE-FG02-05ER63980), the Alliance for Global Sustainability andthe Molina Center for Strategic Studies in Energy and the Environment for this work is gratefullyacknowledged.
References
Banta, R. and Cotton, W. R.: An analysis of the structure of local wind systems in a broad25
mountain basin, J. Appl. Meteorol., 20, 1255–1266, 1981. 11057, 11069Banta, R. M., Darby, L. S., Fast, J. D., Pinto, J. O., Whiteman, C. D., Shaw, W. J., and Orr,
B. W.: Nocturnal low-level jet in a mountain basin complex. part I: Evolution and effects onlocal flows, J. Appl. Meteorol., 43, 1348–1365, 2004. 11057
11072

ACPD5, 11055–11090, 2005
Basin convergencepatterns due to low
level jets
B. de Foy et al.
Title Page
Abstract Introduction
Conclusions References
Tables Figures
J I
J I
Back Close
Full Screen / Esc
Print Version
Interactive Discussion
EGU
Bossert, J. E.: An investigation of flow regimes affecting the Mexico City region, J. Appl. Mete-orol., 36, 119–140, 1997. 11058, 11059
de Foy, B., Caetano, E., Magana, V., Zitacuaro, A., Cardenas, B., Retama, A., Ramos, R.,Molina, L. T., and Molina, M. J.: Mexico City basin wind circulation during the MCMA-2003field campaign, Atmos. Chem. Phys., 5, 2267–2288, 2005a,5
SRef-ID: 1680-7324/acp/2005-5-2267. 11058, 11059, 11061, 11062, 11071de Foy, B., Molina, L. T., and Molina, M. J.: Satellite-derived land surface parameters for
mesoscale modelling of the Mexico City basin, Atmos. Chem. Phys. Discuss., 5, 9861–9906,2005b,SRef-ID: 1680-7375/acpd/2005-5-9861. 11060, 11062, 1107110
Doran, J. C. and Zhong, S.: Thermally driven gap winds into the Mexico City basin, J. Appl.Meteorol., 39, 1330–1340, 2000. 11058, 11059, 11067, 11068
Doran, J. C., Abbott, S., Archuleta, J., Bian, X., Chow, J., Coulter, R. L., de Wekker, S. F. J.,Edgerton, S., Elliott, S., Fernandez, A., Fast, J. D., Hubbe, J. M., King, C., Langley, D., Leach,J., Lee, J. T., Martin, T. J., Martinez, D., Martinez, J. L., Mercado, G., Mora, V., Mulhearn, M.,15
Pena, J. L., Petty, R., Porch, W., Russell, C., Salas, R., Shannon, J. D., Shaw, W. J., Sosa,G., Tellier, L., Templeman, B., Watson, J. G., White, R., Whiteman, C. D., and Wolfe, D.: TheIMADA-AVER boundary layer experiment in the Mexico City area, Bull. Amer. Met. Soc., 79,2497–2508, 1998. 11058
Doran, J. C., Fast, J. D., and Horel, J.: The VTMX 2000 campaign, Bull. Amer. Met. Soc., 83,20
537–551, 2002. 11057Fast, J. D. and Zhong, S. Y.: Meteorological factors associated with inhomogeneous ozone
concentrations within the Mexico City basin, J. Geophys. Res.-Atmos., 103, 18 927–18 946,1998. 11058, 11059
Grell, G. A., Dudhia, J., and Stauffer, D. R.: A Description of the Fifth-Generation Penn25
State/NCAR Mesoscale Model (MM5), Tech. Rep. NCAR/TN-398+STR, NCAR, 1995.11060
Jazcilevich, A. D., Garcıa, A. R., and Ruiz-Suarez, L. G.: A study of air flow patterns affectingpollutant concentrations in the Central Region of Mexico, Atmos. Environ., 37, 183–193,2003. 1105830
Kimura, F. and Kuwagata, T.: Thermally-induced wind passing from plain to basin over amountain-range, J. Appl. Meteorol., 32, 1538–1547, 1993. 11057, 11058
Kossmann, M. and Fiedler, F.: Diurnal momentum budget analysis of thermally induced slope
11073

ACPD5, 11055–11090, 2005
Basin convergencepatterns due to low
level jets
B. de Foy et al.
Title Page
Abstract Introduction
Conclusions References
Tables Figures
J I
J I
Back Close
Full Screen / Esc
Print Version
Interactive Discussion
EGU
winds, Meteorology Atmospheric Phys., 75, 195–215, 2000. 11058Kossmann, M., Sturman, A. P., Zawar-Reza, P., McGowan, H. A., Oliphant, A. J., Owens, I. F.,
and Spronken-Smith, R. A.: Analysis of the wind field and heat budget in an alpine lakebasin during summertime fair weather conditions, Meteorology Atmospheric Phys., 81, 27–52, 2002. 110585
Liu, M., Westphal, D. L., Holt, T. R., and Xu, Q.: Numerical simulation of a low-level jet overcomplex terrain in southern Iran, Mon. Weather Rev., 128, 1309–1327, 2000. 11057
Mayr, G. J., Armi, L., Arnold, S., Banta, R. M., Darby, L. S., Durran, D. D., Flamant, C.,Gabersek, S., Gohm, A., Mayr, R., Mobbs, S., Nance, L. B., Vergeiner, I., Vergeiner, J.,and Whiteman, C. D.: Gap flow measurements during the Mesoscale Alpine Programme,10
Meteorology Atmospheric Phys., 86, 99–119, 2004. 11057Molina, L. T. and Molina, M. J. (Eds.): Air Quality in the Mexico Megacity, Kluwer Academic
Publishers, 2002. 11058Regmi, R. P., Kitada, T., and Kurata, G.: Numerical simulation of late wintertime local flows
in Kathmandu valley, Nepal: Implication for air pollution transport, J. Appl. Meteorol., 42,15
389–403, 2003. 11058Rife, D. L., Davis, C. A., Liu, Y. B., and Warner, T. T.: Predictability of low-level winds by
mesoscale meteorological models, Mon. Weather Rev., 132, 2553–2569, 2004. 11057Schultz, D. M., Bracken, W. E., and Bosart, L. F.: Planetary- and synoptic-scale signatures
associated with central American cold surges, Mon. Weather Rev., 126, 5–27, 1998. 1106120
Stensrud, D. J.: Importance of low-level jets to climate: a review, J. Climate, 9, 1698–1711,1996. 11056
Whiteman, C. D., Zhong, S., Bian, X., Fast, J. D., and Doran, J. C.: Boundary layer evolution andregional-scale diurnal circulations over the Mexico Basin and Mexican Plateau, J. Geophys.Res.-Atmos., 105, 10 081–10 102, 2000. 11058, 1106325
Zangl, G., Chimani, B., and Haberli, C.: Numerical Simulations of the Foehn in the Rhine Valleyon 24 October 1999 (MAP IOP 10), Mon. Weather Rev., 132, 368–389, 2004. 11057
11074

ACPD5, 11055–11090, 2005
Basin convergencepatterns due to low
level jets
B. de Foy et al.
Title Page
Abstract Introduction
Conclusions References
Tables Figures
J I
J I
Back Close
Full Screen / Esc
Print Version
Interactive Discussion
EGU
Table 1. Froude numbers based on model Brunt-Vaisala frequency and representative meanvelocity for mountain heights of 1000 m, representing the western ridge and 1500 m represent-ing the volcanoes to the east.
U Nbv λ = 2πUNbv
Froude No. = λh
m/s s−1 m h = 1000 m h = 1500 m
0.005 12 500 12.5 8.410 0.01 6300 6.3 4.2
0.015 4200 4.2 2.8
11075

ACPD5, 11055–11090, 2005
Basin convergencepatterns due to low
level jets
B. de Foy et al.
Title Page
Abstract Introduction
Conclusions References
Tables Figures
J I
J I
Back Close
Full Screen / Esc
Print Version
Interactive Discussion
EGU
Table 2. Least squares fit (y=mx+c) for correlation of jet strength with temperature gradientacross the basin rim and wind direction aloft by episode type, with 95% confidence bound onm and correlation coefficient of the fit.
∆T vs. Jet Strength WD vs. Jet StrengthO3-South O3-North O3-South O3-North
m 0.23 −.01 −55 −795% bounds on m −0.4, 0.8 −0.5, 0.5 −82, −28 −25, 11
c 5.1 5.3 24 −88r2 0.16 0.00 0.84 0.05
11076
ACPD5, 11055–11090, 2005
Basin convergencepatterns due to low
level jets
B. de Foy et al.
Title Page
Abstract Introduction
Conclusions References
Tables Figures
J I
J I
Back Close
Full Screen / Esc
Print Version
Interactive Discussion
EGU
Fig. 1. Map of Mexico showing locations of radiosonde observations: Mexico City (GSMN),Manzanillo (MANZ), Acapulco (ACAP), Veracruz (VER) and Brownsville, Texas (BRO). Alsoshown are the surface stations Ciudad Constitucion (CDCO) and Matamoros (MATA) and thelimits of the 3 MM5 domains.
11077

ACPD5, 11055–11090, 2005
Basin convergencepatterns due to low
level jets
B. de Foy et al.
Title Page
Abstract Introduction
Conclusions References
Tables Figures
J I
J I
Back Close
Full Screen / Esc
Print Version
Interactive Discussion
EGU
Fig. 2. Map of the Mexico City basin with topography represented by shading and the MCMA(as of 1995) in beige. Campaign supersite was at CENICA. Circles denote SMN stations. Blackline A-B is the cross-section used in Fig. 8.
11078

ACPD5, 11055–11090, 2005
Basin convergencepatterns due to low
level jets
B. de Foy et al.
Title Page
Abstract Introduction
Conclusions References
Tables Figures
J I
J I
Back Close
Full Screen / Esc
Print Version
Interactive Discussion
EGU
31 02 04 06 08 10 12 14 16 18 20 22 24 26 28 30 02 045750
5800
5850
5900
5950
April 2003
500
hPa
heig
ht (
m)
CS CS CSO3N O3NO3S O3S
ManzanilloAcapulcoMexicoBrownsvilleVeracruz
31 02 04 06 08 10 12 14 16 18 20 22 24 26 28 30 02 04−16
−14
−12
−10
−8
−6
−4
−2
April 2003
500
hPa
tem
pera
ture
( o C
)
CS CS CSO3N O3NO3S O3S
Fig. 3. 500 hPa height and temperature from radiosonde observations during MCMA-2003.Background shading corresponds to episode types: red for O3-South, green for O3-North andblue for Cold Surge.
11079

ACPD5, 11055–11090, 2005
Basin convergencepatterns due to low
level jets
B. de Foy et al.
Title Page
Abstract Introduction
Conclusions References
Tables Figures
J I
J I
Back Close
Full Screen / Esc
Print Version
Interactive Discussion
EGU
31 02 04 06 08 10 12 14 16 18 20 22 24 26 28 30 02 041000
1005
1010
1015
1020
1025
April 2003
Sur
face
Pre
ssur
e (h
Pa)
CS CS CSO3N O3NO3S O3S
Cd. Constitucion (Baja California)Acapulco (Pacific Coast)Matamoros (Gulf Coast North)Veracruz (Gulf Coast)
31 02 04 06 08 10 12 14 16 18 20 22 24 26 28 30 02 04
16
18
20
22
24
26
28
30
April 2003
Sur
face
Tem
pera
ture
( o C
)
CS CS CSO3N O3NO3S O3S
Fig. 4. Daily averaged surface pressure and temperature on the Pacific and Gulf coasts fromSMN stations. Shading as for Fig. 3.
11080

ACPD5, 11055–11090, 2005
Basin convergencepatterns due to low
level jets
B. de Foy et al.
Title Page
Abstract Introduction
Conclusions References
Tables Figures
J I
J I
Back Close
Full Screen / Esc
Print Version
Interactive Discussion
EGU
−1
0
1
2
3
4
5Obs St Dev
Mod
el S
t Dev
0 1 2 3 4 5 6 7−1
0
1
2
3
4
5
RMSEc K
Bia
s (M
odel
−O
bs)
K
Temperature
03290206101216212529
−2
−1.5
−1
−0.5
0
0.5
1
1.5
2
2.5Obs St Dev
Mod
el S
t Dev
0 0.5 1 1.5 2 2.5−2
−1.5
−1
−0.5
0
0.5
1
1.5
2
2.5
RMSEc g/kg
Bia
s (M
odel
−O
bs)
g/kg
Water Vapour Mixing Ratio
03290206101216212529
−1
−0.5
0
0.5
1
1.5
2
2.5Obs St Dev
Mod
el S
t Dev
0 0.2 0.4 0.6 0.8 1 1.2 1.4 1.6 1.8 2−1
−0.5
0
0.5
1
1.5
2
2.5
RMSEc m/s
Bia
s (M
odel
−O
bs)
m/s
Wind Speed
03290206101216212529
Fig. 5. Statistics diagram for temperature water vapour mixing ratio and wind speed comparingthe fine MM5 domain with the 5 SMN surface stations in the basin. Different symbols for each 4day simulation period labelled by starting day (April except for 0329). Large symbols representthe centred root mean square error (RMSEc) versus the bias. Small symbols represent thestandard deviation of the model versus the observations. Ellipses are drawn for each modelcase centred on the average of all the points and with radii corresponding to the standarddeviation. 11081

ACPD5, 11055–11090, 2005
Basin convergencepatterns due to low
level jets
B. de Foy et al.
Title Page
Abstract Introduction
Conclusions References
Tables Figures
J I
J I
Back Close
Full Screen / Esc
Print Version
Interactive Discussion
EGU
0 3 6 9 12 15 18 21 240
1
2
3
4
5
6
7
8
Time of Day (CDT)
Win
d S
peed
(m
/s)
SouthNorthCloud
0 3 6 9 12 15 18 21 24
S
W
N
E
S
W
Time of Day (CDT)
Win
d D
irect
ion
SouthNorthCloud
Fig. 6. Simulated diurnal variation of wind speed and direction at CENICA by episode type.Thick line indicates median values, thin lines show the 25 and 75 percentile and dotted linesshow minimum and maximum data range.
11082

ACPD5, 11055–11090, 2005
Basin convergencepatterns due to low
level jets
B. de Foy et al.
Title Page
Abstract Introduction
Conclusions References
Tables Figures
J I
J I
Back Close
Full Screen / Esc
Print Version
Interactive Discussion
EGU
16−
Apr
−20
03 (
O3−
Sou
th)
23−
Apr
−20
03 (
O3−
Nor
th)
09−
Apr
−20
03 (
Col
d S
urge
)
16:00 CDT 19:00 CDT5m/s
Fig. 7. Horizontal surface (10 m) wind vectors in the Mexico City basin for 16 April (O3-South),19 April (O3-North) and 9 April (Cold Surge) at 16:00 and 19:00 CDT. Model output with alter-nate vectors shown only, contour lines of terrain elevation (500 m interval).
11083

ACPD5, 11055–11090, 2005
Basin convergencepatterns due to low
level jets
B. de Foy et al.
Title Page
Abstract Introduction
Conclusions References
Tables Figures
J I
J I
Back Close
Full Screen / Esc
Print Version
Interactive Discussion
EGU
16−Apr−2003 (O3−South)
23−Apr−2003 (O3−North)
09−Apr−2003 (Cold Surge)
16:00 CDT
16:00 CDT
16:00 CDT
19:00 CDT
19:00 CDT
19:00 CDT
1000
2000
3000
4000
5000
6000
7000
314
316318
320 320
322322
324324326326
328 328330
10 m/s
E
S
A B
Hei
gth
(m a
sl)
316318 320 32
0
322322
324324
326 326328 328
33010 m/s
E
S
A B
1000
2000
3000
4000
5000
6000
7000
314
316318
320
320322
322324
324326326328328330
10 m/s
E
S
A B
Hei
gth
(m a
sl)
314
316 316
318318
320320
320
322322324
324326326328 328
330 33010 m/s
E
S
A B
2060 2080 2100 2120 2140 2160 2180 2200 22201000
2000
3000
4000
5000
6000
7000
312 312
314314316
316
318318
320 320322 322324 324
326326328
10 m/s
E
S
A B
UTMN (km)
Hei
gth
(m a
sl)
2060 2080 2100 2120 2140 2160 2180 2200 2220
310 310312
312
314314
316316
318318320
320322322324
324326326328
33010 m/s
E
S
A B
UTMN (km)
Fig. 8. Vertical cross-section through the Chalco gap and the east side of the basin (line A-B,Fig. 2). Horizontal winds and potential temperature contours (K) depicted for the same timesas Fig. 7. Arrows pointing left are westerlies (going East), those pointing down are northerlies(going south, out of the page).
11084

ACPD5, 11055–11090, 2005
Basin convergencepatterns due to low
level jets
B. de Foy et al.
Title Page
Abstract Introduction
Conclusions References
Tables Figures
J I
J I
Back Close
Full Screen / Esc
Print Version
Interactive Discussion
EGU
15−
Apr
−20
0316
−A
pr−
2003
Convergence MM5 Dom2 Convergence MM5 Dom3 Daily Max RAMA Ozone GOES Composite
(40 − 146 ppb) 16:15
(10 − 180 ppb)
11
12
13
14
15
16
17
18
19
20
21
22
Hr
16:15
Fig. 9. Convergence lines for O3-South, 15 & 16 April for the medium and fine domain. Each convergence lineis coloured by time of day per the colorbar. Surface RAMA ozone concentrations in the basin are shown goingfrom blue to red (highest). GOES cloud imagery for an area similar to the medium domain courtesy of GOESBiomass Burning Monitoring Team, UW-Madison, Cooperative Institute for Meteorological Satellite Studies(CIMSS).
23−
Apr
−20
0324
−A
pr−
2003
Convergence MM5 Dom2 Convergence MM5 Dom3 Daily Max RAMA Ozone GOES Composite
(42 − 209 ppb) 18:15
(64 − 210 ppb)
11
12
13
14
15
16
17
18
19
20
21
22
Hr
16:15
Fig. 10. Convergence lines, ozone and cloud imagery for O3-North, 23 & 24 April, see Fig. 9.
24
Fig. 9. Convergence lines for O3-South, 15 and 16 April for the medium and fine domain.Each convergence line is coloured by time of day per the colorbar. Surface RAMA ozoneconcentrations in the basin are shown going from blue to red (highest). GOES cloud imageryfor an area similar to the medium domain courtesy of GOES Biomass Burning Monitoring Team,UW-Madison, Cooperative Institute for Meteorological Satellite Studies (CIMSS).
11085
ACPD5, 11055–11090, 2005
Basin convergencepatterns due to low
level jets
B. de Foy et al.
Title Page
Abstract Introduction
Conclusions References
Tables Figures
J I
J I
Back Close
Full Screen / Esc
Print Version
Interactive Discussion
EGU
15−
Apr
−20
0316
−A
pr−
2003
Convergence MM5 Dom2 Convergence MM5 Dom3 Daily Max RAMA Ozone GOES Composite
(40 − 146 ppb) 16:15
(10 − 180 ppb)
11
12
13
14
15
16
17
18
19
20
21
22
Hr
16:15
Fig. 9. Convergence lines for O3-South, 15 & 16 April for the medium and fine domain. Each convergence lineis coloured by time of day per the colorbar. Surface RAMA ozone concentrations in the basin are shown goingfrom blue to red (highest). GOES cloud imagery for an area similar to the medium domain courtesy of GOESBiomass Burning Monitoring Team, UW-Madison, Cooperative Institute for Meteorological Satellite Studies(CIMSS).
23−
Apr
−20
0324
−A
pr−
2003
Convergence MM5 Dom2 Convergence MM5 Dom3 Daily Max RAMA Ozone GOES Composite
(42 − 209 ppb) 18:15
(64 − 210 ppb)
11
12
13
14
15
16
17
18
19
20
21
22
Hr
16:15
Fig. 10. Convergence lines, ozone and cloud imagery for O3-North, 23 & 24 April, see Fig. 9.
24
Fig. 10. Convergence lines, ozone and cloud imagery for O3-North, 23 and 24 April, see Fig. 9.
11086

ACPD5, 11055–11090, 2005
Basin convergencepatterns due to low
level jets
B. de Foy et al.
Title Page
Abstract Introduction
Conclusions References
Tables Figures
J I
J I
Back Close
Full Screen / Esc
Print Version
Interactive Discussion
EGU
08−
Apr
−20
0309
−A
pr−
2003
Convergence MM5 Dom2 Convergence MM5 Dom3 Daily Max RAMA Ozone GOES Composite
(43 − 147 ppb) 16:15
(43 − 122 ppb)
11
12
13
14
15
16
17
18
19
20
21
22
Hr
16:15
Fig. 11. Convergence lines, ozone and cloud imagery for Cold Surge, 8 & 9 April, see Fig. 9.
12 14 16 18 20 22 240
0.5
1
1.5
2
2.5
3
3101 02
03
0405
06
07
08
09
1011
12
1314
15
1617
18
19
20
21
22
23
24
25
2627
28
29
30
01
02
03
04b
Obs Jet Time (hr)
Obs
Jet
Str
engt
h (m
/s)
O3−SouthO3−NorthCold Surge
12 14 16 18 20 22 240
0.5
1
1.5
2
2.5
3
31
0103
04
05
06
07
08
091011
1213
14
15
16
17
18
19
2021
22
23
2425
26
27
28
29
30
01
02
03
04b
Model Jet Time (hr)
Mod
el J
et S
tren
gth
(m/s
)
O3−SouthO3−NorthCold Surge
Fig. 12. Jet strength versus jet time for observations and simulations, labelled by day, symbols correspond toepisode types (04b is May 4, others are unambiguously April or May).
25
Fig. 11. Convergence lines, ozone and cloud imagery for Cold Surge, 8 and 9 April, see Fig. 9.
11087

ACPD5, 11055–11090, 2005
Basin convergencepatterns due to low
level jets
B. de Foy et al.
Title Page
Abstract Introduction
Conclusions References
Tables Figures
J I
J I
Back Close
Full Screen / Esc
Print Version
Interactive Discussion
EGU
12 14 16 18 20 22 240
0.5
1
1.5
2
2.5
3
3101 02
03
0405
06
07
08
09
1011
12
1314
15
1617
18
19
20
21
22
23
24
25
2627
28
29
30
01
02
03
04b
Obs Jet Time (hr)
Obs
Jet
Str
engt
h (m
/s)
O3−SouthO3−NorthCold Surge
12 14 16 18 20 22 240
0.5
1
1.5
2
2.5
3
31
0103
04
05
06
07
08
091011
1213
14
15
16
17
18
19
2021
22
23
2425
26
27
28
29
30
01
02
03
04b
Model Jet Time (hr)
Mod
el J
et S
tren
gth
(m/s
)
O3−SouthO3−NorthCold Surge
Fig. 12. Jet strength versus jet time for observations and simulations, labelled by day, symbolscorrespond to episode types (04b is 4 May, others are unambiguously April or May).
11088

ACPD5, 11055–11090, 2005
Basin convergencepatterns due to low
level jets
B. de Foy et al.
Title Page
Abstract Introduction
Conclusions References
Tables Figures
J I
J I
Back Close
Full Screen / Esc
Print Version
Interactive Discussion
EGU
0 0.5 1 1.5 2 2.5 3−6
−4
−2
0
2
4
6
01
02
03
05
06
07
08
10
11
121416
17
18
1921
22
24
25
26
2829
30
01
02
03
Obs Jet Strength (m/s)
∆ T 19
:00
− 0
7:00
CD
T G
SM
N, 2
250
to 3
250
m a
sl (
K) O3−South
O3−NorthCold Surge
0 0.5 1 1.5 2 2.5 31
2
3
4
5
6
7
31
01
0203
04
05
06
07
08
09
10
11
12
13
14
15
16
17 1819
2021
22 23
2425
26
27
28
29 30
0102
03
04b
Obs Jet Strength (m/s)
∆ T C
EN
ICA
− C
uaut
la, 1
5:00
, 225
0 to
325
0 m
asl
(K
)
O3−SouthO3−NorthCold Surge
Fig. 13. Temperature differences in the bottom 1000 m versus jet strength. (a) Temperaturedifference at GSMN between 19:00 and 07:00 measured by radiosonde. (b) Temperature dif-ferences between CENICA and Cuautla, to the south of the gap at 15:00. Lines of best fit fromTable 2 shown.
11089

ACPD5, 11055–11090, 2005
Basin convergencepatterns due to low
level jets
B. de Foy et al.
Title Page
Abstract Introduction
Conclusions References
Tables Figures
J I
J I
Back Close
Full Screen / Esc
Print Version
Interactive Discussion
EGU
0 0.5 1 1.5 2 2.5 3E
SE
S
SW
W
NW
N
NE
E
31
01
02
03
04
05
06
0708
09
10
11
1213
14
151617
18
19
20
21 22 232425
262728
2930
01
02
03
04b
Obs Jet Strength (m/s)
Win
d D
ir G
SM
N, 0
7:00
, 425
0 to
625
0 m
asl
O3−SouthO3−NorthCold Surge
Fig. 14. Wind direction at GSMN at 07:00 averaged between 4250 and 6250 m above sea levelversus jet strength. Lines of best fit from Table 2 shown.
11090