distinct wind convergence patterns in the mexico city basin due to
TRANSCRIPT
Atmos. Chem. Phys., 6, 1249–1265, 2006www.atmos-chem-phys.net/6/1249/2006/© Author(s) 2006. This work is licensedunder a Creative Commons License.
AtmosphericChemistry
and Physics
Distinct wind convergence patterns in the Mexico City basin due tothe interaction of the gap winds with the synoptic flow
B. de Foy1,*, A. Clappier2, L. T. Molina 1,*, and M. J. Molina1
1Department of Earth, Atmospheric and Planetary Sciences, Massachusetts Institute of Technology, USA2Air and Soil Pollution Laboratory, Swiss Federal Institute of Technology, Lausanne (EPFL), Switzerland* now at: Molina Center for Energy and the Environment (MCE2), La Jolla, CA 92037, USA
Received: 7 October 2005 – Published in Atmos. Chem. Phys. Discuss.: 1 November 2005Revised: 8 February 2006 – Accepted: 21 February 2006 – Published: 24 April 2006
Abstract. Mexico City lies in a high altitude basin whereair quality and pollutant fate is strongly influenced by localwinds. The combination of high terrain with weak synop-tic forcing leads to weak and variable winds with complexcirculation patterns. A gap wind entering the basin in the af-ternoon leads to very different wind convergence lines overthe city depending on the meteorological conditions. Surfaceand upper-air meteorological observations are analysed dur-ing the MCMA-2003 field campaign to establish the meteo-rological conditions and obtain an index of the strength andtiming of the gap wind. A mesoscale meteorological model(MM5) is used in combination with high-resolution satellitedata for the land surface parameters and soil moisture mapsderived from diurnal ground temperature range. A simplemethod to map the lines of wind convergence both in thebasin and on the regional scale is used to show the differentconvergence patterns according to episode types. The gapwind is found to occur on most days of the campaign and isthe result of a temperature gradient across the southern basinrim which is very similar from day to day. Momentum mix-ing from winds aloft into the surface layer is much more vari-able and can determine both the strength of the flow and thepattern of the convergence zones. Northerly flows aloft leadto a weak jet with an east-west convergence line that pro-gresses northwards in the late afternoon and early evening.Westerlies aloft lead to both stronger gap flows due to chan-nelling and winds over the southern and western basin rim.This results in a north-south convergence line through themiddle of the basin starting in the early afternoon. Improvedunderstanding of basin meteorology will lead to better airquality forecasts for the city and better understanding of thechemical regimes in the urban atmosphere.
Correspondence to:B. de Foy([email protected])
1 Introduction
The interaction of a low level jet with regional air flows intothe Mexico City basin leads to complex convergence patternsthat determine the concentration and fate of air pollutants,with strong associated health effects (Molina and Molina,2002). The Mexico City Metropolitan Area (MCMA) lies ina dry lake bed at 2240 m altitude surrounded by high moun-tains on three sides.Bossert(1997) modelled the local windcirculation and showed distinct pollution venting patterns de-pending on the interaction of the synoptic and local winds,and in particular on the combination of the Pacific and Gulfcoast sea breezes with the mountain winds.Jazcilevich et al.(2003) examine cases of convective transport of pollutants inthe basin and the flushing of pollutants through the passageto the southeast.
The IMADA-AVER field campaign (Doran et al., 1998)made extensive meteorological observations in the basin andfound large day-to-day variation in the wind patterns.Fastand Zhong(1998) describe in detail some of the wind pat-terns leading to high surface ozone concentrations, includingthe presence of a convergence zone that moves through theMCMA from south to north. This is due to southerly gapwinds forming in a mountain pass in the southeast of thebasin near Chalco. As they enter the basin, they encounterthe northerly surface winds from the Mexican plateau andsweep through the city transporting air pollutants with them.Whiteman et al.(2000) analyse the heat budget in the basinto highlight the importance of an influx of cool moist airthrough the Chalco gap. This cooling term is larger thanthe solar heat flux in the afternoon and is similar to flowsdescribed byKimura and Kuwagata(1993) (see below).Do-ran and Zhong(2000) analyse this gap flow in terms of theheat balance on the regional scale and across the basin rimto find that the jet strength is a function of the thermal forc-ing. A different episode was analysed byJazcilevich et al.(2005) who found a north–south convergence line forming inthe city in January 2001.
Published by Copernicus GmbH on behalf of the European Geosciences Union.

1250 B. de Foy et al.: Basin convergence patterns due to gap winds
Stensrud(1996) reviews the climatological importance oflow level jets and their impact on deep convection. Whiletheir focus is on the regional scale, they review low level jetsinduced by terrain effects on smaller scales. They also sug-gest that model simulations of low level jets may serve asa proxy for evaluating the accuracy of the simulated plane-tary boundary layers.Kimura and Kuwagata(1993) study ingreater detail the thermal forcing in an elevated basin, lead-ing to low pressures and a strong flow from neighbouring val-leys over mountain ridges. Optimum conditions are a basinless than 100 km and mountain ranges slightly lower than themixing height.Banta and Cotton(1981) analysed the struc-ture of the local wind systems in a broad mountain basin andfound that in addition to night-time drainage and day-timeup-slope flows, there were afternoon winds due to down-mixing of momentum aloft into the boundary layer. Bothof these studies are particularly relevant to the Mexico Citybasin as it is of the order of 100 km wide and has high mixingheights that reach into the tropospheric free flow.
A number of recent field campaigns have taken place inmountain valleys and basins. The Vertical Transport andMixing (VTMX, Doran et al., 2002) field campaign stud-ied the meteorological processes in Salt Lake city in Oc-tober 2000. Banta et al.(2004) found that cold drainageflows from the surrounding mountains could lead to conver-gence in the basin and vertical motion within a cold stableatmosphere.Rife et al. (2004) looked at the performanceof a range of mesoscale meteorological models for the com-plex local flows measured during VTMX. They found thatby standard verification measures, high resolution modelsdid not perform significantly better than the regional mod-els. This was traced to the high fraction of spectral powerin the sub-diurnal range which the models cannot simulateexactly. Nevertheless, the high resolution models did sim-ulate the fine flow features more realistically. Accountingfor the spectral power range of the observations suggests thatthe high resolution models do perform better. Mexico Cityhas the potential for similar model validation issues giventhe weak and variable surface winds and the possibility fordrainage flows to interact with urban heat island effects.
The Mesoscale Alpine Programme (MAP,Mayr et al.,2004) provided extensive measurements in a gap through theAlps. The aim of the study is to study the interaction ofthe gap flow with the flow aloft, develop local forecastingmethods and improve model verification.Zangl et al.(2004)developed the MM5 model to use true horizontal diffusion.This leads to improved simulations of the progression of theFoehn down the valley and its impact on the cold air pool atLake Constance due in part to the improved modelling of thevertical turbulent mixing. It was also used for Mexico Cityleading to improved surface wind simulations (de Foy et al.,2006). Liu et al. (2000) describe a different low level jet inIran where a synoptic surface high leads to a gap wind and anoutflow of cold air down valley. The forces determining thestrength of the jet are analysed, as is the ability of the model
to represent the flow features.Kossmann and Fiedler(2000) analysed the diurnal mo-
mentum budget of thermally induced slope winds. The bal-ance between the buoyancy and pressure gradient forces withthe friction forces was found to determine the strength of theslope flows. These were also found to react to changes offorcing within 120 s. The formation of a mesoscale heat lowwas described byKossmann et al.(2002) in an alpine lakebasin. This is similar toKimura and Kuwagata(1993) andleads to an intrusion of cold air into the basin in the late af-ternoon.Regmi et al.(2003) find a similar situation in Kath-mandu, Nepal. Shallow surface influx of cool southwest-erly air from the Indian plateau forms a stable layer beneathnorthwesterly valley flow. The resulting layers suppress ver-tical mixing and lead to high air pollution events.
The present study is focused on the meteorologicalepisodes occurring during the MCMA-2003 field campaign(de Foy et al., 2005) which took place from 1 April to 5 May2003. Three different wind circulation episode types are pro-posed for the duration of the campaign. O3-South are dayswhen ozone is high in the south and a weak late afternoongap flow forms in the southeast. O3-North days are whenthe ozone peak is in the north due to the combination of astrong gap flow and winds over the south and west edges ofthe basin. Cold Surge days are when cold northerlies sweepthe basin atmosphere clean.
This paper seeks to build on the analysis ofDoran andZhong (2000) for the wind jets occurring during MCMA-2003, classifying the results according to the three episodetypes. Convergence zones suggested byFast and Zhong(1998) are shown explicitly thereby illustrating the interac-tion of synoptic and local scales proposed byBossert(1997).
After describing the observations and model used inSect.2, the synoptic conditions during MCMA-2003 will bereviewed in Sect.3 and the model results will be evaluatedin Sect.4. Sections5 and6 will describe the low level jetand the convergence patterns. Section7 will discuss how thecirculation patterns relate to the local and synoptic forcings.
2 Observations and model description
The observations described inde Foy et al.(2005) are used,in particular the surface meteorological observation networkand the radiosondes of the Mexican National Weather Ser-vice (Servicio Meteorologico Nacional, SMN) and the moni-toring data from the campaign super-site at the National Cen-tre for Environmental Research and Training (Centro Na-cional de Investigacion y Capacitacion Ambiental, CENICA)as well as the surface ozone measurements from the AmbientAir Monitoring Network (Red Automatica de Monitoreo At-mosferico, RAMA). Figure1 shows the radiosonde and sur-face stations along with geographical reference points. Fig-ure 2 shows the basin topography and the urban area alongwith the stations in the MCMA. All times in this paper are
Atmos. Chem. Phys., 6, 1249–1265, 2006 www.atmos-chem-phys.net/6/1249/2006/
B. de Foy et al.: Basin convergence patterns due to gap winds 1251
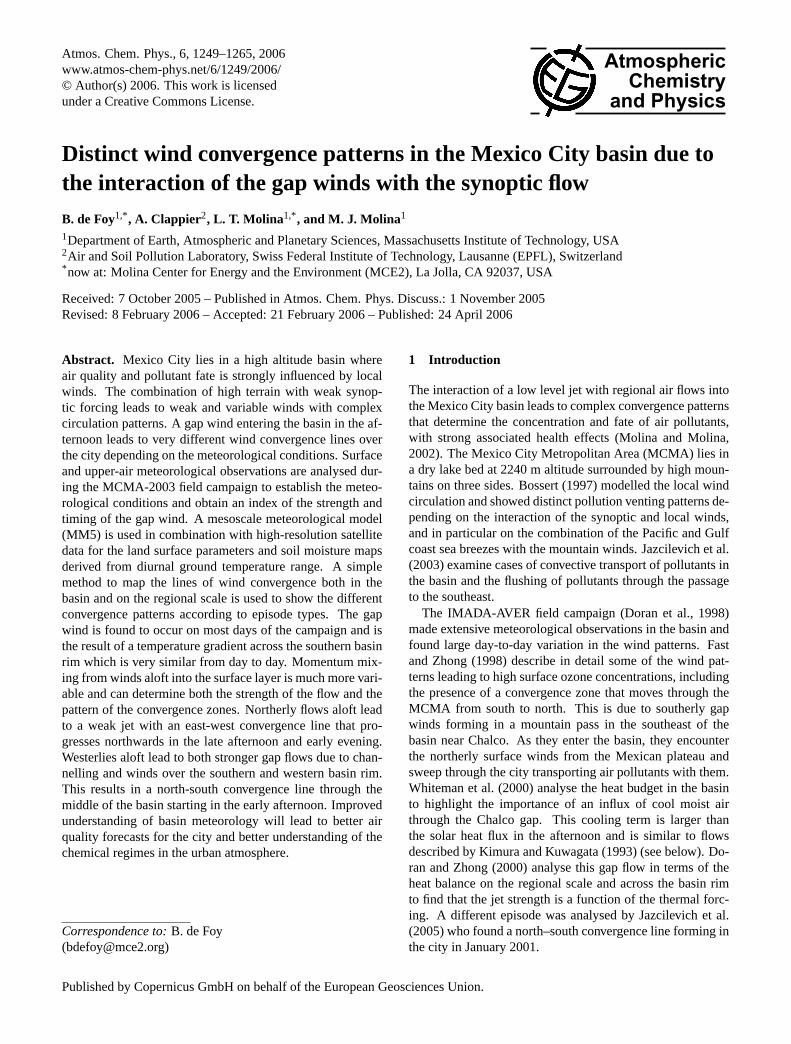
Fig. 1. Map of Mexico showing locations of radiosonde obser-vations: Mexico City (GSMN), Manzanillo (MANZ), Acapulco(ACAP), Veracruz (VER) and Brownsville, Texas (BRO). Alsoshown are the surface stations Ciudad Constitucion (CDCO) andMatamoros (MATA) and the limits of the 3 MM5 domains.
stated as local time, per field campaign guidelines, which isCentral Daylight savings Time (CDT=UTC–5 h).
The basin circulation is simulated using the PennsylvaniaState University/National Center for Atmospheric ResearchMesoscale Model (MM5,Grell et al., 1995) version 3.7.2 us-ing three nested grids with one-way nesting. The grid resolu-tion used is 36, 12 and 3 km, with 40×50, 55×64 and 61×61grid cells for domains 1, 2 and 3, respectively. The simula-tion procedure is described in detail inde Foy et al.(2006)and makes use of high resolution satellite remote sensing forinitialising the land surface parameters. Nine simulations of4 days duration were used to cover the entire field campaign,with the following two modifications. The initialisation pe-riod was increased from 18 to 42 h, yielding better results forthe first simulation day.
The previous modelling study used soil moisture valuesfrom the Air Force Weather Agency’s (AFWA) AgriculturalMeteorology modelling system (AGRMET). Due to an un-verified moistening of the soil in the AGRMET model half-way during the campaign, the soil moisture field was aver-aged over the first part of the month and held constant in timeduring the episode. This method fails to capture the variationof the soil moisture during the field campaign. Furthermore,satellite soil moisture products were not found to be satis-factory for estimating the surface heat budget (de Foy et al.,2006).
An alternative was therefore obtained by relating the soilmoisture to the diurnal range of the skin temperature mea-sured by MODIS on the AQUA platform. 8-day average val-ues were used for the months of March–May 2003. An em-pirical relationship was devised to produce fields of similarmagnitudes to those from AGRMET. Soil temperature differ-ences in the range of 15 K to 45 K were linearly mapped to
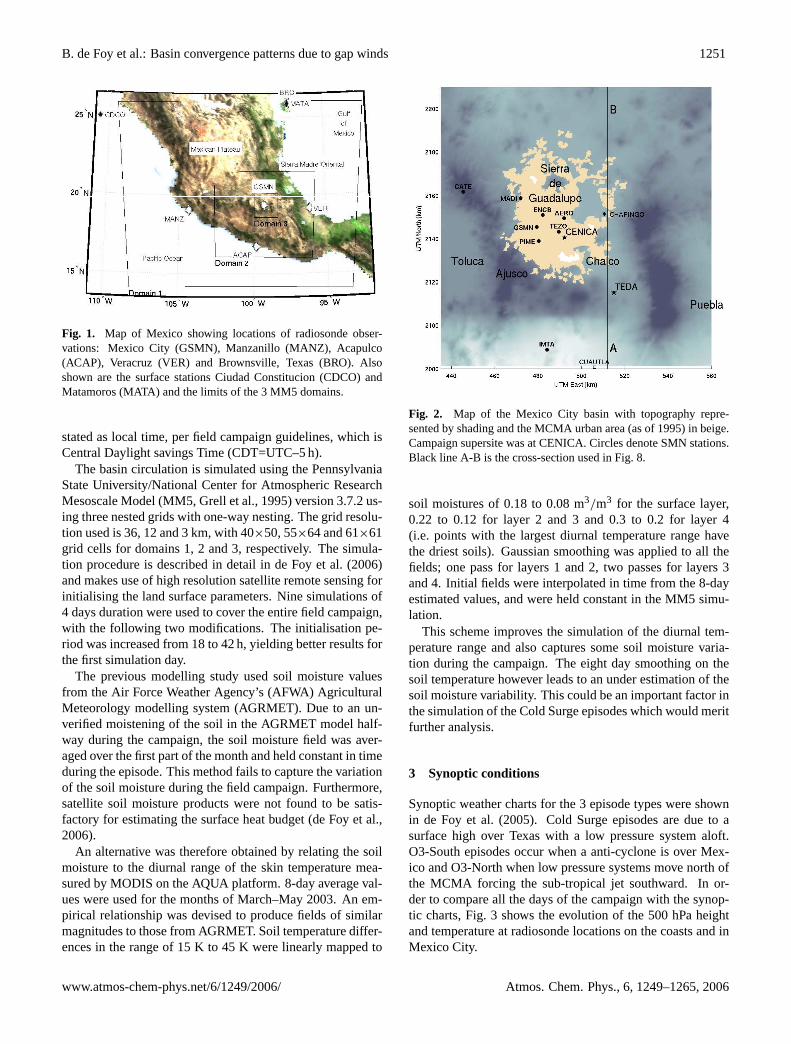
Fig. 2. Map of the Mexico City basin with topography repre-sented by shading and the MCMA urban area (as of 1995) in beige.Campaign supersite was at CENICA. Circles denote SMN stations.Black line A-B is the cross-section used in Fig.8.
soil moistures of 0.18 to 0.08 m3/m3 for the surface layer,0.22 to 0.12 for layer 2 and 3 and 0.3 to 0.2 for layer 4(i.e. points with the largest diurnal temperature range havethe driest soils). Gaussian smoothing was applied to all thefields; one pass for layers 1 and 2, two passes for layers 3and 4. Initial fields were interpolated in time from the 8-dayestimated values, and were held constant in the MM5 simu-lation.
This scheme improves the simulation of the diurnal tem-perature range and also captures some soil moisture varia-tion during the campaign. The eight day smoothing on thesoil temperature however leads to an under estimation of thesoil moisture variability. This could be an important factor inthe simulation of the Cold Surge episodes which would meritfurther analysis.
3 Synoptic conditions
Synoptic weather charts for the 3 episode types were shownin de Foy et al.(2005). Cold Surge episodes are due to asurface high over Texas with a low pressure system aloft.O3-South episodes occur when a anti-cyclone is over Mex-ico and O3-North when low pressure systems move north ofthe MCMA forcing the sub-tropical jet southward. In or-der to compare all the days of the campaign with the synop-tic charts, Fig.3 shows the evolution of the 500 hPa heightand temperature at radiosonde locations on the coasts and inMexico City.
www.atmos-chem-phys.net/6/1249/2006/ Atmos. Chem. Phys., 6, 1249–1265, 2006

1252 B. de Foy et al.: Basin convergence patterns due to gap winds
31 02 04 06 08 10 12 14 16 18 20 22 24 26 28 30 02 045750
5800
5850
5900
5950
April 2003
500
hPa
heig
ht (
m)
CS CS CSO3N O3NO3S O3S
ManzanilloAcapulcoMexicoBrownsvilleVeracruz
31 02 04 06 08 10 12 14 16 18 20 22 24 26 28 30 02 04−16
−14
−12
−10
−8
−6
−4
−2
April 2003
500
hPa
tem
pera
ture
( o C
)
CS CS CSO3N O3NO3S O3S
Fig. 3. 500 hPa height and temperature from radiosonde obser-vations during MCMA-2003. Background shading corresponds toepisode types: red for O3-South, green for O3-North and blue forCold Surge.
The most variability occurs at Brownsville where the highpressure for O3-South days can be clearly seen. O3-Northepisodes are characterised by a north–south pressure gradientwhich drives the westerlies aloft and Cold Surge episodesby falling pressure at most of the stations. The temperatureat 500 hPa is high and rising for O3-South days, constantwith a stronger north–south gradient for O3-North days anddecreasing for Cold Surge days.
31 02 04 06 08 10 12 14 16 18 20 22 24 26 28 30 02 041000
1005
1010
1015
1020
1025
April 2003
Sur
face
Pre
ssur
e (h
Pa)
CS CS CSO3N O3NO3S O3S
Cd. Constitucion (Baja California)Acapulco (Pacific Coast)Matamoros (Gulf Coast North)Veracruz (Gulf Coast)
31 02 04 06 08 10 12 14 16 18 20 22 24 26 28 30 02 04
16
18
20
22
24
26
28
30
April 2003
Sur
face
Tem
pera
ture
( o C
)
CS CS CSO3N O3NO3S O3S
Fig. 4. Daily averaged surface pressure and temperature on the Pa-cific and Gulf coasts from SMN stations. Shading as for Fig.3.
Daily average surface pressure and temperature are shownin Fig. 4. High surface pressures at Matamoros and Ver-acruz during Cold Surge episodes force cold northerly sur-face flows. O3-South days have minimal pressure gradientsbetween the two coasts with increasing surface temperatures.On O3-North days the pressure on the Gulf coast tends to belower than on the Pacific Coast.
From this, it is clear that the three Cold Surge episodes fol-low the pattern described bySchultz et al.(1998), with vary-ing intensities. Both the O3-South and O3-North episodes,with the exception of the transition periods, have well defined
Atmos. Chem. Phys., 6, 1249–1265, 2006 www.atmos-chem-phys.net/6/1249/2006/

B. de Foy et al.: Basin convergence patterns due to gap winds 1253
−1
0
1
2
3
4
5Obs St Dev
Mod
el S
t Dev
0 1 2 3 4 5 6 7−1
0
1
2
3
4
5
RMSEc K
Bia
s (M
odel
−O
bs)
KTemperature
03290206101216212529
−2
−1.5
−1
−0.5
0
0.5
1
1.5
2
2.5Obs St Dev
Mod
el S
t Dev
0 0.5 1 1.5 2 2.5−2
−1.5
−1
−0.5
0
0.5
1
1.5
2
2.5
RMSEc g/kg
Bia
s (M
odel
−O
bs)
g/kg
Water Vapour Mixing Ratio
03290206101216212529
−1
−0.5
0
0.5
1
1.5
2
2.5Obs St Dev
Mod
el S
t Dev
0 0.2 0.4 0.6 0.8 1 1.2 1.4 1.6 1.8 2−1
−0.5
0
0.5
1
1.5
2
2.5
RMSEc m/s
Bia
s (M
odel
−O
bs)
m/s
Wind Speed
03290206101216212529
Fig. 5. Statistics diagrams for temperature, water vapour mixing ratio and wind speed comparing the fine MM5 domain with the 5 SMNsurface stations in the basin. Larger symbols show the model bias versus the centred root mean square error (RMSEc), which should be assmall as possible. Smaller symbols show the model standard deviation versus that of the observations, which should be of similar magnitude.Statistics are calculated for each 4 day simulation period for each station. Periods are labelled by starting day (April except for 0329), andellipses are drawn to show the average performance and the spread in agreement between the stations for each episode.
synoptic characteristics that vary little across the differentdays.
4 Model results
Model statistics were calculated for each simulation for theSMN weather stations in the basin. Figure5 shows statis-tics diagrams described inde Foy et al.(2006) for tempera-
ture, humidity and wind speed. The bias is plotted versus thecentred root mean square error (RMSEc) for each station foreach simulation run. The model standard deviation is thenplotted versus the observed standard deviation. All four vari-ables plotted have the same units as the observed variable. Inorder to compare the different simulation runs, ellipses aredrawn centred on the average of the statistics with radii cal-culated from the standard deviation of the results from the
www.atmos-chem-phys.net/6/1249/2006/ Atmos. Chem. Phys., 6, 1249–1265, 2006

1254 B. de Foy et al.: Basin convergence patterns due to gap winds
individual stations. In this way, the diagram conveys boththe overall accuracy of the model and the variability in modelagreement at different stations. Ideally, both the bias and theRMSEc are low with corresponding ellipses close to the ori-gin. The model standard deviation should be similar to that ofthe observations, with corresponding ellipses along they=x
line.Temperature biases are less than 1 K with the exception
of the first Cold Surge episode. RMSEc are within 2 K withthe exception of the first two Cold Surge episodes. For watermixing ratio, the biases are within 1.5 g/kg and the RMSEcin the range of 1 to 2 g/kg, although the first Cold Surgeepisode is too moist and has larger errors than the other sim-ulations. Wind speed performance is similar for all the simu-lations with the exception of the second Cold Surge episodewhen the winds are too strong and the errors largest. Overall,this suggests that the simulation performance for the wholecampaign is similar to that of the O3-South episode describedin de Foy et al.(2006). The Cold Surge episodes are an ex-ception to this however and would need further refinement.Sensitivity tests were not carried out for these episodes al-though candidate factors would be the cloud parameterisa-tion and the soil moisture field. The latter can have moistspikes lasting just a few days following heavy rainfall, an ef-fect that was disabled in the current simulations by holdingthe soil moisture field constant over the individual simulationperiods.
Continuous time series for the field campaign were ob-tained by collating the results from the nine simulations. Fig-ure 6 shows the comparison of the diurnal variation of theobserved and simulated winds at CENICA by episode. Foreach episode, the median is shown by a bold line, the inter-quartile range by thin lines and the total range by dotted lines.The winds are southeasterly and below 2 m/s in the earlymorning turning to northerly during the day and then back tosoutherly in the range of 4 to 6 m/s by sunrise. This showsthat the main features are well represented by the model. Themain differences are in the timing and level of the afternoonwind peak. O3-South events have the correct wind speed in-crease in the morning, but O3-North and Cold Surge havea delayed increase into the mid-afternoon. The peak itselfis well simulated for O3-North events. Both O3-South andCold Surge have similar peaks in the model even though theyare weaker in reality.
In terms of wind directions, the main feature of the obser-vations is the afternoon wind shift which takes place around15:00 for O3-North, around 18:00 for O3-South and around04:00 for Cold Surge. The model simulates this although thedifference between O3-North and O3-South is not as stark.In the morning there is a sharp transition from southeasterlyto northwesterly whereas the observations show a more grad-ual turning via the east. In the afternoon there is a large vari-ability in the Cold Surge winds with a southerly componentwhich the observations do not show. The Cold Surge episodetype contains the greatest variation of circulation patterns and
in addition is the least well simulated of the three types. Nev-ertheless, the afternoon wind direction is better simulated atstations further from the Chalco gap in the southeast, bothin the city and to the east of the basin at Chapingo. Thissuggests that the poor performance is due to inaccuracies insimulating the gap flow intensity.
5 Gap winds
The wind shifts observed at CENICA are part of the gapwind that passes through the Chalco passage, as describedin Whiteman et al.(2000). Figure7 shows the surface windsin the basin for selected days of the three episode types at16:00 and 19:00, along with total cloud water predicted bythe model.
O3-South days such as 16 April have weaker northerlywinds and a gap flow influencing the southeast of the cityin the early evening. 23 April, an O3-North day, has a gapflow that is already influencing the whole eastern half of thebasin by 16:00. It meets with westerly winds coming over thebasin rim leading to a convergence line in the middle of thecity. This is pushed further north as the afternoon progresses.On this particular day, the convergence leads to strong con-vection and cloud formation causing highly variable surfacewinds. On 9 April, a Cold Surge day, strong northerly flowsare forced into the gap and are followed by a shift to westerlywinds throughout the basin.
North–south cross-sections through the Chalco gap inFig. 8 show the horizontal winds and contours of potentialtemperature. Vertical profiles of wind speed and direction areshown at Tenango del Aire (TEDA) in the Chalco passage, inFig. 9 and at CENICA in Fig.10 for 16:00 and 19:00 CDT.These are boxplots segregated by episode type using profilesfrom every day of the campaign. The extent of the jet heightscan be clearly seen, with jet heights estimated visually as theheight of the wind minimum.
On O3-South days the winds aloft are weaker. Wester-lies above 6000 m give way to northerly winds below. Astrong temperature gradient forms between the basin and theCuautla valley to the south. The associated pressure dif-ference drives a low level jet less than 1000 m thick whichbrings in cold air. The jet progresses gradually through thebasin turning to easterly as it meets the northerly flow in thebasin.
The profiles at TEDA show that for O3-South events the jetis purely southerly and quite thick at 16:00 with a wind min-imum at 1500 ma.g.l.. At 19:00, the median profile showsa decrease in heights to approximately 500 m. At CENICA,there is no effect of the gap winds at 16:00 for O3-Southepisodes but the winds have shifted by 19:00. The influx ofsoutherly air leads to a layer of increased winds up to around1500 m.
On O3-North days, the winds aloft are still from the west,but stronger and with no layer of northerlies below. The
Atmos. Chem. Phys., 6, 1249–1265, 2006 www.atmos-chem-phys.net/6/1249/2006/

B. de Foy et al.: Basin convergence patterns due to gap winds 1255
0 3 6 9 12 15 18 21 240
1
2
3
4
5
6
7
8
Time of Day (CDT)
Win
d S
peed
(m
/s)
O3−South ObsO3−South Model
0 3 6 9 12 15 18 21 24
S
W
N
E
S
W
Time of Day (CDT)
Win
d D
irect
ion
O3−South ObsO3−South Model
0 3 6 9 12 15 18 21 240
1
2
3
4
5
6
7
8
Time of Day (CDT)
Win
d S
peed
(m
/s)
O3−North ObsO3−North Model
0 3 6 9 12 15 18 21 24
S
W
N
E
S
W
Time of Day (CDT)
Win
d D
irect
ion
O3−North ObsO3−North Model
0 3 6 9 12 15 18 21 240
1
2
3
4
5
6
7
8
Time of Day (CDT)
Win
d S
peed
(m
/s)
Cold Surge ObsCold Surge Model
0 3 6 9 12 15 18 21 24
S
W
N
E
S
W
Time of Day (CDT)
Win
d D
irect
ion
Cold Surge ObsCold Surge Model
Fig. 6. Comparison of observed and simulated diurnal variation of wind speed (left) and direction (right) at CENICA by episode type:O3-South (top), O3-North (middle), Cold Surge (bottom). Thick line indicates median values, thin lines show the 25 and 75 percentile anddotted lines show minimum and maximum data range.
www.atmos-chem-phys.net/6/1249/2006/ Atmos. Chem. Phys., 6, 1249–1265, 2006

1256 B. de Foy et al.: Basin convergence patterns due to gap winds
16−
Apr
−20
03 (
O3−
Sou
th)
23−
Apr
−20
03 (
O3−
Nor
th)
09−
Apr
−20
03 (
Col
d S
urge
)
16:00 CDT 19:00 CDT5m/s
0.00
0.01
0.04
0.25
1.58
10.00
mm
Fig. 7. Horizontal surface (10 m) wind vectors in the Mexico City basin for 16 April (O3-South), 19 April (O3-North) and 9 April (ColdSurge) at 16:00 and 19:00 CDT. Model output with alternate vectors shown only, contour lines of terrain elevation (500 m interval). Shadingrepresents millimetres of cloud water (note log colour scale).
potential temperature difference between the basin and thevalley to the south, at 6 K, is the same as 16 April. The lowlevel jet however is much stronger and deeper. By 16:00 it ismore than 1000 m thick and extends all the way to the north-ern edge of the basin. By 19:00, horizontal convergence ofwinds leads to strong convective activity and the formationof cumulus clouds in the north of the basin.
The profiles at TEDA are similar to the O3-South eventsfor 16:00, but the jet is markedly stronger at 19:00 with a
depth of 1500 m. At CENICA, the winds have already shiftedat 16:00 with maximum speeds at the surface. By 19:00 thereis a well defined jet flow below 1500 m.
Cold Surge days have strong westerly winds aloft withnortheasterlies entering the basin from the Gulf coast. At16:00 the model simulates a limited low level jet which meetsthe moist Gulf air leading to westerly winds into the earlyevening. The model simulates a similar vertical structure ofthe gap flow at TEDA and CENI as for O3-North episodes.
Atmos. Chem. Phys., 6, 1249–1265, 2006 www.atmos-chem-phys.net/6/1249/2006/

B. de Foy et al.: Basin convergence patterns due to gap winds 1257
16−Apr−2003 (O3−South)
23−Apr−2003 (O3−North)
09−Apr−2003 (Cold Surge)
16:00 CDT
16:00 CDT
16:00 CDT
19:00 CDT
19:00 CDT
19:00 CDT
1000
2000
3000
4000
5000
6000
7000
314
316318
320 320
322322
324324326326
328 328330
10 m/s
E
S
A B
Hei
gth
(m a
sl)
316318 320 32
0
322322
324324
326 326328 328
33010 m/s
E
S
A B
1000
2000
3000
4000
5000
6000
7000
314
316318
320
320322
322324
324326326328328330
10 m/s
E
S
A B
Hei
gth
(m a
sl)
314
316 316
318318
320320
320
322322324
324326326328 328
330 33010 m/s
E
S
A B
2060 2080 2100 2120 2140 2160 2180 2200 22201000
2000
3000
4000
5000
6000
7000
312 312
314314316
316
318318
320 320322 322324 324
326326328
10 m/s
E
S
A B
UTMN (km)
Hei
gth
(m a
sl)
2060 2080 2100 2120 2140 2160 2180 2200 2220
310 310312
312
314314
316316
318318320
320322322324
324326326328
33010 m/s
E
S
A B
UTMN (km)
Fig. 8. Vertical cross-section through the Chalco gap and the east side of the basin (line A-B, Fig.2). Horizontal winds and potentialtemperature contours (K) depicted for the same times as Fig.7. Arrows pointing left are westerlies (going East), those pointing down arenortherlies (going south, out of the page).
By 19:00, the situation has changed markedly however withwesterly winds in the surface layer. There is a jet patternin the vertical profile of velocity at CENICA, but none atTEDA.
6 Wind convergence
6.1 Convergence patterns from model simulations
Convergence zones form in the basin at the interface betweensoutherly gap winds and northerly plateau flows. On the re-gional scale, convergence zones are also formed due to theopposite flows from the sea breezes of the Pacific Ocean andof the Gulf of Mexico. These can be diagnosed by looking
www.atmos-chem-phys.net/6/1249/2006/ Atmos. Chem. Phys., 6, 1249–1265, 2006

1258 B. de Foy et al.: Basin convergence patterns due to gap winds
0 2 4 6 8 10 120
500
1000
1500
2000
2500
Wind Speed (m/s)
Hei
ght (
m a
gl)
16:00 CDT
0 2 4 6 8 10 120
500
1000
1500
2000
2500
Wind Speed (m/s)
19:00 CDT
N E S W N E S0
500
1000
1500
2000
2500
Wind Direction
Hei
ght (
m a
gl)
16:00 CDTO3SO3NCS
N E S W N E S W N0
500
1000
1500
2000
2500
Wind Direction
19:00 CDT
Fig. 9. Profiles of wind speed and direction from model resultsat Tenango del Aire (TEDA) in the Chalco passage for 16:00 and19:00 CDT. Boxplots of all the profiles segregated by episode typesare shown, bold lines indicates the median, thin lines the 25 and 75percentile and dotted lines the data range.
0 2 4 6 8 10 120
500
1000
1500
2000
2500
Wind Speed (m/s)
Hei
ght (
m a
gl)
16:00 CDT
0 2 4 6 8 10 120
500
1000
1500
2000
2500
Wind Speed (m/s)
19:00 CDT
N E S W N E S W N0
500
1000
1500
2000
2500
Wind Direction
Hei
ght (
m a
gl)
16:00 CDTO3SO3NCS
S W N E S W N E S0
500
1000
1500
2000
2500
Wind Direction
19:00 CDT
Fig. 10. Profiles of wind speed and direction from model results atCENICA for 16:00 and 19:00 CDT, as for Fig.9.
at vertical velocities above a given threshold, chosen to be0.5 m/s. For each column, the values at sigma level 17 werechosen as this corresponds to roughly 1300 m above ground
level. With mixing heights ranging from 1000 m to 4000 m,this level corresponds to a height were vertical velocities dueto local convergence are well established.
Figures11 to 13show such plots for the medium and finedomains for the three episode types, with convergence zonesfor a whole day coloured by time of day. O3-South days haveweak synoptic forcing and a much clearer signature of terraininduced flow. On the regional scale, convergence lines areformed from the meeting of the sea breezes from the Pacificand the Gulf. These are relatively stationary moving south-west only slightly during the afternoon. The combination ofterrain blocking from the east-west range of volcanoes form-ing the south of the basin and the flat Mexican plateau to thenorth of the basin leads to an advance of the convergence linewhich now passes through the MCMA. On the basin scale,the low level jet coming from the Chalco passage forms avery clear signature, starting at 15:00 and sweeping throughthe whole city by 22:00. Similar jets can be seen throughToluca to the west and past Puebla on the east, due to thesame terrain elevation differential between the plateaus to thenorth and the low-lying Cuautla valley to the south.
On O3-North days, the regional convergence line is now atthe edge of the Sierra Madre Oriental, due to the strength ofthe westerlies. In the basin, the low level jet is much strongerand leads to an early convergence zone that runs north–souththrough the centre of the city. On 23 April, the meeting pointof the gap flow and the winds coming over the basin rim ex-hibits some meandering in the northwest of the basin. Inaddition, later afternoon convection can be seen as east-westlines across the basin. Cloud formation in the model canbe seen in Fig.7 along the convergence lines. For 24 Aprilhowever there were no clouds and the convergence line isquite stationary. Three air masses can be seen pushing intothe basin: the gap flow from Chalco, the westerlies over theToluca pass to the west and the flow over the Ajusco moun-tain to the south.
For 8 April, strong cold northerly winds from the Gulf leadto up-slope flows on the edge of the Sierra Madre Oriental.The winds then continue over the Mexican plateau and high-lands meeting in a convergence zone nearer to the Pacificcoast. In the basin, the situation is complicated with strongconvective activity in the basin and slope flows on the basinedge. On 9 April, drier conditions lead to reduced convec-tion compared with 8 April and a clearer convergence zonealong the southwest of the country. In the basin, we now seethe convergence lines due to the low level jet radiating fromthe Chalco passage. There is still substantial cloudiness overthe MCMA however as can be seen in both Figs.7 and13.These are limited in both time and space however, with lateafternoon convergence above the mountains.
6.2 Verification with surface ozone and cloud imagery
Verification of the convergence lines is difficult to achieveby comparisons with instantaneous observed winds. Their
Atmos. Chem. Phys., 6, 1249–1265, 2006 www.atmos-chem-phys.net/6/1249/2006/

B. de Foy et al.: Basin convergence patterns due to gap winds 1259
15−
Apr
−20
0316
−A
pr−
2003
Convergence MM5 Dom2 Convergence MM5 Dom3 Daily Max RAMA Ozone GOES Composite
(40 − 146 ppb) 16:15
(10 − 180 ppb)
11
12
13
14
15
16
17
18
19
20
21
22
Hr
16:15
Fig. 11. Convergence lines for O3-South, 15 and 16 April for the medium and fine domain. Each convergence line is coloured by time ofday per the colourbar. Surface RAMA ozone concentrations in the basin are shown going from blue to red (highest). GOES cloud imageryfor an area similar to the medium domain courtesy of GOES Biomass Burning Monitoring Team, UW-Madison, Cooperative Institute forMeteorological Satellite Studies (CIMSS).
23−
Apr
−20
0324
−A
pr−
2003
Convergence MM5 Dom2 Convergence MM5 Dom3 Daily Max RAMA Ozone GOES Composite
(42 − 209 ppb) 18:15
(64 − 210 ppb)
11
12
13
14
15
16
17
18
19
20
21
22
Hr
16:15
Fig. 12. Convergence lines, ozone and cloud imagery for O3-North, 23 and 24 April, see Fig.11.
impact on the basin circulation can be seen however by look-ing at the transport of pollutants and water vapour. The max-imum daily ozone measured by RAMA in the MCMA alongwith a GOES visible image taken in the afternoon are shownalongside the convergence patterns in Figs.11 to 13.
O3-South days have high ozone peaks in the southwest, aswould be predicted from the convergence patterns. In par-ticular, ozone is higher on 16 April than on 15 April due tothe delayed gap flow. The Goes image shows very clearlythe low level clouds on the Gulf coast plains due to the sea
breeze. Scattered cloud formation is limited to the high vol-canoes due to the dry prevailing conditions.
On O3-North days the ozone peak is in the northwest ofthe city, due to the gap flow pushing all the pollutants backthrough the basin to the northwest. The peaks are equiva-lent for 23 and 24 April, but on the 23 the spatial extent islarger and on the 24 the peak is further to the east. This is inaccordance with the convergence lines that are meanderingover the northwest on the first day, and oriented towards thenortheast with stronger westerlies flushing the basin on the
www.atmos-chem-phys.net/6/1249/2006/ Atmos. Chem. Phys., 6, 1249–1265, 2006

1260 B. de Foy et al.: Basin convergence patterns due to gap winds
08−
Apr
−20
0309
−A
pr−
2003
Convergence MM5 Dom2 Convergence MM5 Dom3 Daily Max RAMA Ozone GOES Composite
(43 − 147 ppb) 16:15
(43 − 122 ppb)
11
12
13
14
15
16
17
18
19
20
21
22
Hr
16:15
Fig. 13. Convergence lines, ozone and cloud imagery for Cold Surge, 8 and 9 April, see Fig.11.
Table 1. Froude numbers based on model Brunt-Vaisala frequencyand representative mean velocity for mountain heights of 1000 m,representing the western ridge and 1500 m representing the volca-noes to the east.
U Nbv λ=2πUNbv
Froude No.= λh
m/s s−1 m h=1000 m h=1500 m
0.005 12 500 12.5 8.410 0.01 6300 6.3 4.2
0.015 4200 4.2 2.8
second day. There is much less cloudiness on the plains fromgulf breezes, but there is convection on the edge of the SierraMadre Oriental, as suggested by the convergence lines thatare very sharply located over the ridge. Afternoon convec-tion in the basin can be clearly see on 23 April, whereas 24April has clear skies.
Cold Surge days have low ozone levels with maxima in thesouth of the basin, confirming wind transport to the south. On8 April, ozone peaks are in the southwest in accordance withearly afternoon convergence resulting from northerly flowmeeting the Ajusco mountain. On 9 April, the peak is tothe southeast which is where a small gap flow is forming ow-ing to the clearer sky conditions on this day. Cloud transportto the eastern flanks of the Sierra Madre Oriental shows thenortherly flows, followed by strong convection over the Mex-ican plateau and above the basin once the winds pass over themountain edge.
7 Discussion
The Froude number determines the impact of complex ter-rain on wind circulation. The Brunt-Vaisala frequency wascalculated from model output and found to be in the rangeof 0.005 to 0.015 s−1 over the basin. Taking a mean free ve-locity of 10 m/s as representative of the conditions near themountain tops, and distances of 1000 and 1500 m as repre-sentative of the mountain ridge heights above basin level onthe eastern and western side yielded Froude numbers in therange of 2.8 to 12.5, see Table1. Because these are alwaysgreater than one, the wind flow can be expected to be over themountain tops with limited mountain waves. The primary ef-fect of the mountains is therefore due more to the generationof up-slope and drainage flows rather than to the disruptionof the mean tropospheric flow.
During the IMADA campaign, the jet forming in theChalco passage was directly measured by a wind profiler.Radiosonde profiles of temperature and humidity were madeat 4 locations in the basin and one on the southern basin rimat several times during the day. A low level jet was definedas taking place when winds in the bottom 337 m were above6 m/s with a 4 m/s reduction below 1000 ma.g.l.. Jets wereobserved on 20 of the 29 study days and further split into 3categories based on strength.
The jet strength was then shown to correlate with two dif-ferent temperature differentials across the basin. The firstwas the average temperature difference in the range of 2800to 3200 m a.s.l. between the Tres Marias site on the south-ern basin rim and the average of 3 radiosondes in the basinat 13:30 CST. The second was the average difference in tem-perature in the range of 2250 to 3150 m a.s.l. between theMexico City and Acapulco radiosondes at 18:00 CST. Based
Atmos. Chem. Phys., 6, 1249–1265, 2006 www.atmos-chem-phys.net/6/1249/2006/
B. de Foy et al.: Basin convergence patterns due to gap winds 1261
on this correlation, it was suggested that thermal forcing isthe main cause of the jets.
During MCMA-2003, there were no direct observationsof the wind profiles in the Chalco passage and no radiosondeobservations from which to get a thermal balance across thebasin rim. A wind flow indicator would therefore need to bebased on routine surface observations in the basin. Becauseconvergence zones were simulated on most days of the cam-paign, an indicator was sought that would represent the influxof southerly air into the basin for all days of MCMA-2003.
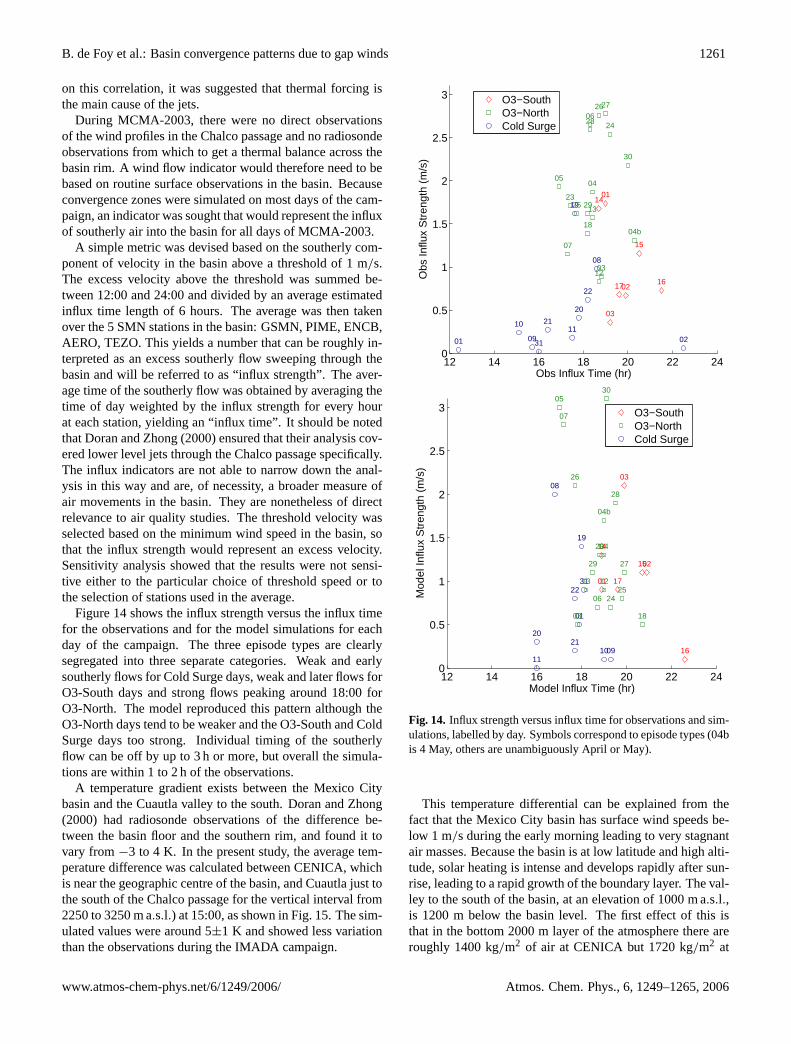
A simple metric was devised based on the southerly com-ponent of velocity in the basin above a threshold of 1 m/s.The excess velocity above the threshold was summed be-tween 12:00 and 24:00 and divided by an average estimatedinflux time length of 6 hours. The average was then takenover the 5 SMN stations in the basin: GSMN, PIME, ENCB,AERO, TEZO. This yields a number that can be roughly in-terpreted as an excess southerly flow sweeping through thebasin and will be referred to as “influx strength”. The aver-age time of the southerly flow was obtained by averaging thetime of day weighted by the influx strength for every hourat each station, yielding an “influx time”. It should be notedthatDoran and Zhong(2000) ensured that their analysis cov-ered lower level jets through the Chalco passage specifically.The influx indicators are not able to narrow down the anal-ysis in this way and are, of necessity, a broader measure ofair movements in the basin. They are nonetheless of directrelevance to air quality studies. The threshold velocity wasselected based on the minimum wind speed in the basin, sothat the influx strength would represent an excess velocity.Sensitivity analysis showed that the results were not sensi-tive either to the particular choice of threshold speed or tothe selection of stations used in the average.
Figure14 shows the influx strength versus the influx timefor the observations and for the model simulations for eachday of the campaign. The three episode types are clearlysegregated into three separate categories. Weak and earlysoutherly flows for Cold Surge days, weak and later flows forO3-South days and strong flows peaking around 18:00 forO3-North. The model reproduced this pattern although theO3-North days tend to be weaker and the O3-South and ColdSurge days too strong. Individual timing of the southerlyflow can be off by up to 3 h or more, but overall the simula-tions are within 1 to 2 h of the observations.
A temperature gradient exists between the Mexico Citybasin and the Cuautla valley to the south.Doran and Zhong(2000) had radiosonde observations of the difference be-tween the basin floor and the southern rim, and found it tovary from−3 to 4 K. In the present study, the average tem-perature difference was calculated between CENICA, whichis near the geographic centre of the basin, and Cuautla just tothe south of the Chalco passage for the vertical interval from2250 to 3250 m a.s.l.) at 15:00, as shown in Fig.15. The sim-ulated values were around 5±1 K and showed less variationthan the observations during the IMADA campaign.
12 14 16 18 20 22 240
0.5
1
1.5
2
2.5
3
3101 02
03
0405
06
07
08
09
1011
12
1314
15
1617
18
19
20
21
22
23
24
25
2627
28
29
30
01
02
03
04b
Obs Influx Time (hr)
Obs
Influ
x S
tren
gth
(m/s
)
O3−SouthO3−NorthCold Surge
12 14 16 18 20 22 240
0.5
1
1.5
2
2.5
3
31
0103
04
05
06
07
08
091011
1213
14
15
16
17
18
19
2021
22
23
2425
26
27
28
29
30
01
02
03
04b
Model Influx Time (hr)
Mod
el In
flux
Str
engt
h (m
/s)
O3−SouthO3−NorthCold Surge
Fig. 14. Influx strength versus influx time for observations and sim-ulations, labelled by day. Symbols correspond to episode types (04bis 4 May, others are unambiguously April or May).
This temperature differential can be explained from thefact that the Mexico City basin has surface wind speeds be-low 1 m/s during the early morning leading to very stagnantair masses. Because the basin is at low latitude and high alti-tude, solar heating is intense and develops rapidly after sun-rise, leading to a rapid growth of the boundary layer. The val-ley to the south of the basin, at an elevation of 1000 m a.s.l.,is 1200 m below the basin level. The first effect of this isthat in the bottom 2000 m layer of the atmosphere there areroughly 1400 kg/m2 of air at CENICA but 1720 kg/m2 at
www.atmos-chem-phys.net/6/1249/2006/ Atmos. Chem. Phys., 6, 1249–1265, 2006

1262 B. de Foy et al.: Basin convergence patterns due to gap winds
0 0.5 1 1.5 2 2.5 3−6
−4
−2
0
2
4
6
01
02
03
05
06
07
08
10
11
121416
17
18
1921
22
24
25
26
2829
30
01
02
03
Obs Influx Strength (m/s)
Obs
Δ T
19:0
0 −
07:
00 C
DT G
SM
N, 2
250−
3250
m a
sl (
K)
O3−SouthO3−NorthCold Surge
0 0.5 1 1.5 2 2.5 31
2
3
4
5
6
7
31
01
0203
04
05
06
07
08
09
10
11
12
13
14
15
16
17 1819
2021
22 23
2425
26
27
28
29 30
0102
03
04b
Obs Influx Strength (m/s)
Mod
el Δ
TC
EN
ICA
− C
uaut
la 1
5:00
, 225
0−32
50 m
asl
(K
)
O3−SouthO3−NorthCold Surge
Fig. 15.Temperature differences in the bottom 1000 m versus influxstrength.(a) Temperature difference at GSMN between 19:00 and07:00 measured by radiosonde.(b) Model temperature differencesbetween CENICA and Cuautla, to the south of the gap at 15:00.Lines of best fit from Table2 shown.
Cuautla. For equivalent surface heating, this leads to an av-erage diurnal temperature variation at CENICA of 5 K andat Cuautla of 3.5 K. Because this leads to lower mixingheights at Cuautla, the temperature at equivalent heights ishigher at CENICA, leading to temperature gradients betweenCENICA and Cuautla in the 2250 to 3250 m a.s.l. range ofaround 5 K.
Table 2. Least squares fit (y=mx+c) for correlation of influxstrength with temperature gradient across the basin rim and winddirection aloft by episode type, with 95% confidence bound onm
and correlation coefficient of the fit.
1T vs. Influx Strength WD vs. Influx StrengthO3-South O3-North O3-South O3-North
m 0.23 −.01 −55 −795% bounds onm −0.4, 0.8 −0.5, 0.5 −82,−28 −25, 11
c 5.1 5.3 24 −88r2 0.16 0.00 0.84 0.05
The other temperature differential used byDoran andZhong(2000) was between the GSMN and Acapulco sound-ings at 19:00. This later sounding was not available duringMCMA-2003. Analysing previous soundings shows how-ever that there is little difference in temperature at that heightrange between the 07:00 and 19:00 soundings. Furthermore,there is little difference between the Acapulco and MexicoCity soundings for this same height range at 07:00. The tem-perature difference between GSMN and Acapulco at 19:00is therefore a proxy for the heating in the Mexico City basinduring the day. Figure15a plots the influx strength versusthe temperature difference in the bottom 1000 m layer aboveground level at GSMN between the 07:00 and 19:00 sound-ings. Substantial heating takes place on nearly all of the days.There is a clear difference between the Cold Surge days withsmall temperature differences and the O3-South days withlarger differences. Overall however there is no clear patternbetween the influx strength and the temperature difference.
Figure 15b plots the model simulated temperature dif-ference between CENICA and Cuautla versus the influxstrength. Table2 shows the parameters for a linear fit to thedata by episode. For O3-South episodes there is a slight pos-itive correlation of temperature gradient and influx strengthwith anr2 of 0.16, but 95% confidence interval so large as tobe meaningless. For O3-North days there is no correlation atall.
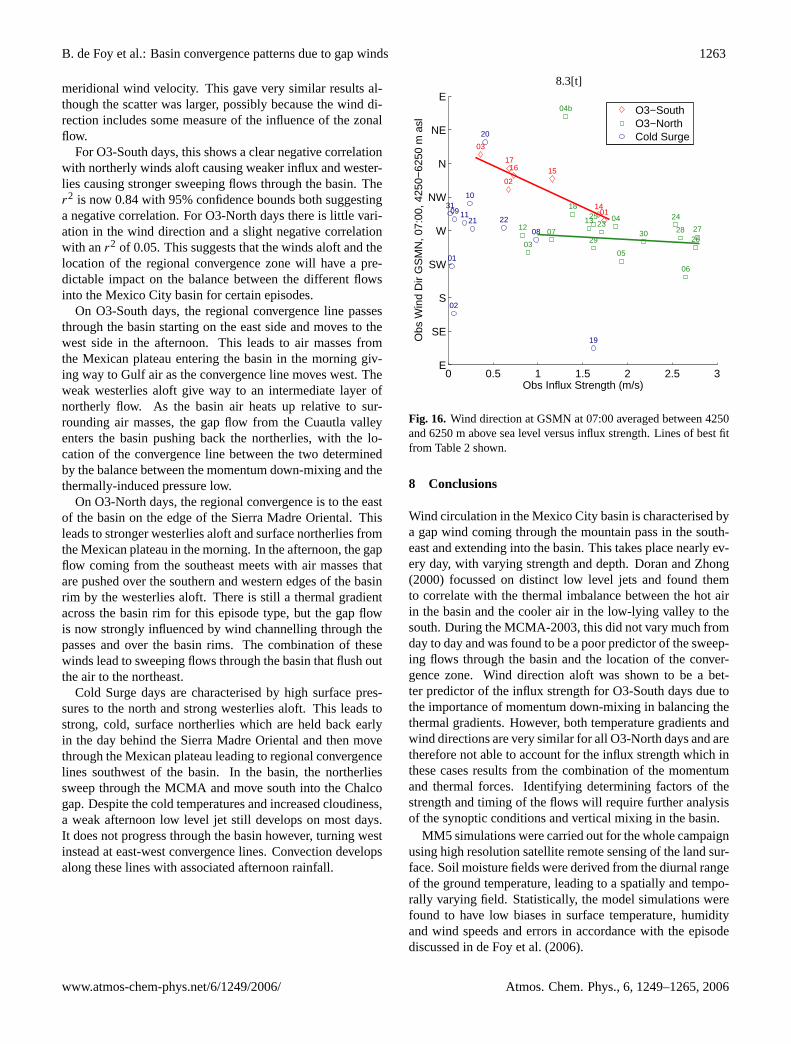
Because the temperature differentials in the model do notvary very much, it was hypothesised that the wind directionaloft would influence the influx strength.Banta and Cot-ton (1981) describe the influence of this on basin winds inSouth Park, Colorado. The mixing layer causes momentumexchange between the synoptic flow and the surface layerleading to “afternoon westerlies” in the basin. The influxstrength was therefore plotted versus average wind directionat the top of the boundary layer (4250 to 6250 m a.s.l.) forthe 07:00 sounding, as shown in Fig.16. For the 4 caseswhere the 07:00 sounding was missing, data was taken fromthe 13:00 or 19:00 sounding depending on availability. Analternative to the wind direction would have been to use the
Atmos. Chem. Phys., 6, 1249–1265, 2006 www.atmos-chem-phys.net/6/1249/2006/
B. de Foy et al.: Basin convergence patterns due to gap winds 1263
meridional wind velocity. This gave very similar results al-though the scatter was larger, possibly because the wind di-rection includes some measure of the influence of the zonalflow.
For O3-South days, this shows a clear negative correlationwith northerly winds aloft causing weaker influx and wester-lies causing stronger sweeping flows through the basin. Ther2 is now 0.84 with 95% confidence bounds both suggestinga negative correlation. For O3-North days there is little vari-ation in the wind direction and a slight negative correlationwith anr2 of 0.05. This suggests that the winds aloft and thelocation of the regional convergence zone will have a pre-dictable impact on the balance between the different flowsinto the Mexico City basin for certain episodes.
On O3-South days, the regional convergence line passesthrough the basin starting on the east side and moves to thewest side in the afternoon. This leads to air masses fromthe Mexican plateau entering the basin in the morning giv-ing way to Gulf air as the convergence line moves west. Theweak westerlies aloft give way to an intermediate layer ofnortherly flow. As the basin air heats up relative to sur-rounding air masses, the gap flow from the Cuautla valleyenters the basin pushing back the northerlies, with the lo-cation of the convergence line between the two determinedby the balance between the momentum down-mixing and thethermally-induced pressure low.
On O3-North days, the regional convergence is to the eastof the basin on the edge of the Sierra Madre Oriental. Thisleads to stronger westerlies aloft and surface northerlies fromthe Mexican plateau in the morning. In the afternoon, the gapflow coming from the southeast meets with air masses thatare pushed over the southern and western edges of the basinrim by the westerlies aloft. There is still a thermal gradientacross the basin rim for this episode type, but the gap flowis now strongly influenced by wind channelling through thepasses and over the basin rims. The combination of thesewinds lead to sweeping flows through the basin that flush outthe air to the northeast.
Cold Surge days are characterised by high surface pres-sures to the north and strong westerlies aloft. This leads tostrong, cold, surface northerlies which are held back earlyin the day behind the Sierra Madre Oriental and then movethrough the Mexican plateau leading to regional convergencelines southwest of the basin. In the basin, the northerliessweep through the MCMA and move south into the Chalcogap. Despite the cold temperatures and increased cloudiness,a weak afternoon low level jet still develops on most days.It does not progress through the basin however, turning westinstead at east-west convergence lines. Convection developsalong these lines with associated afternoon rainfall.
8.3[t]
0 0.5 1 1.5 2 2.5 3E
SE
S
SW
W
NW
N
NE
E
31
01
02
03
04
05
06
0708
09
10
11
1213
14
151617
18
19
20
21 22 232425
262728
2930
01
02
03
04b
Obs Influx Strength (m/s)
Obs
Win
d D
ir G
SM
N, 0
7:00
, 425
0−62
50 m
asl
O3−SouthO3−NorthCold Surge
Fig. 16. Wind direction at GSMN at 07:00 averaged between 4250and 6250 m above sea level versus influx strength. Lines of best fitfrom Table2 shown.
8 Conclusions
Wind circulation in the Mexico City basin is characterised bya gap wind coming through the mountain pass in the south-east and extending into the basin. This takes place nearly ev-ery day, with varying strength and depth.Doran and Zhong(2000) focussed on distinct low level jets and found themto correlate with the thermal imbalance between the hot airin the basin and the cooler air in the low-lying valley to thesouth. During the MCMA-2003, this did not vary much fromday to day and was found to be a poor predictor of the sweep-ing flows through the basin and the location of the conver-gence zone. Wind direction aloft was shown to be a bet-ter predictor of the influx strength for O3-South days due tothe importance of momentum down-mixing in balancing thethermal gradients. However, both temperature gradients andwind directions are very similar for all O3-North days and aretherefore not able to account for the influx strength which inthese cases results from the combination of the momentumand thermal forces. Identifying determining factors of thestrength and timing of the flows will require further analysisof the synoptic conditions and vertical mixing in the basin.
MM5 simulations were carried out for the whole campaignusing high resolution satellite remote sensing of the land sur-face. Soil moisture fields were derived from the diurnal rangeof the ground temperature, leading to a spatially and tempo-rally varying field. Statistically, the model simulations werefound to have low biases in surface temperature, humidityand wind speeds and errors in accordance with the episodediscussed inde Foy et al.(2006).
www.atmos-chem-phys.net/6/1249/2006/ Atmos. Chem. Phys., 6, 1249–1265, 2006
1264 B. de Foy et al.: Basin convergence patterns due to gap winds
Wind convergence patterns over Mexico can be clearlyidentified by plotting the vertical velocity above a giventhreshold near the top of the surface layer. Combining thesefor every hour of the afternoon into a single map shows thedevelopment of the convergence zones. The Mexico Citybasin circulation was shown to depend on the interaction oftwo convergence zones: those resulting from the sea breezesfrom the Pacific Ocean and the Gulf of Mexico, and thoseformed from the interaction of gap winds with northerly day-time flows in the basin. The resulting basin convergencepatterns fit into the three episode types proposed inde Foyet al. (2005). O3-South days have a convergence lines radi-ating northwards from the Chalco gap, moving through thebasin in the late afternoon and early evening. O3-North dayshave north–south convergence lines through the middle ofthe MCMA due to the meeting of the gap flow with surfacewesterlies over the southern and western edges of the basin.Cold Surge days have east-west convergence line across thebasin leading to cumulus convection and rainfall.
Verification of the convergence patterns was made pos-sible by analysing surface ozone patterns in the basin andcloud formation observed by satellite. The spatial distribu-tion of surface ozone can be clearly linked to the location ofthe afternoon convergence lines. Cloud patterns act as clearindicators of sea-breeze fronts and moist air movements overthe mountains as well as convection lines in the basin. Thesewere shown to correspond to the model simulated conver-gence lines on both the regional and local scale. An improvedunderstanding of the transport processes in the Mexico Citybasin will improve air quality forecasts in the MCMA andfacilitate the evaluation of the regional impact of the MCMAplume. The increased understanding of the chemical regimesof the urban atmosphere will improve the evaluation of pollu-tion control policies and the mitigation of health effects suf-fered by the people of the MCMA.
Acknowledgements.The analysis contained in this paper was madepossible by the collaborative efforts of many people involved in fieldmeasurements, both during the campaign and over longer periods oftime. We are indebted to the staff of CENICA who hosted the cam-paign and would like to thank B. Cardenas, S. Blanco, A. Sanchez,O. Fentanes, J. Zaragoza, A. P. Ocampo, C. Cruz, C. Aguirre,R. Romo, A. Pino, R. Castaneda, R. Rodrıguez, P. Escamilla as wellas R. Ramos, A. Retama and the operators and analyst personnel ofthe “Red Automatica de Monitoreo Atmosferico del Gobierno delDistrito Federal” for their contribution in administering and gather-ing the data used in this manuscript. We are grateful to M. Rosen-gaus, J. L. Razo, J. Olalde and P. Garcıa of the Mexican NationalMeteorological Service for providing the EHCA and Radiosondedata.
MM5 is made publicly available and supported by the Mesoscaleand Microscale Meteorology division at the National Center for At-mospheric Research. Their dedication and hard work is gratefullyacknowledged. The satellite data used in this study were acquired aspart of the NASA’s Earth Science Enterprise. The algorithms weredeveloped by the MODIS Science Teams. The data were processed
by the MODIS Adaptive Processing System (MODAPS) and God-dard Distributed Active Archive Center (DAAC), and are archivedand distributed by the Goddard DAAC.
We thank A. Garcıa and A. Jazcilevich of the Universidad NacionalAutonoma de Mexico, A. Soler and F. Hernandez of the Secretarıadel Medio Ambiente, Gobierno del Distrito Federal, Mexicoand J. Fast of Pacific Northwest National Laboratory for helpfuldiscussions. The reviews from two anonymous referees wereparticularly helpful in clarifying the discussion and improving thequality of the paper. The financial support from the US NationalScience Foundation (Award ATM-0511803), the US Departmentof Energy (Award DE-FG02-05ER63980), the Alliance for GlobalSustainability and the Molina Center for Strategic Studies in Energyand the Environment for this work is gratefully acknowledged.
Edited by: C. E. Kolb
References
Banta, R. and Cotton, W. R.: An analysis of the structure of localwind systems in a broad mountain basin, J. Appl. Meteorol., 20,1255–1266, 1981.
Banta, R. M., Darby, L. S., Fast, J. D., Pinto, J. O., Whiteman,C. D., Shaw, W. J., and Orr, B. W.: Nocturnal low-level jet in amountain basin complex. part I: Evolution and effects on localflows, J. Appl. Meteorol., 43, 1348–1365, 2004.
Bossert, J. E.: An investigation of flow regimes affecting the Mex-ico City region, J. Appl. Meteorol., 36, 119–140, 1997.
de Foy, B., Caetano, E., Magana, V., Zitacuaro, A., Cardenas, B.,Retama, A., Ramos, R., Molina, L. T., and Molina, M. J.: MexicoCity basin wind circulation during the MCMA-2003 field cam-paign, Atmos. Chem. Phys., 5, 2267–2288, 2005.
de Foy, B., Molina, L. T., and Molina, M. J.: Satellite-derived landsurface parameters for mesoscale modelling of the Mexico Citybasin, Atmos. Chem. Phys., 6, 1315–1330, 2006.
Doran, J. C. and Zhong, S.: Thermally driven gap winds into theMexico City basin, J. Appl. Meteorol., 39, 1330–1340, 2000.
Doran, J. C., Abbott, S., Archuleta, J., Bian, X., Chow, J., Coulter,R. L., de Wekker, S. F. J., Edgerton, S., Elliott, S., Fernandez, A.,Fast, J. D., Hubbe, J. M., King, C., Langley, D., Leach, J., Lee,J. T., Martin, T. J., Martinez, D., Martinez, J. L., Mercado, G.,Mora, V., Mulhearn, M., Pena, J. L., Petty, R., Porch, W., Russell,C., Salas, R., Shannon, J. D., Shaw, W. J., Sosa, G., Tellier, L.,Templeman, B., Watson, J. G., White, R., Whiteman, C. D., andWolfe, D.: The IMADA-AVER boundary layer experiment in theMexico City area, Bull. Amer. Met. Soc., 79, 2497–2508, 1998.
Doran, J. C., Fast, J. D., and Horel, J.: The VTMX 2000 campaign,Bull. Amer. Met. Soc., 83, 537–551, 2002.
Fast, J. D. and Zhong, S. Y.: Meteorological factors associated withinhomogeneous ozone concentrations within the Mexico Citybasin, J. Geophys. Res.-Atmos., 103, 18 927–18 946, 1998.
Grell, G. A., Dudhia, J., and Stauffer, D. R.: A Description of theFifth-Generation Penn State/NCAR Mesoscale Model (MM5),Tech. Rep. NCAR/TN-398+STR, NCAR, 1995.
Jazcilevich, A. D., Garcıa, A. R., and Ruiz-Suarez, L. G.: A study ofair flow patterns affecting pollutant concentrations in the CentralRegion of Mexico, Atmos. Environ., 37, 183–193, 2003.
Atmos. Chem. Phys., 6, 1249–1265, 2006 www.atmos-chem-phys.net/6/1249/2006/
B. de Foy et al.: Basin convergence patterns due to gap winds 1265
Jazcilevich, A. D., Garcia, A. R., and Caetano, E.: Locally inducedsurface air confluence by complex terrain and its effects on airpollution in the valley of Mexico, Atmos. Environ., 39, 5481–5489, 2005.
Kimura, F. and Kuwagata, T.: Thermally-induced wind passingfrom plain to basin over a mountain-range, J. Appl. Meteorol.,32, 1538–1547, 1993.
Kossmann, M. and Fiedler, F.: Diurnal momentum budget analy-sis of thermally induced slope winds, Meteorology AtmosphericPhys., 75, 195–215, 2000.
Kossmann, M., Sturman, A. P., Zawar-Reza, P., McGowan, H. A.,Oliphant, A. J., Owens, I. F., and Spronken-Smith, R. A.: Anal-ysis of the wind field and heat budget in an alpine lake basinduring summertime fair weather conditions, Meteorol. Atmos.Phys., 81, 27–52, 2002.
Liu, M., Westphal, D. L., Holt, T. R., and Xu, Q.: Numerical sim-ulation of a low-level jet over complex terrain in southern Iran,Mon. Weather Rev., 128, 1309–1327, 2000.
Mayr, G. J., Armi, L., Arnold, S., Banta, R. M., Darby, L. S.,Durran, D. D., Flamant, C., Gabersek, S., Gohm, A., Mayr,R., Mobbs, S., Nance, L. B., Vergeiner, I., Vergeiner, J., andWhiteman, C. D.: Gap flow measurements during the MesoscaleAlpine Programme, Meteorol. Atmos. Phys., 86, 99–119, 2004.
Molina, L. T. and Molina, M. J. (Eds.): Air Quality in the MexicoMegacity, Kluwer Academic Publishers, 2002.
Regmi, R. P., Kitada, T., and Kurata, G.: Numerical simulation oflate wintertime local flows in Kathmandu valley, Nepal: Implica-tion for air pollution transport, J. Appl. Meteorol., 42, 389–403,2003.
Rife, D. L., Davis, C. A., Liu, Y. B., and Warner, T. T.: Predictabilityof low-level winds by mesoscale meteorological models, Mon.Wea. Rev., 132, 2553–2569, 2004.
Schultz, D. M., Bracken, W. E., and Bosart, L. F.: Planetary- andsynoptic-scale signatures associated with central American coldsurges, Mon. Wea. Rev., 126, 5–27, 1998.
Stensrud, D. J.: Importance of low-level jets to climate: a review, J.Climate, 9, 1698–1711, 1996.
Whiteman, C. D., Zhong, S., Bian, X., Fast, J. D., and Doran, J. C.:Boundary layer evolution and regional-scale diurnal circulationsover the Mexico Basin and Mexican Plateau, J. Geophys. Res.-Atmos., 105, 10 081–10 102, 2000.
Zangl, G., Chimani, B., and Haberli, C.: Numerical Simulations ofthe Foehn in the Rhine Valley on 24 October 1999 (MAP IOP10), Mon. Wea. Rev., 132, 368–389, 2004.
www.atmos-chem-phys.net/6/1249/2006/ Atmos. Chem. Phys., 6, 1249–1265, 2006