determination of the erosive susceptibility from … · determination of the erosive susceptibility...
TRANSCRIPT
DETERMINATION OF THE EROSIVE SUSCEPTIBILITYFROM A HYDROGRAPHIC BASIN USING FREE
AVAILABLE GEO-TECHNOLOGY
João Lucas Alves da SILVA1
Vinícius de Oliveira RIBEIRO2
Leonardo Lima dos SANTOS3
Abstract
Erosion is a natural process resulting from the interaction of rainfall and soil,which is enhanced by factors such as inadequate management of soil and removal ofvegetation cover. This causes an excessive production of sediments, generatingphenomena such as eutrophication and silting of watercourses. The Universal Soil LossEquation (USLE), allows to estimate erosion under different land use/land conditions aswell as under variable slope, slope length, soil types and rainfall. It allows the elaborationof thematic maps and it is an important research tool to analyze the erosive process.When applied with open and free available geo-technologies, it dramatically reduces thecosts of performing the study. This study aimed to map and analyze qualitatively theerosive susceptibility of the Laranja Doce hydrographic basin, located in the city of Dourados� Mato Grosso do Sul State in the year of 2016, applying the USLE and geo-technologiesthat are available free on Internet. The average annual soil losses ranging 0-33 ton/ha/year were obtained. Most of the area was classified with Low to Moderate Erosion since itserosive rate was lower than 15 ton/ha/year. It was observed that the spatial distributionof erosion is influenced especially by the soil cover and relief features described by theCP and LS factors, respectively.
Key words: Erosion. Free geo-technologies. QGIS.
1 Environmental Engineering Student - Universidade Estadual de Mato Grosso do Sul � UEMS.Cidade Universitária de Dourados - Rodovia Itahum, Km 12, s/n - Jardim Aeroporto, 79804-970,Dourados � MS. E-mail: [email protected]
2 Researcher and Professor of Environmental Engineering -Universidade Estadual de Mato Grossodo Sul � UEMS. Cidade Universitária de Dourados - Rodovia Itahum, Km 12, s/n - Jardim Aeroporto,79804-970, Dourados � MS. E-mail: [email protected]
3 Environmental Engineering Student - Universidade Estadual de Mato Grosso do Sul � UEMS.Cidade Universitária de Dourados - Rodovia Itahum, Km 12, s/n - Jardim Aeroporto, 79804-970,Dourados � MS. E-mail: [email protected]
GEOGRAFIA, Rio Claro, v. 42, n. 3, Especial - GeoPantanal 6, p. 57-70, set./dez. 2017
5 8 GEOGRAFIADetermination of the erosive susceptibility from a hydrographic
basin using free available geo-technology
Resumo
Determinação da susceptibilidade erosiva de bacia hidrográficautilizando geotecnologias livres e gratuitas
A erosão hídrica é um processo natural que decorre da interação das chuvas e dosolo, a qual é potencializada por fatores como o manejo inadequado deste solo eretirada da cobertura vegetal, o que causa a produção excessiva de sedimentos, gerandofenômenos como a eutrofização dos corpos d�água e também o assoreamento destes.A Equação Universal de Perda do Solo (USLE), permite estimar a erosão, sob variadascondições de uso e cobertura do solo, declividade, comprimento de rampa, tipos desolo e chuva, e por meio da elaboração de mapas temáticos representa importanteinstrumento de investigação sobre o processo erosivo. Quando aplicada por meio degeotecnologias livres e gratuitas, reduz drasticamente os gastos de execução do estudo.Este trabalho teve por objetivo mapear e analisar qualitativamente a susceptibilidadeerosiva dos solos da bacia hidrográfica do córrego Laranja Doce, localizada no municípiode Dourados � MS no ano de 2016, por meio da aplicação da Equação Universal dePerda do Solo � USLE e das geotecnologias disponíveis de forma gratuita na rede.Obteve-se perdas médias anuais de solo variando de 0 a 33 ton/ha.ano. A maior parteda área é classificada com erosão nula a moderada por possuir taxa erosiva menor que15 ton/ha.ano. Observou-se que a distribuição espacial da erosão é influenciadaprincipalmente pela cobertura vegetal do solo e das características do relevodemonstradas através dos fatores CP e LS respectivamente.
Palavras-chave: Erosão. USLE. QGIS.
INTRODUCTION
Water erosion is a natural process resulting from the interaction of rainfall andsoil. This interaction is potentiated by factors such as the inadequate management ofthis soil and removal of vegetation cover, which causes excessive sediment production,generating phenomena such as eutrophication and siltation of water bodies (SPATTIJUNIOR, 2011). These processes eliminate or reduce the flow of fountains, modify theflow of the drainage in river channels and decrease the useful life of reservoirs.
In addition to release of particles that will clog soil pores, the impact of raindrops on the unprotected soil causing its thickening, resulting in the sealing of itssurface and, therefore reducing the water infiltration capacity (SILVA et al., 1995).
The Universal Soil Loss Equation (USLE) (WISCHMEIER; SMITH, 1978) is anempirical model to estimate the average annual loss of soil by laminar erosion, whichrepresents an important investigative tool to study the erosion process. Thecharacteristics and properties of properties of the environmental factors are responsiblefor soil losses, allowing partitioning of the landscape into instability levels, thus permittingeffective actions of planning and optimization of natural resources (WISCHMEIER ANDSMITH, 1978).
Geographic Information Systems facilitated the application of USLE at variousscales, as they are particularly useful for handling heterogeneous data such astopographic charts, soil charts, land cover, land use, meteorological data, etc. Althoughthey are of different nature and scale, these charts supplemented with other informationallow the quantitative estimation of the eroded soil, per year, caused by the rainwaterflow along the slopes.
5 9Silva, J. L. A. da / Ribeiro, V. de O. /
Santos, L. L. dosv. 42, n. 3, set./dez. 2017
Paranhos Filho et al. (2015) modeled USLE in a GIS environment using openand free geo-technologies to analyze qualitatively the soil erosion susceptibility in amunicipality in Mato Grosso do Sul State. These authors concluded that GIS are a toolof great efficiency to characterize areas susceptible to laminar erosion, allowing thequick and easy acquisition, manipulation and integration of data.
OBJECTIVE
The objective of this study is to map and qualitatively analyze the erosivesusceptibility of the soil from the Laranja Doce hydrographic basin, located in the cityof Dourados, Mato Grosso do Sul State, using the Universal Soil Loss Equation (USLE)and the free geo-technologies available at Internet.
MATERIALS AND METHODS
Area under study
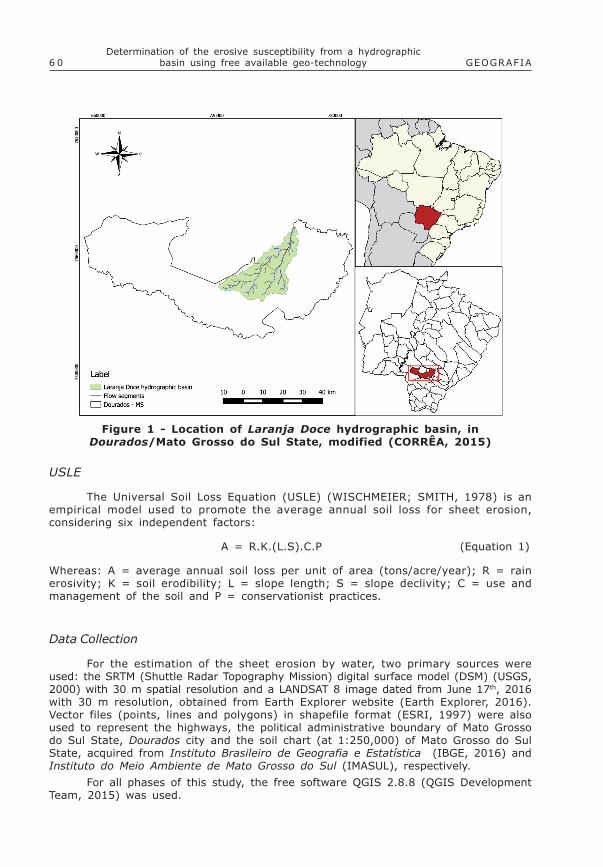
The area under study is the Laranja Doce micro basin, delimited by latitude S21°55� - 22°16� and longitude WGr 54°28� - 54°52�, extending over an area of about715 km², with a length of 57.49 km in NE - SW direction involving two cities: Douradosand Douradina (SOARES FILHO, 2006).
The micro basin is located within the Paraná hydrographic system, the IvinhemaRiver sub-basin and the Bilhante River basin. About 80% of its area is located in thecity of Dourados and the other 20% in the city of Douradina, both in Mato Grosso doSul.
Among the main streams that flow across the city, only Laranja Doce crossesthe north of it, in the W-E direction, presenting the largest volume of water among allthese streams and the longest length in the urban perimeter. The stream has its springsin the city of Dourados / Mato Grosso do Sul State and its mouth flows into the BrilhanteRiver. Its location is shown in Figure 1.
6 0 GEOGRAFIADetermination of the erosive susceptibility from a hydrographic
basin using free available geo-technology
USLE
The Universal Soil Loss Equation (USLE) (WISCHMEIER; SMITH, 1978) is anempirical model used to promote the average annual soil loss for sheet erosion,considering six independent factors:
A = R.K.(L.S).C.P (Equation 1)
Whereas: A = average annual soil loss per unit of area (tons/acre/year); R = rainerosivity; K = soil erodibility; L = slope length; S = slope declivity; C = use andmanagement of the soil and P = conservationist practices.
Data Collection
For the estimation of the sheet erosion by water, two primary sources wereused: the SRTM (Shuttle Radar Topography Mission) digital surface model (DSM) (USGS,2000) with 30 m spatial resolution and a LANDSAT 8 image dated from June 17th, 2016with 30 m resolution, obtained from Earth Explorer website (Earth Explorer, 2016).Vector files (points, lines and polygons) in shapefile format (ESRI, 1997) were alsoused to represent the highways, the political administrative boundary of Mato Grossodo Sul State, Dourados city and the soil chart (at 1:250,000) of Mato Grosso do SulState, acquired from Instituto Brasileiro de Geografia e Estatística (IBGE, 2016) andInstituto do Meio Ambiente de Mato Grosso do Sul (IMASUL), respectively.
For all phases of this study, the free software QGIS 2.8.8 (QGIS DevelopmentTeam, 2015) was used.
Figure 1 - Location of Laranja Doce hydrographic basin, inDourados/Mato Grosso do Sul State, modified (CORRÊA, 2015)
6 1Silva, J. L. A. da / Ribeiro, V. de O. /
Santos, L. L. dosv. 42, n. 3, set./dez. 2017
Data processing
The methodology used followed five main phase, namely:
Obtainment of the Topographic Factor (LS)
After inserting the SRTM (USGS, 2000) into QGIS 2.8.8 (QGIS DEVELOPMENTTEAM, 2015), the Slope, aspect, curvature tool of the SAGA GIS complement wasused to obtain a map corresponding to inclination angle (θ). Subsequently, using theRaster Calculator tool, the map of factor β was calculated with Equation (5). Using thesame tool at equation (4), the factor m was obtained. The factor λ � Slope Length �was with the r.watershed tool of the GRASS complement. Hence, it was possible toconsider equation (3) to obtain the factor L. The S factor was calculated with equations(6) and (7) of the Raster Calculator tool. Finally, the maps of factors L and S weremultiplied, and thus the Topographic Factor map of the hydrographic basin � LS wasobtained.
LS = L.S (Equation 2)
(Equation 3)
(Equation 4)
(Equation 5)
S = 10.8.senθ + 0.03 if θ < 9% (Equation 6)
S = 16.8.senθ - 0.50 if θ ≥ 9% (Equation 7)
Where: λ � Slope Length; m - exponent of the Length-Declivity variation; β - factorthat varies according to the slope declivity and θ � inclination angle. McCool et al.(1989).
Obtainment of the Land Use and Vegetation Cover Map
The land use and vegetation cover thematic map was created based on thesupervised classification of the LANDSAT 8 image, taken on June 17th, 2016 (EARTHEXPLORER, 2016) using the open and free software QGIS 2.8.8 (QGIS DEVELOPMENTTEAM, 2015) and the Semi-automatic Classification Plugin (SCP), a complement thatallows the semi-automatic or supervised classification of images pixel by pixel. UsingSCP it is possible to create very fast sample areas, called ROIs (Regions of Interest),which are saved in a shapefile format (ESRI, 1997). Four categories of vegetationcover were established: Dense vegetation (Cerrado), Bare soil, Wet areas and Mediumto low size vegetation. After determining the areas of interest, the spectral signatureswere automatically calculated, creating the vegetation cover thematic map of thehydrographic basin.
6 2 GEOGRAFIADetermination of the erosive susceptibility from a hydrographic
basin using free available geo-technology
Obtainment of the Rain Erosivity Map � Factor (R)
The R factor from USLE was obtained based on the rain erosivity chart of MatoGrosso do Sul State (MS), developed by Oliveira et al. (2012) according to data obtainedfrom three pluviographic stations located in the cities Dourados, Coxim and CampoGrande, and also the precipitation data available from the Hydrological InformationSystem of ANA - Agencia Nacional das Águas (Hidroweb) from 109 pluviometric stationslocated in Mato Grosso do Sul.
Obtainment of the Soil Erodibility Map - Factor (K)
To obtain this factor, the Map of Soils of Mato Grosso do Sul provided by theEnvironmental Institute of Mato Grosso do Sul (IMASUL) was used in 1:250000 scale,in shapefile format (ESRI, 1997), which was inserted into the QGIS 2.8.8 software(QGIS DEVELOPMENT TEAM, 2015) and trimmed according to the boundary of thehydrographic basin considered.
The nomenclature of soil classification was updated according to the BrazilianSoil Classification System (EMBRAPA, 2013) and the K values attributed to each soilclassification were those ones adopted by Paranhos Filho (2000) (Table1). The K valueswere inserted into the attribute table according to its respective soil groups. Afterwardsthe shapefile was transformed into raster format with 30m², so it could be used in theUSLE equation.
Table 1 - K factor for each soil classificationof the hydrographic basin
Table 2 - CP values for each land use classification(STEIN ET AL.,1987 E OLIVEIRA, 2012)
Obtainment of the Map on Use, Management and Conservationist Practices � Factor(CP)
The C and P factors from USLE were integrated, generating only one map.According to Stein et al. (1987) it is only necessary to work with these factors (C andP) separately if the purpose of the study is to define more appropriate forms ofagricultural production. However, if the focus is on soil loss caused by erosion, thevariables C and P are interrelated in such a way that they should be analyzed together.Consequently, it is observed that the distribution of CP factors in the study area isdirectly related to the vegetation cover of the hydrographic basin.
Thus, for each classification on use and vegetation cover, a CP value wasdetermined according to those suggested by Stein et al. (1987) and Oliveira (2012)(Table 2). Afterwards the map of the CP factor was generated in raster format, with 30x 30m pixel, to be compared with other USLE factors.
6 3Silva, J. L. A. da / Ribeiro, V. de O. /
Santos, L. L. dosv. 42, n. 3, set./dez. 2017
Integration of the USLE factors
After completing the steps to obtain the USLE component factors, the tool �RasterCalculator� of the free and open software QGIS 2.8.8 (QGIS DEVELOPMENT TEAM,2015) was used to perform the map algebra. From the integration of the equationfactors a map of the soil loss estimate by laminar water erosion was created, which isthe USLE factor A.
RESULTS AND DISCUSSION
LS Factor
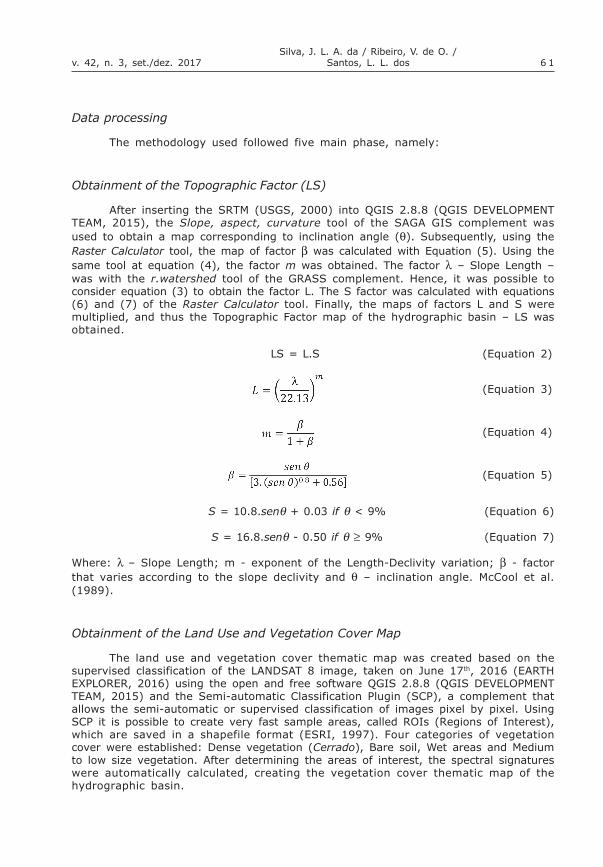
The map obtained for the LS Factor, which represents the Topographic Potentialof Sheet Water Erosion (PARANHOS FILHO, 2000), presents values between 0 and0.65. It is observed that there is a predominance of values between 0 and 0.30, withgreat frequency of values close to zero (Figure 2). Thus it can be inferred that most ofthe area under study has low surface runoff rates, which impairs the sheet watererosion.
Figure 2 - Chart of the Topographic Factor of theLaranja Doce hydrographic basin - LS Factor
6 4 GEOGRAFIADetermination of the erosive susceptibility from a hydrographic
basin using free available geo-technology
K Factor
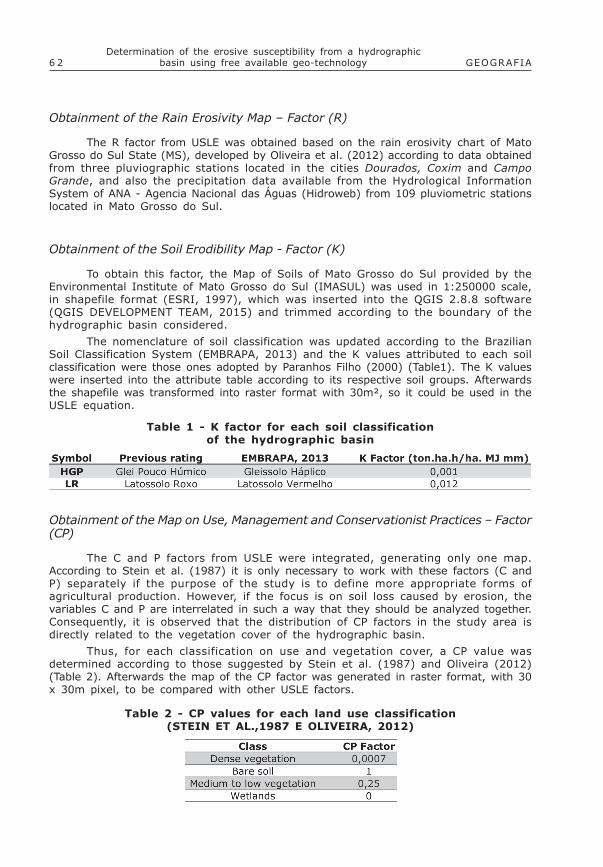
The soils map of the river basin with the K values was assigned according toParanhos Filho (2000) (Figure 3). It can be observed that the entire hydrographicbasin area presents Red Latosols, according to the Brazilian Soil Classification System(EMBRAPA, 2013). Latosols are very fertile, and due to that they are widely used forfarming activities.
According to Paranhos Filho (2000), despite the good resistance to erosion dueto good physical characteristics, Red Latosols require adequate conservation treatmentsaccording to the slope and the types of use. A small portion of the basin is composedby Histosols, which presents a low susceptibility to erosion, as they are subject tofrequent flooding.
Figure 3 - K Factor - Chart of soils erodibility,Laranja Doce hydrographic basin
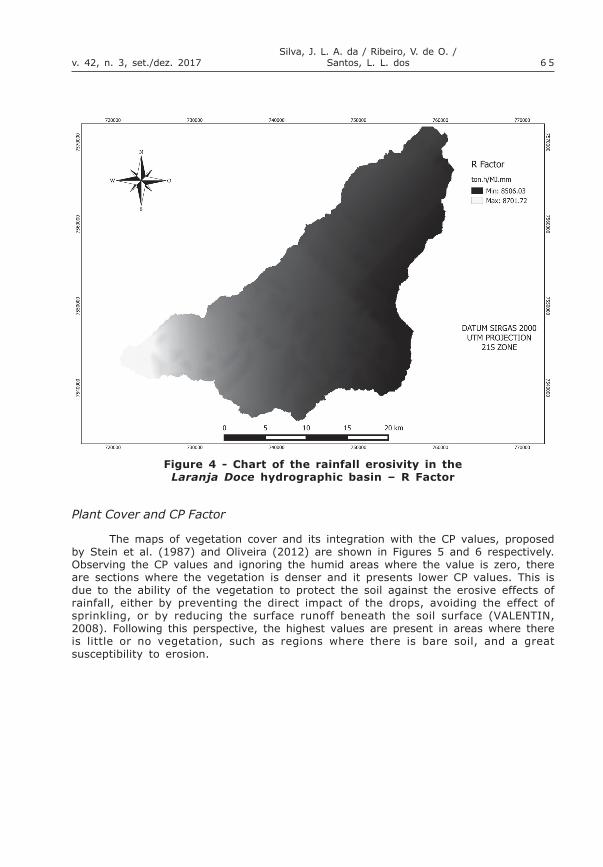
R Factor
According to the R-Factor map (Figure 4) obtained, the maximum and minimumvalues for the area under study are 8506.03 and 8701.72 MJ.mm /ha/year, respectively.The whole area has an erosivity classified by Santos (2008) as high, in other words, R> 7000 MJ.mm / ha/year, which may favor the increase of sheet water erosion rates.These values can be explained by the location of the hydrographic basin, where intenserainfall occurs often at different periods of the year.
6 5Silva, J. L. A. da / Ribeiro, V. de O. /
Santos, L. L. dosv. 42, n. 3, set./dez. 2017
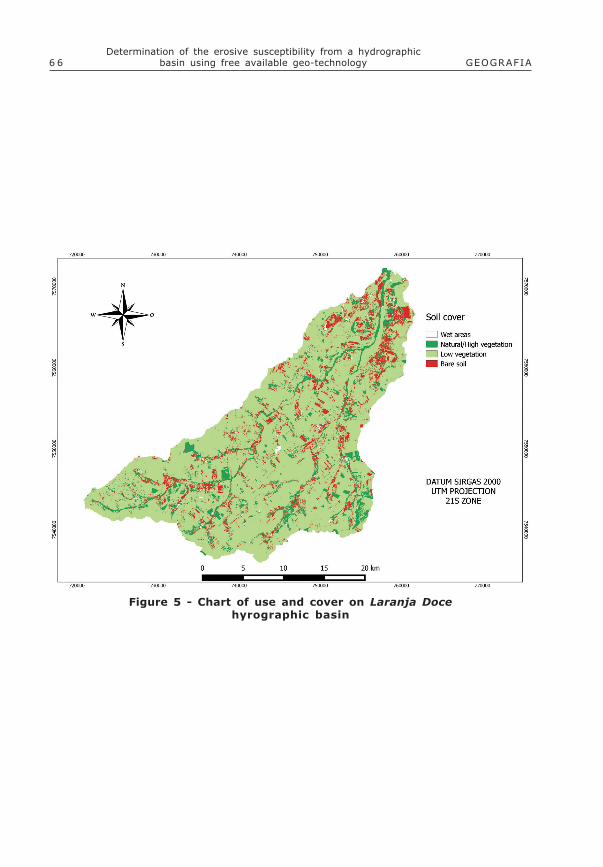
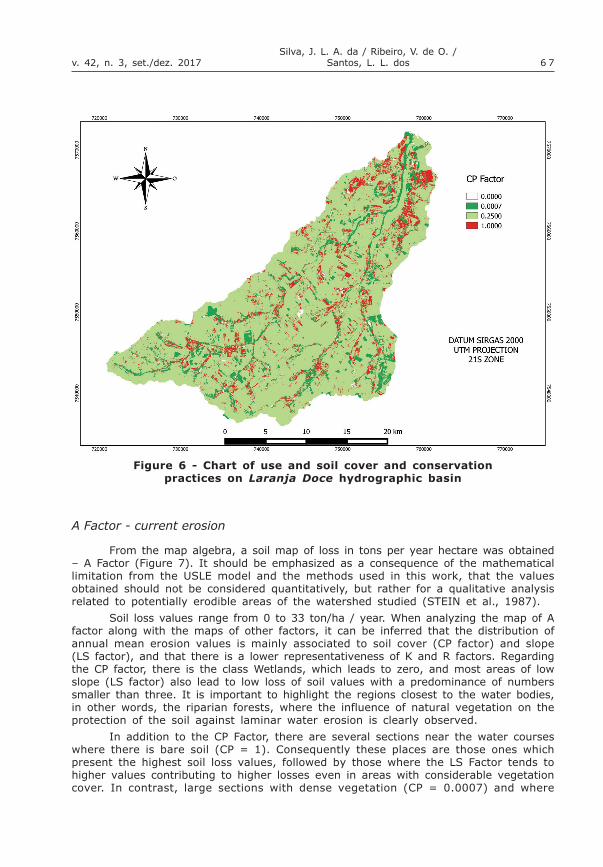
Plant Cover and CP Factor
The maps of vegetation cover and its integration with the CP values, proposedby Stein et al. (1987) and Oliveira (2012) are shown in Figures 5 and 6 respectively.Observing the CP values and ignoring the humid areas where the value is zero, thereare sections where the vegetation is denser and it presents lower CP values. This isdue to the ability of the vegetation to protect the soil against the erosive effects ofrainfall, either by preventing the direct impact of the drops, avoiding the effect ofsprinkling, or by reducing the surface runoff beneath the soil surface (VALENTIN,2008). Following this perspective, the highest values are present in areas where thereis little or no vegetation, such as regions where there is bare soil, and a greatsusceptibility to erosion.
Figure 4 - Chart of the rainfall erosivity in theLaranja Doce hydrographic basin � R Factor
6 6 GEOGRAFIADetermination of the erosive susceptibility from a hydrographic
basin using free available geo-technology
Figure 5 - Chart of use and cover on Laranja Docehyrographic basin
6 7Silva, J. L. A. da / Ribeiro, V. de O. /
Santos, L. L. dosv. 42, n. 3, set./dez. 2017
Figure 6 - Chart of use and soil cover and conservationpractices on Laranja Doce hydrographic basin
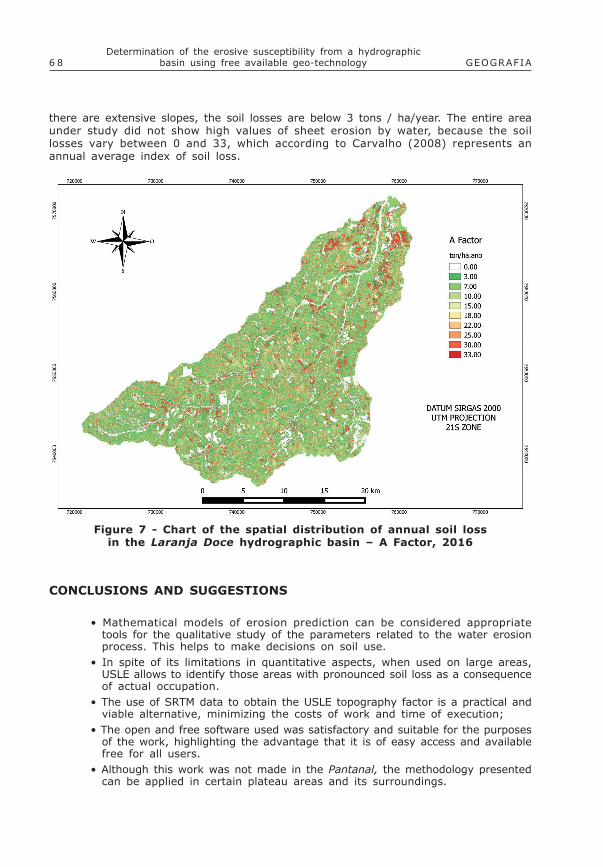
A Factor - current erosion
From the map algebra, a soil map of loss in tons per year hectare was obtained� A Factor (Figure 7). It should be emphasized as a consequence of the mathematicallimitation from the USLE model and the methods used in this work, that the valuesobtained should not be considered quantitatively, but rather for a qualitative analysisrelated to potentially erodible areas of the watershed studied (STEIN et al., 1987).
Soil loss values range from 0 to 33 ton/ha / year. When analyzing the map of Afactor along with the maps of other factors, it can be inferred that the distribution ofannual mean erosion values is mainly associated to soil cover (CP factor) and slope(LS factor), and that there is a lower representativeness of K and R factors. Regardingthe CP factor, there is the class Wetlands, which leads to zero, and most areas of lowslope (LS factor) also lead to low loss of soil values with a predominance of numberssmaller than three. It is important to highlight the regions closest to the water bodies,in other words, the riparian forests, where the influence of natural vegetation on theprotection of the soil against laminar water erosion is clearly observed.
In addition to the CP Factor, there are several sections near the water courseswhere there is bare soil (CP = 1). Consequently these places are those ones whichpresent the highest soil loss values, followed by those where the LS Factor tends tohigher values contributing to higher losses even in areas with considerable vegetationcover. In contrast, large sections with dense vegetation (CP = 0.0007) and where
6 8 GEOGRAFIADetermination of the erosive susceptibility from a hydrographic
basin using free available geo-technology
there are extensive slopes, the soil losses are below 3 tons / ha/year. The entire areaunder study did not show high values of sheet erosion by water, because the soillosses vary between 0 and 33, which according to Carvalho (2008) represents anannual average index of soil loss.
CONCLUSIONS AND SUGGESTIONS
� Mathematical models of erosion prediction can be considered appropriatetools for the qualitative study of the parameters related to the water erosionprocess. This helps to make decisions on soil use.
� In spite of its limitations in quantitative aspects, when used on large areas,USLE allows to identify those areas with pronounced soil loss as a consequenceof actual occupation.
� The use of SRTM data to obtain the USLE topography factor is a practical andviable alternative, minimizing the costs of work and time of execution;
� The open and free software used was satisfactory and suitable for the purposesof the work, highlighting the advantage that it is of easy access and availablefree for all users.
� Although this work was not made in the Pantanal, the methodology presentedcan be applied in certain plateau areas and its surroundings.
Figure 7 - Chart of the spatial distribution of annual soil lossin the Laranja Doce hydrographic basin � A Factor, 2016
6 9Silva, J. L. A. da / Ribeiro, V. de O. /
Santos, L. L. dosv. 42, n. 3, set./dez. 2017
REFERENCES
CARVALHO, N.O. 2008. Hidrossedimentologia Prática. Rio de Janeiro: CPRM �Companhia de Pesquisa em Recursos Minerais, 600 p.
CORRÊA, N. F. Obtenção de MDE corrigido para delimitação de baciahidrográfica com auxílio de geotecnologias livres e gratuitas. Trabalho deConclusão de Curso. Universidade Estadual de Mato Grosso do Sul. Dourados, 2015.
EARTH EXPLORER. Imagens Landsat 8. 2016. Disponível em: <http://earthexplorer.usgs.gov/>.
EMBRAPA. Centro Nacional de Pesquisa de Solos (Rio de Janeiro, RJ). Sistemabrasileiro de classificação de solos. 3. ed. � Rio de Janeiro: EMBRAPA-SPI, 2013,306p.
ESRI INC. - ARC / INFO version 7.11. Environmental Systems Research InstituteInc. New York, 1997, 1 CD ROM.
IBGE - Instituto Brasileiro de Geografia e Estatistica, 2013. Disponivel em:<http://www.ibge.gov.br/home/geociencias/.htm>
OLIVEIRA, J.S. Avaliação de modelos de elevação na estimativa de perda desolos em ambiente SIG. 2012, Dissertação de Mestrado, Universidade de São Paulo,Escola Superior de Agricultura Luiz de Queiroz 103p.
OLIVEIRA, P.T.S.; RODRIGUES, D.B.B.; ALVES SOBRINHO, T.; CARVALHO, D.F.;PANACHUKI, E. Spatial variability of the rainfall erosive potential in the state of MatoGrosso do Sul, Brazil. Revista Engenharia Agrícola, v. 32, n. 1, p. 69-79, 2012.
PARANHOS FILHO, A. C.; OLIVEIRA, E. F.; MIOTO, C.L. BARBOSA, A. F.; Aplicação daEquação Universal de Perda do Solo (USLE) em Softwares Livres e Gratuitos. Anuáriodo Instituto de Geociências � UFRJ. v. 38, n. 1, p. 170-179, 2015.
PARANHOS FILHO, A.C. Análise geo-ambiental multitemporal: o estudo de casoda região de Coxim e da Bacia do Taquarizinho (MS � Brasil). 2000, Tese de Doutorado,Universidade Federal do Paraná, 213p.
QGIS DEVELOPMENT TEAM. QuantumGIS 2.8.8, 2015. Disponível em: <http://www.qgis.org/en/site/>.
SANTOS, C.N. El Niño, La Niña e a erosividade das chuvas no Estado do RioGrande do Sul. Universidade Federal de Pelotas, Faculdade de Agronomia EliseuMaciel, Programa de Pós-Graduação em Agronomia, 2008.
SILVA, M. L. N.; CURI, N.; MARQUES, J. J. G. S. M.; LIMA, L. A.; FERREIRA, M. M.Resistência ao Salpico Provocado por Impacto de Gotas de Chuva Simulada emLatossolos e sua Relação com Características Químicas e Mineralógicas. Ciência ePrática, Lavras, v. 19, n.2, p. 176-182, 1995.
SOARES FILHO; COMUNELLO, E. ; SOARES, J. S. . Caracterização Espaço-Temporaldo Uso do Solo na Microbacia Hidrográfica do Córrego Laranja Doce, Sul de MatoGrosso Do Sul. SIMPÓSIO BRASILEIRO DE GEOGRAFIA FÍSICA APLICADA, 13. Viçosa,2009, Anais...
SPATTI JUNIOR, E. Avaliação Ambiental, Caracterização da Qualidade de Águae Transporte de Sedimentos na Bacia Hidrográfica do Ribeirão MonjoloGrande (SP), 2011. Disertação de Mestrado, Universidade Estadual Paulista, RioClaro.
7 0 GEOGRAFIADetermination of the erosive susceptibility from a hydrographic
basin using free available geo-technology
STEIN, D.P.; DONZELLI, P.; GIMENEZ, A.F.; PONÇANO, W.L.; LOMBARDI NETO, F. 1987.Potencial de erosão laminar natural e antrópica na bacia do Peixe-Paranapanema. In:SIMPÓSIO NACIONAL DE CONTROLE DE EROSÃO, 4, Marília, 1987. Anais... Marília,p. 105-135.
USGS, United States Geological Survey. Shuttle Radar Topography Mission (SRTM),Global Land Cover Facility, University of Maryland, College Park, Maryland, 2000.
WISCHMEIER, W.H.; SMITH, D.D. 1978. Predicting rainfall erosion losses; a guideto conservation planning. Washington: U.S. Department of Agriculture, (AgricultureHandbook n. 537), 58p.