demographics, aging and financial sustainability
DESCRIPTION
Demographics, aging and financial sustainability. Michael M Rachlis MD MSc FRCPC CHSRF Health Systems Planning for the Aging Population Toronto November 4, 2010 www.michaelrachlis.com. Outline. The context of our discussions The sustainability of Medicare - PowerPoint PPT PresentationTRANSCRIPT

Demographics, aging and financial sustainability
Michael M Rachlis MD MSc FRCPCCHSRF Health Systems Planning for the Aging Population
Toronto November 4, 2010 www.michaelrachlis.com
Outline• The context of our discussions• The sustainability of Medicare• Will the elderly undermine Medicare’s
sustainability?– Not if we change our health system
• What would a high performing health system for the elderly look like?

The context
• There are assertions that Medicare is not sustainable
• There are assertions that even if Medicare is sustainable now the aging of the population will make it unsustainable in the future
• Canada is just now slowly pulling out of a serious economic downturn

“Certainly those who knew the most were the least scared.”
Winston Churchill. The Second World War. 1949.Volume II. Book One. Chapter 14. The Invasion Problem

The sustainability of Medicare
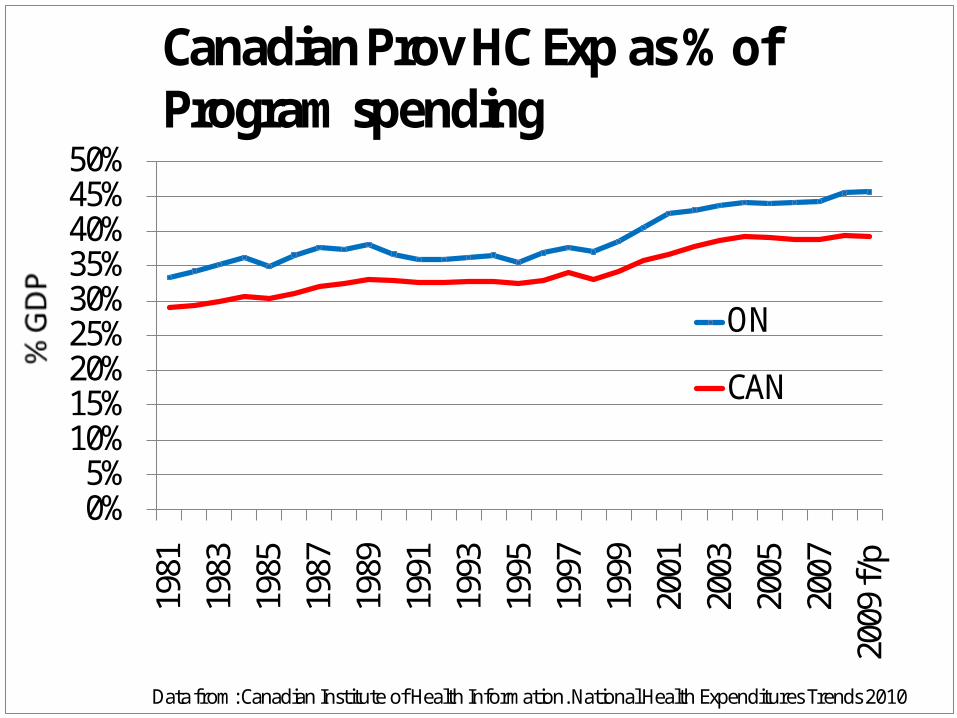
• Canada’s health care costs are increasing• Health has increased its share of GDP since 2000• But recent increases in health care’s share of the GDP
are almost totally due to the recession • Health care has slightly increased its share of
provincial budgets due mainly to cuts in other areas rather than increases in health spending
• Canada’s health costs are similar to other wealthy countries and substantially less than those in the US

0%
2%
4%
6%
8%
10%
12%
14%19
8119
8319
8519
8719
8919
9119
9319
9519
9719
9920
0120
0320
0520
0720
09 f/
p
PublicPrivateTotal
Canadian Health Care Costs as % of GDP (Dashed lines with 1998-2008 rates of GDP growth)
Data from: Canadian Institute of Health Information. National Health Expenditures Trends 2010

0%2%4%6%8%
10%12%14%
1981
1983
1985
1987
1989
1991
1993
1995
1997
1999
2001
2003
2005
2007
2009
f/p
PubPvtTotal
ON HC Exp as % of GDP (Dashed lines with 1998-2008 rates of GDP growth)
Data from: Canadian Institute of Health Information. National Health Expenditures Trends 2010
0%5%
10%15%20%25%30%35%40%45%50%
1981
1983
1985
1987
1989
1991
1993
1995
1997
1999
2001
2003
2005
2007
2009
f/p
ON
CAN
Data from: Canadian Institute of Health Information. National Health Expenditures Trends 2010
Canadian Prov HC Exp as % of Program spending

0%2%4%6%8%
10%12%14%16%18%20%
1981
1983
1985
1987
1989
1991
1993
1995
1997
1999
2001
2003
2005
2007
2009
ON Program Exp
ON Prov HC exp
ON Non HC
ON Provincial Expenditures as % of GDP
Data from: Canadian Institute of Health Information. National Health Expenditures Trends 2010

0%
10%
20%
30%
40%
50%
60%19
8119
8319
8519
8719
8919
9119
9319
9519
9719
9920
0120
0320
0520
0720
09
CAN Prov HC exp
Govt outlays
Canadian Gov't Outlays and Provincial HC exp as % of GDP
Data from: Canadian Institute of Health Information. National Health Expenditures Trends 2010and Federal Dept of Finance fiscal Reference Tables 2010

0
10
20
30
40
50
6019
70
1973
1976
1979
1982
1985
1988
1991
1994
1997
2000
2003
2006
2009
Government Outlays as a share of GDP%
of G
DP
Can Dept Finance: http://www.fin.gc.ca/frt-trf/2010/frt-trf-10-eng.asp

Notes * Data for 2007. † Data for 2006. Source Organisation for Economic Co-operation and Development, OECD Health Data 2010 (June edition) (Paris, France: OECD, 2010).
Most data 2008

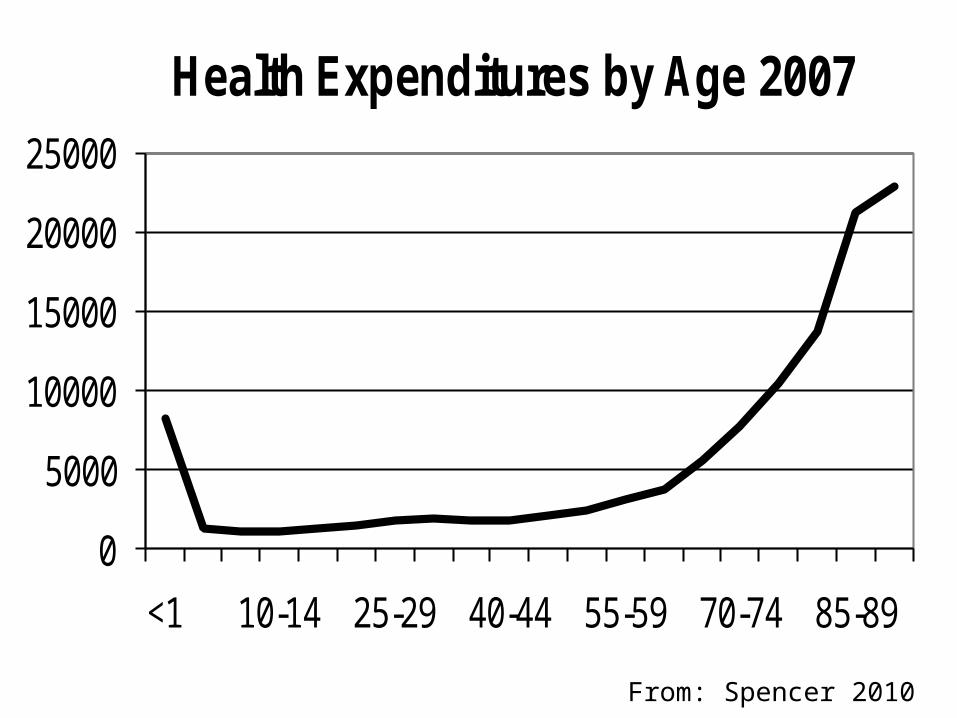
Will the elderly undermine Medicare’s sustainability?• Canada is aging and health costs increase with age• Aging is responsible for only moderate cost increases• The elderly are healthier than ever• The major reason for increases in health costs are due
to increases in utilization • There are unmet needs for the elderly but there is also
considerable evidence of waste – Health Care has quality problems
• High performing health systems can hold costs while enhancing quality

From: Spencer 2010
0
5000
10000
15000
20000
25000
<1 10-14 25-29 40-44 55-59 70-74 85-89
Health Expenditures by Age 2007
From: Spencer 2010

From Mackenzie and Rachlis 2010
Annual impact of Aging on health costs 2001-2010

From Mackenzie and Rachlis 2010
Annual impact of Aging on health costs 2010-2036

The elderly are healthier than ever?!
• The elderly are living longer than ever• We do not have accurate data on the
Canadian prevalence of elderly disability– The PALS and CCHS exclude persons in “non-
institutional collective dwellings”
• We do have fairly accurate US data and it mainly indicates less disability
• Should we extrapolate poor Canadian data or better American data?

The Compression of Morbidity JF Fries. Millbank Memorial Fund Quarterly. 1983.
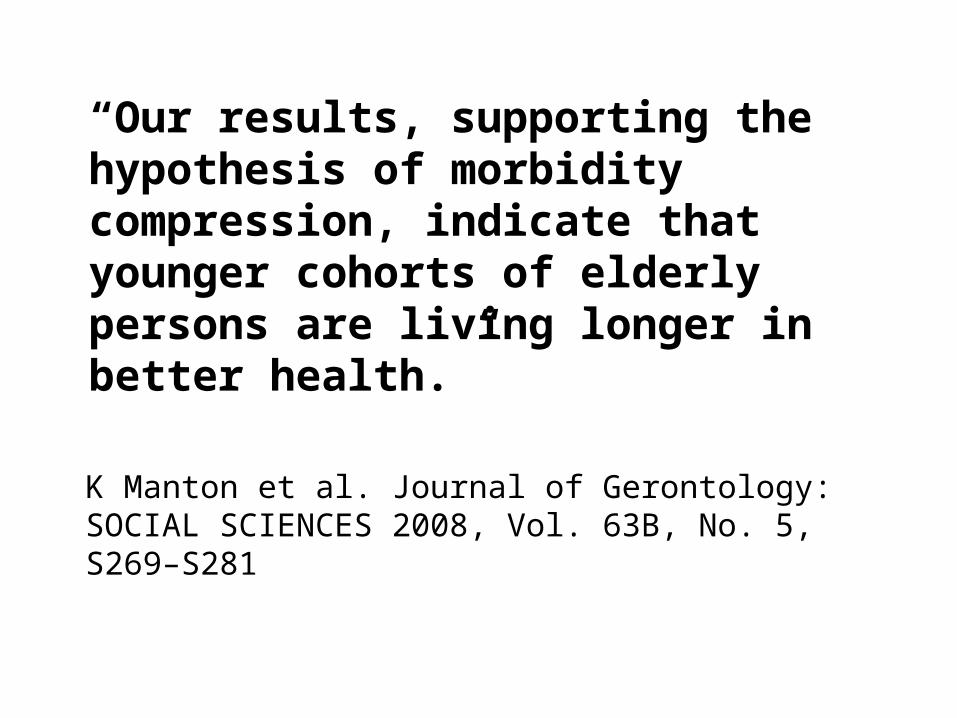
K Manton et al. Journal of Gerontology: SOCIAL SCIENCES 2008, Vol. 63B, No. 5, S269–S281
“Our results, supporting the hypothesis of morbidity compression, indicate that younger cohorts of elderly persons are living longer in better health.”

Year
Disability
1984 1989 1994 1999 2004
NoDisability
73.8% 75.2% 76.8% 78.8% 81.0%
Light or Moderate
15.9% 14.8% 13.9% 13.3% 11.8%
Severe 10.3% 10.0% 9.2% 7.9% 7.2%
American prevalence of disabled elderly 1984 - 2004
Manton et al. PNAS. 2006:103(48):18734-9
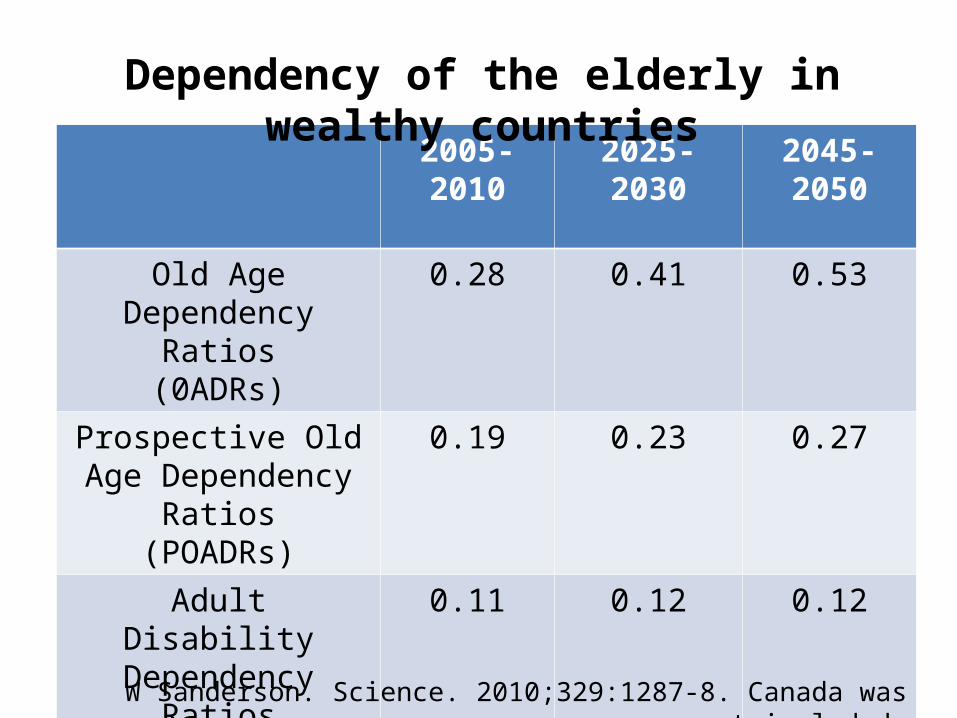
2005-2010 2025-2030 2045-2050
Old Age Dependency Ratios
(0ADRs)
0.28 0.41 0.53
Prospective Old Age Dependency Ratios
(POADRs)
0.19 0.23 0.27
Adult Disability Dependency Ratios
(ADDRs)
0.11 0.12 0.12
Dependency of the elderly in wealthy countries
W Sanderson. Science. 2010;329:1287-8. Canada was not included

Increased utilization by all ages is causing increased health costs
• The elderly are increasing their utilization at the same relative rates as younger Canadians but their absolute increase is greater

-50%
0%
50%
100%
150%
200%
250%
<1 5-9 15-19 25-29 35-39 45-49 55-59 65-69 75-79 85-89
Hosp Phys Total
Change in per capita health costs by age (1998-2007)
Adapted from: Spencer 2010

-50%
0%
50%
100%
150%
200%
250%
<1 5-9 15-19 25-29 35-39 45-49 55-59 65-69 75-79 85-89
Hosp Oth Inst Phys Drugs Total
Adapted from: Spencer 2010
Change in per capita health costs by age (1998-2007)

There are unmet needs but also considerable evidence of waste
• Chronic disease management• Access• Drug prescribing

Canada’s health care system has a quality problem

Hospitals have quality problems
• Studies in more 7 countries indicate that 5-10% of all deaths in developed countries are due to preventable deaths in hospitals– In Canada that means 9000 – 24,000 deaths per year
• The Canadian Adverse Events Study (Baker Norton CMAJ 2004) cites that 7.5 % of hospital patients have an adverse event – 185,000 adverse events with 70,000 of these being
potentially preventable

92 91 89
66
5449
36
2619 15 14
0
25
50
75
100
NZ AUS UK ITA NET SWE GER US NOR FR CAN
Practices with Advanced Electronic Health Information Capacity
Source: 2009 Commonwealth Fund International Health Policy Survey of Primary Care Physicians.
%

Family Drs’ Perception of Access Barriers
Percent reporting patients OFTEN:
AUS CAN FR GER ITA NET NZ NOR SWE UK US
Have difficulty getting specialized diagnostic tests
21 47 42 26 52 15 60 11 22 16 24
Experience long waiting times to see a specialist
34 75 53 66 75 36 45 55 63 22 28
Source: 2009 Commonwealth Fund International Health Policy Survey of Primary Care Physicians.

“Many attribute the quality problems to a lack of money. Evidence and analysis have convincingly refuted this claim. In health care, good quality often costs considerably less than poor quality.”
Fyke Report 2001 (Saskatchewan)
High performing health systems can hold costs and enhance quality

Quality provides sustainability• An Alberta aftercare program for congestive
heart failure patients leaving hospital reduced future hospital use by 60% with $2500 in overall net cost savings per participant.
• New Westminster's Royal Columbian Hospital reduced post heart surgery pain complications by 80% and length of stay by 33%.
• BC’s Reference Drug Program kept Vioxx as a second line drug and saved $23 million per year and dozens of lives.

“It is not the aging of our population that threatens to precipitate a financial crisis in health care, but a failure to examine and make appropriate changes to our health care system, especially patterns of utilization.”
Dr. William Dalziel. CMAJ. 1996;115:1584-6

What would a high performing health system for the elderly look like?• Need for Intersectoral Action for Health• Follow frameworks for quality, e.g. Ontario
Health Quality Council, Saskatchewan Health Quality Council, etc.
• Examples of high performing care• Example of Denmark internationally

Intersectoral Action for Health
• The frail elderly, like those with severe persistent mental illness often need housing as part of their health program
• Transportation is major problem particularly outside of downtown areas of major cities
• Food accessibility is a problem and combined with inaccessibility to transportation leads to under nutrition

Attributes of High Performing Health Systems Ontario Health Quality Council. (www.ohqc.ca)
1. Safe2. Effective3. Patient-Centred4. Accessible5. Efficient6. Equitable7. Integrated8. Appropriately resourced9. Focused on Population Health

IHI’s Triple Aim1. Enhance the Care
experience for patients
2. Improve the health of the population
3. Control overall health care costs

A high performing health system for the elderly
• Chronic disease management and primary health care• Health assessment• Health promotion
• Home care• Long term care• End of Life care• Acute Care

Self-care SupportCoaching and support to promote self-care and maintain healthy behaviours
Care ManagementCoaching and support for Managing care needs
Intensive Care ManagementFrequent contact and coaching,coordinating of care
Individuals with no chronic conditions & no self-care challenges
Individuals With 1 chronic
Condition & fewself-care challenges
Multiple chronic
conditions & self-care challenges
Services tailored to the level of client capacity

Per Person Average overall costs of health care for continuing care patients in areas with/without cuts to social and preventive home care (Hollander 2001)
Year Priorto Cuts
First YearAfter Cuts
Second Year
After Cuts
Third YearAfter Cuts
Areas with cuts
$5,052 $6,683 $9,654 $11,903
Areas without
cuts
$4,535 $5,963 $6,771 $7,808
http://www.hollanderanalytical.com/Hollander/Reports_files/preventivehomecarereport.pdf

Outcome at 3 yrs
Group
Living in the community
Resident of a LTC facility or dead
Health Promotion
Group (N=81)
75.3%(61)
24.7%(20)
Control Group
(N=167)
58.7%(98)
42.3%(69)
Health Promotion intervention for BC frail elders
(P = 0.04) N Hall et al. Canadian Journal on Aging. 1992;11(1):72-91

Step right up!Get your ELIXIR of Health Promotion! Reduce your risk of dying or ending up in a nursing home by over
40%!Increase your chances of staying in your own home by nearly
30%!

Good News! We could improve access to care
• We could access primary health care within 24 hrs
• We could have elective specialty consultations within one week

Why is integrated primary health care so important?
• Canada has problems with access, chronic disease management and prevention, and population health
• Primary health care is the key for access, chronic disease management and prevention, and population health
• Primary health care = sustainability

Trying to deliver health services without adequate primary health care is like pulling
your goalie in the first period!

Comprehensive community care
• US Program for All-inclusive Care of the Elderly (PACE)
• Edmonton Comprehensive Home Option of Integrated Care for the Elderly (CHOICE)
• Calgary Comprehensive Community Care (C3)

An ecological view of long term care
• Residents of long term care facilities typically spend 23+ hours per day in the centre
• How can we make these environments promote residents’ health and well• How can we make them as
homelike as possible• E.g. Saskatoon Sherbrooke
Community Centre

End of Life care• Palliative care• Advanced directives• Great potential (Malloy 2000) • Hard to implement without
serious culture change• We will all eventually die and
most of us would prefer to die in our own homes or a homelike setting

Acute Care for the Elderly (ACE units)
• Gentle care• Reduces delerium• Reduces skin ulcers• Improves nutrition

Denmark: A country of best practices
• 1987 moratorium on building new nursing home beds– Accompanied by giving all benefits of long term
care to home care clients– Longstanding Scandinavian public responsibility
for housing– Increased construction of supportive housing
• 1998 country-wide policy of home visits/assessments for people > 75

Denmark: A country of best practices
• Denmark has 16.1% population > 65 while Canada has 15.2% > 65
• In 2008, Denmark spent 9.7% of GDP on health while Canada spent 10.4%
• Public funding: Denmark 85% Canada 70%– Denmark has better coverage for home care,
drugs, and appliances and devices

Final thoughts
• A decentralized federation stifles national progress• Intersectoral action, and particularly healthy public
policy is the foundation of an effective, efficient health system– But most Canadian governments do not have effective
instruments for the coordination of social policy
• The challenges of changing health systems – Culture eats evidence for breakfast– It seems even harder here than elsewhere
• There are opportunities offered by the quality agenda to re-design service delivery

Summary:• Health care costs are rising but not nearly as fast as
most people think– In 2010/2011 health will likely continue to decrease it’s
share of GDP
• The elderly by themselves will not undermine Medicare’s sustainability– They need a lot of help from the health system
• Canada’s health system has a quality problem• A high performing health system for the elderly can
control costs and improve quality and outcomes

Canada’s health policy is in evolution from a 19th century passive insurance
program for an 18th century-style professional practice to a 21st century population health service based upon
high performing, patient/family/community-centred,
team-based programs.