light water reactor sustainability program interdigital ... aging and degradation...light water...
TRANSCRIPT

PNNL-26087
Light Water Reactor Sustainability Program
Interdigital Capacitance Local Non-Destructive Examination of Nuclear Power Plant Cable for Aging Management Programs – Interim Report
September 2017
U.S. Department of Energy
Office of Nuclear Energy

DISCLAIMERThis information was prepared as an account of work sponsored by an
agency of the U.S. Government. Neither the U.S. Government nor any agency thereof, nor any of their employees, makes any warranty, expressed or implied, or assumes any legal liability or responsibility for the accuracy, completeness, or usefulness, of any information, apparatus, product, or process disclosed, or represents that its use would not infringe privately owned rights. References herein to any specific commercial product, process, or service by trade name, trade mark, manufacturer, or otherwise, does not necessarily constitute or imply its endorsement, recommendation, or favoring by the U.S. Government or any agency thereof. The views and opinions of authors expressed herein do not necessarily state or reflect those of the U.S. Government or any agency thereof.

PNNL-26807
Interdigital Capacitance Local Non-Destructive Examination of Nuclear Power Plant Cable for Aging
Management Programs – Interim Report
Authors: S.W. Glass1, A.M. Jones1, L.S. Fifield1, M.R. Larche1, N. Bowler2,A. Sriraman2, W.C. Palmer2
1Pacific Northwest National Laboratory2Iowa State University
September 2017
Prepared for theU.S. Department of EnergyOffice of Nuclear Energy
Light Water Reactor Sustainability Program
Interdigital Capacitance Local Non-Destructive Examination of Nuclear Power Plant Cable for Aging
Management Programs
PNNL-26807
September 2017
Approved by:
September 11, 2017Steve Schlahta, DirectorNuclear Science Project Management Office
Date

iii
SUMMARYThis Pacific Northwest National Laboratory milestone report describes progress to date on the
investigation of nondestructive test methods focusing on local cable insulation and jacket testing using an interdigital capacitance (IDC) approach. This report addresses relevant literature coupled with a discussion of the theory of IDC measurements, work on finite element modeling (FEM) and sensor optimization, development of a test fixture, and a preliminary initial measurement of the targeted ethylene propylene rubber (EPR) cable to be used in this study. The program will continue with planned work including:
Application of the test configuration developed to evaluate various degrees of aged EPR cable samples
Fabrication of sensors whose design has been optimized using FEM tools developed and discussed within this report
Assessment of the ability to measure insulation degradation through an outer cable jacket.
This is an interim report and very little real data has been acquired. At the time of this report, samples are being aged for evaluation; however, this process takes months and is not complete. These samples will be available soon for evaluation using the test setup developed and results will be reported in a subsequent final report. Interim conclusions and observations at this stage of the project are as follows:
A substantial body of work suggests feasibility to measure cable jacket and insulation conditions using various forms of interdigital capacitance sensors
FEM models predict sensor behavior and can be used to optimize sensor configurations
Preliminary data is consistent with previous measurements on EPR-jacketed bipolar cable.

iv
ACKNOWLEDGMENTSFunding for this work is provided by the U.S. Department of Energy Office of Nuclear Energy Light
Water Reactor Sustainability Program Material Aging and Degradation pathway under the leadership of Keith Leonard and Tom Rosseel.
Pacific Northwest National Laboratory (PNNL) is a multi-program national laboratory operated for the U.S. Department of Energy by Battelle Memorial Institute.
The work performed by Iowa State University was performed under a subcontract from PNNL.

v
CONTENTS
SUMMARY................................................................................................................................................. iii
ACKNOWLEDGMENTS ........................................................................................................................... iv
CONTENTS.................................................................................................................................................. v
FIGURES..................................................................................................................................................... vi
TABLES .....................................................................................................................................................vii
ACRONYMS AND ABREVIATIONS....................................................................................................... ix
1. OBJECTIVES..................................................................................................................................... 1
2. INTRODUCTION AND BACKGROUND ....................................................................................... 3
3. CABLE DESIGN, CLASSIFICATION, AND LAYOUT................................................................. 7
4. AGING AND ACCELERATED AGING.......................................................................................... 9
5. IDC THEORY AND LITERATURE REVIEW .............................................................................. 11 5.1 Principles of Capacitive Testing ............................................................................................ 11 5.2 Permittivity of Polymers ........................................................................................................ 11 5.3 Interdigital Capacitors for Cable Polymer Monitoring .......................................................... 13
5.3.1 Literature Review...................................................................................................... 13 5.3.2 Test Setup Considerations......................................................................................... 13
6. FEM SIMULATIONS (ISU AND PNNL)....................................................................................... 17 6.1 Coplanar Interdigital Electrodes ............................................................................................ 18 6.2 Cylindrical Interdigital Electrodes ......................................................................................... 18
6.2.1 Single Core Cable with Insulation and Jacket........................................................... 18 6.2.2 Single Core Cable with Insulation ............................................................................ 20
7. TEST FIXTURE CONFIGURATION............................................................................................. 23 7.1 Background ............................................................................................................................ 23 7.2 Design .................................................................................................................................... 23
8. PRELIMINARY DATA................................................................................................................... 27
9. INTERIM CONCLUSIONS ............................................................................................................ 29
10. PLANS FOR CONTINUED WORK ............................................................................................... 31
11. REFERENCES................................................................................................................................. 33

vi
FIGURESFigure 3.1. Configurations of typical cable designs used in NPPs............................................................. 7
Figure 3.2. Typical cable layout allows access at control racks and termination junction boxes but much of the cable is protected within cable trays and conduit thereby limiting access for local inspections...................................................................................................... 8
Figure 5.1. Parallel capacitor model with dielectric sandwiched between two conductive plates........... 11
Figure 5.2. Frequency-dependence of and for relaxation modes in typical polymers (Bowler and Liu 2015)........................................................................................................... 12
Figure 5.3. Specific capacitance (a) and loss tangent (b) measured on tri-core, EPR-insulated cable with PVC jacket. Samples were aged thermally at 140°C for the number of hours shown in the legend (Imperatore 2017). ...................................................................... 15
Figure 6.1. ANSYS Maxwell 3D model of interdigital capacitor wrapped onto a cylindrical dielectric material (left) and simulated electric flux distribution inside the dielectric material (right)....................................................................................................................... 17
Figure 6.2. ANSYS Maxwell 2D model of interdigital capacitor wrapped onto a cylindrical cable (left) with resulting finite element mesh (center) and simulated electric flux distribution (right). ................................................................................................................ 18
Figure 6.3. Perspective view of a coplanar, interdigital capacitive sensor showing geometrical parameters g, the separation distance between neighboring digits, and w, the digit width (Huang et al. 2017). ..................................................................................................... 18
Figure 6.4. Schematic diagram of the design problem considered by Shao and Bowler (2017). ............ 19
Figure 6.5. Sensor sensitivity S as a function of the number of digits, N. Other calculation parameters are given in Table 6.1 and Table 6.2. .................................................................. 20
Figure 6.6. Schematic diagram of an interdigital capacitive sensor in contact with EPR-insulated Okoguard® 15 kV aerial jumper cable.................................................................................. 20
Figure 6.7. Measured real relative permittivity of Okoguard® EPR-based insulation material used in Okoguard® 15 kV aerial jumper cable. .................................................................... 21
Figure 6.8. Output capacitance of the sensor calculated using AC/DC packages of COMSOLTM
for digit gaps of 1, 2, 3, and 4 mm. The number of digits N = 11, the width of the digits w = 1 mm, and the sensor length along the axial direction of the cable is 25 mm. Other sensor parameters are given in Table 6.2. Some parameters of the cable are listed in Table 6.3 and the insulation real relative permittivity as a function of frequency is plotted in Figure 6.7. ......................................................................................... 22
Figure 7.1. Photograph of IDC described in Sheldon and Bowler (2014b). The IDC accommodates wires with diameter up to approximately 3 mm. IDC particulars: N =14, w = 0.1 mm, g = 0.3 mm, and l = 25 mm. ....................................................................... 23
Figure 7.2. Photograph of the JET Parallel Clamp. The area of the clamp surface is approximately 20 cm 5 cm. ................................................................................................ 24
Figure 7.3. Upper (a) and lower (b) shaped sample holders for adhering to the jaws of the parallel clamp. The side box in the lower holder (b) is for mounting a small connector to the interdigital electrodes that will lie in the curved recess. ............................. 24
vii
Figure 7.4. Clamp sensor setup with Agilent E4980A Precision LCR Meter, acrylic sample holder, printed interdigital capacitor electrodes, and SMA connector. Inset: (a) capacitor electrodes, two sizes; and (b) clamp setup with Okoguard® Aerial Jumper Cable sample in position........................................................................................................ 25
Figure 8.1. Capacitance measured by an interdigital sensor with N = 15, w = 0.1 mm, g = 1 mm, and l = 30 mm on pristine Okoguard® Aerial Jumper Cable. ............................................... 27
Figure 8.2. Capacitance measured by an interdigital sensor with N = 9, w = 0.1 mm, g = 1 mm, and l = 25 mm on EPR-jacketed bipolar cable with diameter approximately 9 mm and jacket thickness approximately 0.9 mm (Sun et al. 2016). Cable samples were thermally aged at 135°C for 0, 5, and 15 weeks. ................................................................... 27
TABLESTable 3.1. A Sort of Insulation Material for U.S. NPPs (from EPRI 1994) ............................................. 7
Table 3.2. Categories of Cable Grouping ................................................................................................. 8
Table 6.1. Cable parameters used in the simulations whose results are presented in Figure 6.4............ 19
Table 6.2. Fixed parameters of the sensor for the simulations whose results are presented in Figure 6.5............................................................................................................................... 19
Table 6.3. Cable parameters used in the simulations whose results are presented in Figure 6.6............ 21


ix
ACRONYMS AND ABREVIATIONSAMP aging management program
C capacitance
CM condition monitoring
CSPE chlorosulphonated polyethylene (Hypalon)
penetration depth
DOE U.S. Department of Energy
complex permittivity
EAB elongation at break
EPR ethylene propylene rubber
EPRI Electric Power Research Institute
f frequency
F SI unit of capacitance
FEM finite element modeling
g IDC electrode gap
Gy Gray (unit measure of ionizing radiation)
IDC interdigital capacitance
LCR inductance-capacitance-resistance
LWRS Light Water Reactor Sustainability Program
N Number of IDC digits
NDE nondestructive evaluation
NPP nuclear power plant
NRC U.S. Nuclear Regulatory Commission
PNNL Pacific Northwest National Laboratory
PVC polyvinyl chloride
S sensitivity
SLR subsequent license renewal
TGA thermogravimetric analysis
w IDC electrode width
XLPE cross-linked polyethylene

1
1. OBJECTIVESThis Pacific Northwest National Laboratory (PNNL) milestone report describes progress to date on
the investigation of nondestructive test methods focusing particularly on interdigital capacitance (IDC) testing of cable jackets and insulation that provide key indicators of cable aging and damage.
The overall objectives of this project are to develop the technical basis for assessing the level and impact of cable insulation aging and degradation in nuclear power plants (NPPs). In July 2012, a workshop (Simmons et al. 2012) was held to lay the groundwork for a research and development roadmap to address aging cable management in NPPs, including methods for nondestructively measuring the condition of aging cables. The project addresses the overall gaps that were identified at that workshop using a phased approach. This phased approach addresses the three areas identified from the workshop:
Determination of key indicators of cable aging. This has largely been addressed in earlier reports (Simmons et al. 2014; Fifield et al. 2015; Ramuhalli et al. 2015).
Characterize and advance current nondestructive evaluation (NDE) methods and develop new NDE methods by using insights from the determination of key indicators. This activity was generally addressed by Glass et al. (2015) describing the overall state of the art for both bulk electrical tests and local tests. A more focused report was prepared to address local NDE cable tests (Glass et al. 2016).This separate 2016 report addresses bulk electrical tests.
Develop models that use the advances in key indicators and NDE methods to assist in predicting remaining life of cables. Modeling has been and continues to be essential to understand the relevance and aid in interpretation of NDE results. Examples of this include Fifield et al. (2017) and Glass et al. (2017).
This report is submitted in fulfillment of deliverable M3LW-17OR0404025 – interim report on IDC assessment of aging cable insulation for Nuclear Power Plant Cable Aging Management Programs.


3
2. INTRODUCTION AND BACKGROUNDAs NPPs consider applying for second, or subsequent, license renewal (SLR) to extend their
operating period from 60 years to 80 years, it is important to understand how the materials installed in plant systems and components will age during that time and develop aging management programs (AMPs) to assure continued safe operation under normal and design-basis events (DBE).
Degradation of the cable jacket, electrical insulation, and other cable components of installed cables within NPPs is known to occur as a function of age, temperature, radiation, and other environmental factors. Although system tests verify cable function under normal loads, concern remains over cable performance under exceptional loads associated with DBEs. The cable’s ability to perform safely over the initial 40-year planned and licensed life has generally been demonstrated and there have been very few age-related cable failures (EPRI 2015; Mantey 2015). With greater than 1000 km of power, control, instrumentation, and other cables typically found in an NPP, replacing all the cables would be a severe cost burden. License renewal to 60 years and subsequent license renewal to 80 years, therefore, requires a cable AMP in accordance with regulatory guidance (NRC 2012) to justify cable performance under normal operation as well as accident conditions.
The aging of insulation and jacketing material in electrical and instrumentation cables is considered to be one of the factors that may limit the ability of light water reactors to continue operations beyond their licensed period (up to 60 and 80 years, depending on the specific plant). The focus for cable SLR qualification is the continued ability to withstand a DBE. Aging and subsequent degradation of insulation will impair the ability of cables to perform their function under all environmental conditions. Methods to nondestructively assess the level of aging and degradation in cable insulation and jacketing materials are therefore needed. In addition to providing an estimate of the level of aging and degradation, such condition assessment or condition monitoring (CM) methods for cable insulation can also provide critical inputs into condition-based qualification approaches, assess corresponding remaining useful qualified life of the cable, and ensure that the cables do not exceed a qualified level of degradation.
The U.S. Nuclear Regulatory Commission (NRC) commissioned the U.S. Department of Energy (DOE) to perform a detailed analysis of NPP material aging in this context. The results of this analysis, the Expanded Materials Degradation Assessment (EMDA), have been published in five volumes. The first provides a summary of the analysis process and results. The second through fourth volumes focus on the aging of individual systems of concern including core internals and piping systems, reactor pressure vessels, and concrete and civil structures. The fifth volume (NRC 2013) considers the aging of cable and cable systems. It identifies age-related degradation scenarios that could be important to the use of NPP electrical cable components over an 80-year timeframe and identifies issues for which enhanced aging management guidance may be warranted.
In July 2012, a workshop (Simmons et al. 2012) was held to lay the groundwork for a research and development roadmap to address aging cable management in NPPs, including methods for nondestructively measuring the condition of aging cables. This workshop brought together subject matterexperts from the NRC, DOE national laboratories, the Electric Power Research Institute (EPRI), universities, and cable manufacturers and inspectors. The workshop focused on identifying key research needs in the NDE of aging cable insulation in NPPs and the associated technical gaps. Identifying measurable quantities due to changes in chemical structure of insulating materials that would be a precursor to eventual failure of an aging cable, and the current state-of-the-art in NDE methods that could be applied to estimate the remaining life of the cable, were determined to be key to addressing the aging management challenge for nuclear cables. The development of new NDE methods or development of new measurement techniques using existing NDE methods that target these types of changes is of significant interest. Further, the ability to perform nondestructive tests to determine chemical, physical, mechanical, and electrical properties of the cable jackets and insulation without significant disturbance of the cables and connectors as they lay in situ is essential. This cable AMP is sponsored by DOE under the Light Water Reactor Sustainability (LWRS) program to address knowledge and technique gaps to support the

4
evolution of industry cable AMPs. Cable NDE methods comprise one topic of ongoing coordination and communication efforts on aging NPP cable research between the DOE, NRC, EPRI, and Iowa State University. Coordination of efforts helps to minimize duplication in research and to ensure that prioritized knowledge gaps are addressed.
Acceptance criteria that define the threshold for degradation below which cables may continue to be used are a challenge, because it is impractical to subject each cable system to loss-of-coolant accident (LOCA) or seismic simulation events following 40+ years of service. The report Initial Acceptance Criteria Concepts and Data for Assessing Longevity of Low-Voltage Cable Insulations and Jackets (EPRI 2005) develops a basis for acceptance criteria and evaluates the aging profiles for many commonly used cable jackets and polymers. The report describes 50 percent elongation at break (EAB) as a conservative practical end-of-life threshold for cables that may be stressed during maintenance or subjected to LOCA exposure. The report also discusses the basis for cautious continued use of cables beyond the 50-percent EAB threshold. EAB inherently compromises the in-service cable use as it is a destructive ex situ test so the challenge is to develop NDE methods that can reasonably be correlated with EAB. Reliable NDE in situ approaches are needed to objectively determine the suitability of installed cables for continued service. A variety of tests are available to assess various aspects of electrical and mechanical cable performance, but none of the available tests are suitable for all cable configurations nor does any single test assess all features of interest. Nevertheless, the complete collection of test possibilities offers a powerful range of tools to assure the integrity of critical cables.
Cable test technologies may generally be divided into:
Bulk/distributed electrical measurements [resistance or impedance measurements, high voltage withstand tests, reflectometry, partial discharge, and other techniques]. These tests are administered in situ from the cable termination ends and test the full length of the cable. Normally both ends of the cable are isolated from the supply or from the indicating instrument and from the motor, actuator, or sensor to perform the test.
Local insulation measurements that include visual or optical inspection, indenter, infrared, or near-infrared spectral measurement. Local tests may be impractical to apply if cables are inaccessible because they are buried, enclosed in conduit, or require expensive scaffolding to access; however,such local tests can be important to justify continued service or repair rather than replacement. Visual tests provide subjective indications of the cable condition. Indenter tests evaluate mechanical properties of the insulation which are shown to correlate well with EAB (Glass et al. 2016). Fourier transform infrared (FTIR) and Fourier transform near infrared (FTNIR) optical methods show promise as a practical way to quickly test accessible cable insulation or jacket material particularly if there is a calibration baseline library of the specific material’s aging behavior (Glass et al. 2016;Fifield et al. 2017). None of these tests however address electrical characteristics of interest. The primary promising technology for local testing of electrical characteristics of the insulation is the interdigital capacitance testing that is the primary subject of this report.
Laboratory sample tests – Virtually all local and bulk and distributed electrical NDE tests may be applied in a laboratory environment if the cable can be moved to that environment; however, the laboratory environment offers some additional test possibilities that are not practical to perform on insitu cables. In order for these tests to aid the utilities in dispositioning in-service cables, these tests require samples from surrogate cables that may have been left in place but are no longer in service (rare) or a section of the actual in-service cable may be sampled, followed by a splice or termination repair. Such tests include EAB, oxidation induction time and temperature (evaluates loss of anti-oxidant compounds), insulation density measurement, temperature at maximum rate of weight loss and activation energy measurements using a thermogravimetric analyzer (TGA), swelling ratio and gel fraction measurements, atomic force microscope for micro-scale visco-elastic properties, nuclear magnetic resonance, and Fourier transform infrared spectroscopy. These tests are mentioned but are

5
not addressed further in this report. Such tests can be useful to characterize general plant cable aging behavior, but their destructive nature and impracticality for field application makes them unsuitablefor justifying continued use of in-service cables.
Cable test motivations may be grouped as follows:
Factory in-process and post manufacture acceptance test. These tests are designed to confirm the quality of the manufactured cable and catch any quality issues prior to releasing the cable to the ultimate customer.
Post-installation tests that prove the cable is fit for service and has not been damaged during installation.
Condition monitoring associated with the cable AMP. The primary focus here is to determine if the cable is currently acceptable and is expected to continue to be acceptable for a period of time. Usually the units or increments of time of interest are the number of operating/refueling cycle periods (typically 2 years).
Troubleshooting tests to determine the nature and location of degradation and to assess whether repair is possible or if replacement is necessary.
Failure and forensics assessments to identify reasons for failure or degradation and recommend mitigation or corrective action on similar applications and circuits.


7
3. CABLE DESIGN, CLASSIFICATION, AND LAYOUTNPP cable designs typically include a conductor to carry power, instrumentation or control signals,
and an insulating cover layer to isolate the conductor (Figure 3.1). They may include more than one insulated conductor within a bundle. Other components typically associated with the overall cable design include a semiconductor screen, a shield over each conductor, and/or over all conductors, binder tape, and a jacket. While the insulation provides electrical isolation, in jacketed cable configurations the jacket mainly serves to provide mechanical protection during installation and sometimes fire or moistureresistance depending on the cable construction. The materials for cable components are chosen based on the use environment, such as wet, dry, radiation, or sunlit conditions, and the application such as for power or instrumentation. Conductors, made from copper, aluminum, or tin, are relatively insensitive to age and related damage. Cross-linked polyethylene (XLPE) and ethylene propylene rubber (EPR) compose the vast majority of insulation materials in the nuclear industry, with silicone rubber also beingof interest. The most significant jacket materials are chlorosulphonated polyethylene (CSPE – also known as Hypalon® [registered trademark of DuPont]), polychloroprene, and poly vinyl chloride (PVC). While installed cables with intact insulation may well be able to continue to provide safe operation with degraded jacket material, the tendency of jacketing materials to degrade more readily than insulation materials enables their use as lead indicators for local stress prior to insulation degradation and failure.
Figure 3.1. Configurations of typical cable designs used in NPPs.
A survey performed by EPRI in the mid 1990s established a representative distribution of insulation materials within the U.S. nuclear fleet (EPRI 1994) (see Table 3.1). Note that over 70 percent of the materials are XLPE or EPR.
Table 3.1. A Sort of Insulation Material for U.S. NPPs (from EPRI 1994)
Insulation Material
Database Entries
Percent of Total (%)
Insulation Material
Database Entries
Percent of Total (%)
XLPE 439 36 ETFE 39 3EPR 434 36 Flame retardant 36 3Silicone Rubber 63 5 CSPE 28 2Kerite 61 5 Butyl rubber 20 2Polyethylene 52 5 All others

8
Numerous standards have been developed over the years to group and categorize cables based on application, voltage, environment, and basic design type (Table 3.2). Exactly what grouping is used depends on the application but for cable aging management, generally the nuclear industry has focused on medium- and low-voltage cables. Low-voltage cables constitute the majority of NPP cables but many safety-critical cables exposed to moisture are medium-voltage cables. Most plants have a rigorous program to test and verify performance of safety-critical medium-voltage cables. Cable CM programs are encouraged through NRC’s Draft Regulatory Guide 1240 (NRC 2010) with particular emphasis on medium-voltage cables citing examples of cable failures particularly for wet environment cables. Although this is not currently a required program, it is encouraged by the NRC to promote discussion between staff and licensees when a facility’s operating experience indicates cable failure or degraded cable performance as a causal factor. The NRC staff will use this guidance to evaluate compliance with the Maintenance Rule.
Table 3.2. Categories of Cable Grouping
Application Voltage Environment Design
PowerControlInstrumentThermocoupleCommunicationSpecialty ConfigurationSafety RelatedNon-Safety Related
–46 KV)High (>46 KV)
Normal operating temperature
High temperatureFire/flame retardantHigh radiationSubmerged – waterAggressive solvents
Single/multi-conductorTriplexThermocouple alloysCoaxialShielded/unshielded (and shield
type – tape, braid, …)Special jacketConductor/shield material
(copper, tinned copper, aluminum, …)
Insulation/jacket material (XLPE, EPR, PVC, …)
Cable layout in typical plants is not designed to facilitate access and inspection of much of the cable lengths. Cable trays and conduits are designed to protect the cables from environmental stresses as well as accidental damage from workers and equipment that may be moving either inside containment, auxiliary buildings, or control buildings. While cable ends are generally accessible at termination boxes and control panels, many cables are grouped together with other cables in trays that do not necessarily follow personnel access pathways, pass through penetration pipes and conduits that may be buried in concrete, under-ground, or even passing through areas that may be flooded (Figure 3.2).
Figure 3.2. Typical cable layout allows access at control racks and termination junction boxes but much of the cable is protected within cable trays and conduit thereby limiting access for local inspections.

9
4. AGING AND ACCELERATED AGINGStressors leading to cable degradation can generally be divided into three groups (Lindsay and
Benson 2012):
Environmental: radiation, heat, moisture, chemical, etc.Operational: high voltage, electrical transients, ohmic heating, flexing/vibration, mechanical damage, etc.Error-induced damage from inappropriate design/selection for the given environmental or operational stressors above, manufacturing, or maintenance deficiencies.
When CM techniques are being applied to evaluate cable condition, consideration of the stressors can be important to point out where to look and what to look for, but the tests are sensitive to changes in the cable material characteristics. These changes can generally be considered as follows:
Various insulation and jacket polymers (XLPE, EPR, PVC) subject to elevated temperature from ohmic heating of the conductor, radiant or ambient acting on the outside of the insulation and jacket, water or chemical attack from the cable exterior, and/or radiation are prone to embrittlement, cracking, decrease in dielectric strength, increased leakage current, reduction in structural integrity, and susceptibility to intrusion of moisture or contaminants.
PVCs (mostly related to jackets) are also subject to hydrogen chloride evolution and salt formation resulting from wet environments that can reduce dielectric strength and increase leakage currents. Because PVCs are rarely used for insulation, however, this may be only a cosmetic issue limited to the jacket.
Various insulation and jacket polymers are also subject to wetting and moisture intrusion in the form of “water trees” resulting in decreased dielectric strength and increased leakage currents.
Copper conductors subjected to wetting may experience corrosion resulting in increased electrical resistance and corresponding ohmic heating that may accentuate the corrosion process.
Various insulation and jacket polymers are subject to handling, physical contact abuse during installation, maintenance, operation, or testing that may result in crushing, cracking, scuffing, cutting, bending deformation, etc. and may result in visually observed damage, reduced dielectric strength, and increased leakage current.
PNNL (Glass et al. 2015) has developed:
extensive capabilities for controlled accelerated aging of cable samples
laboratory measurements of cable and particularly insulation characteristics, and
a collection of laboratory and in situ techniques that may be applied to cable CM assessment.
The principal concerns for adverse environments experienced by polymer insulated/jacketed electrical cables in the NPPs are elevated temperature, gamma radiation exposure, and the presence of moisture or other chemical environmental stress. Typical NPP temperatures and dose environments allow the cable to operate for 40+ years before material degradation is of sufficient concern to warrant specific tests and repair or replacement if necessary. Because it is not practical to wait 40+ years for suitably aged samples, the ability to accelerate aging is essential to the program. A series of aging ovens has been acquired with room to house either racks of samples inside or support pass-through intact cables. In addition, PNNL has a Co-60 gamma radiation facility that can subject samples to up to 1 kGy/hr. The facility can also combine the ovens and the radiation test source for combined thermal and radiation aging. The capability to specify both temperature and dose rate during sample preparation enables PNNL to address knowledge gaps in the understanding of degradation from combined exposure including synergistic effects and inverse temperature effects. These facilities have been used to generate the representative aged samples where PNNL and PNNL collaborators have performed verification or demonstration CM measurements.

11
5. IDC THEORY AND LITERATURE REVIEW5.1 Principles of Capacitive Testing
Capacitive sensors are utilized in the area of materials characterization known as dielectrometry(Nassr and El-Dakhakhni 2009; Sheldon and Bowler 2014a). The output capacitance of a capacitive sensor placed in the vicinity of a test-material is sensitive to the dielectric properties of that material.Capacitance can be measured using a typical inductance-capacitance-resistance (LCR) meter, connected to a capacitive probe.
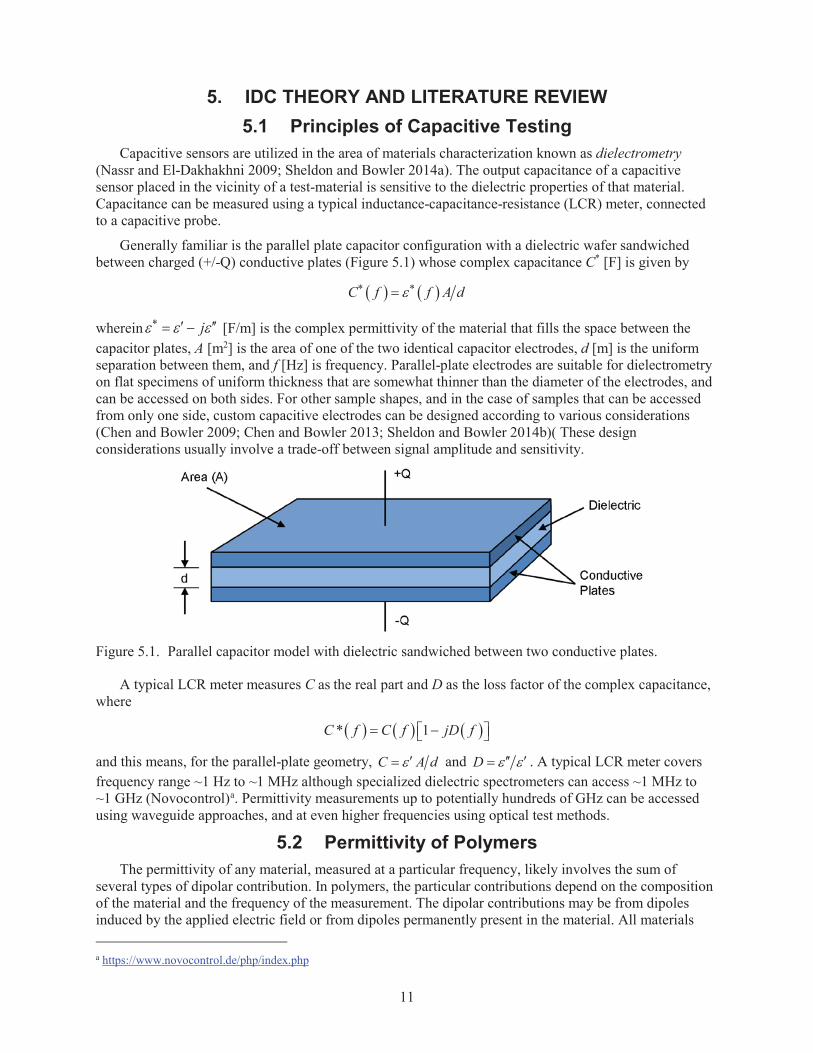
Generally familiar is the parallel plate capacitor configuration with a dielectric wafer sandwiched between charged (+/-Q) conductive plates (Figure 5.1) whose complex capacitance C* [F] is given by
C f f A d
wherein j [F/m] is the complex permittivity of the material that fills the space between the capacitor plates, A [m2] is the area of one of the two identical capacitor electrodes, d [m] is the uniform separation between them, and f [Hz] is frequency. Parallel-plate electrodes are suitable for dielectrometry on flat specimens of uniform thickness that are somewhat thinner than the diameter of the electrodes, and can be accessed on both sides. For other sample shapes, and in the case of samples that can be accessed from only one side, custom capacitive electrodes can be designed according to various considerations(Chen and Bowler 2009; Chen and Bowler 2013; Sheldon and Bowler 2014b)( These design considerations usually involve a trade-off between signal amplitude and sensitivity.
Figure 5.1. Parallel capacitor model with dielectric sandwiched between two conductive plates.
A typical LCR meter measures C as the real part and D as the loss factor of the complex capacitance, where
* 1C f C f jD f
and this means, for the parallel-plate geometry, C A d and D . A typical LCR meter covers frequency range ~1 Hz to ~1 MHz although specialized dielectric spectrometers can access ~1 MHz to ~1 GHz (Novocontrol)a. Permittivity measurements up to potentially hundreds of GHz can be accessed using waveguide approaches, and at even higher frequencies using optical test methods.
5.2 Permittivity of PolymersThe permittivity of any material, measured at a particular frequency, likely involves the sum of
several types of dipolar contribution. In polymers, the particular contributions depend on the composition of the material and the frequency of the measurement. The dipolar contributions may be from dipoles induced by the applied electric field or from dipoles permanently present in the material. All materials
a https://www.novocontrol.de/php/index.php

12
exhibit electronic polarization that arises as a consequence of relative displacement of electronic and nuclear charge in the presence of an applied electric field. Since the electron cloud is relatively light and responsive to the presence of the applied electric field, this polarization mechanism persists up to ~1015 Hz. Permanent dipole moments in the polymer itself also contribute to the permittivity of the material. These may be associated with side groups attached to the polymer main chain, or with the polymer main chain itself. Those dipole moments associated with the polymer chain tend to become active in their polarization contribution at temperatures above the glass transition temperature Tg of the polymer, and the observance of this contribution to polarization can indeed be used as a measure of Tg.Contributions from side groups may be observable at temperatures both above and below Tg, with relaxation frequency higher than that of any relaxation associated with the polymer main chain. For further information see, for example, (Menczel and Prime 2009, Chapter 6).
Each dipole has associated with it a polarizability, , and dipole moment p = E. The extent to which each dipole may contribute to the overall polarization of the material depends on the strength of the individual contribution, represented by its polarizability. The polarizability is a function of frequency,giving rise to frequency dependence of the permittivity. Each type of contribution has a characteristic relaxation frequency associated with it, above which its contribution to the overall polarization of the material falls off. This behavior is illustrated in Figure 5.2, which shows the frequency dependence of permittivity for a typical polymer. Three relaxations are illustrated—interfacial polarization relaxation that can occur when free charges in a semi-crystalline polymer become trapped at the crystal-amorphous boundary, for example; the alpha relaxation associated with the glass transition mentioned before; and a beta relaxation associated with polarization of a side group. The strength of each relaxation and its frequency depends on the particulars of the material. Notice that each relaxation is characterized by a decline in and a peak in ". These real and imaginary parts of the same complex number are related mathematically by the Kramers-Kronig relations that are rooted in the causal nature of the relaxation process (Landau and Lifshitz 1960).
Figure 5.2. Frequency-dependence of and for relaxation modes in typical polymers (Bowler and Liu 2015).

13
5.3 Interdigital Capacitors for Cable Polymer Monitoring5.3.1 Literature Review5.3.1.1 Coplanar capacitive sensors
Early work investigating coplanar capacitive sensors for defect detection in dielectric materials, both at and below the surface, and for surface flaw detection in metals, showed promise and noted the high lift-off sensitivity of capacitive sensors (Shull et al. 1990). Rectangular, coplanar, interdigital dielectrometry sensors, and a semi-analytical model for inferring the permittivity of a dielectric plate from the measured capacitance, were presented (Shay and Zahn 2005). Rectangular coplanar capacitive sensors were also applied to detect water intrusion in composite structures (Nassr et al. 2008) and evanescent field dielectrometry was used to monitor fresco degradation due to moisture and soluble salts (Olmi et al. 2006). Building upon these works, a concentric coplanar capacitive sensor was analyzed for quantitative dielectrometry, motivated by the need to detect ingressed water or excessive inhomogeneity due to improper repair of modern radome structures (Chen and Bowler 2009; Chen et al. 2011). The concentric coplanar capacitive sensor consists of a charged disc and coplanar annular ring that exhibit a measurable transcapacitance CT. The effectiveness of the sensor for detecting water ingression in glassfiber-honeycomb-glassfiber sandwich panels was demonstrated (Chen and Bowler 2010).
Recognizing that the sensing area of the concentric coplanar capacitive sensor is limited to the vicinity of the circular gap between the two electrodes, and that the magnitude of is essentially proportional to the length of this gap, concentric interdigital electrodes were introduced to increase the sensing area of the sensor and the measured capacitance (Chen and Bowler 2013).
5.3.1.2 Capacitive sensors for cylindrical surfacesMotivated by the need to inspect wire insulation in air- and spacecraft, a capacitive sensor whose two
electrodes conform to the cylindrical surface of the insulated wire was developed (Chen et al. 2012). By means of a semi-analytical model developed through a Green’s function analysis of the electric field distribution in the wire due to a point charge on its surface, with a method-of-moments calculation to determine the charge distribution upon the curved electrodes, the permittivity of the wire insulation was inferred from measured capacitance. In an accelerated aging experiment, differences between wireinsulation thermally exposed at various temperatures were observed (Chen and Bowler 2012a). Again recognizing the advantages of interdigital electrodes for increasing the measured capacitance and the sensing area of the sensor, a clamp fixture with interdigital capacitive sensor was developed for in situ evaluation of wire insulation (Sheldon and Bowler 2013, 2014a; Sheldon and Bowler 2014b). It was demonstrated that the sensor was capable of detecting differences between aircraft wires exposed to various types of aviation fluids (Sheldon and Bowler 2014b).
The interdigital capacitive sensor was applied to nuclear-related wires and cables beginning in 2014.EPR-insulated wires of various colors that had been exposed to thermal- and radiation-induced oxidative aging were tested and very good correlations were observed between measured C and D at 1 kHz and 1 MHz, EAB and indenter modulus measurements (Arvia et al. 2014; Bowler et al. 2015). These encouraging results provided significant momentum for continuing development of interdigital capacitive sensing for monitoring polymer components (jacket and insulation) in NPP cables. Correlation magnitudes of around 0.85 were found between measured C at 1 kHz and EAB in thermally aged EPR and cross-linked polyolefin (XLPO) cable jacket materials; for example, Sun et al. (2016).
5.3.2 Test Setup ConsiderationsNondestructive testing of dielectrics using interdigital capacitors offers various design parameters that
can be adjusted to improve signal strength, sensitivity, or sensing area. As mentioned above, increase in signal strength and sensing area can often be accomplished by increasing the number of sensor digits.Sensitivity to a particular depth of the sample can be increased by adjusting the separation of the digits,
14
and sensitivity to material property changes in a particular polymer can be increased by selecting a frequency at which the expected changes are large.
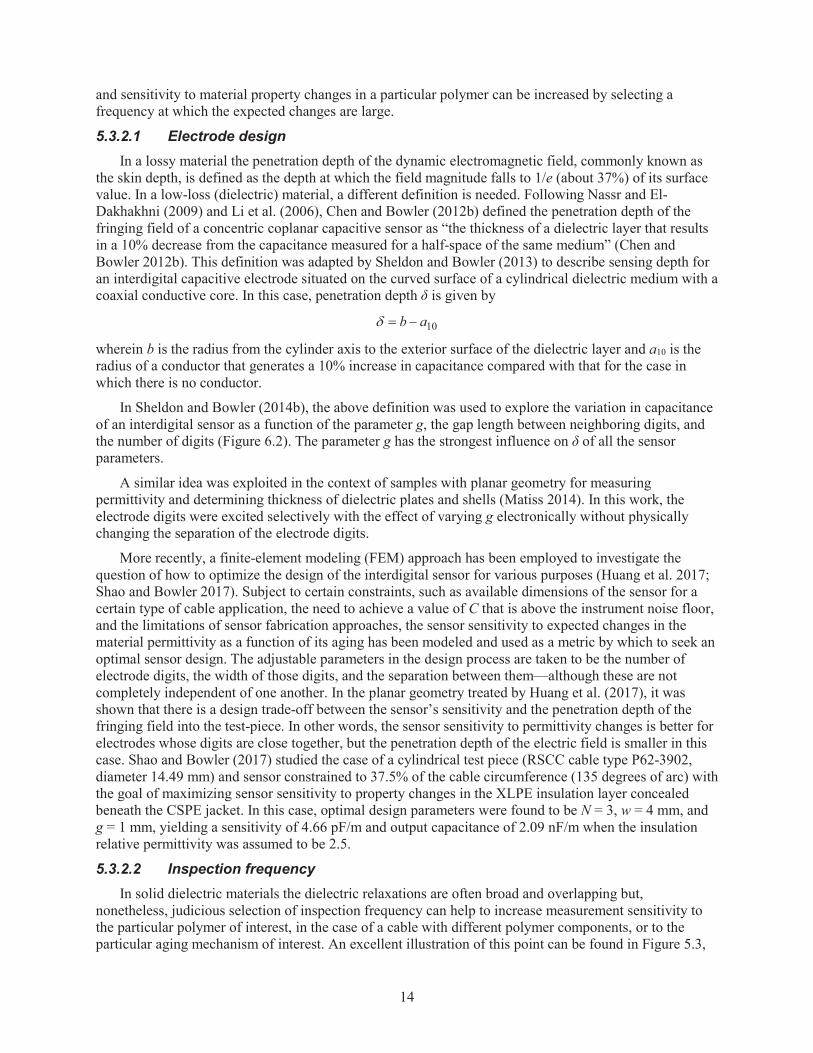
5.3.2.1 Electrode designIn a lossy material the penetration depth of the dynamic electromagnetic field, commonly known as
the skin depth, is defined as the depth at which the field magnitude falls to 1/e (about 37%) of its surface value. In a low-loss (dielectric) material, a different definition is needed. Following Nassr and El-Dakhakhni (2009) and Li et al. (2006), Chen and Bowler (2012b) defined the penetration depth of the fringing field of a concentric coplanar capacitive sensor as “the thickness of a dielectric layer that results in a 10% decrease from the capacitance measured for a half-space of the same medium” (Chen and Bowler 2012b). This definition was adapted by Sheldon and Bowler (2013) to describe sensing depth for an interdigital capacitive electrode situated on the curved surface of a cylindrical dielectric medium with a coaxial conductive core. In this case, penetration depth is given by
10b a
wherein b is the radius from the cylinder axis to the exterior surface of the dielectric layer and a10 is the radius of a conductor that generates a 10% increase in capacitance compared with that for the case in which there is no conductor.
In Sheldon and Bowler (2014b), the above definition was used to explore the variation in capacitance of an interdigital sensor as a function of the parameter g, the gap length between neighboring digits, and the number of digits (Figure 6.2). The parameter g has the strongest influence on of all the sensor parameters.
A similar idea was exploited in the context of samples with planar geometry for measuring permittivity and determining thickness of dielectric plates and shells (Matiss 2014). In this work, the electrode digits were excited selectively with the effect of varying g electronically without physically changing the separation of the electrode digits.
More recently, a finite-element modeling (FEM) approach has been employed to investigate the question of how to optimize the design of the interdigital sensor for various purposes (Huang et al. 2017;Shao and Bowler 2017). Subject to certain constraints, such as available dimensions of the sensor for a certain type of cable application, the need to achieve a value of C that is above the instrument noise floor, and the limitations of sensor fabrication approaches, the sensor sensitivity to expected changes in the material permittivity as a function of its aging has been modeled and used as a metric by which to seek an optimal sensor design. The adjustable parameters in the design process are taken to be the number of electrode digits, the width of those digits, and the separation between them—although these are not completely independent of one another. In the planar geometry treated by Huang et al. (2017), it was shown that there is a design trade-off between the sensor’s sensitivity and the penetration depth of the fringing field into the test-piece. In other words, the sensor sensitivity to permittivity changes is better for electrodes whose digits are close together, but the penetration depth of the electric field is smaller in this case. Shao and Bowler (2017) studied the case of a cylindrical test piece (RSCC cable type P62-3902,diameter 14.49 mm) and sensor constrained to 37.5% of the cable circumference (135 degrees of arc) with the goal of maximizing sensor sensitivity to property changes in the XLPE insulation layer concealed beneath the CSPE jacket. In this case, optimal design parameters were found to be N = 3, w = 4 mm, and g = 1 mm, yielding a sensitivity of 4.66 pF/m and output capacitance of 2.09 nF/m when the insulation relative permittivity was assumed to be 2.5.
5.3.2.2 Inspection frequencyIn solid dielectric materials the dielectric relaxations are often broad and overlapping but,
nonetheless, judicious selection of inspection frequency can help to increase measurement sensitivity to the particular polymer of interest, in the case of a cable with different polymer components, or to the particular aging mechanism of interest. An excellent illustration of this point can be found in Figure 5.3,

15
which shows broadband permittivity data measured from 0.01 Hz to 1 MHz on thermally-aged cable samples with EPR insulation and PVC jacket (Imperatore 2017). It can be seen that there are two peaks in the loss tangent, Figure 5.3(a), corresponding to the decline in specific capacitance plotted in Figure 5.3(b). The pronounced peak observable at around 0.1 Hz corresponds to a relaxation process occurring in EPR (Verardi 2013). The lower-amplitude peak at around 100 kHz corresponds to a relaxation process occurring in PVC (Orrit-Prat et al. 2011). For this cable, then, it should be possible to separate the influences of the two different materials by selecting the appropriate frequency range in which to work. To access property changes occurring in the insulation, therefore, it would be appropriate to work in a frequency range below 1 Hz.
Figure 5.3. Specific capacitance (a) and loss tangent (b) measured on tri-core, EPR-insulated cable with PVC jacket. Samples were aged thermally at 140°C for the number of hours shown in the legend (Imperatore 2017).


17
6. FEM SIMULATIONS (ISU AND PNNL)Finite-element modeling has been used to explore the design space associated with interdigital
electrodes with the aim of optimizing the sensor design for certain inspection tasks. Generally speaking, a modeling or simulation tool can assist with sensor design and optimization in a design process that avoids a large number of laboratory trials. For this effort, commercially available simulation packages from ANSYS and COMSOL have been used to predict the capacitance and electric field distributions associated with interdigital sensor configurations. PNNL has used ANSYS Maxwell while ISU has usedCOMSOL Multiphysics. Both tools include electrostatic field solvers for 2D and 3D geometries.
An example ANSYS 3D model of an interdigital sensor conformed to the outer surface of acylindrical dielectric material representing a cable is shown in Figure 6.1. This design has 15 electrodes printed on a flexible 0.05 mm thick Kapton polyimide substrate material. The outer dimensions are 12.7 mm wide by 25.4 mm long including the headers, and the simulated capacitance is 13 pF. The plot of the electric flux distribution shows that the sensor field penetration (and thus sensitivity) is primarily confined to the local region below the capacitor. To improve the overall sensitivity, the electrodes should be distributed around the entire cable. Simulation allows efficient parameter studies for optimization of key design choices such as the number, size, and distribution of electrodes.
Figure 6.1. ANSYS Maxwell 3D model of interdigital capacitor wrapped onto a cylindrical dielectric material (left) and simulated electric flux distribution inside the dielectric material (right).
Several interdigital sensors with electrodes distributed around the cable circumference were initiallystudied to benchmark the results between the simulation tools and measurements. These designs consisted of 6-electrode, 22-electrode, and 30-electrode configurations presented in Sheldon and Bowler (2014b).The interdigital sensors were conformed to a dielectric-coated conductive cylinder which represented asimple cable configuration. The dielectric materials consisted of Tecaform, acrylic, and Teflon.
The benchmark results showed that good agreement was obtained between the ANSYS and COMSOL electrostatic field models and the corresponding 1 MHz LCR meter measurements. As an example, Figure 6.2 shows the ANSYS 2D model and predicted electric flux distribution for the 22-electrode sensor. The predicted capacitance was 17.8 pF for an electrode length of 4 cm and Tecaformdielectric material.

18
Figure 6.2. ANSYS Maxwell 2D model of interdigital capacitor wrapped onto a cylindrical cable (left)with resulting finite element mesh (center) and simulated electric flux distribution (right).
6.1 Coplanar Interdigital ElectrodesHuang et al. (2017) investigated the effect of varying the geometrical parameters g, w (and
consequently the number of digits, N) of a coplanar, interdigitated sensor with fixed overall dimensionsupon its output capacitance and sensitivity. A schematic diagram of the sensor is given in Figure 6.3(Huang et al. 2017).
Figure 6.3. Perspective view of a coplanar, interdigital capacitive sensor showing geometrical parameters g, the separation distance between neighboring digits, and w, the digit width (Huang et al. 2017).
It was shown that there is a design trade-off between sensitivity S, defined as the rate of change of capacitance as a function of test piece permittivity,
CS
and the depth of penetration of the electric fringing field into the test piece.
6.2 Cylindrical Interdigital Electrodes6.2.1 Single Core Cable with Insulation and Jacket
Shao and Bowler (2017) addressed the problem of designing curved interdigital capacitive electrodesfor maximal sensitivity to permittivity changes in second-layer dielectric material. Given certain

19
geometrical constraints, the sensor’s geometrical parameters g and w were varied with the goal of determining the electrode design with best sensitivity to permittivity changes in the insulation layer of an unshielded, single-core cable, when the sensor was applied to the exterior surface of the cable jacket,(Figure 6.4). Recognizing that the penetration depth increases as the separation of the digits w increase, but that increasing w forces the output capacitance of the sensor C to drop, this design exercise deals with the trade-off between the need for a large depth of penetration while maintaining an output capacitance well above the noise floor.
Figure 6.4. Schematic diagram of the design problem considered by Shao and Bowler (2017).
For cable type P62-3092 supplied by RSCC company whose parameters are given in Table 6.1, and for certain fixed parameters of the sensor given in Table 6.2, sensor sensitivity and output capacitance were computed using AC/DC packages of COMSOLTM as functions of parameters g and w (Figure 6.5).
Table 6.1. Cable parameters used in the simulations whose results are presented in Figure 6.4
Company Cable Type Total Diameter (mm)Jacket Insulation
Thickness (mm) Material Thickness (mm) MaterialRSCC P62-3902 14.49 1.143 CSPE 1.4 XLPE
Table 6.2. Fixed parameters of the sensor for the simulations whose results are presented in Figure 6.5.
Thickness, te(μm) Material
Relative Permittivity
Electrode 17.8 Copper n/aSubstrate 25.4 PTFE 2.1Back Plane 17.8 Copper n/a
Optimal design parameters for nondestructive evaluation of the XLPE insulation layer for the cable configuration were found to be N = 3, w = 4 mm, and g = 1 mm when the cable surface available for inspection is assumed to be 37.5% of the full circumference. With these assumptions, a sensitivity of 4.66 pF/m and output capacitance of 2.09 nF/m were determined for the sensor when the insulation relative permittivity was assumed to be 1 = 2.5.

20
Figure 6.5. Sensor sensitivity S as a function of the number of digits, N. Other calculation parameters are given in Table 6.1 and Table 6.2.
6.2.2 Single Core Cable with InsulationIn more recent work, an interdigital capacitive sensor with curved electrodes conforming to the
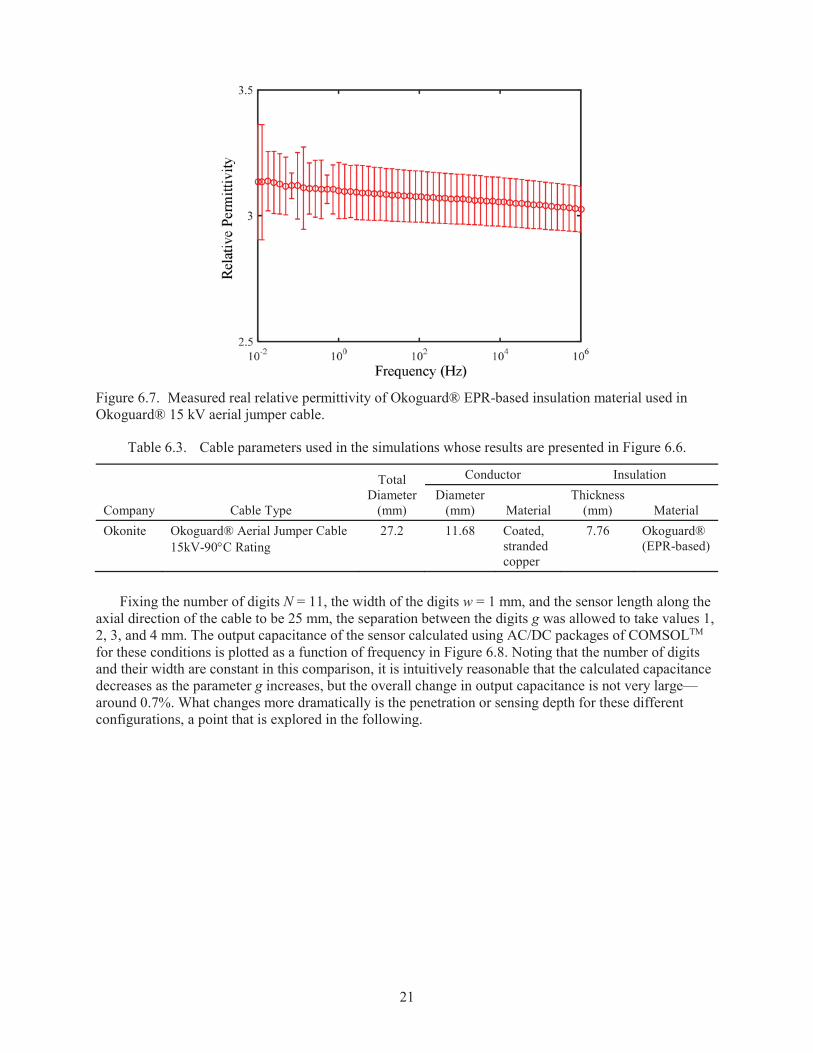
surface of Okoguard® 15 kV aerial jumper cable (The Okonite Company N.D.) was modeled (Figure 6.6). Some parameters of the cable are listed in Table 6.3 and the insulation real relative permittivity as a function of frequency is plotted in Figure 6.7. This data was measured on a flat sample of the material with thickness 0.8145 ± 0.0004 mm using parallel plate capacitive electrodes with diameter 31.75 mm. Fixed parameters of the sensor are listed in Table 6.2.
Figure 6.6. Schematic diagram of an interdigital capacitive sensor in contact with EPR-insulated Okoguard® 15 kV aerial jumper cable.
21
Figure 6.7. Measured real relative permittivity of Okoguard® EPR-based insulation material used in Okoguard® 15 kV aerial jumper cable.
Table 6.3. Cable parameters used in the simulations whose results are presented in Figure 6.6.
Company Cable Type
Total Diameter
(mm)
Conductor InsulationDiameter
(mm) MaterialThickness
(mm) MaterialOkonite Okoguard® Aerial Jumper Cable
15kV-90 C Rating27.2 11.68 Coated,
stranded copper
7.76 Okoguard® (EPR-based)
Fixing the number of digits N = 11, the width of the digits w = 1 mm, and the sensor length along the axial direction of the cable to be 25 mm, the separation between the digits g was allowed to take values 1, 2, 3, and 4 mm. The output capacitance of the sensor calculated using AC/DC packages of COMSOLTM
for these conditions is plotted as a function of frequency in Figure 6.8. Noting that the number of digitsand their width are constant in this comparison, it is intuitively reasonable that the calculated capacitancedecreases as the parameter g increases, but the overall change in output capacitance is not very large—around 0.7%. What changes more dramatically is the penetration or sensing depth for these different configurations, a point that is explored in the following.

22
Figure 6.8. Output capacitance of the sensor calculated using AC/DC packages of COMSOLTM for digit gaps of 1, 2, 3, and 4 mm. The number of digits N = 11, the width of the digits w = 1 mm, and the sensor length along the axial direction of the cable is 25 mm. Other sensor parameters are given in Table 6.2.Some parameters of the cable are listed in Table 6.3 and the insulation real relative permittivity as a function of frequency is plotted in Figure 6.7.
The thickness of the Okonite® insulation layer in the Okoguard® 15 kV aerial jumper cable is almost 8 mm (Table 6.3). It is possible that, in some service environments, the exterior of this relatively thick polymer layer may age differently than the interior. In the same way that the study by Shao and Bowler (2017) considered sensitivity of the designed sensor in relation to sensing depth, it is interesting to consider developing a sensor for this aerial jumper cable that may be able to assess the polymer dielectric properties as a function of depth. One way that this may be achieved is by sequential excitation of different combinations of electrode digits, thereby varying the effective gap between the digits, g. This idea has also been proposed by Matiss (2014) in the planar electrode configuration.

23
7. TEST FIXTURE CONFIGURATION7.1 Background
The clamp-based interdigital capacitive sensor whose design is described in Sheldon and Bowler (2014b) and which was employed in generating test results discussed in Sheldon and Bowler (2013),Sheldon and Bowler (2014a), and Arvia et al. (2014), was designed for testing wire of diameter approximately 2 mm (Figure 7.1). Since many cables are of larger diameter, and Okoguard® Aerial Jumper Cable in particular has diameter 27.2 mm, a new fixture and sensor design is needed.
Figure 7.1. Photograph of IDC described in Sheldon and Bowler (2014b). The IDC accommodates wires with diameter up to approximately 3 mm. IDC particulars: N = 14, w = 0.1 mm, g = 0.3 mm, and l = 25 mm.
7.2 DesignTo accommodate a cable with diameter approximately 28 mm, a clamp fixture with suitable
dimensions was selected. The JET Parallel Clamp (WMH Tool Group Inc. 2005) is a clamp designed for woodworking projects that includes a Precision-RuleTM measurement system to facilitate repeatable set upin terms of separation of the clamp faces and applied pressure to the sample (Figure 7.2). Acrylic blocks were designed, machined, and adhered to the faces of the parallel clamp to hold the cable samplessecurely during measurements (Figure 7.3). The assembled prototype test cell is shown in Figure 7.4. In the setup shown, the electrodes were available from a previous project and not optimized for this particular set of samples, but allowed preliminary data to be obtained and reported here.

24
Figure 7.2. Photograph of the JET Parallel Clamp. The area of the clamp surface is approximately 20 cm 5 cm.
Figure 7.3. Upper (a) and lower (b) shaped sample holders for adhering to the jaws of the parallel clamp. The side box in the lower holder (b) is for mounting a small connector to the interdigital electrodes that will lie in the curved recess.

25
Figure 7.4. Clamp sensor setup with Agilent E4980A Precision LCR Meter, acrylic sample holder, printed interdigital capacitor electrodes, and SMA connector. Inset: (a) capacitor electrodes, two sizes;and (b) clamp setup with Okoguard® Aerial Jumper Cable sample in position.

27
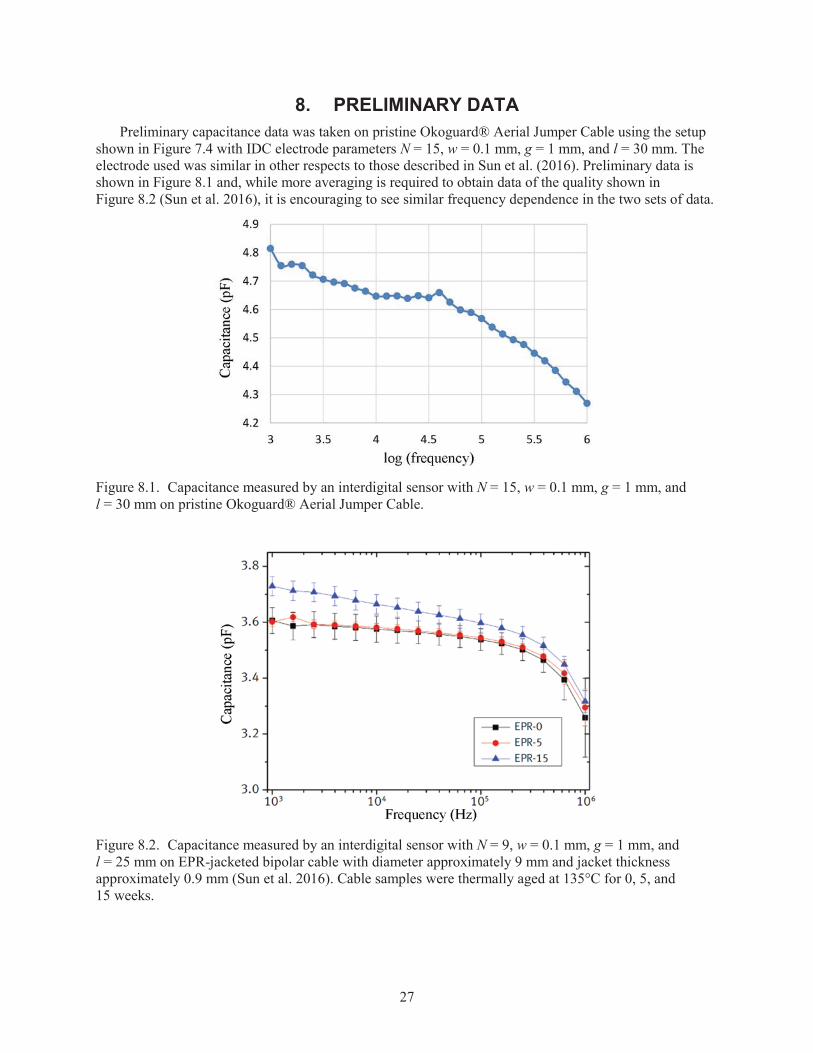
8. PRELIMINARY DATAPreliminary capacitance data was taken on pristine Okoguard® Aerial Jumper Cable using the setup
shown in Figure 7.4 with IDC electrode parameters N = 15, w = 0.1 mm, g = 1 mm, and l = 30 mm. The electrode used was similar in other respects to those described in Sun et al. (2016). Preliminary data is shown in Figure 8.1 and, while more averaging is required to obtain data of the quality shown in Figure 8.2 (Sun et al. 2016), it is encouraging to see similar frequency dependence in the two sets of data.
Figure 8.1. Capacitance measured by an interdigital sensor with N = 15, w = 0.1 mm, g = 1 mm, and l = 30 mm on pristine Okoguard® Aerial Jumper Cable.
Figure 8.2. Capacitance measured by an interdigital sensor with N = 9, w = 0.1 mm, g = 1 mm, and l = 25 mm on EPR-jacketed bipolar cable with diameter approximately 9 mm and jacket thickness approximately 0.9 mm (Sun et al. 2016). Cable samples were thermally aged at 135°C for 0, 5, and 15 weeks.


29
9. INTERIM CONCLUSIONSThis is an interim report and very little real data has been acquired. At the time of this report, samples
are being aged for evaluation; however, this process takes months and is not complete. These samples will be available soon for evaluation using the test setup developed and results will be reported in a subsequent final report. Interim conclusions and observations at this stage of the project are as follows:
A substantial body of work suggests feasibility to measure cable jacket and insulation conditions using various forms of interdigital capacitance sensors.
FEM models predict sensor behavior and can be used to optimize sensor configurations.
Preliminary data is consistent with previous measurements on EPR-jacketed bipolar cable.


31
10. PLANS FOR CONTINUED WORKIn the next phase of this project, a more complete set of aged EPR 25 mm jumper cable samples will
be available for trending performance of the capacitance sensor. The COMSOLTM simulation study of the various combinations of N, g, and w that give output capacitance above the noise floor will be explored looking at correlation between degree of aging and the measured capacitance.
The 25 mm EPR jumper cable is known to be susceptible to a significant variation in the oxidation state of accelerated aged cable due to the diffusion limited oxidation (DLO) effect. The capacitance sensor will be applied to assess sensitivity of the DLO effect on these cables by testing the outside surface of the insulation, the interior or middle section, and the full thickness area nearest to the center conductor.
In addition, a jacketed cable configuration will be evaluated to assess the ability to estimate dielectric properties and corresponding age-related damage of insulation beneath the outer jacket.


33
11. REFERENCESArvia EM, RT Sheldon and N Bowler. 2014. "A Capacitive Test Method for Cable Insulation Degradation Assessment." In 2014 IEEE Conference on Electrical Insulation and Dielectric Phenomena (CEIDP 2014), pp. 514-517. October 19-22, 2014, Des Moines, Iowa. DOI 10.1109/CEIDP.2014.6995857. IEEE, New York.
Bowler N and S Liu. 2015. "Aging Mechanisms and Monitoring of Cable Polymers." International Journal of Prognostics and Health Management 6.https://www.phmsociety.org/sites/phmsociety.org/files/phm_submission/2015/ijphm_15_029.pdf.
Bowler N, RT Sheldon and EM Arvia. 2015. "A New Test Method for Cable Insulation Degradation Assessment: Capacitive Sensing." In ANS Topical Meeting on Nuclear Plant Instrumentation, Control and Human-Machine Interface Technologies (NPIC-HMIT) 2015. February 23-26, 2015, Charlotte, North Carolina. American Nuclear Society, La Grange Park, Illinois.
Chen T and N Bowler. 2009. "Analysis of Concentric Coplanar Capacitor for Quantitative Dielectrometry." In Studies in Applied Electromagnetics and Mechanics, Volume 33: Electromagnetic Nondestructive Evaluation (XIII), pp. 61-68 eds: JS Knopp, MP Blodgett, B Wincheski and N Bowler. IOS Press, The Netherlands.
Chen T and N Bowler. 2010. "Analysis of a Concentric Coplanar Capacitive Sensor for Nondestructive Evaluation of Multi-Layered Dielectric Structures." IEEE Transactions on Dielectrics and Electrical Insulation 17(4):1307-1318. DOI: 10.1109/TDEI.2010.5539703.
Chen T and N Bowler. 2012a. "Analysis of a Capacitive Sensor for the Evaluation of Circular Cylinders with a Conductive Core." Measurement Science and Technology 23(4):045102. DOI: 10.1088/0957-0233/23/4/045102.
Chen T and N Bowler. 2012b. "A Rotationally-Invariant Capacitive Probe for Materials Evaluation." Materials Evaluation 70:161-172.
Chen T and N Bowler. 2013. "Design of Interdigital and Concentric Capacitive Sensors for Materials Evaluation." In Proceedings of the 39th Annual Review of Progress in Quantitative Nondestructive Evaluation, pp. 1593-1600. July 15-20, 2012, Denver, Colorado. American Institute of Physics, Melville, New York. AIP Vol. 1511.
Chen T, N Bowler and JR Bowler. 2012. "Analysis of Arc-Electrode Capacitive Sensors for Characterization of Dielectric Cylindrical Rods." IEEE Transactions on Instrumentation and Measurement 61(1):233-240. DOI: 10.1109/TIM.2011.2157573.
Chen T, JM Song, JR Bowler and N Bowler. 2011. "Analysis of a Concentric Coplanar Capacitive Sensor Using a Spectral Domain Approach." In Annual Review of Progress in Quantitative Nondestructive Evaluation, Vol. 30B, pp. 1647-1654. July 18-23, 2010, San Diego, California. American Institute of Physics, Melville, New York.
EPRI. 1994. Low-Voltage Environmentally-Qualified Cable License Renewal Industry Report; Revision 1. TR-103841, Electric Power Research Institute (EPRI), Palo Alto, California.
EPRI. 2005. Initial Acceptance Criteria Concepts and Data for Assessing Longevity of Low-Voltage Cable Insulations and Jackets. TR-1008211, Electric Power Research Institute (EPRI), Palo Alto, California.

34
EPRI. 2015. Plant Engineering: Evaluation and Insights from Nuclear Power Plant Tan Delta Testing and Data Analysis - Update. TR-3002005321, Electric Power Research Institute, Palo Alto, California.
Fifield LS, Y Shin and KL Simmons. 2017. "Non-destructive Evaluation of Polyolefin Thermal AgingUsing Infrared Spectroscopy." In Proceedings of SPIE 10169, Nondestructive Characterization and Monitoring of Advanced Materials, Aerospace, and Civil Infrastructure 2017, p. 101690U. March 25-29,2017, Portland, Oregon. DOI 10.1117/12.2261983. SPIE, Bellingham, Washington.
Fifield LS, MP Westman, A Zwoster and B Schwenzer. 2015. Assessment of Cable Aging Equipment, Status of Acquired Materials, and Experimental Matrix at the Pacific Northwest National Laboratory.PNNL-24198, Pacific Northwest National Laboratory, Richland, Washington.
Glass SW, LS Fifield, G Dib, JR Tedeschi, AM Jones and TS Hartman. 2015. State of the Art Assessment of NDE Techniques for Aging Cable Management in Nuclear Power Plants FY2015. M2LW-15OR0404024, PNNL-24649, Pacific Northwest National Laboratory, Richland, Washington.
Glass SW, LS Fifield and TS Hartman. 2016. Evaluation of Localized Cable Test Methods for Nuclear Power Plant Cable Aging Management Programs. M3LW-16OR0404022, PNNL-25432, Pacific Northwest National Laboratory, Richland, Washington.
Glass SW, AM Jones, LS Fifield, TS Hartman and N Bowler. 2017. Physics-Based Modeling of Cable Insulation Conditions for Frequency Domain Reflectometry (FDR). PNNL-26493, Pacific Northwest National Laboratory, Richland, Washington.
Huang Y, Z Zhan and N Bowler. 2017. "Optimization of the Coplanar Interdigital Capacitive Sensor." AIP Conference Proceedings 1806(1):110017. DOI: 10.1063/1.4974695.
Imperatore MV. 2017. Dielectric Spectroscopy as a Condition Monitoring Diagnostic Technique for Thermally Aged PVC/EPR Nuclear Power Plant Cables. Masters Thesis, University of Bologna, Italy.
Landau LD and EM Lifshitz. 1960. Mechanics, Third Edition, Volume 1 of Course of Theoretical Physics, Butterworth Heinemann, Oxford.
Li XB, SD Larson, AS Zyuzin and AV Mamishev. 2006. "Design Principles for Multichannel Fringing Electric Field Sensors." IEEE Sensors Journal 6(2):434-440. DOI: 10.1109/JSEN.2006.870161.
Lindsay P and S Benson. 2012. Ageing Management of Cable in Nuclear Generating Stations. RSP-0284, 13395-REP-00001 Rev. 0, RCM Technologies, Canadian Nuclear Safety Commission, Canada.
Mantey A. 2015. "Evaluation and Insights from Nuclear Power Plant Tan Delta Testing and Data Analysis-Update." Presented at IEEE Proceedings of the Power and Energy Society Insulated Conductors Committee, November 1-4, 2015, Tuscon, Arizona.
Matiss I. 2014. "Multi-Element Capacitive Sensor for Non-Destructive Measurement of the Dielectric Permittivity and Thickness of Dielectric Plates and Shells." NDT & E International 66:99-105. DOI: 10.1016/j.ndteint.2014.05.003.
Menczel JD and RB Prime, Eds. 2009. Thermal Analysis of Polymers: Fundamentals and Applications.Wiley, Hoboken, New Jersey.
Nassr AA, WH Ahmed and WW El-Dakhakhni. 2008. "Coplanar Capacitance Sensors for Detecting Water Intrusion in Composite Structures." Measurement Science and Technology 19(7):075702. DOI: 10.1088/0957-0233/19/7/075702.

35
Nassr AA and WW El-Dakhakhni. 2009. "Non-destructive Evaluation of Laminated Composite Plates Using Dielectrometry Sensors." Smart Materials and Structures 18(5):055014. DOI: 10.1088/0964-1726/18/5/055014.
NRC. 2010. Condition Monitoring Program for Electric Cables Used in Nuclear Power Plants. Draft Regulatory Guide DG-1240, U.S. Nuclear Regulatory Commission, Washington, D.C. Available at http://pbadupws.nrc.gov/docs/ML1007/ML100760364.pdf.
NRC. 2012. Condition-Monitoring Techniques for Electric Cables Used in Nuclear Power Plants.Regulatory Guide 1.218, U.S. Nuclear Regulatory Commission, Washington, D.C. Available at http://pbadupws.nrc.gov/docs/ML1035/ML103510447.pdf. ADAMS Accession No. ML103510447.
NRC. 2013. Expanded Materials Degradation Assessment (EMDA), Volume 5: Aging of Cables and Cable Systems. NUREG/CR-7153, Vol. 5; ORNL/TM-2013/532, U.S. Nuclear Regulatory Commission, Washington, D.C.
Olmi R, M Bini, A Ignesti, S Priori, C Riminesi and A Felici. 2006. "Diagnostics and Monitoring of Frescoes using Evanescent-Field Dielectrometry." Measurement Science and Technology 17(8):2281. DOI: 10.1088/0957-0233/17/8/032.
Orrit-Prat J, R Mujal-Rosas, A Rahhali, M Marin-Genesca, X Colom-Fajula and J Belana-Punseti. 2011. "Dielectric and Mechanical Characterization of PVC Composites with Ground Tire Rubber." Journal of Composite Materials 45(11):1233-1243. DOI: 10.1177/0021998310380289.
Ramuhalli P, LS Fifield, MS Prowant, G Dib, JR Tedeschi, JD Suter, AM Jones, MS Good, SW Glass and AF Pardini. 2015. Assessment of Additional Key Indicators of Aging Cables in Nuclear Power Plants -- Interim Status for FY2015. PNNL-24309, Pacific Northwest National Laboratory, Richland, Washington.
Shao ZH and N Bowler. 2017. "Capacitive Nondestructive Evaluation of Aged Cross-Linked Polyethylene (XLPE) Cable Insulation Material." In 18th International Conference on Environmental Degradation of Materials in Nuclear Power Systems – Water Reactors. August 13-17, 2017, Portland, Oregon. The Minerals, Metals & Materials Society.
Shay IC and M Zahn. 2005. "Cylindrical Geometry Electroquasistatic Dielectrometry Sensors." IEEE Transactions on Dielectrics and Electrical Insulation 12(1):41-49. DOI: 10.1109/TDEI.2005.1394014.
Sheldon RT and N Bowler. 2013. "An Interdigital Capacitive Sensor for Quantitative Characterization of Wire Insulation." In Review of Progress in Quantitative Nondestructive Evaluation, Vol. 32, pp. 1578-1585. July 15-20, 2012, Denver, Colorado. American Institute of Physics, Mellville, New York.
Sheldon RT and N Bowler. 2014a. "Dielectometry Sensors for Nondestructive Testing of Glass-fiber Polymer-matrix Composites." Materials Evaluation 72(11):1421-1427.
Sheldon RT and N Bowler. 2014b. "An Interdigital Capacitive Sensor for Nondestructive Evaluation of Wire Insulation." IEEE Sensors Journal 14(4):961-970. DOI: 10.1109/JSEN.2014.2301293.
Shull PJ, AV Clark, PR Heyliger, JC Moulder and BA Auld. 1990. "Characterization of Capacitive Array for NDE Applications." Research in Nondestructive Evaluation 2(1):11-27. DOI: 10.1007/bf01606376.
Simmons KL, LS Fifield, MP Westman, JR Tedeschi, AM Jones, MS Prowant, AF Pardini and P Ramuhalli. 2014. Determining Remaining Useful Life of Aging Cables in Nuclear Power Plants --

36
Interim Status for FY2014. PNNL-23624; INL-EXT-14-32505 Rev. 0, Pacific Northwest National Laboratory, Richland, Washington.
Simmons KL, P Ramuhalli, DL Brenchley and JB Coble. 2012. Light Water Reactor Sustainability (LWRS) Program – Non-Destructive Evaluation (NDE) R&D Roadmap for Determining Remaining Useful Life of Aging Cables in Nuclear Power Plants. PNNL-21731, Pacific Northwest National Laboratory, Richland, Washington.
Sun W, R Ding and N Bowler. 2016. "A Capacitive Sensor for Nuclear Power Planat Cable Monitoring." Materials Evaluation 74(10):1467-1471.
The Okonite Company. N.D. Okoguard Aerial Jumper Cable. Ramsey, New Jersey. Accessed September 7, 2017. Available at http://okonite.com/Product_Catalog/section6/sheet4.html.
Verardi L. 2013. Aging of Nuclear Power Plant Cables: In Search of Nondestructive Diagnostic Quantities. Ph.D. Thesis, University of Bologna, Italy.
WMH Tool Group Inc. 2005. "JET Parallel Clamp." http://content.jettools.com/assets/sellsheets/70412_SS_EN.pdf.