aging in america: trends. consumers: demographics health needs cost options
TRANSCRIPT

Aging in America: TRENDS

Consumers:
DemographicsHealthNeedsCost
Options

Sources: Seniors Commission Report: A Quiet Crisis in America, 2002 and U.S. Census Bureau and National Center for Health Statistics, 2000.
Aging in AmericaChanges Over a Century & Ahead
Americans Aged 65+
2000 - 35 million/1:12 2020 - 53 million/1:6 2030 - 70 million/1:5
1900 — Seniors < 5% of U.S. population 122,000 aged 85 and up
2002 — 12.4% of U.S. population 4.5 million aged 85 and up

Projected Population Growth Rates by Age Group
2000-2020
Source: Seniors Commission Report: A Quiet Crisis in America, 2002.
8.9%
16.3%
11.5%14.0%
34.2%
8.4%
48.7%
20.0%
35.3%
16.9%
0%
5%
10%
15%
20%
25%
30%
35%
40%
45%
50%
2000 to 2010 2010 to 2020
Total Population Age 65 to 74 Age 75 + Age 65 + Age 85+

Percentage of Adults Ages 65 and Older with Disabilities, 2000-2040
Disability Trends
Source: “Meeting the Long-Term Care Needs of the Baby Boomers: How Changing Families Will Affect Paid Helpers and Institutions,”Johnson, Richard W., Toohey, Desmond and Wiener, Joshua M., May 2007.

Year
Age 65-74.
Age 75-84.
Age 85+ Total
2000 0.3 2.4 1.8 4.5 2010 0.3 2.4 2.4 5.12020 0.3 2.6 2.8 5.72030 0.5 3.8 3.5 7.72040 0.4 5.0 5.6 11.0.2050 0.4 4.8 8.0 13.2.
Source: National Institutes of Health Press Release, 2003.
Number of Persons with Alzheimer’s Disease (in millions)
Alzheimer’s Disease

Residents Needing Assistance with Activities of Daily Living
Freestanding Assisted Living (AL)
Freestanding Dementia Care (DC)
AL / DC (with/out Independent Living—IL)
AL / IL
AL / Nursing (with/out DC)
Continuing Care Retirement Community (CCRC)
TOTAL
Need Bathing Assistance
60% 90% 78% 73% 61% 68% 68%
Need Dressing Assistance
41% 83% 60% 43% 32% 40% 47%
Need Toileting Assistance
30% 78% 46% 30% 13% 25% 34%
Need Transferring Assistance
25% 65% 35% 22% 12% 11% 25%
Need Eating Assistance
19% 60% 26% 14% 13% 13% 22%
Source: 2006 Overview of Assisted Living, p. 34, Table 7.2, “ADL Summary,” copyright 2006, AAHSA, ASHA, ALFA, NCAL and NIC.

SNF Resident ADL Limitations by ADL – USA (2007)
Bathing 95.77%
Dressing 86.16%
Toileting 83.03%
Transferring 79.07%
Eating 52.20%
Source: Nursing Home Statistical Yearbook, 2007, Page 32, Cowel Research Group.

Source: Seniors Commission Report: A Quiet Crisis in America, 2002.
Supportive Service Needs

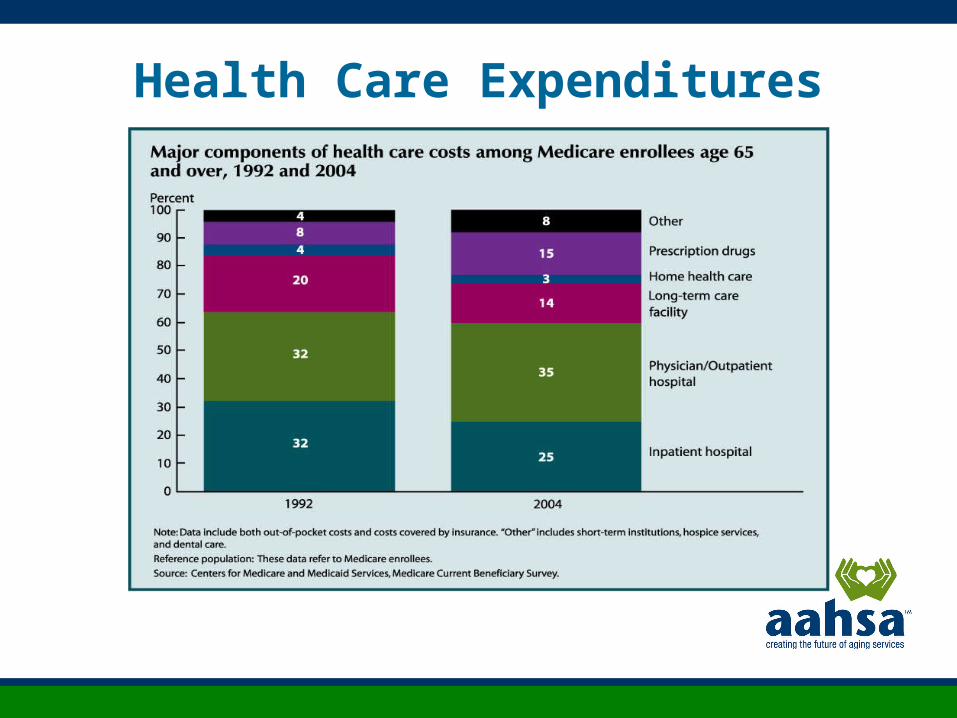
Use of Health Care Services

Effect of U.S. Population on Health Care Costs
Source: Aging Plays a Limited Role in Health Care Cost Trends, Center for Studying Health System
Change, 2002.
Annual Percentage Change

Income
Health Care Expenditures

Long-Term Care Spending by Payer

• 2001—State Medicaid programs paid nearly 62% of the $137 billion spent nationally on long-term care
• 2030—Government spending on long-term care to absorb nearly 75% of federal revenue
Source: Senate Aging Committee Report—McKnight’s Online Daily Update, 2002.
Senate Special Committee on Aging Report
Long-Term Care Costs to Government: Projected

Percent of Age 65 and Older Households that are Homeowners: 2000, 2010 & 2020
Source: Seniors Commission Report: A Quiet Crisis in America, 2002.
Home: The Location of Choice

Section 202 Capital Advances and Number of Units Built
Year Capital Advances Units
2000 $426,258,926 5,471
2001 $495,915,966 5,189
2002 $485,585,696 5,816
2003 $473,750,170 5,689
2004 $495,163,781 5,353
2005 $462,906,712 4,681
2006 $443,167,647 4,313
2007 $518,900 3,667
Subsidized Housing:HUD Section 202 Program Trend

Caregiving in America
• 44.4 million caregivers, aged 18+ • 22.9 million households• 69% help one person• 48% provide ≤ 8 hours/week• 17% provide > 40 hours/week• 4.3 years – average length of caregiving role• 2006 economic value: $350 billion*
Sources: Caregiving in the U.S., National Alliance for Caregiving and AARP, 2004 and *Houser, Ari N. and Gibson, Mary Jo,“Valuing the Invaluable: A New Look at State Estimates of the Economic Value of Family Caregiving,” AARP Public Policy
Institute, November 2007.

Caregivers at Risk
• High levels of stress & frustration• Higher levels of depression• Diminished physical health• Neglect of personal health care• May lack health insurance coverage• May have higher mortality rates• May have increased alcohol or drug
use
Source: “Caregivers at Risk: A Public Health Concern,” Family Caregiver Alliance, 2007.

Transportation • Must be available, accessible, safe, dignified &
affordable• Low-income senior taxi services• Independent Transportation Network® (ITN) - initiated in Portland, ME in 1991 - strives for 40 city affiliates by 2010 - seniors trade their cars for rides - converts assets & community support into mileage credits managed via state-of-the-art technology
Source: Freund, Katherine, “Dignified Transportation for Seniors,” Capital Commons Quarterly, Issue No. 2, Vol. 2, July 2008.

Community Innovations
• Home energy assistance programs• Consumer education networks for LTC info• Development funds for aging-in-place models• “Umbrella” programs• New York @ Home – a comprehensive
consumer program• On-call home maintenance

Environmental Factors
WorkforceTechnology
Public Policy

Workforce• Increased demand for services (particularly in
non-institutional settings)• Higher acuity levels of care recipients• Potentially smaller family caregiver pool• Shrinking direct care worker labor pool• Increased cultural diversity of caregivers• Increased cultural diversity of care recipients• Greater divide between “haves” & “have nots”
Source: “The Link Between the Informal and Formal Care Networks: Why We Should Care,”Robyn Stone, DrPH, Family Caregiver Alliance Conference Proceedings, 2007.

Emerging Technologies• Assistance call system• Cognitive aids• Communication devices• Electronic health records• Medicine management • Mobility aids• Personal monitoring• Personal assistance• Smart home systems• Telemedicine• Wander Management
Source: CAST Website: www.agingtech.org

AAHSA: Creating the Future of Aging Services
Advocacy for the right public policy for the right reasons
Advancing 5 Big Ideas that reflect major corecompetencies that will define future success
of aging-services providers

• Quality the public can trust• Transitions as care needs change• Talent from front-line to boardroom• Finance system that’s sustainable,
affordable, fair and offers choice• Technology to improve quality of care
and life

Quality
Quality the public can trust results from excellence in service, transparency in governance and
operations, and an enduring commitment to people and
community.

Quality
• Build on foundation of Quality First• Undertake and report ongoing quality
improvement activities• Replicate evidence-based solutions• Measure consumer / family / staff
satisfaction• Strengthen social accountability results• Communicate not-for-profit
commitment to external audiences

Transitions
Consumers deserve a clear path to affordable, accessible services and supports as their needs change.
Providers are essential community leaders in planning and implementing a community network and in partnering with consumers to address their individual needs.

Transitions• Lead or participate in community
networks to mitigate silos and enhance successful transitions
• Use evidence-based tools, practices for better chronic care management coordination
• Engage consumers in creating systems for smooth and informed transitions
Talent
From the front-line to the boardroom, talent is highly correlated with quality.
A healthy workplace culture supports teamwork, trust and competence to advance missions. An organization’s success depends on talented people.

Talent
• Apply knowledge gained from “Better Jobs, Better Care” research and practice
• Measure staff satisfaction; act on results• Use AAHSA checklist for ethical workplace
commitment• Develop leaders at all levels• Follow Independent Sector governance
principles

Finance
Current methods of financing aging services are not working and are unsustainable.
A new, national insurance approach is needed wherein all are covered, payment streams are adequate, and people with disabilities are supported based on choice, fairness and self-responsibility.

Finance
• Support AAHSA’s plan for a national insurance approach to financing aging services.• Join us in advancing the public’s and
policymakers’ awareness/support of the plan.• Assess community needs and adopt
strategies to capitalize models of person-centered housing, care and services.
• Strengthen financial stewardship/ accountability for tax exemption.

Technology
Technology holds great promise as a catalyst for improving quality of life as people age.
Investments in technology solutions must be built on evidence of efficacy. Such solutions will support more effective transitions, enhance quality, support the workforce and lead to better use of resources.

Technology
• Participate as a “living laboratory” for piloting technology applications
• Develop and implement a strategic plan for technology integration
• Broaden service scope through technology
• Evaluate and embrace emerging technologies, electronic health records, etc., as part of quality improvement to facilitate transitions and reduce errors

Strategic Compass for Profiting From Uncertainty
Source: “The Long and Winding Road,” 2006, AAHSA and Decision Strategies International (DSI), p. 11.

Elements of a Robust Strategic Vision
• Statement of where you want to be and how to get there
• Concrete goals and milestones (financial and otherwise)
• Core capabilities that need to be developed• Description of how to change the organization• Proposed market and product scope supporting
the vision

Elements of a Robust Strategic Vision
• Robustness in the face of multiple scenarios
• Ability to stretch to reach beyond the company’s current grasp
• Passion, in order to galvanize the organization
• Simplicity and clarity of purpose
Source: Paul J.H. Schoemaker, Profiting from Uncertainty, Free Press, 2002.

Our Field Responds…
The Green House Concept
• small, intentional elder communities• model alters facility size, interior design, staffing patterns & skilled care delivery• de-institutionalizes long term care• residences designed for 6-10 elders• more private, home-like environment• no rigid, institutional schedules• cost-effective, “green” & comfortable• promotes elder choices in food, activities, etc.
Source: NCB website: www.ncbcapitalimpact.org, 2008.

A rendering of Boulder CO’s Washington Village
COHOUSING
Six Defining Characteristics
• Participatory Process – Designed to meet resident needs• Neighborhood Design – Encourages sense of community• Common Facilities – Supplement the private residences• Resident Management – Residents manage & maintain community• Non-Hierarchical Structure & Decision-Making – No single person or persons has authority over other residents• No Shared Community Economy – Community is not a source of income for its residents
Source: The Cohousing Association of the United States website: www.cohousing.org

Bethel Health Care Rehabilitation Center – Derby, CT
PLANETREE
Continuing Care Components• Recognizing the primary importance of human interactions• Enhancing each individual’s life journey• Supporting independence, dignity & choice• Incorporating family, friends & social support networks in in the life of the community• Supporting spirituality as a source of inner strength• Promoting paths to well-being• Empowering individuals through information & education• Recognizing the nutritional & nurturing aspects of food• Offering meaningful arts, activities & entertainment• Providing an environment conducive to quality living
Source: Planetree website: www.planetree.org

Intentional Communities
• “An inclusive term for ecovillages, cohousing, residential land trusts, communes, student co-ops, urban housing cooperatives, alternative communities and other projects where people strive together with a common vision”• Over 700 communities around the country
Source: Intentional Communities website: www.ic.org

Intergenerational Settings & Programs
Advantages
• Both elders & children benefit from the interaction• Human & financial resources are utilized more wisely when they are applied to multiple individuals/populations• Unites & improves our communities, while informing our values• Generation blending fosters understanding & empathy – it also reduces the potential for discrimination & ageism
Source: Generations United website: www.gu.org
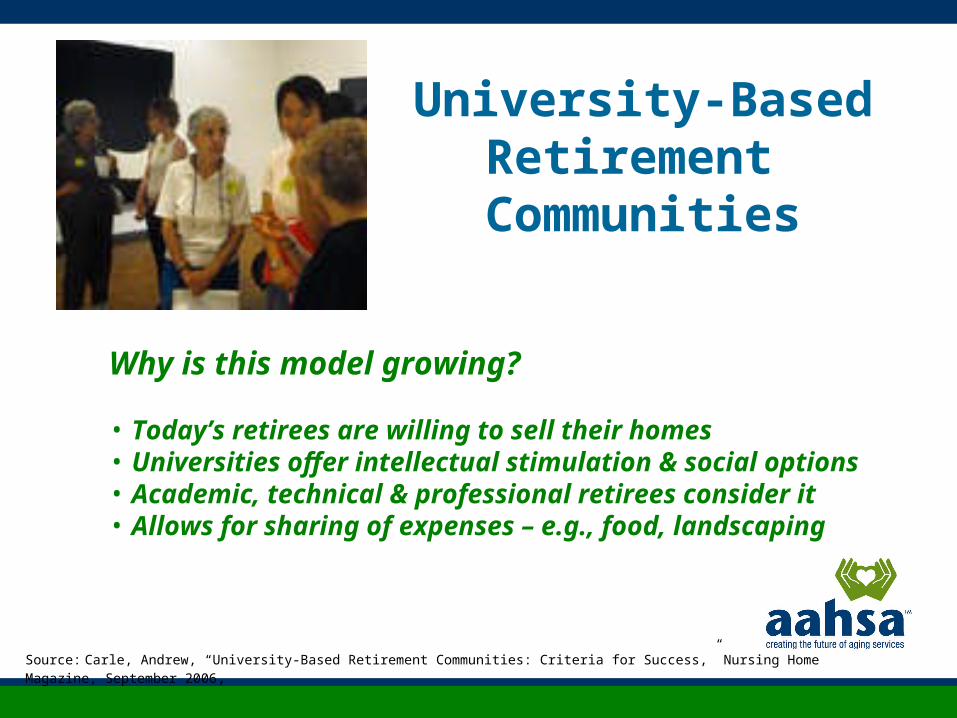
University-BasedRetirement Communities
Why is this model growing?
• Today’s retirees are willing to sell their homes• Universities offer intellectual stimulation & social options• Academic, technical & professional retirees consider it• Allows for sharing of expenses – e.g., food, landscaping
Source: Carle, Andrew, “University-Based Retirement Communities: Criteria for Success,” Nursing Home Magazine, September 2006,

• All-season swimming pool and spa
• Fitness Center with personal trainers
• Restaurants with a variety of dining options
• Computer lab • Creative arts studio • Personal gardening area • Billiards room • Game room • Classrooms • Music room • Woodwork and hobby shop
• Consumer education• Electronic medical records• Wellness & fall prevention
programs• Companion care• Personal care assistance• Medication management• Nursing care management• Short-term rehabilitation• Extended care• Assisted living• Long-term, skilled care • Medicare Advantage plan
Amenities Health & Wellness
Middle Income CCRCs - Erickson Model -
Source: Erickson Retirement Community website: www. ericksoncommunities.com

Active Adult Communities - Del Webb Model -
• First Sun City built in 1960• Offers “a lifestyle choice” • 55+ active adult communities• Award-winning home designs• Golf courses designed by PGA legends• Accommodates varied tastes & styles• Offers beautiful grounds, state-of-the-art recreation buildings, fitness centers, art studios, clubs & numerous activity choices
Source: Del Webb website: www.delwebb.com.

AAHSA Ziegler 100 Facts
• The 100 largest senior living systems own 925 total communities; 192,000 units
• Over 50% of these communities are CCRCs• SNF community mix declined from 21.1% in 2000
to 17.4% in 2007• 70% of AZ100 in a single state’s boundaries• 54% provide govt.-subsidized housing• 78% provide home and community-based services• 45% offered more HCBS in 2007 than in 2006 • 25 have been in operation over 100 years!
Source: AAHSA Ziegler 100, 2008.

“The leadership, competence and management of the social sector nonprofit organization
will thus largely determine the values, the vision, the cohesion
and the performance of the 21st century society.”
- Peter F. Drucker