democracy versus dictatorship? the political determinants
TRANSCRIPT

email: [email protected] Effective States and Inclusive Development Research Centre (ESID) Global Development Institute, School of Environment, Education and Development,
The University of Manchester, Oxford Road, Manchester M13 9PL, UK www.effective-states.org
ESID Working Paper No. 70
Democracy versus dictatorship? The political determinants of growth episodes
Kunal Sen,1 Lant Pritchett,2 Sabyasachi Kar,3 and Selim Raihan4
December, 2016
1Global Development Institute, The University of Manchester Email correspondence: [email protected] 2 Harvard University 3 Institute of Economic Growth, India 4 SANEM and the University of Dhaka, Bangladesh
ISBN: 978-1-908749-71-0

Democracy versus dictatorship? The political determinants of growth episodes
2
Abstract
In contrast to previous literature, which looks at the effect of democracy on long-run growth or short-run volatility of growth, we examine the effect of political institutions on medium-term growth episodes. These are episodes of accelerations and decelerations that characterise the growth experience of most developing countries. We find that the effect of political institutions on growth is asymmetric across accelerations and decelerations, and that democracies do not necessarily outperform autocracies in a growth acceleration episode, though they are likely to prevent large growth collapses. When we disaggregate the type of autocracy, we find that party-based autocracies outperform democracies in growth acceleration episodes, though they do not limit the fall in the magnitude in growth deceleration episodes in comparison to democracies.
Keywords: Political institutions, economic growth, growth episodes, democracy,
autocracy.
Sen, K., Pritchett, L., Kar, S. and Raihan, S. (2016) Democracy versus dictatorship? The political determinants of growth episodes. ESID Working Paper No. 70. Manchester, UK: The University of Manchester. Available at www.effective-states.org
This document is an output from a project funded by UK Aid from the UK government for the benefit of developing countries. However, the views expressed and information contained in it are not necessarily those of, or endorsed by the UK government, which can accept no responsibility for such views or information or for any reliance placed on them.
Democracy versus dictatorship? The political determinants of growth episodes
3
I. Introduction
Whether democracy causes long-term economic growth has been a matter of theoretical and empirical debate. A large literature has examined the relationship between democracy and economic growth, without reaching any firm conclusions. From a theoretical perspective, strong economic growth is possible under both autocracies and democracies. Positive economic growth may occur in autocracies if the autocrat is a ‘stationary bandit (that) has an encompassing interest in the territory he controls and accordingly provides domestic order and other public goods’ (Olson 1993, 569). A leader in a democracy may also have a similar interest in providing law and order, and other public goods (Saint-Paul and Verdier 1993; Benabou 1996; Lizzeri and Persico 2004). Democracy can also provide a natural check to the power of kleptocratic leaders, reduce social conflict and prevent powerful political groups from monopolising economic opportunities (Acemoglu and Robinson 2012). Autocratic leaders are also likely to have an adverse effect on growth if the autocrat has a sufficiently short time horizon, so that it would be in ‘his interest to confiscate the property of his subjects, to abrogate any contracts he has signed in borrowing money from them, and generally to ignore the long-run economic consequences of his choices’ (Olson 1993, 572). At the same time, democratisation may hurt economic growth if this leads to distortionary redistribution (Alesina and Rodrik 1994; Persson and Tabellini 1994). In addition, interest groups politics are more prevalent in democracies, and their presence can lead to stagnation (Olson 1982). The large empirical literature that has studied the democracy–growth relationship has also not found an unambiguous result (Doucouliagos and Ulubasoglu 2008; Kelsall 2014). In one of the early empirical contributions to this literature, Barro (1996) found that the overall effect of democracy on growth is weakly negative, using repeated cross-sections for 84 countries. A similar finding is obtained by Tavares and Wacziarg (2001), also with cross-sectional data. On the other hand, Rodrik and Wacziarg (2005) and Persson and Tabellini (2007) find a positive effect, using panel data.1 Persson and and Tabellini (2009) find that the cumulative number of years that a country spends in democracy has a positive effect on economic growth. More recently, Acemoglu et al. (2014) find a sizeable and robust effect of democracy on economic growth using annual panel data and generalised method of moment estimators for 175 countries for 1960–2010. Their estimates suggest that a country that switches from non-democracy to democracy achieves an increase in GDP per capita of about 20 percent in the subsequent 30 years. This magnitude of income gain is not particularly large, suggesting that the effect of democracy in increasing per capita incomes is quite muted. A related literature has examined the effect of democracy on the short-run volatility of growth. Building on the conjecture of Sah (1991) that autocracies are likely to show
1 Masaki and Van de Walle (2014) find a positive effect of democracy on growth for Sub-Saharan African countries for the period 1982-2012.

Democracy versus dictatorship? The political determinants of growth episodes
4
more variability in performance than democracies, a set of papers in this literature show that democracies have lower volatility in growth rates than autocracies (Weede 1996; Almeida and Fereira 2002; Mobarak 2005; Yang 2008; Easterly 2011). However, this literature has not been able to explain why some autocracies have shown rapid growth, while some autocracies have observed large growth collapses. Neither is it clear from this literature whether there are differences in the economic performance of democracies versus autocracies over upswings in economic growth relative to downswings in economic growth. A recent literature on the empirics of growth has shown that long-run average growth rates hide distinct medium-term episodes of successful growth and growth failures (Jones and Olken 2008).2 This literature has highlighted that economic growth in developing countries is characterised by ‘boom and bust’ growth, with frequent shifts in growth regimes from stagnant or declining growth to accelerations in growth and back again to decelerating growth (Easterly et al. 1993; Pritchett 2000; Rodrik 1999; Hausmann et al. 2005 and 2006; Arbache and Page 2007; Jones and Olken 2008; Aizenman and Spiegel 2010). As Pritchett et al. (2016) show, the income gains and losses during these episodes of growth are large, with the top 20 growth accelerations in developing countries having a net present value (NPV) magnitude of 30 trillion dollars – twice US GDP, and the top 20 growth decelerations accounting for 35 trillion dollars less in NPV of output.3 In this paper, we ask whether political institutions are causally related to the magnitude of growth in accelerations and deceleration episodes. Therefore, in contrast to the previous literature, which has either looked at the relationship between democracy and long-term growth on one hand, and the relationship between democracy and short-run volatility of growth on the other hand, we examine the political determinants of medium-term growth that is reflected in the large income gains and losses we observe in growth acceleration and deceleration episodes. We also examine whether the effects of political institutions are asymmetrical across growth acceleration and growth deceleration episodes. A further question we address in this paper is whether the heterogenous growth outcomes that we observe in autocracies relative to democracies can be related to the type of autocracy. Drawing from the literature that argues that party-based autocracies may have attributes that are likely to be more conducive to growth than other types of autocracies (Cheibub et al. 2010; Gelhbach and Keefer 2011), we
2 Furthermore, as Acemoglu et al. (2008) note, the positive association between democracy and long-run economic development may be driven by historical factors that shaped the divergent political and economic paths of different societies, so that democracy may not be causal to economic growth. 3 Individual country examples illustrate how significant these income gains and losses can be in a growth episode. The growth deceleration that began in Malawi in 1978 and lasted until 2002 cost each person cumulatively almost 10,000 dollars. On the other hand, the growth acceleration in Indonesia that started in 1967 and lasted until 1996 increased incomes per person cumulatively by almost the same amount (Pritchett et al. 2016).

Democracy versus dictatorship? The political determinants of growth episodes
5
study whether party-based autocracies are likely to yield a larger magnitude of growth in a growth episode, as compared to other types of autocracies. Our units of analysis are growth episodes, which are identified by discrete breaks in the country’s rate of economic growth. A large literature has attempted to identify breaks in growth rates using subjective rule-based (filter-based) or statistical methods. We follow Kar et al. (2013), who provide a unified approach to identifying multiple breaks in growth rates, combining filter-based and statistical methods. Following this approach, we obtain 314 growth episodes for 125 countries from 1950 to 2010 with comparable Penn World Tables GDP per capita data. The dependent variable in our empirical analysis is the magnitude of growth in the episode (which we define as the ‘episode magnitude’), which is the product of the actual growth rate in the episode relative to counter-factuals and the duration of the episode. In this paper, we use a procedure for estimating episode magnitude that takes into account the actual growth dynamics that we observe in the time-series data on GDP per capita. Episode magnitude of growth in any particular episode will be higher, the higher the duration of the episode, or the higher the actual growth rate as compared to a counter-factual growth rate. We find clear evidence that democratic regimes are more likely to yield higher magnitudes of growth. However, differentiating between growth acceleration and growth deceleration episodes, we find that there is no discernible difference between democracies and autocracies in causing larger growth acceleration episodes. Instead, democracies have a significant effect in preventing large growth collapses, as compared to autocracies. This finding is in accordance with the theoretical literature, which suggests that we should not expect any performance difference between autocracies ruled by leaders with long-term time horizons and democracies. On the other hand, democracies prevent the worst excesses of a predatory leader (as such a leader is likely to be voted out of office), as compared to autocracies where there are no checks on the predatory power of a dictator. We then disaggregate authoritarian regimes by type of regime, and show that party-based authoritarian regimes outperform personalist, military-based and monarchic authoritarian regimes in their effects on growth in such episodes. On the other hand, there is no discernible effect of the type of autocracy on episode magnitude in a growth deceleration episode. Again, our results are in accord with the theoretical literature, which highlights the importance of the type of autocracy in understanding the effects of regime type on growth.
II. Identifying growth episodes and estimating episode magnitudes
An episode-based analysis of growth is different from the Barro-type growth regressions or other standard regressions of long run growth in two different ways. The first difference is that in standard regressions, the period over which growth is

Democracy versus dictatorship? The political determinants of growth episodes
6
measured is decided in an ad hoc manner (say a decade) while episode-based approaches have to precisely define how to identify the length of an episode. The second difference is that while average growth rates are a suitable measure of the impact of growth in the standard regressions, they are not so in episode-based approaches, as the duration of episodes (which vary widely) is as important as the growth rate in this approach. In this section, we use a procedure to identify growth episodes proposed by Kar et al. (2013) and introduce the concept of ‘episode-magnitude’ that we have defined as a measure of the impact of a growth episode. This measure combines in an intuitive way the impact of a change in the growth rate due to the episode, and the duration of the episode. Thus for example, an acceleration to a modest growth rate which is sustained over decades may have a larger episode-magnitude than a high but short-lived burst of growth.
Identifying growth episodes
Moving away from explaining long-run growth averages to explaining transitions between growth regimes necessitates the knowledge of the timing of the breaks in economic growth. Following Pritchett (2000), a set of recent studies attempted to identify breaks in growth rates of GDP per capita for countries with comparable income data. Two distinct approaches have been developed by this literature. The first is a ‘filter-based’ approach that identifies growth breaks on the basis of subjectively defined rules. Using this approach, Hausmann et al. (2005) studies breaks that involve growth accelerations; Hausmann et al. (2006) studies growth collapses; and Aizenman and Spiegel (2010) studies takeoffs – periods of sustained high growth following periods of stagnation. The second approach is based on statistical structural break tests that uses estimation and testing procedures to identify growth breaks in terms of statistically significant changes in (average) growth rates. The studies that have adopted the ‘statistical’ approach have used the Bai-Perron (BP) methodology (1998), which locates and tests for multiple growth breaks within a time-series framework (Jones and Olken 2008). Both approaches have serious shortcomings that call for a better alternative. The limitation of the filter-based approach is well known – the use of filters pre-determined by the researcher is ad hoc, and leads to a lack of consistency in the identification of breaks across papers that use the filter-based approach. On the other hand, a significant shortcoming with the statistical approach is that it is limited by the low power of the Bai-Perron test, which leads to the rejection of true breaks which are suggested by the behaviour of the underlying GDP per capita series (Berg et al. 2012). Kar et al. (2013) propose an approach that provides a unified framework for identifying breaks in economic growth drawing from filter-based and statistical approaches. We provide more information on the Kar et al. approach in the Online
Democracy versus dictatorship? The political determinants of growth episodes
7
Appendix. Application of this procedure to the PWT7.1 data for 125 countries4 for 1950-2010 identifies 314 structural breaks in growth, with some countries having no breaks (e.g. USA, France, Australia) and others having four breaks (e.g. Argentina, Zambia). Appendix A in Kar et al. (2013) provides a list of all 314 breaks identified by country and year of break.
Estimating the episode-magnitude of growth accelerations and decelerations
We define the episode-magnitude as the magnitude of the gain (or loss) in per capita income by the end of the episode, as a result of the growth in the episode. Equivalently, it is the product of (i) the additional growth during the episode and (ii) the duration of the episode. The additional growth during the episode is the difference between the actual growth rate during the episode, and a predicted counter-factual growth rate of the economy, had it not transitioned to this particular episode. How do we predict this counter-factual growth rate? One simple (although naive) prediction is that the growth rate would be what it was in the last episode (no change). This prediction however, ignores a very robust ‘'stylised fact’ about medium-term growth rates, i.e., the tendency of these growth rates to ‘regress to the mean’. Like other volatile variables, such as returns on financial investments, medium-term growth rates have been shown to have very low persistence and hence, for example, high growth in the current period increases the possibility of lower growth in the future (Easterly et. al 1993; Pritchett and Summers 2014). In terms of growth episodes, this implies that a predicted counter-factual growth rate can do much better than a ‘no change’ assumption, by adopting some version of regression to mean. Based on these considerations, we propose three predicted ‘counter-factual’ growth rates, i.e.: (a) the growth rate in the previous episode reflecting the idea of ‘no regression to mean’; (b) the world average growth rate during the episode reflecting the idea of ‘complete regression to mean’; and (c) a predicted growth rate based on the idea of ‘partial regression to mean’. The ‘partial regression to mean’ growth rate uses a regression for each country/episode to allow ‘predicted’ growth to depend on a country’s initial GDP per capita, the episode-specific world average growth and a flexibly specified regression to the mean (we provide more detail on how we estimate the episode magnitude of growth under the three counter-factuals in the online appendix).
4 From the PWT7.1 data we eliminated all countries that had very small populations (less than 700,000 in 1980) and those that did not have data since 1970 (which eliminated many former Soviet sphere countries and some oil countries like Kuwait and Saudi Arabia).

Democracy versus dictatorship? The political determinants of growth episodes
8
Figure 1. Episode magnitude of a growth episode based on three counter-factuals
Source: Our illustration. Figure 1 illustrates the estimates of the episode magnitude for the three counter-factuals for the case of an acceleration from low growth to high growth. In this (hypothetical) case, the ‘no regression to mean’ counter-factual implies a very large magnitude, the ‘complete regression to mean’ counter-factual a small magnitude (as the post-acceleration growth is not much higher than the world average). The ‘partial regression to mean’ counter-factual will essentially be a regression-determined weighted average of the two and hence will tend to be between the two extremes. When using the ‘Complete regression to mean’ or ‘Partial regression to mean‘ counter-factual a growth acceleration could have a negative magnitude (or a growth deceleration a positive magnitude). Our preferred specification is the PRM counter-factual. Zero regression to the mean (no change) or complete regression to the mean, while easy to understand, impose strong and empirically unsupported assumptions about the actual dynamics of growth, which is characterised by strong but not complete regression to the mean (Pritchett and Summers 2014) We have estimated the episode magnitude of growth for all 314 episodes, based on the three counter-factual growth rates and these are reported in the Online Appendix (Tables A1 and A2). Our estimates of episode magnitude are differences in natural log units of changes in GDP per capita of end of episode actual versus the counter-factual growth rate. So an episode magnitude of 0.20 in log unit of GDP terms implies that GDP per capita is 20 percent higher at the end of the episode, as compared to the relevant counter-factual growth rate.
gbefore
t‐Nbt t+Nep
gep
gbefore
gW
y
gPRM

Democracy versus dictatorship? The political determinants of growth episodes
9
For our empirical exercises, we will be using the two episode-magnitudes based on the idea of regression to mean. Figure 2 gives a kernel density estimate of these two measures, representing the underlying statistical distribution for these variables. The figure on the left-hand side of the panel represents episode-magnitudes where the counter-factual is the world average growth rate (complete regression to mean). The figure on the right-hand side of the panel shows episode-magnitudes for which the predicted counter-factual reflects partial regression to mean. The two figures are significantly similar to each other, having a central tendency that is close to zero, and most of the density symmetrically distributed between -1 and 1. Figure 2. Distribution of episode magnitudes
Source: Our calculations.
III. Relationship between political regimes and the episode magnitude of growth
As stated in the introduction, a large theoretical literature has looked at the relationship between the political regime and economic growth. In this section, we develop two hypotheses from this theoretical literature in understanding the effects of political regimes on the magnitude of growth in growth episodes. To start with, consider two types of autocrats, one a leader with a long-term vision and a commitment to enact institutional reforms and policies that are likely to be growth-
0.2
.4.6
.81
De
nsity
-2 -1 0 1 2Episode Magnitude (Complete Regression to Mean)
kernel = epanechnikov, bandwidth = 0.1035
Kernel density estimate
0.2
.4.6
.81
De
nsity
-2 -1 0 1 2Episode Magnitude (Partial Reression to Mean)
kernel = epanechnikov, bandwidth = 0.1008
Kernel density estimate

Democracy versus dictatorship? The political determinants of growth episodes
10
enhancing (such as Deng Xiaoping in China).5 The second type of leader has a short-term vision (perhaps because he is in an unstable political environment where he may lose power), and engages in high levels of predation (such as Mugabe in Zimbabwe) (Clague et al. 1996). In an autocratic regime, both types of leader have limited checks on their power to engage in growth-enhancing or growth-limiting policies (Olsen 1993).6 In the first case, a large episode of growth acceleration is likely to result, while in the second case, there is a likelihood of a growth collapse. In contrast, a leader in a democracy has strong constraints on his/her power, with a large number of veto players in the political system (North and Weingast 1989). This does not allow him/her to enact growth-oriented policies with the same degree of freedom as the growth-oriented autocrat.7 Moreover, for a leader in a democracy, the long-term benefits of growth-oriented policies and reforms need to be balanced against the possible repercussions that such policies may have for the leader politically, if these policies and reforms are seen as being unpopular among the electorate or if the reforms lead to diminution of the rents that vested interests obtain from the prevalence of previous policies and sets of institutions (Krueger 1974).8 Given the possibility of losing power in a future election, leaders in democracies are less willing to take risks in economic policy that may be necessary for rapid growth to ensue, as compared to autocracies. Further, democracies allow ‘some degree of public deliberation that increases the portfolio of information about politically costly policies, thereby preventing leaders from advocating bold economic strategies’ (Chandra and Rudra 2015, 258). This would suggest that democracies are unlikely to outperform autocracies in growth accelerations. At the same time, the higher constraints on the democrat’s executive power, as well as the potential threat of losing power in future elections, prevents him/her from engaging in the kind of predation that one may observe with an autocrat with kleptocratic tendencies (or if the leader in a democracy does engage in predatory policies that lead to a fall in income, there is a high chance that the leader will lose power in a future election) (Geddes 1999; Quinn and Woolley 2001; Burke and Leigh 2010; Justesen and Kurrild-Klitgaard 2013). In contrast, in autocracies, leaders with short-term time horizons and a high discount rate may be willing to engage in predation, with the expectation that the autocrat is not likely to be in place for too long. Therefore, it is possible to argue that while leaders in democracies are unlikely to follow policies or act in ways that lead to large growth collapses, autocrats do not
5 As Londegran and Poole (1990) note, even authoritarian governments have powerful incentives to promote growth, not out of concern for the welfare of their citizens, but because poor economic performance may lead to their removal by force. 6 As De Luca et al. (2015) show, autocrats may obtain support from elites if they can generate higher growth rates than under democracies, effectively reducing any threat to their staying in power. 7 As Jones and Olken (2005) note,‘democracies may be able to prevent the disastrous economic policies of Robert Mugabe in Zimbabwe or Samora Michel in Mozambigue; however, they might also have constrained the successful economic policies of Lee-Kwan Yew in Singapore or Deng Xiaoping in China’ (p. 862). 8 For example, trade reforms which may increase economic growth in the medium term may be unpopular if they lead to job losses or the reduction of profits of protected politically influential firms.

Democracy versus dictatorship? The political determinants of growth episodes
11
have the same constraints on abusive power, which suggests that democracies are unlikely to observe growth decelerations of the magnitude that autocracies do. How autocrats behave with respect to long-term commitment to growth versus short-term predation would also depend on the type of incentives as well as the constraints that they face. In party-based autocracies, leader succession is typically institutionalised within the party structure, leading to lower uncertainty on what investors may expect when one leader makes way for the next (Wright 2008a). This also allows party-based autocracies to have long time horizons, as the death of a leader does not imply the end of credible commitment from the leadership to a set of policies or institutions (Clague et al. 1996). In contrast, in personalist, monarchic and military-based autocracies, leader succession is typically informal and ad hoc, leading to significant uncertainty on the part of the leader as to when (s)he will be removed (Geddes 1999). This leads to short time horizons on the part of the leader, providing a strong incentive to him/her to engage in predatory and distortionary economic policy, and a weak commitment to institutions such as protection of property rights (Wright 2008b). A second feature of party-based autocracies that makes them qualitatively different from non-party-based autocracies with respect to growth outcomes is that leaders in party-based autocracies use ruling party institutionalisation as a commitment device to investors (Gehlbach and Keefer 2011). By solving collective action problems within the ruling elite through institutionalisation, autocrats signal their intention not to expropriate from investors who are members of the ruling party (as happened in China in the post-Mao area). Thus, party-based autocracies are more likely to observe higher investment than non-party-based autocracies, leading to higher growth. We sketch out our argument on the effects of political institutions on magnitude of growth in growth episodes in Figure 3. Let g be the magnitude of growth (which goes from negative to positive values) and X be a measure of political institutions (such as Polity) where higher X implies greater democracy, and countries can be classified as autocracies or democracies depending on a threshold level of X, denoted as X* (in the case of Polity, the threshold is zero). Let L be a variable that captures the characteristics of the political regime/leader that matter for growth – such as the length of the time horizon of political leaders, or the extent of predation of the leader, and the higher the L, the more positive are the characteristics of the political leader for growth. Autocracies are more likely to have leaders that are in both sides of the distribution of L, with very high L (stationary bandits) or very low L (roving bandits – that is, L greater than L+ or lower than L-. On the other hand, democracies are constrained by checks on the executive that limits the possibility of very high or very low L. The relationship between g and X at different levels of L is shown by the curved line in Figure 3.

Democracy versus dictatorship? The political determinants of growth episodes
12
Following our argument on the limits of leaders in democracies to follow policies that can lead to very rapid growth in accelerations, or large collapses in decelerations, we hypothesise that when it comes to growth decelerations, democracies are less likely to see large growth collapses, as compared to autocracies (that is, democracies are bounded in the lower limit of L on how negative g can be in deceleration episodes, as shown in Figure 3). Further, we hypothesise that when it comes to growth accelerations, party-based autocracies are more likely to have the political characteristics necessary for rapid growth, as compared to democracies or other types of autocracy (so that such autocracies are more likely to have L greater than L+ , and would have higher g than democracies, as shown in Figure 3). Figure 3. Growth magnitude outcomes in autocracies and democracies
Source: Our illustration. Thus, our discussion leads us to the following two hypotheses: H1: Democracies are unlikely to out-perform autocracies in growth acceleration episodes. However, they are likely to yield lower income losses as compared to autocracies in growth deceleration episodes. H2: Party-based autocracies are more likely to be associated with larger magnitudes of growth than non-party based autocracies during growth episodes.
IV. Empirical strategy
Our interest centres around the causal effect of the political regime on the magnitude of growth in the growth episodes we have identified from Section II. To test our two core hypotheses, we estimate regressions of the following generic form:

Democracy versus dictatorship? The political determinants of growth episodes
13
ijjk
kijkijij eXPgm
2
10 (1)
Where the subscript i denotes country, and j the growth episode in question for country I; gmij is our episode magnitude measure as discussed in Section II for country I and episode j, Pij is the measure of the political regime, Xkj is a vector of controls, δj are year effects (where the year is when the growth episode began for the particular country), and eij is the error term. Equation (1) does not make any distinction between growth accelerations and growth decelerations, and makes the restrictive assumption that the effect of political regimes on the magnitude of growth in acceleration and deceleration episodes is identical. We relax this assumption by estimating the effect of the political regime on episode magnitude in growth accelerations and decelerations separately, as follows:
ija
ja
kkijk
aij
aaij
a eXPgm
2
10 (2a)
ijd
jd
kkijk
dij
ddij
d eXPgm
2
10 (2b)
Here, gma and gmd are the episode magnitudes in growth accelerations and growth decelerations, respectively. As a measure of the type of political regime, we use POLITY, from Polity IV. This measure goes from -10 to +10, with regimes coded as -10 to 0 characterised as autocracies and regimes coded from 0 to +10 characterised as democracies.9 In addition to POLITY, we use a measure of the degree of constraints on the executive (XCONST), and capture the extent of institutionalised constraints on the decision-making powers of chief executive, either individuals or collectivities.10 This measure has been widely used in the empirical literature on institutions and growth as the preferred measure of the degree that there are institutional mechanisms of credible
9 Each country-year observation in Polity IV is coded according to: a) the competitiveness and openness of executive recruitment; b) the competitiveness and regulation of political participation; and the c) the constraints on the executive. Mature democracies, according to this measure, are regimes where there is the presence of institutions and procedures through which citizens can express effective preferences about alternative policies and leaders, the existence of institutionalised constraints on the exercise of power by the executive, and the guarantee of civil liberties to all citizens in their daily lives and in acts of political participation. Mature autocracies, on the other hand, sharply restrict or suppress competitive political participation. Their chief executives are chosen in a regularised process of selection within the political elite, and once in office they exercise power with few institutional constraints (Marshall et al. 2011). 10 The variable XConst varies from a value of 1, when there are no regular limitations on the executive’s actions, to a value of 7, when accountability groups have effective authority equal to or greater than the executive in most areas of activity.

Democracy versus dictatorship? The political determinants of growth episodes
14
commitment on the part of the state (Acemoglu et al. 2001; Besley and Persson 2011). We use the values of POLITY and XCONST in the beginning year of the growth episode to address potential reverse causality issues – that is, the possibility that higher growth leads to better quality political institutions, or that output contractions lead to more open political institutions (Burke and Leigh 2010). However, though we rely on ordinary least squares as our primary method of estimation, we also use instrumental variables estimators as a robustness test. To assess the effect of type of autocracy on episode magnitude, we use the classification of autocracies in the data-set compiled by Geddes, Wright and Frantz (GWF, 2014). GWF identifies 280 autocratic regimes during the period 1946–2010 in independent countries with more than one million inhabitants in 2009. Each country-year is coded autocratic, democratic, ruled by a provisional government charged with overseeing a transition to democracy, not independent, occupied by foreign troops, or lacking a central government. Autocracies are then classified into dominant-party, military, personalist, or monarchic autocracies, depending on whether the leadership group in control of policy, leadership selection and the security apparatus is in the hands of a ruling party (party-based autocracies), a royal family (monarchy), the military (rule by a military institution) or a narrower group centred around an individual dictator (personalist dictatorships). We use the classification of type of autocracy at the beginning of the episode provided by GWF (each type of autocracy is coded as a dummy variable – 1 if the regime is of a particular type, 0 otherwise; we create a dummy variable for non-party-based autocracies, where the dummy is 1 if the autocracy is personalist, monarchic or military, 0 otherwise). The literature on drivers of growth outcomes is large. In line with Chandra and Rudra (2015), we include other variables whose exclusion would produce omitted variable bias. Our control variables are those that are standard in the growth empirics literature – the log of initial per capita income at the beginning of the episode to capture conditional convergence (Barro and Sala-i-Martin 1992), trade openness (that is, exports plus imports as a ratio of GDP) (Frankel and Romer 1995; Sachs and Warner 1995; Dollar and Kraay 2004,), resource rents as a ratio of GDP) (Isham et al. 2005), commodity price shocks11 (Burke and Leigh 2010), conflict intensity,12 ethnic fractionalisation (Montalvo and Reynal-Querol. 2005)13 and latitude (Sachs and Warner 1997). We would expect that trade-openness will have a positive effect on growth magnitude. On the other hand, the effects of resource rents and commodity price shocks on the magnitude of growth is indeterminate – a resource boom or a surge in commodity prices may lead to a boom in economic growth, but
11 We measure the latter as the difference in the average of real commodity prices three years after the onset of the episode and the average of real commodity prices for the three years before the onset of the episode. 12 Conflict intensity is the number of armed conflicts in a given year, as reported in the UCDP/PRIO armed conflict data. 13 We use the Alesina et al. (2003) measure of ethnic fractionalisation.

Democracy versus dictatorship? The political determinants of growth episodes
15
could also have more likelihood of a growth collapse, due to over-investment in the initial years of the growth episode. Conflict intensity, ethnic fractionalisation and latitude may have a negative effect on growth (Besley and Persson 2011; Alesina et al. 2003; Sachs and Warner 1997).14 We also use year fixed effects to incorporate common period shocks to GDP across all countries (e.g. an oil price increase or a global recession).15
V. Data and descriptive statistics
Data
The data on political regimes are obtained from the Polity IV project hosted by the Centre for Systemic Peace)16 and data on the type of autocracy is obtained from the Autocratic Regime Data project by Geddes, Wright and Frantz (2014).17 The data on per capita income, trade openness and resource rents is obtained from the World Bank’s World Development Indicators. The data on commodity prices is obtained from Burke and Leigh (2010). The data on the International Country Risk Guide (ICRG, 2013) protection of property rights (also to be used in the empirical analysis) is obtained directly from Political Risk Services (PRS). 18 The data on conflict intensity, ethnic fractionalisation and latitude are obtained from the Quality of Government data-base.19
Descriptive statistics
We begin with looking at the top ten growth accelerations and growth decelerations ranked by the value of the episode magnitude obtained by the partial regression to the mean procedure (Table 1). The largest growth acceleration episode occurred in Taiwan from 1962 to 1993, with Taiwan’s GDP per capita 170 percent higher than it would have been had it grown at the predicted rate versus the actual rate. The largest growth deceleration episode occurred in Iran, from 1976 to 1987, with Iran’s GDP per capita 176 percent lower than it would have been had it grown at the predicted rate versus the actual rate. We also observe that nine of the ten countries with the largest growth acceleration episodes were autocracies at the beginning of their episodes. Similarly, nine of the ten countries with the largest growth deceleration episodes were autocracies at the beginning of their episodes.
14 With regard to latitude, Sachs (2001) shows that countries with tropical climates tend to do worse in income outcomes than countries with temperate climates. 15 A commonly used control variable in growth regressions is the Barro-Lee measure of human capital (Barro and Lee 2013). Due to the non-availability of the data for many country-years, the inclusion of this variable in our econometric analysis leads to a significant drop in the number of observations in our regressions by one-third, so we do not include human capital as one of our control variables. However, when we do include the human capital measure as a robustness test with a smaller sample, we find that there is no change in our overall findings. 16 See http://www.systemicpeace.org/polityproject.htm. We omit the episodes where Polity IV coded these episodes as interruption, interregnum and transitional periods, as the type of political regime for these episodes was indeterminate. 17 See http://sites.psu.edu/dictators/. 18 See https://www.prsgroup.com/ 19 See http://qog.pol.gu.se/data

Democracy versus dictatorship? The political determinants of growth episodes
16
Table 1. Top growth accelerations and deceleration episodes Top ten growth accelerations Country Year
started Year ended
Episode magnitude
Duration(years)
Polity Constraints on executive
Autocracy?
Taiwan 1962 1993 1.699
32 -8 2 Yes (Party-based)
Indonesia 1967 1995 1.01
28 -7 2 Yes (Party-based)
Egypt 1976 1991 0.908
16 -6 3 Yes (Party-based)
China 1977 1990 0.776
14 -7 3 Yes (Party-based)
Vietnam 1989 2010 0.717
21 -7 3 Yes (Party-based)
Singapore 1968 1979 0.698
12 -2 3 Yes (Party-based)
Laos 1979 2001 0.678
23 -7 3 Yes (Party-based)
Trinidad and Tobago
2002 2010
0.622
8 10 7 No
China 1991 2010 0.606
19 -7 3 Yes (Party-based)
Albania 1992 2010 0.595 18 5 5 No
Top ten growth decelerations
Country Year started
Year ended
Episode magnitude
Duration Polity Constraints on executive
Authoritarian?
Iran 1976 1987 -1.755 12 -10 1 Yes (Monarchy)
Afghanistan 1986 1993 -1.201 8 -8 2 Yes (Party-based)
Malawi 1978 2001 -1.195 24 -9 1 Yes (Personalist)
Congo, Dem. Republic
1989 1999 -1.086 11 -10 Yes (Personalist)
Iraq 1979 1990 -1.061 12 -9 1 Yes (Party-based)
Jordan 1965 1973 -0.996 9 -9 2 Yes (Monarchy)
Trinidad and Tobago
1980 1988 -0.958 9 8 7 No
Jordan 1982 1990 -0.928 9 -10 1 Yes (Monarchy)
Brazil 1980 2001 -0.898 22 -4 1 Yes (Military)
Somalia 1978 2010 -0.862 32 -7 1 Yes (Personalist
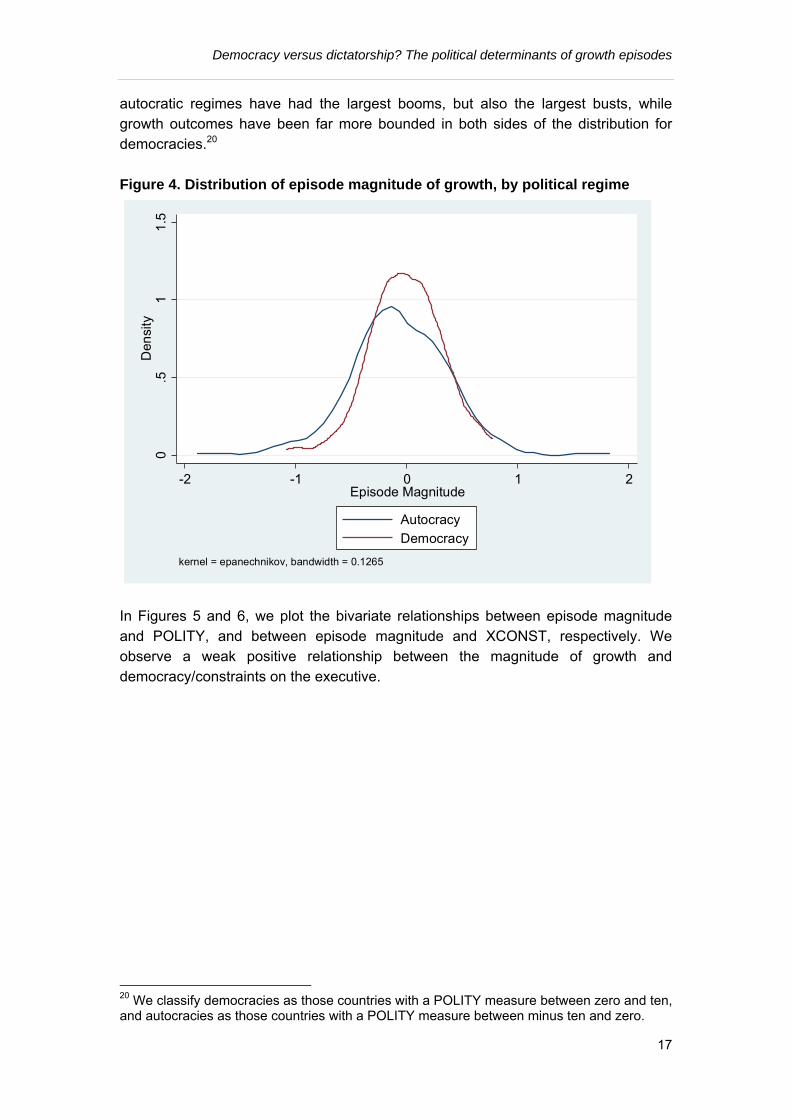
Note: Autocracy: type of autocracy in brackets. Episode magnitude is in log units of GDP. Source: our calculations, Autocracy classification from Polity IV and GWF. Interestingly, all the autocracies associated with the largest growth acceleration episodes are party-based autocracies, while the autocracies associated with the largest growth deceleration episodes are a mix of party-based, monarchic, military-based and personalist autocracies. The higher variance in growth outcomes among autocracies as compared to democracies is also observed in Figure 4, where we see
Democracy versus dictatorship? The political determinants of growth episodes
17
autocratic regimes have had the largest booms, but also the largest busts, while growth outcomes have been far more bounded in both sides of the distribution for democracies.20 Figure 4. Distribution of episode magnitude of growth, by political regime
In Figures 5 and 6, we plot the bivariate relationships between episode magnitude and POLITY, and between episode magnitude and XCONST, respectively. We observe a weak positive relationship between the magnitude of growth and democracy/constraints on the executive.
20 We classify democracies as those countries with a POLITY measure between zero and ten, and autocracies as those countries with a POLITY measure between minus ten and zero.
0.5
11
.5D
ensi
ty
-2 -1 0 1 2Episode Magnitude
Autocracy
Democracy
kernel = epanechnikov, bandwidth = 0.1265

Democracy versus dictatorship? The political determinants of growth episodes
18
Figure 5. Episode magnitude of growth and POLITY
Figure 6. Episode magnitude of growth and XCONST
afg
afg
ago
ago
alb
alb
arg
arg
arg
arg
aus
aus
autbdi
bdi
bel
bel
ben
ben ben
bfabfa
bgd
bgd
bgr
bgr
bolbol
bol
bra
bra
bra
bwa
bwa
bwacaf
caf chechl
chl
chl
chl
chn
chn
chn
chn
cmr
cmr
cmr
cog
cog
cog
col
col
colcri
cri
cri
cub
cub
cyp
cyp
cyp
cyp
dnk
dnk
dom
dom
dom
domdza
dza
dza
ecu
ecu
ecu
egy
egy
egy
espeth
etheth eth fin
fin
finfin
fji
fji
fji
gab
gab
gab
gbr
gbrgha
gha
gha
gha
gin gmbgmbgnb
gnb
gnb
grc
grc
gtm
gtm
gtm
guy
guy
hnd
hnd
hti
hti
htihun
idn
idn
indind irl
irl
irl
irl
irn
irn
irq
irq
isr
isr
itaitaita
jamjam
jam
jam
jor
jor
jor
jor jpnjpn
jpn
ken
khm
lao
lao
lbr
lkalka
lkalso
lso
lsomar
mar
mar
mar
mdg
mdgmex
mex
mli
mli
mng
mng
moz
moz
moz
mrtmrt
mrt
mus
mus
mwi
mwi
mwi
mys
mys
mys
mys
nam
nernerner nga
nga
nga
nga
nicnic
nic
nicnld
npl
nzl
nzl
omn
pakpan
pan
panper
per
per
per
phlphlphl
png
pngpol
pol
prt
prt
prt
prt
pry
pry pry
pryrom
rom
rom
rwa
rwa rwa
sdn
sdn
sen
sgp
sgpsle
sle
slv
slv
som
swz
swz
syr
syr
syr
tcd
tcd tcd
tgotgo
tgo
tha thatto
tto
tto
tto
tuntun
tur
twn
twntza
tzauga
uga
ugauga
ury
ury
ury
ury
venven
ven
vnm
zaf
zaf
zmbzmb
zmb
zmbzwezwe
zwe
zwe
-2-1
01
2E
pis
ode
Ma
gni
tude
-10 -5 0 5 10POLITY
afg
afg
ago
ago
alb
alb
arg
arg
arg
arg
aus
aus
autbdi
bdi
bel
bel
ben
ben ben
bfabfa
bgd
bgd
bgr
bgr
bolbol
bol
bra
bra
bra
bwa
bwa
bwacaf
caf chechl
chl
chl
chl
chn
chn
chn
chn
cmr
cmr
cmr
cog
cog
cog
col
col
colcri
cri
cri
cub
cub
cyp
cyp
cyp
cyp
dnk
dnk
dom
dom
dom
domdza
dza
dza
ecu
ecu
ecu
egy
egy
egy
espeth
etheth eth fin
fin
finfin
fji
fji
fji
gab
gab
gab
gbr
gbrgha
gha
gha
gha
gin gmbgmb gnb
gnb
gnb
grc
grc
gtm
gtm
gtm
guy
guy
hnd
hnd
hti
hti
htihun
idn
idn
indindirl
irl
irl
irl
irn
irn
irq
irq
isr
isr
itaitaita
jamjam
jam
jam
jor
jor
jor
jor jpnjpn
jpn
ken
khm
lao
lao
lbr
lkalka
lkalso
lso
lsomar
mar
mar
mar
mdg
mdgmex
mex
mli
mli
mng
mng
moz
moz
moz
mrtmrt
mrt
mus
mus
mwi
mwi
mwi
mys
mys
mys
mys
nam
nerner
ner nga
nga
nga
nga
nicnic
nic
nicnld
npl
nzl
nzl
omn
pakpan
pan
panper
per
per
per
phlphlphl
png
pngpol
pol
prt
prt
prt
prt
pry
pry pry
pryrom
rom
rom
rwa
rwarwa
sdn
sdn
sen
sgp
sgpsle
sle
slv
slv
som
swz
swz
syr
syr
syr
tcd
tcd tcd
tgotgotgo
tha thatto
tto
tto
tto
tuntun
tur
twn
twntza
tzauga
uga
ugauga
ury
ury
ury
ury
venven
ven
vnm
zaf
zaf
zmbzmb
zmb
zmbzwezwe
zwe
zwe
-2-1
01
2E
pis
ode
Ma
gni
tude
0 2 4 6 8XCONST

Democracy versus dictatorship? The political determinants of growth episodes
19
Next, we examine whether the average magnitude of growth in an episode differs by political regime (Table 2). While the average magnitude of growth across all episodes is negative for both autocracies and democracies, democratic regimes perform better than autocratic regimes on average across all episodes, with a lower average income loss (-0.005 versus -0.068) and a lower standard deviation (0.326 versus 0.438). However, disaggregating the data by growth accelerations and decelerations, we find that autocratic regimes have a higher magnitude of growth in growth accelerations than democratic regimes, suggesting in a boom, autocracies see higher income gains than democracies. At the same time, the standard deviation of the episode magnitude is higher in autocracies than democracies, indicating the higher volatility in growth outcomes for autocracies. In contrast, in growth decelerations, autocracies witness larger income losses than democracies (an average episode magnitude of growth of -0.358 for autocracies, as compared to -0.256 for democracies), again with a higher standard deviation (0.292 for autocracies versus 0.211 for democracies). This suggests that a focus on the average effect of democracy on growth outcomes is misleading, as autocracies are likely to observe larger booms, as well as larger busts, than democracies.
Table 2. Episode magnitude, summary statistics, by regime type Political regime
Number of observations
Mean Standard deviation
Minimum Maximum
Autocratic regimes Episode magnitude, all episodes
154 -0.068 0.438 -1.755 1.699
Episode magnitude, accelerations
65 0.321 0.266 0.006 1.699
Episode magnitude, decelerations
89 -0.358 0.292 -1.755 -0.001
Democratic regimes Episode magnitude, all episodes
133 -0.005 0.326 -1.086 0.771
Episode magnitude, accelerations
66 0.255 0.192 0.006 0.771
Episode magnitude, decelerations
67 -0.256 0.211 -1.086 -0.002
Note: Episode magnitude is the change in log unit of GDP at the end of the episode as compared to the counter-factual. Source: Our estimates. Do growth outcomes differ by the type of autocracy? Table 3 suggests that they do, with party-based autocracies likely to witness a higher magnitude of growth on average across all episodes as compared to military regimes, monarchies and personalised autocracies (an average of 0.004 for party-based autocracies, as

Democracy versus dictatorship? The political determinants of growth episodes
20
Table 3. Episode magnitude, summary statistics, by type of autocracy Political regime
Number of observations
Mean Standard deviation
Minimum Maximum
Party-based regimes Episode magnitude, all episodes
88 0.004 0.464 -1.201 1.699
Episode magnitude, accelerations
41 0.393 0.326 0.033 1.699
Episode magnitude, decelerations
47 -0.336 0.248 -1.201 -0.008
Military regimes Episode magnitude, all episodes
35 -0.117 0.417 -0.898 0.771
Episode magnitude, accelerations
14 0.282 0.257 0.030 0.771
Episode magnitude, decelerations
21 -0.383 0.258 -0.898 -0.012
Monarchies Episode magnitude, all episodes
14 -0.245 0.639 -1.755 0.436
Episode magnitude, accelerations
7 0.245 0.158 0.066 0.436
Episode magnitude, decelerations
7 -0.735 0.548 -1.755 -0.091
Personalist autocracies Episode magnitude, all episodes
40 -0.111 0.355 -1.195 0.410
Episode magnitude, accelerations
15 0.233 0.126 0.008 0.410
Episode magnitude, decelerations
25 -0.317 0.279 -1.195 -0.005
Note: Episode magnitude is the change in log unit of GDP at the end of the episode as compared to the counter-factual. Source: Our estimates. compared to -0.117 for military regimes, -0.245 for monarchies and -0.111 for personalised regimes). In the case of growth accelerations, party-based autocracies significantly outperform all other types of autocracy, with an average episode magnitude of 0.393, as compared to 0.282 for military regimes, -0.245 for monarchies and 0.233 for personalised regimes. When it comes to growth decelerations, the picture is mixed, with personalist monarchies having the lowest income loss among all types of autocracy (an average of -0.317 for personalised

Democracy versus dictatorship? The political determinants of growth episodes
21
regimes, as compared to -0.336 for party based autocracies, -0.383 for military regimes, and -0.735 for monarchies).
VI. Results
We now turn to the estimation of equations (1), (2a) and (2b). Table 4 presents the summary statistics of the variables included in the regressions and Table 5 presents the main results. In columns. (1) and (2), we present the results of the basic specification of equation (1) estimated with ordinary least squares, without controls (initial level of per capita income, trade/GDP, resource rents/GDP, and commodity price shocks, conflict intensity, ethnic fractionalisation and latitude), but with the year fixed effects included in the regressors. We first estimate equation (1) with the POLITY measure and then with XCONST as our key right-hand side (RHS) variable. We find that democracy as well as higher degree of constraints on the executive has a positive and significant effect on the magnitude of growth. When we add the control variables in columns (3) and (4), the main results do not change – the coefficients on POLITY and XCONST are positive and significant. This suggests that, on average, more democratic regimes are likely to observe a higher magnitude of growth. The first of our core hypotheses is that democracy and constraints on the executive are likely to have a different effect on growth accelerations as compared to growth decelerations. To test this hypothesis, we estimate equations (2a) and (2b), with controls and year effects, with POLITY and XCONST included in turn as the key explanatory variable. We present these results in columns (5) and (6) for growth accelerations, and in columns. (7) and (8) for growth decelerations. We find that POLITY and XCONST do not have any discernible effect on the magnitude of growth during a growth acceleration – the coefficients on these two variables are statistically not different from zero, both with and without controls. However, both POLITY and XCONST are positive and statistically significant for growth decelerations. This supports our hypothesis that democracy and the constraints on the executive and political competition matter more in limiting negative growth episodes than in enhancing positive growth episodes. Thus, the greater the extent of democracy and the constraints on the executive, the less likely is the possibility of growth collapses, without any discernible change in the likelihood of growth booms. With respect to the control variables, trade openness as expected has a positive effect on growth magnitude. Resource rents have a positive effect on magnitude of growth in acceleration episodes, but do not limit the loss in income in growth deceleration episodes. Conflict intensity does not affect the magnitude of growth in acceleration or deceleration episodes. Ethnic fractionalisation has a negative effect on growth magnitude in deceleration episodes, but not in acceleration episodes. Commodity price shocks and latitude do not have any discernible negative effect on growth magnitude. The initial level of per capita income has a negative effect on magnitude of growth in growth accelerations, but not in growth decelerations, suggesting that conditional convergence is more likely to be observed in growth acceleration episodes than in growth deceleration episodes.

Democracy versus dictatorship? The political determinants of growth episodes
22
Robustness tests
Our preferred measures of political institutions are the continuous measures of democracy and constraints to the executive, as in Polity IV. Would our results change if we used a discrete measure of democracy, such as in Cheibub et al. (2010)?21 We present the results using the Cheibub et al. measure instead of the Polity measures in column (1) of Table 6, and find that as in Table 5, democracies do not do better than autocracies in growth accelerations, but limit the loss in income as compared to autocracies in decelerations. One other possibility with our main regression results, as in Table 5, is that both the magnitude of growth and our key political institutions are correlated with unobserved country characteristics. This is a remote possibility, as the maximum number of episodes for any country is four, and the average number of episodes per country is two. Nevertheless, to test for this possibility, we include country fixed effects in our set of controls (column (2)). Here, and in the rest of the robustness tests (Table 6), we focus on the constraints on the executive as our preferred variable to capture political institutions.22 We find that the coefficient on constraints to the executive remain statistically significant at the 1 percent level (column (2)).23 A third robustness test we perform is whether our results are sensitive to the exclusion of the truncated episodes (i.e., episodes which begin in 2002 and end in 2010, due to lack of data availability after that year). Dropping all post-2002 episodes, we find no change in our finding that constraints on the executive have a positive and statistically significant effect on episode magnitude for growth deceleration episodes, but there is no such positive effect for growth acceleration episodes (column. (3)). One other possibility of omitted variable bias is that our measures of political institutions may be correlated with the quality of economic institutions, and it is the latter which may explain the association we have found so far between our preferred measures of political institutions and the magnitude of growth. To address this possibility, we include the ICRG measure of the protection of protection rights that is commonly used in the econometric analysis of the effects of institutions on economic growth (Acemoglu, Johnson and Robinson 2001; Rodrik, Subramanian and Trebbi 2004). This measure is only available from 1984, and so we confine our analysis to growth episodes which begin in 1984 or later. We find that our main finding – that higher constraints on the executive limit the likelihood of large growth collapses, but do not necessarily increase the likelihood of large growth booms – is remarkably 21 The Cheibub et al. measure categorises countries as democracies for a particular year if there are contested elections in the country in that year. 22In all our robustness tests, we also used POLITY as the key RHS variable, with no change in our results. 23We also examined whether our results are sensitive to our calculation of the magnitude of growth using the ‘unconditional predicted’ counter-factual growth rate. As a robustness test, we used our estimates of episode magnitude using the ‘world average’ counter-factual growth rate, and find that there is no change in our results.

Democracy versus dictatorship? The political determinants of growth episodes
23
robust to the inclusion of economic institutions on the RHS and to the reduction in the sample (column. 4)). A further issue of concern is that growth collapses are more likely to see a switch in the political regime (say, from an autocracy to a democracy or vice versa) than growth booms, so that the role of the political regime is ambiguous in growth decelerations as compared to growth accelerations. To address this possibility, we only retain episodes where there has been no switch in the political regime during the duration of the episode. We present the estimates in column. (5). We do not find any change in our results, even when we omit episodes where there has been a change in the political regime. A further robustness test we perform is to see if our results are sensitive to the inclusion of high-income OECD countries in our sample. It could be argued that most high-income OECD countries which have been democracies for a long time have also seen less volatile growth in the post-World War II period (that is, less boom and bust growth). Their inclusion may bias the result on the positive effect of democracy on income loss during decelerations, purely due to the fact that countries with strong and established democracies are unlikely to witness large deceleration episodes. We re-estimate equations (2a) and (2b) by omitting episodes associated with all high- income OECD countries and find that our main finding remains with a sample of only developing countries (column (6)). Would our results change if we simply use the difference between the actual growth rate during the episode and the counter-factual growth rate? We present our results with the growth rate difference on the left-hand side, instead of the episode magnitude (column. (7)). We find no difference in our main result – that a higher constraint on the executive has no discernible effect on growth accelerations, but limits the fall in income in growth decelerations.24 As a final robustness test, we explore the possibility that there may be reverse causality in the positive relationship between our core political institution variable and the episode magnitude, with the positive growth episodes (or less negative growth episodes) leading to greater state capacity (as captured by the strengthening of the constraints that are placed on executives) and democratisation (Burke and Leigh 2010). To address the possibility of reverse causality, we use two squares least squares (2SLS) estimates and a novel instrument that we draw from Persson and Tabellini (2009), who show that a higher stock of democratic capital implies a lower probability of autocracy in the future. We use the stock of XCONST at the beginning of the episode (cumulatively aggregated from 1958 onwards or from the first year that that the data for the variable was available in Polity IV). The stock of democratic
24 Does XCONST have a differential effect on the duration of growth as well? We find that the coefficient on XCONST is insignificant for growth accelerations and weakly significant at the 10 percent level for growth decelerations, suggesting that most of the effect of political institutions on the episode magnitude of growth is through their effect on changes in growth rates, rather than duration of growth episodes.

Democracy versus dictatorship? The political determinants of growth episodes
24
capital meets the exclusion restriction as it does not affect the magnitude of growth directly, but indirectly does so by influencing the probability that the regime is a democracy in the beginning of the episode. We construct the stock variable of XCONST, using the following formula:
, , 1 ∗ 1 (3)
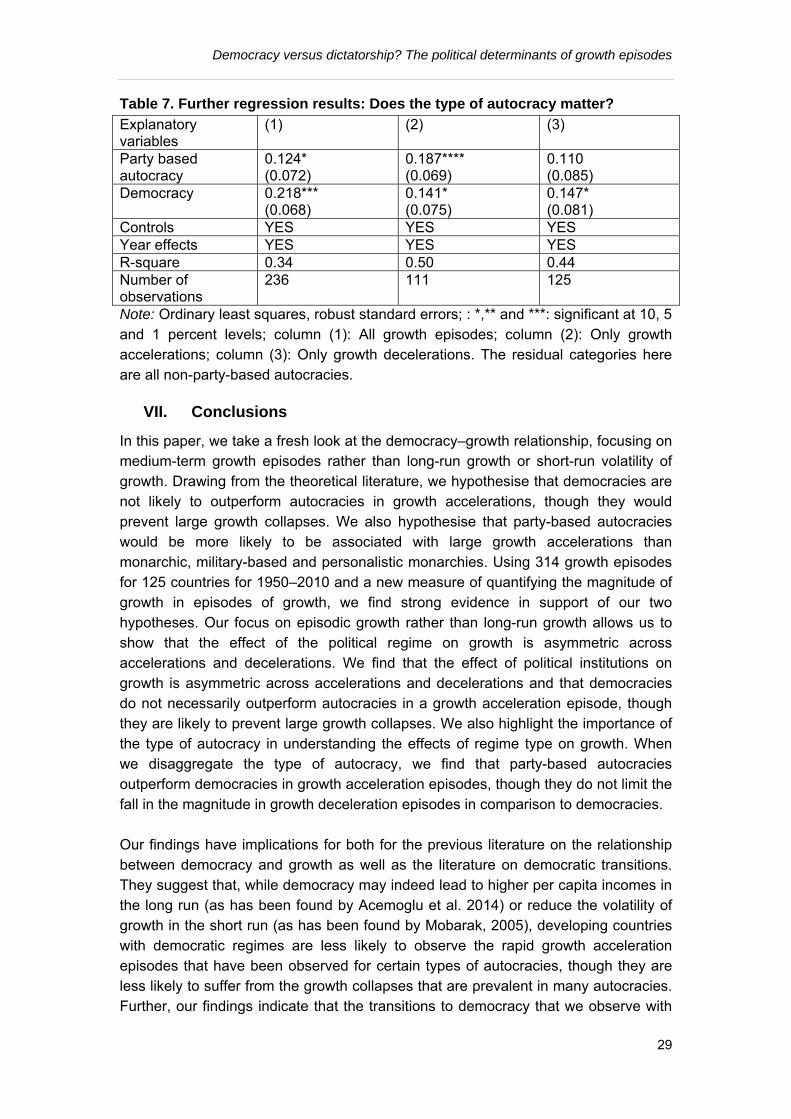
Where Stk (i,t) and Stk(I,t-1) is the stock value of XCONST in year t and t-1, and d is the depreciation rate (we use a 5 percent depreciation rate to start with, and experiment with 10 percent and 1 percent depreciation rates too). The use of this instrument gets around the problems associated with the standard instruments that are usually proposed in the institutions literature, such as the settler mortality rate proposed by Acemoglu, Johnson and Robinson (AJR, 2001) and the ethnic fractionalisation measure proposed by Alesina et al. (2003). The settler mortality rate has been critiqued as not being reliable (Albouy 2012), while the ethnic fractionalisation measure may not meet the exclusion restriction as it directly affects growth outcomes, as we have already seen in our estimates in Table 5 (Montalvo and Reynal-Quirol 2005). The 2SLS estimates of the effect of XCONST on episode magnitude for growth decelerations is significant at the 10 percent level (column (8)). For growth accelerations, as with the OLS estimates, the coefficient on constraints on the executive is statistically not different from zero in the 2SLS estimate. Our finding that the coefficient on the core political institutions variable remains positive and significant in the 2SLS estimates increases our confidence that higher constraints on the executive are a cause and not a consequence of a lower likelihood of a fall in incomes during a growth collapse. Finally, we look at the effect of type of autocracy on episode magnitude in Table 7. We find that, along with democratic regimes, party-based autocracies lead to a larger magnitude of growth across all growth episodes (column (1)). 25 When we disaggregate episodes by whether the episode is an acceleration or a deceleration, we find that party-based autocracies and democracies are both likely to yield larger acceleration episodes (column (2)). 26 Interestingly, the effect of party-based autocracies on episode magnitude is larger than that of democracies. In contrast, in growth deceleration episodes, party-based autocracies do not perform better than other types of autocracies in preventing large growth collapses. The effect of democracy in reducing the magnitude of income loss in a deceleration episode, as
25 In the regressions, we include two dummy variables, one if the regime is a party-based autocracy, and the other if the regime is a democracy. The residual category is non-party- based autocracies. 26 We exclude the country-episode observations where the country is ruled by a provisional government charged with overseeing a transition to democracy, not independent, occupied by foreign troops, or lacking a central government.

Democracy versus dictatorship? The political determinants of growth episodes
25
found earlier, remains, even when we control for the type of autocracy. These results provide some support for our second core hypothesis: that party-based autocracies are likely to yield larger magnitudes of growth in growth episodes – however, we find that while party-based autocracies outperform non-party-based autocracies in growth acceleration episodes, there is no such difference in growth deceleration episodes. Here, democracies do better than all types of autocracies in preventing large income losses in growth deceleration episodes.27
Table 4. Summary statistics, all variables Variable Number of
observations Mean Standard
deviation Minimum Maximum
Episode magnitude, all (log units of GDP)
314 -0.044
0.394 -1.755 1.699
Episode magnitude, only accelerations (log units of GDP)
144 0.282 0.236 0.006 1.699
Episode magnitude, only decelerations (log units of GDP)
170 -0.320
0.270 -1.755 -0.001
POLITY 287 -0.341
7.388 -10 10
XCONST 287 3.756 2.347 1 7 Initial per capita Income (ln) 314 7.931 1.205 5.115 10.515
Trade/GDP (per cent) 299 67.58 47.20 2.137 373.179
Resource rents/GDP (per cent) 293 7.640 10.814 0 61.723
Commodity price Shocks 282 -0.022
0.090 -0.277 0.269
Conflict intensity 293 0.344 0.163 0 7
Ethnic fractionalisation 305 0.469 0.265 0.001 0.930
Latitude 308 0.237 0.163 0 0.711
Source: Our estimates
27 One other issue is whether it matters what type of democracy it is in explaining episode magnitude in growth episodes. We also estimate equations (2a) and (2b) with democracies disaggregated by presidential, semi-presidential and parliamentary democracies. We find that the type of democracy does not matter in growth acceleration episodes, but that parliamentary democracies limit losses in income more than other types of democracies in deceleration episodes.

Democracy versus dictatorship? The political determinants of growth episodes
26
Table 5. Regression results: Does the political regime matter? Explanatory
variables
All episodes Growth
accelerations
Growth
decelerations
(1) (2) (3) (4) (5) (6) (7) (8)
POLITY 0.007
**
(0.00
5)
0.015**
*
(0.004)
-- -- 0.001
(0.004
)
-- 0.012**
*
(0.004)
--
XCONST -- -- 0.022*
*
(0.034
)
0.040**
*
(0.013)
-- 0.001
(0.013)
-- 0.044**
(0.014)
Initial per
capita income
(ln)
-- -
0.150**
*
(0.033)
-- -
0.141**
*
(0.033)
-
0.055*
(0.031
)
-0.051*
(0.029)
-0.005
(0.033)
-0.047
(0.032)
Trade/GDP -- 0.002**
*
(0.001)
-- 0.002**
*
(0.001)
0.001*
*
(0.019
)
0.001**
(0.0006
)
0.001**
(0.0004
)
0.001**
(0.0004
)
Resource
Rents/GDP
-- 0.004*
(0.003)
-- 0.005*
(0.003)
0.004*
(0.003
)
0.006*
(0.003)
-0.002
(0.002)
-0.002
(0.002)
Commodity
price shocks
-- 0.063
(0.308)
-- 0.056
(0.304)
0.474
(0.309
)
0.471
(0.310)
-0.555*
(0.282)
-0.581
(0.293)
Conflict
intensity
0.046**
(0.019)
0.043**
(0.019)
-0.002
(0.022
)
-0.003
(0.022)
0.003
(0.030)
0.009
(0.029)

Democracy versus dictatorship? The political determinants of growth episodes
27
Ethnic
fractionalisation
-
0.382**
*
(0.126)
-
0.387**
*
(0.135_
-0.205
(0.141
)
-0.203
(0.140)
-
0.308**
(0.144)
-
0.317**
(0.140)
Latitude 0.287
(0.193)
0.222
(0.193)
-0.044
(0.211
)
-0.051
(0.210)
-0.128
(0.188)
-0.198
(0.194)
Year effects YES YES YES YES YES YES YES YES
R-square 0.20 0.32 0.16 0.21 0.40 0.40 0.44 0.46
Number of
observations
287 249 258 249 112 112 137 137
Note: Ordinary least squares, robust standard errors; *,** and ***: significant at 10, 5 and 1 percent levels; we do not report the intercept term.

Democracy versus dictatorship? The political determinants of growth episodes
28
Table 6. Robustness tests Explanatory variables
(1) (2) (3) (4) (5) (6) (7) (8)
Growth accelerations XCONST 0.032
(0.059) 0.017 (0.035)
-0.004 (0.013)
0.008 (0.023)
0.003 (0.015)
0.005 (0.015)
-0.001 (0.001)
0.029 (0.019)
Protection of property rights
-- -- -- 0.039 (0.025)
-- -- -- --
Controls YES YES YES YES YES YES YES YES Year effects YES NO YES YES YES YES YES YES R-square 0.37 0.77 0.36 0.53 0.42 0.45 0.52 0.38
First stage F statistic -- -- -- -- -- -- 34.93***
Number of observations
121 112 101 73 96 96 112 110
Growth decelerations
XCONST 0.125* (0.066)
0.050* (0.030)
0.042*** (0.015)
0.037** (0.017)
0.042* (0.022)
0.043** (0.021)
0.003** (0.002)
0.031* (0.019)
Protection of property rights
-- -- -- 0.015 (0.025)
-- -- -- --
Controls YES YES YES YES YES YES YES YES
Year effects YES NO YES YES YES YES YES YES
R-square 0.40 0.81 0.44 0.47 0.62 0.46 0.41 0.45
First stage F statistic -- -- -- -- -- -- -- 52.22***
Number of observations
141 137 127 112 92 118 137 137
Note: Ordinary least squares (except column (8)), robust standard errors; *,** and ***: significant at 10, 5 and 1 percent levels; Col (1): With Cheibub et al. measure of democracy; column. (2): With country fixed effects; column (3): Dropping all growth episodes which begin in 2002; Col. (4): Including protection of property rights (ICRG), from 1984; column (5): Dropping all episodes where there is a switch from democracy/autocracy to autocracy/democracy; column (6): All OECD high income countries omitted; column (7): the dependent variable is the difference between actual growth during the episode and the PRM counter-factual growth rate; column (8): IV estimates, instrument for XCONST: stock of XCONST at beginning of episode.
Democracy versus dictatorship? The political determinants of growth episodes
29
Table 7. Further regression results: Does the type of autocracy matter?
Explanatory variables
(1) (2) (3)
Party based autocracy
0.124* (0.072)
0.187**** (0.069)
0.110 (0.085)
Democracy 0.218*** (0.068)
0.141* (0.075)
0.147* (0.081)
Controls YES YES YES Year effects YES YES YES R-square 0.34 0.50 0.44 Number of observations
236 111 125
Note: Ordinary least squares, robust standard errors; : *,** and ***: significant at 10, 5 and 1 percent levels; column (1): All growth episodes; column (2): Only growth accelerations; column (3): Only growth decelerations. The residual categories here are all non-party-based autocracies.
VII. Conclusions
In this paper, we take a fresh look at the democracy–growth relationship, focusing on medium-term growth episodes rather than long-run growth or short-run volatility of growth. Drawing from the theoretical literature, we hypothesise that democracies are not likely to outperform autocracies in growth accelerations, though they would prevent large growth collapses. We also hypothesise that party-based autocracies would be more likely to be associated with large growth accelerations than monarchic, military-based and personalistic monarchies. Using 314 growth episodes for 125 countries for 1950–2010 and a new measure of quantifying the magnitude of growth in episodes of growth, we find strong evidence in support of our two hypotheses. Our focus on episodic growth rather than long-run growth allows us to show that the effect of the political regime on growth is asymmetric across accelerations and decelerations. We find that the effect of political institutions on growth is asymmetric across accelerations and decelerations and that democracies do not necessarily outperform autocracies in a growth acceleration episode, though they are likely to prevent large growth collapses. We also highlight the importance of the type of autocracy in understanding the effects of regime type on growth. When we disaggregate the type of autocracy, we find that party-based autocracies outperform democracies in growth acceleration episodes, though they do not limit the fall in the magnitude in growth deceleration episodes in comparison to democracies. Our findings have implications for both for the previous literature on the relationship between democracy and growth as well as the literature on democratic transitions. They suggest that, while democracy may indeed lead to higher per capita incomes in the long run (as has been found by Acemoglu et al. 2014) or reduce the volatility of growth in the short run (as has been found by Mobarak, 2005), developing countries with democratic regimes are less likely to observe the rapid growth acceleration episodes that have been observed for certain types of autocracies, though they are less likely to suffer from the growth collapses that are prevalent in many autocracies. Further, our findings indicate that the transitions to democracy that we observe with

Democracy versus dictatorship? The political determinants of growth episodes
30
increasing frequency in many parts of the developing world may not necessarily lead to rapid economic development, if the transition is from party-based autocracies to democracies. For the international development policy community, this suggests that it matters what type of autocracy is in place in a given country when pushing for democratic transition in that country.

Democracy versus dictatorship? The political determinants of growth episodes
31
References Acemoglu, D., Johnson, S. and Robinson, J. (2001). ‘The colonial origins of
comparative development’, American Economic Review, 91: 1369-1401. Acemoglu, D., Johnson, S., Robinson, J. A. and Yared, P. (2008). ‘Income and
democracy’, American Economic Review, 98 (3): 808-842. Acemoglu. D., Naidu, S., Restrepo, P. and Robinson, J. (2014). ‘Democracy does
cause growth’, NBER Working Papers 20004, National Bureau of Economic Research.
Acemoglu, D. and Robinson, J. (2012). Why Nations Fail: The Origins of Power,
Prosperity, and Poverty. New York: Crown. Aizenman, J. and Spiegel, M. (2010). ‘Takeoffs.’ Review of Development Economics
14: 177-196. Albouy, D. (2012). ‘The colonial origins of comparative development: A comment’,
American Economic Review, 102(6): 3059-3076. Alesina, A. and Rodrik, D. (1994). ‘Distributive politics and economic growth’. The
Quarterly Journal of Economics, 109: 465-490. Alesina, A., Devleeschauwer, A., Easterly, W., Kurlat, S. and Wacziarg, R. (2003).
‘Fractionalization’, Journal of Economic Growth, 8: 155-194. Almeida, H. and Ferreira, D. (2002). ‘Democracy and the variability of economic
performance’. Economics & Politics 14(3): 225–257. Arbache, J. S. and Page, J. (2007). 'More growth or fewer collapses? A new look at
long run growth in Sub-Saharan Africa’. Policy Research Working Paper 4384, World Bank, Washington, DC.
Bai, J., and Perron, P. (1998). 'Estimating and testing linear models with multiple
structural change,' Econometrica 66: 47-78. Barro, R. (1996), ‘Democracy and growth’, Journal of Economic Growth, 1: 1-27. Barro, R. and Lee, J. W. (2013). ‘A new data set of educational attainment in the
world, 1950-2010‘. Journal of Development Economics, 104: 184-198. Barro, R. J. and Sala-i-Martin, X. (1992). ‘Convergence’, Journal of Political
Economy, 100(2: 223-251.

Democracy versus dictatorship? The political determinants of growth episodes
32
Benabou, R. (1996). ‘Inequality and growth’. In: B. S. Bernanke and J. Rotemberg (eds.), NBER Macroeconomics Annual 1996. Cambridge, MA: MIT Press, 11-74.
Berg, A., Ostry, J. and Zettelmeyer, J. (2012). ‘What makes growth sustained?’
Journal of Development Economics 98(2): 149-166. Barro, R. (1996). ‘Democracy and growth’, Journal of Economic Growth, 1: 1-27. Besley, T. and Persson, T. (2011). Pillars of Prosperity: The Political Economics of
Development Clusters. Princeton, NJ: Princeton University Press. Burke, P. and Leigh, A. (2010). ‘Do output contractions trigger democratic change?’
American Economic Journal: Macroeconomics 2 (October 2010): 124-157 Chandra, S. and Rudra, N. (2015). ‘Reassessing the links between regime type and
economic performance: Why some authoritarian regimes show stable growth and others do not’." British Journal of Political Science, 45(02): 253-285.
Cheibub, J. A., Gandhi, J. and Vreeland, J. R. (2010). ‘Democracy and dictatorship
revisited’, Public Choice, 143: 67-101. Clague, C., Keefer, P., Knack, S. and Olson, M. (1996). ‘Property and contract rights
in autocracies and democracies’, Journal of Economic Growth, 1: 243-276. De Luca G., Litina, A. and Sekeris, P. G. (2015). ‘Growth-friendly dictatorships’,
Journal of Comparative Economics, 43: 98-111. Dollar, D. and A. Kraay (2004), ‘Trade, growth and poverty’, The Economic Journal,
114(493): F22-F49. Doucouliagos, H. and Ulubasoglu, M. A. (2008). ‘Democracy and economic growth: A
meta-analysis’, American Journal of Political Science, 52(1): 61-83. Easterly, W. (2011), ‘Benevolent autocrats’, mimeo. Easterly, W., Kremer, M., Pritchett, L. and Summers, L. (1993). 'Good policy or good
luck? Country growth performance and temporary shocks', Journal of Monetary Economics 32: 459-483.
Frankel, J., and Romer, D. (1999). 'Does trade cause growth?' American Economic
Review, 89(3): 379-399. Geddes, B. (1999). ‘What do we know about democratization after twenty years?’
American Review of Political Science, 2: 115-144.

Democracy versus dictatorship? The political determinants of growth episodes
33
Geddes, B., Wright, J. and Frantz, E. (2014). ‘Authoritarian breakdown and regime transitions: A new data-set’, Perspectives in Politics, 12(2):. 313-331.
Gehlbach, S, and Keefer, P. (2011). ‘Investment without democracy: Ruling-party
institutionalisation and credible commitment in autocracies’, Journal of Comparative Economics, 39: 123-139.
Hausmann, R., Pritchett, L. and Rodrik, D. (2005). ‘Growth accelerations’, Journal of
Economic Growth, 10: 303-329. Hausmann, R., Rodriguez, F. and Wagner, R. (2006). ‘Growth collapses’. Kennedy
School of Government Working Paper RWP06-046, Cambridge, MA. ICRG (2013). International Country Risk Guide. East Syracuse, NY: The Political
Risk Services Group. Isham, J., Pritchett, L., Woolcock, M. and Busby, G. (2005). ‘The varieties of
resource experience: Natural resource export structures and the political economy of economic growth’, World Bank Economic Review, 19( 2): 141-174.
Jones, B. F. and Olken, B. A. (2005). ‘Do leaders matter? National leadership and
growth since World War II’, The Quarterly Journal of Economics 120(3): 835-864
Jones, B. F. and Olken, B. A. (2008). ‘The anatomy of start-stop growth’. Review of
Economics and Statistics 90(3): 582-587. Justesen, M. K. and Kurrild-Klitgaard, P. (2013). ‘Institutional interactions and
economic growth: The joint effects of property rights, veto players and democratic capital’, Public Choice, 157: 449-474.
Kar, S., Pritchett, L., Raihan, S. and Sen, K. (2013). ‘Looking for a break: Identifying
transitions in growth regimes’, Journal of Macroeconomics, 38(B): 151-166. Kelsall, T. (2014). ‘Authoritarianism, democracy and development’, DLP State of the
Art Working Paper No. 3, available at www.dlprog.org. Krueger, A. (1974). ‘The political economy of the rent-seeking society’, American
Economic Review, 74(3): 291-303. Lizzeri, A. and Persico, N. (2004). ‘Why did the elites extend the suffrage?
Democracy and the scope of government, with an application to Britain's “age of reform”’. The Quarterly Journal of Economics 119: 707-765.

Democracy versus dictatorship? The political determinants of growth episodes
34
Londregan, J. B. and Poole, K.T. (1990). ‘Poverty, the coup trap and the seizure of executive power’, World Politics, 42(2):. 151-183.
Marshall, M. G., Jagger, K. and Gurr, T. D. (2011). Political Regime Characteristics
and Transitions, 1800-2010. Dataset Users’ Manual. Online resource: http://www.systemicpeace.org/inscr/p4manualv2015.pdf (accessed 6 December 2016).
Masaki, T. and van de Walle, N. (2014). ‘The impact of democracy on economic
growth in sub-Saharan Africa, 1982-2012’, UNU-WIDER Working Paper 2014/057.
Mobarak, A. M. (2005). ‘Democracy, volatility, and economic
development’. Review of Economics and Statistics 87: 348-361. Montalvo, J. G. and Reynal-Querol, M. (2005). ‘Ethnic diversity and economic
development’. Journal of Development Economics Volume 76(2): 293-323. North, D. C. and Weingast, B. R. (1989). ‘Constitutions and commitment: The
evolution of institutions governing public choice in seventeenth-century England’, Explorations in Economic History, XLIX(4):. 803-832.
Olson, M. (1982). The Rise and Decline of Nations: Economic Growth, Stagflation,
and Social Rgidities. New Haven, CT: Yale University Press. Olson, M. (1993). ‘Dictatorship, democracy and development’, American Political
Science Review, 87(3): 567-576. Persson, T. and Tabellini, G. (1994). ‘Is inequality harmful for growth?’ The American
Economic Review 84: 600-621. Persson, T. and Tabellini, G. (2007). ‘The growth effect of democracy: Is it
heterogenous and how can it be estimated?’ CESifo Working Paper Series 2016, CESifo Group, Munich.
Persson, T. and Tabellini, G. (2009). ‘Democratic capital: The nexus of political and
economic change’, American Economic Journal: Macroeconomics, 1(2): 88-126.
Pritchett, L. (2000). ‘Understanding patterns of economic growth: Searching for hills
among plateaus, mountains and plains’. World Bank Economic Review 14(2): 221-250.
Pritchett, L. and Summers, L. H. (2014). ‘Asiaphoria meets regression to the mean’,
NBER Working Paper 20573.

Democracy versus dictatorship? The political determinants of growth episodes
35
Pritchett, L., Sen, K., Kar, S. and Raihan, S. (2016). ‘Trillions gained and lost: Estimating the magnitude of growth episodes’, Economic Modelling, 55: 279-291.
Quinn, D. P. and Woolley, J. T. (2001).‘Democracy and national economic
performance: The preference for stability’. American Journal of Political Science 45: 634-657.
Rodrik, D. (1999). ‘Where did all the growth go? External shocks, social conflict, and
growth collapses’. Journal of Economic Growth 4(4): 385-412. Rodrik, D., Subramanian, A. and Trebbi, F. (2004). ‘Institutions rule: The primacy of
institutions over geography and integration in economic development’, Journal of Economic Growth 9(2): 131-165.
Rodrik, D. and Wacziarg, R. (2005). ‘Do democratic transitions produce bad
economic outcomes?’ American Economic Review 95: 50-55. Sachs, J. D. and Warner, A. M. (1995). 'Economic reform and the process of global
integration.' Brookings Papers on Economic Activity 1: 1-95. Sachs, J. D. and Warner, A. M. (1997). ‘Sources of slow growth in African
economies’. Journal of African Economies 6: 335-376. Sachs, J. D. (2001). ‘Tropical underdevelopment’. NBER Working Paper No. w8119
(February). Sah, R. K. (1991). ‘Fallibility in human organisations and political systems’, Journal of
Economic Perspectives, 5: 67-88. Saint-Paul, G. and Verdier, T. (1993). ‘Education, democracy and growth’. Journal of
Development Economics 42: 399-407. Tavares, J. and Wacziarg, R. (2001). ‘How democracy affects growth’. European
Economic Review 45: 1341-1378. Weede, E. (1996). ‘Political regime type and variation in economic growth rates’.
Constitutional Political Economy 7(3): 167-176. Wright, J. (2008a). ‘Do authoritarian institutions constrain? How legislatures affect
econonomic growth and investment’, American Journal of Political Science, 52(2): 322-343.
Wright, J. (2008b). ‘To invest or insure? How authoritarian time horizons impact
foreign aid effectiveness’, Comparative Political Studies41(7): 971-1000.

Democracy versus dictatorship? The political determinants of growth episodes
36
Yang, B. (2008). ‘Does democracy lower growth volatility? A dynamic panel analysis’. Journal of Macroeconomics 30(1) March: 562-574.

Democracy versus dictatorship? The political determinants of growth episodes
37
Online appendix: ‘Democracy vs. dictatorship’: The political determinants of growth episodes
Identifying growth breaks
Kar et al. (2013) propose an approach that provides a unified framework for identifying breaks in economic growth drawing from filter-based and statistical approaches. They use a procedure for identifying structural breaks in economic growth that uses the Bai-Perron (BP) procedure of maximising the F-statistic to identify candidate years for structural breaks in growth with thresholds on the magnitude of the shift to determine which are actual breaks. This procedure involves the best fit of the BP method to the data in the first stage, and the application of a filter to the breaks identified in the first stage in the second stage. The magnitude filter was that the absolute value of the change in the growth rate after a BP potential break had to be (a) 2 percentage points if it was the first break, (b) 3 percentage points if the potential break was of the opposite sign of the previous break (an acceleration that followed a deceleration had to have accelerated growth by more than 3 ppa to qualify as a break) and (c) 1 percentage point if the BP potential break was of the same sign as the previous break, so if BP identified an acceleration that directly followed an acceleration (or deceleration that followed a previous deceleration) the magnitude had to be larger than 1 percentage point to qualify as a break. To estimate potential breaks, they assumed that a ‘growth regime’ lasts a minimum of eight years (as in Berg et al., 2012). The use of shorter periods (e.g. three or five years) risks conflation with ‘business cycle fluctuations’ or truly ‘short run’ shocks (e.g. droughts). Longer periods (e.g. ten or 12 years) reduce the number of potential breaks.
Our procedure for estimating the episode magnitude of growth
Suppose we have a structural break in growth in year t that ends a previous growth episode. Also suppose the growth in the previous episode was gbefore that lasted for Nb years and the growth in the current episode is gep and this episode lasts Nep years. We define the episode magnitude of the current growth episode (where F denotes the episode) as the difference in logs between its actual GDP per capita (GDPPC) in year t+ Nep, and its counter-factual level. If natural log of GDPPC is y then the equation is:
1
By definition, the right-hand side of equation 1 is nothing but the product of the actual growth rate during the episode (relative to the counterfactual) and the duration of the episode. This definition of episode magnitude thus fulfils our criteria for a measure of the impact of a growth episode. Let us now formalise each of the three counter-factuals discussed above.

Democracy versus dictatorship? The political determinants of growth episodes
38
‘No regression to mean’ (NRM): Counter-factual growth continues at pre-break levels. This assumes there is zero regression to the mean and the counter-factual for growth during the episode was the pre-break growth rate.28 In this case, the magnitude of the total gain/loss from the episode is:
2 ∗
‘Complete regression to mean’: Counter-factual growth during the episode is world average (WA) growth during the episode. Complete regression to the mean assumes the growth rate during the episode would have been the world average growth during the same period.29
3 ,∗
‘Partial regression to mean’ (PRM): Counter-factual growth during the episode is predicted from past growth. This counter-factual growth (denoted by gPRM) is the prediction from a country/episode specific regression of growth for all countries j other than the country with the break on a constant plus initial GDP per capita plus previous growth. We use a spline to allow the coefficient on previous growth to be different whether the country’s growth rate before the episode was higher or lower than the world average.
4 ∗ ∗ ∗
∗ ∗
This functional form for the counter-factual growth allows for four things: (1) the constant αep allows the world average growth rate to vary over time and be specific to the period of the episode to accommodate a global ‘business cycle’; (2) regression to the mean is period specific; (3) regression to the mean depends on previous growth (as recoveries from negative/slow growth make have different dynamics that the slowing of accelerations), with the persistence coefficients,
and capturing regression to the mean, if previous growth was below
and above the previous world average growth rate, respectively (with cj =1 and dj = 1 if the previous growth rate of the country in question was lower and higher than the previous world average growth rate, respectively, 0 otherwise); (4) growth to depend on the initial level of income, given by the coefficient γ (without
28 The NRM growth rate is the coefficient from an OLS regression of ln(GDPPC) on a time trend over the pre-break period. 29 The world average growth rate is the average of the growth rates of all countries minus the country in question for the period of the growth episode.

Democracy versus dictatorship? The political determinants of growth episodes
39
conditioning variables this is not estimating ‘conditional convergence’)30 . The error term of the regression is given by εj. The episode-magnitude of a growth episode, using the ‘Partial regression to mean’ as the counter-factual growth rate, is given by:
5 ∗
Basic summary statistics on growth episode magnitudes
Table A1 gives the summary statistics for each of the three counter-factuals, by all growth episodes (314) and accelerations and decelerations separately. Table A2 gives our detailed estimates of the episode magnitude of growth based on our three counter-factuals: No change; Complete regression to the mean; and Partial regression to the mean. The estimates of growth episode magnitude are differences in natural log units of changes in GDP per capita of end of episode actual versus the counter-factual growth rate. So an episode magnitude of 0.20 in log unit of GDP terms implies that GDPPC is 20 percent higher at the end of the episode, as compared to the relevant counter-factual growth rate. This table illustrates the importance of allowing for regression to the mean in the counter-factual. The median magnitude with the No Change counter-factual is 0.426 for accelerations and -0.439 for decelerations, as it presumes that, say, negative growth rates would stay negative rather than revert to, say, the world average. Once we allow for regression to the mean using either PRM or CRM (World average), the episode magnitudes are much smaller, with the median for PRM being 0.206 and for CRM being 0.187 for accelerations and the median for PRM being -0.245 and CRM being -0.205 for decelerations, respectively.
30 For the period from the beginning of the data to the first growth break, the PRM growth rate is just a regression of growth on the natural log level of initial output.

Democracy versus dictatorship? The political determinants of growth episodes
40
Table A1: Summary statistics of episode magnitude estimates (in units of
natural log of GDP per capita)
Counter-factual
used
All Only accelerations Only decelerations
314 153 161
Partial regression
to the mean
Median -0.030 0.206 -0.245
Standard
deviation
0.394 0.291 0.310
Complete
regression to the
mean
Median 0.000 0.187 -0.205
Standard
deviation
0.380 0.310 0.332
No change Median -0.062 0.426 -0.439
Standard
deviation
0.709 0.486 0.390
Source: Our estimates.

Democracy versus dictatorship? The political determinants of growth episodes
41
Table A2: Estimates of the episode magnitude of the gain/loss from each of 314 growth transitions using three counter-factual growth rates: continuation of previous trend; complete regression to the mean (world period average); and partial regression to the mean (PRM). Country
code Beginning of episode
Counter-factual
No change Complete regression to the mean (world
average)
Partial regression to the mean
AFG 1986 -1.525 -1.238 -1.201
AFG 1994 3.095 0.266 0.027
AGO 1993 0.358 0.156 0.206
AGO 2001 0.540 0.576 0.577
ALB 1982 -0.761 -0.496 -0.502
ALB 1992 1.809 0.563 0.595
ARG 1977 -0.323 -0.222 -0.189
ARG 1985 0.336 0.018 0.106
ARG 1994 -0.107 -0.127 -0.147
ARG 2002 0.331 0.166 0.177
AUS 1961 0.020 -0.129 -0.085
AUS 1969 -0.112 0.112 0.129
AUT 1979 -0.761 0.093 -0.515
BDI 1992 -0.712 -0.591 -0.522
BDI 2000 0.776 -0.157 -0.184
BEL 1959 0.310 0.189 0.246
BEL 1974 -0.819 0.139 -0.217
BEN 1978 0.127 0.175 0.179
BEN 1986 -0.278 -0.202 -0.141
BEN 1994 0.333 -0.169 -0.173
BFA 1971 0.065 0.037 0.059
BFA 1979 -0.247 -0.200 -0.066
BGD 1967 0.279 -0.398 -0.346
BGD 1982 0.324 0.074 0.319
BGD 1996 0.222 0.114 0.109
BGR 1988 -0.716 -0.306 -0.501
BGR 1997 1.019 0.315 0.310
BOL 1958 0.780 -0.338 -0.250
BOL 1977 -0.347 -0.271 -0.138
BOL 1986 0.966 -0.122 0.011
BRA 1967 0.130 0.368 0.288
BRA 1980 -1.145 -0.304 -0.898
BRA 2002 0.256 0.017 -0.034
BWA 1973 -0.372 0.403 0.174
BWA 1982 0.057 0.498 0.331
BWA 1990 -0.769 0.186 -0.127
CAF 1986 -0.226 -0.367 -0.199
CAF 1996 0.399 -0.374 -0.347
CHE 1974 -0.766 -0.350 -0.337

Democracy versus dictatorship? The political determinants of growth episodes
42
CHL 1968 -0.183 -0.308 -0.264
CHL 1976 0.096 -0.028 0.030
CHL 1986 0.614 0.493 0.573
CHL 1997 -0.439 0.066 -0.028
CHN 1960 -0.198 -0.205 -0.247
CHN 1968 0.322 0.123 0.110
CHN 1977 0.460 0.909 0.776
CHN 1991 0.193 1.207 0.606
CIV 1978 -1.176 -0.702 -0.695
CMR 1976 0.229 0.306 0.334
CMR 1984 -0.995 -0.643 -0.719
CMR 1994 1.119 -0.078 0.008
COG 1976 0.208 0.422 0.392
COG 1984 -0.782 -0.285 -0.434
COG 1994 0.298 -0.326 -0.261
COL 1967 0.100 0.109 0.157
COL 1994 -0.221 -0.170 -0.202
COL 2002 0.335 0.080 0.045
CRI 1958 -0.193 -0.062 -0.067
CRI 1979 -0.415 -0.189 -0.230
CRI 1991 0.670 0.087 0.121
CUB 1984 -0.965 -0.421 -0.581
CUB 1995 1.126 0.257 0.255
CYP 1967 -0.097 -0.079 -0.114
CYP 1975 0.324 0.460 0.479
CYP 1984 -0.179 0.211 -0.287
CYP 1992 -0.368 -0.062 -0.110
DNK 1958 0.274 0.144 0.158
DNK 1969 -1.203 0.089 -0.009
DOM 1960 -0.162 -0.173 -0.239
DOM 1968 0.411 0.254 0.228
DOM 1976 -0.792 -0.010 -0.061
DOM 1991 0.533 0.316 0.332
DZA 1971 0.260 0.175 0.200
DZA 1979 -0.738 -0.212 -0.390
DZA 1994 0.406 -0.031 0.033
ECU 1970 0.396 0.312 0.334
ECU 1978 -1.458 -0.368 -0.610
ECU 1999 0.361 0.031 -0.002
EGY 1965 -0.122 -0.219 -0.213
EGY 1976 0.707 0.732 0.908
EGY 1992 -0.500 0.114 -0.121
ESP 1974 -1.198 0.157 -0.485
ETH 1969 -0.389 -0.366 -0.365
ETH 1983 -0.117 -0.234 -0.012
ETH 1992 0.291 -0.095 0.071

Democracy versus dictatorship? The political determinants of growth episodes
43
ETH 2002 0.382 0.278 0.062
FIN 1974 -0.085 0.193 0.102
FIN 1985 -0.250 -0.098 -0.276
FIN 1993 0.301 0.142 0.109
FIN 2001 -0.177 -0.051 -0.019
FJI 1979 -0.453 -0.153 -0.233
FJI 1988 0.461 0.106 0.196
FJI 2000 -0.202 -0.194 -0.229
GAB 1968 0.442 0.492 0.483
GAB 1976 -1.311 -0.342 -0.710
GAB 1987 0.505 -0.504 -0.432
GBR 1981 0.171 0.346 0.358
GBR 2002 -0.116 -0.129 0.028
GHA 1966 0.155 -0.096 -0.055
GHA 1974 -0.566 -0.427 -0.456
GHA 1983 1.008 -0.044 0.264
GHA 2002 0.206 0.094 -0.008
GIN 2002 0.144 -0.060 -0.179
GMB 1982 -0.324 -0.252 -0.138
GMB 1995 0.244 -0.297 -0.245
GNB 1970 -0.590 -0.275 -0.289
GNB 1981 0.055 -0.198 -0.001
GNB 1997 -0.263 -0.602 -0.581
GRC 1960 0.285 0.487 0.229
GRC 1973 -2.027 -0.064 -0.653
GTM 1962 0.512 0.158 0.250
GTM 1980 -0.535 -0.251 -0.467
GTM 1988 0.980 -0.134 -0.063
GUY 1981 -0.437 -0.348 -0.336
GUY 1990 1.522 0.359 0.445
HKG 1981 -0.229 0.555 -0.010
HKG 1994 -0.337 -0.110 -0.245
HKG 2002 0.305 0.165 0.273
HND 1970 0.244 0.112 0.141
HND 1979 -0.951 -0.462 -0.619
HTI 1972 0.379 0.134 0.161
HTI 1980 -0.800 -0.423 -0.471
HTI 1994 0.449 -0.244 -0.179
HUN 1978 -0.753 -0.035 -0.151
IDN 1967 0.885 0.878 1.010
IDN 1996 -0.460 -0.078 -0.230
IND 1993 0.193 0.309 0.177
IND 2002 0.165 0.278 0.257
IRL 1958 0.548 0.188 0.277
IRL 1979 -0.343 -0.060 -0.241
IRL 1987 1.036 0.686 0.686

Democracy versus dictatorship? The political determinants of growth episodes
44
IRL 2002 -0.482 -0.168 0.018
IRN 1976 -1.744 -0.969 -1.755
IRN 1988 2.260 0.201 0.314
IRQ 1979 -1.972 -0.931 -1.061
IRQ 1991 2.136 0.329 0.399
ISR 1967 -0.001 0.159 0.038
ISR 1975 -1.115 0.006 -0.340
ITA 1974 -0.363 0.176 -0.006
ITA 1990 -0.071 -0.001 -0.131
ITA 2001 -0.149 -0.212 -0.148
JAM 1961 -0.269 -0.134 -0.456
JAM 1972 -0.578 -0.468 -0.350
JAM 1986 0.451 0.191 0.289
JAM 1994 -0.703 -0.448 -0.512
JOR 1965 -1.061 -0.800 -0.996
JOR 1974 1.089 0.531 0.436
JOR 1982 -1.128 -0.494 -0.928
JOR 1991 1.229 -0.022 0.079
JPN 1959 0.303 0.582 0.103
JPN 1970 -1.173 0.419 0.213
JPN 1991 -0.494 -0.219 -0.389
KEN 1967 -0.057 -0.664 -0.619
KHM 1982 1.499 0.497 0.706
KHM 1998 0.301 0.439 0.420
KOR 1962 1.074 0.714 0.758
KOR 1982 0.193 0.684 0.033
KOR 1991 -0.439 0.242 -0.139
KOR 2002 -0.090 0.063 0.026
LAO 1979 0.166 0.492 0.678
LAO 2002 0.358 0.332 0.321
LBN 1982 0.837 0.262 0.289
LBN 1991 -0.102 0.070 0.006
LBR 1994 0.883 0.159 0.188
LBR 2002 -0.332 -0.288 -0.327
LKA 1959 0.656 0.017 0.168
LKA 1973 0.088 0.285 0.291
LKA 1981 -0.265 0.555 0.189
LSO 1970 0.242 0.193 0.253
LSO 1978 -0.532 -0.130 -0.215
LSO 1986 1.134 0.340 0.536
MAR 1960 0.616 0.308 0.394
MAR 1968 -0.306 0.112 0.176
MAR 1977 -0.530 -0.040 -0.091
MAR 1995 0.306 0.098 0.066
MDG 1974 -0.612 -0.783 -0.589
MDG 2002 0.147 -0.213 -0.272

Democracy versus dictatorship? The political determinants of growth episodes
45
MEX 1981 -0.362 -0.108 -0.249
MEX 1989 0.572 -0.115 -0.081
MLI 1974 0.326 0.196 0.348
MLI 1986 -0.105 0.069 0.099
MNG 1982 -0.912 -0.398 -0.431
MNG 1993 1.029 0.084 0.115
MOZ 1976 -0.479 -0.355 -0.353
MOZ 1986 0.378 0.023 0.225
MOZ 1995 0.639 0.533 0.533
MRT 1968 -0.684 0.001 -0.173
MRT 1976 -0.747 -0.344 -0.260
MRT 2002 0.277 0.027 -0.005
MUS 1963 -0.013 -0.399 -0.183
MUS 1971 0.536 0.321 0.273
MUS 1979 -0.525 0.643 0.084
MWI 1964 0.304 0.270 0.277
MWI 1978 -1.688 -0.915 -1.195
MWI 2002 0.629 0.197 -0.022
MYS 1970 0.354 0.454 0.450
MYS 1979 -0.492 0.079 -0.206
MYS 1987 0.466 0.433 0.482
MYS 1996 -0.642 -0.033 -0.268
NAM 1974 -0.583 -0.339 -0.326
NAM 1985 0.448 -0.148 -0.032
NAM 2002 0.276 0.099 0.105
NER 1968 -0.114 -0.405 -0.346
NER 1979 -0.324 -0.411 -0.264
NER 1987 1.076 -0.519 -0.390
NGA 1960 -0.337 -0.377 -0.388
NGA 1968 0.553 0.197 0.101
NGA 1976 -1.347 -0.824 -0.838
NGA 1987 2.109 0.104 0.359
NIC 1967 -0.359 -0.322 -0.319
NIC 1979 -0.281 -0.304 -0.198
NIC 1987 -0.154 -0.559 -0.463
NIC 1995 1.115 -0.009 0.068
NLD 1974 -0.529 0.049 -0.062
NPL 1983 0.427 0.222 0.394
NZL 1958 -0.209 -0.233 -0.220
NZL 1974 -0.083 -0.111 0.125
OMN 1985 -1.048 0.000 -0.487
PAK 1960 0.407 0.054 0.151
PAK 1970 -0.723 0.250 0.379
PAN 1959 0.459 0.359 0.476
PAN 1982 -0.538 0.021 -0.486
PAN 2002 0.354 0.219 0.196
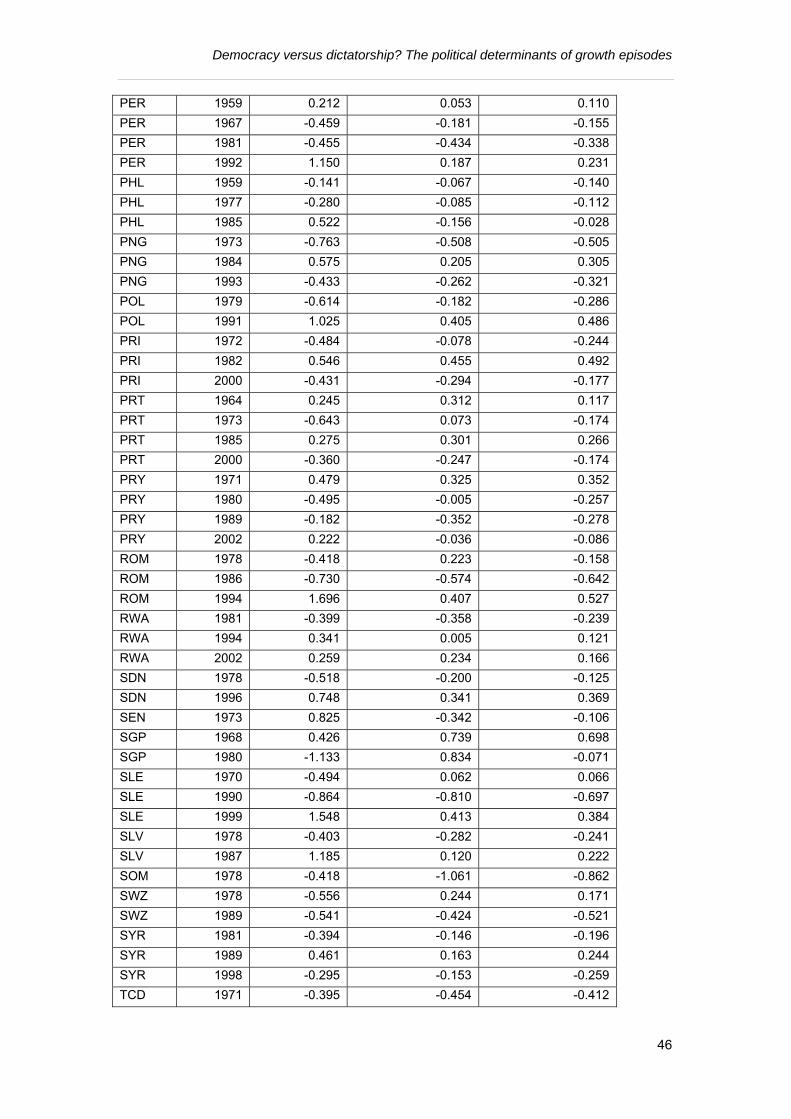
Democracy versus dictatorship? The political determinants of growth episodes
46
PER 1959 0.212 0.053 0.110
PER 1967 -0.459 -0.181 -0.155
PER 1981 -0.455 -0.434 -0.338
PER 1992 1.150 0.187 0.231
PHL 1959 -0.141 -0.067 -0.140
PHL 1977 -0.280 -0.085 -0.112
PHL 1985 0.522 -0.156 -0.028
PNG 1973 -0.763 -0.508 -0.505
PNG 1984 0.575 0.205 0.305
PNG 1993 -0.433 -0.262 -0.321
POL 1979 -0.614 -0.182 -0.286
POL 1991 1.025 0.405 0.486
PRI 1972 -0.484 -0.078 -0.244
PRI 1982 0.546 0.455 0.492
PRI 2000 -0.431 -0.294 -0.177
PRT 1964 0.245 0.312 0.117
PRT 1973 -0.643 0.073 -0.174
PRT 1985 0.275 0.301 0.266
PRT 2000 -0.360 -0.247 -0.174
PRY 1971 0.479 0.325 0.352
PRY 1980 -0.495 -0.005 -0.257
PRY 1989 -0.182 -0.352 -0.278
PRY 2002 0.222 -0.036 -0.086
ROM 1978 -0.418 0.223 -0.158
ROM 1986 -0.730 -0.574 -0.642
ROM 1994 1.696 0.407 0.527
RWA 1981 -0.399 -0.358 -0.239
RWA 1994 0.341 0.005 0.121
RWA 2002 0.259 0.234 0.166
SDN 1978 -0.518 -0.200 -0.125
SDN 1996 0.748 0.341 0.369
SEN 1973 0.825 -0.342 -0.106
SGP 1968 0.426 0.739 0.698
SGP 1980 -1.133 0.834 -0.071
SLE 1970 -0.494 0.062 0.066
SLE 1990 -0.864 -0.810 -0.697
SLE 1999 1.548 0.413 0.384
SLV 1978 -0.403 -0.282 -0.241
SLV 1987 1.185 0.120 0.222
SOM 1978 -0.418 -1.061 -0.862
SWZ 1978 -0.556 0.244 0.171
SWZ 1989 -0.541 -0.424 -0.521
SYR 1981 -0.394 -0.146 -0.196
SYR 1989 0.461 0.163 0.244
SYR 1998 -0.295 -0.153 -0.259
TCD 1971 -0.395 -0.454 -0.412

Democracy versus dictatorship? The political determinants of growth episodes
47
TCD 1980 0.873 -0.003 0.304
TCD 2000 0.486 0.333 0.284
TGO 1969 -0.633 -0.283 -0.322
TGO 1979 -0.268 -0.430 -0.262
TGO 1993 0.276 -0.480 -0.400
THA 1958 1.702 0.755 0.771
THA 1987 0.128 0.490 -0.054
THA 1995 -0.698 -0.070 -0.092
TTO 1961 -0.214 0.308 0.023
TTO 1980 -1.001 -0.639 -0.958
TTO 1989 1.350 0.225 0.288
TTO 2002 0.491 0.590 0.622
TUN 1972 -0.093 0.159 0.158
TUN 1981 -0.320 0.092 0.033
TUR 1958 -0.733 0.146 0.339
TWN 1962 0.756 1.526 1.699
TWN 1994 -0.526 0.270 -0.152
TZA 1971 -1.158 -0.230 -0.123
TZA 2000 0.499 0.305 0.279
UGA 1961 0.358 0.001 0.137
UGA 1969 -0.784 -0.643 -0.566
UGA 1980 0.203 -0.114 0.335
UGA 1988 1.004 0.336 0.410
URY 1977 -0.007 -0.026 0.123
URY 1985 0.316 0.219 0.284
URY 1994 -0.308 -0.150 -0.201
URY 2002 0.319 0.131 0.142
VEN 1977 -0.459 -0.321 -0.298
VEN 1985 0.588 -0.276 -0.197
VEN 2002 0.125 -0.074 -0.095
VNM 1989 0.602 0.805 0.717
ZAF 1981 -0.444 -0.285 -0.269
ZAF 1993 0.712 0.041 0.055
ZAR 1958 -0.260 -0.486 -0.379
ZAR 1974 -0.353 -0.498 -0.321
ZAR 1989 -0.917 -1.347 -1.086
ZAR 2000 1.391 0.103 0.021
ZMB 1967 -0.401 -0.405 -0.380
ZMB 1975 -0.319 -0.518 -0.501
ZMB 1983 0.430 -0.339 -0.095
ZMB 1994 0.805 0.164 0.159
ZWE 1968 0.215 0.065 0.014
ZWE 1983 -0.239 -0.087 -0.008
ZWE 1991 -0.195 -0.450 -0.280
ZWE 2002 -0.066 -0.432 -0.616
Note: All estimates are in log units of GDP per capita. Source: our estimates.

Democracy versus dictatorship? The political determinants of growth episodes
48
TABLE A3: Country codes
COUNTRY CODE COUNTRY CODE
Afghanistan AFG Dominican Republic DOM
Albania ALB Ecuador ECU Algeria DZA Egypt, Arab Rep. EGY Angola AGO El Salvador SLV Argentina ARG Ethiopia ETH Australia AUS Fiji FJI Austria AUT Finland FIN Bangladesh BGD France FRA Belgium BEL Gabon GAB Benin BEN Gambia, The GMB Bolivia BOL Germany DEU Botswana BWA Ghana GHA Brazil BRA Greece GRC Bulgaria BGR Guatemala GTM Burkina Faso BFA Guinea GIN Burundi BDI Guinea-Bissau GNB Cambodia KHM Guyana GUY Cameroon CMR Haiti HTI Canada CAN Honduras HND Central African Republic CAF
Hong Kong SAR, China HKG
Chad TCD Hungary HUN Chile CHL India IND China CHN Indonesia IDN Colombia COL Iran, Islamic Rep. IRN Congo, Rep. COG Iraq IRQ Congo, Dem Rep. ZAR Ireland IRL Costa Rica CRI Israel ISR Côte d'Ivoire CIV Italy ITA Cuba CUB Jamaica JAM Cyprus CYP Japan JPN Denmark DNK Jordan JOR Kenya KEN Poland POL Korea, Rep. KOR Portugal PRT Lao PDR LAO Puerto Rico PRI Lebanon LBN Romania ROM Lesotho LSO Rwanda RWA Liberia LBR Senegal SEN Madagascar MDG Sierra Leone SLE Malawi MWI Singapore SGP Malaysia MYS Somalia SOM Mali MLI South Africa ZAF Mauritania MRT Spain ESP Mauritius MUS Sri Lanka LKA Mexico MEX Sudan SDN Mongolia MNG Swaziland SWZ Morocco MAR Sweden SWE Mozambique MOZ Switzerland CHE
Namibia NAM Syrian Arab Republic SYR

Democracy versus dictatorship? The political determinants of growth episodes
49
Nepal NPL Taiwan TWN Netherlands NLD Tanzania TZA New Zealand NZL Thailand THA Nicaragua NIC Togo TGO
Niger NER Trinidad and Tobago TTO
Nigeria NGA Tunisia TUN Norway NOR Turkey TUR Oman OMN Uganda UGA Pakistan PAK United Kingdom GBR Panama PAN United States USA Papua New Guinea PNG Uruguay URY Paraguay PRY Venezuela, RB VEN Peru PER Vietnam VNM Philippines PHL Zambia ZMB Zimbabwe ZWE

email: [email protected] Effective States and Inclusive Development Research Centre (ESID) Global Development Institute, School of Environment, Education and Development, The University of Manchester, Oxford Road, Manchester M13 9PL, UK www.effective-states.org
The Effective States and Inclusive Development Research Centre The Effective States and Inclusive Development Research Centre (ESID) aims to improve the use of governance research evidence in decision-making. Our key focus is on the role of state effectiveness and elite commitment in achieving inclusive development and social justice.
ESID is a partnership of highly reputed research and policy institutes based in Africa, Asia, Europe and North America. The lead institution is the University of Manchester.
The other institutional partners are:
• BRAC Institute of Governance and Development, BRAC University, Dhaka
• Center for Democratic Development, Accra
• Center for International Development, Harvard University, Boston
• Department of Political and Administrative Studies, University of Malawi, Zomba
• Graduate School of Development, Policy & Practice, Cape Town University
• Institute for Economic Growth, Delhi
In addition to its institutional partners, ESID has established a network of leading research collaborators and policy/uptake experts.