crop prospects and food situation, no. 3 october 2014 prospects and food situation ... the...
TRANSCRIPT

global information and early warning system on food and agriculture www.fao.org/giewsGIEWS
HIGHLIGHTS CONTENTS
No. 3 n October 2014
Crop Prospects and Food Situation
Countries requiring external assistance for food 2
Global overview 5
LIFDC food situation overview 9
Regional reviews Africa 11Asia 20Latin America and the Caribbean 25North America, Europe and Oceania 27
Statistical appendix 30
n The forecast for global cereal production in 2014 has been raised closer to last year’s record, which is expected to boost inventories to a multi-year high.
n Export prices of wheat and maize decreased further in September to multi-year lows, driven by expectations of large global supplies in 2014/15. Even rice prices, which had been rising in previous months, fell in September.
n In Western Africa, the Ebola virus disease outbreak in Guinea, Liberia and Sierra Leone has disrupted markets, farming activities and livelihoods, seriously affecting the food security situation of large numbers of people. Moreover, irregular rains in several areas of the Sahelian belt result in mixed production prospects.
n In Central Africa, food crop production in the Central African Republic is estimated to have increased from the sharply reduced 2013 output, but still remains well below average due to the impact of widespread civil insecurity.
n In Eastern Africa, the overall food security situation is improving as harvesting has started in several countries. While food prices are generally stable or declining, they are at record high levels in Somalia and the Sudan.
n In Southern Africa, food security conditions improved significantly in response to bumper maize harvests and generally lower prices.
n In North Africa, a slightly below-average cereal crop was gathered in 2014. Wheat production in Tunisia recovered from last year’s weather-stricken harvest, while reduced plantings following poor rains caused a sharp reduction in Morocco.
n In Central America, drought conditions have significantly reduced the 2014 main first season harvest in key producing countries. In Mexico, cereal production is expected to remain above average due to better-than-expected yields.
n In South America, higher yields offset reduced plantings, with coarse grains production estimated at an above-average level. Wheat production is forecast to recover strongly following two consecutive low crops, due to increased plantings.
n In the Near East, drought conditions resulted in a below-average cereal harvest. Food security in the Syrian Arab Republic and Iraq continues to deteriorate as a result of the persisting conflict.
n In the Far East, aggregate cereal output is estimated to be close to last year’s record level. A considerable drop in the exportable surplus from India is expected to reduce aggregate cereal exports in the 2014/15 marketing year.
n In CIS Europe, cereal production is estimated at a record level. Accordingly, exports are forecast at an all-time high.
nFAO estimates that globally 35 countries, including 26 countries in Africa, are in need of external assistance for food due to conflict, crop failures and the impact of localized high food prices on vulnerable groups.
100
200
300
400
500
600
700
SAJJMAMFJDNOSAJJMAMFJDNOS
2012 20142013
Wheat
Rice
USD/tonne
Maize
Selected international cereal prices
Note: Prices refer to monthly average. See Table 3 for details

No. 3 n October 20142
Crop Prospects and Food Situation
Countries requiring external assistance for food1
AFRICA (26 countries)
Exceptional shortfall in aggregate food production/supplies
Central African Republic
Despite some improvements, mainly due to humanitarian assistance, the food situation in 2014 remains serious due to continued conflict and displacements. The number of people in need of food assistance was estimated in April 2014 at about 1.7 million, out of a total population of 4.6 million. The IDP caseload, as of late September, was estimated at 488 000 persons. Furthermore, food crop production in 2014 is estimated to be 58 percent below average, despite an 11 percent increase from the sharply reduced 2013 output.
Widespread lack of accessBukina Faso
A massive influx of refugees from Mali has put additional pressure on local food supplies. Over 33 000 Malian refugees are estimated to be living in the country as of September 2014.
Chad
Influx of refugees, estimated at over 461 000 people from the Sudan’s Darfur region, the Central African Republic and northern Nigeria, and the return of an estimated 340 000 Chadians, have put additional pressure on the local food supply negatively affecting food security.
DjiboutiAbout 90 000 people are severely food insecure, mainly in pastoral southeastern areas and in the Obock region, due to a succession of three poor rainy seasons and reduced access to humanitarian assistance.
EritreaVulnerability to food insecurity due to economic constraints.
GuineaThe Ebola virus disease (EVD) outbreak has disrupted markets, farming activities and livelihoods, seriously affecting the food security situation of large numbers of people.
LiberiaThe EVD outbreak has disrupted markets, farming activities and livelihoods, seriously affecting the food security situation of large numbers of people.
MaliInsecurity in northern areas has resulted in large population displacement, worsening the already precarious food security situation created by previous droughts and floods. Over 1.9 million people, located mostly in the northern part of the country, were estimated to be in Phase 3: “Crisis” according to the last “Cadre Harmonisé” analysis.
Countries requiring external assistance for food
World: 35 countries

No. 3 n October 2014 3
Crop Prospects and Food Situation
MauritaniaLingering More than 54 700 Malian refugees were still living in southeastern Mauritania as of September 2014. Moreover, Mauritania continues to be affected by relatively high domestic food prices. Over 367 000 people are estimated to be in Phase 3: “Crisis” and above according to the last “Cadre Harmonisé” analysis.
NigerThe country has been struck by successive severe food crises in recent years that resulted in the depletion of household assets and high level of indebtedness. Over 51 000 Malian refugees are estimated to be living in the country as of September 2014. About 2.2 million people are estimated to be in Phase 3: “Crisis” and above according to the last “Cadre Harmonisé” analysis conducted in March 2014.
Sierra LeoneThe EVD outbreak has disrupted markets, farming activities and livelihoods, negatively affecting the food security situation of large numbers of people.
ZimbabweFood security conditions improved in 2014, with a 78 percent decrease in the number of food insecure persons compared to 2013. The improvement is attributed to the larger 2014 cereal output and lower food prices. An estimated 331 000 people still require assistance due to reduced localized harvests.
Severe localized food insecurityCameroonIn North and Far North regions, recurrent climatic shocks in recent years have negatively impacted agricultural activities causing a deterioration in the food security situation. In addition, the number of refugees from the CAR which entered mainly East, Adamaoua and North regions was estimated at 237 000 in late September 2014, while 39 000 refugees from Nigeria entered mainly the Far North region since May 2013.
estimated at more than 2.5 million, while therefugees from CAR and the returnees from the Republic of the Congo were estimated in July and September at 67 000 and 185 000, respectively.
EthiopiaThe number of people in need of humanitarian assistance is stable at 2.4 million.
LesothoFood security conditions remain strained, with an estimated 447 760 people requiring assistance, due to low cereal production.
MadagascarFood insecurity remains severe in southern regions, following a successive poor cereal harvest in 2014. However, improved conditions were estimated in central and northern parts, reflecting production gains in these regions, while lower prices compared to 2013 have improved access.
CongoSignificant food security problems are faced by a large number of households. In addition, as of early September 2014, about 19 000 refugees from the CAR are sheltering in the country.
Côte d’IvoireConflict related damage to agriculture in recent years and the lack of support services, mainly in the northern regions.
Democratic Republic of the CongoThe number of people in need of urgent humanitarian assistance in conflict-affected eastern provinces was estimated in June 2014 at about 4.1 million, 8 percent up from the 3.8 million estimated in December 2013. As of June 2013, the total number of IDPs was
MalawiSignificantly improved food security conditions at the national level, reflecting the larger 2014 maize output. However, an estimated 640 000 people require assistance (a sharp decline compared to the 1.5 million estimated in 2013), due to localized production shortfalls following a dry period in early 2014.
MozambiqueAn estimated 150 000 people require assistance, mainly due to a weather-depressed cereal production. This figure is approximately 60 000 below the level estimated last year.
SenegalCereal production in 2013 was estimated to be 15 percent below the average. Another below-average crop is expected this year. About 2.9 million people are estimated to be at risk of food insecurity this year.
SomaliaOver 1 million people are estimated to be in need of emergency assistance, mainly IDPs and poor households in southern and central areas.
South Sudan
The number of severely food insecure people has decreased from 3.9 to 2.2 million, including 1.3 million IDPs, due to the availability of newly-harvested crops and the delivery of humanitarian aid.
Sudan
The number of people estimated to be in need of humanitarian assistance, mainly IDPs in conflict-affected areas, has increased to 5.3 million.
Uganda
About 100 000 people in Karamoja region are estimated to be severely food insecure following two years of below-average crop production.
No. 3 n October 20144
Crop Prospects and Food Situation
ASIA (6 countries)
Exceptional shortfall in aggregate food production/supplies
IraqSevere Conflict escalation, together with large internal displacements, coincided with winter crop harvesting and seriously compromised the final output. Nearly 2.8 million people were displaced within Iraq, nearly 1.8 million of whom have been displaced since January 2014.
Syrian Arab RepublicDue to worsening civil conflict, approximately 10.8 million people continue to be in need of urgent humanitarian assistance within the country, including more than 6.4 million people who are internally displaced. Although some international food assistance is provided, the Syrian refugees are also putting strain on other countries in the region.
Widespread lack of access
Democratic People’s Republic of KoreaDespite generally good aggregate cereal harvests for the fourth consecutive year in 2014/15, some 16 million people remain at risk of food insecurity. The food system in the DPRK remains highly vulnerable to shocks and serious shortages exist particularly in the production of protein-rich crops. Economic constraints and lack of agricultural inputs are leading to inadequate food production and aggravated food insecurity.
YemenThe severely food-insecure population in need of emergency food assistance is estimated at 4.5 million people (18 percent of the population), as a result of high levels of prolonged conflict, poverty, high food and fuel prices.
Severe localized food insecurity
AfghanistanSome groups, particularly IDPs displaced by the conflict, returnees from Pakistan and natural disaster-affected households continue to face high levels of food insecurity.
KyrgyzstanThe situation is stable and has significantly improved. Some concerns still exist with high food prices combined with poverty and uncertainty with this year’s cereal harvest.
LATIN AMERICA AND THE CARIBBEAN (3 countries )
Exceptional shortfall in aggregate food production/supplies
El SalvadorDrought conditions during the 2014 main first season, accounting for more than half of annual production, have significantly reduced supplies of maize and beans, causing severe shortages. Around 96 000 families have been severely affected and are in need of assistance.
+
Honduras
Drought conditions during the 2014 main first season, accounting for more than half of annual production, have significantly reduced supplies of maize and beans causing severe shortages. The affected population is estimated at 76 712 families of small farmers.
+
Severe localized food insecurity
GuatemalaDrought conditions during the 2014 main first season, accounting for more than half of annual production, have significantly reduced supplies of maize and beans, causing severe shortages. Official estimates point to 268 000 families being affected and the Government has appealed for international assistance.
+
Countries with unfavourable prospects for current crops2 (total: 2 countries)
AFRICA (2 countries)
KenyaBelow-average cereal production expected in western key cropping areas due to a series of dry spells and high incidence of pests and diseases, including some outbreaks of the Maize Lethal Necrosis Disease (MLND).
+
UgandaCereal crop production in agro-pastoral areas of Karamoja region is forecast at below-average levels following reduced plantings due to unfavourable rains in April and significant water deficits in eastern parts of the region.
+
Key - Changes since last report (July 2014)No change Improving Deteriorating New Entry +
Terminology1 Countries requiring external assistance for food are expected to lack the resources to deal with reported critical problems of food insecurity. Food crises are nearly always due to a combination of factors but for the purpose of response planning, it is important to establish whether the nature of food crises is predominantly related to lack of food availability, limited access to food, or severe but localized problems. Accordingly, the list of countries requiring external assistance is organized into three broad, not mutually exclusive, categories:
•Countries facing an exceptional shortfall in aggregate food production/supplies as a result of crop failure, natural disasters, interruption of imports, disruption of distribution, excessive post-harvest losses, or other supply bottlenecks.
•Countries withwidespread lack of access, where a majority of the population is considered to be unable to procure food from local markets, due to very low incomes, exceptionally high food prices, or the inability to circulate within the country.
•Countrieswithsevere localized food insecurity due to the influx of refugees, a concentration of internally displaced persons, or areas with combinations of crop failure and deep poverty.
2 Countries facing unfavourable prospects for current crops are countries where prospects point to a shortfall in production of current crops as a result of a reduction of the area planted and/or yields due to adverse weather conditions, plant pests, diseases and other calamities.

No. 3 n October 2014 5
Crop Prospects and Food Situation
Global overview
Large cereal crops and rising inventories keep prices under downward pressureWorld cereal production in 2014 is
anticipated to reach 2 523 million tonnes,
some 65 million tonnes higher than FAO’s
initial forecast earlier this year. A continued
upgrading of this year’s coarse grain
harvests, maize in particular, has been
the main underlying factor. Under current
expectations, world cereal production
would fractionally decline from the 2013
peak; with wheat production achieving
a new record, at 718.5 million tonnes,
and coarse grains virtually matching
last year’s high of 1 308 million tonnes.
By contrast, unfavourable weather
conditions have lowered prospects for rice
production, which is now forecast to reach
496.4 million tonnes, down 0.4 percent
from 2013.
Global wheat production in 2014
is forecast at 718.5 million tonnes,
a marginal increase compared to the 2013
record output and the earlier forecast
from the July publication of this report.
The increase reflects upward revisions in
Europe, which are expected to more than
compensate for smaller crops in Oceania
(Australia) and North America.
Production in Europe is put at
236.3 million tonnes for 2014, about
5 percent (11 million tonnes) up from
the 2013 estimate and the highest level
since the record in 2008. The bulk of
the increase is accounted for by the
Russian Federation’s 13 percent rise,
to 59 million tonnes on account of
higher yields. In North America, despite
increased plantings in the United
States of America, production fell
by 5 percent to 55.2 million tonnes,
reflecting reduced yields caused by
dry weather. Production in Canada is
sharply down, decreasing by 26 percent
to 27.7 million tonnes. In Asia, with
harvesting complete, the aggregate
wheat output in 2014 is estimated
at 321 million tonnes, slightly above
last year, reflecting increases in India
(+2.6 percent), China (+2.8 percent) and
Pakistan (+4.5 percent). These gains
were partly offset by a 10 percent decline
in Turkey, which accounts for about half
of the Near East production. Aggregate
wheat production in North Africa
decreased due to dry weather and
smaller plantings compared to last year’s
record level. In the Southern Hemisphere,
the wheat harvest is underway and will
only be completed early next year. In
South America, production prospects
are positive, with the aggregate output
forecast to grow for a second successive
GLOBAL CEREAL SUPPLY AND DEMAND ROUNDUP
Table 1. World cereal production1 (million tonnes)
20122013
estimate2014
forecastChange: 2014 over 2013 (%)
Asia 1 091.5 1 125.1 1 119.7 -0.5Far East 995.2 1 017.8 1 019.1 0.1Near East 69.3 74.3 68.0 -8.4CIS in Asia 27.0 33.1 32.6 -1.6
Africa 162.3 163.2 164.1 0.5North Africa 33.9 36.0 34.2 -5.0Western Africa 50.6 49.7 48.2 -3.0Central Africa 4.7 4.7 4.7 -1.5Eastern Africa 43.3 43.9 43.0 -2.0Southern Africa 29.7 28.9 34.0 17.7
Central America and Caribbean 39.9 40.8 40.4 -1.2
South America 153.5 173.3 174.0 0.4
North America 406.1 500.2 494.1 -1.2
Europe 416.2 480.8 494.5 2.8EU 279.3 304.2 307.6 1.1CIS in Europe 124.1 162.6 173.3 6.6
Oceania 35.9 42.6 36.1 -15.2
World 2 305.4 2 526.1 2 522.9 -0.1Developing countries 1 396.1 1 445.6 1 439.4 -0.4Developed countries 909.3 1 080.5 1 083.5 0.3
- wheat 660.6 717.1 718.5 0.2- coarse grains 1 153.9 1 310.7 1 308.0 -0.2- rice (milled) 490.9 498.4 496.4 -0.4
Note: Totals and percentage change computed from unrounded data.1 Includes rice in milled terms.
2000
2100
2200
2300
2400
2500
2600
201420122010200820062004
Million tonnes
Figure 1. World cereal production and utilization
Production
Utilization
f’cast

No. 3 n October 20146
Crop Prospects and Food Situation
production stands at 60.1 million tonnes,
virtually unchanged from 2013.
Global rice production in 2014 is
forecast at 496.4 million tonnes in
milled rice equivalent. Under the current
prospects, global rice production would
be marginally (0.4 percent) lower than the
2013 estimate, marking a third year of
below trend growth.
Prospects for a reduced 2014 output
is mostly linked to the poor performance
of crops in Asia, where production is now
forecast to fall by about 3 million tonnes
or 0.7 percent. If confirmed, this would
be the first contraction (albeit rather
contained, in percentage terms) registered
by the region since 2009, when an El Niño
weather anomaly last manifested. In
India, the world’s second largest rice
producer, irregular monsoon rains are
anticipated to bring 2014 production
down by 2.4 percent to 104 million
year, forecast at 23.8 million tonnes,
25 percent above 2013’s output. The
wheat 2014 output is forecast to decline
by 10 percent in Australia, where dry
weather has reduced yield prospects,
particularly in Western Australia, the
largest producing state. In Southern
Africa, aggregate production is estimated
to fall by 8 percent to just over 2 million
tonnes, driven by lower plantings.
World production of coarse grains in
2014 is forecast at 1 308 million tonnes,
virtually unchanged from the 2013 record.
The maize output is expected to reach
1 018 million tonnes, about 1 percent
above the record output in 2013, reflecting
higher expected outputs in the United
States of America, the European Union
(EU) and the Russian Federation.
In the Northern Hemisphere, harvesting
of the 2014 maize crop is underway or
about to commence. Maize production
in the United States of America is
forecast at 366 million tonnes, 3.4 percent
up on the record crop of 2013, while a
20 percent production decline is foreseen
in Canada. In China, maize production is
forecast to continue its increasing trend,
but at a more moderate rate in 2014.
The latest forecast for China stands at
220 million tonnes, about 1 percent higher
than the previous year. In Europe, a near
8 percent production gain is forecast in the
EU, largely on the back of higher yields.
The Russian Federation is expected to
register a significant production increase
of 12 percent, to a new high of 13 million
tonnes, more than compensating for
a 14 percent decrease in Ukraine. Maize
production in Western Africa is forecast to
contract by 7 percent from 2013’s record,
mainly due to dry weather. Similarly, dry
weather contributed to lower forecasts in
Eastern Africa, where maize production
is expected to decline by 7 percent from
the record level of 2013. The output is
still anticipated to remain well above the
five-year average. In India, a 14 percent
production decline compared to the 2013
peak is forecast.
In Southern Hemisphere
countries, the main 2014 maize crop
was harvested earlier in the year. The
output in South America declined by
3 percent from the 2013 record, largely
reflecting Brazil’s 4 percent contraction
to 77.4 million tonnes. Decreased outputs
were also estimated in the other South
American countries, with the exception of
Argentina and Bolivia. Aggregate maize
production in Southern Africa increased
sharply (by 21 percent) to 27.4 million
tonnes. Significant gains were registered
in South Africa, the subregion’s main
producer, where white maize production
recovered from the drought-affected
2013 harvest.
World barley production in 2014 is
forecast at 140 million tonnes, 4 percent
below the record in 2013, mainly reflecting
smaller outputs in the EU, Canada and
Australia. The forecast for global sorghum
Table 2. Basic facts of world cereal situation (million tonnes)
2012/132013/14 estimate
2014/15 forecast
Change: 2014/15 over 2013/14 (%)
PRODUCTION 1
World 2 305.4 2 526.1 2 522.9 -0.1Developing countries 1 396.1 1 445.6 1 439.4 -0.4Developed countries 909.3 1 080.5 1 083.5 0.3
TRADE 2
World 308.8 354.8 337.0 -5.0Developing countries 125.4 106.9 105.6 -1.2Developed countries 183.4 248.0 231.4 -6.7
UTILIZATION
World 2 330.4 2 417.8 2 461.3 1.8Developing countries 1 496.4 1 546.3 1 577.0 2.0Developed countries 834.0 871.5 884.3 1.5
Per caput cereal food use (kg per year) 152.5 153.1 153.0 -0.1
STOCKS 3
World 504.9 579.5 627.5 8.3Developing countries 387.1 437.5 451.9 3.3Developed countries 117.8 142.0 175.5 23.6
WORLD STOCK-TO-USE RATIO (%) 20.9 23.5 25.2 6.9
Note: Totals and percentage change computed from unrounded data.1 Data refer to calendar year of the �rst year shown and include rice in milled terms.2 For wheat and coarse grains, trade refers to exports based on July/June marketing season. For rice, trade refers to exports based on the calendar year of the second year shown. 3 Data are based on an aggregate of carryovers level at the end of national crop years and, therefore, do not represent world stock levels at any point in time.

No. 3 n October 2014 7
Crop Prospects and Food Situation
use, on the other hand, is likely to expand
by 2.5 percent, a much slower pace than
in 2013/14.
Based on the latest forecasts for
production and utilization, world
cereal stocks at the close of the crop
seasons ending in 2015 would surge
to 627.5 million tonnes, up 8.3 percent
from an already large volume at the
start of the season and its highest level
in 15 years. Maize would account for
the biggest increase, followed by wheat,
while rice stocks are forecast to decline,
albeit from a record level. The overall
positive outlook, if realized, will result in
the cereal stocks-to-use ratio increasing
to 25.2 percent in 2014/15 from
23.5 percent in 2013/14, and the highest
since 2001/02.
This year’s abundant supplies have
already resulted in sharp declines in
international prices of all cereals, with
the exception of rice. However, the lower
prices are not expected to stimulate trade,
as the major cereal importing countries
are holding large supplies, which may
depress import demand and result in total
cereal trade contracting by 5.0 percent to
337 million tonnes in 2014/15.
For more detailed analysis please see
the October 2014 issue of Food Outlook
released on 9 October.
INTERNATIONAL PRICE ROUNDUP
International wheat prices decreased
further in September, although at a slower
pace than in the previous three months.
The benchmark US wheat (No.2 Hard Red
Winter) averaged USD 279 per tonne,
11 percent lower than at the same time
last year. The decline mainly reflects an
anticipated record global crop in 2014 for
the second consecutive year. Strong export
competition coupled with an appreciation
of the US dollar also weighed on prices.
However, concerns about crop quality in
some growing areas of the United States
of America and Canada provided support.
tonnes. Unfavourable weather conditions
resulted in expected reduced outputs in
Indonesia, Cambodia, the Republic of
Korea, Nepal, Pakistan, the Philippines,
Sri Lanka and Thailand. In the case of
Thailand, the anticipated 1.6 percent
decline is associated with a late arrival of
the rains and the February 2014 abolition
of the rice pledging scheme, which had
guaranteed high prices to farmers since
2011, contributing to reduced plantings.
Weaker price incentives are also expected
to foster a contraction of the rice area and
production in Japan. Although adverse
climatic conditions also affected crops in
Bangladesh (floods) and China (drought
in the northeastern region; cold and excess
rains in the south), production prospects
still indicate an increase from last year.
On the other hand, favourable growing
conditions are anticipated to underpin
production gains in Viet Nam, despite a
small, price-driven reduction in plantings.
In Latin America and the Caribbean, the
outlook remains generally positive, in spite
of rainfall deficits, which impaired crops in
the central part of the continent. Under
current prospects, about 18.9 million
tonnes are expected to be collected in the
region, up 0.6 percent from 2013, largely
reflecting the good performance in the
southern cone.
The outlook for crops in Africa has
also been scaled back since earlier
expectations, but is still forecast to
increase by 0.8 percent from 2013. Part
of the downward revisions concerned
Egypt, and Western African countries,
where several important producers
suffered from erratic rains. As a result,
production is anticipated to fall, especially
in Benin, Chad, Guinea-Bissau, Nigeria
and Senegal. On the other hand,
larger rice outputs are expected in Côte
d’Ivoire, Ghana, Guinea, Mali, Niger
and Sierra Leone. Although crop-
related activities in countries affected
by Ebola may be disrupted, it is difficult
at this stage to assess the impact on
production. In Southern Africa, forecasts
were also lowered substantially mostly on
account of Madagascar, where uneven
rains, locust problems and rundown
infrastructure prevented a full recovery
of production from last year’s sharp
drop. In Eastern Africa, good results in
the United Republic of Tanzania will
sustain an increase in the subregion, in
spite of anticipated declines in Burundi,
Ethiopia and Rwanda. In Oceania, latest
official forecasts in Australia indicate a
28 percent reduction in the rice output,
reflecting lower plantings. In North
America, production in the United States
of America, with harvesting underway,
is officially anticipated to rebound by
14 percent from the poor 2013 outcome.
In Europe, production in the EU is
anticipated to remain near the 2013
relatively poor result, reflecting less
than favourable conditions in most
producing countries. The outlook for
the Russian Federation is more positive,
with production forecast to rebound by
10 percent.
Utilization, Stocks and Trade Global cereal utilization in 2014/15 is set
to increase by 1.8 percent from 2013/14.
Total food use is expected to rise by just
over 1 percent, implying a stable per
capita basis of 153 kg per annum. Feed
% %
10
14
18
22
26
30
34
38
10
14
18
22
26
30
34
38
14/1513/1412/1311/1210/11 2
Total cereals
Rice
Coarse grains
Wheat
f’cast
Figure 2. Ratio of world cerealstocks to utilization1
1 Compares closing stocks with utilization in following season.2 Utilization in 2014/15 is a trend value based on extrapolation from the 2003/04-2013/14 period.
estimate

No. 3 n October 20148
Crop Prospects and Food Situation
production forecast in the United States
of America and the abundant global
supply outlook in 2014/15, pushed prices
down.
International rice prices gave signs of
weakness in September, reversing three
months of steady increases. The price
softening affected all origins, including
Thailand, but also India, Pakistan and
Viet Nam. The benchmark Thai White
100%B rice quotation was quoted USD
444 per tonne, 3.1 percent less than in
August, reflecting a slowing of import
demand but also strong competition for
markets, as the arrival of newly-harvested
crops mounted the urgency to release
storage space. Part of the price decline
was also induced by a strengthening the
US dollar, the denominator of international
prices.
Please see the Global Food Price
Monitor for the latest monthly analysis on
domestic food prices.
Table 3. Cereal export prices* (USD/tonne)
2013 2014 Sept. April May June July Aug. Sept.
United States Wheat1 311 340 345 314 294 284 279Maize2 209 224 217 202 182 175 164Sorghum2 217 226 223 220 203 183 174
Argentina3 Wheat 300 361 372 365 287 270 248Maize 219 229 224 204 192 181 166
Thailand4 Rice, white5 460 408 408 419 439 458 444Rice, broken6 406 307 298 313 325 343 336
*Prices refer to the monthly average.1 No.2 Hard Red Winter (Ordinary Protein) f.o.b. Gulf.2 No.2 Yellow, Gulf.3 Up river, f.o.b.4 Indicative traded prices.5 100% second grade, f.o.b. Bangkok.6 A1 super, f.o.b. Bangkok.
Export prices of maize declined
markedly in September for the fifth
consecutive month, with the benchmark
US maize (No.2, Yellow) averaging
USD 164 per tonne, more than 20 percent
below the corresponding period in 2013
and the lowest level in the past four
years. The upward revision of the 2014

No. 3 n October 2014 9
Crop Prospects and Food Situation
Lower 2014 cereal production in Asia and Africa result in a slight decline in LIFDCs aggregate output from last year’s recordFAO’s latest 2014 cereal production
forecast for LIFDCs stands at 439 million
tonnes, about 1 percent below the record
2013 output, reflecting reduced forecasts
in Africa and Asia.
In India, the largest producing
LIFDC, reduced cereal plantings and
lower expected yields following poor
monsoon rains are anticipated to result
in a 4.7 million production decline
(-2 percent) from the record 2013 harvest.
Elsewhere in Asia, cereal outputs are
expected to be close to their levels of the
previous year, except in Sri Lanka where a
21 percent decline is forecast, putting the
2014 output at below-average levels. In
CIS Asia, with harvesting almost complete,
cereal outputs in Kyrgyzstan and
Tajikistan are anticipated to fall to below
average levels in response to lower yields.
While in the Near East, 2014 production is
expected to decline marginally.
In Africa, cereal production in 2014
is forecast at 107 million tonnes, close
to the previous year, as reductions in
Eastern, Western and Central Africa offset
a strong production gain in Southern
Africa. In Western Africa, with crop
harvesting underway, the aggregate
cereal output is forecast to contract by
3 percent from 2013’s bumper level
following dry weather in June and July in
several parts of the Sahel belt, notably in
Senegal, the Gambia, Mauritania and
Guinea-Bissau. In Nigeria, the largest
producer of the subregion, production
is expected to fall by 5 percent to near-
average levels, while a recovery is forecast
in Mali bringing the harvest to above
average levels. The overall output in Eastern
Africa is forecast to decrease by 2 percent
to 43 million tonnes, largely on account
of dry weather, but is still anticipated to
remain well above the five-year average.
The expected declines in Ethiopia, Kenya
and the United Republic of Tanzania
are forecast to more than outweigh an
anticipated recovery in the Sudan from
the drought-affected 2013 output. In
Southern Africa, with the main harvest
completed earlier in the year, aggregate
production is estimated at 11.4 million
tonnes, a significant 16 percent increase
compared to 2013. Production gains
were estimated in all countries reflecting
favourable climatic conditions, except in
Lesotho which registered a minor decline.
In Central Africa, aggregate production in
2014 is estimated at an average level.
In Central America, with the first main
2014 harvest completed in September,
which accounts for more than half the
annual output, a sharp decline in total
cereal production is forecast reflecting
severe drought conditions during the
cropping season. As a result, the 2014
outputs in Honduras and Nicaragua
are expected at below-average levels.
By contrast, favourable weather in Haiti
resulted in a second consecutive annual
production increase.
Cereal imports for 2014/15 estimated to be close to last year’s above-average levelThe 2014/15 cereal import forecast
for LIFDCs now stands at 53.1 million
tonnes, about 3 million tonnes higher
Low-Income Food-Deficit Countries food situation overview1
Table 4. Basic facts of the Low-Income Food-De�cit Countries (LIFDCs) cereal situation (million tonnes, rice in milled basis)
2012/132013/14 estimate
2014/15 forecast
Change: 2014/15 over 2013/14 (%)
Cereal production1 441.1 444.7 439.2 -1.2 excluding India 199.3 201.4 200.5 -0.4
Utilization 456.4 469.1 473.4 0.9Food use 375.0 382.8 389.2 1.7 excluding India 183.1 186.8 189.5 1.4Per caput cereal food use (kg per year) 0.2 0.2 0.2 -0.1 excluding India 0.1 0.1 0.1 -0.8Feed 29.4 31.2 31.3 0.1 excluding India 21.6 23.2 23.1 -0.1
End of season stocks2 88.5 90.7 90.3 -0.5 excluding India 39.0 38.6 37.5 -2.7
1 Data refer to calendar year of the �rst year shown.2 May not equal the di�erence between supply and utilization because of di�erences in individual country marketing years.
1 The Low-Income Food-Deficit Countries (LIFDCs) group includes net food deficit countries with annual per caput income below the level used by World Bank to determine eligibility for IDA assistance (i.e. USD 1 945 in 2011). The current 2014 FAO list has been recently revised, with seven countries graduating, these are: Cambodia, Egypt, Indonesia, Iraq, Kiribati, Lao People’s Democratic Republic and Zambia. Of these, Cambodia, Lao PDR and Zambia graduated from the list on the basis of net food-exporter criterion, while the other four (Egypt, Indonesia, Iraq and Kiribati) graduated based on income criterion. For full details see: http://www.fao.org/countryprofiles/lifdc/en/

No. 3 n October 201410
Crop Prospects and Food Situation
than the initial forecast in July and
virtually unchanged compared to last
year’s above-average level. The revision
reflects expectations of increased
imports in Eastern Africa, mainly due to
higher forecasts for Kenya, following an
expected 8 percent production decrease
in 2014. In Central and Western Africa,
Table 5. Cereal production1 of LIFDCs(million tonnes)
20122013
estimate2014
forecastChange: 2014 over 2013 (%)
Africa (37 countries) 109.1 108.1 107.2 -0.8Eastern Africa 43.3 43.9 43.0 -2.0Southern Africa 10.6 9.8 11.4 15.7Western Africa 50.6 49.7 48.2 -3.0Central Africa 4.6 4.7 4.6 -1.5
Asia (13 countries) 330.1 334.5 330.1 -1.3CIS in Asia 9.6 10.1 10.4 2.4Far East 313.2 317.2 312.6 -1.5 - India 241.8 243.3 238.6 -1.9Near East 7.3 7.3 7.2 -1.0
Central America (3 countries) 1.8 2.0 1.8 -9.9
Oceania (2 countries) 0.0 0.0 0.0 8.8
LIFDC (55 countries) 441.1 444.7 439.2 -1.2
Note: Totals and percentage change computed from unrounded data.1 Includes rice in milled terms.
anticipated smaller harvests in some
countries are forecast to result in a minor
increase in import requirements. By
contrast, in Southern Africa, significant
production gains in 2014 resulted
in lower import needs compared to
the above-average level of 2013/14.
In the Far East, a decrease in cereal
imports is forecast reflecting higher
domestic outputs in the large importing
countries, namely Bangladesh and
the Philippines, as well as in CIS Asia,
largely on account of substantial
carryover stocks. In Central America,
projected lower outputs in Honduras
and Nicaragua, led to an upward revision
of the subregional import forecast to
2.2 million tonnes, 12 percent above
last year’s high level. In the Near East
and Oceania, import requirements are
anticipated to remain virtually unchanged
from the previous year.
Table 6. Cereal import position of LIFDCs(thousand tonnes)
2012/13 2013/14 or 2014 2014/15 or 2015
or 2013 Requirements1 Import position2 Requirements1
Actual
importsTotal
imports:of which food aid
Total imports:
of which food aid pledges
Total imports:
of which food aid
Africa (37 countries) 26 059 29 024 1 593 13 386 761 29 363 1 573Eastern Africa 7 308 8 754 1 066 4 510 604 9 063 1 091Southern Africa 2 015 2 950 154 2 004 46 2 469 141Western Africa 14 657 15 198 224 6 112 83 15 652 191Central Africa 2 079 2 121 149 761 28 2 179 151
Asia (13 countries) 17 689 21 657 493 13 143 209 21 165 561CIS in Asia 3 661 3 978 1 3 842 1 3 856 1Far East 8 376 11 517 341 6 530 148 11 142 409Near East 5 652 6 162 151 2 772 61 6 167 151
Central America (3 countries) 1 794 1 929 92 1 423 24 2 157 92
Oceania (2 countries) 471 450 0 129 0 458 0
Total (55 countries) 46 013 53 060 2 178 28 081 994 53 144 2 227
Note: Totals computed from unrounded data.1 The import requirement is the di�erence between utilization (food, feed, other uses, export plus closing stocks) and domestic availability (production plus opening stocks).2 Estimates based on information available as of early September 2014.
No. 3 n October 2014 11
Crop Prospects and Food Situation
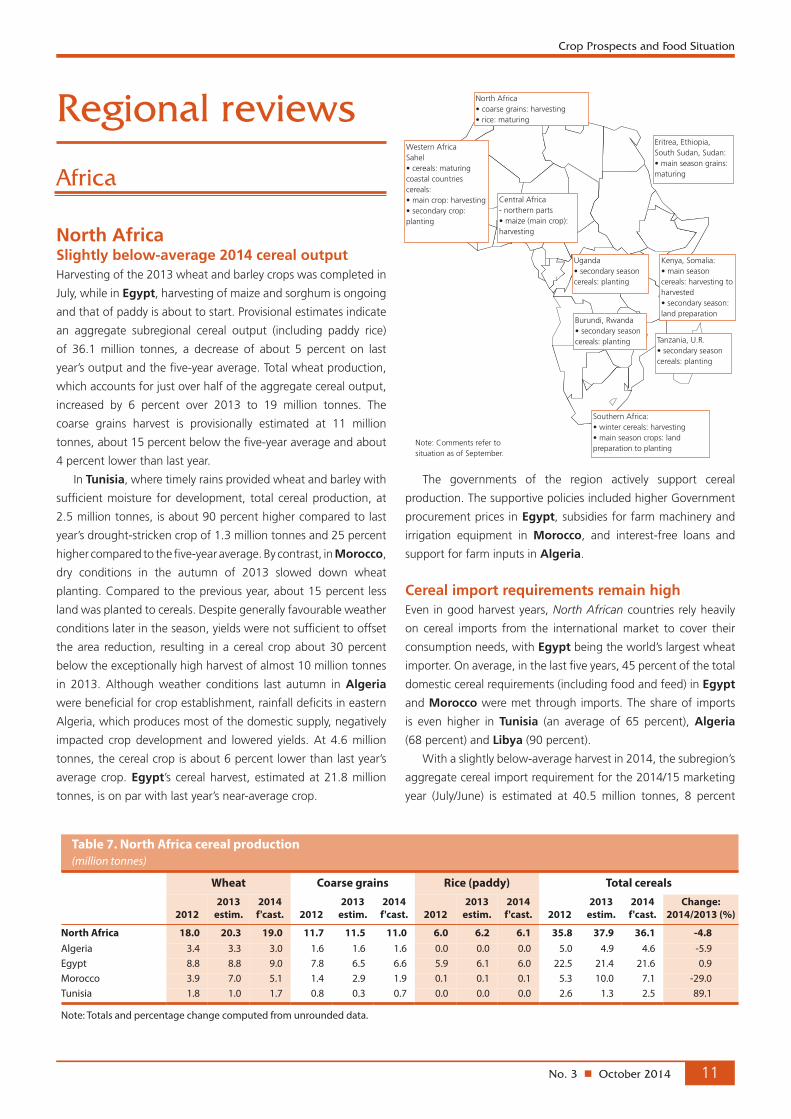
North AfricaSlightly below-average 2014 cereal outputHarvesting of the 2013 wheat and barley crops was completed in
July, while in Egypt, harvesting of maize and sorghum is ongoing
and that of paddy is about to start. Provisional estimates indicate
an aggregate subregional cereal output (including paddy rice)
of 36.1 million tonnes, a decrease of about 5 percent on last
year’s output and the five-year average. Total wheat production,
which accounts for just over half of the aggregate cereal output,
increased by 6 percent over 2013 to 19 million tonnes. The
coarse grains harvest is provisionally estimated at 11 million
tonnes, about 15 percent below the five-year average and about
4 percent lower than last year.
In Tunisia, where timely rains provided wheat and barley with
sufficient moisture for development, total cereal production, at
2.5 million tonnes, is about 90 percent higher compared to last
year’s drought-stricken crop of 1.3 million tonnes and 25 percent
higher compared to the five-year average. By contrast, in Morocco,
dry conditions in the autumn of 2013 slowed down wheat
planting. Compared to the previous year, about 15 percent less
land was planted to cereals. Despite generally favourable weather
conditions later in the season, yields were not sufficient to offset
the area reduction, resulting in a cereal crop about 30 percent
below the exceptionally high harvest of almost 10 million tonnes
in 2013. Although weather conditions last autumn in Algeria
were beneficial for crop establishment, rainfall deficits in eastern
Algeria, which produces most of the domestic supply, negatively
impacted crop development and lowered yields. At 4.6 million
tonnes, the cereal crop is about 6 percent lower than last year’s
average crop. Egypt’s cereal harvest, estimated at 21.8 million
tonnes, is on par with last year’s near-average crop.
Africa
Regional reviews
The governments of the region actively support cereal
production. The supportive policies included higher Government
procurement prices in Egypt, subsidies for farm machinery and
irrigation equipment in Morocco, and interest-free loans and
support for farm inputs in Algeria.
Cereal import requirements remain highEven in good harvest years, North African countries rely heavily
on cereal imports from the international market to cover their
consumption needs, with Egypt being the world’s largest wheat
importer. On average, in the last five years, 45 percent of the total
domestic cereal requirements (including food and feed) in Egypt
and Morocco were met through imports. The share of imports
is even higher in Tunisia (an average of 65 percent), Algeria
(68 percent) and Libya (90 percent).
With a slightly below-average harvest in 2014, the subregion’s
aggregate cereal import requirement for the 2014/15 marketing
year (July/June) is estimated at 40.5 million tonnes, 8 percent
Table 7. North Africa cereal production (million tonnes)
Wheat Coarse grains Rice (paddy) Total cereals
20122013
estim.2014 f'cast. 2012
2013 estim.
2014 f'cast. 2012
2013 estim.
2014 f'cast. 2012
2013 estim.
2014 f'cast.
Change: 2014/2013 (%)
North Africa 18.0 20.3 19.0 11.7 11.5 11.0 6.0 6.2 6.1 35.8 37.9 36.1 -4.8Algeria 3.4 3.3 3.0 1.6 1.6 1.6 0.0 0.0 0.0 5.0 4.9 4.6 -5.9Egypt 8.8 8.8 9.0 7.8 6.5 6.6 5.9 6.1 6.0 22.5 21.4 21.6 0.9Morocco 3.9 7.0 5.1 1.4 2.9 1.9 0.1 0.1 0.1 5.3 10.0 7.1 -29.0Tunisia 1.8 1.0 1.7 0.8 0.3 0.7 0.0 0.0 0.0 2.6 1.3 2.5 89.1
Note: Totals and percentage change computed from unrounded data.
North Africa •coarsegrains:harvesting•rice:maturing
Southern Africa: •wintercereals:harvesting•mainseasoncrops:landpreparation to planting
Note: Comments refer to situation as of September.
Kenya, Somalia: •mainseasoncereals: harvesting to harvested•secondaryseason:land preparation
Uganda•secondaryseasoncereals: planting
Western Africa Sahel•cereals:maturingcoastal countries cereals:•maincrop:harvesting•secondarycrop:planting
Central Africa - northern parts•maize(maincrop):harvesting
Eritrea, Ethiopia, South Sudan, Sudan:•mainseasongrains:maturing
Burundi, Rwanda•secondaryseasoncereals: planting Tanzania, U.R.
•secondaryseasoncereals: planting
No. 3 n October 201412
Crop Prospects and Food Situation
Western AfricaAgriculture and food sector hard-hit by the Ebola virus disease outbreak in Guinea, Liberia and Sierra Leone The most significant shock to the agriculture and food sectors
in 2014 has been the Ebola virus disease (EVD) outbreak, which
has severely affected Guinea, Liberia and Sierra Leone. In
these countries, labour shortages, due to movement restrictions
and migrations to other areas, have disrupted the agriculture
sector, seriously affecting harvesting activities. The impact of
the EVD has been exacerbated by the fact that the areas with
high incidences of the disease are among the most productive
regions of the affected countries. These include Lofa county in
Liberia, and Kailahun and Kenema districts in Sierra Leone. Both
cash and food crop production were affected. In Guinea for
instance, cocoa production is estimated to have fallen by one-
third (from 3 511 tonnes to 2 296 tonnes) between the first six
months of 2013 and the first six months of 2014, while palm
oil production has dropped by 75 percent, according to a recent
World Bank report. Similarly, rubber exports are estimated to
drop by 20 percent in Liberia. A rapid assessment conducted
by FAO in August in Kailahun, the most affected district in
Sierra Leone, found that farms have been abandoned by at
least 40 percent of the farmers. A series of additional rapid
assessments on the impact of the EVD on farm households and
agricultural markets, are underway by FAO, WFP, several NGOs
and the governments of Guinea, Liberia and Sierra Leone.
Mixed prospects for 2014 cereal crops elsewhere in the regionElsewhere in the coastal countries of the Gulf of Guinea,
harvesting of the first maize crop has started in the south,
while harvesting of cereals will begin in October in the north
which only has one rainy season. Rainfall has been generally
adequate in these countries, although irregular precipitation
was reported in the northern parts of Benin, Côte d’Ivoire,
below the record imports of last year but some 7 percent above
the average of the previous five years. Wheat accounts for almost
60 percent of cereal imports. In Egypt and Algeria, cereal
import requirements in 2014/15 are estimated at about 17.4 and
10.7 million tonnes, respectively, some 8 percent lower than in
2013/14. Despite the below-average 2014 harvest in Morocco,
lower cereal imports are forecast at 6.2 million tonnes (10 percent
below 2013/14 imports), supported by higher carryover stocks.
Even higher decreases in imports are expected in Tunisia as
a result of an above-average harvest.
Food price inflation varies across the subregionIn Algeria, in June 2014, the food component of the Consumer
Price Index (CPI) increased by about 4.3 percent compared to
the previous year mainly due to a 30 percent increase in the
price of potatoes, and a 12–15 percent increase in the price
of fruit, vegetables and poultry; bread, dairy, milk, sugar and
cooking oils benefit from ongoing Government subsidies. In
Egypt, the annual food and beverage inflation rate in August
2014 reached about 11.6 percent compared to 12.4 percent
in July 2014. The decline was attributed to decreasing prices
of poultry and fish. In Morocco, food inflation stood at
0.2 percent in the 12 months to the end of December 2013.
In April 2014 (the latest data available), there was no change
reported in food indices compared to a year ago. In spite of
the country’s high import dependency rate, the impact of the
changes in international prices on domestic prices is mitigated
by government subsidies of more than 1 million tonnes of
“national flour”, a common wheat of standard quality used to
make flour for the low income consumers. In Tunisia, the CPI
reached over 6 percent in July 2014 on a yearly basis, while food
price inflation reached 8.2 percent.
In many countries of the subregion, budgetary constraints have
forced governments to examine the costs of subsidies, especially
related to fuel and under-priced staples. In Libya, where it is
estimated that around one-third of subsidized food and fuel are
smuggled into neighbouring
countries, the Government
is considering launching a
food and fuel subsidy reform
and replacing it with a direct
monthly cash transfer. In
Morocco, the Government
removed fuel subsidies in
February 2014, contributing
to the narrowing of the fiscal
deficit from MAD 36.9 billion
(USD 4.4 billion) in June
2013 to MAD 23.6 billion in
June 2014.
Table 8. Western Africa cereal production (million tonnes)
Coarse grains Rice (paddy) Total cereals 1
20122013
estim.2014 f'cast. 2012
2013 estim.
2014 f'cast. 2012
2013 estim.
2014 f'cast.
Change: 2014/2013 (%)
Western Africa 42.5 40.9 39.4 12.7 13.7 13.7 55.3 54.7 53.2 -2.8Burkina Faso 4.6 4.6 4.3 0.3 0.3 0.3 4.9 4.9 4.6 -6.2Chad 3.0 2.2 2.0 0.2 0.4 0.3 3.2 2.6 2.2 -14.6Ghana 2.4 2.2 2.0 0.5 0.5 0.5 2.9 2.6 2.5 -4.4Mali 4.7 3.5 4.4 1.9 2.2 2.3 6.7 5.7 6.7 17.3Niger 5.3 4.3 4.0 0.1 0.1 0.1 5.3 4.3 4.1 -5.3Nigeria 16.5 18.5 17.4 4.4 4.7 4.6 20.9 23.3 22.1 -5.2
Note: Totals and percentage change computed from unrounded data.1 Total cereals includes wheat, coarse grains and rice (paddy).
12000
16000
20000
24000
28000
32000
AJJMAMFJDNOSAJJMAMFJDNOSA2012 20142013
Niger Niamey
Figure 3. Millet prices in selected Western Africanmarkets
CFA Franc BCEAO (XOF)/100kg Burkina Faso Ouagadougou
Source: Afrique Verte.
Mali Bamako

No. 3 n October 2014 13
Crop Prospects and Food Situation
In the Sahel, millet and sorghum prices in Burkina Faso,
Mali and Niger remained stable or declined in some markets
in August and September. In particular, millet prices dropped
significantly in August and remained unchanged in September
in Bamako, the capital city of Mali, and in the Maradi market
in Niger. Overall, coarse grain prices in these countries were
considerably below their year-earlier levels. In Chad, by contrast,
millet prices increased seasonally in most markets in July. Prices
have been less stable than in other Sahelian countries during the
current 2013/14 marketing year (November/October) due to the
sharp decline in the 2013 cereal production.
In Nigeria, maize prices remained mostly unchanged from May
to July in the main northern Kano market after several months of
instability. Increased supplies from the new 2014 harvest in the
southern part of the country and generally favourable prospects
in the main producing regions contributed to the price stability
observed in recent months. In Benin and Togo, maize prices
declined in most markets in July and August, as harvesting of the
2014 first season maize crop is already underway.
In Guinea, Liberia and Sierra Leone, the outbreak of the
EVD has caused serious market disruptions and restricted trade
flows both internally and across borders. Despite favourable
prospects for the 2014 main crop harvesting season, due to
widespread good rains throughout the cropping season in
the Mano River subregion, trade disruptions, combined with
a significant depreciation of the local currencies, with all three
countries net cereal importers, have caused food price spikes in
some areas, particularly in Liberia.
Food security affected by the EVD outbreak and civil insecurityBeyond its impact on the agricultural and food sector, the EVD is
seriously affecting all other sectors of the economies of Guinea,
Liberia and Sierra Leone. Mining, manufacturing and services
sectors have been the hardest hit. As a result, the World Bank
estimates the short-term impact of the epidemic on national
outputs to be a decrease of 2.1 percentage points of GDP in
Guinea, 3.4 percentage points in Liberia and 3.3 percentage
points in Sierra Leone. Over 24 000 jobs have already been lost in
Sierra Leone, according to estimates of the Ministry of Finance. In
particular, the ban on bush meat is depriving many households of
an important source of nutrition and income. Access to food for
many households is being constrained by disruption of livelihoods
and loss of income combined with increasing food prices.
The continuing civil conflict in the Central African
Republic (CAR), Mali and northern Nigeria has resulted in
large population displacement in the subregion. For example, in
Nigeria, there are an estimated 1.5 million Internally Displaced
Persons (IDPs) in the six states of the Northeast, while at least
75 000 people have sought refuge in neighbouring countries
Ghana and Nigeria. By contrast, in the Sahel region, most
countries witnessed a late start of the rainy season as well as
prolonged dry spells through late July that resulted in replanting
in some areas. Precipitation improved significantly since the
beginning of August over the main producing areas, thus
replenishing water reserves, providing relief to stressed crops
and improving crop prospects in several countries. Nevertheless,
in the areas affected by earlier dry conditions, potential yields
will be reduced. Extended rains (until October) will be required
for late-planted crops. The most affected areas are in western
parts of the Sahel belt with low yields expected in Senegal,
Mauritania, the Gambia and Guinea-Bissau. In Burkina
Faso, Chad, Mali and Niger, although more favourable rainfall
has been recorded, overall prospects for the 2014 harvest, to
start from October, remain uncertain.
Cereal prices generally stable and at low levels, except in areas affected by the EVDPrices of locally-produced sorghum, millet and maize have
remained mostly stable in recent months and were significantly
below the corresponding period last year, reflecting adequate
supplies from good production in 2013, as well as generally
favourable prospects for the 2014 cropping season in the major
producing countries. In coastal countries along the Gulf of
Guinea, the beginning of the 2014 first harvesting season has
put downward pressure on prices in some markets. However,
in countries affected by the EVD outbreak, restricted trade
flows and market disruptions led to significant food price spikes
in some areas.
12000
16000
20000
24000
28000
32000
AJJMAMFJDNOSAJJMAMFJDNOSA2012 20142013
Niger Niamey
Figure 3. Millet prices in selected Western Africanmarkets
CFA Franc BCEAO (XOF)/100kg Burkina Faso Ouagadougou
Source: Afrique Verte.
Mali Bamako

No. 3 n October 201414
Crop Prospects and Food Situation
(Cameroon, Chad and Niger), as of early September. According
to UNHCR forecasts, the number of Nigerian refugees in
neighbouring countries will reach 95 000 by the end of the year.
Similarly, in Chad, civil conflict in the Sudan, the CAR, Nigeria
and Libya, has increased the number of refugees and returnees.
More than 461 000 refugees are estimated to be living in
Chad, while about 340 000 Chadians have returned to their
country. Moreover, most Sahelian countries have been struck by
successive severe food crises in recent years that have had very
adverse, longer-term impact on household assets and savings.
As a result, the United Nations and humanitarian partners
launched a three-year Regional Strategic Response Plan (RSRP)
in 2014 to provide aid to millions of people in nine countries
of the Sahel belt. The RSRP is seeking to mobilize USD 2 billion
to provide food and non-food assistance to nearly 30 million
people across the subregion.
Central AfricaIn the CAR agricultural production recovered slightly in 2014, but still well below average largely due to continuing conflictIn Cameroon and in the CAR, harvesting of the 2014 main
maize crop in southern parts is well underway, while in the
northern uni-modal areas, harvesting of millet and sorghum
crops has just started. In Cameroon, a prolonged dry spell
which occurred in July in southern parts had a negative impact
on maize yields, while in the uni-modal north abundant rainfall
benefited millet and sorghum crops.
In the CAR, according to the preliminary estimates of a joint
FAO/WFP Crop and Food Security Assessment Mission (CFSAM),
which visited the country in August, the 2014 aggregate
production of food crops increased by 11 percent from the
sharply reduced 2013 output, but still remains 58 percent
below the pre-crisis five-year average (2008-2012). This year’s
aggregate outcome is mainly driven by a significant increase in
cassava production (+45 percent), while cereal output declined
by about 46 percent from 2013. The ongoing socio-political
crisis and widespread insecurity severely disrupted agricultural
and marketing activities and caused the depletion of already
inadequate households’ productive assets. This, coupled with
erratic rainfall in western parts as well as pest attacks, led to
a reduction in the planted area by 23 percent. FAO and NGO
partners helped to avert a major food crisis, by providing crop
production support to a total of 111 750 vulnerable families
across the country. For the main planting season, 83 950 families
each received 25 kg of crop seeds (groundnut, maize and rice)
and two hoes. In addition, FAO assisted 27 800 families with
seeds (beans, maize, millet, niébé, sesame and sorghum) and
tools as part of the short-cycle (secondary) season support.
In the Democratic Republic of the Congo (DRC), the main
season maize crop is currently reaching maturity in the northern
Equateur and Oriental provinces, which will be harvested from
October. According to remote sensing analysis, rainfall levels
have been near-average. In central regions, harvesting of the
main maize crop, sown in July/August, will begin in November.
Abundant precipitation was received at the start of the cropping
season in most areas, the performance of rainfall in the coming
weeks will be crucial for crop development. Earlier in the year,
the second season maize crop was negatively affected in parts
by reduced precipitation in March/April.
In the Republic of the Congo and Gabon, the second
season maize crop, harvested in June-July, benefited from
adequate precipitation, while the planting of the main crop,
normally completed by September, may have been delayed
in some parts by early season dryness. However, in both of
these countries, the bulk of the national cereal requirement is
imported. FAO’s provisional forecast for the subregion indicates
a 2014 cereal production slightly below the levels of 2013.
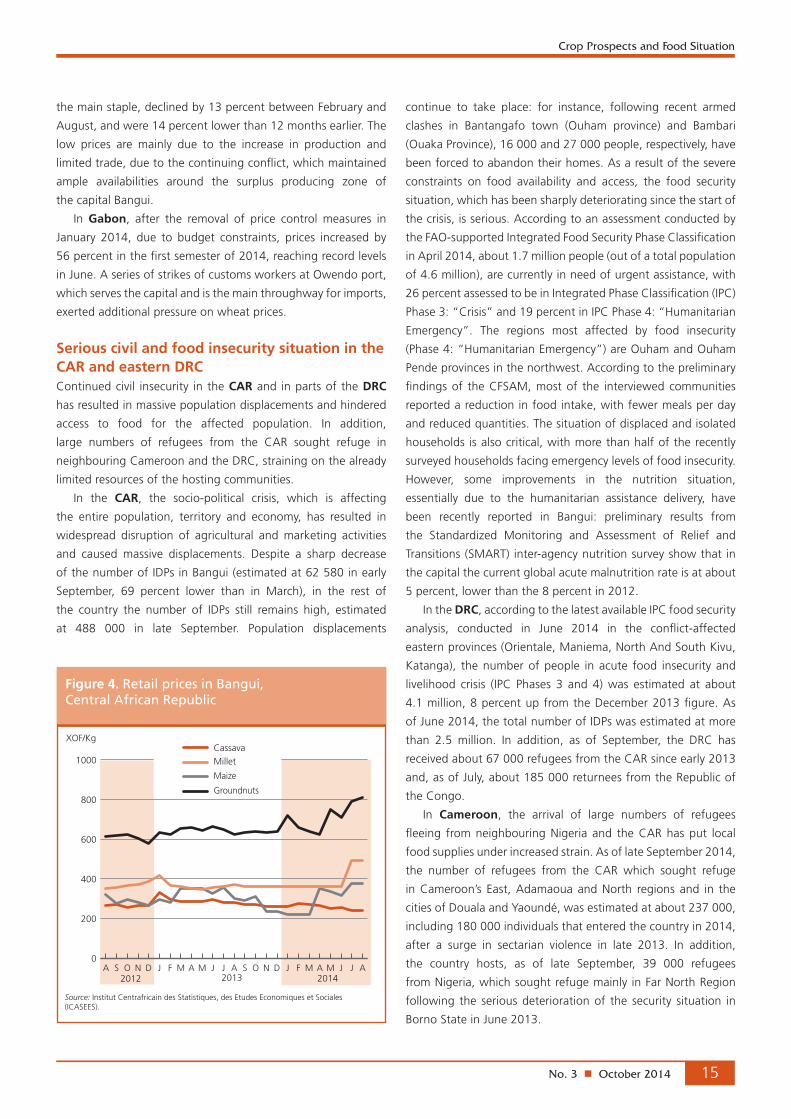
Food prices surge in the CARIn the CAR, prices of agricultural commodities, which remained
at comparatively low levels in the capital Bangui throughout
most of the crisis period, surged in recent months. Prices of
maize, millet and groundnuts increased by 30-70 percent
between March-April and
August 2014, when they
were about 30 percent higher
than 12 months earlier. The
sharp rise is mainly due to
an increase in demand, as
payments to civil servants
resumed in March, injecting
more cash in the economic
system, and large numbers of
IDPs returned to their homes in
the capital. By contrast, prices
of locally-produced cassava,
Table 9. Central Africa cereal production (million tonnes)
Coarse grains Rice (paddy) Total cereals 1
20122013
estim.2014 f'cast. 2012
2013 estim.
2014 f'cast. 2012
2013 estim.
2014 f'cast.
Change: 2014/2013 (%)
Central Africa 4.3 4.4 4.3 0.5 0.5 0.6 4.9 4.9 4.9 -1.4Cameroon 2.8 2.9 2.9 0.2 0.2 0.2 3.0 3.1 3.1 -0.9Central African Rep. 0.1 0.1 0.0 0.0 0.0 0.0 0.2 0.1 0.0 -54.4Dem.Rep.of the Congo 1.2 1.3 1.2 0.3 0.3 0.3 1.6 1.6 1.5 -2.3
Note: Totals and percentage change computed from unrounded data.1 Total cereals includes wheat, coarse grains and rice (paddy).
0
200
400
600
800
1000
AJJMAMFJDNOSAJJMAMFJDNOSA2012 20142013
Maize
Millet
Cassava
Groundnuts
Figure 4. Retail prices in Bangui, Central African Republic
XOF/Kg
Source: Institut Centrafricain des Statistiques, des Etudes Economiques et Sociales (ICASEES).
No. 3 n October 2014 15
Crop Prospects and Food Situation
the main staple, declined by 13 percent between February and
August, and were 14 percent lower than 12 months earlier. The
low prices are mainly due to the increase in production and
limited trade, due to the continuing conflict, which maintained
ample availabilities around the surplus producing zone of
the capital Bangui.
In Gabon, after the removal of price control measures in
January 2014, due to budget constraints, prices increased by
56 percent in the first semester of 2014, reaching record levels
in June. A series of strikes of customs workers at Owendo port,
which serves the capital and is the main throughway for imports,
exerted additional pressure on wheat prices.
Serious civil and food insecurity situation in the CAR and eastern DRC Continued civil insecurity in the CAR and in parts of the DRC
has resulted in massive population displacements and hindered
access to food for the affected population. In addition,
large numbers of refugees from the CAR sought refuge in
neighbouring Cameroon and the DRC, straining on the already
limited resources of the hosting communities.
In the CAR, the socio-political crisis, which is affecting
the entire population, territory and economy, has resulted in
widespread disruption of agricultural and marketing activities
and caused massive displacements. Despite a sharp decrease
of the number of IDPs in Bangui (estimated at 62 580 in early
September, 69 percent lower than in March), in the rest of
the country the number of IDPs still remains high, estimated
at 488 000 in late September. Population displacements
continue to take place: for instance, following recent armed
clashes in Bantangafo town (Ouham province) and Bambari
(Ouaka Province), 16 000 and 27 000 people, respectively, have
been forced to abandon their homes. As a result of the severe
constraints on food availability and access, the food security
situation, which has been sharply deteriorating since the start of
the crisis, is serious. According to an assessment conducted by
the FAO-supported Integrated Food Security Phase Classification
in April 2014, about 1.7 million people (out of a total population
of 4.6 million), are currently in need of urgent assistance, with
26 percent assessed to be in Integrated Phase Classification (IPC)
Phase 3: “Crisis” and 19 percent in IPC Phase 4: “Humanitarian
Emergency”. The regions most affected by food insecurity
(Phase 4: “Humanitarian Emergency”) are Ouham and Ouham
Pende provinces in the northwest. According to the preliminary
findings of the CFSAM, most of the interviewed communities
reported a reduction in food intake, with fewer meals per day
and reduced quantities. The situation of displaced and isolated
households is also critical, with more than half of the recently
surveyed households facing emergency levels of food insecurity.
However, some improvements in the nutrition situation,
essentially due to the humanitarian assistance delivery, have
been recently reported in Bangui: preliminary results from
the Standardized Monitoring and Assessment of Relief and
Transitions (SMART) inter-agency nutrition survey show that in
the capital the current global acute malnutrition rate is at about
5 percent, lower than the 8 percent in 2012.
In the DRC, according to the latest available IPC food security
analysis, conducted in June 2014 in the conflict-affected
eastern provinces (Orientale, Maniema, North And South Kivu,
Katanga), the number of people in acute food insecurity and
livelihood crisis (IPC Phases 3 and 4) was estimated at about
4.1 million, 8 percent up from the December 2013 figure. As
of June 2014, the total number of IDPs was estimated at more
than 2.5 million. In addition, as of September, the DRC has
received about 67 000 refugees from the CAR since early 2013
and, as of July, about 185 000 returnees from the Republic of
the Congo.
In Cameroon, the arrival of large numbers of refugees
fleeing from neighbouring Nigeria and the CAR has put local
food supplies under increased strain. As of late September 2014,
the number of refugees from the CAR which sought refuge
in Cameroon’s East, Adamaoua and North regions and in the
cities of Douala and Yaoundé, was estimated at about 237 000,
including 180 000 individuals that entered the country in 2014,
after a surge in sectarian violence in late 2013. In addition,
the country hosts, as of late September, 39 000 refugees
from Nigeria, which sought refuge mainly in Far North Region
following the serious deterioration of the security situation in
Borno State in June 2013.
0
200
400
600
800
1000
AJJMAMFJDNOSAJJMAMFJDNOSA2012 20142013
Maize
Millet
Cassava
Groundnuts
Figure 4. Retail prices in Bangui, Central African Republic
XOF/Kg
Source: Institut Centrafricain des Statistiques, des Etudes Economiques et Sociales (ICASEES).

No. 3 n October 201416
Crop Prospects and Food Situation
Eastern AfricaMixed prospects for 2014 main season cereal harvestsHarvesting of the 2014 first season cereal crops has recently
been completed in southern parts of the subregion with mixed
outcomes. In Somalia, the main “gu” season coarse grains,
crops were affected by a prolonged dry spell in April and an
early cessation of rains in southern regions of Shabelle, Hiran,
Bakool and Gedo and production is estimated at well below-
average levels. Similarly, erratic rains affected maize production
in southeastern and coastal lowlands of Kenya, with very low
yields estimated in Taita Taveta, Kitui, Makueni, east Kajiado
and west Kwale counties. In Rwanda and Burundi, the 2014B
season crops, harvested in July, were affected by significant
moisture deficits and early cessation of rains by mid-April. By
contrast, rainfall was generally favourable in bi-modal rainfall
areas of Uganda, and in the “msimu” and “masika” cropping
areas of the United Republic of Tanzania, where production is
estimated at average to above-average levels. In South Sudan,
harvesting of first season crops is almost complete in bi-modal
rainfall areas and production prospects are favourable in Western
and Central Equatoria states, while moderate water deficits in
April affected yields in some southeastern areas.
In the rest of the subregion, main season cereal crops are at
the development and harvesting stage, with varying production
prospects. In Kenya, cereal production in western key-cropping
areas is forecast at below-average levels due to a series of dry
spells that affected crop germination and development, leading
to high incidences of pests and diseases. Outbreaks of the viral
Maize Lethal Necrosis Disease (MLND) caused crop losses in
Nandi, Uasin Gishu, Elgeyo Marakwet and Trans Nzoia counties
of the Rift Valley province. In Ethiopia, production prospects
are generally favourable, despite some water deficits in Arsi and
West Arsi zones in the central Oromia region. In the Sudan,
cereal production is expected to recover from last year’s very
low drought-affected harvest. However, a combination of erratic
rains in some important producing areas, (such as Gadaref and
Sennar states), reduced plantings in conflict-affected areas of
South Kordofan, Blue Nile, North Darfur and South Darfur,
and flooding since late July in many parts of the country, are
expected to limit larger production gains. In Uganda, cereal crop
production in the agro-pastoral areas of the Karamoja region is
forecast at below-average levels following reduced plantings due
to unfavourable rains in April and significant water deficits in
eastern parts of the region, along the border with Kenya.
Planting of the second season crops is about to start in
southeastern and coastal areas of Kenya (“short rains” crops),
southern and central Somalia (“deyr” crops) as well as in bi-modal
rainfall areas of Uganda and the United Republic of Tanzania
(“vuli” crops), while it has already been completed in southern
Greenbelt states of South Sudan. The September-December
rains are forecast to be average to above-average, with likely
positive impacts on crop production, but also with some risks of
flooding especially in lowlands.
In Eastern Africa, the overall 2014 cereal production, including
an expected average production for the secondary season crops to
be harvested at the beginning of next year, is tentatively forecast
at 44 million tonnes, about 2 percent below the output of 2013,
but nearly 7 percent above the previous five-year average.
Cereal prices decline seasonally in most countries, but remain high in Somalia and the SudanAfter a steady rise since the beginning of 2014, prices of coarse
grains have seasonally declined in July/August in most markets of
the United Republic of Tanzania, Uganda, Kenya, Somalia
and Rwanda. At the same time, high cereal prices, often at
record levels, are reported in Somalia and the Sudan, due
to inadequate supplies and market disruptions as a result of
conflicts, past poor harvests, depleted stocks and floods.
In the United Republic of Tanzania and Uganda, maize
prices have declined in recent months by about 20-40 percent
in most wholesale markets and
in August they were about
10-25 percent below last year’s
levels despite sustained export
demand from neighbouring
countries. In Kenya, maize
prices decreased between June
and August by 20–30 percent,
following the harvest in coastal
and southeastern areas, while
further downward pressure
was applied by a substantial
flow of imports, mostly
duty-free, from the United
Table 10. Eastern Africa cereal production (million tonnes)
Wheat Coarse grains Total cereals 1
20122013
estim.2014 f'cast. 2012
2013 estim.
2014 f'cast. 2012
2013 estim.
2014 f'cast.
Change: 2014/2013 (%)
Eastern Africa 4.5 5.0 4.9 37.2 37.1 36.3 44.1 44.8 44.0 -1.9Ethiopia 3.5 4.0 3.9 17.4 19.5 18.5 21.1 23.7 22.6 -4.4Kenya 0.4 0.5 0.5 3.9 3.7 3.3 4.5 4.3 3.9 -10.0Sudan 0.3 0.2 0.3 4.9 2.6 3.9 5.2 2.9 4.2 45.2Tanzania U.R. 0.1 0.1 0.1 6.2 6.5 6.2 8.1 8.7 8.4 -3.0Uganda 0.0 0.0 0.0 3.3 3.3 3.1 3.5 3.5 3.4 -3.7
Note: Totals and percentage change computed from unrounded data.1 Total cereals includes wheat, coarse grains and rice (paddy).

No. 3 n October 2014 17
Crop Prospects and Food Situation
Republic of Tanzania and Uganda. In the capital Nairobi,
prices of maize in August were about 20 percent below the
level of the same month of the previous year. In Somalia, prices
of locally-produced maize and sorghum declined in most key
markets in August 2014 as newly-harvested main “gu” season
crops increased supplies, but remain up to two times higher than
12 months earlier, also due to the scaling back of humanitarian
assistance and access constraints resulting from insecurity.
In Ethiopia, prices of maize were stable in recent months
in most monitored markets, with moderate increases in some
agro-pastoral zones, such as Dire Dawa and Jijiga. In general,
August prices were between 10 and 25 percent below their
levels of 12 months earlier, due to the ample stocks from the
bumper 2013 main “meher” harvest that is still available for local
consumption as well as increased availability from the recently-
completed secondary “belg” season harvest.
By contrast, in the Sudan, prices of sorghum and millet
continued to follow the increasing trend which started in late
2013. In August they reached new record highs in most markets
as stocks from last year’s poor harvest have been depleted. Trade
disruptions due to conflict and heavy rains provided further
support to prices. In August, sorghum prices were double their
levels of a year earlier in the main markets of Khartoum, Port
Sudan and El Obeid. Similar trends were observed for millet
prices, which were traded in August at almost three times the
level of a year earlier in Khartoum. Prices of mostly imported
wheat, an important staple in urban areas, increased by
20 percent in August in the capital Khartoum and were well
above their year-earlier levels.
In South Sudan, prices of white sorghum declined in the
capital, Juba, by about 40 percent from January to July on
account of increased availability of imports from neighbouring
countries, carryover stocks from last year’s long-cycle crops, food
aid distributions as well as the recent commercialization of 2014
first season crops. By contrast, prices seasonally increased in Wau
and Aweil by 10 and 15 percent, respectively. In conflict-affected
Unity, Upper Nile and Jonglei States, despite the start of the
green harvest, civil insecurity and seasonal deterioration of road
conditions continued to disrupt both domestic and cross-border
trade, underpinning exceptionally high prices.
Food security conditions improve in South Sudan, but concerns remain for early 2015The lean season is peaking in Ethiopia, Eritrea, the Sudan and
in pastoral areas of Kenya, Somalia and the Karamoja region in
Uganda, while food security conditions are generally improving in
the rest of the subregion as recently-harvested crops improved food
availability. In particular, substantial improvements are reported in
South Sudan where, according to preliminary results of the latest
IPC analysis, the estimated number of people in acute food insecurity
and livelihood crisis declined from 3.9 million in July to nearly
2.2 million. The decrease is mainly due to the availability of first
season crops in Greater Equatoria states, the start of consumption
of green maize in uni-modal rainfall areas, as well as the positive
effect of the humanitarian response. This figure is likely to decline
further until the end of the year when main season crops will be
harvested. However, serious concerns remain for the beginning of
2015 as household food stocks are expected to be only partially
replenished in some areas due to a below-average production,
while most vulnerable households may have exhausted their coping
mechanisms. Since the start of the conflict at the end of last year,
over 1.3 million people are internally displaced and are in need
of humanitarian assistance, while about 450 000 people left the
country and are hosted in Ethiopia, Kenya and Uganda as refugees.
In the Sudan, during the last three months, the number of
severely food insecure people has increased from 5 to 5.3 million.
They are mainly located in conflict-affected North, Central and
South Darfur states as well as in drought-prone areas of Red Sea,
Kassala, White Nile and South Kordofan states where the current
lean season has been particularly long and harsh following last
year’s very poor harvest. The ongoing conflict in South Sudan is
also having a significant impact on local food security.
In Somalia, the number of people in need of humanitarian
assistance is currently estimated at over 1 million, including about
220 000 children under the age of five. This figure shows an
increase of about 20 percent since last January, mainly due to
high food prices and the renewed conflict in southern and central
regions which caused disruption of trade flows and hampered
the delivery of humanitarian assistance.
100
200
300
400
500
600
700
AJJMAMFJDNOSAJJMAMFJDNOSA2012 20142013
USD/tonne
Tanzania U.R. Dar-es-Salaam
Kenya Nairobi
Figure 5. Maize prices in selected Eastern African markets
Uganda Kampala
Sources: Regional Agricultural Trade Intelligence Network;Ethiopian Grain Trade Enterprise.
Ethiopia Addis Ababa

No. 3 n October 201418
Crop Prospects and Food Situation
In Kenya, food security conditions deteriorated in pastoral
districts of Turkana, Marsabit, Samburu and Wajir as well as in
southeastern and coastal areas where the lean season started
in July instead of August for some households that harvested
a below-average “short rains” season production in January/
February and were not able to plant short-cycle “long rains”
season crops due to erratic precipitations. Consequently, during
the last three months, the estimated number of people in need
of humanitarian assistance has increased from 1.3 to 1.5 million.
Overall, in Eastern Africa, the number of people in need
of humanitarian assistance is currently estimated at about
12.6 million (including 5.3 million in the Sudan, 2.2 million in
South Sudan, 2.4 million in Ethiopia, 1.5 million in Kenya,
1 million in Somalia, 100 000 in the Karamoja region of Uganda
and 90 000 in Djibouti), down 5 percent compared to July’s
estimate of 13.3 million people.
Southern AfricaPlanting of 2015 crops expected to commence soon under overall favourable rainfall forecastsLand preparation is underway for the 2015 crops, to be harvested
from March 2015. Seasonal rainfall forecasts indicate an increased
chance of normal to above-normal rains in the October 2014 to
March 2015 cropping period throughout most of the region,
but with higher deficit probability forecast for northern Angola
during the first quarter of 2015. Although, the overall preliminary
forecasts point to positive cropping conditions, monthly variations
will largely determine the impact on crop development and 2015
production outcomes. These forecasts also take into account
the 60-65 percent chance of an El Niño manifesting during this
period, which is normally associated with below-average rains in
some parts of the region.
Farmers are also expected to continue to benefit from
government production support, largely through subsidized input
programmes that are expected to bolster access to fertilizers and
seeds. However, the current lower year-on-year maize prices in
the subregion, may act as a disincentive to expand plantings
this season, particularly for the commercial sector. Preliminary
planting intentions and estimates will only be available towards
the end of the year.
Bumper and record cereal crops estimated in 2014Harvesting of the 2014 cereal crops was completed in July and
aggregate production is estimated at 35.5 million tonnes, up
17 percent from the drought-affected 2013 output. The increase
largely reflects a strong rebound in South Africa’s maize output,
while large maize crops were also estimated in Zambia and
Malawi. Harvesting of the winter wheat crop, mainly produced
in South Africa and Zambia, is underway and current forecasts
point to an 8 percent reduction to 2.1 million tonnes, reflecting
lower plantings.
Maize output in South Africa increased by an estimated
20 percent to just below 15 million tonnes. Despite lower
plantings, favourable weather boosted yields, resulting in a
significant 37 percent increase for the commercial white maize
crop compared with the drought-affected 2013 output. In
Zambia and Malawi, generally stable weather conditions
and increased plantings resulted in larger crops of 3.35 and
3.9 million tonnes, respectively. Government support also
fostered greater access to inputs, while the re-engagement of
commercial farmers in maize production contributed to Zambia’s
record 2014 maize output. Following a severely drought-reduced
harvest in 2013, Zimbabwe’s cereal output is estimated to
have increased significantly by 77 percent in 2014, following
beneficial rains throughout the growing season. Similarly, in
Namibia, although production is relatively small, the cereal
output is estimated to have increased by about 50 percent to
122 000 tonnes, compared to the sharply drought-reduced
harvest in 2013. However, the increase is mainly from the
commercial sector and the overall cereal harvest still remains
5 percent below the short-term average. Near average 2014
cereal outputs are estimated for Botswana and Lesotho,
Table 11. Southern Africa cereal production (million tonnes)
Wheat Coarse grains Rice (paddy) Total cereals
20122013
estim.2014 f'cast. 2012
2013 estim.
2014 f'cast. 2012
2013 estim.
2014 f'cast. 2012
2013 estim.
2014 f'cast.
Change: 2014/2013 (%)
Southern Africa 2.2 2.2 2.1 24.1 23.8 28.9 5.1 4.2 4.5 31.4 30.3 35.5 17.2 - excl. South Africa 0.3 0.4 0.3 10.8 10.9 13.3 5.1 4.2 4.5 16.3 15.4 18.0 17.2Madagascar 0.0 0.0 0.0 0.4 0.4 0.4 4.6 3.6 3.9 5.0 4.0 4.3 7.2Malawi 0.0 0.0 0.0 3.7 3.8 4.1 0.1 0.1 0.1 3.8 3.9 4.2 7.8Mozambique 0.0 0.0 0.0 1.8 1.8 2.2 0.3 0.4 0.3 2.2 2.2 2.5 13.3South Africa 1.9 1.9 1.8 13.3 13.0 15.6 0.0 0.0 0.0 15.2 14.9 17.4 17.2Zambia 0.3 0.3 0.2 2.9 2.6 3.4 0.0 0.0 0.0 3.2 2.9 3.6 24.5Zimbabwe 0.0 0.0 0.0 1.1 1.0 1.7 0.0 0.0 0.0 1.2 1.0 1.7 77.0
Note: Totals and percentage change computed from unrounded data.
0.1
0.2
0.3
0.4
0.5
0.6
AJJMAMFJDNOSAJJMAMFJDNOSA2012 20142013
Figure 6. White maize prices in selected Southern African markets
USD/kg
Mozambique Nampula
Zambia (national average)
South Africa* Randfontein
Sources: Central Statistical Office, Zambia; Sistema De Informação De Mercados Agrícolas De Moçambique, Mozambique; SAFEX Agricultural Products Division, South Africa.
*Wholesale prices, all others retail prices.

No. 3 n October 2014 19
Crop Prospects and Food Situation
which were affected by uneven rains, as well as frost damage
in the latter country, while production in Swaziland, another
import-dependant country, is estimated to have increased by
about 22 percent to above-average levels. A second consecutive
annual production increase is estimated in Mozambique,
reflecting improved yields as a result of favourable rains. In
Madagascar, rice production is estimated to have somewhat
recovered from the sharply reduced output of 2013. However,
uneven rains in southern regions, locust damage and poorly
maintained irrigation infrastructure limited the gains. The rice
output is estimated to be close to 4 million tonnes, about
8 percent higher than the previous year.
Reduced import requirements forecast in 2014/15The maize import requirement for Southern Africa for the
2014/15 marketing year (generally May/April) is expected to
decline to 1 million tonnes, compared to the 1.45 million tonnes
imported in 2013/14. The steep decline reflects improved 2014
domestic harvests, particularly in Zimbabwe, the subregion’s
largest importer.
South Africa is expected to remain as the dominant exporter,
given their abundant supplies in 2014/15 and lower year-on-year
prices; substantial volumes of yellow maize have already been
exported this year, mostly to Asia. Zambia is likely to retain its
position as the second largest exporter, following the lifting of the
export ban, with an exportable surplus of about 1 million tonnes,
while informal trade within the subregion will help bridge deficits
in border areas. Overall, current trade prospects for maize remain
favourable for the import dependent countries of the subregion.
Imports of wheat and rice, of which the subregion is a
deficit producer, are estimated to remain comparatively stable
in 2014/15. Rice imports in Madagascar, which increased
sharply in the previous marketing year, as the country sought
to compensate for the 2013 production shortfall, are estimated
to decline, on account of the larger domestic 2014 output.
Aggregate wheat and rice import requirements are forecast at
3.65 and 2.67 million tonnes, respectively.
Abundant supplies contribute to lower year-on-year maize pricesOverall, prices of maize are at lower levels than a year
earlier, driven down by the larger 2014 harvests. Prices in
South Africa, the subregion’s main producer and exporter,
declined sharply since their record levels of February 2014,
but remained relatively stable between July and September, as
export demand offset the downward pressure exerted by the
ample supplies and lower international prices. The lower year-
on-year prices in South Africa are expected to exert downward
pressure on import prices in Lesotho, Swaziland, Botswana
and Namibia, which satisfy a large proportion of their cereal
needs with South African grain.
Prices of maize in Malawi, Mozambique and Zimbabwe,
which are beginning to increase seasonally, are generally below
their year-earlier levels, reflecting the increased 2014 outputs.
Prices in Zambia are also rising seasonally and remain slightly
above their levels of last year, despite the record 2014 harvest.
The removal of maize subsidies and the depreciation of the
national currency added inflationary pressure and contributed to
maintaining the higher year-on-year prices. In Madagascar, the
large volume of imports in 2013/14 and the moderate rebound
in the domestic rice production, contributed to the lower year-
on-year prices.
Significant improvement in food security conditions in 2014/15 Reflecting larger maize outputs and lower prices, a significant
recovery in food security conditions was recorded in 2014.
Based on the national vulnerability assessments conducted in
June-July, there was a 56 percent decrease in the number of
people requiring food assistance compared to the elevated level
of 2013/14 (excluding Angola, Madagascar and South Africa).
Substantial improvements were seen in Zimbabwe and Malawi,
where the number of people in need of food assistance decreased
to 565 000 (-74 percent) and 640 009 (-56 percent), respectively.
Similarly, the larger 2014 cereal harvests in Mozambique and
Namibia improved food supplies and contributed to reducing
the number of food insecure, estimated at 150 000 (down from
212 000 estimated in 2013/14) and about 118 000 people
0.1
0.2
0.3
0.4
0.5
0.6
AJJMAMFJDNOSAJJMAMFJDNOSA2012 20142013
Figure 6. White maize prices in selected Southern African markets
USD/kg
Mozambique Nampula
Zambia (national average)
South Africa* Randfontein
Sources: Central Statistical Office, Zambia; Sistema De Informação De Mercados Agrícolas De Moçambique, Mozambique; SAFEX Agricultural Products Division, South Africa.
*Wholesale prices, all others retail prices.
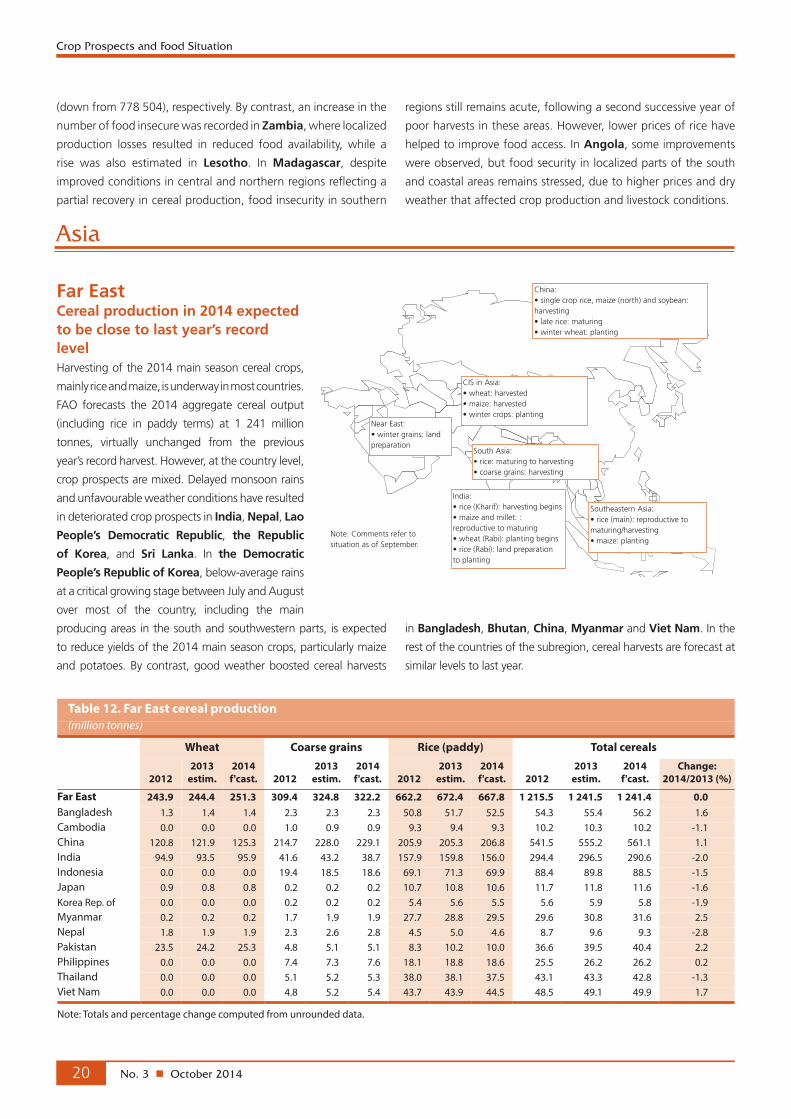
No. 3 n October 201420
Crop Prospects and Food Situation
Asia
(down from 778 504), respectively. By contrast, an increase in the
number of food insecure was recorded in Zambia, where localized
production losses resulted in reduced food availability, while a
rise was also estimated in Lesotho. In Madagascar, despite
improved conditions in central and northern regions reflecting a
partial recovery in cereal production, food insecurity in southern
regions still remains acute, following a second successive year of
poor harvests in these areas. However, lower prices of rice have
helped to improve food access. In Angola, some improvements
were observed, but food security in localized parts of the south
and coastal areas remains stressed, due to higher prices and dry
weather that affected crop production and livestock conditions.
Far EastCereal production in 2014 expected to be close to last year’s record levelHarvesting of the 2014 main season cereal crops,
mainly rice and maize, is underway in most countries.
FAO forecasts the 2014 aggregate cereal output
(including rice in paddy terms) at 1 241 million
tonnes, virtually unchanged from the previous
year’s record harvest. However, at the country level,
crop prospects are mixed. Delayed monsoon rains
and unfavourable weather conditions have resulted
in deteriorated crop prospects in India, Nepal, Lao
People’s Democratic Republic, the Republic
of Korea, and Sri Lanka. In the Democratic
People’s Republic of Korea, below-average rains
at a critical growing stage between July and August
over most of the country, including the main
producing areas in the south and southwestern parts, is expected
to reduce yields of the 2014 main season crops, particularly maize
and potatoes. By contrast, good weather boosted cereal harvests
Table 12. Far East cereal production (million tonnes)
Wheat Coarse grains Rice (paddy) Total cereals
20122013
estim.2014 f'cast. 2012
2013 estim.
2014 f'cast. 2012
2013 estim.
2014 f'cast. 2012
2013 estim.
2014 f'cast.
Change: 2014/2013 (%)
Far East 243.9 244.4 251.3 309.4 324.8 322.2 662.2 672.4 667.8 1 215.5 1 241.5 1 241.4 0.0Bangladesh 1.3 1.4 1.4 2.3 2.3 2.3 50.8 51.7 52.5 54.3 55.4 56.2 1.6Cambodia 0.0 0.0 0.0 1.0 0.9 0.9 9.3 9.4 9.3 10.2 10.3 10.2 -1.1China 120.8 121.9 125.3 214.7 228.0 229.1 205.9 205.3 206.8 541.5 555.2 561.1 1.1India 94.9 93.5 95.9 41.6 43.2 38.7 157.9 159.8 156.0 294.4 296.5 290.6 -2.0Indonesia 0.0 0.0 0.0 19.4 18.5 18.6 69.1 71.3 69.9 88.4 89.8 88.5 -1.5Japan 0.9 0.8 0.8 0.2 0.2 0.2 10.7 10.8 10.6 11.7 11.8 11.6 -1.6Korea Rep. of 0.0 0.0 0.0 0.2 0.2 0.2 5.4 5.6 5.5 5.6 5.9 5.8 -1.9Myanmar 0.2 0.2 0.2 1.7 1.9 1.9 27.7 28.8 29.5 29.6 30.8 31.6 2.5Nepal 1.8 1.9 1.9 2.3 2.6 2.8 4.5 5.0 4.6 8.7 9.6 9.3 -2.8Pakistan 23.5 24.2 25.3 4.8 5.1 5.1 8.3 10.2 10.0 36.6 39.5 40.4 2.2Philippines 0.0 0.0 0.0 7.4 7.3 7.6 18.1 18.8 18.6 25.5 26.2 26.2 0.2Thailand 0.0 0.0 0.0 5.1 5.2 5.3 38.0 38.1 37.5 43.1 43.3 42.8 -1.3Viet Nam 0.0 0.0 0.0 4.8 5.2 5.4 43.7 43.9 44.5 48.5 49.1 49.9 1.7
Note: Totals and percentage change computed from unrounded data.
in Bangladesh, Bhutan, China, Myanmar and Viet Nam. In the
rest of the countries of the subregion, cereal harvests are forecast at
similar levels to last year.
Note: Comments refer to situation as of September.
Southeastern Asia: •rice(main):reproductivetomaturing/harvesting•maize:planting
Near East: •wintergrains:landpreparation
China: •singlecroprice,maize(north)andsoybean:harvesting•laterice:maturing•winterwheat:planting
South Asia: •rice:maturingtoharvesting•coarsegrains:harvesting
India: •rice(Kharif):harvestingbegins•maizeandmillet::reproductive to maturing•wheat(Rabi):plantingbegins•rice(Rabi):landpreparationto planting
CIS in Asia: •wheat:harvested•maize:harvested•wintercrops:planting
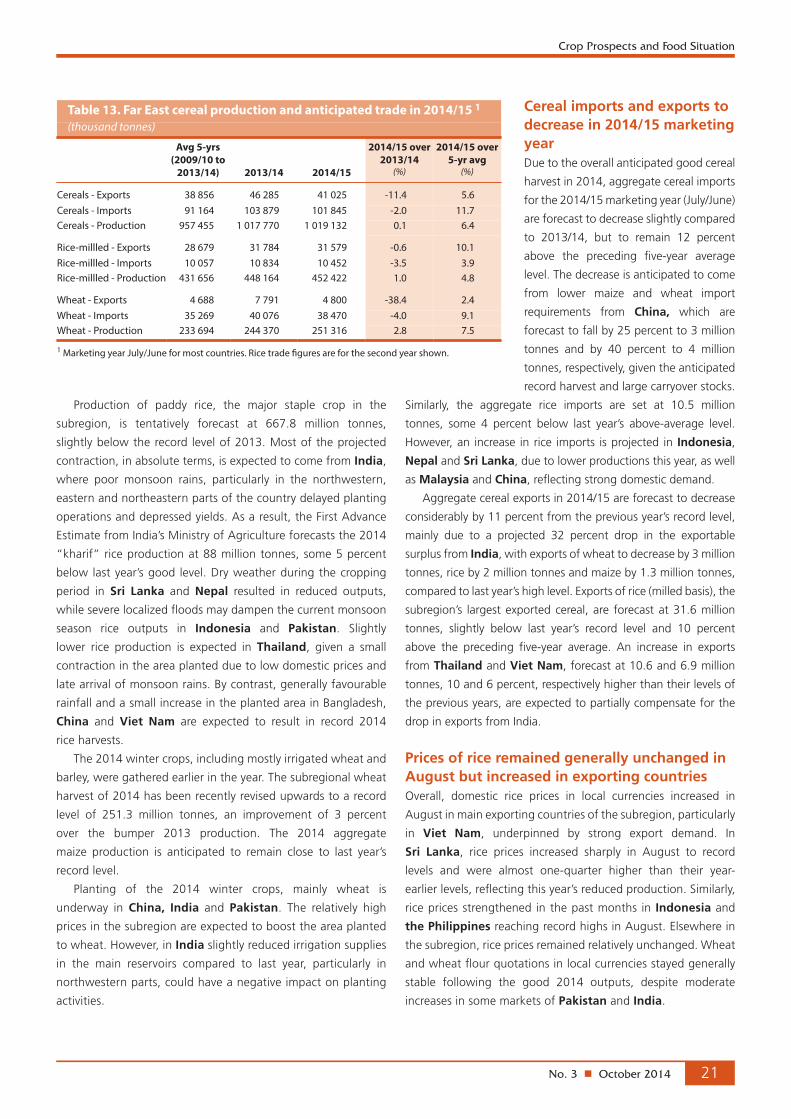
No. 3 n October 2014 21
Crop Prospects and Food Situation
Cereal imports and exports to decrease in 2014/15 marketing yearDue to the overall anticipated good cereal
harvest in 2014, aggregate cereal imports
for the 2014/15 marketing year (July/June)
are forecast to decrease slightly compared
to 2013/14, but to remain 12 percent
above the preceding five-year average
level. The decrease is anticipated to come
from lower maize and wheat import
requirements from China, which are
forecast to fall by 25 percent to 3 million
tonnes and by 40 percent to 4 million
tonnes, respectively, given the anticipated
record harvest and large carryover stocks.
Similarly, the aggregate rice imports are set at 10.5 million
tonnes, some 4 percent below last year’s above-average level.
However, an increase in rice imports is projected in Indonesia,
Nepal and Sri Lanka, due to lower productions this year, as well
as Malaysia and China, reflecting strong domestic demand.
Aggregate cereal exports in 2014/15 are forecast to decrease
considerably by 11 percent from the previous year’s record level,
mainly due to a projected 32 percent drop in the exportable
surplus from India, with exports of wheat to decrease by 3 million
tonnes, rice by 2 million tonnes and maize by 1.3 million tonnes,
compared to last year’s high level. Exports of rice (milled basis), the
subregion’s largest exported cereal, are forecast at 31.6 million
tonnes, slightly below last year’s record level and 10 percent
above the preceding five-year average. An increase in exports
from Thailand and Viet Nam, forecast at 10.6 and 6.9 million
tonnes, 10 and 6 percent, respectively higher than their levels of
the previous years, are expected to partially compensate for the
drop in exports from India.
Prices of rice remained generally unchanged in August but increased in exporting countriesOverall, domestic rice prices in local currencies increased in
August in main exporting countries of the subregion, particularly
in Viet Nam, underpinned by strong export demand. In
Sri Lanka, rice prices increased sharply in August to record
levels and were almost one-quarter higher than their year-
earlier levels, reflecting this year’s reduced production. Similarly,
rice prices strengthened in the past months in Indonesia and
the Philippines reaching record highs in August. Elsewhere in
the subregion, rice prices remained relatively unchanged. Wheat
and wheat flour quotations in local currencies stayed generally
stable following the good 2014 outputs, despite moderate
increases in some markets of Pakistan and India.
Production of paddy rice, the major staple crop in the
subregion, is tentatively forecast at 667.8 million tonnes,
slightly below the record level of 2013. Most of the projected
contraction, in absolute terms, is expected to come from India,
where poor monsoon rains, particularly in the northwestern,
eastern and northeastern parts of the country delayed planting
operations and depressed yields. As a result, the First Advance
Estimate from India’s Ministry of Agriculture forecasts the 2014
“kharif” rice production at 88 million tonnes, some 5 percent
below last year’s good level. Dry weather during the cropping
period in Sri Lanka and Nepal resulted in reduced outputs,
while severe localized floods may dampen the current monsoon
season rice outputs in Indonesia and Pakistan. Slightly
lower rice production is expected in Thailand, given a small
contraction in the area planted due to low domestic prices and
late arrival of monsoon rains. By contrast, generally favourable
rainfall and a small increase in the planted area in Bangladesh,
China and Viet Nam are expected to result in record 2014
rice harvests.
The 2014 winter crops, including mostly irrigated wheat and
barley, were gathered earlier in the year. The subregional wheat
harvest of 2014 has been recently revised upwards to a record
level of 251.3 million tonnes, an improvement of 3 percent
over the bumper 2013 production. The 2014 aggregate
maize production is anticipated to remain close to last year’s
record level.
Planting of the 2014 winter crops, mainly wheat is
underway in China, India and Pakistan. The relatively high
prices in the subregion are expected to boost the area planted
to wheat. However, in India slightly reduced irrigation supplies
in the main reservoirs compared to last year, particularly in
northwestern parts, could have a negative impact on planting
activities.
Table 13. Far East cereal production and anticipated trade in 2014/15 1 (thousand tonnes)
Avg 5-yrs (2009/10 to
2013/14) 2013/14 2014/15
2014/15 over 2013/14
(%)
2014/15 over 5-yr avg
(%)
Cereals - Exports 38 856 46 285 41 025 -11.4 5.6Cereals - Imports 91 164 103 879 101 845 -2.0 11.7Cereals - Production 957 455 1 017 770 1 019 132 0.1 6.4
Rice-millled - Exports 28 679 31 784 31 579 -0.6 10.1Rice-millled - Imports 10 057 10 834 10 452 -3.5 3.9Rice-millled - Production 431 656 448 164 452 422 1.0 4.8
Wheat - Exports 4 688 7 791 4 800 -38.4 2.4Wheat - Imports 35 269 40 076 38 470 -4.0 9.1Wheat - Production 233 694 244 370 251 316 2.8 7.5
1 Marketing year July/June for most countries. Rice trade �gures are for the second year shown.

No. 3 n October 201422
Crop Prospects and Food Situation
Near EastBelow-average winter crop production due to drought and conflictHarvesting of the 2014 winter wheat and barley crops is
complete. With drought conditions affecting the main regional
producers coupled with conflict escalation in some parts, the
aggregate subregional cereal output (including paddy rice) is put
at 70 million tonnes, a decrease of about 8 percent on last year’s
record output and 4 percent on the five-year average.
In Turkey, official forecasts indicate a 10 percent decrease
in cereal production in 2014 compared to last year, to about
33.8 million tonnes. The forecast includes 19.8 million tonnes
of wheat (11 percent decrease on last year) and 13.1 million
tonnes of coarse grains (also a 10 percent decline). Similarly, as
drought conditions affected yields in the Islamic Republic of
Iran, a preliminary forecast puts the 2014 wheat production
at 13 million tonnes, 7 percent lower than the 2013 wheat
harvest. In Iraq, the ongoing and spreading conflict has serious
implications especially in Ninevah and Salah-Aldeen governorates
which normally produce approximately one-third of total annual
national wheat and barley production, respectively. The final
estimates of the 2014 harvest are not yet available but according
to Government reports, the Iraqi Grain Board managed to buy
some 3.4 million tonnes from farmers. Likewise, in the Syrian
Arab Republic, lower plantings as a result of high costs
of production reduced input availability (including labour),
prevailing violence, as well as drought conditions later in the
season in some parts of the country, negatively impacted yields
and overall production. FAO estimates put the cereal harvest at
about 2.4 million tonnes consisting of about 2 million tonnes of
wheat and 400 000 tonnes of barley and other cereals. In Saudi
Arabia, wheat production is estimated at 500 000 tonnes,
2012 2014
0.2
0.3
0.4
0.5
0.6
0.7
0.8
0.9
1.0
AJJMAMFJDNOSAJJMAMFJDNOSA2013
USD/kg
Figure 7. Rice retail prices in selected Far Eastcountries
Indonesia (medium quality) national average
Sources: Ministry of Trade, Indonesia; Ministry of Consumer Affairs, India; Bureau of Agriculture Statistics, Philippines; Agroinfo, Viet Nam.
Philippines (RMR) national average
Viet Nam (25% broken milled) Dong Thap
India Delhi
2012 2014
0.2
0.3
0.4
0.5
0.6
0.7
0.8
AJJMAMFJDNOSAJJMAMFJDNOSA2013
USD/kg
Figure 8. Wheat and wheat flour retail prices in selected Far East countries
Sources: Pakistan Bureau of Statistics; Ministry of Consumer Affairs, India; Management Information System and Monitoring, Bangladesh; National Bureau of Statistics of China.
India (wheat)Delhi
Pakistan (wheat)Lahore
Bangladesh (wheat flour)Dhaka
China (wheat flour)Average of main 50 cities
Table 14. Near East cereal production (million tonnes)
Wheat Coarse grains Rice (paddy) Total cereals
20122013
estim.2014 f'cast. 2012
2013 estim.
2014 f'cast. 2012
2013 estim.
2014 f'cast. 2012
2013 estim.
2014 f'cast.
Change: 2014/2013 (%)
Near East 45.6 48.0 43.9 20.8 23.1 21.0 4.7 4.9 5.0 71.1 76.1 69.8 -8.2Afghanistan 5.1 5.2 5.1 0.8 0.7 0.7 0.7 0.8 0.8 6.6 6.7 6.6 -1.0Iran (Islamic Rep. of ) 13.8 14.0 13.0 4.7 4.5 4.5 2.8 2.9 3.0 21.3 21.4 20.4 -4.4Iraq 2.4 3.3 3.0 0.8 1.2 1.2 0.4 0.4 0.4 3.5 4.9 4.5 -7.1Syrian Arab Republic 2.8 2.4 2.0 1.0 1.1 0.4 0.0 0.0 0.0 3.8 3.5 2.4 -31.0Turkey 20.1 22.1 19.8 12.4 14.5 13.1 0.9 0.9 0.9 33.4 37.5 33.8 -9.9
Note: Totals and percentage change computed from unrounded data.
No. 3 n October 2014 23
Crop Prospects and Food Situation
2012 2014
0.2
0.3
0.4
0.5
0.6
0.7
0.8
AJJMAMFJDNOSAJJMAMFJDNOSA2013
USD/kg
Figure 8. Wheat and wheat flour retail prices in selected Far East countries
Sources: Pakistan Bureau of Statistics; Ministry of Consumer Affairs, India; Management Information System and Monitoring, Bangladesh; National Bureau of Statistics of China.
India (wheat)Delhi
Pakistan (wheat)Lahore
Bangladesh (wheat flour)Dhaka
China (wheat flour)Average of main 50 cities
some 17 percent lower than in 2013, following the 2008 decree
that aims at phasing out domestic wheat production by 2016
because of strong concerns over the depletion of local water
reserves in irrigated wheat production. A similar decree is being
considered to phase-out forage production as some farmers
shifted from wheat to even more water demanding forage
crops. By contrast, in Afghanistan, reports indicate an above-
average wheat harvest of 5.1 million tonnes, slightly lower than
last year’s exceptional harvest of almost 5.2 million tonnes.
Elsewhere in the region, average harvests were gathered.
Consequently, reflecting smaller subregional production,
at 69.8 million tonnes, the total subregional cereal imports are
estimated to be 18 percent above the five-year average and
6 percent more than last year’s imports. Wheat constitutes
about half of these imports, and at almost 30 million tonnes are
expected to be about 10 percent more than last year and about
25 percent higher than the five-year average. Coarse grains,
mostly barley and maize, are imported mainly for animal feed.
Civil unrest affects food security of large number of people, mixed developments observed in food inflation In the Syrian Arab Republic, approximately 10.8 million people
continue to be in need of urgent humanitarian assistance within the
country, including more than 6.4 million people who are internally
displaced. Around 4.7 million people reside in areas categorized as
hard-to-reach, including at least 241 000 people whose movements
are severely restricted by the conflict. As of mid-September 2014,
3 million refugees are registered in the region covering Egypt, Iraq,
Jordan, Lebanon and Turkey. Although WFP continues to provide
food assistance to vulnerable Syrian populations in the region,
resources in host communities remain under strain. In Yemen,
persistent conflict continues to displace households in central areas
of the country. Internal conflict, coupled with the recent removal
of fuel subsidies (as of 30 July 2014), is likely to exacerbate the
food security crisis in Yemen. In Iraq, as of early September 2014,
there were nearly 2.8 million people displaced within Iraq, nearly
1.8 million of whom have been displaced since January 2014.
Many of these people have been repeatedly displaced. At the
moment there are reports of deteriorating access to drinking water
as well as basic food items and other essential non-food items,
particularly with the breakdown of the Public Distribution System
in the militant-held areas. Food security conditions are likely to
deteriorate with large number of IDPs putting strain on hosting
communities, in particular as a large share of IDPs have fled towards
cities in the Kurdish region of Iraq. In the Gaza Strip, despite an
open-ended cease fire reached in August 2014, 72 percent of
the households are food insecure or vulnerable to food insecurity
following a period of escalated hostilities, compared to 66 percent
before the crisis.
In Afghanistan, the overall food security situation has
generally been stable owing to the above-average harvest.
However, food security concerns remain in some areas, particularly
for households displaced by conflict or natural disasters.
Trends in price inflation were varied across the subregion.
Increases in food price inflation were reported in Turkey
(14.4 percent in August 2014 compared to an average of
around 10 percent earlier in 2014), Iraq (3.3 percent on a yearly
basis in August 2014 as opposed to 1.4 percent in May 2014)
and Afghanistan (the food component of the CPI increased
by 5.3 percent in August 2014 compared to 2 percent in
July 2014). By contrast, in the Islamic Republic of Iran, the
latest official information indicates that in July 2014 the food
and beverages price inflation index stood at 0.8 percent on a
monthly and 6.8 percent on a yearly basis. For comparison, in
June 2013 the food price inflation was above 50 percent on a
year-on-year basis. Across the subregion, stable prices prevail
for subsidized food commodities, such as bread and cereal in
Iraq, Jordan and Saudi Arabia.
CIS in Asia2
Aggregate 2014 cereal output forecast to decline slightly Harvesting of 2014 cereal crops is almost complete. The
aggregate cereal output is estimated at almost 33 million tonnes,
slightly below last year’s good level. Overall, unfavourable
weather conditions during the cropping season and shortages of
irrigation water dampened cereal production in most countries,
except in Armenia and Uzbekistan, where generally favourable
rains and improved agricultural inputs availability boosted the
cereal harvest to record levels. Wheat production, the main crop
produced in CIS in Asia, is estimated at 25.8 million tonnes. In
Kazakhstan, the main producer and exporter of the subregion,
FAO estimates the 2014 wheat output at 13.6 million tonnes,
3 percent down from last year’s good level. This is the result
of a small contraction in planted area, as well as anticipated
lower yields, due to excessive rains in early September over the
northwestern part of the country, particularly in the Kostanay
region, one of the main wheat producing area.
2 Georgia is no longer a member of CIS but its inclusion in this group is maintained for the time being.

No. 3 n October 201424
Crop Prospects and Food Situation
Planting of the winter wheat crops to be harvested in 2015 is
underway or about to start in the Asian CIS countries, except in
the main producer, Kazakhstan, where the bulk of the crop is
planted in the spring. Early indications point to an area planted
with winter crops similar to the good level of the previous year.
Cereal exports to decrease in 2014/15 marketing year Cereal exports, mostly wheat, in the 2014/15 marketing year
(July/June) are forecast at 8 million tonnes or 13 percent below
the high level of 2013/14. The decrease is mainly attributed to
an anticipated 15 percent contraction in wheat exports from
Kazakhstan, compared to last year’s high level. The other Asian
CIS countries are heavily dependent on cereal imports, mostly
wheat, to cover their annual consumption requirements.
The total cereal import requirement of the subregion in
the 2014/15 marketing year (July/June) is forecast to decrease
by 4 percent to 6.6 million tonnes as higher carryover stocks
compensated for the reduced outputs. This includes about
6.1 million tonnes of wheat.
Domestic prices of wheat and wheat flour were generally stableIn most importing countries of
the subregion, prices of wheat
and wheat flour products
remained largely unchanged
in August and around their
year-earlier levels despite new
supplies from the recently-
completed wheat harvests. In
Kyrgyzstan and Azerbaijan
prices were supported by
production shortfalls this year
and higher fuel costs.
Table 15. CIS in Asia cereal production (million tonnes)
Wheat Coarse grains Total cereals 1
20122013
estim.2014 f'cast. 2012
2013 estim.
2014 f'cast. 2012
2013 estim.
2014 f'cast.
Change: 2014/2013 (%)
CIS in Asia 21.4 26.2 25.8 5.1 6.3 6.2 27.3 33.4 32.9 -1.6Armenia 0.2 0.3 0.3 0.2 0.2 0.2 0.4 0.5 0.5 2.0Azerbaijan 2.0 2.1 2.0 0.8 0.9 0.9 2.8 3.0 2.9 -3.7Georgia 0.1 0.1 0.1 0.4 0.4 0.4 0.5 0.5 0.5 -5.6Kazakhstan 9.8 14.0 13.6 2.2 3.3 3.3 12.4 17.6 17.3 -2.0Kyrgyzstan 0.6 0.8 0.7 0.7 0.8 0.8 1.4 1.6 1.5 -7.1Tajikistan 0.8 0.8 0.7 0.2 0.3 0.2 1.1 1.1 1.1 -4.9Turkmenistan 1.2 1.4 1.1 0.1 0.1 0.1 1.4 1.6 1.3 -18.2Uzbekistan 6.7 6.9 7.3 0.4 0.4 0.4 7.3 7.5 7.9 5.5
Note: Totals and percentage change computed from unrounded data.1 Total cereals includes wheat, coarse grains and rice (paddy).
0.5
0.6
0.7
0.8
0.9
1.0
1.1
1.2
AJJMAMFJDNOSAJJMAMFJDNOSA2013 20142012
USD/kg
Figure 9. Retail wheat flour prices in selected CIS in Asia countries
Sources: National Statistical Service of Republic of Armenia; National Statistical Committee of the Kyrgyz Republic; State Committee on Statistics, Republic of Tajikistan; State Statistical Committee of the Republic of Azerbaijan; National Statistics Office of Georgia.
Tajikistan (national average)
Kyrgyzstan (national average)Armenia (national average)
Azerbaijan (national average)
Georgia (national average)

No. 3 n October 2014 25
Crop Prospects and Food Situation
Central America and the CaribbeanWheat production in 2014 higher than last yearIn Mexico, virtually the only wheat producer in the subregion,
harvesting of the main irrigated winter wheat was completed in
July. The 2014 aggregate (spring and winter seasons) production
is estimated up 4 percent from last year’s level and average,
mainly reflecting an increase in the area planted.
Maize production in 2014 forecast to remain close to last yearHarvesting of the 2014 main season maize crop was concluded
in most countries of the subregion, except in the main producer
Mexico, where it is scheduled for the end of October. The
subregion’s aggregate maize output is forecast to remain at
almost the same level as in 2013, mainly reflecting another
bumper crop in Mexico, where a reduction in area planted to
white maize, driven by low prices, during the secondary crop
season was offset by higher than expected yields. In aggregate,
maize production is forecast close to 22.4 million tonnes, well
above the country’s five-year average.
Elsewhere in the subregion, early estimates for the aggregate
2014 maize crop (excluding Mexico) point to a sharp decline
in production. Harvesting of the 2014 main “de primera”
maize season, accounting on average for some 60 percent
of the subregion’s annual maize crop, but also rice and beans,
concluded in September. Despite generally favourable rains at
the beginning of the season, an unusually early and extended
“canicula”, a recurrent dry period of about ten days that occurs
around July/August, had a negative impact on crops in the final
stages of development. Most distressed is the area known as the
“Dry Corridor”, which covers most of El Salvador and parts of
Costa Rica, Guatemala, Honduras and Nicaragua. Recent
assessments, at country level, have confirmed that crop losses
during the main season were severe. Planting of the second “de
postrera” season has just concluded under generally favourable
conditions. Assuming normal weather during the remainder of the
season, the 2014 aggregate maize production for Central America
Table 16. Latin America and Caribbean cereal production (million tonnes)
Wheat Coarse grains Rice (paddy) Total cereals
20122013
estim.2014 f'cast. 2012
2013 estim.
2014 f'cast. 2012
2013 estim.
2014 f'cast. 2012
2013 estim.
2014 f'cast.
Change: 2014/2013 (%)
Central America & Caribbean 3.3 3.5 3.7 34.8 35.4 34.8 2.8 2.9 2.9 40.9 41.8 41.4 -1.2El Salvador 0.0 0.0 0.0 1.1 1.1 0.9 0.0 0.0 0.0 1.1 1.1 0.9 -16.9Guatemala 0.0 0.0 0.0 1.7 1.8 1.7 0.0 0.0 0.0 1.8 1.8 1.7 -5.0Honduras 0.0 0.0 0.0 0.6 0.6 0.5 0.1 0.1 0.1 0.7 0.7 0.5 -16.6Mexico 3.3 3.5 3.7 30.2 30.5 30.3 0.2 0.2 0.2 33.6 34.2 34.1 0.0Nicaragua 0.0 0.0 0.0 0.5 0.6 0.5 0.4 0.4 0.4 0.9 1.0 0.9 -12.0
South America 16.3 19.1 23.8 120.7 137.3 133.2 24.7 25.2 25.4 161.6 181.6 182.4 0.4Argentina 8.0 9.2 11.5 31.2 37.8 38.8 1.6 1.6 1.6 40.8 48.6 51.9 6.8Brazil 4.4 5.7 7.9 74.1 83.5 80.3 11.6 11.8 12.2 90.1 101.1 100.3 -0.8
Note: Totals and percentage change computed from unrounded data.
Latin America and the Caribbean
Mexico•coarsegrains(summercrop):vegetativetomaturing•paddycrop(summercrop):harvesting•wheat(wintercrop):landpreparation
Brazil •maize(mainseason):planting(centre-southern states) •winterwheat:harvesting
Argentina•winterwheat:vegetative•maize(mainseason):planting
Uruguay •winterwheat,barley:vegetative•maize(mainseason):planting
Note: Comments refer to situation as of September.
Central America (excl. Mexico)•maize(firstseason):harvesting

No. 3 n October 201426
Crop Prospects and Food Situation
(excluding Mexico) is forecast at 10 percent below last year’s
bumper crop and well below the past five-year average.
In Haiti, the main 2014 coarse grains season is virtually
concluded and prospects are favourable. Despite a delayed onset
of the rainy season in June, subsequent precipitation during the
season was good. Coarse grains production is forecast to increase
4 percent from last year’s reduced level, putting the 2014 output
close to the country’s five-year average.
Cereal imports forecast at high levels in 2014/15Cereal imports for the 2014/15 marketing year (July/June) are
forecast to remain close to last year’s high level of 27 million
tonnes and well above the subregion’s five-year average.
However, in the drought-affected countries, El Salvador,
Guatemala, Honduras and Nicaragua, the aggregate cereal
imports are expected to increase by 11 percent to almost
4 million tonnes.
Maize prices rose markedly in August, red bean prices persist at high levelsIn most countries, maize prices increased seasonally in August
but at a quicker pace than in previous years due to the drought-
reduced 2014 main first season harvest. However, increased
imports in the past few months and distribution of governments’
food reserves have kept prices below their levels of a year earlier
in Guatemala, Honduras and Nicaragua. The exception is
El Salvador, where prices in August were more than 40 percent
higher and the highest in the subregion. Prices were underpinned
by lower imports in the immediate preceding three-month period
from August. Tariff-free imports and food aid are expected to
continue to put downward pressure on prices in the subregion.
Prices of red beans persisted at record or near-record levels
in August, despite significant imports from Ethiopia by most
countries in the subregion. Low stock levels due to last year’s
reduced regional production, particularly in Nicaragua, the main
producer and regional exporter, and an anticipated drought-
reduced first season red bean crop underpinned prices.
South AmericaCoarse grain production in 2014 anticipated to remain at high levelsIn the main producing countries of South America, harvesting of the
2014 main season coarse grains and rice crops is concluded. Latest
estimates for the 2014 subregion’s maize output have been revised
upward to 119 million tonnes, reflecting better than expected
yields particularly in Brazil and Argentina. At the forecast level,
production is 3 percent below last year’s record crop but still well
above the average. In Ecuador, initial estimates point to a maize
output similar to last year’s record level. By contrast, in Peru, this
year’s maize production is anticipated to fall by 5 percent from last
year’s high level, as a result of yield reductions due to dry weather.
The main season rice harvest is virtually concluded in the
subregion. The aggregate subregional production is estimated
at around last year’s high level and above the five-year average,
mainly due to favourable weather conditions. In Brazil, the
subregion’s main producer, production is estimated at 3 percent
higher than last year and close to the average. The increase
mainly reflects larger sowings in response to higher prices and
better than expected yields. However, less than ideal weather
during the season depressed production in Bolivia, Ecuador,
Peru and Uruguay.
The 2014 wheat output to recover from low levels of the past two yearsFollowing an increase in the area planted and satisfactory weather
conditions during the season, the outlook for the 2014 wheat
crop, to be harvested from November, is positive. Strong regional
demand and high prices, particularly in Argentina and Brazil,
underpinned the increase in sowings. The subregion’s aggregate
production is expected to reach almost 24 million tonnes, a
significant increase from the low levels of the previous two years.
Cereal prices declining or stable in August, but those of wheat flour still at high levelsWheat flour prices in the subregion generally declined in August
with favourable prospects for the forthcoming harvests and
increased import volumes in recent months. In Brazil, flour prices
2012 2013
200
250
300
350
400
450
500
550
600
AJJMAMFJDNOSAJJMAMFJDNOSA2014
Nicaragua Managua
Honduras Tegucigalpa
Guatemala Guatemala City
El Salvador San Salvador
USD/tonne
Figure 10. Wholesale white maize prices in selected countries in Central America
Sources: Secretaria de Agricultura y Ganaderia, Honduras; Ministerio de Agricultura, Ganadería y Alimentación, Guatemala; Ministerio agropecuario y forestal, Nicaragua, Dirección General de Economía Agropecuaria, El Salvador.

No. 3 n October 2014 27
Crop Prospects and Food Situation
North AmericaThe United States of America wheat production down but record maize crop forecast in 2014In the United States of America, with the bulk of the wheat
harvest completed by mid-September, the aggregate output in
2014 was estimated at 55.2 million tonnes, down nearly 5 percent
from 2013 and below the five-year average, despite increased
plantings. Dry weather in major producing areas led to significant
yield reductions. As of late September, winter wheat planting for
the 2015 harvest was well underway with some 43 percent of
planting reported complete, slightly ahead of the average by that
date. Regarding coarse grains, the United States Department of
Agriculture’s (USDA) September report forecasts the 2014 maize
output at 366 million tonnes, 3.4 percent up from last year, and a
new record. The rise reflects record yields, which are expected to
more than offset a smaller harvested area.
In Canada, prospects for the 2014 wheat harvest have
deteriorated with dry conditions and frost in the Prairies in early
September causing crop damage. Although this year’s output
was already expected to fall significantly from the 2013 record
300
400
500
600
700
800
900
1000
1100
1200
AJJMAMFJDNOSAJJMAMFJDNOSA2013 20142012
USD/tonne
Figure 11. Wholesale wheat flour prices in selected countries in South America
Sources: Servicio Informativo de Mercados Agropecuarios, Bolivia; Instituto de Economía Agrícola, Brazil; Bolsa de Cereales, Argentina.
Brazil, São Paulo
Argentina, Buenos Aires
Bolivia, Santa Cruz
remained unchanged (in local currency) in August, but those
of grain fell by 8 percent with the good prospects for the 2014
harvest and adequate import levels. In Argentina, wheat flour
prices declined moderately in August and were substantially
below their peaks at the beginning of the year on expectations
of a good 2014 wheat harvest and significant export restrictions.
However, in local currency, wheat flour prices remained 57 percent
above their August 2013 levels reflecting two consecutive years
of below-average production. In Bolivia, wheat flour prices fell
markedly in August and were one-third lower than a year earlier,
with high volumes of imports in the past few months, nine times
higher than at the same period in 2013.
Yellow maize prices remained unchanged or declined in
August reflecting the large availability of maize in the subregion
due to the good 2014 recently-completed harvests. Overall,
prices were around their levels of a year earlier, with the
exception of Argentina, where despite a significant decrease in
August, prices (in local currency) were some 20 percent higher
than a year earlier.
North America, Europe and Oceania
Note: Comments refer to situation as of September.
Northern Europe•wintergrains:planting/earlydevelopment
Centre-Southern Europe•maize:harvesting•wintergrains:landpreparation to planting
Canada•smallgrains:maturingtoharvesting•maize:maturing
United States•maize:harvesting•wintergrains:plantingtoearlydevelopment
CIS in Europe•wheat:harvested•smallgrains:mostlyharvested•wintergrains:planting
Australia•wintercereals:reproductivetomaturing

No. 3 n October 201428
Crop Prospects and Food Situation
high, official estimates in mid-September put the total wheat
output in 2014 down further at 27.7 million tonnes, some
26 percent below last year and below the average of the past
five years. The maize crop, mostly grown in Eastern Canada, is
also forecast to fall significantly by 19 percent from the record
high last year to about 11.4 million tonnes.
EuropeEuropean UnionProduction of wheat and maize increases in 2014Harvesting of wheat in the European Union (EU) is complete
and the 2014 aggregate output is estimated at about 147 million
tonnes, 2.4 percent up from last year. Wheat plantings rose from
the previous year and yields were above the five-year average.
Winter wheat planting for the 2015 is well underway under
satisfactory conditions. Maize production in the EU is forecast
to rise also this year, with latest reports putting the aggregate
output at 69.6 million tonnes, 7.8 percent up from 2013 and the
largest crop on record. By contrast, the barley output is estimated
to decrease by 5.3 percent to 56.5 million tonnes.
CIS in EuropeAggregate 2014 cereal production forecast at a record levelIn the European CIS countries (Belarus, Republic of Moldova,
the Russian Federation and Ukraine), harvesting of the
2014 cereal crops is virtually complete, except for maize. The
subregion’s aggregate cereal output is forecast at 174 million
tonnes, up 7 percent from last year’s bumper level. The major
improvement is expected from the Russian Federation, with
an estimated 14 percent increase in production, compared
to last year, to about 103 million tonnes. Most of the growth
is anticipated on account of strong production gains for wheat
and barley, set at 59 million tonnes (+13 percent on last year)
and 20 million tonnes (+30 percent), respectively. This is the
result of higher yields, following favourable weather conditions
throughout the cropping season and continued Government
support to the sector. In Belarus, a record cereal harvest was
gathered, mainly due to higher barley and wheat production. In
Ukraine, the 2014 aggregate cereal production is estimated at
about 59.7 million tonnes, a 4 percent decrease from the previous
year’s record level, as a result of a return to more normal yields,
but still well above the average. In the Republic of Moldova,
this year’s cereal production is expected to remain close to last
year’s bumper level.
Table 17. North America, Europe and Oceania cereal production (million tonnes)
Wheat Coarse grains Rice (paddy) Total cereals
20122013
estim.2014 f'cast. 2012
2013 estim.
2014 f'cast. 2012
2013 estim.
2014 f'cast. 2012
2013 estim.
2014 f'cast.
Change: 2014/2013 (%)
North America 88.9 95.5 82.9 310.9 398.6 404.2 9.1 8.6 9.9 408.8 502.7 497.0 -1.1Canada 27.2 37.5 27.7 24.5 28.8 21.7 0.0 0.0 0.0 51.7 66.4 49.4 -25.5United States 61.7 58.0 55.2 286.3 369.8 382.4 9.1 8.6 9.9 357.0 436.3 447.6 2.6
Europe 193.1 225.4 236.3 220.4 252.9 255.6 4.4 4.0 4.1 417.9 482.3 496.0 2.8Belarus 2.1 2.0 2.2 6.7 6.2 6.6 0.0 0.0 0.0 8.8 8.2 8.8 8.4EU 132.6 143.7 147.1 144.8 158.8 158.8 3.1 2.9 2.9 280.6 305.4 308.8 1.1Russian Federation 37.7 52.1 59.0 29.5 36.6 42.5 1.1 0.9 1.0 68.2 89.6 102.5 14.4Serbia 1.9 2.7 2.2 3.9 6.6 7.0 0.0 0.0 0.0 5.8 9.3 9.2 -1.5Ukraine 15.8 22.0 23.0 29.9 40.3 36.5 0.2 0.2 0.2 45.9 62.4 59.7 -4.4
Oceania 23.2 27.3 24.5 12.1 14.5 11.0 0.9 1.2 0.9 36.2 43.0 36.4 -15.3Australia 22.9 27.0 24.2 11.5 13.9 10.5 0.9 1.2 0.8 35.3 42.1 35.5 -15.6
Note: Totals and percentage change computed from unrounded data.
0.2
0.3
0.4
0.5
0.6
0.7
0.8
0.9
1.0
1.1
AJJMAMFJDNOSAJJMAMFJDNOSA2013 20142012
USD/kg
Figure 12. Retail wheat and wheat flour prices in Belarus, Russian Federation and Republic of
Moldova
Sources: National Statistical Committee of the Republic of Belarus; ACSA, Rep. of Moldova; Ministry of Agriculture of the Russian Federation.
Rep. of Moldova (wheat, Chisinau)
Russian Federation (wheat flour, national average)
Belarus (wheat flour, national average)

No. 3 n October 2014 29
Crop Prospects and Food Situation
Planting of the 2015 winter cereal crops, mainly wheat
and barley, is currently underway under favourable weather
conditions. Early indications point to a small expansion in the
planted area under winter crops in the Russian Federation
and Ukraine.
Exports in 2014/15 marketing year forecast at record levelsAggregate cereal exports in the 2014/15 marketing year
(July/June) are forecast to reach a record level of 59.9 million
tonnes, up 3 percent compared to 2013/14. The increase is
mainly attributed to higher wheat and barley exports from
the Russian Federation, forecast at 22.5 and 3.5 million
tonnes, respectively, about 22 and 32 percent higher than their
levels of the previous year. By contrast, a projected contraction
in the exportable surplus of maize from Ukraine is expected to
result in an aggregate 13 percent decrease for the subregion.
Wheat and wheat flour prices declining in most countriesDomestic prices of wheat and wheat flour in the Russian
Federation, Ukraine and the Republic of Moldova declined
in recent months as a result of the bumper 2014 wheat
harvests, recently completed. Wheat export prices in the Russian
Federation and Ukraine continued their declining trend in
August, but at a slower pace compared to the previous months,
and were slightly below their year-earlier levels. The downward
pressure on prices from the bumper 2014 winter harvests was
partly offset by strong export demand, which contributed to
limiting price decreases.
OceaniaWheat production forecast to decline in 2014 due to adverse dryness in partsThe prospects for the 2014 winter cereal crops in Australia
have improved in some parts, particularly Western Australia,
where rainfall in September benefitted late-planted crops.
However, reflecting prolonged dry conditions earlier in the
season in Western Australia, and persisting moisture deficits in
southern growing regions, the overall outlook is for a reduction
in the country’s wheat production this year, despite an increase
in plantings. The latest official estimate in September puts the
country’s total wheat output in 2014 at 24.2 million tonnes,
10 percent down from last year.
The early outlook for the minor summer grain crop for harvest
in 2015, mainly sorghum and maize to be planted in the coming
weeks, points to a significant 26 percent increase in sorghum
area. Conditions for planting are reported to be favourable as
widespread rainfall received in mid-August increased the level
of upper layer soil moisture. However, further rainfall will be
required during the spring and summer to realize the forecast
planted area. At this early stage, assuming average yields,
production of sorghum in 2014 is forecast to rise by 67 percent
to 1.8 million tonnes.

No. 3 n October 201430
Crop Prospects and Food Situation
Statistical appendixTable A1 Global cereal supply and demand indicators ............................................................................................ 32
Table A2 World cereal stocks ................................................................................................................................. .33
Table A3 Selected international prices of wheat and coarse grains ......................................................................... .34
Table A4a. Cereal Import requirements of Low-Income Food-Deficit Countries, 2013/14 or 2014 estimates ............... 35
Table A4b. Cereal Import requirements of Low-Income Food-Deficit Countries, 2013/14 or 2014 estimates ............. .36
Table A5 Cereal Import requirements of Low-Income Food-Deficit Countries, 2014/15 estimates ........................... .37

No. 3 n October 2014 31
Crop Prospects and Food Situation
Table A1. Global cereal supply and demand indicators(percent)
Average 2007/08 - 2011/12 2010/11 2011/12 2012/13 2013/14 2014/15
1. Ratio of world stocks to utilization Wheat 25.2 26.4 26.3 23.0 25.2 26.9Coarse grains 15.9 14.8 15.3 13.8 17.6 20.2Rice 29.9 30.9 33.9 35.7 36.2 34.8Total cereals 21.5 21.5 22.4 20.9 23.5 25.2
2. Ratio of major grain exporters' suppliesto normal market requirements 121.1 124.5 115.8 118.3 108.2 121.8
3. Ratio of major exporters' stocks to their total disappearance Wheat 18.3 20.7 17.9 14.1 14.1 15.6Coarse grains 12.9 10.7 10.8 8.4 11.1 15.0Rice 22.0 20.7 25.2 28.2 27.7 25.1Total cereals 17.7 17.4 18.0 16.9 17.7 18.6
Annual trendgrowth rate Change from previous year
2004-2013 2010 2011 2012 2013 2014
4. Changes in world cereal production 2.2 -0.4 4.3 -2.1 9.6 -0.1
5. Changes in cereal production in the LIFDCs 1.2 8.9 1.8 4.5 0.8 -1.2
6. Changes in cereal production in the LIFDCsless India -0.5 9.9 -3.7 6.3 1.1 -0.4
Average Change from previous year
2007-2011 2010 2011 2012 2013 2014*
7. Selected cereal price indices: Wheat 184.9 10.6 31.8 -4.8 -4.9 -6.7Maize 194.8 12.0 57.6 2.2 -12.9 -28.8Rice 232.2 -10.0 6.6 -4.6 0.8 0.2
Notes:
Utilization is de�ned as the sum of food use, feed and other uses.Cereals refer to wheat, coarse grains and rice; grains refer to wheat and coarse grains.
Major wheat exporters are Argentina, Australia, Canada, the EU, Kazakhstan, the Russian Federation, Ukraine and the United States of America; major coarse grain exporters are Argentina, Australia, Brazil, Canada, the EU, the Russian Federation, Ukraine and the United States of America; major rice exporters are India, Pakistan, Thailand, the United States of America and Viet Nam.
Normal market requirements for major grain exporters are de�ned as the average of domestic utilization plus exports in the three preceding seasons.Disappearance is de�ned as domestic utilization plus exports for any given season.
Price indices: The Wheat Price Index has been constructed based on the IGC Wheat Price Index, rebased to 2002-2004=100; for maize, the U.S. maize No.2 Yellow (delivered U.S. Gulf ports) with base 2002-2004=100; for rice, the FAO Rice Price Index, 2002-2004=100, is based on 16 rice export quotations.
*January-September average.

No. 3 n October 201432
Crop Prospects and Food Situation
Table A2. World cereal stocks1 (million tonnes)
2010 2011 2012 20132014
estimate2015
forecast
TOTAL CEREALS 523.1 501.2 521.4 504.9 579.5 627.5
Wheat 190.1 184.8 180.8 158.2 176.5 192.4held by: - main exporters2 55.2 51.2 42.7 36.0 40.1 41.4- others 134.9 133.6 138.1 122.2 136.4 151.0
Coarse grains 195.4 171.0 178.5 171.0 221.8 257.4held by: - main exporters2 87.7 62.8 59.5 47.8 68.7 90.8- others 107.7 108.2 119.0 123.2 153.1 166.6
Rice (milled basis) 137.6 145.4 162.1 175.7 181.3 177.7held by: - main exporters2 33.4 33.3 41.5 47.3 48.4 44.6- others 104.2 112.1 120.6 128.4 132.9 133.1
Developed countries 191.7 153.3 150.4 117.8 142.0 175.5Australia 7.5 9.7 7.8 5.1 6.7 5.3Canada 13.6 11.2 9.4 8.2 15.4 8.9European Union 45.7 32.5 32.7 25.8 33.4 37.8Japan 4.8 4.8 4.9 5.2 4.7 5.3Russian Federation 21.2 18.0 15.2 7.6 9.2 16.8South Africa 3.1 4.0 2.5 2.3 1.5 2.7Ukraine 6.8 5.3 10.9 6.6 8.1 9.9United States 75.9 57.3 49.3 44.2 49.7 74.1
Developing countries 331.4 347.8 371.0 387.1 437.5 451.9
Asia 275.9 285.3 306.2 331.7 368.4 381.8China 164.2 167.6 172.6 188.9 217.6 231.1India 35.5 38.3 45.6 49.4 52.2 52.8Indonesia 8.3 10.4 12.4 13.6 14.0 12.8Iran (Islamic Republic of ) 5.0 3.6 2.1 6.6 7.7 9.5Korea, Republic of 3.8 4.3 4.2 4.0 4.6 5.1Pakistan 4.8 3.4 5.4 3.7 3.8 4.2Philippines 4.3 3.3 2.6 3.1 3.0 3.2Syrian Arab Republic 4.7 3.8 3.4 2.6 2.2 1.4Turkey 4.2 4.1 4.9 4.2 5.1 4.7
Africa 30.2 34.9 37.3 35.2 38.0 35.3Algeria 3.5 4.0 4.7 5.4 6.9 6.7Egypt 6.6 5.9 7.8 6.1 6.7 5.7Ethiopia 1.5 1.9 2.0 1.9 2.6 2.0Morocco 3.1 4.0 4.6 3.4 5.9 5.1Nigeria 1.2 1.4 1.3 0.8 1.3 1.0Tunisia 1.5 0.8 0.8 1.3 1.1 1.3
Central America 4.4 6.1 4.8 5.0 6.2 6.3Mexico 2.4 3.7 2.3 2.5 3.5 3.5
South America 20.6 21.1 22.2 14.9 24.5 28.2Argentina 2.1 5.5 4.9 2.2 5.2 7.8Brazil 11.9 8.4 9.1 5.6 11.3 13.0
Note: Based on o�cial and uno�cial estimates. Totals computed from unrounded data.1 Stocks data are based on an aggregate of carryovers at the end of national crop years and do not represent world stock levels at any point in time.2 Major wheat exporters are Argentina, Australia, Canada, the EU, Kazakhstan, the Russian Federation, Ukraine and the United States of America; major coarse grain exporters are Argentina, Australia, Brazil, Canada, the EU, the Russian Federation, Ukraine and the United States of America; major rice exporters are India, Pakistan, Thailand, the United States of America and Viet Nam.

No. 3 n October 2014 33
Crop Prospects and Food Situation
Table A3. Selected international prices of wheat and coarse grains(USD/tonne)
Wheat Maize Sorghum
US No.2 Hard Red Winter Ord.
Prot.1 US Soft Red
Winter No.2 2 Argentina Trigo Pan3
US No.2 Yellow2 Argentina3
US No.2 Yellow2
Annual (July/June) 2003/04 161 149 154 115 109 1182004/05 154 138 123 97 90 992005/06 175 138 138 104 101 1082006/07 212 176 188 150 145 1552007/08 361 311 318 200 192 2062008/09 270 201 234 188 180 1702009/10 209 185 224 160 168 1652010/11 316 289 311 254 260 2482011/12 300 256 264 281 269 2642012/13 348 310 336 311 278 2812013/14 318 265 335 217 219 218
Monthly 2012 - September 372 341 336 323 278 2862012 - October 373 339 332 320 274 2902012 - November 374 346 345 324 294 2892012 - December 359 325 360 310 288 2882013 - January 348 311 362 303 294 2872013 - February 329 297 358 303 283 2882013 - March 323 286 346 309 276 2972013 - April 324 279 324 282 242 2612013 - May 329 277 315 295 257 2542013 - June 321 270 310 300 264 2462013 - July 311 257 302 282 241 2322013 - August 315 251 281 238 221 2192013 - September 312 258 300 209 219 2172013 - October 333 289 344 201 207 2042013 - November 317 274 353 199 207 1962013 - December 301 267 340 197 212 2072014 - January 288 248 330 198 215 2162014 - February 303 261 328 209 218 2242014 - March 334 285 340 222 226 2282014 - April 340 281 361 224 229 2262014 - May 345 271 372 217 224 2232014 - June 314 235 365 202 204 2202014 - July 294 218 287 182 192 2032014 - August 284 219 270 175 181 1832014 - September 279 204 248 164 166 174
Sources: International Grains Council and USDA.1 Delivered United States f.o.b. Gulf.2 Delivered United States Gulf.3 Up River f.o.b.

No. 3 n October 201434
Crop Prospects and Food Situation
Table A4a. Cereal import requirements of Low-Income Food-De�cit Countries1 , 2013/14 or 2014 estimates(thousand tonnes)
2012/13 or 2013 2013/14 or 2014
Actual imports Import position2
Marketing
yearCommercial purchases Food aid
Total commercial
and aid
Total import requirements (excl. re-exports)
Total commercial
and aid
Food aid allocated,
committed or shipped
Commercial purchases
AFRICA 24 923.3 1 135.9 26 059.2 29 023.9 13 386.2 760.6 12 625.6
Eastern Africa 6 795.9 512.0 7 307.9 8 754.1 4 510.0 604.1 3 905.9 Burundi Jan/Dec 138.4 13.3 151.7 125.0 28.2 5.1 23.1 Comoros Jan/Dec 59.5 0.0 59.5 61.0 16.2 0.0 16.2 Djibouti Jan/Dec 97.1 10.4 107.5 98.0 83.4 1.8 81.6 Eritrea Jan/Dec 399.0 7.0 406.0 419.0 0.5 0.0 0.5 Ethiopia Jan/Dec 329.1 129.7 458.8 763.7 224.4 136.7 87.7 Kenya Oct/Sep 1 951.0 76.6 2 027.6 2 421.9 1 134.2 108.5 1 025.7 Rwanda Jan/Dec 146.0 0.7 146.7 116.2 52.8 0.8 52.0 Somalia Aug/Jul 392.8 63.3 456.1 530.8 133.2 79.3 53.9 Sudan Nov/Oct 2 139.9 172.6 2 312.5 2 855.0 1 878.2 216.4 1 661.8 Tanzania U.R. Jun/May 768.6 9.3 777.9 858.5 790.8 48.6 742.2 Uganda Jan/Dec 374.5 29.1 403.6 505.0 168.1 6.9 161.2
Southern Africa 1 795.3 220.0 2 015.3 2 950.4 2 003.6 45.6 1 958.0 Lesotho Apr/Mar 242.0 5.0 247.0 173.0 110.0 1.2 108.8 Madagascar Apr/Mar 241.5 16.6 258.1 570.4 249.7 16.5 233.2 Malawi Apr/Mar 79.0 18.2 97.2 212.0 204.0 18.9 185.1 Mozambique Apr/Mar 760.2 120.8 881.0 1 254.0 1 010.2 4.3 1 005.9 Zimbabwe Apr/Mar 472.6 59.4 532.0 741.0 429.7 4.7 425.0
Western Africa 14 428.5 228.7 14 657.2 15 198.4 6 111.6 82.6 6 029.0Coastal Countries 10 920.9 79.0 10 999.9 11 605.5 4 580.6 9.3 4 571.3 Benin Jan/Dec 433.0 14.0 447.0 462.0 462.0 0.0 462.0 Côte d'Ivoire Jan/Dec 1 767.2 3.4 1 770.6 1 820.5 714.8 3.9 710.9 Ghana Jan/Dec 1 038.9 6.1 1 045.0 1 050.0 318.9 2.3 316.6 Guinea Jan/Dec 456.8 5.6 462.4 432.5 201.5 1.5 200.0 Liberia Jan/Dec 340.0 44.0 384.0 414.0 102.0 0.7 101.3 Nigeria Jan/Dec 6 320.0 0.0 6 320.0 6 870.0 2 468.5 0.0 2 468.5 Sierra Leone Jan/Dec 320.0 5.4 325.4 291.0 164.9 0.9 164.0 Togo Jan/Dec 245.0 0.5 245.5 265.5 148.0 0.0 148.0Sahelian Countries 3 507.6 149.7 3 657.3 3 592.9 1 531.0 73.3 1 457.7 Burkina Faso Nov/Oct 436.9 7.2 444.1 415.0 74.8 5.1 69.7 Chad Nov/Oct 118.2 59.6 177.8 142.2 67.1 35.4 31.7 Gambia Nov/Oct 192.0 20.5 212.5 205.5 114.8 0.1 114.7 Guinea-Bissau Nov/Oct 148.1 6.2 154.3 154.3 26.7 1.7 25.0 Mali Nov/Oct 199.6 11.6 211.2 258.2 157.6 6.3 151.3 Mauritania Nov/Oct 457.0 13.5 470.5 487.0 259.3 2.6 256.7 Niger Nov/Oct 431.7 30.2 461.9 457.4 65.1 18.2 46.9 Senegal Nov/Oct 1 524.1 0.9 1 525.0 1 473.3 765.6 3.9 761.7
Central Africa 1 903.6 175.2 2 078.8 2 121.0 761.0 28.3 732.7 Cameroon Jan/Dec 948.3 1.8 950.1 947.0 413.9 5.5 408.4 Cent.Afr.Rep. Jan/Dec 39.7 11.3 51.0 75.0 12.5 7.8 4.7 Congo Jan/Dec 303.2 7.8 311.0 312.0 164.7 1.3 163.4 Dem.Rep.of the Congo Jan/Dec 599.7 150.3 750.0 770.0 163.9 13.4 150.5 Sao Tome and Principe Jan/Dec 12.7 4.0 16.7 17.0 6.0 0.3 5.7
Source: FAO1 The Low-Income Food-De�cit Countries (LIFDCs) group includes net food de�cit countries with annual per caput income below the level used by the World Bank to determine eligibility for IDA assistance (i.e. USD 1 945 in 2011); for full details see http://www.fao.org/countrypro�les/lifdc2 Estimates based on information as of early September 2014.

No. 3 n October 2014 35
Crop Prospects and Food Situation
Table A4b. Cereal import requirements of Low-Income Food-De�cit Countries1 , 2013/14 or 2014 estimates(thousand tonnes)
2012/13 or 2013 2013/14 or 2014
Actual imports Import position2
Marketing
yearCommercial purchases Food aid
Total commercial
and aid
Total import requirements (excl. re-exports)
Total commercial
and aid
Food aid allocated,
committed or shipped
Commercial purchases
ASIA 17 034.9 654.1 17 689.0 21 656.6 13 142.9 209.0 12 933.9
Cis in Asia 3 657.5 3.7 3 661.2 3 978.1 3 841.5 0.7 3 840.8 Kyrgyzstan Jul/Jun 525.5 3.7 529.2 566.1 541.0 0.7 540.3 Tajikistan Jul/Jun 1 112.0 0.0 1 112.0 1 022.0 1 022.0 0.0 1 022.0 Uzbekistan Jul/Jun 2 020.0 0.0 2 020.0 2 390.0 2 278.5 0.0 2 278.5
Far East 7 876.4 499.4 8 375.8 11 516.5 6 529.8 147.5 6 382.3 Bangladesh Jul/Jun 1 973.3 131.2 2 104.5 3 430.0 1 953.2 74.6 1 878.6 Bhutan Jul/Jun 78.0 0.0 78.0 77.1 8.2 0.0 8.2 D.P.R. of Korea Nov/Oct 108.3 290.3 398.6 340.1 39.4 22.4 17.0 India Apr/Mar 116.6 0.5 117.1 130.0 78.1 0.0 78.1 Mongolia Oct/Sep 115.8 0.0 115.8 155.8 43.7 0.0 43.7 Nepal Jul/Jun 530.1 1.7 531.8 521.8 7.3 4.4 2.9 Philippines Jul/Jun 3 851.0 40.0 3 891.0 5 787.0 4 025.5 45.9 3 979.6 Sri Lanka Jan/Dec 1 103.3 35.7 1 139.0 1 074.7 374.4 0.2 374.2
Near East 5 501.0 151.0 5 652.0 6 162.0 2 771.6 60.8 2 710.8 Afghanistan Jul/Jun 1 551.0 101.0 1 652.0 1 942.0 941.3 14.8 926.5 Yemen Jan/Dec 3 950.0 50.0 4 000.0 4 220.0 1 830.3 46.0 1 784.3
CENTRAL AMERICA 1 703.1 91.2 1 794.3 1 929.4 1 422.6 24.2 1 398.4 Haiti Jul/Jun 542.3 82.4 624.7 656.1 432.4 17.6 414.8 Honduras Jul/Jun 749.2 6.0 755.2 877.0 694.6 3.5 691.1 Nicaragua Jul/Jun 411.6 2.8 414.4 396.3 295.6 3.1 292.5
OCEANIA 470.9 0.0 470.9 450.2 129.1 0.0 129.1 Papua New Guinea Jan/Dec 390.2 0.0 390.2 415.2 120.4 0.0 120.4 Solomon Islands Jan/Dec 80.7 0.0 80.7 35.0 8.7 0.0 8.7
TOTAL 44 132.2 1 881.2 46 013.4 53 060.1 28 080.8 993.8 27 087.0
Source: FAO1 The Low-Income Food-De�cit Countries (LIFDCs) group includes net food de�cit countries with annual per caput income below the level used by the World Bank to determine eligibility for IDA assistance (i.e. USD 1 945 in 2011); for full details see http://www.fao.org/countrypro�les/lifdc2 Estimates based on information as of early September 2014.
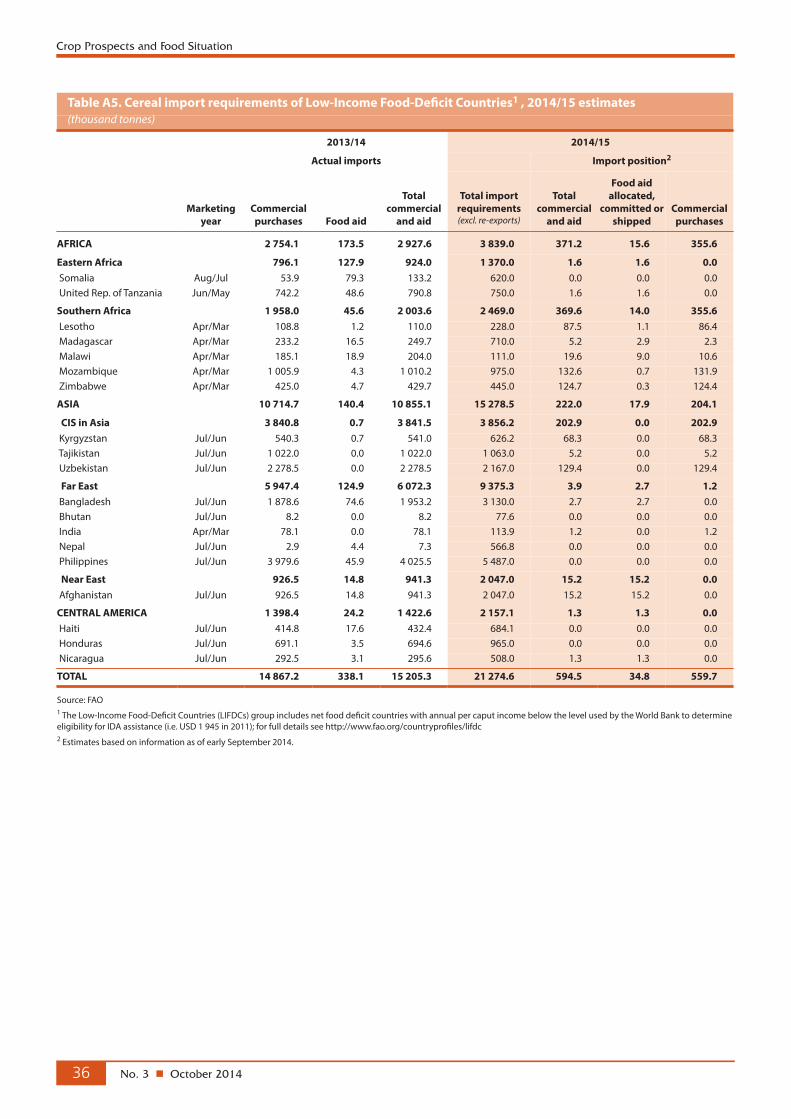
No. 3 n October 201436
Crop Prospects and Food Situation
Table A5. Cereal import requirements of Low-Income Food-De�cit Countries1 , 2014/15 estimates (thousand tonnes)
2013/14 2014/15
Actual imports Import position2
Marketing year
Commercial purchases Food aid
Total commercial
and aid
Total import requirements (excl. re-exports)
Total commercial
and aid
Food aid allocated,
committed or shipped
Commercial purchases
AFRICA 2 754.1 173.5 2 927.6 3 839.0 371.2 15.6 355.6
Eastern Africa 796.1 127.9 924.0 1 370.0 1.6 1.6 0.0 Somalia Aug/Jul 53.9 79.3 133.2 620.0 0.0 0.0 0.0 United Rep. of Tanzania Jun/May 742.2 48.6 790.8 750.0 1.6 1.6 0.0
Southern Africa 1 958.0 45.6 2 003.6 2 469.0 369.6 14.0 355.6 Lesotho Apr/Mar 108.8 1.2 110.0 228.0 87.5 1.1 86.4 Madagascar Apr/Mar 233.2 16.5 249.7 710.0 5.2 2.9 2.3 Malawi Apr/Mar 185.1 18.9 204.0 111.0 19.6 9.0 10.6 Mozambique Apr/Mar 1 005.9 4.3 1 010.2 975.0 132.6 0.7 131.9 Zimbabwe Apr/Mar 425.0 4.7 429.7 445.0 124.7 0.3 124.4
ASIA 10 714.7 140.4 10 855.1 15 278.5 222.0 17.9 204.1
CIS in Asia 3 840.8 0.7 3 841.5 3 856.2 202.9 0.0 202.9 Kyrgyzstan Jul/Jun 540.3 0.7 541.0 626.2 68.3 0.0 68.3 Tajikistan Jul/Jun 1 022.0 0.0 1 022.0 1 063.0 5.2 0.0 5.2 Uzbekistan Jul/Jun 2 278.5 0.0 2 278.5 2 167.0 129.4 0.0 129.4
Far East 5 947.4 124.9 6 072.3 9 375.3 3.9 2.7 1.2 Bangladesh Jul/Jun 1 878.6 74.6 1 953.2 3 130.0 2.7 2.7 0.0 Bhutan Jul/Jun 8.2 0.0 8.2 77.6 0.0 0.0 0.0 India Apr/Mar 78.1 0.0 78.1 113.9 1.2 0.0 1.2 Nepal Jul/Jun 2.9 4.4 7.3 566.8 0.0 0.0 0.0 Philippines Jul/Jun 3 979.6 45.9 4 025.5 5 487.0 0.0 0.0 0.0
Near East 926.5 14.8 941.3 2 047.0 15.2 15.2 0.0 Afghanistan Jul/Jun 926.5 14.8 941.3 2 047.0 15.2 15.2 0.0
CENTRAL AMERICA 1 398.4 24.2 1 422.6 2 157.1 1.3 1.3 0.0 Haiti Jul/Jun 414.8 17.6 432.4 684.1 0.0 0.0 0.0 Honduras Jul/Jun 691.1 3.5 694.6 965.0 0.0 0.0 0.0 Nicaragua Jul/Jun 292.5 3.1 295.6 508.0 1.3 1.3 0.0
TOTAL 14 867.2 338.1 15 205.3 21 274.6 594.5 34.8 559.7
Source: FAO1 The Low-Income Food-De�cit Countries (LIFDCs) group includes net food de�cit countries with annual per caput income below the level used by the World Bank to determine eligibility for IDA assistance (i.e. USD 1 945 in 2011); for full details see http://www.fao.org/countrypro�les/lifdc2 Estimates based on information as of early September 2014. www.fao.org/giews/food-prices
The FPMA activities include a monthly electronic bulletin, the Global Food Price Monitor, reporting on recent food price developments at world, regional and country level, with focus on developing countries.
The online GIEWS data and analysis tool provides easy access to over 1 100 monthly retail and/or wholesale domestic staple food price series in 85 countries, as well as 43 international export price series (as of September 2014). The tool also contains a series of analysis features, including basic statistics and multi-series charts.
FPMA data tool
FPMA bulletin
The new Food Price Monitoring and Analysis (FPMA) website, developed by GIEWS to strengthen market and food security assessments, contains latest information and dynamic analysis on domestic prices of basic foods mainly in developing countries, complementing FAO’s work on international markets.
What’s in the website?
►map visualizing countries with abnormally high food prices
► domestic food price roundups by region
► overview of international benchmark prices
► latest food policy and market developments
► relevant market indicators
FPMA website
Monitoring and analysis of Domestic Food Prices in support of Early Warning for Food Security
Monitoring and analyis of Domestic Food Prices in support of Early Warning for Food Security

I4096E
www.fao.org/giews/food-prices
The FPMA activities include a monthly electronic bulletin, the Global Food Price Monitor, reporting on recent food price developments at world, regional and country level, with focus on developing countries.
The online GIEWS data and analysis tool provides easy access to over 1 100 monthly retail and/or wholesale domestic staple food price series in 85 countries, as well as 43 international export price series (as of September 2014). The tool also contains a series of analysis features, including basic statistics and multi-series charts.
FPMA data tool
FPMA bulletin
The new Food Price Monitoring and Analysis (FPMA) website, developed by GIEWS to strengthen market and food security assessments, contains latest information and dynamic analysis on domestic prices of basic foods mainly in developing countries, complementing FAO’s work on international markets.
What’s in the website?
►map visualizing countries with abnormally high food prices
► domestic food price roundups by region
► overview of international benchmark prices
► latest food policy and market developments
► relevant market indicators
FPMA website
Monitoring and analysis of Domestic Food Prices in support of Early Warning for Food Security
Monitoring and analyis of Domestic Food Prices in support of Early Warning for Food Security

continuously monitors crop prospects and food security situation at global, regional, national and sub-national levels and warns of impending
food difficulties and emergencies. Established in the wake of the world food crisis of the early 1970s, GIEWS maintains a unique database
on all aspects of food supply and demand for every country of the world. The System regularly provides policy makers and the international
community with up-to-date information so that timely interventions can be planned and suffering avoided.
The Global Information and Early Warning System on Food and AgricultureGIEWS
Crop Prospects and Food Situation is published by the Trade and Markets Division of FAO under the Global Information and Early Warning System (GIEWS). It is published four times a year and focuses on developments affecting the food situation of developing countries and the Low-Income Food-Deficit Countries (LIFDCs) in particular. The report provides a review of the food situation by geographic region, a section dedicated to the LIFDCs and a list of countries requiring external assistance for food. It also includes a global cereal supply and demand overview to complement the biannual analysis in the Food Outlook publication. Crop Prospects and Food Situation is available in English, French and Spanish in electronic format.
Crop Prospects and Food Situation and other GIEWS reports are available on the internet as part of the FAO world wide web (http:/www.fao.org/) at the following URL address: http:/www.fao.org/giews/. In addition, GIEWS Special Reports and Special Alerts, when published, can be received by e-mail through automatic mailing lists: subscription information is available at http:/www.fao.org/giews/english/listserv.htm.
This report is based on information available as of early September 2014.
Enquiries may be directed to: Global Information and Early Warning System on Food and Agriculture (GIEWS) Trade and Markets Division (EST) Food and Agriculture Organization of the United Nations Viale delle Terme di Caracalla 00153 Rome - Italy Direct Facsimile: 0039-06-5705-4495 E-mail: [email protected]
© FAO 2014
FAO encourages the use, reproduction and dissemination of material in this information product. Except where otherwise indicated, material may be copied, downloaded and printed for private study, research and teaching purposes, or for use in non-commercial products or services, provided that appropriate acknowledgement of FAO as the source and copyright holder is given and that FAO’s endorsement of users’ views, products or services is not implied in any way.
All requests for translation and adaptation rights, and for resale and other commercial use rights should be made via www.fao.org/contact-us/licence-request or addressed to [email protected].
Disclaimer
This report is prepared by the FAO’s Global Information and Early Warning System, with information from official and unofficial sources. None of the information in this report should be regarded as statements of governmental views.
Furthermore, the designations employed and the presentation of material in this report do not imply the expression of any opinion whatsoever on the part of the Food and Agriculture Organization of the United Nations concerning the legal status of any country, territory, city or area or of its authorities, or concerning the delimitation of its frontiers or boundaries.
E4096E