crop prospects and food situation · crop prospects and food situation no. 1 n march 2017 n fao’s...
TRANSCRIPT

Crop Prospects and Food Situation
No. 1 n March 2017
n FAO’s first forecast of global wheat production in 2017 points to an above-average output, but down from the record high of 2016, mostly reflecting expectations of reduced crops in North America.
n COUNTRIES IN NEED OF EXTERNAL ASSISTANCE: FAO estimates that 37 countries, including 28 in Africa, are in need of external assistance for food. Conflicts and weather-related shocks are the main drivers of food insecurity. The food security situation is of grave concern in northern Nigeria, Somalia, South Sudan and Yemen, where over 20 million people are facing severe food insecurity due to the protracted conflicts compounded by droughts in some cases. Famine was already officially declared in South Sudan.
n AFRICA: Dry weather-reduced outputs in North and Southern Africa drove the 2016 regional output downwards to a below-average level; however production in these subregions are expected to recover in 2017 due to overall beneficial weather. Conflicts in parts of Central, East and West Africa continue to severely stress food security conditions and undermine the agriculture sector, while drought in parts of East African has also intensified food insecurity.
n ASIA: Early prospects for the 2017 winter wheat crop are generally favourable, following an above-average regional cereal output in 2016. Conflicts continue to acutely impact agriculture, livelihoods and food security in the Syrian Arab Republic, Yemen and Iraq, resulting in low harvests and increased humanitarian needs.
n LATIN AMERICA AND THE CARIBBEAN: A record cereal crop in Mexico and production recoveries elsewhere in Central America, after last year’s drought-reduced harvests, resulted in a bumper 2016 cereal output in the subregion. Prospects for the 2017 maize harvest in South America are overall favourable, mainly reflecting price-induced expansion in plantings in the main producing countries Argentina and Brazil.
HIGHLIGHTS CONTENTSCountries Requiring External Assistance for Food 2
Global Overview 6
LIFDC Food Situation Overview 9
Regional Reviews Africa 11 Asia 21 Latin America and the Caribbean 27 North America, Europe and Oceania 30
Statistical Appendix 33
GIEWS global information and early warning system on food and agriculture
2000
2100
2200
2300
2400
2500
2600
201620142012201020082006
(+2.6%)
(+2.4%)
Million tonnes
World cereal production
World cereal utilization
Global cereal supply and demand situation comfortablefor the third consecutive season, supported by a furtherlifting of the 2016 world production estimate
300
350
400
450
500
201620142012201020082006
(+4.3%)
(+5.2%)
Million tonnes
LIFDC cereal production
LIFDC cereal utilization
LIFDC production partially recovers in 2016, reflecting more favourable weather conditions in several countries

2
Crop Prospects and Food Situation
No. 1 n March 2017
WIDESPREAD LACK OF ACCESS
BurundiCivil insecurity and economic downturn • Disruptions to markets, farming activities and livelihoods,
coupled with limited humanitarian assistance and declining food import capacity, continue to seriously affect food security conditions of households, especially in Kirundo, Muyinga, Rutada and Ruyigi provinces.
• About 1.5 million people are estimated to be severely food insecure.
ChadPopulation displacements and civil insecurity• Approximately 393 000 refugees, 108 000 IDPs, as well as
an estimated 115 000 Chadian returnees, continue to add pressure on local food supplies, negatively affecting food security.
• About 456 000 people are estimated to be in need of food assistance according to the latest “Cadre Harmonisé” analysis (November 2016).
Democratic Republic of the CongoConflict and displacements in eastern provinces, as well as influx of refugees putting strain on host communities• As of late December 2016, the IDP caseload was
estimated at 2.2 million, 300 000 more than the previous estimate in late September. About 6 million people are estimated to be in acute food insecurity and livelihood crisis (IPC Phase 3: “Crisis” and IPC Phase 4: “Emergency”). The country hosts 102 500 refugees from the Central African Republic, 66 700 from South Sudan and 36 300 from Burundi.
AFRICA (28 countries)
EXCEPTIONAL SHORTFALL IN AGGREGATE FOOD PRODUCTION/SUPPLIES
Central African RepublicConflict, displacements and food supply constraints• The Internally Displaced Person (IDP) caseload was
estimated at 412 000 in mid-January, a slight decline from its peak of 434 000 in late November 2016 when renewed violence displaced about 150 000 people in central and southern prefectures. About 2 million people (40 percent of the total population) are in need of urgent assistance (IPC Phase 3: “Crisis” and IPC Phase 4: “Emergency”) as a result of three consecutive years of reduced harvests and food access constraints due to market disruptions and declining purchasing power.
MalawiTight cereal supplies and higher food prices • An estimated 6.7 million people are in need of
humanitarian assistance, mainly a result of the reduced harvest in 2016 and higher food prices.
• Production prospects for the 2017 cereal crop are overall favourable, but an army worm infestation and localized floods may restrain outputs in some areas.
ZimbabweSignificant reduction in cereal production in 2016 • An estimated 44 percent (4.07 million people) of the rural
population are currently food insecure, mostly due to the impact of the 2016 drought on agricultural production.
• The production outlook for the 2017 cereal crop is more favourable than the previous year, but an army worm infestation may limit outputs in some areas, further stressing food security conditions.
Countries requiring external assistance for food1
country requiring external assistance for food
World: 37 countries

No. 1 n March 2017 3
Crop Prospects and Food Situation
DjiboutiLingering effects of unfavourable rainy seasons on pastoral livelihoods• About 197 000 people are severely food insecure, down
from the previous estimate, mainly concentrated in pastoral inland areas of Obock and Dikhil regions.
EritreaEconomic constraints have increased the population’s vulnerability to food insecurity
EthiopiaLingering effects of the previous year’s severe drought on local livelihood systems • Drought affected second season crops and pastures in
south and southeastern areas; lingering effects of 2015 severe drought on local livelihood systems.
• Overall, an estimated 5.6 million people are food insecure.
LesothoTighter domestic supplies and higher food prices• Just under 710 000 people are estimated to be food
insecure on account of the drought-reduced 2016 harvest and higher food prices.
MozambiqueTighter supplies and sharply higher food prices• Drought conditions in 2016 resulted in lower cereal
outputs in southern provinces and in parts of central provinces, while higher prices are adversely impacting food access. Nearly 2 million people are food insecure and require humanitarian assistance.
• Recent flooding in some central and southern parts is likely to restrain 2017 cereal production in the affected areas.
NigerPopulation displacements and civil insecurity • More than 300 000 people are estimated to be in Phase
3: “Crisis” and above according to the last “Cadre Harmonisé” analysis.
• Approximately 61 000 Malian refugees are estimated to be living in the country.
• Almost 121 000 people, mostly in the southeast Diffa Region, have been displaced due to fear of attacks.
NigeriaEconomic downturn, steep depreciation of the local currency, population displacements and severe civil insecurity in northern areas• About 8.1 million people are estimated to be facing acute
food insecurity and require urgent lifesaving response and livelihood protection, including 55 000 people in CH Phase 5: “Famine” (i.e. IPC Catastrophy), according to the latest “Cadre Harmonisé” analysis. Despite the above-average cereal harvest gathered in 2016, the sharp depreciation of the Naira, coupled with persisting civil conflict in northern states has continued to disrupt market activities and keep prices at high levels.
• Approximately 1.8 million people have been internally displaced in the northeastern region of the country.
South SudanConflict, civil insecurity and severe economic downturn• Famine has been declared in parts of former Unity State.
Over 4.9 million people are severely food insecure, mainly in the conflict-affected states of Jonglei, Unity and Upper Nile, but also in traditional surplus-producing areas of Greater Bahr el Ghazal and Greater Equatoria regions due to insecurity, trade disruptions and high prices.
SwazilandReduced agricultural output following drought conditions• Nearly 640 000 people are in need of assistance, reflecting
the impact of the drought-reduced 2016 harvest and livestock losses. Higher food prices have further affected food security conditions.
• Production prospects for the 2017 crop are favourable and an improved agricultural output will help to recuperate food security conditions.
SEVERE LOCALIZED FOOD INSECURITY
Burkina FasoRefugees putting strain on host communities • Over 32 000 Malian refugees are estimated to be living in
the country.• About 153 000 people are estimated to be in need of
food assistance according to the last “Cadre Harmonisé” analysis, despite the bumper 2016 cereal harvest.
CameroonInflux of refugees putting strain on host communities and displacements • The number of refugees from the Central African Republic
was estimated in December at 276 000. Insecurity along the borders with Nigeria also led to the internal displacement of 192 000 individuals.
• The number of food insecure people is currently estimated at 2.8 million.
CongoInflux of refugees straining the already limited resources of host communities • As of mid-November 2016, about 23 600 refugees from
the Central African Republic are sheltering in the country.
GuineaLingering impact of the Ebola Virus Disease (EVD) outbreak • All neighbouring countries have re-opened their borders
with Guinea, which has led to a significant increase in trade flows.
• About 51 000 people are estimated to be in need of food assistance according to the last “Cadre Harmonisé” analysis.
KenyaDrought impact on crop production and livestock during the last quarter of 2016 • About 2.7 million people are severely food insecure,
mainly located in eastern, southeastern and coastal areas, following the negative impact of poor 2016 “short-rains”.
LiberiaLingering impact of the EVD outbreak • The country is hosting approximately 19 000 refugees as of
end-December 2016, most of them from Côte d’Ivoire.• About 53 000 people are estimated to be in need of food
assistance according to the latest “Cadre Harmonisé” analysis.
MadagascarSevere drought conditions in southern areas • The sharp decrease in the 2016 cereal harvest compared to
the average resulted in severe food insecurity conditions; approximately 850 000 people require humanitarian assistance in Androy, Anosy and Astimo Andrefana. Higher food prices have also exacerbated the situation.
• Agricultural conditions in southern parts have improved in 2017 due to beneficial seasonal rains, but drier conditions in eastern and some northern parts may limit this year’s harvest in the affected areas.

4
Crop Prospects and Food Situation
No. 1 n March 2017
MaliPopulation displacements and civil insecurity in northern areas• An estimated 37 000 people have been internally displaced
in the country mostly residing in Timbuktu, the most affected region.
• About 177 000 people, located mostly in Timbuktu, Mopti and Bamako regions, are estimated to be in Phase 3: “Crisis” and above, according to the last “Cadre Harmonisé” analysis.
MauritaniaRefugee caseload continues to put additional pressure on local food supplies• As of December 2016, about 45 000 Malian refugees
remain in southeastern Mauritania in the Mbeera camp. • Over 119 000 people are estimated to be in
Phase 3: “Crisis” and above, according to the last “Cadre Harmonisé” analysis.
Sierra LeoneLingering impact of the EVD outbreak• About 159 000 people are estimated to be in need of
food assistance according to the latest “Cadre Harmonisé” analysis.
SomaliaConflict, civil insecurity and widespread drought conditions• About 2.9 million people are estimated to be in need of
emergency assistance, mainly IDPs and drought-affected agro-pastoral communities across the country.
SudanConflict and civil insecurity • An estimated 3 million people are in need of humanitarian
assistance, mainly IDPs and host communities in conflict-affected areas.
UgandaBelow-average crop production• About 1.6 million people are estimated to be severely food
insecure following two consecutive seasons of reduced agricultural outputs.
ASIA (8 countries)
EXCEPTIONAL SHORTFALL IN AGGREGATE FOOD PRODUCTION/SUPPLIES
Syrian Arab RepublicWorsening civil conflict• Agricultural production continues to be significantly
affected by conflict, despite favourable weather.• About 7 million people are estimated to be food insecure
and a further 2 million are at risk of food insecurity.• Although some international food assistance is being
provided, Syrian refugees are also putting strain on other host communities in neighbouring countries.
WIDESPREAD LACK OF ACCESS
Democratic People’s Republic of KoreaLow agricultural output and economic downturn• Localized floods across northeastern parts of the country
in September 2016, resulted in damage to arable land, housing and infrastructure. These areas were also negatively impacted by the floods in August 2015.
• Despite an expected partial recovery in the 2016 aggregate food production, supplies remain tight and 18 million people remain dependent on Government-distributed food rations.
• Given the overall tight supply situation, most households are anticipated to continue to experience borderline or poor food consumption rates.
YemenConflict, poverty, and high food and fuel prices• According to the Emergency Food and Nutrition
Assessment, over 17 million people are food insecure, with an increase of 3 million from the last IPC analysis of June 2016. The risk of famine declaration is high.
• A below-average cereal harvest was gathered in 2016 but abundant rainfall had positive effects on livestock production.
SEVERE LOCALIZED FOOD INSECURITY
AfghanistanContinuing conflict and population displacement• Almost 1.6 million people are severely food insecure and
9.7 million people moderately food insecure. • Over 630 000 people were displaced by the conflict in
2016, mostly in the hard-to-access areas.• Since 1 January 2016, over 728 000 undocumented
Afghans have returned mostly due to changes in refugee policies in Pakistan.
IraqCivil conflict• Over 3 million people have been internally displaced.• About 2.4 million people are estimated to be food
insecure, of which 1.5 million severely food insecure.
Libya Civil insecurity• The number of people in need of food assistance is
estimated at 0.4 million, with refugees, asylum seekers and internally-displaced among the most vulnerable.
• Food shortages are reported mostly in the south and east where basic food items, including wheat, bread, flour, pasta, oil, milk and fortified blended foods for children are in short supply. Access to subsidized food among the affected population is limited.
MyanmarImpact of floods for a second consecutive year and renewed conflict in northern parts of Rakhine State• Floods in 2016 severely affected an estimated 500 000 people.• Households in Chin and Rakhine states still remain highly
vulnerable as they have not yet recovered from the impact of the floods in 2015.
• Around 120 000 people are estimated to have been displaced in Rakhine and 98 000 in Kachin and Shan states. Around 162 000 people are estimated to be food insecure with at least 78 000 in urgent need of food.
PakistanPopulation displacement and localized cereal production shortfalls• As of January 2017 an estimated 3.2 million people were
in need of humanitarian aid. About 504 000 people (approximately 74 000 families) remain displaced in northern Pakistan due to recurrent insecurity.
• In Tharparkar District and the surrounding areas of Sindh Province, the drought-affected cereal production and the loss of livestock for the third consecutive year have aggravated the food insecurity and caused acute malnutrition.
LATIN AMERICA AND THE CARIBBEAN (1 country)
SEVERE LOCALIZED FOOD INSECURITY
HaitiRecurrent droughts and hurricane damage • Recurring droughts in 2014 and 2015, coupled with
the effects of Hurricane Matthew in 2016, had a devastating impact on food security.
• As a result of the reduced availability and access to food in the affected areas, an estimated 1.5 million people are food insecure, of which 1.3 million will be assisted in 2017.

No. 1 n March 2017 5
Crop Prospects and Food Situation
Key - New Entry +
Terminology1 Countries requiring external assistance for food are expected to lack the resources to deal with reported critical problems of food insecurity. Food crises are nearly always due to a combination of factors but for the purpose of response planning, it is important to establish whether the nature of food crises is predominantly related to lack of food availability, limited access to food, or severe but localized problems. Accordingly, the list of countries requiring external assistance is organized into three broad, not mutually exclusive, categories:
•Countries facing an exceptional shortfall in aggregate food production/supplies as a result of crop failure, natural disasters, interruption of imports, disruption of distribution, excessive post-harvest losses, or other supply bottlenecks.
•Countrieswithwidespread lack of access, where a majority of the population is considered to be unable to procure food from local markets, due to very low incomes, exceptionally high food prices, or the inability to circulate within the country.
•Countrieswithsevere localized food insecurity due to the influx of refugees, a concentration of internally displaced persons, or areas with combinations of crop failure and deep poverty.
2 Countries facing unfavourable prospects for current crops are countries where prospects point to a shortfall in production of current crops as a result of a reduction of the area planted and/or yields due to adverse weather conditions, plant pests, diseases and other calamities.
Countries with unfavourable prospects for current crops2 (total: 2 countries)
AFRICA (1 country)
Central African RepublicWidespread conflict, which caused large-scale displacements, the loss and depletion of households’ productive assets and input shortages continues to weigh on the early 2017 production prospects.
ASIA (1 country)
Sri LankaProlonged dry weather has lowered production prospects for the 2017 crop and almost 1 million people in 23 districts, out of 25, have been negatively affected by drought conditions. FAO and WFP will conduct a joint Crop and Food Security Assessment Mission (CFSAM) from mid-March 2017, at the request of the Government, to assess the impact of the drought on the 2017 main crop harvest and to evaluate the food security situation.

No. 1 n March 20176
Crop Prospects and Food Situation
Cereal Supply and Demand
CEREAL PRODUCTION 2016
With the bulk of the crop already
gathered, FAO estimates world cereal
production in 2016 at 2 600 million
tonnes, up 7.9 million tonnes
(0.3 percent) from February expectations,
mainly reflecting improved prospects for
wheat in Australia, maize in Ukraine and
rice in India. At this level, global cereal
production would be 66.2 million tonnes
(2.6 percent) higher than in 2015, with a
large part of this growth resulting from
the 37.5 million tonnes (2.9 percent)
expansion in coarse grains output to
1 344 million tonnes. Global wheat output
also registered strong growth, expanding
by 22.8 million tonnes or 3.1 percent to
758 million tonnes. In the case of rice, an
expected 5.9 million tonne (1.2 percent)
annual increase would position world
rice production in 2016 at a fresh peak of
498 million tonnes.
WHEAT 2017Looking ahead, FAO’s first forecast of
global wheat production in 2017 stands
at 744.5 million tonnes, indicating a
1.8 percent decline from the 2016 record
level but still above the last five-year
average. The year-on-year decline would
mostly reflect the projected decrease in
plantings in North America, and a return
to normal production levels in Australia
following an exceptionally high output
in 2016. With the winter wheat crop
emerging from dormancy in Northern
Hemisphere countries, prospects are
good in Asia, where larger plantings in
China, India and Pakistan are expected
to push production upwards. In Europe,
conducive winter weather and a small
expansion in the area sown are set to
result in higher outputs, especially in
the European Union and the Russian
Federation. In North America, wheat
production is forecast to decline in the
United States of America and Canada,
mostly reflecting price-induced cuts in
winter wheat sowings, coupled with
some concerns about potentially lower
crop yields. Planting of the wheat crop
in Southern Hemisphere countries will
begin later in the year.
COARSE GRAINS 2017Prospects for 2017 coarse grains
production, mainly maize, are generally
favourable in the Southern Hemisphere
with the crop in its final development
stage. Reflecting wetter conditions in
most of Southern Africa, production
is expected to recover from the
drought-reduced output of 2016, with
South Africa harvesting a maize crop
50 percent larger than in 2016. However,
an outbreak of armyworms and localized
floods are likely to limit production gains
in some other countries of the subregion.
In South America, sharp increases in
production are forecast for Argentina and
Brazil, given the increase in plantings and
generally favourable weather conditions.
In the Northern Hemisphere, maize
plantings in the key-producing countries
will only commence in late spring.
GLO
BA
L O
VER
VIE
W
Table 1. World cereal production1 (million tonnes)
2014 20152016
estimateChange: 2016 over 2015 (%)
Asia 1 116.3 1 120.2 1 132.8 1.1Far East 1 019.9 1 015.1 1 028.6 1.3Near East 64.4 70.5 67.9 -3.7CIS in Asia 32.1 34.6 36.2 4.7
Africa 175.3 166.4 161.0 -3.2North Africa 33.1 37.3 28.6 -23.4West Africa 51.9 51.7 55.0 6.5Central Africa 4.7 4.5 4.1 -8.6East Africa 51.6 46.1 49.4 7.1Southern Africa 34.0 26.8 23.9 -10.9
Central America and Caribbean 41.9 40.4 44.1 9.3
South America 179.1 186.7 170.9 -8.5
North America 491.3 482.9 530.4 9.8
Europe 523.7 498.7 506.4 1.5European Union 330.6 313.3 300.5 -4.1CIS in Europe 178.5 172.8 193.0 11.7
Oceania 36.9 38.4 54.3 41.4
World 2 564.5 2 533.6 2 599.8 2.6Developing countries 1 454.3 1 457.5 1 453.1 -0.3Developed countries 1 110.2 1 076.1 1 146.7 6.6
- wheat 730.5 735.2 758.0 3.1- coarse grains 1 339.2 1 306.5 1 344.0 2.9- rice (milled) 494.8 491.9 497.8 1.2
Note: Totals and percentage change computed from unrounded data.1 Includes rice in milled terms.

No. 1 n March 2017 7
Crop Prospects and Food Situation
GLO
BA
L OV
ERV
IEW
RICE 2017Prospects for 2017 paddy crops along
and south of the Equator remain mixed.
Among the major rice producers,
abundant rains permitted main crop
plantings in Indonesia to begin ahead of
schedule and advance at a fast pace, while
in Brazil conducive weather is expected
to sustain a yield-driven output recovery.
At the same time, overly wet conditions
in Viet Nam slowed winter-spring sowing
progress, further clouding the yield
outlook for this first crop of the season.
UTILIZATION 2016/17The forecast of world cereal utilization
in 2016/17 has been raised by 11 million
tonnes since February to almost
2 578 million tonnes, mostly reflecting a
significant upward revision for the 2016
wheat crop in India, as well as a higher
anticipated use of maize for feed in China
and Mexico. At the current forecast
level, global cereal utilization would
be 2.4 percent (60.4 million tonnes)
greater than in 2015/16, sustained by a
1.4 percent (15 million tonnes) increase
in food consumption and a 3.1 percent
(28 million tonnes) expansion in feed
utilization. Large wheat supplies, coupled
with generally lower prices, are behind an
expected 3.5 percent (25 million tonnes)
increase in total wheat utilization in
2016/17, to 739 million tonnes. Total use
of wheat for direct human consumption is
forecast at 499 million tonnes, 1.1 percent
higher than in 2015/16 and sufficient to
keep the average global per caput wheat
consumption level stable at 67.2 kg.
Feed utilization of wheat is also forecast
to increase by as much as 6 percent to
nearly 145 million tonnes, underpinned
by notable increases in feed use of wheat
in North America, China and the Russian
Federation. Total utilization of coarse
grains is forecast to rise by 2.4 percent
(31 million tonnes) to almost 1 340 million
tonnes in 2016/17. Global feed use would
account for 759 million tonnes of this total
volume, with the 2.7 percent year-on-year
expansion led by sharp increases in maize
feed utilization in China, Mexico and the
United States of America, which would
more than offset expected reductions in
Brazil and the European Union. World rice
utilization is predicted to reach 500 million
tonnes in 2016/17, with growing
consumption of rice as food sustaining
much of the projected 1 percent annual
expansion.
STOCKS 2016/17FAO’s February forecast of world cereal
stocks at the close of the crop seasons
ending in 2017 has been lowered by
about 3 million tonnes, mainly reflecting
downward adjustments to wheat
inventories in India. At 678 million tonnes,
the revised cereal global carryover forecast
would still be 2.5 percent (16.8 million
tonnes) higher than a year earlier.
This would position the world cereal
stock-to-use ratio in 2016/17 slightly
above the previous season’s level, at close
to 26 percent. The major cereal exporters’
stock-to-disappearance ratio (defined as
domestic utilization plus exports) is also set
to increase, from 16 percent in 2015/16
to 17 percent in 2016/17. Among the
major cereals, wheat global inventories are
anticipated to rise the most, by 6.6 percent
(15 million tonnes) to nearly 240 million
tonnes. Much of this projected expansion
reflects significant inventory build-ups in
Australia, China, the Russian Federation
and the United States of America, which
would more than offset drawdowns in
the European Union and India. At almost
267 million tonnes, the forecast for world
coarse grains carryovers remains nearly
unchanged from February and from last
year’s high level. This season’s record
maize crop in the United States of America
is expected to boost the size of total
coarse grains inventories in the country
to an all-time high of nearly 63 million
tonnes, up as much as 31 percent from
their opening level. At the same time,
other major producers, most notably
China, Brazil, the European Union and
South Africa, are projected to draw their
stocks down sharply, in most cases due
Table 2. Wheat production: leading producers 1 (million tonnes)
Average 2014-16 2015
2016 estimate
2017 forecast
Change: 2017 over 2016 (%)
European Union 154.0 160.5 144.5 150.0 3.8China (Mainland) 128.3 130.2 128.6 129.0 0.3India 91.5 86.5 92.3 95.5 3.5Russian Federation 64.9 61.8 73.3 74.0 1.0United States of America 58.0 56.1 62.9 50.0 -20.5Canada 29.6 27.6 31.7 28.6 -9.8Australia 27.7 24.2 35.1 28.0 -20.2Pakistan 25.5 25.1 25.5 26.0 2.0Ukraine 25.5 26.5 26.0 25.0 -3.8Turkey 20.7 22.6 20.6 21.0 1.9Kazakhstan 13.9 13.7 14.9 13.5 -9.4Argentina 13.9 11.3 16.5 16.0 -3.0Iran Islamic Rep. of 11.9 11.5 13.5 12.0 -11.1Egypt 9.1 9.0 9.0 9.0 0.0Uzbekistan 7.1 7.0 6.7 7.0 4.5Other countries 59.7 59.7 59.8 59.9 0.2
World 741.2 735.2 758.0 744.5 -1.8
1 Countries ranked according to average production in 2014-16.

No. 1 n March 20178
Crop Prospects and Food Situation
to lower domestic production. Following
a 1.6 million-tonne upward adjustment,
world rice inventories in 2017 are seen
largely stable year-to-year at 172 million
tonnes. India accounted for most of
this month’s upward revision to rice
closing stocks, consistent with improved
production outlook for the country and the
fast progress of Government procurement.
TRADE 2016/17World trade in cereals in 2016/17 is
forecast to reach nearly 393 million
tonnes, slightly more than predicted in
February, but still 0.4 percent (1.8 million
tonnes) below the 2015/16 level. All of
the annual contraction in world cereal
flows is expected to be driven by a sharp
reduction in trade of coarse grains, while
global trade of both wheat and rice
are set to expand. Total trade in coarse
grains in 2016/17 (July/June) is forecast
to fall as much as 4.5 percent (8.4 million
tonnes) below the 2015/16 record level to
177.5 million tonnes. However, most of
this decrease would reflect smaller imports
of barley, maize and sorghum by China,
in line with expectations of much higher
utilization of locally-produced maize given
the country’s ample maize inventories.
While smaller imports are also forecast
for the European Union (maize) and
Saudi Arabia (barley), a number of other
countries are expected to increase their
level of purchases, particularly Morocco
(maize and barley) and Viet Nam (maize).
World trade in wheat (including wheat
flour in wheat equivalent) in 2016/17
(July/June) is forecast at a new record of
172 million tonnes, 1 million tonnes higher
than predicted in February, as a result of
upward revisions to imports by Bangladesh
and Viet Nam. At the current forecast level,
world trade in wheat would stand some
3 percent (5.2 million tonnes) above the
2015/16 level, with most of the increase
driven by larger wheat projected purchases
by Brazil, India, Turkey and Viet Nam.
International trade in rice in calendar year
2017 is still forecast to expand by 4 percent
to 43 million tonnes. On the export side,
India and Viet Nam are predicted to lead
the world trade upturn, although in both
cases growth could be capped by intense
competition for markets and lingering
subdued demand in key markets.
GLO
BA
L O
VER
VIE
W

No. 1 n March 2017 9
Crop Prospects and Food Situation
Low-Income Food-Deficit Countries Food Situation Overview1
1 The Low-Income Food-Deficit Countries (LIFDCs) group includes net food deficit countries with annual per caput income below the level used by the World Bank to determine eligibility for IDA assistance (i.e. USD 1 945 in 2011). The current list of the LIFDCs stands at 54 countries. For full details see: http://www.fao.org/countryprofiles/lifdc/en/
Early prospects for LIFDC cereal production in 2017 are mixedIn Low-Income Food-Deficit Countries
(LIFDCs), harvesting of the 2017 crops has
already commenced in some countries of
East Africa for the minor season, and will
continue in April in Southern Africa and
parts of Asia for the main season crops.
In Asia, an expansion in wheat
plantings in India, the largest producing
LIFDC, is expected to result in an increased
crop in 2017. In Pakistan, the wheat
output is also forecast to rise on a yearly
basis, supported by a larger sown area
and a recovery in yields. In the Near East,
the ongoing conflict and lack of inputs
in the Syrian Arab Republic and
Yemen continues to significantly hamper
agricultural activities.
In sub-Saharan Africa, the main
season harvest will commence in April in
Southern Africa, where the 2017 cereal
production is expected to recover from the
drought-reduced level of last year, mostly
owing to wetter conditions. However,
an army worm outbreak and localized
flooding could limit larger production
gains. In East Africa, with planting
operations for the main season underway,
a severe drought since late 2016 has
heightened concerns about the 2017 crop,
particularly with drier conditions predicted
for the March-May rainy season. In
Burundi and Rwanda, production of the
first season’s crop, harvested in February,
LOW
-INC
OM
E FOO
D-D
EFICIT C
OU
NTR
IES
Table 3. Basic facts of the Low-Income Food-De�cit Countries (LIFDCs) cereal situation (million tonnes, rice in milled basis)
2014/152015/16 estimate
2016/17 forecast
Change: 2016/17 over 2015/16 (%)
Cereal production1 436.7 413.7 435.3 5.2 excluding India 192.3 184.1 190.3 3.4
Utilization 464.0 462.4 482.6 4.4Food use 371.4 375.9 384.4 2.3 excluding India 178.9 182.6 188.0 2.9Per caput cereal food use (kg per year) 146.8 146.0 146.7 0.5 excluding India 144.9 144.4 145.2 0.6Feed 36.3 35.8 36.8 2.8 excluding India 21.7 21.3 21.4 0.5
End of season stocks2 89.5 79.2 73.7 -6.9 excluding India 41.0 38.9 38.3 -1.5
1 Data refer to calendar year of the �rst year shown.2 May not equal the di�erence between supply and utilization because of di�erences in individual country marketing years.
Table 4. Cereal production1 of LIFDCs(million tonnes)
2014 20152016
estimateChange: 2016 over 2015 (%)
Africa (37 countries) 119.1 111.3 116.8 4.9East Africa 51.6 46.1 49.4 7.1Southern Africa 11.0 9.1 8.3 -8.7West Africa 51.9 51.7 55.0 6.5Central Africa 4.6 4.4 4.0 -8.7
Asia (12 countries) 316.2 301.1 316.8 5.2CIS in Asia 10.6 10.9 10.8 -0.9Far East 295.6 280.3 297.2 6.0 - India 244.4 229.6 245.1 6.7Near East 10.0 9.9 8.7 -11.9Central America and the Caribbean (3 countries) 1.5 1.2 1.7 41.2
Oceania (2 countries) 0.0 0.0 0.0 0.0
LIFDC (54 countries) 436.7 413.7 435.3 5.2
Note: Totals and percentage change computed from unrounded data.1 Includes rice in milled terms.

No. 1 n March 201710
Crop Prospects and Food Situation
was already estimated to be down from
the previous year due to below-average
rains. In Central Africa, despite some
improvements, insecurity continues to
weigh negatively on the production
outlook in the Central African Republic,
where households’ productive capacity
has already been eroded after successive
years of conflict.
Production rebounds in Far East Asia and East Africa boost LIFDC cereal output in 2016 FAO’s latest estimate for aggregate
cereal production of LIFDCs in 2016
was raised marginally by 1.4 million
tonnes since the previous issue of this
publication in December 2016, to
435.3 million tonnes. The increase is
mainly accounted for by an upward
revision of India’s output (mostly
maize and rice), while small positive
adjustments were made to production
estimates for East and Central Africa.
average levels. In the Near East, production
is estimated at a well-below average level
and is over 1 million tonnes down from
2015, as the persisting conflicts severely
weakened the agriculture sector in
Afghanistan, the Syrian Arab Republic
and Yemen.
LIFDC imports forecast to increase in 2016/17The forecast for aggregate cereal imports
by LIFDCs in the 2016/17 marketing year
was raised by about 2 million tonnes
since the previous edition of this report
in December 2016. Most of this growth
relates to higher imports of wheat by India.
On an annual basis, Imports are forecast to
expand by 5.3 percent, mainly on account
of increased imports in Southern African
countries, following the sharp production
decline in 2016, and in India. Imports by
LIFDCs in West and Central Africa are also
foreseen to rise but moderately, and in
East Africa import expectations increased in
Kenya mainly reflecting
the drought-reduced
output. In Asia, cereal
imports are forecast to
contract in CIS Asian
countries as a result of
recoveries in domestic
outputs, while larger
volumes of imported
wheat in India pushed
up the aggregate
import forecast for the
Far East. In the Near
East, conflicts continue
to constrain import
capacities, although
food aid needs are
higher. In Central
America, imports are
foreseen to fall on
the back of a partial
recovery in cereal
production in 2016.
LOW
-IN
CO
ME
FOO
D-D
EFIC
IT C
OU
NTR
IES
At this level, aggregate LIFDC cereal
production in 2016 is 5.2 percent above
the 2015 output.
In sub-Saharan Africa, the 2016
aggregate production estimate for
LIFDCs stands at 116.8 million tonnes,
5 percent higher than the previous year’s
level. Larger outputs in East and West
Africa were the main drivers behind the
year-on-year increase, mostly reflecting
beneficial weather that boosted yields.
These increases more than outweighed
production declines in Southern African
countries, which were severely affected
by drought conditions, and in Central
Africa, where conflicts negatively affected
production, despite generally beneficial
weather.
In Asia, aggregate production of
LIFDCs is forecast at 316.8 million tonnes,
5.2 percent higher than the level in 2015.
The bulk of the increase mainly relates to a
near 16-million-tonne recovery in India’s
output, due to a rebound in yields to
Table 5. Cereal imports of LIFDCs(thousand tonnes)
2014/15 2015/16 or 2016 2016/17 or 2017
or 2015
Actual
importsImport
forecastof which food aid
Import requirement 1
of which food aid
Africa (37 countries) 32 326 32 159 1 223 33 846 953East Africa 10 459 10 671 873 10 709 624Southern Africa 2 718 2 891 37 4 091 47West Africa 17 247 16 827 156 17 027 124Central Africa 1 903 1 770 156 2 019 157
Asia (12 countries) 19 601 22 894 803 24 295 809CIS in Asia 4 138 4 387 1 4 241 1Far East 6 455 8 335 201 9 862 198Near East 9 007 10 172 602 10 192 610Central America and the Caribbean (3 countries) 1 973 2 248 37 2 065 14
Oceania (2 countries) 473 481 0 470 0
Total (54 countries) 54 372 57 782 2 063 60 676 1 775
Note: Totals computed from unrounded data.1 The import requirement is the di�erence between utilization (food, feed, other uses, export plus closing stocks) and domestic availability (production plus opening stocks).

No. 1 n March 2017 11
Crop Prospects and Food Situation
Regional reviews
wheat accounts for about 60 percent) for the 2016/17 marketing
year (July/June) is estimated at approximately 51.1 million
tonnes, 17 percent above the previous five-years average. The
below-average 2016 harvest in Morocco increased forecasted
cereal imports to 8.8 million tonnes (18 percent above the
2015/16 volumes), while a slightly improved crop in Tunisia
decreased the import requirement by about 4 percent compared
to last year. At 21 million and 13.6 million tonnes, respectively,
the cereal import forecasts in Egypt and Algeria are about the
same as in the previous year.
NORTH AFRICA
Favourable prospects for 2017 winter crops Prospects for the 2017 winter wheat and coarse grains crops,
to be harvested from May, remain favourable. While parts of
Morocco and western Algeria suffered from autumn drought
up to mid-November 2016, delaying plantings in some areas,
good precipitation in December and January replenished
soil moisture maintaining good yield prospects in Morocco,
Algeria and Tunisia. In Egypt, with mostly irrigated wheat,
reports indicate average conditions, resulting in a preliminary
wheat production forecast of 9 million tonnes, similar to last
year’s average level.
Above-average import requirement estimated for the 2016/17 marketing year owing to a below-average 2016 cereal harvestThe aggregate 2016 subregional cereal production (including rice
in paddy terms) is estimated at 30.5 million tonnes, 22 percent
down from previous year’s above-average output and 18 percent
below the five-year average. Total wheat production in 2016
decreased by almost 28 percent on a annual basis to 15 million
tonnes, while the coarse grain harvest is estimated at 9.2 million
tonnes, about 20 percent below the five-year average and about
25 percent lower than the previous year. The biggest year-on-year
decline in wheat production was recorded in Morocco, where
only 2.7 million tonnes of wheat were harvested compared to
8 million tonnes in 2015, mainly due to poor rains that significantly
restricted yields.
With a significantly below-average 2016 harvest, the
subregion’s aggregate cereal import requirement (of which
AFR
ICA
Note: Comments refer to situation as of March.
North Africa • winter grains: vegetative
Southern Africa • main season (summer cereals): harvesting
Kenya, Somalia • main season cereals: land preparation/ planting
Uganda• main season cereals: planting
Eritrea, Ethiopia• secondary season grains: land preparation/ planting
Tanzania, U.R.• main season cereals: plantings
Sudan• secondary season wheat: maturing
West Africa coastal countries • main season cereals: land preparation/ planting
Burundi, Rwanda• main season cereals: land preparation/ planting
Table 6. North Africa cereal production (million tonnes)
Wheat Coarse grains Rice (paddy) Total cereals
2014 20152016
estim. 2014 20152016
estim. 2014 20152016
estim. 2014 20152016
estim.Change:
2016/2015 (%)
North Africa 18.0 20.9 15.0 10.7 12.3 9.2 6.3 5.9 6.3 35.0 39.1 30.5 -22.0Algeria 1.9 2.8 2.2 1.3 1.3 1.1 0.0 0.0 0.0 3.2 4.1 3.3 -19.5Egypt 9.3 9.0 9.0 6.6 6.8 6.8 6.2 5.9 6.3 22.1 21.7 22.1 1.9Morocco 5.1 8.0 2.7 1.9 3.7 0.8 0.0 0.0 0.0 7.0 11.7 3.5 -69.8Tunisia 1.5 0.9 0.9 0.8 0.4 0.4 0.0 0.0 0.0 2.3 1.3 1.3 -2.1
Note: Totals and percentage change computed from unrounded data.
No. 1 n March 201712
Crop Prospects and Food Situation
Inflation increases in Egypt, remains stable elsewhereFood price inflation in January 2017 (or December 2016,
depending on data availability) ranged from 2.6 percent in
Morocco (December 2016) to over 37 percent in Egypt. A food
price inflation of 4.9 percent in December 2016 was reported
in Algeria and 4.7 percent in January 2017 in Tunisia. While
only small adjustments took place across the subregion, unusually
large increases in Egypt (up from 13.8 percent in October
2016) were driven by the sharp currency depreciation in early
November 2016 causing prices of imported goods to increase,
while consequent higher fuel prices pushed up distribution costs.
In Libya, where the overall yearly inflation rate in 2016 was
estimated at over 14 percent, driven by supply chain disruptions
due to infrastructure destruction, that offset the downward
pressure from fuel and food subsidies.
WEST AFRICA
Seasonal dry conditions in 2017 prevail in the Sahel, while in
the coastal countries along the Gulf of Guinea land preparation
for the first maize crop is underway. Planting will begin with the
arrival of rains, usually from April.
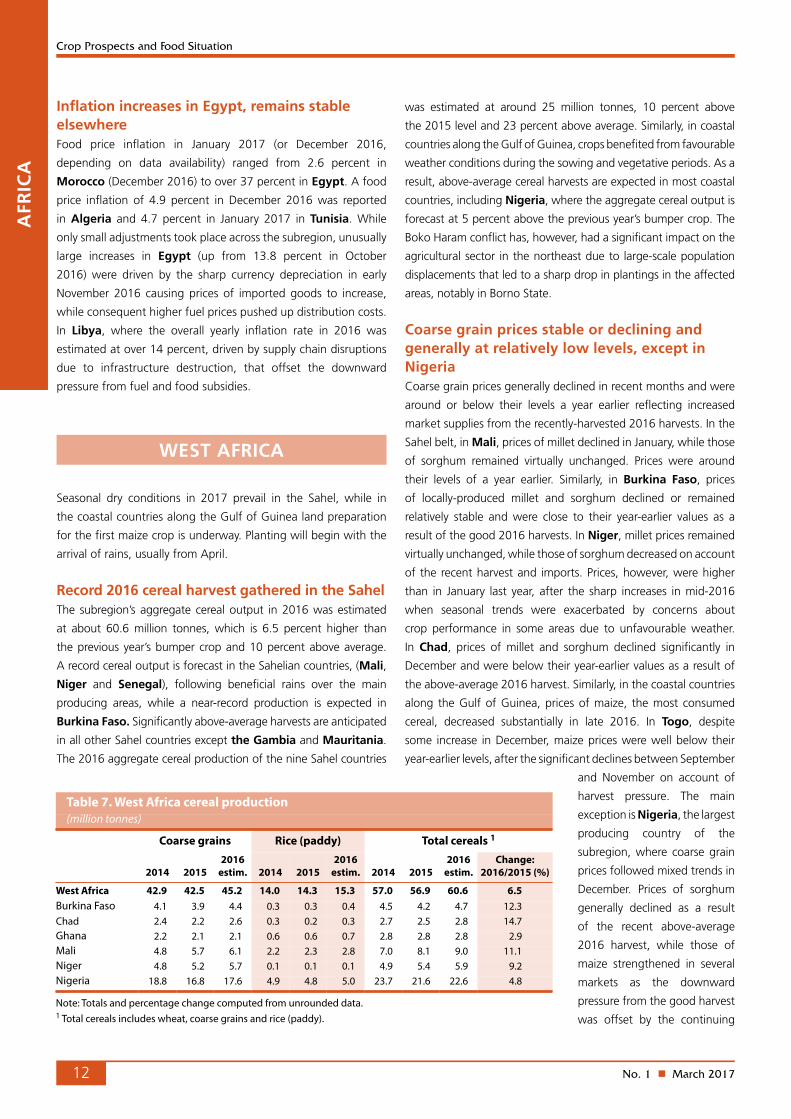
Record 2016 cereal harvest gathered in the SahelThe subregion’s aggregate cereal output in 2016 was estimated
at about 60.6 million tonnes, which is 6.5 percent higher than
the previous year’s bumper crop and 10 percent above average.
A record cereal output is forecast in the Sahelian countries, (Mali,
Niger and Senegal), following beneficial rains over the main
producing areas, while a near-record production is expected in
Burkina Faso. Significantly above-average harvests are anticipated
in all other Sahel countries except the Gambia and Mauritania.
The 2016 aggregate cereal production of the nine Sahel countries
was estimated at around 25 million tonnes, 10 percent above
the 2015 level and 23 percent above average. Similarly, in coastal
countries along the Gulf of Guinea, crops benefited from favourable
weather conditions during the sowing and vegetative periods. As a
result, above-average cereal harvests are expected in most coastal
countries, including Nigeria, where the aggregate cereal output is
forecast at 5 percent above the previous year’s bumper crop. The
Boko Haram conflict has, however, had a significant impact on the
agricultural sector in the northeast due to large-scale population
displacements that led to a sharp drop in plantings in the affected
areas, notably in Borno State.
Coarse grain prices stable or declining and generally at relatively low levels, except in NigeriaCoarse grain prices generally declined in recent months and were
around or below their levels a year earlier reflecting increased
market supplies from the recently-harvested 2016 harvests. In the
Sahel belt, in Mali, prices of millet declined in January, while those
of sorghum remained virtually unchanged. Prices were around
their levels of a year earlier. Similarly, in Burkina Faso, prices
of locally-produced millet and sorghum declined or remained
relatively stable and were close to their year-earlier values as a
result of the good 2016 harvests. In Niger, millet prices remained
virtually unchanged, while those of sorghum decreased on account
of the recent harvest and imports. Prices, however, were higher
than in January last year, after the sharp increases in mid-2016
when seasonal trends were exacerbated by concerns about
crop performance in some areas due to unfavourable weather.
In Chad, prices of millet and sorghum declined significantly in
December and were below their year-earlier values as a result of
the above-average 2016 harvest. Similarly, in the coastal countries
along the Gulf of Guinea, prices of maize, the most consumed
cereal, decreased substantially in late 2016. In Togo, despite
some increase in December, maize prices were well below their
year-earlier levels, after the significant declines between September
and November on account of
harvest pressure. The main
exception is Nigeria, the largest
producing country of the
subregion, where coarse grain
prices followed mixed trends in
December. Prices of sorghum
generally declined as a result
of the recent above-average
2016 harvest, while those of
maize strengthened in several
markets as the downward
pressure from the good harvest
was offset by the continuing
AFR
ICA
Table 7. West Africa cereal production (million tonnes)
Coarse grains Rice (paddy) Total cereals 1
2014 20152016
estim. 2014 20152016
estim. 2014 20152016
estim.Change:
2016/2015 (%)
West Africa 42.9 42.5 45.2 14.0 14.3 15.3 57.0 56.9 60.6 6.5Burkina Faso 4.1 3.9 4.4 0.3 0.3 0.4 4.5 4.2 4.7 12.3Chad 2.4 2.2 2.6 0.3 0.2 0.3 2.7 2.5 2.8 14.7Ghana 2.2 2.1 2.1 0.6 0.6 0.7 2.8 2.8 2.8 2.9Mali 4.8 5.7 6.1 2.2 2.3 2.8 7.0 8.1 9.0 11.1Niger 4.8 5.2 5.7 0.1 0.1 0.1 4.9 5.4 5.9 9.2Nigeria 18.8 16.8 17.6 4.9 4.8 5.0 23.7 21.6 22.6 4.8
Note: Totals and percentage change computed from unrounded data.1 Total cereals includes wheat, coarse grains and rice (paddy).
2015 20172016
14000
16000
18000
20000
22000
24000
26000
JDNOSAJJMAMFJDNOSAJJMAMFJ
Niger Niamey
Figure 1. Millet prices in selected West Africanmarkets
CFA Franc BCEAO (XOF)/100kg Burkina Faso Ouagadougou
Source: Afrique Verte.
Mali Bamako

No. 1 n March 2017 13
Crop Prospects and Food Situation
steep depreciation of the local currency and civil insecurity, which
kept prices well above their year-earlier levels.
Deepening food crisis in northern NigeriaIn spite of two consecutive years of above-average cereal
harvests, the humanitarian situation remains critical in northern
Nigeria, mainly due to the continuing civil conflict which has
resulted in large population displacements, both internally and in
the neighbouring countries of Cameroon, Chad and the Niger.
According to the United Nations Office for the Coordination of
Humanitarian Affairs (OCHA), about 2.6 million people have
been internally displaced in the Lake Chad Basin region, including
1.8 million in northern Nigeria. The conflict has also caused
widespread disruption to agricultural and marketing activities.
Results of the Cadre Harmonisé (CH) analysis held in November
2016 in 16 states of northern Nigeria indicate that about
8.1 million people (9 percent of the population studied) were facing
acute food insecurity and required urgent life-saving response
and livelihood protection. Disaggregated, about 6.2 million
people were in CH Phase 3: “Crisis”, 1.8 million in CH Phase
4: “Emergency” and 55 000 in CH Phase 5: “Famine” (i.e. IPC
Catastrophe). A further 18.6 million people (22 percent) were in
CH Phase 2: Stress, requiring resilience-building interventions.
Projections indicate that the situation is likely to deteriorate during
the next lean period (June-August 2017): 8.7 million people are
expected to be in “Crisis”, 2 million in “Emergency” and 121 000
in “Famine” conditions, bringing the total number of severely
food-insecure people to 11 million in case of lack of adequate
and timely response. Chad has also seen increased numbers of
refugees and returnees due to the civil conflict in the Sudan, the
Central African Republic, Nigeria and Libya. The refugee crisis has
exacerbated an already fragile food security situation. Overall,
about 456 000 people are estimated to be in Phase 3 and above
in the country. In the Ebola Virus Disease-affected countries of
Guinea, Liberia and Sierra Leone, in spite of the relatively low
impact of the outbreak on agricultural production in the previous
years, the lingering negative impact on economic activities and
livelihoods, continue to affect households’ food security. As a
result of the shocks mentioned above, the aggregate subregional
number of people in Phase 3: “Crisis” and above is estimated to
be over 10 million, including 8.1 million in Nigeria according to
the latest “Cadre Harmonisé” analysis.
CENTRAL AFRICA
Main 2017 cropping season is about to start; uncertain prospects in the Central African Republic due to persistent civil insecurityPlanting of the 2017 main season maize crops, due for harvest
from July, will begin in March. In the Central African Republic,
agricultural activities continue to be hampered by the widespread
conflict which resulted in massive population displacements,
caused input shortages and depleted households’ productive assets
that were already inadequate. Although the security situation has
improved in some areas and FAO will continue to assist crisis-affected
households through input distributions and resilience strengthening
programmes, prospects remain uncertain for the 2017 crops. In
southern uni-modal rainfall areas of the Democratic Republic
of the Congo, where the rainfall pattern is similar to Southern
Africa, the maize crop, for harvest from March 2017, benefited
from favourable weather conditions this season, except in the
southernmost Haut Katanga Province, where planting operations
have been delayed by early season dryness.
Below-average 2016 cereal harvest, amid continued conflict in some countriesIn the Central African Republic, harvesting of the 2016 main
season cereal crops was completed in October. According to the
preliminary findings of a joint FAO/WFP Crop and Food Security
Assessment Mission (CFSAM) conducted in January 2017, the
2016 aggregate production of food crops increased by 16 percent
from the sharply-reduced 2015 output, mainly due to an increase
in cassava production (+26 percent), but still remained 17 percent
below the pre-crisis five-year average (2008-2012). The cereal
output increased by a 9 percent from 2015, but is 30 percent
lower than the pre-crisis average. Despite some improvements in
the security situation, the ongoing socio-political crisis continued
AFR
ICA
2015 20172016
14000
16000
18000
20000
22000
24000
26000
JDNOSAJJMAMFJDNOSAJJMAMFJ
Niger Niamey
Figure 1. Millet prices in selected West Africanmarkets
CFA Franc BCEAO (XOF)/100kg Burkina Faso Ouagadougou
Source: Afrique Verte.
Mali Bamako

No. 1 n March 201714
Crop Prospects and Food Situation
to constrain agricultural and marketing activities. FAO and NGO
partners helped to mitigate the impact of the crisis by providing
crop production support to 123 600 vulnerable households
(618 000 individuals) across the country, distributing 3 311 tonnes
of cereal, groundnut and sesame seeds and 320 400 tools. In
addition, about 850 000 heads of livestock have been vaccinated
and treated. In Cameroon, with harvesting of the second season
crops completed in January in the Centre and South, total cereal
production for 2016 is estimated to be lower than the previous
year and the five-year average. This decline mainly reflects erratic
rains that adversely affected the 2016 main season’s crop. In
addition, in Far North Region, civil insecurity continued to severely
disrupt agricultural activities and caused a further reduction in
the planted area. For instance, according to the findings of a
multi-agency Crop Assessment Mission conducted last November
in East, Adamaoua, North and Far North regions, the 2016 cereal
production in the Far North Region was 25 percent lower than
the already reduced 2015 output. In the Democratic Republic
of the Congo, harvesting of the 2016 main maize crops was
completed in November in the north, while in central parts it has
been recently concluded. According to remote sensing analysis,
average to above-average rainfall was received in northern and
western cropping areas, while in central and eastern parts of the
country the cumulative rainfall from July to December was about
20 percent below average. In addition, in eastern provinces (Ituri,
North Kivu and South Kivu) an increased incidence of crop pests,
including cassava brown streak disease and banana bacterial wilt
has been reported. In the Congo and Gabon, where the main
season harvest normally starts in December, coastal cropping
areas were affected by erratic and poor precipitation. Earlier in
the year, the second season maize crop, harvested in June-July,
was also affected by erratic rainfall resulting in below-average
vegetation conditions in several cropping areas. In both countries,
however, the bulk of the national cereal requirement is imported.
Overall, the subregional production forecast for cereals in 2016
is put at 4.3 million tonnes, 8 percent less than the previous year
and 12 percent below the average of the previous five years.
Food prices declining in the Central African Republic but still well above their pre-crisis levels In the Central African Republic, the inflation rate declined
to about 4 percent in 2015 and 2016 from the high levels
of 2014 and was still slightly above the convergence rate
of 3 percent set by the “Communauté économique et
monétaire de l’Afrique centrale”. In the capital, Bangui, prices
of maize, the most consumed cereal, declined by 25 percent
between October and December reflecting increased supplies
from the main harvest. December prices were 35 percent
below the levels of a year earlier but still 49 percent above their
pre-crisis levels of December 2012. In Bangui, prices of cassava,
the main staple, declined by 16 percent between September and
December 2016 and were 17 percent higher than the very low
levels in December 2015, when trade disruptions restricted the
flow of cassava away from the producing regions surrounding
Bangui, but 14 percent
below their pre-crisis levels.
Prices of bovine meat in
December were 19 percent
lower than 12 months earlier
due to a partial resumption
of trade flows between
the key livestock market
in Kaga Bandoro and the
slaughterhouse in Bangui.
However, prices remained
53 percent higher than their
pre-crisis levels. Similarly,
AFR
ICA
201620152014
0
100
200
300
400
500
600
700
800
DNOSAJJMAMFJDNOSAJJMAMFJD
Figure 2. Retail prices in Bangui, Central AfricanRepublic
CFA Franc (XAF)/Kg
Source: Institut Centrafricain des Statistiques des Etudes Economiques et Sociales.
Maize
Cassava
Table 8. Central Africa cereal production (million tonnes)
Coarse grains Rice (paddy) Total cereals 1
2014 20152016
estim. 2014 20152016
estim. 2014 20152016
estim.Change:
2016/2015 (%)
Central Africa 4.3 4.1 3.7 0.6 0.5 0.5 4.9 4.7 4.3 -8.3Cameroon 2.8 2.7 2.4 0.2 0.2 0.2 3.0 2.9 2.6 -10.2Central African Republic 0.1 0.1 0.1 0.0 0.0 0.0 0.1 0.1 0.1 2.1Democratic Republic of the Congo 1.3 1.3 1.2 0.3 0.3 0.3 1.6 1.6 1.5 -6.1
Note: Totals and percentage change computed from unrounded data.1 Total cereals includes wheat, coarse grains and rice (paddy).

No. 1 n March 2017 15
Crop Prospects and Food Situation
prices of various types of fish in December were about
20 percent lower than one year earlier, due to improvements
in the security situation in some fishing areas near Bangui,
but still about 70 percent higher than before the crisis. In
northern regions of Cameroon, where widespread insecurity
disrupted agricultural and marketing activities, cereal prices
in November were reported to be 25-50 percent higher than
12 months earlier. In the Democratic Republic of the Congo,
prices of cassava flour (a main food staple in northern and
eastern parts) increased by 10 percent between October and
December 2016 in Goma market, northeastern North-Kivu
Province, and were 15 percent up on an annual basis, partly
due to the heightened demand from increasing numbers
of Burundian refugees. In Lubumbashi market, located in
the far south, prices of maize, the main staple in southern
areas, more than doubled in the second semester of 2016,
reaching record levels in December, as seasonal patterns were
compounded by reduced imports from neighbouring Zambia
and the devaluation of the local currency. In Gabon, prices
of imported wheat and imported rice, the most important
staples for urban consumers, increased by 13 and 6 percent,
respectively, between November 2016 and January 2017 in
the capital, Libreville. In January, prices of imported wheat
were 26 percent higher than 12 months earlier, while prices
of imported rice were around their year-earlier levels. In
the Congo, prices of imported rice increased by 10-36 percent
between September and December in most monitored
markets partly due to the instability of disrupting trade flows
in neighbouring Democratic Republic of the Congo.
Conflict worsens food insecurity in the Central African Republic and parts of Cameroon and the Democratic Republic of the CongoContinued civil insecurity in the Central African Republic and
in eastern Democratic Republic of the Congo has resulted in
massive population displacements hindering access to food for
the affected population. As of December 2016, about 473 000
refugees from the Central African Republic have sought
refuge in neighbouring Cameroon (276 000), the Democratic
Republic of the Congo (102 500), Chad (71 000) and the
Congo (23 600), straining the already limited resources of the
hosting communities. The Internally Displaced Person (IDP)
caseload in the Central African Republic, which peaked at
434 000 in late November as renewed violence displaced about
150 000 people in central and southern Haute Kotto, Basse Kotto
and Ouaka prefectures, decreased to 412 000 by mid-January as
some displaced persons returned to the capital, Bangui, where
the security situation is improving. Three consecutive years of
reduced harvests, compounded by access constraints due to
market disruptions and declining purchasing power, resulted
in an alarming food security situation. According to the latest
Integrated Food Security Phase Classification (IPC), in August
2016, about 2 million people (40 percent of the total population)
were in need of urgent assistance (IPC Phase 3: “Crisis” and
IPC Phase 4: “Emergency”). Ten out of 16 prefectures are in
IPC Phase 3: “Crisis”, while Vakaga Prefecture, Kabo and Batangafo
subprefectures (Ouham Prefecture), Ngaoundaye subprefecture
(Ouham Pendè Prefecture) and Mbrès subprefecture (Nana-Gribizi
Prefecture) were in IPC Phase 4: “Emergency”. Similarly, in the
Democratic Republic of the Congo, civil conflict especially in
the eastern provinces, has continued to severely damage local
livelihood systems and caused massive population displacements.
As of late December 2016, the IDP caseload was estimated
at 2.2 million, 300 000 more than the previous estimate in
September. The increase is mostly due to the surge in inter-
communal violence in Tanganyika Province since mid-December
2016. About 40 percent of the displaced population is located in
North Kivu and the rest mainly resides in South-Kivu, Maniema,
Tanganyika and Haut Katanga provinces. The country also hosts
102 500 refugees from the Central African Republic, 66 700
from South Sudan and 36 300 from Burundi. According to
the latest available IPC analysis, in June 2016, the number of
people in acute food insecurity and livelihood crisis (IPC Phase 3:
“Crisis” and IPC Phase 4: “Emergency”) was estimated at about
5.9 million, about 10 percent less than a year earlier. However,
armed clashes in late October-early November in the Dibaya
territory (Kasaï Central Province), which caused the destruction
of standing crops and food stocks and affected about 100 000
individuals, and the recent resurgence of conflict in Tanganyika
Province are likely to have caused an increase in the food insecure
AFR
ICA
201620152014
200
300
400
500
600
700
800
900
1000
1100
1200
DNOSAJJMAMFJDNOSAJJMAMFJD
Figure 3. Retail prices of cassava (flour) and maize(flour) in selected Democratic Republic of theCongo markets
CFA Franc/Kg
Source: Institut National de la Statistique, WFP/VAM
Goma (cassava flour)
Lubumbashi (maize flour)
201620152014
0
100
200
300
400
500
600
700
800
DNOSAJJMAMFJDNOSAJJMAMFJD
Figure 2. Retail prices in Bangui, Central AfricanRepublic
CFA Franc (XAF)/Kg
Source: Institut Centrafricain des Statistiques des Etudes Economiques et Sociales.
Maize
Cassava
No. 1 n March 201716
Crop Prospects and Food Situation
caseload. In Cameroon, as of early February 2017, the Far North
Region hosted about 84 500 refugees fleeing civil unrest in
Nigeria, which has spread into neighbouring countries and has
also resulted in the displacement of 192 000 Cameroonians.
The number of food insecure people in Cameroon is currently
estimated at 2.8 million, including 300 000 severely food insecure
individuals. The area most affected by food insecurity is the Far
North Region, where one-third of the population is food insecure.
EAST AFRICA
Drought severely affects secondary season crops in Somalia, Kenya, Uganda and northern United Republic of TanzaniaHarvesting of the 2016 secondary season crops is almost
complete, except in Ethiopia where planting of the “belg” season
crops is about to start. Cereal production in 2016 is estimated
well below-average levels in several countries following the
extremely poor performance of the October to December rainy
season, especially over the eastern part of the subregion.
In southern and central Somalia, production of the “deyr”
crops is estimated to be about 70 percent below average, as rains
were particularly unfavourable over major cropping areas, severely
affecting the extent of planted area and yields. In addition,
following poor rains over eastern Ethiopian highlands, the
levels of Juba and Shabelle rivers have been very low during the
season, limiting opportunities for irrigated crops. Production of
off-season crops, to be harvested by March, is also expected to be
reduced due to lack of seasonal floods and their residual moisture
normally used for recession cultivation. Also in southeastern
and coastal areas of Kenya, “short-rains” maize production
is estimated at very low levels, ranging from 50 to 80 percent
of the previous five-year average. In these areas, seasonal rains
were characterized by the late onset, below-average values and
erratic distribution, leading to reduced yields and plantings as a
significant number of farmers decided to not plant at all or to opt
for more drought-tolerant crops, such as cassava.
Below-average secondary season cereal production has
been gathered in most central and southern areas of Uganda.
Rainfall has been particularly poor and erratic in some districts
around the Lake Victoria basin and in most parts of Acholi and
Teso subregions in the north. Similarly, in northeastern and
central areas of the United Republic of Tanzania, the “vuli”
maize crops have been affected by dry weather conditions and
production is expected to be about half of the five-year average,
with very low yields recorded in high potential producing areas of
Arusha and Shinyanga districts.
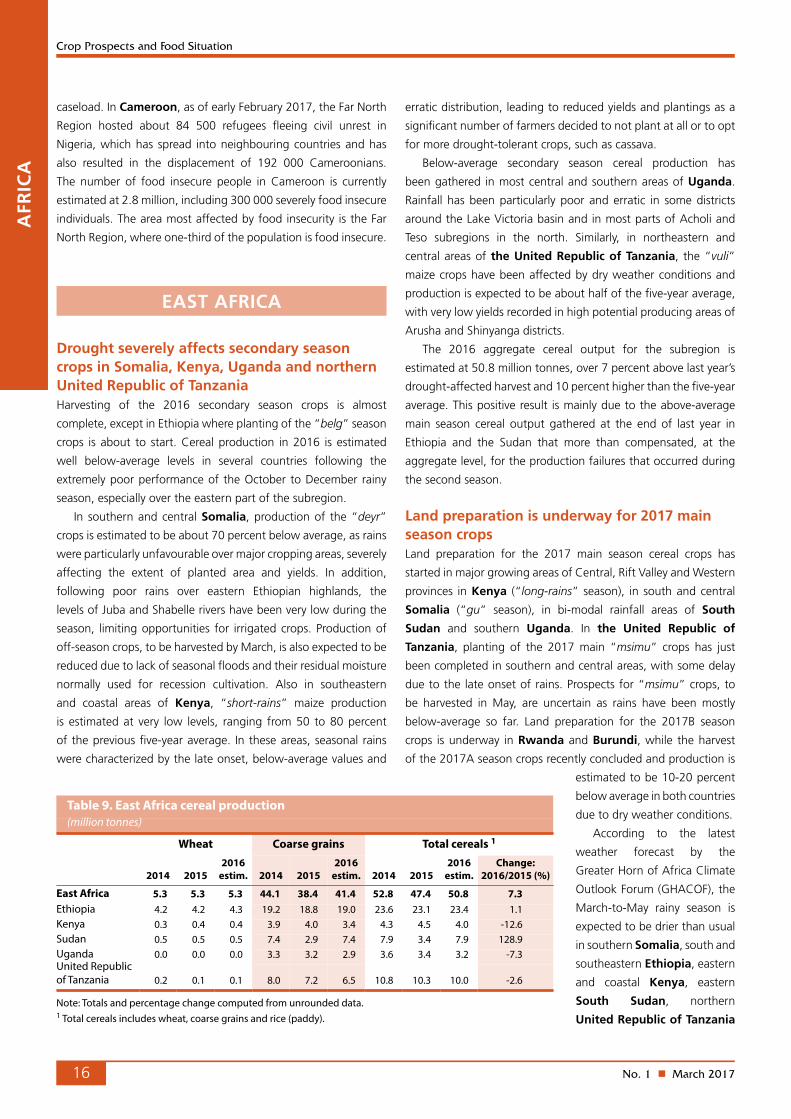
The 2016 aggregate cereal output for the subregion is
estimated at 50.8 million tonnes, over 7 percent above last year’s
drought-affected harvest and 10 percent higher than the five-year
average. This positive result is mainly due to the above-average
main season cereal output gathered at the end of last year in
Ethiopia and the Sudan that more than compensated, at the
aggregate level, for the production failures that occurred during
the second season.
Land preparation is underway for 2017 main season cropsLand preparation for the 2017 main season cereal crops has
started in major growing areas of Central, Rift Valley and Western
provinces in Kenya (“long-rains” season), in south and central
Somalia (“gu” season), in bi-modal rainfall areas of South
Sudan and southern Uganda. In the United Republic of
Tanzania, planting of the 2017 main “msimu” crops has just
been completed in southern and central areas, with some delay
due to the late onset of rains. Prospects for “msimu” crops, to
be harvested in May, are uncertain as rains have been mostly
below-average so far. Land preparation for the 2017B season
crops is underway in Rwanda and Burundi, while the harvest
of the 2017A season crops recently concluded and production is
estimated to be 10-20 percent
below average in both countries
due to dry weather conditions.
According to the latest
weather forecast by the
Greater Horn of Africa Climate
Outlook Forum (GHACOF), the
March-to-May rainy season is
expected to be drier than usual
in southern Somalia, south and
southeastern Ethiopia, eastern
and coastal Kenya, eastern
South Sudan, northern
United Republic of Tanzania
AFR
ICA
Table 9. East Africa cereal production (million tonnes)
Wheat Coarse grains Total cereals 1
2014 20152016
estim. 2014 20152016
estim. 2014 20152016
estim.Change:
2016/2015 (%)
East Africa 5.3 5.3 5.3 44.1 38.4 41.4 52.8 47.4 50.8 7.3Ethiopia 4.2 4.2 4.3 19.2 18.8 19.0 23.6 23.1 23.4 1.1Kenya 0.3 0.4 0.4 3.9 4.0 3.4 4.3 4.5 4.0 -12.6Sudan 0.5 0.5 0.5 7.4 2.9 7.4 7.9 3.4 7.9 128.9Uganda 0.0 0.0 0.0 3.3 3.2 2.9 3.6 3.4 3.2 -7.3United Republic of Tanzania 0.2 0.1 0.1 8.0 7.2 6.5 10.8 10.3 10.0 -2.6
Note: Totals and percentage change computed from unrounded data.1 Total cereals includes wheat, coarse grains and rice (paddy).

No. 1 n March 2017 17
Crop Prospects and Food Situation
and the Karamoja region in Uganda. Most of these areas have
already suffered well below-average October-to-December rains
in 2016. By contrast, there is high probability of above-average to
average rains in central United Republic of Tanzania, Rwanda,
Burundi, western Kenya and the “green belt” zone in western
South Sudan.
Poor pasture conditions persist in large parts of Kenya, Somalia, Ethiopia and United Republic of TanzaniaAn alarming situation is reported in most pastoral and
agro-pastoral areas of northeastern, eastern and coastal Kenya,
southern and central Somalia, southern parts of SNNPR, Oromia
and Somali regions in Ethiopia and northern United Republic
of Tanzania, where grazing resources have been severely
affected by the poor October-to-December rainy season. As
a result, trekking distances have generally increased, livestock
body conditions range from fair to poor and milk production is
generally below average. In these areas, pasture conditions and
water availability are further deteriorating during the current
dry season and improvements are not expected earlier than
end-March or early April with the likely onset of the next rainy
season.
High and rising prices of cereals following drought-reduced harvestsPrices of cereals surged in recent months to near-record or
record levels in most countries of the subregion, while prices of
livestock declined to very low levels in drought-affected areas as
animal body conditions dramatically deteriorated. In Somalia,
prices of locally-produced maize and sorghum continued to soar
in January on the back of the dismal performance of 2016/17
secondary “deyr” harvest. In Mogadishu and Marka, located
in the key maize-producing region of Lower Shabelle, prices
of maize and sorghum increased by 20-35 percent. Overall,
prices of coarse grains in January in key markets of central and
southern Somalia were up to twice their levels of 12 months
earlier. At the same time, livestock prices sharply declined in
recent months to very low levels. For instance in Middle Juba,
prices of goats decreased by about 50 percent between October
2016 and January 2017. In the United Republic of Tanzania
and Uganda, prices of maize increased by about 40 percent
between September/October and January, when they were
at near record to record levels, underpinned by unfavourable
prospects for the recently-concluded harvests. In Kenya,
reflecting the impact of the reduced “short-rains” harvest,
prices of maize in January were 20-30 percent higher than
12 months earlier. In drought-affected coastal counties, sharper
year-on-year increases were recorded and prices of maize were
up to 40 percent higher on a yearly basis as of January 2017. In
eastern and northern pastoral areas, where drought conditions
prevailed, prices of livestock declined significantly in recent
months and in January 2017 were up to 30 percent below their
year-earlier levels.
In the Sudan, prices of locally-produced sorghum declined
by about 20 percent between August and December with
the commercialization of the 2016 above-average harvest
and started to seasonally increase in January. Prices of
millet, mainly grown and consumed in western regions also
declined. Prices of wheat, mostly imported and consumed in
urban areas, surged by 23 percent between November and
January in Khartoum reaching record levels as austerity policy
measures, introduced in November, caused the depreciation of
local currency and increased of transport costs following the
reduction of fuel subsidies. In Ethiopia, maize prices declined
by about 20 percent between September and January as the
2016 “meher” main season harvest increased supplies. In
drought-affected Somali Region, by contrast, prices of cereals
are reported to be about twice their average levels. Here, prices
of goats and sheep in December were about one-third of their
average values. In South Sudan, prices of maize and sorghum
declined in January in Juba partly as a result of the harvesting of
2016 second season crops in southern bi-modal rainfall areas,
while in markets located in central and northern uni-modal
rainfall areas prices of sorghum continued to increase. However,
in January, cereal prices in nominal terms were between two
and four times above their year-earlier levels, due to insecurity,
a tight supply situation and a significant depreciation of the
local currency.
AFR
ICA
2015 20172016
100
150
200
250
300
350
400
450
500
JDNOSAJJMAMFJDNOSAJJMAMFJ
USD/tonne
Tanzania U.R. Dar-es-Salaam
Kenya Nairobi
Figure 4. Maize prices in selected East African markets
Uganda Kampala
Sources: Regional Agricultural Trade Intelligence Network;Ethiopian Grain Trade Enterprise.
Ethiopia Addis Ababa

No. 1 n March 201718
Crop Prospects and Food Situation
Famine declared in parts of South Sudan, alarming food insecurity persists in SomaliaIn South Sudan, food insecurity has escalated during the last
three years due to conflict, violence, macro-economic collapse
and exhaustion of households’ coping mechanisms. According to
the latest IPC analysis, localized famine conditions are reported
in Unity State, with a caseload of about 100 000 people in
IPC category 5 (“Catastrophe”) in Leer and Mayendit counties.
There is an elevated risk that famine is also occurring in Koch
County, but it cannot be confirmed due to limited available
evidence, while in Panyijiar County famine has been avoided so
far only thanks to adequate humanitarian assistance. Between
February and April, about 4.9 million people, over 40 percent of
the total population, are estimated to be severely food insecure
and this figure is projected to reach 5.5 million people at the peak
of the lean season in July. Although most food insecure people
are concentrated in Greater Upper Nile region, food security has
drastically deteriorated in Northern Bahr el Ghazal and Greater
Equatoria Region.
The situation is extremely worrisome also in Somalia, where
nearly 3 million people are estimated to be severely food insecure.
This represents a more than twofold increase compared to six
months ago. Three consecutive poor rainfall seasons have severely
affected livelihoods of pastoral and agro-pastoral households.
Food stocks from the well below-average “deyr” harvest have
already been depleted and livestock body conditions are generally
poor, with low milk productivity and birth rates. Widespread
livestock deaths are reported throughout the country. Food
insecurity is expected to further deteriorate until June/July, when
first green “gu” crops will be available for consumption.
In the rest of the subregion, the number of food insecure people
has declined in Ethiopia and the Sudan, following favourable
main season crops harvested at the end of last year. However, in
drought-affected areas of southern and southeastern Ethiopia,
purchasing power and access to food of pastoralist households
are severely constrained. Here, milk availability is poor and terms
of trade for pastoralists are at low levels as declining livestock
prices, due to poor animal body conditions and low demand,
are combined with higher-than-normal staple food prices. The
situation is likely to deteriorate further until May/June when the
next rainy season is expected to start. Food insecurity levels have
recently significantly worsened also in parts of Uganda, northern
United Republic of Tanzania and pastoral and coastal areas of
Kenya due to the effects on crops and livestock of below-average
second rainy season. The estimated total caseload of severely
food insecure people in these three countries has escalated from
1.7 million people at the end of 2016 to 5.5 million people.
The aggregate number of people in need of humanitarian
assistance is estimated at record high of 23.6 million people,
about 2.5 million higher than one year ago when the
subregion was affected by the El Niño phenomenon. It includes
5.6 million in Ethiopia, 4.9 million in South Sudan, 3 million
in the Sudan, 2.9 million in Somalia, 2.7 million in Kenya,
1.6 million in Uganda, 1.5 million in Burundi, 1.2 million in the
United Republic of Tanzania and 200 000 in Djibouti. As a
consequence of conflicts and economic crises, the number of
refugees and IDPs in the subregion has almost reached 10 million
people which, together with host communities, show the highest
levels of food insecurity and malnutrition.
SOUTHERN AFRICA
Cereal production forecast to recover in 2017, but pest infestations and localized floods will restrain output in some areas Cereal production in 2017 is forecast to recover from the
sharply-reduced output of the previous year, mainly on account of
overall beneficial seasonal rains that are expected to raise yields.
An anticipated increase in the area harvested, particularly in
South Africa, will also help to spur aggregate cereal production
this year. Despite the favourable prospects, pests and flood
damages are likely to restrain outputs in some areas.
An outbreak of African army worms and fall army worms,
a new invasive species in the subregion, was detected in
Zambia in December and has since reportedly spread to
Botswana, Malawi, Mozambique, Namibia, South Africa
and Zimbabwe. Affected cropped areas are likely to experience
reduced yields and in some cases total crop losses. Governments
have responded with spraying operations, with FAO supporting
the control activities. In addition, heavy rains and localized
flooding in January and February also pose a key risk to this
year’s harvest, while it has also lessened the effectiveness of army
worm control operations in some areas, washing away pesticides.
Localized flood-related crop losses have already been reported
in Mozambique and Zimbabwe, while the excessive rains
and water-logging could restrain yields in other areas. Monthly
rainfall volumes for January were well-above the average and in
some regions of Mozambique, Zambia and Zimbabwe were
nearly twice the normal levels. Localized floods mainly occurred
in riverine areas, notably in downstream parts of the Zambezi
and Limpopo river basins in Mozambique, which also suffered
further agricultural damage from Cyclone Dineo in mid-February.
With above-average rains forecast to continue until the end of
the season in April/May, the risk of further flooding remains high.
On the positive side, the heavy rains have also helped to replenish
water reserves, including dams that were at critically low levels,
and revitalize pastures that were severely affected by the drought
conditions in 2016.
AFR
ICA

No. 1 n March 2017 19
Crop Prospects and Food Situation
At the country level, maize production in South Africa is
forecast to rebound by more than 50 percent, which could result
in an output of 13 million tonnes or higher. The expected increase
would mostly rest on an expansion in plantings, mostly stimulated
by higher prices, while the good seasonal rains are forecast to
boost yields. Elsewhere in the subregion, the recovery in crop
yields are expected to be the main driver of increased production in
2017, as constrained seed supplies, particularly from households’
own production following two years of below-average outputs,
will restrain significant increases in plantings. Initial reports from
Zimbabwe, which suffered a sharply reduced harvest in 2016,
point to a near-average area planted of 1.2 million hectares for
maize, up on a yearly basis, and with yields expected to rebound
production could reach close to 1 million tonnes in 2017.
Malawi and Zambia are also anticipated to harvest larger maize
crops and prevailing vegetation conditions, despite poor rains at
the start of the season in some of the main producing areas,
confirm generally favourable production prospects. However the
army worm infestation in the three aforementioned countries,
may limit year-on-year gains. Crop conditions in Botswana,
Lesotho and Swaziland appear favourable and year-on-year
production gains are projected. Vegetation conditions in Angola
and Namibia are much improved compared to the previous
year, and while below-average rains were recorded in northern
parts of Angola and western areas of Namibia resulting in
abnormal seasonal dryness, production is expected to be higher
than the previous year in both countries. In Madagascar,
cumulative rainfall levels between October and January were
close to average in the southern regions helping to somewhat
reverse the impact of drought conditions in 2016. By contrast,
eastern and some northern areas, including parts of the main
rice-producing regions, received well below-normal rains
retarding vegetation growth compared to average conditions.
Given the current conditions, rice production is forecast to
remain close to 2016’s below-average level. Mozambique has
experienced varied conditions, with abundant rains in southern
parts, while suppressed seasonal rains were observed in the main
cereal-producing northern provinces causing below-average
vegetation growth in cropped zones. As a result, prospects are
uncertain and the 2017 maize harvest is expected to remain close
to the previous year’s slightly above-average output.
Tight supply situation to ease in 2017/18Aggregate maize import requirements for the forthcoming
2017/18 marketing year (generally May/April) are expected
to contract from the increased needs of the current marketing
season, reflecting the improved production prospects in 2017.
However, with domestic supplies still expected to be tight,
following two consecutive poor agricultural outputs in 2015 and
2016, import levels are forecast to remain higher than average as
countries seek to replenish depleted stocks.
In the current 2016/17 marketing year, subregional maize
imports are forecast at well-above the average levels. Most
of this higher volume is accounted for by increased needs in
South Africa and Zimbabwe. About 2 million tonnes of maize
was imported by South Africa as of early February 2017, and
total imports are forecast to reach 2.5 million tonnes, about
25 percent up on the previous year. Despite being a net importer,
South Africa still remains the main exporter of maize in the
subregion, and is forecast to export 0.85 million tonnes, of which
about 0.65 million tonnes have already been exported; Botswana,
Swaziland and Zimbabwe were the main recipients. South Africa
is also a conduit for other countries to import maize, with about
160 000 tonnes imported via the country, mostly destined for
Zimbabwe.
Prices remained high and firm, but declined in South AfricaTight supplies and currency weakness have contributed to
sustaining maize prices at levels well above those of a year earlier.
South Africa, however, is an exception, with white maize prices
generally falling since mid-2016 and in January 2017 were about
AFR
ICA
Table 10. Southern Africa cereal production (million tonnes)
Wheat Coarse grains Rice (paddy) Total cereals
2014 20152016
estim. 2014 20152016
estim. 2014 20152016
estim. 2014 20152016
estim.Change:
2016/2015 (%)
Southern Africa 2.0 1.7 2.2 28.9 22.2 18.8 4.6 4.3 4.3 35.6 28.2 25.3 -10.2 - excl. South Africa 0.3 0.3 0.3 13.4 11.1 10.1 4.6 4.3 4.3 18.2 15.6 14.7 -5.8Madagascar 0.0 0.0 0.0 0.4 0.3 0.3 4.0 3.7 3.8 4.3 4.1 4.1 2.0Malawi 0.0 0.0 0.0 4.1 2.9 2.4 0.1 0.1 0.1 4.2 3.0 2.5 -15.8Mozambique 0.0 0.0 0.0 1.6 2.1 2.1 0.4 0.4 0.3 2.0 2.5 2.4 -3.6South Africa 1.8 1.4 1.9 15.6 11.1 8.7 0.0 0.0 0.0 17.3 12.6 10.6 -15.7Zambia 0.2 0.2 0.3 3.4 2.7 2.9 0.0 0.0 0.0 3.7 2.9 3.2 10.0Zimbabwe 0.0 0.0 0.0 1.7 0.8 0.6 0.0 0.0 0.0 1.8 0.9 0.6 -26.9
Note: Totals and percentage change computed from unrounded data.

No. 1 n March 201720
Crop Prospects and Food Situation
30 percent below their near-record highs of February 2016. The
decreasing trend is reflective of a favourable supply outlook for
the 2017 crop, the appreciation of the local currency against
the US dollar and previously declining international prices.
Prices of maize meal in Lesotho, Namibia and Swaziland have
remained relatively stable in recent months and were still above
their levels of the previous year. The overall declining price trend
in South Africa, their key source of cereal supplies, contributed
to offset the upward pressure from still tight domestic supplies
after the 2016 drought-reduced outputs. Tighter supplies and
the rapid depreciation of the currency in Mozambique caused
persistent maize price increases throughout the country, notably
in southern markets where prices were more than double their
year-earlier levels in January. In Zimbabwe, the positive impact
of the US dollar’s strength (the main currency used in the
country) on food import costs has weakened in recent months
due to an appreciation of the South African rand. However, the
decline in maize prices in South Africa, which has supplied
150 00 tonnes of maize since May last year, has contributed
to maintaining stable prices. In Malawi, maize grain prices
increased in recent months and were 60 percent above their
year-earlier levels as of December 2016, mostly reflecting the
drought-reduced domestic harvest in 2016 coupled with a weak
currency.
Food insecurity peaks, but conditions expected to improve with the 2017 harvestFood insecurity is expected to have peaked in the first quarter
of 2017, with approximately 18.6 million people requiring
assistance, up from 10.8 million in the previous year, according
to the 2016 Vulnerability Assessment Committees’ (VACs)
evaluations. The sharp increase is mainly reflective of the impact
of the drought-reduced agricultural output and higher food
prices. The food insecurity situation was further exacerbated
by an economic downturn in some countries that weakened
households’ capacity to effectively respond to shocks. Malawi
and Zimbabwe were estimated to have the highest numbers of
food insecure persons, put at 6.7 million, recently revised upwards,
and 4.1 million people, respectively. Governments and the
humanitarian community are providing food assistance to the
affected population, in addition to supporting the agricultural
productive capacities of farming households in the current
cropping season, which were eroded due to consecutive seasons
of reduced harvests. Conditions are expected to improve in the
next months as the newly-harvested 2017 crops will help to
replenish households food supplies.
AFR
ICA
3 This figure excludes South Africa.
2015 20172016
0.1
0.2
0.3
0.4
0.5
0.6
JDNOSAJJMAMFJDNOSAJJMAMFJ
Figure 5. White maize prices in selected Southern African markets
USD/kg
Malawi(national average)
MozambiqueNampula
South Africa* Randfontein
Sources: Sistema De Informação De Mercados Agrícolas De Moçambique, Mozambique; Ministry of Agriculture and Food Security, Malawi; SAFEX Agricultural Products Division, South Africa.
*Wholesale prices, all others retail prices.

No. 1 n March 2017 21
Crop Prospects and Food Situation
FAR EAST
Favourable prospects for 2017 wheat crop productionThe subregion’s 2017, mostly irrigated, winter
wheat crop is at the late maturing stage in most
countries, with harvest operations to start from
April. Ample irrigation water supplies and overall
favourable weather conditions since the start of
the season in October supported expansions in
plantings and are benefitting crop development. In
India, FAO forecasts the 2017 wheat production
at 95.5 million tonnes, 2 percent above last year’s
normal level. A return to average yields, from last
year’s near-record level, is expected to partially
offset a 7 percent expansion in plantings. In
China, given a small increase in the area planted
and assuming normal weather conditions from
March, when most winter wheat crops will break
dormancy, the 2017 wheat production is projected by FAO to
increase marginally to 129 million tonnes. Similarly, in Pakistan,
the 2017 wheat output is officially forecast to increase slightly and
reach a record level of 26 million tonnes, reflecting some increase in
plantings and good expectations about irrigation water availability,
fertilizers and herbicides that are anticipated to increase yields.
Aggregate cereal production in 2016 estimated at a record level, mainly reflecting a strong increase in IndiaHarvesting of the 2016 main season paddy and coarse grains
crop was completed at the end of last year, while harvesting of
the 2016 secondary season is expected to start in March-April.
FAO forecasts the subregion’s 2016 aggregate cereal production
at 1 255 million tonnes, representing a 16.3-million-tonne
recovery (in absolute terms) from the weather-affected 2015
harvest and a record high. The bulk of the production upturn
is expected to come from India, the subregion’s second largest
cereal producer, mainly reflecting increased yields following
favourable monsoon rains. Including the ongoing secondary
2016/17 “rabi” season cereal crops, India’s aggregate cereal
productions is forecast at a record level of 299.5 million
tonnes, a 17.7-million-tonne (including rice in paddy terms) or
6 percent increase compared with the 2015 reduced output.
ASIA
Note: Comments refer to situation as of March.
Southeastern Asia: • rice (second): growing/harvesting•maize(second):growing
Near East:• winter grains: dormant to vegetative
China: • winter wheat: growing
South Asia:• wheat and coarse grains: vegetative to reproductive
India:• maize (Rabi): growing•wheat(Rabi):growing•barley(Rabi):growing•sorghum(Rabi):growing•rice(Rabi):growing
Asia (CIS):• winter grains: growing
Table 11. Far East cereal production (million tonnes)
Wheat Coarse grains Rice (paddy) Total cereals
2014 20152016
estim. 2014 20152016
estim. 2014 20152016
estim. 2014 20152016
estim.Change:
2016/2015 (%)
Far East 252.9 246.4 251.2 323.0 327.3 330.8 668.6 664.7 672.7 1 244.6 1 238.4 1 254.7 1.3Bangladesh 1.3 1.4 1.4 2.6 2.8 2.9 51.8 52.5 52.6 55.7 56.6 56.9 0.4Cambodia 0.0 0.0 0.0 0.5 0.4 0.7 9.3 9.3 9.5 9.9 9.7 10.2 4.8China 126.2 130.2 128.6 225.2 234.2 230.3 208.2 209.8 208.5 559.7 574.2 567.5 -1.2India 95.9 86.5 92.3 43.1 38.7 43.9 158.2 156.6 163.3 297.1 281.8 299.5 6.3Japan 0.9 1.0 0.8 0.2 0.2 0.2 10.8 10.5 10.7 11.8 11.7 11.6 -0.7Myanmar 0.2 0.2 0.2 1.6 1.8 1.9 28.2 27.5 28.0 30.1 29.4 30.1 2.2Nepal 2.0 1.7 1.9 2.5 2.6 2.6 4.8 4.3 5.2 9.3 8.6 9.7 13.0Pakistan 26.0 25.1 25.5 5.5 5.6 5.8 10.5 10.2 10.0 42.0 40.9 41.3 0.8Philippines 0.0 0.0 0.0 7.7 7.0 8.1 18.9 17.5 18.5 26.6 24.4 26.6 8.8Republic of Korea 0.0 0.0 0.0 0.2 0.2 0.2 5.6 5.8 5.6 5.9 6.0 5.9 -2.2Thailand 0.0 0.0 0.0 4.9 4.8 4.8 33.5 28.5 31.1 38.4 33.3 35.9 7.8Viet Nam 0.0 0.0 0.0 5.2 5.3 5.2 45.0 45.2 43.6 50.2 50.5 48.8 -3.3
Note: Totals and percentage change computed from unrounded data.

No. 1 n March 201722
Crop Prospects and Food Situation
Similarly, favourable weather conditions boosted cereal
production in Cambodia, the Democratic People’s Republic
of Korea and Thailand and resulted in a recovery from 2015’s
reduced harvests in Nepal, the Philippines, the Lao People’s
Democratic Republic and Myanmar. By contrast, reduced
outputs are forecast in Indonesia, Viet Nam, Timor-Leste
and Sri Lanka, mostly due to recurrent dry spells during
the cropping season. In China, adverse weather conditions
negatively impacted on the 2016 wheat and rice crops,
whereas maize output have decreased as a result of lower
plantings, following the Government’s decision to end maize
procurement in 2016. In Bangladesh, Bhutan, Japan and
Pakistan, cereal production in 2016 is forecast to remain close
to 2015’s level.
Aggregate 2016 paddy output is forecast at 673 million
tonnes, 1.2 percent above 2015’s reduced level, mainly
reflecting abundant monsoon rains and improved water
availabilities for irrigation. India is expected to account for much
of the subregion’s projected growth, with paddy production in
the country set to reach a record of 163.3 million tonnes, up
6.7 million tonnes from 2015’s reduced output. The increase
would be driven by an expansion in plantings, reflecting State
incentives provided in the form of large public sector purchases
at a higher Minimum Support Price (MSP), and favourable yields
resulting from beneficial rains. Abundant monsoon rains and
improved water availability are also expected to lead to large
recoveries in paddy output in Nepal, the Philippines and
Thailand. Although smaller in absolute terms, gains in paddy
output are also expected in Bangladesh, Cambodia, Japan
and the Lao People’s Democratic Republic, as well as
the Democratic People’s Republic of Korea and Myanmar,
where the 2016 paddy outputs are seen to be recovering from
the 2015 reduced levels. By contrast, dry weather conditions
linked to the 2015/16 El Niño phenomenon negatively affected
the main season crops, which were
harvested by the second quarter of the
year, resulting in overall lower harvests in
Indonesia, Timor-Leste and Viet Nam.
In China (Mainland), paddy production
is officially reported at 206.9 million
tonnes, slightly below the 2015 record,
mostly on account of lower yields,
following excessively wet conditions and
storm-related damages. Paddy output
is also estimated to have decreased in
Pakistan, owing to a price-induced
reduction in plantings, while in Sri Lanka
unfavourable weather reduced the 2016
secondary crop, resulting in an 8 percent
decrease in the overall output.
The subregion’s 2016 maize output is forecast at 300 million
tonnes, close to 2015’s record level. Larger outputs in India and
the Philippines are seen to more than offset a 5-million-tonne
cut estimated for China maize production in 2016. Last year,
the Government of China decided to end maize procurement at
high minimum support prices and it prompted farmers to shift
land from maize to more profitable crops, including soybeans,
rice and peanuts.
With most official estimates now available, FAO has revised
down the estimate for the subregion’s 2016 wheat production
to 251.2 million tonnes. The latest revision mainly takes into
account the final official figure released by India, which indicates
a smaller harvest than previously anticipated. At 92.3 million
tonnes, the output is set to have recovered only partially from
2015’s reduced level and remain 3.6 million tonnes below the
record crop gathered in 2014.
Cereal imports forecast to fall, while exports expected to expand slightlyAggregate cereal imports in the 2016/17 marketing year are
forecast at 125.7 million tonnes, 3 percent below the 2015/16 level,
but 8 percent above the average of the past five years. The bulk
of the decline is on account of falling purchases of barley, maize
and sorghum by China (Mainland) due to expectations of a much
larger use of domestic maize for feed in view of the Government’s
plan to cut its inventories. Consequently, imports of barley and
sorghum, which are two of the main grains used for feed, are both
forecast to fall in the 2016/17 marketing year by around 45 percent.
Similarly, imports of maize are currently foreseen to decrease by
almost 40 percent to 2 million tonnes. Subregional aggregate
wheat imports in 2016/17 are set to increase sharply, underpinned
by a growing demand for both food and feed. Wheat imports by
Indonesia, the subregion’s largest wheat importer, are projected
at 9.6 million tonnes, with a 9 percent increase year-on-year.
ASI
A
Table 12. Far East cereal production and anticipated trade in 2016/17 1 (thousand tonnes)
Avg 5-yrs (2011/12 to
2015/16) 2015/16 2016/17
2016/17 over 2015/16
(%)
2016/17 over 5-yr avg
(%)
Coarse grains- Exports 4 613 2 643 3 055 15.6 -33.8Coarse grains - Imports 59 859 69 008 60 529 -12.3 1.1Coarse grains - Production 322 716 327 349 330 808 1.1 2.5
Rice-millled - Exports 35 013 33 354 34 955 4.8 -0.2Rice-millled - Imports 13 726 12 485 13 466 7.9 -1.9Rice-millled - Production 443 420 441 405 446 659 1.2 0.7
Wheat - Exports 5 435 2 697 2 835 5.1 -47.8Wheat - Imports 42 429 45 454 51 513 13.3 21.4Wheat - Production 247 679 246 372 251 176 1.9 1.4
1 Marketing year July/June for most countries. Rice trade �gures are for the second year shown.

No. 1 n March 2017 23
Crop Prospects and Food Situation
Similarly, wheat imports are expected to increase in Bangladesh,
China (Mainland), India, Japan, Republic of Korea, Malaysia
and the Philippines. In case of rice, imports in 2017 calendar year
are forecast to increase by 8 percent to 13.5 million tonnes, mostly
reflecting higher anticipated deliveries to China (Mainland), the
Philippines and Sri Lanka.
Exports of cereals in the subregion consist mostly of rice and,
to a lesser extent, wheat. Aggregate rice exports in calendar year
2017 are forecast at 35 million tonnes, implying only a partial
recovery from last year’s reduced level, given expectations of
relatively subdued global import demand. Wheat exports are also
projected to increase by 5 percent to 2.8 million tonnes, but remain
well below the five-year average reflecting lower exports by India.
Rice prices followed mixed trends, while prices of wheat are stableDomestic rice prices, in local currencies, have followed mixed trends
across the subregion in recent months. In Thailand, after four
consecutive months of declines, rice prices edged up in January, as
main crop harvests drew to a close and demand from African and
Asian countries revived. Similarly, in India, rice prices strengthened
in January on account of renewed demand coupled with large
ongoing Government procurement programmes. Domestic
rice prices also increased in Cambodia, due to reduced harvest
pressure. In Viet Nam, rice prices remained virtually unchanged
as seasonal upward pressure ahead of the 2017 winter/spring
crop harvest was offset by a slow pace of exports. By contrast,
rice prices in Myanmar continued to decline in January and were
down from a year earlier, reflecting improved supplies from the
2016 main season harvest and weak import demand from the
country’s main buyer, China. Among the importing countries,
including China, the Philippines and Indonesia, rice prices were
overall stable in recent months and close to their year-earlier levels,
reflecting good domestic availabilities from the 2016 harvests and
imports. Also in Bangladesh, adequate supplies from the 2016
recently-harvested “aman” paddy crop, accounting for 40 percent
of the annual output, kept rice prices stable. However, quotations
remained above their year-earlier levels after the steep increases
recorded in the second half of last year due to lower imports and
a reduced 2016 main “boro” output. By contrast, in Sri Lanka
rice prices increased steeply for the fourth consecutive month and
reached record levels in January reflecting the reduced outputs
of the 2016 secondary “yala” output, gathered in September,
and the 2017 main “maha” crop, currently harvested. Prices of
wheat and wheat flour were generally stable in recent months,
but increased in China, reflecting damage caused by rains to
wheat crops at harvest, which downgraded crop quality, mainly
across East China’s wheat-growing provinces. In India, wheat
prices stabilized in January, after previously rising, on account of
increased imports after the removal of import duties in December
and ongoing releases of wheat reserves through the Open Market
Scheme. Similarly, wheat flour quotations remained stable in
Bangladesh, Sri Lanka and Indonesia, mirroring sustained
imports, as these countries mostly rely on imports to meet their
consumption requirements. In Pakistan, prices of wheat grain and
wheat flour remained stable and generally low, reflecting ample
supplies from the 2016 bumper harvest and generally favourable
prospects for the 2017 crop.
ASIA
2015 20172016
0.2
0.3
0.4
0.5
0.6
0.7
0.8
0.9
1.0
JDNOSAJJMAMFJDNOSAJJMAMFJ
USD/kg
Figure 6. Rice retail prices in selected Far Eastcountries
Sri Lanka (white rice) Colombo
Sources: Department of Census and Statistics, Sri Lanka; Ministry of Consumer Affairs, India; Bureau of Agriculture Statistics, Philippines; Agroinfo, Viet Nam.
Philippines (regular milled rice) national average
Viet Nam (wholesale, 25% broken milled) Dong Thap
India New Delhi
2015 20172016
0.2
0.3
0.4
0.5
0.6
0.7
0.8
JDNOSAJJMAMFJDNOSAJJMAMFJ
USD/kg
Figure 7. Wheat and wheat flour retail prices in selected Far East countries
Sources: Pakistan Bureau of Statistics; Ministry of Consumer Affairs, India; Management Information System and Monitoring, Bangladesh; National Bureau of Statistics of China.
India (wheat)Mumbai
Pakistan (wheat)Lahore
BangladeshDhaka (wheat flour)
China (wheat flour)Average of main 50 cities

No. 1 n March 201724
Crop Prospects and Food Situation
NEAR EAST
Favourable outlook for the 2017 winter crops in major producing countriesWheat and barley crops, for harvest from June, remain in their
final stages of dormancy. After prevailing dry weather conditions
in October and November, abundant precipitation resumed
in December. As of mid-February, moisture supplies remained
generally favourable across the subregion for crop development
although slightly above average temperatures were melting the
protective snow cover in central Turkey and northwestern Iran
(Islamic Republic of). If normal weather conditions prevail for the
remainder of the season, preliminary forecasts of wheat production
in Iran (Islamic Republic of) and Turkey, the main producing
countries of the subregion, are estimated at slightly above average
levels of 12 and 21 million tonnes, respectively. This result is
expected, despite the early season dryness in Turkey where wheat
sown in the autumn became dormant by late November following
a cold spell and which will rely on sufficient winter precipitation
for spring emergence and establishment. The ongoing conflict and
lack of inputs are continuously hampering agricultural activities in
the Syrian Arab Republic, Yemen and Iraq.
Above-average 2016 winter cereal crop harvested, despite ongoing conflict in parts, resulting in a lower import requirementThe aggregate subregional 2016 cereal output (including paddy
rice) is put at 69.6 million tonnes, a decrease of about 4 percent
from last year’s exceptional production, but 3 percent above the
five-year average. In Turkey, the main producer in the subregion,
official estimates indicate a 9 percent decrease in cereal production
in 2016 compared to last year, with about 35.3 million tonnes,
including 20.6 million tonnes of wheat (10 percent below
the output in 2015) and 13.8 million tonnes of coarse grains
(11 percent down from the 2015 harvest). In Iran (Islamic
Republic of), the second biggest wheat producer in the subregion,
the 2016 production exceeds the 2015 harvest by 2 million tonnes
and was 38 percent above the five-year average. In Afghanistan,
despite higher-than-usual winter temperatures that diminished
water moisture, an average 4.6 million tonnes of wheat where
harvested. As a result of the above-average harvest, the cereal
import requirement was 2.5 percent below the five-year average.
Yemen at risk of famine; civil unrest affects food security of large numbers of people across the subregionFood security situation remains extremely worrisome in Yemen,
where the latest multi-agency Emergency Food Security and
Nutrition Assessment (EFSNA), using data collected in November
2016, estimated that over 17 million people are food insecure,
with an increase of 3 million from the last available Integrated
Food Security Phase Classification (IPC), from June 2016. About
65 percent of Yemeni households are estimated to be food
insecure, compared to 41 percent in the pre-crisis period (2014).
Out of 17 million food insecure, about 7.3 million people are
estimated to be in need of emergency food assistance. The risk of
famine declaration in the country is very high.
In Iraq, as of November 2016, about 3 million people are
internally displaced. The changing conflict dynamics are mirrored
into a volatile food security situation across the country with
2.4 million people estimated to be food insecure, of which
1.5 million are severely food insecure. In the Syrian Arab
Republic, as of November 2016, about 7 million Syrians were
estimated to be food insecure and a further 2 million are at risk
of food insecurity. In Afghanistan, almost 1.6 million people
are considered to be severely food insecure and 9.7 million
people moderately food insecure. Over 630 000 individuals were
displaced by the conflict in 2016 and a large share of the displaced
are located in the hard-to-access areas. Both documented and
undocumented Afghans have been returning for a variety of
reasons, including from the deteriorating protection space in
Pakistan. Since 1 January 2016, over 728 000 undocumented
Afghans have returned to the country.
ASI
A
Table 13. Near East cereal production (million tonnes)
Wheat Coarse grains Rice (paddy) Total cereals
2014 20152016
estim. 2014 20152016
estim. 2014 20152016
estim. 2014 20152016
estim.Change:
2016/2015 (%)
Near East 41.3 45.0 43.7 20.3 22.7 21.2 4.4 4.3 4.7 66.0 72.1 69.6 -3.4Afghanistan 5.4 4.7 4.6 0.7 0.7 0.7 0.8 0.6 0.6 6.9 6.0 5.9 -2.1Iran (Islamic Republic of ) 10.6 11.5 13.5 3.7 3.9 3.9 2.3 2.7 2.9 16.7 18.1 20.3 12.1Iraq 3.5 3.2 3.0 1.2 1.1 1.0 0.4 0.1 0.3 5.1 4.4 4.3 -1.8Syrian Arab Republic 1.9 2.4 1.5 0.8 1.1 1.0 0.0 0.0 0.0 2.6 3.6 2.6 -27.9Turkey 19.0 22.6 20.6 12.9 15.1 13.8 0.8 0.9 0.9 32.8 38.6 35.3 -8.7
Note: Totals and percentage change computed from unrounded data.

No. 1 n March 2017 25
Crop Prospects and Food Situation
Similarly, in Armenia, Georgia and Tajikistan, wheat production
is estimated to reach a new record in 2016, resulting from higher
yields and a moderate increase in plantings. By contrast, wheat
production is estimated to decline from the previous year’s level in
Azerbaijan. In Kyrgyzstan, the wheat output is down 7 percent
from the 2015 level following a sharp reduction in plantings.
The 2016 coarse grains output is estimated to have increased
by 5 percent on an annual basis, with most of the increase
attributed to maize crop production.
Total cereal exports in 2016/17 forecast to increase from last year’s levelTotal cereal exports in the 2016/17 marketing year (July/June)
are forecast to rise by 10 percent on a yearly basis to 9.7 million
tonnes, of which 8.8 million tonnes is wheat.
The increase is anticipated to come from higher wheat
shipments from Kazakhstan, the main wheat exporter of the
subregion, with exports forecast at 8 million tonnes, about
1 million tonnes above the previous year’s volume. The expected
increase is mainly driven by higher import demand for high-quality
wheat and wheat flour produced in Kazakhstan.
The subregion’s total cereal import requirement during
2016/17 is forecast slightly below last year’s level, following good
domestic outputs and large imports in the previous year that
replenished stocks.
Domestic prices of wheat and wheat flour stable, with the exception of some countries due to weaker currenciesExport prices of milling wheat in Kazakhstan have been relatively
stable in recent months. However, at the end of February, prices
ASIA
Across the countries in conflict, food insecurity remains higher in
conflict and displacement-affected parts. Households and Internally
Displaced Persons (IDPs) in the affected areas, and returnees in the
liberated areas, remain the most vulnerable and food insecure.
CIS IN ASIA2
Winter wheat plantings close to last year’s level Planting of winter cereals, to be harvested between June and
September 2017, was completed in November under generally
favourable weather conditions and the area sown is estimated to
be unchanged from last year’s level. Overall prospects are good,
however, in Kazakhstan, temperature swings in February are
expected to have negatively affected the winter wheat quality in
some areas of the country. The total area planted in the subregion
is estimated to be close to last year. Planting of 2017 spring wheat
and barley crops, which represent the majority of the annual
production, will be sown later this year in May.
Record cereal output in 2016, reflecting higher yieldsFAO’s latest estimate puts the 2016 total cereal production at a
record level of 36.5 million tonnes, 5 percent above the 2015
good level. Wheat, which represents more than 60 percent of
the total cereal output, is forecast at 27.4 million tonnes in 2016,
1.2 million tonnes above previous year’s level. The increase is
mainly due to improved yields following overall favourable weather
conditions. Moreover, better yields compensated a contraction in
plantings in some countries, which occurred following a shift to
more profitable crops. Most of
the increase in wheat production
originates from Kazakhstan,
where the total wheat output
is estimated at 14.9 million
tonnes, around 8 percent
higher than in the previous year.
However, the share of milling
quality wheat is reported to be
lower than last year, following
heavy precipitations during
spring. In Turkmenistan, wheat
production increased sharply in
2016, where increased yields,
reflecting beneficial weather,
drove production upwards.
2 Georgia is no longer a member of CIS but its inclusion in this group is maintained for the time being.
Table 14. CIS in Asia cereal production (million tonnes)
Wheat Coarse grains Total cereals 1
2014 20152016
estim. 2014 20152016
estim. 2014 20152016
estim.Change:
2016/2015 (%)
CIS in Asia 25.1 26.2 27.4 6.4 7.8 8.2 32.3 34.9 36.5 4.7Armenia 0.3 0.4 0.4 0.2 0.2 0.2 0.6 0.6 0.6 3.7Azerbaijan 1.4 2.0 1.9 0.9 1.3 1.2 2.4 3.3 3.1 -4.6Georgia 0.1 0.1 0.2 0.4 0.3 0.4 0.4 0.4 0.6 50.6Kazakhstan 13.0 13.7 14.9 3.4 3.8 4.1 16.8 17.9 19.4 8.2Kyrgyzstan 0.6 0.7 0.7 0.8 1.0 1.0 1.4 1.8 1.7 -5.5Tajikistan 0.9 0.9 1.0 0.2 0.2 0.3 1.2 1.1 1.4 18.6Turkmenistan 1.2 1.4 1.6 0.1 0.1 0.1 1.4 1.6 1.8 11.9Uzbekistan 7.6 7.0 6.7 0.4 0.9 0.9 8.2 8.1 7.9 -2.7
Note: Totals and percentage change computed from unrounded data.1 Total cereals includes wheat, coarse grains and rice (paddy).

No. 1 n March 201726
Crop Prospects and Food Situation
gained some support from reviving demand from key importers
and increasing export prices in the Black Sea Region. Since then,
prices were around 6 percent higher than a year earlier. In import
dependent countries of the subregion, prices were generally
stable but with some exceptions. In Tajikistan, domestic prices
of wheat and wheat flour were generally unchanged over
last month and down from a year earlier following the 2016
bumper crop and ample imports of wheat grain, which in
2016 were reportedly more than 15 percent higher than in the
previous year. Similarly, in Armenia, adequate market supplies
from the 2016 domestic harvest and imports contributed to
keep retail prices of wheat flour virtually unchanged between
November-January and down from a year earlier. In Kyrgyzstan,
prices of wheat flour remained stable and were well below their
values in January last year. The elimination of taxes on imported
grain and flour in early 2016 together with some strengthening
of the national currency during the year contributed to lower
prices. In Uzbekistan, despite a strong depreciation of the
local currency, wheat flour prices remained unchanged over
the last three months since the Government regulatd prices of
main staple foods. By contrast, in Georgia, which is a highly
import-dependent country, wheat flour prices rose significantly,
mainly due to a weak national currency and the high import
dependency of the country. In spite of a good domestic harvest
and imports in Azerbaijan, prices of wheat flour rose in January
and were higher than a year earlier reflecting the continued
depreciation of the local currency.
ASI
A
2016 20172015
0.4
0.5
0.6
0.7
0.8
0.9
1.0
1.1
JDNOSAJJMAMFJDNOSAJJMAMFJ
USD/kg
Figure 8. Retail wheat flour prices in selected CIS in Asia countries
Sources: National Statistical Service of Republic of Armenia; National Statistical Committee of the Kyrgyz Republic; State Committee on Statistics, Republic of Tajikistan; State Statistical Committee of the Republic of Azerbaijan; National Statistics Office of Georgia.
Tajikistan (national average)
Kyrgyzstan (national average)Armenia (national average)
Azerbaijan (national average)
Georgia (national average)

No. 1 n March 2017 27
Crop Prospects and Food Situation
CENTRAL AMERICA AND THE CARIBBEAN
Planting of the 2017 autumn/winter wheat crop anticipated to decline from a year earlierIn Mexico, virtually the only wheat producer in the subregion,
planting of the 2017 autumn/winter crop concluded in January.
Early official estimates point to a decline of 13 percent in the area
sown compared to same season last year to about 0.5 million
hectares. The decline mainly reflects good supplies from the
bumper 2016 wheat output, which has been estimated at
3.9 million tonnes or almost 5 percent above its 2015 level.
Maize production in 2016 estimated at a record levelThe subregion’s aggregate 2016 maize production has been
estimated at 32.1 million tonnes, a record high. The bumper
2016 maize crop mainly reflects the good results in Mexico,
the subregion’s main producer accounting for 86 percent of
the subregional maize output. In Mexico, the aggregate 2016
maize output has been estimated at a record of 27.6 million
tonnes. Elsewhere in the subregion, the 2016 maize crop is
estimated at 4.6 million tonnes, a bumper level and just below
the record level obtained in 2013. The large output mainly
reflects the dissipation of the El Niño phenomenon during
the summer period of 2016 and good rainfall during the
second season, which concluded in late December, resulting
in good harvests in El Salvador, Guatemala, Honduras
and Nicaragua. In Haiti, 2016 cereal production has been
estimated at an average level of 459 000 tonnes significantly
above the drought-reduced harvests of the past two seasons
and at average levels. This estimate is significantly below the
forecasts at the beginning of the season as a result of Hurricane
Matthew, which made landfall in the southwest of the country
at the beginning of October and caused significant damage to
the then-recently-planted cereal crops.
White maize prices continued their decreasing trend in the December-February periodWhite maize prices continued their decreasing trend during
the December-February period, particularly in El Salvador,
Guatemala, Honduras and Nicaragua. Prices are overall below
their year-earlier levels, reflecting good market availabilities
LATIN
AM
ERIC
A A
ND
THE C
AR
RIB
EAN
Table 15. Latin America and Caribbean cereal production (million tonnes)
Wheat Coarse grains Rice (paddy) Total cereals
2014 20152016
estim. 2014 20152016
estim. 2014 20152016
estim. 2014 20152016
estim.Change:
2016/2015 (%)
Central America & Caribbean 3.7 3.7 3.9 36.4 35.0 38.4 2.8 2.6 2.8 43.0 41.3 45.1 9.2El Salvador 0.0 0.0 0.0 0.9 0.8 1.0 0.0 0.0 0.0 1.0 0.9 1.0 16.7Guatemala 0.0 0.0 0.0 1.9 1.9 1.9 0.0 0.0 0.0 1.9 1.9 2.0 2.0Honduras 0.0 0.0 0.0 0.5 0.4 0.6 0.1 0.0 0.1 0.5 0.4 0.6 39.4Mexico 3.7 3.7 3.9 31.8 30.8 33.5 0.3 0.2 0.3 35.8 34.7 37.6 8.4Nicaragua 0.0 0.0 0.0 0.5 0.4 0.5 0.3 0.3 0.3 0.8 0.7 0.9 22.0
South America 24.4 21.0 27.1 137.9 148.2 128.0 24.7 25.7 23.3 187.0 194.9 178.4 -8.5Argentina 13.9 11.3 16.5 40.0 42.4 46.9 1.6 1.6 1.4 55.5 55.3 64.8 17.2Brazil 6.3 5.5 6.7 82.9 88.2 65.8 12.1 12.4 10.6 101.3 106.1 83.1 -21.7
Note: Totals and percentage change computed from unrounded data.
Mexico:• coarse grains (winter crop): planting•wheat(wintercrop):vegetative
Brazil:• maize (main, northeast): planting maize (main, centresouth): vegetative•paddy(north&northeast):plantingpaddy(centre&south):harvesting
Argentina:• coarse grains: vegetative •paddy:vegetative
Uruguay: • coarse grains: vegetative•paddy:vegetative
Note: Comments refer to situation as of March.
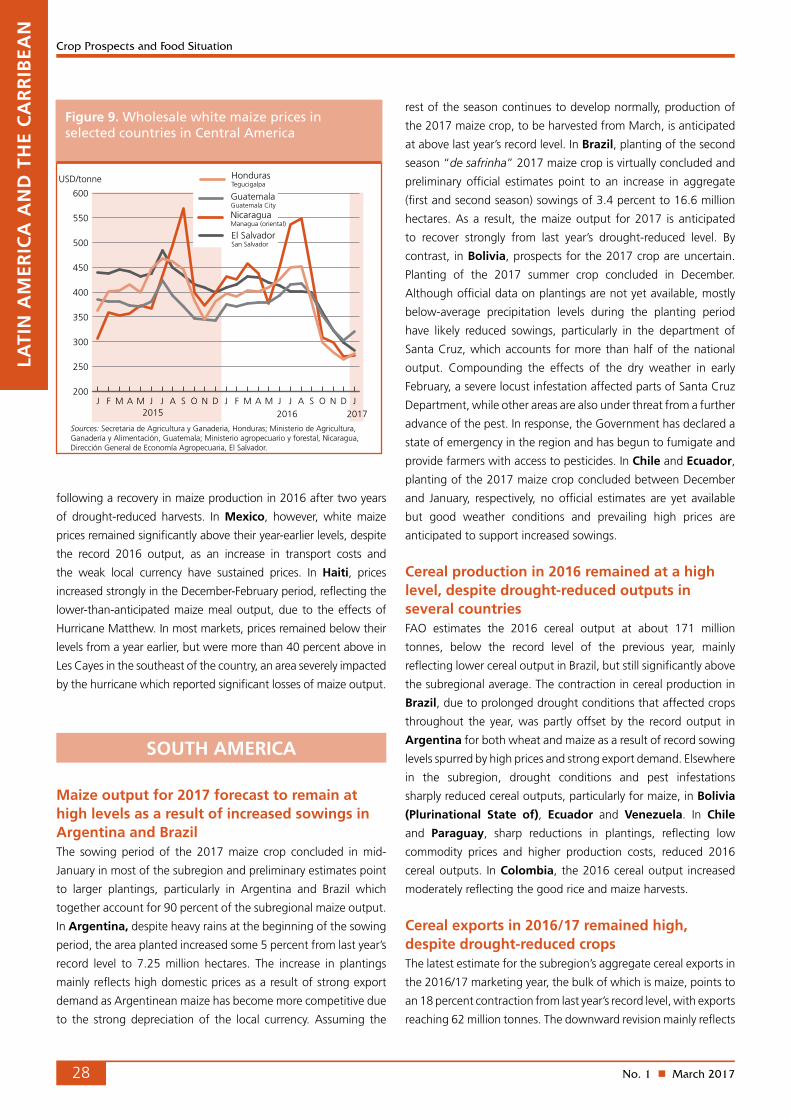
No. 1 n March 201728
Crop Prospects and Food Situation
following a recovery in maize production in 2016 after two years
of drought-reduced harvests. In Mexico, however, white maize
prices remained significantly above their year-earlier levels, despite
the record 2016 output, as an increase in transport costs and
the weak local currency have sustained prices. In Haiti, prices
increased strongly in the December-February period, reflecting the
lower-than-anticipated maize meal output, due to the effects of
Hurricane Matthew. In most markets, prices remained below their
levels from a year earlier, but were more than 40 percent above in
Les Cayes in the southeast of the country, an area severely impacted
by the hurricane which reported significant losses of maize output.
SOUTH AMERICA
Maize output for 2017 forecast to remain at high levels as a result of increased sowings in Argentina and BrazilThe sowing period of the 2017 maize crop concluded in mid-
January in most of the subregion and preliminary estimates point
to larger plantings, particularly in Argentina and Brazil which
together account for 90 percent of the subregional maize output.
In Argentina, despite heavy rains at the beginning of the sowing
period, the area planted increased some 5 percent from last year’s
record level to 7.25 million hectares. The increase in plantings
mainly reflects high domestic prices as a result of strong export
demand as Argentinean maize has become more competitive due
to the strong depreciation of the local currency. Assuming the
rest of the season continues to develop normally, production of
the 2017 maize crop, to be harvested from March, is anticipated
at above last year’s record level. In Brazil, planting of the second
season “de safrinha” 2017 maize crop is virtually concluded and
preliminary official estimates point to an increase in aggregate
(first and second season) sowings of 3.4 percent to 16.6 million
hectares. As a result, the maize output for 2017 is anticipated
to recover strongly from last year’s drought-reduced level. By
contrast, in Bolivia, prospects for the 2017 crop are uncertain.
Planting of the 2017 summer crop concluded in December.
Although official data on plantings are not yet available, mostly
below-average precipitation levels during the planting period
have likely reduced sowings, particularly in the department of
Santa Cruz, which accounts for more than half of the national
output. Compounding the effects of the dry weather in early
February, a severe locust infestation affected parts of Santa Cruz
Department, while other areas are also under threat from a further
advance of the pest. In response, the Government has declared a
state of emergency in the region and has begun to fumigate and
provide farmers with access to pesticides. In Chile and Ecuador,
planting of the 2017 maize crop concluded between December
and January, respectively, no official estimates are yet available
but good weather conditions and prevailing high prices are
anticipated to support increased sowings.
Cereal production in 2016 remained at a high level, despite drought-reduced outputs in several countriesFAO estimates the 2016 cereal output at about 171 million
tonnes, below the record level of the previous year, mainly
reflecting lower cereal output in Brazil, but still significantly above
the subregional average. The contraction in cereal production in
Brazil, due to prolonged drought conditions that affected crops
throughout the year, was partly offset by the record output in
Argentina for both wheat and maize as a result of record sowing
levels spurred by high prices and strong export demand. Elsewhere
in the subregion, drought conditions and pest infestations
sharply reduced cereal outputs, particularly for maize, in Bolivia
(Plurinational State of), Ecuador and Venezuela. In Chile
and Paraguay, sharp reductions in plantings, reflecting low
commodity prices and higher production costs, reduced 2016
cereal outputs. In Colombia, the 2016 cereal output increased
moderately reflecting the good rice and maize harvests.
Cereal exports in 2016/17 remained high, despite drought-reduced cropsThe latest estimate for the subregion’s aggregate cereal exports in
the 2016/17 marketing year, the bulk of which is maize, points to
an 18 percent contraction from last year’s record level, with exports
reaching 62 million tonnes. The downward revision mainly reflects
LATI
N A
MER
ICA
AN
D T
HE
CA
RR
IBEA
N
2015 2016 2017
200
250
300
350
400
450
500
550
600
JDNOSAJJMAMFJDNOSAJJMAMFJ
Nicaragua Managua (oriental)
Honduras Tegucigalpa
Guatemala Guatemala City
El Salvador San Salvador
USD/tonne
Figure 9. Wholesale white maize prices in selected countries in Central America
Sources: Secretaria de Agricultura y Ganaderia, Honduras; Ministerio de Agricultura, Ganadería y Alimentación, Guatemala; Ministerio agropecuario y forestal, Nicaragua, Dirección General de Economía Agropecuaria, El Salvador.

No. 1 n March 2017 29
Crop Prospects and Food Situation
lower maize exports from Brazil during the 2016/17 marketing
year (March/February), which are estimated at 48 percent below
last year’s level reflecting low domestic availabilities. By contrast,
in Argentina, maize exports in the 2016/17 marketing year
(March/February) are estimated at a record level of 24 million
tonnes. This estimate is largely underpinned by the removal of
export restrictions and ample availabilities from this year’s record
maize crop. Subregional wheat exports are anticipated to remain
close to the previous year’s level reflecting the record 2016
crop in Argentina, which accounts for about 80 percent of the
subregion’s exports.
Cereal prices mostly declined in the December-February period pressured by high import levelsIn the December-February period, prices for wheat and wheat
flour followed mixed trends in the subregion. In Argentina,
the weak currency and high export demand has sustained an
increasing price trend for both wheat and wheat flour. Price
quotations for wheat and wheat flour were significantly above
their levels for the same period a year earlier. By contrast, in
Brazil, high import levels boosted domestic supplies and have
resulted in relative price stability during the December-February
period, with prices well below the same period a year earlier. In
Bolivia (Plurinational State of), increased wheat flour imports
maintained stable prices in most markets, but in main market,
Santa Cruz, prices remained above their levels of a year earlier,
reflecting the tight supply situation. By contrast, in the main
importers, Chile, Colombia, Ecuador and Peru, wheat and
wheat flour prices either declined or were unchanged during the
December-February period and below their levels from the same
period last year as imports continue to supply the local markets.
Generally, maize prices have recently declined in the subregion,
with the exceptions of Chile and Ecuador, where reduced 2016
outputs continued to sustain prices at a high level. In Argentina,
prices declined in the December-February period reflecting an
appreciation of the local currency and a seasonal slowdown in
export demand, as most countries in the subregion will begin to
harvest maize in March. In Brazil and Colombia, maize imports
pressured prices downward during the December-February
period and maintained them below their levels from a year earlier.
In Bolivia (Plurinational State of), while maize prices declined
or remained unchanged in the main markets, prices remained
significantly above their year-earlier levels pressured by the
reduced 2016 maize crop and uncertainty about the 2017 crop.
LATIN
AM
ERIC
A A
ND
THE C
AR
RIB
EAN
2016 20172015
100
200
300
400
500
600
700
800
900
1000
JDNOSAJJMAMFJDNOSAJJMAMFJ
USD/tonne
Figure 10. Wholesale wheat flour prices in selected countries in South America
Sources: Servicio Informativo de Mercados Agropecuarios, Bolivia; Instituto de Economía Agrícola, Brazil; Bolsa de Cereales, Argentina.
Brazil, São Paulo
Argentina, Buenos Aires
Bolivia, Santa Cruz

No. 1 n March 201730
Crop Prospects and Food Situation
NORTH AMERICA
United States of America winter wheat plantings lowest in more than 100 hundred yearsIn the United States of America, latest official estimates put
the area sown to winter wheat for the 2017 harvest at just some
13 million hectares, 10 percent down from the previous year and
the lowest level in 108 years. Furthermore, although the condition
of the crop is reported to have improved somewhat in January, it is
nevertheless generally lower than in the previous year implying that
winter abandonment could increase. For spring wheat, factors such
as the survival rate of winter crops, weather conditions at planting
time and developments in price prospects relative to other crops will
all influence the planted area. At this early stage, based on the area
and current condition of the winter crop and assuming a normal
spring crop season, the country’s aggregate wheat output in 2017
is tentatively forecast at 50 million tonnes, 20 percent down from
the previous year’s above-average output. In Canada, conditions
for the minor winter wheat crop are generally favourable. The main
crop will be sown later this spring and plantings are expected to
decline. With yields likely to decline also from the above-average
levels of last year, 2017 output is tentatively forecast at about
29 million tonnes, which would be 10 percent down from 2016.
NO
RTH
AM
ERIC
A,
EUR
OPE
AN
D O
CEA
NIA
Northern Europe:• winter grains: dormant to vegetative
Centre-Southern Europe:• winter grains: vegetative•summergrains:planting
CIS in Europe:• winter grains: dormant to vegetative
Note: Comments refer to situation as of March.
Canada:• winter grains: dormant to vegetative
United States of America:• winter grains: vegetative
Australia:• summer grains: filling
Table 16. North America, Europe and Oceania cereal production (million tonnes)
Wheat Coarse grains Rice (paddy) Total cereals
2014 20152016
estim. 2014 20152016
estim. 2014 20152016
estim. 2014 20152016
estim.Change:
2016/2015 (%)
North America 84.6 83.7 94.6 399.6 393.1 428.7 10.1 8.8 10.2 494.3 485.5 533.5 9.9Canada 29.4 27.6 31.7 22.1 25.7 25.8 0.0 0.0 0.0 51.5 53.3 57.5 7.9United States 55.1 56.1 62.9 377.6 367.3 402.9 10.1 8.8 10.2 442.8 432.2 475.9 10.1
Europe 249.0 256.7 252.1 272.2 239.3 251.7 4.0 4.2 4.2 525.2 500.3 508.0 1.5Belarus 2.9 2.9 2.9 6.1 5.7 6.1 0.0 0.0 0.0 9.0 8.6 9.0 4.9European Union 157.1 160.5 144.5 171.7 151.0 154.2 2.9 3.0 3.0 331.7 314.5 301.7 -4.1Russian Federation 59.7 61.8 73.3 42.4 39.5 41.8 1.0 1.1 1.1 103.1 102.4 116.1 13.4Serbia 2.3 2.4 2.4 7.7 5.9 5.9 0.0 0.0 0.0 10.0 8.3 8.3 0.5Ukraine 24.1 26.5 26.0 39.7 33.4 39.3 0.1 0.1 0.1 63.8 60.0 65.4 9.0
Oceania 24.1 24.5 35.4 12.3 13.4 18.6 0.8 0.7 0.3 37.2 38.6 54.4 40.8Australia 23.7 24.2 35.1 11.7 12.9 18.1 0.8 0.7 0.3 36.3 37.7 53.5 41.7
Note: Totals and percentage change computed from unrounded data.

No. 1 n March 2017 31
Crop Prospects and Food Situation
EUROPE
European UnionIn the European Union, the wheat area for the 2017 harvest
may be up marginally from the previous year but no significant
change is expected. However, yields are expected to recover
somewhat from the relatively low levels of last year and, at this
early stage, a 4 percent increase in the wheat output in 2017 to
150 million tonnes is tentatively forecast.
CIS in EuropeProspects for the 2017 winter cereal crops are mixedThe 2017 winter crops are at dormant stage over much of
the subregion now. In the Russian Federation, dry weather
conditions in August caused some planting delays of winter
cereal crops for harvest in the summer 2017. However, by
mid-October, delays have been overcome and the total area
under winter cereals was reported to have reached 17.4 million
hectares, around 7 percent more than in 2016. Although
2016/17 winter temperatures have been lower than a year
ago, the snow coverage is sufficient in most areas to protect
crops. Only 4 percent of the total planted crop is reported to
be in bad condition, which is much lower proportion than in
last year. Considering very good conditions of the winter crop
and assuming favourable weather conditions during the crop
development period, the Russian Federation’s total wheat
production is forecast at 74 million tonnes, slightly above the
record of last year. In Ukraine, excessive precipitations during
October-November delayed winter plantings that consequently
lasted until mid-November. The planted area under winter
cereals is reported to be 6.1 million hectares, down 1 percent
from the previous year. By mid-February, around 80 percent of
the plantings were reported to be in good or fair conditions.
Assuming that spring output will partially compensate for the
projected decrease in the winter season’s production, FAO’s early
forecast puts the 2017 wheat output in Ukraine at 25 million
tonnes, a 4 percent decline from the previous year’s level. In the
Republic of Moldova and Belarus, dry weather conditions
during autumn delayed planting operations. However, weather
conditions during the winter were satisfactory for the survival
of winter crops.
Aggregate cereal output reached a new record in 2016FAO puts the subregional 2016 aggregate cereal production at a
record high of 193 million tonnes, an increase of 12 percent over
the already high level of last year. The estimated increase is mainly
on account of well-above the average subregional wheat output,
which in 2016 is set at 103.5 million tonnes. Most of the increase
occurred in the Russian Federation, which harvested a record
crop of 73 million tonnes in 2016. This output has more than
offset the decline in wheat production in Ukraine, estimated
at 26 million tonnes, 2 percent down from the previous year,
attributed to slight a reduction in the area planted.
Maize production in the subregion is also estimated to rise by
16 percent to 44 million tonnes. Most of this increase originated
from Ukraine, where the maize production was estimated at
28 million tonnes, mainly due to higher yields. Barley production
is set higher than the previous year at around 30 million tonnes,
on the back of higher harvests in Ukraine and the Russian
Federation.
Cereal exports are estimated at record level in 2016/17Despite recent downward revisions due to a reduced forecast for
wheat exports in the Russian Federation, subregional cereal
exports are still projected to reach a new record of 78 million
tonnes in the 2016/17 marketing year (July/June), following
higher shipments of wheat and maize. Most of the annual
increase in wheat exports comes from the Russian Federation,
where shipments are expected at a record level of 28.5 million
tonnes. This would put the country at the leading position among
wheat exporters. The increase in maize shipments is expected
to mostly originate from Ukraine, where exports are set at
19.2 million tonnes, slightly below the record of 2013/14. By
NO
RTH
AM
ERIC
A, EU
RO
PE AN
D O
CEA
NIA
2016 20172015
100
150
200
250
300
350
400
JDNOSAJJMAMFJDNOSAJJMAMFJ
Figure 11. Wholesale wheat and wheat flour pricesin Russian Federation and Ukraine
Source: APK-Inform Agency.
Ukraine (wheat, national average)
Russian Federation (wheat flour, Southern region)
Ukraine (wheat flour, national average)
USD/tonne
Russian Federation (wheat, National average)

No. 1 n March 201732
Crop Prospects and Food Situation
contrast, subregional barley exports are estimated to decline by
2 percent and are set at 8.6 million tonnes in 2016/17.
Domestic prices of wheat and wheat flour increased due to shortage of milling quality wheat and weak local currenciesDespite a record crop production obtained in the subregion,
export prices of milling wheat in the Russian Federation and
Ukraine increased over the past three months, supported by
shortages of high quality milling wheat and trends in global
markets.
Domestic prices of wheat declined slightly over the last
three months in the Russian Federation on account of
the record wheat output and a stable Rouble. Wheat prices
in February 2017 were 7 percent down on a yearly basis.
By contrast, in Ukraine, they increased by 12 percent since
November following year-on-year declines in local production
and a sharp devaluation of the national currency. Similarly,
in Belarus prices of wheat flour increased in recent months,
mainly following a further depreciation of the local currency. In
the Republic of Moldova, wheat flour prices remained stable
in January, but at high levels reflecting the reduced domestic
output.
OCEANIA
Australia reaps record 2016 winter grain cropThe recently-completed 2016 wheat harvest in Australia is officially
estimated at a record 35.1 million tonnes, some 45 percent up
from the previous year’s crop reflecting generally favourable
seasonal conditions. Barley production also rose to a record high
of 13.4 million tonnes, 56 percent up from the previous year’s
crop. Regarding the 2017 summer coarse grains, sowing is mostly
complete. The area planted to sorghum is officially forecast to be
down by 35 percent, mostly because of larger areas dedicated
to growing cotton, for which irrigation supplies are plentiful and
returns are expected to be higher. With yields expected to be
constrained by unfavourable dry conditions that have set-in in
the main growing areas in the past three months, production is
forecast to fall by 41 percent to 1.2 million tonnes. However, for
the irrigated rice crop, the area planted is estimated to be almost
four times higher for the 2017 harvest and production is forecast
to increase to 870 000 tonnes from 250 000 tonnes in 2016.
Early indications for the 2017 wheat crop, which will be planted from April to June, point towards some decline after the record output of 2016.
NO
RTH
AM
ERIC
A,
EUR
OPE
AN
D O
CEA
NIA

Crop Prospects and Food Situation
No. 1 n March 2017 33
Statistical appendix
Table A1. Global cereal supply and demand indicators ............................................................................................. 34
Table A2. World cereal stocks ................................................................................................................................... 35
Table A3. Selected international prices of wheat and coarse grains ........................................................................... 36
Table A4a. Cereal import requirements of Low-Income Food-Deficit Countries, 2015/16 or 2016 estimates ................ 37
Table A4b. Cereal import requirements of Low-Income Food-Deficit Countries, 2015/16 or 2016 estimates ............... 38
Table A5. Cereal import requirements of Low-Income Food-Deficit Countries, 2016/17 estimates ............................. 39
STATISTIC
AL A
PPEND
IX

No. 1 n March 201734
Crop Prospects and Food Situation
Table A1. Global cereal supply and demand indicators
Average 2009/10 - 2013/14 2012/13 2013/14 2014/15 2015/16 2016/17
1. Ratio of world stocks to utilization (%) Wheat 27.7 24.8 25.9 29.1 30.4 32.4Coarse grains 17.7 15.7 18.2 20.8 19.8 19.5Rice 31.5 33.5 35.1 35.3 34.3 33.8Total cereals 23.4 21.8 23.7 26.0 25.7 25.9
2. Ratio of major grain exporters' suppliesto normal market requirements (%) 118.1 108.2 121.6 123.2 122.6 121.8
3. Ratio of major exporters' stocks to their total disappearance (%) Wheat 18.3 14.3 14.6 16.8 16.9 19.2Coarse grains 11.4 8.2 10.5 13.4 11.7 13.2Rice 25.0 27.8 28.9 24.2 19.3 18.6Total cereals 18.3 16.8 18.0 18.1 16.0 17.0
Annual trendgrowth rate Change from previous year
2006-2015 2012 2013 2014 2015 2016
4. Changes in world cereal production (%) 2.6 -2.1 9.8 1.8 -1.2 2.6
5. Changes in cereal production in the LIFDCs (%) 2.1 4.0 0.6 3.2 -5.3 5.2
6. Changes in cereal production in the LIFDCsless India (%) 2.7 6.0 -0.5 7.0 -4.3 3.4
Average Change from previous year (%)
2010-2014 2013 2014 2015 2016 2017*
7. Selected cereal price indices: Wheat 191.2 -4.9 -6.6 -20.5 -13.0 1.2Maize 232.8 -12.9 -25.8 -11.8 -6.4 0.4Rice 233.9 0.8 0.8 -10.5 -8.1 -2.1
Notes:
Utilization is de�ned as the sum of food use, feed and other uses.Cereals refer to wheat, coarse grains and rice; grains refer to wheat and coarse grains.
Major wheat exporters are Argentina, Australia, Canada, the European Union, Kazakhstan, the Russian Federation, Ukraine and the United States of America; major coarse grain exporters are Argentina, Australia, Brazil, Canada, the European Union, the Russian Federation, Ukraine and the United States of America; major rice exporters are India, Pakistan, Thailand, the United States of America and Viet Nam.
Normal market requirements for major grain exporters are de�ned as the average of domestic utilization plus exports in the three preceding seasons.Disappearance is de�ned as domestic utilization plus exports for any given season.
Price indices: The Wheat Price Index has been constructed based on the IGC Wheat Price Index, rebased to 2002-2004=100; for maize, the U.S. maize No.2 Yellow (delivered U.S. Gulf ports) with base 2002-2004=100; for rice, the FAO Rice Price Index, 2002-2004=100, is based on 16 rice export quotations.
*January-February average.

No. 1 n March 2017 35
Crop Prospects and Food Situation
Table A2. World cereal stocks1 (million tonnes)
2012 2013 2014 20152016
estimate2017
forecast
TOTAL CEREALS 551.3 530.1 591.7 655.1 661.5 678.2
Wheat 196.8 172.2 182.7 207.7 224.7 239.6held by: - main exporters2 69.5 49.3 53.7 63.3 65.8 78.1- others 127.3 122.9 129.0 144.4 158.9 161.5
Coarse grains 208.0 196.5 236.2 272.6 265.6 266.9held by: - main exporters2 74.5 55.1 81.0 104.4 92.9 106.0- others 133.5 141.4 155.2 168.2 172.7 160.9
Rice (milled basis) 146.5 161.4 172.8 174.7 171.2 171.7held by: - main exporters2 41.3 46.6 49.5 43.3 34.0 32.5- others 105.2 114.8 123.3 131.4 137.2 139.2
Developed countries 154.9 119.3 140.6 168.7 169.4 200.4Australia 9.0 6.6 5.9 6.4 6.9 12.6Canada 9.4 8.2 15.1 10.4 9.9 11.9European Union 32.6 24.4 31.5 39.2 36.4 31.7Japan 5.5 6.2 5.6 5.2 5.0 4.9Russian Federation 15.9 6.7 6.8 8.6 6.9 14.2South Africa 2.6 2.5 1.7 3.3 3.6 2.2Ukraine 10.6 6.1 8.9 10.7 6.5 6.7United States 49.3 44.2 51.4 69.0 76.1 95.5
Developing countries 396.3 410.8 451.1 486.4 492.1 477.9
Asia 330.1 353.5 378.0 399.2 407.7 399.1China 198.0 216.7 238.5 257.4 279.9 282.8India 50.4 52.2 49.9 48.5 40.3 35.4Indonesia 10.5 11.2 10.9 9.9 9.6 9.4Iran (Islamic Republic of ) 1.5 3.6 3.5 6.6 6.4 5.9Korea, Republic of 3.7 3.3 3.7 3.9 4.3 4.6Pakistan 6.0 4.2 4.8 6.2 5.2 4.7Philippines 2.9 3.1 3.1 3.9 3.6 3.8Syrian Arab Republic 3.5 2.6 2.2 1.4 1.6 0.9Turkey 4.5 4.6 5.7 5.1 5.0 3.4
Africa 37.7 35.6 38.2 43.0 44.7 40.9Algeria 3.1 3.5 5.1 5.4 6.2 5.8Egypt 7.9 5.5 6.2 6.2 6.4 6.2Ethiopia 2.0 1.9 1.7 2.7 2.8 2.8Morocco 4.8 3.4 5.5 5.2 8.9 5.9Nigeria 2.1 1.8 1.6 1.8 1.2 1.2Tunisia 0.8 1.3 1.1 1.3 1.1 0.9
Central America 5.6 5.6 6.6 7.5 8.9 10.4Mexico 2.3 2.6 3.3 3.6 4.6 6.2
South America 22.6 15.7 27.9 36.3 30.4 27.0Argentina 4.8 2.1 5.8 10.3 7.9 9.5Brazil 9.5 6.1 12.0 15.2 9.9 5.3
Note: Based on o�cial and uno�cial estimates. Totals computed from unrounded data.1 Stocks data are based on an aggregate of carryovers at the end of national crop years and do not represent world stock levels at any point in time.2 Major wheat exporters are Argentina, Australia, Canada, the European Union, Kazakhstan, the Russian Federation, Ukraine and the United States of America; major coarse grain exporters are Argentina, Australia, Brazil, Canada, the European Union, the Russian Federation, Ukraine and the United States of America; major rice exporters are India, Pakistan, Thailand, the United States of America and Viet Nam.

No. 1 n March 201736
Crop Prospects and Food Situation
Table A3. Selected international prices of wheat and coarse grains(USD/tonne)
Wheat Maize Sorghum
US No.2 Hard Red Winter Ord.
Prot.1 US Soft Red
Winter No.2 2 Argentina Trigo Pan3
US No.2 Yellow2 Argentina3
US No.2 Yellow2
Annual (July/June) 2003/04 161 149 154 115 109 1182004/05 154 138 123 97 90 992005/06 175 138 138 104 101 1082006/07 212 176 188 150 145 1552007/08 361 311 318 200 192 2062008/09 270 201 234 188 180 1702009/10 209 185 224 160 168 1652010/11 316 289 311 254 260 2482011/12 300 256 264 281 269 2642012/13 348 310 336 311 278 2812013/14 318 265 335 217 219 2182014/15 266 221 246 173 177 2102015/16 211 194 208 166 170 174
Monthly 2015 - February 252 221 241 174 178 2302015 - March 250 219 228 173 169 2262015 - April 239 209 225 172 168 2232015 - May 231 199 228 166 168 2172015 - June 242 211 226 170 173 2242015 - July 238 208 229 179 176 2232015 - August 216 190 227 163 160 1802015 - September 218 195 223 166 161 1772015 - October 221 208 223 172 164 1822015 - November 211 201 210 166 167 1732015 - December 212 191 193 164 166 1702016 - January 213 192 194 161 161 1652016 - February 205 189 194 160 167 1652016 - March 207 189 192 159 163 1612016 - April 201 193 199 164 170 1622016 - May 193 189 202 169 187 1532016 - June 198 186 210 181 197 1702016 - July 188 168 210 161 179 1472016 - August 188 157 215 150 177 1402016 - September 188 158 201 148 170 1412016 - October 193 164 184 152 174 1462016 - November 191 167 176 152 178 1432016 - December 187 162 168 154 181 1542017 - January 201 173 177 159 183 1552017 - February 210 180 186 163 179 157
Sources: International Grains Council and USDA.1 Delivered United States f.o.b. Gulf.2 Delivered United States Gulf.3 Up River f.o.b.

No. 1 n March 2017 37
Crop Prospects and Food Situation
Table A4a. Estimated cereal import requirements of Low-Income Food-De�cit Countries1 , 2015/16 or 2016(thousand tonnes)
2014/15 or 2015 2015/16 or 2016
Marketing yearCommercial purchases Food aid
Total imports (commercial and aid)
Total import requirements (excl. re-exports)
AFRICA 31 291.3 1 034.9 32 326.2 32 161.0
East Africa 9 898.1 560.9 10 459.0 10 685.8 Burundi Jan/Dec 147.4 3.0 150.4 164.9 Comoros Jan/Dec 70.0 0.0 70.0 56.0 Djibouti Jan/Dec 217.0 3.5 220.5 231.0 Eritrea Jan/Dec 427.0 0.0 427.0 437.3 Ethiopia Jan/Dec 1 700.0 111.5 1 811.5 1 620.0 Kenya Oct/Sep 2 640.5 94.6 2 735.1 2 512.6 Rwanda Jan/Dec 126.2 2.6 128.8 116.0 Somalia Aug/Jul 590.0 58.0 648.0 730.0 South Sudan Nov/Oct n.a. n.a. 545.0 535.0 Sudan Nov/Oct 1 955.9 257.3 2 213.2 2 835.0 Uganda Jan/Dec 317.4 20.8 338.2 498.0 United Republic of Tanzania Jun/May 1 161.7 9.6 1 171.3 950.0
Southern Africa 2 662.1 55.5 2 717.6 2 891.3 Lesotho Apr/Mar 226.5 5.0 231.5 192.0 Madagascar Apr/Mar 543.7 7.4 551.1 492.8 Malawi Apr/Mar 117.0 13.2 130.2 258.8 Mozambique Apr/Mar 1 266.8 22.2 1 289.0 1 003.0 Zimbabwe Apr/Mar 508.1 7.7 515.8 944.7
West Africa 16 977.4 269.2 17 246.6 16 813.8Coastal Countries 12 872.5 146.3 13 018.8 12 610.8 Benin Jan/Dec 361.0 6.0 367.0 387.0 Côte d'Ivoire Jan/Dec 1 889.7 3.5 1 893.2 1 940.0 Ghana Jan/Dec 1 090.3 7.8 1 098.1 1 451.0 Guinea Jan/Dec 610.5 16.5 627.0 912.5 Liberia Jan/Dec 275.0 77.0 352.0 285.2 Nigeria Jan/Dec 8 020.0 0.0 8 020.0 7 050.0 Sierra Leone Jan/Dec 351.0 35.0 386.0 266.0 Togo Jan/Dec 275.0 0.5 275.5 319.1Sahelian Countries 4 104.9 122.9 4 227.8 4 203.0 Burkina Faso Nov/Oct 479.0 6.0 485.0 573.0 Chad Nov/Oct 104.0 40.6 144.6 151.7 Gambia Nov/Oct 141.0 11.5 152.5 209.8 Guinea-Bissau Nov/Oct 88.0 6.3 94.3 134.3 Mali Nov/Oct 366.2 9.7 375.9 399.2 Mauritania Nov/Oct 514.5 10.0 524.5 459.0 Niger Nov/Oct 468.2 36.8 505.0 526.0 Senegal Nov/Oct 1 944.0 2.0 1 946.0 1 750.0
Central Africa 1 753.7 149.3 1 903.0 1 770.1 Cameroon Jan/Dec 1 016.6 2.0 1 018.6 887.0 Central African Republic Jan/Dec 52.0 23.0 75.0 75.0 Democratic Republic of the Congo Jan/Dec 669.7 120.3 790.0 790.0 Sao Tome and Principe Jan/Dec 15.4 4.0 19.4 18.1
Source: FAO1 The Low-Income Food-De�cit Countries (LIFDCs) group includes net food de�cit countries with annual per caput income below the level used by the World Bank to determine eligibility for IDA assistance (i.e. USD 1 945 in 2011); for full details see http://www.fao.org/countrypro�les/lifdc

No. 1 n March 201738
Crop Prospects and Food Situation
Table A4b. Estimated cereal import requirements of Low-Income Food-De�cit Countries1 , 2015/16 or 2016(thousand tonnes)
2014/15 or 2015 2015/16 or 2016
Marketing yearCommercial purchases Food aid
Total import (commercial and aid)
Total import requirements (excl. re-exports)
ASIA 19 106.8 493.9 19 600.7 22 717.2
Cis in Asia 4 137.8 0.5 4 138.3 4 510.2 Kyrgyzstan Jul/Jun 570.8 0.3 571.1 515.2 Tajikistan Jul/Jun 1 082.0 0.2 1 082.2 1 089.0 Uzbekistan Jul/Jun 2 485.0 0.0 2 485.0 2 906.0
Far East 6 309.2 146.2 6 455.4 8 035.0 Bangladesh Jul/Jun 5 271.0 15.0 5 286.0 5 329.6 Bhutan Jul/Jun 90.4 1.0 91.4 73.0 Democratic People's Republic of Korea Nov/Oct 309.5 100.2 409.7 694.0 India Apr/Mar 38.7 0.0 38.7 724.2 Mongolia Oct/Sep 67.8 0.0 67.8 243.4 Nepal Jul/Jun 531.8 30.0 561.8 970.8
Near East 8 659.8 347.2 9 007.0 10 172.0 Afghanistan Jul/Jun 2 161.0 16.0 2 177.0 2 832.0 Syrian Arab Republic Jul/Jun 2 278.8 281.2 2 560.0 2 940.0 Yemen Jan/Dec 4 220.0 50.0 4 270.0 4 400.0CENTRAL AMERICA AND THE CARIB-BEAN 1 896.5 76.4 1 972.9 2 253.1 Haiti Jul/Jun 580.0 68.1 648.1 674.1 Honduras Jul/Jun 869.4 5.5 874.9 1 014.0 Nicaragua Jul/Jun 447.1 2.8 449.9 565.0
OCEANIA 472.6 0.0 472.6 480.6 Papua New Guinea Jan/Dec 415.2 0.0 415.2 420.2 Solomon Islands Jan/Dec 57.4 0.0 57.4 60.4
TOTAL 52 767.2 1 605.2 54 372.4 57 611.9
Source: FAO1 The Low-Income Food-De�cit Countries (LIFDCs) group includes net food de�cit countries with annual per caput income below the level used by the World Bank to determine eligibility for IDA assistance (i.e. USD 1 945 in 2011); for full details see http://www.fao.org/countrypro�les/lifdc
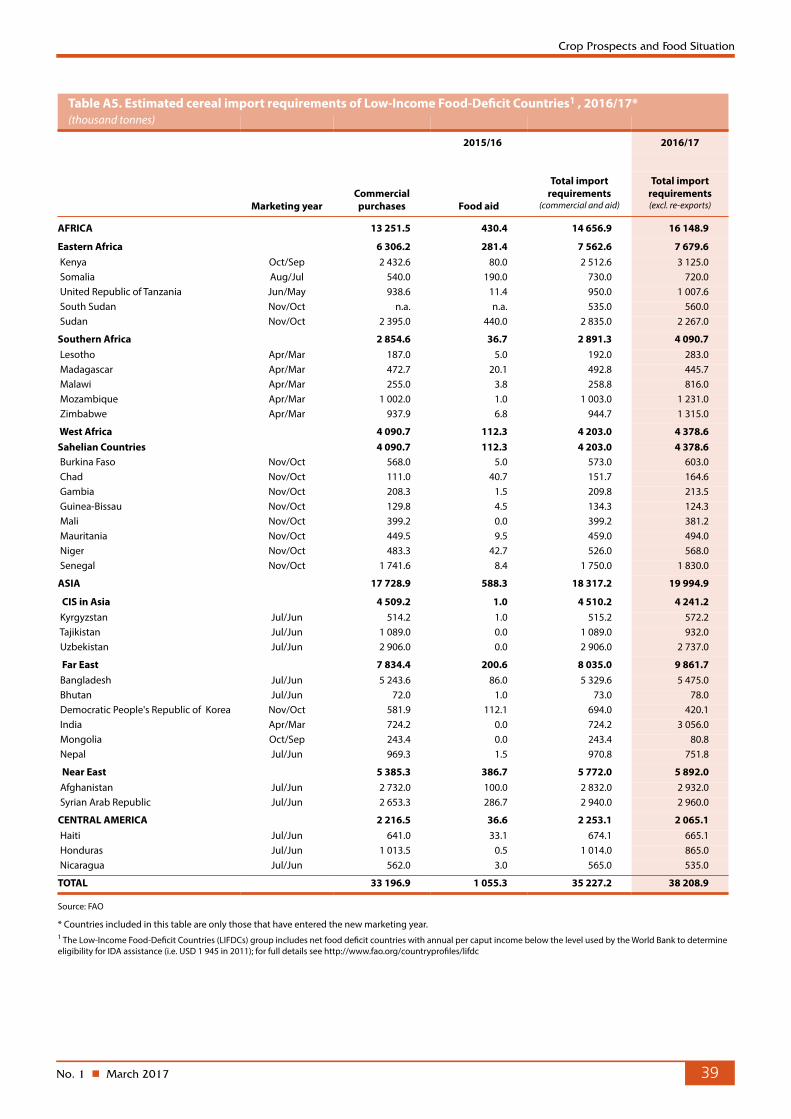
No. 1 n March 2017 39
Crop Prospects and Food Situation
Table A5. Estimated cereal import requirements of Low-Income Food-De�cit Countries1 , 2016/17*(thousand tonnes)
2015/16 2016/17
Marketing yearCommercial purchases Food aid
Total import requirements
(commercial and aid)
Total import requirements (excl. re-exports)
AFRICA 13 251.5 430.4 14 656.9 16 148.9
Eastern Africa 6 306.2 281.4 7 562.6 7 679.6 Kenya Oct/Sep 2 432.6 80.0 2 512.6 3 125.0 Somalia Aug/Jul 540.0 190.0 730.0 720.0 United Republic of Tanzania Jun/May 938.6 11.4 950.0 1 007.6 South Sudan Nov/Oct n.a. n.a. 535.0 560.0 Sudan Nov/Oct 2 395.0 440.0 2 835.0 2 267.0
Southern Africa 2 854.6 36.7 2 891.3 4 090.7 Lesotho Apr/Mar 187.0 5.0 192.0 283.0 Madagascar Apr/Mar 472.7 20.1 492.8 445.7 Malawi Apr/Mar 255.0 3.8 258.8 816.0 Mozambique Apr/Mar 1 002.0 1.0 1 003.0 1 231.0 Zimbabwe Apr/Mar 937.9 6.8 944.7 1 315.0
West Africa 4 090.7 112.3 4 203.0 4 378.6Sahelian Countries 4 090.7 112.3 4 203.0 4 378.6 Burkina Faso Nov/Oct 568.0 5.0 573.0 603.0 Chad Nov/Oct 111.0 40.7 151.7 164.6 Gambia Nov/Oct 208.3 1.5 209.8 213.5 Guinea-Bissau Nov/Oct 129.8 4.5 134.3 124.3 Mali Nov/Oct 399.2 0.0 399.2 381.2 Mauritania Nov/Oct 449.5 9.5 459.0 494.0 Niger Nov/Oct 483.3 42.7 526.0 568.0 Senegal Nov/Oct 1 741.6 8.4 1 750.0 1 830.0
ASIA 17 728.9 588.3 18 317.2 19 994.9
CIS in Asia 4 509.2 1.0 4 510.2 4 241.2 Kyrgyzstan Jul/Jun 514.2 1.0 515.2 572.2 Tajikistan Jul/Jun 1 089.0 0.0 1 089.0 932.0 Uzbekistan Jul/Jun 2 906.0 0.0 2 906.0 2 737.0
Far East 7 834.4 200.6 8 035.0 9 861.7 Bangladesh Jul/Jun 5 243.6 86.0 5 329.6 5 475.0 Bhutan Jul/Jun 72.0 1.0 73.0 78.0 Democratic People's Republic of Korea Nov/Oct 581.9 112.1 694.0 420.1 India Apr/Mar 724.2 0.0 724.2 3 056.0 Mongolia Oct/Sep 243.4 0.0 243.4 80.8 Nepal Jul/Jun 969.3 1.5 970.8 751.8
Near East 5 385.3 386.7 5 772.0 5 892.0 Afghanistan Jul/Jun 2 732.0 100.0 2 832.0 2 932.0 Syrian Arab Republic Jul/Jun 2 653.3 286.7 2 940.0 2 960.0
CENTRAL AMERICA 2 216.5 36.6 2 253.1 2 065.1 Haiti Jul/Jun 641.0 33.1 674.1 665.1 Honduras Jul/Jun 1 013.5 0.5 1 014.0 865.0 Nicaragua Jul/Jun 562.0 3.0 565.0 535.0
TOTAL 33 196.9 1 055.3 35 227.2 38 208.9
Source: FAO
* Countries included in this table are only those that have entered the new marketing year.1 The Low-Income Food-De�cit Countries (LIFDCs) group includes net food de�cit countries with annual per caput income below the level used by the World Bank to determine eligibility for IDA assistance (i.e. USD 1 945 in 2011); for full details see http://www.fao.org/countrypro�les/lifdc

GIEWS continuously monitors crop prospects and food security situation at global, regional, national and sub-national
levels and warns of impending food difficulties and emergencies. Established in the wake of the world food crisis of the
early 1970’s, GIEWS maintains a unique database on all aspects of food supply and demand for every country of the
world. The System regularly provides policy makers and the international community with up-to-date information so that
timely interventions can be planned and suffering avoided.
The Global Information and Early Warning System on Food and AgricultureGIEWS
Disclaimer
The designations employed and the presentation of material in this information product do not imply the expression of any opinion whatsoever on the part of the Food and Agriculture Organization of the United Nations (FAO) concerning the legal or development status of any country, territory, city or area or of its authorities, or concerning the delimitation of its frontiers or boundaries. The mention of specific companies or products of manufacturers, whether or not these have been patented, does not imply that these have been endorsed or recommended by FAO in preference to others of a similar nature that are not mentioned.
The views expressed in this information product are those of the author(s) and do not necessarily reflect the views or policies of FAO.
© FAO, 2017
Crop Prospects and Food Situation is published by the Trade and Markets Division of FAO under the Global Information
and Early Warning System (GIEWS). It is published four times a year and focuses on developments affecting the food
situation of developing countries and the Low-Income Food-Deficit Countries (LIFDCs) in particular. The report provides
a review of the food situation by geographic region, a section dedicated to the LIFDCs and a list of countries requiring
external assistance for food. It also includes a global cereal supply and demand overview to complement the biannual
analysis in the Food Outlook publication. Crop Prospects and Food Situation is available in English, French and
Spanish in electronic format.
Crop Prospects and Food Situation and other GIEWS reports are available online at: http:/www.fao.org/giews/. In addition, GIEWS Special Reports and Special Alerts, when published, can be received by e-mail through automatic
mailing lists. Subscription information is available at: http:/www.fao.org/giews/english/listserv.htm.
This report is based on information available as of February 2017.
Enquiries may be directed to: Global Information and Early Warning System on Food and Agriculture (GIEWS) Trade and Markets Division (EST) Food and Agriculture Organization of the United Nations (FAO) Viale delle Terme di Caracalla 00153 Rome - Italy E-mail: [email protected]
I6903EN/1/03.17