crop prospects and food situation - no. 2 june 2011 - fao
TRANSCRIPT

global information and early warning system on food and agricultureGIEWS
HIGHLIGHTS CONTENTS
No. 2 n June 2011
Crop Prospects and Food Situation
Countries requiring external assistance for food 2
Global overview 4
LIFDC food situation overview 8
Regional reviews Africa 11Asia 19Latin America and the Caribbean 24North America, Europe and Oceania 26
Statistical appendix 29
n FAO’s latest cereal production forecast for 2011 stands at 2 302 million tonnes, nearly 3 percent higher than in 2010, but 13 million tonnes lower than the forecast published in Food Outlook on 7 June. At this revised level, world cereal production would now be slightly below overall utilization, leading to a further decline in world stocks. The revision largely reflects a downward adjustment to this year’s official maize production forecast in the United States, released on 9 June by USDA.*
n International grain prices remained high in the first half of June. Cereal prices continue to rise in several developing country regions, particularly in import-dependent CIS, Central America and drought-affected Eastern Africa. Staple food prices, however, have remained low and relatively stable in southern and western Africa due to relatively good domestic production in 2010, and in most countries of North Africa due to government interventions.
n The aggregate cereal output of LIFDCs is forecast to increase by about 2 percent in 2011. However, excluding India, the production of this group is anticipated to remain around the level of 2010.
n In Eastern Africa, food insecurity has reached an alarming level in some areas of Djibouti, Ethiopia, Kenya and Somalia due to two consecutive seasons of below-average rainfall which reduced harvests and grazing resources, as well as to escalating food and fuel prices.
n In North Africa, prospects for the winter cereal crops in most countries remain favourable. However, the ongoing armed conflict in Libyan Arab Jamahiriya has resulted in large population displacements, both internally and externally, with serious impacts on food security in the subregion.
n In Western Africa, food insecurity remains a concern due to the impact of the recent post-election crisis in Côte d’Ivoire and the effects of the conflict in Libyan Arab Jamahiriya.
n In the Far East, harvests of the 2011 winter wheat and the first season rice (mainly as a secondary crop) have been generally satisfactory but in Japan, the triple disaster - earthquake, tsunami and nuclear radiation - is expected to reduce rice production this year.
n In CIS, the 2011 cereal production is anticipated to recover from the drought-affected crop of 2010.
*FAO’s global market outlook for major food commodities, including cereals, is published twice a year (June and November) in Food Outlook. The last issue of Food Outlook, published on 7 June, reported a slightly higher cereal production forecast for 2011, before the latest official maize production forecast for the United States was available. FAO monitors the world cereal situation closely and publishes monthly Global Cereal Supply and Demand Briefs on its World Food Situation portal at: http://www.fao.org/worldfoodsituation. The next issue will be released on 7 July 2011.
20102008 2011
100
200
300
400
500
600
700
800
900
1000
JMAMFJDNOSAJJMAMFJDNOSAJJMAMFJDNOSAJJMAMFJ
2009
Wheat
Rice
USD/tonne
Maize
Selected international cereal prices
Note: Prices refer to monthly average. See Table 3 for details

No. 2 n June 20112
Crop Prospects and Food Situation
Countries requiring external assistance for food1
Severe localized food insecurity
BeninReduced crop harvest in 2010, generally low food stocks and persistent high prices exacerbate current food insecurity situation
Burundi Reduced crop harvest in early 2011, generally low food stocks and sustained high prices worsen current food security situation
Central African RepublicCivil insecurity restricts access to agricultural land, while volatile prices hamper food access
ChadLarge numbers of refugees located in southern and eastern regions - approximately 270 000 Sudanese and 82 000 from Central African Republic. Also, the lingering effects of drought that led to livestock deaths and other damages in 2009/10, notably in western-central areas of the country
CongoInflux of more than 100 000 refugees, mostly from DRC, since the end of 2009, has increased pressure on limited food resources
Côte d’IvoireConflict-related damage to agriculture in recent years and the lack of support services mainly in the northern regions. The recent post-election crisis has forced over 180 000 people to leave the country and seek refuge mostly in eastern Liberia. Another 150 000 people have been internally displaced including 82 000 in the western part of the country mostly in Duékoué, as of early May 2011
Dem. Rep. of CongoCivil strife, internally displaced persons, returnees and high food prices
EthiopiaThe estimated number of people requiring food assistance increased from 2.8 to 3.2 million due to poor rains in “belg” areas and in southern and south-eastern pastoral areas
AFRICA (23 countries)
Exceptional shortfall in aggregate food production/supplies
LesothoHeavy rains, flooding and prolonged water-logging caused a large decline in 2010/11 cereal production
+
ZimbabweEconomic constraints and reduced production in southern areas aggravated food insecurity despite the overall improvement in availability of maize and good production prospects
Widespread lack of access
DjiboutiAbout 120 000 people are in need of humanitarian assistance due to high food prices and the effects on pastoralists of four consecutive poor rainy seasons
+
EritreaA high level of food insecurity persists due to economic constraints, internal displacement of population and the negative impact of dry weather conditions especially for the pastoralists
LiberiaSlow recovery from war-related damage. Inadequate social services and infrastructure, as well as poor market access. Massive influx of refugees from Côte d’Ivoire: as of early May over 165 000 people have fled to Nimba, Grand Gedeh and Maryland counties, in the western part of Liberia
NigerLingering effects of the 2009/10 food crisis which had depleted household assets, including loss of animals and high level of indebtedness
Sierra LeoneSlow recovery from war-related damage. Depreciation of currency led to higher inflation rates negatively affecting households’ purchasing power and food security conditions
SomaliaAbout 2.4 million people are in need of food assistance due to the ongoing civil conflict and the severe drought that has affected pasture and crops since last October
country requiring external assistance for food
World: 30 countries

No. 2 n June 2011 3
Crop Prospects and Food Situation
GuineaAccess to food is negatively affected by high food prices and general inflation
KenyaAn estimated 2.4 million people are food insecure, mainly in pastoralist and agro-pastoralist areas in northern, eastern and north-eastern pastoral areas and in south-eastern and coastal lowlands due to late and erratic 2011 long-rains
Madagascar Localized flooding and the passing of Cyclone Bingiza in early 2011 caused damage to infrastructure and crops in eastern and southern parts of the country
MalawiFlooding and a dry-spell have caused localized crop losses, particularly affecting the northern district of Karonga. However, a bumper maize crop will assist to improve food security conditions
MozambiqueFlooding and dry conditions in central and southern provinces result in localized production losses of the 2011 crop. Overall, good production prospects will help to improve the food security situation
SudanAbout 6 million people in need of food assistance, due to a combination of factors, including civil strife (Darfur), insecurity, returnees (southern Sudan) and high food prices
UgandaHigh food prices affecting urban households. About 815 000 people are estimated to be moderately food insecure, mainly in Karamoja region
ASIA (6 countries)
Exceptional shortfall in aggregate food production/supplies
IraqSevere civil insecurity
Widespread lack of access
DPR KoreaEconomic constraints and lack of agricultural inputs leading to inadequate food production of the main season and aggravated food insecurity. Further severe winter conditions reduced wheat harvest and damaged stored seed potatoes
MongoliaLingering effects of the extreme cold (Dzud) last winter resulted in the death of nearly 6 million heads of livestock out of a total of 44 million and adversely affected livelihoods of some 500 000 people
Severe localized food insecurity
AfghanistanConflict, insecurity and high food prices. Moderately food insecure areas are in the centre and north-east of the country. Poor prospects for 2011 wheat harvest likely to exacerbate food insecurity condition
Key - Changes since last report (March 2011)No change Improving Deteriorating New Entry +
Terminology1 Countries requiring external assistance for food are expected to lack the resources to deal with reported critical problems of food insecurity. Food crises are nearly always due to a combination of factors but for the purpose of response planning, it is important to establish whether the nature of food crises is predominantly related to lack of food availability, limited access to food, or severe but localized problems. Accordingly, the list of countries requiring external assistance is organized into three broad, not mutually exclusive, categories:
•Countriesfacinganexceptional shortfall in aggregate food production/supplies as a result of crop failure, natural disasters, interruption of imports, disruption of distribution, excessive post-harvest losses, or other supply bottlenecks.
•Countrieswithwidespread lack of access, where a majority of the population is considered to be unable to procure food from local markets, due to very low incomes, exceptionally high food prices, or the inability to circulate within the country.
•Countrieswithsevere localized food insecurity due to the influx of refugees, a concentration of internally displaced persons, or areas with combinations of crop failure and deep poverty.
2 Countries facing unfavourable prospects for current crops are countries where prospects point to a shortfall in production of current crops as a result of the area planted and/or adverse weather conditions, plant pests, diseases and other calamities, which indicate a need for close monitoring of the crops for the remainder of the growing season.
Countries with unfavourable prospects for current crops2
AFRICA (6 countries)
DjiboutiPoor 2011 “diraac/sougum” short rains severely affecting grazing resources
+
EthiopiaDelayed and insufficient 2011 “belg” short rains in Amhara, Oromia, SNNPR and Tigray
+
Kenya Delayed and insufficient 2011 long rains affecting crop production in southern and coastal marginal agricultural areas
Somalia Delayed and insufficient rains during the 2011 “gu” season severely affecting crop production and grazing resources
United Republic of Tanzania Delayed and insufficient rainfall during the 2011 “msimu” season affecting crops in central uni-modal rainfall areas
UgandaDelayed and erratic rainfall during the 2011 long-rains season affecting pasture and crops in northern regions of Acholi, West Nile and Karamoja
+
ASIA (1 country)
AfghanistanUnfavourable weather - long precipitation deficit and localized floods
+
LATIN AMERICA AND THE CARIBBEAN (1 country)Severe localized food insecurity
HaitiFood assistance needed for food-insecure households affected by the cholera epidemic and Hurricane Tomas; lingering effects of devastating earthquake in January 2010
KyrgyzstanLingering effects of socio-political conflict during April-June 2010 in Jalalabad, Osh and Batken Oblasts; and sharp rise in food prices since July 2010
YemenEffects of recent socio-political unrest, high food prices, internally displaced persons (about 300 000 people still in camps) and refugees (about 170 000 people)
No. 2 n June 20114
Crop Prospects and Food Situation
Global overview
GLOBAL SUPPLY AND DEMAND SUMMARY
A tight cereal supply and demand balance to prevail in 2011/12FAO’s latest forecast for world cereal
production in 2011 stands at 2 302
million tonnes, 2.9 percent up from the
2010 harvest. This forecast is 13 million
tonnes lower than was reported at the
beginning of the month (June issue of
Food Outlook), reflecting a downward
adjustment to the 2011 maize production
forecast in the United States (based on
the latest official forecast published on
9 June, USDA/WASDA-495), and a cut
in the forecasts for the wheat and barley
crops in the EU. Excessive wet conditions
continued in the United States in June,
significantly hindering maize planting,
while persistent dry weather in major
grain growing regions of Europe has led
to a reduction in yield forecasts.
Based on latest indications, global
wheat output is expected to be 2.8
percent higher than last year’s reduced
crop, mostly reflecting improved yield
prospects in the Russian Federation.
World production of coarse grains could
increase by 3 percent, slightly exceeding
the 2008 record. Most of this increase is
expected in the United States, in spite of
the latest downward revision, and in the
Commonwealth of Independent States
(CIS). Although still very tentative, FAO’s
forecast for world paddy production in
2011 points to a new record high, 2.5
percent up from 2010, based largely on
the assumption of a return to normal
weather conditions.
World cereal utilization in 2011/12 is
forecast to increase by 1.2 percent from
2010/11, compared with a 2 percent rise
in 2010/11, as a result of a slowdown in
the rate of increase of industrial use of
cereals for production of biofuels.
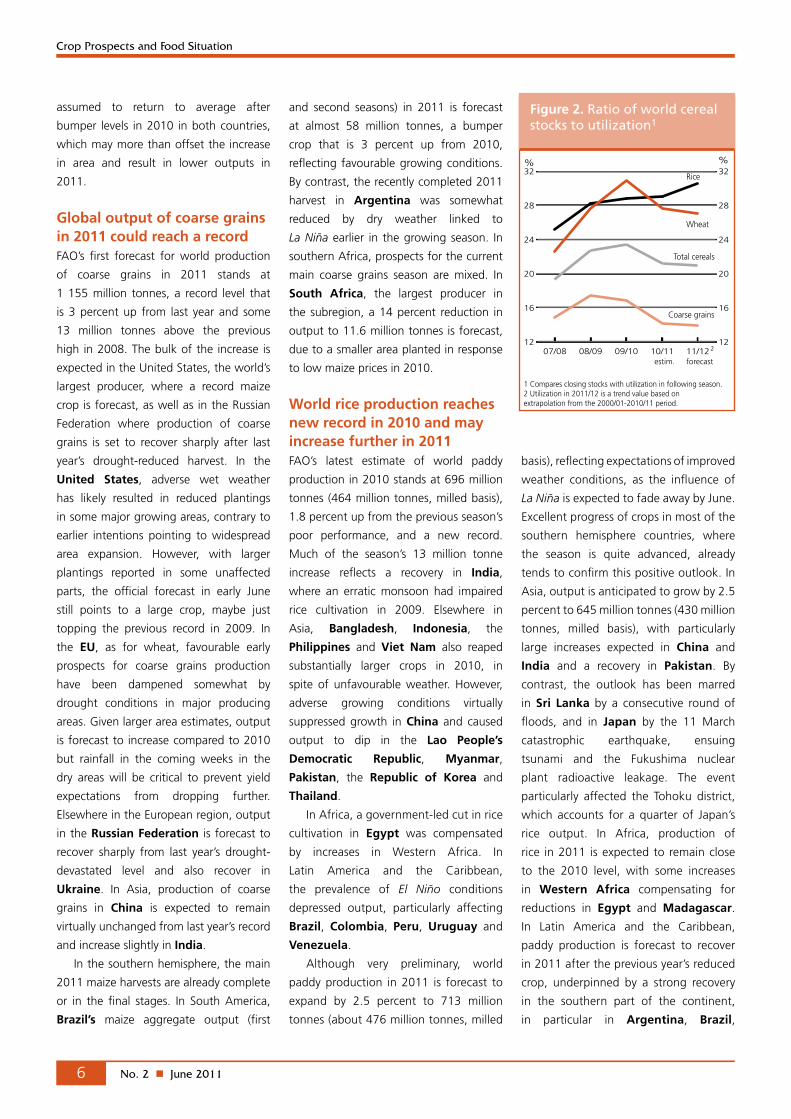
Given the latest production forecast
and the expectation for utilization in
2011/12, world cereal stocks at the
close of crop seasons ending in 2012
are now estimated at about 486 million
tonnes, marginally below their sharply
reduced opening levels. Except for rice,
the inventories of which are forecast
to increase, stocks of coarse grains and
wheat are anticipated to decline. As a
result, the cereal stocks-to-use ratio,
which at the time of publication of Food
Outlook was expected to remain close to
the 2010/11 low of 21.2 percent, is now
heading to a second consecutive annual
decline, to 20.7 percent.
With total cereal production in
2011 below the anticipated utilization,
international prices are likely to remain
high, especially in the wheat and coarse
grain markets. The removal of the Russian
Federation export ban from 1 July could
help to offset reduced exportable supplies
from the EU, but with grain inventories
remaining at low levels, especially for
maize, international grain prices are
expected to stay not only high, but also
volatile in the 2011/12 marketing season.
GLOBAL PRODUCTION ROUNDUP
World wheat production to recover in 2011 FAO’s latest forecast for 2011 global
wheat production stands at about
671 million tonnes, significantly
below earlier expectations because of
deteriorating yield prospects in some parts
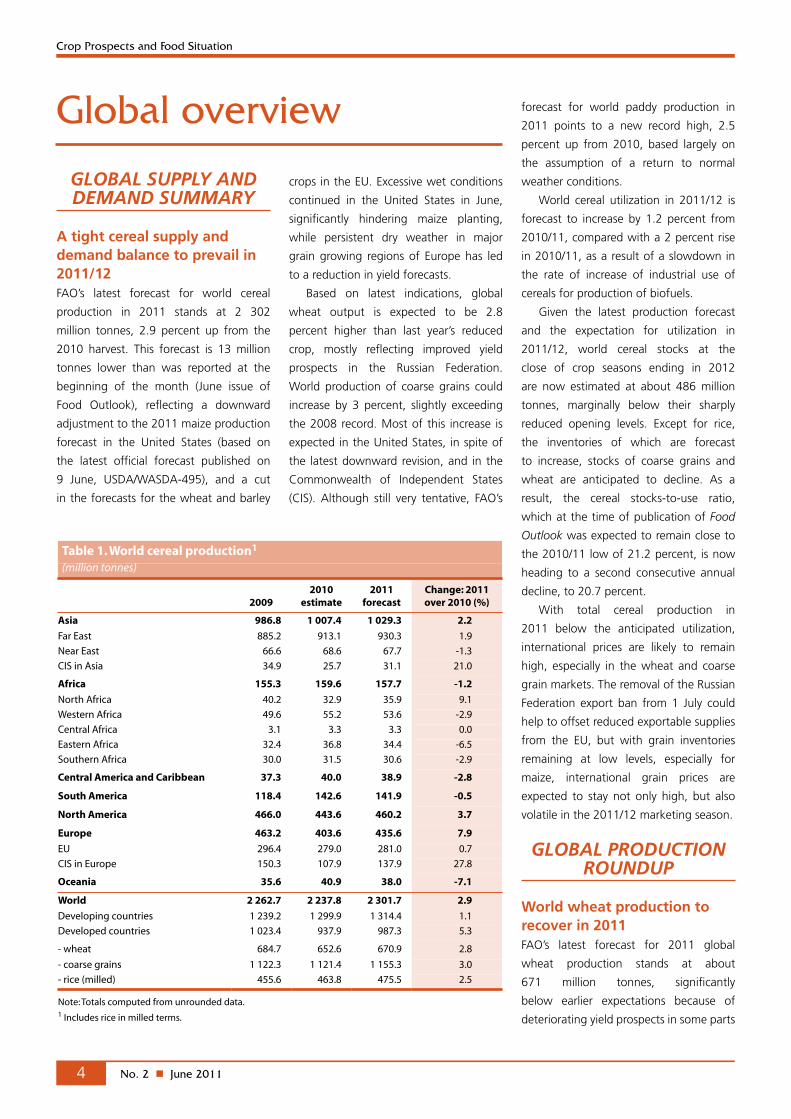
Table 1. World cereal production1 (million tonnes)
20092010
estimate2011
forecastChange: 2011 over 2010 (%)
Asia 986.8 1 007.4 1 029.3 2.2
Far East 885.2 913.1 930.3 1.9
Near East 66.6 68.6 67.7 -1.3
CIS in Asia 34.9 25.7 31.1 21.0
Africa 155.3 159.6 157.7 -1.2
North Africa 40.2 32.9 35.9 9.1
Western Africa 49.6 55.2 53.6 -2.9
Central Africa 3.1 3.3 3.3 0.0
Eastern Africa 32.4 36.8 34.4 -6.5
Southern Africa 30.0 31.5 30.6 -2.9
Central America and Caribbean 37.3 40.0 38.9 -2.8
South America 118.4 142.6 141.9 -0.5
North America 466.0 443.6 460.2 3.7
Europe 463.2 403.6 435.6 7.9
EU 296.4 279.0 281.0 0.7
CIS in Europe 150.3 107.9 137.9 27.8
Oceania 35.6 40.9 38.0 -7.1
World 2 262.7 2 237.8 2 301.7 2.9
Developing countries 1 239.2 1 299.9 1 314.4 1.1
Developed countries 1 023.4 937.9 987.3 5.3
- wheat 684.7 652.6 670.9 2.8
- coarse grains 1 122.3 1 121.4 1 155.3 3.0
- rice (milled) 455.6 463.8 475.5 2.5
Note: Totals computed from unrounded data.1 Includes rice in milled terms.

No. 2 n June 2011 5
Crop Prospects and Food Situation
of the United States and Europe due to
dry weather. However, at the current
forecast level, global wheat output
in 2011 would still be 2.8 percent up
from last year’s reduced crop, reflecting
expectations of an overall increase in
planted area in response to strong prices
and of yield recoveries in some areas, the
Russian Federation in particular, that were
affected by severe drought in 2010.
In the EU, latest indications point to a
wheat crop of 134 million tonnes in 2011,
less than earlier expected but still up
marginally from the 2010 harvest. Drought
conditions in major producing parts have
reduced yield prospects. Elsewhere in
Europe, a strong recovery in production is
still expected in the CIS region, particularly
in the Russian Federation, after last
year’s sharply reduced crop. In North
America, persisting severe drought in
the United States’ central and southern
plains has caused further deterioration of
crop conditions over the past weeks and
national output is now forecast at 56
million tonnes, down 7 percent from last
year. In Canada, this year’s wheat area is
forecast to rebound sharply in response to
high prices, assuming satisfactory weather
for the completion of planting by the end
of June.
In Asia, prospects for the 2011 wheat
crop in China remain satisfactory despite
a persistent lack of rainfall in some areas.
Intensive government initiatives to provide
irrigation and other inputs are expected to
mitigate the impact of the drought in the
affected areas. This year’s output, forecast
at 114.5 million tonnes, is just marginally
down from last year’s. Elsewhere, in the
Far East subregion, a record crop of nearly
84 million tonnes is being harvested in
India, where high prices spurred a large
area increase and growing conditions
were mostly favourable. In Pakistan, in
spite of the severe flood-related damage
to infrastructure and seed stocks last year,
production is expected to recover in 2011
and match the record level of 2009. In
the CIS in Asia subregion, the bulk of the
spring crop is cultivated in Kazakhstan,
which is the main producer. Plantings
are expected to be maintained at the
relatively high level of the past two years,
and assuming a recovery in yields after last
year’s drought-reduced level, a significant
increase in production is forecast. In the
Near East, overall wheat output this year
looks likely to remain virtually unchanged.
A forecast increase in Turkey will be
virtually offset by the reductions elsewhere
in the subregion.
In North Africa, growing conditions for
wheat production have generally improved
this year after last year’s drought. Overall
production in the subregion is forecast
to recover by about 14 percent from the
2010 reduced harvest.
In the southern hemisphere, where
wheat sowing takes place from May to
July in the major producing countries,
plantings are expected to increase in
1800
1900
2000
2100
2200
2300
201120092007200520032001
Million tonnes
Figure 1. World cereal production and utilization
Production
Utilization
f’cast
Australia and Argentina in response
to this year’s favourable price prospects.
However, at this early stage, yields are
Table 2. Basic facts of world cereal situation (million tonnes)
2009/102010/11 estimate
2011/12 forecast
Change: 2011/12 over 2010/11 (%)
PRODUCTION 1
World 2 262.7 2 237.8 2 301.7 2.9
Developing countries 1 239.2 1 299.9 1 314.4 1.1
Developed countries 1 023.4 937.9 987.3 5.3
TRADE 2
World 276.1 274.8 275.9 0.4
Developing countries 75.2 86.0 85.9 -0.1
Developed countries 201.0 188.8 190.0 0.6
UTILIZATION
World 2 234.4 2 279.3 2 306.3 1.2
Developing countries 1 370.7 1 413.3 1 436.7 1.7
Developed countries 863.7 866.0 869.6 0.4
Per caput cereal food use (kg per year) 151.9 152.5 154.1 1.0
STOCKS 3
World 533.6 489.1 486.2 -0.6
Developing countries 351.4 363.6 369.1 1.5
Developed countries 182.2 125.5 117.2 -6.6
WORLD STOCK-TO-USE RATIO% 23.4 21.2 20.7 -2.3
Note: totals computed from unrounded data.1 Data refer to calendar year of the first year shown and include rice in milled terms.2 For wheat and coarse grains, trade refers to exports based on July/June marketing season. For rice, trade refers to exports based on the calendar year of the second year shown. 3 Data are based on an aggregate of carryovers level at the end of national crop years and, therefore, do not represent world stock levels at any point in time.
No. 2 n June 20116
Crop Prospects and Food Situation
assumed to return to average after
bumper levels in 2010 in both countries,
which may more than offset the increase
in area and result in lower outputs in
2011.
Global output of coarse grains in 2011 could reach a recordFAO’s first forecast for world production
of coarse grains in 2011 stands at
1 155 million tonnes, a record level that
is 3 percent up from last year and some
13 million tonnes above the previous
high in 2008. The bulk of the increase is
expected in the United States, the world’s
largest producer, where a record maize
crop is forecast, as well as in the Russian
Federation where production of coarse
grains is set to recover sharply after last
year’s drought-reduced harvest. In the
United States, adverse wet weather
has likely resulted in reduced plantings
in some major growing areas, contrary to
earlier intentions pointing to widespread
area expansion. However, with larger
plantings reported in some unaffected
parts, the official forecast in early June
still points to a large crop, maybe just
topping the previous record in 2009. In
the EU, as for wheat, favourable early
prospects for coarse grains production
have been dampened somewhat by
drought conditions in major producing
areas. Given larger area estimates, output
is forecast to increase compared to 2010
but rainfall in the coming weeks in the
dry areas will be critical to prevent yield
expectations from dropping further.
Elsewhere in the European region, output
in the Russian Federation is forecast to
recover sharply from last year’s drought-
devastated level and also recover in
Ukraine. In Asia, production of coarse
grains in China is expected to remain
virtually unchanged from last year’s record
and increase slightly in India.
In the southern hemisphere, the main
2011 maize harvests are already complete
or in the final stages. In South America,
Brazil’s maize aggregate output (first
and second seasons) in 2011 is forecast
at almost 58 million tonnes, a bumper
crop that is 3 percent up from 2010,
reflecting favourable growing conditions.
By contrast, the recently completed 2011
harvest in Argentina was somewhat
reduced by dry weather linked to
La Niña earlier in the growing season. In
southern Africa, prospects for the current
main coarse grains season are mixed. In
South Africa, the largest producer in
the subregion, a 14 percent reduction in
output to 11.6 million tonnes is forecast,
due to a smaller area planted in response
to low maize prices in 2010.
World rice production reaches new record in 2010 and may increase further in 2011FAO’s latest estimate of world paddy
production in 2010 stands at 696 million
tonnes (464 million tonnes, milled basis),
1.8 percent up from the previous season’s
poor performance, and a new record.
Much of the season’s 13 million tonne
increase reflects a recovery in India,
where an erratic monsoon had impaired
rice cultivation in 2009. Elsewhere in
Asia, Bangladesh, Indonesia, the
Philippines and Viet Nam also reaped
substantially larger crops in 2010, in
spite of unfavourable weather. However,
adverse growing conditions virtually
suppressed growth in China and caused
output to dip in the Lao People’s
Democratic Republic, Myanmar,
Pakistan, the Republic of Korea and
Thailand.
In Africa, a government-led cut in rice
cultivation in Egypt was compensated
by increases in Western Africa. In
Latin America and the Caribbean,
the prevalence of El Niño conditions
depressed output, particularly affecting
Brazil, Colombia, Peru, Uruguay and
Venezuela.
Although very preliminary, world
paddy production in 2011 is forecast to
expand by 2.5 percent to 713 million
tonnes (about 476 million tonnes, milled
basis), reflecting expectations of improved
weather conditions, as the influence of
La Niña is expected to fade away by June.
Excellent progress of crops in most of the
southern hemisphere countries, where
the season is quite advanced, already
tends to confirm this positive outlook. In
Asia, output is anticipated to grow by 2.5
percent to 645 million tonnes (430 million
tonnes, milled basis), with particularly
large increases expected in China and
India and a recovery in Pakistan. By
contrast, the outlook has been marred
in Sri Lanka by a consecutive round of
floods, and in Japan by the 11 March
catastrophic earthquake, ensuing
tsunami and the Fukushima nuclear
plant radioactive leakage. The event
particularly affected the Tohoku district,
which accounts for a quarter of Japan’s
rice output. In Africa, production of
rice in 2011 is expected to remain close
to the 2010 level, with some increases
in Western Africa compensating for
reductions in Egypt and Madagascar.
In Latin America and the Caribbean,
paddy production is forecast to recover
in 2011 after the previous year’s reduced
crop, underpinned by a strong recovery
in the southern part of the continent,
in particular in Argentina, Brazil,
% %
12
16
20
24
28
32
12
16
20
24
28
32
11/1210/1109/1008/0907/08 2
Total cereals
Rice
Coarse grains
Wheat
forecastestim.
Figure 2. Ratio of world cerealstocks to utilization1
1 Compares closing stocks with utilization in following season.2 Utilization in 2011/12 is a trend value based on extrapolation from the 2000/01-2010/11 period.
No. 2 n June 2011 7
Crop Prospects and Food Situation
Colombia, Uruguay and Venezuela,
where harvesting of the 2011 main
paddy crops is virtually completed.
INTERNATIONAL PRICE ROUNDUP
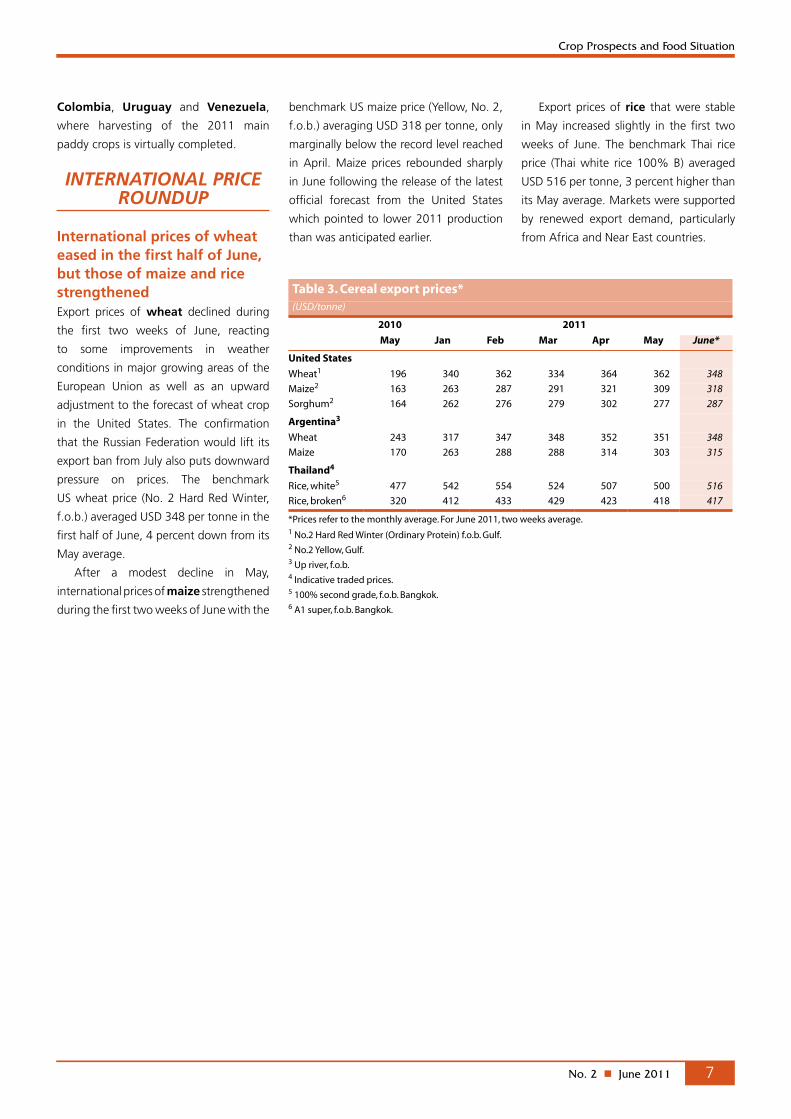
International prices of wheat eased in the first half of June, but those of maize and rice strengthenedExport prices of wheat declined during
the first two weeks of June, reacting
to some improvements in weather
conditions in major growing areas of the
European Union as well as an upward
adjustment to the forecast of wheat crop
in the United States. The confirmation
that the Russian Federation would lift its
export ban from July also puts downward
pressure on prices. The benchmark
US wheat price (No. 2 Hard Red Winter,
f.o.b.) averaged USD 348 per tonne in the
first half of June, 4 percent down from its
May average.
After a modest decline in May,
international prices of maize strengthened
during the first two weeks of June with the
Table 3. Cereal export prices* (USD/tonne)
2010 2011 May Jan Feb Mar Apr May June*
United States Wheat1 196 340 362 334 364 362 348
Maize2 163 263 287 291 321 309 318
Sorghum2 164 262 276 279 302 277 287
Argentina3 Wheat 243 317 347 348 352 351 348
Maize 170 263 288 288 314 303 315
Thailand4 Rice, white5 477 542 554 524 507 500 516
Rice, broken6 320 412 433 429 423 418 417
*Prices refer to the monthly average. For June 2011, two weeks average.1 No.2 Hard Red Winter (Ordinary Protein) f.o.b. Gulf.2 No.2 Yellow, Gulf.3 Up river, f.o.b.4 Indicative traded prices.5 100% second grade, f.o.b. Bangkok.6 A1 super, f.o.b. Bangkok.
benchmark US maize price (Yellow, No. 2,
f.o.b.) averaging USD 318 per tonne, only
marginally below the record level reached
in April. Maize prices rebounded sharply
in June following the release of the latest
official forecast from the United States
which pointed to lower 2011 production
than was anticipated earlier.
Export prices of rice that were stable
in May increased slightly in the first two
weeks of June. The benchmark Thai rice
price (Thai white rice 100% B) averaged
USD 516 per tonne, 3 percent higher than
its May average. Markets were supported
by renewed export demand, particularly
from Africa and Near East countries.

No. 2 n June 20118
Crop Prospects and Food Situation
1 The Low-Income Food-Deficit (LIFDC) group of countries includes net food deficit countries with annual per caput income below the level used by the World Bank to determine eligibility for IDA assistance (i.e. USD 1 855 in 2008); for full details see http://www.fao.org/countryprofiles/lifdc.asp. The 2011 list of LIFDCs includes 70 countries as opposed to 77 on the earlier list. Countries removed from the list are Angola, Armenia, Azerbaijan, China, Equatorial Guinea, Morocco and Swaziland.
Low-Income Food-Deficit Countries food situation overview1
Favourable cereal production in 2011 in LIFDCs as a group but mixed performance in individual countriesHarvesting of winter cereals in the
northern hemisphere countries and of
the main summer (wet) season crops in
the southern hemisphere countries will
be nearly completed in June. The main
wet season crops, mainly rice and coarse
grains, in the north and the winter season
crops, mainly wheat and barley, in the
south are currently being planted in most
countries under generally favourable
rainfall conditions. The projected annual
total cereal production (including
estimates for the first and forecast for the
second season for 2011) of all 70 LIFDCs
is likely to increase by about 2 percent
over the bumper production of 2010 (see
Tables 4 and 5). However, much of this
increase is due to India alone. In fact, the
aggregate cereal production of LIFDCs,
excluding India, in 2011 is anticipated
to remain more or less at the same level
as in 2010. Prospects for bumper cereal
harvests are foreseen in Cambodia,
India, Pakistan and the Philippines, in
the southern part of Asia, where rainfall
for the winter crops was generally good
and early forecasts of the second season
crops are considered favourable. Similarly,
the main rainy season for maize and other
coarse grains, the dominant crops in the
region, has resulted in bumper harvests
in southern Africa for Malawi and
Zambia. Elsewhere, in Egypt, Senegal
and Turkmenistan among others, cereal
production is estimated to rise over
the previous year due to the conducive
weather, improved input supplies and
high commodity prices. However, poor
or uncertain harvest forecasts are in the
offing for cereal crops in Afghanistan,
Iraq, Sri Lanka, Uzbekistan in Asia and
Chad, Ethiopia, Ghana, Kenya, Niger,
Sudan, United Republic of Tanzania
and Uganda in Africa.
Among regions, Asian LIFDCs (22
countries), in aggregate, are forecast
to increase 2011 cereal production
as compared to 2010, while the total
cereal production of 39 African LIFDCs is
expected to decline. The biggest positive
change is foreseen in the Southern Africa
and Far East subregions and in Europe
(one country), while the biggest declines
are forecast in the Near East and
Eastern Africa subregions.
The aggregate 2010 cereal production of LIFDCs estimated at record level with highest year-on-year growth rate in the previous five year periodThe latest revised 2010 cereal production
in the 70 LIFDCs is now estimated at
543 million tonnes (including rice in milled
basis), or 4.8 percent higher than the poor
and nearly stagnant harvest of 2009. Most
importantly, the growth in global cereal
production in 2010 came entirely from
LIFDCs as the world aggregate production
declined by 1.1 percent over 2009. Most
regions with the exception of North Africa
and CIS in Asia, had larger crops in 2010
as compared to 2009. It should be noted,
however, that the population of the LIFDCs
as a group grew by about 1.8 percent in
2010, thus leaving the per capita cereal
production growth rate at 3 percent.
By comparison, the per capita domestic
cereal availability in non-LIFDCs declined
by about 3.6 percent. The improved cereal
supply situation in 2010 in LIFDCs resulted
in the increase in cereal consumption levels
in 2010/11 as indicated by the estimated
Table 4. Basic facts of the Low-Income Food-Deficit Countries (LIFDCs)1 cereal situation (million tonnes, rice in milled basis)
2009/10 2010/11 2011/12Change: 2011/12 over 2010/11 (%)
Cereal production2 518.3 543.0 553.2 1.9
excluding India 314.7 328.0 327.6 -0.1
Utilization 583.8 603.2 615.2 2.0
Food use 468.6 480.5 491.4 2.3
excluding India 285.0 292.3 299.1 2.3
Per caput cereal food use (kg per year) 156.9 158.0 159.2 0.8
excluding India 159.3 160.0 161.1 0.7
Feed 54.3 57.6 59.3 3.0
excluding India 44.2 47.0 48.0 2.1
End of season stocks3 105.0 107.8 108.2 0.4
excluding India 64.7 67.1 65.0 -3.1
1 The Low-Income Food-Deficit (LIFDC) group of countries includes net food deficit countries with annual per caput income below the level used by the World Bank to determine eligibility for IDA assistance (i.e. USD 1 855 in 2008); for full details see http://www.fao.org/countryprofiles/lifdc.asp.2 Data refer to calendar year of the first year shown.3 May not equal the difference between supply and utilization because of differences in individual country marketing years.

No. 2 n June 2011 9
Crop Prospects and Food Situation
Table 5. Cereal production1 of LIFDCs(million tonnes)
20092010
estimate2011
forecastChange: 2011 over 2010 (%)
Africa (39 countries) 119.6 128.8 126.1 -2.1
North Africa 20.9 19.1 19.7 3.1
Eastern Africa 32.4 36.8 34.4 -6.5
Southern Africa 13.7 14.5 15.2 4.8
Western Africa 49.6 55.2 53.6 -2.9
Central Africa 3.1 3.2 3.2 0.0
Asia (22 countries) 394.6 409.8 422.6 3.1
CIS in Asia 11.6 11.4 11.3 -0.9
Far East 369.1 383.9 398.3 3.8
- India 203.7 215.0 225.7 5.0
Near East 13.8 14.5 13.0 -10.3
Central America (3 countries) 2.0 2.0 2.0 0.0
Oceania (5 countries) - - - -
Europe (1 country) 2.2 2.4 2.5 4.2
LIFDC (70 countries) 518.3 543.0 553.2 1.9
Note: Totals computed from unrounded data.1 Includes rice in milled terms. '-' means nil or negligible.
rise in total utilization (Table 4). Part of the
increase in production is estimated to have
gone to stock build-up in 2010/11.
Cereal imports of LIFDCs for 2011/12 estimated to go up compared to the year before Given that the 2011 aggregate cereal
production of LIFDCs, excluding India,
is forecast to remain stagnant, the
cereal imports of LIFDCs as a group for
2011/12 (marketing years) are estimated
to rise to 81.35 million, some 3 million
tonnes above the previous year (Table
6). Only the Far East and North Africa
subregions are expected to experience
lower import requirements, mainly due
to better domestic food availability.
Table 6. Cereal import position of LIFDCs(thousand tonnes)
2009/10 2010/11 or 2011 2011/12 or 2012
or 2010 Requirements1 Import position2 Requirements1
Actual
importsTotal
imports:of which food aid
Total imports:
of which food aid pledges
Total imports:
of which food aid
Africa (39 countries) 40 750 38 044 2 453 17 093 792 40 087 2 498North Africa 15 652 15 971 0 11 606 0 15 761 0Eastern Africa 8 558 6 304 1 717 1 582 350 7 761 1 847Southern Africa 2 174 1 707 242 1 411 234 1 909 211Western Africa 12 590 12 246 376 2 115 165 12 742 296Central Africa 1 776 1 816 119 380 43 1 914 145
Asia (22 countries) 39 459 38 087 1 514 23 808 538 39 015 1 059CIS in Asia 3 841 3 702 54 2 747 53 3 990 38Far East 19 490 21 537 1 284 16 247 377 19 608 851Near East 16 128 12 848 176 4 814 108 15 417 170
Central America (3 countries) 1 669 1 716 183 803 121 1 711 183
Oceania (5 countries) 435 452 0 44 0 463 0
Europe (1 country) 75 61 0 49 0 76 0
Total (70 countries) 82 388 78 360 4 150 41 796 1 451 81 351 3 740
Note: Totals computed from unrounded data.1 The import requirement is the difference between utilization (food, feed, other uses, export plus closing stocks) and domestic availability (production plus opening stocks).2 Estimates based on information available as of mid-May 2011.
No. 2 n June 201110
Crop Prospects and Food Situation
0
20
40
60
80
100
Africa (22)
Nicaragua
HondurasHaiti
Vanuatu
Tuvalu
Solomon Is.
Kiribati
Papua New G
uinea
Sri Lanka
Syrian Arab Republic
Tajik
istan
Mongolia Iraq
Georgia
Yemen
Cameroon
Zimbabwe
KenyaEgypt
Guinea-Bissau
Eritrea
Gambia
Senegal
Côte D'iv
oire
Lesoth
o
Somalia
Liberia
Mauritania
Comoros
Congo
Sao Tome and Prin
cipe
Djibouti
Others (8)Asia (9)
Average 2006/07-2010/11
2011/12 import requirement
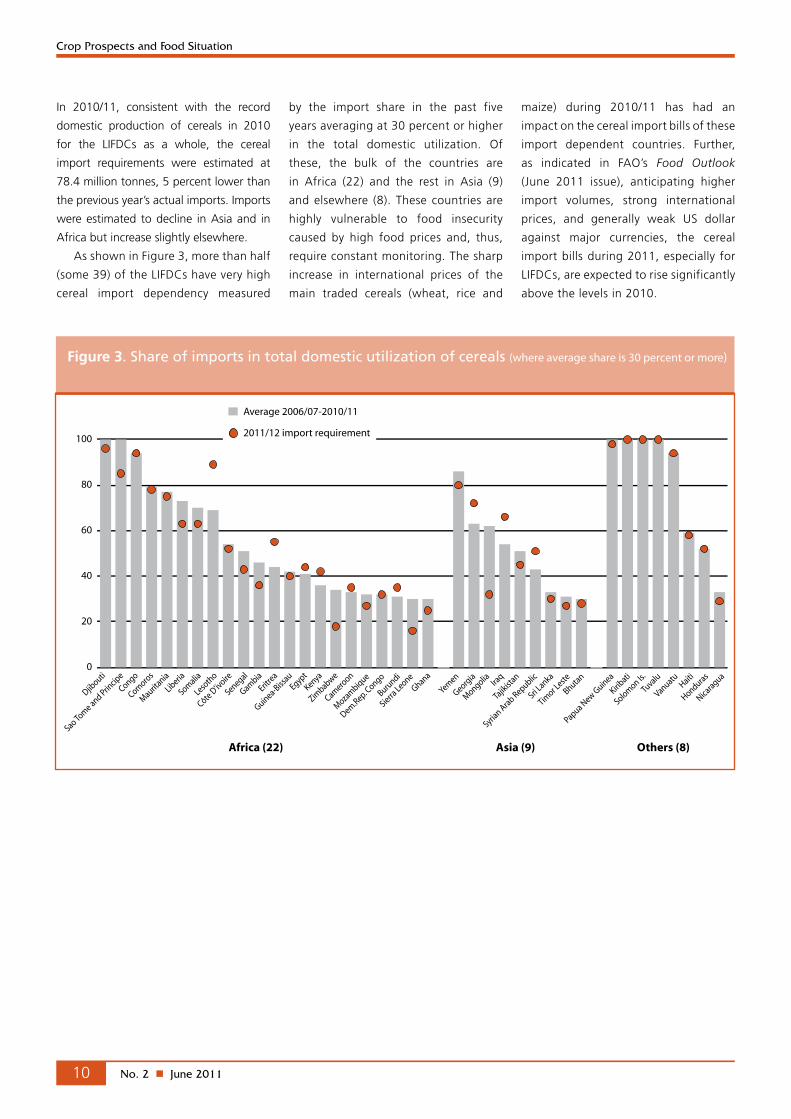
Figure 3. Share of imports in total domestic utilization of cereals (where average share is 30 percent or more)
Bhutan
Timor L
este
Sierra Leone
Burundi
Dem.Rep. Congo
Mozambique
Ghana
In 2010/11, consistent with the record
domestic production of cereals in 2010
for the LIFDCs as a whole, the cereal
import requirements were estimated at
78.4 million tonnes, 5 percent lower than
the previous year’s actual imports. Imports
were estimated to decline in Asia and in
Africa but increase slightly elsewhere.
As shown in Figure 3, more than half
(some 39) of the LIFDCs have very high
cereal import dependency measured
by the import share in the past five
years averaging at 30 percent or higher
in the total domestic utilization. Of
these, the bulk of the countries are
in Africa (22) and the rest in Asia (9)
and elsewhere (8). These countries are
highly vulnerable to food insecurity
caused by high food prices and, thus,
require constant monitoring. The sharp
increase in international prices of the
main traded cereals (wheat, rice and
maize) during 2010/11 has had an
impact on the cereal import bills of these
import dependent countries. Further,
as indicated in FAO’s Food Outlook
(June 2011 issue), anticipating higher
import volumes, strong international
prices, and generally weak US dollar
against major currencies, the cereal
import bills during 2011, especially for
LIFDCs, are expected to rise significantly
above the levels in 2010.

No. 2 n June 2011 11
Crop Prospects and Food Situation
Regional reviews
North Africa • small grains: harvesting• rice: planting
Southern Africa: • summer cereals (main season): harvesting• winter cereals (secondary season): planting
Sudan•coarsegrains:planting
Note: Comments refer to situation as of June.
Kenya, Somalia: • cereals (main season): reproductive to maturing
Uganda• main cereal crop: maturing to harvesting
Western Africa Sahel:• coarse grains, rice (main season): plantingcoastal countries: • coarse grains,rice (main season): reproductive
Central Africa - northern parts• maize (main season): harvesting• millet, sorghum: planting• rice: planting- DRC• maize (main season): planting• sorghum, millet: reproductive
Eritrea• grains: plantingEthiopia: •Meher grains (main season): planting•Belg grains (minor): harvesting
Burundi, Rwanda• main season crop: harvesting
Africa
North AfricaOverall crop prospects remain favourableHarvesting of the 2011 winter cereal crops is due to start from June
in most countries of the subregion. Crop prospects are generally
favourable, especially in Algeria, Egypt, Morocco and Tunisia.
FAO forecasts the aggregate output of wheat in the subregion
at about 18 million tonnes, 14 percent up on last year’s average
crop, while that of barley is put at about 5.5 million tonnes, an
increase of nearly 22 percent compared to the 2010 crop. In
Tunisia, substantial recovery in output from last year’s drought-
reduced crop is expected, provided normal weather prevails in the
coming weeks. Although insufficient rains affected crops in parts
of the country in January and February, increased precipitation
from March boosted yields and improved harvest prospects in
main producing zones. The outlook is also favourable in Egypt,
the largest cereal producer of the subregion, due to the increase
in area planted to wheat and the use of improved seeds; crops
are also largely irrigated. Early prospects are also good in Algeria
and Morocco, where in addition to adequate weather since the
beginning of the growing season, governments have continued
their support to the agricultural sector mostly through input
subsidies.
Wheat imports remain high, but food inflation is moderate, except, in EgyptNorthern African countries rely heavily on wheat imports
from the international market to cover their consumption
needs, with Egypt being the world’s largest wheat importer.
Given the relatively good prospects for 2011 crops, the import
requirements for the marketing year 2011/12 (July/June) are
likely to be lower than this year. In the past, over 50 percent of
Egypt’s wheat imports used to be from the Russian Federation.
In view of the reduced supply from that country, alternative
sources are sought. As a result, in spite of the high level of
international prices due to last year’s reduced crop production,
the subregion’s aggregate imports of wheat in 2010/11 (July/
June) were estimated to increase by almost 10 percent to about
22.6 million tonnes.
So far, however, the hike in international food prices has
not translated into high domestic prices in most countries
due to government intervention. In Tunisia, the inflation rate
in the food sector remained low and stable in the first quarter
of 2011, with the year-on-year inflation rate estimated at
about 3 percent in April 2011. In Morocco, the food price
inflation rate has been following a downward trend since
November 2010, while in Algeria, the year-on-year inflation
rate in March 2011 was 3.7 percent in the food sector and
Table 7. North Africa cereal production (million tonnes)
Wheat Coarse grains Rice (paddy) Total cereals
20092010
estim.2011 f'cast 2009
2010 estim.
2011 f'cast 2009
2010 estim.
2011 f'cast 2009
2010 estim.
2011 f'cast
Change: 2011/2010 (%)
North Africa 20.3 16.1 18.3 16.1 13.6 14.6 5.6 4.5 4.3 42.0 34.3 37.3 8.7
Algeria 3.6 3.1 3.1 2.5 1.6 1.6 - - - 6.1 4.7 4.7 0.0
Egypt 8.5 7.2 7.9 8.6 8.9 8.8 5.5 4.5 4.3 22.7 20.5 21.1 2.9
Morocco 6.4 4.9 5.9 4.0 2.8 3.3 - - - 10.4 7.7 9.3 20.8
Tunisia 1.7 0.8 1.3 0.9 0.3 0.7 - - - 2.5 1.1 2.0 81.8
Note: Totals computed from unrounded data, '-' means nil or negligible.
No. 2 n June 201112
Crop Prospects and Food Situation
only 1.8 percent in the cereal sector. The moderate food
inflation rate in these countries is due to a variety of measures
taken by governments, including subsidizing or reducing
import taxes on some food items. The situation is different in
Egypt, where the year-on-year rate of inflation in the food
sector was estimated at 21.7 percent in April 2011. The high
food inflation rate in Egypt (in spite of the Government’s
bread subsidy programme) is driven mostly by a 38 percent
increase in wheat price in the year to April 2011 as well as a
52 percent jump in the price of fruits and vegetables and a
16 percent rise in the prices of other food items (excluding
fruits and vegetables) over the same period.
Continued food assistance required due to massive movement of refugees and returnees from Libyan Arab JamahiriyaThe civil strife in Libyan Arab Jamahiriya has resulted in
high levels of internal insecurity and population displacement,
both internally and externally. Current estimates indicate
that about one million people have fled the country as of
early June. Most of them have crossed into Tunisia, Egypt,
Niger, Chad and Algeria. Within Libyan Arab Jamahiriya,
large numbers of internally displaced persons (IDPs) are also
reported to be in need of food assistance and the affected
areas are now widened to include western parts of the
country. According to a recent assessment, food stocks are
rapidly being depleted in Libyan Arab Jamahiriya in the
absence of any replenishment pipeline because of insecurity.
This, in addition to the deteriorating exchange rate, points to
the risk of serious food shortage in the country. As a response
to the humanitarian situation, WFP’s Emergency Operation
(EMOP), initiated in March 2011 to distribute food aid to
about 1.5 million people in the affected countries, is now
extended until August 2011.
Western AfricaOnset of seasonal rains herald the start of the 2011 cropping seasonIn western Africa, rains
started in April in southern
parts of the coastal
countries, allowing sowing
of the first 2011 maize
crops, for harvest from July.
Planting of coarse grains
will progress northwards in
these countries following
the onset of the rains. By
contrast, seasonably dry
conditions prevail in the Sahelian zone where planting will
start in June.
Good cereal harvest in 2010 following favourable weather conditions Latest official estimates put the subregion’s aggregate 2010 cereal
output, consisting mostly of coarse grains, at a record 60 million
tonnes, 11 percent up on 2009 and 20 percent above the past
five-year average. Bumper cereal harvests were gathered in most
Sahelian countries, including Burkina Faso, Chad, the Gambia,
Guinea-Bissau, Mali, Niger and Senegal. Production was also
good in the coastal countries along the Gulf of Guinea, notably
in Nigeria.
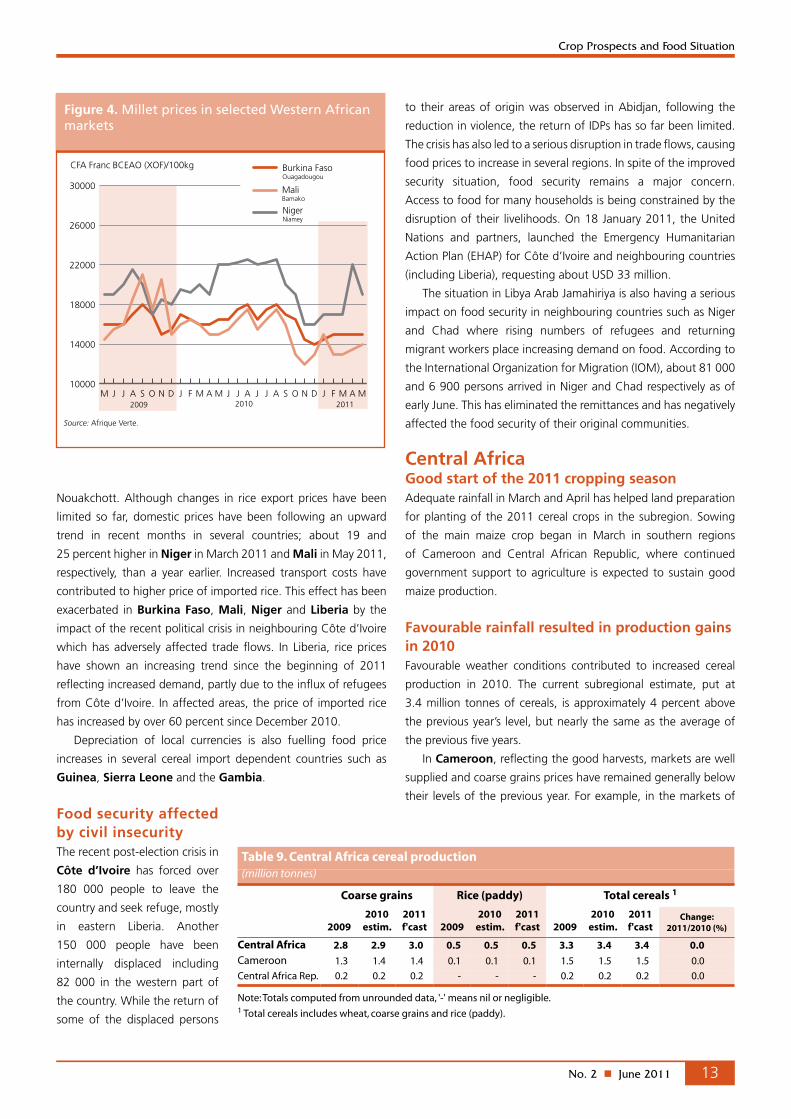
Coarse grain prices have remained mostly stable, while prices of imported commodities, such as rice and wheat, are increasingReflecting the good harvests from late last year, markets were
generally well supplied. Although coarse grain prices increased
from January-February 2011 in most countries, following
seasonal patterns, they remained generally below their levels
of the corresponding months of the previous year. For instance,
millet prices in markets in Niger (Niamey), Burkina Faso
(Ouagadougou) and Mali (Bamako) in May 2011, were 14,
9 and 7 percent, respectively, lower than in May 2010. Millet
prices in Senegal (Dakar) in March 2011, were about 8 percent
below their level of a year earlier. In Nigeria, sorghum prices
in Kano, in the northern part of the country, remained below
their level of a year earlier until March 2011 but in April 2011
prices were up by about 7 percent on their levels of a year ago.
The situation is generally different for the prices of imported
commodities, which are determined by world prices and have
exhibited significant pass-through from the international market.
For example, in Mauritania, the average wheat price is reported
to have increased by 40 percent in the year to March 2011 in
Table 8. Western Africa cereal production (million tonnes)
Coarse grains Rice (paddy) Total cereals 1
20092010
estim.2011 f'cast 2009
2010 estim.
2011 f'cast 2009
2010 estim.
2011 f'cast
Change: 2011/2010 (%)
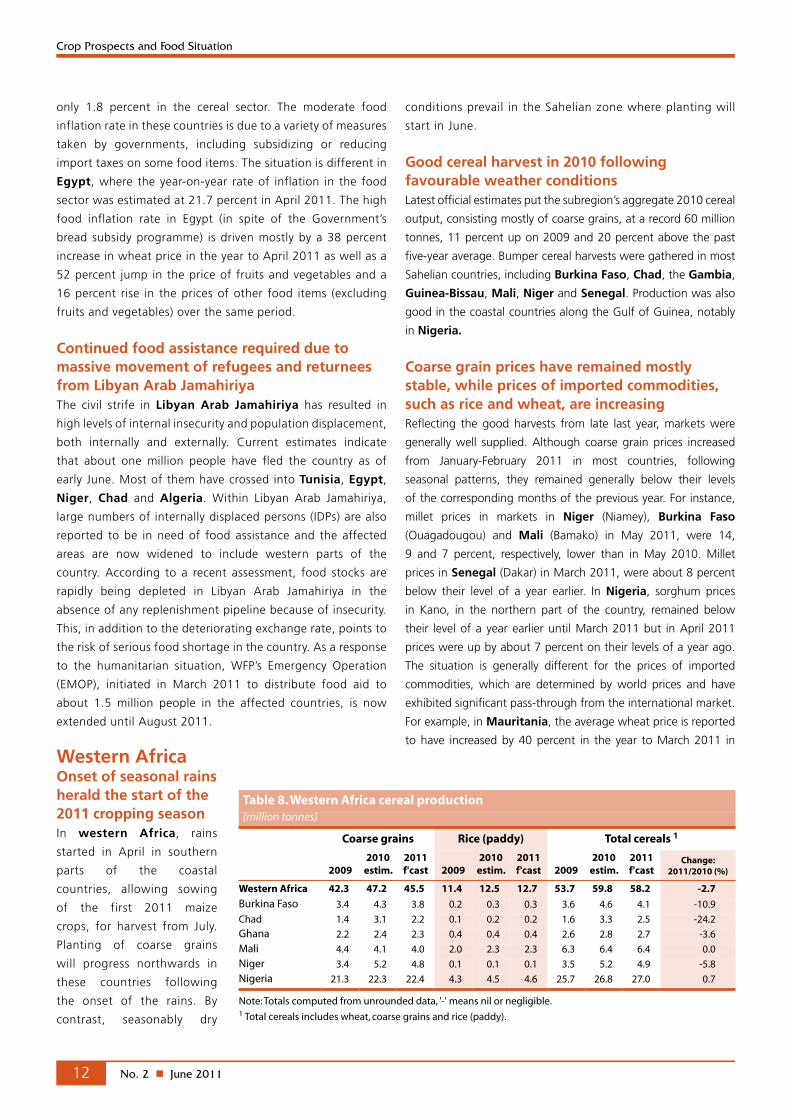
Western Africa 42.3 47.2 45.5 11.4 12.5 12.7 53.7 59.8 58.2 -2.7
Burkina Faso 3.4 4.3 3.8 0.2 0.3 0.3 3.6 4.6 4.1 -10.9
Chad 1.4 3.1 2.2 0.1 0.2 0.2 1.6 3.3 2.5 -24.2
Ghana 2.2 2.4 2.3 0.4 0.4 0.4 2.6 2.8 2.7 -3.6
Mali 4.4 4.1 4.0 2.0 2.3 2.3 6.3 6.4 6.4 0.0
Niger 3.4 5.2 4.8 0.1 0.1 0.1 3.5 5.2 4.9 -5.8
Nigeria 21.3 22.3 22.4 4.3 4.5 4.6 25.7 26.8 27.0 0.7
Note: Totals computed from unrounded data, '-' means nil or negligible.1 Total cereals includes wheat, coarse grains and rice (paddy).
No. 2 n June 2011 13
Crop Prospects and Food Situation
Nouakchott. Although changes in rice export prices have been
limited so far, domestic prices have been following an upward
trend in recent months in several countries; about 19 and
25 percent higher in Niger in March 2011 and Mali in May 2011,
respectively, than a year earlier. Increased transport costs have
contributed to higher price of imported rice. This effect has been
exacerbated in Burkina Faso, Mali, Niger and Liberia by the
impact of the recent political crisis in neighbouring Côte d’Ivoire
which has adversely affected trade flows. In Liberia, rice prices
have shown an increasing trend since the beginning of 2011
reflecting increased demand, partly due to the influx of refugees
from Côte d’Ivoire. In affected areas, the price of imported rice
has increased by over 60 percent since December 2010.
Depreciation of local currencies is also fuelling food price
increases in several cereal import dependent countries such as
Guinea, Sierra Leone and the Gambia.
Food security affected by civil insecurity The recent post-election crisis in
Côte d’Ivoire has forced over
180 000 people to leave the
country and seek refuge, mostly
in eastern Liberia. Another
150 000 people have been
internally displaced including
82 000 in the western part of
the country. While the return of
some of the displaced persons
to their areas of origin was observed in Abidjan, following the
reduction in violence, the return of IDPs has so far been limited.
The crisis has also led to a serious disruption in trade flows, causing
food prices to increase in several regions. In spite of the improved
security situation, food security remains a major concern.
Access to food for many households is being constrained by the
disruption of their livelihoods. On 18 January 2011, the United
Nations and partners, launched the Emergency Humanitarian
Action Plan (EHAP) for Côte d’Ivoire and neighbouring countries
(including Liberia), requesting about USD 33 million.
The situation in Libya Arab Jamahiriya is also having a serious
impact on food security in neighbouring countries such as Niger
and Chad where rising numbers of refugees and returning
migrant workers place increasing demand on food. According to
the International Organization for Migration (IOM), about 81 000
and 6 900 persons arrived in Niger and Chad respectively as of
early June. This has eliminated the remittances and has negatively
affected the food security of their original communities.
Central AfricaGood start of the 2011 cropping seasonAdequate rainfall in March and April has helped land preparation
for planting of the 2011 cereal crops in the subregion. Sowing
of the main maize crop began in March in southern regions
of Cameroon and Central African Republic, where continued
government support to agriculture is expected to sustain good
maize production.
Favourable rainfall resulted in production gains in 2010Favourable weather conditions contributed to increased cereal
production in 2010. The current subregional estimate, put at
3.4 million tonnes of cereals, is approximately 4 percent above
the previous year’s level, but nearly the same as the average of
the previous five years.
In Cameroon, reflecting the good harvests, markets are well
supplied and coarse grains prices have remained generally below
their levels of the previous year. For example, in the markets of
10000
14000
18000
22000
26000
30000
MAMFJDNOSAJJAJJMAMFJDNOSAJJM2009 20112010
Niger Niamey
Figure 4. Millet prices in selected Western African markets
CFA Franc BCEAO (XOF)/100kg Burkina Faso Ouagadougou
Source: Afrique Verte.
Mali Bamako
Table 9. Central Africa cereal production (million tonnes)
Coarse grains Rice (paddy) Total cereals 1
20092010
estim.2011 f'cast 2009
2010 estim.
2011 f'cast 2009
2010 estim.
2011 f'cast
Change: 2011/2010 (%)
Central Africa 2.8 2.9 3.0 0.5 0.5 0.5 3.3 3.4 3.4 0.0
Cameroon 1.3 1.4 1.4 0.1 0.1 0.1 1.5 1.5 1.5 0.0
Central Africa Rep. 0.2 0.2 0.2 - - - 0.2 0.2 0.2 0.0
Note: Totals computed from unrounded data, '-' means nil or negligible.1 Total cereals includes wheat, coarse grains and rice (paddy).

No. 2 n June 201114
Crop Prospects and Food Situation
Garoua and Bafoussam, during February 2011, maize prices were
at 32 and 5 percent below levels recorded in the corresponding
period in the previous year. By contrast, in Gabon, recent
developments in the international cereals market have resulted
in high inflationary pressure on the domestic food market, due
to the country’s high dependence on cereal imports. Similarly, in
the Central African Republic, after one year of stable prices,
inflation picked up during the last quarter of 2010 driven by a
renewed wave of violence in the north and high international
commodity prices, making access to food difficult for large
segments of the population.
Civil insecurity still a major cause of food insecurityPersistent civil insecurity continues to impede agricultural
recovery and restrict humanitarian efforts in the region. Civil
conflict in neighbouring Democratic Republic of Congo (DRC)
during the end of 2009 led to a large influx of refugees into the
Republic of Congo from the Equateur Province during October
and November 2009. The current figures from UNHCR indicate
that 115 100 civilians have fled to Likouala Province (a structurally
food-deficit region), in the far north of Congo. Likouala is
the poorest and currently the most food insecure province
in Republic of Congo. The sharp increase in population (by
89 percent in affected areas) puts pressure on natural resources,
a major source of livelihood for the local population. Trading
routes between the Democratic Republic of Congo and the
Republic of Congo have been disrupted, further affecting food
availability. A similar situation is reported in eastern and northern
parts of the Central African Republic, where civil conflict has
exacerbated the already poor food security situation. Some
100 000 IDPs and 30 000 refugees and asylum seekers from the
Democratic Republic of Congo, Chad and Sudan continue to
require food assistance.
Eastern AfricaProlonged dry weather conditions raise serious food security concernsThe outlook for the 2011
harvests and livestock
conditions raises serious food
security concerns following
poor and erratic rainfall from
March to May. The current
lack of adequate pastures
has led to a worsening of
livestock body conditions
and even some deaths. This
has consequently reduced good market prospects, directly
impacting pastoralists’ incomes and their access to staple food.
In addition, the reproduction rates of livestock have suffered
from dry weather conditions that prevailed for more than nine
months. The 2010 short rainy season (October to December)
almost totally failed and led to a depletion of grazing resources.
This makes the recovery of pastoral livelihood systems more
difficult and worsens the long-term food security. Pastoral and
agro-pastoral areas of northern, north-eastern and eastern
Kenya, southern and central Somalia, southern Sudan, inland
Djibouti, northern Uganda and south and south-eastern
Ethiopia are of particular concern. Although recent good
rains have helped replenish water catchments, significant soil
moisture deficits still persist.
The prolonged dry spells have also affected seasonal crop
production in several countries of the subregion. In Ethiopia,
unfavourable secondary “belg” season rains (March to May)
have negatively affected crops, to be harvested from late June-
July. This has also affected planting of long cycle “meher”
crops, especially in the lowlands, while in many areas of Tigray
and Amhara regions, farmers have switched to planting short
cycle varieties. An early multi-agency “belg” assessment has
been carried out, and although its results are not yet available,
crop production is expected to be very poor as rains were late
and poorly distributed. Inadequate moisture has also led to
a near total failure of the sweet potato crop in the south-
western parts of the country, where the crop is crucial for local
food security during the lean season.
Following the late onset of seasonal rains, delayed planting of
2011 main season cereal crops is underway in Kenya (“long-rains”),
Somalia (“gu”), southern Sudan and Karamoja region of Uganda.
In Ethiopia, Eritrea and northern Sudan, the main cropping season
is expected to start in June-July. The overall performance of 2011
cereal production will depend on the adequacy of seasonal rains
until next September. A close monitoring of the rainfall situation in
the remainder of the season is, therefore, warranted.
Table 10. Eastern Africa cereal production (million tonnes)
Wheat Coarse grains Total cereals 1
20092010
estim.2011 f'cast 2009
2010 estim.
2011 f'cast 2009
2010 estim.
2011 f'cast
Change: 2011/2010 (%)
Eastern Africa 4.2 4.1 3.7 26.9 31.4 29.4 33.0 37.5 35.1 -6.4
Ethiopia 3.3 3.0 2.7 13.0 13.7 12.9 16.5 16.9 15.8 -6.5
Kenya 0.2 0.4 0.3 2.6 3.1 2.7 2.9 3.6 3.1 -13.9
Sudan 0.4 0.4 0.5 3.1 5.3 5.1 3.6 5.8 5.6 -3.4
Tanzania U.R. 0.1 0.1 0.1 4.3 4.7 4.3 5.7 6.2 5.7 -8.1
Uganda - - - 2.6 3.2 3.0 2.8 3.4 3.3 -2.9
Note: Totals computed from unrounded data, '-' means nil or negligible.1 Total cereals includes wheat, coarse grains and rice (paddy).

No. 2 n June 2011 15
Crop Prospects and Food Situation
Cereal prices escalating across the subregionAcross eastern Africa, cereal prices continued their upward
trend that started in September-October 2010. Record levels
have been registered in some retail markets including Somalia’s
Mogadishu and Marka markets, where April prices of red
sorghum were between 160 and 177 percent higher than 12
months earlier. A similar situation is reported in Kenya where
wholesale prices in May in the main urban markets of Nairobi
and Mombasa were between 60 and 85 percent above their
levels twelve months earlier. In Ethiopia, relatively low price
levels were experienced from late last year into the beginning
of 2011, with cereal prices rising from February; maize prices
have increased between 60 and 120 percent only in the last
four months from February to May. In southern Sudan, food
prices are on the rise, especially in markets along the north-
south border and in the capital city Juba where the influx
of about 300 000 returnees has created additional demand
for main staple food. A contrasting situation is reported in
Khartoum, where sorghum (feterita) was traded at an average
of SDG 890 per tonne in April 2011, almost 40 percent less
than 12 months earlier, indicating good stock levels, following
the bumper crop harvested at the end of last year and the
decreasing trade flows towards the south.
The number of people in need of food assistance has risen significantly in the subregionFood insecurity rose sharply in pastoral and agro-pastoral
areas of Somalia, Kenya and Ethiopia as a consequence of the
prolonged drought. The total number of food insecure people
in need of humanitarian assistance in the subregion is currently
estimated at about 15.5 million people (including 6 million in
Sudan, 3.2 million in Ethiopia, 2.4 million each in Kenya and
Somalia, 815 000 in Uganda and 120 000 in Djibouti). This is
about 500 000 people more than previously reported by FAO
in April 2011. These figures are likely to increase further in the
coming months as food stocks gradually run out and the lean
season deepens before the next main harvest in the last quarter
of the year.
Civil conflicts and insecurity continue to negatively affect
the food security situation in most areas of southern and
central Somalia and Darfur and South Kordofan in northern
Sudan, disrupting local markets and trade flows and hindering
humanitarian aid distribution. In southern Sudan, food security
conditions are also significantly affected by the socio-political
tensions linked to the results of last January’s self-determination
referendum especially in the disputed area of Abyei and in
urban areas of Northern Bahr el Ghazal, Warrap, Unity, Jonglei
and Upper Nile states where the majority of returnees are
concentrated.
Southern AfricaFavourable prospects for current crops, being harvested, in the subregion; however, localized floods and a recent dry-spell have caused some damage Harvesting of the main season cereal crops is nearing completion
in most countries in Southern Africa. Despite irregular rainfall
patterns, particularly during the second half of the main rainy
season (January-March), production of maize, the main staple,
is mostly favourable. However, prospects are mixed in individual
countries, where some countries were affected by floods or rainfall
deficits, while others experienced good weather conditions that
supported record harvests.
Rainfall during the first three months of the cropping season
(October-December) was generally positive, despite some early
moisture deficits. Towards the end of 2010 and into January,
torrential rains across the Zambezi basin and southern and
western parts of the subregion resulted in localized flooding and
crop damage. The heavy rains also affected northern regions of
Namibia and Lesotho, in particular, negatively impacting crop
development and dampening cereal production. During February
and the beginning of March, rainfall levels dropped, with the short
dry spell impacting portions of Botswana, Zimbabwe, central and
southern Mozambique, southern Zambia and Malawi, as well
as northern parts of South Africa’s maize triangle. The rainfall
deficits caused some soil moisture stress to early-planted maize,
reportedly negatively impacting on yield levels in the affected
areas. However, improved rains were recorded in the following
months, which also caused some delays of harvesting activities
100
200
300
400
500
600
MAMFJDNOSAJJMAMFJDNOSAJJM2009 20112010
USD/tonne
Tanzania U.R. Dar-es-Salaam
Kenya Nairobi
Figure 5. Maize prices in selected Eastern African markets
Uganda Kampala
Sources: Regional Agricultural Trade Intelligence Network;Ethiopian Grain Trade Enterprise.
Ethiopia Addis Ababa
No. 2 n June 201116
Crop Prospects and Food Situation
in some areas of South Africa. Furthermore, the continuation of
input assistance by governments and partner agencies improved
seed and fertilizer availability for the agricultural season, leading
to increased plantings, and thus contributing to production gains.
Record maize crops are estimated for Malawi and Zambia
at 3.9 and 3 million tonnes respectively, which is expected to
enable the countries to retain healthy surpluses for the current
2011/12 marketing year that began in April-May. In Zimbabwe
and Swaziland, despite the increase in planted area to maize,
only moderate production increases are estimated, mainly on
account of the irregular rains. Production of the main cereal
staples in Angola, Mozambique (maize) and Madagascar
(rice) is anticipated to be at similar levels to the previous season.
By contrast, Namibia and, in particular, Lesotho are expected
to experience production shortfalls following a flood-affected
cropping season. In South Africa, the largest maize-producing
country in the subregion, a contraction in maize plantings led
to lower production estimates; however, maize production,
estimated at 11.6 million tonnes is still about 8 percent higher than
the previous five-year average. Overall, total maize production
for the subregion is estimated at just under 24 million tonnes,
about 1.1 million tonnes lower than the good 2010 crop, but
still 20 percent higher than the five-year average (2006-2010).
Millet and sorghum production is estimated at marginally lower
levels as compared to last year’s output, while production of the
winter wheat crop, which is currently being planted, is forecast
to expand compared to 2010. Increased plantings in South Africa
and Zambia are reported, and early estimates point to a crop of
about 2 million tonnes for the subregion.
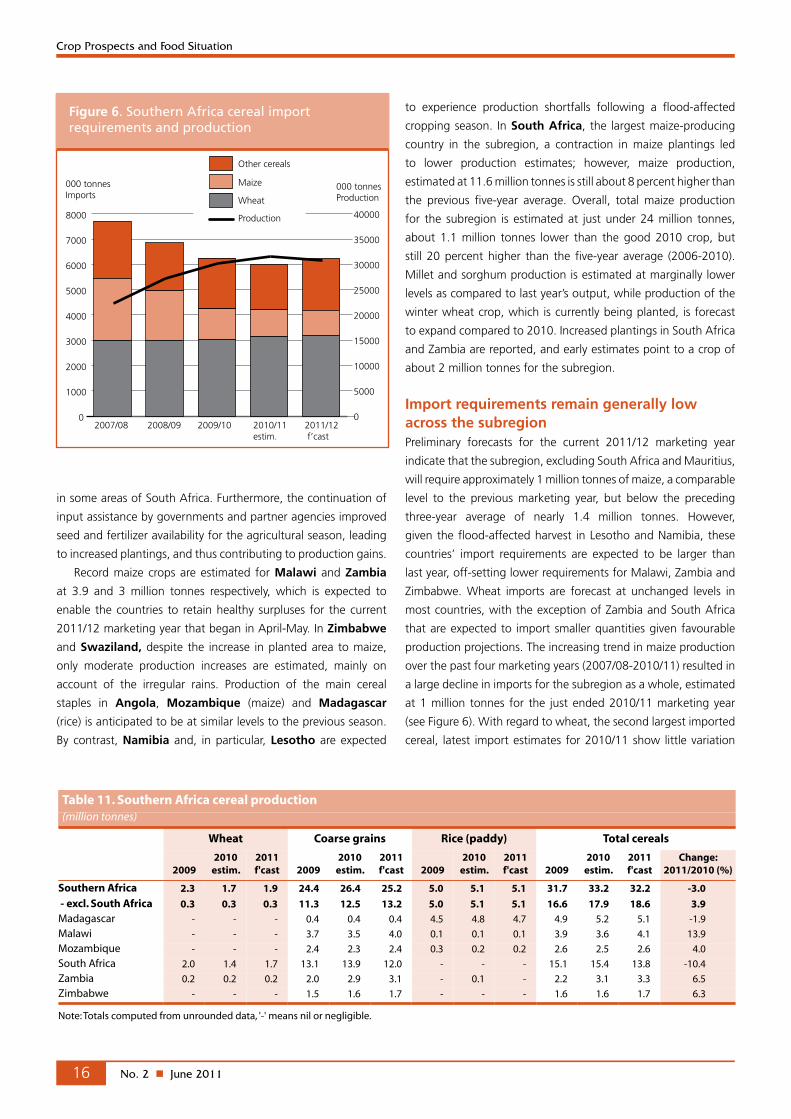
Import requirements remain generally low across the subregionPreliminary forecasts for the current 2011/12 marketing year
indicate that the subregion, excluding South Africa and Mauritius,
will require approximately 1 million tonnes of maize, a comparable
level to the previous marketing year, but below the preceding
three-year average of nearly 1.4 million tonnes. However,
given the flood-affected harvest in Lesotho and Namibia, these
countries’ import requirements are expected to be larger than
last year, off-setting lower requirements for Malawi, Zambia and
Zimbabwe. Wheat imports are forecast at unchanged levels in
most countries, with the exception of Zambia and South Africa
that are expected to import smaller quantities given favourable
production projections. The increasing trend in maize production
over the past four marketing years (2007/08-2010/11) resulted in
a large decline in imports for the subregion as a whole, estimated
at 1 million tonnes for the just ended 2010/11 marketing year
(see Figure 6). With regard to wheat, the second largest imported
cereal, latest import estimates for 2010/11 show little variation
Table 11. Southern Africa cereal production (million tonnes)
Wheat Coarse grains Rice (paddy) Total cereals
20092010
estim.2011 f'cast 2009
2010 estim.
2011 f'cast 2009
2010 estim.
2011 f'cast 2009
2010 estim.
2011 f'cast
Change: 2011/2010 (%)
Southern Africa 2.3 1.7 1.9 24.4 26.4 25.2 5.0 5.1 5.1 31.7 33.2 32.2 -3.0
- excl. South Africa 0.3 0.3 0.3 11.3 12.5 13.2 5.0 5.1 5.1 16.6 17.9 18.6 3.9Madagascar - - - 0.4 0.4 0.4 4.5 4.8 4.7 4.9 5.2 5.1 -1.9
Malawi - - - 3.7 3.5 4.0 0.1 0.1 0.1 3.9 3.6 4.1 13.9
Mozambique - - - 2.4 2.3 2.4 0.3 0.2 0.2 2.6 2.5 2.6 4.0
South Africa 2.0 1.4 1.7 13.1 13.9 12.0 - - - 15.1 15.4 13.8 -10.4
Zambia 0.2 0.2 0.2 2.0 2.9 3.1 - 0.1 - 2.2 3.1 3.3 6.5
Zimbabwe - - - 1.5 1.6 1.7 - - - 1.6 1.6 1.7 6.3
Note: Totals computed from unrounded data, '-' means nil or negligible.
0
1000
2000
3000
4000
5000
6000
7000
8000
2007/08 2008/09 2009/10 2010/11estim.
2011/12 f’cast
Production
0
5000
10000
15000
20000
25000
30000
35000
40000
Figure 6. Southern Africa cereal importrequirements and production
Wheat
Maize000 tonnesImports
Other cereals
000 tonnesProduction
No. 2 n June 2011 17
Crop Prospects and Food Situation
from the previous three marketing years. However, in Lesotho
and Swaziland, wheat imports did fall in 2010/11, attributed to
higher international prices and was, thereby, compensated by
larger quantities of maize imports.
Overall, aggregate cereal import requirements are forecast
at 3.3 million tonnes for the 2011/12 marketing year (excluding
South Africa and Mauritius), slightly larger than last year’s
estimates, largely on account of expected production shortfalls in
Lesotho and Namibia.
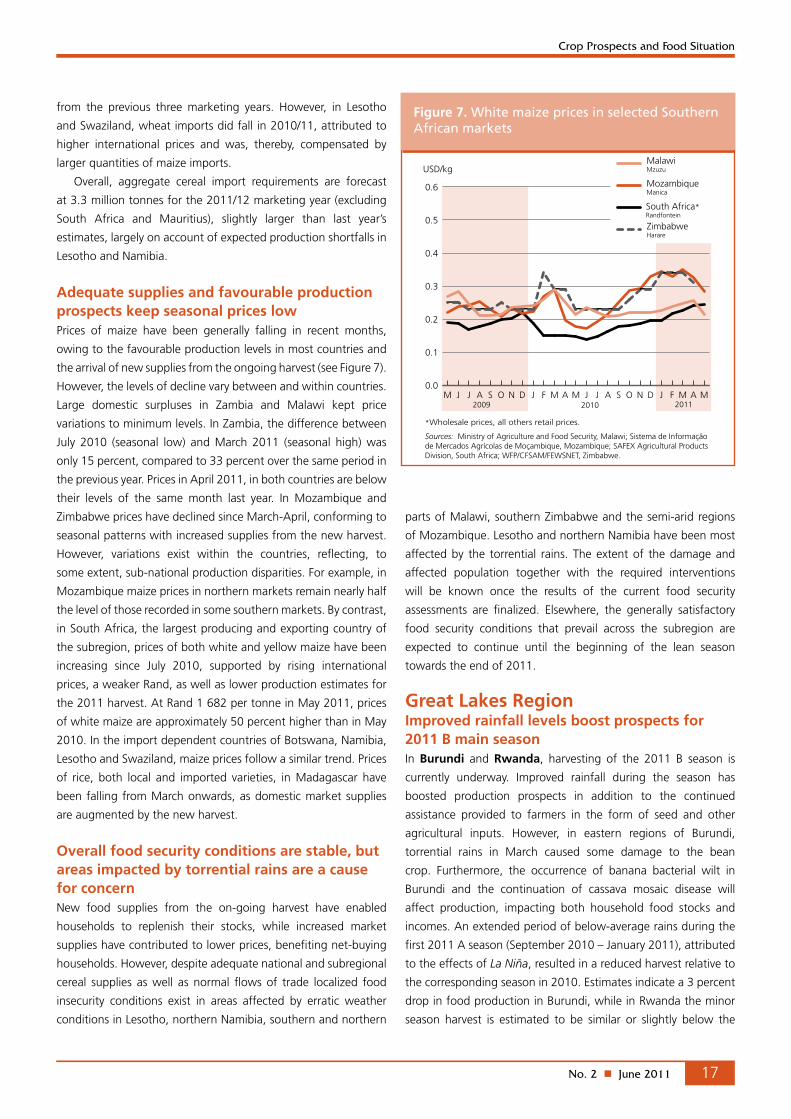
Adequate supplies and favourable production prospects keep seasonal prices low Prices of maize have been generally falling in recent months,
owing to the favourable production levels in most countries and
the arrival of new supplies from the ongoing harvest (see Figure 7).
However, the levels of decline vary between and within countries.
Large domestic surpluses in Zambia and Malawi kept price
variations to minimum levels. In Zambia, the difference between
July 2010 (seasonal low) and March 2011 (seasonal high) was
only 15 percent, compared to 33 percent over the same period in
the previous year. Prices in April 2011, in both countries are below
their levels of the same month last year. In Mozambique and
Zimbabwe prices have declined since March-April, conforming to
seasonal patterns with increased supplies from the new harvest.
However, variations exist within the countries, reflecting, to
some extent, sub-national production disparities. For example, in
Mozambique maize prices in northern markets remain nearly half
the level of those recorded in some southern markets. By contrast,
in South Africa, the largest producing and exporting country of
the subregion, prices of both white and yellow maize have been
increasing since July 2010, supported by rising international
prices, a weaker Rand, as well as lower production estimates for
the 2011 harvest. At Rand 1 682 per tonne in May 2011, prices
of white maize are approximately 50 percent higher than in May
2010. In the import dependent countries of Botswana, Namibia,
Lesotho and Swaziland, maize prices follow a similar trend. Prices
of rice, both local and imported varieties, in Madagascar have
been falling from March onwards, as domestic market supplies
are augmented by the new harvest.
Overall food security conditions are stable, but areas impacted by torrential rains are a cause for concernNew food supplies from the on-going harvest have enabled
households to replenish their stocks, while increased market
supplies have contributed to lower prices, benefiting net-buying
households. However, despite adequate national and subregional
cereal supplies as well as normal flows of trade localized food
insecurity conditions exist in areas affected by erratic weather
conditions in Lesotho, northern Namibia, southern and northern
parts of Malawi, southern Zimbabwe and the semi-arid regions
of Mozambique. Lesotho and northern Namibia have been most
affected by the torrential rains. The extent of the damage and
affected population together with the required interventions
will be known once the results of the current food security
assessments are finalized. Elsewhere, the generally satisfactory
food security conditions that prevail across the subregion are
expected to continue until the beginning of the lean season
towards the end of 2011.
Great Lakes RegionImproved rainfall levels boost prospects for 2011 B main season In Burundi and Rwanda, harvesting of the 2011 B season is
currently underway. Improved rainfall during the season has
boosted production prospects in addition to the continued
assistance provided to farmers in the form of seed and other
agricultural inputs. However, in eastern regions of Burundi,
torrential rains in March caused some damage to the bean
crop. Furthermore, the occurrence of banana bacterial wilt in
Burundi and the continuation of cassava mosaic disease will
affect production, impacting both household food stocks and
incomes. An extended period of below-average rains during the
first 2011 A season (September 2010 – January 2011), attributed
to the effects of La Niña, resulted in a reduced harvest relative to
the corresponding season in 2010. Estimates indicate a 3 percent
drop in food production in Burundi, while in Rwanda the minor
season harvest is estimated to be similar or slightly below the
0.0
0.1
0.2
0.3
0.4
0.5
0.6
MAMFJDNOSAJJMAMFJDNOSAJJM2009 20112010
Figure 7. White maize prices in selected Southern African markets
USD/kg
South Africa* Randfontein
Mozambique Manica
Malawi Mzuzu
*Wholesale prices, all others retail prices.
Zimbabwe Harare
Sources: Ministry of Agriculture and Food Security, Malawi; Sistema de Informação de Mercados Agrícolas de Moçambique, Mozambique; SAFEX Agricultural Products Division, South Africa; WFP/CFSAM/FEWSNET, Zimbabwe.
No. 2 n June 201118
Crop Prospects and Food Situation
output of the year before. Consequently, the low seasonal
supplies acted to constrain households’ ability to replenish food
stocks. In the Democratic Republic of Congo, harvesting of the
main season’s maize crop in central and southern parts will be
completed in June. Although no official crop production estimates
are available, satellite-based images indicate good vegetation
conditions during the main agricultural season in these areas.
Food prices display mixed trends, but remain at high levels In Burundi, following a period of decline immediately after the
2011 A harvest, prices of beans, a main food staple, remained
comparatively steady in most markets during March and April,
and on average, were about 10 percent below levels of last
year, except in Ruyigi and Gitega markets, where prices were
higher. In Kigali, Rwanda, prices have been similarly high, but
remained unchanged from April to May, following a temporary
decline at the beginning of 2011. Wholesale prices (in US dollar
terms) of maize and beans in May 2011 were 40 and 10 percent
above their levels in 2010 respectively. Given the large portion
of households’ income allocated to food purchases, the higher
prices are expected to further aggravate the food insecurity
conditions of vulnerable groups, but the arrival of the 2011 B
harvest will provide a boost to both household and market food
supplies.
In the Democratic Republic of Congo, food prices exhibit
mixed trends and great variability across the country, primarily
reflecting the availability of food items locally. Lower maize prices
were recorded in Lubumbashi on account of larger imports from
neighbouring Zambia, while rice prices in the northern town of
Kisangani, located in the main rice growing region, fell between
November 2010 and February 2011, following the harvest, but
rose marginally in March. Civil insecurity continues to constrain
agricultural production and exacerbates the food insecurity
conditions of vulnerable groups, particularly in north-eastern
parts of the country, while limited agricultural productive capacity
and the deterioration of the mining industry has severely affected
food security in central provinces.
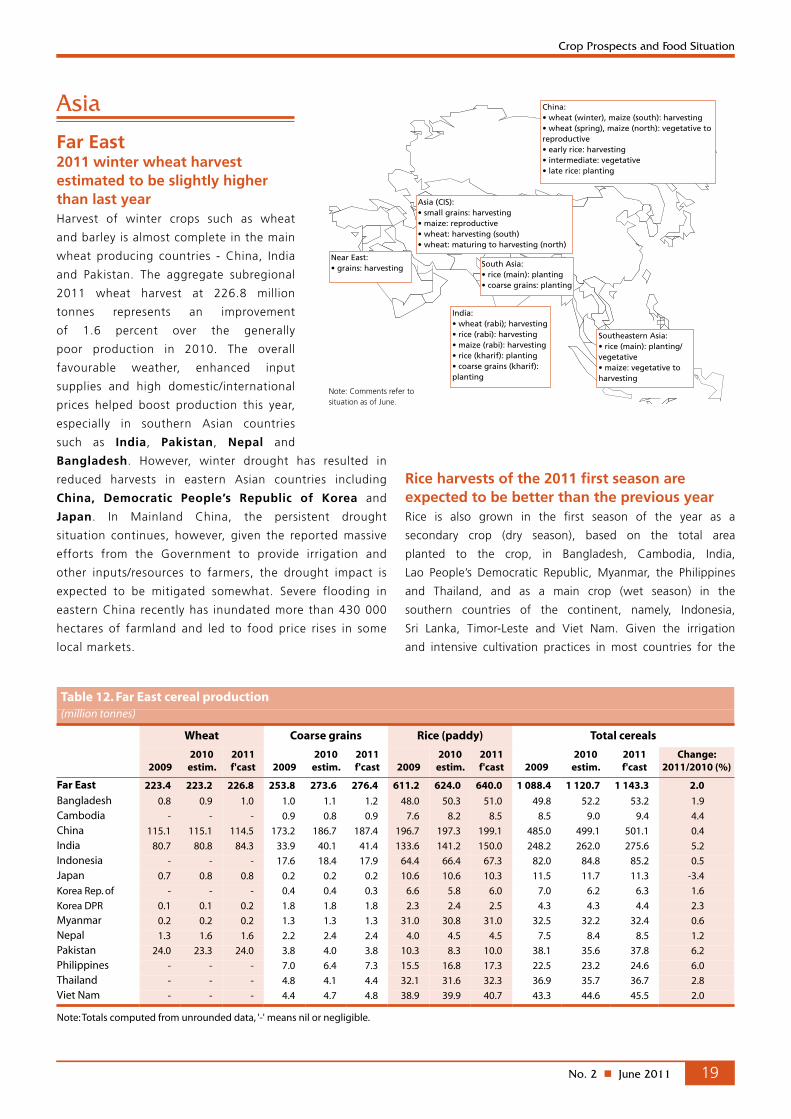
No. 2 n June 2011 19
Crop Prospects and Food Situation
Note: Comments refer to situation as of June.
Asia (CIS): • small grains: harvesting• maize: reproductive• wheat: harvesting (south)• wheat: maturing to harvesting (north)
Southeastern Asia: • rice (main): planting/vegetative• maize: vegetative to harvesting
Near East: • grains: harvesting
China: • wheat (winter), maize (south): harvesting• wheat (spring), maize (north): vegetative to reproductive• early rice: harvesting• intermediate: vegetative• late rice: planting
South Asia: • rice (main): planting• coarse grains: planting
India: • wheat (rabi); harvesting• rice (rabi): harvesting• maize (rabi): harvesting• rice (kharif): planting• coarse grains (kharif): planting
Asia
Far East2011 winter wheat harvest estimated to be slightly higher than last yearHarvest of winter crops such as wheat
and barley is almost complete in the main
wheat producing countries - China, India
and Pakistan. The aggregate subregional
2011 wheat harvest at 226.8 million
tonnes represents an improvement
of 1.6 percent over the generally
poor production in 2010. The overall
favourable weather, enhanced input
supplies and high domestic/international
prices helped boost production this year,
especially in southern Asian countries
such as India, Pakistan, Nepal and
Bangladesh. However, winter drought has resulted in
reduced harvests in eastern Asian countries including
China, Democratic People’s Republic of Korea and
Japan. In Mainland China, the persistent drought
situation continues, however, given the reported massive
efforts from the Government to provide irrigation and
other inputs/resources to farmers, the drought impact is
expected to be mitigated somewhat. Severe flooding in
eastern China recently has inundated more than 430 000
hectares of farmland and led to food price rises in some
local markets.
Rice harvests of the 2011 first season are expected to be better than the previous yearRice is also grown in the first season of the year as a
secondary crop (dry season), based on the total area
planted to the crop, in Bangladesh, Cambodia, India,
Lao People’s Democratic Republic, Myanmar, the Philippines
and Thailand, and as a main crop (wet season) in the
southern countries of the continent, namely, Indonesia,
Sri Lanka, Timor-Leste and Viet Nam. Given the irrigation
and intensive cultivation practices in most countries for the
Table 12. Far East cereal production (million tonnes)
Wheat Coarse grains Rice (paddy) Total cereals
20092010
estim.2011 f'cast 2009
2010 estim.
2011 f'cast 2009
2010 estim.
2011 f'cast 2009
2010 estim.
2011 f'cast
Change: 2011/2010 (%)
Far East 223.4 223.2 226.8 253.8 273.6 276.4 611.2 624.0 640.0 1 088.4 1 120.7 1 143.3 2.0
Bangladesh 0.8 0.9 1.0 1.0 1.1 1.2 48.0 50.3 51.0 49.8 52.2 53.2 1.9
Cambodia - - - 0.9 0.8 0.9 7.6 8.2 8.5 8.5 9.0 9.4 4.4
China 115.1 115.1 114.5 173.2 186.7 187.4 196.7 197.3 199.1 485.0 499.1 501.1 0.4
India 80.7 80.8 84.3 33.9 40.1 41.4 133.6 141.2 150.0 248.2 262.0 275.6 5.2
Indonesia - - - 17.6 18.4 17.9 64.4 66.4 67.3 82.0 84.8 85.2 0.5
Japan 0.7 0.8 0.8 0.2 0.2 0.2 10.6 10.6 10.3 11.5 11.7 11.3 -3.4
Korea Rep. of - - - 0.4 0.4 0.3 6.6 5.8 6.0 7.0 6.2 6.3 1.6
Korea DPR 0.1 0.1 0.2 1.8 1.8 1.8 2.3 2.4 2.5 4.3 4.3 4.4 2.3
Myanmar 0.2 0.2 0.2 1.3 1.3 1.3 31.0 30.8 31.0 32.5 32.2 32.4 0.6
Nepal 1.3 1.6 1.6 2.2 2.4 2.4 4.0 4.5 4.5 7.5 8.4 8.5 1.2
Pakistan 24.0 23.3 24.0 3.8 4.0 3.8 10.3 8.3 10.0 38.1 35.6 37.8 6.2
Philippines - - - 7.0 6.4 7.3 15.5 16.8 17.3 22.5 23.2 24.6 6.0
Thailand - - - 4.8 4.1 4.4 32.1 31.6 32.3 36.9 35.7 36.7 2.8
Viet Nam - - - 4.4 4.7 4.8 38.9 39.9 40.7 43.3 44.6 45.5 2.0
Note: Totals computed from unrounded data, '-' means nil or negligible.
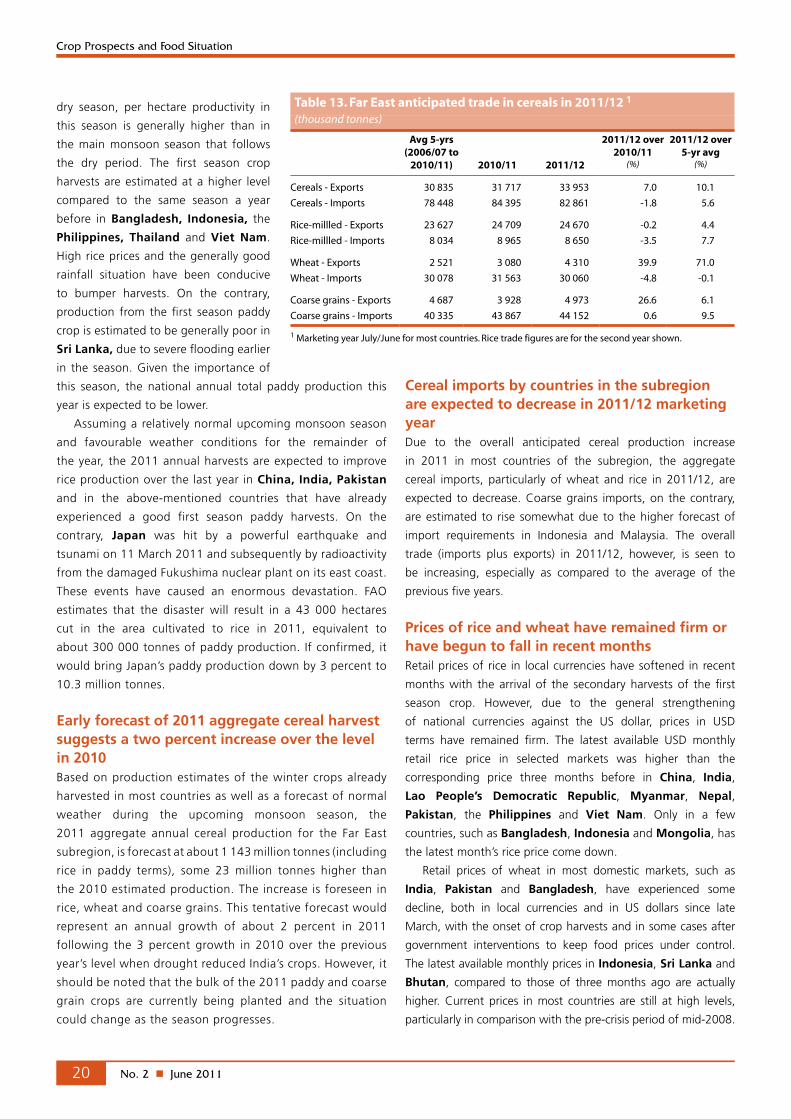
No. 2 n June 201120
Crop Prospects and Food Situation
dry season, per hectare productivity in
this season is generally higher than in
the main monsoon season that follows
the dry period. The first season crop
harvests are estimated at a higher level
compared to the same season a year
before in Bangladesh, Indonesia, the
Philippines, Thailand and Viet Nam.
High rice prices and the generally good
rainfall situation have been conducive
to bumper harvests. On the contrary,
production from the first season paddy
crop is estimated to be generally poor in
Sri Lanka, due to severe flooding earlier
in the season. Given the importance of
this season, the national annual total paddy production this
year is expected to be lower.
Assuming a relatively normal upcoming monsoon season
and favourable weather conditions for the remainder of
the year, the 2011 annual harvests are expected to improve
rice production over the last year in China, India, Pakistan
and in the above-mentioned countries that have already
experienced a good first season paddy harvests. On the
contrary, Japan was hit by a powerful earthquake and
tsunami on 11 March 2011 and subsequently by radioactivity
from the damaged Fukushima nuclear plant on its east coast.
These events have caused an enormous devastation. FAO
estimates that the disaster will result in a 43 000 hectares
cut in the area cultivated to rice in 2011, equivalent to
about 300 000 tonnes of paddy production. If confirmed, it
would bring Japan’s paddy production down by 3 percent to
10.3 million tonnes.
Early forecast of 2011 aggregate cereal harvest suggests a two percent increase over the level in 2010Based on production estimates of the winter crops already
harvested in most countries as well as a forecast of normal
weather during the upcoming monsoon season, the
2011 aggregate annual cereal production for the Far East
subregion, is forecast at about 1 143 million tonnes (including
rice in paddy terms), some 23 million tonnes higher than
the 2010 estimated production. The increase is foreseen in
rice, wheat and coarse grains. This tentative forecast would
represent an annual growth of about 2 percent in 2011
following the 3 percent growth in 2010 over the previous
year’s level when drought reduced India’s crops. However, it
should be noted that the bulk of the 2011 paddy and coarse
grain crops are currently being planted and the situation
could change as the season progresses.
Cereal imports by countries in the subregion are expected to decrease in 2011/12 marketing yearDue to the overall anticipated cereal production increase
in 2011 in most countries of the subregion, the aggregate
cereal imports, particularly of wheat and rice in 2011/12, are
expected to decrease. Coarse grains imports, on the contrary,
are estimated to rise somewhat due to the higher forecast of
import requirements in Indonesia and Malaysia. The overall
trade (imports plus exports) in 2011/12, however, is seen to
be increasing, especially as compared to the average of the
previous five years.
Prices of rice and wheat have remained firm or have begun to fall in recent monthsRetail prices of rice in local currencies have softened in recent
months with the arrival of the secondary harvests of the first
season crop. However, due to the general strengthening
of national currencies against the US dollar, prices in USD
terms have remained firm. The latest available USD monthly
retail rice price in selected markets was higher than the
corresponding price three months before in China, India,
Lao People’s Democratic Republic, Myanmar, Nepal,
Pakistan, the Philippines and Viet Nam. Only in a few
countries, such as Bangladesh, Indonesia and Mongolia, has
the latest month’s rice price come down.
Retail prices of wheat in most domestic markets, such as
India, Pakistan and Bangladesh, have experienced some
decline, both in local currencies and in US dollars since late
March, with the onset of crop harvests and in some cases after
government interventions to keep food prices under control.
The latest available monthly prices in Indonesia, Sri Lanka and
Bhutan, compared to those of three months ago are actually
higher. Current prices in most countries are still at high levels,
particularly in comparison with the pre-crisis period of mid-2008.
Table 13. Far East anticipated trade in cereals in 2011/12 1 (thousand tonnes)
Avg 5-yrs (2006/07 to
2010/11) 2010/11 2011/12
2011/12 over 2010/11
(%)
2011/12 over 5-yr avg
(%)
Cereals - Exports 30 835 31 717 33 953 7.0 10.1
Cereals - Imports 78 448 84 395 82 861 -1.8 5.6
Rice-millled - Exports 23 627 24 709 24 670 -0.2 4.4
Rice-millled - Imports 8 034 8 965 8 650 -3.5 7.7
Wheat - Exports 2 521 3 080 4 310 39.9 71.0
Wheat - Imports 30 078 31 563 30 060 -4.8 -0.1
Coarse grains - Exports 4 687 3 928 4 973 26.6 6.1
Coarse grains - Imports 40 335 43 867 44 152 0.6 9.5
1 Marketing year July/June for most countries. Rice trade figures are for the second year shown.

No. 2 n June 2011 21
Crop Prospects and Food Situation
Near EastHarvesting of 2011 winter wheat and barley crops is currently
underway throughout the subregion, while further north in
Turkey, it is expected to start in June. The wheat crop outlook
is very promising in main producing areas of Turkey, namely,
Central Anatolia, Aegean and Cukurova regions, and the early
national forecast of the 2011 crop is set at a bumper level of
20.5 million tonnes. On the contrary, in Afghanistan and the
Syrian Arab Republic, prospects are unfavourable. Despite
abundant rainfall in April that benefited crops at grain filling
stage, wheat production is likely to be below average due to
the late onset of the rainy season and persistent dry spells in the
first three months of 2011. The Afghanistan wheat harvest is
also expected to be much reduced from last year, mainly due to
the precipitation deficits during the early months of the season,
resulting in the reduction of area planted to the crop, especially in
the rainfed areas in the north and centre. In the rest of the region,
winter cereal production is forecast at about average levels. In
Yemen and the Syrian Arab Republic, current political and social
unrest may cause disruptions in commodity distribution channels,
with consequent localized food shortages in main markets and a
further increase in local prices.
CIS in Asia2
Early prospects for the 2011 cereal crops generally favourableSowing of cereals is nearly completed in the countries of the
subregion under generally satisfactory soil moisture conditions.
Adding the estimated winter cereal harvest to the preliminary
2009 2011
0.2
0.3
0.4
0.5
0.6
0.7
0.8
0.9
1.0
1.1
MAMFJDNOSAJJMAMFJDNOSAJJM2010
USD/kg
Figure 8. Rice retail prices in selected Far Eastcountries
Indonesia national average
Sources: Badan Pusat Statistik (BPS), Indonesia; Ministry of Consumer Affairs, India; Bureau of Agriculture Statistics, Philippines; Agroinfo, Viet Nam.
Philippines, (RMR) national average
Viet Nam, (25% broken milled) Dong Thap
India Delhi
2009 2011
0.2
0.3
0.4
MAMFJDNOSAJJMAMFJDNOSAJJM2010
USD/kg
Figure 9. Wheat retail prices in selected Far East countries
Sources: Pakistan Bureau of Statistics; Ministry of Consumer Affairs, India; Management Information System and Monitoring, Bangladesh.
IndiaDelhi
PakistanLahore
BangladeshDhaka
Table 14. Near East cereal production (million tonnes)
Wheat Coarse grains Rice (paddy) Total cereals
20092010
estim.2011 f'cast 2009
2010 estim.
2011 f'cast 2009
2010 estim.
2011 f'cast 2009
2010 estim.
2011 f'cast
Change: 2011/2010 (%)
Near East 45.1 44.8 44.4 19.1 21.1 20.6 3.8 4.2 4.2 68.0 70.1 69.3 -1.1
Afghanistan 5.1 4.5 4.0 0.8 0.8 0.8 0.6 0.6 0.6 6.5 5.9 5.4 -8.5
Iran (Islamic Rep. of ) 13.0 13.5 13.5 3.5 4.7 5.0 2.3 2.5 2.5 18.8 20.7 21.0 1.4
Iraq 1.4 1.9 1.7 0.7 1.4 1.1 0.2 0.2 0.2 2.2 3.4 2.9 -14.7
Syrian Arab Republic 3.7 3.6 3.2 1.0 0.9 0.8 - - - 4.7 4.5 4.1 -8.9
Turkey 20.6 19.7 20.5 12.2 12.2 11.9 0.8 0.9 0.9 33.6 32.7 33.3 1.8
Note: Totals computed from unrounded data, '-' means nil or negligible.
2 Georgia is no longer a member of CIS but its inclusion in this group is maintained temporarily.
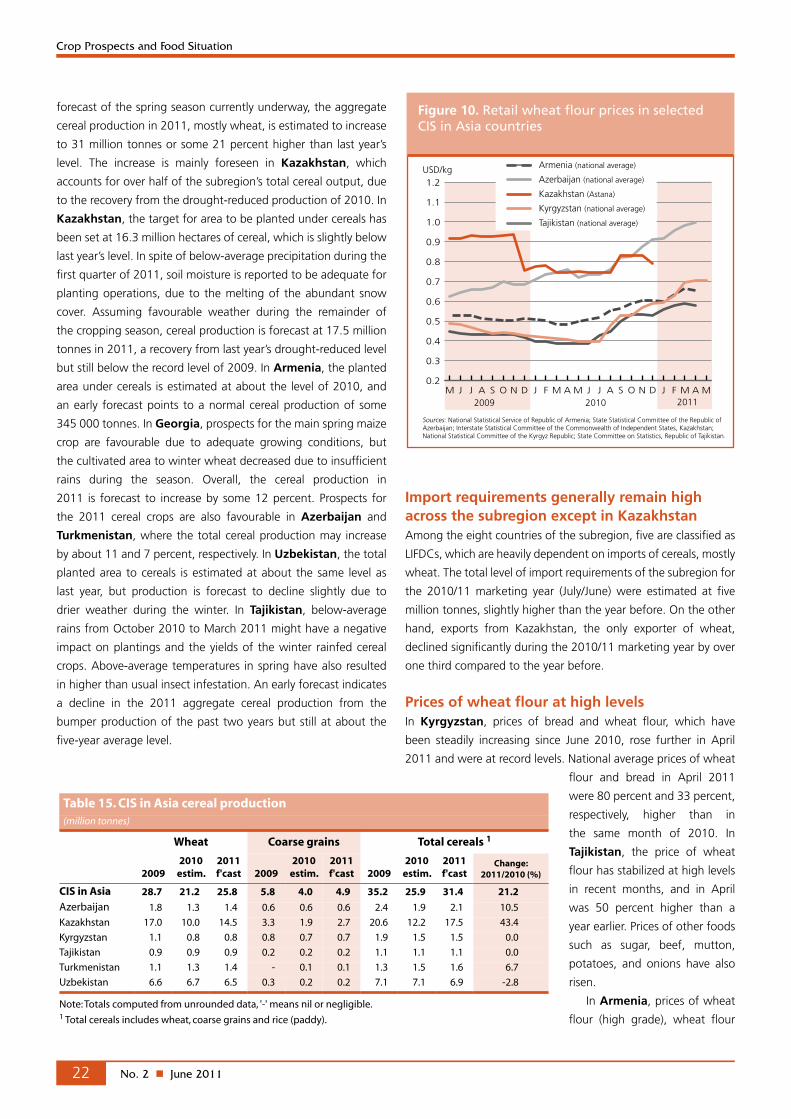
No. 2 n June 201122
Crop Prospects and Food Situation
forecast of the spring season currently underway, the aggregate
cereal production in 2011, mostly wheat, is estimated to increase
to 31 million tonnes or some 21 percent higher than last year’s
level. The increase is mainly foreseen in Kazakhstan, which
accounts for over half of the subregion’s total cereal output, due
to the recovery from the drought-reduced production of 2010. In
Kazakhstan, the target for area to be planted under cereals has
been set at 16.3 million hectares of cereal, which is slightly below
last year’s level. In spite of below-average precipitation during the
first quarter of 2011, soil moisture is reported to be adequate for
planting operations, due to the melting of the abundant snow
cover. Assuming favourable weather during the remainder of
the cropping season, cereal production is forecast at 17.5 million
tonnes in 2011, a recovery from last year’s drought-reduced level
but still below the record level of 2009. In Armenia, the planted
area under cereals is estimated at about the level of 2010, and
an early forecast points to a normal cereal production of some
345 000 tonnes. In Georgia, prospects for the main spring maize
crop are favourable due to adequate growing conditions, but
the cultivated area to winter wheat decreased due to insufficient
rains during the season. Overall, the cereal production in
2011 is forecast to increase by some 12 percent. Prospects for
the 2011 cereal crops are also favourable in Azerbaijan and
Turkmenistan, where the total cereal production may increase
by about 11 and 7 percent, respectively. In Uzbekistan, the total
planted area to cereals is estimated at about the same level as
last year, but production is forecast to decline slightly due to
drier weather during the winter. In Tajikistan, below-average
rains from October 2010 to March 2011 might have a negative
impact on plantings and the yields of the winter rainfed cereal
crops. Above-average temperatures in spring have also resulted
in higher than usual insect infestation. An early forecast indicates
a decline in the 2011 aggregate cereal production from the
bumper production of the past two years but still at about the
five-year average level.
0.2
0.3
0.4
0.5
0.6
0.7
0.8
0.9
1.0
1.1
1.2
MAMFJDNOSAJJMAMFJDNOSAJJM2010 20112009
USD/kg
Figure 10. Retail wheat flour prices in selected CIS in Asia countries
Sources: National Statistical Service of Republic of Armenia; State Statistical Committee of the Republic of Azerbaijan; Interstate Statistical Committee of the Commonwealth of Independent States, Kazakhstan; National Statistical Committee of the Kyrgyz Republic; State Committee on Statistics, Republic of Tajikistan.
Tajikistan (national average)
Kazakhstan (Astana)
Kyrgyzstan (national average)
Armenia (national average)
Azerbaijan (national average)
Import requirements generally remain high across the subregion except in KazakhstanAmong the eight countries of the subregion, five are classified as
LIFDCs, which are heavily dependent on imports of cereals, mostly
wheat. The total level of import requirements of the subregion for
the 2010/11 marketing year (July/June) were estimated at five
million tonnes, slightly higher than the year before. On the other
hand, exports from Kazakhstan, the only exporter of wheat,
declined significantly during the 2010/11 marketing year by over
one third compared to the year before.
Prices of wheat flour at high levelsIn Kyrgyzstan, prices of bread and wheat flour, which have
been steadily increasing since June 2010, rose further in April
2011 and were at record levels. National average prices of wheat
flour and bread in April 2011
were 80 percent and 33 percent,
respectively, higher than in
the same month of 2010. In
Tajikistan, the price of wheat
flour has stabilized at high levels
in recent months, and in April
was 50 percent higher than a
year earlier. Prices of other foods
such as sugar, beef, mutton,
potatoes, and onions have also
risen.
In Armenia, prices of wheat
flour (high grade), wheat flour
Table 15. CIS in Asia cereal production (million tonnes)
Wheat Coarse grains Total cereals 1
20092010
estim.2011 f'cast 2009
2010 estim.
2011 f'cast 2009
2010 estim.
2011 f'cast
Change: 2011/2010 (%)
CIS in Asia 28.7 21.2 25.8 5.8 4.0 4.9 35.2 25.9 31.4 21.2
Azerbaijan 1.8 1.3 1.4 0.6 0.6 0.6 2.4 1.9 2.1 10.5
Kazakhstan 17.0 10.0 14.5 3.3 1.9 2.7 20.6 12.2 17.5 43.4
Kyrgyzstan 1.1 0.8 0.8 0.8 0.7 0.7 1.9 1.5 1.5 0.0
Tajikistan 0.9 0.9 0.9 0.2 0.2 0.2 1.1 1.1 1.1 0.0
Turkmenistan 1.1 1.3 1.4 - 0.1 0.1 1.3 1.5 1.6 6.7
Uzbekistan 6.6 6.7 6.5 0.3 0.2 0.2 7.1 7.1 6.9 -2.8
Note: Totals computed from unrounded data, '-' means nil or negligible.1 Total cereals includes wheat, coarse grains and rice (paddy).

No. 2 n June 2011 23
Crop Prospects and Food Situation
(first grade) and bread in April 2011 were 26 percent, 28 percent
and 15 percent, respectively, higher than a year earlier. In
Azerbaijan, food prices have increased markedly since mid-
2010. Prices of wheat flour in April 2011 were 30 percent higher
than a year earlier and those of potatoes were at record levels. In
most countries of the subregion, in response to high food prices,
governments have undertaken market interventions in recent
months to stabilize prices of wheat products.
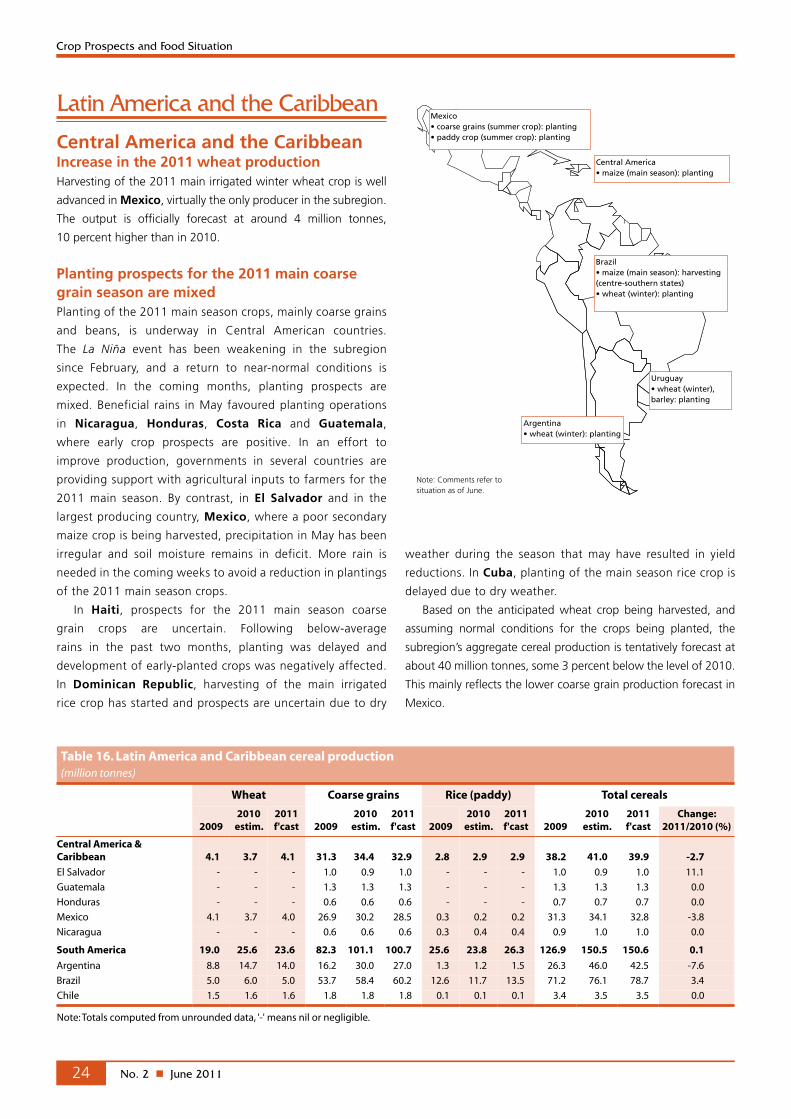
No. 2 n June 201124
Crop Prospects and Food Situation
Latin America and the Caribbean
Central America and the CaribbeanIncrease in the 2011 wheat productionHarvesting of the 2011 main irrigated winter wheat crop is well
advanced in Mexico, virtually the only producer in the subregion.
The output is officially forecast at around 4 million tonnes,
10 percent higher than in 2010.
Planting prospects for the 2011 main coarse grain season are mixed Planting of the 2011 main season crops, mainly coarse grains
and beans, is underway in Central American countries.
The La Niña event has been weakening in the subregion
since February, and a return to near-normal conditions is
expected. In the coming months, planting prospects are
mixed. Beneficial rains in May favoured planting operations
in Nicaragua, Honduras, Costa Rica and Guatemala,
where early crop prospects are positive. In an effort to
improve production, governments in several countries are
providing support with agricultural inputs to farmers for the
2011 main season. By contrast, in El Salvador and in the
largest producing country, Mexico, where a poor secondary
maize crop is being harvested, precipitation in May has been
irregular and soil moisture remains in deficit. More rain is
needed in the coming weeks to avoid a reduction in plantings
of the 2011 main season crops.
In Haiti, prospects for the 2011 main season coarse
grain crops are uncertain. Following below-average
rains in the past two months, planting was delayed and
development of early-planted crops was negatively affected.
In Dominican Republic, harvesting of the main irrigated
rice crop has started and prospects are uncertain due to dry
weather during the season that may have resulted in yield
reductions. In Cuba, planting of the main season rice crop is
delayed due to dry weather.
Based on the anticipated wheat crop being harvested, and
assuming normal conditions for the crops being planted, the
subregion’s aggregate cereal production is tentatively forecast at
about 40 million tonnes, some 3 percent below the level of 2010.
This mainly reflects the lower coarse grain production forecast in
Mexico.
Mexico• coarse grains (summer crop): planting• paddy crop (summer crop): planting
Brazil • maize (main season): harvesting (centre-southern states) • wheat (winter): planting
Argentina• wheat (winter): planting
Uruguay • wheat (winter), barley: planting
Note: Comments refer to situation as of June.
Central America• maize (main season): planting
Table 16. Latin America and Caribbean cereal production (million tonnes)
Wheat Coarse grains Rice (paddy) Total cereals
20092010
estim.2011 f'cast 2009
2010 estim.
2011 f'cast 2009
2010 estim.
2011 f'cast 2009
2010 estim.
2011 f'cast
Change: 2011/2010 (%)
Central America & Caribbean 4.1 3.7 4.1 31.3 34.4 32.9 2.8 2.9 2.9 38.2 41.0 39.9 -2.7
El Salvador - - - 1.0 0.9 1.0 - - - 1.0 0.9 1.0 11.1
Guatemala - - - 1.3 1.3 1.3 - - - 1.3 1.3 1.3 0.0
Honduras - - - 0.6 0.6 0.6 - - - 0.7 0.7 0.7 0.0
Mexico 4.1 3.7 4.0 26.9 30.2 28.5 0.3 0.2 0.2 31.3 34.1 32.8 -3.8
Nicaragua - - - 0.6 0.6 0.6 0.3 0.4 0.4 0.9 1.0 1.0 0.0
South America 19.0 25.6 23.6 82.3 101.1 100.7 25.6 23.8 26.3 126.9 150.5 150.6 0.1
Argentina 8.8 14.7 14.0 16.2 30.0 27.0 1.3 1.2 1.5 26.3 46.0 42.5 -7.6
Brazil 5.0 6.0 5.0 53.7 58.4 60.2 12.6 11.7 13.5 71.2 76.1 78.7 3.4
Chile 1.5 1.6 1.6 1.8 1.8 1.8 0.1 0.1 0.1 3.4 3.5 3.5 0.0
Note: Totals computed from unrounded data, '-' means nil or negligible.
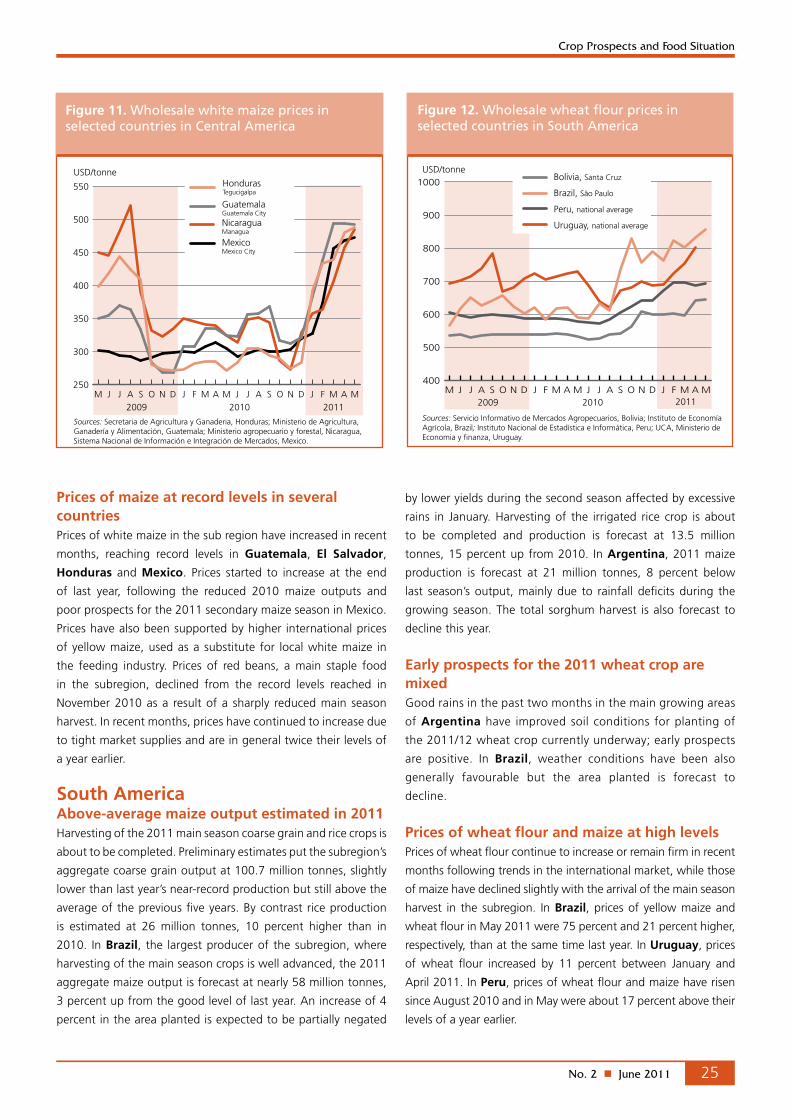
No. 2 n June 2011 25
Crop Prospects and Food Situation
Prices of maize at record levels in several countriesPrices of white maize in the sub region have increased in recent
months, reaching record levels in Guatemala, El Salvador,
Honduras and Mexico. Prices started to increase at the end
of last year, following the reduced 2010 maize outputs and
poor prospects for the 2011 secondary maize season in Mexico.
Prices have also been supported by higher international prices
of yellow maize, used as a substitute for local white maize in
the feeding industry. Prices of red beans, a main staple food
in the subregion, declined from the record levels reached in
November 2010 as a result of a sharply reduced main season
harvest. In recent months, prices have continued to increase due
to tight market supplies and are in general twice their levels of
a year earlier.
South AmericaAbove-average maize output estimated in 2011Harvesting of the 2011 main season coarse grain and rice crops is
about to be completed. Preliminary estimates put the subregion’s
aggregate coarse grain output at 100.7 million tonnes, slightly
lower than last year’s near-record production but still above the
average of the previous five years. By contrast rice production
is estimated at 26 million tonnes, 10 percent higher than in
2010. In Brazil, the largest producer of the subregion, where
harvesting of the main season crops is well advanced, the 2011
aggregate maize output is forecast at nearly 58 million tonnes,
3 percent up from the good level of last year. An increase of 4
percent in the area planted is expected to be partially negated
by lower yields during the second season affected by excessive
rains in January. Harvesting of the irrigated rice crop is about
to be completed and production is forecast at 13.5 million
tonnes, 15 percent up from 2010. In Argentina, 2011 maize
production is forecast at 21 million tonnes, 8 percent below
last season’s output, mainly due to rainfall deficits during the
growing season. The total sorghum harvest is also forecast to
decline this year.
Early prospects for the 2011 wheat crop are mixedGood rains in the past two months in the main growing areas
of Argentina have improved soil conditions for planting of
the 2011/12 wheat crop currently underway; early prospects
are positive. In Brazil, weather conditions have been also
generally favourable but the area planted is forecast to
decline.
Prices of wheat flour and maize at high levels Prices of wheat flour continue to increase or remain firm in recent
months following trends in the international market, while those
of maize have declined slightly with the arrival of the main season
harvest in the subregion. In Brazil, prices of yellow maize and
wheat flour in May 2011 were 75 percent and 21 percent higher,
respectively, than at the same time last year. In Uruguay, prices
of wheat flour increased by 11 percent between January and
April 2011. In Peru, prices of wheat flour and maize have risen
since August 2010 and in May were about 17 percent above their
levels of a year earlier.
2009 2010
250
300
350
400
450
500
550
MAMFJDNOSAJJMAMFJDNOSAJJM2011
Nicaragua Managua
Honduras Tegucigalpa
Guatemala Guatemala City
Mexico Mexico City
USD/tonne
Figure 11. Wholesale white maize prices in selected countries in Central America
Sources: Secretaria de Agricultura y Ganaderia, Honduras; Ministerio de Agricultura, Ganadería y Alimentación, Guatemala; Ministerio agropecuario y forestal, Nicaragua, Sistema Nacional de Información e Integración de Mercados, Mexico.
400
500
600
700
800
900
1000
MAMFJDNOSAJJMAMFJDNOSAJJM2010 20112009
USD/tonne
Figure 12. Wholesale wheat flour prices in selected countries in South America
Sources: Servicio Informativo de Mercados Agropecuarios, Bolivia; Instituto de Economía Agrícola, Brazil; Instituto Nacional de Estadística e Informática, Peru; UCA, Ministerio de Economia y finanza, Uruguay.
Brazil, São Paulo
Uruguay, national average
Peru, national average
Bolivia, Santa Cruz
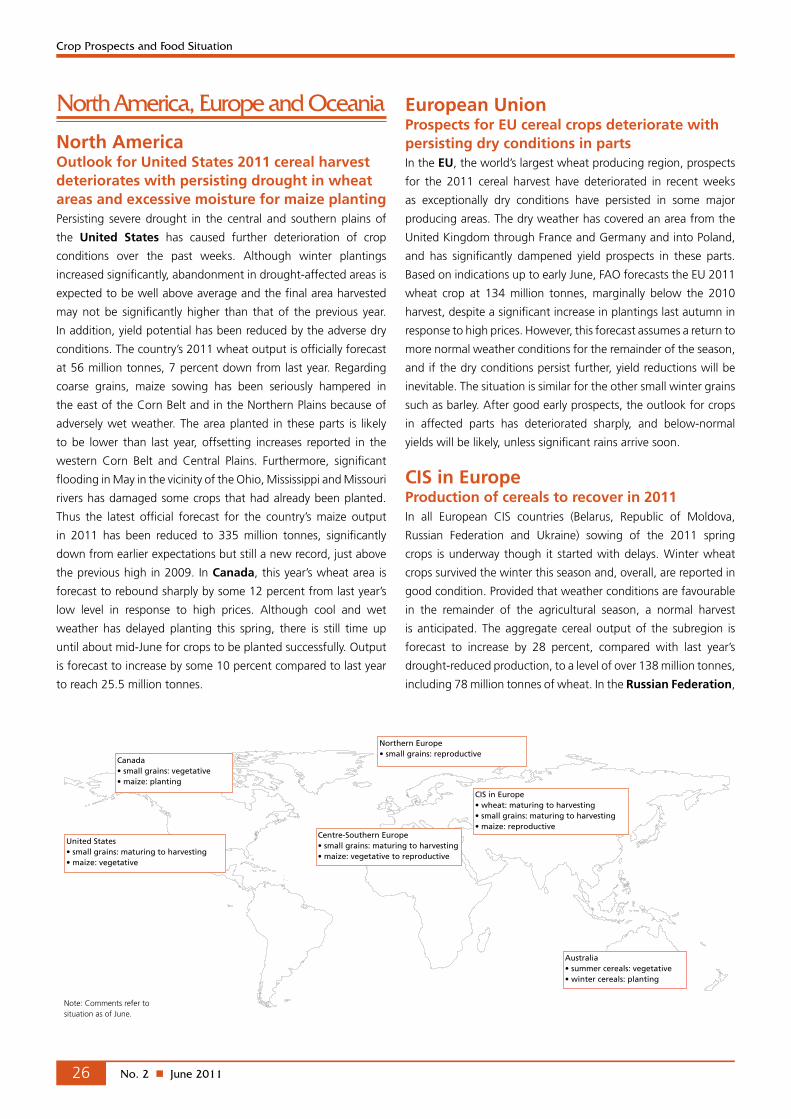
No. 2 n June 201126
Crop Prospects and Food Situation
European UnionProspects for EU cereal crops deteriorate with persisting dry conditions in partsIn the EU, the world’s largest wheat producing region, prospects
for the 2011 cereal harvest have deteriorated in recent weeks
as exceptionally dry conditions have persisted in some major
producing areas. The dry weather has covered an area from the
United Kingdom through France and Germany and into Poland,
and has significantly dampened yield prospects in these parts.
Based on indications up to early June, FAO forecasts the EU 2011
wheat crop at 134 million tonnes, marginally below the 2010
harvest, despite a significant increase in plantings last autumn in
response to high prices. However, this forecast assumes a return to
more normal weather conditions for the remainder of the season,
and if the dry conditions persist further, yield reductions will be
inevitable. The situation is similar for the other small winter grains
such as barley. After good early prospects, the outlook for crops
in affected parts has deteriorated sharply, and below-normal
yields will be likely, unless significant rains arrive soon.
CIS in EuropeProduction of cereals to recover in 2011In all European CIS countries (Belarus, Republic of Moldova,
Russian Federation and Ukraine) sowing of the 2011 spring
crops is underway though it started with delays. Winter wheat
crops survived the winter this season and, overall, are reported in
good condition. Provided that weather conditions are favourable
in the remainder of the agricultural season, a normal harvest
is anticipated. The aggregate cereal output of the subregion is
forecast to increase by 28 percent, compared with last year’s
drought-reduced production, to a level of over 138 million tonnes,
including 78 million tonnes of wheat. In the Russian Federation,
North America, Europe and Oceania
North AmericaOutlook for United States 2011 cereal harvest deteriorates with persisting drought in wheat areas and excessive moisture for maize plantingPersisting severe drought in the central and southern plains of
the United States has caused further deterioration of crop
conditions over the past weeks. Although winter plantings
increased significantly, abandonment in drought-affected areas is
expected to be well above average and the final area harvested
may not be significantly higher than that of the previous year.
In addition, yield potential has been reduced by the adverse dry
conditions. The country’s 2011 wheat output is officially forecast
at 56 million tonnes, 7 percent down from last year. Regarding
coarse grains, maize sowing has been seriously hampered in
the east of the Corn Belt and in the Northern Plains because of
adversely wet weather. The area planted in these parts is likely
to be lower than last year, offsetting increases reported in the
western Corn Belt and Central Plains. Furthermore, significant
flooding in May in the vicinity of the Ohio, Mississippi and Missouri
rivers has damaged some crops that had already been planted.
Thus the latest official forecast for the country’s maize output
in 2011 has been reduced to 335 million tonnes, significantly
down from earlier expectations but still a new record, just above
the previous high in 2009. In Canada, this year’s wheat area is
forecast to rebound sharply by some 12 percent from last year’s
low level in response to high prices. Although cool and wet
weather has delayed planting this spring, there is still time up
until about mid-June for crops to be planted successfully. Output
is forecast to increase by some 10 percent compared to last year
to reach 25.5 million tonnes.
Northern Europe• small grains: reproductive
Centre-Southern Europe• small grains: maturing to harvesting• maize: vegetative to reproductive
CIS in Europe• wheat: maturing to harvesting• small grains: maturing to harvesting• maize: reproductive
Note: Comments refer to situation as of June.
Australia• summer cereals: vegetative• winter cereals: planting
Canada• small grains: vegetative• maize: planting
United States• small grains: maturing to harvesting• maize: vegetative

No. 2 n June 2011 27
Crop Prospects and Food Situation
flour and bread in April 2011 were 20 and 31 percent,
respectively, higher compared with the same period a year
ago and those of potatoes were 112 percent higher than
in April 2010 because low supplies of potatoes forced the
country to import large quantities of the commodity. In
Ukraine, from December 2010 until April, wholesale prices
on wheat and wheat flour increased by 14 and 10 percent,
respectively, pushing up retail prices of bread. In Belarus,
potato prices in April were up by 77 percent from a year
earlier. In the Republic of Moldova, prices of bread rose by
11 percent from July 2010 to April 2011.
Table 17. North America, Europe and Oceania cereal production (million tonnes)
Wheat Coarse grains Rice (paddy) Total cereals
20092010
estim.2011 f'cast 2009
2010 estim.
2011 f'cast 2009
2010 estim.
2011 f'cast 2009
2010 estim.
2011 f'cast
Change: 2011/2010 (%)
North America 87.2 83.3 81.5 371.7 352.7 372.3 10.0 11.0 9.0 468.9 447.0 462.9 3.6
Canada 26.8 23.2 25.5 22.6 22.2 23.5 - - - 49.5 45.3 49.0 8.2
United States 60.4 60.1 56.0 349.0 330.6 348.8 10.0 11.0 9.0 419.4 401.7 413.8 3.0
Europe 228.1 202.2 215.9 232.4 198.7 217.0 4.3 4.4 4.5 464.8 405.3 437.3 7.9
Belarus 1.6 1.7 1.8 5.7 5.2 6.4 - - - 7.3 6.9 8.2 18.8
EU 138.5 136.8 134.0 155.9 140.3 145.1 3.2 3.1 3.2 297.7 280.2 282.3 0.7
Russian Federation 61.7 41.5 55.0 33.4 17.5 27.4 0.9 1.1 1.1 96.1 60.1 83.5 38.9
Serbia 2.1 1.6 1.6 6.9 7.6 7.6 - - - 9.0 9.2 9.2 0.0
Ukraine 20.8 17.2 20.2 24.2 21.5 23.7 0.1 0.2 0.2 45.1 38.9 44.0 13.1
Oceania 22.2 26.6 24.6 13.3 14.1 12.9 0.1 0.2 0.8 35.6 41.0 38.3 -6.6
Australia 21.9 26.3 24.3 12.8 13.5 12.3 0.1 0.2 0.8 34.8 40.1 37.4 -6.7
Note: Totals computed from unrounded data, '-' means nil or negligible.
0.2
0.3
0.4
0.5
0.6
0.7
0.8
0.9
AMFJDNOSAJJMAMFJDNOSAJJMA2010 20112009
USD/kg
Figure 13. Retail wheat flour prices in Belarus,Russian Federation and Republic of Moldova
Sources: National Statistical Committee of the Republic of Belarus; ACSA, Rep. of Moldova; Ministry of Agriculture of the Russian Federation.
Rep. of Moldova (Chisinau)
Russian Federation (national average)
Belarus (national average)
winter crops are reported to be in generally good condition. The
target area for spring cereals in 2011 has been set at an above-
normal level of 30 million hectares, to compensate for reductions
in the area under 2011 winter cereals, which decreased to
15 million hectares due to insufficient soil moisture following
severe drought last year. Early forecasts of the 2011 aggregate
cereal production (winter and spring crops) indicate a cereal
harvest of 83.5 million tonnes, 39 percent higher than last year’s
drought-reduced crop. This forecast assumes normal weather
during the remainder of the cropping season. The Government
has just announced that as of 1 July 2011 the ban on the cereal
exports imposed in August 2010 will be lifted.
In Ukraine, growing conditions for the winter and the recently
planted spring crops, much improved in May due to favourable
rains. The 2011 cereal crops production is expected to recover
from the reduced level of last year affected by dry weather
during summer. Early forecasts indicate a 2011 aggregate
cereal production (winter and spring crops) of 44 million tonnes
including 20.2 million tonnes of wheat. Grain export quotas will
be replaced with export duties of 9 percent for wheat, 14 percent
for barley and 12 percent for maize. The duties will be effective
from June to December 2011.
In the other two European CIS countries, Belarus and the
Republic of Moldova, crop conditions are reported to be
satisfactory and early forecasts indicate above average production
this year.
High cereal and potato pricesA steady increase of staple food prices has been observed
in countries of the subregion since July 2010, reflecting the
sharp decline in production in the major exporting countries.
In the Russian Federation, national average prices of wheat

No. 2 n June 201128
Crop Prospects and Food Situation
OceaniaFavourable prospects for 2011 winter grain crops in AustraliaIn Australia, planting of the 2011 winter grain prospects was
well underway as of late May and favourable early prospects
continue to point to another good crop. High price prospects are
an incentive to producers to keep a relatively large area of land
in wheat this year and favourable planting weather should allow
intentions to be realized. However, the harvest outcome will still
depend greatly on weather for the remainder of the season. This
is especially true in the west of the country where some recent
rainfall has been beneficial for planting but soils remain very dry
after last year’s drought so good follow-up rains will be essential
to ensure a satisfactory crop. In eastern areas, the situation is less
critical as high subsoil moisture levels following substantial rains
last year, offer a buffer against drier weather later in the season.
Crop Prospects and Food Situation
No. 2 n June 2011 29
Statistical appendix
Table. A1 - Global cereal supply and demand indicators ............................................................................................ .30
Table. A2 - World cereal stocks.................................................................................................................................. .31
Table. A3 - Selected international prices of wheat and coarse grains .......................................................................... .32
Table. A4 - Estimated cereal import requirements of Low-Income Food-Deficit Countries 2010/11 or 2011 ............... .33
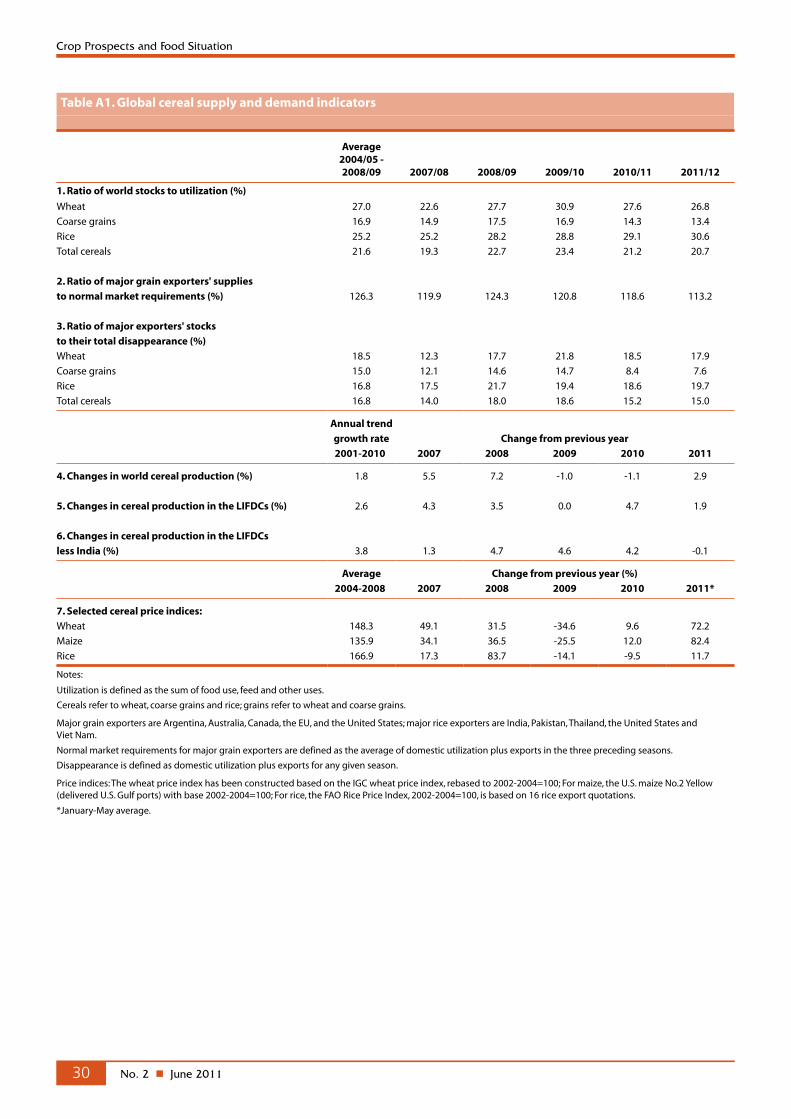
No. 2 n June 201130
Crop Prospects and Food Situation
Table A1. Global cereal supply and demand indicators
Average 2004/05 - 2008/09 2007/08 2008/09 2009/10 2010/11 2011/12
1. Ratio of world stocks to utilization (%)
Wheat 27.0 22.6 27.7 30.9 27.6 26.8
Coarse grains 16.9 14.9 17.5 16.9 14.3 13.4
Rice 25.2 25.2 28.2 28.8 29.1 30.6
Total cereals 21.6 19.3 22.7 23.4 21.2 20.7
2. Ratio of major grain exporters' supplies
to normal market requirements (%) 126.3 119.9 124.3 120.8 118.6 113.2
3. Ratio of major exporters' stocks
to their total disappearance (%)
Wheat 18.5 12.3 17.7 21.8 18.5 17.9
Coarse grains 15.0 12.1 14.6 14.7 8.4 7.6
Rice 16.8 17.5 21.7 19.4 18.6 19.7
Total cereals 16.8 14.0 18.0 18.6 15.2 15.0
Annual trend
growth rate Change from previous year
2001-2010 2007 2008 2009 2010 2011
4. Changes in world cereal production (%) 1.8 5.5 7.2 -1.0 -1.1 2.9
5. Changes in cereal production in the LIFDCs (%) 2.6 4.3 3.5 0.0 4.7 1.9
6. Changes in cereal production in the LIFDCs
less India (%) 3.8 1.3 4.7 4.6 4.2 -0.1
Average Change from previous year (%)
2004-2008 2007 2008 2009 2010 2011*
7. Selected cereal price indices:
Wheat 148.3 49.1 31.5 -34.6 9.6 72.2
Maize 135.9 34.1 36.5 -25.5 12.0 82.4
Rice 166.9 17.3 83.7 -14.1 -9.5 11.7
Notes:
Utilization is defined as the sum of food use, feed and other uses.
Cereals refer to wheat, coarse grains and rice; grains refer to wheat and coarse grains.
Major grain exporters are Argentina, Australia, Canada, the EU, and the United States; major rice exporters are India, Pakistan, Thailand, the United States and Viet Nam.
Normal market requirements for major grain exporters are defined as the average of domestic utilization plus exports in the three preceding seasons.
Disappearance is defined as domestic utilization plus exports for any given season.
Price indices: The wheat price index has been constructed based on the IGC wheat price index, rebased to 2002-2004=100; For maize, the U.S. maize No.2 Yellow (delivered U.S. Gulf ports) with base 2002-2004=100; For rice, the FAO Rice Price Index, 2002-2004=100, is based on 16 rice export quotations.
*January-May average.

No. 2 n June 2011 31
Crop Prospects and Food Situation
Table A2. World cereal stocks1 (million tonnes)
2007 2008 2009 20102011
estimate2012
forecast
TOTAL CEREALS 429.5 422.7 506.4 533.6 489.1 486.2
Wheat 164.8 146.1 182.5 206.9 187.0 181.3
held by:
- main exporters2 40.0 30.3 47.9 55.9 50.8 47.7
- others 124.8 115.8 134.6 151.0 136.2 133.6
Coarse grains 159.4 164.6 197.3 194.4 165.4 161.8
held by:
- main exporters2 60.0 69.8 81.3 82.6 49.0 43.3
- others 99.4 94.8 116.0 111.8 116.4 118.5
Rice (milled basis) 105.2 111.9 126.6 132.3 136.7 143.1
held by:
- main exporters2 23.1 26.5 33.4 30.1 29.2 31.6
- others 82.1 85.4 93.2 102.2 107.5 111.5
Developed countries 130.8 123.3 168.3 182.2 125.5 117.2
Australia 6.3 5.4 5.9 5.9 9.2 8.8
Canada 10.5 8.5 13.0 13.6 9.2 8.8
European Union3 30.0 25.8 41.9 43.5 31.3 28.0
Japan 5.3 4.8 4.6 4.8 4.9 4.9
Russian Federation 6.5 7.3 16.7 16.1 3.5 4.1
South Africa 2.7 1.8 2.5 3.2 3.9 3.2
Ukraine 4.2 4.5 3.9 3.4 5.5 6.2
United States 49.9 54.3 65.9 75.9 46.1 40.8
Developing countries 298.7 299.3 338.1 351.4 363.6 369.1
Asia 249.2 253.5 284.0 298.6 307.1 313.8
China 158.0 155.8 172.1 183.5 193.7 198.2
India 28.5 37.0 45.4 40.3 40.7 43.2
Indonesia 5.2 6.1 7.4 8.8 10.6 11.1
Iran (Islamic Republic of ) 3.5 3.0 5.5 5.4 4.0 3.0
Korea, Republic of 2.2 3.0 2.9 4.1 4.1 4.4
Pakistan 2.4 3.2 3.4 4.0 2.9 2.8
Philippines 2.7 3.2 4.2 4.7 3.8 3.8
Syrian Arab Republic 3.0 1.9 1.6 2.4 1.9 1.6
Turkey 7.1 5.2 4.1 4.5 4.3 4.5
Africa 29.1 24.1 27.3 31.8 33.2 31.1
Algeria 3.8 3.6 3.0 3.9 3.6 3.2
Egypt 4.3 3.3 5.6 7.1 6.7 6.3
Ethiopia 0.7 1.0 1.4 1.9 1.8 1.2
Morocco 4.0 2.1 1.6 3.0 3.4 3.7
Nigeria 2.1 1.0 1.5 1.6 1.6 1.6
Tunisia 1.2 2.0 1.6 1.8 1.3 1.1
Central America 5.2 5.4 5.9 4.5 5.5 5.0
Mexico 3.0 3.2 4.1 2.7 3.7 3.3
South America 14.7 16.0 20.6 16.2 17.4 18.8
Argentina 5.3 7.7 4.2 1.6 6.3 6.7
Brazil 3.6 2.3 9.9 8.5 5.2 6.2
Note: Based on official and unofficial estimates. Totals computed from unrounded data, 1 Stocks data are based on an aggregate of carryovers at the end of national crop years and do not represent world stock levels at any point in time.2 The major wheat and coarse grains exporters are Argentina, Australia, Canada, the EU and the United States. The major rice exporters are India, Pakistan, Thailand, the United States and Viet Nam.3 Up to 2007 25 member countries, from 2008 27 member countries.
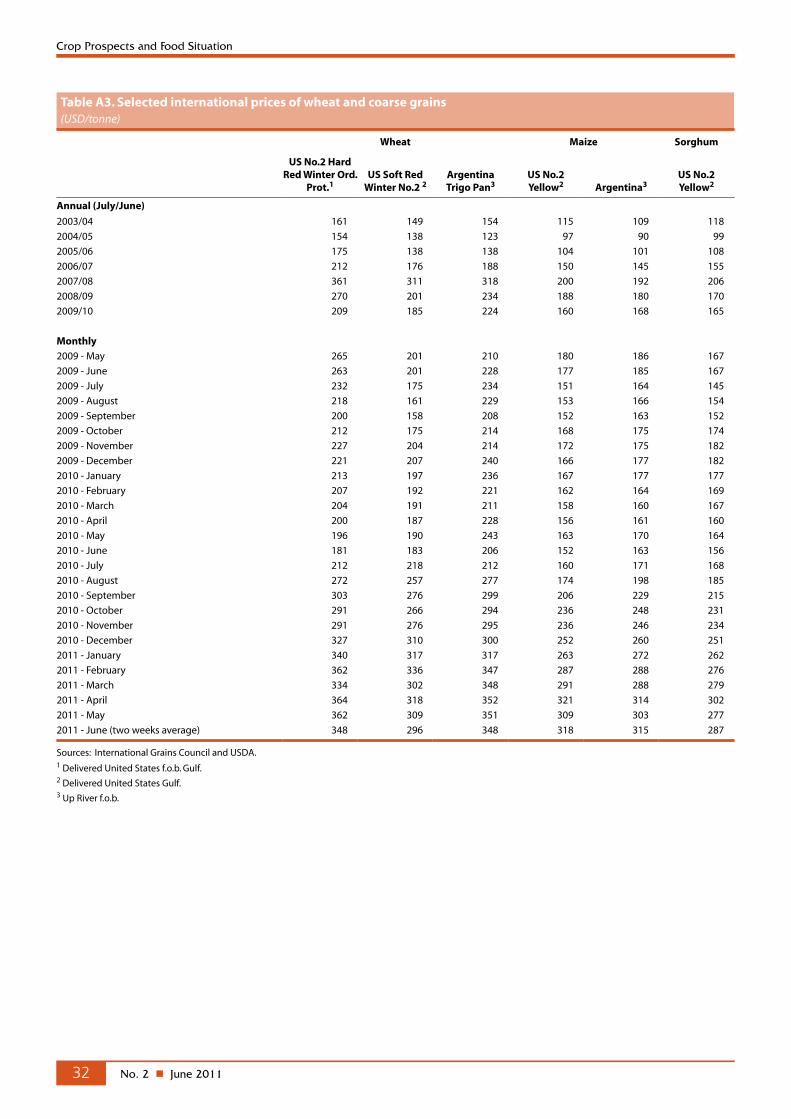
No. 2 n June 201132
Crop Prospects and Food Situation
Table A3. Selected international prices of wheat and coarse grains(USD/tonne)
Wheat Maize Sorghum
US No.2 Hard Red Winter Ord.
Prot.1 US Soft Red
Winter No.2 2 Argentina Trigo Pan3
US No.2 Yellow2 Argentina3
US No.2 Yellow2
Annual (July/June)
2003/04 161 149 154 115 109 118
2004/05 154 138 123 97 90 99
2005/06 175 138 138 104 101 108
2006/07 212 176 188 150 145 155
2007/08 361 311 318 200 192 206
2008/09 270 201 234 188 180 170
2009/10 209 185 224 160 168 165
Monthly
2009 - May 265 201 210 180 186 167
2009 - June 263 201 228 177 185 167
2009 - July 232 175 234 151 164 145
2009 - August 218 161 229 153 166 154
2009 - September 200 158 208 152 163 152
2009 - October 212 175 214 168 175 174
2009 - November 227 204 214 172 175 182
2009 - December 221 207 240 166 177 182
2010 - January 213 197 236 167 177 177
2010 - February 207 192 221 162 164 169
2010 - March 204 191 211 158 160 167
2010 - April 200 187 228 156 161 160
2010 - May 196 190 243 163 170 164
2010 - June 181 183 206 152 163 156
2010 - July 212 218 212 160 171 168
2010 - August 272 257 277 174 198 185
2010 - September 303 276 299 206 229 215
2010 - October 291 266 294 236 248 231
2010 - November 291 276 295 236 246 234
2010 - December 327 310 300 252 260 251
2011 - January 340 317 317 263 272 262
2011 - February 362 336 347 287 288 276
2011 - March 334 302 348 291 288 279
2011 - April 364 318 352 321 314 302
2011 - May 362 309 351 309 303 277
2011 - June (two weeks average) 348 296 348 318 315 287
Sources: International Grains Council and USDA.1 Delivered United States f.o.b. Gulf.2 Delivered United States Gulf.3 Up River f.o.b.

No. 2 n June 2011 33
Crop Prospects and Food Situation
Table A4a. Cereal import requirements of Low-Income Food-Deficit Countries1 , 2010/11 or 2011 estimates(thousand tonnes)
2009/10 or 2010 2010/11 or 2011
Actual imports Import position2
Marketing
yearCommercial purchases Food aid
Total commercial
and aid
Total import requirements (excl. re-exports)
Total commercial
and aid
Food aid allocated,
committed or shipped
Commercial purchases
AFRICA 37 320.4 3 429.6 40 750.0 38 043.7 17 092.5 791.7 16 300.8
North Africa 15 652.0 0.0 15 652.0 15 971.0 11 605.6 0.0 11 605.6
Egypt July/June 15 652.0 0.0 15 652.0 15 971.0 11 605.6 0.0 11 605.6
Eastern Africa 6 191.1 2 366.9 8 558.0 6 304.0 1 582.0 349.8 1 232.2
Burundi Jan./Dec. 103.5 31.7 135.2 147.0 13.7 1.1 12.6
Comoros Jan./Dec. 53.2 0.0 53.2 53.0 7.6 0.0 7.6
Djibouti Jan./Dec. 80.8 10.3 91.1 92.0 21.2 1.8 19.4
Eritrea Jan./Dec. 322.0 0.0 322.0 337.0 0.0 0.0 0.0
Ethiopia Jan./Dec. 262.0 1 313.3 1 575.3 831.0 100.3 100.3 0.0
Kenya Oct./Sept. 2 401.3 169.4 2 570.7 1 558.0 402.1 65.8 336.3
Rwanda Jan./Dec. 156.0 1.8 157.8 110.0 5.6 5.6 0.0
Somalia Aug./July 212.3 174.9 387.2 428.0 9.0 9.0 0.0
Sudan Nov./Oct. 1 711.3 612.4 2 323.7 2 020.0 533.5 135.6 397.9
Uganda Jan./Dec. 148.7 38.3 187.0 265.0 7.7 7.7 0.0
United Rep. of Tanzania June/May 740.0 14.8 754.8 610.0 481.3 22.9 458.4
Southern Africa 1 781.4 393.0 2 174.4 1 707.0 1 410.9 233.9 1 177.0
Lesotho April/March 228.3 3.1 231.4 209.0 209.0 0.5 208.5
Madagascar April/March 214.9 20.5 235.4 143.0 97.0 16.2 80.8
Malawi April/March 93.9 44.8 138.7 107.0 81.6 24.4 57.2
Mozambique April/March 814.2 137.8 952.0 852.0 663.7 149.5 514.2
Zambia May/April 39.0 1.6 40.6 30.0 18.8 2.0 16.8
Zimbabwe April/March 391.1 185.2 576.3 366.0 340.8 41.3 299.5
Western Africa 12 125.1 464.5 12 589.6 12 245.7 2 114.5 165.0 1 949.5
Coastal Countries 9 215.8 89.5 9 305.3 9 189.4 1 482.1 28.0 1 454.1
Benin Jan./Dec. 80.7 12.6 93.3 86.0 30.0 1.6 28.4
Côte d'Ivoire Jan./Dec. 1 461.4 21.3 1 482.7 1 340.0 240.6 1.9 238.7
Ghana Jan./Dec. 739.2 1.0 740.2 780.2 143.0 17.0 126.0
Guinea Jan./Dec. 471.9 4.1 476.0 487.0 83.4 1.4 82.0
Liberia Jan./Dec. 311.3 27.5 338.8 345.7 32.6 4.3 28.3
Nigeria Jan./Dec. 5 920.0 0.0 5 920.0 5 920.0 924.5 0.0 924.5
Sierra Leone Jan./Dec. 144.8 21.2 166.0 129.0 9.3 1.8 7.5
Togo Jan./Dec. 86.5 1.8 88.3 101.5 18.7 0.0 18.7
Sahelian Countries 2 909.3 375.0 3 284.3 3 056.3 632.4 137.0 495.4
Burkina faso Nov./Oct. 346.3 35.3 381.6 330.0 9.8 4.8 5.0
Chad Nov./Oct. 136.9 103.9 240.8 203.5 106.1 79.4 26.7
Gambia Nov./Oct. 160.7 18.3 179.0 164.0 28.8 0.4 28.4
Guinea-Bissau Nov./Oct. 116.5 7.3 123.8 124.0 10.4 2.8 7.6
Mali Nov./Oct. 211.3 13.9 225.2 207.1 30.6 0.0 30.6
Mauritania Nov./Oct. 449.1 39.1 488.2 504.0 163.1 14.9 148.2
Niger Nov./Oct. 355.0 136.5 491.5 377.7 42.6 31.6 11.0
Senegal Nov./Oct. 1 133.5 20.7 1 154.2 1 146.0 241.0 3.1 237.9
Central Africa 1 570.8 205.2 1 776.0 1 816.0 379.5 43.0 336.5
Cameroon Jan./Dec. 614.5 10.0 624.5 672.0 199.3 3.0 196.3
Cent.Afr.Rep. Jan./Dec. 47.1 8.3 55.4 62.0 8.7 5.1 3.6
Congo Jan./Dec. 342.0 7.2 349.2 349.0 32.8 3.6 29.2
Dem.Rep.of the Congo Jan./Dec. 552.4 176.4 728.8 715.0 137.8 31.3 106.5
Sao Tome and Principe Jan./Dec. 14.8 3.3 18.1 18.0 0.9 0.0 0.9
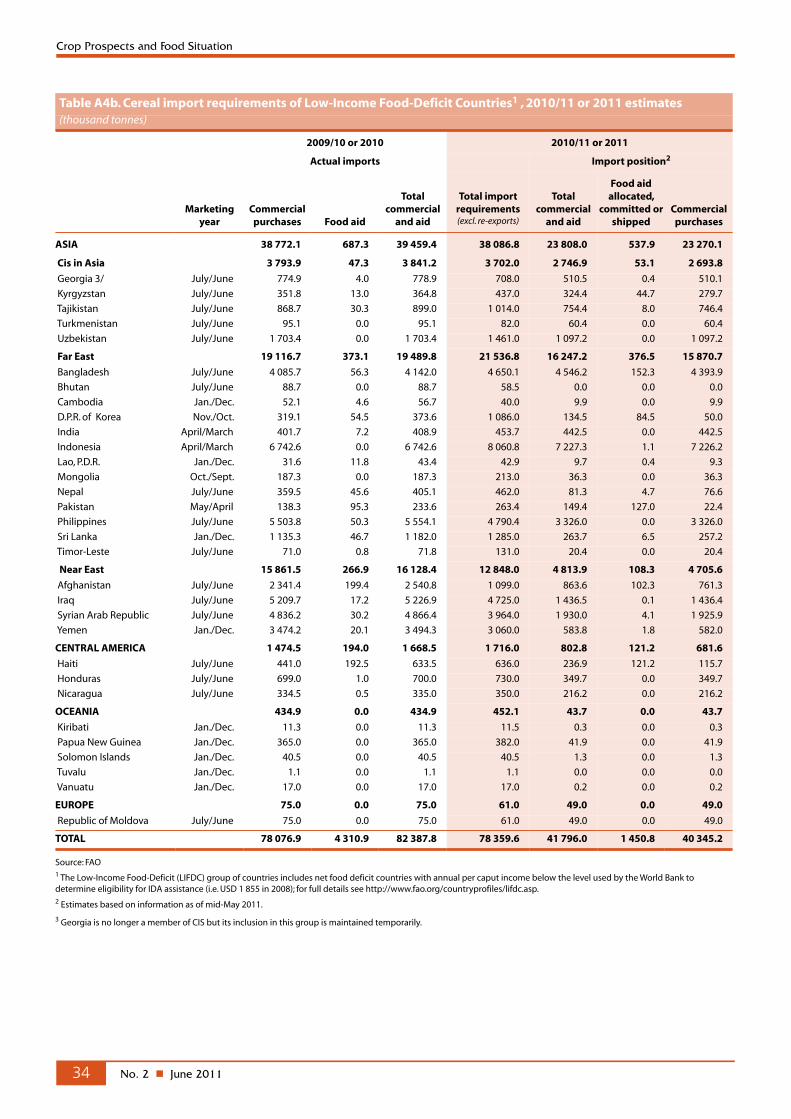
No. 2 n June 201134
Crop Prospects and Food Situation
Table A4b. Cereal import requirements of Low-Income Food-Deficit Countries1 , 2010/11 or 2011 estimates(thousand tonnes)
2009/10 or 2010 2010/11 or 2011
Actual imports Import position2
Marketing
yearCommercial purchases Food aid
Total commercial
and aid
Total import requirements (excl. re-exports)
Total commercial
and aid
Food aid allocated,
committed or shipped
Commercial purchases
ASIA 38 772.1 687.3 39 459.4 38 086.8 23 808.0 537.9 23 270.1
Cis in Asia 3 793.9 47.3 3 841.2 3 702.0 2 746.9 53.1 2 693.8
Georgia 3/ July/June 774.9 4.0 778.9 708.0 510.5 0.4 510.1
Kyrgyzstan July/June 351.8 13.0 364.8 437.0 324.4 44.7 279.7
Tajikistan July/June 868.7 30.3 899.0 1 014.0 754.4 8.0 746.4
Turkmenistan July/June 95.1 0.0 95.1 82.0 60.4 0.0 60.4
Uzbekistan July/June 1 703.4 0.0 1 703.4 1 461.0 1 097.2 0.0 1 097.2
Far East 19 116.7 373.1 19 489.8 21 536.8 16 247.2 376.5 15 870.7
Bangladesh July/June 4 085.7 56.3 4 142.0 4 650.1 4 546.2 152.3 4 393.9
Bhutan July/June 88.7 0.0 88.7 58.5 0.0 0.0 0.0
Cambodia Jan./Dec. 52.1 4.6 56.7 40.0 9.9 0.0 9.9
D.P.R. of Korea Nov./Oct. 319.1 54.5 373.6 1 086.0 134.5 84.5 50.0
India April/March 401.7 7.2 408.9 453.7 442.5 0.0 442.5
Indonesia April/March 6 742.6 0.0 6 742.6 8 060.8 7 227.3 1.1 7 226.2
Lao, P.D.R. Jan./Dec. 31.6 11.8 43.4 42.9 9.7 0.4 9.3
Mongolia Oct./Sept. 187.3 0.0 187.3 213.0 36.3 0.0 36.3
Nepal July/June 359.5 45.6 405.1 462.0 81.3 4.7 76.6
Pakistan May/April 138.3 95.3 233.6 263.4 149.4 127.0 22.4
Philippines July/June 5 503.8 50.3 5 554.1 4 790.4 3 326.0 0.0 3 326.0
Sri Lanka Jan./Dec. 1 135.3 46.7 1 182.0 1 285.0 263.7 6.5 257.2
Timor-Leste July/June 71.0 0.8 71.8 131.0 20.4 0.0 20.4
Near East 15 861.5 266.9 16 128.4 12 848.0 4 813.9 108.3 4 705.6
Afghanistan July/June 2 341.4 199.4 2 540.8 1 099.0 863.6 102.3 761.3
Iraq July/June 5 209.7 17.2 5 226.9 4 725.0 1 436.5 0.1 1 436.4
Syrian Arab Republic July/June 4 836.2 30.2 4 866.4 3 964.0 1 930.0 4.1 1 925.9
Yemen Jan./Dec. 3 474.2 20.1 3 494.3 3 060.0 583.8 1.8 582.0
CENTRAL AMERICA 1 474.5 194.0 1 668.5 1 716.0 802.8 121.2 681.6
Haiti July/June 441.0 192.5 633.5 636.0 236.9 121.2 115.7
Honduras July/June 699.0 1.0 700.0 730.0 349.7 0.0 349.7
Nicaragua July/June 334.5 0.5 335.0 350.0 216.2 0.0 216.2
OCEANIA 434.9 0.0 434.9 452.1 43.7 0.0 43.7
Kiribati Jan./Dec. 11.3 0.0 11.3 11.5 0.3 0.0 0.3
Papua New Guinea Jan./Dec. 365.0 0.0 365.0 382.0 41.9 0.0 41.9
Solomon Islands Jan./Dec. 40.5 0.0 40.5 40.5 1.3 0.0 1.3
Tuvalu Jan./Dec. 1.1 0.0 1.1 1.1 0.0 0.0 0.0
Vanuatu Jan./Dec. 17.0 0.0 17.0 17.0 0.2 0.0 0.2
EUROPE 75.0 0.0 75.0 61.0 49.0 0.0 49.0
Republic of Moldova July/June 75.0 0.0 75.0 61.0 49.0 0.0 49.0
TOTAL 78 076.9 4 310.9 82 387.8 78 359.6 41 796.0 1 450.8 40 345.2
Source: FAO1 The Low-Income Food-Deficit (LIFDC) group of countries includes net food deficit countries with annual per caput income below the level used by the World Bank to determine eligibility for IDA assistance (i.e. USD 1 855 in 2008); for full details see http://www.fao.org/countryprofiles/lifdc.asp.2 Estimates based on information as of mid-May 2011.
3 Georgia is no longer a member of CIS but its inclusion in this group is maintained temporarily.

Enquiries may be directed to:
Global Information and Early Warning System
Trade and Markets Division (EST)
Food and Agriculture Organization of the United Nations
Via delle Terme di Caracalla
00153 Rome - Italy
Direct Facsimile: 0039-06-5705-4495,
E-mail: [email protected]
Disclaimer
This report is prepared by the FAO’s Global nformation and Early Warning Service,
with information from official and unofficial sources. None of the information in
this report should be regarded as statements of governmental views.
Furthermore, the designations employed and the presentation of material in this
report do not imply the expression of any opinion whatsoever on the part of the
Food and Agriculture Organization of the United Nations concerning the legal
status of any country, territory, city or area or of its authorities, or concerning the
delimitation of its frontiers or boundaries.
continuously monitors crop prospects and food security situation at global, regional, national and sub-national levels and warns of impending
food difficulties and emergencies. Established in the wake of the world food crisis of the early 1970’s, GIEWS maintains a unique database
on all aspects of food supply and demand for every country of the world. The System regularly provides policy makers and the international
community with up-to-date information so that timely interventions can be planned and suffering avoided.
The Global Information and Early Warning System on Food and AgricultureGIEWS
Crop Prospects and Food Situation is published by the Trade and Markets Division of FAO under the Global Information and Early Warning System (GIEWS). It is published four times a year and focuses on developments affecting the food situation of developing countries and the Low-Income Food-Deficit Countries (LIFDCs) in particular. The report provides a review of the food situation by geographic region, a section dedicated to the LIFDCs and a list of countries requiring external assistance for food. It also includes a global cereal supply and demand overview to complement the biannual analysis in the Food Outlook publication. Crop Prospects and Food Situation is available in English, French, Spanish and Chinese in print as well as electronic format.
Crop Prospects and Food Situation and other GIEWS reports are available on the internet as part of the FAO world wide web (http:/www.fao.org/) at the following URL address: http:/www.fao.org/giews/. In addition, GIEWS Special Reports and Special Alerts, when published, can be received by e-mail through automatic mailing lislts: subscription information is available at http:/www.fao.org/giews/english/listserv.htm.
This report is based on information available up to mid-June 2011.