world economic situation and prospects 2011
DESCRIPTION
The publication predicts weaker global growth in 2011 and 2012 as the recovery has lost momentum since the middle of 2010. World gross product is forecast to expand by 3.1 per cent in 2011 and 3.5 per cent in 2012, following estimated growth of 3.6 per cent in 2010. The report emphasizes that the outlook remains uncertain, surrounded by serious downside risks. It further indicates that, in the short run, more fiscal stimulus will be needed to reinvigorate the global recovery, but that it will need to be better coordinated with monetary policies and reoriented to provide stronger support to employment generation.TRANSCRIPT

Printed at the United Nations, New York
10-61546—December 2010— 4,270
USD 30
ISBN 978-92-1-109162-5
World Economic Situationand Prospects
World Econom
ic Situation and Prospects 2011United Nations


World Economic Situation and Prospects 2011
asdfUnited NationsNew York, 2011
AcknowledgementsThe report is a joint product of the United Nations Department of Economic and Social Affairs (UN/DESA), the United Nations Conference on Trade and Development (UNCTAD) and the five United Nations regional commissions (Economic Commission for Africa (ECA), Economic Commission for Europe (ECE), Economic Commission for Latin America and the Caribbean (ECLAC), Economic and Social Commission for Asia and the Pacific (ESCAP) and Economic and Social Commission for Western Asia (ESCWA)).
For the preparation of the global outlook, inputs were received from the national centres of Project LINK and from the participants at the annual LINK meeting held in New York from 20 to 22 October 2010. The cooperation and support received through Project LINK are gratefully acknowledged.
The United Nations World Tourism Organization (UNWTO) contributed to the section on international tourism.
The report has been prepared by a team coordinated by Rob Vos and comprising staff from all collaborating agencies, including Grigor Agabekian, Tarik Alami, Clive Altshuler, Shuvojit Banerjee, Sudip Ranjan Basu, Jeffrey Bliss, Alfredo Calcagno, Rodrigo Cárcamo, Jaromir Cekota, Ann D’Lima, Oumar Diallo, Adam Elhiraika, Kumi Endo, Pilar Fajarnes, Heiner Flassbeck, Marco Fugazza, Samuel Gayi, Sergei Gorbunov, Cordelia Gow, Yejin Ha, Aynul Hasan, Pingfan Hong, Alberto E. Isgut, Alex Izurieta, Osvaldo Kacef, Jane Karonga, Matthias Kempf, John Kester, Detlef Kotte, Nagesh Kumar, Alexandra Laurent, Daniel Jeongdae Lee, Hung-Yi Li, Muhammad Hussain Malik, Sandra Manuelito, Joerg Mayer, Nicolas Maystre, Simon Neaime, Victor Ognivtsev, Ann Orr, Oliver Paddison, José Palacin, Ingo Pitterle, Marco V. Sánchez, Benu Schneider, Krishnan Sharma, Robert Shelburne, Amos Taporaie, Alexander Trepelkov, Aimable Uwizeye-Mapendano, Sergio Vieira, Jürgen Weller, Yasuhisa Yamamoto and Anida Yupari.
Jomo Kwame Sundaram, Assistant Secretary-General for Economic Development, provided comments and guidance.
For further information, see http://www.un.org/esa/policy or contact:
DESA:Mr. Sha Zukang, Under-Secretary-General, Department of Economic and Social Affairs, Room DC2-2320, United Nations, New York, NY 10017, USA; telephone: +1-212-9635958; email: [email protected]:Mr. Supachai Panitchpakdi, Secretary-General, United Nations Conference on Trade and Development, Room E-9042, Palais de Nations, CH-1211, Geneva 10, Switzerland; telephone +41-22-9175806; email: [email protected]:Mr. Abdoulie Janneh, Executive Secretary, United Nations Economic Commission for Africa, P.O. Box 3005, Addis Ababa, Ethiopia; telephone: +251-11-544 3336; email: [email protected]:Mr. Ján Kubiš, Executive Secretary, United Nations Economic Commission for Europe, Information Service, Palais des Nations, CH-1211, Geneva 10, Switzerland; telephone: +41-22-9174444; email: [email protected]:Ms. Alicia Bárcena, Executive Secretary, Economic Commission for Latin America and the Caribbean, Av. Dag Hammarskjold 3477, Vitacura, Santiago, Chile; telephone: +56-2-2102000; email: [email protected]:Ms. Noeleen Heyzer, Executive Secretary, Economic and Social Commission for Asia and the Pacific, United Nations Building, Rajadamnern Nok Avenue, Bangkok 10200, Thailand; telephone: +66-2-2881234; email: [email protected]:Ms. Rima Khalaf, Executive Secretary, Economic and Social Commission for Western Asia, P.O. Box 11-8575, Riad el-Solh Square, Beirut, Lebanon; telephone: +961-1-978800; website: http://www.escwa.un.org/about/staff.aspCover photo credits:iStockphoto.com/Konstantin Inozemtsev

iii
Executive SummaryThe global economic outlook
Weaker global growth is expected in 2011 and 2012…
After a year of fragile and uneven recovery, global economic growth started to decelerate on a broad front in mid-2010. The slowdown is expected to continue into 2011 and 2012 as weaknesses in major developed economies continue to provide a drag on the global re-covery and pose risks for world economic stability in the coming years. The unprecedented scale of the policy measures taken by Governments during the early stage of the crisis no doubt helped stabilize financial markets and jump-start a recovery. The policy response weakened during 2010, however, and is expected to be much less supportive in the near term also, especially as widening fiscal deficits and rising public debt have undermined support for further fiscal stimuli. Many Governments, particularly those in developed countries, are already shifting towards fiscal austerity. This will adversely affect global economic growth during 2011 and 2012.
…as multiple risks to the recovery remain
Despite the notable progress made by the banking sector in disposing of its troubled assets, multiple risks remain. Real estate markets may deteriorate further, credit growth remains feeble, and levels of unemployment are persistently high. Most countries have kept in place, or even intensified, policies of cheap money (low interest rates and quantitative easing) in efforts to help financial sectors return to normalcy and stimulate economic activity as fiscal stimuli are being phased out. This has, however, added new risks, includ-ing greater exchange-rate volatility among major currencies and a surge of volatile capital flows to emerging markets, which have already become a source of economic tension and could harm the recovery in the near term. Such tensions have weakened the commitment to coordinate policies at the international level, which in turn has made dealing with the global imbalances and other structural problems that led to the crisis, as well as those that were created by it, all the more challenging.
The global recovery has been dragged down by the developed economies
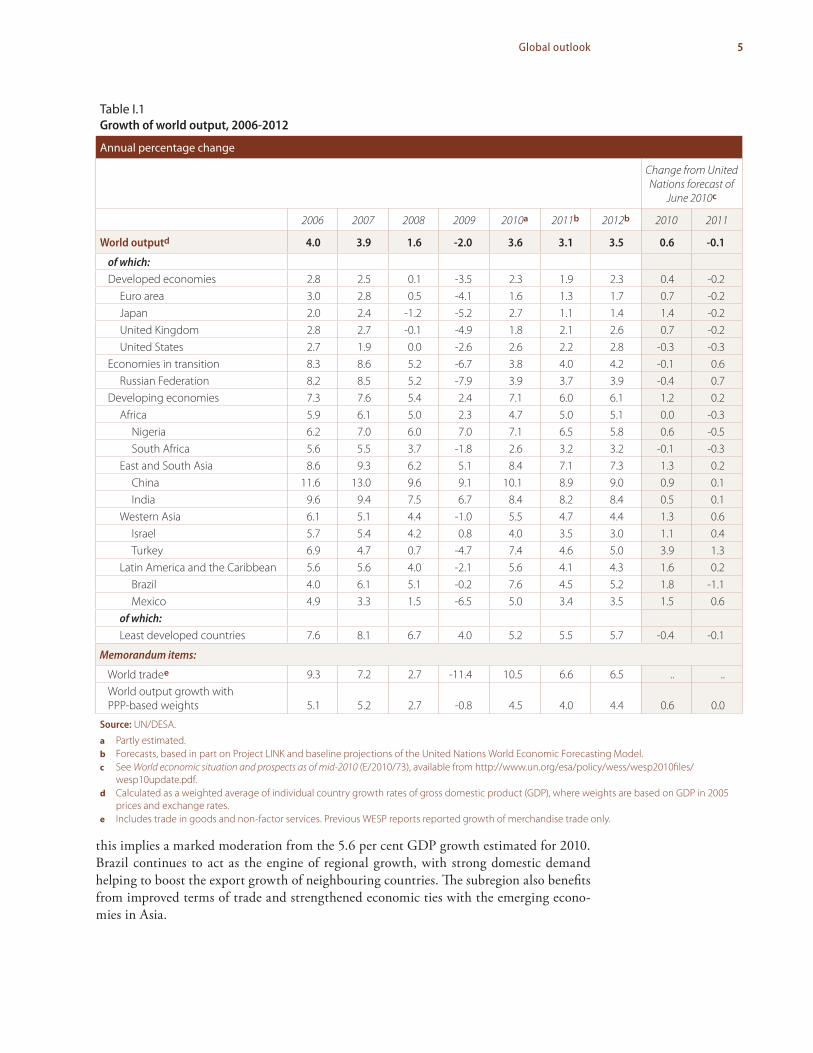
World gross product (WGP) is forecast to expand by 3.1 per cent in 2011 and 3.5 per cent in 2012. The recovery may, however, suffer setbacks and slow to below 2 per cent, while some developed economies may slip back into recession if several of the downside risks take shape.
Among the developed economies, the United States of America has been on the mend from its longest and deepest recession since the Second World War, but has nonetheless been experiencing the weakest recovery pace in history. Although the level of gross domestic product (GDP) will return to its pre-crisis peak by 2011, a full recovery of employment will take at least another four years. Growth in many European countries will also remain low; drained by drastic fiscal cuts, some may continue to be in recession. Growth in Japan will also decelerate notably.

iv World Economic Situation and Prospects 2011
Developing country growth will also moderate
Developing countries and the economies in transition continue to drive the global recovery, but their output growth is also expected to moderate during 2011 and 2012. Developing Asia continues to show the strongest growth performance. Strong growth in major devel-oping economies, especially China, is an important factor in the rebound in global trade
A decelerating global recovery
Percentage change in world gross product
4.0
3.6
4.1 4.0 3.5
1.6
-2.0
3.6
3.1
-3
-2
-1
0
1
2
3
4
5
2004 2005 2006 2007 2008 2009 2010a 2011b 2012b
Baseline
Optimistic
Pessimistic
Source: UN/DESA and Project LINK.
Note: For the baseline forecast assumptions, see
box I.1. The pessimistic scenario refers to a situation
of enhanced macroeconomic uncertainty in the outlook
(see box I.4), while the optimistic scenario is one of limited, but improved,
international policy coordination (see box I.5).
a Partly estimated.b United Nations forecasts.
Percentage
Developing country growth is leading the recovery
Developedeconomies
Economies intransition
Developingeconomies
Least developedcountries
2009
2010a
2011b
2012b
-8
-6
-4
-2
0
2
4
6
8
Source: UN/DESA and Project LINK.
a Partly estimated. b United Nations forecasts.

vExecutive Summary
and commodity prices, which is benefiting growth in Latin America, the Commonwealth of Independent States and parts of Africa. Yet, the economic recovery remains below potential in all three regions. The fuel-exporting economies of Western Asia have not levelled oil production after the cutbacks made in response to the global recession; hence, the recovery in this region is also below pre-crisis levels of output growth.
Formidable challenges remain for the long-run development of many low-income countries. In particular, the recovery in many of the least developed countries (LDCs) will also be below potential.
The outlook for employment, achievement of the Millennium Development Goals and inflation
Between 2007 and the end of 2009, at least 30 million jobs were lost worldwide as a result of the global financial crisis. Despite a rebound in employment in parts of the world, espe-cially in developing countries, the global economy will still need to create at least another 22 million new jobs in order to return to the pre-crisis level of global employment. At the current speed of the recovery, this would take at least five years.
Long-term unemployment is rising
Owing to the below-potential pace of output growth in the recovery, particularly in developed economies, few new jobs have been created to rehire those workers who have been laid off. As more Governments are embarking on fiscal tightening, the prospects for a quick recovery of employment look even gloomier. The longer term employment consequences of the present crisis are already becoming visible, as the share of the structurally or long-term unemployed has increased significantly in most developed countries since 2007.
Percentage share of labour force
Persistent high unemployment in developed countries
5
6
7
8
9
2005 2006 2007 2008 2009 2010a 2011b 2012b
Source: UN/DESA.a Partly estimated. b United Nations baseline forecasts.

vi World Economic Situation and Prospects 2011
The recovery of employment has been faster in developing countries
Workers in developing countries and economies in transition have also been severely af-fected by the crisis, although the impact in terms of job losses emerged later and was much more short-lived than in developed countries. The impact on aggregate employment was also softened by the absorption of many workers into the informal sector, although many more workers have ended up in more vulnerable jobs with lower pay as a result. Job growth in developing countries started to rebound from the second half of 2009; by the end of the first quarter of 2010, unemployment rates had already fallen back to pre-crisis levels in a number of developing countries.
The crisis has caused important setbacks in progress towards the MDGs
The economic downturn has caused important setbacks in progress towards the Millennium Development Goals (MDGs). Achieving the millennium target of halving global poverty rates by 2015 (from 1990 levels) is within reach for the world as a whole, although it will not be met in sub-Saharan Africa nor, possibly, in parts of South Asia. However, the crisis has significantly increased the challenge of achieving targets for universal primary educa-tion, reducing child and maternal mortality and improving environmental and sanitary conditions. The requirements for stepping up economic growth and social spending posed significant macroeconomic challenges even before the crisis; these have become all the more pressing in cases where setbacks have been the greatest. Unfortunately, the mood for fiscal tightening is taking hold even in those developing countries with a policy intention of safeguarding “priority” social spending. This is a worrying trend, particularly where GDP growth is still well below potential and tax revenues have declined significantly because of the crisis. Among the many low-income countries especially, sufficient support through official development assistance (ODA) will be critical for enabling stepped-up efforts to achieve the MDGs.
Inflation does not pose a present danger, except in parts of South Asia
The current rates of headline inflation have stayed at very low levels despite the massive monetary expansion. Except in some Asian economies, where increasingly strong infla-tionary pressures reflect a combination of supply and demand-side factors, inflationary expectations are likely to remain muted in the near future owing to the stagnation in credit growth, alongside wide output gaps and elevated unemployment in most developed economies.
Trade and commodity prices The rebound in world trade decelerated during 2010
World trade continued to recover in 2010, but the momentum of the strong growth ob-served in the first half of the year has started to peter out. While the volume of exports of many emerging economies has already recovered to, or beyond, pre-crisis peaks, exports of developed economies have not yet seen a full recovery. In the outlook, world trade is expected to grow by about 6.5 per cent in both 2011 and 2012, moderating from the 10.5 per cent rebound in 2010.

viiExecutive Summary
Despite the gradual recovery of the past two years, the value of imports of the three largest developed economies was still significantly below pre-crisis peaks by August 2010. Meanwhile, export recovery in these economies is mirrored in the fast growth of im-ports by countries in East Asia and Latin America. The question now is whether emerging economies can continue to act as the engines of world trade growth in the outlook, par-ticularly as the dynamics of the initial phase of the recovery seem to be fading and as growth in developed countries remains sluggish.
Financial factors are exacerbating the volatility in food and other commodity prices
Most commodity prices have rebounded. The world price of crude oil fluctuated around $78 per barrel during 2010, up from an average of $62 for 2009. However, oil prices are expected to decrease somewhat in 2011. World prices of metals followed a similar trend in 2010 and are expected to edge up only slightly in 2011 and 2012.
Food prices declined during the first half of 2010, but rebounded in the second. While the expansion of global acreage and favourable weather patterns in key producing areas helped increase global food supplies considerably during 2009 and early 2010, adverse weather conditions in mid-2010 affected the harvests of basic staples. In ad-dition, speculation amplified many commodity prices. Food prices will remain vulnerable to supply shocks and speculative responses in commodity derivatives markets.
International finance for developmentNet transfers from developing to developed countries increased again in 2010 and are set to continue on this trend
Developing countries as a group continued to transfer vast amounts of financial resources to developed countries. In 2010, net transfers amounted to an estimated $557 billion—a slight increase from the level registered in the previous year. As has been the pattern for more than a decade, much of the net transfers reflect additional reserve accumulation by developing countries. In the outlook, net resource transfers from developing countries are expected to increase moderately along with the projected widening of current-account im-balances. This continuation of the pre-crisis pattern, in which, on balance, poor countries transfer significant amounts of resources to much richer nations, is also a reflection of the need felt by developing countries to continue to accumulate foreign-exchange reserves as a form of self-protection against global economic shocks. Instances of global financial market turbulence, increased exchange-rate volatility among major reserve currencies and a surge in short-term private capital flows have added to the sense of high macroeconomic uncertainty and the perceived need for self-insurance.
Net private capital flows to developing countries have increased significantly
Net private capital flows to developing countries have recovered strongly from their slump in 2008 and early 2009. Investors are searching for higher returns, and economic growth in emerging and other developing economies has been much stronger than in advanced economies; also, extensive monetary easing has kept interest rates very low in the latter.

viii World Economic Situation and Prospects 2011
With continued fragility and the substantial excess liquidity in developed financial mar-kets, investors have shifted parts of their portfolios to emerging markets. Much of the surge in private capital flows to developing countries has taken the form of short-term, and probably volatile, equity investments, though foreign direct investment (FDI), especially in the extractive industries of commodity-exporting economies, has also increased.
The crisis has increased the need for ODA, but has complicated the delivery on commitments
The global financial crisis and economic recession of 2008 and 2009 negatively impacted many developing countries and put a severe strain on many low-income countries, making the delivery of committed ODA even more critical. Although net transfers to low-income countries have remained positive during 2010, the fragile recovery in developed countries and the possible threat of a double-dip recession create considerable uncertainty about the future volume of ODA flows. Moreover, aid delivery is falling short of commitments by the donor community.
The debt situation in many developing countries has improved, but problems remain
Despite improvements in the debt position of many developing countries prior to the cri-sis, some countries, including some small middle-income countries, remain in vulnerable situations. In the wake of the crisis, other developing economies have moved into more critical debt positions. The total external debt (public and private) of developing countries as a share of GDP rose to 24.8 per cent in 2009, an increase of 2.2 percentage points over the previous year, while the downward trajectory of the debt service-to-exports ratio was
Billions of dollars
Net financial transfers from poor to rich countries still flow at an increased rate
Low-income countriesLower middle
income countriesUpper middle
income countriesAll developing
countries
Average 2000-2008
2009
2010
-600
-500
-400
-300
-200
-100
0
100
Source: UN/DESA, based on International Monetary Fund
(IMF), World Economic Outlook Database, October 2010 and
IMF, Balance of Payments Statistics.

ixExecutive Summary
reversed because of the negative impact of the crisis on the dollar value of both GDP and exports. As a result, the average external debt-to-export ratio of developing countries and transition economies increased from 64.1 per cent in 2008 to 82.4 per cent in 2009. In many countries, debt ratios increased even more significantly, as managing the impact of the crisis resulted in rapid increases in public debt. Despite the generous debt relief pro-vided, 13 (out of 40) heavily indebted poor countries (HIPCs) are classified as being “in debt distress” or at “high risk of debt distress”, while 7 non-HIPC low-income countries are identified as facing debt problems.
The persisting external debt problems among both low- and middle-income countries and the surge of sovereign debt distress among a number of developed countries points to the limits of the existing arrangements for dealing with debt problems. It also points to the urgent need for setting up an international sovereign debt workout mecha-nism which would allow countries to restructure their debt in a timely and comprehensive manner.
Some progress has been made towards providing a better framework for regulating the financial sector
A reform agenda set out by the Group of Twenty (G20) envisaged the introduction of macroprudential supervision that would take due account of systemic risk and the overall stability of the financial system, including pro-cyclicality and moral hazard caused by activities of systemically important financial institutions. A new capital and liquidity re-form package, Basel III, was agreed upon and issued by the Basel Committee on Banking Supervision. This is an important step forward, as it requires banks to hold larger amounts of capital and reserves against outstanding loans so as to increase their resilience under more turbulent financial market conditions. However, these new capital and liquidity standards apply only to banks. Consequently, more also needs to be done to address risks outside the traditional banking system (investment banks, hedge funds, derivatives mar-kets, and so forth), which represented a major factor in generating the global crisis in 2008. The new standards and rules will have to be made applicable across different types of financial markets and institutions offering similar products.
Uncertainties and risksKey uncertainties and risks to the baseline scenario for 2011 and 2012 are slanted towards the downside.
Fiscal austerity could risk further deceleration of the recovery
Despite continued fragile recovery, the sense of urgency and the will to move fiscal and monetary policies in tandem dissipated during 2010 over worries, especially in developed countries, that fiscal sustainability could be in jeopardy. Such worries are juxtaposed to fears that the phasing-out of fiscal stimulus and a quick retreat into fiscal austerity would risk further deceleration of the recovery and fail to bring unemployment down, while public debt ratios would continue to rise because of insufficient output growth.
Since budget deficits have widened sharply, public debt of developed countries will continue to increase, even under conservative assumptions, surpassing 100 per cent of GDP, on average, in the next few years. Governments of many advanced economies

x World Economic Situation and Prospects 2011
will thus face large and increasing funding needs. At the same time, the risk of enhanced financial fragility has increased because of the way in which public indebtedness became linked to the health of the banking sector during the crisis: while Governments have guaranteed vast amounts of bank liabilities, banks have been purchasing large amounts of government securities. As a result, a heightened risk for the financial health of one of these two parties will feed into the other, possibly forming a vicious circle that could amplify the risk throughout the whole economy.
Increased exchange-rate instability remains a risk…
The exchange rates among major currencies experienced high volatility during 2010, with escalated tension spreading rapidly to other currencies. The failure to maintain exchange-rate stability among the three major international reserve currencies has also affected cur-rencies of emerging economies. The surge in capital inflows to emerging economies, fuelled by the quantitative easing in developed countries and portfolio reallocation by international investors, as well as by the weakening of the dollar, has led to upward pressure on the exchange rates of some emerging economies. Developing countries have responded by in-tervening in currency markets and/or imposing capital controls to avoid soaring exchange rates, loss of competitiveness and inflating asset bubbles. Currency instability and perceived misalignment of exchange rates could become part of a major skirmish over trade, which may well turn into a wave of protectionist measures and retaliations worldwide, once again risking derailment of global growth and destabilization of financial markets.
…as does an uncoordinated rebalancing of the world economy
The global imbalances may widen again, which in turn could feed more instability back into financial markets. Prospects for narrowing the imbalances will depend on how suc-cessful economies will be in making structural adjustments. However, the path of these adjustments is unclear, particularly given the uncertainties about how the risks of a further slowing of growth and the persistence of high rates of unemployment, sovereign debt problems and further exchange-rate instability will all play out. Even if the global imbal-ances do not edge up significantly in the near term, the underlying adjustment in stocks of international asset and liability positions would continue to move in a risky direction, particularly as the global financial crisis has caused a surge in net foreign liabilities of the United States.
More quantitative easing and a further depreciation of the dollar might be a way for the United States to try to inflate and export its way out of its large foreign liability position, but it would more likely risk disruption of trade and financial markets. Moreover, dollar weakness poses a threat because it increases import prices in the United States, the world’s largest consumer market, and thus erodes purchasing power. This could lead to a decline in global trade, constituting the antithesis of the United States consumption boom that fuelled global economic growth before the financial crisis.
Accordingly, if concerns grow about exports’ being hit by dollar weakness, developing countries will understandably feel inclined to intervene in their foreign-exchange markets, as is already the case. However, frequent intervention in foreign-exchange markets increases the potential for international currency and trade conflicts, which could further undermine the international cooperation shaped at the level of the G20. A further waning of the commitment to international policy coordination will be an added liability for the prospects of a balanced and more sustained global recovery.

xiExecutive Summary
Policy challengesFive major policy challenges need to be addressed
The potentially damaging spillover effects of national policies once again highlight the need for strengthened international policy coordination. Unfortunately, during 2010, the cooperative spirit among policymakers in the major economies has been waning. World Economic Situation and Prospects 2011 suggests that avoiding a double-dip recession and moving towards a more balanced and sustainable global recovery would require that at least five related major policy challenges be addressed.
First, continued and coordinated stimulus
First, by using the ample fiscal space that is still available in many countries, additional fiscal stimulus, in tandem with appropriate monetary policies, is needed in the short run to boost the global recovery. Such action should be adequately coordinated among the major economies to ensure a reinvigoration of global growth that will also provide external demand for those economies which have exhausted their fiscal space. Absent a new net fiscal stimulus and faster recovery of bank lending to the private sector, growth is likely to remain anaemic in many countries in the foreseeable future.
Second, redesigning fiscal stimulus
Second, fiscal policy needs to be redesigned to strengthen its impact on employment and aid in the transition towards promoting structural change for more sustainable economic growth. A prudent policy would be to target public investments with a view to alleviating infrastructure bottlenecks that mitigate growth prospects. One priority area would be to expand public investment in renewable clean energy as part of commitments to reduce greenhouse gas (GHG) emissions, and in infrastructure that provides greater resilience to the effects of climate change. Another area might be to expand and improve public transportation networks, which would create potentially significant amounts of new jobs while at the same time helping to reduce GHG emissions, particularly in rapidly urbaniz-ing environments. Social protection policies are another crucial element in cushioning the impact of economic shocks, boosting aggregate demand and contributing to the sustain-ability of economic growth.
Third, more effective monetary policy and addressing international spillover effects
The third challenge is to find greater synergy between fiscal and monetary stimulus, while counteracting damaging international spillover effects in the form of increased currency tensions and volatile short-term capital flows. This will require reaching agreement about the magnitude, speed and timing of quantitative easing policies within a broader frame-work of targets to redress the global imbalances. It will also require deeper reforms of financial regulation, including those for managing cross-border capital flows, as well as in the global reserve system in order to reduce dependence on the United States dollar.

xii World Economic Situation and Prospects 2011
Fourth, more predictable access to development finance for achieving the MDGs
The fourth challenge is to ensure that sufficient resources are made available to developing countries, especially those possessing limited fiscal space and facing large development needs. These resources will be needed, in particular, to accelerate progress towards the achievement of the MDGs and for investments in sustainable and resilient growth. Apart from delivering on existing aid commitments, donor countries should consider mecha-nisms to delink aid flows from their business cycles so as to prevent delivery shortfalls in times of crisis, when the need for development aid is most urgent.
Fifth, more concrete and enforceable targets for international policy coordination
The fifth challenge is to find ways to arrive at credible and effective policy coordination among major economies. In this regard, there is some urgency in making the G20 frame-work for sustainable global rebalancing more specific and operational. In this context, establishing concrete “current-account target zones” might be a meaningful way forward. Having clear and verifiable targets for desired policy outcomes would help make parties accountable, while the possible loss of reputation through non-compliance would be an incentive to live up to policy agreements. Such target zones would also highlight the need for both surplus and deficit countries to contribute to sustaining global effective demand.
The target zones should not, however, be seen as an end in themselves, but rather as a guide towards a sustainable growth path for the world, which should encompass the proposed actions to address all five challenges listed above. They should also be seen as an intermediate step towards the more fundamental reforms of the global reserve system and the financial regulation that are needed to prevent future global financial instability and meltdowns.

xiii
Contents Executive Summary ...................................................................................................................................................................................... iii
Contents .............................................................................................................................................................................................................. xiii
Explanatory Notes ......................................................................................................................................................................................... xvii
I Global outlook .................................................................................................................................................. 1
Macroeconomic prospects for the world economy ................................................................................................................ 1 Growth prospects ..................................................................................................................................................................... 3 Outlook for employment ..................................................................................................................................................... 10 Prospects for achieving the Millennium Development Goals ...................................................................... 13 Continued low inflation ........................................................................................................................................................ 17International economic conditions for developing countries and economies in transition ......................... 18 Returning, but risky, capital flows ................................................................................................................................... 18 Rebounding world trade, volatile commodity prices ........................................................................................ 20 Declining remittances ............................................................................................................................................................ 22Uncertainties and risks................................................................................................................................................................................ 23 Risks associated with sovereign debt and fiscal austerity ............................................................................... 23 Risk of increased exchange-rate instability ............................................................................................................... 28 Risks of an uncoordinated rebalancing of the world economy ................................................................... 30Policy challenges ............................................................................................................................................................................................ 33 Continued and coordinated stimulus .......................................................................................................................... 36 Redesigning fiscal stimulus ................................................................................................................................................. 37 Making monetary policy more effective and addressing its international spillover effects ...... 39 Financing for achieving the MDGs and investments in sustainable development in low-income countries ......................................................................................... 40 Strengthening the framework for policy coordination ..................................................................................... 40Appendix ............................................................................................................................................................................................................. 44
II International trade ........................................................................................................................................... 47
The below-trend recovery of world trade ...................................................................................................................................... 47Terms of trade of developing and transition economies ..................................................................................................... 49Trends in primary commodity markets ............................................................................................................................................ 51 Markets for non-oil commodities ................................................................................................................................... 51 Agricultural commodities .................................................................................................................................................... 55 Minerals and metals ................................................................................................................................................................ 57 The oil market .............................................................................................................................................................................. 58Trade in services ............................................................................................................................................................................................. 60Developments in trade policy ............................................................................................................................................................... 65 The Doha Round ....................................................................................................................................................................... 65 Resumption of the trend towards more preferential trade agreements ................................................ 66 The continuation of low-intensity protectionism ................................................................................................. 67

xiv World Economic Situation and Prospects 2011
III Financial flows to developing countries ........................................................................................................ 63
Net resource transfers from poor to rich countries .................................................................................................................. 63Private capital flows to developing countries .............................................................................................................................. 71International financial cooperation .................................................................................................................................................... 74 Official development assistance ...................................................................................................................................... 74 South-South cooperation .................................................................................................................................................... 77 Innovative sources of development finance ........................................................................................................... 77 Debt relief ...................................................................................................................................................................................... 81Strengthening the international financial architecture ......................................................................................................... 85 Reform of the framework for financial regulation ................................................................................................ 85 Multilateral surveillance and policy coordination ................................................................................................ 88 A global financial safety net ............................................................................................................................................... 90 The international reserve system .................................................................................................................................... 92 Strengthening global economic governance......................................................................................................... 94
IV Regional developments and outlook ............................................................................................................ 97
Developed market economies .............................................................................................................................................................. 97 North America: decelerating recovery ......................................................................................................................... 98 Developed Asia and the Pacific: diverging outlook ............................................................................................. 101 Developed Europe: cautious recovery ......................................................................................................................... 103Economies in transition ............................................................................................................................................................................. 108 South-eastern Europe: a feeble recovery ................................................................................................................... 109 The Commonwealth of Independent States: a muted recovery ................................................................ 110Developing economies .............................................................................................................................................................................. 114 Africa: divergent growth recovery .................................................................................................................................. 115 East Asia: moderate growth, but the outlook is still good ............................................................................... 118 South Asia: robust growth momentum ...................................................................................................................... 123 Western Asia: solid growth after a sharp rebound ............................................................................................... 125 Latin America and the Caribbean: strong economic recovery, but diverging across countries ................................................................................................................. 128
Statistical annexCountry classification .................................................................................................................................................................................. 133Annex tables ..................................................................................................................................................................................................... 145
Boxes I. 1 Key assumptions for the United Nations baseline forecast for 2011 and 2012 ...................................................... 4 I. 2 Prospects for the least developed countries ................................................................................................................................ 7 I. 3 Impact of the crisis and macroeconomic challenges to meeting the Millennium Development Goals .......................................................................................................................... 14 I. 4 A pessimistic scenario for the world economy ........................................................................................................................... 34 I. 5 Feasible policy coordination for rebalancing the world economy ................................................................................. 42

xvContents
II. 1 The financialization of commodity trading ................................................................................................................................... 53 II. 2 International tourism ................................................................................................................................................................................... 63 III. 1 Mechanisms underlying innovative financing for global health ..................................................................................... 80 IV. 1 Banking systems and financial risks in the CIS economies .................................................................................................. 112 IV. 2 Addressing global macroeconomic imbalances in East Asia ............................................................................................. 121 IV. 3 Currency appreciation in Latin America and the Caribbean .............................................................................................. 130
Figures I. 1 Growth of the world economy, 2004-2012 ................................................................................................................................... 6 I. 2 Growth of GDP per capita, by level of development, 2000-2012 .................................................................................... 7 I. 3 Post-recession employment recovery in the United States, 1973, 1980, 1981, 1990, 2001 and 2007 ...... 11 I. 4 Proportion of working poor, 2003, 2008 and 2009 ................................................................................................................... 13 I. 5 Foreign reserve accumulation by developing countries, first quarter 2007-second quarter 2010 ............ 19 I. 6 Volume of world merchandise trade, January 2005-August 2010 .................................................................................. 20 I. 7 Historical best case, worst case and average scenarios for the general government gross debt burden, selected developed economies .............................................................................. 25 I. 8 Flow costs of public debt, selected emerging and other developing countries, 2000-2009 ........................ 27 I. 9 Exchange rates among major currencies, March-October 2010 ..................................................................................... 29 I. 10 Trade-weighted effective exchange rates, selected countries, March-October 2010 ........................................ 30 I. 11 Resurge in global imbalances, 1996-2011 ...................................................................................................................................... 31 I. 12 Net international investment position of the United States, 1976-2009 .................................................................... 32 II. 1 Growth of world income and of the volume of imports, 2002-2012 ............................................................................ 47 II. 2 Growth of the volume and dollar values of world exports, 2002-2012 ....................................................................... 48 II. 3a Net barter terms of trade, selected developing and transition economies, by trade structure, 2000-2010 ........................................................................................................... 50 II. 3b Terms of trade, selected developing and transition economies, 2000-2010 ........................................................... 50 II. 4 Trade shocks by export specialization, country groups, 2001-2010 .............................................................................. 52 II. 5 Non-oil commodity price index, all groups, in dollar and SDR terms, January 2006-September 2010 ... 53 II. 6 Price indices of selected agricultural commodities, current United States dollars, January 2006-September 2010 ......................................................................................................... 55 II. 7 Price indices of selected minerals, in current United States dollars , January 2006-September 2010 ...... 57 II. 8 Growth of exports of trade in services in current United States dollars, 2005-2009............................................ 60 II. 9 Components of liner shipping connectivity, country averages, July 2004-July 2010 ......................................... 62 III. 1a Net financial transfers to economies in transition and developing countries, 1998-2010 .............................. 70 III. 1b Net financial transfers, by income categories, 2000-2010 .................................................................................................... 70 III. 2 Net ODA of DAC members, 1990-2009, and DAC secretariat simulations to 2010 .............................................. 75 III. 3 Low-income countries in debt distress or at high risk of debt distress, October 2010 ...................................... 84 IV. 1 Unemployment rates in the G7 countries, 2008-2012 ........................................................................................................... 97 IV. 2 Evolution of United States civilian employment during the recession, and possible future path, June 2007-October 2013 .............................................................................................................. 99 IV. 3 Industrial production in the euro area and selected Western European economies, second quarter 2008-fourth quarter 2010 ................................................................................................................................... 104

xvi World Economic Situation and Prospects 2011
IV. 4 Industrial production, excluding construction, selected new EU member States, October 2009-August 2010........................................................................................................... 107 IV. 5 Comparison of retail turnover in countries of the Commonwealth of Independent States, 2009 and 2010 (January-June) ............................................................................................................. 111 IV. 6 Africa growth map ........................................................................................................................................................................................ 116 IV. 7 GDP growth in selected East Asian economies, 2009-2011 ................................................................................................ 119 IV. 8 Year-on-year changes in the consumer price index in selected South Asian economies, January 2007-July 2010 ................................................................................................................... 124 IV. 9 GDP growth in Western Asia, 2002-2012 ........................................................................................................................................ 126 IV. 10 Latin America: GDP growth rate and contribution to growth of components of aggregate demand, 2004-2010 ..................................................................................................................... 128 IV. 11 Latin America and the Caribbean: government revenue, expenditure and fiscal balances, 2006-2010 .............................................................................................................................. 132
Tables I. 1 Growth of world output, 2006-2012 .................................................................................................................................................. 5 I. 2 Frequency of high and low growth of per capita output, 2008–2012 ......................................................................... 9 I. 3 Growth of worker remittances to developing countries and economies in transition, 2004-2009 ........... 22 II. 1 Income gains or losses from the terms of trade of selected developing and transition economies, by trade structure, 2002-2010 ................................................................................................. 51 II. 2 Growth of trade in services by category, 2006-2009 ............................................................................................................... 61 II. 3 Major providers of international services among developing countries, 1990, 2000, 2007, 2008 and 2009 ................................................................................................... 62 II. 4 Growth rate of export services of LDCs and comparison with developing countries, 2005-2009 ............. 63 III. 1 Net transfer of financial resources to developing economies and economies in transition, 1998-2010 ...................................................................................................................................... 71 III. 2 Net financial flows to developing countries and economies in transition, 1997-2011 ..................................... 72 III. 3 Official development assistance in 2009 and 2010 in relation to commitments and targets ....................... 76

xvii
Explanatory Notes
The following symbols have been used in the tables throughout the report:
.. Two dots indicate that data are not available or are not separately reported.
– A dash indicates that the amount is nil or negligible.
- A hyphen (-) indicates that the item is not applicable.
- A minus sign (-) indicates deficit or decrease, except as indicated.
. A full stop (.) is used to indicate decimals.
/ A slash (/) between years indicates a crop year or financial year, for example, 2008/09.
- Use of a hyphen (-) between years, for example, 2008-2009, signifies the full period involved, including the beginning and end years.
Reference to “dollars” ($) indicates United States dollars, unless otherwise stated.
Reference to “billions” indicates one thousand million.
Reference to “tons” indicates metric tons, unless otherwise stated.
Annual rates of growth or change, unless otherwise stated, refer to annual compound rates.
Details and percentages in tables do not necessarily add to totals, because of rounding.
Project LINK is an international collaborative research group for econometric modelling, jointly coordinated by the Development Policy and Analysis Division of the United Nations Secretariat and the University of Toronto.
Data presented in this publication incorporate information available as at 30 November 2010.

xviii World Economic Situation and Prospects 2011
The following abbreviations have been used:
ASEAN Association of Southeast Asian Nations
BCBS Basel Committee on Banking Supervision
BIS Bank for International Settlements
BRIC Brazil, China, India and Russia
CFA Communauté fianancière africaine
CIS Commonwealth of Independent States
CMIM Chiang Mai Initiative Multilateralization Agreement
CRA credit-rating agency
CTT currency transactions tax
DAC Development Assistance Committee (of the Organization for Economic Cooperation and Development)
DCF Development Cooperation Forum
DFQF duty-free, quota-free
DRF Debt Reduction Facility
ECA Economic Commission for Africa
ECB European Central Bank
ECE Economic Commission for Europe
ECLAC Economic Commission for Latin America and the Caribbean
ECU European Currency Unit
EMBI+ Emerging Markets Bond Index Plus
ESCAP Economic and Social Commission for Asia and the Pacific
ESCWA Economic and Social Commission for Western Asia
EU European Union
FAO Food and Agriculture Organization of the United Nations
FCL Flexible Credit Line
FDI foreign direct investment
Fed United States Federal Reserve
FSAP Financial Sector Assessment Program (of the International Monetary Fund)
FSB Financial Stability Board
FTAs free trade agreements
FTT financial transactions tax
G8 Group of Eight
G20 Group of Twenty
GAVI Global Alliance for Vaccines and Immunisation, now called the GAVI Alliance
GCC Gulf Cooperation Council
GDP gross domestic product
GHGs greenhouse gases
GNI gross national income
HICP Harmonised Index of Consumer Prices
HIPCs heavily indebted poor countries
IBRD International Bank for Reconstruction and Development
IDA International Development Association
IFC International Finance Corporation
IFIs international financial institutions
ILO International Labour Organization
IMF International Monetary Fund
IMFC International Monetary and Financial Committee
LDCs least developed countries
LSCI Liner Shipping Connectivity Index (of the United Nations Conference on Trade and Development)
MAP Mutual Assessment Process
mbd millions of barrels per day
MDGs Millennium Development Goals
MDRI Multilateral Debt Relief Initiative
MBS mortgage-backed securities
NAMA non-agricultural market access
NAB New Arrangements to Borrow
NGOs non-governmental organizations
NPLS non-performing loans
NTM non-tariff measures
ODA official development assistance
OECD Organization for Economic Cooperation and Development
OPEC Organization of the Petroleum Exporting Countries
pb per barrel
PCL Precautionary Credit Line
RTAs regional trade agreements
SDRs Special Drawing Rights
SIFIs systemically important financial institutions
SGP Stability and Growth Pact
TEUs twenty-foot equivalent units
UNCTAD United Nations Conference on Trade and Development
UN/DESA Department of Economic and Social Affairs of the United Nations Secretariat
UNICEF United Nations Children’s Fund
UNWTO United Nations World Tourism Organization
WEFM World Economic Forecasting Model (of the United Nations)
WGP world gross product
WHO World Health Organization
WTO World Trade Organization

1
Chapter IGlobal outlook
Macroeconomic prospects for the world economyThe road to recovery from the Great Recession is proving to be long, winding and rocky. After a year of fragile and uneven recovery, growth of the world economy is now decelerat-ing on a broad front, presaging weaker global growth in the outlook.
Weaknesses in major developed economies continue to drag the global recov-ery and pose risks for world economic stability in the coming years. There will be no quick fix for the problems these economies are still facing in the aftermath of the financial crisis. The unprecedented scale of the policy measures taken by Governments during the early stage of the crisis has no doubt helped stabilize financial markets and jump-start a recovery, but overcoming the structural problems that led to the crisis and those that were created by it is proving much more challenging and will be a lengthy process. For example, despite the notable progress made by the banking sector in disposing of its troubled as-sets, many of the banks in major developed countries remain vulnerable to multiple risks. Those risks include a further deterioration in real estate markets, more distress in sovereign debt markets, and continued low credit growth associated with overall economic weakness and the ongoing deleveraging among firms and households. Persistent high levels of unem-ployment, with increasing numbers of workers that have been without a job for prolonged periods, are restraining private consumption demand; they are also a continued cause of increasing housing foreclosures, which are adding to the fragility of the financial system. Troubles with public finances have become daunting as well. Fiscal deficits have widened dramatically and have become a source of political contention. Deficits have increased, mainly as a consequence of the impact of the crisis on falling government revenues and rising social benefit payments. The costs of fiscal stimulus measures have compounded this situation but, contrary to popular belief, have contributed only in minor part to the increase in public indebtedness. Yet, rising public debt has engendered political and finan-cial stress in a number of European countries and, more broadly, has undermined support for further fiscal stimuli. However, as Governments shift from fiscal stimulus to austerity, the recovery process is being placed in further jeopardy. The fiscal consolidation plans that have been announced so far by Governments of developed countries will impact negatively on gross domestic product (GDP) growth in the outlook for 2011 and 2012.
This contrasts with the strong GDP growth in many developing countries and economies in transition, which has been contributing to more than half of the expansion of the world economy since the third quarter of 2009. The rebound has been led by the large emerging economies in Asia and Latin America, particularly China, India and Brazil. Many developing countries have been able to use the policy buffers (in the form of ample fiscal space and vast foreign-exchange reserves) they had generated in the years before the crisis to adopt aggressive stimulus packages. These have helped boost domestic demand and have thus facilitated a relatively quick recovery from the global downturn. Since the second quarter of 2009, low- and middle-income countries have also led the recovery of international trade, building on ties among developing countries through global value chains. Many smaller economies in Africa and Latin America have been able to benefit from these South-South linkages, as well as from more buoyant international primary
Weaker global growth is expected in 2011 and 2012
There will be no quick fix for economic problems in advanced countries
Developing country growth remains the main driver of the global recovery…

2 World Economic Situation and Prospects 2011
commodity prices which have rebounded largely on account of the recovery in demand in the large developing economies. The return of private capital inflows to middle-income countries has further supported the recovery. By late 2010, developing country trade and industrial output had climbed to above pre-crisis levels.
It is uncertain, however, whether the developing countries and economies in transition can sustain the same robust pace of growth in 2011 and beyond. Despite strengthened trade ties amongst these countries, they remain highly dependent on demand in the developed countries for their exports. Access to capital flows and official develop-ment finance is also highly conditioned by financial circumstances and fiscal stances in advanced economies. A faltering recovery in those economies, on account of the above-mentioned risks, should thus be expected to moderate growth prospects for developing economies as well.
In addition, there are also important risks associated with the surge in private capital flows to emerging market economies. These flows are causing upward pressure on these countries’ currencies and risk inflating domestic asset bubbles. The return of capital flows is associated, to some degree, with the strong monetary expansion in the major developed countries, which has induced investors to seek more profitable ventures given continued weakness in financial sectors and the real economy in those countries. It has led policymakers in the emerging market economies to worry about the competitive-ness of exports and the possibility of sudden capital flow reversals. They are responding by intervening in currency markets and imposing controls on short-term capital inflows. Fears of protectionist retaliation by developed countries have increased. As primary com-modities are increasingly seen as alternative financial assets, short-term capital has also moved deeper into commodity markets, risking higher volatility in commodity prices and raising economic insecurity for many developing countries. Together with the increase in volatility in the exchange rates of major reserve currencies (the dollar, the euro and the yen) and a weakening commitment to coordinate policies to redress the global imbalances effectively, these factors pose increasing risks to the stability of international trade and finance, and, unless addressed in a timely fashion, will impede a strong, sustainable and balanced recovery of the global economy.
Mitigating these risks poses enormous policy challenges. In major developed economies, macroeconomic policy options are limited by political factors restraining fur-ther fiscal stimulus and market responses to sovereign debt distress. This has led policymak-ers to rely increasingly on monetary policy. Authorities in the main developed countries have cut interest rates further and moved deeper into quantitative easing, but it is unlikely that this will suffice to boost aggregate demand and create new jobs, especially as long as financial sector weaknesses remain and fiscal stimulus is on the wane. Active income policy could be an alternative or complementary tool for strengthening domestic demand, but it remains largely unused. The surge in capital flows to emerging and other developing economies and the consequent pressures on currencies are complicating the international environment for developing countries, rendering policies to restructure their economies in support of sustained growth all the more challenging. The spillover effects of national poli-cies are significant and a potential source of renewed instability. This once again highlights the need for strengthened international policy coordination. In this regard, the waning cooperative spirit among policymakers in the major economies has become an additional risk to the recovery of the world economy.
…but developing countries face challenges
in the outlook

3Global outlook
Growth prospects
After a year of fragile and uneven recovery, global economic growth started to decelerate on a broad front in mid-2010. The slowdown is expected to continue into 2011 and 2012. The outlook is shrouded in great uncertainty and serious downside risks remain. Premised on the key assumptions delineated in box I.1, the United Nations baseline forecast for the growth of world gross product (WGP) is 3.1 per cent for 2011 and 3.5 per cent for 2012, which is below the 3.6 per cent estimated for 2010 and the pre-crisis pace of global growth (see table I.1 and figure I.1). The recovery may suffer further setbacks if some downside risks take shape. In such a pessimistic scenario—discussed further in box I.4—growth of the world economy could slow significantly, to 1.7 per cent in 2011 and 2.3 per cent in 2012. Better outcomes may be expected only through strengthened international policy coordination (see the section on policy challenges and box I.5 below).
Among the developed economies, the United States of America has been on the mend from its longest and deepest recession since the Second World War. Yet, the pace of the recovery has been the weakest in the country’s post-recession experience. At 2.6 per cent in 2010, growth is expected to moderate further to 2.2 per cent in 2011 and to improve slightly to 2.8 per cent in 2012. At these rates, the level of GDP will return to its pre-crisis peak by 2011, but a full recovery of employment would take at least another four years (see below), leaving the level of output well below potential.
The growth prospects for Europe and Japan are even dimmer. Assuming con-tinued, albeit moderate, recovery in Germany, GDP growth in the euro area is forecast to virtually stagnate at 1.3 per cent in 2011 and 1.7 per cent in 2012 (growth in 2010 was 1.6 per cent). Many European countries will see even less growth, especially those in which drastic fiscal cuts and continued high unemployment rates are draining domestic demand. This is especially the case in Greece, Ireland, Portugal and Spain, which are entrapped in sovereign debt distress and whose economies will either remain in recession or stagnate. Japan’s initially strong rebound, fuelled by net export growth, started to falter in the course of 2010. Challenged by persistent deflation and elevated public debt, the economy is expected to grow by a meagre 1.1 per cent in 2011 and 1.4 per cent in 2012.
Among the economies in transition, the Commonwealth of Independent States (CIS) and Georgia experienced a rebound in GDP by about 4 per cent on average in 2010, up from the deep contraction of 6.7 per cent in 2009. Increased external demand and rebounding commodity prices are the drivers of the recovery. Domestic demand remains weak in most economies, especially in Ukraine. The recovery has slowed in the course of 2010, however. Output growth is not expected to accelerate in the outlook for 2011 and 2012. After a prolonged period of contraction, output growth in the economies in transi-tion in South-eastern Europe, except for Croatia, returned to positive territory in 2010. In this case, too, export growth has been driving most of the recovery so far, while domestic consumption and investment demand remain subdued. In 2011 and 2012, the pace of recovery in South-eastern Europe is expected to be rather slow.
Developing countries continue to drive the global recovery, but their output growth is also expected to moderate to 6.0 per cent on average during 2011-2012, down from 7.1 per cent in 2010. Developing Asia, led by China and India, continues to show the strongest growth performance, but GDP growth in these two new economic giants is expected to experience some moderation in 2011 and 2012.
Growth in Latin America, particularly that in the South American economies, is projected to remain relatively robust at about 4.1 per cent in the baseline forecast. Yet,
The global recovery started to falter in mid-2010
Slower economic growth is expected in the United States, Europe and Japan
Developing country growth is also expected to moderate during 2011-2012

4 World Economic Situation and Prospects 2011
Key assumptions for the United Nations baseline forecast for 2011 and 2012
The forecast presented in the text is based on estimates calculated using the United Nations World Economic Forecasting Model (WEFM) and is informed by country-specific economic outlooks pro-vided by participants in Project LINK, a network of institutions and researchers supported by the Department of Economic and Social Affairs of the United Nations. The provisional individual country forecasts submitted by country experts are adjusted based on harmonized global assumptions and the imposition of global consistency rules (especially for trade flows measured both in volumes and values) set by the WEFM. The main global assumptions are discussed below. The baseline forecast does not include any specific assumption about international coordination of macroeconomic poli-cies. It is also supposed that, other than the changes indicated below, there are no other exogenous shocks to the global economy. (See box I.4, box I.5 and the section on policy challenges for alterna-tive scenarios.)
Monetary and fiscal policy assumptions for major economies
It is assumed that the United States Federal Reserve (Fed) will hold the federal funds rate at its current level of 0.00-0.25 per cent until the fourth quarter of 2011, to be followed by a gradual increase in the rate in 2012. Similarly, the European Central Bank (ECB) is also expected to hold its main policy rate (the minimum bid rate) at its current level of 1 per cent until the end of 2011, also with a gradual tightening in 2012. The Bank of Japan is expected to hold its policy rate at virtually 0.00 per cent until the end of 2011, also with gradual tightening in 2012. The central banks of the three major developed economies are expected to continue their unconventional measures of quantitative easing.
Fiscal policy in the United States of America is assumed to feature continued implemen-tation of the remaining parts of the American Recovery and Reinvestment Act of 2009 and extension of the current tax cuts, but the overall fiscal policy stance will become negative in 2011 and 2012. Most economies in the euro area and the rest of Western Europe have announced plans for fiscal consolidation, which are reflected in the baseline assumptions. The degree and timing of these plans vary significantly, but the overall stance for the region will be contractionary. Fiscal stimulus through public investment spending has already been phased out in Japan, but supportive tax policy meas-ures are assumed to remain in place.
Fiscal policies among major developing countries and economies in transition are as-sumed to implement or phase out stimulus plans, as has been announced. Additionally, monetary policy stances vary across countries (see chapter IV for details) and are reflected in the baseline as-sumptions. These include increases in policy interest rates in several of the emerging economies to reflect anticipated moves from monetary easing back to more neutral monetary stances during 2010 and 2011.
Exchange rates
The exchange rates of major currencies have fluctuated significantly over the past two years. Given no significant change in interest differentials between the United States and the euro area and no significant difference between the two regions’ growth prospects, it is assumed that the dollar-euro exchange rate will remain at its current average of 1.35 for the years 2011 and 2012, but with fluctua-tions around that level.
The yen has been appreciating vis-à-vis both the dollar and the euro, its value reaching 83 yen to the dollar in September 2010, the highest in 15 years, and triggering an intervention of the Japanese Government in foreign-exchange markets. It is assumed that the average exchange rate of the yen vis-à-vis the dollar will average 85 yen per dollar for the years 2011 and 2012.
Oil and other commodity prices
The price of Brent crude oil is expected to average $75 per barrel in 2011 and $80 per barrel in 2012. The prices of non-oil commodities are assumed to fluctuate around their current levels in the fore-cast period of 2011 and 2012.
Box I.1
5Global outlook
this implies a marked moderation from the 5.6 per cent GDP growth estimated for 2010. Brazil continues to act as the engine of regional growth, with strong domestic demand helping to boost the export growth of neighbouring countries. The subregion also benefits from improved terms of trade and strengthened economic ties with the emerging econo-mies in Asia.
Table I.1 Growth of world output, 2006-2012
Annual percentage change
Change from United Nations forecast of
June 2010c
2006 2007 2008 2009 2010a 2011b 2012b 2010 2011
World outputd 4.0 3.9 1.6 -2.0 3.6 3.1 3.5 0.6 -0.1
of which:
Developed economies 2.8 2.5 0.1 -3.5 2.3 1.9 2.3 0.4 -0.2Euro area 3.0 2.8 0.5 -4.1 1.6 1.3 1.7 0.7 -0.2Japan 2.0 2.4 -1.2 -5.2 2.7 1.1 1.4 1.4 -0.2United Kingdom 2.8 2.7 -0.1 -4.9 1.8 2.1 2.6 0.7 -0.2United States 2.7 1.9 0.0 -2.6 2.6 2.2 2.8 -0.3 -0.3
Economies in transition 8.3 8.6 5.2 -6.7 3.8 4.0 4.2 -0.1 0.6Russian Federation 8.2 8.5 5.2 -7.9 3.9 3.7 3.9 -0.4 0.7
Developing economies 7.3 7.6 5.4 2.4 7.1 6.0 6.1 1.2 0.2Africa 5.9 6.1 5.0 2.3 4.7 5.0 5.1 0.0 -0.3
Nigeria 6.2 7.0 6.0 7.0 7.1 6.5 5.8 0.6 -0.5South Africa 5.6 5.5 3.7 -1.8 2.6 3.2 3.2 -0.1 -0.3
East and South Asia 8.6 9.3 6.2 5.1 8.4 7.1 7.3 1.3 0.2China 11.6 13.0 9.6 9.1 10.1 8.9 9.0 0.9 0.1India 9.6 9.4 7.5 6.7 8.4 8.2 8.4 0.5 0.1
Western Asia 6.1 5.1 4.4 -1.0 5.5 4.7 4.4 1.3 0.6Israel 5.7 5.4 4.2 0.8 4.0 3.5 3.0 1.1 0.4Turkey 6.9 4.7 0.7 -4.7 7.4 4.6 5.0 3.9 1.3
Latin America and the Caribbean 5.6 5.6 4.0 -2.1 5.6 4.1 4.3 1.6 0.2Brazil 4.0 6.1 5.1 -0.2 7.6 4.5 5.2 1.8 -1.1Mexico 4.9 3.3 1.5 -6.5 5.0 3.4 3.5 1.5 0.6
of which:
Least developed countries 7.6 8.1 6.7 4.0 5.2 5.5 5.7 -0.4 -0.1
Memorandum items:
World tradee 9.3 7.2 2.7 -11.4 10.5 6.6 6.5 .. ..World output growth with PPP-based weights 5.1 5.2 2.7 -0.8 4.5 4.0 4.4 0.6 0.0
Source: UN/DESA.
a Partly estimated.b Forecasts, based in part on Project LINK and baseline projections of the United Nations World Economic Forecasting Model.c See World economic situation and prospects as of mid-2010 (E/2010/73), available from http://www.un.org/esa/policy/wess/wesp2010files/
wesp10update.pdf.d Calculated as a weighted average of individual country growth rates of gross domestic product (GDP), where weights are based on GDP in 2005
prices and exchange rates.e Includes trade in goods and non-factor services. Previous WESP reports reported growth of merchandise trade only.

6 World Economic Situation and Prospects 2011
The economic recovery in Western Asia is also expected to moderate from 5.5 per cent in 2010 to 4.7 per cent in 2011 and 4.4 per cent in 2012. At this pace, average annual output growth will be below the rates prevailing in the years before the crisis. The fuel-exporting economies of the region have not levelled oil production after the cutbacks made in response to the global recession.
Economic recovery has been solid but below potential in most countries in Africa. In South Africa especially, the region’s largest economy, output growth remains sub-par as a result of, inter alia, weak manufacturing export growth. Elsewhere in the region, the economic recovery has been supported by the rebound in the demand for and prices of primary commodities as well as by increases in public investments in infrastructure, foreign direct investment (FDI) in extracting industries and improvements in conditions for agricultural production. In the outlook, the economic growth in the region is expected to remain somewhat below pre-crisis rates, averaging about 5.0 per cent for 2011-2012.
On the other hand, formidable challenges remain in the long-run development of many low-income countries. Although average per capita income growth for these coun-tries is expected to return to near pre-crisis rates in the outlook (figure I.2), it will not be sufficient to fully make up for the setbacks caused by the crisis. In particular, the recovery in many of the least developed countries (LDCs) will be below potential. Per capita income growth among LDCs is expected to reach about 3 per cent per annum during 2010 and 2011, which is well below the annual average of 5 per cent achieved during 2004-2007. The LDCs face diverging conditions. Bangladesh and the LDCs in East and Southern Africa are showing strong economic growth, while production in the Sahel, West Africa and parts of Asia is suffering either from adverse weather conditions or from fragile political and security situations, or both (see box I.2 for the economic prospects for the LDCs).
Overall, the number of countries experiencing declines in per capita income dropped significantly, from 52 in 2009 to 12 in 2010 (table I.2). During 2010, 45 developing
The recovery in least developed countries will
be below potential in the near term
Figure I.1Growth of the world economy, 2004-2012
Percentage change
4.0
3.6
4.1 4.0 3.5
1.6
-2.0
3.6
3.1
-3
-2
-1
0
1
2
3
4
5
2004 2005 2006 2007 2008 2009 2010a 2011b 2012b
Baseline
Optimistic
Pessimistic
Source: UN/DESA and Project LINK.
Note: See box I.1 for the baseline forecast
assumptions. The pessimistic scenario refers to a situation
of enhanced macroeconomic uncertainty in the outlook
(see box I.4), while the optimistic scenario is one of limited, but improved,
international policy coordination (see box I.5).
a Estimates.b United Nations forecast.

7Global outlook
Figure I.2Growth of GDP per capita, by level of development, 2000-2012
Percentage
-6.0
-4.0
-2.0
0.0
2.0
4.0
6.0
8.0
10.0
2000 2002 2004 2006 2008 2010 2012
Source: UN/DESA and Project LINK.
Lower middle income countries
Upper middle income countries
Least developed countries
High-income countries
Low-income countries
Prospects for the least developed countriesa
Most least developed countries (LDCs) have weathered the crisis relatively well owing to their limited exposure to the international financial system and, in the case of a number of non-fuel exporters, their relatively low exports-to-gross domestic product (GDP) ratios. Yet, none of the LDCs have been immune to the synchronized global slowdown, which depressed exports and reduced investment. The crisis has set back the progress made in these countries towards achieving the Millennium Development Goals (MDGs). The welfare losses suffered in late 2008 and early 2009 will be long-lasting, as nearly all LDCs will see a recovery well below pre-crisis growth rates in the outlook for 2011 and 2012. The outlook differs significantly across countries, however.
A number of LDCs have been severely affected by natural disasters. Haiti was hit by a catastrophic earthquake, with damage totalling about 120 per cent of the country’s GDP for 2009. Droughts in the Sahel have severely affected Chad, Mauritania and especially Niger, where up to half the population has faced acute food shortages. In Benin, months of heavy rain resulted in the worst flooding since 1963. Meanwhile, a number of countries, including Afghanistan, the Democratic Republic of the Congo, Haiti and Liberia, obtained some financial relief through debt relief or debt restructuring.
Economic activity in most LDCs improved in 2010 along with the recovery in interna-tional trade and the rebound in many commodity prices. In addition, growth in several economies was supported by increased government spending. Aggregate growth for the group will accelerate from 4.0 per cent in 2009—the lowest rate in over a decade—to about 5.5 per cent in 2010-2012, with significant divergence among the poorest and structurally handicapped nations (see figure). Nevertheless, growth will remain well below the annual average of 7.2 per cent during the period 2003-2008. In the five fuel-exporting LDCs, growth is forecast to decelerate from an annual average of 9.2 per cent in 2003-2008 to 4.6 per cent in 2010-2012, with oil output declining in Equatorial Guinea
Box I.2
a While the group of least developed countries (LDCs) includes 49 economies, only the 38 members for which macroeconomic data are available are covered here. For details on the definition of the category of LDCs, see http://www.un.org/esa/policy/devplan/.

8 World Economic Situation and Prospects 2011
and growth decelerating to about 5 per cent in Angola. By contrast, growth for fuel-importing LDCs will accelerate from 5.5 per cent in 2009 to 6.1 per cent in the outlook period, only marginally below the 6.3 per cent average during the period 2003-2008. Yet, these aggregate figures mask consider-able variation in both subgroups.
The economies of several LDCs in East and Southern Africa are expected to perform strongly in the near term, with GDP projected to grow at 6 per cent or more in 2011-2012. This ex-pectation is based in part on available macroeconomic policy space, improved governance and planned increases in public expenditures, especially infrastructure. GDP growth alone will not suffice to meet major development challenges. For example, in countries like Mozambique, despite high and sustained GDP growth for many years, food insecurity remains a central concern. It is likely that continuing food price hikes will lead to growing food security pressures in other LDCs as well.
Growth in most West African LDCs, except Liberia, will continue to be rather modest owing to severe gaps in infrastructure, especially insufficient power generation capacity and high transport costs, which are not expected to be overcome in the near term.
Bangladesh—the most populous LDC—proved to be relatively resilient to the finan-cial crisis owing to robust domestic demand, partly supported by increased government spending. During 2010, however, GDP growth was hampered by a slowdown in industrial output owing to energy shortages, slower growth in remittance inflows and, early in the year, a sharp deceleration in the garments sector as a result of weak demand from Europe and the United States. With investment spending expected to strengthen, GDP growth is forecast to pick up slightly, to 6.0 per cent in 2011 and 6.2 per cent in 2012.
Political instability and fragile security conditions are affecting economic develop-ment in a number of LDCs, including the Comoros, Eritrea, Haiti, Madagascar, Nepal, Somalia, Togo and Yemen. For these countries, any lasting progress in the medium run will ultimately depend on improved domestic stability and security. There are also concerns regarding the situation in many coastal West African LDCs (the Gambia, Guinea, Guinea-Bissau, Liberia, Senegal and Sierra Leone), where drug trafficking is undermining the security situation as well as efforts to strengthen govern-ance and the promotion of the rule of law.
As the recovery is proceeding at different speeds, all LDCs face two common downside risks. First, the slowdown and fiscal tightening in developed economies threaten to affect aid flows in the near term. Second, any deterioration in global food markets will accentuate the problem of food insecurity, particularly for the 21 LDCs that heavily depend on food aid.b
Box I.2 (cont’d) Divergence in economic performance in least developed countries, 2003-2011
Annu
al G
DP
grow
th ra
te in
per
cent
age
2003-2007 2008 2009 2010 2011
20
10
0
-10
b Food and Agriculture Organization of the United
Nations (FAO), “Countries in crisis requiring external
assistance for food”, Global Information and Early
Warning System (GIEWS), September 2010. Available
from http://www.fao.org/giews/english/hotspots/
index.htm (accessed on 28 October 2010).
Source: UN/DESA and Project LINK.
Note: The five horizontal bars, from bottom to top,
correspond to the minimum, the mean of the first quartile,
the median, the mean of the third quartile and the
maximum value of the inter- quartile range between the
third and first quartiles of the distribution of the observed
data. The outliers are represented by the dots.

9Global outlook
Table I.2 Frequency of high and low growth of per capita output, 2008–2012
Number of countries
monitored
Decline in GDP per capitaGrowth of GDP per capita
exceeding 3 per cent
2008 2009 2010a 2011b 2012b 2008 2009 2010a 2011b 2012b
Number of countries
World 160 29 95 20 11 7 72 21 59 66 73
of which:
Developed economies 35 16 33 6 5 2 6 0 4 6 8Economies in transition 18 0 10 2 0 0 15 3 10 12 15Developing countries 107 13 52 12 6 5 51 18 45 48 50
of which:
Africa 51 6 19 7 5 4 25 11 17 21 22East Asia 13 2 8 1 1 1 4 3 12 11 12South Asia 6 2 0 0 0 0 4 2 3 3 3Western Asia 13 1 8 0 0 0 7 1 3 4 5Latin America 24 2 17 4 0 0 11 1 10 9 8
Memorandum items:
Commonwealth of Independent States 12 0 5 1 0 0 10 3 10 11 11Least developed countries 39 5 13 8 5 4 20 8 9 15 15Sub-Saharan Africac 44 6 17 7 5 4 21 9 13 17 17Landlocked developing countries 25 2 8 2 1 1 17 8 13 12 14Small island developing States 17 4 7 3 1 1 7 2 4 6 5
Shared Percentage of world populationd
Developed economies 15.3 11.3 14.4 1.3 1.1 0.2 1.2 0.0 2.1 0.9 1.4Economies in transition 4.7 0.0 3.4 0.1 0.0 0.0 3.6 0.6 4.1 4.3 4.5Developing countries 80.0 6.1 17.4 1.5 0.4 0.4 61.5 50.3 65.9 63.8 65.5
of which:
Africa 14.3 1.1 3.5 0.9 0.4 0.4 9.8 5.2 7.8 8.3 8.3East Asia 29.9 0.1 4.0 0.0 0.0 0.0 25.2 25.1 29.9 28.6 29.9South Asia 24.3 3.9 0.0 0.0 0.0 0.0 21.6 21.1 21.7 22.0 22.3Western Asia 3.0 1.1 2.1 0.0 0.0 0.0 0.7 0.1 1.2 1.5 1.9Latin America 8.5 0.2 7.8 0.6 0.0 0.0 5.2 0.0 6.8 5.2 5.2
Memorandum items:
Commonwealth of Independent States 4.3 0.0 3.1 0.1 0.0 0.0 3.3 0.6 4.1 4.2 4.3Least developed countries 11.1 0.5 2.1 1.0 0.4 0.4 8.2 4.7 6.2 7.1 6.5Sub-Saharan Africac 8.9 1.1 2.6 0.9 0.4 0.4 5.8 2.6 3.7 4.3 3.8Landlocked developing countries 5.1 0.3 0.8 0.3 0.2 0.2 3.9 2.8 3.3 3.0 3.2Small island developing states 0.8 0.3 0.2 0.2 0.0 0.0 0.5 0.0 0.3 0.3 0.4
Source: UN/DESA, including population estimates and projections from World Population Prospects: The 2008 Revision.
a Partly estimated.b Forecast, based in part on Project LINK and baseline projections of the United Nations World Economic Forecasting Model.c Excluding Nigeria and South Africa.d Percentage of world population for 2005.

10 World Economic Situation and Prospects 2011
countries achieved per capita growth rates of 3 per cent or more, which is sometimes consid-ered the minimum rate needed to facilitate substantial poverty reduction. In comparison, before the crisis in 2007, there were 68 developing countries with welfare increases above that threshold. In sub-Saharan Africa, 13 countries registered per capita growth of more than 3 per cent in 2010, compared with 23 in 2007. In the outlook, 48 developing countries are expected to have per capita growth of more than 3 per cent in 2011, and 50 in 2012.
Outlook for employment
Next to the continued financial fragility in developed countries, the lack of remunera-tive employment growth is probably the weakest link in the recovery. Between 2007 and the end of 2009, at least 30 million jobs were lost worldwide as a result of the global financial crisis.1 Even this number most likely underestimates the true depth of the jobs crisis, since it is based on official labour statistics, which in many developing countries only account for formal sector employment in urban areas and hence may not include those pushed into precarious employment in the informal sector or underemployment in low-productivity rural economic activities. Owing to the below-potential pace of output growth in the recovery—particularly in developed economies—which barely matched the natural growth rate of the labour force, few new jobs have been created to hire back those workers who have been laid off. Meanwhile, as more Governments are embarking on fiscal tightening, including tax hikes and spending cuts, the prospects for a fast recovery of employment look even gloomier.
Only a few developed economies, such as Australia and Germany, have seen a discernable improvement in labour markets. In the United States, the labour market improved slightly in early 2010, only to falter again later, in particular as state and local Governments started to lay off workers. The unemployment rate may increase to 10 per cent in early 2011, up from 9.6 per cent in the third quarter of 2010. All projections indi-cate that it will take more than a few years before the unemployment rate in the United States falls to its pre-crisis level.
In the euro area, despite improvements in Germany’s job market, the average unemployment rate has continued to drift upwards, reaching 10.1 per cent in 2010, up from 7.5 per cent before the crisis. In Spain, the unemployment rate more than doubled, to 20.5 per cent. It also increased dramatically in Ireland, where it reached 14.9 per cent in 2010, and in other countries in the region. In France, unemployment edged up along aver-age lines for the euro area. In the outlook, unemployment in Europe is expected to come down at only a snail’s pace. In Japan, the improvement in the labour market was marginal during 2010, with the unemployment rate expecting to remain above 5 per cent in 2011.
A “jobless” recovery such as the one being faced at present by the developed countries is not uncommon in the recent history of the business cycle. However, the time needed for employment levels to recover to pre-recession levels has become successively longer. Data for the United States indicate that after each recession during the 1950s and 1960s it took about one year to recover the jobs lost in the downturn. In the 1970s and 1980s, it took between one and two years, but after the recession of the early 1990s and after the 2001 dotcom crisis, the period for job recovery lengthened to two and a half years or more (figure I.3). Today’s Great Recession, however, has caused a faster and steeper rise
1 See International Monetary Fund (IMF) and International Labour Organization (ILO), “The challenges of growth, employment and social cohesion”, discussion document from the Joint ILO-IMF conference in cooperation with the office of the Prime Minister of Norway, 13 September 2010, Oslo, Norway. Available from http://www.osloconference2010.org/discussionpaper.pdf.
Thirty million jobs have been lost worldwide because of the crisis
It may take several years for employment to return
to pre-crisis levels in developed economies

11Global outlook
in the rate of unemployment in the United States than in any previous downturn. It has already been three years since employment started to fall in 2007, longer than any previous episode, and it is yet to see any significant recovery. At the present pace of job recovery, it will take many more years for employment to be back at pre-crisis levels.
A few interrelated factors explain the lagging recovery in the job markets of major developed economies. First, the pace of GDP growth in the recovery phase has become less and less robust after each business cycle. Second, rapid technological progress, along with structural economic change, especially in the form of a smaller share of manufacturing and a larger share of services in the economy, explain why purely cyclical movements have become less important than structural factors in determining the upward and downward swings in developed economies. In earlier business cycle episodes, workers who lost jobs during the downturn would, for the most part, be able to regain employment relatively quickly in the upturn in the same sector, if not the same company, in which they had been work-ing. Nowadays, however, more and more job losses during the downturn tend to become permanent, forcing the unemployed to find jobs in other sectors during the recovery. This often means workers have to acquire different skills, and ones that are highly dependent upon the development of new industrial sectors in the economy. In addition, the history of financial crises suggests that when a recession is caused or accompanied by a banking crisis, the recovery of output, employment and real wages is much more protracted.
The longer term employment consequences of the present crisis are already becoming visible. Workers have been without a job for more time, and in some coun-tries youth unemployment has reached alarming heights. The share of the structurally or long-term unemployed has increased significantly in most developed countries since 2007. In the United States, for instance, the share of workers who have been unemployed for 27 weeks or more has been rising at a disturbing pace during 2010; about half of the
Long-term unemployment is rising and youth unemployment is reaching alarming heights
Figure I.3Post-recession employment recovery in the United States, 1973, 1980, 1981, 1990, 2001 and 2007
Percentage
-7
-6
-5
-4
-3
-2
-1
0
1
0 6 12 18 24 30 36Number of months from start of recession
Deg
ree
of e
mpl
oym
ent b
elow
(-) o
r abo
ve (+
) pre
-rec
essio
n le
vel
2007
198119731980 2001 1990
Source: UN/DESA calculations, based on data from U.S. Department of Labor, Bureau of Labor Statistics (www.bls.gov/ces).Note: Data refer to “civilian employment”, seasonally adjusted, for workers 16 years of age and older.

12 World Economic Situation and Prospects 2011
workers without a job are now in that position. The situation is equally worrisome in many European countries.
Unemployment and underemployment rates are very high among young peo-ple (15 to 24 years of age), both in developed and developing regions. At the end of 2009, there were an estimated 81 million unemployed young people, and the rate of global youth unemployment stood at 13.0 per cent, having increased by 0.9 percentage points from 2008. This represents a significant acceleration compared with the 0.6 percentage point increase seen in the rate of youth unemployment between 1998 and 2008.
Persistent high unemployment, stagnant or declining real wages and subdued output recovery can push the economy into a vicious circle and entrap it in a protracted period of below-potential growth, or, in some cases, it may even cause a double-dip reces-sion. High unemployment and lower real wages will constrain the recovery in household consumption, which in turn will drag output growth; below-potential output growth will, for its part, constrain employment growth. The longer this vicious circle lasts, the higher the risk of “cyclical” unemployment becoming “structural”, thereby impairing potential growth of the economy in the longer run. For younger workers who stay without a job for a prolonged period, the likely implications will seriously jeopardize future earnings opportunities as a result of their being deprived of years of working experience.
Workers in developing countries and economies in transition have been se-verely affected by the crisis also, though the impact in terms of job losses emerged later and was much more short-lived than in developed countries. Most job losses occurred in export sectors and were greatest during the last quarter of 2008 and the first quarter of 2009 when global trade collapsed. Where domestic demand was also affected, further job losses oc-curred in other parts of the economy, especially in construction. The impact on aggregate unemployment rates was softened by the absorption of many workers into the informal sectors and, in fact, even allowed aggregate employment levels to continue to grow during 2009, albeit only weakly. The consequence is that while the impact on open unemploy-ment rates has been muted, many more workers have ended up in vulnerable jobs with lower pay. The International Labour Organization (ILO) estimates that the proportion of workers earning less than $2 per day increased by 3 percentage points, implying that the number of working poor increased by about 100 million during 2009 (figure I.4).
With the recovery in production, employment also started to rebound in many developing countries and economies in transition from the second half of 2009. Improvements in employment conditions are also noticeable in some CIS countries, includ-ing Belarus, the Russian Federation and Kazakhstan. In East Asia, the strong economic growth in the first half of 2010 was reflected in a visible decline in unemployment rates. Job growth was strongest in the manufacturing, construction and services sectors. By the end of the first quarter of 2010, unemployment rates had already fallen back to pre-crisis levels in most East Asian economies. Employment levels were also back up to pre-crisis levels by the first quarter of 2010 in a number of other developing countries, including Argentina, Brazil, Chile, Colombia, Egypt, Mexico, Peru, the Philippines and Turkey.
Despite this rebound in employment in parts of the world during 2010, the global economy would still need to create at least another 22 million new jobs in order to return to the pre-crisis level of global employment. At the current speed of the recovery, this would take at least five years, according to recent estimates by the ILO.2 This is al-most entirely on account of the weak recovery in advanced countries and the increasingly structural nature of unemployment in those countries.
2 ILO, World of Work Report 2010: From one crisis to the next? (Geneva: International Institute for Labour Studies).
High unemployment is the Achilles heel of the recovery
in developed economies
Recovery of employment has been faster in
developing countries
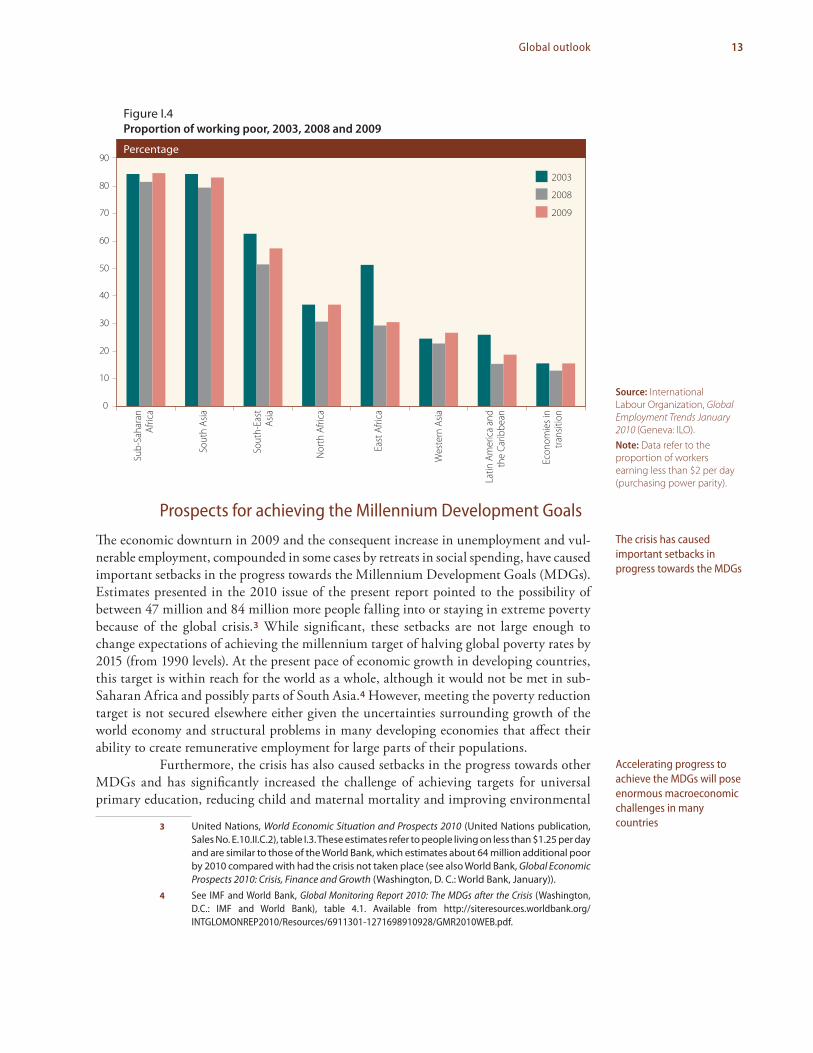
13Global outlook
Prospects for achieving the Millennium Development Goals
The economic downturn in 2009 and the consequent increase in unemployment and vul-nerable employment, compounded in some cases by retreats in social spending, have caused important setbacks in the progress towards the Millennium Development Goals (MDGs). Estimates presented in the 2010 issue of the present report pointed to the possibility of between 47 million and 84 million more people falling into or staying in extreme poverty because of the global crisis.3 While significant, these setbacks are not large enough to change expectations of achieving the millennium target of halving global poverty rates by 2015 (from 1990 levels). At the present pace of economic growth in developing countries, this target is within reach for the world as a whole, although it would not be met in sub-Saharan Africa and possibly parts of South Asia.4 However, meeting the poverty reduction target is not secured elsewhere either given the uncertainties surrounding growth of the world economy and structural problems in many developing economies that affect their ability to create remunerative employment for large parts of their populations.
Furthermore, the crisis has also caused setbacks in the progress towards other MDGs and has significantly increased the challenge of achieving targets for universal primary education, reducing child and maternal mortality and improving environmental
3 United Nations, World Economic Situation and Prospects 2010 (United Nations publication, Sales No. E.10.II.C.2), table I.3. These estimates refer to people living on less than $1.25 per day and are similar to those of the World Bank, which estimates about 64 million additional poor by 2010 compared with had the crisis not taken place (see also World Bank, Global Economic Prospects 2010: Crisis, Finance and Growth (Washington, D. C.: World Bank, January)).
4 See IMF and World Bank, Global Monitoring Report 2010: The MDGs after the Crisis (Washington, D.C.: IMF and World Bank), table 4.1. Available from http://siteresources.worldbank.org/INTGLOMONREP2010/Resources/6911301-1271698910928/GMR2010WEB.pdf.
The crisis has caused important setbacks in progress towards the MDGs
Accelerating progress to achieve the MDGs will pose enormous macroeconomic challenges in many countries
Figure I.4Proportion of working poor, 2003, 2008 and 2009
Percentage
0
10
20
30
40
50
60
70
80
90
Sub-
Saha
ran
Afric
a
Sout
h As
ia
Nor
th A
frica
East
Afri
ca
Wes
tern
Asia
Latin
Am
eric
a an
dth
e Ca
ribbe
an
Sout
h-Ea
stAs
ia
Econ
omie
s in
trans
ition
2003
2008
2009
Source: International Labour Organization, Global Employment Trends January 2010 (Geneva: ILO).Note: Data refer to the proportion of workers earning less than $2 per day (purchasing power parity).

14 World Economic Situation and Prospects 2011
and sanitary conditions. Despite increasing fiscal constraints, many Governments in de-veloping countries made laudable efforts during the crisis to protect the most vulnerable by directing a significant proportion of stimulus measures at pro-poor and social protection programmes.5 Countries that managed to do so, such as Bolivia and Ecuador, were able to mitigate the impact of the crisis on education and health outcomes, but nonetheless could not avoid certain setbacks. Accelerating progress towards the MDGs has become more costly as a consequence, both in these cases and even more so in countries that did not manage to protect social spending during the crisis (see box I.3). The requirements for stepping up economic growth and social spending had posed significant macroeconomic challenges even before the crisis, but they have become all the more pressing in cases where setbacks have been the greatest. In Nicaragua, for instance, additional spending requirements for education, health, water and sanitation have increased to about 11 per cent of GDP annually between 2010 and 2015 in order to meet the MDG targets, up from 8 per cent of GDP in a scenario absent the impact of the global crisis. In Ecuador, the additional requirements are significantly less, despite a stronger drop in GDP growth, as the Government managed to protect social spending better during the crisis.
5 See, for instance, Yongzheng Yang and others, Creating Policy Space in Low-Income Countries during the Recent Crises (Washington, D. C.: IMF, 2009), which shows that in 16 out of 19 low-income countries an average of about 24 per cent of the total announced fiscal stimulus was directed at pro-poor and social protection programmes.
Impact of the crisis and macroeconomic challenges to meeting the Millennium Development Goals
Slower or negative per capita income growth has undoubtedly caused setbacks in the progress towards the Millennium Development Goals (MDGs) in many developing countries. How much? That is more difficult to answer as it depends on country conditions. Slower growth affects household incomes and job creation, which will have a direct impact on income poverty (MDG1). But some parts of the economy, such as export sectors, have been hit harder than others in most economies, and the degree of the impact will also depend on how many poor find employment in export activities or how much an expansion of informal sector employment pushes down the average remuneration in that part of the economy. Less income will also affect access to social services and hence progress towards the other MDGs. But that impact will further depend on the fiscal space countries have to protect spending on education, health and basic sanitation during the crisis. In cases where setbacks were unavoidable, accelerating progress to meet the MDGs by 2015 will provide an even greater chal-lenge for spending strategies and macroeconomic policies. To take account of all the interactions at work, to estimate the macroeconomic costs of achieving the MDGs and to evaluate alternative financing strategies, an economy-wide macro-micro framework was applied to a reasonable number of developing countries.a As indicated in the body of the chapter, the macroeconomic challenges of accelerating progress towards the MDGs differ widely across countries. This is illustrated further by the six country cases discussed below.
Under a scenario of the observed impact of the crisis on output growth and govern-ment spending during 2008-2010 and a projected slow and gradual economic recovery towards 2015, Nicaragua and the Philippines would suffer a setback of 2 percentage points in poverty reduction, whereas Bolivia, Ecuador and Kyrgyzstan would experience a setback of about 1 percentage point (see table). In the case of Uzbekistan, setbacks for all of the MDGs have been minimal as the country barely suffered any downturn and was thus able to sustain spending towards the MDGs. In the other countries, differences in the impact on projected outcomes for primary school completion rates, child and maternal mortality and access to drinking water and sanitation by 2015 can be attributed in part to different responses to adjusting social spending during the crisis. Bolivia and Ecuador managed to
Box I.3
a For a description of the methodology, see Marco
V. Sánchez and others, Public Policies for Human
Development (London: Palgrave, 2010), chapters
1 and 3. The country-level analysis was conducted by national researchers
and government experts with technical support
from the Department of Economic and Social Affairs
of the United Nations (UN/DESA) and the World
Bank. The methodology involves, inter alia, a
detailed microeconomic analysis of determinants of MDG achievement, which
is used as an input to a dynamic economy-wide
modelling framework called MAMS (MAquette for MDG
Simulations).

15Global outlook
protect spending better than Kyrgyzstan and the Philippines, where setbacks have been relatively larger. Based on announced social spending plans, in Nicaragua the impact may have been less severe (as shown in the table), than in a situation where social spending had been scaled down.
In the face of these setbacks, the Governments of Ecuador, the Philippines and Nicaragua would need to spend an additional 1.0-1.5 per cent of GDP per year between 2010 and 2015 in order to meet the MDG targets for education, health and basic services, compared with the pre-crisis scenario (see figure). In the cases of Bolivia and Kyrgyzstan, the additional cost of achieving these MDGs would be 0.7 per cent and 0.5 per cent of GDP, respectively; the extra cost would be negligible in the case of Uzbekistan. While these additional costs may seem manageable, they come
Box I.3 (cont’d)Impact of the crisis on MDG achievement by 2015, selected countries
Percentage point increase in the gap towards the 2015 target, unless otherwise indicated
Bolivia Ecuador Nicaragua Kyrgyzstan Uzbekistan Philippines
MDG 1: Poverty (income less than $1.25 a day, PPP) 0.8 0.8 2.2 1.3 n.a. 2.1MDG 2: Completion rate of primary education 0.6 2.4 0.3 0.1 0.1 6.4MDG 4: Child mortality (deaths per 1,000 live births) 1.7 1.3 1.3 3.2 0.1 1.4MDG 5: Maternal mortality (deaths per 1,000 live births) 8.0 6.1 4.7 5.3 0.1 12.0MDG 7a: Access to drinking water 0.9 2.1 0.5 0.0 0.1 1.8MDG 7b: Access to basic sanitation 2.2 4.8 1.8 1.8 0.2 0.7
Source: UN/DESA, based on simulation results using the MAMS modelling framework adapted to each country context. The original country models were adapted specifically to each context by national researchers and government experts, with technical support provided by UN/DESA and the World Bank.
Additional public spending needed to achieve MDG targets for education, health and water and sanitation by 2015
Percentage of GDP; average annual cost for 2010-2015
1.0
1.1
0.5
0.7
1.5
0.2
0.0 2.0 4.0 6.0 8.0 10.0
Nicaragua
Bolivia
Kyrgyzstan
Uzbekistan
Ecuador
PhilippinesPre-crisis
Crisis
Source: UN/DESA, based on simulation results using the MAMS modelling framework adapted to each country context. The original country models were adapted specifically to each context by national researchers and government experts, with technical support provided by UN/DESA and the World Bank.

16 World Economic Situation and Prospects 2011
Unfortunately, the mood for fiscal tightening also seems to be taking hold in many developing countries, even in those with a policy intention of safeguarding “priority” social spending.6 This is a worrying trend, particularly where GDP growth is moderating because of weaker export growth and continued weak domestic demand, and also because protecting social spending is not the same as the significant expansion needed in most countries that still display large shortfalls in MDG achievement. The difficulties in most low-income countries in sustaining (or increasing) expenditure patterns has thus far been caused mainly by substantial declines in tax revenue rather than major declines in official
6 A recent study by UNICEF concluded that real government expenditure in about one quarter of 126 developing countries is expected to contract in 2010-2011 (see Isabel Ortiz and others, “Prioritizing expenditures for a recovery for all: A rapid review of public expenditures in 126 developing countries”, Social and Economic Policy Working Paper (New York: United Nations Children’s Fund (UNICEF), 2010)). Moreover, another study has found that two thirds of the 56 low-income countries surveyed are cutting budget allocations in 2010 to one or more “priority” pro-poor sectors, which include education, health, agriculture and social protection (see Katerina Kyrili and Matthew Martin, “The impact of the global economic crisis on the budgets of low-income countries”, research report for Oxfam International (Oxford, United Kingdom: Oxfam GB, July 2010)).
on top of the already considerable MDG spending requirements prior to the crisis (given pre-existing shortfalls). As a result, the challenge for Nicaragua would be to increase spending for education, health and basic services by 9.5 per cent of GDP during 2010-2015. The required efforts would be of a similar magnitude in Bolivia and Kyrgyzstan, while in Ecuador, the Philippines and Uzbekistan the estimated additional macroeconomic costs in these policy simulations would be in the order of 3.0-5.0 per cent of GDP. Such impacts may be even larger in many countries that are poorer than these lower middle income countries. Clearly, additional costs of this magnitude may stretch government finances and could lead to steep increases in public debt or demand infeasible increases in domestic tax burdens. The situation would be even more pronounced absent a simultaneous acceleration of economic growth.
The additional government spending for the achievement of the MDGs could have a counter-cyclical impact. Further analysis shows, however, that without a broader set of accom-panying growth-stimulating policies, even large increases in social spending may be partially off-set by macroeconomic trade-offs. For instance, in a scenario where all additional spending was financed through foreign borrowing (as assumed in the simulations discussed above) significant real exchange-rate appreciation would have a negative impact on export and investment growth. Similar macroeconomic trade-offs would be induced if additional aid inflows covered the additional costs of achieving the MDGs. In alternative financing scenarios in which the tax burden were increased or the Government were to borrow on domestic capital markets, private consumption or investment spending, or both, would be affected and thus lower the aggregate growth effects. Such trade-offs tend to be stronger where the MDG spending strategy is not accompanied by productivity improve-ments. Better education and health outcomes are likely to have a positive impact on overall labour productivity. However, as assumed in the present analysis, such an impact is not likely to take shape in the short run. Education cycles are long and today’s improvements in the health status of the young will take time before they translate into higher labour productivity. Much of the productivity growth effects of additional action taken today to accelerate progress towards the MDGs will likely take effect after 2015. The MDG strategy may thus pose important intertemporal macroeconomic trade-offs. These would need to be addressed by broader economic policies that strengthen employment and productivity growth, such as infrastructure investments, credit policies and other support measures fostering investments in economic diversification and counteracting exchange-rate appreciation. Such policies would further need the support of an enabling external environment, especially in the form of a stronger recovery of export demand. This in turn, however, will require strengthened international policy coordination, as discussed in the body of the chapter.
Box I.3 (cont’d)

17Global outlook
development assistance (ODA). However, the outlook for more generous aid delivery in the near future is sombre, and this will make the achievement of the MDGs all the more challenging in many developing countries.
Continued low inflation
Inflation is expected to remain low worldwide during 2010-2012 (annex tables A.4-A.6). Except for a few Asian developing economies, inflation should not be of much concern to policymakers in most countries in the near outlook.
In several developed economies, aggregate price levels actually declined (defla-tion) during the nadir of the recession in 2009, but with the recovery in aggregate demand, inflation returned, though at low levels. During 2010, inflation ranged between 1 and 2 per cent in most developed countries. Deflation persists in Japan, however.
With the huge amounts of liquidity provided by the central banks of developed countries, the extremely low interest rates and the widening government deficits, some analysts have been warning of risks of escalating inflation. However, not only have the current rates of headline inflation stayed at very low levels despite the massive monetary expansion, inflationary expectations, as measured by inflation-indexed bonds and various business surveys, also remain muted. As explained in the section on policy challenges be-low, much of the liquidity provided by the central banks has been retained in the banking system, with hardly any growth in credit supplies to the real economy. The stagnation in credit growth, along with wide output gaps and elevated unemployment in most developed economies, should give rise to little concern that inflation would escalate much in the near future. Moreover, central banks in developed economies have already announced plans to withdraw liquidity once the recovery has matured in order to pre-empt any surge in inflation.
Among developing countries and economies in transition, South Asia is a cause for some concern as regards inflation. Consumer price inflation is expected to average 11.0 per cent in 2010 in this subregion. The continuing strong inflationary pressures in most countries of the region reflect a combination of supply- and demand-side factors. These include higher fuel prices, partly as a result of reduced subsidies, strong demand for manu-factured goods and rapidly rising food prices, which account for a large share of consumer price indices. While food price inflation has eased somewhat in the second half of 2010 owing to good harvests, it has still pushed the general price level higher. In India, the central bank continues to be particularly concerned with inflation, which has remained persistently high despite significant monetary tightening in 2010. In Pakistan, consumer price inflation increased sharply in the second half of the year as the disastrous floods of July and August destroyed crops and rural infrastructure, leading to food shortages and driving up food prices further. Rapidly rising food prices have also exerted upward pressure on consumer prices in some East Asian economies, most notably in China, where authorities have started to reduce the monetary stimulus injected during the financial crisis. In other developing regions, inflation rates have also increased during 2010, but only modestly, such that inflation is still below pre-crisis levels.
Inflation poses no present danger…
…except in parts of South Asia
18 World Economic Situation and Prospects 2011
International economic conditions for developing countries and economies in transition
Returning, but risky, capital flows
During 2010, net private capital inflows to emerging economies7 continued to recover from their precipitous decline in late 2008 and early 2009. A better economic performance of emerging economies has been conducive to the recovery of private inflows. In addition, the extremely low nominal interest rates and unprecedented scale of quantitative easing in major developed economies have led international investors to relocate funds towards emerging markets in search of higher returns. The expectations of currency appreciation in emerging economies and improved prospects for the prices of primary commodities that many emerging economies export have heightened perceptions of much higher profit-ability in these markets, and much of the increase in financial flows appears to be short term and speculative in nature.
Net private inflows to these economies are estimated to be above $800 billion in 2010, a more than 30 per cent increase from the previous year, though still about $400 billion lower than the pre-crisis peak levels registered in 2007. The momentum of the capital inflows to these economies tapered off somewhat in late 2010, and the outlook for 2011 is for only a slight increase in the inflows.
FDI inflows remain the largest component, accounting for more than 40 per cent of the total inflows to emerging economies in 2010. However, the increase in in-flows of portfolio equity has been strongest among the different types of capital flows and increased by 25 per cent in 2010. While inflows of portfolio equity to Asia account for the lion’s share, the rebound in inflows to Latin America has also been particularly strong, doubling the amount of inflows received in 2009. In the outlook for 2011, some moderation is expected. An important part of the increase in equity inflows in 2010 was related to a reallocation in the portfolios of major institutional investors, including pen-sion funds, which some observers expect to be a “one-off” adjustment, moderating the prospect of any large increases in the near outlook. The appetite for investing in emerging markets may also moderate because those equities now look more expensive than they did a year ago. Yet, the prospects for private capital flows remain subject to great uncertainty given the risks of further exchange-rate instability and global monetary conditions, as discussed below.
International bank lending to emerging economies also resumed in 2010 after negative net flows in 2009. Even so, the share of bank lending in total private capital flows to emerging markets is still far below that of the pre-crisis period and reflects the ongoing process of deleveraging in international banks. Non-bank lending has recovered more vigorously, as both private and public sectors in emerging economies managed to increase issuance of bonds in developed countries and take advantage of low interest rates. With the improved outlook in emerging markets and positive perceptions of investors, the external financing costs for emerging economies have fallen back to pre-crisis levels.
While private capital returned, emerging economies also significantly stepped up their own investments abroad. Direct investments from countries like China continued
7 The reference is to a group of some 30 developing countries and economies in transition, which are well integrated into the global economy through trade and finance linkages. For more details, see Institute of International Finance, “Capital flows to emerging market economies”, IIF Research Note, 4 October 2010. Available from http://www.iif.com/press/press+161.php.
A surge in private capital flows is posing policy concerns in emerging
economies
Capital outflows from emerging markets continue
to increase…

19Global outlook
to increase and private residents in emerging markets sought safe havens in assets abroad. Outflows fell in 2009, to increase again in 2010 and 2011. New FDI by firms established in emerging economies, destined especially towards commodity production in other de-veloping countries, explain a large part of the increase.
In addition, developing countries and economies in transition have continued to accumulate foreign-exchange reserves in 2010, adding about $500 billion to the total of $5.4 trillion by the end of 2009. A large proportion was accumulated by developing coun-tries in Asia, particularly China, which is holding about $2.6 trillion in foreign-exchange reserves. During the trough of the crisis, the last quarter of 2008 and the first of 2009, developing countries tapped into this buffer, and reserve holdings dropped by about $300 billion in the aggregate (figure I.5). The recovery of exports and the subsequent return of capital flows facilitated the resumption of the growth in reserve holdings.
Many low-income economies have weaker policy buffers and limited access to capital markets. As detailed in chapter III, stagnation in flows of ODA and shortfalls in the delivery on commitments made by donor countries to increase those flows in support of the achievement of the MDGs, estimated at $20 billion in 2010, are limiting scope for counter-cyclical responses in low-income countries. The shortcomings in ODA delivery were compensated to some degree through increased funding and reform of multilateral financial facilities.8 In January 2010, countries that qualified to draw on concessional re-sources obtained enhanced access to International Monetary Fund (IMF) facilities under much simplified conditions. By 30 April 2010, 30 low-income countries had arranged concessional IMF programmes totalling almost $5 billion, up from $0.2 billion in 2007. Multilateral development banks also sharply boosted their lending. While the majority of
8 United Nations, MDG Gap Task Force Report 2010: The Global Partnership for Development at a Critical Juncture (United Nations publication, Sales No. E.10.I.12).
…as do their reserve holdings
Figure I.5Foreign reserve accumulation by developing countries, first quarter 2007-second quarter 2010
Trillions of US dollars
20082007 2009 2010
0.0
1.0
2.0
3.0
4.0
5.0
6.0
I II III IV I II III IV I II III IV I II
Use of reservesduring trough
of crisis
Other developing countries
China
Source: IMF, Statistics Department COFER database; and International Financial Statistics.

20 World Economic Situation and Prospects 2011
their outlays were non-concessional, there were very significant increases in concessional lending as well. In particular, the International Development Association of the World Bank committed $14 billion in loans in 2009, a 20 per cent increase over 2008, to be disbursed over several years.
Rebounding world trade, volatile commodity prices
World trade continued to recover in 2010, but the momentum of the strong growth observed in the first half of the year started to peter out in the second. The volume of exports of many emerging economies, including Brazil, China, India and other developing economies in Asia, have already recovered to, or beyond, pre-crisis peaks. In contrast, exports of developed economies have not yet reached full recovery and were still 8 per cent below the pre-crisis peaks seen in the third quarter of 2010 (figure I.6). In the outlook, world trade is expected to grow by about 6.5 per cent in 2011 and 2012, moderating from the 10.5 per cent rebound in 2010.
At the height of the crisis, the value of imports of the European Union (EU), Japan and the United States plummeted by almost 40 per cent between July 2008 and April 2009 and triggered the worldwide collapse in international trade.9 Despite the gradual recovery of the past two years, the value of imports of the three largest developed economies was still about 25 per cent below pre-crisis peaks by August 2010. The export recovery in these economies is mirrored in the fast growth of imports by countries in East Asia and Latin America. For instance, in China the contribution of net exports to GDP
9 The volume of imports of the three major developed economies fell by about 18 per cent during that period, compounded by a decline of about 24 per cent in import prices. These estimates are based on the same source as that for figure I.6.
The rebound in world trade decelerated during 2010
Figure I.6Volume of world merchandise trade, January 2005-August 2010
Index, 2005=100
2005 2006 2007 2008 2009 2010
Jan
May
Sep
Jan
May
Sep
Jan
May
Sep
Jan
May
Sep
Jan
May
Sep
Jan
May
Emerging economies
Developed economies
World
80
90
100
110
120
130
140
150
Source: CPB Netherlands Bureau for Economic
Policy Analysis.

21Global outlook
growth was negative during 2010, implying that the contribution of China’s net imports to GDP growth in the rest of the world has been positive.
The question is, however, whether emerging economies can continue to act as the engines of world trade growth in the outlook. As discussed in the previous section, there is reason not to be overly optimistic in this regard. The dynamics of the initial phase of the recovery seems to be fading, especially as growth in developed countries remains sluggish. Without a stronger recovery in import demand from developed economies, ex-port growth of developing countries is also bound to slow, given their continued high dependence on advanced country markets. Furthermore, as some major surplus countries, like China, are reorienting growth to rely more on domestic demand, growth of import demand is likely to slow given the lower import propensity of domestic demand compared with that of export production.
The value of world trade received a boost as most commodity prices have re-bounded. The world price of crude oil fluctuated at about $78 per barrel during 2010, up from an average of $62 for the year 2009. In the outlook for 2011, global oil demand is expected to increase further, but at a more moderate pace than in 2010. Most of the demand growth will continue to come from emerging economies, especially China and India. The efforts towards achieving greater energy efficiency in these countries are being offset by the economic expansion and higher living standards which keep up the demand for fossil-fuel based energy. In contrast, oil demand in developed economies is expected to register a modest decline, owing to the combination of subdued economic growth and further efficiency gains, as well as the progressive substitution of conventional fuel with ethanol and other biofuels.
On the supply side, fuel-producing countries that are not members of the Organization of the Petroleum Exporting Countries (OPEC) are expected to post a small increase in output in 2011, driven by oil production increases in Brazil, Azerbaijan and Colombia. These expansions will outweigh the fall in production among oil producers in advanced economies, mainly caused by the decline in output from maturing oil fields in Europe. OPEC producers, however, retain ample spare output capacity. As a result, oil prices are expected to decrease somewhat in 2011, to fluctuate at about $75 per barrel, and to edge up to about $80 per barrel in 2012.
World prices of metals followed a similar trend in 2010, being sensitive to changes in the prospects for output growth in emerging economies, especially China. China’s demand for copper, aluminium and other base metals is estimated to account for about 40 per cent of the world total. In the outlook for 2011 and 2012, global demand for metals is expected to stabilize at 2010 levels, partly reflecting sluggishness in world investment demand. No major changes in supply conditions are expected in the short run. Consequently, metal prices are expected to edge up only slightly in 2011 and 2012.
Food prices declined during the first half of 2010, but rebounded in the second. World food prices are much more sensitive to changes in supply conditions than those of demand. The expansion of global acreage in response to higher prices during 2005-2008 and favourable weather patterns in key producing areas helped increase global food sup-plies considerably during 2009 and early 2010. In mid-2010, however, drought and fires in the Russian Federation, Ukraine and, to a lesser extent, North America affected the harvests of basic staples, especially wheat, leading to a spike in prices for these crops. The spike was short lived, in part because of ample availability in global wheat inventories and because the Russian Federation and Ukraine have only minor shares in global wheat trade. Speculation in wheat markets thus seems to have had a strong influence on grain
Financial market trends are exacerbating the volatility in food and other commodity prices
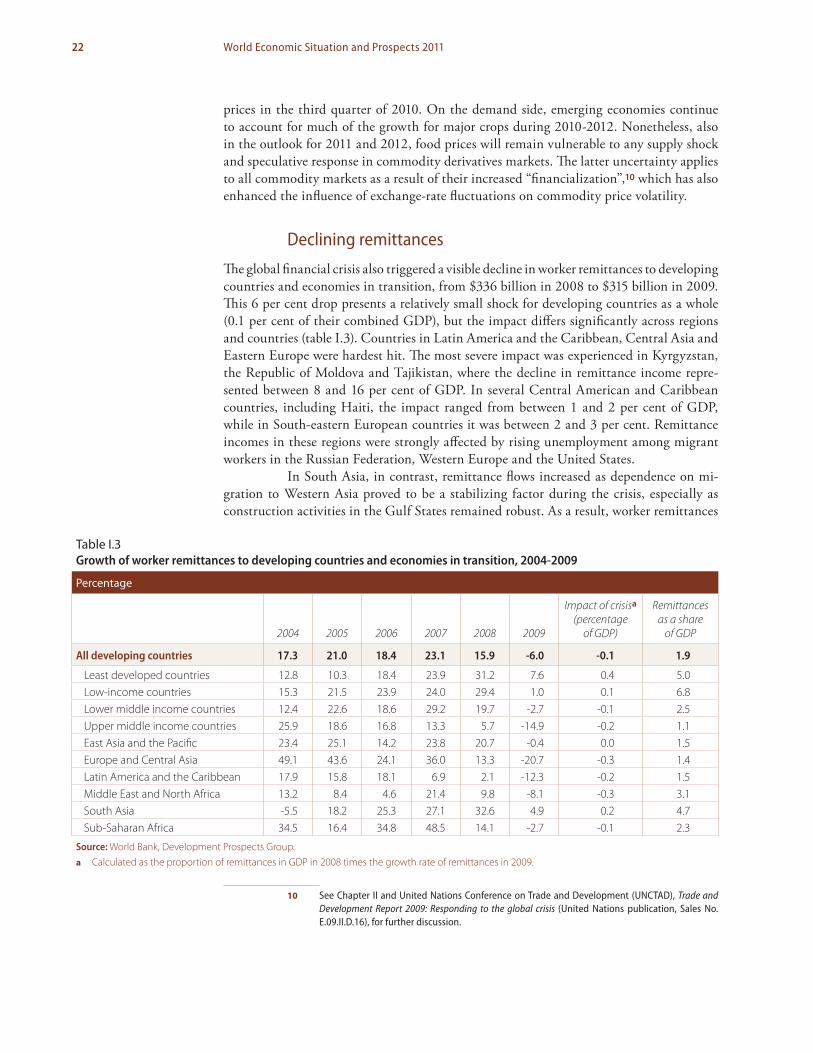
22 World Economic Situation and Prospects 2011
prices in the third quarter of 2010. On the demand side, emerging economies continue to account for much of the growth for major crops during 2010-2012. Nonetheless, also in the outlook for 2011 and 2012, food prices will remain vulnerable to any supply shock and speculative response in commodity derivatives markets. The latter uncertainty applies to all commodity markets as a result of their increased “financialization”,10 which has also enhanced the influence of exchange-rate fluctuations on commodity price volatility.
Declining remittances
The global financial crisis also triggered a visible decline in worker remittances to developing countries and economies in transition, from $336 billion in 2008 to $315 billion in 2009. This 6 per cent drop presents a relatively small shock for developing countries as a whole (0.1 per cent of their combined GDP), but the impact differs significantly across regions and countries (table I.3). Countries in Latin America and the Caribbean, Central Asia and Eastern Europe were hardest hit. The most severe impact was experienced in Kyrgyzstan, the Republic of Moldova and Tajikistan, where the decline in remittance income repre-sented between 8 and 16 per cent of GDP. In several Central American and Caribbean countries, including Haiti, the impact ranged from between 1 and 2 per cent of GDP, while in South-eastern European countries it was between 2 and 3 per cent. Remittance incomes in these regions were strongly affected by rising unemployment among migrant workers in the Russian Federation, Western Europe and the United States.
In South Asia, in contrast, remittance flows increased as dependence on mi-gration to Western Asia proved to be a stabilizing factor during the crisis, especially as construction activities in the Gulf States remained robust. As a result, worker remittances
10 See Chapter II and United Nations Conference on Trade and Development (UNCTAD), Trade and Development Report 2009: Responding to the global crisis (United Nations publication, Sales No. E.09.II.D.16), for further discussion.
Table I.3 Growth of worker remittances to developing countries and economies in transition, 2004-2009
Percentage
2004 2005 2006 2007 2008 2009
Impact of crisisa (percentage
of GDP)
Remittances as a share
of GDP
All developing countries 17.3 21.0 18.4 23.1 15.9 -6.0 -0.1 1.9
Least developed countries 12.8 10.3 18.4 23.9 31.2 7.6 0.4 5.0Low-income countries 15.3 21.5 23.9 24.0 29.4 1.0 0.1 6.8Lower middle income countries 12.4 22.6 18.6 29.2 19.7 -2.7 -0.1 2.5Upper middle income countries 25.9 18.6 16.8 13.3 5.7 -14.9 -0.2 1.1East Asia and the Pacific 23.4 25.1 14.2 23.8 20.7 -0.4 0.0 1.5Europe and Central Asia 49.1 43.6 24.1 36.0 13.3 -20.7 -0.3 1.4Latin America and the Caribbean 17.9 15.8 18.1 6.9 2.1 -12.3 -0.2 1.5Middle East and North Africa 13.2 8.4 4.6 21.4 9.8 -8.1 -0.3 3.1South Asia -5.5 18.2 25.3 27.1 32.6 4.9 0.2 4.7Sub-Saharan Africa 34.5 16.4 34.8 48.5 14.1 -2.7 -0.1 2.3
Source: World Bank, Development Prospects Group.a Calculated as the proportion of remittances in GDP in 2008 times the growth rate of remittances in 2009.

23Global outlook
to Bangladesh, Nepal and Pakistan actually increased, and were also a factor in keeping up resource flows to the Philippines in East Asia and to several African countries.
Exchange-rate effects also had a bearing on flows, with the depreciation of the Russian rouble affecting remittance flows to Central Asian and Eastern European countries, especially during the first half of 2009. Depreciation of national currencies in the Philippines and other South Asian countries, in contrast, appears not only to have increased the domestic value of remittances, but also to have provided an incentive for migrants to buy long-term assets at home.11
As a result of these diverging patterns, remittance incomes to low-income countries proved resilient during the crisis, while mostly middle-income countries saw an adverse shock. In the outlook, some rebound in remittance flows may be expected during 2010-2012 but, given the persistent high unemployment in important recipient countries of migratory flows as well as rising anti-immigrant sentiments in those countries, the rebound will be weak at best. Increased exchange-rate instability, as discussed below, poses a risk to the rebound and stability of remittance flows in the outlook.
Uncertainties and risksKey uncertainties and risks to the baseline scenario for 2011 and 2012 remain on the downside. A much weaker recovery of the world economy is far from a remote possibility, especially as continued high unemployment, financial fragility, enhanced perceptions of sovereign debt distress and inadequate policy responses could further undermine business and consumer confidence in the developed countries. For the dynamic developing countries and economies in transition, the recent surge in capital inflows is posing challenges to growth and stability, especially in the form of currency appreciation and risk of domestic credit and asset price bubbles. These challenges are closely related to the financial weak-nesses and policy stances in developed countries. Further large-scale quantitative easing in the United States is likely to push down the value of the dollar and send even more money flowing into the faster-growing economies of Asia and Latin America, where rates of return are higher. Heightened tensions over currency and trade have already led to defensive inter-ventions in emerging market economies in efforts to keep exchange rates competitive and to curb the flow of capital into their economies. Such tensions are compounding the increased volatility in exchange rates among the major reserve currencies which emerged during 2010 as a result of uncoordinated quantitative easing strategies in Europe, Japan and the United States. Failure to arrive at more coordinated policy responses aimed at a more benign global rebalancing will put the process of economic recovery and the stability of financial markets at further risk. The importance of each of these risks is weighed below.
Risks associated with sovereign debt and fiscal austerity
The dire outlook of the global economy in the second half of 2008 propagated unprec-edented fiscal expansion in most developed economies and several developing countries. Arguably, the fiscal stimulus and coordinated monetary expansion stabilized the global
11 See Dilip Ratha, Sanket Mohapatra and Ani Silwal, “Migration and Development Brief”, No. 12, (Washington, D. C.: World Bank, Development Prospects Group, April 2010). Available from http://siteresources.worldbank.org/INTPROSPECTS/Resources/334934-1110315015165/MigrationAndDevelopmentBrief12.pdf.
The rebound in worker remittances will likely be weak in 2011-2012
Early retreat to fiscal austerity, enhanced exchange-rate volatility and weaker policy coordination pose major downside risks to the recovery

24 World Economic Situation and Prospects 2011
economy in the aftermath of the financial meltdown in the United States, preventing employment collapses of the type experienced during the Great Depression. Despite a still fragile recovery, the sense of urgency and the will to move fiscal and monetary policies in tandem dissipated during 2010 over worries that fiscal sustainability, especially in devel-oped countries, was in jeopardy. The sovereign debt distress in several Southern European countries became a source of global financial turmoil in early 2010 and also led to greater concerns among policymakers that further increases in public debt might lead to higher interest rates down the road, increasing the debt-service burden and crowding out private investment. The response to these concerns is already evident in the form of fiscal austerity plans, especially in European countries. Further quantitative easing in the form of central bank purchases of government securities has been the answer to keep interest rates low. Such policy responses are raising concerns at the other end of the spectrum: there are fears that the phasing out of fiscal stimulus and a quick retreat to fiscal austerity would risk further deceleration of the recovery, prolong high unemployment and be self-defeating, and that budget deficits and public debt ratios as a share of GDP would continue to rise because of insufficient output growth and despite the fiscal tightening. How should these two sides of the coin be assessed in the present-day context?
First, it is clear that budget deficits have widened sharply and that public debt will increase further in the near term. The average deficit for developed economies soared to 10 per cent of GDP by the end of 2009, with public debt reaching over 80 per cent. The deficit is estimated to decline to about 9 per cent in 2010, mainly on account of the phasing-out of the government spending associated with the bailout of the financial sector in the United States. Many developed economies continued to experience deficit increases. The projected deficits for 2011 suggest an improvement by 1 percentage point of GDP, premised on continued GDP growth as delineated in the baseline, smooth implementa-tion of announced fiscal consolidation plans and accommodative capital markets. Under conservative assumptions, the public debt of developed countries will continue to increase, surpassing 100 per cent of GDP, on average, in the next few years.
It should be emphasized, however, that while fiscal stimulus measures may have added to the widening of budget deficits and rising debt burdens, the impact of the crisis itself (in particular through lower tax revenues) has had the greatest bearing on projected future public debt ratios.12
The second question is whether this situation is likely to cause rapid upward-spiralling debt growth as perceptions of emerging debt stress push up interest rates (as well as risk premium) on government securities, thereby putting greater pressure on deficits to widen and on public debt to increase. These kinds of dynamics have clearly affected Greece, Ireland, Portugal, Spain and several economies in Eastern Europe, countries that still have a relatively limited tax capacity, making the vicious forces at work more power-ful. Yet, despite these experiences, evidence that there would also be strong dynamics between public indebtedness and the cost of servicing the debt in developed countries is scanty. During the present crisis, real interest rates have remained low and have even seen a decline despite mounting public debt in the United States, the major economies of the euro area and Japan. There is also not much historical evidence to support the claim
12 The IMF estimates that only about 20 per cent of the projected increase in public debt of the developed countries belonging to the Group of Twenty (G20) is due to fiscal stimulus measures and financial rescue operations undertaken in response to the crisis. Revenue loss explains about half of the debt increase, and debt dynamics another 20 per cent. See IMF, “Navigating the fiscal challenges ahead”, Fiscal Monitor, 14 May 2010, p. 14. Available from http://www.imf.org/external/pubs/ft/fm/2010/fm1001.pdf.
Public debt of developed countries will rise to over
100 per cent of GDP…
…but in most countries the cost of higher debt
remains very low

25Global outlook
for such dynamics to emerge under all circumstances. The most glaring example may be Japan, where public debt has soared to 200 per cent of GDP during two decades of defla-tion and low interest rates since the late 1980s. Further back in history, the level of public debt in the United States increased to over 100 per cent of GDP at the end of the Second World War without inducing a major increase in interest rates. Several studies on public finances in the United States found no significant relationship between debt-to-GDP ra-tios and inflation or interest rates over the period 1946-2008.13
A study prepared for this report traced the flow cost of servicing the public debt in developed countries in the present-day context.14 It finds that the cost of public debt in the United States and the major economies of the euro area has remained very low so far. Figure I.7 reports the average flow cost of the projected debt burden (measured as the dif-ference between the real interest rate on debt and GDP growth) of 26 developed countries, using IMF projections of public debt-to-GDP by 2015. It also shows the cost of public debt
13 See Alessandro Missale and Olivier Jean Blanchard, “The debt burden and debt maturity”, American Economic Review, vol. 84, No. 1 (March), pp. 309-319; and, Joshua Aizenman and Nancy P. Marion, “Using inflation to erode the U.S. public debt”, NBER Working Paper, No. 15562 (Cambridge, Massachusetts: National Bureau of Economic Research, 2009).
14 See Joshua Aizenman and Yothin Jinjarak, “The role of fiscal policy in response to the financial crisis”, background paper for the World Economic Situation and Prospects 2011, available from http://www.un.org/esa/policy/index.html. The argument in the text is based on a commonly used measure of fiscal burden; that is to say, a measure of the funding flow needed to keep public debt-to-GDP constant. Specifically, the public debt-to-GDP ratio, d, would grow over time at a rate equal to the gap between the real interest rate on the debt, r, minus the growth rate of the economy, g, assuming a primary fiscal balance of zero. The gap (r – g) can be referred to as the flow cost of public debt. The fiscal burden associated with a given public debt-to-GDP ratio, d, equals (r-g)*d. Consequently, annual taxes of (r-g)*d (as a fraction of the GDP) assures that public debt-to-GDP would remain stable over time as long as the primary fiscal balance is zero.
Figure I.7Historical best case, worst case and average scenarios for the general government gross debt burden, selected developed economies
Projected 2015 debt/GDP
0
5
-5
-25
-20
-15
-10
10
15Projected 2015 debt-to-GDP
Japa
n
Irela
nd
Port
ugal
Slov
akia
Uni
ted
King
dom
Aust
riaa
Switz
erla
nd
Cana
da
Aust
ralia
Net
herla
nds
Pola
nd
Hun
gary
Uni
ted
Stat
es
Belg
ium
Fran
ce
Czec
h Re
publ
ic
Spai
n
Nor
way
New
Zea
land
Swed
en
Ger
man
y
Den
mar
k
Finl
and
Iraly
Gre
ece
Best case
Worst case
Average over best and worst cases
Source: Aizenman and Jinajarak, “The role of fiscal policy in response to the financial crisis”.Note: The gross debt burden representing the lowest flow costs is calculated by taking an average of the two lowest values of the difference (r-g) and multiplying it with the projected debt-to-GDP ratio. For countries for which flow costs for less than four periods are available, the single highest and lowest costs are used.a Real rates for Austria are based on the average return on bonds with maturities greater than one year for 1970-1982, and with a 9-10 year maturity for 1983-2010. Real rates for all other countries are the real rates on the maturity closest to the most recent average maturity of general government debt in table 2. The growth rate of the GDP deflator was used to convert nominal interest rates to real rates.

26 World Economic Situation and Prospects 2011
under the historical worst- and best-case scenarios during the last four decades. Intriguingly, for most countries, the flow cost of servicing the debt is below 2 per cent of GDP, except for Greece, Italy and Finland. For most of the developed countries, including the United States, the projected expected public debt burden is zero or negative. The country with the greatest uncertainty in the future debt burden is Japan, followed by Greece, Belgium, Ireland, France and Canada. The United States has the eleventh highest uncertainty in terms of (worst-best) scenarios. While most countries that have low projected debt ratios occupy the lower end of the scale, that is to say, they have lower uncertainty in future debt burdens, this uncertainty does not increase monotonically with the size of the projected debt. For instance, the projected debt of the United States for 2015 is higher than that of seven countries that face a much greater uncertainty in future debt burden.
From this perspective, one could conclude that, insofar as future growth de-pends on short-term stabilization during or in the aftermath of a financial crash and a deep recession, the additional debt incurred for such stabilization may not translate into excessively high medium-term flow costs of public debt for an important part of the de-veloped countries. This finding should not be used as an excuse for fiscal complacency, as it remains true that the degree of uncertainty of the future debt burden likely increases with the size of the future public debt-to-GDP ratios. This is illustrated by looking at the worst-case fiscal scenario in figure I.7, in which permanent low growth would likely create onerous debt burdens in most developed countries. The flow cost of the debt burden in the United States would climb to above average, at 3.9 per cent of GDP, while Greece’s would rise to about 12.4 per cent of GDP.
These findings highlight that the risk of triggering vicious public debt dynamics depends critically on the growth scenario. A focus on belt-tightening today, which would slow and delay economic recovery, could well trigger such a vicious circle. Developed countries with less fiscal space that already have high public debt ratios and flow costs may see few options but to engage in fiscal consolidation, but they would risk entering into vicious debt dynamics anyway if the consequent demand contraction cannot be offset by other sources of growth, including export growth, which would require demand expan-sion elsewhere.
Third, the higher projected growth for developing countries implies that the flow costs of public debt are lower, increasing their fiscal space. Emerging markets with modest public debt may benefit by using this fiscal space to accommodate the adjustment challenges associated with lower demand in developed countries. The flow costs of public debt in several fast-growing emerging markets and developing countries are actually very low or even negative, reflecting the high growth and low real interest rates of recent years (figure I.8). In particular, since 2000, a high rate of growth, coupled with relatively low levels of public debt and large domestic savings, have allowed the Governments of develop-ing countries in Asia and Latin America to build up local-currency bond issuance and ex-tend the maturity of their public debt. Indeed, the negative flow cost of public debt is most evident in Asia. However, the notion of fiscal space is country-specific and countries with better adjustment capacities, lower debt overhang and a greater tax base tend to possess more of it. Low-income countries tend to have weaker tax bases and hence significantly less fiscal space.15 As a result, their scope for counter-cyclical policies depends to a greater degree on inflows of development assistance.
In sum, continued slow GDP growth in developed economies will have significant implications for fiscal sustainability. If the ongoing trend of deceleration in
15 See Aizenman and Jinjarak, ibid., for comparative estimates.
Fiscal austerity that dampens growth poses
the greatest threat for the emergence of public
debt distress
Developing countries grow faster and have more
fiscal space

27Global outlook
0
0.01
0.02
0.03
0.04
0.05
0.06
0.07
0.08
0.09 Brazil
2000
2001
2002
2003
2004
2005
2006
2007
2008
2009
India
2000
2001
2002
2003
2004
2005
2006
2007
2008
2009
-0.06
-0.04
-0.02
0
0.02
Mexico
2000
2001
2002
2003
2004
2005
2006
2007
2008
2009
-0.04
-0.02
0
0.02
0.04
China
2000
2001
2002
2003
2004
2005
2006
2007
2008
2009
-0.04
-0.03
-0.02
-0.01
0
Republic of Korea
2000
2001
2002
2003
2004
2005
2006
2007
2008
2009
-0.015
-0.01
-0.005
0
Figure I.8 Flow costs of public debt, selected emerging and other developing countries, 2000-2009 (percentage of GDP)
Thailand
2000
2001
2002
2003
2004
2005
2006
2007
2008
2009
-0.02
0
0.02
0.04
Source: Aizenman and Jinajarak, “The role of fiscal policy in response to the financial crisis”.

28 World Economic Situation and Prospects 2011
global growth continues, leading to significantly lower growth than the baseline, or even a double-dip recession in some developed economies, the fiscal position of these economies would deteriorate further. At the same time, in the present context, global growth is af-fected by waning fiscal stimulus. Additional fiscal austerity will weaken growth further. In developed countries, GDP growth will fall, on average, by about 1 percentage point per 1 per cent of GDP decline in government spending. Such fiscal retrenchment among advanced economies would spill over to developing countries and lower their growth by 0.3 percentage points.16
Government balances in a number of European economies are especially vul-nerable to lower GDP growth, as they are, too, in Japan. In the outlook, Governments of many advanced economies will face large and increasing funding needs, the cost of which will be highly vulnerable to changes in market sentiment. If sovereign risk premiums in capital markets continue to surge, they will jeopardize market access for some of these countries, as has been seen in the cases of Greece and a few other countries in 2010. The risk does not seem to be a major concern in most developed economies, which still have fiscal space and should be more concerned with protracted low growth. They should, how-ever, be wary of the risk of enhanced financial fragility because of the way in which public indebtedness became linked to the health of the banking sector during the crisis. On the one hand, Governments have guaranteed vast amounts of bank liabilities, and in some cases have taken partial ownership of banks; on the other, banks, stashed with cash, have been purchasing large amounts of government securities at home and abroad. As a result, a heightened risk for the financial health of any of these two parties will feed throughout the other, possibly forming a vicious circle that could amplify the risk into the whole economy. For example, higher sovereign credit spreads for some countries could push up bank spreads, increasing financing needs for Governments and banks alike.
Risk of increased exchange-rate instability
The exchange rates among major currencies experienced extremely high volatility during 2010, with an escalated tension spreading rapidly to other currencies. The volatility in the first half of 2010 featured the sharp devaluation of the euro, triggered by heightened concerns about sovereign debt in a number of European economies. Between the begin-ning of the year and June, the euro depreciated by about 20 per cent against the United States dollar and the Japanese yen (figure I.9). The tide in foreign-exchange markets has since reversed, however, featuring a sharp weakness of the dollar driven by the deteriorat-ing growth prospects for the United States, along with, as indicated above, the anticipated need for further quantitative easing, that is to say, for further printing of the dollar. As a result, the euro rebounded by nearly 20 per cent vis-à-vis the dollar, while the yen hit a 15-year high against the dollar, engendering intervention by the Japanese Government in foreign-exchange markets.
The announcement of large-scale purchases of government securities by the United States Federal Reserve (Fed) might be a source of further nervousness in global
16 These estimates are based on a simulation using the United Nations World Economic Forecasting Model, assuming an additional, across-the-board 1 per cent cut in government spending in Europe and the United States in comparison with the baseline. The implied average growth elasticity of fiscal expenditures of about 1 for the first-year effect is approximately the mean of that reflected in other global models or macroeconomic models of individual major developed countries.
Exchange-rate volatility among major currencies
has caused tensions worldwide
A weakening dollar is raising concerns in Europe
and elsewhere

29Global outlook
financial markets in the near term.17 The prospect of further weakening of the dollar has already raised concerns, especially in Europe, as it would dampen hopes of an export-led recovery in countries like Greece, Ireland, Spain and the United Kingdom of Great Britain and Northern Ireland, who need to offset the negative demand effects from fiscal austerity. But it will also affect growth in Germany, which is strongly export-oriented, unless that country manages to stimulate domestic demand.
The failure to maintain exchange-rate stability among the three major inter-national reserve currencies has also affected currencies of emerging economies. The surge in capital inflows to emerging economies, fuelled by the quantitative easing in developed countries and portfolio reallocation by international investors, as well as by the weakening of the dollar, has led to upward pressure on the exchange rates of some emerging econo-mies. For example, Brazil’s real appreciated by about 10 per cent vis-à-vis the currencies of its trading partners in 2010, while the Republic of Korea and South Africa also saw their exchange rates strengthen significantly in the third quarter of 2010 (figure I.10).
Developing countries have responded by intervening in currency markets, buy-ing foreign exchange and/or imposing capital controls in order to avoid soaring exchange rates, loss of competitiveness and inflating asset bubbles. Brazil, for instance, tripled the tax rate on foreign purchases of its domestic debt, while Thailand announced a 15 per cent withholding tax for such purchases. China has received continuous political pressure to revalue its currency further, but has resisted making major adjustments out of concern for possible disruptive effects on its economy.
17 The Fed announced on 3 November 2010 that it would purchase an additional $600 billion in long-term United States government securities by June 2011. This is, however, far less than the $1.75 trillion worth of debt the Fed bought between early 2009 and early 2010 in its first round of quantitative easing.
Figure I.9Exchange rates among major currencies, March-October 2010
Inverted scale, dollars per euro and dollars per 100 yen1.00
1.05
1.10
1.15
1.20
1.25
1.30
1.35
1.40
1.45
1.50
1 M
ar 2
010
1 Ap
r 201
0
1 M
ay 2
010
1 Ju
n 20
10
1 Ju
l 201
0
1 Au
g 20
10
1 Se
p 20
10
1 O
ct 2
010
Dollar to yen
Dollar to euro
Source: United States Federal Reserve Board.

30 World Economic Situation and Prospects 2011
Currency instability and perceived misalignment of exchange rates could be-come part of a major skirmish over trade, which may well turn into a wave of protection-ist measures and retaliations worldwide. It remains to be seen whether this will actually transpire, but clearly, the unpredictability of exchange rates risks derailing global growth and destabilizing financial markets once again.
Risks of an uncoordinated rebalancing of the world economy
The risks associated with uncoordinated fiscal and monetary policies and the large swings in exchange rates are not only slower global growth but also a widening of the global imbalances, which in turn could feed more instability back into financial markets.
The global imbalances narrowed markedly along with the global recession (fig-ure I.11). The large external deficit of the United States declined from its peak of 6 per cent of GDP before the recession to a trough of 2.7 per cent in 2009. Commensurately, the external surpluses in China, Germany, Japan and a group of fuel-exporting countries, have also reduced. China’s surplus, for instance, dropped from a high of 10 per cent of GDP to 6 per cent in the same period. Related changes were also made in domestic savings and investment in these economies. In the United States, the household savings rate increased from about 2 per cent in 2007 to 5.9 per cent in 2009, although a large part of the increase in private savings was offset by the rise in the budget deficit. In China, the ratio of private consumption to GDP started to rise for the first time in a decade, although it remains extremely low, below 40 per cent, compared with that of between 60 and 70 per cent in most other major economies.
Figure I.10Trade-weighted effective exchange rates, selected countries, March-October 2010
Index, average for 2009=100
1 M
ar 2
010
15 M
ar 2
010
29 M
ar 2
010
12 A
pr 2
010
26 A
pr 2
010
10 M
ay 2
010
24 M
ay 2
010
7 Ju
n 20
10
21 Ju
n 20
10
5 Ju
l 201
0
19 Ju
l 201
0
2 Au
g 20
10
16 A
ug 2
010
30 A
ug 2
010
13 S
ep 2
010
27 S
ep 2
010
95
100
105
110
115
120
125
Source: UN/DESA calculations, based on
J.P. Morgan data.
Brazil
South Africa
Republic of Korea
Russian Federation
China

31Global outlook
In 2010, the global imbalances widened again along with the global recovery. The external deficit of the United States increased slightly to above 3 per cent of GDP, while surpluses of fuel-exporting countries and those of Germany and Japan widened, somewhat. China’s external surplus, while increasing in absolute terms, continued to decline relative to its GDP (to 4 per cent). At these levels, the global imbalances may be considered moderate compared with those prior to the crisis. A critical issue is whether the global imbalances will widen again substantially in the coming years and compound the above-mentioned risk factors, thus endangering global growth and stability.
In the near-term outlook, pressure on the imbalances to widen in flow terms does not seem excessively great, but the forces that could lead to a narrowing of the imbal-ances are equally weak. Households in the deficit countries, mainly the United States, are not expected to resume the debt-financed expansion of consumption quickly, and further widening of the government deficit relative to GDP is likely to be politically constrained. With a mild growth in demand from the deficit countries, room for an increase of the external surpluses in the surplus countries will also be small.
The prospects of narrowing the imbalances in the longer run will depend on how successful economies will be in making structural adjustments. Changes in the right direction are visible in both deficit and surplus countries. For example, China has taken various measures to boost private consumption, reducing its dependence on exports. But it will take a long time before a more significant structural change is achieved that will also make a global impact. Such structural change would also entail important sectoral shifts and institutional change, which will take time to effectuate. Household savings in the United States have increased as a result of more cautious consumption behaviour and ongoing deleveraging of household balance sheets.
The global imbalances are widening again, albeit moderately
Figure I.11Resurge in global imbalances, 1996-2011
Current-account balances as a percentage of world gross producta
-3
-2
-1
0
1
2
3
2000 2001 2002 2003 2004 2005 2006 2007 2008 2009 2010 2011
Source: UN/DESA, based on data from IMF World Economic Outlook Database.a Summation of each
country’s GDP.
Fuel-exporting countries
East Asia
Germany and Japan
United States
European deficit countries
Others

32 World Economic Situation and Prospects 2011
Uncertainties remain regarding the future path of these adjustments, particularly given the unknown quantity of how the risks of a further slowing of growth and the persistence of high rates of unemployment, sovereign debt problems and further exchange-rate instability will play out. A weaker dollar would certainly increase the com-petitiveness of United States exports, which could help reduce the economy’s large external deficit. However, as discussed, the factors underlying the weakening of the dollar also point to much greater unpredictability and volatility in exchange rates which would be harmful for trade. Clearly, without more effective international policy coordination that recognizes the interconnectedness between these problems, the risk of a disorderly adjust-ment in the global imbalances remains high.
Even if the global imbalances do not edge up strongly in the outlook, the un-derlying adjustment in stocks of international asset and liability positions would continue to move in a risky direction. Continued external deficits add further to the net external liability position of the United States. The global financial crisis caused a surge in the country’s net foreign liabilities, which reached a record high of $3.5 trillion by the end of 2008 (figure I.12). They declined somewhat during 2009, to a level of $2.7 trillion, strongly influenced by the recovery in asset prices and the depreciation of the United States dollar in the second half of the year. This also increased the value of the assets held abroad by the United States by more than that of the country’s foreign liabilities.18
Further quantitative easing and a further depreciation of the dollar could be a way for the United States to try to inflate and export its way out of its large foreign liability position, but it could more likely risk disruption of trade and financial markets. Expectations for a further and sustained weakening of the dollar could sour foreign inves-tors’ attraction to dollar-denominated assets. This, in turn, could spur an exodus of capital
18 For more information, see the United States Bureau of Economic Analysis, available from http://www.bea.gov/international/index.htm#iip.
The ever-increasing foreign liability position of the
United States will put further downward pressure
on the dollar
Figure I.12Net international investment position of the United States, 1976-2009
Billions of US dollars
-3 500
-3 000
-2 500
-2 000
-1 500
-1 000
-500
0
500
1976
1978
1980
1982
1984
1986
1988
1990
1992
1994
1996
1998
2000
2002
2004
2006
2008
Source: U.S. Department of Commerce, Bureau of
Economic Analysis.

33Global outlook
out of the United States and also cut the influx of international capital into United States markets. Even the temporary appreciation of the dollar after mid-2008 did not prevent a sharp decline in the net inflow of foreign investment funds into the United States, reflect-ing concerns about the United States economy. If international investors start to avoid dollar-denominated financial assets, it would be natural for the influx of liquidity into financial markets outside the United States to increase. It would also be likely to spill over into more price instability in commodity markets given the high degree of financialization of those markets and the impact of exchange rates (especially the value of the dollar) on commodity prices (see chapter II).
Moreover, for countries trying to export their way out of the global slump, dol-lar weakness poses a threat because it will increase import prices in the United States, the world’s largest consumer market, and thus erode purchasing power. A decline in United States’ household demand for imported goods could lead to a decline in global trade. It would be the antithesis of the United States consumption boom that fuelled global eco-nomic growth before the financial crisis. Accordingly, if concerns grow about exports’ be-ing hit by dollar weakness, affected developing countries will understandably feel inclined to intervene in their foreign-exchange markets, as is already happening. However, frequent intervention in foreign-exchange markets by emerging economies increases the potential for international currency and trade conflicts. If the unnecessary political confrontations surrounding the issue of foreign-exchange rates continue to deepen, they could further un-dermine the international cooperation shaped at the level of the Group of Twenty (G20), which has spearheaded the global economic recovery. Commitment to coordinated policy responses has already suffered over disagreements regarding the role of fiscal policy in the context of a slowing recovery and mounting public indebtedness, as manifested at the G20 Summit in Toronto in July 2010, and the uncoordinated retreats to fiscal austerity and further monetary easing, and have resulted in greater global economic uncertainty, as discussed above. The Seoul Summit of the G20, held on 11 and 12 November 2010, recognized the currency risks and the need for national macroeconomic policies to take ac-count of international spillover effects, but it failed to offer any specifics for a coordinated solution. A further waning of the commitment to international policy coordination will be an added liability to the prospects for a balanced and more sustained global recovery.
Policy challengesOvercoming the risks outlined above and reinvigorating the global recovery in a balanced and sustainable manner poses enormous policy challenges. Doing so has become even more challenging, given that the sense of urgency and the will to coordinate policies that existed during the peak of the crisis seems to have unravelled. The risks enhance uncer-tainty in the global economy and that, in itself, may well contribute to a further slowdown. Business and consumer confidence may be further restrained against the backdrop of continued high unemployment, the anticipation that further quantitative easing in the United States will do little to boost aggregate demand but will further weaken the dollar, and the expected growth costs of fiscal consolidation in major economies.
According to an alternative simulation using the United Nations World Economic Forecasting Model (WEFM) (see box I.4), in this more pessimistic scenario of greater uncertainty, but with an unchanged fiscal and monetary stance in developed economies, Europe could well see a double-dip recession, while the economies of the United States and Japan might virtually stagnate and possibly also fall back into recession
A waning commitment to international policy coordination poses a further threat to global growth and stability
Further uncertainty and unchanged policies may lead to a double-dip recession in major developed economies

34 World Economic Situation and Prospects 2011
A pessimistic scenario for the world economy
Risks arising from macroeconomic uncertainty clearly increased during 2010. Concerns are that the global recovery is losing steam and that the present poorly coordinated policy stances may be inad-equate for reinvigorating growth and could be a source of renewed instability.
A pessimistic scenario was simulated using the United Nations World Economic Forecasting Model (WEFM), in order to quantify the possible implications for global growth if some downside risks, as discussed in the body of the chapter, were to become a present danger. The scenario delineates a situation in which greater macroeconomic uncertainty would cause a further weakening of growth in developed economies, dragging down growth of the world economy as a whole. Specifically, it is assumed that the prospect of fiscal consolidation and continued weakness in financial institutions, especially the banks, in the United States of America and the countries of the European Union (EU) would make them even more risk-averse in their lending to households and businesses, while higher uncertainty among unemployed workers of finding a job in the near future is assumed to hamper private consumption demand more severely than in the baseline. It is assumed further that the sovereign debt problems of some EU members will start to agitate financial markets again, thereby aggravating the difficulties facing the banking sector and depressing confidence more generally. On the policy front, the monetary policy stance, in terms of quantitative easing, would be the same as that assumed in the baseline scenario, but in the pessimistic scenario it is assumed that its anticipated effects on aggregate demand and employment would be even smaller. Fiscal policy stances, particularly the fiscal consolidation plans of developed economies, are also unaltered with respect to the baseline assumptions, but with greater uncertainty, the adverse impact of the fiscal consolidation on aggregate demand will be larger.
Under these assumptions, private consumption, business investment, the housing sector and import demand in major developed economies would all be significantly weaker than in the baseline. For example, in the United States, consumption growth would decelerate from 1.6 per cent in 2010 to 0.5 per cent in 2011 and 2012, compared with the more than 2 per cent growth in the baseline outlook. Growth in business investment would slow to 1.8 per cent in 2011, down from 6.4 per cent in the baseline. The housing sector, as measured by residential investment, would continue to contract by another 5 per cent instead of rebounding as in the baseline. Overall, gross domestic product (GDP) growth in the United States would come to a virtual standstill in 2011 and then rise to 1.1 per cent in 2012, 2 percentage points lower than in the baseline forecast. A slowdown of similar magnitude is expected in private consumption and business investment in the EU, where GDP would fall by 0.4 per cent in 2011, followed by a feeble recovery of 1.4 per cent in 2012. In Japan, much weaker export growth, combined with a faltering domestic demand, would cause renewed stagnation of the economy, with GDP growing by a mere 0.4 per cent in 2011 and by 0.9 per cent in 2012 (see table).
Pessimistic scenario for the world economy, 2011-2012
Percentage annual growth rate
Baseline forecast Pessimistic scenario
2011 2012 2011 2012
World GDP growth rate 3.1 3.5 1.7 2.3Developed economies 1.9 2.3 0.1 1.1Economies in transition 4.0 4.2 3.6 3.5Developing economies 6.0 6.1 5.3 5.1Least developed economies 5.5 5.7 5.3 5.2
Memorandum item:
World trade volume (goods and non-factor services) 6.6 6.5 5.1 4.5
Source: UN/DESA.
Box I.4
35Global outlook
during 2011. Growth in the developed countries would be almost 2 percentage points lower in 2011 than in the baseline forecast, and this would also significantly lower growth prospects for developing countries (by almost 1 percentage point).
There have been contentious policy discussions in the political constituencies of a number of key countries regarding the future role of fiscal stimulus and tax poli-cies, and among countries about exchange-rate realignments. For instance, facing close to double-digit unemployment, stagnating employment rates and the uncertainty regarding the strength of the economic recovery—particularly as there seems to be no end in sight for the continued sizeable foreclosures—the United States has been vigorously debating the case for a second federal fiscal stimulus package. But the likelihood of new fiscal stimulus has evaporated following the election results of November 2010. Meanwhile, the Greek crisis has shaken confidence in many developed economies and has propagated doubts about the fiscal soundness of several European countries. Gaps between France, which has a more pro-fiscal stimulus stance, and Germany, which has advocated more fiscal consolidation and belt-tightening, are indicative of differences in policy perspectives within Europe. In addition, the stronger automatic stabilizers and broader social security provisions in Europe in comparison with the United States has led to further complica-tions as not all countries share the impetus for fiscal stimulus that continues to prevail in some quarters in the United States. Indeed, several countries already embarked upon fiscal retrenchment in 2010, while others have announced plans to do so in 2011. This is making the task of coordinating fiscal policy between Europe and the United States much harder. It is also making it harder to arrive at a national consensus on whether to start fiscal consolidation sooner or later.
At the same time, monetary and exchange-rate policies have become issues of contention across countries. China’s resistance to let its currency appreciate faster has been blamed for hampering the adjustment of global imbalances; China and other emerging economies, on the other hand, view excessive quantitative easing, especially in the United States, as a greater source of distortion in the global economy, and one that has been
For a balanced and sustainable global recovery, five policy challenges need to be addressed
Growth prospects for developing countries and economies in transition will be hurt by a further slowdown in developed countries. This analysis accounts for the impact through the trade channel only. The dependence of these economies on demand from major developed economies remains high, as more than 50 per cent of their exports are still destined for developed economies. Consequently, cumulative GDP growth of developing countries would be 1.7 percentage points lower in the two years of the forecasting period compared with the baseline. Some Asian and Latin American economies would be hit harder because of greater trade dependence on demand growth in major developed economies.
Global economic growth would slow to 1.7 per cent in 2011 and 2.3 per cent in 2012, compared with 3.1 per cent and 3.5 per cent, respectively, in the baseline.
Because of certain limitations of the WEFM, particularly the lack of a detailed specifica-tion of international financial linkages and contagion effects in financial sectors, the scenario does not consider all the risk factors discussed in the body of the chapter. If the increased exchange-rate volatility and the spillover effects into commodity prices were accounted for, for instance, the out-comes would likely be even gloomier. At the same time, however, worsening economic prospects could trigger shifts in policy stances; for example, some developed economies might postpone fiscal consolidation plans, which could mitigate a further slowdown. The purpose of the analysis in this scenario is to show to what extent increased uncertainty, caused by the downside risks, would further harm growth given the present macroeconomic policy positions.
Box I.4 (cont’d)

36 World Economic Situation and Prospects 2011
causing exchange-rate volatility among major reserve currencies and a flood of short-term and volatile capital to flow their way and put upward pressure on their own currencies. These policy quarrels reflect differences in perspective regarding the role of policies as well as more fundamental problems in the world economy, which can only be overcome through a common and coordinated approach. Given existing discrepancies, reaching a more common understanding and approach may seem difficult. But recognition that the world economy is still fragile and that current uncoordinated policy stances risk adding insult to injury, as analysed above, should suffice to motivate and forcefully seek coordi-nated solutions. Moving towards a more balanced and sustainable global recovery would require addressing at least five related major policy challenges. The first is to provide ad-ditional fiscal stimulus, by using the existing fiscal space available in many countries, and to coordinate it to the degree needed to ensure a reinvigoration of global growth that will also provide external demand for those economies which have exhausted their fiscal space. The second is to redesign fiscal stimulus and other economic policies to lend a stronger ori-entation towards measures that directly support job growth, reduce income inequality and strengthen sustainable production capacity on the supply side. The third challenge is to find greater synergy between fiscal and monetary stimulus, while counteracting damaging international spillover effects in the form of increased currency tensions and volatile short-term capital flows. The fourth is to ensure that sufficient and stable development finance is made available for developing countries with limited fiscal space and large developmental deficits, including those in the form of the large shortfalls in progress towards the MDGs. The fifth challenge is to make the G20 framework for sustainable global rebalancing more specific and concrete, which would include having verifiable and, ideally, enforceable tar-gets for more balance and sustainable global growth.
Continued and coordinated stimulus
The first challenge, as mentioned above, is to ensure that there is enough stimulus world-wide to reignite global demand. This needs to be done in a concerted fashion to avoid resurging global imbalances. Coordination is also needed to strike a balance between, on the one hand, those countries which have little fiscal space left and need to rely on greater foreign demand to avoid deep contractions and, on the other, those that still posses an ample degree of fiscal space.
Structural and policy shortcomings that have contributed to significant fiscal deficits in a number of developed countries need to be addressed, particularly where long-term entitlement adjustments (old-age pension systems and health systems) will absorb increasingly large proportions of public expenditure. However, the fragility of the eco-nomic recovery, particularly in developed economies, requires that there be an additional and coordinated push for fiscal stimulus to reignite the global economy. Indeed, fiscal expenditure can have a large multiplier effect when interest rates are zero bound, as is currently the case. It is premature to declare that an enduring stabilization and resump-tion of sustainable growth has been accomplished, particularly as aggregate demand from the private sector remains weak in most developed, and in many developing, economies. Absent a new net fiscal stimulus and faster recovery of bank lending to the private sector, growth is likely to remain anaemic in many countries in the foreseeable future.
As analysed above, at times of global slack with very low interest rates, the cost of further fiscal stimulus is low relative to the growth risk of fiscal consolidation. This is es-pecially the case when the short-term impact of contractionary fiscal policy is exacerbated
Further fiscal stimulus is needed
The cost of further fiscal stimulus is low relative to
the growth risk of fiscal consolidation

37Global outlook
by near zero interest rates, as it is in many developed economies. Fiscal consolidation has been accompanied by growth in the past. However, upon closer inspection, enabling factors—such as exchange-rate policy and net export demand—played a pivotal role in most cases. Against the backdrop of a global crisis, it not clear from where such enabling factors will originate: beggar-thy-neighbour policies such as exchange-rate readjustments to increase competitiveness might lead to successive rounds of depreciations, with little real impact; additionally, there is no obvious source for export demand that can com-pensate for the lack of demand from developed economies. Meanwhile, the inability, or unwillingness, to provide greater fiscal support in most developed countries is negatively impacting upon emerging and developing economies.
Larger capital inflows, resulting from policies of quantitative easing that are being implemented in many developed economies to make up for the lack of fiscal support, are causing upward pressure on the currencies of many developing economies. Despite having managed their fiscal policy prudently before the global crisis and having significant room for counter-cyclical fiscal policies, authorities in emerging economies may therefore be inclined to implement contractionary fiscal policies to offset these pressures and to try to overcome bottlenecks in labour markets at home, irrespective of continued weak demand for exports. Doing so will clearly frustrate their growth prospects. It will also have knock-on effects in low-income countries, many of which remain painfully exposed to the looming uncertainty regarding global growth and depend on the demand for commodities from developed and emerging economies. By leading to a downward spiral in the global economy, austerity measures in developed economies could well trigger a similar spiral of pro-cyclical fiscal adjustment. It is likely that fiscal consolidation will turn out to be self-defeating on a global scale.
It is therefore important to continue to provide accommodative and coordi-nated fiscal stimulus in the short run, in tandem with appropriate monetary policies (see below), in order to reinvigorate the global recovery.
Redesigning fiscal stimulus
The second challenge will be to redesign fiscal policy—and economic policies more broadly—in order to strengthen its impact on employment and aid in its transition from a purely demand stimulus to one that promotes structural change for more sustainable economic growth. Thus far, stimulus packages in developed countries have mostly fo-cused on income support measures, with tax-related measures accounting for more than half of the stimulus packages. In many developing countries, such as Argentina, China and the Republic of Korea, in contrast, infrastructure investment tended to make up the larger share of the stimulus and strengthened supply-side conditions. The optimal mix of supporting demand directly through taxes or income subsidies or indirectly through strengthening supply-side conditions, including by investing in infrastructure and new technologies, may vary across countries. In most contexts, however, direct government spending tends to generate stronger employment effects.
A prudent policy would be to target public investments to alleviate infrastruc-ture bottlenecks that mitigate growth prospects, and to supplement this policy with fiscal efforts to broaden the tax base. One priority area would be to expand public investment in renewable clean energy as part of commitments to reduce greenhouse gas (GHG) emissions and in infrastructure that provides greater resilience to the effects of climate change. Some
Fiscal policies, in tandem with income and structural policies, will need to be reoriented to foster job creation and green growth
38 World Economic Situation and Prospects 2011
countries, like the Republic of Korea, have already laid out ambitious plans to that end. Such a reorientation of stimulus measures has the potential to provide significantly greater employment effects, as the renewable energy sector tends to be more labour-intensive than existing, non-renewable energy generation.19 Another area might be to expand and im-prove public transportation networks, which would create potentially significant amounts of new jobs while at the same time helping to reduce GHG emissions, particularly in rapidly urbanizing environments. These strategies would represent win-win scenarios by both orienting the recovery towards job creation and combating climate change.20
The redesigned fiscal strategy would also need to monitor closely the way in which income growth and productivity gains are shared in society. A recent discussion paper of the IMF and the ILO suggests that rising inequality has implications for the effectiveness of macroeconomic policies and global rebalancing.21 Declining wage shares (resulting from higher unemployment and underemployment or lagging real wage growth) may undermine consumption growth and thereby contribute to national and international imbalances. Labour-market and income policies may thus need to supplement fiscal and monetary policies for a more balanced outcome. In particular, allowing labour incomes to grow at the pace of productivity growth can help underpin a steady expansion of domestic demand and prevent income inequality from rising.22
The supplementary policies could target the unemployed, such as by provid-ing job-search training, short vocational training or general and remedial training. These have worked in a number of countries to compensate for sharp declines in vacancies. Job subsidies have been useful in stimulating an early pick-up in employment after a recession, as successfully demonstrated in Germany, for example. Similarly, in the United Kingdom and the United States, for instance, income subsidies to low-paid workers that make it more attractive for beneficiaries of income support to move into employment have proven to be effective in reducing poverty and stimulating demand. In other countries, employment programmes targeted at disadvantaged communities have proven effective. For instance, India’s Mahatma Gandhi National Rural Employment Guarantee Act provides one hun-dred days of employment at the minimum wage to 43 million low-income households, while in Mexico the temporary employment programme in response to the crisis has been expanded, creating more than half a million jobs between January and July of 2009.
Social protection policies are another crucial element in cushioning the impact of economic shocks and helping people avoid falling into poverty. They are also important tools for boosting aggregate demand and contributing to the sustainability of economic growth. While social transfers, such as family benefits, unemployment benefits and other cash transfers, help protect household consumption against shocks or crises, they also pre-vent asset depletion that may have adverse long-term consequences and further undermine a sustainable recovery.
19 See, for instance, ECOTEC, “Analysis of the EU Eco-Industries, their Employment and Export Potential”, a Final Report to DG Environment, 2002. Available from http://ec.europa.eu/environment/enveco/eco_industry/pdf/main_report.pdf.
20 As shown in annex table A.22, GHG emissions in Annex I countries are projected to decline by about 2 per cent during 2010-2012 given the slow recovery in GDP growth and existing plans for trends in improving energy efficiency and emissions reductions. However, the pace of reduction in a number of Annex I countries is too slow for them to meet the agreed targets under the Kyoto Protocol.
21 IMF and ILO, op. cit.
22 UNCTAD, Trade and Development Report 2010: Employment, globalization and development (United Nations publication, Sales No. E.10.II.D.3).

39Global outlook
Making monetary policy more effective and addressing its international spillover effects
The third challenge relates to monetary and exchange-rate policies. As indicated above, quantitative easing in major developed countries will likely be more effective when sup-ported by greater fiscal stimulus in the short run. Printing more money to buy government bonds will only work if the extra liquidity can find its way into aggregate demand growth. In the United States, it may do relatively little, as the transmission channels are either clogged or relatively weak. First, lower real yields could spur borrowing and investment demand; but households cannot borrow because they are still overleveraged as a result of the fall in home values, corporate firms are already stashed with cash and demanding little credit and banks are reluctant to lend to small-scale firms and households. Second, the quantitative easing has helped stock markets rebound and has increased household wealth; this could spur some additional spending, but with unemployment still high, home prices still down and high mortgages still to be paid, this channel will also be weak at best. Third, a weaker dollar could spur United States exports; but not all exports are responsive to a weaker dollar (primary commodity prices, for instance, tend to increase with a depre-ciating dollar) and the United States needs more structural policies to develop new export niches. Moreover, the share of exports in GDP of the United States is only about 10 per cent, meaning that a very large expansion of net exports will be needed in order to make a strong impact on aggregate output growth.
In the present context, maintaining an accommodative monetary policy could be supportive of additional fiscal stimuli in the short run as it would help limit the flow costs of rising public debt. A key condition for this to work, however, would be the refocusing of fiscal policy to accelerate job creation and provide incentives for structural change that would put economies on a sustainable growth path. It would also work better if comple-mentary policies were undertaken which would help unclog the financial system, including through additional measures to reduce the mortgage debt overhang and by providing tem-porary guarantees which could enhance credit access for small and medium-sized firms.
A similar approach could be tailored to the conditions of other major econo-mies. However, international repercussion effects should be borne in mind, and this would hence require explicit policy coordination. Quantitative easing in the United States is spilling over to the rest of the world, as indicated, through its impact on exchange rates and capital flow surges. The euro area, Japan and many developing economies have seen upward pressure on their currencies. The challenge is to avoid a damaging round of cur-rency interventions and even stronger exchange-rate volatility among major reserve cur-rencies. If the European Central Bank (ECB), the Bank of Japan and the Fed were all to print more money without mopping up the excess liquidity, they could easily exacerbate such volatility. Hence, coordinating monetary and fiscal policy is important, as are agree-ments about the magnitude, speed and timing of quantitative easing policies within a broader framework of targets to redress the global imbalances (see below).
This will also be important for emerging economies and other developing countries that are well integrated into the international financial system. It would take some steam out of the push for short-term capital to move to emerging markets. In the meantime, it makes sense for developing countries to impose capital controls, as has al-ready been done by several countries, to extend the maturity of capital inflows and miti-gate their volatility. The IMF is now also supportive of such measures. Effective capital controls should also reduce the need to accumulate vast amounts of foreign reserves as it would limit the risk of sudden capital-flow reversals.
Further quantitative easing is unlikely to work without additional fiscal stimulus and a resolution of financial sector weaknesses
Strong policy coordination is needed to avoid trade and currency wars

40 World Economic Situation and Prospects 2011
The suggested responses should be within reach as long as the authorities of the major economies take the risks posed by the spillover effects of national monetary policies sufficiently seriously. Such responses are no panacea in the medium term, however. There will be a limit to how much capital controls imposed by recipient countries can achieve. Aside from coordinated monetary policies, additional corrective measures to incentives for interest-rate arbitrage at the source of capital flows may need to be considered. For instance, a reserve requirement on cross-border capital flows could be agreed upon and made part of the ongoing reform of financial regulatory systems. But deeper reforms of the international monetary system would still be needed since the more fundamental causes conducive to exchange-rate volatility are inherent in the present system, which overly relies on a single national currency as the world’s reserve.23 In the transition towards a new monetary system, further enhancing the role of special drawing rights (SDRs)—which countries can convert into other currencies if need be—and including the Chinese renminbi in the basket of cur-rencies that determine the value of SDRs could be included in the steps towards reducing reliance on the United States dollar as a reserve currency for the world.
Financing for achieving the MDGs and investments in sustainable development in low-income countries
The fourth challenge is to ensure that sufficient resources become available to develop-ing countries with limited fiscal space and large development needs, including resources for achieving the MDGs and investing in sustainable and resilient growth. Low-income countries with limited fiscal space are in need of additional ODA to finance the expansion of social services and programmes needed to meet the MDGs and to engage in counter-cyclical and broader development policies. These increased needs contrast with the signifi-cant shortfall still existing in aid delivery against commitments. Apart from delivering on existing aid commitments, donor countries should consider mechanisms to delink aid flows from their business cycles so as to prevent delivery shortfalls in times of crisis, when the need for development aid is most urgent.
More broadly, the global crisis has highlighted the need for very large liquidity buffers to deal with sudden, large capital market shocks. In response to the financial crises of the 1990s, many developing countries accumulated vast amounts of reserves as a form of self-protection. But doing so comes with high opportunity costs and has, moreover, con-tributed to the problem of the global imbalances. A better pooling of reserves, regionally and internationally, could reduce such costs to individual countries and could also form the basis for more reliable emergency financing and the establishment of an international lender-of-last-resort mechanism. Broadening existing SDR arrangements could form part of such new arrangements.
Strengthening the framework for policy coordination
The need for strengthened international policy coordination thus seems more urgent than ever. Yet, the cooperative spirit that emerged in the immediate aftermath of the crisis has been waning. Governments in major economies have become more focused on domestic policy challenges than on the spillover effects of their actions. While it is clear that global
23 These issues were discussed extensively in United Nations, World Economic Situation and Prospects 2010, op. cit.; United Nations, World Economic and Social Survey 2010: Retooling Global Development (United Nations publication, Sales No. E.10.II.C.1); and, in UNCTAD, 2009, op. cit.
Over the medium run, more fundamental reforms in
the international financial architecture need to be effectuated
Developing countries need more predictable access to development finance
to achieve the MDGs and sustainable development
Concrete and enforceable targets for international
policy coordination should be considered

41Global outlook
demand needs rebalancing, achieving this will not be easy as it will require a range of structural reforms, a high degree of policy coherence and several years of continued ef-forts. The focus in recent policy debates on exchange-rate realignment is too narrow and bilaterally focused and seems to reflect a misunderstanding of the global spillover effects of present macroeconomic policy stances. The fifth major challenge, therefore, will be for leaders of the major economies to make the G20 framework for strong, balanced and sustainable global growth more concrete and to implement it.
A renewal of pledges to intensify and broaden macroeconomic policy coor-dination will, in itself, not guarantee that all parties will remain committed to agreed joint responses. Having clear and verifiable targets for desired policy outcomes will help make parties accountable, and the possible loss of reputation through non-compliance would be an incentive to live up to policy agreements. The proposal of the United States Secretary of the Treasury made at the G20 finance ministers meeting in October 2010, to establish “current account target zones” among major economies did not receive much support. Nevertheless, apart from establishing transparent targets, the proposal reflects the need for both surplus and deficit countries to contribute more to sustain global effec-tive demand. Overall economic policies, rather than simple exchange-rate realignment, determine the balance of national savings and investments underpinning growth of output and employment. Moreover, the proposal explicitly recognizes that national policies have international consequences.
It seems feasible to combine policies which would, when conducted simul-taneously, be both growth enhancing and reduce current-account surpluses and deficits to likely more manageable proportions of, say, 3 per cent of GDP or less for the major economies (including China). It would seem reasonable that other emerging and develop-ing countries, such as major fuel exporters and smaller economies, be allowed to run somewhat larger surpluses or deficits. Simulations with the other United Nations global modeling framework, the Global Policy Model—reflecting the key policy directions sug-gested above—show that this would be a win-win scenario for all economies, as it would enhance GDP and employment growth compared with the baseline, while reducing public debt-to-GDP ratios and requiring limited exchange-rate realignment (see box I.5). WGP would accelerate to over 4 per cent per year during 2012-2015, especially as developed economies would be lifted from their anaemic growth, while developing countries would also reach a higher growth path compared with the baseline situation where policy coor-dination is absent.
The mutual assessment process that is to accompany the implementation of the G20 framework for policy coordination would become more concrete with the establish-ment of current-account target zones. The target zones should not be seen as an end in themselves, but as a guide towards a sustainable growth path for the world, which should be considerate of the proposed actions to address all five challenges listed above. They should also be seen as an intermediate step towards more fundamental reforms of the global reserve system and the financial regulation that are needed to prevent future global financial instability and meltdowns.

42 World Economic Situation and Prospects 2011
Feasible policy coordination for rebalancing the world economy
A scenario of strengthened policy coordination aimed at strong, sustainable and balanced growth was simulated using the United Nations Global Policy Model.a It takes on board several of the policy directions suggested in the chapter, including a stronger role for fiscal policy in the short-term out-look, one that aims at strengthening the supply side through government spending, investment in-centives and structural policies. While the assumptions underlying the simulation aim to strengthen output and employment growth, policies are coordinated so as to help place the global imbalances within a narrower and more sustainable band.
The scenario pursues growth targets per country and per country grouping (as speci-fied in the table contained in the appendix to this chapter), which are considered sensible in view of their historical experience and strategic concerns. The growth targets for developed economies are close to (non-inflationary) potential, while those for developing and emerging economies represent reasonable improvements over the present rates and baseline projections, even if still below poten-tial and hence having room for improvement.
To achieve these targets, policy instruments are adjusted in small, feasible steps in the desired direction. The scenario assumes policymakers have opted for certain choices. First, additional incentives to private investment are provided to ensure increases in the capital stock needed to sus-tain the target rate of growth of gross domestic product (GDP), but these incentives are assumed to be biased in favour of using more energy and commodity-efficient technologies so as to also comply with the sustainability objective. Second, the investment push is supported by increased government spending for improvements in infrastructure and expansion of research and development in energy efficiency. Third, government spending is increased further, as part of income policies to strengthen household consumption, to allow expansion of social services and social protection programmes, as well as tax cuts and subsidies. The latter set of measures is assumed to support consumption growth in developing countries at a moderate but sustained pace. In surplus developed countries, these measures equally result in rising disposable household income, including pension income in countries with ageing populations. In developed countries with large external deficits, these policies are designed to enhance private savings and to limit consumption growth.
Under these assumptions, Governments in all major developed countries and China would easily be able to comply with a target of narrowing current-account balances to less than 3 per cent of GDP (see figure). The external surpluses of major oil and mineral exporting countries adjust more slowly, mainly as a result of higher initial oil and other commodity prices induced by stronger global growth; but over time these surpluses would also narrow further once the impact of investments in greater energy and raw material efficiency have taken effect. Many other developing countries may still need to be allowed a wider margin of external imbalances, but one that would not endanger exchange-rate instability or risk unsustainable levels of public indebtedness. Indeed, public sector borrowing requirements and debt-to-GDP ratios would decline with the coordinated policies for stronger and sustainable growth across all country groupings (appendix table).
Box I.5
a Available from http://www.un.org/esa/
policy/publications/ ungpm.html.

43Global outlook
Box I.5 (cont’d)
(i) Selected developed economies(percentage of GDP)
BaselineBalanced growth scenario
- 5
- 4
- 3
- 2
- 1
0
1
2
3
4
5
6
2010 2011 2012 2013 2014 2015
Japan
Europe
United States
(iii) Developed economies and major fuel exporters(percentage)
0
1
2
3
4
5
6
7
8
9
1 0
2010 2011 2012 2013 2014 2015
CIS and Western Asia
United States, Japan and Europe
(iv) Selected developing economies(percentage)
0
1
2
3
4
5
6
7
8
9
10
2010 2011 2012 2013 2014 2015
China and India
Other developing countries
Source: UN/DESA Global Policy Model, available from http://www.un.org/esa/policy/publications/ungpm.html.
(ii) Developing economies(percentage of GDP)
-5
-4
-3
-2
-1
0
1
2
3
4
5
6
2010 2011 2012 2013 2014 2015
CIS and Western Asia
China
India
Other developing economies
(a) Current account of selected countries and country groups, 2010-2015
(b) GDP growth of selected countries and country groups, 2010-2015

44 World Economic Situation and Prospects 2011
AppendixTable A balanced growth scenario: main outcomes by groups of countries, 2010-2015
2010 2011 2012 2013 2014 2015
GDP growth (percentage)
Europe 1.7 2.0 2.9 2.7 2.6 2.6Japan 2.8 2.3 2.3 2.7 2.9 3.0United States, Canada and other developed countries 2.7 2.9 3.4 3.2 3.2 3.2China 10.0 10.2 9.6 9.2 9.0 8.8India 8.4 8.6 9.1 8.6 8.3 8.1CIS and Western Asia (major fuel exporters) 4.8 4.8 4.8 5.2 5.1 5.0Other developing countries 5.9 5.5 5.5 5.4 5.4 5.4
Current account (percentage of GDP)
Europe 0.4 0.4 0.3 0.3 0.3 0.2Japan 2.8 2.0 1.9 1.8 1.7 1.6United States, Canada and other developed countries -2.6 -2.2 -2.1 -2.2 -2.4 -2.6China 3.6 3.5 3.4 3.3 3.2 3.2India -3.7 -3.4 -2.9 -2.6 -2.4 -2.1CIS and Western Asia (major fuel exporters) 4.3 4.9 4.6 4.5 4.5 4.4Other developing countries -1.0 -1.5 -1.5 -1.3 -1.0 -0.8
Growth of private investment (constant prices)
Europe -6.5 0.1 1.7 3.3 3.5 3.6Japan -4.2 6.1 3.5 3.0 3.1 3.1United States, Canada and other developed countries -6.0 -1.0 2.2 4.3 4.7 5.0China 13.1 10.4 8.8 7.6 7.0 6.6India 8.9 7.5 7.2 7.6 7.1 6.9CIS and Western Asia (major fuel exporters) -6.1 10.5 9.7 8.2 7.7 7.0Other developing countries 4.5 12.3 9.5 7.8 6.8 6.3
Private investment (percentage of GDP)
Europe 15.7 15.5 15.3 15.5 15.7 15.8Japan 18.9 19.6 19.9 19.9 19.9 19.9United States, Canada and other developed countries 12.0 11.7 11.6 11.7 11.8 12.0China 39.3 39.5 39.1 38.5 37.8 37.0India 31.4 31.3 30.9 30.7 30.4 30.0CIS and Western Asia (major fuel exporters) 13.8 14.3 14.8 15.1 15.5 15.7Other developing countries 16.9 18.0 18.6 19.0 19.2 19.3
Growth of government spending (constant prices)Europe 1.3 0.6 0.6 0.7 0.8 0.8Japan 1.4 1.5 0.9 0.9 1.0 1.0United States, Canada and other developed countries 4.2 2.5 1.9 2.1 2.1 2.1China 8.1 6.9 7.1 6.7 6.3 5.9India 6.2 5.2 5.5 6.0 6.3 6.5CIS and Western Asia (major fuel exporters) 8.1 5.4 4.6 4.2 4.0 3.9Other developing countries 5.6 5.9 5.3 4.8 4.5 4.4

45Global outlook
Table (cont’d)
2010 2011 2012 2013 2014 2015
Government spending (percentage of GDP)
Europe 24.9 24.6 24.1 23.7 23.3 23.0Japan 21.8 21.6 21.3 21.0 20.6 20.1United States, Canada and other developed countries 22.9 22.9 22.6 22.4 22.2 21.9China 17.9 17.4 17.0 16.6 16.2 15.7India 16.1 15.7 15.2 14.9 14.6 14.4CIS and Western Asia (major fuel exporters) 25.4 25.2 25.0 24.5 24.0 23.7Other developing countries 19.3 19.4 19.3 19.1 18.9 18.7
Private consumption (percentage of GDP)
Europe 59.2 59.0 59.1 59.3 59.7 60.0Japan 59.3 58.7 58.6 58.7 59.0 59.4United States, Canada and other developed countries 69.0 68.2 67.9 68.0 68.1 68.2China 37.5 37.7 38.6 39.5 40.6 41.7India 53.2 54.0 54.6 55.0 55.4 55.8CIS and Western Asia (major fuel exporters) 53.9 52.9 53.0 53.2 53.3 53.5Other developing countries 62.0 61.2 60.8 60.4 60.1 59.9
Net private sector financial surplus (percentage of GDP)
Europe 4.9 4.1 3.3 2.5 1.9 1.4Japan 2.7 0.9 0.0 -0.8 -1.3 -1.8United States, Canada and other developed countries 6.5 5.9 5.0 4.1 3.3 2.7China 5.9 5.5 5.2 4.9 4.6 4.3India 2.3 1.5 0.9 0.4 0.2 0.1CIS and Western Asia (major fuel exporters) 8.7 8.9 8.4 8.0 7.7 7.4Other developing countries 0.8 0.3 0.1 0.2 0.3 0.4
Net government financial surplus (percentage of GDP)
Europe -4.5 -3.8 -3.0 -2.3 -1.7 -1.1Japan 0.1 1.1 1.9 2.5 3.0 3.4United States, Canada and other developed countries -9.1 -8.1 -7.1 -6.4 -5.8 -5.2China -2.3 -2.0 -1.8 -1.6 -1.4 -1.1India -6.0 -4.9 -3.8 -3.1 -2.6 -2.2CIS and Western Asia (major fuel exporters) -4.3 -4.1 -3.9 -3.5 -3.2 -3.0Other developing countries -1.8 -1.7 -1.6 -1.5 -1.4 -1.2
Government debt (percentage of GDP)
Europe 89 91 91 91 90 88Japan 170 169 167 162 157 152United States, Canada and other developed countries 79 82 84 86 87 87China 8 7 7 8 8 8India 70 67 63 60 58 55CIS and Western Asia (major fuel exporters) 40 41 42 42 42 42Other developing countries 44 45 46 47 48 49

46 World Economic Situation and Prospects 2011
Table (cont’d)
2010 2011 2012 2013 2014 2015
Nominal exchange-rate appreciation (percentage)
Europe -5.0 -5.0 0.0 0.0 0.0 0.0Japan 6.0 5.0 2.0 3.0 3.0 3.0United States, Canada and other developed countries 1.8 1.4 0.2 -0.4 -0.6 -0.5China 1.0 0.0 0.0 -1.0 -1.0 0.0India -3.0 -2.0 -3.0 -4.0 -4.0 -4.0CIS and Western Asia (major fuel exporters) 0.0 0.0 -1.0 -6.0 -7.0 -7.0Other developing countries 4.0 3.0 -2.0 -6.0 -6.0 -5.0
Memorandum items (percentage)
Growth of gross world product at market rate (percentage) 3.6 3.7 4.2 4.1 4.1 4.1Growth of gross world product at PPP rate (percentage) 4.5 4.7 5.0 4.9 4.9 4.9Growth of exports of good and services (percentage) 6.9 7.0 8.4 8.3 8.3 8.4Real world price of energy (index) 1.3 1.4 1.5 1.5 1.6 1.6Real world price of food and primary commodities (index) 1.1 1.1 1.1 1.1 1.1 1.1Real world price of manufactures (index) 1.0 1.0 1.1 1.1 1.1 1.1
Source: UN/DESA Global Policy Model, availble from http://www.un.org/esa/policy/publications/ungpm.html.

47
Chapter IIInternational trade
The below-trend recovery of world tradeWorld trade had declined by more than 11 per cent in 2009 (figure II.1). The 3.6 per cent rebound of global output in 2010 was accompanied by a 10.5 per cent expansion of the worldwide volume of imports of goods and services. Monthly data for world trade in goods, produced by the CPB Netherlands Bureau for Economic Policy Analysis, indicate that the turnaround in trade took place in mid-2009 (see chap. I, figure I.6). The recovery was particularly strong between mid-2009 and mid-2010 when the trade volume increased at an annualized rate of nearly 20 per cent. Since then, however, world trade growth has lost steam along with the slowdown in the recovery of the world economy.
Compared with the average growth rates attained between 2004 and 2007, cumulative losses of world gross product (WGP) and world trade volume of about 8 and 26 percentage points were seen during 2008 and 2009, respectively, as a result of the global financial crisis. In the outlook, growth of world income is expected to average 3.3 per cent between 2011 and 2012 and that of world trade to be about 6.7 per cent. As the rates of recovery between 2011 and 2012 do not make up for the cumulative losses of income and trade experienced during the crisis, such losses can be said to be permanent. This state of affairs also corroborates the hypothesis that economic recoveries following financial crises tend to be protracted and also keep import demand depressed for several years.1
1 See, for example, Caroline Freund, “The trade response to global downturns: historical evidence”, World Bank Policy Research Working Paper, No. 5015 (Washington, D. C.: World Bank, August 2009).
The recovery of world trade decelerated in the second half of 2010
Growth of world trade will be far too slow to return to the levels it would have reached at continued pre-crisis trends
Figure II.1Growth of world income and of the volume of imports,a 2002-2012
Percentage
-15.0
-10.0
-5.0
0.0
5.0
10.0
15.0
2002 2003 2004 2005 2006 2007 2008 2009 2010b 2011c 2012c
World imports
World gross product
Source: UN/DESA and Project Link.a Growth rates are calculated on the basis of GDP and import values in constant 2005 United States dollars. Imports cover both goods and non-factor services.b Partly estimated.c Projections based on the United Nations World Economic Forecasting Model and Project LINK.
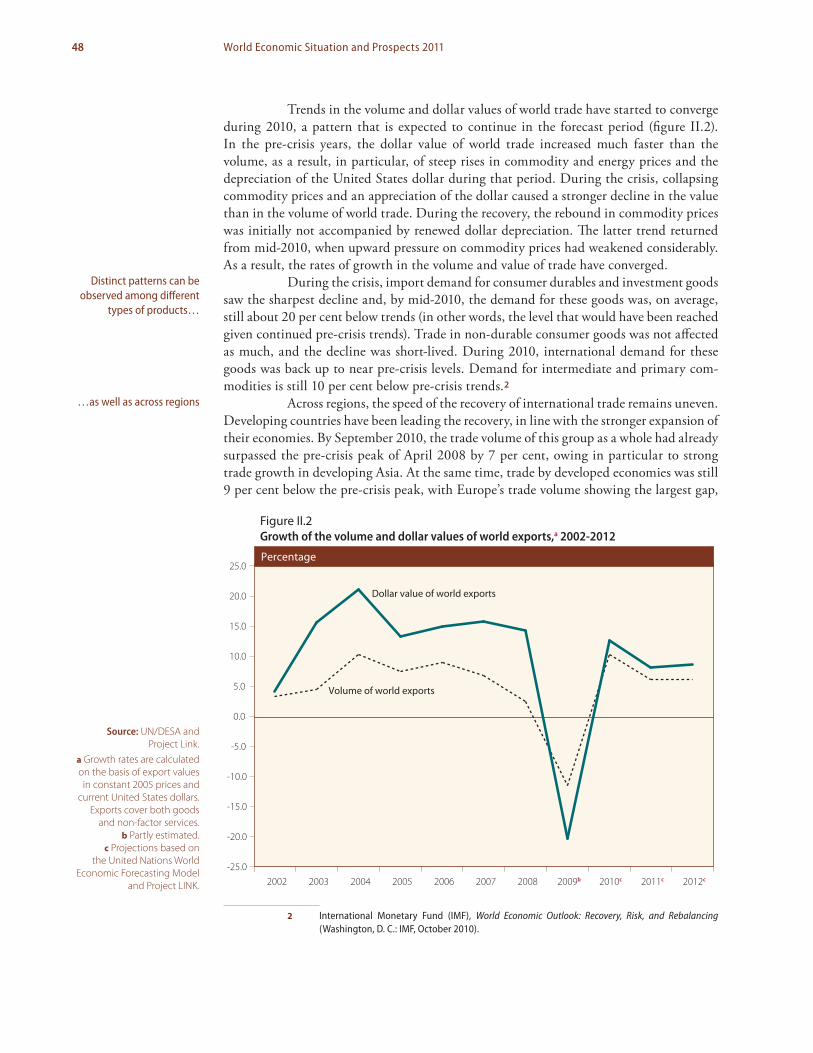
48 World Economic Situation and Prospects 2011
Trends in the volume and dollar values of world trade have started to converge during 2010, a pattern that is expected to continue in the forecast period (figure II.2). In the pre-crisis years, the dollar value of world trade increased much faster than the volume, as a result, in particular, of steep rises in commodity and energy prices and the depreciation of the United States dollar during that period. During the crisis, collapsing commodity prices and an appreciation of the dollar caused a stronger decline in the value than in the volume of world trade. During the recovery, the rebound in commodity prices was initially not accompanied by renewed dollar depreciation. The latter trend returned from mid-2010, when upward pressure on commodity prices had weakened considerably. As a result, the rates of growth in the volume and value of trade have converged.
During the crisis, import demand for consumer durables and investment goods saw the sharpest decline and, by mid-2010, the demand for these goods was, on average, still about 20 per cent below trends (in other words, the level that would have been reached given continued pre-crisis trends). Trade in non-durable consumer goods was not affected as much, and the decline was short-lived. During 2010, international demand for these goods was back up to near pre-crisis levels. Demand for intermediate and primary com-modities is still 10 per cent below pre-crisis trends.2
Across regions, the speed of the recovery of international trade remains uneven. Developing countries have been leading the recovery, in line with the stronger expansion of their economies. By September 2010, the trade volume of this group as a whole had already surpassed the pre-crisis peak of April 2008 by 7 per cent, owing in particular to strong trade growth in developing Asia. At the same time, trade by developed economies was still 9 per cent below the pre-crisis peak, with Europe’s trade volume showing the largest gap,
2 International Monetary Fund (IMF), World Economic Outlook: Recovery, Risk, and Rebalancing (Washington, D. C.: IMF, October 2010).
Distinct patterns can be observed among different
types of products…
…as well as across regions
Figure II.2Growth of the volume and dollar values of world exports,a 2002-2012
Dollar value of world exports
Volume of world exports
-25.0
-20.0
-15.0
-10.0
-5.0
0.0
5.0
10.0
15.0
20.0
25.0
2002 2003 2004 2005 2006 2007 2008 2009b 2010c 2011c 2012c
Percentage
Source: UN/DESA and Project Link.
a Growth rates are calculated on the basis of export values in constant 2005 prices and
current United States dollars. Exports cover both goods
and non-factor services.b Partly estimated.
c Projections based on the United Nations World
Economic Forecasting Model and Project LINK.

49International trade
at 11 per cent. As a result, the developing country share in global trade increased from about one third to more than 40 per cent between 2008 and 2010 (see annex tables A.16 and A.17 for annual figures per region).
Terms of trade of developing and transition economies
Primary commodity prices have fluctuated strongly compared with prices of manufactures. As a result, countries specializing in exports of primary commodities and those with high shares of imports of energy, food and industrial raw materials have had large swings in their terms of trade. During 2010, the terms of trade of the fuel exporters and exporters of minerals and mining products improved significantly along with rebounding commodity prices, but stayed below the peaks reached in 2008 and 2007, respectively. Concomitantly, exporters of manufactures saw part of the gains in their terms of trade dissipate. In 2010, exporters of agricultural products experienced an increase in the unit prices of both their exports and imports but, on balance, saw a modest improvement in their terms of trade. The countries that are net food importers and that do not export oil or mining products on a significant scale suffered a slight deterioration in their terms of trade during 2010, continuing a longer trend (figure II.3a).
Trends across regions show similarly diverging patterns, depending on the pre-dominant trade structures (figure II.3b). The economies in transition, Africa, Western Asia and Latin America and the Caribbean saw a significant rebound in their terms of trade, having suffered important losses in 2009 following trends in primary commodity prices. The predominantly manufactured exports in East and South Asia, in contrast, saw stag-nant or slightly declining terms of trade in 2010, after a modest improvement during the global recession. Greater export diversification explains the mild fluctuations in the terms of trade among these economies. Similarly, developed countries saw little movement, on average, in their terms of trade.
Broadly, terms-of-trade indices moved back to 2007 levels. This may be seen as a correction of the exceptionally large spikes (upward and downward) in commodity prices during 2008, caused by the global crisis and exacerbated by large-scale financial speculation. The present levels seem to be more in line with the upward trend in primary commodity prices relative to those of manufactures that had set in in the late 1990s. This trend has been strongly influenced by the fast economic growth in the large economies in developing Asia, which has pushed down world market prices of manufactures through the vast expansion of the supply of a large range of low-priced industrial products and has pushed up demand for and prices of primary commodities.
Future trends remain uncertain, however, given the high degree of “financiali-zation” of commodity markets and the influence on prices of speculative investments in commodity futures markets (see box II.1), as well as the uncertainties regarding the global economic recovery, as discussed in chapter I.
The large terms-of-trade fluctuations of the past few years have had measurable effects on national income and the balance of trade of many economies. Countries lacking the means (such as adequate foreign-exchange reserves or stabilization funds) to cope with swings of this magnitude tend to suffer adverse long-term growth consequences because of the macroeconomic volatility caused by these shocks. Table II.1 shows the income gains and losses caused by swings in the terms of trade (with all other things being equal) rela-tive to the income of selected developing countries and economies in transition.
While primary commodity-exporting countries benefited the most from the turnaround in the terms of trade, they also suffered from price falls during the crisis
Greater volatility affecting countries with a higher concentration in exports of primary commodities necessitates the preservation of adequate foreign-exchange reserves or stabilization funds
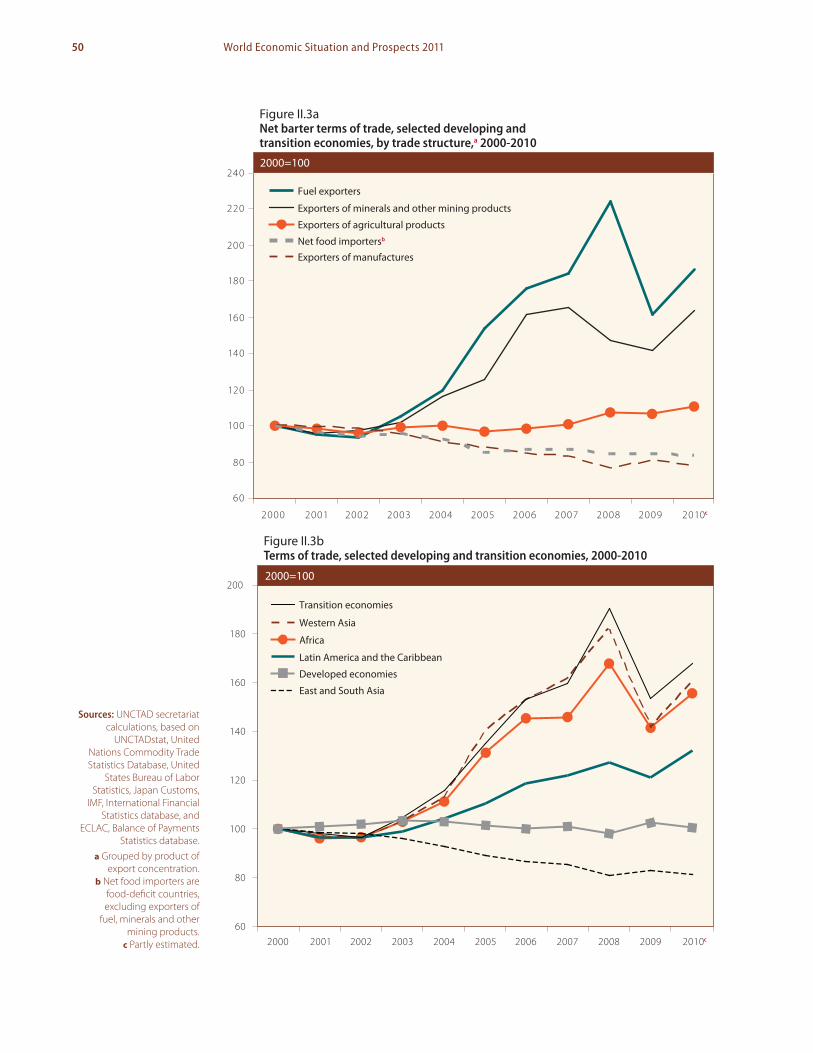
50 World Economic Situation and Prospects 2011
60
80
100
120
140
160
180
200
220
240
2000 2001 2002 2003 2004 2005 2006 2007 2008 2009 2010c
Fuel exporters
Exporters of minerals and other mining products
Exporters of manufactures
Net food importersb
Exporters of agricultural products
Figure II.3aNet barter terms of trade, selected developing and transition economies, by trade structure,a 2000-2010
2000=100
Transition economies
Western Asia
Developed economies
East and South Asia
Latin America and the Caribbean
Africa
60
80
100
120
140
160
180
200
2000 2001 2002 2003 2004 2005 2006 2007 2008 2009 2010c
Figure II.3bTerms of trade, selected developing and transition economies, 2000-2010
2000=100
Sources: UNCTAD secretariat calculations, based on
UNCTADstat, United Nations Commodity Trade Statistics Database, United
States Bureau of Labor Statistics, Japan Customs,
IMF, International Financial Statistics database, and
ECLAC, Balance of Payments Statistics database.
a Grouped by product of export concentration.
b Net food importers are food-deficit countries, excluding exporters of
fuel, minerals and other mining products.
c Partly estimated.

51International trade
Exporters of minerals and other mining products, and above all fuel exporters, saw particularly large income effects because of changes in the terms of trade. This is the result not only of the large swings in their export prices but also of the high dependence of their economies on those products. More diversified economies, which generally also have a greater share of manufactured exports, typically suffer much less from terms-of-trade shocks.
The pattern of total trade shocks, which combines the fluctuations in the terms of trade and export demand, confirms the marked effect caused by price fluctuations alone (figure II.4).3 Countries dependent upon exports of primary commodities experienced far greater trade shocks (positive or negative) than those with more diversified export struc-tures or reliance on manufactured exports. Shocks of any significance among the latter are typically driven by fluctuations in import costs of energy and other raw materials, but show little volatility in export earnings and demand. Agriculture exporters are typically in the mid-range of fluctuations in both prices and demand.
Trends in primary commodity markets
Markets for non-oil commodities
The non-oil commodity sector is still reeling from the sharp slide of primary commodity prices that started in the second half of 2008. Prices progressively recovered during 2009, but receded, in dollar terms, during the second quarter of 2010 owing to the financial turmoil in Europe. In the second half of 2010, prices surged again (figure II.5) as a result of rising demand for commodities in emerging Asian economies, replenishment of industrial inventories in advanced countries, the depreciation of the United States dollar amidst greater exchange-rate volatility and increasing interest from financial investors in commod-ity markets (see box II.1). The influences of the last two factors are particularly worrisome as they signal greater uncertainty about future price dynamics for non-oil commodities.
3 The analysis in the following paragraphs is based on the world economic vulnerability framework of UN/DESA. Demand shocks are defined by the change in the volume of merchandise exports. Terms of trade shocks refer to the income gains or losses emanating from the change in export prices relative to that of import prices, as defined in figures II.3a-b, in any given year. The total trade shock is the sum of these two types of shocks. For further details of the related methodology, see the technical note available from http://www.un.org/esa/policy/publications/wespwevm/monitor_note.pdf.
Significant volatility remains in primary commodity markets amidst large exchange-rate variations and greater financialization of trading
Table II.1 Income gains or losses from the terms of trade of selected developing and transition economies, by trade structure, 2002-2010
Percentage of GDP
2002-2007 2008 2009 2010
Exporters of manufactures -0.9 -2.6 1.8 -1.0
Fuel exporters 4.6 7.7 -10.5 5.0
Exporters of minerals and other mining products 3.0 -4.4 -1.0 4.6
Exporters of agricultural products 0.2 1.6 -0.5 1.0
Source: UNCTAD secretariat calculations, based on UNCTADstat.

52 World Economic Situation and Prospects 2011
(a) Developed economies
-18-15-12
-9-6-30
369
12
1518
Who
le g
roup
Ener
gy
Min
eral
s
Agric
ultu
re
Man
ufac
turin
g
Div
ersi�
ied
0.5 2.
1
7.1
5.5
2.0 3.
7
-0.4
-2.7
-14.
1
-2.3
-2.5
-5.0
-1.5 -0.5
1.8
4.2
8.8
0.9
0.5 1.1
(d) Western Asia
4.0
8.3
7.2
12.0
1.6
7.7
-1.6
0.3
0.0
-12.
0
-18-15-12
-9-6-30
369
12
1518
17.2
-21.
7
Who
le g
roup
Ener
gy
Min
eral
s
Agric
ultu
re
Man
ufac
turin
g
Div
ersi�
ied
(b) Economies in transition
5.8 6.
8
6.4
4.9 5.6
3.4
1.3
8.5
-3.5
-3.1
-10.
0
-12.
1
1.7 2.2
-2.1
-1.4
-5.3
3.7
2.6
1.2
-18
-15
-12
-9
-6
-3
0
3
6
9
12
15
18
Who
le g
roup
Ener
gy
Min
eral
s
Agric
ultu
re
Man
ufac
turin
g
Div
ersi�
ied
(c) East and South Asia
-2.2
-13.
4
-1.7
-4.0
4.7
1.9
6.6
6.6
9.6
2.9
10.4
6.5 6.8
10.0 12
.4
-4.1
1.5
4.3
14.6
2.1 4.
5 5.2
-18
-15-12
-9-6-30
369
1215
18
23.2
Who
le g
roup
Ener
gy
Min
eral
s
Agric
ultu
re
Man
ufac
turin
g
Div
ersi�
ied
-14.
4
(e) Latin America and the Caribbean
1.7 3.
5 4.2
1.6
1.3
0.9
0.6
-0.5
0.5
-1.3
-2.3
-7.5
-3.6 -1
.3
-1.5 -1.0
6.1
0.9
4.4 6.
2
11.1
4.1 4.6
2.2
-18-15-12
-9-6-30
369
12
1518
Who
le g
roup
Ener
gy
Min
eral
s
Agric
ultu
re
Man
ufac
turin
g
Div
ersi�
ied
Figure II.4 Trade shocks by export specialization, country groups, 2001-2010 (percentage of group GDP)
(f) Africa
2.1 3.
5
-3.3 -1
.7
4.0
4.5 5.
9
6.0
8.9
1.8
0.6
0.4
0.3
-0.3-0.1
-0.7
-5.3
-11.
1
-0.9
2.9
2.8 3.3
2.1
1.0
-18-15
-12-9-6
-303
69
12
1518
Who
le g
roup
Ener
gy
Min
eral
s
Agric
ultu
re
Man
ufac
turin
g
Div
ersi�
ied
Source: UN/DESA, World Economic Vulnerability framework based on Comtrade and UNCTAD data, available from http://www.un.org/esa/policy/publications/wespwevm/monitor_note.pdf.Note: Economies are considered “diversified” in terms of export structure if there is no major commodity category that makes up more than 40 per cent of the total. For manufactures, this limit is set at 50 per cent because of the great range of products falling into that category. Any concentration above these limits defines the specialization by type of commodity.
2001-2007 2008 2009 2010

53International trade
Figure II.5Non-oil commodity price index, all groups, in dollar and SDR terms, January 2006-September 2010
Index 2000=100
2006 2007 2008 2009 2010
Jan
Apr
Jul
Oct Jan
Apr
Jul
Oct Jan
Apr
Jul
Oct Jan
Apr
Jul
Oct Jan
Apr
Jul
50
0
100
150
200
250
300
350
United States dollars
Special drawing rights
Source: UNCTADstat.
The financialization of commodity trading
The traditional function of the commodity exchanges has been to facilitate price discovery and al-low for the transfer of price risk from producers and consumers to other agents that are prepared to assume such risk. But these functions have become impaired by the growing “financialization of commodity trading”. This term refers to the increasing role of financial motives, financial markets and financial actors in the operation of commodity markets. It is visible, for example, in the increased correlation between commodity and equity prices, as well as between commodity prices and the ex-change rates of currencies important in carry trade (in particular, the dollar, the yen and the euro).a
Many financial investors enter commodity markets with the motive of diversifying their portfolios, their position-taking being typically unrelated to the fundamentals of supply and demand in commodity markets. They regard commodities merely as an alternative class of assets, next to equities, bonds and so forth. As a result, conditions in financial markets have been increasingly influ-encing commodity prices.
Financialization has had a number of adverse effects on commodity exchanges. First, it has led to greater volatility in commodity market prices. Second, it has caused shifts in price trends that are unrelated to the relative scarcity of primary commodities. Third, it has made hedging against commodity price risk more complex and expensive. For example, as the risk increases with greater price volatility, so do margin payments—the normally small payments made to clearing houses by suppliers and buyers of a commodity to cover the risk assumed by the clearing house. Fourth, increased margins owing to volatility and greater transaction costs owing to more complex trading have substantially reduced the affordability of price hedging for many developing country actors in the market.
Financial investors can choose from a range of instruments through which to invest in commodity markets. Index investment is one of the more popular ones. This type of investment tends to drive up commodity prices as it implies taking long positions; that is to say, positions that indicate an interest in buying commodities at a future date. At the same time, money managers (especially hedge fund managers) have become increasingly important players in commodity derivatives trad-ing, particularly in the market for crude oil.b In contrast to index investors, money managers tend to have a shorter investment horizon and may alternate between taking long or short positions. Much
Box II.1
a For further discussion, see, UNCTAD, Trade and Development Report 2009: Responding to the global crisis; Climate change mitigation and development (United Nations publication, Sales No. E.09.II.D.16), chap. 2.
b R.K. Kaufmann, “The role of market fundamentals and speculation in recent price changes for crude oil”, Energy Journal, forthcoming.
54 World Economic Situation and Prospects 2011
of this short-term position-taking relies on automatic trading, which is determined by pre-defined algorithms based on standardized trading strategies. These strategies combined tend to multiply responses in one particular direction, allowing such automatic trading to easily ignite self-reinforcing speculative bubbles.
In theory, arbitrage should help eliminate price changes that are not justified by chang-es in fundamentals. In practice, however, the overoptimism and overconfidence of market players affect the decision-making processes, forming expectations that prices will tend to move upwards indefinitively (as is typical of speculative financial markets). Moreover, there are limits to arbitrage—for example, constraints on the risk-bearing capacity of rational arbitrageurs.c As risks increase with the degree of perceived under- or overpricing of commodities, individual arbitrageurs may lack the funds to hedge against large risks and will be outcompeted by financial investors who typically have less funding constraints. Given their increasingly dominant role, financial investors are enacting a substantial and often lasting impact on commodity prices.
Holding physical positions in commodities would be an alternative strategy to bet against perceived mispricing of commodities. However, taking physical hold of commodities would add significant transportation and storage costs. In addition, information asymmetries regarding quality, for instance, may drive up costs further. These factors are likely to discourage financial arbi-trageurs from taking “physical” market positions.
While its growing importance is clear, it is nonetheless difficult to quantify the precise impact of financialization on price trends. This is in part because it is not easy to disentangle the impact of financial market developments on supply and demand conditions (since they may affect overall economic growth and, hence, commodity demand) from the more direct impact of financial market conditions on commodity prices through speculative behaviour. It is also difficult because financial speculation is intrinsically unpredictable. One prominent recent empirical study that made a respectable attempt to disentangle the impacts of fundamental and financial factors has refuted the notion that the growing demand for commodities from emerging economies was the main driver of the commodity price hike in 2006–2008 and supported the hypothesis that financialization was at least equally as important.d
Containing the influence of financialization on commodity price volatility is equally challenging. Some action is under way, however, including through stricter regulation. Debates on measures in other areas are ongoing.
It is widely recognized that much of the commodity trading activities of financial investors is not recorded. Scheduled changes in financial regulation in both the United States of America and the European Union should help to address this deficiency and improve transparency in commodity exchanges. The question remains whether over-the-counter (OTC) trading will also be subject to the regulated exchanges. Difficulties herein are exemplified by the divergence in the views of regulators and industry representatives regarding which market players can be identified as swap dealers in order to subject them to the new regulation. It is hoped that in the United States, regulation of commodity trading will become stricter through the application of upper limits on the positions that can be taken in energy and agricultural commodity trading across futures markets and equivalent OTC markets, as mandated by the Wall Street Reform and Consumer Protection Act.
Beyond tighter regulation, new commodity price stabilization schemes have been proposed. These include, for instance, the creation of a virtual reserve and intervention mechanism that would intercede in the futures markets if market prices differed significantly from the estimated dynamic price band based on market fundamentals. In addition, a multitier transaction tax system for commodity derivatives markets has been proposed. Under this scheme, transaction tax surcharges of increasing scale would be levied as soon as prices start to move beyond the price band defined either on the basis of commodity market fundamentals e or on the basis of the observed degree of correlation between the price changes of equities, currencies and commodities. Both proposals de-serve due consideration, even though putting them into practice appears to be difficult both for ad-ministrative reasons and because they face strong opposition from vested interests in the industry.
Mitigating the adverse effects of financialization in commodity trading would seem im-perative, but more research is needed into the kinds of measures that would be the most effective to this end. The Government of France has placed both commodity price and exchange-rate stabilization priorities in the agenda for the Group of Twenty (G20) meeting to take place in 2011 under its presi-dency. Political recognition of the problem thus exists, but workable options are urgently needed.
Box II.1 (cont’d)
c See, for example, A. Shleifer and R.W. Vishny,
“The limits of arbitrage”, Journal of Finance, vol. 52,
No. 2, pp. 737-783; and Denis Gromb and Dimitri Vayanos,
“The ‘limits of arbitrage’ agenda”, available from
http://www.voxeu.org/index.php?q=node/4841.
d Kei Tang and Wei Xiong, “Index investment
and financialization of commodities”, NBER
Working Paper, No. 16385 (Cambridge, Massachusetts:
National Bureau of Economic Research, September 2010).
e On both proposals, see Joachim von Braun and
Maximo Torero, “Physical and virtual global food reserves to protect the
poor and prevent market failure”, IFPRI Policy Brief, No. 4 (Washington, D. C.: International Food Policy
Research Institute, June); and M. Nissanke, “Mitigating the
commodity-dependence trap in LDCs through global facilities”, mimeo, School of
Oriental and African Studies, University of London.

55International trade
Agricultural commodities
During 2009 and up until the third quarter of 2010, the price of agricultural commodities fluctuated around an upward trend (figure II.6). The trend reflected rising global demand, while the volatility around the trend resulted from commodity-specific supply shortfalls caused by adverse climatic conditions, policy measures in some countries to restrict exports of commodities in short supply, and speculative behaviour.
Specifically, wheat prices reached a two-year high in September 2010, owing to adverse weather conditions in major producing and exporting countries (Argentina, Canada, France, Germany, Pakistan and countries in the Black Sea region). The emerging supply shortage was only partly offset by robust harvests in Brazil. Preliminary United Nations Conference on Trade and Development (UNCTAD) estimates, based on data from the International Grains Council, show that the stock-to-use ratio for total grains was about 20 per cent in 2009-2010, while for wheat it stood at 28 per cent in 2010, compared with 17 per cent and 20 per cent, respectively, during the food crisis of 2007 and 2008. Thus, grain prices, in general, and wheat prices, in particular, are not likely to increase sharply again in the near term.
Meanwhile, the prices of rice, corn and sugar followed a downward trend during the first half of 2010, although they are still higher than the average for the decade. More recently, however, price trends reversed slightly owing to a variety of factors, including ad-verse weather conditions in major Asian rice-producing countries, growing world demand for corn amidst concerns about the sufficiency of yields in corn fields in the United States of America, increased interest in biofuels as the rise in oil prices resumes, and higher world demand for refined sugar in a context of stocks’ approaching critically low levels.
Adverse climatic conditions and export bans pushed up the prices of several agricultural commodities amidst increased speculative behaviour
Figure II.6Price indices of selected agricultural commodities, current United States dollars, January 2006-September 2010Index 2000=100
2006 2007 2008 2009 2010
Jan
Apr
Jul
Oct Jan
Apr
Jul
Oct Jan
Apr
Jul
Oct Jan
Apr
Jul
Oct Jan
Apr
Jul
Vegetable oilseeds and oils
100
50
0
150
200
250
300
350
400
FoodAgricultural raw materialsTropical beverages
Source: UNCTADstat.

56 World Economic Situation and Prospects 2011
Over the 15 months up to July 2010, the index for oilseeds and vegetable oils remained more or less flat, after spiking to record highs during the 2007-2008 food crisis. From mid-2010, prices started to rise again (figure II.6). Prices of soybeans, soybean oil and palm oil recovered following fears of tightening supplies owing to droughts in South America and delayed planting for the production of soybean oil in the United States. This upward trend in prices is expected to moderate as soybean production has resumed in Argentina, Brazil and the United States.
Developments in food prices will continue to be influenced by further diversion of land use for biofuel production, encouraged by government subsidies.4 Brazil, China, the European Union (EU), India and the United States have all set targets to increase the production and use of biofuels. Considering that biofuel production is competitive above the threshold price of fossil fuels (in Europe, for instance, this threshold stands at about $70 per barrel (pb) of oil), future prices of food crops that could alternatively be useful for biofuel production would remain linked to the evolution of oil prices. In addition, increased demand for production inputs has led to increased world prices for other food crops.
Weather-induced factors affected supply and price trends of tropical beverages in 2010. Coffee prices steadily increased over the first nine months of 2010 as world coffee production decreased by about 6.6 per cent in 2009/2010 owing to the fall in output in several major producing countries (such as Brazil, Colombia and Viet Nam) as a result of bad weather conditions. If demand for coffee increases at existing trend rates, stocks of the commodity will continue to fall to critical levels, particularly for the highest grades of Arabica, thereby exerting additional upward pressure on prices.
Cocoa prices peaked at $1.60 per pound in January 2010, mainly owing to supply deficits. Prices dipped to a three-month low of $1.39 per pound in August 2010, however, but rallied again for three months following the speculative behaviour of a hedge fund which had bought a stake in cocoa beans equivalent to about 7 per cent of the global supply. Prices have since fallen and are likely to remain subdued in the coming year based on reports of improved cocoa harvests in Côte d’Ivoire and Ghana and despite concerns over the potential impact of black pod disease in West Africa.
The price index of agricultural raw materials rose steadily from 139 in March 2009 to 212 in September 2010 on the back of strong world demand. Commodity-specific factors affected rubber prices, which rose because of a forecast fall in world production following adverse weather in the main producing countries. Cotton prices reached historic peaks as a significant drop in world cotton production was recorded in 2009/2010, while demand for fibres from Asian emerging economies increased sharply. As stocks will remain low, prices are likely to remain high.
Looking ahead, price developments for agricultural commodities are uncer-tain as they are largely influenced by weather-induced supply shocks and the speed of stock depletion, which depends on the strength of demand in a context of uncertainty about the global recovery. For food items, additional sources of uncertainty lie in the possible implementation of national trade policies such as export bans, and the scope for greater demand for biofuels which, in turn, is influenced by uncertain trends in crude oil prices.
4 See “The future energy matrix and renewable energy: implications for energy and food security” (TD/B/C.1/MEM.2/8).
Developments in food prices will continue to
be influenced by further diversion of land use for
biofuel production

57International trade
Minerals and metals
The price index of minerals, ores and metals increased sharply from early 2009 onwards (figure II.7) in response to the stronger-than-expected recovery in emerging economies, coupled with decreasing inventories. The largest price gains were posted for copper, lead and zinc. Further increases in metal prices would depend on the growth prospects of large, metal-intense economies, such as China, Brazil, India and the Russian Federation. If current demand trends prevail, prices are expected to remain high over the short-to-medium term.
Copper prices reached historic highs in the months prior to the global financial crisis, fell by about two thirds in the following few months, but have started to rise again since early 2009 owing to a combination of stronger-than-expected industrial production worldwide and strikes in key copper mines in Chile. By end-2010, it is estimated that the world copper price will have returned to its pre-crisis peak.5 Zinc prices were on a decline in the years before the global financial crisis, but reversed trend from early 2009 and had effectively doubled by the end of 2010, pushed by global demand. Tin prices reached historic highs in the early months of 2008 but had fallen by half by early 2009; they have since recovered to nearly pre-crisis levels, however. The rebound was underpinned by a combination of a drop in production in Indonesia and increased demand from China’s electronic sector. The price of gold continued to soar, surging to an average price of $1,180 per troy ounce during the first nine months of 2010, at times reaching levels above $1,400. An estimated 8.5 per cent fall in world supply during 2010, plus sustained increases in demand by the jewellery (15.5 per cent) and the electronic (21 per cent) sectors, combined with its character as a safe portfolio investment in times of uncertainty, contributed to
5 United Nations Conference on Trade and Development (UNCTAD) and International Copper Study Group (ICSG) statistics, October 2010.
The rebound of industrial activity in emerging economies boosted prices of minerals and metals
Figure II.7Price indices of selected minerals, in current United States dollars , January 2006-September 2010
Index 2000=100
2006 2007 2008 2009 2010
Jan
Apr
Jul
Oct Jan
Apr
Jul
Oct Jan
Apr
Jul
Oct Jan
Apr
Jul
Oct Jan
Apr
Jul
NickelCopperMinerals, ores and metalsGold
100
0
200
300
400
500
600
700
Source: UNCTADstat.

58 World Economic Situation and Prospects 2011
the surge in gold prices. Because of the uncertainty inherent in each of these factors, the outlook for gold remains uncertain in the medium run. In the short run, however, the price is likely to remain high.
The partial recovery of the world economy, boosted by the robust, albeit mod-erating, growth of the major emerging economies, is likely to support a slight upward trend in the prices of basic and precious metals and minerals. This may continue in the medium term, with further price increases being fed by expected declines in productivity of existing mines and concerns over the environmental impact of metal smelting that may weaken the capacity of supply to respond to increases and shifts in demand. While sluggish supply conditions could attract investments in new mines, the impact on supply would be felt only in the medium-to-long run, considering the lengthy gestation periods of typically more than 10 years for investments to mature in base and precious metal mines.
The oil market
Oil demand mirrored trends in global economic growth. During the crisis, demand fell from 86.0 million barrels per day (mbd) in 2008 to 84.7 mbd in 2009.6 With the global economic recovery, oil demand is estimated to have picked up again, to reach 86.6 mbd in 2010.
These headline figures for oil demand mask marked differences in the driving forces behind global oil demand. Demand in Organization for Economic Cooperation and Development (OECD) countries, which makes up 54 per cent of global demand, fell by 4.6 per cent in 2009, but increased only modestly, by 0.4 per cent, in 2010. The non-OECD economies, in contrast, registered an increase in oil demand of 2.3 per cent in 2009, which strengthened to 4.3 per cent in 2010.
On the supply side, the Organization of the Petroleum Exporting Countries (OPEC) announced significant cuts in its production quotas in 2008 in response to the emerging global crisis. Initially, the compliance rate with the new quota was high and the total supply of oil by OPEC member States fell from 31.2 mbd in 2008 to 28.7 mbd in 2009. Increasing crude prices and greater needs for revenues eventually eroded compliance with the reduced production quota. As a result, OPEC output increased somewhat to 29.0 mbd in the second quarter of 2010. Nevertheless, spare capacity in OPEC remained at a relatively high level of almost 17.3 per cent of potential.
Oil supply by non-OPEC countries remained flat, at 50.9 mbd, during the trough of the economic crisis in 2008 and 2009. By the second quarter of 2010, non-OPEC output had increased to 52.6 mbd. The increase came mainly from fuel-exporting develop-ing countries. Oil production in OECD countries remained virtually unchanged, with that in North America increasing modestly to offset a continued decline in European output.
As further evidence of a well-provisioned market, total stocks of oil in OECD countries remained at relatively high levels, falling only modestly from 96 days of forward demand coverage in the second quarter of 2009 to 95 days in the second quarter of 2010.7
Oil prices rebounded from their 2009 levels as expectations regarding an ac-celerating global economic recovery carried over into 2010, though only briefly. Supported by exceptionally cold weather in the northern hemisphere, oil prices reached a 15-month high of $80.67 pb in January 2010, a jump of 15.0 per cent from the low in December of the previous year. However, prices subsequently reversed course and fell by almost 14.0 per
6 Data for demand and supply are provided by the International Energy Agency.
7 These figures refer to inventories of both industries and governments.
Oil demand picked up owing to acceleration in the growth of major non-OECD
economies
OPEC and non-OPEC countries increased their
production

59International trade
cent, to $69.50 pb, in early February in view of concerns about possible slower economic growth as a consequence of the potential fallout from fiscal instability in the euro area as well as fears of a premature withdrawal of fiscal stimulus policies.
From February onwards, however, oil prices were back on an upward trend, peaking at $88.09 pb in early May. A number of factors underpinned this turnaround. Global equity markets boomed based on perceived expectations of a continued global economic recovery and the strong rebound in emerging market economies, which created a generally more positive outlook for oil demand. This, in turn, also helped support a tighter market for gasoline in anticipation of stronger demand in the summer months. In a second-round effect, the resulting higher crack spreads fed back into rising crude demand and crude prices. In the geopolitical sphere, increasing political tensions in some major suppliers, such as the Islamic Republic of Iran and Iraq, intensified fears of possible supply disruptions.
But oil prices subsequently declined by more than 23.0 per cent in less than a month, to $67.61 pb at the end of May, resulting from continued instability in financial markets triggered by the Greek debt crisis. The downward spiral came to a halt as EU Governments showed support for the public debt of member States. Subsequently, prices crept higher with the continued recovery of equity markets, the threat of supply disrup-tions from the hurricane season and a weakening dollar. However, after reaching a high of $85.28 pb in early August, prices again receded in tandem with equity markets following weak job numbers in the United States and general doubts about the strength of the global economic recovery.
In the outlook, global oil demand is assumed to increase by 1.5 per cent in 2011, to 87.8 mbd, stoked by a jump in demand from non-OECD countries by 3.7 per cent. Demand from China and India will continue to provide the bulk of the expansion in the market and is projected to increase by 4.3 per cent and 3.1 per cent, respectively. In these economies, efforts to increase energy efficiency are outweighed by the effects of con-tinued subsidies of fuel prices as well as the impact of strong economic growth. In contrast, OECD demand will register a modest decline of 0.2 mbd owing to economic weakness and further efficiency gains, as well as the ongoing substitution of conventional fuel with ethanol and biofuels. On the financial side of the oil market, the continued environment of low interest rates creates both the liquidity and the motivation for seeking higher yields that will preserve interest in crude oil as an investment asset (see box II.1 above).
On the supply side, non-OPEC countries are expected to post an increase in output of 0.6 per cent in 2011, to 52.9 mbd, driven by non-OECD producers such as Azerbaijan, Brazil, Colombia and Ghana. However, OECD producers, which provide about 35.0 per cent of non-OPEC output, will see their production fall by 1.6 per cent in 2011, to 18.4 mbd. The bulk of this decline will be the result of maturing oil fields in Europe. In the United States, the explosion of the Deepwater Horizon drilling rig in April 2010 has had only a limited effect on total national output. The main output risks pertain to future projects that depend on the evolving regulatory environment.
For 2011, oil prices are assumed to average $75 pb in a market characterized by ample spare capacity among OPEC producers, eroding quota compliance by OPEC members as well as relatively high levels of inventories. While continued solid demand expansion in markets such as China and India will provide support to crude prices, the fading of stimulus measures in developed markets and limited potential for any additional such initiatives in light of growing fiscal constraints will constitute a significant offset-ting demand factor. In parallel, financial investors are expected to tread rather cautiously.
Unless the dollar depreciates markedly, no further significant increase of oil prices is expected in the outlook

60 World Economic Situation and Prospects 2011
Consequently, upward pressure on crude prices resulting from these forces will likely be limited as well.
This outlook is subject to significant uncertainty, however. Weaker-than-expected economic activity would also create significant downward pressure on oil prices. Possible sources for such economic weakening include a premature tightening of monetary policy and a more pronounced slowdown of the Chinese economy. Conversely, a number of geopolitical factors could lead to an unexpected jump in oil prices. In particular, a further rise in international tensions regarding the Islamic Republic of Iran’s nuclear programme could also affect expected or actual oil supply. In addition, more pronounced swings in the value of the dollar would have a significant impact on oil price volatility.
Trade in servicesWorld trade in services has been severely hit by the financial and economic crisis. It is presumed to have recovered during 2010, but insufficient data were available at the end of the year to confirm this. UNCTAD data indicate that the value of international trade in services fell by 12 per cent in 2009, a significant drop, but less than the 23 per cent decline in merchandise trade during the same year. The weaker downturn in services trade during the global crisis could reflect a lesser dependence on intermediate inputs as much as a lesser reliance on trade finance of certain services sectors like communications.
During 2009, international trade in services decreased by 13 per cent in devel-oped countries, by 10 per cent in developing countries and by 17 per cent in the economies in transition (figure II.8). The worst performance of the economies in transition reflects a greater contraction in all services sectors, but especially those related to construction, travel and transportation.
Trade in services was more resilient than trade in goods, although some
sub-categories within this group were badly
hit in 2009
Figure II.8Growth of exports of trade in services in current United States dollars, 2005-2009
Annual rates of growth in per cent
-20
-15
-10
-5
0
5
10
15
20
25
30
World Developing economies Economies in transition Developed economies
2005 2006 2007 2008 2009
Source: UNCTAD Secretariat calculations, based
on UNCTADstat.

61International trade
Disaggregated data for 198 countries reveal that all types of services trade, with the exception of two, faced negative growth in 2009 (table II.2). Trade in computer and information services increased by 3 per cent and services earning royalties and licence fees expanded by 19 per cent. The largest drop was in the construction services sector, which shrank by 20 per cent, followed by financial services, which contracted by 16 per cent. Travel and transportation services, which account for about half of world trade in services, also suffered heavily from the global crisis and declined by 16 per cent and 9 per cent, respectively.
A large share of trade in manufactured goods is shipped around the world through container ships. The annual UNCTAD Liner Shipping Connectivity Index (LSCI)8 indicates that the average maximum vessel size per country has seen a continu-ous increase since July 2010 (figure II.9), and was 7 per cent higher than the year before and more than 20 per cent higher than it had been in July 2008. While ship sizes have increased, the number of companies providing services has decreased. The average number of shipping companies per country dropped by one fifth, from 21.8 in 2004 to 17.6 in 2010. The increased concentration in the shipping industry is also visible in the fact that, in 2010, 41 countries were receiving ships from only four companies or fewer, an increase of 25 per cent over 2004. Mergers and acquisitions have led to less competition in the mar-ket and are of particular concern to countries with lower trade volumes, which have seen visible increases in unit costs. In contrast, the number of ships, and especially their total twenty-foot equivalent unit (TEU) carrying capacity, rebounded in 2010, as China—the country with the highest LSCI—expanded notably. In July 2010, the number of ships that included a Chinese port in their liner shipping route was 13 per cent higher year on year, while their TEUs registered an increase of 17 per cent.
Of the top 10 developing country providers of international services, the Republic of Korea felt the greatest impact from the crisis (table II.3). The poor performance
8 The index is published in UNCTAD, Review of Maritime Transport 2009 (United Nations publication, Sales No. E.09.II.D.11), p. 121, available from http://www.unctad.org/en/docs/rmt2009_en.pdf. Data are available from http://unctadstat.unctad.org/TableViewer/tableView.aspx?ReportId=92 (accessed on 29 November 2010).
Increased concentration in the shipping industry remains of particular concern for developing countries with lower trade volumes
Table II.2 Growth of trade in services by category, 2006-2009
Category 2006 2007 2008 2009
Communication services 13 10 13 -4Computer and information services 36 29 18 3Construction services 11 13 24 -20Financial services 8 27 25 -16Government services 4 6 7 -8Insurance 2 36 5 -2Other business services 15 24 12 -9Personal cultural and recreational services 24 24 6 -11Royalties and licence fees 7 6 9 19Transport 11 12 15 -16Travel 12 18 14 -9Other services 12 17 13 -6
Source: UNCTAD secretariat calculations, based on UNCTADstat.

62 World Economic Situation and Prospects 2011
Figure II.9Components of liner shipping connectivity, country averages, July 2004-July 2010
July 2004=100
100
110
120
70
80
90
130
140
150
160
170
2004 2005 2006 2007 2008 2009 2010
Maximum vessel sizeTwenty-foot equivalent units (TEUs)VesselsServicesCompanies
Source: UNCTAD, calculated from data provided by Containerisation
International online.Note: UNCTAD Liner Shipping
Connectivity Index (LSCI) is generated from five
components: (1) the largest vessel deployed on services to a country’s ports, (2) the number of companies that
provide services to a country’s ports, (3) the number of
services offered by the liner companies, (4) the number of ships deployed on services to
a country’s ports, (5) the TEU capacity on the
deployed ships.
Table II.3 Major providers of international services among developing countries, 1990, 2000, 2007, 2008 and 2009
1990 2000 2007 2008 2009
Val ST SWT Val ST SWT Val ST SWT Val ST SWT Val ST SWT
Developing economies 150.0 100.0 18.0 348.0 100.0 23.0 881.6 100.0 25.0 1000.3 100.0 26.0 902.5 100.0 26.0China 5.9 3.90 0.71 30.4 8.74 1.99 122.2 13.86 3.53 147.1 14.71 3.78 129.5 14.35 3.79Hong Kong SARa 17.9 11.93 2.16 40.4 11.62 2.65 84.7 9.61 2.44 92.1 9.21 2.37 86.3 9.56 2.53India 4.6 3.08 0.56 16.7 4.79 1.09 87.0 9.86 2.51 102.9 10.29 2.65 91.1 10.09 2.67Singapore 12.8 8.54 1.55 28.2 8.09 1.84 80.7 9.15 2.33 83.2 8.32 2.14 73.9 8.18 2.16Republic of Korea 9.6 6.43 1.17 30.5 8.77 2.00 63.3 7.19 1.83 77.2 7.72 1.98 58.5 6.48 1.71Taiwan Province of China 7.0 4.67 0.85 20.0 5.75 1.31 31.3 3.55 0.90 33.9 3.39 0.87 31.0 3.43 0.91Thailand 6.4 4.28 0.78 13.9 3.98 0.91 30.4 3.44 0.88 33.4 3.34 0.86 30.2 3.35 0.88Malaysia 3.9 2.57 0.47 13.9 4.01 0.91 29.5 3.34 0.85 30.3 3.03 0.78 28.7 3.18 0.84Turkey 8.0 5.35 0.97 19.5 5.61 1.28 29.0 3.29 0.84 35.0 3.50 0.90 33.2 3.68 0.97Brazil 3.8 2.51 0.46 9.5 2.73 0.62 24.0 2.72 0.69 30.5 3.04 0.78 27.7 3.07 0.81Egypt 6.0 3.98 0.72 9.8 2.82 0.64 19.9 2.26 0.58 24.9 2.49 0.64 21.5 2.38 0.63Mexico 8.1 5.40 0.98 13.8 3.95 0.90 17.6 2.00 0.51 18.5 1.85 0.48 15.4 1.71 0.45Saudi Arabia 3.0 2.02 0.37 4.8 1.37 0.31 16.0 1.81 0.46 9.4 0.94 0.24 9.7 1.07 0.28Macao SARa 1.5 0.98 0.18 3.6 1.03 0.23 13.9 1.57 0.40 17.5 1.75 0.45 17.1 1.90 0.50South Africa 3.4 2.27 0.41 5.0 1.45 0.33 13.8 1.57 0.40 12.8 1.28 0.33 12.0 1.33 0.35Lebanon 0.1 0.1 1.41 1.2 0.3 7.71 12.8 1.4 36.80 17.6 1.8 45.19 16.9 1.9 49.45
Source: UNCTAD secretariat calculations, based on UNCTADstat.Abbreviations: Val, value (billions of US dollars); ST, share in trade by developing countries (percentage); SWT, share in world trade (percentage).
a Special Administrative Region of China.

63International trade
was reflected in declines in trade of all major services. The Republic of Korea’s exports of construction, financial and transport services dropped by 43 per cent, 37 per cent and 35 per cent, respectively. Services exports from least developed countries (LDCs), in contrast, were affected only marginally by the global crisis, decreasing by no more than 2.9 per cent in 2009 (table II.4). Services provided by the poorest countries are only weakly integrated into the global economy, however, and the growth of their services trade has been well below the average for developing countries as a whole.
Tourism (which is part of trade in travel and transportation services) provides an important source of income to many developing countries. International tourism de-clined during 2009 but picked up again during 2010, in some cases returning to levels reached in 2008 (see box II.2).
Tourism, an important source of income to many developing countries, returned to 2008 levels
Table II.4 Growth rate of export services of LDCs and comparison with developing countries, 2005-2009
Percentage
Country 2005 2006 2007 2008 2009
Least developed countries 11.1 14.2 21.5 23.0 -2.9African LDCs and Haiti 13.2 12.4 22.3 23.6 -1.6Asian LDCs 14.0 13.6 20.5 24.7 -5.6Island LDCs -16.6 37.1 18.8 10.4 -2.8
Heavily indebted poor countries (HIPCs) 14.5 12.4 23.1 18.2 -1.4
Developing economies 16.6 16.1 21.4 13.5 -9.8
Share of exports of LDCs in relation to developing countries as a whole 2.8 2.1 1.9 2.1 2.2
Source: UNCTAD secretariat calculations, based on UNCTADstat.
International tourism
International tourism started to pick up again at the end of 2009, having declined starkly from the second half of 2008. The global economic recession, aggravated by the uncertainty created by the AH1N1 influenza pandemic, turned 2009 into an exceptionally difficult year for a sector accustomed to continuous growth over recent decades. International tourist arrivals for business, leisure and other purposes worldwide totalled 880 million in 2009, down from 919 million in 2008. This corresponds to a decline of 4.2 per cent, compared with a growth of 2.0 per cent in 2008 and about 6.0 per cent per year during 2004-2007. With the exception of Africa, which bucked the global trend with a 3 per cent growth, all regions of the world closed 2009 in negative territory, Europe (-6.0 per cent), the Middle East (-5.0 per cent) and the Americas (-5.0 per cent) being hit hardest.
Visitor expenditures are an important source of revenue and employment for many destination countries. Worldwide international tourism receipts reached $852 billion in 2009, down from $941 billion in the previous year. The revenue decline corresponded closely with the drop in ar-rivals in 2009, suggesting that the slowdown in tourism proceeds has more to do with tourists taking less trips on holiday than with their spending less per trip they make.
International tourism receipts are recorded as services exports (travel credit) in balance-of-payments statistics. Receipts from international passenger transport contracted from companies outside the travellers’ countries of residence are not included, but reported under a separate catego-ry (passenger transport credit). After adding international passenger transport, total tourism receipts worldwide exceeded $1 trillion in 2009, thus contributing close to $3 billion a day to worldwide export earnings.
As an internationally traded service, tourism exports account for as much as 30.0 per cent of the world’s exports of commercial services and 6.0 per cent of the overall exports of goods and services. Globally, as an export category, tourism ranks fourth after fuels, chemicals and automotive products, while for many developing countries it is the number one export category. Although 2009 results were below standard, this performance can also be read as a sign of comparative resilience,
Box II.2

64 World Economic Situation and Prospects 2011
given the extremely difficult economic environment in which it was achieved. This becomes even more evident when compared with the estimated 11.0 per cent slump in overall exports resulting from the global crisis.
The rebound in international tourism, which started at the end of 2009, continued in 2010. Based on preliminary data available at end-October 2010 for almost 150 destination countries, international tourist arrivals are estimated to have grown by 7.0 per cent in the first eight months of 2010 (see figure). Growth was positive in all regions of the world, led by a robust performance in emerging economies (8.0 per cent compared to 6.0 per cent for advanced economies).
Asia and the Pacific showed resilience and a quick recovery. Tourism in the region suf-fered early on in the global economic crisis but it was also first to rebound, posting an impressive 14.0 per cent growth in international arrivals through August 2010. Growth was also strong in the Middle East (17.0 per cent), but this reflected a rebound from a deep downturn in the first part of 2009. Africa (10.0 per cent) maintained momentum, further helped by the worldwide exposure created by the FIFA World Cup hosted by South Africa. The Americas (8.0 per cent) just exceeded average worldwide growth, while Europe posted the weakest recovery (3.0 per cent). By August 2010, total international tourist arrivals were back to the record level registered in August 2008. Many destinations have al-ready received more tourists than during their pre-crisis peaks, but Europe and parts of the Americas are still lagging in the recovery.
For the remainder of 2010, international tourism growth is expected to have slowed down, with a projected increase in the range of 5.0-6.0 per cent for the year as a whole. The prelimi-nary assessment for 2011 points to a growth close to the long-term average of 4.0 per cent, based on the current trend and the continued rising level of confidence as expressed by the World Tourism Organization (UNWTO) Panel of Experts.
The precise impact of international tourism on employment is difficult to track because, in most contexts, providers service both residents and international visitors at the same time. Taking national and international tourism together, the related services are estimated to generate about 6.0-7.0 per cent of jobs worldwide.
Box II.2 (cont’d)
World international tourist arrivals, monthly evolution, 2008-2010
Year-on-year percentage change
-15
-10
-5
0
5
10
15
2008 2009 2010Source: World Tourism
Organization (UNWTO).

65International trade
Developments in trade policy
The Doha Round
The global financial and economic crisis has brought to the forefront new realities in the international trading environment, including risks of resurgent protectionism, and has distracted the attention of policymakers from the Doha Round of multilateral trade nego-tiations, which was launched almost a decade ago, in November 2001, by the World Trade Organization (WTO). In 2010, there were several attempts, including by two summit meetings of the Group of Twenty (G20), to push for the Round’s successful and prompt conclusion. In practice, however, little progress has been made on key issues of the nego-tiations, including in the areas of agriculture, non-agricultural market access (NAMA), services and special and differential treatment for developing countries. The precarious state of the Doha Round and the uncertainty in its development outcome constitute a major challenge for the credibility of the multilateral trading system.
Many observers coincide—even more so after the November 2010 summit of the G20 in Seoul—that there exists only a very narrow window of opportunity to conclude these negotiations in 2011.
It has been widely acknowledged that a balanced and ambitious outcome of the Doha negotiations would send a powerful signal that Governments acting jointly are capable of providing adequate multilateral trade policy responses by adopting new rules which would correct the existing asymmetries and become more development-oriented, including through the provision of more policy space to developing countries. Such an outcome is necessary not only for the stability of international trade, but also for reform-ing the global monetary and financial system, which requires new multilaterally agreed arrangements.9 The absence of visible progress in building a cohesive regulatory system for international finance, along with the limited ability of current practices to ensure a contri-bution of international finance to growth and stability in the real economy, poses the risk that emerging and developing countries might feel compelled to erect higher protection barriers against unfettered global finance.10 The communiqué of the G20 Seoul Summit recognized this risk and suggested alternatively that, “policy responses in emerging market economies with adequate reserves and increasingly overvalued flexible exchange rates may also include carefully designed macro-prudential measures”.11
One expectation was that the poorest developing countries would obtain early benefits from the Round, in particular by introducing a largely duty-free and quota-free (DFQF) treatment for LDC exports and by adopting measures to facilitate their trade through both negotiating new rules for trade facilitation and providing targeted aid-for-trade programmes. Indeed, there has been some progress, as several developed and devel-oping countries have increased DFQF to LDCs. But the increases still fall well short of the targets set. An “early harvest” for LDCs is needed to allow them more time to adapt to the inevitable preference erosion process following the Doha Round’s final completion. For the time being, according to UNCTAD estimates of relative market access conditions, a number of LDCs have faced an increase in their average effective preference margins
9 See UNCTAD, Trade and Development Report 2010: Employment, globalization and development (United Nations publication, Sales No. E.10.II.D.3), p. 24.
10 Ibid., p. 25.
11 The Seoul Summit Document, para. 6, available from http://www.g20.utoronto.ca/2010/g20seoul-doc.pdf.
The Doha Round has delivered little progress on key development areas
New rules for trade facilitation for the least developed countries still fall well short of established targets

66 World Economic Situation and Prospects 2011
over recent years.12 However, a growing concern is that DFQF treatment is becoming less relevant, since main competitors have embarked upon free trade agreements (FTAs) with major importing countries, thus reducing the effective preference margin of LDCs when measured, on a trade-weighted basis, against competitors’ trade within FTAs.13 Finally, reliance on preferences should not be considered as a viable long-term strategy for these countries, nor for small and vulnerable developing countries.
Resumption of the trend towards more preferential trade agreements
In the absence of results from the Doha Round, the trading system has moved in the direction of multiplying regional, plurilateral and bilateral preferential trade agreements14 which are crowding the trade policy landscape and making it difficult, in practice, for countries to navigate through it. According to the WTO, almost 300 preferential trade agreements are currently in force worldwide, half of which have come into effect since 2000. The global financial crisis had somehow halted the negotiation of new agreements but, with the recovery, the process appears to have regained momentum and several new initiatives were launched in 2010, such as the Trans-Pacific Partnership Agreement.
Despite proclaimed benefits for the participants, preferential trade agreements through bilateral or regional FTAs tend to discriminate against other trading partners by eroding the most favoured nation (MFN) principle, the cornerstone of the multilateral trading system. Today, more than half of world trade is subject to multiple preferential arrangements. Furthermore, there are worrying signs that the private sector, both in devel-oped and developing countries, may consider preferential agreements more desirable than the multilateral trade liberalization and rule setting, which is deemed lengthy, unpredict-able and overly politicized. For instance, tariff reductions under preferential agreements are considered “real” in the sense that they cut applied tariff rates, while they can also provide some “WTO-plus” rules to areas of business concerns such as investment protec-tion, environmental regulations, labour standards and government procurement. Ideally, the WTO multilateral rules should have provided an overarching regulatory framework for all types of trade agreements, within which preferential agreements could have specific rules according to the needs of their own members and economic operators.15 Since this is not the case, there is a serious risk that the multilateral trading system could gradually lose its relevance.
A common problem facing LDCs, and to a lesser degree other developing countries, relates to their limited capacity to contribute actively to the trade policy debate
12 M. Fugazza and A. Nicita, “Policy issues in international trade and commodities”, Study Series No. 51 (UNCTAD/ITCD/TAB/51), forthcoming.
13 See C. Carrere and J. de Melo, “The Doha Round and market access for LDCs: scenarios for the EU and US markets”, Journal of World Trade, vol. 44, No. 1, pp. 251-290.
14 All of these preferential agreements are termed “regional trade agreements” (RTAs) by the WTO.
15 In the Doha Round, the situation with the WTO rules on FTAs has recently been described as follows: “The situation at present is that while we have a growing spaghetti bowl of regional trade agreements, some more comprehensive than others, and a well functioning Mechanism to promote transparency and our understanding of these RTAs, we are not making much progress in the substantive part of our work to define WTO rules on RTAs. The problem, it would seem is that we are trying to negotiate rules on RTAs, without a complete understanding of the market access pursued by RTAs and implications of RTAs on the parties’ and multilateral trade.” (from “The situation of the RTA negotiations”, communication from Ambassador Valles Galmés, Chair of the WTO Negotiating Group on Rules (TN/RL/25), 6 May 2010).
Regional trade agreements continue to emerge as the
multilateral negotiations remain stalled

67International trade
and, furthermore, to take proper advantage of negotiating trade agreements, owing to the lack of institutional capacity and the lack of relevant trade data, in general, and data on trade in services, in particular.16
Developing countries may see preferential agreements with developed coun-tries as a way to attract foreign direct investment (FDI) and improve their access to export markets. However, obvious downsides to such a strategy are the substantially increased pressure on developing countries to open markets beyond what is agreed to at the WTO and the imposition on them of a WTO-plus regulatory framework by their developed partners. For example, a typical North-South preferential trade agreement today would involve a full and reciprocal tariff liberalization of trade in industrial products (that is to say, zero tariffs), a more comprehensive liberalization of key services sectors (including financial services) and the inclusion of specific rules in areas which are either not covered by the WTO agreements (for example, investment, environment and labour standards) or which go beyond what has been agreed multilaterally (for example, protection of intel-lectual property and government procurement). In this context, UNCTAD suggested that “when assessing the potential economic and social benefits and costs of entering into such agreements, they should take into account not only the potential impact on exports and imports arising from market opening, and possible increases in FDI, but also the impact of these agreements on their ability to use alternative policy options and instruments in the pursuit of a longer term developing strategy”.17
The continuation of low-intensity protectionism
At the G20 summits in Toronto (June 2010) and Seoul (November 2010), leaders reaf-firmed their pledge to renew their commitment to refrain, at least until the end of 2013, from increasing or imposing new barriers to investment or trade in goods and services, from imposing new export restrictions or from implementing WTO-inconsistent measures to stimulate exports, and committed themselves to rectifying any such measures should they arise. In the early stages of the crisis, such commitments helped to avoid slippage into extended protectionist measures. However, in the present situation of fragile and uneven recovery, the risk of rising protectionism should not be underestimated. Indeed, persistent high levels of unemployment, shrinking fiscal space in developed countries, competitive devaluations of exchange rates to support exports, and the eventual probability of resurg-ing global imbalances in the absence of serious adjustment efforts are all policy factors that can fuel protectionist pressures.
One hedge against protectionism lies in the unbroken resilience of exist-ing multilateral trade rules. The other defence probably lies in global supply chains and
16 A survey is currently being conducted by the secretariat of the United Nations Committee for Development Policy in the context of a project aimed at improving the capacity of LDCs to gain access to and benefit from the special support measures adopted by the international development community (http://www.un.org/esa/policy/devplan/ldcproject.html). Preliminary observations reveal that poor data availability remains a major shortcoming in many LDCs, particularly in relation to the implementation of WTO processes (Survey question No. 15). More generally, lacking the capacity to actively participate in the negotiating processes and, moreover, lacking data to ensure effective results deriving from the reform, many developing countries risk giving concessions without getting anything in return or without properly understanding their development implications, as also noted by C. Raghavan, Developing Countries and Services Trade: Chasing a Black Cat in a Dark Room, Blindfolded (Penang, Malaysia: Third World Network, 2002).
17 UNCTAD, Trade and Development Report 2007: Regional cooperation for development (United Nations publication, Sales No. E.07.II.D.11), chap. 3.
In the present situation of a fragile and uneven recovery, the risk of rising protectionism should not be underestimated
68 World Economic Situation and Prospects 2011
production networks, through which producers, exporters and importers have developed increasing mutual dependence and support. Over the past two decades, a growing share of international trade is taking place in components and intermediates of final products transacted through the supply chains and intrafirm trade. This phenomenon has likely diminished the importance of traditional arguments for protectionism.
The most recent joint WTO-OECD-UNCTAD report indicates that new im-port restrictions, introduced in the period between May and October 2010, applied to 0.2 per cent of total world imports, much less than during the trough of the crisis when such trade measures covered about 0.8 per cent of total world imports. The most affected sectors were electrical machinery and equipment, chemical products, machinery and mechanical appliances, iron and steel, and dairy products.18
At the same time, however, more subtle and not-so-subtle non-tariff measures (NTMs) are being erected under various permissible pretexts (such as the protection of health and the environment), but these have a much more ambiguous effect on trade than tariffs that are based on price or transparent policy measures. The majority of such NTMs fall into two categories: technical barriers to trade (such as technical regulations and standards) and sanitary and phytosanitary measures. Moreover, in spite of their growing importance, there is little understanding of the exact implications of NTMs on trade flows, export-led growth, and social welfare in general. A recent UNCTAD/International Trade Centre (ITC) survey of over 2,000 small and medium-sized firms in several developing countries (Brazil, Chile, India, the Philippines, Thailand, Tunisia and Uganda) revealed that the majority of NTMs perceived to be restrictive for exports could in fact be categorized under technical barriers to trade or sanitary and phytosanitary regulations. These measures particularly affected such sectors as electrical and machinery products, textiles and clothing, chemical and allied industries, base metal, and agriculture and fisheries.19
18 See “Reports on G20 Trade and Investment Measures”, issued on 4 November 2010 by the World Trade Organization, the Organization for Economic Cooperation and Development and the United Nations Conference on Trade and Development, available from http://www.unctad.org/en/docs/unctad_oecd2010_fourthsummary_en.pdf.
19 UNCTAD, Developing Countries in International Trade Studies 2009 (UNCTAD/DITC/TAB/2009/3), forthcoming.
While the increase in tariffs remains marginal,
the erection of non-tariff measures have more
adverse effects on trade

69
Chapter IIIFinancial flows to developing countriesNet resource transfers from poor to rich countries
Developing countries as a group are expected to have continued to provide a net transfer of financial resources,1 of approximately $557 billion, to developed countries in 2010 (see figures III.1a-b and table III.1). The volume of net financial resource transfers was up slightly from 2009, but remained well below the peak of $881 billion in 2007. The decline in net transfers since 2007 reflected narrowing global trade imbalances as a result of the dampening effect of the global recession on imports of major deficit countries. As discussed in chapter I, this change was transitory, and net transfers from developing to de-veloped countries increased again during 2010. The aggregate trade surplus of developing countries also increased again as exports recovered, while private portfolio capital inflows surged. This situation allowed for additional reserve accumulation by these countries.
Western Asia and Africa experienced the strongest increase in net outward resource transfers in 2010, reflecting much higher export revenues of net fuel exporters in both regions, owing to the rebound in oil prices. Low-income countries in sub-Saharan Africa are expected to remain recipients, however, and to continue to receive positive net transfers, as are the group of low-income countries as a whole (figure III.1b). The crisis hurt export revenues, while more compensatory financing was made available to them. The net inflow of resource transfers to low-income countries is expected to increase slightly in 2010, but may taper off in the outlook if official development assistance (ODA) suffers from the fiscal retrenchment in many donor countries.
Net transfers from East and South Asia continued to decline modestly in 2010, along with China’s smaller trade surplus. Net transfers from Latin America and Caribbean countries similarly declined moderately, influenced by factors that included the return of private capital flows. Net outward transfers from economies in transition increased sub-stantially in 2010 as trade surpluses increased from the rebound in oil export revenues of the Russian Federation and other net fuel exporters of the Commonwealth of Independent States (CIS).
Net resource transfers from developing countries are expected to increase mod-erately along with the projected widening of current-account imbalances (see chap. I). This continuation of the pre-crisis pattern in which poor countries transfer significant resources to much richer nations also reflects the need felt by developing countries to continue accu-mulating foreign-exchange reserves as self-protection against new global economic shocks. Instances of global financial market turbulence, enhanced exchange-rate volatility among the major reserve currencies and the short-term surges and volatile private capital flows have added to high macroeconomic uncertainty and the perceived need for self-protection dur-ing 2010. Several emerging markets and other developing countries have responded with new capital controls and foreign-exchange rate market interventions in order to mitigate
1 The net transfer of financial resources measures the total receipts of financial and other resource inflows from abroad and foreign investment income minus total resource outflows, including increases in foreign reserves and foreign investment income payments. The net transfer of a country’s financial resources is thus defined as the financial counterpart to the balance of trade in goods and services.
Net transfers from developing to developed countries increased again in 2010
Western Asia and Africa experienced the greatest increase in outward resource transfers
The trend of increasing resource transfers from developing countries is set to continue

70 World Economic Situation and Prospects 2011
-1000
-900
-800
-700
-600
-500
-400
-300
-200
-100
0
100
1998 1999 2000 2001 2002 2003 2004 2005 2006 2007 2008 2009 2010b
Developing countries
Economies in transition
Billions of dollars
Figure III.1aNet financial transfers to economies in transition and developing countries, 1998-2010
Billions of dollars
Figure III.1bNet financial transfers, by income categories, 2000-2010
-400
-300
-200
-100
0
100
Low-income countries Lower middle income countries Upper middle income countries
Average 2000-2008
2009
2010Source: UN/DESA, based on IMF, World Economic Outlook Database, October 2010; and
IMF, Balance of Payments Statistics.

71Financial flows to developing countries
the adverse impacts of these developments on their economies. In spite of the increased availability of international assistance, developing economies will continue to accumulate reserves for self-protection as a first line of defence against financial shock. Despite the ef-fective use of foreign reserve holdings by emerging market economies to buffer the impact of financial instability, capital outflows from these countries during the financial crisis have highlighted the importance of building a global financial safety net. During 2010, there has been some progress in tightening international rules for regulating financial sectors worldwide to enhance the voice and representation of developing countries in the Bretton Woods institutions. But key systemic issues, such as the faltering global reserve system, an inadequate global financial safety net, the lack of sovereign debt workout mechanisms and deficiencies in the existing global economic governance mechanisms still need to be tackled to safeguard against further, potentially severe, global instability in the future.
Private capital flows to developing countriesNet private capital flows to developing countries have continued to recover strongly from their slump in 2008 and early 2009.2 They increased from about $110 billion in 2008 to about $386 billion in 2009 and are estimated to have grown strongly in 2010 (see table III.2). This trend has been driven by the combination of stronger economic growth in a number of developing countries and problematic economic fundamentals in many advanced econo-mies. Extensive monetary easing has kept interest rates low, while fragility in the financial
2 Unlike the section on international finance in chapter I, net capital flows are defined here as “net net”, that is to say, net capital inflows less net capital outflows; coverage is of all developing countries and economies in transition. At variance with the net transfer concept, net capital outflows refer only to items of the capital account (including reserves) of the balance of payments.
Net private capital flows to developing countries have increased significantly
Table III.1 Net transfer of financial resources to developing economies and economies in transition, 1998-2010
Billions of dollars
1998 1999 2000 2001 2002 2003 2004 2005 2006 2007 2008 2009 2010a
Developing economies -41.0 -128.0 -194.0 -164.4 -210.2 -302.7 -379.5 -597.2 -807.8 -881.1 -876.4 -545.1 -557.0
Africa 2.9 1.6 -31.7 -16.4 -4.2 -16.1 -34.5 -76.4 -108.3 -100.9 -99.1 2.9 -35.3Sub-Saharan Africa (excluding Nigeria and South Africa) 11.5 7.9 2.3 6.4 4.4 5.3 3.5 -0.6 -10.5 -9.1 -4.8 27.3 14.6
East and South Asia -129.8 -139.8 -122.8 -120.8 -149.2 -175.6 -183.4 -265.7 -385.7 -529.8 -481.3 -427.5 -352.9Western Asia 34.5 2.7 -35.3 -29.7 -23.2 -46.7 -76.3 -143.7 -175.6 -144.0 -222.5 -48.4 -112.7Latin America and the Caribbean 41.5 7.4 -4.2 2.5 -33.6 -64.3 -85.4 -111.4 -138.0 -106.4 -73.5 -72.1 -56.1
Economies in transition 0.7 -25.1 -51.6 -32.9 -28.0 -38.0 -62.5 -96.0 -117.1 -95.9 -149.1 -81.1 -133.0
Memorandum items:
Heavily indebted poor countries (HIPCs) 8.8 9.5 7.9 8.3 8.9 8.8 10.7 13.4 11.2 19.0 31.0 29.6 31.0Least developed countriesb 12.5 10.2 5.0 8.2 5.9 7.5 5.0 1.3 -7.9 -5.2 -4.5 26.3 16.8
Source: UN/DESA, based on IMF, World Economic Outlook Database, October 2010; and IMF, Balance of Payments Statistics.
a Partly estimated.b Cape Verde graduated in December 2007 and is not included in the calculations.

72 World Economic Situation and Prospects 2011
Table III.2 Net financial flowsa to developing countries and economies in transition, 1997-2011
Average annual flow
2007 2008 2009 2010b 2011c1997-2000 2001-2006
Developing countries
Net private capital flows 92.3 103.5 383.7 110.0 385.7 659.2 602.8Net direct investment 146.4 161.9 311.8 341.6 193.3 247.5 270.9Net portfolio investmentd 31.1 -59.4 7.7 -135.5 77.7 93.4 79.9Other net investmente -85.3 1.0 64.1 -96.0 114.7 318.2 252.1
Net official flows -0.4 -69.1 -140.7 -113.5 -26.8 -249.4 -217.7Total net flows 91.9 34.4 243.0 -3.5 358.9 409.7 385.1Change in reservesf -76.7 -373.1 -1059.4 -787.8 -687.5 -654.2 -561.6
Africa
Net private capital flows 7.8 13.3 31.5 26.0 38.8 53.8 57.4Net direct investment 8.5 22.5 41.9 52.5 42.3 39.9 50.3Net portfolio investmentd 2.3 3.7 8.4 -31.1 -3.4 14.4 12.9Other net investmente -3.0 -12.8 -18.8 4.6 -0.1 -0.5 -5.7
Net official flows 0.9 -10.3 -6.7 -1.2 8.9 12.9 15.4Total net flows 8.7 3.0 24.8 24.9 47.7 66.7 72.8Change in reservesf -8.0 -34.8 -86.9 -75.3 1.5 -25.3 -26.6
East and South Asia
Net private capital flows 4.7 65.7 137.6 -23.6 267.2 426.4 377.7Net direct investment 62.8 72.8 133.6 138.9 57.3 67.8 63.7Net portfolio investmentd 20.9 -34.9 2.2 -88.8 27.9 48.0 40.0Other net investmente -79.0 27.8 1.8 -73.7 182.0 310.6 273.9
Net official flows -0.4 -16.3 -43.4 -17.5 -16.5 -259.9 -185.2Total net flows 4.2 49.5 94.2 -41.1 250.7 166.5 192.5Change in reservesf -59.7 -269.2 -674.5 -529.0 -644.1 -497.1 -460.7
Western Asia
Net private capital flows 15.9 -2.7 109.1 50.1 56.0 47.3 34.5Net direct investment 6.6 18.2 49.5 57.8 31.2 61.8 60.8Net portfolio investmentd -4.8 -20.7 -39.2 2.2 22.1 -17.0 -13.0Other net investmente 14.1 -0.3 98.9 -9.8 2.7 2.5 -13.3
Net official flows -7.7 -32.7 -84.8 -96.1 -64.1 -28.9 -54.3Total net flows 8.2 -35.4 24.3 -46.0 -8.1 18.5 -19.9Change in reservesf -6.6 -46.4 -164.8 -133.2 6.4 -56.8 -45.8
Latin America and the Caribbean
Net private capital flows 63.9 27.2 105.4 57.4 23.7 131.6 133.2Net direct investment 68.5 48.4 86.8 92.4 62.6 78.1 96.0Net portfolio investmentd 12.7 -7.5 36.4 -17.9 31.1 48.0 40.0Other net investmente -17.3 -13.7 -17.8 -17.1 -69.9 5.6 -2.8
Net official flows 6.8 -9.7 -5.7 1.3 44.9 26.4 6.4Total net flows 70.8 17.5 99.6 58.7 68.6 158.1 139.6Change in reservesf -2.4 -22.6 -133.2 -50.2 -51.2 -75.0 -28.5

73Financial flows to developing countries
systems of the major developed economies and the weak recovery continue to constrain credit growth in the major high-income countries. This has created substantial excess li-quidity in advanced financial markets. In search of higher returns, investors have shifted to emerging markets. Improving terms of trade have attracted foreign direct investment (FDI) in commodity-exporting economies, contributing to greater private capital flows.
The more favourable perceptions of emerging market risk are also reflected in the narrowing spreads of United States government debt. J.P. Morgan’s Emerging Markets Bond Index Plus (EMBI+) spread is, at the time of writing, trading at close to 260 basis points, in comparison to close to 700 basis points at the end of 2008.3
Evidence of an ongoing reallocation of assets by institutional investors towards emerging markets, away from mature economies, is consistent with these developments. Looking ahead, this may continue, driven by both short-term cyclical factors as well as more embedded structural developments. In the immediate period, a further round of monetary easing, led by the United States of America and Japan, would make more funds available to investors that could be used to purchase emerging market assets. On a longer term basis, there is still potential for further significant asset reallocation. The major glo-bal financial institutions currently hold between 2 and 7 per cent of their total assets in emerging markets, whereas the share of emerging markets in global gross domestic product (GDP) has increased to more than 30 per cent.4 Medium-term projections for strong growth in net private capital flows to developing countries arising from continuing asset reallocation by institutional investors might, however, be tempered by the possibility that a large increase in the public sector financing requirements of developed economies would enhance competition for global funds and raise borrowing costs for developing countries. This could limit the growth in debt flows to developing countries in the near future. As discussed in chapter I, however, global financial market trends are subject to great uncertainty.
3 J.P. Morgan Emerging Markets Bond Index Plus (EMBI+) database.
4 Stefan Wagstyl and David Oakley, “Bubble fears as emerging nations test fresh highs”, Financial Times, 8 October 2010.
Institutional investors have been reallocating assets towards emerging markets
Table III.2 (cont’d)
Average annual flow
2007 2008 2009 2010b 2011c1997-2000 2001-2006
Economies in transition
Net private capital flows -20.1 27.7 149.0 -77.2 -49.6 1.9 14.2Net direct investment 5.8 14.3 39.3 62.0 21.6 25.6 36.2Net portfolio investmentd -12.7 2.9 20.9 -32.3 -10.4 -0.5 0.5Other net investmente -13.2 10.5 88.8 -107.0 -60.7 -23.2 -22.5
Net official flows 9.3 -8.9 -5.5 -18.3 46.1 7.5 8.4Total net flows -10.7 18.9 143.5 -95.5 -3.5 9.4 22.6Change in reservesf -4.8 -56.9 -170.3 30.0 -12.1 -69.7 -71.2
Sources: IMF, World Economic Outlook Database, October 2010; Institute of International Finance, “Capital flows to emerging market economies”, IIF Research Note, 4 October 2010; UNCTAD; and UN/DESA.
a Net financial flows are defined here as “net net”, that is to say, net financial inflows less net financial outflows.b Partly estimated.c Forecasts.d Including portfolio debt and equity investment.e Including short- and long-term bank lending, and possibly including some official flows owing to data limitations.f Negative values denote increases in reserves.

74 World Economic Situation and Prospects 2011
After declining markedly during the crisis, portfolio equity flows to develop-ing countries recovered strongly in 2009 and 2010. This recovery was particularly strong for those countries in Asia and Latin America that are viewed as having better growth prospects. Stockmarkets in Colombia, Indonesia and the Philippines hit record levels in October 2010; markets in Brazil and India also boomed.5 The revival in flows from 2009 onwards also reflected a return of investors who had feared that the global crisis would have more severe effects on the corporate sector in emerging economies.6
Portfolio debt flows have also been staging a strong recovery from the finan-cial crisis. This has been helped by the fact that both non-bank credit institutions and emerging market issuers of debt have been less damaged by the crisis. In addition, low interest rates in some of the major advanced economies appear to have been encouraging a wave of foreign currency bond issuance in their capital markets by emerging market borrowers. Bond inflows to Latin America and Asia have been particularly strong, as has issuance by the non-financial corporate sector. Non-portfolio debt flows (bank credit) have also rebounded. However, mounting non-performing loans have restrained lending in the transition economies of Europe and Central Asia.
FDI remains the single largest component of private capital flows to developing economies. FDI was affected by the crisis through reduced access to finance for investing firms and low investor confidence as a result of gloomy economic prospects and market conditions. Despite a revival in corporate earnings, the weak global investment environ-ment has limited the recovery in FDI flows.
Outward FDI by companies based in developing countries has also increased. Companies have invested in both developed and developing countries. The rise of South-South FDI is often closely linked to extractive industries and infrastructure.
While the recovery in private capital flows to developing economies can be seen as beneficial, there is concern that a recovery in investor appetite for emerging-market risk could herald a surge in short-term capital flows to certain countries that may gener-ate inflationary pressures and have the potential to destabilize currencies and financial markets. In addition, there are downward risks to the general expectation of continued robustness in private capital flows to the developing world. Most importantly, another round of economic slowdown in developed countries could sharply affect the access to capital of developing economies. Moreover, continuing public debt concerns in Europe could place at risk countries, especially in emerging Europe, whose financial sectors are closely linked to those of highly indebted countries.
International financial cooperation
Official development assistance
The global financial crisis and economic recession of 2008and 2009 negatively impacted many developing countries and has placed severe strain on many low-income countries, making ODA delivery even more critical. The fragile recovery in developed countries and the possible double-dip recession create considerable uncertainty about the future volume of ODA flows. Aid delivery, although higher than 2002 levels, has fallen short of commit-ments by the donor community.
5 Ibid.
6 Institute of International Finance, “Capital flows to emerging market economies”, IIF Research Note, 4 October 2010.
Asia and Latin America, in particular, saw a surge in
portfolio inflows
The surge in short-term capital flows involves risks
to stability in developing countries
The crisis has increased the need for ODA but
complicated the delivery on commitments

75Financial flows to developing countries
In 2009, total net ODA from the members of the Development Assistance Committee (DAC) of the Organization for Economic Cooperation and Development (OECD), including the Republic of Korea, whose membership became effective on 1 January 2010, rose slightly by 0.7 per cent in real terms, to $120 billion. This represented 0.31 per cent of their combined gross national income (GNI). Debt relief—exceptionally high in 2005 and 2006 owing to extraordinary Paris Club packages for Iraq and Nigeria—fell sharply. With the exclusion of debt relief, the rise in ODA in real terms in 2009 was 6.8 per cent. The further exclusion of humanitarian aid brings the increase to 8.5 per cent in real terms. Most of the rise took the form of new lending, but grants also increased.
The pledges made at the 2005 Group of 20 (G20) Gleneagles Summit implied lifting ODA from its 2004 level of about $80 billion to nearly $130 billion (at 2004 prices and exchange rates) by 2010, or to 0.36 per cent of the combined GNI of the DAC members. It is now clear that the DAC members as a group will fail to meet the Gleneagles target.7 With only modest growth projected, the shortfall in aid delivery will be $18 bil-lion (in 2004 prices), or $20 billion (in 2009 prices), against the Gleneagles commitment set for 2010. This shortfall is expected to reduce the volume of ODA to Africa, and the increase in net ODA to that continent in 2010 is now projected to be less than half of the pledged increase of $25 billion. At 2009 exchange rates and prices, the gap in the delivery against the Gleneagles commitments is $18 billion, and the delivery gap on commitments for the least developed countries (LDCs) is estimated at between $23 billion and $43 billion (table III.3).
The Gleneagles target can be seen as an intermediate commitment towards meeting the longstanding United Nations ODA target of 0.7 per cent of donor GNI. The
7 United Nations, MDG Gap Task Force Report 2010: The Global Partnership for Development at a Critical Juncture (United Nations publication, Sales No. E.10.I.12).
The Gleneagles targets will not be reached
Figure III.2Net ODA of DAC members, 1990-2009, and DAC secretariat simulations to 2010
0.33
0.22
0.26
0.33
0.28
0.31 0.32
0.00
0.05
0.10
0.15
0.20
0.25
0.30
0.35
0.40
1990
1991
1992
1993
1994
1995
1996
1997
1998
1999
2000
2001
2002
2003
2004
2005
2006
2007
2008
2009
2010
Perc
enta
ge o
f GN
I
0
20
40
60
80
100
120
140
160Bi
llion
s of d
olla
rs (2
004
pric
es)
ODA as a percentageof GNI (left scale)
Total ODA(right scale)
ODA to Africa(right scale)
Source: OECD/DAC.Note: Dashed line (-----)indicates the growth-adjusted trajectory envisaged at Gleneagles.Dotted line (.....) indicates estimates based on reported intentions or current 2010 budget plans made by DAC members.Dotted line for Africa (.....)indicates a DAC secretariat estimate of probable spending.

76 World Economic Situation and Prospects 2011
MDG Gap Task Force Report 20108 estimates the gap in delivery towards this commitment at $153 billion in 2009 (see table III.3). Thus, in order to reach the 2015 target, ODA for 2011-2015 needs to increase by approximately $35 billion per year.
The United Nations Millennium Development Goals (MDG) summit in September 2010 reiterated the importance of fulfilling all ODA commitments, including that of meeting the target of 0.7 per cent of donor country GNI. All donor countries were strongly encouraged “to establish…rolling indicative timetables that illustrate how they aim to reach their goals, in accordance with their respective budget allocation process”.9
Only slow progress has been made on improving aid effectiveness as defined by the five principles of the 2005 Paris Declaration—national ownership, alignment, harmo-nization, managing for results and mutual accountability—with considerable variations across indicators and countries.10 Slow progress towards the targets is especially visible in countries receiving lower levels of aid, fragile States and LDCs, where distortions in aid al-location have been exacerbated. In 2008, the Accra Agenda for Action reiterated the need for strengthening country ownership, building more effective partnerships, and deliver-ing and accounting for development results. During 2010, further agreements have been reached to improve the quality of aid to fragile States (the Dili Declaration: A new vision for peacebuilding and statebuilding of April 2010) and the quality of development assistance
8 Ibid.
9 United Nations, General Assembly resolution A/65/1 of 22 September 2010, paragraph 78 (f ).
10 Organization for Economic Cooperation and Development (OECD), 2008 Survey on Monitoring the Paris Declaration: Making Aid More Effective by 2010 (Paris: OECD, 2008).
Little progress has been made in improving aid
effectiveness
Table III.3 Official development assistance in 2009 and 2010 in relation to commitments and targets
Billions of 2004 dollars
Billions of 2009 dollars
Percentage of GNI
Total ODA
Commitment for 2010 125.8 145.7 ..Delivery in 2009 103.3 119.6 ..Gap in 2009 22.5 26.1 ..Projected shortfall in 2010a 17.7 19.7 ..Overall United Nations target .. 272.2 0.7Delivery in 2009 .. 119.6 0.31Gap in 2009 .. 152.7 0.39
ODA to Africa
Commitment for 2010 53.1 61.5 ..Delivery in 2009b 37.9 43.9 ..Gap in 2009b 15.2 17.6 ..Projected shortfall in 2010b 14.1 16.3 ..
ODA to least developed countries
Target .. 58.9-78.5 0.15-0.20Delivery in 2008 .. 36.0 0.09Gap in 2008 .. 22.9-42.5 0.06-0.11
Source: United Nations, MDG Gap Task Force Report 2010: The Global Partnership for Development at a Critical Juncture (United Nations publication, Sales No. E.10.I.12).
a Based on the OECD review of donors’ budget plans for 2010, excluding the Republic of Korea.b Based on OECD estimates of ODA to Africa.

77Financial flows to developing countries
by middle-income countries, civil society and non-government organizations (NGOs) (the Bogota Statement: Towards Effective and Inclusive Development Partnerships of March 2010). In addition, at the Group of Eight (G8) summit in Muskoka, Canada, on 26 June 2010 leaders endorsed an action plan to enhance efforts towards development-related com-mitments that included a reconfirmation of commitments to untie aid and disburse it in a timely and predictable manner.
Aid predictability is one of the goals of the Paris Declaration and requires the inclusion of aid commitments in national budgetary plans of donor countries. The 2010 Development Cooperation Forum (DCF) of the United Nations Economic and Social Council recognized that aid predictability had improved in some programme countries, but emphasized that greater flexibility was needed to fund changing priorities and counter exogenous shocks. Durability, stability and flexibility in aid delivery need to be improved further to meet the goal of aid effectiveness. The conditionality attached to aid flows, despite some streamlining, continues to contradict international agreements on national ownership and leadership in policymaking. Donor earmarking of aid also becomes a prob-lem when a donor’s priorities do not match the needs and goals of the recipient country and undermine the recipient’s leadership in and ownership of budgeting and program-ming. Progress on mutual accountability, a cornerstone of the Paris Declaration, remains limited. As at end-2009, only seven recipient countries had established fully functioning mutual accountability mechanisms, and the change in donor behaviour was uneven.11
South-South cooperation
South-South cooperation is gaining importance, even though, according to available estimates, it accounts for only 10 per cent of global aid flows. More than 90 per cent of South-South cooperation is “country programmed”. Three quarters of South-South aid flows still take the form of project finance, but budget support and debt relief have recently increased in importance. Furthermore, South-South philanthropy is increasing, mainly in social and rural development, as through microfinance charities. Technical cooperation remains vital for smaller providers, and humanitarian assistance is rising rapidly.
The 2010 DCF stressed that several features of South-South cooperation set it apart from North-South cooperation. These include the typical absence of policy condi-tionality, the establishment of horizontal relationships, and the often high degree of com-plementarity between the cooperating parties. These features are among the reasons the DCF recommended that South-South cooperation need not be subject to the principles of harmonization established by OECD donors.
Innovative sources of development finance
The MDG summit of September 2010 stressed the important role innovative financing mechanisms can play in fulfilling the financing needs of developing countries to accelerate progress towards the international development goals.12 According to available estimates, innovative sources of finance for development have generated an estimated $57.1 billion between 2000 and 2008. The most successful of such schemes have supported the imple-mentation of global health programmes.
11 United Nations, MDG Gap, op. cit., p. 21.
12 United Nations, General Assembly resolution A/65/1, op. cit., para. 78 (h).
Greater durability, stability and flexibility of ODA are the key elements of improved aid effectiveness
South-South cooperation is becoming increasingly important
Greater importance is being attached to innovative financing mechanisms

78 World Economic Situation and Prospects 2011
Given the global economic and financial crisis and the need for sources of finance complementary to ODA, greater attention has been given to the possible introduc-tion of an (international) currency or financial transactions tax (CTT or FTT). The G20 Pittsburgh Summit (24 and 25 September 2009) requested the International Monetary Fund (IMF) to evaluate the option of a tax on financial sector activity.13 In July 2010, the Leading Group on Innovative Financing for Development released a report on the FTT entitled Globalizing Solidarity: the Case for Financial Levies. Based on four criteria (sufficiency; market impact; feasibility; and sustainability and suitability), the report con-cluded that, among five FTT options,14 a centrally collected multicurrency transaction tax was the most appropriate for financing global public goods and sharing wealth gener-ated through global financial integration. This option was labelled the “Global Solidarity Levy”. The Leading Group estimated that such a levy could generate as much as between $25 billion and $34 billion annually if a tax rate of 0.005 per cent were imposed on global cross-border currency transactions.
During the MDG summit in September 2010, the leaders of France and Spain stressed the need for innovative financing with explicit reference to introducing a global FTT, while 60 member States of the Leading Group, led by Belgium, France and Japan, encouraged non-Leading Group countries to join the initiative to move forward by host-ing a high-level side event.
The achievements made so far in the health sector by UNITAID and two multi-lateral donors utilizing some innovative financing mechanisms—namely, the Global Alliance for Vaccines and Immunisation (GAVI), now called the “GAVI Alliance”, and the Global Fund to Fight AIDS, Tuberculosis and Malaria—have been commended in international forums. Since 2006, UNITAID, an international drug purchasing facility, has raised more than $1.5 billion for scaling up access to treatments for AIDS, tuberculosis and malaria in 93 countries through multilateral organizations, including the World Health Organization (WHO) and the United Nations Children’s Fund (UNICEF). About 70 per cent of revenues for UNITAID come from air ticket levies introduced in France and one dozen developing countries. A part of Norway’s tax on carbon dioxide (CO2)
emissions from air travel has also been contributed to UNITAID. The remaining part of UNITAID funding comes from multiyear contributions from private foundations and five Governments (including Brazil), of which one country (Spain) collects contributions from air passengers on a voluntary ba-sis.15 UNITAID now finances antiretroviral drugs for three quarters of the children around the world and has managed to reduce the price of the medicine by more than half.
In March 2010, the Millennium Foundation launched a voluntary solidar-ity contribution scheme on travel products under the trademark “MASSIVEGOOD” in support of UNITAID funding. The Millennium Foundation estimates that this scheme will generate over $2 billion annually if implemented globally.16 In July 2010, UNITAID
13 In response, the International Monetary Fund (IMF) published a report entitled “A fair and substantial contribution by the financial sector: Final report for the G20” in June 2010.
14 The five options examined were: (1) a financial sector activity tax; (2) a value added tax on financial services; (3) a broad FTT; (4) a nationally collected single-currency transaction tax; and (5) a centrally collected global multicurrency transaction tax.
15 Based on information provided by the delegation of the European Union to the United Nations in its statement delivered during the United Nations Informal Event on Innovative Sources of Development Finance, Panel discussion 1 on “Mechanisms of innovative development financing in operation”, held in New York on 3 June 2010.
16 Bernard Salome and Philippe Douste-Blazy, “The voluntary solidarity contribution project for UNITAID”, in Innovative Financing for Development: The I-8 Group Leading Innovative Financing for Equity [L.I.F.E.], Philippe Douste-Balzy, ed. (New York: United Nations, December 2009).
A financial transactions tax is under consideration
Innovative financing has been successful in
supporting global health initiatives

79Financial flows to developing countries
established a voluntary patent pool mechanism, the Medicines Patent Pool Foundation, under which the production of new HIV/AIDS medicines will be facilitated to make them available in developing countries at more affordable prices. In September 2010, the United States National Institutes of Health became the first patent holder to share its intellectual property with the Medicines Patent Pool.17
The GAVI Alliance and the Global Fund have become the major multilateral donors in the health sector, having contributed to the 14 per cent growth in global health funding from 2000 ($5.5 billion) to 2007 ($13.5 billion).18 In 2008, the Global Fund was the second-largest multilateral donor in the health sector with a commitment of $2.2 billion, or 12 per cent of total donor commitments, and the GAVI Alliance was ranked the fifth-largest donor. From 2000 to July of 2010, the GAVI Alliance had received total donor commitments of $10.6 billion.19 From 2001 to September of 2010, the Global Fund had received $18.2 billion against pledges of $30.1 billion.20 These funds make use of different mechanisms of innovative financing, but further expansion remains challenging (see box III.1). As a result, the scale of revenues generated through currently operational mechanisms for global health initiatives is too small to meet funding needs. At the Global Fund’s Third Voluntary Replenishment meeting, more than 40 countries committed $11.7 billion for 2011-2013, up from the $9.7 billion provided during 2008-2010.21 The new commitment falls short of the lower bound of the estimated funding needs of $13 billion. No firm pledges were obtained from the private sector, nor could they be secured through innovative funding mechanisms. UNITAID also faces a funding challenge. As at June 2010, there was a delay in receiving committed funds from some donors, and only four donors had committed funding for 2011.22
Additional funding would need to be secured in order to scale up operations and step up efforts to meet the internationally agreed health goals. Recognizing these needs, the G8 reaffirmed its commitment to improving the health of mothers and young children in the developing world in its 27 June 2010 Muskoka Initiative on Maternal, Newborn and Child Health,23 while the United Nations Global Strategy for Women’s and Children’s Health was launched at the MDG summit.
17 UNITAID, “US National Institutes of Health (NIH) First to Share Patents with Medicines Patent Pool”, 30 September 2010, available from http://www.unitaid.eu/en/20100930290/News/US-National-Institutes-of-Health-NIH-First-to-Share-Patents-with-Medicines-Patent-Pool.html.
18 OECD, 2010 DAC Report on Multilateral Aid (Paris: OECD, September 2010).
19 GAVI Alliance, “Donor contributions & commitments: latest figures as of October 2010”, available from http://www.gavialliance.org/about/donors/table/index.php (accessed on 23 November 2010).
20 Global Fund to Fight AIDS, Tuberculosis and Malaria, “Pledges as of 31 October 2010”, available from http://www.theglobalfund.org/documents/pledges_contributions.xls (accessed on 23 November 2010).
21 Global Fund to Fight AIDS, Tuberculosis and Malaria, “Donors commit US$ 11.7 billion to the Global Fund for next three years”, press release, 5 October 2010, available from http://www.theglobalfund.org/en/pressreleases/?pr=pr_101005c. According to a list of pledges for 2011-2013, the Global Fund expects about 2 per cent of revenues during this period ($109 million) to be generated from the Debt2Health initiative and other innovative financing schemes ($163 million). The role played by the innovative mechanisms in the overall funding remains modest.
22 UNITAID, “More countries should apply solidarity air levy to complement funding for global health: Secure funding key to keep expanding treatment for people with AIDS, Malaria and TB”, press release of 10 June 2010, available from http://www.unitaid.eu/en/20100610264/News/MORE-COUNTRIES-SHOULD-APPLY-SOLIDARITY-AIR-LEVY-TO-COMPLEMENT-FUNDING-FOR-GLOBAL-HEALTH.html.
23 G8 Muskoka Declaration: Recovery and New Beginnings, Muskoka, Canada, 25-26 June 2010, available from http://g8.gc.ca/wp-content/uploads/2010/07/declaration_eng.pdf .
The GAVI Alliance and the Global Fund face funding challenges

80 World Economic Situation and Prospects 2011
Innovative finance mechanisms thus far have been by and large confined to supporting global health initiatives. Their usage to increase funding for other develop-ment purposes, such as education, climate change adaptation and food security, are being explored. The Leading Group formed a new task force on education, which brought out a report in September of 2010, entitled “2+3=8: Innovating in Financing Education”. The United Nations High-Level Advisory Group on Climate Change Financing also studied
Innovative financing options are being explored
for education, climate change adaptation and
food security
Mechanisms underlying innovative financing for global health
Innovative forms of financing have been effectively introduced to support global health initiatives. The two innovative mechanisms used by the GAVI Alliance are the International Financing Facility for Immunisation (IFFIm) and the Advance Market Commitment (AMC). The IFFIm has been the major source of funding for GAVI since 2006, having raised $2.6 billion (as of March 2010), mostly through issuance of foreign currency-denominated bonds against long-term official development assistance (ODA) pledges of $6 billion made by nine donor countries (including South Africa). In relation to the overall financial requirements of $4.3 billion for 2010-2015, GAVI expects that these two mechanisms will generate revenues to cover about half of its funding needs, namely, $1.3 billion through the IFFIm and $920 million through the AMC.
The Global Fund to Fight AIDS, Tuberculosis and Malaria receives resources through three mechanisms. First, voluntary contributions from (PRODUCT)redtm, which collects profits gener-ated from products and events under the trademark (RED)tm. Second, it receives half of the value of cancelled debt under Debt2Health debt-swap agreements. And, third, it obtains contributions from UNITAID. It should be noted, however, that in the case of the Global Fund, these innovative sources of financing provide only a fraction of its overall revenues. Since 2006, (PRODUCT)redtm has trans-ferred over $150 million to the Global Fund.a Under the Debt2Health initiative, the Global Fund has implemented health projects in Indonesia and Pakistan worth €45 million through two debt-swap agreements since 2007, by securing the commitment of €200 million for 2008-2010 from Germany.b The cumulative paid-in contributions by UNITAID to the Global Fund amounted to $130 million. The sum of revenues raised by these three mechanisms, therefore, accounts for not more than 2 per cent of the Global Fund’s cumulative contributions received so far.
Further expansion of these mechanisms remains challenging. In the case of the GAVI Alliance, IFFIm commitments after 2010 are levelling off, creating an estimated funding gap of $2.6 billion during 2010-2015. Although a few new donors have been added, GAVI would need to find ad-ditional IFFIm donors or secure larger contributions from existing donors in order to fill its financing gap. In March 2010, the GAVI Alliance did manage to secure the participation of two pharmaceutical companies in making long-term commitments to supply new vaccines under the AMC.
Progress in enhancing the Debt2Health initiative has also been slow. Debt2Health was incorporated as a permanent feature of resource mobilization for the Global Fund in November 2009, but only two new agreements have been signed so far. The two new agreements included one between Australia and Indonesia involving a debt write-off worth AS$ 75 million, signed in July; and one between Germany and Côte d’Ivoire signed in September 2010, cancelling €19 million of the latter’s debt. With these agreements, the total amount of debt swapped under this initiative is now €164 million (US$ 213 million). While no new official donors have been added to the Debt2Health initiative, the Global Fund did manage to forge two innovative financing agreements with private agents which could yield important new revenue: it agreed with the Dow Jones Indexes to explore the creation of a new blue chip index, which could be licensed as the basis for investible products, and with the National Bank of Abu Dhabi to launch an Exchange-Traded Fund, from which the Global Fund would receive a portion of the licence and management fees.
Box III.1
a See, (RED)tm, available from http://www.joinred.
com/FAQ (accessed on 18 August 2010).
b The Global Fund to Fight Aids, Tuberculosis
and Malaria, “Debt2Health: Innovative Financing of the Global Fund”, available from http://www.theglobalfund.org/en/publications/other/
debt2health/?lang=en (accessed on
18 August 2010).

81Financial flows to developing countries
funding options, including innovative mechanisms, to raise $100 billion per year by 2020, and presented its final report in November 2010.24
As new options are being explored, questions are being raised whether in-novative financing for global initiatives should not also be subjected to aid effectiveness criteria as established by the Paris Declaration. There is also criticism that new financing mechanisms are further complicating the already complex aid architecture and contribut-ing to its further fragmentation.
Debt relief
Sovereign debt problems appeared to have become a thing of the past in mid-2008, as debt indicators of developing countries had improved remarkably, aided by several years of unhampered economic growth and debt relief for many low-income countries. However, while many developing countries were reducing their indebtedness, many developed countries were increasing their borrowing. Discussions on debt sustainability, which for decades focused on overindebtedness in low-income and emerging market countries, have now become global. Public debt in advanced countries reached about 70 per cent of GDP as at end-2007, and is projected to rise to above 100 per cent of GDP at the end of 2015.
Despite improvements in the debt positions of many developing countries prior to the crisis, some countries, including some small middle-income countries, remained in vulnerable situations; since the crisis, many more have vulnerable debt positions. The total external debt (public and private) of developing countries as a share of GDP rose to 24.8 per cent in 2009, an increase of 2.2 percentage points over the previous year. The downward trajectory of the debt service-to-exports ratio was reversed owing to the negative impact of the crisis on the dollar value of both GDP and exports. As a result, the average external debt-to-export ratio of developing countries and transition economies increased from 64.1 per cent in 2008 to 82.4 per cent in 2009. In many countries, debt ratios increased even more significantly as efforts to manage the impact of the crisis resulted in rapid increases in public debt. The public debt of a large number of developing countries is above 40 per cent of GDP, including the debt of countries that benefited from the Heavily Indebted Poor Countries (HIPC) Initiative. Many post-completion point HIPCs have increased debt to levels above the thresholds utilized for their debt writeoffs.
Gross IMF lending commitments, which stood at $1 billion in 2007, went up to $49 billion in 2008 and $120 billion in 2009. IMF concessional lending commitments in 2007 amounted to $0.2 billion, and rose to $1.2 billion in 2008 and $3.8 billion in 2009. Other multilateral financial institutions also sharply increased their lending levels. The World Bank increased its gross commitments from $36.5 billion in 2007 to $65 billion in 2009. Most of the increase was for International Bank for Reconstruction and Development (IBRD) loans targeted to middle-income countries. The main regional development banks also increased their lending from $30 billion to $50 billion over the same period.
Although generous debt relief has been provided to low-income countries under the HIPC Initiative, vulnerabilities remain. As at end-September 2010, after the Comoros reached its decision point in June of 2010, 36 out of 40 countries qualified for debt relief under HIPC (“post-decision point HIPCs”). Since the beginning of 2010, four countries—Afghanistan (January), the Congo (January), Liberia (June) and the
24 United Nations, “Report of the Secretary-General’s High-level Advisory Group on Climate Change Financing”, 5 November 2010, available from http://www.un.org/wcm/webdav/site/climatechange/shared/Documents/AGF_reports/AGF_Final_Report.pdf (accessed on 23 November 2010).
Debt problems have now engulfed developed countries also
The debt situation in many developing countries has improved, but problems remain
Despite generous debt-relief measures, a number of countries remain vulnerable

82 World Economic Situation and Prospects 2011
Democratic Republic of the Congo (July)—have reached their completion points and qualified for irrevocable debt relief from the HIPC Initiative and the Multilateral Debt Relief Initiative (MDRI), increasing the number of post-completion point countries to 30. Six countries are now between their decision and their completion points (“interim HIPCs”), three of which are expected to reach their completion point within the next 12 to 18 months. Assistance committed to the 36 post-decision point HIPCs ($127 billion, including $51 billion under the MDRI) represents, on average, 38 per cent of their 2009 GDP. The debt burden of these countries has been reduced by more than 80 per cent on average compared to pre-decision point levels.25
The total cost of the HIPC Initiative is estimated at $76.4 billion by end-2009 in present value terms (an increase of $2.5 billion from end-2008 in present value terms), of which $54.3 billion represents irrevocable debt relief to the 30 post-completion point countries. The estimated costs for the six interim countries and four pre-decision point countries are $5.3 billion and $16.9 billion, respectively. Additional HIPC assistance re-ceived so far by the six interim HIPCs represents less than 3 per cent of the total cost. In order to provide debt relief to the few HIPCs with protracted arrears to international financial institutions (IFIs), more funds will be required.26
The total cost of the MDRI is estimated at $30.3 billion at end-2009 in present value terms (an increase of 1.9 billion from end-2008 in present value terms)27, of which $26.7 billion has been delivered to the 30 post-completion point HIPCs. In addition, the IMF has also provided MDRI relief to Cambodia and Tajikistan. While the World Bank’s Debt Relief Trust Fund and International Development Association (IDA) have sufficient resources to cover debt relief costs under the HIPC Initiative over the IDA-15 commitment period (FY 2009-2011), IMF resources are sufficient to cover the costs of the remaining HIPCs, except for the protracted arrears of Somalia and Sudan, for which no provision had been made under the original HIPC financing framework. Additional resources will be needed if more countries, such as Myanmar (whose end-2004 debt data to determine eligibility are yet to be made available), become eligible for assistance under the Initiative.
Non-Paris Club official creditors and commercial creditors account for 13 per cent and 6 per cent of debt relief, respectively.28 While Paris Club creditors’ costs are mostly for debt relief to post-completion point HIPCs, more than half of the estimated costs of non-Paris Club and commercial creditors relate to pre-decision point HIPCs. The IDA and IMF estimate that non-Paris Club creditors have delivered between 34 and 39 per cent of their programmed debt relief.29 Delivery of debt relief by commercial creditors has improved in recent years. Some commercial creditors continue to pursue litigation against HIPCs to recover claims. The number of litigation cases declined from 33 to 14 cases in 2009; the situation was similar in 2010, the key changes being the conclusion or withdrawal of two cases.30 The limited participation of non-Paris Club official creditors in
25 World Bank, “HIPC At-A-Glance Guide (Fall 2010)”, available from http://siteresources.worldbank.org/INTDEBTDEPT/Resources/468980-1256580106544/HIPCFall2010_ENG.pdf (accessed on 18 October 2010).
26 International Development Association (IDA) and IMF, “Heavily Indebted Poor Countries (HIPC) Initiative and Multilateral Debt Relief Initiative (MDRI): Status of implementation”, 14 September 2010.
27 World Bank, op. cit.
28 IDA and IMF, op. cit.
29 Based on IDA and IMF, op. cit., annex table 15.
30 IDA and IMF, op. cit.
More funds are needed to provide debt relief to HIPCs
with protracted arrears
More than half of the costs of non-Paris Club and
commercial creditors relate to pre-decision point HIPCs

83Financial flows to developing countries
the debt relief process and litigation by commercial creditors remain obstacles to minimiz-ing the risk of future debt-servicing difficulties of HIPCs.
One positive development in the litigation cases by commercial creditors was the agreement in principle of the litigants in the two lawsuits against Liberia in April 2009 to participate in an external commercial buy-back operation, with support from the IDA Debt Reduction Facility (DRF). Another relates to national and multilateral initia-tives, such as the United Kingdom of Great Britain and Northern Ireland’s Debt Relief (Developing Countries) Act of April 2010 which limits the amounts that litigating credi-tors can recover in the country’s courts against HIPCs. A member of the United States House of Representatives has also presented legislation that would limit the ability of non-participating creditors to seek awards from HIPCs via United States courts. While no legal support facility is yet available for HIPCs outside Africa, the African Legal Support Facility, launched by the African Development Bank with an initial endowment of $16 million, is now operational to provide support for African countries facing litigation from commercial creditors.31
The global financial crisis has enhanced the debt vulnerabilities of many low-income countries, including HIPCs, although the IMF forecasts that systemic post-crisis debt difficulties are unlikely.32 According to the latest information from the IDA and IMF on implementation of the HIPC and MDRI initiatives, five HIPCs are classified as being “in debt distress”, while eight others are at “high risk of debt distress” (figure III.3). Seven non-HIPC low-income countries are identified as facing debt problems. Two new post-completion point HIPCs, namely, the Democratic Republic of the Congo and Liberia, were classified as being “in debt distress” in the April 2010 study;33 however, at the time of the study, both were interim HIPCs. Since then, the Democratic Republic of the Congo has exited the HIPC Initiative with a “high risk” rating,34 while the most recent IMF country report dated July 2010 indicates that Liberia exited with a “low risk” rating.35
Despite the debt relief already provided, the World Bank classifies almost half (19) of the 40 HIPCs as being in “fragile situations”, lacking effective delivery of develop-ment finance and services.36 Only a few HIPCs are on track to meet the MDGs, while progress in eradicating extreme poverty and hunger and in improving maternal health has been particularly slow. Continued and increased access to concessional financing needs to be considered if post-completion point HIPCs are to maintain debt sustainability beyond their completion points.
After the fourth extension of the sunset clause, which expired at the end of December 2006, no further extension is being considered in the light of the crisis. This means that, no matter how unsustainable their debt levels may be, developing countries
31 IDA and IMF, op. cit., pp. 20-23.
32 IMF and World Bank, “Preserving debt sustainability in low-income countries in the wake of the global crisis”, paper prepared by the staffs of the IMF and the World Bank, 1 April 2010, available from http://www.imf.org/external/np/pp/eng/2010/040110.pdf.
33 Ibid., p.17.
34 IDA and IMF, op. cit., p.9.
35 Based on IMF Country Report No. 10/192 of 8 June 2010, “Liberia: Enhanced Initiative for Heavily Indebted Poor Countries—Completion Point Document and Multilateral Debt Relief Initiative”, which contains Liberia’s debt sustainability analysis and concludes that “Liberia’s risk of debt distress remains low following the debt relief under the HIPC initiative and the MDRI, although delays in implementing structural reforms aimed at raising growth, investment and exports could be a source of external vulnerability.” (p. 55).
36 IMF and World Bank, Global Monitoring Report 2010: The MDGs after the Crisis (Washington, D.C.: IMF and World Bank).
Some positive developments have occurred in the area of litigation
Only some HIPCs are on track to meet the MDGs
No further extension of the sunset clause is being considered

84 World Economic Situation and Prospects 2011
that did not meet the HIPC eligibility criteria in 2006 will not be able to enjoy the benefits of HIPC or MDRI debt relief despite new debt vulnerability and distress. Zimbabwe, for example, currently assessed as being in debt distress,37 did not meet the World Bank’s income criteria based on its end-2004 data. For the country to be eligible for HIPC debt relief, the eligibility criteria would have to be modified. Additional efforts need to be made to ensure that all eligible countries benefit under the HIPC and MDRI initiatives.
The 2009 review of the joint World Bank-IMF Debt Sustainability Framework for Low-Income Countries resulted in a change in approach towards the debt of State-owned enterprises, remittances and the growth-investment nexus. However, the review did not allay concerns about country policy and institutional assessments, whose continued inclusion in the framework have come under greater criticism. While institutions matter for long-term development, thresholds for debt-carrying capacity defined in the short- and medium-term, based on institutional quality, give greater weight to institutional and governance factors, without recognizing that improvement of these factors requires fiscal capacity. A needs-based assessment for the allocation of grants to invest in the MDGs and other development goals would therefore need to be considered so that development gains lead to improved institutional governance and debt-carrying capacity.
While the debt problems of small middle-income countries do not pose sys-temic risks, they reduce space for growth and development expenditure. For the majority of countries in this category, the bulk of the debt is owed to multilateral institutions. Many of these countries are beset with structural vulnerabilities and suffer from debt overhang. New borrowing in these cases would only make these economies even more in-debted. Other complementary policy tools are needed in addition to official sector lending.
37 IMF and World Bank, “Preserving debt sustainability”, op. cit., p.17.
Figure III.3Low-income countries in debt distress or at high risk of debt distress, October 2010
0
2
4
6
8
10
12
14
HIPCs Non-HIPCs
Decision point
Pre-decision point
Post-completionpoint
Number of countries
Source: UN/DESA, based on IMF, “List of LIC DSAs for PRGT-Eligible Countries, as
of October 12, 2010” and IDA and IMF, “Heavily Indebted
Poor Countries (HIPC) Initiative and Multilateral
Debt Relief Initiative (MDRI)—Status of Implementation”,
14 September 2010.Note: Debt distress rating
according to the latest DSA publication.

85Financial flows to developing countries
Further work is needed to provide the technical basis for a balance between new resources and other debt resolution tools.
The unfolding debt distress in some European countries, as well as renewed indebtedness in some developing countries, points to the limits of the existing arrange-ments for dealing with debt problems. There is an urgent need to set up an international sovereign debt workout mechanism which would allow countries to restructure their debt in a timely and comprehensive manner, if necessary.
Strengthening the international financial architecture
The international community has continued its efforts to overhaul financial regulation and supervision, as well as to review the mandate of the IMF and its responsibilities for surveillance, financing and stability of the international monetary system, including the international reserve system. There have also been further deliberations on improving global economic governance and governance reform of the IFIs, with a view to enhancing their legitimacy, credibility and effectiveness.
Reform of the framework for financial regulation
The financial crisis has demonstrated the urgent need to significantly improve financial regulation and supervision in order to achieve global financial stability. The June 2009 United Nations Conference on the World Financial and Economic Crisis and Its Impact on Development called for expanding the scope of regulation and supervision and making them more effective with respect to all major financial centres, instruments and actors.
It has also been recognized that financial regulation at the microprudential level, focused on individual financial institutions, is not enough to achieve global financial sta-bility and has to be supplemented by an adequate macroprudential framework. The reform agenda—set in motion by the G20 summits in Washington, London, Pittsburgh, Toronto and Seoul—envisages the introduction of macroprudential supervision that would take due account of the overall stability of the financial system, including pro-cyclicality, and systemic risks and moral hazard caused by systemically important financial institutions (SIFIs). Close cooperation and coordination among numerous national and international regulatory and standard-setting bodies is important to ensure coherence and consistency of reform measures and to assess the costs and benefits of the proposed changes.
A major step in the reform process is the modification of the Basel II frame-work for capital and liquidity regulation. The goal of Basel III is to raise the level, quality, consistency and transparency of bank capital. Banks have already increased their capital and liquidity buffers beyond those required by Basel II following market pressures and increased scrutiny by bank supervisors after the crisis. Nevertheless, significantly higher formal minimum capital requirements are deemed necessary to help avoid any return to the low pre-crisis capital and liquidity levels when financial conditions return to normal and competitive pressures reassert themselves. The new capital and liquidity reform pack-age, Basel III, was agreed to and issued by the Basel Committee on Banking Supervision (BCBS) between July and September 2010.38
38 Bank for International Settlements (BIS), “The Basel Committee’s response to the financial crisis: report to the G20”, October 2010, available from http://www.bis.org/publ/bcbs179.htm.
Surging sovereign debt problems point to the need for an international debt restructuring mechanism
Efforts to overhaul financial regulation and supervision are continuing
Global financial stability requires a macroprudential framework

86 World Economic Situation and Prospects 2011
A key element of Basel III is an increase in the minimum common equity requirement, to 4.5 per cent from 2.0 per cent under Basel II.39 To address pro-cyclicality, in addition to minimum requirements, the BCBS agreed to introduce capital conservation and counter-cyclical buffers to be built up in good times and drawn upon in periods of stress. A capital conservation buffer of 2.5 per cent of common equity is aimed to ensure that capital remains available to support the bank’s ongoing business operations during times of stress. A counter-cyclical capital buffer in a range of 0.0-2.5 per cent may be built during periods of rapid credit growth if, in the judgement of national authorities, a credit bubble has led to the build-up of system-wide risk. The buffer will be released in the downturn of the credit cycle to help absorb losses in the banking system that pose risks to financial stability.
There is also an agreement to introduce a leverage ratio, that is to say, a cap on the amount of assets a bank may have in relation to its equity. This backstop is seen as sup-plementary to the risk-based capital framework. In addition, there will be higher capital charges related to bank-trading activities, complex securitizations and derivatives.
Along with more and better capital to absorb unexpected losses, the BCBS has proposed a global liquidity standard which would require banks to better match the maturities of their assets and liabilities. Another feature of this standard is the requirement for banks to hold sufficient stocks of high-quality liquid assets to allow them to survive a 30-day loss of access to market funds.
According to the BCBS, implementation of the main components of Basel III should be completed by the beginning of 2019. It has been agreed that phase-in arrange-ments for adopting the new standards should reflect different national starting points and circumstances.40 In particular, special attention needs to be given to the characteristics, depth and capacity of local financial markets.
Higher capital requirements would force banks to raise additional capital. This may have a negative impact on banks’ ability to lend and could result in somewhat slower global growth. However, according to the Financial Stability Board (FSB)/BCBS Macroeconomic Assessment Group, the reforms proposed by the Basel Committee are likely to have, at most, a modest impact on aggregate output, provided appropriate transi-tion arrangements are in place.41
According to many observers, Basel III represents a substantial improvement in the quantity and quality of bank capital. It has been stressed, however, that these new capital and liquidity standards apply only to banks. Consequently, despite some progress, much more needs to be done to address risks outside traditional banks and to ensure consistency in the application of regulations across different types of financial markets and institutions offering similar products.
Furthermore, work is under way at the FSB to develop principles to reduce the reliance of authorities and market participants on credit-rating agency (CRA) ratings. The
39 The minimum ratio of 2.0 per cent under Basel II is more like 1.0 per cent for an average bank in the new, stronger definition under Basel III (see, “Basel III: towards a safer financial system”, speech by Jaime Caruana, General Manager of the BIS, at the Third Santander International Banking Conference, Madrid, 15 September 2010, available from http://www.bis.org/speeches/sp100921.htm).
40 The G20 Toronto Summit Declaration, Toronto, Canada, 26-27 June 2010, available from http://www.g20.org/Documents/g20_declaration_en.pdf.
41 BIS, “Assessing the macroeconomic impact of the transition to stronger capital and liquidity requirements: Interim report”, prepared by the Macroeconomic Assessment Group, established by the Financial Stability Board and the Basel Committee on Banking Supervision, August 2010, available from http://www.bis.org/publ/othp10.pdf.
A higher minimum common equity
requirement constitutes a key element of Basel III
In addition, a cap on the leverage ratio will
be introduced
The phase-in of the new conditions will differ
according to national circumstances
The new standards only apply to banks, while better
regulation of non-banking institutions is at least
as important

87Financial flows to developing countries
goal is to reduce the effects of CRA ratings that amplify pro-cyclicality and cause systemic disruption.42
Apart from addressing pro-cyclicality, the FSB and BCBS are developing policy approaches for addressing the “too-big-to-fail” problems associated with SIFIs. These are considered major concerns of regulatory reform, as the crisis has exposed an alarming disparity between the global activities of these banks and the constraints of mainly national regulation. The starting point is to identify systemically important institutions, size not always being the sole indication of systemic relevance. Interconnectedness, sub-stitutability and the state of the markets are also relevant. However, there is not yet consensus on the issue.43
As regards ensuring the safety and soundness of SIFIs, the introduction of the Basel III framework and the resulting improvement in the capacity of these institutions to absorb losses are considered to be only part of the solution. It has been agreed that SIFIs should have loss-absorbing capacity beyond the general standards. Proposed measures include capital surcharges and levies related to the institutions’ contribution to systemic risk, contingent capital and bail-in debt. The proposed policy framework also includes enhanced on-site supervision, harmonized enforcement activities and strengthened super-visory cooperation and coordination, including a mutual policy review process to promote consistent national policies.
Another important focus of reform is the development of legal and policy frameworks for cross-border resolution that should allow institutions of all types and sizes to fail without putting the rest of the financial system or taxpayers at risk. Given the com-plexity of the tasks and the different interests of the countries involved, harmonization of national wind-down rules that would allow regulators to step in promptly and in a coordi-nated way when problems emerge in financial institutions is a precondition for an effective resolution framework. Standards for global firms should set a common floor, while actions across countries must be sufficiently coordinated to avoid unilateral responses and regula-tory arbitrage. There may also be a need in an international agreement for principles that would promote equitable outcomes on the disposition of assets and payment of the costs of resolving failed institutions. Besides, every important firm, regardless of the institution’s legal form, must be included within the parameters of such regulation.
Should attempts to create such a comprehensive framework not succeed, some alternative solutions may gain broader acceptance, including the placing of restrictions on certain business activities and on the size and structure of financial firms so as to make all institutions resolvable without adverse systemic implications.
Options to devise a fair and substantial contribution from the financial sec-tor to fund the fiscal costs of financial failures are also being explored internationally. Initially, the discussion was centred on the imposition of levies and taxes on financial institutions. However, global bank taxation lacks the necessary support. Accordingly, it was acknowledged that there was a range of policy options, with countries pursuing dif-ferent approaches.44
42 Statement of Mario Draghi, Chairman of the Financial Stability Board, at the twenty-second meeting of the International Monetary and Financial Committee (IMFC) of the IMF, Washington, D. C., 9 October 2010, available from http://www.imf.org/External/AM/2010/imfc/statement/eng/fsb.pdf.
43 See, “The G20 agenda on financial regulation”, speech by Axel A. Weber, President of the Deutsche Bundesbank at the International Conference on Financial Market Regulation, Berlin, Germany, 19 May 2010, available from http://www.bis.org/review/r100520a.pdf.
44 The G20 Toronto Summit Declaration, op. cit.
“Too-big-to-fail” problems remain a major policy concern
Creating an orderly cross-border default mechanism poses another challenge for policymakers
Other options include restrictions on certain business activities
88 World Economic Situation and Prospects 2011
The crisis has shown that prudential regulation alone cannot ensure financial stability and that monetary and fiscal policies also matter in helping to mitigate the build-up of financial imbalances. According to many observers,45 besides controlling inflation, monetary policy should take better account of asset prices and credit booms. Fiscal policy must play a supporting role in a financial stability framework. While the major goal of fiscal policy is counter-cyclical demand management, it should also take into account the need to build fiscal buffers in good times to respond to financial system stress.
Multilateral surveillance and policy coordination
The IMF has recognized that, unlike the outside world, Fund surveillance has not changed much since the late 1970s and is almost the same for all members.46 The crisis, however, has forcefully demonstrated that, in a world of integrated capital markets and interconnected national financial sectors, the status quo is no longer acceptable. A key goal of reform is therefore to strengthen multilateral surveillance and enhance the coverage and depth of analysis of financial sector issues and policies. To promote global stability, the Fund’s surveillance activities need to pay more attention to policy spillovers, especially those of systemically important countries. Surveillance at the country level remains fundamental, but is no longer sufficient. Assessing international coherence and promoting coordination among national policies should become a central objective of the collaboration.
According to the Independent Evaluation Office of the IMF, most members support a greater direct Fund presence in international policy coordination and spillover analysis.47 However, the Fund’s role is not well defined; it is therefore deemed useful to clarify what is expected of the Fund and its membership in order to preserve sys-temic stability, including key modalities, procedures and outcomes. In this regard, the International Monetary and Financial Committee (IMFC) has requested the Fund to study the cross-border implications of the policies of systemically important economies under consideration.48 The goal of the reports is to raise the members’ awareness of their responsibilities in preserving global financial stability, and to more clearly highlight the risks faced by countries affected by international spillover effects. A trial exercise with five major economies (China, the euro area, Japan, the United Kingdom and the United States) is to be completed by July 2011.
There have also been suggestions to hold multilateral consultations, as needed, on specific topics that have systemic implications, in order to foster collaboration and col-lective action.49 One such topic might be growing sovereign risks of developed countries.
45 See, for instance, “Towards a global financial stability framework”, speech by Hervé Hannoun, Deputy General Manager of BIS at the 45th SEACEN Governors’ Conference, Siem Reap Province, Cambodia, 26-27 February 2010, pp. 19-23, available from http://www.bis.org/speeches/sp100303.htm.
46 IMF, “Modernizing surveillance mandate and modalities”, paper prepared by the IMF Strategy, Policy and Review Department and the Legal Department, 26 March 2010, p. 4, available from http://www.imf.org/external/np/pp/eng/2010/032610.pdf.
47 Independent Evaluation Office of the IMF, “IMF Interactions with Member Countries”, Evaluation report, 25 November 2009, p. 34, available from http://ieo-imf.org/eval/complete/pdf/01202010/IMC_Full_Text_Main_Report.pdf.
48 Communiqué of the Twenty-Second Meeting of the International Monetary and Financial Committee of the Board of Governors of the International Monetary Fund, Press release No. 10/379, 9 October 2010, available from http://www.imf.org/external/np/sec/pr/2010/pr10379.htm.
49 IMF, “IMF Executive Board discusses modernizing the Surveillance Mandate and Modalities and Financial Sector Surveillance and the Mandate of the Fund”, Public Information Notice (PIN) No. 10/52, 22 April 2010, available from http://www.imf.org/external/np/sec/pn/2010/pn1052.htm.
Regulation alone cannot ensure financial stability
Surveillance needs to place greater emphasis on
policy spillovers

89Financial flows to developing countries
Thus far, the most major attempt at the highest political level to take account of multilateral dimensions when setting national policies has been initiated outside of the IMF surveillance process. At the September 2009 Pittsburgh Summit, G20 leaders announced the Framework for Strong, Sustainable and Balanced Growth and committed themselves to submitting their actions to peer review via the Mutual Assessment Process (MAP). Through the MAP, the world’s largest economies are supposed to be accountable to one another for the global coherence and consistency of their budget, monetary and structural policies. At the G20 Summit in Seoul, participants agreed to enhance the MAP through, among other things, the establishment of indicative guidelines with respect to the global imbalances.
However, there have been signs that the momentum for closer cooperation and coordination is decreasing and giving way to diverse narrow domestic agendas. Global eco-nomic prospects have been threatened by tensions over current-account imbalances and exchange-rate issues. In November 2010, in an attempt to reinvigorate commitment to cooperation, G20 leaders, at their Summit in Seoul, the Republic of Korea, made a com-mitment to move towards more market-determined exchange-rate systems, to enhance exchange-rate flexibility so as to reflect underlying economic fundamentals (while being vigilant of excess volatility and disorderly movements in exchange rates), and to refrain from competitive devaluation of currencies.50 The Seoul Summit also reaffirmed its commitment to strengthen multilateral cooperation, to promote external sustainability and to pursue policies conducive to reducing excessive imbalances. In this regard, the G20 leaders noted the importance of assessing, against indicative guidelines (to be agreed upon by the G20 Finance Ministers and Central Bank Governors), the nature of persistently large imbalances and the root causes of impediments to adjustment as part of the MAP, while recognizing the need to take into account national and regional circumstances.51 However, no precise guidelines, targets or policies on how to rebalance the global economy were agreed to.
The IMF has been asked to assist the MAP by providing an analysis of how G20 member policies fit together and whether these policies are consistent with more sustainable and balanced global growth. Such technical assistance is separate from Fund surveillance. Nevertheless, it holds some promise of greater engagement by systemically important coun-tries with the Fund, including in ways that involve the whole IMF membership. Moreover, IMF involvement in the MAP could inform discussion on surveillance reform.
The global financial crisis has revealed the critical importance of enhancing the coverage and depth of analysis of financial sector issues in Fund surveillance. To better un-derstand and assess the risks of transmission of macrofinancial instability across countries, the Fund would need closer engagement with members with systemically important finan-cial sectors, as well as those with large and complex financial institutions. In September 2010, the IMF Executive Board approved making financial stability assessments under the Financial Sector Assessment Program (FSAP) a regular and mandatory part of the Fund’s Article IV surveillance for 25 members with systemically important financial sectors. This group of countries covers almost 90 per cent of the global financial system and 80 per cent of global economic activity.
Financial sector surveillance is not the purview of the IMF alone. There is a need for closer collaboration with the FSB, the Bank for International Settlements (BIS) and financial sector standard-setting bodies. Coordination and enhanced collaboration should
50 The G20 Seoul Summit Leaders’ Declaration, 11-12 November 2010, available from http://www.g20.utoronto.ca/2010/g20seoul.pdf.
51 The Seoul Summit Document, available from http://www.g20.utoronto.ca/2010/g20seoul-doc.pdf.
Tensions over current-account imbalances have prompted new, but vague, pledges by the G20
The crisis has illustrated the importance of including financial sector issues in Fund surveillance

90 World Economic Situation and Prospects 2011
help to avoid excessive duplication and to develop a division of labour and a clearer delinea-tion of responsibilities, with each party making the most of its comparative advantage.
There is also a need to revise analysis, as well as policy prescriptions, related to cross-border capital flows. Low interest rates and highly liquid conditions in developed countries, the result of monetary policy measures undertaken to forestall the crisis, have led to surges of capital flows to many emerging market economies with comparatively higher interest rates and a stronger growth outlook. Sudden inflow surges complicate mac-roeconomic management and may lead to inflation and asset price bubbles. There are also risks of abrupt stops or reversals in those flows. It has been recognized that, along with macroeconomic and prudential policy measures, and depending on the circumstances, the imposition of capital controls may be an appropriate response.52 Moreover, free flows of capital may not necessarily be preferred for emerging market and developing countries, as fully open capital accounts can be problematic.53
To help its members deal with capital flows, and as part of its surveillance activities, the Fund will continue work to fill information gaps on cross-border capital flows and exposures and to deepen the understanding of capital flows and their interrela-tionships with other policy areas. This should include providing countries with pragmatic policy advice on how to limit excessive short-term flows. Moreover, on the basis of this analysis, the Fund could provide a much-needed multilateral perspective on the issue by advising both capital-exporting and capital-importing countries on the economic policy choices necessary for ensuring orderly capital flows. Such a multilateral platform for man-aging capital flows would be an appropriate response to the current crisis that once again underscored the capriciousness of capital flows.
Despite expanding the Fund’s surveillance mandate, there is general concern that this surveillance does not have enough traction in member countries and can only be effective to the extent that members are cooperative and responsive. Going forward, the challenge is to ensure that the international community will be more willing and able to respond to global risks in a more coordinated fashion. This requires more flexibility, receptiveness and willingness by member countries to implement policy advice (and is part of membership obligations that they should clearly commit to fulfilling).
A global financial safety net
Alongside prudential regulation and surveillance, an effective global financial safety net is an important backstop for the preservation of global economic and financial stability. The crisis has been a powerful reminder that liquidity, both domestic and international, may dry up concurrently everywhere in the world, leading to simultaneous sharp falls in output and trade. When such a global liquidity shock occurs, public provision of liquidity should fill the gap.
The multilateral safety net was strengthened significantly during the recent crisis through $350 billion in capital increases for the multilateral development banks, reform of IMF credit facilities and the commitment to treble IMF resources. The Fund is increasingly seen as a provider of insurance-like crisis prevention facilities in the face of volatile cross-border capital flows and risk of contagion.
52 See, “Macro-Prudential Policies—an Asian Perspective”, closing remarks by Dominique Strauss-Kahn, IMF Managing Director, at the high-level conference in Shanghai, China, 18 October 2010, available from http://www.imf.org/external/np/speeches/2010/101810.htm.
53 See, for instance, statement of Guido Mantega, Minister of Finance of Brazil, at the twenty-second meeting of the International Monetary and Financial Committee of the IMF, Washington, D.C., 9 October 2010, available from http://www.imf.org/external/am/2010/imfc/statement/eng/bra.pdf.
Current economic conditions require a
reassessment of the role of measures to manage
capital flows
The Fund could provide a much-needed multilateral
perspective on capital flow management
A global financial safety net would help in dealing with
any liquidity crises

91Financial flows to developing countries
In August 2010, the Fund increased the duration and credit available under the existing Flexible Credit Line (FCL), an insurance option for countries with very strong policies and economic fundamentals, and established a new Precautionary Credit Line (PCL). The PCL, a form of contingent protection, is designed for those countries that do not qualify for the FCL but have only moderate vulnerabilities. Unlike the FCL, the PCL features ex post conditionalities focused on reducing any remaining vulnerabilities identi-fied in the qualification assessment.
At its October 2010 meeting, the IMFC called upon the IMF “to continue its work on ways to improve its capacity to help members cope with systemic shocks, and to cooperate with other relevant bodies, in particular regional financial arrangements”.54 In this regard, discussions are under way on the merits of creating a global stabilization mechanism to strengthen the Fund’s ability to channel liquidity proactively, in close coop-eration with central banks, regional institutions and systemic-risk bodies, to countries that may be affected by a systemic event. A critical issue here is to find an appropriate balance and develop effective coordinating mechanisms among multilateral, regional and bilateral liquidity support arrangements.
To effectively provide a global financial safety net, the IMF needs adequate financing. In 2009, it was decided to triple the Fund’s resources to over $850 billion. However, as a share of global GDP, this amount is still smaller than it was when the Fund was created, as the Fund’s quota-based resources have not kept pace with growth of the world economy. As a result, supporting its members during the recent crisis required recourse to bilateral loan agreements and prompted expansion of the New Arrangements to Borrow (NAB).
At their October 2010 meeting, the G20 finance ministers proposed a doubling of IMF quotas, with a corresponding rollback of the NAB. The Fund is a quota-based insti-tution, and quotas should be its primary resource. In exceptional crisis situations, like the one recently experienced, the IMF can and should resort to borrowed resources—bilateral or, preferably, multilateral—through the expanded and enlarged NAB. The new and ex-panded NAB should be seen as a backstop against extreme situations and not as a major source of Fund resources. Its activation must remain the exception rather than the rule.
A broader financial safety net at the global level also includes self-protection through reserve accumulation, bilateral foreign-exchange swap arrangements between major central banks, and regional reserve pools. There have been discussions on how to improve coordination and collaboration among the IMF, central banks and regional fi-nancial arrangements in case of market stress. For instance, during the current crisis, Latin American regional and subregional financial institutions played a significant role by providing credit on more flexible conditions, particularly to help finance the liquid-ity needs of small countries. The ASEAN+3 Chiang Mai Initiative Multilateralization (CMIM) Agreement, covering a total of $120 billion credit lines and developed from the Chiang Mai Initiative bilateral swap network, came into effect in March 2010. It has also been emphasized that the recent actions taken to strengthen economic and financial stability in the euro area by using a combination of insurance options may be a model for future cooperation.55
To address sovereign risk, on 10 May 2010, the European leaders announced the establishment of a European financial stabilisation mechanism, which would entail up
54 Communiqué of the Twenty-Second Meeting of the IMFC, op. cit.
55 IMF Survey online, 11 May 2010, available from http://www.imf.org/external/pubs/ft/survey/so/2010/NEW051110A.htm.
The establishment of a global stabilization mechanism is being considered
A broader financial safety net will require strengthened international cooperation

92 World Economic Situation and Prospects 2011
to $77 billion in European Union (EU) funding and a special-purpose vehicle that could raise up to $568 billion in additional funds in capital markets with guarantees provided by the euro area member Governments. The IMF also agreed to cooperate with the EU if so requested by euro area members. Total available support through loans and credit lines, including potential IMF loans to member countries (up to $284 billion), could be as large as $930 billion. Upon request by individual countries, the IMF is ready to provide financial assistance in parallel with the EU, similar to the cofinancing already provided to Greece, Hungary, Latvia and Romania.
To address market liquidity, the European Central Bank (ECB) announced that it was prepared to purchase government and private debt securities. The ECB also expanded its liquidity provision facilities. In addition, to forestall an emerging shortage of dollar liquidity, the United States Federal Reserve (Fed) reopened temporary dollar liquidity swap lines with the ECB and other major central banks.
The initiatives to strengthen the global safety net are unlikely to radically change countries’ incentives to accumulate reserves, which remain their first line of de-fence against potential shocks. Reserve accumulation has been an effective option for emerging market economies to protect them from the crisis. During the crisis, central banks in many emerging and some developed countries used part of their reserves to ease domestic tensions created by dollar liquidity shortages. It is hardly possible that, in the foreseeable future, countries will have automatic access to a sufficient quantity of foreign currency funding to cope with a major crisis. Consequently, countries will continue to hold some reserves of their own and, as discussed in chapter I, there are strong indications that reserve accumulation will persist and grow in the aftermath of the crisis. The practice of relying, to varying degrees, on a mix of complementary self-insurance and bilateral and multilateral agreements will likely continue.
The international reserve system
Much of the debate surrounding the international monetary system is centred on the sustainability of an international monetary regime in which one national currency, the United States dollar, serves as a primary international reserve asset. The current interna-tional reserve system made an important contribution in the absence of a smooth adjust-ment to imbalances, volatile capital flows and lopsided provision of liquidity. The need to reform the international reserve system is now broadly acknowledged.
There have been suggestions to move towards a system based on several, com-peting national currencies that would perform reserve functions on a more or less equal footing. However, there are few alternatives, if any, readily available to assume a reserve role comparable to that of the United States dollar. Besides, such a system may result in even higher exchange-rate volatility owing to the possibility of sharp shifts in demand from one international currency to another, since they are likely to be close substitutes.
A more modest solution might be for countries with surplus savings to ex-pand the range of their own safe and liquid financial assets to domestic and international investors. This would raise the efficiency of domestic financing, provide investors with a broader range of choices and reduce incentives to export capital in order to protect its value. Another option is the introduction of a new global reserve currency issued by a global central bank. The establishment of a full-fledged international currency, however, requires far-reaching changes, including relinquishment of national sovereignty over key
Incentives for individual countries to accumulate
currency reserves persist
The potential for moving to a multicurrency reserve
system is limited

93Financial flows to developing countries
issues of economic policy, which the international community does not yet seem ready to make. Nevertheless, the international community should continue discussions on future needs and parameters of the financial system.
A more realistic path to reform may be to broaden existing special drawing right (SDR) arrangements which could, over time, evolve into a widely accepted world reserve currency. This may also require broadening the composition of the SDR basket to make it more representative. All component currencies, however, should be fully convert-ible and have well-developed financial markets. Along with reducing the inherent instabil-ity of the current system, the greater use of SDRs may result in more democratic control of global liquidity.
In August 2009, for the first time since the late 1960s, IMF member govern-ments took a decision on a general SDR allocation by the IMF equivalent to $250 billion. This will be complemented by a network of voluntary arrangements allowing SDRs to be traded effectively among members. Together with the special one-time allocation of about $33 billion in September 2009, the outstanding stock of SDRs increased nearly tenfold, from about $33 billion to about $321 billion.56 Nevertheless, SDRs still represent less than 5 per cent of global foreign-exchange reserves. As not all members need to increase their international reserves, the Fund should explore mechanisms for redistributing SDRs to countries most in need, especially in times of crisis. Such allocations would be cancelled once the crisis has passed. The crisis allocations should not be linked to individual coun-try situations, but rather to systemic risk stemming from liquidity shocks on a global or regional scale.
For SDRs to take on a significant role, their issuance should be made regular, with possible linkage to expected additional long-term demand for foreign reserves. SDR use in international trade and financial transactions, as well as in a functioning settlement system to facilitate the direct exchange of SDR claims into all constituent currencies, needs to be enhanced. Thus far, a private SDR market has not taken off. Reaching a critical mass that would allow the development of a deep, diversified and liquid market for SDR instruments would likely be impossible without strong support from the public sector; actions could include some of those taken to foster the development of the European Currency Unit (ECU) market, including the issuance of SDR-denominated debt by na-tional governments and multilateral institutions.
Additionally, SDR-denominated reserve accounts may need to be established at the IMF. These would allow large reserve holders to exchange their currency reserves for SDR-denominated securities and deposits without encountering undesirable exchange-rate effects. The resulting shift of the exchange-rate risk from the original holders of currency reserves to other parties will require agreement on an appropriate burden-sharing arrange-ment. This issue was discussed when the substitution account was negotiated within the IMF more than a quarter century ago.
Past experience suggests that any reform of the current international reserve system should be part of a broader framework. Indeed, it is unlikely that any feasible reform will bring about smooth and automatic balance-of-payments adjustments. For in-stance, while reserve alternatives would increase pressure on the United States to adjust, incentives for surplus countries would not change much. Therefore, along with moving towards greater reserve options, policy dialogue and cooperation aimed at more balanced and sustainable global growth will remain indispensable.
56 IMF, “Special Drawing Rights”, Factsheet, 29 September 2010, available from http://www.imf.org/external/np/exr/facts/sdr.htm.
Expanding existing SDR arrangements could be a more practical way forward
The Fund should explore mechanisms for redistributing SDRs to countries most in need
Reform of the international reserve system should be part of a broader framework

94 World Economic Situation and Prospects 2011
Strengthening global economic governance
Addressing global economic governance issues is a prerequisite for all other changes in the international financial architecture. The emergence of the G20 as an ad hoc governance group in response to the crisis underscores the shortcomings in global institutions and rules that were shaped, for the most part, more than 60 years ago, at the time of the found-ing of the United Nations. There is a diversity of views among countries regarding the increased role of the G20. Some feel that it has succeeded in averting a global depression and has managed to put the world economy on a path towards recovery. Others point out that 172 countries were left out of the process and their voices not heard.
The emergence of the G20 as the major forum for global discussions on inter-national economic cooperation is a welcome development. However, the majority of the United Nations Member States are still excluded. The G20 process will need to develop greater legitimacy, including through forging stronger institutional linkages with non-member States and developing constructive dialogue with universal international bodies, such as the United Nations, to ensure that the views and concerns of all countries, espe-cially the poorest, are taken into account.
An initiative aimed at developing such dialogue on coordination and coop-eration between G20 and non-G20 members is the formation of the informal Global Governance Group (3G), comprising 24 United Nations Member States. The establish-ment of the Group underscores that, given the complexities and interdependencies of the global economy, it is important for the G20 to be consultative, inclusive and transparent in its deliberations for its outcomes to be implemented effectively on a global scale. The 3G has put forward several ideas on how to improve engagement between the G20 and the United Nations through regular and predictable channels. It has also proposed allow-ing non-G20 countries to participate in G20 ministerial gatherings and senior-level and expert working groups on specialized issues.57
Achieving more sustainable and balanced global growth will also require close coordination of macroeconomic policy decisions with other areas of global govern-ance, including those related to the multilateral trading system; aid architecture; the pov-erty eradication and sustainable development agenda; and climate change. No specific mechanism to promote coherent policy responses to these interdependent issues exists at present. A strengthened United Nations framework for enhancing coordination and complementarity should be at the centre of efforts to bridge this gap. For instance, there has been a proposal to create, within the United Nations, a global economic coordina-tion council, which would promote development, seek consistency of policy goals and policies of major international organizations, and support consensus-building among Governments on efficient and effective solutions for global economic, social and environ-mental issues.58
It has also been recognized that IFIs need more representative, responsive and accountable governance reflecting the realities of the twenty-first century. Accordingly, both the IMF and the World Bank have taken important steps to redress imbalances in voice and representation.
57 See “Letter dated 11 March 2010 from the Permanent Representative of Singapore to the United Nations addressed to the Secretary-General” (A/64/706).
58 See “Report of the Commission of Experts of the President of the United Nations General Assembly on Reforms of the International Monetary and Financial System”, New York, 21 September 2009, p. 91, available from http://www.un.org/ga/econcrisissummit/docs/FinalReport_CoE.pdf.
The substitution of the G20 for the G8 is welcome
but insufficient
Further efforts are needed to make international
cooperation more transparent
Achieving sustainable and balanced growth requires
coordination among different policy areas

95Financial flows to developing countries
At their October 2010 meeting, the G20 finance ministers proposed a shift of over 6 per cent of aggregate quota shares in the IMF to underrepresented dynamic emerging market and developing countries, and reiterated their commitment to protect the voting share of the poorest members. As a result of the quota rebalancing, the 10 biggest mem-bers of the Fund in terms of quota will be the United States, Japan, the four BRIC coun-tries (Brazil, China, India and Russia), and four European countries (France, Germany, Italy and the United Kingdom). The ministers also agreed to increase representation for emerging market and developing countries at the Fund’s 24-member Executive Board by reducing Board membership from advanced European countries by two; to allow scope for appointing second Alternate Executive Directors to enhance representation of multi-country constituencies; and to move to an all-elected Board. It has also been suggested that, following the completion of the 14th General Review of Quotas by January 2014, the Board’s composition should be reviewed every eight years. On 5 November 2010, the IMF Executive Board approved these proposals and recommended the reform package to the Board of Governors. The target date for completion of the changes to IMF governance is the IMF-World Bank Annual Meetings in October 2012.59
According to many Fund members, the current quota formula falls short of the objective of achieving legitimate representation in the Fund based on a country’s economic weight.60 To address the deficiencies in the present formula, the G20 ministers called for a comprehensive review by January 2013. There have been proposals to assign a greater weight to GDP, preferably at purchasing power parity prices, so as to better reflect the growing role and contribution to global growth of emerging market and other developing countries.61 Many developing countries also insist on adjustments to the measures of vari-ability and openness.
Political will and the strong support of the entire Fund membership are neces-sary to translate reform commitments into reality. Indeed, the very modest 2008 IMF quota and voice reform, involving quota redistribution among the group of emerging mar-ket and developing countries, has not yet gone into effect. As of mid-August 2010, 85 out of the required 112 members, representing about 78 per cent of the total voting power (the requirement being 85 per cent), had accepted the proposed amendment to the Articles of Agreement to enhance voice and participation in the Fund.
Agreement on the second phase of governance reform for the World Bank Group was reached during the World Bank-IMF Spring Meetings in April 2010.62 According to the agreement, there will be a small shift in voting power to developing and transition countries in the IBRD, the International Finance Corporation (IFC) and the IDA. For the
59 IMF, “IMF Executive Board approves major overhaul of quotas and governance”, Press release No. 10/418, 5 November 2010, available from https://www.imf.org/external/np/sec/pr/2010/pr10418.htm.
60 See, for instance, statement of Timothy F. Geithner, Secretary of the Treasury of the United States, at the Twenty-First Meeting of the International Monetary and Financial Committee of the IMF, Washington, D. C., 24 April 2010, available from https://www.imf.org/External/spring/2010/imfc/statement/eng/usa.pdf.
61 Communiqué of the Intergovernmental Group of Twenty-Four on International Monetary Affairs and Development, 7 October 2010, available from http://www.imf.org/external/np/cm/2010/100710.htm.
62 The initial package of reforms (Phase 1), adopted in 2008, concentrated mainly on the IBRD and included the doubling of basic votes and the allocation of authorized but unallocated shares to 16 developing countries and countries with economies in transition (DTCs) whose voting power would be reduced by the increase in basic votes. The Phase 1 reforms will increase DTC voting power in the IBRD from 42.6 per cent to 44.1 per cent. In addition, it was decided to add an elected Executive Director for sub-Saharan Africa on the World Bank Group Executive Board.
The IMF Executive Board has agreed on significant reform steps
Many Fund members view the current quota formula as being insufficient
Agreement on the second phase of governance reform in the World Bank Group has been reached

96 World Economic Situation and Prospects 2011
IBRD, the voting power of developing and transition countries was increased by 3.13 per cent, bringing it to 47.19 per cent (representing a total shift of 4.59 per cent since 2008). For the IFC, an increase in basic votes and selective capital increases were endorsed which represented a shift of 6.07 per cent (bringing the total to 39.48 per cent). For IDA, the voting share of developing countries would be raised from 40 per cent prior to the start of the reforms to about 46 per cent. These reform targets fall short of the recommendation of the High-Level Commission on Modernization of World Bank Group Governance that the balance in voting power in the World Bank be evenly split between developed and developing countries.63
At the World Bank-IMF 2010 Spring Meetings, ministers also reaffirmed their commitment to continue moving, over time, towards equitable voting power at the World Bank, while protecting the voting power of the smallest poor countries. The next shareholding review is scheduled for 2015. Accordingly, it has been decided to establish a work programme to arrive at a dynamic formula which primarily reflects countries’ evolv-ing economic weight and the Bank’s development mission. Along with the shareholding review, work is under way at the Bank on strengthening Board effectiveness and internal governance, deepening responsiveness to developing and transition countries’ views on de-velopment and establishing a merit-based and transparent selection process for the Bank’s President.
63 See “Repowering the World Bank for the 21st Century”, Report of the High-Level Commission on Modernization of the World Bank Group Governance, October 2009, available from http://siteresources.worldbank.org/NEWS/Resources/WBGovernanceCOMMISSIONREPORT.pdf.

97
Chapter IVRegional developments and outlook
Developed market economiesDeveloped market economies recovered from recession during 2010, posting generally strong growth in the first half of the year. The recovery has slowed since, however, as global trade has decelerated, fiscal stimuli are replaced by austerity-based fiscal consolida-tion, and inventory restocking is coming to an end. Trade and industrial production have rebounded, but levels of both remain below their previous cyclical peaks and will take some time to reach them, given the deceleration in activity under way. Tentative signs of a recovery maturing to where consumption and investment spending take the leading roles has been seen in some instances. But domestic demand growth generally remains sluggish and is expected be slow in recovery: balance sheets of firms and consumers are still not repaired, bank lending conditions remain tight, capacity utilization—while improved—remains low, and unemployment is still very high (see figure IV.1). A new push for fiscal stimuli is unlikely and, in fact, many developed countries have already taken steps towards drastic budgetary retrenchment. Monetary policy remains highly accommodative, but may not provide much of a boost to output and employment growth, and may exacerbate tensions in foreign-exchange markets, as discussed in chapter I. The value of the United States dollar has seen wide swings against other major currencies during 2010.
Figure IV.1Unemployment ratesa in the G7 countries, 2008-2012
Percentage of labour force
0.0
2.0
4.0
6.0
8.0
10.0
12.0
Germany France Italy United Kingdom Canada United States Japan
2008 2009 2010 2011 2012
Source: UN/DESA and Project LINK, based on data from the OECD Main Economic Indicators.a Standardized unemployment rates (see OECD, Standardized Unemployment Rates: Sources and Methods (Paris, 1985)).

98 World Economic Situation and Prospects 2011
North America: decelerating recovery
Weakening growth in the United States
Economic growth resumed in the third quarter of 2009 in the United States of America. Initially, the speed of the expansion was comparable to that observed during previous recoveries. However, by mid-2010, the rate of growth of gross domestic product (GDP) had decelerated to about 2 per cent (annualized rate), with other indicators also pointing to more subdued growth in the rest of the year. The GDP growth rate is estimated to be 2.6 per cent in 2010, decelerating to 2.2 per cent in 2011 as inventory restocking as a driver of recovery is coming to an end and fiscal stimuli are waning. Private consumption and investment demand may pick up gradually, allowing for the projected acceleration of GDP growth to 2.8 per cent in 2012 (see annex table A.1).
During 2009 and 2010, inventory restocking contributed about 60 per cent to total growth. Rebounding consumer demand started to contribute only later on in the recovery. Government consumption and investment demand have only marginally contributed to growth over the past two years. While certainly helping to prevent a steeper downturn, the impact of federal Government stimulus measures has been diluted by spending cuts and tax increases at state and local levels made necessary by the tremendous drops in revenues stemming from the recession. Investment in residential and business construction has been too weak to support output growth, and in the early stages of the recovery, still detracted from it. Only business investment in equipment and software has shown solid growth. The collapse in import demand mitigated the decline in GDP during the height of the recession, but net exports have weakened aggregate demand during the recovery as imports have increased faster than exports.
Unemployment rates did not come down during 2010. Household survey data show that civilian employment had dropped by almost 6 percentage points when it reached its trough in late 2009. During 2010, job growth remained anaemic, total employment was still about 5 percentage points below its previous peak level, and the unemployment rate remained high, reaching 9.5 per cent at the end of 2010. Compared with previous recessions, labour market recovery is significantly slower. At the rate of output growth of the United Nations baseline forecast, it will take another three years to bring employment back to its pre-crisis level of early 2008 (figure IV.2). The unemployment rate is expected to decline only modestly to 9.3 per cent in 2011 and to 8.7 per cent in 2012 (see annex table A.7)
The grave employment situation is expected to restrain consumption ex-penditure in the near term. It is already restraining labour income growth, but high and persistent unemployment is also causing greater income insecurity among workers and their families, delaying consumption and investment decisions. Furthermore, household wealth, both financial and housing, has been significantly eroded by the crisis, leading households to save more to rebuild their balance sheets. The shift in household behaviour is expected to be long-lasting and, as a result, consumer demand in the United States will remain weak in the coming years.
The United States housing market did not show much improvement during 2010. The federal first-time homebuyer tax credit programme induced some qualified buy-ers to advance home purchases, but after its expiration in early 2010, residential housing activity dropped significantly. Given the many structural impediments, the outlook is for a very slow recovery. Business structure investment spending, as a whole, has remained
Consumption and investment have yet
to make an impact
Unemployment remains high
The housing market remains weak but business
investment is improving
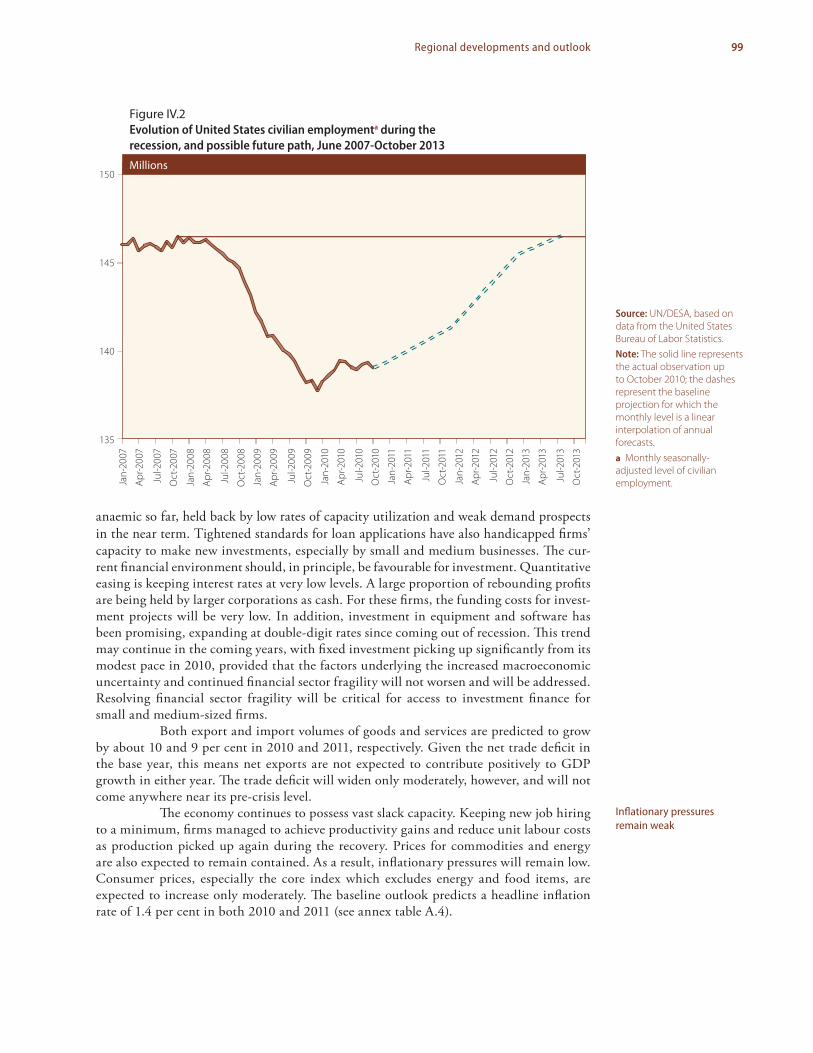
99Regional developments and outlook
anaemic so far, held back by low rates of capacity utilization and weak demand prospects in the near term. Tightened standards for loan applications have also handicapped firms’ capacity to make new investments, especially by small and medium businesses. The cur-rent financial environment should, in principle, be favourable for investment. Quantitative easing is keeping interest rates at very low levels. A large proportion of rebounding profits are being held by larger corporations as cash. For these firms, the funding costs for invest-ment projects will be very low. In addition, investment in equipment and software has been promising, expanding at double-digit rates since coming out of recession. This trend may continue in the coming years, with fixed investment picking up significantly from its modest pace in 2010, provided that the factors underlying the increased macroeconomic uncertainty and continued financial sector fragility will not worsen and will be addressed. Resolving financial sector fragility will be critical for access to investment finance for small and medium-sized firms.
Both export and import volumes of goods and services are predicted to grow by about 10 and 9 per cent in 2010 and 2011, respectively. Given the net trade deficit in the base year, this means net exports are not expected to contribute positively to GDP growth in either year. The trade deficit will widen only moderately, however, and will not come anywhere near its pre-crisis level.
The economy continues to possess vast slack capacity. Keeping new job hiring to a minimum, firms managed to achieve productivity gains and reduce unit labour costs as production picked up again during the recovery. Prices for commodities and energy are also expected to remain contained. As a result, inflationary pressures will remain low. Consumer prices, especially the core index which excludes energy and food items, are expected to increase only moderately. The baseline outlook predicts a headline inflation rate of 1.4 per cent in both 2010 and 2011 (see annex table A.4).
Inflationary pressures remain weak
Figure IV.2Evolution of United States civilian employmenta during the recession, and possible future path, June 2007-October 2013
Millions
135
140
145
150
Jan-
2007
Apr-2
007
Jul-2
007
Oct
-200
7
Jan-
2008
Apr-2
008
Jul-2
008
Oct
-200
8
Jan-
2009
Apr-2
009
Jul-2
009
Oct
-200
9
Jan-
2010
Apr-2
010
Jul-2
010
Oct
-201
0
Jan-
2011
Apr-2
011
Jul-2
011
Oct
-201
1
Jan-
2012
Apr-2
012
Jul-2
012
Oct
-201
2
Jan-
2013
Apr-2
013
Jul-2
013
Oct
-201
3
Source: UN/DESA, based on data from the United States Bureau of Labor Statistics.Note: The solid line represents the actual observation up to October 2010; the dashes represent the baseline projection for which the monthly level is a linear interpolation of annual forecasts.a Monthly seasonally-adjusted level of civilian employment.

100 World Economic Situation and Prospects 2011
The collapse in government revenue and the large fiscal stimulus package have significantly widened fiscal deficits at all levels of government. The federal deficit amounted to about 10.0 per cent and 8.8 per cent of nominal GDP, respectively, in the fis-cal years 2009 and 2010. The budget situation of most state and local governments is also of some concern. Without additional federal support, many state and local governments will be forced to make severe budget cuts. Further stimuli are extremely unlikely in the near term, however, given political constraints. At the federal level, execution of the final part of the existing fiscal stimulus package will still have an impact on the economy during 2011, though increased pressures for fiscal consolidation may lead to retrenchments in the same year, or become effective in 2012.
The United States Federal Reserve (Fed) has kept its policy rate at an extremely low level since late 2008 and is expected to continue doing so for “an extended period”. The first round of quantitative easing was terminated in early 2010. After observing the slower-than-expected recovery, the Fed decided in November 2010 to start the second round of quantitative easing by purchasing $600 billion of longer-term securities over the span of eight months. By doing so, the Fed intends to keep long-term interest rates at a low level. Nevertheless, this action has raised concerns, both domestically and internationally. Domestically, the concern is focused on the implications for future inflation. After the Fed first hinted at the possibility of a second round of quantitative easing in August, expected inflation (measured by the yield differential between inflation-indexed and non-indexed bonds) increased by about 70 basis points within a span of seven weeks between August and the end of October. Internationally, the expressed concern is that low interest rates in the United States are encouraging surges in short-term capital flows and causing exchange-rate instability.
Next to persistent high unemployment, the major risk faced by the United States economy is that a dangerous cycle will develop between the housing and financial sectors. If housing prices continue to decline and force more mortgages into foreclosure, financial institutions are likely to tighten credit supply further, reducing the supply of mortgage loans even more, and reducing the number of potential buyers for foreclosed homes, further pushing down prices. This could cause new shockwaves in the economy. First, it would reinforce low consumer confidence. Second, declining housing prices would encourage more mortgage holders to abandon their homes, weakening financial institu-tions. Third, it would reduce the value of mortgage-backed securities (MBS) and further weaken the financial health of holders of this type of assets. Given the international dis-tribution of MBS, this may trigger demand for a higher risk premium for United States securities by foreign investors.
Canada: continued recovery despite weakening export demand
The Canadian economy exited from recession in the second half of 2009. However, after a few quarters of solid growth, economic expansion decelerated. GDP growth is estimated to be 2.9 per cent in 2010 and to slow to 2.5 per cent in 2011.
Domestic demand continues to be the main driver of growth. Given relatively healthy balance sheets, Canadian households have been able to keep up consumption at the rate of growth of disposable income. Private consumption is expected to continue to grow steadily in 2010 and 2011. Residential investment demand increased strongly until the middle of 2010. Many home buyers advanced purchases in order to avoid the higher
Fiscal stimulus is petering out
Quantitative easing is raising concerns
Risks centre on housing and financial markets

101Regional developments and outlook
cost of new housing imposed by new tax rules introduced in some provinces. Housing investment has cooled down since then. Investment in machinery and equipment and non-residential construction will remain strong, partially due to a change in the tax law which provides incentives in the form of higher capital cost allowance, lower corporate income tax and the elimination of corporate capital tax.
Weaker export demand was a major cause of the slowdown in 2008 and 2009. The recession in the United States could be quickly transmitted to the Canadian economy given the latter’s high dependence on markets in its bigger neighbour. The slower-than-usual recovery in the United States and the appreciation of the Canadian dollar vis-à-vis the United States dollar will adversely affect net export growth in 2011 and 2012 and keep Canada’s external balance in deficit.
During 2010, most jobs lost during the recession were recovered. In the third quarter of 2010, the level of employment had returned to its peak of 2008. Nonetheless, continuous growth of the labour force has kept the rate of unemployment at 8.1 per cent, on average, during 2010. This is 2 percentage points above the unemployment rate of 2008. Employment growth is expected to barely keep up with labour force growth, so no significant drop in the unemployment rate is expected in 2011.
Developed Asia and the Pacific: diverging outlook
Tenacious deflation in Japan
Japan’s economy showed strong recovery in early 2010. GDP grew by nearly 5 per cent in the first quarter. However, the recovery has been faltering since, with output growth decelerating to less than 2 per cent in the following quarters. For the year as a whole, GDP is estimated to have grown by only 2.7 per cent, a sub-par rebound after the deep recession of 2009 when the economy contracted by 5 per cent. In the outlook, growth is to slow further to 1.1 per cent for 2011 and 1.4 per cent in 2012 (see annex table A.1). Weak domestic demand, particularly the phasing-out of the public investment programmes that formed part of the early fiscal stimulus, will impede output growth. Export growth has also weakened as a result of slowing world trade and yen appreciation. A new stimulus package was announced in September 2010 to prevent the economy from sliding into a double-dip recession. The size of the stimulus seems to be too small, however, to make up for the drop in aggregate demand growth. Persistent deflation and the already high and growing public debt are posing additional policy challenges.
Exports remain the key driver for output growth in Japan. After falling at an annualized rate of 50 per cent during the global downturn at the end of 2008 and early 2009, Japan’s exports rebounded in line with the global recovery and stronger import demand in China in the first half of 2010. In the second half of 2010, export growth decelerated to below 20 per cent, and is expected to decelerate further to about 10 per cent in 2011.
Domestic demand has recovered only slowly. Public investment started to de-cline in the second half of 2010. Fixed investment by businesses has recovered gradually, fi-nanced by rising corporate profits. Excess production capacity is still considerable, however, and will restrain new capital spending in the near term. Private consumption has picked up slightly thanks to fiscal stimulus measures, but further strengthening is limited, as the employment and income situations for most Japanese households remain challenging.
The main growth engine, exports, is sputtering

102 World Economic Situation and Prospects 2011
The unemployment rate rose to an all-time high of 5.7 per cent in 2009 and did not come down by much during 2010, remaining above 5 per cent. The average pay of workers, which had declined since 2008, started to show some improvement in late 2010. Deflation persists in Japan. It has characterized much of the last two decades. Since 2009, all price indices have been falling even more sharply and deflationary conditions are expected to persist during 2011 and 2012.
The Bank of Japan has implemented various monetary policy measures, in-cluding reductions in the policy interest rate, measures to ensure stability in financial markets and measures to facilitate corporate financing. Facing tenacious deflation, further measures have been taken to inject more liquidity into the economy through the purchase of corporate debt and long-term government bonds. In September 2010, the yen reached a 15-year high vis-à-vis the dollar, leading the Bank of Japan to intervene in the foreign-exchange market in order to stave off further appreciation. The policy interest rate was already very low at 0.1 per cent, but the Bank of Japan cut it further to zero. As with defla-tion, the real interest rates are still positive and nominal rates cannot be cut further, so the Bank of Japan has engaged in further quantitative easing. In the outlook, monetary policy is expected to maintain its current extremely accommodative stance until late 2011. If economic activity picks up in 2012, policy interest rates are likely to be gradually increased and quantitative easing phased out.
A series of fiscal stimulus packages have been launched since mid-2008. Some of the stimulus was rolled back in the 2010 budget with the reduction in public invest-ment, but direct support to households, on the other hand, was increased. In late 2010, the Government announced a new stimulus package of ¥915 billion in additional public spending. Expectations are that this will boost GDP by about 0.3 per cent, create 200,000 jobs and encourage consumer and business spending. The boost to GDP growth is, how-ever, much less than the deceleration in aggregate demand observed in the second half of 2010. Japan’s budget deficit was over 6 per cent of GDP in 2010 and public debt increased to about 200 per cent of GDP. Corporate and household savings have matched the budget deficit, however, limiting the sovereign debt risk so far, and Japan continues to be a net exporter of capital to the rest of the world.
Australia’s economy showing resilience
Australia is the only developed economy that avoided recession during 2008-2009. Buttressed by stimulus measures, the growth of domestic demand has been exceptionally strong since late 2009, particularly private investment in the booming mining sector. The rise in the prices of Australia’s commodity exports, together with the rebound in export volumes, particularly to emerging economies, pushed the trade balance to its largest sur-plus as a share of GDP since the 1970s. Growth has slowed somewhat since mid-2010, but the economy is still estimated to have grown by 3.3 per cent for the year as a whole. In the outlook, public demand is expected to detract from GDP growth as stimulus projects are gradually completed, but private consumption should continue to grow along with jobs. GDP is forecast to grow at 3.7 per cent in 2011. The Reserve Bank of Australia has been raising interest rates since 2009, but no further increases in the policy interest rate are expected in 2011 and 2012.
Labour market conditions are weak and deflation
remains persistent
The Bank of Japan is maintaining
unconventional policy measures
The new fiscal stimulus package may fall short
of what is needed
Strong domestic demand is driving GDP growth
in Australia

103Regional developments and outlook
New Zealand recovering from a prolonged recession
New Zealand has been recovering at a moderate pace from a prolonged recession. While net exports have made a solid contribution to growth, household consumption and busi-ness investment have also increased, driven in part by low interest rates. Consumer and business confidence continues to improve, but credit conditions remain tight and busi-nesses continue to deleverage their balance sheets. As a result, domestic demand growth is expected to be mild in the outlook. The damage from the earthquake in Canterbury in September 2010 is estimated to have slowed quarterly GDP by about 0.3 per cent, but the post-quake reconstruction is expected to boost the economy. GDP is estimated to have increased by 2.7 per cent in 2010 and is forecast to grow by 2.4 per cent in 2011 and 3.0 per cent in 2012.
Developed Europe: cautious recovery
Western Europe: slow growth of domestic demand
Economic activity picked up strongly in Western Europe during the first half of 2010, through an export-driven industrial rebound, fiscal support measures of varying intensi-ties and inventory restocking. Output growth slowed in the second half of 2010, however, with the weakening rebound in global trade, the turn in the inventory cycle, the gradual withdrawal of fiscal stimuli and, in some countries, the shift to fiscal austerity. This pat-tern was reinforced by large swings in the values of the euro and other currencies of the region, which depreciated strongly against the United States dollar in the first half of the year, but subsequently rose in the second half. This lower pace of growth is expected to continue into 2011 as more countries push for deep fiscal cuts. Given the strong carry-over from the first half of the year and continued moderate activity, GDP growth for the EU-15 is estimated to be 1.7 per cent in 2010, slowing to 1.5 in 2011. Growth is expected to pick up slightly in 2012, to 1.9 per cent, as domestic demand strengthens.
While growth has recovered, it is not robust. The recovery in 2010 masks a number of important weaknesses. Industrial production, for example, remains 12 per cent below its peak of April 2008, indicating that, in terms of levels, recovery is far from complete (see figure IV.3). Unemployment rates remain high in many countries (and ex-ceptionally high in some, like Spain). More ominously, the recovery is taking place at different speeds. At one end are the countries (led by Germany) showing a relatively strong rebound, whose economic activity expanded by 3.4 per cent in 2010 and who were able to take full advantage of the improvement in global trade. At the other end of the spectrum are the countries entrenched in fiscal crises, such as Greece, Ireland, Portugal and Spain, which will either remain in recession or see minimal recovery at best.
Private consumption expenditure acted as a stabilizing factor during the down-turn in many European countries, thanks to measures to mitigate the rise in unemploy-ment and the broad coverage of social security. However, it has yet to assume a more prominent role in leading the recovery, held back by high rates of unemployment in most countries and subdued wage growth. In the outlook, consumption expenditure is expected to improve gradually for the majority of countries in the region, but without much vigour: labour markets are stabilizing and are expected to improve slowly, savings rates have re-treated from their highs during the financial crisis, and inflation is expected to remain low. Financing conditions remain more challenging than before the crisis, but bank lending to
Export growth and fiscal stimulus have driven the recovery
Consumption continues to support GDP growth but is anything but vibrant

104 World Economic Situation and Prospects 2011
the household sector has been increasing slowly. The situation is far worse in countries with severe fiscal consolidation programmes. In Greece, for example, consumption expenditure is expected to continue to decline through 2012.
The precipitous decline in investment in both equipment and housing was a major driver of the recession, and evidence for a turnaround is sparse, with the second quarter seeing the first positive investment growth for the euro area since the recession. Going forward, with the exception of the countries undergoing severe fiscal consolidation programs, investment is expected to pick up gradually, registering positive, but low, rates of growth in 2011 and 2012. Capacity utilization has moved up significantly since its record low in the third quarter of 2009. Industrial new orders continue to improve, as have business profits. One major obstacle to a more significant rebound is that external financing conditions remain tight. The cost of external finance is low, but banks continue to tighten credit standards, and although this appears to have reached a nadir, conditions are significantly tighter than before the recession. This may not be a constraint in the near term as loans to the non-financial sector typically lag the pick-up in economic activity dur-ing a recovery, with firms relying more on internal financing. As the recovery progresses, however, any persisting major weaknesses in the banking sector could then bring further recovery to a halt. So far, however, loans to non-financial corporations have continued to decline, but at a slower pace, which could suggest that a turning point is near.
The rate of unemployment in the euro area drifted up from 7.2 per cent in March of 2008 to 10.1 per cent in September of 2010, but most of the increase took place in 2009—since September of that year, the jobless rate has risen by only 0.3 percentage points. The picture differs widely across countries, however, with rates of unemployment reaching 20.0 per cent in the case of Spain, 14.1 per cent in Ireland and 10.0 per cent in France, while in Germany, the rise in unemployment has been largely contained and is
Investment could be nearing a turning point
High unemployment remains worrisome,
although conditions differ across countries
Figure IV.3Industrial production in the euro area and selected Western European economies,second quarter 2008-fourth quarter 2010
Index: April 2008 = 100
2008 2009 2010
II III IV I II III IV I II III IV
0.70
0.75
0.80
0.85
0.90
0.95
1.00
1.05
Euro areaFrance
ItalyUnited Kingdom
Germany
Source: OECD Main Economic Indicators.

105Regional developments and outlook
currently 6.7 per cent of the workforce. The modest increases in 2010 could indicate that labour markets are approaching a turning point. Germany has turned the corner already, as the unemployment rate has fallen by a full percentage point since its peak in 2009. The decline has been more modest in other European countries. In Greece and Spain, however, unemployment rates are still increasing and the situation is likely to worsen with the pro-longation of the recession and the severe fiscal austerity. The divergence in labour market outcomes is explained by differences in the speed of recovery, labour market policies and economic structure. In Spain, for instance, much of the initial increase in unemployment was caused by the collapse of the construction sector after a long real estate boom. It will take years for employment to rebound, requiring both a reorientation of the sources of growth in the economy and a resolution to the present mismatch in demand and supply for skills. Italy is another case where skills mismatches, coupled with a weak growth outlook, are expected to lead to increasing rates of unemployment. In the outlook for the euro area, unemployment is anticipated to have peaked in 2010, coming down only gradually over the forecast horizon, held back by low levels of growth and the transitional costs of structural economic change in some cases.
Headline inflation, as measured by the Harmonised Index of Consumer Prices (HICP), increased slightly with the rebound in global commodity prices in the first half of 2010 and the currency depreciation, which pushed up import prices. Core inflation—which abstracts from energy, food, alcohol and tobacco, in an attempt to measure underlying inflationary pressures—bottomed at 0.8 per cent in May and has ticked up since, but there is no evidence that inflation is either accelerating or decelerating. Continued weak labour market conditions mean that wage growth will remain slow and, with rising productivity, unit labour costs will remain contained. Output gaps remain large and are expected to narrow only slowly during 2011-2012. World market prices for commodities are projected to increase only slightly on average and, hence, will only have a limited impact on consumer prices. Consequently, headline inflation is expected to remain below 2 per cent.
Fiscal policy and the workings of automatic stabilizers played a major role in softening the impact of the global downturn on most European economies. It has come, however, at the cost of large increases in fiscal deficits and public debt. Across the region, policy stances are shifting towards tightening budgets. The budget deficit in the euro area rose from 2.0 per cent of GDP in 2008 to 6.2 per cent in 2009, while the debt-to-GDP ratio rose from 69.3 per cent to 78.7 per cent. Both ratios are estimated to have increased further in 2010. In some countries, however, including Greece, Ireland, Portugal and Spain, the fiscal situation deteriorated to such an extent that the cost of borrowing surged, with marked increases in sovereign bond spreads vis-à-vis the German Bund rate. Spreads hit record levels in some cases after downgrades of investment ratings by credit rating agencies. In the first half of 2010, Greece faced a sovereign debt crisis which could only be quelled with the announcement of a massive European financial stabilization fund worth €720 billion, consisting of government-backed loan guarantees and bilateral loans provided by euro area members; an expansion of the existing balance of payments facility (involving all European Union (EU) members); and money provided by the International Monetary Fund (IMF). Nonetheless, at the end of 2010, concerns remained over the ca-pacity of Greece to bring down its public debt, while Ireland and Portugal continued to suffer imminent debt distress, spurring calls for an international bail out.
Towards the end of the year, another crisis erupted. After weeks of resisting assistance from the EU, and amidst tremendous pressure in the financial markets, Ireland finally requested, and was granted, emergency finance to deal with the huge increase in its
There are no signs of inflationary pressures
Fiscal policy is transitioning to consolidation, spurred by the sovereign debt crisis

106 World Economic Situation and Prospects 2011
deficit, which had resulted from bailing out its insolvent banking system. This assistance totals up to €85 billion and consists of a mix of EU and IMF sources, made conditional upon Ireland’s adopting further austerity measures as part of its planned four-year fiscal adjustment and structural reform programme. But markets have so far reacted sceptically. Sovereign bond spreads for Ireland, Greece, Portugal and Spain continue to be elevated, and there is evidence of further contagion—spreads for Italy and Belgium have increased since the onset of this phase of the crisis, and the euro has again weakened against the United States dollar. Pressure for fiscal consolidation remains high.
More generally, all members of the euro area, with the exception of Finland and Luxembourg, are required to consolidate their budgets, as their deficits exceed the 3 per cent of GDP limit enshrined in the Stability and Growth Pact (SGP). Fiscal retrench-ment in most countries is scheduled to start in 2011, and it will take from two to four years to bring deficits to below the ceiling. The countries facing deeper fiscal crises, however, were already forced into drastic fiscal austerity in 2010 and the degree of retrenchment ahead is considerable. The Greek Government, for example, aims to reduce its deficit by more than 10 percentage points of GDP by 2014.
Monetary policy continues to rely on unconventional measures. In the early stage of the crisis, central banks aggressively cut their main policy rates. The European Central Bank (ECB) cut its main policy interest rate from 4.25 per cent in July 2008 to 1.00 per cent in May 2009, and has maintained that rate since. The Bank of England, as well as all other central banks in Europe, also brought rates down drastically. After reducing interest rates, central banks moved to less conventional measures. The ECB targeted mostly money markets. It modified and extended its refinancing operations by moving from a variable-rate tender with fixed allotment to a fixed-rate tender with unlim-ited allotment of liquidity, and then extended lending maturities up to one year. Other policies included: ample provision of foreign currency liquidity; purchases of covered bonds; expansion of the list of eligible assets for use as collateral; lowering of the credit rating standards for accepted collateral. The Bank of England adopted quantitative easing through the Asset Purchase Facility, allowing it to purchase securities (gilts) issued by the British Government in the secondary market as well as high-quality private sector assets, including commercial paper and corporate bonds. The ECB subsequently added quantita-tive easing to its policies, purchasing sovereign bonds of the constituent economies of the euro area. Some of these measures have already been phased out, but others will only be withdrawn gradually during 2011-2012. It is expected that policy interest rates will be kept low during 2011, with very gradual tightening beginning in 2012.
Risks to the forecast are slanted to the downside. The impact of the fiscal austerity under way or planned could risk a renewed economic downturn. Sovereign debt distress for some countries could cause renewed financial market turbulence. Problems for Governments to repay or refinance their debts would also cause problems for banks holding the debt. Without a concerted EU response, it could affect confidence in the euro, as the affected economies are part of the common currency area. There is a risk for further appreciation of the euro and other regional currencies, given the forces in play that are weakening the United States dollar. Exchange-rate appreciation would erode export com-petitiveness and thus weaken a key driver of growth in the region. If remaining financial fragility is not addressed, bank lending could remain constrained, hampering the rebound in investment, while consumption spending would falter if labour market conditions are too slow to improve. On the upside, export growth may strengthen if growth in emerging market economies remains robust, and investment expenditure could be stronger if bank-lending conditions were to ease sooner than expected.
Unconventional measures of monetary easing are
being phased out gradually
Risks are skewed to the downside, led by fiscal concerns

107Regional developments and outlook
The new EU member States:1 a cautious export-led recovery
Following the sharp economic downturn of 2009, the new EU member States in Eastern Europe saw a modest recovery in 2010. The recovery was mainly driven by rebounding exports, supported by stronger external demand. In the case of the Baltic States, export growth was stimulated further by the decline in nominal wages, reducing labour costs and enhancing competitiveness. Inventory restocking was also important, especially in the first half of the year. Private consumption and investment demand, by contrast, either stagnated or contracted further, being restrained by lower nominal and/or real wages, high unemployment, fiscal austerity measures, higher indirect taxes and tight credit. Low capacity utilization rates deterred both domestic and foreign investment, undermining the region’s long-run growth prospects.
The recovery remains fragile in most economies. Only Poland and Slovakia ex-hibited solid economic performance in 2010, with output increasing at more than 3.5 per cent. Elsewhere, the upturn was feeble, while in Latvia, Lithuania and Romania, economic contraction continued. On average, GDP of the new EU member States increased by 1.9 per cent in 2010, having shrunk by 3.6 per cent in 2009 (see annex table A.1). Growth is expected to strengthen to 3.2 per cent in 2011, as consumption demand gradually recov-ers, domestic investment and FDI picks up, and absorption of EU funding improves. It will take time, however, before pre-crisis growth rates will be achieved again. To improve long-term competitiveness, further structural reforms are needed.
External conditions for the new EU member States improved in 2010. Import de-mand, particularly for durable consumer goods and capital and intermediate goods, strength-ened in many important trading-partner economies. This supported the rebound in indus-trial production, including in the automotive industries in Central Europe (see figure IV.4).
1 This section mainly refers to the new EU member States in Central and Eastern Europe.
Exports help the new EU members out of recession
External conditions improved in 2010
Figure IV.4Industrial production, excluding construction, selected new EU member States, October 2009-August 2010
Percentage
2009 2010
Oct
Nov
Dec Jan
Feb
Mar
Apr
May Jun Jul
Aug
-30
-20
-10
0
10
20
30
40
Chan
ge in
the
indu
stria
l pro
duct
ion
inde
x ov
er th
eco
rresp
ondi
ng m
onth
of t
he p
revi
ous y
ear
Czech RepublicEstoniaLatviaHungaryPolandSlovakiaSlovenia
Source: Eurostat.

108 World Economic Situation and Prospects 2011
Access to international capital markets also improved. Parent banks in the EU-15 avoided withdrawing more capital as the financial sectors of the new EU countries stabilized.
Inflation remained low among new EU members in 2010, as their economies operated well below full capacity. Latvia experienced deflation following the demand con-traction forced by the fixed exchange-rate regime. Increases in energy prices and indirect taxes pushed up headline inflation in countries with flexible exchange rates, most notably Romania. Although producer prices strengthened in late 2010, a build-up of serious inflation-ary pressures in these countries during 2011 is highly unlikely. Headline inflation is projected to increase by 1 to 2 percentage points as a consequence of higher world market prices for energy and primary commodities and possible further increases in indirect tax rates.
The space for stronger counter-cyclical measures which could speed up recov-ery is limited. There is an urgent need for countries to undertake deeper structural reforms to underpin more sustained long-term growth. Better utilization of available EU funds could support such reforms. Budget deficits are large, especially in the economies most affected by the global crisis. In Latvia and Lithuania, fiscal deficits exceeded 8 per cent of GDP in 2010. Given their commitment to the SGP of the EU, all Governments of the new EU member States will be engaging in drastic fiscal retrenchment over the next three or four years in an attempt to bring deficits below the ceiling of 3 per cent of GDP. This includes Estonia, whose deficit is already below 3 per cent of GDP, but nevertheless aims to balance its government budget in the medium term. This will be challenging in most cases and could come at substantial cost to growth in the short run.
The central banks of the new EU member States continued to keep policy rates low during 2010, hoping to encourage private lending and discourage inflows of specula-tive capital. Monetary authorities in the Czech Republic, Hungary and Romania cut inter-est rates in successive rounds. In the case of Slovakia and Slovenia, which have become members of the euro area, the very low rates set by the ECB apply. Estonia, in turn, will adopt the euro in January 2011 and is gradually reducing its reserve requirements to those mandated by the ECB. Accommodative policy should continue in 2011, but thus far it has not unleashed much credit because of continued fragility in the banking sectors.
Unemployment rates remain relatively high in most new EU member States although they seem to have stabilized by mid-2010. In Latvia, the unemployment rate reached 19.7 per cent in 2009, but had declined to 15 per cent in August 2010. Nevertheless, the time during which unemployed workers are without a job has increased. This is all the more worrisome as fiscal stimulus measures that supported job creation are being with-drawn and more public employment is lost through fiscal austerity measures. This will hold back further improvements in labour markets during 2011.
Economies in transitionDuring 2010, economies in transition recovered visibly from the steep downturn caused by the global crisis. On average, GDP expanded by 3.8 per cent, a significant turnaround, but far short of what it will take to make up for the dramatic setback of 6.7 per cent in 2009. The recovery was primarily a result of more favourable external conditions, which helped the rebound in exports. The impact of the crisis was greater in the Commonwealth of Independent States (CIS) than in the transition economies of South-eastern Europe, with the former contracting by 7.0 per cent in 2009 compared to 3.6 per cent for the latter. The CIS economies benefited from higher commodity prices and GDP growth reached 4.1
The large output gap is containing inflation
Central banks are maintaining low
policy rates
There are mixed trends in labour markets

109Regional developments and outlook
per cent in 2010. Economic performance in South-eastern Europe, by contrast, remained lacklustre as weak domestic demand stifled most of the impetus from export growth. GDP expanded by a mere 0.1 per cent in 2010 (see annex table A.2).
In the outlook, GDP growth is expected to remain subdued in 2011, but may accelerate somewhat in 2012. Downside risks emanate in particular from further weaken-ing of the global recovery and fragility in financial sectors, especially in the CIS. Possible renewed financial turmoil over sovereign debt distress in Greece would be potentially harmful to the recovery in South-eastern Europe.
South-eastern Europe: a feeble recovery
Export growth was the main driving force behind an otherwise weak recovery in Bosnia and Herzegovina, Montenegro, Serbia and the former Yugoslav Republic of Macedonia during 2010. Croatia, however, failed to climb out of the recession as continued declines in consumption and investment outweighed export growth. Domestic demand growth led the recovery in Albania. The recovery is expected to provide an impetus for the entire region in 2011, with GDP growth averaging 2.5 per cent on the expectation of continued favourable external conditions and modest revivals in domestic demand.
The weakness in domestic demand acted as a drag on aggregate output in 2010. Importantly, after several years of growth driven by booming domestic demand accompa-nied by heavy external borrowing and large current-account deficits, export growth was the main factor in whatever economic recovery the countries in the region saw during 2010. However, in order to sustain more dynamic, export-led growth in the future, manufactur-ing and services sectors will need to be modernized and become more diversified. This will require additional foreign direct investment (FDI) and technological change. To facilitate this, additional structural reforms will be needed to change the business environment.
Consumer inflation remained subdued in most countries of the region, re-strained by stagnant real household incomes and tight consumer credit. Inflation is ex-pected to accelerate by 1 percentage point in 2011, as domestic demand gradually picks up. In Serbia, inflation exceeded 5 per cent, reflecting the effect of currency depreciation as well as the one-off effect of a poor harvest on food prices. Inflationary pressures will likely increase in 2011, following the end to the temporary freeze in pensions and public sector wages (see annex table A.5).
As businesses continued to shed workers, unemployment increased in the region in 2010, with the exception of Albania. Unemployment is particularly high in Bosnia and Herzegovina and the former Yugoslav Republic of Macedonia. As the economic recovery is expected to gain some speed in 2011, job creation in the private sector is also expected to improve. Large numbers of workers have now been without a job for a long period of time. This problem is likely to persist in the absence of targeted measures to encourage retraining and hiring in the formal sector (see annex table A.8).
Macroeconomic policies in South-eastern Europe have been characterized by fiscal discipline. Policymakers have given priority to providing businesses with better ac-cess to finance and to incentives aiming to attract strategic investors from abroad. In most countries, monetary policy remained accommodative in 2010 and no change in this regard is expected. Only in Serbia has the central bank increased its policy rate to counter-act rising inflation, doing so several times in the second half of the year. More generally, boosting credit to the private sector and encouraging lending in domestic currency are key components of the recovery strategy. Invariably, however, this has not been successful. In
A weak recovery is driven by exports
Medium-term prospects depend on structural reforms
Inflation remains subdued
Labour markets have deteriorated further
While fiscal policy is tightening, monetary policy remains accommodative

110 World Economic Situation and Prospects 2011
Croatia, for instance, credit supply remains tight despite the lowering of official reserve requirements, and in Montenegro, credit supply fell sharply.
Moderate export growth and weak import demand led to a narrowing of current-account deficits of all economies in the region, except Serbia. All countries secured the external financing needed to cover the deficits. Serbia and Bosnia and Herzegovina needed support from the IMF in order to do so. FDI inflows have remained subdued and are unlikely to reach the high pre-crisis levels in the near term, especially given the adverse impact of the Greek financial crisis on the confidence of prospective investors.
In addition to weakening global demand conditions, downward risks include the high degree of euroization of bank loans, particularly in Serbia, which given prevailing currency mismatches, could lead to large numbers of non-performing loans in the case of a devaluation. The banking sector of the countries in the region will likely also be affected directly from any serious further deterioration in the financial situation in Greece.
The Commonwealth of Independent States:2 a muted recovery
After a sharp contraction in 2009, output in the CIS bounced back in 2010, driven by the recovery of commodity prices and general improvement in the external environment. The return to economic expansion in the Russian Federation particularly contributed to the renewed dynamism in the region, boosting exports, financial flows and remittances, which remain critical for low-income countries in the region. However, despite these positive influences, recovery remained muted, as continued fragility in the financial sector and uncertain economic prospects constrained domestic demand in the largest economies in the region. Some further strengthening of domestic demand can be expected in 2011, but the external environment remains uncertain and cannot be relied upon as a major source of economic dynamism. After growing by around 4.1 per cent in 2010, aggregate GDP in the region is expected to increase at a similar pace in 2011.
Domestic demand is gathering strength (see figure IV.5). However, despite improvement in the terms of trade and reduction of unemployment, recovery of domestic demand has been limited and remains dependent upon a favourable external environment. In the Russian Federation, consumer demand benefited from expansionary fiscal policy, which included increases in pensions and public sector wages. Higher remittances have also boosted consumption in small, low-income countries, although adverse weather con-tributed to depressed agricultural output throughout the region. Exports have increased as the world economy has stabilized, while growth of imports has been constrained by the weakness of the recovery (see annex table A.16). However, unlike in 2009 when net external demand was the main factor sustaining economic activity, domestic demand has played an increasing role in driving economic expansion.
Output recovery was accompanied by an improvement in labour market indica-tors across the region (see annex table A.8). In the Russian Federation, the return to growth was accompanied by a sharp fall in wage arrears and job creation. In Kazakhstan, the ex-pansion of employment has been the fastest in the region, being particularly remarkable as the country continued to create new jobs during the economic slowdown in 2009. However, performance remains far below potential in most economies. While the fiscal consolidation
2 Georgia officially left the Commonwealth of Independent States on 18 August 2009. However, its performance is discussed in the context of this group of countries for reasons of geographic proximity and similarities in economic structure.
Current-account deficits are narrowing
The economic recovery in the CIS faces uncertain
prospects
Although domestic demand is gathering strength, the region
depends on a favourable external environment

111Regional developments and outlook
that is expected in 2011 may dampen prospects for employment in the region, credit revival and strengthening domestic demand will provide a positive impulse.
Inflation continued to decline early in 2010 in the CIS, despite the economic rebound, the delayed impact of past devaluations and generally loose monetary policies (see annex table A.5). However, a number of supply shocks put an end to this trend and infla-tion started to pick up in the second half of 2010 in some countries. Food prices increased sharply as a consequence of adverse weather in the Russian Federation and Ukraine, while border-crossing problems in Central Asia contributed to inflationary pressures. However, weak demand limited the impact of supply-driven inflationary pressures in the region.
Monetary authorities have supported the economic recovery with interest rate cuts in most countries, amidst benign inflation conditions. In some cases, strengthening of national currencies, following the devaluations and exchange-rate volatility observed in 2009, increased the scope for accommodating monetary policies. However, monetary authorities put an end to the easing with the resurgence of inflationary expectations fol-lowing supply shocks over the summer, stronger economic activity and concerns over the rapid growth of monetary aggregates. Amidst concerns over the fragility of the recovery, interest rates remained unchanged despite accelerating inflation in most countries, with the exception of Armenia and Georgia.
The economic recovery has boosted revenues, particularly in energy-producing countries where there is a direct link between commodity prices and fiscal performance. However, fiscal deficits persist throughout the region. In 2010, the Russian Federation continued to run a fiscal gap for a second year, following a long period of surpluses. Official financing has eased financing constraints and avoided the need to undertake sharper ad-justments in other countries, but the fiscal situation remains precarious. A shift towards fiscal retrenchment has already started, dampening GDP growth. However, the increases
After sharp declines, inflationary pressures are re-emerging
Monetary easing is coming to an end, while fiscal tightening has begun
Figure IV.5Comparison of retail turnover in countries of the Commonwealth of Independent States, 2009 and 2010 (January-June)
-20
-15
-10
-5
0
5
10
15
20
Kyrg
yzst
an
Arm
enia
a
Ukr
aine
Russ
ian
Fede
ratio
na
Repu
blic
of
Mol
dova
a,b
Azer
baija
n
Uzb
ekist
an
Tajik
istan
Kaza
khst
ana
Bela
rus
First half of 2009 as percentage of the �rst half of 2008
First half of 2010 as percentage of the �rst half of 2009
Source: Based on data from the Interstate Statistical Committee of the CIS.a Excluding turnover of catering enterprises.b Trading organizations.

112 World Economic Situation and Prospects 2011
in social expenditures and public sector wages are perceived to be permanent, thereby making fiscal adjustment more challenging as government revenues remain dependent on volatile commodity prices.
Higher commodity prices and recovery of export volumes amidst an improved external environment have boosted export earnings. Import growth also accelerated as domestic demand strengthened, particularly in the Russian Federation. While several non-energy exporting countries, such as Armenia, Georgia and Tajikistan, also benefited from rising export prices, their current-account deficits remain large. Overall, the com-bined current-account surplus of the CIS increased. This was, however, primarily due to significant improvements in the region’s terms of trade in 2010.
The return to growth in the region largely reflects the improvement in external circumstances. Overall dynamics in the CIS remain highly dependent upon the economic performance in the Russian Federation. Greater access to external financing also remains critical for many countries in the region. The lack of export diversification makes most CIS economies highly vulnerable to external shocks. Government revenues also remain highly dependent upon revenue from primary commodity exports, making public finances vul-nerable to volatility in world market prices. The continued fragility of the financial sector (see box IV.1) remains a policy concern that will need to be addressed to create solid foundations for economic expansion.
The current-account surplus of the region
has widened
Fragilities remain, particularly in the
financial sector
Banking systems and financial risks in the CIS economies
The financial sector was one of the main channels through which the external shocks of the finan-cial crisis were transmitted to the economies of the Commonwealth of Independent States (CIS). In several countries, the banking system came under severe pressure, prompting the need for strong policy responses. In contrast, a low degree of financial development and limited integration into international capital markets provided some protection elsewhere, particularly to the financial sec-tors of the low-income economies of the region.
Policy interventions, an improved external environment and the ongoing economic recovery have helped stabilize the overall economic situation in the CIS. However, the banking sector remains fragile due to a combination of funding problems and rising non-performing loans. Despite improved liquidity, this fragility, the need to rebuild balance sheets and weak demand for credit have all contributed to the sluggish growth of credit throughout the region. Among the largest countries, there have been clear signs of improvement only in the Russian Federation.
Rapid credit growth in the pre-crisis period came to an abrupt halt as access to interna-tional capital markets dried up (figure A). In Kazakhstan, for instance, annual credit growth exceeded 100 per cent in mid-2007, but was almost flat in the next year. Dependence on external sources of finance, even in countries with current-account surpluses, was a common feature among the largest economies in the region. However, the role of the banking system in intermediating foreign financing has varied from country to country. In Kazakhstan, the crisis started earlier and was more severe ow-ing to the strong reliance of domestic banks on foreign borrowing. In Ukraine, access to international funding was channelled, in part, through foreign-owned banks, which initially represented a source of resilience. While banks’ access to external finance was more limited in the Russian Federation, this was not the case for large firms, some of which benefited at times from implicit State guaran-tees. These firms were, however, directly affected by the turmoil in financial markets. Meanwhile, in the low-income economies, declining remittances deprived banks of a source of liquidity and also reduced borrowers’ creditworthiness. Overall, countries that relied to a larger extent on domestic deposits as a source of funding (such as Uzbekistan and Turkmenistan) were relatively sheltered from the effects of the financial crisis.
Looser monetary policy and a temporary relaxation of financial sector regulation helped offset dwindling access to external finance. In energy-exporting countries, sovereign funds
Box IV.1

113Regional developments and outlook
were also tapped to provide additional liquidity, while in Ukraine, foreign banks contributed to repair-ing the balance sheets of their subsidiaries through additional capital contributions. By contrast, in Kazakhstan, where direct foreign equity participation was limited but external debt was substantial, debt restructuring resulted in write-offs of $11 billion.
The banking sector faces two main challenges
Financial sectors in the region face two key challenges: overcoming remaining fragilities, especially the high shares of non-performing loans (NPLs) and currency mismatches, and how to mobilize more domestic resources now that reliance on foreign borrowing is neither possible nor desirable.
The economic slowdown resulted in a sharp deterioration in the quality of loan port-folios. This has been particularly marked in Kazakhstan, where NPLs are expected to peak at around 30 per cent. In Ukraine, the official estimate of the ratio of NPLs reached almost 12 per cent in August 2010, and is projected to continue to rise. Such high levels of NPLs will require concerted efforts to rehabilitate the financial sector, particularly as the latest stress tests have identified recapitalization needs of around $5 billion in Ukraine.
Moreover, foreign currency lending and foreign currency deposits remain significant throughout the region, reflecting a mixture of macroeconomic concerns, risk mispricing and pre-crisis access to international funding. In most countries, the share of foreign currency in banking activities declined in the years prior to the crisis as consumer confidence improved and as, in some cases, local currencies appreciated. This was especially the case in those countries that experienced large inflows of foreign currency, such as Kazakhstan and the Russian Federation. Responding to the large capital outflows that occurred in the wake of the crisis, several countries in the region were, however, forced to depreciate their currencies, which in turn contributed to a rise in foreign currency banking activity (figure B). It also intensified the problems of the banking sector in countries such as Ukraine, where most borrowers do not have income sources in foreign currency and—in contrast to banks that raise funding in international capital markets—are unable to hedge against the currency risk by lending in foreign currencies. Consequently, in these countries, credit risk has been replaced by currency risks.
Box IV.1 (cont’d)
Figure ABanking sector, net capital flows, 2004-2009
Billions of dollars
-20
-15
-10
-5
0
5
10
15
20
25
2004 2005 2006 2007 2008 2009-60
-40
-20
0
20
40
60KazakhstanRussian Federation(right-hand scale)Ukraine
Source: Central banks.

114 World Economic Situation and Prospects 2011
Developing economiesDeveloping economies have been experiencing a robust economic recovery in 2010 with GDP growth averaging 7.1 per cent, up from 2.3 per cent in the previous year. Growth performance has been fairly balanced across regions, with East Asia continuing to post the highest growth rate, averaging 8.8 per cent, followed by South Asia with 7.0 per cent. In both Western Asia and Latin America, the rebound in 2010 followed an economic con-traction in 2009. While the revival in global trade has remained a key driver of economic
Several countries in the region, including low-income economies in Central Asia, have reacted by introducing regulatory changes, such as higher reserve deposit requirements, in order to reduce external vulnerability in general and foreign currency risk in particular. In Ukraine, foreign currency lending to households has been prohibited outright. Such changes, however, contribute to dampening credit growth in the short term. A deepening of domestic financial markets to reduce external vulnerability may be better as it would reduce foreign-exchange risks structurally and en-able greater mobilization of domestic savings through the financial system. While doing so has been a stated policy target in some countries in the region for some time, the recent crisis has provided new impetus to pursue this goal, particularly in Kazakhstan and the Russian Federation.
However, progress in this area is closely linked with the quality of monetary and fiscal institutions. The credibility of macroeconomic policy and the commitment to support growth and stability are necessary to facilitate the deepening of a sound domestic financial system. Given the long-term financing needs of public sectors, the development of well-functioning domestic markets for government securities should be an important ingredient of the financial deepening process. It would further foster the creation of necessary trading infrastructure and facilitate the pricing of cor-porate bonds. Moreover, better regulation of the activities of institutional investors, such as pension funds, would also support the domestic supply of long-term finance.
Box IV.1 (cont’d)Figure BForeign currency-denominated deposits and credits as a percentage of total, end-year 2002, 2005, 2007 and 2009
Billions of dollars
0
10
20
30
40
50
60
70
80
KazakhstanRussian
FederationRussian
FederationUkraine Kazakhstan Ukraine
Deposits Credits
2002 2005 2007 2009
Source: Central banks.

115Regional developments and outlook
expansion, economic performance has been fairly broad-based as domestic demand has taken on more significance in underpinning growth with the support of fiscal stimulus measures and accommodative monetary policy stances. In 2011, economic growth is ex-pected to slow down somewhat, but should still reach a solid pace averaging 6.0 per cent. There is a major risk of a further slowdown of growth in developed economies which would weaken global trade. Surging but volatile capital flows pose a further risk to mac-roeconomic stability in many developing countries. Several have already seen significant currency appreciation, which is, inter alia, undermining export competitiveness.
The economic rebound has helped improve the employment situation, as seen in falling unemployment rates in many countries. In many regions, however, job growth is lagging the rebound, and high levels of vulnerable and informal employment continue to hamper accelerated progress in poverty reduction and achievement of the other Millennium Development Goals (MDGs).
Africa: divergent growth recovery
Africa’s rebound from the Great Recession has been faster and stronger than from previous global downturns. GDP growth accelerated to 4.7 per cent on average in 2010, up from 2.3 per cent in 2009 (see annex table A.3). Exports were not the only driver of growth, as was the case in previous cycles. This time, the positive turn in external conditions was supported by domestic factors as well. These included rising public spending on infrastruc-ture, increasing FDI in extractive industries, good harvests and increasing agricultural productivity. Nevertheless, high levels of underemployment and vulnerable employment, as well as continued widespread malnourishment, remain concerns. The continued reliance on a narrow export base and primary production is a hurdle to faster poverty reduction and more broadly shared welfare improvements.
The speed of recovery varies greatly among countries in the region. The re-bound among fuel exporters was stronger than in other countries, continuing the trend of the past decade. Yet, a simple distinction in performance between fuel and non-fuel economies is no longer a good basis for explaining divergent performance, because not all output growth in fuel-exporting economies has been on account of expanding activity in the oil sector, as differences in domestic factors also weigh in.
Four patterns can be observed by looking at growth performances before and after the crisis. For this exercise, 3 per cent per capita GDP growth is used to identify fast-growing economies.3 Some economies remained in the same growth category before and after the crisis. A small group of economies managed to accelerate above the 3 per cent threshold between the “pre-crisis” high-growth period of 2004-2007,4 and 2010-2011, while others decelerated. Figure IV.6 maps the four patterns of growth performance across the region.
Countries belonging to the first group of slow-growing economies are mostly characterized by continued political instability and/or insecurity, with presumed adverse effects on investment and other drivers of growth. In some countries, such conditions were compounded by adverse weather conditions: prolonged droughts in Chad and Niger significantly reduced food production and slowed overall economic activity. In Niger, the
3 In the African context, a GDP per capita growth rate of 3 per cent is widely seen as the minimum rate of growth to make a dent in poverty rates.
4 The comparison focuses on factors of growth across these two periods, thus overlooking the effect of the 2008-2009 crisis, which was, in significant ways, an “external” crisis.
Improved external conditions as well as domestic demand growth have supported economic recovery in Africa
Fuel exporters continue to grow faster, but oil is not the only thing that counts

116 World Economic Situation and Prospects 2011
decline in food production outweighed growth in mining output. In contrast, insuffi-ciently widespread structural reforms to diversify and dynamize Algeria’s economy pulled its average below 3 per cent in the periods before and after the crisis. Nevertheless, in the medium run, Algeria’s massive $286 billion development plan for 2010-2014 should provide enough impetus to boost GDP per capita above this threshold.
UNITED REP. OFT A N Z A N I A
S O U T HA F R I C A
DEMOCRATICREPUBLIC
OF THEC O N G O
CENTRALAFRICAN REPUBLIC
TOG
O
BURKINAFASO
CÔTED'IVOIRE
LIBYAN ARABJAMAHIRIYA
WesternSahara
ERITREA
SOMALIA
UGANDACONGO
CAMEROON
BEN
IN
GHANA
MAURITANIA
MOROCCO
TUNISIA
MALAWI
MOZAMBIQUE
SEYCHELLES
MADAGASCAR
LESOTHO
SIERRALEONE
GUINEA-BISSAU
GAMBIA
C H A D
N I G E R
A L G E R I A
M A L I
N I G E R I AG U I N E A
SENEGAL
SWAZILAND
BOTSWANA
ZIMBABWE
MAURITIUSN A M I B I A
A N G O L AZ A M B I A
BURUNDI
RWANDA
Cabinda (ANGOLA)
Annobón(EQUATORIAL GUINEA)
GABON
EQUATORIAL GUINEA
LIBERIA
COMOROS
KENYA
E T H I O P I A
S U D A N
E G Y P T
DJIBOUTI
medium gray
darker green
darker green
darkergreen
SAO TOME and PRINCIPE
CAPEVERDE
The boundaries and names shownand the designations used on this mapdo not imply official endorsementor acceptance by the United Nations.
Map No. 4427 UNITED NATIONSNovember 2010
Department of Field SupportCartographic Section
E C O N O M I C G R O W T H M A T R I X
- Matrix combines the growth rates for both periods- Percentages are annualized Gross Domestic Product per capita- Colour represents economy type from its growth performance- Countries coloured in medium gray are not monitored
3 per centor more
3 per centor more
Less than3 per cent
Less than3 per cent
P e r i o d 2 0 1 0 - 2 0 1 1
Per iod2 0 0 4 -2 0 0 7 Fast Growing
Accelerating
Decelerating
Slow Growing
Figure IV.6 Africa growth map

117Regional developments and outlook
The group of fast-growing economies, by contrast, has shown resilience which can be attributed to the robustness of their manufacturing and services sectors, as in Egypt and Uganda; strong expansion of investments in infrastructure and/or of mining activity, as in Ethiopia and the United Republic of Tanzania; agricultural productivity growth, as in Rwanda and Zambia; or a combination of higher oil exports and vibrant domestic activity, as in Nigeria, Africa’s most populous country.
Decelerating economies ran out of fortune for different reasons. In Equatorial Guinea, declining oil output and slow growth in the non-oil sector limited economic growth to about 2 per cent, after double-digit economic growth rates for many years be-fore the crisis. In South Africa, depressed demand for manufactures, major labour strikes and subdued domestic demand explain the country’s rather weak economic recovery.
Several economies where growth accelerated saw significant improvements in external conditions. Botswana took advantage by also implementing strong counter-cyclical fiscal policies. In Mali, new investments in gold mining played an important role. In the Congo and Zimbabwe, political instability abated, spurring expectations of strong growth. As political tensions may linger, the near-term growth projection is surrounded by uncertainty.
Efforts at containing inflationary pressures in the region have not been equally successful. Cost-push effects weakened with lower food prices in 2010. In most parts of East and Southern Africa, improved weather conditions allowed for greater harvests and helped to moderate food prices. In several countries, like Ethiopia, Mozambique and Sierra Leone, however, inflation is expected to remain high—between 10 and 20 per cent—as a result of pass-through effects from exchange-rate devaluation. In South Africa, high unemployment and low capacity utilization rates have offloaded demand pressures on the aggregate price level. Low inflationary pressures in most countries have persuaded central banks to continue policies of monetary easing or, at the minimum, to refrain from monetary tightening. The two central banks in the Communauté financière africaine (CFA) zone, for instance, de-layed further monetary easing, after a sequence of interest rate cuts and reserve requirement relaxations. The South African Reserve Bank reduced its repurchase rate by 50 basis points to 6.0 per cent in September 2010 in an attempt to strengthen the economic recovery. The Central Bank of Nigeria, however, engaged in monetary tightening as inflationary pressures mounted and increased the interest rate payable on reserve deposits held with the Central Bank by 225 basis points. Irrespective of the stance, however, the transmission effects of monetary policies into the real sector remain weak in most countries because the lenders are risk averse amidst continued high macroeconomic uncertainty. Lower interest rates have not induced any significant expansion in credits provided to the private sector, despite most banks’ being well capitalized.
Fiscal policy remained supportive in the majority of countries, reflecting both Governments’ commitments to nurture the recovery as well as ongoing efforts geared towards bridging infrastructural gaps, a key objective of many medium-term development plans. Such expansionary stances contributed to a short-term widening of fiscal deficits. In the aggregate, the fiscal deficit for the region as a whole is estimated to have increased to between 3 and 4 per cent of GDP in 2010, up from about 2 per cent in 2009. A larger budget deficit has prompted some countries to shift focus from short-term demand management to medium-term fiscal sustainability and to tighten fiscal policy stances. This could risk weakening the economic recovery, which would make accomplishing fiscal consolidation a more difficult task.
Inflationary pressures have declined, creating more headroom for expansionary monetary policy
Fiscal policies have supported the recovery

118 World Economic Situation and Prospects 2011
The strong recovery of merchandise export revenues helped improve Africa’s external accounts markedly in 2010. The rebound was mostly on account of growth in revenue from exports of hydrocarbons and minerals, which comprise approximately four fifths of the total of the region. The rebound has not been strong enough, however, to bring the level of total merchandise exports back to its pre-crisis peak in 2011, especially because demand from advanced economies remains subdued. Africa’s import bill has also been growing, albeit at a slower pace. In volume terms, however, imports grew at a faster pace than exports, highlighting Africa’s dependence on foreign manufactures.
Official development assistance (ODA) to the region is estimated to have in-creased by nearly 4 per cent in 2010 in real terms. Yet, ODA flows continue to fall well short of the targets and commitments made by the international donor community.
Private capital flows to Africa have been growing steadily with the exception of the short-lived slump in the last part of 2008 and the early months of 2009. FDI rebounded sharply, particularly in the primary sector which is receiving growing interest from Asian and South American companies. Although to a much lesser extent, foreign investments in services and light manufacturing sectors have also increased. Meanwhile, there have been growing cross-border mergers and acquisitions of South African enterprises.
As in other emerging markets, there was also a surge in portfolio inflows dur-ing 2010, mainly to the countries with the two largest stock markets in the region, Egypt and South Africa. In Egypt, for instance, private transfers from abroad in the second quarter soared by 235 per cent, to $4.19 billion. There has also been a surge in short-term, speculative capital flows into South Africa, where the large interest rate differential with developed-country financial markets and exchange-rate appreciation has stimulated the carry trade.
Macroeconomic prospects for 2011 are generally positive. Average GDP growth is forecast to grow by 5.0 per cent in 2011 and 5.1 per cent in 2012, which means that growth of GDP per capita will be 2.7 and 2.8 per cent, respectively, and hence below the 3 per cent threshold. Several factors that supported the recovery in 2010 are expected to support economic development in Africa in the near future, but growth is expected to remain below pre-crisis rates. A possible further slowdown of global growth, caused by the weaknesses in developed economies, poses an important downside risk and would affect both demand for and prices of African exports. Another risk is posed by possible retreats in fiscal stimuli and public investment in infrastructure, as noted earlier.
East Asia: moderate growth, but the outlook is still good
East Asia’s economies rebounded strongly in 2010, with manufacturing output and ex-ports returning to pre-crisis levels earlier than expected. Driven by rapid growth in China and a rebound in the export-oriented economies, the region’s GDP expanded by 8.8 per cent in 2010, up from 4.9 per cent in 2009. Following a very strong recovery in the first two quarters of 2010, growth across the region decelerated in the second half as global conditions weakened and the impact of stimulus measures moderated. This trend is likely to continue in the quarters ahead with GDP forecast to grow, on average, by 7.2 per cent in 2011 and 7.4 per cent in 2012 (see annex table A.3). Given the subdued outlook in developed economies, countries with large and buoyant domestic markets, such as China, Indonesia and Viet Nam, are in a better position to maintain the growth momentum than highly export-oriented economies. Despite the vigorous recovery from the crisis, inflation increased only slowly in most countries, leaving room for central banks to keep monetary
Africa’s external balance improved markedly in 2010
ODA also increased in 2010 but fell short of targets
Private capital inflows have returned and are increasing
Growth is expected to moderate in 2011 as
external demand weakens

119Regional developments and outlook
policy accommodative. In 2011 and 2012, Governments and central banks will gradually move towards a neutral policy stance.
The region’s recovery since mid-2009 has increasingly been driven by private sector demand. Loose monetary conditions and a rebound in export demand—partly owing to the restocking of inventories—led to strong growth in business investment, es-pecially in the first half of 2010. Thanks to improved labour market conditions, consump-tion demand also expanded at a robust pace. Government spending continued to provide significant stimulus in many countries, but contributed less to growth than in 2009. While economic activity expanded at a rapid pace virtually everywhere in East Asia, China and the highly export-oriented economies of Singapore and Taiwan Province of China re-corded the fastest growth (see figure IV.7). The Chinese economy grew by 10.1 per cent in 2010 as exports rebounded and domestic demand soared amidst continuing government support. However, the monetary measures taken to slow credit growth, investment spend-ing and property speculation, have also moderated output growth. GDP growth in China is forecast to decelerate to 8.9 per cent in 2011 and 9.0 per cent in 2012.
Labour market conditions in East Asia generally improved in 2010. Strong growth has reduced excess production capacity and boosted employment, especially in manufacturing, construction and services. Unemployment rates have continued to decline and are back to or below pre-crisis levels in most economies. Notably, the employment situation improved considerably in Indonesia and the Philippines, which had faced high unemployment rates. In Indonesia, the unemployment rate dropped to 7.1 per cent in the first quarter of 2010, the lowest level in almost 10 years. The gradual tightening of labour markets, combined with somewhat higher inflation, has led to upward pressure on wages. In most countries, average real wages are estimated to have risen moderately in 2010. China has seen a particularly strong increase in real wages, following significant minimum
Private sector demand has become more important to the recovery
Unemployment is back to pre-crisis levels in most economies
Figure IV.7GDP growth in selected East Asian economies, 2009-2011
Chin
a
Hon
g Ko
ngSA
Ra
Indo
nesia
Kore
a,Re
publ
ic o
f
Mal
aysia
Phili
ppin
es
Sing
apor
e
Taiw
an P
rovi
nce
of C
hina
Thai
land
Viet
Nam
-5
0
5
10
15
2009 2010 2011
Source: UN/DESA.a Special Administrative Region of China.

120 World Economic Situation and Prospects 2011
wage hikes in several provinces. In the outlook, labour market trends in East Asia will likely continue to be favourable. Unemployment and underemployment rates are expected to decline slowly and real wages are forecast to increase further.
Consumer price inflation in East Asia started to pick up in mid-2009 but has remained well contained in most countries. Average inflation in the region rose from a low of 0.7 per cent in 2009 to 3.2 per cent in 2010 (see annex table A.6). In all economies, except Myanmar, Papua New Guinea and Viet Nam, annual inflation rates are estimated to remain below 5 per cent and inflationary expectations are generally within central banks’ target ranges. Most of the increase in consumer price indices over the past year can be attributed to higher food prices, whereas core inflation continues to be low. In China, for example, food prices increased by about 6 per cent during the first three quarters of 2010, well above the increase in the consumer price index of 3 per cent. In most countries, core inflation continued to be mitigated by limited labour cost pressures and stronger currencies. With the slowing of global growth and expected stabilization of world commodity prices, inflation is forecast to accelerate only slightly to about 3 per cent in both 2011 and 2012.
Central banks across East Asia maintained an accommodative monetary policy stance in 2010 as inflationary pressures remained subdued and uncertainties about glo-bal recovery persisted. Despite the economic rebound, authorities have been very cautious about tightening monetary policy, keeping interest rates at or close to the very low levels adopted in 2008 and 2009. In China, Malaysia, the Republic of Korea, Taiwan Province of China and Thailand, policy rates were raised between 25 and 75 basis points. Despite the increases in policy rates and reserve requirements, the People’s Bank of China maintained its overall “moderately loose” monetary policy stance. Growth of money supply and credit in China has returned to a more sustainable level in the course of 2010. Authorities also resumed the basket exchange-rate regime, adopted in 2005 but suspended since mid-2008, allowing for a more flexible exchange rate. However, appreciation of the renminbi has so far been very mild as concerns about possible shocks to exports persist. In the outlook, most central banks are expected to tighten monetary conditions slowly. However, in doing so, authorities will remain vigilant to the strength of the recovery in developed economies and the risk of further encouraging capital inflows by increasing the interest rate differential.
Across East Asia, fiscal policy continued to support growth, especially in the first half of 2010, as stimulus measures adopted earlier were being implemented. This is particularly the case for infrastructure investment, which represents the largest component in most stimulus packages. Government consumption expenditure also expanded at a robust pace in most economies, albeit slower than GDP growth. Like other countries in the region, China continued its proactive fiscal policy in 2010, aiming at faster economic restructuring. Going forward, most Governments are likely to gradually move towards a more neutral fiscal policy stance by phasing out the stimulus. In general, Governments in export-oriented economies such as Malaysia and Singapore may reduce their stimuli earlier than others. Mainly as a result of strong growth, budget deficits as a share of GDP narrowed in most countries in 2010; this trend is likely to continue in 2011 and 2012.
East Asia’s exports rebounded in 2010, driven by a restocking of inventories and rising import demand from China. In many economies, total export earnings were up by more than 25 per cent compared to 2009 despite a slowdown in the second half of the year. The manufacturing sector accounted for most of the growth as demand for machinery and electrical equipment rapidly increased. This lifted the revenues of the export-oriented economies in the region, in particular. Commodity-exporting countries, such as Indonesia and Papua New Guinea, benefited from strong increases in the prices of their main export
Inflation has picked up, but remains well contained
Central banks remain cautious about tightening
monetary policy
Governments are expected to phase out fiscal stimulus
Export growth is expected to slow
down markedly in 2011

121Regional developments and outlook
goods. Overall, intraregional trade rebounded faster than trade with the United States and European countries. In 2011, export revenues are expected to grow further, although at a much slower pace than in 2010 as demand from developed economies weakens. Owing to higher international commodity prices and strong domestic demand, import spend-ing rose even faster than export revenues in early 2010, thus reducing trade and current surpluses. However, with import demand slowing markedly, trade surpluses have begun to widen again, most notably in China and the Republic of Korea. In value terms, the full-year surplus is therefore expected to increase in most economies in 2011. By contrast, trade surpluses as shares of GDP are likely to continue to decline to levels well below those reached in the years before the global financial crisis (see box IV.2).
Addressing global macroeconomic imbalances in East Asia
Prior to the global financial crisis of 2008 and 2009, the world economy was characterized by record large and increasing trade and current-account imbalances among major trading partners. While the United States current-account deficit soared to a record 6.0 per cent of GDP in 2006, the current-account surpluses of four East Asian economies (China, Indonesia, Malaysia and Thailand) reached a peak of 9.8 per cent of their combined GDP in 2007. Although the global financial crisis reduced these imbalances in 2009, they are still large by historical standards (see figure).
In fact, during the period 1996 to 2006, net exports became an important source of economic growth for these four East Asian countries. Net exports increased not only as a share of GDP but also in their contribution to GDP growth: they accounted for 13.0 per cent of China’s aver-age growth of 9.3 per cent during this period and for as much as 72.7 per cent of Thailand’s average growth of 2.9 per cent.
Box IV.2
Trade and current-account balances of selected East Asian countriesa and the United States, 1980-2010
Percentage of GDP
-8
-6
-4
-2
0
2
4
6
8
10
1980 1983 1986 1989 1992 1995 1998 2001 2004 2007 2010b
Trade balance, East Asian countriesCurrent-account balance, East Asian countriesCurrent-account balance, United StatesTrade balance, United States
Source: UN/DESA, based on IMF World Economic Outlook database.a China, Indonesia, Malaysia and Thailand.b Estimates.

122 World Economic Situation and Prospects 2011
While East Asia has rebounded strongly from the crisis and is expected to con-tinue on a firm recovery path, there are several downside risks. A key risk is related to the rapid inflows of short-term capital to some economies owing to very low interest rates and abundant liquidity in developed countries. These capital flows lead to exchange-rate pres-sures, while also increasing the risk of asset price bubbles and of accelerating inflation. In 2010, several East Asian currencies, most notably the Malaysian ringgit and the Thai baht, appreciated significantly against the dollar and the renminbi. Indonesia, the Republic of Korea, Taiwan Province of China and Thailand have put in place capital controls to limit the impact of volatile foreign capital on the exchange rate. Since most East Asian econo-mies rely heavily on external demand, competitive devaluations, combined with other protectionist measures, would be particularly damaging to growth in the region.
Large and volatile capital inflows pose serious risks
for some economies
Going forward, with the sputtering recovery in developed countries and the implementa-tion of medium-term fiscal consolidation plans in many European countries, global macroeconomic imbalances may continue to decline. But given the high degree of export orientation of East Asian econ-omies, such an adjustment process will have detrimental effects for the region’s recovery and growth. Hence, there is an emerging consensus that the region should rely more on its domestic and regional markets to sustain its dynamism, which could contribute to reducing global imbalances. However, in or-der to design appropriate policies at the national and regional levels, it is necessary to take into account important differences in the nature of the macroeconomic imbalances across countries in the region.
The large surpluses of China, on the one hand, and Indonesia, Malaysia and Thailand, on the other, have different underlying causes. By definition, a current-account surplus reflects an excess of national savings over domestic investment. In the case of China, this results mainly from a very high savings rate. The share of household consumption in GDP dropped steadily over time, from 57 per cent in 1986 to 46.1 per cent in 1996 and to 36.7 per cent in 2006. As a result, the contribution of household consumption to GDP growth was only 30.7 per cent during 1996-2006. By contrast, during the same period, the share of consumption in GDP increased slightly in Indonesia and Malaysia, and remained roughly the same in Thailand. In these three countries, the share of investment in GDP decreased sharply and the contribution of investment to GDP growth was negative. For example, in Malaysia, the share of gross fixed capital formation in GDP declined from 43.6 per cent in 1995 to 20.5 per cent in 2005.
Hence, a “one-size-fits-all” approach will not work when reducing economic imbalances in Asia and the Pacific. First, although China’s average growth rate of household consumption in-creased from 7.7 per cent during 1996-2006 to 10 per cent during 2006-2010, the share of household consumption in GDP is still very low. One reason for this phenomenon lies in precautionary motives for savings associated with the shifting burden of education and health care expenditures from the State to households, as well as uncertainties about State enterprise restructuring in a period of rapid reforms. The unusually high level of savings among younger age groups, in particular, has been attributed to underdeveloped financial markets and the scarcity of mortgage products accessible to younger, urban households.a Therefore, policy reforms aimed at enhancing the coverage and scope of social protection systems and at fostering inclusive financial development could boost household consumption in China.
Second, given the declines in investment rates in Indonesia, Malaysia and Thailand dur-ing 1996-2006, boosting investment should play a major role in any rebalancing towards domestic demand in these countries. However, it is important to keep in mind that the dramatic drops in investment after 1997 partly reflected the end of real estate price bubbles. Thus the investments to be promoted should be carefully considered. In this respect, it has been estimated that the members of the Association of Southeast Asian Nations (ASEAN) needed about $60 billion per year in infra-structure investment over the period 2006-2015, amounting to roughly five times the average annual level of private sector investment.b
Box IV.2 (cont’d)
a Marcos Chamon and Eswar Prasad, “Why are
saving rates of urban households in China rising?”,
American Economic Journal: Macroeconomics, vol. 2, No. 1
(January), pp. 93-130.b Biswa Nath Bhattacharya,
“Infrastructure development and ASEAN economic
integration,” ADBI Working Paper Series, No. 138 (Tokyo,
Japan: Asian Development Bank Institute, May 2009).

123Regional developments and outlook
South Asia: robust growth momentum
The global economic crisis had only a limited impact on South Asia and economic activity gained further strength in 2010, most notably in India and Sri Lanka. A rebound in private investment and exports, along with a strong industrial expansion and improved agricultural performance, supported the growth momentum. Aggregate GDP expanded by 7.0 per cent in 2010, the second-highest rate of any region after East Asia. Growth is forecast to deceler-ate slightly in 2011 to 6.9 per cent, before picking up to 7.2 per cent in 2012 (see annex table A.3). Strong inflationary pressures continue to be a major concern for policymakers, however. In several countries, consumer price inflation has remained at double-digit levels, with food prices rising particularly fast. In response, a number of central banks tightened monetary policy in 2010. Governments have started to implement fiscal consolidation plans to reduce the large budget deficits. The combination of tighter monetary and fiscal policy is expected to moderate output growth in 2011.
The strong regional growth masks stark differences among South Asian coun-tries. India continued to lead the region’s recovery in 2010, owing to a rapid expansion in gross fixed capital formation, increased government spending and robust growth in private consumption. The manufacturing sector expanded at a fast pace, driven by strong domes-tic and external demand. Agricultural output was boosted by good monsoon rains. After accelerating to 8.4 per cent in 2010, growth is forecast to moderate to 8.2 per cent in 2011, mainly as a result of tighter monetary and fiscal policies. Sri Lanka’s economy is reaping a peace dividend. Following the end of its violent domestic conflict, agricultural output has expanded strongly, domestic trade and transport activities have surged, tourist arriv-als have increased and post-conflict reconstruction activities have boosted the investment rate. In contrast to these two economies, the Islamic Republic of Iran, Nepal, Pakistan and, to a lesser extent, Bangladesh are growing at much more subdued paces, owing mostly to country-specific structural factors such as political uncertainties, weak infrastructure and a poor investment climate. Driven by robust private consumption, Bangladesh re-corded moderate growth in 2010 despite massive power shortages. Pakistan’s recovery was adversely affected by the worst flooding in the country’s history, which severely damaged agricultural crops and physical infrastructure. In the Islamic Republic of Iran, economic activity in 2010 was supported by higher oil prices, but it continues to be below potential owing to insufficient investment in the hydrocarbon industry in recent years and slow growth in private consumption.
The recovery in several South Asian economies since mid-2009 has led to some improvements in the labour market. In India, employment in export-oriented industries increased owing to stronger global demand, while in Sri Lanka, the unemployment rate declined markedly. However, most countries continue to face serious employment chal-lenges, including high rates of vulnerable and informal employment, large labour surpluses in rural areas and low productivity in the agricultural sector. In addition, youth unem-ployment remains a core problem. In Sri Lanka, 18.6 per cent of young men and 24.6 per cent of young women were unemployed in the second quarter of 2010. The employment situation is particularly dire in Pakistan, where more than 5.3 million jobs were lost or affected by the recent flooding.
High inflation remains a key challenge in most countries, with weighted-aver-age regional consumer price inflation standing at 11.0 per cent in 2010 (see figure IV.8). Continued strong inflationary pressures reflect a combination of supply- and demand-side factors, including rapidly rising food prices and growing demand for manufactured goods.
Economic growth gained strength, but inflation remains a concern
India and Sri Lanka enjoy strong growth, driven by rising investment demand
The employment situation remains a key challenge despite some recent improvements
Inflation is expected to decelerate somewhat in 2011 with weaker food prices

124 World Economic Situation and Prospects 2011
Moreover, higher electricity charges and lower fuel subsidies have pushed up the cost of production and transportation of consumer goods and services. In Pakistan, the inflation rate increased sharply in the second half of the year as the flooding destroyed crops and rural infrastructure. In the outlook, inflation is forecast to decline moderately in most countries, averaging 8.7 per cent in 2011 and 7.7 per cent in 2012, as a result of a slower rise in food prices and tighter monetary policies (see annex table A.6).
Given ongoing strong inflationary pressures, several central banks have started to tighten monetary policy. In India, key policy rates were raised six times in 2010, more often than anywhere else. These moves follow sharp policy rate reductions in late 2008 and early 2009, thus largely reflecting a normalization of monetary conditions. In Bangladesh and Pakistan, key policy rates were also increased in the course of 2010. Pakistan’s mon-etary authorities view high inflation and heavy government borrowing as major risks to macroeconomic stability. By contrast, monetary policy was eased in Sri Lanka in the third quarter after inflation declined in the first six months. In the outlook, monetary policy is expected to become tighter, although slowing inflation may give central banks greater room to manoeuvre.
Although budget deficits were already high prior to the global crisis, Governments had little choice but to increase them further as a means of counter-cyclical stabilization policies. The fiscal deficit rose to about 10 per cent of GDP in Sri Lanka and to almost 7 per cent in India. In 2010, Governments in both countries started to imple-ment fiscal consolidation plans, based on a combination of increased tax and non-tax revenues and lower expenditures. Owing to strong economic growth and reduced fuel subsidies, India is in a good position to achieve the target of reducing its deficit to 4.8 per cent of GDP in 2011. Sri Lanka’s budget situation benefited from improved security conditions, which facilitated improved tax collection and allowed for a gradual reduction
Central banks have tightened monetary policy
to contain inflation
Several Governments have started to implement fiscal
consolidation plans
Figure IV.8Year-on-year changes in the consumer price index in selected South Asian economies, January 2007-July 2010
Jan
Apr
Jul
Oct Jan
Apr
Jul
Oct Jan
Apr
Jul
Oct Jan
Apr
Jul
Percentage
2007 2008 2009 2010
0
5
10
15
20
25
30
BangladeshIndiaPakistanSri Lanka
Source: Official national sources.

125Regional developments and outlook
in defence spending. In Bangladesh, however, the fiscal deficit is expected to rise in 2011 as expenditures grow faster than revenues. Pakistan’s fiscal deficit increased markedly in the fiscal year 2009/10, missing the IMF target by a wide margin. Given low tax revenues, increased military expenditures, shortfalls in budgetary support from donors and post-flood reconstruction work, the Government will face difficulties in reducing the deficit in the outlook period.
Following a sharp decline in 2009, trade activity has picked up significantly in 2010. Strong demand from East Asia for agricultural commodities and manufacturing goods boosted export revenues. This was particularly the case in India, where export earn-ings increased by about 25 per cent in 2010. In Bangladesh, the garments sector, which accounts for almost 70 per cent of total merchandise exports, rebounded in the second half of the year as Pakistan and Sri Lanka lost orders. Despite the improved export perform-ance, trade deficits widened in all South Asian countries in 2010, except for the Islamic Republic of Iran. Higher prices for energy products, along with strong domestic demand, caused a significant increase in import bills. The factors causing trade deficits to widen were offset, in part, by increased worker remittances, which continued to grow in 2010, albeit at a slower rate than in recent years. In 2011 and 2012, trade deficits are expected to increase further, although at a more moderate pace than in 2010.
Downside risks for the region’s outlook are related to the expected tightening of monetary and fiscal policies amidst relatively weak global conditions. If energy and food prices increase in 2011 and become more volatile, policymakers will find it even more difficult to bring inflation back to target and to consolidate fiscal balances. A more rapid-than-expected tightening could weaken growth and lead to further social unrest in some countries. In Pakistan, a further deterioration of the security situation would hinder the reconstruction of the flood-hit areas and lead to a sharper economic slowdown.
Western Asia: solid growth after a sharp rebound
Western Asia’s economic prospects have been improving continuously after the pessimism that prevailed during 2008-2009. After a pronounced economic recovery in 2010, the re-gion will see solid economic growth of about 4.5 per cent in both 2011 and 2012, although this remains below the levels reached in the years preceding the global economic crisis (see annex table A.3 and figure IV.9).
The economic performance of fuel exporters mirrors the trajectory of oil prices. After dropping by 37 per cent in 2009, the annual average oil price increased by 28 per cent in 2010 and is expected to fall by 5 per cent in 2011. Against this background, oil exporters will register growth rates in 2011 comparable to those for 2010, although non-oil related engines of growth seem to be becoming more important. In Saudi Arabia, for example, which is the second-largest producer of crude oil after Russia and where oil-related activities represent almost 30 per cent of GDP, both government consumption and public investment have become stronger drivers of growth in an overall fairly balanced economic performance. The picture is similar in the United Arab Emirates, with government spending underpin-ning robust growth in 2011. However, as a payback to the economic diversification strategy, the services sector, particularly tourism, and the manufacturing sector are also providing significant growth impulses. In Yemen, by contrast, the economy will benefit from increases in its gas production capacity, while water shortage hampers the agricultural sector and political instability casts a shadow over the general economic performance.
Trade deficits have widened despite a recovery in exports
An increase in energy and food prices could lead to more rapid policy tightening
Growth is recovering but remains below pre-crisis levels
Higher oil prices are driving growth for the fuel exporters

126 World Economic Situation and Prospects 2011
The non-oil exporters are forecast to see continued solid growth rates, with private consumption representing a major pillar of support. This is the case, for example, in Turkey, whose economy contracted by 4.7 per cent in 2009 and where supportive mon-etary and fiscal policies have been propelling private consumption and investment, leading to a pronounced jump in GDP growth to 7.4 per cent in 2010. The recovery is expected to continue in 2011, but at a more moderate pace of 4.6 per cent. A similar constellation emerges in Israel, where strong private consumption will more than offset the dampening effect from relatively weaker export demand, resulting in growth rates of about 3.0 per cent or higher in both 2011 and 2012. As an example of the positive ripple effects of gener-ally positive regional growth conditions, Lebanon is forecast to register growth of more than 5.0 per cent in 2011 and 2012. One of the main drivers of this performance remains tourism, which has significant positive impacts for construction activity, employment and, thus, available household incomes and private consumption.
The employment situation generally remains challenging, referring to both open and hidden unemployment as well as underemployment. However, some relatively positive signs have emerged in the aftermath of the peak of the crisis. In Turkey, after a jump to above 14 per cent in 2009, the unemployment rate is expected to fall modestly to below 13 per cent in 2010 and 2011. Likewise, in Israel, after reaching 7.6 per cent in 2009, unemployment will drop below the 7 per cent mark in 2011. The global recovery, not least reflected in the revival of international trade, has been a major factor in this respect.
Since its peak during the second half of 2008, consumer price inflation in the region has slowed down considerably, with the lower level of commodity prices being a major factor. Iraq, Jordan and Qatar experienced deflation in 2009. In the case of Qatar, deflation persisted in 2010. In 2011, all economies in the region are forecast to see positive inflation rates on the back of upward price pressure in the form of gradually increasing
Private consumption is supporting economic
activity for the non-oil exporters
Unemployment has stabilized but remains a
major challenge
The inflation picture remains mixed
Figure IV.9GDP growth in Western Asia, 2002-2012
-2.0
0.0
2.0
4.0
6.0
8.0
10.0
2002 2003 2004 2005 2006 2007 2008 2009 2010a 2011b 2012b
Western Asia
Gulf Cooperation Council countries
Source: UN/DESA, based on Project LINK.
a Partly estimated.b Baseline scenario forecasts, based in part on Project LINK.
127Regional developments and outlook
food prices and rising public sector wages, particularly in the Gulf Cooperation Council (GCC) countries. However, second-round effects on inflation from the expected public sector wage increases are expected to be limited.
In line with the inflation outlook, monetary policy in the region will likely vary as well. In Turkey, the central bank is expected to increase its policy interest rate in the first half of 2011 in view of rising price pressures on the back of stronger domestic demand. By contrast, in Israel, where monetary policy tightening has already been in progress since 2009, the central bank is expected to proceed more slowly with any further interest rate hikes in light of a slight drop in inflation to 2.4 per cent in 2011. Other countries such as Jordan, Kuwait and Qatar saw lower policy interest rates in 2010 and are expected to maintain their policy stances in 2011, not least in view of relatively tighter financing conditions in the regional credit market.
In general, Western Asia’s Governments remained prudent in their budget planning and implementation. The fiscal stance of GCC countries has remained active in 2010 and is expected to stay in the range of active to neutral in 2011. Overall, fuel exporters will post solid budget surpluses in 2011, although these will be moderately lower than in 2010, reflecting slightly lower oil prices. By contrast, non-fuel exporters will face increasing fiscal policy constraints. Both Jordan and Lebanon, for example, will continue to run budget deficits of about 10 per cent of GDP in 2010 and 2011. Consequently, outstanding public debt and the implied interest payments are significant factors limiting fiscal room to manoeuvre.
External balances in the fuel-exporting countries will continue to show solid surpluses in 2011 in light of the combination of only slightly lower oil prices and largely stable output. In Saudi Arabia, for example, the current-account surplus is forecast to remain at about 10 per cent of GDP in 2011, after more than doubling to about 12 per cent in tandem with recovering oil prices in the immediate aftermath of the global eco-nomic crisis in 2010. The general dynamics of global trade also remain relevant for the fuel-exporting economies, as illustrated by the case of Oman. The economy will benefit not only from its oil sector but also from the increasing role of re-exports through its port facilities. The outlier in the region remains Qatar, where major new liquefied natural gas projects will boost exports and lead to a tripling of the trade surplus in 2010 and a further increase by about 65 per cent in 2011.
By contrast, non-fuel exporters saw an increase in trade deficits during the re-covery from the crisis, not least due to vigorous domestic demand that outpaced impulses from the main export markets. In 2011, trade balances will register further increases in deficits as the effect of slightly lower oil prices on the import bill is more than offset by strength in domestic demand. This will generally keep current accounts in deficit. In the case of Israel, however, strong exports of business services, including computer software, will continue to ensure a solid current-account surplus.
Sharper volatility and a possible drop in oil prices remain major downside risks for fuel exporters. Economic performance of non-fuel exporters will be directly affected by weaker growth in the major developed economies. For example, almost half of Turkey’s exports go to the EU, while about 40 per cent of the exports of Israel go to the United States. Consequently, any renewed economic slowdown in these export markets holds the potential to significantly alter the growth trajectory in the region. At the same time, however, the prospects for the region’s major international debtors are fair with respect to achieving balance-sheet adjustments through debt rescheduling.
Monetary policy will also vary depending on the phase of the recovery
Fiscal policies will remain active but will become increasingly subject to constraints
Oil exports drive solid external surpluses in the fuel-exporting countries
Strong domestic demand is pushing trade balances further into deficit for the non-fuel exporters
Oil price volatility and the weakening recovery of developed economies remain major downside risks

128 World Economic Situation and Prospects 2011
Latin America and the Caribbean: strong economic recovery, but diverging across countries
Latin America and the Caribbean saw a stronger-than-expected economic recovery in 2010. GDP of the region as a whole is estimated to have increased by 5.6 per cent in 2010, after contracting by 2.1 per cent in 2009. In 2011 and 2012, economic growth is expected to slow to 4.1 per cent and 4.3 per cent, respectively, but to remain relatively robust by historical standards of the region (see annex table A.3).
The strong rebound has been supported in part by counter-cyclical macr-oeconomic policies initiated in 2009, which helped restore confidence and strengthened domestic demand through 2010. Private consumption growth was generally strong, stimulated by lower interest rates, higher real wages—as a consequence of sharp reduc-tions in inflation—and targeted social programmes. As a result, in most Latin American countries, the recovery was led by domestic demand. Despite improved external condi-tions, the contribution of net exports to growth was negative in 2010 (see figure IV.10). Strong domestic demand pushed up import volumes at a rate faster than export growth. In 2011, growth is expected to decelerate as counter-cyclical policies are being phased out and inventory-building will make a smaller contribution to GDP.
The recovery has been especially strong among the South American countries, which were more proactive in implementing counter-cyclical macroeconomic policies, but which also saw a strong return of private capital flows and benefited from high demand for and prices of primary commodities (especially, mining and agricultural products). The combination of these factors supported strong growth of domestic demand. During the first half of 2010, Argentina, Brazil, Paraguay and Uruguay posted the highest GDP growth (9.4, 8.9, 11.7 and 9.6 per cent, respectively). The Bolivarian Republic of Venezuela was the main outlier as it saw its economy shrink by 3.5 per cent in the first half of 2010, owing to strong declines in domestic demand and oil production. On average, however,
The region will see higher-than-anticipated growth
South America has seen a strong economic rebound
Figure IV.10Latin America: GDP growth rate and contribution to growth of components of aggregate demand, 2004-2010
Constant 2000 dollars
- 6
- 4
- 2
0
2
4
6
8
2004 2005 2006 2007 2008 2009 2010a
Private consumption
Public consumption
Investment
Net exports
GDP (annual growth rate)
Source: Economic Commission for Latin America
and the Caribbean (ECLAC), on the basis of official figures.
a First trimester.

129Regional developments and outlook
GDP growth in South America reached an estimated 6.3 per cent of GDP growth in 2010 but is expected to slow to 4.5 per cent in 2011 with the phasing out of stimulus measures and a weakening of global trade growth.
The economic recovery in Mexico, Central America and the Caribbean has been slower, as these countries continue to be highly dependent upon output growth in the United States. Mexico recovered steadily in the first half of 2010, supported mainly by external demand for automobiles produced in the country. The rebound is expected to weaken, however, as recovery of the United States economy is losing its momentum. Domestic demand growth in Mexico and Central America is not strong enough to offset weakening external demand, as consumer confidence remains low and Governments are tightening budgets. The Mexican economy is estimated to have grown by 5.0 per cent in 2010, but GDP growth is projected to slow to 3.4 per cent in 2011. In the Caribbean, de-spite some improvements in remittances and tourist inflows through 2010, the economic situation is also expected to continue to be particularly challenging in 2011 and 2012.
The strong rebound in output has boosted job creation in several South American countries. This has helped to bring down the average rate of unemployment for the region, which dropped to 7.8 per cent in 2010, down from 8.2 per cent in 2009, but is still above that reached in 2008. The situation is more dramatic in some Caribbean coun-tries, such as Jamaica, where double-digit unemployment is increasing further. Real wages have increased in several countries across the region, particularly in Chile, Costa Rica, El Salvador, Paraguay and Uruguay, as inflation rates dropped significantly from 2008 levels and employment growth put upward pressure on nominal wages.
Inflation rates have been on an upward trend in 2010, but remain low compared with pre-crisis levels. Higher inflation is mainly explained by an increase in commodity prices and the withdrawal of subsidies for energy and food products in Central America and the Caribbean. Inflationary pressures are expected to remain weak in the near term in most countries. The situation is more challenging in Argentina and the Bolivarian Republic of Venezuela, where inflation rates are expected to continue in the double digits.
Current-account deficits are expected to widen somewhat in 2011 and 2012, as a result of weakening export prospects. During 2010, the rebound in global trade and rising commodity prices boosted export revenue, especially for net commodity exporters, includ-ing the Bolivarian Republic of Venezuela, Colombia, Ecuador and the Plurinational State of Bolivia. For the region as a whole, the terms of trade are estimated to have improved by about 7 per cent in 2010. Despite gains in the terms of trade, the regional trade surplus observed in 2009 is expected to have eroded in 2010, as import volumes have increased at a faster pace. The current-account deficit is estimated at about 0.5 per cent of regional GDP in 2010 and is expected to widen in 2011 and 2012, reflecting a deterioration of the trade account.
Remittance inflows have recovered modestly, rising by an estimated 5 per cent in 2010, having fallen significantly in 2009, by 12 per cent. As labour markets in Europe and the United States are not expected to improve rapidly, prospects for remittances re-main weak for 2011 and the losses in 2009 will not be recovered.
Private capital inflows to Mexico and South America recovered during 2010. FDI inflows are estimated to have increased by 40 to 50 per cent in 2010. This outweighed the increase in the current-account deficit, allowing for further accumulation of foreign-exchange reserves. In addition, risk premia on external borrowing have declined to below pre-crisis levels. Lower borrowing costs and easier access to external financing support the expansion of domestic demand, but also contribute to the exchange-rate appreciation (see box IV.3). Currencies of the region appreciated on average by about 4.5 per cent in 2010. Monetary authorities in several countries have responded by intervening in foreign-exchange markets and introducing stricter controls on short-term capital inflows.
Growth in Mexico, Central America and the Caribbean is highly sensitive to that of the United States
Employment creation has strengthened, but unemployment is above pre-crisis rates
The inflation outlook remains benign
Current-account deficits will widen as export growth weakens
The surge in capital inflows to Latin America contributes to currency appreciations

130 World Economic Situation and Prospects 2011
Currency appreciation in Latin America and the Caribbean
Since the end of the first quarter of 2009, there have been strong and persistent upward pressures on most currencies of the countries in Latin America and the Caribbean (see figure).
Several external and internal factors explain these pressures. First, unprecedented ex-pansionary monetary policy in the United States of America, the euro area and Japan, including ag-gressive interest rate cuts and quantitative easing measures, has led to low rates of return and excess liquidity in the financial markets of developed economies. Higher rates of return in emerging markets, including those in South America and Mexico, have induced international investors to change their portfolios. The rate of return differential is expected to persist in the near future as developed coun-tries are expected to continue their expansionary monetary policy stance given the weak recovery of their economies, while economic growth in Latin America is forecast to remain relatively strong in 2011. Second, several countries, including Brazil, Chile and Peru, have started to tighten monetary policies during 2010 in efforts to take some air out of emerging asset price bubbles and to limit domestic credit expansion. This has led to a further widening of the interest rate differentials with financial markets in Europe and the United States, providing further stimulus to capital inflows.
The surge in capital inflows has put upward pressure on real exchange rates in the region, thus posing macroeconomic policy challenges. The currency appreciation is eroding the competitiveness of exports and making imports cheaper. With domestic demand staying strong, current-account deficits are set to widen. In the short run, exports of manufactures are likely to be hurt most, being more sensitive to exchange-rate adjustments. The consequences will be felt most in the economies of Mexico and Central America, which rely more heavily on manufacturing exports and face even stronger competition from exports from China in the United States market, particularly as the Chinese currency does not appreciate significantly.
The currency appreciation induced by capital inflows is structurally weakening export capacity. Booming commodity prices helped the strong recovery, especially in the South American economies, but they also reinforced existing export specialization patterns with a heavy reliance on primary exports. The real exchange-rate appreciation will further limit incentives towards greater diversification, which may harm economic growth in the medium term. Primary export specializa-tion makes economies more vulnerable to external shocks as fluctuating exchange rates and inter-est rates cause high volatility in key domestic prices. This in turn induces greater macroeconomic uncertainty, which tends to affect productive investment and thereby weaken long-term growth and employment generation.
Box IV.3
Real effective exchange-rate variables,a third quarter 2008 to third quarter 2010
Percentage
-20 -15 -10 -5 0 5 10 15 20
Costa RicaTrinidad and Tobago
ColombiaUruguay
HondurasEcuador
PeruBrazil
PanamaBolivia, Plurinational State of
ChileEl Salvador
Dominican RepublicJamaica
ArgentinaNicaragua
GuatemalaMexico
Venezuela, Bolivarian Republic ofParaguay
Source: ECLAC, on the basis of official figures.
a A decline in the real effective exchange rate
represents appreciation, while an increase indicates
depreciation.

131Regional developments and outlook
On the whole, fiscal revenues in Latin America and the Caribbean increased, on average, by about 1 per cent of GDP in 2010, reflecting the robust economic recovery in South America. This has narrowed the primary deficit and contributed to the reduc-tion of the average fiscal deficit of the region, estimated to have fallen from 2.7 per cent in 2009 to about 2.1 per cent of regional GDP in 2010 (see figure IV.11). However, fiscal conditions vary across the region. Not all countries saw government revenue increase, while most expanded public spending during 2010 to support the recovery. As a result, a number of countries, especially several in Central America and the Caribbean, have limited fiscal space left and face high levels of public indebtedness. Some will need additional external financing to cover expenditure needs. By contrast, most South American countries have sufficient fiscal space left and should be able to continue stimulus as needed to keep the momentum of recovery. This includes Chile, which has large additional expenditure needs in order to continue the post-earthquake reconstruction.
As domestic demand rebounded strongly and fears of overheating economies increased, a number of countries in South America have started to tighten monetary pol-icy. Several central banks, including those of Brazil, Chile and Peru, have increased their policy interest rates and their reserve requirements for banks to stem excessive lending. As the inflation outlook remains benign, central banks are not expected to tighten monetary conditions much further in the near term. In several countries in Central America and the Caribbean, monetary policy is expected to continue to be relatively loose, given limited fiscal space and the need for further stimulus given the outlook for a weak economic recovery in the near term.
Risks to the outlook are associated with both external and domestic factors. External risks are related to a worse-than-anticipated slowdown in developed economies. This could affect commodity prices and export volumes in general. Further appreciation of national currencies against the dollar could also undermine export growth. At the do-mestic level, fears of domestic asset bubbles or lack of fiscal space could push countries to withdraw their monetary and fiscal stimuli faster than expected, which could be harmful to GDP growth in the near term.
Fiscal balances have strengthened in South America, but fiscal policy space is limited in Central America and the Caribbean
Monetary tightening has started in South America in the light of fears of economic overheating
Downside risks are associated with external and domestic factors
Policymakers in the region have responded with measures to stem the volatility of short-term capital inflows and offload pressure on their exchange rates. The central banks of Argentina, Colombia, and, more recently, Brazil and Peru have introduced capital controls. Brazilian authorities, for instance, reintroduced a tax on foreign purchases of domestic equity and bonds, and tripled the rate from 2 per cent to 6 per cent. The monetary authorities in Peru increased reserve requirements on short-term foreign loans. In addition, several central banks are actively intervening in foreign-exchange markets—accumulating more international reserves in the process—in efforts to reduce pressures for further appreciation of their national currencies. By heavily intervening in foreign currency markets, monetary authorities in Argentina were successful in avoiding an apprecia-tion of the peso. In the Bolivarian Republic of Venezuela, the Government introduced a multitiered fixed exchange rate regime and devalued the national currency against the United States dollar—by 21 per cent for certain purchases abroad and by 50 per cent for non-essential products—in January 2010. The devaluation was large enough to more than offset the real appreciation of the bolívar in the period prior to that.
Capital-account regulations and reserve accumulation appear sensible policy responses in the present context, but may not be enough. The measures will need to be supplemented with structural policies to support sustained growth over the medium term and fiscal and/or monetary measures to contain domestic demand that has grown too quickly, spurred by asset price bubbles. In addition, greater coordination at the international level in managing exchange rates, readjusting the global imbalances and improving financial regulation will be needed for a more lasting solution.
Box IV.3 (cont’d)

132 World Economic Situation and Prospects 2011
Figure IV.11Latin America and the Caribbean: government revenue, expenditure and fiscal balances, 2006-2010a
Percentage of GDP
-25
-20
-15
-10
-5
0
5
10
15
20
25
2006 2007 2008 2009 2010b
Reve
nues
and
exp
endi
ture
s
-5
-4
-3
-2
-1
0
1
2
3
4
5
Prim
ary
bala
nce
Source: ECLAC, based on official figures.
a Coverage refers to the central government, except for the Plurinational State of Bolivia where it refers to the
general government. b Projections.
Other revenue
Tax revenue
Current expenditure
Capital expenditure
Total revenue
Total expenditure
Primary balance

Statistical annex


135
Country classificationData sources, country classifications and aggregation methodology
The statistical annex contains a set of data that the World Economic Situation and Prospects (WESP) employs to delineate trends in various dimensions of the world economy.
Data sources
The annex was prepared by the Development Policy and Analysis Division (DPAD) of the Department of Economic and Social Affairs of the United Nations Secretariat (UN/DESA). It is based on information obtained from the Statistics Division and the Population Division of UN/DESA, as well as from the five United Nations regional commissions, the United Nations Conference on Trade and Development (UNCTAD), the United Nations World Tourism Organization (UNWTO), the International Monetary Fund (IMF), the World Bank, the Organization for Economic Cooperation and Development (OECD), and national and private sources. Estimates for the most recent years were made by DPAD in consultation with the regional commissions, UNCTAD, UNWTO and participants in Project LINK, an international collaborative research group for econometric modelling coordinated jointly by DPAD and the University of Toronto. Forecasts for 2011 and 2012 are primarily based on the World Economic Forecasting Model of DPAD, with support from Project LINK.
Data presented in WESP may differ from those published by other organi-zations for a series of reasons, including differences in timing, sample composition and aggregation methods. Historical data may differ from those in previous editions of WESP because of updating and changes in the availability of data for individual countries.
Country classifications
For analytical purposes, WESP classifies all countries of the world into one of three broad categories: developed economies, economies in transition and developing countries. The composition of these groupings, specified in tables A, B and C, is intended to reflect basic economic country conditions. Several countries (in particular the economies in transition) have characteristics that could place them in more than one category; however, for purposes of analysis, the groupings have been made mutually exclusive. Within each broad category, some subgroups are defined based either on geographical location or on ad hoc criteria, such as the subgroup of “major developed economies”, which is based on the membership of the Group of Seven. Geographical regions for developing countries are as follows: Africa, East Asia, South Asia, Western Asia, and Latin America and the Caribbean.a
In parts of the analysis, a distinction is made between fuel exporters and fuel importers from among the economies in transition and the developing countries. An economy is classified as a fuel exporter if the share of fuel exports in its total merchandise exports is greater than 20 per cent and the level of fuel exports is at least 20 per cent higher than that of the country’s fuel imports. This criterion is drawn from the share of fuel
a Names and composition of geographical areas follow those specified in the statistical paper entitled “Standard country or area codes for statistical use” (ST/ESA/STAT/SER.M/49/Rev. 4).

136 World Economic Situation and Prospects 2011
exports in the total value of world merchandise trade. Fuels include coal, oil and natural gas (table D).
For other parts of the analysis, countries have been classified by their level of development as measured by per capita gross national income (GNI). Accordingly, coun-tries have been grouped as high-income, upper middle income, lower middle income and low-income (table E). To maintain compatibility with similar classifications used elsewhere, the threshold levels of GNI per capita are those established by the World Bank. Countries with less than $995 GNI per capita are classified as low-income countries, those with between $996 and $3,945 as lower middle income countries, those with between $3,946 and $12,195 as upper middle income countries, and those with incomes of more than $12,196 as high-income countries. GNI per capita in dollar terms is estimated using the World Bank Atlas method,b and the classification in table E is based on data for 2009.
The list of the least developed countries (LDCs) is decided upon by the United Nations Economic and Social Council and, ultimately, by the General Assembly, on the basis of recommendations made by the Committee for Development Policy. The basic criteria for inclusion require that certain thresholds be met with regard to per capita GNI, a human assets index and an economic vulnerability index.c As at 25 November 2010, there were 49 LDCs (table F).
WESP also makes reference to the group of heavily indebted poor countries (HIPCs), which are considered by the World Bank and IMF as part of their debt-relief initiative (the Enhanced HIPC Initiative).d In November 2010, there were 40 HIPCs (see table G).
Aggregation methodology
Aggregate data are either sums or weighted averages of individual country data. Unless otherwise indicated, multi-year averages of growth rates are expressed as compound annual percentage rates of change. The convention followed is to omit the base year in a multi-year growth rate. For example, the 10-year average growth rate for the decade of the 2000s would be identified as the average annual growth rate for the period from 2001 to 2010.
WESP utilizes exchange-rate conversions of national data in order to aggregate output of individual countries into regional and global totals. The growth of output in each group of countries is calculated from the sum of gross domestic product (GDP) of individual countries measured at 2005 prices and exchange rates. Data for GDP in 2005 in national currencies were converted into dollars (with selected adjustments) and extended forwards and backwards in time using changes in real GDP for each country. This method supplies a reasonable set of aggregate growth rates for a period of about 15 years, centred on 2005.
The exchange-rate based method differs from the one mainly applied by the IMF and the World Bank for their estimates of world and regional economic growth, which is based on purchasing power parity (PPP) weights. Over the past two decades, the growth of world gross product (WGP) on the basis of the exchange-rate based approach
b See http://data.worldbank.org/about/country-classifications.
c Handbook on the Least Developed Country Category: Inclusion, Graduation and Special Support Measures (United Nations publication, Sales No. E.07.II.A.9). Available from http://www.un.org/esa/analysis/devplan/cdppublications/2008cdphandbook.pdf.
d International Development Association (IDA) and IMF, “Heavily Indebted Poor Countries (HIPC) Initiative and Multilateral Debt Relief Initiative (MDRI): Status of implementation”, 14 September 2010. Available from http://www.imf.org/external/np/pp/eng/2010/091410.pdf.

137Country classification
has been below that based on PPP weights. This is because developing countries, in the aggregate, have seen significantly higher economic growth than the rest of the world in the 1990s and 2000s and the share in WGP of these countries is larger under PPP measure-ments than under market exchange rates.
Table A Developed economies
Europe
Other countries Major developed economies (G7)European Union Other Europe
EU-15
AustriaBelgiumDenmarkFinlandFranceGermanyGreeceIrelandItalyLuxembourgNetherlandsPortugalSpainSwedenUnited Kingdom
IcelandNorwaySwitzerland
AustraliaCanadaJapanNew ZealandUnited States
Canada Japan FranceGermanyItalyUnited States
New EU member StatesBulgariaCyprusCzech RepublicEstoniaHungaryLatviaLithuaniaMaltaPolandRomaniaSlovakiaSlovenia

138 World Economic Situation and Prospects 2011
Table B Economies in transition
South-eastern EuropeCommonwealth of Independent States and Georgiaa
AlbaniaBosnia and HerzegovinaCroatiaMontenegroSerbia The former Yugoslav Republic of Macedonia
ArmeniaAzerbaijanBelarusGeorgiaa
KazakhstanKyrgyzstanRepublic of Moldova Russian FederationTajikistanTurkmenistanUkraine Uzbekistan
a Georgia officially left the Commonwealth of Independent States on 18 August 2009. However, its performance is discussed in the context of this group of countries for reasons of geographic proximity and similarities in economic structure.

139Country classification
Table C Developing economies by regiona
Latin America and the Caribbean Africa East Asia South Asia Western Asia
ArgentinaBarbadosBolivia (Plurinational State of )BrazilChileColombiaCosta RicaCubaDominican RepublicEcuadorEl SalvadorGuatemalaGuyanaHaitiHondurasJamaicaMexicoNicaraguaPanamaParaguayPeruTrinidad and TobagoUruguayVenezuela (Bolivarian Republic of )
AlgeriaAngolaBeninBotswanaBurkina FasoBurundiCameroonCape VerdeCentral African RepublicChadComorosCongoCôte d’IvoireDemocratic Republic of the CongoDjiboutiEgyptEquatorial GuineaEritreaEthiopiaGabonGambiaGhanaGuineaGuinea-BissauKenyaLesothoLiberiaLibyan Arab JamahiriyaMadagascarMalawiMaliMauritaniaMauritiusMoroccoMozambiqueNamibiaNigerNigeriaRwandaSao Tome and PrinicipeSenegalSierra LeoneSomaliaSouth AfricaSudanTogoTunisiaUgandaUnited Republic of TanzaniaZambiaZimbabwe
Brunei DarussalamChinaHong Kong SARb
IndonesiaMalaysiaMyanmarPapua New GuineaPhilippinesRepublic of KoreaSingaporeTaiwan Province of ChinaThailandViet Nam
BangladeshIndiaIran (Islamic Republic of )NepalPakistanSri Lanka
BahrainIraqIsraelJordanKuwaitLebanonOmanQatarSaudi ArabiaSyrian Arab RepuplicTurkeyUnited Arab EmiratesYemen
a Economies systematically monitored by the Global Economic Monitoring Unit of DPAD.b Special Administrative Region of China.

140 World Economic Situation and Prospects 2011
Table D Fuel-exporting countries
Economies in transition
Developing countries
Latin America and the Caribbean Africa East Asia South Asia Western Asia
AzerbaijanKazakhstanRussian FederationTurkmenistanUzbekistan
Bolivia (Plurinational State of )ColombiaEcuadorTrinidad and TobagoVenezuela (Bolivarian Republic of )
AlgeriaAngolaCameroonChadCongoCôte d’IvoireEgyptEquatorial GuineaGabonLibyan Arab JamahiriyaNigeriaSudan
Brunei DarussalamIndonesiaViet Nam
Iran (Islamic Republic of )
BahrainIraqKuwaitOmanQatarSaudi ArabiaUnited Arab EmiratesYemen

141Country classification
Table E Economies by per capita GNI
High income Upper middle income Lower middle income Low income
AustraliaAustriaBahrainBarbadosBelgiumBrunei DarussalamCanadaCroatiaCyprusCzech RepublicDenmarkEquatorial GuineaEstoniaFinlandFranceGermanyGreeceHong Kong SARa
HungaryIcelandIrelandIsraelItalyJapanKuwaitLatviaLuxembourgMaltaNetherlandsNew ZealandNorwayOmanPolandPortugalQatarRepublic of KoreaSaudi ArabiaSingaporeSlovakiaSloveniaSpainSwedenSwitzerlandTaiwan Province of ChinaTrinidad and TobagoUnited Arab EmiratesUnited KingdomUnited States
AlbaniaAlgeriaArgentinaAzerbaijanBelarusBosnia and HerzegovinaBotswanaBrazilBulgariaChileColombiaCosta RicaCubaDominican RepublicGabonIran (Islamic Republic of )JamaicaKazakhstanLebanonLibyan Arab JamahiriyaLithuaniaMalaysiaMauritiusMexicoMontenegroNamibiaPanamaPeruRomaniaRussian FederationSerbia South AfricaThe former Yugoslav Republic of MacedoniaTurkeyUruguayVenezuela (Bolivarian Republic of )
AngolaArmeniaBolivia (Plurinational State of )CameroonCape VerdeChinaCongoCôte d’IvoireDjiboutiEcuadorEgyptEl SalvadorGeorgiaGuatemalaGuyanaHondurasIndiaIndonesiaIraqJordanLesothoMoroccoNicaraguaNigeriaPakistanPapua New GuineaParaguayPhilippinesRepublic of MoldovaSao Tome and PrinicipeSenegalSri LankaSudanSyrian Arab RepublicThailandTunisiaTurkmenistanUkraineUzbekistanViet NamYemen
BangladeshBeninBurkina FasoBurundiCentral African RepublicChadComorosDemocratic Republic of the CongoEritreaEthiopiaGambiaGhanaGuineaGuinea-BissauHaitiKenyaKyrgyzstanLiberiaMadagascarMalawiMaliMauritaniaMozambiqueMyanmarNepalNigerRwandaSierra LeoneSomaliaTajikistanTogoUgandaUnited Republic of Tanzania ZambiaZimbabwe
a Special Administrative Region of China.

142 World Economic Situation and Prospects 2011
Table F Least developed countries
As of November 2010
Africa East Asia South Asia Western AsiaLatin America and the Caribbean
AngolaBeninBurkina FasoBurundiCentral African RepublicChadComorosDemocratic Republic of the CongoDjiboutiEquatorial GuineaEritreaEthiopiaGambiaGuineaGuinea-BissauLesothoLiberiaMadagascarMalawiMaliMauritaniaMozambiqueNigerRwandaSao Tome and PrincipeSenegalSierra LeoneSomaliaSudanTogoUgandaUnited Republic of TanzaniaZambia
Cambodiaa
KiribatiaLao People’s Democratic Republica
MyanmarSamoaa, b
Solomon Islandsa
Timor Lestea
Tuvalua
Vanuatua
Afghanistana
BangladeshBhutana
Maldivesa, c
Nepal
Yemen Haiti
a Not included in the WESP discussion because of insufficient data.b Samoa will graduate from the list of the least developed countries in January 2014.c Maldives will graduate in January 2011.

143Country classification
Table G Heavily indebted poor countries
As of end-July 2010
Post-completion point HIPCsa Interim HIPCsb Pre-decision point HIPCsc
AfghanistanBeninBoliviaBurkina FasoBurundiCameroonCentral African RepublicCongoDemocratic Republic of the CongoEthiopiaGhanaGuyanaGambiaHaitiHondurasLiberiaMadagascarMalawiMaliMauritaniaMozambiqueNicaraguaNigerRwandaSao Tome and PrincipeSenegalSierra LeoneUgandaUnited Republic of TanzaniaZambia
ChadComorosCôte D’IvoireGuineaGuinea-BissauTogo
EritreaKyrgyzstand
SomaliaSudan
a Countries that have qualified for irrevocable debt relief under the HIPC Initiative.b Countries that have qualified for assistance under the HIPC Initiative (that is to say, have reached decision
point), but have not yet reached completion point.c Countries that are potentially eligible and may wish to avail themselves of the HIPC Initiative or the Multilateral
Debt Relief Initiative (MDRI).d The Kyrgyz authorities indicated in early 2007 that they did not wish to avail themselves of debt relief under the
HIPC Initiative, but subsequently expressed interest in the MDRI. Based on the latest available data, however, indebtedness indicators were estimated to be below the applicable HIPC Initiative thresholds, while income levels were estimated to be above the MDRI thresholds.


Annex tables

List of tables
A. 1 Developed economies: rates of growth of real GDP, 2002-2012 ...................................................................................... 147A. 2 Economies in transition: rates of growth of real GDP, 2002-2012 .................................................................................... 148A. 3 Developing economies: rates of growth of real GDP, 2002-2012 .................................................................................... 149A. 4 Developed economies: consumer price inflation, 2002-2012........................................................................................... 151A. 5 Economies in transition: consumer price inflation, 2002-2012 ......................................................................................... 152A. 6 Developing economies: consumer price inflation, 2002-2012 ......................................................................................... 153A. 7 Developed economies: unemployment rates, 2002-2012 .................................................................................................. 155A. 8 Economies in transition and developing economies: unemployment rates, 2001-2010 ................................ 157A. 9 Major developed economies: quarterly indicators of growth, unemployment and inflation, 2008-2010 .................................................................................................................................... 159A.10 Selected economies in transition: quarterly indicators of growth and inflation, 2008-2010 ......................... 160A.11 Major developing economies: quarterly indicators of growth, unemployment and inflation, 2008-2010 .................................................................................................................................... 161A.12 Major developed economies: financial indicators, 2001-2010 .......................................................................................... 163A.13 Selected economies: real effective exchange rates, broad measurement, 2001-2010 ...................................... 164A.14 Indices of prices of primary commodities, 2001-2010 ........................................................................................................... 166A.15 World oil supply and demand, 2002-2011 ..................................................................................................................................... 167A.16 World trade: changes in value and volume of exports and imports, by major country group, 2002-2012 ............................................................................................................................................... 168A.17 Balance of payments on current accounts, by country or country group, summary table, 2001-2009 ................................................................................................... 170A.18 Balance of payments on current accounts, by country or country group, 2001-2009 ...................................... 171A.19 Net ODA from major sources, by type, 1989-2009 ................................................................................................................... 174A.20 Total net ODA flows from OECD Development Assistance Committee countries, by type, 2000-2009 ............................................................................................................................................................. 175A.21 Commitments and net flows of financial resources, by selected multilateral institutions, 2000-2009 ...................................................................................................................... 176A.22 Greenhouse gas emissions of Annex 1 Parties to the United Nations Framework Convention on Climate Change, 1990-2012 ..................................................................................................... 177

147Annex tables
Table A.1 Developed economies: rates of growth of real GDP, 2002-2012
Annual percentage change
2002-2009a 2002 2003 2004 2005 2006 2007 2008 2009 2010b 2011c 2012c
Developed economies 1.3 1.4 1.8 3.0 2.5 2.8 2.5 0.1 -3.5 2.3 1.9 2.3
United States 1.6 1.8 2.5 3.6 3.1 2.7 1.9 0.0 -2.6 2.6 2.2 2.8Canada 1.7 2.9 1.9 3.1 3.0 2.8 2.2 0.5 -2.5 2.9 2.5 3.1Japan 0.5 0.3 1.4 2.7 1.9 2.0 2.4 -1.2 -5.2 2.7 1.1 1.4Australia 3.1 3.9 3.2 3.6 3.2 2.6 4.8 2.2 1.2 3.3 3.7 3.0New Zealand 2.6 4.6 4.4 4.0 3.1 2.3 3.1 -0.5 -0.4 2.7 2.4 3.0
European Union 1.2 1.2 1.3 2.5 2.0 3.2 2.9 0.5 -4.2 1.8 1.6 2.0
EU-15 1.0 1.2 1.2 2.4 1.8 3.0 2.8 0.3 -4.3 1.7 1.5 1.9Austria 1.6 1.6 0.8 2.5 2.5 3.6 3.7 2.2 -3.9 1.8 2.0 2.1Belgium 1.4 1.4 0.8 3.2 1.7 2.7 2.9 1.0 -2.7 2.0 1.0 1.6Denmark 0.6 0.5 0.4 2.3 2.4 3.4 1.7 -0.9 -4.7 1.4 1.8 2.0Finland 1.6 1.8 2.0 4.1 2.9 4.4 5.3 0.9 -8.0 2.6 3.0 2.5France 1.1 1.0 1.1 2.5 1.9 2.2 2.4 0.2 -2.6 1.6 1.2 1.3Germany 0.5 0.0 -0.2 1.2 0.8 3.4 2.7 1.0 -4.7 3.4 2.2 2.4Greece 3.1 3.4 5.9 4.6 2.2 4.5 4.5 2.0 -2.0 -4.8 -3.6 0.1Ireland 2.5 6.5 4.4 4.6 6.0 5.3 5.6 -3.5 -7.6 -1.0 -0.9 1.5Italy 0.0 0.5 0.0 1.5 0.7 2.0 1.5 -1.3 -5.0 1.3 1.1 1.2Luxembourg 3.0 4.1 1.5 4.4 5.4 5.0 6.6 1.4 -3.7 3.2 2.0 2.6Netherlands 1.2 0.1 0.3 2.2 2.0 3.4 3.9 1.9 -3.9 1.8 1.5 2.4Portugal 0.4 0.7 -0.9 1.6 0.8 1.4 2.4 0.0 -2.6 0.8 -0.9 0.2Spain 2.2 2.7 3.1 3.3 3.6 4.0 3.6 0.9 -3.7 -0.7 0.4 1.0Sweden 1.7 2.5 2.3 4.2 3.2 4.3 3.3 -0.4 -5.1 4.3 3.4 3.0United Kingdom 1.3 2.1 2.8 3.0 2.2 2.8 2.7 -0.1 -5.0 1.8 2.1 2.6
New EU member States 3.8 3.1 4.3 5.6 4.7 6.5 6.2 4.0 -3.6 1.9 3.2 4.3Bulgaria 4.6 4.7 5.5 6.7 6.4 6.5 6.4 6.2 -4.9 0.4 3.4 5.5Cyprus 2.9 2.1 1.9 4.2 3.9 4.1 5.1 3.6 -1.7 1.0 1.5 1.5Czech Republic 3.4 1.9 3.6 4.5 6.3 6.8 6.1 2.5 -4.1 2.0 2.0 3.0Estonia 3.5 7.9 7.6 7.2 9.4 10.6 6.9 -5.1 -13.9 1.5 3.0 3.0Hungary 2.0 4.4 4.3 4.9 3.5 4.0 1.0 0.6 -6.3 0.8 2.5 3.5Latvia 3.6 6.5 7.2 8.7 10.6 12.2 10.0 -4.2 -18.0 -0.8 3.0 3.8Lithuania 4.5 6.9 10.2 7.4 7.8 7.8 9.8 2.9 -14.7 -0.6 2.7 3.5Malta 1.9 2.6 -0.3 0.9 4.0 3.6 3.7 2.6 -2.1 1.5 2.0 1.5Poland 4.2 1.4 3.9 5.3 3.6 6.2 6.8 5.1 1.6 3.6 4.2 5.5Romania 4.6 5.1 5.2 8.5 4.2 7.9 6.3 7.3 -7.1 -1.5 2.5 4.0Slovakia 5.1 4.6 4.8 5.0 6.7 8.5 10.6 6.2 -4.7 3.8 3.5 4.0Slovenia 2.9 4.0 2.8 4.3 4.5 5.9 6.9 3.7 -8.1 0.6 2.4 3.1
Other Europe 1.6 0.9 0.4 3.2 2.8 3.1 3.3 1.4 -1.8 1.3 2.1 2.2
Iceland 2.7 0.1 2.4 7.7 7.5 4.6 6.0 1.0 -6.8 -3.4 0.5 0.5Norway 1.7 1.5 1.0 3.9 2.7 2.3 2.7 0.8 -1.4 1.0 2.4 2.2Switzerland 1.5 0.4 -0.2 2.5 2.6 3.6 3.6 1.9 -1.9 1.8 1.9 2.2
Memorandum items:
North America 1.6 1.9 2.4 3.5 3.1 2.7 2.0 0.0 -2.6 2.6 2.2 2.8Western Europe 1.2 1.2 1.3 2.5 2.0 3.2 3.0 0.5 -4.1 1.7 1.6 2.0Asia and Oceania 0.9 0.8 1.7 2.9 2.1 2.1 2.7 -0.7 -4.2 2.8 1.5 1.7Major developed economies 1.1 1.3 1.7 2.9 2.3 2.6 2.2 -0.2 -3.6 2.5 1.9 2.3
Sources: UN/DESA, based on data of the United Nations Statistics Division, OECD and individual national sources.Note: Country groups are calculated as a weighted average of individual country growth rates of gross domestic product (GDP), where weights are based on GDP in 2005 prices and exchange rates.
a Average percentage change.b Partly estimated.c Baseline scenario forecasts, based in part on Project LINK and UN/DESA World Economic Forecasting Model.
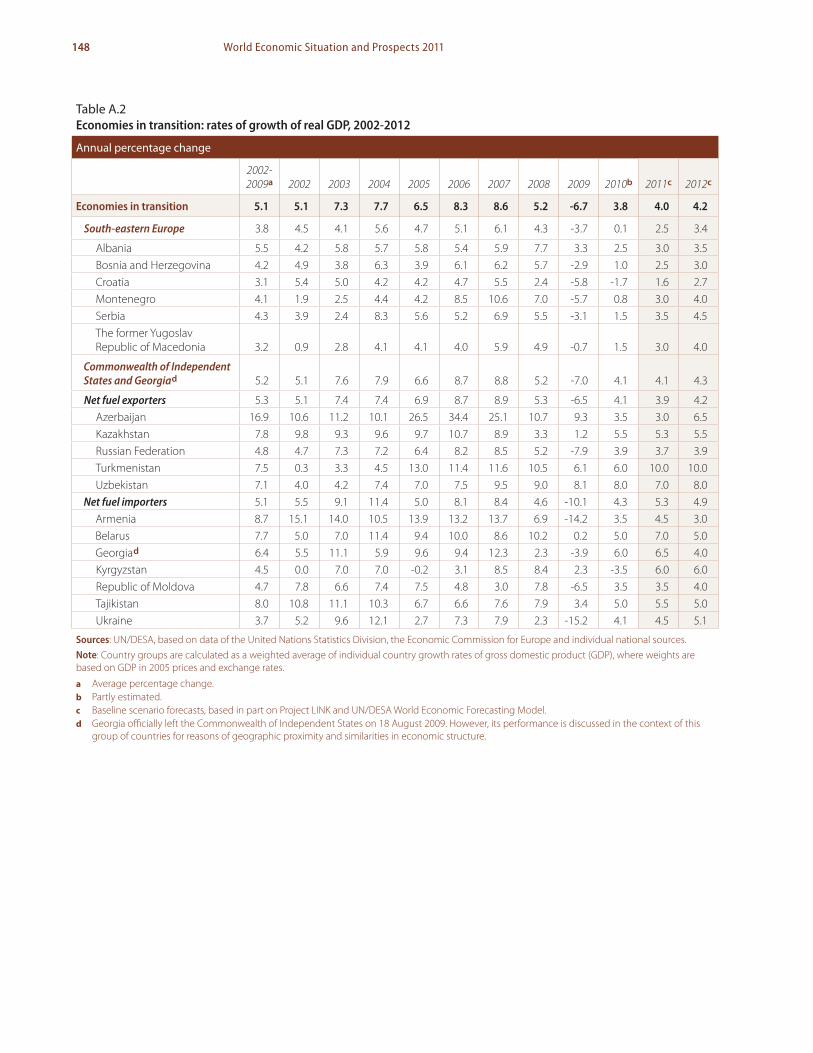
148 World Economic Situation and Prospects 2011
Table A.2Economies in transition: rates of growth of real GDP, 2002-2012
Annual percentage change
2002-2009a 2002 2003 2004 2005 2006 2007 2008 2009 2010b 2011c 2012c
Economies in transition 5.1 5.1 7.3 7.7 6.5 8.3 8.6 5.2 -6.7 3.8 4.0 4.2
South-eastern Europe 3.8 4.5 4.1 5.6 4.7 5.1 6.1 4.3 -3.7 0.1 2.5 3.4
Albania 5.5 4.2 5.8 5.7 5.8 5.4 5.9 7.7 3.3 2.5 3.0 3.5Bosnia and Herzegovina 4.2 4.9 3.8 6.3 3.9 6.1 6.2 5.7 -2.9 1.0 2.5 3.0Croatia 3.1 5.4 5.0 4.2 4.2 4.7 5.5 2.4 -5.8 -1.7 1.6 2.7Montenegro 4.1 1.9 2.5 4.4 4.2 8.5 10.6 7.0 -5.7 0.8 3.0 4.0Serbia 4.3 3.9 2.4 8.3 5.6 5.2 6.9 5.5 -3.1 1.5 3.5 4.5The former Yugoslav Republic of Macedonia 3.2 0.9 2.8 4.1 4.1 4.0 5.9 4.9 -0.7 1.5 3.0 4.0
Commonwealth of Independent States and Georgiad 5.2 5.1 7.6 7.9 6.6 8.7 8.8 5.2 -7.0 4.1 4.1 4.3
Net fuel exporters 5.3 5.1 7.4 7.4 6.9 8.7 8.9 5.3 -6.5 4.1 3.9 4.2Azerbaijan 16.9 10.6 11.2 10.1 26.5 34.4 25.1 10.7 9.3 3.5 3.0 6.5Kazakhstan 7.8 9.8 9.3 9.6 9.7 10.7 8.9 3.3 1.2 5.5 5.3 5.5Russian Federation 4.8 4.7 7.3 7.2 6.4 8.2 8.5 5.2 -7.9 3.9 3.7 3.9Turkmenistan 7.5 0.3 3.3 4.5 13.0 11.4 11.6 10.5 6.1 6.0 10.0 10.0Uzbekistan 7.1 4.0 4.2 7.4 7.0 7.5 9.5 9.0 8.1 8.0 7.0 8.0
Net fuel importers 5.1 5.5 9.1 11.4 5.0 8.1 8.4 4.6 -10.1 4.3 5.3 4.9Armenia 8.7 15.1 14.0 10.5 13.9 13.2 13.7 6.9 -14.2 3.5 4.5 3.0Belarus 7.7 5.0 7.0 11.4 9.4 10.0 8.6 10.2 0.2 5.0 7.0 5.0Georgiad 6.4 5.5 11.1 5.9 9.6 9.4 12.3 2.3 -3.9 6.0 6.5 4.0Kyrgyzstan 4.5 0.0 7.0 7.0 -0.2 3.1 8.5 8.4 2.3 -3.5 6.0 6.0Republic of Moldova 4.7 7.8 6.6 7.4 7.5 4.8 3.0 7.8 -6.5 3.5 3.5 4.0Tajikistan 8.0 10.8 11.1 10.3 6.7 6.6 7.6 7.9 3.4 5.0 5.5 5.0Ukraine 3.7 5.2 9.6 12.1 2.7 7.3 7.9 2.3 -15.2 4.1 4.5 5.1
Sources: UN/DESA, based on data of the United Nations Statistics Division, the Economic Commission for Europe and individual national sources.Note: Country groups are calculated as a weighted average of individual country growth rates of gross domestic product (GDP), where weights are based on GDP in 2005 prices and exchange rates.
a Average percentage change.b Partly estimated.c Baseline scenario forecasts, based in part on Project LINK and UN/DESA World Economic Forecasting Model.d Georgia officially left the Commonwealth of Independent States on 18 August 2009. However, its performance is discussed in the context of this
group of countries for reasons of geographic proximity and similarities in economic structure.

149Annex tables
Table A.3 Developing economies: rates of growth of real GDP, 2002-2012
Annual percentage change
2002-2009a 2002 2003 2004 2005 2006 2007 2008 2009 2010b 2011c 2012c
Developing countriesd 5.8 4.3 5.2 7.2 6.6 7.3 7.6 5.4 2.4 7.1 6.0 6.1
Africa 5.3 5.2 5.3 5.9 5.5 5.9 6.1 5.0 2.3 4.7 5.0 5.1North Africa 4.6 3.0 6.3 4.8 5.1 5.4 5.0 4.7 2.8 4.6 5.1 5.7Sub-Saharan Africa (excluding Nigeria and South Africa) 5.9 4.1 4.2 6.5 6.2 6.7 7.4 5.9 3.1 5.3 5.8 5.6Net fuel exporters 5.6 7.2 6.8 6.7 6.1 5.8 6.9 5.3 3.5 5.3 5.4 5.7Net fuel importers 5.1 3.5 4.0 5.1 5.1 6.1 5.4 4.7 1.1 4.0 4.7 4.5
East and South Asia 7.2 6.6 6.7 7.8 7.7 8.6 9.3 6.2 5.1 8.4 7.1 7.3East Asia 7.4 7.2 6.8 7.9 7.6 8.7 9.6 6.4 4.9 8.8 7.2 7.4South Asia 6.6 4.8 6.6 7.4 8.0 8.4 8.5 5.8 5.5 7.0 7.0 7.2Net fuel exporters 5.5 5.8 5.9 5.2 5.5 5.9 7.0 4.1 3.6 5.0 5.1 5.4Net fuel importers 7.3 6.7 6.8 8.0 8.0 8.9 9.7 6.3 5.0 8.8 7.3 7.5
Western Asia 4.9 2.8 5.8 8.3 6.9 6.1 5.1 4.4 -1.0 5.5 4.7 4.4Net fuel exporters 5.4 1.0 7.7 8.5 6.6 5.8 5.3 7.0 0.6 4.6 4.9 4.2Net fuel importers 4.4 4.6 4.0 8.1 7.2 6.3 4.9 2.0 -2.6 6.4 4.4 4.6
Latin America and the Caribbean 3.7 0.2 1.8 5.9 4.6 5.6 5.6 4.0 -2.1 5.6 4.1 4.3South America 3.9 0.0 1.8 7.1 5.0 5.6 6.5 5.3 -0.3 6.3 4.5 4.8Mexico and Central America 2.9 0.4 1.6 4.1 3.4 5.1 3.7 1.8 -5.9 4.8 3.4 3.5Caribbean 5.2 3.4 3.6 3.8 8.0 10.4 6.5 3.5 1.3 2.9 3.1 3.4Net fuel exporters 3.4 -2.1 -0.5 10.6 7.2 8.3 6.5 4.1 -1.0 1.5 3.2 3.6Net fuel importers 3.9 0.6 2.1 5.2 4.0 5.1 5.4 4.0 -2.3 6.4 4.2 4.4
Memorandum items:
Least developed countries 6.7 5.3 5.7 7.3 7.6 7.6 8.1 6.7 4.0 5.2 5.5 5.7East Asia (excluding China) 4.8 5.6 4.0 5.9 5.0 5.7 5.9 2.8 0.0 7.2 4.8 5.1South Asia (excluding India) 5.3 5.4 6.1 5.9 5.9 6.1 6.8 2.2 3.0 3.7 4.0 4.3Western Asia (excluding Israel and Turkey) 5.3 1.5 7.0 8.3 6.3 5.6 5.3 6.9 0.9 4.6 4.9 4.2Landlocked developing economies 7.1 5.5 5.9 7.6 8.1 9.4 8.7 5.9 3.2 5.8 5.5 6.2Small island developing economies 5.1 3.7 4.0 6.1 7.2 8.6 7.3 3.0 0.1 7.4 3.8 4.2
Major developing economies
Argentina 3.7 -10.9 8.8 9.0 9.2 8.5 8.7 6.8 0.8 8.0 5.0 4.4Brazil 3.7 2.7 1.1 5.7 3.2 4.0 6.1 5.1 -0.2 7.6 4.5 5.2Chile 4.2 2.2 4.0 6.0 5.6 4.6 4.6 3.7 -1.5 5.0 6.0 4.5China 10.0 9.1 10.0 10.1 10.4 11.6 13.0 9.6 9.1 10.1 8.9 9.0Colombia 4.4 2.5 3.9 5.3 5.0 7.1 6.3 2.7 0.8 4.5 4.7 4.5Egypt 4.9 3.2 3.2 4.1 4.5 6.8 7.1 7.2 4.7 5.5 6.4 6.7Hong Kong SARe 4.9 1.8 3.0 8.5 7.1 7.0 6.4 2.2 -2.8 6.5 4.4 4.6India 7.2 4.6 6.9 8.1 9.1 9.6 9.4 7.5 6.7 8.4 8.2 8.4Indonesia 5.1 4.5 4.8 5.0 5.7 5.5 6.3 6.0 4.5 6.1 6.2 6.4Iran, Islamic Republic of 5.2 7.5 7.2 5.1 4.7 5.8 7.8 1.0 1.8 3.0 3.1 3.4Israel 3.8 -0.4 1.5 5.0 4.9 5.7 5.4 4.2 0.8 4.0 3.5 3.0Korea, Republic of 4.8 7.1 2.8 4.6 4.0 5.2 5.1 2.3 0.2 6.2 4.5 4.7

150 World Economic Situation and Prospects 2011
Table A.3 (cont’d)
2002-2009a 2002 2003 2004 2005 2006 2007 2008 2009 2010b 2011c 2012c
Malaysia 5.5 5.4 5.8 6.8 5.3 5.8 6.5 4.7 -1.7 7.1 5.0 5.3Mexico 2.8 0.1 1.3 4.0 3.2 4.9 3.3 1.5 -6.5 5.0 3.4 3.5Nigeria 8.8 21.2 10.3 10.6 5.4 6.2 7.0 6.0 7.0 7.1 6.5 5.8Pakistan 5.5 3.2 4.9 7.4 7.7 6.1 5.6 1.6 3.4 3.3 3.8 4.2Peru 5.6 5.0 4.0 5.0 6.8 7.7 8.9 9.8 0.9 8.5 5.5 5.7Philippines 5.1 4.4 4.9 6.4 5.0 5.3 7.1 3.7 1.1 6.8 4.6 5.1Saudi Arabia 3.9 0.1 7.7 5.3 5.6 3.2 2.0 4.2 0.6 3.4 3.8 3.9Singapore 5.4 4.2 4.6 9.2 7.4 8.6 8.5 1.8 -1.3 13.5 4.6 5.0South Africa 4.1 3.7 2.9 4.6 5.3 5.6 5.5 3.7 -1.8 2.6 3.2 3.2Taiwan Province of China 3.6 5.3 3.7 6.2 4.7 5.4 6.0 0.7 -1.9 9.0 4.5 4.9Thailand 5.0 5.3 7.1 6.3 4.6 5.1 4.9 2.5 -2.2 7.3 4.8 5.1Turkey 4.7 6.2 5.3 9.4 8.4 6.9 4.7 0.7 -4.7 7.4 4.6 5.0Venezuela, Bolivarian Republic of 4.4 -8.9 -7.8 18.3 10.3 9.9 8.2 4.8 -3.3 -1.8 2.0 3.0
Sources: UN/DESA, based on data of the United Nations Statistics Division, IMF and individual national sources.Note: Country groups are calculated as a weighted average of individual country growth rates of gross domestic product (GDP), where weights are based on GDP in 2005 prices and exchange rates.
a Average percentage change.b Partly estimated.c Baseline scenario forecasts, based in part on Project LINK and UN/DESA World Economic Forecasting Model.d Covering countries that account for 98 per cent of the population of all developing countries.e Special Administrative Region of China.

151Annex tables
Table A.4 Developed economies: consumer price inflation, 2002-2012
Annual percentage changea
2002 2003 2004 2005 2006 2007 2008 2009 2010b 2011c 2012c
Developed economies 1.6 1.9 2.0 2.3 2.3 2.1 3.3 0.1 1.4 1.4 1.6
United States 1.6 2.3 2.7 3.4 3.2 2.9 3.8 -0.4 1.4 1.4 1.6Canada 2.3 2.8 1.9 2.2 2.0 2.1 2.4 0.3 1.8 2.3 2.2Japan -0.9 -0.2 0.0 -0.3 0.2 0.1 1.4 -1.4 0.3 0.1 1.0Australia 3.0 2.8 2.3 2.7 3.5 2.3 4.4 1.8 1.3 1.4 1.6New Zealand 2.7 1.8 2.3 3.0 3.4 2.4 4.0 2.1 2.5 4.0 2.4
European Union 2.3 2.1 2.1 2.2 2.2 2.2 3.5 0.8 1.9 1.8 1.7
EU-15 2.1 2.0 1.9 2.1 2.2 2.1 3.3 0.7 1.8 1.7 1.6Austria 1.7 1.3 2.0 2.1 1.7 2.2 3.2 0.4 1.7 1.8 1.7Belgium 1.6 1.5 1.9 2.5 2.3 1.8 4.5 0.0 2.3 2.7 2.4Denmark 2.4 2.0 0.9 1.7 1.9 1.7 3.6 1.1 2.3 1.9 1.0Finland 2.0 1.3 0.1 0.8 1.3 1.6 3.9 1.6 1.6 1.9 2.0France 1.9 2.2 2.3 1.9 1.9 1.6 3.2 0.1 1.7 1.4 2.0Germany 1.4 1.0 1.8 1.9 1.8 2.3 2.8 0.2 1.1 1.4 1.5Greece 3.9 3.4 3.0 3.5 3.3 3.0 4.2 1.4 4.7 1.2 -0.6Ireland 4.7 4.0 2.3 2.2 2.7 2.9 3.1 -1.7 -1.0 0.6 0.9Italy 2.6 2.8 2.3 2.2 2.2 2.0 3.5 0.8 1.6 1.6 1.4Luxembourg 2.1 2.5 3.2 3.8 3.0 2.7 4.1 0.0 2.1 2.0 2.0Netherlands 3.9 2.2 1.4 1.5 1.7 1.6 2.2 1.0 0.8 1.5 2.0Portugal 3.7 3.3 2.5 2.1 3.0 2.4 2.7 -0.9 1.0 1.2 0.9Spain 3.6 3.1 3.1 3.4 3.6 2.8 4.1 -0.2 1.7 1.6 1.8Sweden 1.9 2.3 1.0 0.8 1.5 1.7 3.4 1.9 1.8 0.9 1.2United Kingdom 1.3 1.4 1.3 2.1 2.3 2.3 3.6 2.2 3.1 2.7 1.8
New EU member States 5.3 3.7 5.1 3.4 3.1 4.1 6.2 3.2 2.8 2.7 2.5Bulgaria 5.8 2.2 6.3 5.0 7.3 8.4 12.3 2.8 2.5 3.0 3.0Cyprus 2.8 4.1 2.3 2.6 2.5 2.4 4.7 0.4 2.0 2.0 2.5Czech Republic 1.8 0.1 2.8 1.8 2.5 2.9 6.4 1.0 1.5 1.9 2.0Estonia 3.6 1.3 3.0 4.1 4.4 6.6 10.4 -0.1 2.7 3.2 2.5Hungary 5.3 4.6 6.8 3.6 3.9 7.9 6.1 4.2 4.5 3.6 2.5Latvia 1.9 3.0 6.2 6.7 6.5 10.1 15.4 3.5 -1.2 1.0 2.0Lithuania 0.3 -1.1 1.1 2.7 3.7 5.7 10.9 4.4 1.0 1.0 2.8Malta 2.2 1.3 2.8 3.0 2.8 1.3 4.3 2.1 2.0 2.0 2.0Poland 1.9 0.8 3.6 2.1 1.1 2.4 4.3 3.8 2.6 2.5 2.5Romania 22.5 15.3 11.9 9.0 6.6 4.8 7.8 5.6 6.0 4.8 3.8Slovakia 3.3 8.6 7.5 2.7 4.5 2.8 4.6 1.6 1.0 1.8 1.8Slovenia 7.5 5.6 3.6 2.5 2.5 3.6 5.7 0.9 1.2 1.5 2.3
Other Europe 0.8 1.2 0.8 1.3 1.8 0.8 3.1 1.1 1.3 1.6 1.8
Iceland 5.3 1.4 2.3 1.4 4.6 3.7 12.7 16.3 5.5 5.5 4.0Norway 0.8 1.9 0.6 1.5 2.5 0.7 3.4 2.3 1.7 2.3 2.6Switzerland 0.6 0.6 0.8 1.2 1.1 0.7 2.4 -0.5 0.7 0.8 1.0
Memorandum items:
Major developed economies 1.2 1.7 1.9 2.3 2.3 2.1 3.2 -0.1 1.4 1.4 1.5Euro area 2.3 2.1 2.2 2.2 2.2 2.1 3.3 0.3 1.5 1.5 1.6
Sources: UN/DESA, based on OECD, Main Economic Indicators; Eurostat; and individual national sources.
a Data for country groups are weighted averages, where weights for each year are based on 2005 GDP in United States dollars.b Partly estimated.c Baseline scenario forecasts, based in part on Project LINK and UN/DESA World Economic Forecasting Model.

152 World Economic Situation and Prospects 2011
Table A.5 Economies in transition: consumer price inflation, 2002-2012
Annual percentage changea
2002 2003 2004 2005 2006 2007 2008 2009 2010b 2011c 2012c
Economies in transition 13.5 11.7 9.9 11.6 9.0 8.9 14.6 10.6 6.7 8.4 6.6
South-eastern Europe 7.1 3.7 4.1 6.4 5.7 3.7 7.9 3.3 2.8 3.5 3.2Albania 7.8 0.5 2.3 2.4 2.4 2.9 3.4 2.2 3.5 3.5 3.0Bosnia and Herzegovina 0.3 0.5 0.3 3.6 6.1 1.5 7.4 -0.3 2.0 2.5 2.5Croatia 1.7 1.8 2.0 3.3 3.2 2.9 6.1 2.4 1.5 2.5 2.7Montenegro 18.4 6.7 2.1 2.7 3.0 4.3 9.0 3.8 1.5 3.0 3.0Serbia 19.5 9.9 11.0 16.1 11.7 6.4 12.9 7.8 5.5 6.0 4.5The former Yugoslav Republic of Macedonia 2.3 1.1 0.9 0.2 3.3 3.6 7.2 -0.3 1.6 2.5 2.6
Commonwealth of Independent States and Georgiad 14.1 12.5 10.5 12.1 9.3 9.4 15.3 11.3 7.1 8.9 6.9
Net fuel exporters 14.6 12.8 10.4 12.1 9.5 9.1 14.3 11.0 6.9 8.3 6.5Azerbaijan 2.8 2.2 6.7 9.7 8.4 16.6 20.8 1.4 5.0 4.6 4.8Kazakhstan 5.8 6.4 6.9 7.6 8.6 10.8 17.2 7.3 6.8 6.5 7.3Russian Federation 15.8 13.7 10.9 12.7 9.7 9.0 14.1 11.7 6.8 8.4 6.4Turkmenistan 8.8 5.6 5.9 10.7 8.2 6.3 14.5 -2.7 6.0 7.0 9.0Uzbekistan 1.0 5.0 7.0 1.0 3.0 4.0 9.0 3.4 12.0 13.0 8.0
Net fuel importers 10.6 10.6 10.8 11.8 8.4 11.3 21.2 13.4 8.7 12.6 9.7Armenia 1.1 4.7 7.0 0.6 2.9 4.4 9.0 3.4 6.7 5.2 6.0Belarus 42.5 28.4 18.1 10.3 7.0 8.4 14.8 12.9 7.1 10.0 8.0Georgiad 5.6 4.8 5.7 8.3 9.2 9.2 10.0 1.7 6.2 7.0 1.3Kyrgyzstan 2.1 3.0 4.1 4.4 5.6 10.2 24.5 6.9 4.5 5.5 5.2Republic of Moldova 5.3 11.7 12.5 12.0 12.8 12.4 12.8 -0.1 7.3 6.2 3.0Tajikistan 12.3 16.3 7.1 7.2 10.0 13.4 20.9 6.4 7.5 8.3 9.5Ukraine 0.8 5.2 9.0 13.6 9.1 12.8 25.2 15.9 9.8 14.9 11.5
Source: UN/DESA, based on data of the Economic Commission for Europe.
a Data for country groups are weighted averages, where weights for each year are based on 2005 GDP in United States dollars.b Partly estimated.c Baseline scenario forecasts, based in part on Project LINK and UN/DESA World Economic Forecasting Model.d Georgia officially left the Commonwealth of Independent States on 18 August 2009. However, its performance is discussed in the context of this
group of countries for reasons of geographic proximity and similarities in economic structure.
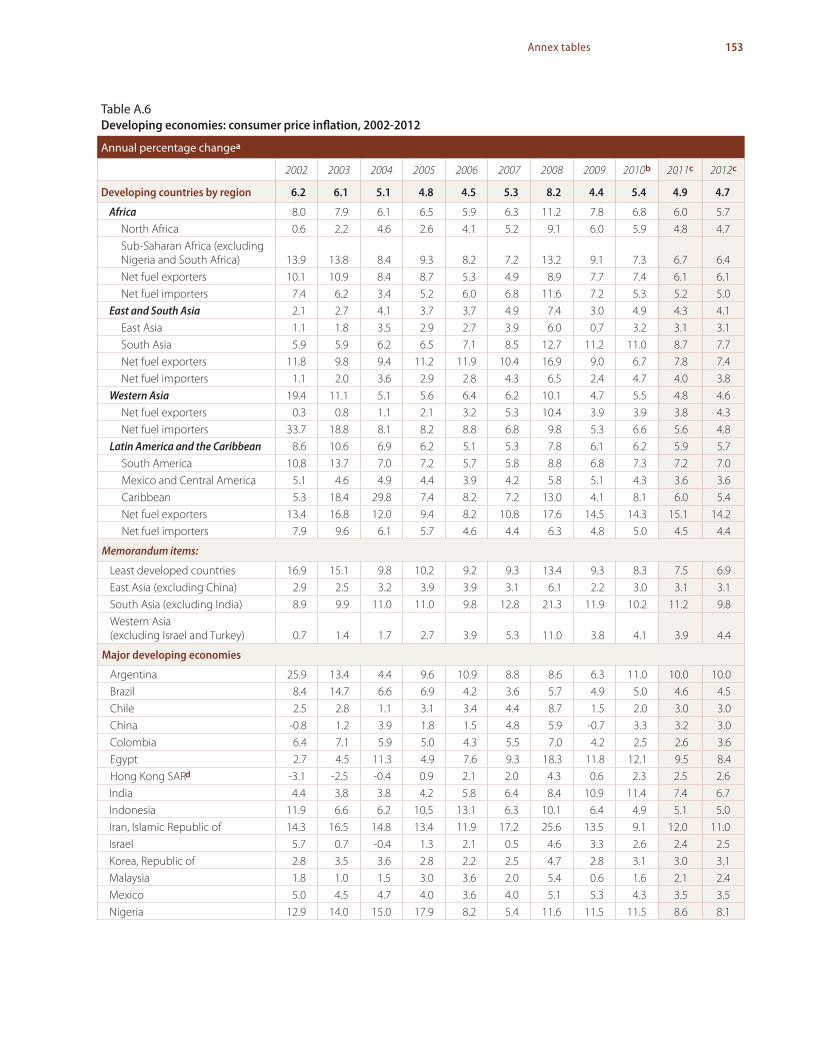
153Annex tables
Table A.6 Developing economies: consumer price inflation, 2002-2012
Annual percentage changea
2002 2003 2004 2005 2006 2007 2008 2009 2010b 2011c 2012c
Developing countries by region 6.2 6.1 5.1 4.8 4.5 5.3 8.2 4.4 5.4 4.9 4.7
Africa 8.0 7.9 6.1 6.5 5.9 6.3 11.2 7.8 6.8 6.0 5.7North Africa 0.6 2.2 4.6 2.6 4.1 5.2 9.1 6.0 5.9 4.8 4.7Sub-Saharan Africa (excluding Nigeria and South Africa) 13.9 13.8 8.4 9.3 8.2 7.2 13.2 9.1 7.3 6.7 6.4Net fuel exporters 10.1 10.9 8.4 8.7 5.3 4.9 8.9 7.7 7.4 6.1 6.1Net fuel importers 7.4 6.2 3.4 5.2 6.0 6.8 11.6 7.2 5.3 5.2 5.0
East and South Asia 2.1 2.7 4.1 3.7 3.7 4.9 7.4 3.0 4.9 4.3 4.1East Asia 1.1 1.8 3.5 2.9 2.7 3.9 6.0 0.7 3.2 3.1 3.1South Asia 5.9 5.9 6.2 6.5 7.1 8.5 12.7 11.2 11.0 8.7 7.7Net fuel exporters 11.8 9.8 9.4 11.2 11.9 10.4 16.9 9.0 6.7 7.8 7.4Net fuel importers 1.1 2.0 3.6 2.9 2.8 4.3 6.5 2.4 4.7 4.0 3.8
Western Asia 19.4 11.1 5.1 5.6 6.4 6.2 10.1 4.7 5.5 4.8 4.6Net fuel exporters 0.3 0.8 1.1 2.1 3.2 5.3 10.4 3.9 3.9 3.8 4.3Net fuel importers 33.7 18.8 8.1 8.2 8.8 6.8 9.8 5.3 6.6 5.6 4.8
Latin America and the Caribbean 8.6 10.6 6.9 6.2 5.1 5.3 7.8 6.1 6.2 5.9 5.7South America 10.8 13.7 7.0 7.2 5.7 5.8 8.8 6.8 7.3 7.2 7.0Mexico and Central America 5.1 4.6 4.9 4.4 3.9 4.2 5.8 5.1 4.3 3.6 3.6Caribbean 5.3 18.4 29.8 7.4 8.2 7.2 13.0 4.1 8.1 6.0 5.4Net fuel exporters 13.4 16.8 12.0 9.4 8.2 10.8 17.6 14.5 14.3 15.1 14.2Net fuel importers 7.9 9.6 6.1 5.7 4.6 4.4 6.3 4.8 5.0 4.5 4.4
Memorandum items:
Least developed countries 16.9 15.1 9.8 10.2 9.2 9.3 13.4 9.3 8.3 7.5 6.9East Asia (excluding China) 2.9 2.5 3.2 3.9 3.9 3.1 6.1 2.2 3.0 3.1 3.1South Asia (excluding India) 8.9 9.9 11.0 11.0 9.8 12.8 21.3 11.9 10.2 11.2 9.8Western Asia (excluding Israel and Turkey) 0.7 1.4 1.7 2.7 3.9 5.3 11.0 3.8 4.1 3.9 4.4
Major developing economies
Argentina 25.9 13.4 4.4 9.6 10.9 8.8 8.6 6.3 11.0 10.0 10.0Brazil 8.4 14.7 6.6 6.9 4.2 3.6 5.7 4.9 5.0 4.6 4.5Chile 2.5 2.8 1.1 3.1 3.4 4.4 8.7 1.5 2.0 3.0 3.0China -0.8 1.2 3.9 1.8 1.5 4.8 5.9 -0.7 3.3 3.2 3.0Colombia 6.4 7.1 5.9 5.0 4.3 5.5 7.0 4.2 2.5 2.6 3.6Egypt 2.7 4.5 11.3 4.9 7.6 9.3 18.3 11.8 12.1 9.5 8.4Hong Kong SARd -3.1 -2.5 -0.4 0.9 2.1 2.0 4.3 0.6 2.3 2.5 2.6India 4.4 3.8 3.8 4.2 5.8 6.4 8.4 10.9 11.4 7.4 6.7Indonesia 11.9 6.6 6.2 10.5 13.1 6.3 10.1 6.4 4.9 5.1 5.0Iran, Islamic Republic of 14.3 16.5 14.8 13.4 11.9 17.2 25.6 13.5 9.1 12.0 11.0Israel 5.7 0.7 -0.4 1.3 2.1 0.5 4.6 3.3 2.6 2.4 2.5Korea, Republic of 2.8 3.5 3.6 2.8 2.2 2.5 4.7 2.8 3.1 3.0 3.1Malaysia 1.8 1.0 1.5 3.0 3.6 2.0 5.4 0.6 1.6 2.1 2.4Mexico 5.0 4.5 4.7 4.0 3.6 4.0 5.1 5.3 4.3 3.5 3.5Nigeria 12.9 14.0 15.0 17.9 8.2 5.4 11.6 11.5 11.5 8.6 8.1
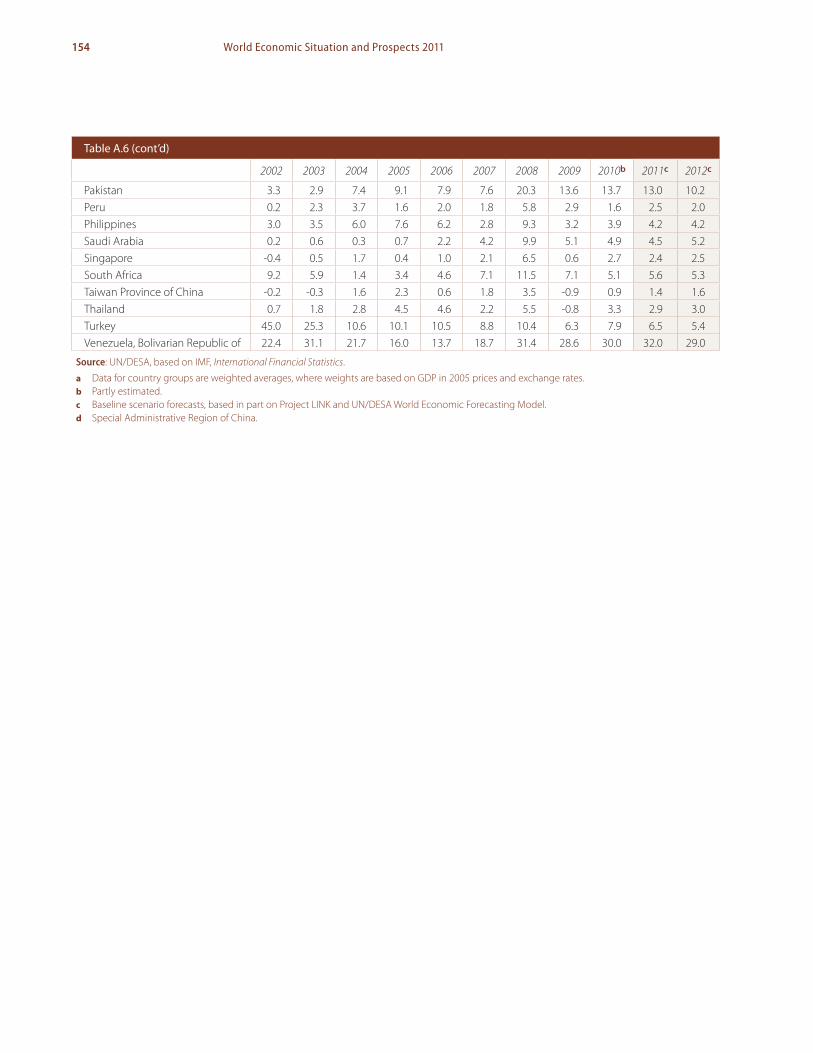
154 World Economic Situation and Prospects 2011
Table A.6 (cont’d)
2002 2003 2004 2005 2006 2007 2008 2009 2010b 2011c 2012c
Pakistan 3.3 2.9 7.4 9.1 7.9 7.6 20.3 13.6 13.7 13.0 10.2Peru 0.2 2.3 3.7 1.6 2.0 1.8 5.8 2.9 1.6 2.5 2.0Philippines 3.0 3.5 6.0 7.6 6.2 2.8 9.3 3.2 3.9 4.2 4.2Saudi Arabia 0.2 0.6 0.3 0.7 2.2 4.2 9.9 5.1 4.9 4.5 5.2Singapore -0.4 0.5 1.7 0.4 1.0 2.1 6.5 0.6 2.7 2.4 2.5South Africa 9.2 5.9 1.4 3.4 4.6 7.1 11.5 7.1 5.1 5.6 5.3Taiwan Province of China -0.2 -0.3 1.6 2.3 0.6 1.8 3.5 -0.9 0.9 1.4 1.6Thailand 0.7 1.8 2.8 4.5 4.6 2.2 5.5 -0.8 3.3 2.9 3.0Turkey 45.0 25.3 10.6 10.1 10.5 8.8 10.4 6.3 7.9 6.5 5.4Venezuela, Bolivarian Republic of 22.4 31.1 21.7 16.0 13.7 18.7 31.4 28.6 30.0 32.0 29.0
Source: UN/DESA, based on IMF, International Financial Statistics.
a Data for country groups are weighted averages, where weights are based on GDP in 2005 prices and exchange rates.b Partly estimated.c Baseline scenario forecasts, based in part on Project LINK and UN/DESA World Economic Forecasting Model.d Special Administrative Region of China.

155Annex tables
Table A.7 Developed economies: unemployment rates, a, b 2002-2012
Percentage of labour force
2002 2003 2004 2005 2006 2007 2008 2009 2010c 2011d 2012d
Developed economies 7.3 7.4 7.1 6.9 6.3 5.7 6.1 8.4 8.7 8.6 8.2
United States 5.8 6.0 5.5 5.1 4.6 4.6 5.8 9.3 9.6 9.3 8.7Canada 7.7 7.6 7.2 6.8 6.3 6.0 6.1 8.3 8.1 8.0 7.6Japan 5.4 5.3 4.7 4.4 4.1 3.9 4.0 5.1 5.0 5.0 4.8Australia 6.4 5.9 5.4 5.0 4.8 4.4 4.2 5.6 5.3 5.2 5.0New Zealand 5.3 4.8 4.1 3.8 3.9 3.7 4.2 6.1 6.4 6.0 5.8
European Union 8.9 9.0 9.1 8.9 8.2 7.2 7.0 8.9 9.6 9.4 9.2
EU-15 7.6 8.0 8.1 8.1 7.7 7.0 7.1 9.1 9.5 9.6 9.3Austria 4.2 4.3 4.9 5.2 4.8 4.4 3.8 4.8 4.4 4.2 4.2Belgium 7.5 8.2 8.4 8.5 8.3 7.5 7.0 7.9 8.3 8.1 7.7Denmark 4.6 5.4 5.5 4.8 3.9 3.8 3.3 6.0 7.1 6.6 6.1Finland 9.1 9.0 8.8 8.4 7.7 6.9 6.4 8.2 8.4 8.0 7.7France 8.6 9.0 9.3 9.3 9.2 8.4 7.8 9.5 9.8 9.6 9.3Germany 8.4 9.3 9.8 10.7 9.8 8.4 7.3 7.5 6.9 6.5 6.0Greece 10.3 9.7 10.5 9.9 8.9 8.3 7.7 9.5 12.0 13.7 13.7Ireland 4.5 4.6 4.5 4.4 4.5 4.6 6.3 11.9 13.8 12.9 12.3Italy 8.6 8.4 8.0 7.7 6.8 6.1 6.7 7.8 8.5 9.3 10.0Luxembourg 2.6 3.8 5.0 4.6 4.6 4.2 4.9 5.1 4.9 4.7 4.5Netherlands 3.1 4.2 5.1 5.3 4.4 3.6 3.1 3.7 4.5 4.5 4.2Portugal 5.1 6.4 6.7 7.7 7.8 8.1 7.7 9.6 10.8 11.7 12.1Spain 11.1 11.1 10.6 9.2 8.5 8.3 11.3 18.0 20.2 19.9 19.2Sweden 6.0 6.6 7.4 7.6 7.0 6.1 6.2 8.3 8.5 8.2 8.0United Kingdom 5.1 5.0 4.7 4.8 5.4 5.3 5.6 7.6 7.8 8.0 7.8
New EU member States 13.7 12.9 12.9 11.9 10.0 7.6 6.5 8.4 9.8 9.0 8.4Bulgaria 18.2 13.7 12.1 10.1 9.0 6.9 5.6 6.8 10.0 9.0 8.0Cyprus 3.6 4.1 4.7 5.3 4.6 4.0 3.6 5.3 6.9 6.5 6.5Czech Republic 7.3 7.8 8.3 7.9 7.2 5.3 4.4 6.7 7.1 6.8 6.3Estonia 10.3 10.0 9.7 7.9 5.9 4.7 5.5 13.8 18.5 17.0 15.5Hungary 5.8 5.9 6.1 7.2 7.5 7.4 7.8 10.0 11.2 10.2 9.1Latvia 12.2 10.5 10.4 8.9 6.8 6.0 7.5 17.1 19.5 17.4 15.5Lithuania 13.5 12.5 11.4 8.3 5.6 4.3 5.8 13.7 17.8 16.1 15.0Malta 7.5 7.6 7.4 7.2 7.1 6.4 5.9 7.0 6.5 6.0 5.8Poland 20.0 19.7 19.0 17.8 13.9 9.6 7.1 8.2 9.6 8.6 8.3Romania 8.6 7.0 8.1 7.2 7.3 6.4 5.8 6.9 7.1 6.8 6.5Slovakia 18.7 17.6 18.2 16.3 13.4 11.1 9.5 12.0 14.5 13.5 12.8Slovenia 6.3 6.7 6.3 6.5 6.0 4.9 4.4 5.9 7.3 6.5 6.0

156 World Economic Situation and Prospects 2011
Table A.7 (cont’d)
2002 2003 2004 2005 2006 2007 2008 2009 2010c 2011d 2012d
Other Europe 3.4 4.2 4.3 4.4 3.8 3.2 3.1 4.0 3.8 3.6 3.6
Icelande 2.5 3.3 3.0 2.6 2.9 2.3 3.0 7.2 7.5 8.1 7.5Norway 3.7 4.2 4.3 4.5 3.4 2.5 2.5 3.1 3.6 3.7 3.8Switzerland 3.2 4.3 4.4 4.4 4.0 3.6 3.5 4.4 3.8 3.3 3.4
Memorandum items:
Major developed economies 6.5 6.6 6.3 6.2 5.8 5.4 5.9 8.0 8.2 8.1 7.7Euro area 8.4 8.8 9.0 9.0 8.3 7.5 7.5 9.4 10.0 10.1 9.8
Source: UN/DESA, based on data of the OECD and Eurostat.
a Unemployment data are standardized by the OECD and Eurostat for comparability among countries and over time, in conformity with the definitions of the International Labour Organization (see OECD, Standardized Unemployment Rates: Sources and Methods (Paris, 1985)).
b Data for country groups are weighted averages, where labour force is used for weights.c Partly estimated.d Baseline scenario forecasts, based in part on Project LINK and UN/DESA World Economic Forecasting Model.e Not standardized.

157Annex tables
Table A.8 Economies in transition and developing economies: unemployment rates,a 2001-2010
2001 2002 2003 2004 2005 2006 2007 2008 2009 2010b
South-eastern Europe
Albaniac 16.4 15.8 15.0 14.4 14.1 13.8 13.4 13.0 13.8 13.8Bosnia and Herzegovina .. .. .. .. .. 31.1 29.0 23.4 24.1 27.0Croatia 15.8 15.1 13.9 13.7 12.6 11.1 9.6 8.4 9.1 12.0Montenegro 36.6 36.5 33.4 31.1 27.3 22.3 18.0 15.9 13.9 16.0Serbia 12.2 13.3 14.6 18.5 20.8 20.9 18.1 14.0 15.9 18.0The former Yugoslav Republic of Macedonia 30.5 31.9 36.7 37.2 37.3 36.0 34.9 33.8 32.2 32.8
Commonwealth of Independent States and Georgiad
Armeniac 9.8 10.5 10.2 9.4 7.6 7.2 6.4 6.3 6.9 7.1Azerbaijan .. .. 10.7 8.4 7.6 6.8 6.5 6.1 6.0 6.0Belarusc 2.3 3.0 3.1 1.9 1.5 1.2 1.0 1.0 0.9 0.9Georgiad 11.1 12.6 11.5 12.6 13.8 13.6 13.3 16.5 16.9 ..Kazakhstan 10.4 9.3 8.8 8.4 8.1 7.8 7.3 6.6 6.6 6.0Kyrgyzstanc 3.2 3.1 2.9 2.9 3.3 3.5 3.3 2.9 2.8 ..Republic of Moldovac 7.3 6.8 8.0 8.2 7.3 7.4 5.1 4.0 6.4 8.1Russian Federation 8.9 7.9 8.2 7.8 7.2 7.2 6.1 6.3 8.5 8.1Tajikistanc 2.3 2.6 2.3 2.0 2.1 2.3 2.5 2.1 2.1 2.2Turkmenistanc 2.6 2.5 2.5 .. 3.7 .. 3.6 .. .. ..Ukraine 10.9 9.6 9.1 8.6 7.2 7.4 6.6 6.4 8.8 8.4Uzbekistanc 0.4 0.4 0.3 0.4 0.3 0.3 0.2 0.2 0.2 0.2
Africa
Algeria 27.3 25.9 23.7 17.7 15.3 12.3 13.8 11.3 10.2 ..Botswana 19.6 .. 23.8 .. .. 17.6 .. .. .. ..Egypt 9.2 10.2 11.9 10.3 11.2 10.7 9.0 8.7 9.4 9.0Mauritius 6.8 7.2 7.7 8.4 9.6 9.1 8.5 7.0 7.5 8.0Morocco 12.5 11.6 11.9 10.8 11.0 9.7 9.8 9.6 9.1 9.1South Africa 27.9 30.0 29.8 27.0 26.6 25.5 23.3 22.9 24.0 25.3Tunisiae .. .. .. .. 12.9 12.5 12.4 12.4 13.3 ..
Developing America
Argentinaf, g 17.4 19.7 17.3 13.6 11.6 10.2 8.5 7.9 8.7 8.1Barbados 9.9 10.3 11.0 9.6 9.1 8.7 7.4 8.1 10.0 10.6Boliviaf 8.5 8.7 9.2 6.2 8.1 8.0 7.7 .. 7.9 6.9Brazilh, i 6.2 11.7 12.3 11.5 9.8 10.0 9.3 7.9 8.1 7.1Chile 9.9 9.8 9.5 10.0 9.2 7.7 7.1 7.8 10.8 8.8Colombiaj 18.2 17.6 16.7 15.4 13.9 13.0 11.2 11.3 12.0 12.5Costa Rica 5.8 6.8 6.7 6.7 6.9 6.0 4.8 5.0 7.8 6.8Dominican Republic 15.6 16.1 16.7 18.4 17.9 16.2 15.6 14.1 14.9 14.2Ecuadork 10.4 8.6 9.8 9.7 8.5 8.1 7.4 6.9 8.5 8.4El Salvador 7.0 6.2 6.2 6.5 7.3 5.7 5.8 5.5 .. ..Guatemala .. 5.4 5.2 4.4 .. .. .. .. .. ..Honduras 5.9 6.1 7.6 8.0 6.5 4.9 4.0 4.1 4.8 5.1Jamaica 15.0 14.2 11.4 11.7 11.3 10.4 9.7 10.6 11.4 13.0

158 World Economic Situation and Prospects 2011
Table A.8 (cont’d)
2001 2002 2003 2004 2005 2006 2007 2008 2009 2010b
Mexico 3.6 3.9 4.6 5.3 4.7 4.6 3.7 4.0 5.5 5.3Nicaragua 11.3 11.6 10.2 9.3 7.0 7.0 6.9 8.0 8.2 7.7Panama 17.0 16.5 15.9 14.1 12.1 10.4 7.8 6.5 6.6 6.5Paraguayf 10.8 14.7 11.2 10.0 7.6 8.9 7.2 7.4 8.0 6.9Peruf, l 9.3 9.4 9.4 9.4 9.6 8.2 8.4 8.4 8.4 8.4Trinidad and Tobago 10.8 10.4 10.5 8.4 8.0 6.2 5.6 4.6 5.3 6.7Uruguayf 15.3 17.0 16.9 13.1 12.2 11.4 9.6 8.2 7.5 7.4Venezuela, Bolivarian Republic of 13.3 15.8 18.0 15.3 12.4 10.0 8.5 6.9 7.9 8.7
Developing Asia
China 3.6 4.0 4.3 4.2 4.2 4.1 4.0 4.2 4.3 4.2Hong Kong SARm 5.1 7.3 7.9 6.8 5.6 4.8 4.0 3.5 5.2 4.4India .. .. .. 5.0 .. .. .. .. .. ..Indonesia 8.1 9.1 9.5 9.9 11.2 10.4 9.4 8.4 8.0 7.2Iran, Islamic Republic of .. 12.8 .. 10.3 11.5 .. 10.5 10.3 11.5 13.8Israel 9.4 10.3 10.7 10.4 9.0 8.4 7.3 6.1 7.6 6.5Jordan 14.7 14.4 14.8 12.5 14.8 14.0 13.1 12.7 13.5 12.3Korea, Republic of 4.0 3.3 3.6 3.7 3.7 3.5 3.2 3.2 3.6 3.7Malaysia 3.5 3.5 3.6 3.6 3.6 3.3 3.3 3.3 3.6 3.3Pakistan 7.8 8.3 8.3 7.7 7.7 6.2 5.3 5.2 5.5 ..Palestinian Occupied Territory 25.2 31.3 25.6 26.8 23.5 23.6 21.5 26.0 29.3 ..Philippinesn, o 9.8 10.2 10.2 10.9 7.8 7.9 7.3 7.4 7.5 7.4Saudi Arabia 4.6 5.3 5.6 5.8 6.1 6.3 5.7 5.1 5.4 ..Singapore 2.7 3.6 4.0 3.4 3.1 2.7 2.1 2.1 3.0 2.2Sri Lankap 7.9 8.8 8.1 8.1 7.7 6.5 6.0 5.4 5.8 5.3Taiwan Province of China 4.6 5.2 5.0 4.4 4.1 3.9 3.9 4.1 5.8 5.2Thailand 3.3 2.4 2.2 2.1 1.8 1.5 1.4 1.4 1.5 1.3Turkey 8.4 10.3 10.5 10.3 10.3 9.9 10.2 10.9 14.0 12.7Viet Namf 6.3 6.0 5.8 5.6 5.3 4.8 4.6 4.7 4.6 4.4
Sources: UN/DESA, based on data of the Economic Commission for Europe (ECE); ILO LABORSTAT database and KILM 6th edition; Economic Commission for Latin America and the Caribbean (ECLAC); national sources.a As a percentage of labour force. Reflects national definitions and coverage. Not comparable across economies.b Partly estimated.c End-of-period registered unemployment data (as a percentage of labour force).d Georgia officially left the Commonwealth of Independent States on 18 August 2009. However, its performance is discussed in the context of this
group of countries for reasons of geographic proximity and similarities in economic structure.e New methodology starting in 2005.f Urban areas.g Break in series: new methodology starting in 2003.h Six main cities.i Break in series: new methodology starting in 2002.j Thirteen main cities.k Covers Quito, Guayaquil and Cuenca.l Metropolitan Lima.m Special Administrative Region of China.n Partly adopts the ILO definition; that is to say, it does not include one ILO criterion, namely, “currently available for work”.o Break in series: new methodology starting in 2005.p Excluding Northern and Eastern provinces.

159Annex tables
Table A.9 Major developed economies: quarterly indicators of growth, unemployment and inflation, 2008-2010
Percentage
2008 2009 2010
I II III IV I II III IV I II III
Growth of gross domestic producta
(percentage change in seasonally adjusted data from preceding quarter)
Canada -0.6 -0.1 0.4 -3.1 -7.0 -2.8 0.9 5.0 5.5 2.3 1.0France 2.1 -2.6 -1.1 -6.0 -5.7 0.6 0.6 2.5 0.8 2.7 1.4Germany 5.6 -2.7 -1.8 -8.5 -13.1 1.9 2.8 1.3 2.3 9.5 2.8Italy 1.8 -2.6 -4.4 -7.9 -11.0 -1.1 1.7 -0.2 1.7 1.9 0.7Japan 1.3 -2.7 -5.4 -10.4 -15.8 9.9 -1.5 4.2 6.6 1.8 3.9United Kingdom 2.0 -1.1 -3.5 -8.1 -9.0 -3.1 -1.2 1.4 1.8 4.7 3.2United States -0.7 0.6 -4.0 -6.8 -4.9 -0.7 1.6 5.0 3.7 1.7 2.5Major developed economies 0.9 -0.9 -3.6 -7.5 -8.5 1.0 0.9 3.6 3.6 2.9 2.6Euro area 2.8 -1.7 -2.1 -7.1 -9.6 -0.6 1.7 0.8 1.4 3.9 1.5
Unemployment rateb
(percentage of total labour force)
Canada 5.9 6.0 6.1 6.5 7.8 8.4 8.5 8.4 8.2 8.0 8.0France 7.6 7.7 7.9 8.2 9.0 9.4 9.6 9.9 9.9 9.9 10.0Germany 7.6 7.4 7.2 7.1 7.3 7.6 7.6 7.5 7.3 6.9 6.8Italy 6.5 6.8 6.8 6.9 7.4 7.6 8.0 8.3 8.4 8.4 ..Japan 3.9 4.0 4.0 4.1 4.5 5.1 5.4 5.2 4.9 5.2 5.1United Kingdom 5.1 5.3 5.8 6.3 7.0 7.7 7.8 7.8 7.9 7.8 ..United States 5.0 5.3 6.0 6.9 8.2 9.3 9.7 10.0 9.7 9.7 9.6Major developed economies 5.5 5.6 6.0 6.5 7.3 8.1 8.3 8.5 8.3 8.2 ..Euro area 7.2 7.4 7.6 8.0 8.8 9.4 9.7 9.9 9.9 10.0 10.0
Change in consumer pricesc
(percentage change from preceding quarter)
Canada 1.3 8.5 4.3 -5.9 -1.3 3.5 0.4 0.6 2.0 2.5 2.2France 3.6 6.2 0.6 -2.1 -1.7 2.3 -0.3 1.4 2.4 3.8 -0.5Germany 3.1 3.2 3.4 -2.8 -0.5 1.0 0.6 0.3 1.3 1.9 1.3Italy 0.6 9.1 0.4 1.7 -5.3 7.0 -2.5 4.2 -3.2 8.2 -1.9Japan -0.4 3.5 4.0 -2.8 -4.9 0.0 -1.2 -2.0 -1.4 0.9 -0.7United Kingdom 1.8 8.3 5.2 0.5 -1.6 4.6 2.4 3.0 3.0 5.3 1.1United States 4.5 9.1 4.8 -10.9 -1.8 4.1 2.9 0.7 1.5 2.2 0.4Major developed economies 3.4 6.9 4.1 -6.8 -2.2 3.4 1.5 0.7 1.1 2.2 0.4Euro area 2.3 6.9 1.1 -1.1 -2.9 3.8 -1.1 2.2 -0.4 5.3 -0.4
Source: UN/DESA, based on Eurostat, OECD and national sources.
a Expressed as an annualized rate. Calculated as a weighted average, where weights are based on annual GDP valued in 2005 prices and exchange rates.
b Seasonally adjusted data as standardized by OECD.c Expressed as an annualized rate. Calculated as a weighted average, where weights are based on 2005 GDP in United States dollars.

160 World Economic Situation and Prospects 2011
Table A.10 Selected economies in transition: quarterly indicators of growth and inflation, 2008-2010
Percentage
2008 2009 2010
I II III IV I II III IV I II III
Rates of growth of gross domestic producta
Armenia 13.0 9.6 15.4 -5.9 -6.1 -17.9 -19.8 -8.4 5.4 6.7 ..Azerbaijan 8.7 10.5 11.3 11.8 5.5 6.0 6.6 16.4 .. .. ..Belarus 11.2 10.5 11.3 8.1 1.1 -0.4 -1.1 1.7 4.0 8.9 ..Croatia 7.6 4.4 0.0 -2.0 -3.6 -5.5 -8.3 -5.5 -1.4 -2.2 ..Georgia 9.9 7.9 -5.0 -0.8 -5.1 -10.1 -1.2 0.4 4.5 8.4 ..Kazakhstan 6.3 5.4 1.1 1.6 -4.5 -2.6 -0.3 10.3 7.1 8.6 ..Kyrgyzstan 6.0 7.6 6.3 13.2 -2.3 -1.7 4.3 5.3 16.4 .. ..Republic of Moldova 3.9 5.5 11.6 8.6 -5.1 -5.4 -7.1 -7.5 4.7 6.4 ..Russian Federation 9.1 7.7 6.4 -1.1 -9.3 -11.0 -8.6 -2.9 3.1 5.2 ..The former Yugoslav Republic of Macedonia 6.4 7.9 6.4 1.2 -1.1 -1.9 -1.9 1.6 -1.1 0.4 ..Ukraine 8.5 6.2 4.3 -7.8 -20.2 -17.8 -16.0 -6.8 4.9 5.9 ..
Change in consumer pricesa
Armenia 7.9 10.1 11.2 6.8 2.0 3.3 3.4 4.9 8.4 6.3 ..Azerbaijan 16.6 23.8 24.1 18.7 8.2 -0.7 -1.0 -0.5 3.8 6.0 5.6Belarus 12.8 15.4 16.2 14.7 15.6 13.9 12.4 10.2 6.1 6.8 7.7Bosnia and Herzegovina 6.4 8.4 9.4 5.5 1.6 -1.0 -1.4 -0.7 1.7 2.5 1.8Croatia 5.9 6.6 7.4 4.5 3.8 2.8 1.2 1.6 0.9 0.7 1.1Georgia 11.2 11.4 11.0 6.3 2.8 2.3 -0.8 3.0 4.7 4.3 8.7Kazakhstan 18.7 19.5 19.5 11.5 8.8 8.3 6.4 5.9 7.3 6.9 ..Kyrgyzstan 22.4 28.7 29.2 18.5 16.2 9.1 2.8 0.6 2.6 3.1 ..Republic of Moldova 14.9 16.3 11.9 8.4 3.1 -0.9 -1.7 -0.6 5.6 7.7 7.7Russian Federation 12.9 14.9 14.9 13.7 13.7 12.4 11.4 9.2 7.2 5.9 ..The former Yugoslav Republic of Macedonia 9.5 9.9 8.4 5.5 0.9 -0.6 -1.4 -2.1 0.5 1.1 1.8Ukraine 22.5 30.2 25.8 22.6 20.4 15.1 15.3 13.3 11.2 8.3 8.5
Source: UN/DESA, based on data of the Economic Commission for Europe and national sources.
a Percentage change from the corresponding period of the preceding year.

161Annex tables
Table A.11 Major developing economies: quarterly indicators of growth, unemployment and inflation, 2008-2010
Percentage
2008 2009 2010
I II III IV I II III IV I II III
Rates of growth of gross domestic producta
Argentina 8.5 7.8 6.9 4.1 2.0 -0.8 -0.3 2.6 6.8 11.8 ..Brazil 6.1 6.2 6.8 1.3 -1.8 -1.2 -0.2 4.8 8.3 8.9 ..Chile 3.7 5.1 5.2 0.7 -2.1 -4.5 -1.4 2.1 1.5 6.6 7.0China 11.5 10.4 9.8 7.5 6.4 7.8 9.0 10.8 11.9 10.3 9.6Colombia 5.1 4.5 3.5 -1.5 -0.4 -0.2 0.9 3.0 4.2 4.5 ..Ecuador 6.5 9.5 8.9 4.0 2.8 0.5 -1.2 -0.5 0.7 2.7 ..Hong Kong SARb 9.8 6.3 3.2 -3.2 -7.0 -2.9 -3.4 2.7 10.1 6.5 9.5India 8.5 7.8 7.5 6.1 5.8 6.0 8.6 6.5 8.6 8.9 8.9Indonesia 6.2 6.3 6.2 5.3 4.5 4.1 4.2 5.4 5.7 6.2 5.8Israel 5.3 5.0 5.0 1.5 0.8 0.1 -0.2 2.5 1.2 4.9 4.3Korea, Republic of 5.5 4.3 3.1 -3.4 -4.3 -2.2 1.0 6.0 8.1 7.2 4.5Malaysia 7.6 6.5 4.9 0.1 -6.2 -3.9 -1.2 4.4 10.1 8.9 5.3Mexico 2.4 3.0 1.6 -1.1 -7.2 -9.6 -5.5 -2.0 4.6 7.6 5.3Philippines 3.9 3.7 4.6 2.8 0.5 1.2 0.2 2.1 7.8 8.2 6.5Singapore 6.7 2.5 0.0 -2.5 -8.9 -1.7 1.8 3.8 16.9 19.5 10.6South Africa 4.0 4.8 3.8 1.8 -1.4 -2.6 -2.1 -0.6 1.7 3.1 2.6Taiwan Province of China 7.6 5.7 -1.2 -7.5 -8.6 -7.2 -1.2 9.2 13.6 12.9 9.8Thailand 6.4 5.2 2.9 -4.2 -7.1 -5.1 -2.5 6.0 12.0 9.2 6.7Turkey 7.0 2.6 0.9 -7.0 -14.6 -7.6 -2.7 6.0 11.7 10.3 ..Venezuela, Bolivarian Republic of 4.9 7.2 3.8 3.5 0.5 -2.6 -4.6 -5.8 -5.2 -1.9 -0.4
Unemployment ratec
Argentina 8.4 8.0 7.8 7.3 8.4 8.8 9.1 8.4 8.3 7.9 7.5Brazil 8.4 8.1 7.8 7.3 8.6 8.6 7.9 7.2 7.4 7.3 6.6Chile 7.4 8.0 8.1 7.5 8.6 10.2 10.6 9.1 9.0 8.5 8.0Colombia 12.1 11.0 11.4 10.6 12.9 11.7 12.2 11.3 13.0 12.0 11.5Ecuador 6.9 6.4 7.1 7.3 8.6 8.3 9.1 7.9 9.1 7.7 7.4Hong Kong SARb 3.3 3.3 3.4 4.1 5.2 5.4 5.3 5.1 4.4 4.6 4.2Israel 5.9 5.7 6.4 6.4 7.1 7.7 7.8 7.5 7.0 5.9 7.2Korea, Republic of 3.4 3.1 3.1 3.1 3.8 3.8 3.6 3.3 4.7 3.5 3.5Malaysia 3.6 3.5 3.1 3.1 4.0 3.5 3.5 3.4 3.6 3.4 3.2Mexico 4.0 3.5 4.2 4.3 5.0 5.2 6.3 5.3 5.4 5.2 5.6Philippines 7.4 8.0 7.4 6.8 7.7 7.5 7.6 7.1 7.3 8.0 6.9Singapore 1.9 2.2 2.3 2.5 3.3 3.2 3.3 2.3 2.2 2.2 2.1South Africa 23.5 23.1 23.2 21.9 23.6 23.6 24.4 24.2 25.2 25.2 25.3Taiwan Province of China 3.9 3.9 4.2 4.7 5.6 5.8 6.1 5.9 5.7 5.2 5.1Thailand 1.7 1.4 1.2 1.3 2.1 1.7 1.2 1.0 1.1 1.3 ..Turkey 11.5 9.5 10.3 12.6 14.2 14.5 14.0 13.2 12.6 11.9 ..Uruguay 8.5 7.5 7.6 6.6 7.5 8.0 7.1 6.6 7.4 7.4 6.6Venezuela, Bolivarian Republic of 8.2 7.3 7.0 6.3 8.2 7.7 7.4 7.3 9.2 8.2 8.9

162 World Economic Situation and Prospects 2011
Table A.11 (cont’d)
2008 2009 2010
I II III IV I II III IV I II III
Change in consumer pricesa
Argentina 8.5 9.1 8.9 7.8 6.6 5.5 5.9 7.1 9.0 10.6 11.1Brazil 4.6 5.5 6.2 6.2 5.8 5.2 4.4 4.2 4.9 5.1 4.6Chile 8.0 8.9 9.3 8.5 5.6 3.1 -0.6 -1.9 -0.3 1.2 2.2China 8.0 7.8 5.3 2.5 -0.6 -1.5 -1.3 0.7 2.2 2.9 3.4Colombia 6.1 6.4 7.7 7.8 6.6 4.8 3.2 2.4 2.0 2.1 2.3Ecuador 5.3 9.1 10.0 9.3 7.9 5.5 3.5 3.9 4.0 3.2 3.6Hong Kong SARb 4.6 5.7 4.6 2.3 1.7 -0.1 -0.9 1.3 1.9 2.6 2.4India 6.3 7.8 9.0 10.2 9.4 8.9 11.8 13.3 15.3 13.7 10.3Indonesia 6.7 10.1 12.0 11.4 8.6 4.8 2.8 2.6 3.7 4.4 6.2Israel 3.7 5.0 5.0 4.5 3.5 3.2 3.1 3.6 3.5 2.8 2.0Korea, Republic of 3.8 4.8 5.5 4.5 3.9 2.8 2.0 2.4 2.7 2.6 2.9Malaysia 2.6 4.9 8.4 5.9 3.7 1.3 -2.3 -0.2 1.3 1.6 1.9Mexico 3.9 4.9 5.5 6.2 6.2 6.0 5.1 4.0 4.8 4.0 3.7Philippines 5.5 9.7 12.2 9.7 6.9 3.2 0.3 2.9 4.3 4.2 3.8Singapore 6.6 7.5 6.6 5.5 2.6 0.3 -0.1 -0.4 0.9 3.1 3.4South Africa 11.2 11.5 12.4 11.0 8.4 7.7 6.4 6.0 5.7 4.5 3.5Taiwan Province of China 3.6 4.2 4.5 1.9 0.0 -0.8 -1.3 -1.3 1.3 1.1 0.4Thailand 5.0 7.5 7.3 2.1 -0.2 -2.8 -2.2 1.9 3.7 3.2 3.3Turkey 8.8 10.3 11.7 10.9 8.4 5.7 5.3 5.7 9.3 9.2 8.4Venezuela, Bolivarian Republic of 26.2 31.0 34.7 33.4 29.5 28.2 28.7 28.1 27.4 29.7 26.3
Sources: IMF, International Financial Statistics, and national sources.a Percentage change from the corresponding quarter of the previous year.b Special Administrative Region of China.c Reflects national definitions and coverage. Not comparable across economies.

163Annex tables
Table A.12 Major developed economies: financial indicators, 2001-2010
Percentage
2001 2002 2003 2004 2005 2006 2007 2008 2009 2010a
Short-term interest ratesb
Canada 4.0 2.6 3.0 2.3 2.8 4.2 4.6 3.3 0.7 0.6Francec 4.3 3.3 2.3 2.1 2.2 3.1 4.3 4.6 1.2 0.7Germanyc 4.3 3.3 2.3 2.1 2.2 3.1 4.3 4.6 1.2 0.7Italyc 4.3 3.3 2.3 2.1 2.2 3.1 4.3 4.6 1.2 0.7Japan 0.1 0.1 0.0 0.0 0.0 0.2 0.7 0.7 0.3 0.2United Kingdom 5.0 4.0 3.7 4.6 4.7 4.8 6.0 5.5 1.2 0.7United States 3.7 1.7 1.2 1.6 3.5 5.2 5.3 3.0 0.6 0.3
Long-term interest ratesd
Canada 5.5 5.3 4.8 4.6 4.1 4.2 4.3 3.6 3.2 3.3France 4.9 4.9 4.1 4.1 3.4 3.8 4.3 4.2 3.6 3.2Germany 4.8 4.8 4.1 4.0 3.4 3.8 4.2 4.0 3.2 2.8Italy 5.2 5.0 4.3 4.3 3.6 4.0 4.5 4.7 4.3 4.0Japan 1.3 1.3 1.0 1.5 1.4 1.7 1.7 1.5 1.3 1.2United Kingdom 4.9 4.9 4.5 4.9 4.4 4.5 5.0 4.6 3.6 3.7United States 5.0 4.6 4.0 4.3 4.3 4.8 4.6 3.7 3.3 3.3
General government financial balancese
Canada 0.7 -0.1 -0.1 0.9 1.5 1.6 1.4 0.0 -5.5 -4.9France -1.6 -3.2 -4.1 -3.6 -3.0 -2.3 -2.7 -3.3 -7.6 -7.4Germany -2.8 -3.6 -4.0 -3.8 -3.3 -1.6 0.3 0.1 -3.0 -4.0Italy -3.1 -3.0 -3.5 -3.6 -4.4 -3.3 -1.5 -2.7 -5.2 -5.0Japanf -6.3 -8.0 -7.9 -6.2 -6.7 -1.6 -2.4 -2.1 -7.1 -7.7United Kingdom 0.6 -2.0 -3.7 -3.6 -3.3 -2.7 -2.8 -4.8 -11.0 -9.6United States -0.6 -4.0 -5.0 -4.4 -3.3 -2.2 -2.9 -6.3 -11.3 -10.5
Sources: UN/DESA, based on OECD, Economic Outlook; OECD, Main Economic Indicators and Eurostat.
a Average for the first nine months.b Three-month Interbank Rate.c From January 1999 onwards, represents the three-month Euro Interbank Offered Rate (EURIBOR).d Yield on long-term government bonds.e Surplus (+) or deficit (-) as a percentage of nominal GNP or GDP. Estimates for 2009.f Deferred tax payments on postal savings accounts are included in 2000 and 2001.

164 World Economic Situation and Prospects 2011
Table A.13 Selected economies: real effective exchange rates, broad measurement,a, b 2001-2010
2001 2002 2003 2004 2005 2006 2007 2008 2009 2010c
Developed economies
Australia 95.7 99.7 111.1 121.0 127.9 133.3 142.4 141.4 130.1 145.4Bulgaria 103.0 105.0 110.5 113.3 116.2 125.8 132.5 142.7 140.0 142.3Canada 96.5 94.7 102.4 104.5 108.0 111.7 112.5 103.3 95.0 101.6Czech Republic 106.7 118.5 117.4 121.5 129.4 133.5 139.1 156.9 149.3 149.5Denmark 102.6 106.8 113.9 114.5 112.0 109.8 109.8 110.5 117.5 112.5Euro area 101.6 105.0 116.8 120.9 119.8 121.0 125.7 131.4 125.6 118.1Hungary 107.2 113.6 115.3 119.1 119.3 115.7 119.9 122.2 119.2 119.1Japan 88.7 82.8 82.8 83.4 79.1 72.0 67.2 73.7 83.8 83.7New Zealand 99.4 111.5 130.5 140.1 147.1 135.8 146.0 134.5 127.4 138.6Norway 102.9 108.9 108.4 110.6 117.1 122.9 131.9 134.3 129.5 139.4Poland 110.8 107.4 99.3 102.0 111.3 113.5 117.5 126.1 109.5 114.3Romania 108.0 113.2 117.3 127.0 153.7 171.3 190.9 181.2 173.8 175.6Slovakia 102.2 104.3 112.7 117.0 117.2 118.4 128.6 131.9 141.4 130.5Sweden 91.3 93.6 97.4 96.3 93.3 94.2 97.6 91.8 89.3 92.0Switzerland 103.2 109.5 111.3 109.1 105.0 100.4 95.5 97.5 105.9 107.9United Kingdom 97.3 98.4 95.7 99.7 97.3 97.1 99.1 87.1 79.7 81.0United States 106.1 106.2 98.1 91.9 89.3 86.9 82.8 79.6 88.1 84.4
Economies in transition
Croatia 105.7 107.0 110.3 114.3 115.2 116.1 117.3 125.0 127.9 128.0Russian Federation 120.9 126.9 131.3 140.8 154.8 170.6 180.5 193.2 183.1 200.1
Developing economies
Argentina 105.0 56.1 62.5 60.8 60.1 58.5 57.8 58.9 57.1 57.7Brazil 90.2 89.8 98.6 105.9 129.7 140.8 155.6 175.2 168.3 190.4Chile 94.7 93.0 92.0 100.1 111.8 118.0 117.3 122.8 127.1 126.0China 105.5 103.0 97.9 96.0 98.3 101.1 103.3 112.3 112.6 114.0Colombia 100.5 99.2 88.1 94.8 104.9 102.8 110.4 114.4 107.9 125.0Ecuador 102.5 111.0 114.4 114.7 121.2 130.7 125.9 136.7 111.1 127.0Egypt 91.2 81.7 65.6 66.3 72.1 74.2 76.5 86.7 85.5 91.5Hong Kong SARd 101.9 101.5 95.0 89.9 86.5 84.1 80.1 75.7 80.7 78.2India 102.6 99.2 98.4 99.2 101.3 98.8 106.1 99.2 93.7 100.1Indonesia 96.3 116.6 123.3 113.5 113.8 142.0 149.3 162.7 163.4 185.3Israel 99.7 89.8 87.6 85.5 86.4 86.9 88.0 98.1 97.7 102.6Korea, Republic of 90.6 93.5 92.9 95.0 104.9 110.0 107.6 90.6 78.7 85.5Kuwait 107.5 109.4 102.5 94.9 96.3 95.3 93.3 99.1 102.7 102.2Malaysia 104.0 101.6 98.7 100.7 103.3 107.0 112.7 115.6 111.2 109.4Mexico 107.9 109.6 100.1 98.2 103.1 106.0 106.0 105.9 91.4 98.6Morocco 97.9 98.7 99.0 97.4 94.8 94.7 93.6 94.1 100.2 96.1Nigeria 111.9 117.0 108.4 111.9 127.7 136.2 133.8 145.2 139.1 151.4Pakistan 95.5 100.2 101.1 100.4 102.3 105.8 105.7 105.5 103.3 113.3Peru 104.2 104.1 100.0 99.6 99.3 99.4 99.7 106.6 105.7 110.3Philippines 107.6 112.5 107.6 100.7 107.1 129.5 136.0 130.7 129.5 120.4

165Annex tables
Table A.13 (cont’d)
2001 2002 2003 2004 2005 2006 2007 2008 2009 2010c
Saudi Arabia 103.6 102.4 94.4 87.7 85.0 84.1 81.9 83.3 92.1 93.4Singapore 97.8 95.9 95.5 102.2 106.8 112.2 119.6 125.3 114.7 118.1South Africa 90.6 80.7 105.8 115.4 117.7 113.6 109.3 100.1 105.6 118.7Taiwan Province of China 96.1 93.9 89.6 90.8 89.2 89.0 87.8 84.6 76.7 79.9Thailand 97.0 101.2 100.3 100.1 102.7 111.6 124.9 121.1 112.4 122.8Turkey 87.6 100.8 110.8 116.3 124.7 120.7 127.9 126.1 116.2 120.8Venezuela, Bolivarian Republic of 109.4 92.6 93.6 98.9 99.3 107.9 119.7 138.6 189.5 116.5
Source: JPMorgan Chase.
a Year 2000=100.b Indices based on a “broad” measure currency basket of 46 currencies (including the euro). The real effective exchange rate, which adjusts the
nominal index for relative price changes, gauges the effect on international price competitiveness of the country’s manufactures owing to currency changes and inflation differentials. A rise in the index implies a fall in competitiveness and vice versa. The relative price changes are based on indices most closely measuring the prices of domestically produced finished manufactured goods, excluding food and energy, at the first stage of manufacturing. The weights for currency indices are derived from 2000 bilateral trade patterns of the corresponding countries.
c Average for the first ten months.d Special Administrative Region of China.

166 World Economic Situation and Prospects 2011
Table A.14 Indices of prices of primary commodities, 2001-2010
Index 2000=100
Non-fuel commodities Combined indexManufac-
tured export prices
Real prices of non-fuel
commo-ditiesa
Crude petroleumbFood
Tropical beverages
Vegetable oilseeds and oils
Agricul-tural raw materials
Minerals and
metals Dollar SDR
2001 103 79 94 96 89 96 100 98 98 83.82002 102 89 117 95 87 97 99 99 98 88.32003 104 94 137 111 98 105 99 108 97 101.82004 119 100 155 125 137 126 112 117 108 130.62005 127 126 141 129 173 140 126 120 117 183.52006 151 134 148 147 278 183 164 123 149 221.32007 164 148 226 164 313 207 178 133 155 250.42008 234 178 298 198 332 256 213 139 184 342.22009 220 181 213 163 232 213 182 132 161 221.2
2007 I 155 143 179 158 288 191 169 129 148 198.0 II 154 142 210 162 336 206 180 131 157 235.5 III 165 150 236 161 321 209 181 133 157 259.0 IV 183 157 278 175 307 219 184 138 159 308.1
2008 I 223 182 342 201 358 261 216 141 185 335.2 II 272 184 359 211 381 293 239 145 202 425.7 III 245 191 306 216 355 271 225 141 192 411.3 IV 196 155 185 163 236 199 173 130 153 190.3
2009 I 206 164 188 146 182 188 167 126 149 155.5 II 213 175 226 150 214 203 177 129 158 212.0 III 228 186 215 164 252 223 188 134 166 245.3 IV 233 201 224 193 278 237 197 137 173 269.3
2010 I 232 198 234 210 299 245 210 134 183 273.2 II 205 201 233 205 296 230 205 129 179 277.5 III 225 220 258 206 301 244 213 .. .. 267.3
Sources: UNCTAD, Monthly Commodity Price Bulletin; United Nations, Monthly Bulletin of Statistics; and data from the Organization of the Petroleum Exporting Countries (OPEC) website, available from http://www.opec.org.
a Combined index of non-fuel commodity prices in dollars, deflated by manufactured export price index.b The new OPEC reference basket, introduced on 16 June 2005, currently has 12 crudes.

167Annex tables
Table A.15 World oil supply and demand, 2002-2011
2002 2003 2004 2005 2006 2007 2008 2009 2010a 2011b
World oil supplyc, d (millions of barrels per day) 76.9 79.8 83.3 84.3 85.0 84.7 85.2 83.5 85.6 87.4
Developed economies 18.3 17.8 17.4 16.5 16.3 16.0 15.5 15.8 15.8 15.7Economies in transition 9.6 10.5 11.6 12.0 12.4 12.9 12.9 13.4 13.7 13.9Developing economies 47.3 49.7 52.5 54.0 54.4 53.6 54.5 52.0 53.9 55.5
OPECe 28.8 30.8 33.1 34.2 34.3 34.6 35.6 33.4 34.9 36.3Non-OPEC 18.5 18.9 19.4 19.8 20.1 19.0 18.9 18.6 19.0 19.2
Processing gainsf 1.8 1.8 1.9 1.9 1.9 2.2 2.2 2.3 2.2 2.2
World total demandg 77.7 79.3 82.5 83.8 85.1 86.5 86.0 84.7 86.6 87.8
Oil prices (dollars per barrel)
OPEC basketh 24.36 28.10 36.05 50.64 61.08 69.08 94.45 61.06 75.82 73.10Brent oil 24.97 28.85 38.30 54.43 65.39 72.7 97.64 61.86 78.00 75.00
Sources: United Nations, World Bank, International Energy Agency, U.S. Energy Information Administration, and OPEC.
a Partly estimated.b Baseline scenario forecasts.c Including crude oil, condensates, natural gas liquids (NGLs), oil from non-conventional sources and other sources of supply.d Totals may not add up because of rounding.e Includes Angola and Ecuador as of January 2007 and December 2007, respectively.f Net volume gains and losses in the refining process (excluding net gain/loss in the economies in transition and China) and marine transportation
losses.g Including deliveries from refineries/primary stocks and marine bunkers, and refinery fuel and non-conventional oils.h The new OPEC reference basket, introduced on 16 June 2005, currently has 12 crudes.

168 World Economic Situation and Prospects 2011
Table A.16 World trade:a changes in value and volume of exports and imports, by major country group, 2002-2012
Annual percentage change
2002 2003 2004 2005 2006 2007 2008 2009b 2010c 2011c 2012c
Dollar value of exports
World 4.4 15.9 21.3 13.6 15.2 16.0 14.5 -20.0 12.8 8.5 8.9Developed economies 4.0 15.0 18.5 9.3 12.5 15.4 11.3 -20.2 10.2 6.9 7.9
North America -2.3 4.8 13.9 11.0 11.5 11.7 9.8 -17.3 13.1 10.5 10.8EU plus other Europe 6.8 19.1 19.6 8.9 13.5 17.1 11.4 -20.6 7.2 5.2 7.3Developed Asia 3.2 13.8 21.0 8.5 8.6 11.1 14.0 -23.8 25.9 10.0 5.5
Economies in transition 8.7 25.5 35.0 27.1 24.3 21.4 32.6 -37.4 22.5 8.0 6.5South-eastern Europe 8.2 33.8 25.5 12.3 19.3 24.9 19.1 -24.1 10.3 6.6 10.5Commonwealth of Independent States 8.7 24.6 36.1 28.7 24.8 21.1 33.8 -38.5 23.7 8.1 6.2
Developing economies 5.0 16.9 26.2 20.9 19.2 16.6 18.2 -17.6 15.9 10.9 10.6Latin America and the Caribbean 1.0 8.0 22.9 20.2 18.7 12.7 15.7 -21.2 9.6 7.0 6.1Africa 2.6 22.2 25.0 28.2 25.4 12.7 23.2 -30.0 19.6 11.5 8.6Western Asia 4.5 22.0 31.5 30.3 19.0 16.3 33.1 -20.2 4.5 5.0 5.3East and South Asia 6.5 17.7 26.1 18.3 18.6 18.1 14.9 -14.5 19.5 12.7 12.7
Dollar value of imports
World 3.5 15.9 21.3 13.2 14.4 15.5 15.5 -22.0 11.0 7.5 8.8Developed economies 3.3 15.7 18.9 11.3 12.8 13.3 11.4 -22.3 8.4 6.4 8.1
North America 2.0 8.2 16.0 13.0 10.6 6.6 7.5 -22.5 12.8 9.6 10.8EU plus other Europe 4.5 20.0 20.0 10.3 14.3 16.7 11.7 -21.9 6.2 5.1 7.4Developed Asia -0.1 13.4 20.5 12.7 9.6 10.5 21.8 -24.1 12.0 6.2 5.0
Economies in transition 13.0 24.6 29.3 20.1 24.2 33.7 29.3 -36.7 20.6 14.8 11.7South-eastern Europe 19.1 28.6 25.7 7.8 16.4 29.4 22.5 -27.3 2.5 4.4 8.5Commonwealth of Independent States 11.8 23.7 30.1 22.8 25.7 34.5 30.5 -38.2 24.0 16.4 12.2
Developing economies 3.3 15.6 26.4 17.1 17.0 18.5 22.3 -20.0 14.6 8.8 9.8Latin America and the Caribbean -7.1 3.6 20.4 18.8 18.0 19.1 20.1 -20.6 17.1 9.7 7.7Africa 5.1 20.0 20.7 20.2 19.5 25.0 21.3 -17.2 17.6 10.9 9.3Western Asia 8.6 18.5 30.2 18.9 19.5 25.5 23.8 -21.9 7.9 5.8 7.6East and South Asia 5.5 17.9 27.9 16.1 16.1 16.3 22.7 -19.8 15.0 8.8 10.7
Volume of exports
World 3.6 4.7 10.6 7.7 9.2 7.1 2.7 -11.3 10.6 6.4 6.3Developed economies 1.6 1.9 8.0 5.7 8.5 6.1 2.0 -12.6 10.2 6.1 5.9
North America -1.2 0.6 8.3 5.5 6.9 7.4 3.7 -10.5 9.7 7.8 8.2EU plus other Europe 1.9 1.6 7.4 5.8 9.1 5.5 1.5 -12.2 9.1 5.5 5.3Developed Asia 5.9 6.6 11.7 5.9 8.3 7.4 1.7 -19.9 19.6 6.2 5.0
Economies in transition 9.7 11.7 12.6 4.1 6.5 7.0 1.4 -9.6 5.0 4.5 3.5South-eastern Europe 2.4 12.7 8.0 6.5 7.1 9.3 3.8 -18.7 7.6 6.4 7.7Commonwealth of Independent States 10.4 11.6 13.0 3.9 6.4 6.8 1.1 -8.8 4.8 4.3 3.1
Developing economies 7.6 10.4 15.5 11.8 10.7 9.0 4.0 -9.1 11.7 6.9 7.2Latin America and the Caribbean 1.8 4.0 12.4 7.8 6.5 5.8 2.2 -10.1 7.7 4.0 4.9Africa 4.4 7.2 7.8 14.4 6.9 7.7 2.8 -12.5 8.6 6.0 5.2Western Asia -0.8 12.1 13.9 8.3 5.8 6.5 -3.9 -11.7 4.2 5.1 4.5East and South Asia 12.0 12.2 17.7 13.2 13.3 10.4 6.1 -8.1 14.1 7.9 8.3

169Annex tables
Table A.16 (cont’d)
2002 2003 2004 2005 2006 2007 2008 2009b 2010c 2011c 2012c
Volume of imports
World 3.5 5.6 11.1 8.3 9.3 7.2 2.8 -11.6 10.3 6.8 6.7Developed economies 2.0 3.7 8.7 6.3 7.8 4.8 0.6 -12.8 8.9 5.7 5.5
North America 3.1 4.4 10.6 6.3 5.9 3.2 -2.0 -13.9 10.9 8.3 8.1EU plus other Europe 1.4 3.2 7.7 6.3 9.2 5.6 1.2 -12.0 7.7 4.4 4.5Developed Asia 2.9 5.2 9.7 6.3 4.5 4.0 4.0 -14.6 12.2 7.0 5.2
Economies in transition 11.1 13.6 18.2 9.6 15.1 22.0 11.8 -23.7 10.2 8.7 9.4South-eastern Europe 14.1 8.7 10.0 -0.6 6.1 14.6 5.7 -22.1 1.4 4.2 8.0Commonwealth of Independent States 10.3 14.8 20.1 11.7 16.8 23.3 12.8 -23.9 11.6 9.3 9.6
Developing economies 7.2 10.0 16.6 12.6 12.1 11.1 6.3 -8.2 12.8 8.5 8.5Latin America and the Caribbean -5.4 1.2 14.2 11.2 13.6 13.2 10.0 -13.9 17.0 9.7 9.2Africa 3.7 11.2 5.6 9.8 12.9 15.6 8.9 -5.7 9.0 7.7 6.5Western Asia 7.8 11.3 17.7 16.1 11.9 16.1 -2.1 -5.3 7.9 6.8 6.1East and South Asia 11.5 12.0 18.4 12.6 11.7 9.2 6.6 -7.6 13.2 8.6 9.0
Sources: UN/DESA, based on data of the United Nations Statistics Division, IMF, OECD and individual national sources.
a Includes goods and non-factor services.b Partly estimated.c Baseline scenario forecasts, based in part on Project LINK and UN/DESA World Economic Forecasting Model.

170 World Economic Situation and Prospects 2011
Table A.17 Balance of payments on current accounts, by country or country group, summary table, 2001-2009
Billions of dollars
2001 2002 2003 2004 2005 2006 2007 2008 2009
Developed economies -282.5 -285.2 -320.0 -336.6 -523.3 -596.5 -540.9 -667.8 -280.3
Japan 87.8 112.6 136.2 172.1 165.7 170.4 211.0 157.1 141.8United States -397.2 -458.1 -520.7 -630.5 -747.6 -802.6 -718.1 -668.9 -378.4Europea 19.5 65.3 85.7 144.6 88.2 68.3 23.4 -103.7 41.7
EU-15 -9.5 37.0 43.7 107.0 27.2 12.5 26.8 -86.4 -26.6New EU member States -19.1 -20.5 -28.5 -42.6 -37.8 -57.1 -93.7 -103.0 -22.1
Economies in transitionb 31.0 25.3 30.3 56.3 80.2 87.5 56.0 85.1 31.5
South-eastern Europe -2.1 -5.1 -5.4 -7.2 -7.4 -8.6 -15.5 -23.3 -11.3Commonwealth of Independent Statesc 33.4 30.6 36.2 63.9 88.2 97.2 73.5 111.3 44.0
Developing economies 78.6 125.7 219.8 282.5 481.8 722.8 799.1 799.5 470.9
Net fuel exporters 57.4 39.0 78.8 131.0 268.0 390.9 353.8 440.7 97.1Net fuel importers 21.3 86.7 141.0 151.4 213.8 331.9 445.4 358.8 373.9Latin America and the Caribbean -52.4 -14.9 10.6 22.3 38.5 52.1 17.7 -26.3 -19.8
Net fuel exporters 0.4 5.0 11.5 16.1 28.2 34.4 22.6 42.2 5.6Net fuel importers -52.8 -19.9 -0.9 6.3 10.2 17.7 -5.0 -68.5 -25.4
Africa 5.4 -7.5 0.0 11.8 35.9 85.1 65.3 59.1 -22.5Net fuel exporters 8.8 -5.0 5.2 24.1 52.2 105.8 98.9 110.2 16.3Net fuel importers -3.4 -2.5 -5.2 -12.3 -16.4 -20.6 -33.6 -51.1 -38.9
Western Asia 31.7 21.0 41.0 70.3 142.3 184.9 149.4 218.9 41.9Net fuel exportersd 31.9 25.8 51.9 86.2 166.2 213.3 188.4 266.4 55.3Net fuel importers -0.2 -4.8 -10.9 -15.9 -23.9 -28.3 -39.0 -47.4 -13.4
East and South Asia 93.9 127.1 168.2 178.0 265.2 400.7 566.7 547.7 471.3Net fuel exporters 16.3 13.2 10.1 4.7 21.4 37.6 43.8 21.8 19.9Net fuel importers 77.7 113.9 158.1 173.3 243.8 363.1 522.9 525.9 451.5
World residuale -172.9 -134.2 -69.9 2.3 38.6 213.8 314.2 216.8 222.1
Sources: IMF, World Economic Outlook, October 2010; and IMF, Balance of Payments Statistics.
a Europe consists of the EU-15, the new EU member States and Iceland, Norway and Switzerland.b Includes Georgia.c Excludes Georgia, which left the Commonwealth of Independent States on 18 August 2009.d Data for Iraq not available prior to 2005.e Statistical discrepancy.

171Annex tables
Table A.18 Balance of payments on current accounts, by country or country group, 2001-2009
Billions of dollars
2001 2002 2003 2004 2005 2006 2007 2008 2009
Developed economies
Trade balance -254.9 -254.6 -304.6 -419.5 -634.2 -784.1 -776.6 -883.7 -437.7Services, net 69.7 90.0 106.1 160.9 200.5 272.3 382.5 435.9 352.0Income, net 39.9 19.6 48.9 124.6 152.1 150.8 140.7 99.8 118.1Current transfers, net -137.3 -140.3 -170.3 -202.7 -241.7 -235.5 -287.4 -319.9 -312.7Current-account balance -282.5 -285.2 -320.0 -336.6 -523.3 -596.5 -540.9 -667.8 -280.3
Japan
Trade balance 69.2 92.5 104.0 128.5 93.9 81.1 105.1 38.4 43.4Services, net -42.7 -40.7 -31.4 -34.3 -24.1 -18.2 -21.2 -20.8 -20.4Income, net 69.2 65.8 71.2 85.7 103.5 118.2 138.6 152.6 131.0Current transfers, net -7.9 -4.9 -7.5 -7.9 -7.6 -10.7 -11.6 -13.1 -12.3Current-account balance 87.8 112.6 136.2 172.1 165.7 170.4 211.0 157.1 141.8
United States
Trade balance -422.0 -475.4 -541.5 -665.6 -783.8 -839.5 -823.2 -834.7 -507.0Services, net 57.6 54.8 47.4 56.3 69.6 80.2 121.1 135.9 132.0Income, net 31.7 27.4 45.3 67.2 72.4 48.1 99.6 152.0 121.4Current transfers, net -64.5 -65.0 -71.8 -88.4 -105.8 -91.5 -115.6 -122.0 -125.0Current-account balance -397.2 -458.1 -520.7 -630.5 -747.6 -802.6 -718.1 -668.9 -378.4
Europea
Trade balance 48.8 96.7 108.0 86.4 20.5 -57.7 -83.6 -125.7 33.0Services, net 59.3 79.0 95.9 146.4 164.6 222.0 300.1 346.7 260.5Income, net -22.2 -39.6 -27.0 18.0 30.1 36.0 -34.3 -140.0 -78.6Current transfers, net -66.4 -70.8 -91.3 -106.1 -127.0 -132.0 -158.9 -184.6 -173.2Current-account balance 19.5 65.3 85.7 144.6 88.2 68.3 23.4 -103.7 41.7
EU-15
Trade balance 52.4 95.5 107.1 83.4 8.1 -64.4 -70.4 -126.7 -18.5Services, net 29.2 49.8 64.4 110.1 122.1 171.0 234.8 266.8 194.5Income, net -26.9 -39.2 -37.0 20.8 22.1 38.9 23.1 -42.4 -32.2Current transfers, net -64.3 -69.1 -90.7 -107.3 -125.0 -133.1 -160.7 -184.1 -170.5Current-account balance -9.5 37.0 43.7 107.0 27.2 12.5 26.8 -86.4 -26.6
New EU member States
Trade balance -26.7 -25.5 -29.1 -34.3 -35.2 -51.0 -72.8 -90.9 -14.8Services, net 9.7 8.7 8.0 9.5 13.1 15.5 21.9 26.9 20.9Income, net -7.1 -10.1 -15.4 -28.0 -27.5 -35.0 -57.7 -55.1 -42.8Current transfers, net 5.0 6.4 8.0 10.3 11.8 13.4 14.8 16.0 14.6Current-account balance -19.1 -20.5 -28.5 -42.6 -37.8 -57.1 -93.7 -103.0 -22.1
Economies in transitionb
Trade balance 37.7 34.3 43.1 71.2 106.5 128.5 110.0 165.2 93.4Services, net -7.1 -8.4 -7.1 -10.5 -12.3 -11.9 -18.5 -22.3 -18.3Income, net -6.8 -8.8 -16.1 -17.0 -28.3 -44.3 -51.1 -77.9 -61.6Current transfers, net 7.2 8.1 10.5 12.7 14.2 15.1 15.7 20.1 17.9Current-account balance 31.0 25.3 30.3 56.3 80.2 87.5 56.0 85.1 31.5

172 World Economic Situation and Prospects 2011
Table A.18 (cont’d)
2001 2002 2003 2004 2005 2006 2007 2008 2009
South-eastern Europe
Trade balance -10.9 -14.1 -18.6 -22.6 -23.1 -25.5 -34.3 -43.3 -30.1Services, net 3.5 3.4 6.1 6.6 7.2 8.0 9.7 11.6 9.9Income, net 0.1 0.0 -0.3 -0.3 -1.0 -1.3 -1.9 -3.1 -3.0Current transfers, net 5.2 5.6 7.3 9.1 9.5 10.2 11.0 11.6 11.8Current-account balance -2.1 -5.1 -5.4 -7.2 -7.4 -8.6 -15.5 -23.3 -11.3
Commonwealth of Independent Statesc
Trade balance 49.1 48.9 62.3 94.7 130.8 156.0 147.2 212.4 125.9Services, net -10.7 -11.8 -13.3 -17.2 -19.5 -20.0 -28.4 -33.9 -28.5Income, net -6.8 -8.8 -15.8 -16.8 -27.4 -43.2 -49.3 -74.6 -58.5Current transfers, net 1.8 2.2 2.9 3.1 4.3 4.5 4.0 7.4 5.2Current-account balance 33.4 30.6 36.2 63.9 88.2 97.2 73.5 111.3 44.0
Developing economies
Trade balance 181.7 220.8 293.4 354.2 549.3 746.5 806.2 843.6 528.6Services, net -58.2 -56.7 -55.7 -50.6 -59.8 -68.9 -76.6 -128.1 -122.0Income, net -111.9 -117.6 -119.6 -138.0 -158.2 -141.9 -138.8 -146.4 -134.1Current transfers, net 67.0 79.2 101.7 116.9 150.5 187.3 208.2 229.9 198.1Current-account balance 78.6 125.7 219.8 282.5 481.8 722.8 799.1 799.5 470.9
Net fuel exporters
Trade balance 141.9 136.8 185.5 255.4 405.7 524.2 534.1 712.0 346.2Services, net -56.9 -62.3 -68.2 -75.6 -90.2 -110.9 -147.5 -210.7 -185.5Income, net -15.3 -25.4 -30.6 -43.1 -56.6 -39.5 -43.3 -64.6 -57.9Current transfers, net -12.5 -10.5 -8.6 -7.3 6.2 14.3 6.3 -1.0 -7.8Current-account balance 57.4 39.0 78.8 131.0 268.0 390.9 353.8 440.7 97.1
Net fuel importers
Trade balance 39.9 84.1 107.9 98.8 143.6 222.3 272.1 131.5 182.4Services, net -1.3 5.5 12.5 24.9 30.3 42.0 70.9 82.6 63.5Income, net -96.6 -92.1 -88.9 -94.9 -101.5 -102.4 -95.5 -81.8 -76.2Current transfers, net 79.5 89.7 110.3 124.2 144.2 173.0 202.0 230.9 205.9Current-account balance 21.3 86.7 141.0 151.4 213.8 331.9 445.4 358.8 373.9
Latin America and the Caribbean
Trade balance -5.3 22.0 43.8 59.2 82.5 101.6 72.8 47.8 54.9Services, net -17.7 -12.6 -11.9 -12.4 -16.4 -17.3 -23.2 -31.1 -31.4Income, net -55.7 -54.1 -59.1 -69.2 -80.8 -96.1 -98.4 -109.6 -100.8Current transfers, net 26.3 29.8 37.8 44.8 53.1 63.9 66.5 66.6 57.6Current-account balance -52.4 -14.9 10.6 22.3 38.5 52.1 17.7 -26.3 -19.8
Africa
Trade balance 16.3 5.6 15.5 33.5 65.6 94.8 94.7 114.4 2.7Services, net -7.7 -9.0 -8.5 -11.2 -15.6 -17.0 -30.3 -55.1 -39.6Income, net -19.4 -22.3 -27.5 -35.4 -45.1 -41.4 -54.8 -63.8 -46.0Current transfers, net 16.2 18.2 20.6 24.9 30.9 48.8 55.5 62.9 60.0Current-account balance 5.4 -7.5 0.0 11.8 35.9 85.1 65.3 59.1 -22.5

173Annex tables
Table A.18 (cont’d)
2001 2002 2003 2004 2005 2006 2007 2008 2009
Western Asiad
Trade balance 64.5 61.9 83.4 111.8 182.9 234.2 221.8 341.3 165.2Services, net -20.6 -23.4 -21.8 -24.5 -28.1 -45.8 -63.1 -91.8 -81.7Income, net -2.2 -6.5 -9.3 -5.6 -4.4 9.6 16.0 3.7 -2.2Current transfers, net -10.0 -11.0 -11.4 -11.4 -8.0 -13.1 -25.3 -34.2 -39.3Current-account balance 31.7 21.0 41.0 70.3 142.3 184.9 149.4 218.9 41.9
East Asia
Trade balance 117.5 139.0 166.0 180.0 255.5 367.4 473.7 448.1 423.8Services, net -12.9 -12.5 -15.4 -9.2 -10.3 -4.8 15.9 20.6 -4.6Income, net -28.0 -27.4 -15.8 -20.5 -17.8 -5.8 7.1 32.8 30.5Current transfers, net 9.8 14.3 19.5 24.9 33.4 38.3 51.5 63.5 51.2Current-account balance 86.4 113.3 154.3 175.2 260.8 395.1 548.2 565.0 500.9
South Asia
Trade balance -11.2 -7.6 -15.3 -30.3 -37.3 -51.6 -56.8 -108.1 -118.1Services, net 0.8 0.8 1.9 6.6 10.6 15.9 24.1 29.2 35.4Income, net -6.6 -7.3 -7.9 -7.2 -10.0 -8.2 -8.8 -9.5 -15.5Current transfers, net 24.6 27.9 35.2 33.7 41.1 49.4 60.0 71.1 68.7Current-account balance 7.6 13.8 13.9 2.9 4.4 5.6 18.5 -17.3 -29.6
World residuale
Trade balance -35.4 0.6 31.8 5.9 21.6 90.8 139.5 125.1 184.3Services, net 4.4 24.9 43.3 99.8 128.4 191.5 287.4 285.5 211.8Income, net -78.8 -106.7 -86.8 -30.4 -34.4 -35.4 -49.2 -124.5 -77.6Current transfers, net -63.1 -53.0 -58.2 -73.0 -77.0 -33.0 -63.5 -69.9 -96.7Current-account balance -172.9 -134.2 -69.9 2.3 38.6 213.8 314.2 216.8 222.1
Sources: IMF, World Economic Outlook, October 2010; and IMF, Balance of Payments Statistics.
a Europe consists of EU-15, new EU member States plus Iceland, Norway and Switzerland.b Includes Georgia.c Excludes Georgia, which left the Commonwealth of Independent States on 18 August 2009.d Data for Iraq not available prior to 2005.e Statistical discrepancy.

174 World Economic Situation and Prospects 2011
Table A.19 Net ODA from major sources, by type, 1989-2009
Donor group or country
Growth rate of ODA (2008 prices and exchange rates)
ODA as a percent-
age of GNI
Total ODA (millions
of dollars)
Percentage distribution of ODA by type, 2009
Bilateral Multilateral
1989-1998
1999-2008 2009 2009
Total (Grants
& Loans)
Grants
Loans
Total (United Nations & Other)
United Nations OtherTotal
of which: Technical
cooperation
Total DAC countries -0.73 5.27 0.31 119 681 69.8 67.5 14.3 2.3 30.2 5.2 25.1
Total EU -0.17 5.48 0.45 67 246 61.0 57.2 16.1 3.8 39.0 5.3 33.7
Austria 3.71 10.61 0.30 1 142 44.4 44.9 17.6 -0.5 55.6 3.1 52.5Belgium -0.73 6.67 0.55 2 610 60.7 61.1 19.6 -0.3 39.3 5.4 33.8Denmark 4.00 -0.11 0.88 2 810 67.8 68.1 4.0 -0.3 32.2 10.0 22.1Finland -5.05 6.62 0.54 1 286 61.1 59.0 22.5 2.0 38.9 11.2 27.7Francea -1.07 2.32 0.46 12 431 55.1 45.8 20.9 9.4 44.9 2.0 42.9Germany 0.03 5.56 0.35 12 079 58.8 55.9 37.4 2.9 41.2 3.0 38.3Greece – 7.39 0.19 607 48.9 48.9 31.2 – 51.1 2.3 48.8Ireland 11.85 14.53 0.54 1 006 68.9 68.9 1.4 – 31.1 7.6 23.5Italy -7.34 4.75 0.16 3 297 26.5 26.4 2.7 0.1 73.5 6.2 67.3Luxembourg 16.89 7.95 1.04 415 64.1 64.1 1.7 – 35.9 16.5 19.4Netherlands 1.10 3.04 0.82 6 426 74.7 76.5 5.2 -1.8 25.3 9.2 16.1Portugal 7.17 1.73 0.23 513 53.9 43.9 28.2 10.1 46.1 2.6 43.5Spain 12.50 9.64 0.46 6 571 65.4 59.6 13.6 5.8 34.6 5.4 29.2Sweden -0.93 8.00 1.12 4 548 66.2 64.2 3.0 2.0 33.8 12.7 21.1United Kingdom 0.69 9.29 0.52 11 505 67.5 61.9 6.7 5.6 32.5 4.0 28.5
Australia -0.45 5.07 0.29 2 761 90.6 87.4 38.7 3.2 9.4 1.1 8.4Canada -2.51 3.64 0.30 4 013 78.4 79.4 38.2 -1.0 21.6 5.2 16.4Japan -0.59 -1.04 0.18 9 480 63.3 56.2 24.6 7.1 36.7 9.1 27.7New Zealand 1.86 4.42 0.28 309 73.1 73.1 17.0 – 26.9 14.2 12.8Norway 1.99 3.11 1.06 4 086 77.5 76.5 11.2 1.1 22.5 12.3 10.1Switzerland 2.22 3.88 0.47 2 305 75.9 75.2 – 0.7 24.1 6.7 17.4United States -3.32 9.96 0.20 28 665 87.6 90.4 2.6 -2.8 12.4 2.6 9.8
Source: UN/DESA, based on data of the OECD online database, available from http://stats.oecd.org/Index.aspx.
a Excluding flows from France to the Overseas Departments, namely Guadeloupe, French Guiana, Martinique and Réunion.

175Annex tables
Table A.20 Total net ODA flows from OECD Development Assistance Committee countries, by type, 2000-2009
2000 2001 2002 2003 2004 2005 2006 2007 2008 2009
Net disbursements at current prices and exchange rates (millions of dollars)
Official Development Assistance 53 962 52 687 58 575 69 431 79 855 107 830 104 823 104 181 122 296 119 681 Bilateral grants and grant-like flows 33 087 33 562 39 885 51 033 57 458 83 750 79 691 75 677 88 174 80 732 of which:
Technical cooperation 12 787 13 623 15 482 18 389 18 725 20 812 22 359 15 037 17 231 17 154 Humanitarian aid 2 213 1 951 2 782 4 363 5 206 7 147 6 748 6 464 8 842 8 415 Debt forgiveness 2 045 2 501 4 538 8 317 7 134 24 999 18 600 9 624 11 067 544
Bilateral loans 3 108 1 720 1 079 -1 053 -2 823 - 862 -2 414 -2 305 -1 214 2 767 Contributions to multilateral institutionsa 17 766 17 404 17 612 19 450 25 220 24 942 27 546 30 809 35 335 36 181
Source: UN/DESA, based on OECD, The DAC Journal of Development Co-operation Report 2009 and DAC online database, available from http://www.oecd.org/dac/stats/idsonline.
a Grants and capital subscriptions. Does not include concessional lending to multilateral agencies.

176 World Economic Situation and Prospects 2011
Table A.21 Commitments and net flows of financial resources, by selected multilateral institutions, 2000-2009
Billions of dollars
2000 2001 2002 2003 2004 2005 2006 2007 2008 2009
Resource commitmentsa 63.1 72.2 95.3 67.6 55.9 71.7 64.7 74.5 135.2 193.7
Financial institutions, excluding IMF 36.9 41.8 38.5 43.1 45.7 51.4 55.7 66.6 76.1 114.5Regional development banksb 16.2 19.3 16.8 20.4 21.5 23.0 23.1 31.3 36.1 54.4World Bank Groupc 20.2 22.0 21.4 22.2 23.7 27.7 31.9 34.7 39.4 59.4
International Bank for Reconstruction and Development (IBRD) 10.7 11.7 10.2 10.6 10.8 13.6 14.2 12.8 13.5 32.9International Development Association (IDA) 5.9 6.9 8.0 7.6 8.4 8.7 9.5 11.9 11.2 14.0International Financial Corporation (IFC) 3.7 3.4 3.2 4.1 4.6 5.4 8.2 10.0 14.6 12.4
International Fund for Agricultural Development (IFAD) 0.4 0.4 0.4 0.4 0.5 0.7 0.7 0.6 0.6 0.7
International Monetary Fund 22.4 25.7 52.2 17.8 2.6 12.6 1.0 2.0 48.7 68.2United Nations operational agenciesd 3.8 4.7 4.6 6.7 7.6 7.7 8.3 6.3 10.5 11.0
Net flows -10.9 14.9 2.0 -11.7 -20.2 -39.6 -25.9 -6.8 40.7 52.3
Financial institutions, excluding IMF -0.1 1.4 -11.2 -14.8 -10.2 0.8 5.2 -11.4 21.8 20.4Regional development banksb 0.3 1.7 -3.9 -8.0 -6.6 -1.7 3.0 5.9 21.2 15.5World Bank Groupc -0.4 -0.3 -7.3 -6.7 -3.7 2.5 2.2 5.5 0.7 4.9International Bank for Reconstruction and Development (IBRD) -4.1 -4.6 -12.1 -11.2 -8.9 -2.9 -5.1 -1.8 -6.2 -2.1International Development Association (IDA) 3.7 4.4 4.8 4.5 5.3 5.4 7.3 7.2 6.8 7.0
International Monetary Fund -10.8 13.5 13.2 3.1 -10.0 -40.4 -31.0 -18.0 18.9 32.0
Memorandum item: (in 2000 purchasing power units)e
Resource commitments 63.1 73.7 97.2 62.6 47.8 59.8 54.9 56.0 97.3 146.7Net flows -10.9 15.2 2.0 -10.8 -17.3 -33.0 -21.9 -5.1 29.3 39.6
Sources: Annual reports of the relevant multilateral institutions, various issues.a Loans, grants, technical assistance and equity participation, as appropriate; all data are on a calendar year basis.b African Development Bank (AfDB), Asian Development Bank (ADB), Caribbean Development Bank (CDB), European Bank for Reconstruction and
Development (EBRD), Inter-American Development Bank (IaDB) (including Inter-American Investment Corporation (IaIC)) and the International Fund for Agricultural Development (IFAD).
c Data is for the fiscal year.d United Nations Development Program (UNDP), United Nations Population Fund (UNFPA), United Nations Children's Fund (UNICEF) and the World
Food Programme (WFP).e Totals deflated by the United Nations index of manufactured export prices (in dollars) of developed economies: 2000=100.

177Annex tables
Table A.22 Greenhouse gas emissionsa of Annex I Parties to the United Nations Framework Convention on Climate Change, 1990-2012
Teragram CO2 equivalent
1990 2000 2005 2006 2007 2008 2009b 2010b 2011c 2012c
Annual growth rate 1990-2012
Cumulative change
between 1990 and 2012
Australia 418 496 528 533 541 550 544 549 556 560 1.3 33.7
Austria 78 80 93 90 87 87 83 86 87 87 0.5 11.8
Belarus 140 79 85 88 88 91 85 73 66 58 -3.9 -58.8
Belgium 143 145 141 136 130 133 122 125 120 116 -0.9 -18.9
Bulgaria 117 69 71 72 76 73 59 52 46 40 -4.7 -65.6
Canada 592 717 731 718 750 734 695 696 700 703 0.8 18.8
Croatia 31 26 30 31 32 31 29 28 28 28 -0.5 -11.1
Czech Republic 195 148 145 147 147 141 133 131 132 132 -1.8 -32.5
Denmark 70 70 65 73 68 65 58 56 54 52 -1.3 -25.7
Estonia 41 18 19 19 22 20 14 13 11 9 -6.5 -77.3
Finland 70 69 68 80 78 70 63 60 59 58 -0.9 -18.2
France 566 561 561 545 535 532 500 491 483 476 -0.8 -15.9
Germany 1 232 1 025 978 983 957 958 896 884 873 863 -1.6 -30.0
Greece 103 125 133 129 132 127 120 110 102 98 -0.2 -5.3
Hungary 97 77 80 78 76 73 65 62 60 58 -2.3 -40.6
Iceland 3 4 4 4 5 5 4 4 4 4 0.4 9.3
Ireland 55 68 69 68 68 67 56 51 51 48 -0.6 -12.4
Italy 517 550 573 562 553 541 508 509 507 506 -0.1 -2.2
Japan 1 269 1 344 1 355 1 337 1 369 1 282 1 208 1 217 1 226 1 228 -0.1 -3.2
Latvia 27 10 11 12 12 12 8 5 3 1 -12.8 -95.1
Liechtenstein 0 0 0 0 0 0 0 0 0 0 0.4 10.3
Lithuania 50 19 23 24 25 24 19 17 16 15 -5.3 -69.7
Luxembourg 13 10 13 13 13 12 11 11 10 9 -1.5 -27.6
Monaco 0 0 0 0 0 0 0 0 0 0 -1.1 -21.1
Netherlands 212 215 212 209 207 207 192 188 182 178 -0.8 -15.9
New Zealand 61 70 77 77 75 75 74 76 77 79 1.2 29.6
Norway 50 53 54 53 55 54 52 49 50 51 0.1 2.3
Poland 453 390 390 403 400 396 372 354 336 320 -1.6 -29.5
Portugal 59 81 87 82 80 78 76 74 69 68 0.6 14.8
Romania 242 136 150 154 153 146 130 122 116 111 -3.5 -54.2
Russian Federation 3 322 2 025 2 115 2 183 2 188 2 230 1 938 1 889 1 894 1 893 -2.5 -43.0
Slovakia 74 49 50 50 48 49 42 42 39 35 -3.3 -52.5
Slovenia 18 19 20 20 21 21 21 22 22 22 0.8 18.6
Spain 285 381 435 427 439 406 403 398 413 415 1.7 45.4
Sweden 72 69 68 67 66 64 58 59 58 58 -1.0 -20.6

178 World Economic Situation and Prospects 2011
Table A.22 (cont’d)
1990 2000 2005 2006 2007 2008 2009b 2010b 2011c 2012c
Annual growth rate 1990-2012
Cumulative change
between 1990 and 2012
Switzerland 53 52 54 54 52 53 52 52 51 51 -0.2 -3.6
Turkey 187 297 330 350 380 367 340 359 383 399 3.5 113.6
Ukraine 928 393 423 440 440 428 349 357 357 365 -4.1 -60.6
United Kingdom 775 676 658 653 644 632 575 552 526 508 -1.9 -34.4
United States 6 112 7 008 7 105 7 010 7 120 6 925 6 626 6 543 6 520 6 515 0.3 6.6
All Annex I Parties 18 733 17 623 18 003 17 976 18 131 17 759 16 579 16 365 16 286 16 217 -0.7 -13.4
Source: UN/DESA, based on data of the United Nations Framework Convention on Climate Change (UNFCCC) online database available from http://unfccc.int/ghg_emissions_data/ghg_data_from_unfccc/time_series_annex_i/items/3814.php (accessed on 5 November 2010).Note: Based on the historical data provided by the UNFCCC for the GHG emissions of the Annex 1 Parties up to 2008, DESA/DPAD extrapolated the data to 2012. The extrapolation is based on the following procedure:
GHG/GDP intensity for each country is modelled using time-series regression techniques, to reflect the historical trend of GHG/GDP. While the ytrend for each individual country would usually be a complex function of such factors as change in structure of the economy, technology change, emission mitigation measures, as well as other economic and environmental policies, the time-series modelling could be considered a reduced form of a more complex structural modelling for the relations between economic output and GHG emissions.GHG/GDP intensity for each country is extrapolated for the out-of-sample period (2009-2012), using parameters derived from the time-series yregression model.In some cases, the extrapolated GHG/GDP intensity for individual countries was adjusted to take account of announced emission control measures ytaken by Governments.The projected GHG emissions were arrived at using GDP estimates in accordance with the y World Economic Situation and Prospects 2011 baseline forecast and the extrapolated GHG/GDP intensity.
a Without land use, land-use change and forestry.b Estimated.c Baseline scenario forecasts.


Litho in United Nations, New York United Nations publication10-61546—January 2011—4,760 Sales No. E.11.II.C.2ISBN 978-92-1-109162-5


Printed at the United Nations, New York
10-61546—December 2010— 4,270
USD 30
ISBN 978-92-1-109162-5
World Economic Situationand Prospects
World Econom
ic Situation and Prospects 2011United Nations