corporate update larrain vial second annual investor
TRANSCRIPT

Corporate Update
Larrain Vial Second Annual Investor ConferenceHotel Ritz Carlton, Santiago de ChileMarch 17 – 19, 2008

1
This presentation may include forward-looking comments regarding the Company’s business outlook and
anticipated financial and operating results. These expectations are highly dependent on the
economy, the airline industry, commodity prices, international markets and external events.
Therefore, they are subject to change and we undertake no obligation to publicly update or revise
any forward looking statements to reflect events or circumstances that may arise after the date of
this presentation. More information on the risk factors that could affect our results are contained on
our Form 20-F for the year ended December 31, 2006.
Information, tables and logos contained in this presentation may not be used without consent from LAN

Contents
I. LAN OVERVIEW
II. FINANCIAL RESULTS
III. FUTURE OUTLOOK
2

LAN: A Growth Story
1993 2007 CAGR
AIRCRAFT 13 83 14%
SALES (millions) US$318 US$3,525 19%
PASSENGERS (millions) 1.0 11.1 19%
CARGO TONS (thousands) 48 604 20%
EMPLOYEES 2,227 15,797 15%
3

LAN Overview: A Passenger + Cargo Airline
4
Passenger Business: Capacity Breakdown by Route Type (ASK)
Chile (Dom)14%
International75%
Peru (Dom)7%
Arg. (Dom)4%
Cargo Business: Capacity Breakdown by Route Type
(ATK)Chile (Dom)
3%
Intl97%
Cargo Operations• Sales (2007): US$1.2 billion• Tons transported (2007): 604 thousand• Fleet: 10 dedicated freighters• Companies: Chile, Brazil, Mexico
Passenger Operations• Sales (2007): US$2.2 billion• Passengers transported (2007): 11.1 million• Fleet: 73 aircraft• Companies: Chile, Argentina, Peru & Ecuador

LAN Business Model: Distinct blend enhances returns and reduces risk
Revenue Mix, Selected Companies, 2007Passenger and Cargo Combination
– Lower Break-Even Load Factors– Increased diversification
7%
13%
21%
33%
21%
16%
7%
8%
12%
88%
90%
73%
79%
86%
80%
67%
60%
59%
62%
6%
6%
3%
4%
29%
22%
5%
6%
9%
12%
19%
Delta
American
Iberia
Qantas
BA
Air France
Singapore
Cathay
Korean Air
LAN
Cargo Others PassengerNote: Information for BA, Air France & Singapore for the year ended March 2007.
Note: Information for Qantas for the year ended June 2007.
BELF Differential for passenger + cargo routes (2007)
13%
59%72%
Load
Fac
tor
BELF w/o Cargo
CargoContribution
BELF w/ Cargo
Note: BELF = Break-even load factor
5

LAN’s Diversified Business Model
6
50%
International(Long Haul)
25%
Regional
14%Dom. Chile
7%Dom. Perú
4%Dom. Argentina
62%Passenger
33%
Cargo5%
Others
Diversified Passenger CapacityDiversified Business Model(% Operating Revenues) (% ASKs)
LAN’s business model is diversified among the passenger and cargo businesses, as well as geographically throughout Latin America and the rest of the world.
This allows LAN the flexibility to better withstand unfavorable economic conditions

LAN Operates with High Efficiency Levels
Lan Dom
Thai
Singapore
Qantas
Korean
JAL
EVA
CathayAir Asia
TAM
LAN
COPA
GOLUS Airways
LUVJBU
United AirlinesDelta
COAMRIB
BAAF-KLM
RyanAir
EasyJet
20
30
40
50
60
70
80
90
100
500 1.000 1.500 2.000 2.500 3.000 3.500 4.000 4.500 5.000
Trip Length (Km)
Tota
l Ope
ratin
g C
ost/A
TKCost/ATK industry comparison (2007)
DOM
LAN’s Cost / ATK increased by 2.8% in 2007 and decreased by 0.2% ex-fuel.
Note: “LAN Dom” refers to the Cost/ATK of LAN’s domestic operation, excluding cargo.
Note: Information for all airlines is for the last full year reported.7

Leading Presence in South American Markets
LAN Market Share in Passenger Markets (December 2007)
Market Size: Passengers Transported 2007(millions)
8Sources: DGAC Chile, DGAC Peru, Undersecretary of Transportation Argentina, DAC Ecuador, LAN Estimates.
2,8
4,93,9
7,5
2,2
4,13,6
5,6
012345678
Ecuador Chile Peru Argentina
International Domestic
Millions ofPassengers
PeruInternational: 27%
Domestic: 68%
ArgentinaInternational: 16%
Domestic: 18%
ChileInternational 50%Domestic: 75%
EcuadorInternational: 21%
Buenos AiresSantiago
Guayaquil
Lima

Guayaquil
Buenos AiresSantiago
Lima
LAN’s Regional Strategy – Passenger Operations
Multi-hub/Multi-airline model– Interlocking hubs protect and
complement each other– Higher asset utilization
1.500 KM
TAM Commercial Agreement– Implemented in December 2007– Main Routes: Santiago, Lima,
Buenos Aires to Sao Paulo– Domestic Markets
• Brazil• Peru• Chile• Argentina
TAM / LAN Agreement
9

Leading South American Passenger Route Network
10
Alliances
TAM
693 destinationsworldwide
Passenger network enhanced with key global strategic alliances
Madrid
Easter Island
Auckland
Papeete
Sydney
Frankfurt
New York
MiamiLos Angeles
Mexico City
Caracas
Sao Paulo
Buenos AiresMontevideo
Cancun
Bariloche
Pta. Arenas
Arica
La Paz
Pto. Montt
Cuzco
Lima
Bogotá
Santiago
Rio de Janeiro
Rosario
Quito
Pta. Cana
Guayaquil
Ushuaia
Salta
Rio Gallegos
Com. Rivadavia
Cordoba
Iguazú
IquiqueAntofagasta
CalamaCopiapo
La Serena
Mendoza
Concepcion
Balmaceda
TemucoValdiviaOsorno
TacnaArequipa
Puerto Maldonado
Iquitos
Piura
TarapatoPucalpa
ChiclayoTrujillo
LAN
Codeshare

DOMESTIC OPERATIONS
New A320 family aircraft
Lower fares
More direct flights
INTERNATIONAL OPERATIONS
New Premium Business Class: first with full flat sleeper seats between Latin America and the United States
State of the art on board entertainmentsystem
Complete retrofit of B767 fleet in 1H08 –US$80 million investment
Begin retrofit of A340 fleet in 2H08
Differentiated Value Propositions in the Passenger Business
11
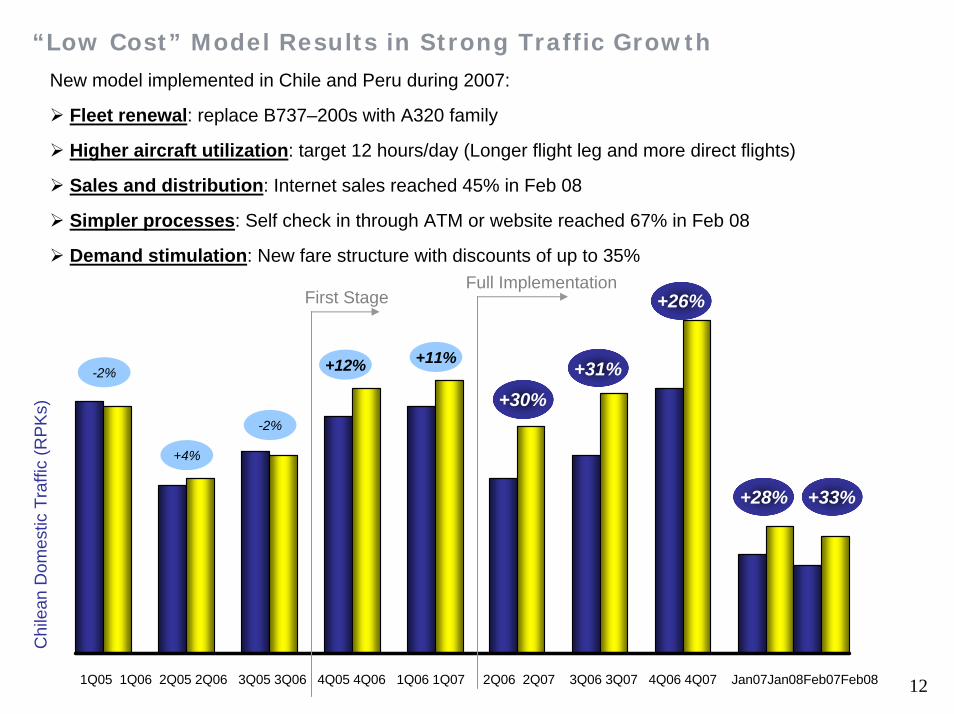
“Low Cost” Model Results in Strong Traffic Growth New model implemented in Chile and Peru during 2007:
Fleet renewal: replace B737–200s with A320 family
Higher aircraft utilization: target 12 hours/day (Longer flight leg and more direct flights)
Sales and distribution: Internet sales reached 45% in Feb 08
Simpler processes: Self check in through ATM or website reached 67% in Feb 08
Demand stimulation: New fare structure with discounts of up to 35%
1Q05 1Q06 2Q05 2Q06 3Q05 3Q06 4Q05 4Q06 1Q06 1Q07 2Q06 2Q07 3Q06 3Q07 4Q06 4Q07 Jan07Jan08Feb07Feb08
+31%+30%
+11%+12%
-2%
+4%
-2%
Chi
lean
Dom
estic
Traf
fic(R
PK
s)
First StageFull Implementation
+26%
+28% +33%
12

Most Complete Cargo Network in Latin America
LAN is the leading cargo operator in Latin America
13
Madrid
Easter Island
Auckland
Papeete
Sydney
FrankfurtLos Angeles
Mexico City
Caracas
Sao Paulo
Buenos AiresMontevideo
Cancun
Bariloche
Pta. Arenas
Arica
La Paz
Pto. Montt
Cuzco
Lima
Bogotá
Santiago
Rosario
Quito
Pta. Cana
Guayaquil
Ushuaia
Salta
Rio Gallegos
Com. Rivadavia
Cordoba
Iguazú
IquiqueAntofagasta
CalamaCopiapo
La Serena
Mendoza
Concepcion
Balmaceda
TemucoValdiviaOsorno
TacnaArequipa
Puerto Maldonado
Iquitos
Piura
TarapatoPucalpa
ChiclayoTrujillo
Houston
San JosePanama
Merida
Rio de Janeiro
Porto Alegre
VitoriaBelo HorizonteSalvador
Manaos
Alliances Passenger networkCargo network
Curitiba
Asunción
Amsterdam
Miami

Dynamics of the Latin America Air Cargo Market
Operational efficiencies must be obtained by managing unbalanced flows and seasonal fluctuations.
Northbound Flows:
dominated by fish, flowers, fruits and vegetables
Southbound Flows:dominated by consumer electronics, machinery,
spare parts and automotive parts
14Source: Boeing World Air Cargo 2006 - 2007
Macro Drivers of the Air Cargo Market:
Product seasonality
GDP growth
Exchange rates
Fuel prices
Eastbound Flows:
dominated by fish and flowers
Westbound Flows:
dominated by consumer electronics, machinery,
spare parts and automotive parts

Contents
I. LAN OVERVIEW
II. FINANCIAL RESULTS
III. FUTURE OUTLOOK
15

Strong Revenue Growth
Operating Revenues 1993 – 2007
3.525
318407
600 694
9721.083
1.237
1.425 1.428 1.4541.639
2.093
2.506
3.034
0
400
800
1.200
1.600
2.000
2.400
2.800
3.200
3.600
1993 1994 1995 1996 1997 1998 1999 2000 2001 2002 2003 2004 2005 2006 2007
US$ Million
CAGR24%
CAGR1%
CAGR19%
US$ Millions
16
$11 $15$34 $44
$83$62
$112
$172
$303
$413
$6
$38
$308
$51$46 $50$80
$142
$48
$164
$241
$0
$64
$31$25
$147
$84
$31$11
$48
$0$25$50$75
$100$125$150$175$200$225$250$275$300$325$350$375$400$425
1993 1994 1995 1996 1997 1998 1999 2000 2001 2002 2003 2004 2005 2006 2007
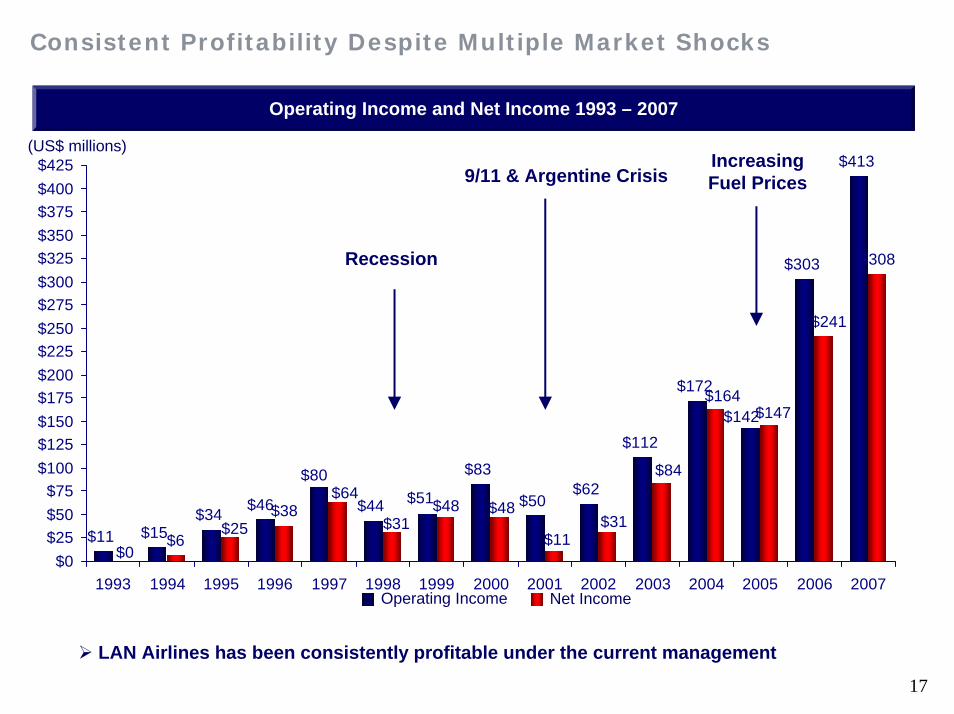
Operating Income and Net Income 1993 – 2007
Operating Income Net Income
(US$ millions)
Recession
9/11 & Argentine CrisisIncreasing Fuel Prices
Consistent Profitability Despite Multiple Market Shocks
LAN Airlines has been consistently profitable under the current management
17

Current Trends in EBITDAR and EBITDAR Margin
$290 $323$382 $370
$583
$726
19,2%20,6%
14,8%
18,3%19,7%19,9%
$0
$100
$200
$300
$400
$500
$600
$700
$800
$900
$1.000
2002 2003 2004 2005 20060%
5%
10%
15%
20%
25%
EBIT
DA
R (U
S$m
illio
ns)
EBITDAR
18EBITDAR Margin
EBITD
AR
Margin
(%)
Improvement in EBITDAR margin driven by:“Low cost” model in domestic operationsStrong revenue growth in international passenger businessEfficiencies in cargo business, reduced ACMI, more profitable route mixEfficiency in back office and support areas
Note: EBITDAR = Operating income + depreciation & amortization + aircraft rentals (does not include fuel hedging gains/losses)
2007

Solid Financial Position
LAN is one of the few Investment Grade airlines in the world (BBB rating)
LAN successfully completed a US$320 million equity offering in June 2007
LAN has no short term debt; long-term debt only related to aircraft financing
Low interest rates, over 90% of interest bearing debt is fixed
Diversified revenue stream: different businesses and different countries
60%
65%
70%
75%
80%
1Q06 2Q06 3Q06 4Q06 1Q07 2Q07 3Q07 4Q07
Leve
rag
e
0%2%4%6%8%10%12%14%16%18%20%
Leverage Liquidity
19

Fuel pass-through in cargo businesses
Change in passenger fuel pass-through table in December 2007
Fuel Strategy: Fuel Cost Pass-Through Mechanism
Regional (US$) Long Haul (US$) Regional (US$) Long Haul (US$)< 40 0 0 <40 0 0
40 - 45 10 20 40-50 10 20 45 - 50 13 30 50-60 15 40 50 - 55 15 40 60-70 20 60 55 - 60 18 50 70-80 25 80 60 - 65 20 60 80-90 30 100 65 - 70 23 70 90< * * 70 - 75 25 80 75 - 80 28 90 80 - 85 30 100 85 - 90 33 110 90 - 95 35 120 95 - 100 38 130 100 - 105 40 140 105 - 110 43 150
Referencia WTI US$
Fuel Surcharge Internacional (OW) Referencia WTI US$
Fuel Surcharge Internacional (OW)International Fuel Surcharge
Note: Fuel surcharges are per segment (ie.one way).
< 40 040 – 50 050 – 60 2,50060 – 70 5,00070 – 80 7,50080 – 90 10,00090 – 100 12,500100 – 110 15,000110 – 120 7,500
Domestic Chile WTI US$ Fuel Surcharge (Ch$)
International US$ 1.00 / Kg.
From Europe Euro 0.80 / Kg.
20
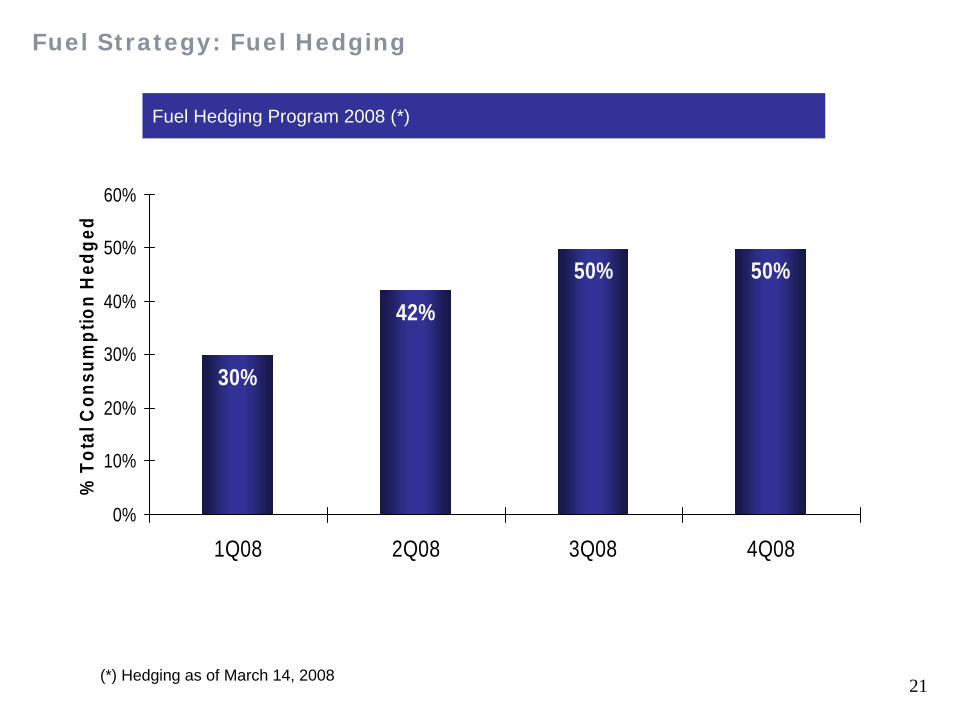
Fuel Hedging Program 2008 (*)
Fuel Strategy: Fuel Hedging
30%
42%
50% 50%
0%
10%
20%
30%
40%
50%
60%
1Q08 2Q08 3Q08 4Q08
% T
otal
Con
sum
ptio
n H
edge
d
(*) Hedging as of March 14, 2008 21

Passenger Capacity and Traffic Evolution
Recent Traffic Trends
78%
81%80%
77%78%
71%
0,0%
5,0%
10,0%
15,0%
20,0%
25,0%
30,0%
35,0%
1Q07 2Q07 3Q07 4Q07 Jan 08 Feb-08
Gro
wth
(%)
64%
66%
68%
70%
72%
74%
76%
78%
80%
82%
Load
Fac
tor (
%)
ASK GrowthRPK GrowthLoad Factor
Cargo Capacity and Traffic Evolution
73%
71%
76%
74%74%74%
0,00%
2,00%
4,00%
6,00%
8,00%
10,00%
12,00%
14,00%
16,00%
1Q07 2Q07 3Q07 4Q07 Jan 08 Feb-08
Gro
wth
(%)
68%
69%
70%
71%
72%
73%
74%
75%
76%
77%
Load
Fac
tor
(%)
ATK GrowthRTK GrowthLoad Factor
22

Contents
I. LAN OVERVIEW
II. FINANCIAL RESULTS
III. FUTURE OUTLOOK
23

Fleet Plan
24
0
2226 28 28 28 28
3750
5766 66
55
5
5
99
9
92
3
4
9
51
32
59
9
0
30
60
90
120
150
2007 2008 2009 2010 2011 2012-16Boeing 737-200 Boeing 767-300ER Airbus A320/A319/A318Boeing 787 Airbus 340-300 Boeing 767-300F CargoBoeing 777-200F Cargo Boeing 737-200F Cargo
1
1
FREIGHTERS
PASSENGERAIRCRAFT
83
139
+ 67%
FLEET CAPEX(USD MM) 471 865 365 243 660 3500
US$6.1 Billion
2 4

Estimated Capacity Expansion
Passenger ASK Growth Cargo ATK Growth
25
0%
5%
10%
15%
2006 2007 2008E
7.0%6.9%
8-10%
0%
5%
10%
15%
20%
25%
30%
2006 2007 2008E
19.5%
20-22%
11.5%
Planes Hours Seats

Importantes iniciativas....crecimiento fuera de Chile....Passenger Business 2008
• Additional frequencies on long-haul routes to Europe and the South Pacific.
• Consolidation of position on regional routes.
• Sustained growth on routes between Latin America and NorthAmerica.
Growing Routes Action Plans
+34%
+20%
+13%
+8%
26

27
0
10
20
30
40
50
60
70
2007 Q12008 Q4
2010 Q32012 Q2
2014 Q12015 Q4
2017 Q32019 Q2
2021 Q12022 Q4
2024 Q32026 Q2
2028 Q12029 Q4
N° Aircraft LH
MIN MAX PLAN
-34 %
-22 %
-52 %
-36 %
Fleet Plan: LAN Maintains the Flexibility to Adjust its Fleet SizeN
umbe
rofL
ong
Hau
lPas
seng
erA
ircra
ft

LAN is Well Positioned for Future Growth
28
Strong footprint in Latin America
Proven business model resilient to adverse economic conditions
Undergoing significant fleet expansion and renewal
Proven ability to operate in a high fuel price environment with “jet fuel pass-through” mechanism
Adjusting value propositions to better serve short haul and long haul passengers
Implementation of new “low cost model” in domestic and regional operations

LAN Investor Relations Contact Information
29
Gisela Escobar, Head of Investor RelationsTel. (562) 565 8785 / (562) 565 [email protected]
Gaelle Duret, Head of ResearchTel. (562) 565 [email protected]
Juan Jose Irarrázaval, Investor Relations AnalystTel. (562) 565 [email protected]