corporate name - marsa maroc€¦ · corporate overview marsa maroc is a multi-disciplinary port...
TRANSCRIPT
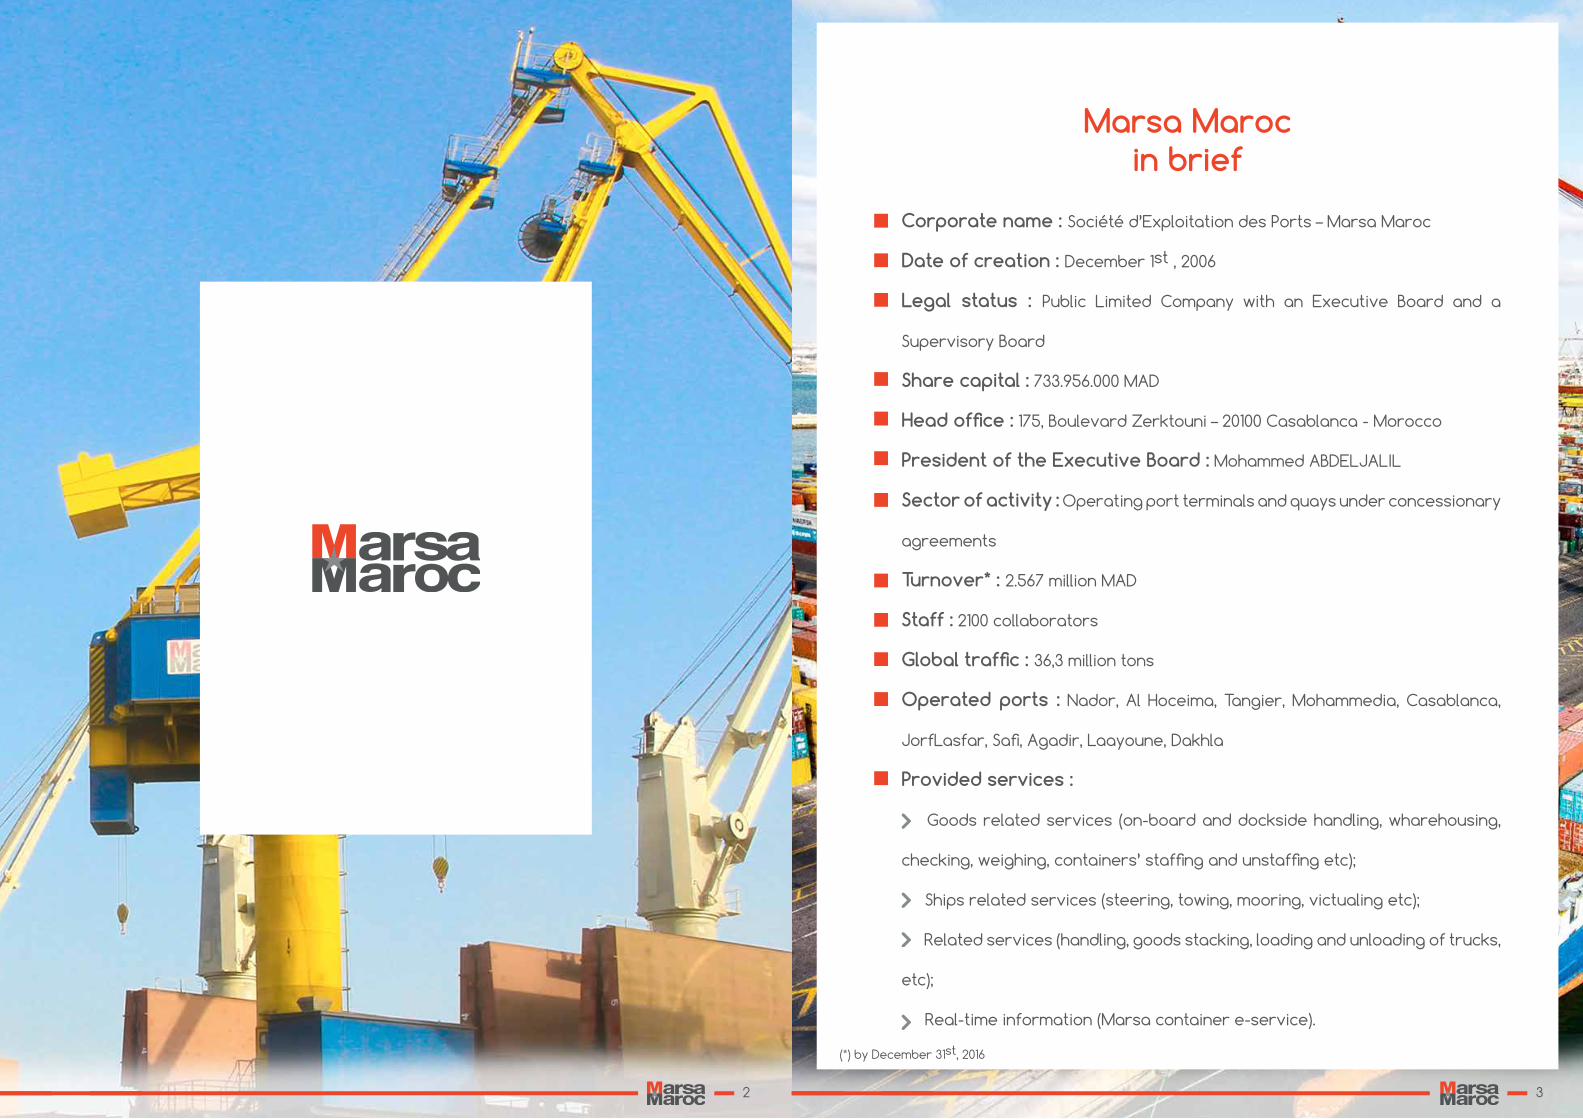
Corporate name : Société d’Exploitation des Ports – Marsa Maroc
Date of creation : December 1st , 2006
Legal status : Public Limited Company with an Executive Board and a
Supervisory Board
Share capital : 733.956.000 MAD
Head office : 175, Boulevard Zerktouni – 20100 Casablanca - Morocco
President of the Executive Board : Mohammed ABDELJALIL
Sector of activity : Operating port terminals and quays under concessionary
agreements
Turnover* : 2.567 million MAD
Staff : 2100 collaborators
Global traffic : 36,3 million tons
Operated ports : Nador, Al Hoceima, Tangier, Mohammedia, Casablanca,
JorfLasfar, Safi, Agadir, Laayoune, Dakhla
Provided services :
Goods related services (on-board and dockside handling, wharehousing,
checking, weighing, containers’ staffing and unstaffing etc);
Ships related services (steering, towing, mooring, victualing etc);
Related services (handling, goods stacking, loading and unloading of trucks,
etc);
Real-time information (Marsa container e-service).
Marsa Maroc in brief
(*) by December 31st, 2016
2 3
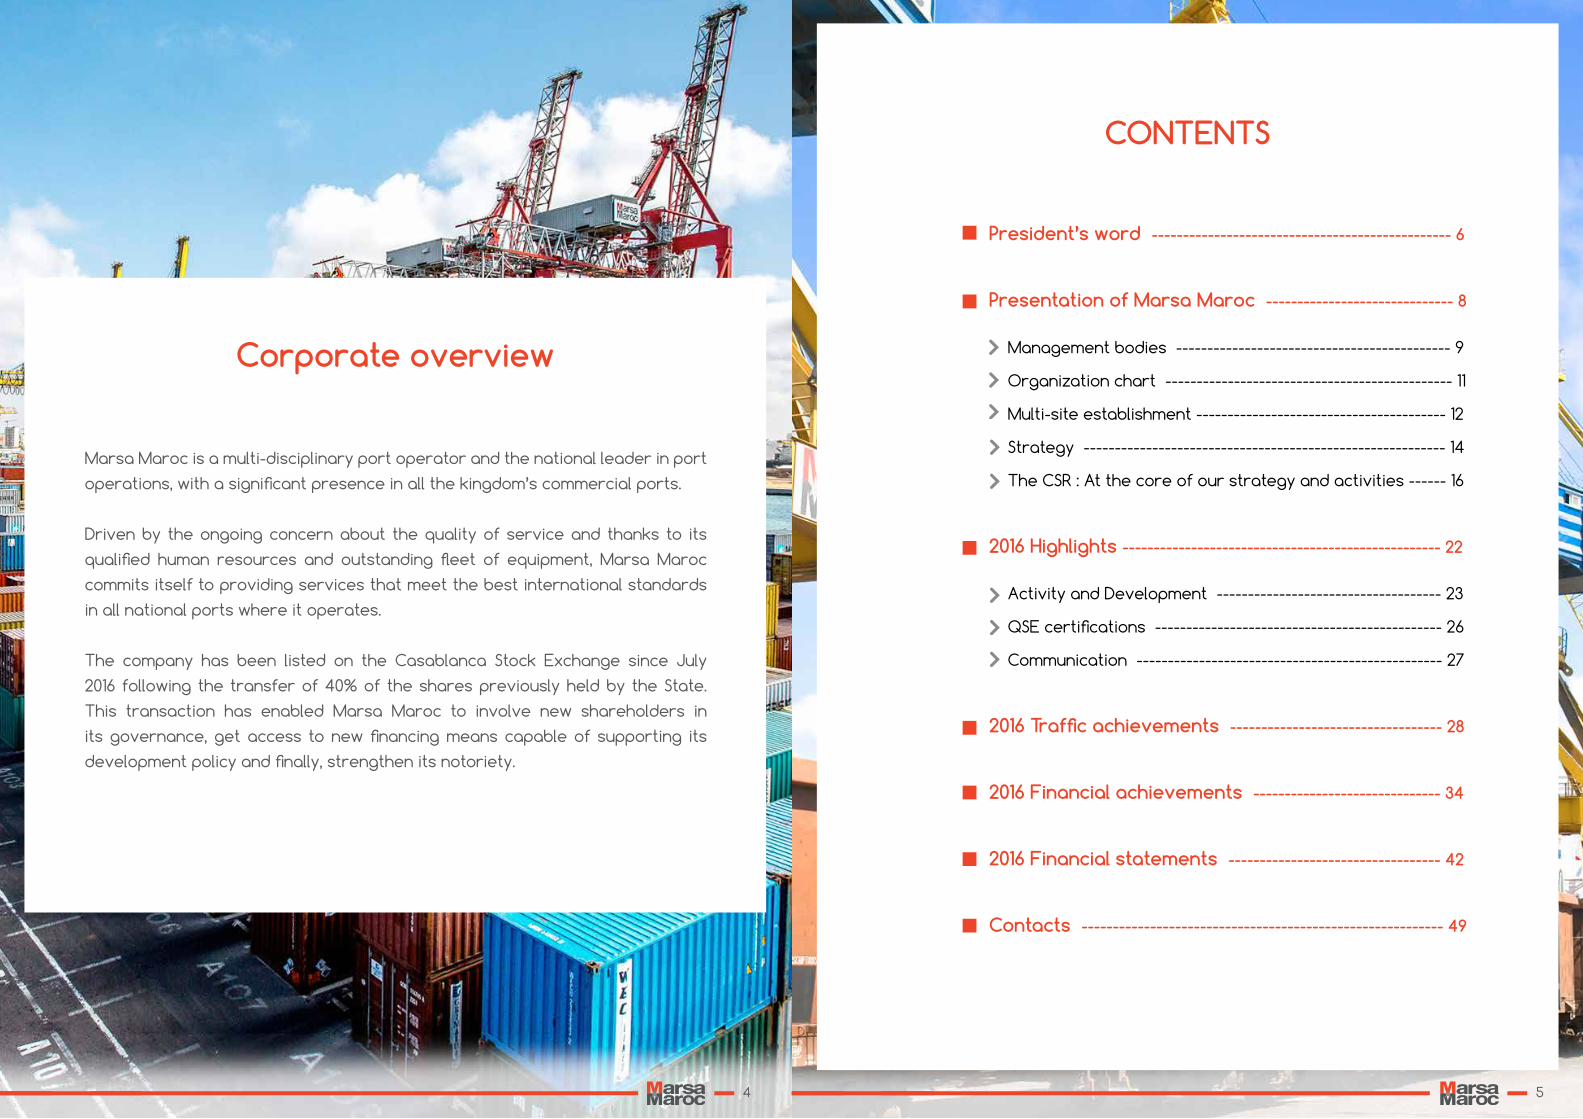
Corporate overview
Marsa Maroc is a multi-disciplinary port operator and the national leader in port
operations, with a significant presence in all the kingdom’s commercial ports.
Driven by the ongoing concern about the quality of service and thanks to its
qualified human resources and outstanding fleet of equipment, Marsa Maroc
commits itself to providing services that meet the best international standards
in all national ports where it operates.
The company has been listed on the Casablanca Stock Exchange since July
2016 following the transfer of 40% of the shares previously held by the State.
This transaction has enabled Marsa Maroc to involve new shareholders in
its governance, get access to new financing means capable of supporting its
development policy and finally, strengthen its notoriety.
President’s word ------------------------------------------------ 6
Presentation of Marsa Maroc ------------------------------ 8
Management bodies -------------------------------------------- 9
Organization chart ---------------------------------------------- 11
Multi-site establishment ---------------------------------------- 12
Strategy ---------------------------------------------------------- 14
The CSR : At the core of our strategy and activities ------ 16
2016 Highlights --------------------------------------------------- 22
Activity and Development ------------------------------------ 23
QSE certifications ---------------------------------------------- 26
Communication ------------------------------------------------- 27
2016 Traffic achievements ---------------------------------- 28
2016 Financial achievements ------------------------------ 34
2016 Financial statements ---------------------------------- 42
Contacts ---------------------------------------------------------- 49
CONTENTS
4 5
Dear Shareholders,
In a decade of its existence and within a context marked by the reform of the port sector and the advancement of the new Tanger-Med port, Marsa Maroc has successfully made the transition to a nationally-leading competitive company. During this period, the company’s management focused on certain priority growth areas while working on strengthening the fundamentals of the company.
Our company’s initial public offering in July was the highlight of the year 2016. In addition, Marsa Maroc has successfully commissioned the new container terminal at the port of Casablanca and the new multi-purpose terminal at the port of Agadir during the last quarter of 2016. Finally, the company was able to renew or maintain the quality, safety and environment certifications of all the port sites where it operates.
We are pleased with the achievements of the first ten years of our existence and we are now working to maintain our position in the Kingdom while ensuring as well our development in the international market. To this end, we will strive new national investment opportunities and will devote the necessary resources to concretize the presence of Marsa maroc in the the medium term in sub-saharan Africa.
Good reading.
7
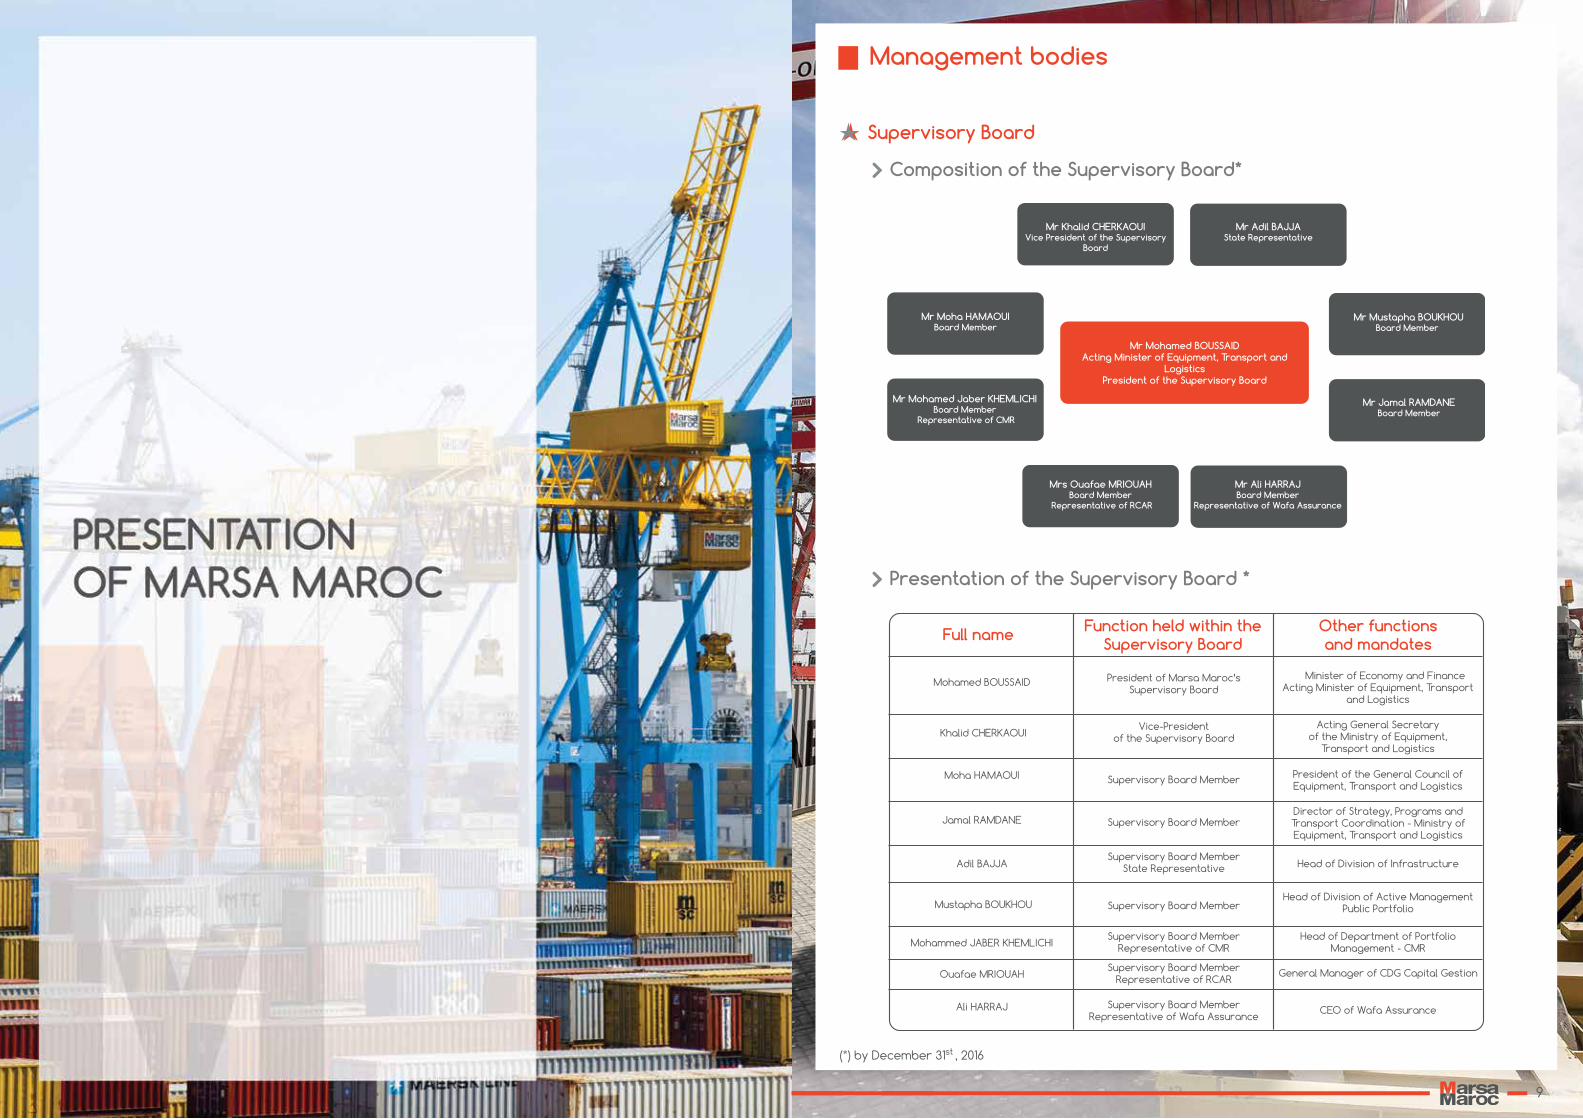
Management bodies
Mr Mohamed BOUSSAIDActing Minister of Equipment, Transport and
Logistics President of the Supervisory Board
Mr Khalid CHERKAOUIVice President of the Supervisory
Board
Mr Moha HAMAOUIBoard Member
Mr Mohamed Jaber KHEMLICHIBoard Member
Representative of CMR
Mrs Ouafae MRIOUAHBoard Member
Representative of RCAR
Mr Adil BAJJAState Representative
Mr Mustapha BOUKHOUBoard Member
Mr Jamal RAMDANEBoard Member
Mr Ali HARRAJ Board Member
Representative of Wafa Assurance
Presentation of the Supervisory Board *
Composition of the Supervisory Board*
Full name Function held within the Supervisory Board
Other functionsand mandates
Minister of Economy and FinanceActing Minister of Equipment, Transport
and Logistics
Acting General Secretaryof the Ministry of Equipment,
Transport and Logistics
Mohamed BOUSSAID
Khalid CHERKAOUI
President of Marsa Maroc’s Supervisory Board
Vice-Presidentof the Supervisory Board
President of the General Council of Equipment, Transport and Logistics
Director of Strategy, Programs and Transport Coordination - Ministry of Equipment, Transport and Logistics
Head of Division of Active Management Public Portfolio
Moha HAMAOUI
Jamal RAMDANE
Mustapha BOUKHOU
Adil BAJJA
Supervisory Board Member
Supervisory Board Member
Supervisory Board Member
Supervisory Board MemberState Representative Head of Division of Infrastructure
Head of Department of Portfolio Management - CMRMohammed JABER KHEMLICHI
Supervisory Board MemberRepresentative of CMR
General Manager of CDG Capital GestionOuafae MRIOUAHSupervisory Board Member
Representative of RCAR
CEO of Wafa AssuranceAli HARRAJ Supervisory Board MemberRepresentative of Wafa Assurance
Supervisory Board
(*) by December 31st , 2016
9
2 Committees attached to the Supervisory Board
Supervisory Board
Audit and Governance Committee
Strategy, Investments, Compensation and
Appointments Committee
The Audit and Governance Committee is responsible for overseeing the financial reporting compliance rules, the compliance with legal and regulatory requirements as well as the qualification, independence and action of external auditors. To this end, it advises the Supervisory Board on the internal control device, the quality of the accounts, the performance and on any matter relating to the system of information and management of the company. It also decides on the appointment of the statutory auditors and any other external auditors. The Audit and Governance Committee decides as well on the work program of external and internal auditors, the accounting principles and methods and on the annual accounts and activity reports before being reviewed by the Supervisory Board.The Audit and Governance Committee also oversees the development and monitoring of the governance rules, the functioning of the Board and its committees, the policy and communication procedures as well as the dissemination of the information relating to the code of ethics and deontology of Board ‘s members .
The Strategy, Investments, Compensation and Appointments Committee is in charge of the following missions:
Assisting the Supervisory Board in evaluating the strategy of Marsa Maroc; Examining, at the request of the Supervisory Board, the strategic investment projects and any acquisition or sale transaction likely to have a significant impact on the revenues, structure and balance sheet of Marsa Maroc;Reviewing Marsa Maroc multiannual plan over three years;Preparing the deliberations of the Supervisory Board relating to Marsa Maroc’s strategy;Giving an opinion and making recommendations on the compensation and recruitment policy implemented by Marsa Maroc and on any proposed change project of this policy;Giving an opinion on the projects of a significant reorganization of the organization chart and structures of Marsa Maroc; Preparing recommendations for the succession to the position of members of the Committees as they approach the expiry of their mandates.
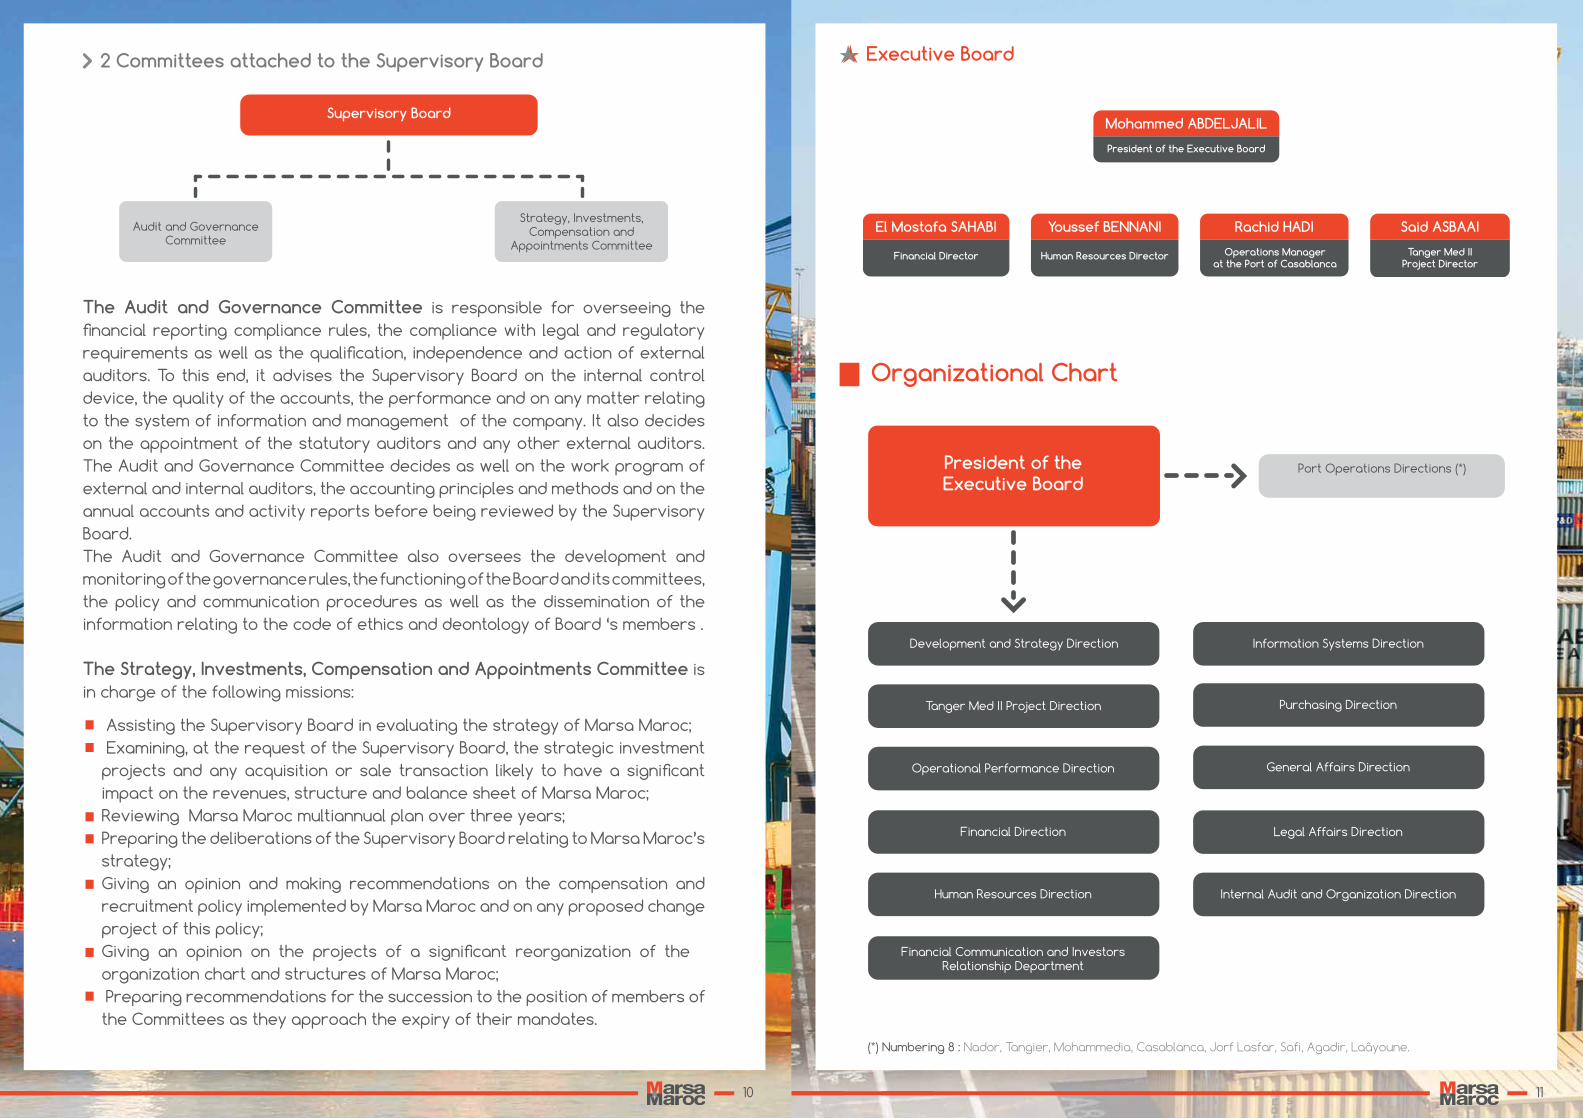
Executive Board
Mohammed ABDELJALIL
President of the Executive Board
Youssef BENNANI
Human Resources Director
Said ASBAAI
Tanger Med IIProject Director
Rachid HADI
Operations Managerat the Port of Casablanca
El Mostafa SAHABI
Financial Director
Port Operations Directions (*)
Development and Strategy Direction
Tanger Med II Project Direction
Operational Performance Direction
Financial Direction
Human Resources Direction
Information Systems Direction
Purchasing Direction
General Affairs Direction
Legal Affairs Direction
Internal Audit and Organization Direction
Financial Communication and Investors Relationship Department
President of the Executive Board
(*) Numbering 8 : Nador, Tangier, Mohammedia, Casablanca, Jorf Lasfar, Safi, Agadir, Laâyoune.
Organizational Chart
10 11
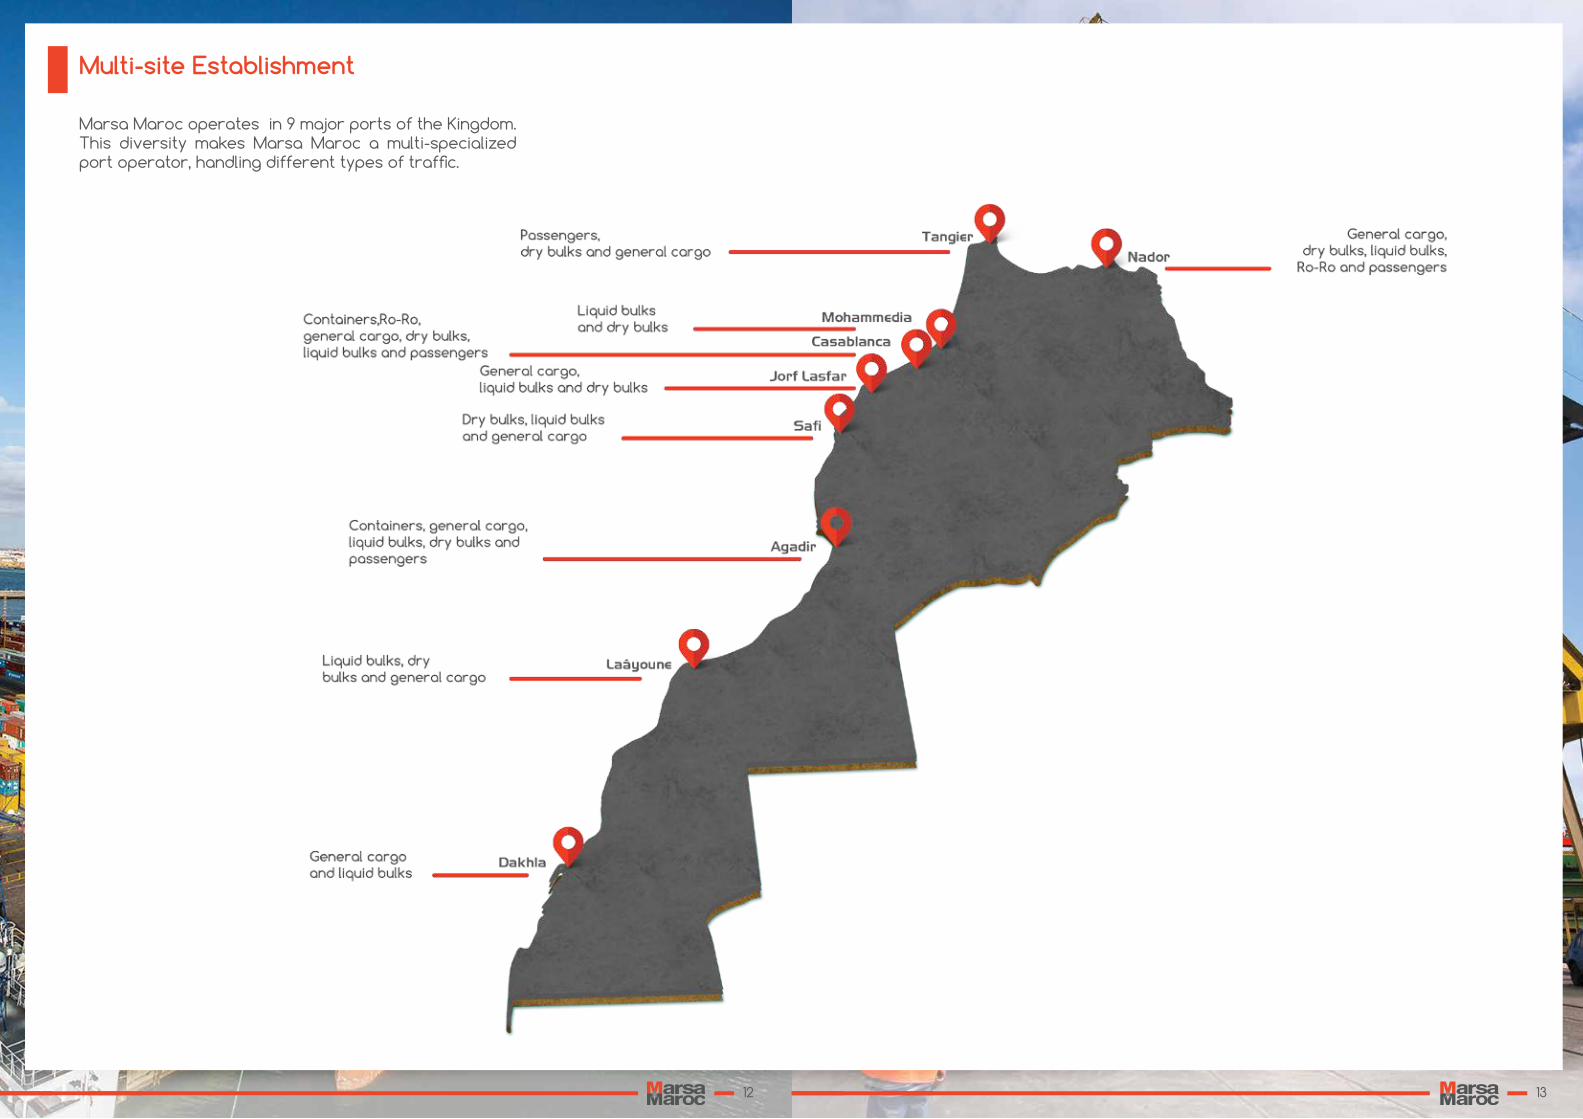
Multi-site Establishment
Marsa Maroc operates in 9 major ports of the Kingdom. This diversity makes Marsa Maroc a multi-specialized port operator, handling different types of traffic.
12 13
Strengthening the position of the leader port operator in Morocco
Establishment of a significant presence in Africa
Participation in the improvement of logistics
This new plan seeks initially that Marsa Maroc be involved in the changes that will take place in the national port sector arising in particular from the planned commissioning of several new generation port infrastructures in the next decade as Safi Grand Vrac, Nador West Med, Kenitra Atlantique and Dakhla Atlantique. And to do so, Marsa Maroc has to obtain new concessions to maintain and strengthen its position as a national leader.
It also aims to capitalize on the expertise of Marsa Maroc in order to geographically diversify its portfolio of activities and to position it as a recognized multi-traffics port operator at the continental level, notably by obtaining port concessions and taking part in structuring projects in Africa.
Finally, thanks to the strategic presence of Marsa Maroc in the main ports of Morocco, this new plan tries to establish its role by developing and diversifying its activities through its participation in the improvement of logistics. The company plans thus to propose, in the near future, to the major industrial companies, a global offer which involves taking entirely in charge of their logistics. Encouraging prospects which are notable signs of Marsa Maroc’s engagement in a development process in line with the dynamics of the logistics sector in Morocco.
Strategy
By engaging in a development process since its creation at the end of 2006, following the port reform, Marsa Maroc has been actively involved in improving the logistics performance of Morocco. To do so, taking into account a newly competitive and rapidly changing environment, the strategic plan implemented by the company in 2008 intended to meet these challenges.
New concessions have thus been added to the portfolio of Marsa Maroc, among which are the Container Terminal 3 (TC3) of the port of Casablanca with a capacity of 600,000 TEU and commissioned in October 2016, the concession of the North Terminal of the port of Agadir which started in September 2016 and the new Container Terminal at Tanger Med II port with a capacity of 1,500,000 TEU and scheduled to be commissioned at the end of 2019.
Other achievements during this decade, in particular the building of the vertical storage space at the car terminal of the port of Casablanca, the QSE certification of all port sites, the strengthening and improvement of the procedures, reflect the firm determination of Marsa Maroc for the continuous improvement of its operational performance, the quality of its services and its risk management.
After the achievements of its first ten years of existence, Marsa Maroc is now turning to new challenges. The company has reconsidered its strategic plan by setting new objectives by 2025.
14 15
The CSR : At the core of our strategy and activities
A committed employer
An operator committed to the environment
An actor in the economic and social development
of the cities where it operates
Nearly 2.100 women and men bound by the common values of commitment, performance, responsibility and transparency, constitute the human capital of Marsa Maroc.Being aware of the important role of its human resources as a lever for competitiveness and performance, Marsa Maroc adopts a modern and innovative HR policy, based on a thorough knowledge of the skills and expectations of the employees and centered on the development of talents, promotion of health and safety at work as well as ensuring constructive social dialogue.
As a port operator, Marsa Maroc has to develop a wide range of specific and specialized functions and professions. The richness and diversity of the profiles of its employees are a real asset for Marsa Maroc.
Below is an overview of the human capital of Marsa Maroc :
Marsa Maroc conducts a human resources management policy that is capable to :ensure results-centered HR management aligned with the company strategy;attract, recruit and retain qualified and motivated staff;maintain a high level of performance and strive for excellence;guarantee a remuneration and compensation that creates a sense of fairness and recognition;provide a serene social climate that fosters development and innovation.
A committed employer
Human profile
HR policy in line with the company’s strategy
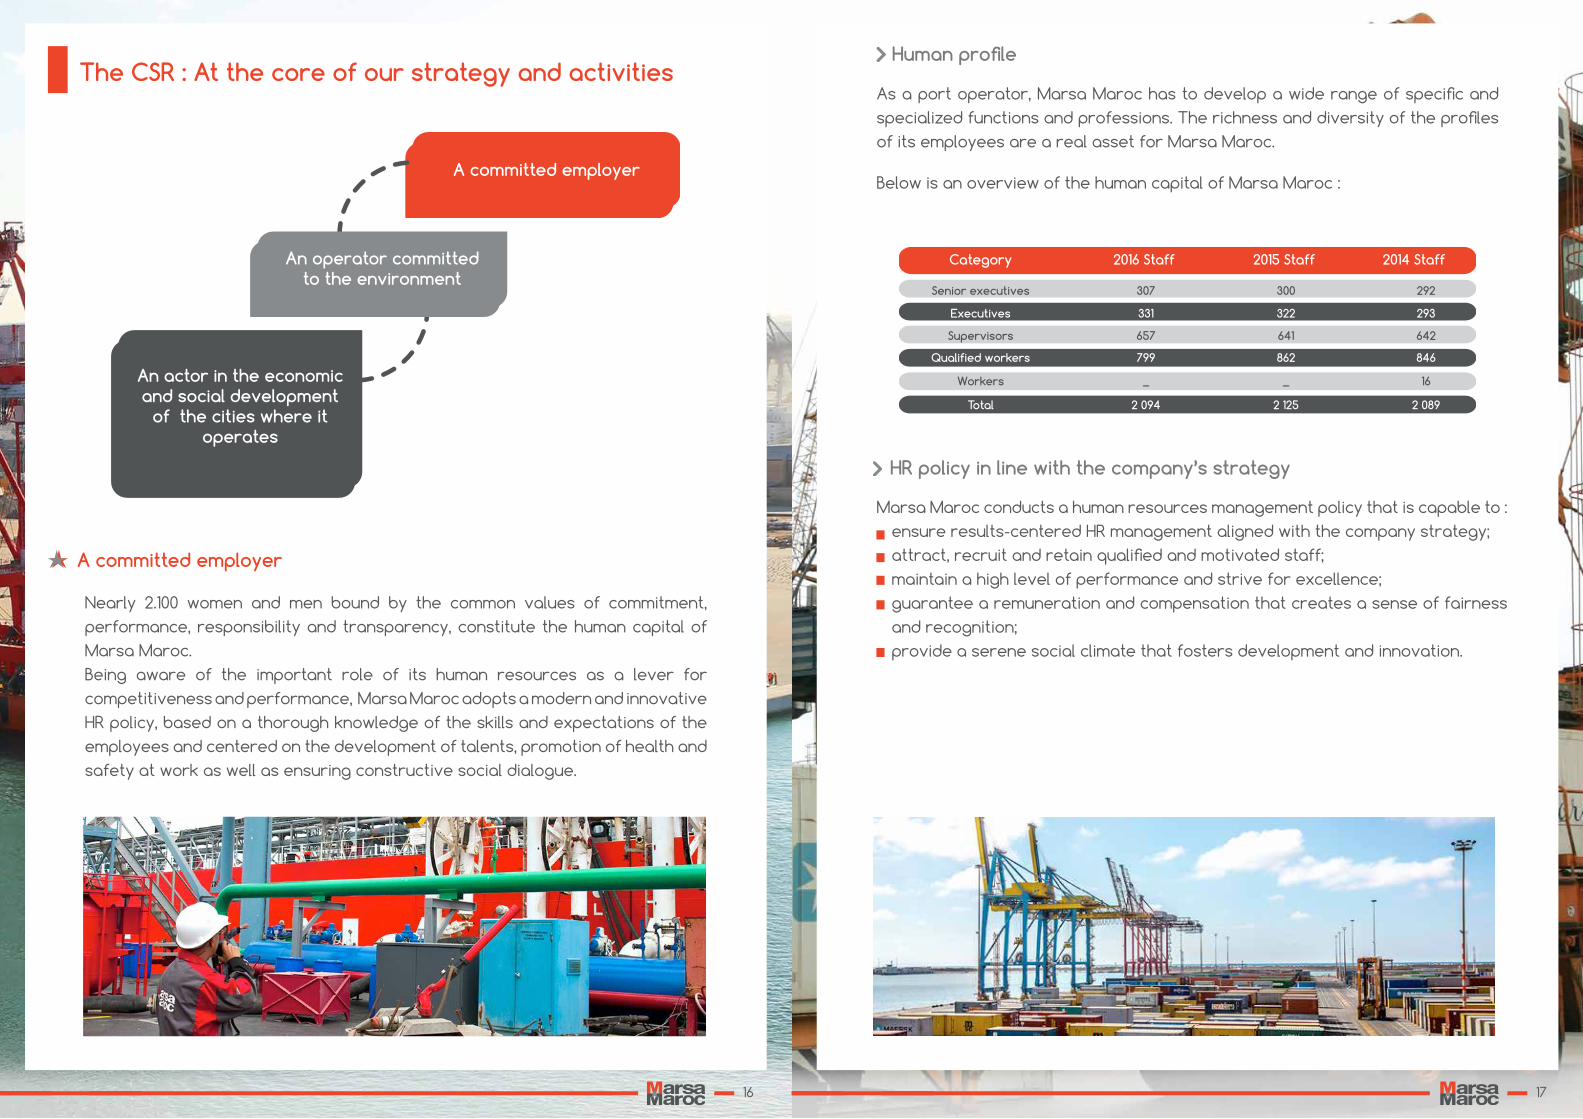
Category 2016 Staff 2015 Staff 2014 Staff
Senior executives
Executives
307
331
300
322
292
293
Supervisors 657 641 642
Qualified workers 799 862 846
Workers _ _ 16
Total 2 094 2 125 2 089
16 17
Recruitment and integration
Training
Health and safety at work
Marsa Maroc’s recruitment policy is based on a sustained presence in the various «employment» fairs and forums both in Morocco and abroad. It also relies on a close relationship with the Moroccan higher education establishments. To this end, Marsa Maroc annually awards prizes to deserving students of several Moroccan higher education establishments .
Given the complexity and singularity of Marsa Maroc’s business, as well as the multi-disciplinary nature of the projects within it, a structured process of integration is put in place to facilitate the smooth and rapid integration of new recruits.
Marsa Maroc has adopted a training policy that meets the demands of quality and innovation imposed by its environment. The staff benefits from business training in partnership with foreign ports and organizations as well as cross-disciplinary training provided by prestigious national and international partners.
In addition and in order to support the career development of its employees, Marsa Maroc partially or entirely finances degree-granting training (MBA, Masters, etc.).
Due to the nature of its business which presents a high level of professional risk, and being concerned about the well-being of its employees, Marsa Maroc makes health and safety at work a priority. It is then committed on a proactive and agile approach fostering :
The prevention of accidents at work through the implementation of systems of measuring, monitoring and controlling of professional risks;The awareness of employees on the various aspects of safety at their workplace;Medical prevention (screening actions, vaccination against influenza, etc.).
An actor committed to the environment
ISO 14001 certified terminals for sustainable performance
Joining « Moroccan Green Logistics » charter
Since May 2015, all quays and terminals operated by Marsa Maroc are ISO 14001 certified. In addition to being an international recognition of the efforts made by Marsa Maroc for setting up an environmental management system, this certification reflects Marsa Maroc’s commitment to integrate the environmental dimension into its corporate strategy.
Marsa Maroc was among the initial members of the “Moroccan Green Logistics” initiative launched on the sidelines of COP22, by the Moroccan Agency for the Development of Logistics on November 11th, 2016, in Marrakech.
This charter aims to enhance the contribution of the national logistics sector to Morocco’s sustainable development objectives and to sustainably mobilize the different actors around new collaborative actions.
Marsa Maroc commits in all of its operational sites to :Complying with current and future regulatory environmental requirements ;Continuously improving its environmental performance ;Integrating the environmental aspect into the study of new projects ;Controlling the pollution risks inherent in its activities ;Having means and methods for the rapid and effective control of environmental pollution ;Ensuring the rational and responsible use of natural resources ;Promoting the awareness and involvement of its employees in the protection of the environment.
Marsa Maroc’s health and safety at work efforts have been rewarded with the OHSAS 18001 certification in all its operational sites.
18 19
Partner of the «Clean Beaches» operation for 9 years, Marsa Maroc is sponsoring the beach of Ain Diab Extension. Thus, it develops each year an action plan covering several aspects :
Upgrading infrastructure: beach access, sanitary blocks, etc;Equipping the beach with rescue and safety equipment;Consciousness raising to the environment and animation program for children.
The commitment of Marsa Maroc was rewarded by obtaining for several years, the blue flag at Ain Diab Extension beach.
Marsa Maroc’s efforts are focused on raising awareness among 3,000 schoolchildren through:
Projection of films on coastal development;Organization of theater plays on the environmental theme;Organization of fun and educational games.
Partner of « Clean beaches » operation
Partner of Mohammed VI Foundation of the «Eco-Schools» program for the Environmental Protection
Marsa Maroc has been a partner of the «Eco-Schools» program for 2 years. This project, being part of the World Environment Day celebration by Mohammed VI Foundation for the Environmental Protection, aims at educating and raising awareness of young schoolchildren to environmental issues.As part of this project and in partnership with the local association « BAYAATI HAYATI », Marsa Maroc organizes awareness-raising activities for approximately ten primary schools of Casablanca-Anfa commune registered in the « Eco-Schools » program.
Marsa Maroc is committed to actively contributing to the social development of the regions where it operates and is thus carrying out several actions and activities in partnership with national associations.The year 2016 was marked by a partnership between Marsa maroc and Zakoura Education Foundation for the establishment of a pre-primary school in a rural area of Grand Casablanca, this as part of the ANEER initiative (National Action for Early Childhood Education in Rural Areas) launched in partnership with UNICEF and the Ministry of National Education and Professional Training.
Inaugurated in September 2016, the school established by Marsa Maroc allows pre-schooling 75 children every 2 years.
Actor in the social development of the regions where it operates
An actor in the economic and social development of the cities where it operates
An offer at the service of the economy of the regions where it operates
Wherever it operates, Marsa Maroc offers to economic operators, logistics services and facilities adapted to the needs of the local economy. From ores to agricultural products, to pelagic products, Marsa Maroc puts its expertise at the service of the enhancement of the natural resources of the different regions of the Kingdom, thus contributing to improving their attractiveness and economic competitiveness.
20 21
Activity and Development
The official ceremony of first listing of Marsa Maroc on the stock exchange was held on July 19th, 2016, at Casablanca Stock Exchange,.This initial public offering followed the opening up of its capital to the public with the obtaining on June 10th, 2016, the visa of the Moroccan Capital Market Authority (AMMC) for the sale of 40% of the company’s capital, that is 29 358 240 shares for a total amount of 1 929 835 017,50 MAD.
This initial public offering enabled Marsa Maroc to institutionalize and open up its capital to new partners, strengthen its governance and access new external financing to support its growth.
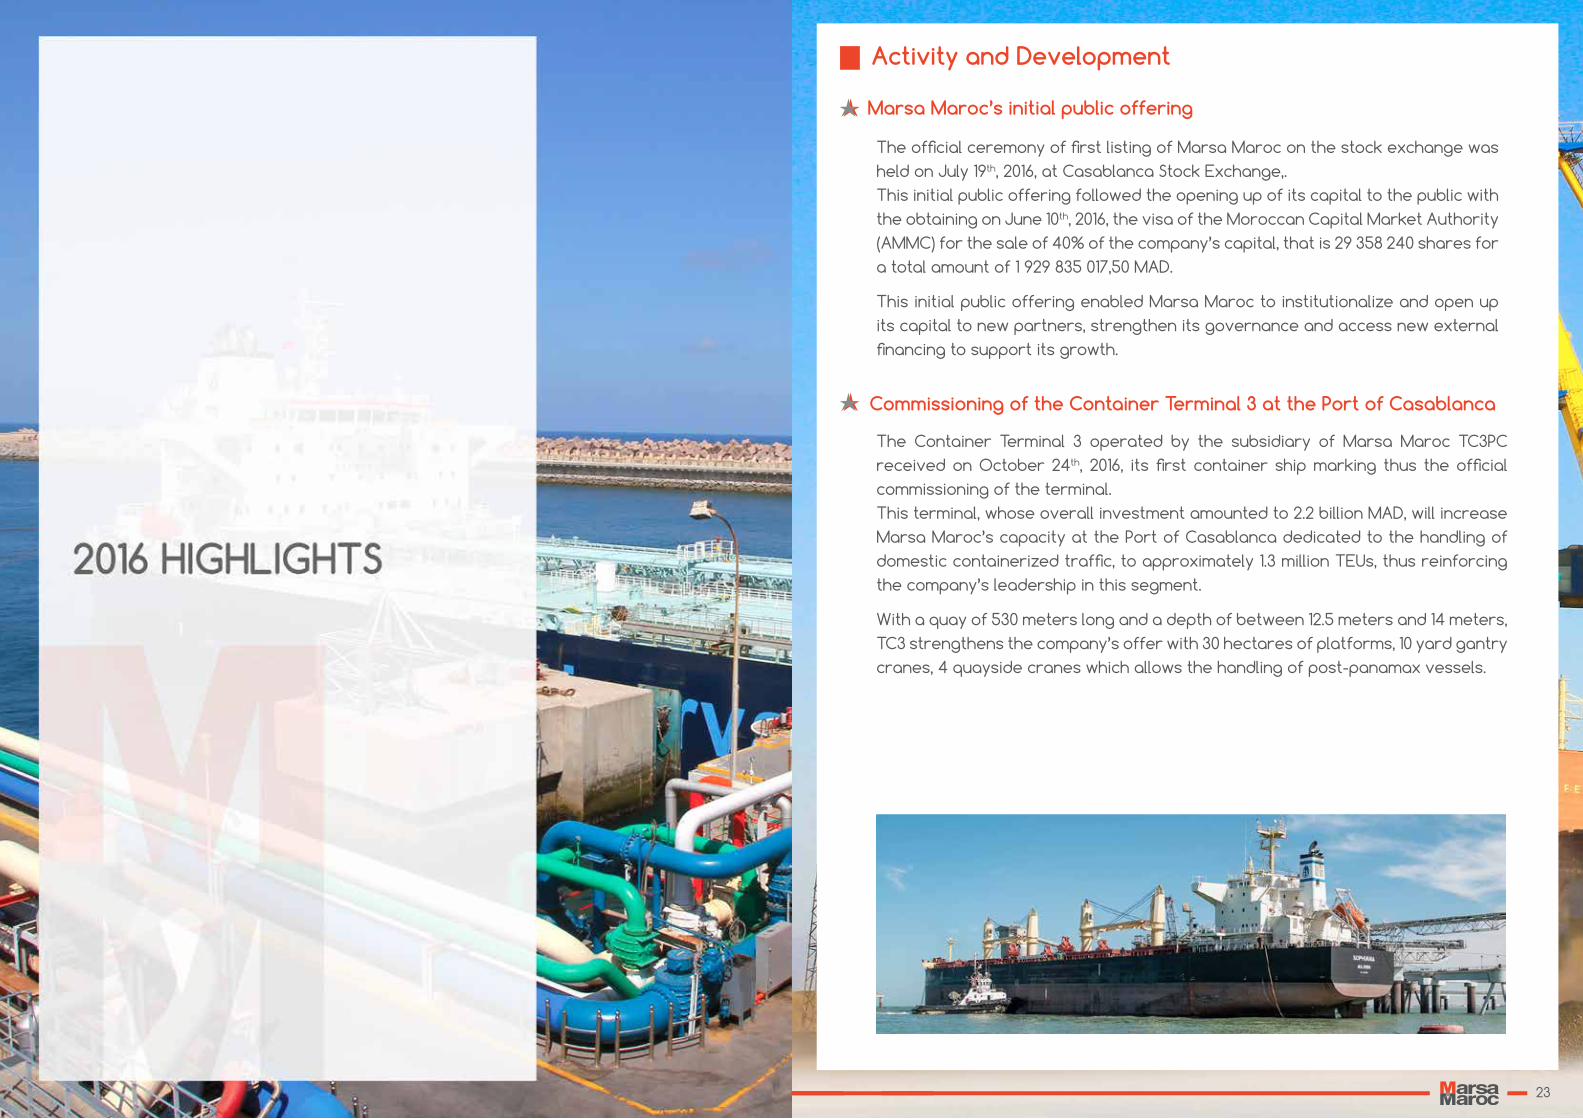
The Container Terminal 3 operated by the subsidiary of Marsa Maroc TC3PC received on October 24th, 2016, its first container ship marking thus the official commissioning of the terminal.This terminal, whose overall investment amounted to 2.2 billion MAD, will increase Marsa Maroc’s capacity at the Port of Casablanca dedicated to the handling of domestic containerized traffic, to approximately 1.3 million TEUs, thus reinforcing the company’s leadership in this segment.
With a quay of 530 meters long and a depth of between 12.5 meters and 14 meters, TC3 strengthens the company’s offer with 30 hectares of platforms, 10 yard gantry cranes, 4 quayside cranes which allows the handling of post-panamax vessels.
Marsa Maroc’s initial public offering
Commissioning of the Container Terminal 3 at the Port of Casablanca
23
Commissioning of the North Terminal at the port of Agadir
Signing of an amendment to the concession agreement of Tanger Med
The consortium made of Marsa Maroc, SOMATIME, INTERNAVI and MANUSSOUSS declared to be the holder of the concession for facilities, equipment, funding, operating, as well as maintenance of the North Terminal of the port of Agadir, signed with the National Ports Agency (ANP), a concession agreement. The commissioning of the terminal operated by SMA company (Agadir Handling Company) of which Marsa Maroc owns 51% of the shares, began on September 1st, 2016.
This new multi-purpose terminal presents 450 linear meters of quay, a depth of 10.5 meters, 13 hectares of platforms and is equipped with 4 cranes.
Marsa Maroc and Tanger Med Special Agency (TMSA) signed in March 2016, an amendment to the concession agreement that binds them together. This amendment grants to Marsa Maroc the concession for 30 years of the multi-user container terminal TC3 at the port of Tanger Med II.
This terminal, which commissioning is scheduled on November 2019, has 800 linear meters of quay and 32 hectares of platforms and offers a capacity of 1.5 million TEU.
Marsa Maroc shortlisted in the tender for the concession of the solid bulk terminal at the port of Takoradi in Ghana
TC3PC contracts with a bank consort ium a pr ivate debt “ Project-F inance” type
On August 23rd, 2016, Marsa Maroc was shortlisted with three other candidates, within the framework of the call for tender issued by Ghana Port Authority (GPHA) for the development and operation over 20 years, of the solid bulk terminal of the port of Takoradi.
This first stage of the process of tendering for the terminal was followed by a second selection phase restricted to the 4 candidates in the running.
On May 11th, 2016, TC3PC company in charge of operating the new Terminal 3 at the port of Casablanca and a subsidiary of Marsa Maroc, signed a long-term credit agreement of an amount of 770 million MAD with the Moroccan bank consortium made of BMCE Bank of Africa (majority shareholder), Attijariwafa Bank and Banque Centrale Populaire.
With a maturity of 15 years plus one year of grace, this project funding was dedicated to financing Terminal 3 which overall cost amounts 2.2 billion MAD excluding taxes (but including cost of entry).
Through this important financing, the bank consortium marks its commitment to support Marsa Maroc in its development projects.
Under the terms of this amendment, Marsa Maroc undertakes to implement and provide all the superstructures, equipment and human resources necessary for the good running of the TC3 and this, for an estimated investment of 200 million euros.
The forthcoming presence of Marsa Maroc in Tanger Med complex which is an important Mediterranean transhipment platform, reinforces the company’s ambition to develop at the regional level.
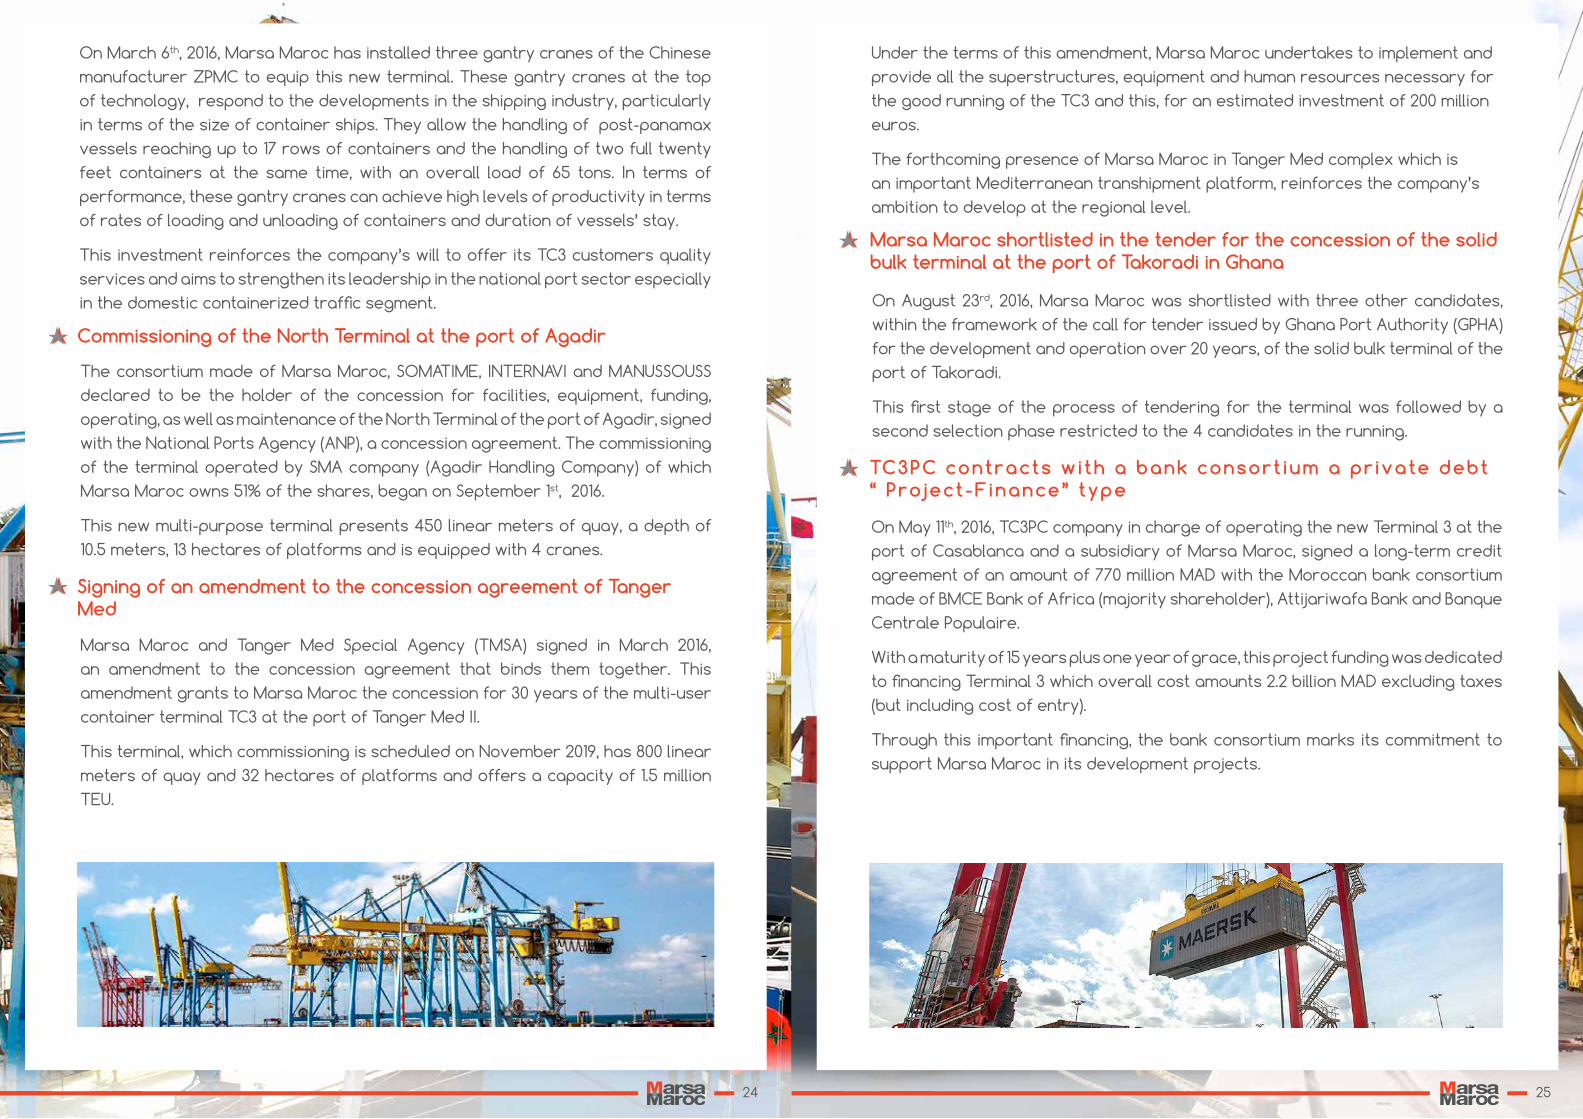
On March 6th, 2016, Marsa Maroc has installed three gantry cranes of the Chinese manufacturer ZPMC to equip this new terminal. These gantry cranes at the top of technology, respond to the developments in the shipping industry, particularly in terms of the size of container ships. They allow the handling of post-panamax vessels reaching up to 17 rows of containers and the handling of two full twenty feet containers at the same time, with an overall load of 65 tons. In terms of performance, these gantry cranes can achieve high levels of productivity in terms of rates of loading and unloading of containers and duration of vessels’ stay.
This investment reinforces the company’s will to offer its TC3 customers quality services and aims to strengthen its leadership in the national port sector especially in the domestic containerized traffic segment.
24 25
Quality, Safety and Environment Certifications
Implementation of the QSE integrated management system in all the operational sites across Morocco
Certification of the QSE management system of the ports of Safi and Casablanca according to the new version 2015
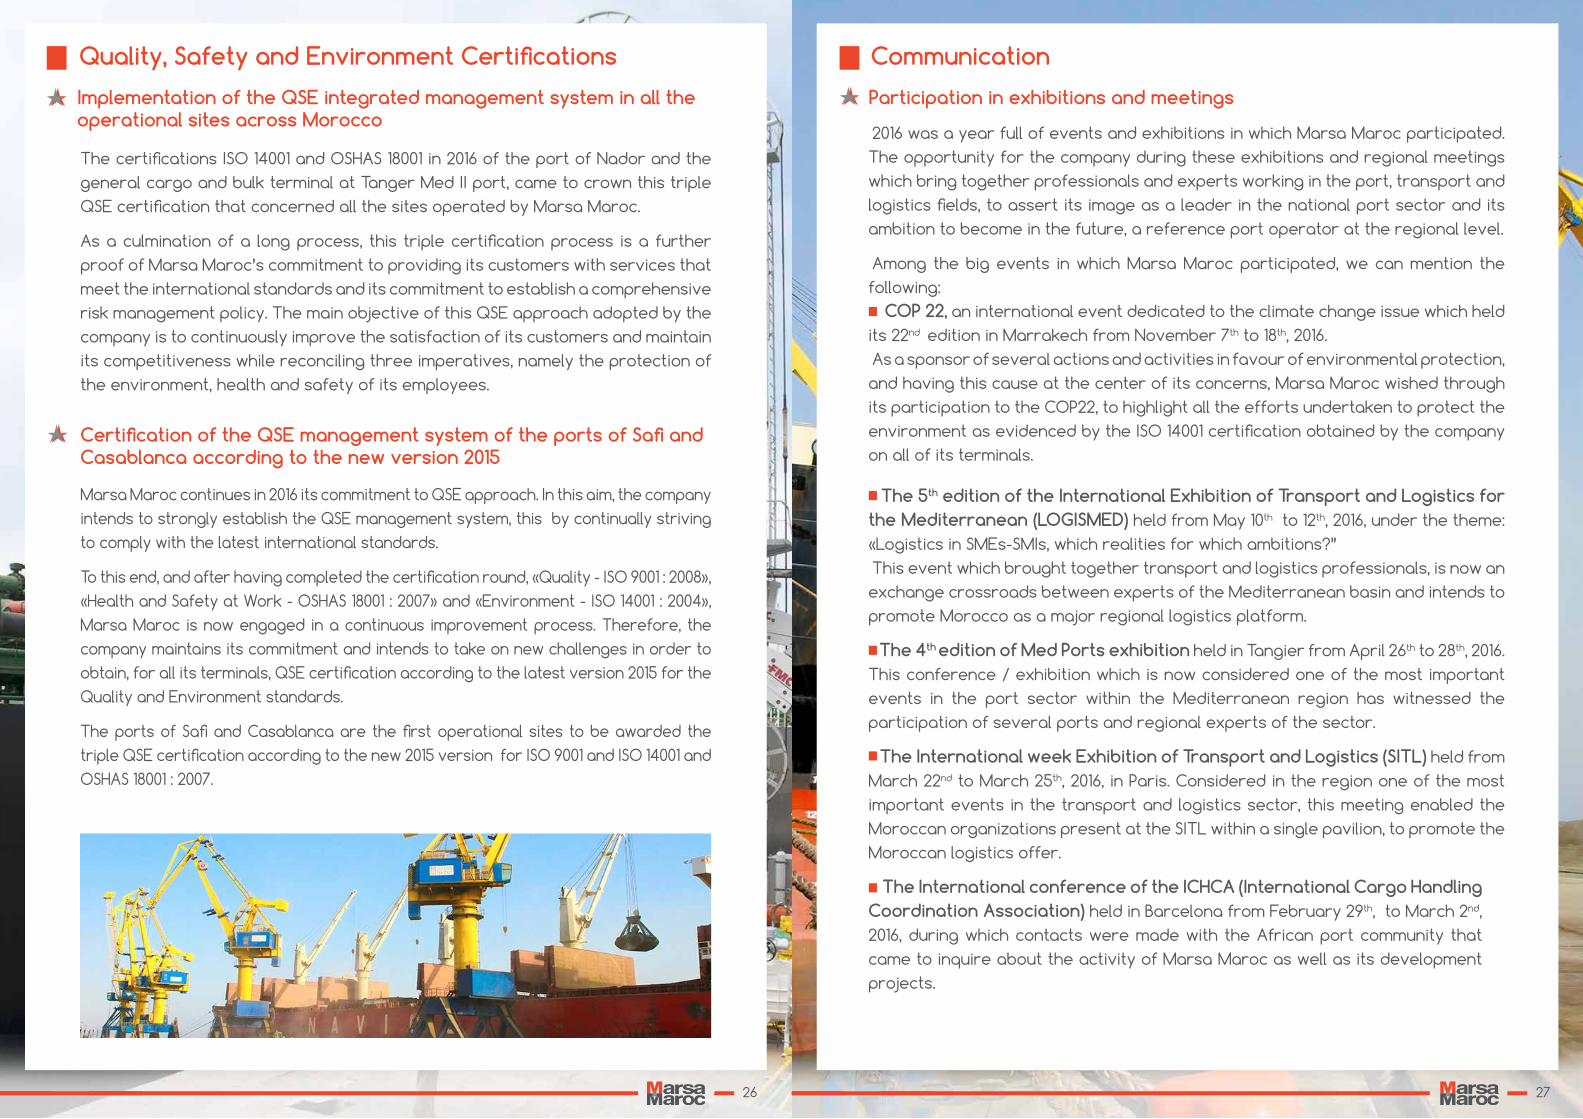
The certifications ISO 14001 and OSHAS 18001 in 2016 of the port of Nador and the general cargo and bulk terminal at Tanger Med II port, came to crown this triple QSE certification that concerned all the sites operated by Marsa Maroc.
As a culmination of a long process, this triple certification process is a further proof of Marsa Maroc’s commitment to providing its customers with services that meet the international standards and its commitment to establish a comprehensive risk management policy. The main objective of this QSE approach adopted by the company is to continuously improve the satisfaction of its customers and maintain its competitiveness while reconciling three imperatives, namely the protection of the environment, health and safety of its employees.
Marsa Maroc continues in 2016 its commitment to QSE approach. In this aim, the company intends to strongly establish the QSE management system, this by continually striving to comply with the latest international standards.
To this end, and after having completed the certification round, «Quality - ISO 9001 : 2008», «Health and Safety at Work - OSHAS 18001 : 2007» and «Environment - ISO 14001 : 2004», Marsa Maroc is now engaged in a continuous improvement process. Therefore, the company maintains its commitment and intends to take on new challenges in order to obtain, for all its terminals, QSE certification according to the latest version 2015 for the Quality and Environment standards.
The ports of Safi and Casablanca are the first operational sites to be awarded the triple QSE certification according to the new 2015 version for ISO 9001 and ISO 14001 and OSHAS 18001 : 2007.
Participation in exhibitions and meetings
2016 was a year full of events and exhibitions in which Marsa Maroc participated. The opportunity for the company during these exhibitions and regional meetings which bring together professionals and experts working in the port, transport and logistics fields, to assert its image as a leader in the national port sector and its ambition to become in the future, a reference port operator at the regional level.
Among the big events in which Marsa Maroc participated, we can mention the following: COP 22, an international event dedicated to the climate change issue which held its 22nd edition in Marrakech from November 7th to 18th, 2016.As a sponsor of several actions and activities in favour of environmental protection, and having this cause at the center of its concerns, Marsa Maroc wished through its participation to the COP22, to highlight all the efforts undertaken to protect the environment as evidenced by the ISO 14001 certification obtained by the company on all of its terminals.
The 5th edition of the International Exhibition of Transport and Logistics for the Mediterranean (LOGISMED) held from May 10th to 12th, 2016, under the theme: «Logistics in SMEs-SMIs, which realities for which ambitions?”This event which brought together transport and logistics professionals, is now an exchange crossroads between experts of the Mediterranean basin and intends to promote Morocco as a major regional logistics platform.
The 4th edition of Med Ports exhibition held in Tangier from April 26th to 28th, 2016. This conference / exhibition which is now considered one of the most important events in the port sector within the Mediterranean region has witnessed the participation of several ports and regional experts of the sector.
The International week Exhibition of Transport and Logistics (SITL) held from March 22nd to March 25th, 2016, in Paris. Considered in the region one of the most important events in the transport and logistics sector, this meeting enabled the Moroccan organizations present at the SITL within a single pavilion, to promote the Moroccan logistics offer.
The International conference of the ICHCA (International Cargo Handling Coordination Association) held in Barcelona from February 29th, to March 2nd, 2016, during which contacts were made with the African port community that came to inquire about the activity of Marsa Maroc as well as its development projects.
Communication
26 27
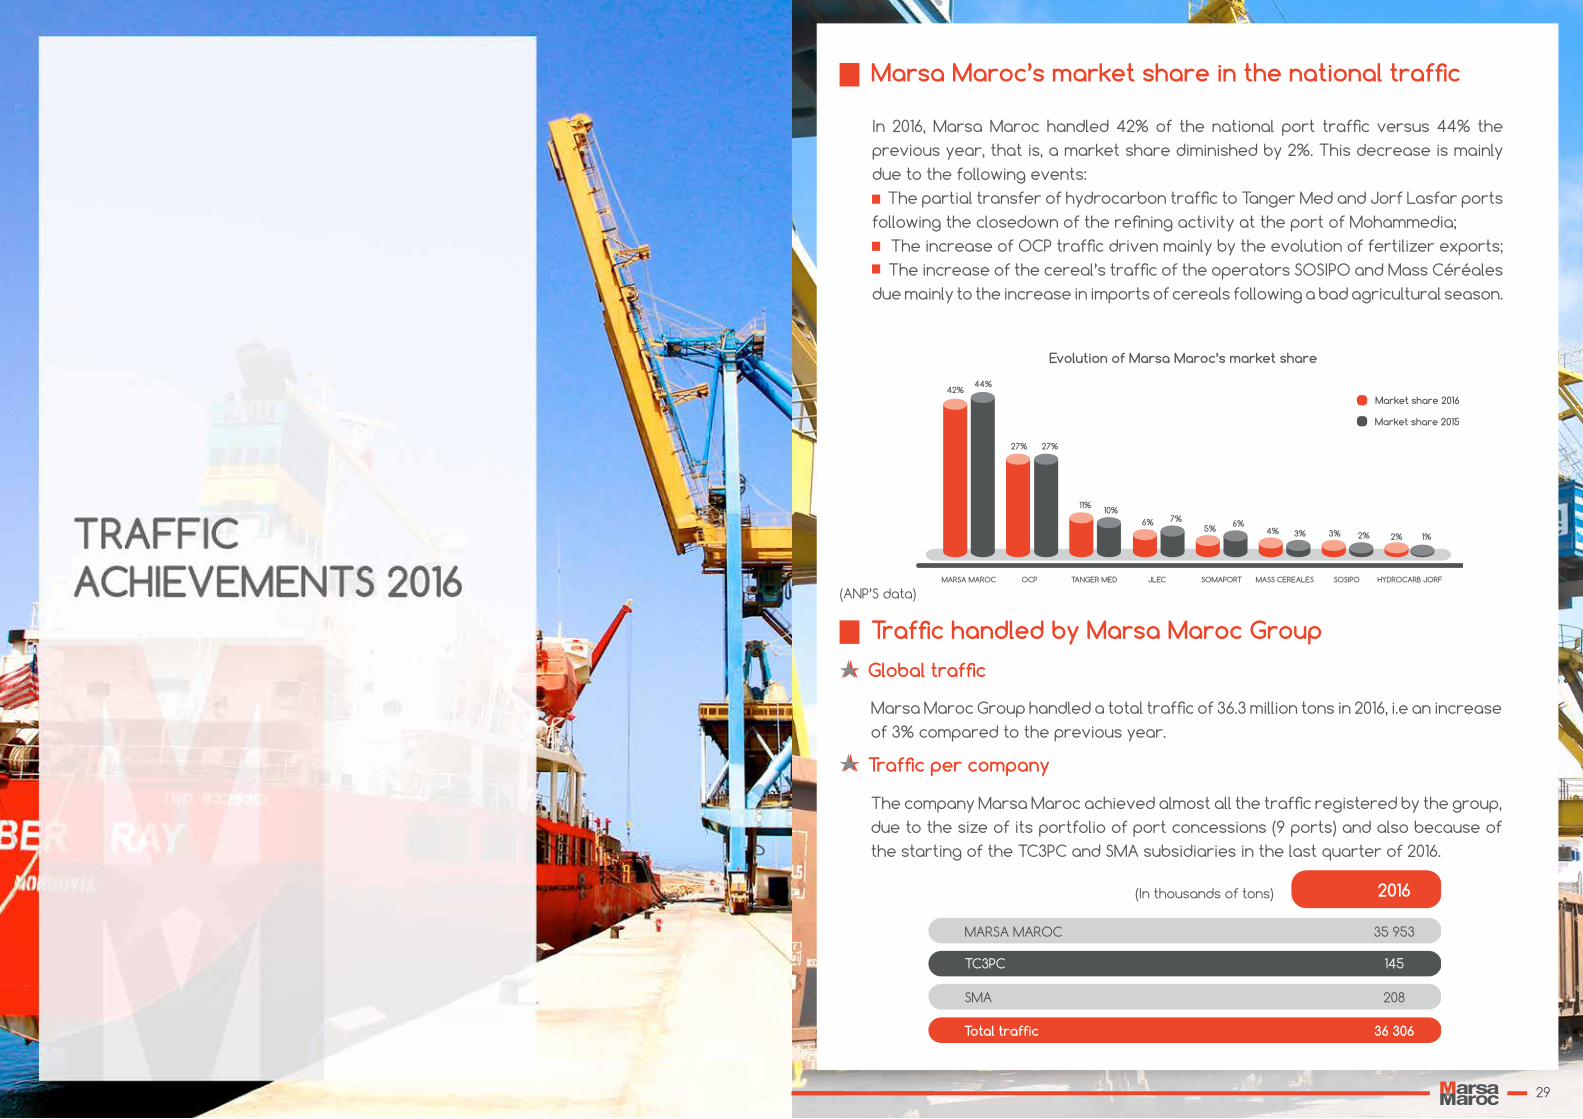
Marsa Maroc’s market share in the national traffic
In 2016, Marsa Maroc handled 42% of the national port traffic versus 44% the previous year, that is, a market share diminished by 2%. This decrease is mainly due to the following events: The partial transfer of hydrocarbon traffic to Tanger Med and Jorf Lasfar ports following the closedown of the refining activity at the port of Mohammedia; The increase of OCP traffic driven mainly by the evolution of fertilizer exports; The increase of the cereal’s traffic of the operators SOSIPO and Mass Céréales due mainly to the increase in imports of cereals following a bad agricultural season.
Marsa Maroc Group handled a total traffic of 36.3 million tons in 2016, i.e an increase of 3% compared to the previous year.
The company Marsa Maroc achieved almost all the traffic registered by the group, due to the size of its portfolio of port concessions (9 ports) and also because of the starting of the TC3PC and SMA subsidiaries in the last quarter of 2016.
42%44%
27% 27%
11%10%
6% 7%5% 6%
4% 3% 3% 2% 2% 1%
MARSA MAROC OCP TANGER MED SOMAPORTJLEC MASS CEREALES SOSIPO HYDROCARB JORF
Market share 2016
Market share 2015
Traffic handled by Marsa Maroc Group
Global traffic
Traffic per company
MARSA MAROC
TC3PC
35 953
145
SMA 208
Total traffic 36 306
1,50%
2016(In thousands of tons)
Evolution of Marsa Maroc’s market share
(ANP’S data)
29
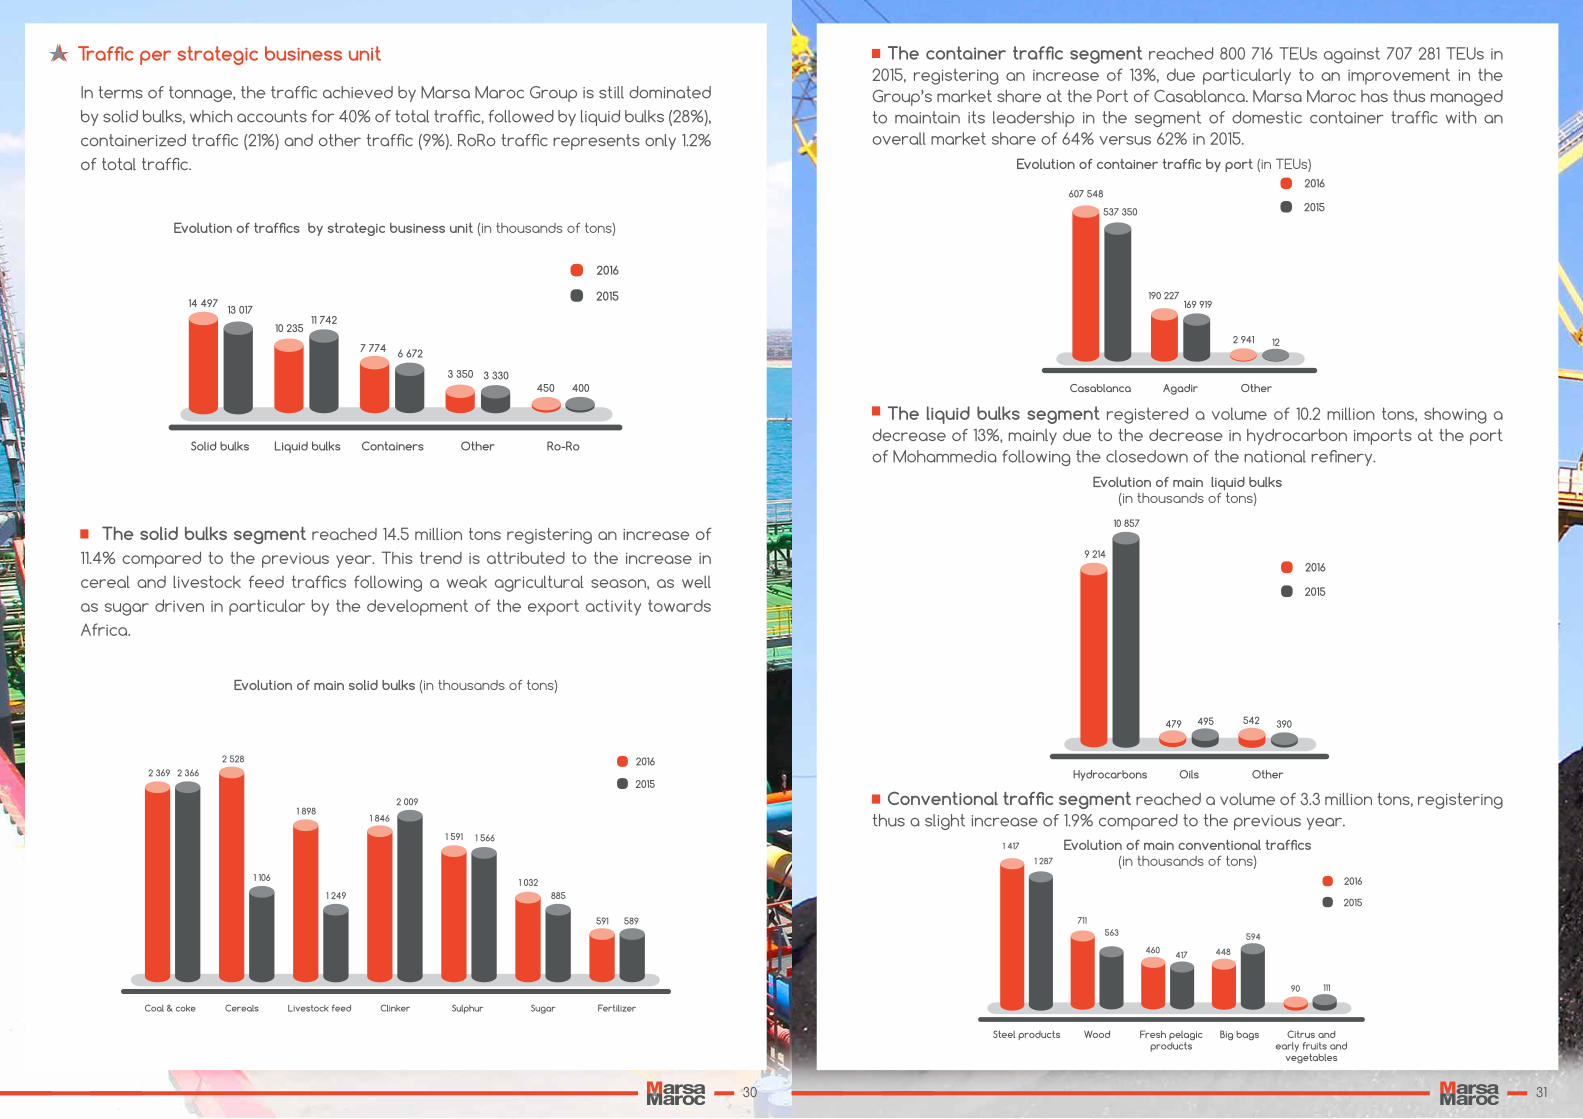
Traffic per strategic business unit
In terms of tonnage, the traffic achieved by Marsa Maroc Group is still dominated by solid bulks, which accounts for 40% of total traffic, followed by liquid bulks (28%), containerized traffic (21%) and other traffic (9%). RoRo traffic represents only 1.2% of total traffic.
The solid bulks segment reached 14.5 million tons registering an increase of 11.4% compared to the previous year. This trend is attributed to the increase in cereal and livestock feed traffics following a weak agricultural season, as well as sugar driven in particular by the development of the export activity towards Africa.
2 369 2 366
2 528
1 106
1 898
1 249
1 846
2 009
1 591 1 566
1 032885
591 589
Coal & coke Cereals Livestock feed Clinker Sulphur Sugar Fertilizer
2016
2015
The container traffic segment reached 800 716 TEUs against 707 281 TEUs in 2015, registering an increase of 13%, due particularly to an improvement in the Group’s market share at the Port of Casablanca. Marsa Maroc has thus managed to maintain its leadership in the segment of domestic container traffic with an overall market share of 64% versus 62% in 2015.
The liquid bulks segment registered a volume of 10.2 million tons, showing a decrease of 13%, mainly due to the decrease in hydrocarbon imports at the port of Mohammedia following the closedown of the national refinery.
Conventional traffic segment reached a volume of 3.3 million tons, registering thus a slight increase of 1.9% compared to the previous year.
Evolution of traffics by strategic business unit (in thousands of tons)
Evolution of main solid bulks (in thousands of tons)
Evolution of main liquid bulks (in thousands of tons)
Evolution of container traffic by port (in TEUs)
14 49713 017
10 23511 742
7 774 6 672
3 350 3 330450 400
Solid bulks Liquid bulks Containers Other Ro-Ro
2016
2015
607 548
190 227169 919
2 941 12
537 350
Casablanca Agadir Other
2016
2015
Hydrocarbons Oils Other
2016
2015
479
9 214
10 857
495 542 390
1 417
1 287
711563
Steel products Fresh pelagicproducts
Wood Big bags Citrus andearly fruits and
vegetables
2016
2015
460 417 448
594
90 111
Evolution of main conventional traffics (in thousands of tons)
30 31
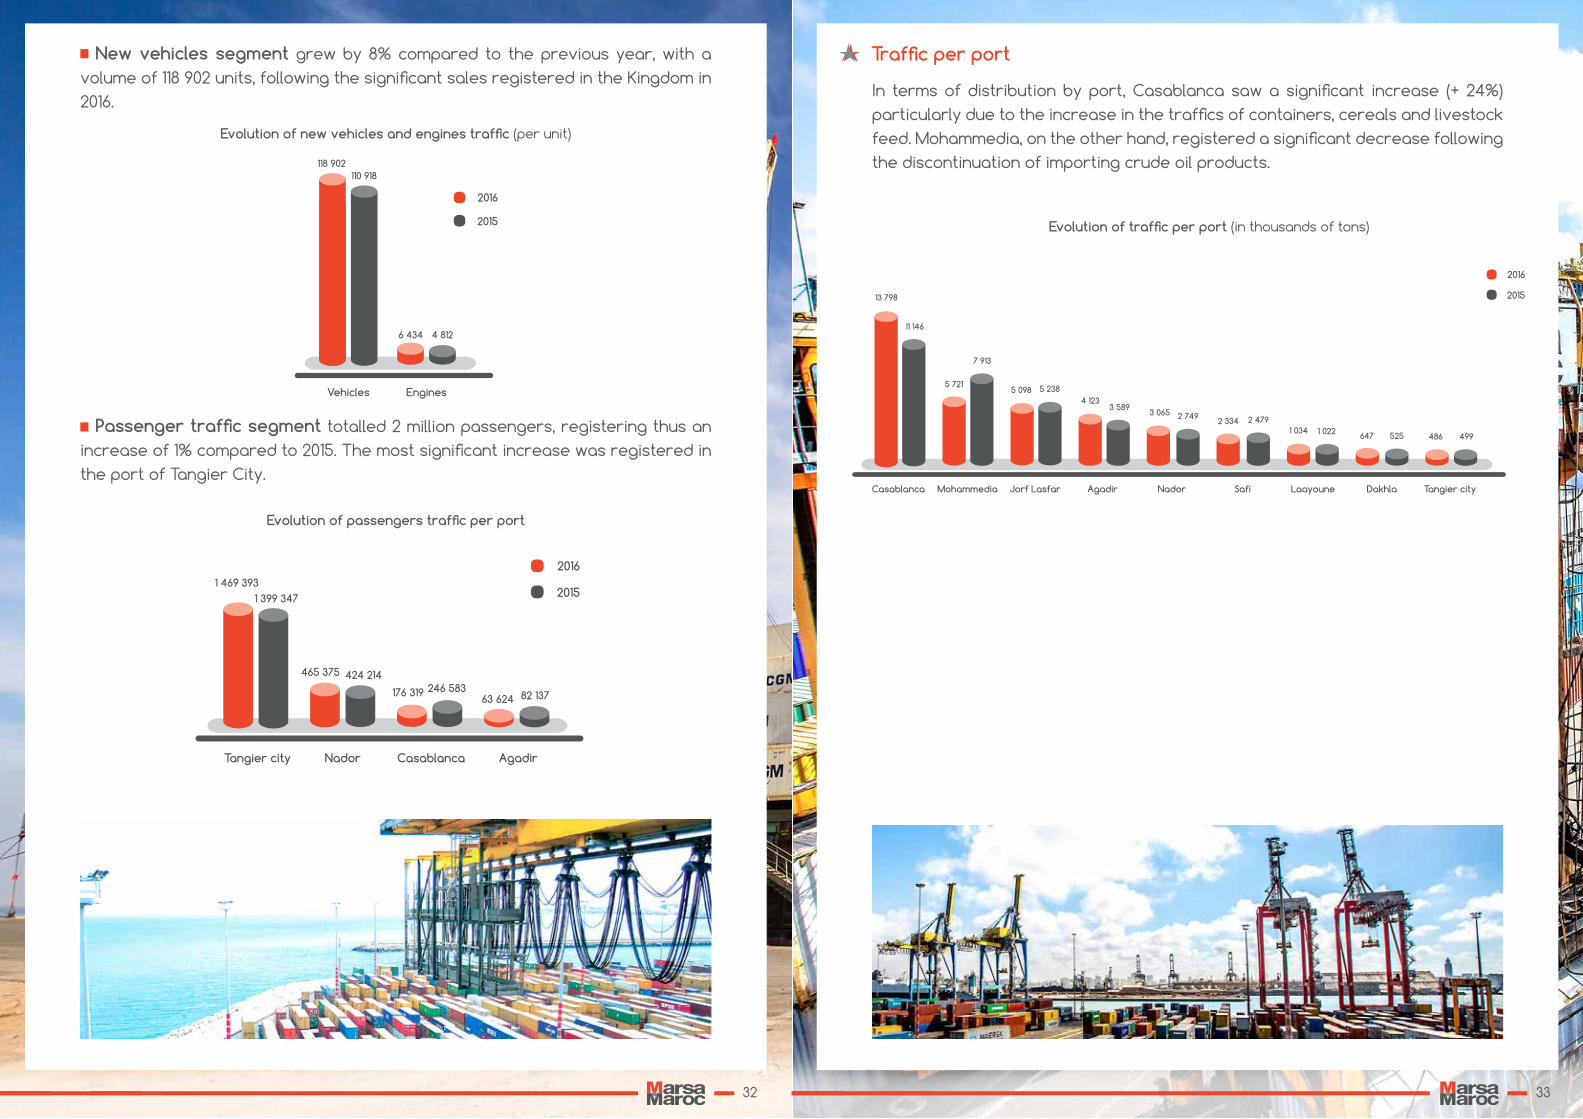
New vehicles segment grew by 8% compared to the previous year, with a volume of 118 902 units, following the significant sales registered in the Kingdom in 2016.
Passenger traffic segment totalled 2 million passengers, registering thus an increase of 1% compared to 2015. The most significant increase was registered in the port of Tangier City.
14 497
118 902110 918
6 434 4 812
Vehicles Engines
2016
2015
1 469 3931 399 347
465 375 424 214
Tangier city CasablancaNador Agadir
2016
2015
176 319 246 58363 624 82 137
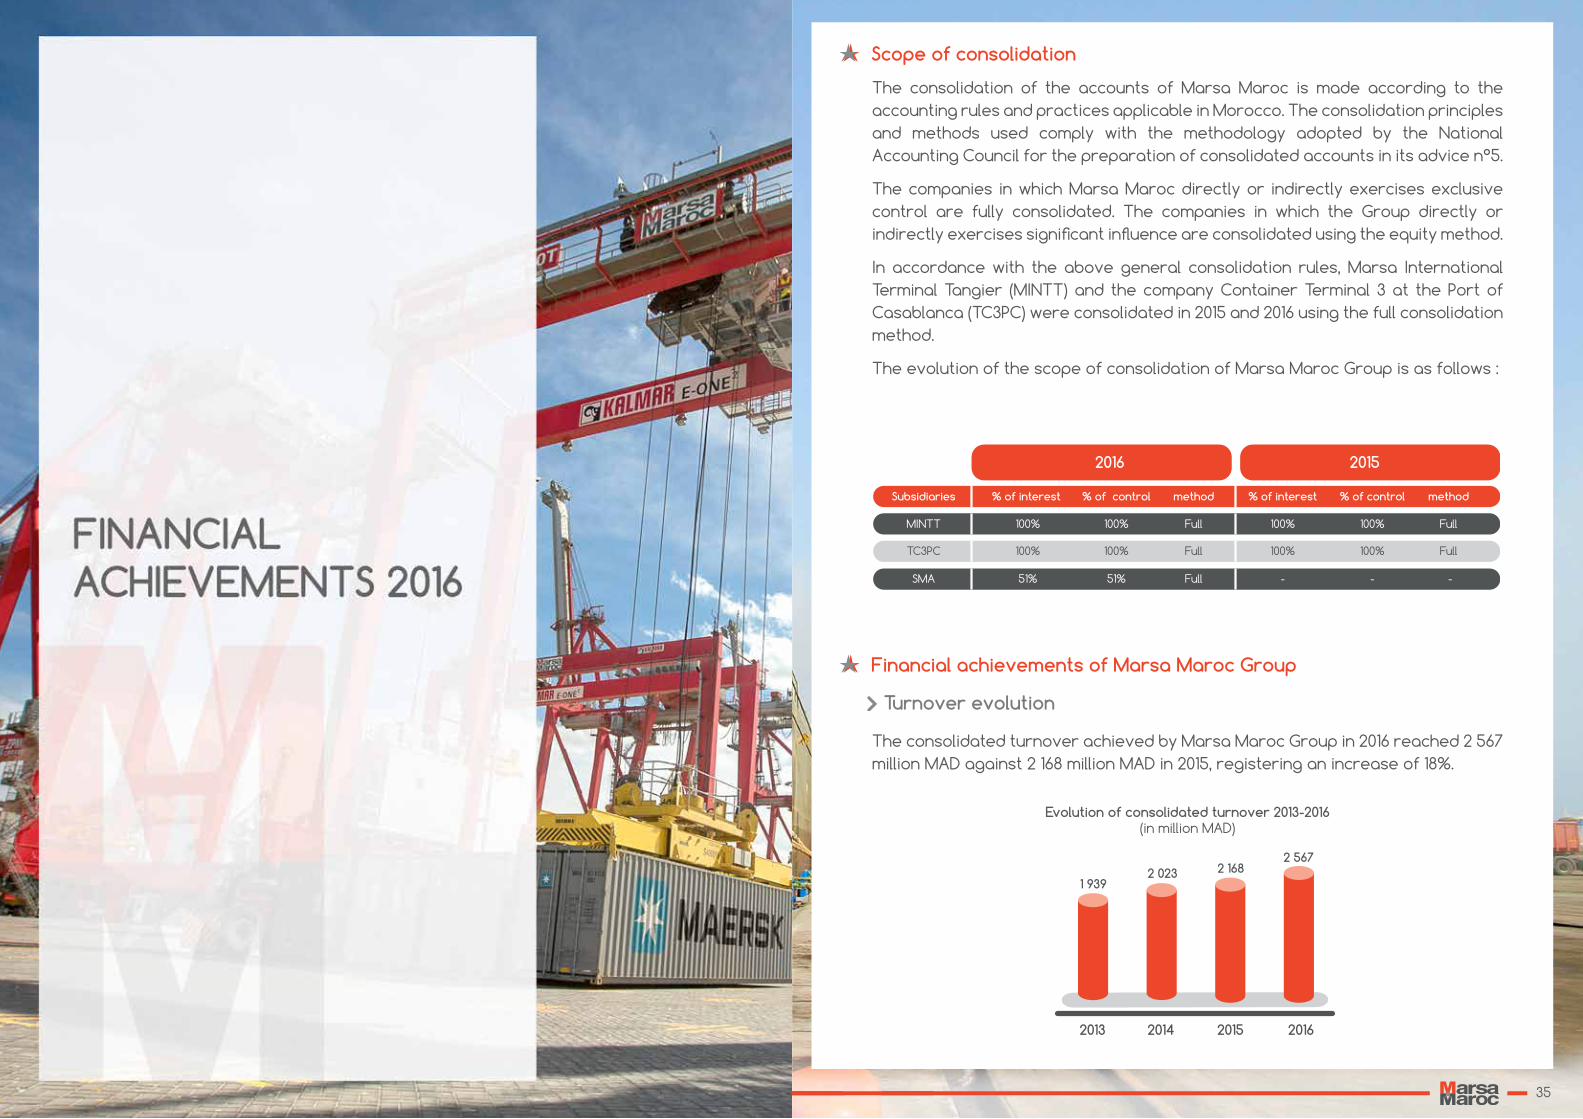
Traffic per port
2016
2015
AgadirJorf Lasfar Safi Laayoune Dakhla Tangier city
13 798
11 146
5 721
7 913
5 098 5 2384 123
3 5893 065 2 749 2 334 2 479
1 034 1 022 647 525 486 499
Casablanca Mohammedia Nador
Evolution of new vehicles and engines traffic (per unit)
Evolution of passengers traffic per port
Evolution of traffic per port (in thousands of tons)
In terms of distribution by port, Casablanca saw a significant increase (+ 24%) particularly due to the increase in the traffics of containers, cereals and livestock feed. Mohammedia, on the other hand, registered a significant decrease following the discontinuation of importing crude oil products.
32 33
Scope of consolidation
Financial achievements of Marsa Maroc Group
The consolidation of the accounts of Marsa Maroc is made according to the accounting rules and practices applicable in Morocco. The consolidation principles and methods used comply with the methodology adopted by the National Accounting Council for the preparation of consolidated accounts in its advice n°5.
The companies in which Marsa Maroc directly or indirectly exercises exclusive control are fully consolidated. The companies in which the Group directly or indirectly exercises significant influence are consolidated using the equity method.
In accordance with the above general consolidation rules, Marsa International Terminal Tangier (MINTT) and the company Container Terminal 3 at the Port of Casablanca (TC3PC) were consolidated in 2015 and 2016 using the full consolidation method.
The evolution of the scope of consolidation of Marsa Maroc Group is as follows :
The consolidated turnover achieved by Marsa Maroc Group in 2016 reached 2 567 million MAD against 2 168 million MAD in 2015, registering an increase of 18%.
2016 2015
Subsidiaries
MINTT
% of interest
100%
% of control
100%
TC3PC 100% 100%
SMA 51% 51%
method
Full
Full
Full
% of interest
100%
% of control
100%
100% 100%
- -
method
Full
Full
-
Turnover evolution
2013 2014 2015 2016
1 9392 023 2 168
2 567
Evolution of consolidated turnover 2013-2016(in million MAD)
35

Handling services
92%Services to ships
7%
Other revenues
1%
Consolidated operating expenses in 2016 amounted to 1 763 million MAD versus 1 560 million MAD in 2015, i.e. an increase of 13%.
Changes in operating expenses were registered by component as follows: staff expenses (+ 27%), purchases and external expenses (+ 17%), duties and taxes (+3%) and operating provisions (-12%).
Evolution of consolidated operating expenses
2013 2014 2015 2016
1 524 1 543 1 560 1 763
The consolidated operating income in 2016 reached 830 million MAD versus 622 million MAD in 2015, i.e. an increase of 33%.
The consolidated net income in 2016 amounted to 580 million MAD against 375 million MAD in 2015, i.e. an increase of 55%.
In regard to the investment budget of Marsa Maroc Group for the year 2016 amounting to 898 million MAD, the commitments reached at the end of December 2016, 383 million MAD, representing an overall commitment rate of 43%.
Evolution of consolidated operating income
Evolution of consolidated net income
Achievement of the 2016 investment budget
2013 2014 2015 2016
469499
622
830
Equipement Infrastructure Financialinvestments
Studies
183
12072
7
2013 2014 2015 2016
256329 375
580
Evolution of consolidated operating expenses 2013-2016(in million MAD)
Evolution of consolidated operating income 2013-2016(in million MAD)
Breakdown of 2016 consolidated turnover by services provided
Evolution of consolidated net income 2013-2016(in million MAD)
2016 Investment budget achievement
Handling services, which represent nearly 92% of the consolidated turnover of Marsa Maroc Group, generated 2 349 million MAD of revenues, i.e. an increase of 19% compared to 2015.
Services provided to ships, which mainly include towing, steering and mooring services, achieved a turnover of 182 million MAD in 2016, i.e. an increase of 21% compared to 2015.
The other operating activities totaled a turnover of 36 million MAD, stagnating compared to 2015.
36 37
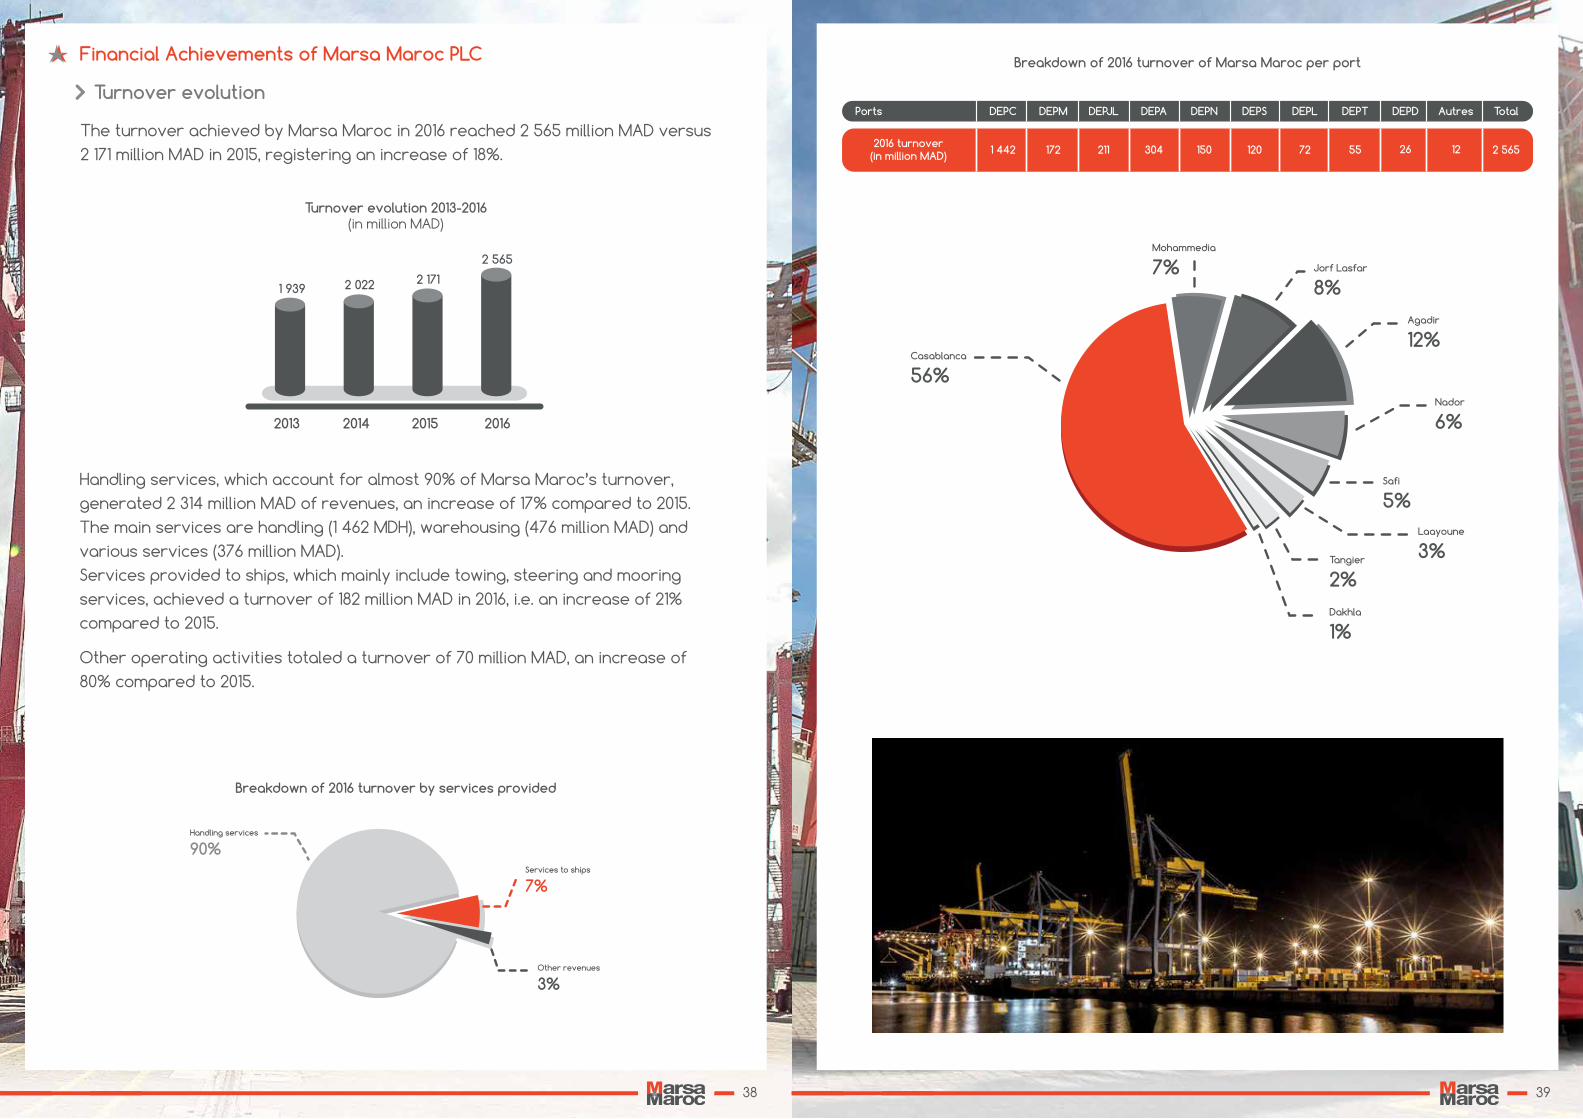
The turnover achieved by Marsa Maroc in 2016 reached 2 565 million MAD versus 2 171 million MAD in 2015, registering an increase of 18%.
2013 2014 2015 2016
1 939 2 022 2 171
2 565
Handling services
90%Services to ships
7%
Other revenues
3%
Turnover evolution
Financial Achievements of Marsa Maroc PLC
Ports DEPC
1 442 172 211 304 150 120 72 55 26 12 2 565
DEPM DEPJL DEPA DEPN DEPS DEPL DEPT DEPD Autres Total
2016 turnover(in million MAD)
Casablanca
56%
Mohammedia
7% Jorf Lasfar
8%Agadir
12%
Nador
6%
Safi
5%Laayoune
3%Tangier
2%Dakhla
1%
Turnover evolution 2013-2016(in million MAD)
Breakdown of 2016 turnover of Marsa Maroc per port
Breakdown of 2016 turnover by services provided
Handling services, which account for almost 90% of Marsa Maroc’s turnover, generated 2 314 million MAD of revenues, an increase of 17% compared to 2015. The main services are handling (1 462 MDH), warehousing (476 million MAD) and various services (376 million MAD).Services provided to ships, which mainly include towing, steering and mooring services, achieved a turnover of 182 million MAD in 2016, i.e. an increase of 21% compared to 2015.
Other operating activities totaled a turnover of 70 million MAD, an increase of 80% compared to 2015.
38 39
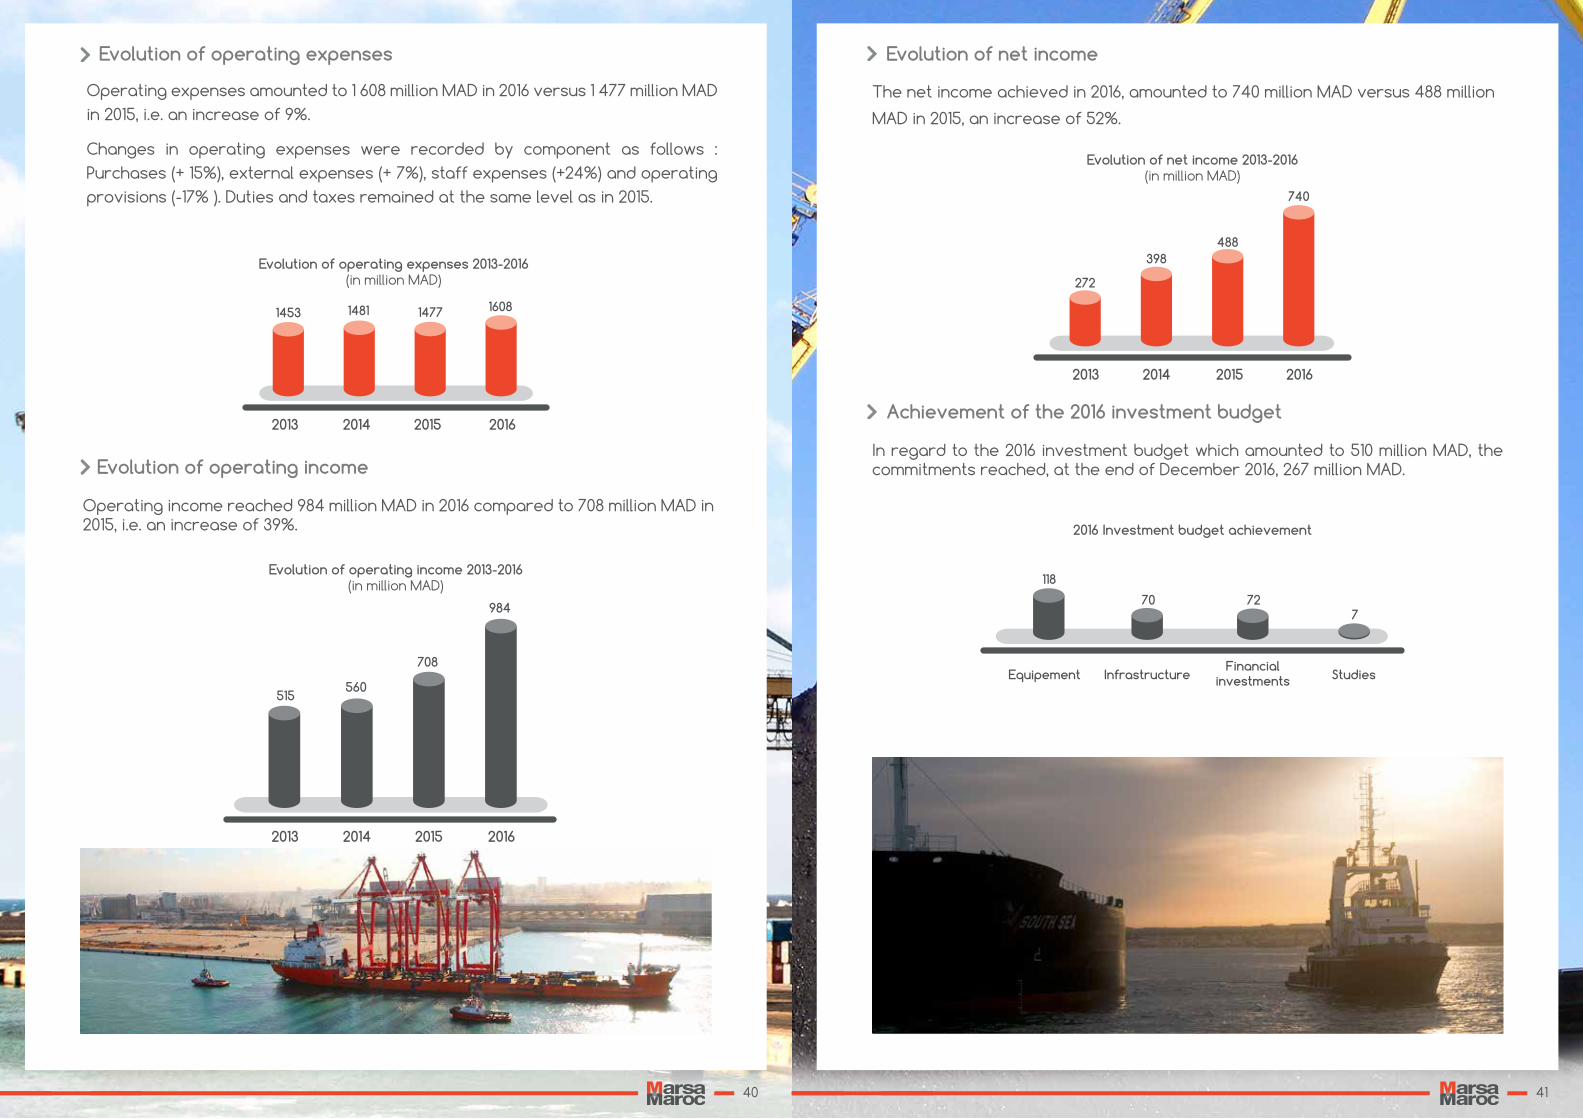
Evolution of operating income
Operating income reached 984 million MAD in 2016 compared to 708 million MAD in 2015, i.e. an increase of 39%.
2013 2014 2015 2016
515560
708
984
Achievement of the 2016 investment budget
In regard to the 2016 investment budget which amounted to 510 million MAD, the commitments reached, at the end of December 2016, 267 million MAD.
Equipement InfrastructureFinancial
investments Studies
118
70 727
Evolution of operating income 2013-2016(in million MAD)
2016 Investment budget achievement
Evolution of net income
2013 2014 2015 2016
272
398488
740
Evolution of net income 2013-2016(in million MAD)
Evolution of operating expenses
Operating expenses amounted to 1 608 million MAD in 2016 versus 1 477 million MAD in 2015, i.e. an increase of 9%.
Changes in operating expenses were recorded by component as follows : Purchases (+ 15%), external expenses (+ 7%), staff expenses (+24%) and operating provisions (-17% ). Duties and taxes remained at the same level as in 2015.
2013 2014 2015 2016
1453 1481 1477 1608
Evolution of operating expenses 2013-2016(in million MAD)
The net income achieved in 2016, amounted to 740 million MAD versus 488 million
MAD in 2015, an increase of 52%.
40 41
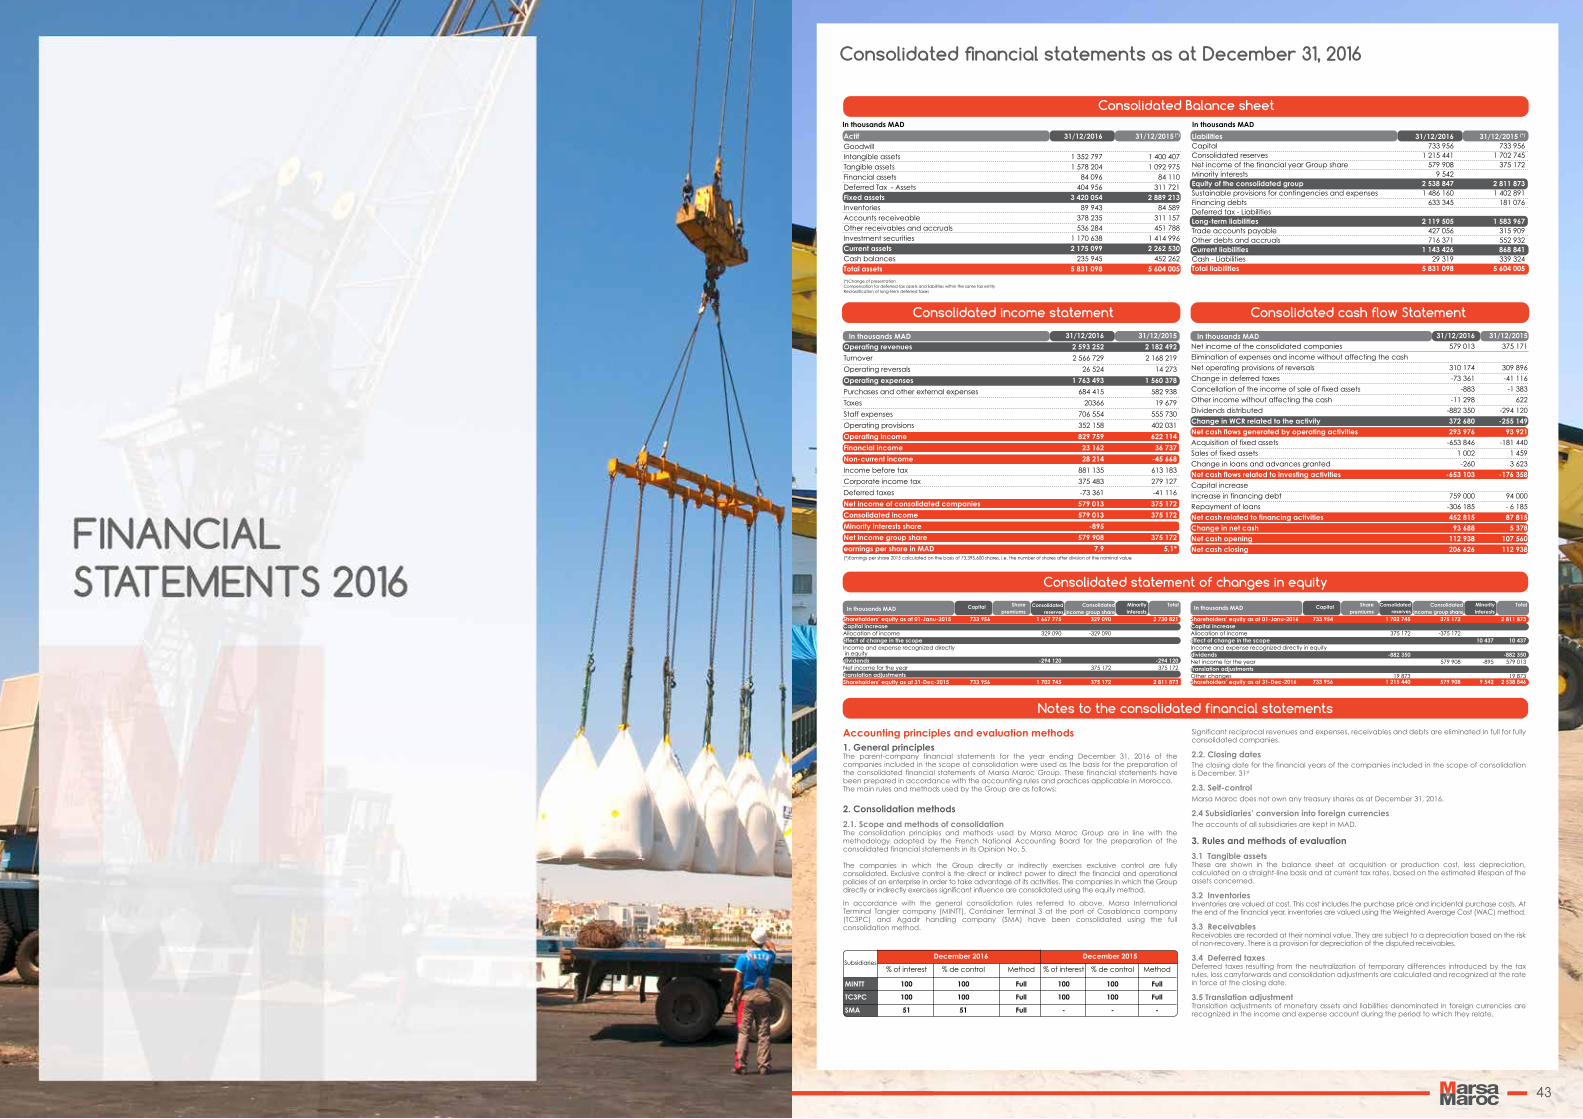
Consolidated financial statements as at December 31, 2016
Consolidated income statement Consolidated cash flow Statement
Accounting principles and evaluation methods1. General principlesThe parent-company financial statements for the year ending December 31, 2016 of the companies included in the scope of consolidation were used as the basis for the preparation of the consolidated financial statements of Marsa Maroc Group. These financial statements have been prepared in accordance with the accounting rules and practices applicable in Morocco.The main rules and methods used by the Group are as follows:
2. Consolidation methods
2.1. Scope and methods of consolidationThe consolidation principles and methods used by Marsa Maroc Group are in line with the methodology adopted by the French National Accounting Board for the preparation of the consolidated financial statements in its Opinion No. 5.
The companies in which the Group directly or indirectly exercises exclusive control are fully consolidated. Exclusive control is the direct or indirect power to direct the financial and operational policies of an enterprise in order to take advantage of its activities. The companies in which the Group directly or indirectly exercises significant influence are consolidated using the equity method.
In accordance with the general consolidation rules referred to above, Marsa International Terminal Tangier company (MINTT), Container Terminal 3 at the port of Casablanca company (TC3PC) and Agadir handling company (SMA) have been consolidated using the full consolidation method.
Significant reciprocal revenues and expenses, receivables and debts are eliminated in full for fully consolidated companies.
2.2. Closing datesThe closing date for the financial years of the companies included in the scope of consolidation is December, 31st
2.3. Self-controlMarsa Maroc does not own any treasury shares as at December 31, 2016.
2.4 Subsidiaries’ conversion into foreign currenciesThe accounts of all subsidiaries are kept in MAD.
3. Rules and methods of evaluation
3.1 Tangible assetsThese are shown in the balance sheet at acquisition or production cost, less depreciation, calculated on a straight-line basis and at current tax rates, based on the estimated lifespan of the assets concerned.
3.2 InventoriesInventories are valued at cost. This cost includes the purchase price and incidental purchase costs. At the end of the financial year, inventories are valued using the Weighted Average Cost (WAC) method.
3.3 ReceivablesReceivables are recorded at their nominal value. They are subject to a depreciation based on the risk of non-recovery. There is a provision for depreciation of the disputed receivables.
3.4 Deferred taxesDeferred taxes resulting from the neutralization of temporary differences introduced by the tax rules, loss carryforwards and consolidation adjustments are calculated and recognized at the rate in force at the closing date.
3.5 Translation adjustmentTranslation adjustments of monetary assets and liabilities denominated in foreign currencies are recognized in the income and expense account during the period to which they relate.
31/12/2016 31/12/2015
Operating revenues 2 593 252 2 182 492
Turnover 2 566 729 2 168 219
Operating reversals 26 524 14 273
Operating expenses 1 763 493 1 560 378
Purchases and other external expenses 684 415 582 938
Taxes 20366 19 679
Staff expenses 706 554 555 730
Operating provisions 352 158 402 031
Operating income 829 759 622 114
Financial income 23 162 36 737
Non-current income 28 214 -45 668
Income before tax 881 135 613 183
Corporate income tax 375 483 279 127
Deferred taxes -73 361 -41 116
Net income of consolidated companies 579 013 375 172
Consolidated income 579 013 375 172
Minority interests share -895
Net income group share 579 908 375 172
earnings per share in MAD 7,9 5,1*
31/12/2016 31/12/2015Net income of the consolidated companies 579 013 375 171
Elimination of expenses and income without affecting the cash
Net operating provisions of reversals 310 174 309 896
Change in deferred taxes -73 361 -41 116
Cancellation of the income of sale of fixed assets -883 -1 383
Other income without affecting the cash -11 298 622
Dividends distributed -882 350 -294 120
Change in WCR related to the activity 372 680 -255 149Net cash flows generated by operating activities 293 976 93 921Acquisition of fixed assets -653 846 -181 440
Sales of fixed assets 1 002 1 459
Change in loans and advances granted -260 3 623
Net cash flows related to investing activities -653 103 -176 358Capital increase
Increase in financing debt 759 000 94 000
Repayment of loans -306 185 - 6 185
Net cash related to financing activities 452 815 87 815Change in net cash 93 688 5 378Net cash opening 112 938 107 560Net cash closing 206 626 112 938
Consolidated Balance sheet
Actif 31/12/2016 31/12/2015 (*)
Goodwill Intangible assets 1 352 797 1 400 407Tangible assets 1 578 204 1 092 975Financial assets 84 096 84 110Deferred Tax - Assets 404 956 311 721Fixed assets 3 420 054 2 889 213Inventories 89 943 84 589Accounts receiveable 378 235 311 157Other receivables and accruals 536 284 451 788Investment securities 1 170 638 1 414 996Current assets 2 175 099 2 262 530Cash balances 235 945 452 262Total assets 5 831 098 5 604 005
Liabilities 31/12/2016 31/12/2015 (*)
Capital 733 956 733 956Consolidated reserves 1 215 441 1 702 745Net income of the financial year Group share 579 908 375 172Minority interests 9 542 Equity of the consolidated group 2 538 847 2 811 873Sustainable provisions for contingencies and expenses 1 486 160 1 402 891Financing debts 633 345 181 076Deferred tax - Liabilities Long-term liabilities 2 119 505 1 583 967Trade accounts payable 427 056 315 909Other debts and accruals 716 371 552 932Current liabilities 1 143 426 868 841Cash - Liabilities 29 319 339 324Total liabilities 5 831 098 5 604 005
Notes to the consolidated financial statements
Consolidated statement of changes in equity
(*)Change of presentationCompensation for deferred tax assets and liabilities within the same tax entityReclassification of long-term deferred taxes
(*)Earnings per share 2015 calculated on the basis of 73,395,600 shares, i.e. the number of shares after division of the nominal value
Shareholders’ equity as at 01-Janu-2015 733 956 1 667 775 329 090 2 730 821Capital increase Allocation of income 329 090 -329 090 Effect of change in the scope Income and expense recognized directly in equity dividends -294 120 -294 120Net income for the year 375 172 375 172Translation adjustments Shareholders’ equity as at 31-Dec-2015 733 956 1 702 745 375 172 2 811 873
Shareholders’ equity as at 01-Janu-2016 733 954 1 702 745 375 172 2 811 873Capital increase Allocation of income 375 172 -375 172 Effect of change in the scope 10 437 10 437Income and expense recognized directly in equity dividends -882 350 -882 350Net income for the year 579 908 -895 579 013Translation adjustments Other changes 19 873 19 873Shareholders’ equity as at 31-Dec-2016 733 956 1 215 440 579 908 9 542 2 538 846
Capital Share premiums
Consolidatedreserves
Consolidatedincome group share
Minority interests
Total Capital Share premiums
Consolidatedreserves
Consolidatedincome group share
Minority interests
Total
% of interest % de control Method % of interest % de control Method
MINTT 100 100 Full 100 100 Full
TC3PC 100 100 Full 100 100 Full
SMA 51 51 Full - - -
December 2016 December 2015Subsidiaries
In thousands MAD
In thousands MAD In thousands MAD
In thousands MAD
In thousands MAD In thousands MAD
43
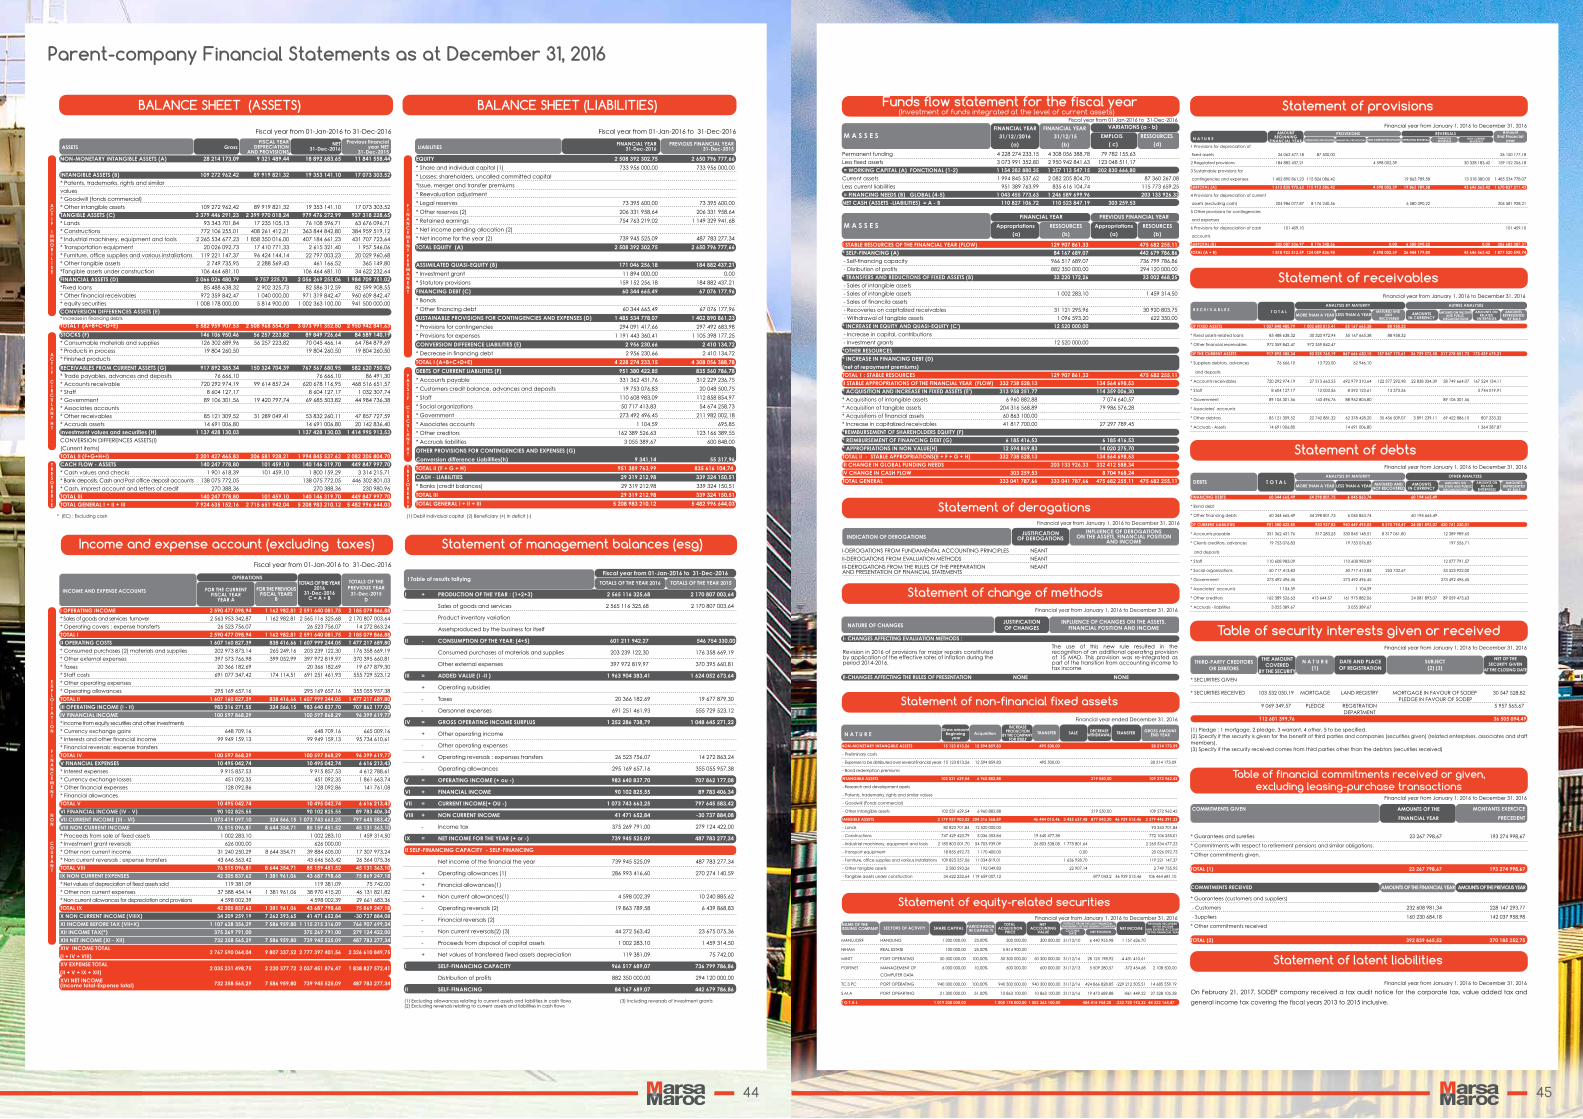
BALANCE SHEET (ASSETS)
Income and expense account (excluding taxes) Statement of management balances (esg)
BALANCE SHEET (LIABILITIES)
Total
NON-MONETARY INTANGIBLE ASSETS (A) 28 214 173,09 9 321 489,44 18 892 683,65 11 841 558,44 INTANGIBLE ASSETS (B) 109 272 962,42 89 919 821,32 19 353 141,10 17 073 303,52* Patents, trademarks, rights and similar values * Goodwill (fonds commercial) * Other intangible assets 109 272 962,42 89 919 821,32 19 353 141,10 17 073 303,52TANGIBLE ASSETS (C) 3 379 446 291,23 2 399 970 018,24 979 476 272,99 937 318 228,65* Lands 93 343 701,84 17 235 105,13 76 108 596,71 63 676 096,71* Constructions 772 106 255,01 408 261 412,21 363 844 842,80 384 959 519,12* Industrial machinery, equipment and tools 2 265 534 677,23 1 858 350 016,00 407 184 661,23 431 707 723,64* Transportation equipment 20 026 092,73 17 410 771,33 2 615 321,40 1 957 546,06* Furniture, office supplies and various installations 119 221 147,37 96 424 144,14 22 797 003,23 20 029 960,68* Other tangible assets 2 749 735,95 2 288 569,43 461 166,52 365 149,80*Tangible assets under construction 106 464 681,10 106 464 681,10 34 622 232,64FINANCIAL ASSETS (D) 2 066 026 480,79 9 757 225,73 2 056 269 255,06 1 984 709 751,02*Fixed loans 85 488 638,32 2 902 325,73 82 586 312,59 82 599 908,55* Other financial receivables 972 359 842,47 1 040 000,00 971 319 842,47 960 609 842,47* equity securities 1 008 178 000,00 5 814 900,00 1 002 363 100,00 941 500 000,00CONVERSION DIFFERENCES ASSETS (E) * Increase in financing debts
TOTAL I (A+B+C+D+E) 5 582 959 907,53 2 508 968 554,73 3 073 991 352,80 2 950 942 841,63
STOCKS (F) 146 106 950,46 56 257 223,82 89 849 726,64 84 589 140,19* Consumable materials and supplies 126 302 689,96 56 257 223,82 70 045 466,14 64 784 879,69* Products in process 19 804 260,50 19 804 260,50 19 804 260,50* Finished products
RECEIVABLES FROM CURRENT ASSETS (G) 917 892 385,34 150 324 704,39 767 567 680,95 582 620 750,98* Trade payables, advances and deposits 76 666,10 76 666,10 86 491,30* Accounts receivable 720 292 974,19 99 614 857,24 620 678 116,95 468 516 651,57* Staff 8 604 127,17 8 604 127,17 1 032 307,74* Government 89 106 301,56 19 420 797,74 69 685 503,82 44 984 736,38* Associates accounts * Other receivables 85 121 309,52 31 289 049,41 53 832 260,11 47 857 727,59* Accruals assets 14 691 006,80 14 691 006,80 20 142 836,40Investment values and securities (H) 1 137 428 130,03 1 137 428 130,03 1 414 995 913,53CONVERSION DIFFERENCES ASSETS(I) (Current items) TOTAL II (F+G+H+I) 2 201 427 465,83 206 581 928,21 1 994 845 537,62 2 082 205 804,70CACH FLOW - ASSETS 140 247 778,80 101 459,10 140 146 319,70 449 847 997,70* Cash values and checks 1 901 618,39 101 459,10 1 800 159,29 3 314 215,71* Bank deposits, Cash and Post office deposit accounts 138 075 772,05 138 075 772,05 446 302 801,03* Cash, imprest account and letters of credit 270 388,36 270 388,36 230 980,96TOTAL III 140 247 778,80 101 459,10 140 146 319,70 449 847 997,70TOTAL GENERAL I + II + III 7 924 635 152,16 2 715 651 942,04 5 208 983 210,12 5 482 996 644,03
EQUITY 2 508 392 302,75 2 650 796 777,66
* Share and individual capital (1) 733 956 000,00 733 956 000,00
* Losses: shareholders, uncalled committed capital
*Issue, merger and transfer premiums
* Reevaluation adjustment
* Legal reserves 73 395 600,00 73 395 600,00
* Other reserves (2) 206 331 958,64 206 331 958,64
* Retained earnings 754 763 219,02 1 149 329 941,68
* Net income pending allocation (2)
* Net income for the year (2) 739 945 525,09 487 783 277,34
TOTAL EQUITY (A) 2 508 392 302,75 2 650 796 777,66
ASSIMILATED QUASI-EQUITY (B) 171 046 256,18 184 882 437,21
* Investment grant 11 894 000,00 0,00
* Statutory provisions 159 152 256,18 184 882 437,21
FINANCING DEBT (C) 60 344 665,49 67 076 177,96
* Bonds
* Other financing debt 60 344 665,49 67 076 177,96
SUSTAINABLE PROVISIONS FOR CONTINGENCIES AND EXPENSES (D) 1 485 534 778,07 1 402 890 861,23
* Provisions for contingencies 294 091 417,66 297 492 683,98
* Provisions for expenses 1 191 443 360,41 1 105 398 177,25
CONVERSION DIFFERENCE LIABILITIES (E) 2 956 230,66 2 410 134,72
* Decrease in financing debt 2 956 230,66 2 410 134,72
TOTAL I (A+B+C+D+E) 4 228 274 233,15 4 308 056 388,78
DEBTS OF CURRENT LIABILITIES (F) 951 380 422,85 835 560 786,78
* Accounts payable 331 362 431,76 312 229 236,75
* Customers credit balance, advances and deposits 19 753 076,83 20 048 500,75
* Staff 110 608 983,09 112 858 854,97
* Social organizations 50 717 413,83 54 674 258,73
* Government 273 492 496,45 211 982 002,18
* Associates accounts 1 104,59 695,85
* Other creditors 162 389 526,63 123 166 389,55
* Accruals liabilities 3 055 389,67 600 848,00
OTHER PROVISIONS FOR CONTINGENCIES AND EXPENSES (G)
Conversion difference Liabilities(h) 9 341,14 55 317,96
TOTAL II (F + G + H) 951 389 763,99 835 616 104,74
CASH - LIABILITIES 29 319 212,98 339 324 150,51
* Banks (credit balances) 29 319 212,98 339 324 150,51
TOTAL III 29 319 212,98 339 324 150,51
TOTAL GENERAL I + II + III 5 208 983 210,12 5 482 996 644,03
ACTIF
IMMOBILISE
FINANCEMENT
PERMANENT
ACTIF
CIRCULANT
HT
PASSIF
CIRCULANT
HT
TRESORERIE
TRESORERIE
ASSETS Gross LIABILITIES FINANCIAL YEAR
31-Dec-2016PREVIOUS FINANCIAL YEAR
31-Dec-2015NET
31-Dec-2016FISCAL YEAR
DEPRECIATIONAND PROVISIONS
Previous financial year NET
31-Dec-2015
Fiscal year from 01-Jan-2016 to 31-Dec-2016 Fiscal year from 01-Jan-2016 to 31-Dec-2016
* (EC) : Excluding cash (1) Debit individual capital (2) Beneficiary (+) In deficit (-)
(1) Excluding allowances relating to current assets and liabilities in cash flows (2) Excluding reversals relating to current assets and liabilities in cash flows
(3) Including reversals of investment grants
I OPERATING INCOME 2 590 477 098,94 1 162 982,81 2 591 640 081,75 2 185 079 866,88* Sales of goods and services turnover 2 563 953 342,87 1 162 982,81 2 565 116 325,68 2 170 807 003,64
* Operating covers : expense transferts 26 523 756,07 26 523 756,07 14 272 863,24
TOTAL I 2 590 477 098,94 1 162 982,81 2 591 640 081,75 2 185 079 866,88II OPERATING COSTS 1 607 160 827,39 838 416,66 1 607 999 244,05 1 477 217 689,80* Consumed purchases (2) materials and supplies 202 973 873,14 265 249,16 203 239 122,30 176 358 669,19
* Other external expenses 397 573 766,98 399 052,99 397 972 819,97 370 395 660,81
* Taxes 20 366 182,69 20 366 182,69 19 677 879,30
* Staff costs 691 077 347,42 174 114,51 691 251 461,93 555 729 523,12
* Other operating expenses
* Operating allowances 295 169 657,16 295 169 657,16 355 055 957,38
TOTAL II 1 607 160 827,39 838 416,66 1 607 999 244,05 1 477 217 689,80III OPERATING INCOME (I - II) 983 316 271,55 324 566,15 983 640 837,70 707 862 177,08IV FINANCIAL INCOME 100 597 868,29 100 597 868,29 96 399 619,77* Income from equity securities and other investments
* Currency exchange gains 648 709,16 648 709,16 665 009,16
* Interests and other financial income 99 949 159,13 99 949 159,13 95 734 610,61
* Financial reversals: expense transfers
TOTAL IV 100 597 868,29 100 597 868,29 96 399 619,77V FINANCIAL EXPENSES 10 495 042,74 10 495 042,74 6 616 213,43* Interest expenses 9 915 857,53 9 915 857,53 4 612 788,61
* Currency exchange losses 451 092,35 451 092,35 1 861 663,74
* Other financial expenses 128 092,86 128 092,86 141 761,08
* Financial allowances
TOTAL V 10 495 042,74 10 495 042,74 6 616 213,43VI FINANCIAL INCOME (IV - V) 90 102 825,55 90 102 825,55 89 783 406,34VII CURRENT INCOME (III - VI) 1 073 419 097,10 324 566,15 1 073 743 663,25 797 645 583,42VIII NON CURRENT INCOME 76 515 096,81 8 644 354,71 85 159 451,52 45 131 363,10* Proceeds from sale of fixed assets 1 002 283,10 1 002 283,10 1 459 314,50
* Investment grant reversals 626 000,00 626 000,00
* Other non current income 31 240 250,29 8 644 354,71 39 884 605,00 17 307 973,24
* Non current reversals : expense transfers 43 646 563,42 43 646 563,42 26 364 075,36
TOTAL VIII 76 515 096,81 8 644 354,71 85 159 451,52 45 131 363,10IX NON CURRENT EXPENSES 42 305 837,62 1 381 961,06 43 687 798,68 75 869 247,18* Net values of depreciation of fixed assets sold 119 381,09 119 381,09 75 742,00
* Other non current expenses 37 588 454,14 1 381 961,06 38 970 415,20 46 131 821,82
* Non current allowances for depreciation and provisions 4 598 002,39 4 598 002,39 29 661 683,36
TOTAL IX 42 305 837,62 1 381 961,06 43 687 798,68 75 869 247,18X NON CURRENT INCOME (VIIIX) 34 209 259,19 7 262 393,65 41 471 652,84 -30 737 884,08XI INCOME BEFORE TAX (VII+X) 1 107 628 356,29 7 586 959,80 1 115 215 316,09 766 907 699,34XII INCOME TAX(*) 375 269 791,00 375 269 791,00 279 124 422,00XIII NET INCOME (XI - XII) 732 358 565,29 7 586 959,80 739 945 525,09 487 783 277,34XIV INCOME TOTAL
2 767 590 064,04 9 807 337,52 2 777 397 401,56 2 326 610 849,75(I + IV + VIII) XV EXPENSE TOTAL
2 035 231 498,75 2 220 377,72 2 037 451 876,47 1 838 827 572,41(II + V + IX + XII) XVI NET INCOME 732 358 565,29 7 586 959,80 739 945 525,09 487 783 277,34(Income total-Expense total)
EXPLOITATION
FINANCEMENT
NON
COURANT
INCOME AND EXPENSE ACCOUNTS FOR THE CURRENTFISCAL YEAR
YEAR A
FOR THE PREVIOUSFISCAL YEARS
B
TOTALS OF THE YEAR2016
31-Dec-2016C = A + B
TOTALS OF THEPREVIOUS YEAR
31-Dec-2015D
Fiscal year from 01-Jan-2016 to 31-Dec-2016
OPERATIONS
I + PRODUCTION OF THE YEAR : (1+2+3) 2 565 116 325,68 2 170 807 003,64
Sales of goods and services 2 565 116 325,68 2 170 807 003,64
Product inventory variation
Assetsproduced by the business for itself
II - CONSUMPTION OF THE YEAR: (4+5) 601 211 942,27 546 754 330,00
Consumed purchases of materials and supplies 203 239 122,30 176 358 669,19
Other external expenses 397 972 819,97 370 395 660,81
III = ADDED VALUE (I -II ) 1 963 904 383,41 1 624 052 673,64
+ Operating subsidies
- Taxes 20 366 182,69 19 677 879,30
- Oersonnel expenses 691 251 461,93 555 729 523,12
IV = GROSS OPERATING INCOME SURPLUS 1 252 286 738,79 1 048 645 271,22
+ Other operating income
- Other operating expenses
+ Operating reversals : expenses transfers 26 523 756,07 14 272 863,24
- Operating allowances 295 169 657,16 355 055 957,38
V = OPERATING INCOME (+ ou -) 983 640 837,70 707 862 177,08
VI + FINANCIAL INCOME 90 102 825,55 89 783 406,34
VII = CURRENT INCOME(+ OU -) 1 073 743 663,25 797 645 583,42
VIII + NON CURRENT INCOME 41 471 652,84 -30 737 884,08
- Income tax 375 269 791,00 279 124 422,00
IX = NET INCOME FOR THE YEAR (+ or -) 739 945 525,09 487 783 277,34
II SELF-FINANCING CAPACITY - SELF-FINANCING
Net income of the financial the year 739 945 525,09 487 783 277,34
+ Operating allowances (1) 286 993 416,60 270 274 140,59
+ Financial allowances(1)
+ Non current allowances(1) 4 598 002,39 10 240 885,62
- Operating reversals (2) 19 863 789,58 6 439 868,83
- Financial reversals (2)
- Non current reversals(2) (3) 44 272 563,42 23 675 075,36
- Proceeds from disposal of capital assets 1 002 283,10 1 459 314,50
+ Net values of transferred fixed assets depreciation 119 381,09 75 742,00
I SELF-FINANCING CAPACITY 966 517 689,07 736 799 786,86
Distribution of profits 882 350 000,00 294 120 000,00
II SELF-FINANCING 84 167 689,07 442 679 786,86
TOTALS OF THE YEAR 2016
Fiscal year from 01-Jan-2016 to 31-Dec-2016
TOTALS OF THE YEAR 2015I Table of results tallying
Statement of derogations
Funds flow statement for the fiscal year
Statement of change of methods
Statement of non-financial fixed assets
Statement of equity-related securities
Statement of provisions
Permanent funding 4 228 274 233,15 4 308 056 388,78 79 782 155,63
Less fixed assets 3 073 991 352,80 2 950 942 841,63 123 048 511,17
= WORKING CAPITAL (A) FONCTIONAL (1-2) 1 154 282 880,35 1 357 113 547,15 202 830 666,80 Current assets 1 994 845 537,62 2 082 205 804,70 87 360 267,08
Less current liabilities 951 389 763,99 835 616 104,74 115 773 659,25
= FINANCING NEEDS (B) GLOBAL (4-5) 1 043 455 773,63 1 246 589 699,96 203 133 926,33NET CASH (ASSETS -LIABILITIES) = A - B 110 827 106,72 110 523 847,19 303 259,53
I STABLE RESOURCES OF THE FINANCIAL YEAR (FLOW) 129 907 861,33 475 682 255,11 * SELF-FINANCING (A) 84 167 689,07 442 679 786,86 - Self-financing capacity 966 517 689,07 736 799 786,86
- Disribution of profits 882 350 000,00 294 120 000,00
* TRANSFERS AND REDUCTIONS OF FIXED ASSETS (B) 33 220 172,26 33 002 468,25 - Sales of intangible assets
- Sales of intangible assets 1 002 283,10 1 459 314,50
- Sales of financila assets
- Recoveries on capitalized receivables 31 121 295,96 30 920 803,75
- Withdrawal of tangible assets 1 096 593,20 622 350,00
* INCREASE IN EQUITY AND QUASI-EQUITY (C') 12 520 000,00 - Increase in capital, contributions
- Investment grants 12 520 000,00
*OTHER RESOURCES * INCREASE IN FINANCING DEBT (D) (net of repayment premiums) TOTAL 1 : STABLE RESOURCES 129 907 861,33 475 682 255,11 II STABLE APPROPRIATIONS OF THE FINANCIAL YEAR (FLOW) 332 738 528,13 134 564 698,53 * ACQUISITION AND INCREASE IN FIXED ASSETS (E') 313 958 251,77 114 359 006,30 * Acquisitions of intangible assets 6 960 882,88 7 074 640,57
* Acquisition of tangible assets 204 316 568,89 79 986 576,28
* Acquisitions of financial assets 60 863 100,00
* Increase in capitalized receivables 41 817 700,00 27 297 789,45
*REIMBURSEMENT OF SHAREHOLDERS EQUITY (F) * REIMBURSEMENT OF FINANCING DEBT (G) 6 185 416,53 6 185 416,53 * APPROPRIATIONS IN NON VALUE(H) 12 594 859,83 14 020 275,70 TOTAL II - STABLE APPROPRIATIONS(E + F + G + H) 332 738 528,13 134 564 698,53 III CHANGE IN GLOBAL FUNDING NEEDS 203 133 926,33 332 412 588,34 IV CHANGE IN CASH FLOW 303 259,53 8 704 968,24 TOTAL GENERAL 333 041 787,66 333 041 787,66 475 682 255,11 475 682 255,11
(Investment of funds integrated at the level of current assets)
M A S S E SFINANCIAL YEAR
31/12//2016(a)
FINANCIAL YEAR 31/12/15
(b)
EMPLOIS ( c)
VARIATIONS (a - b)
RESSOURCES (d)
M A S S E S Appropriations (a)
RESSOURCES(b)
Appropriations(a)
PREVIOUS FINANCIAL YEARFINANCIAL YEAR
RESOURCES(b)
I-DEROGATIONS FROM FUNDAMENTAL ACCOUNTING PRINCIPLES NEANT
II-DEROGATIONS FROM EVALUATION METHODS NEANT
III-DEROGATIONS FROM THE RULES OF THE PREPARATION NEANTAND PRESENTATION OF FINANCIAL STATEMENTS
INDICATION OF DEROGATIONSJUSTIFICATION
OF DEROGATIONSINFLUENCE OF DEROGATIONS
ON THE ASSETS, FINANCIAL POSITIONAND INCOME
Financial year from January 1, 2016 to December 31, 2016
Financial year from January 1, 2016 to December 31, 2016
Financial year ended December 31, 2016
Financial year from January 1, 2016 to December 31, 2016
Financial year from January 1, 2016 to December 31, 2016Fiscal year from 01-Jan-2016 to 31-Dec-2016
Financial year from January 1, 2016 to December 31, 2016
I- CHANGES AFFECTING EVALUATION METHODS :
II-CHANGES AFFECTING THE RULES OF PRESENTATION NONE NONE
Revision in 2016 of provisions for major repairs constituted by application of the effective rates of inflation during the period 2014-2016.
The use of this new rule resulted in the recognition of an additional operating provision of 15 MAD. This provision was re-integrated as part of the transition from accounting income to tax income
NATURE OF CHANGES
N A T U R EGross amount
Beginning year
INCREASE PRODUCTION
BY THE COMPANY FOR ITSELF
Acquisition TRANSFER SALE DECREASEWITHDRAWAL TRANSFER GROSS AMOUNT
END YEAR
JUSTIFICATIONOF CHANGES
INFLUENCE OF CHANGES ON THE ASSETS,FINANCIAL POSITION AND INCOME
NON-MONETARY INTANGIBLE ASSETS 15 123 813,26 12 594 859,83 495 500,00 28 214 173,09
- Preliminary costs
- Expenses to be distributed over several financial years 15 123 813,26 12 594 859,83 495 500,00 28 214 173,09
- Bond redemption premiums
INTANGIBLE ASSETS 102 531 629,54 6 960 882,88 219 550,00 109 272 962,42
- Research and development assets
- Patents, trademarks, rights and similar values
- Goodwill (Fonds commercial)
- Other intangible assets 102 531 629,54 6 960 882,88 219 550,00 109 272 962,42
TANGIBLE ASSETS 3 179 937 903,02 204 316 568,89 46 444 015,46 3 435 637,48 877 043,20 46 939 515,46 3 379 446 291,23
- Lands 80 823 701,84 12 520 000,00 93 343 701,84
- Constructions 747 429 423,79 5 036 353,84 19 640 477,38 772 106 255,01
- Industrial machinery, equipment and tools 2 185 803 001,70 54 703 939,09 26 803 538,08 1 775 801,64 2 265 534 677,23
- Transport equipment 18 855 692,73 1 170 400,00 0,00 20 026 092,73
- Furniture, office supplies and various installations 109 823 257,06 11 034 819,01 1 636 928,70 119 221 147,37
- Other tangible assets 2 580 593,26 192 049,83 22 907,14 2 749 735,95
- Tangible assets under construction 34 622 232,64 119 659 007,12 877 043,2 46 939 515,46 106 464 681,10
1 Provisions for depreciation of
fixed assets 26 062 677,18 87 500,00 26 150 177,18
2 Regulated provisions 184 882 437,21 4 598 002,39 30 328 183,42 159 152 256,18
3 Sustainable provisions for
contingencies and expenses 1 402 890 861,23 115 826 086,42 19 863 789,58 13 318 380,00 1 485 534 778,07
SUBTOTAL (A) 1 613 835 975,62 115 913 586,42 4 598 002,39 19 863 789,58 43 646 563,42 1 670 837 211,43
4 Provisions for depreciation of current
assets (excluding cash) 204 986 077,87 8 176 240,56 6 580 390,22 206 581 928,21
5 Other provisions for contingencies
and expenses
6 Provisions for depreciation of cash 101 459,10 101 459,10
accounts
SUBTOTAL (B) 205 087 536,97 8 176 240,56 0,00 6 580 390,22 0,00 206 683 387,31
TOTAL (A + B) 1 818 923 512,59 124 089 826,98 4 598 002,39 26 444 179,80 43 646 563,42 1 877 520 598,74
MANUJORF HANDLING 1 200 000,00 25,00% 300 000,00 300 000,00 31/12/10 6 440 955,98 1 157 626,70
NIHAM REAL ESTATE 100 000,00 25,00% 5 814 900,00
MINTT PORT OPERATING 50 300 000,00 100,00% 50 300 000,00 50 300 000,00 31/12/16 28 125 198,92 -4 431 410,61
PORTNET MANAGEMENT OF 6 000 000,00 10,00% 600 000,00 600 000,00 31/12/13 5 509 280,57 -372 454,68 2 108 500,00
COMPUTER DATA
TC 3 PC PORT OPERATING 940 300 000,00 100,00% 940 300 000,00 940 300 000,00 31/12/16 424 866 828,85 -229 212 505,51 14 685 559,19
S.M.A PORT OPEARTING 21 300 000,00 51,00% 10 863 100,00 10 863 100,00 31/12/16 19 473 689,88 -861 449,22 27 528 105,28
T O T A L 1 019 200 000,00 1 008 178 000,00 1 002 363 100,00 484 415 954,20 -233 720 193,32 44 322 164,47
NAME OF THEISSUING COMPANY
N A T U R E
R E C E I V A B L E S T O T A LMORE THAN A YEAR
ANALYSIS BY MATURITY AUTRES ANALYSES
LESS THAN A YEARMATURED AND
NOT RECOVERED
AMOUNTSIN CURRENCY
AMOUNTS ON THE STATE AND PUBLIC
ORGANIZATIONS
AMOUNTS ON RELATED
ENTERPRISES
AMOUNTS REPRESENTED
BY BILLS
AMOUNTBEGINNING
FINANCIAL YEAR OPERATING PROVISIONS OPERATING REVERSALS
PROVISIONS REVERSALS AmountEnd Financial
yearFINANCIAL PROVISIONS NON CURRENT PROVISIONS NON CURRENTREVERSALS
Statement of receivables
SECTORS OF ACTIVITY SHARE CAPITAL PARTICIPATION IN CAPITAL %
TOTAL ACQUISITION
PRICE
NET ACCOUNTING
VALUENET INCOME
CLOSINGDATE NET POSITION
REVENUES RECORDED IN THE INCOME
AND EXPENSE ACCOUNT OF THE FINANCIAL YEAR
EXTRACT FROM THE LAST FINANCIAL STATEMENTS OF THE ISSUING COMPANY
OF FIXED ASSETS 1 057 848 480,79 1 002 680 815,41 55 167 665,38 88 958,32
* Fixed assets-related loans 85 488 638,32 30 320 972,94 55 167 665,38 88 958,32
* Other financial receivables 972 359 842,47 972 359 842,47
OF THE CURRENT ASSETS 917 892 385,34 50 225 765,19 867 666 620,15 157 847 175,61 26 729 573,50 217 278 851,73 173 439 675,21
* Suppliers debtors, advances 76 666,10 13 720,00 62 946,10
and deposits
* Accounts receivables 720 292 974,19 27 313 663,55 692 979 310,64 122 377 292,98 22 838 334,39 58 749 664,07 167 524 134,11
* Staff 8 604 127,17 12 003,56 8 592 123,61 13 373,56 3 744 019,91
* Government 89 106 301,56 143 496,76 88 962 804,80 89 106 301,56
* Associates’ accounts
* Other debtors 85 121 309,52 22 742 881,32 62 378 428,20 35 456 509,07 3 891 239,11 69 422 886,10 807 233,32
* Accruals - Assets 14 691 006,80 14 691 006,80 1 364 287,87
Financial year from January 1, 2016 to December 31, 2016
DEBTS T O T A LMORE THAN A YEAR
ANALYSIS BY MATURITY OTHER ANALYZES
LESS THAN A YEAR MATURED ANDNOT RECOVERED
AMOUNTSIN CURRENCY
AMOUNTS ONTHE STATE AND PUBLIC
ORGANIZATIONS
AMOUNTS ONRELATED
ENTERPRISES
AMOUNTSREPRESENTED
BY BILLS
Statement of debts
FINANCING DEBTS 60 344 665,49 54 298 801,75 6 045 863,74 60 194 665,49
* Bond debt
* Other financing debts 60 344 665,49 54 298 801,75 6 045 863,74 60 194 665,49
OF CURRENT LIABILITIES 951 380 422,85 930 927,82 950 449 495,03 8 570 794,47 24 081 893,07 420 741 230,01
* Accounts payable 331 362 431,76 517 283,25 330 845 148,51 8 317 061,80 12 389 989,65
* Clients creditors, advances 19 753 076,83 19 753 076,83 197 556,71
and deposits
* Staff 110 608 983,09 110 608 983,09 12 077 791,57
* Social organizations 50 717 413,83 50 717 413,83 253 732,67 33 523 922,00
* Government 273 492 496,45 273 492 496,45 273 492 496,45
* Associates’ accounts 1 104,59 1 104,59
* Other creditors 162 389 526,63 413 644,57 161 975 882,06 24 081 893,07 89 059 473,63
* Accruals - liabilities 3 055 389,67 3 055 389,67
Financial year from January 1, 2016 to December 31, 2016
THIRD-PARTY CREDITORSOR DEBTORS
THE AMOUNTCOVERED
BY THE SECURITY
N A T U R E(1)
DATE AND PLACEOF REGISTRATION
SUBJECT(2) (3)
NET OF THESECURITY GIVEN
AT THE CLOSING DATE
Table of security interests given or received
Statement of latent liabilities
(1) Pledge : 1 mortgage, 2 pledge, 3 warrant, 4 other, 5 to be specified.(2) Specify if the security is given for the benefit of third parties and companies (securities given) (related enterprises, associates and staff members). (3) Specify if the security received comes from third parties other than the debtors (securities received)
* SECURITIES GIVEN
* SECURITIES RECEIVED 103 532 050,19 MORTGAGE LAND REGISTRY MORTGAGE IN FAVOUR OF SODEP 30 547 528,82 PLEDGE IN FAVOUR OF SODEP 9 069 349,57 PLEDGE REGISTRATION 5 957 565,67 DEPARTMENT 112 601 399,76 36 505 094,49
Financial year from January 1, 2016 to December 31, 2016
Financial year from January 1, 2016 to December 31, 2016
Table of financial commitments received or given,excluding leasing-purchase transactions
COMMITMENTS GIVEN MONTANTS EXERCICE
PRECEDENT
* Guarantees and sureties 23 267 798,67 193 274 998,67
* Commitments with respect to retirement pensions and similar obligations.
* Other commitments given.
TOTAL (1) 23 267 798,67 193 274 998,67
COMMITMENTS RECEIVED
* Guarantees (customers and suppliers)
- Customers 232 608 981,34 228 147 293,77
- Suppliers 160 230 684,18 142 037 958,98
* Other commitments received
TOTAL (2) 392 839 665,52 370 185 252,75
On February 21, 2017, SODEP company received a tax audit notice for the corporate tax, value added tax and
general income tax covering the fiscal years 2013 to 2015 inclusive.
FINANCIALREVERSALS
AMOUNTS OF THE
FINANCIAL YEAR
AMOUNTS OF THE FINANCIAL YEAR AMOUNTS OF THE PREVIOUS YEAR
Parent-company Financial Statements as at December 31, 2016
44 45
46 47
HEAD OFFICE :
175, Bd Zerktouni - 20 100 Casablanca - Maroc Phone : 05 22 23 23 24 – Fax : 05 22 23 23 35
Site web : www.marsamaroc.co.ma
Financial Communication and Investors Relationship DepartmentPhone : 05 22 77 67 94/84 - Fax : 05 22 99 97 07/ 05 22 99 96 52
E-mail : [email protected]
PORTS
Nador :B.P.88 Béni-Ensar – Nador
Phone : 05 36 60 85 18(6LG) – Fax : 05 36 60 85 31 E-mail : [email protected]
Al Hoceima : B.P.88 Béni-Ensar – Nador
Phone : 06 61 91 57 49 – Fax : 05 36 98 48 62E-mail : [email protected]
Tangier :N°2 , Rue 14 – Bella Vista – Tanger
Phone : 05 39 30 93 50 – Fax : 05 39 30 93 53E-mail : [email protected]
Mohammedia :Port de commerce – B.P 98 – Mohammedia
Phone : 05 23 32 40 80 – Fax : 05 23 32 40 75E-mail : [email protected]
Casablanca : Boulevard des Almohades - Casablanca
Phone : 05 22 31 71 11 (15LG) – Fax : 05 22 31 58 95E-mail : [email protected]
Jorf lasfar :Km 22 Route d’El Jadida – B.P. 407 - Plateau RI Jadida
Phone : 05 23 34 54 54 / 05 23 34 51 06 – Fax : 05 23 34 51 12E-mail : [email protected]
Safi :B.P 8 Fond de Mer – Safi
Phone : 05 24 46 22 56 / 05 24 46 23 90 – Fax : 05 24 46 48 48E-mail : [email protected]
Agadir :B.P.36 Port d’Agadir
Phone : 05 28 84 37 00 - Fax : 05 28 84 28 25E-mail : [email protected]
Laâyoune :B.P.48 Elmersa
Phone : 05 28 99 88 88 – Fax : 05 28 99 80 65E-mail : [email protected]
Dakhla :Nouveau Port de Dakhla – B.P 335 - Dakhla
Phone : 05 28 89 88 17/ 18 – 05 28 89 71 76 – Fax : 05 28 89 88 25E-mail : [email protected]