2010 - marsa maroc - accueil · marsa maroc is the national operator in ports’ management, thanks...
TRANSCRIPT


Corporate Name Société d’Exploitation des Ports - Marsa Maroc
Date of establishment December 1st, 2006
Legal status Limited Company with Board of Directors and Supervisory Board
Registered capital 733.956.000 MAD
Headquarter 175, Bd. Zerktouni - 20100 Casablanca - Morocco
President of the Executive Board Mohammed ABDELJALIL
Business area Terminals and ports operating within the framework of concessions
Turnover 2.086.793.590,43 MAD*
Staff 2.183 collaborators*
Global traffic 35.6 million tons*
Operated ports Nador, Al Hoceima, Tangier, Mohammedia, Casablanca, Jorf Lasfar,
Safi, Agadir, Laayoune, Dakhla.
Provided Services Ship-related Services (piloting, towing, mooring, victualling, etc).
Goods related Services handling (on board and on dockside), storing,
checking, weighting, containers’ staffing and unstaffing)
Related services (handling, goods stacking, loading and unloading
of trucks, etc).
Real-time Information (E-service “Marsa Conteneur”).
ANNUAL REPORT 2010
Marsa Marocin brief
CorporateProfile
>
O4
Marsa Maroc is the national operator in ports’ management, thanks to its
presence in the Kingdom’s most important infrastructures.
Since its creation at the end of 2006, Marsa Maroc started a development
process going along with the dynamic of the logistics sector in Morocco.
Besides establishing the quality of service, human resources training
and acquiring efficient equipments as a priority, Marsa Maroc aspires to
become a reference port operator at the regional scale.
The obtaining of the Container Terminal 4 concession in the port of Tanger
Med II constitutes rightly a major first step in deploying the company’s
development strategy.
* To the end of 2010

President’s word 9
Presentation of Marsa Maroc 10Management bodies 10Marsa Maroc Organization Chart 11
Activity and Development 122010 highlights 14
2010 Activity 18Traffic achievements 20Financial results 26
Financial statements 30Balance sheet (Assets) 32Balance sheet (Liabilities) 33Profit and loss account 34Management accounts 36Funds statement 37
Contacts 38
Table of contents
>
07
ANNUAL REPORT 2010

2010 has been another special year put
under the sign of development. If the year
2009 was remembered by significant
events, especially the signature of the
container terminal concession contract
in the port of Tanger Med II, the year
2010 saw in turn major achievements
worthy of our customers’ expectations.
Indeed, For us, the growth of our
customer sectors means that we should
expand our capacities and develop
our range of services. That’s why we
launched the construction of a car
terminal at the port of Casablanca. This
infrastructure, with its commissioning
scheduled at the end of the year 2011,
has all the trumps to become a national
and regional reference in the processing
and storage of new vehicles: standards
along with the world’s biggest car
terminals, a large storage and processing
capacity as well as a wide range of value-
added services.
The 2010 has also known the
commissioning of a high-capacity new oil
terminal at the port of Jorf Lasfar. Thanks
to such an infrastructure, we meet the
needs of a very dynamic hinterland that
knows the implementation of a growing
number of industrial units.
Within the framework of our develop-
ment strategy, our teams operate, since
November 2010, at the port of Tanger
Med with the signature of a contract
with TMSA for subcontracting operation
of bulk and general cargo terminal at the
port of Tanger Med I.
As for the 2010 achievements, and in
spite of a context marked by the entry of
new operators and the transfer of almost
all the IRT traffic to the port of Tanger
Med, we have been able to uphold our
leadership with a market share bordering
50 % of the national port traffic. As
regards our financial performance,
Marsa Marco’s turnover was set at 2,069
million MAD, up by 4% in comparison
with our forecasts.
With these achievements, we show
major progress in the deployment of
our corporate project “Cap 15” and
we continue to show determination in
getting our working sites of corporate
development implemented.
President’s
Word
>
For us, the
growth of our
customer sectors
means that
we should expand
our capacities
and develop
our range
of services
09
ANNUAL REPORT 2010

11
Management bodies
Supervisory Board : M. Karim GHELLAB Minister of Equipment and Transport, Chairman of the Supervisory Board
M. Younes TAZI Vice-president of the Supervisory Board
M. Abdelhak KHOUADRA Representative of the Ministry of Economy and Finance
M. Hamid ZHAR Secretary of the Supervisory Board
> Marsa Maroc Organization Chart
bodiesMarsa Maroc
Mohammed ABDELJALILChairman of the Executive Board
El Mahjoub BAYRIDirector and Tanger Med
Project Manager
Mustapha SAHABIFinance Manager
Rachid HADIOperations’ Manager
in the port of Casablanca
Youssef BENNANIDevelopment Manager
Executive Board
ANNUAL REPORT 2010
* There are 8 of them: Nador, Tangier, Mohammedia, Casablanca, Jorf Lasfar, Safi, Agadir, and Laâyoune.
Chairman of the Executive Board
Development Management
Tanger Med Project Management
Technical Management
Human Resources and General Affairs Management
Staff and Corporate affairs Management
Information System Management
Purchase & Market Management
Legal Matters Management
Internal Audit Management
Port Operations Managers*

Activityand Development

Launch of the construction of a car terminal at the port of Casablanca On Monday, March 29th 2010, his Majesty King Mohammed VI, May God assists
him, launched the building works of a terminal dedicated to the processing and
storage of vehicles passing in transit through the port of Casablanca. The total
investment amounts to more than 150 million MAD.
This vertical storage space was designed in accordance with the most demanding
international standards. It will be set up on a covered area of 75,000 m² which can
accommodate 5,000 units with an annual processing capacity of 100,000 vehicles.
It will allow to meet also the needs of vehicles’ importers and exporters in terms of
capacity, saving of time but also service quality thanks to a wide range of services.
This new structure will be built on five floors and will be commissioned at the end
of 2011.
This investment comes further to the big development that the vehicles’ traffic
knew. It will also play a leading role for the positioning of Morocco as a vehicles
exporting platform towards the countries of the Region.
Commissioning of a new high-capacity oil dock at the Jorf Lasfar port On January 25th 2010, a new oil dock (station n°8) has been commissioned at
the port of Jorf Lasfar and this, with the processing of a gas carrier transporting
more than 13,000 tons of DWT.
The new wharf is almost 166 m in length and 15.6 m in depth, allowing
Marsa Maroc ‘s facilities to accommodate ships of a capacity of more than
100,000 tons.
The putting into service of this new facility will support the dynamism of the
Jorf Lasfar area by meeting the local needs and supplying industries with
hydrocarbons.
Operating of General Cargo and Bulk Terminal at the port of Tanger Med I Marsa Maroc was given the operating of General Cargo and Bulk terminal
at the port of Tanger Med I and this, under the terms of a subcontract
agreement signed with TMSA (Tangier Med Special Agency) on October
15th 2010.
Marsa Maroc, whose mission concerns port operations as well as
management, set up the necessary means to the terminal good running
as for resources and equipment, as well as for management and security.
Thus, some 70 employees will ensure the operating and management
of the General Cargo and Bulk terminal. This latter has been equipped
with two mobile cranes, and other handling appliances and accessories.
The terminal is 568 meters long, and from 12 to 15 meters deep,
has 9.3 ha as open area and a deconsolidation depot of 5,000 m²
as a surface area.
15
and Development Activity
> 2010 highlights
ANNUAL REPORT 2010
Besides our processing
capacity which will rise
by 150 %, we will be in
a position to offer vehicles’
importers and exporters a wide
range of value-added services
and to meet their expectations
in terms of security”.
Mr. Rachid HADI,
Operations Manager
in the port of Casablanca
Our teams have
shown once again that
their expertise represents
a major differentiating
factor for Marsa Maroc.
They were warmly
congratulated by
the first customers of the
general cargo and bulk
terminal for their efforts
and quality of services”.
M. Mohammed SAABOU, Manager of the Tanger Med I Operations Department

This achievement represents a new opportunity of development for Marsa Maroc,
allowing the reinforcement of its position toward the future concession of General
Cargo and Bulk terminal, in addition to the pride of being present in this promising
port since the year 2010.
The operating of the General Cargo and Bulk terminal was launched on November
27th 2010 with the processing of a first roll-on/roll-off ship to export.
Equipments’ reinforcement in different portsNew equipments enhancing the quality of service and backing up growth in the
different traffics were put into service, mainly:
• Two cranes at the multi-purpose terminal of the port of Casablanca for
70 million MAD as amount of investment,
• Two mobile cranes intended for the new multi-purpose terminal at the port of
Jorf lasfar for 91 million MAD as amount of investment,
• A container crane at the port of Agadir for 35 million MAD as amount of
investment,
• A crane at the port of Laâyoune for 28 million MAD as amount of investment.
Launch of a study about equipments maintenance managementConcerned about providing a better rate of availability of its equipments in
order to reach, and even exceed, its objectives of operational performance
and of customer satisfaction, Marsa Maroc has launched a study about
the maintenance function within its different facilities.
The study, started in October 2010, aimed at designing and setting up a
maintenance management system by the end of 2011. More concretely,
the study will get the equipments maintenance policy defined and
formalized and will be carried out on the performance objectives and
the implementation strategy; the aim is the setting up of an efficient
organization and a system of follow-up and appraisal of the maintenance
function performances.
17
ANNUAL REPORT 2010
On the strategic level,
maintenance of the technical
facilities and equipments is at
the heart of our business and
represents an essential element
to meet our commitments
towards our customers
in terms of guarantee
of service and of productivity.
Therefore, maintenance fully
contributes to Marsa Maroc’s
competitiveness (*).
The objective of this study is
to analyze the performance
of services provided by the
equipment maintenance function
and to make suggestions
in order to optimize the ratio
“operational availability/
life cycle cost” (*).
(*) M. Rachid SAlAMA,
Technical Manager
Activity2010

Traffic processed by Marsa Maroc
Global Traffic In 2010, Marsa Maroc handled a total traffic of 35.4 million tons, an almost slacking volume compared to the
previous year. This performance has been marked by the effective entry of new port operators and the transfer of
almost all the traffic handled by Marsa Maroc from the port of Tangier to the port of Tanger Med I.
Traffic by Business UnitIn 2010, dry bulks and liquid bulks respectively increased by 8% and 10% in comparison with last year. Except
these two business units, all the other units processed by Marsa Maroc decreased.
The liquid bulks segment recorded a volume of almost 15 million tons, up by 10%. An outstanding performance
which is explained by the increasing importations of crude oil and liquid gas and this, further to the starting up of
the new Samir facilities for the production of raffinates.
2010 Activity
> Traffic Achievements
Marsa Maroc’s market share in the national trafficIn 2010, Marsa Maroc market share reached 50 %
of the national port traffic. Marsa Maroc upholds its
leading position in the majority of traffic segments
especially the containerized traffic for which its market
share goes up to more than 77 %;
As for the IRT traffic (International Road Transportation),
Marsa Maroc’s market share goes down from 80 % to
44 % further to the transfer of the totality of the traffic
of the port of Tanger Med and to the suspension by
ACCIONNA of the RORO shipping line linking Agadir
to Barcelona. %
> Marsa Maroc’s market share in the IRT National Traffic
%
> Marsa Maroc’s market share in the Container National Traffic
20092010
Crude Oil Liquiefied Gaz Raffinates
> Evolution of liquid bulks traffic by product
ANNUAL REPORT 2010
21
n to
ns
6 000 000
5 000 000
4 000 000
3 000 000
2 000 000
1 000 000
0
62
15
17
6
30
821
54
5 MM Nador
MM Tanger
MM Casa
MM Agadir
Somaport
Tanger Med
MM Casa
MM Agadir
Somaport
Tanger Med
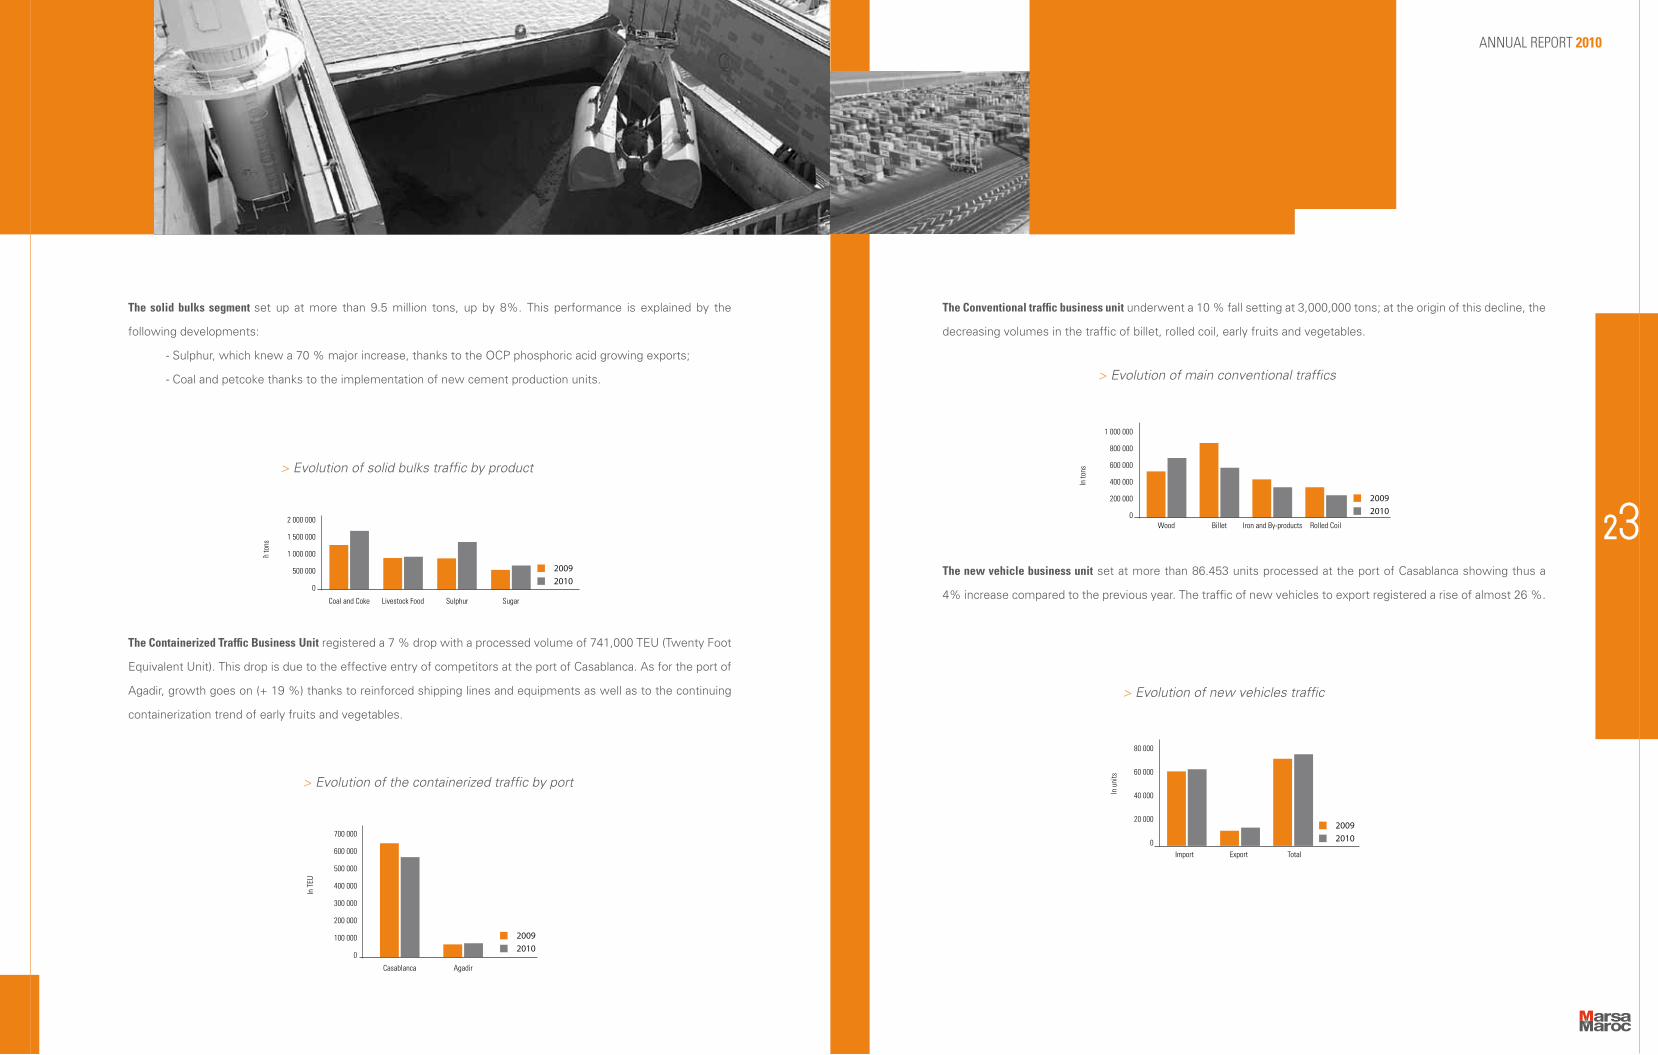
The solid bulks segment set up at more than 9.5 million tons, up by 8%. This performance is explained by the
following developments:
- Sulphur, which knew a 70 % major increase, thanks to the OCP phosphoric acid growing exports;
- Coal and petcoke thanks to the implementation of new cement production units.
The Containerized Traffic Business Unit registered a 7 % drop with a processed volume of 741,000 TEU (Twenty Foot
Equivalent Unit). This drop is due to the effective entry of competitors at the port of Casablanca. As for the port of
Agadir, growth goes on (+ 19 %) thanks to reinforced shipping lines and equipments as well as to the continuing
containerization trend of early fruits and vegetables.
The Conventional traffic business unit underwent a 10 % fall setting at 3,000,000 tons; at the origin of this decline, the
decreasing volumes in the traffic of billet, rolled coil, early fruits and vegetables.
The new vehicle business unit set at more than 86.453 units processed at the port of Casablanca showing thus a
4% increase compared to the previous year. The traffic of new vehicles to export registered a rise of almost 26 %.
> Evolution of the containerized traffic by port
20092010
Casablanca Agadir
> Evolution of main conventional traffics
20092010
Wood Iron and By-productsBillet Rolled Coil
> Evolution of new vehicles traffic
Import Export Total
20092010
ANNUAL REPORT 2010
23
In to
ns
In u
nits
In T
EU
> Evolution of solid bulks traffic by product
20092010
Coal and Coke Livestock Food SugarSulphur
n to
ns
2 000 000
1 500 000
1 000 000
500 000
0
1 000 000
800 000
600 000
400 000
200 000
0
80 000
60 000
40 000
20 000
0700 000
600 000
500 000
400 000
300 000
200 000
100 000
0

The passengers traffic business unit set at 3,083,227 passengers, including 453,644 cruise passengers,
showing thus a 26 % drop.
Traffic by portIn 2010, the ports of Mohammedia, Jorf Lasfar, Safi, Agadir and Dakhla saw their activity growing significantly
compared to the previous year, especially the port of Safi, which showed the sharpest increase in traffic with
a 44 % rise. The strongest drops were recorded at the port of Casablanca, which knew the effective entry of
competing operators, and at the port of Tangier, having almost all its traffic transferred to the port of Tanger
Med I.
> Evolution of Passenger traffic by port
20092010
Nador Tangier Casablanca other ports
> Traffic Evolution by port
20092010
Nador Jorf-LasfarMohammedia Agadir DakhlaTangier Safi LaayouneCasablanca
In p
erso
n
In to
ns
4 000 000
3 000 000
2 000 000
1 000 000
0
12 000 000
10 000 000
8 000 000
6 000 000
2 000 000
0
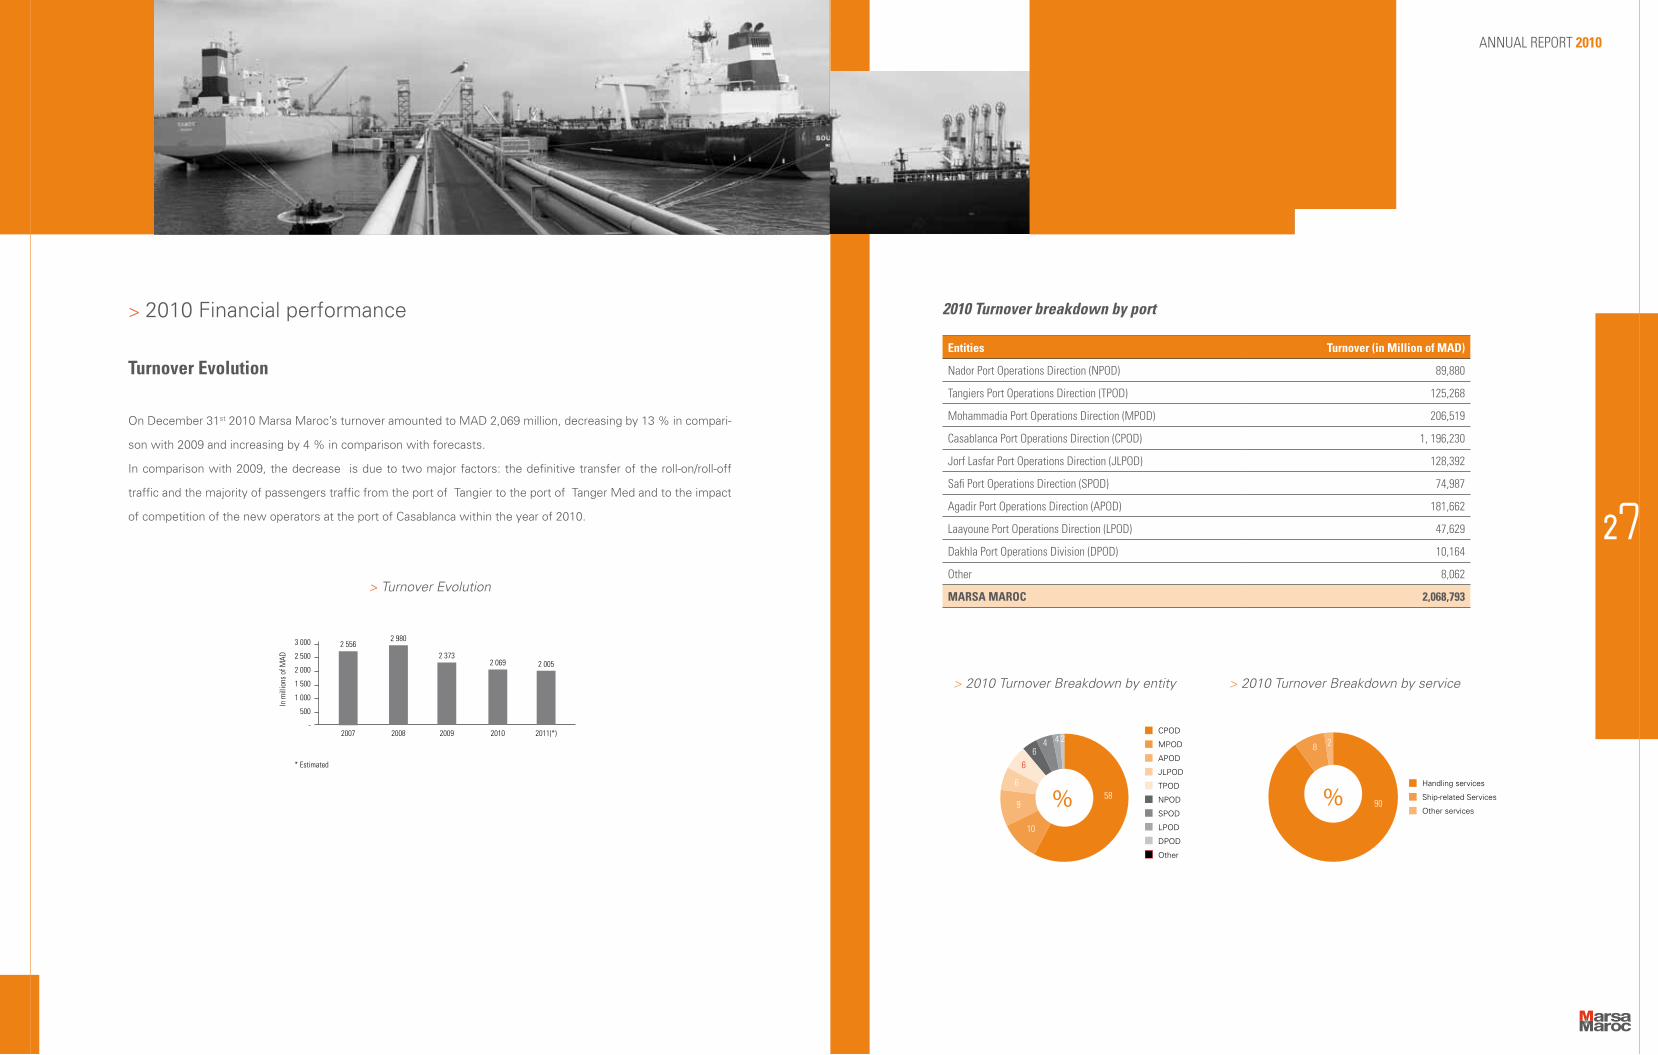
> 2010 Financial performance
Turnover Evolution
On December 31st 2010 Marsa Maroc’s turnover amounted to MAD 2,069 million, decreasing by 13 % in compari-
son with 2009 and increasing by 4 % in comparison with forecasts.
In comparison with 2009, the decrease is due to two major factors: the definitive transfer of the roll-on/roll-off
traffic and the majority of passengers traffic from the port of Tangier to the port of Tanger Med and to the impact
of competition of the new operators at the port of Casablanca within the year of 2010.
2010 Turnover breakdown by port
ANNUAL REPORT 2010
27
In m
illio
ns o
f MAD
> Turnover Evolution
* Estimated
3 000
2 500
2 000
1 500
1 000
500
-2007
2 556
2008
2 980
2009
2 373
2010
2 069
2011(*)
2 005
> 2010 Turnover Breakdown by entity
CPOD
MPOD
APOD
JLPOD
TPOD
NPOD
SPOD
LPOD
DPOD
Other
% 58
10
9
6
66
4 4 2
> 2010 Turnover Breakdown by service
Handling services
Ship-related Services
Other services90
8 2
%
Entities Turnover (in Million of MAD)
Nador Port Operations Direction (NPOD) 89,880
Tangiers Port Operations Direction (TPOD) 125,268
Mohammadia Port Operations Direction (MPOD) 206,519
Casablanca Port Operations Direction (CPOD) 1, 196,230
Jorf Lasfar Port Operations Direction (JLPOD) 128,392
Safi Port Operations Direction (SPOD) 74,987
Agadir Port Operations Direction (APOD) 181,662
Laayoune Port Operations Direction (LPOD) 47,629
Dakhla Port Operations Division (DPOD) 10,164
Other 8,062
MARSA MAROC 2,068,793

Evolution of operating expenses
At the end of December 2010, the operating expenses amounted to 1,572 million MAD, compared to 1,757
million MAD in the same period of 2009, which means an 11 % decrease. These expenses mainly include
151 million MAD as expenses of operations subcontracting aboard vessels at the port of Casablanca and this further
to the progressive taking over of these operations by Marsa Maroc as from the month of June 2009.
Evolution of operating results
At the end of December 2010, Marsa Maroc’s operating result amounted to 549 million MAD compared to
651 million MAD achieved in the same period of 2009, which means a 15 % decrease.
The net profit at the end of December 2010 reached 410 million MAD compared to MAD 391 million achieved in
the same period of 2009, which means a 5 % increase.
2010 Capital Budget Performance
Compared to the 2010 budget allowance, which amounted to 569 million MAD, the commitments at the end of
2010 reached 397 million MAD, i.e. a commitment rate of 70 %.
ANNUAL REPORT 2010
29> Evolution of operating expenses
* Estimated
2 500
2 000
1 500
1 000
500
-2007
1 649
2008
2 042
2009
1 757
2010
1 572
2011(*)
1 638
> Evolution of operating results and net profit
* Estimated
1 000
800
600
400
200
02007 2008 2009 2010 2011(*)
925978
651
549
367345
656
391 410
235Operating profit
Net income
100%
90%
80%
70%
60%
50%
40%
30%
20%
10%
0
Infrastructures
Studies & Financial interest
Equipments
362
163
44
255
127
15
70%
78%
34%
2010 Budget Achieved at 2010 All commitments
Inm
illio
ns o
f MAD
In m
illio
ns o
f MAD

Financialstatements

Financialstatements
ANNUAL REPORT 2010
33
BALANCE SHEET (ASSETS) Financial Year from 01/01/2010 to 31/12/2010
ASSETS Financial Year PREVIOUS Financial Year
GROSS DEPRECIATIONS AND PROVISIONS
NET31/12/2010
NET31/12/2009
DEFERRED EXPENSES RECORDED AS ASSET (A)
INTANGIBLE FIXED ASSETS (B) 80 151 679,39 37 834 724,00 42 316 955,39 46 610 691,05
• Other intangible fixed assets 80 151 679,39 37 834 724,00 42 316 955,39 46 610 691,05
TANGIBLE FIXED ASSETS (C) 2 573 392 290,98 1 115 056 396,98 1 458 335 894,00 1 301 720 461,69
• Lands 80 823 701,84 16 901 141,50 63 922 560,34 63 741 056,34
• Buildings 380 912 299,27 120 960 175,18 259 952 124,09 210 730 761,18
• Technical fittings, material and equipment 1 820 298 190,89 914 621 655,18 905 676 535,71 783 310 934,14
• transportation equipment 21 767 972,01 15 913 413,63 5 854 558,38 8 551 409,71
• Furniture, office equipment and various facilities 78 499 564,83 45 470 937,28 33 028 627,55 35 223 641,10
• Other tangible fixed assets 2 006 406,59 1 189 074,21 817 332,38 1 071 038,75
• Tangible fixed assets in process 189 084 155,55 189 084 155,55 199 091 620,47
CAPITAL ASSETS (D) 145 686 624,78 2 905 840,61 142 780 784,17 171 221 106,54
• Fixed advances 138 057 131,63 2 865 840,61 135 191 291,02 163 671 613,39
• Other financial claims 1 514 593,15 40 000,00 1 474 593,15 1 434 593,15
• Equity securities 6 114 900,00 6 114 900,00 6 114 900,00
ASSET TRANSLATION ADJUSTMENT (E) 250 299,18 250 299,18 2 430 211,06
• Increase in financing debts 250 299,18 250 299,18 2 430 211,06
TOTAL I (A+B+C+D+E) 2 799 480 894,33 1 155 796 961,59 1 643 683 932,74 1 521 982 470,34
STOCKS (F) 138 004 782,57 13 819 352,23 124 185 430,34 134 532 126,25
• Supplies 118 200 522,07 13 819 352,23 104 381 169,84 114 727 865,75
• Work in process inventory 19 804 260,50 19 804 260,50 19 804 260,50
FLOATING ASSET RECEIVABLES (G) 532 769 687,24 52 912 508,89 479 857 178,35 431 077 105,40
• Advances to suppliers, Advances and payments on account 10 404 642,19 10 404 642,19 35 030,00
• Trade account receivable and related accounts 282 420 246,39 40 792 785,69 241 627 460,70 214 282 273,54
• Staff 1 020 883,96 1 020 883,96 1 086 885,85
• Government 103 086 143,73 103 086 143,73 117 582 769,23
• Current accounts
• Other receivables 110 001 279,80 12 119 723,20 97 881 556,60 86 785 672,90
• Accruals 25 836 491,17 25 836 491,17 11 304 473,88
SECURITIES AND INVESTMENT SECURITIES (H) 1 847 616 588,82 1 847 616 588,82 1 644 731 872,31
TOTAL II (F+G+H+I) 2 518 391 058,63 66 731 861,12 2 451 659 197,51 2 210 341 103,96
CASH RESOURCES - ASSET 228 659 441,26 27 673,50 228 631 767,76 413 914 095,71
• Uncashed cheques and instruments 4 469 736,91 27 673,50 4 442 063,41 1 884 242,12
• Banks, TG and CP 223 964 152,28 0,00 223 964 152,28 411 540 546,05
• Cash, imprests and sums at disposal 225 552,07 0,00 225 552,07 489 307,54
TOTAL III 228 659 441,26 27 673,50 228 631 767,76 413 914 095,71
GRAND TOTAL I + II + III 5 546 531 394,22 1 222 556 496,21 4 323 974 898,01 4 146 237 670,01
BALANCE SHEET (LIABILITIES) Financial Year from 01/01/2010 to 31/12/2010
LIABILITIES Financial Year31/12/2010
Previous Financial Year
31/12/2009
SHAREHOLDERS’ EQUITY 2 199 783 376,26 1 892 274 885,08
• Personal funds or registered capital (1) 733 956 000,00 733 956 000,00
• Shareholders, uncalled subscribed capital ...,
• Share premiums, merger premiums,
• Revaluation adjustment
• Reserve 69 605 382,55 50 065 549,50
• Other reserves (2) 10 796 459,41 10 796 459,41
• Balance carried forward 975 163 203,12 706 660 215,16
• Incomes pending allocation (2)
• Income of the Financial Year (2) 410 262 331,18 390 796 661,01
SHAREHOLDERS’ EQUITY TOTAL (A) 2 199 783 376,26 1 892 274 885,08
EQUIVALENT SHAREHOLDERS’ EQUITY (B) 161 153 317,02 326 331 238,27
• Amortization expense 161 153 317,02 326 331 238,27
FINANCING DEBTS (C) 157 469 823,50 186 535 265,22
• Debenture loans
• Other financing debts 157 469 823,50 186 535 265,22
PERMANENT PROVISIONS FOR RISK EXPOSURES AND EXPENSES (D) 699 014 547,32 511 414 772,13
• Provisions for risk exposures 195 428 932,07 181 278 975,92
• Provisions for expenses 503 585 615,25 330 135 796,21
TOTAL I (A+B+C+D) 3 217 421 064,10 2 916 556 160,70
DEBTS OF THE FLOATING LIABILITY (F) 901 540 723,67 870 727 965,78
• Trade accounts payable and related accounts 337 336 713,18 352 789 516,41
• Advances and payments on account from customers 19 833 526,01 20 458 611,99
• Staff 97 954 094,38 62 274 063,67
• Social institutions 49 282 743,16 47 443 187,14
• Government 151 794 355,02 161 481 364,69
• Current accounts 178,20 127,80
• Other creditors 244 227 540,74 225 057 215,90
• Accruals 1 111 572,98 1 223 878,18
Translation Adjustments Liabilities (H) 4 067,49
TOTAL II (F + G + H) 901 544 791,16 870 727 965,78
CASH RESOURCES - LIABILITY 205 009 042,75 358 953 543,53
• Banks (credit balances) 205 009 042,75 358 953 543,53
TOTAL III 205 009 042,75 358 953 543,53
GRAND TOTAL I + II + III 4 323 974 898,01 4 146 237 670,01 (1) Debit personal funds (2) Beneficiary (+) In the red (-)
ANNUAL REPORT 2010
35
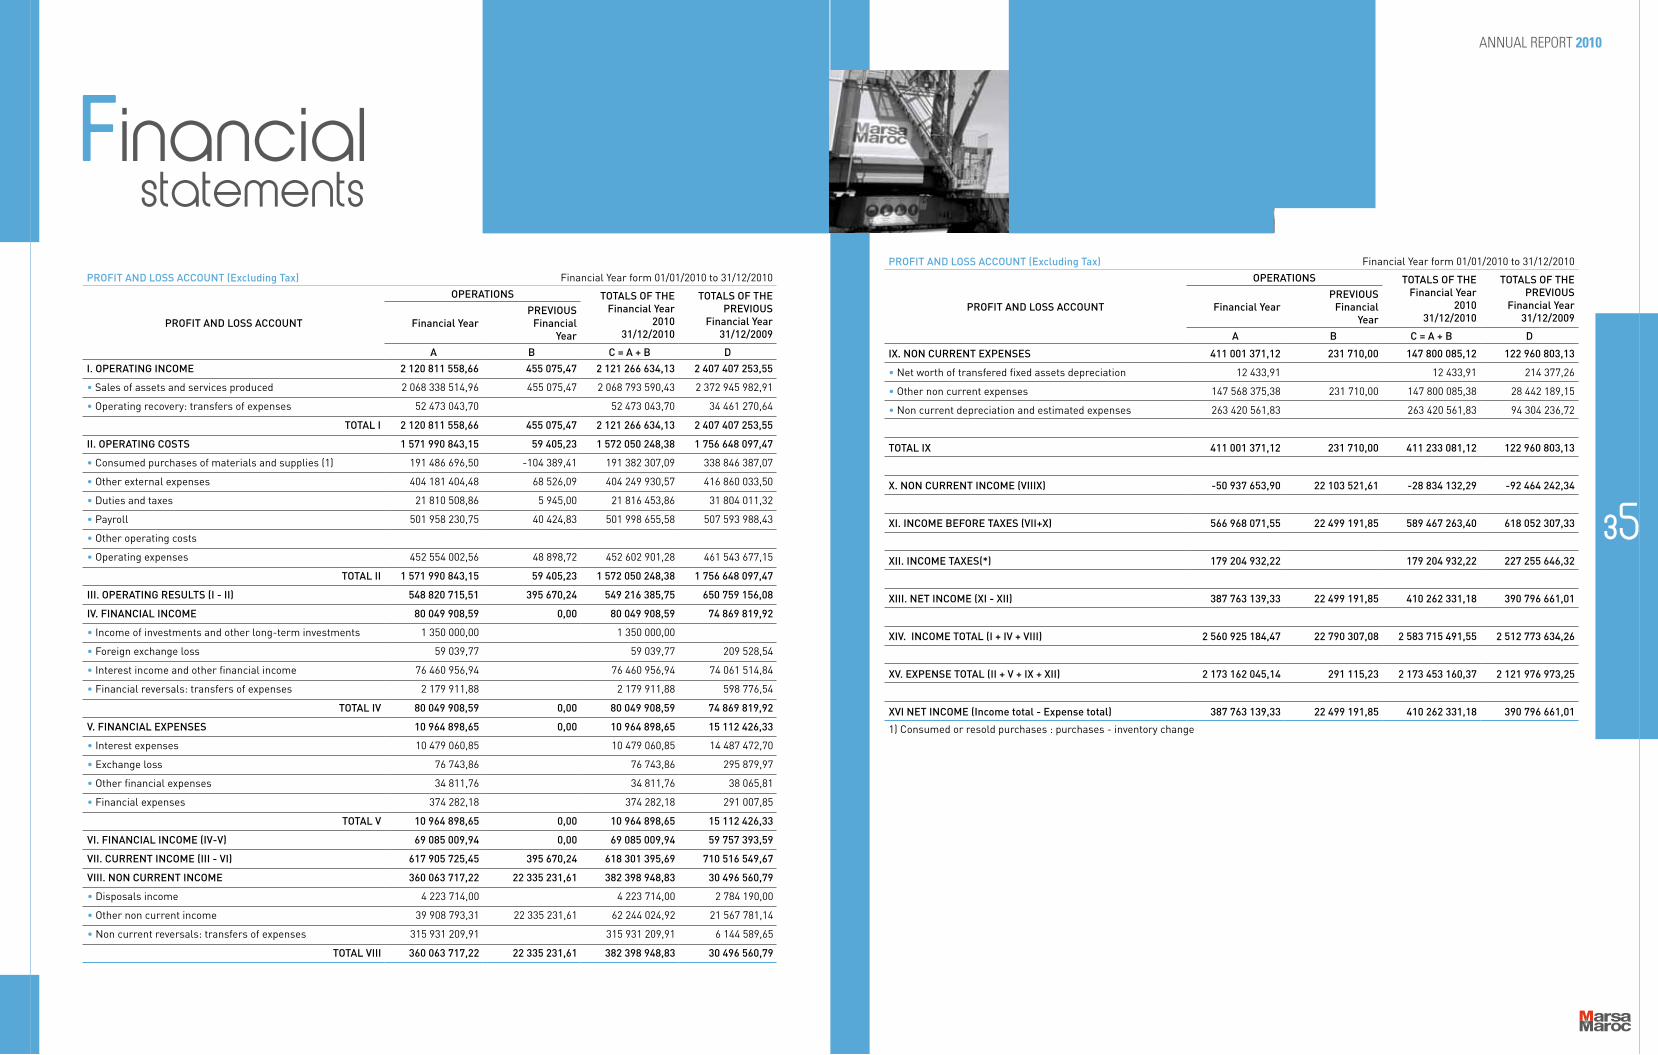
PROFIT AND LOSS ACCOUNT (Excluding Tax) Financial Year form 01/01/2010 to 31/12/2010
PROFIT AND LOSS ACCOUNT
OPERATIONS TOTALS OF THE Financial Year
201031/12/2010
TOTALS OF THE PREVIOUS
Financial Year31/12/2009
Financial YearPREVIOUS
Financial Year
A B C = A + B D
I. OPERATING INCOME 2 120 811 558,66 455 075,47 2 121 266 634,13 2 407 407 253,55
• Sales of assets and services produced 2 068 338 514,96 455 075,47 2 068 793 590,43 2 372 945 982,91
• Operating recovery: transfers of expenses 52 473 043,70 52 473 043,70 34 461 270,64
TOTAL I 2 120 811 558,66 455 075,47 2 121 266 634,13 2 407 407 253,55
II. OPERATING COSTS 1 571 990 843,15 59 405,23 1 572 050 248,38 1 756 648 097,47
• Consumed purchases of materials and supplies (1) 191 486 696,50 -104 389,41 191 382 307,09 338 846 387,07
• Other external expenses 404 181 404,48 68 526,09 404 249 930,57 416 860 033,50
• Duties and taxes 21 810 508,86 5 945,00 21 816 453,86 31 804 011,32
• Payroll 501 958 230,75 40 424,83 501 998 655,58 507 593 988,43
• Other operating costs
• Operating expenses 452 554 002,56 48 898,72 452 602 901,28 461 543 677,15
TOTAL II 1 571 990 843,15 59 405,23 1 572 050 248,38 1 756 648 097,47
III. OPERATING RESULTS (I - II) 548 820 715,51 395 670,24 549 216 385,75 650 759 156,08
IV. FINANCIAL INCOME 80 049 908,59 0,00 80 049 908,59 74 869 819,92
• Income of investments and other long-term investments 1 350 000,00 1 350 000,00
• Foreign exchange loss 59 039,77 59 039,77 209 528,54
• Interest income and other financial income 76 460 956,94 76 460 956,94 74 061 514,84
• Financial reversals: transfers of expenses 2 179 911,88 2 179 911,88 598 776,54
TOTAL IV 80 049 908,59 0,00 80 049 908,59 74 869 819,92
V. FINANCIAL EXPENSES 10 964 898,65 0,00 10 964 898,65 15 112 426,33
• Interest expenses 10 479 060,85 10 479 060,85 14 487 472,70
• Exchange loss 76 743,86 76 743,86 295 879,97
• Other financial expenses 34 811,76 34 811,76 38 065,81
• Financial expenses 374 282,18 374 282,18 291 007,85
TOTAL V 10 964 898,65 0,00 10 964 898,65 15 112 426,33
VI. FINANCIAL INCOME (IV-V) 69 085 009,94 0,00 69 085 009,94 59 757 393,59
VII. CURRENT INCOME (III - VI) 617 905 725,45 395 670,24 618 301 395,69 710 516 549,67
VIII. NON CURRENT INCOME 360 063 717,22 22 335 231,61 382 398 948,83 30 496 560,79
• Disposals income 4 223 714,00 4 223 714,00 2 784 190,00
• Other non current income 39 908 793,31 22 335 231,61 62 244 024,92 21 567 781,14
• Non current reversals: transfers of expenses 315 931 209,91 315 931 209,91 6 144 589,65
TOTAL VIII 360 063 717,22 22 335 231,61 382 398 948,83 30 496 560,79
PROFIT AND LOSS ACCOUNT (Excluding Tax) Financial Year form 01/01/2010 to 31/12/2010
PROFIT AND LOSS ACCOUNT
OPERATIONS TOTALS OF THE Financial Year
201031/12/2010
TOTALS OF THE PREVIOUS
Financial Year31/12/2009
Financial YearPREVIOUS
Financial Year
A B C = A + B D
IX. NON CURRENT EXPENSES 411 001 371,12 231 710,00 147 800 085,12 122 960 803,13
• Net worth of transfered fixed assets depreciation 12 433,91 12 433,91 214 377,26
• Other non current expenses 147 568 375,38 231 710,00 147 800 085,38 28 442 189,15
• Non current depreciation and estimated expenses 263 420 561,83 263 420 561,83 94 304 236,72
TOTAL IX 411 001 371,12 231 710,00 411 233 081,12 122 960 803,13
X. NON CURRENT INCOME (VIIIX) -50 937 653,90 22 103 521,61 -28 834 132,29 -92 464 242,34
XI. INCOME BEFORE TAXES (VII+X) 566 968 071,55 22 499 191,85 589 467 263,40 618 052 307,33
XII. INCOME TAXES(*) 179 204 932,22 179 204 932,22 227 255 646,32
XIII. NET INCOME (XI - XII) 387 763 139,33 22 499 191,85 410 262 331,18 390 796 661,01
XIV. INCOME TOTAL (I + IV + VIII) 2 560 925 184,47 22 790 307,08 2 583 715 491,55 2 512 773 634,26
XV. EXPENSE TOTAL (II + V + IX + XII) 2 173 162 045,14 291 115,23 2 173 453 160,37 2 121 976 973,25
XVI NET INCOME (Income total - Expense total) 387 763 139,33 22 499 191,85 410 262 331,18 390 796 661,01
1) Consumed or resold purchases : purchases - inventory change
Financialstatements

ANNUAL REPORT 2010
37
MANAGEMENT ACCOUNTS (MA) Financial year from 01/01/2010 to 31/12/2010
TOTALS OF THE Financial year 2010
TOTALS OF THE Financial year 2009
I. MANAGEMENT ACCOUNTS REANALYSIS FORM (MARF)
I + PRODUCTION OF THE FINANCIAL YEAR: (1+2+3) 2 068 793 590,43 2 372 945 982,91
1 Purchases of produced goods and services 2 068 793 590,43 2 372 945 982,91
2 Inventory changes
3 Fixed assets produced by the company for itslef
II - CONSUMPTION OF THE FINANCIAL YEAR: (4+5) 595 632 237,66 755 706 420,57
4 Consumed purchases of materials and supplies 191 382 307,09 338 846 387,07
5 Other external expenses 404 249 930,57 416 860 033,50
III = VALUE ADDED (I -II ) 1 473 161 352,77 1 617 239 562,34
6 + Operating grants
7 - Duties & taxes 21 816 453,86 31 804 011,32
8 - Payroll 501 998 655,58 507 593 988,43
IV = Earnings before interest, taxes, depreciation & amortization (EBITDA)
949 346 243,33 1 077 841 562,59
9 + Other operating incomes
10 - Other operating expenses
11 + Operating reversals: transfers of expenses 52 473 043,70 34 461 270,64
12 - Operating expenses 452 602 901,28 461 543 677,15
V = OPERATING RESULTS (+ ou -) 549 216 385,75 650 759 156,08
VI + FINANCIAL INCOME 69 085 009,94 59 757 393,59
VII = CURRENT INCOME (+ OU -) 618 301 395,69 710 516 549,67
VIII ± NON CURRENT INCOME -28 834 132,29 -92 464 242,34
13 - Income taxes 179 204 932,22 227 255 646,32
IX = NET INCOME OF THE FINANCIAL YEAR (+ ou -) 410 262 331,18 390 796 661,01
II. SELF-FINANCING CAPACITY / SELF-FINANCING
1 Net income of the Financial year 410 262 331,18 390 796 661,01
2 + Operating expenses (1) 418 445 625,47 453 078 548,04
3 + Financial expenses (1) 372 709,78 291 007,85
4 + Non current expenses (1) 263 420 561,83 94 272 151,72
5 - Operating reversals (2) 35 524 876,93 19 583 246,25
6 - Financial reversals (2) 2 179 911,88 598 776,54
7 - Non current reversals (2) (3) 315 931 209,91 4 129 196,66
8 - Disposals income 4 223 714,00 2 784 190,00
9 + Net worth of transfered fixed assets depreciation 12 433,91 214 377,26
I CASH FLOWS FROM OPERATING ACTIVITIES 734 653 949,45 911 557 336,43
10 Distribution of earnings 102 753 840,00 161 470 320,00
II SELF-FINANCING 631 900 109,45 750 087 016,43
(1) Excluding the expenses relating to the treasury floating assets and liabilities NOTA : The Self-financing Capacity can also be calculated based on earnings before interests, taxes, dépreciation and amortization(2) Excluding the reversals relating to the treasury floating assets and liabilities (3) Including reversals on investment grants
CASH FLOW STATEMENT Financial Year from 01/01/2010 to 31/12/2010
A S S E T SFinancial Year31/12//2010
(a)
Financial Year 31/12/2009
(b)
VARIATIONS (a - b)
APPROPRIATIONS ( c)
RESOURCES (d)
• Permanent financing 3 217 421 064,10 2 916 556 160,70 300 864 903,40
• Minus fixed asset 1 643 683 932,74 1 521 982 470,34 121 701 462,40
= WORKING CAPITAL (A) FUNCTIONAL (1-2) 1 573 737 131,36 1 394 573 690,36 179 163 441,00
• Floating assets 2 451 659 197,51 2 210 341 103,96 241 318 093,55
• Minus floating assets 901 544 791,16 870 727 965,78 30 816 825,38
= FINANCING REQUIREMENT (B) GLOBAL (4-5) 1 550 114 406,35 1 339 613 138,18 210 501 268,17
NET CASH (ASSET - LIABILITY) = A - B 23 622 725,01 54 960 552,18 31 337 827,17
A S S E T SFinancial Year PREVIOUS Financial Year
APPROPRIATIONS (a)
RESOURCES (b)
APPROPRIATIONS (a)
RESOURCES (b)
I. PERMANENT RESOURCES OF THE FINANCIAL YEAR (FLOW) 684 994 129,74 793 612 272,59
SELF-FINANCING (A) 631 900 109,45 750 087 016,43
• Funds from operations 734 653 949,45 911 557 336,43
• Disribution of earnings 102 753 840,00 161 470 320,00
DISPOSLAS AND DECREASE OF CAPITAL ASSETS (B) 53 094 020,29 43 525 256,16
• Disposals of intangible assets
•Disposals of tangible assets 4 223 714,00 2 784 190,00
• Disposals of capital assets
• Nonperforming assets recovery 48 792 906,29 40 671 066,16
• Intangible assets withdrawal 77 400,00 70 000,00
INCREASE IN CAPITALS AND EQUIVALENTS (C)
• Increase in capital, contributions
• Capital grants
OTHER RESOURCES
INCREASE IN FINANCING DEBTS (D) (net of redemption premiums)
TOTAL 1 : PERMANENT RESOURCES 684 994 129,74 793 612 272,59
II. PERMANENT APPROPRIATIONS OF THE FINANCIAL YEAR (FLOW) 505 830 688,74 556 910 778,65
ACQUISITION AND INCREASE OF FIXED ASSETS (E) 478 945 158,90 385 116 709,36
• Acquisitions of intangible assets 7 739 911,78 20 062 165,00
• Acquisition of tangible assets 450 479 953,42 336 938 099,31
• Acquisitions of capital assets
• Increase in nonperforming debt 20 725 293,70 28 116 445,05
REDEMPTION OF CAPITAL (F)
REDEMPTION OF FINANCING DEBTS (G) 26 885 529,84 171 794 069,29
APPROPRIATIONS AS DEFERRED CHARGES (H)
TOTAL II - PERMANENT APPROPRIATIONS (E + F + G + H) 505 830 688,74 556 910 778,65
III. VARIATION IN THE GLOBAL FINANCING REQUIREMENT (G.F.R) 210 501 268,17 255 331 660,43
IV. VARIATION IN CASH FLOW 31 337 827,17 18 630 166,49
GRAND TOTAL 716 331 956,91 716 331 956,91 812 242 439,08 812 242 439,08
Financialstatements

Contacts
Contacts
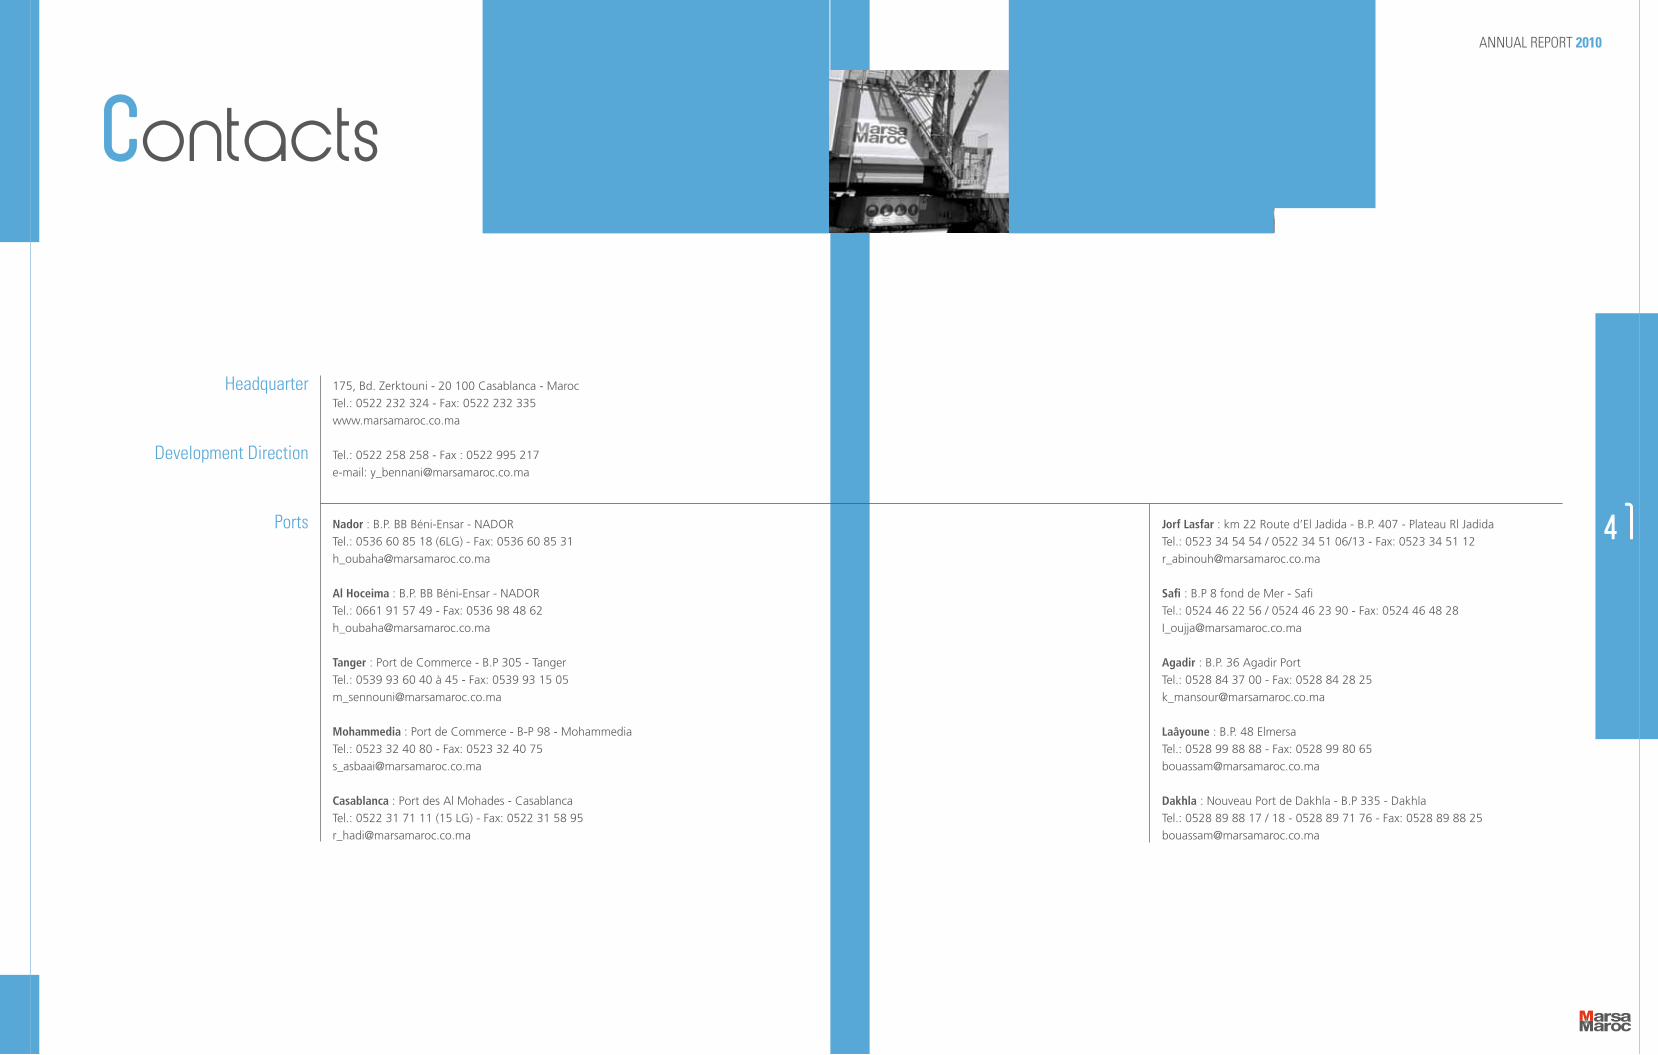
Headquarter 175, Bd. Zerktouni - 20 100 Casablanca - Maroc
Tel.: 0522 232 324 - Fax: 0522 232 335
www.marsamaroc.co.ma
Development Direction Tel.: 0522 258 258 - Fax : 0522 995 217
e-mail: [email protected]
Ports Nador : B.P. BB Béni-Ensar - NADOR
Tel.: 0536 60 85 18 (6LG) - Fax: 0536 60 85 31
Al Hoceima : B.P. BB Béni-Ensar - NADOR
Tel.: 0661 91 57 49 - Fax: 0536 98 48 62
Tanger : Port de Commerce - B.P 305 - Tanger
Tel.: 0539 93 60 40 à 45 - Fax: 0539 93 15 05
Mohammedia : Port de Commerce - B-P 98 - Mohammedia
Tel.: 0523 32 40 80 - Fax: 0523 32 40 75
Casablanca : Port des Al Mohades - Casablanca
Tel.: 0522 31 71 11 (15 LG) - Fax: 0522 31 58 95
Jorf Lasfar : km 22 Route d’El Jadida - B.P. 407 - Plateau Rl Jadida
Tel.: 0523 34 54 54 / 0522 34 51 06/13 - Fax: 0523 34 51 12
Safi : B.P 8 fond de Mer - Safi
Tel.: 0524 46 22 56 / 0524 46 23 90 - Fax: 0524 46 48 28
Agadir : B.P. 36 Agadir Port
Tel.: 0528 84 37 00 - Fax: 0528 84 28 25
Laâyoune : B.P. 48 Elmersa
Tel.: 0528 99 88 88 - Fax: 0528 99 80 65
Dakhla : Nouveau Port de Dakhla - B.P 335 - Dakhla
Tel.: 0528 89 88 17 / 18 - 0528 89 71 76 - Fax: 0528 89 88 25
ANNUAL REPORT 2010
41


Head Quarter175, Bd Zerktouni - 20 100 Casablanca - MarocTél. : 0522 232 324 - Fax : 0522 232 335www.marsamaroc.co.ma