congress of the united states congressional budget office … · the congress of the united states...
TRANSCRIPT
CONGRESS OF THE UNITED STATESCONGRESSIONAL BUDGET OFFICE
CBOAlternative
Approaches to Funding Highways
MARCH 2011 © S
hutte
rsto
ck L
LC

Pub. No. 4090

A
S T U D Y
CBO
Alternative Approaches to Funding Highways
March 2011
The Congress of the United States O Congressional Budget Office

CBO
Notes
Unless otherwise indicated, all years are calendar years.
Numbers in the text and tables may not add up to totals because of rounding.
On the cover: Photo of high-occupancy toll lanes courtesy of the Washington State Department of Transportation.

Preface
The federal government collects revenues from taxes paid by highway users, mostly from those levied on gasoline and diesel fuel, and credits them to the Highway Trust Fund. Those revenues and others are subsequently used for federal spending on highways and transit and for some other purposes. In fiscal year 2010, the trust fund’s revenues totaled about $35 billion. Some policymakers and transportation analysts have expressed interest in devel-oping new sources of funding, for two main reasons. One is that, over fiscal years 2008 to 2010, federal spending on highways exceeded the revenues available in the trust fund, and the government supplemented the fund with about $30 billion from the Treasury’s general reve-nues. As scheduled increases in federal standards for average vehicle fuel efficiency take effect, dedicated revenues may fall further below spending. The other main reason is that the current taxes do not give highway users an incentive to consider all of the costs their use of roads imposes on others; as a consequence, road use exceeds the efficient amount, and the quality of service that users receive from the highway network is lower than it would be otherwise.
This Congressional Budget Office (CBO) study, prepared at the request of the Chairman of the Senate Budget Committee, analyzes the effects of alternative approaches to funding high-ways. In particular, it compares the effects of current fuel taxes and of possible new taxes on the number of miles highway users drive. Some costs of highway use, such as those associ-ated with emissions of greenhouse gases and the nation’s dependence on foreign oil, are directly related to fuel consumption. But the larger share of costs—for pavement damage, congestion, accidents, and noise—is more directly tied to the number of miles traveled. Therefore, having users pay the actual cost of their highway use would involve imposing a combination of fuel taxes and per-mile charges. Although such an approach would lead to more efficient use of highways, it would distribute the burden of highway funding somewhat differently than would fuel taxes alone. In keeping with CBO’s mandate to provide objective, impartial analysis, this study does not make any recommendations.
The study was prepared by Perry Beider of CBO’s Microeconomic Studies Division, under the direction of Joseph Kile and David Moore and with support from Grant Driessen, Jacob Kuipers (formerly of CBO), Brian Prest, and Sarah Puro. CBO staff members Lindsay Coleman, T.J. McGrath, Shannon Mok, Nathan Musick, Frank Sammartino, Robert Shackleton Jr., Chad Shirley, and Alan van der Hilst provided valuable input. Helpful comments came from Douglas B. Lee Jr. of the Department of Transportation, Craig Lentzsch of Bulkley Capital, Ian W.H. Parry of the International Monetary Fund, John R. Svadlenak of the Oregon Department of Transportation, and Clifford Winston of the Brookings Institution. (The assistance of external reviewers implies no responsibility for the final product, which rests solely with CBO.)
CBO

CBO
IV PREFACE
Kate Kelly edited the manuscript, Loretta Lettner proofread it, and Jeanine Rees prepared the study for publication. Maureen Costantino designed the cover. Monte Ruffin produced the printed copies, and Linda Schimmel coordinated the print distribution. An electronic version is available from CBO’s Web site (www.cbo.gov).
Douglas W. ElmendorfDirector
March 2011

Contents
Summary vii
Introduction 1
Charging for the Costs of Highway Use 3
Comparing Marginal Costs with Construction and Maintenance Costs 4
Estimates of Marginal Costs 5
Fuel Taxes: The Current Approach 9
Equity 9
Efficiency 10
Potential Taxes on Vehicle-Miles Traveled 14
Equity 15
Efficiency 15
Privacy 19
Potential Goals and Their Implications 20
Appendix: Selected Approaches to Highway Funding 23
CBO

VI ALTERNATIVE APPROACHES TO FUNDING HIGHWAYS
CBO
Tables
S-1.
Implications of Fuel Taxes and VMT Taxes ix1.
Estimated Relative Pavement Costs for Tractor-Semitrailers, by Two Factors 102.
Implications of Fuel Taxes and VMT Taxes 113.
Average Effective Gasoline Tax Rates by Household Income Group, 2004 144.
Estimated Fuel Taxes Needed to Maximize Efficiency of Highway Use Under Various Policy Scenarios 15A-1.
Implications of Alternative Sources of Highway Funding 24Figures
1.
Tax Receipts Credited to the Highway Trust Fund, Fiscal Year 2010 22.
Estimated Costs per Mile of Highway Use, 2000 63.
Estimated Mileage-Related Costs and Vehicle-Miles Traveled in Various Years 84.
Estimated Fuel-Related Costs and Fuel Consumed in Various Years 9Boxes
1.
Uncertainty in the Estimates of the Marginal Costs of Highway Use 122.
Pilot Tests for Mileage-Based User Fees 16
Summary
A bout 25 percent of the nation’s highways, which carry about 85 percent of all road traffic, are paid for in part by the federal government; the remaining funding for highways comes from state and local governments.1 Federal spending on highways is funded primarily by taxes on gasoline and diesel fuel, but those and other taxes paid by highway users do not yield enough revenue to support either current federal spending on highways or the higher levels of spending that have been proposed by some observers. Although raising those taxes would bring in a larger amount of revenue, a more fundamental issue would remain: By themselves, fuel taxes cannot provide a strong incentive for people to avoid overusing high-ways—that is, to forgo trips for which the costs to them-selves and others exceed the benefits. This study examines broad alternatives for federal funding of highways, focus-ing on fuel taxes and on taxes that could be assessed on the basis of the number of miles that vehicles travel.2
Approaches to funding highways can be evaluated in terms of equity and economic efficiency. Equity, or fair-ness, is subjective and can be assessed in several ways. Observers of highway funding often gauge fairness by considering the share of funding that is obtained from taxes paid by highway users rather than from general taxpayer funds, from people in households that fall into various income categories, or from people in rural versus urban households.
The economic efficiency of a funding approach depends partly on its effects on users’ travel behavior and partly on what it costs to implement. Charging users for the costs their travel imposes on society would create incentives for people to limit highway use to trips for
1. This study follows the practice of the Federal Highway Administration of using “highway” and “road” synonymously.
2. Related questions are discussed in Congressional Budget Office, Spending and Funding for Highways, Issue Brief, January 2011.
which the benefits exceed the costs, thus reducing or eliminating overuse of highways and helping identify the economic value of investments in highways. However, the costs of collecting and enforcing such user charges also must be considered in evaluating their net effect on efficiency.
Charging for the Costs of Highway UseThe cost of users’ travel is different from the cost of highway construction and maintenance, although those costs overlap. Some construction and maintenance costs are tied to use. For example, the cost of some mainte-nance depends on the extent of pavement damage caused by heavy vehicles. In contrast, other maintenance costs—such as those to repair damage caused by aging and weathering—are fixed and would accrue regardless of how much a road is used.
Any given driver’s highway use also imposes costs on other users, on nearby nonusers, on the environment, and on the economy in the form of congestion, risk of accidents, noise, emissions of greenhouse gases and pol-lutants that affect local air quality, and dependence on foreign oil.
Different types of vehicles traveling in different locations contribute differently to the social costs of highway use. Passenger vehicles log more than 90 percent of all miles traveled on U.S. highways, and they are responsible for the largest share of the total costs of highway travel. In particular, urban travel by passenger vehicles constitutes about two-thirds of all vehicle-miles traveled, and it is the primary source of congestion, the largest category of social costs. Heavy trucks travel less than 10 percent of all vehicle miles, but their costs per mile are far higher than are those for passenger vehicles, and they are responsible for most pavement damage.
CBO

VIII ALTERNATIVE APPROACHES TO FUNDING HIGHWAYS
CBO
Estimates from several sources indicate that most high-way users currently pay much less than the full cost of their travel. Given current fuel efficiency, federal and state fuel taxes combined produce revenue of roughly 2 cents per mile for automobiles. In contrast, the Federal High-way Administration estimates that the national average cost for congestion caused by automobile travel is about 10 cents per mile—much higher in large metropolitan areas and much lower in rural communities. Total costs, including those for accident risk and noise, are higher still.
Judging from estimates of the costs of highway use, a sys-tem that charged for all such costs would have most if not all motorists paying substantially more than they do now—perhaps several times more. Such a system would maximize the efficiency of highway use by discouraging trips for which costs exceed benefits. Alternatively, taxes that were set below the full costs of use but were struc-tured to reflect those costs more closely than current taxes do could yield a portion of the efficiency gains by dis-couraging some high-cost trips.
Most of the costs of using a highway, including pavement damage, congestion, accidents, and noise, are tied more closely to the number of miles traveled than to the amount of fuel consumed. (Because of the way passenger vehicles are regulated, their emissions of local air pollut-ants, such as particulate matter and sulfur dioxide, also are more closely related to miles traveled. The cost of local air pollution from trucks, which is regulated differ-ently, is fuel related.) Fuel consumption depends not only on the number of miles traveled but also on fuel effi-ciency, which can differ from one vehicle to another and can change with driving conditions; therefore, charging highway users for the full costs of their use, or in propor-tion to the full costs, could not be accomplished solely through fuel taxes. Accomplishing those goals would require a combination of fuel taxes and per-mile charges, sometimes called vehicle-miles traveled (VMT) taxes.
Fuel TaxesViewed according to different conceptions of equity, fuel taxes offer a mix of positive and negative characteristics. They satisfy a “user-pays” criterion, but they also can impose a larger burden, relative to income, on people who live in low-income or rural households (see Sum-mary Table 1). Even for households that do not own pas-senger vehicles, the taxes impose an indirect burden
because they raise the transportation costs that are reflected in the prices of purchased goods.
Fuel taxes have two desirable characteristics for efficiency: They cost relatively little to implement (the government collects taxes from fuel distributors, and users pay the taxes when they purchase fuel), and they offer users some incentive to curtail fuel use, thus reducing some of the social costs of travel. At best, however, the strength of that incentive can be right only as a rough average, discourag-ing some travel too much and other travel too little, because it does not reflect the large differences in cost for use of crowded roads compared with uncrowded roads or for travel by trucks that have similar fuel efficiency but cause different amounts of pavement damage. Moreover, for a given tax rate on fuels, the incentive to reduce mileage-related costs diminishes over time as more driv-ing is done in fuel-efficient vehicles.
Potential Taxes on Vehicle-Miles TraveledVMT taxes are qualitatively similar to fuel taxes in their implications for equity. Like fuel taxes, they satisfy the user-pays principle, but they impose larger burdens relative to income on people in low-income or rural households. However, to the extent that members of such households tend to drive vehicles that are less fuel effi-cient, such as pickup trucks or older automobiles, those highway users would pay a smaller share of VMT taxes than of fuel taxes.
VMT taxes that are aligned with the costs imposed by users would provide a better incentive for efficient high-way use than fuel taxes do because the majority of those costs are related to miles driven. However, VMT taxes’ effect on overall efficiency also would depend on how much it costs to put the taxes in place and to collect the money. Estimates of what it would cost to establish and operate a nationwide program are rough. One source of uncertainty is the cost to install metering equipment in all of the nation’s cars and trucks. Having the devices installed as original equipment under a mandate to vehi-cle manufacturers would be relatively inexpensive but could lead to a long transition; requiring vehicles to be retrofitted with the devices could be faster but much more costly, and the equipment could be more suscepti-ble to tampering than factory-installed equipment might be. Despite the various uncertainties and impediments, some transportation experts have identified VMT taxes as a preferred option.

SUMMARY ALTERNATIVE APPROACHES TO FUNDING HIGHWAYS IX
Summary Table 1.
Implications of Fuel Taxes and VMT Taxes
Source: Congressional Budget Office.
Note: VMT = vehicle-miles traveled.
a. Some low-income people do not own motor vehicles; however, they pay fuel taxes indirectly because the prices of goods they buy reflect the goods’ transportation costs.
b. Fuel-related costs include greenhouse gas emissions, dependence on foreign oil, and local air pollution from trucks.
c. Mileage-related costs include road wear, congestion, accidents, local air pollution from passenger vehicles, and noise.
d. Fuel taxes would have proportionately less effect on miles driven than on fuel use and provide minimal incentive for users to avoid congestion or increase the number of axles on trucks they purchase.
e. VMT taxes would have a proportionately equal effect on fuel use and mileage but provide no incentive for users to increase fuel efficiency.
Efficiency
Equity
Address Fuel-Related Costsb
Address Mileage-Related Costsc
Collection Costs
User Pays
Larger Relative Burden on
Low-Income Peoplea
Larger Relative Burden on People in
Rural AreasPrivacyIssues
Fuel Taxes Yes Generally, yes Yes Yes Somewhatd Low No
VMT Taxes Yes Generally, yes, but perhaps less than fuel taxes
Yes, but less than fuel taxes
Significantlye Yes High Yes
One step in developing per-mile charges would be to determine the goals of VMT taxation; different goals would require different charges. For example, if VMT taxes were intended to maximize the efficiency of high-way use, they would need to vary greatly by vehicle type and by time and place of travel. Pavement damage increases sharply with vehicle weight but decreases with the number of axles on a vehicle, so the portion of VMT taxes assessed to maintain pavement would need to be small or nonexistent for passenger vehicles but substantial for heavy-duty trucks, particularly those with high weight per axle. Similarly, every vehicle would be assessed more to travel on crowded urban roads during peak hours than in off-peak hours or to travel on less congested roads at any time. The rates charged for peak-hour travel would be set in keeping with specific local or regional condi-tions, including the duration and severity of daily conges-tion, rather than on the basis of national averages. If the VMT taxes were intended to achieve some other goal, the structure of the taxes might be different.
The idea of imposing VMT taxes that vary by time and place has raised concerns about privacy because the process of assessing such taxes could give the government access to specific information about how individual vehi-cles are used. Various approaches have been suggested to allay those concerns, including restricting the amount of information about a vehicle’s travel that is used in billing
or restricting the kind of information that is conveyed to the government; making devices appealing to the public by allowing businesses to use them to provide other ser-vices, such as real-time traffic reports or electronic pay-ment for parking; and allowing users to opt out of paying per-mile charges and instead pay higher fuel taxes. (The optional fuel taxes would be set at rates high enough to appeal only to users with the greatest privacy concerns.)
A system of VMT taxes need not apply to all vehicles on every road. Indeed, there are already less comprehensive systems of direct charges for road use: Toll roads, lanes, and bridges are common in the United States, and several states and foreign countries levy weight-and-distance charges on trucks. Expansion of existing systems could focus on highly congested roads or on entry points into congested areas; that targeted approach could cost less to implement if it required relatively simple in-vehicle equipment. (The E-ZPass transponder is one example. E-ZPass is an electronic collection system that allows prepayment of tolls in 14 states, from Maine in the northeast, to Virginia in the south, to Illinois in the west.) Alternatively, the focus could be on specific vehicle types, such as trucks. Although less than 4 percent of the nation’s fleet is made up of trucks (excluding light-duty trucks), they account for roughly 25 percent of all costs highway users impose on others, including almost all of the costs associated with pavement damage.
CBO


Alternative Approaches to Funding Highways
IntroductionHighways are a crucial component of the nation’s infrastructure. According to the Federal Highway Admin-istration (FHWA), the United States has about 4 million miles of public highways. In 2007, users traveled about 3 trillion vehicle-miles and 5 trillion passenger-miles on those roads, accounting for almost 90 percent of all passenger-miles by surface and air. (This study follows the FHWA’s practice of using “highway” and “road” as synonyms.) People benefit from the nation’s highways not only as direct users but also as consumers of shipped goods. In 2007, 1.3 trillion ton-miles of freight—about 30 percent of the total—traveled on U.S. highways; only railroads carried a larger share.1 Particularly important are the roads in the National Highway System, which includes the Interstate highways. Although that group of roads accounts for only 4 percent of highway-miles and 7 percent of highway lane-miles in the United States, it carries about 45 percent of all vehicle-miles traveled (VMT).2
Spending on highways is a significant item in federal, state, and local governments’ budgets. In fiscal year 2007, combined public spending was about $146 billion for highway construction, operations, maintenance, adminis-tration, and safety. About one-fourth of the funding came from the federal government; state and local governments
1. See Department of Transportation, Federal Highway Administration, Highway Statistics 2008 (December 2009), Table VM-1, www.fhwa.dot.gov/policyinformation/statistics/2008/vm1.cfm; and Bureau of Transportation Statistics, Pocket Guide to Transportation, 2010 (January 2010), pp. 19–20, www.bts.gov/publications/pocket_guide_to_transportation/2010/pdf/entire.pdf.
2. See Department of Transportation, Federal Highway Administration and Federal Transit Administration, 2008 Status of the Nation’s Highways, Bridges, and Transit: Conditions and Performance (January 2010), p. 2-13, www.fhwa.dot.gov/policy/2008cpr/pdfs.htm.
provided the rest.3 Almost all federal spending on high-ways occurs through grants to state and local govern-ments; federal agencies own just 3 percent of the nation’s miles of highway.4 Federal grant money can be spent on roads in the National Highway System and on other highways classified as “arterials,” “urban collectors,” and “rural major collectors.” In 2006, those “federal-aid high-ways” constituted 984,000 miles of road or about 25 per-cent of the U.S. total, and they accounted for 85 percent of all vehicle-miles traveled.5 The local and rural minor collector roads that are not eligible for federal aid none-theless benefit indirectly: Federal grant money allows states to reallocate funds they would have spent on federal-aid highways either to spending on other roads or to spending for other purposes. Because of such realloca-tions, total spending on federal-aid highways does not increase dollar for dollar with the federal grants.
Federal spending on highways is generally financed through the Highway Trust Fund (HTF), which was created as an accounting mechanism within the federal budget and is credited with revenues from taxes on
3. Converted to 2009 dollars, highway spending in 2007 was $155 billion: $88 billion for construction and $67 billion for other categories; see Congressional Budget Office, Public Spending on Transportation and Water Infrastructure (November 2010), p. 7. Complete data on state and local spending are not yet available for fiscal year 2008.
4. Those roads are in federal parks and forests and on reservations; see Department of Transportation, Highway Statistics 2008, Table HM-16, www.fhwa.dot.gov/policyinformation/statistics/2008/hm16.cfm. For a discussion of federal and state roles in highway spending, see Congressional Budget Office, Spending and Funding for Highways, Issue Brief (January 2011).
5. Department of Transportation, Highway Statistics 2008, Table HM-16, www.fhwa.dot.gov/policyinformation/statistics/2008/hm16.cfm; and Table VM-203, www.fhwa.dot.gov/policyinformation/statistics/2008/vm203.cfm.
CBO
2 ALTERNATIVE APPROACHES TO FUNDING HIGHWAYS
CBO
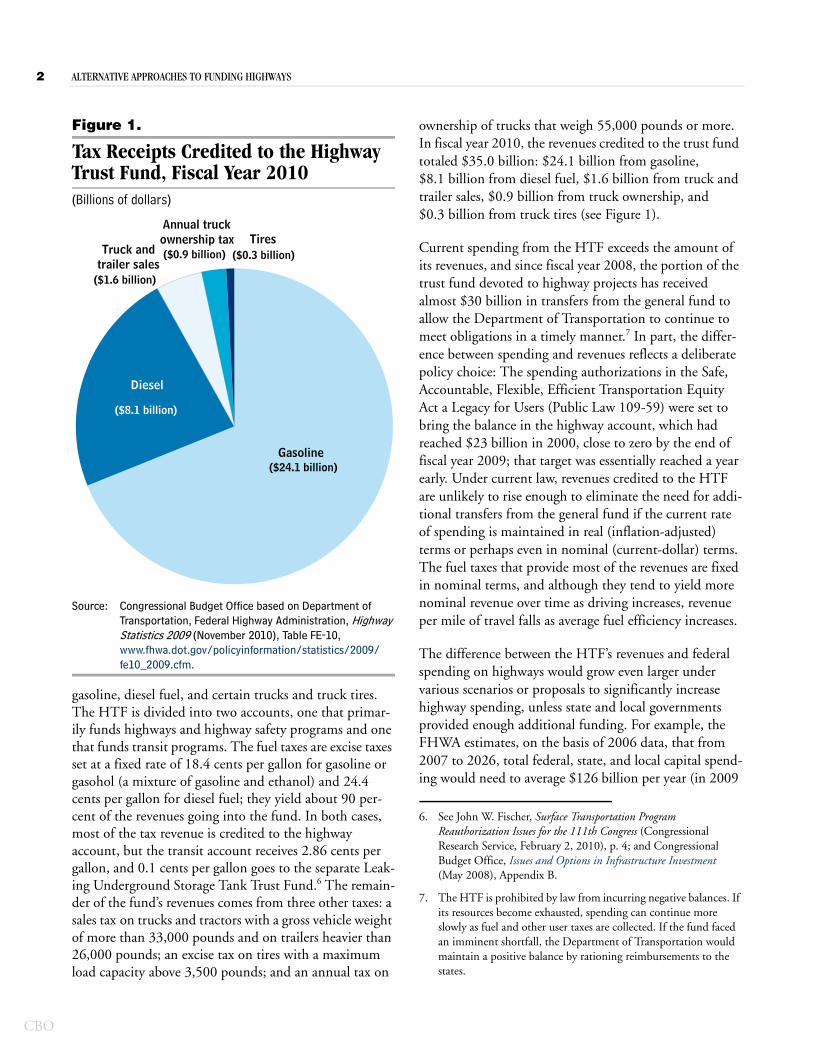
Figure 1.
Tax Receipts Credited to the Highway Trust Fund, Fiscal Year 2010(Billions of dollars)
Source: Congressional Budget Office based on Department of Transportation, Federal Highway Administration, Highway Statistics 2009 (November 2010), Table FE-10, www.fhwa.dot.gov/policyinformation/statistics/2009/fe10_2009.cfm.
gasoline, diesel fuel, and certain trucks and truck tires. The HTF is divided into two accounts, one that primar-ily funds highways and highway safety programs and one that funds transit programs. The fuel taxes are excise taxes set at a fixed rate of 18.4 cents per gallon for gasoline or gasohol (a mixture of gasoline and ethanol) and 24.4 cents per gallon for diesel fuel; they yield about 90 per-cent of the revenues going into the fund. In both cases, most of the tax revenue is credited to the highway account, but the transit account receives 2.86 cents per gallon, and 0.1 cents per gallon goes to the separate Leak-ing Underground Storage Tank Trust Fund.6 The remain-der of the fund’s revenues comes from three other taxes: a sales tax on trucks and tractors with a gross vehicle weight of more than 33,000 pounds and on trailers heavier than 26,000 pounds; an excise tax on tires with a maximum load capacity above 3,500 pounds; and an annual tax on
Gasoline
Diesel
Truck andtrailer sales
Annual truckownership tax Tires
($24.1 billion)
($8.1 billion)
($1.6 billion)
($0.9 billion) ($0.3 billion)
ownership of trucks that weigh 55,000 pounds or more. In fiscal year 2010, the revenues credited to the trust fund totaled $35.0 billion: $24.1 billion from gasoline, $8.1 billion from diesel fuel, $1.6 billion from truck and trailer sales, $0.9 billion from truck ownership, and $0.3 billion from truck tires (see Figure 1).
Current spending from the HTF exceeds the amount of its revenues, and since fiscal year 2008, the portion of the trust fund devoted to highway projects has received almost $30 billion in transfers from the general fund to allow the Department of Transportation to continue to meet obligations in a timely manner.7 In part, the differ-ence between spending and revenues reflects a deliberate policy choice: The spending authorizations in the Safe, Accountable, Flexible, Efficient Transportation Equity Act a Legacy for Users (Public Law 109-59) were set to bring the balance in the highway account, which had reached $23 billion in 2000, close to zero by the end of fiscal year 2009; that target was essentially reached a year early. Under current law, revenues credited to the HTF are unlikely to rise enough to eliminate the need for addi-tional transfers from the general fund if the current rate of spending is maintained in real (inflation-adjusted) terms or perhaps even in nominal (current-dollar) terms. The fuel taxes that provide most of the revenues are fixed in nominal terms, and although they tend to yield more nominal revenue over time as driving increases, revenue per mile of travel falls as average fuel efficiency increases.
The difference between the HTF’s revenues and federal spending on highways would grow even larger under various scenarios or proposals to significantly increase highway spending, unless state and local governments provided enough additional funding. For example, the FHWA estimates, on the basis of 2006 data, that from 2007 to 2026, total federal, state, and local capital spend-ing would need to average $126 billion per year (in 2009
6. See John W. Fischer, Surface Transportation Program Reauthorization Issues for the 111th Congress (Congressional Research Service, February 2, 2010), p. 4; and Congressional Budget Office, Issues and Options in Infrastructure Investment (May 2008), Appendix B.
7. The HTF is prohibited by law from incurring negative balances. If its resources become exhausted, spending can continue more slowly as fuel and other user taxes are collected. If the fund faced an imminent shortfall, the Department of Transportation would maintain a positive balance by rationing reimbursements to the states.
ALTERNATIVE APPROACHES TO FUNDING HIGHWAYS 3
dollars) to maintain the highway system’s current “perfor-mance,” which is defined in terms of average user costs for travel time, operations, and accidents. By contrast, actual capital spending in fiscal year 2008 was $91 bil-lion.8 The estimate reflects the effects of pavement age and economic and population growth and accounts for signs that the road network is under strain today. Accord-ing to the FHWA, in 2006, 47 percent of the miles trav-eled by all vehicles on roads eligible for federal funding occurred on pavement that, on the basis of a measure of surface roughness, was considered to be in good condi-tion; 39 percent of travel occurred on pavement classified as acceptable but not good; and 14 percent occurred on pavement that was rated less than acceptable. Measures of congestion in urban areas developed for the FHWA show that congestion resulted in 4.8 billion hours of traveler delays and consumption of an additional 3.9 billion gal-lons of fuel in 2009 (34 hours in delays and 28 gallons of additional fuel per traveler).9 Shortcomings of the road network affect people not only directly as highway users but also as consumers who must pay more for the goods they buy because of higher shipping costs.
Some approaches to highway funding involve greater use of loans from federal or state infrastructure banks, pro-ceeds from bond sales, or payments from public–private partnerships in exchange for the right to collect tolls.10 Such methods, however, cannot solve the underlying problem of highway funding: Up-front money must be repaid and, ultimately, all funding for construction and maintenance of public highways must come from user charges or from other federal, state, or local government revenues. (The small exception is voluntary contribu-tions, such as the in-kind donations made through “Adopt A Highway” programs.)
8. Department of Transportation, Highway Statistics 2008, “Total Disbursements for Highways, by Function, 1945–2008,” www.fhwa.dot.gov/policyinformation/statistics/2008/disb.cfm.
9. David Schrank and Tim Lomax, Urban Mobility Report 2010 (College Station: Texas Transportation Institute, December 2010), p.1, http://tti.tamu.edu/documents/mobility_report_2010.pdf.
10. See Congressional Budget Office and Joint Committee on Taxation, Subsidizing Infrastructure Investment with Tax-Preferred Bonds (October 2009); and Congressional Budget Office Issues and Options in Infrastructure Investment (May 2008), and Innovative Financing of Highways: An Analysis of Proposals (January 1998).
This study by the Congressional Budget Office (CBO) analyzes the implications of various methods of raising funds from users, from taxpayers in general, or from both groups, with a focus on current fuel taxes and some new taxes that might be levied on the basis of vehicle-miles traveled. The analysis considers the incentives such meth-ods could provide for the efficient use of highways as well as other implications for efficiency and equity.
Charging for the Costs of Highway UseTwo questions that policymakers face in determining how to fund highways concern how much to spend and how much to collect from users. The answers need not be the same. On one hand, spending can exceed revenues that come from users; indeed, much of the funding that state and local governments raise for highways comes from other sources, such as general sales taxes, property taxes, and development impact fees, rather than from the taxes that highway users pay. In recent years, the federal government has funded some of its highway spending from general revenues.11 On the other hand, money col-lected from highway users and credited to the HTF is used to support other projects, such as mass transit, walk-ways, bike paths, and scenic trails. Nonetheless, policy discussions often frame the problem of funding highways in terms of how to raise money from users.
One reason for the connection between spending plans and user charges is that charges equal to spending would be consistent with one concept of distributional equity, which holds that it is appropriate for those who benefit from public spending to pay for it. Under other concep-tions of equity, however, a user fee might not be consid-ered fair if, for example, it placed a proportionately greater burden on low-income households or on residents of rural areas. And under a view of equity that focuses primarily on how closely each state’s share of federal grants matches its share of contributions to federal reve-nues, the key issue is not the charges themselves but how funding is allocated.
11. Some observers assert that the amount transferred from the general fund to the Highway Trust Fund in recent years corresponds to interest or other revenues that should have accrued to it. Until 1998, the trust fund was credited with interest on its balances; the Transportation Equity Act for the 21st Century (P.L. 105-178) ended that practice and transferred $8 billion in accumulated interest earnings to the general fund.
CBO

4 ALTERNATIVE APPROACHES TO FUNDING HIGHWAYS
CBO
A separate rationale for charging users rests on the goal of economic efficiency, which is to allocate resources to pro-duce the greatest satisfaction of wants within the con-straints of available technology. More efficient methods of funding highways produce higher net benefits, taking into account their collection costs, their effects on road use and on other decisions users or taxpayers make, and any effects they have on decisions governments make about where and how to spend the money collected. Maximum efficiency is achieved if the following condi-tions hold:
� Existing highway capacity is used most efficiently—that is, if users make all of the trips, and only those trips, whose value exceeds the costs to users themselves and to others, in turn reducing the need for invest-ment in additional highways or highway lanes;
� The money to be spent on highways is raised most efficiently—that is, if the total costs associated with generating revenues are minimized, taking into account the direct costs of collection and the indirect costs of any resulting distortions of people’s decisions, such as decisions about how much to work or save or whether and what type of new vehicle to buy; and
� Highways are built and maintained in the most effi-cient manner—that is, if governments undertake all of the projects, and only those projects, for which the benefits exceed the costs, including the direct and indirect costs of raising funds.12
The extent to which any highway user fee achieves those goals depends in large part on how closely the amount paid by each user corresponds to the costs associated with his or her highway use. For any good or service, charging consumers prices equal to their marginal costs—that is, equal to the incremental costs for their individual additional uses—gives consumers the incentive to buy only to the extent that the benefits they would receive equal or exceed the costs associated with their consump-tion.13 As discussed below, applying the concept of full marginal-cost pricing to highway users would involve
12. For simplicity, in discussing efficiency, this study ignores the possibility of interactions among possible trips or projects. If some trips are substitutes for one another or if some projects are more valuable if done in conjunction with other projects, then efficiency is achieved when the benefits of each action exceed its costs and net benefits are maximized.
charging them a combination of taxes because a vehicle’s consumption of fuel and its presence on roadways both contribute, in different ways, to total costs.
Comparing Marginal Costs with Construction and Maintenance Costs For some goods and services, the sum of users’ marginal costs equals or approximates the production costs of the good or service. In the case of highways, however, users’ total marginal costs do not equal the total costs of pro-duction (road construction and maintenance), for two reasons.
First, like other infrastructure networks, such as water and telecommunications systems, highways have signifi-cant fixed costs that are associated with making the network available for use at all, not with the number or type of individual uses (in this case, trips). In particular, the deterioration of a highway’s pavement that occurs simply because of aging and exposure to the elements, which would occur even if the highway was never used, is a fixed cost. In that sense, the cost of removing snow from a highway also is fixed: Plowing a given amount of snow from a given road surface costs the same regardless of the number of vehicles that use the road afterward.
Second, marginal costs of travel include not only the con-struction and maintenance costs associated with road wear but also costs that are imposed on other users, nearby households and businesses, and the environment. Those costs—which economists call externalities—include delays and uncertainty caused by congestion, emissions of greenhouse gases and local air pollutants, accidents, noise, and dependence on foreign oil. Analysts often identify two effects of greater dependence on for-eign oil: the cost that oil users impose on one another by driving up demand (and, consequently, the price of oil) and the cost to the economy as a whole associated with
13. The text covers the case in which all of the benefits accrue to the purchaser. In the more general case, external benefits—benefits to others that are not considered by the purchaser—are treated in the same manner as external costs: The efficient price is the marginal cost of production, plus the marginal value of external costs, minus the marginal value of external benefits. If external benefits exceed external costs, then maximizing efficiency requires subsidizing the good or service because the efficient price is below the marginal cost of production. In the case of highways, the mobility of police officers is an external benefit in that it helps to deter crime.

ALTERNATIVE APPROACHES TO FUNDING HIGHWAYS 5
greater risk of recession in the event of an oil price shock.14
Because highways have significant fixed costs and external costs of use, there is no direct relationship between the sum of marginal costs of highway use for all users and the cost of construction and maintenance. If a road’s fixed costs are greater than the sum (over all users and over time) of the external costs attributable to the use of that road, then the road cannot be fully paid for under marginal-cost pricing. Total revenues under marginal-cost pricing (which would correspond to the aggregate costs of road wear plus aggregate external costs) would be insufficient to cover the costs of construction and mainte-nance (aggregate road wear costs plus fixed costs). A road that cannot pay for itself through marginal-cost pricing can still be efficient—that is, building or maintaining it may be economically worthwhile. In particular, such pricing does not involve charging users according to the benefit they receive, and the value of a highway’s total benefit to all users could exceed its construction, mainte-nance, and external costs even if the sum of all its mar-ginal costs does not.15 Funding such roads requires tap-ping other sources of revenue, whether they are derived from roads that generate surplus funds, from charges that are above users’ marginal cost, from other user fees, or from taxpayers generally.
Alternatively, if the aggregate external costs that result from the use of a particular highway are larger than its fixed costs, then setting prices equal to the marginal cost would yield surplus revenue. That money could be used to help fund other roads, other modes of transportation
14. See, for example, Ian W.H. Parry, “How Much Should Highway Fuels Be Taxed?” in Gilbert E. Metcalf, ed., U.S. Energy Tax Policy (Cambridge, U.K.: Cambridge University Press, 2011), pp. 269–296.
15. If all trips whose benefits exceeded their costs could be priced just slightly below the benefits’ value, efficient use of highways could be promoted and all efficient highway projects could be funded with enough revenue left over to compensate those who bear the external costs. Thus, when benefits exceed costs, any price between the two amounts provides the proper incentive for efficient use. However, acquiring the additional information needed to set prices on the basis of the benefit each person receives (which is more than is required to estimate aggregate benefits in a benefit–cost analysis) and then charging users different amounts will not generally be feasible. Then, charging a price above the marginal cost might lead some users to forgo using the highway, in turn leading to underused capacity and reduced efficiency.
(including mass transit), or other government programs; it could be used to compensate people who are adversely affected by the charges or who are harmed by externali-ties; or it could be used to reduce deficits or offset a reduction in taxes.
Estimates of Marginal Costs The marginal costs of highway use cannot be calculated precisely, and even the best available estimates are accom-panied by significant uncertainty. Nonetheless, the estimates can be used to illustrate several points.
One point is that the costs imposed by highway users can be divided into two categories: those more directly related to miles driven and those more closely related to the amount of fuel consumed. Mileage-related costs, which include the costs associated with pavement damage, con-gestion, accidents, noise, and emissions of local air pollut-ants by passenger vehicles, in fact account for the major-ity of total costs. (The costs associated with local air pollution from passenger vehicles are considered mileage related because those emissions, unlike emissions from trucks, are regulated on a per-mile basis.)16 Fuel-related costs include the costs of local air pollution from trucks, climate change, and dependence on foreign oil. To com-pare costs on a consistent basis, the costs of fuel use can be expressed in cents per mile by dividing the cents-per-gallon costs by average fuel efficiency in miles per gallon. When the two types of costs are expressed in the same terms, the costs related to vehicle miles are significantly larger than those related to fuel use—several times larger for passenger vehicles and for trucks traveling in urban
16. Emissions standards for trucks are specified in “grams per brake horsepower-hour,” a measure of engine power use that is roughly proportional to fuel use. In contrast, passenger vehicles’ emissions are capped on a per-mile basis so vehicles that use more fuel per mile must compensate with superior emissions control systems. Although fuel combustion is the source of air pollution (including particulate matter, sulfur dioxide, nitrogen oxides, and carbon monoxide), giving owners of different kinds of passenger vehicles efficient incentives requires charging everyone the same emissions fee per mile. See Ian W.H. Parry, “How Much Should Highway Fuels Be Taxed?” and Ian W.H. Parry, Margaret Walls, and Winston Harrington, “Automobile Externalities and Policies,” Journal of Economic Literature, vol. 45, no. 2 (June 2007), pp. 373–399. The Environmental Protection Agency has announced regulations on greenhouse gas emissions defined on a per-mile basis. However, with the exception of reductions in leakage of air-conditioning refrigerants, most reductions are likely to come from increased fuel efficiency. Thus, greenhouse gas emissions are classified as fuel related.
CBO

6 ALTERNATIVE APPROACHES TO FUNDING HIGHWAYS
CBO
Figure 2.
Estimated Costs per Mile of Highway Use, 2000(2009 cents per mile)
Sources: Congressional Budget Office based on Department of Transportation, Federal Highway Administration, Highway Statistics 2008 (December 2009), Table VM-1, www.fhwa.dot.gov/policyinformation/statistics/2008/vm1.cfm; 1997 Federal Highway Cost Allocation Study: Final Report (1997), Tables V-22 (noise), V-23 (conges-tion), V-24 (accidents), and V-26 (pavement damage), www.fhwa.dot.gov/policy/hcas/final/index.htm; Addendum to the 1997 Federal Highway Cost Allocation Study Final Report (May 2000), Table 13, www.fhwa.dot.gov/policy/hcas/addendum.htm; and Ian W.H. Parry, “How Should Heavy-Duty Trucks Be Taxed?” Journal of Urban Economics, vol. 63 (2008), p. 660.
Notes: Passenger vehicles have two axles and four tires and include automobiles and light trucks (pickup trucks, minivans, and sport-utility vehicles).
Local air pollution costs are classified as mileage related for passenger vehicles and fuel related for trucks.
Fuel-related costs were converted to cents per mile using estimates of fuel efficiency in miles per gallon based on data for travel in all areas. Fuel efficiency was assumed to be 30 percent higher on rural highways than on urban highways for passenger vehicles and trucks without trailers or semi-trailers; for trucks with at least one trailer or semitrailer (which do a smaller share of their urban travel during congested hours), the difference was assumed to be 25 percent.
RuralPassengerVehicles
UrbanPassengerVehicles
RuralTrucks
UrbanTrucks
0
10
20
30
40
50
60
70
80
Mileage-Related Costs
Fuel-Related CostsConverted to Cents per Mile
areas (see Figure 2).17 Because highway use involves both types of costs, the most efficient set of user charges would include a mix of fuel taxes and mileage taxes. Users might pay the two separately or as a single charge—for example, as a VMT tax with a component that varies according to the amount of fuel consumed.
A second point is that the estimates shown in Figure 2 imply that user charges that fully reflected marginal costs—charges that equal the incremental contribution to external costs of each mile driven and each gallon of fuel consumed—would be much higher, on average, than are the taxes that currently fund highways and transit. In Jan-uary 2011, combined federal and state fuel taxes were about 48 cents per gallon for gasoline and 53 cents per gallon for diesel fuel, on average.18 If converted, those tax rates work out to about 2 cents per mile for average pas-senger vehicles and less than 10 cents per mile for trucks—in either case, well below the sum of estimated mileage-related and fuel-related costs shown in Figure 2. (Including the relatively small nonfuel federal taxes paid by truck users would not affect that conclusion.) Judging from those estimates, raising and restructuring user charges to maximize the efficiency of road use through full marginal-cost pricing would yield more than enough revenue to support an efficient amount of spending on highways, and there would be money left over to spend on other projects or programs, to reduce taxes, or to lower the federal budget deficit. User charges that do not achieve full marginal-cost pricing but are set to meet par-ticular revenue targets also could yield some efficiency gains if they more closely reflected costs imposed by users.
17. To estimate fuel efficiency in rural and urban areas, CBO used data on fuel use nationwide and data on rural and urban mileage by vehicle type. CBO adopted the assumption that efficiency is 30 percent greater in rural areas than in urban areas for most vehicles. The same assumption was proposed by Ian W.H. Parry in “How Should Heavy-Duty Trucks Be Taxed?” Journal of Urban Economics, vol. 63, no 2 (March 2008), pp. 651–668. For the largest trucks, which do a larger share of their urban travel during uncongested hours, CBO assumed that the difference in fuel efficiency was 25 percent.
18. The American Petroleum Institute publishes average fuel taxes each calendar quarter; see www.api.org/statistics/fueltaxes/upload/Gasoline_Diesel_Summary.pdf, for the latest figures. Some taxes shown in that report, such as oil inspection fees and underground storage tank fees, do not yield revenues for transportation.

ALTERNATIVE APPROACHES TO FUNDING HIGHWAYS 7
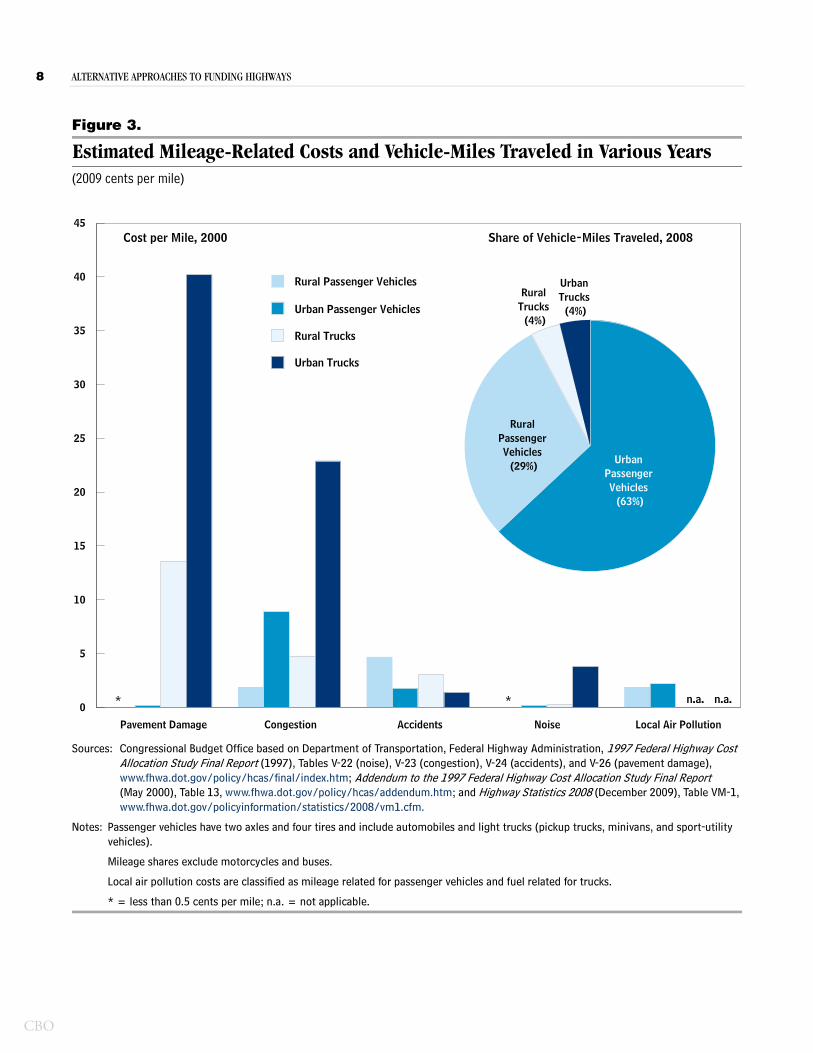
A third point is that different classes of vehicles contrib-ute to the costs of highway use in different ways and to varying degrees. Passenger vehicles constitute the largest group of vehicles in use, and they also account for the majority of the costs of highway use even though their costs per mile and per gallon are much lower than are those for trucks. In 2008, passenger vehicles accounted for more than 90 percent of vehicle-miles traveled (com-bining the 63 percent attributable to passenger vehicles traveling in urban areas and 29 percent traveling in rural areas, see Figure 3) and for almost 80 percent of fuel use (using 58 percent of the total in urban areas and 21 per-cent in rural areas, see Figure 4). Travel by passenger vehi-cles in urban areas is the predominant source of conges-tion, and congestion is the largest single category of costs of highway use. Nationally, passenger vehicles account for almost all of the costs associated with accidents. Trucks are responsible for almost all of the costs of pavement damage. Because pavement damage is a function of weight per axle, moreover, heavier trucks with fewer axles cause more damage than other trucks do.19 According to one set of estimates, a combination truck with a tractor and one semitrailer that weighs 105,000 pounds does 13 times more pavement damage per mile than a similar vehicle that weighs 55,000 pounds (see Table 1 on page 10).20 Conversely, the damage done by a tractor-semitrailer combination with six axles is about one-fourth that done by a truck with the same total weight on four axles. Costs per mile for congestion and noise also are higher for trucks than they are for cars because trucks are larger, less maneuverable, and louder. Trucks have larger fuel-related costs than cars, but the contrast reflects the different classifications of air pollution costs rather than actual differences in costs of highway use. If the cost of local air pollution was considered fuel related rather than mileage related for cars, as it is for trucks, then fuel-related costs would be roughly the same for both.
A fourth point is that the costs that highway users impose on others, and the corresponding efficient user charges,
19. The cost of pavement damage shown in Figure 3 is the incremental cost of road repair and maintenance; it does not include the cost of additional wear on vehicles that occurs during travel on worn pavement.
20. See Kenneth A. Small, Clifford Winston, and Carol A. Evans, Road Work (Washington, D.C.: Brookings Institution), 1989, Table 3-4.
vary greatly by time and place. Congestion costs in par-ticular differ considerably from one area to another, among different parts of a road network in a given area, and by time of day and day of week in a given part of the network. For example, the estimated national average congestion cost for passenger vehicles is roughly 10 cents per mile; by contrast, one estimate of the congestion cost of peak-period driving in the Washington, D.C., metro-politan area in 2002 was about 34 cents per mile (in 2009 dollars).21 The costs per mile associated with pavement damage, noise, and local air pollution also are higher in urban areas because of higher road repair costs and greater traffic volume and population density (see Figure 3). Accident costs per mile are higher in rural areas, where higher average travel speeds contribute to a higher rate of fatal crashes. Overall, total mileage-related costs of highway use are about 25 percent greater in urban areas than in rural areas for passenger vehicles and roughly three times greater in urban areas for heavy-duty trucks (see Figure 2).
Again, the reason for focusing on the qualitative implica-tions of estimated marginal costs of highway use rather than their specific numerical values is that the estimates are accompanied by significant uncertainty. Those mar-ginal costs cannot be observed directly but must be calcu-lated from relationships among other factors, and those relationships in turn often are based on interpretations or applications of data that are outdated or obtained from studies on other topics. For example, estimating the mar-ginal cost of traffic congestion requires first quantifying the relationship between traffic volume and delays, the value of drivers’ time, how strongly drivers dislike the risk of being late, and the cost of additional inventory held by businesses as a hedge against delivery delays. In addition, some estimates—notably those associated with the costs of emissions of greenhouse gases and dependence on
21. Ian W.H. Parry and Kenneth A. Small, “Should Urban Transit Subsidies Be Reduced?” American Economic Review, vol. 99, no. 3 (2009), pp. 700–724, Table 2. A full analysis of efficient congestion charges would consider any effects of such charges on land use. If some drivers responded in part by moving closer to the center of a metropolitan area, the net benefits of congestion charges to society could be greater. See Ashley Langer and Clifford Winston, “Toward a Comprehensive Assessment of Road Pricing Accounting for Land Use,” in Gary Burtless and Janet Rothenberg Pack, eds., Brookings–Wharton Papers on Urban Affairs, 2008 (Washington, D.C.: Brookings Institution), pp. 127–174.
CBO
8 ALTERNATIVE APPROACHES TO FUNDING HIGHWAYS
CBO
Figure 3.
Estimated Mileage-Related Costs and Vehicle-Miles Traveled in Various Years(2009 cents per mile)
Sources: Congressional Budget Office based on Department of Transportation, Federal Highway Administration, 1997 Federal Highway Cost Allocation Study Final Report (1997), Tables V-22 (noise), V-23 (congestion), V-24 (accidents), and V-26 (pavement damage), www.fhwa.dot.gov/policy/hcas/final/index.htm; Addendum to the 1997 Federal Highway Cost Allocation Study Final Report (May 2000), Table 13, www.fhwa.dot.gov/policy/hcas/addendum.htm; and Highway Statistics 2008 (December 2009), Table VM-1, www.fhwa.dot.gov/policyinformation/statistics/2008/vm1.cfm.
Notes: Passenger vehicles have two axles and four tires and include automobiles and light trucks (pickup trucks, minivans, and sport-utility vehicles).
Mileage shares exclude motorcycles and buses.
Local air pollution costs are classified as mileage related for passenger vehicles and fuel related for trucks.
* = less than 0.5 cents per mile; n.a. = not applicable.
Pavement Damage Congestion Accidents Noise Local Air Pollution
0
5
10
15
20
25
30
35
40
45
UrbanPassengerVehicles (63%)
RuralPassengerVehicles (29%)
RuralTrucks (4%)
UrbanTrucks (4%)
n.a.n.a.**
Share of Vehicle-Miles Traveled, 2008Cost per Mile, 2000
Rural Trucks
Urban Trucks
Rural Passenger Vehicles
Urban Passenger Vehicles

ALTERNATIVE APPROACHES TO FUNDING HIGHWAYS 9
Figure 4.
Estimated Fuel-Related Costs and Fuel Consumed in Various Years
Sources: Congressional Budget Office based on Ian W.H. Parry, “How Should Heavy-Duty Trucks Be Taxed?” Journal of Urban Economics, vol. 63 (2008), p. 660; and Department of Transportation, Federal Highway Administration, Highway Statistics 2008 (December 2009), Table VM-1, www.fhwa.dot.gov/policyinformation/statistics/2008/vm1.cfm.
Notes: Passenger vehicles have two axles and four tires and include automobiles and light trucks (pickup trucks, minivans, and sport-utility vehicles).
Fuel use shares exclude motorcycles and buses.
Local air pollution costs are classified as mileage related for passenger vehicles and fuel related for trucks.
RuralPassengerVehicles
UrbanPassengerVehicles
RuralTrucks
UrbanTrucks
0
10
20
30
40
50
60
70
80
Cost per Gallon, 2000
(2009 Cents)
UrbanPassengerVehicles (58%)
RuralPassengerVehicles (21%)
UrbanTrucks (12%)
RuralTrucks (10%)
Share of Fuel Consumed, 2008
foreign oil—rest on speculation about contingencies in the future. In many cases, the estimates lie within ranges with plausible upper bounds that are 5 to 10 times larger than the lower bounds (see Box 1 on page 12).
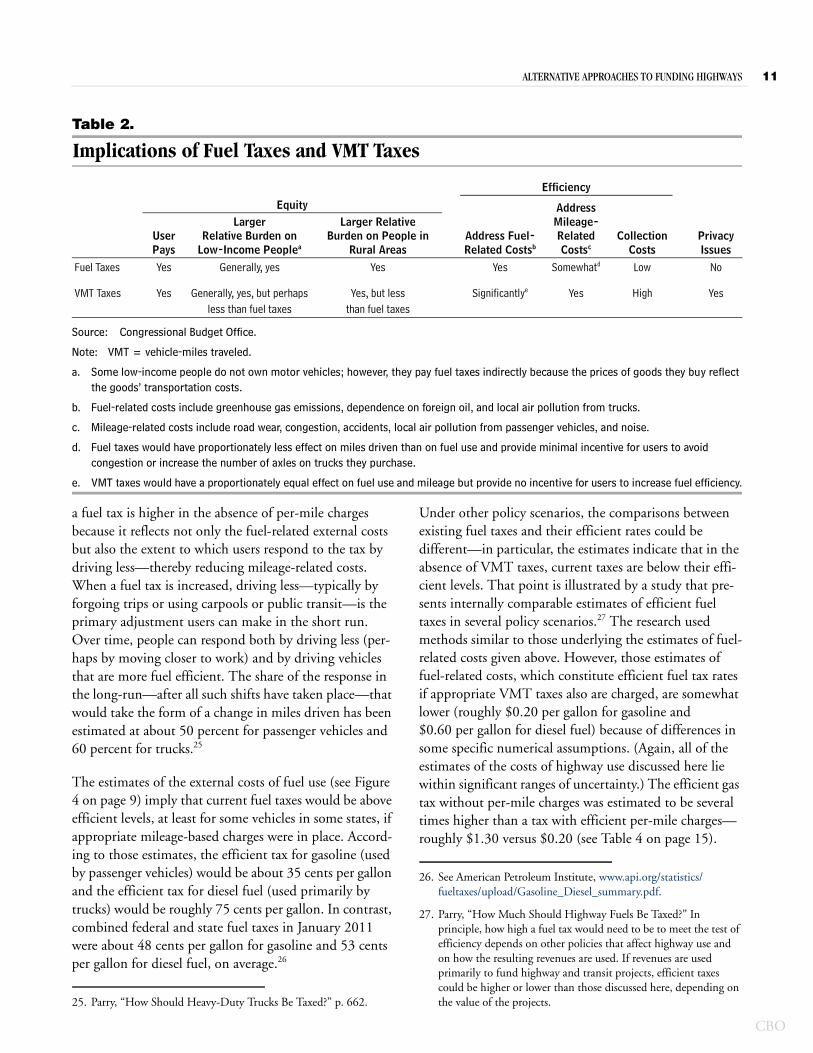
Fuel Taxes: The Current ApproachMost of the advantages and disadvantages of funding highways through fuel taxes and VMT taxes can be ana-lyzed in terms of equity and efficiency (see Table 2 on page 11). The same framework can be applied to other current taxes on highway users, to new fees that could be imposed on users, and to general revenues (see the appendix).
EquityThe equity implications of fuel taxes, the primary current source of HTF revenues, are mixed: Fuel taxes satisfy the
user-pays criterion, but they tend to be regressive; that is, they impose a larger relative burden on low-income than on high-income households. An analysis of 2004 data on effective tax rates (taxes paid divided by income) that divided all households into five groups of equal size by income showed that people whose households were in the second-lowest and middle quintiles paid somewhat larger shares of their income in gasoline taxes than did people in the lowest quintile or in the top two quintiles (see Table 3 on page 14).22 Fuel taxes are less directly burdensome for households in the bottom group of earners, in part because people in some of those households do not own automobiles. However, the diesel fuel tax also imposes an
22. See Andrew Chamberlain and Gerald Prante, Who Pays Taxes and Who Receives Government Spending? An Analysis of Federal, State, and Local Tax and Spending Distributions, 1991–2004, Working Paper 1 (Washington, D.C.: Tax Foundation, March 2007), p. 42.
CBO

10 ALTERNATIVE APPROACHES TO FUNDING HIGHWAYS
CBO
Table 1.
Estimated Relative Pavement Costs for Tractor-Semitrailers, by Two Factors(Index, 1 = 55,000 pounds and 4 axles)
Source: Congressional Budget Office based on Kenneth A. Small, Clifford Winston, and Carol A. Evans, Road Work (Washington, D.C.: Brookings Institution, 1989), Table 3-4.
indirect burden (which is not reflected in the table) through the effect on the prices of shipped goods. Because lower-income households consume larger shares of their income, that indirect effect would add to the overall regressivity of the fuel taxes considered together.
Some observers find another equity concern in the fact that fuel taxes disproportionately affect people who live in rural areas. According to data from the Department of Transportation’s National Household Travel Survey, peo-ple in rural households spend more, on average, on gaso-line or diesel fuel because their vehicles (including light-duty trucks and older cars) tend to be less fuel efficient than are the vehicles of their urban counterparts and because people in rural areas tend to drive more. The sur-vey data indicate that rural households at all income lev-els spend more on gasoline and diesel fuel than is spent by comparable urban or suburban households. For exam-ple, rural households with income below $25,000 spent 30 percent more than did their urban counterparts, in part because they drove 13 percent more miles. Relative differences in spending on fuel between rural and urban households were even greater among other income groups.23
23. Department of Transportation, Federal Highway Administration, Rising Fuel Cost—A Big Impact, NHTS Brief (June 2006), http://nhts.ornl.gov/briefs/Rising%20Fuel%20Costs--A%20Big%20Impact.pdf.
Gross Vehicle Weight (Pounds)
0.131.004.48
13.28
Axles
3 2.104 1.005 0.416 0.24
33,00055,00080,000
105,000
Relative Cost
EfficiencyIn terms of efficiency, two aspects of fuel taxes are posi-tive: First, the costs of collection and enforcement are low, in part because fuel taxes are not collected directly from individual service stations or from users of fuel but from fuel distributors, which collect them from the ser-vice stations where the money is collected from fuel pur-chasers. (In 2008, there were 114,000 filling stations and about 8,000 distributors in the United States.)24 Second, in combination with state and local fuel taxes, the federal taxes give motorists an incentive to reduce fuel consump-tion, thereby reducing the external costs associated with that consumption and, to some extent, the costs related to mileage.
By themselves, however, fuel taxes cannot give motorists incentives to use highways most efficiently. The effect on mileage-related costs of an increase in fuel taxes is less-ened to the extent that users shift to driving vehicles that use less fuel. Similar logic applies to any given fuel tax: The higher the current fuel economy, the smaller the effect on mileage. (Gasoline and diesel taxes have zero direct effect on people who drive electric vehicles.) A fur-ther limitation of federal fuel taxes is that, at best, they can be based only on average national conditions, not on such local conditions as the extent of congestion in a par-ticular area. Even at rates set to maximize efficiency, such taxes are a compromise: They are inefficiently low for congested roads, giving users too little incentive to avoid contributing to the problem, and inefficiently high for uncongested roads, giving users reason to forgo some trips for which the total benefits would exceed the costs. Having fuel taxes set by states can ameliorate that prob-lem if states with more congested roads set higher taxes. Even then, fuel taxes do little to encourage users to drive during off-peak hours—they do so only to the extent that travel on congested roads uses more fuel—or to purchase trucks with more axles.
For each fuel, the total (federal plus state and local) tax rate that maximizes efficiency depends on other policies that affect highway use. For example, the efficient rate for
24. For the number of service stations, see Census Bureau, Statistics of U.S. Businesses, “U.S., all industries,” www2.census.gov/econ/susb/data/2008/us_6digitnaics_empl_2008.xls, cell 10668E; for the number of licensed payers of federal fuel taxes, see Department of Transportation, Federal Highway Administration, Office of Highway Policy Information, “Highway Information Seminar—Motor Fuel Session—November 16, 2004,” www.fhwa.dot.gov/ohim/mfhtf/mfbigpicture.htm.
ALTERNATIVE APPROACHES TO FUNDING HIGHWAYS 11
Table 2.
Implications of Fuel Taxes and VMT Taxes
Source: Congressional Budget Office.
Note: VMT = vehicle-miles traveled.
a. Some low-income people do not own motor vehicles; however, they pay fuel taxes indirectly because the prices of goods they buy reflect the goods’ transportation costs.
b. Fuel-related costs include greenhouse gas emissions, dependence on foreign oil, and local air pollution from trucks.
c. Mileage-related costs include road wear, congestion, accidents, local air pollution from passenger vehicles, and noise.
d. Fuel taxes would have proportionately less effect on miles driven than on fuel use and provide minimal incentive for users to avoid congestion or increase the number of axles on trucks they purchase.
e. VMT taxes would have a proportionately equal effect on fuel use and mileage but provide no incentive for users to increase fuel efficiency.
Efficiency
Equity
Address Fuel-Related Costsb
Address Mileage-Related Costsc
Collection Costs
User Pays
Larger Relative Burden on
Low-Income Peoplea
Larger Relative Burden on People in
Rural AreasPrivacyIssues
Fuel Taxes Yes Generally, yes Yes Yes Somewhatd Low No
VMT Taxes Yes Generally, yes, but perhaps less than fuel taxes
Yes, but less than fuel taxes
Significantlye Yes High Yes
a fuel tax is higher in the absence of per-mile charges because it reflects not only the fuel-related external costs but also the extent to which users respond to the tax by driving less—thereby reducing mileage-related costs. When a fuel tax is increased, driving less—typically by forgoing trips or using carpools or public transit—is the primary adjustment users can make in the short run. Over time, people can respond both by driving less (per-haps by moving closer to work) and by driving vehicles that are more fuel efficient. The share of the response in the long-run—after all such shifts have taken place—that would take the form of a change in miles driven has been estimated at about 50 percent for passenger vehicles and 60 percent for trucks.25
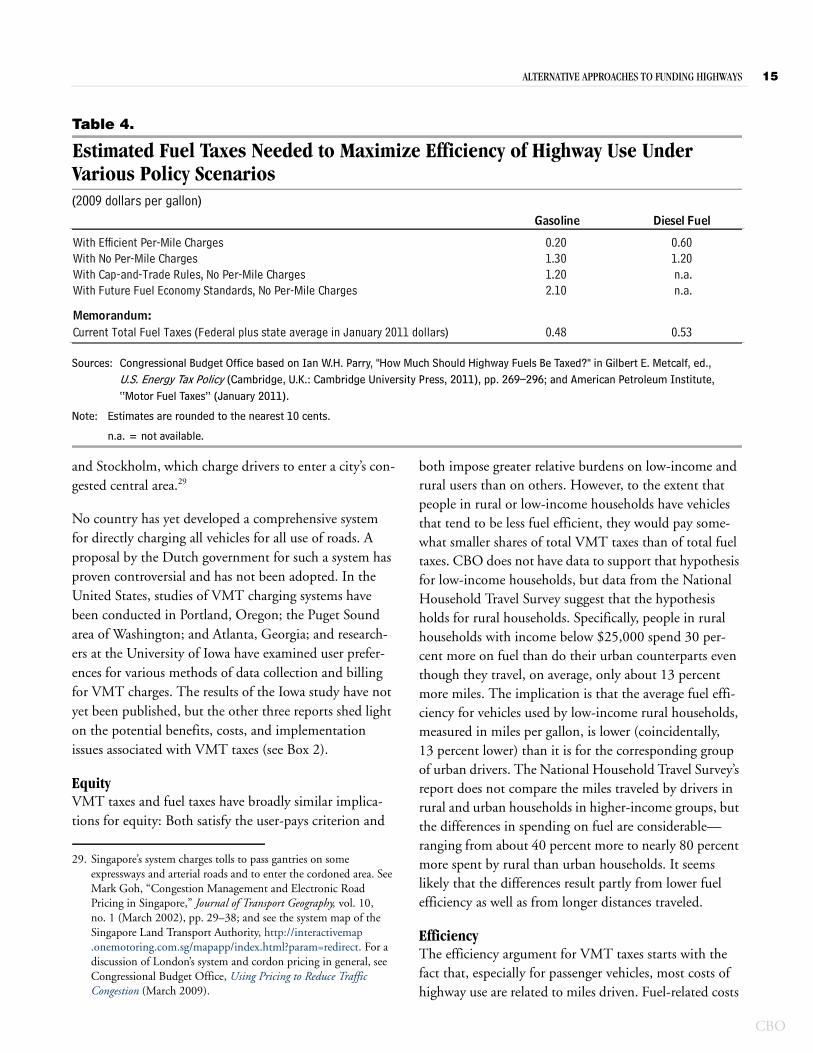
The estimates of the external costs of fuel use (see Figure 4 on page 9) imply that current fuel taxes would be above efficient levels, at least for some vehicles in some states, if appropriate mileage-based charges were in place. Accord-ing to those estimates, the efficient tax for gasoline (used by passenger vehicles) would be about 35 cents per gallon and the efficient tax for diesel fuel (used primarily by trucks) would be roughly 75 cents per gallon. In contrast, combined federal and state fuel taxes in January 2011 were about 48 cents per gallon for gasoline and 53 cents per gallon for diesel fuel, on average.26
25. Parry, “How Should Heavy-Duty Trucks Be Taxed?” p. 662.
Under other policy scenarios, the comparisons between existing fuel taxes and their efficient rates could be different—in particular, the estimates indicate that in the absence of VMT taxes, current taxes are below their effi-cient levels. That point is illustrated by a study that pre-sents internally comparable estimates of efficient fuel taxes in several policy scenarios.27 The research used methods similar to those underlying the estimates of fuel-related costs given above. However, those estimates of fuel-related costs, which constitute efficient fuel tax rates if appropriate VMT taxes also are charged, are somewhat lower (roughly $0.20 per gallon for gasoline and $0.60 per gallon for diesel fuel) because of differences in some specific numerical assumptions. (Again, all of the estimates of the costs of highway use discussed here lie within significant ranges of uncertainty.) The efficient gas tax without per-mile charges was estimated to be several times higher than a tax with efficient per-mile charges—roughly $1.30 versus $0.20 (see Table 4 on page 15).
26. See American Petroleum Institute, www.api.org/statistics/fueltaxes/upload/Gasoline_Diesel_summary.pdf.
27. Parry, “How Much Should Highway Fuels Be Taxed?” In principle, how high a fuel tax would need to be to meet the test of efficiency depends on other policies that affect highway use and on how the resulting revenues are used. If revenues are used primarily to fund highway and transit projects, efficient taxes could be higher or lower than those discussed here, depending on the value of the projects.
CBO

12 ALTERNATIVE APPROACHES TO FUNDING HIGHWAYS
CBO
Continued
Box 1.
Uncertainty in the Estimates of the Marginal Costs of Highway Use
In selecting estimates of the marginal costs of high-way use (see Figures 2, 3, and 4 in the text), the Congressional Budget Office drew primarily from three studies—two reports from the Federal Highway Administration (FHWA) and one journal article.1 Information in those publications and elsewhere in the economics literature indicates that significant uncertainty surrounds those estimates.
There are large differences between the FHWA’s low, medium, and high estimates of the costs per mile that highway users impose on others in the forms of con-gestion, accidents, noise, and local air pollution (see the figure). The FHWA’s reports do not provide ranges for estimated costs per mile of pavement dam-age in part because the focus on pavement damage is less on the costs that users impose on each other and more on the total costs of federally supported high-way projects, including the fixed costs of pavement damage that is caused simply by aging and weather-ing. The FHWA’s high estimates (for travel by all vehicles on all highways) for congestion, accidents, and noise are roughly three times its medium esti-mates, which correspond to the mileage-weighted averages of the costs by vehicle type on rural and urban roads shown in Figure 3 in the text; the low
estimates are between about a quarter and a half of the medium estimates.
The uncertainty surrounding the medium estimate for the cost of air pollution seems to be more concen-trated on the high side; the high estimate is more than seven times the medium estimate. That contrast with the more symmetric uncertainty around the other categories of costs in the figure could be a prod-uct of the methods of estimation: The low, medium, and high estimates for congestion, accidents, and noise were developed as part of the FHWA’s analysis of highway cost allocation; the medium estimate for the cost of air pollution was combined with low and high estimates from another source.2
One source of the uncertainty in fuel-related costs for trucks is the imprecision in estimates of the costs of local air pollution. (Because of differences in the regulation of vehicle emissions, those costs are mileage related for passenger vehicles.) The remain-ing uncertainty in fuel-related costs comes from the highly imprecise estimates of the costs of greenhouse gas emissions and dependence on foreign oil.
The Department of Energy uses estimates of the global cost of additional emissions of carbon dioxide into the atmosphere that differ by a factor of 11, ranging from $5 to $55 per ton, in 2007 dollars.3 The factors that account for the variation include
1. See Department of Transportation, Federal Highway Administration, 1997 Federal Highway Cost Allocation Study Final Report (1997), www.fhwa.dot.gov/policy/hcas/final/index.htm; Addendum to the 1997 Federal Highway Cost Allocation Study Final Report (May 2000), www.fhwa.dot.gov/policy/hcas/addendum.htm; and Ian W.H. Parry, “How Should Heavy-Duty Trucks Be Taxed?” Journal of Urban Economics, vol. 63 (2008), pp. 651–668. The FHWA is currently at work on a new cost allocation study.
2. See Department of Transportation, Addendum to the 1997 Federal Highway Cost Allocation Study, Table 10 and Figure 8.
3. See Department of Energy, “Energy Conservation Program: Energy Conservation Standards for Refrigerated Bottled or Canned Beverage Vending Machines,” Federal Register, vol. 74, no. 167 (August 31, 2009), p. 44948.

ALTERNATIVE APPROACHES TO FUNDING HIGHWAYS 13
Box 1. Continued
Uncertainty in the Estimates of the Marginal Costs of Highway Use
Relative Dispersion Around Best Estimates of Selected Marginal Costs of Highway Use
(Ratio to medium estimate)
Source: Congressional Budget Office based on Department of Transportation, Federal Highway Administration, 1997 Highway Cost Allocation Study: Final Report (1997); and Addendum to the 1997 Federal Highway Cost Allocation Study Final Report (May 2000).
differences in the estimates of future damage, the dis-count rates used to express that damage in terms of its present value, and the models of the risk of sudden catastrophic changes in climate.4
In most analyses of the external costs of fuel use, the cost of dependence on foreign oil has two compo-nents: the cost that consumers of gasoline, diesel, and other oil products impose on each other by raising the world price of oil and the cost to the economy as a whole that is associated with vulnerability to oil price shocks. Estimates of those costs vary not only because of different assumptions about the numerical
values of specific parameters (for example, the sensi-tivity of oil prices to world demand), but also because of different views on conceptual issues. For example, some economists believe that there is a flaw in the standard conception of the cost that consumers of oil products impose on one another by increasing demand and, consequently, raising the world price of oil. They argue that such a conception does not con-sider the role of oil exporters in determining world oil prices. The cost of vulnerability to price shocks, moreover, depends on the likelihood that any shock will occur and on the probabilities of different sizes of shocks if one does occur. All of those factors are diffi-cult to estimate.
Although the available estimates of the costs of high-way use reflect the best research so far, the uncer-tainty surrounding them limits their usefulness for policymaking. One of the FHWA reports com-mented about the medium cost estimates presented there: “The large uncertainty surrounding these esti-mates suggests that caution should be exercised in making decisions that could significantly influence either user costs or highway investment based upon these social costs.”5 Further research could help nar-row the uncertainty that accompanies the estimates of highway costs.
Congestion Accidents Noise LocalAir Pollution
0
1
2
3
4
5
6
7
8
9
0.3
1.0
2.9
0.61.0
3.1
0.3
1.0
2.6
0.71.0
7.6Low
Medium
High
4. See Ian W.H. Parry, “How Much Should Highway Fuels Be Taxed?” in Gilbert E. Metcalf, ed., U.S. Energy Tax Policy (Cambridge, U.K.: Cambridge University Press, January 2011). See Congressional Budget Office, Uncertainty in Analyzing Climate Change: Policy Implications (January 2005), for a broader discussion of the sources of uncertainty in economic analyses of climate change. Present value is a single number that expresses a flow of current and future income, or payments, in terms of an equivalent lump sum received or paid today.
5. Department of Transportation, Federal Highway Administration, Addendum to the 1997 Federal Highway Cost Allocation Study Final Report.
CBO

14 ALTERNATIVE APPROACHES TO FUNDING HIGHWAYS
CBO
Table 3.
Average Effective Gasoline Tax Rates by Household Income Group, 2004(Percentage of household income)
Source: Congressional Budget Office based on Andrew Chamberlain and Gerald Prante, Who Pays Taxes and Who Receives Government Spending? An Analysis of Federal, State and Local Tax and Spending Distributions, 1991–2004, Working Paper 1 (Washington, D.C.: Tax Foundation, March 2007), p. 42.
Federal Tax 0.21 0.27 0.27 0.25 0.210.29 0.37 0.38 0.35 0.29____ ____ ____ ____ ____
Total 0.50 0.64 0.65 0.60 0.50
State and Local Taxes
Quintile Quintile QuintileQuintileQuintileBottom Second Third Fourth Top
Those estimates include about 10 cents for the external cost of greenhouse gas emissions, so they would be about 10 cents lower—roughly $0.10 with efficient mileage charges and $1.20 with no mileage charges—if the exter-nal cost of climate change was built into the fuel price through some other mechanism, such as a carbon tax or a cap-and-trade policy that included transportation. By contrast, the efficient gas tax would be higher if there were higher standards for average fuel economy—about $2.10 in the absence of a VMT tax, under fuel economy standards that are scheduled to go into effect in 2016—because any given decline in fuel use would yield a larger reduction in mileage-related costs. As with the gasoline tax, the efficient tax on diesel fuel would be greater with-out VMT charges than with them, although the esti-mated difference between the two ($1.20 versus $0.60) is not as large as it is for gasoline.
Potential Taxes on Vehicle-Miles Traveled A consensus view of many transportation experts and economists is that a system of taxes on vehicle-miles trav-eled should be viewed as the leading alternative to fuel taxes as a source of funding for highways.28 The implica-tions of VMT taxes for equity and efficiency—and for concerns about privacy (an issue that does not fit neatly into the equity–effciency framework)—are different from those for fuel taxes. In implementing VMT taxes, policy-makers would confront interrelated questions about the goals of the system, which vehicles and roads to include, and what methods and technology would be used to administer the system, as well as questions about how the system should be introduced.
Many jurisdictions in the United States and abroad charge directly for some highway use, but existing charges
apply either to specific types of vehicles or to the use of specific roads. Four states—Kentucky, New Mexico, New York, and Oregon—and several European countries levy weight-and-distance charges on trucks (although most of the European systems are limited to certain major roads). New Zealand has weight-and-distance charges for trucks and for passenger vehicles that use a fuel (usu-ally diesel) that is not taxed at the wholesale level. Tolls on particular highways, highway lanes, or bridges are examples of direct pricing that applies to all vehicles on particular routes. Somewhat related are “cordon-pricing” systems, such as those in London, Singapore,
28. See Transportation Research Board of the National Academies, Committee for the Study of the Long-Term Viability of Fuel Taxes for Transportation Finance, The Fuel Tax and Alternatives for Transportation Funding, Special Report 285 (Washington, D.C.: National Research Council, 2006), http://onlinepubs.trb.org/onlinepubs/sr/sr285.pdf; National Surface Transportation Policy and Revenue Study Commission, Transportation for Tomorrow (December 2007), http://transportationfortomorrow.com/final_report/index.htm; and National Surface Transportation Infrastructure Financing Commission, Paying Our Way: A New Framework for Transportation Finance (February 2009), http://financecommission.dot.gov/Documents/NSTIF_Commission_Final_Report_Advance%20Copy_Feb09.pdf. For additional information on VMT charging systems, see Paul Sorensen and others, Implementable Strategies for Shifting to Direct Usage-Based Charges for Transportation Funding, Transportation Research Board of the National Academies, National Cooperative Highway Research Program, Web-Only Document 143 (Washington, D.C.: National Research Council, 2009), http://onlinepubs.trb.org/onlinepubs/nchrp/nchrp_w143.pdf; and System Trials to Demonstrate Mileage-Based Road Use Charges, Transportation Research Board of the National Academies, National Cooperative Highway Research Program, Web-Only Document 161 (Washington, D.C.: National Research Council, 2010), http://onlinepubs.trb.org/onlinepubs/nchrp/nchrp_w161.pdf.
ALTERNATIVE APPROACHES TO FUNDING HIGHWAYS 15
Table 4.
Estimated Fuel Taxes Needed to Maximize Efficiency of Highway Use Under Various Policy Scenarios(2009 dollars per gallon)
Sources: Congressional Budget Office based on Ian W.H. Parry, "How Much Should Highway Fuels Be Taxed?" in Gilbert E. Metcalf, ed., U.S. Energy Tax Policy (Cambridge, U.K.: Cambridge University Press, 2011), pp. 269–296; and American Petroleum Institute, “Motor Fuel Taxes” (January 2011).
Note: Estimates are rounded to the nearest 10 cents.
n.a. = not available.
With Efficient Per-Mile Charges 0.20 0.60With No Per-Mile Charges 1.30 1.20With Cap-and-Trade Rules, No Per-Mile Charges 1.20 n.a.With Future Fuel Economy Standards, No Per-Mile Charges 2.10 n.a.
Memorandum: Current Total Fuel Taxes (Federal plus state average in January 2011 dollars) 0.48 0.53
Gasoline Diesel Fuel
and Stockholm, which charge drivers to enter a city’s con-gested central area.29
No country has yet developed a comprehensive system for directly charging all vehicles for all use of roads. A proposal by the Dutch government for such a system has proven controversial and has not been adopted. In the United States, studies of VMT charging systems have been conducted in Portland, Oregon; the Puget Sound area of Washington; and Atlanta, Georgia; and research-ers at the University of Iowa have examined user prefer-ences for various methods of data collection and billing for VMT charges. The results of the Iowa study have not yet been published, but the other three reports shed light on the potential benefits, costs, and implementation issues associated with VMT taxes (see Box 2).
Equity VMT taxes and fuel taxes have broadly similar implica-tions for equity: Both satisfy the user-pays criterion and
29. Singapore’s system charges tolls to pass gantries on some expressways and arterial roads and to enter the cordoned area. See Mark Goh, “Congestion Management and Electronic Road Pricing in Singapore,” Journal of Transport Geography, vol. 10, no. 1 (March 2002), pp. 29–38; and see the system map of the Singapore Land Transport Authority, http://interactivemap.onemotoring.com.sg/mapapp/index.html?param=redirect. For a discussion of London’s system and cordon pricing in general, see Congressional Budget Office, Using Pricing to Reduce Traffic Congestion (March 2009).
both impose greater relative burdens on low-income and rural users than on others. However, to the extent that people in rural or low-income households have vehicles that tend to be less fuel efficient, they would pay some-what smaller shares of total VMT taxes than of total fuel taxes. CBO does not have data to support that hypothesis for low-income households, but data from the National Household Travel Survey suggest that the hypothesis holds for rural households. Specifically, people in rural households with income below $25,000 spend 30 per-cent more on fuel than do their urban counterparts even though they travel, on average, only about 13 percent more miles. The implication is that the average fuel effi-ciency for vehicles used by low-income rural households, measured in miles per gallon, is lower (coincidentally, 13 percent lower) than it is for the corresponding group of urban drivers. The National Household Travel Survey’s report does not compare the miles traveled by drivers in rural and urban households in higher-income groups, but the differences in spending on fuel are considerable—ranging from about 40 percent more to nearly 80 percent more spent by rural than urban households. It seems likely that the differences result partly from lower fuel efficiency as well as from longer distances traveled.
EfficiencyThe efficiency argument for VMT taxes starts with the fact that, especially for passenger vehicles, most costs of highway use are related to miles driven. Fuel-related costs
CBO

16 ALTERNATIVE APPROACHES TO FUNDING HIGHWAYS
CBO
Box 2.
Pilot Tests for Mileage-Based User Fees
Four studies in the United States have tested approaches to charging drivers to use highways. Three—one each in Portland, Oregon; the Puget Sound region of Washington; and Atlanta, Georgia—examined the effects of assessing drivers vehicle-miles traveled (VMT) charges. All were structured so that participants would not lose money: Each participant was given an initial cash balance based on the num-ber of untaxed miles driven during a baseline period; the participant then kept any money that remained either at the end of a calendar quarter or at the end of the study, depending on the study.
The Portland research project involved 260 vehicles.1 About half of the participants were charged a flat rate of 1.2 cents per mile for all travel within Oregon. The rest (except a small control group) were charged 10 cents per mile for peak-hour travel in an area around Portland and 0.43 cents per mile for travel outside of the peak hours or elsewhere in the state. The researchers reported that peak-hour pricing reduced participants’ travel during those hours by 22 percent relative to flat-rate pricing.
The Puget Sound Regional Council’s study involved 500 vehicles in the area around Seattle, Washington.2 Participants were charged according to the time of day to travel on a network of major highways, up to 50 cents per mile for travel on some roads during eve-ning peak hours.3 The researchers reported that study
participants reduced by 13 percent the number of miles traveled on toll roads and cut the number of miles they traveled by 12 percent overall.
Researchers at the Georgia Institute of Technology and Clemson University collaborated on a multi-phase study in the Atlanta area. The first stage involved collecting baseline travel data on 475 vehi-cles from 273 households. More than 100 households participated in the second phase, in which partici-pants were assessed VMT charges of 5 cents to 15 cents per mile. The researchers concluded that no effect could be reliably quantified.4 Although they observed a 3 percent reduction in overall miles trav-eled, the researchers could not isolate the effects of road pricing from those of other factors that affect driving. In particular, about two-thirds of participat-ing households had experienced some change in a key determinant of driving behavior, such as a change in vehicle ownership, a change in employment, or a move to a new home.
The fourth study was a nationwide survey by the University of Iowa for the federal Department of Transportation that focused on equipment for moni-toring travel and methods of billing. That study involved about 2,700 vehicles in 12 locations. Partic-ipants were surveyed on their reactions to receiving two types of monthly bills: one providing aggregate data only and the other showing detailed information that included routes of travel. The study’s final report has not yet been released.
1. James M. Whitty, Oregon’s Mileage Fee Concept and Road User Fee Pilot Program: Final Report (Salem, Ore.: Oregon Department of Transportation, November 2007), www.oregon.gov/ODOT/HWY/RUFPP/docs/RUFPP_finalreport.pdf; and Jack Svadlenak, Oregon Department of Transportation, personal communication (August 18, 2010). Study participants who faced flat-rate prices actually drove peak-hour miles that were about 12 percent above the baseline (although their total in-state miles were about 9 percent below), perhaps because the baseline period included the summer months, which might involve more vacation travel and fewer commuting trips (see page 44 of the report). The control group increased its peak-hour miles by 14 percent above the baseline.
2. Paul Sorensen and others, Implementable Strategies for Shifting to Direct Usage-Based Charges for Transportation Funding, Transportation Research Board of the National Academies, National Cooperative Highway Research Program, Web-Only Document 143 (Washington, D.C.: National Research Council, 2009), http://onlinepubs.trb.org/onlinepubs/nchrp/nchrp_w143.pdf, p. 105.
3. Puget Sound Regional Council, Traffic Choices Study: Summary Report (Seattle, Wash., April 2008), http://psrc.org/assets/37/summaryreport.pdf.
4. Randall Guensler, Georgia Institute of Technology, July 25, 2010, personal communication.

ALTERNATIVE APPROACHES TO FUNDING HIGHWAYS 17
for passenger vehicles traveling on rural and urban high-ways are roughly 1 to 2 cents per mile (see Figure 2 on page 6), well below estimated mileage-related costs (roughly 10 cents per mile).30 Fuel-related costs also are lower, on average, than mileage-related costs for heavy trucks, although the differences are not as great in relative terms. (There is wide variation among trucks for axle weight, patterns of use, and fuel efficiency, so there could be some classes for which fuel-related costs exceed mileage-related costs.) Because highway costs are more directly determined by miles driven than by fuel used, appropriately designed VMT taxes can do more to improve the efficiency of road use than fuel taxes can. Specifically, VMT taxes that account for the type and weight of a vehicle and the location and time of its use could provide appropriate incentives to reduce conges-tion, pavement damage, local air pollution from passen-ger vehicles, noise, and risk of accidents. (It is possible that the risk of accidents could be reduced even more effi-ciently, however, if drivers paid by the mile for auto-mobile insurance because their driving records and other relevant data could be included in rate calculations.)31
Although VMT taxes can do more than fuel taxes to encourage the efficient use of highways, a combination of both can do better still. If there were no fuel taxes, the efficient VMT taxes would be somewhat higher than otherwise, because they would serve to reduce the costs that are directly associated with fuel use as well as those that are more directly related to miles driven. How-ever, that would be a second-best approach. VMT charges would not provide the best incentive for reducing fuel-related costs because they cannot account for differ-ences in fuel economy among vehicles and thus would not give drivers an incentive to switch to vehicles that are more fuel efficient.
Varying VMT Taxes by Location and Time. To account for location and time of use, efficient user charges would not be based on nationwide averages. Instead, they would consist of two parts: a base rate that accounted for the
30. Future increases in fuel efficiency, resulting from higher federal standards or caused by consumer responses to fuel prices, would increase the importance of per-mile relative to per-gallon costs.
31. Pay-per-mile insurance is available in Texas and several foreign countries. In other places, policies are available that include mileage-related discounts. See Sorensen and others, System Trials to Demonstrate Mileage-Based Road Use Charges, pp. 114–116.
cost of miles driven under low-volume, uncongested con-ditions and an additional local or regional charge assessed and imposed as appropriate, particularly during peak travel hours. Such time-and-place-specific pricing would improve efficiency not only by reducing the delays, schedule uncertainty, and fuel waste associated with congestion but also by reducing demand for additional capacity. The FHWA has estimated that widespread congestion pricing could reduce by nearly one-third the investment needed to sustain the operational perfor-mance and condition of the highway system—an average savings of $41 billion per year (in 2009 dollars).32 In addition, other estimates reviewed by CBO suggest that the operational benefits of congestion pricing in reduced delays and fuel consumption could equal roughly $20 billion to $50 billion per year.33 Thus, the total annual benefits could be roughly $60 billion to $90 billion.
The effectiveness of road pricing in changing users’ behavior has been confirmed by experience. In the first year of London’s cordon-pricing system, the volume of traffic in the city center decreased by 15 percent, and there was a 30 percent drop in congestion delays (defined as the difference between actual travel time and that under free-flow conditions).34 Germany’s weight-and-distance taxes for trucks have produced a 15 percent reduction in travel by empty trucks on the Autobahn and contributed to a significant increase in purchases of trucks that meet higher environmental standards, for which tax rates are lower.35 The reports published after pilot studies of VMT charges in Portland and
32. Department of Transportation, 2008 Status of the Nation’s Highways, Bridges, and Transit, p. ES-16. In the FHWA’s definition, operational performance and road conditions are sustained over the 20-year study period if two measures—average user costs (time, operating, and accident costs) per mile and the value of the backlog of economically justifiable bridge projects—are the same in 2026 as they were in 2006.
33. See Congressional Budget Office, Using Pricing to Reduce Traffic Congestion, p. 7.
34. Ibid., p. 8.
35. See Andreas Kossak, “Germany’s Truck Tolling: Road Pricing for High Performance Transportation” (presentation at the Urban Partnerships Workshop, Washington, D.C., January 25, 2007), www.hhh.umn.edu/centers/slp/transportation/congestion_pricing/pdf/Germany_Truck_Tolls_Jan07.pdf.
CBO

18 ALTERNATIVE APPROACHES TO FUNDING HIGHWAYS
CBO
Puget Sound also noted significant effects on travel (see Box 2 on page 16).36
Implementation Costs. Whether charging highway users by the mile would improve efficiency would depend not only on the effects on highway use but on the costs of implementing the charges, including the capital costs for equipment and the operational costs of metering (that is, of determining what users owe), payment collection (pre-ceded in most but not all system designs by billing), and enforcement. In the past, the efficiency costs of imple-menting a system of VMT charges—particularly the costs of users’ time for slowing and queuing at tollbooths—would clearly have outweighed the potential benefits from more efficient use of highway capacity. Now, elec-tronic metering and billing are making per-mile charges a practical option. Still, the operational costs of VMT systems are higher than are the costs associated with cur-rent fuel taxes, and they have high start-up costs as well.
Data to indicate how much more it would cost to imple-ment a system of VMT taxes—whether comprehensive or targeted to particular roads or vehicles—are sparse and inconclusive. Costs as a percentage of revenue collected would depend on the rates charged. Most implementa-tion costs, other than for enforcement, do not depend on the rates, so higher rates yield lower costs per dollar of revenue, and vice versa. One report has cited estimates based on preliminary FHWA research showing that administrative costs for a nationwide VMT system would include $10 billion in capital costs for a billing agency and operating costs of 1.7 percent of revenues, compared with 1.0 percent for current fuel taxes.37 Reported operat-ing costs for existing VMT systems have been much higher than 1.7 percent of revenues, however, perhaps in part because they operate on a smaller scale. The esti-mates for truck VMT charges range from 4 percent for Switzerland’s system (which has higher rates per kilo-meter than other European systems) to 30 percent for the Czech Republic’s, and estimates for cordon-pricing sys-tems go up to about 50 percent for London’s system.38 A
36. James M. Whitty, Oregon’s Mileage Fee Concept and Road User Fee Pilot Program: Final Report (Salem, Ore.: Oregon Department of Transportation, November 2007), pp. 43–44, www.oregon.gov/ODOT/HWY/RUFPP/docs/RUFPP_finalreport.pdf; and Puget Sound Regional Council, Traffic Choices Study: Summary Report (April 2008), p. 12, www.psrc.org/assets/37/summaryreport.pdf.
37. National Surface Transportation Infrastructure Financing Commission, Paying Our Way, p. 150.
forthcoming study administered by the Transportation Research Board could provide more specific estimates of the costs of particular configurations of VMT systems.39
Implementation costs of a VMT system would depend heavily on its scope and scale but also would be affected by some choices about specific technologies. For example, initial capital costs might be higher but operational costs might be lower if the VMT taxes were collected “at the pump,” the method tested in the Portland pilot study and already used for collecting fuel taxes, rather than through periodic invoicing from a central office to individual users, the approach tested in the Puget Sound study. If VMT taxes were collected at the pump, each time fuel was purchased, information would be sent from a device in the vehicle to a device at the filling station. The data would identify the accumulated charges themselves or list miles traveled (identified if necessary by times and locations) since the previous purchase. The appropriate amount of taxes would be collected as part of the fuel- purchasing transaction.
However, collecting VMT taxes in this way would be more complicated and more expensive than the current system of collecting fuel taxes. Estimated taxes paid in advance by distributors would need to be reconciled with actual amounts collected at filling stations. The amounts collected from fuel purchasers would depend on the state and local taxes in effect (including any congestion charges) where the fuel is consumed, rather than where it is sold; vehicle fuel efficiencies; and, for trucks, the weight per axle or some other measure of vehicle size.
38. See European Conference of Ministers of Transport, “Summary and Conclusions,” Conference on Road Charging Systems: Technology Choice and Cost Effectiveness, Paris, France, June 1, 2006 (Paris: International Transport Forum, 2006), p. 8, www.internationaltransportforum.org/IntOrg/ecmt/taxes/pdf/Paris06Conclus.pdf; and Robert Arnold and others, Reducing Congestion and Funding Transportation Using Road Pricing in Europe and Singapore, FHWA-PL-10-030 (Federal Highway Administration, December 2010), pp. 8–9, http://international.fhwa.dot.gov/pubs/pl10030/pl10030.pdf. The studies from Portland and Puget Sound also included analyses of the costs of full-scale implementation but it is difficult to extrapolate costs from one region or state to the nation as a whole.
39. The underlying research project, “Costs of Alternative Revenue-Generation Systems” (National Cooperative Highway Research Program Project 19-08), is complete. For a description of the project, see http://144.171.11.40/cmsfeed/TRBNetProjectDisplay.asp?ProjectID=2513.

ALTERNATIVE APPROACHES TO FUNDING HIGHWAYS 19
Under a different approach, the government could collect taxes after the fact, perhaps from individual stations (there were 114,000 in 2008). Another possible difficulty with a pay-at-the-pump system would arise from the need to create a separate billing mechanism to collect VMT charges for electric-powered vehicles.
For users, capital costs would be high if older vehicles had to be retrofitted with the equipment used to meter travel and communicate data, and the potential for technical problems and tampering could be high as well. Waiting until that equipment became standard in all new vehicles would reduce capital costs—particularly the incremental costs if equipment with similar capabilities would have been installed anyway—but the transition period might be 15 or 20 years. Between 4 percent and 7 percent of cars are scrapped every year, and the average age of a light-duty vehicle (as of October 2009) was 10.2 years.40
Privacy Although many policy issues can be analyzed primarily in terms of effects on efficiency and equity, proposals for VMT taxes may involve a third important category of effects—namely, effects on people’s ability to keep infor-mation about their driving private. The type of VMT tax that provides the strongest incentive for efficient highway use could pose the greatest concerns about protecting users’ privacy. Specifically, the more detailed the informa-tion a system uses—including the data on location and time of travel needed to discourage travel on congested roads—the more the information could be used to recon-struct, or even monitor in real time, a vehicle’s travel. Pri-vacy concerns can be viewed as issues of equity, and they have implications for efficiency in that they could lead people to avoid making some trips that otherwise would offer net benefits. However, equity and efficiency con-cepts do not get to the core of the potential privacy issues, which are therefore better analyzed as a separate category.
Several approaches have been suggested for preventing misuse of data under a VMT system.41 One method is simply to restrict the kind of information collected. For example, a vehicle’s location could be noted only at the borders of jurisdictions, at entrances to or exits from areas
40. R. L. Polk & Co., “Polk Finds More Vehicles Scrapped Than Added to Fleet” (press release, March 30, 2010), http://usa.polk.com/news/latestnews/201003-scrappage.htm.
41. See Sorensen and others, System Trials to Demonstrate Mileage-Based Road Use Charges, pp. 39–42.
of high congestion, or along specific routes. Alternatively, vehicles’ locations could be determined with medium precision, perhaps by communications with nearby cellu-lar radio towers instead of the more precise tracking that would be possible using Global Positioning Systems. The trade-off is that the systems that use less information pro-vide weaker incentives for drivers to reduce congestion on particular highways or to curtail other costs that are related to routes and times of travel.
In a system that uses detailed travel data, some approaches to protecting privacy focus on limiting the government’s access to the data. (However, the gov-ernment would have to maintain access to information necessary to enforce the VMT system.) Some of the pro-posed approaches would limit the government’s access to the data by using equipment inside each vehicle to calcu-late the charges owed, either continuously or periodically, perhaps by the month. Periodic recording would require travel data to be stored at least for the duration of the bill-ing cycle. Storage of the information would not be required for continuous calculation but could be imple-mented anyway to give users a way to check the accuracy of their bills. One advantage of continuous calculation inside vehicles is that it could allow payment through the use of prepaid debit cards, as is the case in Singapore. There, drivers are charged as they pass through toll points; if vehicles lack a working debit card or the card has an insufficient balance, a notice is sent requesting payment of the toll along with an administrative pen-alty.42 A disadvantage of all in-vehicle billing, whether continuous or periodic, is that any changes in the tax rates would have to be communicated to all vehicles.
The government’s access to travel data also could be lim-ited in systems in which charges were calculated outside of the vehicles. In one system, each vehicle periodically would send its travel information anonymously to an external calculator, which would transmit the amount of the charge to the vehicle; in turn, the vehicle would report the charge amount, but not the underlying travel data, to the collection authority. Or the detailed informa-tion could be sent with information identifying the source vehicle to a private collection service under con-tract to the government. Although that approach is simi-lar to direct billing by the government, users might be
42. See Singapore Government, Land Transport Authority, “Electronic Road Pricing: What Is ERP?” www.lta.gov.sg/motoring_matters/index_motoring_erp.htm.
CBO

20 ALTERNATIVE APPROACHES TO FUNDING HIGHWAYS
CBO
more willing to share their travel data with a commercial entity than with the government, just as many people now routinely share data about their purchases with retailers and credit card companies.
A different approach to privacy issues seeks to assuage concern by making the system appealing in other ways—for example, by giving discounts on pay-as-you-drive insurance or by providing additional travel services, such as route-specific traffic updates, identification of open parking spaces, or automated parking payments. That approach could allow a VMT tax to be introduced earlier if it hastened the installation of the required in-vehicle equipment.
It is not clear how successful any approach would be in allaying privacy concerns because the issue is partly one of perception. Assurances that a device transmits specific limited information could simply be rejected by some users. If some fuel taxes remained in place when a VMT tax was adopted, users might be permitted to opt out and pay higher fuel taxes instead. The higher rate could be calculated to include both the per-gallon equivalent of average per-mile charges for the user’s vehicle and a pre-mium to keep users from opting out of the new system simply because their VMT charges would be higher than average. (Allowing users of electric vehicles to opt out would require a different approach.) Allowing users with the strongest concerns about privacy to opt out of the VMT taxes would reduce the coverage of the VMT sys-tem and the associated efficiency gains but might serve as a safety valve to make the system more acceptable to the public.
The Puget Sound study shed some limited light on pri-vacy issues, although the participants were volunteers and thus not necessarily representative of all highway users. The share that rated their concerns about privacy as mod-erate declined from 49 percent initially to about 35 per-cent by the end of the study, the share that expressed low concern increased from 26 percent to 31 percent, and the share that expressed relatively high concern rose from 25 percent to 33 percent.43
Potential Goals and Their ImplicationsThe goals identified for a system of VMT taxes would help determine basic approaches and relevant technol-ogies and help policymakers decide whether a system
43. Puget Sound Regional Council, Traffic Choices Study: Summary Report, p. 30.
should be comprehensive or should focus on specific vehicles or highways. Another set of choices would involve assigning responsibility for introducing the new charges.
One goal would be relatively simple: VMT taxes could provide an additional source of federal revenues to sup-port highways. For that goal, metering users’ travel would involve only recording total mileage, either manually or automatically. Among the possible manual methods for tracking mileage are annual inspections and self-reporting with spot checks. Automatic recording could be done by internal devices that communicated odometer readings to a VMT billing system or by electronic vehicle identifiers read by gasoline or diesel fuel pumps. The pumps would estimate miles driven on the basis of fuel usage and a standard estimate of fuel economy for each vehicle model and year. It is not clear, however, that the goal of raising revenues would, by itself, justify the costs of developing and implementing a VMT system because additional rev-enues could be raised more easily by raising existing fuel taxes.
A second goal, reducing pavement damage, could focus on the 9 million heavy-duty trucks on U.S. roads.44 Although a small number compared with the nation’s roughly 240 million passenger vehicles, trucks account for roughly one-quarter of the mileage-related costs of highway use as well as about one-quarter of fuel-related costs. For maximum efficiency, the rates charged in a VMT system would consider a truck’s weight per axle, thus giving truck owners and operators an incentive to use vehicles with more axles to carry a given load. Many current systems for taxation on the basis of weight alone or weight and distance combined use the number of axles as a proxy for weight instead of considering weight and axles separately, so trucks with more axles are charged more.
A third goal could be to use VMT taxes to help state, regional, or local governments solve particular congestion problems, whether on major roads, at bridge or tunnel bottlenecks, or in central cities. Such problems could be addressed by charging tolls on segments of individual roads or at entry points to bridges, tunnels, or areas with high traffic. In many cases, tolls could be collected less expensively by means of cameras that record license
44. Department of Transportation, Highway Statistics 2008, Table VM-1, www.fhwa.dot.gov/policyinformation/statistics/2008/vm1.cfm.

ALTERNATIVE APPROACHES TO FUNDING HIGHWAYS 21
plate numbers or by using readers mounted on tollbooths or overhead gantries than is possible with human or mechanical methods. Tolls are perhaps most useful for addressing congestion at facilities with controlled points of entrance and exit, such as bridges, tunnels, and limited-access highways, although cordon-pricing sys-tems, such as that in London, demonstrate that other applications are possible.45 A national system of VMT charges would not be required if the goal was to manage congestion, but federal action to lift restrictions on imposing tolls on Interstate highways could be important because Interstates account for one-quarter of vehicle-miles traveled in urban areas.46
A fourth goal could be to move toward providing com-plete incentives for efficient use of the nation’s highways’ capacity through a comprehensive system of VMT taxes. Such a system would be a new source of federal funds, and it would provide a platform for regional or local con-gestion charges. Some aspects of the system, such as the capabilities of the required in-vehicle equipment, would depend on the costs of congestion: If costs tended to be relatively uniform, involving most of the roads in an area, the in-vehicle meters could track location roughly (as in the Oregon pilot study). If some costs of congestion were associated with particular highways, the devices would need to track vehicles’ locations with high accuracy (as in the Puget Sound study). Congestion pricing also would require the ability to monitor when people travel, again with less precision or more depending on the policy goals. If it is sufficient to charge congestion prices during specific periods (for example, during rush hour or at night), then the relevant information is simply the period in which travel occurs. In contrast, if it is desirable to adjust VMT charges in real time to match conditions, the metering equipment needs to monitor time—or, equiva-lently, the real-time prices—almost continuously.
Even if policymakers were to pursue a comprehensive national system of VMT taxes, they would still face a pro-cedural choice about whether the federal government should lead its introduction or turn that duty over to
45. Implementation costs for the first few years of London’s system and its western extension totaled about $600 million; see Congressional Budget Office, Using Pricing to Reduce Traffic Congestion, p. 15.
46. Department of Transportation, Highway Statistics 2008, Table VM-1, www.fhwa.dot.gov/policyinformation/statistics/2008/vm1.cfm.
state governments or the private sector acting within a broad federal framework.47 In the state-led model, the federal government could provide incentives (including direct funding) for states to participate and technical sup-port to ensure that systems in various places worked well together. Ultimately, the federal government could develop a national VMT system that accounted for les-sons learned in the states. The approach emphasizing ini-tial involvement by the private sector could be marked by development and marketing of equipment that would appeal to users by facilitating pay-as-you-drive insurance or other travel services. As in the state-led approach, the initial federal role could include spurring participa-tion through financial incentives (perhaps to equipment vendors, states, cities, insurance companies, or even motorists) and setting equipment standards.
Each approach would have advantages and disadvantages. Direct federal leadership would facilitate planning for new revenues to the Highway Trust Fund. It also would allow for the greatest economies of scale and could be used to test and resolve issues that are relevant to imple-mentation of a national system, such as any assistance needed from state governments to implement federal charges.
Leadership by the states would offer the advantage of direct access to law enforcement agencies to enforce com-pliance. The state-led approach also might offer more incentives for voluntary adoption, such as the opportu-nity to convert annual vehicle registration fees to per-mile charges, and it could allow for more variety and innova-tion in developing VMT systems. A possible disadvantage of state leadership would be the development of systems that were incompatible from one state to another.
Having the private sector facilitate the introduction of a VMT system could minimize public resistance by focus-ing initially on the voluntary participation of users who wanted to take advantage of other travel services provided through the in-vehicle equipment and by demonstrating the system’s ability to protect subscribers’ privacy. How-ever, it is not clear how strong the demand for the equip-ment would be or whether users would choose to pay VMT fees along with paying for the other services.
47. The three approaches are discussed in Sorensen and others, System Trials to Demonstrate Mileage-Based Road Use Charges, pp. 73–80.
CBO


Appendix: Selected Approaches to Highway Funding
A t least three sources of revenue, in addition to the current fuel taxes and the potential per-mile charges discussed in the text, are now or could be tapped to sup-port federal spending on highways: existing taxes credited to the Highway Trust Fund (HTF) on truck ownership and sales of trucks and truck tires, new federal user charges other than per-mile charges, and revenues from the Treasury’s general fund.1 Using any of those sources would offer various advantages, but they all share the disadvantage of failing to offer an efficient incentive for people to reduce the costs of their highway use (see Table A-1).
Existing Federal Taxes on Trucks and TiresThe trust fund currently is credited with revenues from sales taxes on trucks and tractors with a gross vehicle weight of more than 33,000 pounds and on trailers that weigh more than 26,000 pounds, from an excise tax on tires with a maximum load capacity above 3,500 pounds, and from an annual tax on ownership of trucks that weigh 55,000 pounds or more. Together, those taxes yield about 10 percent of the fund’s receipts. If truck users were charged directly and fully for their use of the highways through a combination of vehicle-miles traveled charges and charges for fuel use, there would be no role for other taxes in improving the efficiency of highway use. But with total (federal plus state) diesel fuel taxes currently
1. Highway users and taxpayers generally could be taxed in many ways. Some are discussed here, but those and many others are considered in the report of the National Surface Transportation Infrastructure Financing Commission, Paying Our Way: A New Framework for Transportation Finance (February 2009), Chapter 3, http://financecommission.dot.gov/Documents/NSTIF_Commission_Final_Report_Advance%20Copy_Feb09.pdf.
below the efficient rate and few direct charges for high-way use, the other taxes in place today help reduce the costs imposed by trucks. The tire tax provides an incen-tive to reduce vehicle-miles traveled, and the purchase and ownership taxes provide an incentive to reduce the number of trucks on the road. In practice, however, the current rates are too low to have a meaningful effect. The annual tax on ownership of heavy trucks, for example, ranges from $100 to $550, depending on gross vehicle weight. Those amounts are small relative to the typical value of a year of truck ownership and thus are likely to induce few owners to sell or dispose of their trucks.
Raising taxes enough to spur a substantial change might reduce rather than increase efficiency because the result-ing incentives are not likely to be well aligned with the cost of pavement damage or with the external costs asso-ciated with truck use. None of the taxes provides drivers with enough incentive to avoid driving when roads are congested or to reduce fuel use by choosing vehicles with better fuel economy.
Each of the three taxes also has specific weaknesses. The responses to higher taxes on truck purchases would include not only a reduction in the number of trucks on the road but also an increase in the average age of trucks in use; older trucks, which tend to use more fuel and pol-lute more, would be kept in operation longer. A larger annual tax on truck ownership would not have that effect, but its effect on use might be less than its effect on the vehicle fleet, for two reasons. First, the least valuable trucks would be taken out of service, and they might be the trucks that are the least used. Second, there is no incentive to reduce mileage or fuel use for a truck that is valuable enough to warrant the annual tax. Raising the tax on truck tires would provide an additional incentive
CBO

24 ALTERNATIVE APPROACHES TO FUNDING HIGHWAYS
CBO
Table A-1.
Implications of Alternative Sources of Highway Funding
Source: Congressional Budget Office.
Note: HTF = Highway Trust Fund; n.a. = not applicable.
a. Fuel-related costs include greenhouse gas emissions, dependence on foreign oil, and local air pollution from trucks.
b. Mileage-related costs include road wear, congestion, accidents, local air pollution from passenger vehicles, and noise.
c. HTF taxes include an annual tax on truck ownership and taxes on purchases of new trucks and truck tires.
d. Possible charges include vehicle sales taxes and license and registration fees.
Equity Efficiency
User Pays
Larger Relative Burden on
Low-Income People
Larger Relative Burden on People in
Rural Areas OtherAddress Fuel-Related Costsa
Address Mileage-Related Costsb
Collection Costs Other
Existing HTF Taxes on Trucks and Tiresc
Yes Indirect effect through prices
of goods transported
by trucks
Possible indirect effect through prices of goods
transportedby trucks
Could bring total taxes on trucks more in line with their costs
No, except partial incentive
from tire tax
No, except partial incentive
from tire tax
Low If large enough, would distort vehicle
purchase decisions
New Federal User Chargesd
Yes Yes, unless assessed on a sliding scale
No Could meet with opposition from state
or local governments
No No Relatively low
n.a.
General Revenues
No No No n.a. No No Negligible Would further distort choices
about labor, capital
investment, and other
taxed products and activities
to reduce mileage (and, indirectly, fuel use) but also create a perverse incentive to use trucks with fewer axles and thus perhaps lead to increased pavement damage by increasing average total weight (vehicle plus cargo) per axle.
Their effects on efficiency aside, the truck taxes also have implications for equity. They are likely to place a larger relative burden on low-income households because they raise the retail prices of goods that are transported by truck, and low-income households tend to spend greater shares of their income on goods in general. Whether the taxes also would present a greater relative burden for rural households is unclear: It would depend both on consumption patterns and on how far goods must travel
to reach rural compared with urban purchasers. In terms of the user-pays conception of equity, the truck taxes can be beneficial if they bring the overall tax burden on truck operators closer to their total contribution to costs, even if the taxes are not based explicitly on the costs and do not provide incentives to reduce the costs. The estimates discussed in the text suggest that fuel taxes alone do not offset the costs of truck travel, so some additional taxa-tion is desirable in promoting the user-pays objective. The question then becomes whether the other HTF taxes, together with any taxes paid to state and local governments, move total payments toward recovery of the full cost of use or overshoot that target. Detailed analysis would be needed to arrive at the answer, which will differ by truck type and size because of differences in

APPENDIX ALTERNATIVE APPROACHES TO FUNDING HIGHWAYS 25
costs of operation and tax rates. A study of the allocation of various highway costs, now under way at the Federal Highway Administration, could help answer the question.2
New Charges for UsersA variety of new federal fees could be imposed on high-way users. State governments already tax sales of motor vehicles and charge fees for vehicle registrations and driv-ers’ licenses; it would cost relatively little to add on federal fees dedicated to the HTF. Given the broad bases of those potential taxes, the federal government could raise signifi-cant revenues at tax rates that were low enough not to cause a significant distortion of users’ choices about vehi-cle ownership or road use. The disadvantage, however, is that such fees would not be closely tied to the mileage- or fuel-related costs of highway use. Moreover, the states might object on the grounds that the additional federal fees could hamper their ability to raise state revenues for highway spending. From the standpoint of equity, licens-ing and registration fees have two positive characteristics: They meet the user-pays test, and they place an equal burden relative to income on urban and rural users. They would tend to be regressive, however, unless they were assessed according to household income.
2. For the predecessor of the current study, see Department of Transportation, Federal Highway Administration, 1997 Federal Highway Cost Allocation Study Final Report (1997), www.fhwa.dot.gov/policy/hcas/final/index.htm; and Addendum to the 1997 Federal Highway Cost Allocation Study Final Report (May 2000), www.fhwa.dot.gov/policy/hcas/addendum.htm. That study included a comparison of the costs imposed by four specific classes of trucks driven on rural or urban Interstates, with the taxes paid for those types of trucks. The taxes paid for all four exceeded their costs of driving on rural Interstate highways; the same was true for the two lighter types of trucks on urban Interstates. The study’s usefulness was limited by the fact that it covered only the four specific types of trucks driven on Interstates and because of a flaw in the data. In response to a question from CBO, a Federal Highway Administration staff member reported that the estimates of taxes paid were too high because of an error in the attribution of revenues received from the tax on truck sales.
General RevenuesTwo arguments can be made in support of funding high-ways through broad-based taxes, such as income taxes: First, the incremental costs of collection would be negli-gible, and second, large amounts could be raised through small changes in the tax rates. The staff of the Joint Com-mittee on Taxation has estimated that raising all tax rates on ordinary individual income by 1 percentage point would yield an average of $48 billion per year from 2012 to 2021—more than all of the current HTF taxes com-bined.3 Moreover, funding highways through broad-based taxes meets at least one standard of equity: Such taxes do not impose a larger burden, relative to income, on rural or low-income users.
In other respects, however, the use of general revenues poses critical disadvantages. In particular, the approach gives users no incentive to reduce the mileage- or fuel-related costs of their highway use, and it does not satisfy the user-pays standard of equity. Moreover, even small increases in existing rates would hamper efficiency by exacerbating existing deviations from efficient prices, thus further distorting many individual decisions.4 The distorted decisions would include reductions in work and saving, shifting of income from taxable to nontaxable forms, and shifting of spending from ordinary to tax-deductible goods and services.
3. See Congressional Budget Office, Reducing the Deficit: Spending and Revenue Options (March 2011), p. 139.
4. The relative increase in the loss of efficiency that results from a higher tax rate is roughly double the relative increase in the rate: Raising a tax rate from 25 percent by one percentage point is a relative increase of 4 percent, but it would be expected to increase the cost of the resulting distortions by about 8 percent. The reason is that the efficiency loss is roughly proportional to the square of the relative increase in the tax, so if the new tax rate is (1 + r) times the old one, then the new loss is about (1 + r)2 times the old one, and the relative increase in the loss is (1 + r)2 - 1, which is approximately equal to 2r. In the example, (1.04 × 1.04 - 1) is about 0.08, or 8 percent.
CBO
