congress of the united states …mchinn/01-31-2012_outlook_summary.pdfthe congress of the united...
TRANSCRIPT
10
6
2
12
4
8
0
0
4
2
-2
-6
-8
-4
-10
-12
2006 201220022000 2008 20142004 2010
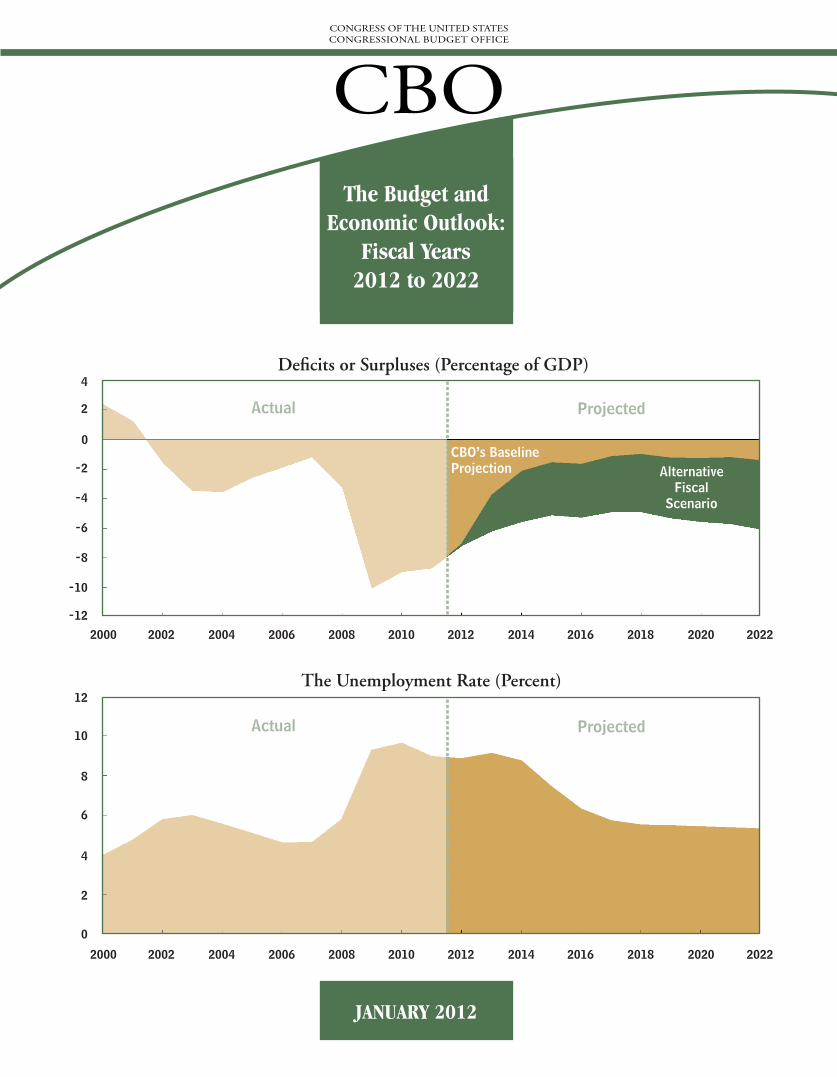
The Unemployment Rate (Percent)
Actual
2018 20202016 2022
2006 201220022000 2008 20142004 2010 2018 20202016 2022
Projected
Actual Projected
CBO’s BaselineProjection Alternative
FiscalScenario
Deficits or Surpluses (Percentage of GDP)
CONGRESS OF THE UNITED STATESCONGRESSIONAL BUDGET OFFICE
CBOThe Budget and
Economic Outlook: Fiscal Years
2012 to 2022
JANUARY 2012
Pub. No. 4474
The Congress of the United States O Congressional Budget Office
CBO
The Budget and Economic Outlook:Fiscal Years 2012 to 2022
January 2012
CBO
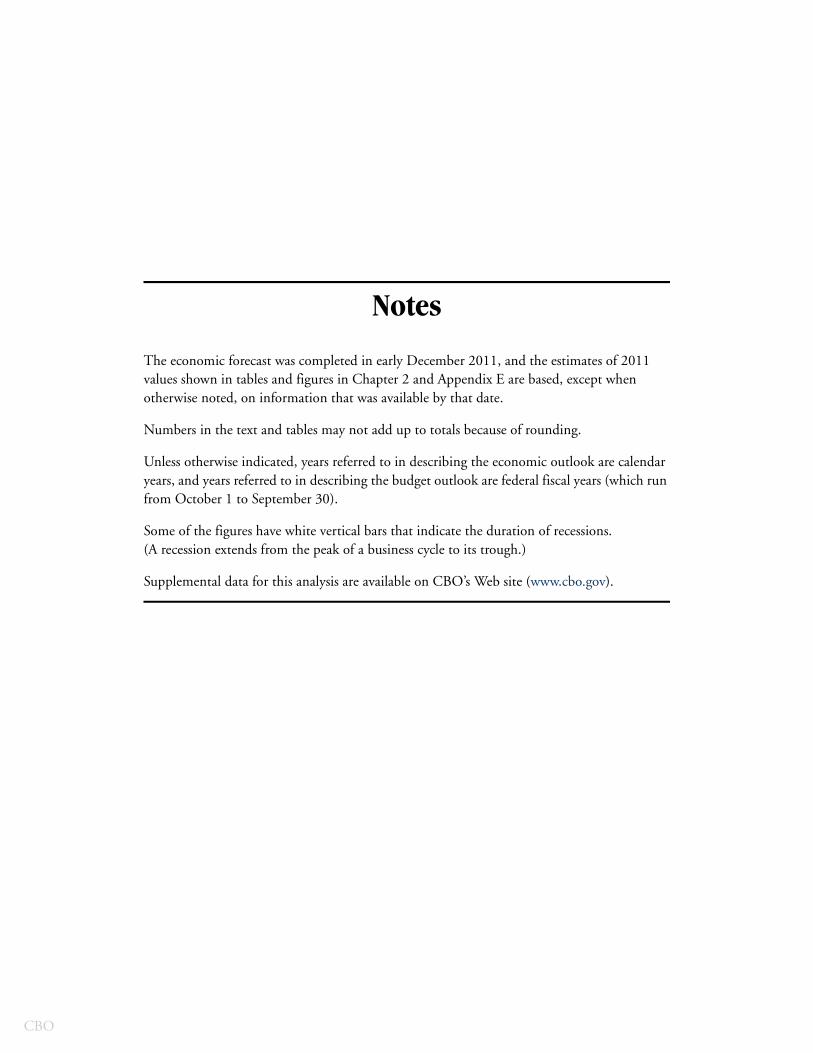
Notes
The economic forecast was completed in early December 2011, and the estimates of 2011 values shown in tables and figures in Chapter 2 and Appendix E are based, except when otherwise noted, on information that was available by that date.
Numbers in the text and tables may not add up to totals because of rounding.
Unless otherwise indicated, years referred to in describing the economic outlook are calendar years, and years referred to in describing the budget outlook are federal fiscal years (which run from October 1 to September 30).
Some of the figures have white vertical bars that indicate the duration of recessions. (A recession extends from the peak of a business cycle to its trough.)
Supplemental data for this analysis are available on CBO’s Web site (www.cbo.gov).
Preface
CBO
This volume is one of a series of reports on the state of the budget and the economy that the Congressional Budget Office (CBO) issues each year. It satisfies the requirement of section 202(e) of the Congressional Budget and Impoundment Control Act of 1974 that CBO submit to the Committees on the Budget periodic reports about fiscal policy and its baseline projections of the federal budget. In accordance with CBO’s mandate to provide objective, impartial analysis, the report makes no recommendations.
The economic projections were prepared by CBO’s Macroeconomic Analysis Division. The revenue estimates were prepared by the agency’s Tax Analysis Division, with assistance from the staff of the Joint Committee on Taxation. The spending projections were prepared by CBO’s Budget Analysis Division. The many people at CBO who worked on this report are listed in Appendix G.
This report, along with supplemental information, is available on the agency’s Web site (www.cbo.gov).
Douglas W. ElmendorfDirector
January 2012

Contents
CBO
Summary xi
1 The Budget Outlook 1
Budgetary Outcomes in 2011 and 2012 4CBO’s Baseline Projections for 2013 to 2022 7Uncertainty in Budget Projections 15Alternative Policy Assumptions 17The Long-Term Budget Outlook 21
2 The Economic Outlook 25
The Economic Outlook Through 2017 26The Economic Outlook for 2018 to 2022 39Comparison with Other Economic Projections 41
3 The Spending Outlook 47
Mandatory Spending 51Discretionary Spending 65Net Interest 73
4 The Revenue Outlook 79
Changes in the Composition of Revenues over Time 81Individual Income Taxes 84Social Insurance Taxes 87Corporate Income Taxes 88Other Sources of Revenues 90Tax Expenditures 93
VI THE BUDGET AND ECONOMIC OUTLOOK: FISCAL YEARS 2012 TO 2022
CBO
A Changes in CBO’s Baseline Since August 2011 97
B How Changes in Economic Projections Might Affect Budget Projections 107
C Automatic Stabilizers 113
D Trust Funds 121
E CBO’s Economic Projections for 2012 to 2022 127
F Historical Budget Data 131
G Contributors to This Report 143
CONTENTS THE BUDGET AND ECONOMIC OUTLOOK: FISCAL YEARS 2012 TO 2022 VII
CBO
Tables
S-1. CBO’s Baseline Budget Outlook xii
S-2. CBO’s Economic Projections for Calendar Years 2012 to 2022 xv
1-1. Deficits or Surpluses Projected in CBO’s Baseline 2
1-2. Changes in Revenues, Outlays, and Deficits Between 2010 and 2012 5
1-3. CBO’s Baseline Budget Projections 10
1-4. Federal Debt Projected in CBO’s Baseline 14
1-5. Changes in CBO’s Baseline Projections of the Deficit Since August 2011 16
1-6. Budgetary Effects of Selected Policy Alternatives Not Included in CBO’s Baseline 18
1-7. Deficits Projected in CBO’s Baseline and Under an Alternative Fiscal Scenario 22
2-1. CBO’s Economic Projections for Calendar Years 2012 to 2022 27
2-2. Economic Effects of Policies in CBO’s Baseline and Under an Alternative Fiscal Scenario 30
2-3. Key Assumptions in CBO’s Projection of Potential GDP 40
2-4. Comparison of CBO’s Current and Previous Economic Projections for Calendar Years 2012 to 2021 43
2-5. Comparison of Economic Projections by CBO, the Blue Chip Consensus, and the Federal Reserve 46
3-1. Outlays Projected in CBO’s Baseline 49
3-2. Mandatory Outlays Projected in CBO’s Baseline 52
3-3. Costs for Mandatory Programs That Continue Beyond Their Current Expiration Date in CBO’s Baseline 66
3-4. Changes in Nondefense Discretionary Funding Between 2011 and 2012 69
3-5. CBO’s Projections of Discretionary Spending Under Selected Policy Alternatives 74
3-6. Discretionary Spending Projected in CBO’s Baseline 76
3-7. Federal Interest Outlays Projected in CBO’s Baseline 77
4-1. Revenues Projected in CBO’s Baseline 85
4-2. Social Insurance Tax Revenues Projected in CBO’s Baseline 87
4-3. Other Sources of Revenues Projected in CBO’s Baseline 91
A-1. Changes in CBO’s Baseline Projections of the Deficit Since August 2011 98
A-2. Net Effect on the Deficit of Including the Automatic Enforcement Procedures of the Budget Control Act in CBO’s January 2012 Baseline 104
VIII THE BUDGET AND ECONOMIC OUTLOOK: FISCAL YEARS 2012 TO 2022
CBO
B-1. How Selected Economic Changes Might Affect CBO’s Baseline Budget Projections 109
C-1. Deficit or Surplus With and Without Automatic Stabilizers and Related Series, by Fiscal Year, in Billions of Dollars 116
C-2. Deficit or Surplus With and Without Automatic Stabilizers and Related Series, by Fiscal Year, as a Percentage of Potential Gross Domestic Product 118
D-1. Trust Fund Balances Projected in CBO’s Baseline 122
D-2. Trust Fund Surpluses or Deficits Projected in CBO’s Baseline 123
D-3. Balances Projected in CBO’s Baseline for the OASI, DI, and HI Trust Funds 124
E-1. CBO’s Economic Projections, by Calendar Year 128
E-2. CBO’s Economic Projections, by Fiscal Year 129
F-1. Revenues, Outlays, Deficits, Surpluses, and Debt Held by the Public Since 1972 132
F-2. Revenues, by Major Source, Since 1972 134
F-3. Outlays, by Major Category, Since 1972 136
F-4. Discretionary Outlays Since 1972 138
F-5. Mandatory Outlays Since 1972 140
Figures
S-1. Deficits Projected in CBO’s Baseline and Under an Alternative Fiscal Scenario xiii
S-2. Federal Debt Held by the Public Projected in CBO’s Baseline and Under an Alternative Fiscal Scenario xiv
1-1. Deficits or Surpluses Since 1946 3
1-2. Outlays Recorded for the Troubled Asset Relief Program 6
1-3. Deficits or Surpluses and Federal Debt Held by the Public, Historically and As Projected in CBO’s Baseline and Under an Alternative Fiscal Scenario 23
2-1. Real Gross Domestic Product 28
2-2. Interest Rates 31
2-3. Vacant Housing Units 32
2-4. Net Business Fixed Investment 33
2-5. Economic Growth in the United States and Among Its Leading Trading Partners 34
2-6. Unemployment Rate 35
Tables (Continued)
CONTENTS THE BUDGET AND ECONOMIC OUTLOOK: FISCAL YEARS 2012 TO 2022 IX
CBO
2-7. Inflation 38
2-8. Labor Income 42
3-1. Outlays, by Category 50
3-2. Outlays Projected in CBO’s Baseline and Under an Alternative Fiscal Scenario 51
3-3. Outlays for Income Security Programs 59
3-4. Outlays for Unemployment Benefits 60
3-5. Discretionary Outlays, by Category 68
4-1. Revenues Projected in CBO’s Baseline and Under an Alternative Fiscal Scenario 80
4-2. Revenues, by Major Source 81
4-3. Average Corporate Tax Rate and Corporations’ Domestic Economic Profits 89
4-4. Selected Major Tax Expenditures in 2012, Compared with Other Categories of Revenues and Outlays 94
4-5. Effects of Selected Major Tax Expenditures from 2013 to 2022 96
C-1. Contribution of Automatic Stabilizers to Budget Deficits and Surpluses 114
C-2. Budget Deficits and Surpluses With and Without Automatic Stabilizers 115
D-1. Annual Surpluses or Deficits Projected in CBO’s Baseline for the OASI, DI, and HI Trust Funds 125
Boxes
1-1. Updated Estimate of the Budgetary Effects of the American Recovery and Reinvestment Act of 2009 8
1-2. Automatic Enforcement Procedures Under the Budget Control Act 12
2-1. Lasting Effects of the Recent Recession on Potential Output 44
3-1. Categories of Federal Spending 48
3-2. Funding for Operations in Afghanistan and Iraq and for Related Activities 70
4-1. Scheduled Changes in the Tax Code That Affect CBO’s Revenue Baseline 82
Figures (Continued)

CBO
Summary
The federal budget deficit—although starting to shrink—remains very large by historical standards. How much and how quickly the deficit declines will depend in part on how well the economy does over the next few years. Probably more critical, though, will be the fiscal policy choices made by lawmakers as they face the sub-stantial changes to tax and spending policies that are slated to take effect within the next year under current law.
The pace of the economic recovery has been slow since the recession ended in June 2009, and the Congressional Budget Office (CBO) expects that, under current laws governing taxes and spending, the economy will continue to grow at a sluggish pace over the next two years. That pace of growth partly reflects the dampening effect on economic activity from the higher tax rates and curbs on spending scheduled to occur this year and especially next. Although CBO projects that growth will pick up after 2013, the agency expects that the economy’s output will remain below its potential until 2018 and that the unemployment rate will remain above 7 percent until 2015.
The Budget OutlookAs specified in law, and to provide a benchmark against which potential policy changes can be measured, CBO constructs its baseline estimates of federal revenues and spending under the assumption that current laws gener-ally remain unchanged. On that basis, the federal budget will show a deficit of nearly $1.1 trillion in fiscal year 2012 (see Summary Table 1). Measured as a share of gross domestic product (GDP), that shortfall will be 7.0 percent, which is nearly 2 percentage points below the deficit recorded last year but still higher than any def-icit between 1947 and 2008. Over the next few years, projected deficits in CBO’s baseline drop markedly, aver-aging 1.5 percent of GDP over the 2013–2022 period.
With deficits small relative to the size of the economy, debt held by the public drops—from about 75 percent of GDP in 2013 to 62 percent in 2022, which is still higher than in any year between 1952 and 2009.
Much of the projected decline in the deficit occurs because, under current law, revenues will rise consider-ably as a share of GDP—from 16.3 percent in 2012 to 20.0 percent in 2014 and 21.0 percent in 2022. In partic-ular, between 2012 and 2014, revenues in CBO’s baseline shoot up by more than 30 percent, mostly because of the recent or scheduled expirations of tax provisions, such as those that lower income tax rates and limit the reach of the alternative minimum tax (AMT), and the imposition of new taxes, fees, and penalties that are scheduled to go into effect. Revenues continue to rise relative to GDP after 2014 largely because increases in taxpayers’ real (inflation-adjusted) income are projected to push more of them into higher tax brackets and because more taxpayers become subject to the AMT.
As the economy expands in the next several years and as statutory caps constrain discretionary appropriations, federal spending in CBO’s baseline projections declines modestly relative to GDP before turning up again because of increasing expenses generated by the aging of the population and rising costs for health care. Pro-jected spending averages 21.9 percent of GDP over the 2013–2022 period, a percentage that is less than the 23.2 percent CBO estimates for 2012 but that is still elevated by historical standards. Spending resulting from the American Recovery and Reinvestment Act and out-lays for unemployment compensation and other benefits that tend to increase during economic downturns will continue to ebb over the next few years. Caps on discre-tionary spending and other procedures established in the recently enacted Budget Control Act also will hold down growth in federal spending. In the baseline, discretionary spending is projected to decline to 5.6 percent of GDP in
XII THE BUDGET AND ECONOMIC OUTLOOK: FISCAL YEARS 2012 TO 2022
CBO
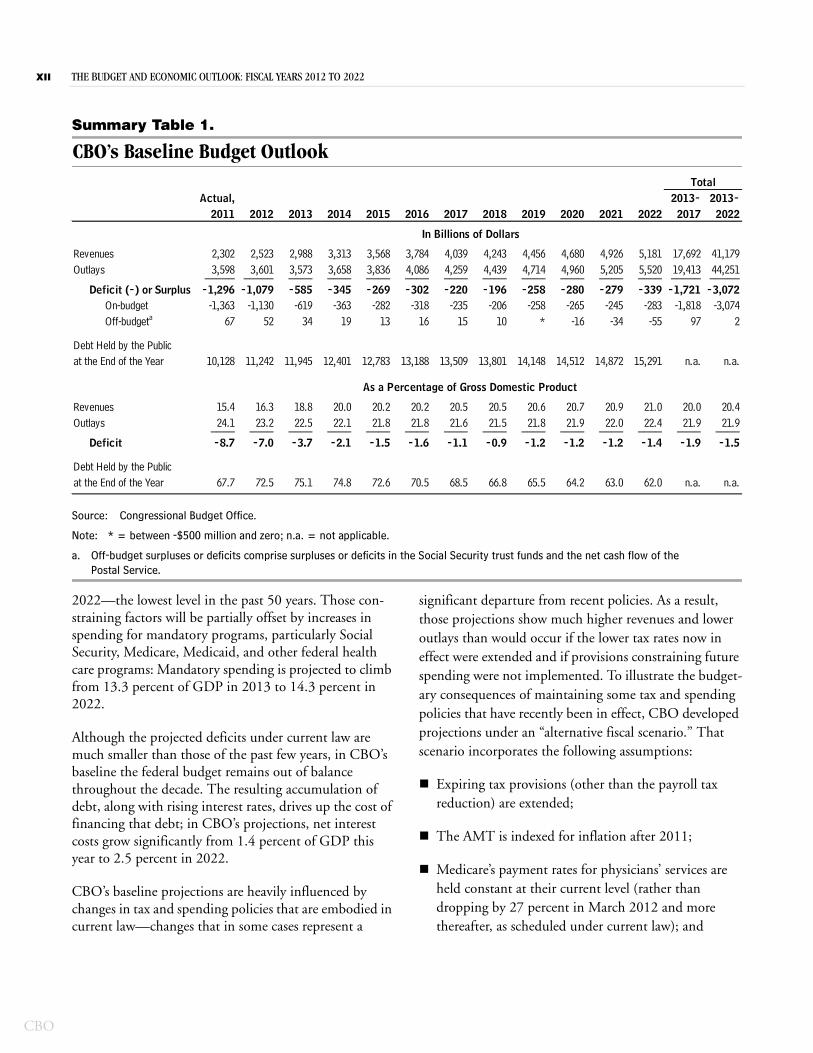
Summary Table 1.
CBO’s Baseline Budget Outlook
Source: Congressional Budget Office.
Note: * = between -$500 million and zero; n.a. = not applicable.
a. Off-budget surpluses or deficits comprise surpluses or deficits in the Social Security trust funds and the net cash flow of thePostal Service.
2022—the lowest level in the past 50 years. Those con-straining factors will be partially offset by increases in spending for mandatory programs, particularly Social Security, Medicare, Medicaid, and other federal health care programs: Mandatory spending is projected to climb from 13.3 percent of GDP in 2013 to 14.3 percent in 2022.
Although the projected deficits under current law are much smaller than those of the past few years, in CBO’s baseline the federal budget remains out of balance throughout the decade. The resulting accumulation of debt, along with rising interest rates, drives up the cost of financing that debt; in CBO’s projections, net interest costs grow significantly from 1.4 percent of GDP this year to 2.5 percent in 2022.
CBO’s baseline projections are heavily influenced by changes in tax and spending policies that are embodied in current law—changes that in some cases represent a
significant departure from recent policies. As a result, those projections show much higher revenues and lower outlays than would occur if the lower tax rates now in effect were extended and if provisions constraining future spending were not implemented. To illustrate the budget-ary consequences of maintaining some tax and spending policies that have recently been in effect, CBO developed projections under an “alternative fiscal scenario.” That scenario incorporates the following assumptions:
Expiring tax provisions (other than the payroll tax reduction) are extended;
The AMT is indexed for inflation after 2011;
Medicare’s payment rates for physicians’ services are held constant at their current level (rather than dropping by 27 percent in March 2012 and more thereafter, as scheduled under current law); and
Actual, 2013- 2013-2011 2012 2013 2014 2015 2016 2017 2018 2019 2020 2021 2022 2017 2022
Revenues 2,302 2,523 2,988 3,313 3,568 3,784 4,039 4,243 4,456 4,680 4,926 5,181 17,692 41,179Outlays 3,598 3,601 3,573 3,658 3,836 4,086 4,259 4,439 4,714 4,960 5,205 5,520 19,413 44,251_____ _____ ____ ____ ____ ____ ____ ____ ____ ____ ____ ____ _____ _____
Deficit (-) or Surplus -1,296 -1,079 -585 -345 -269 -302 -220 -196 -258 -280 -279 -339 -1,721 -3,072On-budget -1,363 -1,130 -619 -363 -282 -318 -235 -206 -258 -265 -245 -283 -1,818 -3,074Off-budgeta 67 52 34 19 13 16 15 10 * -16 -34 -55 97 2
Debt Held by the Publicat the End of the Year 10,128 11,242 11,945 12,401 12,783 13,188 13,509 13,801 14,148 14,512 14,872 15,291 n.a. n.a.
Revenues 15.4 16.3 18.8 20.0 20.2 20.2 20.5 20.5 20.6 20.7 20.9 21.0 20.0 20.4Outlays 24.1 23.2 22.5 22.1 21.8 21.8 21.6 21.5 21.8 21.9 22.0 22.4 21.9 21.9____ ____ ____ ____ ____ ____ ____ ____ ____ ____ ____ ____ ____ ____
Deficit -8.7 -7.0 -3.7 -2.1 -1.5 -1.6 -1.1 -0.9 -1.2 -1.2 -1.2 -1.4 -1.9 -1.5
Debt Held by the Publicat the End of the Year 67.7 72.5 75.1 74.8 72.6 70.5 68.5 66.8 65.5 64.2 63.0 62.0 n.a. n.a.
Total
In Billions of Dollars
As a Percentage of Gross Domestic Product
SUMMARY THE BUDGET AND ECONOMIC OUTLOOK: FISCAL YEARS 2012 TO 2022 XIII
CBO
Summary Figure 1.
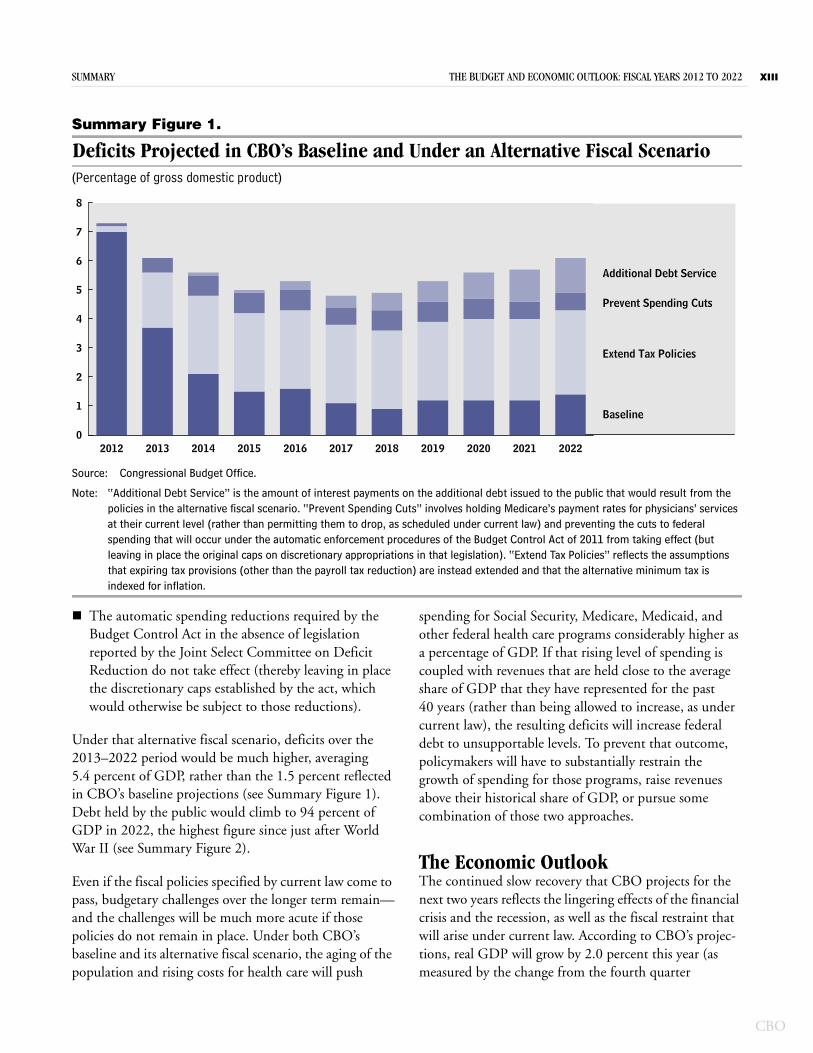
Deficits Projected in CBO’s Baseline and Under an Alternative Fiscal Scenario(Percentage of gross domestic product)
Source: Congressional Budget Office.
Note: “Additional Debt Service” is the amount of interest payments on the additional debt issued to the public that would result from the policies in the alternative fiscal scenario. “Prevent Spending Cuts” involves holding Medicare’s payment rates for physicians’ services at their current level (rather than permitting them to drop, as scheduled under current law) and preventing the cuts to federal spending that will occur under the automatic enforcement procedures of the Budget Control Act of 2011 from taking effect (but leaving in place the original caps on discretionary appropriations in that legislation). “Extend Tax Policies” reflects the assumptions that expiring tax provisions (other than the payroll tax reduction) are instead extended and that the alternative minimum tax is indexed for inflation.
The automatic spending reductions required by the Budget Control Act in the absence of legislation reported by the Joint Select Committee on Deficit Reduction do not take effect (thereby leaving in place the discretionary caps established by the act, which would otherwise be subject to those reductions).
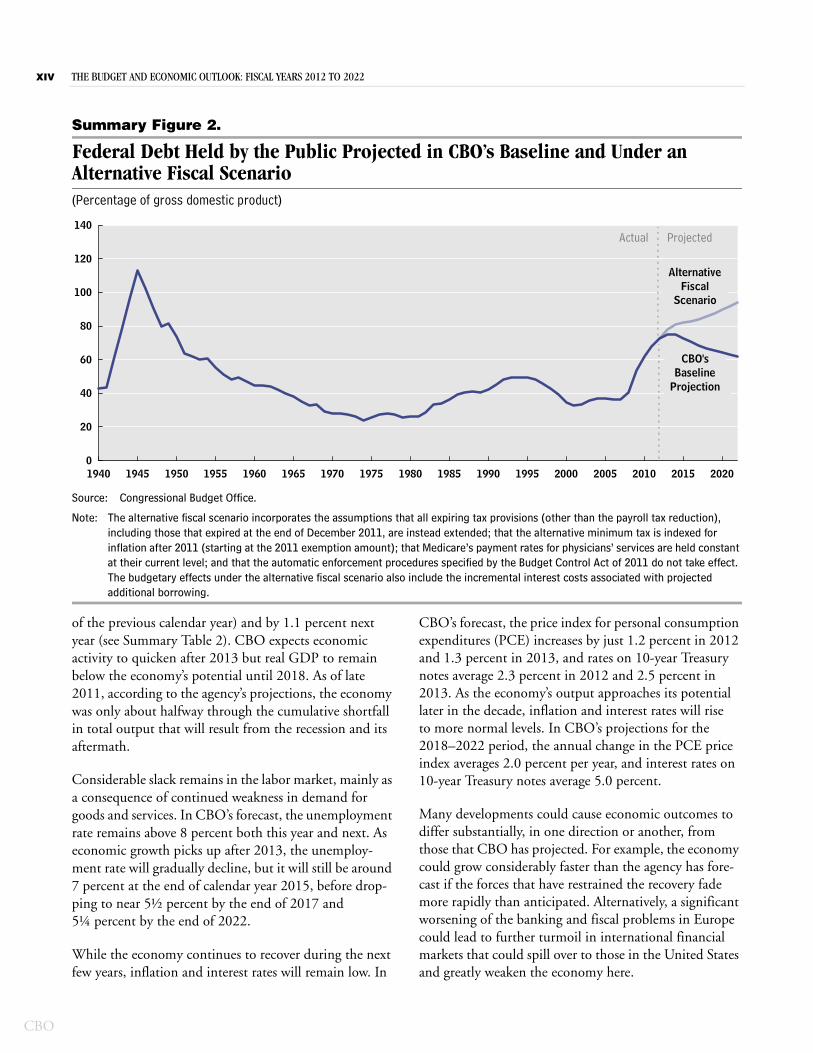
Under that alternative fiscal scenario, deficits over the 2013–2022 period would be much higher, averaging 5.4 percent of GDP, rather than the 1.5 percent reflected in CBO’s baseline projections (see Summary Figure 1). Debt held by the public would climb to 94 percent of GDP in 2022, the highest figure since just after World War II (see Summary Figure 2).
Even if the fiscal policies specified by current law come to pass, budgetary challenges over the longer term remain—and the challenges will be much more acute if those policies do not remain in place. Under both CBO’s baseline and its alternative fiscal scenario, the aging of the population and rising costs for health care will push
spending for Social Security, Medicare, Medicaid, and other federal health care programs considerably higher as a percentage of GDP. If that rising level of spending is coupled with revenues that are held close to the average share of GDP that they have represented for the past 40 years (rather than being allowed to increase, as under current law), the resulting deficits will increase federal debt to unsupportable levels. To prevent that outcome, policymakers will have to substantially restrain the growth of spending for those programs, raise revenues above their historical share of GDP, or pursue some combination of those two approaches.
The Economic OutlookThe continued slow recovery that CBO projects for the next two years reflects the lingering effects of the financial crisis and the recession, as well as the fiscal restraint that will arise under current law. According to CBO’s projec-tions, real GDP will grow by 2.0 percent this year (as measured by the change from the fourth quarter
2012 2013 2014 2015 2016 2017 2018 2019 2020 2021 20220
1
2
3
4
5
6
7
8
Additional Debt Service
Prevent Spending Cuts
Extend Tax Policies
Baseline
XIV THE BUDGET AND ECONOMIC OUTLOOK: FISCAL YEARS 2012 TO 2022
CBO
Summary Figure 2.
Federal Debt Held by the Public Projected in CBO’s Baseline and Under an Alternative Fiscal Scenario(Percentage of gross domestic product)
Source: Congressional Budget Office.
Note: The alternative fiscal scenario incorporates the assumptions that all expiring tax provisions (other than the payroll tax reduction), including those that expired at the end of December 2011, are instead extended; that the alternative minimum tax is indexed for inflation after 2011 (starting at the 2011 exemption amount); that Medicare’s payment rates for physicians’ services are held constant at their current level; and that the automatic enforcement procedures specified by the Budget Control Act of 2011 do not take effect. The budgetary effects under the alternative fiscal scenario also include the incremental interest costs associated with projected additional borrowing.
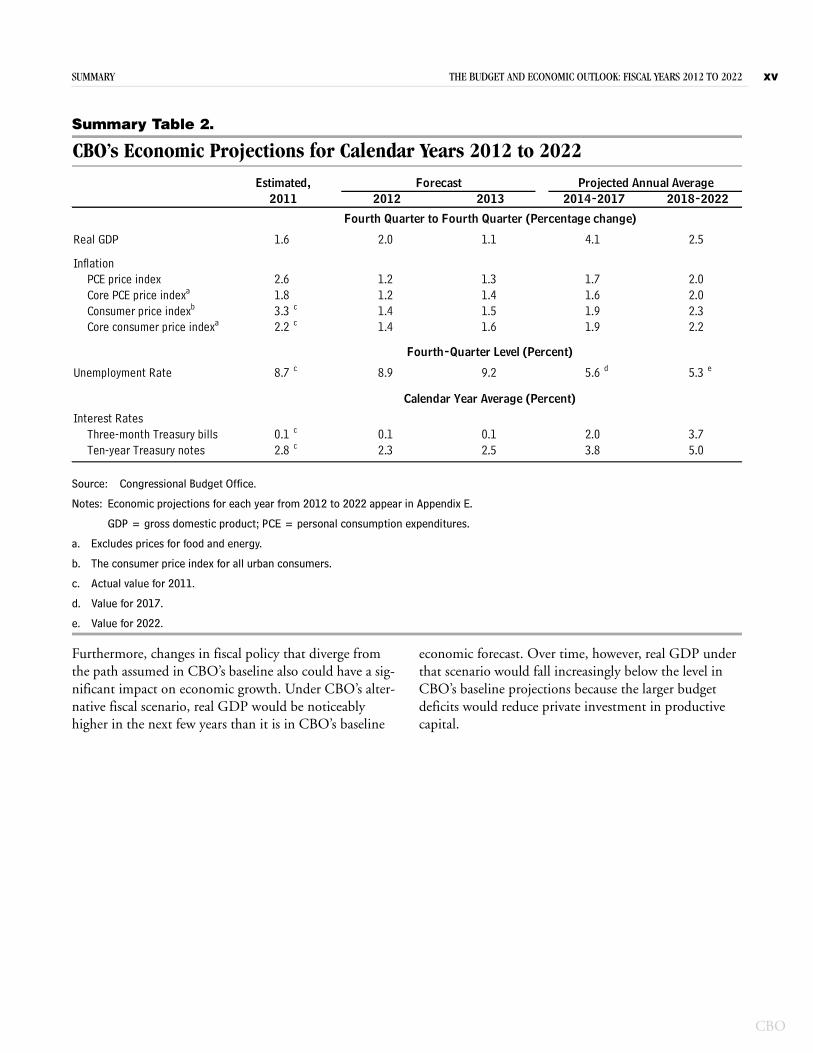
of the previous calendar year) and by 1.1 percent next year (see Summary Table 2). CBO expects economic activity to quicken after 2013 but real GDP to remain below the economy’s potential until 2018. As of late 2011, according to the agency’s projections, the economy was only about halfway through the cumulative shortfall in total output that will result from the recession and its aftermath.
Considerable slack remains in the labor market, mainly as a consequence of continued weakness in demand for goods and services. In CBO’s forecast, the unemployment rate remains above 8 percent both this year and next. As economic growth picks up after 2013, the unemploy-ment rate will gradually decline, but it will still be around 7 percent at the end of calendar year 2015, before drop-ping to near 5½ percent by the end of 2017 and 5¼ percent by the end of 2022.
While the economy continues to recover during the next few years, inflation and interest rates will remain low. In
CBO’s forecast, the price index for personal consumption expenditures (PCE) increases by just 1.2 percent in 2012 and 1.3 percent in 2013, and rates on 10-year Treasury notes average 2.3 percent in 2012 and 2.5 percent in 2013. As the economy’s output approaches its potential later in the decade, inflation and interest rates will rise to more normal levels. In CBO’s projections for the 2018–2022 period, the annual change in the PCE price index averages 2.0 percent per year, and interest rates on 10-year Treasury notes average 5.0 percent.
Many developments could cause economic outcomes to differ substantially, in one direction or another, from those that CBO has projected. For example, the economy could grow considerably faster than the agency has fore-cast if the forces that have restrained the recovery fade more rapidly than anticipated. Alternatively, a significant worsening of the banking and fiscal problems in Europe could lead to further turmoil in international financial markets that could spill over to those in the United States and greatly weaken the economy here.
1940 1945 1950 1955 1960 1965 1970 1975 1980 1985 1990 1995 2000 2005 2010 2015 20200
20
40
60
80
100
120
140Actual Projected
AlternativeFiscal
Scenario
CBO'sBaseline
Projection
SUMMARY THE BUDGET AND ECONOMIC OUTLOOK: FISCAL YEARS 2012 TO 2022 XV
CBO
Summary Table 2.
CBO’s Economic Projections for Calendar Years 2012 to 2022
Source: Congressional Budget Office.
Notes: Economic projections for each year from 2012 to 2022 appear in Appendix E.
GDP = gross domestic product; PCE = personal consumption expenditures.
a. Excludes prices for food and energy.
b. The consumer price index for all urban consumers.
c. Actual value for 2011.
d. Value for 2017.
e. Value for 2022.
Furthermore, changes in fiscal policy that diverge from the path assumed in CBO’s baseline also could have a sig-nificant impact on economic growth. Under CBO’s alter-native fiscal scenario, real GDP would be noticeably higher in the next few years than it is in CBO’s baseline
economic forecast. Over time, however, real GDP under that scenario would fall increasingly below the level in CBO’s baseline projections because the larger budget deficits would reduce private investment in productive capital.
Real GDP 1.6 2.0 1.1 4.1 2.5
InflationPCE price index 2.6 1.2 1.3 1.7 2.0Core PCE price indexa 1.8 1.2 1.4 1.6 2.0Consumer price indexb 3.3 c 1.4 1.5 1.9 2.3Core consumer price indexa 2.2 c 1.4 1.6 1.9 2.2
Unemployment Rate 8.7 c 8.9 9.2 5.6 d 5.3 e
Interest RatesThree-month Treasury bills 0.1 c 0.1 0.1 2.0 3.7Ten-year Treasury notes 2.8 c 2.3 2.5 3.8 5.0
Fourth-Quarter Level (Percent)
Forecast Projected Annual Average2012 2013 2014-2017 2018-2022
Fourth Quarter to Fourth Quarter (Percentage change)
Calendar Year Average (Percent)
2011Estimated,