the congressional budget office's work in 2016: a … the congressional budget office’s work...
TRANSCRIPT

CONGRESSIONAL BUDGET OFFICE
COST ESTIMATE
June 3, 2016
H.R. 5278
Puerto Rico Oversight, Management, and Economic Stability Act
As ordered reported by the House Committee on Natural Resources on May 25, 2016
SUMMARY
H.R. 5278 would create a legal framework for the federal government to oversee the fiscal
and budgetary affairs of certain U.S. territories. In particular, the bill would outline
procedures under which the governments of such territories and their instrumentalities
could establish an oversight board and thus restructure their public debt. The bill would
immediately establish such a board for the Commonwealth of Puerto Rico.
In CBO’s view, and in keeping with guidance specified by the 1967 President’s
Commission on Budget Concepts, a control board established under H.R. 5278 should be
considered a federal entity largely because of the extent of federal control involved in its
establishment and operations. Because it would be a federal entity, all cash flows related to
the board’s administrative costs should be recorded in the federal budget. On that basis,
over the 2017-2026 period, CBO estimates that enacting H.R. 5278 would:
Increase direct spending by $370 million for the board’s administrative costs;
Increase revenues—from amounts transferred to the oversight board by the
government of Puerto Rico to cover the board’s expenses—by $370 million; and
Have no significant net effect on the federal deficit.
In addition, CBO estimates that completing various reports and administrative
requirements specified by the bill would cost about $1 million in 2017; such spending
would be subject to the availability of appropriated funds.
Pay-as-you-go procedures apply because enacting the legislation would affect direct
spending and revenues. CBO estimates that enacting the legislation would not increase net
direct spending or on-budget deficits in any of the four consecutive 10-year periods
beginning in 2027.
CONGRESS OF THE UNITED STATES
CONGRESSIONAL BUDGET OFFICE
CBOThe U.S. Military’s
Force Structure:
A Primer
JULY 2016
TheFEDERALBUDGET IN 2015
CATEGORIES of the BUDGET
DEFICITS and the DEBT
MandatorySpending
Consists primarily of benefit programs for which laws set eligibility rules and benefit
formulas
Consists of spending that lawmakers control through annual appropriation acts
Consists of the government’s interest payments on debt held by the public, offset by interest
income the government receives
Consists of funds collected from the public that arise from the government’s exercise of
its sovereign powers
Deficit in 2015 as a percentage of GDP
Debt held by the public as a percentage of
GDP, on average, over the past 50 years
Net Interest Revenues
At $439 billion, the 2015 deficit constituted the smallest since 2007, and at 2.5 percent of gross domestic product, it was below the average deficit (relative to the size of the economy) over the past 50 years.
However, the large deficits recorded during the most recent recession and subsequent weak recovery substantially increased federal debt—in 2015, debt reached 74 percent of GDP, slightly less than the ratio in 2014 but higher than in any other year since 1950.
Such a high level of debt could have serious negative consequences for the nation, including restraining economic growth in the long term, giving policymakers less flexibility to respond to unexpected challenges, and eventually increasing the risk of a financial crisis.
Deficits as a percentage of GDP, on average, over
the past 50 years
Debt held by the public as a percentage of GDP at the end of
2015
74%39%2.5%2.8%
Prepared by Maureen Costantino and Leigh Angres
Source: Congressional Budget Office, January 2016
Contact: CBO Projections Unit, Budget Analysis Division
All data are for federal fiscal years,
which run from October 1 to September 30.
Numbers may not add up to totals because of rounding.
DiscretionarySpending
SocialSecurity
5.0% of GDP$882 Billion
Net Interest1.3% of GDP$224 Billion
Defense3.3% of GDP$582 Billion
Nondefense3.3% of GDP$583 Billion
Medicaid2.0% of GDP$350 Billion
Other3.0 % of GDP$528 Billion
Consists of spending on certain programs related to transportation, education, veterans’ benefits, health, housing assistance, and other activities
Consists of spending on unemployment compensation, federal civilian and military retirement, some veterans’ benefits, the earned income tax credit, the Supplemental Nutrition Assistance Program, and other mandatory programs, minus income from offsetting receipts
Spending$3.7 Trillion
MandatorySpending
12.9% of GDP$2.3 Trillion
DiscretionarySpending
6.5 % of GDP$1.2 Trillion
Medicare3.0% of GDP$539 Billion
Consists of Medicare spending minus income from premiums and other offsetting receipts
Payroll(Social Insurance)
Taxes6.0% of GDP$1.1 Trillion
CorporateIncome Taxes
1.9% of GDP$344 Billion
IndividualIncome Taxes
8.7% of GDP$1.5 Trillion
Other1.7% of GDP$299 Billion
Revenues$3.2 Trillion
Consists of payroll taxes that fund social insurance programs, primarily Social Security and Medicare’s Hospital Insurance program
Consists of excise taxes, estate and gift taxes, customs duties, receipts from the Federal Reserve, and miscellaneous fees and fines
1966 1971 1976 1981 1986 1991 1996 2001 2006 2011 2015
Annual Deficit or Surplus = Revenues − Outlays
To fund government spending in years of deficits, the government borrows from individuals,
businesses, or other countries by selling them Treasury securities.
Federal Deficits, 1966 to 2015Percentage of Gross Domestic Product
Federal Debt, 1966 to 2015Percentage of Gross Domestic Product
−10
−8
−6
−4
−2
0
2
4
Average Deficit,1966 to 2015
1966 1971 1976 1981 1986 1991 1996 2001 2006 2011 2015
Debt
Debt held by the public is roughly equal to the sum of annual deficits and surpluses. Other factors, such as borrowing to fund student
loans and other federal credit programs, can also affect debt held by the public.
0
20
40
60
80
Average Debt,1966 to 2015
CONGRESSIONAL BUDGET OFFICE
COST ESTIMATE March 9, 2016
H.R. 4441
Aviation Innovation, Reform, and Reauthorization Act of 2016
As ordered reported by the House Committee on Transportation and Infrastructure
on February 11, 2016
SUMMARY
H.R. 4441 would establish a federally chartered, not-for-profit corporation (known as the
ATC Corporation) to assume responsibility for operating the U.S. air traffic control
system, a function currently performed by the Federal Aviation Administration (FAA).
The proposed corporation would be governed by a 13-member board of directors
composed of individuals representing certain aviation stakeholder groups. To finance the
costs of providing air traffic services, the bill would authorize the corporation to charge
fees to users of such services and to issue debt.
The Secretary of Transportation would manage and oversee the transition of operational
control over air traffic services to the proposed corporation, which would occur on
October 1, 2019. Until that time, the bill would authorize appropriations for the FAA to
continue to operate, maintain, and modernize the air traffic control system and carry out the
agency’s other traditional responsibilities related to civil aviation. After the proposed
transition of all air traffic control-related personnel and programs to the ATC Corporation,
the bill would authorize additional appropriations for FAA and the Department of
Transportation (DOT) to continue to meet traditional aviation-related responsibilities, such
as performing certain regulatory and safety-related activities, making grants to airports to
support capital projects, and subsidizing air service to certain rural communities.
Although the proposed corporation would be independent and autonomous, in CBO’s view
it would effectively act as an agent of the federal government in carrying out a regulatory
function. Hence, in keeping with guidance specified by the 1967 President’s Commission
on Budget Concepts, the proposed corporation’s cash flows should be recorded in the
federal budget. More specifically, fees charged by the proposed corporation should be
recorded as federal revenues, and its expenditures should be classified as federal direct
spending.
CONGRESSIONAL BUDGET OFFICE COST ESTIMATE
June 10, 2016 S. 2943 National Defense Authorization Act for Fiscal Year 2017
As reported by the Senate Committee on Armed Services on May 18, 2016
SUMMARYS. 2943 would authorize appropriations totaling an estimated $603.9 billion for the military
functions of the Department of Defense (DoD), for certain activities of the Department of
Energy (DOE), and for other purposes. In addition, S. 2943 would prescribe personnel
strengths for each active-duty and selected-reserve component of the U.S. armed forces.
CBO estimates that appropriation of the authorized amounts would result in outlays of
$587.8 billion over the 2017-2021 period.Of the amount authorized for 2017, $544.1 billion—if appropriated—would count against
that year’s defense cap set in the Budget Control Act (BCA), as amended. Another
$0.2 billion authorized for nondefense programs would count against the nondefense cap
and an additional $58.9 billion authorized and designated for overseas contingency
operations would not be constrained by caps. The bill also contains provisions that would affect the costs of defense programs funded
through discretionary appropriations in 2018 and future years. Those provisions mainly
would affect force structure, compensation and benefits, the military health system, and
various procurement programs. CBO has analyzed the costs of a select number of those
provisions and estimates that they would, on a net basis, decrease the cost of those
programs relative to current law by about $14 billion over the 2018-2021 period. The net
costs of those provisions in 2018 and beyond are not included in the total amount of outlays
mentioned above because funding for those activities would be covered by specific
authorizations in future years. In addition, CBO estimates that enacting the bill would increase direct spending by
$10.9 billion over the 2017-2026 period. S. 2943 would have an insignificant effect on
revenues. Because enacting the bill would affect direct spending and revenues,
pay-as-you-go procedures apply.
0
10
20
30
Percentage of GDP
Net Interest
OtherNoninterestSpending
Major Health CarePrograms
Social Security
2016
RevenuesSpending
2046
DeficitOther RevenuesCorporateIncome Taxes
IndividualIncome Taxes
Deficit
Payroll Taxes
20162046
RevenuesSpending
CONGRESS OF THE UNITED STATES
CONGRESSIONAL BUDGET OFFICECBOThe 2016 Long-Term Budget Outlook
JULY 2016
CONGRESS OF THE UNITED STATESCONGRESSIONAL BUDGET OFFICE
CBOOptions for
Reducing the Deficit:
2017 to 2026
DECEMBER 2016
1966 1971 1976 1981 1986 1991 1996 2001 2006 2011 2016 2021 2026
0
20
40
60
80
100
ActualProjecte
d In CBO’s projections, growing
deficits drive up debt over the next
decade, as spending rises and
revenues remain relatively flat as a
share of the economy.Percentage of GDP
1966 1971 1976 1981 1986 1991 1996 2001 2006 2011 2016 2021 2026
0
10
20
30
40
50
60
70
ActualProjecte
d
Millions of People
Spending for Social Security
and Medicare increases as the
number of people age 65 or
older grows.
1966 1971 1976 1981 1986 1991 1996 2001 2006 2011 2016 2021 2026
050
55
60
65
70
ActualProjecte
d
Employed
UnemployedPercentage of the Population
Because retiring baby boomers
reduce the percentage of the
population in the labor force, the
economy expands more moderately
in later years after growing solidly this
year and next.
CONGRESS OF THE UNITED STATES
CONGRESSIONAL BUDGET OFFICE
CBOThe Budget and
Economic Outlook:
2016 to 2026
JANUARY 2016
CONGRESS OF THE UNITED STATESCONGRESSIONAL BUDGET OFFICE
CBOThe Congressional
Budget Office’s Work in 2016: A Report to the
Congress
JUNE 2017

The Congressional Budget Office was established under the Congressional Budget Act of 1974 to provide infor-mation that would support the Congressional budget process and help the Congress make effective budget and economic policy. CBO provides estimates and other analyses in response to requests from the Committees on the Budget, the Committees on Appropriations, the House Committee on Ways and Means, the Senate Committee on Finance, other committees, and the lead-ership of the House and Senate.
The agency is committed to providing information that is:
O Objective—representing not the personal opinions of CBO staff but the consensus and diversity of views of experts from around the country;
O Insightful—applying the best new evidence and inno-vative ideas as well as the lessons of experience;
O Timely—responding as quickly as possible to the needs of the Congress; and
O Clearly presented and explained—so that policymak-ers and analysts understand the basis for the agency’s findings and have the opportunity to question the analysis and methods used.
In keeping with CBO’s mandate to provide analysis that is objective as well as impartial, the agency makes no pol-icy recommendations. Instead, it strives to present fully and fairly the likely consequences of alternative proposals being considered by the Congress so that lawmakers can make informed policy choices.
To fulfill its mission, CBO analyzes trends and recent developments related to the economy and the budget. It then develops baseline projections for the next 10 years and the longer term. Those baseline projections serve as neutral benchmarks for gauging the effects of spending and revenue proposals relative to what would occur if current laws generally remained unchanged. Using those benchmarks in most of its analyses, the agency does the following:
O Issues formal cost estimates for almost all bills reported by committees of the House and Senate, including estimates of the cost of intergovernmental and private-sector mandates;
O Provides informal cost estimates while legislation is being developed and while amendments are being considered by the House and Senate;
O Estimates the cost of all appropriation bills;
O Prepares analytic reports and working papers—including testimony about the outlook for the econ-omy and the budget, examinations of the President’s budget, and studies on a broad range of budgetary and economic issues;
O Posts files of data on its website documenting its baseline projections and providing other information underlying the analytic reports; and
O Publishes descriptions of policy options that would reduce budget deficits, as well as information to clearly present and explain CBO’s analyses.
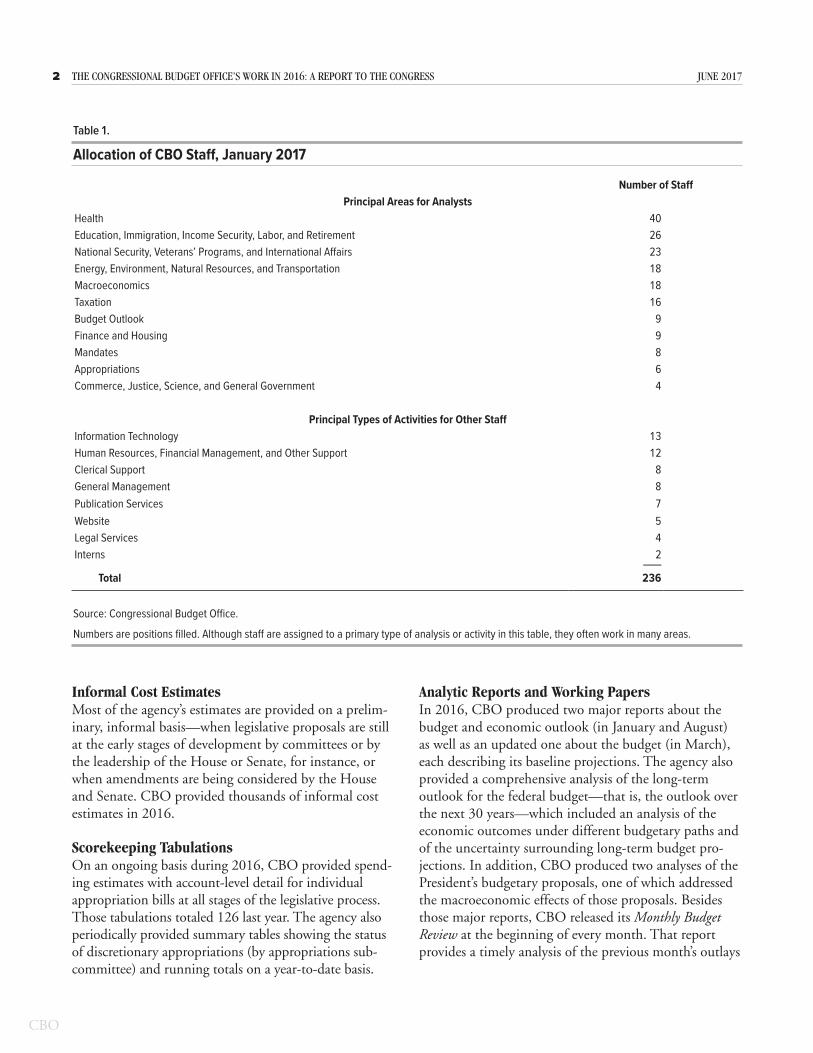
The agency employs analysts with many types of exper-tise who undertake those activities in collaboration with managers and support staff. At the beginning of January 2017, 236 positions at CBO were filled, with the largest concentration in the area of health (see Table 1).
Information Provided to the Congress in 2016As it does each year, CBO analyzed trends and recent developments related to the economy and the budget during calendar year 2016 and developed baseline pro-jections. With those projections used as benchmarks in most of its analyses, CBO produced hundreds of formal cost estimates and mandate statements, as well as thou-sands of informal estimates, more than 100 scorekeeping estimates for appropriation bills, and many analytic reports, working papers, data files, budget options, and other publications.
Formal Cost Estimates and Mandate StatementsCBO completed 676 formal cost estimates in 2016. They generally included explanations of the components of the estimates and the estimating methodology used. The vast majority also included mandate statements, which assess whether legislation contains intergovern-mental or private-sector mandates as defined in the Unfunded Mandates Reform Act and, if so, assess the magnitude of the mandates’ effects on the private sector and on state, local, and tribal governments.
2 The Congressional BudgeT offiCe’s Work in 2016: a reporT To The Congress June 2017
Informal Cost Estimates Most of the agency’s estimates are provided on a prelim-inary, informal basis—when legislative proposals are still at the early stages of development by committees or by the leadership of the House or Senate, for instance, or when amendments are being considered by the House and Senate. CBO provided thousands of informal cost estimates in 2016.
Scorekeeping TabulationsOn an ongoing basis during 2016, CBO provided spend-ing estimates with account-level detail for individual appropriation bills at all stages of the legislative process. Those tabulations totaled 126 last year. The agency also periodically provided summary tables showing the status of discretionary appropriations (by appropriations sub-committee) and running totals on a year-to-date basis.
Analytic Reports and Working PapersIn 2016, CBO produced two major reports about the budget and economic outlook (in January and August) as well as an updated one about the budget (in March), each describing its baseline projections. The agency also provided a comprehensive analysis of the long-term outlook for the federal budget—that is, the outlook over the next 30 years—which included an analysis of the economic outcomes under different budgetary paths and of the uncertainty surrounding long-term budget pro-jections. In addition, CBO produced two analyses of the President’s budgetary proposals, one of which addressed the macroeconomic effects of those proposals. Besides those major reports, CBO released its Monthly Budget Review at the beginning of every month. That report provides a timely analysis of the previous month’s outlays
Table 1 .
Allocation of CBO Staff, January 2017
Number of StaffPrincipal Areas for Analysts
Health 40Education, Immigration, Income Security, Labor, and Retirement 26National Security, Veterans’ Programs, and International Affairs 23Energy, Environment, Natural Resources, and Transportation 18Macroeconomics 18Taxation 16Budget Outlook 9Finance and Housing 9Mandates 8Appropriations 6Commerce, Justice, Science, and General Government 4
Principal Types of Activities for Other StaffInformation Technology 13Human Resources, Financial Management, and Other Support 12Clerical Support 8General Management 8Publication Services 7Website 5Legal Services 4Interns 2
____
Total 236
Source: Congressional Budget Office.
Numbers are positions filled. Although staff are assigned to a primary type of analysis or activity in this table, they often work in many areas.
3June 2017 The Congressional BudgeT offiCe’s Work in 2016: a reporT To The Congress
and revenues and a review of budgetary developments for the fiscal year to date.
CBO published numerous other analyses in 2016, with increased emphasis on providing explanations of the agency’s analytical methods in appendixes and as separate documents. Some of those analyses were published as formal reports; others were conveyed as answers to ques-tions for the record following a Congressional hearing or as letters to Members of Congress. Still others were published as working papers, some of which provided technical descriptions of official CBO analyses and others of which presented independent research by CBO analysts. The agency also presented the results of its work in the form of testimony at Congressional hearings.
All told, the agency produced 63 analytic reports and working papers; they are arrayed by category below.
PROJECTIONS AND BUDGET ISSUES IN MAJOR RECURRING REPORTS
An Update to the Budget and Economic Outlook: 2016 to 2026 (August)
The 2016 Long-Term Budget Outlook (July)
A Macroeconomic Analysis of the President’s 2017 Budget (June)
An Analysis of the President’s 2017 Budget (March)
Updated Budget Projections: 2016 to 2026 (March)
The Budget and Economic Outlook: 2016 to 2026 (January)
BUDGET ISSUES
Monthly Budget Review (12 issues)
Options for Reducing the Deficit: 2017 to 2026 (December)
Answers to Questions for the Record Following a Hearing on the Oversight of the Congressional Budget Office Conducted by the Senate Committee on the Budget (November)
The Effects of Increasing Fannie Mae’s and Freddie Mac’s Capital (October)
CBO’s Projections of Federal Receipts and Expenditures in the National Income and Product Accounts (September)
Sequestration Update Report: August 2016 (August)
CBO’s Activities Under the Unfunded Mandates Reform Act (May)
Budgetary and Economic Outcomes Under Paths for Federal Revenues and Noninterest Spending Specified by Chairman Price, March 2016 (March)
Answers to Questions for the Record Following a Hearing on Unauthorized Appropriations Conducted by the Senate Budget Committee (February)
Answers to Questions for the Record Following a Hearing on the Federal Government’s Responsibilities and Liabilities Under the Nuclear Waste Policy Act (February)
The Budget and Economic Outlook: 2016 to 2026 (Testimony before the House Budget Committee) (February)
Appropriations With Expired Authorizations (Testimony before the Senate Budget Committee) (February)
Explanation of CBO’s Cost Estimate for H.R. 308, the Keep the Promise Act (Letter to the Honorable Trent Franks) (February)
Unauthorized Appropriations and Expiring Authorizations (January)
DISASTERS, ENERGY, AND TRANSPORTATION
Potential Increases in Hurricane Damage in the United States: Implications for the Federal Budget (June)
CBO’s Approach to Estimating Expected Hurricane Damage (June)
The Outlook for U.S. Production of Shale Oil (May)
Options for Increasing Federal Income From Crude Oil and Natural Gas on Federal Lands (April)
Approaches to Making Federal Highway Spending More Productive (February)
4 The Congressional BudgeT offiCe’s Work in 2016: a reporT To The Congress June 2017
FINANCE
Options to Improve the Financial Condition of the Pension Benefit Guaranty Corporation’s Multiemployer Program (August)
The Budgetary Effects of the United States’ Participation in the International Monetary Fund (June)
Report on the Troubled Asset Relief Program—March 2016 (March)
HEALTH CARE
Answers to Questions for the Record Following a Hearing by the House Committee on the Budget on CBO’s Estimates of the Budgetary Effects of the Center for Medicare & Medicaid Innovation (October)
CBO’s Estimates of the Budgetary Effects of the Center for Medicare & Medicaid Innovation (Testimony before the House Committee on the Budget) (September)
Projecting Hospitals’ Profit Margins Under Several Illustrative Scenarios (September)
Federal Subsidies for Health Insurance Coverage for People Under Age 65: 2016 to 2026 (March)
Private Health Insurance Premiums and Federal Policy (February)
INCOME SECURITY
CBO’s 2016 Long-Term Projections for Social Security: Additional Information (December)
Answers to Questions for the Record From Ranking Member Becerra Following a Hearing by the House Ways and Means Subcommittee on Social Security on Understanding Social Security’s Solvency Challenge (December)
The Economic Effects of Canceling Scheduled Changes to Overtime Regulations (November)
Answers to Questions for the Record From Chairman Johnson Following a Hearing by the House Subcommittee on Social Security, Committee on Ways and Means, on the Comparison of CBO’s Long-Term Projections With Those of the Social Security Trustees (November)
Comparing CBO’s Long-Term Projections With Those of the Social Security Trustees (Testimony before the House Subcommittee on Social Security, Committee on Ways and Means) (September)
Trends in Family Wealth, 1989 to 2013 (August)
Social Security Disability Insurance: Participation and Spending (June)
Trends in the Joblessness and Incarceration of Young Men (May)
Spending for Means-Tested Programs in CBO’s Baseline, 2016–2026 (Letter to the Honorable Tom Price) (February)
MACROECONOMIC ANALYSIS
How Preferential Trade Agreements Affect the U.S. Economy (September)
The Macroeconomic and Budgetary Effects of Federal Investment (June)
NATIONAL SECURITY
The U.S. Military’s Force Structure: A Primer (July)
Scanning and Imaging Shipping Containers Overseas: Costs and Alternatives (June)
Inflation in the Costs of Building Aircraft Carriers (April)
Long-Term Implications of the 2016 Future Years Defense Program (January)
TAXES
Factors Affecting Revenue Estimates of Tax Compliance Proposals (November)
The Distribution of Asset Holdings and Capital Gains (August)
The Short-Term Effects of Tax Changes—Evidence for State Dependence (August)
The Distribution of Household Income and Federal Taxes, 2013 (June)
5June 2017 The Congressional BudgeT offiCe’s Work in 2016: a reporT To The Congress
Files of Data Underlying ReportsCBO issued 10-year budget and economic projections in January and August and an update of the 10-year budget projections in March. An analysis of the President’s bud-get request for fiscal year 2017 was also released in March. In July, the agency issued long-term budget projections looking 30 years ahead. In conjunction with all of those projections, CBO posted on its website (in 68 separate files) detailed data on spending and revenues and on various aspects of the economy. The agency also posted supplemental data with some of its analytic reports.
Budget OptionsTo help inform lawmakers about the budgetary impli-cations of various approaches to altering federal poli-cies, CBO issued a volume of policy options covering a broad range of issues, as well as a number of reports that included policy options in particular areas. (To devote the necessary effort to that volume, which is generally published every two years, CBO produced fewer ana-lytic reports than it did the previous year; analysis of the options was the result of work by more than 130 peo-ple.) The agency made the 115 options in that volume and 6 from the other publications individually available in an easily accessible format on its website.
Other PublicationsIn addition to analytical reports and working papers, CBO prepared other publications, which increased the transparency of its work and communicated about that work graphically. For instance, CBO’s blog made various types of information available simultaneously to all Members of Congress and the public, including answers to some questions that the agency received from the Congress, explanations of how CBO conducts certain analyses, and indications of additional research that would be particularly helpful. To explain how CBO conducts its work and allocates its resources, the agency provided testimony about its operations and its funding request. And to make CBO’s projections and the composition of the federal budget easier to under-stand, the agency published a set of infographics and slide decks.
Sixteen such publications are listed below. CBO also published information on its website in various other forms. For instance, the blog included excerpts from reports highlighting key issues, and 42 presentations, most of them drawn from published analyses, were posted on the website.
BLOG POSTS INCREASING TRANSPARENCY
Challenges in Estimating the Number of People With Nongroup Health Insurance Coverage Under Proposals for Refundable Tax Credits (December)
How Does CBO Define and Estimate Health Insurance Coverage for People Under Age 65? (December)
CBO’s Analysis of Financial Pressures Facing Hospitals Identifies Need for Additional Research on Hospitals’ Productivity and Responses (September)
INFORMATION ABOUT CBO’S OPERATIONS
Testimony on the Congressional Budget Office’s Work Since May 2015 and Plans for the Future (Testimony before the Senate Committee on the Budget) (September)
Glossary (July)
The Congressional Budget Office’s Work in 2015: A Report to the Congress (April)
Statement for the Record Regarding CBO’s Appropriation Request for Fiscal Year 2017 (Testimony before the Subcommittee on the Legislative Branch, House Committee on Appropriations) (March)
Testimony on CBO’s Appropriation Request for Fiscal Year 2017 (Testimony before the Subcommittee on the Legislative Branch, Senate Committee on Appropriations) (March)
INFOGRAPHICS
The 2016 Long-Term Budget Outlook (July)
Revenues in 2015 (January)
Discretionary Spending in 2015 (January)
Mandatory Spending in 2015 (January)
The Federal Budget in 2015 (January)
SLIDE DECKS
The 2016 Long-Term Budget Outlook in 22 Slides (July)
The Economic Outlook for 2016 to 2026 in 17 Slides (February)
The Budget Outlook for 2016 to 2026 in 19 Slides (February)
6 The Congressional BudgeT offiCe’s Work in 2016: a reporT To The Congress June 2017
Improvements in Internal Operations in 2016In 2016, CBO continued to focus on staff development and internal communication. The agency conducted its biennial employee satisfaction survey to assess the needs of its staff and identify ways to improve employees’ satisfaction and CBO’s productivity. The results indi-cated that the agency has been successful at developing employees’ skills and also suggested ways to improve internal communication. CBO is incorporating those results into its management goals.
To ensure that staff members stay current on topics of importance to CBO’s work for the Congress, the agency hosted presentations by a broad range of outside researchers and other experts, and staff members partic-ipated in numerous seminars to share information on their analyses, data, and estimating techniques. CBO also sustained its emphasis on training. The agency funded participation in conferences of researchers, practitioners, and government employees on various economic and policy topics, as well as training in analytic tools and various skills. CBO continued to emphasize the need to clearly communicate the results of analyses, providing courses on writing analytic reports. And the agency developed a set of multimedia resources to help staff improve their public speaking skills.
CBO implemented numerous improvements to its infor-mation technology infrastructure and practices last year. Among other advances, CBO:
O Improved its ability to monitor, and counter in advance, potential cyberthreats around the clock and to assess and fix potential vulnerabilities on an ongoing basis;
O Installed a new desktop backup system that is much more effective than its predecessor, ensuring that desktop computers are reliably backed up daily and that their data can be recovered if necessary;
O Continued to upgrade network switches and connec-tivity to increase the speed of data transfers and com-munications within the agency’s offices in the Ford House Office Building and between that location and the agency’s off-site Alternate Computing Facility, in order to facilitate the backup of systems and to improve the process of recovering from disasters;
O Continued to migrate the agency’s email to a cloud-based system, reducing the need for on-site equip-ment and the risks associated with recovering from disasters; and
O Continued to improve remote access and teleworking capabilities, covering the entire CBO workforce.
CBO continually strives to make its work more easily accessible on its public website and on its social media platforms. In 2016, CBO:
O Launched a new, mobile-friendly website and redesigned the home page accordingly;
O Developed and implemented a formal method for getting feedback about the website from Congressional staff and other users;
O Made enhancements to the website on the basis of that feedback, improving users’ experience;
O Created an online search tool for intergovernmental and private-sector mandates that CBO identifies in bills and public laws, replacing a printed report that had been published annually;
O Developed a new web page for budget and economic data to make it easier for users to find those data;
O Created a new web page that is a one-stop shop for tables of CBO’s baseline projections;
O Developed a digital version of Options for Reduc-ing the Deficit: 2017 to 2026, making the options described in that publication searchable;
O Added a new web page containing the agendas of past meetings of CBO’s Panel of Economic Advisers and Panel of Health Advisers, to bolster transparency; and
O Launched a redesigned web page for members of the press.
Also in 2016, CBO redesigned its web page listing job opportunities to make it more user-friendly and added a new page about diversity and inclusion. Parts of its intranet were revamped as well to allow easier use.

7June 2017 The Congressional BudgeT offiCe’s Work in 2016: a reporT To The Congress
To help keep the Congress informed about its work and operations, CBO prepared this report. It was written by Leigh Angres, Theresa Gullo, Deborah Kilroe, Cierra Liles, Terry Owens, Stephanie Ruiz, and Mark Smith, with guidance from Joseph E. Evans, Jr.
The report was reviewed by Mark Hadley, Jeffrey Kling, and Robert Sunshine. Benjamin Plotinsky edited the report, and Jorge Salazar prepared it for publication. An electronic version is available on CBO’s website (www.cbo.gov/publication/52767).
Keith Hall Director June 2017