congressional budget office douglas w. elmendorf, …congressional budget office douglas w....
TRANSCRIPT

CONGRESSIONAL BUDGET OFFICE Douglas W. Elmendorf, Director U.S. Congress Washington, DC 20515
March 20, 2010
Honorable Nancy Pelosi Speaker U.S. House of Representatives Washington, DC 20515 Dear Madam Speaker: The Congressional Budget Office (CBO) and the staff of the Joint Committee on Taxation (JCT) have completed an estimate of the direct spending and revenue effects of an amendment in the nature of a substitute to H.R. 4872, the Reconciliation Act of 2010. The amendment discussed in this letter (hereafter called “the reconciliation proposal”) is the one that was made public on March 18, 2010, as modified by subsequent changes incorporated in a proposed manager’s amendment that was made public on March 20. This estimate differs from the preliminary estimate that CBO issued on March 18 in that it reflects CBO and JCT’s review of the legislative language of the earlier amendment and the manager’s amendment, as well as modest technical refinements of the budgetary projections.1 This estimate is presented in two ways:
An estimate of the budgetary effects of the reconciliation proposal, in combination with the effects of H.R. 3590, the Patient Protection and Affordable Care Act (PPACA), as passed by the Senate; and
An estimate of the incremental effects of the reconciliation proposal, over and above the effects of enacting H.R. 3590 by itself.2
1 For the preliminary estimate by CBO and JCT of the direct spending and revenue effects of the reconciliation proposal, see Congressional Budget Office, letter to the Honorable Nancy Pelosi providing a preliminary analysis of the reconciliation proposal (March 18, 2010). 2 For the estimate by CBO and JCT of the direct spending and revenue effects of H.R. 3590 as passed by the Senate, see Congressional Budget Office, cost estimate of H.R. 3590, Patient Protection and Affordable Care Act (March 11, 2010). JCT’s detailed table of revenue effects is available at www.jct.gov.
Honorable Nancy Pelosi Page 2 CBO and JCT have not yet updated their preliminary and partial estimate of the budgetary impact of the reconciliation proposal under the assumption that H.R. 3590 is not enacted—that is, the reconciliation proposal’s impact under current law. H.R. 3590 would, among other things, establish a mandate for most residents of the United States to obtain health insurance; set up insurance exchanges through which certain individuals and families could receive federal subsidies to substantially reduce the cost of purchasing that coverage; significantly expand eligibility for Medicaid; substantially reduce the growth of Medicare’s payment rates for most services (relative to the growth rates projected under current law); impose an excise tax on insurance plans with relatively high premiums; and make various other changes to the federal tax code, Medicare, Medicaid, and other programs. The reconciliation proposal includes provisions related to health care and revenues, many of which would amend H.R. 3590. (The changes with the largest budgetary effects are described below.) The reconciliation proposal also includes amendments to the Higher Education Act of 1965, which authorizes most federal programs involving postsecondary education. (Those provisions and their budgetary effects are described below as well.) Estimated Budgetary Impact of the Legislation CBO and JCT estimate that enacting both pieces of legislation—H.R. 3590 and the reconciliation proposal—would produce a net reduction in federal deficits of $143 billion over the 2010–2019 period as result of changes in direct spending and revenues (see Table 1). That figure comprises $124 billion in net reductions deriving from the health care and revenue provisions and $19 billion in net reductions deriving from the education provisions. Approximately $114 billion of the total reduction would be on-budget; other effects related to Social Security revenues and spending as well as spending by the U.S. Postal Service are classified as off-budget. CBO has not completed an estimate of the potential impact of the legislation on discretionary spending, which would be subject to future appropriation action. CBO and JCT previously estimated that enacting H.R. 3590 by itself would yield a net reduction in federal deficits of $118 billion over the 2010–2019 period, of which about $65 billion would be on-budget. The incremental effect of enacting the reconciliation proposal—assuming that H.R. 3590 had already been enacted—would be the difference between the estimate of their combined effect and the previous estimate for H.R. 3590. That

Honorable Nancy Pelosi Page 3 incremental effect is an estimated net reduction in federal deficits of $25 billion during the 2010–2019 period over and above the savings from enacting H.R. 3590 by itself; almost all of that reduction would be on-budget.3 Additional details on the budgetary effects of the reconciliation proposal and H.R. 3590 are provided in Tables 2 through 7 attached to this letter:
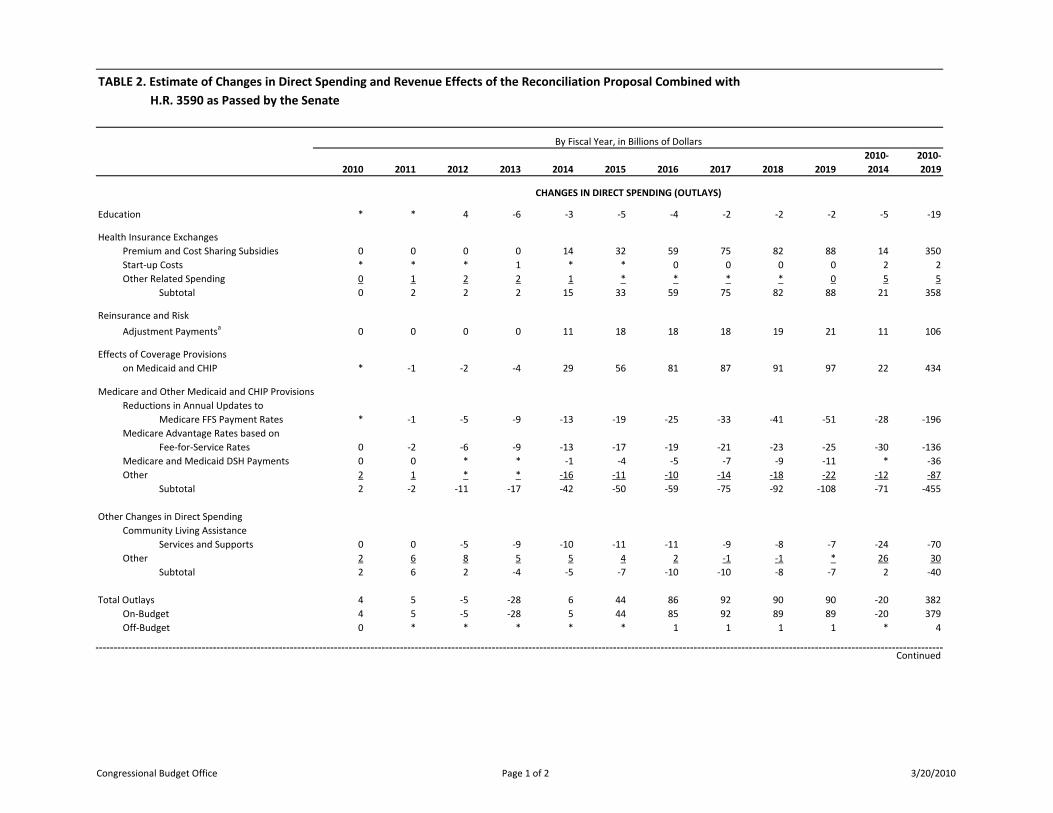
Table 2 shows budgetary cash flows for direct spending and revenues associated with the two pieces of legislation combined.
Table 3 summarizes the incremental changes in direct spending and revenues resulting from the reconciliation proposal, assuming that H.R. 3590 had already been enacted.
For the two pieces of legislation combined, Table 4 provides estimates of the changes in the number of nonelderly people in the United States who would have health insurance and presents the primary budgetary effects of the provisions related to health insurance coverage.
For the two pieces of legislation combined, Table 5 displays detailed estimates of the costs or savings from the health care provisions that are not related to health insurance coverage (primarily involving the Medicare program). The table does not include the effects of revenue provisions; those effects are reported separately by JCT in JCX-17-10 at www.jct.gov.
Table 6 presents details on the incremental effects of the health care and revenue provisions of the reconciliation proposal—that is, the difference between the effects of those provisions in the two pieces of legislation combined and the effects of H.R. 3590 by itself (as shown in CBO’s cost estimate of March 11, 2010).
Table 7 summarizes the incremental effects of the health care, revenue, and education provisions of the reconciliation proposal, also assuming that H.R. 3590 had been enacted.
3 As originally introduced, the reconciliation proposal would require transfers from on-budget general funds to the off-budget Social Security trust funds to offset any reduction in the balances of those trust funds resulting from other provisions of the proposal. The effects of that provision were reflected in CBO’s preliminary estimate. However, the manager’s amendment to the reconciliation proposal strikes that provision, so its effects are not included in this estimate.

Honorable Nancy Pelosi Page 4 The estimate provided here covers the 2010–2019 period to be consistent with the budget horizon used under S. Con. Res. 13, the Concurrent Resolution on the Budget for Fiscal Year 2010. The Congress has not yet adopted a new budget resolution that would extend the House and Senate budget enforcement periods through 2020. Because the reconciliation proposal and H.R. 3590 would affect direct spending and revenues, pay-as-you-go procedures would apply. The time periods used for pay-as-you-go calculations under the new Statutory Pay-As-You-Go Act extend from 2010 through 2015 and from 2010 through 2020. Although CBO and JCT have not conducted a detailed analysis of the effects of the reconciliation proposal and H.R. 3590 in 2020, enacting that legislation would probably reduce the budget deficit modestly in that year. Reflecting that assessment, CBO and JCT estimate that enacting that legislation would reduce projected on-budget deficits both through 2015 and through 2020.4 The remainder of this letter discusses the major components of the education provisions contained in the reconciliation proposal; reviews the main changes that the reconciliation proposal would make to the health care and revenue provisions of H.R. 3590; describes the effects of the legislation on health insurance coverage; presents information about the effects of the legislation on discretionary spending; provides CBO’s analysis of the legislation’s impact on the federal budget beyond the first 10 years; and analyzes certain other effects of the legislation.
4 Pay-as-you-go procedures do not apply to off-budget effects, which include changes to Social Security or the U.S. Postal Service. Under the Statutory Pay-As-You-Go Act, estimated changes in the on-budget deficit from direct spending and revenues are recorded on 5-year and 10-year “scorecards” by the Office of Management and Budget, which is required to order a sequestration (cancellation) of certain direct spending if either scorecard reflects a net cost in the budget year at the end of a Congressional session.

Honorable Nancy Pelosi Page 5
Table 1. Estimate of the Effects on the Deficit of the Reconciliation Proposal Combined
with H.R. 3590, as Passed by the Senate
By Fiscal Year, in Billions of Dollars
2010 2011 2012 2013 2014 2015 2016 2017
2018 20192010-2014
2010-2019
NET CHANGES IN THE DEFICIT FROM INSURANCE COVERAGE PROVISIONS a,b Effects on the Deficit 3 7 9 10 49 87 132 154 164 172 78 788
NET CHANGES IN THE DEFICIT FROM OTHER PROVISIONS AFFECTING DIRECT SPENDING c Effects on the Deficit of Changes in Outlays 3 3 -7 -28 -50 -60 -70 -86 -101 -116 -79 -511
NET CHANGES IN THE DEFICIT FROM OTHER PROVISIONS AFFECTING REVENUES d Effects on the Deficit of Changes in Revenues * -9 -12 -38 -50 -48 -59 -65 -69 -71 -109 -420
NET CHANGES IN THE DEFICIT a Net Increase or Decrease (-) in the Budget Deficit 6 1 -10 -56 -51 -20 3 4 -5 -15 -109 -143 On-Budget 6 1 -10 -55 -50 -18 8 10 2 -6 -108 -114 Off-Budget e * * 1 -1 -1 -2 -5 -6 -7 -9 -1 -29 Memorandum: Incremental Effects on the Deficit of H.R. 4872 Incorporating the Manager’s Amendment, Relative to H.R. 3590 as Passed by the Senate Net Increase or Decrease 2 4 4 -3 -13 -4 -7 -3 -2 -3 -5 -25 On-Budget 2 4 4 -6 -14 -7 -11 -7 -6 -7 -10 -48 Off-Budget e 0 * * 4 1 3 4 4 4 4 5 23 Effects on the Deficit of Provisions of the Reconciliation Proposal Combined with H.R. 3590 Health Care and Revenue
Provisions 6 1 -13 -50 -48 -16 7 6
-4 -13 -104 -124 Education Provisions * * 4 -6 -3 -5 -4 -2 -2 -2 -5 -19
Continued

Honorable Nancy Pelosi Page 6
Table 1. Continued.
Sources: Congressional Budget Office and staff of the Joint Committee on Taxation (JCT). Notes: Positive numbers indicate increases in the deficit, and negative numbers indicate reductions in the deficit. Components may not sum to totals because of rounding; * = between $0.5 billion and -$0.5 billion. a. Does not include effects on spending subject to future appropriations. b. Includes excise tax on high-premium insurance plans. c. These estimates reflect the effects of provisions affecting Medicare, Medicaid, and other federal health programs, and include
the effects of interactions between insurance coverage provisions and those programs; they also reflect the effects of education provisions.
d. The changes in revenues include effects on Social Security revenues, which are classified as off-budget. The 10-year figure of
$420 billion includes $406 billion in revenues from tax provisions (estimated by JCT) apart from receipts from the excise tax on high-premium insurance plans and $14 billion in revenues from certain provisions affecting Medicare, Medicaid, and other programs (estimated by CBO and JCT). (For JCT’s estimates, see JCX-17-10.)
e. Off-budget effects include changes in Social Security spending and revenues as well as U.S. Postal Service spending.
Education Provisions Contained in the Reconciliation Proposal Subtitle A of title II of the reconciliation proposal would amend the Higher Education Act of 1965, which authorizes most federal postsecondary education programs. The reconciliation proposal would eliminate the federal program that provides guarantees for student loans and replace those loans with direct loans made by the Department of Education. It would also increase direct spending for the Pell Grant program and other education grant programs. CBO estimates that those provisions would reduce direct spending by $5 billion over the 2010–2014 period and $19 billion over the 2010–2019 period (see Table 7). Federal Student Loan Programs. On net, CBO estimates that the reconciliation proposal would reduce direct spending in the federal student loan programs by $28 billion over the 2010–2014 period and $58 billion over the 2010–2019 period. In the Federal Family Education Loan (FFEL) program, private lenders originate loans to postsecondary students; the federal government makes payments to those lenders, guarantees them against significant loss in the case of default, and provides funds to guaranty agencies to help administer those loans. In the direct loan program, eligible borrowers receive nearly identical loans that are administered by the Department of Education and funded through the U.S. Treasury.

Honorable Nancy Pelosi Page 7 The reconciliation proposal would eliminate new loans in the FFEL program beginning in July 2010. Under the proposal, CBO expects that all of the guaranteed loans that would have been made under current law—estimated to be roughly $500 billion through 2019—would instead be made through the direct loan program. The Federal Credit Reform Act specifies that the cost of new federal loans and loan guarantees be recorded in the budget in the year that the loans are disbursed, and that the cost be calculated as the net present value of the government’s expected cash flows over the lifetime of a loan or guarantee, using interest rates on Treasury securities of comparable maturity to discount the estimated cash flows.5 Using this methodology, CBO estimates that eliminating new guaranteed loans and replacing them with direct loans would yield reductions in direct spending of $61 billion over the 2010–2019 period. CBO also estimates that the expanded program for direct loans would incur about $5 billion in additional administrative costs during that period. However, those additional costs are classified as discretionary spending and are subject to future appropriation; they are not incorporated in the estimates of changes in direct spending and revenues reported in this letter. The legislation would also make other changes to federal loan programs for education. CBO estimates that those changes would increase direct spending by $1 billion over the 2010–2014 period and $3 billion over the 2010–2019 period—partially offsetting the gross savings from eliminating new guaranteed loans in the FFEL program. Federal Pell Grant Program. The reconciliation proposal would alter the structure of the Pell Grant program and provide additional funding for that program. CBO estimates that those changes would increase direct spending by $21 billion over the 2010–2014 period and $36 billion over the 2010–2019 period. Under current law, Pell grants are funded through both discretionary and mandatory funding. The annual discretionary appropriation sets a base award level, and a mandatory account provides additional funding to
5 An alternative approach to estimating the cost of federal loans and loan guarantees is to estimate what a private entity would need to be paid to assume the costs and risks to the government from providing such loans or guarantees. For further discussion of that so-called “fair-value” methodology, and for estimates of the cost of replacing guaranteed loans with direct loans based on different methodologies, see Congressional Budget Office, letter to the Honorable Judd Gregg regarding the budgetary impact of the President’s proposal to alter federal student loan programs (March 15, 2010).

Honorable Nancy Pelosi Page 8 students eligible for the program. The dollar amount of the additional mandatory awards is determined by the amount directly appropriated in the Higher Education Act. Beginning in fiscal year 2010, the reconciliation proposal would appropriate the amounts necessary to cover the cost of specified award levels in the Pell Grant program. For academic years through 2012–2013, the proposal would maintain the additional mandatory award at $690, as specified in current law for 2010–2011 and 2011–2012. (Under current law, however, there are not sufficient funds to cover all the costs of providing that $690 add-on to all Pell grant recipients; the proposal would provide the incremental funds necessary to do so.) Beginning in academic year 2013–2014, the mandatory award would increase according to a formula specified in the legislation. CBO estimates that the add-on would reach $1,115 for academic year 2017–2018 and subsequent years. CBO estimates that the increase in the mandatory add-on for Pell grants would raise direct spending by $23 billion over the 2010–2019 period. In addition, the legislation would provide roughly $14 billion in further mandatory funds to the Pell Grant program; CBO expects that most of that additional funding would be spent in fiscal years 2011 and 2012. Other Education Grant Programs. Finally, the education subtitle would appropriate $255 million per year through 2019 for grants to Historically Black Colleges and Universities and other Minority Serving Institutions. It would also appropriate $150 million per year through 2014 for College Access Challenge Grants. CBO estimates that those provisions would increase direct spending by $2 billion over the 2010–2014 period and by $3 billion over the 2010–2019 period. Changes to H.R. 3590 Contained in the Reconciliation Proposal The reconciliation proposal would make a variety of changes to H.R. 3590, as passed by the Senate. The changes with the largest budgetary effects over the 2010–2019 period include these:
Increasing the subsidies for premiums and cost sharing that would be offered through the new insurance exchanges;
Increasing the penalties for employers that do not offer health insurance and modifying the penalties for individuals who do not obtain insurance;

Honorable Nancy Pelosi Page 9
Increasing the federal share of spending for certain Medicaid beneficiaries;
Changing eligibility for Medicaid in a way that effectively increases the income threshold from 133 percent of the federal poverty level to 138 percent for certain individuals;
Reducing overall payments to insurance plans under the Medicare Advantage program;
Expanding Medicare’s drug benefit by phasing out the “doughnut hole” in that benefit;
Modifying the design and delaying the implementation of the excise tax on insurance plans with relatively high premiums; and
Increasing the rate and expanding the scope of a tax that would be charged to higher-income households.
Effects of the Legislation on Insurance Coverage CBO and JCT estimate that by 2019, the combined effect of enacting H.R. 3590 and the reconciliation proposal would be to reduce the number of nonelderly people who are uninsured by about 32 million, leaving about 23 million nonelderly residents uninsured (about one-third of whom would be unauthorized immigrants). Under the legislation, the share of legal nonelderly residents with insurance coverage would rise from about 83 percent currently to about 94 percent. Approximately 24 million people would purchase their own coverage through the new insurance exchanges, and there would be roughly 16 million more enrollees in Medicaid and the Children’s Health Insurance Program than the number projected under current law. Relative to currently projected levels, the number of people purchasing individual coverage outside the exchanges would decline by about 5 million. Under the legislation, certain employers could allow all of their workers to choose among the plans available in the exchanges, but those enrollees would not be eligible to receive subsidies via the exchanges (and thus are shown in Table 4 as enrollees in employment-based coverage rather than as exchange enrollees). Approximately 5 million people would obtain coverage in that way in 2019, bringing the total number of people enrolled in exchange plans to about 29 million in that year.

Honorable Nancy Pelosi Page 10 On balance, the number of people obtaining coverage through their employer would be about 3 million lower in 2019 under the legislation, CBO and JCT estimate. The net change in employment-based coverage under the proposal would be the result of several flows, which can be illustrated using the estimates for 2019:
Between 6 million and 7 million people would be covered by an employment-based plan under the proposal who would not be covered by one under current law (largely because the mandate for individuals to be insured would increase workers’ demand for coverage through their employers).
Between 8 million and 9 million other people who would be covered
by an employment-based plan under current law would not have an offer of such coverage under the proposal. Firms that would choose not to offer coverage as a result of the proposal would tend to be smaller employers and employers that predominantly employ lower-wage workers—people who would be eligible for subsidies through the exchanges—although some workers who would not have employment-based coverage because of the proposal would not be eligible for such subsidies. Whether those changes in coverage would represent the dropping of existing coverage or a lack of new offers of coverage is difficult to determine.
Between 1 million and 2 million people who would be covered by
their employer’s plan (or a plan offered to a family member) under current law would instead obtain coverage in the exchanges. Under the legislation, workers with an offer of employment-based coverage would generally be ineligible for exchange subsidies, but that “firewall” would be enforced imperfectly and an explicit exception to it would be made for workers whose offer was deemed unaffordable.
Effects of the Legislation on Discretionary Costs CBO has not completed an estimate of the potential impact of the legislation on discretionary spending, which would be subject to future appropriation action. Discretionary costs would arise from the effects of the legislation on several federal agencies and on a number of new and existing programs subject to future appropriation. Those discretionary costs fall into three general categories.

Honorable Nancy Pelosi Page 11 The first category is implicit authorization of discretionary costs associated with implementing the new policies established under the legislation. Although no provisions in the legislation specifically authorize such spending, it would be necessary for agencies to carry out the responsibilities that would be required of them by the bill. For example:
CBO expects that the cost to the Internal Revenue Service of
implementing the eligibility determination, documentation, and verification processes for premium and cost sharing subsidies would probably be between $5 billion and $10 billion over 10 years.
CBO expects that the costs to the Department of Health and Human Services (especially the Centers for Medicare and Medicaid Services) and the Office of Personnel Management of implementing the changes in Medicare, Medicaid, and the Children’s Health Insurance Program, as well as certain reforms to the private insurance market, would probably be at least $5 billion to $10 billion over 10 years. (The administrative costs of establishing and operating the exchanges were included as direct spending in CBO’s estimate for the legislation.)
The second category of discretionary costs is explicit authorizations for a variety of grant and other programs for which specified funding levels for possible future appropriations are set in the act for one or more years. (Such cases include provisions where a specified funding level is authorized for an initial year along with the authorization of such sums as may be necessary for continued funding in subsequent years.) CBO has identified at least $50 billion in such specified and estimated authorizations in H.R. 3590, as passed by the Senate.6 A third category of discretionary spending is explicit authorizations for a variety of grant and other programs for which no funding levels are specified in the legislation. CBO has not yet completed estimates of the amounts of such authorizations. Effects of the Legislation Beyond the First 10 Years Although CBO does not generally provide cost estimates beyond the 10-year budget projection period, certain Congressional rules require some information about the budgetary impact of legislation in subsequent
6 For further details, see Congressional Budget Office, Potential Effects of the Patient Protection and Affordable Care Act on Discretionary Spending (March 15, 2010).

Honorable Nancy Pelosi Page 12 decades, and many Members have requested CBO’s analysis of the long-term budgetary impact of broad changes in the nation’s health care and health insurance systems. Therefore, CBO has developed a rough outlook for the decade following the 2010–2019 period by grouping the elements of the legislation into broad categories and (together with JCT) assessing the rate at which the budgetary impact of each of those broad categories is likely to increase over time. Effects on the Deficit. Using this analytic approach, CBO estimated that enacting H.R. 3590, as passed by the Senate, would reduce federal budget deficits over the ensuing decade relative to those projected under current law—with a total effect during that decade in a broad range between one-quarter percent and one-half percent of gross domestic product (GDP).7 The imprecision of that calculation reflects the even greater degree of uncertainty that attends to it, compared with CBO’s 10-year budget estimates. The reconciliation proposal would make a variety of changes to H.R. 3590 that would have significant effects on the legislation’s overall budgetary impact—both in the 10-year projection period and in the ensuing decade. For example, the reconciliation proposal would increase the premium subsidies offered in the new insurance exchanges beginning in 2014, but would also change the annual indexing provisions beginning in 2019 so that those subsidies would grow more slowly thereafter. Over time, the spending on exchange subsidies would therefore fall back toward the level under H.R. 3590 by itself. As another example, the reconciliation proposal would reduce the impact in the 10-year projection period of an excise tax on health insurance plans with relatively high premiums, but would index the thresholds for the tax, beginning in 2020, to the rate of general inflation rather than to inflation plus 1 percentage point (as in H.R. 3590). Reflecting the changes made by the reconciliation proposal, the combined effect of enacting H.R. 3590 and the reconciliation proposal would also be to reduce federal budget deficits over the ensuing decade relative to those projected under current law—with a total effect during that decade in a broad range around one-half percent of GDP. The incremental effect of enacting the reconciliation bill (over and above the effect of enacting H.R. 3590 by itself) would thus be to further reduce federal budget deficits
7 For a more extensive explanation of that analysis, see Congressional Budget Office, letter to the Honorable Harry Reid regarding the longer-term effects of the manager’s amendment to the Patient Protection and Affordable Care Act (December 20, 2009).

Honorable Nancy Pelosi Page 13 in that decade, with an effect in a broad range between zero and one-quarter percent of GDP. CBO has not extrapolated estimates further into the future because the uncertainties surrounding them are magnified even more. However, in view of the projected net savings during the decade following the 10-year budget window, CBO anticipates that the reconciliation proposal would probably continue to reduce budget deficits relative to those under current law in subsequent decades, assuming that all of its provisions continued to be fully implemented. Congressional rules governing the consideration of reconciliation bills also require an assessment of their budgetary impact separately by title, as shown in Table 7 for the 2010–2019 period. Relative to H.R. 3590, CBO’s analysis of the longer-term effects of the reconciliation proposal, by title, is as follows:
Most of the changes to H.R. 3590 having significant budgetary effects would be made by title I of the reconciliation proposal, so the conclusions about the longer-term impact for the proposal as a whole—that it would reduce deficits relative to those under H.R. 3590—also apply to that title.
The changes regarding health care contained in title II would have a much smaller budgetary impact than those in title I and would, by themselves, increase budget deficits somewhat during the 2010–2019 period and in the ensuing decade. That title also contains the proposal’s education provisions, which CBO estimates would reduce deficits during the next 10 years and in the following decade. In CBO’s estimation, the savings generated by the education provisions would outweigh the costs related to health care arising from title II, so the title as a whole would reduce budget deficits in both the 10-year projection period and subsequent years.
CBO has not yet completed an assessment of the impact for the longer term of enacting the reconciliation proposal by itself—that is, an assessment of the reconciliation proposal’s longer-term impact under current law. Key Considerations. Those longer-term calculations reflect an assumption that the provisions of the reconciliation proposal and H.R. 3590 are enacted and remain unchanged throughout the next two decades, which is often not the case for major legislation. For example, the sustainable growth rate

Honorable Nancy Pelosi Page 14 mechanism governing Medicare’s payments to physicians has frequently been modified (either through legislation or administrative action) to avoid reductions in those payments, and legislation to do so again is currently under consideration by the Congress. The reconciliation proposal and H.R. 3590 would maintain and put into effect a number of policies that might be difficult to sustain over a long period of time. Under current law, payment rates for physicians’ services in Medicare would be reduced by about 21 percent in 2010 and then decline further in subsequent years; the proposal makes no changes to those provisions. At the same time, the legislation includes a number of provisions that would constrain payment rates for other providers of Medicare services. In particular, increases in payment rates for many providers would be held below the rate of inflation (in expectation of ongoing productivity improvements in the delivery of health care). The projected longer-term savings for the legislation also reflect an assumption that the Independent Payment Advisory Board established by H.R. 3590 would be fairly effective in reducing costs beyond the reductions that would be achieved by other aspects of the legislation.8 Under the legislation, CBO expects that Medicare spending would increase significantly more slowly during the next two decades than it has increased during the past two decades (per beneficiary, after adjusting for inflation). It is unclear whether such a reduction in the growth rate of spending could be achieved, and if so, whether it would be accomplished through greater efficiencies in the delivery of health care or through reductions in access to care or the quality of care. The long-term budgetary impact could be quite different if key provisions of the legislation were ultimately changed or not fully implemented.9 If those changes arose from future legislation, CBO would estimate their costs when that legislation was being considered by the Congress. Other Effects of the Legislation Many Members have expressed interest in the effects of proposals on various other measures of spending on health care. One such measure is the
8 The Independent Payment Advisory Board would be required, under certain circumstances, to recommend changes to the Medicare program to limit the rate of growth in that program’s spending. The Board’s recommendations would go into effect automatically unless blocked by subsequent legislative action. 9 For an example of the long-term budgetary effect of altering several key features of the legislation, see Congressional Budget Office, letter to the Honorable Paul Ryan responding to questions about the preliminary estimate of the reconciliation proposal (March 19, 2010).

Honorable Nancy Pelosi Page 15 “federal budgetary commitment to health care,” a term that CBO uses to describe the sum of net federal outlays for health programs and tax preferences for health care.10 CBO estimated that H.R. 3590, as passed by the Senate, would increase the federal budgetary commitment to health care over the 2010–2019 period; the net increase in that commitment would be about $210 billion over that 10-year period. The combined effect of enacting H.R. 3590 and the reconciliation proposal would be to increase that commitment by about $390 billion over 10 years. Thus, the incremental effect of the reconciliation proposal (if H.R. 3590 had been enacted) would be to increase the federal budgetary commitment to health care by about $180 billion over the 2010–2019 period. In subsequent years, the effects of the provisions of the two bills combined that would tend to decrease the federal budgetary commitment to health care would grow faster than the effects of the provisions that would increase it. As a result, CBO expects that enacting both proposals would generate a reduction in the federal budgetary commitment to health care during the decade following the 10-year budget window—which is the same conclusion that CBO reached about H.R. 3590, as passed by the Senate. Members have also requested information about the effect of the legislation on health insurance premiums. On November 30, 2009, CBO released an analysis prepared by CBO and JCT of the expected impact on average premiums for health insurance in different markets of PPACA as originally proposed.11 Although CBO and JCT have not updated the estimates provided in that letter, the effects on premiums of the legislation as passed by the Senate and modified by the reconciliation proposal would probably be quite similar. CBO and JCT previously determined that H.R. 3590, as passed by the Senate, would impose several intergovernmental and private-sector mandates as defined in the Unfunded Mandates Reform Act (UMRA). CBO and JCT estimated that the total costs of those mandates to state, local, and tribal governments and the private sector would greatly exceed the annual thresholds established in UMRA ($70 million and $141 million,
10 For additional discussion of that term, see Congressional Budget Office, letter to the Honorable Max Baucus regarding different measures for analyzing current proposals to reform health care (October 30, 2009). 11 See Congressional Budget Office, letter to the Honorable Evan Bayh providing an analysis of health insurance premiums under the Patient Protection and Affordable Care Act (November 30, 2009).

Honorable Nancy Pelosi Page 16 respectively, in 2010, adjusted annually for inflation) in each of the first five years that the mandates would be in effect. If both the reconciliation proposal and H.R. 3590 were enacted, that combination would impose similar mandates on both intergovernmental and private-sector entities with costs exceeding the thresholds established in UMRA. The incremental effect of enacting the reconciliation proposal—assuming that H.R. 3590 had already been enacted—would be to increase the costs of the mandates on private-sector entities. That increase in costs would exceed the annual UMRA threshold as well. I hope this analysis is helpful for the Congress’s deliberations. If you have any questions, please contact me or CBO staff. Many people at CBO have contributed to this analysis, but the primary staff contacts are David Auerbach, Colin Baker, Reagan Baughman, James Baumgardner, Tom Bradley, Stephanie Cameron, Julia Christensen, Mindy Cohen, Anna Cook, Noelia Duchovny, Sean Dunbar, Philip Ellis, Peter Fontaine, April Grady, Stuart Hagen, Holly Harvey, Tamara Hayford, Jean Hearne, Janet Holtzblatt, Lori Housman, Justin Humphrey, Paul Jacobs, Deborah Kalcevic, Daniel Kao, Jamease Kowalczyk, Julie Lee, Kate Massey, Alexandra Minicozzi, Keisuke Nakagawa, Kirstin Nelson, Lyle Nelson, Andrea Noda, Sam Papenfuss, Lisa Ramirez-Branum, Lara Robillard, Robert Stewart, Robert Sunshine, Bruce Vavrichek, Ellen Werble, Chapin White, and Rebecca Yip.
Sincerely,
Douglas W. Elmendorf Director
Enclosures cc: Honorable John A. Boehner
Republican Leader Honorable John M. Spratt Jr. Chairman Committee on the Budget
Honorable Nancy Pelosi Page 17
Honorable Paul Ryan Ranking Member
Honorable Harry Reid Senate Majority Leader
Honorable Mitch McConnell Senate Republican Leader Honorable Kent Conrad Chairman Senate Committee on the Budget
Honorable Judd Gregg Ranking Member
Congressional Budget Office Page 1 of 2 3/20/2010
2010 2011 2012 2013 2014 2015 2016 2017 2018 20192010-2014
2010-2019
Education * * 4 -6 -3 -5 -4 -2 -2 -2 -5 -19
Health Insurance ExchangesPremium and Cost Sharing Subsidies 0 0 0 0 14 32 59 75 82 88 14 350Start-up Costs * * * 1 * * 0 0 0 0 2 2Other Related Spending 0 1 2 2 1 * * * * 0 5 5
Subtotal 0 2 2 2 15 33 59 75 82 88 21 358
Reinsurance and Risk
Adjustment Paymentsa 0 0 0 0 11 18 18 18 19 21 11 106
Effects of Coverage Provisions on Medicaid and CHIP * -1 -2 -4 29 56 81 87 91 97 22 434
Medicare and Other Medicaid and CHIP ProvisionsReductions in Annual Updates to
Medicare FFS Payment Rates * -1 -5 -9 -13 -19 -25 -33 -41 -51 -28 -196Medicare Advantage Rates based on
Fee-for-Service Rates 0 -2 -6 -9 -13 -17 -19 -21 -23 -25 -30 -136Medicare and Medicaid DSH Payments 0 0 * * -1 -4 -5 -7 -9 -11 * -36Other 2 1 * * -16 -11 -10 -14 -18 -22 -12 -87
Subtotal 2 -2 -11 -17 -42 -50 -59 -75 -92 -108 -71 -455
Other Changes in Direct SpendingCommunity Living Assistance
Services and Supports 0 0 -5 -9 -10 -11 -11 -9 -8 -7 -24 -70Other 2 6 8 5 5 4 2 -1 -1 * 26 30
Subtotal 2 6 2 -4 -5 -7 -10 -10 -8 -7 2 -40
Total Outlays 4 5 -5 -28 6 44 86 92 90 90 -20 382On-Budget 4 5 -5 -28 5 44 85 92 89 89 -20 379Off-Budget 0 * * * * * 1 1 1 1 * 4
Continued
H.R. 3590 as Passed by the SenateTABLE 2. Estimate of Changes in Direct Spending and Revenue Effects of the Reconciliation Proposal Combined with
By Fiscal Year, in Billions of Dollars
CHANGES IN DIRECT SPENDING (OUTLAYS)

Congressional Budget Office Page 2 of 2 3/20/2010
2010 2011 2012 2013 2014 2015 2016 2017 2018 20192010-2014
2010-2019
H.R. 3590 as Passed by the SenateTABLE 2. Estimate of Changes in Direct Spending and Revenue Effects of the Reconciliation Proposal Combined with
By Fiscal Year, in Billions of Dollars
Coverage-Related ProvisionsExchange Premium Credits 0 0 0 0 -5 -11 -18 -22 -24 -26 -5 -107Reinsurance and Risk Adjustment
Collections 0 0 0 0 12 16 18 18 19 22 12 106Small Employer Tax Credit -2 -4 -5 -6 -5 -3 -3 -3 -4 -4 -21 -37Penalty Payments by Employers
and Uninsured Individuals 0 0 0 0 3 9 12 13 13 14 3 65Excise Tax on High-Premium Plans 0 0 0 0 0 0 0 0 12 20 0 32Associated Effects of Coverage
Provisions on Revenues * -1 -2 -5 1 6 14 18 10 7 -8 46
Other ProvisionsFees on Certain Manufacturers
and Insurersb 0 2 3 5 12 15 15 18 19 18 22 107Additional Hospital insurance Tax 0 0 1 21 17 29 33 35 37 39 38 210
Other Revenue Provisionsc * 7 8 13 22 4 11 12 13 14 49 103
Total Revenues -3 3 5 27 57 65 83 89 95 104 89 525On-Budget -3 4 5 27 55 62 78 82 87 95 88 492Off-Budget * * -1 1 2 3 5 7 8 9 1 33
Net Change in the Deficit 6 1 -10 -56 -51 -20 3 4 -5 -15 -109 -143
On-Budget 6 1 -10 -55 -50 -18 8 10 2 -6 -108 -114Off-Budget * * 1 -1 -1 -2 -5 -6 -7 -9 -1 -29
Sources: Congressional Budget Office and staff of the Joint Committee on Taxation (JCT).
NotesDoes not include effects on spending subject to future appropriation. Components may not sum to totals because of rounding.* = between $0.5 billion and -$0.5 billion.CHIP = Children’s Health Insurance Program; FFS = Fee-for-service; DSH = Disproportionate Share Hospital.
a. Risk-adjustment payments lag revenues shown later in the table by one quarter. Reinsurance payments total $20 billion over the 10-year period.b. Amounts include fees on manufacturers and importers of branded drugs and certain medical devices as well as fees on health insurance providers.
d. Positive numbers indicate increases in the deficit, and negative numbers indicate reductions in the deficit.
In addition, this line includes an increase in revenues of about $14 billion for other provisions shown in Table 5.
c. Amounts include $89 billion in increased revenues, as estimated by JCT, for tax provisions other than those broken out separately in the table.
NET IMPACT ON THE DEFICIT FROM CHANGES IN DIRECT SPENDING AND REVENUESd
CHANGES IN REVENUES

Table 3. Estimate of the Incremental Effects on Deficits of the Reconciliation Proposal, Relative to
H.R. 3590 as Passed by the Senate
2010 2011 2012 2013 2014 2015 2016 2017 2018 2019
2010-
2014
2010-
2019
Change in Outlays * 6 6 -1 * -1 3 5 5 4 12 27
On Budget * 6 6 -1 * -1 3 6 5 4 12 28
Off Budget 0 * * * * * * * * * * -1
Change in Revenues -2 2 2 2 13 3 10 8 7 7 17 52
On Budget -2 3 2 5 13 6 14 13 11 12 21 76
Off Budget 0 * * -4 -1 -3 -4 -5 -4 -4 -5 -24
Net Change in Deficits 2 4 4 -3 -13 -4 -7 -3 -2 -3 -5 -25
On Budget 2 4 4 -6 -14 -7 -11 -7 -6 -7 -10 -48
Off Budget 0 * * 4 1 3 4 4 4 4 5 23
Sources: Congressional Budget Office and staff of the Joint Committee on Taxation (JCT).
Notes: Positive numbers indicate increases in the deficit, and negative numbers indicate reductions in the deficit.
Components may not sum to totals because of rounding; * = between $0.5 billion and -$0.5 billion.
a. Positive numbers indicate increases in the deficit, and negative numbers indicate reductions in the deficit.
By Fiscal Year, in Billions of Dollars
CHANGES IN DIRECT SPENDING
CHANGES IN REVENUES
NET IMPACT ON DEFICITS FROM CHANGES IN DIRECT SPENDING AND REVENUES /a
Congressional Budget Office Page 1 of 1 3/20/2010

EFFECTS ON INSURANCE COVERAGE /a 2010 2011 2012 2013 2014 2015 2016 2017 2018 2019
(Millions of nonelderly people, by calendar year)
Current Law Medicaid & CHIP 40 39 39 38 35 34 35 35 35 35
Coverage /b Employer 150 153 156 158 161 162 162 162 162 162
Nongroup & Other /c 27 26 25 26 28 29 29 29 30 30
Uninsured /d 50 51 51 51 51 51 52 53 53 54
TOTAL 267 269 271 273 274 276 277 279 281 282
Change (+/-) Medicaid & CHIP * -1 -2 -3 10 15 17 16 16 16
Employer * 3 3 3 4 1 -3 -3 -3 -3
Nongroup & Other /c * * * * -2 -3 -5 -5 -5 -5
Exchanges 0 0 0 0 8 13 21 23 24 24
Uninsured /d * * -1 -1 -19 -25 -30 -31 -31 -32
Post-Policy Uninsured Population
Number of Nonelderly People /d 50 50 50 50 31 26 21 21 22 23
Insured Share of the Nonelderly Population /a
Including All Residents 81% 82% 82% 82% 89% 91% 92% 92% 92% 92%
Excluding Unauthorized Immigrants 83% 83% 83% 83% 91% 93% 95% 95% 95% 94%
Memo: Exchange Enrollees and Subsidies
Number w/ Unaffordable Offer from Employer /e * 1 1 1 1 1
Number of Unsubsidized Exchange Enrollees 1 2 4 5 5 5
Average Exchange Subsidy per Subsidized Enrollee $5,200 $5,300 $5,500 $5,700 $6,000
Sources: Congressional Budget Office and the staff of the Joint Committee on Taxation.
Note: CHIP = Children's Health Insurance Program; * = between 0.5 million and -0.5 million people.
a. Figures for the nonelderly population include only residents of the 50 states and the District of Columbia.
b. Figures reflect average annual enrollment; individuals reporting multiple sources of coverage are assigned a primary source.
c. Other, which includes Medicare, accounts for about half of current-law coverage in this category; the effects of the proposal are almost entirely on nongroup coverage. 3/20/2010
d. The count of uninsured people includes unauthorized immigrants as well as people who are eligible for, but not enrolled in, Medicaid. Page 1 of 2
e. Workers who would have to pay more than a specified share of their income (9.5 percent in 2014) for employment-based coverage could receive subsidies via an exchange.
Table 4. Estimated Effects of the Insurance Coverage Provisions of the Reconciliation Proposal Combined with H.R. 3590 as
Passed by the Senate

EFFECTS ON THE FEDERAL DEFICIT / a,b 2010 2011 2012 2013 2014 2015 2016 2017 2018 2019 2010-2019
(Billions of dollars, by fiscal year)
Medicaid & CHIP Outlays /c 0 -1 -2 -4 29 56 81 87 91 97 434
Exchange Subsidies & Related Spending /d 0 2 2 2 20 45 77 97 106 113 464
Small Employer Tax Credits /e 2 4 5 6 5 4 3 3 4 4 40
Gross Cost of Coverage Provisions 2 5 5 5 54 104 161 187 201 214 938
Penalty Payments by Uninsured Individuals 0 0 0 0 0 -2 -3 -4 -4 -4 -17
Penalty Payments by Employers /e 0 0 0 0 -3 -8 -10 -10 -10 -11 -52
Excise Tax on High-Premium Insurance Plans /e 0 0 0 0 0 0 0 0 -12 -20 -32
Other Effects on Tax Revenues and Outlays /f 1 3 4 5 -1 -7 -15 -20 -11 -7 -48
NET COST OF COVERAGE PROVISIONS 3 7 9 10 49 87 132 154 164 172 788
Sources: Congressional Budget Office and the staff of the Joint Committee on Taxation.
Note: CHIP = Children's Health Insurance Program.
a. Does not include federal administrative costs that would be subject to appropriation.
b. Components may not sum to totals because of rounding; positive numbers indicate increases in the deficit, and negative numbers indicate reductions in the deficit.
e. The effects on the deficit of this provision include the associated effects of changes in taxable compensation on tax revenues. 3/20/2010
Page 2 of 2f. The effects are almost entirely on tax revenues. CBO estimates that outlays for Social Security benefits would increase by about $2 billion over the 2010-2019 period,
and that the coverage provisions would have negligible effects on outlays for other federal programs.
d. Includes $5 billion in spending for high-risk pools and the net budgetary effects of proposed collections and payments for reinsurance and risk adjustment.
Table 4. Estimated Effects of the Insurance Coverage Provisions of the Reconciliation Proposal Combined with H.R. 3590 as
Passed by the Senate
c. Under current law, states have the flexibility to make programmatic and other budgetary changes to Medicaid and CHIP. CBO estimates that state spending on
Medicaid and CHIP in the 2010-2019 period would increase by about $20 billion as a result of the coverage provisions.

Table 5. Estimate of the Effects of Non-Coverage Health Provisions of the Reconciliation Proposal
Combined with H.R. 3590 as Passed by the SenateEstimated effects on direct spending and revenues in billions of dollars, by fiscal year
2010 2011 2012 2013 2014 2015 2016 2017 2018 2019
2010-
2014
2010-
2019
Change
from
H.R. 3590a
Changes in Direct Spending Outlays
TITLE I—QUALITY, AFFORDABLE HEALTH CARE FOR ALL AMERICANS
Subtitle A—Immediate Improvements in Health Care Coverage for All Americans
1001 Amendments to the Public Health Service Act Included in estimate for expanding health insurance coverage.
1002 Helping Consumers Receive Quality Accountable Coverage 0.0 0.0 0.0 0.0 0.0 0.0 0.0 0.0 0.0 0.0 0.0 0.0 0.0
Subtitle B—Immediate Assistance to Preserve and Expand Coverage
1101 Temporary High Risk Health Insurance Pool Included in estimate for expanding health insurance coverage.
1102 Reinsurance for Early Retirees 1.3 2.5 1.3 0.0 0.0 0.0 0.0 0.0 0.0 0.0 5.0 5.0 0.0
1103 Assistance to Consumers in Identifying Affordable Coverage Options Included in estimate for expanding health insurance coverage.
1104 Administrative Simplification
Effects on Medicaid spending 0.0 0.0 -0.1 -0.1 -0.2 -0.4 -0.9 -1.7 -1.9 -2.1 -0.4 -7.3 -0.2
Effects on exchange subsidies 0.0 0.0 0.0 0.0 -0.1 -0.3 -0.6 -1.0 -1.2 -1.2 -0.1 -4.3 0.0
Subtitle C—Effective Coverage for All Americans Included in estimate for expanding health insurance coverage.
Subtitle D—Available Coverage for All Americans Included in estimate for expanding health insurance coverage.
Subtitle E—Affordable Coverage for All Americans Included in estimate for expanding health insurance coverage.
Subtitle F—Shared Responsibility for Health Care Included in estimate for expanding health insurance coverage.
Subtitle G—Miscellaneous Provisions
1556 Equity for Certain Eligible Survivors 0.0 0.0 0.0 0.0 0.0 0.0 0.0 0.0 0.0 0.0 0.0 0.0 0.0
Sections 1551-1555 and 1557-1562 Included in estimate for expanding health insurance coverage.
TITLE II—ROLE OF PUBLIC PROGRAMS
Subtitle A—Improved Access to Medicaid
Sections 2001-2004 Included in estimate for expanding health insurance coverage.
2005 Payments to Territories 0.0 0.3 0.7 0.7 0.9 0.9 0.9 1.0 1.0 1.0 2.5 7.3 2.0
2006 Special Adjustment to FMAP Determination for Certain States
Recovering from a Major Disaster 0.0 0.1 0.1 0.0 0.0 0.0 0.0 0.0 0.0 0.0 0.2 0.2 0.0
2007 Medicaid Improvement Fund Rescission 0.0 0.0 0.0 0.0 0.0 -0.2 -0.2 -0.2 -0.2 0.0 0.0 -0.6 0.0
Subtitle B—Enhanced Support for the Children’s Health Insurance Program
2101 Additional Federal Financial Participation for CHIP Included in estimate for expanding health insurance coverage.
2102 Technical Corrections 0.0 0.0 0.0 0.0 0.1 0.0 0.0 0.0 0.0 0.0 0.1 0.1 0.0
Subtitle C—Medicaid and CHIP Enrollment Simplification Included in estimate for expanding health insurance coverage.
Congressional Budget Office Page 1 of 11 3/20/2010

Table 5. Estimate of the Effects of Non-Coverage Health Provisions of the Reconciliation Proposal
Combined with H.R. 3590 as Passed by the SenateEstimated effects on direct spending and revenues in billions of dollars, by fiscal year
2010 2011 2012 2013 2014 2015 2016 2017 2018 2019
2010-
2014
2010-
2019
Change
from
H.R. 3590a
Subtitle D—Improvements to Medicaid Services
2301 Coverage for Freestanding Birth Center Services 0.0 0.0 0.0 0.0 0.0 0.0 0.0 0.0 0.0 0.0 0.0 0.0 0.0
2302 Concurrent Care for Children 0.0 0.0 0.0 0.0 0.0 0.0 0.0 0.0 0.0 0.0 0.1 0.2 0.0
2303 State Eligibility Option for Family Planning Services 0.0 0.0 0.0 0.0 0.0 0.0 0.0 0.0 0.0 0.0 0.0 0.0 0.0
2304 Clarification of Definition of Medical Assistance 0.0 0.0 0.0 0.0 0.0 0.0 0.0 0.0 0.0 0.0 0.0 0.0 0.0
Subtitle E—New Options for States to Provide Long-Term Services and Supports
2401 Community First Choice Option 0.0 0.0 0.1 0.2 0.3 0.8 0.9 1.0 1.2 1.4 0.6 6.0 -0.9
2402 Removal of Barriers to Providing Home and Community-Based Services 0.0 0.1 0.1 0.1 0.2 0.3 0.4 0.4 0.4 0.4 0.5 2.4 0.0
2403 Money Follows the Person Rebalancing Demonstration 0.0 0.0 0.0 0.0 0.1 0.2 0.3 0.4 0.3 0.3 0.2 1.7 0.0
2404 Protection for Recipients of Home and Community-Based Services
Against Spousal Impoverishment 0.0 0.0 0.0 0.0 0.2 0.3 0.3 0.3 0.3 0.2 0.2 1.5 0.0
2405 Funding to Expand State Aging and Disability Resource Centers 0.0 0.0 0.0 0.0 0.0 0.0 0.0 0.0 0.0 0.0 0.0 0.1 0.0
2406 Sense of the Senate Regarding Long-Term Care 0.0 0.0 0.0 0.0 0.0 0.0 0.0 0.0 0.0 0.0 0.0 0.0 0.0
10202 Incentives for States to Offer Home and Community-Based Services as a
Long-Term Care Alternative to Nursing Homes 0.0 0.0 0.1 0.2 0.3 0.3 0.2 0.2 0.2 0.2 0.7 1.8 0.2
Subtitle F—Medicaid Prescription Drug Coverage -0.4 -2.5 -3.2 -3.3 -3.7 -4.1 -4.7 -5.0 -5.4 -5.8 -13.1 -38.1 -0.1
Subtitle G—Medicaid Disproportionate Share Hospital (DSH) Payments 0.0 0.0 0.0 0.1 -0.5 -0.6 -0.6 -1.8 -5.0 -5.6 -0.4 -14.0 4.1
Subtitle H—Improved Coordination for Dual Eligible Beneficiaries
2601 5-Year Period for Demonstration Projects 0.0 0.0 0.0 0.0 0.0 0.0 0.0 0.0 0.0 0.0 0.0 0.0 0.0
2602 Providing Federal Coverage and Payment Coordination for
Dual Eligible Beneficiaries 0.0 0.0 0.0 0.0 0.0 0.0 0.0 0.0 0.0 0.0 0.0 0.0 0.0
Subtitle I—Improving the Quality of Medicaid for Patients and Providers
2701 Adult Health Quality Measures 0.0 0.0 0.0 0.1 0.1 0.0 0.0 0.0 0.0 0.0 0.2 0.3 0.0
2702 Payment Adjustment for Health Care-Acquired Conditions 0.0 0.0 0.0 0.0 0.0 0.0 0.0 0.0 0.0 0.0 0.0 0.0 0.0
2703 State Option to Provide Health Homes for Enrollees With Chronic Conditions 0.0 0.0 0.0 0.1 0.1 0.1 0.1 0.1 0.1 0.1 0.2 0.7 0.0
2704 Demonstration Project to Evaluate Integrated Care Around a Hospitalization 0.0 0.0 0.0 0.0 0.0 0.0 0.0 0.0 0.0 0.0 0.0 0.0 0.0
2705 Medicaid Global Payment System Demonstration Project 0.0 0.0 0.0 0.0 0.0 0.0 0.0 0.0 0.0 0.0 0.0 0.0 0.0
2706 Pediatric Accountable Care Organization Demonstration Project 0.0 0.0 0.0 0.0 0.0 0.0 0.0 0.0 0.0 0.0 0.0 0.0 0.0
2707 Medicaid Emergency Psychiatric Demonstration Project 0.0 0.0 0.0 0.0 0.0 0.0 0.0 0.0 0.0 0.0 0.1 0.1 0.0
Subtitle J—Improvements to the Medicaid and CHIP Payment and
Access Commission (MACPAC)
2801 MACPAC Assessment of Policies Affecting All Medicaid Beneficiaries 0.0 0.0 0.0 0.0 0.0 0.0 0.0 0.0 0.0 0.0 0.0 0.0 0.0
Congressional Budget Office Page 2 of 11 3/20/2010

Table 5. Estimate of the Effects of Non-Coverage Health Provisions of the Reconciliation Proposal
Combined with H.R. 3590 as Passed by the SenateEstimated effects on direct spending and revenues in billions of dollars, by fiscal year
2010 2011 2012 2013 2014 2015 2016 2017 2018 2019
2010-
2014
2010-
2019
Change
from
H.R. 3590a
Subtitle K—Protections for American Indians and Alaska Natives
2901 Special Rules Relating to Indians
No Cost Sharing for Indians with Income at or Below 300 Percent of Poverty Enrolled in Coverage Through a State Exchange Included in estimate for expanding health insurance coverage.
Payer of Last Resort 0.0 0.0 0.0 0.0 0.0 0.0 0.0 0.0 0.0 0.0 0.0 0.0 0.0
Facilitating Enrollment of Indians Through the Express Lane Option 0.0 0.0 0.0 0.0 0.0 0.0 0.0 0.0 0.0 0.0 0.0 0.0 0.0
2902 Elimination of Sunset for Reimbursement for All Medicare Part B Services
Furnished by Certain Indian Hospitals and Clinics 0.0 0.0 0.0 0.0 0.0 0.0 0.0 0.0 0.0 0.0 0.1 0.2 0.0
Indian Health Improvement Act 0.0 0.0 0.0 0.0 0.0 0.0 0.0 0.0 0.0 0.0 0.0 0.0 0.0
Subtitle L—Maternal and Child Health Services
2951 Maternal, Infant, and Early Childhood Home Visiting Programs 0.0 0.1 0.3 0.4 0.4 0.2 0.1 0.0 0.0 0.0 1.2 1.5 0.0
2952 Support, Education, and Research for Postpartum Depression 0.0 0.0 0.0 0.0 0.0 0.0 0.0 0.0 0.0 0.0 0.0 0.0 0.0
2953 Personal Responsibility Education 0.0 0.0 0.1 0.1 0.1 0.1 0.0 0.0 0.0 0.0 0.3 0.4 0.0
2954 Restoration of Funding for Abstinence Education 0.0 0.0 0.0 0.0 0.0 0.0 0.0 0.0 0.0 0.0 0.1 0.1 0.0
2955 Inclusion of Information About The Importance of Having a Health-Care
Power of Attorney in Transition Planning for Children Aging Out of
Foster Care and Independent Living Programs 0.0 0.0 0.0 0.0 0.0 0.0 0.0 0.0 0.0 0.0 0.0 0.0 0.0
Support for Pregnant and Parenting Teens and Women 0.0 0.0 0.0 0.0 0.0 0.0 0.0 0.0 0.0 0.0 0.1 0.2 0.0
TITLE III—IMPROVING THE QUALITY AND EFFICIENCY OF HEALTH CARE
Subtitle A—Transforming the Health Care Delivery System
PART I—LINKING PAYMENT TO QUALITY OUTCOMES UNDER THE MEDICARE PROGRAM
3001 Hospital Value-Based Purchasing Program 0.0 0.0 0.0 0.0 0.0 0.0 0.0 0.0 0.0 0.0 0.0 0.0 0.0
3002 Physician Quality Reporting System
PPO Stabilization Fund 0.0 0.0 0.0 0.0 -0.1 0.0 0.0 0.0 0.0 0.0 -0.1 -0.2 0.0
Physicians' Services 0.0 0.0 0.2 0.2 0.2 0.3 -0.1 -0.2 -0.2 -0.2 0.6 0.3 0.0
3003 Improvements to the Physician Feedback Program 0.0 0.0 0.0 0.0 0.0 0.0 0.0 0.0 0.0 0.0 0.0 0.0 0.0
3004 Quality Reporting for Long-Term Care Hospitals, Inpatient Rehabilitation
Hospitals, and Hospice Programs 0.0 0.0 0.0 0.0 0.0 0.0 0.0 0.0 0.0 0.0 0.0 -0.1 0.0
3005 Quality Reporting for PPS-Exempt Cancer Hospitals 0.0 0.0 0.0 0.0 0.0 0.0 0.0 0.0 0.0 0.0 0.0 0.0 0.0
3006 Plans for a Value-Based Purchasing Program for Skilled Nursing
Facilities and Home Health Agencies 0.0 0.0 0.0 0.0 0.0 0.0 0.0 0.0 0.0 0.0 0.0 0.0 0.0
3007 Value-based Payment Modifier Under the Physician Fee Schedule 0.0 0.0 0.0 0.0 0.0 0.0 0.0 0.0 0.0 0.0 0.0 0.0 0.0
3008 Payment Adjustment for Conditions Acquired in Hospitals 0.0 0.0 0.0 0.0 0.0 -0.2 -0.3 -0.3 -0.3 -0.3 0.0 -1.4 0.0
PART II—NATIONAL STRATEGY TO IMPROVE HEALTH CARE QUALITY
3011 National Strategy 0.0 0.0 0.0 0.0 0.0 0.0 0.0 0.0 0.0 0.0 0.0 0.0 0.0
3012 Interagency Working Group on Health Care Quality 0.0 0.0 0.0 0.0 0.0 0.0 0.0 0.0 0.0 0.0 0.0 0.0 0.0
3013 Quality Measure Development 0.0 0.0 0.0 0.0 0.0 0.0 0.0 0.0 0.0 0.0 0.0 0.0 0.0
3014 Quality Measurement 0.0 0.0 0.0 0.0 0.0 0.0 0.0 0.0 0.0 0.0 0.1 0.1 0.0
3015 Data Collection; Public Reporting 0.0 0.0 0.0 0.0 0.0 0.0 0.0 0.0 0.0 0.0 0.0 0.0 0.0
Effect of Quality-Measure Development/Endorsement Provisions
on Medicare Spending 0.0 0.0 0.0 0.0 0.0 0.0 0.0 0.0 0.0 0.0 0.0 0.0 0.0
Congressional Budget Office Page 3 of 11 3/20/2010

Table 5. Estimate of the Effects of Non-Coverage Health Provisions of the Reconciliation Proposal
Combined with H.R. 3590 as Passed by the SenateEstimated effects on direct spending and revenues in billions of dollars, by fiscal year
2010 2011 2012 2013 2014 2015 2016 2017 2018 2019
2010-
2014
2010-
2019
Change
from
H.R. 3590a
PART III—ENCOURAGING DEVELOPMENT OF NEW PATIENT CARE MODELS
3021 Establishment of Center for Medicare and Medicaid Innovation 0.0 0.1 0.2 0.2 0.2 0.2 0.0 -0.3 -0.7 -1.2 0.7 -1.3 0.0
3022 Medicare Shared Savings Program 0.0 0.0 0.0 -0.1 -0.3 -0.6 -0.7 -0.9 -1.0 -1.2 -0.5 -4.9 0.0
3023 National Pilot Program on Payment Bundling 0.0 0.0 0.0 0.0 0.0 0.0 0.0 0.0 0.0 0.0 0.0 0.0 0.0
3024 Independence at Home Demonstration Program 0.0 0.0 0.0 0.0 0.0 0.0 0.0 0.0 0.0 0.0 0.0 0.0 0.0
3025 Hospital Readmissions Reduction Program 0.0 0.0 0.0 -0.1 -0.3 -1.1 -1.3 -1.3 -1.4 -1.5 -0.5 -7.1 0.0
3026 Community-Based Care Transitions Program 0.0 0.0 0.1 0.1 0.1 0.1 0.1 0.0 0.0 0.0 0.3 0.5 0.0
3027 Extension of Gainsharing Demonstration 0.0 0.0 0.0 0.0 0.0 0.0 0.0 0.0 0.0 0.0 0.0 0.0 0.0
Subtitle B—Improving Medicare for Patients and Providers
PART I—ENSURING BENEFICIARY ACCESS TO PHYSICIAN CARE AND OTHER SERVICES
3101 Increase in the Physician Payment Update 0.0 0.0 0.0 0.0 0.0 0.0 0.0 0.0 0.0 0.0 0.0 0.0 0.0
3102 Extension of the Work Geographic Index Floor and Revisions to the
Practice Expense Geographic Adjustment Under the
Medicare Physician Fee Schedule 0.9 1.0 0.3 0.0 0.0 0.0 0.0 0.0 0.0 0.0 2.2 2.2 0.4
3103 Extension of Exceptions Process for Medicare Therapy Caps 0.3 0.4 0.0 0.0 0.0 0.0 0.0 0.0 0.0 0.0 0.8 0.8 0.0
3104 Extension of Payment for Technical Component of Certain
Physician Pathology Services 0.1 0.0 0.0 0.0 0.0 0.0 0.0 0.0 0.0 0.0 0.1 0.1 0.0
3105 Extension of Ambulance Add-Ons 0.1 0.0 0.0 0.0 0.0 0.0 0.0 0.0 0.0 0.0 0.1 0.1 0.0
3106 Extension of Certain Payment Rules for Long-Term Care Hospital
Services and of Moratorium on the Establishment of
Certain Hospitals and Facilities 0.0 0.1 0.1 0.0 0.0 0.0 0.0 0.0 0.0 0.0 0.2 0.2 0.0
3107 Extension of Physician Fee Schedule Mental Health Add-On 0.0 0.0 0.0 0.0 0.0 0.0 0.0 0.0 0.0 0.0 0.0 0.0 0.0
3108 Permitting Physician Assistants to Order Post-Hospital
Extended Care Services 0.0 0.0 0.0 0.0 0.0 0.0 0.0 0.0 0.0 0.0 0.0 0.0 0.0
3109 Exemption of Certain Pharmacies From Accreditation Requirements 0.0 0.0 0.0 0.0 0.0 0.0 0.0 0.0 0.0 0.0 0.0 0.0 0.0
3110 Part B Special Enrollment Period for Disabled TRICARE Beneficiaries 0.0 0.0 0.0 0.0 0.0 0.0 0.0 0.0 0.0 0.0 0.0 0.0 0.0
3111 Payment for Bone Density Tests 0.1 0.1 0.0 0.0 0.0 0.0 0.0 0.0 0.0 0.0 0.1 0.1 0.0
3112 Revision to the Medicare Improvement Fund 0.0 0.0 0.0 0.0 -15.6 -5.2 0.0 0.0 0.0 0.0 -15.6 -20.7 0.0
3113 Treatment of Certain Complex Diagnostic Laboratory Tests 0.0 0.0 0.0 0.0 0.0 0.0 0.0 0.0 0.0 0.0 0.1 0.1 0.0
3114 Improved Access for Certified-Midwife Services 0.0 0.0 0.0 0.0 0.0 0.0 0.0 0.0 0.0 0.0 0.0 0.0 0.0
Congressional Budget Office Page 4 of 11 3/20/2010

Table 5. Estimate of the Effects of Non-Coverage Health Provisions of the Reconciliation Proposal
Combined with H.R. 3590 as Passed by the SenateEstimated effects on direct spending and revenues in billions of dollars, by fiscal year
2010 2011 2012 2013 2014 2015 2016 2017 2018 2019
2010-
2014
2010-
2019
Change
from
H.R. 3590a
PART II—RURAL PROTECTIONS
3121 Extension of Outpatient Hold Harmless Provision 0.1 0.0 0.0 0.0 0.0 0.0 0.0 0.0 0.0 0.0 0.2 0.2 0.0
3122 Reasonable Costs Payments for Certain Clinical Diagnostic Laboratory
Tests Furnished to Hospital Patients in Certain Rural Areas 0.0 0.0 0.0 0.0 0.0 0.0 0.0 0.0 0.0 0.0 0.0 0.0 0.0
3123 Extension of the Rural Community Hospital Demonstration Program 0.0 0.0 0.0 0.0 0.0 0.0 0.0 0.0 0.0 0.0 0.0 0.0 0.0
3124 Extension of the Medicare-Dependent Hospital (MDH) Program 0.0 0.0 0.0 0.0 0.0 0.0 0.0 0.0 0.0 0.0 0.0 0.0 0.0
3125 Payment Adjustment for Low-Volume Hospitals 0.0 0.0 0.1 0.2 0.0 0.0 0.0 0.0 0.0 0.0 0.0 0.3 0.0
3126 Demonstration Project on Community Health Integration Models 0.0 0.0 0.0 0.0 0.0 0.0 0.0 0.0 0.0 0.0 0.0 0.0 0.0
3127 Study on Adequacy of Medicare Payments in Rural Areas 0.0 0.0 0.0 0.0 0.0 0.0 0.0 0.0 0.0 0.0 0.0 0.0 0.0
3128 Technical Correction Related to Critical Access Hospital Services 0.0 0.0 0.0 0.0 0.0 0.0 0.0 0.0 0.0 0.0 0.0 0.0 0.0
3129 Medicare Rural Hospital Flexibility Program 0.0 0.0 0.0 0.0 0.0 0.0 0.0 0.0 0.0 0.0 0.0 0.0 0.0
PART III—IMPROVING PAYMENT ACCURACY
3131 Payment Adjustments for Home Health Care (includes effect
of section 3401) 0.0 -0.4 -0.8 -1.1 -1.9 -3.3 -5.3 -7.5 -9.0 -10.3 -4.2 -39.7 0.0
3132 Hospice Reform 0.0 0.0 0.0 0.0 0.0 0.0 0.0 0.0 0.0 0.0 0.0 -0.1 0.0
3133 Medicare Disproportionate Share Hospital (DSH) Payments 0.0 0.0 0.0 0.0 0.0 -3.6 -4.0 -5.0 -4.4 -5.1 0.0 -22.1 3.0
3134 Misvalued Codes Under the Physician Fee Schedule 0.0 0.0 0.0 0.0 0.0 0.0 0.0 0.0 0.0 0.0 0.0 0.0 0.0
3135 Equipment Utilization Factor for Advanced Imaging Services 0.0 -0.1 -0.2 -0.2 -0.3 -0.3 -0.3 -0.3 -0.3 -0.3 -0.9 -2.3 -1.2
3136 Revision of Payment for Power-Driven Wheelchairs 0.0 -0.4 -0.1 0.0 0.0 0.0 0.0 -0.1 -0.1 -0.1 -0.6 -0.8 0.0
3137 Hospital Wage Index Improvement 0.2 0.0 0.0 0.0 0.0 0.0 0.0 0.0 0.0 0.0 0.3 0.3 0.0
3138 Treatment of Certain Cancer Hospitals 0.0 0.0 0.0 0.0 0.0 0.0 0.0 0.0 0.0 0.0 0.0 0.0 0.0
3139 Payment for Biosimilar Biological Products Included in estimate for title VII, subtitle A.
3140 Medicare Hospice Concurrent Care Demonstration Program 0.0 0.0 0.0 0.0 0.0 0.0 0.0 0.0 0.0 0.0 0.0 0.0 0.0
3141 Application of Budget Neutrality on a National Basis in the
Calculation of the Medicare Hospital Wage Index Floor 0.0 0.0 0.0 0.0 0.0 0.0 0.0 0.0 0.0 0.0 0.0 0.0 0.0
3142 HHS Study on Urban Medicare-Dependent Hospitals 0.0 0.0 0.0 0.0 0.0 0.0 0.0 0.0 0.0 0.0 0.0 0.0 0.0
Subtitle C—Provisions Relating to Part C
3201 Medicare Advantage Payments 0.0 -1.8 -6.0 -9.4 -13.1 -16.7 -19.2 -21.3 -23.2 -25.0 -30.3 -135.6 -17.5
3202 Benefit protection and simplification 0.0 0.0 0.0 0.0 0.0 0.0 0.0 0.0 0.0 0.0 0.0 0.0 0.0
3203 Repealed 0.0 0.0 0.0 0.0 0.0 0.0 0.0 0.0 0.0 0.0 0.0 0.0 0.7
3204 Simplification of Annual Beneficiary Election Periods 0.0 0.0 0.0 0.0 0.0 0.0 0.0 0.0 0.0 0.0 0.0 0.0 0.0
3205 Extension for Specialized MA Plans for Special Needs Individuals 0.0 0.1 0.2 0.2 0.2 0.0 0.0 0.0 0.0 0.0 0.6 0.7 -0.2
3206 Extension of Reasonable Cost Contracts 0.0 0.0 0.0 0.0 0.0 0.0 0.0 0.0 0.0 0.0 0.0 0.0 0.0
3207 Technical Correction to MA Private Fee-for-Service Plans 0.0 0.0 0.0 0.0 0.0 0.0 0.0 0.0 0.0 0.0 0.0 0.1 0.0
3208 Making Senior Housing Facility Demonstration Permanent Included in estimate for section 3205.
3209 Authority to Deny Plan Bids Included in estimate for section 3201.
3210 Development of New Standards for Certain Medigap Plans 0.0 0.0 0.0 0.0 0.0 0.0 0.0 0.0 0.0 0.0 0.0 -0.1 0.0
Congressional Budget Office Page 5 of 11 3/20/2010

Table 5. Estimate of the Effects of Non-Coverage Health Provisions of the Reconciliation Proposal
Combined with H.R. 3590 as Passed by the SenateEstimated effects on direct spending and revenues in billions of dollars, by fiscal year
2010 2011 2012 2013 2014 2015 2016 2017 2018 2019
2010-
2014
2010-
2019
Change
from
H.R. 3590a
Subtitle D—Medicare Part D Improvements for Prescription Drug Plans and MA–PD Plans
3301 Medicare Coverage Gap Discount Program 0.2 2.4 1.6 2.1 2.9 3.8 5.2 6.4 7.6 10.4 9.2 42.6 24.8
3302 Determination of Medicare Part D Low-Income Benchmark Premium 0.0 0.0 0.1 0.1 0.1 0.1 0.1 0.1 0.1 0.1 0.3 0.7 0.0
3303 Voluntary de minimis Policy for Subsidy Eligible Individuals Under
Prescription Drug Plans and MA–PD Plans 0.0 0.0 0.0 0.0 0.0 0.0 0.0 0.1 0.1 0.1 0.1 0.4 0.0
3304 Special Rule for Widows and Widowers Regarding Eligibility
for Low-Income Assistance 0.0 0.0 0.0 0.0 0.0 0.0 0.0 0.0 0.0 0.0 0.1 0.2 0.0
3305 Improved Information for Subsidy Eligible Individuals Reassigned to
Prescription Drug Plans and MA–PD Plans 0.0 0.0 0.0 0.0 0.0 0.0 0.0 0.0 0.0 0.0 0.0 0.0 0.0
3306 Funding Outreach and Assistance for Low-Income Programs 0.0 0.0 0.0 0.0 0.0 0.0 0.0 0.0 0.0 0.0 0.0 0.0 0.0
3307 Improving Formulary Requirements for Prescription Drug Plans and MA–PD
Plans With Respect to Certain Categories or Classes of Drugs 0.0 0.0 0.0 0.0 0.0 0.0 0.0 0.0 0.0 0.0 0.0 0.0 0.0
3308 Reducing Part D Premium Subsidy for High-Income Beneficiaries 0.0 -0.3 -0.5 -0.7 -0.9 -1.1 -1.3 -1.6 -2.0 -2.4 -2.4 -10.7 0.0
3309 Elimination of Cost Sharing for Certain Dual Eligible Individuals. 0.0 0.0 0.1 0.1 0.1 0.1 0.2 0.2 0.2 0.2 0.3 1.1 0.0
3310 Reducing Wasteful Dispensing of Outpatient Prescription Drugs in
Long-Term Care Facilities 0.0 0.0 -0.1 -0.3 -0.5 -0.8 -1.0 -1.0 -0.9 -1.1 -1.0 -5.7 0.0
3311 Medicare Prescription Drug Plan and MA–PD Plan Complaint System 0.0 0.0 0.0 0.0 0.0 0.0 0.0 0.0 0.0 0.0 0.0 0.0 0.0
3312 Uniform Exceptions and Appeals Process for Prescription Drug Plans
and MA–PD Plans 0.0 0.0 0.0 0.0 0.0 0.0 0.0 0.0 0.0 0.0 0.0 0.0 0.0
3313 Office of the Inspector General Studies and Reports 0.0 0.0 0.0 0.0 0.0 0.0 0.0 0.0 0.0 0.0 0.0 0.0 0.0
3314 Including Costs Incurred by AIDS Drug Assistance Programs and
Indian Health Service in Providing Prescription Drugs Toward the
Annual Out-of-Pocket Threshold Under Part D 0.0 0.0 0.1 0.1 0.1 0.1 0.1 0.1 0.1 0.1 0.2 0.6 0.0
3315 Immediate Reduction in Coverage Gap in 2010 0.0 0.0 0.0 0.0 0.0 0.0 0.0 0.0 0.0 0.0 0.0 0.0 0.0
10328 Improvement in Part D Medication Therapy Management Programs 0.0 0.0 0.0 0.0 0.0 0.0 0.0 0.0 0.0 0.0 0.0 0.0 0.0
Subtitle E—Ensuring Medicare Sustainability
3401 Revision of Certain Market Basket Updates and Incorporation of services
Productivity Improvements into Market Basket Updates that do not
Already Incorporate Such Improvements (effect of productivity adjustment
for home health included in estimate for section 3131) -0.1 -1.1 -3.8 -7.4 -11.3 -15.3 -19.5 -25.4 -32.3 -40.5 -23.7 -156.6 -9.9
3402 Temporary Adjustment to the Calculation of Part B Premiums 0.0 -1.3 -1.9 -1.9 -2.5 -2.6 -2.8 -3.2 -4.0 -4.9 -7.5 -25.0 0.0
3403 Independent Payment Advisory Board 0.0 0.0 0.0 0.0 0.0 -1.5 -2.6 -3.0 -3.7 -4.7 0.0 -15.5 12.6
Subtitle F—Health Care Quality Improvements 0.0 0.0 0.0 0.0 0.0 0.0 0.0 0.0 0.0 0.0 0.0 0.0 0.0
10323 Medicare Coverage for Individuals Exposed to
Environmental Health Hazards 0.0 0.0 0.0 0.0 0.0 0.0 0.0 0.0 0.0 0.0 0.1 0.3 0.0
10324 Protections for Frontier States 0.0 0.1 0.2 0.2 0.2 0.2 0.2 0.2 0.2 0.3 0.8 2.0 0.0
10325 Revision to Skilled Nursing Facility Prospective Payment System 0.0 0.0 0.0 0.0 0.0 0.0 0.0 0.0 0.0 0.0 0.0 0.0 0.0
10326 Pilot Testing of Pay-for-Performance 0.0 0.0 0.0 0.0 0.0 0.0 0.0 0.0 0.0 0.0 0.0 0.0 0.0
10329 Methodology to Assess Health Plan Value 0.0 0.0 0.0 0.0 0.0 0.0 0.0 0.0 0.0 0.0 0.0 0.0 0.0
10330 Modernizing CMS Computer and Data Systems 0.0 0.0 0.0 0.0 0.0 0.0 0.0 0.0 0.0 0.0 0.0 0.0 0.0
10331 Public Reporting of Performance Information 0.0 0.0 0.0 0.0 0.0 0.0 0.0 0.0 0.0 0.0 0.0 0.0 0.0
10332 Availability of Medicare Data 0.0 0.0 0.0 0.0 0.0 0.0 0.0 0.0 0.0 0.0 0.0 0.0 0.0
10333 Community-based Collaborative Care Networks 0.0 0.0 0.0 0.0 0.0 0.0 0.0 0.0 0.0 0.0 0.0 0.0 0.0
Congressional Budget Office Page 6 of 11 3/20/2010

Table 5. Estimate of the Effects of Non-Coverage Health Provisions of the Reconciliation Proposal
Combined with H.R. 3590 as Passed by the SenateEstimated effects on direct spending and revenues in billions of dollars, by fiscal year
2010 2011 2012 2013 2014 2015 2016 2017 2018 2019
2010-
2014
2010-
2019
Change
from
H.R. 3590a
TITLE IV—PREVENTION OF CHRONIC DISEASE AND IMPROVING PUBLIC HEALTH
Subtitle A—Modernizing Disease Prevention and Public Health Systems
4002 Prevention and Public Health Fund 0.1 0.6 0.8 1.0 1.3 1.6 1.8 1.9 2.0 2.0 3.7 12.9 0.0
Sections 4001, 4003, 4004 0.0 0.0 0.0 0.0 0.0 0.0 0.0 0.0 0.0 0.0 0.0 0.0 0.0
Subtitle B—Increasing Access to Clinical Preventive Services
4101 School-Based Health Centers 0.0 0.1 0.0 0.0 0.0 0.0 0.0 0.0 0.0 0.0 0.2 0.2 0.0
4102 Oral Healthcare Prevention Activities 0.0 0.0 0.0 0.0 0.0 0.0 0.0 0.0 0.0 0.0 0.0 0.0 0.0
4103 Medicare Coverage of Annual Wellness Visit Providing a
Personalized Prevention Plan 0.0 0.3 0.3 0.4 0.4 0.4 0.4 0.4 0.5 0.5 1.4 3.6 0.0
4104 Removal of Barriers to Preventive Services in Medicare 0.0 0.1 0.1 0.1 0.1 0.1 0.1 0.1 0.1 0.1 0.3 0.8 0.0
4105 Evidence-Based Coverage of Preventive Services in Medicare 0.0 0.0 -0.1 -0.1 -0.1 -0.1 -0.1 -0.1 -0.1 -0.1 -0.3 -0.7 0.0
4106 Improving Access to Preventive Services for Eligible Adults in Medicaid 0.0 0.0 0.0 0.0 0.0 0.0 0.0 0.0 0.0 0.0 0.0 0.1 0.0
4107 Coverage of Comprehensive Tobacco Cessation Services for
Pregnant Women in Medicaid 0.0 0.0 0.0 0.0 0.0 0.0 0.0 0.0 0.0 0.0 0.0 -0.1 0.0
4108 Incentives for Prevention of Chronic Diseases in Medicaid 0.0 0.0 0.1 0.0 0.0 0.0 0.0 0.0 0.0 0.0 0.1 0.1 0.0
Subtitle C—Creating Healthier Communities
4201 Community Transformation Grants 0.0 0.0 0.0 0.0 0.0 0.0 0.0 0.0 0.0 0.0 0.0 0.0 0.0
4202 Healthy Aging, Living Well; Evaluation of Community-Based Prevention
and Wellness Programs for Medicare Beneficiaries 0.0 0.0 0.0 0.0 0.0 0.0 0.0 0.0 0.0 0.0 0.1 0.1 0.0
4203 Removing Barriers and Improving Access to Wellness for
Individuals With Disabilities 0.0 0.0 0.0 0.0 0.0 0.0 0.0 0.0 0.0 0.0 0.0 0.0 0.0
4204 Immunizations 0.0 0.0 0.0 0.0 0.0 0.0 0.0 0.0 0.0 0.0 0.0 0.0 0.0
4205 Nutrition Labeling of Standard Menu Items at Chain Restaurants 0.0 0.0 0.0 0.0 0.0 0.0 0.0 0.0 0.0 0.0 0.0 0.0 0.0
4206 Demonstration Project Concerning Individualized Wellness Plan 0.0 0.0 0.0 0.0 0.0 0.0 0.0 0.0 0.0 0.0 0.0 0.0 0.0
4207 Reasonable Break Time for Nursing Mothers 0.0 0.0 0.0 0.0 0.0 0.0 0.0 0.0 0.0 0.0 0.0 0.0 0.0
Subtitle D—Support for Prevention and Public Health Innovation
4301 Research On Optimizing The Delivery of Public Health Services 0.0 0.0 0.0 0.0 0.0 0.0 0.0 0.0 0.0 0.0 0.0 0.0 0.0
4302 Understanding Health Disparities: Data Collection and Analysis
Data Collection, Analysis, and Quality 0.0 0.1 0.1 0.1 0.0 0.0 0.0 0.0 0.0 0.0 0.2 0.2 0.0
Addressing Health Care Disparities 0.0 0.0 0.0 0.0 0.0 0.0 0.0 0.0 0.0 0.0 0.0 0.0 0.0
4303 CDC and Employer-Based Wellness Programs 0.0 0.0 0.0 0.0 0.0 0.0 0.0 0.0 0.0 0.0 0.0 0.0 0.0
4304 Epidemiology-Laboratory Capacity Grants 0.0 0.0 0.0 0.0 0.0 0.0 0.0 0.0 0.0 0.0 0.0 0.0 0.0
4305 Advancing Research and Treatment for Pain-Care Management 0.0 0.0 0.0 0.0 0.0 0.0 0.0 0.0 0.0 0.0 0.0 0.0 0.0
4306 Funding for Childhood Obesity Demonstration Project 0.0 0.0 0.0 0.0 0.0 0.0 0.0 0.0 0.0 0.0 0.0 0.0 0.0
10407 Better Diabetes Care 0.0 0.0 0.0 0.0 0.0 0.0 0.0 0.0 0.0 0.0 0.0 0.0 0.0
10408 Grants for Workplace Wellness 0.0 0.0 0.0 0.0 0.0 0.0 0.0 0.0 0.0 0.0 0.0 0.0 0.0
10409 Cures Acceleration Network 0.0 0.0 0.0 0.0 0.0 0.0 0.0 0.0 0.0 0.0 0.0 0.0 0.0
10410 Centers of Excellence for Depression 0.0 0.0 0.0 0.0 0.0 0.0 0.0 0.0 0.0 0.0 0.0 0.0 0.0
10411 Programs Relating to Congenital Heart Disease 0.0 0.0 0.0 0.0 0.0 0.0 0.0 0.0 0.0 0.0 0.0 0.0 0.0
10412 Automated Defribrillation 0.0 0.0 0.0 0.0 0.0 0.0 0.0 0.0 0.0 0.0 0.0 0.0 0.0
10413 Young Women's Breast Health 0.0 0.0 0.0 0.0 0.0 0.0 0.0 0.0 0.0 0.0 0.0 0.0 0.0
Subtitle E—Miscellaneous Provisions 0.0 0.0 0.0 0.0 0.0 0.0 0.0 0.0 0.0 0.0 0.0 0.0 0.0
Congressional Budget Office Page 7 of 11 3/20/2010

Table 5. Estimate of the Effects of Non-Coverage Health Provisions of the Reconciliation Proposal
Combined with H.R. 3590 as Passed by the SenateEstimated effects on direct spending and revenues in billions of dollars, by fiscal year
2010 2011 2012 2013 2014 2015 2016 2017 2018 2019
2010-
2014
2010-
2019
Change
from
H.R. 3590a
TITLE V—HEALTH CARE WORKFORCE
Subtitle A—Purpose and Definitions 0.0 0.0 0.0 0.0 0.0 0.0 0.0 0.0 0.0 0.0 0.0 0.0 0.0
Subtitle B—Innovations in the Health Care Workforce 0.0 0.0 0.0 0.0 0.0 0.0 0.0 0.0 0.0 0.0 0.0 0.0 0.0
Subtitle C—Increasing the Supply of the Health Care Workforce 0.0 0.0 0.0 0.0 0.0 0.0 0.0 0.0 0.0 0.0 0.0 0.0 0.0
Subtitle D—Enhancing Health Care Workforce Education and Training
Sections 5301-5314 0.0 0.0 0.0 0.0 0.0 0.0 0.0 0.0 0.0 0.0 0.0 0.0 0.0
5315 United States Public Health Sciences Track Included in estimate for section 4002.
5316 Family Nurse Practitioner Training Programs 0.0 0.0 0.0 0.0 0.0 0.0 0.0 0.0 0.0 0.0 0.0 0.0 0.0
Subtitle E—Supporting the Existing Health Care Workforce 0.0 0.0 0.0 0.0 0.0 0.0 0.0 0.0 0.0 0.0 0.0 0.0 0.0
Subtitle F—Strengthening Primary Care and Other Workforce Improvements
5501 Expanding Access to Primary Care Services and General Surgery Services 0.0 0.4 0.6 0.7 0.7 0.8 0.3 0.0 0.0 0.0 2.5 3.5 0.0
5502 Medicare Federally Qualified Health Center Improvements 0.0 0.0 0.0 0.0 0.0 0.1 0.1 0.1 0.1 0.1 0.0 0.4 0.0
5503- 5506 Medicare Graduate Medical Education Policies 0.0 0.0 0.1 0.1 0.1 0.1 0.1 0.2 0.2 0.2 0.3 1.1 0.0
5507 Demonstration Projects to Address Health Professions Workforce Needs and
Extension of Family-To-Family Health Information Centers 0.0 0.1 0.1 0.1 0.1 0.1 0.0 0.0 0.0 0.0 0.4 0.4 0.0
5508 Increasing Teaching Capacity 0.0 0.0 0.0 0.0 0.0 0.0 0.0 0.0 0.0 0.0 0.2 0.2 0.0
5509 Graduate Nurse Education Demonstration Program 0.0 0.0 0.0 0.1 0.1 0.1 0.0 0.0 0.0 0.0 0.1 0.2 0.0
Subtitle G—Improving Access to Health Care Services 0.0 0.0 0.0 0.0 0.0 0.0 0.0 0.0 0.0 0.0 0.0 0.0 0.0
5707 Infrastructure to Expand Access to Care 0.0 0.1 0.0 0.0 0.0 0.0 0.0 0.0 0.0 0.0 0.1 0.1 0.0
5606 State Grants to Health Care Providers 0.0 0.0 0.0 0.0 0.0 0.0 0.0 0.0 0.0 0.0 0.0 0.0 0.0
Medical Training in Underserved Communities 0.0 0.0 0.0 0.0 0.0 0.0 0.0 0.0 0.0 0.0 0.0 0.0 0.0
Preventive Medicine and Public Health Training Program 0.0 0.0 0.0 0.0 0.0 0.0 0.0 0.0 0.0 0.0 0.0 0.0 0.0
Scholarship and Loan program 0.0 0.0 0.0 0.0 0.0 0.0 0.0 0.0 0.0 0.0 0.0 0.0 0.0
5708 Community Health Centers and the National Health Service Corps Fund 0.0 0.7 2.2 1.8 2.3 3.3 1.8 0.2 0.0 0.0 7.0 12.3 2.5
5709 Demonstration Project to Provide Access to Affordable Care 0.0 0.0 0.0 0.0 0.0 0.0 0.0 0.0 0.0 0.0 0.0 0.0 0.0
Subtitle H—General Provisions 0.0 0.0 0.0 0.0 0.0 0.0 0.0 0.0 0.0 0.0 0.0 0.0 0.0
TITLE VI—TRANSPARENCY AND PROGRAM INTEGRITY
Subtitle A—Physician Ownership and Other Transparency
6001 Limitation on Medicare Exception to the Prohibition on Certain
Physician Referrals for Hospitals 0.0 0.0 0.0 0.0 0.0 0.0 -0.1 -0.1 -0.1 -0.1 -0.1 -0.5 0.1
6002 Reporting of Physician Ownership or Investment Interests 0.0 0.0 0.0 0.0 0.0 0.0 0.0 0.0 0.0 0.0 0.0 0.0 0.0
6003 Disclosure Requirements for In-Office Ancillary Services Exception to the
Prohibition on Physician Self-Referral for Certain Imaging Services 0.0 0.0 0.0 0.0 0.0 0.0 0.0 0.0 0.0 0.0 0.0 0.0 0.0
6004 Prescription Drug Sample Transparency 0.0 0.0 0.0 0.0 0.0 0.0 0.0 0.0 0.0 0.0 0.0 0.0 0.0
6005 Pharmacy Benefit Managers Transparency Requirements 0.0 0.0 0.0 0.0 0.0 0.0 0.0 0.0 0.0 0.0 0.0 0.0 0.0
Congressional Budget Office Page 8 of 11 3/20/2010

Table 5. Estimate of the Effects of Non-Coverage Health Provisions of the Reconciliation Proposal
Combined with H.R. 3590 as Passed by the SenateEstimated effects on direct spending and revenues in billions of dollars, by fiscal year
2010 2011 2012 2013 2014 2015 2016 2017 2018 2019
2010-
2014
2010-
2019
Change
from
H.R. 3590a
Subtitle B—Nursing Home Transparency and Improvement 0.0 0.0 0.0 0.0 0.0 0.0 0.0 0.0 0.0 0.0 0.0 0.0 0.0
Subtitle C—Nationwide Program for National and State Background Checks on Direct
Patient Access Employees of Long-term Care Facilities and Providers 0.0 0.1 0.0 0.0 0.0 0.0 0.0 0.0 0.0 0.0 0.1 0.1 0.0
Subtitle D—Patient-Centered Outcomes Research
6301 Patient-Centered Outcomes Research
Medicare 0.0 0.0 0.0 0.0 0.0 0.0 0.0 0.0 -0.1 -0.2 0.1 -0.3 0.0
Non-Medicare 0.0 0.0 0.1 0.1 0.2 0.3 0.4 0.4 0.4 0.5 0.4 2.5 0.0
6302 Federal Coordinating Council for Comparative Effectiveness Research 0.0 0.0 0.0 0.0 0.0 0.0 0.0 0.0 0.0 0.0 0.0 0.0 0.0
Subtitle E—Medicare, Medicaid, and CHIP Program Integrity Provisions
6401 Provider Screening and Other Enrollment Requirements Under
Medicare, Medicaid, and CHIP 0.0 0.0 0.0 0.0 0.0 0.0 0.0 0.0 0.0 0.0 0.0 -0.1 0.0
6402 Enhanced Medicare and Medicaid Program Integrity Provisions 0.0 -0.2 -0.3 -0.3 -0.3 -0.3 -0.4 -0.4 -0.4 -0.4 -1.1 -2.9 0.3
6403 Elimination of Duplication Between the Healthcare Integrity and
Protection Data Bank and the National Practitioner Data Bank 0.0 0.0 0.0 0.0 0.0 0.0 0.0 0.0 0.0 0.0 0.0 0.0 0.0
6404 Maximum Period for Submission of Medicare Claims 0.0 0.0 0.0 0.0 0.0 0.0 0.0 0.0 0.0 0.0 0.0 0.0 0.0
6405 Physicians Who Order Items or Services Required to Be
Medicare-Enrolled Physicians or Eligible Professionals 0.0 0.0 0.0 0.0 0.0 0.0 -0.1 -0.1 -0.1 -0.1 -0.2 -0.4 0.0
6406 Requirement for Physicians to Provide Documentation on Referrals
to Programs At High Risk of Waste and Abuse 0.0 0.0 0.0 0.0 0.0 0.0 0.0 0.0 0.0 0.0 0.0 0.0 0.0
6407 Face to Face Encounter With Patient Required Before Physicians May
Certify Eligibility for Home Health Services or
Durable Medical Equipment Under Medicare 0.0 -0.1 -0.1 -0.1 -0.1 -0.1 -0.1 -0.1 -0.1 -0.2 -0.3 -1.0 0.0
6408 Enhanced Penalties 0.0 0.0 0.0 0.0 0.0 0.0 0.0 0.0 0.0 0.0 0.0 0.0 0.0
6409 Medicare Self-Referral Disclosure Protocol 0.0 0.0 0.0 0.0 0.0 0.0 0.0 0.0 0.0 0.0 0.0 0.0 0.0
6410 Adjustments to the Competitive Acquisition Program in Medicare for
Durable Medical Equipment, Prosthetics, Orthotics, and Supplies 0.0 0.0 0.0 -0.1 -0.2 -0.2 -0.2 -0.2 -0.2 -0.2 -0.3 -1.4 0.0
6411 Expansion of the Recovery Audit Contractor (RAC) Program 0.0 0.0 0.0 0.0 0.0 0.0 0.0 0.0 0.0 0.0 0.0 0.0 0.0
10606 Health Care Fraud Enforcement 0.0 0.0 0.0 0.0 0.0 0.0 0.0 0.0 0.0 0.0 0.0 0.0 0.0
Subtitle F—Additional Medicaid Program Integrity Provisions
6501 Termination of Provider Participation Under Medicaid If
Terminated Under Medicare or Other State Plan 0.0 0.0 0.0 0.0 0.0 0.0 0.0 0.0 0.0 0.0 0.0 0.0 0.0
6502 Medicaid Exclusion From Participation Relating to Certain Ownership,
Control, and Management Affiliations 0.0 0.0 0.0 0.0 0.0 0.0 0.0 0.0 0.0 0.0 0.0 0.0 0.0
6503 Billing Agents, Clearinghouses, or Other Alternate Payees
Required to Register Under Medicaid 0.0 0.0 0.0 0.0 0.0 0.0 0.0 0.0 0.0 0.0 0.0 0.0 0.0
6504 Requirement to Report Expanded Set of Data Elements Under MMIS
to Detect Fraud and Abuse 0.0 0.0 0.0 0.0 0.0 0.0 0.0 0.0 0.0 0.0 0.0 0.0 0.0
6505 Prohibition on Payments to Institutions or Entities
Located Outside of the United States 0.0 0.0 0.0 0.0 0.0 0.0 0.0 0.0 0.0 0.0 0.0 0.0 0.0
6506 Overpayments 0.1 0.1 0.0 0.0 0.0 0.0 0.0 0.0 0.0 0.0 0.1 0.1 0.0
6507 Mandatory State Use of National Correct Coding Initiative 0.0 0.0 0.0 0.0 0.0 0.0 0.0 0.0 0.0 -0.1 -0.1 -0.3 0.0
6508 General Effective Date 0.0 0.0 0.0 0.0 0.0 0.0 0.0 0.0 0.0 0.0 0.0 0.0 0.0
Congressional Budget Office Page 9 of 11 3/20/2010

Table 5. Estimate of the Effects of Non-Coverage Health Provisions of the Reconciliation Proposal
Combined with H.R. 3590 as Passed by the SenateEstimated effects on direct spending and revenues in billions of dollars, by fiscal year
2010 2011 2012 2013 2014 2015 2016 2017 2018 2019
2010-
2014
2010-
2019
Change
from
H.R. 3590a
Subtitle G—Additional Program Integrity Provisions 0.0
10607 State Demonstration Programs: Alternatives to Tort Litigation 0.0 0.0 0.0 0.0 0.0 0.0 0.0 0.0 0.0 0.0 0.0 0.0 0.0
10608 Liability Coverage in Free Clinics 0.0 0.0 0.0 0.0 0.0 0.0 0.0 0.0 0.0 0.0 0.0 0.1 0.0
10609 FDA Labeling Changes 0.0 0.0 0.0 0.0 0.0 0.0 0.0 0.0 0.0 0.0 0.0 -0.1 0.0
Subtitle H—Elder Justice Act 0.0 0.0 0.0 0.0 0.0 0.0 0.0 0.0 0.0 0.0 0.0 0.0 0.0
Subtitle I—Sense of the Senate Regarding Medical Malpractice 0.0 0.0 0.0 0.0 0.0 0.0 0.0 0.0 0.0 0.0 0.0 0.0 0.0
TITLE VII—IMPROVING ACCESS TO INNOVATIVE MEDICAL THERAPIES
Subtitle A—Biologics Price Competition and Innovation 0.0 0.0 0.0 0.0 -0.1 -0.3 -0.7 -1.2 -1.9 -2.7 -0.1 -7.0 0.1
Subtitle B—More Affordable Medicines for Children and Underserved Communities
7101 Expanded Participation in 340B Program Included in estimate for section 2501.
7102 Improvements to 340B Program Integrity 0.0 0.0 0.0 0.0 0.0 0.0 0.0 0.0 0.0 0.0 0.0 0.0 0.0
7103 GAO Study to Make Recommendations on Improving the 340B Program 0.0 0.0 0.0 0.0 0.0 0.0 0.0 0.0 0.0 0.0 0.0 0.0 0.0
TITLE VIII—COMMUNITY LIVING ASSISTANCE SERVICES AND SUPPORTS 0.0 0.0 -5.4 -8.8 -10.0 -11.3 -11.1 -9.1 -7.6 -7.0 -24.1 -70.2 0.0
TITLE IX—REVENUE PROVISIONS Estimates provided by the Joint Committee on Taxation in a Separate Table (see JCX-17-10).
PROVISIONS OF RECONCILIATION BILL THAT ARE NOT INCLUDED IN
ESTIMATES FOR PROVISIONS OF H.R. 3590
1005 Administrative Funding 0.0 0.4 0.5 0.1 0.0 0.0 0.0 0.0 0.0 0.0 1.0 1.0 1.0
1109 Payment for Qualifying Hospitals 0.1 0.3 0.0 0.4 0.4 0.4
1202 Improving Payments to Primary Care Practitioners 0.0 0.0 0.0 1.9 3.0 1.6 0.9 0.8 0.1 0.0 4.9 8.3 8.3
1206 Drug Rebates for New Formulations of Existing Drugs 0.0 0.1 0.1 0.1 0.1 0.1 0.1 0.1 0.1 0.1 0.2 0.6 0.6
1301, 1302, 1304 Program Integrity Provisions: Sections 1301, 1302,1304 0.0 0.0 -0.1 -0.1 -0.1 -0.1 -0.1 -0.1 -0.1 -0.1 -0.3 -0.9 -0.9
1305 Increased Funding to Fight
Fraud, Waste, and Abuse Included in estimate for section 6402. 0.0
1501 Community College and Career Training Grant Program 0.0 0.0 0.4 0.5 0.5 0.5 0.1 0.0 0.0 0.0 1.3 2.0 2.0
2303 Drugs Purchased by Covered Entities 0.1 0.2 0.2 0.2 0.2 0.3 0.3 0.3 0.4 0.4 0.8 2.5 2.5
INTERACTIONS
Medicare Advantage Interactions 0.0 0.0 -0.6 -1.9 -7.9 -7.8 -8.9 -11.7 -14.1 -17.2 -10.4 -70.3 -52.9
Premium Interactions 0.0 -0.2 0.5 1.1 6.3 4.8 4.8 6.0 7.0 8.1 7.6 38.4 6.8
Medicare Part D Interactions with Medicare Advantage Provisions 0.0 0.0 0.1 0.1 0.2 0.2 0.2 0.2 0.2 0.3 0.4 1.5 -1.5
Medicare Part B Interactions with Medicare Part D Provisions 0.0 0.0 0.1 0.1 0.1 0.1 0.1 0.1 0.1 0.1 0.3 0.8 0.0
Medicaid Interactions with Medicare Part D Provisions 0.0 0.0 0.0 0.0 0.0 0.1 0.1 0.1 0.1 0.2 0.1 0.7 0.0
Medicare Interaction with 340b 0.0 0.0 0.0 0.0 -0.1 -0.1 -0.1 -0.1 -0.1 -0.1 -0.1 -0.5 0.0
TRICARE Interaction 0.0 0.0 -0.1 -0.2 -0.3 -0.4 -0.6 -0.8 -1.0 -1.2 -0.5 -4.4 -0.9
FEHB Interaction (on-budget) 0.0 0.0 0.0 0.0 0.2 0.3 0.3 0.4 0.8 0.9 0.3 2.9 0.1
FEHB Interaction (off-budget) 0.0 0.0 0.0 0.0 0.2 0.2 0.2 0.1 0.3 0.3 0.3 1.3 -0.2
Total, Changes in On-Budget Direct Spending 3.0 3.0 -10.7 -22.0 -47.5 -55.7 -66.6 -83.2 -99.1 -114.7 -74.1 -493.3 -13.7
Total, Changes in Unified-Budget Direct Spending 3.0 3.0 -10.6 -22.0 -47.3 -55.5 -66.4 -83.1 -98.9 -114.4 -73.8 -492.0 -13.9
Congressional Budget Office Page 10 of 11 3/20/2010

Table 5. Estimate of the Effects of Non-Coverage Health Provisions of the Reconciliation Proposal
Combined with H.R. 3590 as Passed by the SenateEstimated effects on direct spending and revenues in billions of dollars, by fiscal year
2010 2011 2012 2013 2014 2015 2016 2017 2018 2019
2010-
2014
2010-
2019
Change
from
H.R. 3590a
Changes in Revenues
Transitional Reinsurance - Collections for Early Retirees 0.0 0.0 0.0 0.0 1.5 1.5 0.8 0.0 0.0 0.0 1.5 3.8 0.0
Fraud, Waste, and Abuse (on-budget) 0.0 0.1 0.1 0.1 0.1 0.1 0.1 0.1 0.1 0.1 0.4 0.9 0.0
Effect of Administrative Simplification on Revenuesb
0.0 -0.2 -0.2 0.0 0.5 0.9 1.3 1.9 2.0 2.0 0.1 8.2 0.0
Effect on Revenues of Changes in Health Insurance Premiums
as a Result of Comparative Effectiveness Research, Changes in
the Medicaid Drug Program, Biosimilar Biological Products,
and FDA Labeling
Income and Medicare payroll taxes (on-budget) 0.0 0.0 0.0 0.0 0.0 0.1 0.1 0.2 0.3 0.3 0.1 1.0 0.0
Social Security payroll taxes (off-budget) 0.0 0.0 0.0 0.0 0.0 0.0 0.1 0.1 0.1 0.2 0.0 0.5 0.0
Total, Changes in Unified-Budget Revenuesc
0.0 -0.1 -0.1 0.2 2.1 2.6 2.4 2.2 2.5 2.6 2.1 14.3 0.0
Total, Changes in Unified-Budget Deficitsc
3.0 3.1 -10.6 -22.1 -49.4 -58.1 -68.7 -85.3 -101.4 -117.0 -75.9 -506.4 -13.9
Memorandum
Non-scoreable Effects
Savings from HCFAC and Medicaid Integrity Spending 0.0 -0.1 -0.1 -0.2 -0.2 -0.2 -0.3 -0.3 -0.4 -0.4 -0.5 -2.1
Recovery Audit Contractor (RAC) Program in Medicaid 0.0 0.0 0.0 0.0 0.0 0.0 0.0 0.0 0.0 0.0 0.0 -0.2
Notes: AIDS = Acquired Immune-Deficiency Syndrome; CDC = Center for Disease Control and Prevention; CHIP = Children's Health Insurance Program; CMS = Centers for Medicare & Medicaid Services;
FMAP = federal medical assistance percentage; FDA = Food and Drug Administration; FEHB = Federal Employees Health Benefits program; GAO = Government Accountability Office;
HCFAC = Health Care Fraud and Abuse Control; HHS = Department of Health and Human Services; MA = Medicare Advantage; MA-PD = Medicare Advantage prescription drug plan;
MMIS = Medicaid Management Information System; PPO = preferred provider organization; PPS = prospective payment system; TRICARE is the health plan operated by the Department of Defense.
a. Incremental effects over the 2010-2019 period of health provisions of the reconciliation proposal relative to H.R. 3590 as passed by the Senate.
b. Includes both on and off-budget revenues.
c. The revenue effects of the provisions of title IX are estimated by the Joint Committee on Taxation, and are not included in this table.
Congressional Budget Office Page 11 of 11 3/20/2010

Table 6. Estimate of the Incremental Effects of the Health and Revenue Provisions of the Reconciliation Proposal
Relative to H.R. 3590 as Passed by the SenateEstimated effects on direct spending and revenues in billions of dollars, by fiscal year
2010 2011 2012 2013 2014 2015 2016 2017 2018 2019
2010-
2014
2010-
2019
Changes in Deficits
TITLE I—COVERAGE, MEDICARE, MEDICAID, AND REVENUES
Subtitle A—Coverage (direct spending and revenues)
Coverage Provisions (sections 1001-1004, 1201, and 1401) 0 0.2 0.3 5.9 14.2 17.4 21.6 30.2 35.0 35.6 20.6 160.4
1005 Implementation Funding 0 0.4 0.5 0.1 0 0 0 0 0 0 1.0 1.0
Subtitle B—Medicare (direct spending)
1101 Closing the Medicare Prescription Drug ‘‘Donut Hole’’ 0.2 1.5 -0.3 0.7 1.3 2.0 3.0 4.1 5.0 7.2 3.5 24.8
1102 Medicare Advantage Payments 0 4.2 1.0 1.4 -1.8 -4.4 -5.2 -4.5 -4.2 -3.4 4.8 -17.0
1103 Savings from Limits on MA Plan Administrative Costs Interacts with section 1102; budgetary effects are included in estimate for that section.
1104 Disproportionate Share Hospital (DSH) Payments 0 0 0 0 * 0.2 0.5 0.7 0.7 0.9 * 3.0
1105 Market Basket Updates 0 0 0 0 -0.2 -0.2 -0.4 -1.6 -3.0 -4.5 -0.2 -9.8
1106 Physician Ownership-Referral * * * * * * * * * * * 0.1
1107 Payment for Imaging Services 0 -0.1 -0.1 -0.1 -0.1 -0.1 -0.1 -0.1 -0.2 -0.2 -0.5 -1.2
1108 Practice Expense Geographic Practice Cost Index Adjustment for 2010 0.3 0.2 0 0 0 0 0 0 0 0 0.4 0.4
1109 Payment for Qualifying Hospitals 0 0.1 0.3 * 0 0 0 0 0 0 0.4 0.4
Subtitle C—Medicaid (direct spending)
1201 Federal Funding for States Included in coverage estimate.
1202 Payments to Primary Care Physicians 0 0 0 1.9 3.0 1.6 0.9 0.8 0.1 0 4.9 8.3
1203 Disproportionate Share Hospital Payments 0 0 * * -0.5 2.2 3.0 2.0 -1.1 -1.6 -0.4 4.1
1204 Funding for the Territories 0 0.2 0.5 0.6 0.2 0.1 0.1 0.1 0.1 0.1 1.5 2.0
1205 Delay in Community First Choice Option 0 -0.1 -0.1 -0.1 -0.3 -0.1 * -0.1 * -0.1 -0.6 -0.9
1206 Drug Rebates for New Formulations of Existing Drugs * 0.1 0.1 0.1 0.1 0.1 0.1 0.1 0.1 0.1 0.2 0.6
Subtitle D—Reducing Fraud, Waste, and Abuse (direct spending)
1301 Community Mental Health Centers 0 * -0.1 -0.1 -0.1 -0.1 -0.1 -0.1 -0.1 -0.1 -0.2 -0.6
1302 Medicare Prepayment Medical Review Limitations 0 0 * * * * * * * * * -0.1
1303 Funding to Fight Fraud, Waste, and Abuse 0 0.1 0.1 * * * * * * * 0.2 0.3
1304 90-Day Period of Enhanced Oversight for Initial Claims of DME Suppliers 0 * * * * * * * * * -0.1 -0.2
Subtitle E—Revenues (direct spending and revenues)a1.9 -2.6 -2.3 -7.7 -23.0 -15.3 -24.1 -26.6 -27.8 -28.7 -33.6 -155.9
Subtitle F—Community College and Career Training Grant Program (direct spending) 0 * 0.4 0.5 0.5 0.5 0.1 * 0 0 1.3 2.0
Congressional Budget Office Page 1 of 2 3/20/2010

Table 6. Estimate of the Incremental Effects of the Health and Revenue Provisions of the Reconciliation Proposal
Relative to H.R. 3590 as Passed by the SenateEstimated effects on direct spending and revenues in billions of dollars, by fiscal year
2010 2011 2012 2013 2014 2015 2016 2017 2018 2019
2010-
2014
2010-
2019
INTERACTIONS (direct spending)
Effect of Coverage Provisions on Medicare/Medicaid/CHIP Spending * -0.2 -0.1 * * -0.2 -0.2 -0.4 -0.1 -0.1 -0.4 -1.3
Medicare Advantage Interactions 0 0 -0.2 -0.9 -6.1 -5.9 -6.5 -8.9 -11.1 -13.3 -7.1 -52.9
Premium Interactions 0 -0.4 -0.1 -0.1 1.1 1.0 1.1 1.2 1.4 1.5 0.5 6.8
IPAB Interactions 0 0 0 0 0 * 1.5 2.6 3.9 4.6 0 12.6
TRICARE Interaction 0 * * * -0.1 -0.1 -0.1 -0.2 -0.2 -0.3 -0.1 -0.9
FEHB Interaction (off-budget) 0 * -0.1 -0.1 0.1 * -0.1 -0.1 * * -0.1 -0.2
Subtotal, Title I Changes in Unified-Budget Deficits 2.4 3.6 -0.2 2.2 -11.9 -1.3 -4.8 -0.8 -1.4 -2.3 -3.8 -14.4
TITLE II—HEALTH, EDUCATION, LABOR, AND PENSIONS
Subtitle A—Education (direct spending) See Table 7.
Subtitle B—Health (direct spending and revenues)
2301 Insurance Reforms 0 0.3 0.4 0.3 0.7 0.6 0.5 0.4 0.4 0.3 1.6 3.8
2302 Drugs Purchased by Covered Entities 0.1 0.2 0.2 0.2 0.2 0.3 0.3 0.3 0.4 0.4 0.8 2.5
2303 Community Health Centers 0 0.2 0.3 0.4 0.5 0.6 0.3 * 0 0 1.5 2.5
Subtotal, Title II Subtitle B Changes in Unified-Budget Deficits 0.1 0.6 0.9 0.9 1.4 1.6 1.1 0.8 0.7 0.7 3.9 8.7
Total Changes in Unified-Budget Deficits
for Title I and Subtitle B of Title II 2.5 4.2 0.7 3.1 -10.4 0.3 -3.7 -0.1 -0.7 -1.6 0.1 -5.7
Sources: Congressional Budget Office and staff of the Joint Committee on Taxation
Notes: * = between -$50 million and $50 million. Negative numbers indicate reductions in the deficit.
CHIP = Children's Health Insurance Program; DME = durable medical equipment; FEHB = Federal Employees Health Benefits program;
IPAB = Independent Payment Advisory Board; MA = Medicare Advantage; TRICARE is the health plan operated by the Department of Defense.
a. Estimated effects on the deficit of section 1401 (High-cost plan excise tax) are included in the estimate for coverage provisions in Title I, Subtitle A.
Congressional Budget Office Page 2 of 2 3/20/2010

Table 7. Estimate of the Incremental Effects of the Reconciliation Proposal, Relative to H.R. 3590 as Passed by the SenateIncludes effects of education provisions as well as health care and revenue provisions
Billions of Dollars, by Fiscal Year
2010 2011 2012 2013 2014 2015 2016 2017 2018 2019
2010-
2014
2010-
2019
Title I - Coverage, Medicare, Medicaid, and Revenuesa
Subtotal, Title I 2.4 3.6 -0.2 2.2 -11.9 -1.3 -4.8 -0.8 -1.4 -2.3 -3.8 -14.4
On-Budget 2.4 3.5 -0.2 -1.2 -12.6 -3.6 -8.2 -5.1 -5.3 -6.3 -8.1 -36.6
Off-Budgetb 0 0.1 0.1 3.4 0.7 2.3 3.4 4.3 3.9 4.0 4.3 22.2
Title II - Health, Education, Labor, and Pensions
Subtitle A - Education -0.3 -0.4 3.7 -5.6 -2.5 -4.5 -3.6 -2.4 -1.8 -1.7 -5.1 -19.2
Subtitle B - Health 0.1 0.6 0.9 0.9 1.4 1.6 1.1 0.8 0.7 0.7 3.9 8.7
Subtotal, Title II -0.3 0.2 4.6 -4.6 -1.1 -3.0 -2.5 -1.7 -1.0 -1.0 -1.2 -10.5
On-Budget -0.3 0.1 4.5 -4.7 -1.3 -3.2 -2.7 -1.8 -1.1 -1.1 -1.7 -11.7
Off-Budgetb 0 0.1 0.1 0.1 0.2 0.2 0.2 0.1 0.1 0.1 0.5 1.2
Net Increase or Decrease (-) in the Deficit 2.2 3.8 4.4 -2.5 -12.9 -4.2 -7.3 -2.5 -2.4 -3.4 -5.0 -24.9
On-Budget 2.2 3.6 4.2 -5.9 -13.9 -6.8 -10.9 -6.9 -6.4 -7.4 -9.8 -48.3
Off-Budgetb 0 0.2 0.2 3.5 0.9 2.6 3.6 4.4 4.0 4.1 4.8 23.4
Sources: Congressional Budget Office and the staff of the Joint Committee on Taxation.
Notes: Components may not sum to totals because of rounding.
a. Also includes funding for Community College and Career Training Grant Program.
b. Off-budget effects include changes in Social Security spending and revenues as well as spending by the U.S. Postal Service.
INCREASE OR DECREASE (-) IN THE DEFICIT FROM CHANGES IN DIRECT SPENDING OR REVENUES
Congressional Budget Office Page 1 of 1 3/20/2010