the budget and economic outlook: fiscal years 2008 to 2017mchinn/summarych2_cbobudgetoutlook.pdf ·...
TRANSCRIPT

CONGRESS OF THE UNITED STATESCONGRESSIONAL BUDGET OFFICE
The Budget and Economic Outlook:Fiscal Years 2008 to 2017
JANUARY 2007
2007 2011 2012 2013 2014
40
20
02015
Projected Growth of the U.S. Economy andFederal Spending for Major Mandatory Programs
60
80
100
2008 2009 2010 2016 2017
Medicare andMedicaid
SocialSecurity
120
140
Gross DomesticProduct
Cumulative Nominal Percentage Growth from 2006 Level

Pub. No. 2941
The Congress of the United States O Congressional Budget Office
CBO
The Budget and Economic Outlook:Fiscal Years 2008 to 2017
January 2007
Notes
Unless otherwise indicated, all of the years referred to in describing the economic outlook are calendar years; other years referred to in this report are federal fiscal years (which run from October 1 to September 30).
Numbers in the text and tables may not add up to totals because of rounding.
Some of the figures in Chapter 2 use shaded vertical bars to indicate periods of recession as well as dashed vertical lines to separate actual from projected data. (A recession extends from the peak of a business cycle to its trough.)
Supplemental data for this analysis are available on the home page of the Congressional Budget Office’s Web site (www.cbo.gov) under “Current Budget Projections” and “Current Economic Projections.”
Preface
This volume is one of a series of reports on the state of the budget and the economy that the Congressional Budget Office (CBO) issues each year. It satisfies the requirement of section 202(e) of the Congressional Budget Act of 1974 for CBO to submit to the Committees on the Budget periodic reports about fiscal policy and to furnish baseline projections of the federal budget. In accordance with CBO’s mandate to provide impartial analysis, the report makes no recommendations.
The baseline spending projections were prepared by the staff of CBO’s Budget Analysis Division under the supervision of Robert Sunshine, Peter Fontaine, Janet Airis, Thomas Bradley, Kim Cawley, Paul Cullinan, Jeffrey Holland, and Sarah Jennings. The revenue estimates were prepared by the staff of the Tax Analysis Division under the supervision of Thomas Woodward, Mark Booth, and David Weiner, with assistance from the Joint Commit-tee on Taxation. (A detailed list of contributors to the revenue and spending projections appears in Appendix F.)
The economic outlook presented in Chapter 2 was prepared by the Macroeconomic Analysis Division under the direction of Robert Dennis, Kim Kowalewski, and John F. Peterson. Robert Arnold and Christopher Williams produced the economic forecast and projections. David Brauer, Ufuk Demiroglu, Richard Farmer (formerly of CBO), Naomi Griffin, Douglas Hamilton, Juann Hung, Kim Kowalewski, Mark Lasky, Angelo Mascaro, Ben Page, and Frank Russek contributed to the analysis. Andrew Gisselquist and Adam Weber provided research assistance.
An early version of CBO’s economic forecast was discussed at a meeting of the agency’s Panel of Economic Advisers. At that time, members of the panel were Martin Baily, Richard Berner, Dan Crippen, J. Bradford DeLong, Martin Feldstein, Robert J. Gordon, Robert E. Hall, Douglas Holtz-Eakin, Ellen Hughes-Cromwick, Lawrence Katz, Allan H. Meltzer, Laurence H. Meyer,William D. Nordhaus, June E. O’Neill, Rudolph G. Penner, James Poterba, Robert Reischauer, Alice Rivlin, Nouriel Roubini, and Diane C. Swonk. Raj Chetty, Sherry Glied, Daniel Kessler, and David Zion attended the panel’s meeting as guests. Although CBO’s outside advisers provided considerable assistance, they are not responsible for the contents of this report.
Jeffrey Holland wrote the summary. Barry Blom, with assistance from Mark Booth and Eric Schatten, wrote Chapter 1 (David Newman compiled Box 1-1). John F. Peterson authored Chapter 2. Christina Hawley Anthony wrote Chapter 3, with assistance from Eric Rollins and Eric Schatten. Mark Booth authored Chapter 4, with assistance fromBarbara Edwards, Pamela Greene, Andrew Langan, and Emily Schlect. Ann Futrell, withassistance from Mark Booth, wrote Appendix A. Luis Serna wrote Appendix B (Frank Russek wrote the box) and Appendix C. Andrew Gisselquist and Adam Weber compiled
Appendix D, and Ann Futrell prepared Appendix E. Mark Hadley and Eric Schatten produced the glossary.
Christine Bogusz, Christian Howlett, Kate Kelly, Loretta Lettner, Leah Mazade, and John Skeen edited the report. Marion Curry, Denise Jordan-Williams, and Linda Lewis Harris assisted in its preparation. Maureen Costantino designed the cover and prepared the report for publication. Lenny Skutnik printed the initial copies, Linda Schimmel handled the print distribution, and Annette Kalicki and Simone Thomas handled the electronic distribution via CBO’s Web site (www.cbo.gov).
Peter R. OrszagDirector
January 2007
Contents
Summary xi
1 The Budget Outlook 1
A Review of 2006 3The Concept Behind CBO’s Baseline Projections 5CBO’s Baseline Projections for 2007 to 2017 5The Long-Term Budget Outlook 10Changes in CBO’s Baseline Since August 2006 11Uncertainty and Budget Projections 14The Outlook for Federal Debt 19Trust Funds and the Budget 22
2 The Economic Outlook 25
The Rise in Interest Rates and the Decline in Housing Construction 27
The Continued Strength in Business Fixed Investment andNet Exports 32
The Slowdown in Consumer Spending 35The Steady Growth in Government Purchases 36The Easing of Core Inflation 37The Outlook Through 2017 40Projections of Income 42Changes in the Outlook Since August 2006 44How CBO’s Forecast Compares with Others 46
3 The Spending Outlook 49
Mandatory Spending 53Discretionary Spending 65

VI THE BUDGET AND ECONOMIC OUTLOOK: FISCAL YEARS 2008 TO 2017
4 The Revenue Outlook 77
Revenues by Source 79CBO’s Current Revenue Projections in Detail 80Changes in CBO’s Revenue Projections Since August 2006 98The Effects of Expiring Tax Provisions 99
A Changes in CBO’s Baseline Since August 2006 109
B How Changes in Economic Assumptions Can Affect Budget Projections 119
C Budget Resolution Targets and Actual Outcomes 125
D CBO’s Economic Projections for 2007 to 2017 135
E Historical Budget Data 139
F Contributors to the Revenue and Spending Projections 153
Glossary 157
CONTENTS VII
Tables
S-1. CBO’s Baseline Budget Outlook xii
S-2. CBO’s Economic Projections for Calendar Years 2007 to 2017 xvi
1-1. Projected Deficits and Surpluses in CBO’s Baseline 2
1-2. Average Annual Growth Rates of Revenues and Outlays 4
1-3. CBO’s Baseline Budget Projections 8
1-4. Changes in CBO’s Baseline Projections of the Deficit or Surplus SinceAugust 2006 13
1-5. The Budgetary Effects of Selected Policy Alternatives Not Included inCBO’s Baseline 16
1-6. CBO’s Baseline Projections of Federal Debt 20
1-7. CBO’s Baseline Projections of Trust Fund Surpluses or Deficits 23
2-1. CBO’s Economic Projections for Calendar Years 2007 to 2017 26
2-2. Key Assumptions in CBO’s Projection of Potential Output 41
2-3. CBO’s Current and Previous Economic Projections for Calendar Years2006 to 2016 45
2-4. Comparison of Forecasts by CBO, the Administration, and the Blue Chip Consensus for Calendar Years 2007 to 2012 47
3-1. CBO’s Baseline Spending Projections 50
3-2. Average Annual Rates of Growth in Outlays Since 1995 and in CBO’s Baseline 51
3-3. CBO’s Baseline Projections of Mandatory Spending 55
3-4. Sources of Growth in Mandatory Spending 61
3-5. CBO’s Baseline Projections of Offsetting Receipts 64
3-6. Costs for Mandatory Programs That CBO’s Baseline Assumes Will ContinueBeyond Their Current Expiration Dates 66
3-7. Defense and Nondefense Discretionary Outlays, 1985 to 2007 68
3-8. Growth in Discretionary Budget Authority, 2006 to 2007 69
3-9. Nondefense Discretionary Funding for 2007 70
3-10. CBO’s Projections of Discretionary Spending Under Selected Policy Alternatives 72
3-11. CBO’s Baseline Projections of Federal Interest Outlays 74
4-1. CBO’s Projections of Revenues, by Source 81
4-2. CBO’s Projections of Individual Income Tax Receipts and the NIPA Tax Base 83
VIII DESIGNING A PREMIUM SUPPORT SYSTEM FOR MEDICARE
4-3. Actual and Projected Capital Gains Realizations and Taxes 86
4-4. CBO’s Projections of Social Insurance Tax Receipts and the SocialInsurance Tax Base 90
4-5. CBO’s Projections of Social Insurance Tax Receipts, by Source 91
4-6. CBO’s Projections of Corporate Income Tax Receipts and Tax Bases 92
4-7. CBO’s Projections of Excise Tax Receipts, by Category 95
4-8. CBO’s Projections of Other Sources of Revenue 97
4-9. Changes in CBO’s Projections of Revenues Since August 2006 98
4-10. Effect of Extending Tax Provisions Scheduled to Expire Before 2017 102
A-1. Changes in CBO’s Baseline Projections of the Deficit Since August 2006 110
A-2. Changes in CBO’s Baseline Projections of Discretionary Outlays SinceAugust 2006 112
B-1. Estimated Effects of Selected Economic Changes on CBO’s BaselineBudget Projections 121
C-1. Comparison of Budget Resolution Targets and Actual Budget Totals, 2006 126
C-2. Sources of Differences Between Budget Resolution Targets and ActualBudget Totals, 2006 127
C-3. Sources of Differences Between Budget Resolution Targets and ActualBudget Totals, 1982 to 2006 129
D-1. CBO’s Year-by-Year Forecast and Projections for Calendar Years 2007 to 2017 136
D-2. CBO’s Year-by-Year Forecast and Projections for Fiscal Years 2007 to 2017 137
E-1. Revenues, Outlays, Surpluses, Deficits, and Debt Held by the Public,1962 to 2006 (Billions of dollars) 140
E-2. Revenues, Outlays, Surpluses, Deficits, and Debt Held by the Public,1962 to 2006 (Percentage of gross domestic product) 141
E-3. Revenues by Major Source, 1962 to 2006 (Billions of dollars) 142
E-4. Revenues by Major Source, 1962 to 2006 (Percentage of gross domestic product) 143
E-5. Outlays for Major Categories of Spending, 1962 to 2006 (Billions of dollars) 144
E-6. Outlays for Major Categories of Spending, 1962 to 2006}(Percentage of gross domestic product) 145
E-7. Discretionary Outlays, 1962 to 2006 (Billions of dollars) 146
E-8. Discretionary Outlays, 1962 to 2006 (Percentage of gross domestic product) 147
Tables (Continued)
CONTENTS IX
E-9. Outlays for Mandatory Spending, 1962 to 2006 (Billions of dollars) 148
E-10. Outlays for Mandatory Spending, 1962 to 2006 (Percentage ofgross domestic product) 149
E-11. Surpluses, Deficits, Debt, and Related Series, 1962 to 2006 150
E-12. Standardized-Budget Surplus or Deficit and Related Series, 1962 to 2006(Billions of dollars) 151
E-13. Standardized-Budget Surplus or Deficit and Related Series, 1962 to 2006(Percentage of potential gross domestic product) 152
Figures
S-1. Projected Growth of the U.S. Economy and Federal Spending for Major Mandatory Programs xiii
S-2. Total Revenues and Outlays as a Percentage of Gross Domestic Product, 1966 to 2017 xiv
1-1. The Total Deficit or Surplus as a Percentage of GDP, 1966 to 2017 3
1-2. Debt Held by the Public as a Percentage of Gross Domestic Product, 1940 to 2017 10
1-3. The Population Age 65 or Older as a Percentage of the Population Ages 20 to 64 11
1-4. Total Federal Spending for Medicare and Medicaid Under DifferentAssumptions About the Health Cost Growth Differential 12
1-5. Uncertainty of CBO’s Projections of the Budget Deficit or SurplusUnder Current Policies 18
1-6. Debt Subject to Limit 22
1-7. Projected Social Security Trust Fund Surpluses 24
2-1. Interest Rates 27
2-2. Monetary and Financial Conditions Index and Real GDP 28
2-3. Single-Family Housing Starts 29
2-4. Real Prices of Houses 29
2-5. Real Business Fixed Investment 32
2-6. Corporate Profits 33
2-7. Nominal U.S. Trade and Current-Account Balances 34
Tables (Continued)
X DESIGNING A PREMIUM SUPPORT SYSTEM FOR MEDICARE
2-8. Delinquency Rates at Commercial Banks 36
2-9. Core PCE Inflation and Unit Labor Costs 37
2-10. Core PCE Inflation, Including and Excluding Rent 39
2-11. Real Potential Output, Potential Labor Force, and Potential Labor ForceProductivity 40
2-12. Actual and Potential Labor Force Participation 42
2-13. Labor Income 43
3-1. Major Components of Spending, 1966 to 2017 53
3-2. Caseload Growth in Social Security and Medicare, 1995 to 2017 63
4-1. Total Revenues as a Share of Gross Domestic Product, 1966 to 2017 77
4-2. Annual Growth of Federal Revenues and Gross Domestic Product, 1966 to 2017 78
4-3. Revenues, by Source, as a Share of Gross Domestic Product, 1966 to 2017 79
4-4. Capital Gains Realizations as a Share of Gross Domestic Product, Calendar Years 1990 to 2017 87
Boxes
1-1. Funding for Activities in Iraq and the War on Terrorism 6
2-1. The Yield Spread and the Risk of a Recession 30
3-1. Categories of Federal Spending 52
3-2. Medicare’s Prescription Drug Benefit 58
4-1. Tax Bases and Tax Liability 84
4-2. The Growing Significance of the Alternative Minimum Tax inCBO’s Projections 88
4-3. Reduced Receipts and Refunds of Telephone Taxes 96
B-1. The Potential Budgetary Impact of a Recession 122
Figures (Continued)
Summary
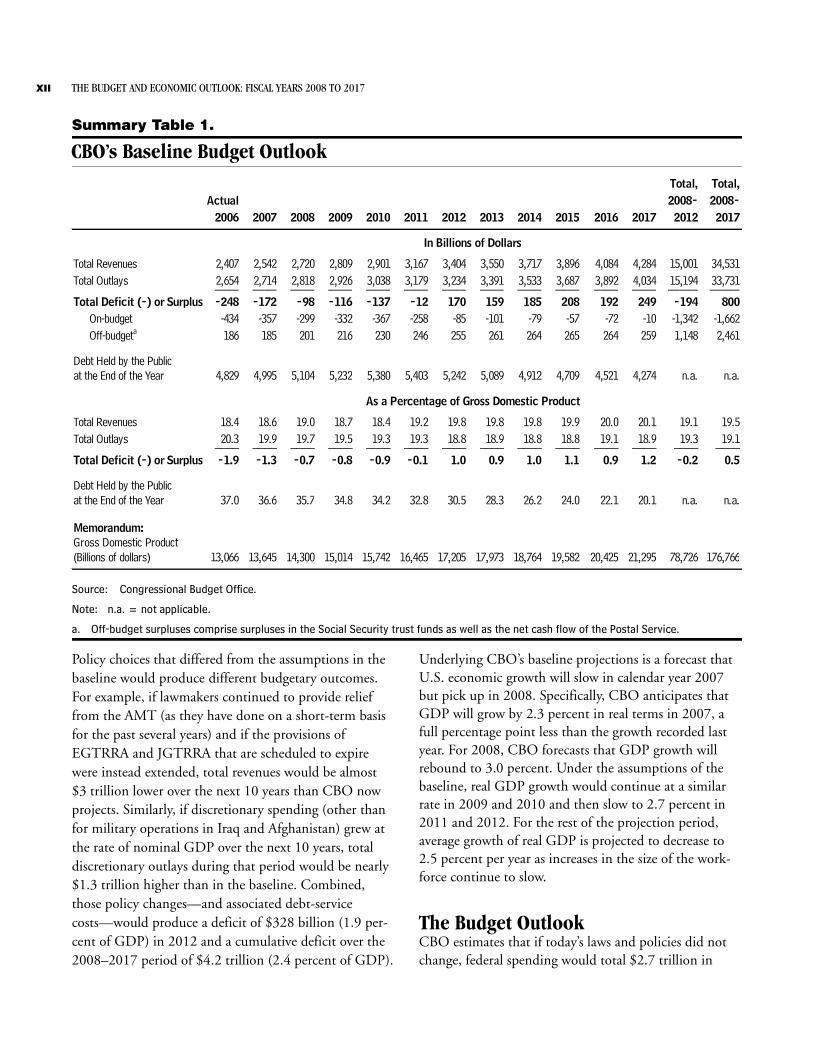
If current laws and policies remained the same, the budget deficit would equal roughly 1 percent of gross domestic product (GDP) each fiscal year from 2007 to 2010, the Congressional Budget Office (CBO) projects. Those deficits would be smaller than last year’s budgetary shortfall, which equaled 1.9 percent of GDP (see Sum-mary Table 1). Under the assumptions that govern CBO’s baseline projections, the budget would essentially be bal-anced in 2011 and then would show surpluses of about 1 percent of GDP each year through 2017 (the end of the current 10-year projection period).
The favorable outlook suggested by those 10-year projec-tions, however, does not indicate a substantial change in the nation’s long-term budgetary challenges. The aging of the population and continuing increases in health care costs are expected to put considerable pressure on the budget in coming decades. Economic growth alone is unlikely to be sufficient to alleviate that pressure as Medi-care, Medicaid, and (to a lesser extent) Social Security require ever greater resources under current law. Either a substantial reduction in the growth of spending, a signifi-cant increase in tax revenues relative to the size of the economy, or some combination of spending and revenue changes will be necessary to promote the nation’s long-term fiscal stability.1
CBO’s baseline budget projections for the next 10 years, moreover, are not a forecast of future outcomes; rather, they are a benchmark that lawmakers and others can use to assess the potential impact of future policy decisions. The deficits and surpluses in the current baseline are predicated on two key projections (which stem from
longstanding procedures that were, until recently, speci-fied in law).2
B Revenues are projected to rise from 18.6 percent of GDP this year to almost 20 percent of GDP in 2012 and then remain near that historically high level through 2017. Much of that increase results from two aspects of current law that have been subject to recent policy changes: the growing impact of the alternative minimum tax (AMT) and, even more significantly, various provisions originally enacted in the Economic Growth and Tax Relief Reconciliation Act of 2001 (EGTRRA) and the Jobs and Growth Tax Relief Rec-onciliation Act of 2003 (JGTRRA) and modified by subsequent legislation, which are scheduled to expire by December 31, 2010.
B Outlays for discretionary programs (activities whose spending levels are set anew each year through appro-priation acts) are projected to decline from 7.8 percent of GDP last year to 5.8 percent of GDP by 2017—a lower percentage than any recorded in the past 45 years. That projection derives mainly from the assumption in the baseline that discretionary funding will grow at the rate of inflation, which is lower than the growth rate that CBO projects for nominal GDP. The projection for discretionary spending implicitly assumes that no additional funding is provided for the war in Iraq in 2007 and that future appropriations for activities related to the war on terrorism remain equiv-alent, in real (inflation-adjusted) terms, to the $70 bil-lion appropriated so far this year.
1. For a detailed discussion of the long-term pressures facing the federal budget, see Congressional Budget Office, The Long-Term Budget Outlook (December 2005), Updated Long-Term Projections for Social Security (March 2005), and The Outlook for Social Secu-rity (June 2004).
2. The Balanced Budget and Emergency Deficit Control Act of 1985, which established rules that govern the calculation of CBO’s baseline, expired on September 30, 2006. Nevertheless, CBO continues to prepare baselines according to the methodol-ogy prescribed in that law.
XII THE BUDGET AND ECONOMIC OUTLOOK: FISCAL YEARS 2008 TO 2017
Summary Table 1.
CBO’s Baseline Budget Outlook
Source: Congressional Budget Office.
Note: n.a. = not applicable.
a. Off-budget surpluses comprise surpluses in the Social Security trust funds as well as the net cash flow of the Postal Service.
Policy choices that differed from the assumptions in the baseline would produce different budgetary outcomes. For example, if lawmakers continued to provide relief from the AMT (as they have done on a short-term basis for the past several years) and if the provisions of EGTRRA and JGTRRA that are scheduled to expire were instead extended, total revenues would be almost $3 trillion lower over the next 10 years than CBO now projects. Similarly, if discretionary spending (other than for military operations in Iraq and Afghanistan) grew at the rate of nominal GDP over the next 10 years, total discretionary outlays during that period would be nearly $1.3 trillion higher than in the baseline. Combined, those policy changes—and associated debt-service costs—would produce a deficit of $328 billion (1.9 per-cent of GDP) in 2012 and a cumulative deficit over the 2008–2017 period of $4.2 trillion (2.4 percent of GDP).
Underlying CBO’s baseline projections is a forecast that U.S. economic growth will slow in calendar year 2007 but pick up in 2008. Specifically, CBO anticipates that GDP will grow by 2.3 percent in real terms in 2007, a full percentage point less than the growth recorded last year. For 2008, CBO forecasts that GDP growth will rebound to 3.0 percent. Under the assumptions of the baseline, real GDP growth would continue at a similar rate in 2009 and 2010 and then slow to 2.7 percent in 2011 and 2012. For the rest of the projection period, average growth of real GDP is projected to decrease to 2.5 percent per year as increases in the size of the work-force continue to slow.
The Budget Outlook CBO estimates that if today’s laws and policies did not change, federal spending would total $2.7 trillion in
Total, Total,Actual 2008- 2008-
2006 2007 2008 2009 2010 2011 2012 2013 2014 2015 2016 2017 2012 2017
2,407 2,542 2,720 2,809 2,901 3,167 3,404 3,550 3,717 3,896 4,084 4,284 15,001 34,5312,654 2,714 2,818 2,926 3,038 3,179 3,234 3,391 3,533 3,687 3,892 4,034 15,194 33,731____ ____ ____ ____ ____ ____ ____ ____ ____ ____ ____ ____ _____ _____-248 -172 -98 -116 -137 -12 170 159 185 208 192 249 -194 800
On-budget -434 -357 -299 -332 -367 -258 -85 -101 -79 -57 -72 -10 -1,342 -1,662 Off-budgeta 186 185 201 216 230 246 255 261 264 265 264 259 1,148 2,461
4,829 4,995 5,104 5,232 5,380 5,403 5,242 5,089 4,912 4,709 4,521 4,274 n.a. n.a.
18.4 18.6 19.0 18.7 18.4 19.2 19.8 19.8 19.8 19.9 20.0 20.1 19.1 19.520.3 19.9 19.7 19.5 19.3 19.3 18.8 18.9 18.8 18.8 19.1 18.9 19.3 19.1____ ____ ____ ____ ____ ____ ____ ____ ____ ____ ____ ____ ____ ____-1.9 -1.3 -0.7 -0.8 -0.9 -0.1 1.0 0.9 1.0 1.1 0.9 1.2 -0.2 0.5
37.0 36.6 35.7 34.8 34.2 32.8 30.5 28.3 26.2 24.0 22.1 20.1 n.a. n.a.
13,066 13,645 14,300 15,014 15,742 16,465 17,205 17,973 18,764 19,582 20,425 21,295 78,726 176,766
In Billions of Dollars
As a Percentage of Gross Domestic Product
Total RevenuesTotal Outlays
Total Deficit (-) or Surplus
Debt Held by the Publicat the End of the Year
Total RevenuesTotal Outlays
Total Deficit (-) or Surplus
Debt Held by the Publicat the End of the Year
Memorandum:Gross Domestic Product(Billions of dollars)
SUMMARY XIII
Summary Figure 1.
Projected Growth of the U.S. Economy and Federal Spending for Major Mandatory Programs(Cumulative nominal percentage growth from 2006 level)
Source: Congressional Budget Office.
2007 and revenues would total $2.5 trillion, resulting in a budget deficit of $172 billion. The additional funding that is likely to be needed to finance military operations in Iraq and Afghanistan would put that deficit in the vicinity of $200 billion. Even so, this year’s shortfall would be smaller than the 2006 deficit of $248 billion.
Baseline Projections for the 2008–2017 PeriodUnder current laws and policies, the deficit would drop further in 2008, to $98 billion. That decrease results pri-marily from two factors. On the revenue side of the bud-get, receipts from the AMT are estimated to increase by about $60 billion next year because of the scheduled expiration of the relief provided through tax year 2006. (In addition, telephone-tax refunds, which totaled $13 billion in 2007, are projected to drop by $10 billion in 2008.) On the spending side of the budget, outlays for operations in Iraq and Afghanistan and for relief and recovery from hurricane damage are about $14 billion lower in 2008 than in 2007 under the assumptions of the baseline.
The baseline deficit is projected to rise modestly over the following two years, 2009 and 2010, as outlays grow by about 3.8 percent annually and revenues increase by about 3.3 percent a year. That projected growth rate for revenues is lower than in recent years, mainly because corporate profits and capital gains realizations are
expected to revert to levels that are more consistent with their historical relationship to GDP.
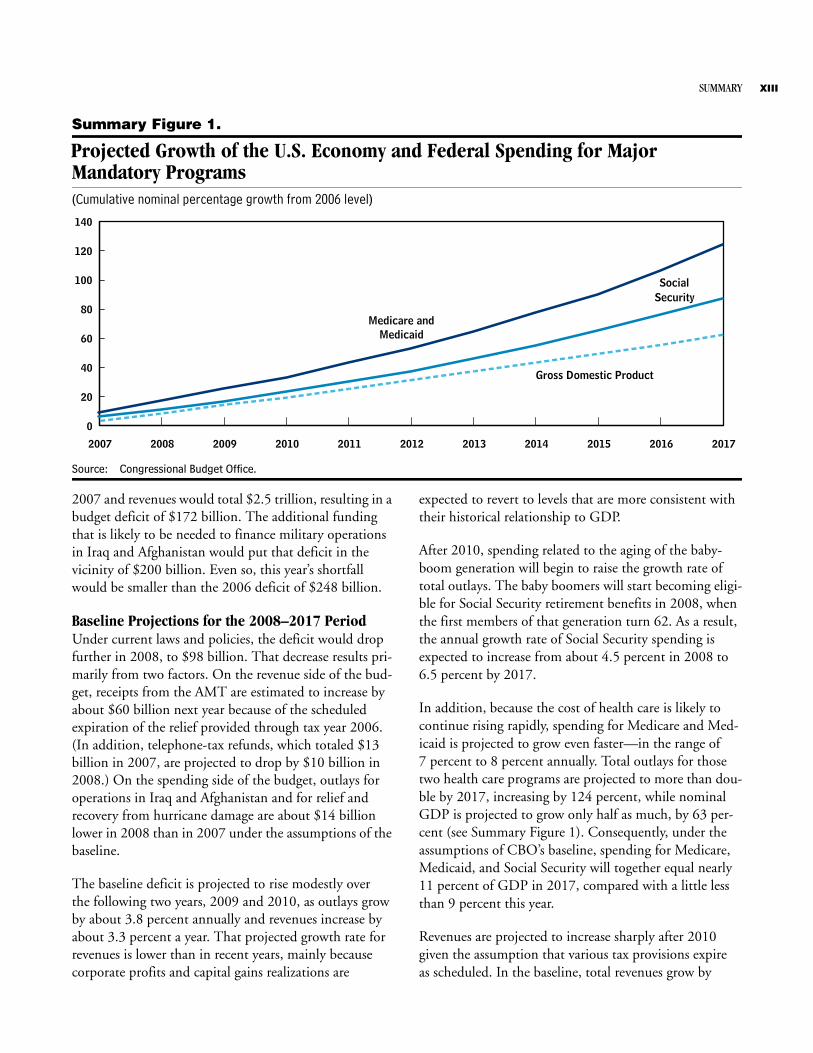
After 2010, spending related to the aging of the baby-boom generation will begin to raise the growth rate of total outlays. The baby boomers will start becoming eligi-ble for Social Security retirement benefits in 2008, when the first members of that generation turn 62. As a result, the annual growth rate of Social Security spending is expected to increase from about 4.5 percent in 2008 to 6.5 percent by 2017.
In addition, because the cost of health care is likely to continue rising rapidly, spending for Medicare and Med-icaid is projected to grow even faster—in the range of 7 percent to 8 percent annually. Total outlays for those two health care programs are projected to more than dou-ble by 2017, increasing by 124 percent, while nominal GDP is projected to grow only half as much, by 63 per-cent (see Summary Figure 1). Consequently, under the assumptions of CBO’s baseline, spending for Medicare, Medicaid, and Social Security will together equal nearly 11 percent of GDP in 2017, compared with a little less than 9 percent this year.
Revenues are projected to increase sharply after 2010 given the assumption that various tax provisions expire as scheduled. In the baseline, total revenues grow by
2007 2008 2009 2010 2011 2012 2013 2014 2015 2016 2017
0
20
40
60
80
100
120
140
Medicare andMedicaid
SocialSecurity
Gross Domestic Product
XIV THE BUDGET AND ECONOMIC OUTLOOK: FISCAL YEARS 2008 TO 2017
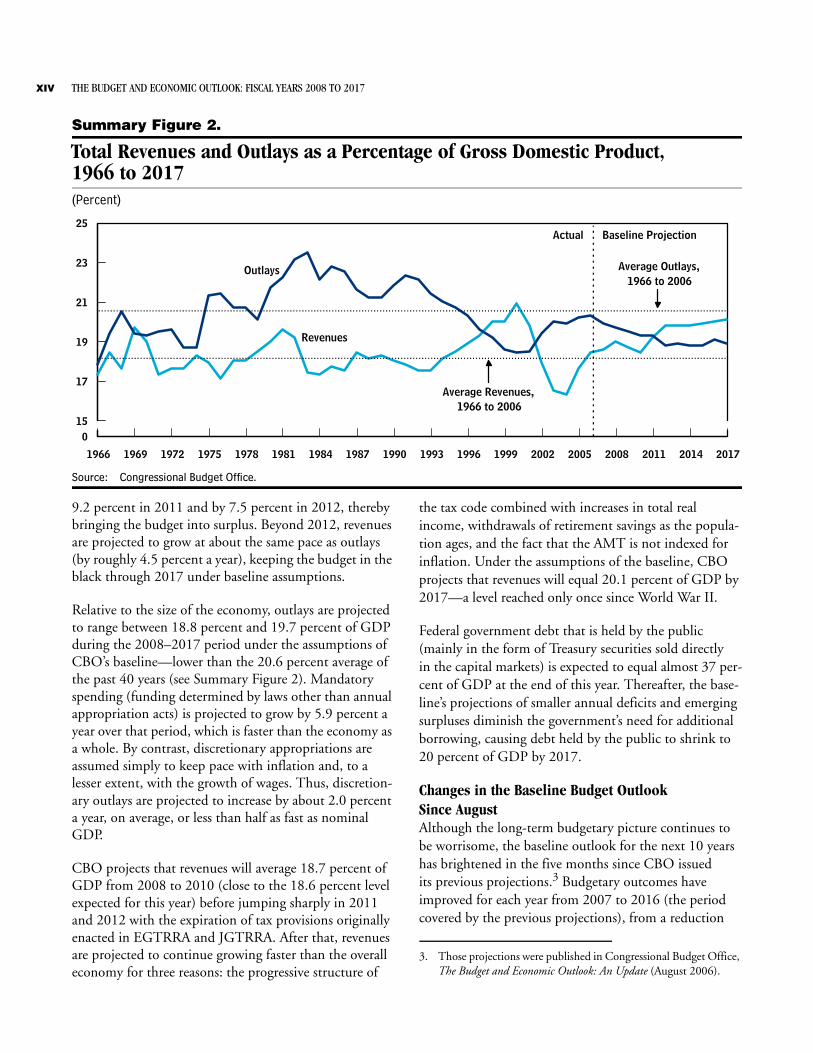
Summary Figure 2.
Total Revenues and Outlays as a Percentage of Gross Domestic Product, 1966 to 2017(Percent)
Source: Congressional Budget Office.
9.2 percent in 2011 and by 7.5 percent in 2012, thereby bringing the budget into surplus. Beyond 2012, revenues are projected to grow at about the same pace as outlays (by roughly 4.5 percent a year), keeping the budget in the black through 2017 under baseline assumptions.
Relative to the size of the economy, outlays are projected to range between 18.8 percent and 19.7 percent of GDP during the 2008–2017 period under the assumptions of CBO’s baseline—lower than the 20.6 percent average of the past 40 years (see Summary Figure 2). Mandatory spending (funding determined by laws other than annual appropriation acts) is projected to grow by 5.9 percent a year over that period, which is faster than the economy as a whole. By contrast, discretionary appropriations are assumed simply to keep pace with inflation and, to a lesser extent, with the growth of wages. Thus, discretion-ary outlays are projected to increase by about 2.0 percent a year, on average, or less than half as fast as nominal GDP.
CBO projects that revenues will average 18.7 percent of GDP from 2008 to 2010 (close to the 18.6 percent level expected for this year) before jumping sharply in 2011 and 2012 with the expiration of tax provisions originally enacted in EGTRRA and JGTRRA. After that, revenues are projected to continue growing faster than the overall economy for three reasons: the progressive structure of
the tax code combined with increases in total real income, withdrawals of retirement savings as the popula-tion ages, and the fact that the AMT is not indexed for inflation. Under the assumptions of the baseline, CBO projects that revenues will equal 20.1 percent of GDP by 2017—a level reached only once since World War II.
Federal government debt that is held by the public (mainly in the form of Treasury securities sold directlyin the capital markets) is expected to equal almost 37 per-cent of GDP at the end of this year. Thereafter, the base-line’s projections of smaller annual deficits and emerging surpluses diminish the government’s need for additional borrowing, causing debt held by the public to shrink to 20 percent of GDP by 2017.
Changes in the Baseline Budget Outlook Since AugustAlthough the long-term budgetary picture continues to be worrisome, the baseline outlook for the next 10 years has brightened in the five months since CBO issued its previous projections.3 Budgetary outcomes have improved for each year from 2007 to 2016 (the period covered by the previous projections), from a reduction
1966 1969 1972 1975 1978 1981 1984 1987 1990 1993 1996 1999 2002 2005 2008 2011 2014 2017
015
17
19
21
23
25
Average Outlays,1966 to 2006
Outlays
Average Revenues,1966 to 2006
Actual Baseline Projection
Revenues
3. Those projections were published in Congressional Budget Office, The Budget and Economic Outlook: An Update (August 2006).
SUMMARY XV
of $114 billion in the deficit for 2007 to a swing of $285 billion in the bottom line for 2016 (from a deficit of $93 billion to a surplus of $192 billion). In all, those reductions represent a difference of about 1.2 percent of GDP over 10 years.
Those changes overstate the fundamental improvement in the underlying budget outlook, however. Roughly half of the total change stems from the baseline’s treatment of previous supplemental appropriations for disaster relief and the irregular pattern of funding for military opera-tions in Iraq and Afghanistan. Consequently, more than half of the improved bottom line is unrelated to changes in the underlying budgetary and economic environment.
Much of the remaining change to the current baseline comes from lower projected spending for Medicare. Total outlays for that program over the 2007–2016 period are nearly 8 percent lower in this baseline than in CBO’s August projections. That reduction is largely attributable to new estimates of per capita costs for all Medicare bene-fits, but it also reflects lower projections of the number of enrollees in the prescription drug benefit program. Those recent changes, however, do not significantly alter the upward trajectory of Medicare spending in the long term.
The Economic OutlookThe Federal Reserve’s shift in monetary policy over the past two and a half years and the recent decline in hous-ing construction are expected to restrain economic growth this year, but the economy is likely to post solid gains next year. CBO forecasts that GDP will grow by 2.3 percent in real terms in calendar year 2007 but by 3.0 percent in 2008 (see Summary Table 2).
Gains in employment, which remained solid in 2006 despite a slowdown in economic growth during the sec-ond half of the year, are expected to lessen in 2007. That change may cause unemployment to edge up from the 4.6 percent rate recorded for 2006. As housing construc-tion stabilizes, however, economic growth and employ-ment should start to recover by the middle of 2007.
Last year, robust investment by businesses and solid growth in exports helped the U.S. economy absorb the decline in housing construction. Investment and exports
are expected to continue to support the economy in 2007. For many years, businesses’ capital stock (the plant, equipment, and software they use for production) grew more slowly than overall demand for U.S. goods and ser-vices; as a result, despite the recent growth of investment, the nation’s capital stock is still low relative to the level of demand. Investment should therefore continue to increase, even if the growth of demand slows. Similarly, export growth is likely to remain strong because increases in demand for U.S. products overseas are durable enough to withstand a slight slowdown in U.S. demand for other countries’ exports.
In the absence of any adverse price shocks to the econ-omy, the core rate of inflation—which excludes prices for food and energy—is expected to ease slightly this year. Overall inflation (as measured by the year-to-year change in the price index for personal consumption expendi-tures) will fall from last year’s rate of 2.8 percent to 1.7 percent in 2007 because of a large drop in prices for motor fuels near the end of last year. The core rate of inflation, however, is expected to decline less rapidly during 2007.
CBO anticipates that the interest rate on three-month Treasury bills will drop slightly this year from the 4.9 percent rate seen at the end of 2006. Further declines are expected during 2008, when that rate will average 4.5 percent. CBO’s forecast assumes that long-term inter-est rates will edge up as short-term interest rates decline. The rate on 10-year Treasury notes, for example, is fore-cast to rise from 4.8 percent this year to 5.0 percent in 2008.
Beyond the two-year horizon, CBO projects that eco-nomic growth (as measured by increases in real GDP) will average 2.7 percent a year from 2009 to 2017. As members of the baby-boom generation begin to retire, the growth of the labor force is expected to slow, pushing down the rate of real GDP growth during the second half of that period. Projected rates of inflation, unemploy-ment, and growth of labor productivity average 2.0 per-cent, 5.0 percent, and 2.2 percent, respectively, after 2008. Interest rates are projected to average 4.4 percent for three-month Treasury bills and 5.2 percent for 10-year Treasury notes.
XVI THE BUDGET AND ECONOMIC OUTLOOK: FISCAL YEARS 2008 TO 2017
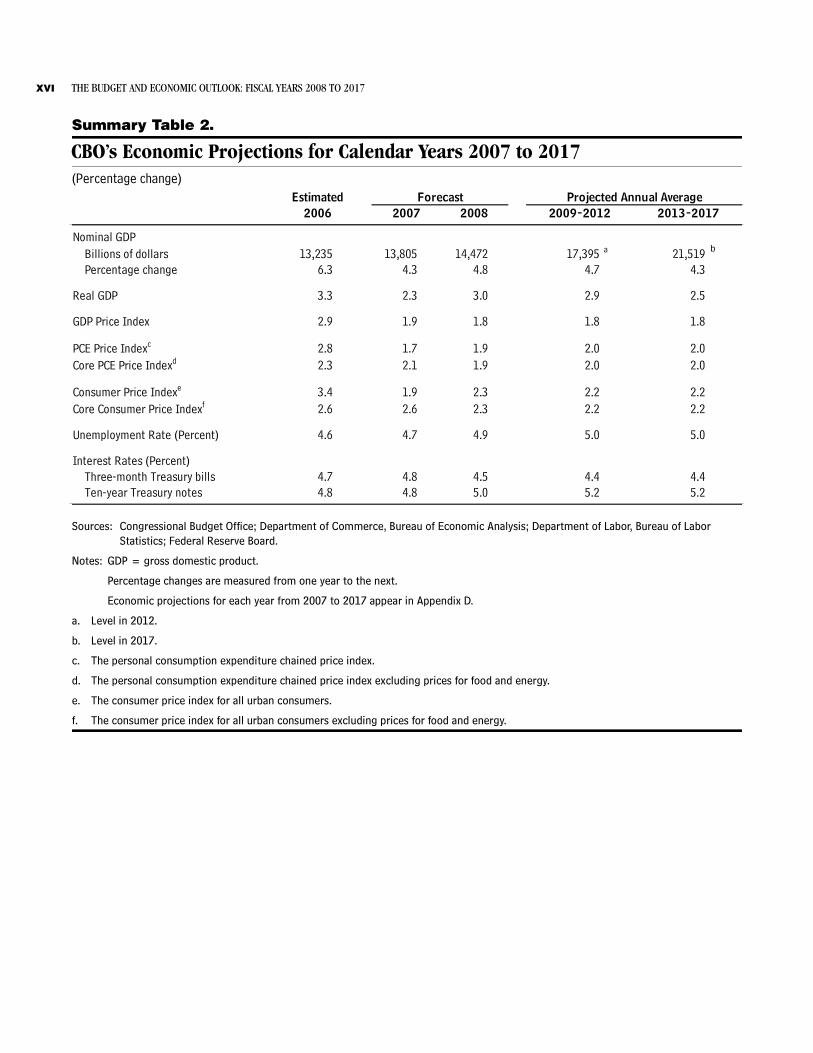
Summary Table 2.
CBO’s Economic Projections for Calendar Years 2007 to 2017(Percentage change)
Sources: Congressional Budget Office; Department of Commerce, Bureau of Economic Analysis; Department of Labor, Bureau of Labor Statistics; Federal Reserve Board.
Notes: GDP = gross domestic product.
Percentage changes are measured from one year to the next.
Economic projections for each year from 2007 to 2017 appear in Appendix D.
a. Level in 2012.
b. Level in 2017.
c. The personal consumption expenditure chained price index.
d. The personal consumption expenditure chained price index excluding prices for food and energy.
e. The consumer price index for all urban consumers.
f. The consumer price index for all urban consumers excluding prices for food and energy.
Billions of dollars 13,235 13,805 14,472 17,395 a 21,519 b
Percentage change 6.3 4.3 4.8 4.7 4.3
3.3 2.3 3.0 2.9 2.5
2.9 1.9 1.8 1.8 1.8
2.8 1.7 1.9 2.0 2.02.3 2.1 1.9 2.0 2.0
3.4 1.9 2.3 2.2 2.22.6 2.6 2.3 2.2 2.2
4.6 4.7 4.9 5.0 5.0
Three-month Treasury bills 4.7 4.8 4.5 4.4 4.4Ten-year Treasury notes 4.8 4.8 5.0 5.2 5.2
Interest Rates (Percent)
Forecast Projected Annual Average2009-2012 2013-20172007 2008
Unemployment Rate (Percent)
Estimated2006
GDP Price Index
Core Consumer Price Indexf
Real GDP
PCE Price Indexc
Core PCE Price Indexd
Consumer Price Indexe
Nominal GDP
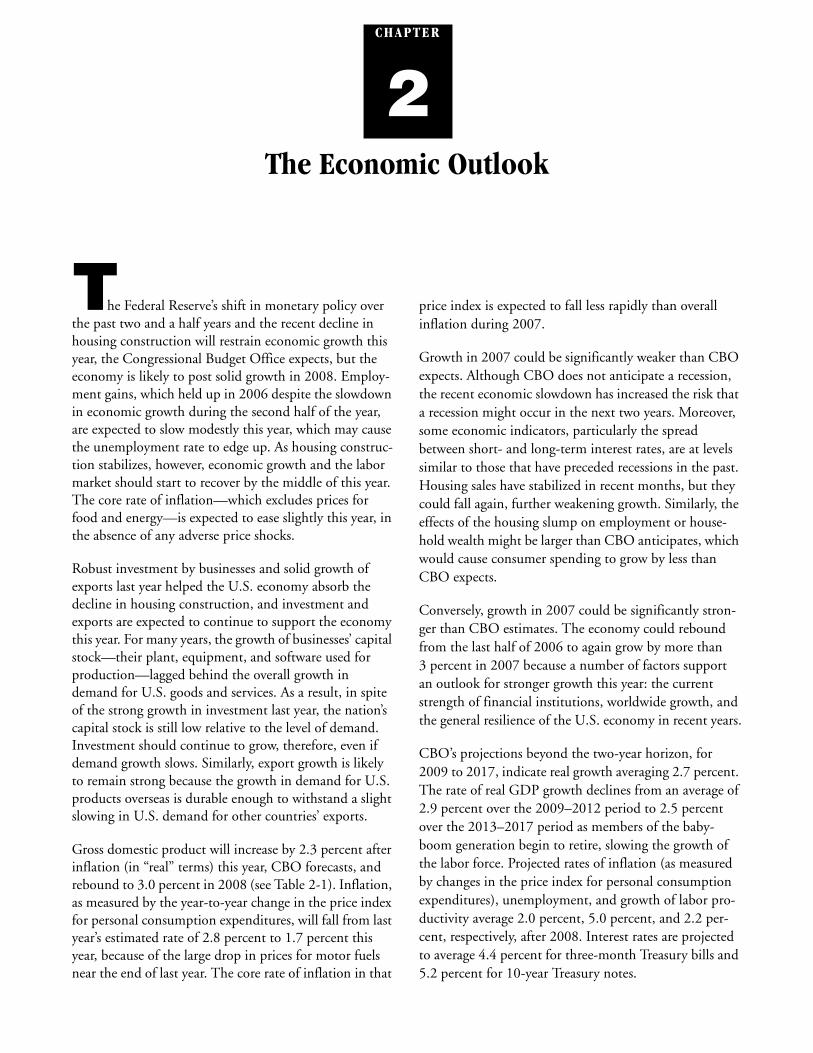
CH A P T E R
2The Economic Outlook
The Federal Reserve’s shift in monetary policy over the past two and a half years and the recent decline in housing construction will restrain economic growth this year, the Congressional Budget Office expects, but the economy is likely to post solid growth in 2008. Employ-ment gains, which held up in 2006 despite the slowdown in economic growth during the second half of the year, are expected to slow modestly this year, which may cause the unemployment rate to edge up. As housing construc-tion stabilizes, however, economic growth and the labor market should start to recover by the middle of this year. The core rate of inflation—which excludes prices for food and energy—is expected to ease slightly this year, in the absence of any adverse price shocks.
Robust investment by businesses and solid growth of exports last year helped the U.S. economy absorb the decline in housing construction, and investment and exports are expected to continue to support the economy this year. For many years, the growth of businesses’ capital stock—their plant, equipment, and software used for production—lagged behind the overall growth in demand for U.S. goods and services. As a result, in spite of the strong growth in investment last year, the nation’s capital stock is still low relative to the level of demand. Investment should continue to grow, therefore, even if demand growth slows. Similarly, export growth is likely to remain strong because the growth in demand for U.S. products overseas is durable enough to withstand a slight slowing in U.S. demand for other countries’ exports.
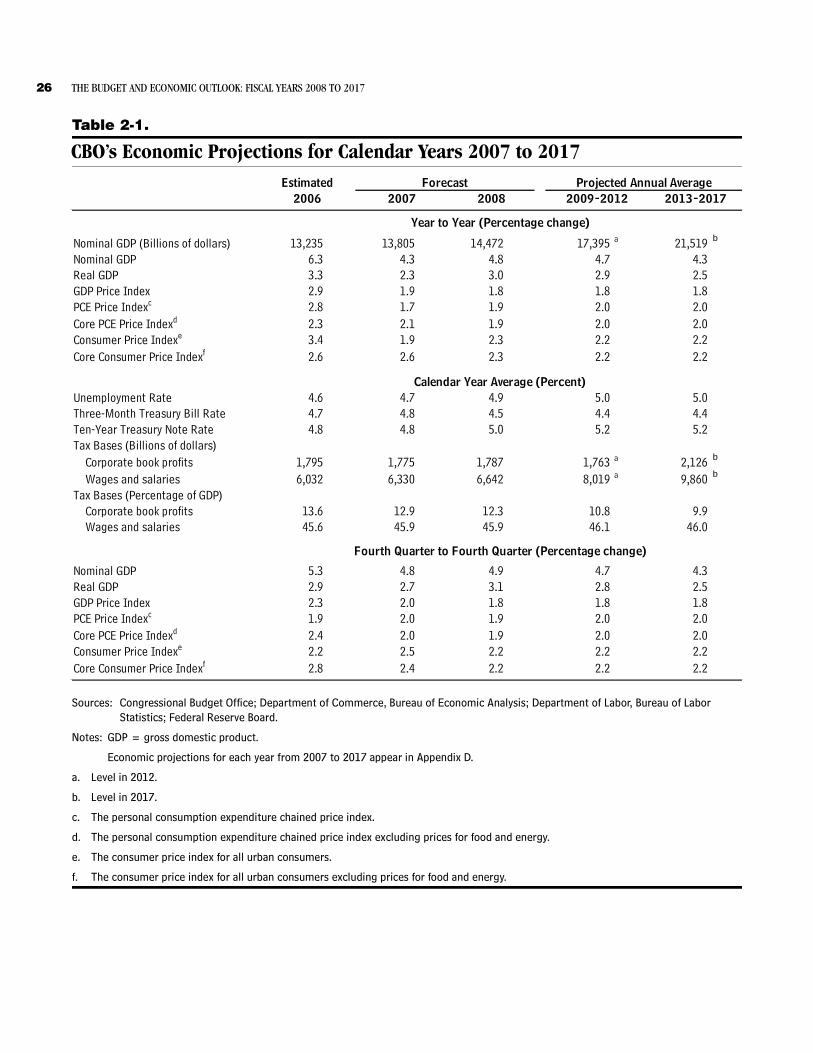
Gross domestic product will increase by 2.3 percent after inflation (in “real” terms) this year, CBO forecasts, and rebound to 3.0 percent in 2008 (see Table 2-1). Inflation, as measured by the year-to-year change in the price index for personal consumption expenditures, will fall from last year’s estimated rate of 2.8 percent to 1.7 percent this year, because of the large drop in prices for motor fuels near the end of last year. The core rate of inflation in that
price index is expected to fall less rapidly than overall inflation during 2007.
Growth in 2007 could be significantly weaker than CBO expects. Although CBO does not anticipate a recession, the recent economic slowdown has increased the risk that a recession might occur in the next two years. Moreover, some economic indicators, particularly the spread between short- and long-term interest rates, are at levels similar to those that have preceded recessions in the past. Housing sales have stabilized in recent months, but they could fall again, further weakening growth. Similarly, the effects of the housing slump on employment or house-hold wealth might be larger than CBO anticipates, which would cause consumer spending to grow by less than CBO expects.
Conversely, growth in 2007 could be significantly stron-ger than CBO estimates. The economy could rebound from the last half of 2006 to again grow by more than 3 percent in 2007 because a number of factors support an outlook for stronger growth this year: the current strength of financial institutions, worldwide growth, and the general resilience of the U.S. economy in recent years.
CBO’s projections beyond the two-year horizon, for 2009 to 2017, indicate real growth averaging 2.7 percent. The rate of real GDP growth declines from an average of 2.9 percent over the 2009–2012 period to 2.5 percent over the 2013–2017 period as members of the baby-boom generation begin to retire, slowing the growth of the labor force. Projected rates of inflation (as measured by changes in the price index for personal consumption expenditures), unemployment, and growth of labor pro-ductivity average 2.0 percent, 5.0 percent, and 2.2 per-cent, respectively, after 2008. Interest rates are projected to average 4.4 percent for three-month Treasury bills and 5.2 percent for 10-year Treasury notes.
26 THE BUDGET AND ECONOMIC OUTLOOK: FISCAL YEARS 2008 TO 2017
Table 2-1.
CBO’s Economic Projections for Calendar Years 2007 to 2017
Sources: Congressional Budget Office; Department of Commerce, Bureau of Economic Analysis; Department of Labor, Bureau of Labor Statistics; Federal Reserve Board.
Notes: GDP = gross domestic product.
Economic projections for each year from 2007 to 2017 appear in Appendix D.
a. Level in 2012.
b. Level in 2017.
c. The personal consumption expenditure chained price index.
d. The personal consumption expenditure chained price index excluding prices for food and energy.
e. The consumer price index for all urban consumers.
f. The consumer price index for all urban consumers excluding prices for food and energy.
13,235 13,805 14,472 17,395 a 21,519 b
6.3 4.3 4.8 4.7 4.33.3 2.3 3.0 2.9 2.52.9 1.9 1.8 1.8 1.82.8 1.7 1.9 2.0 2.02.3 2.1 1.9 2.0 2.03.4 1.9 2.3 2.2 2.22.6 2.6 2.3 2.2 2.2
4.6 4.7 4.9 5.0 5.04.7 4.8 4.5 4.4 4.44.8 4.8 5.0 5.2 5.2
1,795 1,775 1,787 1,763 a 2,126 b
6,032 6,330 6,642 8,019 a 9,860 b
13.6 12.9 12.3 10.8 9.945.6 45.9 45.9 46.1 46.0
Nominal GDP 5.3 4.8 4.9 4.7 4.3Real GDP 2.9 2.7 3.1 2.8 2.5GDP Price Index 2.3 2.0 1.8 1.8 1.8PCE Price Indexc 1.9 2.0 1.9 2.0 2.0Core PCE Price Indexd 2.4 2.0 1.9 2.0 2.0Consumer Price Indexe 2.2 2.5 2.2 2.2 2.2Core Consumer Price Indexf 2.8 2.4 2.2 2.2 2.2
Forecast
Wages and salaries
Tax Bases (Billions of dollars)Corporate book profits
Consumer Price Indexe
Unemployment Rate
Tax Bases (Percentage of GDP)Wages and salaries
Corporate book profits
Estimated2006
Fourth Quarter to Fourth Quarter (Percentage change)
Calendar Year Average (Percent)
Year to Year (Percentage change)
2007 2008 2009-2012 2013-2017Projected Annual Average
GDP Price Index
Three-Month Treasury Bill RateTen-Year Treasury Note Rate
Core Consumer Price Indexf
Nominal GDPReal GDP
PCE Price Indexc
Core PCE Price Indexd
Nominal GDP (Billions of dollars)
CHAPTER TWO THE ECONOMIC OUTLOOK 27
Figure 2-1.
Interest Rates(Percent)
Sources: Congressional Budget Office; Federal Reserve Board.
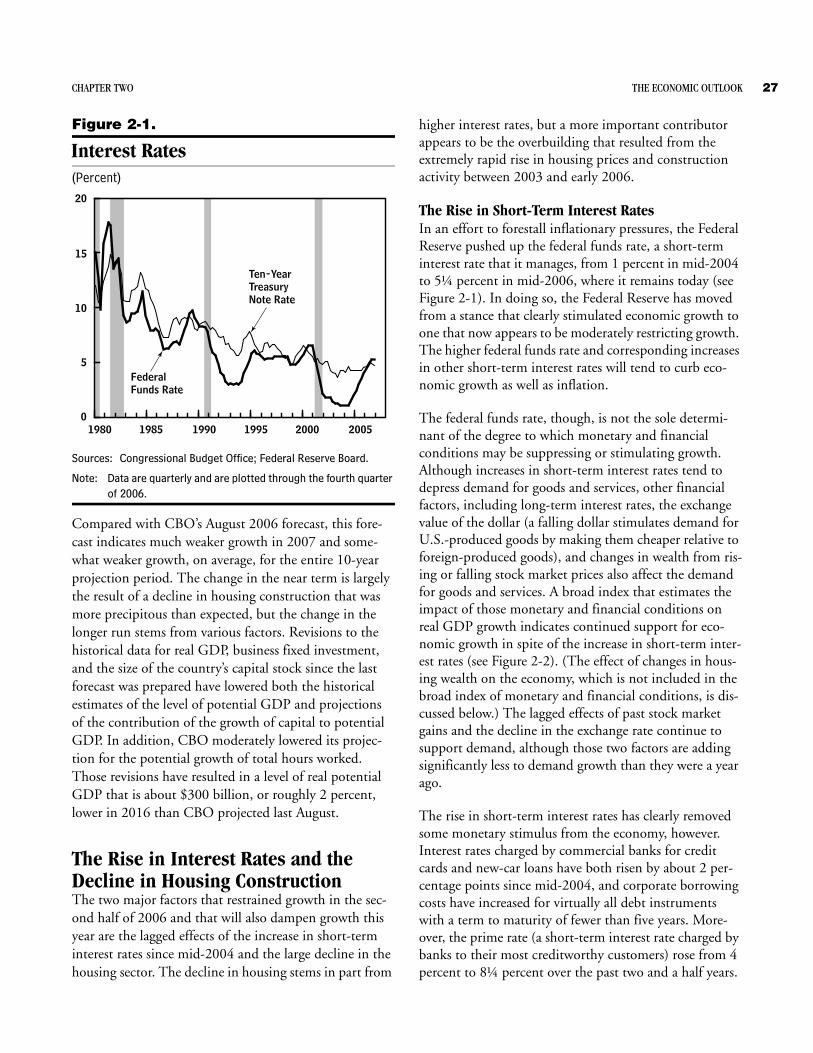
Note: Data are quarterly and are plotted through the fourth quarter of 2006.
Compared with CBO’s August 2006 forecast, this fore-cast indicates much weaker growth in 2007 and some-what weaker growth, on average, for the entire 10-year projection period. The change in the near term is largely the result of a decline in housing construction that was more precipitous than expected, but the change in the longer run stems from various factors. Revisions to the historical data for real GDP, business fixed investment, and the size of the country’s capital stock since the last forecast was prepared have lowered both the historical estimates of the level of potential GDP and projections of the contribution of the growth of capital to potential GDP. In addition, CBO moderately lowered its projec-tion for the potential growth of total hours worked. Those revisions have resulted in a level of real potential GDP that is about $300 billion, or roughly 2 percent, lower in 2016 than CBO projected last August.
The Rise in Interest Rates and the Decline in Housing Construction The two major factors that restrained growth in the sec-ond half of 2006 and that will also dampen growth this year are the lagged effects of the increase in short-term interest rates since mid-2004 and the large decline in the housing sector. The decline in housing stems in part from
higher interest rates, but a more important contributor appears to be the overbuilding that resulted from the extremely rapid rise in housing prices and construction activity between 2003 and early 2006.
The Rise in Short-Term Interest RatesIn an effort to forestall inflationary pressures, the Federal Reserve pushed up the federal funds rate, a short-term interest rate that it manages, from 1 percent in mid-2004 to 5¼ percent in mid-2006, where it remains today (see Figure 2-1). In doing so, the Federal Reserve has moved from a stance that clearly stimulated economic growth to one that now appears to be moderately restricting growth. The higher federal funds rate and corresponding increases in other short-term interest rates will tend to curb eco-nomic growth as well as inflation.
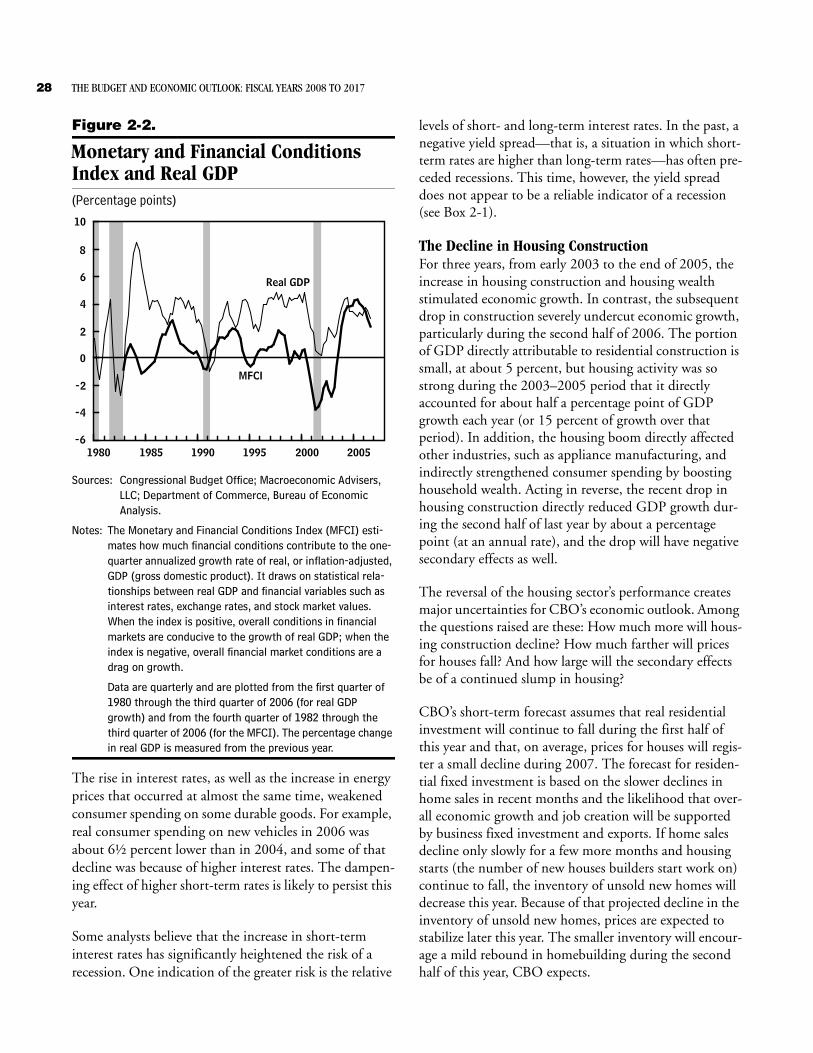
The federal funds rate, though, is not the sole determi-nant of the degree to which monetary and financial conditions may be suppressing or stimulating growth. Although increases in short-term interest rates tend to depress demand for goods and services, other financial factors, including long-term interest rates, the exchange value of the dollar (a falling dollar stimulates demand for U.S.-produced goods by making them cheaper relative to foreign-produced goods), and changes in wealth from ris-ing or falling stock market prices also affect the demand for goods and services. A broad index that estimates the impact of those monetary and financial conditions on real GDP growth indicates continued support for eco-nomic growth in spite of the increase in short-term inter-est rates (see Figure 2-2). (The effect of changes in hous-ing wealth on the economy, which is not included in the broad index of monetary and financial conditions, is dis-cussed below.) The lagged effects of past stock market gains and the decline in the exchange rate continue to support demand, although those two factors are adding significantly less to demand growth than they were a year ago.
The rise in short-term interest rates has clearly removed some monetary stimulus from the economy, however. Interest rates charged by commercial banks for credit cards and new-car loans have both risen by about 2 per-centage points since mid-2004, and corporate borrowing costs have increased for virtually all debt instruments with a term to maturity of fewer than five years. More-over, the prime rate (a short-term interest rate charged by banks to their most creditworthy customers) rose from 4 percent to 8¼ percent over the past two and a half years.
200520001995199019851980
20
15
10
5
0
Ten-Year Treasury Note Rate
FederalFunds Rate
28 THE BUDGET AND ECONOMIC OUTLOOK: FISCAL YEARS 2008 TO 2017
Figure 2-2.
Monetary and Financial Conditions Index and Real GDP(Percentage points)
Sources: Congressional Budget Office; Macroeconomic Advisers, LLC; Department of Commerce, Bureau of EconomicAnalysis.
Notes: The Monetary and Financial Conditions Index (MFCI) esti-mates how much financial conditions contribute to the one-quarter annualized growth rate of real, or inflation-adjusted, GDP (gross domestic product). It draws on statistical rela-tionships between real GDP and financial variables such as interest rates, exchange rates, and stock market values. When the index is positive, overall conditions in financial markets are conducive to the growth of real GDP; when the index is negative, overall financial market conditions are a drag on growth.
Data are quarterly and are plotted from the first quarter of 1980 through the third quarter of 2006 (for real GDP growth) and from the fourth quarter of 1982 through the third quarter of 2006 (for the MFCI). The percentage change in real GDP is measured from the previous year.
The rise in interest rates, as well as the increase in energy prices that occurred at almost the same time, weakened consumer spending on some durable goods. For example, real consumer spending on new vehicles in 2006 was about 6½ percent lower than in 2004, and some of that decline was because of higher interest rates. The dampen-ing effect of higher short-term rates is likely to persist this year.
Some analysts believe that the increase in short-term interest rates has significantly heightened the risk of a recession. One indication of the greater risk is the relative
levels of short- and long-term interest rates. In the past, a negative yield spread—that is, a situation in which short-term rates are higher than long-term rates—has often pre-ceded recessions. This time, however, the yield spread does not appear to be a reliable indicator of a recession (see Box 2-1).
The Decline in Housing ConstructionFor three years, from early 2003 to the end of 2005, the increase in housing construction and housing wealth stimulated economic growth. In contrast, the subsequent drop in construction severely undercut economic growth, particularly during the second half of 2006. The portion of GDP directly attributable to residential construction is small, at about 5 percent, but housing activity was so strong during the 2003–2005 period that it directly accounted for about half a percentage point of GDP growth each year (or 15 percent of growth over that period). In addition, the housing boom directly affected other industries, such as appliance manufacturing, and indirectly strengthened consumer spending by boosting household wealth. Acting in reverse, the recent drop in housing construction directly reduced GDP growth dur-ing the second half of last year by about a percentage point (at an annual rate), and the drop will have negative secondary effects as well.
The reversal of the housing sector’s performance creates major uncertainties for CBO’s economic outlook. Among the questions raised are these: How much more will hous-ing construction decline? How much farther will prices for houses fall? And how large will the secondary effects be of a continued slump in housing?
CBO’s short-term forecast assumes that real residential investment will continue to fall during the first half of this year and that, on average, prices for houses will regis-ter a small decline during 2007. The forecast for residen-tial fixed investment is based on the slower declines in home sales in recent months and the likelihood that over-all economic growth and job creation will be supported by business fixed investment and exports. If home sales decline only slowly for a few more months and housing starts (the number of new houses builders start work on) continue to fall, the inventory of unsold new homes will decrease this year. Because of that projected decline in the inventory of unsold new homes, prices are expected to stabilize later this year. The smaller inventory will encour-age a mild rebound in homebuilding during the second half of this year, CBO expects.
200520001995199019851980
10
8
6
4
2
0
-2
-4
-6
Real GDP
MFCI

CHAPTER TWO THE ECONOMIC OUTLOOK 29
Figure 2-3.
Single-Family Housing Starts(Millions)
Sources: Congressional Budget Office; Department of Commerce, Bureau of the Census.
Note: Data are quarterly and are plotted through the fourth quarter of 2006.
Overall, the secondary effects of the drop in housing activity are estimated to be relatively modest. The growth of housing wealth slowed in 2006 as a result of the com-bined slowing in the growth of the housing stock and in home prices, and it is expected to grow even less this year. The slowdown in the growth of housing wealth, in turn, is expected to cut growth in personal consumer spending this year by about one-third of a percentage point. Employment growth is also expected to be restrained this year by the loss of jobs in housing and related industries, but again, the direct effect is likely to be small.
The Boom and Bust in Housing. The recent boom and bust in housing construction have been unique in many ways, and the causes of the large swings in the recent cycle are not entirely clear. Historically, housing booms and busts have typically been synchronized with the gen-eral business cycle, with turns in housing cycles occurring before business-cycle peaks (see Figure 2-3). Housing has not moved in tandem with the general business cycle since 1990, however. Housing starts did not weaken during the recession of 2001, and the current drop in housing is occurring independently of a recession.
The large upswing in construction in the last housing market cycle appears to be due largely to the combination
of extraordinarily low mortgage rates and expectations for rapid growth of housing prices. Rates for 30-year conven-tional mortgages, which had averaged 7.6 percent from 1995 through 2000, dropped to 5.8 percent in 2003 and generally remained below 6 percent until the third quar-ter of 2005. Against a background of solid employment and household income growth, the drop in mortgage rates (along with the increase in the use of innovative financing arrangements, such as interest-only loans) made it easier for households to finance housing pur-chases, which strengthened demand and ultimately bid up prices.
Housing prices grew rapidly from the middle of 2003 to early 2006 (see Figure 2-4). That rapid growth may have
Figure 2-4.
Real Prices of Houses(Percentage change from previous year)
Sources: Congressional Budget Office; Office of Federal Housing Enterprise Oversight (OFHEO).
Notes: The measures of house prices in this figure are the house price index, which includes purchase price data and refinanc-ings, and the purchase-only house price index, both of which are published by OFHEO. Both house price indexes have been adjusted for inflation by dividing them by the core personal consumption expenditure chained price index.
Data are quarterly and are plotted from the first quarter of 1976 through the third quarter of 2006 (for the house price index) and from the first quarter of 1992 through the third quarter of 2006 (for the house price purchase-only index).
The purchase-only price index fell by 0.7 percent at an annual rate from the second quarter to the third quarter of 2006 (not shown in the figure).
20051995198519751965
1.8
1.6
1.4
1.2
1.0
0.8
0.6
0
2005200019951990198519801975
14
12
10
8
6
4
2
0
-2
-4
-6
House PriceIndex
Purchase-Only Index
30 THE BUDGET AND ECONOMIC OUTLOOK: FISCAL YEARS 2008 TO 2017
fueled demand by unrealistically inflating some buyers’ forecasts of future prices, particularly for houses in areas where employment and income growth were relatively strong. Then, in 2006, increases in housing prices slowed dramatically, from a combination of factors. A slight rise in mortgage rates and the high prices of houses made it more difficult for potential buyers to qualify for mort-gages, and houses failed to sell as quickly as they had in the past. In some markets, housing prices fell sharply.
To be sure, it is difficult to determine the “fundamental” or “appropriate” price of a house at the time of purchase, and expectations of future prices are known to be unreal-istic only in hindsight. That is why the forecast for hous-ing prices is one of the major uncertainties in this eco-nomic outlook. CBO has assumed that the national average price of housing will decline slightly this year but edge up next year. That view is based on CBO’s overall
economic outlook and the recent indications of some firming in home sales. The declines in sales of both new and existing homes have slowed in recent months, and continued gains in employment and low mortgage rates also imply that the weakness in home sales may bottom out during the first half of this year. If so, the combina-tion of a mild rebound in sales later this year and contin-ued weakness in new-home construction will bring the inventory of unsold homes down and keep housing prices, on average, from falling sharply.
The Effect of Housing Wealth on Consumer Spending. Slower growth in housing wealth will dampen growth in consumer spending this year relative to last year, CBO expects. In 2004 and 2005, the increase in housing wealth appears to have added about one-half of a percent-age point to the growth of consumer spending nationally; last year, it added about one-third of a percentage point.
Box 2-1.
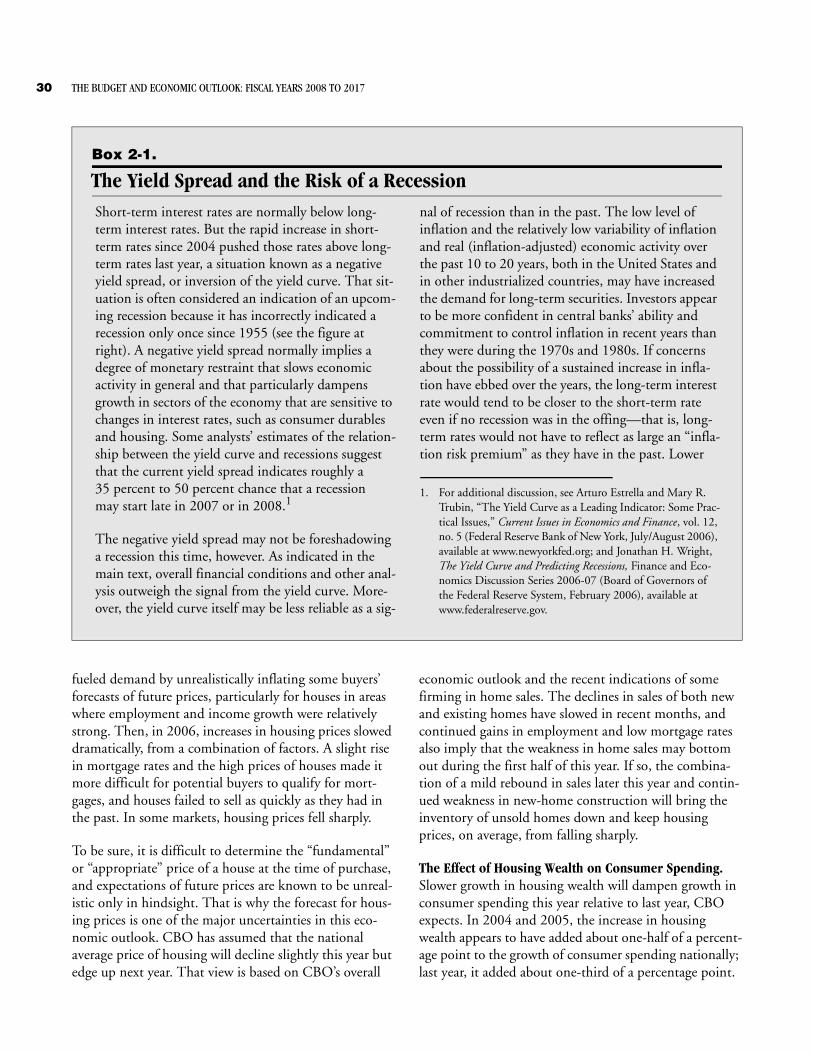
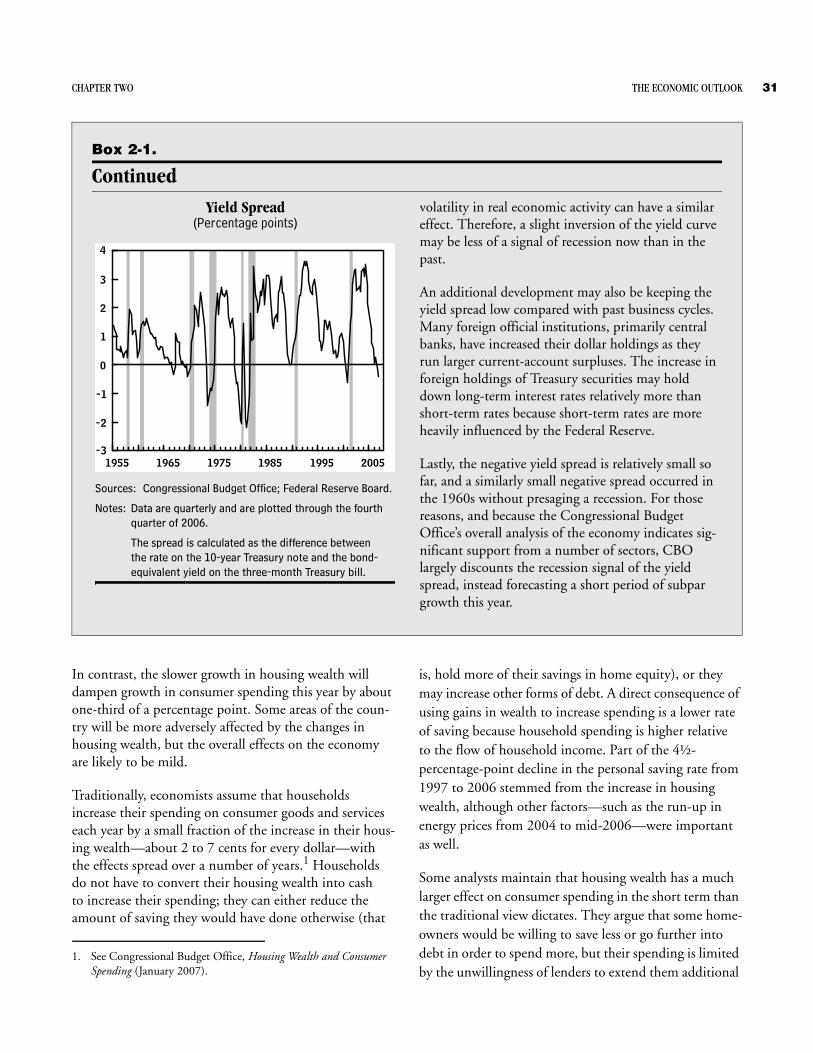
The Yield Spread and the Risk of a RecessionShort-term interest rates are normally below long-term interest rates. But the rapid increase in short-term rates since 2004 pushed those rates above long-term rates last year, a situation known as a negative yield spread, or inversion of the yield curve. That sit-uation is often considered an indication of an upcom-ing recession because it has incorrectly indicated a recession only once since 1955 (see the figure at right). A negative yield spread normally implies a degree of monetary restraint that slows economic activity in general and that particularly dampens growth in sectors of the economy that are sensitive to changes in interest rates, such as consumer durables and housing. Some analysts’ estimates of the relation-ship between the yield curve and recessions suggest that the current yield spread indicates roughly a 35 percent to 50 percent chance that a recessionmay start late in 2007 or in 2008.1
The negative yield spread may not be foreshadowing a recession this time, however. As indicated in the main text, overall financial conditions and other anal-ysis outweigh the signal from the yield curve. More-over, the yield curve itself may be less reliable as a sig-
nal of recession than in the past. The low level of inflation and the relatively low variability of inflation and real (inflation-adjusted) economic activity over the past 10 to 20 years, both in the United States and in other industrialized countries, may have increased the demand for long-term securities. Investors appear to be more confident in central banks’ ability and commitment to control inflation in recent years than they were during the 1970s and 1980s. If concerns about the possibility of a sustained increase in infla-tion have ebbed over the years, the long-term interest rate would tend to be closer to the short-term rate even if no recession was in the offing—that is, long-term rates would not have to reflect as large an “infla-tion risk premium” as they have in the past. Lower
1. For additional discussion, see Arturo Estrella and Mary R. Trubin, “The Yield Curve as a Leading Indicator: Some Prac-tical Issues,” Current Issues in Economics and Finance, vol. 12, no. 5 (Federal Reserve Bank of New York, July/August 2006), available at www.newyorkfed.org; and Jonathan H. Wright, The Yield Curve and Predicting Recessions, Finance and Eco-nomics Discussion Series 2006-07 (Board of Governors of the Federal Reserve System, February 2006), available at www.federalreserve.gov.
CHAPTER TWO THE ECONOMIC OUTLOOK 31
In contrast, the slower growth in housing wealth will dampen growth in consumer spending this year by about one-third of a percentage point. Some areas of the coun-try will be more adversely affected by the changes in housing wealth, but the overall effects on the economy are likely to be mild.
Traditionally, economists assume that households increase their spending on consumer goods and services each year by a small fraction of the increase in their hous-ing wealth—about 2 to 7 cents for every dollar—with the effects spread over a number of years.1 Households do not have to convert their housing wealth into cash to increase their spending; they can either reduce the amount of saving they would have done otherwise (that
is, hold more of their savings in home equity), or they may increase other forms of debt. A direct consequence of using gains in wealth to increase spending is a lower rate of saving because household spending is higher relative to the flow of household income. Part of the 4½-percentage-point decline in the personal saving rate from 1997 to 2006 stemmed from the increase in housing wealth, although other factors—such as the run-up in energy prices from 2004 to mid-2006—were important as well.
Some analysts maintain that housing wealth has a much larger effect on consumer spending in the short term than the traditional view dictates. They argue that some home-owners would be willing to save less or go further into debt in order to spend more, but their spending is limited by the unwillingness of lenders to extend them additional
Box 2-1.
Continued
Yield Spread(Percentage points)
Sources: Congressional Budget Office; Federal Reserve Board.
Notes: Data are quarterly and are plotted through the fourth quarter of 2006.
The spread is calculated as the difference between the rate on the 10-year Treasury note and the bond-equivalent yield on the three-month Treasury bill.
volatility in real economic activity can have a similar effect. Therefore, a slight inversion of the yield curve may be less of a signal of recession now than in the past.
An additional development may also be keeping the yield spread low compared with past business cycles. Many foreign official institutions, primarily central banks, have increased their dollar holdings as they run larger current-account surpluses. The increase in foreign holdings of Treasury securities may hold down long-term interest rates relatively more than short-term rates because short-term rates are more heavily influenced by the Federal Reserve.
Lastly, the negative yield spread is relatively small so far, and a similarly small negative spread occurred in the 1960s without presaging a recession. For those reasons, and because the Congressional Budget Office’s overall analysis of the economy indicates sig-nificant support from a number of sectors, CBO largely discounts the recession signal of the yield spread, instead forecasting a short period of subpar growth this year.
200519951985197519651955
4
3
2
1
0
-1
-2
-3
1. See Congressional Budget Office, Housing Wealth and Consumer Spending (January 2007).
32 THE BUDGET AND ECONOMIC OUTLOOK: FISCAL YEARS 2008 TO 2017
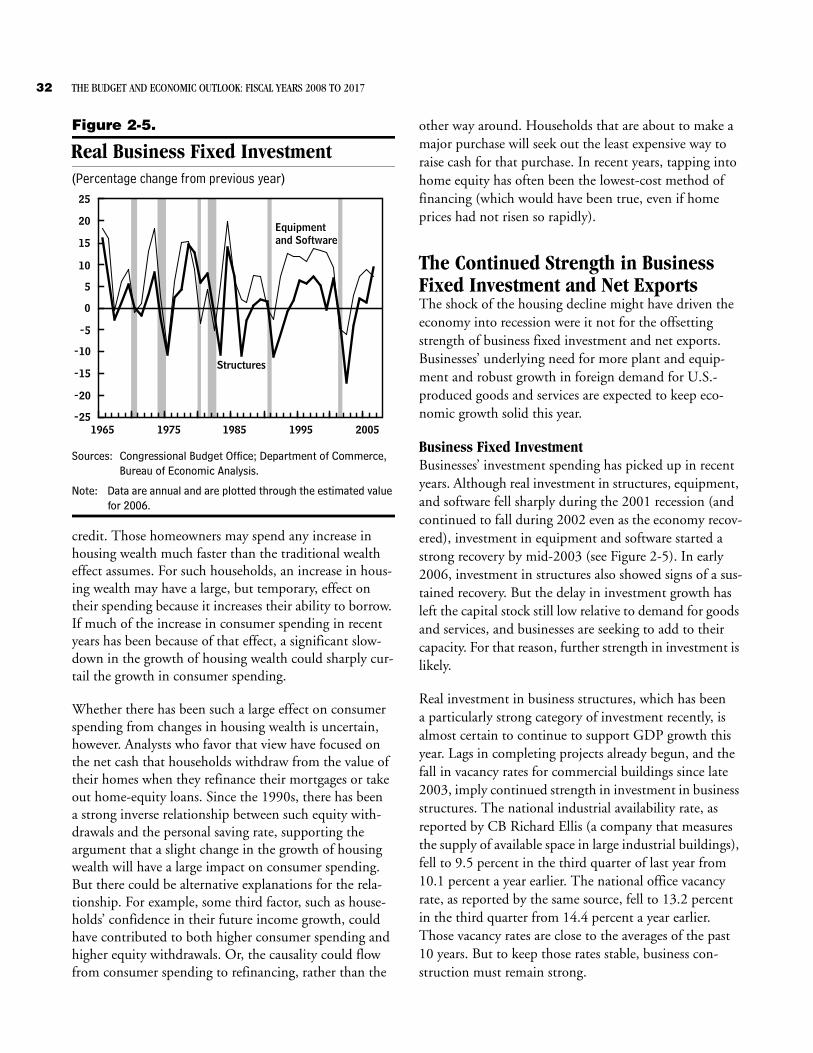
Figure 2-5.
Real Business Fixed Investment(Percentage change from previous year)
Sources: Congressional Budget Office; Department of Commerce, Bureau of Economic Analysis.
Note: Data are annual and are plotted through the estimated value for 2006.
credit. Those homeowners may spend any increase in housing wealth much faster than the traditional wealth effect assumes. For such households, an increase in hous-ing wealth may have a large, but temporary, effect on their spending because it increases their ability to borrow. If much of the increase in consumer spending in recent years has been because of that effect, a significant slow-down in the growth of housing wealth could sharply cur-tail the growth in consumer spending.
Whether there has been such a large effect on consumer spending from changes in housing wealth is uncertain, however. Analysts who favor that view have focused on the net cash that households withdraw from the value of their homes when they refinance their mortgages or take out home-equity loans. Since the 1990s, there has been a strong inverse relationship between such equity with-drawals and the personal saving rate, supporting the argument that a slight change in the growth of housing wealth will have a large impact on consumer spending. But there could be alternative explanations for the rela-tionship. For example, some third factor, such as house-holds’ confidence in their future income growth, could have contributed to both higher consumer spending and higher equity withdrawals. Or, the causality could flow from consumer spending to refinancing, rather than the
other way around. Households that are about to make a major purchase will seek out the least expensive way to raise cash for that purchase. In recent years, tapping into home equity has often been the lowest-cost method of financing (which would have been true, even if home prices had not risen so rapidly).
The Continued Strength in Business Fixed Investment and Net Exports The shock of the housing decline might have driven the economy into recession were it not for the offsetting strength of business fixed investment and net exports. Businesses’ underlying need for more plant and equip-ment and robust growth in foreign demand for U.S.-produced goods and services are expected to keep eco-nomic growth solid this year.
Business Fixed InvestmentBusinesses’ investment spending has picked up in recent years. Although real investment in structures, equipment, and software fell sharply during the 2001 recession (and continued to fall during 2002 even as the economy recov-ered), investment in equipment and software started a strong recovery by mid-2003 (see Figure 2-5). In early 2006, investment in structures also showed signs of a sus-tained recovery. But the delay in investment growth has left the capital stock still low relative to demand for goods and services, and businesses are seeking to add to their capacity. For that reason, further strength in investment is likely.
Real investment in business structures, which has been a particularly strong category of investment recently, is almost certain to continue to support GDP growth this year. Lags in completing projects already begun, and the fall in vacancy rates for commercial buildings since late 2003, imply continued strength in investment in business structures. The national industrial availability rate, as reported by CB Richard Ellis (a company that measures the supply of available space in large industrial buildings), fell to 9.5 percent in the third quarter of last year from 10.1 percent a year earlier. The national office vacancy rate, as reported by the same source, fell to 13.2 percent in the third quarter from 14.4 percent a year earlier. Those vacancy rates are close to the averages of the past 10 years. But to keep those rates stable, business con-struction must remain strong.
20051995198519751965
25
20
15
10
5
0
-5
-10
-15
-20
-25
Equipmentand Software
Structures
CHAPTER TWO THE ECONOMIC OUTLOOK 33
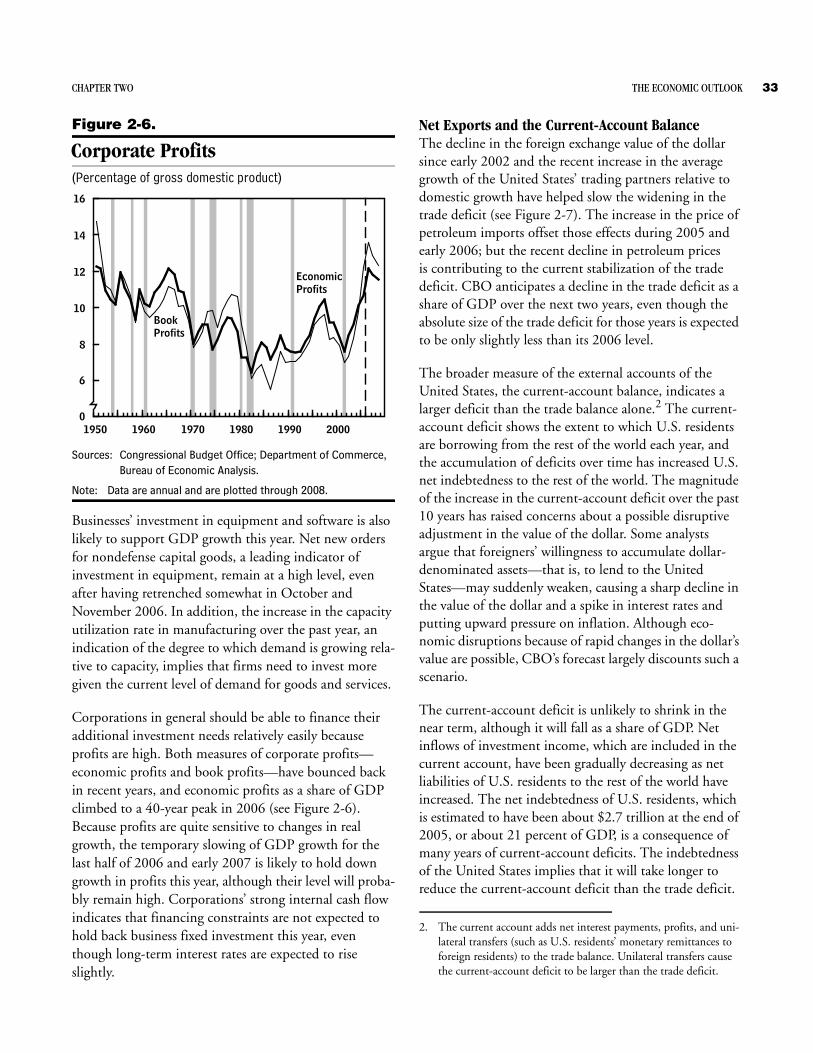
Figure 2-6.
Corporate Profits(Percentage of gross domestic product)
Sources: Congressional Budget Office; Department of Commerce, Bureau of Economic Analysis.
Note: Data are annual and are plotted through 2008.
Businesses’ investment in equipment and software is also likely to support GDP growth this year. Net new orders for nondefense capital goods, a leading indicator of investment in equipment, remain at a high level, even after having retrenched somewhat in October and November 2006. In addition, the increase in the capacity utilization rate in manufacturing over the past year, an indication of the degree to which demand is growing rela-tive to capacity, implies that firms need to invest more given the current level of demand for goods and services.
Corporations in general should be able to finance their additional investment needs relatively easily because profits are high. Both measures of corporate profits—economic profits and book profits—have bounced back in recent years, and economic profits as a share of GDP climbed to a 40-year peak in 2006 (see Figure 2-6). Because profits are quite sensitive to changes in real growth, the temporary slowing of GDP growth for the last half of 2006 and early 2007 is likely to hold down growth in profits this year, although their level will proba-bly remain high. Corporations’ strong internal cash flow indicates that financing constraints are not expected to hold back business fixed investment this year, even though long-term interest rates are expected to rise slightly.
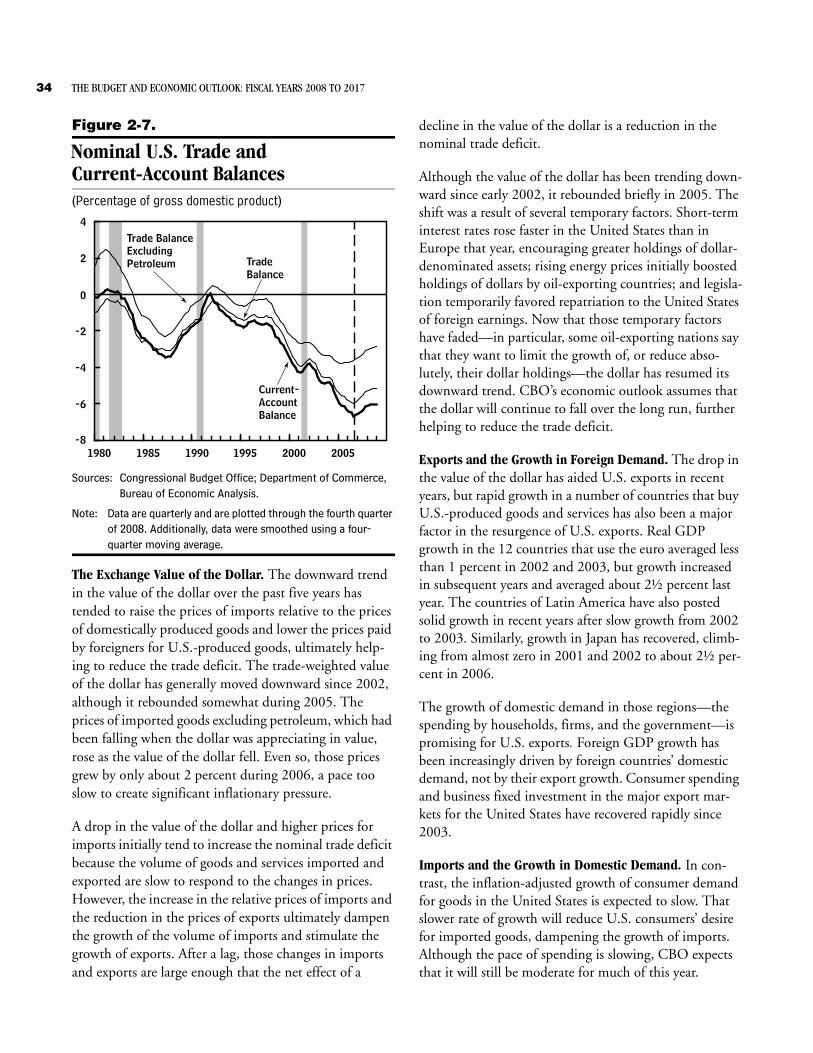
Net Exports and the Current-Account BalanceThe decline in the foreign exchange value of the dollar since early 2002 and the recent increase in the average growth of the United States’ trading partners relative to domestic growth have helped slow the widening in the trade deficit (see Figure 2-7). The increase in the price of petroleum imports offset those effects during 2005 and early 2006; but the recent decline in petroleum prices is contributing to the current stabilization of the trade deficit. CBO anticipates a decline in the trade deficit as a share of GDP over the next two years, even though the absolute size of the trade deficit for those years is expected to be only slightly less than its 2006 level.
The broader measure of the external accounts of the United States, the current-account balance, indicates a larger deficit than the trade balance alone.2 The current-account deficit shows the extent to which U.S. residents are borrowing from the rest of the world each year, and the accumulation of deficits over time has increased U.S. net indebtedness to the rest of the world. The magnitude of the increase in the current-account deficit over the past 10 years has raised concerns about a possible disruptive adjustment in the value of the dollar. Some analysts argue that foreigners’ willingness to accumulate dollar-denominated assets—that is, to lend to the United States—may suddenly weaken, causing a sharp decline in the value of the dollar and a spike in interest rates and putting upward pressure on inflation. Although eco-nomic disruptions because of rapid changes in the dollar’s value are possible, CBO’s forecast largely discounts such a scenario.
The current-account deficit is unlikely to shrink in the near term, although it will fall as a share of GDP. Net inflows of investment income, which are included in the current account, have been gradually decreasing as net liabilities of U.S. residents to the rest of the world have increased. The net indebtedness of U.S. residents, which is estimated to have been about $2.7 trillion at the end of 2005, or about 21 percent of GDP, is a consequence of many years of current-account deficits. The indebtedness of the United States implies that it will take longer to reduce the current-account deficit than the trade deficit.
200019901980197019601950
16
14
12
10
8
6
0
BookProfits
EconomicProfits
2. The current account adds net interest payments, profits, and uni-lateral transfers (such as U.S. residents’ monetary remittances to foreign residents) to the trade balance. Unilateral transfers cause the current-account deficit to be larger than the trade deficit.
34 THE BUDGET AND ECONOMIC OUTLOOK: FISCAL YEARS 2008 TO 2017
Figure 2-7.
Nominal U.S. Trade and Current-Account Balances(Percentage of gross domestic product)
Sources: Congressional Budget Office; Department of Commerce, Bureau of Economic Analysis.
Note: Data are quarterly and are plotted through the fourth quarter of 2008. Additionally, data were smoothed using a four-quarter moving average.
The Exchange Value of the Dollar. The downward trend in the value of the dollar over the past five years has tended to raise the prices of imports relative to the prices of domestically produced goods and lower the prices paid by foreigners for U.S.-produced goods, ultimately help-ing to reduce the trade deficit. The trade-weighted value of the dollar has generally moved downward since 2002, although it rebounded somewhat during 2005. The prices of imported goods excluding petroleum, which had been falling when the dollar was appreciating in value, rose as the value of the dollar fell. Even so, those prices grew by only about 2 percent during 2006, a pace too slow to create significant inflationary pressure.
A drop in the value of the dollar and higher prices for imports initially tend to increase the nominal trade deficit because the volume of goods and services imported and exported are slow to respond to the changes in prices. However, the increase in the relative prices of imports and the reduction in the prices of exports ultimately dampen the growth of the volume of imports and stimulate the growth of exports. After a lag, those changes in imports and exports are large enough that the net effect of a
decline in the value of the dollar is a reduction in the nominal trade deficit.
Although the value of the dollar has been trending down-ward since early 2002, it rebounded briefly in 2005. The shift was a result of several temporary factors. Short-term interest rates rose faster in the United States than in Europe that year, encouraging greater holdings of dollar-denominated assets; rising energy prices initially boosted holdings of dollars by oil-exporting countries; and legisla-tion temporarily favored repatriation to the United States of foreign earnings. Now that those temporary factors have faded—in particular, some oil-exporting nations say that they want to limit the growth of, or reduce abso-lutely, their dollar holdings—the dollar has resumed its downward trend. CBO’s economic outlook assumes that the dollar will continue to fall over the long run, further helping to reduce the trade deficit.
Exports and the Growth in Foreign Demand. The drop in the value of the dollar has aided U.S. exports in recent years, but rapid growth in a number of countries that buy U.S.-produced goods and services has also been a major factor in the resurgence of U.S. exports. Real GDP growth in the 12 countries that use the euro averaged less than 1 percent in 2002 and 2003, but growth increased in subsequent years and averaged about 2½ percent last year. The countries of Latin America have also posted solid growth in recent years after slow growth from 2002 to 2003. Similarly, growth in Japan has recovered, climb-ing from almost zero in 2001 and 2002 to about 2½ per-cent in 2006.
The growth of domestic demand in those regions—the spending by households, firms, and the government—is promising for U.S. exports. Foreign GDP growth has been increasingly driven by foreign countries’ domestic demand, not by their export growth. Consumer spending and business fixed investment in the major export mar-kets for the United States have recovered rapidly since 2003.
Imports and the Growth in Domestic Demand. In con-trast, the inflation-adjusted growth of consumer demand for goods in the United States is expected to slow. That slower rate of growth will reduce U.S. consumers’ desire for imported goods, dampening the growth of imports. Although the pace of spending is slowing, CBO expects that it will still be moderate for much of this year.
200520001995199019851980
4
2
0
-2
-4
-6
-8
Trade Balance
Trade BalanceExcludingPetroleum
Current- AccountBalance
CHAPTER TWO THE ECONOMIC OUTLOOK 35
The Slowdown in Consumer Spending Over the past four years, real growth in consumer spend-ing has been bolstered by solid gains in household employment and income, increases in housing wealth, and, in 2003 and 2004, unusually low interest rates. Those supports to consumer spending were partially undercut by the increase in energy prices from 2004 to mid-2006, but the growth in consumer spending (after inflation) still remained above 3 percent in those years. The factors that affect consumer spending are now par-tially reversing their roles. The slower growth in employ-ment, household income, and housing wealth is expected to restrain consumer spending, whereas the drop in energy prices that occurred last year will boost it. On balance, inflation-adjusted consumer spending is likely to be slower in 2007 than the 3½ percent pace of growth in 2006, in CBO’s estimation, and the personal saving rate is expected to increase slightly. However, that forecast is dependent on the ability of exports and business fixed investment to keep employment growth from slowing too much.
Employment and Household IncomeEmployment growth has been healthy, with only a slight easing in net job creation during the fourth quarter of last year. Current data indicate that jobs were added to the economy in the first nine months of 2006 at a pace of about 160,000 per month; that rate ebbed—to about 135,000 per month—during the last three months of the year. CBO anticipates that job growth will slow further, to an average of about 100,000 a month, in the near future.3 The forecasted slowdown in employment largely reflects the decline in housing activity, as jobs in residen-tial construction and industries related to housing (real estate, mortgage banking, and so forth) fell by about 20,000 per month during the last half of 2006. CBO’s forecast assumes further job declines in that sector, aver-aging about 45,000 per month, through the end of this year.4
Even though employment will continue to grow, the unemployment rate is expected to inch up during 2007. The outlook for the growth in demand for goods and ser-vices, and therefore for the growth in demand for work-ers, implies that job growth this year will not quite keep up with the growth of the labor force.
Although it may increase slightly, the unemployment rate is likely to remain low; therefore, wage growth is expected to hold relatively steady this year in spite of the slowdown in employment growth. Hourly wages, as measured by the employment cost index, rebounded to grow by 3 per-cent during 2006 after a three-year slump during which real gains in total labor compensation (wages plus bene-fits) trailed productivity gains. Real growth in total labor compensation will probably outpace productivity growth over the next two years because of the low level of unem-ployment, CBO estimates.
The Personal Saving Rate and the FinancialCondition of HouseholdsThe personal saving rate is currently extremely low, and, according to some measures, households’ financial posi-tion has deteriorated recently. Those measures have prompted concern that a significant percentage of house-holds may be vulnerable to a downturn in employment or income growth. The data do not indicate that house-holds overall are experiencing financial distress, but it is difficult to get up-to-date information about the financial condition of households at various income levels. There-fore, although the overall measures do not imply that the projected slowdown in employment growth will sharply restrain the growth of overall consumer spending, there is a risk that a significant percentage of households are vul-nerable to a slowdown in employment or income growth and that such a slowdown could amplify the drop in con-sumer spending.
Debt-service burdens have continued to rise, although most consumers and homeowners appear to be able to handle their debt load. Although debt service as a per-centage of disposable personal income has increased in recent years, delinquency rates do not indicate significant
3. In February 2007, the Bureau of Labor Statistics (BLS) will revise the establishment employment data for 2005 and 2006. BLS has indicated that it will revise the growth of employment upward by approximately 800,000 jobs for the period between March 2005 and March 2006, an extraordinarily large revision. The current data indicate that 2,029,000 jobs were created over that period. BLS may also revise the data from March 2006 to the present. (Some analysts believe that there will be a small upward revision to the growth of employment for that period.)
4. For an analysis of the effect of the housing boom on employment, see Matthew Miller, “A Virtual Essay: Post-Recessionary Employ-ment Growth Related to the Housing Market,” Monthly Labor Review (Department of Labor, Bureau of Labor Statistics, October 2006), available at http://stats.bls.gov/opub/mlr/2006/10/ressum.pdf.
36 THE BUDGET AND ECONOMIC OUTLOOK: FISCAL YEARS 2008 TO 2017
Figure 2-8.
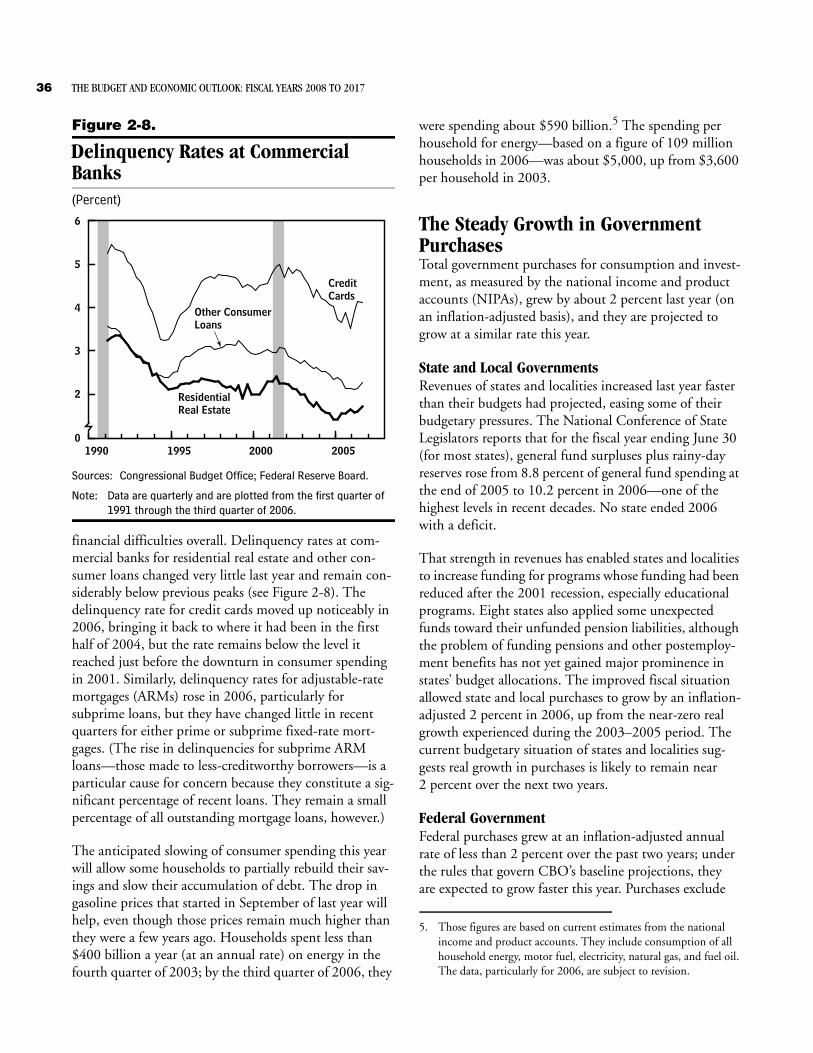
Delinquency Rates at Commercial Banks(Percent)
Sources: Congressional Budget Office; Federal Reserve Board.
Note: Data are quarterly and are plotted from the first quarter of 1991 through the third quarter of 2006.
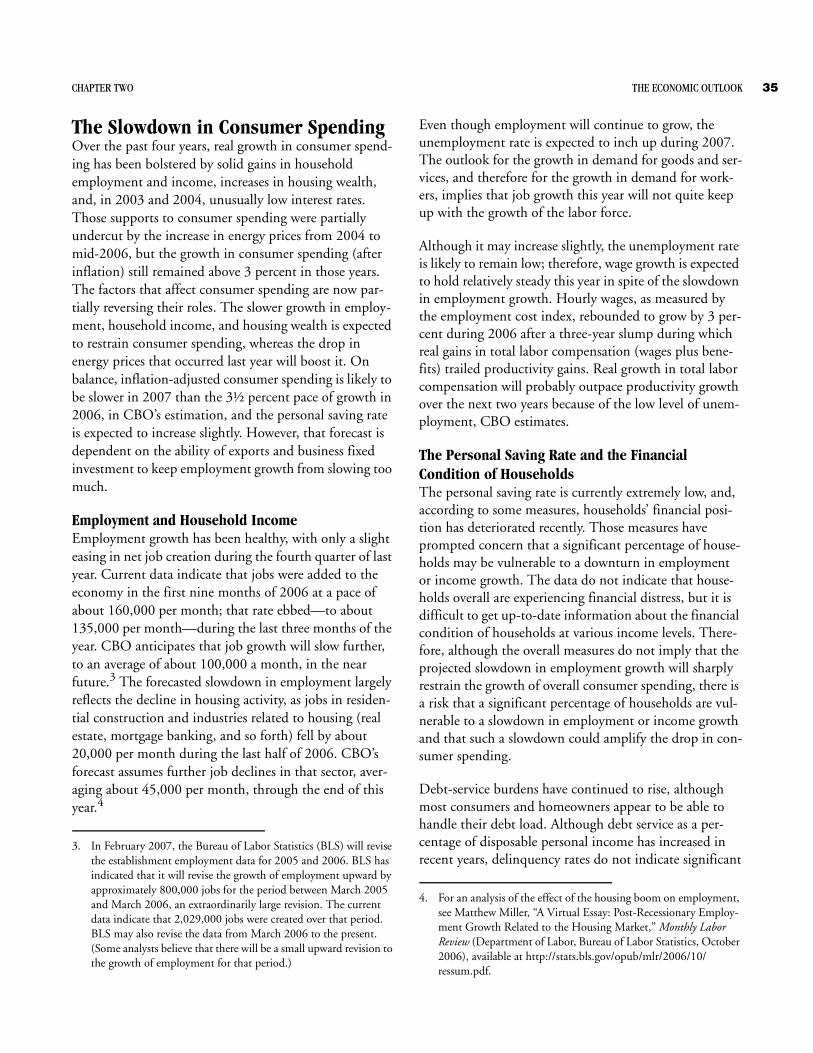
financial difficulties overall. Delinquency rates at com-mercial banks for residential real estate and other con-sumer loans changed very little last year and remain con-siderably below previous peaks (see Figure 2-8). The delinquency rate for credit cards moved up noticeably in 2006, bringing it back to where it had been in the first half of 2004, but the rate remains below the level it reached just before the downturn in consumer spending in 2001. Similarly, delinquency rates for adjustable-rate mortgages (ARMs) rose in 2006, particularly for subprime loans, but they have changed little in recent quarters for either prime or subprime fixed-rate mort-gages. (The rise in delinquencies for subprime ARM loans—those made to less-creditworthy borrowers—is a particular cause for concern because they constitute a sig-nificant percentage of recent loans. They remain a small percentage of all outstanding mortgage loans, however.)
The anticipated slowing of consumer spending this year will allow some households to partially rebuild their sav-ings and slow their accumulation of debt. The drop in gasoline prices that started in September of last year will help, even though those prices remain much higher than they were a few years ago. Households spent less than $400 billion a year (at an annual rate) on energy in the fourth quarter of 2003; by the third quarter of 2006, they
were spending about $590 billion.5 The spending per household for energy—based on a figure of 109 million households in 2006—was about $5,000, up from $3,600 per household in 2003.
The Steady Growth in GovernmentPurchasesTotal government purchases for consumption and invest-ment, as measured by the national income and product accounts (NIPAs), grew by about 2 percent last year (on an inflation-adjusted basis), and they are projected to grow at a similar rate this year.
State and Local GovernmentsRevenues of states and localities increased last year faster than their budgets had projected, easing some of their budgetary pressures. The National Conference of State Legislators reports that for the fiscal year ending June 30 (for most states), general fund surpluses plus rainy-day reserves rose from 8.8 percent of general fund spending at the end of 2005 to 10.2 percent in 2006—one of the highest levels in recent decades. No state ended 2006 with a deficit.
That strength in revenues has enabled states and localities to increase funding for programs whose funding had been reduced after the 2001 recession, especially educational programs. Eight states also applied some unexpected funds toward their unfunded pension liabilities, although the problem of funding pensions and other postemploy-ment benefits has not yet gained major prominence in states’ budget allocations. The improved fiscal situation allowed state and local purchases to grow by an inflation-adjusted 2 percent in 2006, up from the near-zero real growth experienced during the 2003–2005 period. The current budgetary situation of states and localities sug-gests real growth in purchases is likely to remain near 2 percent over the next two years.
Federal GovernmentFederal purchases grew at an inflation-adjusted annual rate of less than 2 percent over the past two years; under the rules that govern CBO’s baseline projections, they are expected to grow faster this year. Purchases exclude
2005200019951990
6
5
4
3
2
0
Credit Cards
Other Consumer Loans
ResidentialReal Estate
5. Those figures are based on current estimates from the national income and product accounts. They include consumption of all household energy, motor fuel, electricity, natural gas, and fuel oil. The data, particularly for 2006, are subject to revision.
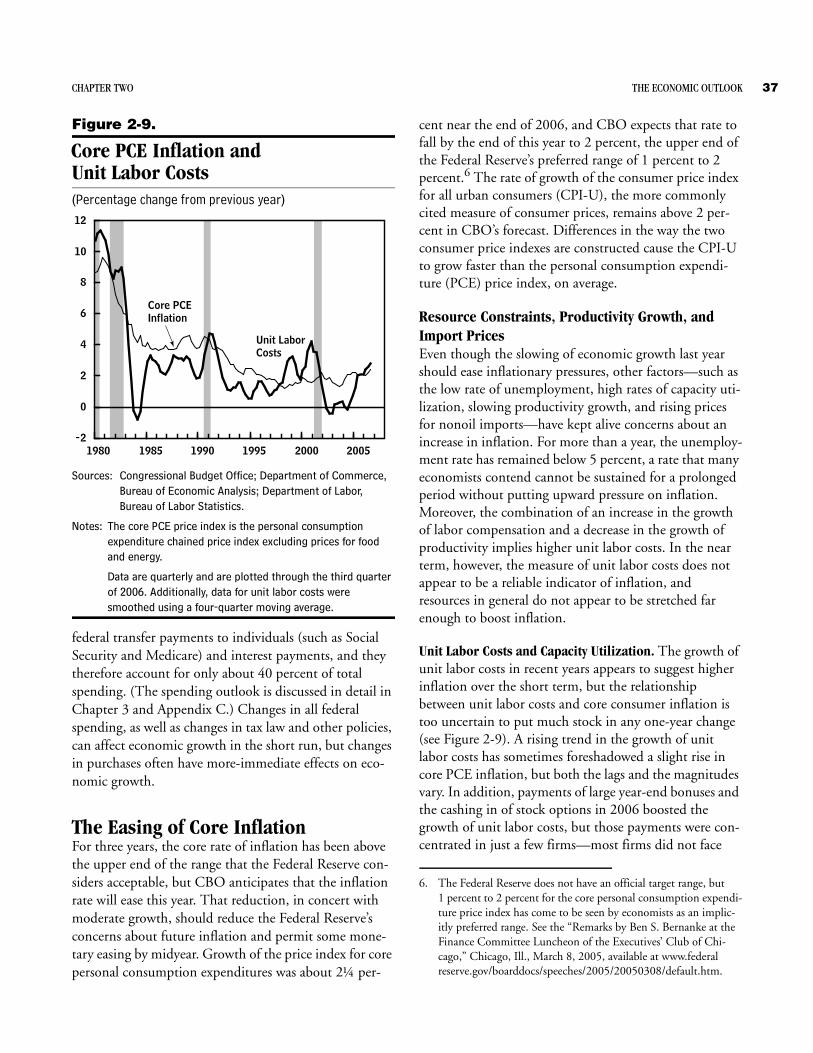
CHAPTER TWO THE ECONOMIC OUTLOOK 37
Figure 2-9.
Core PCE Inflation and Unit Labor Costs(Percentage change from previous year)
Sources: Congressional Budget Office; Department of Commerce, Bureau of Economic Analysis; Department of Labor, Bureau of Labor Statistics.
Notes: The core PCE price index is the personal consumption expenditure chained price index excluding prices for food and energy.
Data are quarterly and are plotted through the third quarter of 2006. Additionally, data for unit labor costs were smoothed using a four-quarter moving average.
federal transfer payments to individuals (such as Social Security and Medicare) and interest payments, and they therefore account for only about 40 percent of total spending. (The spending outlook is discussed in detail in Chapter 3 and Appendix C.) Changes in all federal spending, as well as changes in tax law and other policies, can affect economic growth in the short run, but changes in purchases often have more-immediate effects on eco-nomic growth.
The Easing of Core Inflation For three years, the core rate of inflation has been above the upper end of the range that the Federal Reserve con-siders acceptable, but CBO anticipates that the inflation rate will ease this year. That reduction, in concert with moderate growth, should reduce the Federal Reserve’s concerns about future inflation and permit some mone-tary easing by midyear. Growth of the price index for core personal consumption expenditures was about 2¼ per-
cent near the end of 2006, and CBO expects that rate to fall by the end of this year to 2 percent, the upper end of the Federal Reserve’s preferred range of 1 percent to 2 percent.6 The rate of growth of the consumer price index for all urban consumers (CPI-U), the more commonly cited measure of consumer prices, remains above 2 per-cent in CBO’s forecast. Differences in the way the two consumer price indexes are constructed cause the CPI-U to grow faster than the personal consumption expendi-ture (PCE) price index, on average.
Resource Constraints, Productivity Growth, and Import PricesEven though the slowing of economic growth last year should ease inflationary pressures, other factors—such as the low rate of unemployment, high rates of capacity uti-lization, slowing productivity growth, and rising prices for nonoil imports—have kept alive concerns about an increase in inflation. For more than a year, the unemploy-ment rate has remained below 5 percent, a rate that many economists contend cannot be sustained for a prolonged period without putting upward pressure on inflation. Moreover, the combination of an increase in the growth of labor compensation and a decrease in the growth of productivity implies higher unit labor costs. In the near term, however, the measure of unit labor costs does not appear to be a reliable indicator of inflation, and resources in general do not appear to be stretched far enough to boost inflation.
Unit Labor Costs and Capacity Utilization. The growth of unit labor costs in recent years appears to suggest higher inflation over the short term, but the relationship between unit labor costs and core consumer inflation is too uncertain to put much stock in any one-year change (see Figure 2-9). A rising trend in the growth of unit labor costs has sometimes foreshadowed a slight rise in core PCE inflation, but both the lags and the magnitudes vary. In addition, payments of large year-end bonuses and the cashing in of stock options in 2006 boosted the growth of unit labor costs, but those payments were con-centrated in just a few firms—most firms did not face
200520001995199019851980
12
10
8
6
4
2
0
-2
Core PCE Inflation
Unit LaborCosts
6. The Federal Reserve does not have an official target range, but 1 percent to 2 percent for the core personal consumption expendi-ture price index has come to be seen by economists as an implic-itly preferred range. See the “Remarks by Ben S. Bernanke at the Finance Committee Luncheon of the Executives’ Club of Chi-cago,” Chicago, Ill., March 8, 2005, available at www.federalreserve.gov/boarddocs/speeches/2005/20050308/default.htm.
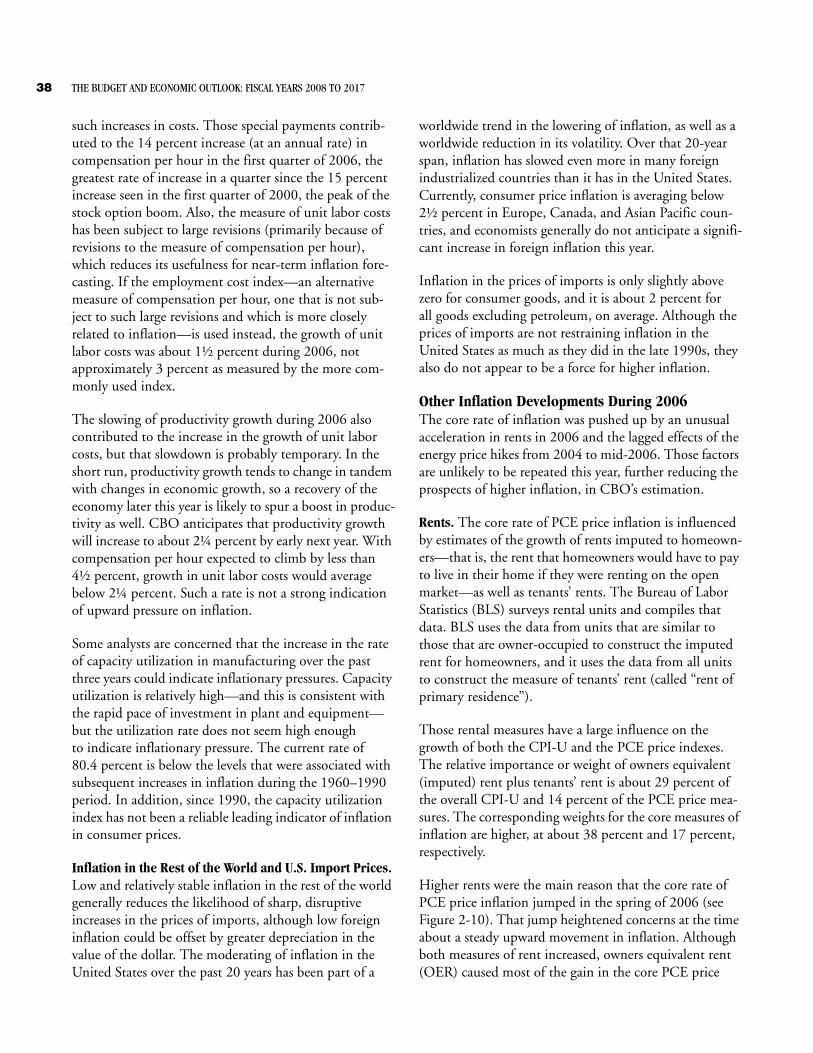
38 THE BUDGET AND ECONOMIC OUTLOOK: FISCAL YEARS 2008 TO 2017
such increases in costs. Those special payments contrib-uted to the 14 percent increase (at an annual rate) in compensation per hour in the first quarter of 2006, the greatest rate of increase in a quarter since the 15 percent increase seen in the first quarter of 2000, the peak of the stock option boom. Also, the measure of unit labor costs has been subject to large revisions (primarily because of revisions to the measure of compensation per hour), which reduces its usefulness for near-term inflation fore-casting. If the employment cost index—an alternative measure of compensation per hour, one that is not sub-ject to such large revisions and which is more closely related to inflation—is used instead, the growth of unit labor costs was about 1½ percent during 2006, not approximately 3 percent as measured by the more com-monly used index.
The slowing of productivity growth during 2006 also contributed to the increase in the growth of unit labor costs, but that slowdown is probably temporary. In the short run, productivity growth tends to change in tandem with changes in economic growth, so a recovery of the economy later this year is likely to spur a boost in produc-tivity as well. CBO anticipates that productivity growth will increase to about 2¼ percent by early next year. With compensation per hour expected to climb by less than 4½ percent, growth in unit labor costs would average below 2¼ percent. Such a rate is not a strong indication of upward pressure on inflation.
Some analysts are concerned that the increase in the rate of capacity utilization in manufacturing over the past three years could indicate inflationary pressures. Capacity utilization is relatively high—and this is consistent with the rapid pace of investment in plant and equipment—but the utilization rate does not seem high enoughto indicate inflationary pressure. The current rate of 80.4 percent is below the levels that were associated with subsequent increases in inflation during the 1960–1990 period. In addition, since 1990, the capacity utilization index has not been a reliable leading indicator of inflation in consumer prices.
Inflation in the Rest of the World and U.S. Import Prices. Low and relatively stable inflation in the rest of the world generally reduces the likelihood of sharp, disruptive increases in the prices of imports, although low foreign inflation could be offset by greater depreciation in the value of the dollar. The moderating of inflation in the United States over the past 20 years has been part of a
worldwide trend in the lowering of inflation, as well as a worldwide reduction in its volatility. Over that 20-year span, inflation has slowed even more in many foreign industrialized countries than it has in the United States. Currently, consumer price inflation is averaging below 2½ percent in Europe, Canada, and Asian Pacific coun-tries, and economists generally do not anticipate a signifi-cant increase in foreign inflation this year.
Inflation in the prices of imports is only slightly above zero for consumer goods, and it is about 2 percent for all goods excluding petroleum, on average. Although the prices of imports are not restraining inflation in the United States as much as they did in the late 1990s, they also do not appear to be a force for higher inflation.
Other Inflation Developments During 2006The core rate of inflation was pushed up by an unusual acceleration in rents in 2006 and the lagged effects of the energy price hikes from 2004 to mid-2006. Those factors are unlikely to be repeated this year, further reducing the prospects of higher inflation, in CBO’s estimation.
Rents. The core rate of PCE price inflation is influenced by estimates of the growth of rents imputed to homeown-ers—that is, the rent that homeowners would have to pay to live in their home if they were renting on the open market—as well as tenants’ rents. The Bureau of Labor Statistics (BLS) surveys rental units and compiles that data. BLS uses the data from units that are similar to those that are owner-occupied to construct the imputed rent for homeowners, and it uses the data from all units to construct the measure of tenants’ rent (called “rent of primary residence”).
Those rental measures have a large influence on the growth of both the CPI-U and the PCE price indexes. The relative importance or weight of owners equivalent (imputed) rent plus tenants’ rent is about 29 percent of the overall CPI-U and 14 percent of the PCE price mea-sures. The corresponding weights for the core measures of inflation are higher, at about 38 percent and 17 percent, respectively.
Higher rents were the main reason that the core rate of PCE price inflation jumped in the spring of 2006 (see Figure 2-10). That jump heightened concerns at the time about a steady upward movement in inflation. Although both measures of rent increased, owners equivalent rent (OER) caused most of the gain in the core PCE price
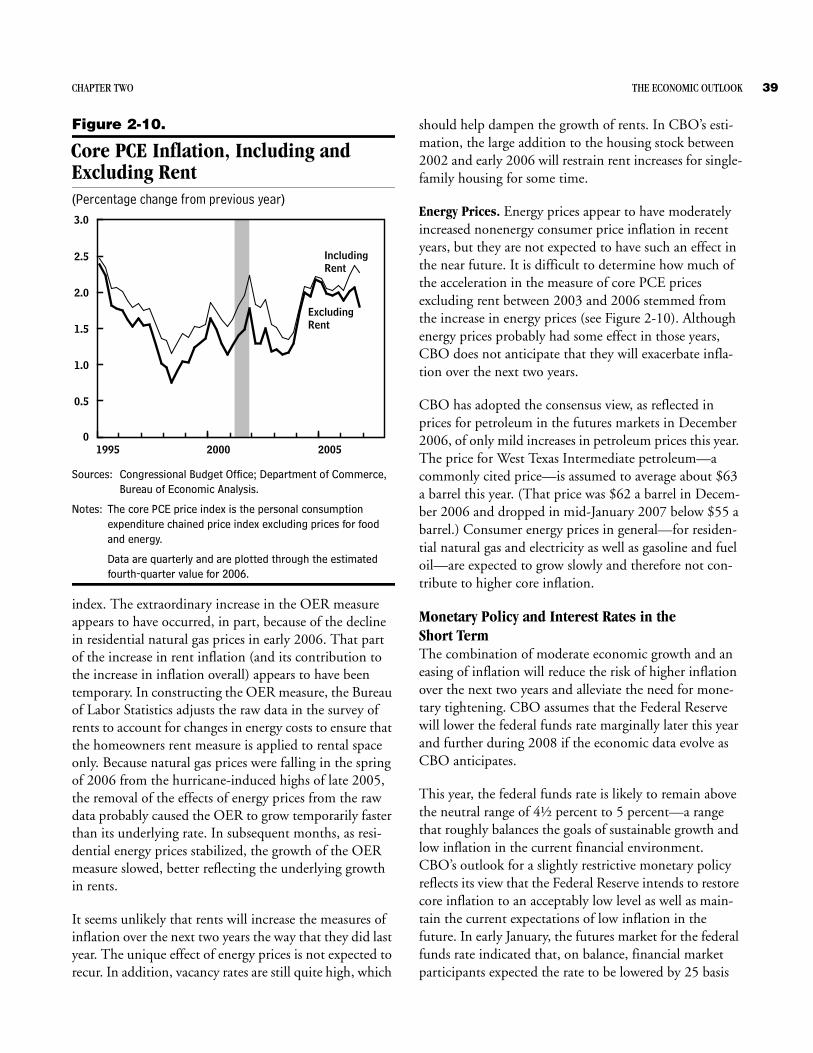
CHAPTER TWO THE ECONOMIC OUTLOOK 39
Figure 2-10.
Core PCE Inflation, Including and Excluding Rent(Percentage change from previous year)
Sources: Congressional Budget Office; Department of Commerce, Bureau of Economic Analysis.
Notes: The core PCE price index is the personal consumption expenditure chained price index excluding prices for food and energy.
Data are quarterly and are plotted through the estimated fourth-quarter value for 2006.
index. The extraordinary increase in the OER measure appears to have occurred, in part, because of the decline in residential natural gas prices in early 2006. That part of the increase in rent inflation (and its contribution to the increase in inflation overall) appears to have been temporary. In constructing the OER measure, the Bureau of Labor Statistics adjusts the raw data in the survey of rents to account for changes in energy costs to ensure that the homeowners rent measure is applied to rental space only. Because natural gas prices were falling in the spring of 2006 from the hurricane-induced highs of late 2005, the removal of the effects of energy prices from the raw data probably caused the OER to grow temporarily faster than its underlying rate. In subsequent months, as resi-dential energy prices stabilized, the growth of the OER measure slowed, better reflecting the underlying growth in rents.
It seems unlikely that rents will increase the measures of inflation over the next two years the way that they did last year. The unique effect of energy prices is not expected to recur. In addition, vacancy rates are still quite high, which
should help dampen the growth of rents. In CBO’s esti-mation, the large addition to the housing stock between 2002 and early 2006 will restrain rent increases for single-family housing for some time.
Energy Prices. Energy prices appear to have moderately increased nonenergy consumer price inflation in recent years, but they are not expected to have such an effect in the near future. It is difficult to determine how much of the acceleration in the measure of core PCE prices excluding rent between 2003 and 2006 stemmed from the increase in energy prices (see Figure 2-10). Although energy prices probably had some effect in those years, CBO does not anticipate that they will exacerbate infla-tion over the next two years.
CBO has adopted the consensus view, as reflected in prices for petroleum in the futures markets in December 2006, of only mild increases in petroleum prices this year. The price for West Texas Intermediate petroleum—a commonly cited price—is assumed to average about $63 a barrel this year. (That price was $62 a barrel in Decem-ber 2006 and dropped in mid-January 2007 below $55 a barrel.) Consumer energy prices in general—for residen-tial natural gas and electricity as well as gasoline and fuel oil—are expected to grow slowly and therefore not con-tribute to higher core inflation.
Monetary Policy and Interest Rates in theShort TermThe combination of moderate economic growth and an easing of inflation will reduce the risk of higher inflation over the next two years and alleviate the need for mone-tary tightening. CBO assumes that the Federal Reserve will lower the federal funds rate marginally later this year and further during 2008 if the economic data evolve as CBO anticipates.
This year, the federal funds rate is likely to remain above the neutral range of 4½ percent to 5 percent—a range that roughly balances the goals of sustainable growth and low inflation in the current financial environment. CBO’s outlook for a slightly restrictive monetary policy reflects its view that the Federal Reserve intends to restore core inflation to an acceptably low level as well as main-tain the current expectations of low inflation in the future. In early January, the futures market for the federal funds rate indicated that, on balance, financial market participants expected the rate to be lowered by 25 basis
200520001995
3.0
2.5
2.0
1.5
1.0
0.5
0
IncludingRent
ExcludingRent
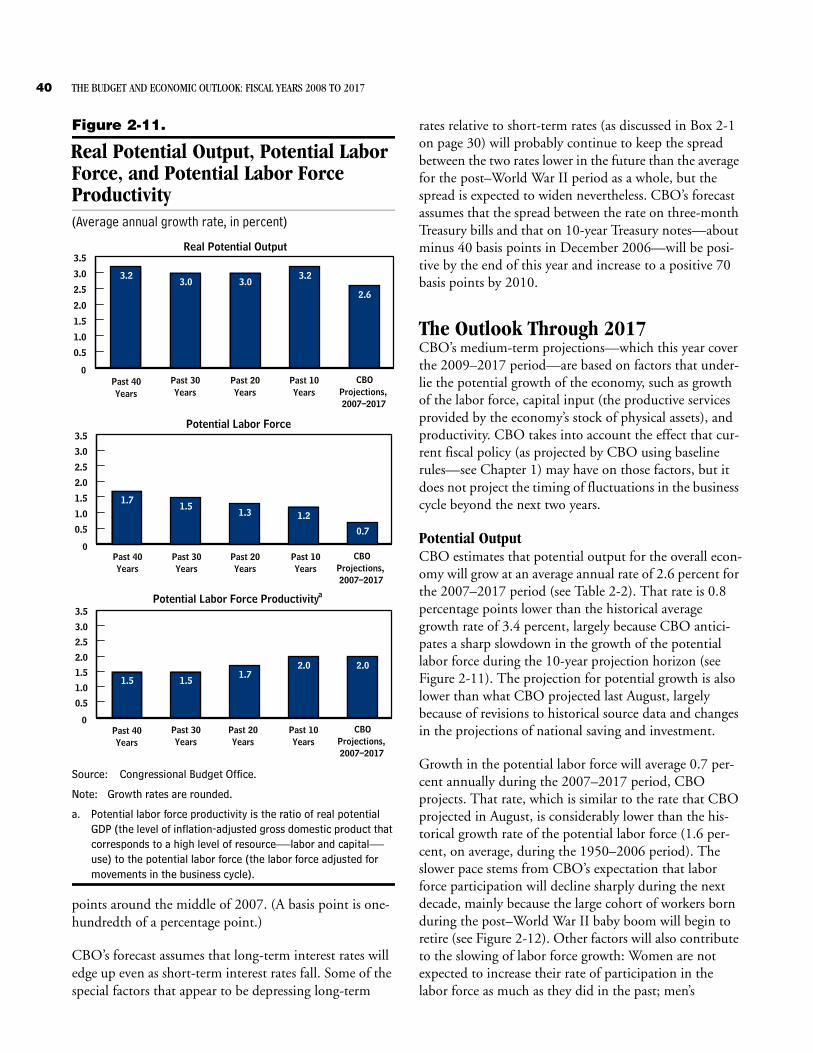
40 THE BUDGET AND ECONOMIC OUTLOOK: FISCAL YEARS 2008 TO 2017
Figure 2-11.
Real Potential Output, Potential Labor Force, and Potential Labor ForceProductivity(Average annual growth rate, in percent)
Source: Congressional Budget Office.
Note: Growth rates are rounded.
a. Potential labor force productivity is the ratio of real potential GDP (the level of inflation-adjusted gross domestic product that corresponds to a high level of resource—labor and capital—use) to the potential labor force (the labor force adjusted for movements in the business cycle).
points around the middle of 2007. (A basis point is one-hundredth of a percentage point.)
CBO’s forecast assumes that long-term interest rates will edge up even as short-term interest rates fall. Some of the special factors that appear to be depressing long-term
rates relative to short-term rates (as discussed in Box 2-1 on page 30) will probably continue to keep the spread between the two rates lower in the future than the average for the post–World War II period as a whole, but the spread is expected to widen nevertheless. CBO’s forecast assumes that the spread between the rate on three-month Treasury bills and that on 10-year Treasury notes—about minus 40 basis points in December 2006—will be posi-tive by the end of this year and increase to a positive 70 basis points by 2010.
The Outlook Through 2017CBO’s medium-term projections—which this year cover the 2009–2017 period—are based on factors that under-lie the potential growth of the economy, such as growth of the labor force, capital input (the productive services provided by the economy’s stock of physical assets), and productivity. CBO takes into account the effect that cur-rent fiscal policy (as projected by CBO using baseline rules—see Chapter 1) may have on those factors, but it does not project the timing of fluctuations in the business cycle beyond the next two years.
Potential OutputCBO estimates that potential output for the overall econ-omy will grow at an average annual rate of 2.6 percent for the 2007–2017 period (see Table 2-2). That rate is 0.8 percentage points lower than the historical average growth rate of 3.4 percent, largely because CBO antici-pates a sharp slowdown in the growth of the potential labor force during the 10-year projection horizon (see Figure 2-11). The projection for potential growth is also lower than what CBO projected last August, largely because of revisions to historical source data and changes in the projections of national saving and investment.
Growth in the potential labor force will average 0.7 per-cent annually during the 2007–2017 period, CBO projects. That rate, which is similar to the rate that CBO projected in August, is considerably lower than the his-torical growth rate of the potential labor force (1.6 per-cent, on average, during the 1950–2006 period). The slower pace stems from CBO’s expectation that labor force participation will decline sharply during the next decade, mainly because the large cohort of workers born during the post–World War II baby boom will begin to retire (see Figure 2-12). Other factors will also contribute to the slowing of labor force growth: Women are not expected to increase their rate of participation in the labor force as much as they did in the past; men’s
0.0
0.5
1.0
1.5
2.0
2.5
3.0
3.5
3.23.0 3.0
3.2
2.6
Past 40Years
Past 30Years
Past 20Years
Past 10Years
CBOProjections,2007–2017
Real Potential Output
0
0.0
0.5
1.0
1.5
2.0
2.5
3.0
3.5
1.71.5
1.3 1.2
0.7
Potential Labor Force
Potential Labor Force Productivitya
Past 40Years
Past 30Years
Past 20Years
Past 10Years
CBOProjections,2007–2017
Past 40Years
Past 30Years
Past 20Years
Past 10Years
CBOProjections,2007–2017
0
0.0
0.5
1.0
1.5
2.0
2.5
3.0
3.5
1.5 1.51.7
2.0 2.0
0

CHAPTER TWO THE ECONOMIC OUTLOOK 41
Table 2-2.
Key Assumptions in CBO’s Projection of Potential Output(By calendar year, in percent)
Source: Congressional Budget Office.
Note: TFP = total factor productivity; GDP = gross domestic product; * = between zero and 0.05 percent.
a. The ratio of potential output to the potential labor force.
b. An adjustment for a conceptual change in the official measure of the GDP chained price index.
c. An adjustment for the unusually rapid growth of TFP between 2001 and 2003.
d. The estimated trend in the ratio of output to hours worked in the nonfarm business sector.
participation rate is likely to resume its slow downward trend; and the increase in marginal personal tax rates in 2011 (after the expiration of provisions originally enacted in the Economic Growth and Tax Relief Reconciliation Act of 2001 and the Jobs and Growth Tax Relief Recon-ciliation Act of 2003) will modestly reduce people’s incentive to work.
The primary labor input in CBO’s model for potential output, potential hours worked in the nonfarm business
sector, is projected to grow at an average annual rate of 0.7 percent through 2017. Like growth in the potential labor force, growth in potential hours worked is projected to slow during the 10-year period and be significantly lower than its long-term historical average. In addition, growth in the projected level of potential hours worked was revised downward since last August because CBO now estimates that the share of total employment in the nonfarm business sector, relative to other sectors of the economy, will rise somewhat more slowly.
Total, Total,1950- 1974- 1982- 1991- 2002- 1950- 2007- 2013- 2007-1973 1981 1990 2001 2006 2006 2012 2017 2017
3.9 3.2 3.1 3.1 2.8 3.4 2.8 2.5 2.61.6 2.5 1.6 1.2 1.1 1.6 0.8 0.5 0.72.3 0.7 1.4 1.9 1.7 1.8 1.9 2.0 2.0
4.0 3.6 3.3 3.5 3.1 3.7 3.1 2.9 3.01.4 2.3 1.7 1.1 1.1 1.5 0.8 0.6 0.73.8 4.2 4.1 4.6 2.4 3.9 3.7 3.7 3.71.9 0.7 0.9 1.3 1.6 1.4 1.4 1.4 1.41.9 0.7 0.9 1.3 1.3 1.4 1.3 1.3 1.3
0 0 0 0.1 0.3 * 0.1 0.1 0.1Price measurementb 0 0 0 0.1 0.1 * 0.1 0.1 0.1Temporary adjustmentc 0 0 0 * 0.2 * 0 0 0
0.9 1.6 1.2 0.8 0.8 1.0 0.6 0.4 0.51.1 1.3 1.2 1.4 0.7 1.2 1.1 1.1 1.11.9 0.7 0.9 1.3 1.6 1.4 1.4 1.4 1.4___ ___ ___ ___ ___ ___ ___ ___ ___
Total Contributions 4.0 3.6 3.3 3.5 3.1 3.6 3.1 2.9 3.0
2.6 1.3 1.6 2.4 2.0 2.2 2.3 2.4 2.3
Capital inputPotential TFP
Memorandum:Potential Labor Productivityin the Nonfarm Business Sectord
Overall Economy
Nonfarm Business Sector
TFP adjustments
Contributions to the Growth of Potential
Potential OutputPotential Labor ForcePotential Labor Force Productivitya
Potential Output
Potential hours worked
Projected AverageAnnual GrowthAverage Annual Growth
Output (Percentage points)
Potential Hours WorkedCapital InputPotential TFP
Potential TFP excluding adjustments

42 THE BUDGET AND ECONOMIC OUTLOOK: FISCAL YEARS 2008 TO 2017
Figure 2-12.
Actual and Potential Labor ForceParticipation(Percent)
Sources: Congressional Budget Office; Department of Labor, Bureau of Labor Statistics.
Notes: Labor force participation covers both sexes, ages 16 and older.
The potential labor force participation rate is the rate consistent with full employment. CBO has adjusted it for significant breaks in census population data.
For the actual participation rate, data are quarterly and are plotted through the fourth quarter of 2006. For the potential participation rate, data are annual and are plotted through 2017.
In contrast to the slower rates of growth projected for the potential labor force and potential hours worked, the rates of growth for capital input and potential total factor productivity are expected to be comparable to their his-torical averages. Capital input, for example, is projected to grow at an average annual rate of 3.7 percent during the 10-year projection period, about two-tenths of a per-centage point slower than its average growth rate since 1950. That rate of growth is also about four-tenths of a percentage point lower than CBO projected in August; the change results from a reduction in the projected level of business fixed investment over the 10-year period.
CBO’s projection for the growth of potential total factor productivity is slightly lower than it was last August and the same as the trend for the entire postwar period. At an annual rate of 1.4 percent, the trend in this measure of the combined productivity of capital and labor is lower
than the 1.6 percent rate of the past few years, a period of unusually strong productivity growth. The corresponding measure of potential labor productivity growth in the nonfarm business sector is projected to be 2.3 percent annually for the 2007–2017 period, about one-tenth of a percentage point higher than its historical rate. Labor productivity in CBO’s projection grows faster than its historical average even though the growth of total factor productivity is the same as its historical average because the capital input is expected to grow faster relative to hours worked than in the past. (Providing labor with more capital enhances the growth of labor productivity.)
Inflation and Interest Rates. CBO projects that inflation, as measured by the CPI-U, will average 2.2 percent a year from 2009 to 2017; as measured by both the PCE price index and the core PCE price index, it will average 2.0 percent a year. Growth of the GDP price index is expected to average 1.8 percent annually. CBO assumes that an average growth rate of 2.0 percent for the core PCE price index is compatible with the Federal Reserve’s preferred range for inflation.
CBO’s projection for interest rates in the medium term reflects its projections for inflation and for inflation-adjusted interest rates. Between 2009 and 2017, therate on three-month Treasury bills is projected to average 4.4 percent, and the rate on 10-year Treasury notes, 5.2 percent. Using projected changes in the CPI-U asa measure of expected inflation, CBO estimates that the real interest rate on three-month Treasury bills will aver-age 2.2 percent and the real rate on 10-year Treasury notes will average 3.0 percent.
Projections of IncomeCBO’s economic projections of various income categories as measured in the national income and product accounts are the basis for its projections of federal revenues. The outlook for revenues is most directly affected by projec-tions of wages and salaries, corporate profits, proprietors’ income, interest income, and dividend income. Although the NIPA measures of those income categories do not precisely correspond to the income concepts reported on tax forms for calculating tax liabilities, projections of income as measured in the NIPAs provide the basisfor CBO’s estimates of tax bases and future federal reve-nues. (See Chapter 4 for details of CBO’s outlook forrevenues.)
20152005199519851975
68
66
64
62
0
Potential
Actual
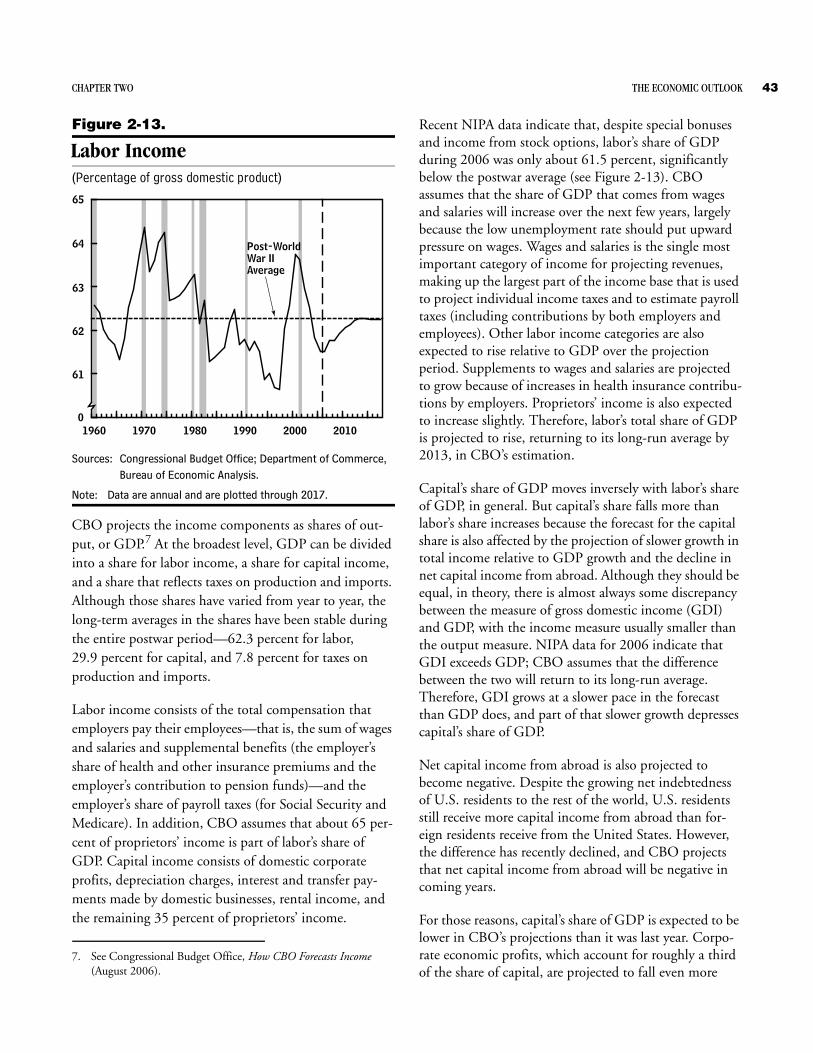
CHAPTER TWO THE ECONOMIC OUTLOOK 43
Figure 2-13.
Labor Income(Percentage of gross domestic product)
Sources: Congressional Budget Office; Department of Commerce, Bureau of Economic Analysis.
Note: Data are annual and are plotted through 2017.
CBO projects the income components as shares of out-put, or GDP.7 At the broadest level, GDP can be divided into a share for labor income, a share for capital income, and a share that reflects taxes on production and imports. Although those shares have varied from year to year, the long-term averages in the shares have been stable during the entire postwar period—62.3 percent for labor, 29.9 percent for capital, and 7.8 percent for taxes on production and imports.
Labor income consists of the total compensation that employers pay their employees—that is, the sum of wages and salaries and supplemental benefits (the employer’s share of health and other insurance premiums and the employer’s contribution to pension funds)—and the employer’s share of payroll taxes (for Social Security and Medicare). In addition, CBO assumes that about 65 per-cent of proprietors’ income is part of labor’s share of GDP. Capital income consists of domestic corporate profits, depreciation charges, interest and transfer pay-ments made by domestic businesses, rental income, and the remaining 35 percent of proprietors’ income.
Recent NIPA data indicate that, despite special bonuses and income from stock options, labor’s share of GDP during 2006 was only about 61.5 percent, significantly below the postwar average (see Figure 2-13). CBO assumes that the share of GDP that comes from wages and salaries will increase over the next few years, largely because the low unemployment rate should put upward pressure on wages. Wages and salaries is the single most important category of income for projecting revenues, making up the largest part of the income base that is used to project individual income taxes and to estimate payroll taxes (including contributions by both employers and employees). Other labor income categories are also expected to rise relative to GDP over the projection period. Supplements to wages and salaries are projected to grow because of increases in health insurance contribu-tions by employers. Proprietors’ income is also expected to increase slightly. Therefore, labor’s total share of GDP is projected to rise, returning to its long-run average by 2013, in CBO’s estimation.
Capital’s share of GDP moves inversely with labor’s share of GDP, in general. But capital’s share falls more than labor’s share increases because the forecast for the capital share is also affected by the projection of slower growth in total income relative to GDP growth and the decline in net capital income from abroad. Although they should be equal, in theory, there is almost always some discrepancy between the measure of gross domestic income (GDI) and GDP, with the income measure usually smaller than the output measure. NIPA data for 2006 indicate that GDI exceeds GDP; CBO assumes that the difference between the two will return to its long-run average. Therefore, GDI grows at a slower pace in the forecast than GDP does, and part of that slower growth depresses capital’s share of GDP.
Net capital income from abroad is also projected to become negative. Despite the growing net indebtedness of U.S. residents to the rest of the world, U.S. residents still receive more capital income from abroad than for-eign residents receive from the United States. However, the difference has recently declined, and CBO projects that net capital income from abroad will be negative in coming years.
For those reasons, capital’s share of GDP is expected to be lower in CBO’s projections than it was last year. Corpo-rate economic profits, which account for roughly a third of the share of capital, are projected to fall even more
7. See Congressional Budget Office, How CBO Forecasts Income (August 2006).
201020001990198019701960
65
64
63
62
61
0
Post-World War II Average
44 THE BUDGET AND ECONOMIC OUTLOOK: FISCAL YEARS 2008 TO 2017
than the capital share because both interest payments and depreciation charges by businesses are projected to rise slightly as a share of GDP. The increase in businesses’ interest payments stems, in turn, from the need of busi-nesses to increase their debt somewhat to pay for the recent pickup in investment (even though their internal cash flow is adequate to finance much of that increase in investment); from a slight increase in long-term interest rates; and from a greater leveraging (an increase in debt relative to assets) of balance sheets.
Corporate tax liabilities are projected on the basis of book profits, not economic profits. Book profits more closely track the profits that firms report under Internal Revenue Service (IRS) rules for depreciation, inventory valuation, and the like. By contrast, economic profits use economic principles for depreciation and inventory valuation rather than IRS rules. Book profits have deviated sharply from economic profits over the past five years—first lower, and then higher—because the tax laws governing depreciation were temporarily changed under the partial-expensing provisions of the Job Creation and Worker Assistance Act of 2002 and JGTRRA. That legislation permitted much larger depreciation charges than were implied by eco-nomic estimates of depreciation during the 2002–2004 period. Since early 2005, however, book depreciation has been smaller than economic depreciation (to make up for the “accelerated” depreciation from 2002 to 2004), and book profits therefore have been higher than economic profits. CBO projects that over the next few years, book depreciation will gradually increase relative to economic depreciation, causing book profits to decline relative to economic profits.
Changes in the Outlook SinceAugust 2006Changes in the economic outlook since August 2006 had almost no impact on spending projections and just a slight negative impact on revenue projections—and the overall budget outlook was affected mostly for the last five years of the projection period, 2012 to 2016. Changes in the economic forecast worsened the budget outlook in those years by an average of $34 billion per year. (The specific revisions to the budget outlook that can be attributed to changes in the economic forecast are described in more detail in Chapter 1.)
The decline in housing construction during the second half of 2006 was much more precipitous than CBO
anticipated in its August 2006 forecast, causing real GDP growth to be significantly slower during that period than CBO had projected. In addition, the housing sector is now expected to continue to depress economic activity during the first half of this year to a greater extent than CBO had previously anticipated. Real GDP growth in 2006 is now estimated to be 3.3 percent, down from the 3.5 percent that CBO had forecast in August, and growth in 2007 is now expected to be 2.3 percent, compared with the 3.0 percent indicated in the August forecast (see Table 2-3).
Consumer price inflation and interest rates in 2006 gen-erally turned out to be as expected in the August forecast, but the current forecast for those rates in 2007 is signifi-cantly lower than last August’s. The drop in motor fuel prices that began in September of last year had little effect on the average rate of inflation in 2006, but it is expected to cause the year-over-year growth in inflation in 2007 to be much lower than anticipated.
The forecast for income has also changed substantially, both in the near term and over the longer run. Wages and salaries’ share of GDP is projected to be slightly higher over the entire projection period than CBO estimated last August, for two reasons. First, the projection of some employer-provided benefits, such as medical insurance premiums, was lowered because of a downward revision to the historical trend, reducing the share of benefits and increasing the share of wages in labor income. Second, CBO’s estimates of the degree to which defined-benefit pension plans are underfunded were lowered, largely because asset returns during 2006 were greater than expected, reducing the need for firms to make additional contributions to those plans over the next few years. However, the increase in wages and salaries’ share of GDP is more than offset by the lower level of nominal GDP projected for the 10-year period, so the level of wages and salaries ends up being significantly lower than CBO had previously anticipated. In contrast to the projection of the level of wages and salaries, the level of corporate book profits is higher in this forecast than in last August’s. The projected increase in book profits as a share of GDP more than offsets the lower level of GDP.
Beyond 2012, the reduction in the projected level of nominal GDP is the major economic reason that reve-nues are expected to be lower. The projections for infla-tion, unemployment, and interest rates for the 2012–2016 period are unchanged from their levels in the

CHAPTER TWO THE ECONOMIC OUTLOOK 45
Table 2-3.
CBO’s Current and Previous Economic Projections for Calendar Years2006 to 2016
Sources: Congressional Budget Office; Department of Commerce, Bureau of Economic Analysis; Department of Labor, Bureau of Labor Statistics; Federal Reserve Board.
Note: GDP = gross domestic product; percentage changes are measured from one year to the next.
a. Level in 2012.
b. Level in 2016.
c. The consumer price index for all urban consumers.
Nominal GDP (Billions of dollars)January 2007 13,235 13,805 14,472 17,395 a 20,639 b
August 2006 13,308 13,993 14,685 17,684 a 21,052 b
Nominal GDP (Percentage change) January 2007 6.3 4.3 4.8 4.7 4.4August 2006 6.6 5.1 4.9 4.8 4.5
Real GDP (Percentage change) January 2007 3.3 2.3 3.0 2.9 2.5August 2006 3.5 3.0 3.1 2.9 2.6
GDP Price Index (Percentage change) January 2007 2.9 1.9 1.8 1.8 1.8August 2006 3.0 2.0 1.8 1.8 1.8
Consumer Price Indexc (Percentage change) January 2007 3.4 1.9 2.3 2.2 2.2August 2006 3.5 2.5 2.2 2.2 2.2
Unemployment Rate (Percent) January 2007 4.6 4.7 4.9 5.0 5.0August 2006 4.7 4.8 4.9 5.0 5.0
Three-Month Treasury Bill Rate (Percent) January 2007 4.7 4.8 4.5 4.4 4.4August 2006 4.8 5.0 4.8 4.4 4.4
Ten-Year Treasury Note Rate (Percent) January 2007 4.8 4.8 5.0 5.2 5.2August 2006 5.1 5.4 5.3 5.2 5.2
Tax Bases (Billions of dollars)
January 2007 1,795 1,775 1,787 1,763 a 2,029 b
August 2006 1,781 1,641 1,624 1,621 a 1,884 b
January 2007 6,032 6,330 6,642 8,019 a 9,471 b
August 2006 5,994 6,354 6,706 8,117 a 9,619 b
Tax Bases (Percentage of GDP)
January 2007 13.6 12.9 12.3 10.8 9.9August 2006 13.4 11.7 11.1 9.6 9.0
January 2007 45.6 45.9 45.9 46.1 46.0August 2006 45.0 45.4 45.7 45.9 45.8
Real Potential GDP (Percentage change)2.7 2.8 2.8 2.7 2.53.1 3.2 3.1 2.8 2.6August 2006
Memorandum:
Corporate book profits
Wages and salaries
January 2007
20082006 2009-2012 2013-2016
Wages and salaries
Corporate book profits
Estimated2007
Projected Annual AverageForecast
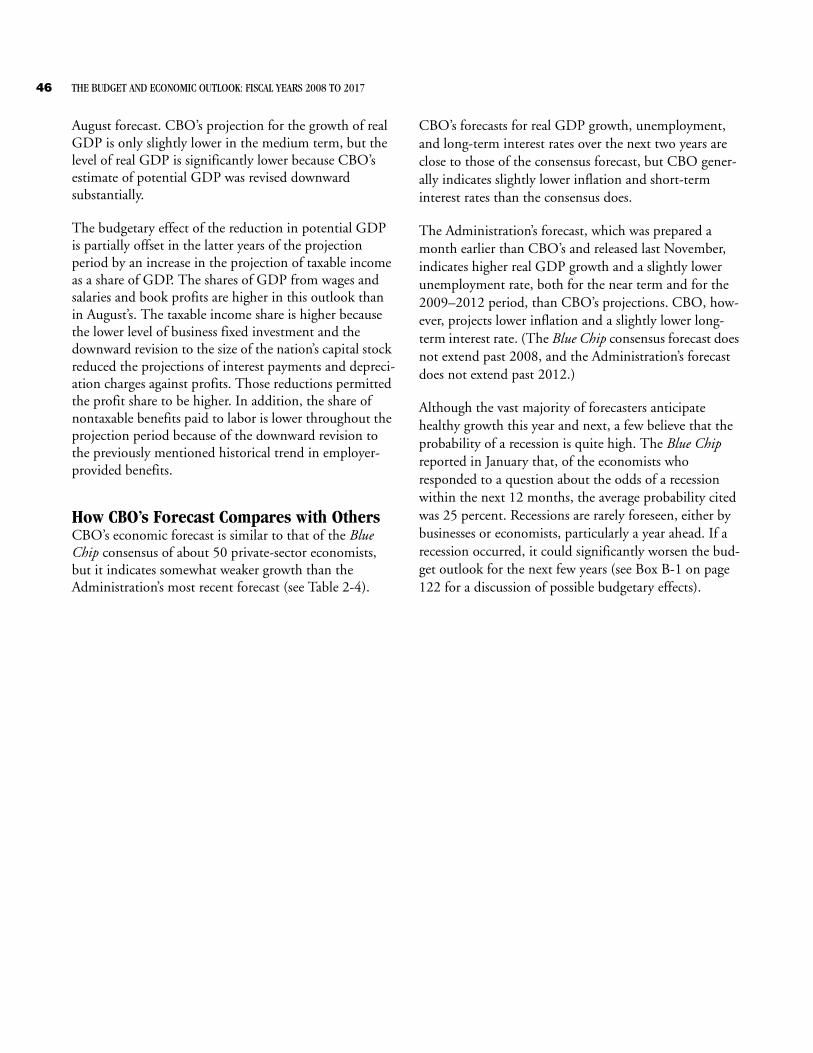
46 THE BUDGET AND ECONOMIC OUTLOOK: FISCAL YEARS 2008 TO 2017
August forecast. CBO’s projection for the growth of real GDP is only slightly lower in the medium term, but the level of real GDP is significantly lower because CBO’s estimate of potential GDP was revised downward substantially.
The budgetary effect of the reduction in potential GDP is partially offset in the latter years of the projection period by an increase in the projection of taxable income as a share of GDP. The shares of GDP from wages and salaries and book profits are higher in this outlook than in August’s. The taxable income share is higher because the lower level of business fixed investment and the downward revision to the size of the nation’s capital stock reduced the projections of interest payments and depreci-ation charges against profits. Those reductions permitted the profit share to be higher. In addition, the share of nontaxable benefits paid to labor is lower throughout the projection period because of the downward revision to the previously mentioned historical trend in employer-provided benefits.
How CBO’s Forecast Compares with Others CBO’s economic forecast is similar to that of the Blue Chip consensus of about 50 private-sector economists, but it indicates somewhat weaker growth than the Administration’s most recent forecast (see Table 2-4).
CBO’s forecasts for real GDP growth, unemployment, and long-term interest rates over the next two years are close to those of the consensus forecast, but CBO gener-ally indicates slightly lower inflation and short-term interest rates than the consensus does.
The Administration’s forecast, which was prepared a month earlier than CBO’s and released last November, indicates higher real GDP growth and a slightly lower unemployment rate, both for the near term and for the 2009–2012 period, than CBO’s projections. CBO, how-ever, projects lower inflation and a slightly lower long-term interest rate. (The Blue Chip consensus forecast does not extend past 2008, and the Administration’s forecast does not extend past 2012.)
Although the vast majority of forecasters anticipate healthy growth this year and next, a few believe that the probability of a recession is quite high. The Blue Chip reported in January that, of the economists who responded to a question about the odds of a recession within the next 12 months, the average probability cited was 25 percent. Recessions are rarely foreseen, either by businesses or economists, particularly a year ahead. If a recession occurred, it could significantly worsen the bud-get outlook for the next few years (see Box B-1 on page 122 for a discussion of possible budgetary effects).
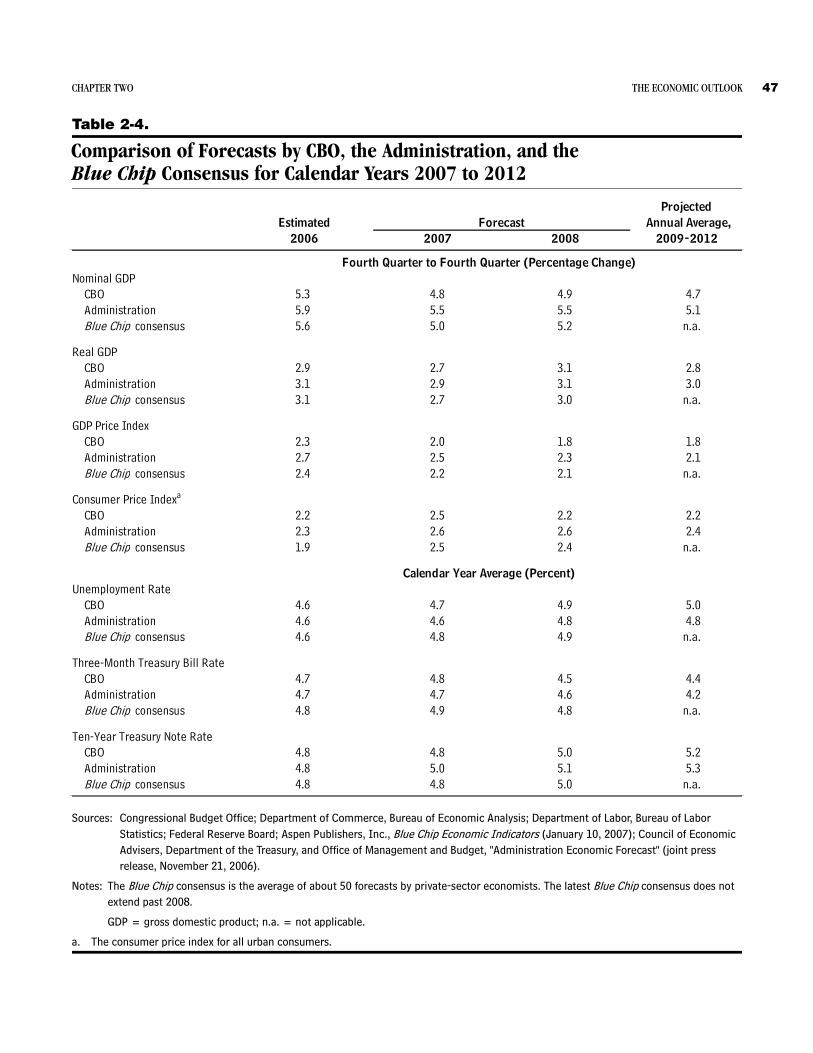
CHAPTER TWO THE ECONOMIC OUTLOOK 47
Table 2-4.
Comparison of Forecasts by CBO, the Administration, and the Blue Chip Consensus for Calendar Years 2007 to 2012
Sources: Congressional Budget Office; Department of Commerce, Bureau of Economic Analysis; Department of Labor, Bureau of Labor Statistics; Federal Reserve Board; Aspen Publishers, Inc., Blue Chip Economic Indicators (January 10, 2007); Council of Economic Advisers, Department of the Treasury, and Office of Management and Budget, "Administration Economic Forecast" (joint press release, November 21, 2006).
Notes: The Blue Chip consensus is the average of about 50 forecasts by private-sector economists. The latest Blue Chip consensus does not extend past 2008.
GDP = gross domestic product; n.a. = not applicable.
a. The consumer price index for all urban consumers.
Nominal GDPCBO 5.3 4.8 4.9 4.7Administration 5.9 5.5 5.5 5.1Blue Chip consensus 5.6 5.0 5.2 n.a.
Real GDPCBO 2.9 2.7 3.1 2.8Administration 3.1 2.9 3.1 3.0Blue Chip consensus 3.1 2.7 3.0 n.a.
GDP Price IndexCBO 2.3 2.0 1.8 1.8Administration 2.7 2.5 2.3 2.1Blue Chip consensus 2.4 2.2 2.1 n.a.
Consumer Price Indexa
CBO 2.2 2.5 2.2 2.2Administration 2.3 2.6 2.6 2.4Blue Chip consensus 1.9 2.5 2.4 n.a.
Unemployment RateCBO 4.6 4.7 4.9 5.0Administration 4.6 4.6 4.8 4.8Blue Chip consensus 4.6 4.8 4.9 n.a.
Three-Month Treasury Bill RateCBO 4.7 4.8 4.5 4.4Administration 4.7 4.7 4.6 4.2Blue Chip consensus 4.8 4.9 4.8 n.a.
Ten-Year Treasury Note RateCBO 4.8 4.8 5.0 5.2Administration 4.8 5.0 5.1 5.3Blue Chip consensus 4.8 4.8 5.0 n.a.
Projected
Calendar Year Average (Percent)
2009-2012Forecast Annual Average,
Fourth Quarter to Fourth Quarter (Percentage Change)
2007 20082006Estimated