comprehensive annual financial report for the year ended ... · comprehensive annual financial...
TRANSCRIPT

The Metropolitan Government of Nashville and Davidson CountyNashville, Tennessee Megan Barry, Mayor
Comprehensive Annual Financial ReportFor the Year Ended
June 30, 2016

Cover: Historic Courthouse Fountain, (Oil Painting) by Jeff Gossage

THE METROPOLITAN GOVERNMENT OF NASHVILLE AND DAVIDSON COUNTY, TENNESSEE
COMPREHENSIVE ANNUAL FINANCIAL REPORT For the Year Ended June 30, 2016 Prepared by DEPARTMENT OF FINANCE

THE METROPOLITAN GOVERNMENT OF NASHVILLE AND DAVIDSON COUNTY COMPREHENSIVE ANNUAL FINANCIAL REPORT TABLE OF CONTENTS Page Numbers INTRODUCTORY SECTION Letter of Transmittal i Certificate of Achievement for Excellence in Financial Reporting viii Form of Government ix Organization Chart of The Metropolitan Government x Elected Officials xi Organization Chart of the Department of Finance and other Financial Offices xii FINANCIAL SECTION Independent Auditors’ Report Management’s Discussion and Analysis A - 1 Basic Financial Statements Statement of Net Position B - 2 Statement of Activities B - 4 Balance Sheet - Governmental Funds B - 6 Reconciliation of the Balance Sheet to the Statement of Net Position - Governmental Funds B - 8 Statement of Revenues, Expenditures and Changes in Fund Balances - Governmental Funds B - 10 Reconciliation of the Statement of Revenues, Expenditures and Changes in Fund Balances of Governmental Funds to the Statement of Activities B - 14 Statement of Revenues, Expenditures and Changes in Fund Balances - Budget and Actual - General Fund B - 16 Statement of Revenues, Expenditures and Changes in Fund Balances - Budget and Actual - General Purpose School Fund B - 17 Statement of Net Position - Proprietary Funds B - 18 Statement of Revenues, Expenses and Changes in Net Position - Proprietary Funds B - 20 Statement of Cash Flows - Proprietary Funds B - 22 Statement of Fiduciary Net Position - Fiduciary Funds B - 24 Statement of Changes in Fiduciary Net Position - Fiduciary Funds B - 25 Statement of Net Position - Component Units B - 26 Statement of Activities - Component Units B - 34 Notes to the Financial Statements B - 39 Required Supplementary Information (Unaudited) Condition Rating of Transportation Network B - 121 Schedule of Employer Contributions – Pension Plans B - 123 Schedule of Changes in the Net Pension Liability and Related Ratios – Pension Plans B - 126 Schedule of Investment Returns – Pension Plans B - 132 Schedule of the Government’s Contributions – Teacher Pension Plans of the TCRS B - 133 Schedule of the Government’s Proportionate Share of the Net Pension Liability (Asset) – Teacher Pension Plans of the TCRS B - 134 Schedule of Employer Contributions – Other Postemployment Benefit Plans B - 135 Schedule of Funding Progress – Other Postemployment Benefit Plans B - 136

THE METROPOLITAN GOVERNMENT OF NASHVILLE AND DAVIDSON COUNTY COMPREHENSIVE ANNUAL FINANCIAL REPORT TABLE OF CONTENTS (CONTINUED) Page Numbers Governmental Funds Combining Balance Sheet - Nonmajor Governmental Funds C - 2 Combining Statement of Revenues, Expenditures and Changes in Fund Balances - Nonmajor Governmental Funds C - 6 Schedule of Revenues, Expenditures and Changes in Fund Balances - Budget and Actual - GSD General Purposes Debt Service Fund C - 9 Schedule of Revenues, Expenditures and Changes in Fund Balances - Budget and Actual - GSD School Purposes Debt Service Fund C - 10 Schedule of Revenues, Expenditures and Changes in Fund Balances - Budget and Actual - USD General Purposes Debt Service Fund C - 11 Description of Nonmajor Governmental Funds C - 12 Proprietary Funds Combining Statement of Net Position - Nonmajor Enterprise Funds D - 2 Combining Statement of Revenues, Expenses and Changes in Net Position - Nonmajor Enterprise Funds D - 10 Combining Statement of Cash Flows - Nonmajor Enterprise Funds D - 14 Combining Statement of Net Position - Internal Service Funds D - 22 Combining Statement of Revenues, Expenses and Changes in Net Position - Internal Service Funds D - 26 Combining Statement of Cash Flows - Internal Service Funds D - 30 Description of Proprietary Funds D - 37 Fiduciary Funds Combining Statement of Fiduciary Net Position - Fiduciary Funds - Pension (and Other Employee Benefit) Trust Funds E - 2 Combining Statement of Fiduciary Net Position - Fiduciary Funds - Agency Funds E - 4 Combining Statement of Changes in Fiduciary Net Position - Fiduciary Funds - Pension (and Other Employee Benefit) Trust Funds E - 6 Combining Statement of Changes in Assets and Liabilities - Fiduciary Funds - Agency Funds E - 8 Description of Fiduciary Funds E - 11 Component Units Balance Sheet - Sports Authority Fund F - 2 Reconciliation of the Balance Sheet to the Statement of Net Position - Sports Authority F - 3 Statement of Revenues, Expenditures and Changes in Fund Balances - Sports Authority Fund F - 4 Reconciliation of the Statement of Revenues, Expenditures and Changes in Fund Balances to the Statement of Activities - Sports Authority F - 5 Balance Sheet - Industrial Development Board Fund F - 6 Statement of Revenues, Expenditures and Changes in Fund Balances - Industrial Development Board Fund F - 7 Schedules Schedule of Combining Balance Sheets - General Fund G - 2 Combining Schedule of Revenues, Expenditures and Changes in Fund Balances - General Fund G - 3 Combining Schedule of Revenues, Expenditures and Changes in Fund Balances - Budget and Actual - General Fund G - 4 Detailed Schedule of Expenditures and Other Financing Sources (Uses) - Budget and Actual - General Fund - General Services District G - 6 Detailed Schedule of Expenditures and Other Financing Sources (Uses) - Budget and Actual - General Fund - Urban Services District G - 9 Schedule of Delinquent Property Taxes Receivable - By Fund G - 10
THE METROPOLITAN GOVERNMENT OF NASHVILLE AND DAVIDSON COUNTY COMPREHENSIVE ANNUAL FINANCIAL REPORT TABLE OF CONTENTS (CONTINUED) Page Numbers Schedules (Continued) Schedule of Delinquent Property Taxes Receivable - By Type G - 12 Schedule of Bonds Payable G - 14 Future Principal and Interest Requirements of Bonds Payable G - 18 Budgetary Schedule of Estimated Revenues and Fund Balances to Support Appropriations - 2016-2017 Fiscal Year G - 22 Budgetary Schedule of Appropriations by Function and/or Funds - 2016-2017 Fiscal Year G - 24 Budgetary Schedule of Requirements of the Debt Service Funds by Function - Debt Service Funds - General Services District - 2016-2017 Fiscal Year G - 25 Budgetary Schedule of Requirements of the Debt Service Funds by Function - Debt Service Funds - Urban Services District - 2016-2017 Fiscal Year G - 26 Budgetary Schedule of Appropriations - School Funds - General Services District - 2016-2017 Fiscal Year G - 27 Summary of Salaries and Surety Bonds of Principal Officers G - 28 STATISTICAL SECTION Table of Contents H - 1 Net Position by Component Last Ten Fiscal Years H - 2 Changes in Net Position Last Ten Fiscal Years H - 4 Fund Balances of Governmental Funds Last Ten Fiscal Years H - 8 Fund Balances of Budgeted Governmental Funds Last Ten Fiscal Years H - 10 Changes in Fund Balances of Governmental Funds Last Ten Fiscal Years H - 12 Assessed Value and Estimated Actual Value of General Services District Taxable Property Last Ten Fiscal Years H - 16 Assessed Value of Urban Services District Taxable Property Last Ten Fiscal Years H - 18 Property Tax Rates Last Ten Fiscal Years H - 19 Principal Property Taxpayers Current Year and Nine Years Ago H - 20 Property Tax Levies and Collections Last Ten Fiscal Years H - 22 Ratios of Outstanding Debt by Type Last Ten Fiscal Years H - 24 Ratios of General Bonded Debt Outstanding General and Urban Services Districts Last Ten Fiscal Years H - 26 Ratios of General Bonded Debt Outstanding Urban Services District Last Ten Fiscal Years H - 27 Legal Debt Margin Information Urban Services District Last Ten Fiscal Years H - 28 Computation of Legal Debt Margin Urban Services District for the Year Ended June 30, 2016 H - 29 Ratio of Annual Debt Service Expenditures for General Bonded Debt to Total General Expenditures Last Ten Fiscal Years H - 30 Pledged Revenue Coverage Department of Water and Sewerage Services Revenue Bonds Last Ten Fiscal Years H - 31 Demographic and Economic Statistics Last Ten Calendar Years H - 32 Principal Employers Current Year and Nine Years Ago H - 33 Full-Time Equivalent Government Employees by Function Last Ten Fiscal Years H - 34 Operating Indicators by Function Last Ten Fiscal Years H - 36 Operating Indicators by Function – Schedule of Unaccounted for Water – Department of Water and Sewerage Services H - 40 Operating Indicators by Function – Schedule of Utility Rates – Department of Water and Sewerage Services H - 42 Operating Indicators by Function – Schedule of Number of Customers – Department of Water and Sewerage Services H - 43 Capital Asset Statistics by Function Last Ten Fiscal Years H - 44
October 31, 2016 To the Citizens of Nashville and Davidson County, Tennessee: FORMAL TRANSMITTAL OF THE COMPREHENSIVE ANNUAL FINANCIAL REPORT We are pleased to submit the Comprehensive Annual Financial Report of the Metropolitan Government of Nashville and Davidson County, Tennessee (the Government) for the fiscal year ended June 30, 2016. Responsibility for both the accuracy of the data and the completeness and fairness of the presentation, including all disclosures, rests with the management of the Government. To the best of our knowledge and belief, the enclosed data is accurate in all material respects and is reported in a manner designed to present fairly the financial position and results of operations of the various funds and component units of the Government in accordance with generally accepted accounting principles (GAAP). All disclosures necessary to enable the reader to gain an understanding of the Government's financial activities have been included. The Government is required to undergo an annual single audit in conformity with the provisions of the Single Audit Act, as amended, and Title 2 U.S. Code of Federal Regulations Part 200, Uniform Administrative Requirements, Cost Principles, and Audit Requirements for Federal Awards (Uniform Guidance). Information related to this single audit, including the schedules of federal and state financial assistance, findings and recommendations, and independent auditors' reports on the internal control structure and compliance with applicable laws and regulations, are not included herein but are reported separately. In conformity with generally accepted accounting principles, this report includes all funds of the primary government and all component units. For purposes of this report, the primary government includes all departments and agencies of the Government which are not separate legal entities, including the Department of Water and Sewerage Services and Metropolitan Nashville Public Schools. The component units include those separate legal entities whose relationships with the primary government meet the criteria for inclusion. The Government is required to provide a narrative introduction, overview and analysis to accompany the basic financial statements in the form of management’s discussion and analysis (MD&A). This letter of transmittal is intended to complement MD&A and should be read in conjunction with it. The Government’s MD&A can be found immediately following the report of the independent auditors. PROFILE OF THE GOVERNMENT Metropolitan Nashville and Davidson County is located in middle Tennessee at the hub of many air, rail and highway transportation routes. The Government provides a full range of services. These services include education; police and fire protection; waste management; construction and maintenance of highways, streets and infrastructure; traffic regulation and control; parking; health and social services; recreational and cultural activities; public libraries; planning and zoning; water and sewerage services; administration of justice; and general administrative services.
METROPOLITAN GOVERNMENT OF NASHVILLE AND DAVIDSON COUNTY
OFFICE OF THE MAYOR MEGAN BARRY METROPOLITAN COURTHOUSE MAYOR NASHVILLE, TENNESSEE 37201 PHONE: (615) 862-6000 EMAIL: [email protected]

ii
FACTORS AFFECTING ECONOMIC AND FINANCIAL CONDITION The local economy is a well-balanced blend of financial, wholesale, retail, manufacturing and service industries. The local mix of these industries roughly reflects the national economy, with no single industry being predominant in the region. Computer technology, automotive, medical, private prison management, insurance, banking, publishing, telecommunications and entertainment companies and private educational institutions all find a home in Nashville. With a rich economic, social and cultural environment, the city consistently scores high in national rankings of preferred business locations, best places to live and favorable environments for the creation and development of businesses. The Nashville Metropolitan Statistical Area (MSA) economy has historically been healthier than the National and State economies, with lower unemployment than the State as a whole. The Government's two most significant locally generated revenue sources are property and sales taxes. MAJOR INITIATIVES The Government continues to emphasize delivery of focused public services in a way that provides efficiency, effectiveness and value to the citizens of Nashville. The Government’s major initiatives for fiscal year 2016, for fiscal year 2017 and for the future are discussed below. FOR FISCAL YEAR 2016: Substitute budget ordinance BL-2015-1122 appropriated a balanced budget of $1,968,285,900 in the budgetary funds, an overall increase of 4.05% from the budget for fiscal year 2015. The FY2016 budget continued to make improvements in the Nashville community’s priority areas:
Public Education – Metro Nashville Public Schools (MNPS) received $810.0 million in FY16. The FY15 MNPS total budget of $790.1 million included $16.1 million to pay debt service, which is being redirected for use by school operations in FY16. This makes the increase in MNPS’s operational funding $36.1 million, or 4.7%. The recommended increase funded pay increases and employee benefits, added approximately 100 new employees, and funded seven new charter schools and two new district schools. The increase also funded the expansion of Reading Recovery (the district’s literacy program), funded increases in leadership stipends for teachers, and expanded English Language Learner services. MNPS’s fund balance at June 30, 2015 was 6.6% of FY16 budgeted expenditures, which is above the 3.0% required by the State.
Public Safety – Resources dedicated to public safety services increased by $8.5 million. The Police
Department’s annual budget for FY16 provided $750,000 in additional funding to support special events to help ensure the safety and well-being of Nashville’s citizens and visitors. The newly accredited Crime Lab received $250,000 of additional funding for operational supplies for its first year of full operations in FY16. The Fire Department’s operational budget for FY16 continued to support full staffing for front line positions in the fire response and emergency management services areas. Metro continued its investment to end domestic violence in our city by establishing an Office of Family Safety. This office provides support to the Jean Crowe Advocacy Center, the Criminal Court Clerk, the District Attorney’s Office, General Sessions Courts, the Public Defender’s Office and the Sheriff’s Office.
Economic Development – For FY16, the city of Nashville invested $1 million in affordable housing
through the Barnes Fund, along with $4 million of capital funding for the Metropolitan Development and Housing Agency to advance affordable housing initiatives.
Citizen Services – There were several other budget increases to enhance direct services to citizens. Metro Public Health received $319,800 to expand dental services at the Lentz Public Health Center and increase staff at the Division of Metro Animal Control. Public Works received an additional $1.26 million to fund a convenience center for residential waste and recycling in southern Davidson County and to provide operating costs for a new recycling program concentrated in the downtown area. The Metro Transit Authority received $3.64 million to fund the bus rapid transit lines on Charlotte Pike and Nolensville Pike to complement the routes already established on Gallatin Pike and Murfreesboro Pike.
iii
FOR FISCAL YEAR 2017: Substitute budget ordinance BL-2016-232 appropriated a balanced budget of $2,087,320,200 in the budgetary funds, an overall increase of 6.1% from the budget for fiscal year 2016. The FY2017 budget continues to make improvements in the Nashville community’s priority areas:
Public Education – Metro Nashville Public Schools (MNPS) received $843.3 million in FY17 which is an increase in MNPS’s operational funding from FY16 of $33.3 million, or 4.1%. The recommended increase will fund pay increases for employees, and a host of other necessary improvements, including funding for 250 new teachers, bus monitors and special education bus drivers. Additionally, the budget includes one new charter school, two new achievement school district schools, and start-up costs for new English language learner and literacy initiatives.
Youth Employment – The administration recognizes the importance of investing in youth as investing in our future and has funded a major youth employment initiative. The Mayor’s goal is to connect 10,000 Nashville youth to jobs or internships by the summer of 2017. The FY17 budget includes $1 million to advance youth employment.
Affordable Housing and Economic Development – The FY17 budget recognizes that Nashville is in
a period of unprecedented growth which has resulted in increasing housing prices, making it unaffordable for some to live in Metro. The Mayor’s housing priorities are focused on funding, building, and preserving affordable housing options. The FY17 budget is expanding funding for the Barnes Fund for Affordable Housing to $15 million. This is the biggest commitment an administration has ever made to affordable housing in Nashville. The Mayor is committed to providing $10 million of funding to the Barnes Fund annually. In FY17, $5 million of additional funding is expected to be provided from the sale of the old Convention Center.
Transportation and Infrastructure – Well thought out transit options are important to maintaining
sustainable growth. Metro’s strategies to address transit and infrastructure issues are under development and include the Metropolitan Transit Agency’s long-range strategic plan called “nMotion.” The FY17 budget slightly expands its investment in the Metropolitan Transit Agency with a $42 million subsidy, a $2 million increase over FY16. The increase is principally targeted to cover Nolensville Road bus rapid transit, Thompson Lane feeder service, and planning for first and last mile service for citizens that do not have easy access to a bus line.
Infrastructure needs are also addressed through increases to the FY17 budgets for the Codes, Planning, Parks, and Public Works Departments. Codes is receiving an additional $164,000 for three positions to cover staffing needs in property standards and zoning, and Planning is receiving an increase of $328,100 for four positions to enhance community plans, capital planning and land development. The FY17 budget also provides an additional $1.6 million to Parks to address the need for additional staff and maintenance services resulting from the expanded number of parks and recreational facilities. Finally, Public Works is receiving an increase of $1.3 million to cover contractual increases and an expansion of cleaning crews.
Quality of Life – The FY17 budget is committed to providing a high quality of life for all Nashville citizens. The Nashville Public Library’s budget is increasing by $975,300 to fund an expansion in Friday service hours, maintain the Special Collections program, which was previously grant-funded, and maintain “Bringing Books to Life”, which provides literacy programs for young children. The budget also includes an increase of $780,100 for Metro Public Health for youth services, food and facility inspections, vital records, and vaccinations.
Public Safety – Resources dedicated to public safety services are increasing by $19.7 million.
The Police Department’s FY17 budget increase of $2 million includes funding to add six additional police officers to existing domestic violence resources to reach more victims and investigate allegations more quickly, four additional staff to Metro Nashville’s Crime Lab to maintain competitive compensation and provide for instrumentation maintenance and supplies, one position to support special events to help maintain safety at Nashville’s ever growing special events, and two positions in the Youth Services program to aid in decreasing youth recidivism.
iv
The Fire Department’s FY17 budget increase of $1.5 million includes funding to expand Emergency Medical Services (EMS) to staff two additional ambulances in daily service with four paramedics to improve the quality and timeliness of EMS services. The budget increase will also fund four additional positions to enhance fire inspection services as Nashville continues to grow.
Although the Criminal Justice Center is being rebuilt, the Sheriff did not request an operating budget improvement for FY17. The Davidson County Sheriff’s Office budget for FY17 continues to support full staffing for correctional services, thus maintaining this administration’s commitment to public safety.
Effective communication in an emergency is critical to a high quality response. Nashville continues to grow, and Metro has addressed this growth by adding ambulance units and police officers. These additions, along with the increasing protocols required for a high standard of care, have placed more demands on emergency call taker time. To address these needs, the FY17 budget is adding five positions to the Emergency Communication Center.
Following a study of Nashville’s Night Court, it was determined that improvements were needed. The FY17 budget addresses identified needs by adding $219,600 and three positions to the General Sessions Court. The FY17 budget also adds $118,900 and two positions to the Mental Health Court to enhance case management services. Probation Services is receiving an increase of $113,500 and two positions in the FY17 budget to add probation officers.
The Mayor has set a high priority on reducing youth violence in Nashville. The Juvenile Court’s budget includes $112,000 for additional probation officers to serve at-risk youth with Adverse Childhood Experiences that are currently underserved by existing court supervision resources. The Court’s budget also includes $47,400 and one position to enhance restorative justice practices in the Juvenile Court and Metro Schools by expanding Youth Court into more area high schools.
These initiatives have all been addressed while ensuring the Government meets its fundamental objectives of maintaining a balanced budget, maintaining existing services, and investing in Nashville’s future. This was achieved for the Fiscal Year 2017 budget without a property tax increase. Revenue increases are anticipated from modest growth in the property tax base, increases in local option sales taxes, and growth in other revenue sources. A measured amount of fund balances have been appropriated to balance the budget, while maintaining fund balance levels in excess of legal requirements. Departmental savings opportunities were also considered. Details of the fiscal year 2016 and 2017 budgets are described in the annual Operating Budget books published by the Department of Finance, Office of Management and Budget. They are also available on the GFOA-award-winning Citizen’s Guide to the Budget at www.nashville.gov/Finance/Management-and-Budget/Citizens-Guide-to-the-Budget.aspx. FOR THE FUTURE: The Metropolitan Government of Nashville and Davidson County will focus on six major priorities:
Education – The administration is committed to strengthening Nashville’s public schools and ensuring every child has access to a high-quality public education. This commitment includes expanding high quality pre-K, ensuring that all students have access to effective teachers and leaders, helping students continue their education after high school, and funding schools to meet the needs of curriculum, instruction, support services, and capital improvements. Metro leaders are also working with Nashville’s non-profit and educational institutions to promote policies that spur innovation and support our parents and teachers.
Public Safety – The administration will work to improve public safety by ensuring that our police officers, fire fighters, and other emergency responders have the tools and resources necessary to keep the community safe by reducing crime and quickly responding to emergencies.
Infrastructure and Sustainability – The administration provides leadership, accountability, and
stakeholder engagement to create an efficient, equitable transportation network, including expansion of mass transit services and bicycle and pedestrian networks. Metro leaders work closely with city departments and community stakeholders in the development, coordination, and

v
implementation of transportation and growth policies for Nashville, including: 1) NashvilleNext – the city’s 25-year comprehensive General Plan, 2) nMotion – the strategic master plan of the Metropolitan Transit Authority and Regional Transportation Authority, 3) WalknBike – Metro’s strategic master plan for sidewalks and bikeways, and 4) the 2016 Parks and Greenways Master Plan. Metro leaders also work to incorporate sustainability throughout all operations of the Metropolitan Government.
Economic and Community Development – The administration is focused on continuing efforts to
grow the local economy while also ensuring that more residents and communities within Nashville are able to participate in the growth and prosperity of our city. In order to further this goal, the Mayor’s Office of Economic and Community Development (ECD) works with the Nashville Area Chamber of Commerce to recruit and retain businesses that will create new, high-quality jobs for residents. In addition to attracting new companies to Nashville, ECD is committed to helping connect citizens from every part of the County to programs designed to promote entrepreneurship and small business ownership, including enhancing our creative economy and enhancing economic opportunities for new Americans.
Neighborhoods and Community Engagement – Metro leaders work with neighborhood and community groups to enhance citizen engagement in the governing process and empower them to take steps to improve their local communities. The administration is committed to making sure that Nashville remains a place where people can live, work and play in their neighborhoods. That means protecting and enhancing our networks of parks, libraries and community centers, as well as preserving the vibrant arts, entertainment and music culture that has made Nashville an international destination.
Economic Opportunity and Empowerment – The administration seeks to ensure that Nashville’s growth results in an increased quality of life for all Nashvillians through innovation and collaboration across all of Nashville’s economic opportunity efforts. Metro leaders routinely engage community partners to efficiently leverage resources and facilitate long-term planning and coordination to reduce poverty in Nashville. With an emphasis on social and economic equity, Metro currently focuses on the economic opportunity priority areas of affordable housing, financial empowerment, workforce development, and reducing homelessness.
FINANCIAL INFORMATION CASH MANAGEMENT: Cash temporarily idle during the year was primarily invested in the State of Tennessee Local Government Investment Pool, the State of Tennessee Intermediate Term Investment Pool, and the First Tennessee Bank Advisors Short Investment Pool. Investments are made either directly or through the Metro Investment Pool. Investments in the pension trust funds also include common stocks, U. S. Treasury Obligations, corporate bonds and other holdings. The Government's investment policy is to preserve principal, minimize credit and market risks and maintain adequate liquidity while maximizing the rate of return on its portfolio. The investment policy encourages conservative, low risk investments and does not permit high risk methods to enhance investment returns. The majority of the cash deposits are held by financial institutions participating in the bank collateral pool administered by the State of Tennessee, thus ensuring that they are collateralized. The banking service agreement provides for the daily investment of demand deposit balances. RISK MANAGEMENT: The Government continued to operate a risk management program, which was initiated in 1978. As part of its comprehensive plan, resources are being accumulated in various internal service funds to meet potential losses. Additionally, the Government has a property insurance policy for losses in excess of certain amounts. Accepted risk control techniques, including employee accident prevention training, have been implemented to minimize potential liability losses. The Government has elected to come under the Tennessee Tort Liability laws in order to limit its potential liability. PENSION TRUST FUNDS: The pension system of the Government covers substantially all full-time employees. It consists of one pension plan that is open to new members and five pension plans that are closed to new members but are still used by some employees of the former City of Nashville, the former Davidson County and Metropolitan Nashville Public Schools.

vi
After recognizing contributions from other funds, employees, and the State of Tennessee, the General Fund is responsible for amounts necessary to fund the Metropolitan Employees' Benefit Trust Fund (which includes Division A, the closed plan, and Division B, the open plan) and the following four closed plans: The County Plan - Davidson County Employees' Retirement Fund The County Education Plan - Employees' Pension and Insurance Fund The City Plan - Closed City Plan Fund The City Education Plan - Teachers' Civil Service and Pension Fund After recognizing contributions from employees and the State of Tennessee, Metropolitan Nashville Public Schools is responsible for funding the Metro Education plan – The Teachers’ Retirement Plan Fund. The total net assets of all pension (and other employee benefit) trust funds were $2.8 billion at June 30, 2016. INTERNAL CONTROL STRUCTURE: Management of the Government establishes and maintains an internal control structure designed to ensure that the assets of the Government are protected from loss, theft, or misuse and to ensure that adequate accounting data is compiled to allow for the preparation of financial statements in conformity with generally accepted accounting principles. The internal control structure is designed to provide reasonable, but not absolute, assurance that these objectives are met. The concept of reasonable assurance recognizes that: (1) the cost of a control should not exceed the benefits likely to be derived, and (2) the valuation of costs and benefits requires estimates and judgments by management. BUDGETARY CONTROLS: The Government maintains budgetary controls in order to ensure compliance with legal provisions embodied in the annual appropriated budget approved by the Government's governing body, the Metropolitan Council. Activities of the General Fund, General Purpose School Fund and the GSD General Purposes, School Purposes and USD General Purposes Debt Service Funds are included in the annual appropriated budget. The Government maintains an encumbrance accounting system to provide management with information regarding obligations against appropriations. Budgetary compliance is based on expenditures during the period (GAAP), rather than expenditures and encumbrances (non-GAAP). Because appropriations lapse at June 30, encumbrances outstanding at June 30, 2016 are disclosed in the notes to the financial statements. Appropriations for fiscal year 2017 will provide authority to complete those transactions. SINGLE AUDIT: As a recipient of federal and state financial assistance, the Government is responsible for ensuring that an adequate internal control structure is in place to ensure compliance with applicable laws and regulations related to those programs. As part of the Government's single audit, tests are performed to determine the adequacy of the internal control structure, including that portion related to federal financial assistance programs, as well as to determine that the Government has complied, in all material respects, with applicable laws and regulations. The results of the Government's single audit for fiscal year 2016 are reported separately. INDEPENDENT AUDIT: Section 6.15 of the Metropolitan Charter requires an annual audit of accounts and other evidences of financial transactions of the Government and of its departments, offices and agencies by independent certified public accountants. The audit is performed by a firm chosen by a three-member audit board consisting of the Vice-Mayor, the Chair of the Budget and Finance Committee of the Metropolitan Council, and the Chair of the Metropolitan Nashville Public School Board. The Government has complied with this requirement. The independent auditors' report is included in the financial section of this report. AWARDS AND ACKNOWLEDGEMENTS AWARDS: The Government Finance Officers Association of the United States and Canada (GFOA) awarded a Certificate of Achievement for Excellence in Financial Reporting to the Government for its Comprehensive Annual Financial Report (CAFR) for the fiscal year ended June 30, 2015. This was the 33rd consecutive year that the Government has achieved this prestigious award. In order to be awarded a Certificate of Achievement, a government must publish an easily readable and efficiently organized CAFR. This report must satisfy both generally accepted accounting principles and applicable legal requirements.

iiv
A Certificate of Achievement is valid for a period of one year only. We believe that our current CAFR continues to meet the Certificate of Achievement Program’s requirements and we are submitting it to the GFOA to determine its eligibility for another certificate. The GFOA presented a Distinguished Budget Presentation Award to the Government for its annual budget for the fiscal year beginning July 1, 2015. In order to receive this award, a governmental unit must publish a budget document that meets program criteria as a policy document, as an operations guide, as a financial plan and as a communications device. The award is valid for a period of one year only. It is the Government’s 25th year to receive this award. ACKNOWLEDGMENTS: Many individuals and organizations throughout the Government assisted in preparing this CAFR. To each of them we gratefully express our sincere appreciation for their dedicated contributions. In conclusion, we acknowledge and express our appreciation for the strong support of the Metropolitan Council. The Council’s support will continue to be vital as we work together to strengthen the financial condition of the Metropolitan Government. Sincerely,
laend’O-xamoL ailaT yrraB nageM ecnaniF fo rotceriD royaM

viii
THE METROPOLITAN GOVERNMENT OF NASHVILLE AND DAVIDSON COUNTY

ix
THE METROPOLITAN GOVERNMENT OF NASHVILLE AND DAVIDSON COUNTY FORM OF GOVERNMENT On April 1, 1963 the governments of the City of Nashville and Davidson County were consolidated into a single "Metropolitan Government of Nashville and Davidson County", under which the boundaries of the City of Nashville and Davidson County are coextensive. The executive and administrative powers are vested in the Mayor, who is elected at large for a four-year term. The Mayor is authorized to administer, supervise and control all departments and to appoint all members of boards and commissions subject to the approval of the Council. A two-thirds vote of the legislative body, the Council, is required to override the Mayor's veto. The Charter also provides for a Vice-Mayor, who is elected at large for a four-year term and is the presiding officer of the Council. The Council is composed of 40 members who are elected for four-year terms. The Charter provides a framework for local government in Nashville to serve the needs of two service districts: (i) the General Services District (the GSD) and (ii) the Urban Services District (the USD). The GSD embraces the entire area of Davidson County and its residents are taxed to support those services, functions and debt obligations which are deemed properly chargeable to the whole population. Such services include general administration, police, fire protection, courts, jails, health, welfare, hospitals, streets and roads, traffic, schools, parks and recreation, airport facilities, auditoriums, public housing, urban renewal, planning and public libraries. The original USD conformed to the corporate limits of the City of Nashville as they existed on April 1, 1963, the date of consolidation. USD residents are charged an additional tax to support those services, functions and debt obligations which benefit only the USD. Such services include additional police protection, storm sewers, street lighting and refuse collection. The Charter provides: "The area of the Urban Services District may be expanded and its territorial limits extended by annexation whenever particular areas of the General Services District come to need urban services, and The Metropolitan Government becomes able to provide such service within a reasonable period which shall be no greater than one year after ad valorem taxes in the annexed area become due." Since April 1, 1963 the area of the USD has been expanded from 72 square miles to 187 square miles.
The USD is a subset of the GSD.
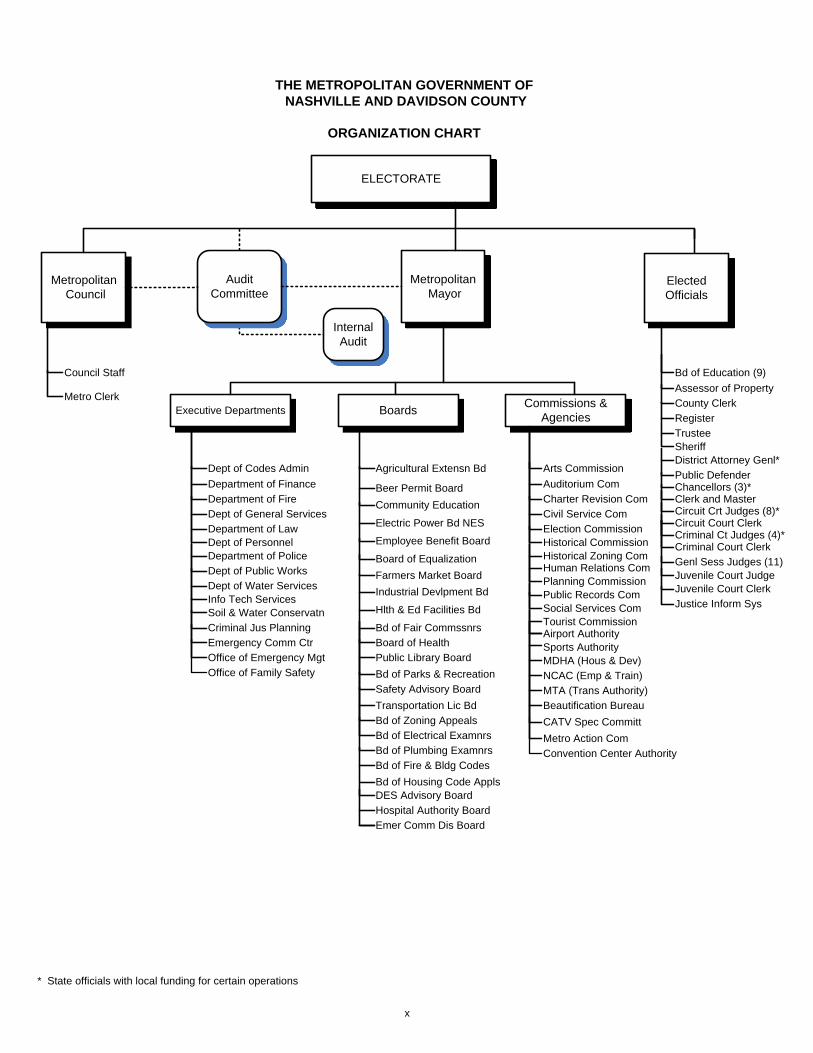
THE METROPOLITAN GOVERNMENT OF NASHVILLE AND DAVIDSON COUNTY
ORGANIZATION CHART
ELECTORATE
Metropolitan Council
ElectedOfficials
Metropolitan Mayor
Executive Departments Boards Commissions & Agencies
Council Staff
Metro Clerk
Dept of Codes AdminDepartment of FinanceDepartment of FireDept of General ServicesDepartment of LawDept of PersonnelDepartment of PoliceDept of Public WorksDept of Water ServicesInfo Tech ServicesSoil & Water Conservatn
Agricultural Extensn Bd
Beer Permit BoardCommunity Education
Electric Power Bd NES
Employee Benefit Board
Board of EqualizationFarmers Market BoardIndustrial Devlpment Bd
Hlth & Ed Facilities Bd
Bd of Fair CommssnrsBoard of HealthPublic Library BoardBd of Parks & RecreationSafety Advisory BoardTransportation Lic BdBd of Zoning AppealsBd of Electrical ExamnrsBd of Plumbing ExamnrsBd of Fire & Bldg CodesBd of Housing Code Appls
Arts CommissionAuditorium ComCharter Revision ComCivil Service ComElection CommissionHistorical CommissionHistorical Zoning ComHuman Relations ComPlanning CommissionPublic Records ComSocial Services ComTourist CommissionAirport AuthoritySports AuthorityMDHA (Hous & Dev)NCAC (Emp & Train)MTA (Trans Authority)Beautification BureauCATV Spec Committ
Bd of Education (9)Assessor of PropertyCounty ClerkRegisterTrusteeSheriffDistrict Attorney Genl*Public DefenderChancellors (3)*Clerk and MasterCircuit Crt Judges (8)*Circuit Court ClerkCriminal Ct Judges (4)*Criminal Court ClerkGenl Sess Judges (11)Juvenile Court JudgeJuvenile Court Clerk Justice Inform Sys
x
Metro Action Com
Criminal Jus Planning
DES Advisory Board
Emer Comm Dis Board
Convention Center Authority
* State officials with local funding for certain operations
Audit Committee
Internal Audit
Hospital Authority Board
Emergency Comm CtrOffice of Emergency MgtOffice of Family Safety

xi
THE METROPOLITAN GOVERNMENT OF NASHVILLE AND DAVIDSON COUNTY
ELECTED OFFICIALS
At June 30, 2016
Megan Barry, Mayor
Finance Officials George Rooker Assessor of Property Charles E. Cardwell Trustee Brenda Wynn County Clerk
The Metropolitan Council David Briley Vice Mayor John Cooper Council Member-at-large Erica Gilmore Council Member-at-large Bob Mendes Council Member-at-large Sharon Hurt Council Member-at-large Jim Shulman Council Member-at-large District No. 1 – Vacant District No. 19 – Freddie O’Connell District No. 2 – DeCosta Hastings District No. 20 – Mary Carolyn Roberts District No. 3 – Brenda Haywood District No. 21 – Ed Kindall District No. 4 – Robert Swope District No. 22 – Sheri Weiner District No. 5 – Scott Davis District No. 23 – Mina Johnson District No. 6 – Brett Withers District No. 24 – Kathleen Murphy District No. 7 – Anthony Davis District No. 25 – Russ Pulley District No. 8 – Nancy VanReece District No. 26 – Jeremy Elrod District No. 9 – Bill Pridemore District No. 27 – Davette Blalock District No. 10 – Doug Pardue District No. 28 – Tanaka Vercher District No. 11 – Larry Hagar District No. 29 – Karen Johnson District No. 12 – Steve Glover District No. 30 – Jason Potts District No. 13 – Holly Huezo District No. 31 – Fabian Bedne District No. 14 – Kevin Rhoten District No. 32 – Jacobia Dowell District No. 15 – Jeff Syracuse District No. 33 – Sam Coleman District No. 16 – Mike Freeman District No. 34 – Angie Henderson District No. 17 – Colby Sledge District No. 35 – Dave Rosenberg District No. 18 – Burkley Allen

Citizens of the Metropolitan Government
METROPOLITAN MAYORMegan Barry
Financial OperationsKim McDoniel
Deputy DirectorGene Nolan
Financial AccountabilityFred Adom
Public PropertySteve Berry
Assessor of Property
PurchasingJeff Gossage
THE METROPOLITAN GOVERNMENT OF NASHVILLE AND DAVIDSON COUNTY
ORGANIZATION OF THE DEPARTMENT OFFINANCE AND OTHER FINANCIAL OFFICES
At June 30, 2016
DEPARTMENT OF FINANCE
DIRECTOR OF FINANCETalia Lomax-O'dneal
xii
Trustee
County Clerk
TreasurerTom Eddlemon
Special Projects ManagerBob Lackey
Budget OfficerStan Romine

The Astoria • 3803 Bedford Avenue, Suite 103 • Nashville, Tennessee 37215 • phone: 615-320-5500 • fax: 615-329-9465 • www.crosslinpc.com An Independent Member of The BDO Alliance USA
Independent Auditor’s Report To the Honorable Mayor and Members of Council The Metropolitan Government of Nashville and Davidson County, Tennessee Report on Financial Statements We have audited the accompanying financial statements of the governmental activities, the business-type activities, the aggregate discretely presented component units, each major fund, and the aggregate remaining fund information of The Metropolitan Government of Nashville and Davidson County, Tennessee (the “Government”) as of and for the year ended June 30, 2016, and the related notes to the financial statements, which collectively comprise the Government’s basic financial statements as listed in the table of contents. We have also audited the financial statements of each of the Government’s nonmajor governmental, nonmajor enterprise, internal service, and fiduciary funds, as well as the financial statements of the Sports Authority Fund and the Industrial Development Board Fund, which are presented as supplementary information in the accompanying financial statements as of and for the year ended June 30, 2016, as listed in the table of contents. We have also audited the financial statements of each of the discretely presented component units of the Government as of and for the year ended June 30, 2016, as presented in the Government’s basic financial statements, except as described in the first paragraph of the Auditor’s Responsibility section of this report. Management’s Responsibility for the Financial Statements Management is responsible for the preparation and fair presentation of these financial statements in accordance with accounting principles generally accepted in the United States of America; this includes the design, implementation, and maintenance of internal control relevant to the preparation and fair presentation of financial statements that are free from material misstatement, whether due to fraud or error. Auditor’s Responsibility Our responsibility is to express opinions on these financial statements based on our audit. We did not audit the financial statements of the following discretely presented component units: The Nashville District Management Corporation, the Gulch Business Improvement District, Inc., the Metropolitan Development and Housing Agency, the Electric Power Board, the Metropolitan Nashville Airport Authority, the Emergency Communications District, and the Convention Center Authority, which represents 85% of the total assets, 83% of total net position and 87% of the total revenues of the aggregate discretely presented component units of the Government. Those financial statements were audited by other auditors whose reports thereon have been furnished to us, and our opinion, insofar as it relates to the amounts included for those entities, is based solely on the reports of the other auditors. We conducted our audit in accordance with auditing standards generally accepted in the United States of America and the standards applicable to financial audits contained in Government Auditing Standards, issued by the Comptroller General of the United States. Those standards require that we plan and perform the audit to obtain reasonable assurance about whether the financial statements are free from material misstatement.

To the Honorable Mayor and Members of Council The Metropolitan Government of Nashville and Davidson County, Tennessee
- 2 -
An audit involves performing procedures to obtain audit evidence about the amounts and disclosures in the financial statements. The procedures selected depend on the auditor’s judgment, including the assessment of the risks of material misstatement of the financial statements, whether due to fraud or error. In making those risk assessments, the auditor considers internal control relevant to the entity’s preparation and fair presentation of the financial statements in order to design audit procedures that are appropriate in the circumstances, but not for the purpose of expressing an opinion on the effectiveness of the entity’s internal control. Accordingly, we express no such opinion. An audit also includes evaluating the appropriateness of accounting policies used and the reasonableness of significant accounting estimates made by management, as well as evaluating the overall presentation of the financial statements. We believe that the audit evidence we have obtained is sufficient and appropriate to provide a basis for our audit opinions. Opinions In our opinion, based on our audit and the reports of other auditors, the financial statements referred to above present fairly, in all material respects, the respective financial position of the governmental activities, the business-type activities, the aggregate discretely presented component units, each major fund, and the aggregate remaining fund information of The Metropolitan Government of Nashville and Davidson County, Tennessee, as of June 30, 2016, and the respective changes in financial position and, where applicable, cash flows thereof, and the respective budgetary comparisons for the General Fund and the General Purpose School Fund for the year then ended in accordance with accounting principles generally accepted in the United States of America. In addition, in our opinion, based on our audit and the reports of other auditors, the financial statements referred to above present fairly, in all material respects, the respective financial position of each of the nonmajor governmental, nonmajor enterprise, internal service, and fiduciary funds, the Sports Authority Fund, the Industrial Development Board Fund, and each of the discretely presented component units as of June 30, 2016, and the respective changes in financial position and, where applicable, cash flows thereof for the year then ended in conformity with accounting principles generally accepted in the United States of America. Emphasis of Matter The accompanying financial statements of the Hospital Authority of Nashville and Davidson County, Tennessee (the “Hospital Authority”, a component unit of the Government), have been prepared assuming that the Hospital Authority will continue as a going concern. As discussed in Note 12E to the accompanying financial statements, Metropolitan Nashville General Hospital (a fund of the Hospital Authority) has experienced recurring losses from operations, reflects current liabilities in excess of current assets, and has a net position deficit and Bordeaux Long Term Care (a fund of the Hospital Authority) has experienced recurring losses from operations and net cash used in operating activities. These conditions raise substantial doubt about the Hospital Authority’s ability to continue as a going concern. The Hospital Authority management’s plans regarding these matters are also described in Note 12E. The financial statements of the Hospital Authority do not include any adjustments that might result from the outcome of this uncertainty. Our opinions are not modified with respect to this matter.

To the Honorable Mayor and Members of Council The Metropolitan Government of Nashville and Davidson County, Tennessee
- 3 -
Other Matters Required Supplementary Information Accounting principles generally accepted in the United States of America require that the management’s discussion and analysis on pages A1 through A11, the condition rating of transportation network, the schedule of employer contributions - pension plans, the schedule of changes in net pension liability and related ratios - pension plans, the schedule of investment returns - pension plans, the schedule of the Government’s contributions - teacher pension plans of the TCRS, the schedule of the Government’s proportionate share of the net pension liability (asset) - teachers pension plans of the TCRS, the schedule of employer contributions - other postemployment benefit plans, and the schedule of funding progress - other postemployment benefit plans on pages B-121 through B-122, B-123 through B-125, B-126 through B-131, B-132, B-133, B-134, B-135, B-136 through B-137, respectively, be presented to supplement the basic financial statements. Such information, although not a part of the basic financial statements, is required by the Governmental Accounting Standards Board, who considers it to be an essential part of financial reporting for placing the basic financial statements in an appropriate operational, economic, or historical context. We have applied certain limited procedures to the required supplementary information in accordance with auditing standards generally accepted in the United States of America, which consisted of inquiries of management about the methods of preparing the information and comparing the information for consistency with management’s responses to our inquiries, the basic financial statements, and other knowledge we obtained during our audit of the basic financial statements. We do not express an opinion or provide any assurance on the information because the limited procedures do not provide us with sufficient evidence to express an opinion or provide any assurance. Other Information Our audit was conducted for the purpose of forming opinions on the financial statements that collectively comprise the Government’s basic financial statements, and each of the nonmajor governmental, nonmajor enterprise, internal service, and fiduciary funds, the Sports Authority Fund, the Industrial Development Board Fund, and the financial statements of each of the discretely presented component units. The schedules on pages C-9, C-10 and C-11, and on pages G-2 through G-28, are presented for purposes of additional analysis and are not a required part of the basic financial statements. Such information is the responsibility of management and was derived from and relates directly to the underlying accounting and other records used to prepare the financial statements. Such information has been subjected to the auditing procedures applied in the audit of the basic financial statements and certain additional procedures, including comparing and reconciling such information directly to the underlying accounting and other records used to prepare the basic financial statements or to the basic financial statements themselves, and other additional procedures in accordance with auditing standards generally accepted in the United States of America. In our opinion, the information is fairly stated, in all material respects, in relation to the basic financial statements as a whole. The introductory and statistical sections listed in the table of contents are presented for purposes of additional analysis and are not a required part of the basic financial statements. Such information has not been subjected to the auditing procedures applied in the audit of the basic financial statements and, accordingly, we do not express an opinion or provide any assurance on it.
To the Honorable Mayor and Members of Council The Metropolitan Government of Nashville and Davidson County, Tennessee
- 4 -
Other Reporting Required by Government Auditing Standards In accordance with Government Auditing Standards, we have also issued our report dated October 31, 2016, on our consideration of the Government’s internal control over financial reporting and on our tests of its compliance with certain provisions of laws, regulations, contracts, and grant agreements and other matters. The purpose of that report is to describe the scope of our testing of internal control over financial reporting and compliance and the results of that testing, and not to provide an opinion on internal control over financial reporting or on compliance. That report is an integral part of an audit performed in accordance with Government Auditing Standards in considering the Government’s internal control over financial reporting and compliance. Nashville, Tennessee October 31, 2016

A-1
MANAGEMENT'S DISCUSSION AND ANALYSIS As management of the Metropolitan Government of Nashville and Davidson County (the Government), we offer readers of the Government's financial statements this narrative overview and analysis of the financial activities of the Government for the fiscal year ended June 30, 2016. FINANCIAL HIGHLIGHTS
• The assets and deferred outflows of resources of the Government exceeded its liabilities and deferred inflows of resources at the close of the most recent fiscal year by $858 million (net position). This amount includes negative $1.3 billion of unrestricted net position.
• The Government’s total net position decreased by $153 million (a decrease of $150 million from
governmental activities and a decrease of $3 million from business-type activities).
• As of the close of the current fiscal year, the Government's governmental funds reported combined ending fund balances of $6 million, an increase of $172 million in comparison with the prior year.
• At the end of the current fiscal year, unassigned fund balance for the general fund was $87 million, or 9.1%
of total general fund expenditures and other financing uses.
• At the end of the current fiscal year, committed fund balance available for the general purpose school fund was $56 million, or 7.1% of total general purpose school fund expenditures and other financing uses.
• The enterprise funds reported a net position at year-end of $1.4 billion, an increase of $300 thousand
during the year.
• The Government's total general obligation and revenue bonds outstanding increased by $315 million (9.8%) during the current fiscal year. New bond issues totaled $691 million, which were offset by principal payments of $135 million and refundings of $336 million. Deferred amounts increased a net amount of $95 million. Other debt decreased by $4 million due to principal repayments.
• The Government borrows funds under commercial paper programs to provide interim or short-term
financing of authorized capital projects prior to the issuance of general obligation or revenue bonds. Total commercial paper outstanding at the close of the fiscal year was $500 million.
OVERVIEW OF THE FINANCIAL STATEMENTS The discussion and analysis provided here are intended to serve as an introduction to the Government's basic financial statements. The Government's basic financial statements consist of three components: 1) government-wide financial statements, 2) fund financial statements, and 3) notes to the financial statements. This report also includes supplementary information intended to furnish additional detail to support the basic financial statements. Government-Wide Financial Statements The government-wide financial statements are designed to provide readers with a broad overview of the Government's finances, in a manner similar to a private-sector business. The Statement of Net Position presents information on all of the Government's assets, deferred outflows of resources, liabilities, and deferred inflows of resources, with the difference reported as net position. Over time, increases or decreases in net position may serve as a useful indicator of whether the financial position of the Government is improving or deteriorating. The Statement of Activities presents information showing how the Government's net position changed during the most recent fiscal year. All changes in net position are reported on an accrual basis as soon as the underlying event giving rise to the change occurs, regardless of the timing of related cash flows. Thus, revenues and expenses are reported in this statement for some items that will only result in cash flows in future fiscal periods (e.g., uncollected taxes, compensated absences, etc.). Both of the government-wide financial statements distinguish functions of the Government that are principally supported by taxes and intergovernmental revenues (governmental activities) from other functions that are intended to recover all or a significant portion of their costs through user fees and charges (business-type activities). The governmental activities of the Government include general government; fiscal administration; administration of justice; law enforcement and care of prisoners; fire prevention and control; regulation and inspection; conservation of natural resources; public welfare; public health and hospitals; public library system; public works, highways and streets; recreational and cultural; and education.

A-2
The business-type activities of the Government include the Department of Water and Sewerage Services, District Energy System, Nashville Convention Center, Board of Fair Commissioners, Farmers Market, Surplus Property Auction, Municipal Auditorium, Police Impound, Stormwater Operations, and Community Education Commission functions. The government-wide financial statements include not only the Government itself (known as the primary government), but also the Nashville District Management Corporation, Gulch Business Improvement District, Inc., Sports Authority, Industrial Development Board, Hospital Authority, Metropolitan Development and Housing Agency, Electric Power Board, Metropolitan Transit Authority, Metropolitan Nashville Airport Authority, Emergency Communications District, and Convention Center Authority. These component units are legally separate organizations for which the Government is financially accountable. Financial information for these component units is reported separately from the financial information presented for the primary government itself. The government-wide financial statements can be found on pages B-2 to B-5 of this report. Fund Financial Statements A fund is a grouping of related accounts that is used to maintain control over resources that have been segregated for specific activities or objectives. The Government, like other state and local governments, uses fund accounting to ensure and demonstrate compliance with finance-related legal requirements. All of the funds of the Government can be divided into three categories: governmental funds, proprietary funds, and fiduciary funds. Governmental funds – Governmental funds are used to account for essentially the same functions reported as governmental activities in the government-wide financial statements. However, unlike the government-wide financial statements, the focus is on near-term inflows and outflows of spendable resources, as well as on balances of spendable resources at the end of the fiscal year. Such information may be useful in evaluating the Government's near-term financing requirements. Because the focus of governmental funds is narrower than that of government-wide financial statements, it is useful to compare the information presented for governmental funds with similar information presented for governmental activities in the government-wide financial statements. By doing so, readers may better understand the long-term impact of the Government's near-term financing decisions. Both the Balance Sheet – Governmental Funds and the Statement of Revenues, Expenditures and Changes in Fund Balances – Governmental Funds provide a reconciliation to facilitate this comparison between governmental funds and governmental activities. The Government reports 20 individual governmental funds. Information is presented separately in the Balance Sheet – Governmental Funds and in the Statement of Revenues, Expenditures, and Changes in Fund Balances – Governmental Funds for the General Fund, General Purpose School Fund, GSD General Purposes Debt Service Fund, GSD School Purposes Debt Service Fund, USD General Purposes Debt Service Fund, GSD Capital Projects Fund, Education Capital Projects Fund and USD Capital Projects Fund, all of which are considered to be major funds. Data from the other governmental funds are combined into a single, aggregated presentation. The Government adopts an annual appropriated budget for each major governmental fund except the Capital Projects Funds. Budgetary comparison statements have been provided in the Basic Financial Statements section for the General Fund and General Purpose School Fund and in the Nonmajor Governmental Funds section for each of the major Debt Service Funds to demonstrate compliance with the budget. The basic governmental fund financial statements can be found on pages B-6 to B-17 of this report. Proprietary funds – The Government maintains two different types of proprietary funds. Enterprise funds are used to report the same functions presented as business-type activities in the government-wide financial statements. The Government uses enterprise funds to account for the Department of Water and Sewerage Services, District Energy System, Nashville Convention Center, Board of Fair Commissioners, Farmers Market, Surplus Property Auction, Municipal Auditorium, Police Impound, Stormwater Operations, and Community Education Commission functions. Internal service funds are an accounting device used to accumulate and allocate costs internally among the Government's various functions. For the fiscal year ended June 30, 2016, the Government used internal service funds to account for its fleet, information systems, radio equipment, insurance, treasury management and school printing functions. Because these services predominantly benefit governmental rather than business-type functions, they have been primarily included within governmental activities in the government-wide financial statements. Proprietary funds provide the same type of information as the government-wide financial statements, only in more detail. The proprietary fund financial statements provide separate information for the Department of Water and Sewerage Services and the District Energy System, which are considered to be major funds of the Government. Data from the other enterprise funds are combined into a single, aggregated presentation. Also, the internal service funds are combined into a single, aggregated presentation in the proprietary fund financial statements. The basic proprietary fund financial statements can be found on pages B-18 to B-23 of this report. Fiduciary funds – Fiduciary funds are used to account for resources held for the benefit of parties outside the

A-3
Government. Fiduciary funds are not reflected in the government-wide financial statements because the resources of those funds are not available to support the Government's own programs. The accounting used for fiduciary funds is much like that used for proprietary funds. The basic fiduciary fund financial statements can be found on pages B-24 to B-25 of this report. Notes to the Financial Statements The notes provide additional information that is essential to a full understanding of the data provided in the government-wide and fund financial statements. The notes to the financial statements can be found on pages B-39 to B-120 of this report. Other Information In addition to the basic financial statements and accompanying notes, this report also presents certain required supplementary information surrounding infrastructure condition and maintenance data, found on pages B-121to B-122, the Government’s progress in funding its obligation to provide pension benefits to employees, found on pages B-123 to B-134, and the Government’s progress in funding its obligation to provide other postemployment benefits to employees, found on pages B-135 to B-137. GOVERNMENT-WIDE FINANCIAL ANALYSIS As noted earlier, net position may serve as a useful indicator over time of a government's financial position. In the case of the Government, assets and deferred inflows of resources exceeded liabilities and deferred outflows of resources by $858 million at the close of the most recent fiscal year.
The Government's Net Position in thousands of dollars
(as of June 30,)
Governmental Activities
Business-type Activities
Total Primary Government
2016
2015
2016
2015
2016
2015
Current and other assets $ 1,741,362
$ 1,698,569
$ 349,702
$ 371,814
$ 2,091,064
$ 2,070,383 Capital assets 3,634,847
3,558,578
2,025,563
1,954,877
5,660,410
5,513,455
Total assets 5,376,209
5,257,147
2,375,265
2,326,691
7,751,474
7,583,838
Deferred outflows of resources 422,422
240,495
18,772
7,399
441,194
247,894
Long-term liabilities
4,550,928
3,944,214
837,177
860,828
5,388,105
4,805,042 Other liabilities 646,715
799,585
220,265
134,811
866,980
934,396
Total liabilities 5,197,643
4,743,799
1,057,442
995,639
6,255,085
5,739,438
Deferred inflows of resources 1,073,468
1,076,515
5,674
4,562
1,079,142
1,081,077
Net position: Net investment in capital assets
817,836
905,271
1,227,147
1,236,872
2,044,983
2,142,143 Restricted
43,203
41,647
66,837
55,270
110,040
96,917
Unrestricted (1,333,519)
(1,269,590)
36,937
41,747
(1,296,582)
(1,227,843)
Total net position $ (472,480)
$ (322,672)
$ 1,330,921
$ 1,333,889
$ 858,441
$ 1,011,217 Governmental activities – Current and other assets for governmental activities increased by 2.5% primarily due to higher assessed values for real property resulting in an increase in the tax levy and related property tax receivable. Capital assets increased by 2.1% due to construction of new schools and other government buildings, renovations to the stormwater system and other infrastructure, the acquisition, redesign and development of park property, and the renovation of existing government buildings. Deferred outflows of resources increased 75.7% primarily due to current year bond refundings resulting in an increase to the related deferral, and an increase in the amounts related

A-4
to pension plans primarily due to differences between projected and actual investment earnings. Long-term liabilities increased by 15.4% primarily due to new debt borrowings partially offset by principal payments and amortization of deferred premiums, as well as increases in the net pension liability and the net other postemployment benefits (OPEB) obligation. Other liabilities decreased by 19.1% primarily due to a decrease in commercial paper outstanding as a portion of the commercial paper was repaid through proceeds of the new debt borrowings. Deferred inflows of resources decreased by .3% primarily due to a decrease in the amounts related to pension plans partially offset by an increase in unavailable revenue from property taxes. The largest portion of the Government's net position for governmental activities (173.1%) reflects its investment in capital assets (e.g., land, buildings, machinery, equipment and infrastructure), less any related outstanding debt used to acquire those assets. The Government uses these capital assets to provide services to citizens; consequently, these assets are not available for future spending. Although the Government's investment in its capital assets is reported net of related debt, it should be noted that the resources needed to repay this debt must be provided from other sources, since the capital assets themselves cannot be used to liquidate these liabilities. An additional portion of the Government’s net position for governmental activities (9.1%) represents resources that are subject to external restrictions on how they may be used. The remaining balance of net position for governmental activities represents unrestricted net position of negative $1.3 billion (-282.2%). Note that the unrestricted net position is negative due to the net OPEB obligation of $1.339 billion and net pension liability of $377 million at June 30, 2016. Business-type activities – Current and other assets for business-type activities decreased by 6.0% primarily due to the current year spending of cash received in prior year commercial paper borrowings. Capital assets increased by 3.6% due to additions to land, utility plants and construction work in progress for the Department of Water and Sewerage Services. Deferred outflows of resources increased by 153.7% due to an increase in the amounts related to pension plans primarily due to differences between projected and actual investment earnings. Long-term liabilities decreased by 2.8% primarily due to principal payments on outstanding bonds and amortization of deferred premiums, partially offset by increases in the net pension liability. Other liabilities increased by 63.4% primarily due to an increase in commercial paper outstanding to provide funding for capital projects prior to the issuance of revenue bonds. Deferred inflows of resources increased by 24.4% due to a decrease in the amounts related to pension plans. The largest portion of the Government's net position for business-type activities (92.2%) reflects its investment in capital assets (e.g., land, buildings, machinery, equipment and infrastructure), less any related outstanding debt used to acquire those assets. The Government uses these capital assets to provide services to citizens; consequently, these assets are not available for future spending. Although the Government's investment in its capital assets is reported net of related debt, it should be noted that the resources needed to repay this debt must be provided from other sources, since the capital assets themselves cannot be used to liquidate these liabilities. An additional portion of the Government’s net position for business-type activities (5.0%) represents resources that are subject to external restrictions on how they may be used. The majority of the restrictions relate to debt retirement and construction. The remaining balance of net position for business-type activities, representing unrestricted net position of $37 million (2.8%), may be used to meet the Government’s ongoing obligations to citizens and creditors. At the end of the current fiscal year, the Government is able to report positive balances in all three categories of net position for its total business-type activities.

A-5
The Government's Changes in Net Position in thousands of dollars
(for the year ended June 30,)
Governmental Activities Business-type Activities Total Primary Government
2016 2015 2016 2015 2016 2015 Revenues: Program revenues: Charges for services $ 173,604 $ 160,993 $ 257,424 $ 256,434 $ 431,028 $ 417,427 Operating grants and contributions 467,388 454,881 - - 467,388 454,881 Capital grants and contributions 30,970 37,301 22,770 20,655 53,740 57,956 General revenues: Property taxes 944,353 927,860 - - 944,353 927,860 Local option sales taxes 365,704 340,077 - - 365,704 340,077 Hotel occupancy taxes 76,993 69,012 - - 76,993 69,012 Beverage taxes 46,058 41,759 - - 46,058 41,759 Wheel taxes 31,534 29,943 - - 31,534 29,943 Business taxes 34,021 31,998 - - 34,021 31,998 Franchise taxes 17,022 20,578 - - 17,022 20,578 Other taxes 518 439 - - 518 439 Revenues from the use of money or property 3,886 1,044 1,334 1,088 5,220 2,132 Revenues from other governmental agencies 83,484 77,625 - - 83,484 77,625 Compensation for loss, sale or damage to property 9,963 11,677 1,053 2 11,016 11,679 Total revenues 2,285,498 2,205,187 282,581 278,179 2,568,079 2,483,366 Expenses: General government 196,012 188,330 - - 196,012 188,330 Fiscal administration 31,729 33,277 - - 31,729 33,277 Administration of justice 96,091 92,902 - - 96,091 92,902 Law enforcement and care of prisoners 378,291 353,933 - - 378,291 353,933 Fire prevention and control 162,323 152,045 - - 162,323 152,045 Regulation and inspection 10,931 11,216 - - 10,931 11,216 Conservation of natural resources 559 480 - - 559 480 Public welfare 56,186 54,279 - - 56,186 54,279 Public health and hospitals 117,686 106,365 - - 117,686 106,365 Public library system 45,268 41,390 - - 45,268 41,390 Public works, highways and streets 202,419 191,499 - - 202,419 191,499 Recreational and cultural 77,342 70,841 - - 77,342 70,841 Education 978,229 907,504 - - 978,229 907,504 Interest and other debt related costs 95,228 93,210 - - 95,228 93,210 Department of Water and Sewerage Services - - 232,501 213,926 232,501 213,926 District Energy System - - 17,940 18,761 17,940 18,761 Nashville Convention Center - - 2,126 3,543 2,126 3,543 Board of Fair Commissioners - - 3,654 3,661 3,654 3,661 Farmers Market - - 1,931 1,849 1,931 1,849 Surplus Property Auction - - 703 650 703 650 Municipal Auditorium - - 1,995 2,041 1,995 2,041 Police Impound - - 375 375 375 375 Stormwater Operations - - 10,945 10,506 10,945 10,506 Community Education Commission - - 391 357 391 357 Total expenses 2,448,294 2,297,271 272,561 255,669 2,720,855 2,552,940 Change in net position before transfers (162,796) (92,084) 10,020 22,510 (152,776) (69,574) Transfers 12,988 11,154 (12,988) (11,154) - - Change in net position (149,808) (80,930) (2,968) 11,356 (152,776) (69,574) Net position, beginning of year (322,672) (241,742) 1,333,889 1,322,533 1,011,217 1,080,791 Net position, end of year $ (472,480) $ (322,672) $ 1,330,921 $ 1,333,889 $ 858,441 $ 1,011,217

A-6
Governmental activities – Governmental activities decreased the Government’s net position by $150 million, compared to a $81 million decrease in the prior year. Total revenue increased by $80 million. Significant variances in revenues included 1) an increase of $16 million in property taxes due to more construction and continued economic recovery, 2) an increase of $26 million in local option sales tax due to continued economic recovery, 3) an increase of $13 million in charges for services primarily due to licenses and permits from increased construction, 4) an increase of $13 million in operating grants and contributions primarily due to an increase in grants and State of Tennessee funding for education, and 5) an increase of $8 million in hotel occupancy taxes due to the opening of new hotels as well as a general increase in tourism. Total expenses increased by $151 million. Operating expenses were generally higher across most functions due to increased appropriations, primarily in salaries and fringe benefits. Additionally, the change in the net pension liability and related deferred amounts is allocated across all functions. The changes in the net pension liability and related deferred amounts decreased expenses by $26 million in the current year compared to a $77 million decrease in the prior year.
Expenses and Program Revenues - Governmental Activities – For the Year Ended June 30, 2016
(in thousands)
$- $200,000 $400,000 $600,000 $800,000 $1,000,000 $1,200,000
interest and other debt related costs
education
recreational and cultural
public works, highways and streets
public library system
public health and hospitals
public welfare
conservation of natural resources
regulation and inspection
fire prevention and control
law enforcement and care of prisoners
administration of justice
fiscal administration
general government
program revenuesexpenses

A-7
Revenues by Source - Governmental Activities – For the Year Ended June 30, 2016
Business-type activities – Business-type activities decreased the Government's net position by $3 million compared to an $11 million increase in the prior year. The decrease in the change in net position is primarily due to the Department of Water and Sewerage Services operating results for the 2016 fiscal year. Operating revenues increased $3 million primarily due to growth in the customer base, while operating expenses increased $19 million due to increases in salaries, depreciation, and various other operating costs.
Revenues by Source – Business-type Activities – For the Year Ended June 30, 2016
charges for services 7.60% operating grants
and contributions
20.45%
capital grants and
contributions 1.36%
property taxes 41.31%
local option sales tax 16.00%
other taxes 9.02%
revenues from the use of money or property 0.17%
revenues from other
governmental agencies
3.65%
compensation for loss, sale or
damage to property 0.44%
charges for services and
other 91.10%
capital grants and
contributions 8.06%
other 0.84%

A-8
FINANCIAL ANALYSIS OF THE GOVERNMENT'S FUNDS As noted earlier, the Government uses fund accounting to ensure and demonstrate compliance with finance-related legal requirements. Governmental funds – The focus of the Government's governmental funds is to provide information on near-term inflows, outflows, and balances of spendable resources. Such information is useful in assessing the Government's financing requirements. In particular, unassigned fund balance may serve as a useful measure of a government's net resources available for spending at the end of the fiscal year. As of the end of the current fiscal year, the Government's governmental funds reported combined ending fund balances of $6 million, an increase of $172 million in comparison with the prior year. Restricted fund balance of $43 million can only be used for specific purposes pursuant to constraints imposed by external parties such as creditors and grantors. Committed fund balance of $137 million can only be used for specific purposes pursuant to constraints imposed by formal legislative action of the Metropolitan Council. Significant commitments include $56 million for education, $17 million for debt service, $56 million for equipment acquisitions, and $8 million for other purposes. Assigned fund balance of $80 million primarily represents the portion of fund balance that is being used to balance the subsequent year budget. Unassigned fund balance of negative $258 million represents the $84 million residual balance of the General Fund offset by deficit balances in other funds, primarily the GSD, Education, and USD Capital Projects Funds where the deficits will be funded by the future issuance of general obligation bonds, and the Flood 2010 Recovery Fund where the deficit is expected to be funded by future grant payments. The remaining fund balance of $4 million represents nonspendable amounts. The general fund is the chief operating fund of the Government. At the end of the current fiscal year, unassigned fund balance of the general fund was $84 million, while total fund balance was $145 million. As a measure of the general fund's liquidity, it may be useful to compare both unassigned fund balance and total fund balance to total general fund expenditures. Unassigned fund balance represents 8.9% of total general fund expenditures and other financing uses, while total fund balance represents 15.1% of total general fund expenditures and other financing uses. The total fund balance of the Government's General Fund increased by $6 million during the current fiscal year as compared to a $21 million increase in the previous year. Revenue collections exceeded budgeted projections by $48 million. The increase was primarily due to improvements in business taxes, building, excavation and street closing permits, and vehicle licenses resulting from the general economic recovery, construction and population growth. Ongoing operating expenditures were under budget $27 million due to savings achieved throughout essentially all departments during the fiscal year. Despite a final budgeted deficit of $68 million that was to be partially funded by assigned fund balance, higher actual revenues along with expenditure savings in the General Fund resulted in the $6 million improvement in fund balance. Despite a final budgeted deficit of $16 million for the Government’s General Purpose School Fund that was to be funded by assigned fund balance, higher actual revenues along with expenditure savings resulted in a $2 million increase in fund balance. Revenue collections exceed budgeted projections by $3 million. The increase was primarily due to improvements in local option sales tax and beverage tax collections that were partially offset by state basic education program revenues that were below budget projections. Ongoing operating expenditures were under budget $15 million due to expenditure savings achieved during the fiscal year. The fund balances of the Government’s GSD General Purposes, GSD School Purposes and USD General Purposes Debt Service Funds decreased by $6 million in total. While the budget for each of the Funds was balanced, the decrease is primarily due to the issuance of bonds in July 2015 which resulted in interest expense in excess of the amounts originally budgeted. The fund balances of the Government’s capital projects funds increased by $152 million as bonds were issued in July 2015 to fund expenditures initially funded through commercial paper borrowings. Proprietary funds – The Government's proprietary funds provide the same type of information found in the government-wide financial statements, but in more detail. Unrestricted net position of proprietary funds at the end of the year amounted to $203 million which was consistent with the prior year ending balance. Factors concerning the finances of the enterprise funds have already been addressed in the discussion of the Government's business-type activities. Proprietary funds also include internal service funds, the operations of which are primarily included in governmental activities in the government-wide statements. The enterprise funds decreased the unrestricted net position of proprietary funds by $2 million, and the internal service funds increased unrestricted net position by $2 million. The increase in internal service funds is primarily due to the increase in unrestricted net position of $10 million in the Injured on Duty Fund which is used to accumulate assets for the payment of self-insured injured on duty claims. This increase was partially offset by decreases in other internal service funds, primarily the Employees’ Medical Benefit Fund, which is used to accumulate assets for the payment of self-insurance medical claims.

A-9
GENERAL FUND BUDGETARY HIGHLIGHTS Original and Final Budgeted Amounts For the General Fund, differences in revenues and other financing sources between the original budget and final amended budget were due to reclassification of a social services grant-funded program from the general fund to a special revenue fund. Differences in expenditures and other financing uses between the original budget and the final amended budget were primarily due to the reclassification of a social services grant-funded program from the general fund to a special revenue fund as well as mid-year supplements for unanticipated expenditures and unspent amounts carried forward from the prior year as authorized by the budget ordinance. Other variances in the budget line items were primarily due to fringe benefit increases and utility contingency costs being originally budgeted under miscellaneous expenditures then later being reallocated to departmental budgets after the final budget was approved. Final Budgeted and Actual Amounts Revenues and other financing uses exceeded budgeted amounts by $49 million. While revenues were budgeted conservatively due to economic uncertainly, collections exceeded budgeted amounts for 1) business, income, sales and excise taxes, 2) building, excavation and street closing permits, and vehicle licenses, and 3) various fees and service charges, all due to the general economic recovery, increased construction, and population growth. Additionally, the sale of a former fire station resulted in proceeds in excess of budgeted amounts for the sale of property. Actual expenditures and other financing uses were under budget by $26 million because of savings achieved by essentially all departments. CAPITAL ASSET AND DEBT ADMINISTRATION Capital Assets – The Government's investment in capital assets for its governmental and business type activities as of June 30, 2016 amounts to $5.7 billion (net of accumulated depreciation). Depreciation charges for the fiscal year totaled $189 million.
The Government's Capital Assets in thousands of dollars
(as of June 30,)
Governmental
Business-type
Total Primary
Activities
Activities
Government
2016
2015
2016
2015
2016
2015
Utility plant in service $ -
$ -
$ 2,793,395
$ 2,734,125
$ 2,793,395
$ 2,734,125 Land
433,706
393,670
30,640
30,640
464,346
424,310
Buildings and improvements
2,007,210
1,992,724
141,913
139,954
2,149,123
2,132,678 Improvements other
than buildings
-
-
57,540
51,935
57,540
51,935 Furniture, machinery
and equipment
445,189
425,389
87,712
63,813
532,901
489,202 Property under
capital lease
-
-
3,645
3,645
3,645
3,645 Infrastructure
1,699,667
1,677,996
-
-
1,699,667
1,677,996
Public art
4,047
3,509
-
-
4,047
3,509 Construction in progress
228,365
154,573
222,820
155,365
451,185
309,938
Less: Accumulated depreciation (1,183,337)
(1,089,283)
(1,312,102)
(1,224,600)
(2,495,439)
(2,313,883)
Total capital assets $ 3,634,847
$ 3,558,578
$ 2,025,563
$ 1,954,877
$ 5,660,410
$ 5,513,455 The total increase in the Government's investment in capital assets for the current fiscal year was 2.7% (a 2.1% increase for governmental activities and a 3.6% increase for business-type activities). Construction of new schools and other government buildings, the acquisition of park property, and the renovation of existing government buildings has continued in accordance with the Government’s capital plan. Additionally, land and infrastructure increased from donated rights of way related to new developments. Significant additions include the renovation of Fort Nashborough on the west bank of the riverfront, renovations to the stormwater system, land acquisitions for parks, redesign and development of Centennial Park, and renovations to existing schools. Additions to utility plants and construction work in progress for the Department of Water and Sewerage Services net of disposals totaled approximately $74 million.

A-10
As allowed by GASB Statement No. 34, the Government has adopted the alternative to recording depreciation expense on selected infrastructure assets. Under this method, referred to as the modified approach, the Government expenses certain maintenance and preservation costs and does not report depreciation expense. Assets accounted for under this approach include approximately 5,880 lane miles of streets and roads and 327 bridges and underpasses that the Government is responsible for maintaining. The Government’s policy is to have at least 70% of roads in fair or better condition and 75% of bridges in fair or better condition. The most recent condition assessments indicate that 66.2% of roads and 97.0% of bridges are in fair or better condition. The maintenance of infrastructure in accordance with the Government’s policy continues to be a priority. The percentage of roads and streets in fair or better condition declined after 2010 because the area was significantly impacted by the May 2010 flood, which was followed by several winters with heavy snowfall, ice and salt usage. Additionally, population growth and construction have added to deterioration of roads and streets. Increased spending on roads and streets maintenance has resulted in overall improvement in recent years in the percentage of roads and streets in fair or better condition. The FY16-17 capital budget included additional funding for road and street maintenance. Additional information on the Government's capital assets can be found in Note 4 beginning on page B-58 of this report. Long-term debt – At the end of the current fiscal year, the Government had total bonded debt outstanding of $3.5 billion. Of this amount, $2.7 billion comprises debt backed by the full faith and credit of the Government. The remaining $745 million of the Government's debt represents bonds secured solely by specified revenue sources (i.e., revenue bonds).
The Government's Outstanding Debt General Obligation and Revenue Bonds
in thousands of dollars (as of June 30,)
Governmental Business-type Total Primary
Activities Activities Government 2016 2015 2016 2015 2016 2015
General obligation bonds $ 2,309,913 $ 2,067,763 $ 54,977 $ 56,327 $ 2,364,890 $ 2,124,090 Deferred amounts, net 366,985 267,444 8,796 7,957 375,781 275,401
Total general obligation bonds outstanding 2,676,898 2,335,207 63,773 64,284 2,740,671 2,399,491
Revenue bonds - - 744,910 765,185 744,910 765,185 Deferred amounts, net - - 39,103 44,805 39,103 44,805
Total revenue bonds outstanding - - 784,013 809,990 784,013 809,990
Total general obligation and revenue bonds outstanding $ 2,676,898 $ 2,335,207 $ 847,786 $ 874,274 $ 3,524,684 $ 3,209,481
The Government's total general obligation and revenue bonds outstanding net of deferred amounts increased by $315 million (9.8%) during the current fiscal year. New bond issues totaled $691 million, which were offset by principal payments of $135 million and refundings of $336 million. Deferred amounts increased a net amount of $95 million. Other debt decreased by $4 million due to principal payments. Construction commitments at June 30, 2016 totaled $222 million for the governmental activities of the Government and $96 million for the Department of Water and Sewerage Services. The Government maintains an “AA” rating from Standard & Poor’s and “Aa2” from Moody’s for general obligation debt. The Government maintains ratings ranging from “A1” to “Aa2“ from Moody’s and “A+” to “AA-” from Standard & Poor’s for the various issues of revenue debt of the Department of Water and Sewerage Services.

A-11
The ratio of general long-term debt (defined as gross debt less debt service monies available and less debt to be repaid from sources other than property taxes) to the actual value of property is 4.01%, and the amount of net debt per capita is $3,910. Additional information on the Government’s long-term debt can be found in Note 5 beginning on page B-62 of this report. Commercial paper – In July 2014, the Government instituted a new general obligation commercial paper program to provide interim or short-term financing for various authorized capital projects. In April 2015, the Government instituted a new Water and Sewer revenue bond commercial paper program to provide interim and short-term financing for various authorized capital projects of the Department of Water and Sewerage Services. Commercial paper obligations of $500 million outstanding at June 30, 2016 were subsequently rolled over into new commercial paper obligations and are considered short-term liabilities of the appropriate capital projects and proprietary funds. ECONOMIC FACTORS AND NEXT YEAR'S BUDGETS AND RATES The most recent (August 2016) unemployment rate for the Nashville combined statistical area is 4.0%. The state’s and nation’s unemployment rates are 4.9% and 4.4%, respectively. The budget for the 2017 fiscal year reflects a balanced budget inclusive of the use of accumulated fund balance. For more comprehensive information on the Metropolitan Government’s approved budget for the 2017 fiscal year, the budget ordinance, the budget book as well as other documents are available at www.nashville.gov. OTHER MATTERS Governmental Accounting Standard Board Statement No. 45, Accounting and Financial Reporting by Employers for Postemployment Benefits Other Than Pensions (OPEB), requires governments to account for and report their costs and obligations related to post employment healthcare and other nonpension benefits. At June 30, 2016, the unfunded accrued liability for these benefits for general government employees was $2.2 billion, and the unfunded accrued liability for teachers was $549 million. These benefits are currently funded on a pay-as-you-go basis and, as a result, the government recognized an increase in net OPEB obligations totaling $147 million in the government-wide statements of net position and activities. Additional information can be found in Note 7 beginning on page B-98 of this report. On November 7, 2006, voters approved a ballot initiative prohibiting the Metropolitan Council from raising real property tax rates above the rate at that time, which was $4.69, without the approval of the voters in a referendum. Prior to the adoption of the ballot initiative, the Metropolitan Council was authorized to set the real property tax rate without any requirement of voter approval. The Government’s legal department has issued a memo stating that the approved initiative violates the Tennessee Constitution because it places the power to set property tax rates with voters, rather than with the Metropolitan Council, as prescribed by the Constitution. However, the Government cannot predict whether there will be a court challenge as to the constitutionality of the approved initiative. If there is a challenge, the Government cannot predict the timing or be certain of the outcome of any court challenge as to the constitutionality of the approved initiative. REQUESTS FOR INFORMATION This financial report is designed to provide a general overview of the Government's finances for citizens, taxpayers, customers, investors, creditors and all others with an interest in the Government's finances. Questions concerning any of the information provided in this report or requests for additional financial information should be forwarded to the Department of Finance, Division of Accounts, at [email protected].


ASSETS:Cash and cash equivalents $ 576,367,065 $ 80,157,893 $ 656,524,958 $ 559,697,911 Investments - 2,310,112 2,310,112 10,170,341 Sales tax receivable 64,390,099 - 64,390,099 - Accounts receivable 154,083,713 25,546,958 179,630,671 227,837,230 Property tax receivable 941,697,508 - 941,697,508 - Allowance for doubtful accounts (22,594,900) (2,937,734) (25,532,634) (55,736,711) Accrued interest receivable 493,952 203,192 697,144 90,808 Internal balances 19,145,694 (19,145,694) - - Due from the primary government - - - 5,809,425 Due from component units 4,879 7,451 12,330 - Inventories of supplies 4,675,848 3,208,693 7,884,541 26,291,714 Other current assets 1,690,967 25,735 1,716,702 12,940,240 Restricted assets:
Cash and cash equivalents - 208,279,914 208,279,914 407,784,631 Investments - - - 108,484,614 Accrued interest receivable - 36,170 36,170 113,298 Due from other governmental agencies - - - 6,364,414 Accounts receivable - 76,133 76,133 3,643,699 Due from the primary government - - - 2,933,384 Other restricted assets - 25,460 25,460 3,800,686
Notes receivable - - - 68,156,951 Capital assets:
Utility plant in service - 2,793,395,374 2,793,395,374 1,367,527,000 Land 433,706,444 30,639,729 464,346,173 365,788,025 Buildings and improvements 2,007,209,724 141,912,904 2,149,122,628 1,925,706,640 Improvements other than buildings - 57,540,313 57,540,313 543,711,778 Furniture, machinery and equipment 445,188,612 87,711,938 532,900,550 447,673,794 Property under capital lease - 3,645,000 3,645,000 - Infrastructure 1,699,667,112 - 1,699,667,112 21,604,679 Public art 4,046,776 - 4,046,776 1,183,844 Construction in progress 228,364,642 222,820,250 451,184,892 120,717,262 Accumulated depreciation (1,183,336,610) (1,312,102,225) (2,495,438,835) (1,770,931,390)
Other noncurrent assets 1,407,899 51,907,728 53,315,627 31,440,382
Total assets 5,376,209,424 2,375,265,294 7,751,474,718 4,442,804,649
DEFERRED OUTFLOWS OF RESOURCES:Deferred charge on refunding 217,493,485 3,968,416 221,461,901 21,591,264 Pensions 204,928,181 14,803,525 219,731,706 70,372,789
Total deferred outflows of resources 422,421,666 18,771,941 441,193,607 91,964,053
THE METROPOLITAN GOVERNMENT OF NASHVILLE AND DAVIDSON COUNTY
STATEMENT OF NET POSITION
June 30, 2016
Activities Activities Total UnitsGovernmental Business-type Component
Primary Government
The accompanying notes are an integral part of this financial statement.
B-2

LIABILITIES:Accounts payable $ 110,481,799 $ 11,918,848 $ 122,400,647 $ 243,003,755 Accrued payroll 58,926,868 2,519,233 61,446,101 13,180,386 Accrued interest 46,345,304 - 46,345,304 - Claims payable 33,630,918 - 33,630,918 - Due to component units 8,677,205 65,604 8,742,809 - Due to the primary government - - - 12,330 Customer deposits - 3,563,565 3,563,565 16,497,534 Unearned revenue 1,698,488 441,407 2,139,895 8,748,289 Commercial paper payable 374,617,413 125,382,587 500,000,000 - Other current liabilities 12,338,043 4,014,963 16,353,006 18,300,350 Liabilities payable from restricted assets:
Accounts payable - 20,637,779 20,637,779 6,672,694 Accrued payroll - 282,180 282,180 - Accrued interest - 20,318,454 20,318,454 34,738,262 Current portion of long-term liabilities - 31,121,105 31,121,105 53,317,000
Noncurrent liabilities:Due within one year 184,352,310 - 184,352,310 7,586,269 Due in more than one year 4,366,575,293 837,176,800 5,203,752,093 2,119,071,629
Total liabilities 5,197,643,641 1,057,442,525 6,255,086,166 2,521,128,498
DEFERRED INFLOWS OF RESOURCES:Assessed and unlevied property taxes 925,195,388 - 925,195,388 - Interest rate swap 813,387 - 813,387 - Pensions 146,619,781 5,673,579 152,293,360 5,489,050 Effective portion of fuel hedging 839,290 - 839,290 523,974 Tax increment financing - - - 28,000,000
Total deferred inflows of resources 1,073,467,846 5,673,579 1,079,141,425 34,013,024
NET POSITION:Net investment in capital assets 817,836,234 1,227,147,047 2,044,983,281 1,522,936,083 Restricted for debt retirement - 66,836,853 66,836,853 154,410,779 Restricted for perpetual care:
Expendable 205,670 - 205,670 - Nonexpendable 185,112 - 185,112 -
Restricted for:Education 23,129,053 - 23,129,053 - Law enforcement and care of prisoners 4,216,501 - 4,216,501 - Public works, highways and streets 3,575,657 - 3,575,657 - Convention center and tourism promotion 3,468,002 - 3,468,002 - Public health 3,726,005 - 3,726,005 - Public library 1,136,819 - 1,136,819 - Other purposes 3,559,966 - 3,559,966 49,919,127
Unrestricted (1,333,519,416) 36,937,231 (1,296,582,185) 252,361,191
Total net position $ (472,480,397) $ 1,330,921,131 $ 858,440,734 $ 1,979,627,180
STATEMENT OF NET POSITION (CONTINUED)
THE METROPOLITAN GOVERNMENT OF NASHVILLE AND DAVIDSON COUNTY
June 30, 2016
Primary GovernmentGovernmental Business-type Component
The accompanying notes are an integral part of this financial statement.
B-3
Activities Activities Total Units
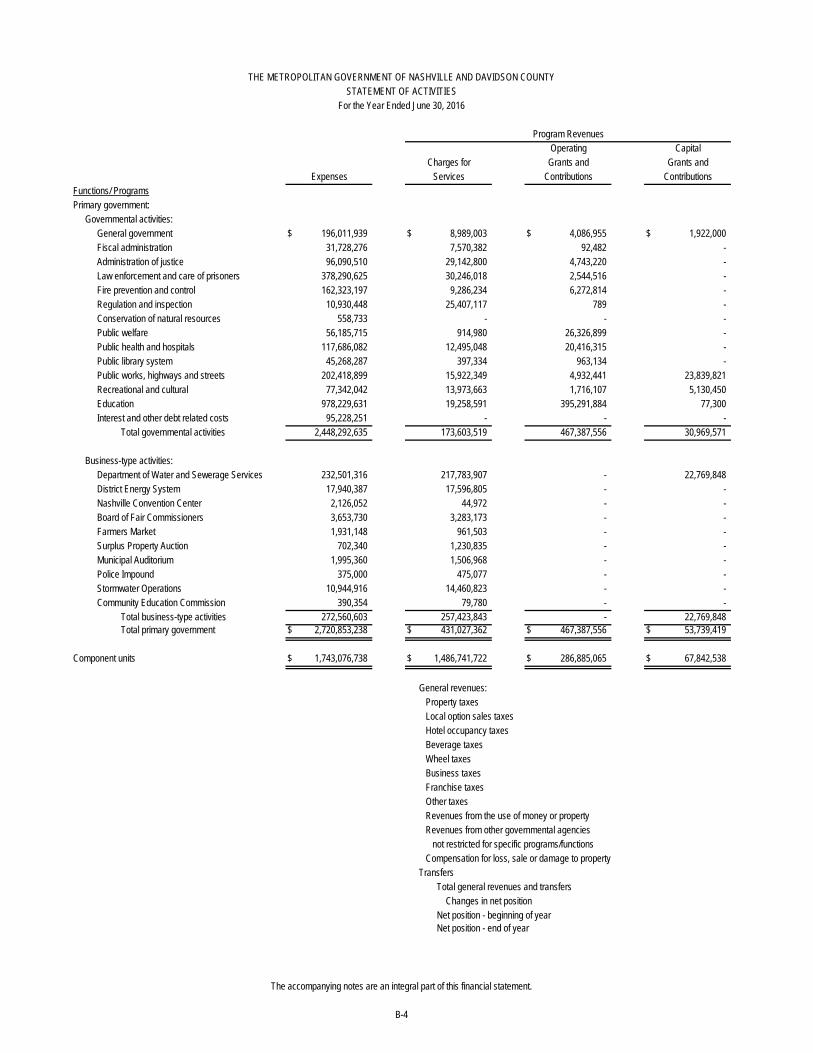
Functions/ ProgramsPrimary government:
Governmental activities:General government $ 196,011,939 $ 8,989,003 $ 4,086,955 $ 1,922,000 Fiscal administration 31,728,276 7,570,382 92,482 - Administration of justice 96,090,510 29,142,800 4,743,220 - Law enforcement and care of prisoners 378,290,625 30,246,018 2,544,516 - Fire prevention and control 162,323,197 9,286,234 6,272,814 - Regulation and inspection 10,930,448 25,407,117 789 - Conservation of natural resources 558,733 - - - Public welfare 56,185,715 914,980 26,326,899 - Public health and hospitals 117,686,082 12,495,048 20,416,315 - Public library system 45,268,287 397,334 963,134 - Public works, highways and streets 202,418,899 15,922,349 4,932,441 23,839,821 Recreational and cultural 77,342,042 13,973,663 1,716,107 5,130,450 Education 978,229,631 19,258,591 395,291,884 77,300 Interest and other debt related costs 95,228,251 - - -
Total governmental activities 2,448,292,635 173,603,519 467,387,556 30,969,571
Business-type activities:Department of Water and Sewerage Services 232,501,316 217,783,907 - 22,769,848 District Energy System 17,940,387 17,596,805 - - Nashville Convention Center 2,126,052 44,972 - - Board of Fair Commissioners 3,653,730 3,283,173 - - Farmers Market 1,931,148 961,503 - - Surplus Property Auction 702,340 1,230,835 - - Municipal Auditorium 1,995,360 1,506,968 - - Police Impound 375,000 475,077 - - Stormwater Operations 10,944,916 14,460,823 - - Community Education Commission 390,354 79,780 - -
Total business-type activities 272,560,603 257,423,843 - 22,769,848 Total primary government $ 2,720,853,238 $ 431,027,362 $ 467,387,556 $ 53,739,419
Component units $ 1,743,076,738 $ 1,486,741,722 $ 286,885,065 $ 67,842,538
General revenues: Property taxes Local option sales taxes Hotel occupancy taxes Beverage taxes Wheel taxes Business taxes Franchise taxes Other taxes Revenues from the use of money or property Revenues from other governmental agencies not restricted for specific programs/functions Compensation for loss, sale or damage to propertyTransfers Total general revenues and transfers Changes in net position Net position - beginning of year Net position - end of year
THE METROPOLITAN GOVERNMENT OF NASHVILLE AND DAVIDSON COUNTYSTATEMENT OF ACTIVITIES
Charges for Grants and Grants andCapital
Program Revenues
For the Year Ended June 30, 2016
Operating
The accompanying notes are an integral part of this financial statement.
B-4
Expenses ContributionsServices Contributions

$ (181,013,981) $ - $ (181,013,981) $ - (24,065,412) - (24,065,412) - (62,204,490) - (62,204,490) -
(345,500,091) - (345,500,091) - (146,764,149) - (146,764,149) -
14,477,458 - 14,477,458 - (558,733) - (558,733) -
(28,943,836) - (28,943,836) - (84,774,719) - (84,774,719) - (43,907,819) - (43,907,819) -
(157,724,288) - (157,724,288) - (56,521,822) - (56,521,822) -
(563,601,856) - (563,601,856) - (95,228,251) - (95,228,251) -
(1,776,331,989) - (1,776,331,989) -
- 8,052,439 8,052,439 - - (343,582) (343,582) - - (2,081,080) (2,081,080) - - (370,557) (370,557) - - (969,645) (969,645) - - 528,495 528,495 - - (488,392) (488,392) - - 100,077 100,077 - - 3,515,907 3,515,907 - - (310,574) (310,574) - - 7,633,088 7,633,088 -
(1,776,331,989) 7,633,088 (1,768,698,901) -
- - - 98,392,587
944,352,690 - 944,352,690 - 365,703,933 - 365,703,933 -
76,992,513 - 76,992,513 - 46,058,609 - 46,058,609 - 31,533,651 - 31,533,651 - 34,020,956 - 34,020,956 - 17,021,876 - 17,021,876 -
518,499 - 518,499 - 3,885,544 1,334,069 5,219,613 4,928,192
83,483,634 - 83,483,634 - 9,962,941 1,052,995 11,015,936 1,875,358
12,988,429 (12,988,429) - - 1,626,523,275 (10,601,365) 1,615,921,910 6,803,550 (149,808,714) (2,968,277) (152,776,991) 105,196,137 (322,671,683) 1,333,889,408 1,011,217,725 1,874,431,043
$ (472,480,397) $ 1,330,921,131 $ 858,440,734 $ 1,979,627,180
Governmental Business-type Component
THE METROPOLITAN GOVERNMENT OF NASHVILLE AND DAVIDSON COUNTYSTATEMENT OF ACTIVITIES (CONTINUED)
For the Year Ended June 30, 2016
Primary GovernmentNet (Expense) Revenue and Changes in Net Position
TotalActivities
The accompanying notes are an integral part of this financial statement.
B-5
UnitsActivities

ASSETS:Cash and cash equivalents $ 142,749,608 $ 59,201,783 $ 7,253,763 $ 792,302 Sales tax receivable 19,722,852 37,957,294 466,417 6,243,536 Accounts receivable 60,787,787 3,625,778 2,948,768 - Accrued interest receivable 129,800 28,248 23,066 - Property tax receivable 487,193,550 306,570,528 91,608,325 39,064,032 Allowance for doubtful accounts (18,145,706) (2,877,698) (1,008,552) (384,701) Due from other funds of the primary
government 3,499,658 13,424,263 301,486 - Due from component units 4,116 - - - Inventories of supplies 275,371 1,483,136 - - Other assets 191,637 412,354 63,368 5,454
Total assets $ 696,408,673 $ 419,825,686 $ 101,656,641 $ 45,720,623
LIABILITIES:Accounts payable $ 15,162,504 $ 11,400,158 $ 370,338 $ 29,805 Accrued payroll 23,803,839 30,322,047 - - Due to other funds of the primary
government 15,132,017 1,344,491 15,083 8,177 Due to component units - - - - Commercial paper payable - - - - Other liabilities 5,254,671 17,636 - -
Total liabilities 59,353,031 43,084,332 385,421 37,982
DEFERRED INFLOWS OF RESOURCES:Unavailable revenue - property taxes 482,217,970 302,629,157 90,281,320 38,543,193 Unavailable revenue - grants - - - - Unavailable revenue - other revenues 10,334,906 15,063 - -
Total deferred inflows of resources 492,552,876 302,644,220 90,281,320 38,543,193
FUND BALANCES (DEFICITS):Nonspendable 467,008 1,863,688 43,369 5,454 Restricted for:
Other purposes - - - - Committed for:
Education (available) - 56,233,446 - - Debt service - - 5,946,531 7,133,994 Equipment acquisitions (appropriated) - - - - Equipment acquisitions (unappropriated) - - - - Other purposes - - - -
Assigned for:Subsequent year budgetary appropriations 50,947,200 16,000,000 5,000,000 - Specific projects 8,595,400 - - -
Unassigned 84,493,158 - - - Total fund balances (deficits) 144,502,766 74,097,134 10,989,900 7,139,448
Total liabilities, deferred inflows ofresources, and fund balances
(deficits) $ 696,408,673 $ 419,825,686 $ 101,656,641 $ 45,720,623
The accompanying notes are an integral part of this financial statement.
B-6
Purposes DebtServiceService
General Purposes DebtGeneral Purpose School
THE METROPOLITAN GOVERNMENT OF NASHVILLE AND DAVIDSON COUNTY
BALANCE SHEETGOVERNMENTAL FUNDS
GSD General
June 30, 2016
GSD School

$ 4,096,158 $ 37,108,207 $ 20,105,415 $ 88,911 $ 132,614,450 $ 404,010,597 - - - - - 64,390,099 - 75,000 6,750 - 85,905,231 153,349,314
3,386 310 82 - 152,396 337,288 17,261,073 - - - - 941,697,508
(178,243) - - - - (22,594,900)
- 617,124 9 969,660 9,887,214 28,699,414 - - - - - 4,116 - - - - 1,176,773 2,935,280
1,177 - - - 500,575 1,174,565
$ 21,183,551 $ 37,800,641 $ 20,112,256 $ 1,058,571 $ 230,236,639 $ 1,574,003,281
$ 9,519 $ 28,181,614 $ 13,298,126 $ 16,206 $ 22,075,074 $ 90,543,344 - 22,462 - - 2,048,926 56,197,274
2,961 2,134,460 8,761 1,848,419 40,691,103 61,185,472
- - - - 8,677,205 8,677,205 - 226,989,985 116,535,397 517,732 30,574,299 374,617,413 - 15,000 - - 3,179,628 8,466,935
12,480 257,343,521 129,842,284 2,382,357 107,246,235 599,687,643
17,016,986 - - - - 930,688,626 - - - - 26,805,259 26,805,259 - - - - - 10,349,969
17,016,986 - - - 26,805,259 967,843,854
1,177 - - - 1,362,461 3,743,157
- - - - 43,018,673 43,018,673
- - - - - 56,233,446 4,152,908 - - - - 17,233,433
- - - - 30,318,995 30,318,995 - - - - 25,210,677 25,210,677 - - - - 8,024,406 8,024,406
- - - - - 71,947,200 - - - - - 8,595,400 - (219,542,880) (109,730,028) (1,323,786) (11,750,067) (257,853,603)
4,154,085 (219,542,880) (109,730,028) (1,323,786) 96,185,145 6,471,784
$ 21,183,551 $ 37,800,641 $ 20,112,256 $ 1,058,571 $ 230,236,639 $ 1,574,003,281
THE METROPOLITAN GOVERNMENT OF NASHVILLE AND DAVIDSON COUNTY
BALANCE SHEETGOVERNMENTAL FUNDS (CONTINUED)
June 30, 2016
GSDCapital Projects
USD General
The accompanying notes are an integral part of this financial statement.
B-7
EducationCapitalProjects
USDCapitalProjects
GovernmentalFunds
TotalOtherPurposes Debt
ServiceGovernmental
Funds

Fund balances - total governmental funds $ 6,471,784
Amounts reported for governmental activities in the Statement of Net Position are differentfrom amounts reported for governmental funds in the Balance Sheet because:
Capital assets used in governmental activities are not financialresources and therefore are not reported in the governmental funds.
Capital assets 4,620,976,825Less accumulated depreciation (1,033,584,057)
Net pension assets are not financial resources and therefore are notreported in the governmental funds. 568,609
Deferred outflows related to pensions are not financial resources andtherefore not reported in the governmental funds. 204,928,181
Deferred inflows related to the fair value of derivative financial instrumentsare not financial obligations and therefore not reported in the governmental funds. (813,387)
Deferred inflows related to pensions are not financial resources andtherefore not reported in the governmental funds. (146,619,781)
Deferred outflows related to the fair value of derivative financial instrumentsare not financial resources and therefore not reported in the governmental funds. (839,290)
Loss contingencies that are probable and reasonably estimable are not financial obligations and therefore not reported in governmental funds. (3,871,108)
Long-term liabilities are not due and payable in the current periodand therefore are not reported in the governmental funds.
Bonds payable (2,309,912,878)Qualified zone academy notes payable (2,072,831)Qualified school construction bond loan payable (38,264,408)Less deferred charge on refunding 217,493,485Add net bond premium/discount (366,938,954)Accrued interest payable (46,345,304)Unamortized swaption proceeds (1,698,488)Net pension liability (377,092,525)Net other postemployment benefits obligation (1,338,966,000)Compensated absences (87,908,492)Claims and judgments (5,079,000)Landfill closure costs (9,111,371)Fair value of derivative financial instruments (9,504,646)
Certain deferred inflows reported in the governmental funds arerecognized as revenues in the governmental activities. 42,648,466
Internal service funds are used by management to charge the costs of certain activitiesto individual funds. The assets and liabilities of the internal service funds less thoseallocated to business-type activities are included in governmental activities. 213,054,773
Net position - governmental activities $ (472,480,397)
June 30, 2016
The accompanying notes are an integral part of this financial statement.
B-8
THE METROPOLITAN GOVERNMENT OF NASHVILLE AND DAVIDSON COUNTY
RECONCILIATION OF THE BALANCE SHEET TO THE STATEMENT OF NET POSITIONGOVERNMENTAL FUNDS

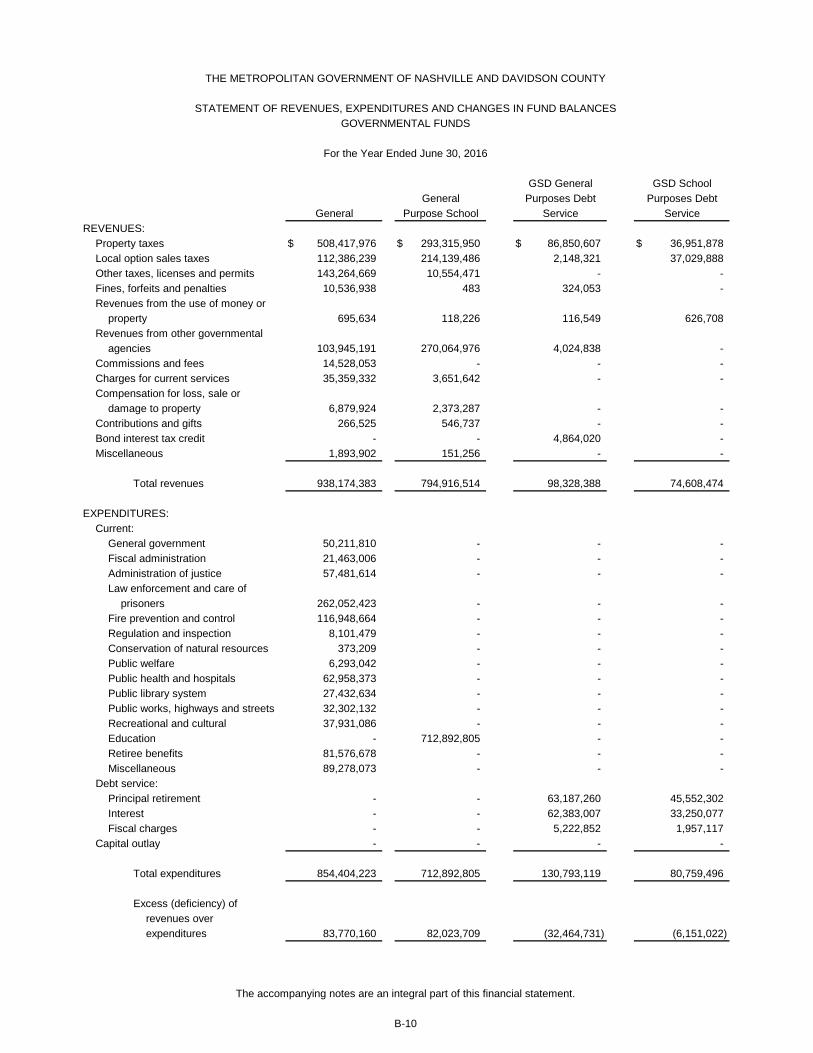
REVENUES:Property taxes $ 508,417,976 $ 293,315,950 $ 86,850,607 $ 36,951,878 Local option sales taxes 112,386,239 214,139,486 2,148,321 37,029,888 Other taxes, licenses and permits 143,264,669 10,554,471 - - Fines, forfeits and penalties 10,536,938 483 324,053 - Revenues from the use of money or
property 695,634 118,226 116,549 626,708 Revenues from other governmental
agencies 103,945,191 270,064,976 4,024,838 - Commissions and fees 14,528,053 - - - Charges for current services 35,359,332 3,651,642 - - Compensation for loss, sale or
damage to property 6,879,924 2,373,287 - - Contributions and gifts 266,525 546,737 - - Bond interest tax credit - - 4,864,020 - Miscellaneous 1,893,902 151,256 - -
Total revenues 938,174,383 794,916,514 98,328,388 74,608,474
EXPENDITURES:Current:
General government 50,211,810 - - - Fiscal administration 21,463,006 - - - Administration of justice 57,481,614 - - - Law enforcement and care of
prisoners 262,052,423 - - - Fire prevention and control 116,948,664 - - - Regulation and inspection 8,101,479 - - - Conservation of natural resources 373,209 - - - Public welfare 6,293,042 - - - Public health and hospitals 62,958,373 - - - Public library system 27,432,634 - - - Public works, highways and streets 32,302,132 - - - Recreational and cultural 37,931,086 - - - Education - 712,892,805 - - Retiree benefits 81,576,678 - - - Miscellaneous 89,278,073 - - -
Debt service:Principal retirement - - 63,187,260 45,552,302 Interest - - 62,383,007 33,250,077 Fiscal charges - - 5,222,852 1,957,117
Capital outlay - - - -
Total expenditures 854,404,223 712,892,805 130,793,119 80,759,496
Excess (deficiency) of revenues over
expenditures 83,770,160 82,023,709 (32,464,731) (6,151,022)
For the Year Ended June 30, 2016
GSD School
THE METROPOLITAN GOVERNMENT OF NASHVILLE AND DAVIDSON COUNTY
STATEMENT OF REVENUES, EXPENDITURES AND CHANGES IN FUND BALANCESGOVERNMENTAL FUNDS
The accompanying notes are an integral part of this financial statement.
ServicePurpose School
GSD General
B-10
Purposes DebtServiceGeneral
General Purposes Debt

$ 16,256,673 $ - $ - $ - $ 2,217,240 $ 944,010,324 - - - - - 365,703,934 - - - - 80,070,054 233,889,194 - - - - 6,193,880 17,055,354
- 706 178 - 776,935 2,334,936
- 1,518,610 - - 205,768,017 585,321,632 - - - - 9,497,930 24,025,983 - 303,291 - - 26,328,246 65,642,511
- 3,089,830 - - 814,777 13,157,818 - 6,724,755 77,300 - 5,016,434 12,631,751 - - - - - 4,864,020 - - - - 696,489 2,741,647
16,256,673 11,637,192 77,478 - 337,380,002 2,271,379,104
- - - - 78,008,259 128,220,069 - - - - 271,676 21,734,682 - - - - 13,872,252 71,353,866
- - - - 21,818,071 283,870,494 - - - - 6,500 116,955,164 - - - - 87,755 8,189,234 - - - - - 373,209 - - - - 32,656,928 38,949,970 - - - - 22,604,542 85,562,915 - - - - 951,871 28,384,505 - - - - 31,551,513 63,853,645 - - - - 2,113,171 40,044,257 - - - - 205,638,603 918,531,408 - - - - - 81,576,678 - - - - - 89,278,073
7,218,200 - - - - 115,957,762 9,349,127 - - - - 104,982,211
718,433 - - - - 7,898,402 - 171,748,439 75,762,934 1,347,958 25,378,504 274,237,835
17,285,760 171,748,439 75,762,934 1,347,958 434,959,645 2,479,954,379
(1,029,087) (160,111,247) (75,685,456) (1,347,958) (97,579,643) (208,575,275)
THE METROPOLITAN GOVERNMENT OF NASHVILLE AND DAVIDSON COUNTY
STATEMENT OF REVENUES, EXPENDITURES AND CHANGES IN FUND BALANCESGOVERNMENTAL FUNDS (CONTINUED)
Total
For the Year Ended June 30, 2016
USD General Other USD
B-11
Governmental GovernmentalEducation
CapitalCapital ProjectsService
The accompanying notes are an integral part of this financial statement.
Purposes Debt CapitalGSDProjectsProjects FundsFunds

OTHER FINANCING SOURCES (USES):Issuance of new debt $ - $ - $ - $ - Issuance of refunding debt - - 231,949,343 78,790,586 Debt issue premium - - 50,113,451 17,022,977 Payments to refunded bond
escrow agent - - (280,386,841) (95,432,894) Transfers in 22,890,396 2,407,975 25,274,582 4,465,803 Transfers out (100,211,388) (82,450,082) - -
Total other financing sources(uses) (77,320,992) (80,042,107) 26,950,535 4,846,472
Net change in fund balances 6,449,168 1,981,602 (5,514,196) (1,304,550)
FUND BALANCES (DEFICITS), beginningof year 138,053,598 72,115,532 16,504,096 8,443,998
FUND BALANCES (DEFICITS), end of year $ 144,502,766 $ 74,097,134 $ 10,989,900 $ 7,139,448
General Purposes Debt
For the Year Ended June 30, 2016
THE METROPOLITAN GOVERNMENT OF NASHVILLE AND DAVIDSON COUNTY
STATEMENT OF REVENUES, EXPENDITURES AND CHANGES IN FUND BALANCES
General
GSD General
GOVERNMENTAL FUNDS (CONTINUED)
GSD School
Service
The accompanying notes are an integral part of this financial statement.
B-12
Purpose SchoolPurposes Debt
Service

$ - $ 240,454,031 $ 97,563,777 $ 8,531,298 $ - $ 346,549,106 27,571,610 - - - - 338,311,539
5,956,941 37,472,659 15,204,462 1,329,528 - 127,100,018
(33,395,342) - - - - (409,215,077) 1,907,600 - - - 138,312,337 195,258,693
- (9,784,017) - (1,965,477) (22,963,426) (217,374,390)
2,040,809 268,142,673 112,768,239 7,895,349 115,348,911 380,629,889
1,011,722 108,031,426 37,082,783 6,547,391 17,769,268 172,054,614
3,142,363 (327,574,306) (146,812,811) (7,871,177) 78,415,877 (165,582,830)
$ 4,154,085 $ (219,542,880) $ (109,730,028) $ (1,323,786) $ 96,185,145 $ 6,471,784
Other
THE METROPOLITAN GOVERNMENT OF NASHVILLE AND DAVIDSON COUNTY
STATEMENT OF REVENUES, EXPENDITURES AND CHANGES IN FUND BALANCES
For the Year Ended June 30, 2016
FundsProjects
USD General Education
GOVERNMENTAL FUNDS (CONTINUED)
CapitalTotalUSD
GSD
The accompanying notes are an integral part of this financial statement.
B-13
GovernmentalService Capital Projects
Purposes DebtFundsProjects
GovernmentalCapital

Net change in fund balances - governmental funds $ 172,054,614
Amounts reported for governmental activities in the Statement of Activities aredifferent from amounts reported for governmental funds in the Statement ofRevenues, Expenditures and Changes in Fund Balances, because:
Governmental funds report capital outlays as expenditures. However, the cost of thoseassets is allocated over their estimated useful lives and reported as depreciation expensefor governmental activities.
Acquisition of capital assets that meet criteria for capitalization 139,450,169 Depreciation expense (86,154,152)
Donations of capital assets increase net position for governmental activities, but do not appearin the governmental funds because they are not financial resources. 23,272,312
The gain or loss on the sale of capital assets is reported for governmental activities, whereas inin the governmental funds, the proceeds from the sale increase financial resources.Thus, the change in net position differs from the change in fund balances by the net book value ofthe capital assets sold. (911,979)
Changes in net pension assets increase or decrease net position for governmental activities, butdo not appear in the governmental funds because they are not current financial resources. (851,993)
Changes in deferred outflows related to pensions increase or decrease net positionfor governmental activities, but do not appear in the governmental funds because they are not current financial resources. 120,777,352
Changes in deferred inflows related to pensions increase or decrease net positionfor governmental activities, but do not appear in the governmental funds because they are not current financial resources. 25,249,883
Bond proceeds provide current financial resources to governmental funds, but the issuanceof debt increases long-term liabilities for governmental activities. Repayment of bond principalis an expenditure in the governmental funds but reduces long-term liabilities for governmentalactivities. Also, governmental funds report the effect of premiums, discounts and similar itemswhen debt is first issued, whereas these amounts are deferred and amortized for governmentalactivities.
Issuance of new debt (346,549,106) Issuance of refunding debt (338,311,539) Principal repayments 115,957,762 Payments to refunded bond escrow agent 409,215,076 Amortization of deferred charge on refunding (15,254,917) Bond premium/discount (127,100,018) Amortization of premium/discount 27,548,199 Change in accrued interest (1,720)
THE METROPOLITAN GOVERNMENT OF NASHVILLE AND DAVIDSON COUNTY
RECONCILIATION OF THE STATEMENT OF REVENUES, EXPENDITURES AND CHANGES INFUND BALANCES OF GOVERNMENTAL FUNDS TO THE STATEMENT OF ACTIVITIES
For the Year Ended June 30, 2016
B-14
The accompanying notes are an integral part of this financial statement.

Swaption proceeds provide current financial resources to governmental funds, but the issuanceof swaptions increases long-term liabilities for governmental activities. Also, these proceedsare amortized for governmental activities.
Amortization of swaptions $ 172,727
Some expenses reported for governmental activities do not require the use of current financialresources and therefore are not reported as expenditures for governmental funds.
Net pension liability (119,230,179) Net other postemployment benefits obligation (146,819,000) Compensated absences (2,504,191) Claims and judgments 101,500 Landfill closure costs 169,134
Some revenues for governmental activities do not provide current financial resources andare not reported as revenues for governmental funds. (5,468,523)
Internal service funds are used by management to charge the costs of certain activities toindividual funds. The net revenue (expense) of the internal service funds less thoseallocated to business-type activities are included in governmental activities. 5,379,875
Change in net position - governmental activities $ (149,808,714)
The accompanying notes are an integral part of this financial statement.
B-15
THE METROPOLITAN GOVERNMENT OF NASHVILLE AND DAVIDSON COUNTY
RECONCILIATION OF THE STATEMENT OF REVENUES, EXPENDITURES AND CHANGES INFUND BALANCES OF GOVERNMENTAL FUNDS TO THE STATEMENT OF ACTIVITIES (CONTINUED)
For the Year Ended June 30, 2016

Variance with
PositiveFinal Amounts (Negative)
REVENUES: Property taxes $ 507,497,300 $ 507,497,300 $ 508,417,976 $ 920,676 Local option sales tax 113,311,200 113,311,200 112,386,239 (924,961) Other taxes, licenses and permits 121,589,400 121,809,400 143,264,669 21,455,269 Fines, forfeits and penalties 11,254,300 11,261,400 10,536,938 (724,462) Revenues from the use of money or property - - 695,634 695,634 Revenues from other governmental agencies 88,739,800 87,265,800 103,945,191 16,679,391 Commissions and fees 13,134,800 13,134,800 14,528,053 1,393,253 Charges for current services 31,881,600 31,851,600 35,359,332 3,507,732 Compensation for loss, sale or damage to property 1,315,700 1,315,700 6,879,924 5,564,224 Contributions and gifts 242,900 2,100 266,525 264,425 Miscellaneous 2,734,000 2,734,000 1,893,902 (840,098)
Total revenues 891,701,000 890,183,300 938,174,383 47,991,083
EXPENDITURES: General government 50,687,100 53,115,900 50,211,810 2,904,090 Fiscal administration 22,132,100 23,297,500 21,463,006 1,834,494 Administration of justice 57,874,500 59,283,300 57,481,614 1,801,686 Law enforcement and care of prisoners 250,339,900 264,543,200 262,052,423 2,490,777 Fire prevention and control 113,446,400 119,119,200 116,948,664 2,170,536 Regulation and inspection 8,753,400 9,066,100 8,101,479 964,621 Conservation of natural resources 374,400 399,700 373,209 26,491 Public welfare 8,095,700 6,617,500 6,293,042 324,458 Public health and hospitals 53,665,700 64,266,000 62,958,373 1,307,627 Public library system 26,737,600 27,494,800 27,432,634 62,166 Public works, highways and streets 32,618,600 33,607,600 32,302,132 1,305,468 Recreational and cultural 37,805,300 38,765,600 37,931,086 834,514 Retiree benefits 83,301,200 83,337,600 81,576,678 1,760,922 Miscellaneous 121,575,300 98,596,700 89,278,073 9,318,627
Total expenditures 867,407,200 881,510,700 854,404,223 27,106,477
Excess (deficiency) of revenues over expenditures 24,293,800 8,672,600 83,770,160 75,097,560
OTHER FINANCING SOURCES (USES): Transfers in 22,309,700 22,309,700 22,890,396 580,696 Transfers out (94,674,200) (99,412,400) (100,211,388) (798,988)
Total other financing sources (uses) (72,364,500) (77,102,700) (77,320,992) (218,292)
Net change in fund balances (48,070,700) (68,430,100) 6,449,168 74,879,268
FUND BALANCES, beginning of year 138,053,598 138,053,598 138,053,598 -
FUND BALANCES, end of year $ 89,982,898 $ 69,623,498 $ 144,502,766 $ 74,879,268
THE METROPOLITAN GOVERNMENT OF NASHVILLE AND DAVIDSON COUNTY
STATEMENT OF REVENUES, EXPENDITURES AND CHANGES IN FUND BALANCES - BUDGET AND ACTUALGENERAL FUND
For the Year Ended June 30, 2016
B-16
OriginalActual
Final Budget -Budgeted Amounts
The accompanying notes are an integral part of this financial statement.
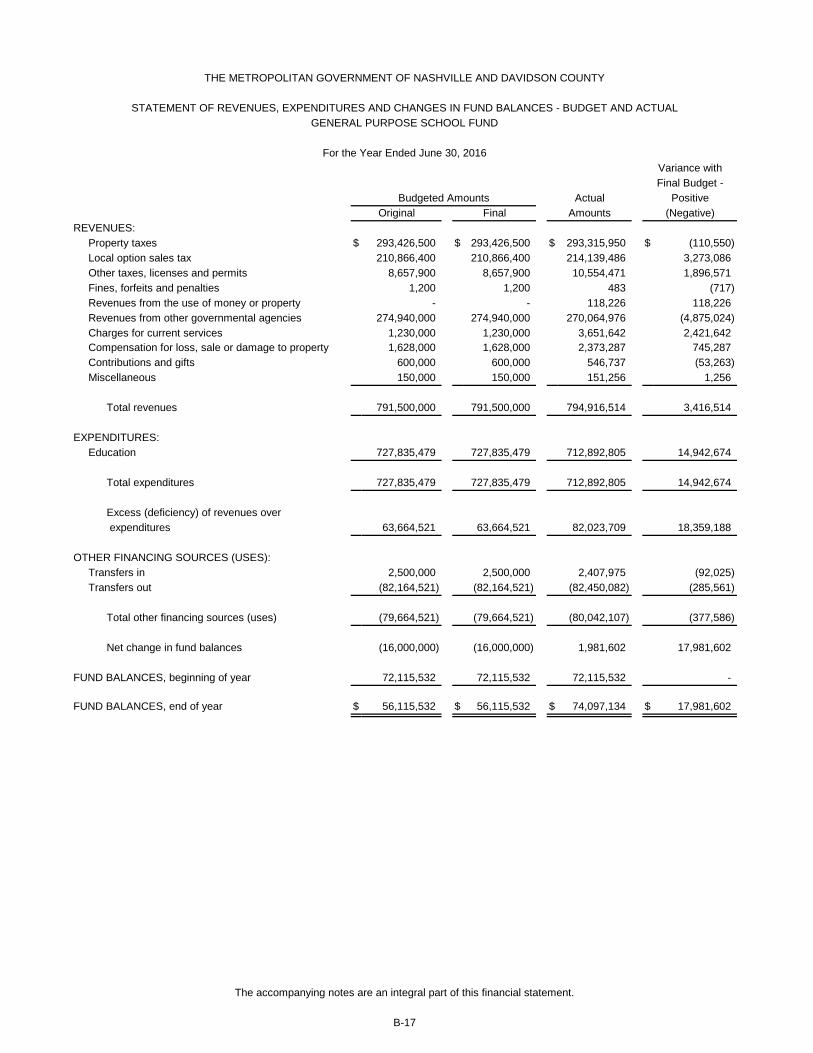
Variance with
PositiveFinal Amounts (Negative)
REVENUES: Property taxes $ 293,426,500 $ 293,426,500 $ 293,315,950 $ (110,550) Local option sales tax 210,866,400 210,866,400 214,139,486 3,273,086 Other taxes, licenses and permits 8,657,900 8,657,900 10,554,471 1,896,571 Fines, forfeits and penalties 1,200 1,200 483 (717) Revenues from the use of money or property - - 118,226 118,226 Revenues from other governmental agencies 274,940,000 274,940,000 270,064,976 (4,875,024) Charges for current services 1,230,000 1,230,000 3,651,642 2,421,642 Compensation for loss, sale or damage to property 1,628,000 1,628,000 2,373,287 745,287 Contributions and gifts 600,000 600,000 546,737 (53,263) Miscellaneous 150,000 150,000 151,256 1,256
Total revenues 791,500,000 791,500,000 794,916,514 3,416,514
EXPENDITURES: Education 727,835,479 727,835,479 712,892,805 14,942,674
Total expenditures 727,835,479 727,835,479 712,892,805 14,942,674
Excess (deficiency) of revenues over expenditures 63,664,521 63,664,521 82,023,709 18,359,188
OTHER FINANCING SOURCES (USES): Transfers in 2,500,000 2,500,000 2,407,975 (92,025) Transfers out (82,164,521) (82,164,521) (82,450,082) (285,561)
Total other financing sources (uses) (79,664,521) (79,664,521) (80,042,107) (377,586)
Net change in fund balances (16,000,000) (16,000,000) 1,981,602 17,981,602
FUND BALANCES, beginning of year 72,115,532 72,115,532 72,115,532 -
FUND BALANCES, end of year $ 56,115,532 $ 56,115,532 $ 74,097,134 $ 17,981,602
THE METROPOLITAN GOVERNMENT OF NASHVILLE AND DAVIDSON COUNTY
STATEMENT OF REVENUES, EXPENDITURES AND CHANGES IN FUND BALANCES - BUDGET AND ACTUALGENERAL PURPOSE SCHOOL FUND
For the Year Ended June 30, 2016
B-17
The accompanying notes are an integral part of this financial statement.
OriginalActual
Final Budget -Budgeted Amounts

ASSETS:Current assets:
Cash and cash equivalents $ 55,010,190 $ 5,452,737 $ 19,694,966 $ 80,157,893 $ 172,356,468 Investments - 2,310,112 - 2,310,112 - Accounts receivable 18,575,410 2,802,116 4,169,432 25,546,958 442,547 Allowance for doubtful accounts (2,206,134) - (731,600) (2,937,734) - Accrued interest receivable 186,676 - 16,516 203,192 156,664 Due from other funds of the
primary government 476,138 - 3,371,266 3,847,404 897,112 Due from component units 7,351 - 100 7,451 763 Inventories of supplies 3,208,693 - - 3,208,693 1,740,568 Other current assets 11,000 - 14,735 25,735 516,402 Restricted assets:
Cash and cash equivalents 49,135,106 1,677,575 - 50,812,681 - Accounts receivable 76,133 - - 76,133 - Accrued interest receivable 36,170 - - 36,170 - Due from other funds of the
primary government 19,322,750 - - 19,322,750 - Other current assets 25,460 - - 25,460 -
Total current assets 143,864,943 12,242,540 26,535,415 182,642,898 176,110,524
Noncurrent assets:Capital assets:
Utility plant in service 2,727,868,400 65,526,974 - 2,793,395,374 - Land 22,509,294 1,311,213 6,819,222 30,639,729 - Buildings and improvements 43,445,872 22,249,490 76,217,542 141,912,904 126,643 Improvements other than buildings 53,186,799 273,754 4,079,760 57,540,313 - Furniture, machinery and equipment 84,429,234 886,904 2,395,800 87,711,938 196,951,292 Property under capital lease - - 3,645,000 3,645,000 - Construction in progress 222,181,863 495,492 142,895 222,820,250 128,550 Less accumulated depreciation (1,228,452,486) (25,836,547) (57,813,192) (1,312,102,225) (149,752,553)
Capital assets - net 1,925,168,976 64,907,280 35,487,027 2,025,563,283 47,453,932 Restricted assets:
Cash and cash equivalents 157,467,233 - - 157,467,233 - Other noncurrent assets 51,907,728 - - 51,907,728 -
Total noncurrent assets 2,134,543,937 64,907,280 35,487,027 2,234,938,244 47,453,932
Total assets 2,278,408,880 77,149,820 62,022,442 2,417,581,142 223,564,456
DEFERRED OUTFLOWS OF RESOURCES:Deferred charge on refunding 1,064,486 2,903,930 - 3,968,416 - Pensions 12,646,716 44,874 2,111,935 14,803,525 -
Total deferred outflows ofresources 13,711,202 2,948,804 2,111,935 18,771,941 -
THE METROPOLITAN GOVERNMENT OF NASHVILLE AND DAVIDSON COUNTY
STATEMENT OF NET POSITIONPROPRIETARY FUNDS
June 30, 2016
Enterprise EnterpriseOtherDistrict
Energy
Business-type Activities - Enterprise FundsDepartment of
TotalInternal
GovernmentalWater and Activities -
Services System
The accompanying notes are an integral part of this financial statement.
Service FundsSewerage
B-18
Funds Funds

Current liabilities:Accounts payable $ 8,773,567 $ 2,034,037 $ 1,111,244 $ 11,918,848 $ 9,200,563 Accrued payroll 1,573,553 6,988 938,692 2,519,233 2,729,594 Claims payable - - - - 33,630,918 Due to other funds of the primary
government 1,482,337 49,572 291,455 1,823,364 203,884 Due to component units - - 65,604 65,604 - Customer deposits 3,445,871 - 117,694 3,563,565 - Unearned revenue - - 441,407 441,407 - Other current liabilities 4,014,963 - - 4,014,963 - Liabilities payable from
restricted assets:Accounts payable 20,637,779 - - 20,637,779 - Accrued payroll 282,180 - - 282,180 - Accrued interest 19,718,717 599,737 - 20,318,454 - Current portion of long term debt 28,795,000 2,326,105 - 31,121,105 -
Commercial paper payable 125,000,000 382,587 - 125,382,587 - Total current liabilities 213,723,967 5,399,026 2,966,096 222,089,089 45,764,959
Noncurrent liabilities:Revenue bonds payable 755,218,162 48,284,482 - 803,502,644 - General obligation bonds payable - 13,162,932 - 13,162,932 - Claims payable - - - - 5,237,208 Net pension liability 17,477,001 58,239 2,975,984 20,511,224 -
Total noncurrent liabilities 772,695,163 61,505,653 2,975,984 837,176,800 5,237,208 Total liabilities 986,419,130 66,904,679 5,942,080 1,059,265,889 51,002,167
DEFERRED INFLOWS OF RESOURCES:Pensions 4,804,506 13,551 855,522 5,673,579 -
Total deferred inflows ofresources 4,804,506 13,551 855,522 5,673,579 -
NET POSITION:Net investment in capital assets 1,188,793,189 2,866,831 35,487,027 1,227,147,047 47,453,932 Restricted for debt retirement 65,759,015 1,077,838 - 66,836,853 - Unrestricted 46,344,242 9,235,725 21,849,748 77,429,715 125,108,357
Total net position $ 1,300,896,446 $ 13,180,394 $ 57,336,775 1,371,413,615 $ 172,562,289
Adjustment to reflect the consolidation of internal service fund activities related to enterprise funds (40,492,484) Net position of business-type activities $ 1,330,921,131
THE METROPOLITAN GOVERNMENT OF NASHVILLE AND DAVIDSON COUNTY
STATEMENT OF NET POSITION
Department of GovernmentalBusiness-type Activities - Enterprise Funds
The accompanying notes are an integral part of this financial statement.
LIABILITIES:
Enterprise
PROPRIETARY FUNDS (CONTINUED)
June 30, 2016
Activities -Sewerage
Other TotalDistrictEnergy
Water and
B-19
Service FundsInternal
Services FundsEnterprise
FundsSystem

OPERATING REVENUES:Charges for services $ 216,300,764 $ 17,596,805 $ 22,043,131 $ 255,940,700 $ 369,523,003 Other 1,057,743 - - 1,057,743 9,835,719
Total operating revenues 217,358,507 17,596,805 22,043,131 256,998,443 379,358,722
OPERATING EXPENSES:Personal services 48,852,045 201,712 9,896,961 58,950,718 17,627,623 Contractual services 42,525,312 13,587,774 8,263,006 64,376,092 27,721,042 Supplies and materials 15,314,179 171,790 579,587 16,065,556 12,522,510 Depreciation 82,842,872 2,329,064 2,334,116 87,506,052 15,279,173 Compensation for damages - - - - 2,269,048 Medical and insurance benefits - - - - 332,773,887 Other 5,516,240 45,921 627,419 6,189,580 4,118,815
Total operating expenses 195,050,648 16,336,261 21,701,089 233,087,998 412,312,098
OPERATING INCOME (LOSS) 22,307,859 1,260,544 342,042 23,910,445 (32,953,376)
NONOPERATING REVENUE (EXPENSE):Investment income (loss) 1,187,544 53,493 93,032 1,334,069 803,646 Interest expense (34,644,137) (1,567,970) - (36,212,107) - Gain (loss) on sale of property 51,376 - 1,001,619 1,052,995 28,914 Other 425,400 (30,025) - 395,375 (2,548,236)
Total nonoperating revenue(expense) (32,979,817) (1,544,502) 1,094,651 (33,429,668) (1,715,676)
INCOME (LOSS) BEFORE CAPITALGRANTS AND CONTRIBUTIONSAND TRANSFERS (10,671,958) (283,958) 1,436,693 (9,519,223) (34,669,052)
CAPITAL GRANTS AND CONTRIBUTIONS 22,769,848 - - 22,769,848 - TRANSFERS IN - 1,794,000 3,065,451 4,859,451 38,901,092 TRANSFERS OUT (12,548,837) (1,330,100) (3,968,943) (17,847,880) (2,082,638)
CHANGE IN NET POSITION (450,947) 179,942 533,201 262,196 2,149,402
NET POSITION, beginning of year 1,301,347,393 13,000,452 56,803,574 170,412,887
NET POSITION, end of year $ 1,300,896,446 $ 13,180,394 $ 57,336,775 $ 172,562,289
Adjustment to reflect the consolidation of internal service fund activities related to enterprise funds (3,230,473)
Change in net position of business-type activities $ (2,968,277)
Enterprise
Governmental
THE METROPOLITAN GOVERNMENT OF NASHVILLE AND DAVIDSON COUNTY
STATEMENT OF REVENUES, EXPENSES AND CHANGES IN NET POSITIONPROPRIETARY FUNDS
For the Year Ended June 30, 2016
Business-type Activities - Enterprise FundsDepartment of
The accompanying notes are an integral part of this financial statement.
B-20
Services
Activities -Internal
Service FundsSewerage
System
DistrictEnergy
Water and
Funds
TotalEnterprise
Funds
Other


Cash flows from operating activities:Receipts from customers and users $ 216,887,323 $ 17,444,023 $ 21,618,823 $ 255,950,169 $ 379,470,697 Payments to suppliers (54,743,973) (14,207,323) (10,406,430) (79,357,726) (380,457,946) Payments to employees (46,659,918) (190,815) (9,547,983) (56,398,716) (16,922,233) Other receipts - - - - 256,386 Other payments (3,791,664) - - (3,791,664) (2,804,622)
Net cash provided by (used in) operatingactivities 111,691,768 3,045,885 1,664,410 116,402,063 (20,457,718)
Cash flows from noncapital financing activities:Transfers in - 1,794,000 3,065,451 4,859,451 38,901,092 Transfers out (12,548,837) (1,330,100) (3,968,943) (17,847,880) (2,082,638) Decrease (increase) in advances from other funds - - (2,291,057) (2,291,057) -
Net cash provided by (used in) non-capital financing activities (12,548,837) 463,900 (3,194,549) (15,279,486) 36,818,454
Cash flows from capital and related financing activities:Acquisition of capital assets (144,868,657) (360,656) (1,175,051) (146,404,364) (15,971,885) Proceeds from the sale of property 51,376 - 1,001,619 1,052,995 109,652 Proceeds from borrowings 75,000,000 1,204,982 - 76,204,982 - Principal payments on borrowings (20,326,424) (2,953,355) - (23,279,779) - Interest subsidy 4,973,546 - - 4,973,546 - Interest paid (40,385,150) (2,052,716) - (42,437,866) - Capital contributions received 11,551,772 - - 11,551,772 -
Net cash provided by (used in) capital andrelated financing activities (114,003,537) (4,161,745) (173,432) (118,338,714) (15,862,233)
Cash flows from investing activities:Increase (decrease) in investments - 629,930 77,320 707,250 - Interest on investments 973,715 37,883 - 1,011,598 653,420
Net cash provided by (used in) investingactivities 973,715 667,813 77,320 1,718,848 653,420
Net changes in cash and cash equivalents (13,886,891) 15,853 (1,626,251) (15,497,289) 1,151,923
Cash and cash equivalents at beginning of year 275,499,420 7,114,859 21,321,217 303,935,496 171,204,545
Cash and cash equivalents at end of year $ 261,612,529 $ 7,130,712 $ 19,694,966 $ 288,438,207 $ 172,356,468
Cash and cash equivalents are classified as:Current assets $ 55,010,190 $ 5,452,737 $ 19,694,966 $ 80,157,893 $ 172,356,468 Current restricted assets 49,135,106 1,677,575 - 50,812,681 - Noncurrent restricted assets 157,467,233 - - 157,467,233 -
Cash and cash equivalents at end of year $ 261,612,529 $ 7,130,312 $ 19,694,966 $ 288,437,807 $ 172,356,468
THE METROPOLITAN GOVERNMENT OF NASHVILLE AND DAVIDSON COUNTY
STATEMENT OF CASH FLOWSPROPRIETARY FUNDS
For the Year Ended June 30, 2016
Activities -
FundsInternal
System
GovernmentalDistrict
EnterpriseOther
Service Funds
The accompanying notes are an integral part of this financial statement.
B-22
Business-type Activities - Enterprise Funds
Services
Department ofWater andSewerage
Total
FundsEnergy Enterprise

Reconciliation of operating income (loss) to net cashprovided by (used in) operating activities:
Operating income (loss) $ 22,307,859 $ 1,260,544 $ 342,042 $ 23,910,445 $ (32,953,376) Adjustments to reconcile operating income (loss)
to net cash provided by (used in) operatingactivities:
Depreciation 82,842,872 2,329,064 2,334,116 87,506,052 15,279,173 Provision for doubtful accounts (240,000) - (210,397) (450,397) - Other receipts 425,400 - - 425,400 256,386 Other payments - (30,025) - (30,025) (2,804,622) Changes in assets, deferred outflows of resources,
liabilities and deferred inflows of resourcesAccounts receivable 872,244 (122,757) (243,079) 506,408 40,500 Due from other funds of the primary
government 159,407 - 109,531 268,938 72,178 Due from component units (1,242) - - (1,242) (703) Inventories of supplies (303,121) - - (303,121) (91,201) Other current assets (6,680) - (962) (7,642) (3,529) Deferred outflows pensions (9,113,840) (35,888) (1,467,964) (10,617,692) - Accounts payable 3,398,639 (405,720) (102,075) 2,890,844 (1,661,600) Accrued payroll 463,700 4,091 70,579 538,370 408,897 Claims payable - - - - 1,068,227 Due to other funds of the primary
government (175,482) 3,882 (32,054) (203,654) (68,048) Due to component units (175,776) - (975,025) (1,150,801) - Customer deposits (45,685) - (80,744) (126,429) - Unearned revenue - - 190,065 190,065 - Other current liabilities 441,206 - (15,986) 425,220 - Net pension liability 9,887,875 38,936 1,592,639 11,519,450 - Deferred inflows pensions 954,392 3,758 153,724 1,111,874 -
Total adjustments 89,383,909 1,785,341 1,322,368 92,491,618 12,495,658 Net cash provided by (used in)
operating activities $ 111,691,768 $ 3,045,885 $ 1,664,410 $ 116,402,063 $ (20,457,718)
Non-Cash Capital, Financing and Investing Activities:
Contributions of capital assets $ 11,725,945 $ - $ - $ 11,725,945 $ - Increase in fair value of investments - 15,619 - 15,619 -
Department ofWater and District
PROPRIETARY FUNDS (CONTINUED)
Activities -TotalGovernmental
Other
THE METROPOLITAN GOVERNMENT OF NASHVILLE AND DAVIDSON COUNTY
STATEMENT OF CASH FLOWS
Business-type Activities - Enterprise Funds
For the Year Ended June 30, 2016
The accompanying notes are an integral part of this financial statement.
Energy
B-23
Service FundsInternal
System FundsEnterprise
FundsEnterpriseSewerage
Services

Pension(and Other
Employee Benefit) AgencyTrust Funds Funds
ASSETS: Cash and cash equivalents $ 192,000,714 $ 45,622,974 Investments, at fair value: Equity commingled funds 59,753,502 - Commercial mortgage backed securities 2,098,728 - Conventional mortgages 940,179 - Emerging markets 18,621,193 - Corporate bonds and notes 157,926,121 - High yield bonds 51,947,627 - Futures 3,944,140 - Common stock 311,642,995 - Preferred stock 3,498,839 - Non agency mortgages/collateralized mortgage obligations 22,963,193 - Venture capital and partnerships 1,693,650,720 - Registered investment companies 92,633,127 - International bonds 2,804,770 - Sector funds 26,039,394 - Non U.S. treasury securities developing markets 5,883,223 - U.S. treasury securities 23,356,041 - Other securities 57,356,723 - Other fixed income 147,774,158 - Commingled funds U.S. debt 10,282,846 - Cash collateral received - securities lending program 34,754,646 - Mortgages and real estate - 1,291,100 Mutual funds - 16,573 Accounts receivable 160,862,094 - Accrued interest receivable 5,461,036 1,570 Due from other funds of the primary government 9,729,011 1,008,881 Other assets - 54,891 Total assets 3,095,925,020 $ 47,995,989
LIABILITIES: Accounts payable 2,319,347 $ - Due to brokers 286,936,758 - Payable for collateral received - securities lending program 34,754,646 - Due to other funds of the primary government 291,852 - Funds held in custody for others - 32,392,764 Other liabilities - 15,603,225 Total liabilities 324,302,603 $ 47,995,989
NET POSITION: Restricted for pensions 2,769,317,881 Held in trust for other employee benefits 2,304,536 Total net position $ 2,771,622,417
The accompanying notes are an integral part of this financial statement.
B-24
THE METROPOLITAN GOVERNMENT OF NASHVILLE AND DAVIDSON COUNTY
STATEMENT OF FIDUCIARY NET POSITIONFIDUCIARY FUNDS
June 30, 2016

THE METROPOLITAN GOVERNMENT OF NASHVILLE AND DAVIDSON COUNTY
STATEMENT OF CHANGES IN FIDUCIARY NET POSITION
(and otherEmployee Benefit)
Trust FundsADDITIONS: Investment income: Interest and dividend income $ 34,274,398 Net appreciation (depreciation) of investments (17,289,402) Miscellaneous 445,861
Net increase (decrease) in fair value of investments 17,430,857
Net income earned on securities lending transactions: Securities lending income 282,797 Securities lending expense (56,541)
Net income earned on securities lending transactions 226,256
Less investment expenses (11,105,060)
Net investment income (loss) 6,552,053
Contributions: Employee contributions 2,155,621 Employer contributions 119,169,946 Transfers in 244,632 Contributions from the State of Tennessee 16,200,749 Miscellaneous 2,321,813
Total contributions 140,092,761
Total additions 146,644,814
DEDUCTIONS: Pension and other employee benefits 204,442,912 Refunds of contributions 14,685 Administrative expenses 15,069,565 Transfers out 1,958,960
Total deductions 221,486,122
Change in net position (74,841,308)
NET POSITION, beginning of year 2,846,463,725
NET POSITION, end of year $ 2,771,622,417
FIDUCIARY FUNDS
For the Year Ended June 30, 2016
The accompanying notes are an integral part of this financial statement.
B-25
Pension

District IndustrialManagement Sports DevelopmentCorporation Authority Board
ASSETS:Cash and cash equivalents $ 59,341 $ 175,626 $ 3,690,138 $ 618,392 Investments - - - - Accounts receivable - - 7,314,179 - Allowance for doubtful accounts - - - - Accrued interest receivable - - 8,360 551 Due from the primary government - - 2,984 - Inventories of supplies - - - - Other current assets 3,051 4,400 - - Restricted assets: Cash and cash equivalents - - 11,729,229 - Investments - - 2,397,346 - Accounts receivable - - 905,289 - Accrued interest receivable - - - - Due from other governmental agencies - - - - Due from the primary government - - - - Other restricted assets - - - - Notes receivable - - 30,068,887 - Capital assets: Utility plant in service - - - - Land - - 75,698,193 - Buildings and improvements - - 453,612,884 - Improvements other than buildings 135,509 - 1,601,646 - Furniture, machinery and equipment 18,697 37,571 40,932,491 - Infrastructure - - - - Public art - - - - Construction in progress - - 10,857,534 - Less accumulated depreciation (154,206) (9,770) (180,578,182) - Other noncurrent assets - - - -
Total assets 62,392 207,827 458,240,978 618,943
DEFERRED OUTFLOWS OF RESOURCES:Deferred charge on refunding - - 3,448,041 - Pensions - - - -
Total deferred outflows of resources - - 3,448,041 -
District, Inc.Improvement
B-26
The accompanying notes are an integral part of this financial statement.
THE METROPOLITAN GOVERNMENT OF NASHVILLE AND DAVIDSON COUNTY
STATEMENT OF NET POSITION
GulchNashville
COMPONENT UNITS
Business
June 30, 2016
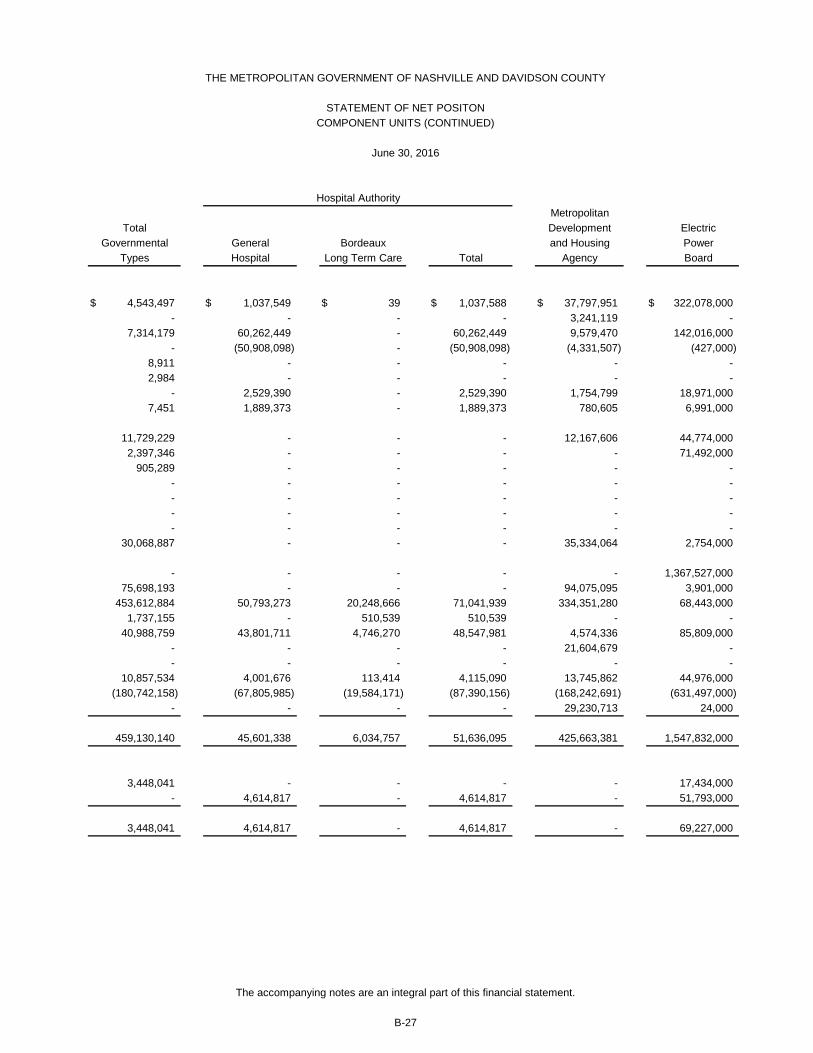
MetropolitanTotal Development Electric
Governmental General Bordeaux and Housing PowerTypes Hospital Long Term Care Total Agency Board
$ 4,543,497 $ 1,037,549 $ 39 $ 1,037,588 $ 37,797,951 $ 322,078,000 - - - - 3,241,119 -
7,314,179 60,262,449 - 60,262,449 9,579,470 142,016,000 - (50,908,098) - (50,908,098) (4,331,507) (427,000)
8,911 - - - - - 2,984 - - - - -
- 2,529,390 - 2,529,390 1,754,799 18,971,000 7,451 1,889,373 - 1,889,373 780,605 6,991,000
11,729,229 - - - 12,167,606 44,774,000 2,397,346 - - - - 71,492,000
905,289 - - - - - - - - - - - - - - - - - - - - - - - - - - - - -
30,068,887 - - - 35,334,064 2,754,000
- - - - - 1,367,527,000 75,698,193 - - - 94,075,095 3,901,000
453,612,884 50,793,273 20,248,666 71,041,939 334,351,280 68,443,000 1,737,155 - 510,539 510,539 - -
40,988,759 43,801,711 4,746,270 48,547,981 4,574,336 85,809,000 - - - - 21,604,679 - - - - - - -
10,857,534 4,001,676 113,414 4,115,090 13,745,862 44,976,000 (180,742,158) (67,805,985) (19,584,171) (87,390,156) (168,242,691) (631,497,000)
- - - - 29,230,713 24,000
459,130,140 45,601,338 6,034,757 51,636,095 425,663,381 1,547,832,000
3,448,041 - - - - 17,434,000 - 4,614,817 - 4,614,817 - 51,793,000
3,448,041 4,614,817 - 4,614,817 - 69,227,000
The accompanying notes are an integral part of this financial statement.
B-27
THE METROPOLITAN GOVERNMENT OF NASHVILLE AND DAVIDSON COUNTY
STATEMENT OF NET POSITON
Hospital Authority
COMPONENT UNITS (CONTINUED)
June 30, 2016

MetropolitanNashville Emergency
Transit Airport CommunicationsAuthority Authority District
ASSETS:Cash and cash equivalents $ 5,094,422 $ 93,189,798 $ 748,048 Investments - - 6,929,222 Accounts receivable 1,210,145 6,214,074 - Allowance for doubtful accounts (6,000) (60,000) - Accrued interest receivable - - - Due from the primary government - - - Inventories of supplies 2,557,325 479,200 - Other current assets 1,258,244 1,406,582 132,944 Restricted assets: Cash and cash equivalents 4,487,978 292,943,216 - Investments - 1,723,000 - Accounts receivable - - - Accrued interest receivable - - - Due from other governmental agencies 4,543,177 1,821,237 - Due from the primary government - - - Other restricted assets - 3,798,414 - Notes receivable - - - Capital assets: Utility plant in service - - - Land 15,155,266 96,968,771 - Buildings and improvements 98,162,186 264,629,088 - Improvements other than buildings - 541,464,084 - Furniture, machinery and equipment 123,791,422 129,795,510 10,824,488 Infrastructure - - - Public art - - - Construction in progress 4,005,886 42,890,290 126,600 Less accumulated depreciation (104,211,653) (539,922,435) (8,154,682) Other noncurrent assets 350,000 1,835,669 -
Total assets 156,398,398 939,176,498 10,606,620
DEFERRED OUTFLOWS OF RESOURCES:Deferred charge on refunding - 709,223 - Pensions 6,255,597 7,141,092 -
Total deferred outflows of resources 6,255,597 7,850,315 -
The accompanying notes are an integral part of this financial statement.
B-28
THE METROPOLITAN GOVERNMENT OF NASHVILLE AND DAVIDSON COUNTY
STATEMENT OF NET POSITIONCOMPONENT UNITS (CONTINUED)
Metropolitan
June 30, 2016

ConventionCenter Proprietary
Authority Types
$ 95,208,607 $ 555,154,414 $ 559,697,911 - 10,170,341 10,170,341
1,240,913 220,523,051 227,837,230 (4,106) (55,736,711) (55,736,711) 81,897 81,897 90,808
5,806,441 5,806,441 5,809,425 - 26,291,714 26,291,714
474,041 12,932,789 12,940,240
41,682,602 396,055,402 407,784,631 32,872,268 106,087,268 108,484,614 2,738,410 2,738,410 3,643,699
113,298 113,298 113,298 - 6,364,414 6,364,414
2,933,384 2,933,384 2,933,384 2,272 3,800,686 3,800,686
- 38,088,064 68,156,951
- 1,367,527,000 1,367,527,000 79,989,700 290,089,832 365,788,025
635,466,263 1,472,093,756 1,925,706,640 - 541,974,623 543,711,778
3,342,298 406,685,035 447,673,794 - 21,604,679 21,604,679
1,183,844 1,183,844 1,183,844 - 109,859,728 120,717,262
(50,770,615) (1,590,189,232) (1,770,931,390) - 31,440,382 31,440,382
852,361,517 3,983,674,509 4,442,804,649
- 18,143,223 21,591,264 568,283 70,372,789 70,372,789
568,283 88,516,012 91,964,053
ComponentUnits
The accompanying notes are an integral part of this financial statement.
B-29
THE METROPOLITAN GOVERNMENT OF NASHVILLE AND DAVIDSON COUNTY
STATEMENT OF NET POSITION
TotalTotal
COMPONENT UNITS (CONTINUED)
June 30, 2016

District IndustrialManagement Sports Development
Authority Board
LIABILITIES:Accounts payable $ 56,264 $ 47,029 $ 6,314,580 $ 86 Accrued payroll - - 4,822 - Due to the primary government - - 2,293 - Customer deposits - - - - Unearned revenue 2,962 332 - - Current portion of long-term liabilities - - - Current portion of capitalized lease obligations - - - - Other current liabilities - - - - Liabilities payable from restricted assets: Accounts payable - - - - Accrued interest - - 3,117,571 - Current portion of long-term liabilities - - 7,320,000 - Revenue bonds payable - - 140,522,021 - Capitalized lease obligations - - - - TVA advances - - - - Other long-term liabilities - - 17,294,933 -
Total liabilities 59,226 47,361 174,576,220 86
DEFERRED INFLOWS OF RESOURCES: Tax increment financing - - 28,000,000 - Effective portion of fuel hedging - - - - Pensions - - - -
Total deferred inflows of resources - - 28,000,000 -
NET POSITION:Net investment in capital assets - 27,801 246,089,182 - Restricted for debt retirement - - 11,765,231 - Restricted for other purposes - - - - Unrestricted 3,166 132,665 1,258,386 618,857
Total net position $ 3,166 $ 160,466 $ 259,112,799 $ 618,857
B-30
Corporation District, Inc.
Nashville GulchBusiness
The accompanying notes are an integral part of this financial statement.
Improvement
STATEMENT OF NET POSITION
June 30, 2016
COMPONENT UNITS (CONTINUED)
THE METROPOLITAN GOVERNMENT OF NASHVILLE AND DAVIDSON COUNTY

MetropolitanTotal Development Electric
Governmental General Bordeaux and Housing PowerTypes Hospital Long Term Care Total Agency Board
$ 6,417,959 $ 18,775,574 $ - $ 18,775,574 $ 6,510,576 $ 190,524,000 4,822 4,364,568 - 4,364,568 635,980 - 2,293 - - - - -
- - - - 613,534 15,884,000 3,294 - - - - -
- - - - 4,069,647 - - 2,327,298 - 2,327,298 - - - 1,084,999 - 1,084,999 8,912,037 -
- - - - - 1,425,000 3,117,571 - - - - 3,048,000 7,320,000 - - - - 25,357,000
140,522,021 - - - - 568,384,000 - 22,800,319 - 22,800,319 - - - - - - - 2,754,000
17,294,933 6,522,524 - 6,522,524 67,136,927 238,247,000 -
174,682,893 55,875,282 - 55,875,282 87,878,701 1,045,623,000
28,000,000 - - - - - - - - - - - - 1,887,635 - 1,887,635 - -
28,000,000 1,887,635 - 1,887,635 - -
246,116,983 5,663,057 6,034,718 11,697,775 258,719,344 410,690,000 11,765,231 - - - - 63,954,000
- - - - 1,096,070 - 2,013,074 (13,209,819) 39 (13,209,780) 77,969,266 96,792,000
$ 259,895,288 $ (7,546,762) $ 6,034,757 $ (1,512,005) $ 337,784,680 $ 571,436,000
B-31
The accompanying notes are an integral part of this financial statement.
Hospital Authority
June 30, 2016
COMPONENT UNITS (CONTINUED)
THE METROPOLITAN GOVERNMENT OF NASHVILLE AND DAVIDSON COUNTY
STATEMENT OF NET POSITION

MetropolitanNashville Emergency
Transit Airport CommunicationsAuthority Authority District
LIABILITIES:Accounts payable $ 2,883,384 $ 14,809,924 $ 107,747 Accrued payroll 1,817,816 5,243,936 - Due to the primary government - - - Customer deposits - - - Unearned revenue - 3,620,476 - Current portion of long-term liabilities - 1,189,324 - Current portion of capitalized lease obligations - - - Other current liabilities 8,243,544 59,770 - Liabilities payable from restricted assets: Accounts payable - 1,807,935 - Accrued interest - 8,143,314 - Current portion of long-term liabilities - 12,775,000 - Revenue bonds payable - 328,943,869 - Capitalized lease obligations - - - TVA advances - - - Other long-term liabilities 65,158,671 47,573,381 -
Total liabilities 78,103,415 424,166,929 107,747
DEFERRED INFLOWS OF RESOURCES:Tax increment financing - - - Effective portion of fuel hedging 523,974 - - Pensions 2,485,237 887,589 -
Total deferred inflows of resources 3,009,211 887,589 -
NET POSITION:Net investment in capital assets 124,676,314 419,177,366 2,796,406 Restricted for debt retirement - 22,868,801 - Restricted for other purposes 737,747 48,085,310 - Unrestricted (43,872,692) 31,840,818 7,702,467
Total net position $ 81,541,369 $ 521,972,295 $ 10,498,873
B-32
The accompanying notes are an integral part of this financial statement.
Metropolitan
STATEMENT OF NET POSITION
June 30, 2016
COMPONENT UNITS (CONTINUED)
THE METROPOLITAN GOVERNMENT OF NASHVILLE AND DAVIDSON COUNTY

ConventionCenter Proprietary
Authority Types
$ 2,974,591 $ 236,585,796 $ 243,003,755 1,113,264 13,175,564 13,180,386
10,037 10,037 12,330 - 16,497,534 16,497,534
5,124,519 8,744,995 8,748,289 - 5,258,971 5,258,971 - 2,327,298 2,327,298 - 18,300,350 18,300,350
3,439,759 6,672,694 6,672,694
20,429,377 31,620,691 34,738,262 7,865,000 45,997,000 53,317,000
612,934,946 1,510,262,815 1,650,784,836 - 22,800,319 22,800,319 - 2,754,000 2,754,000
799,038 425,437,541 442,732,474
654,690,531 2,346,445,605 2,521,128,498
- - 28,000,000 - 523,974 523,974
228,589 5,489,050 5,489,050
228,589 6,013,024 34,013,024
49,061,895 1,276,819,100 1,522,936,083 55,822,747 142,645,548 154,410,779
- 49,919,127 49,919,127 93,126,038 250,348,117 252,361,191
$ 198,010,680 $ 1,719,731,892 $ 1,979,627,180
Units
B-33
The accompanying notes are an integral part of this financial statement.
ComponentTotal Total
THE METROPOLITAN GOVERNMENT OF NASHVILLE AND DAVIDSON COUNTY
COMPONENT UNITS (CONTINUED)STATEMENT OF NET POSITION
June 30, 2016
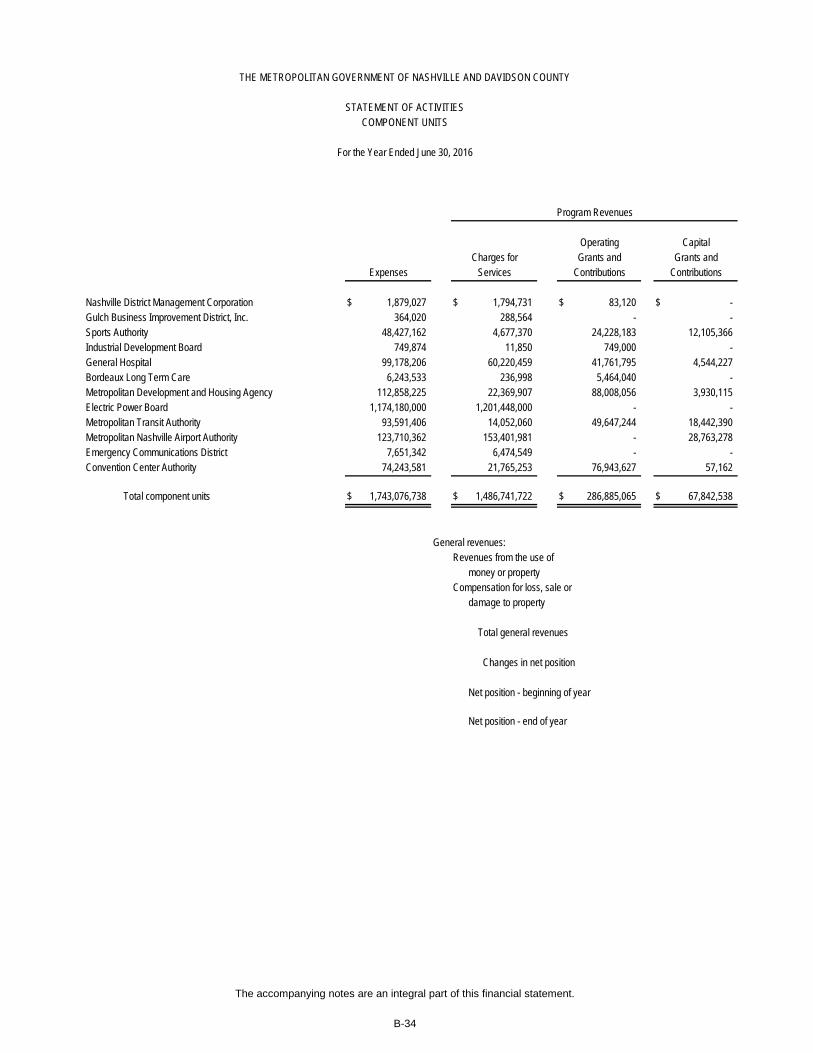
Nashville District Management Corporation $ 1,879,027 $ 1,794,731 $ 83,120 $ - Gulch Business Improvement District, Inc. 364,020 288,564 - - Sports Authority 48,427,162 4,677,370 24,228,183 12,105,366 Industrial Development Board 749,874 11,850 749,000 - General Hospital 99,178,206 60,220,459 41,761,795 4,544,227 Bordeaux Long Term Care 6,243,533 236,998 5,464,040 - Metropolitan Development and Housing Agency 112,858,225 22,369,907 88,008,056 3,930,115 Electric Power Board 1,174,180,000 1,201,448,000 - - Metropolitan Transit Authority 93,591,406 14,052,060 49,647,244 18,442,390 Metropolitan Nashville Airport Authority 123,710,362 153,401,981 - 28,763,278 Emergency Communications District 7,651,342 6,474,549 - - Convention Center Authority 74,243,581 21,765,253 76,943,627 57,162
Total component units $ 1,743,076,738 $ 1,486,741,722 $ 286,885,065 $ 67,842,538
General revenues:Revenues from the use of
money or propertyCompensation for loss, sale or
damage to property
Total general revenues
Changes in net position
Net position - beginning of year
Net position - end of year
THE METROPOLITAN GOVERNMENT OF NASHVILLE AND DAVIDSON COUNTY
STATEMENT OF ACTIVITIES
For the Year Ended June 30, 2016
Program Revenues
COMPONENT UNITS
Charges for Grants and Grants andCapitalOperating
B-34
The accompanying notes are an integral part of this financial statement.
Expenses Services Contributions Contributions

$ (1,176) $ - $ - $ - $ (1,176) $ - $ - $ - - (75,456) - - (75,456) - - - - - (7,416,243) - (7,416,243) - - - - - - 10,976 10,976 - - - - - - - - 7,348,275 - 7,348,275 - - - - - - (542,495) (542,495) - - - - - - - - - - - - - - - - - - - - - - - - - - - - - - - - - - - - - - - - - - - - - - - -
(1,176) (75,456) (7,416,243) 10,976 (7,481,899) 7,348,275 (542,495) 6,805,780
1,176 1,900 1,363,203 3,057 1,369,336 - - -
- - 1,875,358 - 1,875,358 - - -
1,176 1,900 3,238,561 3,057 3,244,694 - - -
- (73,556) (4,177,682) 14,033 (4,237,205) 7,348,275 (542,495) 6,805,780
3,166 234,022 263,290,481 604,824 264,132,493 (14,895,037) 6,577,252 (8,317,785)
$ 3,166 $ 160,466 $ 259,112,799 $ 618,857 $ 259,895,288 $ (7,546,762) $ 6,034,757 $ (1,512,005)
Long Term Care
The accompanying notes are an integral part of this financial statement.
Sports GovernmentalBoard
COMPONENT UNITS (CONTINUED)
Gulch
THE METROPOLITAN GOVERNMENT OF NASHVILLE AND DAVIDSON COUNTY
STATEMENT OF ACTIVITIES
Net (Expense) Revenue and Changes in Net Position
For the Year Ended June 30, 2016
NashvilleDistrict
Corporation
Business Total Hospital AuthorityIndustrialGeneralManagement Improvement BordeauxDevelopment
District, Inc. Authority Types Hospital Total
B-35

Nashville District Management Corporation $ - $ - $ - $ - Gulch Business Improvement District, Inc. - - - - Sports Authority - - - - Industrial Development Board - - - - General Hospital - - - - Bordeaux Long Term Care - - - - Metropolitan Development and Housing Agency 1,449,853 - - - Electric Power Board - 27,268,000 - - Metropolitan Transit Authority - - (11,449,712) - Metropolitan Nashville Airport Authority - - - 58,454,897 Emergency Communications District - - - - Convention Center Authority - - - -
Total component units 1,449,853 27,268,000 (11,449,712) 58,454,897
General revenues:Revenues from the use of
money or property 172,702 1,303,000 - 333,542 Compensation for loss, sale or
damage to property - - - -
Total general revenues 172,702 1,303,000 - 333,542
Changes in net position 1,622,555 28,571,000 (11,449,712) 58,788,439
Net position - beginning of year 336,162,125 542,865,000 92,991,081 463,183,856
Net position - end of year $ 337,784,680 $ 571,436,000 $ 81,541,369 $ 521,972,295
and Housing AirportPower TransitDevelopment Metropolitan
MetropolitanElectric Nashville
STATEMENT OF ACTIVITIES
Metropolitan
THE METROPOLITAN GOVERNMENT OF NASHVILLE AND DAVIDSON COUNTY
COMPONENT UNITS (CONTINUED)
Net (Expense) Revenue and Changes in Net Position
For the Year Ended June 30, 2016
The accompanying notes are an integral part of this financial statement.
Board AuthorityAuthority
B-36
Agency

$ - $ - $ - $ (1,176) - - - (75,456) - - - (7,416,243) - - - 10,976 - - 7,348,275 7,348,275 - - (542,495) (542,495) - - 1,449,853 1,449,853 - - 27,268,000 27,268,000 - - (11,449,712) (11,449,712) - - 58,454,897 58,454,897
(1,176,793) - (1,176,793) (1,176,793) - 24,522,461 24,522,461 24,522,461
(1,176,793) 24,522,461 105,874,486 98,392,587
16,826 1,732,786 3,558,856 4,928,192
- - - 1,875,358
16,826 1,732,786 3,558,856 6,803,550
(1,159,967) 26,255,247 109,433,342 105,196,137
11,658,840 171,755,433 1,610,298,550 1,874,431,043
$ 10,498,873 $ 198,010,680 $ 1,719,731,892 $ 1,979,627,180
ProprietaryTotal
ComponentUnits
CommunicationsAuthority
ConventionCenter
THE METROPOLITAN GOVERNMENT OF NASHVILLE AND DAVIDSON COUNTY
STATEMENT OF ACTIVITIESCOMPONENT UNITS (CONTINUED)
For the Year Ended June 30, 2016
Net (Expense) Revenue and Changes in Net Position
Emergency
The accompanying notes are an integral part of this financial statement.
Total
B-37
TypesDistrict


THE METROPOLITAN GOVERNMENT OF NASHVILLE AND DAVIDSON COUNTY
NOTES TO THE FINANCIAL STATEMENTS
B-39
NOTE 1 – SUMMARY OF SIGNIFICANT ACCOUNTING POLICIES The Metropolitan Government of Nashville and Davidson County (the Government) operates under a metropolitan form of government and provides the following services as authorized by its charter: public safety (police and fire), highways and streets, sanitation, health and social services, education, culture and recreation, public improvements, planning and zoning and general administrative services. The accounting policies of the Government conform to accounting principles generally accepted in the United States of America as applied to governmental units. The following is a summary of the most significant policies: A. Reporting Entity
The financial statements of the Government present the primary government and its component units. The component units discussed below are included in the Government's reporting entity because of the significance of their operational or financial relationships with the Government. Each discretely presented component unit is reported separately in the basic financial statements to emphasize that it is legally separate from the Government. The financial statements of the following component units have been discretely presented:
The Nashville District Management Corporation was established in 1998 to administer special assessment revenue collected by the Government for the benefit of the Central Business Improvement District (CBID). The Corporation’s duties and responsibilities are defined in a memorandum of agreement with the Government and include, but are not limited to, providing services for improvement and operation of the CBID through security enhancement, downtown marketing, and improving downtown beautification, sanitation and maintenance. The original agreement was one year, renewable annually by mutual notification by each party to the other. The agreement may be terminated by the Government upon thirty days notice. The Corporation is a legally separate entity which is closely related to and financially dependent on the Government as the Government has the legal obligation to levy the CBID taxes and approve the CBID tax rate. These taxes represent substantially all of the Corporation’s revenue. Complete financial statements of the Corporation can be obtained from its offices at Accounting Office, 211 Commerce Street, Suite 100, Nashville, TN 37201.
The Gulch Business Improvement District, Inc. (GBID, Inc.) was established in 2006 to administer special assessment revenue collected by the Government for the benefit of the Gulch Business Improvement District (GBID). GBID, Inc.’s duties and responsibilities are defined in the legislation approved by the Metropolitan Council creating the entity and include, but are not limited to, providing services for improvement and operation of the GBID such as promotion and marketing, security, sanitation, and aesthetic enhancements. GBID, Inc. is a legally separate entity which is closely related to and financially dependent on the Government as the Government has the legal obligation to levy the GBID taxes and approve the GBID tax rate. These taxes represent substantially all of GBID, Inc.’s revenue. Complete financial statements of GBID, Inc. can be obtained from its offices at 138 Second Avenue North, Suite 300, Nashville, TN 37201.
The Sports Authority was established in 1995 to act as the financing and building authority for both the Nashville arena and stadium. The Sports Authority administers and manages these facilities and other sports projects, including the ballpark, for the Government. The Government is responsible for annual funding for both the Nashville arena and stadium. The underlying credit for the Sports Authority Revenue bonds is a pledge on the non-tax revenues of the Government’s General Fund, and the Government is required to approve debt issuances of the Sports Authority. The members of the Sports Authority’s Board are all appointed and can also be removed by the Government. The Sports Authority does not issue separate financial statements. A Balance Sheet and Statement of Revenues, Expenditures and Changes in Fund Balances for its only fund are included in the Component Units section with reconciliations of those statements to the Statement of Net Position – Component Units and Statement of Activities – Component Units included in the basic financial statements. The Industrial Development Board (the IDB) assists private businesses within Davidson County in obtaining public financing through the issuance of bonds. The members of the IDB are appointed and can be removed by the Government. All debt of the IDB is considered conduit debt and is issued in the name of the Government. The IDB does not issue separate financial statements. A Balance Sheet and Statement of Revenues, Expenditures and Changes in Fund Balances for its only fund are included in the Component Units section. There are no reconciling items between those statements and the Statement of Net Position – Component Units and Statement of Activities – Component Units included in the basic financial statements. The Hospital Authority operates General Hospital (a full service medical facility) and Bordeaux Long Term Care (a long-term care facility) for the residents of Nashville and Davidson County. The Hospital Authority was created in March 1999 to operate both entities, which were previously accounted for as enterprise funds of the Government. The members of the Hospital Authority Board are all appointed and can also be removed by the Government. The Government approves and can modify the annual operating budget of each entity. Hospital
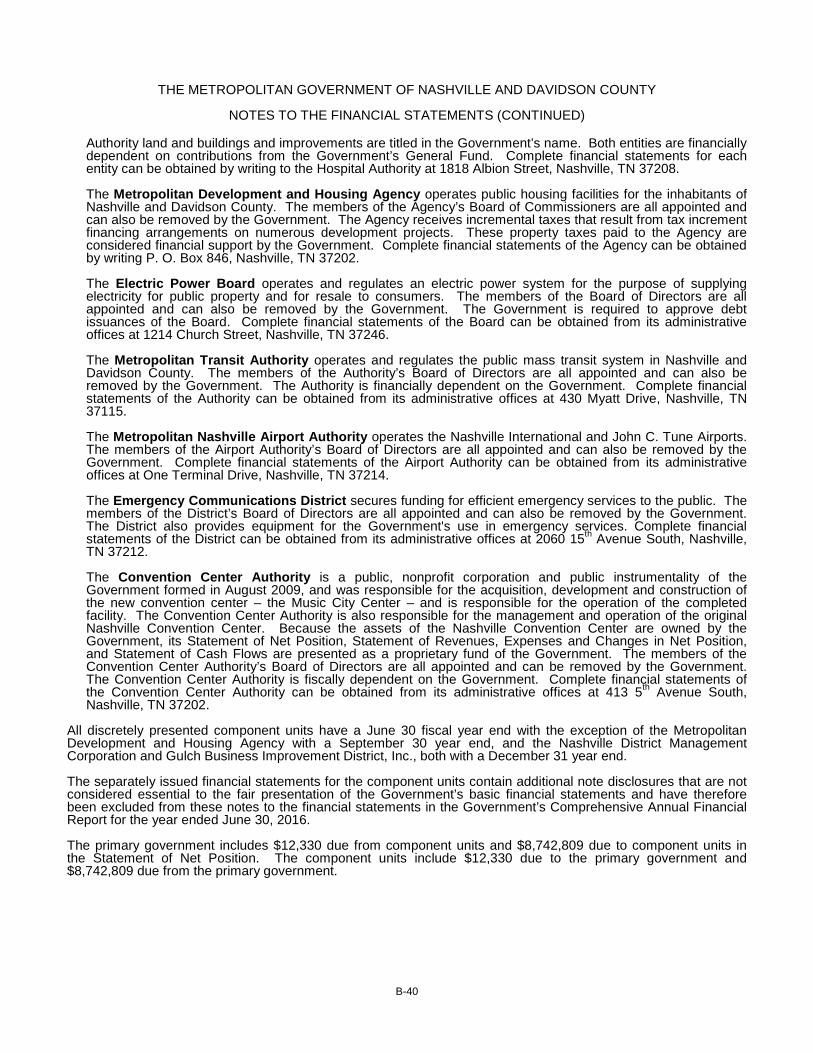
THE METROPOLITAN GOVERNMENT OF NASHVILLE AND DAVIDSON COUNTY
NOTES TO THE FINANCIAL STATEMENTS (CONTINUED)
B-40
Authority land and buildings and improvements are titled in the Government’s name. Both entities are financially dependent on contributions from the Government’s General Fund. Complete financial statements for each entity can be obtained by writing to the Hospital Authority at 1818 Albion Street, Nashville, TN 37208.
The Metropolitan Development and Housing Agency operates public housing facilities for the inhabitants of Nashville and Davidson County. The members of the Agency’s Board of Commissioners are all appointed and can also be removed by the Government. The Agency receives incremental taxes that result from tax increment financing arrangements on numerous development projects. These property taxes paid to the Agency are considered financial support by the Government. Complete financial statements of the Agency can be obtained by writing P. O. Box 846, Nashville, TN 37202. The Electric Power Board operates and regulates an electric power system for the purpose of supplying electricity for public property and for resale to consumers. The members of the Board of Directors are all appointed and can also be removed by the Government. The Government is required to approve debt issuances of the Board. Complete financial statements of the Board can be obtained from its administrative offices at 1214 Church Street, Nashville, TN 37246. The Metropolitan Transit Authority operates and regulates the public mass transit system in Nashville and Davidson County. The members of the Authority’s Board of Directors are all appointed and can also be removed by the Government. The Authority is financially dependent on the Government. Complete financial statements of the Authority can be obtained from its administrative offices at 430 Myatt Drive, Nashville, TN 37115.
The Metropolitan Nashville Airport Authority operates the Nashville International and John C. Tune Airports. The members of the Airport Authority’s Board of Directors are all appointed and can also be removed by the Government. Complete financial statements of the Airport Authority can be obtained from its administrative offices at One Terminal Drive, Nashville, TN 37214.
The Emergency Communications District secures funding for efficient emergency services to the public. The members of the District’s Board of Directors are all appointed and can also be removed by the Government. The District also provides equipment for the Government's use in emergency services. Complete financial statements of the District can be obtained from its administrative offices at 2060 15th Avenue South, Nashville, TN 37212. The Convention Center Authority is a public, nonprofit corporation and public instrumentality of the Government formed in August 2009, and was responsible for the acquisition, development and construction of the new convention center – the Music City Center – and is responsible for the operation of the completed facility. The Convention Center Authority is also responsible for the management and operation of the original Nashville Convention Center. Because the assets of the Nashville Convention Center are owned by the Government, its Statement of Net Position, Statement of Revenues, Expenses and Changes in Net Position, and Statement of Cash Flows are presented as a proprietary fund of the Government. The members of the Convention Center Authority’s Board of Directors are all appointed and can be removed by the Government. The Convention Center Authority is fiscally dependent on the Government. Complete financial statements of the Convention Center Authority can be obtained from its administrative offices at 413 5th Avenue South, Nashville, TN 37202.
All discretely presented component units have a June 30 fiscal year end with the exception of the Metropolitan Development and Housing Agency with a September 30 year end, and the Nashville District Management Corporation and Gulch Business Improvement District, Inc., both with a December 31 year end. The separately issued financial statements for the component units contain additional note disclosures that are not considered essential to the fair presentation of the Government’s basic financial statements and have therefore been excluded from these notes to the financial statements in the Government’s Comprehensive Annual Financial Report for the year ended June 30, 2016. The primary government includes $12,330 due from component units and $8,742,809 due to component units in the Statement of Net Position. The component units include $12,330 due to the primary government and $8,742,809 due from the primary government.

THE METROPOLITAN GOVERNMENT OF NASHVILLE AND DAVIDSON COUNTY
NOTES TO THE FINANCIAL STATEMENTS (CONTINUED)
B-41
B. Accounting Pronouncements The Government adopted GASB Statement No. 72, Fair Value Measurement and Application, required for fiscal periods beginning after June 15, 2015, in fiscal 2016. This Statement addresses accounting and financial reporting issues related to fair value measurements. The Government adopted or plans to adopt GASB Statement No. 73, Accounting and Financial Reporting for Pension and Related Assets That Are Not within the Scope of GASB Statement 68, and Amendments to Certain Provisions of GASB Statements 67 and 68, required for fiscal periods beginning after June 15, 2015 and 2016, in fiscal 2016 and 2017, respectively. This Statement improves the usefulness of information about pensions included in the general purpose external financial reports of state and local governments for making decisions and assessing accountability. The Government plans to adopt GASB Statement No. 74, Financial Reporting for Postemployment Benefit Plans Other Than Pension Plans, required for fiscal periods beginning after June 15, 2016, in fiscal 2017. This Statement improves the usefulness of information about postemployment benefits other than pensions (other postemployment benefits or OPEB) included in the general purpose external financial reports of state and local governmental OPEB plans for making decisions and assessing accountability. The Government plans to adopt GASB Statement No. 75, Accounting and Financial Reporting for Postemployment Benefits Other Than Pensions, required for fiscal periods beginning after June 15, 2017, in fiscal 2018. This Statement improves accounting and financial reporting by state and local governments for postemployment benefits other than pensions (other postemployment benefits or OPEB). The Government adopted GASB Statement No. 76, The Hierarchy of Generally Accepted Accounting Principles for State and Local Governments, required for fiscal periods beginning after June 15, 2015, in fiscal 2016. This Statement identifies – in the context of the current governmental financial reporting environment – the hierarchy of generally accepted accounting principles. The Government adopted GASB Statement No. 77, Tax Abatement Disclosures, required for fiscal periods beginning after December 15, 2015, in fiscal 2016. This Statement improves financial reporting by giving users of financial statements essential information regarding tax abatements that is not currently reported consistently or comprehensively. The Government plans to adopt GASB Statement No. 78, Pensions Provided through Certain Multiple-Employer Defined Benefit Pension Plans, required for fiscal periods beginning after December 15, 2015, in fiscal 2017. This Statement amends the scope and applicability of Statement No. 68 regarding pensions provided to employees of state and local government employers through certain cost-sharing multiple-employer defined benefit pension plans. The Government adopted or plans to adopt GASB Statement No. 79, Certain External Investment Pools and Pool Participants, required for fiscal periods beginning after June 15, 2015, except for certain provisions effective for fiscal periods beginning after December 15, 2015, in fiscal 2016 and 2017, respectively. This Statement addresses accounting and financial reporting for certain external investment pools and pool participants. The Government plans to adopt GASB Statement No. 80, Blending Requirements for Certain Component Units – an amendment of GASB Statement No. 14, required for fiscal periods beginning after June 15, 2016, in fiscal 2017. This Statement improves financial reporting by clarifying the financial statement presentation requirements for certain component units. The Government plans to adopt GASB Statement No. 81, Irrevocable Split-Interest Agreements, required for fiscal periods beginning after December 15, 2016, in fiscal 2018. This Statement improves accounting and financial reporting for irrevocable split-interest agreements by providing recognition and measurement guidance for situations in which a government is a beneficiary of the agreement. The Government plans to adopt GASB Statement No. 82, Pension Issues, required for fiscal periods beginning after June 15, 2016, except for certain provisions effective for fiscal periods beginning after June 15, 2017, in fiscal 2017 and 2018. This Statement improves financial reporting by enhancing consistency in the application of financial reporting requirements to certain pension issues. Unless otherwise noted, management is in the process of determining the effects that the adoption of these Statements will have on the Government’s financial statements.

THE METROPOLITAN GOVERNMENT OF NASHVILLE AND DAVIDSON COUNTY
NOTES TO THE FINANCIAL STATEMENTS (CONTINUED)
B-42
C. Government-Wide and Fund Financial Statements The government-wide financial statements (i.e., Statement of Net Position and Statement of Activities) report information on all of the non-fiduciary activities of the Government and its component units. Except for interfund services provided and used, all material interfund activity has been removed from these statements. Governmental activities, which normally are supported by taxes and intergovernmental revenues, are reported separately from business-type activities, which rely to a significant extent on fees and charges for support. Likewise, the primary government is reported separately from certain legally separate component units for which the primary government is financially accountable. The Statement of Net Position presents the Government’s non-fiduciary assets, deferred outflows of resources, liabilities, and deferred inflows of resources, with the difference reported as net position. Net position is reported in three categories:
Net investment in capital assets consists of capital assets, net of accumulated depreciation and reduced by outstanding debt that is attributable to the acquisition, construction and improvement of those assets.
Restricted net position consists of restricted assets reduced by liabilities and deferred inflows of resources related to those assets.
Unrestricted net position consists of net position which does not meet the definition of the two preceding categories.
The Statement of Activities demonstrates the degree to which the direct expenses of a given function are offset by program revenues. Direct expenses are those that are clearly identifiable with a specific function. Program revenues include 1) charges to customers who purchase, use, or directly benefit from goods, services, or privileges provided by a given function and 2) grants and contributions that are restricted to meeting the operational or capital requirements of a particular function. Taxes and other items not properly included among program revenues are reported instead as general revenues. Separate financial statements are provided for governmental funds, proprietary funds and fiduciary funds, even though the latter are excluded from the government-wide financial statements. Major individual governmental funds and major individual enterprise funds are reported as separate columns in the fund financial statements; nonmajor funds are combined in a single column. D. Measurement Focus, Basis of Accounting and Financial Statement Presentation The government-wide financial statements are reported using the economic resources measurement focus and the accrual basis of accounting, as are the proprietary and pension (and other employee benefit) trust fund financial statements. Revenues are recorded when earned and expenses are recorded when a liability is incurred, regardless of the timing of related cash flows. Property taxes are recognized as revenue in the year in which the levy is assessed. Grants and similar items are recognized as revenue as soon as all eligibility requirements have been met. Governmental fund financial statements are reported using the current financial resources measurement focus and the modified accrual basis of accounting. Revenues are recognized as soon as they are both measurable and available. Revenues are considered to be available when they are collectible within the current period or soon enough thereafter to pay liabilities of the current period. For this purpose, the Government considers revenues to be available if they are collected within 60 days of the end of the current fiscal period or up to one year for grant revenues. Property taxes, sales taxes, franchise taxes, licenses, interest and grant revenues associated with the current fiscal period are all considered to be susceptible to accrual and so have been recognized as receivables in the current fiscal period. Only the portion of special assessments receivable due within the current fiscal period is considered susceptible to accrual as revenue of the current period. All other revenue items are considered to be measurable and available only when cash is received by the Government. Expenditures generally are recorded when a liability is incurred, as under accrual accounting. However, debt service expenditures, as well as expenditures related to sick pay, compensated absences and other long-term commitments and contingencies are recorded only when payment is due. Agency fund financial statements report only assets and liabilities and accordingly have no measurement focus. However, they do use the accrual basis of accounting to recognize receivables and payables. Amounts reported as program revenues include 1) charges to customers for goods, services or privileges provided and fines and forfeitures, 2) operating grants and contributions and 3) capital grants and contributions. Amounts reported as general revenues include 1) all taxes, 2) unrestricted revenues from the use of money or

THE METROPOLITAN GOVERNMENT OF NASHVILLE AND DAVIDSON COUNTY
NOTES TO THE FINANCIAL STATEMENTS (CONTINUED)
B-43
property, 3) unrestricted revenues from other governmental agencies and 4) compensation for loss, sale or damage of property. Expenses reported by function include direct expenses that are specifically associated with a service or program and are clearly identifiable to a particular program. Some functions, such as general government and fiscal administration, include expenses that are in essence indirect expenses of other functions. The Government has elected not to charge these indirect expenses to other functions. Proprietary funds distinguish operating revenues and expenses from nonoperating items. Operating revenues and expenses generally result from providing services and producing and delivering goods and services in connection with the fund’s principal ongoing operations and consist primarily of charges to customers or departments, cost of sales and services, administrative expense and depreciation on capital assets. All revenues and expenses not meeting this definition are reported as nonoperating revenues and expenses. When both restricted and unrestricted resources are available for use, it is the Government’s policy to use restricted resources first, then unrestricted resources as they are needed. The Government reports the following major governmental funds:
The General Fund is the Government’s primary operating fund which is used to account for all financial resources of the general operations of the Government, except those required to be accounted for in another fund.
The General Purpose School Fund is used to account for the receipt and disbursement of federal, state and local funds for education purposes, except those required to be accounted for in another fund. The GSD General Purposes Debt Service Fund is used to account for the accumulation of resources and the payment of principal and interest for the General Services District general obligation debt. The GSD School Purposes Debt Service Fund is used to account for the accumulation of resources and the payment of principal and interest for the debt related to schools.
The USD General Purposes Debt Service Fund is used to account for the accumulation of resources and the payment of principal and interest for the Urban Services District general obligation debt. The GSD Capital Projects Fund is used to account for the use of bond proceeds for the construction and equipping of various public projects in the General Services District.
The Education Capital Projects Fund is used to account for the use of bond proceeds for the construction and equipping of various school facilities. The USD Capital Projects Fund is used to account for the use of bond proceeds for the construction and equipping of various public projects in the Urban Services District.
The Government reports the following major enterprise funds:
The Department of Water and Sewerage Services provides services to customers on a self-supporting basis utilizing a rate structure designed to produce revenues sufficient to fund debt service requirements, operating expenses and adequate working capital. The District Energy System provides heating and cooling services to the Government and downtown businesses. The System is managed by a third party and is self-supporting by utilizing a rate structure designed to fund debt service requirements, pay for operating expenses and generate adequate working capital.
Additionally, the Government reports the following fund types: Internal service funds are used to account for the operations of self-sustaining agencies rendering services to other agencies of the Government on a cost reimbursement basis. For the year ended June 30, 2016, these services include fleet management, information systems, radio maintenance, insurance, treasury management, and printing. Pension (and other employee benefit) trust funds are used to account for assets and liabilities held by the Government in a fiduciary capacity to provide retirement and disability benefits for employees and retirees.

THE METROPOLITAN GOVERNMENT OF NASHVILLE AND DAVIDSON COUNTY
NOTES TO THE FINANCIAL STATEMENTS (CONTINUED)
B-44
Agency funds are used to account for assets held by elected officials as agents for individuals, collections by the Government due to the purchasers of certain outstanding property tax receivables, funds held by the Sheriff’s Department for inmates, and funds held by the Planning Commission for performance bonds for contractors. E. Assets, Liabilities, Deferred Outflows/Inflows of Resources and Net Position or Equity Cash and cash equivalents – Cash and cash equivalents include amounts in demand deposits and highly liquid short-term investments with maturity dates within three months of the date of acquisition and other available pooled funds. The cash and cash equivalents of various funds and component units of the Government are invested in pooled accounts. Funds or component units with negative cash and cash equivalents report the negative amount as due to other funds of the primary government or due to component units, and the funds or component units lending funds report an offsetting due from other funds of the primary government or due from component units. Investment income earned on funds invested in pooled accounts is allocated to the respective funds and component units on the basis of relative balances. Investments – Investments, except in the pension funds, consist primarily of U.S. Government securities and are stated at fair value. Pension fund investments, which also include common stocks, bonds and U.S. Government and other domestic and foreign securities, are stated at quoted fair value at June 30, 2016. The Government and certain component units also invest in the Tennessee Local Government Investment Pool which is maintained and managed by the State of Tennessee. This Pool is not registered with the Securities and Exchange Commission (SEC) but does operate in a manner consistent with the SEC’s Rule 2a7 of the Investment Company Act of 1940. Accordingly, the Government’s investments in the Pool have been determined based on the Pool’s share price. Investment income consists of realized and unrealized appreciation or depreciation in the fair value of assets. Investment income of the capital projects funds is reported in those funds and is transferred to the debt service funds after arbitrage calculations, as applicable. Inventories – Inventories, principally materials, supplies and replacement parts, are valued at cost in governmental fund statements and at the lower of cost or market in the government-wide and proprietary fund statements, with cost determined using the first-in, first-out, moving weighted average or average cost method. Inventory items are recorded as expenditures when used under the consumption method. Capital assets – Capital assets, which include property, plant, equipment and infrastructure assets, are reported in the applicable governmental or business-type activities columns in the government-wide financial statements. Capital assets are generally defined as assets with an individual cost in excess of $10,000 and a useful life in excess of one year. Such assets are recorded at historical cost at the time of acquisition. Donated capital assets are recorded at estimated fair market value at the date of donation. The costs of normal maintenance and repairs that do not add to the value of the asset or materially extend assets’ lives are not capitalized. Major outlays for capital assets and improvements are capitalized as projects are constructed. Net interest cost incurred during the construction of facilities is capitalized as part of the cost of such facilities for business-type activities. As the majority of construction for the year ended June 30, 2016 was funded with accumulated resources, no interest was capitalized. Depreciation is provided using the straight-line method over the estimated useful lives of the respective assets. The estimated useful lives are as follows: Utility plant in service 7 - 100 years Buildings and improvements 3 - 50 years Improvements other than buildings 20 - 100 years Furniture, machinery and equipment 3 - 50 years Stormwater infrastructure 50 years The Government has elected to use the “modified approach” to account for certain infrastructure assets as provided by GASB Statement No. 34. Under this approach, depreciation expense is not recorded nor are amounts capitalized in connection with improvements to these assets unless they expand capacity. Utilization of this approach requires that the Government 1) have an up-to-date inventory of assets, 2) perform condition assessments and summarize the results using a measurement scale, 3) estimate each year the annual amount to maintain and preserve the assets at the condition level established and disclosed by the Government and 4) document that the assets are being preserved approximately at (or above) the condition level established and disclosed. Roads and bridges are accounted for using the modified approach.
THE METROPOLITAN GOVERNMENT OF NASHVILLE AND DAVIDSON COUNTY
NOTES TO THE FINANCIAL STATEMENTS (CONTINUED)
B-45
Property under capital leases is stated at the lower of the present value of minimum lease payments or the fair market value at the inception of the lease. Once placed in use, such property is amortized using the straight-line method over the remaining lease term. The Government maintains certain collections of art which have not been capitalized as they are 1) held for public exhibition, education, or research in furtherance of public service rather than financial gain, 2) protected, kept unencumbered, cared for and preserved and 3) subject to policy that requires the proceeds from any sales of collection items to be used to acquire other items for the collection. Deferred outflows of resources – In addition to assets, the Statements of Net Position report a separate section for deferred outflows of resources. Deferred outflows of resources represent a consumption of net position that applies to a future period and so will not be recognized as an outflow of resource (expense) until then. The deferred charge on refunding results from the difference in the carrying value of refunded debt and its reacquisition price. The amount is deferred and amortized over the shorter of the life of the refunded or refunding debt. The amount for pensions relates to certain differences between projected and actual actuarial results, certain differences between projected and actual investment earnings, as well as contributions between the measurement and reporting dates, which are accounted for as deferred outflows of resources. Claims payable – Losses for claim liabilities are reported in the self-insurance funds for claims payable from those funds. Claims payable include reported claims and an estimated liability for claims incurred but not reported at June 30, 2016. The claims liabilities are based on the estimated cost of settling the claim, including nonincremental claim adjustments, using past experience and adjusting for current conditions. Losses for uninsured judgments against the Government payable from governmental funds not expected to be liquidated with expendable available resources are reported in the applicable governmental activities in the Statements of Net Position and Activities. Compensated absences – General policy of the Metropolitan Civil Service Commission permits the accumulation, within certain limitations, of unused vacation days and sick leave. Vacation days may accumulate to an amount equal to three times the current annual vacation accrual rate. Although sick pay may accumulate, no amounts are vested in the event of employee termination. Unused earned vacation pay that is due and payable, such as after employees’ resignations or retirements, is reported in the governmental funds. Accumulated unpaid vacation pay related to governmental fund type operations that has not been used is reported in the applicable governmental activities in the Statements of Net Position and Activities, but is not a governmental fund liability, because it is not expected to be liquidated with expendable available resources. Accumulated unpaid vacation pay related to proprietary fund type operations is reported as a liability in the appropriate individual proprietary funds. The policy of the Metropolitan Nashville Public Schools allows employees to accumulate sick leave without limitation. In addition, the Board allows vesting of accumulated sick leave depending on length of service beyond 15 years. Vested sick leave for Metropolitan Nashville Public Schools employees is reported in the applicable governmental activity in the Statements of Net Position and Activities, but is not a governmental fund liability, because it is not expected to be liquidated with expendable available resources. Accumulated unpaid vacation pay related to proprietary fund type operations is reported as a liability in the appropriate individual proprietary funds. Arbitrage rebates – For the governmental funds, arbitrage rebates due to the federal government under the Internal Revenue Code of 1986, as amended, for excess earnings on invested proceeds of tax exempt securities are reported as a liability in the Statements of Net Position and Activities and as a commitment of fund balance in the Balance Sheet - Governmental Funds. For proprietary funds (including component units) any such rebates are reflected as liabilities in the appropriate individual proprietary funds. Landfills – State and federal laws and regulations require the Government to place a final cover on all its landfill sites when they stop accepting waste, and to perform certain maintenance and monitoring functions at the sites for thirty years after closure. Although closure and postclosure care costs will be paid only near, or after, the date the landfill stops accepting waste, the Government is required to report a portion of these closure and postclosure care costs as an expense in the government-wide financial statements. This expense is based on landfill capacity used at the reporting date. The current year expenditures of the landfills are reported in the Solid Waste Operations Fund, a nonmajor governmental fund, in the Governmental Funds section of this report. The long term liability and expense are reported in the Statements of Net Postion and Activities. The total liability for landfill purposes is $9,111,371. Bordeaux Sanitary Landfill – This landfill has stopped accepting solid waste, and closure procedures
are 100% complete. Estimated postclosure costs of $5,633,995 are included in the long-term liability. Metro Thermal Ash Landfill – This landfill has stopped accepting solid waste, and closing procedures
are 100% complete. Estimated postclosure costs of $1,198,245 are included in the long-term liability.

THE METROPOLITAN GOVERNMENT OF NASHVILLE AND DAVIDSON COUNTY
NOTES TO THE FINANCIAL STATEMENTS (CONTINUED)
B-46
Due West Landfill – This landfill has stopped accepting waste, and closing procedures are 100% complete. Estimated postclosure costs of $1,553,935 are included in the long-term liability.
Lebanon Road Landfill – This landfill has stopped accepting waste, and closing procedures are 100%
complete. Estimated postclosure costs of $725,196 are included in the long-term liability. These estimates are based on an independent evaluation of the cost to perform all closure and care. Actual costs may be higher due to inflation, changes in technology or changes in regulations. Closure and care financial requirements are expected to be met by the operations of the Solid Waste Operations Fund. To the extent the Solid Waste Operations Fund operations create a deficit, the General Fund is required to fund its operations. Bond premiums and discounts – In the governmental funds, bond premiums and discounts are treated as other financing sources or uses or expenditures in the year of issue. In the government-wide and proprietary fund statements, bond premiums and discounts are deferred and amortized over the term of the related bonds. Derivative financial instruments – Derivative financial instruments consist of interest rate swap agreements and fuel hedging agreements and are accounted for at fair value in accordance with GASB Statement No. 53, Accounting and Financial Reporting for Derivative Instruments. The Government analyzes its derivative financial instruments into hedging derivative instruments and investment derivative instruments. If a derivative is classified as a hedging derivative instrument, changes in its fair value are deferred on the Statement of Net Position as either deferred inflows or deferred outflows. If a derivative is classified as an investment derivative instrument, changes in its fair value are reported on the Statement of Activities in the period in which they occur. Deferred inflows of resources – In addition to liabilities, the Balance Sheets and Statements of Net Position report a separate section for deferred inflows of resources. Deferred inflows of resources represent an acquisition of net position that applies to a future period and so will not be recognized as an inflow of resource (revenue) until that time. The unavailable revenue reported in the Balance Sheet, which arises under a modified accrual basis of accounting, represents amounts that are deferred and recognized as an inflow of resources in the periods that the amounts become available. The assessed and unlevied property taxes reported in the Statement of Net Position, arises from imposed nonexchange revenues (property taxes) which are assessed prior to the end of the fiscal year but levied in the subsequent year. The interest rate swap, which relates to an interest rate swap agreement, is considered to be a hedging derivative. Changes in the fair market value of hedging derivatives are reported as deferred inflows or outflows of resources. The effective portion of fuel hedging relates to the Government’s fuel hedging program. The Government’s fuel hedges are considered to be derivatives, the effective portion of which is accounted for as a deferred inflow of resources. The amounts for pensions relate to certain differences between projected and actual actuarial results and certain differences between projected and actual investment earnings, which are accounted for as deferred inflows of resources. Deferred inflows for tax increment financing represent amounts that will be received in the future by the Sports Authority, a component unit, from a note receivable from Metropolitan Development and Housing Agency (MDHA), a component unit, to be paid from future tax increment revenues related to the developments near a new ballpark facility. The Sports Authority has a note receivable from MDHA, and as the note is paid back to the Sports Authority, the deferred inflows will be recognized as revenue and used to pay principal and interest on the Series 2013 Ballpark Bonds. Fund balances – Restricted fund balances are amounts that can only be used for specific purposes pursuant to constraints imposed by external parties such as creditors or grantors or by law through constitutional provisions or enabling legislation. Committed fund balances are amounts that can only be used for specific purposes pursuant to constraints imposed by formal legislative action of the Metropolitan Council, the Government’s highest level of decision-making authority. Committed fund balances are established and can only be modified or rescinded by resolution approved by the Metropolitan Council. Assigned fund balances are amounts intended to be used for specific purposes as designated by management of the Finance Department of the Government. The Metropolitan Council has by ordinance authorized the Finance Director to assign fund balance. The Metropolitan Council may also assign fund balance as it does when appropriating fund balance to cover a gap between estimated revenue and appropriations in the subsequent year’s appropriated budget. Unlike commitments, assignments generally exist temporarily; no additional action is required for the removal of an assignment. Unassigned fund balance is the residual classification for the General Fund and for negative fund balances in other governmental funds. When an expenditure is incurred for purposes for which both restricted and unrestricted fund balance are available, the Government considers restricted amounts to have been spent first. When an expenditure is incurred for which committed, assigned, or unassigned fund balance amounts are available, the Government considers committed fund balance to have been spent first, followed by assigned, then unassigned. Per the Tennessee Code Annotated 49-3-352, the General Purpose School Fund is required to maintain a fund balance in excess of three percent of budgeted operating expenditures.
THE METROPOLITAN GOVERNMENT OF NASHVILLE AND DAVIDSON COUNTY
NOTES TO THE FINANCIAL STATEMENTS (CONTINUED)
B-47
F. Revenues, Expenditures and Expenses Grants – The Government receives grant revenues from various federal, state and non-profit agencies. The Government reports capital contributions, including capital grants, in the Statement of Revenues, Expenses and Changes in Fund Net Position – Proprietary Funds as a separate line item after non-operating revenues and expenses. In the Statement of Activities, capital grants and contributions are presented as program revenues. Pass-through grant proceeds – Capital and operating grant amounts received on behalf of secondary recipients are reported in agency funds. Unbilled revenues – Revenues from the Department of Water and Sewerage Services are recognized from meters read on a monthly cycle basis. At the end of each month, an estimate of service rendered from the latest date of each meter-reading cycle to month end is accrued and included in accounts receivable. Property taxes – The Government's property taxes are levied for the current fiscal year each September 1 on the assessed value listed as of the prior January 1 for all real and personal property located in Nashville and Davidson County. Property taxes are secured by a statutory lien effective as of the original assessment date of January 1 and as such an enforceable legal claim to the subsequent fiscal year levy exists at fiscal year end. In accordance with state law, the real property assessment includes supplemental assessments made through September 1 for improved, demolished or damaged property. Assessed values are established by the State of Tennessee at the following percentages of assessed market value: - Public utility property 55% (Railroads and certain telecommunication services at 40%) - Industrial and commercial property - Real 40% - Personal 30% - Farm and residential property 25% Taxes are levied at a rate of $3.924 per $100 of assessed value for the entire metropolitan area (General Services District) with an additional tax of $.592 per $100 of assessed value levied upon properties within the Urban Services District. Payments are due by February 28 of the following year and are delinquent on March 1. Property taxes receivable have been included in the Balance Sheet – Governmental Funds with offsetting deferred inflows to reflect amounts not available at June 30, 2016. Amounts available at June 30, 2016 have been recorded as revenue in the governmental fund statements. Current tax collections of $889,764,582 for the fiscal year ended June 30, 2016 were approximately 99% of the tax levy. Of the $941,697,508 property tax receivable, $925,195,388 represents the 2017 property taxes which have been assessed but not yet levied and recorded as required by GASB Statement No. 33, Accounting and Financial Reporting for Nonexchange Transactions. G. Estimates Estimates used in the preparation of financial statements require management to make assumptions that affect the reported amounts of assets and liabilities and the disclosure of contingent assets and liabilities at the date of the financial statements and the reported amounts of revenues and expenditures during the reporting period. Actual results could differ from those estimates. NOTE 2 – STEWARDSHIP, COMPLIANCE AND ACCOUNTABILITY A. Compliance With Finance Related Legal and Contractual Provisions Management believes that the Government has no material violations of finance related legal and contractual provisions as of June 30, 2016. B. Budgets and Budgetary Accounting The Government's procedures in establishing the budget as reflected in the basic financial statements are as follows:

THE METROPOLITAN GOVERNMENT OF NASHVILLE AND DAVIDSON COUNTY
NOTES TO THE FINANCIAL STATEMENTS (CONTINUED)
B-48
1. The Director of Finance annually obtains information from all officers, departments, boards, commissions
and other agencies of the Government for which appropriations are made and/or revenues are collected and compiles the annual operating budget for the ensuing fiscal year beginning July 1. The compiled information, including various expenditure options and the means of financing them, is submitted to the Mayor for review.
2. The Mayor, with the assistance of the Department of Finance, determines the programs to be
recommended to the Metropolitan Council, the expenditures proposed to operate those programs and the revenue changes needed to fund those expenditures. That information is compiled into a balanced operating budget which is submitted to the Metropolitan Council by May 1.
3. Copies of the Mayor's proposed budget and budget message are distributed to interested persons, and a
summary of the budget is published in the area daily newspaper. The budget is a public record open for public inspection.
4. The Metropolitan Council's Budget and Finance Committee holds hearings with the officers, departments,
boards, commissions and other agencies to explore the impact of the recommended operating budget and to explore other departmental budget options. In addition, advertised public hearings are held to obtain taxpayers' comments prior to final passage.
5. The budget is legally enacted effective July 1 through passage of an ordinance by the Metropolitan
Council. In no event shall the total appropriations for any fund included in the budget exceed the estimated revenues and fund balance.
6. The amounts in the adopted operating budgets for each organizational unit, purpose or activity constitute
the annual appropriation for such items, and no expenditure can be made which will result in the annual appropriation being exceeded unless an additional appropriation is made.
7. The Metropolitan Council may make appropriations in addition to those contained in the current operating
budgets, but any such additional appropriations may be made only from an existing unappropriated surplus in the fund to which it applies.
8. The Mayor may transfer the available balance of any appropriation for any purpose to the appropriation
for any other purpose within the same department or by resolution approved by the Metropolitan Council, the available balance of any appropriation may be transferred to another appropriation within the same section of the budget and within the same fund.
9. All available balances of appropriations in the current operating budget lapse into the fund balance of the
fund or funds from which the appropriations were originally made at the end of the fiscal year. Encumbrances do not lapse at the end of the fiscal year. Appropriations for the subsequent year will provide authority to complete these transactions.
The Government is legally required to prepare, and the Metropolitan Council is required to approve, the annual budgets of the General Fund, the General Purpose School Fund, and the GSD General Purposes, GSD School Purposes and USD General Purposes Debt Service Funds. In preparing the budgets, the Government utilizes generally accepted accounting principles (GAAP) for all legally required budgeted funds. In accordance with Article 6 of the Metropolitan Charter, the Annual Operating Budget of the Government for the fiscal year 2016-2017 was submitted to the Metropolitan Council and subsequently approved by Substitute Bill Number BL 2016-232. Fund balance resources at June 30, 2016 have been assigned to the 2016-2017 fiscal year operating budget as follows: General Services District General Fund $ 43,372,400 Urban Services District General Fund 7,574,800 General Purpose School Fund 16,000,000 General Services District General Purposes Debt Service Fund 5,000,000 Encumbrances – Information regarding encumbrances is available to assist in the management of commitments against appropriations. Encumbrance accounting is utilized for budgetary control purposes. Encumbrances, however, are not treated as expenditures in the basic financial statements. Outstanding encumbrances for the governmental funds at June 30, 2016 were as follows:

THE METROPOLITAN GOVERNMENT OF NASHVILLE AND DAVIDSON COUNTY
NOTES TO THE FINANCIAL STATEMENTS (CONTINUED)
B-49
Outstanding
Encumbrances
General Fund
$ 4,095,167
Special Revenue Funds: General Purpose School
3,837,352 Metropolitan Action Commission
181,552
General Fund 4% Reserve
1,950,019 Solid Waste Operations
952,209
Flood 2010 Recovery
662,255 Education Services
4,738,616
Other Governmental Services
2,308,952
Capital Projects Funds: GSD Capital Projects
128,713,469 Education Capital Projects
92,389,489
USD Capital Projects
597,386 C. Deficit Balances and Excess Expenditures The following funds have deficit balances at June 30, 2016:
Unassigned
Fund Balance/
Unrestricted
Net Position
Capital Project Funds: GSD Capital Projects
$ (219,542,880) Education Capital Projects
(109,730,028)
USD Capital Projects
(1,323,786)
Special Revenue Funds: Flood 2010 Recovery
(11,750,067) The deficits in the GSD, Education, and USD Capital Project Funds will be funded by the future issuance of notes and bonds. The deficit in the Flood 2010 Recovery Fund is expected to be funded by future revenues from the Federal and Tennessee Emergency Management Agencies (FEMA and TEMA). Certain flood-related expenditures continue to be on appeal with FEMA.

THE METROPOLITAN GOVERNMENT OF NASHVILLE AND DAVIDSON COUNTY
NOTES TO THE FINANCIAL STATEMENTS (CONTINUED)
B-50
During the year ended June 30, 2016, the Government exceeded the budgeted level of expenditures at the department or significant line item level as follows:
Budgeted Unit
Budget
Actual
Variance
General Fund: General Services District: Transfers Out: Nonmajor Governmental Funds
39,876,200
40,626,125
(749,925) Internal Service Funds
18,583,400
18,625,646
(42,246)
Fiduciary Funds
100,400
109,817
(9,417) GSD General Purposes Debt Service Fund:
Interest
59,951,200
62,383,007
(2,431,807) Fiscal Charges
3,139,900
5,222,852
(2,082,952)
Payments to Refunded Bond Escrow Agent
-
280,386,841
(280,386,841) GSD School Purposes Debt Service Fund:
Interest
30,989,700
33,250,077
(2,260,377) Fiscal Charges
1,495,000
1,957,117
(462,117)
Payments to Refunded Bond Escrow Agent
-
95,432,894
(95,432,894) USD General Purposes Debt Service Fund:
Payments to Refunded Bond Escrow Agent
-
33,395,342
(33,395,342) Transfers Out to Nonmajor Governmental Funds are over budget due to transfers to the General Fund 4% Reserve Fund. These transfers are calculated as a percentage of certain General Fund revenues, and as those actual revenues exceeded budget, the related transfers out exceeded budget. Transfers Out to Internal Service Funds are over budget due to transfers to the Office of Fleet Management Fund to fund certain fleet acquisitions from General Fund operational funds. Transfers Out to Fiduciary Funds are over budget due to transfers in excess of expected amounts to the Metropolitan Employees’ Benefit Trust Fund related to police officers that work secondary employment law enforcement. Expenditures for the Debt Service Funds are not controlled on a line item basis, and refundings – including the related fiscal charges – are not budgeted as the net impact on the budget is zero. Interest is over budget due to a difference in the budgeted and actual interest expense for the General Obligation Improvement Bonds, Series 2015C, issued in July 2015. The Council’s approval of the bond issue authorizes the funding for the actual debt service required by the Bonds. Also, interest in the GSD School Purposes Debt Service Fund is budgeted net of bond interest tax credits, which are reported as transfers in.

THE METROPOLITAN GOVERNMENT OF NASHVILLE AND DAVIDSON COUNTY
NOTES TO THE FINANCIAL STATEMENTS (CONTINUED)
B-51
NOTE 3 – DEPOSITS AND INVESTMENTS Primary Government The Government is authorized by policy to invest funds that are not immediately needed in: United States Treasury Bills, Bonds and Notes; The State of Tennessee Local Government Investment Pool (LGIP); the State of Tennessee Intermediate Term Investment Fund (ITIF); the First Tennessee Bank Advisors Short Investment Pool (FTB Short Pool); most bonds issued by U.S. Government Agencies and other investments such as repurchase agreements and commercial paper. The Government is authorized to invest in these instruments either directly or through the Metro Investment Pool (MIP). The Metro Investment Pool is invested in the LGIP, the ITIF, and the FTB Short Pool. Primary oversight for the LGIP and the ITIF rests with the State of Tennessee Funding Board. The LGIP and ITIF are similar to a SEC 2a-7 account (SEC designation). The ITIF and the FTB Short Pool are primarily invested in bonds issued by U.S. Government Agencies. The Government’s amounts included in the LGIP and ITIF are reported at the fair value of its position in the LGIP or ITIF, which approximates the value of the shares at amortized cost. The Government’s amounts in the FTB Short Pool are reported at fair value. The Metropolitan Employees’ Benefit Trust is authorized to invest funds in accordance with the Statement of Investment Policy of the Investment Committee of the Government, which states that the Investment Committee may make investments it deems suitable for the Trust. Investments of the Teachers Retirement Plan are administered by the Administrative Retirement Committee of the Metropolitan Nashville Public Schools, which adopted the Metropolitan Employees’ Benefit Trust Statement of Investment Policy effective July 1, 2011. A. Deposits Custodial credit risk is the risk that in the event of a bank failure, the Government’s deposits may not be returned to it. As of June 30, 2016, all deposits were insured or collateralized, as required by Government policy. B. Investments The majority of the Government’s investments are managed as a part of the Metro Investment Pool. However, certain business-type activities and elected officials have limited investments that are managed under Separate Portfolios. Both the Metro Investment Pool and Separate Portfolio investments are administered according to the Investment Policy of the Government. Investments related to the Metropolitan Employees’ Benefit Trust and the Teachers’ Retirement Plan are administered under the Statement of Investment Policy adopted by their respective Committees. As of June 30, 2016, the Government had the following investments:
Total Portfolio
Average Weighted
Investment Type
Fair Value
Maturity (in Years)
Metro Investment Pool:
Tennessee Local Government Investment Pool
$ 365,364,201
0.10 Tennessee Intermediate Term Investment Fund
62,430,040
2.10
First Tennessee Bank Advisors Short Investment Pool
325,126,198
2.37
Total Metro Investment Pool (a)
$ 752,920,439
Separate Portfolios:
U.S. Treasuries (a)
$ 19,527,302
(b) U.S. Government Bonds
2,310,112
1.98
Total Separate Portfolios
$ 21,837,414

THE METROPOLITAN GOVERNMENT OF NASHVILLE AND DAVIDSON COUNTY
NOTES TO THE FINANCIAL STATEMENTS (CONTINUED)
B-52
Total Portfolio
Average Weighted
Investment Type
Fair Value
Maturity (in Years) Metropolitan Employees' Benefit Trust and
Teachers' Retirement Plan:
Equity Commingled Funds
$ 59,753,502
(b) Commercial Mortgage Backed Securities
2,098,728
(b)
Conventional Mortgages
940,179
(b) Emerging Markets
18,621,193
(b)
Corporate Bonds and Notes
157,926,121
2.04 High Yield Bonds
51,947,627
(b)
Futures
3,944,140
0.24 Common Stock
311,642,995
(b)
Preferred Stock
3,497,839
0.08 Non Agency Mortgages/Collateralized Mortgage Obligations
22,963,193
0.10
Venture Capital and Partnerships
1,693,650,720
(b) Registered Investment Companies
92,633,127
(b)
International Bonds
2,804,770
(b) Sector Funds
26,039,394
4.59
Non U.S. Treasury Securities Developing Markets
5,883,223
(b) U.S. Treasury Securities
23,356,041
(b)
Other Securities
57,356,723
(b) Other Fixed Income
147,774,158
(b)
Commingled Funds U.S. Debt
10,283,846
(b)
Total Metropolitan Employees' Benefit Trust and Teachers' Retirement Plan
$ 2,693,117,519
(a) These amounts are included in cash and cash equivalents in the financial statements.
(b) The investment types are not subject to interest rate risk. Therefore, average weighted maturity is not applicable.
Interest rate risk is the risk that changes in interest rates will adversely affect the fair value of an investment. The investment policies place no specific limit on the weighted average maturity of the Government’s investment portfolios. However, the average maturity of the portfolios are monitored and managed so that the changing interest rates will cause only minimal deviations in the net asset value. As of June 30, 2016, the investments of the Government had average weighted maturities as noted on the preceding table. Credit risk is the risk that an issuer or other counterparty to an investment will not fulfill its obligations. The Government’s Investment Policy limits the majority of fixed income investments, other than short-term paper, at purchase to investment grade as established by one or more of the nationally recognized bond rating agencies.

THE METROPOLITAN GOVERNMENT OF NASHVILLE AND DAVIDSON COUNTY
NOTES TO THE FINANCIAL STATEMENTS (CONTINUED)
B-53
Also, the use of futures, options and swaps is permitted as long as the particular investment manager’s strategy or mandate allows it. As of June, 30, 2016, the investments of the Government had credit ratings as follows:
Credit Ratings
Investment Type Fair Value
A
AA
AAA
B
BB
BBB
CC - D
Not Rated
Metropolitan Employees' Benefit Trust and Teachers' Retirement Plan
Commercial Mortgage Backed Securities $ 2,098,728 $ -
$ 591,413
$ 1,255,103
$ -
$ -
$ -
$ -
$ 252,212
Conventional Mortgages
940,179
-
940,179
-
-
-
-
-
-
Preferred Stock
3,497,839
251,479
-
-
-
1,449,345
1,694,607
-
102,408
Corporates
157,926,121
30,955,522
4,360,349
-
-
1,257,463
114,168,160
-
7,184,627
Emerging Markets
18,621,193
4,828,010
470,284
466,860
2,735,357
3,313,810
4,766,956
34,219
2,005,697
High Yield
51,947,627
-
-
-
17,395,673
30,260,674
-
2,643,250
1,648,030
International Bonds
2,804,770
738,938
(3,280)
111,404
420,448
773,533
11,673
-
752,054
Non Agency Mortgages
22,963,193
-
367,856
418,071
1,021,616
475,839
423,042
12,995,433
7,261,336
Sector Funds
26,039,394
-
2,722,045
-
-
-
-
-
23,317,349
Treasury Inflation Protected Securities
4,861,393
-
4,861,393
-
-
-
-
-
-
Treasury Non U.S. Developing Markets
1,021,830
1,060,379
-
-
(8,939)
-
(29,610)
-
-
U.S. Treasuries
23,356,041
-
23,356,041
-
-
-
-
-
-
Total Metropolitan Employees' Benefit Trust and Teachers'
Retirement Plan $ 316,078,308 $ 37,834,328
$ 37,666,280
$ 2,251,438
$ 21,564,155
$ 37,530,664
$ 121,034,828
$ 15,672,902
$ 42,523,713
Concentration of credit risk is the risk of loss attributed to the magnitude of the Government’s investment in a single issuer. The Government’s Investment Policy limits single issuer exposure to 5% except for the securities of the U.S. Government or its agencies. There is no single issuer that exceeds 5% of total investments at June 30, 2016. Custodial credit risk is the risk that, in the event of a failure of the counterparty to a transaction, the Government will not be able to recover the value of investment or collateral securities that are in the possession of an outside party. The Government does not have a policy with regard to custodial credit risk of investments. As of June 30, 2016, all investments were insured or registered or the securities were held by the Government or its agent in the Government’s name.

THE METROPOLITAN GOVERNMENT OF NASHVILLE AND DAVIDSON COUNTY
NOTES TO THE FINANCIAL STATEMENTS (CONTINUED)
B-54
Foreign currency risk is the risk that changes in exchange rates will adversely affect the fair value of an investment. As of June 30, 2016, no Metro Investment Pool or Separate Portfolio investments were held in foreign currency. The Investment Policy for the Metropolitan Employees’ Benefit Trust and Teachers’ Retirement Plan places no specific limits on investments in international markets; however, investments in international markets are targeted at 16% with a maximum exposure not to exceed 30% of the portfolios. As of June 30, 2016, the Government’s exposure to foreign currency risk is as follows:
Base Currency
Fair Value
Common Stock:
Australian Dollar
$ 4,766,934
British Pound Sterling
28,146,061 Canadian Dollar
6,726,725
Danish Krone
1,273,965 Euro
28,125,964
Japanese Yen
17,283,514 Norwegian Krone
3,327,935
Singapore Dollar
1,021,495 Swedish Krona
3,545,978
Swiss Franc
5,290,021 Total Common Stock
99,508,590
Venture Capital and Partnerships: Euro
72,153,551
Total Venture Capital and Partnerships
72,153,551
Total Metropolitan Employees'
Benefit Trust and Teachers' Retirement Plan
$ 171,662,141 C. Securities Lending Program The Metropolitan Employees’ Benefit Trust (Trust) and Teachers’ Retirement Plan (Plan) are authorized by the Metropolitan Charter and the Statement of Investment Policy to lend securities to brokerage firms on a temporary basis through their custodian bank, Bank of New York Mellon (Custodian). During the fiscal year, the Custodian lent the Trust securities and received cash, U.S. Government securities, and irrevocable letters-of-credit as collateral. The Custodian did not have the ability to pledge or sell non-cash collateral delivered absent a borrower default. Borrowers were required to deliver collateral for each loan in amounts equal to not less than 102% of the market value of loaned domestic securities and 105% of the market value of loaned foreign securities. The Trust imposed no restrictions on the amount of securities lent by the Custodian during the year on their behalf. There were no violations of legal or contractual provisions and there were no borrower or lending agent default losses during the year. The contract with the Custodian requires indemnification only in cases of Custodian negligence. All securities loans can be terminated on demand by either the lender or the borrower. The average term of the Trust loans for the year ended June 30, 2016 was approximately 60 days. Cash collateral is invested in a short term investment pool. The relationship between the maturities of the investment pool and the Custodian’s loans is affected by the maturities of the securities loans made by other entities that use the Custodian’s pool, which the Custodian’s system cannot determine. Cash collateral may also be invested separately in “term loans”, in which case the investments match the loan term. As the loans are terminable at will, the duration of the investments generally did not match the duration of the investments made with the cash collateral.

THE METROPOLITAN GOVERNMENT OF NASHVILLE AND DAVIDSON COUNTY
NOTES TO THE FINANCIAL STATEMENTS (CONTINUED)
B-55
The collateral held and the market value of the securities on loan as of June 30, 2016 was $34,754,646 and $33,806,834 respectively, for the Trust. The cash collateral is recorded as both an asset and a liability on the Trust financial statements. Securities and letters-of-credit received as collateral at June 30, 2016 are not recorded in the Statement of Plan Net Position, as the Trust cannot sell or pledge the collateral received absent a borrower default. At year end, the Trust has no credit risk by the borrowers because the amount the Trust owes the borrowers exceeds the amount the borrowers owe the Trust. The gross earnings for securities lending were $121,141 and borrowers rebates were $161,656 for total income of $282,797, and the related expenses were $56,541 in agent fees, netting $226,256 in securities lending income for the Trust. D. Fair Value Measurement GASB Statement No. 72, Fair Value Measurement and Application, categorizes the inputs to valuation techniques used to measure fair value into three levels. Level 1 inputs are quoted prices (unadjusted) for identical assets or liabilities in active markets. Level 2 inputs are inputs – other than quoted prices included in Level 1 – that are observable for an asset or liability, either directly or indirectly. Level 3 inputs are unobservable inputs for an asset or liability. For the Metropolitan Government investment pool, the input levels are not applicable to LGIP as investments are reported at amortized cost. The investments in ITIF and the FTIB Short Pool are considered Level 2. The Separate Portfolio which is comprised of U.S. Treasuries and U.S. Government Bonds are valued by the Government as Level 1 inputs. These investments are made on behalf of the respective Departments and component units of the Government. Similarly, these investments can be valued from quoted prices (unadjusted) to identical assets or liabilities in active markets that a government can access at the measurement date. For the Metropolitan Employees’ Benefit Trust (Trust) and Teachers’ Retirement Plan (Plan) investments, the custodian uses a proprietary matrix based on asset class (i.e., “sector code” or “firm code”). The custodian established a framework of thirteen major asset classifications, with over 1,100 sub-classifications, allowing the client to aggregate or disaggregate based on the strategies and investment policies that they identify as most appropriate for their plans. The sub-classifications are assigned a fair value level based on the attributes and pricing guidelines of the sub-classification. This information is passed on from the security level to the individual asset holder’s account. The fair value hierarchy level matrix is based on discussions with 1) pricing vendors, 2) brokers and dealers, 3) investment managers, 4) industry groups, and 5) independent accounting firms. Examples of Level 1 securities that have quoted prices (unadjusted) in an active market for identical assets or liabilities include U.S. equities, non-U.S. equities, EFT’s, regulated investment companies and U.S. treasuries. Examples of Level 2 securities that have inputs other than quoted prices that are observable for the assets or liabilities include corporate bonds, asset backed securities and government bonds. Examples of Level 3 securities that have unobservable inputs for the assets or liabilities used to measure fair value that rely on the other assumptions include limited partnerships, private placement investments, hedge funds, and commingled funds. The Investment Committee used this matrix and did not override any of the fair value levels reported by the custodian.

THE METROPOLITAN GOVERNMENT OF NASHVILLE AND DAVIDSON COUNTY
NOTES TO THE FINANCIAL STATEMENTS (CONTINUED)
B-56
Quoted Prices
Significant
In Active
Other
Significant
Markets for
Observable
Unobservable
Identical Assets
Inputs
Inputs
Investment Type
Fair Value
Level 1
Level 2
Level 3
Metro Investment Pool:
Tennessee Local Government Investment Pool
$ 365,364,201
$ n/a
$ n/a
$ n/a Tennessee Intermediate Term Investment Fund
62,430,040
-
62,430,040
-
First Tennessee Bank Advisors Short Investment Pool
325,126,198
325,126,198
-
-
Total Metro Investment Pool
$ 387,556,238
$ 325,126,198
$ 62,430,040
$ -
Separate Portfolios:
U.S. Treasuries
$ 19,527,302
$ 19,527,302
$ -
$ - U.S. Government Bonds
2,310,112
2,310,112
-
-
Total Separate Portfolios
$ 21,837,414
$ 21,837,414
$ -
$ -
Metropolitan Employees' Benefit Trust and Teachers' Retirement Plan:
Common Stock $ 349,612,987
$ 311,642,745
$ -
$ 37,970,242 Equity Commingled Funds
59,753,502
59,753,502
-
-
Fixed Income Funds
106,025,083
22,598,594
-
83,426,489 Futures
3,559,436
3,559,436
-
-
Registered Investment Companies
92,633,127
92,633,127
-
- U.S. Government Securities
108,353,330
108,353,330
-
-
Asset Backed Securities
49,029,387
-
49,029,387
- Corporate Debt Instruments
155,865,055
-
155,865,055
-
Municipals
1,014,042
-
1,014,042
- Non U.S. Government Bonds
10,537,439
-
10,537,439
-
Non U.S. Government Private Placement
1,100,178
-
1,100,178
- Swaps
(10,125,811)
-
(10,125,811)
-
U.S. Private Placement
75,956,780
-
75,956,780
- Bank Debt Notes
7,428,373
-
-
7,428,373
Commingled Funds US Debt
10,283,846
-
-
10,283,846 Partnership Joint Venture Interest
1,693,650,720
-
-
1,693,650,720
Less Amounts Reported as Cash and Cash Equivalents (1)
(21,559,955)
(21,559,955)
-
-
$ 2,693,117,519
$ 576,980,779
$ 283,377,070
$ 1,832,759,670
(1) The amounts categorized in the fair value levels were determined from information provided by the custodian and include cash held by the custodian that is reported in the financial statements as cash and cash equivalents.
Securities classified in Level 1 of the fair value hierarchy are valued using prices quoted in active markets for those securities. Securities classified in Level 2 are primarily fixed income assets that may have not traded, but the prices are derived from substantially similar assets that have traded. Securities classified in Level 3 are primarily private equity and private debt in limited partnership securities, and the prices are generally derived from 1) fair value capital balances which may be adjusted by investment managers where appropriate giving consideration to various factors, or 2) the value that is most likely to be an exit price in an orderly arm’s length transaction between market participants using one of the accepted valuation methods under U.S. generally accepted accounting

THE METROPOLITAN GOVERNMENT OF NASHVILLE AND DAVIDSON COUNTY
NOTES TO THE FINANCIAL STATEMENTS (CONTINUED)
B-57
principles. The valuation for Level 3 assets is consistent with industry standards, and valuation changes are primarily due to fundamental changes at the company level, subsequent transactions, or observable market pricing. Component Units A. Deposits All component units are subject to State of Tennessee statute which requires that deposits in financial institutions be secured and collateralized by such institutions. The collateral must meet certain requirements and must have a total minimum market value of 105% of the value of the deposits placed in the institutions, less the amount protected by federal depository insurance. Collateral requirements are not applicable for financial institutions that participate in the State of Tennessee’s collateral pool. The degrees of risk regarding deposits vary with each component unit as noted in their separately issued financial statements. B. Investments Each component unit manages its own investments and creates its own policies, except for the Sports Authority, Industrial Development Board, and Convention Center Authority which participate in the Metro Investment Pool of the primary government. Certain component units are subject to the same investment risks as the primary government. The degrees of risk regarding investments and the policies addressing each type of risk vary with each component unit as noted in their separately issued financial statements.

THE METROPOLITAN GOVERNMENT OF NASHVILLE AND DAVIDSON COUNTY
NOTES TO THE FINANCIAL STATEMENTS (CONTINUED)
B-58
NOTE 4 – CAPITAL ASSETS Capital asset activity for the year ended June 30, 2016 was as follows: Primary Government Governmental activities:
Balance
Balance
July 1, 2015
Increases
Decreases
June 30, 2016
Capital assets, not being depreciated: Land
$ 393,669,561
$ 40,296,867
$ (259,984)
$ 433,706,444 Transportation infrastructure
1,532,464,100
7,374,556
-
1,539,838,656
Public art
3,509,396
537,380
-
4,046,776 Construction in progress
154,573,537
82,538,575
(8,747,470)
228,364,642
Total capital assets, not being depreciated
2,084,216,594
130,747,378
(9,007,454)
2,205,956,518
Capital assets, being depreciated: Buildings and improvements
1,992,724,067
15,606,817
(1,121,160)
2,007,209,724 Furniture, machinery and equipment
425,388,839
26,791,531
(6,991,758)
445,188,612
Stormwater infrastructure
145,532,347
14,296,109
-
159,828,456
Total capital assets, being depreciated
2,563,645,253
56,694,457
(8,112,918)
2,612,226,792
Less accumulated depreciation: Building and improvements
(739,364,793)
(65,049,516)
496,959
(803,917,350) Furniture, machinery and equipment
(306,467,239)
(33,449,726)
6,883,227
(333,033,738)
Stormwater infrastructure
(43,451,439)
(2,934,083)
-
(46,385,522)
Total accumulated depreciation
(1,089,283,471)
(101,433,325)
7,380,186
(1,183,336,610)
Total capital assets, being depreciated, net
1,474,361,782
(44,738,868)
(732,732)
1,428,890,182
Governmental activities capital assets, net
$ 3,558,578,376
$ 86,008,510
$ (9,740,186)
$ 3,634,846,700 Governmental activities include the capital assets of the internal service funds.

THE METROPOLITAN GOVERNMENT OF NASHVILLE AND DAVIDSON COUNTY
NOTES TO THE FINANCIAL STATEMENTS (CONTINUED)
B-59
Business-type activities:
Balance
Balance
July 1, 2015
Increases
Decreases
June 30, 2016
Capital assets, not being depreciated:
Land
$ 30,639,729
$ -
$ -
$ 30,639,729
Construction in progress
155,364,687
145,238,605
(77,783,042)
222,820,250
Total capital assets, not being depreciated
186,004,416
145,238,605
(77,783,042)
253,459,979
Capital assets, being depreciated: Utility plant in service
2,734,125,390
59,338,860
(68,876)
2,793,395,374 Buildings and improvements
139,953,730
1,959,174
-
141,912,904
Improvements other than buildings
51,934,753
5,605,560
-
57,540,313 Furniture, machinery and equipment
63,813,276
23,902,138
(3,476)
87,711,938
Property under capital lease
3,645,000
-
-
3,645,000
Total capital assets, being depreciated
2,993,472,149
90,805,732
(72,352)
3,084,205,529
Less accumulated depreciation: Utility plant in service
(1,058,851,828)
(77,954,779)
-
(1,136,806,607) Buildings and improvements
(85,707,416)
(3,730,818)
-
(89,438,234)
Improvements other than buildings
(39,555,099)
(1,296,590)
-
(40,851,689) Furniture, machinery and equipment
(38,746,462)
(4,432,740)
3,476
(43,175,726)
Property under capital lease
(1,738,844)
(91,125)
-
(1,829,969)
Total accumulated depreciation
(1,224,599,649)
(87,506,052)
3,476
(1,312,102,225)
Total capital assets, being depreciated, net
1,768,872,500
3,299,680
(68,876)
1,772,103,304
Business-type activities capital assets, net
$ 1,954,876,916
$ 148,538,285
$ (77,851,918)
$ 2,025,563,283

THE METROPOLITAN GOVERNMENT OF NASHVILLE AND DAVIDSON COUNTY
NOTES TO THE FINANCIAL STATEMENTS (CONTINUED)
B-60
Depreciation expense was charged to functions/programs of the primary government as follows:
Governmental activities: General government
$ 17,269,727 Fiscal administration
748,151
Administration of justice
2,381,581 Law enforcement and care of prisoners
7,675,179
Fire prevention and control
1,925,617 Education
36,832,278
Regulation and inspection
5,971 Public welfare
1,577,659
Public health and hospitals
1,311,289 Public library system
2,699,303
Public works, highways and streets,
including depreciation of stormwater infrastructure
5,394,214
Recreational and cultural
8,333,183 Capital assets held by internal service funds are
charged to the various functions based on each function's usage of the services provided by the funds
15,279,173
Total depreciation expense, governmental activities
$ 101,433,325
Business-type activities: Department of Water and Sewerage Services
$ 82,842,872 District Energy System
2,329,064
Nashville Convention Center
1,390,282 Board of Fair Commissioners
389,176
Farmers Market
291,521 Municipal Auditorium
263,137
Total depreciation expense, business-type activities
$ 87,506,052

THE METROPOLITAN GOVERNMENT OF NASHVILLE AND DAVIDSON COUNTY
NOTES TO THE FINANCIAL STATEMENTS (CONTINUED)
B-61
Component Units Capital asset activity for the year ended June 30, 2016 was as follows:
Balance
Balance
July 1, 2015
Increases
Decreases
June 30, 2016
Capital assets, not being depreciated: Land
$ 354,416,367
$ 11,371,658
$ -
$ 365,788,025
Public art
1,183,844
-
-
1,183,844 Construction in progress
140,991,815
91,613,117
(111,887,670)
120,717,262
Total capital assets, not being depreciated
496,592,026
102,984,775
(111,887,670)
487,689,131
Capital assets, being depreciated: Utility plant in service
1,333,243,000
47,475,000
(13,191,000)
1,367,527,000
Buildings and improvements
1,871,285,968
57,567,888
(3,147,216)
1,925,706,640 Improvements other than buildings
489,648,782
54,062,996
-
543,711,778
Furniture, machinery and equipment 412,566,300
44,360,115
(9,252,621)
447,673,794 Infrastructure
21,185,548
419,131
-
21,604,679
Total capital assets, being depreciated
4,127,929,598
203,885,130
(25,590,837)
4,306,223,891
Less accumulated depreciation for: Utility plant in service
(528,977,000)
(66,591,393)
19,015,000
(576,553,393)
Buildings and improvements
(561,646,128)
(60,337,253)
2,963,020
(619,020,361) Improvements other than buildings
(313,910,767)
(91,687)
-
(314,002,454)
Furniture, machinery and equipment (227,011,114)
(32,349,049)
8,784,052
(250,576,111) Infrastructure
(10,053,855)
(725,216)
-
(10,779,071)
Total accumulated depreciation
(1,641,598,864)
(160,094,598)
30,762,072
(1,770,931,390)
Total capital assets, being depreciated, net
2,486,330,734
43,790,532
5,171,235
2,535,292,501
Component units activities capital assets, net
$ 2,982,922,760
$ 146,775,307
$ (106,716,435)
$ 3,022,981,632
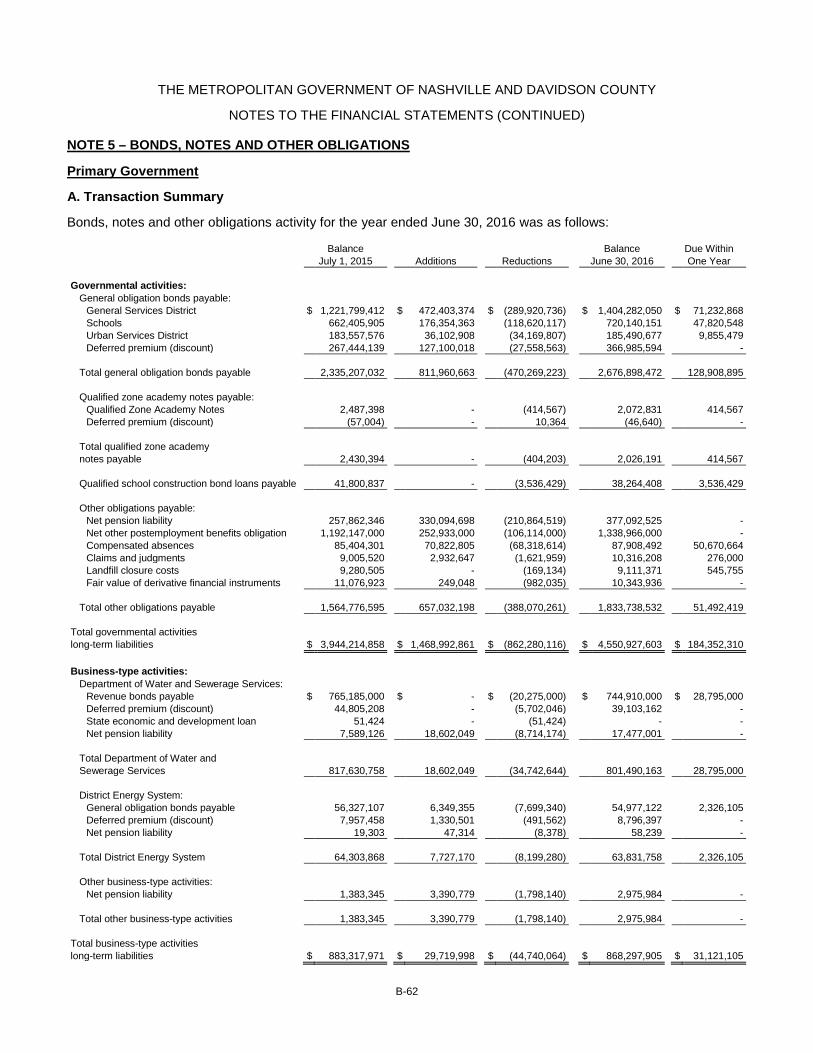
THE METROPOLITAN GOVERNMENT OF NASHVILLE AND DAVIDSON COUNTY
NOTES TO THE FINANCIAL STATEMENTS (CONTINUED)
B-62
NOTE 5 – BONDS, NOTES AND OTHER OBLIGATIONS Primary Government A. Transaction Summary Bonds, notes and other obligations activity for the year ended June 30, 2016 was as follows:
Balance
Balance
Due Within
July 1, 2015
Additions
Reductions
June 30, 2016
One Year
Governmental activities:
General obligation bonds payable:
General Services District $ 1,221,799,412
$ 472,403,374
$ (289,920,736)
$ 1,404,282,050
$ 71,232,868
Schools
662,405,905
176,354,363
(118,620,117)
720,140,151
47,820,548
Urban Services District
183,557,576
36,102,908
(34,169,807)
185,490,677
9,855,479
Deferred premium (discount)
267,444,139
127,100,018
(27,558,563)
366,985,594
-
Total general obligation bonds payable 2,335,207,032
811,960,663
(470,269,223)
2,676,898,472
128,908,895
Qualified zone academy notes payable:
Qualified Zone Academy Notes
2,487,398
-
(414,567)
2,072,831
414,567
Deferred premium (discount)
(57,004)
-
10,364
(46,640)
-
Total qualified zone academy
notes payable 2,430,394
-
(404,203)
2,026,191
414,567
Qualified school construction bond loans payable 41,800,837
-
(3,536,429)
38,264,408
3,536,429
Other obligations payable:
Net pension liability
257,862,346
330,094,698
(210,864,519)
377,092,525
-
Net other postemployment benefits obligation
1,192,147,000
252,933,000
(106,114,000)
1,338,966,000
-
Compensated absences
85,404,301
70,822,805
(68,318,614)
87,908,492
50,670,664
Claims and judgments
9,005,520
2,932,647
(1,621,959)
10,316,208
276,000
Landfill closure costs
9,280,505
-
(169,134)
9,111,371
545,755
Fair value of derivative financial instruments
11,076,923
249,048
(982,035)
10,343,936
-
Total other obligations payable 1,564,776,595
657,032,198
(388,070,261)
1,833,738,532
51,492,419
Total governmental activities long-term liabilities $ 3,944,214,858
$ 1,468,992,861
$ (862,280,116)
$ 4,550,927,603
$ 184,352,310
Business-type activities:
Department of Water and Sewerage Services:
Revenue bonds payable $ 765,185,000
$ -
$ (20,275,000)
$ 744,910,000
$ 28,795,000
Deferred premium (discount)
44,805,208
-
(5,702,046)
39,103,162
-
State economic and development loan
51,424
-
(51,424)
-
-
Net pension liability
7,589,126
18,602,049
(8,714,174)
17,477,001
-
Total Department of Water and
Sewerage Services 817,630,758
18,602,049
(34,742,644)
801,490,163
28,795,000
District Energy System:
General obligation bonds payable
56,327,107
6,349,355
(7,699,340)
54,977,122
2,326,105
Deferred premium (discount)
7,957,458
1,330,501
(491,562)
8,796,397
-
Net pension liability
19,303
47,314
(8,378)
58,239
-
Total District Energy System 64,303,868
7,727,170
(8,199,280)
63,831,758
2,326,105
Other business-type activities:
Net pension liability
1,383,345
3,390,779
(1,798,140)
2,975,984
-
Total other business-type activities 1,383,345
3,390,779
(1,798,140)
2,975,984
-
Total business-type activities long-term liabilities $ 883,317,971
$ 29,719,998
$ (44,740,064)
$ 868,297,905
$ 31,121,105
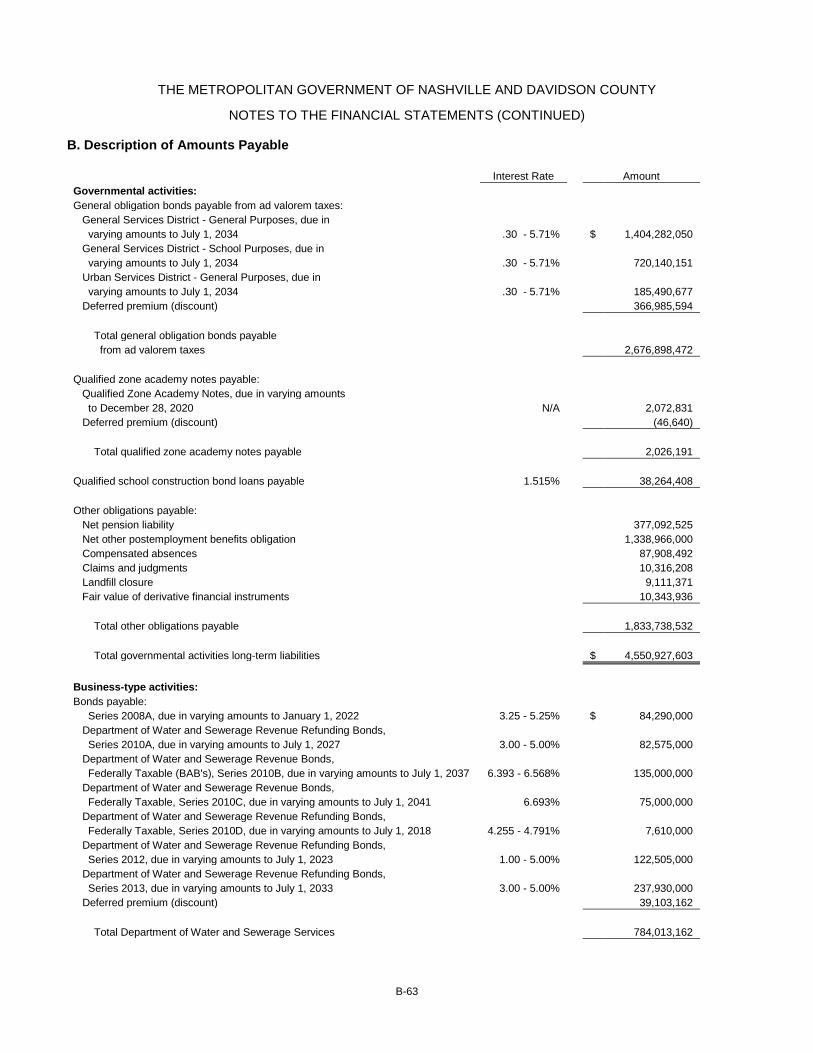
THE METROPOLITAN GOVERNMENT OF NASHVILLE AND DAVIDSON COUNTY
NOTES TO THE FINANCIAL STATEMENTS (CONTINUED)
B-63
B. Description of Amounts Payable
Interest Rate
Amount
Governmental activities: General obligation bonds payable from ad valorem taxes: General Services District - General Purposes, due in varying amounts to July 1, 2034 .30 - 5.71%
$ 1,404,282,050
General Services District - School Purposes, due in varying amounts to July 1, 2034 .30 - 5.71%
720,140,151
Urban Services District - General Purposes, due in varying amounts to July 1, 2034 .30 - 5.71%
185,490,677
Deferred premium (discount)
366,985,594
Total general obligation bonds payable from ad valorem taxes
2,676,898,472
Qualified zone academy notes payable: Qualified Zone Academy Notes, due in varying amounts to December 28, 2020 N/A
2,072,831
Deferred premium (discount)
(46,640)
Total qualified zone academy notes payable
2,026,191
Qualified school construction bond loans payable 1.515%
38,264,408
Other obligations payable: Net pension liability
377,092,525 Net other postemployment benefits obligation
1,338,966,000
Compensated absences
87,908,492 Claims and judgments
10,316,208
Landfill closure
9,111,371 Fair value of derivative financial instruments
10,343,936
Total other obligations payable
1,833,738,532
Total governmental activities long-term liabilities
$ 4,550,927,603
Business-type activities: Bonds payable: Series 2008A, due in varying amounts to January 1, 2022 3.25 - 5.25%
$ 84,290,000
Department of Water and Sewerage Revenue Refunding Bonds, Series 2010A, due in varying amounts to July 1, 2027 3.00 - 5.00%
82,575,000
Department of Water and Sewerage Revenue Bonds, Federally Taxable (BAB's), Series 2010B, due in varying amounts to July 1, 2037 6.393 - 6.568%
135,000,000
Department of Water and Sewerage Revenue Bonds, Federally Taxable, Series 2010C, due in varying amounts to July 1, 2041 6.693%
75,000,000
Department of Water and Sewerage Revenue Refunding Bonds, Federally Taxable, Series 2010D, due in varying amounts to July 1, 2018 4.255 - 4.791%
7,610,000
Department of Water and Sewerage Revenue Refunding Bonds, Series 2012, due in varying amounts to July 1, 2023 1.00 - 5.00%
122,505,000
Department of Water and Sewerage Revenue Refunding Bonds, Series 2013, due in varying amounts to July 1, 2033 3.00 - 5.00%
237,930,000
Deferred premium (discount)
39,103,162
Total Department of Water and Sewerage Services
784,013,162

THE METROPOLITAN GOVERNMENT OF NASHVILLE AND DAVIDSON COUNTY
NOTES TO THE FINANCIAL STATEMENTS (CONTINUED)
B-64
Interest Rate
Amount
Business-type activities: (Continued) District Energy System G. O. Multi-purpose Bonds,
Series 2010A, due in varying amounts to July 1, 2026 2.75 - 5.00%
265,867 District Energy System G. O. Refunding Bonds,
Series 2010D, due in varying amounts to July 1, 2024 1.50 - 5.00%
929,568 District Energy System G. O. Refunding Bonds,
Series 2011, due in varying amounts to July 1, 2023 2.00 - 5.00%
504,087 District Energy System Revenue Refunding Bonds,
Series 2012A, due in varying amounts to October 1, 2033 2.00 - 5.00%
42,870,000 District Energy System G. O. Refunding Bonds,
Series 2012B, due in varying amounts to July 1, 2024 .32 - 2.767%
3,068,062 District Energy System G. O. Refunding Bonds,
Series 2013A, due in varying amounts to July 1, 2033 3.00 - 5.00%
990,183 District Energy System G. O. Improvement Bonds,
Series 2015C, due in varying amounts to July 1, 2034 4.00 - 5.00%
685,894 District Energy System G. O. Refunding Bonds,
Series 2016, due in varying amounts to January 1, 2033 2.00 - 5.00%
5,663,461 Deferred premium (discount)
8,796,397
Total District Energy System
63,773,519
Total bonds payable
847,786,681
Net pension liability: Department of Water and Sewerage Services
17,477,001 District Energy System
58,239
Other business-type activities
2,975,984
Total net pension liability
20,511,224
Total business-type activities long-term liabilities
$ 868,297,905 The bonds, notes and other obligations are classified in the Statement of Net Position as follows:
Governmental activities: Noncurrent liabilities: Due within one year
$ 184,352,310 Due in more than one year
4,366,575,293
Total governmental activities
$ 4,550,927,603
Business-type activities:
Liabilities payable from restricted assets:
Current portion of long-term liabilities
$ 31,121,105 Noncurrent liabilities:
Due in more than one year
837,176,800
Total business-type activities
$ 868,297,905 The general obligation bonds and notes payable are direct obligations of the Government for which its full faith and credit are pledged. These obligations are payable from the assessment of ad valorem taxes. In addition, the Government has additional sources of funds which are utilized to meet the annual principal and interest payments of certain general obligation bonds and notes.

THE METROPOLITAN GOVERNMENT OF NASHVILLE AND DAVIDSON COUNTY
NOTES TO THE FINANCIAL STATEMENTS (CONTINUED)
B-65
For the governmental activities, the other obligations are generally liquidated from the following: Net pension liability Fund incurring the related employees’ compensation, primarily the General Fund and General Purpose School Fund Other postemployment benefits obligation Fund incurring the related employees’ compensation, primarily the General Fund, General Purpose School Fund and Department of Water and Sewerage Services Fund Compensated absences Fund incurring the related employees’ compensation, primarily the General Fund and the General Purpose School Fund Claims and judgments Fund to which the claim or judgment relates Landfill closure costs Solid Waste Operations Fund For the business-type activities, the other obligations are generally liquidated from the funds reporting the liabilities. C. Collateral for Obligations of the Proprietary Funds All bonds of the Department of Water and Sewerage Services and the District Energy System are collateralized by the revenues of those entities. D. Bond Covenants The various revenue bond indentures contain significant limitations and restrictions on annual debt service requirements, maintenance of a flow of monies through various restricted accounts, minimum amounts to be maintained in various sinking funds, and minimum revenue bond coverages. As of June 30, 2016, the Government believes it is in compliance with all financial limitations and restrictions. E. Annual Debt Service Requirements The annual requirements to amortize all general obligation bonds and revenue bonds outstanding as of June 30, 2016 are as follows:
Year Ending
General Obligation Bonds
Revenue Bonds
Total Primary Government June 30
Principal
Interest
Principal
Interest
Principal
Interest
2017
$ 131,235,000
$ 99,248,866
$ 28,795,000
$ 39,028,808
$ 160,030,000
$ 138,277,674 2018
139,150,000
100,510,825
37,475,000
37,476,030
176,625,000
137,986,855
2019
145,505,000
94,036,951
38,225,000
35,654,524
183,730,000
129,691,475 2020
143,835,000
88,318,608
39,120,000
33,743,634
182,955,000
122,062,242
2021
150,005,000
82,146,381
40,180,000
31,823,496
190,185,000
113,969,877 2022-2026
803,510,000
303,533,836
127,665,000
134,210,707
931,175,000
437,744,543
2027-2031
533,285,000
142,847,481
96,055,000
109,375,084
629,340,000
252,222,565 2032-2036
318,365,000
30,921,715
119,955,000
78,480,182
438,320,000
109,401,897
2037-2041
-
-
150,200,000
38,861,315
150,200,000
38,861,315 2042-2044
-
-
67,240,000
3,599,017
67,240,000
3,599,017
Total
2,364,890,000
941,564,663
744,910,000
542,252,797
3,109,800,000
1,483,817,460
Deferred Premium (Discount)
375,781,991
-
39,103,162
-
414,885,153
-
Total
$ 2,740,671,991
$ 941,564,663
$ 784,013,162
$ 542,252,797
$ 3,524,685,153
$ 1,483,817,460

THE METROPOLITAN GOVERNMENT OF NASHVILLE AND DAVIDSON COUNTY
NOTES TO THE FINANCIAL STATEMENTS (CONTINUED)
B-66
F. Commercial Paper In July 2014, the Government entered into agreements with two banks to provide a $500 million traditional commercial paper program, one through a Standby Note Purchase Agreement (SNPA) and one through a Standby Letter of Credit and Reimbursement Agreement (LOC). The SNPA supports $300 million of commercial paper notes. If the commercial paper dealer was ever unable to market notes in the amount needed to pay the maturing notes, the liquidity provider would issue bank notes. The proceeds of the bank notes would be applied to pay the principal of commercial paper notes on the respective maturity dates. The LOC supports $200 million of commercial paper notes. If the commercial paper dealer was ever unable to market notes in the amount needed to pay the maturing notes, the liquidity provider would make advances against the LOC. The proceeds of the LOC advance would be applied to pay the principal of commercial paper notes on the respective maturity dates. Also, in July 2014, the Government began a $200 million Extendable Commercial Paper (ECP) program. The ECP dealer issues commercial paper notes with original maturity of 1 to 90 days. If the ECP dealer was ever unable to market notes in the amount needed to pay the maturing notes, the Government could extend the original maturity date to 270 days from the original date of issue. During this period long-term financing would be arranged to pay the notes at maturity. The combined programs total $700 million of commercial paper notes available for short term capital financing. General obligation commercial paper is issued as federally tax-exempt notes. The commercial paper is sold at par as interest-bearing obligations in minimum denominations of $100,000 with interest payable at maturity. The commercial paper has varying maturities not to exceed 270 days, and all rollover commercial paper will not have a final maturity more than two years from the initial dates of issuance. The State has waived the two year final maturity limitation and approved a final maturity not to exceed six years. Interest rates vary depending on the market. At June 30, 2016, the amount of principal outstanding could not exceed $700 million. In April 2015, the Government established a $200 million Water and Sewerage commercial paper program. The program allows the Government to issue short-term notes to finance water and sewer capital projects, until long-term bonds can be issued to provide permanent project financing. As notes mature (prior to the issuance of the long-term bonds) new notes are issued to repay the maturing notes. If market conditions are such that new notes cannot be issued, the bank has agreed to pay the principal amount of any maturing commercial paper notes pursuant to a revolving credit agreement. If the bank advances funds pursuant to the revolving credit agreement, the Government has 180 days within which to reimburse the bank, either from the proceeds of a new commercial paper note issue, the proceeds of long-term bonds or funds of the Government. If the Government cannot reimburse the bank within 180 days, the bank advance converts to a term loan, payable in equal semi-annual installments of principal over three years. The Government may at any time prepay the term loan from the proceeds of a new commercial paper note issue or long-term bonds. In October 2015, the revolving credit agreement was replaced by a letter of credit and reimbursement agreement (LOC). The par amount of the commercial paper program was also reduced from $200 million to $183 million, the payment of which is now supported by the LOC on substantially the same terms as the revolving credit agreement as described above. In April 2015, the Government began a $100 million Extendable Commercial Paper (ECP) program. The ECP dealer issues commercial paper notes with original maturities of 1 to 90 days. If the ECP dealer was ever unable to market notes in the amount needed to pay the maturing notes, the Government could extend the original maturity date to 270 days from the original date of issue. During this period long-term financing would be arranged to pay the notes at maturity. The combined programs total $300 million of commercial paper notes available for short term capital financing. Revenue commercial paper is issued as federally tax-exempt notes. The commercial paper is sold at par as interest-bearing obligations in minimum denominations of $100,000 with interest payable at maturity. The commercial paper has varying maturities not to exceed 270 days, and all rollover commercial paper will not have a final maturity more than two years from the initial dates of issuance. The State has waived the two year final maturity limitation and approved a final maturity not to exceed six years. Interest rates vary depending on the market. At June 30, 2016, the amount of principal outstanding could not exceed $300 million. Commercial paper obligations of $500,000,000 with interest rates ranging from .42% to .68% were outstanding at June 30, 2016. These obligations were refunded subsequent to year-end with rollover notes. The obligations are considered short-term debt at June 30, 2016 and are recorded as a liability in the Capital Project Funds, Flood 2010 Recovery Fund, Department of Water and Sewerage Services, and the District Energy System of the Government.

THE METROPOLITAN GOVERNMENT OF NASHVILLE AND DAVIDSON COUNTY
NOTES TO THE FINANCIAL STATEMENTS (CONTINUED)
B-67
Commercial paper activity for the year ended June 30, 2016 was as follows:
Balance
Balance
July 1, 2015
Additions
Reductions
June 30, 2016
Commercial paper payable
$ 575,000,000
$ 325,000,000
$ (400,000,000)
$ 500,000,000 The commercial paper is classified in the Statement of Net Position as follows:
Governmental activities: Commercial paper payable $ 374,617,413
Total governmental activities 374,617,413
Business-type activities: Commercial paper payable 125,382,587
Total business-type activities 125,382,587
Total commercial paper payable $ 500,000,000 G. Issuance of Bonds On July 30, 2015, the Government issued $347,235,000 General Obligation Improvement Bonds, Series 2015C, maturing on July 1, 2034, with interest rates ranging from 4.50% to 5.00%. The net proceeds of the Series 2015C Bonds totaled $401,348,540 (including original issue premium). $400,000,000 of the net proceeds was used to fund maturing commercial paper notes, and $1,348,540 was used to cover underwriting fees and other costs of issuance. On June 1, 2016, the Government issued $343,975,000 General Obligation Refunding Bonds, Series 2016, maturing on January 1, 2033, with interest rates ranging from 2.00% to 5.00%. The Series 2016 Bonds refunded certain maturities of General Obligation Refunding Bonds, Series 2010A, General Obligation Refunding Bonds, Series 2012, and General Obligation Bonds, Series 2013A. By issuing the Series 2016 Bonds, the Government obtained an estimated economic gain (difference between the present values of the debt service payments on the defeased and new debt) of $16,270,215. The refunding will reduce the Government’s debt service payments over the next seventeen years by an estimated $19,466,142. H. Defeased Bonds The Government has defeased certain other bonds by placing the proceeds of new bonds in irrevocable trusts to provide for all future debt service requirements on the retired bonds. Accordingly, the trust account assets and the liability for the defeased bonds are not included in the Government’s financial statements. As of June 30, 2016, $972,155,000 of general obligation bonds are considered defeased. I. Redemption Options Certain bonds are subject to redemption prior to maturity at the option of the Government. The stated payments of principal and interest on the Department of Water and Sewerage Services Series 1992 and Series 2010A, B, C and D are insured by municipal bond insurance policies which cannot be canceled. J. Qualified Zone Academy Notes Qualified Zone Academy Bonds (QZAB) are issued by the Tennessee State School Bond Authority (TSSBA) to finance improvement loans for qualifying primary and secondary schools in the State. The QZAB’s are a part of a federal government program administered by the Tennessee Department of Education in which a federal tax credit is given to investors in lieu of interest on the bonds.

THE METROPOLITAN GOVERNMENT OF NASHVILLE AND DAVIDSON COUNTY
NOTES TO THE FINANCIAL STATEMENTS (CONTINUED)
B-68
The Government entered into a loan agreement with the TSSBA in December, 2005 where by the Government would receive an amount not to exceed $6,350,000 of the proceeds from the TSSBA QZAB, Series 2005. Actual proceeds totaled $6,218,500. Under the provisions of the agreement, the proceeds of the loan must be spent on specific authorized projects within a limited time period. The TSSBA will hold and invest the proceeds from the Series 2005 Bonds, and as allowable expenditures are incurred, the Government will request reimbursement. The Government is required to make annual principal payments to TSSBA. An investment credit applied to the Government’s portion of the bond proceeds will be used to reduce future payments. QZAB note principal maturities at June 30, 2016 are summarized below:
Year Ending
Investment June 30
Principal
Credit (1)
2017
$ 414,567
$ 97,031 2018
414,567
97,031
2019
414,567
97,031 2020
414,567
97,031
2021
414,563
97,031
Total qualified zone academy notes payable
$ 2,072,831
$ 485,155
(1) The investment tax credit is estimated and subject to adjustment based on investment earnings and other factors.
K. Qualified School Construction Bond Loan Qualified School Construction Bonds (QSCB) are issued by the Tennessee State School Bond Authority (TSSBA) to finance improvement loans for qualifying primary and secondary schools in the State. The QSCB’s are part of the federal government’s American Recovery and Reinvestment Act of 2009 (ARRA). The Government entered a loan agreement with the TSSBA in December 2009 whereby the Government received an amount not to exceed $21,760,000 of the proceeds from the TSSBA QSCB, Series 2009. Actual proceeds totaled $21,120,000. Interest on the loan is 1.515%, and the loan matures in 2027. Under the provisions of the agreement, the proceeds of the loan must be spent on specific authorized projects within a limited time period. The TSSBA will hold and invest the proceeds from the Series 2009 Bonds, and as allowable expenditures are incurred, the Government will request reimbursement. The Government is required to make annual principal payments to TSSBA. An investment credit applied to the Government’s portion of the bond proceeds will be used to reduce future payments. On October 7, 2010, the Government entered a loan agreement with the TSSBA whereby the Government received $35,555,000 from the TSSBA’s QSCB’s issued on October 7, 2010. Interest on the loan is 4.848%, and the loan matures in 2028. The Government also receives a share of the TSSBA’s interest subsidy payments received from the Federal government. The Government’s share of the subsidy is estimated to offset its interest payments. Under the provisions of the agreement, the proceeds of the loan must be spent on specific authorized projects within a limited time period. The TSSBA will hold and invest the proceeds from the Series 2010 Bonds, and as allowable expenditures are incurred, the Government will request reimbursement. The Government is required to make annual principal payments to TSSBA. Interest earned by the TSSBA on the Government’s portion of the bond proceeds will be used to reduce future payments.

THE METROPOLITAN GOVERNMENT OF NASHVILLE AND DAVIDSON COUNTY
NOTES TO THE FINANCIAL STATEMENTS (CONTINUED)
B-69
QSCB note principal maturities at June 30, 2016 are summarized below:
Year Ending
June 30
Principal
Interest
Subsidy
2017
$ 3,536,429
$ 2,043,674
$ 1,723,706 2018
3,536,429
2,043,674
1,723,706
2019
3,536,429
2,043,674
1,723,706 2020
3,536,429
2,043,674
1,723,706
2021
3,536,429
2,043,674
1,723,706 2022-2026
17,811,866
10,218,372
8,618,532
2027-2028
2,770,397
1,920,130
2,585,560
Total qualified school construction
bond loan payable
$ 38,264,408
$ 22,356,872
$ 19,822,622 L. The Department of Water and Sewerage Services – State Economic and Development Loan In January 2009, the Department entered a loan agreement with the Tennessee Department of Economic Development for $330,000. The proceeds of the loan were used to fund the installation of variable frequency drives on the raw water pumps at the K.R. Harrington water treatment plant. The energy savings resulting from the ability to gradually increase or decrease pump speeds rather than adding or dropping pumps at full capacity were used to repay the loan. The last payment on the loan was made during the year ended June 30, 2016. M. Derivative Financial Instruments In connection with outstanding variable rate debt, the Government competitively bid the sale of a pay-fixed receive-variable Securities Industry and Financial Market Association (SIFMA), formerly the Bond Market Association, swaption (Swaption). This transaction generated an upfront payment of $3,800,000, which is deferred and being amortized over the term of the related interest rate swap in the government-wide statements. The Swaption was sold on a SIFMA floating to fixed interest rate swap and, when it was exercised by the winning bidder, SunTrust Bank (Counterparty), the Government was placed into a variable to fixed interest rate swap commencing on May 15, 2006. The interest rate swap is a hedging derivative instrument (cash flow hedge) maintained by the Government in order to manage its exposure to market risk from fluctuations in interest rates on its variable rate debt. On February 2, 2012, the Government refunded the Tennessee Municipal Bond Fund (TMBF) Loan, which was the debt previously associated with the hedging derivative instrument. Upon the refunding of the TMBF Loan, the Government terminated hedge accounting for the derivative instrument. The related deferral account totaled $16,126,556 at the date of the refunding and has been included in the net carrying amount of the TMBF Loan for purposes of determining the deferred charge related to its refunding. The Government has subsequently employed the interest rate swap as a hedging derivative instrument maintained in order to manage its exposure to market risk from fluctuations in interest rates on its commercial paper program. The swap agreement provides that the Government will pay a fixed rate of 5.4% to the Counterparty and will receive the SIFMA rate on the outstanding notional amount which reduces annually and was $39,650,000 at June 30, 2016. The SIFMA rate at June 30, 2016 was .41%. All terms of the swap remain in effect and expire May 15, 2026. The credit rating of the Counterparty at June 30, 2016 is BBB+. The fair value of this swap contract was a liability of $10,343,936 at June 30, 2016 and is recorded in noncurrent liabilities in the Statement of Net Position. The liability increased by $249,048 for the year ended June 30, 2016. This change in fair value is reported as a deferred inflow of resources in the Statement of Net Position. The fair value of the interest rate swap was determined by the Counterparty using valuation models and assumptions and available market data. Arrangements made in the Government’s interest rate swap agreement do not alter the Government’s obligation to pay the principal and interest on the related debt. See Section F. The net receipts/payments on the hedging derivative instrument at June 30, 2016 are summarized below. The amounts assume that the current reference rate (.41%) of the interest rate swap will remain the same for the term of the swap agreement. As this rate varies, the net receipts/payments will vary.

THE METROPOLITAN GOVERNMENT OF NASHVILLE AND DAVIDSON COUNTY
NOTES TO THE FINANCIAL STATEMENTS (CONTINUED)
B-70
Year Ending
Hedging Derivative, June 30
Net Payments
2017
$ 1,978,535 2018
1,825,841
2019
1,664,664 2020
1,494,505
2021
1,314,616 2022-2026
3,496,992
Total hedging derivative, net payments
$ 11,775,153 Credit risk – The Government is exposed to credit risk on hedging derivative instruments that are in asset positions. There were no such instruments in asset positions at June 30, 2016. However, should interest rates change and the fair value of the swap becomes positive, the Government would be exposed to credit risk in the amount of the derivative’s fair value. The Government relies primarily on the credit rating of the counterparty to assess credit risk. Interest rate risk – The Government is exposed to interest rate risk on its interest rate swap. On its pay-fixed, receive-variable interest rate swap, as the variable swap index decreases, the Government’s net payments on the swaps increase. Basis risk – The Government is exposed to basis risk on its pay-fixed interest rate swaps because the variable rate payments received by the Government on this hedging derivative instrument is, in certain circumstances, based on a rate or index other than interest rates that the Government pays on its hedged debt. Termination risk – The Government or the Counterparty may terminate the derivative instrument if the other party fails to perform under the terms of the contract. If at the time of termination, the hedging derivative instrument is in a liability position, the Government would be liable to the Counterparty for a payment equal to the liability. N. Unissued Bonds or Notes At June 30, 2016, authorized but unissued general obligation bonds totaled $1,709,373,000. Commercial paper borrowings are used to fund capital spending prior to the issuance of bonds. Component Units A. Transaction Summary Bonds, notes and other liabilities activity for the year ended June 30, 2016 was as follows:
Balance
Balance
Due Within
July 1, 2015
Additions
Reductions
June 30, 2016
One Year
Governmental types: Revenue bonds payable: Sports Authority
$ 153,759,725
$ -
$ (5,917,704)
$ 147,842,021
$ 7,320,000
Total revenue bonds payable - governmental types
153,759,725
-
(5,917,704)
147,842,021
7,320,000
Proprietary types: Revenue bonds payable: Electric Power Board
630,572,000
-
(36,831,000)
593,741,000
25,357,000 Metropolitan Nashville Airport Authority
144,962,902
226,903,756
(30,147,789)
341,718,869
12,775,000
Convention Center Authority
624,100,438
-
(3,300,492)
620,799,946
7,865,000
Total revenue bonds payable - proprietary types
1,399,635,340
226,903,756
(70,279,281)
1,556,259,815
45,997,000

THE METROPOLITAN GOVERNMENT OF NASHVILLE AND DAVIDSON COUNTY
NOTES TO THE FINANCIAL STATEMENTS (CONTINUED)
B-71
Balance
Balance
Due Within
July 1, 2015
Additions
Reductions
June 30, 2016
One Year
Proprietary types: (Continued) Notes payable:
Metropolitan Development and Housing Agency
14,239,737
58,496,481
(3,249,145)
69,487,073
4,069,647 Metropolitan Nashville Airport Authority
9,209,342
4,300,000
(885,768)
12,623,574
1,189,324
Total notes payable - proprietary types
23,449,079
62,796,481
(4,134,913)
82,110,647
5,258,971
Total revenue bonds and notes payable
1,576,844,144
289,700,237
(80,331,898)
1,786,212,483
58,575,971
Other liabilities payable: Sports Authority: Other liabilities
7,524,159
11,532,436
(1,761,662)
17,294,933
- Hospital Authority:
Capitalized lease obligation
27,290,090
-
(2,162,473)
25,127,617
2,327,298 Net pension liability
3,062,503
7,506,639
(4,046,618)
6,522,524
-
Metropolitan Development and Housing Agency: Other liabilities
1,450,613
1,719,501
(1,450,613)
1,719,501
- Electric Power Board:
TVA advances and other
8,912,000
6,421,000
(8,303,000)
7,030,000
- Net pension liability
165,435,000
93,136,000
(24,600,000)
233,971,000
-
Metropolitan Transit Authority: Advance lease receipts
10,327,470
-
(590,001)
9,737,469
- Refundable grants
3,771,767
76,929
(98,465)
3,750,231
-
Net pension liability
11,794,276
8,259,860
(5,557,571)
14,496,565
- Other postemployment benefits obligation
32,306,716
7,211,331
(2,343,641)
37,174,406
-
Metropolitan Nashville Airport Authority: Fair value of derivative financial
instruments
1,542,095
-
(407,506)
1,134,589
- Unearned income
1,890,423
40,015
(102,158)
1,828,280
-
Net pension liability
10,621,488
8,075,235
(12,157,785)
6,538,938
- Other postemployment benefits obligation
26,686,104
1,915,044
(1,963,824)
26,637,324
-
Convention Center Authority: Net pension liability
368,709
677,918
(247,589)
799,038
-
Total other liabilities payable - proprietary types
312,983,413
146,571,908
(65,792,906)
393,762,415
2,327,298
Total revenue bonds, notes and other liabilities payable - component units
$ 1,889,827,557
$ 436,272,145
$ (146,124,804)
$ 2,179,974,898
$ 60,903,269

THE METROPOLITAN GOVERNMENT OF NASHVILLE AND DAVIDSON COUNTY
NOTES TO THE FINANCIAL STATEMENTS (CONTINUED)
B-72
B. Description of Amounts Payable Amounts payable at June 30, 2016 are as follows:
Interest Rates
Amount
Governmental types: Revenue bonds payable: Series 2012A (Stadium Project), due in varying amount to July 1, 2033
1.142 - 5.231%
$ 20,560,000 Taxable Public Facility Revenue Refunding Bonds,
Series 2012B (Arena Project), due in varying amount to July 1, 2018
.38 - 2.944%
4,690,000 Taxable Public Facility Revenue Improvement Bonds (Hockey Project),
Series 2013A, due in varying amount to July 1, 2033
.793 - 5.150%
13,125,000 Taxable Public Improvement Revenue Refunding Bonds,
Series 2013B, due in varying amount to July 1, 2025
.793 - 4.050%
25,195,000 Public Improvement Revenue Bonds (Ballpark Project),
Series 2013A due in varying amounts to August 1, 2043
3.00 - 5.250%
53,760,000 Taxable Public Improvement Revenue Bonds (Ballpark Project),
Series 2013B due in varying amounts to August 1, 2043
1.25 - 5.625%
11,240,000 Public Improvement Revenue Refunding Bonds,
Series 2014 due in varying amounts to July 1, 2026
4.00 - 5.000%
15,005,000 Deferred premium (discount)
4,267,021
Total revenue bonds payable - governmental types
147,842,021
Proprietary types: Revenue bonds payable: Electric Power Board Electric System Revenue Bonds, 1998 Series A, due in varying amounts to May 15, 2023
5.125 - 5.40%
32,161,000 Electric Power Board Electric System Revenue Bonds, 1998
Series B, due in varying amounts to May 15, 2017
4.75 - 5.50%
6,372,000 Electric Power Board Electric System Revenue Bonds, 2008
Series A, due in varying amounts to May 15, 2033
3.25 - 5.00%
6,975,000 Electric Power Board Electric System Revenue Bonds, 2008
Series B, due in varying amounts to May 15, 2023
3.25 - 5.00%
7,688,000 Electric Power Board Electric System Revenue Bonds, 2011
Series A, due in varying amounts to May 15, 2036
1.50 - 5.00%
94,988,000 Electric Power Board Electric System Revenue Bonds, 2011
Series B, due in varying amounts to May 15, 2026
2.00 - 5.00%
133,008,000 Electric Power Board Electric System Revenue Bonds, 2013
Series A, due in varying amounts to May 15, 2029
3.25 - 5.00%
60,786,000 Electric Power Board Electric System Revenue Bonds, 2014
Series A, due in varying amounts to May 15, 2039
2.00 - 5.00%
118,363,000 Electric Power Board Electric System Revenue Bonds, 2015
Series A, due in varying amounts to May 15, 2039
5.00%
133,400,000 Airport Improvement Revenue Bonds, Series 2003 B,
due in varying amounts to July 1, 2033
4.13 - 5.94%
14,785,000 Airport Improvement Revenue Bonds, Series 2008A,
due in varying amounts to July 1, 2019
4.49%
12,000,000 Airport Improvement Revenue Bonds, Series 2009A,
due in varying amounts to July 1, 2019
3.00 - 5.25%
20,040,000 Airport Improvement Revenue Bonds, Series 2010A,
due in varying amounts to July 1, 2017
3.00 - 5.00%
7,525,000 Special Facility Revenue Bonds, Series 2010,
due in varying amounts to July 1, 2029 (includes terms bonds at 6.79%)
2.25 - 6.19%
58,980,000 Airport Improvement Revenue Bonds, Series 2010C,
due in varying amounts to July 1, 2016
3.00 - 4.00%
1,740,000 Airport Improvement Revenue Bonds, Series 2015A,
due in varying amounts to July 1, 2040
4.00 - 5.00%
91,855,000

THE METROPOLITAN GOVERNMENT OF NASHVILLE AND DAVIDSON COUNTY
NOTES TO THE FINANCIAL STATEMENTS (CONTINUED)
B-73
Interest Rates
Amount
Proprietary types: (Continued) Airport Improvement Revenue Bonds, Series 2015B,
due in varying amounts to July 1, 2040
4.00 - 5.00%
108,145,000 Metropolitan Nashville Airport Authority:
Deferred premium (discount)
26,648,869 Convention Center Authority Revenue Bonds, 2010A-1
due in varying amounts to July 1, 2026
3.35 - 5.00%
48,510,000 Convention Center Authority Revenue Bonds, 2010A-2
due in varying amounts to July 1, 2043
7.431%
152,395,000 Convention Center Authority Revenue Bonds, 2010B
due in varying amounts to July 1, 2043
4.862 - 6.731%
419,090,000 Convention Center Authority:
Deferred premium (discount)
804,946
Total revenue bonds payable - proprietary types
1,556,259,815
Notes payable: Metropolitan Development and Housing Agency
69,487,073 Metropolitan Nashville Airport Authority
12,623,574
Total notes payable - proprietary types
82,110,647
Total revenue bonds and notes payable
1,786,212,483
Other liabilities payable: Sports Authority: Other liabilities
17,294,933 Hospital Authority:
Capitalized lease obligation
25,127,617 Net pension liability
6,522,524
Metropolitan Development and Housing Agency: Other liabilities
1,719,501 Electric Power Board:
TVA advances
2,754,000 Other
4,276,000
Net pension liability
233,971,000 Metropolitan Transit Authority:
Advance lease receipts
9,737,469 Refundable grants
3,750,231
Net pension liability
14,496,565 Other postemployment benefits obligation
37,174,406
Metropolitan Nashville Airport Authority: Fair value of derivative financial instruments
1,134,589 Unearned income
1,828,280
Net pension liability
6,538,938 Other postemployment benefits obligation
26,637,324
Convention Center Authority: Net pension liability
799,038
Total other liabilities payable - proprietary types
393,762,415
Total bonds, notes and other liabilities payable - component units
$ 2,179,974,898

THE METROPOLITAN GOVERNMENT OF NASHVILLE AND DAVIDSON COUNTY
NOTES TO THE FINANCIAL STATEMENTS (CONTINUED)
B-74
The bonds, notes and other liabilities of the component units are classified in the Statement of Net Position as follows:
Liabilities payable from restricted assets:
Current portion of long-term liabilities $ 53,317,000
Noncurrent liabilities:
Due within one year
7,586,269
Due in more than one year 2,119,071,629
Total component units long-term liabilities $ 2,179,974,898 C. Collateral for Obligations of the Component Units Sports Authority The Public Improvement Revenue Refunding Bonds, Series 2004, are limited obligations of the Sports Authority payable solely from the revenues and receipts pledged to the payment of these bonds and secured by the non-tax revenues of the General Fund of the Government. Neither the faith and credit of the Sports Authority nor the faith and credit or the taxing power of the Government is pledged to the payment of the principal or interest on the bonds. D. Description of Bonds Sports Authority On December 19, 2013, the Sports Authority issued $53,760,000 Public Improvement Revenue Bonds (Ballpark), Series 2013A, maturing on August 1, 2043, with interest rates ranging from 3.00% to 5.25%, and $11,240,000 Public Improvement Revenue Bonds (Ballpark), Series 2013B (Federally Taxable), maturing on August 1, 2043, with interest rates ranging from 1.25% to 5.625%. The proceeds of the 2013A and 2013B Ballpark Bonds were used to pay costs to acquire land and construct a minor league baseball park and related public improvements, capitalized interest, and costs related to issuance. The net proceeds of the 2013A and 2013B Ballpark Bonds totaled $66,397,938 (net of underwriting fees) and were deposited with the Sports Authority. In conjunction with the issuance of the Series 2013 Ballpark Bonds, the Sports Authority entered into a loan and security agreement with the Metropolitan Development and Housing Agency (the Agency) whereby a tax increment revenue note was issued by the Agency to the Sports Authority in exchange for the loan of $28,000,000 to the Agency from the Tax Increment Financing (TIF) Loan Account of the Construction Fund. The loan dated December 19, 2013, maturing July 1, 2043, with interest at a fixed rate of 4.55% per annum, was used to pay for certain TIF eligible expenses for the redevelopment project. Collateral for this loan is ninety-five percent (95%) of all ad valorem real property tax increment revenues for specific projects in the vicinity of the Ballpark and the ballpark development. In addition to the aforementioned TIF payments from the Agency, state and local sales tax revenues generated at the ballpark, ballpark lease payments and – to the extent the foregoing revenues are insufficient – non-tax revenues collected in the General Fund of the Urban Services District of the Government are pledged for the payment of principal and interest on the Series 2013 Ballpark Bonds. E. Conduit Debt Obligations Industrial Development Board The Government, through the Industrial Development Board, has issued Industrial Revenue Bonds to provide financial assistance to private sector entities for the acquisition and construction of facilities deemed to be in the public interest. The bonds are secured by the property financed and are payable solely from payments received on the underlying mortgage loans. Upon repayment of the bonds, ownership of the acquired facilities transfers to the private sector entities served by the bond issuances. Neither the Government nor any political subdivision thereof is obligated in any manner for repayment of the bonds. Accordingly, the bonds are not reported as liabilities of the Government. The aggregate principal amount as of June 30, 2016 for the Industrial Revenue Bonds issued after April 1, 1996 was approximately $744,455,073. The aggregate principal amount payable for the Industrial Revenue Bonds issued prior to April 1, 1996 could not be determined; however, their original issue amount totaled $1,414,846,369.
THE METROPOLITAN GOVERNMENT OF NASHVILLE AND DAVIDSON COUNTY
NOTES TO THE FINANCIAL STATEMENTS (CONTINUED)
B-75
Health and Educational Facilities Board The Health and Educational Facilities Board of The Metropolitan Government of Nashville and Davidson County, Tennessee, (The Board) is a public, non-profit corporation and instrumentality of the Government organized in 1974 pursuant to Chapter 101, Part 3, Title 48 of the TCA as amended (the Act). The Board is not considered to be part of the Government’s reporting entity. The Act empowers the Board, among other things, to acquire and furnish property suitable for use by educational institutions, hospital institutions, or multifamily housing facilities in connection with their operations, and to loan to such entities the proceeds from the sale of its bonds to finance such security for the payment of the principal and interest on bonds issued. The Government is not liable for the payment of the principal or any interest on any of the revenue bonds of the Board. Accordingly, the revenue bonds of the Board are not reported as liabilities of the Government. The aggregate principal amount of revenue bonds issued by the Board on or after April 1, 1996 totals approximately $5,566,856,525. The aggregate principal amount of revenue bonds which were issued by the Board and were still outstanding as of April 1, 1996 could not be determined; however, the total aggregate principal amount of revenue bonds issued by the Board prior to April 1, 1996 was $1,367,025,500. F. Other Matters Sports Authority The Authority has a $10,000,000 revolving credit line with First Tennessee Bank (Bank) for the purpose of financing capital improvements at the Bridgestone Arena. Interest is calculated monthly at a variable rate as set forth in the loan agreement based on the outstanding principal balance of the loan. The monthly interest is payable from capital improvement fees received by the Metropolitan Government, and any excess monthly revenues over the interest due are paid against the outstanding principal balance. As amended during this fiscal year, the loan expires December 31, 2020 at which time the principal outstanding balance and any interest will be due to the Bank. As a condition of lending, the loan agreement requires the Metropolitan Government provide a line of credit loan (Metro loan) of $2,000,000 to the Authority. Upon the occurrence of any event of default, the Bank may require that the Authority draw the full amount of the Metro loan and pay those proceeds to the Bank to be applied against the Bank loan. The total outstanding bank loan balance as of June 30, 2016 is $8,011,619. The Authority has a $15,000,000 non-revolving credit line with Pinnacle Bank (Administrative Agent), First Tennessee Bank and Fifth Third Bank for the purpose of financing capital improvements at the Nissan Stadium. The loan dated October 19, 2015 matures on October 1, 2027. Interest is due quarterly at a variable rate as set forth in the loan agreement based on the outstanding principal balance of the loan. Conditions of lending include that the Authority expend at least $1,100,000 of its own funds toward project costs; set aside a cash reserve of $1,900,000 held by the Authority from previously issued bonds Series 2012A, Series 2013B and Series 2014; and maintain a minimum balance of $1,000,000 in the revenue fund held by the Administrative Agent. Pledged revenues include ticket tax collections (excluding that which is allocated to prior bonds Series 2012A as specified in the agreement) and CMAfest revenues. Collected revenues are remitted monthly by the Metropolitan Government to the revenue account held by Pinnacle Bank. Remittances are applied toward principal; quarterly the Administrative Agent transfers the amount due for accrued interest. The total outstanding balance as of June 30, 2016 is $9,273,550.

THE METROPOLITAN GOVERNMENT OF NASHVILLE AND DAVIDSON COUNTY
NOTES TO THE FINANCIAL STATEMENTS (CONTINUED)
B-76
G. Annual Debt Service Requirements The annual principal maturities of all bonds and notes payable as of June 30, 2016 for the component units are as follows:
Year Ending
Revenue Bonds and Notes Payable June 30
Principal
Interest
2017
$ 59,065,971
$ 83,994,514
2018
68,702,974
82,388,257
2019
64,458,036
80,449,234
2020
77,924,129
69,801,155
2021
68,575,445
66,769,378
2022-2026
347,678,027
285,463,732
2027-2031
305,321,509
209,056,089
2032-2036
261,915,557
135,962,009
2037-2041
241,324,000
53,806,288
2042-2046
182,634,999
9,093,169
Total
1,677,600,647
1,076,783,825
Deferred charges
108,611,836
-
Total
$ 1,786,212,483
$ 1,076,783,825 Deferred amounts for the Electric Power Board are netted with principal. H. Additional Information Additional information regarding the bonds, notes and other obligations of the component units can be found in their separately issued financial statements.

THE METROPOLITAN GOVERNMENT OF NASHVILLE AND DAVIDSON COUNTY
NOTES TO THE FINANCIAL STATEMENTS (CONTINUED)
B-77
NOTE 6 – PENSION PLANS The Government has the following single-employer pension plans: Name Type Status Administering Fund Primary Government Fiduciary Fund Types: County Defined Benefit Closed 1963 Davidson County Employees’ Retirement Metro - Division A Defined Benefit Closed 1995 Metropolitan Employees Benefit Trust Metro - Division B Defined Benefit Open Metropolitan Employees Benefit Trust County Education Defined Benefit Closed 1963 Employees’ Pension and Insurance Metro Education Defined Benefit Closed 1969 Teachers’ Retirement Plan City Defined Benefit Closed 1963 Closed City Plan City Education Defined Benefit Closed 1963 Teachers’ Civil Service and Pension The City, County, Metro Education, City Education, and County Education plans are participants in the Guaranteed Payment Program (GPP), an umbrella program created by the Metropolitan Council to ensure actuarially sound funding for the five closed plans. Under the GPP, unfunded liabilities of the aggregate program are amortized over a period of no more than thirty years. Contributions on behalf of the five individual plans move to a payment account from which distributions are paid to the constituent plans of the GPP as necessary to satisfy current benefit needs and to satisfy long-term funding objectives of the GPP. No separate financial reports are issued for these plans. The Government also participates in cost-sharing, multiple-employer plans administered by the Tennessee Consolidated Retirement System (TCRS). Component Units Sports Authority, Included in primary Hospital Authority, and government plans (1) Convention Center Authority Hospital Authority Defined Contribution Open N/A Convention Center Authority Defined Contribution Open N/A Metropolitan Development and Housing Agency Defined Contribution Open N/A Electric Power Board Defined Benefit Open N/A Metropolitan Transit Authority Defined Benefit Open N/A Metropolitan Nashville Airport Authority Defined Benefit Closed N/A Metropolitan Nashville Airport Authority Defined Contribution Open N/A (1) Employees of the Sports Authority are eligible to participate in the plans of the Government. Employees of Hospital Authority and Convention Center Authority hired before certain dates are eligible to participate in the plans of the Government. Employees hired subsequent to those dates are only eligible to participate in the plans administered by those Authorities. The allocation of the primary government plans to the component units is not material for disclosure. The Metropolitan Transit Authority guarantees the plan sponsored by the Davidson Transit Organization (DTO), which provides Metropolitan Transit Authority labor. Additional information regarding the pension plans of the component units can be found in their separately issued financial statements.

THE METROPOLITAN GOVERNMENT OF NASHVILLE AND DAVIDSON COUNTY
NOTES TO THE FINANCIAL STATEMENTS (CONTINUED)
B-78
Plans Administered by the Government A. Summary of Significant Accounting Policies Measurement Focus, Basis of Account and Financial Statement Presentation The pension funds are reported using the accrual basis of accounting. Employer and employee contributions are recognized in the period due. Benefits and refunds are recognized when due and payable in accordance with the terms of the plans. The net pension liability (asset) is reported in the applicable governmental and business-type activities in the Statements of Net Position and Activities. Method Used to Value Investments Investments are reported at fair value. Securities traded on national or international exchange are valued at the last reported sales price at current exchange rates. Real estate plan assets are reported at fair value utilizing an income approach to valuation. An independent appraisal is obtained once every year to determine the fair market value of the real estate assets. Accounts receivable include amounts due from investment brokers for pending trades. B. Plan Descriptions Plan Administration All plans of the primary government were established or continue under the authority of the Metropolitan Charter, Article XIII, effective April 1, 1963. Approval of the Metropolitan Council is required to establish and amend benefit provisions. Article XIII also requires that all pension plans be actuarially sound. Administrative costs of the plans are financed through plan assets. The plans are managed and administered by the Metropolitan Employee Benefit Board (the Board), an independent board created by the Metropolitan Charter. The Board is composed of ten members, as follows: Finance Director, Human Resources Director, three members appointed by the Mayor, and five members selected by employees and retirees of the Metropolitan Government. Plan Membership Plan membership is summarized on the Selected Pension Information Schedules on pages B-86 to B-87. Benefits Provided Metro Plan Division A This plan (The Metropolitan Employees' Benefit Trust Fund) was established at the inception of the Government on April 1, 1963 and implemented on November 4, 1964. At that time, all employees of the former city and county governments were given the option of continuing as participants of the pension plans of those organizations or transferring to the Metro Plan. Division A of the Metro Plan was closed to new members on July 1, 1995. Normal retirement for employees other than police officers and fire fighters occurs at age 65 and entitles employees to a lifetime monthly benefit of 1/12 of the sum of 1% of average base earnings, as defined by the Social Security Administration, plus 1.75% of average excess earnings as defined in the Plan, multiplied by the years of credited service, plus cost-of-living adjustments. Average earnings are the average earnings for the last 60 consecutive months in which earnings were highest. Benefits fully vest on completing 10 years of service. Normal retirement for police officers and fire fighters occurs upon reaching age 55 and completing 20 years of service. The lifetime monthly benefit is calculated as 1/12 of the sum of 2% of average earnings up to 25 years of credited service plus 1.75% of average earnings for all years of credited service in excess of 25, reduced by the amount of primary social security benefits at age 65 and increased by cost-of-living adjustments. In no event shall police and fire pensions be less than that due to employees who are not policemen or firemen. Benefits fully vest on completing 10 years of service. Any employee who terminates after the completion of at least 10 years of service and before eligibility for normal retirement shall be eligible to receive a monthly deferred pension which shall commence on the first day of the month following the attainment of age 65, computed and payable in accordance with the Metro Plan.
THE METROPOLITAN GOVERNMENT OF NASHVILLE AND DAVIDSON COUNTY
NOTES TO THE FINANCIAL STATEMENTS (CONTINUED)
B-79
Division B As of July 1, 1995, Division B of the Metro Plan was established for all non-certificated employees of the Metropolitan Nashville Public Schools and all other Government employees. Employees with an effective hire date of July 1, 1995 or later are only eligible to participate in Division B of the Metro Plan. Also, Government employees as of June 30, 1995 who were qualified members of Division A were given the option to transfer to Division B as of January 1, 1996, subject to written application approved by the Benefit Board. Substantially all employees transferred to Division B of the Metro Plan. Normal retirement for employees other than police officers and fire fighters occurs at the unreduced retirement age which is the earlier of (a) the date when the employee’s age plus the completed years of credited employee service equals 85, but not before age 60; or (b) the date when the employee reaches age 65 and completes 5 years of credited employee service. The lifetime monthly benefit is calculated as 1/12 of the sum of 1.75% of average earnings based upon the previous 60 consecutive months of credited service which produce the highest earnings. Benefits fully vest on completing 5 years of service for employees employed on or between October 1, 2001 and December 31, 2012 who vest before leaving employment. Benefits fully vest on completing 10 years of service for employees and non-vested employees hired or rehired on or after January 1, 2013. Normal retirement for police officers and fire fighters occurs any time after attaining the unreduced retirement age which is the date when the employee’s age plus the completed years of credited police and fire service equals 75, but not before age 53 nor after age 60. The lifetime monthly benefit is 1/12 of the sum of 2% of average earnings for each year of credited fire and police service not in excess of 25 years; plus 1.75% of average earnings for each year that the credited police or fire service exceeds 25 years. Benefits fully vest on completing 5 years of service for employees employed on or between October 1, 2001 and December 31, 2012 who vest before leaving employment. Benefits fully vest on completing 10 years of service for employees and non-vested employees hired or rehired on or after January 1, 2013. An early retirement pension is available for retired employees if the termination occurs prior to the eligibility under normal retirement but after age 50 (45 for police and fire) and after the completion of 10 years of credited employee service. Such shall be payable as either a monthly deferred early employee service pension beginning the month after the attainment of the normal retirement age or an immediate monthly early employee service pension beginning on the first day of the month following termination. The lifetime monthly benefit for the immediate monthly early employee service pension is reduced by 4% for each of the first 5 years by which the retirement date precedes the normal retirement age, and by 8% for each additional year by which the retirement date precedes the normal retirement age; provided, however, that the immediate monthly benefit shall not be less than the actuarial equivalent of the deferred pension provided by the Metro Plan. Any employee who terminates after the completion of at least 10 years of service (or 5 years of service if hired before January 1, 2013) and before eligibility for normal retirement or early retirement shall be eligible to receive a monthly deferred pension which shall commence on the first day of the month following the attainment of unreduced retirement age, computed and payable in accordance with the Metro Plan. Any employee with unused sick leave time at service retirement shall receive 100% credit for the time, subject to an affirmative election at the time of retirement. Any employee who terminates and is rehired is eligible to reconnect prior service after being regularly employed continuously for one year. Dependent children of vested employees are eligible for a survivor benefit if the employee should die leaving no surviving spouse. All assets of the Metropolitan Employees’ Benefit Trust Fund may legally be used to pay benefits to any plan members or beneficiaries, regardless of whether the members participate in Division A or Division B of the Metro Plan. City Plan This plan (the Closed City Plan Fund) covers certain employees of the former city of Nashville who have elected to remain under this plan and not transfer to the Metro Plan. This plan was closed to new members on April 1, 1963. Normal retirement for police officers and fire fighters occurs upon completing 25 years of service; for other participants, age 60 must be reached in addition to completing 25 years of service. The monthly lifetime benefit of all participants is 50% of the final monthly salary. All participants in the City Plan are fully vested.

THE METROPOLITAN GOVERNMENT OF NASHVILLE AND DAVIDSON COUNTY
NOTES TO THE FINANCIAL STATEMENTS (CONTINUED)
B-80
County Plan This plan (the Davidson County Employees' Retirement Fund) covers employees of the former government of Davidson County who have elected to remain under this plan and not transfer to the Metro Plan. This plan was closed to new members on April 1, 1963. Participants elected coverage under Division A or B. Normal retirement under Division A occurs at age 65; lifetime monthly benefits are the years of credited service multiplied by 0.75% of defined average base earnings per month plus 1.5% of average excess earnings as defined in the Plan per month. Average earnings are the average earnings for the 10 full consecutive calendar years in which earnings were highest. Normal retirement under Division B occurs after 30 years of service or after 24 years of service and reaching age 60; lifetime monthly benefits are 1/12 of 50% of the highest calendar year earnings. All participants in the County Plan are fully vested. Metro Education Plan This plan (the Teachers' Retirement Plan Fund) covers participants who elected to transfer from the City Education Plan and County Education Plan and professional employees of Metropolitan Nashville Public Schools hired between April 1, 1963 and July 1, 1969. Normal retirement occurs upon reaching age 60 with 20 years of service, completing 25 years of service, or reaching age 65. The lifetime monthly benefit is determined as 1/12 of 2% of the highest average earnings multiplied by the years of service, plus cost-of-living adjustments. Highest average earnings are the average earnings for the 36 consecutive months in which earnings were highest. All participants in the Metro Education Plan are fully vested. After July 1, 1969 professional employees hired became members of the State Employees, Teachers, and Higher Education Employees Pension Plan, a cost-sharing multiple employer defined benefit pension plan administered by the Tennessee Consolidated Retirement System (TCRS) that provides retirement, death, and disability benefits. City Education Plan This plan (the Teachers' Civil Service and Pension Fund) covers employees who were teachers of the former City of Nashville who elected to remain under this plan and not transfer to the Metro Education Plan. This plan was closed to new members on April 1, 1963. Normal retirement occurs upon reaching age 60 and completing 15 years of service, or completing 25 years of service before reaching age 60. With 15 years of service, the lifetime monthly benefit is 1/12 of 2.5% of the highest annual salary multiplied by the years of service up to 24. With 25 years of service, the lifetime monthly benefit is 1/12 of 2% of the highest annual salary multiplied by the years of service up to 30. Benefits are adjusted for cost-of-living increases. All participants in the City Education Plan are fully vested. County Education Plan This plan (the Employees' Pension and Insurance Fund) covers teachers and classified employees of the former Davidson County Board of Education who have elected to remain under this plan and not transfer to the Metro Education Plan. This plan was closed to new members on April 1, 1963. Normal retirement occurs upon reaching age 60 and completing 15 years of service, or completing 25 years of service before reaching age 60. With 15 years of service, the lifetime monthly benefit is 1/12 of 2.5% of the highest annual salary multiplied by the years of service up to 24. With 25 years of service, the lifetime monthly benefit is 1/12 of 2% of the highest annual salary multiplied by the years of service up to 30. Benefits are adjusted for cost-of-living increases. All participants in the County Education Plan are fully vested. Contributions Metro Plan The funding policy is to provide for periodic contributions at actuarially determined rates that are designed to accumulate sufficient assets to pay benefits when due. All other funding is provided by the Government with an actuarially recommended employer contribution rate of 15.510% for the non-certificated employees of Metropolitan Nashville Public Schools and all other Metro employees. City Plan Funding is on a pay-as-you-go basis whereby contributions are made in amounts sufficient to cover benefits paid during the year.

THE METROPOLITAN GOVERNMENT OF NASHVILLE AND DAVIDSON COUNTY
NOTES TO THE FINANCIAL STATEMENTS (CONTINUED)
B-81
County Plan Funding is on a pay-as-you-go basis whereby contributions are made in amounts sufficient to cover benefits paid during the year. Metro Education Plan The Metro Education Plan is financed by contributions from Metropolitan Nashville Public Schools, participating employees and the State of Tennessee. Employees contribute a specified percentage of their earnings, the State of Tennessee contributes an amount to reimburse current benefits paid equivalent to the benefits which would have been earned under the Tennessee Consolidated Retirement System (TCRS) and Metropolitan Nashville Public Schools contributes an additional amount to provide for periodic contributions as actuarially determined to accumulate sufficient assets to pay benefits when due. City Education Plan The plan is financed by contributions from the Government, participating employees and the State of Tennessee. Employees contribute a specified percentage of their earnings, the State of Tennessee contributes an amount to reimburse current benefits paid equivalent to the benefits which would have been earned under TCRS and the Government contributes an additional amount to cover current benefits (pay-as-you-go). County Education Plan The plan is financed by contributions from the Government, participating employees and the State of Tennessee. Employees contribute a specified percentage of their earnings, the State of Tennessee contributes an amount to reimburse current benefits paid equivalent to the benefits which would have been earned under TCRS and the Government contributes an additional amount to cover current benefits (pay-as-you-go). C. Investments Investment Policy The investments of the Metro Plan and Metro Education Plans are administered in accordance with the Statement of Investment Policy of the Government’s Employee Benefit System. The Investment Committee of the Government’s Employee Benefit System has been given the authority under Section 13.04 of the Metropolitan Charter to regulate and determine all matters dealing with the investments of the Plans. The policy emphasizes a long-term investment strategy. Short-term fluctuations in the market value of the portfolio should not influence the investment structure under normal circumstances. The policy outlines asset allocation targets as follows:
Asset Class
Target
Domestic Equity
20.00 % International Equity
13.00
Equity Hedge
7.00 Fixed Income
21.00
Fixed income Alternatives
15.00 Real Assets
12.00
Private Equity
12.00
Total All Asset Classes
100.00 %
There were no changes in the investment policy in the current year. Concentrations There are no individual investments in the Metro Plan or the Metro Education Plan that exceed 5% of plan assets at June 30, 2016.

THE METROPOLITAN GOVERNMENT OF NASHVILLE AND DAVIDSON COUNTY
NOTES TO THE FINANCIAL STATEMENTS (CONTINUED)
B-82
Rate of Return For the year ended June 30, 2016, the annual money-weighted rate of return on investments of the Metro Plan and Metro Education Plan, net of investment expense, was .64%. The money-weighted rate of return expresses investment performance, net of investment expense, adjusted for the changing amounts actually invested. D. Net Pension Liability Actuarial Assumptions The total pension liability was determined by an actuarial valuation as of July 1, 2015. Actuarial assumptions are summarized on the Selected Pension Information Schedules on pages B-86 to B-87. Mortality rates were based on the 110% RP-2000 Healthy Annuitant Mortality Table for Males and Females, as determined by the periodic actuarial experience study. The actuarial assumptions used in the July 1, 2015 valuations were based on the results of an actuarial experience study for the period 2007 to 2012. The long-term expected rate of return on pension plan investments was determined using a building-block method in which best-estimate ranges of expected future real rates of return (expected returns, net of pension plan investment expense and inflation) are developed for each major asset class from historical returns and consensus expectations of future returns. These ranges are combined to produce the long-term expected rate of return by weighting the expected future real rates of return by the target asset allocation percentage and by adding expected inflation. Best estimates of arithmetic real rates of return for each major asset class included in the Plans’ target asset allocation are summarized in the following table:
Long-Term
Long-Term
Historical Real
Expected Real
Asset Class
Rate of Return
Rate of Return
Domestic Equity
7.10 %
6.60 % International Equity
10.00
10.10
Equity Hedge
6.40
5.80 Fixed Income
3.40
1.80
Fixed income Alternatives
3.40
5.60 Real Assets
2.30
6.10
Private Equity
7.10
7.60
Discount Rate The discount rate used to measure the total pension liability was 7.50%. Based on the Plan assumptions and funding policy, the fiduciary net position for each Plan was projected to be available to make all projected future benefit payments to current members. Therefore, the long-term expected rate of return on investments was applied to all periods of projected benefit payments to determine the total pension liability (asset).

THE METROPOLITAN GOVERNMENT OF NASHVILLE AND DAVIDSON COUNTY
NOTES TO THE FINANCIAL STATEMENTS (CONTINUED)
B-83
Sensitivity of the Net Pension Liability to Changes in the Discount Rate The following presents the net pension liability, calculated using the discount rate of 7.50%, as well as what the net pension liability would be if it were calculated using a discount rate that is 1-percentage-point lower (6.50%) or 1-percentage-point higher (8.50%) than the current rate:
1% Decrease
Current Discount
1% Increase
Plan
(6.50%)
Rate (7.50%)
(8.50%)
County $ 7,861,059
$ 7,486,223
$ 7,146,159 Metro
577,309,325
221,317,760
(99,060,063)
County Education
26,377,929
25,230,145
23,988,484 Metro Education
110,785,923
101,574,332
92,915,316
City
35,999,560
34,240,762
32,647,225 City Education 12,079,046
11,599,369
11,057,052
Total net pension liability $ 770,412,842
$ 401,448,591
$ 68,694,173 E. Pension Expense For the year ended June 30, 2016, the Government recognized pension expense for each of the plans as follows:
Pension Expense
County $ 454,345 Metro
116,910,599
County Education
2,615,865 Metro Education
10,928,454
City
1,490,861 City Education 1,164,990
Total pension expense $ 133,565,114 Pension expense is comprised of various elements including service cost, interest, changes in benefit terms, investment experience, and the amortization of deferred outflows and inflows of resources, which are all factors used by the actuaries in the calculation of the net pension liability (asset). F. Special Funding Situations The County Education, Metro Education, and City Education Plans are funded by the State of Tennessee as well as the Government. The determination of proportionate shares has been made in a manner consistent with the actual provision of benefits by each contributor.
County Education
Metro Education
City Education
Plan
Plan
Plan
Employer's proportionate share
73.51 %
54.41 %
71.15 %
Collective pension expense
$ 2,615,865
$ 10,928,454
$ 1,164,990 Support of State of Tennessee
(692,943)
(4,982,282)
(336,100)
Collective net pension liability
34,321,916
186,686,322
16,302,012 Proportionate share of net pension liability
25,230,145
101,574,332
11,599,369
Proportionate share of deferred outflows of resources
47,442
3,218,061
37,881

THE METROPOLITAN GOVERNMENT OF NASHVILLE AND DAVIDSON COUNTY
NOTES TO THE FINANCIAL STATEMENTS (CONTINUED)
B-84
G. Additional Pension Information Additional information regarding the changes in the net pension liability and deferred outflows of resources and deferred inflows of resources related to pensions for the plans of the primary government is summarized on the Selected Pension Information Schedules on pages B-88 to B-91. The significant actuarial assumptions underlying the plans of the primary government and plan membership are summarized on the Selected Pension Information Schedules on pages B-86 to B-87. The assumptions used to calculate the actuarially determined contribution requirements are the same as those used to compute the net pension liability except where indicated.


CountyCounty Metro Education
ACTUARIAL VALUATION INFORMATION
Valuation date July 1, 2015 July 1, 2015 July 1, 2015
Measurement date June 30, 2016 June 30, 2016 June 30, 2016
Actuarial cost method entry age entry age entry agenormal normal normal
Amortization method level dollar level dollar level dollaropen closed open
Amortization period 7 years 30 years 8 years
Asset valuation method market 5 year market smoothed market
Actuarial assumptions:
Investment rate of return* 7.50% 7.50% 7.50%
Projected salary increases* N/A 4.00% N/A
Inflation 2.60% 2.60% 2.60%
Postretirement benefit increase adjustments 2.50% 2.50% Division A 3.00%1.50% Division B
* Includes inflation
PLAN MEMBERSHIP
Active: Fully vested - 8,489 - Non-vested and partially vested - 3,082 - Total active - 11,571 -
Retirees and beneficiaries receiving benefits 82 8,498 200 Terminated vested - 3,519 - Total 82 23,588 200
THE METROPOLITAN GOVERNMENT OF NASHVILLE AND DAVIDSON COUNTY
NOTES TO THE FINANCIAL STATEMENTS (CONTINUED)
SELECTED PENSION INFORMATION
B-86

Metro CityEducation City Education
July 1, 2015 July 1, 2015 July 1, 2015
June 30, 2016 June 30, 2016 June 30, 2016
entry age entry age entry agenormal normal normal
level dollar level dollar level dollarclosed open open
30 years 7 years 7 years
5 year market marketsmoothed
market
7.50% 7.50% 7.50%
N/A N/A N/A
2.60% 2.60% 2.60%
3.00% 2.50% 3.00%
- - - - - - - - -
980 362 108 1 - -
981 362 108
NOTES TO THE FINANCIAL STATEMENTS (CONTINUED)
THE METROPOLITAN GOVERNMENT OF NASHVILLE AND DAVIDSON COUNTY
B-87
SELECTED PENSION INFORMATION
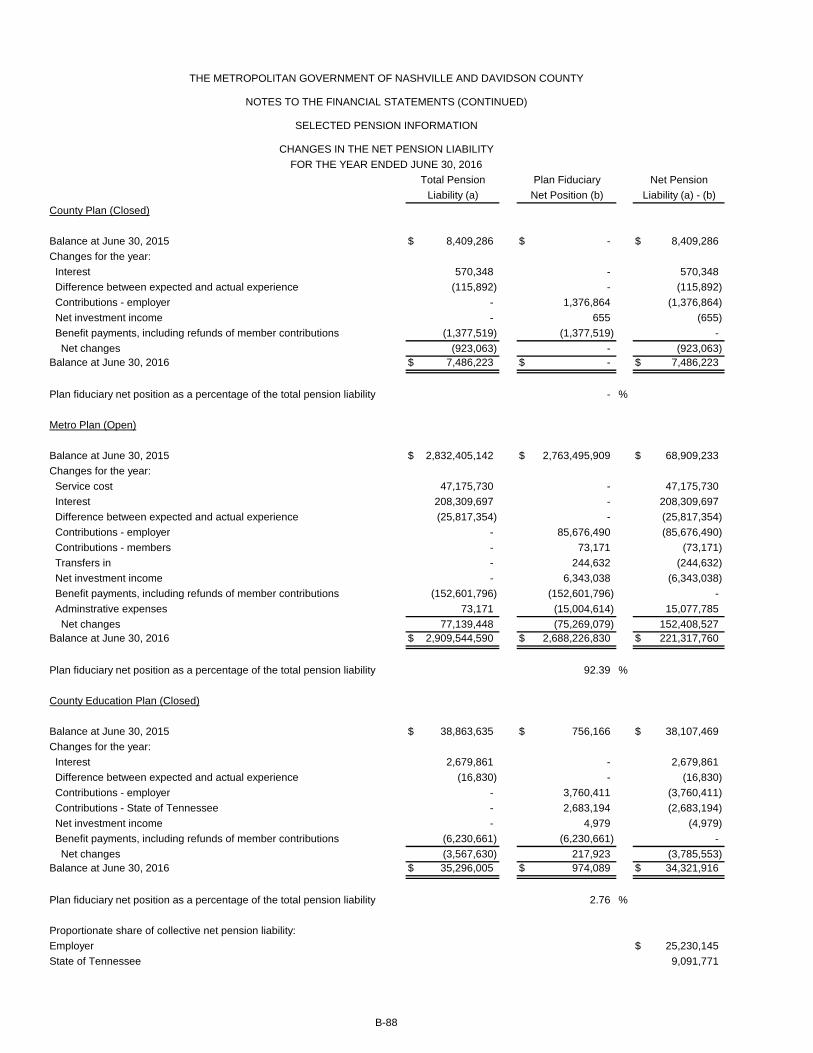
County Plan (Closed)
Balance at June 30, 2015 $ 8,409,286 $ - $ 8,409,286 Changes for the year: Interest 570,348 - 570,348 Difference between expected and actual experience (115,892) - (115,892) Contributions - employer - 1,376,864 (1,376,864) Net investment income - 655 (655) Benefit payments, including refunds of member contributions (1,377,519) (1,377,519) - Net changes (923,063) - (923,063) Balance at June 30, 2016 $ 7,486,223 $ - $ 7,486,223
Plan fiduciary net position as a percentage of the total pension liability - %
Metro Plan (Open)
Balance at June 30, 2015 $ 2,832,405,142 $ 2,763,495,909 $ 68,909,233 Changes for the year: Service cost 47,175,730 - 47,175,730 Interest 208,309,697 - 208,309,697 Difference between expected and actual experience (25,817,354) - (25,817,354) Contributions - employer - 85,676,490 (85,676,490) Contributions - members - 73,171 (73,171) Transfers in - 244,632 (244,632) Net investment income - 6,343,038 (6,343,038) Benefit payments, including refunds of member contributions (152,601,796) (152,601,796) - Adminstrative expenses 73,171 (15,004,614) 15,077,785 Net changes 77,139,448 (75,269,079) 152,408,527 Balance at June 30, 2016 $ 2,909,544,590 $ 2,688,226,830 $ 221,317,760
Plan fiduciary net position as a percentage of the total pension liability 92.39 %
County Education Plan (Closed)
Balance at June 30, 2015 $ 38,863,635 $ 756,166 $ 38,107,469 Changes for the year: Interest 2,679,861 - 2,679,861 Difference between expected and actual experience (16,830) - (16,830) Contributions - employer - 3,760,411 (3,760,411) Contributions - State of Tennessee - 2,683,194 (2,683,194) Net investment income - 4,979 (4,979) Benefit payments, including refunds of member contributions (6,230,661) (6,230,661) - Net changes (3,567,630) 217,923 (3,785,553) Balance at June 30, 2016 $ 35,296,005 $ 974,089 $ 34,321,916
Plan fiduciary net position as a percentage of the total pension liability 2.76 %
Proportionate share of collective net pension liability: Employer $ 25,230,145 State of Tennessee 9,091,771
CHANGES IN THE NET PENSION LIABILITYFOR THE YEAR ENDED JUNE 30, 2016
B-88
THE METROPOLITAN GOVERNMENT OF NASHVILLE AND DAVIDSON COUNTY
NOTES TO THE FINANCIAL STATEMENTS (CONTINUED)
SELECTED PENSION INFORMATION
Total PensionLiability (a)
Plan FiduciaryNet Position (b)
Net PensionLiability (a) - (b)

Metro Education Plan (Closed)
Balance at June 30, 2015 $ 283,540,148 $ 79,635,968 $ 203,904,180 Changes for the year: Interest 19,702,025 - 19,702,025 Difference between expected and actual experience (4,470,482) - (4,470,482) Contributions - employer - 20,620,889 (20,620,889) Contributions - State of Tennessee - 11,713,047 (11,713,047) Net investment income - 180,416 (180,416) Benefit payments, including refunds of member contributions (32,751,992) (32,751,992) - Adminstrative expenses - (64,951) 64,951 Net changes (17,520,449) (302,591) (17,217,858) Balance at June 30, 2016 $ 266,019,699 $ 79,333,377 $ 186,686,322
Plan fiduciary net position as a percentage of the total pension liability 29.82 %
Proportionate share of collective net pension liability:Employer $ 101,574,332 State of Tennessee 85,111,990
City Plan (Closed)
Balance at June 30, 2015 $ 38,889,081 $ - $ 38,889,081 Changes for the year: Interest 2,603,078 - 2,603,078 Difference between expected and actual experience (1,111,344) - (1,111,344) Contributions - employer - 6,134,921 (6,134,921) Net investment income - 5,132 (5,132) Benefit payments, including refunds of member contributions (6,140,053) (6,140,053) - Net changes (4,648,319) - (4,648,319) Balance at June 30, 2016 $ 34,240,762 $ - $ 34,240,762
Plan fiduciary net position as a percentage of the total pension liability - %
City Education Plan (Closed)
Balance at June 30, 2015 $ 19,142,904 $ 635,435 $ 18,507,469 Changes for the year: Interest 1,305,770 - 1,305,770 Difference between expected and actual experience (102,207) - (102,207) Contributions - employer - 1,600,371 (1,600,371) Contributions - State of Tennessee - 1,804,508 (1,804,508) Net investment income - 4,141 (4,141) Benefit payments, including refunds of member contributions (3,260,870) (3,260,870) - Net changes (2,057,307) 148,150 (2,205,457) Balance at June 30, 2016 $ 17,085,597 $ 783,585 $ 16,302,012
Plan fiduciary net position as a percentage of the total pension liability 4.59 %
Proportionate share of collective net pension liability:Employer $ 11,599,369 State of Tennessee 4,702,643
CHANGES IN THE NET PENSION LIABILITYFOR THE YEAR ENDED JUNE 30, 2016
B-89
THE METROPOLITAN GOVERNMENT OF NASHVILLE AND DAVIDSON COUNTY
NOTES TO THE FINANCIAL STATEMENTS (CONTINUED)
Liability (a) Net Position (b) Liability (a) - (b)Total Pension Plan Fiduciary Net Pension
SELECTED PENSION INFORMATION

DEFERRED OUTFLOWS OF RESOURCES AND DEFERRED INFLOWS OF RESOURCES RELATED TO PENSIONS
County Plan
Net difference between projected and actual earnings on pension plan investments $ - $ (544) Balance at June 30, 2016 $ - $ (544)
Amounts reported as deferred outflows of resources and deferred inflows of resources related to pensions will be recognized as pensionexpense as follows:
Year ended June 30,2017 $ (136) 2018 (136) 2019 (136) 2020 (136)
Metro Plan
Difference between expected and actual experience $ - $ (73,122,547) Net difference between projected and actual earnings on pension plan investments 189,439,285 - Balance at June 30, 2016 $ 189,439,285 $ (73,122,547)
Amounts reported as deferred outflows of resources and deferred inflows of resources related to pensions will be recognized as pensionexpense as follows:
Year ended June 30,2017 $ 39,091,638 2018 39,091,638 2019 39,091,637 2020 25,567,452 2021 (11,649,230) Thereafter (14,876,397)
County Education Plan
Net difference between projected and actual earnings on pension plan investments $ 47,442 $ - Balance at June 30, 2016 $ 47,442 $ -
Amounts reported as deferred outflows of resources and deferred inflows of resources related to pensions will be recognized as pensionexpense as follows:
Year ended June 30,2017 $ 12,888 2018 12,888 2019 12,887 2020 8,779
THE METROPOLITAN GOVERNMENT OF NASHVILLE AND DAVIDSON COUNTY
NOTES TO THE FINANCIAL STATEMENTS (CONTINUED)
SELECTED PENSION INFORMATION
Deferred Outflowsof Resources
Deferred Inflowsof Resources
B-90
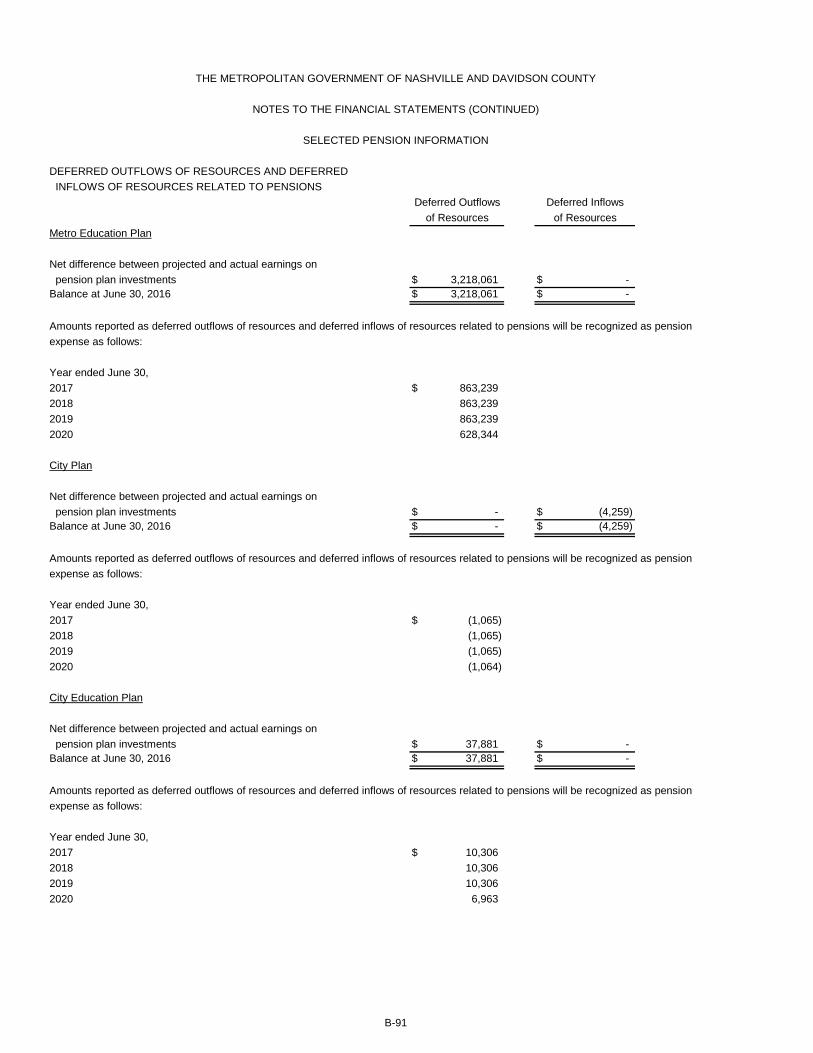
DEFERRED OUTFLOWS OF RESOURCES AND DEFERRED INFLOWS OF RESOURCES RELATED TO PENSIONS
Metro Education Plan
Net difference between projected and actual earnings on pension plan investments $ 3,218,061 $ - Balance at June 30, 2016 $ 3,218,061 $ -
Amounts reported as deferred outflows of resources and deferred inflows of resources related to pensions will be recognized as pensionexpense as follows:
Year ended June 30,2017 $ 863,239 2018 863,239 2019 863,239 2020 628,344
City Plan
Net difference between projected and actual earnings on pension plan investments $ - $ (4,259) Balance at June 30, 2016 $ - $ (4,259)
Amounts reported as deferred outflows of resources and deferred inflows of resources related to pensions will be recognized as pensionexpense as follows:
Year ended June 30,2017 $ (1,065) 2018 (1,065) 2019 (1,065) 2020 (1,064)
City Education Plan
Net difference between projected and actual earnings on pension plan investments $ 37,881 $ - Balance at June 30, 2016 $ 37,881 $ -
Amounts reported as deferred outflows of resources and deferred inflows of resources related to pensions will be recognized as pensionexpense as follows:
Year ended June 30,2017 $ 10,306 2018 10,306 2019 10,306 2020 6,963
B-91
THE METROPOLITAN GOVERNMENT OF NASHVILLE AND DAVIDSON COUNTY
NOTES TO THE FINANCIAL STATEMENTS (CONTINUED)
SELECTED PENSION INFORMATION
of Resources of ResourcesDeferred Outflows Deferred Inflows

THE METROPOLITAN GOVERNMENT OF NASHVILLE AND DAVIDSON COUNTY
NOTES TO THE FINANCIAL STATEMENTS (CONTINUED)
B-92
Plans Administered by the Tennessee Consolidated Retirement System (TCRS) H. Summary of Significant Accounting Policies For purposes of measuring the net pension liability, deferred outflows of resources and deferred inflows of resources related to pensions, and pension expense, information about the fiduciary net position of the Teacher Legacy Pension Plan and Teacher Retirement Plan (TCRS Plans) in the TCRS and additions to/deductions from each of the TCRS Plan’s fiduciary net position have been determined on the same basis as they are reported by the TCRS. For this purpose, benefits (including refunds of employee contributions) are recognized when due and payable in accordance with the benefit terms of the TCRS Plans. Investments are reported at fair value. I. General Information about the Pension Plan Plan Description Teachers of the Government membership in the TCRS before July 1, 2014 of Davidson County Schools are provided with pensions through the Teacher Legacy Pension Plan, a cost sharing multiple-employer pension plan administered by the TCRS. The Teacher Legacy Pension Plan closed to new membership on June 30, 2014, but will continue providing benefits to existing members and retirees. Beginning July 1, 2014, the Teacher Retirement Plan became effective for teachers employed by Local Education Agencies (LEA’s) after June 30, 2014. The Teacher Retirement Plan is a separate cost-sharing, multiple-employer defined benefit plan. The TCRS was created by state statute under Tennessee Code Annotated Title 8, Chapters 34-37. The TCRS Board of Trustees is responsible for the proper operation and administration of all employer pension plans in the TCRS. The Tennessee Treasury Department, an agency in the legislative branch of state government, administers the plans of the TCRS. The TCRS issues a publically available financial report that can be obtained at www.treasury.tn.gov/tcrs. Benefits Provided Tennessee Code Annotated Title 8, Chapters 34-37 establishes the benefit terms and can be amended only by the Tennessee General Assembly. Members of the Teacher Legacy Pension Plan are eligible to retire with an unreduced benefit at age 60 with 5 years of service credit or after 30 years of service credit regardless of age. Benefits are determined by a formula using the member’s highest five consecutive year average compensation and the member’s years of service credit. A reduced early retirement benefit is available at age 55 and vested. Members are vested with five years of service credit. Service related disability benefits are provided regardless of length of service. Five years of service is required for non-service related disability eligibility. The service related and non-service related disability benefits are determined in the same manner as a service retirement benefit but are reduced 10 percent and include projected service credits. A variety of death benefits are available under various eligibility criteria. Member and beneficiary annuitants are entitled to automatic cost of living adjustments (COLAs) after retirement. A COLA is granted each July for annuitants retired prior to the 2nd of July of the previous year. The COLA is based on the change in the consumer price index (CPI) during the prior calendar year, capped at 3 percent, and applied to the current benefit. No COLA is granted if the change in the CPI is less than one-half percent. A one percent COLA is granted if the CPI change is between one-half percent and one percent. A member who leaves employment may withdraw their employee contributions, plus any accumulated interest. Members of the Teacher Retirement Plan are eligible to retire at age 65 with 5 years of service credit or pursuant to the rule of 90 in which the member’s age and service credit total 90. Members are entitled to receive unreduced service retirement benefits, which are determined by a formula using the member’s highest five consecutive year average compensation and the member’s years of service credit. Service related disability benefits are provided regardless of length of service. Five years of service is required for non-service related disability eligibility. The service related and non-service related disability benefits are determined in the same manner as a service retirement benefit but are reduced 10 percent and include projected service credits. A variety of death benefits are available under various eligibility criteria. Member and beneficiary annuitants are entitled to automatic cost of living adjustments (COLAs) after retirement. A COLA is granted each July for annuitants retired prior to the 2nd of July of the previous year. The COLA is based on the change in the consumer price index (CPI) during the prior calendar year, capped at 3 percent, and applied to the current benefit. No COLA is granted if the change in the CPI is less than one-half percent. A one percent COLA is granted if the CPI change is between one-half percent and one percent. A member who leaves employment may withdraw their employee contributions, plus any accumulated interest. Under the Teacher Legacy Pension Plan and the Teacher Retirement Plan, benefit terms and conditions, including COLA, can be adjusted on a prospective basis. Moreover, there are defined cost controls and unfunded liability controls that provide for the adjustment of benefit terms and conditions on an automatic basis.

THE METROPOLITAN GOVERNMENT OF NASHVILLE AND DAVIDSON COUNTY
NOTES TO THE FINANCIAL STATEMENTS (CONTINUED)
B-93
Contributions Contributions for teachers are established in the statutes governing the TCRS and may only be changed by the Tennessee General Assembly. Teachers contribute 5 percent of salary. The LEA’s make employer contributions at the rate set by the Board of Trustees as determined by an actuarial valuation. By law, employer contributions for the Teacher Legacy Pension Plan are required to be paid. The TCRS may intercept the state shared taxes of the sponsoring governmental entity of the LEA if the required employer contributions are not remitted. Employer contributions by Davidson County Schools for the year ended June 30, 2016 to the Teacher Legacy Pension Plan were $27,095,828 which is 9.04% of covered payroll. Employer contributions for the year ended June 30, 2016 to the Teacher Retirement Plan were $2,240,133 which is 4.00% of covered payroll. The employer rate, when combined with member contributions, is expected to finance the costs of benefits earned by members during the year, the cost of administration, as well as an amortized portion of any unfunded liability of the TCRS Plans. J. Pension Liability (Asset), Pension Expense, and Deferred Outflows and Deferred Inflows of Resources Pension Liability (Asset) At June 30, 2016, the Government reported a liability of $3,476,720 for its proportionate share of net pension liability of the Teacher Legacy Pension Plan. The net pension liability was measured as of June 30, 2015, and the total pension liability used to calculate the net pension liability was determined by an actuarial valuation as of that date. The Government’s proportion of the net pension liability was based on its employer contributions to the pension plan during the year ended June 30, 2015 relative to the contributions of all LEA’s for the year ended June 30, 2015. At the June 30, 2015 measurement date, the Government’s proportion was 8.49%. The proportion measured as of June 30, 2014 was 8.74%. At June 30, 2016, the Government reported an asset of $568,609 for its proportionate share of the net pension asset of Teacher Retirement Plan. The net pension asset was measured as of June 30, 2015, and the total pension asset used to calculate the net pension asset was determined by an actuarial value as of that date. The Government’s proportion of the net pension asset was based on its employer contributions to the pension plan during the year ended June 30, 2015 relative to the contributions of all LEA’s for the year ended June 30, 2015. At the June 30, 2015 measurement date, the Government’s proportion was 14.13%. Pension Income and Expense For the year ended June 30, 2016, the Government recognized a negative pension expense of $3,842,164 in the Teacher Legacy Pension Plan. For the year ended June 30, 2016, the Government recognized a pension expense of $745,176 in the Teacher Retirement Plan.
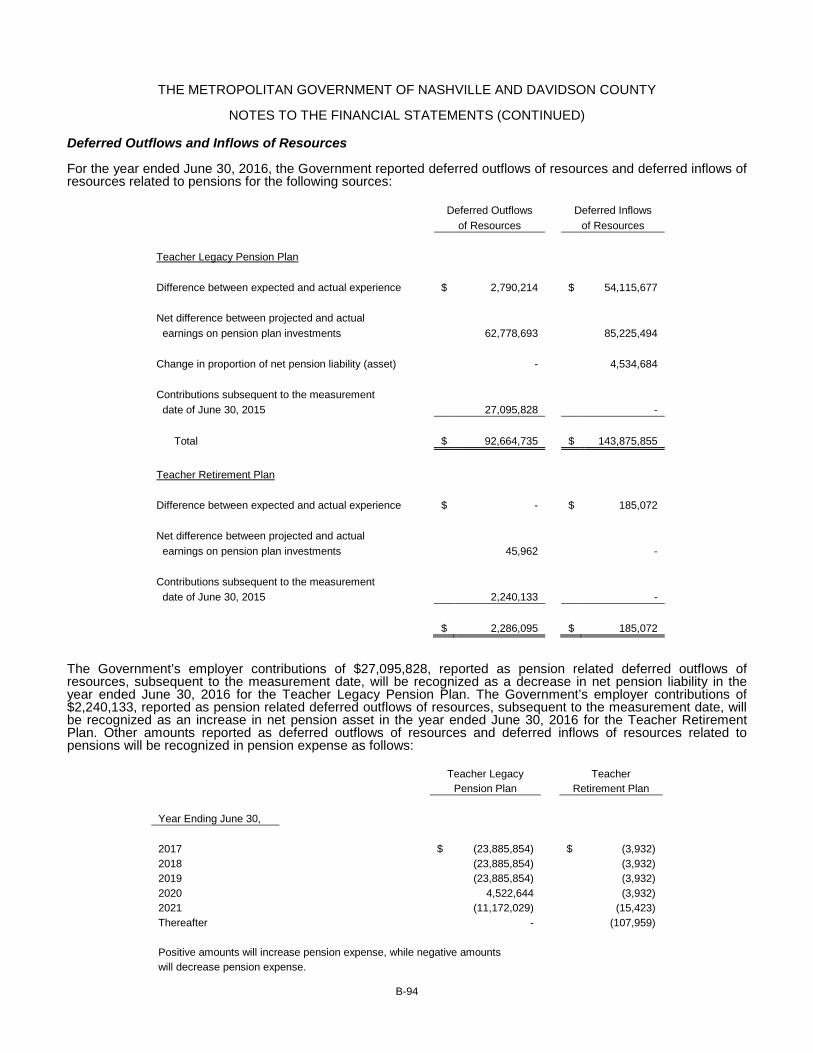
THE METROPOLITAN GOVERNMENT OF NASHVILLE AND DAVIDSON COUNTY
NOTES TO THE FINANCIAL STATEMENTS (CONTINUED)
B-94
Deferred Outflows and Inflows of Resources For the year ended June 30, 2016, the Government reported deferred outflows of resources and deferred inflows of resources related to pensions for the following sources:
Deferred Outflows
Deferred Inflows
of Resources
of Resources
Teacher Legacy Pension Plan
Difference between expected and actual experience
$ 2,790,214
$ 54,115,677
Net difference between projected and actual earnings on pension plan investments
62,778,693
85,225,494
Change in proportion of net pension liability (asset)
-
4,534,684
Contributions subsequent to the measurement date of June 30, 2015
27,095,828
-
Total
$ 92,664,735
$ 143,875,855
Teacher Retirement Plan
Difference between expected and actual experience
$ -
$ 185,072
Net difference between projected and actual earnings on pension plan investments
45,962
-
Contributions subsequent to the measurement date of June 30, 2015
2,240,133
-
$ 2,286,095
$ 185,072 The Government’s employer contributions of $27,095,828, reported as pension related deferred outflows of resources, subsequent to the measurement date, will be recognized as a decrease in net pension liability in the year ended June 30, 2016 for the Teacher Legacy Pension Plan. The Government’s employer contributions of $2,240,133, reported as pension related deferred outflows of resources, subsequent to the measurement date, will be recognized as an increase in net pension asset in the year ended June 30, 2016 for the Teacher Retirement Plan. Other amounts reported as deferred outflows of resources and deferred inflows of resources related to pensions will be recognized in pension expense as follows:
Teacher Legacy
Teacher
Pension Plan
Retirement Plan
Year Ending June 30,
2017
$ (23,885,854)
$ (3,932) 2018
(23,885,854)
(3,932)
2019
(23,885,854)
(3,932) 2020
4,522,644
(3,932)
2021
(11,172,029)
(15,423) Thereafter
-
(107,959)
Positive amounts will increase pension expense, while negative amounts will decrease pension expense.

THE METROPOLITAN GOVERNMENT OF NASHVILLE AND DAVIDSON COUNTY
NOTES TO THE FINANCIAL STATEMENTS (CONTINUED)
B-95
Actuarial Assumptions The total pension liability in the June 30, 2015 actuarial valuation was determined using the following actuarial assumptions, applied to all periods included in the measurement: Inflation 3.0% Salary increases Graded salary ranges from 8.97% to 3.71% based on age, including inflation,
averaging 4.25% Investment rate of return 7.5%, net of pension plan investment expenses, including inflation Cost of living adjustment 2.5% Mortality rates are customized based on the June 30, 2012 actuarial experience study and included some adjustment for expected future improvement in life expectancy. The actuarial assumptions used in the June 30, 2015 actuarial valuation were based on the results of an actuarial experience study performed for the period July 1, 2008 through June 30, 2012. The demographic assumptions were adjusted to more closely reflect actual and expected future experience. The long-term expected rate of return on pension plan investments was established by the TCRS Board of Trustees in conjunction with the June 30, 2012 actuarial experience study by considering the following three techniques: (1) the 25-year historical return of the TCRS at June 30, 2012, (2) the historical market returns of asset classes from 1926 to 2012 using the TCRS investment policy asset allocation, and (3) capital market projections that were utilized as a building-block method in which best-estimate ranges of expected future real rates of return (expected returns, net of pension plan investment expense and inflation) are developed for each major asset class. Four sources of capital market projections were blended and utilized in the third technique. The blended capital market projection established the long-term expected rate of return by weighting the expected future real rates of return by the target asset allocation percentage and by adding inflation of 3%. The target allocation and best estimates of arithmetic real rates of return for each major asset class are summarized in the following table:
Long-Term
Historical Real Asset Class
Rate of Return
Target Allocation
U.S. Equity
6.46 %
33.00 % Developing Market Internation Equity
6.26
17.00
Emerging Market Internation Equity
6.40
5.00 Private Equity and Strategic Lending
4.61
8.00
U.S. Fixed Income
0.98
29.00 Real Estate
4.73
7.00
Short-term Securities
-
1.00
100.00 % The long-term expected rate of return on pension plan investments was established by the TCRS Board of Trustees as 7.5% based on a blending of the three factors described above. Discount Rate The discount rate used to measure the total pension liability was 7.5%. The projection of cash flows used to determine the discount rate assumed that employee contributions will be made at the current rate and that contributions from the all LEA’s will be made at the actuarially determined contribution rate pursuant to an actuarial valuation in accordance with the funding policy of the TCRS Board of Trustees and as required to be paid by state statute. Based on those assumptions, the pension plan’s fiduciary net position was projected to be available to make projected future benefit payments of current active and inactive members. Therefore, the long-term expected rate of return on pension plan investments was applied to all periods of projected benefit payments to determine the total pension liability. Sensitivity of the Proportionate Share of Net Pension Liability (Asset) to Changes in the Discount Rate The following presents the Government’s proportionate share of the net pension liability (asset) calculated using the discount rate of 7.5%, as well as what the Government’s proportionate share of the net pension liability (asset)

THE METROPOLITAN GOVERNMENT OF NASHVILLE AND DAVIDSON COUNTY
NOTES TO THE FINANCIAL STATEMENTS (CONTINUED)
B-96
would be if it were calculated using a discount rate that is 1-percentage-point lower (6.5%) or 1-percentage-point higher (8.5%) than the current rate:
1% Decrease
Current Discount
1% Increase
Plan
(6.50%)
Rate (7.50%)
(8.50%)
Teacher Legacy Pension Plan $ 237,031,122
$ 3,476,720
$ (189,878,781)
Teacher Retirement Plan
100,829
(568,609)
(1,059,582) Pension Plan Fiduciary Net Position Detailed information about the pension plan’s fiduciary net position is available in a separately issued TCRS financial report. K. Payable to the Pension Plan At June 30, 2016, the Government reported a payable of $6,270 for the outstanding amount of contributions to the pension plans required at the year ended June 30, 2016.

THE METROPOLITAN GOVERNMENT OF NASHVILLE AND DAVIDSON COUNTY
NOTES TO THE FINANCIAL STATEMENTS (CONTINUED)
B-97
Classification in the Statement of Net Position The total net pension liability (asset) and deferred outflows and inflows of resources related to pensions are allocated between governmental activities, business-type activities, and component units. The following reconciles the total net pension liability (asset), deferred outflows of resources, and deferred inflows of resources by plan to the classification in the Statement of Net Position:
Net Pension Deferred Outflows Deferred Inflows Liability (Asset) of Resources of Resources
Plans: County $ 7,486,223 $ - $ 544 Metro 221,317,760 189,439,285 73,122,547 County Education 25,230,145 47,442 - Metro Education 101,574,332 3,218,061 - City 34,240,762 - 4,259 City Education 11,599,369 37,881 - Teacher Legacy (TCRS) 3,476,720 92,664,735 143,875,855 Teacher Retirement (TCRS) (568,609) 2,286,095 185,072
Total by plan $ 404,356,702 $ 287,693,499 $ 217,188,277
Reconciliation: Statement of Net Position: Primary government: Governmental activities $ 377,092,525 $ 204,928,181 146,619,781 Business-type activities 20,511,224 14,803,525 5,673,579
Total primary government 397,603,749 219,731,706 152,293,360
Component units: Hospital Authority 6,522,524 4,614,817 1,887,635 Convention Center Authority 799,038 568,283 228,589
Total component units 7,321,562 5,183,100 2,116,224
Total Statement of Net Position 404,925,311 224,914,806 154,409,584
Less Statement of Net Position other assets (568,609) - -
Netting of deferred outflows and inflows of resources (1) - 62,778,693 62,778,693
Total allocation $ 404,925,311 $ 287,693,499 $ 217,188,277
(1) In the Statement of Net Position, differences between projected and actual pension plan investment earnings in different measurement periods are aggregated and reported as a net deferred inflow of resources.
Since the internal service functions primarily support governmental activities, the portion of the net pension liability (asset) applicable to internal service functions is considered an obligation of the governmental activities and is not allocated to the internal service funds, as the obligation will not be funded through the internal service rate structure.

THE METROPOLITAN GOVERNMENT OF NASHVILLE AND DAVIDSON COUNTY
NOTES TO THE FINANCIAL STATEMENTS (CONTINUED)
B-98
NOTE 7 – OTHER POSTEMPLOYMENT BENEFIT (OPEB) PLANS Primary Government A. Plan Descriptions Metropolitan Government Retirees in the Metro, City or County Plans may elect to participate in the Metro Employees’ Medical Benefit Plan, a single-employer defined benefit healthcare plan. The Metro Plan is administered by the Employee Benefit Board and provides medical, dental and life insurance. The other postemployment benefits for Government employees were authorized by the Government’s Charter and Code. The Metro Plan does not issue a stand-alone financial report. Metropolitan Nashville Public Schools Retirees in the Metro, City or County Education Plans may elect to participate in the School Professional Employees’ Insurance Plan, a single-employer defined benefit healthcare plan. The School Plan is administered by the Metro Nashville Board of Education and provides medical and dental insurance. The other postemployment benefits for teachers of Metropolitan Nashville Public Schools were authorized by the Government's charter and code. The School Plan does not issue a stand-alone financial report. B. Funding Policies Metropolitan Government The contribution requirements of Metro Employees’ Medical Benefit Plan members and the Government are established and may be amended by the Employee Benefit Board. The required contribution is based on projected pay-as-you-go financing requirements under which contributions are made in amounts sufficient to cover benefits paid, administrative costs and anticipated inflationary increases. For health insurance, the Government contributes 75% of all premium payments, and the retirees contribute 25%. For the fiscal year ended June 30, 2016, the Government and retirees contributed $46,488,493 and $15,496,164 to the Metro Plan, respectively, for health insurance. The Government also provides a 50% matching contribution on dental insurance for any retiree who elects to participate. For the fiscal year ended June 30, 2016, the Government and retirees each contributed $2,708,814 for dental insurance. Finally, the Government provides life insurance at no charge to the retirees. For the fiscal year ended June 30, 2016, the Government contributed $2,981,770 for life insurance. Metropolitan Nashville Public Schools The contribution requirements of the School Professional Employees’ Insurance Plan members and the Government are established and may be amended by the Metro Nashville Board of Education. The required contribution is based on projected pay-as-you-go financing requirements under which contributions are made in amounts sufficient to cover benefits paid. The Government contributes 75% of all premium payments, and the retirees contribute 25%. For the fiscal year ended June 30, 2016, the Government and retirees contributed $21,340,985 and $6,882,827 to the School Plan, respectively. C. Annual OPEB Cost and Net OPEB Obligation The Government’s annual OPEB cost (expense) is calculated based on the annual required contribution of the employer (ARC), an amount actuarially determined in accordance with the parameters of GASB Statement No. 45. The ARC represents a level of funding that, if paid on an ongoing basis, is projected to cover normal cost each year and amortize any unfunded actuarial liabilities over a period not to exceed thirty years. The Plans contain both active employees and retirees. Although the Government’s contribution is 75% of premium payments for the combined participants, the share of claims related to retirees represents a higher percentage of the total claims. Accordingly, contributions reflected in the OPEB calculations, including contributions made, have been adjusted to reflect that a portion of contributions for active employees are subsidizing the retiree claims.

THE METROPOLITAN GOVERNMENT OF NASHVILLE AND DAVIDSON COUNTY
NOTES TO THE FINANCIAL STATEMENTS (CONTINUED)
B-99
The following table shows the components of the Government’s annual OPEB cost for the year, the amounts contributed to the Plans, and changes in the Government’s net OPEB obligation.
The Government’s annual OPEB cost, the percentage of annual OPEB cost contributed to the Plans, and the net OPEB obligation for the current and preceding two years were as follows:
Percentage of
Fiscal
Annual
Annual OPEB
Net OPEB
Year Ended
OPEB Cost
Cost Contributed
Obligation
Metro Employees' Medical Benefit Plan
June 30, 2016
$ 202,873,000
40.04 %
$ 1,123,729,000
June 30, 2015
194,156,000
39.63
1,002,094,000
June 30, 2014
181,188,000
35.98
884,876,000
School Professional Employees' Insurance Plan
June 30, 2016
50,061,000
49.69
215,237,000
June 30, 2015
43,184,000
53.63
190,053,000
June 30, 2014
39,413,000
50.54
170,029,000
D. Funded Status and Funding Progress Metropolitan Government As of June 30, 2016 the most recent actuarial valuation date, the Metro Employee’ Medical Benefit Plan was 0% funded. The actuarial accrued liability for benefits was $2.24 billion, and the actuarial value of assets was $0, resulting in an unfunded actuarial accrued liability (UAAL) of $2.24 billion. The covered payroll (annual payroll of active employees covered by the Metro Plan) was $557 million, and the ratio of the UAAL to the covered payroll was 402%. Metropolitan Nashville Public Schools As of June 30, 2016 the most recent actuarial valuation date, the School Professional Employees’ Insurance Plan was 0% funded. The actuarial accrued liability for benefits was $549 million, and the actuarial value of assets was $0, resulting in an unfunded actuarial accrued liability (UAAL) of $549 million. The covered payroll (annual payroll of active employees covered by the School Plan) was $327 million, and the ratio of the UAAL to the covered payroll was 168%.
Metro Employees'
School Professional
Medical Benefit
Employees'
Plan
Insurance Plan
Total
Annual required contribution
$ 196,832,000
$ 49,020,000
$ 245,852,000 Interest on net OPEB obligation
45,094,000
8,553,000
53,647,000
Adjustment to annual required contribution
(39,054,000)
(7,512,000)
(46,566,000)
Annual OPEB cost
202,872,000
50,061,000
252,933,000
Contributions made
(81,237,000)
(24,877,000)
(106,114,000)
Increase (decrease) in net OPEB obligation
121,635,000
25,184,000
146,819,000
Net OPEB obligation beginning of year
1,002,094,000
190,053,000
1,192,147,000
Net OPEB obligation end of year
$ 1,123,729,000
$ 215,237,000
$ 1,338,966,000

THE METROPOLITAN GOVERNMENT OF NASHVILLE AND DAVIDSON COUNTY
NOTES TO THE FINANCIAL STATEMENTS (CONTINUED)
B-100
E. Actuarial Valuations Actuarial valuations of an ongoing plan involve estimates of the value of reported amounts and assumptions about probability of occurrence of events far into the future. Examples include assumptions about future employment, mortality, and healthcare cost trends. Amounts determined regarding the funded status of the Plans and the annual required contributions of the Government and Plan members are subject to continual revision as actual results are compared with past expectations and new estimates are made about the future. The Schedule of Funding Progress, presented as required supplementary information following the notes to the financial statements, presents multiyear trend information about whether the actuarial value of plan assets is increasing or decreasing over time relative to the actuarial accrued liabilities. F. Actuarial Methods and Assumptions Projections of benefits for financial reporting purposes are based on the substantive Plans (the Plans as understood by the employer and the Plan members) and include the types of benefits provided at the time of each valuation and the historical pattern of sharing of benefit costs between the Government and Plan members at that point. The actuarial methods and assumptions used include techniques that are designed to reduce the effects of short-term volatility in actuarial accrued liabilities and the actuarial value of assets, consistent with the long-term perspective of the calculations. In the June 30, 2016 valuations for both Plans, the entry age actuarial cost method was used. The actuarial assumptions included a 4.5% rate of return (net of administrative expenses), 2.75% rate of inflation, and 4.5% projected increase in salaries. Because the Government has not begun funding the Plans, the rate of return was based on the Government’s historic interest earned on idle cash. Annual non prescription drug medical costs are assumed to increase 7.0% in the first year of valuation. Future annual increases are assumed to grade uniformly from 7.0% to 5.0% over a four year period. Annual prescription drug costs are assumed to increase 7.0% in the first year of valuation. Future annual increases are assumed to grade uniformly from 7.0% to 5.0% over a four year period. Costs for supplemental insurance for retirees are assumed to remain level in the first year of valuation and 7.0% in the second year of valuation. Future annual increases are assumed to grade uniformly to 5.0% over a four year period. Dental costs are assumed to have no increase from fiscal 2015 through fiscal 2018 and increase 4% each year thereafter. The UAAL is being amortized as a level percentage of projected payroll on an open basis. The remaining amortization period for the initial amortization amount at June 30, 2016 was 22 years. Component Units Information regarding the other postemployment benefits provided by component units can be found in their separately issued financial statements. NOTE 8 – DEFERRED COMPENSATION AND PROFIT SHARING PLANS Primary Government Metro Plan The Government offers its employees a deferred compensation plan created in accordance with Internal Revenue Code Section 457. The plan, available to all employees, permits deferral of a portion of salary until future years. The deferred compensation is not available to employees until termination, retirement, death or unforeseeable emergency. Because the assets are not held in a trustee capacity by the Government, they are not included in the Government’s financial statements. No contributions are made to this plan by the Government. Component Units Information regarding deferred compensation and profit sharing plans provided by component units can be found in their separately issued financial statements. NOTE 9 – LEASES Primary Government The Government entered a lease agreement commencing November, 2005, for additional office space. The terms of the agreement call for a base annual rent of $600,191 before a 50% credit for tenant improvements. Thereafter, rent will be adjusted upward based on either the consumer price index or 3.5% annually, whichever is less. The credit for tenant improvements is capped at $5 million; the Government has incurred in excess of that amount through June 30, 2016. There is an additional credit in excess of $1 million available for roof replacement. The

THE METROPOLITAN GOVERNMENT OF NASHVILLE AND DAVIDSON COUNTY
NOTES TO THE FINANCIAL STATEMENTS (CONTINUED)
B-101
roof replacement was completed in fiscal 2009. The lease agreement expired February, 2016; however, the Government exercised the first of six renewal options for five additional years. As part of the renewal, the base annual rent increased to $656,609. Rent expense for the year ended June 30, 2016 was $355,663. The Government entered into operating lease agreements in 2008 and 2013 for downtown office space. These leases were amended during the year ended June 30, 2014 to provide for additional space through 2024. Rent expense for the year ended June 30, 2016 totaled $1,921,671. Future minimum rental payments are as follows:
Year Ending June 30, 2017
$ 1,921,706 2018
1,943,158
2019
1,979,011 2020
2,018,480
2021
2,059,086 2022-2024
4,903,402
Total future minimum lease payments
$ 14,824,843
The Government entered into an operating lease agreement during the year ended June 30, 2014 for space to be used as a clinic for employees who are injured in the line of duty. Rent expense for the year ended June 30, 2016 totaled $105,963. Future minimum rental payments are as follows:
Year Ending June 30, 2017
$ 109,141 2018
112,415
2019
28,310
Total future minimum lease payments
$ 249,866 The Government leases certain other facilities from various lessors under operating lease agreements. Total rental expenditures under these leases are nominal for the year ended June 30, 2016. The Government leases certain warehouse and office space and various other places for periodic use to various lessees. Such leases are accounted for as operating leases and range in duration from less than one year to five years. The lease agreements provide for fixed rental payments. Annual rental income under these operating leases is nominal. Component Units Nashville District Management Corporation The Corporation leases office space under a noncancelable operating lease which expires December, 2017. The space is paid for and used by Nashville Downtown Partnership, Inc., a related nonprofit organization. In connection with the lease, the lessor provided rent reductions totaling $42,120 for the year ended December 31, 2015 that has been reflected in the financial statements as contributions with an offsetting charge to expense. Under the terms of the lease, the lessor will continue to provide rent reductions of similar amounts each year of the lease. The lease provides for additional rent to be payable in the event property taxes and/or building operating costs increase from base year amounts. Rent expense totaled $81,864 for the year ended December 31, 2015. Future minimum lease payments at December 31, 2015 totaled $138,612. General Hospital The Government, on behalf of General Hospital, entered into a capital lease agreement with Meharry Medical College for the use of the Hubbard Hospital site on the Meharry campus. Under the terms of the agreement, the Government will lease the building for 30 years at $4 million per year, including imputed interest at 7.5% per annum. Lease payments began in December 1994 after Meharry Medical College and the Board of Hospitals agreed on a program of renovations by Meharry Medical College to the property. This lease has been subleased to the Hospital Authority. At June 30, 2016, the leased building is carried in the proprietary type component units at the present value of minimum future lease payments of $48,000,000, less accumulated depreciation.

THE METROPOLITAN GOVERNMENT OF NASHVILLE AND DAVIDSON COUNTY
NOTES TO THE FINANCIAL STATEMENTS (CONTINUED)
B-102
In fiscal 2015, General Hospital entered into a new capital lease for computer software and hardware with a three year term and monthly payments of $10,690, which contains a requirement to purchase the assets at a bargain price of $1 by the end of the lease term. A summary of future minimum lease payments required under the agreements as of June 30, 2016 follows:
Year Ending June 30, 2017
$ 4,128,286 2018
4,096,214
2019
4,000,000 2020
4,000,000
2021-2025
17,666,666
Total future minimum lease payments
33,891,166
Less: Amount representing interest
8,763,550
Current portion of capital lease
2,327,298
Long-term capitalized lease obligation
$ 22,800,318 Convention Center Authority On December 30, 2010 the Convention Center Authority (the Authority) entered into a Development Agreement for the Country Music Hall of Fame and Museum Expansion with Omni and into a Development, Lease and Operating Agreement with the County Music Foundation, Inc. (Hall of Fame). Under the terms of the agreements, Omni constructed a connector (expansion project) between its headquarters hotel and the Hall of Fame with funding from tax increment financing provided by the Metropolitan Development and Housing Agency. Upon completion of construction, the connector was transferred to the Authority on June 20, 2014 and is now leased to the Hall of Fame for an initial term of 60 years. Future minimum lease payments to the Authority will be as follows:
Years Ending June 30,
Annual Rent
2017-2019
$ 250,000 2020-2024
350,000
2025-2064
500,000 2065-2069
650,000
2070-2074
750,000 The Hall of Fame is responsible for all interior and exterior operating costs, maintenance and repairs. As required by the agreements, the Authority will establish a reserve fund for the majority of the rental income received from the Hall of Fame to cover future capital costs related to the connector. The cost and carrying amount of the connector on the Authority’s statement of net position at June 30, 2016 is $35,350,519. Information regarding the lease transactions of the other component units can be found in their separately issued financial reports.

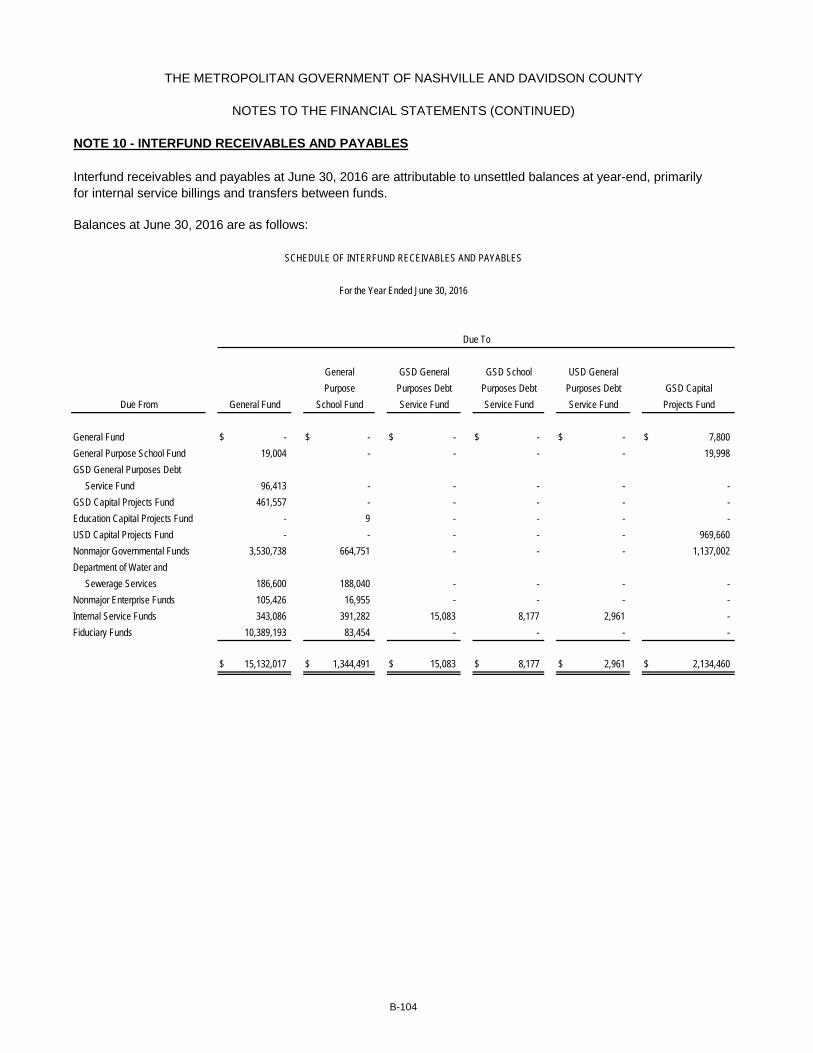
NOTE 10 - INTERFUND RECEIVABLES AND PAYABLES
Interfund receivables and payables at June 30, 2016 are attributable to unsettled balances at year-end, primarilyfor internal service billings and transfers between funds.
Balances at June 30, 2016 are as follows:
General Fund $ - $ - $ - $ - $ - $ 7,800 General Purpose School Fund 19,004 - - - - 19,998 GSD General Purposes Debt
Service Fund 96,413 - - - - - GSD Capital Projects Fund 461,557 - - - - - Education Capital Projects Fund - 9 - - - - USD Capital Projects Fund - - - - - 969,660 Nonmajor Governmental Funds 3,530,738 664,751 - - - 1,137,002 Department of Water and
Sewerage Services 186,600 188,040 - - - - Nonmajor Enterprise Funds 105,426 16,955 - - - - Internal Service Funds 343,086 391,282 15,083 8,177 2,961 - Fiduciary Funds 10,389,193 83,454 - - - -
$ 15,132,017 $ 1,344,491 $ 15,083 $ 8,177 $ 2,961 $ 2,134,460
PurposeDue From
GSD CapitalPurposes Debt
B-104
Service FundService Fund Service Fund Projects FundSchool Fund
Due To
Purposes DebtPurposes DebtGeneral Fund
GSD School
THE METROPOLITAN GOVERNMENT OF NASHVILLE AND DAVIDSON COUNTY
NOTES TO THE FINANCIAL STATEMENTS (CONTINUED)
SCHEDULE OF INTERFUND RECEIVABLES AND PAYABLES
GSD General USD GeneralGeneral
For the Year Ended June 30, 2016

$ - $ - $ 3,300,599 $ 18,470 $ - $ 7,346 $ 163,142 $ 2,301 $ 3,499,658 8,761 - 13,343,657 - - 12,377 20,466 - 13,424,263
- - 205,073 - - - - - 301,486 - 14,664 140,903 - - - - - 617,124 - - - - - - - - 9 - - - - - - - - 969,660 - 1,833,755 1,896,761 607,375 - 216,408 424 - 9,887,214
- - 19,321,629 - 49,472 46,672 6,475 - 19,798,888 - - 2,391,838 854,954 100 1,993 - - 3,371,266 - - 90,643 1,538 - 6,659 13,377 24,306 897,112 - - - - - - - 265,245 10,737,892
$ 8,761 $ 1,848,419 $ 40,691,103 $ 1,482,337 $ 49,572 $ 291,455 $ 203,884 $ 291,852 $ 63,504,572
Services FundsEnterprise
FundsEnergy
B-105
System TotalProjects
Fund FundsProjects FundCapital Sewerage
Capital Water andNonmajorEducation
Due To
Service FiduciaryGovernmentalFunds
THE METROPOLITAN GOVERNMENT OF NASHVILLE AND DAVIDSON COUNTY
Internal
SCHEDULE OF INTERFUND RECEIVABLES AND PAYABLES (CONTINUED)
For the Year Ended June 30, 2016
USD
NOTES TO THE FINANCIAL STATEMENTS (CONTINUED)
District NonmajorDepartment of

NOTE 11 - INTERFUND TRANSFERS
Interfund transfers are attributable to the budgeted allocation of resources from one fund to another, primarily for debtservice requirements, operating subsidies and the funding of capital items.
Transfers from fiduciary funds represent unused employee contributions to the flexible benefit plans, which reverted tothe Government.
Interfund transfers for the year ended June 30, 2016 consist of the following:
General Fund $ 481,000 $ - $ 22,054,600 $ - $ - General Purpose School Fund 192,000 - 101,000 2,863,521 - GSD Capital Projects Fund 30,000 - 510,210 - - USD Capital Projects Fund - - - - - Nonmajor Governmental Funds 12,971,896 2,015,090 1,023,572 1,602,282 583,400 Department of Water and Sewerage
Services 5,658,000 - 85,200 - - District Energy System 5,900 - - - 1,324,200 Nonmajor Enterprise Funds 1,475,300 - 1,500,000 - - Internal Service Funds 2,076,300 - - - - Fiduciary Funds - 392,885 - - -
$ 22,890,396 $ 2,407,975 $ 25,274,582 $ 4,465,803 $ 1,907,600
PurposesDebt
Fund Fund FundTransferred From Fund Fund
B-106
General
General
ServiceSchool Service
Purposes
Service
PurposesDebtPurpose Debt
GSDGeneral
THE METROPOLITAN GOVERNMENT OF NASHVILLE AND DAVIDSON COUNTY
NOTES TO THE FINANCIAL STATEMENTS (CONTINUED)
SCHEDULE OF INTERFUND TRANSFERS
For the Year Ended June 30, 2016
General SchoolGSD USD
Transferred To
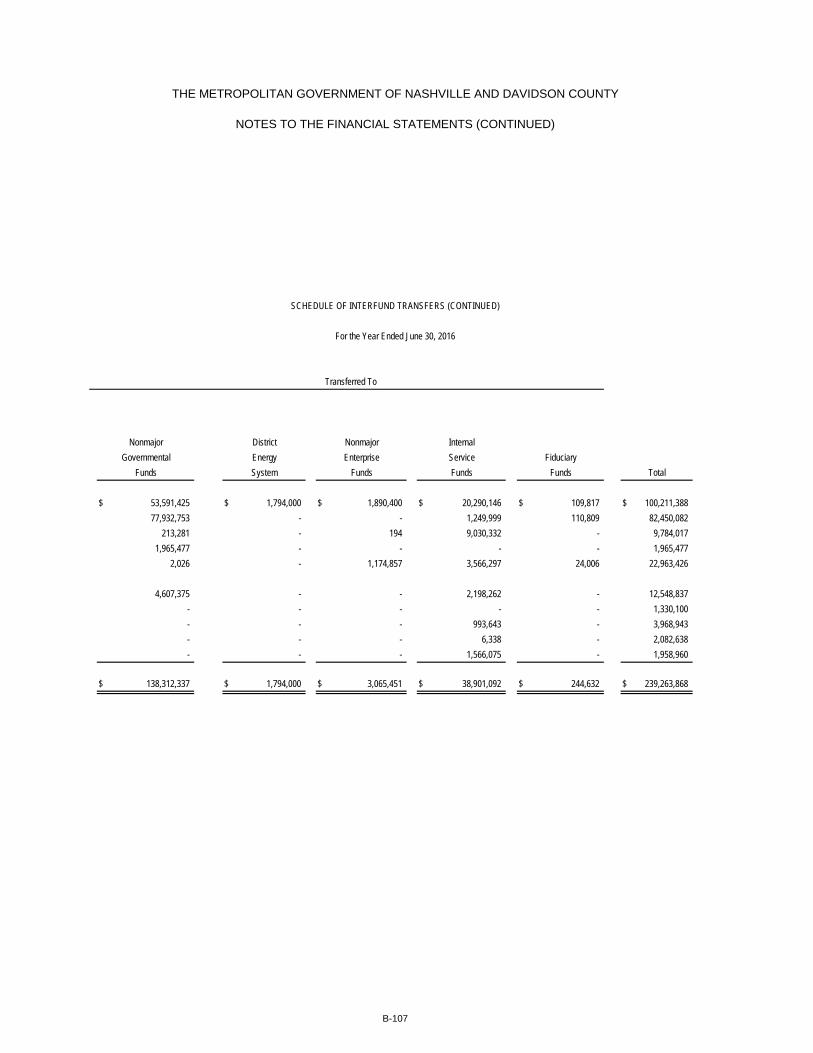
$ 53,591,425 $ 1,794,000 $ 1,890,400 $ 20,290,146 $ 109,817 $ 100,211,388 77,932,753 - - 1,249,999 110,809 82,450,082
213,281 - 194 9,030,332 - 9,784,017 1,965,477 - - - - 1,965,477
2,026 - 1,174,857 3,566,297 24,006 22,963,426
4,607,375 - - 2,198,262 - 12,548,837 - - - - - 1,330,100 - - - 993,643 - 3,968,943 - - - 6,338 - 2,082,638 - - - 1,566,075 - 1,958,960
$ 138,312,337 $ 1,794,000 $ 3,065,451 $ 38,901,092 $ 244,632 $ 239,263,868
EnterpriseGovernmental ServiceNonmajor District
EnergyInternal
Funds
B-107
FiduciaryNonmajor
System FundsFundsFunds Total
Transferred To
THE METROPOLITAN GOVERNMENT OF NASHVILLE AND DAVIDSON COUNTY
NOTES TO THE FINANCIAL STATEMENTS (CONTINUED)
SCHEDULE OF INTERFUND TRANSFERS (CONTINUED)
For the Year Ended June 30, 2016

THE METROPOLITAN GOVERNMENT OF NASHVILLE AND DAVIDSON COUNTY
NOTES TO THE FINANCIAL STATEMENTS (CONTINUED)
B-108
NOTE 12 – COMMITMENTS AND CONTINGENCIES A. Litigation The Metropolitan Department of Law estimated a potential liability for claims, suits and judgments filed for damages to persons and property and for other alleged claims arising out of matters incidental to the operation of the Government. The estimated liability is not expected to be liquidated with expendable available resources and is recorded in the applicable governmental activities in the Statements of Net Position and Activities. Any estimated liabilities attributable to proprietary funds and component units are recorded in those funds and units. B. Insurance and Benefits The Government and its component units are subject to various risks of loss related to torts; theft of, damage to, and destruction of assets; errors and omissions; illnesses or injuries to employees; and natural disasters. Primary Government The Government is self-insured with respect to liability claims. Liabilities for all accidents are generally limited under the Governmental Tort Liability Act of the Tennessee Code as follows:
Accidents
Bodily injury
$ 300,000 per person
700,000 per accident
Property damage
100,000 per accident The Government is also self-insured with respect to casualty losses on real and personal property. Each loss is subject to a per occurrence deductible of $10,000 to a maximum of $1,000,000 per occurrence and a $3,000,000 annual aggregate. If a single loss reaches $1,000,000, the property insurance policy will respond. After the $3,000,000 annual aggregate has been exhausted, a $50,000 per occurrence deductible will apply to each and every loss and the property insurance policy will respond. Losses from the perils of flood and earth movement will not erode the aggregate. Settled claims have not exceeded the self insured retention in any of the past three fiscal years. The Government is also self-insured with respect to medical benefits and employee blanket bond coverage. Estimated losses for all self-insured risks of $38,868,126 are recorded as liabilities in internal service funds. The following summarizes the changes in the estimated claims payable in the respective internal service funds for the years ended June 30, 2015 and 2016:
Total
General
School
Internal
School
Government
Professional
Employees'
Injured
Service
Self
Self
Employees'
Medical
on
Fund
Insurance
Insurance
Insurance
Benefit
Duty
Types
Claims payable June 30, 2014
$ 729,053
$ 7,035,820
$ 5,556,551
$ 16,841,000
$ 6,400,000
$ 36,562,424
Add: Provision for events of the current fiscal year
619,612
5,764,060
93,726,987
201,122,583
16,627,601
317,860,843
Deduct: Payments on claims during the fiscal year
519,397
3,735,263
92,426,524
204,775,583
15,166,601
316,623,368
Claims payable June 30, 2015
829,268
9,064,617
6,857,014
13,188,000
7,861,000
37,799,899
Add: Provision for events of the current fiscal year
826,428
1,442,620
105,063,883
216,400,157
11,309,847
335,042,935
Deduct: Payments on claims during the fiscal year
734,947
2,296,921
103,358,836
214,242,157
13,341,847
333,974,708
Claims payable June 30, 2016
$ 920,749
$ 8,210,316
$ 8,562,061
$ 15,346,000
$ 5,829,000
$ 38,868,126

THE METROPOLITAN GOVERNMENT OF NASHVILLE AND DAVIDSON COUNTY
NOTES TO THE FINANCIAL STATEMENTS (CONTINUED)
B-109
Component Units The Hospital Authority participates in the Government’s insurance programs. The Convention Center Authority is exposed to various risks of loss incidental to its operations and has obtained several insurance policies after performing risk assessment analyses. The Convention Center Authority retains risk up to $4,000,000, and has obtained excess insurance for any claims above that amount. These policies provide insurance for property, builder’s risk, workers’ compensation, automobile, general liability and other exposures. There have been no settlements exceeding insurance coverage since the inception of the Convention Center Authority. Information regarding the insurance and benefits of the other component units can be found in their separately issued financial reports. C. Federal and State Financial Assistance The Government and its component units have received federal and state financial assistance for specific purposes that is subject to review and audit by the grantor agencies. Although such audits could generate expenditure disallowances under terms of the programs, the Government believes that any required reimbursements would not be material to the basic financial and individual fund and component unit financial statements. Accordingly, no provision has been made for any potential reimbursements to the grantor agencies. Prior to the issuance of the Water and Sewer Revenue Refunding Bonds, Series 2010A, on December 16, 2010, the full faith and credit of the Government was pledged for possible deficiencies in the collection of required state sewer user fees established in connection with certain grants received from the State Funding Board (TCA 68-221-202 through 68-221-214). The Department of Water and Sewerage Services acted as a conduit with respect to sewer user fees imposed by the state. These user fees were set at an amount sufficient to recover the project costs, including related interest expense. A portion of the proceeds from the Series 2010A Bonds was used to fully prepay the Tennessee Local Development Authority (TLDA) loans. Subsequent to the issuance of the Bonds, the user fees are considered a general sewer charge and reflected as revenue. The amount of prepayment is $51,907,728 at June 30, 2016 and is reported as other noncurrent assets. The amounts received were recorded as capital grants and contributions by the Department of Water and Sewerage Services. D. Construction Commitments Primary Government At June 30, 2016, the governmental activities of the Government had commitments of $222,362,599 for construction contracts. At June 30, 2016, the Department of Water and Sewerage Services had commitments of $96,197,287 for construction contracts. The Department of Water and Sewerage Services (the Department), the Metropolitan Council, the State of Tennessee Department of Environment and Conservation (TDEC), the United States Department of Justice (DOJ) and the United States Environmental Protection Agency (EPA), have agreed on a consent decree to address and correct deficiencies within the Department’s sewer system that have caused violations of the Clean Water Act (CWA). The consent decree was approved by the Federal Court in March 2009. Per the original decree, the Department was required to fully develop, in two years, a Corrective Action Plan/Engineering Report (CAP/ER) for its sanitary sewer system and a Long-term Control Plan (LTCP) for its combined sewer system to achieve the goals of the CWA and meet water quality requirements in the Cumberland River. Upon submittal and approval of the Plans, the Department would have an additional nine years to complete the work as developed by the Plans. Due to the historic floods that occurred in Nashville in May 2010, the Department petitioned EPA and TDEC for a six-month extension for developing the CAP/ER and LTCP and a two year extension for completing the work (final compliance) under the force majeure clause of the consent decree. Approval has been granted for both extensions. The due date for the CAP/ER and LTCP was September 11, 2011, and the due date for all work coming out of those two Plans (final compliance) is eleven years after approval of the Plans by EPA and TDEC. The Department submitted both Plans on September 9, 2011, and is waiting for feedback from EPA and TDEC. The Department is proceeding with the submitted Plans pending approval. The Department has hired an internal program director as well as an external program management team composed of engineering consultants to manage planning, design and oversight of the program. The Department has also contracted for a construction management team to protect the investment in construction projects. A group of project set designers has been selected to assist with the design of individual projects. A total of seventeen different design firms were selected for large projects and six additional small business design firms were selected for smaller projects.

THE METROPOLITAN GOVERNMENT OF NASHVILLE AND DAVIDSON COUNTY
NOTES TO THE FINANCIAL STATEMENTS (CONTINUED)
B-110
The future related capital expenditures are expected to be between $1 billion and $1.5 billion. Continuing to have sewer overflows along with failure to comply with the mandate and meet future established deadlines could result in stipulated penalties of up to $3,000 per occurrence for sanitary sewer overflows, and up to $5,000 per day for failure to implement the improvements on a timely basis. EPA sent a demand letter for $147,000 in stipulated penalties for sanitary overflow on September 9, 2011. This was for a negotiated 147 violations for 2010 and the first quarter of 2011. No penalties have been demanded for any delays in submitting reports and deliverables nor from the failure to timely implement work. Proposed plans to fund capital expenditures for the next few years include internally generated cash and borrowings. E. Liquidity Component Units The Government has budgeted and legally approved an appropriation of $35 million to the Hospital Authority for the year ended June 30, 2017. The Government has also not committed to provide additional funding to the Hospital Authority should such funding become necessary. The financial statements of General Hospital (General) and Bordeaux Long Term Care (Bordeaux) have been prepared on a going-concern basis, which contemplates the realization of assets and the satisfaction of liabilities in the normal course of business. General experienced an operating loss of $36.4 million for the year ended June 30, 2016 and reflected a net deficit of $7.5 million at June 30, 2016. Current liabilities exceeded current assets by $11.7 million at June 30, 2016. Bordeaux experienced an operating loss of $5.6 million and a decrease in net position of approximately $.5 million for the year ended June 30, 2016. The deficits were funded primarily by the Government in the form of revenue or capital contributions reflected in the financial statements. General and Bordeaux are and will continue to be dependent upon the Government to subsidize current and future operations. Accordingly, these factors among others indicate that General and Bordeaux may be unable to continue as going concerns for a reasonable period of time. The financial statements for General and Bordeaux do not include any adjustments relating to the recoverability and classification of liabilities that might be necessary should the entities be unable to continue as going concerns. The ability for General and Bordeaux to continue as going concerns is dependent upon their ability to generate sufficient cash flow to meet their obligations on a timely basis and to generate revenues exceeding operating expenses. General has implemented several strategic initiatives to increase cash flow including implementing several operational efficiencies as well as renegotiating several material service agreements to enhance quality of services in a more efficient manner. Bordeaux has implemented several strategies to increase cash flow including outsourcing operations. General continues the ongoing development and implementation of a formal Operational and Strategic Plan that includes the review of current service lines, staffing levels, internal cost controls, professional service agreements, and information technology platform functionality in an effort to establish a sustainable business model. Significant operational improvements are anticipated as General repurposes itself to successfully address the economic and market realities facing the safety net academic medical center under a shifting competitive landscape. In October 2016, the Government entered into an operating lease and transfer agreement with a third party to lease the property and operations of Bordeaux as discussed below in Section G. Other Commitments. Under the terms of the agreement, the Government will cover the losses incurred by Bordeaux up to a maximum amount, the third party will pursue the replacement of Bordeaux, and the existing facility will cease operations. F. Financial Pledges The Government has pledged certain non tax revenues in conjunction with various revenue bonds and other agreements of component units as approved by the Metropolitan Council and in accordance with the Sports Authorities Act of 1993 and the Convention Center Authorities Act of 2009, as applicable, under Title 7 of the Tennessee Code Annotated, and the Amended and Restated Intergovernmental Project Agreement dated October 22, 2014, between the Government and the Metropolitan Development and Housing Agency. The issuers, the Government’s pledges, the length of time of the pledges, and the amount of the pledges outstanding at June 30, 2016 (including total future interest of $553,443,235) are as follows:
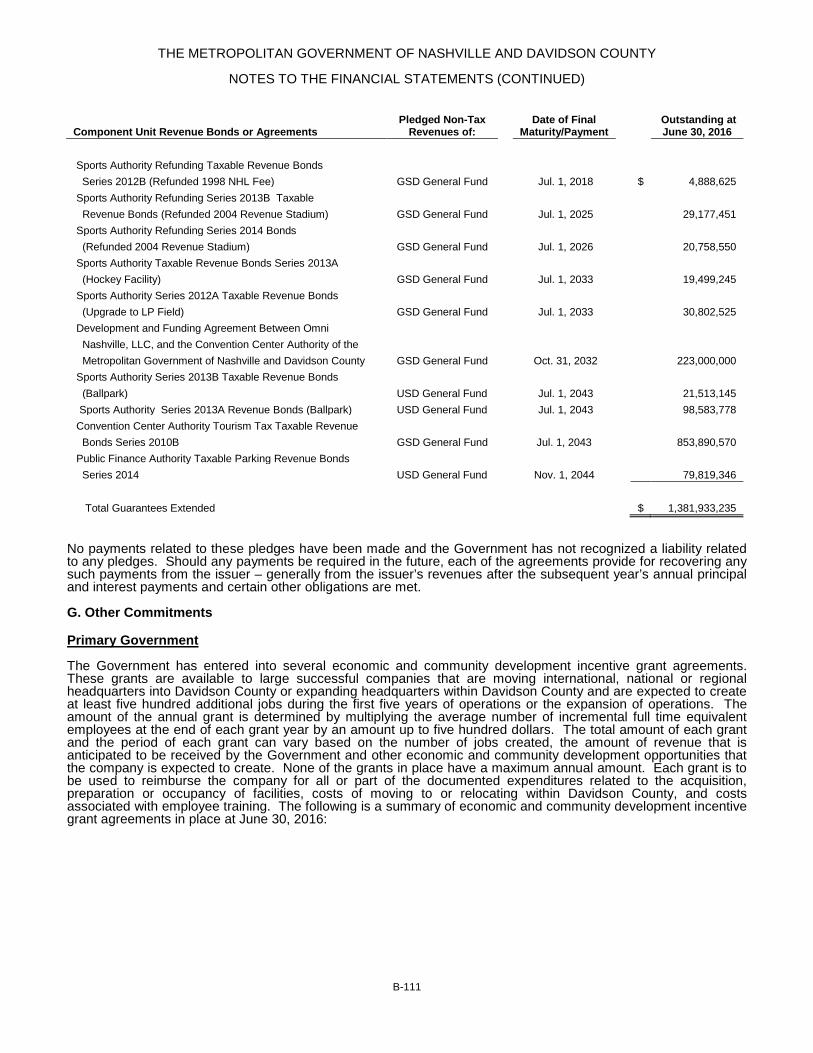
THE METROPOLITAN GOVERNMENT OF NASHVILLE AND DAVIDSON COUNTY
NOTES TO THE FINANCIAL STATEMENTS (CONTINUED)
B-111
Component Unit Revenue Bonds or Agreements Pledged Non-Tax
Revenues of:
Date of Final Maturity/Payment
Outstanding at June 30, 2016
Sports Authority Refunding Taxable Revenue Bonds Series 2012B (Refunded 1998 NHL Fee) GSD General Fund
Jul. 1, 2018
$ 4,888,625
Sports Authority Refunding Series 2013B Taxable Revenue Bonds (Refunded 2004 Revenue Stadium) GSD General Fund
Jul. 1, 2025
29,177,451
Sports Authority Refunding Series 2014 Bonds (Refunded 2004 Revenue Stadium) GSD General Fund
Jul. 1, 2026
20,758,550
Sports Authority Taxable Revenue Bonds Series 2013A (Hockey Facility) GSD General Fund
Jul. 1, 2033
19,499,245
Sports Authority Series 2012A Taxable Revenue Bonds (Upgrade to LP Field) GSD General Fund
Jul. 1, 2033
30,802,525
Development and Funding Agreement Between Omni Nashville, LLC, and the Convention Center Authority of the Metropolitan Government of Nashville and Davidson County GSD General Fund
Oct. 31, 2032
223,000,000
Sports Authority Series 2013B Taxable Revenue Bonds (Ballpark) USD General Fund
Jul. 1, 2043
21,513,145
Sports Authority Series 2013A Revenue Bonds (Ballpark) USD General Fund
Jul. 1, 2043
98,583,778 Convention Center Authority Tourism Tax Taxable Revenue
Bonds Series 2010B GSD General Fund
Jul. 1, 2043
853,890,570 Public Finance Authority Taxable Parking Revenue Bonds
Series 2014 USD General Fund
Nov. 1, 2044
79,819,346
Total Guarantees Extended
$ 1,381,933,235 No payments related to these pledges have been made and the Government has not recognized a liability related to any pledges. Should any payments be required in the future, each of the agreements provide for recovering any such payments from the issuer – generally from the issuer’s revenues after the subsequent year’s annual principal and interest payments and certain other obligations are met. G. Other Commitments Primary Government The Government has entered into several economic and community development incentive grant agreements. These grants are available to large successful companies that are moving international, national or regional headquarters into Davidson County or expanding headquarters within Davidson County and are expected to create at least five hundred additional jobs during the first five years of operations or the expansion of operations. The amount of the annual grant is determined by multiplying the average number of incremental full time equivalent employees at the end of each grant year by an amount up to five hundred dollars. The total amount of each grant and the period of each grant can vary based on the number of jobs created, the amount of revenue that is anticipated to be received by the Government and other economic and community development opportunities that the company is expected to create. None of the grants in place have a maximum annual amount. Each grant is to be used to reimburse the company for all or part of the documented expenditures related to the acquisition, preparation or occupancy of facilities, costs of moving to or relocating within Davidson County, and costs associated with employee training. The following is a summary of economic and community development incentive grant agreements in place at June 30, 2016:

THE METROPOLITAN GOVERNMENT OF NASHVILLE AND DAVIDSON COUNTY
NOTES TO THE FINANCIAL STATEMENTS (CONTINUED)
B-112
Company
Grant Approval
Date
Grant Commencement
Date
Grant Period
Additional Grant Terms
Amount Payable for
June 30, 2016
Amount Budgeted for 2016-
2017
Dell Computer Corporation
August 1999 October 1, 1999 40 years None $ 562,500 $ 562,500
UBS AG, New York Branch
October 2013
After January 1, 2014 and within 3
years of occupancy permit (Summer of 2014)
5 years
Base jobs of 240, minimum of 500 incremental jobs required for grant
- 328,000
Bridgestone Americas, Inc.
December 2014
Within 5 years of occupancy permit
(under construction)
7 years
Minimum of 500 incremental jobs required for grant - -
Asurion, LLC June 2015 July 1, 2015 2 years
Base jobs at project location of 640 and base total jobs in
Davidson County of 1,840, for full time jobs with annual
salaries over published average
- -
WCP Properties, LLC - affiliate of HCA Holdings, Inc.
July 2015
Amended August 2015
Within 5 years of occupancy permit
(under construction)
7 years
Minimum of 500 incremental jobs
required for grant for headquarters.
Amendment extends to new project, two locations relocating
more jobs.
- -
In February 2016, the Government entered into a participation agreement with LifeWay wherein the Government would fund infrastructure development for LifeWay’s planned new headquarters at Capitol View development site as an economic incentive to retain LifeWay and its 1,100 employees. The approved incentive for the benefit of LifeWay was provided as a reduction of $2.5 million in the sales price of the land to LifeWay by Capitol View in exchange for the Government agreeing to reimburse Capitol View $2.5 million for public infrastructure improvements related to the LifeWay project. Furthermore, the Government agreed to pay $990,000 to Capitol View for additional public infrastructure improvements needed at the development site but not related to the LifeWay project with Capitol View agreeing to convey 1.26 acres in the development site to the Government for the purpose of creating a public park to be connected to the Music City Greenway. In total the Government agreed to pay $3,490,000 to Capitol View as a contribution in aid for the infrastructure. The first installment of $990,000 was paid in May 2016 with the remaining $2.5 million due after final inspection and approval by the Government at completion of the public infrastructure improvements and will be paid at the time of conveyance to the Government. In October 2016, the Government entered into an operating lease and transfer agreement with Signature Healthcare, LLC (Signature) to lease the property and operations of the Bordeaux Long Term Care (Bordeaux) to Signature. Bordeaux is an operation of the Hospital Authority, a component unit of the Government. As Bordeaux is currently operating at a loss, Signature is obligated to pay rent of $10 annually. The Government will submit quarterly payments to Signature in the amount of $750,000 as reimbursement for the operating loss. To the extent the annual operating loss exceeds $3 million, the Government will reimburse for the excess not to exceed a total of $3.5 million annually. If the annual operating loss is less than $3 million, Signature will remit the difference back to the Government. Under the terms of the agreement, Signature will identify and purchase a site (Relocation Site) for the purpose of constructing a new nursing home facility with a capacity of at least 120 skilled nursing home beds to replace Bordeaux. Once the replacement facility is constructed, approved for occupancy, and licensed by the required regulatory agencies, Signature will transfer the appraised value of all rights related to the relocated skilled nursing home beds less fifty percent of the outstanding amount owed to Signature for providing ancillary services at Bordeaux to the Government (the Purchase Price). The term of the agreement began on May 1, 2016 and expires

THE METROPOLITAN GOVERNMENT OF NASHVILLE AND DAVIDSON COUNTY
NOTES TO THE FINANCIAL STATEMENTS (CONTINUED)
B-113
on June 30, 2020. Either party shall be entitled to terminate the agreement at the end of each lease year, or the agreement will terminate in the event that Signature begins operation at the Relocation Site. Component Units The healthcare industry is subject to numerous laws and regulations of federal, state and local governments. These laws and regulations include, but are not necessarily limited to, matters such as licensure, accreditation, government healthcare program participation requirements, reimbursement for patient services, Medicare fraud and abuse and patient records privacy. Recently, government activity has increased with respect to investigations and allegations concerning possible violations of fraud and abuse statues and regulations by healthcare providers. Violations of these laws and regulations could result in expulsion from government healthcare programs together with the imposition of significant fines and penalties, as well as significant repayments for patient services previously billed. Compliance with such laws and regulations can be subject to future government review and interpretation as well as regulatory actions unknown or unasserted at this time. In March 2010, Congress adopted comprehensive healthcare insurance legislation, Patient Care Protection and Affordable Care Act and Healthcare and Education Reconciliation Act. The legislation, among other matters, is designated to expand access to coverage to substantively all citizens by 2019 through a combination of public program expansion and private industry health insurance. Changes to existing TennCare and Medicaid coverage and payments are also expected to occur as a result of this legislation. Implementing regulations are generally required for these legislative acts, which are to be adopted over a period of years and, accordingly, the specific impact of any future regulations is not determinable. The Nashville District Management Corporation has an agreement with the Government to provide program administration of the Nashville Central Business Improvement District in accordance with Tennessee law. The Corporation’s duties and responsibilities under the agreement include but are not limited to providing services for improvement and operation of the District through security enhancement, downtown marketing, and improving downtown beautification, sanitation and maintenance. The term of the agreement extends to December 31, 2017, renewable annually by the mutual notification by each party to the other. The agreement may be terminated by the Government upon thirty days notice. The Nashville District Management Corporation has entered into an agreement with Nashville Downtown Partnership, a related nonprofit organization, to perform all the duties and responsibilities for day-to-day management and implementation of services and improvements for the Nashville Central Business Improvement District (CBID), as defined in the Memorandum of Agreement with the Government, in exchange for substantially all revenues received from CBID assessments. During the year ended December 31, 2015, the Corporation recognized expense of $1,764,886 related to the agreement. The agreement expires December 31, 2017. The Gulch Business Improvement District, Inc. has an agreement with the Government in accordance with Tennessee law to provide services for improvement and operation of the Gulch Business Improvement District through security enhancement, marketing, and improving beautification, sanitation, and maintenance. The term of the agreement extends to January 1, 2017, and may be terminated upon receipt of written petition filed by either (a) the owners of 75% of the assessed value of the taxable property in the District or (b) 50% of the owners of record within the District. The Gulch Business Improvement District, Inc. has entered into an agreement with Nashville Downtown Partnership to provide cleaning and safety services for the Gulch Business Improvement District in exchange for a monthly fee. During the year ended December 31, 2015, $25,000 was recognized as expense related to the agreement. The agreement expires December 31, 2016. On October 19, 2010 the Convention Center Authority (the Authority) entered into a Development and Funding Agreement with Omni Nashville, LLC (Omni) to facilitate the development of a premier headquarters hotel adjacent to the Music City Center. Under the terms of the development and funding agreement, the Authority will pay Omni annual economic development payments and incentives from excess tourism tax revenues collected. These payments are additionally secured by a pledge of the Government’s nontax revenues of the General Fund of the General Services District, subject to prior pledge and application of certain requirements related to bonds issued by the Sports Authority. No payments related to this financial guarantee have been made by the Government. Should any payments be made by the Government in the future, the agreements provide for recovering any such payments from the Authority’s revenues after operating expenses are covered and annual principal and interest payments and certain other obligations are met. These payments began after the hotel opened for business, including the renting of rooms. The amount remitted to Omni during the year ended June 30, 2016 was $9,000,000. The schedule of future annual payments is expected to be as follows.
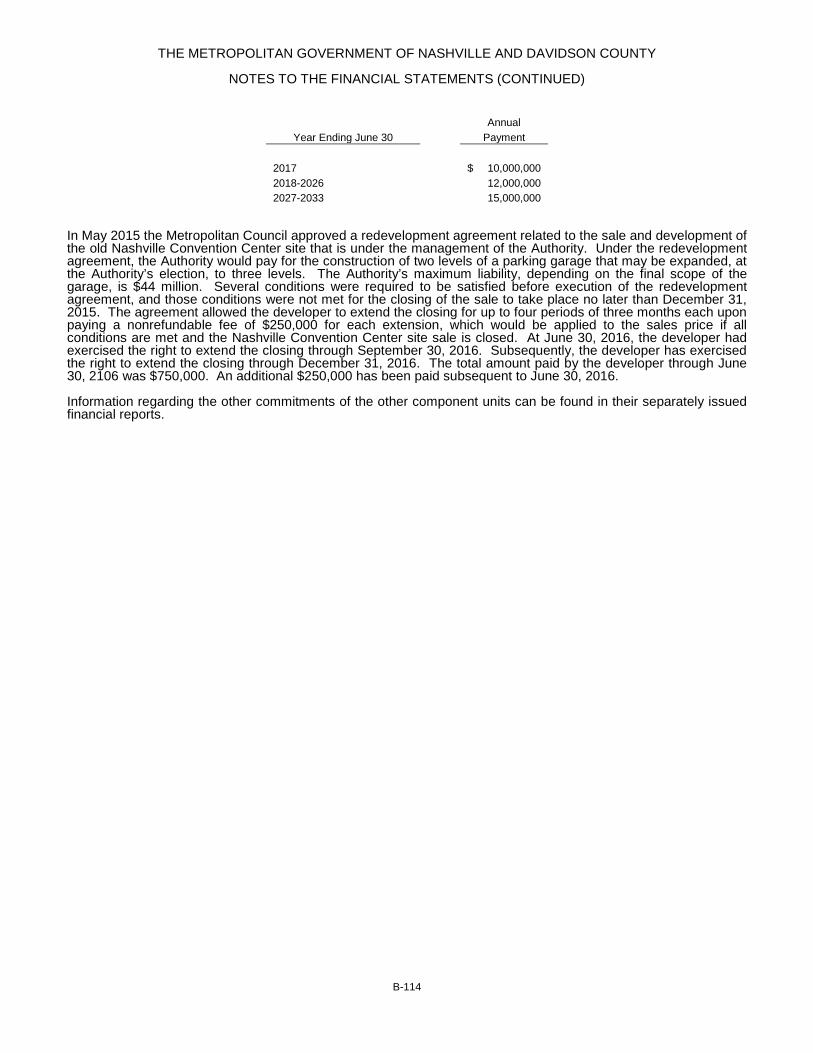
THE METROPOLITAN GOVERNMENT OF NASHVILLE AND DAVIDSON COUNTY
NOTES TO THE FINANCIAL STATEMENTS (CONTINUED)
B-114
Annual
Year Ending June 30
Payment
2017
$ 10,000,000 2018-2026
12,000,000
2027-2033
15,000,000 In May 2015 the Metropolitan Council approved a redevelopment agreement related to the sale and development of the old Nashville Convention Center site that is under the management of the Authority. Under the redevelopment agreement, the Authority would pay for the construction of two levels of a parking garage that may be expanded, at the Authority’s election, to three levels. The Authority’s maximum liability, depending on the final scope of the garage, is $44 million. Several conditions were required to be satisfied before execution of the redevelopment agreement, and those conditions were not met for the closing of the sale to take place no later than December 31, 2015. The agreement allowed the developer to extend the closing for up to four periods of three months each upon paying a nonrefundable fee of $250,000 for each extension, which would be applied to the sales price if all conditions are met and the Nashville Convention Center site sale is closed. At June 30, 2016, the developer had exercised the right to extend the closing through September 30, 2016. Subsequently, the developer has exercised the right to extend the closing through December 31, 2016. The total amount paid by the developer through June 30, 2106 was $750,000. An additional $250,000 has been paid subsequent to June 30, 2016. Information regarding the other commitments of the other component units can be found in their separately issued financial reports.


NOTE 13 - FUND BALANCES
Certain categories of fund balance are presented on the Balance Sheets for Governmental Funds in the aggregateThe detail components of the nonspendable, restricted, committed, and assigned fund balances are as follows:
FUND BALANCES (DEFICITS):
Nonspendable: Inventories of supplies $ 275,371 $ 1,483,136 $ - $ - $ - $ - Prepaid expenditures 191,637 380,552 43,369 5,454 1,177 - Permanent fund principal - - - - - - Total nonspendable 467,008 1,863,688 43,369 5,454 1,177 - Restricted for: Public welfare - - - - - - Convention center and tourism promotion - - - - - - Education - - - - - - Solid waste - - - - - - General government - - - - - - Public health - - - - - - Public works, highways and streets - - - - - -
Administration of justice - - - - - - Law enforcement and care of prisoners - - - - - - Recreation and culture - - - - - - Public library system - - - - - - Total restricted - - - - - - Committed for: Education - 56,233,446 - - - - Debt service - - 5,946,531 7,133,994 4,152,908 - Equipment acquisitions (appropriated) - - - - - - Equipment acquisitions (unappropriated) - - - - - - Solid waste - - - - - - General government - - - - - - Law enforcement and care of prisoners - - - - - - Recreation and culture - - - - - - Total committed - 56,233,446 5,946,531 7,133,994 4,152,908 - Assigned for:
Subsequent year budgetary appropriation 50,947,200 16,000,000 5,000,000 - - - Specific projects 8,595,400 - - - - - Total assigned 59,542,600 16,000,000 5,000,000 - - - Unassigned 84,493,158 - - - - (219,542,880)
Total fund balances (deficits) $ 144,502,766 $ 74,097,134 $ 10,989,900 $ 7,139,448 $ 4,154,085 $ (219,542,880)
Purpose
General School
ServiceService
General PurposesDebt
School
B-116
General ServiceFund Fund FundFund Fund
DebtPurposes
USDGeneral
Purposes
THE METROPOLITAN GOVERNMENT OF NASHVILLE AND DAVIDSON COUNTY
NOTES TO THE FINANCIAL STATEMENTS (CONTINUED)
FUND BALANCES
For the Year Ended June 30, 2016
GSDGSD
ProjectsFund
GSDCapitalDebt

$ - $ - $ 1,176,773 $ 2,935,280 - - 576 622,765 - - 185,112 185,112 - - 1,362,461 3,743,157
- - 952,489 952,489 - - 3,468,002 3,468,002 - - 23,237,460 23,237,460 - - 663,437 663,437 - - 1,053,599 1,053,599 - - 3,726,005 3,726,005 - - 3,575,657 3,575,657 - - 679,744 679,744 - - 4,216,501 4,216,501 - - 308,960 308,960 - - 1,136,819 1,136,819 - - 43,018,673 43,018,673
- - - 56,233,446 - - - 17,233,433 - - 30,318,995 30,318,995 - - 25,210,677 25,210,677 - - 1,750,712 1,750,712 - - 5,494,708 5,494,708 - - 114,147 114,147 - - 664,839 664,839 - - 63,554,078 137,020,957
- - - 71,947,200 - - - 8,595,400 - - - 80,542,600
(109,730,028) (1,323,786) (11,750,067) (257,853,603)
$ (109,730,028) $ (1,323,786) $ 96,185,145 $ 6,471,784
Projects GovernmentalProjectsFund Funds
GovernmentalFunds
B-117
Funds
CapitalEducation
OtherUSD
TotalCapital
THE METROPOLITAN GOVERNMENT OF NASHVILLE AND DAVIDSON COUNTY
NOTES TO THE FINANCIAL STATEMENTS (CONTINUED)
For the Year Ended June 30, 2016
FUND BALANCES (CONTINUED)
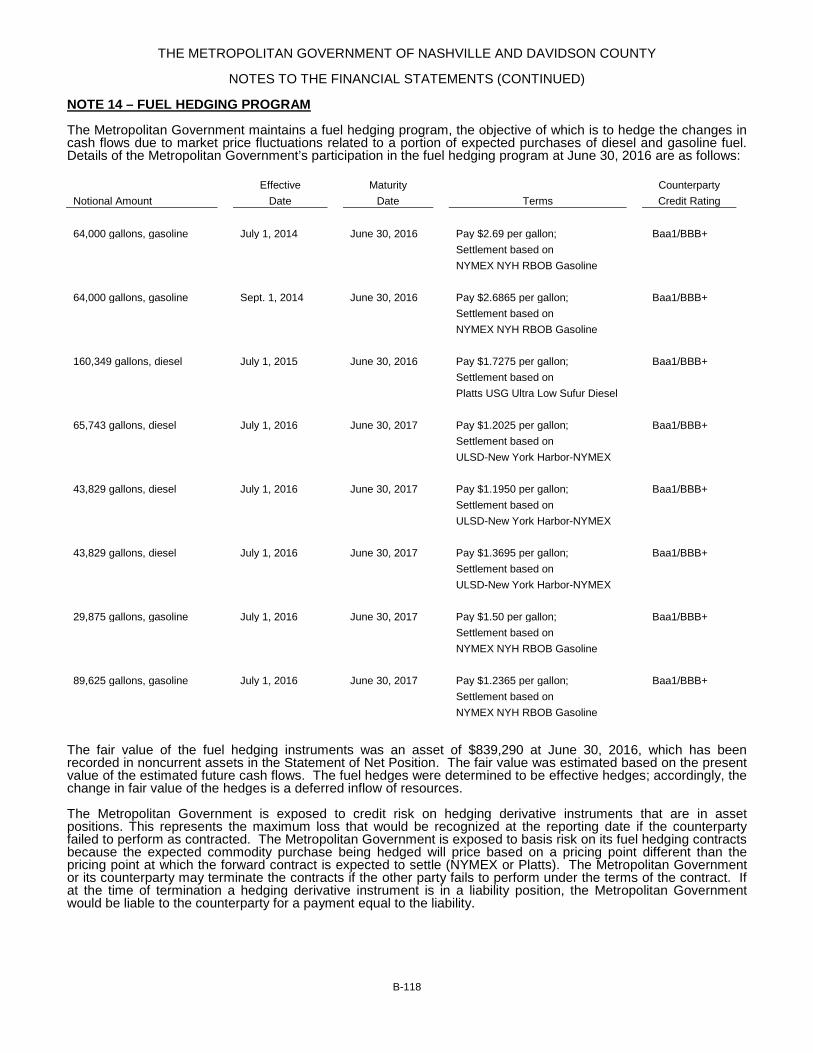
THE METROPOLITAN GOVERNMENT OF NASHVILLE AND DAVIDSON COUNTY
NOTES TO THE FINANCIAL STATEMENTS (CONTINUED)
B-118
NOTE 14 – FUEL HEDGING PROGRAM The Metropolitan Government maintains a fuel hedging program, the objective of which is to hedge the changes in cash flows due to market price fluctuations related to a portion of expected purchases of diesel and gasoline fuel. Details of the Metropolitan Government’s participation in the fuel hedging program at June 30, 2016 are as follows:
Effective
Maturity
Counterparty
Notional Amount
Date
Date
Terms
Credit Rating
64,000 gallons, gasoline
July 1, 2014
June 30, 2016
Pay $2.69 per gallon;
Baa1/BBB+
Settlement based on
NYMEX NYH RBOB Gasoline
64,000 gallons, gasoline
Sept. 1, 2014
June 30, 2016
Pay $2.6865 per gallon;
Baa1/BBB+
Settlement based on
NYMEX NYH RBOB Gasoline
160,349 gallons, diesel
July 1, 2015
June 30, 2016
Pay $1.7275 per gallon;
Baa1/BBB+
Settlement based on
Platts USG Ultra Low Sufur Diesel
65,743 gallons, diesel
July 1, 2016
June 30, 2017
Pay $1.2025 per gallon;
Baa1/BBB+
Settlement based on
ULSD-New York Harbor-NYMEX
43,829 gallons, diesel
July 1, 2016
June 30, 2017
Pay $1.1950 per gallon;
Baa1/BBB+
Settlement based on
ULSD-New York Harbor-NYMEX
43,829 gallons, diesel
July 1, 2016
June 30, 2017
Pay $1.3695 per gallon;
Baa1/BBB+
Settlement based on
ULSD-New York Harbor-NYMEX
29,875 gallons, gasoline
July 1, 2016
June 30, 2017
Pay $1.50 per gallon;
Baa1/BBB+
Settlement based on
NYMEX NYH RBOB Gasoline
89,625 gallons, gasoline
July 1, 2016
June 30, 2017
Pay $1.2365 per gallon;
Baa1/BBB+
Settlement based on
NYMEX NYH RBOB Gasoline
The fair value of the fuel hedging instruments was an asset of $839,290 at June 30, 2016, which has been recorded in noncurrent assets in the Statement of Net Position. The fair value was estimated based on the present value of the estimated future cash flows. The fuel hedges were determined to be effective hedges; accordingly, the change in fair value of the hedges is a deferred inflow of resources. The Metropolitan Government is exposed to credit risk on hedging derivative instruments that are in asset positions. This represents the maximum loss that would be recognized at the reporting date if the counterparty failed to perform as contracted. The Metropolitan Government is exposed to basis risk on its fuel hedging contracts because the expected commodity purchase being hedged will price based on a pricing point different than the pricing point at which the forward contract is expected to settle (NYMEX or Platts). The Metropolitan Government or its counterparty may terminate the contracts if the other party fails to perform under the terms of the contract. If at the time of termination a hedging derivative instrument is in a liability position, the Metropolitan Government would be liable to the counterparty for a payment equal to the liability.

THE METROPOLITAN GOVERNMENT OF NASHVILLE AND DAVIDSON COUNTY
NOTES TO THE FINANCIAL STATEMENTS (CONTINUED)
B-119
NOTE 15 – TAX ABATEMENTS The Industrial Development Board (Board) is authorized by Tennessee Code Annotated (TCA) Section 7-53-305, a provision of the Tennessee Industrial Development Corporations Act, and by Ordinance of the Metropolitan Government to negotiate and accept payments in lieu of ad valorem taxes in furtherance of the Board’s public purposes of economic welfare to maintain and increase employment opportunities and household income as set forth in TCA Section 7-53-102. As such, the Board acts as a conduit organization for property tax abatements through payment in lieu of taxes (PILOT) agreements. The Director of the Mayor’s Office of Economic and Community Development serves as the Executive Director of the Board and negotiates PILOT agreements, presents them to the Metropolitan Council for approval, and if approved, presents them to the Board for approval. The abatements, which may be as much as 100% of the standard real and/or personal property taxes, may be granted to any qualified business located within or relocating to property within the boundaries of the Metropolitan Government and that makes significant capital investments and retains or increases a significant number of full-time employees. Consideration is given on a case-by-case basis and includes analyses of job creation, economic impact, capital investment and wage rates. During the fiscal year ended June 30, 2016, there were nine PILOT agreements in force with tax abatements totaling $5,248,328. Each of these tax abatement agreements is described below with the terms in effect for the fiscal year reported. None of these agreements include a provision for the recapture of abated taxes in the event an abatement recipient does not fulfill the commitment it makes in return for the tax abatement.
• Dell Computer Corporation – The abatement commenced September 28, 1999 with Dell committing to locate computer manufacturing, assembly and distribution facilities and technological support operations within the boundaries of the Metropolitan Government. Dell will remit the lesser of (1) 2% of the standard tax for each 15 employees (determined as set forth in the agreement) by which the total employed during the calendar year preceding the tax year falls below the contractual minimum of 1,500 employees; or (2) 100% of the standard tax. The agreement is applicable to real property subleased and used by Dell and personal property acquired and used by Dell at the aforementioned real property. The abatement period is 40 years for real and personal property taxes. The average number of employees for the calendar year 2014 was 1,125, and the abatement for the year ended June 30, 2016 was $446,538.
• Omni Nashville, LLC – The abatement commenced September 20, 2011 with the construction of a hotel adjacent to the Music City Center. Omni will remit 37.5% of the standard tax applicable to real property and to personal property included in the equipment lease. If Omni defaults on or assigns, transfers or conveys (except to an affiliate) the facility lease or equipment lease, the PILOT period will terminate as of the day of such action. The abatement period is 20 years for real and personal property taxes. The abatement for June 30, 2016 was $1,820,482.
• HealthSpring, Inc. – The abatement commenced August 16, 2011 with the construction (in two phases) of a new consolidated campus for use by HealthSpring. HealthSpring will remit 40% and 0% of the standard tax in Phase I and Phase II, respectively, applicable to real property. The abatement period is 10 years for real property taxes. The abatement for the year ended June 30, 2016 was $388,219.
• Carlex Glass America, LLC – the abatement commenced August 22, 2011 with Carlex’s acquisition of Nashville Glass Plant, allowing the plant to continue operations. Carlex will remit 40% of the standard tax applicable to real property. The abatement period is 5 years for real property taxes. The abatement for the year ended June 30, 2016 was $124,438.
• LifePoint Hospitals, Inc. – The abatement commenced December 1, 2013 with the relocation and consolidation of headquarters and certain central corporate operations to a location within the boundaries of the Metropolitan Government. LifePoint will remit 0% of the standard real property tax (excluding 15% of a garage which is not subleased by LifePoint) and 0% of the personal property tax applicable only to property of and related to their IT center. The abatement period is 15 years for real and personal property taxes. The abatement for the year ended June 30, 2016 was $936,636.
• HCA Information & Technology Services, Inc. – The abatement commenced on December 31, 2013 with the construction of a new regional data center. HCA will remit 40% of standard tax for real property applicable to the new regional data center and 40% of the standard tax for personal property, applicable to acquisitions for the new regional data center and those used in connection to the existing facilities expansion. The abatement period is 7 years real and personal property taxes. The abatement for the year ended June 30, 2016 was $1,023,356.
• Standard Candy Company, Inc. – The abatement commenced October 9, 2012 with the expansion of
Standard’s existing location. Standard will remit 50% of the standard tax for real property applicable to the building addition and 50% of the standard tax for personal property used in the building addition. The abatement period is 6 years for real and personal property taxes. The abatement for the year ended June 30, 2016 was $17,682.

THE METROPOLITAN GOVERNMENT OF NASHVILLE AND DAVIDSON COUNTY
NOTES TO THE FINANCIAL STATEMENTS (CONTINUED)
B-120
• AmSurg Corp. – The abatement commenced January 23, 2015 with the construction of new consolidated
headquarters. AmSurg will remit 0% of the standard tax applicable to real property. The abatement period is 8 years for real property taxes. The abatement for the year ended June 30, 2016 was $445,030.
• Oberto Sausage Company – The abatement commenced December 31, 2013 with the renovation and
improvement of an existing manufacturing facility. Oberto will remit the real property tax equal to $89,846 (tax year 2011 standard tax) plus 50% of the current year standard tax less $89,846. Oberto will remit the personal property tax equal to $65,680 (tax year 2011 standard tax) plus 50% of the current year standard tax less $65,680. The abatement period is 5 years for real and personal property taxes. The abatement for the year ended June 30, 2016 was $45,947. In January 2016, Oberto announced plans to discontinue its operations at the Nashville facility and subsequently closed the plant at the end of April. In May 10, 2016, the Board approved the equipment purchase option exercised by Oberto which ended the PILOT agreement on personal property, and the Board accepted notice of assignment of the real property PILOT agreement to JCG Foods Co., LLC. JCG retained the Oberto Nashville plant employees.
NOTE 16 – SUBSEQUENT EVENTS Primary Government On July 20, 2016, the Government issued Water and Sewer commercial paper notes in the amount of $25,000,000 maturing on September 20, 2016 at an interest rate of .51%. These obligations were refunded with rollover notes at their maturity dates. On August 30, 2016, the Government issued general obligation commercial paper notes in the amount of $30,000,000 maturing on November 3, 2016 at an interest rate of .70%. These obligations will be refunded with rollover notes at their maturity dates. On August 30, 2016, the Government issued general obligation commercial paper notes in the amount of $20,000,000 maturing on October 4, 2016 at an interest rate of .65%. These obligations were refunded with rollover notes at their maturity dates. On October 3, 2016, the Government issued Water and Sewer commercial paper notes in the amount of $25,000,000 maturing on December 2, 2016 at an interest rate of .95%. These obligations will be refunded with rollover notes at their maturity dates. On October 17, 2016, the Government issued general obligation commercial paper notes in the amount of $50,000,000 with various maturity dates ranging from November 15, 2016 through December 7, 2016, at interest rates ranging from .83% to .85%. These obligations will be refunded with rollover notes at their maturity dates. In October 2016, the Government entered into an operating lease and transfer agreement with Signature Healthcare, LLC (Signature) to lease the property and operations of the Bordeaux Long Term Care (Bordeaux) to Signature, as discussed in Note 12 – Commitments and Contingencies, G. Other Commitments. The Government has included $3 million in assigned fund balance of the General Fund at June 30, 2016 as the Government will remit that amount to Signature during the year ending June 30, 2017 under the terms of the agreement.

B-121
THE METROPOLITAN GOVERNMENT OF NASHVILLE AND DAVIDSON COUNTY
REQUIRED SUPPLEMENTARY INFORMATION
CONDITION RATING OF TRANSPORTATION NETWORK
Unaudited – See Accompanying Accountants’ Report The transportation network of the Government is segregated into two subsystems: roads and streets, and bridges and underpasses. Information regarding condition and needed, budgeted and actual maintenance costs is presented below. ROADS AND STREETS PAVING
Percentage of Lane Miles in Fair or Better Condition
2016
2015
2014
2013
2012
66.2 %
60.5 %
61.6 %
60.1 %
57.5 % The condition of road and street pavement is measured using a vehicle called the South Dakota Road Profiler and calculated using the Cartegraph Pavement View Plus pavement management system. The condition is determined based on data collected by the laser road surface test located beneath the Profiler (surface condition) and the distresses are collected from roadway images along with other road and street information such as traffic surface type, street length, street width, area and location. The system uses a measurement scale that is based on a condition index ranging from zero for a pavement in very poor condition to 100 for a pavement in excellent condition. The condition index is used to classify roads and streets as excellent (100-85), good (84-80), fair (79-70) and below standard (less than 69). Condition assessments are collected on an annual basis for half of the county. For assessment purposes, the county is divided into 5 groups with groups 1, 3 and 4 assessed in one year and groups 2 and 5 assessed in the alternate year. The condition of groups 1, 3 and 4 was assessed and reported in fiscal year 2016. The condition of groups 2 and 5 was assessed in fiscal year 2015. It is the policy of the Government to maintain at least 70 percent of its road and street system at a fair or better condition. In May 2010, the Government experienced a major, historic flood which had a significant negative impact on the condition of roads and streets, and the percentage of roads and streets in fair or better condition decreased from 70.0% in the 2010 assessment to 52.7% in the 2011 assessment. Several recent winters of snow, ice and salt usage have continued to provide challenges to improving road and street condition. Also, the Government has experienced population growth, increased tourism, and significant construction which have added more vehicles and equipment on the roadways causing additional deterioration. While there have been lower than historical percentages in the years subsequent to the flood, the condition of roads and streets continues a steady recovery through the Government’s efforts as evidenced by the improvement over the 2011 rate. There were 14 lane miles of roads added in 2016, bringing the total to 5,888 lane miles of roads and streets in the transportation network. The majority of the growth is due to additions of two-lane roads from new developments.
Comparison of Needed and Budgeted to Actual Maintenance
2016
2015
2014
2013
2012
2011
Needed
$ 20,000,000 $ 32,000,000
$ 20,000,000
$ 20,000,000
$ 20,000,000
$ 20,000,000
Budgeted
$ 20,000,000 $ 30,000,000
$ 20,000,000
$ 25,000,000
$ -
$ 12,000,000
Cumulative Spent
5,109,647
20,079,091
18,206,750
25,000,000
-
11,893,344
Difference
$ 14,890,353 $ 9,920,909
$ 1,793,250
$ -
$ -
$ 106,656
The needed amount represents the estimated amount that would need to be spent annually to maintain 70% of the roads and streets at a fair or better condition. The budgeted amount is the amount approved in each year’s capital spending plan (there was no capital spending plan in 2012). The cumulative spent is total actual expenditures across all fiscal years for each capital spending plan.

B-122
THE METROPOLITAN GOVERNMENT OF NASHVILLE AND DAVIDSON COUNTY
REQUIRED SUPPLEMENTARY INFORMATION
CONDITION RATING OF TRANSPORTATION NETWORK (CONTINUED)
Unaudited – See Accompanying Accountants’ Report Maintaining the condition of the roads and streets in accordance with the policy referenced above continues to be a priority as evidenced by the continual funding in the capital plans. BRIDGES AND UNDERPASSES
Percentage of Deck Area in Fair or Better Condition
2016
2015
2014
2013
2012
97.0 %
97.1 %
97.1 %
98.9 %
98.9 % Condition assessments are determined by the State every two years. Results are released by the State late in the calendar year. Thus, the most recent assessment results were provided late in calendar year 2015 and reported for fiscal 2016. Due to this timing, condition assessments reported above for each even year are the results provided by the State. The condition for each odd year is reported at the previous year’s value unless the Public Works Department of the Government has a basis for recalculation internally. Although the conditions reported for 2014 and subsequent years reflect a slight decrease from 2013, the condition remains high at a rate of 97.0%. The condition of bridges and underpasses is measured using the Federal Aid Bridge Inspection System supervised by the Tennessee Department of Transportation (TDOT), which is based on a two-year cycle of inspections of structures designated in two categories: Non-Federal Aid and Federal Aid Urban. The inspection system uses a measurement that classifies the condition as good, fair, poor or critical. The Public Works Department of the Government reviews all findings on all inspections. It is the policy of the Government to maintain at least 75 percent of its bridges and underpasses in fair or better condition. There are currently 218 Non-Federal Aid and 109 Federal Aid Urban bridges and underpasses in the transportation network determined from the final analysis of the 2015 inspection which is the same as the totals from the final analysis of the 2013 inspection. Total square feet of deck area is estimated to be 1,319,519. Deck area is calculated based on TDOT inspection reports for bridges conveying vehicular traffic only.
Comparison of Needed and Budgeted to Actual Maintenance
2016
2015
2014
2013
2012
2011
Needed
$ 10,000,000 $ 6,000,000
$ -
$ 4,750,000
$ -
$ 4,000,000
Budgeted
$ 10,000,000 $ 6,000,000
$ -
$ 4,750,000
$ -
$ 4,000,000
Cumulative Spent
718,888
2,788,886
-
4,429,834
-
4,000,000
Difference
$ 9,281,112 $ 3,211,114
$ -
$ 320,166
$ -
$ -
The needed amount represents the estimated amount that would need to be spent annually to maintain 75% of the bridges and underpasses at a fair or better condition. The budgeted amount is the amount approved in each year’s capital spending plan (there was no capital spending plan in 2012). For 2014, the capital spending plan including $18 million for bridges which was all designated for the construction of a new Gulch connector bridge. The cumulative spent is total actual expenditures across all fiscal years for each capital spending plan. Maintaining the condition of bridges and underpasses in accordance with the Government’s policy referenced above continues to be a priority as evidenced by the continual funding in the capital plans and as reflected in the consistently high condition ratings.

2016 2015 2014County PlanActuarily determined contribution $ 1,376,864 $ 1,473,420 $ 1,413,489 Contributions 1,376,864 1,473,442 1,571,769 Contribution deficiency (excess) $ - $ (22) $ (158,280) Covered-employee payroll $ - $ - $ - Contributions as a percentage of covered- employee payroll - % - % - %
Metro PlanActuarily determined contribution $ 60,266,986 $ 79,682,979 $ 87,643,045 Contributions 85,676,490 94,045,896 87,643,045 Contribution deficiency (excess) $ (25,409,504) $ (14,362,917) $ - Covered-employee payroll $ 531,266,978 $ 513,759,048 $ 556,220,289 Contributions as a percentage of covered- employee payroll 16.13 % 18.31 % 15.76 %
County Education PlanActuarily determined contribution $ 3,760,411 $ 4,594,448 $ 4,570,592 Contributions 3,760,411 4,594,448 3,975,666 Contribution deficiency (excess) $ - $ - $ 594,926 Covered-employee payroll $ - $ - $ - Contributions as a percentage of covered- employee payroll - % - % - %
Metro Education PlanActuarily determined contribution $ 12,289,725 $ 13,593,369 $ 14,708,257 Contributions 20,620,889 18,340,834 18,808,832 Contribution deficiency (excess) $ (8,331,164) $ (4,747,465) $ (4,100,575) Covered-employee payroll $ - $ - $ - Contributions as a percentage of covered- employee payroll - % - % - %
City PlanActuarily determined contribution $ 6,134,921 $ 6,688,724 $ 6,650,683 Contributions 6,134,921 6,688,827 7,223,872 Contribution deficiency (excess) $ - $ (103) $ (573,189) Covered-employee payroll $ - $ - $ - Contributions as a percentage of covered- employee payroll - % - % - %
City Education PlanActuarily determined contribution $ 1,600,371 $ 2,427,465 $ 2,190,063 Contributions 1,600,371 2,427,465 1,932,219 Contribution deficiency (excess) $ - $ - $ 257,844 Covered-employee payroll $ - $ - $ - Contributions as a percentage of covered- employee payroll - % - % - %
(1) Information regarding contributions is only available for the last three fiscal years.
THE METROPOLITAN GOVERNMENT OF NASHVILLE AND DAVIDSON COUNTY
REQUIRED SUPPLEMENTAL INFORMATION
SCHEDULE OF EMPLOYER CONTRIBUTIONS - PENSION PLANS
LAST THREE FISCAL YEARS (1)
B-123
Unaudited - See Accompanying Accountants' Report

County MetroCounty Metro Education Education
Plan Plan Plan PlanNotes to Schedule Valuation date: Actuarially determined contribution rates are calculated as of July 1,one year prior to the end of the fiscal year in which contributions are reported.
Methods and assumptions used to determine contribution rates:
Actuarial cost method entry age entry age entry age entry agenormal normal normal normal
Amortization method level dollar level dollar level dollar level dollaropen closed open closed
Amortization period 7 years 30 years 8 years 30 years
Asset valuation method market 5 year market 5 yearsmoothed smoothed
market market
Investment rate of return 7.50% 7.50% 7.50% 7.50%
Projected salary increases N/A 4.00% N/A N/A
Inflation 2.60% 2.60% 2.60% 2.60%
Postretirement benefit increase adjustments 2.50% 2.50% Division A 3.00% 3.00%1.50% Division B
Unaudited - See Accompanying Accountants' Report
B-124
THE METROPOLITAN GOVERNMENT OF NASHVILLE AND DAVIDSON COUNTY
REQUIRED SUPPLEMENTAL INFORMATION
SCHEDULE OF EMPLOYER CONTRIBUTIONS - PENSION PLANS
LAST THREE FISCAL YEARS (CONTINUED)

CityCity EducationPlan Plan
entry age entry agenormal normal
level dollar level dollaropen open
7 years 7 years
market market
7.50% 7.50%
N/A N/A
2.60% 2.60%
2.50% 3.00%
B-125
Unaudited - See Accompanying Accountants' Report
THE METROPOLITAN GOVERNMENT OF NASHVILLE AND DAVIDSON COUNTY
REQUIRED SUPPLEMENTAL INFORMATION
SCHEDULE OF EMPLOYER CONTRIBUTIONS - PENSION PLANS
LAST THREE FISCAL YEARS (CONTINUED)
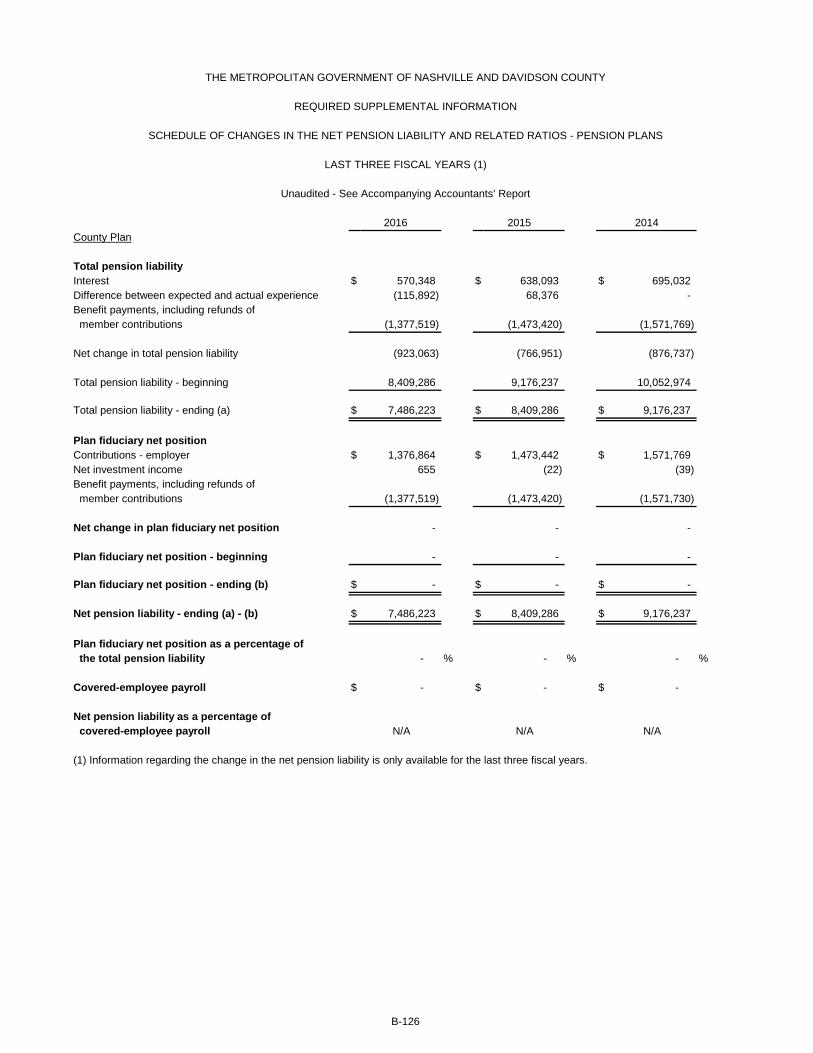
2016 2015 2014County Plan
Total pension liabilityInterest $ 570,348 $ 638,093 $ 695,032 Difference between expected and actual experience (115,892) 68,376 - Benefit payments, including refunds of member contributions (1,377,519) (1,473,420) (1,571,769)
Net change in total pension liability (923,063) (766,951) (876,737)
Total pension liability - beginning 8,409,286 9,176,237 10,052,974
Total pension liability - ending (a) $ 7,486,223 $ 8,409,286 $ 9,176,237
Plan fiduciary net positionContributions - employer $ 1,376,864 $ 1,473,442 $ 1,571,769 Net investment income 655 (22) (39) Benefit payments, including refunds of member contributions (1,377,519) (1,473,420) (1,571,730)
Net change in plan fiduciary net position - - -
Plan fiduciary net position - beginning - - -
Plan fiduciary net position - ending (b) $ - $ - $ -
Net pension liability - ending (a) - (b) $ 7,486,223 $ 8,409,286 $ 9,176,237
Plan fiduciary net position as a percentage of the total pension liability - % - % - %
Covered-employee payroll $ - $ - $ -
Net pension liability as a percentage of covered-employee payroll N/A N/A N/A
(1) Information regarding the change in the net pension liability is only available for the last three fiscal years.
Unaudited - See Accompanying Accountants' Report
THE METROPOLITAN GOVERNMENT OF NASHVILLE AND DAVIDSON COUNTY
REQUIRED SUPPLEMENTAL INFORMATION
LAST THREE FISCAL YEARS (1)
SCHEDULE OF CHANGES IN THE NET PENSION LIABILITY AND RELATED RATIOS - PENSION PLANS
B-126

2016 2015 2014Metro Plan
Total pension liabilityService cost $ 47,248,901 $ 45,995,228 $ 49,413,232 Interest 208,309,697 202,724,640 200,086,120 Difference between expected and actual experience (25,817,354) (67,376,484) - Benefit payments, including refunds of member contributions (152,601,796) (146,745,385) (140,187,828)
Net change in total pension liability 77,139,448 34,597,999 109,311,524
Total pension liability - beginning 2,832,405,142 2,797,807,144 2,688,495,620
Total pension liability - ending (a) $ 2,909,544,590 $ 2,832,405,143 $ 2,797,807,144
Plan fiduciary net positionContributions - employer $ 85,676,490 $ 94,045,896 $ 87,643,045 Contributions - members 73,171 57,996 73,973 Net investment income 6,343,038 124,578,432 410,309,219 Transfers in 244,632 169,363 132,383 Benefit payments, including refunds of member contributions (152,601,796) (146,745,385) (140,187,828) Adminstrative expense (15,004,614) (5,974,504) (2,888,963)
Net change in plan fiduciary net position (75,269,079) 66,131,798 355,081,829
Plan fiduciary net position - beginning 2,763,495,909 2,697,364,111 2,342,282,282
Plan fiduciary net position - ending (b) $ 2,688,226,830 $ 2,763,495,909 $ 2,697,364,111
Net pension liability - ending (a) - (b) $ 221,317,760 $ 68,909,234 $ 100,443,033
Plan fiduciary net position as a percentage of the total pension liability 92.39 % 97.57 % 96.41 %
Covered-employee payroll $ 531,266,978 $ 513,759,048 $ 556,220,289
Net pension liability as a percentage of covered-employee payroll 41.66 % 13.41 % 18.06 %
(1) Information regarding the change in the net pension liability is only available for the last three fiscal years.
Unaudited - See Accompanying Accountants' Report
LAST THREE FISCAL YEARS (1)
SCHEDULE OF CHANGES IN THE NET PENSION LIABILITY AND RELATED RATIOS - PENSION PLANS
B-127
REQUIRED SUPPLEMENTAL INFORMATION
THE METROPOLITAN GOVERNMENT OF NASHVILLE AND DAVIDSON COUNTY

2016 2015 2014County Education Plan
Total pension liabilityInterest $ 2,679,861 $ 2,944,102 $ 3,138,071 Difference between expected and actual experience (16,830) 1,090,757 - Benefit payments, including refunds of member contributions (6,230,661) (6,670,328) (6,959,832)
Net change in total pension liability (3,567,630) (2,635,469) (3,821,761)
Total pension liability - beginning 38,863,635 41,499,104 45,320,865
Total pension liability - ending (a) $ 35,296,005 $ 38,863,635 $ 41,499,104
Plan fiduciary net positionContributions - employer $ 3,760,411 $ 4,594,448 $ 3,975,666 Contributions - State of Tennessee 2,683,194 2,831,644 2,983,251 Net investment income 4,979 402 915 Benefit payments, including refunds of member contributions (6,230,661) (6,670,328) (6,959,832)
Net change in plan fiduciary net position 217,923 756,166 -
Plan fiduciary net position - beginning 756,166 - -
Plan fiduciary net position - ending (b) $ 974,089 $ 756,166 $ -
Net pension liability - ending (a) - (b) $ 34,321,916 $ 38,107,469 $ 41,499,104
Plan fiduciary net position as a percentage of the total pension liability 2.76 % 1.95 % - %
Covered-employee payroll $ - $ - $ -
Net pension liability as a percentage of covered-employee payroll N/A N/A N/A
Proportionate share of collective net pension liability:Employer $ 25,230,145 $ 28,119,171 $ 30,819,136State of Tennessee 9,091,771 9,988,298 10,679,968
Employer's share of net pension liability as a percentage of covered-employee payroll N/A N/A N/A
(1) Information regarding the change in the net pension liability is only available for the last three fiscal years.
LAST THREE FISCAL YEARS (1)
THE METROPOLITAN GOVERNMENT OF NASHVILLE AND DAVIDSON COUNTY
REQUIRED SUPPLEMENTAL INFORMATION
SCHEDULE OF CHANGES IN THE NET PENSION LIABILITY AND RELATED RATIOS - PENSION PLANS
Unaudited - See Accompanying Accountants' Report
B-128

2016 2015 2014Metro Education Plan
Total pension liabilityInterest $ 19,702,025 $ 20,961,496 $ 22,092,743 Difference between expected and actual experience (4,470,482) (2,986,289) - Benefit payments, including refunds of member contributions (32,751,992) (33,815,913) (34,563,595)
Net change in total pension liability (17,520,449) (15,840,706) (12,470,852)
Total pension liability - beginning 283,540,148 299,380,854 311,851,706
Total pension liability - ending (a) $ 266,019,699 $ 283,540,148 $ 299,380,854
Plan fiduciary net positionContributions - employer $ 20,620,889 $ 18,340,834 $ 18,808,832 Contributions - State of Tennessee 11,713,047 12,196,548 12,635,252 Net investment income 180,416 3,663,454 12,453,816 Benefit payments, including refunds of member contributions (32,751,992) (33,815,913) (34,563,595) Adminstrative expense (64,951) (29,951) (30,318)
Net change in plan fiduciary net position (302,591) 354,972 9,303,987
Plan fiduciary net position - beginning 79,635,968 79,280,996 69,977,009
Plan fiduciary net position - ending (b) $ 79,333,377 $ 79,635,968 $ 79,280,996
Net pension liability - ending (a) - (b) $ 186,686,322 $ 203,904,180 $ 220,099,858
Plan fiduciary net position as a percentage of the total pension liability 29.82 % 28.09 % 26.48 %
Covered-employee payroll $ - $ - $ -
Net pension liability as a percentage of covered-employee payroll N/A N/A N/A
Proportionate share of collective net pension liability:Employer $ 101,574,332 $ 112,853,583 $ 123,003,473State of Tennessee 85,111,990 91,050,597 97,096,385
Employer's share of net pension liability as a percentage of covered-employee payroll N/A N/A N/A
(1) Information regarding the change in the net pension liability is only available for the last three fiscal years.
LAST THREE FISCAL YEARS (1)
THE METROPOLITAN GOVERNMENT OF NASHVILLE AND DAVIDSON COUNTY
REQUIRED SUPPLEMENTAL INFORMATION
SCHEDULE OF CHANGES IN THE NET PENSION LIABILITY AND RELATED RATIOS - PENSION PLANS
Unaudited - See Accompanying Accountants' Report
B-129

2016 2015 2014City Plan
Total pension liabilityInterest $ 2,603,078 $ 2,946,519 $ 3,276,664 Difference between expected and actual experience (1,111,344) (722,290) - Benefit payments, including refunds of member contributions (6,140,053) (6,688,724) (7,223,872)
Net change in total pension liability (4,648,319) (4,464,495) (3,947,208)
Total pension liability - beginning 38,889,081 43,353,576 47,300,784
Total pension liability - ending (a) $ 34,240,762 $ 38,889,081 $ 43,353,576 hard coded - should be per formulaPlan fiduciary net positionContributions - employer $ 6,134,921 $ 6,688,827 $ 7,223,872 Net investment income 5,132 (103) (186) Benefit payments, including refunds of member contributions (6,140,053) (6,688,724) (7,223,686)
Net change in plan fiduciary net position - - -
Plan fiduciary net position - beginning - - -
Plan fiduciary net position - ending (b) $ - $ - $ -
Net pension liability - ending (a) - (b) $ 34,240,762 $ 38,889,081 $ 43,353,576
Plan fiduciary net position as a percentage of the total pension liability - % - % - %
Covered-employee payroll $ - $ - $ -
Net pension liability as a percentage of covered-employee payroll N/A N/A N/A
(1) Information regarding the change in the net pension liability is only available for the last three fiscal years.
REQUIRED SUPPLEMENTAL INFORMATION
SCHEDULE OF CHANGES IN THE NET PENSION LIABILITY AND RELATED RATIOS - PENSION PLANS
Unaudited - See Accompanying Accountants' Report
B-130
LAST THREE FISCAL YEARS (1)
THE METROPOLITAN GOVERNMENT OF NASHVILLE AND DAVIDSON COUNTY

2016 2015 2014City Education Plan
Total pension liabilityInterest $ 1,305,770 $ 1,463,455 $ 1,567,660 Difference between expected and actual experience (102,207) 830,248 - Benefit payments, including refunds of member contributions (3,260,870) (3,666,567) (3,908,042)
Net change in total pension liability (2,057,307) (1,372,864) (2,340,382)
Total pension liability - beginning 19,142,904 20,515,768 22,856,150
Total pension liability - ending (a) $ 17,085,597 $ 19,142,904 $ 20,515,768 hard coded - should be per formulaPlan fiduciary net positionContributions - employer $ 1,600,371 $ 2,427,465 $ 1,932,219 Contributions - State of Tennessee 1,804,508 1,874,231 1,975,167 Net investment income 4,141 306 656 Benefit payments, including refunds of member contributions (3,260,870) (3,666,567) (3,908,042)
Net change in plan fiduciary net position 148,150 635,435 -
Plan fiduciary net position - beginning 635,435 - -
Plan fiduciary net position - ending (b) $ 783,585 $ 635,435 $ -
Net pension liability - ending (a) - (b) $ 16,302,012 $ 18,507,469 $ 20,515,768
Plan fiduciary net position as a percentage of the total pension liability 4.59 % 3.32 % - %
Covered-employee payroll $ - $ - $ -
Net pension liability as a percentage of covered-employee payroll N/A N/A N/A
Proportionate share of collective net pension liability:Employer $ 11,599,369 $ 13,104,977 $ 14,738,952State of Tennessee 4,702,643 5,402,492 5,776,816
Employer's share of net pension liability as a percentage of covered-employee payroll N/A N/A N/A
(1) Information regarding the change in the net pension liability is only available for the last three fiscal years.
Unaudited - See Accompanying Accountants' Report
B-131
REQUIRED SUPPLEMENTAL INFORMATION
SCHEDULE OF CHANGES IN THE NET PENSION LIABILITY AND RELATED RATIOS - PENSION PLANS
LAST THREE FISCAL YEARS (1)
THE METROPOLITAN GOVERNMENT OF NASHVILLE AND DAVIDSON COUNTY

For the year ended June 30, 2016 0.64 %
2015 4.87
2014 17.83
2013 13.72
2012 1.07
2011 20.93
2010 15.17
2009 (20.80)
2008 (3.23)
2007 18.95
Rate of Return, Net ofInvestment Expense
Unaudited - See Accompanying Accountants' Report
B-132
THE METROPOLITAN GOVERNMENT OF NASHVILLE AND DAVIDSON COUNTY
REQUIRED SUPPLEMENTAL INFORMATION
LAST TEN FISCAL YEARS
SCHEDULE OF INVESTMENT RETURNS - PENSION PLANS
Annual Money-Weighted

2016 2015 2014Teacher Legacy Pension Plan
Actuarily determined contribution $ 27,095,828 $ 28,722,365 $ 30,470,761 Contributions 27,095,828 28,722,365 30,470,761 Contribution deficiency (excess) $ - $ - $ -
Covered-employee payroll $ 299,732,644 $ 317,726,673 $ 343,139,202
Contributions as a percentage of covered- employee payroll 9.04 % 9.04 % 8.88 %
Teacher Retirement Plan (2)
Actuarily determined contribution $ 2,240,133 $ 29,367 $ N/AContributions 2,240,133 1,174,675 N/AContribution deficiency (excess) $ - $ (1,145,308) $ N/A
Covered-employee payroll $ 56,003,368 $ 29,366,650 $ N/A
Contributions as a percentage of covered- employee payroll 4.00 % 4.00 % N/A %
(1) Information regarding contributions is only available for the last three fiscal years.
(2) The Teacher Retirement Plan was established July 1, 2014. Information for 2014 is not applicable.
B-133
THE METROPOLITAN GOVERNMENT OF NASHVILLE AND DAVIDSON COUNTY
REQUIRED SUPPLEMENTAL INFORMATION
SCHEDULE OF THE GOVERNMENT'S CONTRIBUTIONSTEACHER PENSION PLANS OF THE TCRS
LAST THREE FISCAL YEARS (1)
Unaudited - See Accompanying Accountants' Report

Teacher Legacy Pension Plan
The Government's proportion of the net pension liability (asset) 8.49 % (8.74) %
The Government's proportionate share of the $ 3,476,720 $ (1,420,602) net pension liability (asset)
The Government's covered-employee payroll $ 317,726,673 $ 343,139,202
The Government's proportionate share of the net pension liability (asset) as a percentage of its covered-employee payroll 1.09 % (0.41) %
Plan fiduciary net position as a percentage of the total pension liability 99.81 % (100.08) %
Teacher Retirement Plan (2)
The Government's proportion of the net pension liability (asset) (14.13) % N/A %
The Government's proportionate share of the $ (568,609) $ N/A net pension liability (asset)
The Government's covered-employee payroll $ 29,366,650 $ N/A
The Government's proportionate share of the net pension liability (asset) as a percentage of its covered-employee payroll (1.94) % N/A %
Plan fiduciary net position as a percentage of the total pension liability 127.46 % N/A %
(1) The amount presented were determined as of June 30 of the prior fiscal year.
(2) The Teacher Retirement Plan was established July 1, 2014. Information for 2014 is not applicable.
Unaudited - See Accompanying Accountants' Report
B-134
THE METROPOLITAN GOVERNMENT OF NASHVILLE AND DAVIDSON COUNTY
REQUIRED SUPPLEMENTAL INFORMATION
For the Year Ended June 30, (1)
SCHEDULE OF THE GOVERNMENT'S PROPORTIONATE SHARE OF THE NET PENSION LIABILITY (ASSET)TEACHER PENSION PLANS OF THE TCRS
20142015

Year AnnualEnded Required Percentage
June 30, Contribution Contributed
Metro Employees' Medical Benefit Plan
2014 $ 175,166,000 37.21 %2015 187,890,000 40.95 2016 196,832,000 41.27
School Professional Employees' Insurance Plan
2014 38,309,000 51.99 2015 42,099,000 55.01 2016 49,020,000 50.75
THE METROPOLITAN GOVERNMENT OF NASHVILLE AND DAVIDSON COUNTY
REQUIRED SUPPLEMENTARY INFORMATION
B-135
SCHEDULE OF EMPLOYER CONTRIBUTIONS - OTHER POSTEMPLOYMENT BENEFIT PLANS
Unaudited - See Accompanying Accountants' Report
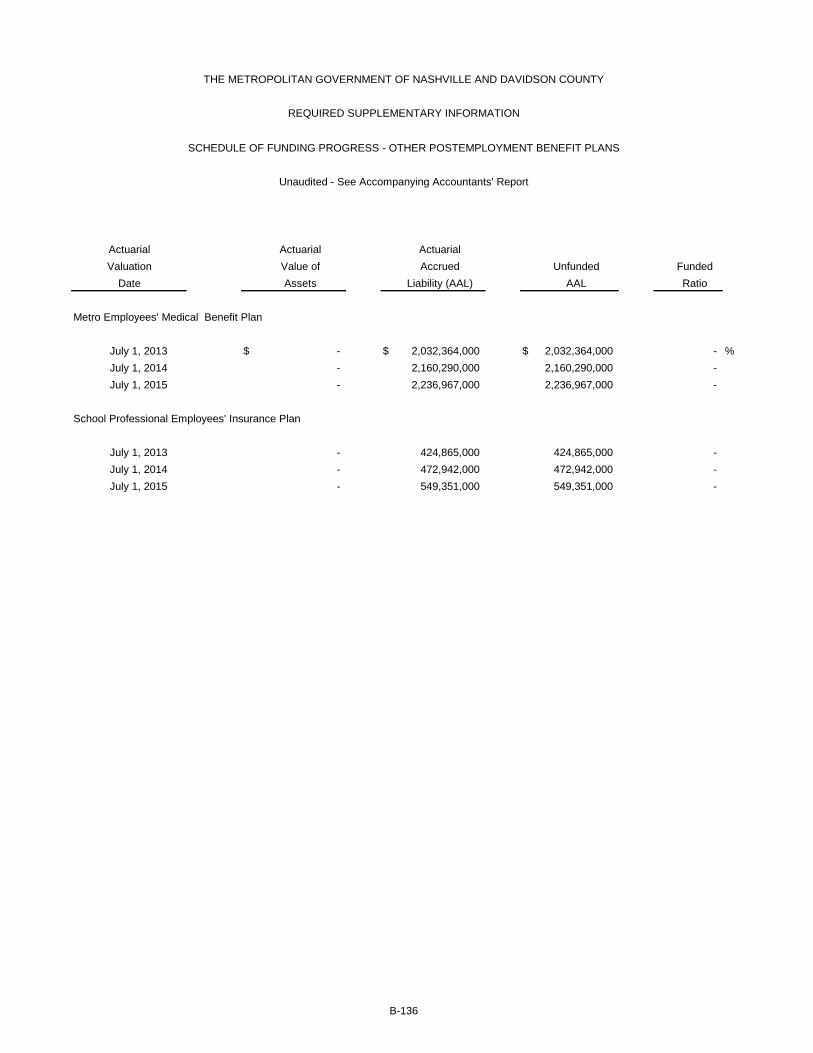
THE METROPOLITAN GOVERNMENT OF NASHVILLE AND DAVIDSON COUNTY
REQUIRED SUPPLEMENTARY INFORMATION
SCHEDULE OF FUNDING PROGRESS - OTHER POSTEMPLOYMENT BENEFIT PLANS
Actuarial Actuarial ActuarialValuation Value of Accrued Unfunded Funded
Date Assets Liability (AAL) AAL Ratio
Metro Employees' Medical Benefit Plan
July 1, 2013 $ - $ 2,032,364,000 $ 2,032,364,000 - % July 1, 2014 - 2,160,290,000 2,160,290,000 - July 1, 2015 - 2,236,967,000 2,236,967,000 -
School Professional Employees' Insurance Plan
July 1, 2013 - 424,865,000 424,865,000 - July 1, 2014 - 472,942,000 472,942,000 - July 1, 2015 - 549,351,000 549,351,000 -
B-136
Unaudited - See Accompanying Accountants' Report

UnfundedAAL as a
Covered Percentage ofPayroll Covered Payroll
$ 517,831,000 392.48 %528,020,000 409.13 556,959,000 401.64
306,110,000 138.79 312,687,000 151.25 326,626,000 168.19
REQUIRED SUPPLEMENTARY INFORMATION
THE METROPOLITAN GOVERNMENT OF NASHVILLE AND DAVIDSON COUNTY
B-137
Unaudited - See Accompanying Accountants' Report
SCHEDULE OF FUNDING PROGRESS - OTHER POSTEMPLOYMENT BENEFIT PLANS (CONTINUED)


MetropolitanAction
Commission OperationsASSETS:Cash and cash equivalents $ 1,052,998 $ 55,309,348 $ 4,031,136 Accounts receivable 1,504,928 - 620,025 Accrued interest receivable 1,454 48,342 3,263 Due from other funds of the primary government 104 2,363,997 46,246 Inventories of supplies - - - Other assets - - -
Total assets $ 2,559,484 $ 57,721,687 $ 4,700,670
LIABILITIES:Accounts payable $ 1,191,533 $ 2,131,725 $ 1,825,061 Accrued payroll 494,903 - 195,780 Due to other funds of the primary government 32,047 60,290 265,680 Due to component units - - - Commercial paper payable - - - Other liabilities 25 - -
Total liabilities 1,718,508 2,192,015 2,286,521
DEFERRED INFLOWS OF RESOURCES:Unavailable revenue - grants - - -
Total deferred inflows of resources - - -
FUND BALANCES (DEFICITS):Nonspendable - - - Restricted for other purposes 840,976 - 663,437 Committed for: Equipment acquisitions (appropriated) - 30,318,995 - Equipment acquisitions (unappropriated) - 25,210,677 - Other purposes - - 1,750,712 Unassigned - - -
Total fund balances (deficits) 840,976 55,529,672 2,414,149
Total liabilities, deferred inflows of resources, and fund balances (deficits) $ 2,559,484 $ 57,721,687 $ 4,700,670
THE METROPOLITAN GOVERNMENT OF NASHVILLE AND DAVIDSON COUNTY
COMBINING BALANCE SHEETNONMAJOR GOVERNMENTAL FUNDS
June 30, 2016
Special Revenue Funds
C-2
Waste
The accompanying notes are an integral part of this financial statement.
SolidGeneralFund 4%Reserve

Hotel Convention Events CBID EventsEducation Occupancy Center And AndServices Tax Tax Marketing Marketing
$ 37,459,028 $ 6,252,585 $ 6,598,639 $ 1,479,219 $ 736,259 $ 1,678,059 23,251,238 36,120,583 6,018,627 1,568,274 302,552 185,117
61,845 8,712 4,711 833 446 1,421 - 207,515 1,585,706 - - - - 915,876 - - - - - 575 500,000 - - -
$ 60,772,111 $ 43,505,846 $ 14,707,683 $ 3,048,326 $ 1,039,257 $ 1,864,597
$ 33,002 $ 3,887,562 $ 4,420,329 $ - $ 548,750 $ - - 210,517 - - - -
19,316,275 13,396,027 1,959,871 1,585,706 - - - - 7,214,585 1,462,620 - -
30,574,299 - - - - - - - - - - -
49,923,576 17,494,106 13,594,785 3,048,326 548,750 -
22,598,602 1,966,235 - - - -
22,598,602 1,966,235 - - - -
- 916,452 - - - - - 23,129,053 1,112,898 - 490,507 1,864,597
- - - - - - - - - - - - - - - - - -
(11,750,067) - - - - -
(11,750,067) 24,045,505 1,112,898 - 490,507 1,864,597
$ 60,772,111 $ 43,505,846 $ 14,707,683 $ 3,048,326 $ 1,039,257 $ 1,864,597
Special Revenue Funds
THE METROPOLITAN GOVERNMENT OF NASHVILLE AND DAVIDSON COUNTY
COMBINING BALANCE SHEETNONMAJOR GOVERNMENTAL FUNDS (CONTINUED)
June 30, 2016
Flood2010
The accompanying notes are an integral part of this financial statement.
C-3
Recovery

OtherGovernment
ServicesASSETS:Cash and cash equivalents $ 17,626,420 $ 203,076 $ 187,683 $ 132,614,450 Accounts receivable 16,333,887 - - 85,905,231 Accrued interest receivable 21,020 181 168 152,396 Due from other funds of the primary government 5,683,646 - - 9,887,214 Inventories of supplies 260,897 - - 1,176,773 Other assets - - - 500,575
Total assets $ 39,925,870 $ 203,257 $ 187,851 $ 230,236,639
LIABILITIES:Accounts payable $ 8,036,786 $ - $ 326 $ 22,075,074 Accrued payroll 1,147,726 - - 2,048,926 Due to other funds of the primary government 4,075,207 - - 40,691,103 Due to component units - - - 8,677,205 Commercial paper payable - - - 30,574,299 Other liabilities 3,179,603 - - 3,179,628
Total liabilities 16,439,322 - 326 107,246,235
DEFERRED INFLOWS OF RESOURCES:Unavailable revenue - grants 2,240,422 - - 26,805,259
Total deferred inflows of resources 2,240,422 - - 26,805,259
FUND BALANCES (DEFICITS):Nonspendable 260,897 105,994 79,118 1,362,461 Restricted for other purposes 14,711,535 97,263 108,407 43,018,673 Committed for: . . Equipment acquisitions (appropriated) - - - 30,318,995 Equipment acquisitions (unappropriated) - - - 25,210,677 Other purposes 6,273,694 - - 8,024,406 Unassigned - - - (11,750,067)
Total fund balances (deficits) 21,246,126 203,257 187,525 96,185,145
Total liabilities, deferred inflows of resources, and fund balances (deficits) $ 39,925,870 $ 203,257 $ 187,851 $ 230,236,639
Special Revenue FundsTotal
Government Education Funds
The accompanying notes are an integral part of this financial statement.
C-4
GeneralNonmajor
Governmental
Permanent Funds
THE METROPOLITAN GOVERNMENT OF NASHVILLE AND DAVIDSON COUNTY
NONMAJOR GOVERNMENTAL FUNDS (CONTINUED)
June 30, 2016
COMBINING BALANCE SHEET


Metropolitan GeneralAction Fund 4%
Commission Reserve OperationsREVENUES: Property taxes $ - $ - $ - Other taxes, licenses and permits - - - Fines, forfeits and penalties - - - Revenues from the use of money or property 6,872 237,961 18,563 Revenues from other governmental agencies 18,545,153 - 104,125 Commissions and fees - - - Charges for current services 192,672 - 5,724,974 Compensation for loss, sale or damage to property 867 - - Contributions and gifts 39,981 - - Miscellaneous 300 - 152,080
Total revenues 18,785,845 237,961 5,999,742
EXPENDITURES: Current: General government - - - Fiscal administration - - - Administration of justice - - - Law enforcement and care of prisoners - - - Fire prevention and control - - - Regulation and inspection - - - Public welfare 23,081,094 - - Public health and hospitals - - - Public library system - - - Public works, highways and streets - - 23,320,621 Recreational and cultural - - - Education - - - Capital outlay 150,983 18,682,096 -
Total expenditures 23,232,077 18,682,096 23,320,621
Excess (deficiency) of revenues over expenditures (4,446,232) (18,444,135) (17,320,879)
OTHER FINANCING SOURCES (USES): Transfers in 4,304,000 28,950,919 17,426,100 Transfers out (25,983) (4,741,204) (636,800)
Total other financing sources (uses) 4,278,017 24,209,715 16,789,300
Net change in fund balances (deficits) (168,215) 5,765,580 (531,579)
FUND BALANCES (DEFICITS), beginning of year 1,009,191 49,764,092 2,945,728
FUND BALANCES (DEFICITS), end of year $ 840,976 $ 55,529,672 $ 2,414,149
THE METROPOLITAN GOVERNMENT OF NASHVILLE AND DAVIDSON COUNTY
COMBINING STATEMENT OF REVENUES, EXPENDITURES AND CHANGES IN FUND BALANCES
C-6
Waste
NONMAJOR GOVERNMENTAL FUNDS
For the Year Ended June 30, 2016
Special Revenue Funds
Solid
The accompanying notes are an integral part of this financial statement.
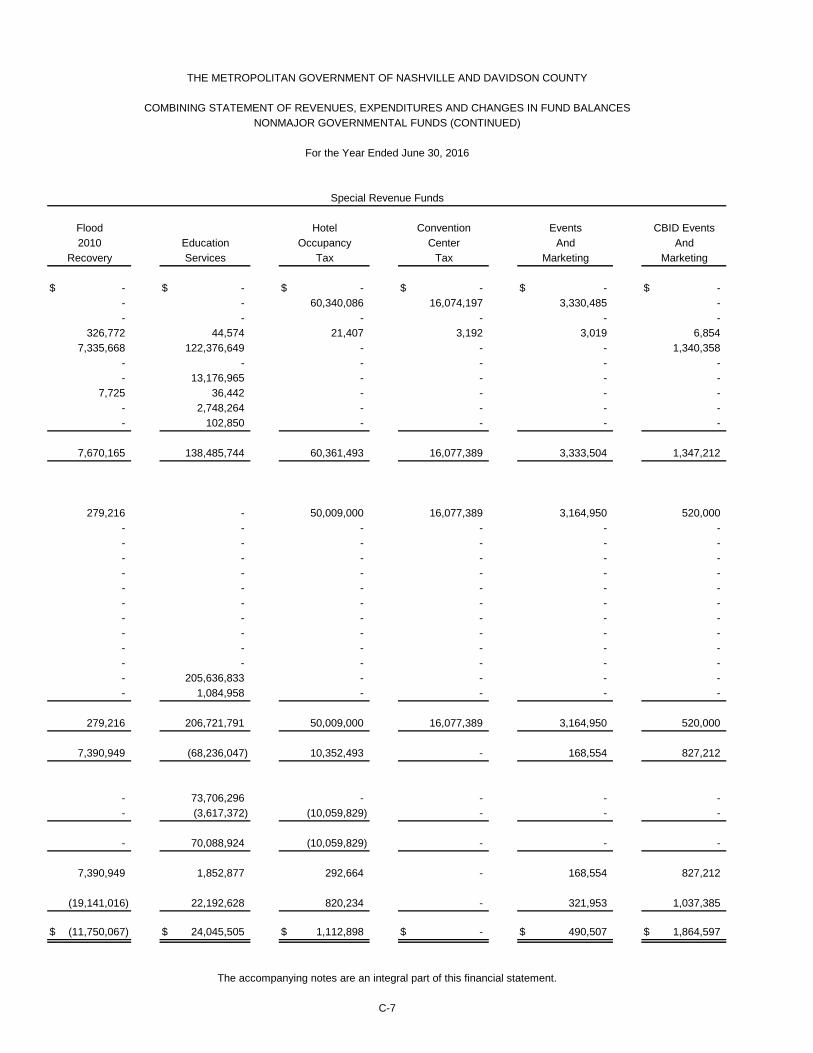
Hotel CBID EventsEducation Occupancy Center AndServices Tax Tax Marketing
$ - $ - $ - $ - $ - $ - - - 60,340,086 16,074,197 3,330,485 - - - - - - -
326,772 44,574 21,407 3,192 3,019 6,854 7,335,668 122,376,649 - - - 1,340,358
- - - - - - - 13,176,965 - - - -
7,725 36,442 - - - - - 2,748,264 - - - - - 102,850 - - - -
7,670,165 138,485,744 60,361,493 16,077,389 3,333,504 1,347,212
279,216 - 50,009,000 16,077,389 3,164,950 520,000 - - - - - - - - - - - - - - - - - - - - - - - - - - - - - - - - - - - - - - - - - - - - - - - - - - - - - - - - - - - - - 205,636,833 - - - -
- 1,084,958 - - - -
279,216 206,721,791 50,009,000 16,077,389 3,164,950 520,000
7,390,949 (68,236,047) 10,352,493 - 168,554 827,212
- 73,706,296 - - - - - (3,617,372) (10,059,829) - - -
- 70,088,924 (10,059,829) - - -
7,390,949 1,852,877 292,664 - 168,554 827,212
(19,141,016) 22,192,628 820,234 - 321,953 1,037,385
$ (11,750,067) $ 24,045,505 $ 1,112,898 $ - $ 490,507 $ 1,864,597
Convention
The accompanying notes are an integral part of this financial statement.
MarketingRecovery
C-7
THE METROPOLITAN GOVERNMENT OF NASHVILLE AND DAVIDSON COUNTY
Flood
COMBINING STATEMENT OF REVENUES, EXPENDITURES AND CHANGES IN FUND BALANCESNONMAJOR GOVERNMENTAL FUNDS (CONTINUED)
For the Year Ended June 30, 2016
AndEvents
Special Revenue Funds
2010
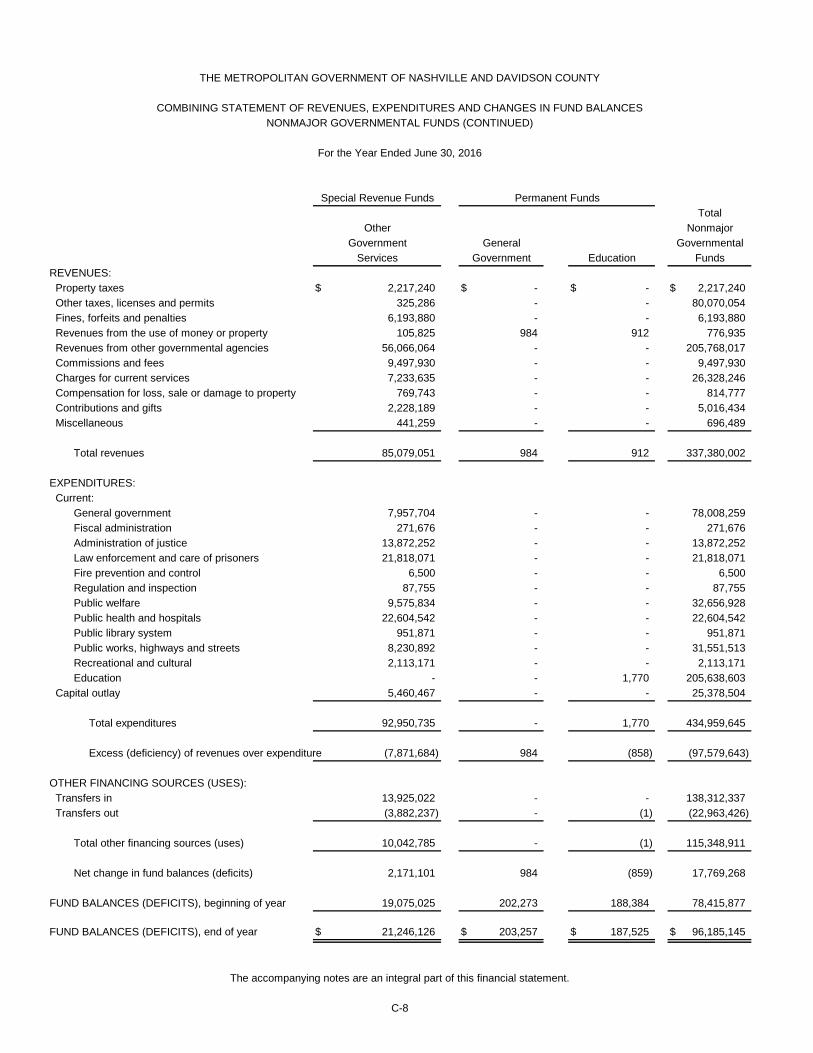
OtherGovernment General
Services GovernmentREVENUES: Property taxes $ 2,217,240 $ - $ - $ 2,217,240 Other taxes, licenses and permits 325,286 - - 80,070,054 Fines, forfeits and penalties 6,193,880 - - 6,193,880 Revenues from the use of money or property 105,825 984 912 776,935 Revenues from other governmental agencies 56,066,064 - - 205,768,017 Commissions and fees 9,497,930 - - 9,497,930 Charges for current services 7,233,635 - - 26,328,246 Compensation for loss, sale or damage to property 769,743 - - 814,777 Contributions and gifts 2,228,189 - - 5,016,434 Miscellaneous 441,259 - - 696,489
Total revenues 85,079,051 984 912 337,380,002
EXPENDITURES: Current: General government 7,957,704 - - 78,008,259 Fiscal administration 271,676 - - 271,676 Administration of justice 13,872,252 - - 13,872,252 Law enforcement and care of prisoners 21,818,071 - - 21,818,071 Fire prevention and control 6,500 - - 6,500 Regulation and inspection 87,755 - - 87,755 Public welfare 9,575,834 - - 32,656,928 Public health and hospitals 22,604,542 - - 22,604,542 Public library system 951,871 - - 951,871 Public works, highways and streets 8,230,892 - - 31,551,513 Recreational and cultural 2,113,171 - - 2,113,171 Education - - 1,770 205,638,603 Capital outlay 5,460,467 - - 25,378,504
Total expenditures 92,950,735 - 1,770 434,959,645
Excess (deficiency) of revenues over expenditures (7,871,684) 984 (858) (97,579,643)
OTHER FINANCING SOURCES (USES): Transfers in 13,925,022 - - 138,312,337 Transfers out (3,882,237) - (1) (22,963,426)
Total other financing sources (uses) 10,042,785 - (1) 115,348,911
Net change in fund balances (deficits) 2,171,101 984 (859) 17,769,268
FUND BALANCES (DEFICITS), beginning of year 19,075,025 202,273 188,384 78,415,877
FUND BALANCES (DEFICITS), end of year $ 21,246,126 $ 203,257 $ 187,525 $ 96,185,145
THE METROPOLITAN GOVERNMENT OF NASHVILLE AND DAVIDSON COUNTY
TotalNonmajor
Permanent Funds
COMBINING STATEMENT OF REVENUES, EXPENDITURES AND CHANGES IN FUND BALANCESNONMAJOR GOVERNMENTAL FUNDS (CONTINUED)
For the Year Ended June 30, 2016
Special Revenue Funds
GovernmentalFunds
The accompanying notes are an integral part of this financial statement.
C-8
Education

Variance with
PositiveFinal Amounts (Negative)
REVENUES: Property taxes $ 86,814,100 $ 86,814,100 $ 86,850,607 $ 36,507 Local option sales tax 1,840,900 1,840,900 2,148,321 307,421 Fines, forfeits and penalties 348,900 348,900 324,053 (24,847) Revenues from the use of money or property - - 116,549 116,549 Revenues from other governmental agencies 2,781,300 2,781,300 4,024,838 1,243,538 Bond interest tax credit 4,843,400 4,843,400 4,864,020 20,620
Total revenues 96,628,600 96,628,600 98,328,388 1,699,788
EXPENDITURES: Principal retirement 63,187,300 63,187,300 63,187,260 40 Interest 59,951,200 59,951,200 62,383,007 (2,431,807) Fiscal charges 3,139,900 3,139,900 5,222,852 (2,082,952)
Total expenditures 126,278,400 126,278,400 130,793,119 (4,514,719)
Excess (deficiency) of revenues over expenditures (29,649,800) (29,649,800) (32,464,731) (2,814,931)
OTHER FINANCING SOURCES (USES): Issuance of refunding debt - - 231,949,343 231,949,343 Debt issue premium - - 50,113,451 50,113,451 Payments to refunded bond escrow agent - - (280,386,841) (280,386,841) Transfers in 24,649,800 24,649,800 25,274,582 624,782
Total other financing sources (uses) 24,649,800 24,649,800 26,950,535 2,300,735
Net change in fund balances (5,000,000) (5,000,000) (5,514,196) (514,196)
FUND BALANCES, beginning of year 16,504,096 16,504,096 16,504,096 -
FUND BALANCES, end of year $ 11,504,096 $ 11,504,096 $ 10,989,900 $ (514,196)
THE METROPOLITAN GOVERNMENT OF NASHVILLE AND DAVIDSON COUNTY
SCHEDULE OF REVENUES, EXPENDITURES AND CHANGES IN FUND BALANCES - BUDGET AND ACTUALGSD GENERAL PURPOSES DEBT SERVICE FUND
For the Year Ended June 30, 2016
C-9
See accompanying auditors' report.
OriginalActual
Final Budget -Budgeted Amounts

Variance with
PositiveFinal Amounts (Negative)
REVENUES: Property taxes $ 36,919,200 $ 36,919,200 $ 36,951,878 $ 32,678 Local option sales taxes 34,857,400 34,857,400 37,029,888 2,172,488 Revenues from the use of money or property 97,000 97,000 626,708 529,708
Total revenues 71,873,600 71,873,600 74,608,474 2,734,874
EXPENDITURES: Principal retirement 45,552,400 45,552,400 45,552,302 98 Interest 30,989,700 30,989,700 33,250,077 (2,260,377) Fiscal charges 1,495,000 1,495,000 1,957,117 (462,117)
Total expenditures 78,037,100 78,037,100 80,759,496 (2,722,396)
Excess (deficiency) of revenues over expenditures (6,163,500) (6,163,500) (6,151,022) 12,478
OTHER FINANCING SOURCES (USES): Issuance of refunding debt - - 78,790,586 78,790,586 Debt issue premium - - 17,022,977 17,022,977 Payments to refunded bond escrow agent - - (95,432,894) (95,432,894) Transfers in 2,863,500 2,863,500 4,465,803 1,602,303
Total other financing sources (uses) 2,863,500 2,863,500 4,846,472 1,982,972
Net change in fund balances (3,300,000) (3,300,000) (1,304,550) 1,995,450
FUND BALANCE, beginning of year 8,443,998 8,443,998 8,443,998 -
FUND BALANCE, end of year $ 5,143,998 $ 5,143,998 $ 7,139,448 $ 1,995,450
THE METROPOLITAN GOVERNMENT OF NASHVILLE AND DAVIDSON COUNTY
SCHEDULE OF REVENUES, EXPENDITURES AND CHANGES IN FUND BALANCES - BUDGET AND ACTUALGSD SCHOOL PURPOSES DEBT SERVICE FUND
For the Year Ended June 30, 2016
C-10
See accompanying auditors' report.
OriginalActual
Final Budget -Budgeted Amounts

Variance with
PositiveFinal Amounts (Negative)
REVENUES: Property taxes $ 14,173,500 $ 14,173,500 $ 16,256,673 $ 2,083,173
Total revenues 14,173,500 14,173,500 16,256,673 2,083,173
EXPENDITURES: Principal retirement 7,218,200 7,218,200 7,218,200 - Interest 9,636,400 9,636,400 9,349,127 287,273 Fiscal charges 726,500 726,500 718,433 8,067
Total expenditures 17,581,100 17,581,100 17,285,760 295,340
Excess (deficiency) of revenues over expenditures (3,407,600) (3,407,600) (1,029,087) 2,378,513
OTHER FINANCING SOURCES (USES): Issuance of refunding debt - - 27,571,610 27,571,610 Debt issue premium - - 5,956,941 5,956,941 Payments to refunded bond escrow agent - - (33,395,342) (33,395,342) Transfers in 1,907,600 1,907,600 1,907,600 -
Total other financing sources (uses) 1,907,600 1,907,600 2,040,809 133,209
Net change in fund balances (1,500,000) (1,500,000) 1,011,722 2,511,722
FUND BALANCES, beginning of year 3,142,363 3,142,363 3,142,363 -
FUND BALANCES, end of year $ 1,642,363 $ 1,642,363 $ 4,154,085 $ 2,511,722
THE METROPOLITAN GOVERNMENT OF NASHVILLE AND DAVIDSON COUNTY
SCHEDULE OF REVENUES, EXPENDITURES AND CHANGES IN FUND BALANCES - BUDGET AND ACTUALUSD GENERAL PURPOSES DEBT SERVICE FUND
For the Year Ended June 30, 2016
C-11
See accompanying auditors' report.
OriginalActual
Final Budget -Budgeted Amounts

C-12
THE METROPOLITAN GOVERNMENT OF NASHVILLE AND DAVIDSON COUNTY DESCRIPTION OF NONMAJOR GOVERNMENTAL FUNDS SPECIAL REVENUE FUNDS METROPOLITAN ACTION COMMISSION FUND The Metropolitan Action Commission Fund accounts for the various programs of the Commission which provide education, social skills, meals and before and after care assistance to low-income and disadvantaged children, and energy assistance to low-income individuals. GENERAL FUND 4% RESERVE FUND The General Fund 4% Reserve Fund accounts for 4% of locally generated revenues deposited in the GSD General Fund. Expenditures from this fund are for capital items and are authorized by resolutions of the Metropolitan Council. SOLID WASTE OPERATIONS FUND The Solid Waste Operations Fund accounts for activities of the Department of Public Works involving refuse collection, recycling, chipper service and other miscellaneous activities as well as federal and state funds for enhancing solid waste management in local communities and solid waste special projects approved by the Metropolitan Council. FLOOD 2010 RECOVERY FUND The Flood 2010 Recovery Fund accounts for expenditures and revenues from insurance, federal, and state reimbursements, and other sources, related to May 2010 flooding. EDUCATION SERVICES FUND The Education Services Fund accounts for a variety of programs supporting educational activities including various state and federal grant programs, funds reserved for unemployment compensation claims of Metropolitan Nashville Public Schools employees, food service operations of the school system, and fund raising activities of individual schools. HOTEL OCCUPANCY TAX FUND The Hotel Occupancy Tax Fund is under the administrative responsibility of the Finance Department and was established to account for hotel occupancy tax receipts first levied in 1976. Currently these tax receipts are utilized two-sixths for direct promotion of tourism, three-sixths for the construction, financing and operation of the new Music City Center, and one-sixth for distribution to the General Fund. CONVENTION CENTER TAX FUND The Convention Center Tax Fund is under the administrative responsibility of the Finance Department and was established to account for additional hotel occupancy and other tourist-related tax receipts levied beginning in 2007 to be utilized for the construction, financing and operation of the new Music City Center. EVENTS AND MARKETING FUND The Events and Marketing Fund is under the administrative responsibility of the Finance Department and was established to account for additional hotel occupancy and other tourist-related tax receipts levied beginning in 2008 to be utilized to support events or projects which have a positive economic impact on the Government.

C-13
THE METROPOLITAN GOVERNMENT OF NASHVILLE AND DAVIDSON COUNTY DESCRIPTION OF NONMAJOR GOVERNMENTAL FUNDS (CONTINUED) CBID EVENTS AND MARKETING FUND The CBID Events and Marketing Fund is under the administrative responsibility of the Finance Department and was established to account for fees beginning in 2014 on retail sales with the Central Business Improvement District to be utilized to support events or projects which have a positive economic impact on the Government. OTHER GOVERNMENT SERVICES FUND The Other Government Services Fund accounts for funds which support various government activities through federal, state and private grants and contributions, proceeds from the sale of seized property used to support various law enforcement programs, and special revenues supporting other governmental operations. PERMANENT FUNDS GENERAL GOVERNMENT FUND The General Government Fund is used to account for restricted trusts under the administrative responsibility of various departments of the general government. EDUCATION FUND The Education Fund is used to account for restricted trusts under the administrative responsibility of the Metropolitan Board of Education.


Nashville Board ofConvention Fair Farmers
Center Commissioners Market
ASSETS: Current assets: Cash and cash equivalents $ 378,860 $ 1,527,392 $ 1,562,356 Accounts receivable 105,435 20,792 2,626 Allowance for doubtful accounts - - - Accrued interest receivable 291 1,246 113 Due from other funds of the primary government 92,391 3,747 277 Due from component units - - - Other current assets - 11,198 -
Total current assets 576,977 1,564,375 1,565,372
Noncurrent assets: Capital assets: Land 6,056,529 175,293 - Buildings and improvements 52,668,319 9,003,132 3,401,046 Improvements other than buildings 50,220 3,781,300 163,589 Furniture, machinery and equipment 432,558 727,963 393,084 Property under capital lease - - 3,645,000 Construction in progress - - 50,417 Less accumulated depreciation (34,681,752) (10,620,527) (3,420,552) Capital assets - net 24,525,874 3,067,161 4,232,584
Total noncurrent assets 24,525,874 3,067,161 4,232,584
Total assets 25,102,851 4,631,536 5,797,956
DEFERRED OUTFLOWS OF RESOURCES: Pensions - 282,270 71,404
Total deferred outflows of resources - 282,270 71,404
THE METROPOLITAN GOVERNMENT OF NASHVILLE AND DAVIDSON COUNTY
COMBINING STATEMENT OF NET POSITIONNONMAJOR ENTERPRISE FUNDS
June 30, 2016
D-2
The accompanying notes are an integral part of this financial statement.

SurplusProperty Municipal Police StormwaterAuction Auditorium Impound Operations
$ 800,306 $ 847,446 $ 335,917 $ 13,892,688 19,731 14,278 - 4,006,570
- - - (731,600) 467 389 299 13,401
- 44 227 3,273,820 - - - 100 - 3,537 - -
820,504 865,694 336,443 20,454,979
- 587,400 - - - 11,145,045 - - - 84,651 - - - 842,195 - - - - - - - 92,478 - - - (9,090,361) - -
- 3,661,408 - -
- 3,661,408 - -
820,504 4,527,102 336,443 20,454,979
128,197 175,536 - 1,418,976
128,197 175,536 - 1,418,976
THE METROPOLITAN GOVERNMENT OF NASHVILLE AND DAVIDSON COUNTY
COMBINING STATEMENT OF NET POSITIONNONMAJOR ENTERPRISE FUNDS (CONTINUED)
June 30, 2016
The accompanying notes are an integral part of this financial statement.
D-3

CommunityEducation
Commission
ASSETS: Current assets: Cash and cash equivalents $ 350,001 $ 19,694,966 Accounts receivable - 4,169,432 Allowance for doubtful accounts - (731,600) Accrued interest receivable 310 16,516 Due from other funds of the primary government 760 3,371,266 Due from component units - 100 Other current assets - 14,735
Total current assets 351,071 26,535,415
Noncurrent assets: Capital assets: Land - 6,819,222 Buildings and improvements - 76,217,542 Improvements other than buildings - 4,079,760 Furniture, machinery and equipment - 2,395,800 Property under capital lease - 3,645,000 Construction in progress - 142,895 Less accumulated depreciation - (57,813,192) Capital assets - net - 35,487,027
Total noncurrent assets - 35,487,027
Total assets 351,071 62,022,442
DEFERRED OUTFLOWS OF RESOURCES: Pensions 35,552 2,111,935
Total deferred outflows of resources 35,552 2,111,935
THE METROPOLITAN GOVERNMENT OF NASHVILLE AND DAVIDSON COUNTY
The accompanying notes are an integral part of this financial statement.
D-4
COMBINING STATEMENT OF NET POSITIONNONMAJOR ENTERPRISE FUNDS (CONTINUED)
June 30, 2016
NonmajorEnterprise
Total
Funds


Nashville Board ofConvention Fair Farmers
Center Commissioners Market
LIABILITIES: Current liabilities: Accounts payable $ 203,572 $ 175,003 $ 242,868 Accrued payroll 4,694 162,528 26,862 Due to other funds of the primary government 2,864 18,689 4,970 Due to component units 62,620 - - Customer deposits - 107,504 10,190 Unearned revenue 79 56,616 -
Total current liabilities 273,829 520,340 284,890
Noncurrent liabilities: Net pension liability - 400,948 104,137
Total noncurrent liabilities - 400,948 104,137
Total liabilities 273,829 921,288 389,027
DEFERRED INFLOWS OF RESOURCES: Pensions - 117,304 32,185
Total deferred inflows of resources - 117,304 32,185
NET POSITION: Net investment in capital assets 24,525,874 3,067,161 4,232,584 Unrestricted 303,148 808,053 1,215,564
Total net position $ 24,829,022 $ 3,875,214 $ 5,448,148
The accompanying notes are an integral part of this financial statement.
D-6
NONMAJOR ENTERPRISE FUNDS (CONTINUED)
June 30, 2016
THE METROPOLITAN GOVERNMENT OF NASHVILLE AND DAVIDSON COUNTY
COMBINING STATEMENT OF NET POSITION
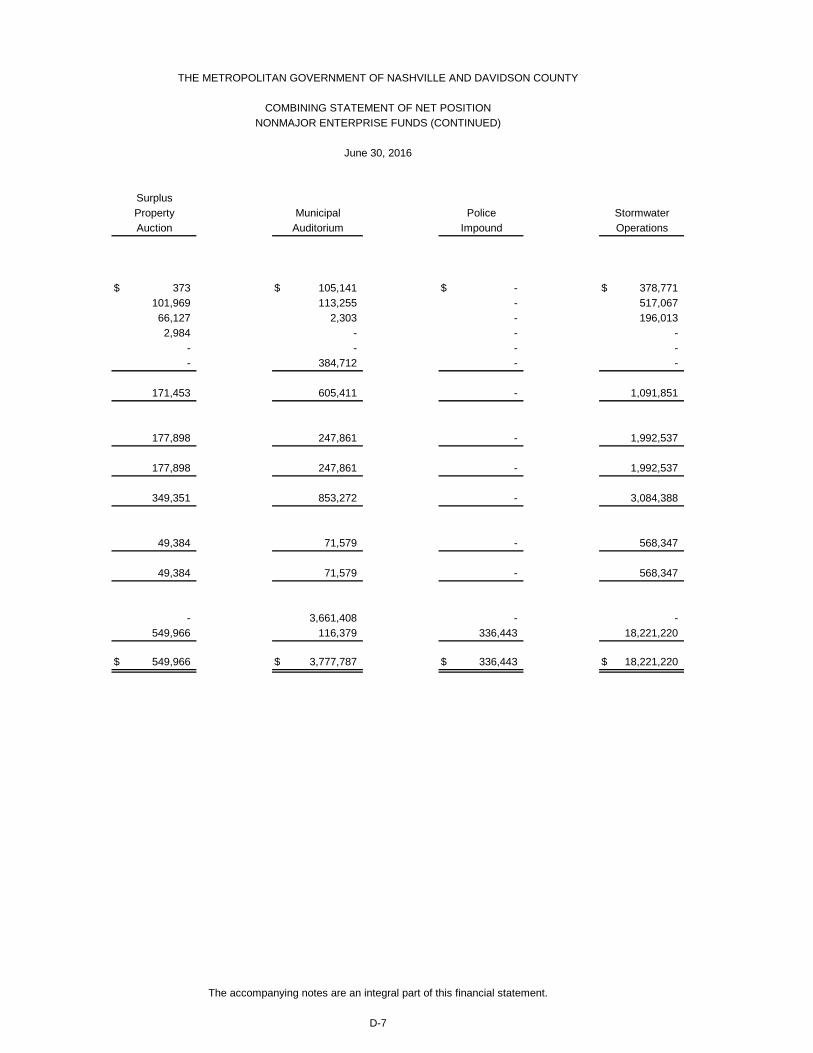
SurplusProperty Municipal Police StormwaterAuction Auditorium Impound Operations
$ 373 $ 105,141 $ - $ 378,771 101,969 113,255 - 517,067 66,127 2,303 - 196,013 2,984 - - -
- - - - - 384,712 - -
171,453 605,411 - 1,091,851
177,898 247,861 - 1,992,537
177,898 247,861 - 1,992,537
349,351 853,272 - 3,084,388
49,384 71,579 - 568,347
49,384 71,579 - 568,347
- 3,661,408 - - 549,966 116,379 336,443 18,221,220
$ 549,966 $ 3,777,787 $ 336,443 $ 18,221,220
The accompanying notes are an integral part of this financial statement.
D-7
NONMAJOR ENTERPRISE FUNDS (CONTINUED)
June 30, 2016
THE METROPOLITAN GOVERNMENT OF NASHVILLE AND DAVIDSON COUNTY
COMBINING STATEMENT OF NET POSITION

CommunityEducation
Commission
LIABILITIES: Current liabilities: Accounts payable $ 5,516 $ 1,111,244 Accrued payroll 12,317 938,692 Due to other funds of the primary government 489 291,455 Due to component units - 65,604 Customer deposits - 117,694 Unearned revenue - 441,407
Total current liabilities 18,322 2,966,096
Noncurrent liabilities: Net pension liability 52,603 2,975,984
Total noncurrent liabilities 52,603 2,975,984
Total liabilities 70,925 5,942,080
DEFERRED INFLOWS OF RESOURCES: Pensions 16,723 855,522
Total deferred inflows of resources 16,723 855,522
NET POSITION: Net investment in capital assets - 35,487,027 Unrestricted 298,975 21,849,748
Total net position $ 298,975 $ 57,336,775
The accompanying notes are an integral part of this financial statement.
D-8
TotalNonmajorEnterprise
Funds
NONMAJOR ENTERPRISE FUNDS (CONTINUED)
June 30, 2016
THE METROPOLITAN GOVERNMENT OF NASHVILLE AND DAVIDSON COUNTY
COMBINING STATEMENT OF NET POSITION


Nashville Board ofConvention Fair Farmers
Center Commissioners MarketOPERATING REVENUES: Charges for services $ 44,972 $ 3,283,173 $ 961,503
Total operating revenues 44,972 3,283,173 961,503
OPERATING EXPENSES: Personal services 133,257 1,485,257 363,025 Contractual services 509,020 1,453,029 1,223,777 Supplies and materials 1,250 166,566 13,304 Depreciation 1,390,282 389,176 291,521 Other 134,526 148,420 24,109
Total operating expenses 2,168,335 3,642,448 1,915,736
OPERATING INCOME (LOSS) (2,123,363) (359,275) (954,233)
NONOPERATING REVENUE (EXPENSE): Investment income 3,586 7,001 178 Gain (loss) on sale of property 1,113 - 1,000,277
Total nonoperating revenue (expense) 4,699 7,001 1,000,455
INCOME (LOSS) BEFORE TRANSFERS (2,118,664) (352,274) 46,222
TRANSFERS IN - 72,952 862,194 TRANSFERS OUT - (115,100) (83,400)
CHANGE IN NET POSITION (2,118,664) (394,422) 825,016
NET POSITION, beginning of year 26,947,686 4,269,636 4,623,132
NET POSITION, end of year $ 24,829,022 $ 3,875,214 $ 5,448,148
THE METROPOLITAN GOVERNMENT OF NASHVILLE AND DAVIDSON COUNTY
COMBINING STATEMENT OF REVENUES, EXPENSES ANDCHANGES IN NET POSITION
NONMAJOR ENTERPRISE FUNDS
D-10
The accompanying notes are an integral part of this financial statement.
For the Year Ended June 30, 2016

SurplusProperty Municipal Police StormwaterAuction Auditorium Impound Operations
$ 1,230,835 $ 1,506,968 $ 475,077 $ 14,460,823
1,230,835 1,506,968 475,077 14,460,823
560,851 731,376 - 6,423,115 104,273 891,984 375,000 3,563,477
2,767 43,616 - 325,214 - 263,137 - -
10,501 54,200 - 250,236
678,392 1,984,313 375,000 10,562,042
552,443 (477,345) 100,077 3,898,781
1,488 1,770 1,424 76,257 - 229 - -
1,488 1,999 1,424 76,257
553,931 (475,346) 101,501 3,975,038
250,000 1,522,305 - - (280,400) (126,600) - (3,262,443)
523,531 920,359 101,501 712,595
26,435 2,857,428 234,942 17,508,625
$ 549,966 $ 3,777,787 $ 336,443 $ 18,221,220
The accompanying notes are an integral part of this financial statement.
D-11
For the Year Ended June 30, 2016
THE METROPOLITAN GOVERNMENT OF NASHVILLE AND DAVIDSON COUNTY
COMBINING STATEMENT OF REVENUES, EXPENSES ANDCHANGES IN NET POSITION
NONMAJOR ENTERPRISE FUNDS (CONTINUED)

CommunityEducation
CommissionOPERATING REVENUES: Charges for services $ 79,780 $ 22,043,131
Total operating revenues 79,780 22,043,131
OPERATING EXPENSES: Personal services 200,080 9,896,961 Contractual services 142,446 8,263,006 Supplies and materials 26,870 579,587 Depreciation - 2,334,116 Other 5,427 627,419
Total operating expenses 374,823 21,701,089
OPERATING INCOME (LOSS) (295,043) 342,042
NONOPERATING REVENUE (EXPENSE): Investment income 1,328 93,032 Gain (loss) on sale of property - 1,001,619
Total nonoperating revenue (expense) 1,328 1,094,651
INCOME (LOSS) BEFORE TRANSFERS (293,715) 1,436,693
TRANSFERS IN 358,000 3,065,451TRANSFERS OUT (101,000) (3,968,943)
CHANGE IN NET POSITION (36,715) 533,201
NET POSITION, beginning of year 335,690 56,803,574
NET POSITION, end of year $ 298,975 $ 57,336,775
THE METROPOLITAN GOVERNMENT OF NASHVILLE AND DAVIDSON COUNTY
COMBINING STATEMENT OF REVENUES, EXPENSES ANDCHANGES IN NET POSITION
D-12
NONMAJOR ENTERPRISE FUNDS (CONTINUED)
The accompanying notes are an integral part of this financial statement.
For the Year Ended June 30, 2016
NonmajorEnterprise
Funds
Total


Nashville Board ofConvention Fair Farmers
Center Commissioners Market
Cash flows from operating activities: Receipts from customers and users $ 3,934 $ 3,248,070 $ 986,636 Payments to suppliers (1,576,611) (1,755,534) (1,191,457) Payments to employees (132,447) (1,453,872) (360,756)
Net cash provided by (used in) operating activities (1,705,124) 38,664 (565,577)
Cash flows from noncapital financing activities: Transfers in - 72,952 862,194 Transfers out - (115,100) (83,400) Decrease (increase) in advances from other funds - - -
Net cash provided by (used in) noncapital financing activities - (42,148) 778,794
Cash flows from capital and related financing activities: Acquisition of capital assets - (72,952) (24,294) Proceeds from the sale of property 1,113 - 1,000,277
Net cash provided by (used in) capital and related financing activities 1,113 (72,952) 975,983
Cash flows from investing activities: Interest on investments 3,351 5,815 75
Net cash provided by (used in) investing activities 3,351 5,815 75
Net changes in cash and cash equivalents (1,700,660) (70,621) 1,189,275
Cash and cash equivalents at beginning of year 2,079,520 1,598,013 373,081
Cash and cash equivalents at end of year $ 378,860 $ 1,527,392 $ 1,562,356
THE METROPOLITAN GOVERNMENT OF NASHVILLE AND DAVIDSON COUNTY
COMBINING STATEMENT OF CASH FLOWSNONMAJOR ENTERPRISE FUNDS
For the Year Ended June 30, 2016
The accompanying notes are an integral part of this financial statement.
D-14

SurplusProperty Municipal Police StormwaterAuction Auditorium Impound Operations
$ 1,289,884 $ 1,748,655 $ 474,100 $ 13,788,524 (154,891) (1,025,148) (375,000) (4,145,411) (537,411) (697,702) - (6,176,553)
597,582 25,805 99,100 3,466,560
250,000 1,522,305 - - (280,400) (126,600) - (3,262,443)
- - - (2,291,057)
(30,400) 1,395,705 - (5,553,500)
- (1,077,805) - - - 229 - -
- (1,077,576) - -
1,032 1,400 1,134 63,480
1,032 1,400 1,134 63,480
568,214 345,334 100,234 (2,023,460)
232,092 502,112 235,683 15,916,148
$ 800,306 $ 847,446 $ 335,917 $ 13,892,688
The accompanying notes are an integral part of this financial statement.
D-15
THE METROPOLITAN GOVERNMENT OF NASHVILLE AND DAVIDSON COUNTY
COMBINING STATEMENT OF CASH FLOWSNONMAJOR ENTERPRISE FUNDS (CONTINUED)
For the Year Ended June 30, 2016

TotalCommunityEducation Enterprise
Commission Funds
Cash flows from operating activities: Receipts from customers and users $ 79,020 $ 21,618,823 Payments to suppliers (182,378) (10,406,430) Payments to employees (189,242) (9,547,983)
Net cash provided by (used in) operating activities (292,600) 1,664,410
Cash flows from noncapital financing activities: Transfers in 358,000 3,065,451 Transfers out (101,000) (3,968,943) Decrease (increase) in advances from other funds - (2,291,057)
Net cash provided by (used in) noncapital financing activities 257,000 (3,194,549)
Cash flows from capital and related financing activities: Acquisition of capital assets - (1,175,051) Proceeds from the sale of property - 1,001,619
Net cash provided by (used in) capital and related financing activities - (173,432)
Cash flows from investing activities: Interest on investments 1,033 77,320
Net cash provided by (used in) investing activities 1,033 77,320
Net changes in cash and cash equivalents (34,567) (1,626,251)
Cash and cash equivalents at beginning of year 384,568 21,321,217
Cash and cash equivalents at end of year $ 350,001 $ 19,694,966
Nonmajor
THE METROPOLITAN GOVERNMENT OF NASHVILLE AND DAVIDSON COUNTY
COMBINING STATEMENT OF CASH FLOWSNONMAJOR ENTERPRISE FUNDS (CONTINUED)
For the Year Ended June 30, 2016
The accompanying notes are an integral part of this financial statement.
D-16


Nashville Board ofConvention Fair Farmers
Center Commissioners Market
Reconciliation of operating income to net cash provided by (used in) operating activities: Operating income (loss) $ (2,123,363) $ (359,275) $ (954,233) Adjustments to reconcile operating income (loss) to net cash provided by (used in) operating activities: Depreciation 1,390,282 389,176 291,521 Provision for doubtful accounts - - - Changes in assets, deferred outflows of resources, liabilities and deferred inflows of resources: Accounts receivable 51,353 52,652 25,410 Due from other funds of the primary government (92,391) 3,450 (277) Other current assets - 1,133 - Deferred outflows pensions - (193,196) (46,322) Accounts payable 52,000 14,182 83,156 Accrued payroll 810 (5,254) (6,517) Due to other funds of the primary government (5,806) (2,834) 2,563 Due to component units (978,009) - - Customer deposits - (80,744) - Unearned revenue - (10,461) - Other current liabilities - - (15,986) Net pension liability - 209,604 50,257 Deferred inflows pensions - 20,231 4,851
Total adjustments 418,239 397,939 388,656
Net cash provided by (used in) operating activities $ (1,705,124) $ 38,664 $ (565,577)
D-18
COMBINING STATEMENT OF CASH FLOWSNONMAJOR ENTERPRISE FUNDS (CONTINUED)
For the Year Ended June 30, 2016
The accompanying notes are an integral part of this financial statement.
THE METROPOLITAN GOVERNMENT OF NASHVILLE AND DAVIDSON COUNTY

Property Municipal Police StormwaterAuction Auditorium Impound Operations
$ 552,443 $ (477,345) $ 100,077 $ 3,898,781
- 263,137 - - - - - (210,397)
(15,368) 41,205 - (398,331) 263,351 (44) (227) (63,571)
- (2,172) - 77 (91,693) (121,534) - (992,864) (37,350) (30,781) - (175,328)
6,050 10,625 - 58,266 (191,918) (2,395) (750) 168,767
2,984 - - - - - - - - 200,526 - - - - - -
99,481 131,856 - 1,077,188 9,602 12,727 - 103,972
45,139 503,150 (977) (432,221)
$ 597,582 $ 25,805 $ 99,100 $ 3,466,560
NONMAJOR ENTERPRISE FUNDS (CONTINUED)
For the Year Ended June 30, 2016
THE METROPOLITAN GOVERNMENT OF NASHVILLE AND DAVIDSON COUNTY
COMBINING STATEMENT OF CASH FLOWS
D-19
The accompanying notes are an integral part of this financial statement.
Surplus

CommunityEducation
Commission
Reconciliation of operating income to net cash provided by (used in) operating activities: Operating income (loss) $ (295,043) $ 342,042 Adjustments to reconcile operating income (loss) to net cash provided by (used in) operating activities: Depreciation - 2,334,116 Provision for doubtful accounts - (210,397) Changes in assets, deferred outflows of resources, liabilities and deferred inflows of resources: Accounts receivable - (243,079) Due from other funds of the primary government (760) 109,531 Other current assets - (962) Deferred outflows pensions (22,355) (1,467,964) Accounts payable (7,954) (102,075) Accrued payroll 6,599 70,579 Due to other funds of the primary government 319 (32,054) Due to component units - (975,025) Customer deposits - (80,744) Unearned revenue - 190,065 Other current liabilities - (15,986) Net pension liability 24,253 1,592,639 Deferred inflows pensions 2,341 153,724
Total adjustments 2,443 1,322,368
Net cash provided by (used in) operating activities $ (292,600) $ 1,664,410
D-20
COMBINING STATEMENT OF CASH FLOWSNONMAJOR ENTERPRISE FUNDS (CONTINUED)
The accompanying notes are an integral part of this financial statement.
NonmajorTotal
EnterpriseFunds
For the Year Ended June 30, 2016
THE METROPOLITAN GOVERNMENT OF NASHVILLE AND DAVIDSON COUNTY


Office of
Fleet RadioManagement Shop
ASSETS: Current assets: Cash and cash equivalents $ 3,408,051 $ 3,155,834 $ 2,680,864 Accounts receivable 7,287 41,341 169,230 Accrued interest receivable 3,721 3,310 2,430 Due from other funds of the primary government 54,417 64,575 116,298 Due from component units - - - Inventories of supplies 1,550,389 - 190,179 Other current assets - - -
Total current assets 5,023,865 3,265,060 3,159,001
Noncurrent assets: Capital assets: Buildings and improvements - - 126,643 Furniture, machinery and equipment 160,258,980 7,473,017 28,931,773 Construction in progress 128,550 - - Less accumulated depreciation (128,041,522) (7,047,173) (14,386,946) Capital assets - net 32,346,008 425,844 14,671,470
Total assets 37,369,873 3,690,904 17,830,471
LIABILITIES: Current liabilities: Accounts payable 1,362,112 1,018,171 673,058 Accrued payroll 723,694 1,725,303 132,573 Claims payable - - - Due to other funds of the primary government 158,195 4,986 35,657
Total current liabilities 2,244,001 2,748,460 841,288
Noncurrent liabilities: Claims payable - - -
Total noncurrent liabilities - - -
Total liabilities 2,244,001 2,748,460 841,288
NET POSITION: Net investment in capital assets 32,346,008 425,844 14,671,470 Unrestricted 2,779,864 516,600 2,317,713
Total net position $ 35,125,872 $ 942,444 $ 16,989,183
June 30, 2016
THE METROPOLITAN GOVERNMENT OF NASHVILLE AND DAVIDSON COUNTY
COMBINING STATEMENT OF NET POSITIONINTERNAL SERVICE FUNDS
D-22
InformationSystems
The accompanying notes are an integral part of this financial statement.

School General Professional
School Government Employees'Self Insurance Self Insurance Insurance
$ 3,218,119 $ 17,443,638 $ 29,931,119 $ 73,609,312 $ 36,216,436 - - 209,987 14,122 -
2,858 15,631 28,465 64,229 33,563 - 1,258 250,081 165,028 - - - - - - - - - - - - - 512,873 - -
3,220,977 17,460,527 30,932,525 73,852,691 36,249,999
- - - - - - - - - - - - - - - - - - - - - - - - -
3,220,977 17,460,527 30,932,525 73,852,691 36,249,999
268,118 142,376 3,127,750 1,923,984 224,655 - 73 18,641 15,223 -
489,235 3,404,622 8,562,061 15,346,000 5,829,000 110 265 559 2,681 -
757,463 3,547,336 11,709,011 17,287,888 6,053,655
431,514 4,805,694 - - -
431,514 4,805,694 - - -
1,188,977 8,353,030 11,709,011 17,287,888 6,053,655
- - - - - 2,032,000 9,107,497 19,223,514 56,564,803 30,196,344
$ 2,032,000 $ 9,107,497 $ 19,223,514 $ 56,564,803 $ 30,196,344
THE METROPOLITAN GOVERNMENT OF NASHVILLE AND DAVIDSON COUNTY
COMBINING STATEMENT OF NET POSITIONINTERNAL SERVICE FUNDS (CONTINUED)
June 30, 2016
Benefit Duty
D-23
The accompanying notes are an integral part of this financial statement.
Injured onMedicalEmployees'

TreasuryManagement
ASSETS: Current assets: Cash and cash equivalents $ 46,605 $ 2,103,415 $ 543,075 $ 172,356,468 Accounts receivable - - 580 442,547 Accrued interest receivable 40 1,937 480 156,664 Due from other funds of the primary government 161,873 56,590 26,992 897,112 Due from component units - 763 - 763 Inventories of supplies - - - 1,740,568 Other current assets - - 3,529 516,402
Total current assets 208,518 2,162,705 574,656 176,110,524
Noncurrent assets: Capital assets: Buildings and improvements - - - 126,643 Furniture, machinery and equipment 10,626 - 276,896 196,951,292 Construction in progress - - - 128,550 Less accumulated depreciation (10,626) - (266,286) (149,752,553) Capital assets - net - - 10,610 47,453,932
Total assets 208,518 2,162,705 585,266 223,564,456
LIABILITIES: Current liabilities: Accounts payable 987 442,021 17,331 9,200,563 Accrued payroll 83,616 - 30,471 2,729,594 Claims payable - - - 33,630,918 Due to other funds of the primary government 464 - 967 203,884
Total current liabilities 85,067 442,021 48,769 45,764,959
Noncurrent liabilities: Claims payable - - - 5,237,208
Total noncurrent liabilities - - - 5,237,208
Total liabilities 85,067 442,021 48,769 51,002,167
NET POSITION: Net investment in capital assets - - 10,610 47,453,932 Unrestricted 123,451 1,720,684 525,887 125,108,357
Total net position $ 123,451 $ 1,720,684 $ 536,497 $ 172,562,289
Service
THE METROPOLITAN GOVERNMENT OF NASHVILLE AND DAVIDSON COUNTY
COMBINING STATEMENT OF NET POSITIONINTERNAL SERVICE FUNDS (CONTINUED)
June 30, 2016
Technology
Total
RevolvingSchool
The accompanying notes are an integral part of this financial statement.
D-24
FundsPrint Shop
Internal


Office ofFleet
Management
OPERATING REVENUES: Charges for services $ 20,406,999 $ 17,265,659 $ 3,167,892 Other - - -
Total operating revenues 20,406,999 17,265,659 3,167,892
OPERATING EXPENSES: Personal services 5,454,873 9,595,518 898,166 Contractual services 2,829,741 4,666,079 1,852,642 Supplies and materials 11,146,021 255,882 189,737 Depreciation 11,551,305 334,026 3,389,131 Compensation for damages - - - Medical and insurance benefits - - - Other 162,300 2,743,275 48,674
Total operating expenses 31,144,240 17,594,780 6,378,350
OPERATING INCOME (LOSS) (10,737,241) (329,121) (3,210,458)
NONOPERATING REVENUE (EXPENSE): Investment income 10,782 12,583 11,209 Gain (loss) on sale of property 23,384 - 5,530 Other 180,769 - -
Total nonoperating revenue (expense) 214,935 12,583 16,739
INCOME (LOSS) BEFORE TRANSFERS (10,522,306) (316,538) (3,193,719)
TRANSFERS IN 15,701,193 9,714 132,428 TRANSFERS OUT - - (6,338)
CHANGE IN NET POSITION 5,178,887 (306,824) (3,067,629)
NET POSITION, beginning of year 29,946,985 1,249,268 20,056,812
NET POSITION, end of year $ 35,125,872 $ 942,444 $ 16,989,183
D-26
The accompanying notes are an integral part of this financial statement.
SystemsRadioShop
Information
For the Year Ended June 30, 2016
INTERNAL SERVICE FUNDS
THE METROPOLITAN GOVERNMENT OF NASHVILLE AND DAVIDSON COUNTY
COMBINING STATEMENT OF REVENUES, EXPENSES ANDCHANGES IN NET POSITION

General Professional Employees' School Government Employees' Medical Injured On
Self Insurance Self Insurance Insurance Benefit Duty
$ - $ 7,557,677 $ 108,299,093 $ 208,152,880 $ 2,972,020 - - - 9,725,795 109,924
- 7,557,677 108,299,093 217,878,675 3,081,944
18,403 276,072 105,175 428,242 - 31,192 3,342,564 5,090,537 7,085,555 2,074,499
50 - 202 - - - - - - -
826,428 1,442,620 - - - - - 105,063,883 216,400,157 11,309,847
2,497 - - 994,189 105,963
878,570 5,061,256 110,259,797 224,908,143 13,490,309
(878,570) 2,496,421 (1,960,704) (7,029,468) (10,408,365)
14,248 82,988 143,104 344,053 170,079 - - - - -
75,617 - (1,551,004) (1,253,618) -
89,865 82,988 (1,407,900) (909,565) 170,079
(788,705) 2,579,409 (3,368,604) (7,939,033) (10,238,286)
1,250,000 213,582 - 1,566,075 20,028,100 - (1,937,800) - (80,200) -
461,295 855,191 (3,368,604) (6,453,158) 9,789,814
1,570,705 8,252,306 22,592,118 63,017,961 20,406,530
$ 2,032,000 $ 9,107,497 $ 19,223,514 $ 56,564,803 $ 30,196,344
D-27
The accompanying notes are an integral part of this financial statement.
For the Year Ended June 30, 2016
School
THE METROPOLITAN GOVERNMENT OF NASHVILLE AND DAVIDSON COUNTY
COMBINING STATEMENT OF REVENUES, EXPENSES ANDCHANGES IN NET POSITION
INTERNAL SERVICE FUNDS (CONTINUED)

OPERATING REVENUES: Charges for services $ 779,093 $ 343,585 $ 578,105 $ 369,523,003 Other - - - 9,835,719
Total operating revenues 779,093 343,585 578,105 379,358,722
OPERATING EXPENSES: Personal services 684,923 - 166,251 17,627,623 Contractual services 28,342 501,019 218,872 27,721,042 Supplies and materials 3,329 869,104 58,185 12,522,510 Depreciation - - 4,711 15,279,173 Compensation for damages - - - 2,269,048 Medical and insurance benefits - - - 332,773,887 Other 3,875 - 58,042 4,118,815
Total operating expenses 720,469 1,370,123 506,061 412,312,098
OPERATING INCOME (LOSS) 58,624 (1,026,538) 72,044 (32,953,376)
NONOPERATING REVENUE (EXPENSE): Investment income 317 11,803 2,480 803,646 Gain (loss) on sale of property - - - 28,914 Other - - - (2,548,236)
Total nonoperating revenue (expense) 317 11,803 2,480 (1,715,676)
INCOME (LOSS) BEFORE TRANSFERS 58,941 (1,014,735) 74,524 (34,669,052)
TRANSFERS IN - - - 38,901,092 TRANSFERS OUT (58,300) - - (2,082,638)
CHANGE IN NET POSITION 641 (1,014,735) 74,524 2,149,402
NET POSITION, beginning of year 122,810 2,735,419 461,973 170,412,887
NET POSITION, end of year $ 123,451 $ 1,720,684 $ 536,497 $ 172,562,289
Print ShopRevolving
D-28
The accompanying notes are an integral part of this financial statement.
For the Year Ended June 30, 2016
Technology School
Management
InternalTotal
FundsService
THE METROPOLITAN GOVERNMENT OF NASHVILLE AND DAVIDSON COUNTY
COMBINING STATEMENT OF REVENUES, EXPENSES ANDCHANGES IN NET POSITION
INTERNAL SERVICE FUNDS (CONTINUED)
Treasury


Cash flows from operating activities: Receipts from customers and users $ 20,518,759 $ 17,366,853 $ 3,022,333 Payments to suppliers (14,573,558) (7,516,395) (1,592,675) Payments to employees (5,438,513) (9,225,696) (886,151) Other receipts 180,769 - - Other payments - - -
Net cash provided by (used in) operating activities 687,457 624,762 543,507
Cash flows from noncapital financing activities: Transfers in 15,701,193 9,714 132,428 Transfers out - - (6,338)
Net cash provided by (used in) noncapital financing activities 15,701,193 9,714 126,090
Cash flows from capital and related financing activities: Acquisition of capital assets (15,829,743) (9,714) (132,428) Proceeds from the sale of property 104,122 - 5,530
Net cash provided by (used in) capital and related financing activities (15,725,621) (9,714) (126,898)
Cash flows from investing activities: Interest on investments 7,160 9,406 8,862
Net cash provided by (used in) investing activities 7,160 9,406 8,862
Net changes in cash and cash equivalents 670,189 634,168 551,561
Cash and cash equivalents at beginning of year 2,737,862 2,521,666 2,129,303
Cash and cash equivalents at end of year $ 3,408,051 $ 3,155,834 $ 2,680,864
THE METROPOLITAN GOVERNMENT OF NASHVILLE AND DAVIDSON COUNTY
COMBINING STATEMENT OF CASH FLOWSINTERNAL SERVICE FUNDS
For the Year Ended June 30, 2016
D-30
Information RadioOffice of
Management
The accompanying notes are an integral part of this financial statement.
FleetSystems Shop

$ - $ 7,557,030 $ 108,128,422 $ 218,152,249 $ 3,084,962 (558,752) (5,930,883) (108,240,796) (225,093,921) (15,498,208)
- - (105,159) (424,789) - 75,617 - - - -
- - (1,551,004) (1,253,618) -
(483,135) 1,626,147 (1,768,537) (8,620,079) (12,413,246)
1,250,000 213,582 - 1,566,075 20,028,100 - (1,937,800) - (80,200) -
1,250,000 (1,724,218) - 1,485,875 20,028,100
- - - - - - - - - -
- - - - -
11,486 68,044 115,868 282,627 137,691
11,486 68,044 115,868 282,627 137,691
778,351 (30,027) (1,652,669) (6,851,577) 7,752,545
2,439,768 17,473,665 31,583,788 80,460,889 28,463,891
$ 3,218,119 $ 17,443,638 $ 29,931,119 $ 73,609,312 $ 36,216,436
Employees'
School
Benefit
The accompanying notes are an integral part of this financial statement.
D-31
SchoolProfessionalEmployees'
Government
THE METROPOLITAN GOVERNMENT OF NASHVILLE AND DAVIDSON COUNTY
COMBINING STATEMENT OF CASH FLOWSINTERNAL SERVICE FUNDS (CONTINUED)
For the Year Ended June 30, 2016
Injured OnDuty
MedicalSelf Insurance Insurance
General
Self Insurance
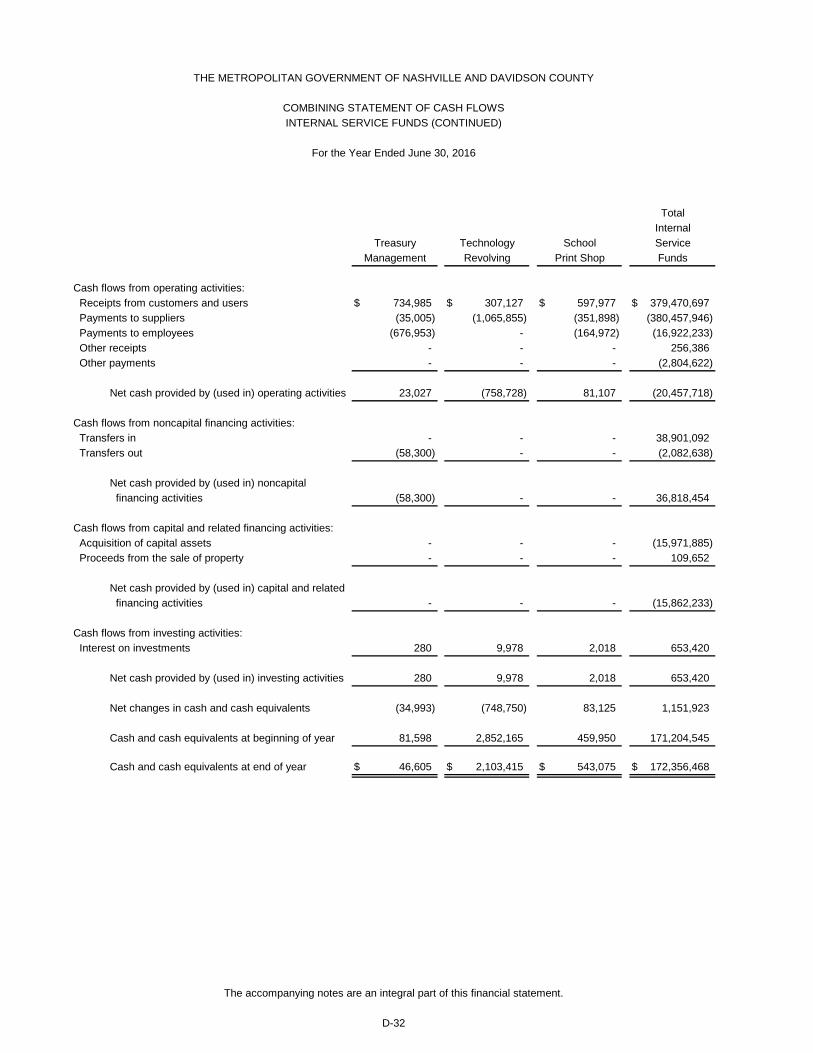
Cash flows from operating activities: Receipts from customers and users $ 734,985 $ 307,127 $ 597,977 $ 379,470,697 Payments to suppliers (35,005) (1,065,855) (351,898) (380,457,946) Payments to employees (676,953) - (164,972) (16,922,233) Other receipts - - - 256,386 Other payments - - - (2,804,622)
Net cash provided by (used in) operating activities 23,027 (758,728) 81,107 (20,457,718)
Cash flows from noncapital financing activities: Transfers in - - - 38,901,092 Transfers out (58,300) - - (2,082,638)
Net cash provided by (used in) noncapital financing activities (58,300) - - 36,818,454
Cash flows from capital and related financing activities: Acquisition of capital assets - - - (15,971,885) Proceeds from the sale of property - - - 109,652
Net cash provided by (used in) capital and related financing activities - - - (15,862,233)
Cash flows from investing activities: Interest on investments 280 9,978 2,018 653,420
Net cash provided by (used in) investing activities 280 9,978 2,018 653,420
Net changes in cash and cash equivalents (34,993) (748,750) 83,125 1,151,923
Cash and cash equivalents at beginning of year 81,598 2,852,165 459,950 171,204,545
Cash and cash equivalents at end of year $ 46,605 $ 2,103,415 $ 543,075 $ 172,356,468
TotalInternal
TreasuryManagement
D-32
SchoolFundsRevolvingServiceTechnology
Print Shop
The accompanying notes are an integral part of this financial statement.
THE METROPOLITAN GOVERNMENT OF NASHVILLE AND DAVIDSON COUNTY
COMBINING STATEMENT OF CASH FLOWSINTERNAL SERVICE FUNDS (CONTINUED)
For the Year Ended June 30, 2016


Office of
Reconciliation of operating income to net cash provided by (used in) operating activities: Operating income (loss) $ (10,737,241) $ (329,121) $ (3,210,458) Adjustments to reconcile operating income (loss) to net cash provided by (used in) operating activities: Depreciation 11,551,305 334,026 3,389,131 Other receipts 180,769 - - Other payments - - - Changes in assets and liabilities: Accounts receivable 429 (28,167) (31,610) Due from other funds of the primary government 111,331 129,301 (113,949) Due from component units - 60 - Inventories of supplies (122,236) - 31,035 Other current assets - - - Accounts payable (313,683) 243,372 432,423 Accrued payroll 16,360 369,822 12,015 Claims payable - - - Due to other funds of the primary government 423 (94,531) 34,920
Total adjustments 11,424,698 953,883 3,753,965
Net cash provided by (used in) operating activities $ 687,457 $ 624,762 $ 543,507
THE METROPOLITAN GOVERNMENT OF NASHVILLE AND DAVIDSON COUNTY
D-34
COMBINING STATEMENT OF CASH FLOWSINTERNAL SERVICE FUNDS (CONTINUED)
For the Year Ended June 30, 2016
The accompanying notes are an integral part of this financial statement.
Fleet InformationManagement Systems
RadioShop

$ (878,570) $ 2,496,421 $ (1,960,704) $ (7,029,468) $ (10,408,365)
- - - - - 75,617 - - - -
- - (1,551,004) (1,253,618) -
- - (109,687) 206,455 3,018 - (647) (60,984) 67,119 - - - - - - - - - - - - - - - -
228,227 (13,573) 213,393 (2,773,188) 25,064 - (2,018) 16 3,453 -
91,481 (854,301) 1,705,047 2,158,000 (2,032,000) 110 265 (4,614) 1,168 (963)
395,435 (870,274) 192,167 (1,590,611) (2,004,881)
$ (483,135) $ 1,626,147 $ (1,768,537) $ (8,620,079) $ (12,413,246)
School
For the Year Ended June 30, 2016
Insurance BenefitGovernment
Self InsuranceEmployees'
DutyMedical Injured On
D-35
THE METROPOLITAN GOVERNMENT OF NASHVILLE AND DAVIDSON COUNTY
COMBINING STATEMENT OF CASH FLOWSINTERNAL SERVICE FUNDS (CONTINUED)
The accompanying notes are an integral part of this financial statement.
Employees'School
General
Self Insurance
Professional

Reconciliation of operating income to net cash provided by (used in) operating activities: Operating income (loss) $ 58,624 $ (1,026,538) $ 72,044 $ (32,953,376) Adjustments to reconcile operating income (loss) to net cash provided by (used in) operating activities: Depreciation - - 4,711 15,279,173 Other receipts - - - 256,386 Other payments - - - (2,804,622) Changes in assets and liabilities: Accounts receivable - - 62 40,500 Due from other funds of the primary government (44,108) (35,695) 19,810 72,178 Due from component units - (763) - (703) Inventories of supplies - - - (91,201) Other current assets - - (3,529) (3,529) Accounts payable 362 304,268 (8,265) (1,661,600) Accrued payroll 7,970 - 1,279 408,897 Claims payable - - - 1,068,227 Due to other funds of the primary government 179 - (5,005) (68,048)
Total adjustments (35,597) 267,810 9,063 12,495,658
Net cash provided by (used in) operating activities $ 23,027 $ (758,728) $ 81,107 $ (20,457,718)
For the Year Ended June 30, 2016
The accompanying notes are an integral part of this financial statement.
COMBINING STATEMENT OF CASH FLOWSINTERNAL SERVICE FUNDS (CONTINUED)
THE METROPOLITAN GOVERNMENT OF NASHVILLE AND DAVIDSON COUNTY
Technology
D-36
Revolving Print ShopTreasury
Management
TotalInternal
SchoolFundsService

D-37
THE METROPOLITAN GOVERNMENT OF NASHVILLE AND DAVIDSON COUNTY
DESCRIPTION OF PROPRIETARY FUNDS
NONMAJOR ENTERPRISE FUNDS NASHVILLE CONVENTION CENTER The Nashville Convention Center was created for the purpose of providing meeting and exhibit space for conventions, trade shows and businesses, on a user charge basis. The assets of the Nashville Convention Center are under the Finance Department and its management is under the Convention Center Authority, a component unit, which also manages the Music City Center. BOARD OF FAIR COMMISSIONERS The Board of Fair Commissioners performs administrative and fiscal duties relative to the Tennessee State Fair and fairgrounds. Revenues are derived primarily from the annual State Fair, monthly flea markets and the Nashville Speedway. FARMERS MARKET The Farmers Market provides farmers with a setting in which to sell their agricultural products to the general public. Revenues are derived from fees collected from vendors for indoor retail space, farmers for display space, and other private vendors for flea market space. SURPLUS PROPERTY AUCTION The Surplus Property Auction was created to sell used capital assets, excess inventory and confiscated property of the Government. Revenues are derived from the proceeds received from individuals and entities that purchase the items through an on-line auction. MUNICIPAL AUDITORIUM The Municipal Auditorium provides space primarily for entertainment and sports events on a user charge basis. POLICE IMPOUND Police Impound provides storage for impounded vehicles. Revenues are derived from user fees paid for vehicle retrieval. STORMWATER OPERATIONS Stormwater Operations is under the administrative responsibility of the Department of Water and Sewerage Services and accounts for the activities surrounding the maintenance of the Government’s stormwater drainage system. Revenues are derived from a stormwater fee assessed on users of the system. COMMUNITY EDUCATION COMMISSION Community Education Commission provides classes and other educational services to the citizens of the Nashville community, on a user fee basis. The operations of Community Education Commission are supported in part by transfers from the General Fund.

D-38
THE METROPOLITAN GOVERNMENT OF NASHVILLE AND DAVIDSON COUNTY
DESCRIPTION OF PROPRIETARY FUNDS (CONTINUED)
INTERNAL SERVICE FUNDS OFFICE OF FLEET MANAGEMENT FUND The Office of Fleet Management Fund is under the administrative responsibility of the Department of General Services. Fleet Management acts as the central service agency with regard to the acquisition, use, maintenance and replacement of vehicles and rolling equipment owned by the Government.
INFORMATION SYSTEMS FUND The Information Systems Fund is under the administrative responsibility of the Information Technology Services Department. Revenues are derived from internal charges to various departments for voice and data communication services and for the use of computer equipment. RADIO SHOP FUND The Radio Shop Fund is under the administrative responsibility of the Department of General Services. The Radio Shop acts as the central service agency with regard to the acquisition, use, maintenance and replacement of radio equipment owned by the Government. SCHOOL SELF INSURANCE FUND The School Self Insurance Fund is used to pay for general liability claims, vehicular liability claims and administrative claims that relate to schools. Premiums are paid from the schools' operating budget to this fund in lieu of paying insurance premiums to private insurance carriers. GENERAL GOVERNMENT SELF INSURANCE FUND The General Government Self Insurance Fund is used to pay claims from a pooling of funds, including claims for bodily injury and property damage. Premiums are paid from various departments to this fund in lieu of paying insurance premiums to private insurance carriers. SCHOOL PROFESSIONAL EMPLOYEES' INSURANCE FUND The School Professional Employees' Insurance Fund is under the administrative responsibility of the Metropolitan Nashville Public Schools and is used for the accumulation of assets for the payment of self insured medical claims. EMPLOYEES' MEDICAL BENEFIT FUND The Employees' Medical Benefit Fund is under the administrative responsibility of the Employee Benefit Board and is used for the accumulation of assets for the payment of self insured medical claims. INJURED ON DUTY FUND The Injured on Duty Fund is under the administrative responsibility of the Department of Human Resources and is used for the accumulation of assets for the payment of self insured injured on duty claims.

D-39
THE METROPOLITAN GOVERNMENT OF NASHVILLE AND DAVIDSON COUNTY
DESCRIPTION OF PROPRIETARY FUNDS (CONTINUED)
TREASURY MANAGEMENT FUND The Treasury Management Fund is under the administrative responsibility of the Department of Finance. Treasury Management is the central service agency responsible for the management of cash, pension investments and debt. Revenue to cover the fund’s activity is from the Metro Investment Pool, Pension Trust Fund and Debt Service Funds. TECHNOLOGY REVOLVING FUND The Technology Revolving Fund is under the administrative responsibility of the Information Technology Services Department and is used to account for the replacement of computer equipment and software. Revenues are derived from internal charges to various departments based on equipment usage. SCHOOL PRINT SHOP FUND The School Print Shop Fund is under the administrative responsibility of the Metropolitan Nashville Public Schools. It is used to account for the operations of printing services and derives its revenues from internal service charges to schools for printing services.


Davidson Metropolitan County Employees' Employees' Teachers'
Employees' Benefit Pension and RetirementRetirement Trust Insurance Plan
ASSETS: Cash and cash equivalents $ 1,350 $ 178,241,536 $ 973,279 $ 9,713,643 Investments, at fair value: Equity commingled funds - 58,346,571 - 1,406,931 Commercial mortgage backed securities - 2,049,312 - 49,416 Conventional mortgages - 918,042 - 22,137 Emerging markets - 18,182,746 - 438,447 Corporate bonds and notes - 154,207,657 - 3,718,464 High yield bonds - 50,724,489 - 1,223,138 Futures - 3,851,273 - 92,867 Common stock - 304,305,177 - 7,337,818 Preferred stock - 3,415,480 - 82,359 Non agency mortgages/collateralized mortgage obligations - 22,422,511 - 540,682 Venture capital and partnerships - 1,653,772,717 - 39,878,003 Registered investment companies - 90,452,025 - 2,181,102 International bonds - 2,738,730 - 66,040 Sector funds - 25,426,281 - 613,113 Non U.S. treasury securities developing markets - 5,744,699 - 138,524 U.S. treasury securities - 22,806,109 - 549,932 Other securities - 56,006,225 - 1,350,498 Other fixed income - 144,294,728 - 3,479,430 Commingled funds U.S. debt - 10,041,707 - 242,139 Cash collateral received - securities lending program - 34,754,646 - - Accounts receivable - 157,009,999 - 3,783,264 Accrued interest receivable - 5,327,949 810 129,192 Due from other funds of the primary government - 393,111 1 9,335,889
Total assets 1,350 3,005,433,720 974,090 86,373,028
LIABILITIES: Accounts payable 4 2,247,276 1 18,313 Due to brokers - 280,180,663 - 6,756,095 Payable for collateral received - securities lending program - 34,754,646 - - Due to other funds of the primary government 1,346 24,305 - 265,243
Total liabilities 1,350 317,206,890 1 7,039,651
NET POSITION: Restricted for pensions - 2,688,226,830 974,089 79,333,377 Held in trust for other employee benefits - - - -
Total net position $ - $ 2,688,226,830 $ 974,089 $ 79,333,377
E-2
The accompanying notes are an integral part of this financial statement.
June 30, 2016
THE METROPOLITAN GOVERNMENT OF NASHVILLE AND DAVIDSON COUNTY
COMBINING STATEMENT OF FIDUCIARY NET POSITIONFIDUCIARY FUNDS
PENSION (AND OTHER EMPLOYEE BENEFIT) TRUST FUNDS

ClosedCityPlan
$ 975 $ 782,925 $ 2,065,316 $ 221,690 $ 192,000,714
- - - - 59,753,502 - - - - 2,098,728 - - - - 940,179 - - - - 18,621,193 - - - - 157,926,121 - - - - 51,947,627 - - - - 3,944,140 - - - - 311,642,995 - - - - 3,497,839 - - - - 22,963,193 - - - - 1,693,650,720 - - - - 92,633,127 - - - - 2,804,770 - - - - 26,039,394 - - - - 5,883,223 - - - - 23,356,041 - - - - 57,356,723 - - - - 147,774,158 - - - - 10,283,846 - - - - 34,754,646 - - 68,831 - 160,862,094 - 660 2,200 225 5,461,036 - - 10 - 9,729,011
975 783,585 2,136,357 221,915 3,095,925,020
17 - 45,844 7,892 2,319,347 - - - - 286,936,758 - - - - 34,754,646
958 - - - 291,852
975 - 45,844 7,892 324,302,603
- 783,585 - - 2,769,317,881 - - 2,090,513 214,023 2,304,536
$ - $ 783,585 $ 2,090,513 $ 214,023 $ 2,771,622,417
THE METROPOLITAN GOVERNMENT OF NASHVILLE AND DAVIDSON COUNTY
COMBINING STATEMENT OF FIDUCIARY NET POSITIONFIDUCIARY FUNDS
PENSION (AND OTHER EMPLOYEE BENEFIT) TRUST FUNDS (CONTINUED)
June 30, 2016
PlanBenefits
Employees'Metropolitan
EducationFlexible
The accompanying notes are an integral part of this financial statement.
Service andPension
BenefitsTrust FundsPlan
Employee Benefit)
Teachers'Civil
Total Pension(and OtherFlexible
E-3

HowardRichard R. Bill
Rooker, Maria M. Brenda Criminal Garrett,Circuit Court Salas, Clerk Wynn, Court County
Clerk and Master County Clerk Clerk RegisterASSETS: Cash and cash equivalents $ 15,607,067 $ 8,208,414 $ 261,728 $ 10,610,355 $ 6,797,595 Investments: Mortgages and real estate - - - 1,291,100 - Mutual funds - 16,573 - - - Accrued interest receivable - - - - - Due from other funds of the primary government - - - - - Other assets - - - - 54,891
Total assets $ 15,607,067 $ 8,224,987 $ 261,728 $ 11,901,455 $ 6,852,486
LIABILITIES: Funds held in custody for others $ 9,254,769 $ 8,215,397 $ - $ 10,000,128 $ - Other liabilities 6,352,298 9,590 261,728 1,901,327 6,852,486
Total liabilities $ 15,607,067 $ 8,224,987 $ 261,728 $ 11,901,455 $ 6,852,486
COMBINING STATEMENT OF FIDUCIARY NET POSITION
THE METROPOLITAN GOVERNMENT OF NASHVILLE AND DAVIDSON COUNTY
FIDUCIARY FUNDS
June 30, 2016
AGENCY FUNDS
Gentry,
The accompanying notes are an integral part of this financial statement.
E-4

David Sold Smith, Property Sheriff Work Total
Juvenile Tax Release and Performance AgencyCourt Clerk Receivables Inmate Trust Bonds Funds
$ 1,840,002 $ 840,438 $ 394,800 $ 1,062,575 $ 45,622,974
- - - - 1,291,100 - - - - 16,573 - 1,570 - - 1,570 - 1,008,881 - - 1,008,881 - - - - 54,891
$ 1,840,002 $ 1,850,889 $ 394,800 $ 1,062,575 $ 47,995,989
$ 1,614,206 $ 1,850,889 $ 394,800 $ 1,062,575 $ 32,392,764 225,796 - - - 15,603,225
$ 1,840,002 $ 1,850,889 $ 394,800 $ 1,062,575 $ 47,995,989
COMBINING STATEMENT OF FIDUCIARY NET POSITIONFIDUCIARY FUNDS
June 30, 2016
THE METROPOLITAN GOVERNMENT OF NASHVILLE AND DAVIDSON COUNTY
AGENCY FUNDS (CONTINUED)
E-5
The accompanying notes are an integral part of this financial statement.
Planning

Davidson MetropolitanCounty Employees' Employees' Teachers'
Employees' Benefit Pension and RetirementRetirement Trust Insurance Plan
ADDITIONS: Investment income: Interest and dividend income $ 655 $ 33,626,120 $ 4,993 $ 619,665 Net appreciation (depreciation) of investments - (16,850,153) - (439,249) Miscellaneous - 445,861 - -
Net increase (decrease) in fair value of investments 655 17,221,828 4,993 180,416
Net income earned on securities lending transactions: Securities lending income - 282,797 - - Securities lending expense - (56,541) - -
Net income earned on securities lending transactions - 226,256 - -
Less investment expenses - (11,105,046) (14) -
Net investment income (loss) 655 6,343,038 4,979 180,416
Contributions: Employee contributions - 73,171 - - Employer contributions 1,376,864 85,676,490 3,760,411 20,620,889 Transfers in - 244,632 - - Contributions from the State of Tennessee - - 2,683,194 11,713,047 Miscellaneous - - - -
Total contributions 1,376,864 85,994,293 6,443,605 32,333,936
Total additions 1,377,519 92,337,331 6,448,584 32,514,352
DEDUCTIONS: Pension and other employee benefits 1,377,519 152,587,111 6,230,661 32,751,992 Refunds of contributions - 14,685 - - Administrative expenses - 15,004,614 - 64,951 Transfers out - - - -
Total deductions 1,377,519 167,606,410 6,230,661 32,816,943
Change in net position - (75,269,079) 217,923 (302,591)
NET POSITION, beginning of year - 2,763,495,909 756,166 79,635,968
NET POSITION, end of year $ - $ 2,688,226,830 $ 974,089 $ 79,333,377
The accompanying notes are an integral part of this financial statement.
E-6
PENSION (AND OTHER EMPLOYEE BENEFIT) TRUST FUNDS
For the Year Ended June 30, 2016
THE METROPOLITAN GOVERNMENT OF NASHVILLE AND DAVIDSON COUNTY
COMBINING STATEMENT OF CHANGES IN FIDUCIARY NET POSITIONFIDUCIARY FUNDS

Closed FlexibleCity BenefitsPlan Plan
$ 5,132 $ 4,141 $ 11,717 $ 1,975 $ 34,274,398 - - - - (17,289,402) - - - - 445,861
5,132 4,141 11,717 1,975 17,430,857
- - - - 282,797 - - - - (56,541)
- - - - 226,256
- - - - (11,105,060)
5,132 4,141 11,717 1,975 6,552,053
- - 1,071,888 1,010,562 2,155,621 6,134,921 1,600,371 - - 119,169,946
- - - - 244,632 - 1,804,508 - - 16,200,749 - - 2,321,813 - 2,321,813
6,134,921 3,404,879 3,393,701 1,010,562 140,092,761
6,140,053 3,409,020 3,405,418 1,012,537 146,644,814
6,140,053 3,260,870 1,280,955 813,751 204,442,912 - - - - 14,685 - - - - 15,069,565 - - 1,566,075 392,885 1,958,960
6,140,053 3,260,870 2,847,030 1,206,636 221,486,122
- 148,150 558,388 (194,099) (74,841,308)
- 635,435 1,532,125 408,122 2,846,463,725
$ - $ 783,585 $ 2,090,513 $ 214,023 $ 2,771,622,417
For the Year Ended June 30, 2016
MetropolitanEducationFlexibleBenefits
Plan
The accompanying notes are an integral part of this financial statement.
E-7
Total Teachers' Civil
Service andPension
Employees'Pension (and OtherEmployee Benefit)
Trust Funds
PENSION (AND OTHER EMPLOYEE BENEFIT) TRUST FUNDS (CONTINUED)
THE METROPOLITAN GOVERNMENT OF NASHVILLE AND DAVIDSON COUNTY
COMBINING STATEMENT OF CHANGES IN FIDUCIARY NET POSITIONFIDUCIARY FUNDS

Balance BalanceJune 30, 2015 Additions Deductions June 30, 2016
Richard R. Rooker, Circuit Court Clerk ASSETS: Cash and cash equivalents $ 16,035,740 $ 63,171,345 $ 63,600,018 $ 15,607,067
LIABILITIES: Funds held in custody for others $ 9,606,361 $ 5,110,755 $ 5,462,347 $ 9,254,769 Other liabilities 6,429,379 58,060,590 58,137,671 6,352,298 Total liabilities $ 16,035,740 $ 63,171,345 $ 63,600,018 $ 15,607,067
Maria M. Salas, Clerk and Master ASSETS: Cash and cash equivalents $ 6,701,752 $ 18,515,342 $ 17,008,680 $ 8,208,414 Mutual funds 16,925 277 629 16,573 Total assets $ 6,718,677 $ 18,515,619 $ 17,009,309 $ 8,224,987
LIABILITIES: Funds held in custody for others $ 6,712,828 $ 17,537,595 $ 16,035,026 $ 8,215,397 Other liabilities 5,849 978,024 974,283 9,590 Total liabilities $ 6,718,677 $ 18,515,619 $ 17,009,309 $ 8,224,987
Brenda Wynn, County Clerk ASSETS: Cash and cash equivalents $ 2,904 $ 113,218,206 $ 112,959,382 $ 261,728
LIABILITIES: Other liabilities $ 2,904 $ 113,218,206 $ 112,959,382 $ 261,728
Howard Gentry, Criminal Court Clerk ASSETS: Cash and cash equivalents $ 10,709,918 $ 13,930,078 $ 14,029,641 $ 10,610,355 Mortgages and real estate 1,291,100 - - 1,291,100 Total assets $ 12,001,018 $ 13,930,078 $ 14,029,641 $ 11,901,455
LIABILITIES: Funds held in custody for others $ 9,975,128 $ 805,000 $ 780,000 $ 10,000,128 Other liabilities 2,025,890 13,125,078 13,249,641 1,901,327 Total liabilities $ 12,001,018 $ 13,930,078 $ 14,029,641 $ 11,901,455
The accompanying notes are an integral part of this financial statement.
THE METROPOLITAN GOVERNMENT OF NASHVILLE AND DAVIDSON COUNTY
COMBINING STATEMENT OF CHANGES IN ASSETS AND LIABILITIES
For the Year Ended June 30, 2016
E-8
FIDUCIARY FUNDSAGENCY FUNDS

Balance BalanceJune 30, 2015 Additions Deductions June 30, 2016
Bill Garrett, County Register ASSETS: Cash and cash equivalents $ 6,172,236 $ 53,190,614 $ 52,565,255 $ 6,797,595 Other assets 123,193 11,794,157 11,862,459 54,891 Total assets $ 6,295,429 $ 64,984,771 $ 64,427,714 $ 6,852,486
LIABILITIES: Other liabilities $ 6,295,429 $ 64,984,771 $ 64,427,714 $ 6,852,486
David Smith, Juvenile Court Clerk ASSETS: Cash and cash equivalents $ 1,965,474 $ 778,189 $ 903,661 $ 1,840,002
LIABILITIES: Funds held in custody for others $ 1,722,564 $ 168,942 $ 277,300 $ 1,614,206 Other liabilities 242,910 609,247 626,361 225,796 Total liabilities $ 1,965,474 $ 778,189 $ 903,661 $ 1,840,002
Sold Property Tax ReceivablesASSETS: Cash and cash equivalents $ 5,986 $ 26,506,270 $ 25,671,818 $ 840,438 Accrued interest receivable 75 3,939 2,444 1,570 Due from other funds of the primary government 2,107,028 1,008,881 2,107,028 1,008,881 Total assets $ 2,113,089 $ 27,519,090 $ 27,781,290 $ 1,850,889
LIABILITIES: Funds held in custody for others $ 2,113,089 $ 27,519,090 $ 27,781,290 $ 1,850,889
Sheriff Work Release and Inmate TrustASSETS: Cash and cash equivalents $ 388,611 $ 2,676,777 $ 2,670,588 $ 394,800
LIABILITIES: Funds held in custody for others $ 388,611 $ 2,676,777 $ 2,670,588 $ 394,800
Planning Performance BondsASSETS: Cash and cash equivalents $ 872,002 $ 671,822 $ 481,249 $ 1,062,575
LIABILITIES: Funds held in custody for others $ 872,002 $ 671,822 $ 481,249 $ 1,062,575
FIDUCIARY FUNDSAGENCY FUNDS (CONTINUED)
E-9
The accompanying notes are an integral part of this financial statement.
For the Year Ended June 30, 2016
THE METROPOLITAN GOVERNMENT OF NASHVILLE AND DAVIDSON COUNTY
COMBINING STATEMENT OF CHANGES IN ASSETS AND LIABILITIES

Balance BalanceJune 30, 2015 Additions Deductions June 30, 2016
Totals - All Agency Funds ASSETS: Cash and cash equivalents $ 42,854,623 $ 292,658,643 $ 289,890,292 $ 45,622,974 Investments: Mortgages and real estate 1,291,100 - - 1,291,100 Mutual funds 16,925 277 629 16,573 Accrued interest receivable 75 3,939 2,444 1,570 Due from other funds of the primary government 2,107,028 1,008,881 2,107,028 1,008,881 Other assets 123,193 11,794,157 11,862,459 54,891 Total assets $ 46,392,944 $ 305,465,897 $ 303,862,852 $ 47,995,989
LIABILITIES: Funds held in custody for others $ 31,390,583 $ 54,489,981 $ 53,487,800 $ 32,392,764 Other liabilities 15,002,361 250,975,916 250,375,052 15,603,225 Total liabilities $ 46,392,944 $ 305,465,897 $ 303,862,852 $ 47,995,989
E-10
THE METROPOLITAN GOVERNMENT OF NASHVILLE AND DAVIDSON COUNTY
COMBINING STATEMENT OF CHANGES IN ASSETS AND LIABILITIES
For the Year Ended June 30, 2016
FIDUCIARY FUNDSAGENCY FUNDS (CONTINUED)
The accompanying notes are an integral part of this financial statement.

E-11
THE METROPOLITAN GOVERNMENT OF NASHVILLE AND DAVIDSON COUNTY DESCRIPTION OF FIDUCIARY FUNDS PENSION (AND OTHER EMPLOYEE BENEFIT) TRUST FUNDS DAVIDSON COUNTY EMPLOYEES' RETIREMENT FUND The Davidson County Employees' Retirement Fund covers certain employees of the former Davidson County and was closed to new members in 1963. Benefits are funded by contributions from the Government. METROPOLITAN EMPLOYEES' BENEFIT TRUST FUND Established in 1963, the Metropolitan Employees' Benefit Trust Fund covers substantially all employees who are not members of any other plan and is used to account for Divisions A & B of the Metro Plan. Division B of the Metro Plan is the only plan open to new members. This Plan is funded by the Government. Under the administrative responsibility of the Employee Benefit Board, this fund provides for the accumulation of assets for the payment of disability and retirement benefits for employees covered under this plan. EMPLOYEES' PENSION AND INSURANCE FUND The Employees' Pension and Insurance Fund covers teachers and classified employees of the Metropolitan Nashville Public Schools of the former Davidson County. The plan is closed to new members and is funded by contributions from the Government, employees and the State of Tennessee. TEACHERS' RETIREMENT PLAN FUND The Teachers' Retirement Plan Fund is funded by contributions from the Metropolitan Nashville Public Schools, employees and the State of Tennessee. The plan was closed to new members on July 1, 1969. CLOSED CITY PLAN FUND This fund accounts for two closed plans. The Civil Service Employees' Pension Fund covers certain employees of the former City of Nashville and was closed to new members in 1963. Benefits are funded by contributions from the Government. The Police and Fireman Pension Fund covers certain employees of the former City of Nashville and was closed to new members in 1963. Benefits are funded by contributions from the Government. TEACHERS' CIVIL SERVICE AND PENSION FUND The Teachers' Civil Service and Pension Fund covers eligible employees who were teachers of the former City of Nashville. Benefits are funded by contributions from the Government and the State of Tennessee. METROPOLITAN EMPLOYEES’ FLEXIBLE BENEFITS PLAN FUND The Metropolitan Employees’ Flexible Benefits Plan Fund was established to account for the pre-tax deductions withheld from compensation to employees of the Government for medical and dependent care reimbursement. EDUCATION FLEXIBLE BENEFITS PLAN FUND The Education Flexible Benefits Plan Fund was established to account for the pre-tax deductions withheld from compensation to employees of the Metropolitan Nashville Public School System for medical and dependent care reimbursement.

E-12
THE METROPOLITAN GOVERNMENT OF NASHVILLE AND DAVIDSON COUNTY DESCRIPTION OF FIDUCIARY FUNDS (CONTINUED) AGENCY FUNDS ELECTED OFFICIALS The following agency funds are used to account for assets held by the Elected Officials as agents for individuals, governmental entities and others. These include: Richard R. Rooker, Circuit Court Clerk Maria M. Salas, Clerk and Master Brenda Wynn, County Clerk Howard Gentry, Criminal Court Clerk Bill Garrett, County Register
David Smith, Juvenile Court Clerk SOLD PROPERTY TAX RECEIVABLES FUND The Sold Property Tax Receivables Fund accounts for property tax funds collected by the Government on behalf of the buyers of certain property tax receivable balances. SHERIFF WORK RELEASE AND INMATE TRUST FUND
The Sheriff Work Release and Inmate Trust Fund administers and accounts for the receipt and usage of individual inmates' personal funds through the Commissary and Work Release accounts. PLANNING PERFORMANCE BONDS FUND The Planning Performance Bonds Fund accounts for performance bond funds received from contractors held until the completion of infrastructure development projects.


ASSETS: Cash and cash equivalents $ 15,419,367 Investments 2,397,346 Accounts receivable 8,219,468 Accrued interest receivable 8,360 Notes receivable 30,068,887 Due from the primary government 2,984
Total assets $ 56,116,412
LIABILITIES: Accounts payable $ 6,314,580 Accrued payroll 4,822 Due to the primary government 2,293
Total liabilities 6,321,695
DEFERRED INFLOWS OF RESOURCES: Unavailable revenue - tax increment financing 28,000,000
Total deferred inflows of resources 28,000,000
FUND BALANCES: Restricted for capital projects 40,883 Restricted for debt service 13,834,118 Unassigned 7,919,716
Total fund balances 21,794,717
Total liabilities, deferred inflows of resources, and fund balances $ 56,116,412
THE METROPOLITAN GOVERNMENT OF NASHVILLE AND DAVIDSON COUNTY
F-2
June 30, 2016
SPORTS AUTHORITY FUND
The accompanying notes are an integral part of this financial statement.
BALANCE SHEET

Fund balances $ 21,794,717
Amounts reported in the Statement of Net Position are different because:
Capital assets of governmental component units are not financial resources and therefore notreported in the Balance Sheet. However, they are reported in the Statement of Net Position.This amount represents the net book value of capital assets at year-end. 402,124,566
Long-term liabilities, including revenue bonds payable, are not due and payable in the currentperiod and therefore are not reported by governmental component units in the Balance Sheet.However, they are reported in the Statement of Net Position. Additionally, related interest isaccrued when incurred in the Statement of Net Position.
Bonds payable (143,575,000)Line of credit (17,285,169)Less deferred charge on refunding 3,448,041Add net bond premium/discount (4,267,021)Accrued interest payable (3,117,571)Compensated absences (9,764)
Net position $ 259,112,799
The accompanying notes are an integral part of this financial statement.
F-3
THE METROPOLITAN GOVERNMENT OF NASHVILLE AND DAVIDSON COUNTY
RECONCILIATION OF THE BALANCE SHEET TO THE STATEMENT OF NET POSITIONSPORTS AUTHORITY
June 30, 2016
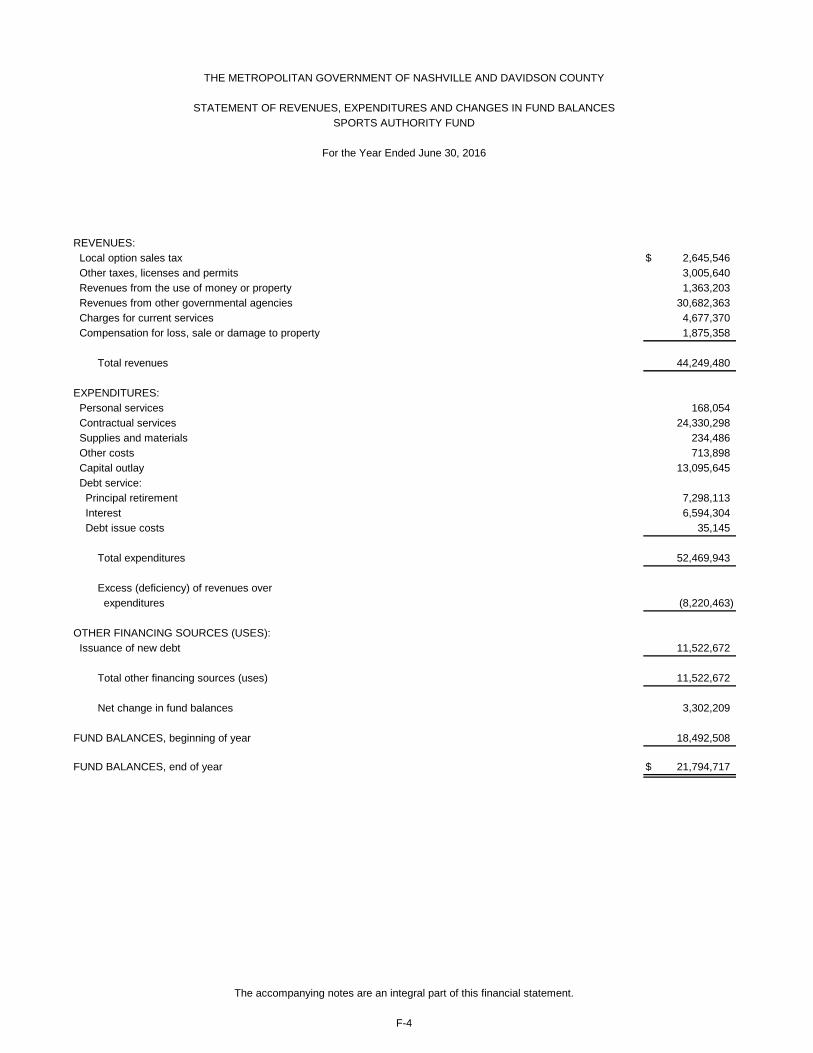
REVENUES: Local option sales tax $ 2,645,546 Other taxes, licenses and permits 3,005,640 Revenues from the use of money or property 1,363,203 Revenues from other governmental agencies 30,682,363 Charges for current services 4,677,370 Compensation for loss, sale or damage to property 1,875,358
Total revenues 44,249,480
EXPENDITURES: Personal services 168,054 Contractual services 24,330,298 Supplies and materials 234,486 Other costs 713,898 Capital outlay 13,095,645 Debt service: Principal retirement 7,298,113 Interest 6,594,304 Debt issue costs 35,145
Total expenditures 52,469,943
Excess (deficiency) of revenues over expenditures (8,220,463)
OTHER FINANCING SOURCES (USES): Issuance of new debt 11,522,672
Total other financing sources (uses) 11,522,672
Net change in fund balances 3,302,209
FUND BALANCES, beginning of year 18,492,508
FUND BALANCES, end of year $ 21,794,717
The accompanying notes are an integral part of this financial statement.
F-4
THE METROPOLITAN GOVERNMENT OF NASHVILLE AND DAVIDSON COUNTY
SPORTS AUTHORITY FUNDSTATEMENT OF REVENUES, EXPENDITURES AND CHANGES IN FUND BALANCES
For the Year Ended June 30, 2016

Net change in fund balances $ 3,302,209
Amounts reported in the Statement of Activities aredifferent because:
Governmental component units report capital outlays as expenditures in the Statement of Revenues,Expenditures and Changes in Fund Balances. However, the cost of those assets is allocated over their estimated useful lives and reported as depreciation expense in the Statement of Activities.
Acquisition of capital assets 13,095,645Depreciation expense (16,411,424)
The issuance of debt provides current financial resources to governmental component unit funds, but theissuance of debt increases long-term liabilities for governmental component unit activities. Repayment ofprincipal is an expenditure in the governmental component unit funds but reduces long-term liabilities forgovernmental component unit activities. Also, governmental component unit funds report the effects ofpremiums, discounts and similar items when debt is first issued, whereas these amounts are deferred andamortized for governmental component unit activities.
Issuance of debt (11,522,672)Principal repayments 7,298,113Amortization of deferred charge on refunding (379,062)Amortization of premium/discount 377,704Change in accrued interest 68,020
Compensated absences reported for governmental activities do not require the use of currentfinancial resources and therefore are not reported as expenditures for governmental funds. (6,215)
Change in net position $ (4,177,682)
The accompanying notes are an integral part of this financial statement.
F-5
THE METROPOLITAN GOVERNMENT OF NASHVILLE AND DAVIDSON COUNTY
RECONCILIATION OF THE STATEMENT OF REVENUES, EXPENDITURES AND CHANGES INFUND BALANCES TO THE STATEMENT OF ACTIVITIES
SPORTS AUTHORITY
For the Year Ended June 30, 2016

ASSETS: Cash and cash equivalents $ 618,392 Accrued interest receivable 551
Total assets $ 618,943
LIABILITIES: Accounts payable $ 86
Total liabilities 86
FUND BALANCES: Unassigned 618,857
Total fund balances 618,857
Total liabilities and fund balances $ 618,943
THE METROPOLITAN GOVERNMENT OF NASHVILLE AND DAVIDSON COUNTY
F-6
June 30, 2016
INDUSTRIAL DEVELOPMENT BOARD FUND
The accompanying notes are an integral part of this financial statement.
BALANCE SHEET

REVENUES: Revenue from the use of money or property $ 3,057 Revenue from other governmental agencies 749,000 Charges for current services 11,850
Total revenues 763,907
EXPENDITURES: Contractual services 432 Supplies and materials 442 Other costs 749,000
Total expenditures 749,874
Net change in fund balances 14,033
FUND BALANCES, beginning of year 604,824
FUND BALANCES, end of year $ 618,857
For the Year Ended June 30, 2016
The accompanying notes are an integral part of this financial statement.
THE METROPOLITAN GOVERNMENT OF NASHVILLE AND DAVIDSON COUNTY
INDUSTRIAL DEVELOPMENT BOARD FUNDSTATEMENT OF REVENUES, EXPENDITURES AND CHANGES IN FUND BALANCES
F-7


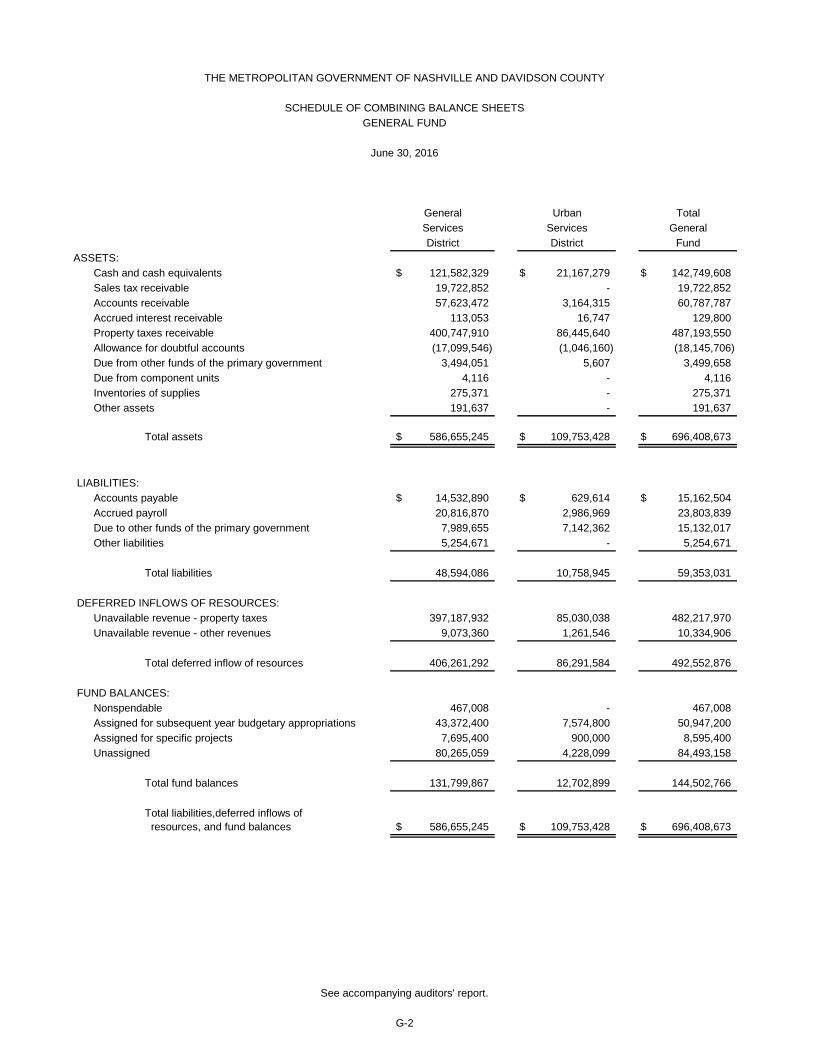
SCHEDULE OF COMBINING BALANCE SHEETSGENERAL FUND
June 30, 2016
General Urban TotalServices Services GeneralDistrict District Fund
ASSETS:Cash and cash equivalents $ 121,582,329 $ 21,167,279 $ 142,749,608 Sales tax receivable 19,722,852 - 19,722,852 Accounts receivable 57,623,472 3,164,315 60,787,787 Accrued interest receivable 113,053 16,747 129,800 Property taxes receivable 400,747,910 86,445,640 487,193,550 Allowance for doubtful accounts (17,099,546) (1,046,160) (18,145,706) Due from other funds of the primary government 3,494,051 5,607 3,499,658 Due from component units 4,116 - 4,116 Inventories of supplies 275,371 - 275,371 Other assets 191,637 - 191,637
Total assets $ 586,655,245 $ 109,753,428 $ 696,408,673
LIABILITIES:Accounts payable $ 14,532,890 $ 629,614 $ 15,162,504 Accrued payroll 20,816,870 2,986,969 23,803,839 Due to other funds of the primary government 7,989,655 7,142,362 15,132,017 Other liabilities 5,254,671 - 5,254,671
Total liabilities 48,594,086 10,758,945 59,353,031
DEFERRED INFLOWS OF RESOURCES:Unavailable revenue - property taxes 397,187,932 85,030,038 482,217,970 Unavailable revenue - other revenues 9,073,360 1,261,546 10,334,906
Total deferred inflow of resources 406,261,292 86,291,584 492,552,876
FUND BALANCES:Nonspendable 467,008 - 467,008 Assigned for subsequent year budgetary appropriations 43,372,400 7,574,800 50,947,200 Assigned for specific projects 7,695,400 900,000 8,595,400 Unassigned 80,265,059 4,228,099 84,493,158
Total fund balances 131,799,867 12,702,899 144,502,766
Total liabilities,deferred inflows of resources, and fund balances $ 586,655,245 $ 109,753,428 $ 696,408,673
See accompanying auditors' report.
THE METROPOLITAN GOVERNMENT OF NASHVILLE AND DAVIDSON COUNTY
G-2

General Urban TotalServices Services GeneralDistrict District Fund
REVENUES:Property taxes $ 410,527,709 $ 97,890,267 $ 508,417,976 Local option sales tax 112,386,239 - 112,386,239 Other taxes, licenses and permits 133,243,365 10,021,304 143,264,669 Fines, forfeits and penalties 10,536,938 - 10,536,938 Revenues from the use of money or property 623,983 71,651 695,634 Revenues from other governmental agencies 102,735,391 1,209,800 103,945,191 Commissions and fees 14,528,053 - 14,528,053 Charges for current services 35,145,956 213,376 35,359,332 Compensation for loss, sale or damage to property 6,879,924 - 6,879,924 Contributions and gifts 266,525 - 266,525 Miscellaneous 1,893,902 - 1,893,902
Total revenues 828,767,985 109,406,398 938,174,383
EXPENDITURES:General government 50,211,810 - 50,211,810 Fiscal administration 21,463,006 - 21,463,006 Administration of justice 57,481,614 - 57,481,614 Law enforcement and care of prisoners 262,052,423 - 262,052,423 Fire prevention and control 49,372,689 67,575,975 116,948,664 Regulation and inspection 8,101,479 - 8,101,479 Conservation of natural resources 373,209 - 373,209 Public welfare 6,293,042 - 6,293,042 Public health and hospitals 62,958,373 - 62,958,373 Public library system 27,432,634 - 27,432,634 Public works, highways and streets 23,434,983 8,867,149 32,302,132 Recreational and cultural 37,931,086 - 37,931,086 Retiree benefits 61,271,415 20,305,263 81,576,678 Miscellaneous 87,286,281 1,991,792 89,278,073
Total expenditures 755,664,044 98,740,179 854,404,223
Excess of revenues over expenditures 73,103,941 10,666,219 83,770,160
OTHER FINANCING SOURCES (USES):Transfers in 22,890,396 - 22,890,396 Transfers out (85,100,588) (15,110,800) (100,211,388)
Total other financing sources (uses) (62,210,192) (15,110,800) (77,320,992)
Net change in fund balances 10,893,749 (4,444,581) 6,449,168
FUND BALANCES, beginning of year 120,906,118 17,147,480 138,053,598
FUND BALANCES, end of year $ 131,799,867 $ 12,702,899 $ 144,502,766
See accompanying auditors' report.
THE METROPOLITAN GOVERNMENT OF NASHVILLE AND DAVIDSON COUNTY
COMBINING SCHEDULE OF REVENUES, EXPENDITURES AND CHANGES IN FUND BALANCESGENERAL FUND
For the Year Ended June 30, 2016
G-3

PositiveFinal (Negative)
REVENUES: Property taxes $ 407,581,500 $ 407,581,500 $ 410,527,709 $ 2,946,209 Local option sales tax 113,311,200 113,311,200 112,386,239 (924,961) Other taxes, licenses and permits 113,455,000 113,675,000 133,243,365 19,568,365 Fines, forfeits and penalties 11,254,300 11,261,400 10,536,938 (724,462) Revenues from the use of money or property - - 623,983 623,983 Revenues from other governmental agencies 87,496,000 86,022,000 102,735,391 16,713,391 Commissions and fees 13,134,800 13,134,800 14,528,053 1,393,253 Charges for current services 31,738,600 31,708,600 35,145,956 3,437,356 Compensation for loss, sale or damage to property 1,215,700 1,215,700 6,879,924 5,664,224 Contributions and gifts 242,900 2,100 266,525 264,425 Miscellaneous 2,734,000 2,734,000 1,893,902 (840,098) Total revenues 782,164,000 780,646,300 828,767,985 48,121,685
EXPENDITURES: General government 50,687,100 53,115,900 50,211,810 2,904,090 Fiscal administration 22,132,100 23,297,500 21,463,006 1,834,494 Administration of justice 57,874,500 59,283,300 57,481,614 1,801,686 Law enforcement and care of prisoners 250,339,900 264,543,200 262,052,423 2,490,777 Fire prevention and control 48,173,500 50,649,900 49,372,689 1,277,211 Regulation and inspection 8,753,400 9,066,100 8,101,479 964,621 Conservation of natural resources 374,400 399,700 373,209 26,491 Public welfare 8,095,700 6,617,500 6,293,042 324,458 Public health and hospitals 53,665,700 64,266,000 62,958,373 1,307,627 Public library system 26,737,600 27,494,800 27,432,634 62,166 Public works, highways and streets 22,778,500 23,713,100 23,434,983 278,117 Recreational and cultural 37,805,300 38,765,600 37,931,086 834,514 Retireee benefits 62,364,200 62,400,600 61,271,415 1,129,185 Miscellaneous 115,128,400 94,674,000 87,286,281 7,387,719 Total expenditures 764,910,300 778,287,200 755,664,044 22,623,156
Excess (deficiency) of revenues over expenditures 17,253,700 2,359,100 73,103,941 70,744,841
OTHER FINANCING SOURCES (USES): Transfers in 22,309,700 22,309,700 22,890,396 580,696 Transfers out (79,563,400) (84,301,600) (85,100,588) (798,988) Total other financing sources (uses) (57,253,700) (61,991,900) (62,210,192) (218,292)
Net change in fund balances (40,000,000) (59,632,800) 10,893,749 70,526,549
FUND BALANCES, beginning of year 120,906,118 120,906,118 120,906,118 -
FUND BALANCES, end of year $ 80,906,118 $ 61,273,318 $ 131,799,867 $ 70,526,549
Variance with
Budgeted AmountsOriginal
General Services District
Actual
G-4
THE METROPOLITAN GOVERNMENT OF NASHVILLE AND DAVIDSON COUNTY
COMBINING SCHEDULE OF REVENUES, EXPENDITURES AND CHANGES IN FUND BALANCESBUDGET AND ACTUAL
See accompanying auditors' report.
Amounts
For the Year Ended June 30, 2016
Final Budget -
GENERAL FUND

Positive PositiveFinal (Negative) Original Final (Negative)
$ 99,915,800 $ 99,915,800 $ 97,890,267 $ (2,025,533) $ 507,497,300 $ 507,497,300 $ 508,417,976 $ 920,676 - - - - 113,311,200 113,311,200 112,386,239 (924,961)
8,134,400 8,134,400 10,021,304 1,886,904 121,589,400 121,809,400 143,264,669 21,455,269 - - - - 11,254,300 11,261,400 10,536,938 (724,462) - - 71,651 71,651 - - 695,634 695,634
1,243,800 1,243,800 1,209,800 (34,000) 88,739,800 87,265,800 103,945,191 16,679,391 - - - - 13,134,800 13,134,800 14,528,053 1,393,253
143,000 143,000 213,376 70,376 31,881,600 31,851,600 35,359,332 3,507,732 100,000 100,000 - (100,000) 1,315,700 1,315,700 6,879,924 5,564,224
- - - - 242,900 2,100 266,525 264,425 - - - - 2,734,000 2,734,000 1,893,902 (840,098)
109,537,000 109,537,000 109,406,398 (130,602) 891,701,000 890,183,300 938,174,383 47,991,083
- - - - 50,687,100 53,115,900 50,211,810 2,904,090 - - - - 22,132,100 23,297,500 21,463,006 1,834,494 - - - - 57,874,500 59,283,300 57,481,614 1,801,686 - - - - 250,339,900 264,543,200 262,052,423 2,490,777
65,272,900 68,469,300 67,575,975 893,325 113,446,400 119,119,200 116,948,664 2,170,536 - - - - 8,753,400 9,066,100 8,101,479 964,621 - - - - 374,400 399,700 373,209 26,491 - - - - 8,095,700 6,617,500 6,293,042 324,458 - - - - 53,665,700 64,266,000 62,958,373 1,307,627 - - - - 26,737,600 27,494,800 27,432,634 62,166
9,840,100 9,894,500 8,867,149 1,027,351 32,618,600 33,607,600 32,302,132 1,305,468 - - - - 37,805,300 38,765,600 37,931,086 834,514
20,937,000 20,937,000 20,305,263 631,737 83,301,200 83,337,600 81,576,678 1,760,922 6,446,900 3,922,700 1,991,792 1,930,908 121,575,300 98,596,700 89,278,073 9,318,627
102,496,900 103,223,500 98,740,179 4,483,321 867,407,200 881,510,700 854,404,223 27,106,477
7,040,100 6,313,500 10,666,219 4,352,719 24,293,800 8,672,600 83,770,160 75,097,560
- - - - 22,309,700 22,309,700 22,890,396 580,696 (15,110,800) (15,110,800) (15,110,800) - (94,674,200) (99,412,400) (100,211,388) (798,988) (15,110,800) (15,110,800) (15,110,800) - (72,364,500) (77,102,700) (77,320,992) (218,292)
(8,070,700) (8,797,300) (4,444,581) 4,352,719 (48,070,700) (68,430,100) 6,449,168 74,879,268
17,147,480 17,147,480 17,147,480 - 138,053,598 138,053,598 138,053,598 -
$ 9,076,780 $ 8,350,180 $ 12,702,899 $ 4,352,719 $ 89,982,898 $ 69,623,498 $ 144,502,766 $ 74,879,268
See accompanying auditors' report.
Budgeted AmountsFinal Budget -
Urban Services District
Original Amounts ActualActual
Variance with
G-5
Total General Fund
Amounts
THE METROPOLITAN GOVERNMENT OF NASHVILLE AND DAVIDSON COUNTY
COMBINING SCHEDULE OF REVENUES, EXPENDITURES AND CHANGES IN FUND BALANCES
Budgeted Amounts
GENERAL FUND (CONTINUED)
BUDGET AND ACTUAL
Variance withFinal Budget -
For the Year Ended June 30, 2016

FinalGENERAL GOVERNMENT: Legislative (Office of Clerk and Council) $ 2,457,500 $ 2,514,000 $ 2,281,633 $ 232,367 Executive (Office of the Mayor) 2,966,000 3,747,700 3,063,715 683,985 Office of Emergency Management 764,000 826,000 804,083 21,917 Election Commission 5,323,400 5,582,900 5,136,850 446,050 Department of Law 5,196,600 5,612,500 5,531,401 81,099 Planning Commission 3,788,800 3,963,300 3,773,566 189,734 Human Resources 4,556,200 4,857,400 4,449,582 407,818 County Register of Deeds 262,800 265,000 262,353 2,647 General Services 22,964,900 23,096,500 22,278,473 818,027 Historical Commission 794,700 843,800 834,238 9,562 Telecommunications 1,612,200 1,806,800 1,795,916 10,884
Total General Government 50,687,100 53,115,900 50,211,810 2,904,090
FISCAL ADMINISTRATION: Department of Finance 7,570,300 8,181,300 7,661,552 519,748 Assessor of Property 6,868,300 7,166,500 6,597,447 569,053 Metropolitan Trustee 2,340,800 2,406,900 2,227,170 179,730 County Clerk 4,109,900 4,251,900 3,955,358 296,542 Internal Audit 1,242,800 1,290,900 1,021,479 269,421
Total Fiscal Administration 22,132,100 23,297,500 21,463,006 1,834,494
ADMINISTRATION OF JUSTICE: District Attorney 5,806,000 6,175,100 6,147,971 27,129 Public Defender 7,022,700 7,400,100 7,173,474 226,626 Juvenile Court Clerk 1,579,500 1,649,900 1,638,576 11,324 Circuit Court Clerk 3,178,100 3,275,400 2,861,082 414,318 Criminal Court Clerk 5,308,700 5,526,600 5,098,814 427,786 Clerk and Master 1,445,000 1,489,300 1,246,904 242,396 Juvenile Court 11,896,400 11,061,200 10,881,554 179,646 General Sessions Court 10,319,700 10,812,700 10,812,668 32 State Trial Courts 7,744,700 8,174,000 8,099,582 74,418 Justice Information System 2,380,000 2,471,000 2,359,004 111,996 Criminal Justice Planning 452,200 490,000 482,794 7,206 Office of Family Safety 741,500 758,000 679,191 78,809
Total Administration of Justice 57,874,500 59,283,300 57,481,614 1,801,686
LAW ENFORCEMENT AND CARE OF PRISONERS: Sheriff 63,892,700 68,211,800 68,211,707 93 Police Department 172,832,800 182,151,200 180,204,265 1,946,935 Emergency Communication Center 13,614,400 14,180,200 13,636,451 543,749
Total Law Enforcement and Care of Prisoners 250,339,900 264,543,200 262,052,423 2,490,777
Budgeted AmountsOriginal
Actual
See accompanying auditors' report.
Amounts
G-6
(Negative)Positive
THE METROPOLITAN GOVERNMENT OF NASHVILLE AND DAVIDSON COUNTY
DETAILED SCHEDULE OF EXPENDITURES AND OTHER FINANCING SOURCES (USES) - BUDGET AND ACTUALGENERAL FUND - GENERAL SERVICES DISTRICT
For the Year Ended June 30, 2016
Variance withFinal Budget -

FinalFIRE PREVENTION AND CONTROL: Fire Department $ 48,173,500 $ 50,649,900 $ 49,372,689 $ 1,277,211
REGULATION AND INSPECTION: Department of Codes Administration 8,384,800 8,686,500 7,744,708 941,792 Beer Board 368,600 379,600 356,771 22,829
Total Regulation and Inspection 8,753,400 9,066,100 8,101,479 964,621
CONSERVATION OF NATURAL RESOURCES: Agricultural Extension Service 285,200 308,200 289,794 18,406 Soil and Water Conservation 89,200 91,500 83,415 8,085
Total Conservation of Natural Resources 374,400 399,700 373,209 26,491
PUBLIC WELFARE: Social Services Commission 7,672,000 6,180,300 5,855,868 324,432 Human Relations Commission 423,700 437,200 437,174 26
Total Public Welfare 8,095,700 6,617,500 6,293,042 324,458
PUBLIC HEALTH AND HOSPITALS: Board of Health 18,665,700 19,266,000 17,958,373 1,307,627 Hospital Authority 35,000,000 45,000,000 45,000,000 -
Total Public Health and Hospitals 53,665,700 64,266,000 62,958,373 1,307,627
PUBLIC LIBRARY SYSTEM: Public Library 26,737,600 27,494,800 27,432,634 62,166
PUBLIC WORKS, HIGHWAYS AND STREETS: Public Works 22,778,500 23,713,100 23,434,983 278,117
RECREATIONAL AND CULTURAL: Parks and Recreation 34,439,400 35,364,700 34,586,888 777,812 Arts Commission 2,643,100 2,670,300 2,613,598 56,702 Sports Authority 722,800 730,600 730,600 -
Total Recreational and Cultural 37,805,300 38,765,600 37,931,086 834,514
Positive(Negative)
See accompanying auditors' report.
G-7
ActualOriginal Amounts
Variance withFinal Budget -
THE METROPOLITAN GOVERNMENT OF NASHVILLE AND DAVIDSON COUNTY
For the Year Ended June 30, 2016
Budgeted Amounts
DETAILED SCHEDULE OF EXPENDITURES AND OTHER FINANCING SOURCES (USES) - BUDGET AND ACTUALGENERAL FUND - GENERAL SERVICES DISTRICT (CONTINUED)
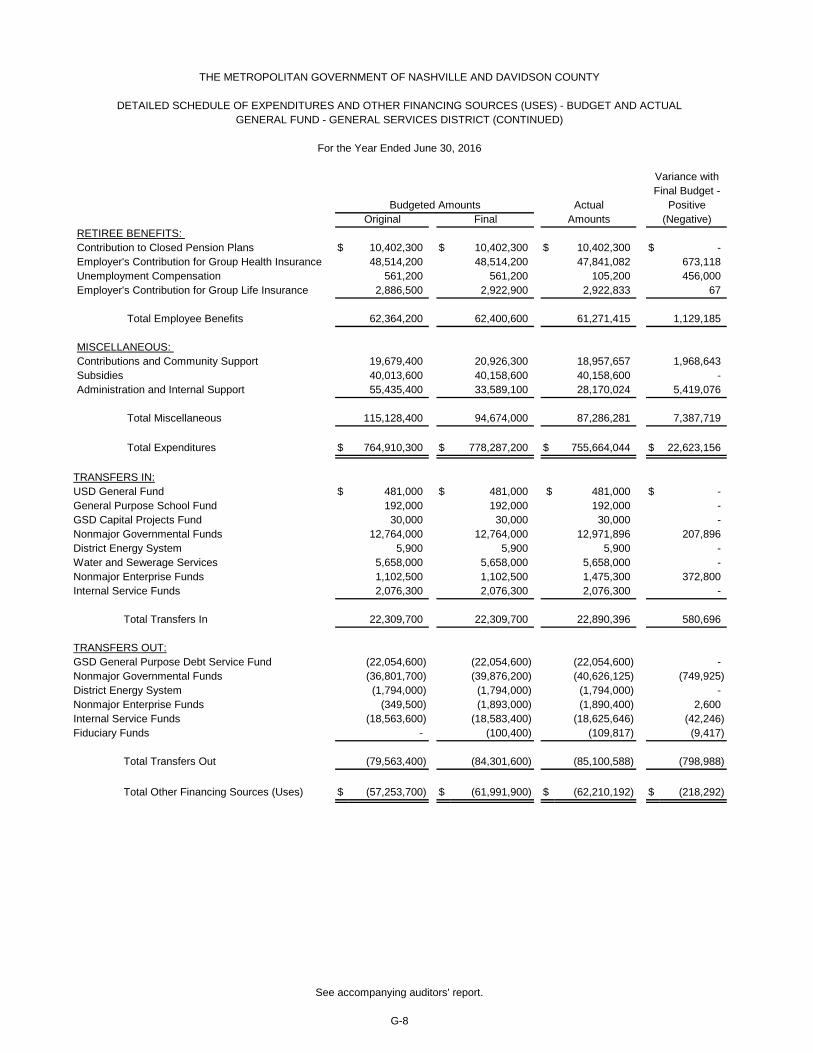
FinalRETIREE BENEFITS: Contribution to Closed Pension Plans $ 10,402,300 $ 10,402,300 $ 10,402,300 $ - Employer's Contribution for Group Health Insurance 48,514,200 48,514,200 47,841,082 673,118 Unemployment Compensation 561,200 561,200 105,200 456,000 Employer's Contribution for Group Life Insurance 2,886,500 2,922,900 2,922,833 67
Total Employee Benefits 62,364,200 62,400,600 61,271,415 1,129,185
MISCELLANEOUS: Contributions and Community Support 19,679,400 20,926,300 18,957,657 1,968,643 Subsidies 40,013,600 40,158,600 40,158,600 - Administration and Internal Support 55,435,400 33,589,100 28,170,024 5,419,076
Total Miscellaneous 115,128,400 94,674,000 87,286,281 7,387,719
Total Expenditures $ 764,910,300 $ 778,287,200 $ 755,664,044 $ 22,623,156
TRANSFERS IN:USD General Fund $ 481,000 $ 481,000 $ 481,000 $ - General Purpose School Fund 192,000 192,000 192,000 - GSD Capital Projects Fund 30,000 30,000 30,000 - Nonmajor Governmental Funds 12,764,000 12,764,000 12,971,896 207,896 District Energy System 5,900 5,900 5,900 - Water and Sewerage Services 5,658,000 5,658,000 5,658,000 - Nonmajor Enterprise Funds 1,102,500 1,102,500 1,475,300 372,800 Internal Service Funds 2,076,300 2,076,300 2,076,300 -
Total Transfers In 22,309,700 22,309,700 22,890,396 580,696
TRANSFERS OUT:GSD General Purpose Debt Service Fund (22,054,600) (22,054,600) (22,054,600) - Nonmajor Governmental Funds (36,801,700) (39,876,200) (40,626,125) (749,925) District Energy System (1,794,000) (1,794,000) (1,794,000) - Nonmajor Enterprise Funds (349,500) (1,893,000) (1,890,400) 2,600 Internal Service Funds (18,563,600) (18,583,400) (18,625,646) (42,246) Fiduciary Funds - (100,400) (109,817) (9,417)
Total Transfers Out (79,563,400) (84,301,600) (85,100,588) (798,988)
Total Other Financing Sources (Uses) $ (57,253,700) $ (61,991,900) $ (62,210,192) $ (218,292)
G-8
Original Amounts
THE METROPOLITAN GOVERNMENT OF NASHVILLE AND DAVIDSON COUNTY
Variance with
Positive
For the Year Ended June 30, 2016
Budgeted Amounts Actual
See accompanying auditors' report.
DETAILED SCHEDULE OF EXPENDITURES AND OTHER FINANCING SOURCES (USES) - BUDGET AND ACTUALGENERAL FUND - GENERAL SERVICES DISTRICT (CONTINUED)
(Negative)
Final Budget -

THE METROPOLITAN GOVERNMENT OF NASHVILLE AND DAVIDSON COUNTY
DETAILED SCHEDULE OF EXPENDITURES AND OTHER FINANCING SOURCES (USES) - BUDGET AND ACTUALGENERAL FUND - URBAN SERVICES DISTRICT
For the Year Ended June 30, 2016
ActualOriginal Final Amounts
FIRE PREVENTION AND CONTROL:Fire Department $ 65,272,900 $ 68,469,300 $ 67,575,975 $ 893,325
PUBLIC WORKS, HIGHWAYS AND STREETS:Public Works 9,840,100 9,894,500 8,867,149 1,027,351
EMPLOYEE BENEFITS:Contribution to Closed Pension Plans 18,890,100 18,890,100 18,890,100 - Employer's Contribution for Group Health Insurance 1,968,400 1,968,400 1,356,225 612,175 Employer's Contribution for Group Life Insurance 78,500 78,500 58,938 19,562
Total Employee Benefits 20,937,000 20,937,000 20,305,263 631,737
MISCELLANEOUS:Administration and Internal Support 6,446,900 3,922,700 1,991,792 1,930,908
Total Miscellaneous 6,446,900 3,922,700 1,991,792 1,930,908
Total Expenditures $ 102,496,900 $ 103,223,500 $ 98,740,179 $ 4,483,321
TRANSFERS OUT:GSD General Fund $ (481,000) $ (481,000) $ (481,000) $ - Nonmajor Governmental Funds (12,965,300) (12,965,300) (12,965,300) - Internal Service Funds (1,664,500) (1,664,500) (1,664,500) -
Total Transfers Out (15,110,800) (15,110,800) (15,110,800) -
Total Other Financing Sources (Uses) $ (15,110,800) $ (15,110,800) $ (15,110,800) $ -
See accompanying auditors' report.
G-9
Variance withFinal Budget -
Positive(Negative)
Budgeted Amounts
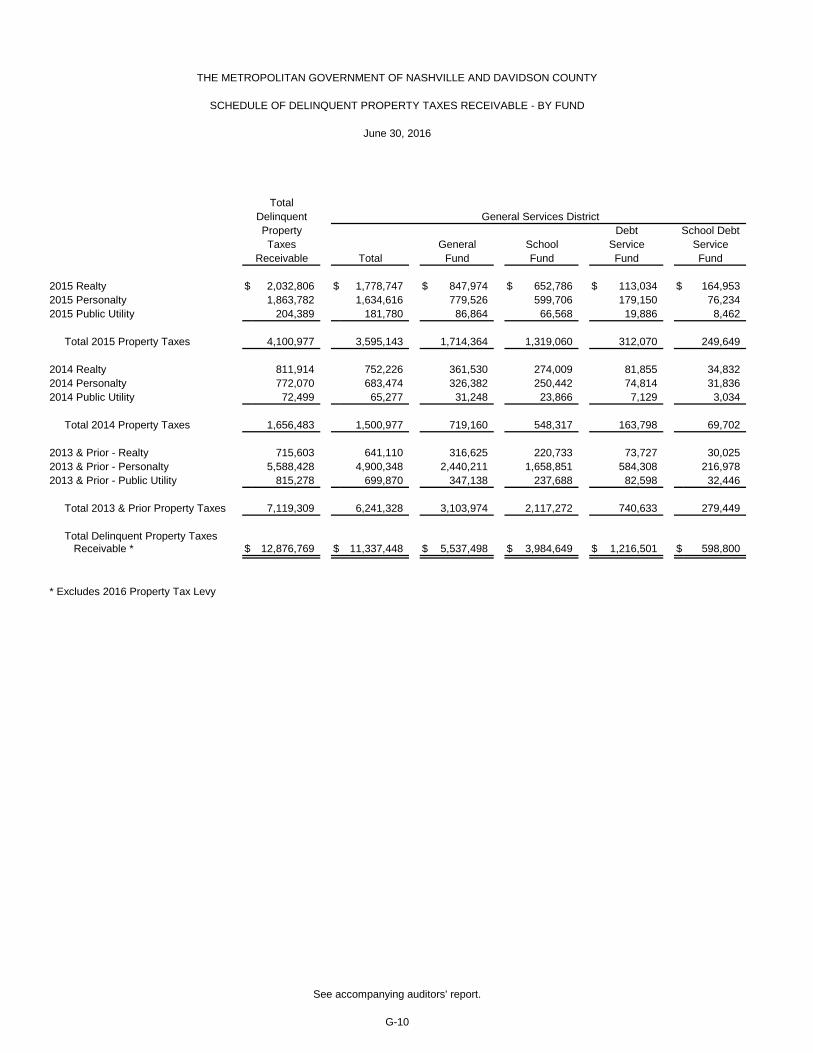
TotalDelinquent General Services District Property Debt School DebtTaxes General School Service Service
Receivable Total Fund Fund Fund Fund
2015 Realty $ 2,032,806 $ 1,778,747 $ 847,974 $ 652,786 $ 113,034 $ 164,9532015 Personalty 1,863,782 1,634,616 779,526 599,706 179,150 76,2342015 Public Utility 204,389 181,780 86,864 66,568 19,886 8,462
Total 2015 Property Taxes 4,100,977 3,595,143 1,714,364 1,319,060 312,070 249,649
2014 Realty 811,914 752,226 361,530 274,009 81,855 34,8322014 Personalty 772,070 683,474 326,382 250,442 74,814 31,8362014 Public Utility 72,499 65,277 31,248 23,866 7,129 3,034
Total 2014 Property Taxes 1,656,483 1,500,977 719,160 548,317 163,798 69,702
2013 & Prior - Realty 715,603 641,110 316,625 220,733 73,727 30,0252013 & Prior - Personalty 5,588,428 4,900,348 2,440,211 1,658,851 584,308 216,9782013 & Prior - Public Utility 815,278 699,870 347,138 237,688 82,598 32,446
Total 2013 & Prior Property Taxes 7,119,309 6,241,328 3,103,974 2,117,272 740,633 279,449
Total Delinquent Property Taxes Receivable * $ 12,876,769 $ 11,337,448 $ 5,537,498 $ 3,984,649 $ 1,216,501 $ 598,800
* Excludes 2016 Property Tax Levy
G-10
THE METROPOLITAN GOVERNMENT OF NASHVILLE AND DAVIDSON COUNTY
SCHEDULE OF DELINQUENT PROPERTY TAXES RECEIVABLE - BY FUND
June 30, 2016
See accompanying auditors' report.
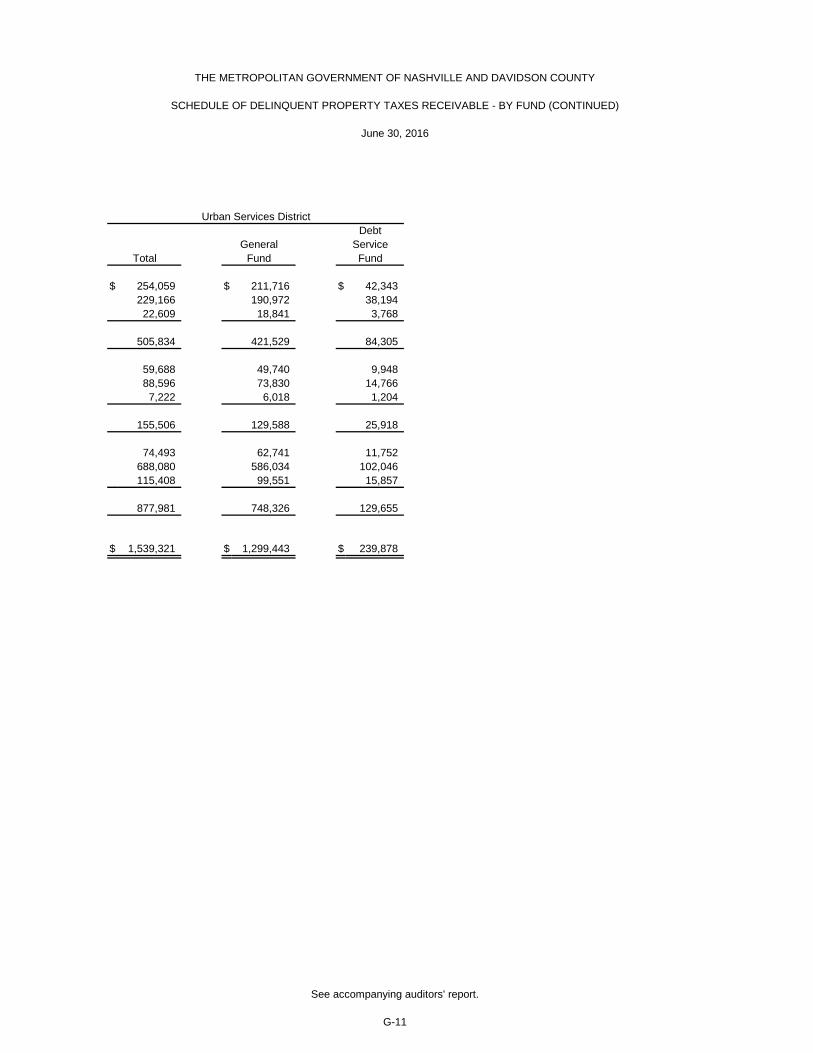
Urban Services DistrictDebt
General ServiceTotal Fund Fund
$ 254,059 $ 211,716 $ 42,343229,166 190,972 38,19422,609 18,841 3,768
505,834 421,529 84,305
59,688 49,740 9,94888,596 73,830 14,7667,222 6,018 1,204
155,506 129,588 25,918
74,493 62,741 11,752688,080 586,034 102,046115,408 99,551 15,857
877,981 748,326 129,655
$ 1,539,321 $ 1,299,443 $ 239,878
G-11
THE METROPOLITAN GOVERNMENT OF NASHVILLE AND DAVIDSON COUNTY
SCHEDULE OF DELINQUENT PROPERTY TAXES RECEIVABLE - BY FUND (CONTINUED)
June 30, 2016
See accompanying auditors' report.
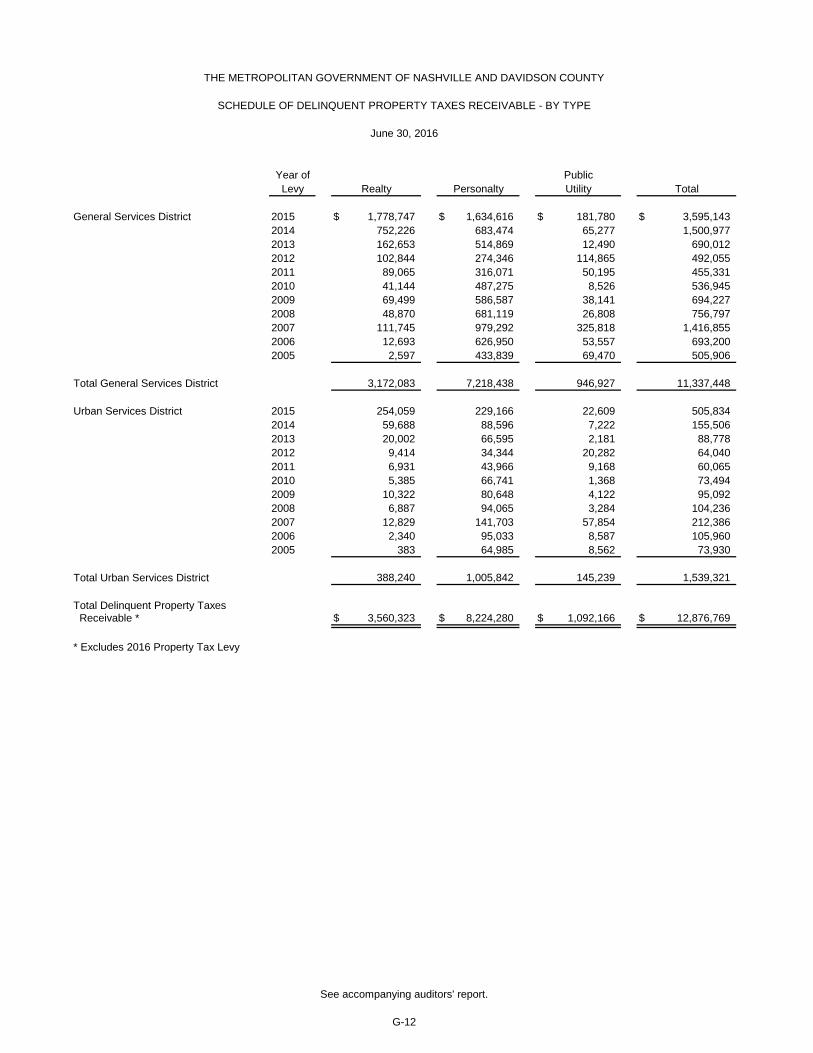
Year of PublicLevy Realty Personalty Utility Total
General Services District 2015 $ 1,778,747 $ 1,634,616 $ 181,780 $ 3,595,1432014 752,226 683,474 65,277 1,500,9772013 162,653 514,869 12,490 690,0122012 102,844 274,346 114,865 492,0552011 89,065 316,071 50,195 455,3312010 41,144 487,275 8,526 536,9452009 69,499 586,587 38,141 694,2272008 48,870 681,119 26,808 756,7972007 111,745 979,292 325,818 1,416,8552006 12,693 626,950 53,557 693,2002005 2,597 433,839 69,470 505,906
Total General Services District 3,172,083 7,218,438 946,927 11,337,448
Urban Services District 2015 254,059 229,166 22,609 505,8342014 59,688 88,596 7,222 155,5062013 20,002 66,595 2,181 88,7782012 9,414 34,344 20,282 64,0402011 6,931 43,966 9,168 60,0652010 5,385 66,741 1,368 73,4942009 10,322 80,648 4,122 95,0922008 6,887 94,065 3,284 104,2362007 12,829 141,703 57,854 212,3862006 2,340 95,033 8,587 105,9602005 383 64,985 8,562 73,930
Total Urban Services District 388,240 1,005,842 145,239 1,539,321
Total Delinquent Property Taxes Receivable * $ 3,560,323 $ 8,224,280 $ 1,092,166 $ 12,876,769
* Excludes 2016 Property Tax Levy
G-12
See accompanying auditors' report.
THE METROPOLITAN GOVERNMENT OF NASHVILLE AND DAVIDSON COUNTY
SCHEDULE OF DELINQUENT PROPERTY TAXES RECEIVABLE - BY TYPE
June 30, 2016


Description Interest Rate Date of Issue
GENERAL OBLIGATION BONDS PAYABLE For General Purposes: GSD G.O. Public Improvement and Refunding Bonds, Series 2004 3.25 - 5.00 Sep. 1, 2004 GSD G.O. Bonds, Series 2006B 4.00 - 5.00 June 15, 2006 GSD G.O. Refunding Bonds, Series 2007A 4.00 - 5.00 April 15, 2007 GSD G.O. Bonds, Series 2008A 4.00 - 5.00 March 15, 2008 GSD G.O. Improvement and Refunding Bonds, Series 2010A 2.75 - 5.00 June 10, 2010 GSD G.O. Improvement Bonds Federally Taxable (BAB's), Series 2010B 5.71 June 10, 2010 GSD G.O. Refunding Bonds, Series 2010D 1.50 - 5.00 Sept. 21, 2010 GSD G.O. Refunding Bonds, Series 2011 2.00 - 5.00 Sept. 29, 2011 GSD G.O. Refunding Bonds, Series 2012 2.00 - 5.00 Feb. 2, 2012 GSD G.O. Improvement Bonds (QECB), Series 2012 3.367 Aug. 15, 2012 GSD G.O. Refunding Bonds, Series 2012B .320 - 2.767 Aug. 15, 2012 GSD G.O. Refunding Bonds, Series 2013 2.00 - 5.00 Feb. 21, 2013 GSD G.O. Improvement Bonds, Series 2013A 3.00 - 5.00 May 9, 2013 GSD G.O. Refunding Bonds, Series 2015A 5.00 Feb. 19, 2015 GSD G.O. Refunding Bonds, Series 2015B (Taxable) .30 - 3.493 Feb. 19, 2015 GSD G.O. Improvement Bonds, Series 2015C 4.00 - 5.00 July 30, 2015 GSD G.O. Refunding Bonds, Series 2016 2.00 - 5.00 June 1, 2016
Total General Obligation Bonds Payable For General Purposes
For School Purposes: GSD G.O. Public Improvement and Refunding Bonds, Series 2004 3.25 - 5.00 Sep. 1, 2004 GSD G.O. Bonds, Series 2006B 4.00 - 5.00 June 15, 2006 GSD G.O. Refunding Bonds, Series 2007A 4.00 - 5.00 April 15, 2007 GSD G.O. Bonds, Series 2008A 4.00 - 5.00 March 15, 2008 GSD G.O. Improvement and Refunding Bonds, Series 2010A 2.75 - 5.00 June 10, 2010 GSD G.O. Improvement Bonds Federally Taxable (BAB's), Series 2010B 5.71 June 10, 2010 GSD G.O. Refunding Bonds, Series 2010D 1.50 - 5.00 Sept. 21, 2010 GSD G.O. Refunding Bonds, Series 2011 2.00 - 5.00 Sept. 29, 2011 GSD G.O. Refunding Bonds, Series 2012 2.00 - 5.00 Feb. 2, 2012 GSD G.O. Refunding Bonds, Series 2012B .320 - 2.767 Aug. 15, 2012 GSD G.O. Refunding Bonds, Series 2013 2.00 - 5.00 Feb. 21, 2013 GSD G.O. Improvement Bonds, Series 2013A 3.00 - 5.00 May 9, 2013 GSD G.O. Refunding Bonds, Series 2015A 5.00 Feb. 19, 2015 GSD G.O. Refunding Bonds, Series 2015B (Taxable) .30 - 3.493 Feb. 19, 2015 GSD G.O. Improvement Bonds, Series 2015C 4.00 - 5.00 July 30, 2015 GSD G.O. Refunding Bonds, Series 2016 2.00 - 5.00 June 1, 2016
Total General Obligation Bonds Payable for School Purposes
Total General Obligation Bonds Payable - General Services District
See accompanying auditors' report.
THE METROPOLITAN GOVERNMENT OF NASHVILLE AND DAVIDSON COUNTY
SCHEDULE OF BONDS PAYABLE
June 30, 2016
G-14

Principal Interest toAmount Maturity
Date of Final Amount of Outstanding as ofMaturity Issue
Nov. 14, 2016 $ 48,367,055 $ 6,764,226 $ 169,105 Feb. 1, 2026 113,783,394 5,350,167 106,996 May 15, 2030 125,908,003 8,701,651 646,261 Jan. 1, 2028 174,880,073 11,787,370 1,178,738 July 1, 2026 159,008,728 114,844,062 20,410,019 July 1, 2034 138,046,756 138,046,756 117,626,973 July 1, 2024 144,150,016 115,689,585 21,307,818 July 1, 2023 49,712,377 40,285,121 9,485,643 July 1, 2025 154,956,701 142,194,316 40,006,138 Aug. 1, 2027 6,440,000 6,440,000 2,493,600 July 1, 2024 67,480,283 64,066,483 7,342,240 July 1, 2027 138,755,487 134,538,871 56,457,758 Jan. 1, 2033 253,070,885 38,396,473 10,806,806 July 1, 2026 33,884,829 33,884,829 13,043,788 July 1, 2029 72,314,470 70,888,766 12,137,071 July 1, 2034 240,454,031 240,454,031 130,193,530 Jan. 1, 2033 231,949,343 231,949,343 125,544,582
2,153,162,431 1,404,282,050 568,957,066
Nov. 14, 2016 2,972,945 415,774 10,395 Feb. 1, 2026 69,160,188 3,251,956 65,048 May 15, 2030 58,421,307 3,750,366 270,256 Jan. 1, 2028 95,095,340 6,409,673 640,967 July 1, 2026 114,567,598 84,153,120 14,283,046 July 1, 2034 70,516,649 70,516,649 60,085,872 July 1, 2024 120,126,326 96,409,047 17,756,708 July 1, 2023 32,574,740 25,336,996 5,824,975 July 1, 2025 53,280,200 48,891,994 13,755,684 July 1, 2024 62,161,564 59,016,832 6,763,533 July 1, 2027 82,814,365 80,297,734 33,696,062 Jan. 1, 2033 84,932,213 12,886,103 3,626,833 July 1, 2026 22,804,914 22,804,914 8,778,632 July 1, 2029 30,240,838 29,644,630 5,075,543 July 1, 2034 97,563,777 97,563,777 52,825,784 Jan. 1, 2033 78,790,586 78,790,586 42,448,646
1,076,023,550 720,140,151 265,907,984
$ 3,229,185,981 $ 2,124,422,201 $ 834,865,050
See accompanying auditors' report.
THE METROPOLITAN GOVERNMENT OF NASHVILLE AND DAVIDSON COUNTY
SCHEDULE OF BONDS PAYABLE (CONTINUED)
June 30, 2016
June 30, 2016 June 30, 2016
G-15

Description Interest RateGENERAL OBLIGATION BONDS PAYABLE USD G.O. Bonds, Series 2006B 4.00 - 5.00 June 15, 2006 USD G.O. Refunding Bonds, Series 2007A 4.00 - 5.00 April 15, 2007 USD G.O. Bonds, Series 2008A 4.00 - 5.00 March 15, 2008 USD G.O. Improvement and Refunding Bonds, Series 2010A 2.75 - 5.00 June 10, 2010 USD G.O. Improvement Bonds Federally Taxable (BAB's), Series 2010B 5.71 June 10, 2010 USD G.O. Refunding Bonds, Series 2010D 1.50 - 5.00 Sept. 21, 2010 USD G.O. Refunding Bonds, Series 2011 2.00 - 5.00 Sept. 29, 2011 USD G.O. Refunding Bonds, Series 2012 2.00 - 5.00 Feb. 2, 2012 USD G.O. Refunding Bonds, Series 2012B .320 - 2.767 Aug. 15, 2012 USD G.O. Refunding Bonds, Series 2013 2.00 - 5.00 Feb. 21, 2013 USD G.O. Improvement Bonds, Series 2013A 3.00 - 5.00 May 9, 2013 USD G.O. Refunding Bonds, Series 2015A 5.00 Feb. 19, 2015 USD G.O. Refunding Bonds, Series 2015B (Taxable) .30 - 3.493 Feb. 19, 2015 USD G.O. Improvement Bonds, Series 2015C 4.00 - 5.00 July 30, 2015 USD G.O. Refunding Bonds, Series 2016 2.00 - 5.00 June 1, 2016
Total General Obligation Bonds Payable (governmental activities)
USD G.O. Improvement and Refunding Bonds, Series 2010A (1) 2.21 - 5.71 June 10, 2010 USD G.O. Refunding Bonds, Series 2010D (1) 1.50 - 5.00 Sept. 21, 2010 USD G.O. Refunding Bonds, Series 2011 (1) 2.00 - 5.00 Sept. 29, 2011 District Energy System Revenue Refunding Bonds, Series 2012A 2.00 - 5.00 Aug. 15, 2012 USD G.O. Refunding Bonds, Series 2012B (1) .320 - 2.767 Aug. 15, 2012 USD G.O. Improvement Bonds, Series 2013A (1) 3.00 - 5.00 May 9, 2013 USD G.O. Improvement Bonds, Series 2015C (1) 4.00 - 5.00 July 30, 2015 USD G.O. Refunding Bonds, Series 2016 (1) 2.00 - 5.00 June 1, 2016
Total General Obligation Bonds Payable (business-type activities)
Total General Obligation Bonds Payable - Urban Services District
REVENUE BONDS PAYABLE Dept. of Water and Sewerage Revenue Refunding Bonds, Series 2008A 3.25 - 5.25 Feb. 15, 2008 Dept. of Water and Sewerage Revenue Refunding Bonds, Series 2010A 3.00 - 5.00 Dec. 9, 2010 Dept. of Water and Sewerage Revenue Bonds Federally Taxable (BAB's), Series 2010B 6.393 - 6.568 Dec. 9, 2010 Dept. of Water and Sewerage Revenue Bonds Federally Taxable, Series 2010C 6.693 Dec. 9, 2010 Dept. of Water and Sewerage Revenue Refunding Bonds Federally Taxable, Series 2010D 4.255 - 4.791 Dec. 9, 2010 Dept. of Water and Sewerage Revenue Refunding Bonds, Series 2012 1.00 - 5.00 Feb. 2, 2012 Dept. of Water and Sewerage Revenue Bonds, Series 2013 3.00 - 5.00 Apr. 25, 2013
Total Revenue Bonds Payable - Department of Water and Sewerage
(1) Portions of these USD G.O. Bonds are directly related to the District Energy System, a proprietary fund, and intended to be repaid from resources of the District Energy System. Therefore, the liability is reported in business-type activities.
SCHEDULE OF BONDS PAYABLE (CONTINUED)
June 30, 2016
See accompanying auditors' report.
G-16
Date of Issue
THE METROPOLITAN GOVERNMENT OF NASHVILLE AND DAVIDSON COUNTY

Principal Interest toAmount Maturity
Date of Final Amount of Outstanding as ofMaturity Issue
Feb. 1, 2026 $ 20,371,418 $ 957,877 $ 19,156 May 15, 2030 2,560,690 172,983 12,731 Jan. 1, 2028 38,024,587 2,562,957 256,295 July 1, 2026 22,899,473 18,146,951 2,456,294 July 1, 2034 43,441,595 43,441,595 37,015,743 July 1, 2024 25,925,413 20,806,800 3,832,216 July 1, 2023 6,688,796 6,688,796 1,649,775 July 1, 2025 18,873,099 17,318,690 4,872,585 July 1, 2024 7,471,610 7,093,623 812,954 July 1, 2027 23,915,148 23,188,395 9,730,756 Jan. 1, 2033 30,135,613 4,572,241 1,286,872 July 1, 2026 3,040,257 3,040,257 1,170,332 July 1, 2029 1,424,692 1,396,604 239,117 July 1, 2034 8,531,298 8,531,298 4,619,261 Jan. 1, 2033 27,571,610 27,571,610 14,933,118
280,875,299 185,490,677 82,907,205
July 1, 2034 274,201 265,867 27,130 July 1, 2024 1,158,245 929,568 171,207 July 1, 2023 504,087 504,087 171,231 Oct. 1, 2033 47,450,000 42,870,000 19,286,200 July 1, 2024 3,231,543 3,068,062 351,611 Jan. 1, 2033 6,526,289 990,183 278,690 July 1, 2034 685,894 685,894 371,376 Jan. 1, 2033 5,663,461 5,663,461 3,134,963
65,493,720 54,977,122 23,792,408
$ 346,369,019 $ 240,467,799 $ 106,699,613
Jan. 1, 2022 $ 122,530,000 $ 84,290,000 $ 15,886,888 July 1, 2027 104,050,000 82,575,000 25,887,500 July 1, 2037 135,000,000 135,000,000 148,233,505 July 1, 2041 75,000,000 75,000,000 119,793,656 July 1, 2018 7,610,000 7,610,000 541,098 July 1, 2023 129,625,000 122,505,000 22,532,375 July 1, 2033 237,930,000 237,930,000 209,377,775
$ 811,745,000 $ 744,910,000 $ 542,252,797
G-17
THE METROPOLITAN GOVERNMENT OF NASHVILLE AND DAVIDSON COUNTY
SCHEDULE OF BONDS PAYABLE (CONTINUED)
June 30, 2016
See accompanying auditors' report.
June 30, 2016 June 30, 2016
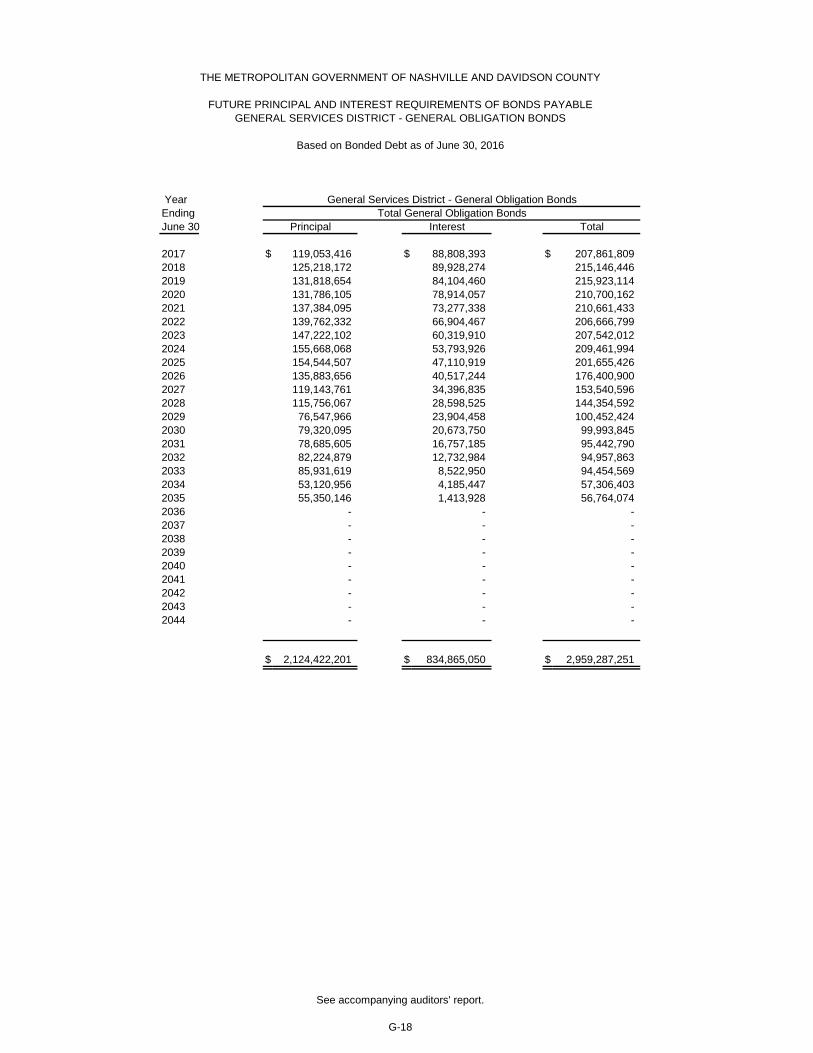
Year EndingJune 30 Principal Interest
2017 $ 119,053,416 $ 88,808,393 $ 207,861,809 2018 125,218,172 89,928,274 215,146,446 2019 131,818,654 84,104,460 215,923,114 2020 131,786,105 78,914,057 210,700,162 2021 137,384,095 73,277,338 210,661,433 2022 139,762,332 66,904,467 206,666,799 2023 147,222,102 60,319,910 207,542,012 2024 155,668,068 53,793,926 209,461,994 2025 154,544,507 47,110,919 201,655,426 2026 135,883,656 40,517,244 176,400,900 2027 119,143,761 34,396,835 153,540,596 2028 115,756,067 28,598,525 144,354,592 2029 76,547,966 23,904,458 100,452,424 2030 79,320,095 20,673,750 99,993,845 2031 78,685,605 16,757,185 95,442,790 2032 82,224,879 12,732,984 94,957,863 2033 85,931,619 8,522,950 94,454,569 2034 53,120,956 4,185,447 57,306,403 2035 55,350,146 1,413,928 56,764,074 2036 - - - 2037 - - - 2038 - - - 2039 - - - 2040 - - - 2041 - - - 2042 - - - 2043 - - - 2044 - - -
$ 2,124,422,201 $ 834,865,050 $ 2,959,287,251
THE METROPOLITAN GOVERNMENT OF NASHVILLE AND DAVIDSON COUNTY
FUTURE PRINCIPAL AND INTEREST REQUIREMENTS OF BONDS PAYABLEGENERAL SERVICES DISTRICT - GENERAL OBLIGATION BONDS
See accompanying auditors' report.
G-18
Based on Bonded Debt as of June 30, 2016
Total
General Services District - General Obligation BondsTotal General Obligation Bonds
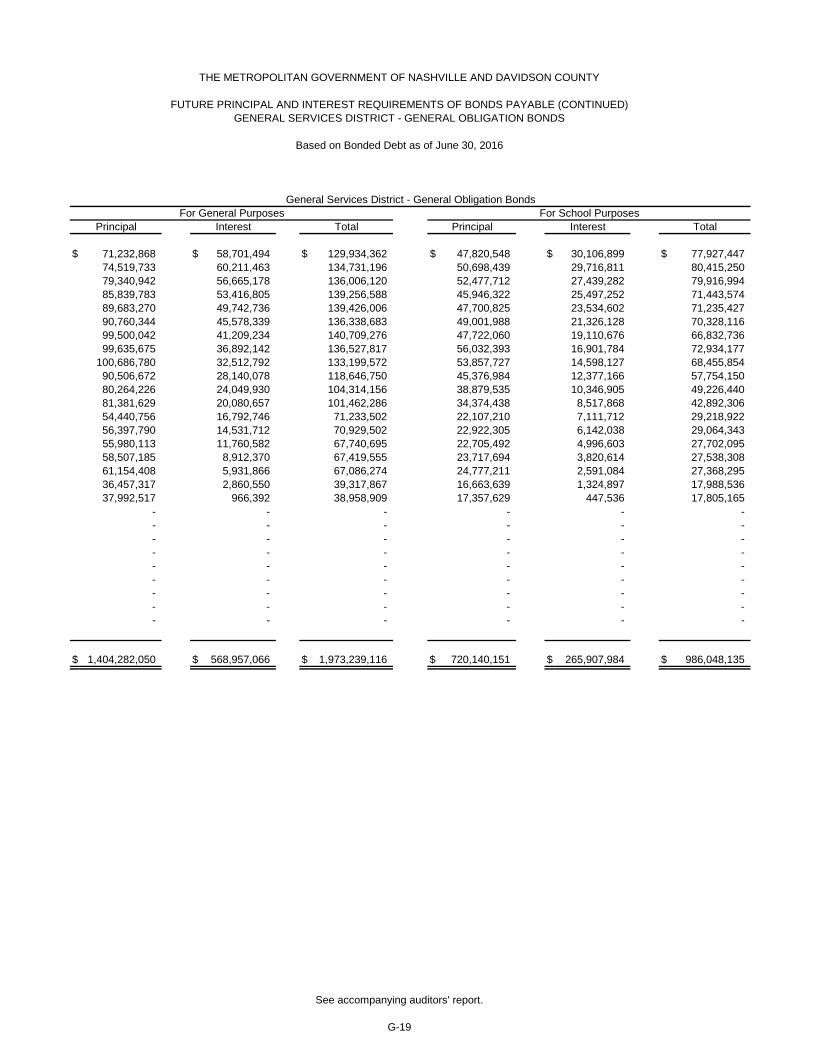
General Services District - General Obligation BondsFor School Purposes
Principal Interest Total Principal Interest Total
$ 71,232,868 $ 58,701,494 $ 129,934,362 $ 47,820,548 $ 30,106,899 $ 77,927,447 74,519,733 60,211,463 134,731,196 50,698,439 29,716,811 80,415,250 79,340,942 56,665,178 136,006,120 52,477,712 27,439,282 79,916,994 85,839,783 53,416,805 139,256,588 45,946,322 25,497,252 71,443,574 89,683,270 49,742,736 139,426,006 47,700,825 23,534,602 71,235,427 90,760,344 45,578,339 136,338,683 49,001,988 21,326,128 70,328,116 99,500,042 41,209,234 140,709,276 47,722,060 19,110,676 66,832,736 99,635,675 36,892,142 136,527,817 56,032,393 16,901,784 72,934,177
100,686,780 32,512,792 133,199,572 53,857,727 14,598,127 68,455,854 90,506,672 28,140,078 118,646,750 45,376,984 12,377,166 57,754,150 80,264,226 24,049,930 104,314,156 38,879,535 10,346,905 49,226,440 81,381,629 20,080,657 101,462,286 34,374,438 8,517,868 42,892,306 54,440,756 16,792,746 71,233,502 22,107,210 7,111,712 29,218,922 56,397,790 14,531,712 70,929,502 22,922,305 6,142,038 29,064,343 55,980,113 11,760,582 67,740,695 22,705,492 4,996,603 27,702,095 58,507,185 8,912,370 67,419,555 23,717,694 3,820,614 27,538,308 61,154,408 5,931,866 67,086,274 24,777,211 2,591,084 27,368,295 36,457,317 2,860,550 39,317,867 16,663,639 1,324,897 17,988,536 37,992,517 966,392 38,958,909 17,357,629 447,536 17,805,165
- - - - - - - - - - - - - - - - - - - - - - - - - - - - - - - - - - - - - - - - - - - - - - - - - - - - - -
$ 1,404,282,050 $ 568,957,066 $ 1,973,239,116 $ 720,140,151 $ 265,907,984 $ 986,048,135
See accompanying auditors' report.
G-19
For General Purposes
Based on Bonded Debt as of June 30, 2016
GENERAL SERVICES DISTRICT - GENERAL OBLIGATION BONDS
THE METROPOLITAN GOVERNMENT OF NASHVILLE AND DAVIDSON COUNTY
FUTURE PRINCIPAL AND INTEREST REQUIREMENTS OF BONDS PAYABLE (CONTINUED)

YearEnding Urban Services District - General Obligation BondsJune 30 Principal Interest Total
2017 $ 12,181,584 $ 10,440,473 $ 22,622,057 2018 13,931,828 10,582,551 24,514,379 2019 13,686,346 9,932,491 23,618,837 2020 12,048,895 9,404,551 21,453,446 2021 12,620,905 8,869,043 21,489,948 2022 12,812,668 8,252,550 21,065,218 2023 13,562,898 7,630,047 21,192,945 2024 15,246,932 7,007,590 22,254,522 2025 15,115,493 6,337,957 21,453,450 2026 13,691,344 5,659,226 19,350,570 2027 14,716,239 4,967,593 19,683,832 2028 14,323,933 4,249,272 18,573,205 2029 11,192,034 3,620,213 14,812,247 2030 11,589,905 3,128,483 14,718,388 2031 12,009,395 2,551,167 14,560,562 2032 12,505,121 1,950,523 14,455,644 2033 13,033,381 1,308,564 14,341,945 2034 9,634,044 624,503 10,258,547 2035 6,564,854 182,816 6,747,670 2036 - - - 2037 - - - 2038 - - - 2039 - - - 2040 - - - 2041 - - - 2042 - - - 2043 - - - 2044 - - -
$ 240,467,799 $ 106,699,613 $ 347,167,412
See accompanying auditors' report.
G-20
THE METROPOLITAN GOVERNMENT OF NASHVILLE AND DAVIDSON COUNTY
FUTURE PRINCIPAL AND INTEREST REQUIREMENTS OF BONDS PAYABLE (CONTINUED)URBAN SERVICES DISTRICT - GENERAL OBLIGATION BONDS
Based on Bonded Debt as of June 30, 2016

YearEnding Department of Water and Sewerage ServicesJune 30 Principal Interest Total
2017 $ 28,795,000 $ 39,028,808 $ 67,823,808 2018 37,475,000 37,476,030 74,951,030 2019 38,225,000 35,654,524 73,879,524 2020 39,120,000 33,743,634 72,863,634 2021 40,180,000 31,823,496 72,003,496 2022 40,985,000 29,812,021 70,797,021 2023 31,780,000 27,663,509 59,443,509 2024 22,235,000 26,448,384 48,683,384 2025 15,945,000 25,539,009 41,484,009 2026 16,720,000 24,747,784 41,467,784 2027 17,545,000 23,901,434 41,446,434 2028 18,430,000 22,945,607 41,375,607 2029 19,185,000 21,945,278 41,130,278 2030 19,990,000 20,883,312 40,873,312 2031 20,905,000 19,699,453 40,604,453 2032 21,860,000 18,451,344 40,311,344 2033 22,880,000 17,135,511 40,015,511 2034 23,940,000 15,759,250 39,699,250 2035 25,055,000 14,319,833 39,374,833 2036 26,220,000 12,814,244 39,034,244 2037 27,445,000 11,239,340 38,684,340 2038 28,720,000 9,588,611 38,308,611 2039 30,025,000 7,852,927 37,877,927 2040 31,330,000 6,034,798 37,364,798 2041 32,680,000 4,145,639 36,825,639 2042 34,015,000 2,256,719 36,271,719 2043 16,280,000 1,003,400 17,283,400 2044 16,945,000 338,898 17,283,898
$ 744,910,000 $ 542,252,797 $ 1,287,162,797
Revenue Bonds
See accompanying auditors' report.
G-21
THE METROPOLITAN GOVERNMENT OF NASHVILLE AND DAVIDSON COUNTY
FUTURE PRINCIPAL AND INTEREST REQUIREMENTS OF BONDS PAYABLE (CONTINUED)DEPARTMENT OF WATER AND SEWERAGE SERVICES
Based on Bonded Debt as of June 30, 2016

SchoolDebt Debt
General Service Service SchoolSOURCE OF REVENUE: Fund Fund Fund Funds Total
Property Taxes - Current Year $ 389,831,200 $ 89,225,400 $ 37,968,200 $ 298,683,500 $ 815,708,300Property Taxes - Non Current Year 33,573,400 240,000 80,000 3,834,700 37,728,100Local Option Sales Tax 121,560,100 3,000,500 46,258,200 217,353,900 388,172,700Other Taxes, Licenses, and Permits 138,385,200 - - 10,839,300 149,224,500Fines, Forfeits, and Penalties 9,840,100 303,000 - 1,200 10,144,300Revenues From Use of Money or Property 0 - 97,000 - 97,000Other Agencies - Federal Direct 330,000 - - 180,000 510,000Other Agencies - Federal Through State 1,868,000 - - - 1,868,000Other Agencies - Other Pass - Through 6,054,200 - - - 6,054,200Other Agencies - State Direct 82,601,500 4,053,100 - 290,294,100 376,948,700Other Agencies - Other Governments 6,559,700 - - 5,000 6,564,700Commissions and Fees 13,388,300 - - - 13,388,300Charges for Current Services 33,699,000 - - 1,230,000 34,929,000Compensation from Property 1,443,100 - - 1,628,000 3,071,100Contributions and Gifts 300 - - 600,000 600,300Miscellaneous 4,297,900 4,843,400 - 150,000 9,291,300
Subtotal 843,432,000 101,665,400 84,403,400 824,799,700 1,854,300,500
Operating Transfers In 14,966,800 30,137,600 - 2,500,000 47,604,400 Non-Operating Transfers In 8,863,500 - - - 8,863,500
Subtotal 23,830,300 30,137,600 - 2,500,000 56,467,900
Appropriated Unreserved Fund Balances 43,372,400 5,000,000 - 16,000,000 64,372,400
Total Available for GSD Appropriations $ 910,634,700 $ 136,803,000 $ 84,403,400 $ 843,299,700 $ 1,975,140,800
* Excerpts from the Metropolitan Council Budget Substitute Bill Number BL2016-232 for the 2016-2017 fiscal year.
For the Year July 1, 2016 Through June 30, 2017
See accompanying auditors' report.
G-22
THE METROPOLITAN GOVERNMENT OF NASHVILLE AND DAVIDSON COUNTY
BUDGETARY SCHEDULE OF ESTIMATED REVENUES AND FUND BALANCESTO SUPPORT APPROPRIATIONS*
GENERAL SERVICES DISTRICT
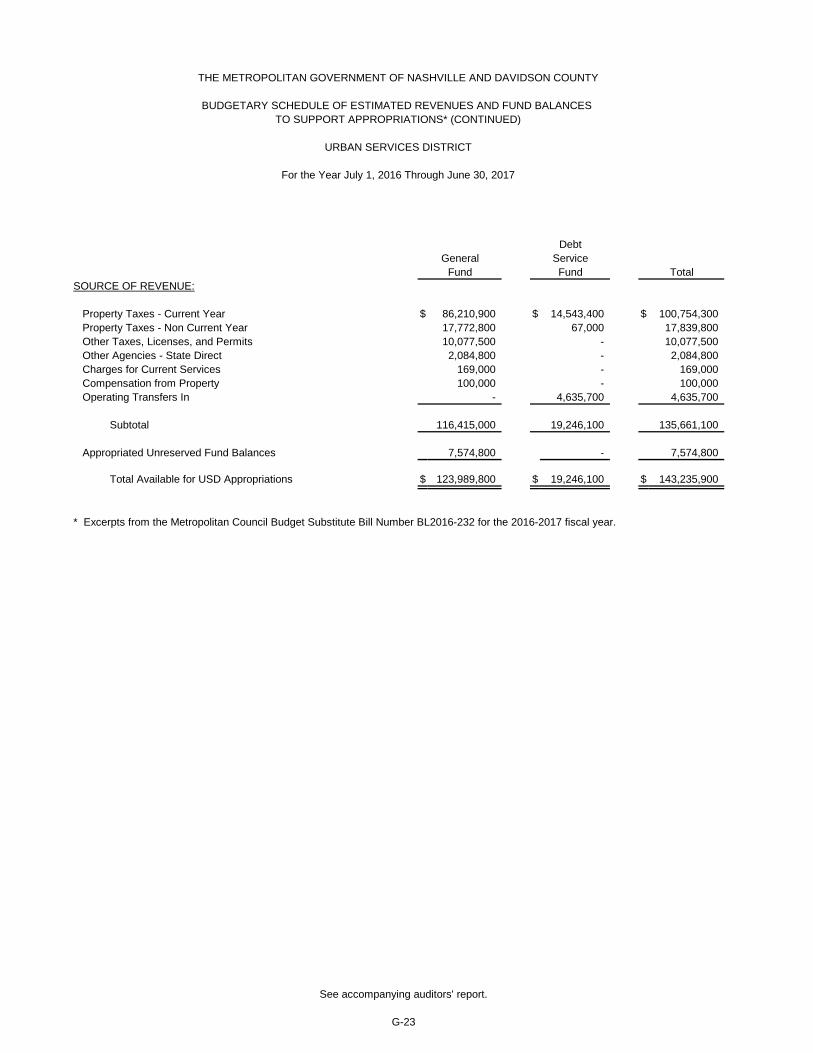
DebtGeneral Service
Fund Fund TotalSOURCE OF REVENUE:
Property Taxes - Current Year $ 86,210,900 $ 14,543,400 $ 100,754,300 Property Taxes - Non Current Year 17,772,800 67,000 17,839,800 Other Taxes, Licenses, and Permits 10,077,500 - 10,077,500 Other Agencies - State Direct 2,084,800 - 2,084,800 Charges for Current Services 169,000 - 169,000 Compensation from Property 100,000 - 100,000 Operating Transfers In - 4,635,700 4,635,700
Subtotal 116,415,000 19,246,100 135,661,100
Appropriated Unreserved Fund Balances 7,574,800 - 7,574,800
Total Available for USD Appropriations $ 123,989,800 $ 19,246,100 $ 143,235,900
* Excerpts from the Metropolitan Council Budget Substitute Bill Number BL2016-232 for the 2016-2017 fiscal year.
G-23
THE METROPOLITAN GOVERNMENT OF NASHVILLE AND DAVIDSON COUNTY
BUDGETARY SCHEDULE OF ESTIMATED REVENUES AND FUND BALANCES TO SUPPORT APPROPRIATIONS* (CONTINUED)
URBAN SERVICES DISTRICT
For the Year July 1, 2016 Through June 30, 2017
See accompanying auditors' report.

Duplicated ByGeneral Urban Interdistrict AppropriationServices Services Interfund By Function
GENERAL FUND District District Transfers And/Or Fund
General Government $ 221,135,500 $ 26,375,400 $ - $ 247,510,900 Fiscal Administration 24,549,700 - - 24,549,700 Administration of Justice 60,488,000 - - 60,488,000 Law Enforcement and Care of Prisoners 248,106,400 481,000 481,000 248,106,400 Fire Prevention and Control 51,446,900 67,769,000 - 119,215,900 Regulation, Inspection, & Economic Development 43,882,100 1,874,300 - 45,756,400 Social Services 8,007,500 - - 8,007,500 Health and Hospitals 72,498,000 - - 72,498,000 Public Library System 28,831,500 - - 28,831,500 Recreational, Cultural, Conservation & Community Support 54,002,600 300,000 - 54,302,600 Infrastructure and Transportation 73,682,200 24,429,000 - 98,111,200 Transfers 24,004,300 2,761,100 - 26,765,400
Total General Funds 910,634,700 123,989,800 481,000 1,034,143,500
DEBT SERVICE FUNDS (See detail on succeeding pages) 221,206,400 19,246,100 - 240,452,500
SCHOOL FUNDS (See detail on succeeding pages) 843,299,700 - - 843,299,700
Total Appropriations By District 1,975,140,800 143,235,900 481,000 2,117,895,700
LESS INTERFUND TRANSFER: GSD Operating to GSD Debt (3,521,300) - - (3,521,300) GSD General to GSD Debt (24,004,300) - - (24,004,300) Schools to GSD Debt (96,800) - - (96,800) Schools to GSD General (192,000) - - (192,000) USD General to USD Debt - (2,761,100) - (2,761,100)
Net Appropriation by District $ 1,947,326,400 $ 140,474,800 $ 481,000 $ 2,087,320,200
* Excerpts from the Metropolitan Council Budget Substitute Bill Number BL2016-232 for the 2016-2017 fiscal year.
G-24
THE METROPOLITAN GOVERNMENT OF NASHVILLE AND DAVIDSON COUNTY
BUDGETARY SCHEDULE OF APPROPRIATIONS BY FUNCTION AND/OR FUNDS *
For the Year July 1, 2016 Through June 30, 2017
See accompanying auditors' report.
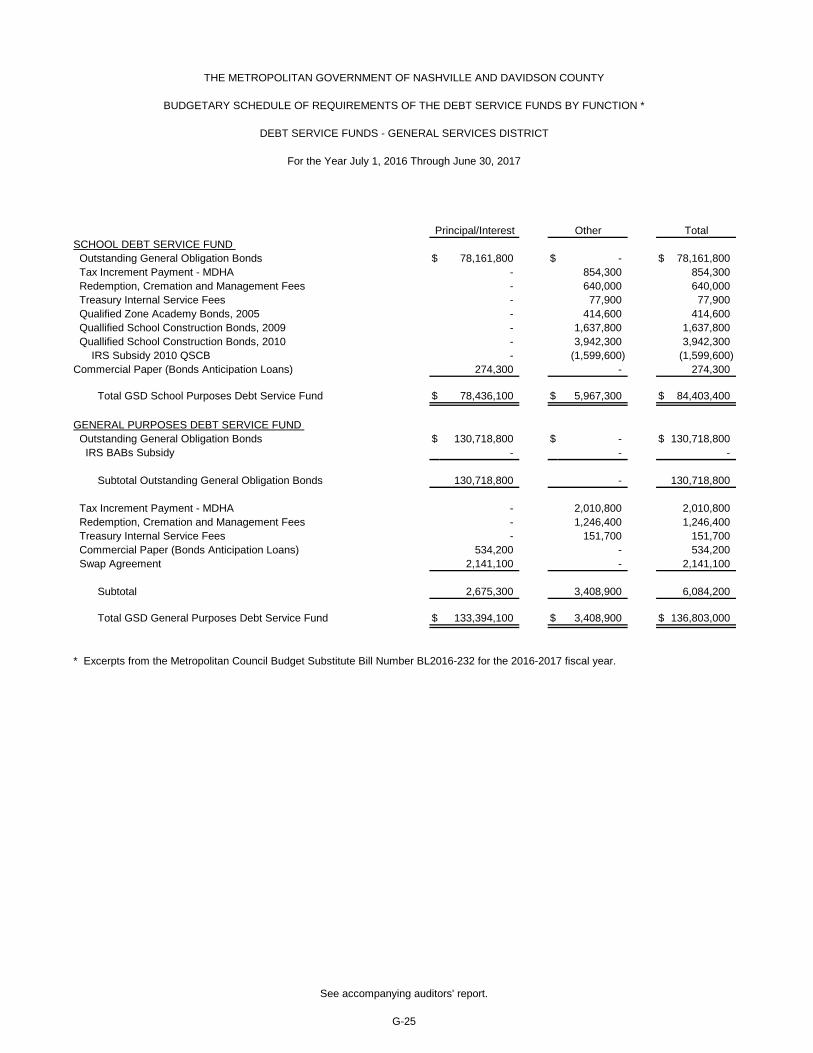
THE METROPOLITAN GOVERNMENT OF NASHVILLE AND DAVIDSON COUNTY
BUDGETARY SCHEDULE OF REQUIREMENTS OF THE DEBT SERVICE FUNDS BY FUNCTION *
DEBT SERVICE FUNDS - GENERAL SERVICES DISTRICT
For the Year July 1, 2016 Through June 30, 2017
Principal/Interest Other TotalSCHOOL DEBT SERVICE FUND Outstanding General Obligation Bonds $ 78,161,800 $ - $ 78,161,800 Tax Increment Payment - MDHA - 854,300 854,300 Redemption, Cremation and Management Fees - 640,000 640,000 Treasury Internal Service Fees - 77,900 77,900 Qualified Zone Academy Bonds, 2005 - 414,600 414,600 Quallified School Construction Bonds, 2009 - 1,637,800 1,637,800 Quallified School Construction Bonds, 2010 - 3,942,300 3,942,300 IRS Subsidy 2010 QSCB - (1,599,600) (1,599,600)Commercial Paper (Bonds Anticipation Loans) 274,300 - 274,300
Total GSD School Purposes Debt Service Fund $ 78,436,100 $ 5,967,300 $ 84,403,400
GENERAL PURPOSES DEBT SERVICE FUND Outstanding General Obligation Bonds $ 130,718,800 $ - $ 130,718,800 IRS BABs Subsidy - - -
Subtotal Outstanding General Obligation Bonds 130,718,800 - 130,718,800
Tax Increment Payment - MDHA - 2,010,800 2,010,800 Redemption, Cremation and Management Fees - 1,246,400 1,246,400 Treasury Internal Service Fees - 151,700 151,700 Commercial Paper (Bonds Anticipation Loans) 534,200 - 534,200 Swap Agreement 2,141,100 - 2,141,100
Subtotal 2,675,300 3,408,900 6,084,200
Total GSD General Purposes Debt Service Fund $ 133,394,100 $ 3,408,900 $ 136,803,000
* Excerpts from the Metropolitan Council Budget Substitute Bill Number BL2016-232 for the 2016-2017 fiscal year.
See accompanying auditors' report.
G-25
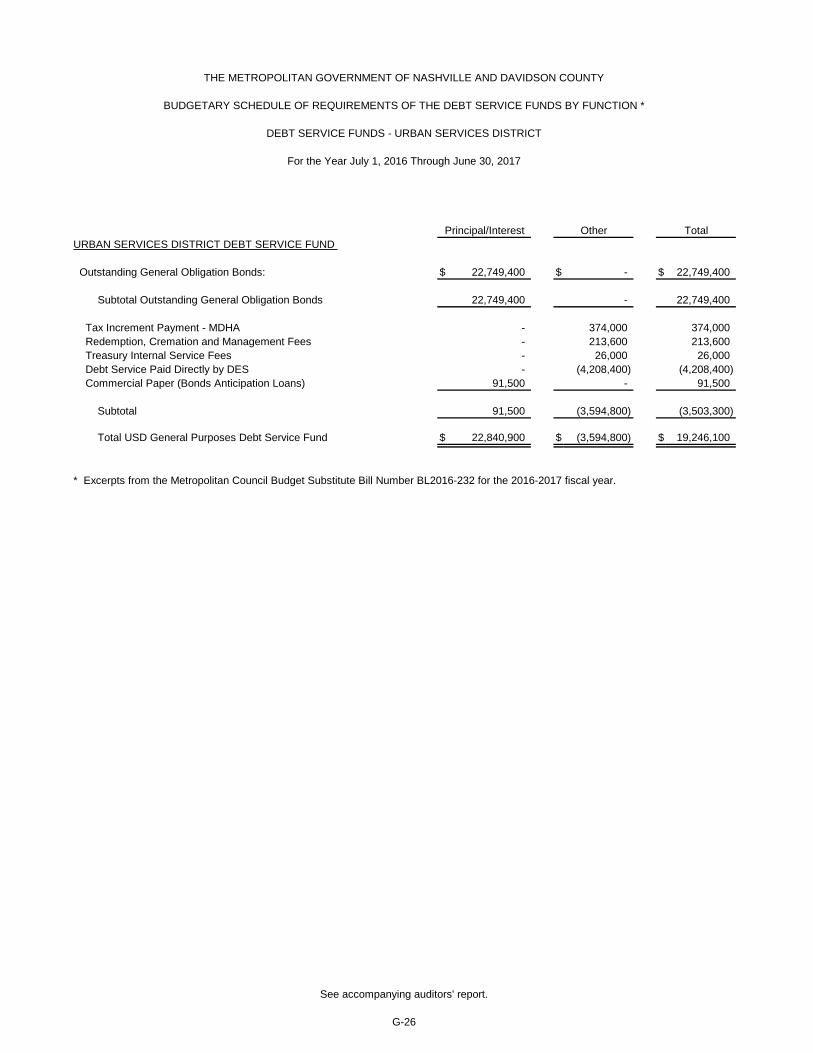
Principal/Interest Other TotalURBAN SERVICES DISTRICT DEBT SERVICE FUND
Outstanding General Obligation Bonds: $ 22,749,400 $ - $ 22,749,400
Subtotal Outstanding General Obligation Bonds 22,749,400 - 22,749,400
Tax Increment Payment - MDHA - 374,000 374,000 Redemption, Cremation and Management Fees - 213,600 213,600 Treasury Internal Service Fees - 26,000 26,000 Debt Service Paid Directly by DES - (4,208,400) (4,208,400) Commercial Paper (Bonds Anticipation Loans) 91,500 - 91,500
Subtotal 91,500 (3,594,800) (3,503,300)
Total USD General Purposes Debt Service Fund $ 22,840,900 $ (3,594,800) $ 19,246,100
* Excerpts from the Metropolitan Council Budget Substitute Bill Number BL2016-232 for the 2016-2017 fiscal year.
See accompanying auditors' report.
G-26
THE METROPOLITAN GOVERNMENT OF NASHVILLE AND DAVIDSON COUNTY
BUDGETARY SCHEDULE OF REQUIREMENTS OF THE DEBT SERVICE FUNDS BY FUNCTION *
DEBT SERVICE FUNDS - URBAN SERVICES DISTRICT
For the Year July 1, 2016 Through June 30, 2017
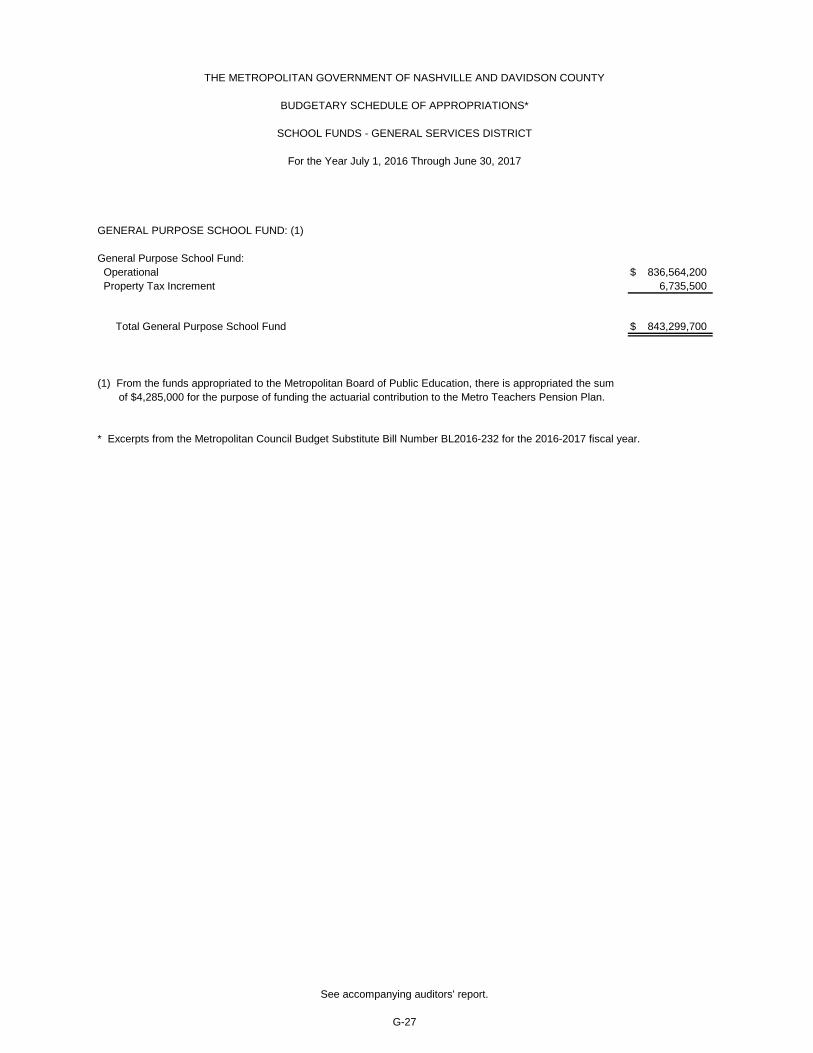
GENERAL PURPOSE SCHOOL FUND: (1)
General Purpose School Fund: Operational $ 836,564,200 Property Tax Increment 6,735,500
Total General Purpose School Fund $ 843,299,700
(1) From the funds appropriated to the Metropolitan Board of Public Education, there is appropriated the sum of $4,285,000 for the purpose of funding the actuarial contribution to the Metro Teachers Pension Plan.
* Excerpts from the Metropolitan Council Budget Substitute Bill Number BL2016-232 for the 2016-2017 fiscal year.
See accompanying auditors' report.
G-27
THE METROPOLITAN GOVERNMENT OF NASHVILLE AND DAVIDSON COUNTY
BUDGETARY SCHEDULE OF APPROPRIATIONS*
SCHOOL FUNDS - GENERAL SERVICES DISTRICT
For the Year July 1, 2016 Through June 30, 2017

THE METROPOLITAN GOVERNMENT OF NASHVILLE AND DAVIDSON COUNTY
SUMMARY OF SALARIES AND SURETY BONDS OF PRINCIPAL OFFICIALS
June 30, 2016
AMOUNTANNUAL OF SURETY
NAME OF OFFICIAL TITLE SALARY BOND
Megan Barry Mayor $ 180,000 $ 50,000 Talia Lomax-O'dneal Director of Finance 165,000 250,000 Tom Eddlemon Treasurer 116,246 2,000,000 Jeff Gossage Purchasing Agent 114,545 - (1)Kim McDoniel Chief Accountant 129,134 - (1)Veronica Frazier Human Resources Director 137,086 - (1)Richard R. Rooker Circuit Court Clerk 137,198 100,000 Richard R. Rooker Probate Clerk - 250,000 William B. Garrett, Jr. Register of Deeds 126,388 150,000 Charles E. Cardwell Trustee 125,453 14,000,000 Brenda P. Wynn County Clerk 121,624 500,000 Howard C. Gentry, Jr. Criminal Court Clerk 137,198 150,000 J. Daron Hall Sheriff 151,718 100,000 George L. Rooker, Jr. Assessor of Property 125,453 10,000 Maria Salas Clerk & Master 125,453 50,000 David A. Smith Juvenile Court Clerk 125,453 100,000 Peggy Duncan Mathes Public Administrator - 100,000 Michael M. Castellarin Public Trustee - 200,000 Richard R. Rooker Commissioner & Receiver - 100,000 Richard R. Rooker Official Revenue - 100,000 Monica C. Fawknotson Executive Director Sports Authority 99,823 50,000 Chris Henson MNPS Assistant Superintendent of
Business, Facility and Services 159,120 1,000,000
(1) A $250,000 blanket surety bond is in place for these officials rather than separate bonds.
See accompanying auditors' report.
G-28
THE METROPOLITAN GOVERNMENT OF NASHVILLE AND DAVIDSON COUNTY
STATISTICAL SECTION (UNAUDITED)
TABLE OF CONTENTS This section of the Comprehensive Annual Financial Report presents detailed information as a context for understanding what the information in the financial statements, note disclosures and required supplementary information says about the Government’s overall financial health. Page Numbers FINANCIAL TRENDS H - 2
These schedules contain trend information to help the reader understand how the Government’s financial performance and well-being have changed over time.
REVENUE CAPACITY H - 16
These schedules contain information to help the reader assess the Government’s most significant local revenue source, the property tax.
DEBT CAPACITY H - 24
These schedules present information to help the reader assess the affordability of the Government’s current levels of outstanding debt and the Government’s ability to issue additional debt in the future.
DEMOGRAPHIC AND ECONOMIC INFORMATION H - 32
These schedules offer demographic and economic indicators to help the reader understand the environment within which the Government’s financial activities take place.
OPERATING INFORMATION H - 34
These schedules contain service and infrastructure data to help the reader understand how the information in the Government’s financial report relates to the services the Government provides and the activities it performs.
Sources: Unless otherwise noted, the information in these schedules is derived from the Comprehensive Annual Financial Reports for the relevant year.
H-1

2007 2008 (1) 2009 2010
Governmental activities Net investment in capital assets $ 1,042,013 $ 1,044,125 $ 1,083,097 $ 1,099,333 Restricted 63,371 47,527 22,917 31,994 Unrestricted 159,368 86,741 (97,423) (383,624)
Total governmental activities net position 1,264,752 1,178,393 1,008,591 747,703 Business-type activities Net investment in capital assets 1,061,440 1,160,088 1,196,149 1,217,101 Restricted 73,134 29,090 22,587 21,481 Unrestricted 22,439 28,682 14,840 26,925 Total business-type activities net position 1,157,013 1,217,860 1,233,576 1,265,507 Primary government Net investment in capital assets 2,103,453 2,204,213 2,279,246 2,316,434 Restricted 136,505 76,617 45,504 53,475 Unrestricted 181,807 115,423 (82,583) (356,699) Total primary government net position $ 2,421,765 $ 2,396,253 $ 2,242,167 $ 2,013,210
(1) Beginning in 2008, the Government began recording its liability for other post employment benefits.
(2) In 2015, the Government implemented GASB Statement No. 68 which revised the reporting for its liability related to pensions. Amounts for prior years have not been restated.
H-2
(amounts expressed in thousands)
Unaudited - See Accompanying Accountants' Report
THE METROPOLITAN GOVERNMENT OF NASHVILLE AND DAVIDSON COUNTY
NET POSITION BY COMPONENTLAST TEN FISCAL YEARS(accrual basis of accounting)

2011 2012 2013 2014 2015 (2) 2016
$ 1,010,874 $ 924,393 $ 857,598 $ 955,256 $ 905,271 $ 817,83642,860 31,771 35,802 39,551 41,647 43,203
(564,405) (637,147) (683,464) (907,694) (1,269,590) (1,333,519)
489,329 319,017 209,936 87,113 (322,672) (472,480)
1,220,912 1,259,241 1,236,765 1,232,187 1,236,872 1,227,147
46,256 49,700 56,720 64,253 55,270 66,83738,908 32,057 27,268 37,930 41,747 36,937
1,306,076 1,340,998 1,320,753 1,334,370 1,333,889 1,330,921
2,231,786 2,183,634 2,094,363 2,187,443 2,142,143 2,044,98389,116 81,471 92,522 103,804 96,917 110,040
(525,497) (605,090) (656,196) (869,764) (1,227,843) (1,296,582)
$ 1,795,405 $ 1,660,015 $ 1,530,689 $ 1,421,483 $ 1,011,217 $ 858,441
H-3
LAST TEN FISCAL YEARS (CONTINUED)(accrual basis of accounting)
(amounts expressed in thousands)
Unaudited - See Accompanying Accountants' Report
THE METROPOLITAN GOVERNMENT OF NASHVILLE AND DAVIDSON COUNTY
NET POSITION BY COMPONENT

2007 2008 2009 2010ExpensesGovernmental activities General government $ 57,026 $ 69,053 $ 83,668 $ 85,444 Fiscal administration 33,876 24,837 34,264 35,358 Administration of justice 75,705 86,417 85,723 89,601 Law enforcement and care of prisoners 258,824 289,629 304,917 321,175 Fire prevention and control 128,067 148,089 143,912 150,117 Regulation and inspection 9,002 7,971 9,910 10,170 Conservation of natural resources 447 502 491 471 Public welfare 58,709 55,272 51,362 60,159 Public health and hospitals 111,396 130,293 131,677 170,662 Public library system 27,818 28,231 29,754 28,742 Public works, highways and streets 130,081 143,076 125,490 130,469 Recreational and cultural 72,024 72,547 76,290 68,667 Education 684,711 780,706 808,285 839,760 Interest and other debt related costs 75,581 77,559 85,651 80,460 Total governmental activities 1,723,267 1,914,182 1,971,394 2,071,255 Business-type activities Department of Water and Sewerage Services 157,581 165,833 177,291 173,215 District Energy System 21,018 19,428 20,206 17,853 Nashville Convention Center 7,246 7,601 7,572 7,134 Board of Fair Commissioners 4,116 4,360 4,428 4,195 Farmers Market 1,156 1,161 1,215 1,080 Police Secondary Employment 1,248 944 881 1,545 Surplus Property Auction 983 961 806 735 Municipal Auditorium 1,979 2,052 1,738 1,654 Police Impound 2,177 1,882 1,882 1,687 School Community Education 915 1,193 1,050 192 Stormwater Operations - - - 10,598 Community Education Commission - - - 358 Total business-type activities 198,419 205,415 217,069 220,246 Total primary government $ 1,921,686 $ 2,119,597 $ 2,188,463 $ 2,291,501 Program RevenuesGovernmental activities Charges for services: General government $ 7,808 $ 9,552 $ 7,292 $ 6,550 Fiscal administration 4,675 4,533 4,591 4,176 Administration of justice 35,213 39,554 34,567 34,344 Law enforcement and care of prisoners 26,787 29,806 31,053 31,282 Fire prevention and control 14,199 13,619 14,358 10,939 Regulation and inspection 12,093 10,587 7,060 7,552 Public welfare 1,291 1,166 1,313 1,367 Public health and hospitals 9,775 13,436 12,788 8,943 Public library system 665 634 579 494 Public works, highways and streets 9,673 10,184 9,295 9,343 Recreational and cultural 8,872 9,246 9,111 8,618 Education 17,946 17,203 16,216 18,225 Operating grants and contributions (1) 314,334 338,746 351,066 390,732 Capital grants and contributions (1) 42,275 48,808 56,163 41,648 Total governmental activities 505,606 547,074 555,452 574,213
(1) Operating and capital grants and contributions primarily represent amounts received from other governments to fund specific programs and projects and the value of roads and other infrastructure donated to the Government. The amounts vary based on the availability and timing of Federal and State funding and the timing and amount of road and infrastructure development within the metropolitan area.(2) In 2015, the Government implemented GASB Statement No. 68 which revised the reporting for its liability related to pensions. Amounts for prior years have not been restated.
Unaudited - See Accompanying Accountants' Report
H-4
THE METROPOLITAN GOVERNMENT OF NASHVILLE AND DAVIDSON COUNTY
CHANGES IN NET POSITIONLAST TEN FISCAL YEARS
(accrual basis of accounting)(amounts expressed in thousands)

2011 2012 2013 2014 2015 (2) 2016
$ 122,913 $ 117,669 $ 118,107 $ 134,592 $ 188,330 $ 196,012 33,613 31,802 32,675 31,357 33,277 31,729 87,374 89,564 92,752 93,224 92,902 96,091
322,782 335,162 371,438 359,502 353,933 378,291 149,619 158,763 170,843 149,551 152,045 162,323
10,248 11,717 10,751 11,231 11,216 10,931 445 439 542 519 480 559
59,386 56,504 57,172 56,449 54,279 56,186 132,993 114,145 119,695 119,828 106,365 117,686
30,033 30,676 33,034 35,739 41,390 45,268 144,012 152,201 169,521 180,008 191,499 202,419
59,421 61,259 68,515 76,759 70,841 77,342 869,449 867,599 903,998 924,418 907,504 978,229 102,859 86,223 77,525 96,842 93,210 95,228
2,125,147 2,113,723 2,226,568 2,270,019 2,297,271 2,448,294
189,521 185,385 205,278 208,945 213,926 232,501 17,837 18,102 17,573 18,774 18,761 17,940
7,539 7,147 7,427 3,591 3,543 2,126 2,814 2,945 3,074 3,140 3,661 3,654 1,193 1,265 1,788 1,605 1,849 1,931
855 832 1,131 190 - - 734 713 735 790 650 703
1,801 1,808 1,787 2,001 2,041 1,995 1,320 967 376 375 375 375
- - - - - - 10,669 10,426 10,717 11,073 10,506 10,945
302 297 352 324 357 391 234,585 229,887 250,238 250,808 255,669 272,561
$ 2,359,732 $ 2,343,610 $ 2,476,806 $ 2,520,827 $ 2,552,940 $ 2,720,855
$ 6,908 $ 9,134 $ 8,329 $ 10,805 $ 7,764 $ 8,989
5,286 5,181 6,768 6,237 6,356 7,570 33,745 32,772 33,232 32,929 31,052 29,143 30,637 33,172 32,210 30,281 30,667 30,247 16,395 12,759 13,431 15,502 11,449 9,286
8,858 10,846 12,368 14,252 18,576 25,407 1,352 1,208 1,098 1,162 1,007 915 9,902 8,796 9,159 9,847 11,173 12,495
484 474 450 438 409 397 11,191 12,594 12,066 12,573 14,272 15,922
9,068 9,755 10,130 10,702 11,332 13,974 17,838 18,485 19,502 18,740 16,936 19,259
432,938 436,073 435,077 438,515 454,881 467,388 38,595 58,447 55,267 58,286 37,301 30,970
623,197 649,696 649,087 660,269 653,175 671,962
THE METROPOLITAN GOVERNMENT OF NASHVILLE AND DAVIDSON COUNTY
CHANGES IN NET POSITIONLAST TEN FISCAL YEARS (CONTINUED)
(accrual basis of accounting)(amounts expressed in thousands)
Unaudited - See Accompanying Accountants' Report
H-5

2007 2008 2009 2010Program Revenues (Continued)Business-type activities Charges for services: Department of Water and Sewerage Services $ 164,900 $ 173,121 $ 169,672 $ 171,520 District Energy System 18,795 17,892 17,812 15,562 Nashville Convention Center 5,248 5,996 5,675 5,366 Board of Fair Commissioners 3,880 3,601 3,438 3,393 Farmers Market 866 863 899 983 Police Secondary Employment 1,654 1,162 1,094 2,437 Surplus Property Auction 994 1,121 958 1,094 Municipal Auditorium 1,176 1,278 1,107 1,364 Police Impound 2,873 2,611 2,182 1,583 School Community Education 156 243 141 31 Stormwater Operations - - - 13,635 Community Education Commission - - - 22 Capital grants and contributions 53,318 58,761 27,463 41,302 Total business-type activities 253,860 266,649 230,441 258,292 Total primary government $ 759,466 $ 813,723 $ 785,893 $ 832,505
Net (Expense) RevenueGovernmental activities $ (1,217,661) $ (1,367,108) $ (1,415,942) $ (1,497,042) Business-type activities 55,441 61,234 13,372 38,046 Total primary government $ (1,162,220) $ (1,305,874) $ (1,402,570) $ (1,458,996)
General Revenues and Other Changes in Net PositionGovernmental activities Property taxes $ 741,901 $ 759,131 $ 773,659 $ 793,293 Local option sales taxes 285,078 285,484 264,573 256,178 Other taxes 121,459 141,112 135,213 126,878 Revenue from the use of money or property 19,801 14,792 6,109 1,445 Revenue from other governmental agencies 68,620 70,072 65,026 58,160 Compensation for loss, sale or damage to property 1,786 1,541 1,022 1,747 Transfers 9,643 8,617 538 (323) Special and extraordinary items (3) - - - (1,224) Total governmental activities 1,248,288 1,280,749 1,246,140 1,236,154 Business-type activities Revenue from the use of money or property 9,213 8,086 2,790 391 Compensation for loss, sale or damage to property 132 144 92 171 Transfers (9,643) (8,617) (538) 323 Special and extraordinary items (3) - - - (7,000) Total business-type activities (298) (387) 2,344 (6,115) Total primary government $ 1,247,990 $ 1,280,362 $ 1,248,484 $ 1,230,039
Change in Net PositionGovernmental activities $ 30,627 $ (86,359) $ (169,802) $ (260,888) Business-type activities 55,143 60,847 15,716 31,931 Total primary government $ 85,770 $ (25,512) $ (154,086) $ (228,957)
(3) Special and extraordinary items consist of: In 2010, the Government experienced significant losses related to flooding in May 2010. In 2011, the Government incurred additional flood related expenses in excess of recoveries.
(amounts expressed in thousands)
Unaudited - See Accompanying Accountants' Report
H-6
THE METROPOLITAN GOVERNMENT OF NASHVILLE AND DAVIDSON COUNTY
CHANGES IN NET POSITIONLAST TEN FISCAL YEARS (CONTINUED)
(accrual basis of accounting)

2011 2012 2013 2014 2015 (2) 2016
$ 195,790 $ 201,060 $ 208,830 $ 211,372 $ 214,751 $ 217,784 15,486 15,962 16,713 18,526 18,542 17,597
5,404 5,490 5,746 2,124 1,768 45 2,109 2,658 2,786 3,021 3,367 3,283
745 961 1,292 1,125 1,038 961 1,103 935 1,285 - - - 1,081 1,298 795 589 712 1,231 1,370 1,607 1,188 1,558 1,427 1,507 1,271 1,584 492 479 475 475
- - - - - - 14,198 13,883 14,199 14,613 14,295 14,461
18 36 45 58 59 80 39,467 25,307 11,890 16,478 20,655 22,770
278,042 270,781 265,261 269,943 277,089 280,194 $ 901,239 $ 920,477 $ 914,348 $ 930,212 $ 930,264 $ 952,156
$ (1,501,950) $ (1,464,027) $ (1,577,481) $ (1,609,750) $ (1,644,096) $ (1,776,332) 43,457 40,894 15,023 19,135 21,420 7,633
$ (1,458,493) $ (1,423,133) $ (1,562,458) $ (1,590,615) $ (1,622,676) $ (1,768,699)
$ 782,192 $ 787,882 $ 895,919 $ 911,661 $ 927,860 $ 944,353 258,107 281,294 301,430 315,479 340,077 365,704 137,141 150,856 160,802 174,556 193,729 206,146
1,095 1,121 1,195 3,244 1,044 3,886 61,262 62,929 66,572 66,010 77,625 83,484
3,290 3,385 7,043 4,296 11,677 9,963 3,400 6,248 35,439 11,681 11,154 12,988
(2,911) - - - - - 1,243,576 1,293,715 1,468,400 1,486,927 1,563,166 1,626,524
230 119 111 1,655 1,088 1,334
282 157 60 196 2 1,053 (3,400) (6,248) (35,439) (11,681) (11,154) (12,988)
- - - - - - (2,888) (5,972) (35,268) (9,830) (10,064) (10,601)
$ 1,240,688 $ 1,287,743 $ 1,433,132 $ 1,477,097 $ 1,553,102 $ 1,615,923
$ (258,374) $ (170,312) $ (109,081) $ (122,823) $ (80,930) $ (149,808) 40,569 34,922 (20,245) 9,305 11,356 (2,968)
$ (217,805) $ (135,390) $ (129,326) $ (113,518) $ (69,574) $ (152,776)
H-7
Unaudited - See Accompanying Accountants' Report
THE METROPOLITAN GOVERNMENT OF NASHVILLE AND DAVIDSON COUNTY
CHANGES IN NET POSITIONLAST TEN FISCAL YEARS (CONTINUED)
(accrual basis of accounting)(amounts expressed in thousands)

2007 2008 2009 2010 2011
General fund Nonspendable $ 13,186,701 $ 29,247,551 $ 32,222,128 $ 299,659 $ 473,335 Assigned 7,412,327 200,000 - 1,370,583 13,878,075 Unassigned 39,986,966 33,670,422 47,504,389 59,228,607 53,134,734 Total general fund 60,585,994 63,117,973 79,726,517 60,898,849 67,486,144 All other governmental funds Nonspendable 1,878,413 2,137,679 1,854,877 2,060,858 2,119,993 Restricted 62,324,858 85,667,575 64,715,883 195,074,104 47,011,877 Committed 178,616,288 149,862,699 106,177,301 106,798,899 121,277,278 Assigned 10,118,900 31,394,900 35,996,400 1,500,000 11,161,900 Unassigned (140,012,364) (66,950,708) (182,094,246) (28,066,901) (39,332,027) Total all other governmental funds 112,926,095 202,112,145 26,650,215 277,366,960 142,239,021
Total governmental funds $ 173,512,089 $ 265,230,118 $ 106,376,732 $ 338,265,809 $ 209,725,165
H-8
Unaudited - See Accompanying Accountants' Report
THE METROPOLITAN GOVERNMENT OF NASHVILLE AND DAVIDSON COUNTY
FUND BALANCES OF GOVERNMENTAL FUNDSLAST TEN FISCAL YEARS
(modified accrual basis of accounting)

2012 2013 2014 2015 2016
$ 367,535 $ 453,627 $ 525,930 $ 546,062 $ 467,008 539,600 16,030,900 34,840,900 54,311,800 59,542,600
69,836,867 84,053,738 81,650,073 83,195,736 84,493,158
70,744,002 100,538,265 117,016,903 138,053,598 144,502,766
2,891,941 2,723,873 3,122,352 4,079,964 3,276,149 36,939,852 160,884,699 39,365,865 41,461,337 43,018,673
145,387,960 145,231,736 125,883,422 126,421,581 137,020,957 - 29,966,900 40,441,000 25,800,000 21,000,000
(174,680,021) (15,710,564) (189,169,860) (501,399,310) (342,346,761)
10,539,732 323,096,644 19,642,779 (303,636,428) (138,030,982)
$ 81,283,734 $ 423,634,909 $ 136,659,682 $ (165,582,830) $ 6,471,784
Unaudited - See Accompanying Accountants' Report
H-9
THE METROPOLITAN GOVERNMENT OF NASHVILLE AND DAVIDSON COUNTY
FUND BALANCES OF GOVERNMENTAL FUNDSLAST TEN FISCAL YEARS (CONTINUED)
(modified accrual basis of accounting)

2007 2008 2009 2010 2011General fund GSD Nonspendable $ 13,186,701 $ 29,247,551 $ 32,222,128 $ 299,659 $ 473,335 Assigned 7,194,227 200,000 - 1,370,583 442,575 Unassigned 24,038,394 20,156,790 25,320,424 34,962,597 44,578,057 Total GSD 44,419,322 49,604,341 57,542,552 36,632,839 45,493,967
USD Assigned 218,100 - - - 13,435,500 Unassigned 15,948,572 13,513,632 22,183,965 24,266,010 8,556,677 Total USD 16,166,672 13,513,632 22,183,965 24,266,010 21,992,177
Total general fund 60,585,994 63,117,973 79,726,517 60,898,849 67,486,144 General purpose school fund Nonspendable 795,274 902,765 738,993 937,417 883,700 Committed 67,566,890 52,557,390 27,356,958 27,102,179 34,449,193 Assigned - 19,264,100 12,431,400 - - Total general purpose school fund 68,362,164 72,724,255 40,527,351 28,039,596 35,332,893 GSD general purposes debt service fund Nonspendable - - - - - Committed 7,631,372 1,761,254 1,107,591 8,406,361 8,626,889 Assigned 372,800 1,408,800 - - -
Total GSD general purposes debt service fund 8,004,172 3,170,054 1,107,591 8,406,361 8,626,889
GSD school purposes debt service fund Nonspendable - - - - - Committed 51,971,417 40,690,069 14,991,134 14,559,256 12,006,081 Assigned 8,566,400 10,722,000 23,565,000 - 11,161,900
Total GSD school purposes debt service fund 60,537,817 51,412,069 38,556,134 14,559,256 23,167,981
USD general purposes debt service fund Nonspendable - - - - - Committed 1,247,752 2,221,176 4,298,707 2,984,488 6,159,913 Assigned 1,179,700 - - - - Total USD general purposes debt service fund 2,427,452 2,221,176 4,298,707 2,984,488 6,159,913
Total budgeted governmental funds $ 199,917,599 $ 192,645,527 $ 164,216,300 $ 114,888,550 $ 140,773,820
Note: The schedule above reflects fund balances for those governmental funds for which legally required budgets are prepared and approved. The general purpose school fund is reported as a special revenue fund. The three debt service funds are reported as debt service funds. All of these funds are considered major funds of the Government.
H-10
Unaudited - See Accompanying Accountants' Report
LAST TEN FISCAL YEARS(modified accrual basis of accounting)
THE METROPOLITAN GOVERNMENT OF NASHVILLE AND DAVIDSON COUNTYFUND BALANCES OF BUDGETED GOVERNMENTAL FUNDS
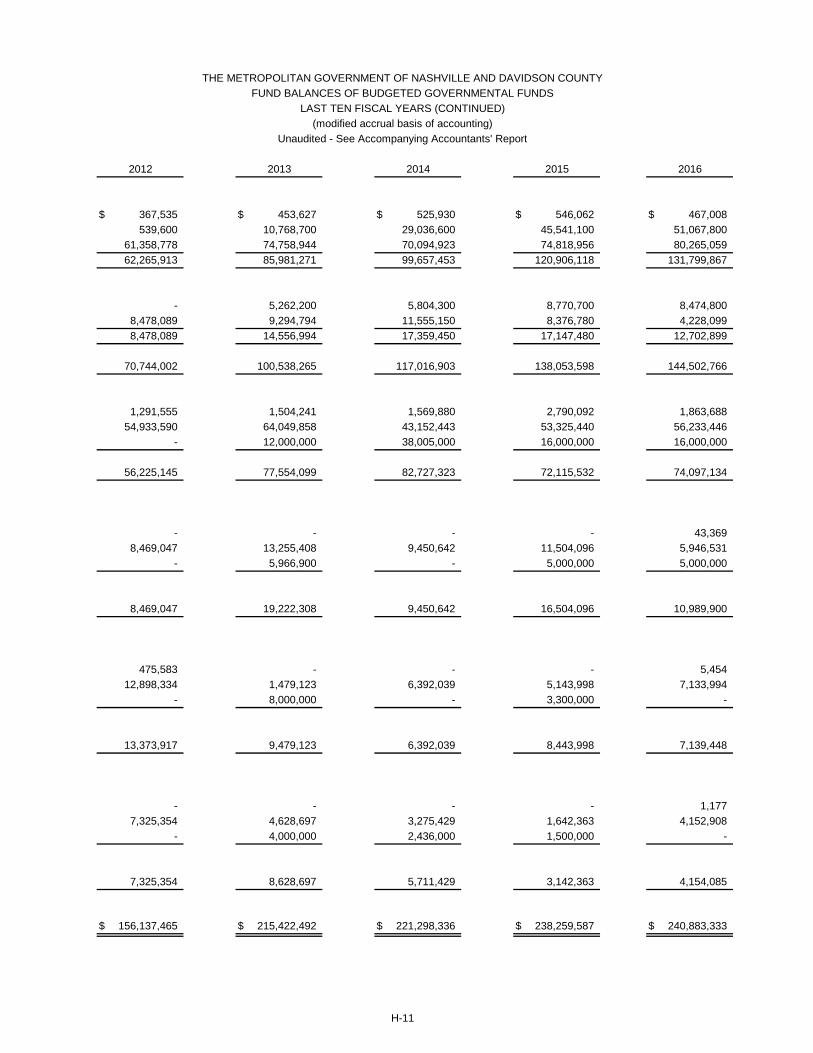
2012 2013 2014 2015 2016
$ 367,535 $ 453,627 $ 525,930 $ 546,062 $ 467,008 539,600 10,768,700 29,036,600 45,541,100 51,067,800
61,358,778 74,758,944 70,094,923 74,818,956 80,265,059 62,265,913 85,981,271 99,657,453 120,906,118 131,799,867
- 5,262,200 5,804,300 8,770,700 8,474,800 8,478,089 9,294,794 11,555,150 8,376,780 4,228,099 8,478,089 14,556,994 17,359,450 17,147,480 12,702,899
70,744,002 100,538,265 117,016,903 138,053,598 144,502,766
1,291,555 1,504,241 1,569,880 2,790,092 1,863,688 54,933,590 64,049,858 43,152,443 53,325,440 56,233,446
- 12,000,000 38,005,000 16,000,000 16,000,000
56,225,145 77,554,099 82,727,323 72,115,532 74,097,134
- - - - 43,369 8,469,047 13,255,408 9,450,642 11,504,096 5,946,531
- 5,966,900 - 5,000,000 5,000,000
8,469,047 19,222,308 9,450,642 16,504,096 10,989,900
475,583 - - - 5,454 12,898,334 1,479,123 6,392,039 5,143,998 7,133,994
- 8,000,000 - 3,300,000 -
13,373,917 9,479,123 6,392,039 8,443,998 7,139,448
- - - - 1,177 7,325,354 4,628,697 3,275,429 1,642,363 4,152,908
- 4,000,000 2,436,000 1,500,000 -
7,325,354 8,628,697 5,711,429 3,142,363 4,154,085
$ 156,137,465 $ 215,422,492 $ 221,298,336 $ 238,259,587 $ 240,883,333
H-11
LAST TEN FISCAL YEARS (CONTINUED)(modified accrual basis of accounting)
THE METROPOLITAN GOVERNMENT OF NASHVILLE AND DAVIDSON COUNTYFUND BALANCES OF BUDGETED GOVERNMENTAL FUNDS
Unaudited - See Accompanying Accountants' Report

2007 2008 2009 2010RevenuesProperty taxes $ 762,416,897 $ 757,993,487 $ 775,403,870 $ 792,882,229 Local option sales tax 285,258,498 285,483,688 264,572,950 256,178,237 Other taxes, licenses and permits 130,176,283 152,575,721 143,696,309 136,182,711 Fines, forfeits and penalties 19,254,517 19,869,757 17,962,587 18,915,362 Revenues from the use of money or property 14,047,969 10,496,414 3,785,674 494,777 Revenues from other governmental agencies 417,169,806 447,314,552 453,448,063 488,535,713 Commissions and fees 26,156,439 29,070,315 25,049,552 22,002,060 Charges for current services 51,607,253 53,939,317 51,137,029 50,686,861 Compensation for loss, sale or damage to property 1,708,877 1,597,492 2,144,252 1,712,551 Contributions and gifts 9,917,112 11,995,898 10,645,368 5,469,908 Bond interest tax credit - - - - Miscellaneous 2,141,108 3,263,508 4,603,664 2,706,377
Total revenues 1,719,854,759 1,773,600,149 1,752,449,318 1,775,766,786
Expenditures Current: General government (1) 40,641,319 46,904,452 60,035,388 88,954,555 Fiscal administration 15,777,516 16,472,712 24,112,437 22,499,859 Administration of justice 63,883,484 65,699,378 56,871,162 54,590,759 Law enforcement and care of prisoners 237,925,605 250,849,440 239,436,458 239,014,459 Fire prevention and control 112,717,674 119,648,604 107,034,837 104,214,957 Regulation and inspection 8,449,218 8,697,029 8,095,128 7,492,864 Conservation of natural resources 444,857 456,284 407,442 352,001 Public welfare 38,037,156 36,967,197 37,924,764 42,946,288 Public health and hospitals (2) 100,408,354 104,398,769 101,575,884 114,094,878 Public library system 21,712,959 22,644,664 20,564,850 19,016,993 Public works, highways and streets 65,518,756 70,954,215 63,204,089 51,039,081 Recreational and cultural 38,633,072 40,513,021 37,312,292 33,235,850 Education 636,140,631 683,222,289 720,909,041 740,550,178 Employee benefits 59,012,395 61,100,542 62,420,127 64,637,576 Miscellaneous 51,967,639 44,480,259 40,260,803 55,652,301
Note: Certain amounts have been reclassified for comparability. Unless otherwise noted, significant variances in expenditures primarily relate to salaries and associated costs. Significant variances in revenues primarily relate to increases in property tax and sales tax rates. (1) Increases in general government expenditures in fiscal years 2010 and 2011 are due primarily to costs related to flooding in May 2010.
(2) In fiscal year 2010, there was a one time appropriation to the Hospital Authority of $32 million to forgive debt owed to the Government.
H-12
THE METROPOLITAN GOVERNMENT OF NASHVILLE AND DAVIDSON COUNTY
CHANGES IN FUND BALANCES OF GOVERNMENTAL FUNDSLAST TEN FISCAL YEARS
(modified accrual basis of accounting)
Unaudited - See Accompanying Accountants' Report

2011 2012 2013 2014 2015 2016
$ 782,238,201 $ 790,774,878 $ 892,398,894 $ 914,121,619 $ 928,796,242 $ 944,010,324 258,106,909 281,294,520 301,430,612 315,478,742 340,076,515 365,703,934 147,382,286 162,804,251 174,702,273 190,370,587 212,923,908 233,889,194 18,574,592 16,253,081 18,652,738 18,225,785 17,727,633 17,055,354 321,354 362,910 489,242 1,895,305 1,720,061 2,334,936 559,516,608 576,547,108 559,780,403 556,743,508 575,416,455 585,321,632 23,460,446 24,002,476 24,211,549 24,120,359 23,102,323 24,025,983 56,593,344 56,309,437 58,600,398 59,783,530 58,921,658 65,642,511 2,016,432 4,109,532 5,231,290 5,265,788 12,107,134 13,157,818 3,783,798 14,418,670 8,948,728 10,160,516 7,583,631 12,631,751 5,327,305 5,895,527 4,900,351 4,837,386 4,839,480 4,864,020
2,718,741 2,269,697 2,081,927 2,200,931 2,390,797 2,741,647
1,860,040,016 1,935,042,087 2,051,428,405 2,103,204,056 2,185,605,837 2,271,379,104
121,146,642 95,085,871 81,829,427 88,894,101 121,382,425 128,220,069 23,760,394 21,912,507 22,316,247 21,746,114 20,710,891 21,734,682 55,407,798 53,575,166 68,479,472 70,290,863 69,233,942 71,353,866
249,724,844 255,276,886 259,384,359 263,774,603 272,907,074 283,870,494 109,108,267 108,609,078 113,452,154 111,520,124 114,494,845 116,955,164
7,867,410 7,760,963 8,057,406 7,782,724 7,629,325 8,189,234 340,296 333,713 398,931 357,658 348,293 373,209
41,385,895 39,169,144 40,056,346 38,361,990 38,429,963 38,949,970 86,019,317 85,975,912 89,757,405 86,084,524 74,416,321 85,562,915 20,542,242 21,178,142 22,328,538 22,349,552 25,044,101 28,384,505 58,151,723 51,792,795 58,251,129 61,817,477 62,968,348 63,853,645 33,630,118 34,454,492 36,110,497 36,336,635 38,335,515 40,044,257
777,009,413 797,821,937 832,361,152 856,362,684 871,208,119 918,531,408 69,327,218 72,920,868 76,165,493 79,043,492 80,114,975 81,576,678 71,067,149 75,985,530 80,080,144 87,709,934 87,245,357 89,278,073
(modified accrual basis of accounting)
Unaudited - See Accompanying Accountants' Report
H-13
THE METROPOLITAN GOVERNMENT OF NASHVILLE AND DAVIDSON COUNTY
CHANGES IN FUND BALANCES OF GOVERNMENTAL FUNDSLAST TEN FISCAL YEARS (CONTINUED)

2007 2008 2009 2010
Expenditures (Continued)Debt service: Principal retirement (1) $ 95,569,567 $ 94,819,566 $ 85,914,567 $ 85,889,567 Interest 72,522,916 79,323,719 83,169,612 80,611,709 Fiscal charges 2,818,981 3,730,505 3,604,978 906,832 Debt issue costs 587,900 323,288 240,000 4,347,663 Capital outlay - capitalized (2) 124,229,635 155,498,310 83,576,267 92,640,446 Capital outlay - noncapitalized 98,191,337 93,929,184 66,712,095 79,800,124
Total expenditures 1,885,190,971 2,000,633,427 1,903,382,221 1,982,488,940
Excess of revenue over (under) expenditures (165,336,212) (227,033,278) (150,932,903) (206,722,154)
Other Financing Sources (Uses)Issuance of new debt - 308,000,000 59,140,000 430,900,000 Issuance of refunding debt 186,890,000 - - 189,895,243 Debt issue premium (discount) 12,632,569 7,867,112 - 36,559,565 Payments to refunded bond escrow agent (198,934,669) - (58,900,000) (206,868,923) Insurance recovery (3) - - - 15,000,000 Transfers in 137,154,461 160,349,393 98,879,725 109,679,961 Transfers out (138,936,079) (157,465,198) (107,040,208) (136,553,615)
Total other financing sources (uses) (1,193,718) 318,751,307 (7,920,483) 438,612,231 Net change in fund balances $ (166,529,930) $ 91,718,029 $ (158,853,386) $ 231,890,077
Debt service as a percentage of noncapitalized expenditures (4) 9.55 % 9.44 % 9.29 % 8.81 %
(1) As the result of a bond refunding in June 2010, principal payments for the years ended June 30, 2011 through 2013 were significantly reduced.
(2) Only a portion of capital outlay expenditures qualify for capitalization under the Government's capitalization policy. For the years prior to the implementation of GASB 34, all capital outlay costs are assumed to be capitalized.
(3) Insurance recoveries in fiscal years 2010 and 2011 are related to flooding in May 2010.
(4) For purposes of calculating debt service as a percentage of noncapital expenditures, debt service includes principal retirement and interest. Noncapitalized expenditures equals total expenditures less capital outlay - capitalized.
Unaudited - See Accompanying Accountants' Report
H-14
THE METROPOLITAN GOVERNMENT OF NASHVILLE AND DAVIDSON COUNTY
CHANGES IN FUND BALANCES OF GOVERNMENTAL FUNDSLAST TEN FISCAL YEARS (CONTINUED)
(modified accrual basis of accounting)

2011 2012 2013 2014 2015 2016
$ 3,397,777 $ 12,943,203 $ 44,743,407 $ 97,320,344 $ 113,588,002 $ 115,957,762 85,123,862 93,879,521 93,272,037 101,497,666 103,301,816 104,982,211 3,406,148 3,257,031 3,716,622 3,226,035 6,911,332 7,898,402 1,925,066 2,207,494 2,704,649 - - -
100,682,804 133,571,317 110,878,249 202,968,322 214,809,446 139,450,169 112,034,900 63,091,834 110,821,632 131,042,781 141,684,515 134,787,666
2,031,059,283 2,030,803,404 2,155,165,296 2,368,487,623 2,464,764,605 2,479,954,379
(171,019,267) (95,761,317) (103,736,891) (265,283,567) (279,158,768) (208,575,275)
35,555,000 - 374,874,554 - - 346,549,106 290,201,755 316,085,913 382,598,457 - 163,710,000 338,311,539 43,480,488 67,444,362 131,109,907 - 13,815,134 127,100,018
(331,757,177) (383,595,322) (433,836,850) - (176,341,921) (409,215,077) 37,000,000 - - - - -
214,988,824 180,292,626 199,600,840 183,807,020 190,050,738 195,258,693 (246,991,267) (212,907,693) (208,258,842) (205,498,680) (214,317,695) (217,374,390)
42,477,623 (32,680,114) 446,088,066 (21,691,660) (23,083,744) 380,629,889
$ (128,541,644) $ (128,441,431) $ 342,351,175 $ (286,975,227) $ (302,242,512) $ 172,054,614
4.59 % 5.63 % 6.75 % 9.18 % 9.64 % 9.44 %
LAST TEN FISCAL YEARS (CONTINUED)(modified accrual basis of accounting)
Unaudited - See Accompanying Accountants' Report
THE METROPOLITAN GOVERNMENT OF NASHVILLE AND DAVIDSON COUNTY
CHANGES IN FUND BALANCES OF GOVERNMENTAL FUNDS
H-15

Fiscal PublicYear Realty Personalty Utility
2006-07 $ 14,249,283,812 $ 1,026,510,506 $ 622,162,501 $ 15,897,956,819
2007-08 14,562,824,424 1,004,636,613 585,267,521 16,152,728,558
2008-09 14,949,650,247 1,003,474,654 601,229,146 16,554,354,047
2009-10 17,452,127,001 1,118,966,031 651,277,995 19,222,371,027
2010-11 17,447,570,422 1,128,934,816 632,009,935 19,208,515,173
2011-12 17,366,226,070 1,098,349,735 639,688,011 19,104,263,816
2012-13 17,404,334,210 1,115,387,381 640,800,994 19,160,522,585
2013-14 18,313,859,433 1,231,932,155 663,744,930 20,209,536,518
2014-15 18,498,390,332 1,177,300,927 700,367,364 20,376,058,623
2015-16 18,866,789,974 1,209,436,393 666,469,036 20,742,695,403
Assessment date: January 1 (Pick-up assessments and cancellations for each year in minor amounts are not reflected inabove figures).
Tax levy: General Services District tax is levied on the entire Metropolitan area. Urban Services District tax is an additional tax levied on properties within the Urban Services District. Personalty and public utility taxes are levied on September 1st of each year, based upon assessed valuation at January 1st of that year. Real property taxes are levied on September 1st of each year, based upon assessed valuation through January 1st of that year. In addition, for the period January 1st through September 1st, supplemental assessments are made and related taxes are levied for improved, demolished or damaged property during such period, in accordance with T.C.A. Section 67-607.
Ratio of assessed value to appraised value: Commercial and industrial properties - 40% for real property and 30% for tangible personal property Farm and residential properties - 25% Public utilities - 55%
Note: The State mandates a reappraisal valuation of property within Davidson County every four years.
(1) All properties within the General Services District are taxed at the GSD tax rate. Only those properties within the Urban Services District are taxed the additional USD tax rate. See schedule on page H-18.
(2) Source: Tax Aggregate Reports for Tennessee State Board of Equalization
THE METROPOLITAN GOVERNMENT OF NASHVILLE AND DAVIDSON COUNTY
ASSESSED VALUE AND ESTIMATED ACTUAL VALUE OF GENERAL SERVICES DISTRICT TAXABLE PROPERTYLAST TEN FISCAL YEARS
Unaudited - See Accompanying Accountants' Report
Total GSD TaxableAssessed Value
H-16

TotalEstimated
Actual PropertyValue (2)
$ 4.040 $ 51,736,469,429 30.73 %
4.040 60,386,015,276 26.75
4.040 61,881,138,204 26.75
3.560 63,157,226,914 30.44
3.560 63,280,838,469 30.35
3.560 63,127,519,037 30.26
4.040 63,259,449,113 30.29
3.924 65,810,054,890 30.71
3.924 66,270,673,259 30.75
3.924 67,533,296,332 30.71
Assessed
THE METROPOLITAN GOVERNMENT OF NASHVILLE AND DAVIDSON COUNTY
ASSESSED VALUE AND ESTIMATED ACTUAL VALUE OF GENERAL SERVICES DISTRICT TAXABLE PROPERTYLAST TEN FISCAL YEARS (CONTINUED)
Unaudited - See Accompanying Accountants' Report
Value as a
H-17
Total GSDTax Rate (1) Actual Value
Percentage of

Fiscal PublicYear Realty Personalty Utility
2006-07 $ 9,609,860,911 $ 812,794,594 $ 497,183,632 $ 10,919,839,137 $ 0.650
2007-08 9,775,778,452 800,146,680 476,649,480 11,052,574,612 0.650
2008-09 10,034,679,742 804,965,057 469,223,447 11,308,868,246 0.650
2009-10 11,845,833,807 899,198,794 507,695,082 13,252,727,683 0.570
2010-11 11,819,864,666 919,181,529 481,388,729 13,220,434,924 0.570
2011-12 11,847,282,828 915,167,902 482,396,101 13,244,846,831 0.570
2012-13 11,877,136,516 928,784,082 477,220,794 13,283,141,392 0.620
2013-14 12,743,560,657 1,042,522,606 500,973,282 14,287,056,545 0.592
2014-15 12,895,435,922 983,507,268 526,411,427 14,405,354,617 0.592
2015-16 13,184,753,548 1,023,107,282 495,162,952 14,703,023,782 0.592
Note: The Urban Services District lies within the General Services District. The above schedule reflects the assessed value of theproperties within the Urban Services District.
THE METROPOLITAN GOVERNMENT OF NASHVILLE AND DAVIDSON COUNTY
ASSESSED VALUE OF URBAN SERVICES DISTRICT TAXABLE PROPERTY LAST TEN FISCAL YEARS
Unaudited - See Accompanying Accountants' Report
Total USD Tax Rate
Total USD Taxable Assessed Value
H-18

GSD General GSD Debt School Total USD USD Debt Total TotalFiscal General Purpose Service Debt Service GSD General Service USD Direct TaxYear Fund (1) School Fund Fund Fund Rate Fund (1) Fund Rate Rate
2006-07 (2) $ 2.070 $ 1.330 $ 0.470 $ 0.170 $ 4.040 $ 0.560 $ 0.090 $ 0.650 $ 4.690
2007-08 (2) 2.060 1.330 0.480 0.170 4.040 0.560 0.090 0.650 4.690
2008-09 (2) 2.060 1.330 0.480 0.170 4.040 0.530 0.120 0.650 4.690
2009-10 (3) 1.820 1.170 0.420 0.150 3.560 0.460 0.110 0.570 4.130
2010-11 1.820 1.170 0.420 0.150 3.560 0.460 0.110 0.570 4.130
2011-12 1.820 1.170 0.420 0.150 3.560 0.460 0.110 0.570 4.130
2012-13 (4) 1.960 1.400 0.430 0.250 4.040 0.510 0.110 0.620 4.660
2013-14 (3) 1.905 1.416 0.423 0.180 3.924 0.480 0.112 0.592 4.516
2014-15 1.905 1.416 0.423 0.180 3.924 0.480 0.112 0.592 4.516
2015-16 (2) 1.905 1.416 0.423 0.180 3.924 0.495 0.097 0.592 4.516
Tax rates are per $100 of assessed valuation. Payments may be made through February 28 of the year following the year of assessment and levywithout penalty.
On November 7, 2006, voters approved a ballot initiative prohibiting the Metropolitan Council from raising real property tax rates from their currentand future levels without the approval of the voters in a referendum. Prior to the adoption of the ballot proposal, the Metropolitan Councilwas authorized to set the real property tax rate without any requirement of voter approval. The Government's legal department has issued amemo stating that the approved initiative violates the Tennessee Constitution because it places the power to set property tax rates with voters,rather than with the Metropolitan Council, as prescribed by the Constitution. However, the Government cannot predict whether there will be acourt challenge as to the constitutionality of the approved initiative. If there is a challenge, the Government cannot predict the timing or be certainof the outcome of any court challenge as to the constitutionality of the approved initiative.
(1) A portion of the revenue of the GSD General Fund generated from the tax levy collected for the area of the USD is recorded in the USD General Fund. Referred to as the levy for fire protection service, this amount of the levy has ranged from $.12 to $.07 over the last ten years. (2) In these fiscal years, the property tax rate was reallocated among the funds receiving property tax revenue. (3) The State mandates a reappraisal valuation of property within Davidson County every four years resulting in a reduction of the combined GSD-USD tax rate. Also, the combined GSD-USD tax rate was reallocated among the funds receiving property tax revenue. The rates above reflect the net change of the reappraisal valuation and the reallocation by the Metropolitan Council.
(4) In this year, the combined GSD-USD tax rate was increased by the Metropolitan Council and reallocated among the funds receiving property tax revenue. The rates above reflect the net change of the increase and reallocation by the Metropolitan Council.
H-19
THE METROPOLITAN GOVERNMENT OF NASHVILLE AND DAVIDSON COUNTY
PROPERTY TAX RATES
General Services District Urban Services District
LAST TEN FISCAL YEARS
Unaudited - See Accompanying Accountants' Report

% of % of Total Total
Tax TaxTaxpayer Rank Levy Rank Levy
Electric Power Board (1) $ N/A $ 30,599,681 1 3.39 % $ N/A $ 23,113,613 1 3.24 %
RHP Hotels Inc./Gaylord (3) 233,724,537 10,550,598 2 1.17 238,419,877 11,169,885 2 1.56
Columbia/HCA 215,832,468 9,393,410 3 1.04 231,272,170 10,085,491 3 1.41
AT&T Telephone/BellSouth (3) 178,897,269 7,940,454 4 0.88 153,635,577 7,054,873 4 0.99
Piedmont Natural Gas 116,084,151 5,072,360 5 0.56 89,124,884 4,039,957 5 0.57
The Mall at Green Hills 88,553,621 4,231,589 6 0.47 - - (2) -
Opry Mills Co 90,924,588 4,107,497 7 0.45 81,014,605 3,799,585 6 0.53
Vanderbilt 87,724,558 3,955,529 8 0.44 66,301,420 3,135,665 8 0.44
Highwoods Realty 67,414,815 3,145,268 9 0.35 - - (2) -
Verizon 67,231,222 2,717,161 10 0.30 - - (2) -
CBL & Associates - - (2) - 76,494,477 3,290,503 7 0.46
Davis Street Land - - (2) - 42,308,870 1,984,286 9 0.28
PREFCO XIV LTD - - (2) - 34,438,376 1,944,712 10 0.28
$ 1,146,387,229 $ 81,713,547 9.05 % $ 1,013,010,256 $ 69,618,570 9.76 %
Source: Tax Assessor's Office, Trustee's Office
(1) The amount of tax for the Electric Power Board represents a payment in lieu of taxes and is not based on an assessed valuation.
(2) Values for taxpayers that are outside the top ten ranking are excluded.
(3) Certain properties have changed ownership between December 31, 2006 and December 31, 2015. For comparability purposes, the current and prior owners are shown jointly.
H-20
Amount ofTax
AssessedValuation
THE METROPOLITAN GOVERNMENT OF NASHVILLE AND DAVIDSON COUNTY
PRINCIPAL PROPERTY TAXPAYERS
Unaudited - See Accompanying Accountants' Report
CURRENT YEAR AND NINE YEARS AGO
December 31, 2015 December 31, 2006
2005Assessed
2014
ValuationAmount of
Tax


Fiscal Amount AmountYear GSD Levy USD Levy
2006-07 $ 633,541,786 $ 79,714,977 $ 713,256,763 $ 705,244,782 98.88 %
2007-08 643,729,137 80,683,950 724,413,087 717,920,126 99.10
2008-09 659,755,545 82,555,463 742,311,008 732,021,054 98.61
2009-10 675,043,791 84,818,421 759,862,212 748,828,597 98.55
2010-11 674,573,125 84,611,716 759,184,841 741,791,912 97.71
2011-12 670,841,793 84,767,649 755,609,442 745,445,734 98.65
2012-13 763,462,757 92,982,763 856,445,520 845,378,327 98.71
2013-14 781,593,235 96,009,026 877,602,261 863,883,378 98.44
2014-15 788,032,918 96,803,988 884,836,906 876,959,909 99.11
2015-16 802,143,672 98,797,912 900,941,584 889,764,582 98.76
Source: Metropolitan Trustee's Office
(1) In June of each year, the Government sold to an outside party the majority of the real property taxes outstanding that had become delinquent the prior March 1. The sales generated property tax revenues and reductions of the property tax receivable balances which are reflected in collection as follows.
2006-07 $ 23,025,457 2007-08 24,448,736 2008-09 21,544,115 2009-10 26,509,998 2010-11 26,178,622 2011-12 20,843,656 2012-13 21,437,137 2013-14 22,238,850 2014-15 21,679,890 2015-16 22,224,919
Current Year
Total Tax Current Tax
H-22
Levy LevyAmount (1)Percent of
THE METROPOLITAN GOVERNMENT OF NASHVILLE AND DAVIDSON COUNTY
PROPERTY TAX LEVIES AND COLLECTIONS
Unaudited - See Accompanying Accountants' Report
LAST TEN FISCAL YEARS
Collections Within theFiscal Year of the Levy
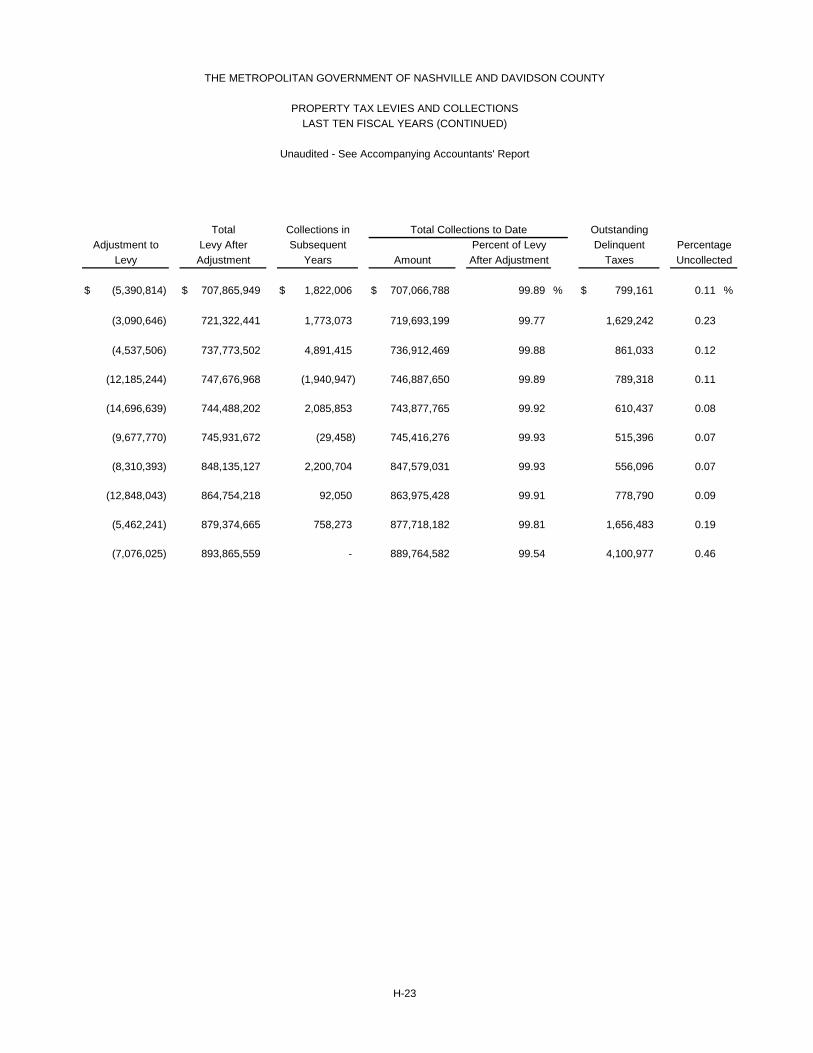
OutstandingDelinquent Percentage
Taxes Uncollected
$ (5,390,814) $ 707,865,949 $ 1,822,006 $ 707,066,788 99.89 % $ 799,161 0.11 %
(3,090,646) 721,322,441 1,773,073 719,693,199 99.77 1,629,242 0.23
(4,537,506) 737,773,502 4,891,415 736,912,469 99.88 861,033 0.12
(12,185,244) 747,676,968 (1,940,947) 746,887,650 99.89 789,318 0.11
(14,696,639) 744,488,202 2,085,853 743,877,765 99.92 610,437 0.08
(9,677,770) 745,931,672 (29,458) 745,416,276 99.93 515,396 0.07
(8,310,393) 848,135,127 2,200,704 847,579,031 99.93 556,096 0.07
(12,848,043) 864,754,218 92,050 863,975,428 99.91 778,790 0.09
(5,462,241) 879,374,665 758,273 877,718,182 99.81 1,656,483 0.19
(7,076,025) 893,865,559 - 889,764,582 99.54 4,100,977 0.46
H-23
Years After AdjustmentLevy Adjustment AmountPercent of LevySubsequentAdjustment to Levy After
Total
THE METROPOLITAN GOVERNMENT OF NASHVILLE AND DAVIDSON COUNTY
PROPERTY TAX LEVIES AND COLLECTIONS
Unaudited - See Accompanying Accountants' Report
LAST TEN FISCAL YEARS (CONTINUED)
Total Collections to DateCollections in

ObligationBonds
FiscalYear Notes Bonds
2006-07 $ 1,572,720 $ 9,313 $ 5,666 $ - $ - $ 1,587,699 $ 478,937 $ 7,916
2007-08 1,791,289 7,609 5,261 - - 1,804,159 446,188 7,624
2008-09 1,646,023 5,825 4,857 56,930 - 1,713,635 412,643 7,316
2009-10 2,003,576 3,956 4,452 52,650 21,120 2,085,754 376,913 6,997
2010-11 1,022,593 1,997 4,048 52,650 55,577 1,136,865 640,249 6,913
2011-12 2,105,210 - 3,643 - 52,410 2,161,263 752,158 7,074
2012-13 2,564,208 - 3,238 - 48,874 2,616,320 884,874 69,097
2013-14 2,446,867 - 2,835 - 45,337 2,495,039 847,596 66,913
2014-15 2,335,207 - 2,430 - 41,801 2,379,438 809,990 64,285
2015-16 2,676,899 - 2,026 - 38,264 2,717,189 784,013 63,773
Note: Details regarding the Government's outstanding debt can be found in the notes to the financial statements.
(1) See the Schedules of Demographic and Economic Statistics on page H-32 for personal income and population data. These ratios are calculated using personal income and population for the prior calendar year.
(2) Per Capita Personal Income statistics for the most recent calendar year were not available at the reporting date.
Business-type Activities
THE METROPOLITAN GOVERNMENT OF NASHVILLE AND DAVIDSON COUNTY
RATIOS OF OUTSTANDING DEBT BY TYPELAST TEN FISCAL YEARS
Unaudited - See Accompanying Accountants' Report
(amounts expressed in thousands, except per capita amount)
QualifiedSchool
General
Governmental ActivitiesGeneral
Total
QualifiedZone Municipal
Tennessee
ObligationLimited
Academy
Loan
BondFund
ConstructionBond
LoanGovernmental Obligation
H-24
NotesRevenueand
Activities BondsBond
BondsRevenue

$ 126,836 $ 1,620 $ 615,309 $ 2,203,008 8.53 % $ 3,806.84
155,648 1,455 610,915 2,415,074 8.97 3,897.63
159,000 1,270 580,229 2,293,864 8.26 3,663.48
165,331 1,095 550,336 2,636,090 9.54 4,146.69
159,681 900 807,743 1,944,608 6.74 3,103.03
197 695 760,124 2,921,387 9.72 4,597.17
150 475 954,596 3,570,916 10.69 5,508.17
101 245 914,855 3,409,894 10.10 5,177.47
51 - 874,326 3,253,764 8.96 4,868.38
- - 847,786 3,564,975 N/A (2) 5,251.19
Capita (1)
TotalBusiness-type
Activities Income (1)Primary
TotalPerLease
THE METROPOLITAN GOVERNMENT OF NASHVILLE AND DAVIDSON COUNTY
(amounts expressed in thousands, except per capita amount)
Unaudited - See Accompanying Accountants' Report
Percentage of
Business-type Activities (Continued)
LAST TEN FISCAL YEARS (CONTINUED)
PersonalCapitalized
RATIOS OF OUTSTANDING DEBT BY TYPE
H-25
Obligations GovernmentLoansState

Less: Amounts
Fiscal Obligation BondsYear and Notes
2006-07 $ 1,572,720 $ 70,969 $ 1,501,751 2.90 % $ 2,595.05
2007-08 1,791,289 56,803 1,734,486 2.87 2,799.25
2008-09 1,646,023 43,962 1,602,061 2.59 2,558.61
2009-10 2,003,576 25,950 1,977,626 3.13 3,110.89
2010-11 1,022,593 37,955 984,638 1.56 1,571.19
2011-12 2,105,210 29,168 2,076,042 3.29 3,266.91
2012-13 2,564,208 37,330 2,526,878 3.99 3,897.73
2013-14 2,446,867 21,554 2,425,313 3.69 3,682.52
2014-15 2,335,207 28,090 2,307,117 3.48 3,451.97
2015-16 2,676,899 22,283 2,654,616 4.01 3,910.24
Note: Details regarding the Government's outstanding debt can be found in the notes to the financial statements.
(1) See the Schedule of Assessed Value and Estimated Actual Value of Taxable Property on pages H-16 and H-17 for property value data.
(2) See the Schedules of Demographic and Economic Statistics on page H-32 for personal income and population data. This ratio is calculated using population for the prior calendar year.
H-26
Percentage ofEstimated
Actual Valueof TaxableDebt Service
Capita (2)Per
Funds Total Property (1)
Available in
Unaudited - See Accompanying Accountants' Report
General
THE METROPOLITAN GOVERNMENT OF NASHVILLE AND DAVIDSON COUNTY
RATIOS OF GENERAL BONDED DEBT OUTSTANDINGGENERAL AND URBAN SERVICES DISTRICTS
LAST TEN FISCAL YEARS(amounts expressed in thousands, except per capita amount)

Less: Amounts
Fiscal Obligation BondsYear and Notes
2006-07 $ 128,353 $ 2,427 $ 125,926 N/A % $ N/A
2007-08 153,286 2,221 151,065 N/A N/A
2008-09 144,049 4,299 139,750 N/A N/A
2009-10 157,592 2,985 154,607 N/A N/A
2010-11 156,260 6,160 150,100 N/A N/A
2011-12 181,076 7,325 173,751 N/A N/A
2012-13 196,077 8,629 187,448 N/A N/A
2013-14 193,855 5,711 188,144 N/A N/A
2014-15 183,558 3,142 180,416 N/A N/A
2015-16 185,491 4,154 181,337 N/A N/A
Note: The above computation is an excerpt from the Ratios of General Bonded Debt Outstanding on page H-26 and reflects ratios of general bonded debt for the Urban Services District only. Details regarding the Government's outstanding debt can be found in the notes to the financial statements.
(1) The actual value of taxable property is not available for the Urban Services District.
(2) Population estimates are not available for the Urban Services District.
PerCapita (2)
H-27
Funds Total Property (1)
General Available in Actual ValueDebt Service of Taxable
Unaudited - See Accompanying Accountants' Report
Percentage ofEstimated
THE METROPOLITAN GOVERNMENT OF NASHVILLE AND DAVIDSON COUNTY
RATIOS OF GENERAL BONDED DEBT OUTSTANDINGURBAN SERVICES DISTRICT
LAST TEN FISCAL YEARS(amounts expressed in thousands, except per capita amount)

Fiscal DebtYear Limit
2006-07 $ 1,644,528 $ 125,926 $ 1,518,602 7.66 %
2007-08 1,665,734 151,065 1,514,669 9.07
2008-09 1,681,640 139,750 1,541,890 8.31
2009-10 1,993,317 154,607 1,838,710 7.76
2010-11 1,983,065 150,100 1,832,965 7.57
2011-12 1,986,727 173,751 1,812,976 8.75
2012-13 1,992,471 187,448 1,805,023 9.41
2013-14 2,143,058 188,143 1,954,915 8.78
2014-15 2,160,803 180,415 1,980,388 8.35
2015-16 2,205,454 181,337 2,024,117 8.22
Note: There is no legal debt margin for the General Services District. Therefore, the calculation is presented for the Urban Services District only.
H-28
(amounts expressed in thousands)
Debt Limit Margin Debt LimitDebt Applicable to Legal Debt Percentage of
Debt Applicable to Total Amount of Debt Limit as a
Unaudited - See Accompanying Accountants' Report
Total Amount of
THE METROPOLITAN GOVERNMENT OF NASHVILLE AND DAVIDSON COUNTY
LEGAL DEBT MARGIN INFORMATIONURBAN SERVICES DISTRICT
LAST TEN FISCAL YEARS

Assessed valuation of taxable property - Urban Services District $ 14,703,023,782
Debt limit - 15 percent of assessed valuation $ 2,205,453,567
Amount of debt applicable to debt limit:
Total bonded debt $ 185,490,677
Less: Amounts available in debt service funds 4,154,085
Total amount of debt applicable to debt limit 181,336,592
Legal debt margin $ 2,024,116,975
Note: The legal debt limit for the Urban Services District is established in the Charter for the Metropolitan Government as presented above. There is no legal debt limit for the General Services District.
H-29
FOR THE YEAR ENDED JUNE 30, 2016URBAN SERVICES DISTRICT
THE METROPOLITAN GOVERNMENT OF NASHVILLE AND DAVIDSON COUNTY
COMPUTATION OF LEGAL DEBT MARGIN
Unaudited - See Accompanying Accountants' Report

Percentage ofDebt Service
Total Total to TotalFiscal Debt General GeneralYear Principal Interest Service Expenditures (1) Expenditures
2006-07 $ 93,585 $ 72,055 $ 165,640 $ 1,682,760 9.8 %
2007-08 92,775 78,916 171,691 1,762,582 9.7
2008-09 81,580 82,842 164,422 1,777,590 9.2
2009-10 81,600 79,968 161,568 1,844,374 8.8
2010-11 (2) - 79,276 79,276 1,863,923 4.3
2011-12 (2) 7,377 86,808 94,185 1,881,454 5.0
2012-13 (2) 40,792 84,680 125,472 1,964,390 6.4
2013-14 93,369 93,059 186,428 2,059,327 9.1
2014-15 109,637 92,396 202,033 2,134,006 9.5
2015-16 112,007 94,221 206,228 2,231,093 9.2
Note: Details regarding the Government's outstanding debt can be found in the notes to the financial statements.
(1) Includes General, Special Revenue and Debt Service Funds.
(2) As the result of a bond refunding in June 2010, principal payments for the years ended June 30, 2011 through 2013 were significantly reduced.
H-30
Unaudited - See Accompanying Accountants' Report
LAST TEN FISCAL YEARS(amounts expressed in thousands)
THE METROPOLITAN GOVERNMENT OF NASHVILLE AND DAVIDSON COUNTY
RATIO OF ANNUAL DEBT SERVICE EXPENDITURES FORGENERAL BONDED DEBT TO TOTAL GENERAL EXPENDITURES

Net RevenueDirect Available
Fiscal Gross Operating ForYear Revenue (1) Expense (2) Debt Service Principal Interest Total Coverage
2006-07 $ 173,220 $ 82,817 $ 90,403 $ 28,770 $ 23,581 $ 52,351 1.73
2007-08 180,862 88,416 92,446 31,185 19,646 50,831 1.82
2008-09 172,379 90,685 81,694 33,370 18,859 52,229 1.56
2009-10 171,966 88,603 83,363 35,525 16,526 52,051 1.60
2010-11 196,268 94,478 101,790 37,830 26,998 64,828 1.57
2011-12 201,263 102,485 98,778 42,410 29,386 71,796 1.38
2012-13 209,110 103,423 105,687 30,765 34,189 64,954 1.63
2013-14 213,055 101,703 111,352 31,500 41,367 72,867 1.53
2014-15 215,709 100,825 114,884 20,275 40,175 60,450 1.90
2015-16 219,023 112,208 106,815 28,795 39,029 67,824 1.57
Note: Details regarding the Government's outstanding debt can be found in the notes to the financial statements.
(1) Includes interest on investments and other income.
(2) Excludes depreciation and amortization expense.
H-31
THE METROPOLITAN GOVERNMENT OF NASHVILLE AND DAVIDSON COUNTY
PLEDGED REVENUE COVERAGEDEPARTMENT OF WATER AND SEWERAGE SERVICES REVENUE BONDS
LAST TEN FISCAL YEARS(amounts expressed in thousands)
Unaudited - See Accompanying Accountants' Report
Debt Service Requirement

Per Capita (amounts Calendar Personal expressed in
Year Population (1) Income (2) thousands) (2)
2006 578,698 $ 42,092 $ 25,838,472 4.2 %
2007 (4) 619,626 43,394 26,916,014 3.9
2008 626,144 44,228 27,784,064 5.5
2009 635,710 43,457 27,626,360 9.3
2010 626,681 45,913 28,835,836 9.0
2011 635,475 47,318 30,069,470 8.5
2012 648,295 51,526 33,403,945 7.2
2013 658,602 51,245 33,749,886 7.1
2014 668,347 54,307 36,295,950 6.3
2015 (5) 678,889 N/A N/A 4.3
(1) Source: U.S. Department of Commerce, Bureau of the Census and Labor
(2) Source: U.S. Department of Commerce, Bureau of Economic Analysis
(3) Source: Tennessee Department of Labor & Workforce Development
(4) Population increase due to Census Bureau adjustments for Hurricanes Katrina and Rita.
(5) Personal income statistics for calendar year 2015 were not available at the reporting date.
THE METROPOLITAN GOVERNMENT OF NASHVILLE AND DAVIDSON COUNTY
DEMOGRAPHIC AND ECONOMIC STATISTICSLAST TEN CALENDAR YEARS
Unemployment
PersonalIncome
H-32
Unaudited - See Accompanying Accountants' Report
Rate (3)

% of % of Total Total
Employer Employees Rank Employment Employees Rank Employment
Vanderbilt University 24,719 1 2.75 % 18,252 3 2.29 %
Metro Nashville-Davidson Co. Government 18,820 2 2.09 19,188 2 2.40 and Public Schools
State of Tennessee 17,219 3 1.91 20,029 1 2.51
U.S. Government 12,225 4 1.36 11,216 4 1.40
Nissan North America 10,900 5 1.21 8,100 7 1.01
Saint Thomas Health 7,100 6 0.79 8,200 6 1.03
HCA Holdings Inc. 7,000 7 0.78 9,649 5 1.21
Community Health Systems Inc. 4,300 8 0.48 - - (1)
Asurion 4,175 9 0.46 - - (1)
Randstad 4,100 10 0.46 - - (1)
Wal-Mart Stores Inc. - - (1) 4,500 10 0.56
Bridgestone America Holdings Inc. - - (1) 4,900 8 0.61
Gaylord Entertainment Company - - (1) 4,519 9 0.57
110,558 12.29 % 108,553 13.59 %
Sources: Principal Employers and Number of Employees - Nashville Area Chamber of Commerce, Nashville Business Journal Total Employment - TN Department of Labor & Workforce Development
Note: The schedule reflects employers and number of employees within the Metropolitan Statistical Area.
(1) Values for employers that are outside the top ten ranking are excluded.
H-33
June 30, 2016 June 30, 2007
THE METROPOLITAN GOVERNMENT OF NASHVILLE AND DAVIDSON COUNTY
PRINCIPAL EMPLOYERSCURRENT YEAR AND NINE YEARS AGO
Unaudited - See Accompanying Accountants' Report

Governmental activities: General government (1) 331 337 330 288 Fiscal administration 317 318 317 306 Administration of justice 811 808 813 773 Law enforcement and care of prisoners (5) 2,714 2,715 2,733 2,787 Fire prevention and control 1,180 1,182 1,150 1,141 Regulation and inspection 108 108 105 95 Conservation of natural resources 10 11 10 9 Public welfare 492 487 483 468 Public health and hospitals 500 508 486 473 Public library system 329 336 317 297 Public works, highways and streets (2) 532 527 470 363 Recreational and cultural 650 682 605 543 Education 9,131 9,275 9,563 9,671 Total governmental activities 17,105 17,294 17,382 17,214
Internal service activities: Office of Fleet Management 91 94 94 89 Information Systems 124 129 130 114 Radio Shop 16 16 18 16 Metro Postal Service 5 5 4 4 Facilities Planning and Construction 18 18 - - Treasury Management 9 8 8 8 General Services (1) 96 107 58 48 Total internal service activities 359 377 312 279
Business-type activities: Department of Water and Sewerage Services 668 668 650 692 Nashville Convention Center (4) 53 53 59 57 Board of Fair Commissioners 29 24 25 28 Farmers Market 8 8 7 7 Police Secondary Employment (5) 5 5 5 5 Surplus Property Auction 7 7 7 7 Police Impound (3) 29 29 29 29 Municipal Auditorium 12 12 11 8 Community Education Commission 11 15 14 8 Stormwater Operations (2) - - - 90 Total business-type activities 822 821 807 931
Total primary government 18,286 18,492 18,501 18,424
Source: Department of Finance, Office of Management and Budgets, "Budget Book" for each fiscal year.
Note: Although the financial balances and operations of the internal service activities are allocated to the various governmental and business-type activities in the government-wide financial statements, the full-time equivalents are reported separately in the above schedule. Also, certain functions previously included in internal service activities were reclassified to governmental activities for consistency in presentation.
(1) During 2009, various programs in General Services previously reported as internal activities ceased operations. Effective July 1, 2014, various programs were moved to the general fund and included in governmental activities - general government.
(2) Prior to 2010, the employees of Stormwater Operations were included in governmental activities - public works, highways and streets.
(3) In the spring of 2012, the operations of Police Impound were outsourced.
20092007 2008 2010
H-34
THE METROPOLITAN GOVERNMENT OF NASHVILLE AND DAVIDSON COUNTY
FULL-TIME EQUIVALENT GOVERNMENT EMPLOYEES BY FUNCTION
Unaudited - See Accompanying Accountants' Report
LAST TEN FISCAL YEARS

297 306 308 302 364 371 296 282 281 282 280 279 804 765 772 777 775 789
2,740 2,802 2,826 2,831 2,893 2,898 1,138 1,170 1,170 1,205 1,206 1,206
97 99 93 94 111 117 9 8 8 8 8 8
488 492 491 492 494 500 469 450 437 464 483 487 292 295 297 309 330 359 364 368 381 389 388 395 534 544 528 546 577 585
9,019 9,154 9,291 9,304 9,294 9,658 16,547 16,735 16,883 17,003 17,203 17,652
89 89 88 89 95 95 112 110 111 112 115 115
16 15 15 15 15 15 4 4 4 4 - - - - - - - - 8 7 7 7 7 7
47 47 47 47 - - 276 272 272 274 232 232
704 700 707 715 713 728 57 52 - - - - 23 22 24 24 25 28
7 7 7 7 7 7 5 5 5 5 - - 7 7 7 7 8 8
29 29 - - - - 8 8 9 9 10 9 5 2 3 3 3 3
90 93 93 93 93 89 935 925 855 863 859 872
17,758 17,932 18,010 18,140 18,294 18,756
(4) With the opening of the Music City Center in the spring of 2013, the Nashville Convention Center employees were transitioned to the Convention Center Authority, a component unit of the Government.
(5) Effecitve July 1, 2014, the operations of Police Secondary Employment were moved to the general fund and are included in governmental activities - law enforcement and care of prisoners.
H-35
2015201320122011 20162014
THE METROPOLITAN GOVERNMENT OF NASHVILLE AND DAVIDSON COUNTY
FULL-TIME EQUIVALENT GOVERNMENT EMPLOYEES BY FUNCTIONLAST TEN FISCAL YEARS (CONTINUED)
Unaudited - See Accompanying Accountants' Report

Governmental activities: General government: Election Commission - registered voters 334,067 340,373 345,243 349,733 Assessor of Property - real property inspections (1) 96,845 69,153 236,459 58,158 Administration of justice: Public Defender - warrants and charges 43,649 43,402 46,006 44,776 Circuit Court Clerk - circuit filings 8,905 9,084 11,324 10,298 Circuit Court Clerk - general sessions civil filings 49,729 51,905 53,441 48,834 Circuit Court Clerk - probate filings 2,060 2,039 1,930 1,954 Law enforcement and care of prisoners: Sheriff - inmate days jails 870,502 894,746 920,662 929,674 Sheriff - inmate days detention facility 374,643 395,777 401,562 397,566 Police - total CAD calls received 1,052,261 1,060,868 1,152,012 1,315,649 Police - incident numbers issued 784,391 844,469 918,749 1,315,455 ECC - total 911 calls received 343,631 361,016 359,926 344,276 ECC - total non 911 calls received 742,344 718,732 696,757 690,297 Fire prevention and control: Fire - life threatening responses 41,633 40,171 41,989 43,124 Fire - non life threatening responses 19,316 20,768 21,045 24,116 Regulation and inspection: Codes - construction/land use permits 11,663 10,598 8,235 10,172 Public welfare: Social Services - clients served 20,164 19,694 18,870 17,291 Public health and hospitals: Health - clinic visits 192,622 180,543 187,717 190,942 Health - restaurant inspections 13,355 13,972 13,796 13,525 Public library system: Library - circulating materials check-outs 4,239,335 4,213,276 4,144,374 4,148,419 Library - number of visits 3,643,610 3,828,825 3,923,154 3,677,765
Source: Department of Finance, Office of Management and Budgets; Various departments of the Government
Note: Certain amounts are excluded because (1) the data is not available for some older years, (2) the data available for some years was not accumulated in a manner consistent with the current years, or (3) the data has yet to be accumulated for the current year. Some amounts are estimated.
(1) Years 2009 and 2013 were reappraisal years where all values are updated with new base rates, depreciation schedules and land tables to produce values at 100% of market value.
2007 2008 2009 2010
H-36
THE METROPOLITAN GOVERNMENT OF NASHVILLE AND DAVIDSON COUNTY
OPERATING INDICATORS BY FUNCTIONLAST TEN FISCAL YEARS
Unaudited - See Accompanying Accountants' Report
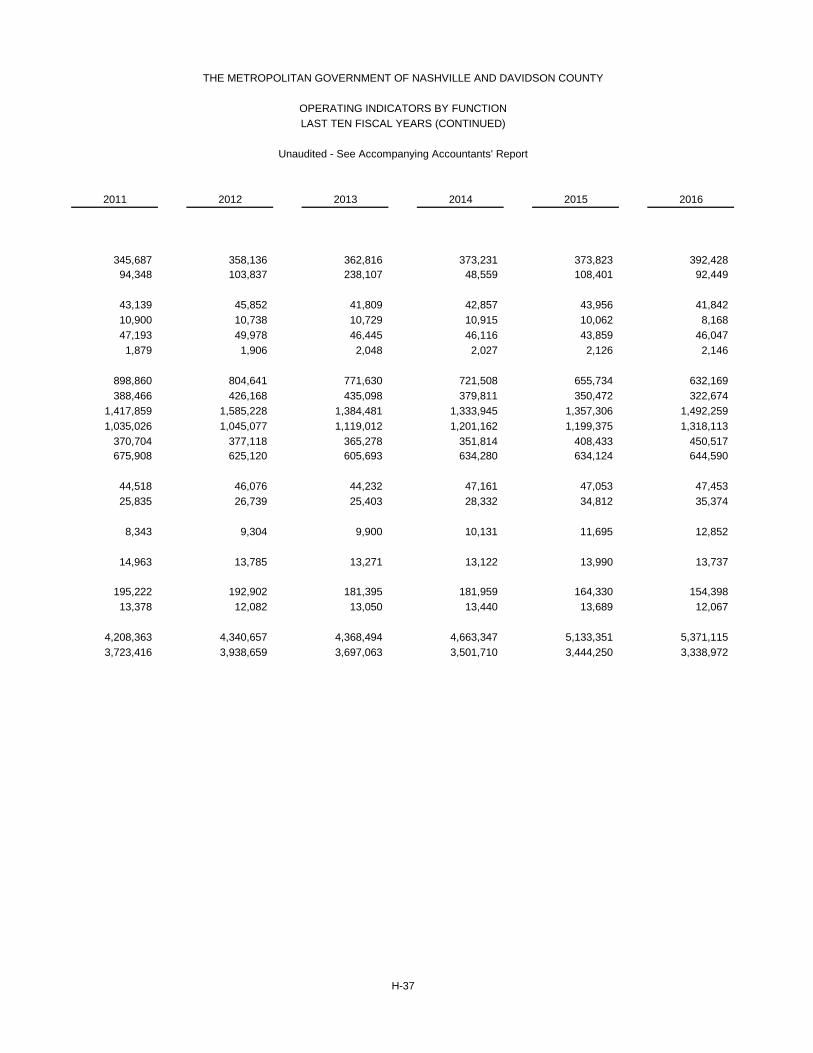
345,687 358,136 362,816 373,231 373,823 392,428 94,348 103,837 238,107 48,559 108,401 92,449
43,139 45,852 41,809 42,857 43,956 41,842 10,900 10,738 10,729 10,915 10,062 8,168 47,193 49,978 46,445 46,116 43,859 46,047 1,879 1,906 2,048 2,027 2,126 2,146
898,860 804,641 771,630 721,508 655,734 632,169 388,466 426,168 435,098 379,811 350,472 322,674
1,417,859 1,585,228 1,384,481 1,333,945 1,357,306 1,492,259 1,035,026 1,045,077 1,119,012 1,201,162 1,199,375 1,318,113
370,704 377,118 365,278 351,814 408,433 450,517 675,908 625,120 605,693 634,280 634,124 644,590
44,518 46,076 44,232 47,161 47,053 47,453 25,835 26,739 25,403 28,332 34,812 35,374
8,343 9,304 9,900 10,131 11,695 12,852
14,963 13,785 13,271 13,122 13,990 13,737
195,222 192,902 181,395 181,959 164,330 154,398 13,378 12,082 13,050 13,440 13,689 12,067
4,208,363 4,340,657 4,368,494 4,663,347 5,133,351 5,371,115 3,723,416 3,938,659 3,697,063 3,501,710 3,444,250 3,338,972
2016201520132012
H-37
2011 2014
THE METROPOLITAN GOVERNMENT OF NASHVILLE AND DAVIDSON COUNTY
OPERATING INDICATORS BY FUNCTIONLAST TEN FISCAL YEARS (CONTINUED)
Unaudited - See Accompanying Accountants' Report

Governmental activities (continued): Public works, highways and streets: Public Works - scheduled garbage collections 6,552,000 6,417,000 6,423,000 6,477,000 Public Works - tons of disposed waste 800,830 865,671 957,837 745,442 Public Works - rehabilitated street lane miles (2) 186 392 171 87 Recreational and cultural: Parks - Sportsplex attendance 400,000 325,822 339,718 344,858 Parks - cultural enrichment class attendance 11,339 11,802 12,374 15,710 Parks - senior citizen program attendance (3) 37,484 38,608 37,932 36,898 Education: Public Schools - students (second month enrollment) 74,155 74,733 75,049 76,329 Business-type activities: Department of Water and Sewerage Services: Customers - water 171,627 174,286 175,121 176,033 Average daily actual water pumped (millions of gallons per day) 97 103 98 119 Customers - wastewater 183,695 191,981 187,655 189,299 Average daily wastewater flow (millions of gallons per day) 128 145 151 166 District Energy System: Steam sales (thousand pounds) 322,648 284,761 283,071 272,448 Chilled water sales (thousand ton hours) 60,720 58,854 52,976 51,273 Nashville Convention Center - events (5) 188 191 234 243 Board of Fair Commissioners: Flea market booth rentals 18,900 16,253 15,743 15,908 State fair attendance (4) 227,478 230,216 192,130 209,385 Municipal Auditorium - events held 91 97 110 111 Component units: Music City Center - events (5) - - - -
Source: Department of Finance, Office of Management and Budgets; Various departments of the Government
Note: Certain amounts are excluded because (1) the data is not available for some older years, (2) the data available for some years was not accumulated in a manner consistent with the current years, or (3) the data has yet to be accumulated for the current year. Some amounts are estimated.
(2) Rehabilitated street line miles were higher in 2008 due to an increase in pavement renewal (rejuvenation, sealing and repair) compared to prior years.
(3) Tracking of senior citizen program attendance was changed from a manual to an automated system in 2012. While there was some increase in participation, the increase is also due to the availability of more accurate information.
(4) The decrease in state fair attendance in 2008 was due to rain on the first weekend of the annual event. The operation of the state fair was outsourced beginning in 2011.
(5) The Music City Center opened in May 2013. 2014 is the first full year of operations. Nashville Convention Center events decreased in 2014 as events move to the Music City Center.
THE METROPOLITAN GOVERNMENT OF NASHVILLE AND DAVIDSON COUNTY
H-38
Unaudited - See Accompanying Accountants' Report
OPERATING INDICATORS BY FUNCTIONLAST TEN FISCAL YEARS (CONTINUED)
2007 201020092008

6,503,700 6,630,000 6,630,000 6,625,840 6,672,700 6,731,500 852,856 569,111 645,224 649,108 725,871 757,332
125 89 167 173 169 164
343,835 333,365 355,999 343,332 355,699 400,830 17,430 18,300 18,202 19,430 39,376 55,55837,970 60,759 61,214 54,152 65,504 104,104
78,014 79,212 81,001 82,307 84,353 85,797
177,475 184,421 187,272 190,699 194,270 197,957
101 100 95 101 87 87 189,898 195,380 198,485 198,119 200,425 203,255
154 148 164 169 168 166
277,943 250,414 374,366 410,084 381,755 325,248 56,118 57,233 62,538 61,768 59,626 61,337
237 217 254 56 15 4
14,510 16,423 16,515 18,612 22,314 20,271 208,131 62,352 67,805 67,635 66,752 70,265
123 90 110 155 135 175
- - - 342 305 293
2011
THE METROPOLITAN GOVERNMENT OF NASHVILLE AND DAVIDSON COUNTY
2013
H-39
LAST TEN FISCAL YEARS (CONTINUED)OPERATING INDICATORS BY FUNCTION
Unaudited - See Accompanying Accountants' Report
2014 2015 20162012

Water Audit Report for:Reporting Year:
All volumes to be entered as: MILLION GALLONS (US) PER YEAR
Master Meter and Supply Error Adjustments
WATER SUPPLIED Pcnt: Value:Volume from own sources: 8 31,842.313 MG/Yr n/a 0.00% MG/Yr
Water imported: n/a 0.000 MG/Yr MG/YrWater exported: 7 422.211 MG/Yr n/a 0.00% MG/Yr
Enter negative % or value for under-registrationWATER SUPPLIED: 31,420.102 MG/Yr Enter positive % or value for over-registration
.
AUTHORIZED CONSUMPTIONBilled metered: 8 22,387.288 MG/Yr
Billed unmetered: n/a 0.000 MG/YrUnbilled metered: 10 42.557 MG/Yr Pcnt: Value:
Unbilled unmetered: 8 94.916 MG/Yr MG/Yr
AUTHORIZED CONSUMPTION: 22,524.761 MG/Yr
WATER LOSSES (Water Supplied - Authorized Consumption) 8,895.341 MG/Yr
Apparent Losses Pcnt: Value:Unauthorized consumption: 7 87.309 MG/Yr MG/Yr
Customer metering inaccuracies: 8 774.844 MG/Yr MG/YrSystematic data handling errors: 8 4.477 MG/Yr MG/Yr
Apparent Losses: 866.630 MG/Yr
Real Losses (Current Annual Real Losses or CARL)Real Losses = Water Losses - Apparent Losses: 8,028.711 MG/Yr
WATER LOSSES: 8,895.341 MG/Yr
NON-REVENUE WATERNON-REVENUE WATER: 9,032.814 MG/Yr
= Water Losses + Unbilled Metered + Unbilled Unmetered
SYSTEM DATA
Length of mains: 9 3,053.0 milesNumber of active AND inactive service connections: 9 191,940
Service connection density: 63 conn./mile main
NoAverage length of customer service line: 9 12.0 ft
Average operating pressure: 8 84.9 psi
COST DATA
Total annual cost of operating water system: 9 $44,352,500 $/YearCustomer retail unit cost (applied to Apparent Losses): 7 $2.79
Variable production cost (applied to Real Losses): 9 $282.02 $/Million gallons
WATER AUDIT DATA VALIDITY SCORE:
PRIORITY AREAS FOR ATTENTION:
1: Volume from own sources 2: Customer retail unit cost (applied to Apparent Losses) 3: Billed metered
Based on the information provided, audit accuracy can be improved by addressing the following components:
$/1000 gallons (US)
Unauthorized consumption volume entered is greater than the recommended default value
4.477
*** YOUR SCORE IS: 82 out of 100 ***
A weighted scale for the components of consumption and water loss is included in the calculation of the Water Audit Data Validity Score
Are customer meters typically located at the curbstop or property line?
774.844
87.309
AWWA Free Water Audit Software: Reporting Worksheet
94.916
2016 7/2015 - 6/2016Nashville Metro Water Services
<----------- Enter grading in column 'E' and 'J' ---------->
? ?
?
?
?
? Click to access definition
? ?
?
?
?
?
Please enter data in the white cells below. Where available, metered values should be used; if metered values are unavailable please estimate a value. Indicate your confidence in the accuracy of the input data by grading each component (n/a or 1-10) using the drop-down list to the left of the input cell. Hover the mouse over the cell to obtain a description of the grades
?
? ?
?
?
?
(length of service line, beyond the property boundary, that is the responsibility of the utility)
Use buttons to select percentage of water
supplied OR
value
? Click here: for help using option buttons below
?
?
?
?
+
+ Click to add a comment
WAS v5.0
+ +
+ +
+
+
American Water Works Association. Copyright © 2014, All Rights Reserved.
? ? ?
+
+ +
+
+
+
+ +
+
+
+
+
+
?
To select the correct data grading for each input, determine the highest grade where the utility meets or exceeds all criteria for that grade and all grades below it.
THE METROPOLITAN GOVERNMENT OF NASHVILLE AND DAVIDSON COUNTY
OPERATING INDICATORS BY FUNCTIONSCHEDULE OF UNACCOUNTED FOR WATER
DEPARTMENT OF WATER AND SEWERAGE SERVICESJune 30, 2016
H-40

THE METROPOLITAN GOVERNMENT OF NASHVILLE AND DAVIDSON COUNTY
OPERATING INDICATORS BY FUNCTIONSCHEDULE OF UNACCOUNTED FOR WATER (CONTINUED)
DEPARTMENT OF WATER AND SEWERAGE SERVICES
June 30, 2016
H-41
Water Audit Report for: Nashville Metro Water ServicesReporting Year:
System Attributes:Apparent Losses: 866.630 MG/Yr
+ Real Losses: 8,028.711 MG/Yr= Water Losses: 8,895.341 MG/Yr
Unavoidable Annual Real Losses (UARL): 1,505.40 MG/Yr
Annual cost of Apparent Losses: $2,417,898Annual cost of Real Losses: $2,264,257 Valued at Variable Production Cost
Performance Indicators:
Non-revenue water as percent by volume of Water Supplied: 28.7%Non-revenue water as percent by cost of operating system: 10.6% Real Losses valued at Variable Production Cost
Apparent Losses per service connection per day: 12.37 gallons/connection/dayReal Losses per service connection per day: 114.60 gallons/connection/day
Real Losses per length of main per day*: N/AReal Losses per service connection per day per psi pressure: 1.35 gallons/connection/day/psi
From Above, Real Losses = Current Annual Real Losses (CARL): 8,028.71 million gallons/year
5.33
* This performance indicator applies for systems with a low service connection density of less than 32 service connections/mile of pipeline
AWWA Free Water Audit Software: System Attributes and Performance Indicators
*** YOUR WATER AUDIT DATA VALIDITY SCORE IS: 82 out of 100 ***
Infrastructure Leakage Index (ILI) [CARL/UARL]:
2016 7/2015 - 6/2016
Return to Reporting Worksheet to change this assumpiton
?
?
American Water Works Association. Copyright © 2014, All Rights Reserved.
WAS v5.0
Financial:
Operational Efficiency:
AWWA Free Water Audit Software v5.0 Performance Indicators 1
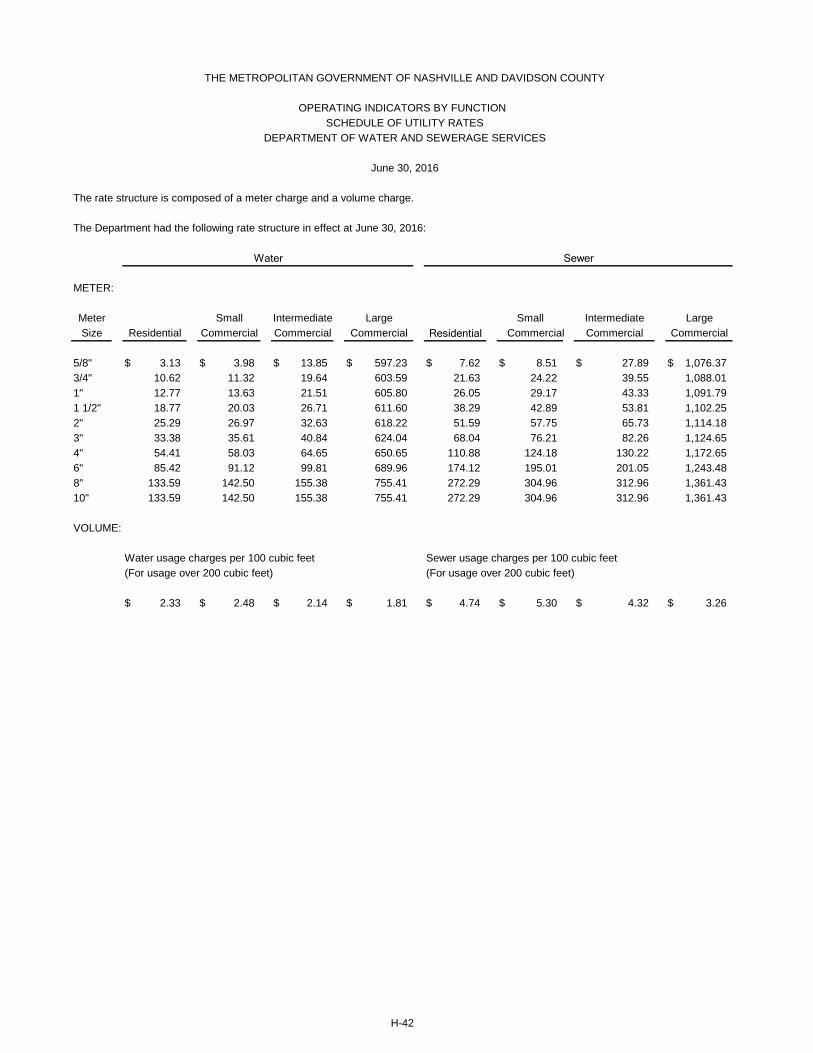
The rate structure is composed of a meter charge and a volume charge.
The Department had the following rate structure in effect at June 30, 2016:
METER:
MeterSize Residential Commercial Commercial
5/8" $ 3.13 $ 3.98 $ 13.85 $ 597.23 $ 7.62 $ 8.51 $ 27.89 $ 1,076.37 3/4" 10.62 11.32 19.64 603.59 21.63 24.22 39.55 1,088.01 1" 12.77 13.63 21.51 605.80 26.05 29.17 43.33 1,091.79 1 1/2" 18.77 20.03 26.71 611.60 38.29 42.89 53.81 1,102.25 2" 25.29 26.97 32.63 618.22 51.59 57.75 65.73 1,114.18 3" 33.38 35.61 40.84 624.04 68.04 76.21 82.26 1,124.65 4" 54.41 58.03 64.65 650.65 110.88 124.18 130.22 1,172.65 6" 85.42 91.12 99.81 689.96 174.12 195.01 201.05 1,243.48 8" 133.59 142.50 155.38 755.41 272.29 304.96 312.96 1,361.43 10" 133.59 142.50 155.38 755.41 272.29 304.96 312.96 1,361.43
VOLUME:
Water usage charges per 100 cubic feet Sewer usage charges per 100 cubic feet(For usage over 200 cubic feet) (For usage over 200 cubic feet)
$ 2.33 $ 2.48 $ 2.14 $ 1.81 $ 4.74 $ 5.30 $ 4.32 $ 3.26
June 30, 2016
THE METROPOLITAN GOVERNMENT OF NASHVILLE AND DAVIDSON COUNTY
SCHEDULE OF UTILITY RATESDEPARTMENT OF WATER AND SEWERAGE SERVICES
OPERATING INDICATORS BY FUNCTION
Small
Large Intermediate Small Large
Commercial
H-42
Commercial
CommercialIntermediate
Residential
Commercial
Water Sewer

THE METROPOLITAN GOVERNMENT OF NASHVILLE AND DAVIDSON COUNTY
DEPARTMENT OF WATER AND SEWERAGE SERVICES
June 30, 2016
Residential Commercial
Water Customers 175,769 22,188 197,957 Sewer Customers 185,365 17,890 203,255
Total Customers 361,134 40,078 401,212
H-43
Total
SCHEDULE OF NUMBER OF CUSTOMERSOPERATING INDICATORS BY FUNCTION
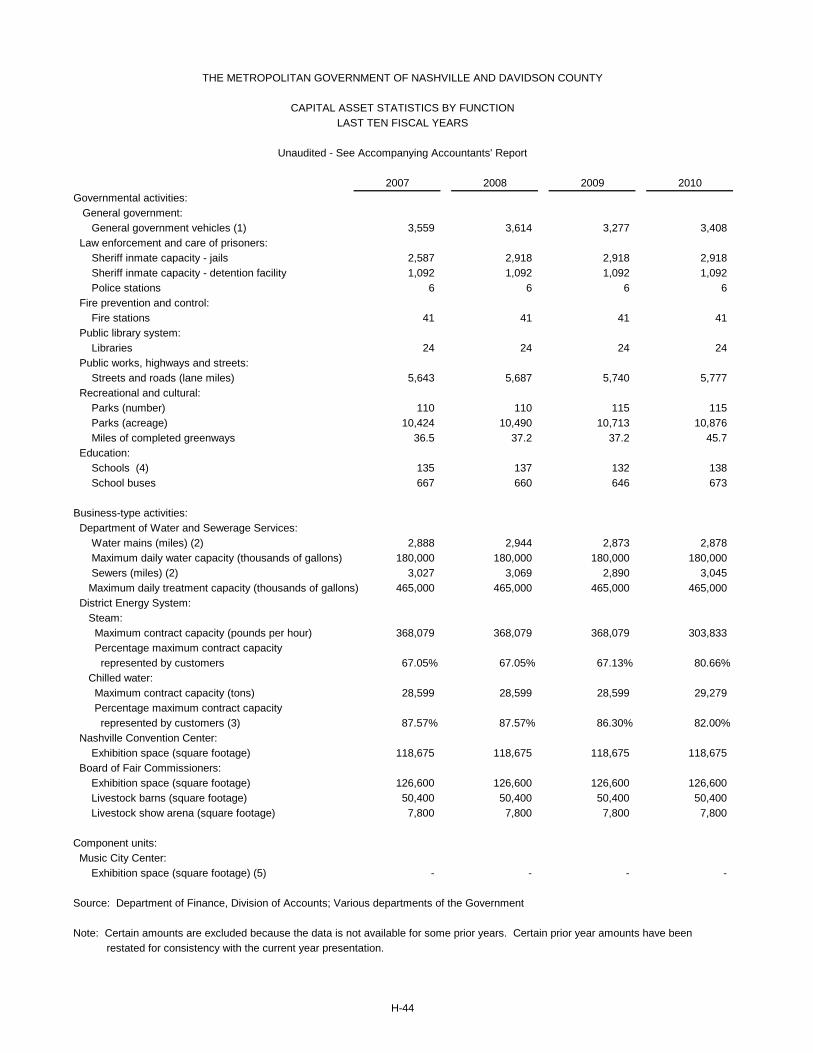
Governmental activities: General government: General government vehicles (1) 3,559 3,614 3,277 3,408 Law enforcement and care of prisoners: Sheriff inmate capacity - jails 2,587 2,918 2,918 2,918 Sheriff inmate capacity - detention facility 1,092 1,092 1,092 1,092 Police stations 6 6 6 6 Fire prevention and control: Fire stations 41 41 41 41 Public library system: Libraries 24 24 24 24 Public works, highways and streets: Streets and roads (lane miles) 5,643 5,687 5,740 5,777 Recreational and cultural: Parks (number) 110 110 115 115 Parks (acreage) 10,424 10,490 10,713 10,876 Miles of completed greenways 36.5 37.2 37.2 45.7 Education: Schools (4) 135 137 132 138 School buses 667 660 646 673
Business-type activities: Department of Water and Sewerage Services: Water mains (miles) (2) 2,888 2,944 2,873 2,878 Maximum daily water capacity (thousands of gallons) 180,000 180,000 180,000 180,000 Sewers (miles) (2) 3,027 3,069 2,890 3,045 Maximum daily treatment capacity (thousands of gallons) 465,000 465,000 465,000 465,000 District Energy System: Steam: Maximum contract capacity (pounds per hour) 368,079 368,079 368,079 303,833 Percentage maximum contract capacity represented by customers 67.05% 67.05% 67.13% 80.66% Chilled water: Maximum contract capacity (tons) 28,599 28,599 28,599 29,279 Percentage maximum contract capacity represented by customers (3) 87.57% 87.57% 86.30% 82.00% Nashville Convention Center: Exhibition space (square footage) 118,675 118,675 118,675 118,675 Board of Fair Commissioners: Exhibition space (square footage) 126,600 126,600 126,600 126,600 Livestock barns (square footage) 50,400 50,400 50,400 50,400 Livestock show arena (square footage) 7,800 7,800 7,800 7,800
Component units: Music City Center: Exhibition space (square footage) (5) - - - -
Source: Department of Finance, Division of Accounts; Various departments of the Government
Note: Certain amounts are excluded because the data is not available for some prior years. Certain prior year amounts have been restated for consistency with the current year presentation.
THE METROPOLITAN GOVERNMENT OF NASHVILLE AND DAVIDSON COUNTY
CAPITAL ASSET STATISTICS BY FUNCTIONLAST TEN FISCAL YEARS
Unaudited - See Accompanying Accountants' Report
H-44
20082007 2009 2010

3,510 3,507 3,524 3,542 3,452 3,393
2,918 2,918 2,918 2,918 2,918 2,918 1,092 1,092 1,348 1,348 1,348 1,348
7 7 7 7 8 8
38 38 38 38 38 38
24 24 24 23 23 22
5,796 5,814 5,832 5,852 5,866 5,880
118 127 126 126 132 185 11,131 12,554 13,022 13,802 15,078 15,873
46.5 51.0 54.5 79.0 82.0 85.0
137 136 135 131 131 131725 697 751 721 831 820
2,912 2,886 2,910 3,042 3,054 3,053 180,000 180,000 180,000 180,000 180,000 180,000
3,051 3,063 3,096 3,082 3,091 3,120 465,000 465,000 483,000 510,000 510,000 510,000
321,430 295,998 299,053 297,389 321,289 321,289
76.00% 73.16% 85.14% 99.70% 93.20% 93.20%
31,169 30,044 30,415 30,533 34,230 34,230
77.00% 73.58% 84.47% 82.33% 88.70% 88.70%
118,675 118,675 118,675 118,675 118,675 118,675
120,919 115,459 115,459 120,919 120,919 70,265 50,400 50,400 50,400 50,400 50,400 50,400 7,800 7,800 7,800 7,800 7,800 7,800
- - - 350,000 350,000 350,000
(1) General government vehicles include vehicles that are used in various other functions of the Government.(2) Decreases in water main and sewer miles in 2009 are due to a conversion to a new system for maintaining records resulting in more accurate measurements and the elimination of abandoned lines.(3) District Energy System diversified capacity for chilled water after planned pump modification in 2010.(4) Beginning in 2014, charter schools, academic academies and pre-k sites are included in total schools.(5) The Music City Center opened in May 2013.
THE METROPOLITAN GOVERNMENT OF NASHVILLE AND DAVIDSON COUNTY
CAPITAL ASSET STATISTICS BY FUNCTIONLAST TEN FISCAL YEARS (CONTINUED)
Unaudited - See Accompanying Accountants' Report
H-45
2011 20152012 20142013 2016

For an ADA accommodation, please contact Kimberly Northern at
615-880-1710 or by email at [email protected]