comprehensive annual financial report for the year ended ...userfiles/editor/docs/... ·...
TRANSCRIPT

Comprehensive Annual Financial Report
for the year ended December 31, 2015
City of Little Rock, Arkansas

On the Cover:
In September 2015, the Main Street Creative Corridor’s Low Impact Development (LID) streetscape was dedicated. The pedestrian and environmentally friendly streetscapes along four blocks of Main Street contain LID features such as bioswales, porous pavers, rain gardens, and biodiverse vegetation.
The Creative Corridor is a mixed-use development project which is restoring the vitality of Main Street by creating an arts district. Recent public art installations and the clustering of creative organizations are transforming the Creative Corridor into a downtown hub. The cover features the Creative Corridor logo as well as Lorri Acott’s Peace sculpture.
Initial planning and design for the Creative Corridor was funded by a 2011 Our Town grant from the National Endowment for the Arts. The plan, created by the University of Arkansas Community Design Center and Marlon Blackwell Architects, has received over ten international, national, regional and local awards.
A variety of public and private entities have been partners in the Creative Corridor including the Arkansas Natural Resources Commission, the Downtown Little Rock Partnership, ArtPlace America, the Educational Foundation of America, the National Endowment for the Arts, and the Environmental Protection Agency.
(Photo of the banner by Scott Whiteley Carter; photo of the sculpture by Kelly Quinn)

City of Little Rock, Arkansas
Comprehensive Annual Financial Report
For the Year Ended December 31, 2015
The Department of Finance
Sara Lenehan, CPA Director of Finance
Ember Strange Assistant Director of Finance

City of Little Rock, Arkansas Year Ended December 31, 2015
Contents
Introductory Section
Letter of Transmittal ............................................................................................................................ i
GFOA Certificate of Achievement for Excellence in Financial Reporting ....................................... xi
Organizational Structure ................................................................................................................... xii
List of Elected and Appointed Officials .......................................................................................... xiii
Financial Section
Independent Auditor’s Report ............................................................................................... 1
Management’s Discussion and Analysis ............................................................................. 4
Financial Statements
Statement of Net Position ................................................................................................................. 24
Statement of Activities ..................................................................................................................... 25
Balance Sheet – Governmental Funds .............................................................................................. 26
Statement of Revenues, Expenditures and Changes in Fund Balances – Governmental Funds ..................................................................................... 28
Statement of Net Position – Proprietary Funds ................................................................................ 30
Statement of Revenues, Expenses and Changes in Net Position – Proprietary Funds.............................................................................................. 31
Statement of Cash Flows – Proprietary Funds ................................................................................. 32
Statement of Fiduciary Net Position – Fiduciary Funds ................................................................... 33
Statement of Changes in Fiduciary Net Position .............................................................................. 34
Statement of Net Position – Discretely Presented Component Units ............................................... 35
Statement of Activities – Discretely Presented Component Units ................................................... 36
Notes to Financial Statements .......................................................................................................... 37

City of Little Rock, Arkansas Year Ended December 31, 2015
Contents (Continued)
Required Supplementary Information
Budgetary Comparison Schedule – General Fund .......................................................................... 104
Notes to Required Supplementary Information .............................................................................. 105
Budgetary Comparison Schedule – Street Fund ............................................................................. 106
Other Postemployment Benefit Plans – Schedule of Funding Progress ......................................... 107
Schedules of Changes in the City’s Net Pension Liability and Related Ratios .............................. 108
Schedules of Contributions ............................................................................................................. 112
Schedules of the City’s Proportionate Share of the Net Pension Liability and Contributions ....... 114
Schedules of Investment Returns ................................................................................................... 118
Other Supplementary Information
Governmental Funds – Nonmajor:
Combining Balance Sheet ......................................................................................................... 119
Combining Statement of Revenues, Expenditures and Changes in Fund Balances ................................................................................................................... 120
Special Revenue Funds – Nonmajor:
Combining Balance Sheet ......................................................................................................... 121
Combining Statement of Revenues, Expenditures and Changes in Fund Balances ................................................................................................................... 122
Debt Service Funds – Nonmajor:
Combining Balance Sheet ......................................................................................................... 123
Combining Statement of Revenues, Expenditures and Changes in Fund Balances ................................................................................................................... 124
Capital Project Funds – Nonmajor:
Combining Balance Sheet ......................................................................................................... 125
Combining Statement of Revenues, Expenditures and Changes in Fund Balances ................................................................................................................... 126

City of Little Rock, Arkansas Year Ended December 31, 2015
Contents (Continued)
Fiduciary Funds
Combining Statement of Fiduciary Net Position ............................................................................ 127
Combining Statement of Changes in Fiduciary Net Position ......................................................... 128
Statement of Changes in Assets and Liabilities – Agency Fund – Court Fund .............................. 129
Nonmajor Discretely Presented Component Units
Combining Statement of Net Position ............................................................................................ 130
Combining Statement of Activities ................................................................................................ 131
Combining Statement of Revenues, Expenses and Changes in Fund Net Position ........................ 132
Combining Statement of Cash Flows – Business-Type Activities ................................................. 133
Combining Statement of Cash Flows – Nonmajor Business-Type Activities ................................ 134
Statistical Section
Net Position by Component – Accrual Basis of Accounting ......................................................... 135
Changes in Net Position – Accrual Basis of Accounting ............................................................... 136
General Governmental Tax Revenues by Source – Accrual Basis of Accounting ......................... 137
Fund Balances of Governmental Funds – Modified Accrual Basis of Accounting ........................ 138
Changes in Fund Balances, Governmental Funds .......................................................................... 139
General Governmental Tax Revenues by Source – Modified Accrual Basis of Accounting ......... 140
Assessed and Appraised Value of Taxable Property ...................................................................... 141
Property Tax Rates and Tax Levies of Direct and Overlapping Governments .............................. 142
Principal Sales Taxpayers ............................................................................................................... 143
Property Tax Levies and Collections .............................................................................................. 144
Ratios of Outstanding Debt by Type .............................................................................................. 145

City of Little Rock, Arkansas Year Ended December 31, 2015
Contents (Continued)
Ratios of General Bonded Debt Outstanding ................................................................................. 146
Direct and Overlapping Governmental Activities Debt ................................................................. 147
Legal Debt Margin Information ..................................................................................................... 148
Revenue Bond Coverage ................................................................................................................ 149
Demographic and Economic Statistics ........................................................................................... 150
Little Rock Area Major Employers ................................................................................................ 151
Full-time Equivalent City Government Employees by Function ................................................... 152
Operating Indicators by Function/Program .................................................................................... 153
Capital Asset Statistics by Function ............................................................................................... 154

awards. These reports are issued separately from the City of Little Rock's Comprehensive Annual Financial Report.
GAAP requires that management provide a narrative introduction, overview, and analysis to accompany the basic financial statements in the form of Management's Discussion and Analysis (MD&A). This letter of transmittal is designed to complement MD&A and should be read in conjunction with it. The City of Little Rock's MD&A can be found immediately following the report of the independent auditor.
Profile of the Government:
The City of Little Rock, incorporated in 1831, is located in the central part of the State, and is considered to be one of the top growth areas in the State. The City of Little Rock currently occupies a land area of 123 square-miles and serves a population of 197,992. The City of Little Rock is empowered to levy a property tax on both real and personal properties located within its boundaries. In addition, the City is empowered by State Statute to extend its corporate limits by annexation, which occurs periodically when deemed appropriate by the governing body.
The City of Little Rock has operated under the Council-Manager form of government since 1957. Policy-making and legislative authority are vested in a governing council consisting of the Mayor and ten (10) other members. The governing council is responsible for, among other things, passing ordinances, adopting the budget, and hiring both the City Manager and City Attorney. The Mayor's position is full-time, and has Board and Commission appointment authority and veto power. The City Board Members are part-time, and all are elected on a nonpartisan basis. The City Manager is responsible for carrying out the policies and ordinances of the governing council, for overseeing the day-to-day operations of the government and for appointing the various Department Directors.
The City of Little Rock provides a full range of services, including Police and Fire protection, the construction and maintenance of streets and other infrastructure, and recreational activities and cultural events. Several services are provided through separate Boards and Commissions which act as a component of the City of Little Rock and therefore have been included as an integral part of the City of Little Rock's financial statements. Additional information regarding the blended and discretely presented component units can be found in the notes to the financial statements (See Note 1 ).
The Annual Budget serves as the foundation for the City of Little Rock's financial planning and control. All Departments of the City of Little Rock are required to submit requests for appropriation to the City Manager. The City Manager utilizes these requests as the starting point for developing a proposed budget. The City Manager and Mayor then present a proposed budget to the Board of Directors for review. The Board of Directors is required to hold public hearings on the proposed budget and to adopt a final budget no later than December 31 5
\ the close of the City of Little Rock's fiscal year. The appropriated budget is prepared by fund, function (e.g., public safety) and Department (e.g., Zoo). Department Directors may make transfers of appropriations within a Department. Transfers of appropriations between Departments; however, require the special approval of the City Manager, unless the amount is above $50,000, and then it requires the approval of the Board of Directors. Budget-to-actual comparisons are provided in this report for each individual governmental fund for which an
ii

appropriated annual budget has been adopted. For the General Fund, this comparison is presented on page 104 as part of the basic financial statements for the governmental funds. For the Street Fund, this comparison is presented on page 106.
Factors Affecting Financial Condition:
The information presented in the financial statements is perhaps best understood when it is considered from the broader perspective of the specific environment within which the City of Little Rock operates.
Local Economy: The primary challenge facing the City of Little Rock remains providing a full complement of services that satisfy the needs of citizens in the midst of an uncertain, but stabilizing, economic climate. While the economic recovery continues, it remains slow but steady.
The latest comparative figures for the City of Little Rock show unemployment at 4.2%, compared with a U.S. average of 5%, according to data from the United States Department of Labor, seasonally adjusted for local figures by Metroplan. According to Metroplan, the City of Little Rock had approximately 6,300 unemployed residents as of December 2012. This number had decreased to approximately 3,800 unemployed residents by December 2015, representing just 4% of the labor force and a decline of 32% in two (2) years. Little Rock remains a vital employment center, accounting for approximately 53% of all jobs, by place of work, in the Little Rock-North Little Rock metropolitan area. A large component of the City's workforce is in the areas of health care, education and public administration. These sectors are less vulnerable to national employment trends.
The Metroplan economic report for early 2016 states that Little Rock retail sales had a good year in 2015. The year saw completion of the Gateway Town Center near the intersection of Interstate 430 and Interstate 30 in Southwest Little Rock. The total inflation-adjusted boost to retail sales over the previous year of 3.6% matches closely with the 3.9% total gain in retail square-footage due to the new center's construction, as reported in the 2015 Office / Retail Industrial Lease Guide from Arkansas Business. Per Metroplan, the City rarely sees retail additions of this size. The general trend in recent years has been for retail sales to grow very slowly, actually declining after the inflation adjustment. Therefore, it is likely that the jump in sales experienced during 2015 was a one-time event, and that 2016 will see a resumption of inflation-adjusted decline in retail sales, fueled by the rise in Internet sales. U.S. Internet sales continued rapid growth accounting for 7.4% of all retail sales. Internet sales have more than doubled in a decade, from Jess than 3% in 2006, and could easily reach 10% of total retail sales by 2020. Internet sales have an advantage over local retailers in Arkansas and other states that are unable to collect Sales and Use Tax on online sales. The City is supportive of the Remote Transactions Parity Act before Congress, which would enable municipalities to collect sales tax from retailers that do not have a physical presence in the State. With sales tax as the primary revenue source for the City of Little Rock, this legislation is critical to retaining the resources required to sustain local services. While State Law requires that citizens prepare use tax returns for such purchases, this method of tax collection is very ineffective.
The regional housing market has seen less growth than the U.S. average over the last several years. Single-family housing permits began to rebound during 2012, moving to an average of
iii

thirty (30) monthly; the highest level since 2008, and were nearing an average of forty ( 40) units per month by the end of 2014. However, the average dropped to 26.5 during 2015. The Metroplan report on Little Rock's Economy in early 2016, describes the Little Rock housing market as follows: Multi-family housing construction has increased in relation to SingleFamily Permits, growing to nearly 60% of all new housing units from 2011 - 2015 compared with 36%-38% in the two (2) preceding five (5)-year intervals. There are several multi-family projects proposed for 2016. Such projects often raise controversy concerning adjoining land uses; however, affordable housing can be an important component of economic development. On August 1, 2013, Moses Tucker Real Estate announced plans to redevelop the old Arkla Gas Building in Downtown Little Rock, converting it into upscale apartments that opened in September 2015. The project, called MacArthur Commons, includes fifty-nine (59) units at the corner of East Capitol and River Market A venues. The development has been a great success, designed to provide upscale, yet affordable housing for residents looking to live downtown. By November, the complex was 97% occupied. During the second quarter of 2015, over 400 new units opened in Little Rock including 262 units at LIV Riverhouse, located at 1200 Brookwood Drive, and 144 units at The Pointe Brodie Creek, Phase II, located at 3400 South Bowman Road in Little Rock. Another 500 units are approved for Bowman Pointe, and a planned development of 250 units has been approved farther south on Bowman Road. The occupancy rate in newly built complexes, those opened since 2010, is 95%. The central market in Little Rock is the most popular in the county. In addition, nine (9) apartment complexes were sold in Pulaski County in the second quarter. The highest price paid was $36 million for Park Avenue Lofts, a luxury apartment complex in Little Rock with 258 units. The price per unit was about $139,000 and the price per square-foot was almost $150. The buyer's CEO, Jack Fiorella of Equity Resources, LLC, of Birmingham, Alabama said, "Equity Resources has great confidence in the Little Rock market. We expect that our strategy to own high-end luxury communities will be well received by the community."
The City's long-term outlook remains bright; most indicators continue showing competitive advantages in the local metropolitan area. Job losses in some sectors have been balanced, even in recession, by gains in areas with future potential. Economic projects are in development in all areas of the City - from Downtown, to Midtown, Southwest Little Rock and West Little Rock. Many of these projects are highlighted as major initiatives below.
Little Rock's strong business environment and quality of life have been recognized by several national publications. In July 2013, Little Rock was named "#1 of America's l O Great Places to Live" by Kiplinger 's Personal Finance. The rankings place an emphasis on small and midsize cities, considering metro areas with a population of one million or less that have good jobs, reasonably priced homes, decent schools and access to great health care. Little Rock is very proud of this ranking.
In addition, Little Rock was recently listed as No. 3 Best State Capital by USA Today Readers' Choice: 10 Best. The article had this to say about Little Rock, "A downtown renaissance has transformed Little Rock into a city with culture, cuisine and abundant outdoor activities. Visitors can rent a bike and pedal the sixteen ( 16)-mile loop along the Arkansas River Trail, visit the Clinton Presidential Center and the Little Rock Central National Historic Site, a National Park Service unit that interprets the crucial role played by the school in the civil rights struggle." The article may be found at (http://www.1Obest.com/awards/travel/best-travelworth y-state-ca p ital/).
iv

Bicycling.com/2016 recently named the Big Dam Bridge in Little Rock as one of the "Coolest Bike and Pedestrian Bridges in the US." The Big Dam Bridge across the Arkansas River in Little Rock is the longest pedestrian/cycling bridge that wasn't formerly a motorist or train bridge.
In May 2016, Arkansas Business reported that Arkansas moved up ten spots in Chief Executive Magazine's latest Best & Worst States for Business annual survey found at (http:// chi efexecuti ve .net/wh y-do-some-areas-of-the-country-thri ve-wh i le-others-see-bu s i nesses-atrophy-and-peop 1 e-flee-at-alarm ing-rates/). Arkansas was also ranked No. 1 in "Best Communication of Business Incentives." Arkansas was second only to Ohio in biggest gains. Per Mike Preston, Executive Director of the Arkansas Economic Development Commission, "What this tells us is that we are building momentum, we are capitalizing on our strengths, and we are working to improve our critical areas."
Long-Term Financial Planning: Little Rock citizens passed an additional one (1)-Cent Local Sales Tax in September 2011 that was effective on January 1, 2012. Faced with significant challenges with stagnant revenue in many areas due to the lingering effects of the economic downturn, and one of the lowest local tax rates in the State, citizens supported the new tax initiative. The City held several public hearings in each Ward to discuss priority needs associated with Public Safety, Public Works, Jobs and Economic Development, Parks and Recreation, Zoo and Tourism, and other priorities, including fleet replacement, information technology needs, pension funding, and public transportation. The priority needs were divided between on-going operating needs and capital needs. The 5/8-cent permanent increase in sales tax for operations is reflected in the 2015 Adopted Budget. The 3/8-cent, ten (I 0)-year sales tax for capital projects, which expires in 2021, is reflected in a Sales Tax Capital Improvements Fund. The tax increase provides funding for additional Police Officers, more Code Enforcement Officers, new Fire and Police facilities, infrastructure projects, and a new emergency communications system. In the first four ( 4) years of collection, the new sales tax provided additional resources of approximately $190 million, including approximately $119 million for operations and $71 million for capital projects.
On February 21, 2012, the Little Rock City Board of Directors approved Resolution No. 13,440, which appointed the Little Rock Citizen's Evaluation of New Tax (LR CENT) Committee. The Committee, which is made of two (2) Co-Chairs, individuals from each of the City's seven (7) Wards and three (3) At-Large Members, meets on a quarterly basis to evaluate the spending of the additional revenue that results from the One (I )-Cent Sales Tax mcrease.
On September 11, 2012, Little Rock citizens showed their on-going support of the City by approving the issuance of up to $105 million in Capital Improvement Bonds to finance $73.5 million in street improvements and $31.5 million in drainage improvements. The bonds are secured by a three (3)-mill ad valorem tax on taxable property located within the City of Little Rock. The City issued $58,105,000 in bonds on July 24, 2013. A second series of bonds will likely be issued in 2018.
In 2002, the Board adopted a policy which established a designated reserve within the General Fund. At the end of the fiscal year, the Board reviews audited financial statements and determines the appropriate amount to place in the reserve. Prior to 2006, the Board had increased the reserve to $9,418,000. The General Fund goal was to set aside the greater of
V

$10,000,000, or 10%, of General Fund revenues in the reserve. The 2015 Budget includes a contingency allocation of an additional $1 million. Following the completion of the 2015 Audit, the City's Management Team will determine the amount of funds available to increase the reserve, with the intent of gradually increasing the designated reserve to achieve 10% of General Fund revenues in the next few years.
Relevant Financial Policies: Revenue growth within the General Fund is restricted by mill levy and franchise fee caps set in State Law. Little Rock levies the maximum mill levy (5 mills) for the General Fund. Franchise fees are at the maximum rate allowed under State Law. Further increases would require the consent of the utility or voter approval. Earlier this decade, revenue growth within the General Fund was sluggish. Although revenue growth began to accelerate in 2003 and had reached a moderate growth rate prior to the economic downturn in 2008, revenue growth did not keep pace with operating cost increases. Annual 2009 sales tax revenues declined in comparison with 2008 by approximately 4.6% due to the weakened national economy. In accordance with the City's financial policies, the Board of Directors has adopted budgets which ensure that current year expenditures are at, or below, current year revenues and available carryovers. When workforce reductions have been necessary, per the City's financial policies, reductions have mainly been accomplished through attrition. However, due to the economic downturn in 2008 and 2009, the City implemented a reduction in force at the 2009 year-end. The 2010 Budget included a reduction of forty-two ( 42) fulltime positions from prior year staffing levels. The 2011 Budget included the same number of authorized full-time positions as the 20 IO Budget. With the passage of the new sales tax, positions were filled and new positions were added in 2012 through 2015, particularly in the areas of Public Safety and Parks and Recreation. The 2016 General Fund Budget supports 1,697 full-time equivalent (FTE) positions, a net increase of eight (8) FTEs compared to 2015 staffing levels. Staffing includes twenty-seven (27) Police positions previously funded by a grant award under the American Recovery and Reinvestment Act COPS Program and eighteen (18) Firefighters previously funded by a SAFER Grant. In addition, special projects and grant awards support forty-two ( 42) employees, including fifteen ( 15) new COPS positions. However, approximately 133 of the budgeted General Fund positions were vacant during 2015. This represents an improvement over the 152 budgeted General Fund positions that were kept vacant in 2011. Many of the initiatives supported by the new sales tax, such as increased funding for building maintenance, expanded park maintenance, Zoo deferred maintenance, operations and staffing, annual fleet replacement, information technology staffing and maintenance, and new transit routes were implemented during 2012 and 2013. The 2016 Budget continues the commitment to Little Rock citizens to fill vacant public safety positions and to support the initiatives outlined in the sales tax proposal.
The City issued a $5.9 million short-term financing note in 2015 to accelerate completion of the West Central Community Center associated with the 3/8-Cent Sales Tax for capital projects and to purchase police vehicles and equipment. Short-term financing notes are authorized under Amendment No. 78 to the Arkansas Constitution for the acquisition, construction and installation of real and tangible personal property having an expected useful life of more than one (1)-year. The notes are repaid from general revenues over a period of five (5) years. The principal portion of the new note that is related to the West Central Community Center will be funded by a transfer to the General Fund from the proceeds of the 3/8-Cent Sales Tax for capital projects. Principal and interest payments are included in the General Fund Budget. Debt service payments will increase by approximately $1,247,000 in 2016 due to the addition of the 2015 note.
vi

Funding of the Pulaski County Jail was continued in order to provide space for prisoners in accordance with the City's primary focus on Public Safety. In addition, an extra allocation is available from a $20 local jail fine to contribute toward operations for expanded Pulaski County Jail space. Combined, the funding for the jail is budgeted at $1,854,576.
A Homeless Services Task Force was established in 2006 to end chronic homelessness within our community. The City of North Little Rock has partnered with Little Rock to financially fund the Jericho Way Day Resource Center. The services provided to homeless individuals and families are focused on finding housing, job referral, and case management services, medical, dental and psychiatric assistance. In addition, both municipalities are working with the various support groups in Central Arkansas as part of the on-going process to address the needs of homeless individuals and families.
The City is appropriating approximately $5.5 million for Children, Youth and Family Programs, including youth employment and re-entry programming in 2016 as part of City's emphasis to foster and enhance youth and community development. In addition, Community Programs Staff has completed the development of a Youth Master Plan following a series of community forums with Little Rock citizens. City Staff will continue to work with community organizations, neighborhood associations, the faith-based community and other groups to ensure resources are targeted appropriately. In addition, the City implemented an in-house pilot program to train and utilize disadvantaged persons for the construction and maintenance of sidewalks. The program is extremely successful and will be continued in 2016. In addition, the City has expanded the program to include additional entry-level positions available in other City Departments.
Other new programs receiving funding in the 2016 Budget include a pilot Neighborhood Housing Rehabilitation Program, a public service announcement program, operating expenses for the West Central Community Center beginning in November and operating expenses for the new Pankey Police Station in West Little Rock.
The 2016 Budget includes a contingency allocation of $1 million or 0.5% of General Fund revenues. The City of Little Rock's Management Team will continue to manage the City in a sound and fiscally prudent manner while striving to deliver the quality and level of service that the citizens of Little Rock expect with available resources. Major Initiatives: Commercial property construction continues to show strong growth. One of the most exciting developments is the Bass Pro Shop that opened in Little Rock on November 13, 2013. The 120,000 square-foot location is at Little Rock's Gateway Town Center, a 169-acre project at the northwest corner of Interstates 30 and 430 in Southwest Little Rock. In addition, The Outlets at Little Rock opened in October 2015 at the same location with approximately sixty-nine (69) retail stores, bringing approximately 1,000 jobs to the area. The center is anticipated to have approximately seventy-five (75) stores when it is complete. Outlet shopping centers are unique and traditionally become destinations and magnets for retail activity. The Outlets of Little Rock is the only outlet center in the State, and the shopping center's location guarantees visibility. More than 40% of Arkansas' population lives within sixty (60) miles of the Outlets. In addition, outlet malls are less impacted by Internet sales because many of the discounts offered are not available online. Developer Tommy Hodges estimated that the Outlets will collect nearly $2.3 million per year in City sales taxes and around $1.5 million per year in County sales taxes. The Gateway's Grove Project is on the northeast
vii

quadrant of the Gateway Town Center. It is envisioned to become an entertainment district with hotels, restaurants and other attractions. A pedestrian promenade would link The Grove's restaurants, shops and venues to the Outlets and Bass Pro Shop. Arkansas' first Dave and Buster's Restaurant and Video Arcade opened at The Grove in June 2016. Plans call for I 0,000 square-feet of retail and restaurant space to be completed later in 2016 followed by additional space for entertainment destinations, hotels and other retailers. Most recently, developers announced that Movie Tavern, a dine-in movie theater chain, is planning a new theater at the shopping center.
In July 2014, the Robinson Center Music Hall in Downtown Little Rock was temporarily closed for a $68 million renovation project. The building will increase from 133,500 squarefeet to 138,000 square-feet. The overhaul includes restoring the exterior, re-working audience entrances, improving performance hall acoustics and seating, upgrading the loading area and building a new conference center and grand hall on the north side of the performance hall. The upgrades are expected to be completed by October 31, 2016.
In February 2015, FedEx held a groundbreaking ceremony with company officials, as well as government leaders including U.S. Sen. Tom Cotton and U.S. Rep. French Hill. The 303,000 square-foot FedEx Corporation Distribution Center opened in Southwest Little Rock in September 2016. The $24.9 million project employs 175 people and can process approximately 15,000 packages per hour.
In June 2015, the American Taekwondo Association International (AT AI) broke ground on its new $13 million, 25,300 square-foot headquarters in Little Rock along Riverfront Drive, complete with a museum, video production studio and international martial arts training. The A TAI' s annual World Expo, held in Little Rock's Statehouse Convention Center, brings in tens of thousands of visitors and competitors each year. In December 2015, Arkansas Business reported that Fidelity Information Services (FIS) would sponsor a startup accelerator in Little Rock devoted to financial technology. FIS, based in Jacksonville, Florida, is a global banking technology services provider whose origins trace back to Systematics of Little Rock. It maintains a large campus in West Little Rock that employs approximately 1,300 workers with a focus on product development. The FinTec Accelerator is housed out of the Venture Center, which shares space with the Little Rock Technology Park in Downtown Little Rock. Launched in 2014, the Venture Center has grown to more than 200 members, seventy-six (76) active startups and thirty-seven (37) trained mentors who have led more than 340 mentor sessions. The center has produced forty-four ( 44) of its Pre-Accelerator Program startups. Six (6) of its member startups have raised more than $2.25 million in venture capital. On August 3, 2016, Governor Asa Hutchinson and FIS Officials announced that the FinTec Accelerator will return to Little Rock in 2017 and 2018.
Downtown Little Rock has attracted three (3) hotel developers who have invested more than $7 .3 million to secure locations to join a hotel market thriving with conventions, commerce and tourism. The 140-room Hilton Garden Inn project is scheduled to be the first to open in spring of 2017.
In April 2016, LM Wind Power broke ground on a new 44,000 square-foot facility at the Little Rock Port. The company, which employs 450 people across two (2) sites in Little Rock, said the expansion will allow it to store materials at its port operation, cutting transportation costs and increasing efficiencies.
viii
In May 2016, Ronald McDonald House Charities of Arkansas announced a $1.2 million donation from the J.E. and L.E. MaBee Foundation to help fund a new 32,000 square-foot facility under construction at the corner of 1 oth Street and Dr. Martin Luther King, Jr., Boulevard in Little Rock. It is scheduled to open in November.
In August 2016, Arkansas Business announced that Welspun Tubular, LLC, of Little Rock had obtained an order for more than $47 million in coated twenty (20)-inch pipe for the Diamond Pipeline, a 440-mile project to move crude oil from the Plains Terminal in Cushing, Oklahoma, to the Valero refinery in Memphis, Tennessee. Included in the report was this quote from Rusty Fisher, Senior Vice President for Sales and Marketing at Welspun. "On behalf of our more than 500 employees in the Little Rock area, we're proud to contribute to bringing the benefits of this important piece of energy infrastructure to our community. Through this prestigious pipeline order, Welspun Tubular continues to fulfill its commitment of supporting jobs to the State of Arkansas."
The City will continue to identify economic development opportunities that result in the expansion, retention or start-up of businesses that create jobs and generate sales tax, property tax or other forms of revenue for the City. The revenue anticipated from the 3/8-Cent Sales Tax of $38,000,000, or 19.4%, for capital projects is dedicated to jobs and economic development through 2021. The funds will be utilized for port expansion, development of a research park, and job recruitment and economic development infrastructure. Job recruitment and economic infrastructure commitments to date include awards to Welspun Tubular, LLC, Martial Arts Services, Inc., FedEx, the research park, and land acquisition at the port.
The City of Little Rock's website, www.littlerock.org, and a strong presence in a wide variety of social media sites including Facebook, Twitter, Instagram, Y ouTube and Flickr allow Little Rock residents and businesses to stay informed about programs and resources available. Before the end of the year, the City expects to launch its new website, www.littlerock.gov. In addition, the City is proud of its local government access channel, LRTV, which broadcasts information regarding the activities of the Little Rock City Board of Directors through live and taped coverage of City Board Meetings and other official proceedings; and produces programming regarding municipal affairs. The City of Little Rock mobile app was implemented in 2014 to enable citizens to connect with City leadership, access City services, report issues, and locate other community information. In 2016, the City launched a new 311 app to enable citizens to easily make requests for City services. These apps are available for download through the App Store or Google Play Store.
Awards and Acknowledgements:
The Government Finance Officers Association (GFOA) awarded a Certificate of Achievement for Excellence in Financial Reporting to the City of Little Rock for its Comprehensive Annual Financial Report (CAFR) for the fiscal year ended December 31, 2014. The City of Little Rock has received a Certificate of Achievement for thirty-three (33) years total. In order to be awarded a Certificate of Achievement, the City published an easily readable and efficiently organized CAFR. This report satisfied both GAAP and applicable legal requirements.
ix

A Certificate of Achievement is valid for a period of one (1)-year only. We believe that our current CAFR continues to meet the Certificate of Achievement Program's requirements, and are submitting it to GFOA to determine its eligibility for another certificate.
The preparation of this report could not have been accomplished without the efforts of certain individuals: Assistant Finance Director Ember Strange; Assistant Comptroller Anita Worley; and the Accounting and Reporting Staff including Alan Bohannon, Tommie Bowman, Octavia Ashford, Ben Damgaard, Ben Jurgens, Nancy Warfield, and Colleen Young; Treasury Manager Scott Massanelli; Purchasing Manager Abdou! Kabaou; and Grants Manager Caran Curry, and the Grants Staff including Gene Brunner, Amanda Jones, and Lottie Keaton; and Internal Audit Manager Debbie Carreiro, should be recognized for their contributions and devotion to meeting the highest standards of accounting and financial reporting. In addition, credit must be given to the Mayor, the Board of Directors and the City Staff for their unfailing support for maintaining the highest standards of professionalism in the management of the City of Little Rock finances.
Respectfully submitted,
-ss,,, ..s..� -Bruce T. Moore City Manager
Sara C. Lenehan Finance Department Director
X

Government Finance Officers Association
Certificate of
Achievement for Excellence
in Financial Reporting
Presented to
City of Little Rock
Arkansas
For its Comprehensive Annual
Financial Report
for the Fiscal Year Ended
December 31, 2014
Executive Director/CEO
xi
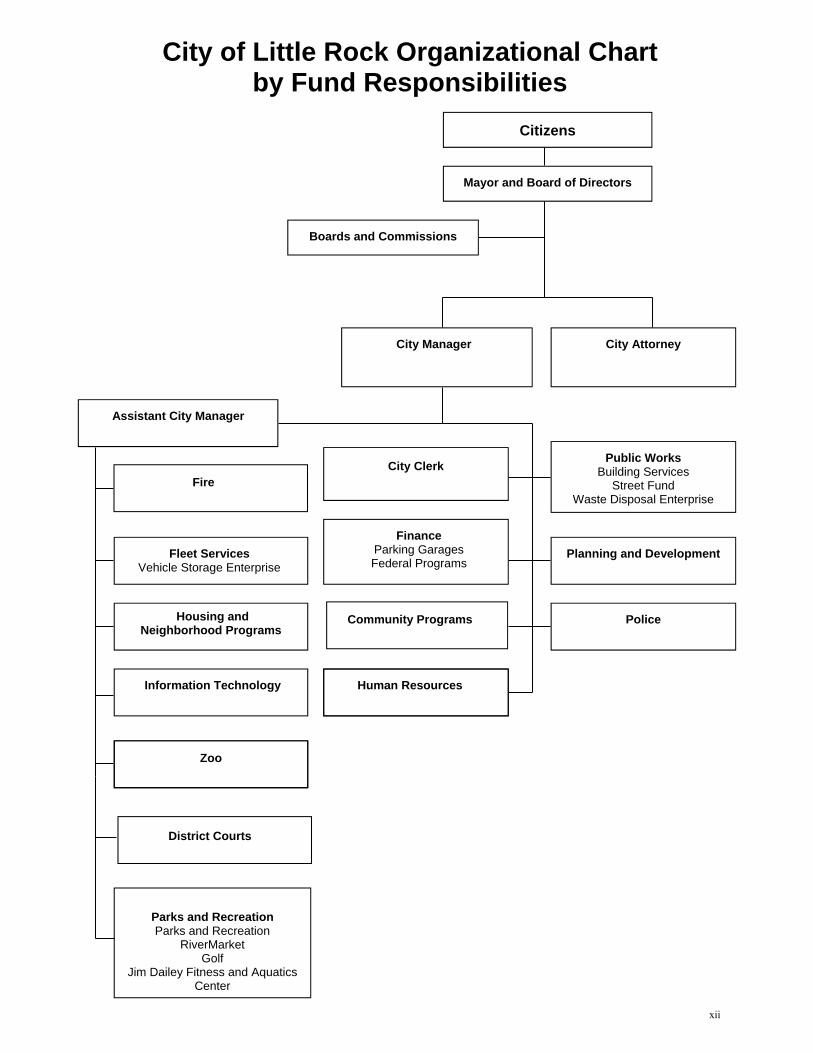
City Manager
Assistant City Manager
Fire
Police
Fleet Services Vehicle Storage Enterprise
Housing and Neighborhood Programs
Information Technology
City Attorney
Human Resources
Public Works Building Services
Street Fund Waste Disposal Enterprise
Planning and Development
City Clerk
Community Programs
Finance Parking Garages Federal Programs
Parks and Recreation Parks and Recreation
RiverMarket Golf
Jim Dailey Fitness and Aquatics Center
Citizens
Mayor and Board of Directors
Boards and Commissions
Zoo
City of Little Rock Organizational Chart by Fund Responsibilities
District Courts
xii

xiii
Elected Officials: Mark Stodola Mayor Lance Hines Vice-Mayor, Director – Ward 5 Erma Hendrix Director – Ward 1 Ken Richardson Director – Ward 2 Kathy Webb Director – Ward 3 Brad Cazort Director – Ward 4 Doris Wright Director – Ward 6 B. J. Wyrick Director – Ward 7 Dean Kumpuris Director – Position 8 Gene Fortson Director – Position 9 Joan Adcock Director – Position 10 Alice Lightle District Court First Division Judge Victor Fleming District Court Second Division Judge Mark Leverett District Court Third Division Judge
Appointed Officials:
Bruce T. Moore City Manager Tom Carpenter City Attorney
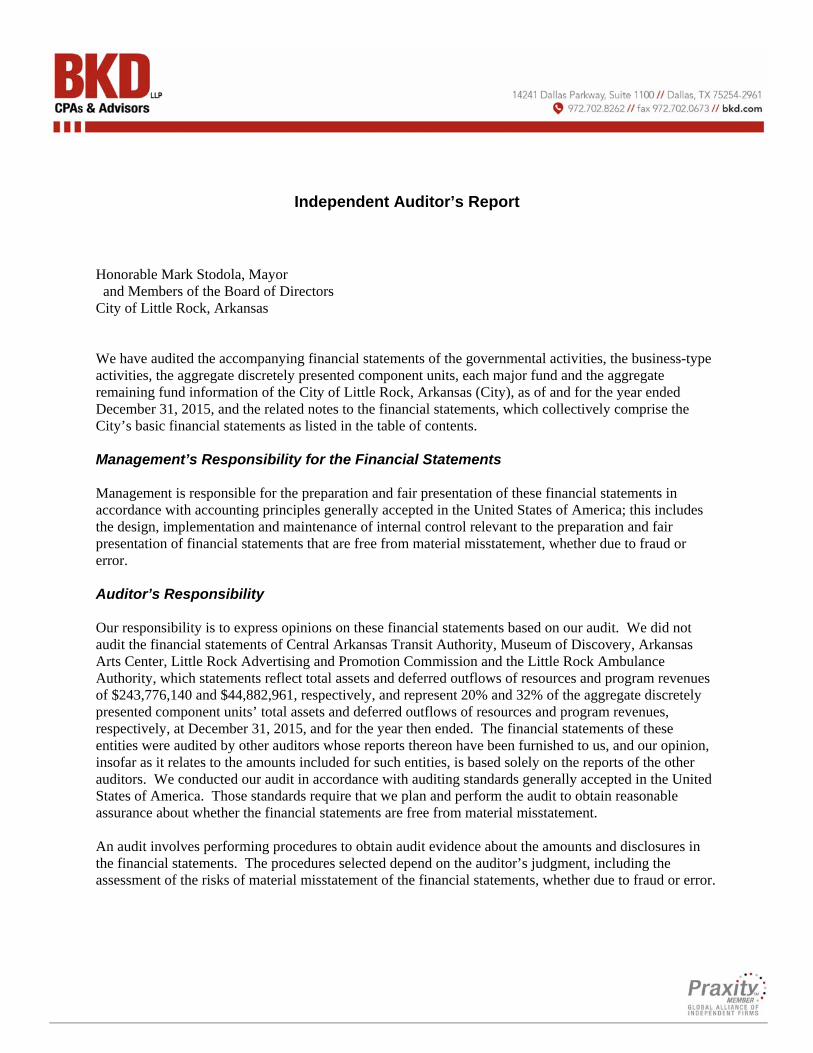
Independent Auditor’s Report
Honorable Mark Stodola, Mayor and Members of the Board of Directors City of Little Rock, Arkansas We have audited the accompanying financial statements of the governmental activities, the business-type activities, the aggregate discretely presented component units, each major fund and the aggregate remaining fund information of the City of Little Rock, Arkansas (City), as of and for the year ended December 31, 2015, and the related notes to the financial statements, which collectively comprise the City’s basic financial statements as listed in the table of contents. Management’s Responsibility for the Financial Statements Management is responsible for the preparation and fair presentation of these financial statements in accordance with accounting principles generally accepted in the United States of America; this includes the design, implementation and maintenance of internal control relevant to the preparation and fair presentation of financial statements that are free from material misstatement, whether due to fraud or error. Auditor’s Responsibility Our responsibility is to express opinions on these financial statements based on our audit. We did not audit the financial statements of Central Arkansas Transit Authority, Museum of Discovery, Arkansas Arts Center, Little Rock Advertising and Promotion Commission and the Little Rock Ambulance Authority, which statements reflect total assets and deferred outflows of resources and program revenues of $243,776,140 and $44,882,961, respectively, and represent 20% and 32% of the aggregate discretely presented component units’ total assets and deferred outflows of resources and program revenues, respectively, at December 31, 2015, and for the year then ended. The financial statements of these entities were audited by other auditors whose reports thereon have been furnished to us, and our opinion, insofar as it relates to the amounts included for such entities, is based solely on the reports of the other auditors. We conducted our audit in accordance with auditing standards generally accepted in the United States of America. Those standards require that we plan and perform the audit to obtain reasonable assurance about whether the financial statements are free from material misstatement. An audit involves performing procedures to obtain audit evidence about the amounts and disclosures in the financial statements. The procedures selected depend on the auditor’s judgment, including the assessment of the risks of material misstatement of the financial statements, whether due to fraud or error.

Honorable Mark Stodola, Mayor and Members of the Board of Directors Page 2
In making those risk assessments, the auditor considers internal control relevant to the entity’s preparation and fair presentation of the financial statements in order to design audit procedures that are appropriate in the circumstances, but not for the purpose of expressing an opinion on the effectiveness of the entity’s internal control. Accordingly, we express no such opinion. An audit also includes evaluating the appropriateness of accounting policies used and the reasonableness of significant accounting estimates made by management, as well as evaluating the overall presentation of the financial statements. We believe that the audit evidence we have obtained is sufficient and appropriate to provide a basis for our audit opinions. Opinions In our opinion, based on our audit and the reports of other auditors, the financial statements referred to above present fairly, in all material respects, the respective financial position of the governmental activities, the business-type activities, the aggregate discretely presented component units, each major fund, and the aggregate remaining fund information of the City as of December 31, 2015, and the respective changes in financial position and, where applicable, cash flows thereof for the year then ended in accordance with accounting principles generally accepted in the United States of America. Emphasis of Matter As discussed in Note 17 to the financial statements, in 2015, the City implemented the provisions of Governmental Accounting Standards Board (GASB) Statement No. 68, Accounting and Financial Reporting for Pensions – an amendment of GASB Statement No. 27 and GASB Statement No. 71, Pension Transition for Contributions Made Subsequent to the Measurement Date – an amendment of GASB Statement No. 68. Our opinions are not modified with respect to this matter. Other Matters Required Supplementary Information Accounting principles generally accepted in the United States of America require that the management’s discussion and analysis and budgetary and pension/other postemployment benefit information listed in the table of contents be presented to supplement the basic financial statements. Such information, although not part of the basic financial statements, is required by the Governmental Accounting Standards Board, who considers it to be an essential part of financial reporting for placing the basic financial statements in an appropriate operational, economic or historical context. We and the other auditors have applied certain limited procedures to the required supplementary information in accordance with auditing standards generally accepted in the United States of America, which consisted of inquiries of management about the methods of preparing the information and comparing the information for consistency with management’s responses to our inquiries, the basic financial statements and other knowledge we obtained during our audit of the basic financial statements. We do not express an opinion or provide any assurance on the information because the limited procedures do not provide us with sufficient evidence to express an opinion or provide any assurance.
Honorable Mark Stodola, Mayor and Members of the Board of Directors Page 3
Supplementary Information Our audit was conducted for the purpose of forming opinions on the financial statements that collectively comprise the City’s basic financial statements. The accompanying supplementary information including the combining and individual fund statements, budgetary comparison schedule – street fund and statement of changes in assets and liabilities – agency fund is the responsibility of management and was derived from and relates directly to the underlying accounting and other records used to prepare the basic financial statements. Such information has been subjected to the auditing procedures applied in the audit of the basic financial statements and certain additional procedures, including comparing and reconciling such information directly to the underlying accounting and other records used to prepare the basic financial statements or to the basic financial statements themselves, and other additional procedures in accordance with auditing standards generally accepted in the United States of America by us and other auditors. In our opinion, based on our audit, the procedures performed as described above, and the report of the other auditors, the information is fairly stated in all material respects in relation to the basic financial statements as a whole. Other Information Our audit was conducted for the purpose of forming opinions on the financial statements that collectively comprise the City’s basic financial statements. The introductory section and statistical section listed in the table of contents are presented for purposes of additional analysis and are not a required part of the basic financial statements. Such information has not been subjected to the auditing procedures applied in the audit of the basic financial statements and, accordingly, we do not express an opinion or provide any assurance on it.
Dallas, Texas October 31, 2016

4
City of Little Rock, Arkansas Management’s Discussion and Analysis
December 31, 2015
The following discussion and analysis of the City of Little Rock’s financial performance provides an overview of the City’s financial activities for the fiscal year ended December 31, 2015. Readers should consider the information presented here in conjunction with our letter of transmittal at the front of this report and the City’s financial statements that follow this section. Financial Highlights
• The City continued to implement projects and initiatives supported by the additional one-cent local sales tax approved by the citizens of Little Rock that became effective on January 1, 2012. The tax supplements the 1/2-cent sales tax that has been in place since 1994. The additional one-cent tax includes a 5/8-cent ongoing tax for operations and a 3/8-cent ten (10) year limited tax to fund specified capital projects.
• Total assets and deferred outflows of the City exceeded total liabilities and deferred inflows at the close of 2015 by $502,332,282. Of this amount, $559,660,470 reflects the net investment in capital assets, $14,266,806 is restricted for debt service, grant funds and other special projects, $250,000 is restricted nonexpendable, and ($71,844,994) is considered unrestricted. The unrestricted net position of the City’s governmental activities decreased $103,703,462 to ($78,833,242) primarily due to the impact of the implementation of GASB Statement No. 68, Accounting and Financial Reporting for Pensions – an amendment of GASB Statement No. 27. The unrestricted net position of the City’s business-type activities increased $1,236,426 to $6,988,248.
• The City’s reported total net position increased by $14,003,276 from operations in 2015. Restatement of beginning net position for a change in accounting principle was ($122,021,882) and is associated with implementation of GASB 68. Net position of the governmental activities increased $11,988,343 and business-type activities increased $2,014,933 from operations. The combined impact of the restatement of beginning net position and the change in net position for governmental activities and business-type activities is a decrease of $109,570,767 and an increase of $1,552,161, respectively for a net decrease of $108,018,606.
• As of the close of the current fiscal year, the City’s governmental funds reported combined ending fund balances of $161,861,832. The combined governmental funds fund balances increased $11,297,282 from the prior year. The primary components of this change were the net increase in capital project funds of approximately $6.1 million, a net increase in General Fund balances of approximately $4.9 million associated primarily with the timing of special project expenditures, and an increase of approximately $3.8 million in special revenue funds, partially offset by a decrease of approximately $3.6 million in debt service funds. The increase in capital project funds is primarily due to proceeds of approximately $19 million available for capital expenditures from the issuance of 2015 library bonds, sales tax receipts dedicated to capital projects of approximately $18.4 million, and the issuance of a short-term financing note in the amount of $5.9 million to fund completion of construction of the West Central Community Center and the purchase of Police vehicles and equipment, net of the expenditure of library bond proceeds of approximately $3.8 million, expenditure of capital improvement bond proceeds for

5
street and drainage projects of approximately $11.4 million, and the expenditure of approximately $16.3 million in sales tax capital improvement funds and short-term note proceeds, and the transfer out of approximately $6.4 million in sales tax proceeds to fund payments on short-term notes previously issued for capital improvement projects. Approximately $22.7 million of the $161,861,832 fund balances is considered unassigned at December 31, 2015, and $123,848,447 is reported as restricted for capital projects or debt service. In addition, $2,667,691 of the governmental fund balances is nonspendable, primarily representing inventories and prepaid expenditures. The committed and assigned portions of the fund balances were $300,264 and $12,331,036, respectively.
• The General Fund reported fund balance of $39,219,245 at the end of the current year. Unassigned fund balance for the General Fund was $25,567,858 or 13.2% of total General Fund expenditures (including transfers out). There was a $4,908,624 increase in the total fund balance for the General Fund for the year ended December 31, 2015. The increase in fund balance is primarily due to the timing of expenditures for special projects that will be completed in 2016. Excluding the timing of special projects and net seized money funds, the fund balance for the General Fund increased by approximately $1.7 million.
• The City’s total debt decreased by $765,438 (0.5% below 2014) during the current year. The key factors in this decrease were principal payments of $32,720,000 for general obligation bonds, including payment to refunded bond escrow agent of $15,685,000, $7,315,438 for temporary notes, and $3,260,000 for revenue bonds, partially offset by the issuance of Library Construction and Refunding Bonds in the amount of $36,620,000 and the issuance of a $5,910,000 2015 Short Term Financing Note.
• At the close of the current year, net position of fiduciary funds was $141,074,494 held in trust for pension and other post-employment benefits. There was a decrease of $7,335,106 in the total fiduciary net position held in trust for the year ended December 31, 2015. The decrease in net position is attributed to contributions to the funds in the amount of $14,335,040, investment income/(loss) and a net change in the fair value of investments of ($4,016,978) and benefits paid directly to participants of $16,965,264, and other participant transfers and administrative expenses of $687,904.
• In 2015, the City implemented GASB Statement No. 68, Accounting and Financial Reporting for Pensions – an amendment of GASB Statement No. 27. The implementation of this new standard resulted in a change in accounting principle adjustment that reduced beginning net position for Governmental Activities and Business-Type Activities in the amounts of $121,559,110 and $462,772, respectively. The net pension liability of $191,586,615 and the related net deferred inflows and outflows of resources of $27,239,084 are discussed in detail in Note 6 on Pages 67–96 of this report. 2014 information in this management’s discussion and analysis has not been restated for the adoption of GASB Statement No. 68.
• The City’s component units reported net position of $852,472,228 as of December 31, 2015, an increase of $26,898,700 from 2015 operations and a decrease of $11,281,581 for a change in accounting principle (implementation of GASB Statement No. 68).
Overview of the Financial Statements This discussion and analysis is intended to serve as an introduction to the City’s basic financial statements which are comprised of three components: 1) government-wide financial statements, 2) fund financial

6
statements and 3) notes to the financial statements. This report also contains other supplementary information in addition to the basic financial statements themselves. Government-wide Financial Statements. The government-wide financial statements are designed to provide readers with a broad overview of the City’s finances, in a manner similar to that of a private-sector business. The statement of net position presents information on all of the City’s assets and deferred outflows of resources and liabilities and deferred inflows of resources, as applicable, with the difference reported as net position. Over time, increases or decreases in net position may serve as a useful indicator of whether the financial position of the City is improving or deteriorating. The statement of activities presents information showing how the government’s net position changed during the year. All changes in net position are reported as soon as the underlying event giving rise to the change occurs, regardless of the timing of the cash flows. Thus, revenue and expenses reported in this statement for some items will only result in cash flows in future periods (e.g., uncollected taxes and earned but unused vacation leave). Both of the government-wide financial statements distinguish functions of the City that are principally supported by taxes and intergovernmental revenues (governmental activities) from other functions that are intended to recover all or a significant portion of their costs through user fees or charges (business-type activities). The governmental activities of the City include general government, public safety, and development. The business-type activities of the City include a solid waste system, vehicle storage and parking garage operations. The government-wide financial statements include not only the City itself (known as the primary government), but also the following discretely presented component units:
• Little Rock Wastewater Utility
• Bill and Hillary Clinton National Airport
• Oakland Fraternal Cemetery
• Mt. Holly Cemetery
• Little Rock Advertising and Promotion Commission
• Little Rock Port Authority
• Little Rock Ambulance Authority
• Central Arkansas Transit Authority (dba Rock Region Metro)
• Museum of Discovery
• Arkansas Arts Center
• Little Rock Workforce Investment Board
• Central Arkansas Library System
Financial information for these component units are reported separately from the financial information presented for the primary government itself. Complete financial statements for these component units may be obtained by contacting the administrative offices listed on Pages 39–40.
7
The government-wide financial statements can be found on Pages 24-25 of this report. Fund Financial Statements. A fund is a grouping of related accounts that is used to maintain control over resources that have been segregated for specific activities or objectives. The City, like other state and local governments, uses fund accounting to ensure and demonstrate compliance with finance-related legal requirements. All of the funds of the City can be divided into three categories: governmental funds, proprietary funds and fiduciary funds. Governmental Funds. Governmental funds are used to account for essentially the same functions reported as governmental activities in the government-wide financial statements. However, unlike the government-wide financial statements, governmental fund financial statements focus on the near-term inflows and outflows of spendable resources, as well as on balances of spendable resources available at the end of the year. Such information may be useful in evaluating a government’s near-term financing requirements. Because the focus of governmental funds is narrower than that of the government-wide financial statements, it is useful to compare the information presented for governmental funds with similar information presented for governmental activities in the government-wide financial statements. By doing so, readers may better understand the long-term impact of the government’s near-term financing decisions. Both the governmental funds balance sheet and the governmental funds statement of revenues, expenditures and changes in fund balances provide a reconciliation to facilitate this comparison between governmental funds and governmental activities. The City maintains twenty-seven (27) individual governmental funds. Information is presented separately in the governmental funds balance sheet and in the governmental funds statement of revenues, expenditures, and changes in fund balances for the General Fund, the Sales Tax Capital Improvement Fund, the 2013 Capital Improvement Fund (debt service), the 2013 Capital Improvement Fund (capital projects), and the Street Fund, which are considered to be major funds. Data from the other twenty-two (22) governmental funds are combined into a single, aggregated presentation. Individual fund data for each of these nonmajor governmental funds is provided in the form of combining statements elsewhere in this report. The basic governmental fund financial statements can be found on Pages 26–29 of this report. Proprietary Funds. The City maintains two different types of proprietary funds. Enterprise funds are used to report the same functions presented as business-type activities in the government-wide financial statements. The City uses enterprise funds to account for its solid waste, vehicle storage and parking garage operations. Internal service funds are an accounting device used to accumulate and allocate costs internally among the City’s various functions for fleet operations. The services provided by the internal service fund predominantly benefit the governmental rather than the business-type activities. They have been included within governmental activities in the government-wide financial statements. Proprietary funds provide the same type of information as the government-wide financial statements, only in more detail. The proprietary fund financial statements provide separate information for the solid waste, vehicle storage and parking garage operations. The Waste Disposal Fund and River Market Garage Fund are considered to be major enterprise funds of the City. The Fleet Fund is the only internal service fund. The basic proprietary fund financial statements can be found on Pages 30–32 of this report.

8
Fiduciary Funds. Fiduciary funds are used to account for resources held for the benefit of parties outside the government. Fiduciary funds are not reflected in the government-wide financial statements because the resources of those funds are not available to support the City’s own programs. The accounting used for fiduciary funds is much like that used for proprietary funds. The basic fiduciary fund financial statements can be found on Pages 33-34 of this report. Notes to the Financial Statements. The notes provide additional information that is essential to a full understanding of the data provided in the government-wide and fund financial statements. The notes to the financial statements can be found on Pages 37–103 of this report. Other Information. In addition to the basic financial statements and accompanying notes, this report also presents certain required supplementary information concerning the City’s General Fund budget and the City’s pension and other postemployment benefit information. The City adopts an annual appropriation budget for its General Fund. A budgetary comparison statement has been provided for the General Fund to demonstrate compliance with this budget. Required supplementary information can be found beginning on Page 104 of this report. The combining statements referred to earlier in connection with nonmajor governmental funds and enterprise funds are presented immediately following the required supplemental information. Combining and individual fund statements and schedules can be found on Pages 119–126 of this report.
9
Government-wide Financial Analysis
2015 2014 2015 2014 2015 2014
Current assets 146,141,942$ 141,699,319$ 15,385,277$ 13,127,076$ 161,527,219$ 154,826,395$ Noncurrent and other
assets 91,853,246 90,406,261 1,567,528 1,510,184 93,420,774 91,916,445 Capital assets 615,429,095 622,161,178 23,281,409 24,553,327 638,710,504 646,714,505
Total assets 853,424,283 854,266,758 40,234,214 39,190,587 893,658,497 893,457,345
Deferred outflows of resources 29,636,595 - 324,005 140,666 29,960,600 140,666
Total deferred outflows of resources 29,636,595 - 324,005 140,666 29,960,600 140,666
Total assets and deferred outflows of resources 883,060,878 854,266,758 40,558,219 39,331,253 923,619,097 893,598,011
Current liabilities 54,534,655 60,523,610 3,313,082 4,326,693 57,847,737 64,850,303 Long-term liabilities
outstandingTotal liabilities 402,128,960 264,800,062 18,070,972 18,447,061 420,199,932 283,247,123
Deferred inflows of resources 1,035,990 - 50,894 - 1,086,884 -
Total deferred inflows of resources 1,035,990 - 50,894 - 1,086,884 -
Net position * 479,895,929$ 589,466,696$ 22,436,353$ 20,884,192$ 502,332,282$ 610,350,888$
Net investment in capital assets 547,314,893$ 549,795,437$ 12,345,577$ 12,152,186$ 559,660,470$ 561,947,623$
Restricted - expendable 11,164,278 14,551,039 3,102,528 2,980,184 14,266,806 17,531,223 Restricted - unexpendable 250,000 250,000 - - 250,000 250,000 Unrestricted (78,833,242) 24,870,220 6,988,248 5,751,822 (71,844,994) 30,622,042
Total net position 479,895,929$ 589,466,696$ 22,436,353$ 20,884,192$ 502,332,282$ 610,350,888$
14,120,368
City of Little Rock, Arkansas
Net Position
362,352,195 218,396,820
Governmental Activities Business-type Activities Total
* The cumulative effect of applying GASB Statement No. 68, Accounting and Financial Reporting for Pensions - an amendment of GASB Statement No. 27 , resulted in beginning net position for 2015 being restated. Fiscal year 2014 was not restated.
347,594,305 204,276,452 14,757,890
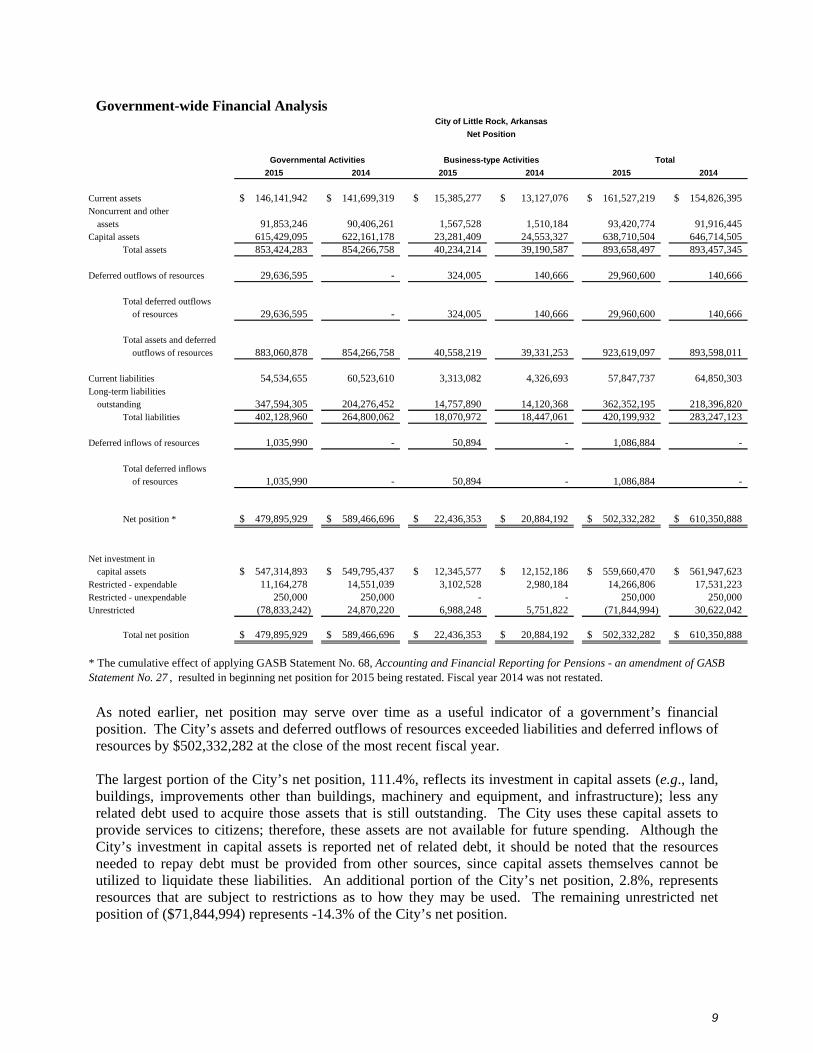
As noted earlier, net position may serve over time as a useful indicator of a government’s financial position. The City’s assets and deferred outflows of resources exceeded liabilities and deferred inflows of resources by $502,332,282 at the close of the most recent fiscal year. The largest portion of the City’s net position, 111.4%, reflects its investment in capital assets (e.g., land, buildings, improvements other than buildings, machinery and equipment, and infrastructure); less any related debt used to acquire those assets that is still outstanding. The City uses these capital assets to provide services to citizens; therefore, these assets are not available for future spending. Although the City’s investment in capital assets is reported net of related debt, it should be noted that the resources needed to repay debt must be provided from other sources, since capital assets themselves cannot be utilized to liquidate these liabilities. An additional portion of the City’s net position, 2.8%, represents resources that are subject to restrictions as to how they may be used. The remaining unrestricted net position of ($71,844,994) represents -14.3% of the City’s net position.
10
Revenues 2015 2014 2015 2014 2015 2014Program revenues:Charges for services 31,944,939$ 31,974,520$ 21,457,756$ 20,944,980$ 53,402,695$ 52,919,500$ Operating grants and
contributions 6,041,316 5,396,151 - - 6,041,316 5,396,151 Capital grants and
contributions 591,966 1,379,420 - 170,289 591,966 1,549,709
General revenues:Property taxes 50,469,150 51,570,745 - - 50,469,150 51,570,745 Sales taxes 118,312,110 114,294,652 - - 118,312,110 114,294,652 Utility franchise taxes 31,065,494 29,898,410 - - 31,065,494 29,898,410 Investment earnings (loss) 775,618 1,131,952 111,523 135,013 887,141 1,266,965 Intergovernmental
revenues 22,990,373 27,219,998 - - 22,990,373 27,219,998 Other - - - - - - Total revenues 262,190,966 262,865,848 21,569,279 21,250,282 283,760,245 284,116,130
ExpensesGeneral government 55,582,516 50,079,445 - - 55,582,516 50,079,445 Public Works 39,559,132 39,260,053 - - 39,559,132 39,260,053 Parks and recreation 11,324,541 11,436,512 - - 11,324,541 11,436,512 River Market 1,298,563 1,337,298 - - 1,298,563 1,337,298 Golf 2,434,632 2,420,678 - - 2,434,632 2,420,678 Jim Dailey Fitness 988,633 1,389,915 - - 988,633 1,389,915 Zoo 10,754,587 6,920,847 - - 10,754,587 6,920,847 Public safety 108,163,993 122,344,908 - - 108,163,993 122,344,908 Education 5,773,774 6,505,814 - - 5,773,774 6,505,814 Housing and neighborhood
programs 10,142,884 6,996,437 - - 10,142,884 6,996,437 Interest on long-term debt 4,680,035 5,096,215 - - 4,680,035 5,096,215 Bond issue costs 117,481 - - - 117,481 - Agent fees on long-term debt 33,030 - - - 33,030 - Waste disposal - - 14,401,947 13,854,376 14,401,947 13,854,376 Parking system - - 1,985,775 1,938,758 1,985,775 1,938,758 Fleet 1,164,920 3,397,637 - - 1,164,920 3,397,637 Vehicle storage - - 1,350,526 1,332,818 1,350,526 1,332,818
Total expenses 252,018,721 257,185,759 17,738,248 17,125,952 269,756,969 274,311,711
Change in net position beforetransfers 10,172,245 5,680,089 3,831,031 4,124,330 14,003,276 9,804,419
Transfers 1,816,098 1,804,131 (1,816,098) (1,804,131) - - Change in net position 11,988,343 7,484,220 2,014,933 2,320,199 14,003,276 9,804,419
Net Position, Beginning of Year, as Previously Reported * 589,466,696 581,982,476 20,884,192 18,563,993 610,350,888 600,546,469
Change in accounting principle (121,559,110) - (462,772) - (122,021,882) -
Net Position, Beginning of Year, As Restated 467,907,586 581,982,476 20,421,420 18,563,993 488,329,006 600,546,469
Net position – December 31 479,895,929$ 589,466,696$ 22,436,353$ 20,884,192$ 502,332,281$ 610,350,888$
Governmental Activities Business-type Activities Total
City of Little RockChanges in Net Position
* The cumulative effect of applying GASB Statement No. 68, Accounting and Financial Reporting for Pensions - an amendment of GASB Statement No. 27 , resulted in beginning net position for 2015 being restated. Fiscal year 2014 was not restated.

11
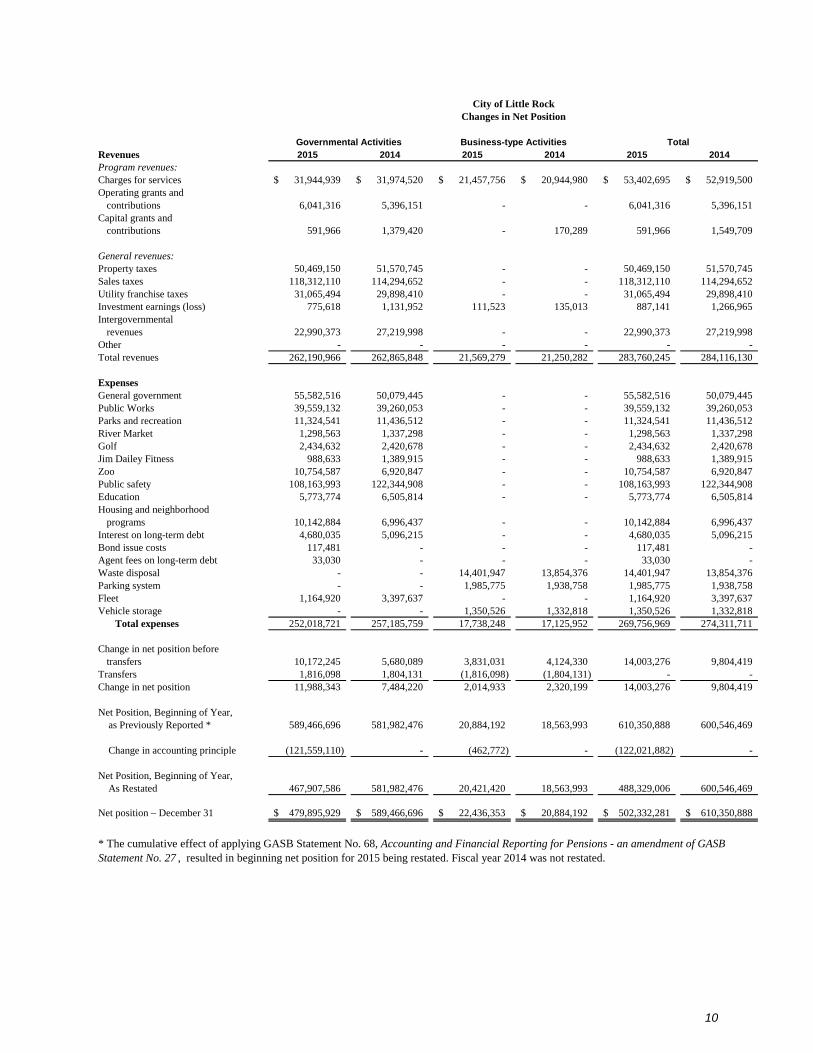
Governmental Activities. Governmental activities increased the City’s net position by $11,988,343. Including the change in accounting principle associated with GASB Statement No. 68, governmental activities net position decreased by $109,570,767. The increase in noncurrent liabilities of $143,317,853, primarily associated with the net pension liability, partially offset by the net deferred outflows and inflows of $28,600,605 associated primarily with pensions account for approximately $114.8 million of the decrease in net position. An increase in current assets of $4,373,205 and noncurrent and other assets of $1,446,985, and a decrease in current liabilities of $6,058,373, increased net position by approximately $11.9 million. A decrease in net capital assets partially offset that increase by approximately $6.7 million. Property tax represents 19.2% of the City’s governmental revenue in 2015. Property tax revenues decreased approximately $1,101,000 due to the decrease in delinquent property tax revenues, partially offset by an increase in current property tax revenues. Sales tax represents 45.1% of the City’s governmental revenue in 2015. Sales tax revenues increased 3.5% in 2015. The decrease in intergovernmental revenues of approximately $4.2 million is primarily due to decreased contributions and donations of capital assets. 2014 revenues included various funds for the new compressed natural gas station placed in service in 2014. Current year expenses were 96.1% of current year revenues, excluding transfers in. Business-type Activities. Business-type activities increased the City’s net position by $2,014,933. Including the change in accounting principle associated with implementation of GASB Statement No. 68, business-type activities net position increased by $1,552,161. Key elements of this increase are as follows:
• Operating income increased net position by $4,280,548. Net nonoperating expenses, primarily interest expense, decreased net position by $449,517. Net transfers decreased net position by $1,816,098, and the change in accounting principle decreased net position by $462,772.
• Waste Disposal net position increased by $2,004,911 before the change in accounting principle which decreased net position by $411,352. Net income, before net transfers out of $1,457,072, was $3,461,983 which was generated primarily by waste disposal and landfill services.
• River Market Garage operating income of $990,165 was offset by net nonoperating expense of $467,313 and transfers out of $359,026. The primary component of net nonoperating expense was interest.
• Other nonmajor enterprise funds operating income decreased net position by $153,804.
Waste Disposal activities contribute 82.8% of the operating revenue to the business-type activities. Current year operating expenses, including transfers out, for business-type activities were 91% of current year operating revenues. Financial Analysis of the Government’s Funds As noted earlier, the City uses fund accounting to ensure and demonstrate compliance with finance-related requirements. Governmental Funds. The focus of the City’s governmental funds is to provide information on near-term inflows, outflows, and balances of spendable resources. Such information is useful in assessing the

12
City’s financing requirements. In particular, unassigned fund balance may serve as a useful measure of a government’s net resources available for spending at the end of the fiscal year. As of December 31, 2015, the City’s governmental funds reported combined ending fund balances of $161,861,832, an increase of $11,297,282 in comparison with the prior year. Approximately $123,848,000 is reported as restricted fund balance for capital projects or debt service. In addition, approximately $2,668,000 of the governmental fund balances is nonspendable, representing inventories and prepaid expenditures. The committed and assigned portions of the fund balances were $300,264 and $12,331,036, respectively. Approximately $22,714,000 constitutes unassigned fund balance and is available for spending at the government’s discretion.
The General Fund is the chief operating fund of the city. At December 31, 2015, unassigned fund balance of the General Fund was $25,567,858, while the total fund balance was $39,219,245. As a measure of the General Fund’s liquidity, it may be useful to compare both unassigned fund balance and total fund balance to total fund expenditures (including transfers out). Unassigned fund balance represents 13.2% of total General Fund expenditures (including transfers out), while total fund balance represents 20.3% of that same amount.
The special revenue funds had total fund balances of $18,472,023. The net increase in fund balances during 2015 for the funds was $3,848,575. Revenues for special projects come from intergovernmental sources, property taxes and charges for services. The net increase in fund balances is primarily attributed to an increase in Street Fund revenues primarily associated with funding from the state ½ cent sales tax allocated to the City for street construction, resurfacing and other road related projects. Unspent funds are being reserved for future street projects. Net changes and ending fund balances by fund are:
Fund Net Change Ending Balance
Street 3,379,752$ 12,677,084$ Special Projects 100,447 2,767,906 Emergency 911 11,808 96,441 CDBG (73,131) 1,059,167 NHSP (7,443) 32,568 HIPP 469,187 872,326 Grant (32,045) 966,531
The debt service funds had total fund balances of $17,791,691. The net decrease in fund balances during 2015 was $3,589,576. The 2008 & 2009 Central Arkansas Library bonds were refunded during 2015. Revenues for debt service funds come from property tax or franchise fees set at the level necessary to meet debt service requirements. Revenues for the 2009 Parks and Recreation debt service come from park operating revenues. Tax increment financing (TIF) funds were issued in 2014 to fund infrastructure improvements associated with an economic development project surrounding the Bass Pro development in Southwest Little Rock. Net changes and ending fund balances by fund are:

13
Fund Net Change Ending Balance
2007 Capital Improvement Bonds 6,723$ 33,028$ 2002 Junior Lien Bonds 206 18,496 TIF #1 2014 Capital Improvements (124,382) 350,216 2008 & 2009 Central Arkansas Library (3,786,101) 100,316 2009 Parks and Recreation 59,953 2,237,184 2012 Central Arkansas Library 98,869 3,621,000 2015 Central Arkansas Library 136,121 136,121 2013 Capital Improvement 19,035 11,295,330
The capital project fund balances increased by $6,129,659 to total fund balances at December 31, 2015, of $86,378,873. In accordance with the terms of the City ordinance for each fund, approximately $31.5 million was used to acquire capital assets. Revenues for capital projects come primarily from the 3/8-cent sales tax which generated approximately $18.4 million in revenue in 2015, and bond and loan proceeds. In addition, the City issued library refunding and capital improvement bonds that provided approximately $19 million for library projects and a new short-term financing note in 2015 in the amount of $5.9 million, primarily to advance projects funded by the 3/8-cent capital sales tax. The net changes and ending fund balances for the capital project funds are:
Fund Net Change Ending Balance
1998 Capital Improvement (154,029)$ 160,039$ TIF #1 2014 Capital Improvements (211,529) - Port TIF 562,882 562,882 Short Term Financing 119,961 147,207 2004 Capital Improvement (950) 5,836 2008 & 2009 Central Arkansas Library (201) - 2009 Parks and Recreation (1,457) - Sales Tax Capital Improvement 1,852,846 29,813,516 2012 Central Arkansas Library (2,926,202) 2,270,770 2015 Central Arkansas Library 18,209,964 18,209,964 2013 Capital Improvement (11,321,626) 35,208,659
Proprietary Funds. The City’s proprietary funds provide the same information found in the government-wide financial statements, but with more detail. Net position (deficit) at the end of the year amounted to $22,670,233, $612,948 and ($846,828) for Waste Disposal, River Market Garage and Vehicle Storage operations, respectively. Net position increased in the Waste Disposal and River Market Garage funds by $1,593,559 and $163,826, respectively. Net position decreased in the Vehicle Storage Fund by $205,224. Factors concerning the finances of these funds have already been addressed in the discussion of the City’s business-type activities.

14
General Fund Budgetary Highlights The final amended General Fund budget had total appropriations of $2,721,939 more than the original budget. The total original appropriations, including those for transfers out, were $194,740,211, while the final appropriations were for $197,462,150. The purpose of the budget amendment was to adjust budgeted revenues and expenditures to reflect increases in year-to-date sales tax, utility franchise fees, and intergovernmental revenues; decreases in charges for services at parks, golf and zoo facilities, primarily associated with significant rainfall for the first half of the year; to set aside funds for the purchase of police cars and safety equipment, increase the allocation for fire overtime, and reserve funds allocated in 2015 for projects delayed until 2016, including implementation of a new Voice over Internet Protocol (VoIP) phone system and operating funds for the West Central Community Center. In addition, the adjustment included the allocation of savings from authorized but vacant positions to the appropriate departments and allocation of vacation/sick payouts for retiring employees. Budget adjustments and actual results are shown as follows:
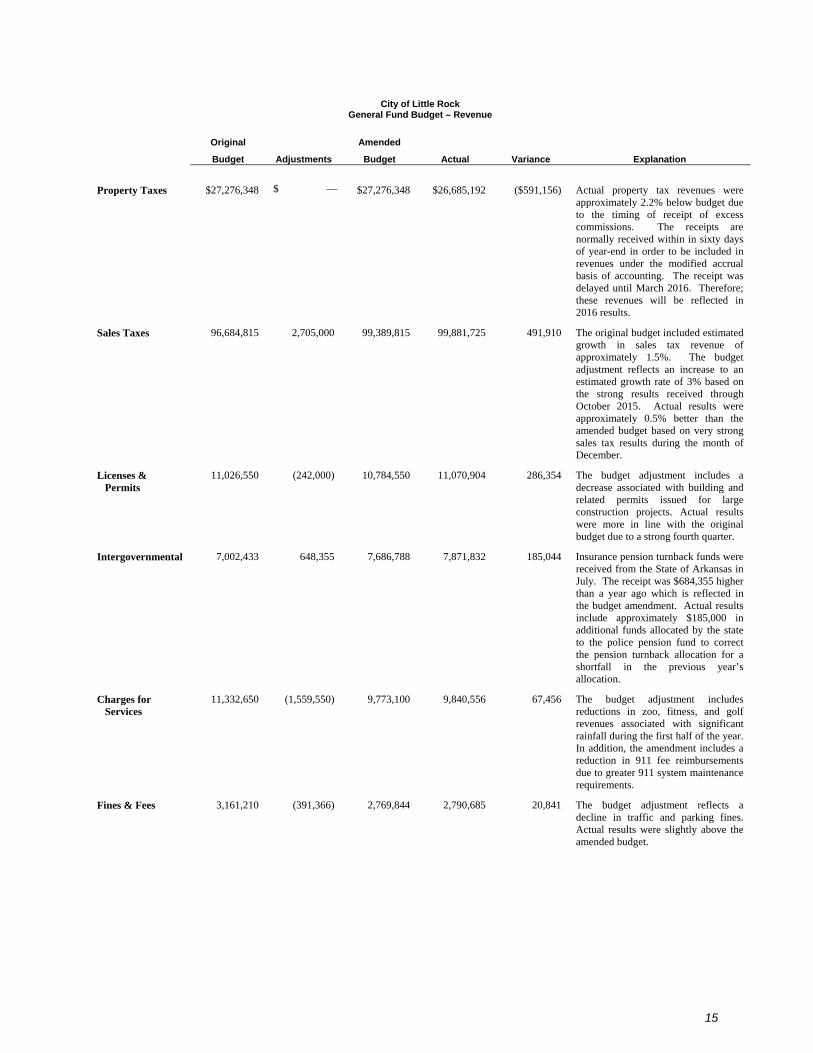
15
City of Little Rock General Fund Budget – Revenue
Original Amended
Budget Adjustments Budget Actual Variance Explanation
Property Taxes $27,276,348 $ — $27,276,348 $26,685,192 ($591,156) Actual property tax revenues were approximately 2.2% below budget due to the timing of receipt of excess commissions. The receipts are normally received within in sixty days of year-end in order to be included in revenues under the modified accrual basis of accounting. The receipt was delayed until March 2016. Therefore; these revenues will be reflected in 2016 results.
Sales Taxes 96,684,815 2,705,000 99,389,815 99,881,725 491,910 The original budget included estimated growth in sales tax revenue of approximately 1.5%. The budget adjustment reflects an increase to an estimated growth rate of 3% based on the strong results received through October 2015. Actual results were approximately 0.5% better than the amended budget based on very strong sales tax results during the month of December.
Licenses & Permits
11,026,550 (242,000) 10,784,550 11,070,904 286,354 The budget adjustment includes a decrease associated with building and related permits issued for large construction projects. Actual results were more in line with the original budget due to a strong fourth quarter.
Intergovernmental 7,002,433 648,355 7,686,788 7,871,832 185,044 Insurance pension turnback funds were received from the State of Arkansas in July. The receipt was $684,355 higher than a year ago which is reflected in the budget amendment. Actual results include approximately $185,000 in additional funds allocated by the state to the police pension fund to correct the pension turnback allocation for a shortfall in the previous year’s allocation.
Charges for Services
11,332,650 (1,559,550) 9,773,100 9,840,556 67,456 The budget adjustment includes reductions in zoo, fitness, and golf revenues associated with significant rainfall during the first half of the year. In addition, the amendment includes a reduction in 911 fee reimbursements due to greater 911 system maintenance requirements.
Fines & Fees 3,161,210 (391,366) 2,769,844 2,790,685 20,841 The budget adjustment reflects a decline in traffic and parking fines. Actual results were slightly above the amended budget.

16
City of Little Rock General Fund Budget – Revenue
Original Amended
Budget Adjustments Budget Actual Variance Explanation
Franchise Fees $28,744,707 $1,000,000 $29,744,707 $29,306,202 ($438,505) The budget adjustment in franchise fees reflects an increase in electricity billings associated with increased usage and an adjustment to the rate to recover a shortfall. The unfavorable actual variance at year-end is primarily due to a lower than anticipated gas revenues due to a very mild fourth quarter and historically low natural gas prices.
Interest Earnings 200,000 — 200,000 217,976 17,976 The year-end favorable variance reflects increased earnings associated with higher cash balances and investments. Investments are held to maturity and are redeemed at par value.
Transfers In 7,994,672 — 7,994,672 8,491,405 496,733 The favorable variance at year-end includes a Fleet transfer for construction of a fueling station at the West Little Rock Police Station and for equipment at the landfill.
Carryover from 2014
550,000 — 550,000 — (550,000) At the time the budget was adopted, it was anticipated that approximately $550,000 of carryover funds would be required to contribute to one-time bonuses for employees in lieu of raises. However; due to an increase in revenue during the year, the carryover funds were not required.
All Other Revenues
766,826 525,500 1,292,326 1,907,311 614,985 The budget adjustment includes approximately $320,000 in funds collected by the Courts that are dedicated to the closed Police Pension Fund administered by LOPFI and approximately $205,000 associated workers compensation refunds, and sales tax rebates that were not included in the original budget. The actual variance includes contributions and seized funds that were not budgeted.
Total General Fund Revenue $ 194,740,211 $ 2,721,939 $ 197,462,150 $ 198,063,788 $ 601,638

17
Expenditures, budget adjustments, and actual results by General Fund department are shown below.
City of Little Rock General Fund Budget – Expenditures
Original Amended
Budget Adjustments Budget Actual Variance Explanation
General Administration
$20,371,325 ($622,486) $19,78,839 $20,429,202 ($680,363) The budget adjustment is primarily associated with vacancy savings and the allocation of vacation and sick leave payouts for retiring employees to other departments. The actual variance includes special project expenditures for homelessness outreach and grant match that were budgeted as transfers out.
Board of Directors
342,027 37 342,064 341,353 711 The favorable year-end variance reflects unspent travel allocations, partially offset by increased supplies and other expenses.
Community Programs
423,578 (21,435) 402,143 6,214,133 (5,811,990) The budget adjustment reflects the allocation of savings from vacant positions. The actual variance is primarily associated with the special project expenditures for Children, Youth and Family and Prevention, Intervention, and Treatment programs which are budgeted as transfers out.
City Attorney 1,836,901 (99,341) 1,737,560 1,726,729 10,831 The budget adjustment primarily reflects savings from vacant positions, net of an allocation for vacation/sick payouts to retiring employees. The actual favorable variance is primarily associated with additional savings from vacant positions.
District Court – First Division
1,405,790 (9,564) 1,396,226 1,281,039 115,187 The budget adjustment is primarily associated with savings from vacant positions. The actual variance includes additional savings in personnel, supplies, and contract cost.
District Court – Third Division
626,782 12,504 639,286 630,352 8,934 The budget adjustment reflects an allocation for vacation/sick payouts to a retiring employee. The favorable variance includes personnel, contract and travel cost savings.
District Court – Second Division
1,248,245 33,343 1,281,588 1,277,214 4,374 The budget adjustment includes an allocation for an additional employee to assist with managing a new courts system. The favorable actual variance reflects savings from a vacant position.
Finance 3,204,124 (61,135) 3,142,989 2,986,334 156,655 The budget adjustment reflects savings from vacant positions, net of an allocation for vacation/sick payouts to a retiring employee. The actual favorable variance includes personnel savings and savings on paper and copier rental in the print shop.

18
City of Little Rock General Fund Budget – Expenditures
Original Amended
Budget Adjustments Budget Actual Variance Explanation
Human Resources
$1,673,177 $98,304 $1,771,481 $1,749,328 $22,153 The budget adjustment reflects the transfer of two (2) positions to Human Resources, previously paid through special projects. In addition, the budget adjustment includes an allocation for license checks and monitoring required certifications of FT positions. The actual variance is primarily associated with savings from vacant positions.
Information Technology
4,679,784 (781,551) 3,898,233 3,753,058 145,175 The budget adjustment reflects savings from vacant positions and an adjustment to transfer approximately $635,000 from the IT budget to a special project for telecommunications equipment and the new Voice over Internet Protocol (VoIP) phone system. The favorable actual variance includes savings on mainframe maintenance and contract expenditures.
Planning & Development
2,564,192 (390,039) 2,174,153 2,047,792 126,361 The budget adjustment reflects savings from vacant positions. The actual variance includes additional supplies, utility, travel, and personnel cost savings.
Public Works 1,159,922 (110,699) 1,049,223 2,135,769 (1,086,546) The budget adjustment reflects savings from vacant positions. The unfavorable actual variance is associated with expenditures from special project allocations for facility repairs and maintenance. The special project allocations were budgeted as transfers out.
Parks & Recreation
9,958,932
(788,736) 9,170,196
9,244,782 (74,586) The budget adjustment reflects savings from vacant positions of approximate $560,000 and a transfer of approximately $227,000 to set aside budgeted operating expenses for the West Central Community Center. The Center’s opening was delayed until 2016. The unfavorable actual variance includes special project expenditures for youth athletic programs and summer playground activities with expenditures of approximately $298,000 that are budgeted as transfers out, partially offset by additional personnel cost and supply savings.
Rivermarket 1,209,164 — 1,209,164 1,188,494 20,670 The actual variance is immaterial.
Golf 2,308,904 88,853 2,397,757 2,390,265 7,492 The budget adjustment includes additional allocations for part-time and overtime expenses and contracts. The favorable variance at year end is primarily associated with fuel savings.
Jim Dailey Fitness
901,127 (24,351) 876,776 855,515 21,261 The budget adjustment reflects savings from vacant positions. The favorable actual variance includes savings in part-time employee cost and additional savings from vacant positions.
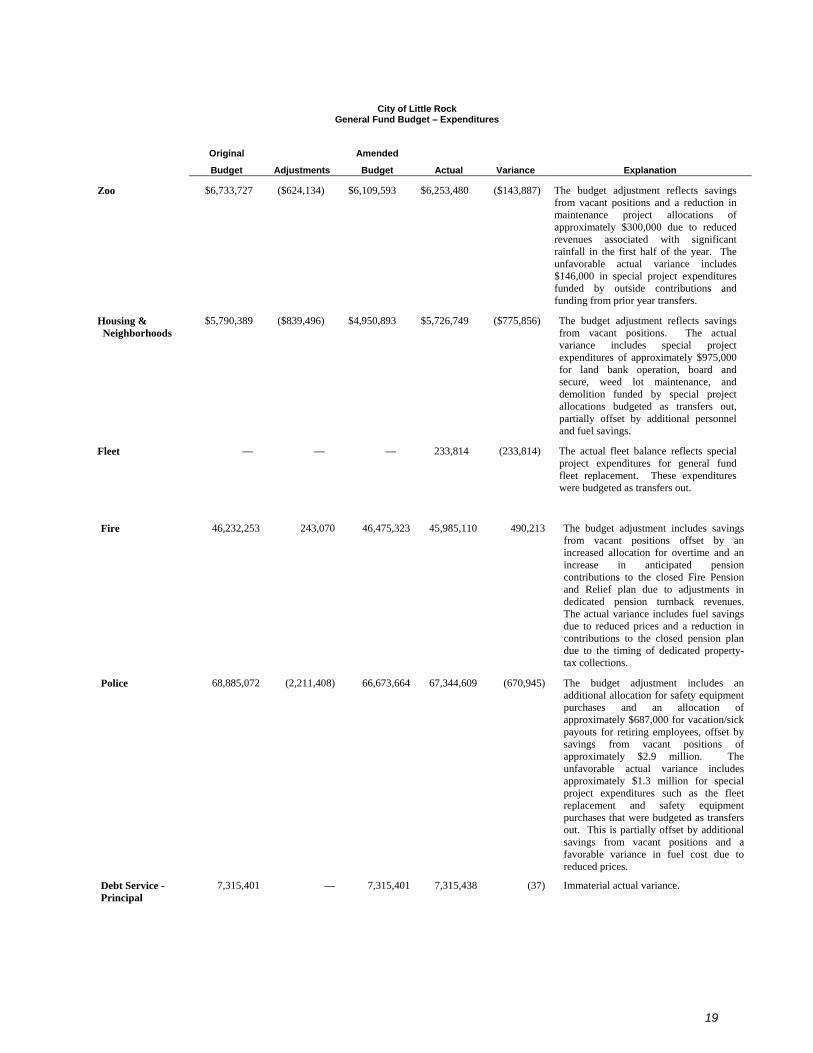
19
City of Little Rock General Fund Budget – Expenditures
Original Amended
Budget Adjustments Budget Actual Variance Explanation
Zoo $6,733,727 ($624,134) $6,109,593 $6,253,480 ($143,887) The budget adjustment reflects savings from vacant positions and a reduction in maintenance project allocations of approximately $300,000 due to reduced revenues associated with significant rainfall in the first half of the year. The unfavorable actual variance includes $146,000 in special project expenditures funded by outside contributions and funding from prior year transfers.
Housing & Neighborhoods
$5,790,389 ($839,496) $4,950,893 $5,726,749 ($775,856) The budget adjustment reflects savings from vacant positions. The actual variance includes special project expenditures of approximately $975,000 for land bank operation, board and secure, weed lot maintenance, and demolition funded by special project allocations budgeted as transfers out, partially offset by additional personnel and fuel savings.
Fleet — — — 233,814 (233,814) The actual fleet balance reflects special project expenditures for general fund fleet replacement. These expenditures were budgeted as transfers out.
Fire 46,232,253 243,070 46,475,323 45,985,110 490,213 The budget adjustment includes savings from vacant positions offset by an increased allocation for overtime and an increase in anticipated pension contributions to the closed Fire Pension and Relief plan due to adjustments in dedicated pension turnback revenues. The actual variance includes fuel savings due to reduced prices and a reduction in contributions to the closed pension plan due to the timing of dedicated property-tax collections.
Police 68,885,072 (2,211,408) 66,673,664 67,344,609 (670,945) The budget adjustment includes an additional allocation for safety equipment purchases and an allocation of approximately $687,000 for vacation/sick payouts for retiring employees, offset by savings from vacant positions of approximately $2.9 million. The unfavorable actual variance includes approximately $1.3 million for special project expenditures such as the fleet replacement and safety equipment purchases that were budgeted as transfers out. This is partially offset by additional savings from vacant positions and a favorable variance in fuel cost due to reduced prices.
Debt Service - Principal
7,315,401 — 7,315,401 7,315,438 (37) Immaterial actual variance.

20
City of Little Rock General Fund Budget – Expenditures
Original Amended
Budget Adjustments Budget Actual Variance Explanation
Debt Service – Interest
$375,317 $ — $375,317 $375,317 $ —
Agent fees — — — 11,375 (11,375) Immaterial actual variance.
Transfers Out 11,494,079 2,830,203 14,324,282 1,657,913 12,666,369 The budget adjustment reflects additional allocations for police fleet replacement and safety equipment of approximately $1.75 million, funds set aside for operation of the West Central Community Center and replacement of the greens at War Memorial Golf Course of approximately $227,000 from the adopted 2015 parks and recreation budget, and funds set aside from the IT budget of approximately $635,000 for the VoIP Phone system. The actual variance is primarily associated with transfers to general special projects. The actual expenditures for the projects are reflected in the appropriate departments above. One example is the allocation of approximately $5.8 million for Children, Youth and Family and Prevention, Intervention, and Treatment programs in Community Programs above.
Vacancy Savings (6,000,000) 6,000,000 — —
— The budget adjustment reflects savings achieved by maintaining vacant positions. As savings are achieved, the budgets of the applicable departments are reduced with an offset to the vacancy savings budget. Actual vacancy savings were approximately $6 million.
Total General Fund Expenditures $ 194,740,212 $ 2,721,939 $ 197,462,151 $ 193,155,164 $ 4,306,987
Capital Assets and Debt Administration Capital assets. The City’s investment in capital assets for governmental and business-type activities as of December 31, 2015, amounts to $638,710,504 (net of accumulated depreciation). This investment in capital assets includes land, buildings, systems, improvements, vehicles and equipment, park facilities, roads, curbs and gutters, streets and sidewalks, and drainage systems. The total decrease in the City’s investment in capital assets for 2015 was 1.2% (a 1% decrease for governmental activities and a 5.2% decrease for business-type activities that is attributable to depreciation exceeding capital additions and asset retirements in 2015).

21
2015 2014 2015 2014 2015 2014
Land 180,995,171$ 179,278,064$ 2,637,147$ 2,637,147$ 183,632,318$ 181,915,211$ Buildings 75,948,576 78,595,925 15,434,971 15,774,149 91,383,547 94,370,074 Improvements other than
buildings 12,653,128 13,851,846 3,090,595 3,853,700 15,743,723 17,705,546 Vehicles and equipment 32,964,707 30,988,747 1,980,964 2,288,331 34,945,671 33,277,078 Infrastructure 290,990,455 297,641,330 - - 290,990,455 297,641,330 Construction in progress 21,877,058 21,805,266 137,732 - 22,014,790 21,805,266
Total 615,429,095$ 622,161,178$ 23,281,409$ 24,553,327$ 638,710,504$ 646,714,505$
Business-type activitiesGovernmental Activities Total
City of Little Rock
Capital Assets, net of depreciation
Major capital asset events during 2015 included the following:
• Infrastructure additions, including right-of-way were $9,082,488
• Vehicle and equipment additions were $11,510,454
• Building additions were $464,204
• Construction in progress additions, net of transfers for assets placed in service were $209,524
• Land and other improvements additions were $1,954,914
• Depreciation expense totaled $29,839,008
• Asset retirements, net of accumulated depreciation were $1,386,577
Additional information on the City’s capital assets can be found in Note 3 on Pages 52-55 of this report. Long-term Debt. At December 31, 2015, the City’s primary government, had $162,352,433 of long-term bonds outstanding, including general obligation bonds of $103,705,000, notes payable of $23,907,433 and $34,740,000 of bonds secured solely by specified revenue sources (i.e. revenue bonds).
City of Little Rock General Obligation and Revenue Bonds Outstanding
Governmental Activities Business-type Activities Total
2015 2014 2015 2014 2015 2014
General obligation bonds
and notes payable $ 127,612,433 $ 125,117,871 $ - $ - $ 127,612,433 $ 125,117,871
Revenue bonds 23,755,000 25,545,000 10,985,000 12,455,000 34,740,000 38,000,000
Total $ 151,367,433 $ 150,662,871 $ 10,895,000 $ 12,455,000 $ 162,352,433 $ 163,117,871
Total long-term bonds and notes payable outstanding at December 31, 2015, decreased $765,438, a decrease of 0.5%. The net decrease includes the issuance of the 2015 Library Capital Improvement and Refunding bonds in the amount of $36,620,000, and the issuance short-term financing notes in the amount of $5,910,000, less bonded debt retirements of $35,980,000 and short-term financing notes retired in the amount of $7,315,438.

22
The City’s general obligation bond rating by Standard & Poor’s Corporation and Moody’s Investors Service, Inc. are “AA” and “Aa2”, respectively. The City’s bond ratings are shown in the following table. Moody’s Investors Standard & Service Poor’s General Obligation Debt 2008 Library Capital Improvement Bonds (retired in 2015) Not Rated AA 2009 Library Capital Improvement Bonds (retired in 2015) Not Rated AA 2012 Library Capital Improvement Bonds Aa2 AA 2013 Capital Improvement Bonds Aa2 AA 2015 Library Capital Improvement and Refunding Bonds Not Rated AA TIF #1 2014 Capital Improvement Not Rated Not Rated Revenue Debt 2003 Capital Improvement and Refunding Revenue A3 BBB+ 2002 Capital Improvement Junior Lien Not Rated A+ 2007 Capital Improvement Revenue Refunding Bonds Aa3 Not Rated 2007 Waste Disposal Capital Improvement Bonds A1 AA- 2009A Parks and Recreation Capital Improvement Bonds Not Rated Not Rated 2009B Parks and Recreation Capital Improvement Bonds Not Rated Not Rated 2010 Waste Disposal Refunding Revenue Bonds A1 AA- Discrete Components 1996 Sewer Revenue Not Rated Not Rated 2004 Sewer Revenue Not Rated Not Rated 2007A Sewer Construction Bonds Aa3 Not Rated 2007C Sewer Construction Bonds Aa3 Not Rated 2008 Sewer Revenue Aa3 Not Rated 2009A Sewer Revenue Not Rated Not Rated 2009B Sewer Revenue Aa3 Not Rated 2011 Sewer Revenue Aa3 Not Rated 2012 Sewer Revenue Aa3 Not Rated 2013 Sewer Revenue Aa3 Not Rated 2014 Sewer Revenue Aa3 Not Rated 2015 Sewer Revenue Aa3 Not Rated 2014 Hotel and Restaurant Gross Receipts Tax Bonds Not Rated A+ 2007 Airport Revenue Refunding and Improvement Bonds A2 A The City is within all of its legal debt limitations. Under the Arkansas Constitution, the City is allowed to issue, with voter approval, general obligation debt up to 20% of total assessed valuation. Outstanding general obligation bonds at December 31, 2015, of $103,705,000 are well below the statutory limit of $809,785,829. The City is allowed to issue short-term financings (maturities of less than five years) up to 5% of total assessed valuation. Outstanding short-term financings at December 31, 2015, of $23,907,433 are well below the statutory limit of $202,446,457. Voter approval is not required for short-term financing. Additional information regarding the City’s long-term debt can be found in Note 4 on Pages 56-65 of this report.
23
Economic Factors and Next Year’s Budgets and Rates The City’s elected and appointed officials considered many factors when setting the 2016 budget. The total 2016 General Fund budget is $201,644,229 which reflects an increase of 3.5% from the original 2015 adopted budget and an increase of 2% from the final amended 2015 General Fund budget. City officials are encouraged by economic development in all sectors of the City as discussed in the letter of transmittal in the introductory section of this report on Pages i–x. The Mayor and the Board of Directors continue to place the highest premium on safety for the people of Little Rock and City employees. In order to meet the objectives of the 2016 budget, the City recognized the need to continue its pattern of cost containment designed to promote long-term fiscal stability. Request for Information This financial report is designed to provide our citizens, taxpayers, customers, and investors and creditors with a general overview of the City’s finances and to show accountability for the money it receives. Questions concerning any of the information provided in this report or requests for additional financial information should be addressed to the Finance Director’s Office, 500 West Markham, Room 208, Little Rock, Arkansas 72201.

Financial Statements
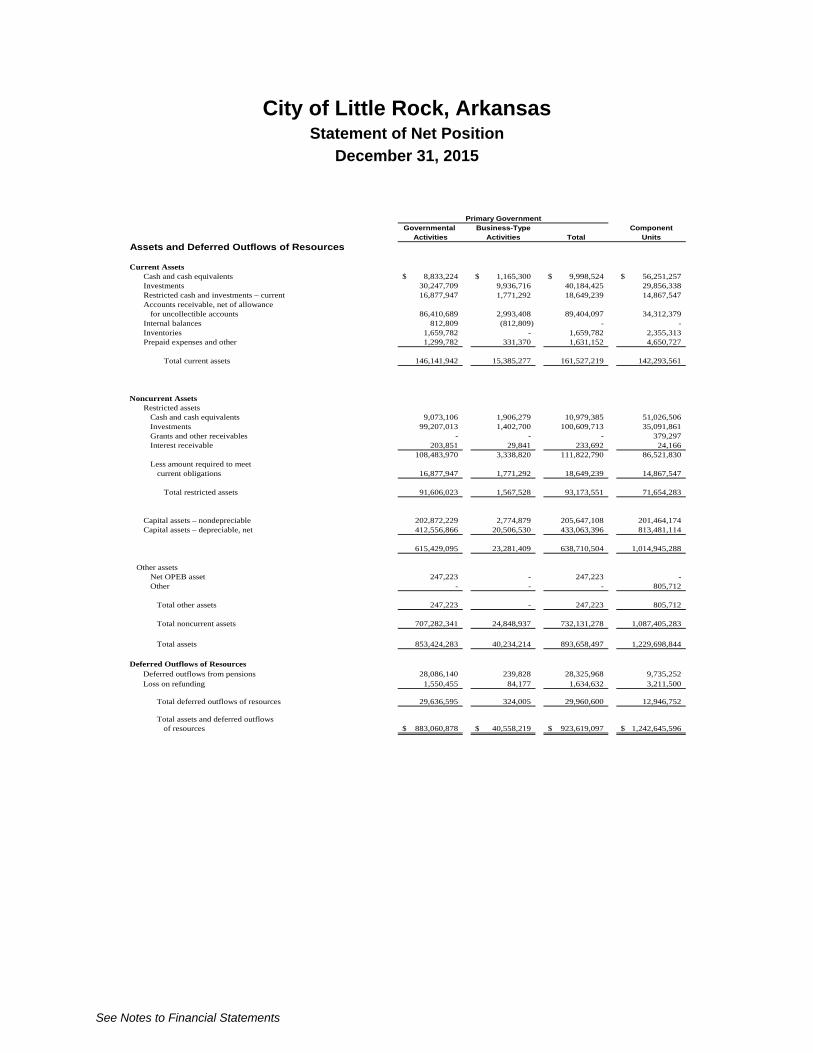
City of Little Rock, Arkansas Statement of Net Position
December 31, 2015
See Notes to Financial Statements
Governmental Business-Type ComponentActivities Activities Total Units
Assets and Deferred Outflows of Resources
Current AssetsCash and cash equivalents 8,833,224$ 1,165,300$ 9,998,524$ 56,251,257$ Investments 30,247,709 9,936,716 40,184,425 29,856,338 Restricted cash and investments – current 16,877,947 1,771,292 18,649,239 14,867,547 Accounts receivable, net of allowance
for uncollectible accounts 86,410,689 2,993,408 89,404,097 34,312,379 Internal balances 812,809 (812,809) - - Inventories 1,659,782 - 1,659,782 2,355,313 Prepaid expenses and other 1,299,782 331,370 1,631,152 4,650,727
Total current assets 146,141,942 15,385,277 161,527,219 142,293,561
Noncurrent AssetsRestricted assets
Cash and cash equivalents 9,073,106 1,906,279 10,979,385 51,026,506 Investments 99,207,013 1,402,700 100,609,713 35,091,861 Grants and other receivables - - - 379,297 Interest receivable 203,851 29,841 233,692 24,166
108,483,970 3,338,820 111,822,790 86,521,830 Less amount required to meet
current obligations 16,877,947 1,771,292 18,649,239 14,867,547
Total restricted assets 91,606,023 1,567,528 93,173,551 71,654,283
Capital assets – nondepreciable 202,872,229 2,774,879 205,647,108 201,464,174 Capital assets – depreciable, net 412,556,866 20,506,530 433,063,396 813,481,114
615,429,095 23,281,409 638,710,504 1,014,945,288
Other assetsNet OPEB asset 247,223 - 247,223 - Other - - - 805,712
Total other assets 247,223 - 247,223 805,712
Total noncurrent assets 707,282,341 24,848,937 732,131,278 1,087,405,283
Total assets 853,424,283 40,234,214 893,658,497 1,229,698,844
Deferred Outflows of ResourcesDeferred outflows from pensions 28,086,140 239,828 28,325,968 9,735,252 Loss on refunding 1,550,455 84,177 1,634,632 3,211,500
Total deferred outflows of resources 29,636,595 324,005 29,960,600 12,946,752
Total assets and deferred outflowsof resources 883,060,878$ 40,558,219$ 923,619,097$ 1,242,645,596$
Primary Government

24
Governmental Business-Type Component
Activities Activities Total UnitsLiabilities, Deferred Inflows of Resources and
Net Position
Current liabilities Accounts payable 5,856,670$ 457,663$ 6,314,333$ 5,592,005$ Accrued wages payable and related liabilities 5,312,419 - 5,312,419 4,055,779 Accrued expenses and other 929,561 80,769 1,010,330 9,713,654 Accrued interest payable 1,593,883 236,292 1,830,175 - Compensated absences - current portion 9,330,193 442,693 9,772,886 1,475,070 Notes payable - current portion 8,564,064 - 8,564,064 70,300 Capital lease obligation - current portion - - - 10,104 Bonds payable - current portion 6,720,000 1,535,000 8,255,000 10,675,549 Due to fiduciary funds 3,162,016 - 3,162,016 - Other current liabilities 3,816,784 - 3,816,784 - Unearned revenue 9,249,065 560,665 9,809,730 2,043,752
Total current liabilities 54,534,655 3,313,082 57,847,737 33,636,213
Noncurrent liabilitiesNotes payable 15,343,369 - 15,343,369 547,110 Capital lease obligation - - - 3,815 Bonds payable, net of unamortized
premium and discount 122,986,225 9,400,832 132,387,057 338,171,244 Net pension liability 190,854,330 732,285 191,586,615 12,869,129 Compensated absences 18,282,155 122,482 18,404,637 821,091 Other long-term liabilities 128,226 4,502,291 4,630,517 2,699,567
Total noncurrent liabilities 347,594,305 14,757,890 362,352,195 355,111,956
Total liabilities 402,128,960 18,070,972 420,199,932 388,748,169
Deferred Inflows of ResourcesDeferred inflows from pensions 1,035,990 50,894 1,086,884 1,425,199
Total deferred inflows of resources 1,035,990 50,894 1,086,884 1,425,199
Net Position Net investment in capital assets 547,314,893 12,345,577 559,660,470 703,337,944 Restricted - expendable
Debt service 6,496,361 3,102,528 9,598,889 8,091,647 Developer contribution account 370,390 - 370,390 - Stormwater retention 302,568 - 302,568 - Court automation 177,689 - 177,689 - Grant funds 2,930,592 - 2,930,592 4,110,273
Cable network 300,264 - 300,264 - Drug abuse 79,294 - 79,294 1,253,455 State acts 133,970 - 133,970 - Zoo promotions 144,914 - 144,914 - Capital projects - - - 17,737,136 Library materials - - - 2,136,149
Art Fund - - - 5,300,167 Police & Fire funeral expenses 228,236 - 228,236 - Cemetery maintenance - - - 1,028,933
Total restricted - expendable 11,164,278 3,102,528 14,266,806 39,657,760
Restricted - nonexpendable 250,000 - 250,000 3,435,590
Unrestricted (78,833,242) 6,988,248 (71,844,994) 106,040,934
Total net position 479,895,929 22,436,353 502,332,282 852,472,228
Total liabilities, deferred inflows of resources and net position 883,060,878$ 40,558,219$ 923,619,097$ 1,242,645,596$
Primary Government

City of Little Rock, Arkansas Statement of Activities
Year Ended December 31, 2015
See Notes to Financial Statements
ComponentUnits
Operating Capital Functions/Programs Charges for Grants and Grants and Governmental Business-TypePrimary Government Expenses Services Contributions Contributions Activities Activities Total
Governmental ActivitiesGeneral administration 32,335,232$ 11,193,601$ 1,389,885$ 378,777$ (19,372,969)$ -$ (19,372,969)$ -$ Board of Directors 341,353 - - - (341,353) - (341,353) - Community programs 6,246,524 27,850 - - (6,218,674) - (6,218,674) - City attorney 1,726,729 600 - - (1,726,129) - (1,726,129) - District court - first division (criminal) 1,297,344 40,354 - - (1,256,990) - (1,256,990) - District court - second division (traffic) 1,287,146 435,749 - - (851,397) - (851,397) - District court - third division (environment) 638,279 266,469 - - (371,810) - (371,810) - Courts - 1,838,378 - - 1,838,378 - 1,838,378 - Finance 3,137,469 537,943 - - (2,599,526) - (2,599,526) - Human resources 1,850,886 106,081 - - (1,744,805) - (1,744,805) - Information technology 4,671,708 - - - (4,671,708) - (4,671,708) - Planning and development 2,049,846 2,270,852 65,508 - 286,514 - 286,514 - Public works 39,559,132 571,436 36,868 5,153 (38,945,675) - (38,945,675) - Parks and recreation services 11,324,541 1,539,875 - 73,511 (9,711,155) - (9,711,155) - Rivermarket 1,298,563 605,207 - - (693,356) - (693,356) - Golf 2,434,632 1,476,467 - - (958,165) - (958,165) - Jim Dailey Fitness 988,633 495,687 - - (492,946) - (492,946) - Zoo 10,754,587 3,798,687 - 100,000 (6,855,900) - (6,855,900) - Fire 36,708,372 2,562,979 - - (34,145,393) - (34,145,393) - Police 71,455,621 3,231,294 233,168 13,920 (67,977,239) - (67,977,239) - Education 5,773,774 - - - (5,773,774) - (5,773,774) - Housing and neighborhood programs 10,142,884 945,430 4,315,887 20,605 (4,860,962) - (4,860,962) - Fleet 1,164,920 - - - (1,164,920) - (1,164,920) - Interest expense on long-term debt 4,680,035 - - - (4,680,035) - (4,680,035) - Bond issue costs 117,481 - - - (117,481) - (117,481) - Agent fees on long-term debt 33,030 - - - (33,030) - (33,030) -
Total governmental activities 252,018,721 31,944,939 6,041,316 591,966 (213,440,500) - (213,440,500) -
Business-Type ActivitiesWaste disposal 14,401,947 17,761,020 - - - 3,359,073 3,359,073 - River Market Garage 1,985,775 2,500,013 - - - 514,238 514,238 - Vehicle storage 1,350,526 1,196,723 - - - (153,803) (153,803) -
Total business-type activities 17,738,248 21,457,756 - - - 3,719,508 3,719,508 -
Total primary government 269,756,969$ 53,402,695$ 6,041,316$ 591,966$ (213,440,500)$ 3,719,508$ (209,720,992)$ -$
Primary Government
Net (Expense) Revenue and
Changes in Net Position
Program Revenues

25
Component UnitsWastewater Utility 49,924,342$ 51,175,869$ -$ -$ -$ -$ -$ 1,251,527$ National Airport 35,839,320 31,237,769 - - - - - (4,601,551) All other component units 103,872,391 48,932,362 3,374,915 5,988,797 - - - (45,576,317)
Total component units 189,636,053$ 131,346,000$ 3,374,915$ 5,988,797$ - - - (48,926,341)
General revenuesGeneral property taxes 50,469,150 - 50,469,150 15,020,320 Sales taxes 118,312,110 - 118,312,110 14,364,513 Utility franchise taxes 31,065,494 - 31,065,494 - Investment income 775,618 111,523 887,141 1,544,564 Grants and contributions not restricted to specific programs 22,990,373 - 22,990,373 23,468,601 Other - - - 21,427,043
Transfers 1,816,098 (1,816,098) - -
Total general revenues, special items and transfers 225,428,843 (1,704,575) 223,724,268 75,825,041
Change in Net Position 11,988,343 2,014,933 14,003,276 26,898,700
Net Position, Beginning of Year, as Previously Reported 589,466,696 20,884,192 610,350,888 836,855,109
Change in accounting principle (121,559,110) (462,772) (122,021,882) (11,281,581)
Net Position, Beginning of Year, as Restated 467,907,586 20,421,420 488,329,006 825,573,528
Net Position, End of Year 479,895,929$ 22,436,353$ 502,332,282$ 852,472,228$

City of Little Rock, Arkansas Balance Sheet
Governmental Funds
December 31, 2015
See Notes to Financial Statements 26
2013 2013
Sales Tax Capital Capital Other
Capital Improvements Improvements Governmental
General Improvements (Debt Service) (Capital Projects) Street Funds TotalAssets
Cash and cash equivalents 5,660,902$ 6,212,349$ 125$ -$ 2,573,446$ 3,057,195$ 17,504,017$ Restricted cash - - 10,975,145 36,555,862 - 27,591,432 75,122,439 Investments 20,023,478 20,631,720 415 - 8,544,467 4,957,320 54,157,400 Accounts receivable 52,327,494 3,403,843 11,808,078 55,239 7,763,823 8,199,382 83,557,859 Due from other funds 3,431,695 - - - - - 3,431,695 Interest receivable 60,132 61,959 1 27,191 25,660 27,577 202,520 Inventories 174,857 - - - - 960,243 1,135,100 Prepaid expenditures and other 845,230 - - - 25,240 412,121 1,282,591
Total assets 82,523,788$ 30,309,871$ 22,783,764$ 36,638,292$ 18,932,636$ 45,205,270$ 236,393,621$
Liabilities, Deferred Inflows of Resources and Fund Balances
LiabilitiesAccounts payable 3,176,086$ 496,355$ -$ 141,341$ 732,717$ 1,066,704$ 5,613,203$ Due to other funds 106,396 - - 1,288,292 - 1,382,239 2,776,927 Accrued wages payable and related liabilities 5,312,419 - - - - 5,312,419 Accrued expenditures and other 929,561 - - - - - 929,561 Unearned revenue 7,098,956 - - - - 2,150,109 9,249,065
Total liabilities 16,623,418 496,355 - 1,429,633 732,717 4,599,052 23,881,175
Deferred Inflows of ResourcesUnavailable revenues - property taxes 26,681,125 - 11,488,434 - 5,522,835 6,958,220 50,650,614
Total deferred inflows of resources 26,681,125 - 11,488,434 - 5,522,835 6,958,220 50,650,614
Fund BalancesNonspendable 1,020,087 - - - 25,240 1,622,364 2,667,691 Restricted - 30,046,636 11,295,330 35,208,659 12,651,844 34,645,978 123,848,447 Committed 300,264 - - - - - 300,264 Assigned 12,331,036 - - - - - 12,331,036 Unassigned (deficit) 25,567,858 (233,120) - - - (2,620,344) 22,714,394
Total fund balances 39,219,245 29,813,516 11,295,330 35,208,659 12,677,084 33,647,998 161,861,832
Total liabilities, deferred inflows of resources and fund balances 82,523,788$ 30,309,871$ 22,783,764$ 36,638,292$ 18,932,636$ 45,205,270$ 236,393,621$

City of Little Rock, Arkansas Reconciliation of the Balance Sheet of Governmental Funds
To the Statement of Net Position
December 31, 2015
See Notes to Financial Statements 27
Total fund balance per statement 161,861,832$
Amounts reported for governmental activities in the statement of net position are different because:
Capital assets used in governmental activities are not financial and are not reported in the funds. 612,557,937
Liabilities that are not due and payable in the current period and are not reported in the funds including:Bonds payable (127,460,000)
Bond issuance premiums (3,444,841)
Bond issuance discounts 1,198,616
Notes payable (23,907,433)
Accrued interest payable (1,593,883)
Net pension liability (190,366,140)
Deferred inflows and outflows of resources 28,474,649
Net OPEB asset 247,223
Workers compensation liability (128,226)
Accrued compensated absences (27,264,141)
Change in accounts receivable net of allowance for doubtful accounts 2,810,136
Property tax pension liability (7,633,567)
An internal service fund is used to charge the costs of fleet management to individual funds. Theassets and liabilities of the internal service fund are included in governmental activitiesin the statement of net position. 3,893,153
Certain amounts reported as unearned revenue and deferred inflows of resources are not recognized at the fund level on the modified accrual basis but are reported as revenues on the full accrual basis in the government-wide statements. 50,650,614
Net position of governmental activities 479,895,929$
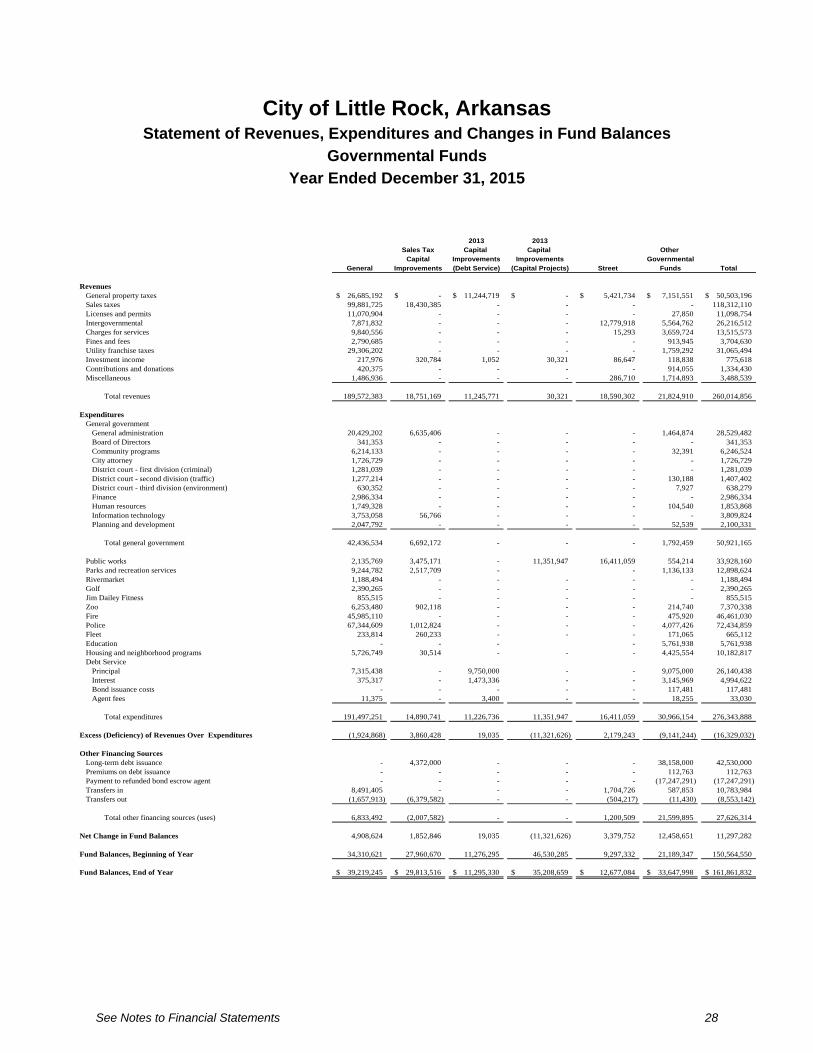
City of Little Rock, Arkansas Statement of Revenues, Expenditures and Changes in Fund Balances
Governmental Funds
Year Ended December 31, 2015
See Notes to Financial Statements 28
2013 2013Sales Tax Capital Capital Other
Capital Improvements Improvements GovernmentalGeneral Improvements (Debt Service) (Capital Projects) Street Funds Total
Revenues General property taxes 26,685,192$ -$ 11,244,719$ -$ 5,421,734$ 7,151,551$ 50,503,196$
Sales taxes 99,881,725 18,430,385 - - - - 118,312,110 Licenses and permits 11,070,904 - - - - 27,850 11,098,754 Intergovernmental 7,871,832 - - - 12,779,918 5,564,762 26,216,512 Charges for services 9,840,556 - - - 15,293 3,659,724 13,515,573 Fines and fees 2,790,685 - - - - 913,945 3,704,630 Utility franchise taxes 29,306,202 - - - - 1,759,292 31,065,494 Investment income 217,976 320,784 1,052 30,321 86,647 118,838 775,618 Contributions and donations 420,375 - - - - 914,055 1,334,430 Miscellaneous 1,486,936 - - - 286,710 1,714,893 3,488,539
Total revenues 189,572,383 18,751,169 11,245,771 30,321 18,590,302 21,824,910 260,014,856
ExpendituresGeneral government
General administration 20,429,202 6,635,406 - - - 1,464,874 28,529,482 Board of Directors 341,353 - - - - - 341,353 Community programs 6,214,133 - - - - 32,391 6,246,524 City attorney 1,726,729 - - - - - 1,726,729 District court - first division (criminal) 1,281,039 - - - - - 1,281,039 District court - second division (traffic) 1,277,214 - - - - 130,188 1,407,402 District court - third division (environment) 630,352 - - - - 7,927 638,279 Finance 2,986,334 - - - - - 2,986,334 Human resources 1,749,328 - - - - 104,540 1,853,868 Information technology 3,753,058 56,766 - - - - 3,809,824 Planning and development 2,047,792 - - - - 52,539 2,100,331
Total general government 42,436,534 6,692,172 - - - 1,792,459 50,921,165
Public works 2,135,769 3,475,171 - 11,351,947 16,411,059 554,214 33,928,160 Parks and recreation services 9,244,782 2,517,709 - - 1,136,133 12,898,624 Rivermarket 1,188,494 - - - - - 1,188,494 Golf 2,390,265 - - - - - 2,390,265 Jim Dailey Fitness 855,515 - - - - - 855,515 Zoo 6,253,480 902,118 - - - 214,740 7,370,338 Fire 45,985,110 - - - - 475,920 46,461,030 Police 67,344,609 1,012,824 - - - 4,077,426 72,434,859 Fleet 233,814 260,233 - - - 171,065 665,112 Education - - - - 5,761,938 5,761,938 Housing and neighborhood programs 5,726,749 30,514 - - - 4,425,554 10,182,817 Debt Service
Principal 7,315,438 - 9,750,000 - - 9,075,000 26,140,438 Interest 375,317 - 1,473,336 - - 3,145,969 4,994,622 Bond issuance costs - - - - - 117,481 117,481 Agent fees 11,375 - 3,400 - - 18,255 33,030
Total expenditures 191,497,251 14,890,741 11,226,736 11,351,947 16,411,059 30,966,154 276,343,888
Excess (Deficiency) of Revenues Over Expenditures (1,924,868) 3,860,428 19,035 (11,321,626) 2,179,243 (9,141,244) (16,329,032)
Other Financing Sources Long-term debt issuance - 4,372,000 - - - 38,158,000 42,530,000 Premiums on debt issuance - - - - - 112,763 112,763 Payment to refunded bond escrow agent - - - - - (17,247,291) (17,247,291) Transfers in 8,491,405 - - - 1,704,726 587,853 10,783,984 Transfers out (1,657,913) (6,379,582) - - (504,217) (11,430) (8,553,142)
Total other financing sources (uses) 6,833,492 (2,007,582) - - 1,200,509 21,599,895 27,626,314
Net Change in Fund Balances 4,908,624 1,852,846 19,035 (11,321,626) 3,379,752 12,458,651 11,297,282
Fund Balances, Beginning of Year 34,310,621 27,960,670 11,276,295 46,530,285 9,297,332 21,189,347 150,564,550
Fund Balances, End of Year 39,219,245$ 29,813,516$ 11,295,330$ 35,208,659$ 12,677,084$ 33,647,998$ 161,861,832$

City of Little Rock, Arkansas Reconciliation of the Statement of Revenues, Expenditures and Changes in
Fund Balances of Governmental Funds to the Statement of Activities
Year Ended December 31, 2015
See Notes to Financial Statements 29
Net change in fund balances - total governmental funds 11,297,282$
Amounts reported for governmental activities in the statement of activities are different because:
Governmental funds report capital outlays as expenditures. However, for government-wide statements, the costof those assets is allocated over their estimated useful lives and reported as depreciation expense.
Capital asset purchases 20,986,577Capital asset contributions 1,426,783Retirements (1,251,463)Depreciation expense (27,796,045)
Revenues that do not provide current financial resources, such as property taxes and fines and feesare not reported as revenues for the funds but are reported as revenues in the statement of activities. (237,688)
Long-term debt issuance provides current financial resources to governmental funds but issuingdebt increases long-term liabilities in the statement of net position. (42,530,000)
The repayment of principal on long-term debt is an expenditure in the governmental funds, but the repayment reduces long-term liabilities in the statement of net position. 41,825,438
Gain on refunding of debt net of accumulated amortization 1,550,455
Expenses that do not require current financial resources (such as interest, litigation, compensated absences, etc.)are not reported as expenses for the funds but are reported as expenses in the statement of activities. (301,896)
Current year pension expenditures are reported on the fiscal year basis in the governmental statement of revenues, 6,924,068expenditures and changes in fund balance and as actuarially determined in the government-wide statement of activities. These differences are reflected in deferred outflows and inflows of resources balances.
An internal service fund is used to charge the costs of fleet management to individual funds. The change in net position of this fund is included in governmental activities in the statement of activities. 94,832
Change in net position of governmental activities 11,988,343$

City of Little Rock, Arkansas Statement of Net Position
Proprietary Funds
December 31, 2015
See Notes to Financial Statements
Governmental
Vehicle Activities -Waste River Market Storage Internal
Disposal Garage (Nonmajor) Total Service Fund
Assets and Deferred Outflowsof Resources
Current assetsCash and cash equivalents 950,775$ 214,125$ 400$ 1,165,300$ 133,961$ Investments 9,484,025 452,691 - 9,936,716 443,235 Restricted cash and investments - current 1,093,715 677,577 - 1,771,292 - Due from other funds - - - - 812,809Accounts receivable 2,910,005 83,403 - 2,993,408 42,694 Accrued interest - - - - 1,331 Inventories - - - - 524,683 Prepaid expenses and other 11,693 319,677 - 331,370 17,191
Total current assets 14,450,213 1,747,473 400 16,198,086 1,975,904
Noncurrent assetsRestricted assets
Cash and cash equivalents 1,906,279 - - 1,906,279 - Investments - 1,402,700 - 1,402,700 - Accrued interest 28,482 1,359 - 29,841 -
1,934,761 1,404,059 - 3,338,820 - Less amount required to meet
current obligations 1,093,715 677,577 - 1,771,292 -
Total restricted assets 841,046 726,482 - 1,567,528 -
Capital assetsLand 1,814,495 822,652 - 2,637,147 270,154 Land improvements 4,149,352 - 174,802 4,324,154 - Landfills, Cells 1, 2 and 4 13,326,165 - - 13,326,165 - Construction in progress - 137,732 - 137,732 14,670 Buildings and improvements 12,794,251 8,715,040 31,043 21,540,334 3,464,933 Vehicles 13,239,025 - 51,154 13,290,179 766,740 Furniture and equipment 3,175,508 106,820 81,765 3,364,093 882,496
48,498,796 9,782,244 338,764 58,619,804 5,398,993 Less accumulated depreciation 32,331,134 2,801,861 205,400 35,338,395 2,527,835
Net capital assets 16,167,662 6,980,383 133,364 23,281,409 2,871,158
Total noncurrent assets 17,008,708 7,706,865 133,364 24,848,937 2,871,158
Total assets 31,458,921 9,454,338 133,764 41,047,023 4,847,062
Deferred outflows of resourcesDeferred outflows from pensions 213,181 - 26,647 239,828 159,885Gain on refunding (16,513) 100,690 - 84,177 -
Total deferred outflows of resources 196,668 100,690 26,647 324,005 159,885
Total assets and deferred outflowsof resources 31,655,589$ 9,555,028$ 160,411$ 41,371,028$ 5,006,947$
Business-Type Activities
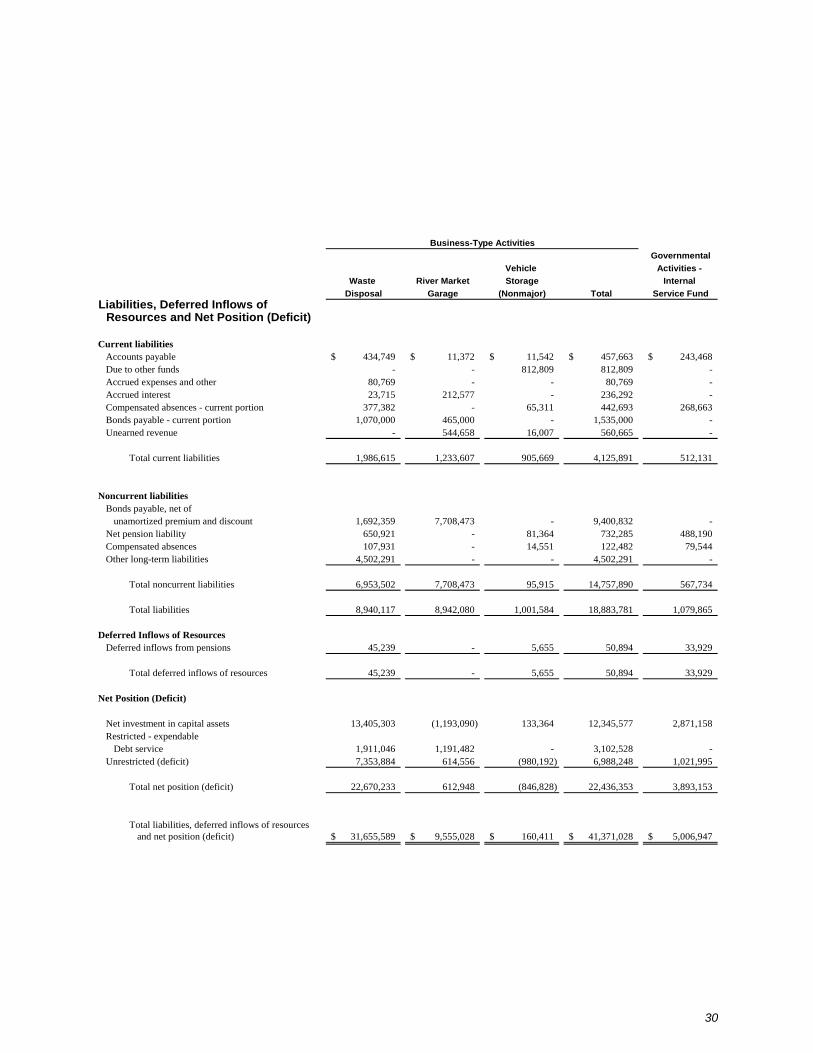
30
Governmental
Vehicle Activities -
Waste River Market Storage Internal
Disposal Garage (Nonmajor) Total Service FundLiabilities, Deferred Inflows of
Resources and Net Position (Deficit)
Current liabilities Accounts payable 434,749$ 11,372$ 11,542$ 457,663$ 243,468$ Due to other funds - - 812,809 812,809 - Accrued expenses and other 80,769 - - 80,769 - Accrued interest 23,715 212,577 - 236,292 - Compensated absences - current portion 377,382 - 65,311 442,693 268,663 Bonds payable - current portion 1,070,000 465,000 - 1,535,000 - Unearned revenue - 544,658 16,007 560,665 -
Total current liabilities 1,986,615 1,233,607 905,669 4,125,891 512,131
Noncurrent liabilitiesBonds payable, net of
unamortized premium and discount 1,692,359 7,708,473 - 9,400,832 - Net pension liability 650,921 - 81,364 732,285 488,190Compensated absences 107,931 - 14,551 122,482 79,544 Other long-term liabilities 4,502,291 - - 4,502,291 -
Total noncurrent liabilities 6,953,502 7,708,473 95,915 14,757,890 567,734
Total liabilities 8,940,117 8,942,080 1,001,584 18,883,781 1,079,865
Deferred Inflows of ResourcesDeferred inflows from pensions 45,239 - 5,655 50,894 33,929
Total deferred inflows of resources 45,239 - 5,655 50,894 33,929
Net Position (Deficit)
Net investment in capital assets 13,405,303 (1,193,090) 133,364 12,345,577 2,871,158 Restricted - expendable
Debt service 1,911,046 1,191,482 - 3,102,528 - Unrestricted (deficit) 7,353,884 614,556 (980,192) 6,988,248 1,021,995
Total net position (deficit) 22,670,233 612,948 (846,828) 22,436,353 3,893,153
Total liabilities, deferred inflows of resources and net position (deficit) 31,655,589$ 9,555,028$ 160,411$ 41,371,028$ 5,006,947$
Business-Type Activities

City of Little Rock, Arkansas Statement of Revenues, Expenses and Changes in Net Position
Proprietary Funds
Year Ended December 31, 2015
See Notes to Financial Statements 31
GovernmentalVehicle Activities -
Waste River Market Storage Internal Disposal Garage (Nonmajor) Total Service Fund
Operating RevenuesCharges for services 17,761,020$ 2,208,179$ 1,179,508$ 21,148,707$ 11,833,168$ Licenses and permits - 291,834 17,215 309,049 -
Miscellaneous - - - - -
Total operating revenues 17,761,020 2,500,013 1,196,723 21,457,756 11,833,168
Operating ExpensesSalaries, wages and employee benefits 4,985,512 - 710,672 5,696,184 3,412,738 Supplies and materials 870,458 - 39,050 909,508 5,005,407 Services 3,565,086 126,317 546,936 4,238,339 2,524,693 Repairs and maintenance 3,315,877 26,506 21,966 3,364,349 285,373 Other - 1,088,649 - 1,088,649 - Depreciation and amortization 1,579,900 268,376 31,903 1,880,179 186,993
Total operating expenses 14,316,833 1,509,848 1,350,527 17,177,208 11,415,204
Operating Income (Loss) 3,444,187 990,165 (153,804) 4,280,548 417,964
Nonoperating Revenues (Expenses)Investment income 102,910 8,614 - 111,524 6,182 Interest expense (181,850) (473,502) - (655,352) - Other, net 96,736 (2,425) - 94,311 (3,628)
Net nonoperating revenues(expenses) 17,796 (467,313) - (449,517) 2,554
Income (Loss) Before Contributions and Transfers 3,461,983 522,852 (153,804) 3,831,031 420,518
Contributions - - - - 89,058 Transfers Out (1,457,072) (359,026) - (1,816,098) (414,744)
(1,457,072) (359,026) - (1,816,098) (325,686)
Changes in Net Position (Deficit) 2,004,911 163,826 (153,804) 2,014,933 94,832
Net Position (Deficit), Beginning of Year,As Previously Reported 21,076,674 449,122 (641,604) 20,884,192 4,105,740
Change in accounting principle (411,352) - (51,420) (462,772) (307,419)
Net Position, Beginning of Year, as Restated 20,665,322 449,122 (693,024) 20,421,420 3,798,321
Net Position (Deficit), End of Year 22,670,233$ 612,948$ (846,828)$ 22,436,353$ 3,893,153$
Business-Type Activities

City of Little Rock, Arkansas Statement of Cash Flows
Proprietary Funds
Year Ended December 31, 2015
See Notes to Financial Statements
GovernmentalVehicle Activities -
Waste River Market Storage Internal Disposal Garage (Nonmajor) Total Service Fund
Operating ActivitiesReceipts from customers 17,650,718$ 2,500,010$ 1,179,508$ 21,330,236$ 11,839,111$ Other receipts - - 17,215 17,215 (3,628) Payments to employees (5,398,917) - (697,130) (6,096,047) (3,210,490) Payments to suppliers (870,107) 11,113 (39,050) (898,044) (5,103,144) Payments to service providers (3,454,784) (99,491) (540,436) (4,094,711) (1,637,815) Other payments (2,430,126) (1,182,944) 79,893 (3,533,177) (1,004,862)
Net cash provided by operatingactivities 5,496,784 1,228,688 - 6,725,472 879,172
Noncapital Financing ActivitiesTransfers to other funds (1,457,072) (359,026) - (1,816,098) (414,744)
Net cash used in noncapitalfinancing activities (1,457,072) (359,026) - (1,816,098) (414,744)
Capital and Related Financing ActivitiesProceeds from the sale of capital assets - - - - 4,128 Purchase of capital assets (443,701) - - (443,701) - Principal paid on long-term debt (1,030,000) (440,000) - (1,470,000) - Other 95,892 (132,365) - (36,473) (15,170) Interest paid on long-term debt (181,850) (470,017) - (651,867) -
Net cash used in capital andrelated financing activities (1,559,659) (1,042,382) - (2,602,041) (11,042)
Investing ActivitiesProceeds from sale of investments 11,432,302 500,399 - 11,932,701 521,430Purchase of investments (12,789,281) (882,488) - (13,671,769) (864,054)Interest income 102,910 8,519 - 111,429 2,554
Net cash provided by (used in) investingactivities (1,254,069) (373,570) - (1,627,639) (340,070)
Incease (Decrease) in Cash and Cash Equivalents 1,225,984 (546,290) - 679,694 113,316
Cash and Cash Equivalents, Beginning of Year 1,631,070 760,415 400 2,391,885 20,645
Cash and Cash Equivalents, End of Year 2,857,054$ 214,125$ 400$ 3,071,579$ 133,961$
Presented on the Statement of Net Position - Proprietary Funds as Follows:Current assets
Cash and cash equivalents 950,775$ 214,125$ 400$ 1,165,300$ 133,961$ Noncurrent assets
Cash and cash equivalents 1,906,279 - - 1,906,279 -
2,857,054$ 214,125$ 400$ 3,071,579$ 133,961$
Business-Type Activities

City of Little Rock, Arkansas Statement of Cash Flows (Continued)
Proprietary Funds
Year Ended December 31, 2015
32
GovernmentalVehicle Activities -
Waste River Market Storage Internal Disposal Garage (Nonmajor) Total Service Fund
Reconciliation of Operating Income (Loss) to to Net Cash Provided By Operating ActivitiesOperating income (loss) 3,444,187$ 990,165$ (153,804)$ 4,280,548$ 417,964$ Adjustment to reconcile operating income (loss) to
net cash provided by operating activitiesDepreciation and amortization expense 1,579,900 268,376 31,903 1,880,179 186,993
Changes in assets and liabilitiesReceivables, net (110,302) 53,148 - (57,154) 4,810Due to/due from other funds, net - - 122,850 122,850 (122,850) Prepaid expenses 351 26,826 - 27,177 643,410Inventories - - - - (97,737)Deferred outflows of resources (191,214) - (26,647) (217,861) (159,885)Accounts payable 266,434 (42,038) (12,437) 211,959 (229,710)Accrued expenses 222,620 (67,789) 2,535 157,366 21,477 Net pension liability 284,808 - 35,600 320,408 214,700
Net cash provided by operatingactivities 5,496,784$ 1,228,688$ -$ 6,725,472$ 879,172$
Noncash Capital ActivitiesDonated capital assets -$ -$ -$ -$ 89,058$
Business-Type Activities
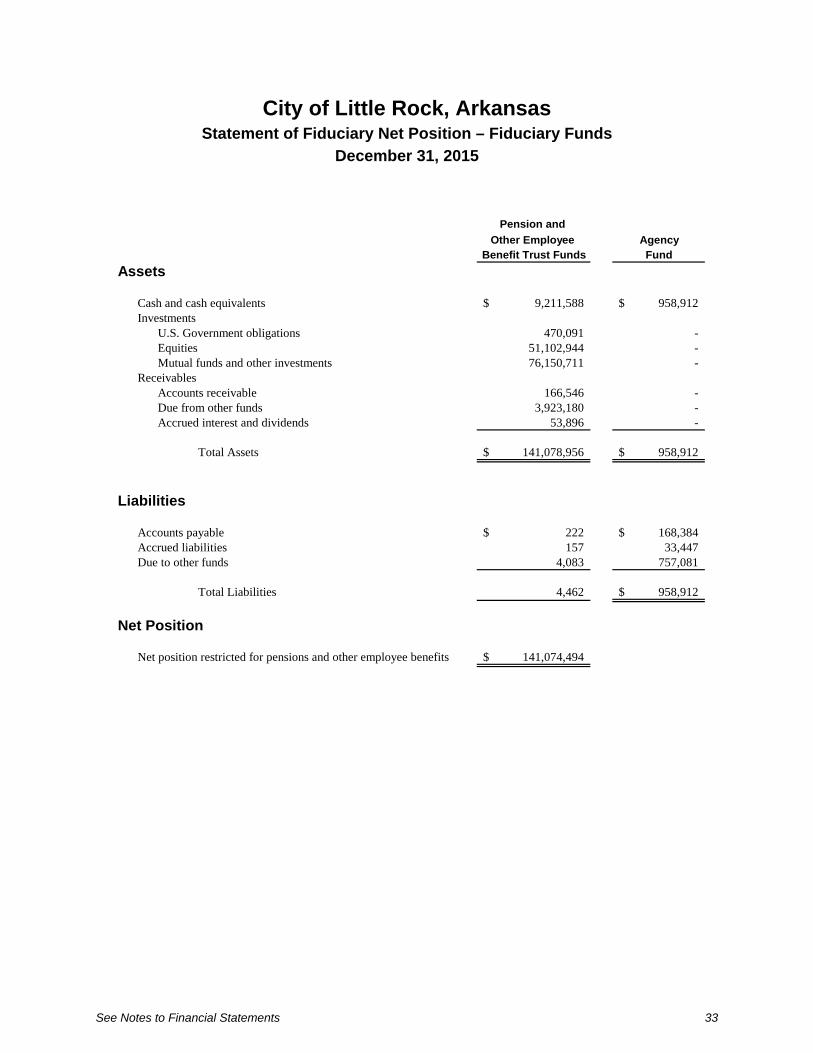
City of Little Rock, Arkansas Statement of Fiduciary Net Position – Fiduciary Funds
December 31, 2015
See Notes to Financial Statements 33
Pension and
Other Employee AgencyBenefit Trust Funds Fund
Assets
Cash and cash equivalents 9,211,588$ 958,912$ Investments
U.S. Government obligations 470,091 - Equities 51,102,944 - Mutual funds and other investments 76,150,711 -
ReceivablesAccounts receivable 166,546 - Due from other funds 3,923,180 - Accrued interest and dividends 53,896 -
Total Assets 141,078,956$ 958,912$
Liabilities
Accounts payable 222$ 168,384$ Accrued liabilities 157 33,447 Due to other funds 4,083 757,081
Total Liabilities 4,462 958,912$
Net Position
Net position restricted for pensions and other employee benefits 141,074,494$

City of Little Rock, Arkansas Statement of Changes in Fiduciary Net Position
Year Ended December 31, 2015
See Notes to Financial Statements 34
Pension and Other Employee
Benefit Trust FundsAdditions
ContributionsEmployer 6,065,078$ Plan members 2,254,542 Property taxes contributed from general fund 3,781,766 State insurance turnback and guarantee fund from general fund 944,540 Other 1,289,114
Total contributions 14,335,040
Investment income Net decrease in fair value of investments (8,368,467) Gain/loss on sale of investments 289,712 Interest and dividends 4,722,623
(3,356,132) Less investment expense 660,846
Net investment loss (4,016,978)
Total additions 10,318,062 Deductions
Benefits paid directly to participants 16,965,264 Administrative expenses 99,974 Other 587,930
Total deductions 17,653,168
Net decrease in Net Position (7,335,106) Net Position Restricted for Pensions and Other Employee Benefits, Beginning of Year 148,409,600
Net Position Restricted for Pensions and Other Employee Benefits, End of Year 141,074,494$

City of Little Rock, Arkansas Statement of Net Position
Discretely Presented Component Units
December 31, 2015
See Notes to Financial Statements
Bill and Hillary Other
Wastewater Clinton National Component
Utility Airport Units TotalAssets and Deferred Outflows
of Resources
Current AssetsCash and cash equivalents 14,921,866$ 24,884,329$ 16,445,062$ 56,251,257$ Investments - - 29,856,338 29,856,338 Restricted cash and investments - current 7,767,164 - 7,100,383 14,867,547 Accounts receivable, net of allowance 3,427,144 3,767,086 27,118,149 34,312,379 Accrued interest receivable 15,288 - 16,297 31,585 Inventories 1,395,960 - 959,353 2,355,313 Prepaid expenses and other 1,937,648 402,158 2,279,336 4,619,142
Total current assets 29,465,070 29,053,573 83,774,918 142,293,561
Noncurrent AssetsRestricted assets
Cash and cash equivalents 8,391,086 12,361,002 30,274,418 51,026,506 Investments 8,645,130 - 26,446,731 35,091,861 Grants and other receivables - 379,297 - 379,297 Interest receivable - - 24,166 24,166
17,036,216 12,740,299 56,745,315 86,521,830 Less amounts required to meet
current obligations 7,767,164 - 7,100,383 14,867,547
Total restricted assets 9,269,052 12,740,299 49,644,932 71,654,283
Capital assetsLand 5,377,335 66,182,688 14,707,288 86,267,311 Construction in progress 53,977,825 9,236,580 51,982,458 115,196,863 Buildings, improvements and other facilities 459,022,968 403,151,843 243,078,531 1,105,253,342 Vehicles - 2,116,820 48,335,725 50,452,545 Furniture and equipment 69,310,923 18,475,935 49,448,896 137,235,754 Books/AV material - - 22,997,074 22,997,074 Other - - 3,019,527 3,019,527
587,689,051 499,163,866 433,569,499 1,520,422,416 Less accumulated depreciation 150,612,022 175,080,253 179,784,853 505,477,128
Net capital assets 437,077,029 324,083,613 253,784,646 1,014,945,288
Other assets - - 805,712 805,712
Total other assets - - 805,712 805,712
Total noncurrent assets 446,346,081 336,823,912 304,235,290 1,087,405,283
Total assets 475,811,151 365,877,485 388,010,208 1,229,698,844
Deferred Outflows of ResourcesDeferred amounts on refunding 9,735,252 - - 9,735,252Deferred outflows from pensions 3,053,329 - 158,171 3,211,500
Total deferred outflows of resources 12,788,581 - 158,171 12,946,752
Total assets and deferred outflows of resources 488,599,732$ 365,877,485$ 388,168,379$ 1,242,645,596$
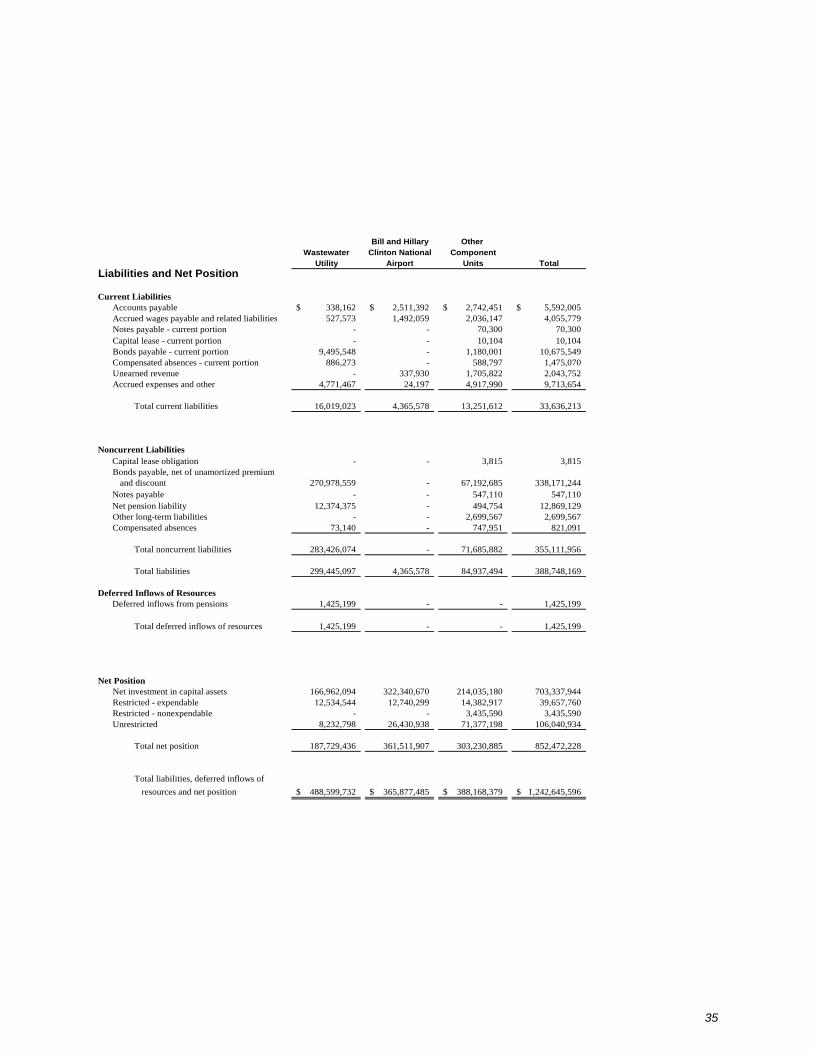
35
Bill and Hillary Other Wastewater Clinton National Component
Utility Airport Units TotalLiabilities and Net Position
Current Liabilities Accounts payable 338,162$ 2,511,392$ 2,742,451$ 5,592,005$ Accrued wages payable and related liabilities 527,573 1,492,059 2,036,147 4,055,779 Notes payable - current portion - - 70,300 70,300 Capital lease - current portion - - 10,104 10,104 Bonds payable - current portion 9,495,548 - 1,180,001 10,675,549 Compensated absences - current portion 886,273 - 588,797 1,475,070 Unearned revenue - 337,930 1,705,822 2,043,752 Accrued expenses and other 4,771,467 24,197 4,917,990 9,713,654
Total current liabilities 16,019,023 4,365,578 13,251,612 33,636,213
Noncurrent LiabilitiesCapital lease obligation - - 3,815 3,815 Bonds payable, net of unamortized premium
and discount 270,978,559 - 67,192,685 338,171,244 Notes payable - - 547,110 547,110 Net pension liability 12,374,375 - 494,754 12,869,129 Other long-term liabilities - - 2,699,567 2,699,567 Compensated absences 73,140 - 747,951 821,091
Total noncurrent liabilities 283,426,074 - 71,685,882 355,111,956
Total liabilities 299,445,097 4,365,578 84,937,494 388,748,169
Deferred Inflows of ResourcesDeferred inflows from pensions 1,425,199 - - 1,425,199
Total deferred inflows of resources 1,425,199 - - 1,425,199
Net PositionNet investment in capital assets 166,962,094 322,340,670 214,035,180 703,337,944 Restricted - expendable 12,534,544 12,740,299 14,382,917 39,657,760 Restricted - nonexpendable - - 3,435,590 3,435,590 Unrestricted 8,232,798 26,430,938 71,377,198 106,040,934
Total net position 187,729,436 361,511,907 303,230,885 852,472,228
Total liabilities, deferred inflows of
resources and net position 488,599,732$ 365,877,485$ 388,168,379$ 1,242,645,596$

City of Little Rock, Arkansas Statement of Activities
Discretely Presented Component Units
Year Ended December 31, 2015
See Notes to Financial Statements 36
Operating Capital OtherCharges for Grants and Grants and Wastewater National Component
Functions/Programs Expenses Services Contributions Contributions Utility Airport Units TotalGovernmental Activities
Other component units 26,860,964$ 443,461$ 3,374,915$ 5,988,797$ -$ -$ (17,053,791)$ (17,053,791)$
Total governmental activities 26,860,964 443,461 3,374,915 5,988,797 - - (17,053,791) (17,053,791)
Business-type ActivitiesWastewater Utility 49,924,342 51,175,869 - - 1,251,527 - - 1,251,527 Bill and Hillary Clinton National Airport 35,839,320 31,237,769 - - - (4,601,551) - (4,601,551) Other component units 77,011,427 48,488,901 - - - - (28,522,526) (28,522,526)
Total business-type activities 162,775,089 130,902,539 - - 1,251,527 (4,601,551) (28,522,526) (31,872,550)
Total component units 189,636,053$ 131,346,000$ 3,374,915$ 5,988,797$ 1,251,527 (4,601,551) (45,576,317) (48,926,341)
General revenuesGeneral property taxes - - 15,020,320 15,020,320 Sales taxes - - 14,364,513 14,364,513 Investment income 154,003 270,189 1,120,372 1,544,564 Grants and contributions not restricted to specific programs 1,819,214 6,549,752 15,099,635 23,468,601 Other 24,693 4,599,629 16,802,721 21,427,043
Total general revenues and transfers 1,997,910 11,419,570 62,407,561 75,825,041
Change in Net Position 3,249,437 6,818,019 16,831,244 26,898,700
Net Position, Beginning of Year, as Previously Reported 195,449,146 354,693,888 286,712,075 836,855,109
Change in accounting principle (10,969,147) - (312,434) (11,281,581)
Net Position, Beginning of Year, as Restated 184,479,999 354,693,888 286,399,641 825,573,528
Net Position, End of Year 187,729,436$ 361,511,907$ 303,230,885$ 852,472,228$
Changes in Net PositionProgram RevenuesNet (Expense) Revenue and

City of Little Rock, Arkansas Notes to Financial Statements
Year Ended December 31, 2015
37
Note 1: Nature of Operations and Summary of Significant Accounting Policies
The City of Little Rock, Arkansas (the City), is a municipal corporation operating under the authority of Arkansas state statute. The City operates under a city manager form of government. Ten elected directors and the Mayor set policy and employ the City Manager. The accounting and reporting policies of the City conform to accounting principles generally accepted in the United States of America for state and local governments as defined by the Governmental Accounting Standards Board (GASB). The following is a summary of the significant accounting and reporting policies of the City.
Reporting Entity
The accompanying government-wide financial statements present the financial statements of the City and its component units. The component units are legally separate entities for which the City is considered to be financially accountable. Accountability is defined as the City’s substantive appointment of the majority of the component unit’s governing board. Furthermore, to be financially accountable, the City must be able to impose its will upon the component unit or there must be a possibility that the component unit may provide specific financial benefits to or impose specific financial burdens on the City. These component units are further distinguished between Blended Component Units, presented as part of the primary government, and Discretely Presented Component Units, presented separately.
The City’s primary government consists of those funds or organizations that make up the legal entity for which it is financially responsible. Under these criteria, the following are included in the primary government reporting entity:
Discretely Presented Component Units
Major Component Units:
Little Rock Wastewater Utility (LRWWU) – The City Manager appoints the governing body of LRWWU with City Board approval. LRWWU receives no financial benefit from the City and provides water treatment services primarily to the citizens of Little Rock; however, the City has the power to impose its will on the LRWWU.
Bill and Hillary Clinton National Airport (Airport) – The Airport is controlled by a seven-member commission appointed by the City Manager with City Board approval. The City has the power to impose its will on the Airport. The Airport primarily serves the central Arkansas area.
There were no significant transactions between the major component units and the City or its other component units in 2015.

City of Little Rock, Arkansas Notes to Financial Statements
Year Ended December 31, 2015
38
Other Component Units:
Little Rock Advertising and Promotion Commission (Commission) – The governing body of the Commission is appointed by the Mayor of Little Rock subject to City Board approval. The City has the power to impose its will on the Commission. The Commission serves as the sales and advertising office for the City’s convention and tourism industry and oversees the Little Rock Convention and Visitors Bureau.
Little Rock Port Authority (LRPA) – The governing board of the LRPA is appointed by the City Manager with City Board approval. The City has the power to impose its will on the LRPA. LRPA operates the Port of Little Rock, which includes railroad and riverport loading facilities and a foreign trade zone.
Little Rock Ambulance Authority (LRAA) – The LRAA, known publicly as Metropolitan Emergency Medical Services (MEMS), has a governing body of eight members, five of whom are appointed by the City Board. The City Board must also approve any rate changes for LRAA. LRAA provides emergency medical transportation services to the greater metropolitan area.
Central Arkansas Transit Authority (CATA) – CATA, which provides public transportation services to the greater metropolitan area, annually receives an operating subsidy from the City equal to 67% of the operating deficit. The City’s contributions to CATA are vital to its operations. In addition, five of the 13 members of its Board of Directors are appointed by the City Board. Based on the level of financial dependency that CATA has on the City, the City has concluded that the nature and significance of this relationship warrant inclusion of CATA in the City’s reporting entity as a discretely presented component unit.
Museum of Discovery (Museum) and Arkansas Arts Center (Arts Center) – The Museum and the Arts Center, serving the greater metropolitan area’s cultural needs, receive significant operating subsidies from the City annually. The governing bodies of the Museum and the Arts Center are appointed with City Board approval. The City has the power to impose its will on both organizations. Additionally, the City owns the facility of the Arts Center. The Arts Center has a fiscal year end of June 30.
City of Little Rock, Arkansas Notes to Financial Statements
Year Ended December 31, 2015
39
Central Arkansas Library System (CALS) – CALS, providing Central Arkansas with library services, receives financial benefit from the City in the form of tax revenue, levied by the City but collected by the Library, and other nonoperating subsidies. In addition, six of the nine members of its Board of Trustees are appointed by the City Board.
Oakland Fraternal Cemetery (Cemetery) – The governing board of the Cemetery is appointed by the City Board. The City has the power to impose its will on the Cemetery. Additionally, the City owns the land which is occupied by the Cemetery. The Cemetery operates the Perpetual Care Fund to invest monies to be used for the future operations and maintenance of the Cemetery. The governing body of the Perpetual Care Fund is composed of three trustees, all of which are appointed by the Cemetery Board.
Mt. Holly Cemetery (Mt. Holly) –The governing board of Mt. Holly is appointed by the City Board. The City has the power to impose its will on Mt. Holly. Additionally, the City owns the land which is occupied by Mt. Holly. Mt. Holly operates the Perpetual Care Fund to invest monies to be used for the future operations and maintenance of the Cemetery. The governing body of the Perpetual Care Fund is composed of three trustees, all of which are appointed by the Mt. Holly Board.
Little Rock Workforce Investment Board (LRWIB) – LRWIB is a non-profit organization created to provide job training. The sitting Mayor of the City of Little Rock serves as the chief executive officer and appoints the board members. The City has the power to impose its will on the Board. The LRWIB has a fiscal year end of June 30.
Complete financial statements of the individual component units, except for Mt. Holly Cemetery and Oakland Fraternal Cemetery which do not issue separate financial statements, can be obtained from their respective administrative offices.
Administrative Offices Little Rock Wastewater Utility 221 East Capitol Avenue Little Rock, Arkansas 72202
Arkansas Arts Center Ninth and Commerce Little Rock, Arkansas 72202
Little Rock Advertising and Promotion Commission 7 Statehouse Plaza Little Rock, Arkansas 72201
Little Rock Port Authority 7500 Lindsey Road Little Rock, Arkansas 72206
Little Rock Ambulance Authority 1101 West 8th Street Little Rock, Arkansas 72201
Central Arkansas Transit Authority 901 North Maple North Little Rock, Arkansas 72114
Bill and Hillary Clinton National Airport 1 Airport Drive Little Rock, Arkansas 72202
Central Arkansas Library System 100 Rock Street Little Rock, Arkansas 72201
Museum of Discovery 500 President Clinton Avenue, Suite 150 Little Rock, Arkansas 72201
Little Rock Workforce Investment Board 300 South University Avenue, Suite D14 Little Rock, Arkansas 72205-5209

City of Little Rock, Arkansas Notes to Financial Statements
Year Ended December 31, 2015
40
Administrative Offices Oakland Fraternal Cemetery 2101 Barber Street Little Rock, Arkansas 72206
Mount Holly Cemetery 1 Sunset Drive Little Rock, Arkansas 72206
Government-wide and Fund Financial Statements
The basic financial statements include both government-wide (based on the City as a whole) and fund financial statements as follows:
Government-wide Financial Statements
The government-wide financial statements report information on all of the nonfiduciary activities of the primary government and its component units. Fiduciary activities are excluded from the government-wide statements because they cannot be used to support the City’s own programs. As a general rule, the effect of interfund activity has been eliminated from the government-wide financial statements. These statements distinguish between the governmental and business-type activities of the City. Governmental activities generally are financed through taxes, intergovernmental revenues and other nonexchange transactions. Business-type activities are financed in whole or in part by fees charged to external parties. Likewise, the primary government is reported separately from certain legally separate component units for which the primary government is financially accountable. The statement of activities demonstrates the degree to which the direct expenses of a given function or identifiable activity are offset by program revenues. Direct expenses are those that are clearly associated with a specific function or identifiable activity. Expenses that cannot be specifically identified to a particular function are charged to funds based on time spent for that function and are included in the functional categories. Program revenues include (a) charges to customers or applicants who purchase, use, or directly benefit from goods, services or privileges provided by a given function or identifiable activity and (b) grants and contributions that are restricted to meeting the operational or capital requirements of a particular program or identifiable activity.
Fund Financial Statements
The fund financial statements provide information about the City’s funds, including its fiduciary funds. Separate statements for each fund type-governmental, proprietary and fiduciary-are presented. The emphasis of fund financial statements is on major governmental and major enterprise funds, each displayed in a separate column. All other governmental and enterprise funds are aggregated and reported as nonmajor funds.

City of Little Rock, Arkansas Notes to Financial Statements
Year Ended December 31, 2015
41
The City reports the following major governmental funds:
The General Fund is the government’s primary operating fund. It accounts for all financial resources of the general government, except those required to be accounted for in another fund.
The Sales Tax Capital Improvements Fund (capital projects fund) accounts for the capital expenditures that are derived from the 3/8 cent capital sales tax dollars.
The 2013 Capital Improvements Fund (debt service fund) accounts for the accumulation of resources for the payment of principal and interest on the 2013 limited tax general obligation debt of the City.
The 2013 Capital Improvements Fund (capital projects fund) accounts for the proceeds of the 2013 Limited Tax General Obligation Capital Improvement Bonds issued to finance various capital improvements for the City.
The Street Fund accounts for gasoline and road taxes received from state and county levies. Revenues are expended for maintenance and repair of streets and sidewalks.
The City reports the following major enterprise funds:
The Waste Disposal Revenue Fund, accounts for the activities of the City’s waste disposal operations.
The River Market Garage Fund accounts for the operations of the City’s two downtown parking garages.
Special Revenue Funds – The special revenue funds, which include federal grants, are used to account for the proceeds of specific revenue sources, other than expendable trusts or major capital projects, which are legally restricted to expenditures for specified purposes.
Debt Service Funds – The debt service funds are used to account for the accumulation of resources for, and the payment of, general long-term debt principal, interest and related costs.
Capital Projects Funds – The capital projects funds are used to account for financial resources to be used for the acquisition or construction of major capital facilities, other than those financed by enterprise funds.
Internal Service Fund – The internal service fund is used to account for centralized services provided to City departments on a cost-reimbursement basis. The City’s internal service fund is the Fleet Service Fund.
Enterprise Fund – The enterprise fund is used to account for vehicle storage whose operations are financed primarily or partially through user charges.
Trust Funds – Accounts for assets held in trust for the Police Pension, Firemen’s Pension and Relief Fund, Nonuniformed Employees’ Defined Contribution Plan, Nonuniformed Employees’ Defined Benefit Pension Plan, 2014 Defined Benefit Plan, the 401(a) Money Purchase and Trust Retirement Fund and the Health Management Trust Fund. Plan trustees must act in accordance with the specific purposes and terms of these retirement plans.
City of Little Rock, Arkansas Notes to Financial Statements
Year Ended December 31, 2015
42
Agency Fund – Accounts for monies collected and held by the courts until they are disbursed to various governmental agencies.
Measurement Focus and Basis of Accounting
Government-wide, Proprietary and Fiduciary Funds
The government-wide, proprietary and fiduciary fund financial statements are reported using the economic resources measurement focus and accrual basis of accounting. Revenues are recorded when earned and expenses are recorded at the time liabilities are incurred, regardless of the timing of related cash flows. The agency fund has no measurement focus but utilizes the accrual basis of accounting for reporting its assets and liabilities.
Operating revenues and expenses are distinguished from nonoperating items. Operating revenues and expenses generally result from providing services in connection with the principal ongoing operations of the fund. All revenues and expenses not meeting this definition are reported as nonoperating items.
Nonexchange transactions, in which the City receives (or gives) value without directly giving (or receiving) equal value in exchange, include taxes; fines and forfeitures; grants, entitlements and similar items; and donations. Recognition standards are based on the characteristics and classes of nonexchange transactions. Franchise taxes, other taxes, and fines and forfeitures are recognized as revenues, net of estimated refunds and uncollectible amounts, in the accounting period when an enforceable legal claim to the assets arises and the use of resources is required or is first permitted. Grants, entitlements and donations are recognized as revenues, net of estimated uncollectible amounts, as soon as all eligibility requirements imposed by the provider have been met. Amounts received before all eligibility requirements have been met are reported as unearned revenues. Grants and similar aid to other organizations are recognized as expenses as soon as recipients have met all eligibility requirements. Amounts paid before all eligibility requirements have been met are reported as prepaid items.
Governmental Fund Financial Statements
Governmental funds are reported using the current financial resources measurement focus and the modified accrual basis of accounting. With this measurement focus, only current assets and liabilities are generally included on the balance sheet. The statement of revenues, expenditures and changes in fund balances presents increases (revenues and other financing sources) and decreases (expenditures and other financing uses) in available spendable resources. General capital asset acquisitions are reported as expenditures and proceeds of general long-term debt are reported as other financing sources. Under the modified accrual basis of accounting, revenues are recognized when both measurable and available. The City considers revenues reported in the governmental funds to be available if they are collectible within 60 days after year-end. Principal revenue sources considered susceptible to accrual include taxes, federal funds, local funds and investment earnings. Other revenues are considered to be measurable and available only when cash is received by the City. Expenditures are recorded when the related fund liability is incurred, except for principal and interest on general long-term debt, claims and judgments, compensated absences and obligations for workers’ compensation, which are recognized as expenditures when payment is due. Pension

City of Little Rock, Arkansas Notes to Financial Statements
Year Ended December 31, 2015
43
expenditures are recognized when contributed to a plan or when expected to be liquidated with expendable available financial resources.
Use of Estimates
The preparation of financial statements in conformity with accounting principles generally accepted in the United States of America requires management to make estimates and assumptions that affect the reported amounts of assets, deferred outflows, liabilities and deferred inflows and disclosure of contingent assets and liabilities at the date of the financial statements and the reported amounts of revenues and expenses/expenditures during the reporting period. Actual results could differ from those estimates.
Cash and Cash Equivalents
Cash and cash equivalents include demand deposits, cash on hand, certificates of deposit and short-term instruments with original maturities at purchase of 90 days or less. The City uses a pooled cash account for operating purposes in which all funds, except the pension trust and agency funds, have an interest.
Investments and Investment Income
All investments in the City’s Pension and Other Employee Benefit Trust Funds, except for alternative investments, are carried at fair value. For all other funds, investments in U.S. Treasury, agency and instrumentality obligations with a remaining maturity of one year or less at time of acquisition and in nonnegotiable certificates of deposit are carried at amortized cost. All other investments are carried at fair value. Fair value is determined using quoted market prices for all investments other than collateralized mortgage obligations and alternative investments. Fair value of collateralized mortgage obligations is estimated using a published pricing service. Alternative investments are measured using the net asset value per share of the investee or the investee’s proportionate share of capital accounts.
Investment income includes dividend and interest income and the net change for the year in the fair value of investments. Investment income is credited to the fund from which the investments were made, except where required otherwise by bond indentures or City policy.
Inventories
Inventories consist of supplies, which are valued at cost, and merchandise and renovated housing available-for-sale (funded by grant programs) valued at the lower of average cost or market value. The costs of governmental fund type inventories are recorded as expenditures when purchased/constructed.

City of Little Rock, Arkansas Notes to Financial Statements
Year Ended December 31, 2015
44
Prepaid Items
Prepaid items in governmental funds are accounted for under the consumption method.
Capital Assets
Capital assets, which include infrastructure, are reported in the government-wide financial statements and the fund financial statements for proprietary funds. Purchased or constructed capital assets are reported at cost or estimated historical cost. Donated capital assets are recorded at their estimated fair value at the date of donation.
Capital assets are defined as assets with an initial value or cost greater than or equal to $5,000 and an estimated useful life of greater than one year. Exceptions are for infrastructure assets which are defined as having a constructed cost greater than $250,000.
Capital assets are depreciated using the straight-line method over their estimated useful lives ranging from 15–50 years for infrastructure, 10–75 years for buildings and 3–25 years for land improvements, vehicles and equipment.
Depreciation expense is charged directly to the department/function based on the department that utilizes the related asset.
Long-term Obligations
In the government-wide financial statements, long-term debt and other long-term obligations are reported as liabilities in the columns for governmental activities, business-type activities and component units. These amounts are also reported as liabilities in the fund financial statements for proprietary funds. Debt premiums, discounts and deferred losses on refundings are generally deferred and amortized using the effective interest rate method. Long-term debt is reported net of the applicable debt premium or discount.
In the fund financial statements, governmental fund types recognize debt premiums, during the current period. The face amount of the debt issued and premiums received are reported as other financing sources. Issuance costs, whether or not withheld from the actual proceeds received, are reported as debt service expenditures.
Compensated Absences
City employees earn sick pay and vacation leave benefits on the basis of length of service time. Subject to certain restrictions, City employees are compensated (historically from the fund which the employee is assigned) for unused sick and vacation time upon leaving the City’s employment. All sick pay and vacation leave is accrued when incurred in the government-wide and proprietary fund financial statements. In governmental funds, a liability for these amounts is reported only as payments come due each period upon the occurrence of relevant events such as employee resignations and retirements. For governmental activities, the liability for compensated absences is generally liquidated from the general fund.

City of Little Rock, Arkansas Notes to Financial Statements
Year Ended December 31, 2015
45
Unearned Revenue
Unearned revenue consists mainly of business licenses received in advance.
Pensions
For purposes of measuring the net pension liability, deferred outflows of resources and deferred inflows of resources related to pensions, and pension expense, information about the fiduciary net position of the City’s defined benefit pension plans (the Plans) and additions to/deductions from the Plans’ fiduciary net position have been determined on the same basis as they are reported by the Plans. For this purpose, benefit payments (including refunds of employee contributions) are recognized when due and payable in accordance with the benefit terms. Investments are reported at fair value.
Deferred Outflows/Inflows of Resources
Deferred outflows of resources represent a consumption of net position that applies to a future period(s) and so will not be recognized as an outflow of resources (expense) until then. The City has a deferred outflow for a bond refunding, which is the difference in the carrying value of refunded debt and its reacquisition price. This amount is deferred or amortized to interest expense over the shorter of the life of the refunded and new debt. In addition the city has deferred outflows related to pensions, with one being the amount of contributions made to the pension plans after the measurement date, and the other the difference in investment experience between actual earnings and projected earnings on pension plan investments and the difference in assumption changes. Deferred outflows related to contributions made after the measurement date will be recognized as a reduction of net pension liability in the following year ended December 31, 2016. The remaining amounts will be amortized to pension expense over future periods as shown within Note 6.
Deferred inflows of resources represent an acquisition of net position that applies to a future period(s) and so will not be recognized as an inflow of resources (revenue) until then. The City’s deferred inflows include property taxes in the governmental funds. The City also has deferred inflows related to pensions. This consists of the difference between the expected and actual experience related to the pension plans as well as the difference in assumption changes. These amounts are amortized over future periods to pension expense as shown within Note 6.
Net Position/Fund Balance
Net position of the government-wide financial statements and proprietary funds of the City are classified in four components. Net investment in capital assets consists of capital assets, net of accumulated depreciation and reduced by the outstanding balances of borrowings used to finance the purchase or construction of those assets. Restricted expendable net position are noncapital assets that must be used for a particular purpose as specified by creditors, grantors or donors external to the City, including amounts deposited with trustees as required by bond indentures, reduced by the outstanding balances of any related borrowings. Restricted nonexpendable net position are noncapital assets that are required to be maintained in perpetuity as specified by parties external to the City, such as permanent endowments. Unrestricted net position is remaining assets and deferred outflows of resources less remaining liabilities and deferred inflows of resources that
City of Little Rock, Arkansas Notes to Financial Statements
Year Ended December 31, 2015
46
do not meet the definition of net investment in capital assets, restricted expendable or restricted nonexpendable.
When both restricted and unrestricted resources are available for use, generally it is the City’s policy to use restricted resources first. For projects funded by tax-exempt debt proceeds and other sources, the debt proceeds are used first.
The fund balances for the City’s governmental funds are displayed in five components:
Nonspendable – Nonspendable fund balances are not in a spendable form or are required to be maintained intact.
Restricted – Restricted fund balances may be spent only for the specific purposes stipulated by external resource providers, constitutionally or through enabling legislation. Restrictions may be changed or lifted only with the consent of resource providers.
Committed – Committed fund balances may be used only for the specific purposes determined by ordinance of the Board of Directors. Commitments may be changed or lifted only by issuance of an ordinance by the Board of Directors.
Assigned – Assigned fund balances are intended to be used by the City for specific purposes as determined by the City Manager or the Board of Directors. The City Manager is allowed to assign funds up to $49,999. Any assignment of $50,000 or more must be approved by the Board of Directors through a resolution. In governmental funds other than the general fund, assigned fund balance represents the amount that is not restricted or committed. This indicates that resources in other governmental funds are, at a minimum, intended to be used for the purpose of that fund.
Unassigned – Unassigned fund balance is the residual classification for the general fund and includes all amounts not contained in the other classifications.
The City considers restricted amounts to have been spent when expenditure is incurred for purposes for which both restricted and unrestricted fund balance is available. The City applies committed amounts first, followed by assigned amounts, and then unassigned amounts when expenditure is incurred for purposes for which amounts in any of those unrestricted fund balance classifications could be used.
Stabilization Arrangement
The City has a general fund reserve which was established by the City’s financial policy. The general fund goal is to set aside $10 million or ten (10) percent of budgeted general fund revenues, whichever is greater, into a restricted reserve fund, absent express action of the Board. The restricted reserve shall be maintained at that level thereafter. The monies in the reserve fund are readily available for appropriation or expenditure, but are used if there is a need to do so because of some extraordinary circumstance not foreseen during the year. Funds can be used, at the Board’s discretion, to meet a unique opportunity for the overall well-being of the City unforeseen during the regular budget process, to continue to operate budgeted City services at the level set forth in the annual budget after a catastrophic event or some unforeseen economic downturn that could not be reasonably predicted during the annual budget process, or to meet some legal obligation imposed upon the City as a result of administrative or legal action not reasonably anticipated during the

City of Little Rock, Arkansas Notes to Financial Statements
Year Ended December 31, 2015
47
annual budget process. As of December 31, 2015, the Board’s established amount of the reserve is $9,418,000, which is included in unassigned fund balance of the General Fund.
Budgetary Information
Annual budgets are adopted on a basis consistent with accounting principles generally accepted in the United States of America for the General and Street Funds. All annual appropriations lapse at year end.
Pension Plan Descriptions
The City participates in seven defined benefit pension plans; which are comprised of three single-employer defined benefit pension plans, three cost-sharing multiple employer defined benefit pension plans and one agent-multiple employer defined benefit pension plan, each of which are described and illustrated in detail in Note 6.
Adoption of Accounting Principles
The City implemented Governmental Accounting Standards Board (GASB) Statement No. 68, Accounting and Financial Reporting for Pension Plans - an amendment of GASB Statement No. 27, for 2015. The statement includes guidance for accounting for participating employers in single employer and multiple-employer defined benefit pension plans, cost-sharing plans, defined contribution plans and plans with insured benefits. The note disclosure and required supplementary information requirements for employers whose employees are provided with defined benefit pensions through qualified trusts also are addressed. Finally, the statement includes guidance on accounting for special funding situations where an entity other than the employer government is legally responsible for plan contributions.
The Statement also requires employers participating in cost-sharing multiple-employer plans to recognize their proportional share of the plan’s collective net pension liability, pension expense and deferred outflows of resources and deferred inflows of resources in the employer’s financial statements. The pension expense is no longer based on the contractually required contribution or contributions actually made, but is actuarially determined. This results in the pension expense and liability being recognized as benefits are earned by employees, and increased current pension expense along with the recognition of the proportional share of the net pension liability. The fiscal year 2015 beginning net position has been restated to reflect the implementation of the new accounting standard.
The City also implemented Governmental Accounting Standards Board (GASB) Statement No. 71, Pension Transition for Contributions Made Subsequent to the Measurement Date - an amendment of GASB Statement No. 68, for 2015. The statement includes guidance for accounting for contributions made to defined benefit pension plans after the measurement date of the net pension liability but prior to the government’s fiscal year end. See Note 6 for a detail of these amounts as they relate to the specific pensions of the City.

City of Little Rock, Arkansas Notes to Financial Statements
Year Ended December 31, 2015
48
Future Adoption of Accounting Pronouncements
The GASB has issued the following potentially significant statements which the City has not yet adopted and which require adoption subsequent to December 31, 2015:
Adoption Required
Statement No. in Fiscal Year
72 Fair Value Measurement and Application 2016
76 The Hierarchy of Generally Accepted Accounting Principles for State and Local Governments
2016
77 Tax Abatement Disclosures 2017
75 Accounting and Financial Reporting for Postmeployment Benefits Other Than Pensions
2018
The impact of these standards on the City’s net position has not been determined.
Note 2: Deposits and Investments
Deposits
Custodial credit risk is the risk that in the event of a bank failure, a government’s deposits may not be returned to it. The City’s deposit policy for custodial credit risk requires compliance with the provisions of state law.
City statute requires that deposits in financial institutions be collateralized with federal depository insurance and bonds or other interest-bearing securities of the United States, the State of Arkansas, Arkansas political subdivisions or agencies or instrumentalities of these entities at 104%. No legal opinion has been obtained regarding the enforceability of any of the collateral arrangements.
At December 31, 2015, none of the City’s primary government bank balances were exposed to custodial credit risk. Of the City’s component units combined bank balances, $3,577,570 were uninsured and uncollateralized.
Investments
Arkansas statutes authorize the City to invest in direct obligations of the U.S. government; obligations on which the principal and interest are fully guaranteed, or are fully secured, insured or covered by commitments or agreements to purchase by the U.S. government; obligations of agencies and instrumentalities created by act of the United States Congress and authorized thereby to issue securities or evidence of indebtedness, regardless of guarantee of repayment by the U.S. government; obligations of political subdivisions of the United States; certain obligations issued by the State Board of Education; short-term warrants of political subdivisions of the State of Arkansas

City of Little Rock, Arkansas Notes to Financial Statements
Year Ended December 31, 2015
49
and municipalities; the sale of federal funds with a maturity of not more than one business day; demand, savings or time deposits fully insured by a federal deposit insurance agency; repurchase agreements that are fully insured by obligations of the U.S. government, any U.S. State or any political subdivision thereof; securities of, or other interest in, any open-end type investment company or investment trust registered under the Investment Company Act of 1940, and which is considered a money market fund, provided that the portfolio is limited principally to U.S. government obligations and the investment company or trust takes delivery of collateral either directly or through an authorized custodian; and bank certificates of deposit.
Arkansas statutes also authorize the City to invest no more than 20% of its capital base in corporate debt obligations; revenue bond issues of any state, municipality or political subdivision; industrial development bonds for corporate obligors issued through any state or political subdivision; securities or interest in an open-end or close-end management type investment company or trust registered under the Investment Company Act of 1940 with certain limitations; securities or interest issued, assumed, or guaranteed by certain international banks; and uninsured demand, savings or time deposits or accounts of any depository institution chartered by the United States, any U.S. state, or District of Columbia. The pension and other employee benefit trust funds are authorized to also invest in common stocks, investment grade corporate bonds and other appropriate securities.
At December 31, 2015, the City had the following investments and maturities:
Less Morethan 1 than 10
U.S. Treasury obligations 9,521,481$ 9,521,481$ -$ -$ -$ U.S. agencies obligations 86,728,268 30,176,182 56,552,086 - Corporate bonds 7,810,931 7,810,931 - - - Alternative investments 8,508,127 8,508,127 - - - Bond mutual funds 33,607,633 33,607,633 - - - Certificate of deposit 200,000 200,000 Money market mutual funds 84,841,319 84,841,319 - - -
231,217,759 174,665,673$ 56,552,086$ -$ -$
Stock mutual funds 6,853,645Corporate stocks 46,964,166
285,035,570$
Type Fair Value 1–5 6–10
Maturities in Years Primary Government

City of Little Rock, Arkansas Notes to Financial Statements
Year Ended December 31, 2015
50
Less Morethan 1 than 10
U.S. Treasury obligations 34,335,703$ 32,900,269$ 1,384,370$ 51,064$ -$ U.S. agencies obligations 9,277,637 766,884 8,413,900 96,853 - Corporate bonds 1,906,368 374,265 327,359 803,283 401,461 Money market mutual funds 5,279,827 5,279,827 - - - Municipal bonds 1,494,700 1,207,068 1,182 - 286,450 Certificate of deposit 9,665,172 3,353,947 6,176,822 55,141 79,262
61,959,407 43,882,260$ 16,303,633$ 1,006,341$ 767,173$
Stock mutual funds 22,951,157Corporate stocks 3,238,144
88,148,708$
Component UnitsMaturities in Years
Type Fair Value 6–101–5
Interest Rate Risk – The City’s policy does not limit the maturity of any single debt security. The City employs a maturity-spacing strategy regarding its investment portfolio. This includes a balanced or laddered maturity strategy with equal spacing of maturities held. The rationale for an equal maturity strategy is to provide the portfolio with some reinvestment risk protection, spreading reinvestment out over the full interest rate cycle. That is, there will be a relatively continuous cash flow over time from maturity laddering and these funds can be reinvested at the then current rates. The effects of overall interest rate change will tend to be averaged, and the extremes of return and risk will be truncated.
Credit Risk – Credit risk is the risk that the issuer or other counterparty will not fulfill its obligations. It is the City’s policy, excluding fiduciary funds, to invest almost exclusively in government-issued treasuries and agencies. At December 31, 2015, the City’s and its component units’ investments not directly guaranteed by the U.S. government were rated as follows:
Investment Type Rating Agency Rating
Money Market Mutual Funds S&P/Moody’s AAA/Aaa U.S. Agency Obligations S&P/Moody’s AA+/Aaa U.S. Treasuries S&P/Moody’s Aaa/AA+ Municipal Bonds S&P/Moody’s A3 to Aa2/A3 to Aa2 Corporate Bonds S&P/Moody’s Baa3 to AA+/B3 to Aaa+
Custodial Credit Risk – For an investment, custodial credit risk is the risk that, in the event of the failure of the counterparty, the City will not be able to recover the value of its investment or collateral securities that are in the possession of an outside party. Investments are exposed to custodial credit risk if they are uninsured, are not registered in the City’s name, and are held by either the counterparty to the investment purchase or are held by the counterparty’s trust department or agent but not held in the City’s name. None of the City’s investments owned at December 31, 2015, were subject to custodial credit risk.
Concentration of Credit Risk – The City places no limit on the amount that may be invested in any one issuer. A fund generally may invest no more than 10% of its total assets in the purchase of a single security.

City of Little Rock, Arkansas Notes to Financial Statements
Year Ended December 31, 2015
51
Pension trust funds had the following investments that exceeded five percent of net position:
Firemen’s Pension and Relief Fund – Ishares Russell 100 Growth ETF, Ishares Russell 2000 Growth ETF, Ishares Russell Midcap Growth ETF, Blackrock Core Bond Fund Class I, Goldman Sachs Strategic Income Fund Class I and Metropolitan West Total Return Bond Fund Class I
Police Pension – Capital Point Partners, L.P.
Nonuniformed Employees’ Defined Contribution Plan – Ishares Russell Midcap Growth, Ishares Russell 1000 growth, Reef America real estate investment trust II, T Rowe Price International Discover Fund, CDARS bearing 0.3% interest with a maturity date of 1/17/2016 and CDARS bearing 0.3% interest with a maturity date of 1/21/2016
401(a) Money Purchase and Trust Retirement Fund – VT Plus Fund, VT Vantagepoint Milestone 2015, VT Vantagepoint MP Trade Growth, VT Vantagepoint MP Long Term Growth, VT Vantagepoint 500 Stock Index Fund and VT Contrafund
Nonuniformed Employees’ Defined Benefit Pension Plan – Ishares Russell Midcap Growth Fund, Ishares Russell 1000 Growth Fund, Reef America Real Estate Investment Trust II, T. Rowe Price International Discovery Fund and Goldman Sachs Strategic Income Fund
2014 Nonuniformed Employees’ Defined Benefit Pension Plan – Ishares Russell 1000 Growth Fund and the Goldman Sachs Strategic Income Fund
Summary of Carrying Values
The carrying values of deposits and investments shown above are included in the statements of net position as follows:
Primary Government
Component Units
Carrying valueDeposits 14,630,723$ 84,077,254$ Investments 285,035,570 88,148,708
299,666,293$ 172,225,962$
Included in the following statements of net position captionsCurrent Assets
Cash and cash equivalents 9,998,524$ 56,251,257$ Short-term investments 40,184,425 29,856,338
Noncurrent AssetsRestricted cash and investments 111,589,098 86,118,367 Cash and investments – fiduciary funds 137,894,246 -
299,666,293$ 172,225,962$
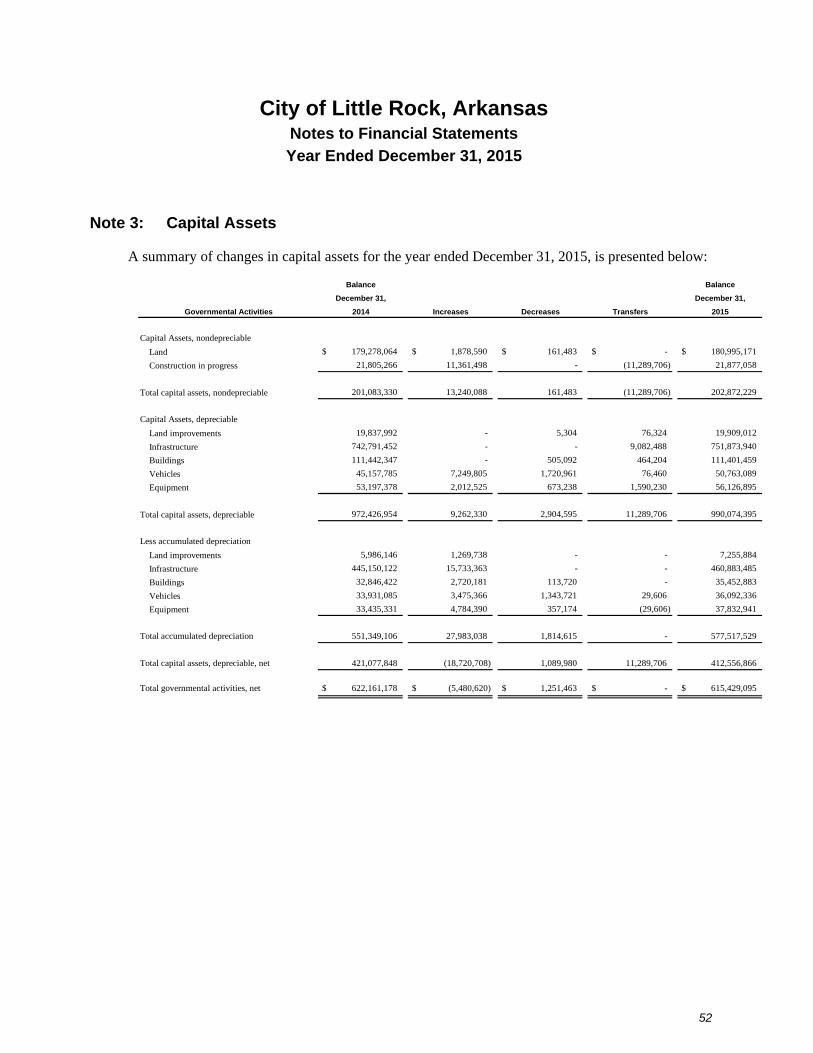
City of Little Rock, Arkansas Notes to Financial Statements
Year Ended December 31, 2015
52
Note 3: Capital Assets
A summary of changes in capital assets for the year ended December 31, 2015, is presented below:
Balance Balance
December 31, December 31,
Governmental Activities 2014 Increases Decreases Transfers 2015
Capital Assets, nondepreciable
Land $ 179,278,064 $ 1,878,590 $ 161,483 $ - $ 180,995,171
Construction in progress 21,805,266 11,361,498 - (11,289,706) 21,877,058
Total capital assets, nondepreciable 201,083,330 13,240,088 161,483 (11,289,706) 202,872,229
Capital Assets, depreciable
Land improvements 19,837,992 - 5,304 76,324 19,909,012
Infrastructure 742,791,452 - - 9,082,488 751,873,940
Buildings 111,442,347 - 505,092 464,204 111,401,459
Vehicles 45,157,785 7,249,805 1,720,961 76,460 50,763,089
Equipment 53,197,378 2,012,525 673,238 1,590,230 56,126,895
Total capital assets, depreciable 972,426,954 9,262,330 2,904,595 11,289,706 990,074,395
Less accumulated depreciation
Land improvements 5,986,146 1,269,738 - - 7,255,884
Infrastructure 445,150,122 15,733,363 - - 460,883,485
Buildings 32,846,422 2,720,181 113,720 - 35,452,883
Vehicles 33,931,085 3,475,366 1,343,721 29,606 36,092,336
Equipment 33,435,331 4,784,390 357,174 (29,606) 37,832,941
Total accumulated depreciation 551,349,106 27,983,038 1,814,615 - 577,517,529
Total capital assets, depreciable, net 421,077,848 (18,720,708) 1,089,980 11,289,706 412,556,866
Total governmental activities, net $ 622,161,178 $ (5,480,620) $ 1,251,463 $ - $ 615,429,095

City of Little Rock, Arkansas Notes to Financial Statements
Year Ended December 31, 2015
53
Balance Balance
December 31, December 31,
2014 Increases Decreases Transfers 2015
Capital Assets, nondepreciable
Land 2,637,147$ -$ -$ -$ 2,637,147$
Construction in progress - 137,732 - - 137,732
Total capital assets, nondepreciable 2,637,147 137,732 - - 2,774,879
Capital Assets, depreciable
Landfills, Cells 1, 2,3,4 and 5 and land improvements 17,650,319 - - - 17,650,319
Buildings 21,540,334 - - - 21,540,334
Vehicles 14,083,289 - 808,819 15,709 13,290,179
Equipment 2,936,100 581,434 137,732 (15,709) 3,364,093
Total capital assets, depreciable 56,210,042 581,434 946,551 - 55,844,925
Less accumulated depreciation
Landfills, Cells 1, 2 and 4 and land improvements 13,796,619 763,105 - - 14,559,724
Buildings 5,766,185 339,178 - - 6,105,363
Vehicles 12,520,263 448,871 811,437 13,353 12,171,050
Equipment 2,210,795 304,816 - (13,353) 2,502,258
Total accumulated depreciation 34,293,862 1,855,970 811,437 - 35,338,395
Total capital assets, depreciable, net 21,916,180 (1,274,536) 135,114 - 20,506,530
Total business-type activities, net 24,553,327$ (1,136,804)$ 135,114$ -$ 23,281,409$
Business-Type Activities

City of Little Rock, Arkansas Notes to Financial Statements
Year Ended December 31, 2015
54
Balance Balance
December 31, December 31,
2014 Increases Decreases Transfers 2015
Capital Assets, nondepreciable
Land 83,912,194$ 1,412,748$ -$ 942,369$ 86,267,311$ Construction in progress 62,794,521 87,017,434 25,213,342 (9,401,750) 115,196,863
Total capital assets, nondepreciable 146,706,715 88,430,182 25,213,342 (8,459,381) 201,464,174
Capital Assets, depreciable
Buildings, improvements and facilities 1,084,050,556 17,521,247 4,733,730 8,415,269 1,105,253,342 Vehicles 42,969,891 8,405,413 927,000 4,241 50,452,545 Equipment 132,603,657 5,560,956 968,730 3,059,398 140,255,281 Books and audio visual material 21,945,781 1,051,293 - - 22,997,074
Total capital assets, depreciable 1,281,569,885 32,538,909 6,629,460 11,478,908 1,318,958,242
Less accumulated depreciation 466,723,663 44,071,634 5,318,169 - 505,477,128
Total capital assets, depreciable, net 814,846,222 (11,532,725) 1,311,291 11,478,908 813,481,114
Total component units, net 961,552,937$ 76,897,457$ 26,524,633$ 3,019,527$ 1,014,945,288$
Component Units

City of Little Rock, Arkansas Notes to Financial Statements
Year Ended December 31, 2015
55
Depreciation expense was charged to functions/programs of the primary government as follows:
Governmental ActivitiesGeneral government
City manager 276,219$ District court – first division (criminal) 16,305 Finance 151,134 Human resources 276 Information technology 826,381 Planning and development 31,773 Fleet services 186,993
Total general government 1,489,081
Public works 16,435,578 Parks and recreation services 2,283,753 River Market 110,069 Golf 44,367 Jim Dailey Fitness 133,118 Zoo 708,371 Fire 2,496,450 Police 3,898,575 Housing and neighborhood programs 383,676
Total depreciation expense – governmental activities 27,983,038
Business-Type ActivitiesWaste disposal 1,582,517 Second and Main parking 241,550 Vehicle storage 31,903
Total depreciation expense – business-type activities 1,855,970
Total depreciation expense – primary government 29,839,008$

City of Little Rock, Arkansas Notes to Financial Statements
Year Ended December 31, 2015
56
Note 4: Long-term Liabilities
Changes in long-term liabilities for the year ended December 31, 2015, were as follows:
Balance
December 31, Balance
2014 December 31,
Governmental Activities (as restated) Increases Decreases 2015
Bonds payableRevenue bonds 25,545,000$ -$ 1,790,000$ 23,755,000$ 1,865,000$ Less issuance discounts 280,053 - 16,284 263,769 - Add issuance premiums 898 - 299 599 -
25,265,845 - 1,774,015 23,491,830 1,865,000
General obligation bonds 99,805,000 36,620,000 32,720,000 103,705,000 4,855,000 Less issuance discounts 721,916 265,495 52,564 934,847 - Add issuance premiums 3,312,207 378,258 246,224 3,444,242 -
102,395,291 36,732,763 32,913,660 106,214,395 4,855,000
Bonds payable, net 127,661,136 36,732,763 34,687,675 129,706,225 6,720,000
Notes payable 25,312,871 5,910,000 7,315,438 23,907,433 8,564,064 Compensated absences 26,926,276 12,427,486 11,741,414 27,612,348 9,330,193 Net pension liability 188,602,383 4,921,513 2,669,566 190,854,330 - Other 1,202,118 676,843 862,868 1,016,093 887,867
Total governmental activities long-term liabilities 369,704,784$ 60,668,605$ 57,276,961$ 373,096,429$ 25,502,124$
Business-Type Activities
Bonds payableRevenue bonds 12,455,000$ -$ 1,470,000$ 10,985,000$ 1,535,000$ Less issuance discounts 53,859 - 4,691 49,168 -
Bonds payable, net 12,401,141 - 1,465,309 10,935,832 1,535,000
Compensated absences 558,947 346,078 339,850 565,175 442,693 Net pension liability 462,770 269,515 - 732,285 - Postclosure landfill costs 4,278,755 223,536 - 4,502,291 -
Total business-type activities long-term liabilities 17,701,613$ 839,129$ 1,805,159$ 16,735,583$ 1,977,693$
Amounts Due in One Year
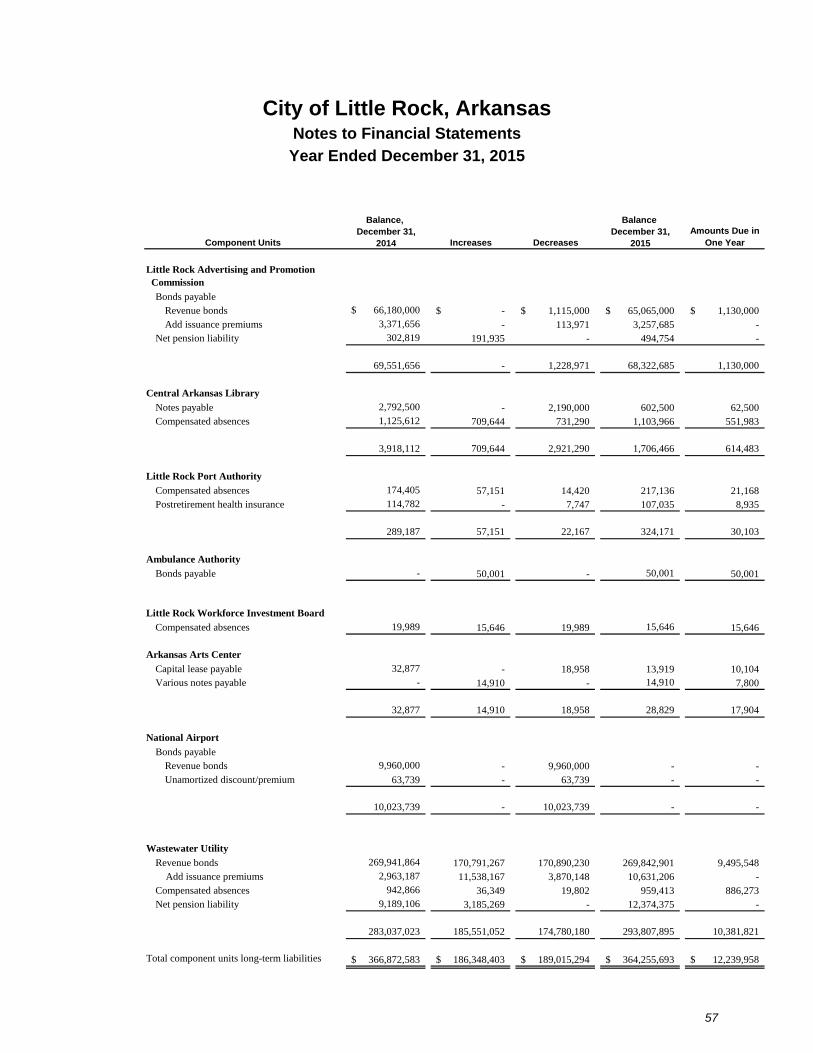
City of Little Rock, Arkansas Notes to Financial Statements
Year Ended December 31, 2015
57
Balance, Balance December 31, December 31,
2014 2015
Little Rock Advertising and Promotion Commission
Bonds payableRevenue bonds 66,180,000$ -$ 1,115,000$ 65,065,000$ 1,130,000$ Add issuance premiums 3,371,656 - 113,971 3,257,685 -
Net pension liability 302,819 191,935 - 494,754 -
69,551,656 - 1,228,971 68,322,685 1,130,000
Central Arkansas Library
Notes payable 2,792,500 - 2,190,000 602,500 62,500 Compensated absences 1,125,612 709,644 731,290 1,103,966 551,983
3,918,112 709,644 2,921,290 1,706,466 614,483
Little Rock Port Authority
Compensated absences 174,405 57,151 14,420 217,136 21,168 Postretirement health insurance 114,782 - 7,747 107,035 8,935
289,187 57,151 22,167 324,171 30,103
Ambulance Authority
Bonds payable - 50,001 - 50,001 50,001
Little Rock Workforce Investment Board
Compensated absences 19,989 15,646 19,989 15,646 15,646
Arkansas Arts Center
Capital lease payable 32,877 - 18,958 13,919 10,104 Various notes payable - 14,910 - 14,910 7,800
32,877 14,910 18,958 28,829 17,904
National Airport
Bonds payableRevenue bonds 9,960,000 - 9,960,000 - - Unamortized discount/premium 63,739 - 63,739 - -
10,023,739 - 10,023,739 - -
Wastewater Utility
Revenue bonds 269,941,864 170,791,267 170,890,230 269,842,901 9,495,548 Add issuance premiums 2,963,187 11,538,167 3,870,148 10,631,206 - Compensated absences 942,866 36,349 19,802 959,413 886,273 Net pension liability 9,189,106 3,185,269 - 12,374,375 -
283,037,023 185,551,052 174,780,180 293,807,895 10,381,821
Total component units long-term liabilities 366,872,583$ 186,348,403$ 189,015,294$ 364,255,693$ 12,239,958$
Component Units Increases DecreasesAmounts Due in
One Year
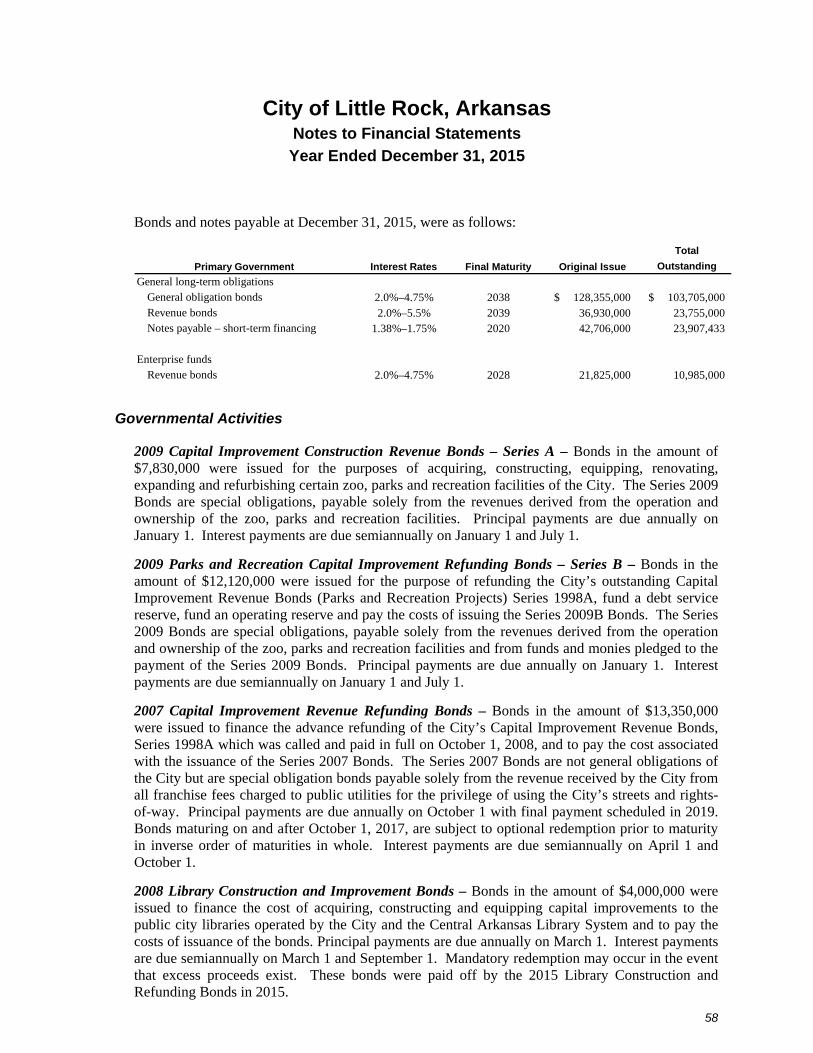
City of Little Rock, Arkansas Notes to Financial Statements
Year Ended December 31, 2015
58
Bonds and notes payable at December 31, 2015, were as follows:
Total
Outstanding
General long-term obligationsGeneral obligation bonds 2.0%–4.75% 2038 128,355,000$ 103,705,000$ Revenue bonds 2.0%–5.5% 2039 36,930,000 23,755,000 Notes payable – short-term financing 1.38%–1.75% 2020 42,706,000 23,907,433
Enterprise fundsRevenue bonds 2.0%–4.75% 2028 21,825,000 10,985,000
Primary Government Interest Rates Final Maturity Original Issue
Governmental Activities
2009 Capital Improvement Construction Revenue Bonds – Series A – Bonds in the amount of $7,830,000 were issued for the purposes of acquiring, constructing, equipping, renovating, expanding and refurbishing certain zoo, parks and recreation facilities of the City. The Series 2009 Bonds are special obligations, payable solely from the revenues derived from the operation and ownership of the zoo, parks and recreation facilities. Principal payments are due annually on January 1. Interest payments are due semiannually on January 1 and July 1.
2009 Parks and Recreation Capital Improvement Refunding Bonds – Series B – Bonds in the amount of $12,120,000 were issued for the purpose of refunding the City’s outstanding Capital Improvement Revenue Bonds (Parks and Recreation Projects) Series 1998A, fund a debt service reserve, fund an operating reserve and pay the costs of issuing the Series 2009B Bonds. The Series 2009 Bonds are special obligations, payable solely from the revenues derived from the operation and ownership of the zoo, parks and recreation facilities and from funds and monies pledged to the payment of the Series 2009 Bonds. Principal payments are due annually on January 1. Interest payments are due semiannually on January 1 and July 1.
2007 Capital Improvement Revenue Refunding Bonds – Bonds in the amount of $13,350,000 were issued to finance the advance refunding of the City’s Capital Improvement Revenue Bonds, Series 1998A which was called and paid in full on October 1, 2008, and to pay the cost associated with the issuance of the Series 2007 Bonds. The Series 2007 Bonds are not general obligations of the City but are special obligation bonds payable solely from the revenue received by the City from all franchise fees charged to public utilities for the privilege of using the City’s streets and rights-of-way. Principal payments are due annually on October 1 with final payment scheduled in 2019. Bonds maturing on and after October 1, 2017, are subject to optional redemption prior to maturity in inverse order of maturities in whole. Interest payments are due semiannually on April 1 and October 1.
2008 Library Construction and Improvement Bonds – Bonds in the amount of $4,000,000 were issued to finance the cost of acquiring, constructing and equipping capital improvements to the public city libraries operated by the City and the Central Arkansas Library System and to pay the costs of issuance of the bonds. Principal payments are due annually on March 1. Interest payments are due semiannually on March 1 and September 1. Mandatory redemption may occur in the event that excess proceeds exist. These bonds were paid off by the 2015 Library Construction and Refunding Bonds in 2015.

City of Little Rock, Arkansas Notes to Financial Statements
Year Ended December 31, 2015
59
2009 Library Construction and Improvement Bonds – Bonds in the amount of $28,000,000 were issued to finance the cost of acquiring, constructing and equipping capital improvements to the public city libraries operated by the City and the Central Arkansas Library System and to pay the costs of issuance of the bonds. Principal payments are due annually on March 1. Interest payments are due semiannually on March 1 and September 1. Mandatory redemption may occur in the event that excess proceeds exist. These bonds were paid off by the 2015 Library Construction and Refunding Bonds in 2015.
2012 Library Construction and Refunding Bonds – Bonds in the amount of $31,015,000 were issued to finance the cost of acquiring, constructing and equipping capital improvements to the public city libraries operated by the City and the Central Arkansas Library System, to refund the outstanding Library Construction Bonds, Series 2004A, to pay interest due on the bonds until collections of the library tax become available for such payments and to pay the costs of issuance of the bonds. Principal payments are due annually on March 1. Interest payments are due semiannually on March 1 and September 1.
2015 Library Construction and Refunding Bonds – Bonds in the amount of $36,620,000 were issued to finance the cost of acquiring, constructing and equipping capital improvements to the public city libraries operated by the City and the Central Arkansas Library System, to refund the outstanding Library Construction Bonds, Series 2008 and Series 2009, and the City of Little Rock Residential Housing and Public Facilities Board Capital Improvement Revenue Bonds, Series 2007 (debt of Central Arkansas Library) and to pay interest due on the bonds until collections of the library tax become available for such payments and to pay the costs of issuance of the bonds. Principal payments are due annually on March 1. Interest payments are due semiannually on March 1 and September 1. The City issued the 2015 series to refund the Library Construction Bonds, Series 2008 and Series 2009, obtain additional funding for capital projects and extend repayment period of existing debt. Reduction of debt service payments and economic gain related to this refunding was minimal.
2002 Capital Improvement Junior Lien Revenue Bonds – Bonds in the amount of $3,630,000 were issued to finance the improvements of infrastructure, the costs of issuance and to fund the debt service reserve. The Series 2002 Bonds are special obligation bonds of the City, payable solely from the franchise fees collected from public utilities for the privilege of using the streets, highways and other public places in the City. Principal payments are due annually on October 1 with final payment scheduled in 2018. Interest payments are due semiannually on April 1 and October 1. Bonds maturing on or after October 1, 2012 are subject to optional redemption at the direction of the City. Extraordinary redemption may occur in the event that excess proceeds exist.
2013 Limited Tax General Obligation Capital Improvement Bonds – Bonds in the amount of $58,105,000 were issued to finance street and drainage capital improvements for the City. The Series 2013 Bonds are limited tax general obligations of the City, secured by all proceeds derived from the 3 mills annual ad valorem tax levied by the City on all taxable and real and personal property located within the jurisdictional limits of the City. Principal payments are due annually on October 1 with final payment scheduled in 2033. Interest payments are due semiannually on April 1 and October 1.

City of Little Rock, Arkansas Notes to Financial Statements
Year Ended December 31, 2015
60
Tax Incremental Financing 2014 Capital Improvement Bonds – The 2014 Tax Incremental Financing 2014 Capital Improvement Bonds for $2,615,000 were issued in April 2014. The bonds are special obligations of the City secured by and payable solely by a pledge of the incremental ad valorem tax receipts derived with respect to the real property within the City’s Redevelopment District No. 1. The bond proceeds were used to finance the cost of acquisition, construction and equipping of a major street system within Development District No. 1. The principal payment is due fully at maturity in 2036. Interest payments are due semiannually on March 1 and September 1.
Notes Payable
In 2001, the State of Arkansas passed Amendment No. 78 and Act No. 1808, allowing cities and counties to obtain short-term financing agreements for the purpose of acquiring, constructing, installing or renting real property or tangible personal property having an expected useful life of more than one year. These financing agreements may not mature over a period to exceed five years and may have fixed or variable interest rates to be repaid with general fund revenues. At December 31, 2015, the outstanding short-term financing agreements were as follows:
2015 Short-term Financing Note – The $5,910,000 promissory note was issued to finance the cost of acquiring, constructing and equipping West Central Community Center and acquiring police vehicles and equipment with principal and interest payable from general revenues. Due annually, payable $1,246,888, on June 24, including interest at 1.81%.
2014 Short-term Financing Note – The $5,916,000 promissory note was issued to finance the cost of acquiring, constructing and equipping the final phase of the 12th Street Station, acquiring fire vehicles and equipment and acquiring and installing information technology equipment and software with principal and interest payable from general revenues. Due annually, payable $1,235,564, on June 27, including interest at 1.46%.
2013 Short-term Financing Note – The $7,700,000 promissory note was issued to finance the cost of acquiring land, software and equipment and constructing buildings for the City’s Police, Fire and Information Technology Departments with principal and interest payable from general revenues. Due annually, payable $1,615,174, on July 30, including interest at 1.61%.
2012 Short-term Financing Note – The $18,580,000 promissory note was issued to finance the cost of acquiring, constructing and installing real property or tangible personal property having an expected useful life of more than one year for the City with principal and interest payable from general revenues. Due annually, payable $3,871,160, on March 28, including interest at 1.38%.
2011 Short-term Financing Note – The $4,600,000 promissory note was issued to finance the cost of acquiring, constructing and installing real property or tangible personal property having an expected useful life of more than one year for the City with principal and interest payable from general revenues. Due annually, payable $968,859, on December 22, including interest at 1.75%.
City of Little Rock, Arkansas Notes to Financial Statements
Year Ended December 31, 2015
61
Other Liabilities
Other liabilities are typically funded by general revenues of the governmental activity that incurred the liability.
Business-Type Activities
Revenue Bonds – Revenue bonds are comprised of various issues for the purpose of acquiring, constructing, equipping, renovating, expanding and refurbishing additions and improvements of City facilities.
2007 Waste Disposal Revenue Bonds – On March 12, 2007, the City issued $3,400,000 in 2007 Waste Disposal Refunding and Improvement Bonds with an interest rate ranging from 5.38% to 5.75%. These bonds were issued to finance all or a portion of the costs of betterments and improvements to the System (the Project), fund a debt service reserve and pay expenses of issuing the bonds. The bonds constitute special obligations of the City, secured by a pledge of net revenues derived from the System. Interest payments are due semiannually each May 1 and November 1. To the extent not previously redeemed, the Bonds maturing on May 1, 2022, are subject to mandatory sinking fund redemption. These bonds are also subject to optional redemption at direction of the City beginning May 1, 2014.
2003 Capital Improvement and Refunding Revenue Bonds (Downtown Parking Projects) – On July 1, 2003, the City issued $11,855,000 in 2003 Capital Improvement Revenue Bonds (Downtown Parking Projects) with an interest rate ranging from 4.8% to 5.4%. The bonds were issued to finance the construction of a new parking deck and advance refund the 1997 Capital Revenue Bonds (Second and Main Street Project) – Series 1997 previously used to construct a parking deck. The bonds constitute special obligations of the City, payable solely from the revenues of the two parking decks, together with all other parking revenues of the City that were not previously pledged by the City. Interest payments are due semiannually each January 1 and July 1. These bonds are subject to redemption in part by sinking fund installments due on July 1. These bonds are also subject to optional redemption at direction of the City beginning July 1, 2013. Extraordinary redemption may occur in the event that excess project funds exist.
Waste Disposal Revenue Bonds – Series 2010 – The $6,570,000 of bonds were issued to refund the Waste Disposal Revenue Bonds – Series 2002, fund a debt service reserve, and pay expenses of issuing the bonds. The Series 2010 Bonds are special obligations secured by the pledge of and payable from the net revenues derived from the operations of the City’s waste collection and disposal system. Principal payments are due annually on May 1 with final payment scheduled in 2014. Interest payments are due semiannually on May 1 and November 1.
Discretely Presented Component Units
Wastewater Utility Revenue Bonds
The following bonds are secured by Wastewater Utility revenues. The $10,000,000 Series 2005 Bonds were issued for the purpose of financing certain costs of construction extensions, betterments and improvements to the sewer system and to pay off the 2004 short-term note. The

City of Little Rock, Arkansas Notes to Financial Statements
Year Ended December 31, 2015
62
2007C Sewer Construction Bonds are part of $71,085,000 bond issue and were issued for the purpose of financing wastewater system capital improvements. In December 2008, the City issued $16,000,000 of sewer revenue bonds, Series 2008, for the purpose of financing wastewater system capital improvements. In March 2009, the City issued $8,000,000 of sewer revenue bonds, Series 2009A, for the purpose of financing costs of the unsewered areas. In November 2009, the City issued $6,655,000 of sewer revenue bonds, Series 2009B, for the purpose of financing wastewater system capital improvements. In July 2011, the City issued $17,675,000 of sewer revenue bonds, Series 2011, for the purpose of refinancing the 2001 Sewer Revenue Bonds, to establish a debt service reserve for the Series 2011 Bonds, and to pay the cost of issuing the 2011 Sewer Bonds. In August 2012, the City issued $28,390,000 of sewer revenue bonds, Series 2012, for the purpose of financing wastewater system capital improvements, to establish a debt service reserve for the Series 2012 Bonds, and to pay the cost of issuing the 2012 Sewer Bonds. In May 2013, the City issued $36,000,000 of sewer revenue bonds, Series 2013, for the purpose of financing the improvements to the Collection System Rehabilitation-Phase Seven and to pay the cost of issuing the bonds. In October 2014, the City issued $11,980,000 to refund the 1999 Sewer Revenue Bond and advance fund the 2005 Sewer Revenue Bond. In March 2015, the City issued $160,070,000 of sewer revenue bonds, Series 2015, to refund the 1996, 2004A, 2004B, 2004C, and advance fund the 2007A and 2007C Sewer Revenue Bond. The reacquisition price exceeded the net carrying amount by $10,049,672. This deferred loss is being amortized over the remaining life of the refunded debt. The City advance refunded the 2007A and 2007C Sewer Revenue Bond Series to reduce its total debt service payments over 23 years by approximately $357,000 per year and to obtain an economic gain (difference between the present value of the debt service payments on the old and new debt) of approximately $8,200,000.
National Airport
Revenue Bonds
City of Little Rock, Arkansas, Airport Revenue Refunding and Improvement Bonds – Series 2007 – The $12,715,000 Special Obligation Bonds dated January 1, 2007, were issued in two series: Series A for $3,600,000, and Series B for $9,115,000, to currently refund $3,705,000 of the City of Little Rock, Arkansas, Airport Revenue Refunding Bonds, Series 1999, to finance the acquisition of real and personal property and constructing improvements for the Airport, to fund a debt service reserve, and to pay issuance costs. The bonds are special obligations payable solely from net revenues of the Airport and amounts on deposit in certain accounts established under the Master and Supplemental Indentures. The bonds are subject to redemption in party by sinking fund installments beginning November 1, 2015.
Principal payments are due annually on November 1, beginning in 2007, and interest payments at a rate of 4.00% to 5.00% are due semi-annually on May 1 and November 1 of each year, commencing May 1, 2007.

City of Little Rock, Arkansas Notes to Financial Statements
Year Ended December 31, 2015
63
In December 2015, the Airport deposited $8,785,480 in an irrevocable trust with an escrow agent to provide funds for the payment of all remaining principal and interest through November 1, 2016, the date the bonds will be fully redeemed. As a result, the 2007 bonds are considered defeased and the liability for those bonds has been removed from the balance sheet. The reacquisition price exceeded the net carrying amount of the 2007 Bonds by $318,220. This amount has been recorded as a loss on the extinguishment of debt in the statement of revenues, expenses and changes in net position.
Advertising and Promotion Commission Bonds
Hotel and Restaurant Gross Receipts Tax Bonds – Series 2014 – The Series 2014 Hotel and restaurant Gross Receipts Tax Bonds were issued for the purpose of financing the renovation of the Robinson Center. Bond principal payments are due each July 1 with final payment due in 2044. These bonds are collateralized by proceeds of the 2% hotel, motel, and restaurant gross receipts tax levy.
Central Arkansas Library System
Central Arkansas Library Debt Administration – During 2006, the Library obtained a note totaling $1,310,000 to expand the Maumelle Public Library. The note bears interest, payable semiannually, at rates of 4.25% to 4.80% and are due in semiannual installments, which began March 15, 2007, and continue until 2021. In 2007, the Library issued a note to pay off a previously issued note and assist with the remodeling of the Geyer and Adam Building. The note bears interest at 4.8% and is due in semi-annual installments through September 2027.
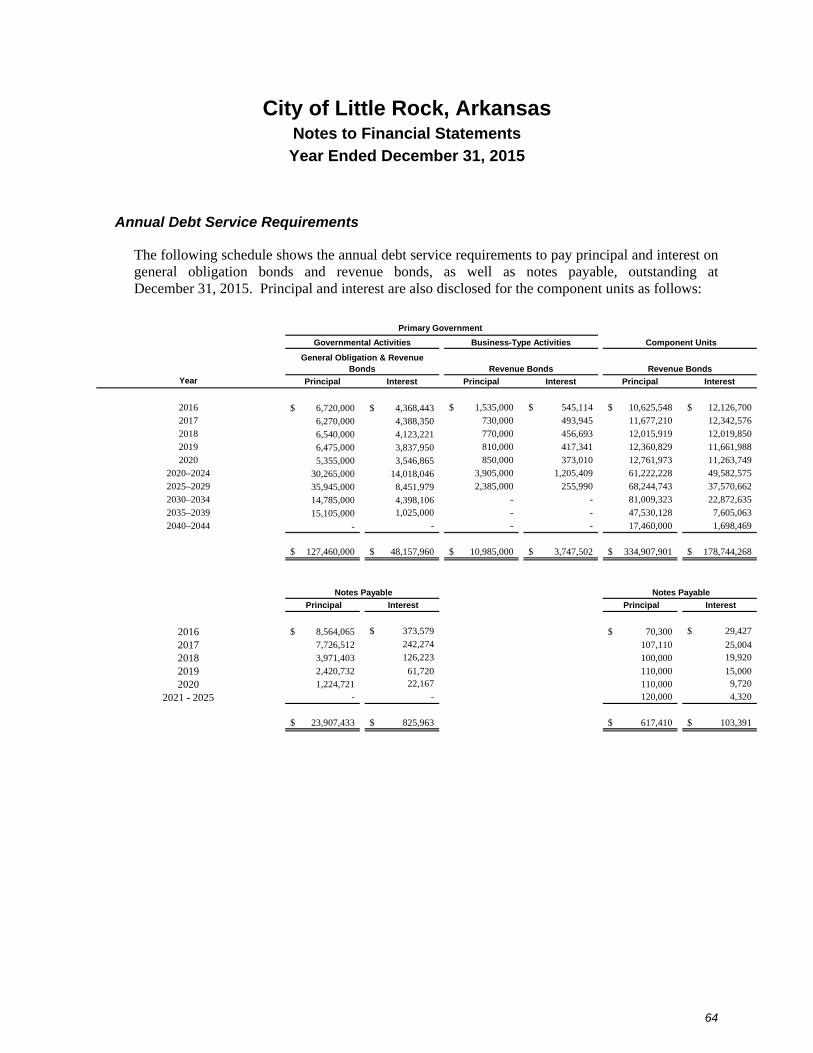
City of Little Rock, Arkansas Notes to Financial Statements
Year Ended December 31, 2015
64
Annual Debt Service Requirements
The following schedule shows the annual debt service requirements to pay principal and interest on general obligation bonds and revenue bonds, as well as notes payable, outstanding at December 31, 2015. Principal and interest are also disclosed for the component units as follows:
Year Principal Interest Principal Interest Principal Interest
2016 6,720,000$ 4,368,443$ 1,535,000$ 545,114$ 10,625,548$ 12,126,700$ 2017 6,270,000 4,388,350 730,000 493,945 11,677,210 12,342,576 2018 6,540,000 4,123,221 770,000 456,693 12,015,919 12,019,850 2019 6,475,000 3,837,950 810,000 417,341 12,360,829 11,661,988 2020 5,355,000 3,546,865 850,000 373,010 12,761,973 11,263,749
2020–2024 30,265,000 14,018,046 3,905,000 1,205,409 61,222,228 49,582,575 2025–2029 35,945,000 8,451,979 2,385,000 255,990 68,244,743 37,570,662 2030–2034 14,785,000 4,398,106 - - 81,009,323 22,872,635 2035–2039 15,105,000 1,025,000 - - 47,530,128 7,605,063 2040–2044 - - - - 17,460,000 1,698,469
127,460,000$ 48,157,960$ 10,985,000$ 3,747,502$ 334,907,901$ 178,744,268$
Principal Interest Principal Interest
2016 8,564,065$ 373,579$ 70,300$ 29,427$
2017 7,726,512 242,274 107,110 25,004
2018 3,971,403 126,223 100,000 19,920
2019 2,420,732 61,720 110,000 15,000
2020 1,224,721 22,167 110,000 9,720
2021 - 2025 - - 120,000 4,320
23,907,433$ 825,963$ 617,410$ 103,391$
Notes Payable Notes Payable
Primary Government
Component Units
General Obligation & Revenue Bonds Revenue Bonds Revenue Bonds
Governmental Activities Business-Type Activities

City of Little Rock, Arkansas Notes to Financial Statements
Year Ended December 31, 2015
65
The following is a summary of pledged revenues of the City and its Component Units for the year ended December 31, 2015:
Debt Revenue Pledged
Total Pledged Revenue
Portion of Pledged Revenue Stream
Percentage Portion of Pledged Revenue Stream
Remaining Principal and
Interest
Period Revenue Will Not Be Available For
Other Purposes
General Government:2009 Parks and Recreation Capital Improvement Refunding Bonds – Series A
Golf, Zoo and Fitness Center revenues 6,516,333 496,565 7.6% 12,382,700 Until 2039
2009 Parks and Recreation Capital Improvement Refunding Bonds – Series B
Golf, Zoo and Fitness Center revenues 6,516,333 797,915 12.2% 19,713,345 Until 2039
2007 Capital Improvement Revenue Refunding Bonds Franchise fees 31,065,495 1,437,250 4.6% 5,726,188 Until 20192002 Capital Improvement Junior Lien Revenue Bonds Franchise fees 31,065,495 322,043 1.0% 967,550 Until 20182012 Library Construction and Refunding Bonds Property tax 3,404,141 2,104,908 61.8% 32,025,409 Until 20312015 Library Construction and Refunding Bonds Property tax 3,404,141 NA NA 50,130,296 Until 20382013 Limited Tax General Obligation Capital Improvement Bonds Property tax 11,244,719 5,673,336 50.5% 48,841,024 Until 2031
2014 TIF #1 Capital Improvement Bond Property tax 156,970 31,897 20.3% 5,831,450 Until 2036
2007 Waste Disposal Revenue Bonds
Net revenues of the waste collection and disposal system 5,095,719 336,783 6.6% 8,568,126 Until 2022
2010 Waste Disposal Revenue Bonds
Net revenues of the waste collection and disposal system 5,095,719 855,338 16.8% 855,834 Until 2016
2003 Capital improvement and Refunding Revenue Bonds
Specific parking revenues and other revenues in the Rivermarket Garage Fund 2,767,255 885,835 32.0% 11,533,540 Until 2028
Debt Revenue Pledged
Total Pledged Revenue
Portion of Pledged Revenue Stream
Percentage Portion of Pledged Revenue Stream
Remaining Principal and
Interest
Period Revenue Will Not Be Available For
Other Purposes
Component Units:
Hotel and Restaurant Gross Receipts Tax Bonds Series 2014
2% hotel, motel, and restaurant gross receipts tax levy 12,189,168 3,995,581 32.8% 115,928,351 Until 2044
2007C Sewer BondsNet revenues of the sewer system 27,373,207 1,176,096 4.3% 16,465,319 Until 2029
2008 Sewer BondsNet revenues of the sewer system 27,373,207 1,097,775 4.0% 25,272,967 Until 2038
2009A Sewer BondsNet revenues of the sewer system 27,373,207 487,290 1.8% 8,040,275 Until 2032
2009B Sewer BondsNet revenues of the sewer system 27,373,207 410,139 1.5% 9,840,331 Until 2039
2011 Sewer BondsNet revenues of the sewer system 27,373,207 2,075,025 7.6% 15,993,412 Until 2022
2012 Sewer BondsNet revenues of the sewer system 27,373,207 1,584,474 5.8% 42,784,939 Until 2042
2013 Sewer BondsNet revenues of the sewer system 27,373,207 2,245,212 8.2% 25,425,260 Until 2036
2014 Sewer BondsNet revenues of the sewer system 27,373,207 1,507,065 5.5% 12,233,250 Until 2025
2015 Sewer BondsNet revenues of the sewer system 27,373,207 NA NA 241,668,075 Until 2037

City of Little Rock, Arkansas Notes to Financial Statements
December 31, 2015
66
Note 5: Interfund Balances and Transfers
Interfund receivables and payables as of December 31, 2015, are as follows:
Interfund Receivables
Interfund Payables
Primary GovernmentGovernmental Funds to/from Nonfiduciary Funds
General fund 2,670,531$ -$ 2013 Capital Improvements - 1,288,292 2015 Central Arkansas Library Capital Improvements - 302,949 Emergency 911 fund - 612,839 TIF #1 2014 Capital Improvement - 2,200 2009A Parks & Recreation debt service fund - 464,251
Governmental Funds to/from Fiduciary FundsGeneral fund 761,164 106,396
Total governmental funds 3,431,695 2,776,927
Proprietary FundsInternal service fund 812,809 - Vehicle storage fund - 812,809
Total proprietary funds 812,809 812,809
Fiduciary FundsAgency fund - 757,081 Firemen’s pension 3,923,180 4,083
Total fiduciary funds 3,923,180 761,164
Government-Wide GovernmentalActivities - 3,816,784
Total 8,167,684$ 8,167,684$

City of Little Rock, Arkansas Notes to Financial Statements
December 31, 2015
67
The outstanding balances between funds result mainly from the time lag between the dates (1) interfund goods and services are provided or reimbursable expenditures occur, (2) transactions are recorded in the accounting system and (3) payments between the funds are made.
The amounts due to the fiduciary funds result from the collection and remittance of property taxes by the General Fund that are levied to fund the Firemen’s Pension Plan. A portion of the amounts receivable by the pension funds from the General Fund are not accrued on the General Fund financial statements, as they are not recognizable under the modified accrual basis of accounting because the amounts due to the pension funds are not expected to be liquidated with available expendable resources. However, $3,816,784 of the amounts receivable by the pension fund from the General fund has been included in the governmental activities statement of net position as due to fiduciary funds.
Interfund transfers in and transfers for the year ended December 31, 2015, are as follows:
General Street Totals
Governmental FundsGeneral $ - $ 504,217 $ 6,379,582 $ 9,490 $ 414,744 $ 1,183,372 $ - $ 8,491,405 Street 1,072,000 - - - - 273,700 359,026 1,704,726 Other Nonmajor Governmental Funds 585,913 - - 1,940 - - - 587,853
$ 1,657,913 $ 504,217 $ 6,379,582 $ 11,430 $ 414,744 $ 1,457,072 $ 359,026 $ 10,783,984
Interfund Transfers Out
Governmental Funds
River Market GarageInterfund Transfers In
Other Nonmajor
Governmental Funds Internal Service Fund
WasteDisposal
Proprietary Funds
Sales Tax Capital
Improvements
Transfers are used to fund special projects and meet debt service requirements.
Note 6: Pension Plans
Pension Trust Funds
Substantially all of the City’s employees receive retirement benefits. The City sponsors three single employer defined benefit plans, one agent-multiple employer defined pension plam and two defined contribution pension plans. The Firemen’s Pension and Relief Fund, The Police Pension, the Nonuniformed Employees’ Defined Benefit Pension Plan, the 2014 Defined Benefit Plan, the Nonuniformed Employees’ Defined Contribution Plan and 401(a) Money Purchase and Trust Retirement Fund are reported as pension funds by the City. Separate stand-alone financial reports are not issued. The City also contributes to three cost-sharing multiple employer defined benefit pension plans. The assets of the plans are maintained in legally separate trusts and each plan’s assets may be used only for the payment of benefits to the members of that plan or their beneficiaries in accordance with the terms of the plan.
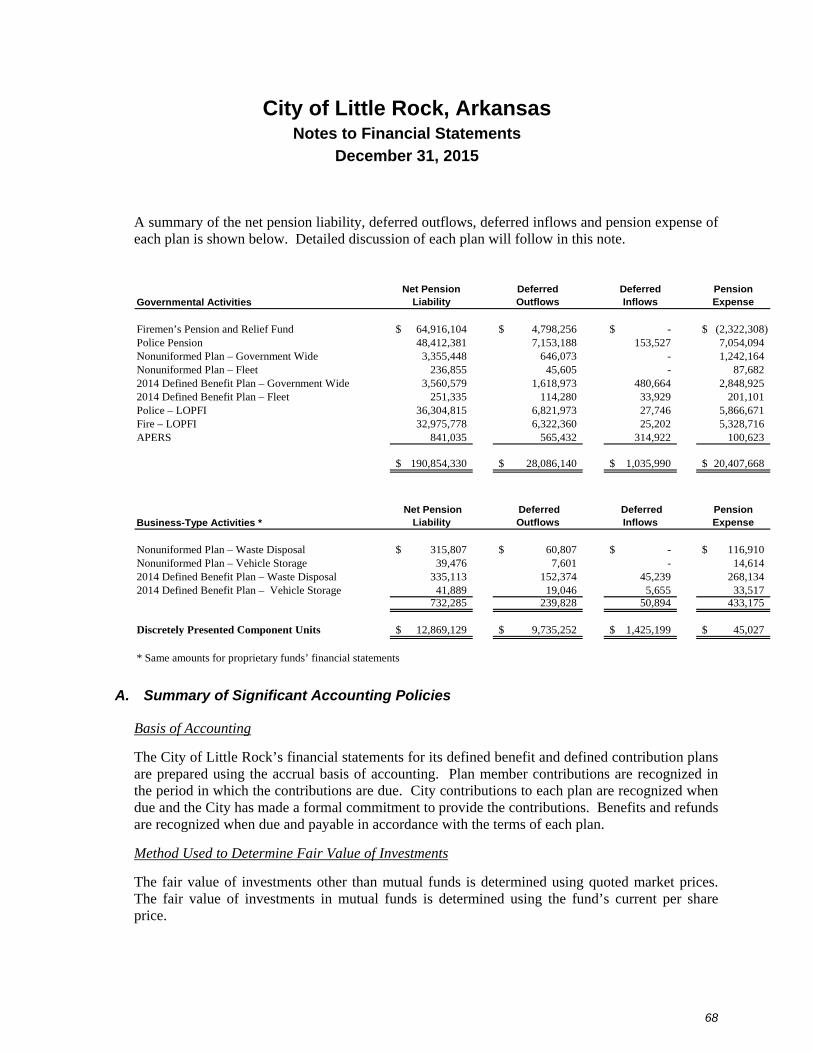
City of Little Rock, Arkansas Notes to Financial Statements
December 31, 2015
68
A summary of the net pension liability, deferred outflows, deferred inflows and pension expense of each plan is shown below. Detailed discussion of each plan will follow in this note.
Governmental ActivitiesNet Pension
LiabilityDeferred Outflows
Deferred Inflows
Pension Expense
Firemen’s Pension and Relief Fund 64,916,104$ 4,798,256$ -$ (2,322,308)$ Police Pension 48,412,381 7,153,188 153,527 7,054,094 Nonuniformed Plan – Government Wide 3,355,448 646,073 - 1,242,164 Nonuniformed Plan – Fleet 236,855 45,605 - 87,682 2014 Defined Benefit Plan – Government Wide 3,560,579 1,618,973 480,664 2,848,925 2014 Defined Benefit Plan – Fleet 251,335 114,280 33,929 201,101 Police – LOPFI 36,304,815 6,821,973 27,746 5,866,671 Fire – LOPFI 32,975,778 6,322,360 25,202 5,328,716 APERS 841,035 565,432 314,922 100,623
190,854,330$ 28,086,140$ 1,035,990$ 20,407,668$
Business-Type Activities *Net Pension
Liability Deferred Outflows
Deferred Inflows
Pension Expense
Nonuniformed Plan – Waste Disposal 315,807$ 60,807$ -$ 116,910$ Nonuniformed Plan – Vehicle Storage 39,476 7,601 - 14,614 2014 Defined Benefit Plan – Waste Disposal 335,113 152,374 45,239 268,134 2014 Defined Benefit Plan – Vehicle Storage 41,889 19,046 5,655 33,517
732,285 239,828 50,894 433,175
Discretely Presented Component Units 12,869,129$ 9,735,252$ 1,425,199$ 45,027$
* Same amounts for proprietary funds’ financial statements
A. Summary of Significant Accounting Policies
Basis of Accounting
The City of Little Rock’s financial statements for its defined benefit and defined contribution plans are prepared using the accrual basis of accounting. Plan member contributions are recognized in the period in which the contributions are due. City contributions to each plan are recognized when due and the City has made a formal commitment to provide the contributions. Benefits and refunds are recognized when due and payable in accordance with the terms of each plan.
Method Used to Determine Fair Value of Investments
The fair value of investments other than mutual funds is determined using quoted market prices. The fair value of investments in mutual funds is determined using the fund’s current per share price.

City of Little Rock, Arkansas Notes to Financial Statements
December 31, 2015
69
B. Membership Information
Membership of each plan consisted of the following at December 31, 2015:
Nonuniformed Nonuniformed 401 (a) 2014
Defined Defined Defined Defined
Firemen’s Benefit Contribution Contribution Benefit Police
Fund Plan Plan Plan Plan Pension
Retirees and beneficiaries receiving benefits 291 81 - - 5 297 Active plan members - 12 53 19 894 - Members on Deferred Retirement Option Plan (DROP) 7 - - - - 8
Total 298 93 53 19 899 305
C. Firemen’s Pension and Relief Fund (Firemen’s Fund)
1. Plan Description and Funding Information
The Firemen’s Pension and Relief Fund (Firemen’s Fund) is a single-employer defined benefit pension plan administered by the City, established in accordance with legislation enacted by the Arkansas General Assembly. Benefit provisions are established by State of Arkansas Act #14, as amended. Fund assets are administered by a Board of Trustees.
The Firemen’s Fund provides retirement benefits for firemen who have completed 20 years of service. Disability benefits are available to firemen who become permanently disabled, unless the disability is the direct result of gainful employment performed outside of the fire department. The Firemen’s Fund also provides benefits for surviving spouses and dependent children of deceased firemen.
No benefits are vested to participants until normal retirement. At normal retirement, participants may elect to continue working and enter the DROP for up to 10 years. All firemen hired after January 1, 1983, participate in the Arkansas Local Police and Fire Retirement System created by Act 364 of 1981. Therefore, the Firemen’s Fund is effectively closed to new members.
Contributions to the Firemen’s Fund are set forth in Arkansas statute. The City’s contribution to the Firemen’s Fund consists of a one mill real and personal property tax collection and an insurance premium tax turnback collected by the State Insurance Commissioner. Additionally, the City contributes a percentage of the firemen’s salaries which amounted to 6% during 2015. The participants contributed 6% of their salaries in 2015. Participant contributions are returned without interest if the participant terminates covered employment. Contribution provisions applicable to the Fund are established by Arkansas code and may not be less than 6%. Administrative costs are financed through Fund assets approved by the Board of Trustees. Total 2015 contributions to the Firemen’s Fund were $5,676,335. The City’s share of contributions was $5,312,855 and included $3,781,766 in property taxes and $944,540 in state insurance premium taxes. On behalf payments (state insurance premium taxes and other supplements received from the state) are recognized as revenues and expenditures in the appropriate fund. The liability for the Firemen’s Fund has typically been liquidated from the general fund.
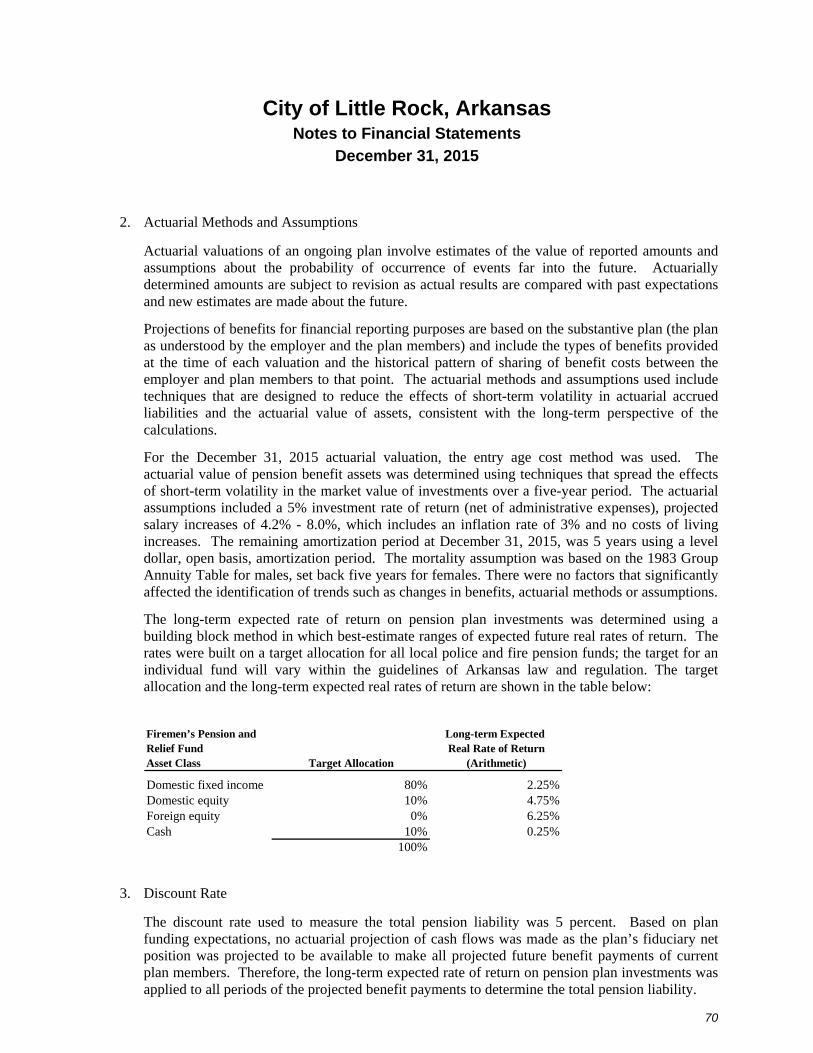
City of Little Rock, Arkansas Notes to Financial Statements
December 31, 2015
70
2. Actuarial Methods and Assumptions
Actuarial valuations of an ongoing plan involve estimates of the value of reported amounts and assumptions about the probability of occurrence of events far into the future. Actuarially determined amounts are subject to revision as actual results are compared with past expectations and new estimates are made about the future.
Projections of benefits for financial reporting purposes are based on the substantive plan (the plan as understood by the employer and the plan members) and include the types of benefits provided at the time of each valuation and the historical pattern of sharing of benefit costs between the employer and plan members to that point. The actuarial methods and assumptions used include techniques that are designed to reduce the effects of short-term volatility in actuarial accrued liabilities and the actuarial value of assets, consistent with the long-term perspective of the calculations.
For the December 31, 2015 actuarial valuation, the entry age cost method was used. The actuarial value of pension benefit assets was determined using techniques that spread the effects of short-term volatility in the market value of investments over a five-year period. The actuarial assumptions included a 5% investment rate of return (net of administrative expenses), projected salary increases of 4.2% - 8.0%, which includes an inflation rate of 3% and no costs of living increases. The remaining amortization period at December 31, 2015, was 5 years using a level dollar, open basis, amortization period. The mortality assumption was based on the 1983 Group Annuity Table for males, set back five years for females. There were no factors that significantly affected the identification of trends such as changes in benefits, actuarial methods or assumptions.
The long-term expected rate of return on pension plan investments was determined using a building block method in which best-estimate ranges of expected future real rates of return. The rates were built on a target allocation for all local police and fire pension funds; the target for an individual fund will vary within the guidelines of Arkansas law and regulation. The target allocation and the long-term expected real rates of return are shown in the table below:
Firemen’s Pension and Long-term Expected Relief Fund Real Rate of ReturnAsset Class Target Allocation (Arithmetic)
Domestic fixed income 80% 2.25%Domestic equity 10% 4.75%Foreign equity 0% 6.25%Cash 10% 0.25%
100%
3. Discount Rate
The discount rate used to measure the total pension liability was 5 percent. Based on plan funding expectations, no actuarial projection of cash flows was made as the plan’s fiduciary net position was projected to be available to make all projected future benefit payments of current plan members. Therefore, the long-term expected rate of return on pension plan investments was applied to all periods of the projected benefit payments to determine the total pension liability.

City of Little Rock, Arkansas Notes to Financial Statements
December 31, 2015
71
The City’s net pension liability as of December 31, 2015 was measured as of December 31, 2015, and the total pension liability used to calculate the net pension liability was determined by an actuarial valuation as of that date.
Changes in the total pension liability, plan fiduciary net position and the net pension liability are as follows for the Firemen’s Fund as determined by the City at December 31, 2015:
Total Pension Liability (a)
Plan Fiduciary Net Position (b)
Net Pension Liability (a) - (b)
Balances as of beginning of year 138,363,417$ 70,777,747$ 67,585,670$
Charges for the year: Interest on total pension liability 6,649,073 - 6,649,073 Difference between expected and actual return (6,896,944) - (6,896,944) Benefit Payments, including refunds of employee contributions (10,763,891) (10,763,891) - Administrative expense - (9,491) 9,491 Contributions – member - 14,993 (14,993) Contributions – employer - 5,312,855 (5,312,855) Net investment income - (2,774,677) 2,774,677 Other - (121,985) 121,985 Net Changes (11,011,762) (8,342,196) (2,669,566)
Balances as of end of year 127,351,655$ 62,435,551$ 64,916,104$
Changes in Net Pension Liability – Firemen’s Plan
4. Sensitivity to Discount Rate Changes
The following presents the City’s net pension liability calculated using the discount rate of 5 percent, as well as what the net pension liability would be if it were calculated using a discount rate that is 1 percentage point lower or 1 percentage point higher than the current rate:
Current 1% Discount 1%
Decrease Rate Increase4.0% 5.0% 6.0%
Firemen’s Pension and Relief Fund Net pension liability 76,145,391$ 64,916,104$ 55,280,375$
5. Pension Expense and Deferred Outflows of Resources Related to Pensions
For the year ended December 31, 2015, the City recognized a reduction in pension expense, as measured in accordance with GASB Statement No. 68, of ($2,322,308), and reported deferred outflows of resources related to pensions from the following sources for the Firemen’s Fund, as determined by the City at December 31, 2015:
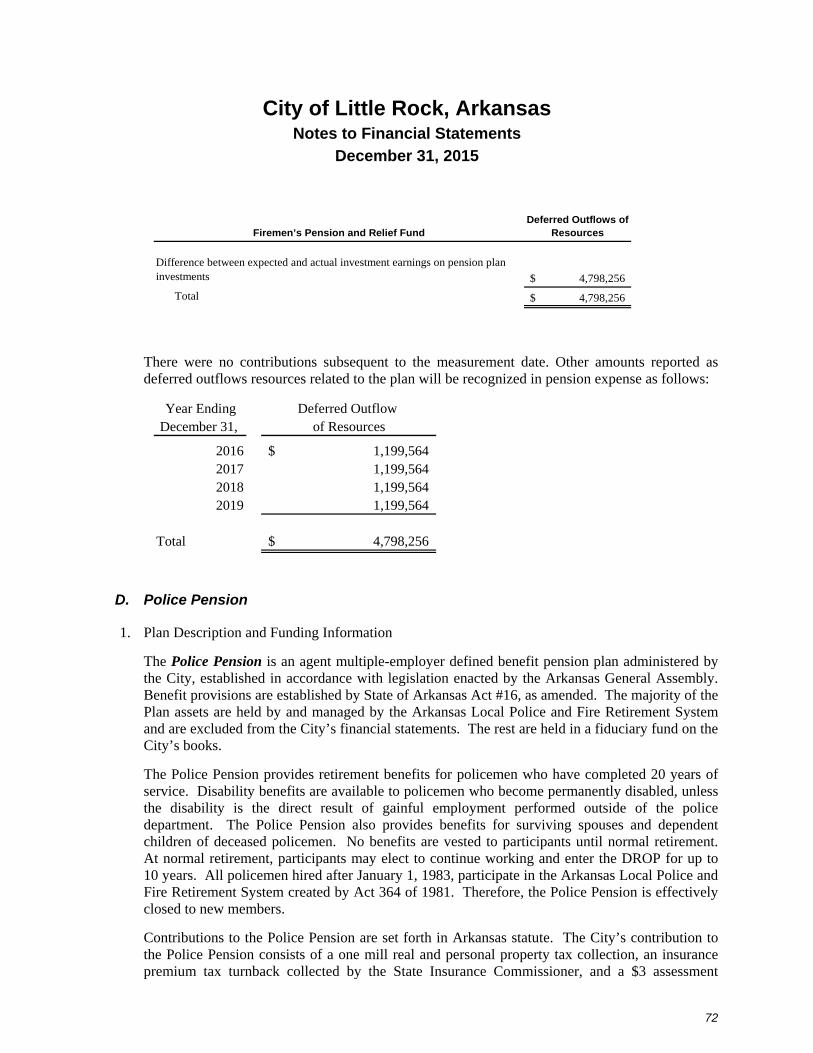
City of Little Rock, Arkansas Notes to Financial Statements
December 31, 2015
72
Firemen’s Pension and Relief FundDeferred Outflows of
Resources
Difference between expected and actual investment earnings on pension plan investments 4,798,256$
Total 4,798,256$
There were no contributions subsequent to the measurement date. Other amounts reported as deferred outflows resources related to the plan will be recognized in pension expense as follows:
Year Ending Deferred Outflow December 31, of Resources
2016 1,199,564$ 2017 1,199,564 2018 1,199,564 2019 1,199,564
Total 4,798,256$
D. Police Pension
1. Plan Description and Funding Information
The Police Pension is an agent multiple-employer defined benefit pension plan administered by the City, established in accordance with legislation enacted by the Arkansas General Assembly. Benefit provisions are established by State of Arkansas Act #16, as amended. The majority of the Plan assets are held by and managed by the Arkansas Local Police and Fire Retirement System and are excluded from the City’s financial statements. The rest are held in a fiduciary fund on the City’s books.
The Police Pension provides retirement benefits for policemen who have completed 20 years of service. Disability benefits are available to policemen who become permanently disabled, unless the disability is the direct result of gainful employment performed outside of the police department. The Police Pension also provides benefits for surviving spouses and dependent children of deceased policemen. No benefits are vested to participants until normal retirement. At normal retirement, participants may elect to continue working and enter the DROP for up to 10 years. All policemen hired after January 1, 1983, participate in the Arkansas Local Police and Fire Retirement System created by Act 364 of 1981. Therefore, the Police Pension is effectively closed to new members.
Contributions to the Police Pension are set forth in Arkansas statute. The City’s contribution to the Police Pension consists of a one mill real and personal property tax collection, an insurance premium tax turnback collected by the State Insurance Commissioner, and a $3 assessment

City of Little Rock, Arkansas Notes to Financial Statements
December 31, 2015
73
against each court case plus 10% of fines and forfeitures collected. The City’s contributions to the Plan for 2015 were $6,633,686.
2. Actuarial Methods and Assumptions
Actuarial valuations of an ongoing plan involve estimates of the value of reported amounts and assumptions about the probability of occurrence of events far into the future. Actuarially determined amounts are subject to revision as actual results are compared with past expectations and new estimates are made about the future.
Projections of benefits for financial reporting purposes are based on the substantive plan (the plan as understood by the employer and the plan members) and include the types of benefits provided at the time of each valuation and the historical pattern of sharing of benefit costs between the employer and plan members to that point. The actuarial methods and assumptions used include techniques that are designed to reduce the effects of short-term volatility in actuarial accrued liabilities and the actuarial value of assets, consistent with the long-term perspective of the calculations.
For the December 31, 2014 actuarial valuation, the entry age cost method was used. The actuarial value of pension benefit assets was determined using techniques that spread the effects of short-term volatility in the market value of investments over a five-year period. The actuarial assumptions included an 8% investment rate of return (net of administrative expenses), projected salary increases of 4%, which includes an inflation rate of 3% and no costs of living increases. The remaining amortization period at December 31, 2014, was 24 years using a closed amortization period based on projected future payroll. The mortality assumption was based on the RP-2000 Combined Mortality Table, projected to 2017 and set forward two years for men. There were no factors that significantly affected the identification of trends such as changes in benefits, actuarial methods or assumptions.
The long-term expected rate of return on pension plan investments was determined using a building block method in which best-estimate ranges of expected future real rates of return. The rates were built on a target allocation for all local police and fire pension funds; the target for an individual fund will vary within the guidelines of Arkansas law and regulation. The target allocation and the long-term expected real rates of return are shown in the table below:
Long-term Expected Police Pension Real Rate of ReturnAsset Class Target Allocation (Arithmetic)
Domestic fixed income 30% 2.97%Domestic equity 33% 5.88%International equity 6% 1.50%Foreign equity 7% 6.25%Index 11% 6.73%Alternatives 10% 6.13%Cash 3% -0.04%
100%
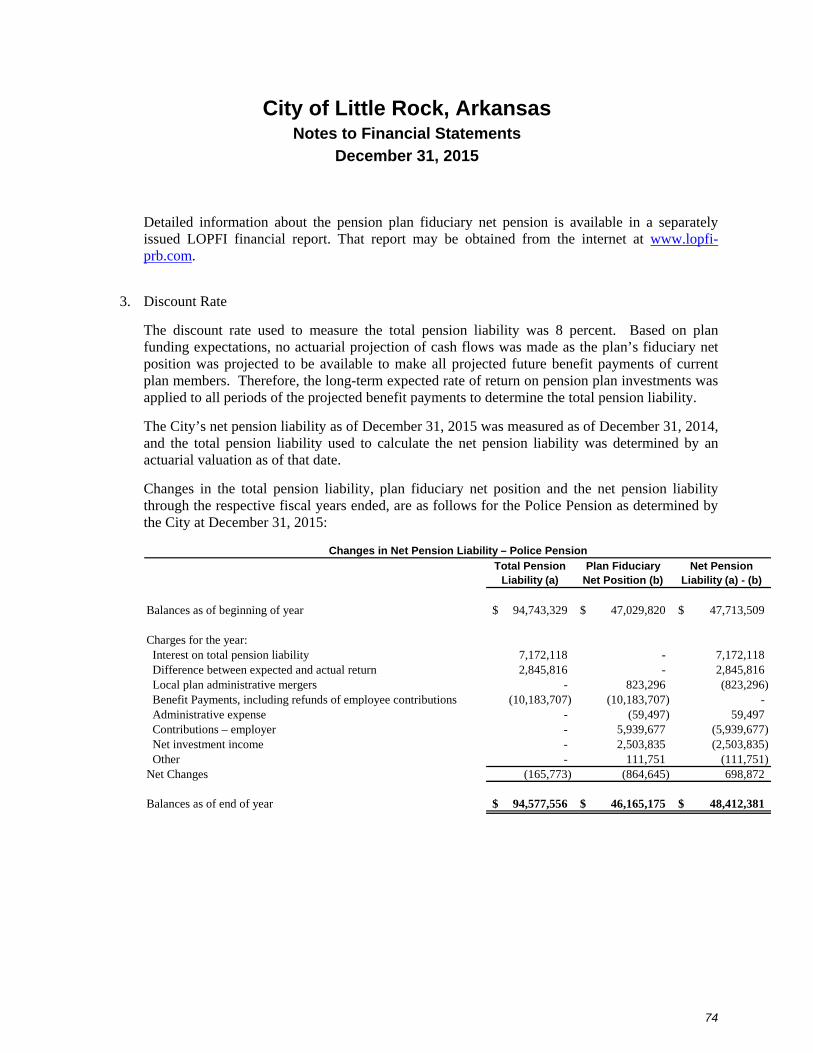
City of Little Rock, Arkansas Notes to Financial Statements
December 31, 2015
74
Detailed information about the pension plan fiduciary net pension is available in a separately issued LOPFI financial report. That report may be obtained from the internet at www.lopfi-prb.com.
3. Discount Rate
The discount rate used to measure the total pension liability was 8 percent. Based on plan funding expectations, no actuarial projection of cash flows was made as the plan’s fiduciary net position was projected to be available to make all projected future benefit payments of current plan members. Therefore, the long-term expected rate of return on pension plan investments was applied to all periods of the projected benefit payments to determine the total pension liability.
The City’s net pension liability as of December 31, 2015 was measured as of December 31, 2014, and the total pension liability used to calculate the net pension liability was determined by an actuarial valuation as of that date.
Changes in the total pension liability, plan fiduciary net position and the net pension liability through the respective fiscal years ended, are as follows for the Police Pension as determined by the City at December 31, 2015:
Total Pension Liability (a)
Plan Fiduciary Net Position (b)
Net Pension Liability (a) - (b)
Balances as of beginning of year 94,743,329$ 47,029,820$ 47,713,509$
Charges for the year: Interest on total pension liability 7,172,118 - 7,172,118 Difference between expected and actual return 2,845,816 - 2,845,816 Local plan administrative mergers - 823,296 (823,296) Benefit Payments, including refunds of employee contributions (10,183,707) (10,183,707) - Administrative expense - (59,497) 59,497 Contributions – employer - 5,939,677 (5,939,677) Net investment income - 2,503,835 (2,503,835) Other - 111,751 (111,751) Net Changes (165,773) (864,645) 698,872
Balances as of end of year 94,577,556$ 46,165,175$ 48,412,381$
Changes in Net Pension Liability – Police Pension

City of Little Rock, Arkansas Notes to Financial Statements
December 31, 2015
75
4. Sensitivity to Discount Rate Changes
The following presents the City’s net pension liability calculated using the discount rate of 8 percent, as well as what the net pension liability would be if it were calculated using a discount rate that is 1 percentage point lower or 1 percentage point higher than the current rate:
Current 1% Discount 1%
Decrease Rate Increase7.0% 8.0% 9.0%
Police Pension Net pension liability 54,571,011$ 48,412,381$ 42,172,581$
5. Pension Expense and Deferred Outflows of Resources
For the year ended December 31, 2015, the City recognized pension expense, as measured in accordance with GASB Statement No. 68, of $7,054,094, and reported deferred outflows of resources related to pensions from the following sources for the Police Pension, as determined by the City at December 31, 2015:
Police PensionDeferred Outflows of
ResourcesDeferred Inflows of
Resources
Difference in expected and actual experience 519,502$ -$ Difference between projected and actual earnings on investments - 153,527 Contributions subsequent to the measurement date 6,633,686 -
Total 7,153,188$ 153,527$
$6,633,686 reported as deferred outflows of resources related to pensions resulting from City contributions subsequent to the measurement date will be recognized as a reduction in the net pension liability for the year ending December 31, 2016.
Other amounts reported as deferred outflows and inflows of resources related to the plan will be recognized in pension expense as follows:
Year Ending Net Deferred Outflow December 31, of Resources
2016 91,493$ 2017 91,493 2018 91,493 2019 91,496
Total 365,975$
City of Little Rock, Arkansas Notes to Financial Statements
December 31, 2015
76
E. Nonuniformed Employees’ Defined Benefit Pension Plan (Nonuniformed Plan)
1. Plan Description and Funding Information
The Nonuniformed Employees’ Defined Benefit Pension Plan (Nonuniformed Plan) is a single-employer, defined benefit pension plan established under Arkansas state law. Benefit provisions are established and amended by City Ordinance #11088. Plan assets are administered by a Board of Trustees.
The Nonuniformed Plan provides retirement, disability and survivor benefits to participating employees and/or their beneficiaries or dependents who have met eligibility requirements set forth in the Plan’s benefit provisions.
Under the original provisions of the Nonuniformed Plan, participants and the City were required to contribute a certain percentage of the participant’s salary. Effective January 1, 1978, the Plan was frozen. Contributions continued to be required through December 31, 1980. As of January 1, 1981, participants of the Nonuniformed Plan became participants in the City of Little Rock Nonuniformed Employees’ Defined Contribution Plan (Defined Contribution Plan), which became effective for all regular, nonuniformed employees of the City as of that date. Currently, the only contributions the City makes to the Plan on an annual basis are those required to make the Plan actuarially sound. These contributions are made on a one year lag. Contributions during 2015 were $878,715. Administrative costs are financed by the Nonuniformed Plan Fund. The liability for the Nonuniformed Plan has typically been liquidated from the general fund.
2. Actuarial Methods and Assumptions
Actuarial valuations of an ongoing plan involve estimates of the value of reported amounts and assumptions about the probability of occurrence of events far into the future. Actuarially determined amounts are subject to revision as actual results are compared with past expectations and new estimates are made about the future.
Projections of benefits for financial reporting purposes are based on the substantive plan (the plan as understood by the employer and the plan members) and include the types of benefits provided at the time of each valuation and the historical pattern of sharing of benefit costs between the employer and plan members to that point. The actuarial methods and assumptions used include techniques that are designed to reduce the effects of short-term volatility in actuarial accrued liabilities and the actuarial value of assets, consistent with the long-term perspective of the calculations.
For the December 31, 2015 actuarial valuation, the entry age cost method was used. The actuarial value of pension benefit assets was determined using techniques that spread the effects of short-term volatility in the market value of investments over a five-year period. The actuarial assumptions included a 6.5% investment rate of return (net of administrative expenses), projected salary increases of 3.5%, which includes an inflation rate of 2.5% and no costs of living increases. The remaining amortization period at December 31, 2015, was 5 years using a level dollar, open basis, amortization period. The mortality assumption was based on the RP 2000 Mortality Table. There were no factors that significantly affected the identification of trends such as changes in benefits, actuarial methods or assumptions.
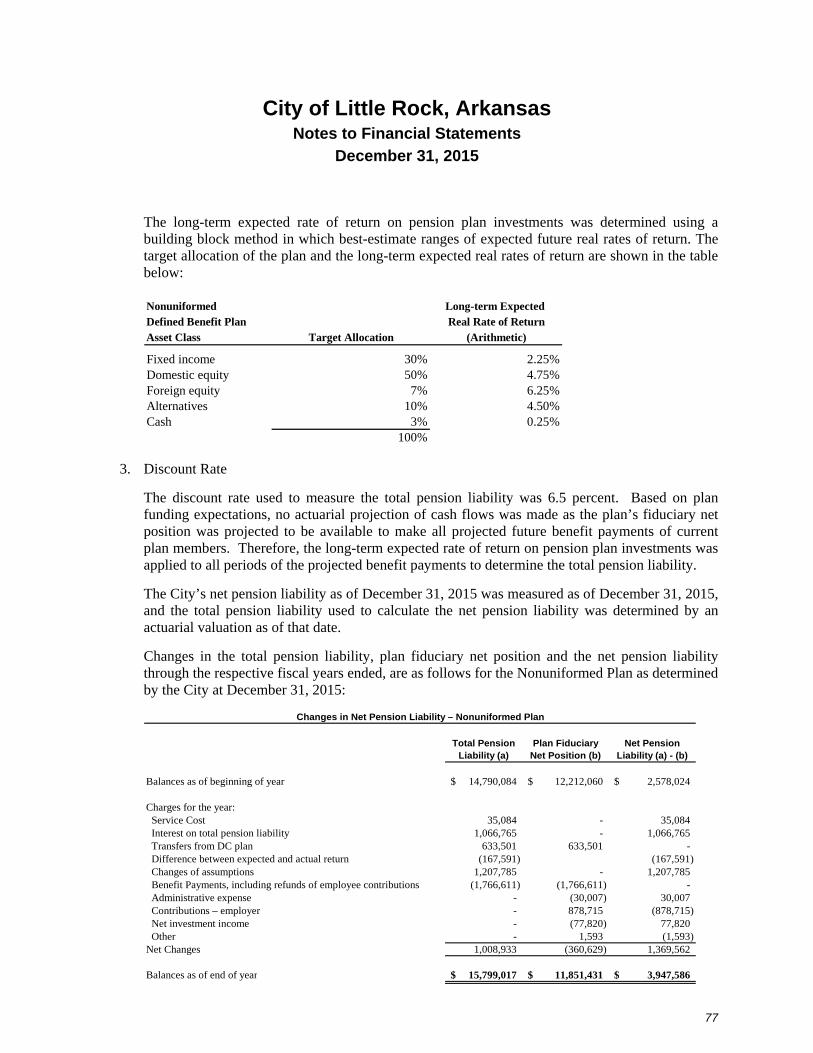
City of Little Rock, Arkansas Notes to Financial Statements
December 31, 2015
77
The long-term expected rate of return on pension plan investments was determined using a building block method in which best-estimate ranges of expected future real rates of return. The target allocation of the plan and the long-term expected real rates of return are shown in the table below: Nonuniformed Long-term Expected Defined Benefit Plan Real Rate of ReturnAsset Class Target Allocation (Arithmetic)
Fixed income 30% 2.25%Domestic equity 50% 4.75%Foreign equity 7% 6.25%Alternatives 10% 4.50%Cash 3% 0.25%
100%
3. Discount Rate
The discount rate used to measure the total pension liability was 6.5 percent. Based on plan funding expectations, no actuarial projection of cash flows was made as the plan’s fiduciary net position was projected to be available to make all projected future benefit payments of current plan members. Therefore, the long-term expected rate of return on pension plan investments was applied to all periods of the projected benefit payments to determine the total pension liability.
The City’s net pension liability as of December 31, 2015 was measured as of December 31, 2015, and the total pension liability used to calculate the net pension liability was determined by an actuarial valuation as of that date.
Changes in the total pension liability, plan fiduciary net position and the net pension liability through the respective fiscal years ended, are as follows for the Nonuniformed Plan as determined by the City at December 31, 2015:
Total Pension Liability (a)
Plan Fiduciary Net Position (b)
Net Pension Liability (a) - (b)
Balances as of beginning of year 14,790,084$ 12,212,060$ 2,578,024$
Charges for the year: Service Cost 35,084 - 35,084 Interest on total pension liability 1,066,765 - 1,066,765 Transfers from DC plan 633,501 633,501 - Difference between expected and actual return (167,591) (167,591) Changes of assumptions 1,207,785 - 1,207,785 Benefit Payments, including refunds of employee contributions (1,766,611) (1,766,611) - Administrative expense - (30,007) 30,007 Contributions – employer - 878,715 (878,715) Net investment income - (77,820) 77,820 Other - 1,593 (1,593) Net Changes 1,008,933 (360,629) 1,369,562
Balances as of end of year 15,799,017$ 11,851,431$ 3,947,586$
Changes in Net Pension Liability – Nonuniformed Plan
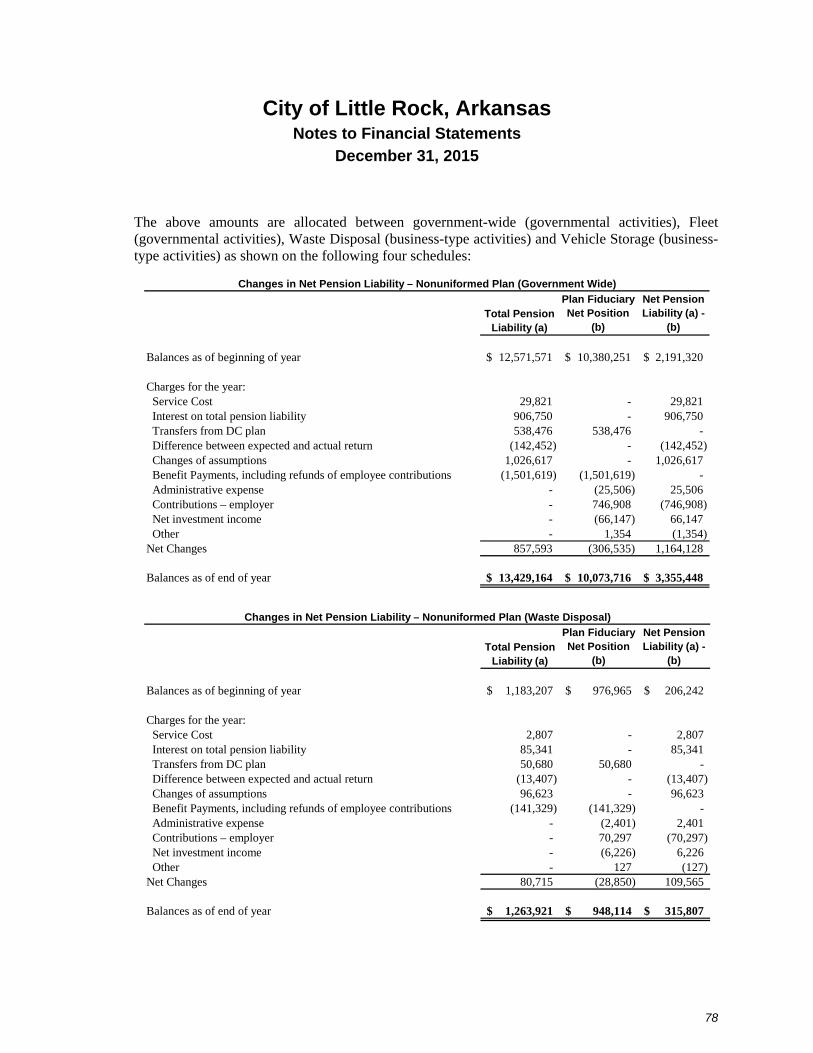
City of Little Rock, Arkansas Notes to Financial Statements
December 31, 2015
78
The above amounts are allocated between government-wide (governmental activities), Fleet (governmental activities), Waste Disposal (business-type activities) and Vehicle Storage (business-type activities) as shown on the following four schedules:
Total Pension Liability (a)
Plan Fiduciary Net Position
(b)
Net Pension Liability (a) -
(b)
Balances as of beginning of year 12,571,571$ 10,380,251$ 2,191,320$
Charges for the year: Service Cost 29,821 - 29,821 Interest on total pension liability 906,750 - 906,750 Transfers from DC plan 538,476 538,476 - Difference between expected and actual return (142,452) - (142,452) Changes of assumptions 1,026,617 - 1,026,617 Benefit Payments, including refunds of employee contributions (1,501,619) (1,501,619) - Administrative expense - (25,506) 25,506 Contributions – employer - 746,908 (746,908) Net investment income - (66,147) 66,147 Other - 1,354 (1,354) Net Changes 857,593 (306,535) 1,164,128
Balances as of end of year 13,429,164$ 10,073,716$ 3,355,448$
Changes in Net Pension Liability – Nonuniformed Plan (Government Wide)
Total Pension Liability (a)
Plan Fiduciary Net Position
(b)
Net Pension Liability (a) -
(b)
Balances as of beginning of year 1,183,207$ 976,965$ 206,242$
Charges for the year: Service Cost 2,807 - 2,807 Interest on total pension liability 85,341 - 85,341 Transfers from DC plan 50,680 50,680 - Difference between expected and actual return (13,407) - (13,407) Changes of assumptions 96,623 - 96,623 Benefit Payments, including refunds of employee contributions (141,329) (141,329) - Administrative expense - (2,401) 2,401 Contributions – employer - 70,297 (70,297) Net investment income - (6,226) 6,226 Other - 127 (127) Net Changes 80,715 (28,850) 109,565
Balances as of end of year 1,263,921$ 948,114$ 315,807$
Changes in Net Pension Liability – Nonuniformed Plan (Waste Disposal)
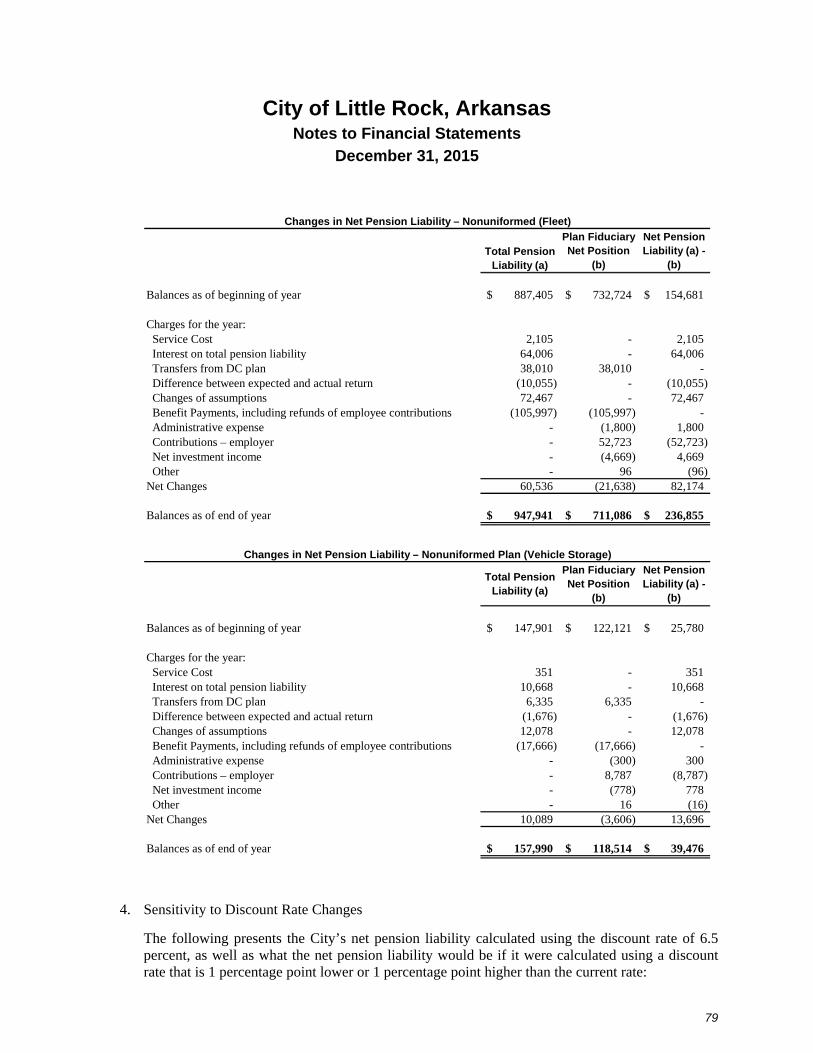
City of Little Rock, Arkansas Notes to Financial Statements
December 31, 2015
79
Total Pension Liability (a)
Plan Fiduciary Net Position
(b)
Net Pension Liability (a) -
(b)
Balances as of beginning of year 887,405$ 732,724$ 154,681$
Charges for the year: Service Cost 2,105 - 2,105 Interest on total pension liability 64,006 - 64,006 Transfers from DC plan 38,010 38,010 - Difference between expected and actual return (10,055) - (10,055) Changes of assumptions 72,467 - 72,467 Benefit Payments, including refunds of employee contributions (105,997) (105,997) - Administrative expense - (1,800) 1,800 Contributions – employer - 52,723 (52,723) Net investment income - (4,669) 4,669 Other - 96 (96) Net Changes 60,536 (21,638) 82,174
Balances as of end of year 947,941$ 711,086$ 236,855$
Changes in Net Pension Liability – Nonuniformed (Fleet)
Total Pension Liability (a)
Plan Fiduciary Net Position
(b)
Net Pension Liability (a) -
(b)
Balances as of beginning of year 147,901$ 122,121$ 25,780$
Charges for the year: Service Cost 351 - 351 Interest on total pension liability 10,668 - 10,668 Transfers from DC plan 6,335 6,335 - Difference between expected and actual return (1,676) - (1,676) Changes of assumptions 12,078 - 12,078 Benefit Payments, including refunds of employee contributions (17,666) (17,666) - Administrative expense - (300) 300 Contributions – employer - 8,787 (8,787) Net investment income - (778) 778 Other - 16 (16) Net Changes 10,089 (3,606) 13,696
Balances as of end of year 157,990$ 118,514$ 39,476$
Changes in Net Pension Liability – Nonuniformed Plan (Vehicle Storage)
4. Sensitivity to Discount Rate Changes
The following presents the City’s net pension liability calculated using the discount rate of 6.5 percent, as well as what the net pension liability would be if it were calculated using a discount rate that is 1 percentage point lower or 1 percentage point higher than the current rate:

City of Little Rock, Arkansas Notes to Financial Statements
December 31, 2015
80
Current 1% Discount 1%
Decrease Rate Increase5.5% 6.5% 7.5%
Nonuniformed Employees’ Defined Benefit Pension Plan Net pension liability 5,318,016$ 3,947,586$ 2,739,801$
5. Pension Expense and Deferred Outflows of Resources Related to Pensions
For the year ended December 31, 2015, the City recognized pension expense, as measured in accordance with GASB Statement No. 68, of $1,461,370, and reported deferred outflows of resources related to pensions from the following sources for the Nonuniformed Plan, as determined by the City at December 31, 2015:
Nonuniformed PlanDeferred Outflows of
Resources
Difference between expected and actual investment earnings on pension plan investments 760,086$
Total 760,086$
There were no contributions subsequent to the measurement date. Amounts reported as deferred outflows related to the plan will be recognized in pension expense as follows:
Year Ending Net Deferred Outflow December 31, of Resources
2016 190,022$ 2017 190,022 2018 190,022 2019 190,020
Total 760,086$
F. 2014 Nonuniformed Employees’ Defined Benefit Pension Plan (2014 Defined Benefit Plan)
1. Plan Description and Funding Information
The 2014 Nonuniformed Employees’ Defined Benefit Pension Plan (2014 Defined Benefit Plan) is a single-employer, defined benefit pension plan established under Arkansas state law. Benefit provisions are established by City Ordinance #20778.
The 2014 Defined Benefit Plan provides retirement, disability and survivor benefits to participating employees and/or their beneficiaries or dependents who have met eligibility requirements set forth in the Plan’s benefit provisions.

City of Little Rock, Arkansas Notes to Financial Statements
December 31, 2015
81
Under the provisions of the 2014 Defined Benefit Plan, the City contributes 9% of the participant’s salary. The participants contribute 4.5% of their salaries. City contributions during 2015 were $3,128,267. Contributions to the plan are made from various city governmental and business type funds.
2. Actuarial Methods and Assumptions
Actuarial valuations of an ongoing plan involve estimates of the value of reported amounts and assumptions about the probability of occurrence of events far into the future. Actuarially determined amounts are subject to revision as actual results are compared with past expectations and new estimates are made about the future.
Projections of benefits for financial reporting purposes are based on the substantive plan (the plan as understood by the employer and the plan members) and include the types of benefits provided at the time of each valuation and the historical pattern of sharing of benefit costs between the employer and plan members to that point. The actuarial methods and assumptions used include techniques that are designed to reduce the effects of short-term volatility in actuarial accrued liabilities and the actuarial value of assets, consistent with the long-term perspective of the calculations.
For the December 31, 2015 actuarial valuation, the entry age cost method was used. The actuarial value of pension benefit assets was determined using techniques that spread the effects of short-term volatility in the market value of investments over a five-year period. The actuarial assumptions included a 6.5% investment rate of return (net of administrative expenses), projected salary increases of 3.5%, which includes an inflation rate of 2.5% and no costs of living increases. The remaining amortization period at December 31, 2015, was 15 years using a level percent of salary basis, amortization period. The mortality assumption was based on the RP 2000 Mortality Table. There were no factors that significantly affected the identification of trends such as changes in benefits, actuarial methods or assumptions.
The long-term expected rate of return on pension plan investments was determined using a building block method in which best-estimate ranges of expected future real rates of return. The target allocation of the plan and the long-term expected real rates of return are shown in the table below: 2014 Defined Benefit Plan Long-term Expected
Real Rate of ReturnAsset Class Target Allocation (Arithmetic)
Fixed income 30% 2.25%Domestic equity 50% 4.75%Foreign equity 7% 6.25%Alternatives 10% 4.50%Cash 3% 0.25%
100%
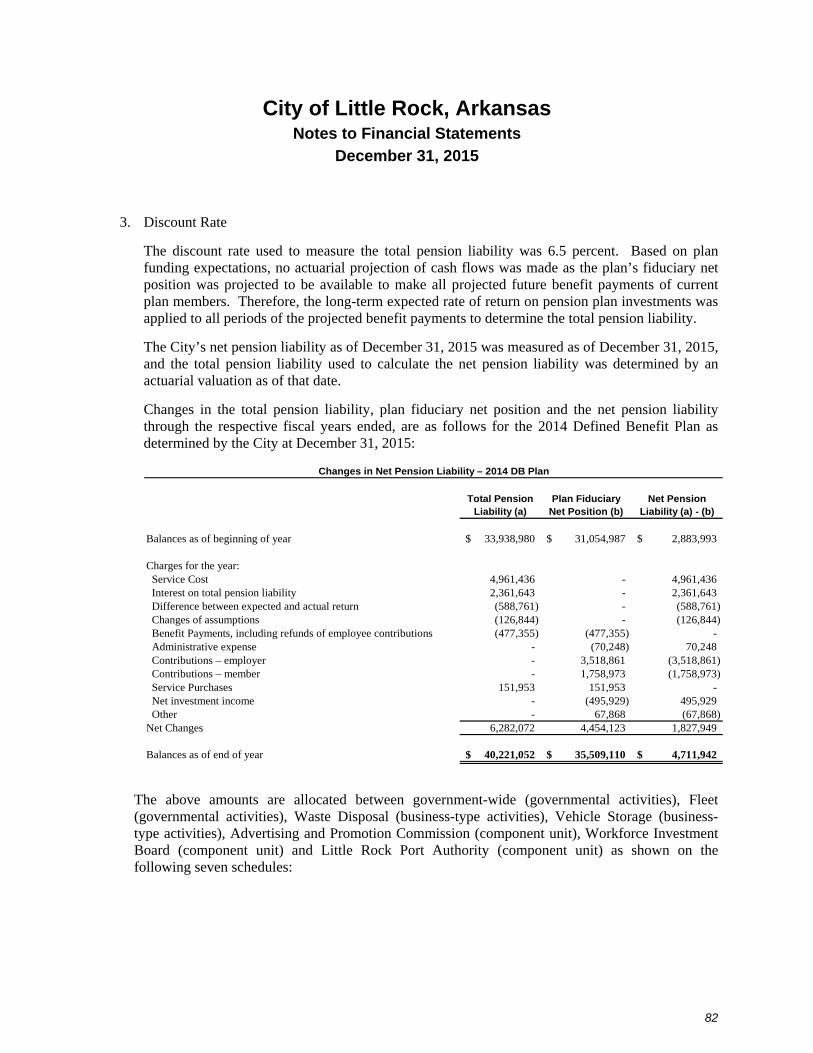
City of Little Rock, Arkansas Notes to Financial Statements
December 31, 2015
82
3. Discount Rate
The discount rate used to measure the total pension liability was 6.5 percent. Based on plan funding expectations, no actuarial projection of cash flows was made as the plan’s fiduciary net position was projected to be available to make all projected future benefit payments of current plan members. Therefore, the long-term expected rate of return on pension plan investments was applied to all periods of the projected benefit payments to determine the total pension liability.
The City’s net pension liability as of December 31, 2015 was measured as of December 31, 2015, and the total pension liability used to calculate the net pension liability was determined by an actuarial valuation as of that date.
Changes in the total pension liability, plan fiduciary net position and the net pension liability through the respective fiscal years ended, are as follows for the 2014 Defined Benefit Plan as determined by the City at December 31, 2015:
Total Pension Liability (a)
Plan Fiduciary Net Position (b)
Net Pension Liability (a) - (b)
Balances as of beginning of year 33,938,980$ 31,054,987$ 2,883,993$
Charges for the year: Service Cost 4,961,436 - 4,961,436 Interest on total pension liability 2,361,643 - 2,361,643 Difference between expected and actual return (588,761) - (588,761) Changes of assumptions (126,844) - (126,844) Benefit Payments, including refunds of employee contributions (477,355) (477,355) - Administrative expense - (70,248) 70,248 Contributions – employer - 3,518,861 (3,518,861) Contributions – member - 1,758,973 (1,758,973) Service Purchases 151,953 151,953 - Net investment income - (495,929) 495,929 Other - 67,868 (67,868) Net Changes 6,282,072 4,454,123 1,827,949
Balances as of end of year 40,221,052$ 35,509,110$ 4,711,942$
Changes in Net Pension Liability – 2014 DB Plan
The above amounts are allocated between government-wide (governmental activities), Fleet (governmental activities), Waste Disposal (business-type activities), Vehicle Storage (business-type activities), Advertising and Promotion Commission (component unit), Workforce Investment Board (component unit) and Little Rock Port Authority (component unit) as shown on the following seven schedules:
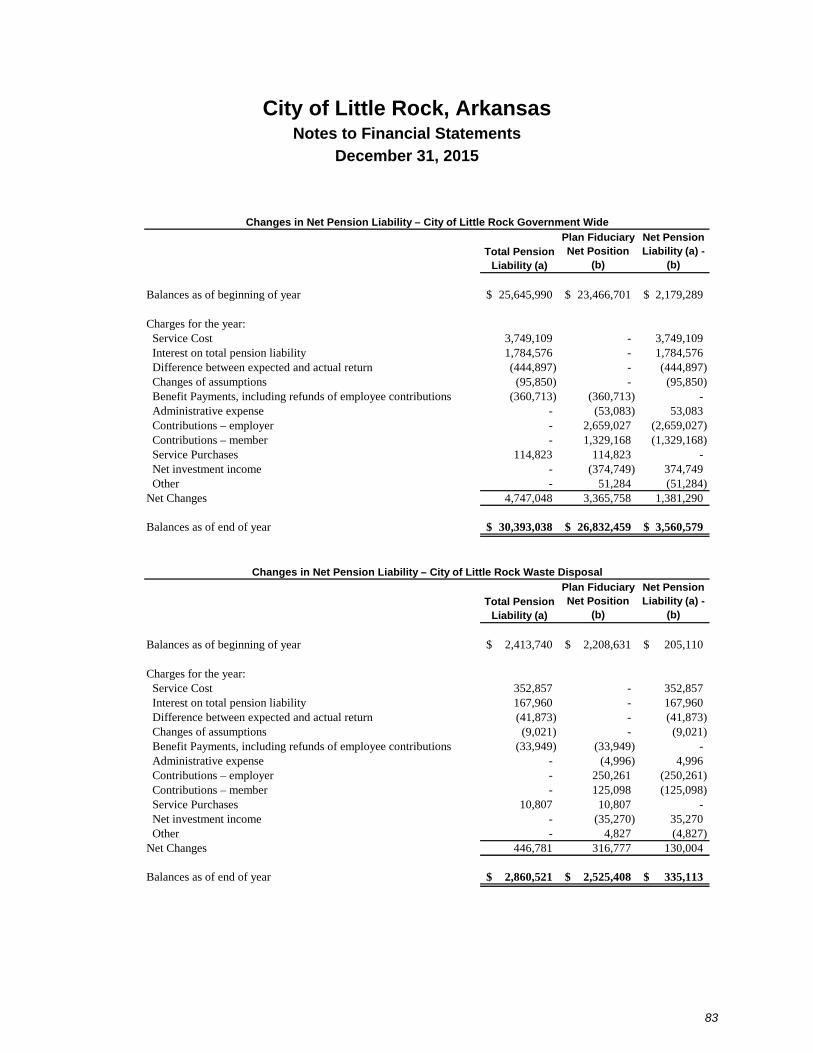
City of Little Rock, Arkansas Notes to Financial Statements
December 31, 2015
83
Total Pension Liability (a)
Plan Fiduciary Net Position
(b)
Net Pension Liability (a) -
(b)
Balances as of beginning of year 25,645,990$ 23,466,701$ 2,179,289$
Charges for the year: Service Cost 3,749,109 - 3,749,109 Interest on total pension liability 1,784,576 - 1,784,576 Difference between expected and actual return (444,897) - (444,897) Changes of assumptions (95,850) - (95,850) Benefit Payments, including refunds of employee contributions (360,713) (360,713) - Administrative expense - (53,083) 53,083 Contributions – employer - 2,659,027 (2,659,027) Contributions – member - 1,329,168 (1,329,168) Service Purchases 114,823 114,823 - Net investment income - (374,749) 374,749 Other - 51,284 (51,284) Net Changes 4,747,048 3,365,758 1,381,290
Balances as of end of year 30,393,038$ 26,832,459$ 3,560,579$
Changes in Net Pension Liability – City of Little Rock Government Wide
Total Pension Liability (a)
Plan Fiduciary Net Position
(b)
Net Pension Liability (a) -
(b)
Balances as of beginning of year 2,413,740$ 2,208,631$ 205,110$
Charges for the year: Service Cost 352,857 - 352,857 Interest on total pension liability 167,960 - 167,960 Difference between expected and actual return (41,873) - (41,873) Changes of assumptions (9,021) - (9,021) Benefit Payments, including refunds of employee contributions (33,949) (33,949) - Administrative expense - (4,996) 4,996 Contributions – employer - 250,261 (250,261) Contributions – member - 125,098 (125,098) Service Purchases 10,807 10,807 - Net investment income - (35,270) 35,270 Other - 4,827 (4,827) Net Changes 446,781 316,777 130,004
Balances as of end of year 2,860,521$ 2,525,408$ 335,113$
Changes in Net Pension Liability – City of Little Rock Waste Disposal
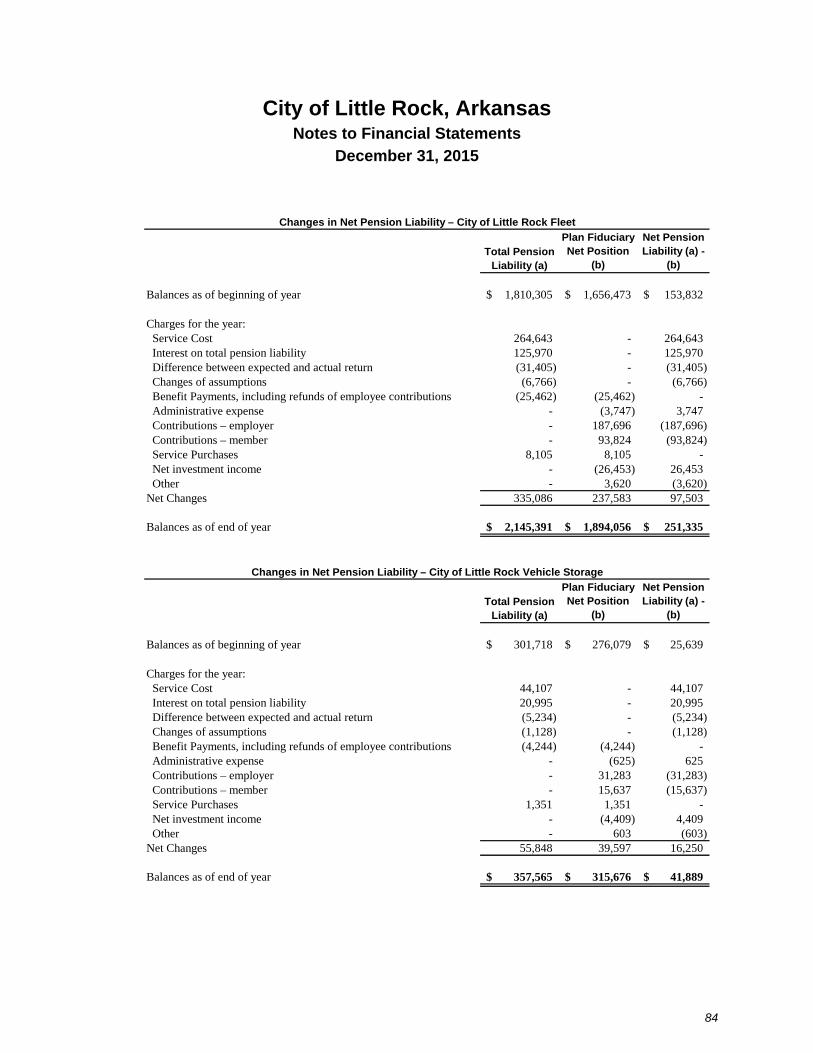
City of Little Rock, Arkansas Notes to Financial Statements
December 31, 2015
84
Total Pension Liability (a)
Plan Fiduciary Net Position
(b)
Net Pension Liability (a) -
(b)
Balances as of beginning of year 1,810,305$ 1,656,473$ 153,832$
Charges for the year: Service Cost 264,643 - 264,643 Interest on total pension liability 125,970 - 125,970 Difference between expected and actual return (31,405) - (31,405) Changes of assumptions (6,766) - (6,766) Benefit Payments, including refunds of employee contributions (25,462) (25,462) - Administrative expense - (3,747) 3,747 Contributions – employer - 187,696 (187,696) Contributions – member - 93,824 (93,824) Service Purchases 8,105 8,105 - Net investment income - (26,453) 26,453 Other - 3,620 (3,620) Net Changes 335,086 237,583 97,503
Balances as of end of year 2,145,391$ 1,894,056$ 251,335$
Changes in Net Pension Liability – City of Little Rock Fleet
Total Pension Liability (a)
Plan Fiduciary Net Position
(b)
Net Pension Liability (a) -
(b)
Balances as of beginning of year 301,718$ 276,079$ 25,639$
Charges for the year: Service Cost 44,107 - 44,107 Interest on total pension liability 20,995 - 20,995 Difference between expected and actual return (5,234) - (5,234) Changes of assumptions (1,128) - (1,128) Benefit Payments, including refunds of employee contributions (4,244) (4,244) - Administrative expense - (625) 625 Contributions – employer - 31,283 (31,283) Contributions – member - 15,637 (15,637) Service Purchases 1,351 1,351 - Net investment income - (4,409) 4,409 Other - 603 (603) Net Changes 55,848 39,597 16,250
Balances as of end of year 357,565$ 315,676$ 41,889$
Changes in Net Pension Liability – City of Little Rock Vehicle Storage

City of Little Rock, Arkansas Notes to Financial Statements
December 31, 2015
85
Total Pension Liability (a)
Plan Fiduciary Net Position
(b)
Net Pension Liability (a) -
(b)
Balances as of beginning of year 3,563,593$ 3,260,774$ 302,819$
Charges for the year: Service Cost 520,951 - 520,951 Interest on total pension liability 247,973 - 247,973 Difference between expected and actual return (61,820) - (61,820) Changes of assumptions (13,319) - (13,319) Benefit Payments, including refunds of employee contributions (50,122) (50,122) - Administrative expense - (7,376) 7,376 Contributions – employer - 369,480 (369,480) Contributions – member - 184,692 (184,692) Service Purchases 15,955 15,955 - Net investment income - (52,073) 52,073 Other - 7,126 (7,126) Net Changes 659,618 467,683 191,935
Balances as of end of year 4,223,210$ 3,728,457$ 494,754$
Changes in Net Pension Liability – Advertising and Promotion Commission
Total Pension Liability (a)
Plan Fiduciary Net Position
(b)
Net Pension Liability (a) -
(b)
Balances as of beginning of year 169,695$ 155,275$ 14,420$
Charges for the year: Service Cost 24,807 - 24,807 Interest on total pension liability 11,808 - 11,808 Difference between expected and actual return (2,944) - (2,944) Changes of assumptions (634) - (634) Benefit Payments, including refunds of employee contributions (2,387) (2,387) - Administrative expense - (351) 351 Contributions - employer - 17,594 (17,594) Contributions - member - 8,795 (8,795) Service Purchases 760 760 - Net investment income - (2,480) 2,480 Other - 339 (339) Net Changes 31,410 22,271 9,140
Balances as of end of year 201,105$ 177,546$ 23,560$
Note: The Workforce Investment Board follows standards established by the Financial Accounting Standards Board and is not required to record the net pension liability.
Changes in Net Pension Liability – Workforce Investment Board
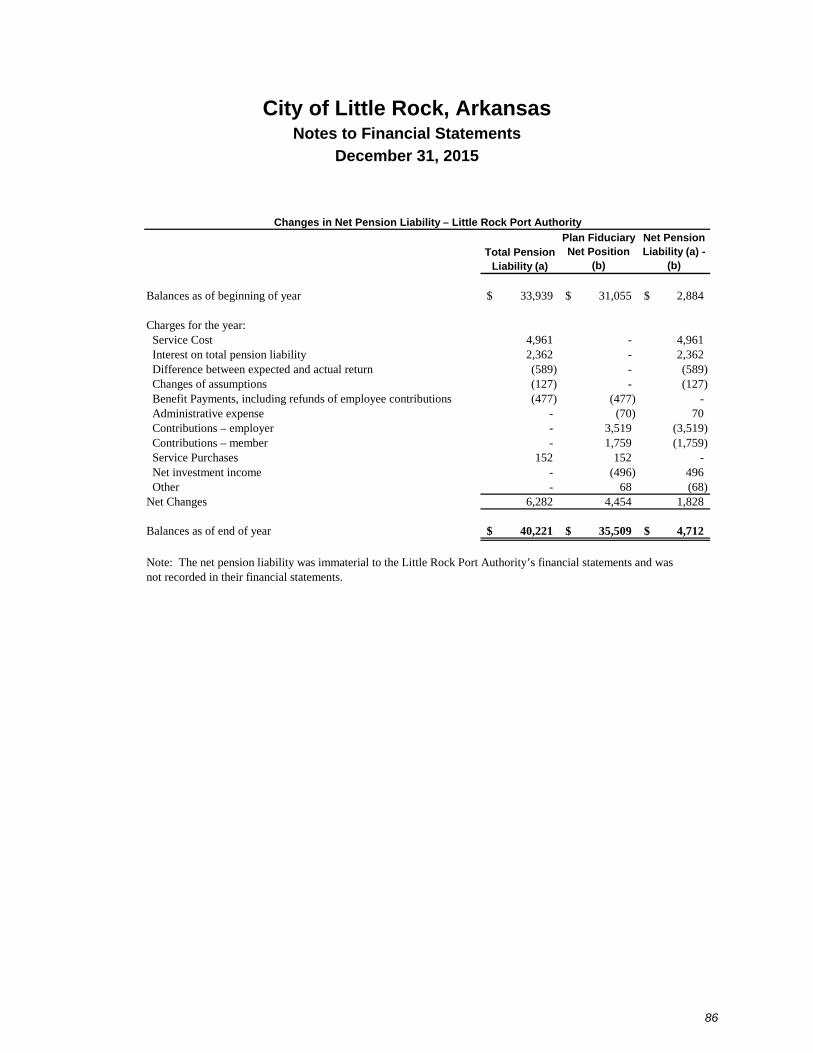
City of Little Rock, Arkansas Notes to Financial Statements
December 31, 2015
86
Total Pension Liability (a)
Plan Fiduciary Net Position
(b)
Net Pension Liability (a) -
(b)
Balances as of beginning of year 33,939$ 31,055$ 2,884$
Charges for the year: Service Cost 4,961 - 4,961 Interest on total pension liability 2,362 - 2,362 Difference between expected and actual return (589) - (589) Changes of assumptions (127) - (127) Benefit Payments, including refunds of employee contributions (477) (477) - Administrative expense - (70) 70 Contributions – employer - 3,519 (3,519) Contributions – member - 1,759 (1,759) Service Purchases 152 152 - Net investment income - (496) 496 Other - 68 (68) Net Changes 6,282 4,454 1,828
Balances as of end of year 40,221$ 35,509$ 4,712$
Note: The net pension liability was immaterial to the Little Rock Port Authority’s financial statements and was not recorded in their financial statements.
Changes in Net Pension Liability – Little Rock Port Authority

City of Little Rock, Arkansas Notes to Financial Statements
December 31, 2015
87
4. Sensitivity to Discount Rate Changes
The following presents the City’s net pension liability calculated using the discount rate of 6.5 percent, as well as what the net pension liability would be if it were calculated using a discount rate that is 1 percentage point lower or 1 percentage point higher than the current rate:
Current 1% Discount 1%
Decrease Rate Increase5.5% 6.5% 7.5%
2014 Defined Benefit Pension Plan Net pension liability (asset) 14,529,840$ 4,711,942$ (2,689,693)$
Current 1% Discount 1%
Decrease Rate Increase5.5% 6.5% 7.5%
Advertising & Promotion Commission Net pension liability (asset) 1,525,633$ 494,754$ (282,418)$
Current 1% Discount 1%
Decrease Rate Increase5.5% 6.5% 7.5%
Workforce Investment Board Net pension liability (asset) 72,649$ 23,560$ (13,448)$
Current 1% Discount 1%
Decrease Rate Increase5.5% 6.5% 7.5%
Little Rock Port Authority Net pension liability (asset) 14,530$ 4,712$ (2,690)$
5. Pension Expense and Deferred Outflows of Resources and Deferred Inflows of Resources Related to Pensions
For the year ended December 31, 2015, the City recognized pension expense, as measured in accordance with GASB Statement No. 68, of $3,351,677, and reported deferred outflows of resources and deferred inflows of resources related to pensions from the following sources for the 2014 Defined Benefit Plan, as determined by the City at December 31, 2015:

City of Little Rock, Arkansas Notes to Financial Statements
December 31, 2015
88
2014 Defined Benefit PlanDeferred Outflows of
ResourcesDeferred Inflows of
Resources
Difference between expected and actual experience -$ 465,252$ Changes of assumptions - 100,235 Difference between expected and actual investment earnings on pension plan investments 1,904,673 -
Total 1,904,673$ 565,487$
Advertising and Promotion CommissionDeferred Outflows of
ResourcesDeferred Inflows of
Resources
Difference between expected and actual experience -$ 54,951$
Changes of assumptions - 11,839 Difference between expected and actual investment earnings on plan investments 224,961 -
Total 224,961$ 66,790$
Workforce Investment BoardDeferred Outflows of
Resources
Deferred Inflows of Resources
Difference between expected and actual experience -$ 2,617$ Changes of assumptions - 564 Difference between expected and actual investment earnings on plan investments 10,712 -
Total 10,712$ 3,181$
Little Rock Port AuthorityDeferred Outflows of
ResourcesDeferred Inflows of
Resources
Difference between expected and actual experience -$ 523$
Changes of assumptions - 113
Difference between expected and actual investment earnings on plan investments 2,142 -
Total 2,142$ 636$

City of Little Rock, Arkansas Notes to Financial Statements
December 31, 2015
89
Amounts reported as deferred outflows and inflows of resources related to the plan will be recognized in pension expense as follows:
Advertising and Promotion2014 Defined Benefit Plan Commission Workforce Investment Board Little Rock Port Authority
Year Ending Net Deferred Outflow Net Deferred Outflow Net Deferred Outflow Net Deferred Outflow December 31, of Resources of Resources of Resources of Resources
2016 267,837$ 31,634$ 1,506$ 301$ 2017 267,837 31,634 1,506 301 2018 267,837 31,634 1,506 301 2019 267,837 31,634 1,506 301 2020 267,838 31,635 1,507 302
Total 1,339,186$ 158,171$ 7,531$ 1,506$
Money-Weighted Rate of Return
The annual money-weighted rate of return on pension plan investments is calculated as the internal rate of return on pension plan investments, net of pension plan investment expense, adjusted for the changing amounts actually invested. The money-weighted rates of returns are shown in the table below:
Annual Fiscal Year Money-weighted
Ending Rate of Return
Firemen’s Pension and Relief Fund 12/31/14 3.87%12/31/15 -4.30%
Nonuniformed Employees’ Defined Benefit Pension Plan 12/31/14 7.82%12/31/15 -0.64%
2014 Defined Benefit Pension Plan 12/31/14 5.93%12/31/15 -1.48%
LOCAL POLICE AND FIRE RETIREMENT SYSTEM (LOPFI)
The Local Police and Fire Retirement System (LOPFI) is a statewide cost sharing multi-employer retirement program that provides retirement, disability and survivor benefits to police and fire employees of political subdivisions of the State of Arkansas. LOPFI was created by Act 364 of the 1981 General Assembly. The authority to establish and amend benefit provisions is set forth in Arkansas state statutes and is vested in the Arkansas Legislature with the concurrence of the Governor. Employees hired after January 1, 1983, whose political subdivision had a retirement system in effect at July 1, 1981, are eligible to participate in the Plan. LOPFI issues a publicly available financial report that includes financial statements and required supplementary information of the Plan, which may be obtained from the internet at www.lopfi-prb.com or by contacting the following:

City of Little Rock, Arkansas Notes to Financial Statements
December 31, 2015
90
Arkansas Local Police and Fire Retirement System P.O. Drawer 34164 Little Rock, Arkansas 72203 501.682.1745
Contribution requirements are set forth in Arkansas statute. LOPFI members were required to contribute 8.5% of their annual covered salary. The City is required to contribute at an actuarially determined rate, which was 25.33% for participating policemen and 19.58% for participating firemen. City contributions for 2015 to the Plan were $11,683,653.
Pension Liabilities, Pension Expense, and Deferred Outflows of Resources and Deferred Inflows of Resources Related to Pensions
At December 31, 2015, the LOPFI Police and LOPFI Fire reported a liability of $36,304,815 and $32,975,778, respectively, for their proportionate share of the net pension liability. The net pension liability was measured as of December 31, 2014, and the total pension liability used to calculate the net pension liability was determined by an actuarial valuation as of December 31, 2014. The City’s proportionate share was 10.0287% and 9.1091% respectively, for LOPFI Police and LOPFI Fire which are unchanged from the prior year. The allocation percentages are based on the ratio of each employer’s contributions to total employer contributions of the group for the fiscal year ended December 31, 2014. The contributions used excluded contributions made for prior service, excess benefits and irregular payments. The employer allocation percentages have been rounded for presentation purposes.
For the year ended December 31, 2015 the LOPFI Police and LOPFI Fire recognized pension expense of $5,866,671 and $5,328,716, respectively. At December 31, 2015, LOPFI Police and LOPFI Fire reported deferred outflows of resources and deferred inflows of resources related to pensions from the following sources:
LOPFI – PoliceDeferred Outflows of
ResourcesDeferred Inflows of
Resources
Difference in expected and actual experience -$ 27,746$ Difference between expected and actual investment earnings on pension plan investments 765,434 - Contributions subsequent to the measurement date 6,056,539 -
Total 6,821,973$ 27,746$
LOPFI – FireDeferred Outflows of
ResourcesDeferred Inflows of
Resources
Difference in expected and actual experience -$ 25,202$ Difference between expected and actual investment earnings on pension plan investments 695,246 - Contributions subsequent to the measurement date 5,627,114 -
Total 6,322,360$ 25,202$
At December 31, 2015, LOPFI Police and LOPFI Fire reported $6,056,539 and $5,627,114 as deferred outflows of resources related to pensions resulting from contributions subsequent to the measurement date that will be recognized as a reduction of the net pension liability in the year ended December 31, 2016. Other amounts reported as deferred outflows of resources and deferred

City of Little Rock, Arkansas Notes to Financial Statements
December 31, 2015
91
inflows of resources at December 31, 2015, related to pensions will be recognized in pension expense as follows:
LOPFI Police LOPFI FireYear Ending Net Deferred Outflow Net Deferred Outflow
December 31, of Resources of Resources
2016 184,422$ 167,511$ 2017 184,422 167,511 2018 184,422 167,511 2019 184,422 167,511
Total 737,688$ 670,044$
Actuarial Assumptions
The total pension liability in the December 31, 2014, actuarial valuation was determined using the following actuarial assumptions, applied to all periods included in the measurement:
LOPFI – Police LOPFI – Fire
Inflation 3% 3%Salary Increases 4.5% 4.5%Investment rate of return 8% 8%Actuarial cost method Entry age normal Entry age normal
Asset valuation method5-year smoothed market;
20% corridor5-year smoothed market;
20% corridor
Mortality rates were based on the RP-2000 Combined Mortality Table for Males and Females, as appropriate, with adjustments for mortality improvements based on scale AA.
The actuarial assumptions used in the December 31, 2014 valuation were based on the results of an actuarial experience study for the period January 1, 2008 to December 31, 2011. As a result of the 2011 actuarial experience study, the expectation of life after disability was adjusted in the December 31, 2014 actuarial evaluation to more closely reflect actual experience.
The long-term expected rate of return on pension plan investments was determined using a building-block method in which expected future real rates of return (expected returns, net of pension plan investment expense and inflation) are developed for each major asset class. Theses real rates of return are combined to produce the long-term expected rate of return by weighting the expected future real rates of return by the target asset allocation percentage and by adding expected inflation. For each major asset class that is included in the pension plan’s target asset allocation as of December 31, 2014, these best estimates are summarized in the following table:

City of Little Rock, Arkansas Notes to Financial Statements
December 31, 2015
92
LOPFI – Police and Fire Long-term Expected Real Rate of Return
Asset Class Target Allocation (Arithmetic)
Domestic fixed income 30% 2.97%Domestic equity 33% 5.88%International equity 6% 1.50%Foreign equity 7% 6.25%Index 11% 6.73%Alternatives 10% 6.13%Cash 3% -0.04%
100%
Discount Rate
A single discount rate of 8 percent was used to measure the total pension liability. This single discount rate was based on the expected rate of return on pension plan investments of 8 percent. The projection of cash flows used to determine this single discount rate assumed that plan member contributions will be made at the current contribution rate and that employer contributions will be made at rates equal to the difference between actuarially determined contribution rates and the member rate. Based on these assumptions, the pension plan’s fiduciary net position was projected to be available to make all projected future benefit payments of current plan members. Therefore, the long-term expected rate of return on pension plan investments was applied to all periods of projected benefit payments to determine the total pension liability.
Regarding the sensitivity of the net pension liability to changes in the single discount rate, the following presents the City’s net pension liability, calculated using a single discount rate of 8 percent, as well as what the plan’s net pension liability would be if it were calculated using a single discount rate that is one percent lower or one percent higher:
Current 1% Discount 1%
Decrease Rate Increase7.0% 8.0% 9.0%
LOPFI – Police Net pension liability 63,934,993$ 36,304,815$ 13,669,020$
Current 1% Discount 1%
Decrease Rate Increase7.0% 8.0% 9.0%
LOPFI – Fire Net pension liability 58,072,357$ 32,975,778$ 12,415,614$

City of Little Rock, Arkansas Notes to Financial Statements
December 31, 2015
93
Arkansas Public Employees Retirement System (APERS)
The following plan description of the Arkansas Public Employees Retirement System (APERS) is provided for general information purposes only. Participants should refer to Arkansas Code Annotated, Title 24 for more complete information. Detailed information about the pension plan fiduciary net pension is available in a separately issued APERS financial report. That report may be obtained from the internet at www.apers.org.
APERS is a cost-sharing multiple-employer defined benefit plan which provides benefits for the City’s municipal judges and court clerks. The plan was established by the authority of the Arkansas General Assembly with the passage of Act 177 of 1957. The costs of administering the plan are paid out of investment earnings.
The general administration and responsibility for the proper operation of the System is vested in the nine members of the Board of Trustees of the Arkansas Public Employees Retirement System (the Board). Membership includes three state and three non-state employees, all appointed by the Governor, and three ex-officio trustees, including the Auditor of the State, the Treasurer of the State and the Director of the Department of Finance and Administration.
Pension Liabilities, Pension Expense, and Deferred Outflows of Resources and Deferred Inflows of Resources Related to Pensions
At December 31, 2015, the City reported a liability of $ 841,035 for its proportionate share of the net pension liability. The City’s proportionate share was .04566542%, which remained unchanged. The net pension liability was measured as of June 30, 2015, and the total pension liability used to calculate the net pension liability was determined by an actuarial valuation as of that date. The City’s proportion of the net pension liability was based on actual City contributions to the pension plan relative to the actual contributions of all participating APERS members for the year ended June 30, 2015.
For the year ended December 31, 2015, the City recognized pension expense of $100,623. At December 31, 2015, the City reported deferred outflows of resources and deferred inflows of resources related to pensions from the following sources:
APERSDeferred Outflows of
ResourcesDeferred Inflows of
Resources
Diffence in expected and actual experience -$ 55,137$
Change in assumptions 124,119 - Difference between expected and actual investment earnings on pension plan investments 211,911 253,635
Change in proportion 9,217 6,150
Contributions subsequent to the measurement date 220,185 -
Total 565,432$ 314,922$
At December 31, 2015, APERS reported $220,185 as deferred outflows of resources related to pensions resulting from contributions subsequent to the measurement date that will be recognized as a reduction of the net pension liability in the year ended December 31, 2016. Other amounts
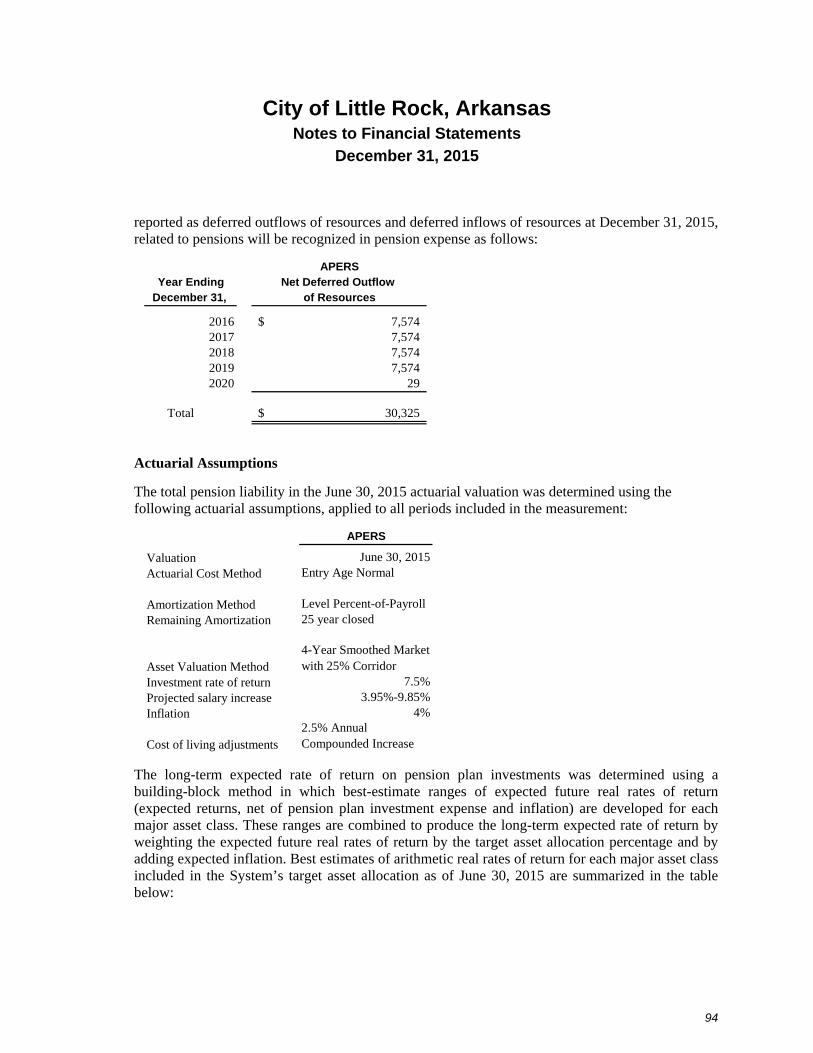
City of Little Rock, Arkansas Notes to Financial Statements
December 31, 2015
94
reported as deferred outflows of resources and deferred inflows of resources at December 31, 2015, related to pensions will be recognized in pension expense as follows:
APERSYear Ending Net Deferred Outflow
December 31, of Resources
2016 7,574$ 2017 7,574 2018 7,574 2019 7,574 2020 29
Total 30,325$
Actuarial Assumptions
The total pension liability in the June 30, 2015 actuarial valuation was determined using the following actuarial assumptions, applied to all periods included in the measurement:
APERS
Valuation June 30, 2015Actuarial Cost Method Entry Age Normal
Amortization Method Level Percent-of-PayrollRemaining Amortization 25 year closed
Asset Valuation Method4-Year Smoothed Market with 25% Corridor
Investment rate of return 7.5%Projected salary increase 3.95%-9.85%Inflation 4%
Cost of living adjustments2.5% Annual Compounded Increase
The long-term expected rate of return on pension plan investments was determined using a building-block method in which best-estimate ranges of expected future real rates of return (expected returns, net of pension plan investment expense and inflation) are developed for each major asset class. These ranges are combined to produce the long-term expected rate of return by weighting the expected future real rates of return by the target asset allocation percentage and by adding expected inflation. Best estimates of arithmetic real rates of return for each major asset class included in the System’s target asset allocation as of June 30, 2015 are summarized in the table below:

City of Little Rock, Arkansas Notes to Financial Statements
December 31, 2015
95
APERS Long-term Expected Asset Class Target Allocation Real Rate of Return
Broad domestic equity 42% 6.82%Internation equity 25% 6.88%Real assets 12% 3.07%Absolute return 5% 3.35%Domestic fixed 16% 0.83%
100%
A single discount rate of 7.5 percent was used to measure the total pension liability. This single discount rate was based on the expected rate of return on pension plan investments of 7.5 percent. The projection of cash flows used to determine this single discount rate assumed that plan member contributions will be made at the current contribution rate and that employer contributions will be made at rates equal to the difference between actuarially determined contribution rates and the member rate. Based on these assumptions, the pension plan’s fiduciary net position was projected to be available to make all projected future benefit payments of current plan members. Therefore, the long-term expected rate of return on pension plan investments was applied to all periods of projected benefit payments to determine the total pension liability.
Regarding the sensitivity of the net pension liability to changes in the single discount rate, the following presents the City’s net pension liability, calculated using a single discount rate of 7.5 percent, as well as what the plan’s net pension liability would be if it were calculated using a single discount rate that is one percent lower or one percent higher:
Current 1% Discount 1%
Decrease Rate Increase6.5% 7.5% 8.5%
APERS Net pension liability 1,385,402$ 841,035$ 388,314$
Defined Contribution Plans
The Nonuniformed Employees’ Defined Contribution Plan (Nonuniformed Contribution Plan) is a defined contribution plan administered by an independent fiduciary agent, but governed by a Board of Trustees consisting of City officials. The Nonuniformed Contribution Plan provides retirement, disability and survivor benefits for nonuniformed full-time employees who have met eligibility requirements as defined by the Plan, with the exception of certain executives and officials who are enrolled in alternate plans. The Nonuniformed Contribution Plan began on January 1, 1981; benefit provisions are established by City Resolution #6482, as amended. The amount of benefits to be paid to any participant depends solely on amounts contributed to the Plan plus investment earnings.
The Plan requires that employees contribute no less than 3.5% and may contribute an additional 10% of their base salary. Only contributions up to 3.5% are pre-tax. The City is required to contribute 4% of covered payroll each pay period. Participants become fully vested in employer contributions and investment earnings credited to their account after five years of service.

City of Little Rock, Arkansas Notes to Financial Statements
December 31, 2015
96
Nonvested City contributions and investment earnings are forfeited when participants leave covered employment and are transferred to a separate account which may be used to reduce City contributions. During 2015, pension expense to the Plan was $2,457,335.
The 401(a) Money Purchase and Trust Retirement Fund is a defined contribution pension plan established under Arkansas state law, covering selected employees. Pension expense is recorded for the amount of the City’s required contributions, determined in accordance with the terms of the Plan. The Plan is administered by a Board of Trustees. The Plan provides retirement benefits to plan members and their beneficiaries. Benefit provisions and contribution requirements are contained in the plan documents and were established, and can be amended, by action of the City’s Board of Directors. During 2015, pension expense to the Plan was $1,086,925.
Note 7: Other Postemployment Benefits
Plan Description: The City of Little Rock sponsors and administers an informal single-employer defined benefit health care plan (Health Management Trust Fund). Arkansas statute provides that any municipal city official or employee vested in any of the City’s retirement plans with 20 years of service and attains 55 years of age may continue to participate in the City’s health care plan after retirement. In addition, members employed at least five years with age plus service exceeding 70 at retirement are eligible for benefits. The State of Arkansas has the authority to establish and amend the requirements of this statute. The City does not issue stand-alone financial statements of the plan but all required information is presented in this report.
Funding Policy: The contribution requirements of plan members are established by the City and may be amended as needed for the first six months of retirement. Plan members pay the entire cost of monthly insurance premiums at the same rate charged to active employees and receive a benefit from the blended premium rate from all of the employees participating in the City’s health insurance plan. After paying full premiums for six months, members are eligible for City-subsidized rates (75% of the single premium rates are paid by the City). The plan has 220 retired participants who pay monthly premiums between $86 for single coverage and $692 for family coverage.
Annual OPEB Cost and Net OPEB Obligation: The City’s other postemployment benefit (OPEB) cost is typically funded by the general fund. The City’s annual OPEB expense is calculated based on the annual required contribution of the employer (ARC), an amount actuarially determined in accordance with the parameters of GASB Statement 45. The ARC represents a level of funding that, if paid on an ongoing basis, is projected to cover normal cost each year and amortize any unfunded actuarial liabilities over a period not to exceed 30 years. The following table shows the components of the City’s annual OPEB cost for the year, the amount actually contributed to the plan, and changes in the City’s net OPEB obligation:

City of Little Rock, Arkansas Notes to Financial Statements
December 31, 2015
97
Annual required contribution $ 1,268,829 30-year amortization of beginning of year net OPEB assets 19,605
Interest on net OPEB asset (17,030)
Annual OPEB Cost 1,271,404
Total annual employer contribution (1,275,345)
Increase in net OPEB asset 3,941
Net OPEB asset – beginning of year 243,282
Net OPEB asset – end of year $ 247,223
The components of the annual required contribution (ARC) calculation reflecting a 30-year amortization period is as follows:
Service cost $ 446,020 Amortization of unfunded obligation 739,802 Interest to end-of-year 83,007
ARC $ 1,268,829
The City’s annual OPEB cost, the percentage of annual OPEB cost contributed to the plan and the net OPEB asset for 2015 and the previous two years are as follows:
Fiscal Year Ended
Annual OPEB Cost
Percentage of Annual OPEB Cost Contributed
Net OPEB Asset
12/31/15 $1,271,404 100% $247,223 12/31/14 $1,252,811 100% $243,282 12/31/13 $972,076 99% $238,791
Funded Status and Funding Progress: As of January 1, 2014, the most recent actuarial valuation date, the OPEB plan was 17.4% funded. The actuarial accrued liability for benefits was $12,075,486, and the actuarial value of assets was $2,095,355, resulting in an unfunded actuarial accrued liability (UAAL) of $9,980,131. The covered payroll (annual payroll of active employees covered by the plan) was $115,408,058, and the ratio of the UAAL to the covered payroll was 8.65%.
Actuarial valuations of an ongoing plan involve estimates of the value of reported amounts and assumptions about the probability of occurrence of events far into the future. Examples include assumptions about future employment, mortality and the health care cost trend. Amounts determined regarding the funded status of the plan and the annual required contributions of the employer are subject to continual revision as actual results are compared with past expectations and

City of Little Rock, Arkansas Notes to Financial Statements
December 31, 2015
98
new estimates are made about the future. The schedule of funding progress, presented as required supplementary information following the notes to the financial statements, will present multiyear trend information about whether the actuarial value of plan assets is increasing or decreasing over time relative to the actuarial accrued liabilities for benefits.
Actuarial Methods and Assumptions: Projections of benefits for financial reporting purposes are based on the substantive plan (the plan as understood by the employer and the plan members) and include the types of benefits provided at the time of each valuation and the historical pattern of sharing of benefit costs between the employer and plan members to that point. The actuarial methods and assumptions used include techniques that are designed to reduce the effects of short-term volatility in actuarial accrued liabilities and the actuarial value of assets, consistent with the long-term perspective of the calculations.
In the January 1, 2014, actuarial valuation, the projected unit credit actuarial cost method was used. The actuarial assumptions included an inflation rate of 2.5%, a 7.0% investment rate of return and an annual health care cost trend rate of 10% initially, reduced by decrements to an ultimate rate of 4% after five years. The UAAL is being amortized on an open basis.
Note 8: Risk Management
Workers’ Compensation
The City participates in a self-funded workers’ compensation plan. All full-time employees are covered by the plan. It is self-funded to a maximum of $400,000 per occurrence, per employee. Coverage amounts in excess of this limit have been obtained by means of a stop loss reinsurance policy. The City records an estimated liability and liquidates that liability within the General Fund based on claims made against the City. Claims liabilities are based on estimates of the ultimate cost of reported claims (including future claim adjustment expenses) and an estimate for claims incurred but not yet reported based on historical experience. Settlements have not exceeded coverage in each of the past three years. The following represents the changes in approximate aggregate liabilities of the workers’ compensation plan for the City from January 1, 2014, to December 31, 2015:
Liability balance, January 1, 2014 $ 1,642,243 Claims and changes in estimates 129,991 Claims payments (570,116)Liability balance, December 31, 2014 1,202,118 Claims and changes in estimates 676,843 Claims payments (862,868)
Liability balance, December 31, 2015 $ 1,016,093
Insurance Coverage
The City and its component units have various insurance policies to cover their potential liability risk areas, i.e., automobile, personal property, contents and outside structures and workers’ compensation. The type of coverage and the liability limits vary with each entity. Coverage is

City of Little Rock, Arkansas Notes to Financial Statements
December 31, 2015
99
provided both commercially and through the Arkansas Municipal League (AML), which is an association of local governments. AML provides the City with automobile and legal defense coverage. Fixed premiums are set annually by AML based on such factors as claims experience, employee class multipliers and population. For risks covered by AML, the City pays no deductible; however, the City pays a $3,000 fee to AML for each legal matter it handles. There have been no significant reductions in coverage from 2014 to 2015; nor have settlement amounts exceeded insurance coverage for each of the past three years.
Note 9: Property Taxes
City property taxes are levied each November 1 on the assessed value listed as of January 1 for all real and personal property located in the City. The property tax is considered due the first Monday in January (the lien date) after the levy; however, the tax is not considered delinquent until October 11 of that year. As a result, the majority of the tax is not collected within the time frame necessary to finance the liabilities of the current period. Property taxes, which remain delinquent for a period of three years, are certified to the land commissioner where a lien is recorded and held on file. If property taxes remain delinquent for a period of seven years, the property will be subsequently sold by the land commissioner. If proceeds from the sale are sufficient to cover all claims, the City will collect on the past due property taxes. Pulaski County is the collecting agent and remits collections to the City, net of a collection fee, on a monthly basis.
In the governmental funds, property taxes are measurable when levied even though not available. As a result, at December 31, 2015, property taxes receivable and related deferred inflows of resources of $50,650,614 have been recorded in the governmental funds. In the government-wide statement of net position, property taxes are considered earned at the time levied. In addition to property taxes levied, any delinquent taxes are recorded net of amounts considered uncollectible. The appraised value of taxable property upon which the property tax is levied is determined by the county assessor. The assessor estimates full market value of the property and applies the statutory rate of 20% to arrive at assessed value.
Millages available to finance City operations and for other purposes are as follows:
MillageDescription Limit
General purpose 5.00 5.00 Municipal improvements 3.00 3.00 Library operations 3.30 3.30 Library capital improvement bonds 1.80 1.80 Firemen’s relief and pension fund 1.00 1.00 Policemen’s pension and relief fund 1.00 1.00 Roads 1.45 1.45
Total 16.55 16.55
Levied
Collections2014 for 2015

City of Little Rock, Arkansas Notes to Financial Statements
December 31, 2015
100
Note 10: Landfill Closure and Postclosure Care Cost
Federal and state laws and regulations require the Solid Waste Landfill to close the landfill that began accepting waste after October 9, 1993, by (1) covering the site with an impermeable cap, (2) implementing additional groundwater monitoring, (3) providing a minimum of 30 years of postclosure care and (4) demonstrating financial assurance for the closure and postclosure care. Although closure and postclosure care costs will be paid only near or after the date that the landfill stops accepting waste, the City reports a portion of these closure and postclosure care costs as an operating expense in each period based on landfill capacity used as of each balance sheet date. The cumulative recognition of this liability of $4,502,291 is based on 21% use of Class I Waste total constructed capacity, and 35.8% use of Class IV Waste constructed capacity. The Waste Disposal Fund will recognize, as the remaining capacity is filled, an estimated additional $11,397,647 for final closure and postclosure of the entire landfill, which is expected to close in or about the year 2065. These amounts are based on engineering estimates of what it would cost to perform all closure and postclosure care in 2015. Actual cost may be higher due to inflation, changes in technology, or changes in regulations. The City Waste Disposal Fund demonstrates financial assurance for closure and postclosure care through the Environmental Protection Agency’s Local Government Financial Test, 40 CFR Part 258, Subpart G, dated November 27, 1996. In this test, the City demonstrates that it is capable of meeting its financial obligations at its municipal solid waste landfill facility through a bond rating requirement where all outstanding general obligation bonds have a current investment grade bond rating.
Note 11: Other Required Disclosures
The following enterprise fund has a deficit net position as of December 31, 2015:
Fund Deficit Amount
Vehicle Storage $ (846,828)
Total deficit net position $ (846,828)
The deficit net position is the result of revenues inadequate to cover expenses, including depreciation, in the current and/or prior years.
Note 12: Contingencies
The City participates in several federal financial assistance programs. The City’s grant programs have been audited in accordance with the provisions of the Single Audit Act of 1984, as amended by the Single Audit Act Amendments of 1996, and are subject to resolution of previously identified questioned costs. The amount, if any, of expenditures which may be disallowed by the granting agencies cannot be determined at this time.
City of Little Rock, Arkansas Notes to Financial Statements
December 31, 2015
101
The City has an ongoing agreement with the Central Arkansas Transit Authority (CATA) to finance 67% of its operating deficits. The City could continue to be required to fund CATA’s operating deficits if the current level of services is to be maintained in the future.
The City is a member of the Arkansas Municipal Legal Defense Program (AMLDP), which provides extraordinary legal defense and extraordinary expenses in suits against municipal officials and employees and civil rights suits against the municipal government. The Program only pays judgments for actual damages (not punitive damages) imposed on municipal governments and their officials and employees; which will not exceed 25% of the Program’s available funds at the time the lawsuit was filed or the judgment becomes final, or $1 million, whichever is less. In the opinion of the City Attorney, the amount of financial exposure to the City as a result of litigation matters handled by the Program is not significant to the City.
The City, its agencies, and its employees are defendants in numerous legal proceedings, many of which normally occur in governmental operations. Such litigation includes, but is not limited to, claims assessed against the City for property damage and personal injury, other alleged torts and alleged violations of state and federal laws. It is not possible to predict with certainty or exactitude the ultimate outcome of all lawsuits pending or threatened against the City. Based on the current status of all of the legal proceedings, it is the opinion of the City Attorney and management that the ultimate outcome will not have a material adverse impact on the City’s financial position. However, events could occur in the near term that would cause these estimates to change materially.
Note 13: Conduit Debt Obligations
From time to time, the City has issued economic development and other revenue bonds to provide financial assistance to private-sector entities for the acquisition and construction of industrial, commercial, health care facilities and other deemed to be in the public interest. The bonds are secured by the property financed and are payable solely from payments received on the underlying mortgage loans. Neither, the City, the State nor any political subdivision thereof, is obligated in any manner for repayment of the bonds.
As of December 31, 2015, the aggregate principal amount payable on these bonds was approximately $249,509,343.
Note 14: Jointly Governed Organization
In 2001, the City of Little Rock and the City of North Little Rock entered into an agreement to create an entity to own and operate a consolidated water system. The created entity serves customers located within the corporate limits of the City parties. Under GASB 14, the entity is considered a jointly governed organization.

City of Little Rock, Arkansas Notes to Financial Statements
December 31, 2015
102
Note 15: Fund Balance
The City classified governmental fund balances as follows:
General Fund
Sales Tax Capital
Improvements
2013 Captial Improvements (Debt Service)
2013 Capital Improvements
(Capital Improvements) Street
Other Govenmental
Funds
Total Governmental
Funds
Fund BalancesNonspendable:
Prepaids and inventories 1,020,087$ -$ -$ -$ 25,240$ 1,622,364$ 2,667,691$ Restricted
Debt service - - 11,295,330 - - 6,496,361 17,791,691 Grant funds - - - - - 1,970,349 1,970,349 Library capital projects - - - - - 20,480,734 20,480,734 Infrastructure - - - - 12,651,844 - 12,651,844 Capital projects - - - - - 875,964 875,964 General administration special projects - 4,089,666 - - - 492,801 4,582,467 Courts special projects - - - - - 259,985 259,985 Finance special projects - 432,043 - - - 19,887 451,930 Human resources special projects - - - - - 559,002 559,002 Information technology special projects - 630,632 - - - 1,618 632,250 Planning and development special projects - - - - - 103,051 103,051 Housing and neighborhood programs special projects - 224,936 - - - 434,602 659,538 Public works special projects - 14,036,325 - 35,208,659 - 965,987 50,210,971 Parks special projects - 5,701,937 - - - 1,111,763 6,813,700 Zoo special projects - - - - - 70,626 70,626 Fire special projects - 511,143 - - - 182,686 693,829 Police special projects - 4,419,954 - - - 451,187 4,871,141 Fleet special projects - - - - - 169,375 169,375
CommittedCable network 300,264 - - - - - 300,264
AssignedGeneral administration special projects 2,132,877 - - - - - 2,132,877 Community programs special projects 3,738,908 - - - - - 3,738,908 Finance special projects 13,000 - - - - - 13,000 City attorneys special projects 2,833 - 2,833 Human resources special projects 19,995 - - - - - 19,995 Information technology special projects 970,525 - - - - - 970,525 Planning special projects 84,170 - - - - - 84,170 Housing and neighborhood programs special projects 369,615 - - - - - 369,615 Public works special projects 2,324,709 - - - - - 2,324,709 Parks special projects 600,235 - - - - - 600,235 Fire special projects 20,000 - - - - - 20,000 Police special projects 904,814 - - - - - 904,814 Fleet special projects 1,021,123 - - - - - 1,021,123 Zoo special projects 128,232 - - - - - 128,232
Unassigned 25,567,858 (233,120) - - - (2,620,344) 22,714,394
Total Fund Balances 39,219,245$ 29,813,516$ 11,295,330$ 35,208,659$ 12,677,084$ 33,647,998$ 161,861,832$

City of Little Rock, Arkansas Notes to Financial Statements
December 31, 2015
103
Note 16: Subsequent Events
Subsequent to year end, the City approved the issuance of a $4,525,000 promissory note to purchase fleet vehicles and equipment, replace the fire self-contained breathing apparatus, the fire suppression system at the information technology building, the information technology fiber infrastructure and planning and permitting software and field devices.
Subsequent to year end, the City approved the issuance of a $2,850,000 promissory note to purchase the facility located at 101 South Spring Street.
Subsequent to year end, the City approved the issuance of the $18,585,000 Sewer Refunding Revenue Bonds, Series 2016B. The bonds are being issued for the purpose of (i) advance refunding the Issuer’s Sewer Revenue Bonds, Series 2008 and the Issuer’s Sewer Revenue Bonds, Series 2009B; (ii) paying a premium for a debt service reserve insurance policy; and (iii) paying the costs of issuing the Bonds.
Note 17: Change in Accounting Principles
The GASB has issued the following statement which became effective for fiscal year 2015. Statement No. 68, Accounting and Financial Reporting for Pensions-an amendment of GASB Statement No. 27, changes the focus of pension accounting for employers from whether they are responsibly funding their plan over time to a point-in-time liability that is reflected in the employer’s financial statements for any actuarially unfunded portion of pension benefits earned to date. Adoption of GASB 68 resulted in adjustments of $121,559,110 and $462,772, to beginning government-wide net position governmental activities and business-type activities, respectively.
The City implemented Governmental Accounting Standards Board (GASB) Statement No. 71, Pension Transition for Contributions Made Subsequent the Measurement Date - an amendment of GASB Statement No. 68, for 2015. The statement includes guidance for accounting for contributions made to defined benefit pension plans after the measurement date of the net pension liability but prior to the government’s fiscal year end. See Note 6 for a detail of these amounts as they relate to the specific pensions of the City.

Required Supplementary Information

City of Little Rock, Arkansas Budgetary Comparison Schedule
General Fund
Year Ended December 31, 2015
104
Variance withFinal Budget
Original Final PositiveBudget Budget Actual (Negative)
RevenuesProperty taxes 27,276,348$ 27,276,348$ 26,685,192$ (591,156)$ Sales taxes 96,684,815 99,389,815 99,881,725 491,910 Licenses and permits 11,026,550 10,784,550 11,070,904 286,354 Intergovernmental 7,002,433 7,686,788 7,871,832 185,044 Charges for services 11,332,650 9,773,100 9,840,556 67,456 Fines and fees 3,161,210 2,769,844 2,790,685 20,841 Utility franchise fees 28,744,707 29,744,707 29,306,202 (438,505) Investment income 200,000 200,000 217,976 17,976 Miscellaneous 766,826 1,292,326 1,907,311 614,985
Total revenues 186,195,539 188,917,478 189,572,383 654,905
ExpendituresGeneral government:
General administration 20,371,325 19,748,839 20,429,202 (680,363) Board of directors 342,027 342,064 341,353 711 Community programs 423,578 402,143 6,214,133 (5,811,990) City attorney 1,836,901 1,737,560 1,726,729 10,831 District court-first division (criminal) 1,405,790 1,396,226 1,281,039 115,187 District court-third division (environmental) 626,782 639,286 630,352 8,934 District court-second division (traffic) 1,248,245 1,281,588 1,277,214 4,374 Finance 3,204,124 3,142,989 2,986,334 156,655 Human resources 1,673,177 1,771,481 1,749,328 22,153 Information technology 4,679,784 3,898,233 3,753,058 145,175 Planning and development 2,564,192 2,174,153 2,047,792 126,361
Total general government 38,375,925 36,534,562 42,436,534 (5,901,972)
Public works 1,159,922 1,049,223 2,135,769 (1,086,546) Parks and recreation services 9,958,932 9,170,196 9,244,782 (74,586) River Market 1,209,164 1,209,164 1,188,494 20,670 Golf 2,308,904 2,397,757 2,390,265 7,492 Jim Daily Fitness 901,127 876,776 855,515 21,261 Zoo 6,733,727 6,109,593 6,253,480 (143,887) Fire 46,232,253 46,475,323 45,985,110 490,213 Police 68,885,072 66,673,664 67,344,609 (670,945) Fleet - - 233,814 (233,814) Housing and neighborhood programs 5,790,389 4,950,893 5,726,749 (775,856) Debt service
Principal 7,315,401 7,315,401 7,315,438 (37) Interest 375,317 375,317 375,317 - Agent fees - - 11,375 (11,375)
Vacancy savings (6,000,000) - - - .
Total expenditures 183,246,133 183,137,869 191,497,251 (8,359,382)
Excess (Deficiency) of Revenues Over (Under) Expenditures 2,949,406 5,779,609 (1,924,868) (7,704,477)
Other Financing Sources (Uses)Carryover - prior year 550,000 550,000 - (550,000) Transfers in 7,994,672 7,994,672 8,491,405 496,733 Transfers out (11,494,079) (14,324,282) (1,657,913) 12,666,369
Total other financing sources (uses) (2,949,407) (5,779,610) 6,833,492 12,613,102
Net Change in Fund Balances (1) (1) 4,908,624 4,908,625
Fund Balances, Beginning of Year 34,310,621 34,310,621 34,310,621 -
Fund Balances, End of Year 34,310,620$ 34,310,624$ 39,219,245$ 4,908,625$
City of Little Rock, Arkansas Notes to Budgetary Comparison Schedule
General Fund
Year Ended December 31, 2015
105
Budgets and Budgetary Accounting
An annual operating budget is prepared for the General Fund by the City Manager. The budget reflects revenues expected to be received during the year and expenditures expected to be incurred. The City Manager is required by city and state law to submit these Required Supplementary Information budgets to the Board of Directors for approval. The Board of Directors subsequently adopts this budget by City ordinance by December 31. Departmental expenditures relating to budget items may not exceed their appropriated amounts without approval. As specified in the budget ordinance, the City Manager has authority to approve budget transfers between departments up to $50,000. Transfers over this amount must receive Board of Directors’ approval. The original budget of the General Fund was amended during 2015.
Appropriations for special projects are made each year by the Board of Directors to finance specific events and capital outlays. These projects are carried forward each year until they are fully expended or repealed by Board of Directors’ ordinance.
The City prepares its annual operating budget on a basis consistent with accounting principles generally accepted in the United States of America (GAAP). Appropriations lapse at the end of each year. The Budgetary Comparison Schedule – General Fund presents the original and revised budget amounts in comparison to the actual amounts of revenues and expenditures for the current year.
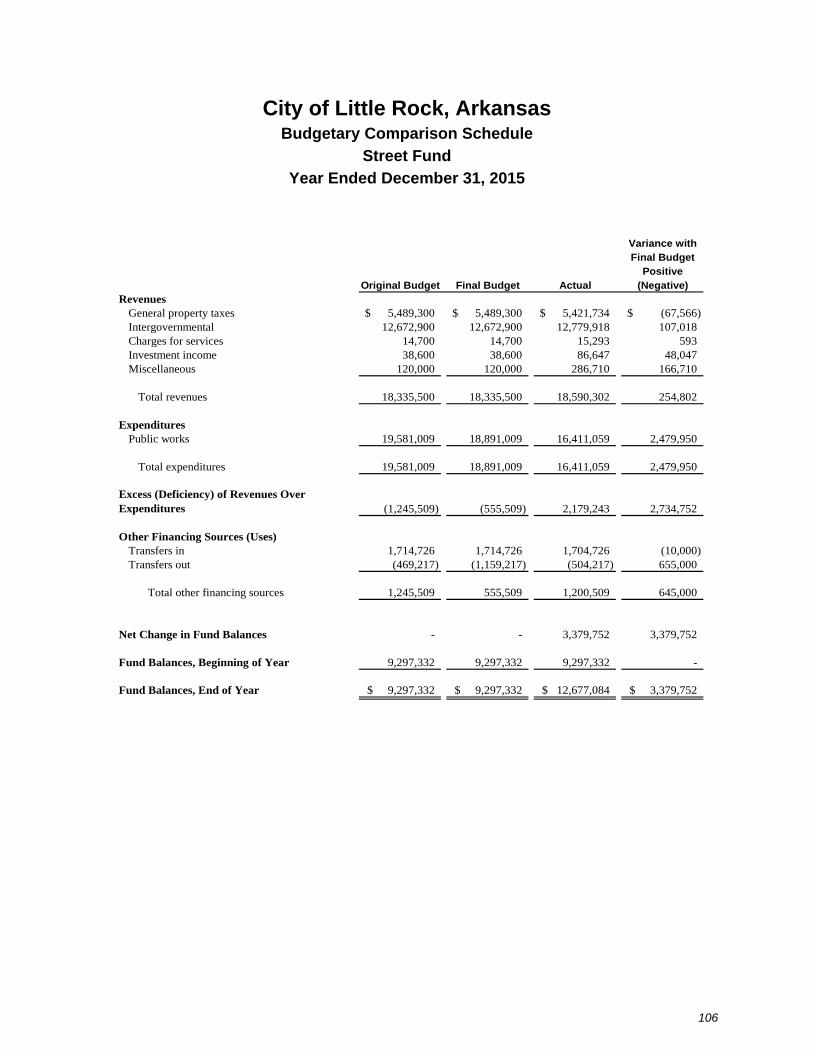
City of Little Rock, Arkansas Budgetary Comparison Schedule
Street Fund
Year Ended December 31, 2015
106
Variance withFinal Budget
PositiveOriginal Budget Final Budget Actual (Negative)
RevenuesGeneral property taxes 5,489,300$ 5,489,300$ 5,421,734$ (67,566)$ Intergovernmental 12,672,900 12,672,900 12,779,918 107,018 Charges for services 14,700 14,700 15,293 593 Investment income 38,600 38,600 86,647 48,047 Miscellaneous 120,000 120,000 286,710 166,710
Total revenues 18,335,500 18,335,500 18,590,302 254,802
ExpendituresPublic works 19,581,009 18,891,009 16,411,059 2,479,950
Total expenditures 19,581,009 18,891,009 16,411,059 2,479,950
Excess (Deficiency) of Revenues Over Expenditures (1,245,509) (555,509) 2,179,243 2,734,752
Other Financing Sources (Uses)Transfers in 1,714,726 1,714,726 1,704,726 (10,000) Transfers out (469,217) (1,159,217) (504,217) 655,000
Total other financing sources 1,245,509 555,509 1,200,509 645,000
Net Change in Fund Balances - - 3,379,752 3,379,752
Fund Balances, Beginning of Year 9,297,332 9,297,332 9,297,332 -
Fund Balances, End of Year 9,297,332$ 9,297,332$ 12,677,084$ 3,379,752$
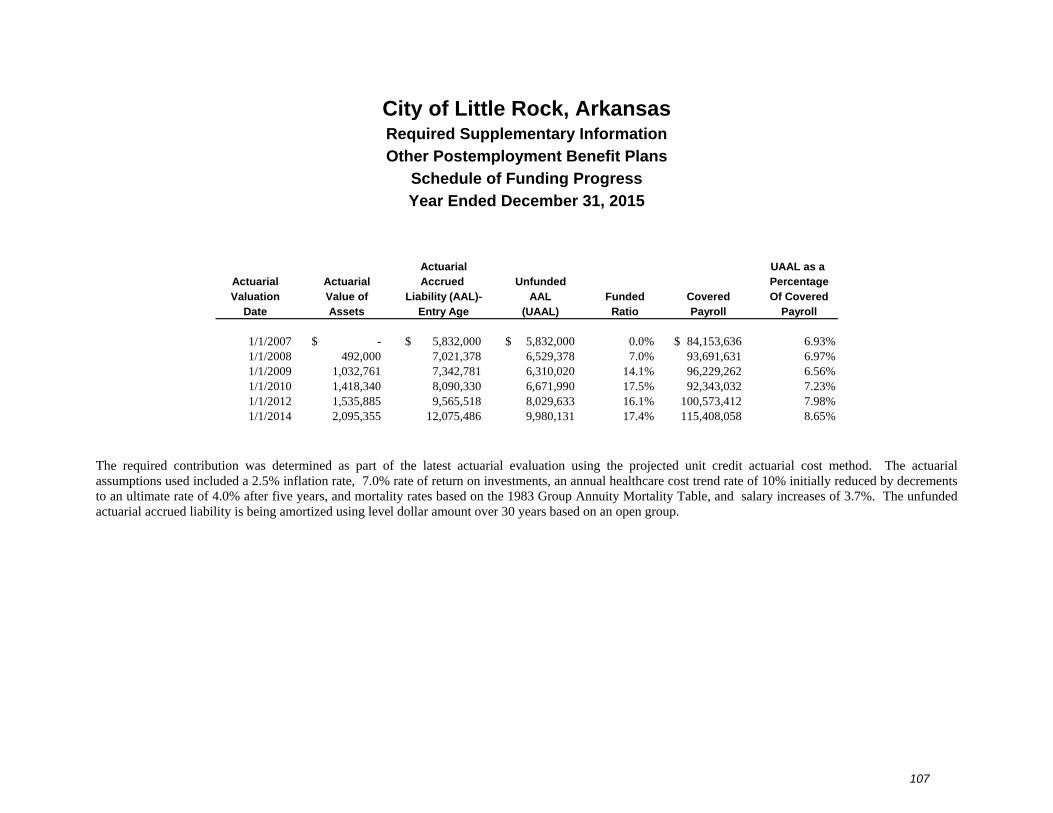
City of Little Rock, Arkansas Required Supplementary Information
Other Postemployment Benefit Plans
Schedule of Funding Progress
Year Ended December 31, 2015
107
Actuarial UAAL as a Actuarial Actuarial Accrued Unfunded PercentageValuation Value of Liability (AAL)- AAL Funded Covered Of Covered
Date Assets Entry Age (UAAL) Ratio Payroll Payroll
1/1/2007 -$ 5,832,000$ 5,832,000$ 0.0% 84,153,636$ 6.93%1/1/2008 492,000 7,021,378 6,529,378 7.0% 93,691,631 6.97%1/1/2009 1,032,761 7,342,781 6,310,020 14.1% 96,229,262 6.56%1/1/2010 1,418,340 8,090,330 6,671,990 17.5% 92,343,032 7.23%1/1/2012 1,535,885 9,565,518 8,029,633 16.1% 100,573,412 7.98%1/1/2014 2,095,355 12,075,486 9,980,131 17.4% 115,408,058 8.65%
The required contribution was determined as part of the latest actuarial evaluation using the projected unit credit actuarial cost method. The actuarial assumptions used included a 2.5% inflation rate, 7.0% rate of return on investments, an annual healthcare cost trend rate of 10% initially reduced by decrements to an ultimate rate of 4.0% after five years, and mortality rates based on the 1983 Group Annuity Mortality Table, and salary increases of 3.7%. The unfunded actuarial accrued liability is being amortized using level dollar amount over 30 years based on an open group.

City of Little Rock, Arkansas Defined Benefit Pension Plans – Required Supplementary Information
Schedules of Changes in the City’s Net Pension Liability and Related Ratios
Year Ended December 31, 2015
108
Firemen's Pension and Relief Fund
Fiscal Year ending December 31, 2015 2014Total pension liability
Interest 6,649,073$ 6,642,747$ Changes of benefit terms - 8,000,000 Difference between expected and actual experience (6,896,944) (3,791,117) Changes in assumptions - - Benefit payments, including refunds of plan member contributions (10,763,891) (10,686,313)
Net change in total pension liability (11,011,762) 165,317
Total pension liability, beginning of year 138,363,417 138,198,100
Total pension liability, end of year 127,351,655$ 138,363,417$
Plan fiduciary net position
Employer contributions 5,312,855$ 5,730,454$ Plan member contributions 14,993 33,835 Net investment income (2,774,677) 2,431,112 Benefit payments, including refunds of plan member contributions (10,763,891) (10,686,313) Administrative expense (9,491) (389,423) Other (121,985) (9,467) Net change in plan fiduciary net position (8,342,196) (2,889,802)
Plan fiduciary net position, beginning of year 70,777,747 73,667,549
Plan fiduciary net position, end of year 62,435,551$ 70,777,747$
City's net pension liability, end of year 64,916,104$ 67,585,670$
Plan's fiduciary net position as a percentage of the total pension liability 49.03% 51.15%
Covered-employee payroll - -
Plan's net pension liability as a percentage of covered-employee payroll NA NA
Note: A full 10 year schedule will be completed as information is available.

City of Little Rock, Arkansas Defined Benefit Pension Plans – Required Supplementary Information
Schedules of Changes in the City’s Net Pension Liability and Related Ratios
Year Ended December 31, 2015
109
Police Pension Plan
Fiscal Year ending December 31, 2015Total pension liability
Service Cost -$ Service cost - service purchase - Interest 7,172,118Changes of benefit terms - Difference between expected - and actual experience 2,845,816 Changes in assumptions - Benefit payments, including refunds - of plan member contributions (10,183,707)
Net change in total pension liability (165,773)
Total pension liability, beginning of year 94,743,329
Total pension liability, end of year 94,577,556$
Plan fiduciary net position
Employer contributions 5,939,677$ Plan member contributions - Contributions - employee service purchase - Net investment income 2,503,835Benefit payments, including refunds of plan - member contributions (10,183,707)Administrative expense (59,497)Other 935,047 Net change in plan fiduciary net position (864,645)
Plan fidicuiary net position, beginning of year 47,029,820
Plan fiduciary net position, end of year 46,165,175$
City's net pension liability, end of year 48,412,381$
Plan's fiduciary net position as a percentage of the total pension liability 48.81%
Covered-employee payroll -
Plan's net pension liability as a percentage of covered-employee payroll NA
Note: A full 10 year schedule will be completed as information is available.
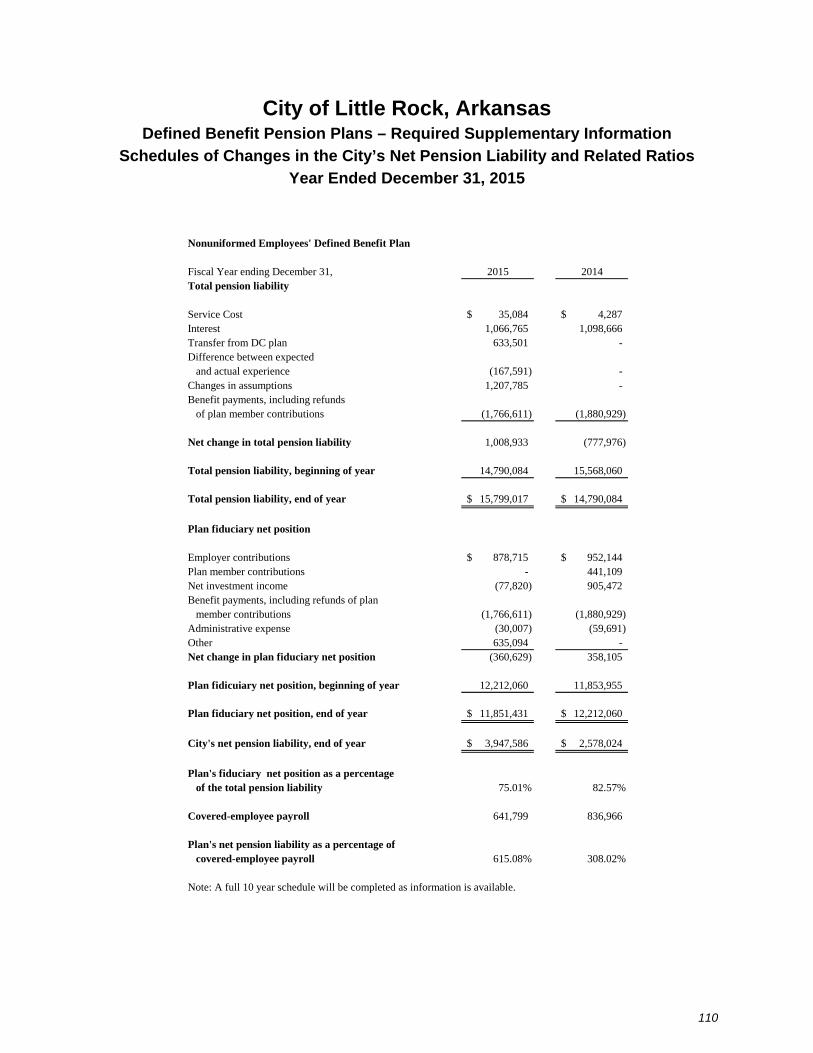
City of Little Rock, Arkansas Defined Benefit Pension Plans – Required Supplementary Information
Schedules of Changes in the City’s Net Pension Liability and Related Ratios
Year Ended December 31, 2015
110
Nonuniformed Employees' Defined Benefit Plan
Fiscal Year ending December 31, 2015 2014Total pension liability
Service Cost 35,084$ 4,287$ Interest 1,066,765 1,098,666Transfer from DC plan 633,501 - Difference between expected and actual experience (167,591) - Changes in assumptions 1,207,785 - Benefit payments, including refunds of plan member contributions (1,766,611) (1,880,929)
Net change in total pension liability 1,008,933 (777,976)
Total pension liability, beginning of year 14,790,084 15,568,060
Total pension liability, end of year 15,799,017$ 14,790,084$
Plan fiduciary net position
Employer contributions 878,715$ 952,144$ Plan member contributions - 441,109 Net investment income (77,820) 905,472Benefit payments, including refunds of plan member contributions (1,766,611) (1,880,929)Administrative expense (30,007) (59,691)Other 635,094 - Net change in plan fiduciary net position (360,629) 358,105
Plan fidicuiary net position, beginning of year 12,212,060 11,853,955
Plan fiduciary net position, end of year 11,851,431$ 12,212,060$
City's net pension liability, end of year 3,947,586$ 2,578,024$
Plan's fiduciary net position as a percentage of the total pension liability 75.01% 82.57%
Covered-employee payroll 641,799 836,966
Plan's net pension liability as a percentage of covered-employee payroll 615.08% 308.02%
Note: A full 10 year schedule will be completed as information is available.
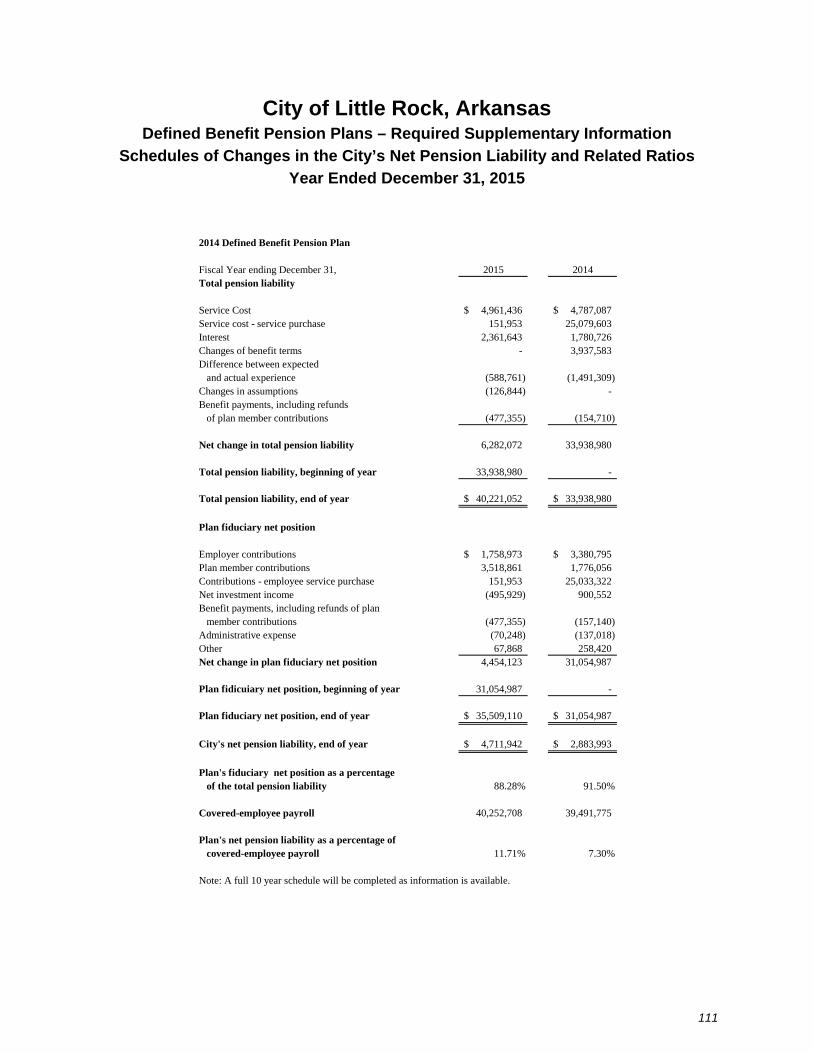
City of Little Rock, Arkansas Defined Benefit Pension Plans – Required Supplementary Information
Schedules of Changes in the City’s Net Pension Liability and Related Ratios
Year Ended December 31, 2015
111
2014 Defined Benefit Pension Plan
Fiscal Year ending December 31, 2015 2014Total pension liability
Service Cost 4,961,436$ 4,787,087$ Service cost - service purchase 151,953 25,079,603Interest 2,361,643 1,780,726Changes of benefit terms - 3,937,583Difference between expected and actual experience (588,761) (1,491,309)Changes in assumptions (126,844) - Benefit payments, including refunds of plan member contributions (477,355) (154,710)
Net change in total pension liability 6,282,072 33,938,980
Total pension liability, beginning of year 33,938,980 -
Total pension liability, end of year 40,221,052$ 33,938,980$
Plan fiduciary net position
Employer contributions 1,758,973$ 3,380,795$ Plan member contributions 3,518,861 1,776,056Contributions - employee service purchase 151,953 25,033,322Net investment income (495,929) 900,552Benefit payments, including refunds of plan member contributions (477,355) (157,140)Administrative expense (70,248) (137,018)Other 67,868 258,420 Net change in plan fiduciary net position 4,454,123 31,054,987
Plan fidicuiary net position, beginning of year 31,054,987 -
Plan fiduciary net position, end of year 35,509,110$ 31,054,987$
City's net pension liability, end of year 4,711,942$ 2,883,993$
Plan's fiduciary net position as a percentage of the total pension liability 88.28% 91.50%
Covered-employee payroll 40,252,708 39,491,775
Plan's net pension liability as a percentage of covered-employee payroll 11.71% 7.30%
Note: A full 10 year schedule will be completed as information is available.

City of Little Rock, Arkansas Defined Benefit Pension Plans – Required Supplementary Information
Schedule of Contributions
Year Ended December 31, 2015
112
Year Ended December 31,
Actuarially Determined Contribution
(ADC)Actual
Contribution
Contribution Deficiency (Excess)
Covered Employee
Payroll
Actual Contribution as a % of Covered
Payroll2015 16,048,838 5,312,855 10,735,983 - NA
Note: A full 10 year schedule will be completed as information is available.
Key Assumptions for ADC:
Year Ended December 31,
Actuarially Determined Contribution
(ADC)Actual
Contribution
Contribution Deficiency (Excess)
Covered Employee
Payroll
Actual Contribution as a % of Covered
Payroll2015 3,875,821 6,633,686 (2,757,865) - NA
Note: A full 10 year schedule will be completed as information is available.
Key Assumptions for ADC:
Firemen's Pension and Relief Fund
Cost method Entry age normalAmortization method Level dollar, openRemaining amortization 5 yearsAsset valuation Market value of assetsInvestment rate of return 5%Mortality 1983 GAM
Police Pension
Cost method Individual entry age normalAmortization method Closed amortizatio period based on projected future payroll
Mortality RP-2000 Combined Mortality Table, prjected to 2017 and set forward two years for men. Disabled lives, the mortality rates are the rates applicable to nondisabled lives set forward 10 years.
5-year smoothes market; 20% corridor24 years beginning January 1, 2016Remaining amortization
Asset valuationInvestment rate of return 8%
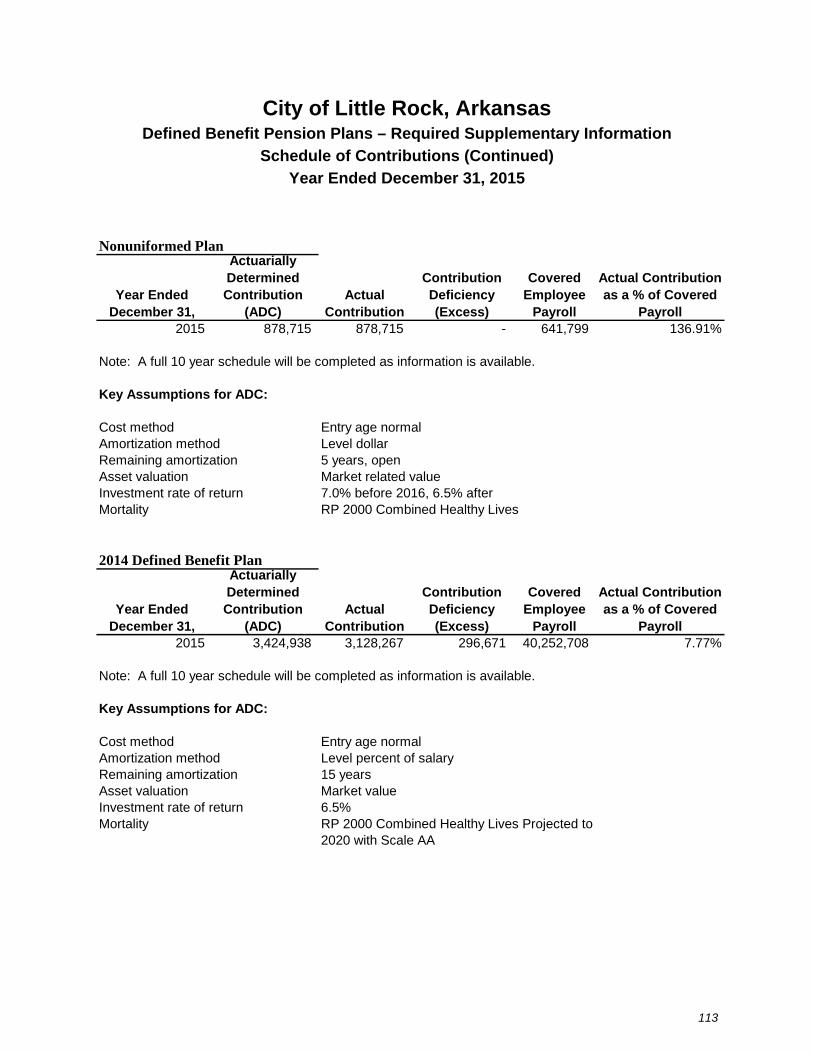
City of Little Rock, Arkansas Defined Benefit Pension Plans – Required Supplementary Information
Schedule of Contributions (Continued)
Year Ended December 31, 2015
113
Year Ended December 31,
Actuarially Determined Contribution
(ADC)Actual
Contribution
Contribution Deficiency (Excess)
Covered Employee
Payroll
Actual Contribution as a % of Covered
Payroll2015 878,715 878,715 - 641,799 136.91%
Note: A full 10 year schedule will be completed as information is available.
Key Assumptions for ADC:
Year Ended December 31,
Actuarially Determined Contribution
(ADC)Actual
Contribution
Contribution Deficiency (Excess)
Covered Employee
Payroll
Actual Contribution as a % of Covered
Payroll2015 3,424,938 3,128,267 296,671 40,252,708 7.77%
Note: A full 10 year schedule will be completed as information is available.
Key Assumptions for ADC:
Nonuniformed Plan
Cost methodAmortization methodRemaining amortizationAsset valuation
Remaining amortization 15 years
Mortality
Entry age normalLevel dollar 5 years, openMarket related value 7.0% before 2016, 6.5% afterRP 2000 Combined Healthy Lives
Investment rate of return
2014 Defined Benefit Plan
Cost method Entry age normalAmortization method Level percent of salary
Asset valuation Market value Investment rate of return 6.5%Mortality RP 2000 Combined Healthy Lives Projected to
2020 with Scale AA
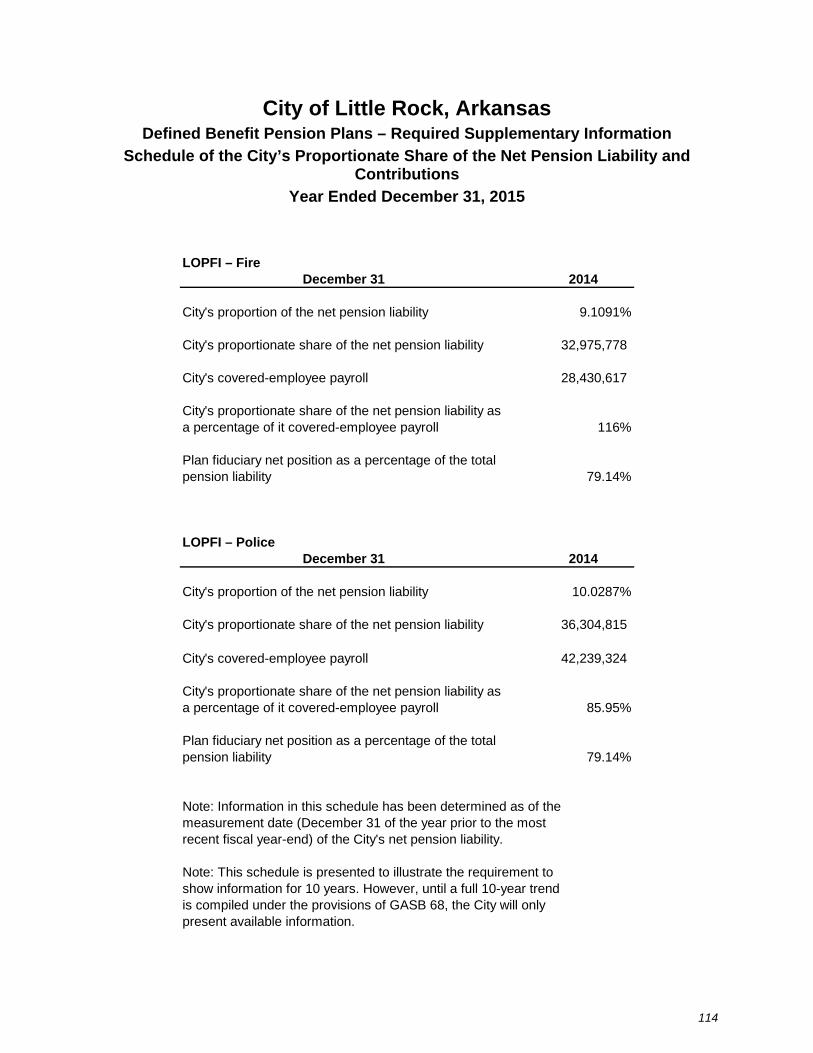
City of Little Rock, Arkansas Defined Benefit Pension Plans – Required Supplementary Information
Schedule of the City’s Proportionate Share of the Net Pension Liability and Contributions
Year Ended December 31, 2015
114
LOPFI – FireDecember 31 2014
City's proportion of the net pension liability 9.1091%
City's proportionate share of the net pension liability 32,975,778
City's covered-employee payroll 28,430,617
116%
79.14%
LOPFI – PoliceDecember 31 2014
City's proportion of the net pension liability 10.0287%
City's proportionate share of the net pension liability 36,304,815
City's covered-employee payroll 42,239,324
85.95%
79.14%
Note: Information in this schedule has been determined as of themeasurement date (December 31 of the year prior to the most recent fiscal year-end) of the City's net pension liability.
Note: This schedule is presented to illustrate the requirement to show information for 10 years. However, until a full 10-year trend is compiled under the provisions of GASB 68, the City will onlypresent available information.
City's proportionate share of the net pension liability as a percentage of it covered-employee payroll
Plan fiduciary net position as a percentage of the total pension liability
City's proportionate share of the net pension liability as a percentage of it covered-employee payroll
Plan fiduciary net position as a percentage of the total pension liability

City of Little Rock, Arkansas Defined Benefit Pension Plans – Required Supplementary Information
Schedule of the City’s Proportionate Share of the Net Pension Liability and Contributions (Continued)
Year Ended December 31, 2015
115
LOPFI – FireDecember 31 2015
Contractually required contribution 5,627,114
(5,627,114)
Contribution deficiency (excess) 0
City's covered-employee payroll 28,505,619
19.74%
LOPFI – PoliceDecember 31 2015
Contractually required contribution 6,056,539
(6,056,539)
Contribution deficiency (excess) -
City's covered-employee payroll 42,209,708
14.35%
Note: Information in this schedule has been determined as of the City's most recent year-end.
Note: This schedule is presented to illustrate the requirement to show information for 10 years. However, until a full 10-year trend is compiled under the provisions of GASB 68, the City will onlypresent available information.
Contributions related to the contractually required contribution
Contributions as a percentage of covered-employee payroll
Contributions related to the contractually required contribution
Contributions as a percentage of covered-employee payroll

City of Little Rock, Arkansas Defined Benefit Pension Plans – Required Supplementary Information
Schedule of the City’s Proportionate Share of the Net Pension Liability and Contributions (Continued)
Year Ended December 31, 2015
116
APERSJune 30 2015
City's proportion of the net pension liability 0.04566542%
City's proportionate share of the net pension liability 841,035
City's covered-employee payroll 532,755
158%
80.39%
Note: Information in this schedule has been determined as of themeasurement date (June 30 of the fiscal year) of the City's net pension liability.
Note: This schedule is presented to illustrate the requirement to show information for 10 years. However, until a full 10-year trend is compiled under the provisions of GASB 68, the City will onlypresent available information.
Plan fiduciary net position as a percentage of the total pension liability
City's proportionate share of the net pension liability as a percentage of it covered-employee payroll
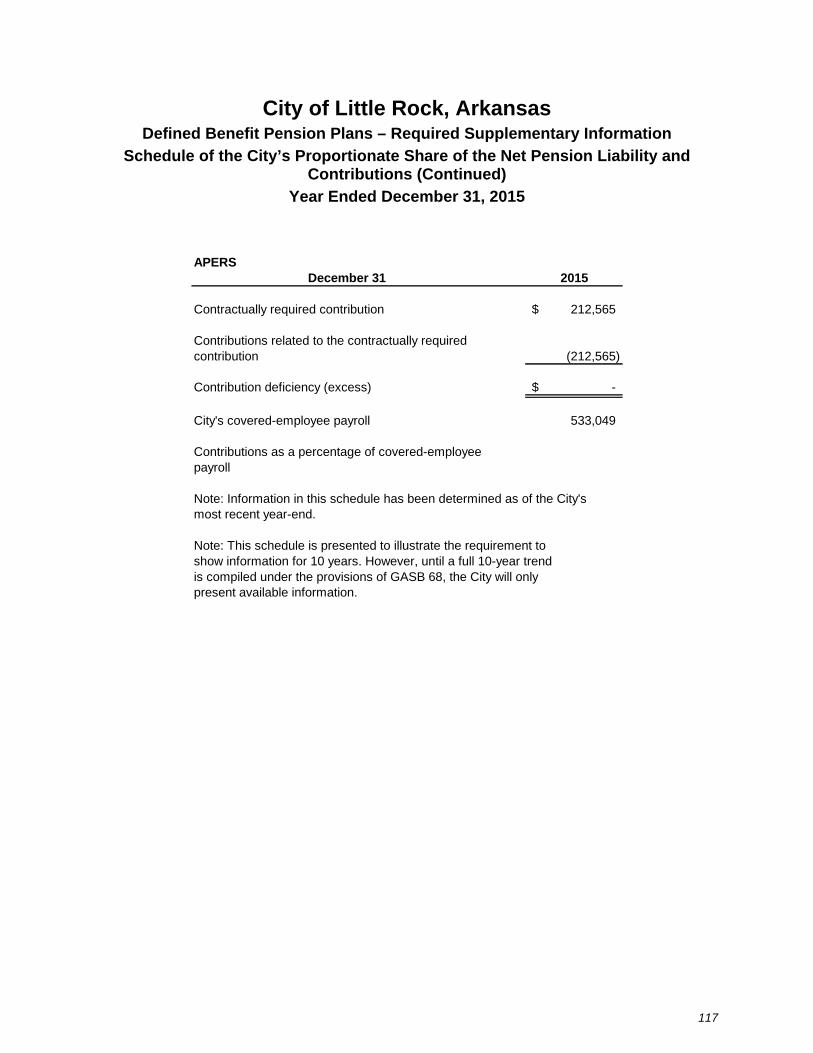
City of Little Rock, Arkansas Defined Benefit Pension Plans – Required Supplementary Information
Schedule of the City’s Proportionate Share of the Net Pension Liability and Contributions (Continued)
Year Ended December 31, 2015
117
APERSDecember 31 2015
Contractually required contribution 212,565$
(212,565)
Contribution deficiency (excess) -$
City's covered-employee payroll 533,049
Note: Information in this schedule has been determined as of the City's most recent year-end.
Note: This schedule is presented to illustrate the requirement to show information for 10 years. However, until a full 10-year trend is compiled under the provisions of GASB 68, the City will onlypresent available information.
Contributions related to the contractually required contribution
Contributions as a percentage of covered-employee payroll
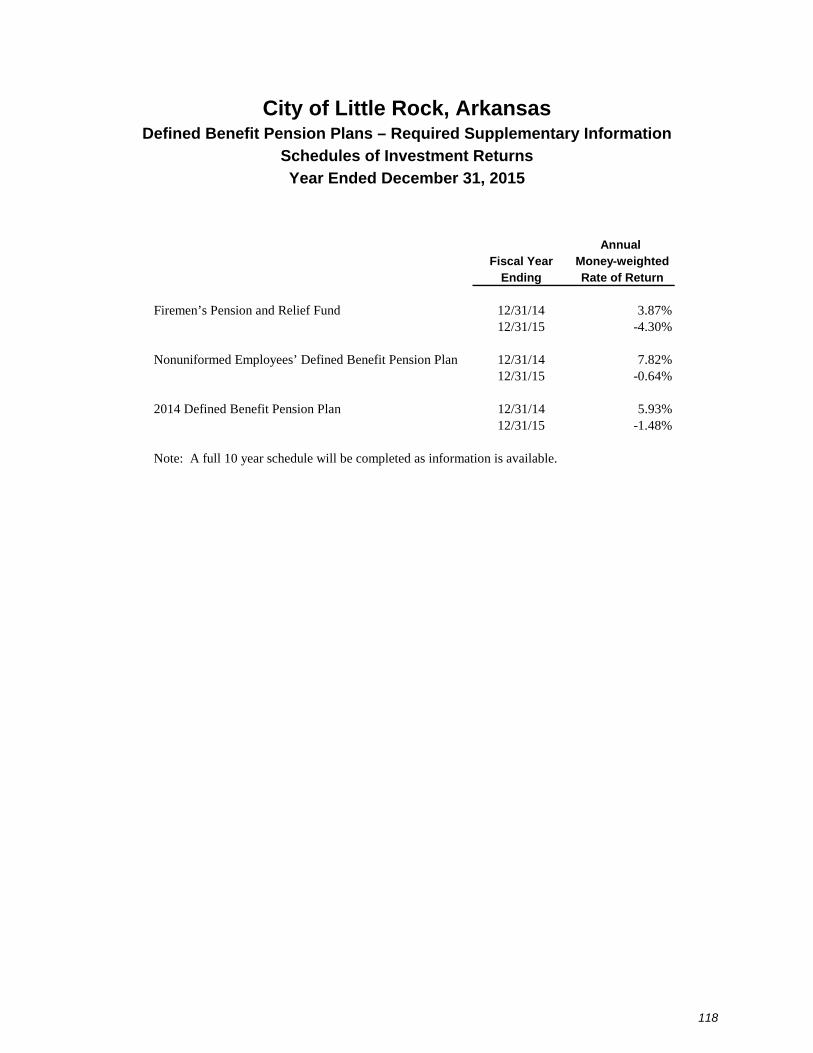
City of Little Rock, Arkansas Defined Benefit Pension Plans – Required Supplementary Information
Schedules of Investment Returns
Year Ended December 31, 2015
118
Annual Fiscal Year Money-weighted
Ending Rate of Return
Firemen’s Pension and Relief Fund 12/31/14 3.87%12/31/15 -4.30%
Nonuniformed Employees’ Defined Benefit Pension Plan 12/31/14 7.82%12/31/15 -0.64%
2014 Defined Benefit Pension Plan 12/31/14 5.93%12/31/15 -1.48%
Note: A full 10 year schedule will be completed as information is available.

NONMAJOR GOVERNMENTAL FUNDS
The Special Revenue Funds account for resources which are designated by law or contractual agreement for particular functions or activities and are legally required to be accounted for in separate funds. Such resources are derived from specific taxes, federal grant and entitlement monies, and multi-year appropriations.
SPECIAL PROJECTS FUND – Accounts for receipts and appropriations to be spent on one-time, multi-year projects that benefit the entire City.
EMERGENCY 9-1-1 FUND – Accounts for remittances for emergency telephone service charges by local telephone companies. These monies are used to establish and operate the uniform emergency telephone number network (9-1-1) for Little Rock.
GRANT FUND – Accounts for grant funds received for various programs. These monies are expended to satisfy purposes as outlined by each federal program.
COMMUNITY DEVELOPMENT FUND (CDBG) – Accounts for CDBG and other funds received from the U.S. Department of Housing and Urban Development. These monies are expended to provide housing or housing assistance to qualifying citizens, to improve neighborhood streets and drainage and to operate community health and recreation facilities.
NEIGHBORHOOD HOUSING SPECIAL PROJECT FUND (NHSP) – Accounts for the proceeds of Community Development Block Grant – Section 108 Guaranteed Loan Program and other City funds that are utilized to provide housing and housing assistance to qualifying citizens and to improve neighborhood infrastructure.
HOME INVESTMENT PARTNERSHIP FUND (HIPP) – Accounts for HOME and other funds received from the U.S. Department of Housing and Urban Development. These monies are expended to provide housing or housing assistance to qualifying citizens, to improve neighborhood streets and drainage and to operate community health and recreation facilities.
The Debt Service Funds account for the accumulation of resources for the payment of principal and interest on general long-term debt.
2007 CAPITAL IMPROVEMENT REVENUE REFUNDING BONDS – The 2007 Capital Improvement Revenue Refunding Bonds were issued to advance refund the 1998 Street and Drainage Bonds and to pay the cost associated with the issuance of the Series 2007 Bonds.
2002 CAPITAL IMPROVEMENT JUNIOR LIEN REVENUE BONDS – 2002 Capital Improvement Junior Lien Revenue Bonds are special obligation bonds payable through the year 2018. Funding is obtained from all franchise fees collected from public utilities for the privilege of using the streets, highways and other public places in the City.
NONMAJOR GOVERNMENTAL FUNDS
(Continued)
2008/2009 CENTRAL ARKANSAS LIBRARY – The 2008/2009 Central Arkansas Library Bonds were issued to finance the cost of acquiring, constructing and equipping capital improvements to the public city libraries operated by the City and the Central Arkansas Library System and to pay the costs of issuance of the bonds.
2009A PARKS AND RECREATION – The 2009A Parks and Recreation Bonds were issued for the purposes of acquiring, constructing, equipping, renovating, expanding, and refurbishing certain zoo, parks, and recreation facilities of the City. The Series 2009 bonds are special obligations, payable solely from the revenues derived from the operation and ownership of the zoo, parks and recreation facilities.
2012 CENTRAL ARKANSAS LIBRARY – The 2012 Central Arkansas Library bonds were issued to finance the cost of acquiring, constructing and equipping capital improvements to the public city libraries operated by the City and the Central Arkansas Library System, to refund the outstanding Library Construction Bonds, Series 2004A, to pay interest due on the bonds until collections of the library tax become available for such payments and to pay the costs of issuance of the bonds. The Series 2012 Bonds are limited obligations, payable solely from the collections of the Library Tax.
2015 CENTRAL ARKANSAS LIBRARY – The 2015 Central Arkansas Library bonds were issued to finance the cost of acquiring, constructing and equipping capital improvements to the public city libraries operated by the City and the Central Arkansas Library System, to refund the outstanding Library Construction Bonds, Series 2008 and Series 2009, to pay interest due on the bonds until collections of the library tax become available for such payments and to pay the costs of issuance of the bonds. The Series 2015 Bonds are limited obligations, payable solely from the collections of the Library Tax.
TIF #1 2014 CAPITAL IMPROVEMENT BOND – The 2014 TIF #1 Capital Improvements bonds were issued to finance the costs of acquisition, construction and equipping of a major street system within Redevelopment District No. 1.
The Capital Projects Funds account for the acquisition or construction of major capital assets from the proceeds from general obligation bond issues and other financing sources.
1998 CAPITAL IMPROVEMENT FUND – The Series 1998A Bonds are issued for the purpose of acquiring, constructing, equipping, renovating, expanding and refurbishing certain street, sidewalk, curb, gutter, drainage and other related infrastructure improvements, including payment of a portion of the interest on the Series 1998A Bonds during the construction period.
SHORT TERM FINANCING – Accounts for proceeds of 2011 Short Term Financing to acquire capital equipment, vehicles and an enterprise resource planning system for the City.
2004 CAPITAL IMPROVEMENTS – The 2004 Capital Improvements were issued to finance the advance refunding of the City’s Capital Improvement Revenue Bonds, Series 1998A and to pay the cost associated with the issuance of the Series 2004 Bonds. The Series 2004 Bonds are not general obligations of the City but are special obligations payable solely from the revenue received by the City from all franchise fees charged to public utilities for the privilege of using the City’s streets and rights-of-way.
2008 AND 2009 CENTRAL ARKANSAS LIBRARY CAPITAL IMPROVEMENTS – The 2008 and 2009 Central Arkansas Library Capital Improvement Bonds were issued for the purpose of acquiring, constructing and equipping capital improvements to the public city libraries operated by the City and the Central Arkansas Library System.

NONMAJOR GOVERNMENTAL FUNDS
(Continued)
TIF #1 2014 CAPITAL IMPROVEMENT FUND – The 2014 TIF #1 Capital Improvements bonds were issued to finance the costs of acquisition, construction and equipping of a major street system within Redevelopment District No. 1.
TAX INCREMENT FINANCING PORT – The Tax Incremental Financing Development District established within the Port of the City of Little Rock was set up in order to levy taxes on property located within the redevelopment district and to the school board of any school district which includes property located within the redevelopment district. Funds from this levy are to be used for public infrastructure projects including reconstruction of streets within the redevelopment district to bring them to interstate-weight capable standards, installation of water and sewer lines to areas within the redevelopment district that are currently not served, construction of dockside improvements including cranes and warehouses, construction of additional railroad facilities and site preparation.
2009A PARKS AND RECREATION CAPITAL PROJECTS – The 2009A Parks and Recreation Bonds were issued for the purposes of acquiring, constructing, equipping, renovating, expanding, and refurbishing certain zoo, parks and recreation facilities of the City. The Series 2009 Bonds are special obligations, payable solely from the revenues derived from the operation and ownership of the zoo, parks and recreation facilities.
2012 CENTRAL ARKANSAS LIBRARY – The 2012 Central Arkansas Library Bonds were issued to finance the cost of acquiring, constructing and equipping capital improvements to the public city libraries.
2015 CENTRAL ARKANSAS LIBRARY – The 2015 Central Arkansas Library Bonds were issued to finance the cost of acquiring, constructing and equipping capital improvements to the public city libraries.

City of Little Rock, Arkansas Combining Balance Sheet
Governmental Funds – Nonmajor
December 31, 2015
119
Special Debt Capital
Revenue Service Projects TotalAssets
Cash and cash equivalents 2,738,599$ 44,307$ 274,289$ 3,057,195$ Restricted cash - 6,869,341 20,722,091 27,591,432 Investments 3,861,815 147,144 948,361 4,957,320 Accounts receivable 1,038,830 7,160,552 - 8,199,382 Interest receivable 10,212 437 16,928 27,577 Inventories 960,243 - - 960,243 Prepaid expenditures and other 412,121 - - 412,121
Total assets 9,021,820$ 14,221,781$ 21,961,669$ 45,205,270$
Liabilities, Deferred Inflows of Resources and Fund Balances
LiabilitiesAccounts payable 463,933$ -$ 602,771$ 1,066,704$ Due to other funds 612,839 767,200 2,200 1,382,239 Unearned revenue 2,150,109 - - 2,150,109
Total liabilities 3,226,881 767,200 604,971 4,599,052
Deferred Inflows of ResourcesUnavailable revenues - property taxes - 6,958,220 - 6,958,220
Total deferred inflows of resources - 6,958,220 - 6,958,220
Fund Balances Nonspendable 1,622,364 - - 1,622,364 Restricted 6,792,919 6,496,361 21,356,698 34,645,978 Unassigned (deficit) (2,620,344) - - (2,620,344)
Total fund balances 5,794,939 6,496,361 21,356,698 33,647,998
Total liabilities, deferred inflows of resources and fund balances 9,021,820$ 14,221,781$ 21,961,669$ 45,205,270$

City of Little Rock, Arkansas Combining Statement of Revenues, Expenditures and Changes in Fund Balances
Governmental Funds – Nonmajor
Year Ended December 31, 2015
120
Special Debt Capital Revenue Service Projects Total
Revenues General property taxes -$ 7,151,551$ -$ 7,151,551$
Licenses and permits 27,850 - - 27,850 Intergovernmental 5,564,762 - - 5,564,762 Charges for services 2,351,674 1,308,050 - 3,659,724 Fines and fees 913,945 - - 913,945 Utility franchise taxes - 1,759,292 - 1,759,292
Investment income 26,438 85,608 6,792 118,838 Contributions and donations 914,055 - - 914,055 Miscellaneous 1,714,893 - - 1,714,893
Total revenues 11,513,617 10,304,501 6,792 21,824,910
ExpendituresGeneral government
General administration 1,464,874 - - 1,464,874 Community programs 32,391 - - 32,391 District court - second division (traffic) 130,188 - - 130,188 District court - third division (environment) 7,927 - - 7,927 Human resources 104,540 - - 104,540 Planning and development 52,539 - - 52,539
Total general government 1,792,459 - - 1,792,459
Public works 186,055 - 368,159 554,214 Parks and recreation services 1,136,133 - - 1,136,133 Zoo 213,722 - 1,018 214,740 Fire 475,920 - - 475,920 Police 2,657,145 - 1,420,281 4,077,426 Fleet 171,065 - - 171,065 Education - - 5,761,938 5,761,938 Housing and neighborhood programs 4,425,554 - - 4,425,554 Debt service
Principal - 9,075,000 - 9,075,000 Interest - 3,145,969 - 3,145,969 Agent fees - 18,255 - 18,255
Total expenditures 11,058,053 12,239,224 7,668,877 30,966,154
Excess (Deficiency) of Revenues Over (Under) Expenditures 455,564 (1,934,723) (7,662,085) (9,141,244)
Other Financing Sources (Uses)Long-term debt issuance - 15,571,946 22,586,054 38,158,000 Premiums on debt issuance - - 112,763 112,763 Payment to refunded bond escrow agent - (17,247,291) - (17,247,291) Transfers in 23,030 1,457 563,366 587,853 Transfers out (9,771) - (1,659) (11,430)
Total other financing sources (uses) 13,259 (1,673,888) 23,260,524 21,599,895
Net Change in Fund Balances 468,823 (3,608,611) 15,598,439 12,458,651
Fund Balances, Beginning of Year 5,326,116 10,104,972 5,758,259 21,189,347
Fund Balances, End of Year 5,794,939$ 6,496,361$ 21,356,698$ 33,647,998$

City of Little Rock, Arkansas Combining Balance Sheet
Special Revenue Funds – Nonmajor
December 31, 2015
121
Special Emergency Grant
Projects 911 Fund CDBG NHSP HIPP TotalAssets
Cash and cash equivalents 753,973$ -$ 886,003$ 354,855$ 29,826$ 713,942$ 2,738,599$ Investments 2,146,344 - 1,696,820 12,991 2,734 2,926 3,861,815 Accounts receivable 12,483 302,193 653,671 69,418 - 1,065 1,038,830 Interest receivable 5,060 - 5,096 39 8 9 10,212 Inventories - - - 777,737 - 182,506 960,243 Prepaid expenditures and other - 412,121 - - - - 412,121
Total assets 2,917,860$ 714,314$ 3,241,590$ 1,215,040$ 32,568$ 900,448$ 9,021,820$
Liabilities, Deferred Inflows of Resources and Fund Balances
LiabilitiesAccounts payable 117,673$ 5,034$ 226,649$ 86,455$ -$ 28,122$ 463,933$
Due to other funds - 612,839 - - - - 612,839 Unearned revenue 32,281 - 2,048,410 69,418 - - 2,150,109
Total liabilities 149,954 617,873 2,275,059 155,873 - 28,122 3,226,881
Fund Balances Nonspendable 250,000 412,121 - 777,737 - 182,506 1,622,364 Restricted 4,822,570 - 966,531 281,430 32,568 689,820 6,792,919 Unassigned (deficit) (2,304,664) (315,680) - - - - (2,620,344)
.Total fund balances 2,767,906 96,441 966,531 1,059,167 32,568 872,326 5,794,939
Total liabilities, deferred inflows of resources and fund balances 2,917,860$ 714,314$ 3,241,590$ 1,215,040$ 32,568$ 900,448$ 9,021,820$

City of Little Rock, Arkansas Combining Statement of Revenues, Expenditures and Changes in Fund Balances
Special Revenue Funds – Nonmajor
Year Ended December 31, 2015
122
Special Emergency GrantProjects 911 Fund CDBG NHSP HIPP Total
RevenuesLicenses and permits 27,850$ -$ -$ -$ -$ -$ 27,850$ Intergovernmental 455,495 - 1,594,066 1,657,054 - 1,858,147 5,564,762 Charges for services 1,082,645 1,269,029 - - - - 2,351,674 Fines and fees 913,945 - - - - - 913,945 Investment income 9,151 6 17,260 21 - - 26,438 Contribution and donations 428,855 - 485,200 - - - 914,055 Miscellaneous 693,359 - - 187,772 123,195 710,567 1,714,893
Total revenues 3,611,300 1,269,035 2,096,526 1,844,847 123,195 2,568,714 11,513,617
ExpendituresGeneral government
General administration 72,195 - 1,392,679 - - - 1,464,874 Community programs 32,391 - - - - - 32,391 District court – second division (traffic) 130,188 - - - - - 130,188 District court – third division (environment) 7,927 - - - - - 7,927 Human resources 104,540 - - - - - 104,540 Planning and development 16,949 - 35,590 - - - 52,539
Total general government 364,190 - 1,428,269 - - - 1,792,459
Public works 170,199 - 15,856 - - - 186,055 Parks and recreation services 1,015,182 - 120,951 - - - 1,136,133 Zoo 92,600 - 121,122 - - - 213,722 Fire 474,252 - 1,668 - - - 475,920 Police 979,834 1,257,227 420,084 - - - 2,657,145 Fleet 171,065 - - - - - 171,065 Housing and neighborhood programs 256,790 - 20,621 1,917,978 130,638 2,099,527 4,425,554
.Total expenditures 3,524,112 1,257,227 2,128,571 1,917,978 130,638 2,099,527 11,058,053
87,188 11,808 (32,045) (73,131) (7,443) 469,187 455,564
Other Financing Sources (Uses)Transfers in 23,030 - - - - - 23,030 Transfers out (9,771) - - - - - (9,771)
Total other financing sources 13,259 - - - - - 13,259
Net Change in Fund Balances 100,447 11,808 (32,045) (73,131) (7,443) 469,187 468,823
Fund Balances, Beginning of Year 2,667,459 84,633 998,576 1,132,298 40,011 403,139 5,326,116
Fund Balances, End of Year 2,767,906$ 96,441$ 966,531$ 1,059,167$ 32,568$ 872,326$ 5,794,939$
Excess (Deficiency) of Revenues Over (Under) Expenditures

City of Little Rock, Arkansas Combining Balance Sheet
Debt Service Funds – Nonmajor
December 31, 2015
123
2007 2002 2008 & 2009 2009A 2012 Central 2015 Central TIF #1
Capital Junior Central Arkansas Parks and Arkansas Arkansas 2014 Capital
Improvement Lien Library Recreation Library Library Improvement TotalAssets
Cash and cash equivalents 7,626$ 4,270$ 23,140$ -$ 8,759$ -$ 512$ 44,307$ Restricted cash 1 - 95 2,701,435 3,483,468 336,342 348,000 6,869,341 Investments 25,325 14,183 76,850 - 29,087 - 1,699 147,144Accounts receivable - - - - 3,537,364 3,540,493 82,695 7,160,552 Interest receivable 76 43 231 - 87 - - 437
Total assets 33,028$ 18,496$ 100,316$ 2,701,435$ 7,058,765$ 3,876,835$ 432,906$ 14,221,781$
Liabilities, Deferred Inflows of Resources and Fund Balances
LiabilitiesDue to other funds -$ -$ -$ 464,251$ -$ 302,949 -$ 767,200$
Total liabilities - - - 464,251 - 302,949 - 767,200
Deferred Inflows of ResourcesUnavailable revenues - property taxes - - - - 3,437,765 3,437,765 82,690 6,958,220
Total deferred inflows of resources - - - - 3,437,765 3,437,765 82,690 6,958,220
Fund BalancesRestricted 33,028 18,496 100,316 2,237,184 3,621,000 136,121 350,216 6,496,361
Total fund balances 33,028 18,496 100,316 2,237,184 3,621,000 136,121 350,216 6,496,361
Total liabilities, deferred inflows of resources and fund balances 33,028$ 18,496$ 100,316$ 2,701,435$ 7,058,765$ 3,876,835$ 432,906$ 14,221,781$
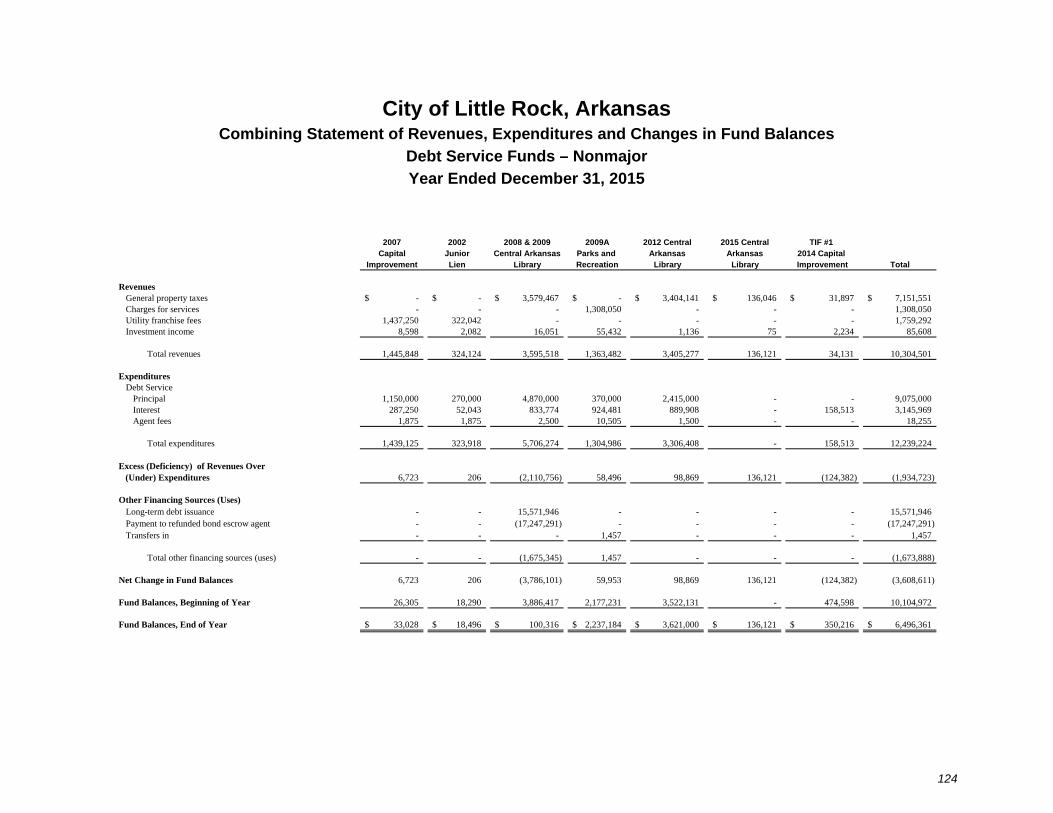
City of Little Rock, Arkansas Combining Statement of Revenues, Expenditures and Changes in Fund Balances
Debt Service Funds – Nonmajor
Year Ended December 31, 2015
124
2007 2002 2008 & 2009 2009A 2012 Central 2015 Central TIF #1 Capital Junior Central Arkansas Parks and Arkansas Arkansas 2014 Capital
Improvement Lien Library Recreation Library Library Improvement Total
Revenues General property taxes -$ -$ 3,579,467$ -$ 3,404,141$ 136,046$ 31,897$ 7,151,551$
Charges for services - - - 1,308,050 - - - 1,308,050 Utility franchise fees 1,437,250 322,042 - - - - - 1,759,292 Investment income 8,598 2,082 16,051 55,432 1,136 75 2,234 85,608
Total revenues 1,445,848 324,124 3,595,518 1,363,482 3,405,277 136,121 34,131 10,304,501
ExpendituresDebt Service
Principal 1,150,000 270,000 4,870,000 370,000 2,415,000 - - 9,075,000 Interest 287,250 52,043 833,774 924,481 889,908 - 158,513 3,145,969 Agent fees 1,875 1,875 2,500 10,505 1,500 - - 18,255
Total expenditures 1,439,125 323,918 5,706,274 1,304,986 3,306,408 - 158,513 12,239,224
6,723 206 (2,110,756) 58,496 98,869 136,121 (124,382) (1,934,723)
Other Financing Sources (Uses)Long-term debt issuance - - 15,571,946 - - - - 15,571,946 Payment to refunded bond escrow agent - - (17,247,291) - - - - (17,247,291) Transfers in - - - 1,457 - - - 1,457
Total other financing sources (uses) - - (1,675,345) 1,457 - - - (1,673,888)
Net Change in Fund Balances 6,723 206 (3,786,101) 59,953 98,869 136,121 (124,382) (3,608,611)
Fund Balances, Beginning of Year 26,305 18,290 3,886,417 2,177,231 3,522,131 - 474,598 10,104,972
Fund Balances, End of Year 33,028$ 18,496$ 100,316$ 2,237,184$ 3,621,000$ 136,121$ 350,216$ 6,496,361$
Excess (Deficiency) of Revenues Over (Under) Expenditures
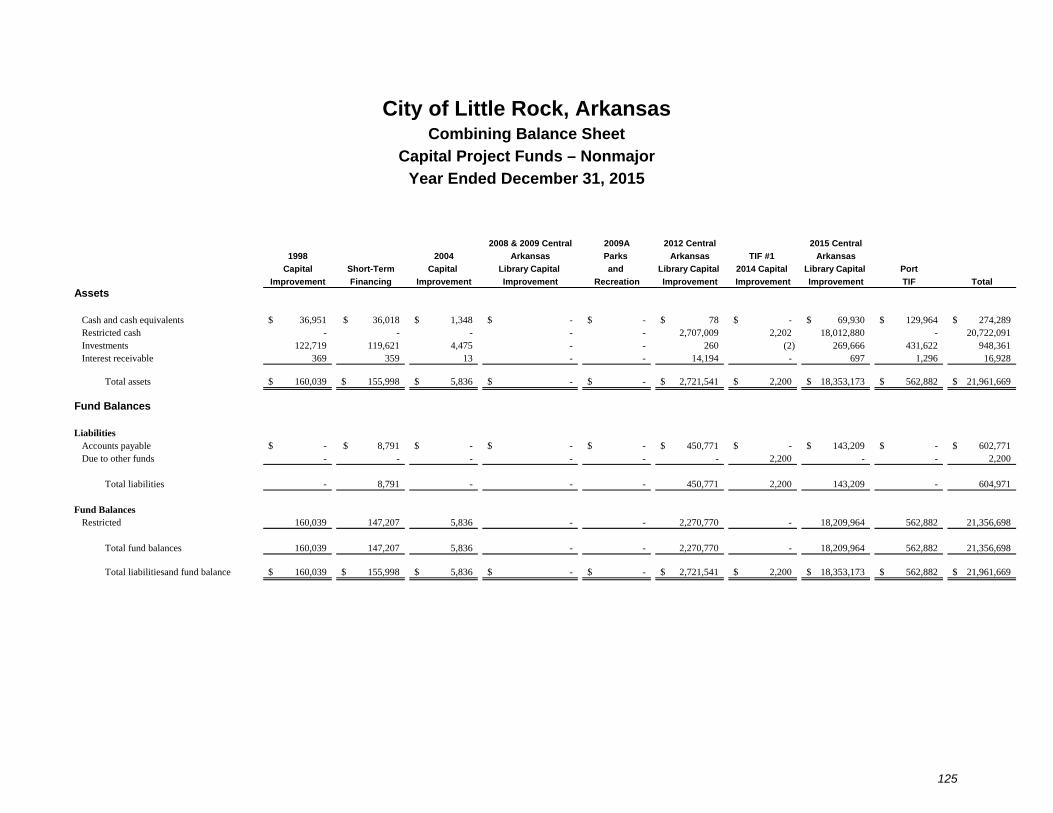
City of Little Rock, Arkansas Combining Balance Sheet
Capital Project Funds – Nonmajor
Year Ended December 31, 2015
125
2008 & 2009 Central 2009A 2012 Central 2015 Central
1998 2004 Arkansas Parks Arkansas TIF #1 Arkansas
Capital Short-Term Capital Library Capital and Library Capital 2014 Capital Library Capital Port
Improvement Financing Improvement Improvement Recreation Improvement Improvement Improvement TIF TotalAssets
Cash and cash equivalents 36,951$ 36,018$ 1,348$ -$ -$ 78$ -$ 69,930$ 129,964$ 274,289$ Restricted cash - - - - - 2,707,009 2,202 18,012,880 - 20,722,091 Investments 122,719 119,621 4,475 - - 260 (2) 269,666 431,622 948,361Interest receivable 369 359 13 - - 14,194 - 697 1,296 16,928
Total assets 160,039$ 155,998$ 5,836$ -$ -$ 2,721,541$ 2,200$ 18,353,173$ 562,882$ 21,961,669$
Fund Balances
LiabilitiesAccounts payable -$ 8,791$ -$ -$ -$ 450,771$ -$ 143,209$ -$ 602,771$ Due to other funds - - - - - - 2,200 - - 2,200
Total liabilities - 8,791 - - - 450,771 2,200 143,209 - 604,971
Fund BalancesRestricted 160,039 147,207 5,836 - - 2,270,770 - 18,209,964 562,882 21,356,698
Total fund balances 160,039 147,207 5,836 - - 2,270,770 - 18,209,964 562,882 21,356,698
Total liabilitiesand fund balance 160,039$ 155,998$ 5,836$ -$ -$ 2,721,541$ 2,200$ 18,353,173$ 562,882$ 21,961,669$
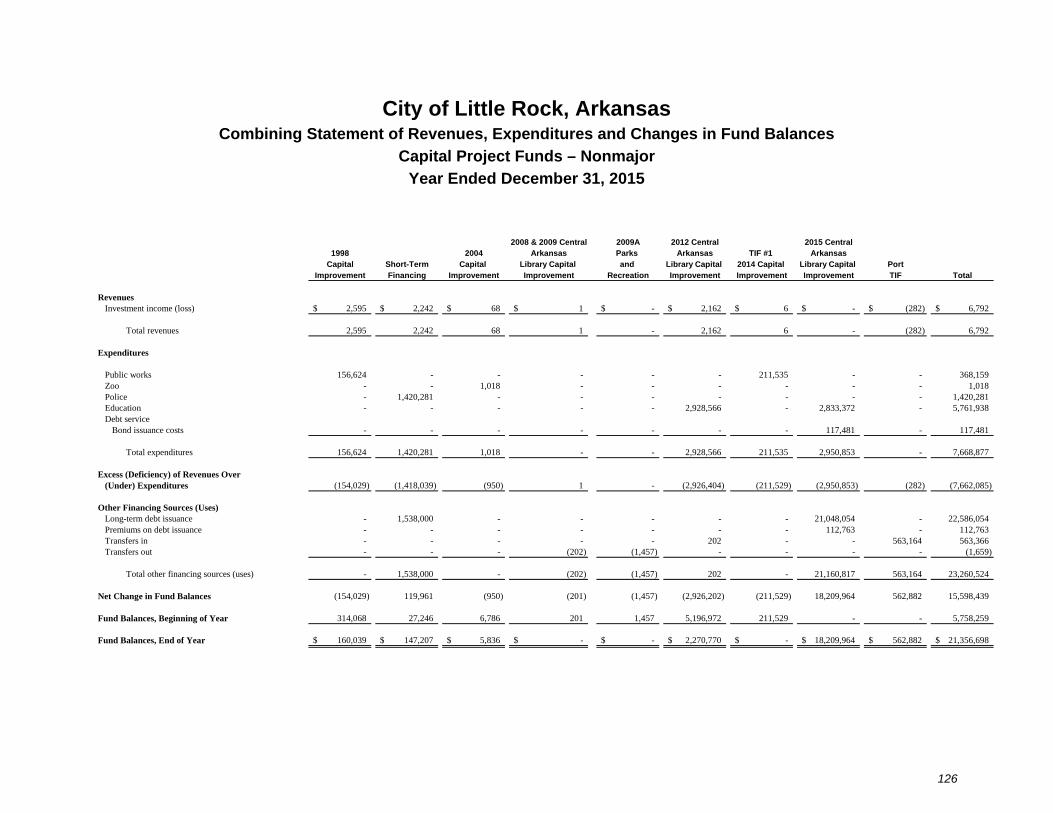
City of Little Rock, Arkansas Combining Statement of Revenues, Expenditures and Changes in Fund Balances
Capital Project Funds – Nonmajor
Year Ended December 31, 2015
126
2008 & 2009 Central 2009A 2012 Central 2015 Central1998 2004 Arkansas Parks Arkansas TIF #1 Arkansas
Capital Short-Term Capital Library Capital and Library Capital 2014 Capital Library Capital PortImprovement Financing Improvement Improvement Recreation Improvement Improvement Improvement TIF Total
Revenues Investment income (loss) 2,595$ 2,242$ 68$ 1$ -$ 2,162$ 6$ -$ (282)$ 6,792$
Total revenues 2,595 2,242 68 1 - 2,162 6 - (282) 6,792
Expenditures
Public works 156,624 - - - - - 211,535 - - 368,159 Zoo - - 1,018 - - - - - - 1,018 Police - 1,420,281 - - - - - - - 1,420,281 Education - - - - - 2,928,566 - 2,833,372 - 5,761,938 Debt service
Bond issuance costs - - - - - - - 117,481 - 117,481
Total expenditures 156,624 1,420,281 1,018 - - 2,928,566 211,535 2,950,853 - 7,668,877
Excess (Deficiency) of Revenues Over (Under) Expenditures (154,029) (1,418,039) (950) 1 - (2,926,404) (211,529) (2,950,853) (282) (7,662,085)
Other Financing Sources (Uses)Long-term debt issuance - 1,538,000 - - - - - 21,048,054 - 22,586,054 Premiums on debt issuance - - - - - - - 112,763 - 112,763 Transfers in - - - - - 202 - - 563,164 563,366Transfers out - - - (202) (1,457) - - - - (1,659)
Total other financing sources (uses) - 1,538,000 - (202) (1,457) 202 - 21,160,817 563,164 23,260,524
Net Change in Fund Balances (154,029) 119,961 (950) (201) (1,457) (2,926,202) (211,529) 18,209,964 562,882 15,598,439
Fund Balances, Beginning of Year 314,068 27,246 6,786 201 1,457 5,196,972 211,529 - - 5,758,259
Fund Balances, End of Year 160,039$ 147,207$ 5,836$ -$ -$ 2,270,770$ -$ 18,209,964$ 562,882$ 21,356,698$

FIDUCIARY FUNDS
TRUST FUNDS
Trust Funds account for assets held in the Firemen’s Pension and Relief Fund, the Police Pension Fund, the Nonuniformed Employees’ Defined Contribution Plan, the Nonuniformed Employees’ Defined Benefit Pension Plan, the 401(a) Money Purchase and Trust Retirement Fund, the 2014 Defined Benefit Plan and Health Management Trust. Fund trustees must act in accordance with the specific purposes and terms of these retirement plans.
AGENCY FUND
The Agency Fund accounts for monies collected and held by the courts until they are disbursed to various governmental agencies.

City of Little Rock, Arkansas Combining Statement of Fiduciary Net Position
December 31, 2015
127
Nonuniformed Nonuniformed 401(a) MoneyEmployees' Employees' Purchase 2014 Health
Firemen's Defined Defined And Trust Defined ManagementPolice Pension and Contribution Benefit Retirement Benefit Trust
Pension Relief Fund Plan Plan Fund Plan Fund Total
Assets
Cash and cash equivalents -$ 2,406,962$ 587,422$ 988,143$ -$ 5,150,273$ 78,788$ 9,211,588$ Investments -
U. S. government obligations - - 611 469,480 - - - 470,091 Equities - 20,687,547 8,827,335 5,105,502 - 15,076,858 1,405,702 51,102,944 Mutual funds and other investments 2,205,615 35,863,162 9,040,522 5,184,671 7,366,149 15,194,353 1,296,239 76,150,711
Receivables Accounts receivable - - - - 119,495 47,051 - 166,546 Due from other funds - 3,923,180 - - - - - 3,923,180 Accrued interest and dividends - - 5,027 8,294 - 40,575 - 53,896
Total assets 2,205,615 62,880,851 18,460,917 11,756,090 7,485,644 35,509,110 2,780,729 141,078,956
Liabilities
Accounts payable - 222 - - - - - 222 Accrued liabilities - 157 - - - - - 157 Due to other funds - 4,083 - - - - - 4,083
Total liabilities - 4,462 - - - - - 4,462
Net Position
Net position restricted for pensions and other employee benefits 2,205,615 62,876,389$ 18,460,917$ 11,756,090$ 7,485,644 35,509,110$ 2,780,729$ 141,074,494$
Employee Retirement Plans

City of Little Rock, Arkansas Combining Statement of Changes in Fiduciary Net Position
Year Ended December 31, 2015
128
Nonuniformed Nonuniformed 401(a) Money Employees' Employees' Purchase 2014 Health
Firemen's Defined Defined And Trust Defined ManagementPolice Pension and Contribution Benefit Retirement Benefit Trust
Pension Relief Fund Plan Pension Plan Fund Plan Fund TotalAdditions
ContributionsEmployer -$ 514,993$ 178,503$ 884,462$ 315,525$ 3,656,624$ 514,971$ 6,065,078$ Plan members - 14,993 194,609 - 217,086 1,827,854 - 2,254,542 Property taxes contributed from general fund - 3,781,766 - - - - - 3,781,766 State insurance turnback from general fund - 944,540 - - - - - 944,540 Other - 420,043 8,817 639,844 589 219,821 - 1,289,114
Total contributions - 5,676,335 381,929 1,524,306 533,200 5,704,299 514,971 14,335,040
Investment income Net increase (decrease) in fair value of investments (411,496) (4,119,171) (1,556,182) (833,469) 6,703 (1,239,065) (215,787) (8,368,467) Gain/loss on sale of investments - 156,342 369,141 156,081 - (443,833) 51,981 289,712 Interest and dividends - 1,905,994 844,603 540,781 - 1,364,188 67,057 4,722,623
(411,496) (2,056,835) (342,438) (136,607) 6,703 (318,710) (96,749) (3,356,132) Less investment expense - 309,916 114,883 71,311 - 137,803 26,933 660,846
Net investment income (loss) (411,496) (2,366,751) (457,321) (207,918) 6,703 (456,513) (123,682) (4,016,978)
Total additions (411,496) 3,309,584 (75,392) 1,316,388 539,903 5,247,786 391,289 10,318,062
Deductions Benefits paid directly to participants - 11,171,291 2,457,335 1,772,358 1,086,925 477,355 - 16,965,264 Administrative expenses - 29,726 - - - 70,248 - 99,974 Other - 9,925 578,005 - - - - 587,930
Total deductions - 11,210,942 3,035,340 1,772,358 1,086,925 547,603 - 17,653,168
Net Increase (Decrease) in Net Position (411,496) (7,901,358) (3,110,732) (455,970) (547,022) 4,700,183 391,289 (7,335,106) Net Position Restricted for Pensions and Other Employee
Benefits, Beginning of Year 2,617,111 70,777,747 21,571,649 12,212,060 8,032,666 30,808,927 2,389,440 148,409,600
Net Position Restricted for Pensions and Other Employee Benefits, End of Year 2,205,615$ 62,876,389$ 18,460,917$ 11,756,090$ 7,485,644$ 35,509,110$ 2,780,729$ 141,074,494$
Employee Retirement Plans

City of Little Rock, Arkansas Statement of Changes in Assets and Liabilities
Agency Fund – Court Fund
Year Ended December 31, 2015
129
BalanceJanuary 1,
BalanceDecember 31,
2015 Additions Deletions 2015
Assets Cash and cash equivalents 169,200$ 924,850$ 135,138$ 958,912$
169,200$ 924,850$ 135,138$ 958,912$
LiabilitiesAccounts payable 14,117$ 167,769$ 13,502$ 168,384Due to other funds - 757,081 93,330 757,081 Accrued liabilities 155,083 - 121,636 33,447
169,200$ 924,850$ 228,468$ 958,912$

(This Page Intentionally Left Blank)

DISCRETELY PRESENTED COMPONENT UNITS

City of Little Rock, Arkansas Combining Statement of Net Position
Discretely Presented Component Units – Nonmajor
December 31, 2015
Advertising Central Oakland Mt. And Arkansas Museum Arkansas Workforce Central Fraternal Holly Promotion Port Ambulance Transit of Arts Investment Arkansas
Cemetery Cemetery Commission Authority Authority Authority Discovery Center Board Library TotalAssets
Current assetsCash and cash equivalents 55,759$ 24,522$ 547,636$ 5,275,288$ 3,069,992$ 3,589,211$ 1,117,097$ 813,006$ 16,536$ 1,936,015$ 16,445,062$ Investments - - - - 3,200,000 - - 26,656,338 - - 29,856,338 Restricted cash and investments - current - - 2,574,426 - 553,940 - 3,972,017 - - - 7,100,383 Accrued interest receivable - - - - 13,826 1,945 526 - - - 16,297 Accounts receivable, net of allowance - - 1,830,337 504,820 6,385,594 6,749 201,145 550,075 174,277 17,465,152 27,118,149 Inventories - - - - 292,374 464,105 50,416 152,458 - - 959,353 Prepaid expenses and other - - 407,641 69,175 240,229 571,142 590,586 117,740 - 282,823 2,279,336
Total current assets 55,759 24,522 5,360,040 5,849,283 13,755,955 4,633,152 5,931,787 28,289,617 190,813 19,683,990 83,774,918
Noncurrent assetsRestricted assets
Cash and cash equivalents 264,855 - 21,615,008 - 553,940 - 3,972,017 - - 3,868,598 30,274,418 Investments 2,056,733 976,970 15,008,550 - 6,000,068 - - - - 2,404,410 26,446,731 Interest receivable - 24,166 - - - - - - - 24,166
2,321,588 976,970 36,647,724 - 6,554,008 - 3,972,017 - - 6,273,008 56,745,315 Less amounts required to meet current obligations - - 2,574,426 - 553,940 - 3,972,017 - - - 7,100,383
Total restricted assets 2,321,588 976,970 34,073,298 - 6,000,068 - - - - 6,273,008 49,644,932
Capital assetsLand 85,278 13,089 3,172,328 4,827,211 646,923 1,737,512 - 156,710 - 4,068,237 14,707,288
Construction in progress - - 46,370,010 - 2,607,449 - 53,342 - - 2,951,657 51,982,458 Buildings, improvements and other facilities 298,689 99,211 53,777,929 31,657,645 1,872,821 39,560,231 4,085,566 14,925,132 - 96,801,307 243,078,531 Vehicles 173,663 - - - 7,665,175 40,487,236 - - 9,651 - 48,335,725 Furniture and equipment 30,321 - 4,066,181 387,480 7,685,495 9,872,795 10,516,200 5,051,539 78,501 11,760,384 49,448,896 Books/AV materials - - - - - - - - - 22,997,074 22,997,074 Other - - 2,699,782 - - - - - - 319,745 3,019,527
587,951 112,300 110,086,230 36,872,336 20,477,863 91,657,774 14,655,108 20,133,381 88,152 138,898,404 433,569,499 Less accumulated depreciation 306,642 17,362 31,092,096 17,461,944 13,860,635 44,895,755 9,493,241 12,900,289 73,493 49,683,396 179,784,853
Net capital assets 281,309 94,938 78,994,134 19,410,392 6,617,228 46,762,019 5,161,867 7,233,092 14,659 89,215,008 253,784,646
Other assets - - - - 5,935 - - 799,777 - - 805,712
Total other assets - - - - 5,935 - - 799,777 - - 805,712
Total noncurrent assets 2,602,897 1,071,908 113,067,432 19,410,392 12,623,231 46,762,019 5,161,867 8,032,869 14,659 95,488,016 304,235,290
Deferred Outflows Of Resources
Deferred outflows of resourcesDeferred outflows of resources from pensions - - 158,171 - - - - - - - 158,171
Total deferred outflows of resources - - 158,171 - - - - - - - 158,171
Total assets and deferred outflows of resources 2,658,656$ 1,096,430$ 118,585,643$ 25,259,675$ 26,379,186$ 51,395,171$ 11,093,654$ 36,322,486$ 205,472$ 115,172,006$ 388,168,379$

130
Liabilities and Net Position
Current liabilities Accounts payable -$ -$ 947,517$ 111,511$ 732,812$ 154,295$ 79,330$ 173,532$ 184,373$ 359,081$ 2,742,451$ Accrued wages payable and related liabilities - - 488,057 29,070 - 1,390,007 - - - 129,013 2,036,147 Bonds payable - current portion - - 1,130,000 - 50,001 - - - - - 1,180,001 Notes payable - current portion - - - - - - - 7,800 - 62,500 70,300 Capital lease payable - current portion - - - - - - - 10,104 - - 10,104 Compensated absences - current portion - - - 21,168 - - - - 15,646 551,983 588,797 Unearned revenue - - 211,142 - 31,687 - 105,941 1,261,379 - 95,673 1,705,822 Accrued expenses and other - - 1,801,246 8,935 1,090,046 6,853 42,880 1,963,241 4,789 - 4,917,990
Total current liabilities - - 4,577,962 170,684 1,904,546 1,551,155 228,151 3,416,056 204,808 1,198,250 13,251,612
Noncurrent liabilitiesBonds payable, net of unamortized premium - - 67,192,685 - - - - - - - 67,192,685 Notes payable - - - - - - - 7,110 - 540,000 547,110 Capital lease obligation - - - - - - - 3,815 - - 3,815 Net pension liability - - 494,754 - - - - - - - 494,754 Other long-term liabilities - - 1,708,926 98,100 - - - - - 892,541 2,699,567 Compensated absences - - - 195,968 - - - - - 551,983 747,951
Total noncurrent liabilities - - 69,396,365 294,068 - - - 10,925 - 1,984,524 71,685,882
Total liabilities - - 73,974,327 464,752 1,904,546 1,551,155 228,151 3,426,981 204,808 3,182,774 84,937,494
Net PositionNet investment in capital assets 281,309 94,938 39,925,998 19,410,392 6,567,227 46,762,019 5,161,867 7,204,263 14,659 88,612,508 214,035,180 Restricted - expendable 51,963 976,970 - - 553,940 1,253,455 4,110,273 5,300,167 - 2,136,149 14,382,917 Restricted - nonexpendable - - - - - - - 2,943,728 - 491,862 3,435,590 Unrestricted (deficit) 2,325,384 24,522 4,685,318 5,384,531 17,353,473 1,828,542 1,593,363 17,447,347 (13,995) 20,748,713 71,377,198
Total net position 2,658,656 1,096,430 44,611,316 24,794,923 24,474,640 49,844,016 10,865,503 32,895,505 664 111,989,232 303,230,885
Total liabilities and net position 2,658,656$ 1,096,430$ 118,585,643$ 25,259,675$ 26,379,186$ 51,395,171$ 11,093,654$ 36,322,486$ 205,472$ 115,172,006$ 388,168,379$

City of Little Rock, Arkansas Combining Statement of Activities
Discretely Presented Component Units – Nonmajor
Year Ended December 31, 2015
131
Operating Capital Charges for Grants and Grants and Governmental Business-Type
Functions/Programs Expenses Services Contributions Contributions Activities Activities TotalGovernmental Activities
Central Arkansas Library 25,507,909$ 443,461$ 2,010,658$ 5,988,797$ (17,064,993)$ -$ (17,064,993)$ Workforce Investment Board 1,353,055 - 1,364,257 - 11,202 - 11,202
- Total governmental activities 26,860,964 443,461 3,374,915 5,988,797 (17,053,791) - (17,053,791)
Business-type ActivitiesOakland Fraternal Cemetery 319,531 36,760 - - - (282,771) (282,771) Mt. Holly Cemetery 167,507 90,348 - - - (77,159) (77,159) Advertising and Promotion Commission 12,633,749 2,687,173 - - - (9,946,576) (9,946,576) Port Authority 3,590,328 3,478,832 - - - (111,496) (111,496) Ambulance Authority 25,878,333 31,690,759 - - - 5,812,426 5,812,426 Central Arkansas Transit Authority 21,090,193 2,468,319 - - - (18,621,874) (18,621,874) Museum of Discovery 4,294,135 1,572,680 - - - (2,721,455) (2,721,455) Arkansas Arts Center 9,037,651 6,464,030 - - - (2,573,621) (2,573,621)
Total business-type activities 77,011,427 48,488,901 - - - (28,522,526) (28,522,526)
Total component units 103,872,391$ 48,932,362$ 3,374,915$ 5,988,797$ (17,053,791) (28,522,526) (45,576,317)
General revenuesGeneral property taxes 15,020,320 - 15,020,320 Sales taxes 1,031,310 13,333,203 14,364,513 Investment income 43,823 1,076,549 1,120,372 Grants and contributions not restricted to specific programs - 15,099,635 15,099,635 Other 4,362,981 12,439,740 16,802,721
Total general revenues 20,458,434 41,949,127 62,407,561
Change in net position 3,404,643 13,426,601 16,831,244
Net Position, Beginning of Year 108,585,253 178,126,822 286,712,075
Change in accounting principle - (312,434) (312,434)
Net Position, Beginning of Year, as Restated 108,585,253 177,814,388 286,399,641
Net Position, End of Year 111,989,896$ 191,240,989$ 303,230,885$
Program RevenuesNet (Expense) Revenue and
Changes in Net Position

City of Little Rock, Arkansas Combining Statement of Revenues, Expenses and Changes in Fund Net Position
Business-Type Activities – Component Units - Nonmajor
Year Ended December 31, 2015
132
Advertising Central Oakland Mt. And Arkansas Museum Arkansas
Fraternal Holly Promotion Port Ambulance Transit of ArtsCemetery Cemetery Commission Authority Authority Authority Discovery Center Total
Operating Revenues Charges for goods and services 36,760$ 90,346$ 1,419,000$ 3,478,832$ 29,608,304$ 2,468,319$ 1,572,680$ 1,731,808$ 40,406,049$ Other - - 1,268,173 - 2,082,455 - - 4,732,222 8,082,850
Total operating revenues 36,760 90,346 2,687,173 3,478,832 31,690,759 2,468,319 1,572,680 6,464,030 48,488,899
Operating Expenses Salaries, wages and employee benefits 94,769 121,402 6,028,291 933,500 18,029,636 11,701,188 482,117 3,501,264 40,892,167 Supplies and materials 12,032 3,953 33,512 505,353 1,205,734 2,944,620 - 1,371,366 6,076,570 Services 24,612 16,689 2,641,218 322,839 1,838,539 922,617 2,431,441 2,020,171 10,218,126 Utilities 6,570 4,649 813,006 54,736 543,761 277,556 - 295,021 1,995,299 Repairs and maintenance 102,867 8,792 823,581 558,634 1,027,817 - - 537,599 3,059,290 Other 3,090 9,542 717,740 138,091 1,878,978 1,140,979 - 620,759 4,509,179 Depreciation and amortization 75,591 2,480 1,576,401 1,077,175 1,353,868 4,103,233 1,380,577 691,471 10,260,796
Total operating expenses 319,531 167,507 12,633,749 3,590,328 25,878,333 21,090,193 4,294,135 9,037,651 77,011,427
Operating Income (Loss) (282,771) (77,161) (9,946,576) (111,496) 5,812,426 (18,621,874) (2,721,455) (2,573,621) (28,522,528)
Nonoperating Revenue (Expenses) Intergovernmental revenue - - 1,035,552 - - 11,137,104 - - 12,172,656 Local tax levy - - 13,333,203 - - - - - 13,333,203 Donations, contributions and grants received - 22,978 - - - 13,378,478 1,223,179 475,000 15,099,635 Investment income - 17,631 129,383 25,069 72,692 4,761 - 827,013 1,076,549 Interest expense - - (65,635) - - - - (4,868) (70,503) Other, net 230,972 (3,208) (373,146) (96) 476,809 - - 6,258 337,589
Net nonoperating revenues (expenses) 230,972 37,401 14,059,357 24,973 549,501 24,520,343 1,223,179 1,303,403 41,949,129
Change in Net Position (51,799) (39,760) 4,112,781 (86,523) 6,361,927 5,898,469 (1,498,276) (1,270,218) 13,426,601
Net Position, Beginning of Year 2,710,455 1,136,190 40,810,969 24,881,446 18,112,713 43,945,547 12,363,779 34,165,723 178,126,822
Change in accounting principle - - (312,434) - - - - - (312,434)
Net Position, Beginning of Year, as Restated 2,710,455 1,136,190 40,498,535 24,881,446 18,112,713 43,945,547 12,363,779 34,165,723 177,814,388
Net Position, End of Year 2,658,656$ 1,096,430$ 44,611,316$ 24,794,923$ 24,474,640$ 49,844,016$ 10,865,503$ 32,895,505$ 191,240,989$

City of Little Rock, Arkansas Combining Statement of Cash Flows
Discretely Presented Component Units – Business-Type Activities
Year Ended December 31, 2015
Bill and Hillary Other
Wastewater Clinton National Component
Utility Airport Units Total
Operating ActivitiesReceipts from customers 50,665,908$ 31,048,602$ 39,377,585$ 121,092,095$ Other receipts 605,803 - 8,193,556 8,799,359Payments to employees (15,805,635) (11,260,284) (41,400,714) (68,466,633)Payments to suppliers (2,315,107) (10,246,526) (13,880,730) (26,442,363)Payments for contractual services (2,870,359) - (9,682,675) (12,553,034)Payments for utilities (1,818,133) - (822,343) (2,640,476)Other payments (1,296,108) - (1,865,366) (3,161,474)
Net cash provided by (used in) operating activities 27,166,369 9,541,792 (20,080,687) 16,627,474
Noncapital Financing ActivitiesDonations, contributions and operating grants/subsidies - 314,605 17,438,331 17,752,936Local tax levy supporting operations - 909,148 10,193,806 11,102,954Other - 164,021 718,454 882,475
Net cash provided by noncapital financing activities - 1,387,774 28,350,591 29,738,365
Capital and Related Financing ActivitiesPurchase of capital assets (28,090,946) (11,783,294) (47,793,944) (87,668,184)Proceeds from sale of capital assets 28,918 22,723 121,207 172,848Contributions, donations and grants - 6,911,694 9,598,069 16,509,763Passenger facility charge - 3,775,320 - 3,775,320Intergovernmental revenue received for debt service - - 1,035,552 1,035,552Local tax levy used for debt service - - 2,960,029 2,960,029Proceeds from issuance of long-term debt 10,721,266 - 50,001 10,771,267Principal paid on long-term debt (14,238,125) (9,967,179) (1,122,786) (25,328,090)Defeasement of long-term debt - (318,220) - (318,220)Interest paid on long-term debt (8,085,572) (429,059) (2,886,319) (11,400,950)Other (905,011) (16,446) (18,957) (940,414)
Net cash used in capital and related financing activities (40,569,470) (11,804,461) (38,057,148) (90,431,079)
Investing ActivitiesProceeds from sale of investments 10,877,787 - 42,986,367 53,864,154Purchase of investments (5,437) - (9,856,089) (9,861,526)Other income - - 95,038 95,038Interest received 199,294 270,189 306,394 775,877
Net cash provided by investing activities 11,071,644 270,189 33,531,710 44,873,543
Increase (Decrease) in Cash and Cash Equivalents (2,331,457) (604,706) 3,744,466 808,303
Cash and Cash Equivalents, Beginning of Year 25,644,409 37,850,037 37,153,865 100,648,311
Cash and Cash Equivalents, End of Year 23,312,952$ 37,245,331$ 40,898,331$ 101,456,614$
Presented on the Statement of Fund Net Position - Proprietary Funds as Follows:Current assets
Cash and cash equivalents 14,921,866$ 24,884,329$ 14,492,511$ 54,298,706$ Noncurrent assets
Cash and cash equivalents 8,391,086 12,361,002 26,405,820 47,157,908
23,312,952$ 37,245,331$ 40,898,331$ 101,456,614$

133
Other
Wastewater National Component
Utility Airport Units Total
Reconciliation of Operating Income (Loss) to Net Cash Provided By (Used In) Operating ActivitiesOperating income (loss) 13,496,582$ (4,601,551)$ (28,522,528)$ (19,627,497)$ Adjustments to reconcile net income (loss) to net cash
provided by (used in) operating activitiesDepreciation and amortization expense 13,722,622 14,459,027 10,260,796 38,442,445Provisions for uncompensated care - - 10,643,993 10,643,993Other - - 4,386 4,386
Changes in assets and liabilitiesReceivables, net 80,158 (189,167) (11,659,376) (11,768,385)Prepaid expenses 110,441 (21,444) 13,763 102,760Inventories 18,124 - (21,296) (3,172)Other assets - - (334,076) (334,076)Accounts payable (125,917) (38,519) (930,932) (1,095,368)Accrued expenses 87,261 - 445,106 532,367Other liabilities (222,902) (66,554) 19,477 (269,979)
Net cash provided by (used in) operating activities 27,166,369$ 9,541,792$ (20,080,687)$ 16,627,474$
Noncash Capital ActivitiesDuring 2015, the Little Rock Wastewater Utility and the Bill and Hillary Clinton National Airport received donated capital assets in the amount of $1,819,214 and $2,170,560, respectively.

City of Little Rock, Arkansas Combining Statement of Cash Flows
Discretely Presented Component Units – Business-Type Activities – Nonmajor
Year Ended December 31, 2015
Advertising Central
Oakland Mt. And Arkansas Museum Arkansas
Fraternal Holly Promotion Port Ambulance Transit of Arts
Cemetery Cemetery Commission Authority Authority Authority Discovery Center Total
Operating ActivitiesReceipts from customers 36,760$ 90,346$ 1,553,564$ 3,744,796$ 28,421,664$ 2,200,068$ 1,572,680$ 1,757,707$ 39,377,585$ Other receipts - - 1,252,510 - 2,027,183 248,109 - 4,665,754 8,193,556 Payments to employees (94,769) (121,402) (5,853,155) (877,717) (19,045,934) (11,575,078) (472,973) (3,359,686) (41,400,714) Payments to suppliers (12,032) (3,953) (14,315) (2,276,473) (5,591,728) (2,915,487) - (3,066,742) (13,880,730) Payments for contractual services (24,612) (16,689) (3,743,439) - - (1,877,699) (2,624,510) (1,395,726) (9,682,675) Payments for utilities (6,570) (4,649) (811,124) - - - - - (822,343) Other payments (105,957) (18,334) (623,505) - - (451,792) - (665,778) (1,865,366)
Net cash provided by (used in) operating activities (207,180) (74,681) (8,239,464) 590,606 5,811,185 (14,371,879) (1,524,803) (2,064,471) (20,080,687)
Noncapital Financing ActivitiesDonations, contributions and operating grants/subsidies - - - - - 14,913,346 1,223,179 1,301,806 17,438,331 Local tax levy supporting operations - - 10,193,806 - - - - - 10,193,806 Other 230,972 (3,208) - (95) 477,679 - 6,848 6,258 718,454
Net cash provided by (used in) noncapital financing activities 230,972 (3,208) 10,193,806 (95) 477,679 14,913,346 1,230,027 1,308,064 28,350,591
Capital and Related Financing ActivitiesPurchase of capital assets (102,288) - (31,322,034) (9,124) (3,754,249) (11,814,783) (598,281) (193,185) (47,793,944) Proceeds from contributions received for construction of capital assets - - - - - 9,517,260 - - 9,517,260 Contributions and donations - 22,978 - 57,831 - - - - 80,809 Intergovernmental revenue received for debt service - - 1,035,552 - - - - - 1,035,552 Local tax levy used for debt service - - 2,960,029 - - - - - 2,960,029 Proceeds from issuance of long-term debt - - - - 50,001 - - - 50,001 Principal paid on long-term debt - - (1,115,000) - - - - (7,786) (1,122,786) Interest paid on long-term debt - - (2,880,581) - (870) - - (4,868) (2,886,319) Proceeds from sale of capital assets - - - - - 120,404 803 - 121,207 Other - - - - - - - (18,957) (18,957)
Net cash provided by (used in) capital and related financing activities (102,288) 22,978 (31,322,034) 48,707 (3,705,118) (2,177,119) (597,478) (224,796) (38,057,148)
Investing ActivitiesProceeds from sale of investments 500,924 31,797 34,000,000 - 5,700,000 - - 2,753,646 42,986,367 Purchase of investments (161,371) - - - (7,950,000) - - (1,744,718) (9,856,089) Other income - - - - - - - 95,038 95,038 Interest received 16,231 17,631 176,421 25,069 67,456 3,379 - 207 306,394
Net cash provided by (used in) investing activities 355,784 49,428 34,176,421 25,069 (2,182,544) 3,379 - 1,104,173 33,531,710
Increase (Decrease) in Cash and Cash Equivalents 277,288 (5,483) 4,808,729 664,287 401,202 (1,632,273) (892,254) 122,970 3,744,466
Cash and Cash Equivalents, Beginning of Year 43,326 30,005 17,353,915 4,611,001 3,222,730 5,221,484 5,981,368 690,036 37,153,865
Cash and Cash Equivalents, End of Year 320,614$ 24,522$ 22,162,644$ 5,275,288$ 3,623,932$ 3,589,211$ 5,089,114$ 813,006$ 40,898,331$
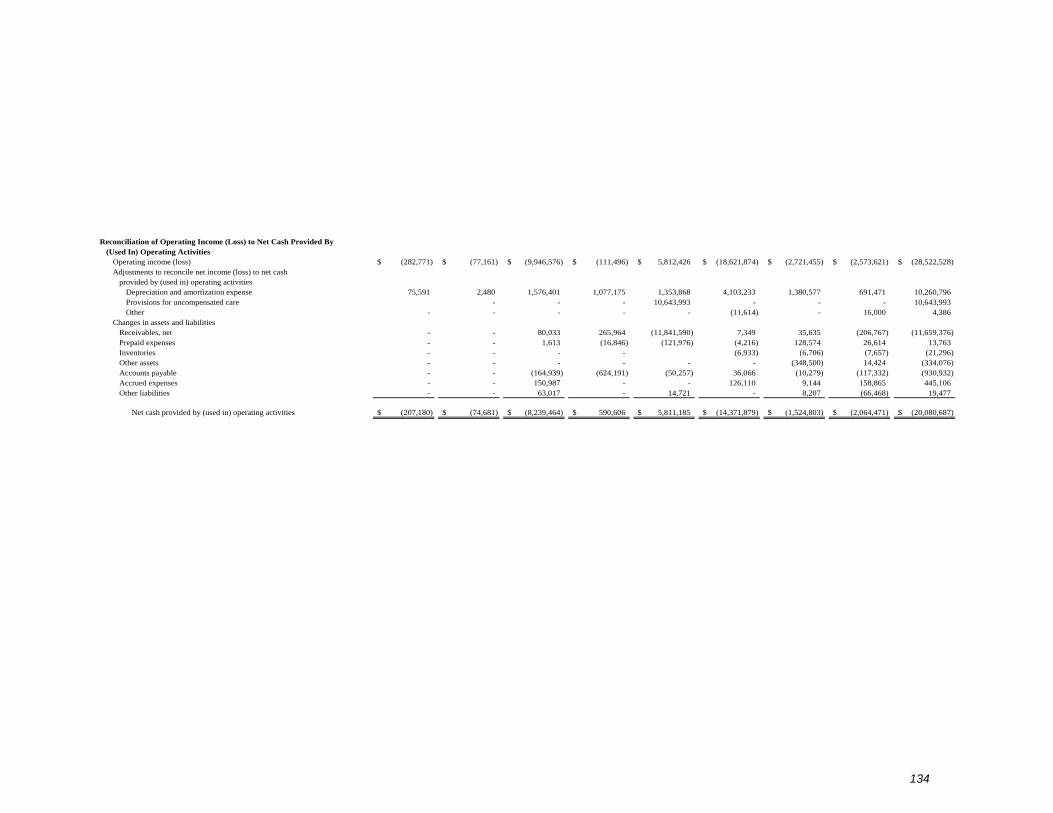
134
Reconciliation of Operating Income (Loss) to Net Cash Provided By(Used In) Operating Activities
Operating income (loss) (282,771)$ (77,161)$ (9,946,576)$ (111,496)$ 5,812,426$ (18,621,874)$ (2,721,455)$ (2,573,621)$ (28,522,528)$ Adjustments to reconcile net income (loss) to net cash
provided by (used in) operating activitiesDepreciation and amortization expense 75,591 2,480 1,576,401 1,077,175 1,353,868 4,103,233 1,380,577 691,471 10,260,796 Provisions for uncompensated care - - - 10,643,993 - - - 10,643,993 Other - - - - - (11,614) - 16,000 4,386
Changes in assets and liabilitiesReceivables, net - - 80,033 265,964 (11,841,590) 7,349 35,635 (206,767) (11,659,376) Prepaid expenses - - 1,613 (16,846) (121,976) (4,216) 128,574 26,614 13,763 Inventories - - - - (6,933) (6,706) (7,657) (21,296) Other assets - - - - - - (348,500) 14,424 (334,076) Accounts payable - - (164,939) (624,191) (50,257) 36,066 (10,279) (117,332) (930,932) Accrued expenses - - 150,987 - - 126,110 9,144 158,865 445,106 Other liabilities - - 63,017 - 14,721 - 8,207 (66,468) 19,477
Net cash provided by (used in) operating activities (207,180)$ (74,681)$ (8,239,464)$ 590,606$ 5,811,185$ (14,371,879)$ (1,524,803)$ (2,064,471)$ (20,080,687)$
(This Page Intentionally Left Blank)
Statistical Section

City of Little Rock, Arkansas Statistical Section
This section of the City of Little Rock, Arkansas comprehensive annual financial report (CAFR) presents detailed information as a context for understanding what the information in the financial statements, note disclosures, and required supplementary information reflects about the City’s overall financial health. Contents Page
Financial Trends (Tables 1–5)
These schedules contain trend information to assist the reader in understanding how the City’s financial performance and well-being have changed over time ............................. 135
Revenue Capacity (Tables 6–10)
These schedules contain information to help the reader assess the City’s most significant revenue sources, local sales taxes and property taxes ................................................................................................ 140
Debt Capacity (Tables 11–15)
These schedules present information to help the reader assess the affordability of the City’s current levels of outstanding debt and the City’s ability to issue additional debt in the future ............................................................................................................ 145
Demographic and Economic Information (Tables 16–17)
These schedules offer demographic and economic indicators to assist the reader in understanding the environment within which the City’s financial activities take place ................................................................... 150
Operating Information (Tables 18–20)
These schedules contain service and infrastructure data to help the reader understand how the information in the City’s financial report relates to services the City provides and the activities it performs ....................................................................................................................... 152

City of Little Rock, Arkansas Net Position by Component
Last Ten Years
(Accrual Basis of Accounting)
Table 1
135
2006 2007 2008 2009 2010 2011 2012 (1) 2013 (2) 2014 2015 (3)
Governmental activitiesNet investment in capital assets 464,980,160$ 470,177,184$ 471,326,637$ 479,611,737$ 494,688,762$ 498,370,816$ 533,940,568$ 539,105,312$ 549,795,437$ 547,314,893$ Restricted 18,189,548 14,861,692 14,747,876 19,792,771 21,106,638 23,201,045 24,208,928 13,951,009 14,801,039 11,414,278Unrestricted (deficit) 746,351 (5,253,750) (6,740,713) (20,707,353) (31,673,380) (37,574,646) (46,682,528) 28,926,155 24,870,220 (78,833,242)
Total governmental activities net position 483,916,059$ 479,785,126$ 479,333,800$ 478,697,155$ 484,122,020$ 483,997,215$ 511,466,968$ 581,982,476$ 589,466,696$ 479,895,929$
Business-type activitiesNet investment in capital assets 12,833,382$ 15,840,848$ 22,649,910$ 25,162,866$ 28,680,633$ 28,587,521$ 8,983,518$ 9,423,026$ 12,152,186$ 12,345,577$ Restricted 8,170,282 7,686,354 6,255,864 8,324,557 4,847,683 5,673,566 3,769,248 2,856,964 2,980,184 3,102,528Unrestricted (deficit) 2,920,311 6,186,519 1,021,866 (7,226,970) (7,490,696) (9,230,768) 3,806,762 6,284,003 5,751,822 6,988,248
Total business-type activities net position 23,923,975$ 29,713,721$ 29,927,640$ 26,260,453$ 26,037,620$ 25,030,319$ 16,559,528$ 18,563,993$ 20,884,192$ 22,436,353$
Primary governmentNet investment in capital assets 477,813,542$ 486,018,032$ 493,976,547$ 504,774,603$ 523,369,395$ 526,958,337$ 542,924,086$ 548,528,338$ 561,947,623$ 559,660,470$ Restricted 26,359,830 22,548,046 21,003,740 28,117,328 25,954,321 28,874,611 27,978,176 16,807,973 17,781,223 14,516,806 Unrestricted (deficit) 3,666,662 932,769 (5,718,847) (27,934,323) (39,164,076) (46,805,414) (42,875,766) 35,210,158 30,622,042 (71,844,994)
Total primary government net position 507,840,034$ 509,498,847$ 509,261,440$ 504,957,608$ 510,159,640$ 509,027,534$ 528,026,496$ 600,546,469$ 610,350,888$ 502,332,282$
(1) At the end of 2012, the City consolidated the Presidential Park, River Market, Golf, Fitness and Aquatics, and Zoo Enterprise funds into the general fund.
(2) At the end of 2013 the City transferred administration of the Police Pension and Relief Fund to the Arkansas Local Police andFire Retirement System. This is the primary reason for the increase of unrestricted net position of the governmental activities.
(3) During 2015, the City adopted Governmental Accounting Standards Board Statements 68 and 71. This is the primary reason for the significant decrease of unrestricted net position of the governmental activities.

City of Little Rock, Arkansas Changes in Net Position
Last Ten Years
(Accrual Basis of Accounting)
Table 2
2006 2007 2008 2009 2010 2011 2012 (1) 2013 (2) 2014 2015ExpensesGovernmental activities:
General government 40,824,314$ 40,902,901$ 39,257,596$ 33,803,817$ 36,758,227$ 35,467,227$ 45,722,245$ 48,076,292$ 50,079,445$ 55,582,516$ Public works 29,576,521 30,198,787 30,546,203 31,689,645 30,920,716 32,290,725 36,100,501 36,968,065 39,260,053 39,559,132 Parks and recreation services 11,652,210 10,948,381 10,761,841 9,886,376 9,032,115 6,740,682 10,131,868 11,209,542 11,436,512 11,324,541 Rivermarket - - - - - - - 1,298,266 1,337,298 1,298,563 Golf - - - - - - - 2,162,056 2,420,678 2,434,632 Jim Dailey Fitness - - - - - - - 983,422 1,389,915 988,633 Zoo - - - - - - - 6,927,190 6,920,847 10,754,587 Fire 35,347,608 36,865,342 38,630,307 46,217,347 48,582,390 49,007,470 49,271,456 48,798,721 48,017,977 36,708,372 Police 50,492,039 56,692,967 56,516,426 64,103,539 62,432,868 63,028,974 66,192,652 64,480,813 74,326,931 71,455,621 Economic development 3,499,207 12,555,927 4,225,034 - - - - - - - Education - 7,591,089 8,372,418 5,282,591 9,439,254 5,747,801 10,523,654 11,361,720 6,505,814 5,773,774 Housing and neighborhood programs 7,498,272 10,400,245 7,702,220 7,815,231 8,621,004 10,462,439 12,611,955 9,238,779 6,996,437 10,142,884 Fleet - - - - - - - 2,714,412 3,397,637 1,164,920 Interest expense on long-term debt 4,131,657 3,528,925 3,216,776 3,654,132 3,849,820 3,222,981 3,791,250 4,203,511 5,096,215 4,680,035 Bond issue costs - - - - - - - - 117,481 Agent fees on long-term debt 13,236 482,975 12,210 9,546 12,780 25,145 13,016 - 33,030 33,030
Total governmental activities expenses 183,035,064 210,167,539 199,241,031 202,462,224 209,649,174 205,993,444 234,358,597 248,422,789 257,218,789 252,018,721 Business-type activities:
Presidential park 837,674 787,099 756,924 727,723 913,050 1,284,265 636,683 - - - Waste disposal 12,749,068 13,943,884 13,778,712 13,805,966 14,158,228 13,967,043 14,715,628 15,117,230 13,854,376 14,401,947 Rivermarket garage 1,475,135 1,732,311 1,652,292 1,648,216 1,585,450 1,658,341 1,703,329 1,729,131 1,938,758 1,985,775 Riverfront park 1,216,683 1,280,521 1,392,804 932,726 977,075 1,085,632 1,283,222 - - - Zoo 3,959,985 4,286,060 4,758,438 4,816,545 4,818,113 5,138,281 6,125,411 - - - Vehicle Storage 1,225,802 1,214,219 1,250,245 1,271,451 1,201,185 1,200,152 1,284,946 1,333,659 1,332,818 1,350,526 Golf courses 2,236,136 2,551,139 2,795,234 2,323,844 2,227,607 2,342,219 2,443,065 - - - Fitness center 1,045,851 1,018,736 1,023,119 1,031,479 1,147,343 1,037,736 1,000,345 - - - Concessions services 120,027 148,389 149,129 104,090 1,712 - - - - -
Total business-type activities expenses 24,866,361 26,962,358 27,556,897 26,662,040 27,029,763 27,713,669 29,192,629 18,180,020 17,125,952 17,738,248 Total primary government expenses 207,901,425$ 237,129,897$ 226,797,928$ 229,124,264$ 236,678,937$ 233,707,113$ 263,551,226$ 266,602,809$ 274,344,741$ 269,756,969$
Program RevenuesGovernmental activities:
Charges for services:General government 15,999,081$ 15,203,736$ 15,314,384$ 14,125,390$ 14,316,575$ 14,375,501$ 15,479,490$ 15,945,908$ 16,062,816$ 16,717,877$ Public works 998,515 629,934 505,189 395,554 1,080,184 350,298 560,006 387,436 593,298 571,436 Parks and recreation services 1,161,408 959,667 1,051,607 1,276,650 2,374,906 2,665,666 1,379,534 1,998,020 1,506,979 1,539,875 Rivermarket - - - - - - - 650,259 617,337 605,207 Golf - - - - - - - 1,497,233 1,581,520 1,476,467 Jim Dailey Fitness - - - - - - - 638,214 920,051 495,687 Zoo - - - - - - - 3,579,391 3,869,582 3,798,687 Fire 1,305,384 2,648,158 2,885,420 2,197,020 2,639,543 2,512,542 2,525,884 1,260,256 2,602,223 2,562,979 Police 4,624,412 3,627,433 3,796,987 3,278,652 3,697,419 3,306,547 3,162,965 5,253,340 3,322,195 3,231,294 Fleet - - - - - 100,151 343,534 229,248 - Housing and neighborhood programs 67,562 962,181 650,746 462,390 543,179 1,566,311 1,179,396 458,891 669,271 945,430
Operating grants and contributions 5,941,370 4,133,325 2,034,054 19,126,353 8,929,758 10,885,382 12,873,846 8,133,436 5,396,151 6,041,316 Capital grants and contributions 1,296,607 18,491,092 10,377,494 1,432,306 4,592,275 8,151,956 4,313,770 2,028,323 1,379,420 591,966
Total governmental activities program revenues 31,394,339 46,655,526 36,615,881 42,294,315 38,173,839 43,814,203 41,575,042 42,174,241 38,750,091 38,578,221
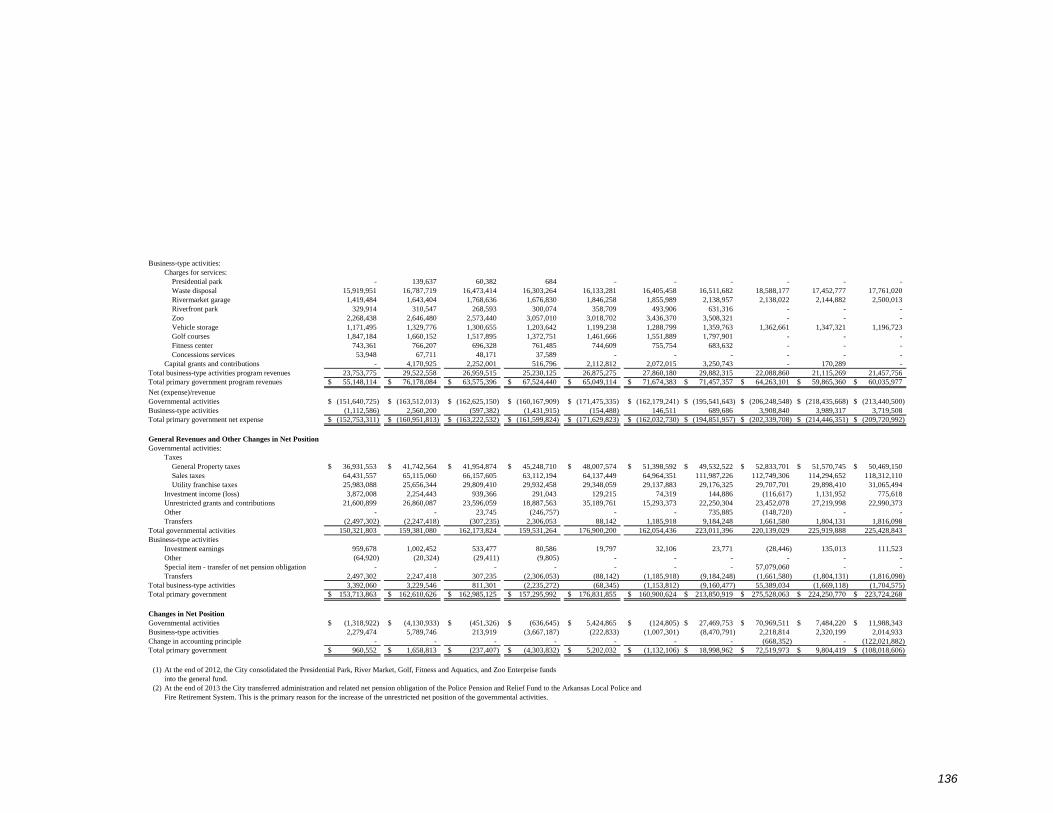
136
Business-type activities:Charges for services:
Presidential park - 139,637 60,382 684 - - - - - - Waste disposal 15,919,951 16,787,719 16,473,414 16,303,264 16,133,281 16,405,458 16,511,682 18,588,177 17,452,777 17,761,020 Rivermarket garage 1,419,484 1,643,404 1,768,636 1,676,830 1,846,258 1,855,989 2,138,957 2,138,022 2,144,882 2,500,013 Riverfront park 329,914 310,547 268,593 300,074 358,709 493,906 631,316 - - - Zoo 2,268,438 2,646,480 2,573,440 3,057,010 3,018,702 3,436,370 3,508,321 - - - Vehicle storage 1,171,495 1,329,776 1,300,655 1,203,642 1,199,238 1,288,799 1,359,763 1,362,661 1,347,321 1,196,723 Golf courses 1,847,184 1,660,152 1,517,895 1,372,751 1,461,666 1,551,889 1,797,901 - - - Fitness center 743,361 766,207 696,328 761,485 744,609 755,754 683,632 - - - Concessions services 53,948 67,711 48,171 37,589 - - - - - -
Capital grants and contributions - 4,170,925 2,252,001 516,796 2,112,812 2,072,015 3,250,743 - 170,289 - Total business-type activities program revenues 23,753,775 29,522,558 26,959,515 25,230,125 26,875,275 27,860,180 29,882,315 22,088,860 21,115,269 21,457,756 Total primary government program revenues 55,148,114$ 76,178,084$ 63,575,396$ 67,524,440$ 65,049,114$ 71,674,383$ 71,457,357$ 64,263,101$ 59,865,360$ 60,035,977$
Net (expense)/revenueGovernmental activities (151,640,725)$ (163,512,013)$ (162,625,150)$ (160,167,909)$ (171,475,335)$ (162,179,241)$ (195,541,643)$ (206,248,548)$ (218,435,668)$ (213,440,500)$ Business-type activities (1,112,586) 2,560,200 (597,382) (1,431,915) (154,488) 146,511 689,686 3,908,840 3,989,317 3,719,508 Total primary government net expense (152,753,311)$ (160,951,813)$ (163,222,532)$ (161,599,824)$ (171,629,823)$ (162,032,730)$ (194,851,957)$ (202,339,708)$ (214,446,351)$ (209,720,992)$
General Revenues and Other Changes in Net PositionGovernmental activities:
TaxesGeneral Property taxes 36,931,553$ 41,742,564$ 41,954,874$ 45,248,710$ 48,007,574$ 51,398,592$ 49,532,522$ 52,833,701$ 51,570,745$ 50,469,150$ Sales taxes 64,431,557 65,115,060 66,157,605 63,112,194 64,137,449 64,964,351 111,987,226 112,749,306 114,294,652 118,312,110 Utility franchise taxes 25,983,088 25,656,344 29,809,410 29,932,458 29,348,059 29,137,883 29,176,325 29,707,701 29,898,410 31,065,494
Investment income (loss) 3,872,008 2,254,443 939,366 291,043 129,215 74,319 144,886 (116,617) 1,131,952 775,618 Unrestricted grants and contributions 21,600,899 26,860,087 23,596,059 18,887,563 35,189,761 15,293,373 22,250,304 23,452,078 27,219,998 22,990,373 Other - - 23,745 (246,757) - - 735,885 (148,720) - - Transfers (2,497,302) (2,247,418) (307,235) 2,306,053 88,142 1,185,918 9,184,248 1,661,580 1,804,131 1,816,098
Total governmental activities 150,321,803 159,381,080 162,173,824 159,531,264 176,900,200 162,054,436 223,011,396 220,139,029 225,919,888 225,428,843 Business-type activities
Investment earnings 959,678 1,002,452 533,477 80,586 19,797 32,106 23,771 (28,446) 135,013 111,523 Other (64,920) (20,324) (29,411) (9,805) - - - - - - Special item - transfer of net pension obligation - - - - - - - 57,079,060 - - Transfers 2,497,302 2,247,418 307,235 (2,306,053) (88,142) (1,185,918) (9,184,248) (1,661,580) (1,804,131) (1,816,098)
Total business-type activities 3,392,060 3,229,546 811,301 (2,235,272) (68,345) (1,153,812) (9,160,477) 55,389,034 (1,669,118) (1,704,575) Total primary government 153,713,863$ 162,610,626$ 162,985,125$ 157,295,992$ 176,831,855$ 160,900,624$ 213,850,919$ 275,528,063$ 224,250,770$ 223,724,268$
Changes in Net PositionGovernmental activities (1,318,922)$ (4,130,933)$ (451,326)$ (636,645)$ 5,424,865$ (124,805)$ 27,469,753$ 70,969,511$ 7,484,220$ 11,988,343$ Business-type activities 2,279,474 5,789,746 213,919 (3,667,187) (222,833) (1,007,301) (8,470,791) 2,218,814 2,320,199 2,014,933 Change in accounting principle - - - - - - - (668,352) - (122,021,882) Total primary government 960,552$ 1,658,813$ (237,407)$ (4,303,832)$ 5,202,032$ (1,132,106)$ 18,998,962$ 72,519,973$ 9,804,419$ (108,018,606)$
(1) At the end of 2012, the City consolidated the Presidential Park, River Market, Golf, Fitness and Aquatics, and Zoo Enterprise funds into the general fund.
(2) At the end of 2013 the City transferred administration and related net pension obligation of the Police Pension and Relief Fund to the Arkansas Local Police andFire Retirement System. This is the primary reason for the increase of the unrestricted net position of the governmental activities.

City of Little Rock, Arkansas General Governmental Tax Revenues by Source
Last Ten Years
(Accrual Basis of Accounting)
Table 3
137
General UtilityProperty Sales Franchise
Year Taxes Taxes Taxes Total
2006 36,931,553$ 64,431,557$ 25,983,088$ 127,346,198$ 2007 41,742,564 65,115,060 25,656,344 132,513,968 2008 41,954,874 66,157,605 29,809,410 137,921,889 2009 45,248,710 63,112,194 29,932,458 138,293,362 2010 48,007,574 64,137,449 29,348,059 141,493,082 2011 51,398,591 64,964,351 29,137,883 145,500,825 2012 49,532,522 111,987,226 (1) 29,176,325 190,696,073 2013 52,833,701 112,749,306 29,707,701 195,290,708 2014 51,570,745 114,294,652 29,898,410 195,763,807 2015 50,469,150 118,312,110 31,065,494 199,846,754
(1) The citizens of Little Rock passed an additional one-cent local sales tax in September 2011 which went into effect on January 1, 2012.

City of Little Rock, Arkansas Fund Balances of Governmental Funds
Last Ten Years
(Modified Accrual Basis of Accounting)
Table 4
138
2006 2007 2008 2009 2010General Fund
Reserved 513,092$ 540,693$ 572,647$ 1,219,426$ 1,368,619$ Unreserved 20,983,516 17,188,490 16,754,381 21,061,786 24,642,501
Total general fund 21,496,608$ 17,729,183$ 17,327,028$ 22,281,212$ 26,011,120$
All other governmental fundsReserved 4,664,091$ 3,612,265$ 4,737,277$ 3,197,741$ 2,368,171$ Unreserved, reported in:
Special revenue funds 6,007,149 5,536,172 5,554,772 2,846,175 4,623,440 Capital projects funds 27,648,782 (1) 14,300,651 (1) 10,159,304 (1) 35,096,989 (2) 20,523,651 Debt service funds 14,256,025 12,072,643 10,852,119 16,593,060 17,369,848
Total all other governmental funds 52,576,047$ 35,521,731$ 31,303,472$ 57,733,965$ 44,885,110$
Post-GASB 54
2011 (3) 2012 2013 2014 2015General fund
Nonspendable 13,255,910$ 1,163,347$ (4) 1,329,476$ 1,251,251$ 1,020,087$ Restricted - - - - - Committed 374,900 368,577 337,892 336,610 300,264 Assigned 1,473,304 7,502,079 9,487,930 8,009,164 12,331,036
Unassigned 10,904,042 17,456,493 (5) 24,369,411 (7) 24,713,596 25,567,858 Total general fund 26,008,156$ 26,490,496$ 35,524,709$ 34,310,621$ 39,219,245$
All other governmental fundsNonspendable 407,391$ -$ 1,229,513$ 1,532,884$ 1,647,604$
Restricted 46,731,379 77,448,650 (6) 131,954,068 (8) 117,940,944 (9) 123,848,447 Committed - - - - - Assigned - - - - - Unassigned (406,965) (2,397) (2,618,735) (3,219,899) (2,853,464)
Total all other governmental funds 46,731,805$ 77,446,253$ 130,564,846$ 116,253,929$ 122,642,587$
(1) The decrease in capital projects fund balance is associated with completion and capitalization of capital improvement projects. The capital assets are not reported in the funds on the modified accrual basis of accounting. (2) The increase in fund balance in the capital projects funds is associated with the 2009 Central Arkansas Library Capital Improvements Bond and the 2009 Parks and Recreation Capital Improvements bond issued to finance capital improvements. (3) In 2011 the City implemented GASB 54 which changed the fund balance classification types. Prior to 2011 fund balance was either reserved or unreserved. With the implementation of GASB 54 there
are now 5 fund balance classifications: nonspendable, restricted, committed, assigned and unassigned. See page 42-43 for more discussion on these classifications. (4) At the end of 2012, the City consolidated the Presidential Park, River Market, Golf, Fitness and Aquatics and Zoo Enterprise funds which eliminated $12.1 million in nonspendable fund balance. (5) The increase in unassigned fund balance is primarily associated with the 5/8 cent operating portion of the new sales tax. (6) The increase in restricted fund balance is associated with 3/8 capital portion of the new sales tax in addition to the debt service and capital projects associated with the issuance of the 2012 Library
Capital Improvement and Refunding Bonds. (7) The increase in unassigned fund balance is associated with the excess receipts of approximately $6.9 million that resulted when the 2004 Limited Tax Bonds were defeased. (8) The increase in restricted fund balance is associated with the issuance of the 2013 Capital Improvement Bonds.(9) The decrease in restricted fund balance is associated with the expenditures in the 2012 Central Arkansas Library Fund and the 2013 Capital Improvement Fund.
Pre-GASB 54

City of Little Rock, Arkansas Changes in Fund Balances, Governmental Funds
Last Ten Years
(Modified Accrual Basis of Accounting)
Table 5
139
2006 2007 2008 2009 2010 2011 2012 2013 2014 2015
Revenues
Taxes (1) 125,804,151$ 128,423,082$ 136,408,241$ 138,552,899$ 140,393,901$ 142,727,033$ 191,473,338$ 191,323,825$ 194,663,920$ 199,880,800$ Licenses and permits 9,894,766 9,965,755 9,493,646 9,491,852 9,378,966 9,716,395 10,137,945 10,602,406 11,116,890 11,098,754 Intergovernmental 17,730,551 35,348,114 24,660,496 23,758,563 25,854,883 30,013,617 31,893,228 27,403,766 26,327,221 26,216,512 Charges for services 6,656,647 7,250,342 7,636,280 5,896,703 6,967,081 7,160,751 7,084,384 14,045,775 14,176,733 13,515,573 Fines and fees 4,277,114 4,406,272 4,094,674 3,866,793 4,646,215 4,322,127 4,030,384 4,395,755 4,044,070 3,704,630 Investment income (loss) 3,872,008 2,254,443 939,366 291,043 129,215 74,319 144,886 (116,609) 1,131,960 775,618 Miscellaneous 3,070,749 3,377,183 3,128,552 3,257,697 6,262,854 7,128,631 4,339,836 4,247,918 5,032,976 4,822,969 Total revenues 171,305,986 191,025,191 186,361,255 185,115,550 193,633,115 201,142,873 249,104,001 251,902,836 256,493,770 260,014,856
ExpendituresGeneral government 42,386,548 61,719,463 53,764,986 47,240,799 50,036,950 40,265,241 57,247,916 61,183,366 58,771,868 50,921,165 Public works 34,392,323 26,478,689 20,997,331 19,131,584 20,331,363 24,626,577 25,760,174 26,713,458 33,693,594 33,928,160 Parks and recreation and zoo 15,918,143 11,331,664 10,852,290 10,671,631 11,868,398 9,402,332 10,612,514 15,318,714 12,626,851 12,898,624 Rivermarket - - - - - - - 1,188,197 1,227,229 1,188,494 Golf - - - - - - - 2,386,863 2,376,310 2,390,265 Jim Dailey Fitness - - - - - - - 847,283 1,253,776 855,515 Zoo - - - - - - - 7,096,614 7,486,377 7,370,338 Fire department 44,706,618 37,455,769 37,142,635 37,943,802 36,670,692 39,865,309 46,728,504 44,669,680 46,506,763 46,461,030 Police department 54,319,391 54,697,552 55,428,567 58,971,285 55,751,125 56,817,357 71,360,040 72,904,543 82,062,673 72,434,859 Housing and neighborhood programs 8,473,162 9,441,274 8,066,771 8,368,709 8,790,445 11,262,328 12,695,568 8,740,138 9,154,001 10,182,817 Fleet - - - - - - - - - 665,112 Education - - - - - - - - - 5,761,938 Debt service
Principal 8,840,000 25,422,407 11,670,000 12,571,500 15,560,000 20,119,830 22,368,344 14,186,058 22,020,574 26,140,438 Interest 4,265,080 3,674,581 3,370,957 3,510,734 4,054,730 3,435,526 2,990,024 4,161,306 5,276,039 4,994,622 Bond issuance costs - - - 95,173 - - 107,193 148,720 117,481 117,481 Other charges 13,236 150,568 12,210 9,545 12,779 25,145 13,016 19,619 21,851 33,030
Total expenditures 213,314,501 230,371,967 201,305,747 198,514,762 203,076,482 205,819,645 249,883,293 259,564,559 282,595,387 276,343,888
Deficiency of revenues under expenditures (42,008,515) (39,346,776) (14,944,492) (13,399,212) (9,443,367) (4,676,772) (779,292) (7,661,723) (26,101,617) (16,329,032)
Other financing sources (uses)Transfers in 2,531,535 3,983,282 6,316,264 10,100,179 7,160,928 6,927,781 9,671,846 16,823,595 10,179,324 10,783,984 Transfers out (5,022,220) (6,224,083) (4,983,289) (6,835,415) (6,836,508) (5,007,278) (21,696,652) (14,866,015) (8,251,193) (8,553,142) Bonds issued 6,550,000 20,765,438 8,991,500 35,830,000 - 4,600,000 49,595,001 65,805,000 2,615,000 42,530,000 Premium on bonds issued - - - - - - 756,028 2,051,949 112,763 112,763 Discount on bonds issued - - - (249,215) - - - - - - Payments to refunded bond escrow agent - - - - - - (6,350,143) - - (17,247,291) Capital leases - - - - - - - - 5,916,000 - Total other financing sources 4,059,315 18,524,637 10,324,475 38,845,549 324,420 6,520,503 31,976,080 69,814,529 10,571,894 27,626,314
Net change in fund balances (37,949,200)$ (20,822,139)$ (4,620,017)$ 25,446,337$ (9,118,947)$ 1,843,731$ 31,196,788$ 62,152,806$ (15,529,723)$ 11,297,282$
Debt service as a percentage ofnoncapital expenditures 7.7% 12.7% 8.0% 8.6% 10.5% 12.4% 13.7% 7.8% 10.4% 12.2%

City of Little Rock, Arkansas General Governmental Tax Revenues by Source
Last Ten Years
(Modified Accrual Basis of Accounting)
Table 6
140
General UtilityProperty Sales Franchise
Year Taxes Taxes Taxes Total
2006 35,389,506$ 64,431,557$ 25,983,088$ 125,804,151$ 2007 37,651,678 65,115,060 25,656,344 128,423,082 2008 40,441,226 66,157,605 29,809,410 136,408,241 2009 45,508,247 63,112,194 29,932,458 138,552,899 2010 46,908,393 64,137,449 29,348,059 140,393,901 2011 48,624,799 64,964,351 29,137,883 142,727,033 2012 50,309,787 111,987,226 (1) 29,176,325 191,473,338 2013 48,866,818 112,749,306 29,707,701 191,323,825 2014 50,470,858 114,294,652 29,898,410 194,663,920 2015 50,503,196 118,312,110 31,065,494 199,880,800
(1) The citizens of Little Rock passed an additional one-cent local sales tax in September 2011 which wentinto effect on January 1, 2012.
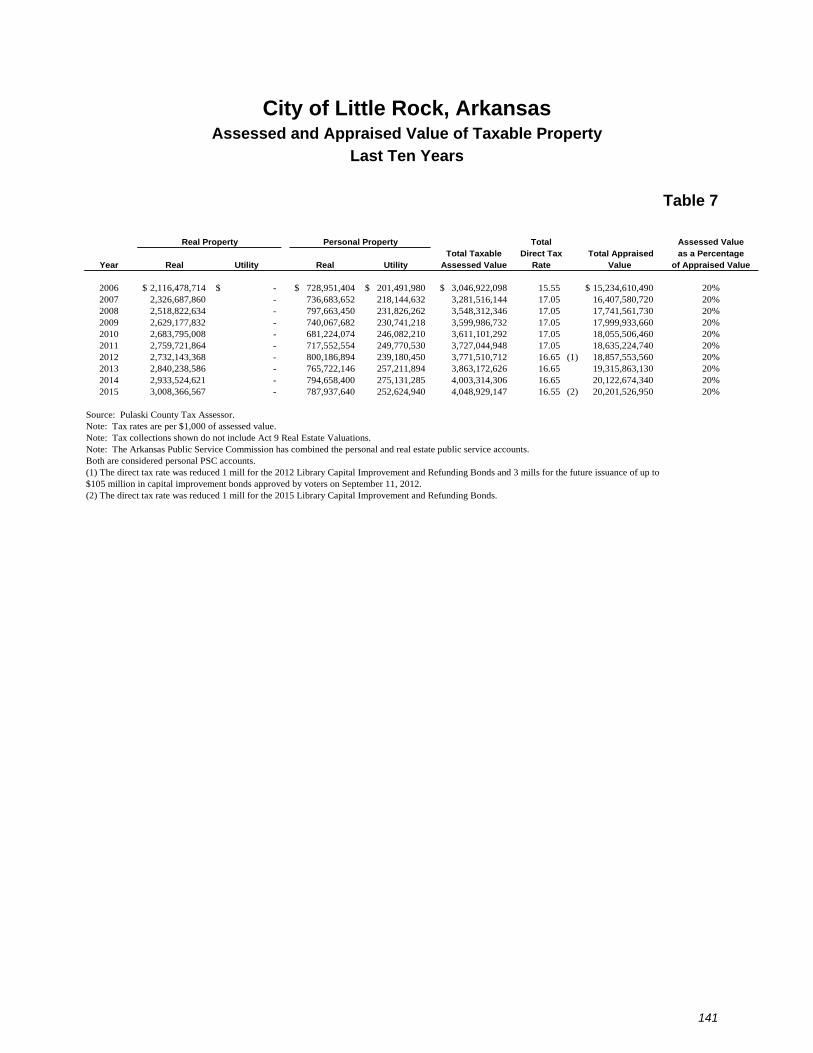
City of Little Rock, Arkansas Assessed and Appraised Value of Taxable Property
Last Ten Years
Table 7
141
Total Assessed ValueTotal Taxable Direct Tax Total Appraised as a Percentage
Year Real Utility Real Utility Assessed Value Rate Value of Appraised Value
2006 2,116,478,714$ -$ 728,951,404$ 201,491,980$ 3,046,922,098$ 15.55 15,234,610,490$ 20%2007 2,326,687,860 - 736,683,652 218,144,632 3,281,516,144 17.05 16,407,580,720 20%2008 2,518,822,634 - 797,663,450 231,826,262 3,548,312,346 17.05 17,741,561,730 20%2009 2,629,177,832 - 740,067,682 230,741,218 3,599,986,732 17.05 17,999,933,660 20%2010 2,683,795,008 - 681,224,074 246,082,210 3,611,101,292 17.05 18,055,506,460 20%2011 2,759,721,864 - 717,552,554 249,770,530 3,727,044,948 17.05 18,635,224,740 20%2012 2,732,143,368 - 800,186,894 239,180,450 3,771,510,712 16.65 (1) 18,857,553,560 20%2013 2,840,238,586 - 765,722,146 257,211,894 3,863,172,626 16.65 19,315,863,130 20%2014 2,933,524,621 - 794,658,400 275,131,285 4,003,314,306 16.65 20,122,674,340 20%2015 3,008,366,567 - 787,937,640 252,624,940 4,048,929,147 16.55 (2) 20,201,526,950 20%
Source: Pulaski County Tax Assessor.Note: Tax rates are per $1,000 of assessed value.Note: Tax collections shown do not include Act 9 Real Estate Valuations.Note: The Arkansas Public Service Commission has combined the personal and real estate public service accounts. Both are considered personal PSC accounts.(1) The direct tax rate was reduced 1 mill for the 2012 Library Capital Improvement and Refunding Bonds and 3 mills for the future issuance of up to $105 million in capital improvement bonds approved by voters on September 11, 2012.(2) The direct tax rate was reduced 1 mill for the 2015 Library Capital Improvement and Refunding Bonds.
Real Property Personal Property
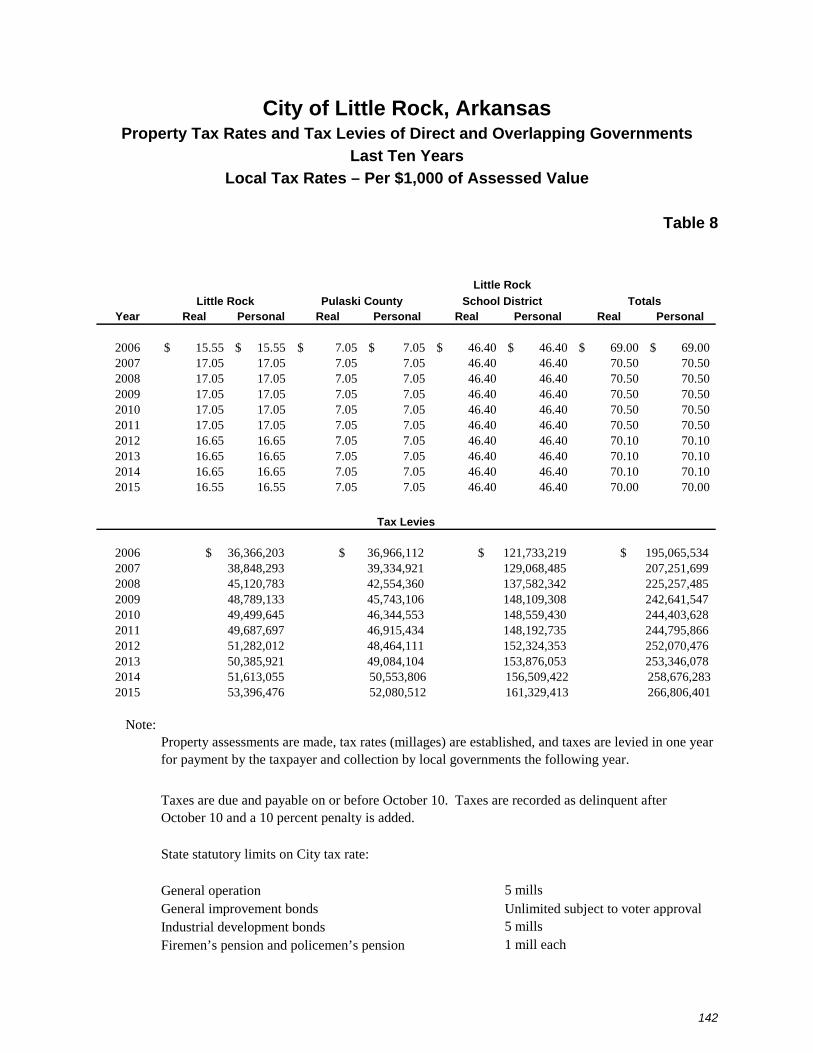
City of Little Rock, Arkansas Property Tax Rates and Tax Levies of Direct and Overlapping Governments
Last Ten Years
Local Tax Rates – Per $1,000 of Assessed Value
Table 8
142
Year Real Personal Real Personal Real Personal Real Personal
2006 $ 15.55 $ 15.55 $ 7.05 $ 7.05 $ 46.40 $ 46.40 $ 69.00 $ 69.00 2007 17.05 17.05 7.05 7.05 46.40 46.40 70.50 70.50 2008 17.05 17.05 7.05 7.05 46.40 46.40 70.50 70.50 2009 17.05 17.05 7.05 7.05 46.40 46.40 70.50 70.50 2010 17.05 17.05 7.05 7.05 46.40 46.40 70.50 70.50 2011 17.05 17.05 7.05 7.05 46.40 46.40 70.50 70.50 2012 16.65 16.65 7.05 7.05 46.40 46.40 70.10 70.10 2013 16.65 16.65 7.05 7.05 46.40 46.40 70.10 70.10 2014 16.65 16.65 7.05 7.05 46.40 46.40 70.10 70.10 2015 16.55 16.55 7.05 7.05 46.40 46.40 70.00 70.00
2006200720082009201020112012201320142015
Note:
5 mills
5 mills1 mill each
$ 121,733,219
53,396,476 52,080,512 161,329,413 266,806,401 156,509,422
School District TotalsLittle Rock
Little Rock
Pulaski County
Tax Levies
$ 195,065,534
50,385,921 153,876,053 49,084,104
45,743,106 137,582,342 45,120,783
38,848,293 39,334,921 $ 36,366,203
129,068,485
General operation
46,915,434 148,192,735 51,282,012 48,464,111
148,109,308
Property assessments are made, tax rates (millages) are established, and taxes are levied in one year for payment by the taxpayer and collection by local governments the following year.
State statutory limits on City tax rate:
Taxes are due and payable on or before October 10. Taxes are recorded as delinquent after October 10 and a 10 percent penalty is added.
225,257,485 207,251,699
Firemen’s pension and policemen’s pension
242,641,547 49,499,645 46,344,553 148,559,430
252,070,476
244,403,628
Unlimited subject to voter approval
253,346,078 50,553,806
49,687,697
Industrial development bonds
152,324,353 244,795,866
51,613,055 258,676,283
48,789,133
General improvement bonds
$ 36,966,112
42,554,360

143
City of Little Rock, Arkansas Principal Sales Taxpayers
December 31, 2015
The City of Little Rock, Arkansas’ largest own-source revenue is sales taxes. Sales taxes primarily come from two separate taxes; a one and one-half cent city tax based on point of sale and a portion of the county’s one cent tax based on population. The City of Little Rock makes up approximately 51% of the county population and receives a like proportion of the county tax. In 2015, the 1 1/2 cent city sales tax generated revenue of $73,821,987.
According to Arkansas State Statutes, the City is required to keep the identity of individual tax payers confidential. Therefore, the City of Little Rock is not able to identify the top 10 tax payers. However, Little Rock enjoys a diverse economic sales tax base.
Table 9
Little Rock Top Ten 1 1/2 Cent Sales Taxpayers TaxIndustry Collected % of Total
All Other General Merchandise 6,481,570$ 8.78%Full Service Restaurants 5,699,057 7.72%Grocery Stores 4,946,073 6.70%Building Materials and Supplies Dealers 3,137,434 4.25%Electric Power Generation, Tranmission and Distribution 3,048,848 4.13%Electronics and Appliance Stores 2,908,586 3.94%Clothing Stores 2,480,419 3.36%Telecommunications 2,089,162 2.83%Traveler Accommodation 1,978,429 2.68%Sporting Goods, Hobby, and Musical Instrument Stores 1,971,047 2.67%
Totals 34,740,625$ 47.06%

City of Little Rock, Arkansas Property Tax Levies and Collections
Last Ten Years
Table 10
144
Total Tax Levy Collections inYear In Prior Year Amount Percentage of Levy Subsequent Years Amount Percentage of Levy
2006 36,366,203$ 31,691,658$ 87.15% 2,934,792$ 34,626,450$ 95.22%2007 38,848,293 34,713,497 89.36% 2,479,637 37,193,134 95.74%2008 45,120,783 40,672,208 90.14% 2,235,852 42,908,060 95.10%2009 48,789,133 43,092,225 88.32% 2,590,493 45,682,718 93.63%2010 49,499,645 43,811,489 88.51% 3,134,144 46,945,633 94.84%2011 49,687,697 45,445,800 91.46% 3,003,035 48,448,835 97.51%2012 51,282,012 46,805,016 91.27% 3,200,327 50,005,343 97.51%2013 50,385,921 45,233,261 89.77% 2,832,651 48,065,912 95.40%2014 51,613,055 47,315,821 91.67% 2,805,622 50,121,443 97.11%2015 53,396,476 48,850,999 91.49% 2,564,574 51,415,573 96.29%
Note: Property assessments are made, tax rates (millages) are established, and taxes are levied in one year for payment by thetaxpayer and collection by local governments the following year. Data is not available to show the current level by year ofoutstanding delinquent taxes.
Taxes Levied in the Prior YearCollected within the current year Total Collections to Date
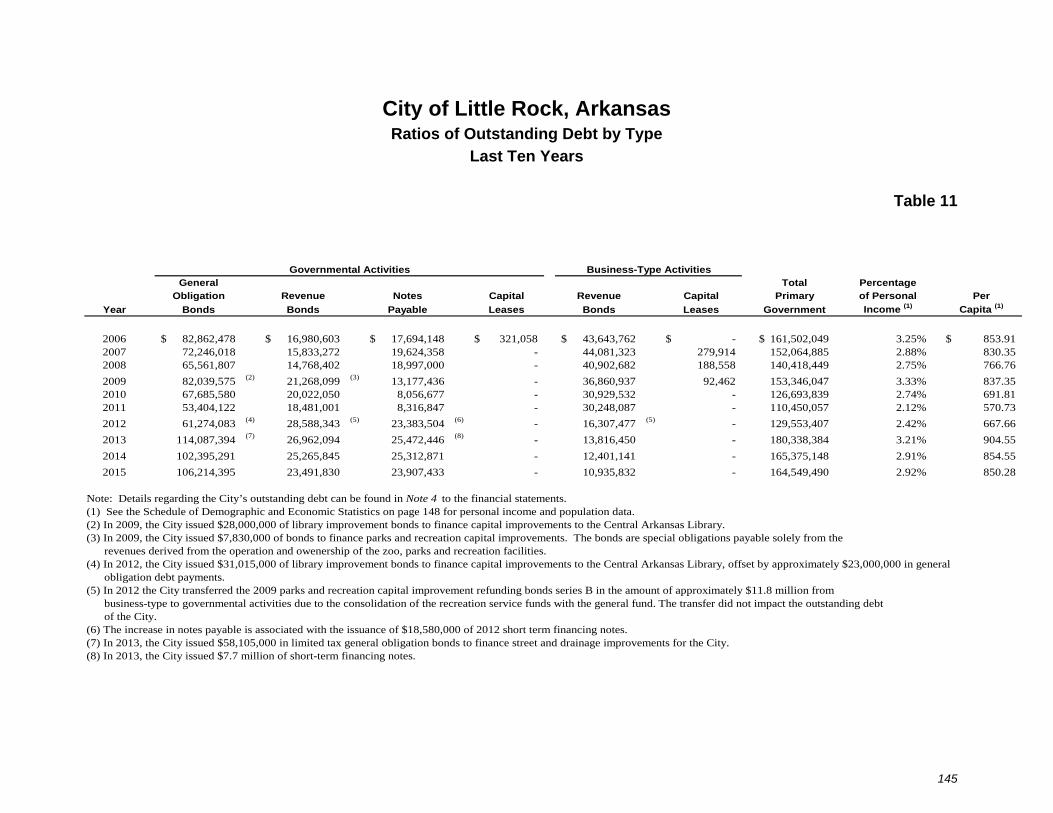
City of Little Rock, Arkansas Ratios of Outstanding Debt by Type
Last Ten Years
Table 11
145
General Total PercentageObligation Revenue Notes Capital Revenue Capital Primary of Personal Per
Year Bonds Bonds Payable Leases Bonds Leases Government Income (1) Capita (1)
2006 82,862,478$ 16,980,603$ 17,694,148$ 321,058$ 43,643,762$ -$ 161,502,049$ 3.25% 853.91$ 2007 72,246,018 15,833,272 19,624,358 - 44,081,323 279,914 152,064,885 2.88% 830.35 2008 65,561,807 14,768,402 18,997,000 - 40,902,682 188,558 140,418,449 2.75% 766.76
2009 82,039,575 (2) 21,268,099 (3) 13,177,436 - 36,860,937 92,462 153,346,047 3.33% 837.35 2010 67,685,580 20,022,050 8,056,677 - 30,929,532 - 126,693,839 2.74% 691.81 2011 53,404,122 18,481,001 8,316,847 - 30,248,087 - 110,450,057 2.12% 570.73
2012 61,274,083 (4) 28,588,343 (5) 23,383,504 (6) - 16,307,477 (5) - 129,553,407 2.42% 667.66
2013 114,087,394 (7) 26,962,094 25,472,446 (8) - 13,816,450 - 180,338,384 3.21% 904.55
2014 102,395,291 25,265,845 25,312,871 - 12,401,141 - 165,375,148 2.91% 854.55
2015 106,214,395 23,491,830 23,907,433 - 10,935,832 - 164,549,490 2.92% 850.28
Note: Details regarding the City’s outstanding debt can be found in Note 4 to the financial statements.(1) See the Schedule of Demographic and Economic Statistics on page 148 for personal income and population data.(2) In 2009, the City issued $28,000,000 of library improvement bonds to finance capital improvements to the Central Arkansas Library. (3) In 2009, the City issued $7,830,000 of bonds to finance parks and recreation capital improvements. The bonds are special obligations payable solely from the revenues derived from the operation and owenership of the zoo, parks and recreation facilities. (4) In 2012, the City issued $31,015,000 of library improvement bonds to finance capital improvements to the Central Arkansas Library, offset by approximately $23,000,000 in general obligation debt payments. (5) In 2012 the City transferred the 2009 parks and recreation capital improvement refunding bonds series B in the amount of approximately $11.8 million from business-type to governmental activities due to the consolidation of the recreation service funds with the general fund. The transfer did not impact the outstanding debt of the City. (6) The increase in notes payable is associated with the issuance of $18,580,000 of 2012 short term financing notes. (7) In 2013, the City issued $58,105,000 in limited tax general obligation bonds to finance street and drainage improvements for the City.(8) In 2013, the City issued $7.7 million of short-term financing notes.
Governmental Activities Business-Type Activities

City of Little Rock, Arkansas Ratios of General Bonded Debt Outstanding
Last Ten Years
Table 12
146
General Less: Amounts PercentageObligation Available in Debt of Appraised Value Per
Year Bonds Service Fund Total of Property (1) Capita (2)
2006 82,862,478$ 11,772,050$ 71,090,428$ 2.33% 375.88$ 2007 72,246,018 11,045,088 61,200,930 1.85% 330.74 2008 65,561,807 11,604,803 53,957,004 1.51% 291.65 2009 82,039,575 (3) 15,200,770 66,838,805 1.84% 362.36 2010 67,685,580 16,529,241 51,156,339 1.41% 278.16 2011 53,404,122 17,518,930 35,885,192 0.96% 185.43 2012 61,274,083 (4) 19,342,676 41,931,407 1.08% 211.30 2013 114,087,394 (5) 16,923,578 97,163,816 2.52% 502.08 2014 102,395,291 20,845,865 81,549,426 2.04% 421.39 2015 106,214,395 14,880,687 91,333,708 2.26% 471.95
Note: Details regarding the City’s outstanding debt can be found in Note 4 to the financial statements.
(1) See the Schedule of Assessed and Appraised Value of Taxable Property on page 139 for property value data.(2) See the Schedule of Demographic and Economic Statistics on page 148 for personal income and population data.(3) In 2009, the City issued $28,000,000 of library improvement bonds to finance capital improvements to the Central Arkansas Library. (4) In 2012, the City issued $31,015,000 of library improvement bonds to finance capital improvements to the Central Arkansas Library, offset by approximately $23,000,000 in general obligation debt payments. (5) In 2013, the City issued $58,105,000 in limited tax general obligation bonds to finance various capital improvements for the City.

City of Little Rock, Arkansas Direct and Overlapping Governmental Activities Debt
December 31, 2015
Table 13
147
City’sDebt Available for Percentage Share of
Governmental Unit Retirement Applicable Overlapping Debt
City of Little Rock, Arkansas 130,121,828$ 100% 130,121,828$
Little Rock Public School District 186,705,741 100% 186,705,741
Total direct and overlapping debt 316,827,569$ 316,827,569$
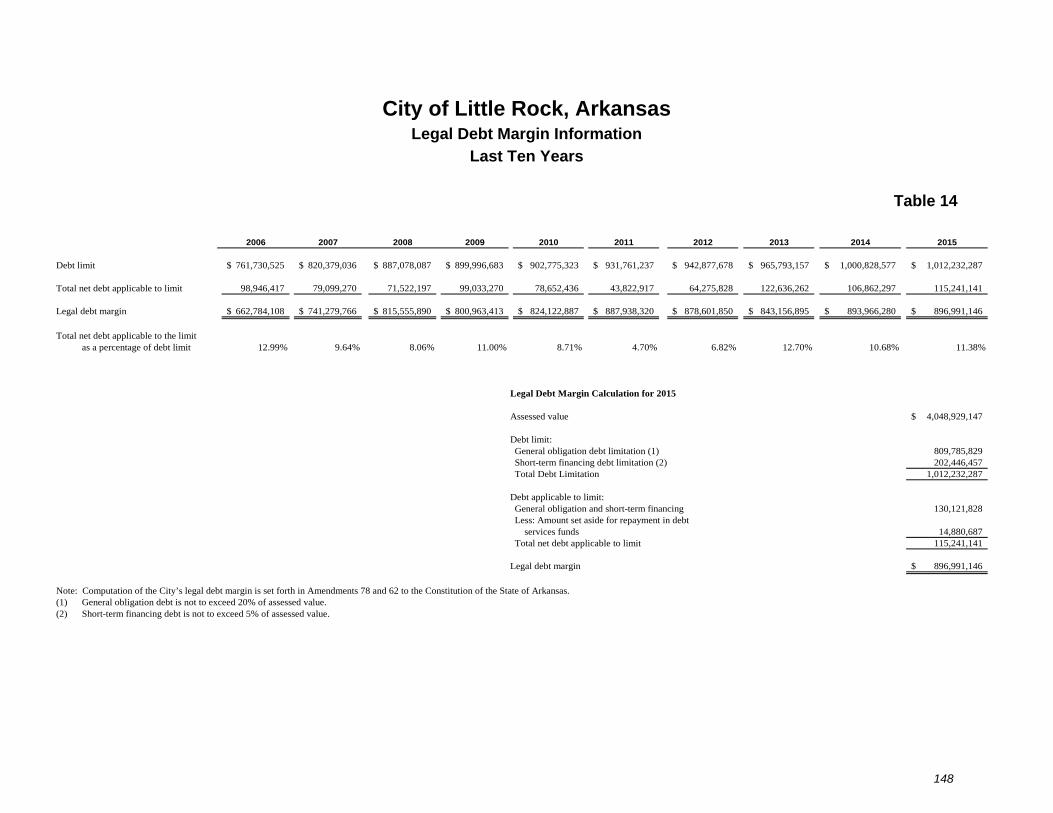
City of Little Rock, Arkansas Legal Debt Margin Information
Last Ten Years
Table 14
148
2006 2007 2008 2009 2010 2011 2012 2013 2014 2015
Debt limit 761,730,525$ 820,379,036$ 887,078,087$ 899,996,683$ 902,775,323$ 931,761,237$ 942,877,678$ 965,793,157$ 1,000,828,577$ 1,012,232,287$
Total net debt applicable to limit 98,946,417 79,099,270 71,522,197 99,033,270 78,652,436 43,822,917 64,275,828 122,636,262 106,862,297 115,241,141
Legal debt margin 662,784,108$ 741,279,766$ 815,555,890$ 800,963,413$ 824,122,887$ 887,938,320$ 878,601,850$ 843,156,895$ 893,966,280$ 896,991,146$
Total net debt applicable to the limitas a percentage of debt limit 12.99% 9.64% 8.06% 11.00% 8.71% 4.70% 6.82% 12.70% 10.68% 11.38%
Legal Debt Margin Calculation for 2015
Assessed value 4,048,929,147$
Debt limit:General obligation debt limitation (1) 809,785,829 Short-term financing debt limitation (2) 202,446,457 Total Debt Limitation 1,012,232,287
Debt applicable to limit:General obligation and short-term financing 130,121,828 Less: Amount set aside for repayment in debt services funds 14,880,687 Total net debt applicable to limit 115,241,141
Legal debt margin 896,991,146$
Note: Computation of the City’s legal debt margin is set forth in Amendments 78 and 62 to the Constitution of the State of Arkansas.(1) General obligation debt is not to exceed 20% of assessed value.(2) Short-term financing debt is not to exceed 5% of assessed value.

City of Little Rock, Arkansas Revenue Bond Coverage
Last Ten Years
Operating Operating
Revenue (1) Expenses (2) Net Revenue Principal (3) Interest Total Coverage
2006 Wastewater Utility 30,398,264$ 22,088,849$ 8,309,415$ 2,625,215$ 2,496,617$ 5,121,832$ 1.62Bill and Hillary Clinton National Airport 19,847,399 14,642,935 5,204,464 1,760,000 1,332,157 3,092,157 1.68
A&P Commission 13,575,601 10,519,446 3,061,155 1,337,500 1,009,844 2,347,344 1.30
Total 63,821,264$ 47,251,230$ 16,575,034$ 5,722,715$ 4,838,618$ 10,561,333$ 1.57
2007 Wastewater Utility 36,360,579$ 28,945,783$ 7,414,796$ 4,703,185$ 9,580,782$ 14,283,967$ 0.52Bill and Hillary Clinton National Airport 21,909,030 15,572,022 6,337,008 2,185,000 1,609,663 3,794,663 1.67
A&P Commission 14,355,358 10,877,344 3,478,014 1,632,248 1,126,356 2,758,604 1.26
Total 72,624,967$ 55,395,149$ 17,229,818$ 8,520,433$ 12,316,801$ 20,837,234$ 0.83
2008 Wastewater Utility 38,883,908$ 33,071,944$ 5,811,964$ 5,591,753$ 10,525,749$ 16,117,502$ 0.36Bill and Hillary Clinton National Airport 24,786,792 18,463,447 6,323,345 2,280,000 1,514,759 3,794,759 1.67
A&P Commission 15,336,586 13,092,408 2,244,178 1,737,353 1,012,215 2,749,568 0.82
Total 79,007,286$ 64,627,799$ 14,379,487$ 9,609,106$ 13,052,723$ 22,661,829$ 0.63
2009 Wastewater Utility 39,769,048$ 34,022,888$ 5,746,160$ 6,614,886$ 11,236,492$ 17,851,378$ 0.32Bill and Hillary Clinton National Airport 23,323,312 16,925,424 6,397,888 2,395,000 1,406,040 3,801,040 1.68
A&P Commission 15,233,008 13,250,137 1,982,871 1,858,399 890,719 2,749,118 0.72
Total 78,325,368$ 64,198,449$ 14,126,919$ 10,868,285$ 13,533,251$ 24,401,536$ 0.58
2010 Wastewater Utility 42,014,840$ 34,022,888$ 7,991,952$ 6,855,607$ 11,004,113$ 17,859,720$ 0.45Bill and Hillary Clinton National Airport 25,309,837 17,419,698 7,890,139 2,515,000 1,290,040 3,805,040 2.07
A&P Commission 15,545,711 12,959,555 2,586,156 1,985,445 756,779 2,742,224 0.94
Total 82,870,388$ 64,402,141$ 18,468,247$ 11,356,052$ 13,050,932$ 24,406,984$ 0.76
Debt Service Requirements

City of Little Rock, Arkansas Revenue Bond Coverage (continued)
Last Ten Years
Table 15
149
Operating Operating
Revenue (1) Expenses (2) Net Revenue Principal (3) Interest Total Coverage
2011 Wastewater Utility 41,343,263$ 32,049,380$ 9,293,883$ 7,285,023$ 10,570,448$ 17,855,471$ 0.52Bill and Hillary Clinton National Airport 27,522,515 17,631,283 9,891,232 2,615,000 1,179,060 3,794,060 2.61
A&P Commission 15,741,893 11,981,824 3,760,069 2,123,554 613,663 2,737,217 1.37
Total 84,607,671$ 61,662,487$ 22,945,184$ 12,023,577$ 12,363,171$ 24,386,748$ 0.94
2012 Wastewater Utility 43,547,696$ 31,653,755$ 11,893,941$ 8,359,601$ 11,332,518$ 19,692,119$ 0.60Bill and Hillary Clinton National Airport 29,021,156 19,639,947 9,381,209 2,745,000 1,050,806 3,795,806 2.47
A&P Commission 16,197,970 12,069,527 4,128,443 1,940,000 460,568 2,400,568 1.72
Total 88,766,822$ 63,363,229$ 25,403,593$ 13,044,601$ 12,843,892$ 25,888,493$ 0.98
2013 Wastewater Utility 48,141,512$ 32,730,309$ 15,411,203$ 8,632,477$ 11,845,306$ 20,477,783$ 0.75Bill and Hillary Clinton National Airport 30,628,890 19,844,695 10,784,195 1,160,000 495,998 1,655,998 6.51
A&P Commission 17,217,912 13,177,614 4,040,298 2,080,000 317,494 2,397,494 1.69
Total 95,988,314$ 65,752,618$ 30,235,696$ 11,872,477$ 12,658,798$ 24,531,275$ 1.23
2014 Wastewater Utility 51,214,190$ 23,313,891$ 27,900,299$ 9,023,866$ 10,562,391$ 19,586,257$ 1.42Bill and Hillary Clinton National Airport 30,733,404 20,101,509 10,631,895 1,565,000 452,118 2,017,118 5.27
A&P Commission 16,679,718 11,495,998 5,183,720 1,115,000 2,880,581 3,995,581 1.30
Total 98,627,312$ 54,911,398$ 43,715,914$ 11,703,866$ 13,895,090$ 25,598,956$ 1.71
2015 Wastewater Utility 51,175,869$ 23,956,665$ 27,219,204$ 9,495,548$ 9,257,270$ 18,752,818$ 1.45
A&P Commission 17,031,779 11,057,348 5,974,431 1,130,000 2,869,431 3,999,431 1.49
Total 68,207,648$ 35,014,013$ 33,193,635$ 10,625,548$ 12,126,701$ 22,752,249$ 1.46
(1) Includes proceeds from long-term debt and various nonoperating revenues
(intergovernmental revenue and local tax levy).
(2) Excludes depreciation.
(3) Includes bond defeasance.
Pledged Operating
Revenue (4) Expenses (5) Net Revenue Principal Interest Total Coverage
River Market Garage $ 2,767,255 $ 1,241,473 $ 1,525,782 $ 440,000 $ 445,835 $ 885,835 1.72
(5) Excludes depreciation.
Note:Amounts shown are for the City’s Discretely Presented Component Units:
Debt Service Requirements
Debt Service Requirements
(4) Includes all revenues of the City derived from the ownership, control and operation of the City’s various parking facilities.

City of Little Rock, Arkansas Demographic and Economic Statistics
Last Ten Years
Table 16
150
Percent of Population Age
Personal Per Capita Median 25+ MA/Professional School Unemployment
Year Population Income (2) Income (2) Age Degree or Higher Enrollment Rate
2006 183,133 (1) 4,966,933,226 27,122 36.0 13.4 28,755 (3) 3.8%
2007 183,133 (1) 5,284,485,848 28,856 36.2 16.9 28,828 (3) 4.8%
2008 183,133 (1) 4,985,063,393 27,221 34.8 13.8 27,899 (3) 4.6%
2009 183,133 (1) 4,642,787,816 25,352 37 13.8 27,866 (3) 6.1%
2010 193,524 (4) 4,906,220,448 25,352 37 13.8 27,950 (3) 6.1%
2011 193,524 (4) 5,205,408,552 26,898 35.1 13.8 27,626 (3) 7.3%
2012 193,524 (4) 5,350,164,504 27,646 36.8 15.8 27,344 (3) 6.8%
2013 193,524 (4) 5,448,087,648 28,152 36.6 15.8 27,369 (3) 6.7%
2014 193,524 (4) 5,686,122,168 29,382 36.1 15.8 26,943 (3) 5.9%
2015 193,524 (4) 5,632,516,020 29,105 35.6 15.8 26,767 (3) 4.8%
Data Sources: Metroplan - Council of Local Governments, Pulaski County, Little Rock Public Schools, State Library
(1) 2000 Census(2) The State Library provides per capita income. Personal Income is a calculation of per capita income multiplied by the population.(3) Little Rock Public Schools(4) 2010 Census

City of Little Rock, Arkansas Little Rock Area Major Employers
Current Year and Nine Years
Table 17
151
Percentage of Percentage ofTotal City Total City
Employer Employees Rank Employment Employees Rank Employment
State of Arkansas (MSA) 34,900 1 18.73% 23,377 1 15.28%Local Government (MSA) 27,200 2 14.60%Federal Government (MSA) 9,900 3 5.31% 12,000 2 7.84%University of Arkansas Medical Sciences 9,100 4 4.88% 8,500 3 5.56%Baptist Health 5,360 5 2.88% 7,000 5 4.58%Little Rock Air Force Base 4,500 6 2.42% 4,500 6 2.94%Arkansas Children's Hospital 4,000 7 2.15%Little Rock School District 3,500 8 1.88%Central Arkansas Veterans Health Care 2,800 9 1.50% 2,785 10 1.82%Entergy Arkansas 2,740 10 1.47% 2,862 9 1.87%Public School Districts 8,434 4 5.51%St. Vincent Infirmary Medical Center 3,500 8 2.29%Acxiom 4,388 7 2.87%
104,000 55.82% 77,346 50.56%
Source: Metroplan - Council of Local GovernmentsNote: The percentage of total city employement was not available for 2006.
2015 2006
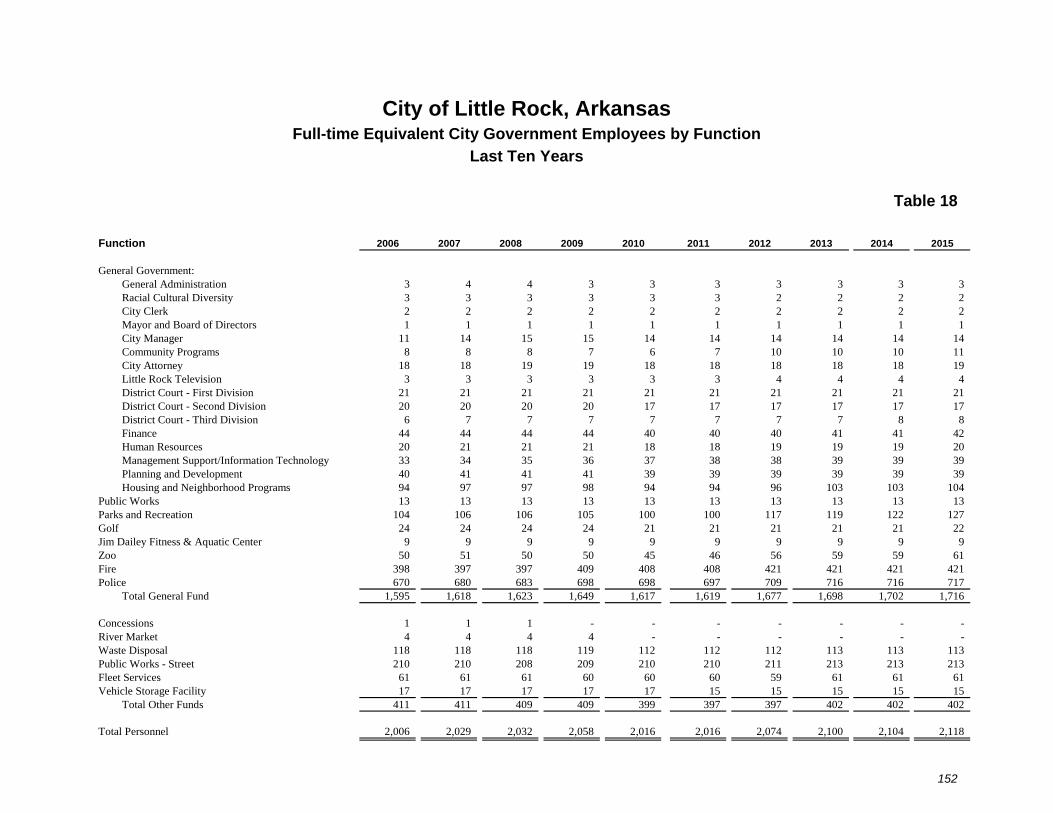
City of Little Rock, Arkansas Full-time Equivalent City Government Employees by Function
Last Ten Years
Table 18
152
Function 2006 2007 2008 2009 2010 2011 2012 2013 2014 2015
General Government:General Administration 3 4 4 3 3 3 3 3 3 3 Racial Cultural Diversity 3 3 3 3 3 3 2 2 2 2 City Clerk 2 2 2 2 2 2 2 2 2 2 Mayor and Board of Directors 1 1 1 1 1 1 1 1 1 1 City Manager 11 14 15 15 14 14 14 14 14 14 Community Programs 8 8 8 7 6 7 10 10 10 11 City Attorney 18 18 19 19 18 18 18 18 18 19 Little Rock Television 3 3 3 3 3 3 4 4 4 4 District Court - First Division 21 21 21 21 21 21 21 21 21 21 District Court - Second Division 20 20 20 20 17 17 17 17 17 17 District Court - Third Division 6 7 7 7 7 7 7 7 8 8 Finance 44 44 44 44 40 40 40 41 41 42 Human Resources 20 21 21 21 18 18 19 19 19 20 Management Support/Information Technology 33 34 35 36 37 38 38 39 39 39 Planning and Development 40 41 41 41 39 39 39 39 39 39 Housing and Neighborhood Programs 94 97 97 98 94 94 96 103 103 104
Public Works 13 13 13 13 13 13 13 13 13 13 Parks and Recreation 104 106 106 105 100 100 117 119 122 127 Golf 24 24 24 24 21 21 21 21 21 22 Jim Dailey Fitness & Aquatic Center 9 9 9 9 9 9 9 9 9 9 Zoo 50 51 50 50 45 46 56 59 59 61 Fire 398 397 397 409 408 408 421 421 421 421 Police 670 680 683 698 698 697 709 716 716 717
Total General Fund 1,595 1,618 1,623 1,649 1,617 1,619 1,677 1,698 1,702 1,716
Concessions 1 1 1 - - - - - - - River Market 4 4 4 4 - - - - - - Waste Disposal 118 118 118 119 112 112 112 113 113 113 Public Works - Street 210 210 208 209 210 210 211 213 213 213 Fleet Services 61 61 61 60 60 60 59 61 61 61 Vehicle Storage Facility 17 17 17 17 17 15 15 15 15 15
Total Other Funds 411 411 409 409 399 397 397 402 402 402
Total Personnel 2,006 2,029 2,032 2,058 2,016 2,016 2,074 2,100 2,104 2,118

City of Little Rock, Arkansas Operating Indicators by Function/Program
Last Ten Years
Table 19
153
Function 2006 2007 2008 2009 2010 2011 2012 2013 2014 2015
Planning and DevelopmentTotal building permits issued 4,694 2,734 1,957 3,690 3,832 3,304 2,011 2,000 2,024 2,059 Estimated building cost $561,752,025 $614,558,257 $433,788,975 $394,776,760 $343,976,010 $356,450,894 $391,789,405 $385,865,486 $593,559,207 $414,586,125New commercial construction permits 78 60 45 31 26 155 94 38 62 45 Commercial construction value $102,602,945 $192,268,739 $109,789,182 $63,687,048 $58,935,859 $134,734,044 $115,487,012 $86,866,172 $189,748,670 $137,075,636New residential construction permits 810 733 398 351 361 344 349 359 343 335 Residential construction value $197,698,324 $191,545,656 $102,855,663 $84,919,683 $74,161,071 $68,783,123 $78,991,948 $96,044,242 $92,447,772 $89,366,181
FireNumber of uniformed employees 374 391 391 402 403 403 403 415 415 415 Fires and explosions 1,752 1,478 1,190 1,256 1,557 1,452 1,595 1,241 1,274 1,302 Overpressure rupture, explosion, overheat (no fire) 143 101 90 61 65 62 96 62 76 72 Rescue, emergency medical calls 13,948 13,946 13,990 14,690 15,256 15,259 15,890 16,312 16,934 17,985 Hazardous condition, standby 1,186 1,177 1,392 1,178 1,130 1,298 1,420 1,233 1,383 1,371 Service calls 1,236 1,265 1,374 1,241 1,210 1,295 1,437 1,440 1,503 1,638 Good intent calls 2,419 3,165 3,176 3,327 3,523 3,332 3,426 3,846 3,839 3,419 False alarm calls 3,019 2,953 2,813 2,714 2,644 2,648 2,753 2,770 3,258 4,343 Natural disaster calls 28 22 64 29 17 75 37 22 26 17 Other calls 142 117 158 132 179 134 136 140 685 437 Total calls 23,873 24,224 24,247 24,628 25,984 25,555 26,790 27,066 28,978 30,584
PoliceNumber of uniformed employees 515 525 520 557 557 557 577 574 574 574 Calls for service 155,110 156,714 150,042 148,409 143,540 143,226 157,093 158,635 150,367 162,844 Arrests 15,023 17,362 10,523 15,445 15,446 10,154 9,778 8,847 9,289 8,373 Accidents (fatality and serious injury) 5,181 5,363 4,054 3,354 3,354 2,877 3,480 2,612 2,890 224 Training man hours 12,778 13,469 26,465 13,525 13,625 10,825 36,780 37,568 38,507 16,230 Uniform Crime Reporting (UCR) Part I offenses 19,220 19,200 17,968 17,775 16,057 16,662 17,330 17,358 16,494 14,932 Clearance rate - all crimes 21.70% 22.36% 24.80% 19.22% 19.47% 38.00% 21.66% 18.83% 20.13% 20.70%
Public WorksMiles of graded and surface treatment 426 398 394 392 425 422 422 422 422 422 Drainage ditches maintained 745 1,578 1,578 1,578 1,578 1,578 1,578 1,578 1,578 1,578 Traffic signals repaired 1,887 2,178 2,464 3,100 2,125 1,832 293 2,568 2,288 2,179
Solid Waste/Garbage CollectionsSolid waste disposal monthly service rate $20.99 $20.99 $20.99 $21.00 $21.00 $20.99 $20.99 $22.02 $22.02 $22.02On-Call service 30,370 30,500 32,000 27,900 24,620 27,135 25,601 26,649 28,148 25,523 KB’s service 5,865 6,000 6,000 8,898 7,499 6,242 5,164 8,675 6,864 6,198 Roll-off service 2,194 2,200 2,100 2,108 1,839 2,139 1,973 2,058 1,935 1,149 Carts 5,124 6,500 5,500 5,664 5,852 5,874 5,742 5,501 5,121 6,667 Dead animals collected 343 500 400 303 451 343 329 265 309 328 Curbside recycling tonnage 4,596 4,800 5,200 5,240 5,414 5,688 9,307 10,287 10,219 9,839 Paper recycling pounds 84,200 59,490 48,942 65,060 7,321 57,820 145,540 31,140 12,160 5,520 Class I and IV tonnage 108,382 116,000 112,500 113,740 102,500 101,283 104,226 131,773 119,013 124,617 Yard Waste tonnage 23,875 23,800 24,000 26,663 25,226 32,585 30,690 47,881 30,562 27,529
Parks and RecreationTotal recorded parks attendance 1,339,653 1,457,419 1,632,030 64,686 (1) 1,672,000 (2) 611,722 604,702 617,537 613,042 675,314 Zoo attendance 257,290 282,334 274,781 277,530 274,621 307,123 323,040 313,762 307,046 267,314 Zoo outreach program 98,479 55,669 69,223 74,153 39,240 37,307 21,584 37,018 18,700 46,202
Sources: Various city departments.Note: Indicators are not available for the general government function.
(1) In 2009, the parks department changed the method in which they recorded parks attendance(2) In 2010, the parks department changed back to the method in which they recorded parks attendance prior to 2009.

City of Little Rock, Arkansas Capital Asset Statistics By Function
Last Ten Years
Table 20
154
Function 2006 2007 2008 2009 2010 2011 2012 2013 2014 2015
Fire Stations 20 20 20 20 20 20 21 21 21 21
Police Stations 5 11 (1) 9 11 11 10 10 10 11 11
Public WorksMiles of Streets 2,548 2,567 2,585 2,601 2,443 2,434 2,448 2,461 2,465 2,468 Miles of paved - permanent streets 2,039 2,105 2,146 2,164 2,018 2,016 2,026 2,039 2,046 2,050 Alleys 63 63 63 63 63 63 63 63 63 63
Waste DisposalMiles of storm sewer 350 350 355 355 357 357 359 361 361 363 Miles of sanitary sewer 2,070 1,292 1,311 1,312 1,320 1,345 1,400 1,365 1,368 1,375 Solid waste containers purchased 1,889 2,984 1,512 2,688 2,688 3,032 4,176 3,654 2,138 1,740
Parks and RecreationAcreage 5,776 5,781 5,780 6,080 6,246 6,313 6,315 6,319 6,467 6,467 Number of parks 55 55 55 56 58 59 59 59 62 62 Number of playgrounds 45 45 45 45 45 45 46 46 46 46 Number of tennis courts 52 52 52 52 48 48 48 48 48 48 Number of basketball courts 35 36 36 37 37 37 37 37 37 37 Number of museums 1 1 1 1 1 1 1 1 1 1 Number of golf courses 4 3 3 3 3 3 3 3 3 3 Number of ball fields 25 25 25 25 25 25 25 25 25 29 Number of play fields 20 20 20 20 20 20 20 20 22 22 Number of zoos 1 1 1 1 1 1 1 1 1 1 Number of adult centers 1 1 1 1 - - 1 1 3 1 Number of community centers 6 6 6 5 4 4 4 5 4 6 Number of fitness centers 1 1 1 1 1 1 1 1 1 1 Number of swimming pools 3 3 3 3 3 3 3 3 2 3 Number of soccer fields 9 9 9 9 9 9 9 9 12 12 Number of pavilions 19 22 20 22 22 22 22 22 28 28 Number of volleyball courts 9 2 2 8 8 9 9 9 8 10
Source: Various city departments.Note: No capital asset indicators are available for the general government.(1) In 2007 the police stations began including substations in this figure.