comprehensive annual financial report … annual financial report for the year ended september 30,...
TRANSCRIPT

COMPREHENSIVE ANNUAL FINANCIAL REPORT
FOR THE YEAR ENDED SEPTEMBER 30, 2007

COMPREHENSIVE ANNUAL FINANCIAL REPORT
of the
EAST TEXAS COUNCIL OF GOVERNMENTS
For the Year Ended September 30, 2007
Judy Durland, CPA, CGFM ETCOG Finance Department Director of Finance Sloane Bodle Liz Jones Lynda Bond Rhonda Barber Member of the Government Finance Officer’s Association of the United States and Canada

THIS PAGE LEFT BLANK INTENTIONALLY

i
EAST TEXAS COUNCIL OF GOVERNMENTS
TABLE OF CONTENTS
SEPTEMBER 30, 2007 Page Number INTRODUCTORY SECTION Letter of Transmittal ..................................................................................................... 1 – 5 Certificate of Achievement ........................................................................................... 6 Organization Chart........................................................................................................ 7 Principal Officials ......................................................................................................... 8 Member Governments .................................................................................................. 9 – 10 FINANCIAL SECTION Independent Auditors’ Report....................................................................................... 11 – 12 Management Discussion and Analysis ......................................................................... 13 – 18 Basic Financial Statements: Government-wide Financial Statements: Statement of Net Assets .......................................................................................... 19 Statement of Activities............................................................................................ 20 – 21 Fund Financial Statements: Balance Sheet.......................................................................................................... 22 – 23 Reconciliation of the Governmental Funds Balance Sheet to the Statement of Net Assets ............................................................................. 24 Statement of Revenues, Expenditures and Changes in Fund Balances – Governmental Funds ................................................................ 25 – 26
(continued)

ii
EAST TEXAS COUNCIL OF GOVERNMENTS
TABLE OF CONTENTS (Continued)
SEPTEMBER 30, 2007 Page Number FINANCIAL SECTION (Continued) Basic Financial Statements: (Continued) Fund Financial Statements: Continued) Reconciliation of the Statement of Revenues, Expenditures and Changes in Fund Balances of Governmental Funds to the Statement of Activities............................................................................... 27 Statement of Net Assets – Proprietary Fund........................................................... 28 Statement of Revenues, Expenses and Changes in Fund Net Assets – Proprietary Fund.................................................................... 29 Statement of Cash Flows – Proprietary Fund ......................................................... 30 Notes to Financial Statements.................................................................................... 31 – 41 Nonmajor Governmental Funds: Combining Balance Sheet.......................................................................................... 42 – 43 Combining Statement of Revenues, Expenditures and Changes in Fund Balances...................................................................................................... 44 – 45
Supplemental Schedules Schedule of Indirect Costs ...................................................................................... 46 Schedule of Employee Benefits .............................................................................. 47
(continued)

iii
EAST TEXAS COUNCIL OF GOVERNMENTS
TABLE OF CONTENTS (Continued)
SEPTEMBER 30, 2007 Page Number STATISTICAL SECTION Net Assets by Component............................................................................................. 48 Changes in Net Assets .................................................................................................. 49 Fund Balances of Governmental Funds........................................................................ 50 – 51 Changes in Fund Balances – Governmental Funds ...................................................... 52 Revenues and Expenditures of Governmental Funds ................................................... 53 Regional County Information ....................................................................................... 54 – 57 Employment Percent Change 1990 – 2006................................................................... 58 Employment by County ................................................................................................ 59 Population Change in 1970s, 80s, and 90s, 2000 and 2010.......................................... 60 Population – Census – 1970 – 2000 – 2010 Census Estimate ...................................... 61 Population and Household Percent Change 2000 – 2030............................................. 62 Population and Household by County .......................................................................... 63 Population Age Historical and Projected 1990 and 2000 Census, 2006 Estimate and 2011 Projection ........................................................................... 64 Total Population Age Historical and Projected ............................................................ 65 Demographic and Economic Statistics ......................................................................... 66 Principal Employers 1000+ Employees........................................................................ 67 Fulltime Employee Equivalents by Function................................................................ 68
(continued)
iv
EAST TEXAS COUNCIL OF GOVERNMENTS
TABLE OF CONTENTS (Continued)
SEPTEMBER 30, 2007 Page Number STATISTICAL SECTION (Continued) Operating Indicators by Function ................................................................................. 69 Capital Asset Statistics by Function ............................................................................. 70 East Texas Workforce Development Area ................................................................... 71 SINGLE AUDIT SECTION Independent Auditors’ Report on Compliance and on Internal Control Over Financial Reporting Based on an Audit of Financial Statements Performed in Accordance With Government Auditing Standards................................................................................ 72 – 73 Independent Auditors’ Report on Compliance With Requirements Applicable to Each Major Program and Internal Control Over Compliance in Accordance With OMB Circular A-133............................................ 74 – 75 Schedule of Expenditures of Federal and State Awards............................................... 76 – 81 Notes to Schedule of Expenditures of Federal and State Awards .............................................................................................................. 82 – 83 Schedule of Findings and Questioned Costs................................................................. 84 Summary Schedule of Prior Audit Findings................................................................. 85

INTRODUCTORY SECTION

THIS PAGE LEFT BLANK INTENTIONALLY

January 31, 2008 Commissioner Bill Hale and the Executive Committee East Texas Council of Governments Kilgore, TX Dear Ladies and Gentlemen: The comprehensive annual financial report for the East Texas Council of Governments (ETCOG) for the fiscal year ended September 30, 2007, is submitted herewith. Responsibility for both the accuracy of the data and the completeness and fairness of the presentation, including all disclosures, rests with ETCOG’s management. We believe the data, as presented, is accurate in all material respects, that it properly reflects the financial position and the results of operations of the Council through the measurement of financial activity of its various funds, and that all disclosures have been made to enable the reader to acquire the maximum understanding of financial affairs concerning ETCOG. These financial statements are presented annually in compliance with Office of Management and Budget’s Circular A-133, the Single Audit Act of 1984, as amended, and the Council’s Bylaws.
REPORT FORMAT ETCOG’s financial statements have been audited by Pattillo, Brown & Hill, L.L.P., a firm of licensed certified public accountants. The goal of the independent audit was to provide reasonable assurance that the financial statements of ETCOG for the fiscal year ended September 30, 2007, are free of material misstatement. The independent audit involved examining, on a test basis, evidence supporting the amounts and disclosures in the financial statements; assessing the accounting principles used and significant estimates made by management; and evaluating the overall financial statement presentation. The independent auditor concluded, based upon the audit, that there was a reasonable basis for rendering an unqualified opinion that ETCOG’s financial statements for the fiscal year ended September 30, 2007, are fairly presented in conformity with GAAP. The independent auditor’s report is presented as the first component of the financial section of this report. The independent audit of the financial statements of ETCOG was part of a broader, federally mandated “Single Audit” designed to meet the special needs of federal grantor agencies. The standards governing Single Audit engagements require the independent auditor to report not only on the fair presentation of the financial statements, but also on the audited government’s internal controls and compliance with legal requirements, with special emphasis on internal controls and legal requirements involving the administration of federal awards. These reports are available in the Single Audit Section of this report.
1

2
GAAP require that management provide a narrative introduction, overview, and analysis to accompany the basic financial statements in the form of Management’s Discussion and Analysis (MD&A). This letter of transmittal is designed to complement MD&A and should be read in conjunction with it. ETCOG’s MD&A can be found immediately following the report of the independent auditors.
PROFILE OF THE COUNCIL
In June 1970, a regional planning commission known as the East Texas Council of Governments was created under authority of State Law now recodified as Local Government Code, Chapter 391. The Council is a voluntary membership organization of local governments in a 14-county region of East Texas. The organization is one of 24 regional councils in Texas. Local governments created ETCOG to develop a systematic method of evaluating and addressing common concerns which affect several governmental jurisdictions. Cooperative efforts to resolve regional issues such as employment, water and air pollution, crime, emergency services, drainage and flooding, transportation, care of the elderly, and waste disposal have received collective action through ETCOG. The Council continues to be dedicated to improving the quality of life of the citizens of the region through cooperative efforts to enhance the physical, social, and economic environment. ETCOG is governed by a Board of 135 delegates from member local governments. The Board of Directors is composed of locally elected officials, members representing county governments, cities, school districts and soil and water conservation districts. The Board of Directors determines policy, while the Executive Committee elected by the Board of Directors is responsible for carrying out that policy. ETCOG’s Executive Committee is comprised of local elected officials who meet monthly to provide specific guidance to the Council. During 2007, ETCOG’s membership was comprised of the 14 county governments, 73 cities, 26 school districts, and 14 special purpose districts, including all major general-purpose local governments in the region. According to 2007 estimates from the Texas State Data Center, these member governments represented approximately 802,803 citizens and covered an area of 9,722 square miles.
FACTORS AFFECTING FINANCIAL CONDITION The information presented in the financial statements is perhaps best understood when it is considered from the broader perspective of the specific environment within which the East Texas Council of Governments operates.

3
LOCAL ECONOMY Located just 90 miles east of the Dallas-Fort Worth Metroplex, the 14-county region that comprises East Texas is uniquely positioned for economic growth. The East Texas Workforce Development Area consists of the following counties: Anderson, Camp, Cherokee, Gregg, Harrison, Henderson, Marion, Panola, Rains, Rusk, Smith, Upshur, Van Zandt and Wood. The 2000 census data shows a population of approximately 745,180 persons in the 14 counties covering approximately 10,000 square miles. While 10 of the 14 counties (covering 7,276 square miles) are rural, the region includes two standard metropolitan statistical areas – Tyler (Smith County) and Longview (Gregg County). The Tyler MSA has an estimated 2007 population of 197,093 and the Longview MSA has an estimated 2007 population of 205,096. The population density for the Workforce Development Area is 82.58 persons per square mile, which is much more concentrated than the western areas of the State. (In comparison, the population density of the Panhandle of Texas in rural counties is about 16 persons per square mile.) According to a report by the State Comptrollers Office, “The population of the East Texas region is large enough to create a demand for a wide variety of services and scattered enough to make delivery in a single location problematic.” Institutionally, East Texas is characterized by local autonomy with continuously increasing economic linkages. All of the counties are affected by the “Interstate Highway 20 Corridor,” which links the East Texas region with Dallas and Shreveport, which are in turn linked with Austin, San Antonio and Houston. There are 14 counties, and 81 cities, 12 of which have populations of 5,000 or more. Tyler and Longview are the economic centers of the region. In particular, Tyler is the leading population center of the region and a retail/marketing hub. The Texas economy and the economy of East Texas are closely tied to that of the U. S. as a whole. In fact, the national economic outlook has a strong bearing on both local and Texas forecasts. Given the number of new and emerging consumer markets around the world, American business is increasingly looking for moneymaking opportunities outside of the United States. With this increased amount of world trade, Texas and East Texas are becoming more dependent on the global economy for much of its prosperity. The East Texas Workforce Development Area is located in the eastern part of the state. While oil and gas production, manufacturing, lumber/agribusiness, and government remain important, the East Texas economy is becoming more like the state and national economies, whose growth is driven by the services industries, which include low skill, low-wage counter help type jobs, along with high skill, high wage jobs in the office oriented managerial, sales and personal services occupations. In 2002, the East Texas region total employment for all industries was 325,700, with projected growth to 387,100 by the year 2012. That is an expected increase of 61,400, or a 19% increase in employment.
4
LONG-TERM FINANCIAL PLANNING Accounting System and Budgetary Control. In developing and evaluating ETCOG’s accounting system, consideration is given to the adequacy of internal accounting controls. Internal accounting controls are designed to provide reasonable, but not absolute, assurance that assets are safeguarded against loss and that reliable financial records are maintained. We believe that adequate precautions have been taken, within cost limitations, to safeguard assets and provide reasonable assurance of proper recording of financial transactions within the Council. As a recipient of federal and state assistance, ETCOG also is responsible for ensuring that an adequate internal control structure is in place to ensure compliance with applicable laws and regulations related to those programs. The internal control structure is subject to periodic evaluation by management, federal and state agencies and independent auditors. The Board of Directors approves a financial plan for revenues and expenditures in all funds. An annual financial plan is adopted for the Special Revenue Funds in September for the next year. Financial plans for the Special Revenue Funds are made on a project (grant) basis, often spanning more than one year. Appropriations for all projects in the Special Revenue Funds lapse at the end of a contract period, which may not coincide with the fiscal year end of ETCOG. ETCOG recognizes that the financial plan must be flexible enough to adjust for revenues which do not materialize and capitalize on unforeseen opportunities as they occur. Financial plans for the Special Revenue Funds are established in accordance with the grant awards received. Amendments to the financial plan are presented to the Board of Directors in their semi-annual meeting. Control of the financial plan is maintained at the fund and project level with management authorized to make transfers of budgeted amounts between object class levels within a fund or project, within restrictions imposed by grantor agencies. The financial plan for the General Fund is prepared on the modified accrual basis, except that expenditures also include amounts for depreciation on general capital assets acquired with General Fund resources and for changes in the liability for accrued vacation leave. The financial plan for the Special Revenue Funds is prepared on the same basis as the plan for the General Fund. As stated in the Management’s Discussion and Analysis, the financial plan for ETCOG is not considered a legally adopted budget. Therefore, comparative budget and actual results are not presented. Management will increase membership dues to promote long-term stability. Since ETCOG is federally and state funded, long-term financial planning is a difficult objective. To meet the objective of long-term financial planning, ETCOG is exploring the development of additional funding sources in areas such as housing, workforce training and cooperative purchasing. Various “fee for service” options will also be investigated.
5
Risk Management. ETCOG is exposed to various risks of loss related to torts; theft of, damage to and destruction of assets; errors and omissions; injuries to employees; and natural disasters. ETCOG maintains workers' compensation and other risks of loss coverage through the Texas Municipal League Intergovernmental Risk Pool, which is a public entity risk pool. The pool is self-sustaining through member premiums and obtains reinsurance through commercial insurance companies for claims in excess of a specified dollar amount. ETCOG management believes such coverage is sufficient to preclude any significant uninsured losses to ETCOG. Cash Management Policies and Practices. ETCOG’s investment policy is to minimize credit and market risks while maintaining a competitive yield on its investments. The Council’s deposits are either insured by federal depository insurance or collateralized. Cash temporarily idle during the year was invested in certificates of deposit and the Texas Local Government Investment Pool (TexPool). The Council earned interest revenue of $199,273 on its investments for the year ended September 30, 2007. Awards and Acknowledgements. The Government Finance Officers Association of the United States and Canada (GFOA) awarded a Certificate of Achievement for Excellence in Financial Reporting to the East Texas Council of Governments for its comprehensive annual financial report for the fiscal year ended September 30, 2006. In order to be awarded a Certificate of Achievement, a government must publish an easily readable and efficiently organized comprehensive annual financial report. This report must satisfy both generally accepted accounting principles and applicable legal requirements. A Certificate of Achievement is valid for a period of one year only. We believe that our current comprehensive annual financial report continues to meet the Certificate of Achievement Program’s requirements and we are submitting it to the GFOA to determine its eligibility for another certificate. This report could not have been accomplished without the dedication and efficiency of the ETCOG’s Financial, Administrative, and Program Management Staff. Special acknowledgement should also be given to ETCOG’s independent auditors, Pattillo, Brown, and Hill, L.L.P, whose expertise greatly assisted in the completion of this report. Finally, we would like to thank the members of the Executive Committee for their interest and support in planning and conducting ETCOG’s financial operations in a responsible and progressive manner.
6
Certificate of Achievement for Excellence
in Financial Reporting
Presented to
East Texas Council of Governments
For its Comprehensive Annual Financial Report
for the Fiscal Year Ended September 30, 2006
A Certificate of Achievement for Excellence in Financial Reporting is presented by the Government Finance Officers
Association of the United States and Canada to government units and public employee retirement systems whose comprehensive annual financial
reports (CAFRs) achieve the highest standards in government accounting
and financial reporting.

7
EAST TEXAS COUNCIL OF GOVERNMENTS
ORGANIZATION CHART
SEPTEMBER 30, 2007
Executive Director
Workforce Development
Programs
Homeland Security &
CJD
Public Information & Reg. Services
Aging Programs
Finance Division
Human Resources
Executive Assistant
Administrative Staff
Monitoring & Tech
Assistance
Planning & Board Support
Contract Services
9-1-1 Emergency
Services
Community and Economic Development
Environmental Services
Public Information
TransportationDivision
Community Care
Benefits Counseling
Program
Financial Assistance
Budget Analysis
Management Services
Child Care
IR& A Admin & Housing
Contract & Program
Management
* Regional Staff
Ombudsman
Database Management
9-1-1 MALI Specialist
Financial Clerks
GIS
9-1-1 Systems Analyst
Operations Management
Dispatch / Operations
Business Development
Executive Committee
Advisory Committees
Board of Directors
Cash Management
State & Financial Reporting
8
EAST TEXAS COUNCIL OF GOVERNMENTS
PRINCIPAL OFFICIALS
OFFICERS OF THE EXECUTIVE COMMITTEE 2007
Carson Joines Chairman – Mayor City of Carthage
Bill Hale 1st Vice-Chairman – Commissioner
Rusk County
John Paul Tallent 2nd Vice-Chairman – Mayor
City of Gladewater
Jerry Galloway 3rd Vice-Chairman – Commissioner
Wood County
George Wilkins Secretary – Treasurer
Upshur – Gregg Counties – Soil & Water Conservation District #417
ADMINISTRATIVE STAFF
Executive Director David Cleveland Director of Workforce Development Programs Wendell Holcombe Director of Area Agency on Aging Claude Andrews Director of Finance Judy Durland Director of Criminal Justice & Homeland Security Angela Norton Director of Public Information & Regional Services Luke Kimbrough Director of 911 Emergency Services Carolyn Flores Director of Transportation Roxanne McKinley

9
EAST TEXAS COUNCIL OF GOVERNMENTS
MEMBER GOVERNMENTS
SEPTEMBER 30, 2007
COUNTIES CITIES: (Continued) Anderson Fruitvale Camp Gallatin Cherokee Gilmer Gregg Gladewater Harrison Grand Saline Henderson Gun Barrel City Marion Hallsville Panola Hawkins Rains Henderson Rusk Jacksonville Smith Jefferson Upshur Kilgore Van Zandt Lakeport Wood Lindale Log Cabin CITIES Longview Mabank Alba Malakoff Alto Marshall Arp Mineola Athens Mt. Enterprise Beckville Murchison Big Sandy New London Brownsboro New Summerfield Bullard Noonday Caney City Ore City Canton Overton Carthage Palestine Chandler Payne Springs Clarksville City Pittsburg Coffee City Point East Mountain Quitman East Tawakoni Reklaw Easton Rusk Edgewood Seven Points Elkhart Star Harbor Emory Tatum Eustace Tool Frankston Trinidad
(continued)

10
EAST TEXAS COUNCIL OF GOVERNMENTS
MEMBER GOVERNMENTS (Continued)
SEPTEMBER 30, 2007 CITIES: (Continued) INDEPENDENT SCHOOL DISTRICTS: (Continued) Troup Neches ISD Tyler New Summerfield ISD Van Ore City ISD Warren City Overton ISD Waskom Rains ISD Wells Slocum ISD Whitehouse Tatum ISD White Oak Troup ISD Wills Point Westwood ISD Winnsboro Yantis ISD Winona Yantis INDEPENDENT SCHOOL DISTRICTS SPECIAL PURPOSE DISTRICTS Athens ISD Cherokee County SWCD #427 Big Sandy ISD Harrison County SWCD #412 Carlisle ISD Upshur-Gregg SWCD #417 Carthage ISD Wood County SWCD #444 Chapel Hill ISD East Texas Cedar Creek Fresh Water Supply District Frankston ISD 9-1-1 Network of East Texas Gilmer ISD Trinity Valley Community College Gladewater ISD Kilgore College Grand Saline ISD Tyler Junior College Harmony ISD Panola College Henderson ISD Jefferson ISD Laneville ISD RIVER AUTHORITIES La Poynor ISD Longview ISD Neches and Trinity Valleys Groundwater Conservation Mt. Enterprise ISD District Upper Neches River Municipal Water Authority Sabine River Authority Trinity River Authority

FINANCIAL SECTION

THIS PAGE LEFT BLANK INTENTIONALLY
INDEPENDENT AUDITORS’ REPORT To the Board of Directors East Texas Council of Governments We have audited the accompanying financial statements of the governmental activities, the discretely presented component unit, each major fund, and the aggregate remaining fund information of the East Texas Council of Governments as of and for the year ended September 30, 2007, which collectively comprise the Council’s basic financial statements, as listed in the table of contents. These financial statements are the responsibility of the Council’s management. Our responsibility is to express opinions on these financial statements based on our audit. We conducted our audit in accordance with auditing standards generally accepted in the United States of America and the standards applicable to financial audits contained in Government Auditing Standards, issued by the Comptroller General of the United States. Those standards require that we plan and perform the audit to obtain reasonable assurance about whether the basic financial statements are free of material misstatement. An audit includes examining, on a test basis, evidence supporting the amounts and disclosures in the basic financial statements. An audit also includes assessing the accounting principles used and significant estimates made by management, as well as evaluating the overall basic financial statement presentation. We believe that our audit provides a reasonable basis for our opinions. In our opinion, the financial statements referred to above present fairly, in all material respects, the respective financial position of the governmental activities, the discretely presented component unit, each major fund, and the aggregate remaining fund information of the Council, as of September 30, 2007, and for the year then ended in conformity with accounting principles generally accepted in the United States of America.
11
401 WEST HIGHWAY 6 g P. O. BOX 20725 g WACO, TX 76702-0725 g (254) 772-4901 g FAX: (254) 772-4920 g www.pbhcpa.com AFFILIATE OFFICES: BROWNSVILLE, TX (956) 544-7778 g HILLSBORO, TX (254) 582-2583
TEMPLE, TX (254) 791-3460 g WHITNEY, TX (254) 694-4600 g ALBUQUERQUE, NM (505) 266-5904

12
In accordance with Government Auditing Standards, we have also issued a report dated March 20, 2008, on our consideration of the Council’s internal control over financial reporting and on our tests of its compliance with certain provisions of laws, regulations, contracts and grant agreements and other matters. The purpose of that report is to describe the scope of our testing of internal control over financial reporting and compliance and the results of that testing, and not to provide an opinion on the internal control over financial reporting or on compliance. That report is an integral part of an audit performed in accordance with Government Auditing Standards and should be considered in assessing the results of our audit. The Management’s Discussion and Analysis on pages 13 through 18 is not a required part of the basic financial statements, but is supplementary information required by accounting principles generally accepted in the United States of America. We have applied certain limited procedures, which consisted principally of inquiries of management regarding the methods of measurement and presentation of the required supplementary information. However, we did not audit the information and express no opinion on it. Our audit was conducted for the purpose of forming opinions on the financial statements that collectively comprise the Council’s basic financial statements. The introductory section, combining nonmajor fund financial statements, supplemental schedules, and statistical section are presented for purposes of additional analysis and are not a required part of the basic financial statements. The combining nonmajor fund financial statements and supplemental schedules have been subjected to the auditing procedures applied in the audit of the basic financial statements and, in our opinion, are fairly stated in all material respects in relation to the basic financial statements taken as a whole. The introductory and statistical sections have not been subjected to the auditing procedures applied in the audit of the basic financial statements and, accordingly, we express no opinion on them. The accompanying Schedule of Expenditures of Federal and State Awards is presented for purposes of additional analysis as required by U. S. Office of Management and Budget Circular A-133, “Audits of States, Local Governments and Nonprofit Organizations,” and the State of Texas Uniform Grant Management Standards, and is not a required part of the basic financial statements of the Council. Such information has been subjected to the auditing procedures applied in the audit of the basic financial statements and, in our opinion, is fairly stated, in all material respects, in relation to the basic financial statements taken as a whole.
March 20, 2008

MANAGEMENT’S DISCUSSION AND ANALYSIS

THIS PAGE LEFT BLANK INTENTIONALLY
13
Management’s Discussion and Analysis As management of the East Texas Council of Governments, we offer readers of the Council’s financial statements this narrative overview and analysis of the financial activities of the Council for the fiscal year ended September 30, 2007. We encourage readers to consider the information presented here in conjunction with additional information that we have furnished in our letter of transmittal, which can be found on pages 1 – 5 of this report. FINANCIAL HIGHLIGHTS
• The assets of East Texas Council of Governments exceeded its liabilities as of September 30, 2007, by $4,617,431 (net assets). Of this amount, $1,017,147 (unrestricted net assets) may be used to meet the Council’s ongoing obligations.
• The Council’s total net assets increased by $1,217,365.
• As of the close of the current fiscal year, East Texas Council of Governments’ governmental funds reported combined ending fund balances of $2,321,036, an increase of $287,188 in comparison with the prior year.
• As of September 30, 2007, unreserved and undesignated fund balance for the General Fund was $1,017,141.
OVERVIEW OF THE FINANCIAL STATEMENTS This discussion and analysis is intended to serve as an introduction to the Council’s basic financial statements. The Council’s basic financial statements are comprised of three components: (1) government-wide financial statements, (2) fund financial statements and (3) notes to the financial statements. This report also contains other supplementary information in addition to the basic financial statements themselves. Government-wide financial statements – The government-wide financial statements are designed to provide readers with a broad overview of the Council’s finances, in a manner similar to a private-sector business. The Statement of Net Assets presents information on all of the Council’s assets and liabilities, with the difference between the two reported as net assets. Over time, increases or decreases in net assets may serve as a useful indicator of whether the financial position of the Council is improving or deteriorating. The Statement of Activities presents information showing how the Council’s net assets changed during the fiscal year. All changes in net assets are reported when the underlying event giving rise to the change occurs, regardless of the timing of related cash flows. Thus, revenues and expenses are reported in this statement for some items that will only result in cash flows in the future fiscal periods (e.g., earned but unused compensated absences). The government-wide financial statements can be found on pages 19 through 21 of this report. Fund financial statements – A fund is a grouping of related accounts that is used to maintain control over resources that have been segregated for specific activities or objectives. The Council, like other state and local governments, uses fund accounting to ensure and demonstrate compliance with finance-related legal requirements.
14
Governmental Funds – Governmental funds are used to account for the same functions reported as governmental activities in the government-wide financial statements. However, unlike the government-wide financial statements, governmental fund financial statements focus on current sources and uses of spendable resources, as well as on balances of spendable resources available at the end of the fiscal year. Such information may be useful in evaluating a government’s near-term financing requirements. Because the focus of governmental funds is narrower than that of the government-wide financial statements, it is useful to compare the information presented for governmental funds with similar information presented for governmental activities in the government-wide financial statements. By doing so, readers may better understand the long-term impact of the Council’s near-term financing decisions. Both the governmental funds balance sheet and the governmental fund statements of revenues, expenditures, and changes in fund balances provide a reconciliation to facilitate this comparison between governmental funds and governmental activities. The Council maintains 17 individual governmental funds. Information is presented separately in the governmental fund balance sheet and in the governmental fund statement of revenues, expenditures and changes in fund balances for the General Fund, the Texas Workforce Commission Fund, Texas Department of Aging and Disability Services Fund, Chapman Revolving Loan Fund, and the Commission on State Emergency Communications Fund, which are considered to be major funds. Data from the other 12 governmental funds are combined into a single, aggregated presentation. Individual fund data for each of these nonmajor governmental funds is provided in the form of combining statements elsewhere in this report. The Council’s Board approves a financial plan for revenue and expenditures in all funds. Although the financial plans are reviewed and approved by the Council’s Board, they are not considered legally adopted annual budgets or appropriations. Accordingly, comparative budget and actual results are not presented in this report. The basic governmental fund financial statements can be found on pages 19 through 30 of this report. Notes to the Financial Statements – The notes provide additional information that is essential to a full understanding of the data provided in the government-wide and fund financial statements. The notes to the financial statements can be found on pages 31 through 41 of this report. Other Information – In addition to the basic financial statements and accompanying notes, this report also presents combining fund statements and other schedules that further support the information in the financial statements. The combining fund statements for nonmajor funds and other schedules can be found on pages 42 through 45 of this report.

15
GOVERNMENT-WIDE FINANCIAL ANALYSIS As noted earlier, net assets may serve over time as a useful indicator of a government’s financial position. In the case of East Texas Council of Governments, assets exceeded liabilities by $4,617,431 as of September 30, 2007.
EAST TEXAS COUNCIL OF GOVERNMENTS’ NET ASSETS
2007 2006 2007 2006
Current assets 7,872,765$ 9,198,764$ 3,378$ -$ Capital assets (net) 2,398,199 1,512,070 - - Total assets 10,270,964 10,710,834 3,378 -
Long-term liabilities 101,804 145,852 - - Other liabilities 5,551,729 7,164,916 4,009 - Total liabilities 5,653,533 7,310,768 4,009 -
Net assets: Invested in capital assets, net of related debt 2,398,199 1,467,687 - - Restricted 1,202,091 1,174,134 - - Unrestricted 1,017,141 758,245 631)( - Total net assets 4,617,431$ 3,400,066$ 631)$( -$
Governmental Activities Business-type Activities
A fairly large portion of the Council’s net assets (52%) reflects its investments in capital assets. The Council uses these assets to provide services; consequently, these assets are not available for spending. Another portion of the Council’s net assets (26%) represents resources that are subject to external restrictions on how they may be used. The remaining balance (22%) of unrestricted net assets may be used to meet the Council’s ongoing obligations. ANALYSIS OF FINANCIAL POSITION The overall financial condition of the East Texas Council of Governments improved from the prior year with ending net assets increasing by $1,217,365 or 36%. The Council experienced an increase in revenue of $1,211,688 or 3%. This increase is primarily attributable to an increase in federal and state funding for various programs and services. Expenses increased from the prior year by $205,478 or .5%. An overall decline occurred in the Workforce development grants of $171,403 or .6%. Declines in Workforce development grants were a result of fewer revenues for the National Emergency Grants to assist Hurricane Rita and Katrina evacuees. Aging expenditures increased by $381,518 or 7.4% thereby increasing services in the meal program, residential repair and various other services for the elderly. Emergency communications increased by $822,831 or 52% due to the expansion of mapping and network services, wireless phase II planning and replacement of 911 point of service equipment in the region. Health and Human Services increased by $157,294 as a result of funding for a Social Services Block Grant for misplaced Rita and Katrina hurricane evacuees.

16
Environmental quality declined by $340,928 or 29%. Air quality studies are performed by vendor arrangement and payable upon completion of strategically planned objectives which were lower for 2007. The East Texas Council of Governments became the service provider for the Rural Transportation program effective September 1, 2007. This resulted in the employment of 35 additional employees and the responsibility of daily program activities. Prior to September 1, 2007, grants funds were passed through to a subrecipient for daily operations. Transportation increased by $389,913 or 31% from 2006. Homeland security decreased by $873,088 or 76.6% as a result of the completion of state mandated emergency plans and replacement of equipment in the prior year. Housing and urban development declined by $87,802 or 59% as a result of the completion in 2006 of a Disaster Recovery Grant to fund and improve emergency shelters for hurricane evacuees and other disaster related emergencies. ANALYSIS OF THE COUNCIL’S OPERATIONS The following table provides a summary of the Council’s operations for the years ended September 30:
EAST TEXAS COUNCIL OF GOVERNMENTS’ CHANGES IN NET ASSETS
2007 2006 2007 2006
Revenues: Program revenues: Operating grants and contributions 40,020,456$ 38,838,134$ 31,048$ -$ General revenues: Grants and contributions not restricted to specific programs 71,313 71,513 - - Investment earnings 133,605 110,878 850 - Miscellaneous 79,966 43,621 - - Total revenues 40,305,340 39,064,146 31,898 -
Expenses after allocation of indirect costs: General government 26,113 71,165 - - Workforce development 27,780,544 27,951,947 - - Aging 5,546,424 5,164,906 - - Emergency communications 2,396,799 1,573,968 - - Health and human services 169,968 12,674 - - Environmental quality 844,837 1,185,765 - - Transportation 1,662,765 1,272,852 - - Homeland security 266,300 1,139,388 - - Criminal justice 268,819 295,087 - - Housing and urban development 61,262 149,064 - - Economic development 64,144 65,681 - - Greyhound - - 32,529 - Total expenses 39,087,975 38,882,497 32,529 -
Change in net assets 1,217,365 181,649 631)( -
Net assets, beginning 3,400,066 3,218,417 - -
Net assets, ending 4,617,431$ 3,400,066$ 631)$( -$
Governmental Activities Business-type Activities

17
FINANCIAL ANALYSIS OF THE COUNCIL’S FUNDS Governmental funds – The focus of East Texas Council of Governments’ governmental funds is to provide information on near-term inflows, outflows, and balances of spendable resources. Such information is useful in assessing the Council’s financing requirements. In particular, unreserved fund balance may serve as a useful measure of a government’s net resources available for spending at the end of the fiscal year. At the end of the current fiscal year, East Texas Council of Governments’ governmental funds reported combined ending fund balances of $2,321,036.
Governmental Funds Expenditures by Function
Aging14%
Emergency Communications
9%
Transportation4%
Workforce Development
70%
Environmental Quality
2%
Other1%
CAPITAL ASSETS
The East Texas Council of Governments’ investment in capital assets for its governmental activities as of September 30, 2007, amounts to $2,398,199 (net of accumulated depreciation). This investment in capital assets includes land, buildings and equipment:
2007 2006
Land 11,495$ 11,495$ Buildings 785,594 785,594 Equipment 3,951,621 3,084,314 Less: accumulated depreciation 2,350,511)( 2,369,333)(
Total capital assets 2,398,199$ 1,512,070$
Additional information on the Council’s capital assets can be found in Note 4, pages 38 – 39 of this report.
18
ECONOMIC FACTORS AND NEXT YEAR’S BUDGET The East Texas Council of Governments is dependent on federal and state funding, which can vary widely from year to year. The federal economic condition and federal budget deficits can impact the reauthorization of funds available to local governments. Additionally, the East Texas Council of Governments contracts as the fiscal entity for the East Texas Workforce Development Board. This contract expires September 30, 2008. However, it is anticipated the contract will be renewed. Loss of this contract would result in a loss of revenue of approximately $27.8 million per year. REQUESTS FOR INFORMATION The financial report is designed to provide a general overview of the Council’s finances. If you have questions about this report or need any additional information, contact the Council’s Director of Finance at 3800 Stone Road, Kilgore, Texas, 75662.

BASIC FINANCIAL STATEMENTS

THIS PAGE LEFT BLANK INTENTIONALLY

TotalGovernmental Business-type Primary Component
Activities Activities Government Unit
ASSETS Cash and equivalents 3,375,368$ 10,206$ 3,385,574$ 71,772$ Receivables: Grantors 2,582,013 - 2,582,013 - Notes 190,341 - 190,341 - Other 1,699,071 161 1,699,232 3,839 Internal balances 6,989 6,989)( - - Due from component unit 18,983 - 18,983 - Capital assets: Land 11,495 - 11,495 - Buildings 785,594 - 785,594 - Equipment 3,951,621 - 3,951,621 - Less: accumulated depreciation 2,350,511)( - 2,350,511)( - Total capital assets 2,398,199 - 2,398,199 -
Total assets 10,270,964 3,378 10,274,342 75,611
LIABILITIES Accounts payable 5,108,820 4,009 5,112,829 1,071 Unearned revenue 442,909 - 442,909 - Due to primary government - - - 18,983 Long-term liabilities: Due within one year: 50,902 - 50,902 - Due in more than one year: 50,902 - 50,902 - Total liabilities 5,653,533 4,009 5,657,542 20,054
NET ASSETS Invested in capital assets, net of related debt 2,398,199 - 2,398,199 - Restricted for grant use 1,202,091 - 1,202,091 - Unrestricted 1,017,141 631)( 1,016,510 55,557
Total net assets 4,617,431$ 631)$( 4,616,800$ 55,557$
The accompanying notes are an integral part of these financial statements.
EAST TEXAS COUNCIL OF GOVERNMENTS
STATEMENT OF NET ASSETS
SEPTEMBER 30, 2007
19

Functions/Programs ExpensesIndirect Cost Allocation
Expenses After Allocation of Indirect Costs
Charges for
Services
Operating Grants and
Contributions
Primary governmentGovernmental activities:
General government 24,707$ 1,406$ 26,113$ -$ -$ Workforce development 27,447,427 333,117 27,780,544 - 27,778,736 Aging 5,395,971 150,453 5,546,424 - 5,549,874 Emergency communications 2,293,267 103,532 2,396,799 - 3,416,130 Health and human services 168,981 987 169,968 - 149,592 Environmental quality 806,313 38,524 844,837 - 844,837 Transportation 1,605,508 57,257 1,662,765 - 1,633,280 Homeland security 223,797 42,503 266,300 - 266,300 Criminal justice 256,351 12,468 268,819 - 268,819 Housing and urban development 50,900 10,362 61,262 - 48,744 Economic development 52,866 11,278 64,144 - 64,144 Indirect costs 761,887 761,887)( - - -
Total governmental activities 39,087,975 - 39,087,975 - 40,020,456
Business-type activities:Greyhound 32,529 - 32,529 31,048 -
Total primary government 39,120,504$ -$ 39,120,504$ 31,048$ 40,020,456$
Component unitEast Texas Regional Development Company 77,274$ 9,296$ 86,570$ -$ 67,304$
Total component unit 77,274$ 9,296$ 86,570$ -$ 67,304$
General revenues:Grants and contributions not restricted to specific programsInvestment earningsMiscellaneous
Total general revenues
Change in net assets
Net assets - beginning
Net assets - ending
The accompanying notes are an integral part of these financial statements.
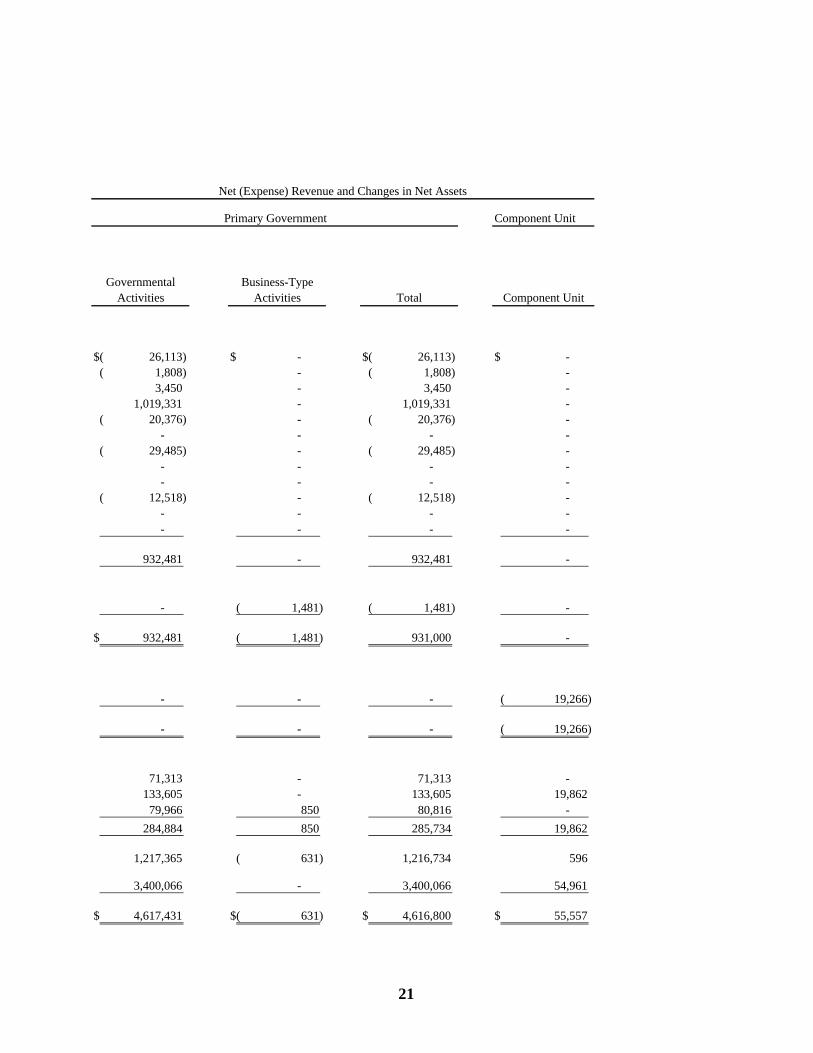
EAST TEXAS COUNCIL OF GOVERNMENTS
STATEMENT OF ACTIVITIES
FOR THE YEAR ENDED SEPTEMBER 30, 2007
Program Revenue
20
Component Unit
Governmental Activities
Business-Type Activities Total Component Unit
26,113)$( -$ 26,113)$( -$ 1,808)( - 1,808)( - 3,450 - 3,450 -
1,019,331 - 1,019,331 - 20,376)( - 20,376)( -
- - - - 29,485)( - 29,485)( -
- - - - - - - -
12,518)( - 12,518)( - - - - - - - - -
932,481 - 932,481 -
- 1,481)( 1,481)( -
932,481$ 1,481)( 931,000 -
- - - 19,266)(
- - - 19,266)(
71,313 - 71,313 - 133,605 - 133,605 19,86279,966 850 80,816 -
284,884 850 285,734 19,862
1,217,365 631)( 1,216,734 596
3,400,066 - 3,400,066 54,961
4,617,431$ 631)$( 4,616,800$ 55,557$
Primary Government
Net (Expense) Revenue and Changes in Net Assets
21

General Fund
Texas Workforce
Commission
Commission on State Emergency Communications
ASSETS Cash and cash equivalents 1,015,203$ 888,993$ 410,378$ Accounts receivable: Grantors - 1,308,838 223,200 Other 2,224 1,627,188 - Notes - - - Due from other funds 308,356 - - Due from component unit 18,983 - -
Total assets 1,344,766$ 3,825,019$ 633,578$
LIABILITIES AND FUND BALANCES Liabilities: Accounts payable 327,625 3,477,125 633,578 Due to other funds - - - Deferred revenue - 347,894 - Total liabilities 327,625 3,825,019 633,578
Fund balances: Reserved for notes receivable - - - Unreserved, reported in: General fund 1,017,141 - - Special revenue funds - - - Total fund balances 1,017,141 - -
Total liabilities and fund balances 1,344,766$ 3,825,019$ 633,578$
The accompanying notes are an integral part of these financial statements.
EAST TEXAS COUNCIL OF GOVERNMENTS
BALANCE SHEET
GOVERNMENTAL FUNDS
SEPTEMBER 30, 2007
22

Texas Department of
Aging and Disability Services
Chapman Revolving
Loan
Other Governmental
Funds
Total Governmental
Funds
-$ 634,383$ 426,411$ 3,375,368$
448,175 - 601,800 2,582,013 63,200 996 5,463 1,699,071
- 190,341 - 190,341 - - - 308,356 - - - 18,983
511,375$ 825,720$ 1,033,674$ 8,174,132$
327,984 670 341,838 5,108,820 52 - 301,315 301,367
3,250 - 91,765 442,909 331,286 670 734,918 5,853,096
- 190,341 - 190,341
- - 1,017,141 180,089 634,709 298,756 1,113,554 180,089 825,050 298,756 2,321,036
511,375$ 825,720$ 1,033,674$ 8,174,132$
23

THIS PAGE LEFT BLANK INTENTIONALLY

Total fund balance, governmental funds 2,321,036$
Capital assets used in governmental activities are not current financial resources andtherefore are not reported in the fund financial statements, but are reported in thegovernmental activities of the Statement of Net Assets. 2,398,199
Some liabilities, (such as compensated absences), are not due and payable in the currentperiod and are not included in the fund financial statements, but are included in thegovernmental activities of the Statement of Net Assets. 101,804)(
Net assets of governmental activities in the Statement of Net Assets 4,617,431$
The accompanying notes are an integral part of these financial statements.
SEPTEMBER 30, 2007
EAST TEXAS COUNCIL OF GOVERNMENTS
RECONCILIATION OF THE GOVERNMENTAL FUNDSBALANCE SHEET TO THE STATEMENT OF NET ASSETS
Amounts reported for governmental activities in the Statement of Net Assets are differentbecause:
24

General FundTexas Workforce
Commission
Commission on State Emergency Communications
REVENUES Intergovernmental -$ 27,670,306$ 3,399,815$ Matching funds - 20,000 - Program income - - - Membership dues 71,313 - - Miscellaneous 148,603 - 16,315 Total revenues 219,916 27,690,306 3,416,130
EXPENDITURES Current: General government 32,542 - - Workforce development - 27,690,306 - Aging - - - Emergency communications - - 3,416,130 Transportation - - - Environmental quality - - - Homeland security - - - Criminal justice - - - Health and human services - - - Housing and urban development Economic development - - - Total expenditures 32,542 27,690,306 3,416,130
EXCESS (DEFICIENCY) OF REVENUES OVER (UNDER) EXPENDITURES 187,374 - -
OTHER FINANCING SOURCES (USES) Proceeds from insurance 27,491 - - Transfers in - - - Transfers out 57,438)( - - Total other financing sources and uses 29,947)( - -
NET CHANGE IN FUND BALANCES 157,427 - -
FUND BALANCES, BEGINNING 859,714 - -
FUND BALANCES, ENDING 1,017,141$ -$ -$
The accompanying notes are an integral part of these financial statements.
FOR THE YEAR ENDED SEPTEMBER 30, 2007
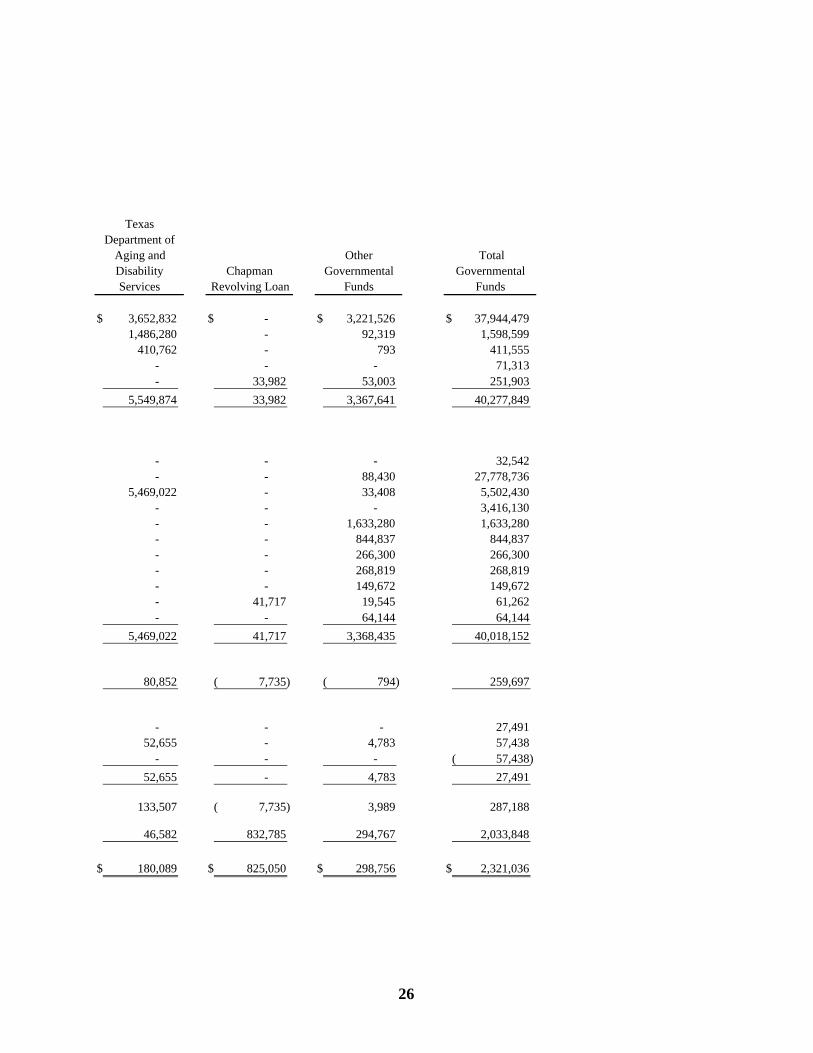
EAST TEXAS COUNCIL OF GOVERNMENTS
STATEMENT OF REVENUES, EXPENDITURES AND CHANGES IN FUND BALANCES
GOVERNMENTAL FUNDS
25
Texas Department of
Aging and Disability Services
Chapman Revolving Loan
Other Governmental
Funds
Total Governmental
Funds
3,652,832$ -$ 3,221,526$ 37,944,479$ 1,486,280 - 92,319 1,598,599
410,762 - 793 411,555 - - - 71,313 - 33,982 53,003 251,903
5,549,874 33,982 3,367,641 40,277,849
- - - 32,542 - - 88,430 27,778,736
5,469,022 - 33,408 5,502,430 - - - 3,416,130 - - 1,633,280 1,633,280 - - 844,837 844,837 - - 266,300 266,300 - - 268,819 268,819 - - 149,672 149,672 - 41,717 19,545 61,262 - - 64,144 64,144
5,469,022 41,717 3,368,435 40,018,152
80,852 7,735)( 794)( 259,697
- - - 27,491 52,655 - 4,783 57,438
- - - 57,438)( 52,655 - 4,783 27,491
133,507 7,735)( 3,989 287,188
46,582 832,785 294,767 2,033,848
180,089$ 825,050$ 298,756$ 2,321,036$
26

THIS PAGE LEFT BLANK INTENTIONALLY

Net change in fund balances - total governmental funds: 287,188$
Governmental funds report outlays for capital assets as expenditures becausesuch outlays use current financial resources. In contrast, the Statement ofActivities reports only a portion of the outlay as expense. The outlay is allocatedover the assets' estimated useful lives as depreciation expense for the period.This is the amount by which capital outlays exceeded depreciation expense in the current period. 963,454
Governmental funds report repayment of capital leases as an expenditure. Incontrast, the Statement of Activities treats such repayments as a reduction inlong-term liabilities. 44,383
The Statement of Activities reports losses arising from the disposal of existing capital assets. Conversely, governmental funds do not report losses on the disposal of capital assets. 77,325)(
Some expenses reported in the Statement of Activities do not require the use ofcurrent financial resources and these are not reported as expenditures ingovernmental funds. 335)(
Change in net assets of governmental activities 1,217,365$
The accompanying notes are an integral part of these financial statements.
FOR THE YEAR ENDED SEPTEMBER 30, 2007
Amounts reported for governmental activities in the Statement of Activities aredifferent because:
EAST TEXAS COUNCIL OF GOVERNMENTS
RECONCILIATION OF THE STATEMENT OF REVENUES, EXPENDITURESAND CHANGES IN FUND BALANCES OF GOVERNMENTAL FUNDS
TO THE STATEMENT OF ACTIVITIES
27

THIS PAGE LEFT BLANK INTENTIONALLY

NonmajorEnterprise Fund
Greyhound
ASSETS Current assets: Cash and investments 10,206$ Accounts receivable - net of allowances for uncollectibles 161 Total current assets 10,367
Total assets 10,367
LIABILITIES Current liabilities: Accounts payable 4,009 Due to other funds 6,989 Total current liabilities 10,998
Total liabilities 10,998
NET ASSETS Unrestricted 631)(
Total net assets 631)$(
The notes to the financial statements are an integral part of this statement.
EAST TEXAS COUNCIL OF GOVERNMENTS
STATEMENT OF NET ASSETS
PROPRIETARY FUND
SEPTEMBER 30, 2007
28

THIS PAGE LEFT BLANK INTENTIONALLY

NonmajorEnterprise Fund
Greyhound
OPERATING REVENUES Charges for services 31,048$ Total operating revenues 31,048
OPERATING EXPENSES Cost of sales and services 32,529 Total operating expenses 32,529
OPERATING LOSS 1,481)(
NONOPERATING REVENUES (EXPENSES) Miscellaneous income 850 Total nonoperating revenues (expenses) 850
CHANGE IN NET ASSETS 631)(
TOTAL NET ASSETS, BEGINNING -
TOTAL NET ASSETS, ENDING 631)$(
The notes to the financial statements are an integral part of this statement.
EAST TEXAS COUNCIL OF GOVERNMENTS
STATEMENT OF REVENUES, EXPENSES, AND CHANGES IN FUND NET ASSETS
PROPRIETARY FUND
FOR THE YEAR ENDED SEPTEMBER 30, 2007
29

NonmajorEnterprise Fund
Greyhound
CASH FLOWS FROM OPERATING ACTIVITIES Cash received from customers 30,887$ Cash payments to suppliers 28,520)( Cash provided by operating activities 2,367
CASH FLOWS FROM NONCAPITAL FINANCING ACTIVITIES Cash received from contributions 850 Cash received from other funds 6,989 Cash provided by noncapital financing activities 7,839
NET INCREASE IN CASH AND CASH EQUIVALENTS 10,206
CASH AND CASH EQUIVALENTS, BEGINNING -
CASH AND CASH EQUIVALENTS, ENDING 10,206$
RECONCILIATION OF OPERATING LOSS TO NET CASH PROVIDED BY OPERATING ACTIVITIES Operating loss 1,481)$( Adjustments to reconcile operating income to net cash provided by operating activities: Change in assets and liabilities: Decrease (increase) in customer receivable 161)( Increase (decrease) in accounts payable 4,009 Total adjustments 3,848
Net cash provided by operating activities 2,367$
The accompanying notes are an integral part of this statement.
EAST TEXAS COUNCIL OF GOVERNMENTS
STATEMENT OF CASH FLOWS
PROPRIETARY FUND
FOR THE YEAR ENDED SEPTEMBER 30, 2007
30

31
EAST TEXAS COUNCIL OF GOVERNMENTS
NOTES TO FINANCIAL STATEMENTS
SEPTEMBER 30, 2007 1. SUMMARY OF SIGNIFICANT ACCOUNTING POLICIES
The financial statements of the East Texas Council of Governments (the “Council”) have been prepared in conformity with generally accepted accounting principles (GAAP) as applied to governmental units. The Governmental Accounting Standards Board (GASB) is the accepted standard-setting body for establishing governmental accounting and financial reporting principles. The following represents the significant accounting policies and practices used by the Council.
A. Description of the Reporting Entity
The East Texas Council of Governments is a political subdivision of the State of Texas and a voluntary association of local governments within the 14-county East Texas Region. The Council was established in 1970 to study and resolve area-wide problems through the cooperation and coordinated action of member cities, counties, school districts and special purpose districts of the East Texas region. Membership in the Council is voluntary. Any county, city or special purpose district within the East Texas region may become a member of the independent association by passing a resolution to join the Council and paying annual dues. Each member government is entitled to have voting representation on the Board of Directors, which is the Council's governing body.
The Council's basic financial statements include the accounts of all the Council operations. The criteria for including organizations within the Council's reporting entity, as set forth in GASB No. 14 "The Financial Reporting Entity," is financial accountability. Financial accountability is defined as appointment of a voting majority of the component unit's board and either the ability to impose will by the primary government or the possibility that the component unit will provide a financial benefit to or impose a financial burden on the primary government. Various local agencies for which grants and funding are issued by the Council have not been included within the financial statements because the Council does not have direct managerial oversight of the operations of those agencies nor does it have the responsibility for funding future deficits or operating deficiencies of those agencies. The following organization has been included within the Council's reporting entity:
(continued)
32
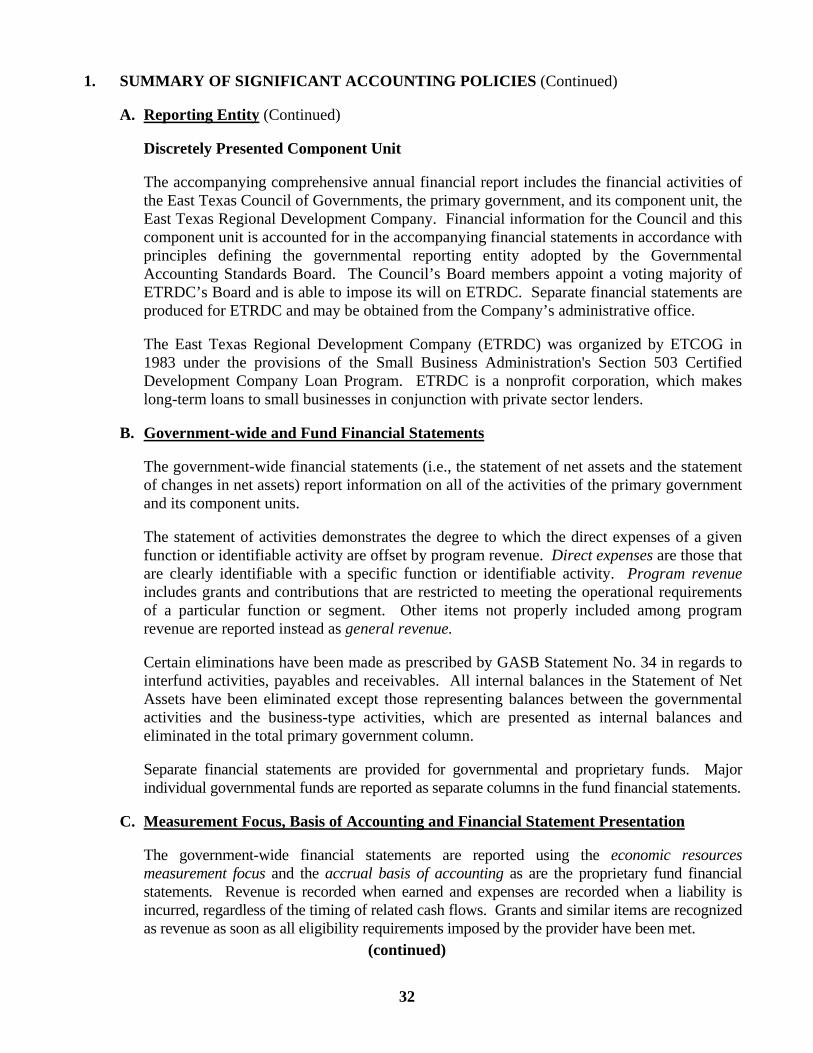
1. SUMMARY OF SIGNIFICANT ACCOUNTING POLICIES (Continued)
A. Reporting Entity (Continued)
Discretely Presented Component Unit
The accompanying comprehensive annual financial report includes the financial activities of the East Texas Council of Governments, the primary government, and its component unit, the East Texas Regional Development Company. Financial information for the Council and this component unit is accounted for in the accompanying financial statements in accordance with principles defining the governmental reporting entity adopted by the Governmental Accounting Standards Board. The Council’s Board members appoint a voting majority of ETRDC’s Board and is able to impose its will on ETRDC. Separate financial statements are produced for ETRDC and may be obtained from the Company’s administrative office.
The East Texas Regional Development Company (ETRDC) was organized by ETCOG in 1983 under the provisions of the Small Business Administration's Section 503 Certified Development Company Loan Program. ETRDC is a nonprofit corporation, which makes long-term loans to small businesses in conjunction with private sector lenders.
B. Government-wide and Fund Financial Statements
The government-wide financial statements (i.e., the statement of net assets and the statement of changes in net assets) report information on all of the activities of the primary government and its component units.
The statement of activities demonstrates the degree to which the direct expenses of a given function or identifiable activity are offset by program revenue. Direct expenses are those that are clearly identifiable with a specific function or identifiable activity. Program revenue includes grants and contributions that are restricted to meeting the operational requirements of a particular function or segment. Other items not properly included among program revenue are reported instead as general revenue.
Certain eliminations have been made as prescribed by GASB Statement No. 34 in regards to interfund activities, payables and receivables. All internal balances in the Statement of Net Assets have been eliminated except those representing balances between the governmental activities and the business-type activities, which are presented as internal balances and eliminated in the total primary government column.
Separate financial statements are provided for governmental and proprietary funds. Major individual governmental funds are reported as separate columns in the fund financial statements.
C. Measurement Focus, Basis of Accounting and Financial Statement Presentation
The government-wide financial statements are reported using the economic resources measurement focus and the accrual basis of accounting as are the proprietary fund financial statements. Revenue is recorded when earned and expenses are recorded when a liability is incurred, regardless of the timing of related cash flows. Grants and similar items are recognized as revenue as soon as all eligibility requirements imposed by the provider have been met.
(continued)

33
1. SUMMARY OF SIGNIFICANT ACCOUNTING POLICIES (Continued)
C. Measurement Focus, Basis of Accounting and Financial Statement Presentation (Continued)
Governmental fund financial statements are reported using the current financial resources measurement focus and the modified accrual basis of accounting. Revenue is recognized as soon as it is both measurable and available. Revenue is considered to be available when it is collectible within the current period or soon enough thereafter to pay liabilities of the current period. For this purpose, the Council considers revenue to be available if it is collected within 60 days of the end of the current fiscal period. Expenditures generally are recorded when a liability is incurred, as under accrual accounting. However, debt service expenditures, as well as expenditures related to compensated absences and claims and judgments, are recorded only when payment is due.
Expenditure-driven grants are recognized as revenue when the qualifying expenditures have been incurred and all other grant requirements have been met. Grant revenue, membership dues and interest are susceptible to accrual. All other revenue items are considered to be measurable and available only when cash is received by the Council.
The Council reports the following major governmental funds:
The General Fund is the Council’s primary operating fund. It accounts for all financial resources of the general government, except those required to be accounted for in another fund.
The Texas Workforce Commission Fund is used to account for federal and state grants awarded to East Texas Council of Governments by the Texas Workforce Commission.
The Commission on State Emergency Communications Fund is used to account for state grants awarded to East Texas Council of Governments by the Commission on State Emergency Communications.
The Texas Department of Aging and Disability Services Fund is used to account for federal and state grants awarded to East Texas Council of Governments by the Texas Department of Aging and Disability Services.
The Chapman Revolving Loan Fund is used to account for the Chapman Revolving Loan program.
Additionally, the Council reports the following fund types:
Special Revenue Funds account for the proceeds of specific revenue sources that are legally restricted to expenditure for specified purposes.
The Proprietary Fund accounts for the activities of the Council’s Greyhound bus line ticket-agency.
(continued)

34
1. SUMMARY OF SIGNIFICANT ACCOUNTING POLICIES (Continued)
C. Measurement Focus, Basis of Accounting and Financial Statement Presentation (Continued)
Proprietary funds distinguish operating revenues and expenses from nonoperating items. Operating revenues and expenses generally result from providing services and delivering goods in connection with a proprietary fund’s ongoing operations. The principal operating revenues of the Greyhound Fund are charges for Greyhound bus tickets. Operating expenses for Enterprise Funds include the cost of sales and services and administrative expenses. All revenues and expenses not meeting this definition are reported as nonoperating revenues and expenses.
D. Use of Estimates
The preparation of financial statements in conformity with generally accepted accounting principles requires management to make estimates and assumptions that affect certain reported amounts and disclosures. Accordingly, actual results could differ from those estimates.
E. Assets, Liabilities and Net Assets or Equity
Cash and Cash Equivalents
Cash and equivalents are defined as short-term, highly liquid investments that are both readily convertible to known amounts of cash and so near their maturity that they present insignificant risk of changes in value because of changes in interest rates. Cash and cash equivalents in the Council’s financial statements include amounts in demand deposits and certificates of deposits. Interest earned is based on the amount of funds invested.
State statutes authorize the Council to invest in obligations of the United States, its agencies, certificates of deposits with banks and savings and local associations, banker’s acceptances, commercial paper, mutual funds, investment pools and repurchase agreements with underlying collateral of government securities. Investments for the Council are reported at fair value.
Grants Receivable
Grants receivable represent amounts due from federal and state agencies for the various programs administered by the Council. The receivable includes amounts due on programs closed-out and those in progress as of September 30, 2007.
Interfund Receivables and Payables
During the course of operations, numerous transactions occur between individual funds that may result in amounts owed between funds. Those related to goods and services type transactions are classified as “due to and from other funds.” The Council had no long-term interfund loans (noncurrent portion) that are generally reported as “advances from and to other funds.” Interfund receivables and payables between governmental funds are eliminated in the Statement of Net Assets.
Restricted Net Assets
When an expense is incurred for purposes for which both restricted and unrestricted net assets are available, the Council’s policy is to apply restricted net assets first.
(continued)
35
1. SUMMARY OF SIGNIFICANT ACCOUNTING POLICIES (Continued)
E. Assets, Liabilities and Net Assets or Equity (Continued)
Deferred Revenue
Deferred revenue represents amounts received from grantors in excess of expenditures for programs in progress as of September 30, 2007.
Capital Assets
Capital assets, which include property and equipment, are reported in the governmental activities column in the government-wide financial statements. Capital assets are defined by the government as assets with an initial, individual cost of more than $5,000 and an estimated useful life in excess of two years. Such assets are recorded at historical cost or estimated historical cost if purchased or constructed. Donated capital assets are recorded at estimated fair market value on the date received.
The costs of normal maintenance and repairs are charged to operations as incurred. Improvements are capitalized and depreciated over the remaining useful lives of the related capital assets, as applicable.
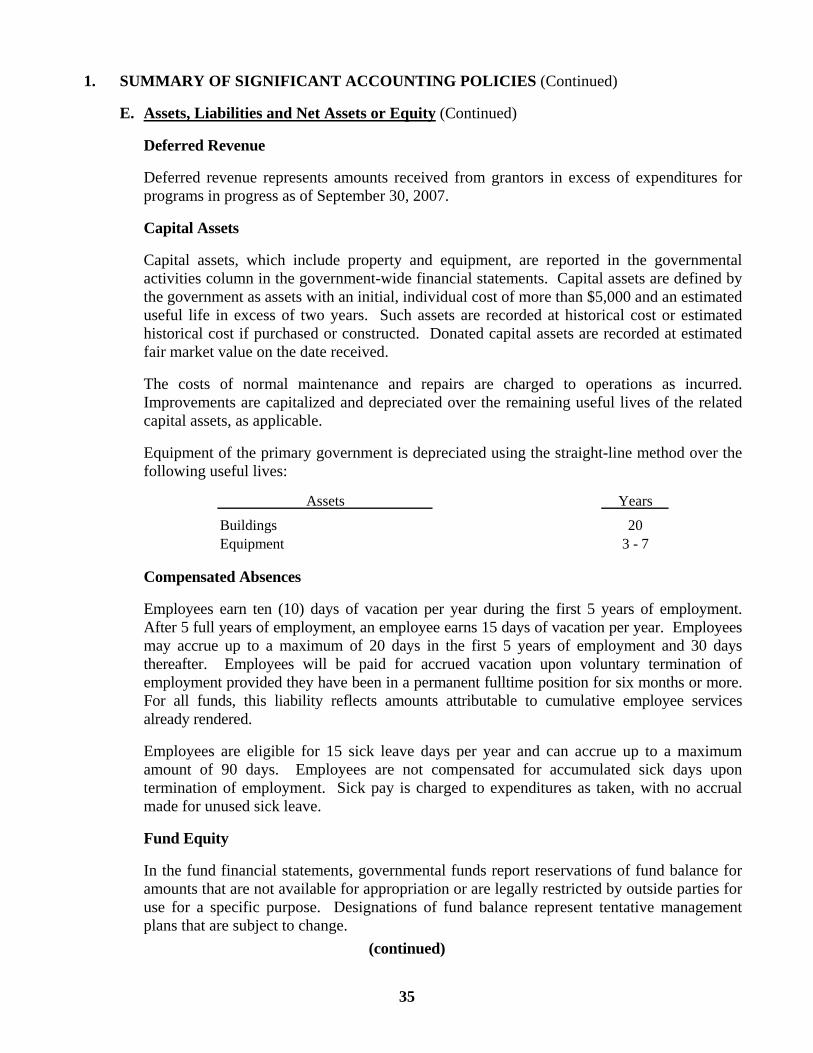
Equipment of the primary government is depreciated using the straight-line method over the following useful lives:
Assets Years
Buildings 20Equipment 3 - 7
Compensated Absences
Employees earn ten (10) days of vacation per year during the first 5 years of employment. After 5 full years of employment, an employee earns 15 days of vacation per year. Employees may accrue up to a maximum of 20 days in the first 5 years of employment and 30 days thereafter. Employees will be paid for accrued vacation upon voluntary termination of employment provided they have been in a permanent fulltime position for six months or more. For all funds, this liability reflects amounts attributable to cumulative employee services already rendered.
Employees are eligible for 15 sick leave days per year and can accrue up to a maximum amount of 90 days. Employees are not compensated for accumulated sick days upon termination of employment. Sick pay is charged to expenditures as taken, with no accrual made for unused sick leave.
Fund Equity
In the fund financial statements, governmental funds report reservations of fund balance for amounts that are not available for appropriation or are legally restricted by outside parties for use for a specific purpose. Designations of fund balance represent tentative management plans that are subject to change.
(continued)
36
1. SUMMARY OF SIGNIFICANT ACCOUNTING POLICIES (Continued)
E. Assets, Liabilities and Net Assets or Equity (Continued)
Indirect Costs
General and administrative costs are recorded in the General Fund as indirect costs in the ETCOG accounting system and allocated to Special Revenue Funds based upon a negotiated indirect cost rate. Indirect costs are defined by Office of Management and Budget (OMB) Circular A-87, Attachment “A” as costs “(a) incurred for a common or joint purpose benefiting more than one cost objective, and (b) not readily assignable to the cost objective specifically benefited, without effort disproportionate to the results achieved.” ETCOG’s indirect cost rate is based upon prior cost experience, documented by a cost allocation plan, and is approved by a state cognizant agency. It is ETCOG’s policy to negotiate with the cognizant agency a provisional rate which is used for billing purposes during ETCOG’s fiscal year. Upon the completion of an independent audit at the end of each fiscal year, the indirect cost rate is finalized with the cognizant agency.
2. RECONCILIATION OF GOVERNMENT-WIDE AND FUND FINANCIAL STATEMENTS
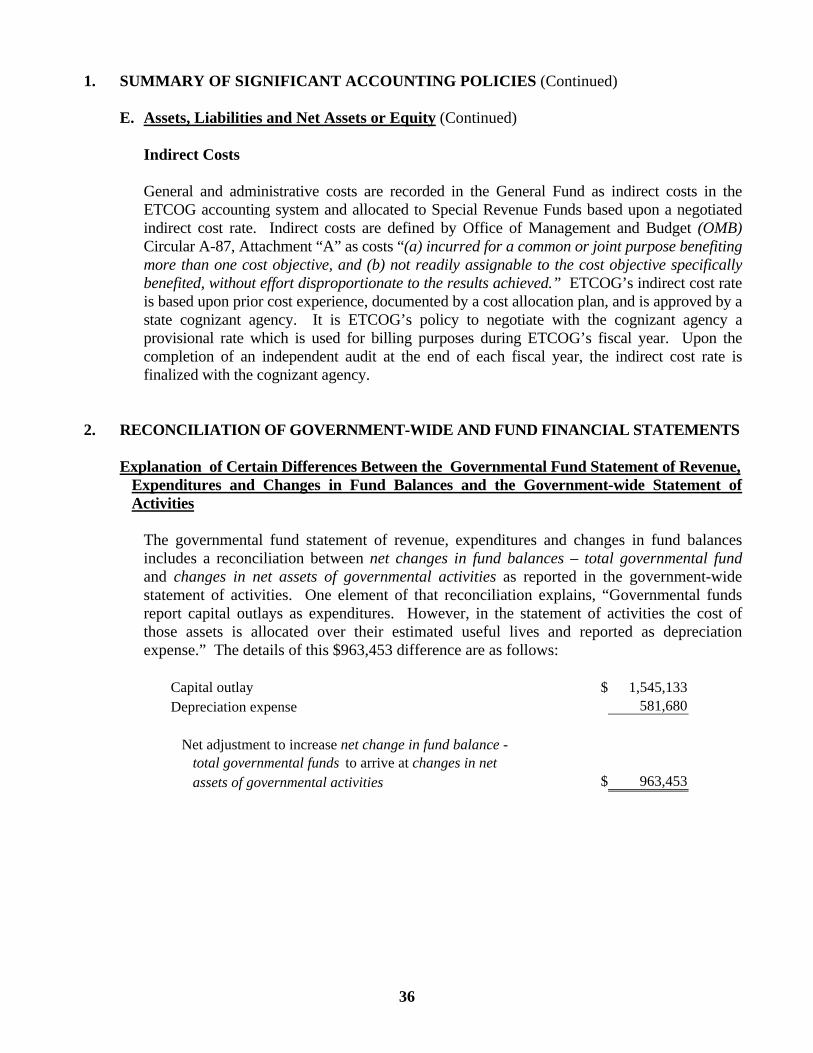
Explanation of Certain Differences Between the Governmental Fund Statement of Revenue, Expenditures and Changes in Fund Balances and the Government-wide Statement of Activities
The governmental fund statement of revenue, expenditures and changes in fund balances includes a reconciliation between net changes in fund balances – total governmental fund and changes in net assets of governmental activities as reported in the government-wide statement of activities. One element of that reconciliation explains, “Governmental funds report capital outlays as expenditures. However, in the statement of activities the cost of those assets is allocated over their estimated useful lives and reported as depreciation expense.” The details of this $963,453 difference are as follows:
Capital outlay 1,545,133$ Depreciation expense 581,680
Net adjustment to increase net change in fund balance - total governmental funds to arrive at changes in net assets of governmental activities 963,453$

37
3. BUDGETARY INFORMATION
ETCOG’s financial plan is controlled at the fund and project level with management authorized to make transfers of budgeted amounts between object class levels within a fund or project, within restrictions imposed by grantor agencies. The Board approves the financial plan for revenue and expenditures in all funds. The financial plan for the Special Revenue Funds is made on a project (grant) basis, spanning more than one year. Appropriations for all projects in the Special Revenue Funds lapse at the end of a contract period which may not coincide with the fiscal year-end of ETCOG. The appropriations for the General Fund lapse at the fiscal year-end. Although the financial plans are reviewed and approved by ETCOG’s Board, they are not considered legally adopted annual budgets or appropriations. Accordingly, comprehensive budget and actual results are not presented in this report.
4. DETAILED NOTES ON ALL FUNDS
Deposits and Investments
As of September 30, 2007, the primary government had the following investment:
Weighted AverageInvestment Type Fair Value Maturity (Days)
Tex Pool 773,518$ 34
As of September 30, 2007, the discretely presented component unit had the following investment:
Weighted AverageInvestment Type Fair Value Maturity (Days)
Tex Pool 54,336$ 34
The Public Funds Investment Act (Government Code Chapter 2256) contains specific provisions in the areas of investment practices, management reports and establishment of appropriate policies. Among other things, it requires the Council to adopt, implement, and publicize an investment policy. That policy must address the following areas: (1) safety of principal and liquidity, (2) portfolio diversification, (3) allowable investments, (4) acceptable risk levels, (5) expected rates of return, (6) maximum allowable stated maturity of portfolio investments, (7) maximum average dollar-weighted maturity allowed based on the stated maturity date for the portfolio, (8) investment staff quality and capabilities, and (9) bid solicitation preferences for certificates of deposit. Statutes authorize the Council to invest in (1) obligations of the U. S. Treasury, certain U. S. agencies, and the State of Texas; (2) certificates of deposit, (3) certain municipal securities, (4) money market savings accounts, (5) repurchase agreements, (6) bankers acceptances, (7) Mutual Funds, (8) investment pools, (9) guaranteed investment contracts, and (10) common trust funds. The Act also requires the Council to have independent auditors perform test procedures related to investment practices as provided by the Act. The Council is in substantial compliance with the requirements of the Act and with local policies.
(continued)

38
4. DETAILED NOTES ON ALL FUNDS (Continued)
Deposits and Investments (Continued)
The Council’s investment pool is 2a7-like pool. A 2a7-like pool is one which is not registered with the Securities and Exchange Commission (“SEC”) as an investment company, but nevertheless has a policy that it will, and does, operate in a manner consistent with the SEC’s Rule 2a7 of the Investment Company Act of 1940.
Interest Rate Risk. In accordance with its investment policy, the Council manages its exposure to declines in fair values by limiting the maximum allowable stated maturity of any individual investment to one year, unless otherwise provided in a specific investment strategy that complies with current law.
Custodial Credit Risk. In the case of deposits, this is the risk that in the event of a bank failure, the Council’s deposits may not be returned to it. As of September 30, 2007, the Council’s $5,014,605 deposit balance was collateralized with securities held by the pledging financial institution or by FDIC insurance. As of September 30, 2007, ETRDC’s deposit balance of $17,436 was covered by FDIC insurance.
Credit Risk. It is the Council’s policy to limit its investments to investment types with an investment quality rating not less than A or its equivalent by a nationally recognized statistical rating organization. The Council’s investment pool was rated AAAm by Standard and Poor’s Investors Service.
Concentration of Credit Risk. The Council’s policy is to diversify its portfolio to eliminate the risk of loss resulting from overconcentration of assets in a specific maturity, a specific issuer, or a specific class of investments.
Capital Assets
Primary government capital asset activity for the year ended September 30, 2007, is as follows:
Governmental activities:Beginning Ending Balance Increases Decreases Balance
Non-depreciable assets: Land 11,495$ -$ -$ 11,495$ Total non-depreciable assets 11,495 - - 11,495
Depreciable assets: Buildings 785,594 - - 785,594 Furniture, fixtures and equipment 3,084,314 1,545,133 677,826 3,951,621 Total depreciable assets 3,869,908 1,545,133 677,826 4,737,215
Total assets 3,881,403 1,545,133 677,826 4,748,710
Less accumulated depreciation: Buildings 408,925 20,857 - 429,782 Furniture, fixtures and equipment 1,960,408 560,822 600,501 1,920,729 Total accumulated depreciation 2,369,333 581,679 600,501 2,350,511
Total capital assets, net 1,512,070$ 963,454$ 77,325$ 2,398,199$
(continued)

39
4. DETAILED NOTES ON ALL FUNDS (Continued)
Capital Assets (Continued)
Depreciation expense was charged to functions/programs of the primary government as follows:
Governmental activities:
General government 4,731$ Emergency communications 298,426 Aging 43,994 Workforce development 1,808 Transportation 212,424 Health and human services 20,296
Total depreciation expense - governmental activities 581,679$
Interfund Transactions
Interfund Transfers In/Out:
The balances recorded as transfers result from local matching funds provided in accordance with the terms and provisions of various grant contracts.
A summary of interfund transfers as of September 30, 2007, is as follows:
Transfers In Transfers Out
Major Funds: General -$ 57,438$ Texas Department of Aging and Disability Services 52,655 - Other Governmental Funds 4,783 -
57,438$ 57,438$
Interfund Receivables and Payables:
The following is a summary of interfund receivables and payables:
Due from Due to
Major Funds: General 308,356$ -$ Texas Department of Aging and Disability Services - 52 Other Governmental Funds - 301,315 Other Enterprise Funds - 6,989
308,356$ 308,356$
All interfund receivables and payables resulted from the time lag between the dates that reimbursable expenditures occur and payments between funds are made.
(continued)

40
4. DETAILED NOTES ON ALL FUNDS (Continued)
Long-term Debt
A summary of long-term liability activity for the year ended September 30, 2007, is as follows:
Beginning Ending Amount DueBalance Additions Deletions Balance in One Year
Primary Government:
Governmental activities: Capital leases 44,383$ -$ 44,383$ -$ -$ Compensated absences 101,469 115,117 114,782 101,804 50,902
145,852$ 115,117$ 159,165$ 101,804$ 50,902$
The compensated absences liability will be liquidated primarily by the General Fund. 5. OTHER INFORMATION
Risk Management
ETCOG is exposed to various risks of loss related to torts; theft of, damage to and destruction of assets; errors and omissions; injuries to employees; and natural disasters. ETCOG maintains workers' compensation and other risks of loss coverage through commercial insurance carriers. ETCOG management believes such coverage is sufficient to preclude any significant uninsured losses to ETCOG. There were no significant reductions in insurance coverage from coverage in the prior year. There were no insurance settlements, which exceeded insurance coverage in any of the past three years.
Contingencies
ETCOG contracts with local governments or other local agencies to perform the specific services
set forth in certain grant agreements. ETCOG disburses grant funds to the agencies based on expenditure reports received from each agency.
Agencies expending $500,000 or more in ETCOG grant funds are required to have an independent
audit each year. Copies of such audits are required to be submitted to ETCOG. If such audits disclose expenditures not in accordance with terms of the grants, the grantor agency could disallow the costs and require reimbursements of the disallowed costs either from ETCOG or the subcontractor. ETCOG generally has the right of recovery from the subcontracted agencies.
Audits of the Council's expenditures for the year ended September 30, 2007, have not been
completed. Based on prior experience, ETCOG management believes that ETCOG will not incur significant losses from possible grant disallowances.
(continued)

41
5. OTHER INFORMATION Retirement Plan
The East Texas Council of Governments provides benefits for all of its full-time employees through a defined contribution plan. The Plan is administered by International City Management Association Retirement Corporation. In a defined contribution plan, benefits depend solely on amounts contributed to the plan plus investment earnings. Employees are eligible to participate from the date of employment. ETCOG contributes an amount equal to 12% of the employee's compensation each year and employees contribute an amount equal to 8% of their compensation each year for a total of 20%. At the beginning of employment, 70% goes to the retirement plan account and 30% is used to purchase universal life insurance. After this initial calculation, the insurance payments remain constant as the employee’s annual salary increases, therefore, the contributions to the retirement plan account increase as a percentage to the total contribution amount. ETCOG's contributions for each employee (and earnings allocated to the employee's account) are fully vested after five years continuous service. ETCOG's contributions for, and earnings forfeited by, employees who leave employment before five years of service may be segregated in a special account. The ETCOG Executive Committee is responsible and has the authority to amend the plan provisions and contribution requirements.
The East Texas Council of Government's total covered payroll for the fiscal year ended September 30, 2007, was $2,198,246. ETCOG made the required 12% contribution, which amounted to $263,790. Employees made the required 8% contribution of $175,860. The total 20% contribution (employer and employee) amounted to $439,650. Of this, $354,010 went to the retirement plan and $85,640 went to the purchase of universal life insurance.
THIS PAGE LEFT BLANK INTENTIONALLY

COMBINING STATEMENTS
NONMAJOR GOVERNMENTAL FUNDS
SPECIAL REVENUE FUNDS
Special revenue funds are used to account for specific revenues that are legally restricted to expenditure for particular purposes. Governor’s Office of Criminal Justice Fund – This fund is used to account for federal and state grants awarded to East Texas Council of Governments by the State of Texas Governor’s Office: Criminal Justice Division. Texas Department of Transportation Fund – This fund is used to account for state grants awarded to East Texas Council of Governments by the Texas Department on Aging. Texas Department of Health Fund – This fund is used to account for state grants awarded to East Texas Council of Governments by the Texas Department of Health. Texas Department of Human Services Fund – This fund is used to account for state funds awarded to East Texas Council of Governments by the Texas Department of Human Services. Texas Commission on Environmental Quality Fund – This fund is used to account for state grants awarded to East Texas Council of Governments by the Texas Commission on Environmental Quality. Texas Health and Human Services Commission Fund – This fund is used to account for federal grants awarded to East Texas Council of Governments by the Texas Health and Human Services Commission. Economic Development Administration Fund – This fund is used to account for federal grants awarded to East Texas Council of Governments by the Economic Development Administration. State Energy Conservation Office Fund – This fund is used to account for state grants awarded to East Texas Council of Governments by the State Energy Conservation Office.

U. S. Department of Homeland Security Fund – This fund is used to account for federal grants awarded to East Texas Council of Governments by the U. S. Department of Homeland Security. U. S. Department of Housing and Urban Development Fund – This fund is used to account for federal grants awarded to East Texas Council of Governments by the U. S. Department of Housing and Urban Development. Texas Veterans Commission Fund – This fund is used to account for state grants awarded to East Texas Council of Governments by the Texas Veterans Commission. Miscellaneous Grants and Contracts Fund – This fund is used to account for various local grants awarded to the East Texas Council of Governments.

Governor's Texas TexasOffice of Texas Texas Department Commission onCriminal Department of Department of Human EnvironmentalJustice Transportation of Health Services Quality
ASSETS Cash and cash equivalents -$ -$ 204,666$ 41,229$ 101,757$ Accounts receivable: Grantors 24,508 330,512 - - 47,362 Other - 4,309 - - -
Total assets 24,508$ 334,821$ 204,666$ 41,229$ 149,119$
LIABILITIES AND FUND BALANCES Liabilities: Accounts payable 17,366$ 145,776$ -$ -$ 68,249$ Due to other funds 7,142 182,253 - - - Deferred revenue - 5,120 - - 80,870
Total liabilities 24,508 333,149 - - 149,119
Fund balances: Unreserved - 1,672 204,666 41,229 -
Total fund balances - 1,672 204,666 41,229 -
Total liabilities and fund balances 24,508$ 334,821$ 204,666$ 41,229$ 149,119$
EAST TEXAS COUNCIL OF GOVERNMENTS
COMBINING BALANCE SHEET
NONMAJOR GOVERNMENTAL FUNDS
SEPTEMBER 30, 2007
42

Texas U. S.Health State U. S. Department
and Human Economic Energy Department of Housing Texas MiscellaneousServices Development Conservation of Homeland and Urban Veterans Grants and
Commission Administration Office Security Development Commission Contracts Totals
-$ 2,575$ 5,724$ -$ -$ 19,836$ 50,624$ 426,411$
78,289 - - 114,365 6,764 - - 601,800 - - 250 121 76 707 - 5,463
78,289$ 2,575$ 5,974$ 114,486$ 6,840$ 20,543$ 50,624$ 1,033,674$
60,505$ 1,688$ 521$ 27,099$ 91$ 20,543$ -$ 341,838$ 17,784 - - 87,387 6,749 - - 301,315
- 322 5,453 - - - - 91,765
78,289 2,010 5,974 114,486 6,840 20,543 - 734,918
- 565 - - - - 50,624 298,756
- 565 - - - - 50,624 298,756
78,289$ 2,575$ 5,974$ 114,486$ 6,840$ 20,543$ 50,624$ 1,033,674$
43

Governor's Texas TexasOffice of Texas Texas Department Commission onCriminal Department of Department of Human EnvironmentalJustice Transportation of Health Services Quality
REVENUES Intergovernmental 268,819$ 1,554,310$ -$ -$ 828,587$ Matching funds - 72,252 - - - Program income - 793 - - - Miscellaneous - 5,925 - - 15,461
Total revenues 268,819 1,633,280 - - 844,048
EXPENDITURES Current: Workforce development - - - - - Environmental quality - - - - 844,048 Transportation - 1,633,280 - - - Homeland security - - - - - Criminal justice 268,819 - - - - Housing and urban development - - - - - Aging - - - - - Health and human services - - - 80 - Economic development - - - - -
Total expenditures 268,819 1,633,280 - 80 844,048
EXCESS (DEFICIENCY) OF REVENUES OVER (UNDER) EXPENDITURES - - - 80)( -
OTHER FINANCING SOURCES Transfers in - - - - -
Total other financing sources - - - - -
NET CHANGE IN FUND BALANCES - - - 80)( -
FUND BALANCES, BEGINNING - 1,672 204,666 41,309 -
FUND BALANCES, ENDING -$ 1,672$ 204,666$ 41,229$ -$
FOR THE YEAR ENDED SEPTEMBER 30, 2007
EAST TEXAS COUNCIL OF GOVERNMENTS
COMBINING STATEMENT OF REVENUES, EXPENDITURESAND CHANGES IN FUND BALANCES
NONMAJOR GOVERNMENTAL FUNDS
44

Texas U. S.Health State U. S. Department
and Human Economic Energy Department of Housing Texas MiscellaneousServices Development Conservation of Homeland and Urban Veterans Grants and
Commission Administration Office Security Development Commission Contracts Totals
149,592$ 44,077$ 789$ 266,300$ 14,762$ 88,430$ 5,860$ 3,221,526$ - 20,067 - - - - - 92,319 - - - - - - - 793 - - - - - - 31,617 53,003
149,592 64,144 789 266,300 14,762 88,430 37,477 3,367,641
- - - - - 88,430 - 88,430 - - 789 - - - - 844,837 - - - - - - - 1,633,280 - - - 266,300 - - - 266,300 - - - - - - - 268,819 - - - - 19,545 - - 19,545 - - - - - - 33,408 33,408
149,592 - - - - - - 149,672 - 64,144 - - - - - 64,144
149,592 64,144 789 266,300 19,545 88,430 33,408 3,368,435
- - - - 4,783)( - 4,069 794)(
- - - - 4,783 - - 4,783
- - - - 4,783 - - 4,783
- - - - - - 4,069 3,989
- 565 - - - - 46,555 294,767
-$ 565$ -$ -$ -$ -$ 50,624$ 298,756$
45

THIS PAGE LEFT BLANK INTENTIONALLY

SUPPLEMENTAL SCHEDULES

THIS PAGE LEFT BLANK INTENTIONALLY

Salaries 326,076$ Benefits 47,341 Total Personnel 373,417
Group hospitalization 69,967 Pension costs 43,808 Minor office equipment/supply 17,632 Computer maintenance 16,753 Staff travel 11,031 Executive committee travel 6,079 Allocated space costs 18,835 Office supplies 32,005 Insurance and bonding 1,459 Books and subscriptions 3,104 Printing and publications 6,502 Leases 18,905 Storage building 2,562 Repairs and maintenance 2,818 Advertising and public notice 7,148 Membership dues 20,086 Registration Fees 4,117 Telephone 16,111 Postage 30,930 Meetings and conferences 10,406 Legal and audit fees 29,497 Other contract services 18,378 Employee recruiting and moving 8,929 Data base services 704 Total Indirect Costs 771,183
Less amount allocated to component unit 9,296)(
Total Indirect Costs Allocated to Special Revenue Funds 761,887$
Computation of Indirect Cost Rate: Direct personnel costs 2,639,969$
Allocation rate 28.86%
Indirect costs as a percentage of qualifying costs 2.1%
EAST TEXAS COUNCIL OF GOVERNMENTS
SCHEDULE OF INDIRECT COSTS
FOR THE YEAR ENDED SEPTEMBER 30, 2007
46

EMPLOYEE BENEFITS Disability 26,191$ Workman's compensation insurance 6,649 Vacation 128,578 Holidays, sick leave, other 185,928 Employment taxes 2,928 Total Employee Benefits 350,274
Less amount allocated to indirect cost pool 47,431)( Less amount allocated to component unit 3,253)(
Total Employee Benefits Allocated to Special Revenue Funds 299,590$
Chargeable time 1,635,690
Benefit rate 18.32%
EAST TEXAS COUNCIL OF GOVERNMENTS
SCHEDULE OF EMPLOYEE BENEFITS
FOR THE YEAR ENDED SEPTEMBER 30, 2007
47
STATISTICAL SECTION

THIS PAGE LEFT BLANK INTENTIONALLY

STATISTICAL SECTION (Unaudited)
This part of the East Texas Council of Government’s comprehensive annual financial report presents detailed information as a context for understanding what the information in the financial statements, note disclosures, and required supplementary information says about the Council’s overall financial health.
Contents Page
Financial Trends 48 These schedules contain trend information to help the reader
understand how the Council’s financial performance and well-being have changed over time.
Revenue Capacity
All of the Council’s significant revenue is provided by other governments. It does not impose any taxes or charge any significant fees of its own. Accordingly, revenue capacity schedules are not presented in the statistical section.
Debt Capacity
For the purposes of the statistical section, debt is limited to long-term debt instruments, such as bonds, notes, loans and capital leases. The Council has no debt. Therefore, debt capacity information is not presented in the statistical section.
Demographic and Economic Indicators 54
These schedules offer demographic and economic indicators to help the reader understand the environment within which the Council’s financial activities take place.
Operating Information 68
These schedules contain service and capital asset data to help the reader understand how the information in the Council’s financial report relates to the services the East Texas Council of Governments provides and the resources it utilizes to provide these services.

2003 2004 2005 2006 2007
Governmental activities: Invested in capital assets, net of related debt 1,028,474$ 1,066,250$ 1,365,348$ 1,467,687$ 2,398,199$ Restricted 1,189,683 1,175,194 1,199,484 1,174,134 1,202,091 Unrestricted 586,958 606,955 653,585 758,245 1,017,141
Total governmental activities net assets 2,805,115$ 2,848,399$ 3,218,417$ 3,400,066$ 4,617,431$
Business-type activities: Invested in capital assets, net of related debt -$ -$ -$ -$ -$ Restricted - - - - - Unrestricted - - - - (631)
Total business-type activities net assets -$ -$ -$ -$ 631)$(
Primary government: Invested in capital assets, net of related debt 1,028,474$ 1,066,250$ 1,365,348$ 1,467,687$ 2,398,199$ Restricted 1,189,683 1,175,194 1,199,484 1,174,134 1,202,091 Unrestricted 586,958 606,955 653,585 758,245 1,016,510
Total primary government net assets 2,805,115$ 2,848,399$ 3,218,417$ 3,400,066$ 4,616,800$
Note:
The Council began to report accrual information when it implemented GASB Statement 34 in fiscal year 2003.
Fiscal Year
EAST TEXAS COUNCIL OF GOVERNMENTS
NET ASSETS BY COMPONENT
LAST FIVE FISCAL YEARS
48
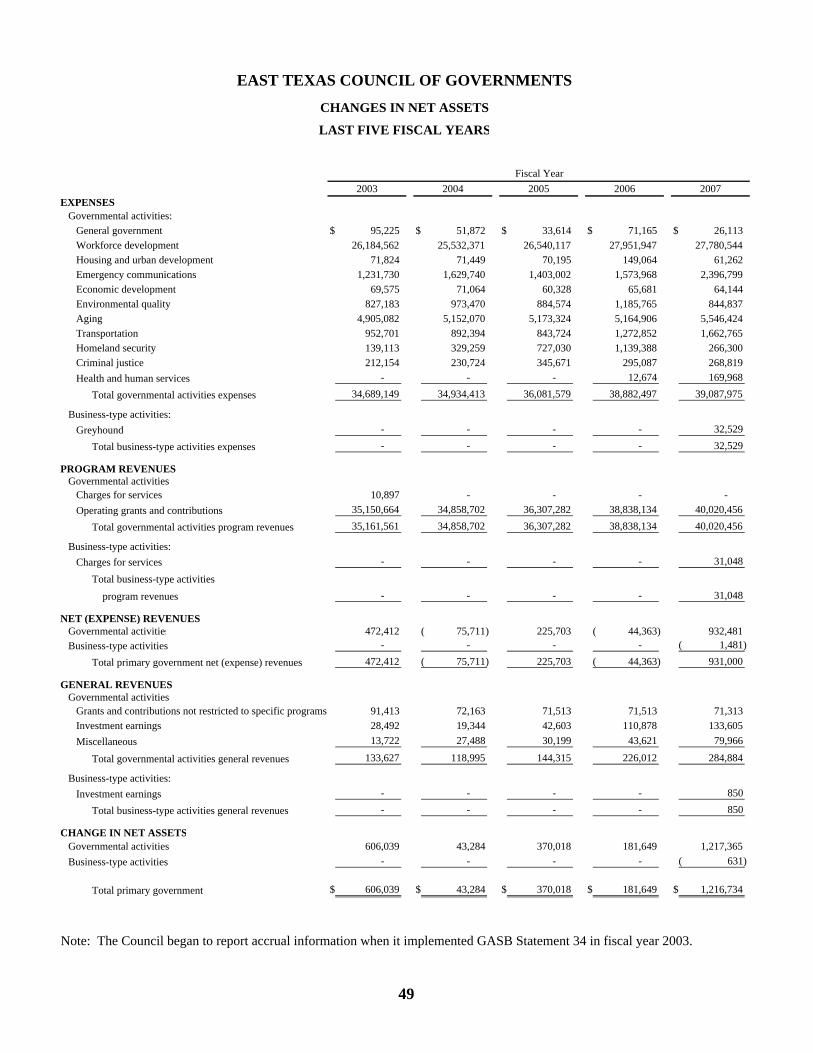
2003 2004 2005 2006 2007EXPENSES Governmental activities: General government 95,225$ 51,872$ 33,614$ 71,165$ 26,113$ Workforce development 26,184,562 25,532,371 26,540,117 27,951,947 27,780,544 Housing and urban development 71,824 71,449 70,195 149,064 61,262 Emergency communications 1,231,730 1,629,740 1,403,002 1,573,968 2,396,799 Economic development 69,575 71,064 60,328 65,681 64,144 Environmental quality 827,183 973,470 884,574 1,185,765 844,837 Aging 4,905,082 5,152,070 5,173,324 5,164,906 5,546,424 Transportation 952,701 892,394 843,724 1,272,852 1,662,765 Homeland security 139,113 329,259 727,030 1,139,388 266,300 Criminal justice 212,154 230,724 345,671 295,087 268,819 Health and human services - - - 12,674 169,968
Total governmental activities expenses 34,689,149 34,934,413 36,081,579 38,882,497 39,087,975
Business-type activities: Greyhound - - - - 32,529
Total business-type activities expenses - - - - 32,529
PROGRAM REVENUES Governmental activities Charges for services 10,897 - - - - Operating grants and contributions 35,150,664 34,858,702 36,307,282 38,838,134 40,020,456
Total governmental activities program revenues 35,161,561 34,858,702 36,307,282 38,838,134 40,020,456
Business-type activities: Charges for services - - - - 31,048
Total business-type activities program revenues - - - - 31,048
NET (EXPENSE) REVENUES Governmental activities 472,412 75,711)( 225,703 44,363)( 932,481 Business-type activities - - - - 1,481)(
Total primary government net (expense) revenues 472,412 75,711)( 225,703 44,363)( 931,000
GENERAL REVENUES Governmental activities Grants and contributions not restricted to specific programs 91,413 72,163 71,513 71,513 71,313 Investment earnings 28,492 19,344 42,603 110,878 133,605 Miscellaneous 13,722 27,488 30,199 43,621 79,966
Total governmental activities general revenues 133,627 118,995 144,315 226,012 284,884
Business-type activities: Investment earnings - - - - 850
Total business-type activities general revenues - - - - 850
CHANGE IN NET ASSETS Governmental activities 606,039 43,284 370,018 181,649 1,217,365 Business-type activities - - - - 631)(
Total primary government 606,039$ 43,284$ 370,018$ 181,649$ 1,216,734$
Note: The Council began to report accrual information when it implemented GASB Statement 34 in fiscal year 2003.
Fiscal Year
EAST TEXAS COUNCIL OF GOVERNMENTS
CHANGES IN NET ASSETS
LAST FIVE FISCAL YEARS
49

1998 1999 2000 2001 2002 2003 2004 2005 2006 2007
General fund Reserved 18,919$ 18,919$ -$ -$ -$ -$ -$ -$ -$ -$ Unreserved 498,950 532,237 550,445 610,548 642,819 664,600 692,436 740,946 859,714 1,017,141
Total general fund 517,869$ 551,156$ 550,445$ 610,548$ 642,819$ 664,600$ 692,436$ 740,946$ 859,714$ 1,017,141$
All other governmental funds Reserved 587,373$ 1,312,845$ 1,038,362$ -$ -$ -$ -$ -$ 346,904$ 190,341$ Unreserved, reported in: Special revenue funds 1,017,491 496,867 702,767 1,294,506 1,104,312 1,189,683 1,175,194 1,199,484 827,230 1,113,554
Total all other governmental funds 1,604,864$ 1,809,712$ 1,741,129$ 1,294,506$ 1,104,312$ 1,189,683$ 1,175,194$ 1,199,484$ 1,174,134$ 1,303,895$
Total primary government 2,122,733$ 2,360,868$ 2,291,574$ 1,905,054$ 1,747,131$ 1,854,283$ 1,867,630$ 1,940,430$ 2,033,848$ 2,321,036$
Fiscal Year
EAST TEXAS COUNCIL OF GOVERNMENTS
FUND BALANCESGOVERNMENTAL FUNDS
LAST TEN FISCAL YEARS
50

51
East Texas Council of GovernmentsFund Balances of Governmental Funds
Last Ten Fiscal Years
$0 $500,000 $1,000,000 $1,500,000 $2,000,000 $2,500,000
1997
1998
1999
2000
2001
2002
2003
2004
2005
2006
2007
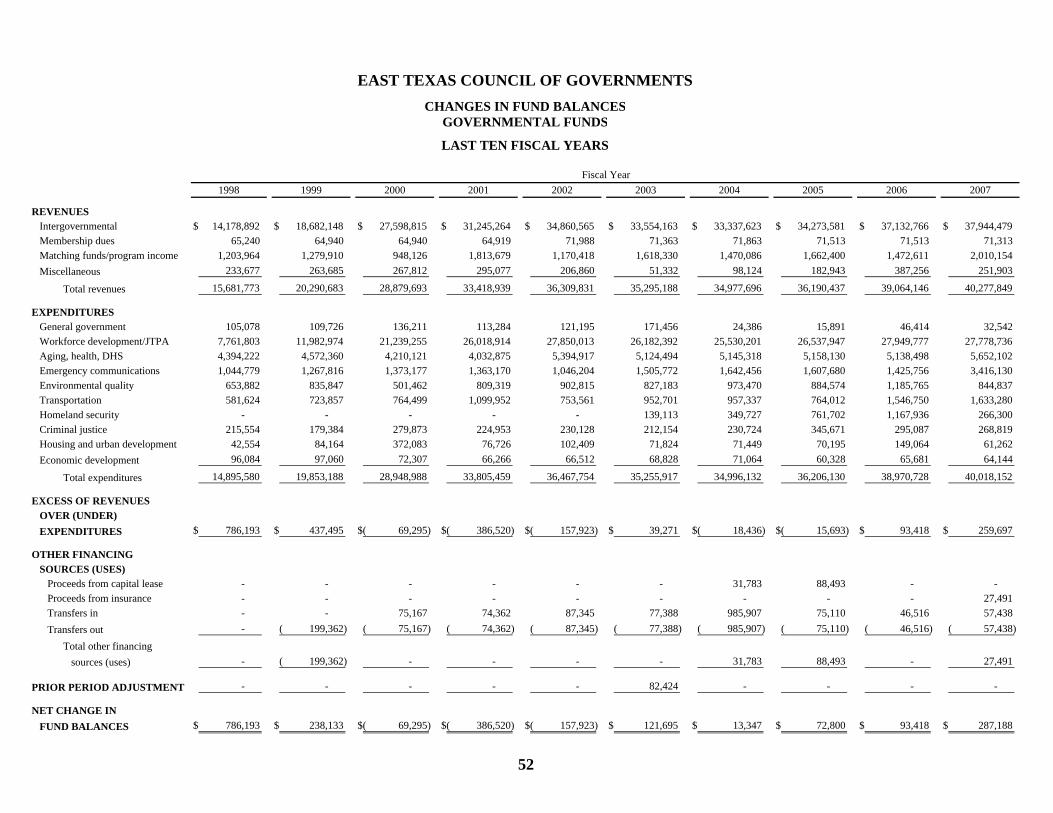
1998 1999 2000 2001 2002 2003 2004 2005 2006 2007
REVENUES Intergovernmental 14,178,892$ 18,682,148$ 27,598,815$ 31,245,264$ 34,860,565$ 33,554,163$ 33,337,623$ 34,273,581$ 37,132,766$ 37,944,479$ Membership dues 65,240 64,940 64,940 64,919 71,988 71,363 71,863 71,513 71,513 71,313 Matching funds/program income 1,203,964 1,279,910 948,126 1,813,679 1,170,418 1,618,330 1,470,086 1,662,400 1,472,611 2,010,154 Miscellaneous 233,677 263,685 267,812 295,077 206,860 51,332 98,124 182,943 387,256 251,903
Total revenues 15,681,773 20,290,683 28,879,693 33,418,939 36,309,831 35,295,188 34,977,696 36,190,437 39,064,146 40,277,849
EXPENDITURES General government 105,078 109,726 136,211 113,284 121,195 171,456 24,386 15,891 46,414 32,542 Workforce development/JTPA 7,761,803 11,982,974 21,239,255 26,018,914 27,850,013 26,182,392 25,530,201 26,537,947 27,949,777 27,778,736 Aging, health, DHS 4,394,222 4,572,360 4,210,121 4,032,875 5,394,917 5,124,494 5,145,318 5,158,130 5,138,498 5,652,102 Emergency communications 1,044,779 1,267,816 1,373,177 1,363,170 1,046,204 1,505,772 1,642,456 1,607,680 1,425,756 3,416,130 Environmental quality 653,882 835,847 501,462 809,319 902,815 827,183 973,470 884,574 1,185,765 844,837 Transportation 581,624 723,857 764,499 1,099,952 753,561 952,701 957,337 764,012 1,546,750 1,633,280 Homeland security - - - - - 139,113 349,727 761,702 1,167,936 266,300 Criminal justice 215,554 179,384 279,873 224,953 230,128 212,154 230,724 345,671 295,087 268,819 Housing and urban development 42,554 84,164 372,083 76,726 102,409 71,824 71,449 70,195 149,064 61,262 Economic development 96,084 97,060 72,307 66,266 66,512 68,828 71,064 60,328 65,681 64,144
Total expenditures 14,895,580 19,853,188 28,948,988 33,805,459 36,467,754 35,255,917 34,996,132 36,206,130 38,970,728 40,018,152
EXCESS OF REVENUES OVER (UNDER) EXPENDITURES 786,193$ 437,495$ 69,295)$( 386,520)$( 157,923)$( 39,271$ 18,436)$( 15,693)$( 93,418$ 259,697$
OTHER FINANCING SOURCES (USES) Proceeds from capital lease - - - - - - 31,783 88,493 - - Proceeds from insurance - - - - - - - - - 27,491 Transfers in - - 75,167 74,362 87,345 77,388 985,907 75,110 46,516 57,438 Transfers out - 199,362)( 75,167)( 74,362)( 87,345)( 77,388)( 985,907)( 75,110)( 46,516)( 57,438)(
Total other financing sources (uses) - 199,362)( - - - - 31,783 88,493 - 27,491
PRIOR PERIOD ADJUSTMENT - - - - - 82,424 - - - -
NET CHANGE IN FUND BALANCES 786,193$ 238,133$ 69,295)$( 386,520)$( 157,923)$( 121,695$ 13,347$ 72,800$ 93,418$ 287,188$
Fiscal Year
EAST TEXAS COUNCIL OF GOVERNMENTSCHANGES IN FUND BALANCES
GOVERNMENTAL FUNDS
LAST TEN FISCAL YEARS
52

53
East Texas Council of GovernmentsRevenues and Expenditures of Governmental Funds
Last Ten Fiscal Years
0 5,000,000 10,000,000 15,000,000 20,000,000 25,000,000 30,000,000 35,000,000 40,000,000 45,000,000
1998
1999
2000
2001
2002
2003
2004
2005
2006
2007
Expenses
Revenues
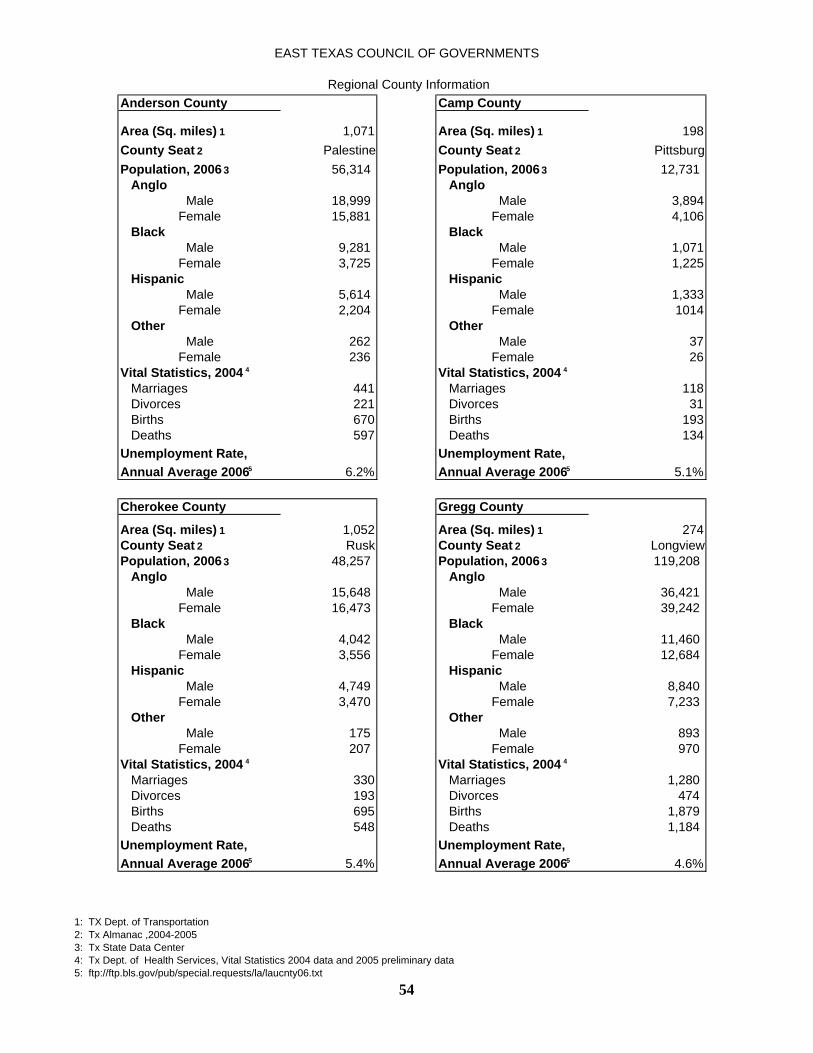
EAST TEXAS COUNCIL OF GOVERNMENTS
Regional County InformationAnderson County Camp County
Area (Sq. miles) 1 1,071 Area (Sq. miles) 1 198County Seat 2 Palestine County Seat 2 PittsburgPopulation, 2006 3 56,314 Population, 2006 3 12,731 Anglo Anglo
Male 18,999 Male 3,894Female 15,881 Female 4,106
Black BlackMale 9,281 Male 1,071
Female 3,725 Female 1,225 Hispanic Hispanic
Male 5,614 Male 1,333Female 2,204 Female 1014
Other Other Male 262 Male 37
Female 236 Female 26Vital Statistics, 2004 4 Vital Statistics, 2004 4 Marriages 441 Marriages 118 Divorces 221 Divorces 31 Births 670 Births 193 Deaths 597 Deaths 134Unemployment Rate, Annual Average 2006 5 6.2%
Unemployment Rate, Annual Average 2006 5 5.1%
Cherokee County Gregg County
Area (Sq. miles) 1 1,052 Area (Sq. miles) 1 274County Seat 2 Rusk County Seat 2 LongviewPopulation, 2006 3 48,257 Population, 2006 3 119,208 Anglo Anglo
Male 15,648 Male 36,421 Female 16,473 Female 39,242
Black BlackMale 4,042 Male 11,460
Female 3,556 Female 12,684 Hispanic Hispanic
Male 4,749 Male 8,840 Female 3,470 Female 7,233
Other OtherMale 175 Male 893
Female 207 Female 970 Vital Statistics, 2004 4 Vital Statistics, 2004 4 Marriages 330 Marriages 1,280 Divorces 193 Divorces 474 Births 695 Births 1,879 Deaths 548 Deaths 1,184 Unemployment Rate, Annual Average 2006 5 5.4%
Unemployment Rate, Annual Average 2006 5 4.6%
54
1: TX Dept. of Transportation 2: Tx Almanac ,2004-2005 3: Tx State Data Center 4: Tx Dept. of Health Services, Vital Statistics 2004 data and 2005 preliminary data 5: ftp://ftp.bls.gov/pub/special.requests/la/laucnty06.txt

EAST TEXAS COUNCIL OF GOVERNMENTS
Regional County Information
Harrison County Henderson County
Area (Sq. miles) 1 899 Area (Sq. miles) 1 874County Seat 2 Marshall County Seat 2 AthensPopulation, 2006 3 63,818 Population, 2006 3 79,704 Anglo Anglo
Male 21,206 Male 32,826 Female 21,977 Female 33,254
Black BlackMale 7,034 Male 2,500
Female 7,919 Female 2,659 Hispanic Hispanic
Male 2,842 Male 4,017 Female 2,251 Female 3,360
Other Other Male 237 Male 341
Female 249 Female 374 Vital Statistics, 2004 4 Vital Statistics, 2004 4 Marriages 462 Marriages 621 Divorces 122 Divorces 162 Births 807 Births 938 Deaths 585 Deaths 889Unemployment Rate, Annual Average 2006 5 5.2%
Unemployment Rate, Annual Average 2006 5 5.3%
Marion County Panola County
Area (Sq. miles) 1 381 Area (Sq. miles) 1 801County Seat 2 Jefferson County Seat 2 CarthagePopulation, 2006 3 10,864 Population, 2006 3 23,299 Anglo Anglo
Male 3,974 Male 8,601 Female 4,000 Female 9,117
Black BlackMale 1,175 Male 2,044
Female 1,362 Female 2,282 Hispanic Hispanic
Male 139 Male 594 Female 115 Female 436
Other OtherMale 53 Male 64
Female 62 Female 87 Vital Statistics, 2004 4 Vital Statistics, 2004 4 Marriages 97 Marriages 198 Divorces 45 Divorces 110 Births 121 Births 286 Deaths 127 Deaths 276Unemployment Rate, Annual Average 2006 5 5.4%
Unemployment Rate, Annual Average 2006 5 4.4%
55
1: TX Dept. of Transportation 2: Tx Almanac ,2004-2005 3: Tx State Data Center 4: Tx Dept. of Health Services, Vital Statistics 2004 data and 2005 preliminary data 5: ftp://ftp.bls.gov/pub/special.requests/la/laucnty06.txt

EAST TEXAS COUNCIL OF GOVERNMENTS
Regional County Information
Rains County Rusk County
Area (Sq. miles) 1 232 Area (Sq. miles) 1 924County Seat 2 Emory County Seat 2 HendersonPopulation, 2006 3 10,665 Population, 2006 3 48,294 Anglo Anglo
Male 4,827 Male 16,735 Female 4,819 Female 16,628
Black BlackMale 148 Male 4,832
Female 134 Female 4,170 Hispanic Hispanic
Male 325 Male 3,066 Female 274 Female 2,337
Other Other Male 57 Male 160
Female 61 Female 165 Vital Statistics, 2004 4 Vital Statistics, 2004 4 Marriages 93 Marriages 338 Divorces 57 Divorces 260 Births 115 Births 618 Deaths 119 Deaths 503Unemployment Rate, Annual Average 2006 5 4.9%
Unemployment Rate, Annual Average 2006 5 4.7%
Smith County Upshur County
Area (Sq. miles) 1 929 Area (Sq. miles) 1 588County Seat 2 Tyler County Seat 2 GilmerPopulation, 2006 3 197,093 Population, 2006 3 37,594 Anglo Anglo
Male 59,424 Male 15,423 Female 64,683 Female 15,666
Black BlackMale 17,014 Male 1,740
Female 19,657 Female 2,055 Hispanic Hispanic
Male 16,155 Male 1,125 Female 14,717 Female 1,008
Other Other Male 1,456 Male 167
Female 1,686 Female 195 Vital Statistics, 2004 4 Vital Statistics, 2004 4 Marriages 1,749 Marriages 258 Divorces 570 Divorces 233 Births 2,876 Births 457 Deaths 1,575 Deaths 386Unemployment Rate, Annual Average 2006 5 4.7%
Unemployment Rate, Annual Average 2006 5 4.7%
56
1: TX Dept. of Transportation 2: Tx Almanac ,2004-2005 3: Tx State Data Center 4: Tx Dept. of Health Services, Vital Statistics 2004 data and 2005 preliminary data 5: ftp://ftp.bls.gov/pub/special.requests/la/laucnty06.txt
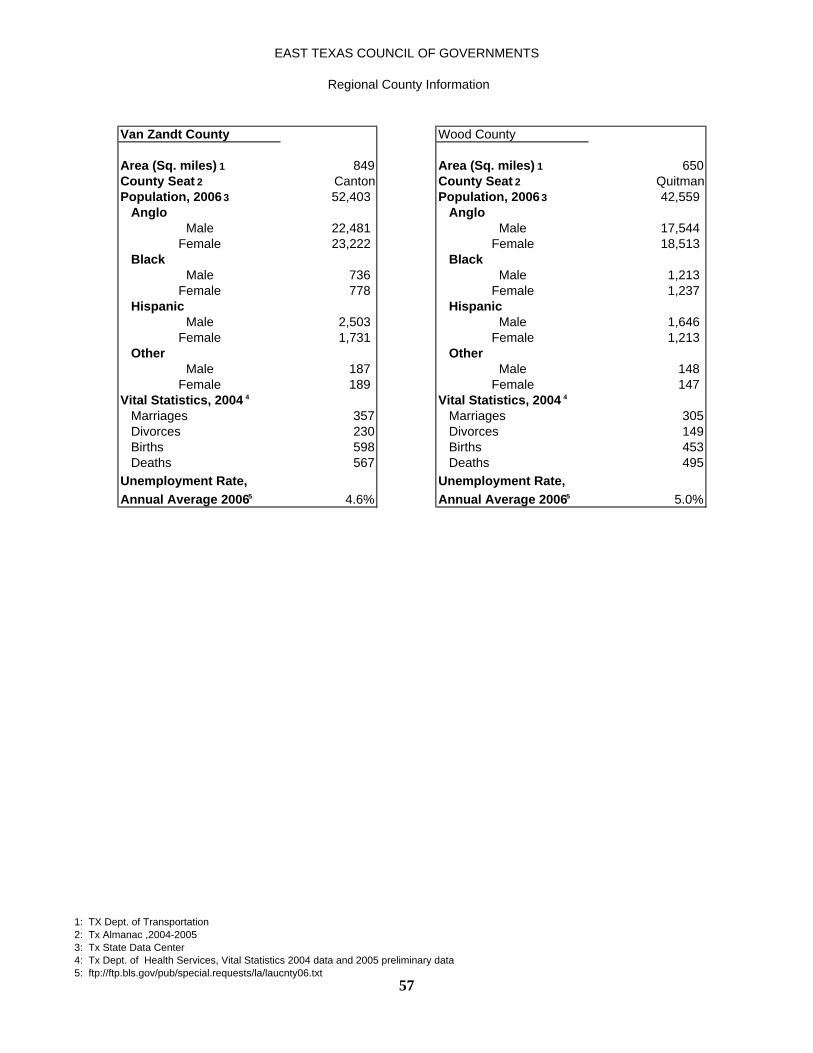
EAST TEXAS COUNCIL OF GOVERNMENTS
Regional County Information
Van Zandt County Wood County
Area (Sq. miles) 1 849 Area (Sq. miles) 1 650County Seat 2 Canton County Seat 2 QuitmanPopulation, 2006 3 52,403 Population, 2006 3 42,559 Anglo Anglo
Male 22,481 Male 17,544 Female 23,222 Female 18,513
Black BlackMale 736 Male 1,213
Female 778 Female 1,237 Hispanic Hispanic
Male 2,503 Male 1,646 Female 1,731 Female 1,213
Other Other Male 187 Male 148
Female 189 Female 147 Vital Statistics, 2004 4 Vital Statistics, 2004 4 Marriages 357 Marriages 305 Divorces 230 Divorces 149 Births 598 Births 453 Deaths 567 Deaths 495Unemployment Rate, Annual Average 2006 5 4.6%
Unemployment Rate, Annual Average 2006 5 5.0%
57
1: TX Dept. of Transportation 2: Tx Almanac ,2004-2005 3: Tx State Data Center 4: Tx Dept. of Health Services, Vital Statistics 2004 data and 2005 preliminary data 5: ftp://ftp.bls.gov/pub/special.requests/la/laucnty06.txt

58
(20.00) (10.00) - 10.00 20.00 30.00 40.00 50.00 60.00 70.00
Anderson
Camp
Cherokee
Gregg
Harrison
Henderson
Marion
Panola
Rains
Rusk
Smith
Upshur
Van Zandt
Wood
EAST TEXAS COUNCIL OF GOVERNMENTS
Employment Percent Change 1990 - 2006
% Change 2000-2006
% Change 1995-2000
% Change 1990-1995
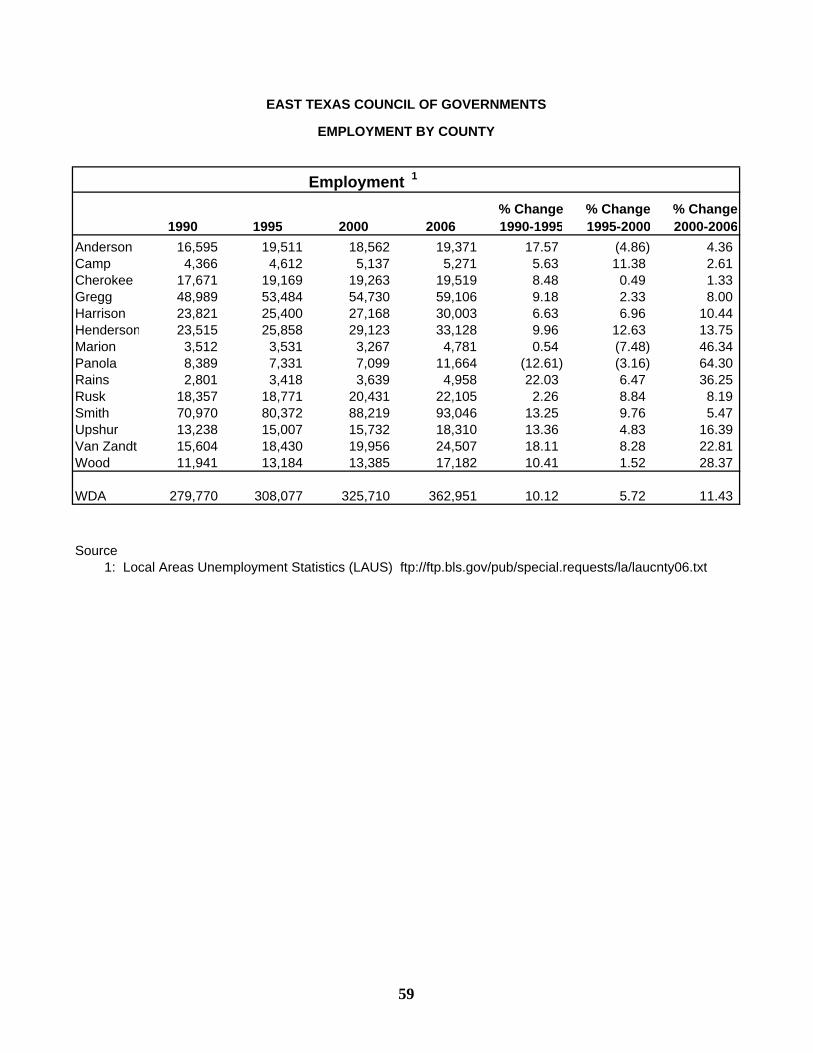
EAST TEXAS COUNCIL OF GOVERNMENTS
EMPLOYMENT BY COUNTY
% Change % Change % Change1990 1995 2000 2006 1990-1995 1995-2000 2000-2006
Anderson 16,595 19,511 18,562 19,371 17.57 (4.86) 4.36 Camp 4,366 4,612 5,137 5,271 5.63 11.38 2.61 Cherokee 17,671 19,169 19,263 19,519 8.48 0.49 1.33 Gregg 48,989 53,484 54,730 59,106 9.18 2.33 8.00 Harrison 23,821 25,400 27,168 30,003 6.63 6.96 10.44 Henderson 23,515 25,858 29,123 33,128 9.96 12.63 13.75 Marion 3,512 3,531 3,267 4,781 0.54 (7.48) 46.34 Panola 8,389 7,331 7,099 11,664 (12.61) (3.16) 64.30 Rains 2,801 3,418 3,639 4,958 22.03 6.47 36.25 Rusk 18,357 18,771 20,431 22,105 2.26 8.84 8.19 Smith 70,970 80,372 88,219 93,046 13.25 9.76 5.47 Upshur 13,238 15,007 15,732 18,310 13.36 4.83 16.39 Van Zandt 15,604 18,430 19,956 24,507 18.11 8.28 22.81 Wood 11,941 13,184 13,385 17,182 10.41 1.52 28.37
WDA 279,770 308,077 325,710 362,951 10.12 5.72 11.43
Source
Employment 1
1: Local Areas Unemployment Statistics (LAUS) ftp://ftp.bls.gov/pub/special.requests/la/laucnty06.txt
59
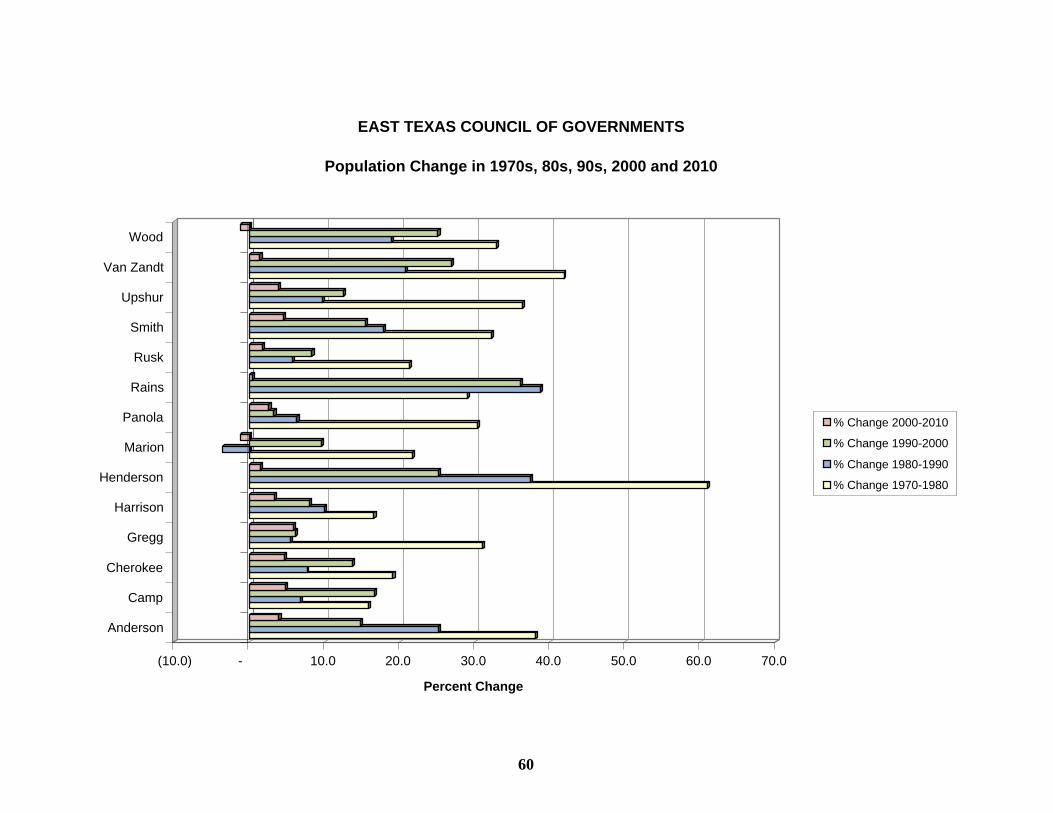
60
(10.0) - 10.0 20.0 30.0 40.0 50.0 60.0 70.0
Percent Change
Anderson
Camp
Cherokee
Gregg
Harrison
Henderson
Marion
Panola
Rains
Rusk
Smith
Upshur
Van Zandt
Wood
EAST TEXAS COUNCIL OF GOVERNMENTS
Population Change in 1970s, 80s, 90s, 2000 and 2010
% Change 2000-2010
% Change 1990-2000
% Change 1980-1990
% Change 1970-1980
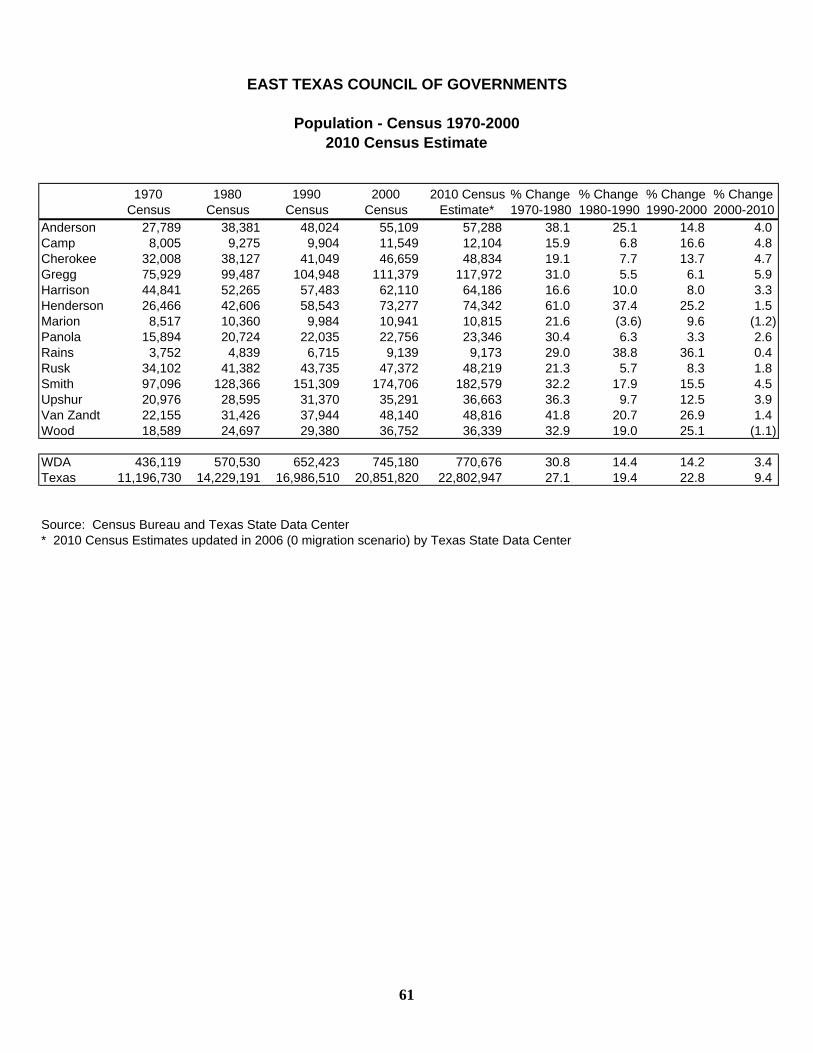
EAST TEXAS COUNCIL OF GOVERNMENTS
Population - Census 1970-20002010 Census Estimate
1970 Census
1980 Census
1990 Census
2000 Census
2010 Census Estimate*
% Change 1970-1980
% Change 1980-1990
% Change 1990-2000
% Change 2000-2010
Anderson 27,789 38,381 48,024 55,109 57,288 38.1 25.1 14.8 4.0 Camp 8,005 9,275 9,904 11,549 12,104 15.9 6.8 16.6 4.8 Cherokee 32,008 38,127 41,049 46,659 48,834 19.1 7.7 13.7 4.7 Gregg 75,929 99,487 104,948 111,379 117,972 31.0 5.5 6.1 5.9 Harrison 44,841 52,265 57,483 62,110 64,186 16.6 10.0 8.0 3.3 Henderson 26,466 42,606 58,543 73,277 74,342 61.0 37.4 25.2 1.5 Marion 8,517 10,360 9,984 10,941 10,815 21.6 (3.6) 9.6 (1.2) Panola 15,894 20,724 22,035 22,756 23,346 30.4 6.3 3.3 2.6 Rains 3,752 4,839 6,715 9,139 9,173 29.0 38.8 36.1 0.4 Rusk 34,102 41,382 43,735 47,372 48,219 21.3 5.7 8.3 1.8 Smith 97,096 128,366 151,309 174,706 182,579 32.2 17.9 15.5 4.5 Upshur 20,976 28,595 31,370 35,291 36,663 36.3 9.7 12.5 3.9 Van Zandt 22,155 31,426 37,944 48,140 48,816 41.8 20.7 26.9 1.4 Wood 18,589 24,697 29,380 36,752 36,339 32.9 19.0 25.1 (1.1)
WDA 436,119 570,530 652,423 745,180 770,676 30.8 14.4 14.2 3.4 Texas 11,196,730 14,229,191 16,986,510 20,851,820 22,802,947 27.1 19.4 22.8 9.4
Source: Census Bureau and Texas State Data Center* 2010 Census Estimates updated in 2006 (0 migration scenario) by Texas State Data Center
61
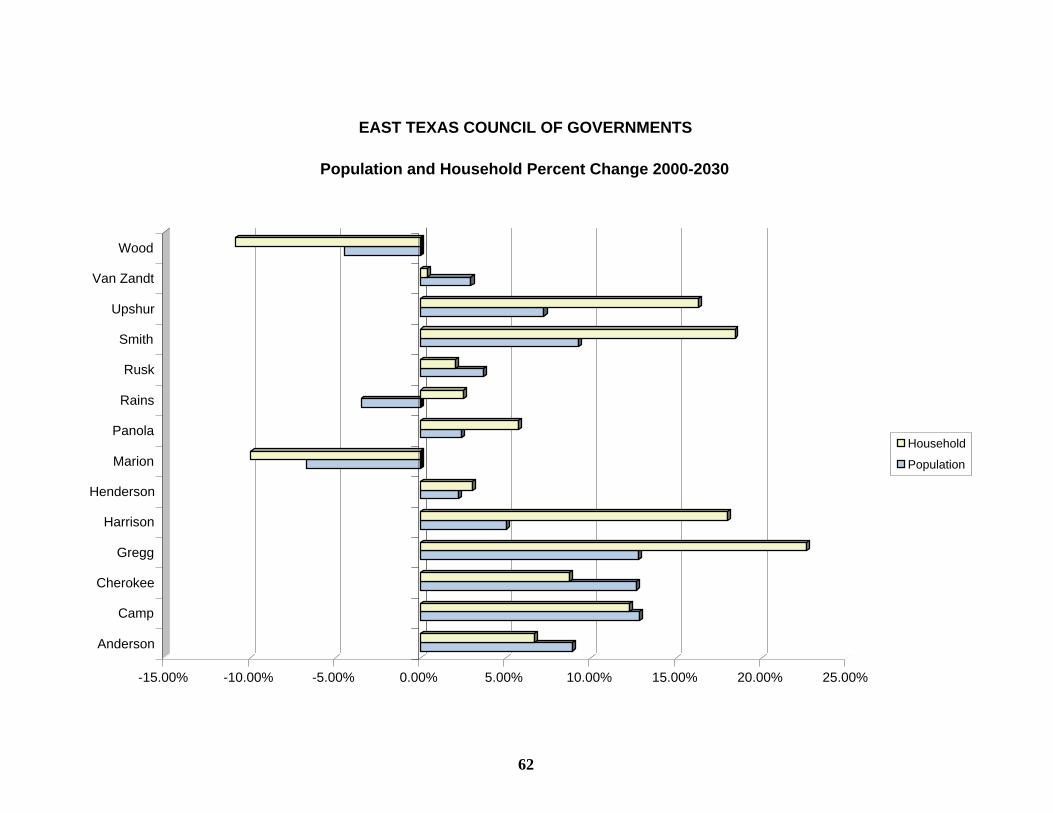
62
-15.00% -10.00% -5.00% 0.00% 5.00% 10.00% 15.00% 20.00% 25.00%
Anderson
Camp
Cherokee
Gregg
Harrison
Henderson
Marion
Panola
Rains
Rusk
Smith
Upshur
Van Zandt
Wood
EAST TEXAS COUNCIL OF GOVERNMENTS
Population and Household Percent Change 2000-2030
Household
Population

EAST TEXAS COUNCIL OF GOVERNMENTS
Population and Household by County
2000 2030* % Change
Anderson 55,109 60,021 8.91%Camp 11,549 13,029 12.81%Cherokee 46,659 52,553 12.63%Gregg 111,379 125,602 12.77%Harrison 62,110 65,225 5.02%Henderson 73,277 74,902 2.22%Marion 10,941 10,208 -6.70%Panola 22,756 23,304 2.41%Rains 9,139 8,818 -3.51%Rusk 47,372 49,119 3.69%Smith 174,706 190,842 9.24%Upshur 35,291 37,843 7.23%Van Zandt 48,140 49,556 2.94%Wood 36,752 35,115 -4.45%
WDA 745,180 796,137 6.84%
2000 2030* %Change
Anderson 15,678 16,728 6.70%Camp 4,336 4,867 12.25%Cherokee 16,651 18,100 8.70%Gregg 42,687 52,335 22.60%Harrison 23,087 27,234 17.96%Henderson 28,804 29,679 3.04%Marion 4,610 4,151 -9.96%Panola 8,821 9,328 5.75%Rains 3,617 3,708 2.52%Rusk 17,364 17,713 2.01%Smith 65,692 77,803 18.44%Usphur 13,290 15,454 16.28%Van Zandt 18,195 18,269 0.41%Wood 14,583 12,997 -10.88%
WDA 277,415 308,366 11.16%
Source: Texas State Data Center, Population Estimates and Projections Programs
Population Forecast
Household Forecast
* 2030 Population & Household Projections based on 2000 Census and updated in 2006 by Texas State Data Center, 0 Migration Scenario
63

64
East Texas Council of GovernmentsPopulation Age Historical and Projected
1990 and 2000 Census, 2007 Estimate and 2012 Projection
0 20,000 40,000 60,000 80,000 100,000 120,000
0 to 4
5 to 14
15 to 19
20 to 24
25 to 34
35 to 44
45 to 54
55 to 64
65 to 74
75 +
2012 Projection
2007 Estimate
2000 Census
1990 Census
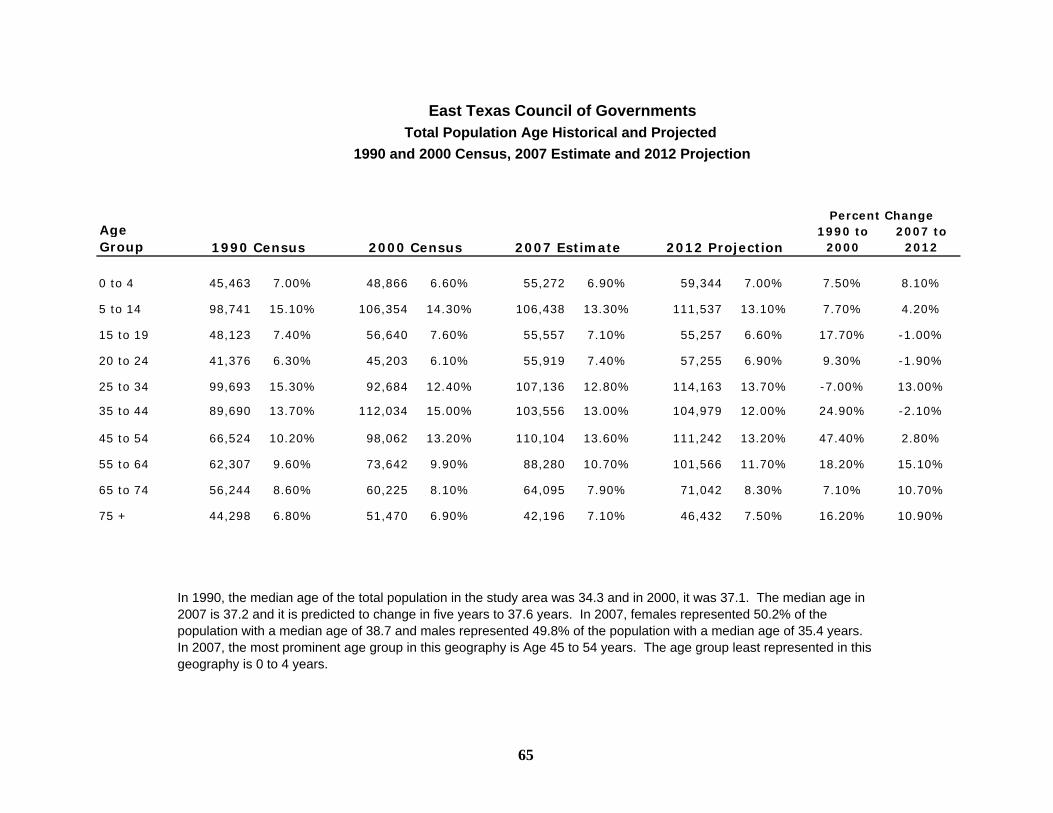
East Texas Council of Governments
1990 and 2000 Census, 2007 Estimate and 2012 Projection
Age Group
1990 to 2000
2007 to 2012
0 to 4 45,463 7.00% 48,866 6.60% 55,272 6.90% 59,344 7.00% 7.50% 8.10%
5 to 14 98,741 15.10% 106,354 14.30% 106,438 13.30% 111,537 13.10% 7.70% 4.20%
15 to 19 48,123 7.40% 56,640 7.60% 55,557 7.10% 55,257 6.60% 17.70% -1.00%
20 to 24 41,376 6.30% 45,203 6.10% 55,919 7.40% 57,255 6.90% 9.30% -1.90%
25 to 34 99,693 15.30% 92,684 12.40% 107,136 12.80% 114,163 13.70% -7.00% 13.00%
35 to 44 89,690 13.70% 112,034 15.00% 103,556 13.00% 104,979 12.00% 24.90% -2.10%
45 to 54 66,524 10.20% 98,062 13.20% 110,104 13.60% 111,242 13.20% 47.40% 2.80%
55 to 64 62,307 9.60% 73,642 9.90% 88,280 10.70% 101,566 11.70% 18.20% 15.10%
65 to 74 56,244 8.60% 60,225 8.10% 64,095 7.90% 71,042 8.30% 7.10% 10.70%
75 + 44,298 6.80% 51,470 6.90% 42,196 7.10% 46,432 7.50% 16.20% 10.90%
Percent Change
Total Population Age Historical and Projected
In 1990, the median age of the total population in the study area was 34.3 and in 2000, it was 37.1. The median age in 2007 is 37.2 and it is predicted to change in five years to 37.6 years. In 2007, females represented 50.2% of the population with a median age of 38.7 and males represented 49.8% of the population with a median age of 35.4 years. In 2007, the most prominent age group in this geography is Age 45 to 54 years. The age group least represented in this geography is 0 to 4 years.
2007 Estimate 2000 Census 2012 Projection 1990 Census
65

EAST TEXAS COUNCIL OF GOVERNMENTSDemographic and Economic Statistics
Last Ten Fiscal Years
Fiscal Year Population 1Personal Income (in thousands) 2
Per Capita Personal Income
3
Gross Sales All Industries 4
Gross Sales, All Industries Subject to
State Tax 5
Total Employed 6
Unemployment Rate 7
2007 802,803 NA NA NA NA 349,335 6.5 2006 759,774 NA NA 27,784,135,121 7,278,104,246 362,951 5.0 2005 757,082 21,786,493 25,658 25,661,141,470 6,576,967,019 358,710 6.0 2004 754,330 20,593,617 22,337 22,635,455,313 6,042,674,290 352,357 5.1 2003 751,642 19,383,744 21,392 21,297,054,428 5,545,857,086 343,323 6.1 2002 749,245 18,621,654 20,886 18,021,691,968 5,362,595,811 334,357 5.8 2001 747,237 18,305,462 22,677 19,970,863,173 5,491,864,293 330,342 4.8 2000 745,180 17,734,964 23,800 19,558,447,428 5,232,245,032 325,710 5.1 1999 737,956 16,360,532 22,642 18,187,572,672 5,041,024,732 323,273 6.0 1998 729,879 15,646,979 21,438 14,902,582,834 5,043,395,916 321,093 6.4 1997 720,773 14,655,618 20,333 14,772,069,063 4,799,973,685 316,700 6.7
Source: 1: Tx State Data Center, (data updated 2007) 2: Regional Economic Info System, Bureau of Economic Analysis, U.S. Department of Commerce 3: Regional Economic Info System, Bureau of Economic Analysis, U.S. Department of Commerce 4: Texas Comptroller of Public Accounts - www.window.state.tx.us/taxinfo/sales/index.html 5: Texas Comptroller of Public Accounts - www.window.state.tx.us/taxinfo/sales/index.html 6: Tx Workforce Commission, LMI Dept. 7: Tx Workforce Commission, LMI Dept. Annual Average NA: Information not available as of January 31, 2007
66

RankEmployees at
Address Listed NAICSPercentage of Total ETCOG
Region Employment
ETMC Regional Healthcare Syst 1 3,650 622110 1.01%1000 S Beckham AveTyler, TX 75701-1908Smith County
Mother Frances Hospital 2 3,522 622110 0.97%536 S Beckham AveTyler, TX 75702-8310Smith County
Tyler ISD 3 2,566 611110 0.71%1319 New Sunnybrook DriveP.O. Box 2035 - 75710Tyler, Texas 75701
Good Shepherd Medical Center 4 2,500 622110 0.69%700 E. Marshall Ave.Longview, TX 75601-5572Gregg County
Trane Residential Systems 5 2,112 333415 0.58%6200 Troup HwyTyler, TX 75707-1948Smith County
Brookshire Grocery CO 6 1,888 445110 0.52%1600 W Southwest Loop 323Tyler, TX 75701-8500Smith County
Wal-Mart 7 1,550 541870 0.43%14863 FM 645Palestine, TX 75803-1220Anderson County
Eastman Chemical CO 8 1,500 325199 0.41%Highway 149 Kodak BlvdLongview, TX 75603Gregg County
Trinity Rail, LLC 9 1,485 482112 0.41%140 Shady Brook Ln.Longview, TX 75602-9576Gregg County
United Technologies Carrier 10 1,202 333415 0.33%1700 E Duncan StTyler, TX 75702-2430Smith County
Longview ISD 11 1,185 611110 0.33%1301 East Young LongviewLongview, TX 75601Gregg County
Letourneau Technologies 12 1,150 333132 0.32%2400 S McarthurLongview, TX 75606Gregg County
Total 24,310 6.70%
Source: www.tedc.org/profile/pro_workforce.php
East Texas Council of GovernmentsPrincipal Employers 1000+ Employees
September 30, 2007
67

Function/Program 1998 1999 2000 2001 2002 2003 2004 2005 2006 2007
General government 6.71 6.99 7.80 8.36 8.60 9.27 8.84 8.23 8.81 11.46
Workforce development 12.26 16.77 19.24 20.19 22.13 251.58 22.05 21.49 22.01 25.43
Housing and urban development 0.78 1.02 0.55 0.62 0.46 0.49 0.48 0.47 0.35 0.57
Emergency communications 3.25 3.16 3.28 2.66 2.55 3.16 3.12 5.86 5.48 7.52
Economic development 2.96 2.91 2.98 2.86 2.80 2.56 1.88 1.73 2.41 1.83
Environmental quality 1.91 2.14 2.21 2.34 2.99 3.13 3.11 3.24 2.99 2.86
Aging 7.66 8.06 8.15 8.24 9.65 10.11 9.16 8.06 9.79 11.27
Transportation 0.92 1.19 1.03 1.20 1.02 0.98 1.72 2.08 1.76 4.36
Homeland security - - - - - 0.05 1.33 3.63 3.94 3.20
Criminal justice 1.14 1.26 1.23 1.45 1.44 1.40 1.20 1.03 1.05 1.06
Health and human services - - - - - - - - 0.08 0.08
EAST TEXAS COUNCIL OF GOVERNMENTS
FULLTIME EMPLOYEE EQUIVALENTS BY FUNCTION
LAST TEN FISCAL YEARS
68
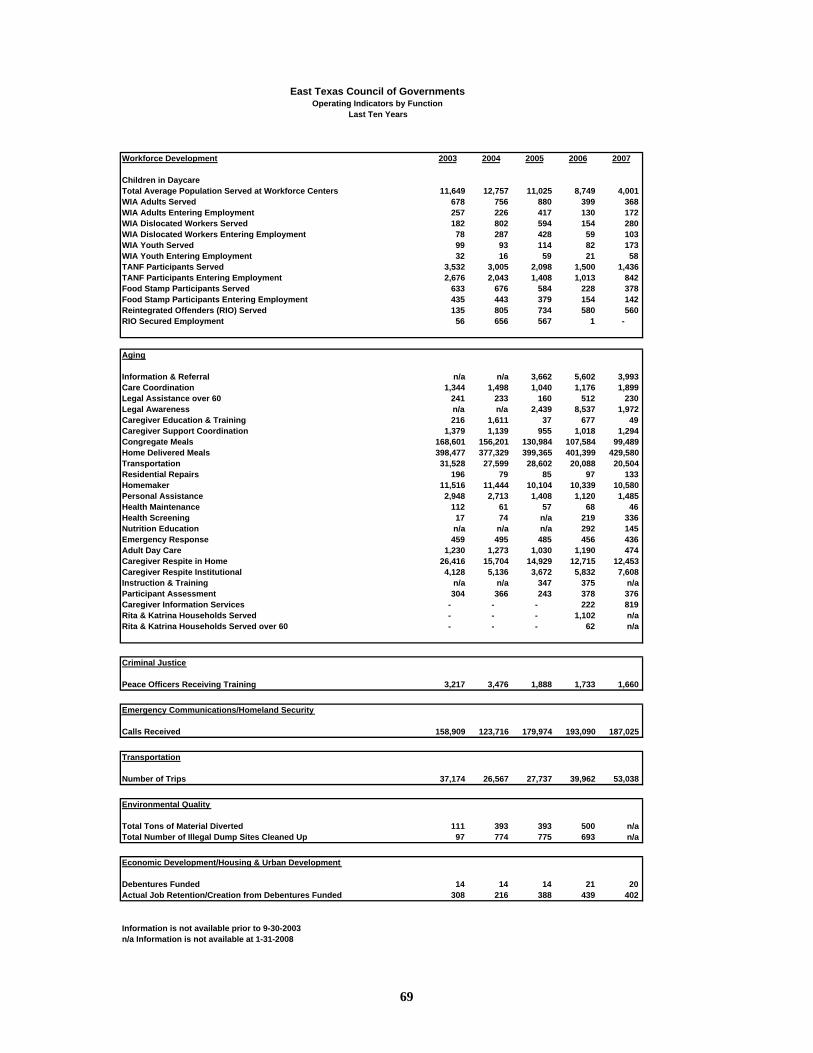
Workforce Development 2003 2004 2005 2006 2007
Children in DaycareTotal Average Population Served at Workforce Centers 11,649 12,757 11,025 8,749 4,001 WIA Adults Served 678 756 880 399 368 WIA Adults Entering Employment 257 226 417 130 172 WIA Dislocated Workers Served 182 802 594 154 280 WIA Dislocated Workers Entering Employment 78 287 428 59 103 WIA Youth Served 99 93 114 82 173 WIA Youth Entering Employment 32 16 59 21 58 TANF Participants Served 3,532 3,005 2,098 1,500 1,436 TANF Participants Entering Employment 2,676 2,043 1,408 1,013 842 Food Stamp Participants Served 633 676 584 228 378 Food Stamp Participants Entering Employment 435 443 379 154 142 Reintegrated Offenders (RIO) Served 135 805 734 580 560 RIO Secured Employment 56 656 567 1 -
Aging Information & Referral n/a n/a 3,662 5,602 3,993 Care Coordination 1,344 1,498 1,040 1,176 1,899 Legal Assistance over 60 241 233 160 512 230 Legal Awareness n/a n/a 2,439 8,537 1,972 Caregiver Education & Training 216 1,611 37 677 49 Caregiver Support Coordination 1,379 1,139 955 1,018 1,294 Congregate Meals 168,601 156,201 130,984 107,584 99,489 Home Delivered Meals 398,477 377,329 399,365 401,399 429,580 Transportation 31,528 27,599 28,602 20,088 20,504 Residential Repairs 196 79 85 97 133 Homemaker 11,516 11,444 10,104 10,339 10,580 Personal Assistance 2,948 2,713 1,408 1,120 1,485 Health Maintenance 112 61 57 68 46 Health Screening 17 74 n/a 219 336 Nutrition Education n/a n/a n/a 292 145 Emergency Response 459 495 485 456 436 Adult Day Care 1,230 1,273 1,030 1,190 474 Caregiver Respite in Home 26,416 15,704 14,929 12,715 12,453 Caregiver Respite Institutional 4,128 5,136 3,672 5,832 7,608 Instruction & Training n/a n/a 347 375 n/a Participant Assessment 304 366 243 378 376 Caregiver Information Services - - - 222 819 Rita & Katrina Households Served - - - 1,102 n/a Rita & Katrina Households Served over 60 - - - 62 n/a
Criminal Justice
Peace Officers Receiving Training 3,217 3,476 1,888 1,733 1,660
Emergency Communications/Homeland Security
Calls Received 158,909 123,716 179,974 193,090 187,025 Transportation
Number of Trips 37,174 26,567 27,737 39,962 53,038
Environmental Quality
Total Tons of Material Diverted 111 393 393 500 n/a Total Number of Illegal Dump Sites Cleaned Up 97 774 775 693 n/a
Economic Development/Housing & Urban Development
Debentures Funded 14 14 14 21 20 Actual Job Retention/Creation from Debentures Funded 308 216 388 439 402
Information is not available prior to 9-30-2003n/a Information is not available at 1-31-2008
East Texas Council of GovernmentsOperating Indicators by Function
Last Ten Years
69

2003 2004 2005 2006 2007
General Government Buildings 1 1 1.59 1.59 1.59 Office Equipment - - 1 1 1
Workforce Development Office Equipment 1 1 1 1 1
Emergency Communications PSAP Equipment 21 23 26 26 25 Office Equipment - - - - 1
Economic Development Office Equipment 1 1 - - -
Aging Buildings 1 1 2.41 2.41 2.41 Transportation Vans 3 3 3 3 3 Office Equipment 1 1 2 1 1
Transportation Transportation Vans 13 17 18 33 33 Digital Dispatch Equipment - - - - 1 Office Equipment 1 1 1 1 1
Homeland Security Equipment - 2 6 9 9
Notes: Assets in excess of $5,000
Assets purchased with grant funds but owned by subrecipients are not included.
Information prior to 2003 is not available.
EAST TEXAS COUNCIL OF GOVERNMENTS
CAPITAL ASSET STATISTICS BY FUNCTION
LAST FIVE FISCAL YEARS
70

71

THIS PAGE LEFT BLANK INTENTIONALLY
SINGLE AUDIT SECTION
REPORT ON INTERNAL CONTROL OVER FINANCIAL REPORTING AND ON COMPLIANCE AND OTHER MATTERS BASED ON AN AUDIT OF
FINANCIAL STATEMENTS PERFORMED IN ACCORDANCE WITH GOVERNMENT AUDITING STANDARDS
To the Board of Directors East Texas Council of Governments Kilgore, Texas We have audited the financial statements of the governmental activities, each major fund, and the aggregate remaining fund information of the East Texas Council of Governments as of and for the year ended September 30, 2007, which collectively comprise the Council’s basic financial statements and have issued our report thereon dated March 20, 2008. We conducted our audit in accordance with auditing standards generally accepted in the United States of America and the standards applicable to financial audits contained in Government Auditing Standards, issued by the Comptroller General of the United States. Internal Control Over Financial Reporting In planning and performing our audit, we considered the Council’s internal control over financial reporting as a basis for designing our auditing procedures for the purpose of expressing our opinions on the financial statements, but not for the purpose of expressing an opinion on the effectiveness of the Council’s internal control over financial reporting. Accordingly, we do not express an opinion on the effectiveness of the Council’s internal control over financial reporting. A control deficiency exists when the design or operation of a control does not allow management or employees, in the normal course of performing their assigned functions, to prevent or detect misstatements on a timely basis. A significant deficiency is a control deficiency, or combination of control deficiencies, that adversely affects the Council’s ability to initiate, authorize, record, process, or report financial data reliably in accordance with generally accepted accounting principles such that there is more than a remote likelihood that a misstatement of the Council’s financial statements that is more than inconsequential will not be prevented or detected by the Council’s internal control. A material weakness is a significant deficiency, or combination of significant deficiencies, that results in more than a remote likelihood that a material misstatement of the financial statements will not be prevented or detected by the Council’s internal control.
72
401 WEST HIGHWAY 6 g P. O. BOX 20725 g WACO, TX 76702-0725 g (254) 772-4901 g FAX: (254) 772-4920 g www.pbhcpa.com AFFILIATE OFFICES: BROWNSVILLE, TX (956) 544-7778 g HILLSBORO, TX (254) 582-2583
TEMPLE, TX (254) 791-3460 g WHITNEY, TX (254) 694-4600 g ALBUQUERQUE, NM (505) 266-5904

73
Our consideration of internal control over financial reporting was for the limited purpose described in the first paragraph of this section and would not necessarily identify all deficiencies in internal control that might be significant deficiencies or material weaknesses. We did not identify any deficiencies in internal control over financial reporting that we consider to be material weaknesses, as defined above. Compliance and Other Matters As part of obtaining reasonable assurance about whether the Council’s financial statements are free of material misstatement, we performed tests of its compliance with certain provisions of laws, regulations, contracts, and grant agreements, noncompliance with which could have a direct and material effect on the determination of financial statement amounts. However, providing an opinion on compliance with those provisions was not an objective of our audit, and accordingly, we do not express such an opinion. The results of our tests disclosed no instances of noncompliance or other matters that are required to be reported under Government Auditing Standards. However, we noted certain matters that were reported to management of the Council, in a separate letter dated March 20, 2008. This report is intended solely for the information and use of the executive committee, management, others within the entity, and appropriate federal and state awarding agencies and pass-through entities and is not intended to be and should not be used by anyone other than these specified parties.
March 20, 2008

INDEPENDENT AUDITORS' REPORT ON COMPLIANCE WITH REQUIREMENTS APPLICABLE TO EACH MAJOR PROGRAM AND ON INTERNAL CONTROL OVER COMPLIANCE IN ACCORDANCE WITH OMB CIRCULAR A-133 AND
THE STATE OF TEXAS UNIFORM GRANT MANAGEMENT STANDARDS Board of Directors East Texas Council of Governments Kilgore, Texas Compliance We have audited the compliance of East Texas Council of Governments (the “Council”) with the types of compliance requirements described in the U. S. Office of Management and Budget (OMB) Circular A-133 Compliance Supplement that are applicable to each of its major federal and state programs for the year ended September 30, 2007. The Council’s major federal and state programs are identified in the summary of auditors’ results section of the accompanying Schedule of Findings and Questioned Costs. Compliance with the requirements of laws, regulations, contracts and grants applicable to each of its major federal and state programs is the responsibility of the Council’s management. Our responsibility is to express an opinion on the Council’s compliance based on our audit. We conducted our audit of compliance in accordance with auditing standards generally accepted in the United States of America; the standards applicable to financial audits contained in Government Auditing Standards, issued by the Comptroller General of the United States; Office of Management and Budget (OMB) Circular A-133, Audits of States, Local Governments and Nonprofit Organizations and the State of Texas Uniform Grant Management Standards (“UGMS”). Those standards require that we plan and perform the audit to obtain reasonable assurance about whether noncompliance with the types of compliance requirements referred to above could have a direct and material effect on a major federal and state program occurred. An audit includes examining on a test basis, evidence about the Council’s compliance with those requirements and performing such other procedures, as we considered necessary in the circumstances. We believe that our audit provides a reasonable basis for our opinion. Our audit does not provide a legal determination on the Council’s compliance with those requirements. In our opinion, the Council complied, in all material respects, with the requirements referred to above that are applicable to each of its major federal and state programs for the year ended September 30, 2007.
74 401 WEST HIGHWAY 6 g P. O. BOX 20725 g WACO, TX 76702-0725 g (254) 772-4901 g FAX: (254) 772-4920 g www.pbhcpa.com
AFFILIATE OFFICES: BROWNSVILLE, TX (956) 544-7778 g HILLSBORO, TX (254) 582-2583 TEMPLE, TX (254) 791-3460 g WHITNEY, TX (254) 694-4600 g ALBUQUERQUE, NM (505) 266-5904

75
Internal Control Over Compliance The management of the East Texas Council of Governments is responsible for establishing and maintaining effective internal control over compliance with requirements of laws, regulations, contracts and grants applicable to federal and state programs. In planning and performing our audit, we considered the Council’s internal control over compliance with requirements that could have a direct and material effect on a major federal or state program in order to determine our auditing procedures for the purpose of expressing our opinion on compliance, but not for the purpose of expressing an opinion on the effectiveness of internal control over compliance. Accordingly, we do not express an opinion on the effectiveness of the Council’s internal control over compliance.
A control deficiency in an entity’s internal control over compliance exists when the design or operation of a control does not allow management or employees, in the normal course of performing their assigned functions, to prevent or detect noncompliance with a type of compliance requirement of a federal or state program on a timely basis. A significant deficiency is a control deficiency, or combination of control deficiencies, that adversely affects the entity’s ability to administer a federal or state program such that there is more than a remote likelihood that noncompliance with a type of compliance requirement of a federal or state program that is more than inconsequential will not be prevented or detected by the entity’s internal control.
A material weakness is a significant deficiency, or combination of significant deficiencies, that results in more than a remote likelihood that material noncompliance with a type of compliance requirement of a federal or state program will not be prevented or detected by the entity’s internal control.
Our consideration of internal control over compliance was for the limited purpose described in the first paragraph of this section and would not necessarily identify all deficiencies in internal control that might be significant deficiencies or material weaknesses. We did not identify any deficiencies in internal control over compliance that we consider to be material weaknesses, as defined above. This report is intended solely for the information of the Board of Directors, management, others within the Council, and federal and state awarding agencies and pass-through entities and is not intended to be and should not be used by anyone other than these specified parties.
March 20, 2008

Federal Pass-throughFederal Grantor/Pass-through CFDA Grantor's
Grantor/Program Title Number Number Expenditures
Federal Awards:
U. S. Department of Agriculture Passed through Texas Workforce Commission: Food Stamp E & T 10/31/06 10.561 0806FSE000 19,535$ Food Stamp E & T 10/31/06 10.561 0806FSE001 7,828 Food Stamp E & T 10/31/07 10.561 0807FSE000 421,156 Transportation - TANF/FSET 08/31/07 10.561 0807DOT000 13,542 Total Passed through Texas Workforce Commission 462,061
Total U. S. Department of Agriculture 462,061
U. S. Department of Commerce Passed through Economic Development Administration District Planning Assistance Program 12/31/08 11.302 08-83-04062 44,077 Total Passed through Economic Development Administration 44,077
Total U. S. Department of Commerce 44,077
U. S. Department of Housing and Urban Development Passed through Office of Rural and Community Affairs: Texas Community Development Program 08/31/07 14.228 C76213 14,036 Texas Community Development Program 08/31/08 14.228 C77213 726 Total Passed through Office of Rural and Community Affairs 14,762
Total U. S. Department of Housing and Urban Development 14,762
U. S. Department of Justice Passed through the Governor's Office Criminal Justice Division: Regional Juvenile Detention Program 08/31/07 16.540 JA-05-J20-14235-08 32,547 Total Passed through the Governor's Office Criminal Justice Division 32,547
Total U. S. Department of Justice 32,547
EAST TEXAS COUNCIL OF GOVERNMENTS
SCHEDULE OF EXPENDITURES OF FEDERAL AND STATE AWARDS
FOR THE YEAR ENDED SEPTEMBER 30, 2007
(continued)
76
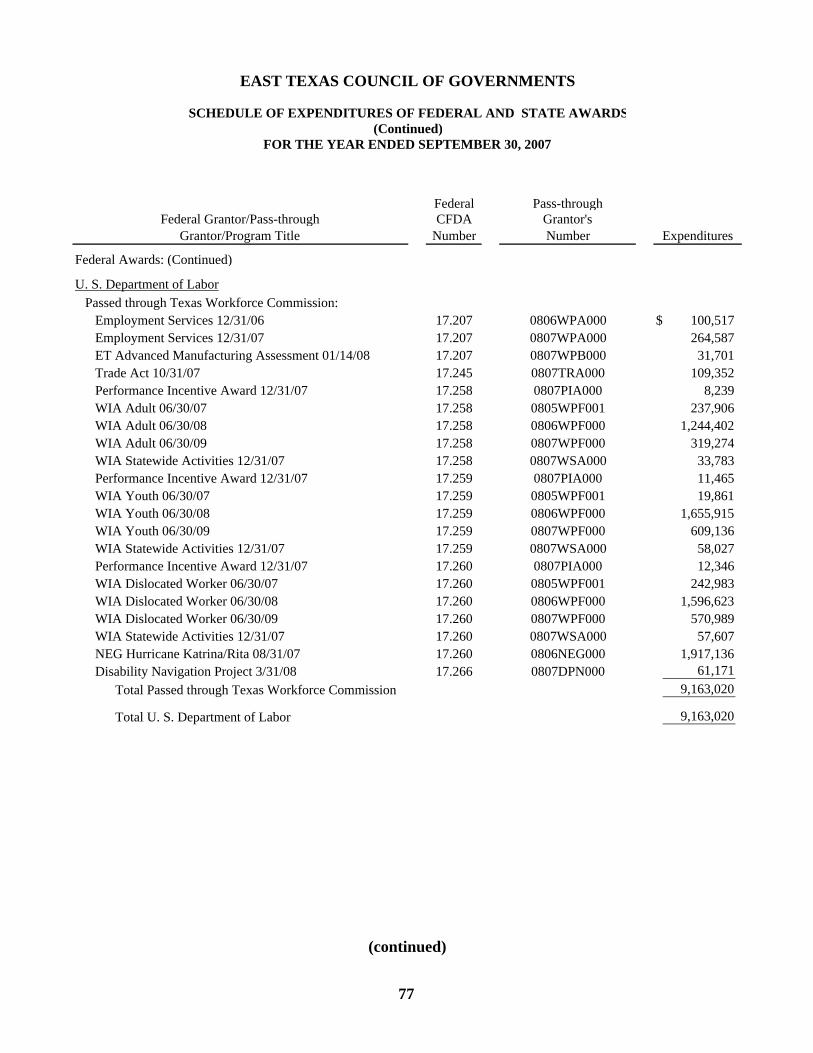
Federal Pass-throughFederal Grantor/Pass-through CFDA Grantor's
Grantor/Program Title Number Number Expenditures
Federal Awards: (Continued)
U. S. Department of Labor Passed through Texas Workforce Commission: Employment Services 12/31/06 17.207 0806WPA000 100,517$ Employment Services 12/31/07 17.207 0807WPA000 264,587 ET Advanced Manufacturing Assessment 01/14/08 17.207 0807WPB000 31,701 Trade Act 10/31/07 17.245 0807TRA000 109,352 Performance Incentive Award 12/31/07 17.258 0807PIA000 8,239 WIA Adult 06/30/07 17.258 0805WPF001 237,906 WIA Adult 06/30/08 17.258 0806WPF000 1,244,402 WIA Adult 06/30/09 17.258 0807WPF000 319,274 WIA Statewide Activities 12/31/07 17.258 0807WSA000 33,783 Performance Incentive Award 12/31/07 17.259 0807PIA000 11,465 WIA Youth 06/30/07 17.259 0805WPF001 19,861 WIA Youth 06/30/08 17.259 0806WPF000 1,655,915 WIA Youth 06/30/09 17.259 0807WPF000 609,136 WIA Statewide Activities 12/31/07 17.259 0807WSA000 58,027 Performance Incentive Award 12/31/07 17.260 0807PIA000 12,346 WIA Dislocated Worker 06/30/07 17.260 0805WPF001 242,983 WIA Dislocated Worker 06/30/08 17.260 0806WPF000 1,596,623 WIA Dislocated Worker 06/30/09 17.260 0807WPF000 570,989 WIA Statewide Activities 12/31/07 17.260 0807WSA000 57,607 NEG Hurricane Katrina/Rita 08/31/07 17.260 0806NEG000 1,917,136 Disability Navigation Project 3/31/08 17.266 0807DPN000 61,171 Total Passed through Texas Workforce Commission 9,163,020
Total U. S. Department of Labor 9,163,020
EAST TEXAS COUNCIL OF GOVERNMENTS
SCHEDULE OF EXPENDITURES OF FEDERAL AND STATE AWARDS(Continued)
FOR THE YEAR ENDED SEPTEMBER 30, 2007
(continued)
77

Federal Pass-throughFederal Grantor/Pass-through CFDA Grantor's
Grantor/Program Title Number Number ExpendituresFederal Awards: (Continued)
U. S. Department of Transportation Passed through Texas Department of Transportation: Rural Transportation 08/31/07 20.509 51610F7105 308,981$ Rural Transportation 08/31/08 20.509 51710F7242 505,597 Elderly & Disabled - Tyler District 10/31/07 20.513 51610F7222 113,163 Elderly & Disabled - Atlanta District 10/31/07 20.513 51619F7157 88,772 Elderly & Disabled - Atlanta and Tyler District 8/31/08 20.513 51710F7171 19,253 Total Passed through Texas Department of Transportation 1,035,766
Total U. S. Department of Transportation 1,035,766
U. S. Department of Health and Human Services Passed through Texas Department of Aging and Disability Services: Title VII, Elder Abuse 09/30/07 93.041 N/A 14,933 Title VII, Ombudsman Services 09/30/07 93.042 N/A 55,558 Title III, Part D, 09/30/07 93.043 N/A 58,212 Title III, Part B, 09/30/07 93.044 N/A 977,096 Title III, Part C, 09/30/07 93.045 N/A 1,511,787 Title III, Part E, Caregiver 09/30/07 93.052 N/A 411,323 Nutrition Service Incentive Program 09/30/07 93.053 N/A 353,650 CMS Basic 03/31/07 93.779 N/A 12,117 CMS Basic 03/31/08 93.779 N/A 29,253 Total Passed through Texas Department of Aging and Disability Services 3,423,929
(Continued)FOR THE YEAR ENDED SEPTEMBER 30, 2007
EAST TEXAS COUNCIL OF GOVERNMENTS
SCHEDULE OF EXPENDITURES OF FEDERAL AND STATE AWARDS
(continued)
78

Federal Pass-throughFederal Grantor/Pass-through CFDA Grantor's
Grantor/Program Title Number Number Expenditures
Federal Awards: (Continued)
U. S. Department of Health and Human Services (Continued) Passed through Texas Health and Human Services Commission: SSBG - Rita and Katrina 9/30/07 93.667 529-06-0432-00001 149,592$ Total Passed through Texas Health and Human Services Commission 149,592
Passed through Texas Workforce Commission: TANF 10/31/06 93.558 0806TAN000 34,587 TANF 10/31/07 93.558 0807TAN000 2,245,531 TANF Learning Disabilities 03/31/08 93.558 0806TLD000 15,134 Child Care 10/31/06 93.575 0806CCF000 303,037 Child Care 10/31/07 93.575 0807CCF000 3,617,388 Child Care Local Match 12/31/06 93.575 0806CCM000 46,647 Child Care Local Match 12/31/07 93.575 0807CCM000 465 Child Care 10/31/06 93.596 0806CCF000 745,545 Child Care 10/31/07 93.596 0807CCF000 8,392,147 Child Care Local Match 12/31/06 93.596 0806CCM000 1,233,686 Child Care Waiver Funds 07/31/07 93.596 0806CCW000 31,068 Child Care Local Match 12/31/07 93.596 0807CCM000 35,714 Total Passed through Texas Workforce Commission 16,700,949
Total U. S. Department of Health and Human Services 20,274,470
U. S. Department of Homeland Security Passed through the Office of the Governor, Division of Emergency Management: Homeland Security 02/28/09 97.073 2006-GE-T6-0068 93,390 Homeland Security 10/31/07 97.073 2005-GE-T5-4025 172,910 Total Passed through the Office of the Governor, Division of Emergency Management 266,300
Total U. S. Department of Homeland Security 266,300
Total Federal Awards 31,293,003
EAST TEXAS COUNCIL OF GOVERNMENTS
FOR THE YEAR ENDED SEPTEMBER 30, 2007
SCHEDULE OF EXPENDITURES OF FEDERAL AND STATE AWARDS(Continued)
(continued)
79

State Grantor/Program Title Expenditures
State Awards: Texas Department of Aging and Disability Services: Residential Repair 09/30/07 6,588$ State General Revenue 09/30/07 159,353 SGR Title III - E 09/30/07 50,000 State Highway Fund/Transportation 09/30/07 12,962 Total Texas Department of Aging and Disability Services 228,903
Office of the Governor; Criminal Justice Division: Police Training 08/31/07 178,666 Police Training 08/31/08 9,559 Criminal Justice 08/31/07 45,626 Criminal Justice 08/31/08 2,421 Total Office of the Governor 236,272
Texas Commission on Environmental Quality: Solid Waste/Landfill 08/31/07 376,828 Solid Waste/Landfill 08/31/09 10,023 Air Quality 08/31/08 441,736 Total Texas Commission on Environmental Quality 828,587
Commission on State Emergency Communications: 911 08/31/06 489,769 911 08/31/07 2,798,682 911 08/31/08 111,364 Total Commission on State Emergency Communications 3,399,815
Texas Department of Transportation : Rural Transportation 10/31/07 484,554 Rural Transportation 08/31/08 32,485 TxDOT Planning 8/31/08 1,505 Total Texas Department of Transportation 518,544
51810F701751710F7017
(continued)
582-8-86688582-6-70890
N/AN/A
10-7XXF7001
SCHEDULE OF EXPENDITURES OF FEDERAL AND STATE AWARDS(Continued)
N/A
N/A
SF-08-I97-14386-09
582-6-78034
SF-07-I97-14386-08SF-08-A10-14265-08
FOR THE YEAR ENDED SEPTEMBER 30, 2007
SF-07-A10-14265-07
N/AN/A
EAST TEXAS COUNCIL OF GOVERNMENTS
Grantor'sNumber
N/A
80

State Grantor/Program Title Expenditures
State Awards:
Texas Workforce Commission: Food Stamp E & T 10/31/06 4,448$ Food Stamp E & T 10/31/06 7,829 Food Stamp E & T 10/31/07 94,075 Transportation - TANF/FSET 08/31/07 185,965 Transportation - TANF/FSET 08/31/08 14,865 Project Rio 10/31/06 159,273 Child Care DFPS 08/31/07 855,369 Child Care DFPS 08/31/08 0808CCP000 22,452 Total Texas Workforce Commission 1,344,276
Texas Veterans Commission: Veterans Services 9/30/07 88,430 Total Texas Veterans Commission 88,430
Total State Awards 6,644,827
Total Federal and State Awards 37,937,830$
N/A
(Continued)
0806FSE000
0807RIO000
0807DOT0000808DOT000
0807CCP000
FOR THE YEAR ENDED SEPTEMBER 30, 2007
0807FSE000
SCHEDULE OF EXPENDITURES OF FEDERAL AND STATE AWARDS
0806FSE001
Grantor'sNumber
EAST TEXAS COUNCIL OF GOVERNMENTS
81
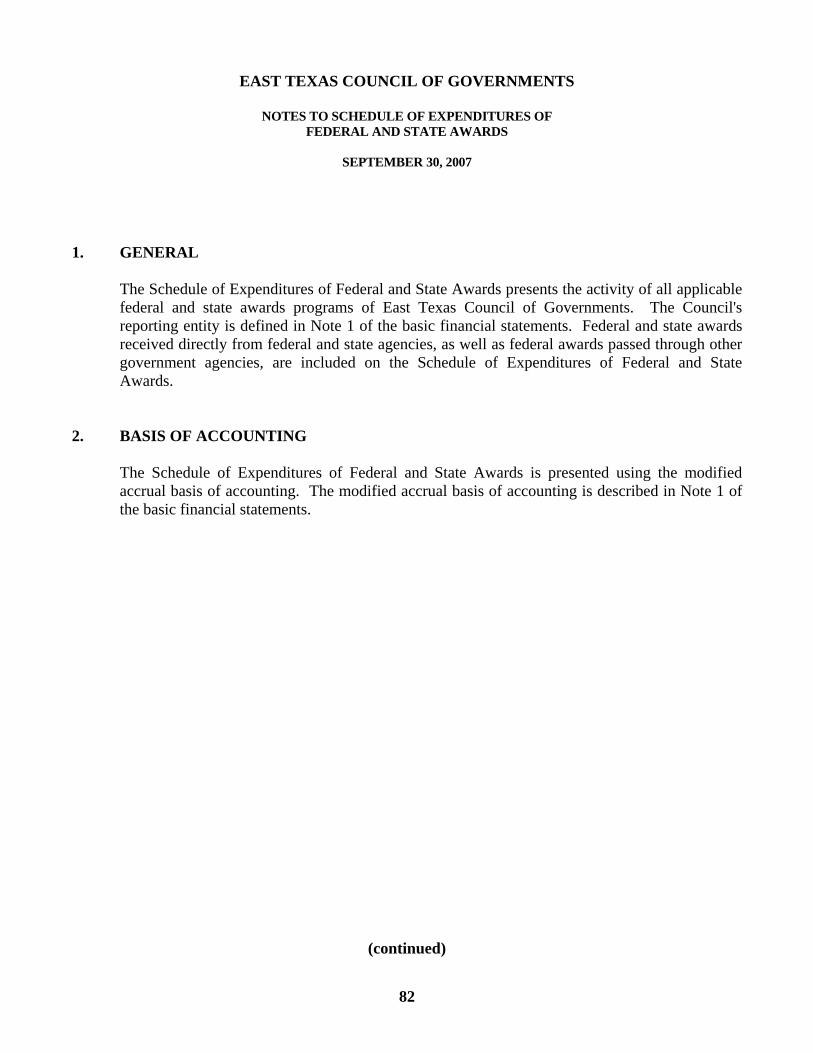
82
EAST TEXAS COUNCIL OF GOVERNMENTS
NOTES TO SCHEDULE OF EXPENDITURES OF FEDERAL AND STATE AWARDS
SEPTEMBER 30, 2007
1. GENERAL The Schedule of Expenditures of Federal and State Awards presents the activity of all applicable
federal and state awards programs of East Texas Council of Governments. The Council's reporting entity is defined in Note 1 of the basic financial statements. Federal and state awards received directly from federal and state agencies, as well as federal awards passed through other government agencies, are included on the Schedule of Expenditures of Federal and State Awards.
2. BASIS OF ACCOUNTING The Schedule of Expenditures of Federal and State Awards is presented using the modified
accrual basis of accounting. The modified accrual basis of accounting is described in Note 1 of the basic financial statements.
(continued)
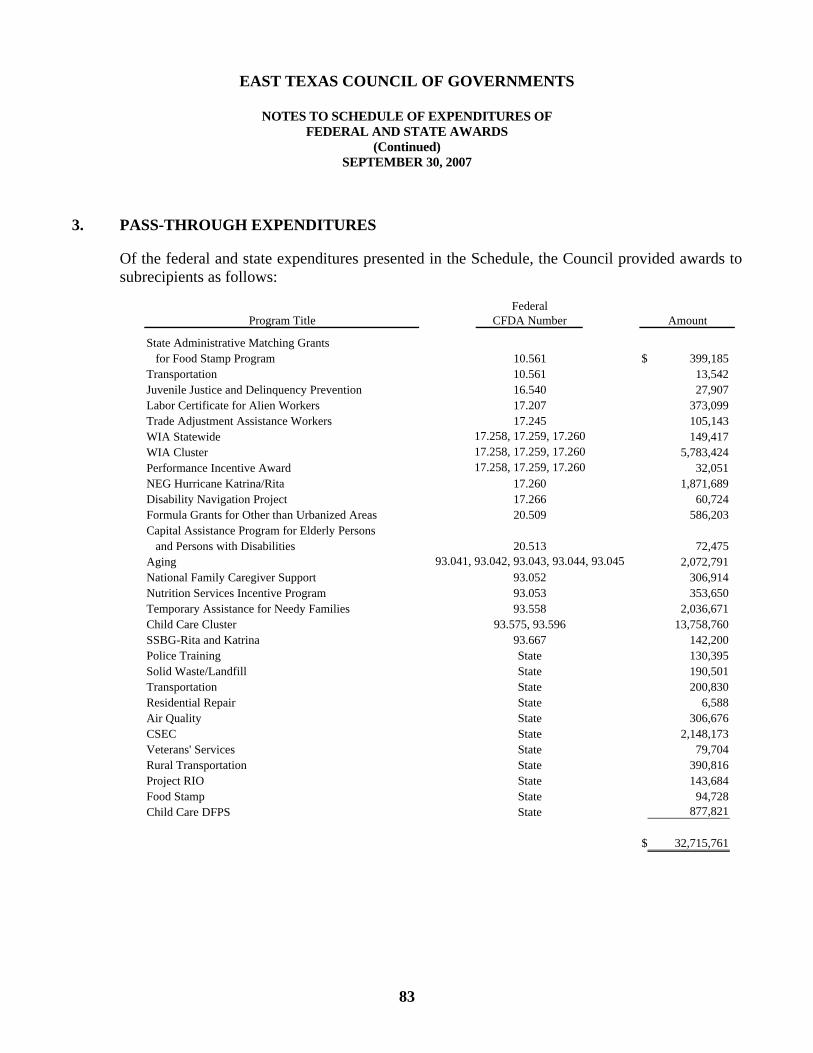
83
EAST TEXAS COUNCIL OF GOVERNMENTS
NOTES TO SCHEDULE OF EXPENDITURES OF FEDERAL AND STATE AWARDS
(Continued) SEPTEMBER 30, 2007
3. PASS-THROUGH EXPENDITURES
Of the federal and state expenditures presented in the Schedule, the Council provided awards to subrecipients as follows:
Federal
Program Title CFDA Number Amount
State Administrative Matching Grants for Food Stamp Program 10.561 399,185$ Transportation 10.561 13,542 Juvenile Justice and Delinquency Prevention 16.540 27,907 Labor Certificate for Alien Workers 17.207 373,099 Trade Adjustment Assistance Workers 17.245 105,143 WIA Statewide 149,417 WIA Cluster 5,783,424 Performance Incentive Award 32,051 NEG Hurricane Katrina/Rita 17.260 1,871,689 Disability Navigation Project 17.266 60,724 Formula Grants for Other than Urbanized Areas 20.509 586,203 Capital Assistance Program for Elderly Persons and Persons with Disabilities 20.513 72,475 Aging 2,072,791 National Family Caregiver Support 93.052 306,914 Nutrition Services Incentive Program 93.053 353,650 Temporary Assistance for Needy Families 93.558 2,036,671 Child Care Cluster 93.575, 93.596 13,758,760 SSBG-Rita and Katrina 93.667 142,200 Police Training State 130,395 Solid Waste/Landfill State 190,501 Transportation State 200,830 Residential Repair State 6,588 Air Quality State 306,676 CSEC State 2,148,173 Veterans' Services State 79,704 Rural Transportation State 390,816 Project RIO State 143,684 Food Stamp State 94,728 Child Care DFPS State 877,821
32,715,761$
17.258, 17.259, 17.260
93.041, 93.042, 93.043, 93.044, 93.045
17.258, 17.259, 17.26017.258, 17.259, 17.260

Summary of Auditors' Results
Type of report on financial statements Unqualified
Internal control over financial reporting: Material weakness(es) identified? No Significant deficiencies identified that are not considered to be material weakness(es)? None reported
Internal control over major programs: Material weakness(es) identified? No Significant deficiencies identified that are not considered to be material weakness(es)? None reported
Noncompliance which is material to the basic financial statements None
Type of report on compliance with major programs Unqualified
Findings and questioned costs for federal awards as defined in Section 501(a), OMB Circular A-133 and state awards as defined by the State of Texas Uniform Grant Management Standards None
Dollar threshold considered between Type A and Federal - $938,790 Type B federal and state programs State - $300,000
Low risk auditee statement The Council was classified as a low-risk auditee in the context of OMB Circular A-133 and the State of Texas Uniform Grant Management Standards
Major federal programs Child Care and Development Block Grant, CFDA #93.575Child Care Mandatory and Matching Funds of the Child Care and Development Fund, CFDA #93.596Special Programs for the Aging - Title III, Part B - Grants for Supportive Services and Senior Centers, CFDA #93.044Special Programs for the Aging - Title III, Part C - Nutrition Services, CFDA #93.045Nutrition Services Incentive Program, CFDA #93.053
Major state programs Texas Commission on Environmental Quality - Solid Waste/ LandfillTexas Commission on Environmental Quality - Air QualityTexas Workforce Commission - Child Care
Findings Relating to the Financial Statements Which are Required to be Reported in Accordance With Generally Accepted Auditing Standards
None
Findings and Questioned Costs for Federal and State Awards
None
FOR THE YEAR ENDED SEPTEMBER 30, 2007
EAST TEXAS COUNCIL OF GOVERNMENTS
SCHEDULE OF FINDINGS AND QUESTIONED COSTS
84
85
EAST TEXAS COUNCIL OF GOVERNMENTS
SUMMARY SCHEDULE OF PRIOR AUDIT FINDINGS
FOR THE YEAR ENDED SEPTEMBER 30, 2007 None

THIS PAGE LEFT BLANK INTENTIONALLY