comprehensive annual financial report -...
TRANSCRIPT

COMPREHENSIVE ANNUAL FINANCIAL REPORT
FOR THE YEAR ENDED AUGUST 31, 2013
STAFFORD MUNICIPAL SCHOOL DISTRICT
1625 STAFFORDSHIRE ROAD
STAFFORD, TEXAS 77477
WWW.STAFFORDMSD.ORG
COMPREHENSIVE ANNUAL FINANCIAL REPORT
FOR THE YEAR ENDED AUGUST 31, 2013
PREPARED BY:
CARLA MERKA
CHIEF FINANCIAL OFFICER
STAFFORD MUNICIPAL SCHOOL DISTRICT
1625 STAFFORDSHIRE ROAD
STAFFORD, TEXAS 77477
WWW.STAFFORDMSD.ORG
STAFFORD MUNICIPAL SCHOOL DISTRICTCOMPREHENSIVE ANNUAL FINANCIAL REPORT
FOR THE YEAR ENDED AUGUST 31, 2013
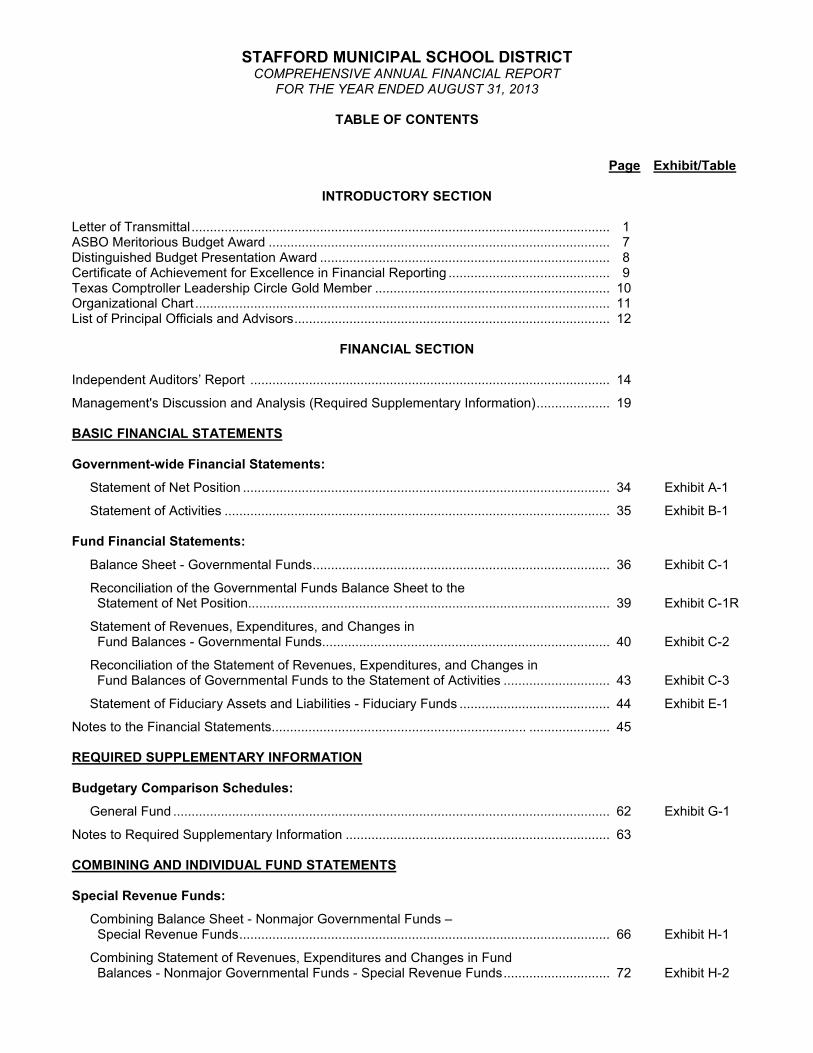
TABLE OF CONTENTS
Page Exhibit/Table
INTRODUCTORY SECTION
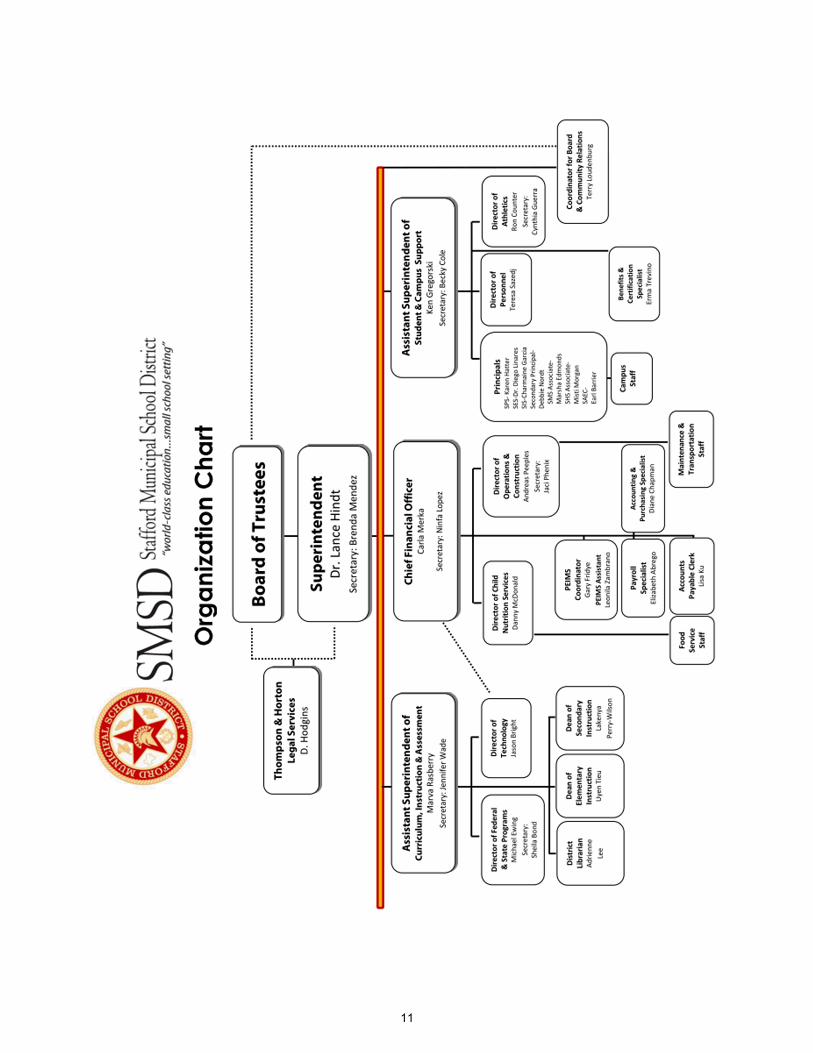
Letter of Transmittal .................................................................................................................. 1ASBO Meritorious Budget Award ............................................................................................. 7Distinguished Budget Presentation Award ............................................................................... 8Certificate of Achievement for Excellence in Financial Reporting ............................................ 9Texas Comptroller Leadership Circle Gold Member ................................................................ 10Organizational Chart ................................................................................................................. 11List of Principal Officials and Advisors...................................................................................... 12
FINANCIAL SECTION
Independent Auditors’ Report .................................................................................................. 14
Management's Discussion and Analysis (Required Supplementary Information).................... 19
BASIC FINANCIAL STATEMENTS
Government-wide Financial Statements:
Statement of Net Position .................................................................................................... 34 Exhibit A-1
Statement of Activities ......................................................................................................... 35 Exhibit B-1
Fund Financial Statements:
Balance Sheet - Governmental Funds................................................................................. 36 Exhibit C-1
Reconciliation of the Governmental Funds Balance Sheet to the Statement of Net Position.......................................... ........................................................ 39 Exhibit C-1R
Statement of Revenues, Expenditures, and Changes in Fund Balances - Governmental Funds.............................................................................. 40 Exhibit C-2
Reconciliation of the Statement of Revenues, Expenditures, and Changes in Fund Balances of Governmental Funds to the Statement of Activities ............................. 43 Exhibit C-3
Statement of Fiduciary Assets and Liabilities - Fiduciary Funds ......................................... 44 Exhibit E-1
Notes to the Financial Statements..................................................................... ...................... 45
REQUIRED SUPPLEMENTARY INFORMATION
Budgetary Comparison Schedules:
General Fund ....................................................................................................................... 62 Exhibit G-1
Notes to Required Supplementary Information ........................................................................ 63
COMBINING AND INDIVIDUAL FUND STATEMENTS
Special Revenue Funds:
Combining Balance Sheet - Nonmajor Governmental Funds – Special Revenue Funds..................................................................................................... 66 Exhibit H-1
Combining Statement of Revenues, Expenditures and Changes in Fund Balances - Nonmajor Governmental Funds - Special Revenue Funds............................. 72 Exhibit H-2
STAFFORD MUNICIPAL SCHOOL DISTRICTCOMPREHENSIVE ANNUAL FINANCIAL REPORT
FOR THE YEAR ENDED AUGUST 31, 2013
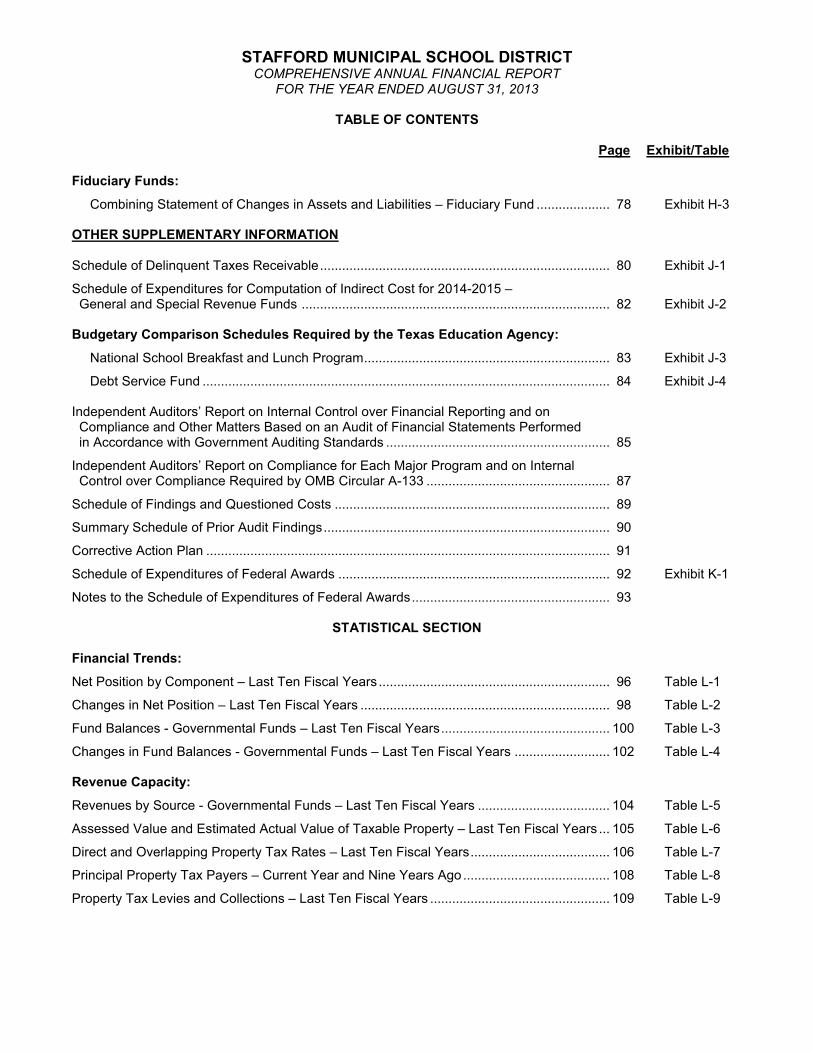
TABLE OF CONTENTS
Page Exhibit/Table
Fiduciary Funds:
Combining Statement of Changes in Assets and Liabilities – Fiduciary Fund .................... 78 Exhibit H-3
OTHER SUPPLEMENTARY INFORMATION
Schedule of Delinquent Taxes Receivable............................................................................... 80 Exhibit J-1
Schedule of Expenditures for Computation of Indirect Cost for 2014-2015 – General and Special Revenue Funds .................................................................................... 82 Exhibit J-2
Budgetary Comparison Schedules Required by the Texas Education Agency:
National School Breakfast and Lunch Program................................................................... 83 Exhibit J-3
Debt Service Fund ............................................................................................................... 84 Exhibit J-4
Independent Auditors’ Report on Internal Control over Financial Reporting and on Compliance and Other Matters Based on an Audit of Financial Statements Performed in Accordance with Government Auditing Standards ............................................................. 85
Independent Auditors’ Report on Compliance for Each Major Program and on Internal Control over Compliance Required by OMB Circular A-133 .................................................. 87
Schedule of Findings and Questioned Costs ........................................................................... 89
Summary Schedule of Prior Audit Findings.............................................................................. 90
Corrective Action Plan .............................................................................................................. 91
Schedule of Expenditures of Federal Awards .......................................................................... 92 Exhibit K-1
Notes to the Schedule of Expenditures of Federal Awards...................................................... 93
STATISTICAL SECTION
Financial Trends:
Net Position by Component – Last Ten Fiscal Years ............................................................... 96 Table L-1
Changes in Net Position – Last Ten Fiscal Years .................................................................... 98 Table L-2
Fund Balances - Governmental Funds – Last Ten Fiscal Years.............................................. 100 Table L-3
Changes in Fund Balances - Governmental Funds – Last Ten Fiscal Years .......................... 102 Table L-4
Revenue Capacity:
Revenues by Source - Governmental Funds – Last Ten Fiscal Years .................................... 104 Table L-5
Assessed Value and Estimated Actual Value of Taxable Property – Last Ten Fiscal Years ... 105 Table L-6
Direct and Overlapping Property Tax Rates – Last Ten Fiscal Years...................................... 106 Table L-7
Principal Property Tax Payers – Current Year and Nine Years Ago........................................ 108 Table L-8
Property Tax Levies and Collections – Last Ten Fiscal Years ................................................. 109 Table L-9

STAFFORD MUNICIPAL SCHOOL DISTRICTCOMPREHENSIVE ANNUAL FINANCIAL REPORT
FOR THE YEAR ENDED AUGUST 31, 2013
TABLE OF CONTENTS
Page Exhibit/Table
Debt Capacity:
Ratios of Outstanding Debt by Type – Last Ten Fiscal Years.................................................. 110 Table L-10
Ratios of General Bonded Debt Outstanding – Last Ten Fiscal Years .................................... 111 Table L-11
Direct and Overlapping Governmental Activities Debt ............................................................. 112 Table L-12
Demographic and Economic Information:
Demographic and Economic Statistics – Last Ten Fiscal Years .............................................. 113 Table L-13
Principal Employers – Current Year and Nine Years Ago........................................................ 115 Table L-14
Operating Information:
Full-Time-Equivalent Employees by Function/Program – Last Ten Fiscal Years .................... 116 Table L-15
Operating Statistics – Last Ten Fiscal Years............................................................................ 118 Table L-16
Teacher Base Salaries – Last Ten Fiscal Years ...................................................................... 119 Table L-17
School Building Information – Last Ten Fiscal Years ............................................................... 120 Table L-18

This page is left blank intentionally.

Introductory Section

This page is left blank intentionally.
1
January 13, 2014
Board of TrusteesStafford Municipal School DistrictFort Bend and Harris Counties, Texas
Dear Board Members:
INTRODUCTION
State law requires that all general-purpose local governments publish within 150 days of the close of eachfiscal year a complete set of financial statements presented in conformity with generally accepted accountingprinciples (GAAP) and audited in accordance with generally accepted auditing standards by a firm of licensedcertified public accountants. Pursuant to that requirement, we hereby issue the Comprehensive Annual Financial Report (CAFR) of the Stafford Municipal School District (SMSD) for the fiscal year ended August 31, 2013.
The CAFR is presented in three sections: introductory, financial, and statistical. The Introductory Section includesthis transmittal letter, list of principal officials, list of consultants and advisors, and the District’s organizational chart. The Financial Section includes the basic financial statements and the combining and individual fund financial statements and schedules, as well as the auditor’s report on the basic financial statements and schedules. The Statistical Section includes selected financial and demographic information, generally presentedon a multiyear basis.
GAAP also requires that management provide a narrative introduction, overview, and analysis to accompany thebasic financial statements in the form of Management’s Discussion and Analysis (MD&A). This letter of transmittalis designed to complement MD&A and should be read in conjunction with it. The District’s MD&A can be foundimmediately following the report of the independent auditors.
This report consists of management’s representations concerning the finances of the District. Consequently, management assumes full responsibility for the completeness and reliability of all of the information presented inthis report. In order to provide a reasonable basis for making those representations, management of SMSDhas established a comprehensive internal control framework that is designed to protect the government’s assets from loss, theft, or misuse. Additionally, the internal control framework is designed to compile sufficient reliable information for the preparation of the District’s financial statements in conformity with GAAP. Since the costs of internal controls should not outweigh their benefits, the District’s comprehensive framework of internal controls has been designed to provide reasonable assurance rather than absolute assurance that the financial statementswill be free from material misstatement. To the best of our knowledge and belief, this financial report is complete and reliable in all material respects.
The financial statements of the Stafford Municipal School District have been audited by Hereford, Lynch, Sellars& Kirkham, P.C., a firm of licensed certified public accountants. The goal of the independent audit is to providereasonable assurance that the financial statements of the District for the fiscal year ended August 31, 2013 are free of material misstatement. The independent audit involves examining, on a test basis, evidence supporting theamounts and disclosures in the financial statements; assessing the accounting principles used and significant estimates made by management; and evaluating the overall financial statement presentation. The independentauditors concluded, based upon the audit, that there was a reasonable basis for rendering an unmodified opinion that the District’s financial statements for the fiscal year ended August 31, 2013 are fairly presented in conformitywith GAAP. The independent auditor’s report is presented as the first component of the financial section of this report.
2
The independent audit of the financial statements is part of a broader, federally mandated “Single Audit” designedto meet the special needs of federal grantor agencies. The standards governing Single Audit engagementsrequire the independent auditor to report not only the fair presentation of the financial statements, but also on the audited government’s internal controls and compliance with legal requirements, with special emphasis on internal controls and legal requirements involving the administration of federal awards.
Copies of this report will be widely distributed throughout the Stafford Municipal School District. A copy will besent to the City of Stafford, the city’s Chamber of Commerce, Moody’s and Standard and Poor’s Financial Rating Services, the Municipal Advisory Council, the Single Audit Clearinghouse, and the Texas Education Agency.
PROFILE OF THE DISTRICT
In 1977, following a disannexation election, Stafford Municipal School District was created out of the 181-square-mile Fort Bend ISD and Houston ISD. The disannexation was the result of a grass roots movement toreturn to a small, city-based school system.
After passage of the election creating the district, the City of Stafford spent five years in federal and state courts in the pursuit of creating the school district. The Fifth Circuit Court of Appeals ruled in favor of the City of Staffordand the district became a reality. Becoming a municipal school district instead of an independent schooldistrict, the school partnered with the city in ways that increased the efficiency of the tax dollar for Stafford residents and businesses.
In the fall of 1982, the elementary school opened to the district’s first 547 students in a leased warehouse. Grades six through eleven were added the following year, bringing the total student enrollment to 1,057. Seniorswere added the next year. In 2000, the new Intermediate School was added to the district facilities onStaffordshire Drive, joining Primary, Elementary, Middle, and High Schools.
Enrollment in the District’s five campuses for the 2012/2013 school year was at 3343 while the Average Daily Attendance (ADA) was 3,120.
There are over 29 home languages spoken by our 3,343 students. Some of these include (but are not limited to):
Amharic, Arabic, Bengali, Cambodian, Cantonese, Farsi, French, Gujarati, Malayalam, Mandarin, Serbian, Sindhi, Telugu, Thai, Tigrinya, Tulu, Urdu, Vietnamese, Yoruba, Tagalog
The District occupies seven square miles within Fort Bend and Harris Counties with diverse geographic areas thatinclude the communities of Promenade, Kingsway, Dove Country, Stafford Run, and other neighborhoods.
The Stafford Municipal School District is an independent public educational governmental unit operating underapplicable laws, and regulations of the State of Texas which provides a full range of educational servicesappropriate to grade levels pre-kindergarten through twelfth grade. These include regular and enriched academic education, special education for handicapped students, occupational education, and educational services for those with limited English proficiency. These basic programs are supplemented by a wide variety of offerings infine arts, athletics, and other extracurricular programs.
A seven member Board of Trustees, with staggered three-year terms, governs the school district.
Effective September 1, 2003 Texas Education Code 11.303 was put into law and it provided for the City Council to participate jointly with the Board of Trustees for the following actions:
Hearings and work sessions on the budget and ad valorem tax rate Adopting of annual budget and ad valorem tax rates Authorization for bonded debt issuance
The District receives funding from local, state and federal funding sources. The District is included in one, the Cityof Stafford, governmental “reporting entity” as defined by the Governmental Accounting Standards Board (GASB) in its Statement Number 14, “The Financial Reporting Entity,” as revised by GASB Statement Number 39, andthere are no component units included within the reporting entity. Management of the District is independent of other state and local governments. The Fort Bend County Tax Assessor-Collector collects taxes for the District, but exercises no control over its expenditures.

3
The annual expenditure budget serves as the foundation for the District’s financial planning and control. Theobjective of these budgetary controls is to ensure compliance with legal provisions embodied in the annual expenditure budget. Stafford MSD has a diverse student population and the instructional methods that will bestsuit the needs of each student is given significant consideration by all parties involved in the budget process.
Budget-to-actual comparisons are provided in this report for the General Fund. This comparison is presented as required supplementary information.
BUDGETING
The annual budget serves as the foundation for the District’s financial planning and control. The budget process begins in January when the Long-Range Plan is presented to the Board of Trustees. The enrollment projectionscontained in this plan form the basis for significant budgetary decisions including per pupil allocations to eachcampus, instructional staffing allocations, and other required service levels. Once the Long-Range Plan isapproved, the SMSD Board of Trustees and City of Stafford City Council can begin discussions concerningbudget strategies and priorities, and establish the budget calendar. Personnel units are allocated to each campus based on projected student enrollment following state mandated ratios, as applicable. Each campus receives abasic allotment per student to be used for supplies, materials, equipment, staff development and other appropriate instructional costs. Decisions concerning utilization of this allocation are made by the site-baseddecision making teams. Budgets for non-campus units are developed by department heads and reviewed by the Superintendent and Chief Financial Officer. Following the budget development process, consolidated budgetary information is presented to the Board of Trustees and City Council in workshops and regular meetings. The proposed budget must be prepared by August 31st for a September 1st fiscal year start date. The BoardPresident must call a special joint meeting for the purpose of discussing and adopting the budget and the taxrate. A notice of this meeting is required to be published at least ten days, but not more than 30 days before the public meeting.
Budget-to-actual comparisons are provided in this report for each individual governmental fund or program for which an appropriated annual budget has been adopted.
The budget may be amended during the year to address unanticipated or changing needs of the District. Changes to functional expenditure categories require Board of Trustee approval. However, budget changes not requiringan increase in total appropriations and within functional categories may be approved by management without Board approval.
FACTORS AFFECTING FINANCIAL CONDITION
IntroductionThe information presented in the financial statements is perhaps best understood when it is considered from thebroader perspective of the specific environment within which the Stafford Municipal School District operates.
Local EconomyThe local economy is based predominantly on commercial and industrial activities. Cardinal Health 411, Inc., is our largest taxpayer for the District. The Fountains is also located in the District - a division of Dunhill PartnersInc.
Stafford has a population of approximately 18,500 and in 2008 the city was named by the Fortune SmallBusiness magazine as one of the 100 best places to live and launch. Stafford ranked 36th for its minimal taxes, cheap housing and ample available land.
The median market value of a residence in Stafford is $142,144 and those taxpayers enjoy a 20% local homestead exemption, a low school district tax rate, and no city property tax.
AccessMajor access to the District is provided by U.S. Highway 59, which extends from Houston to the Rio Grande Valley, and U.S. Highway 90-A, which travels westward through the District to San Antonio and to the Davis Mountains of West Texas.

4
EnrollmentApproximately 21.6% of SMSD students reside in apartments, while the remaining 78.4% reside in variousresidential areas in or around Stafford. Since apartment construction and occupancy rates heavily influence enrollment rates, SMSD personnel carefully monitor these factors during the year.
The District continued the Limited Open Enrollment (LOE) program in 2012/2013. The LOE program allows fornon-Stafford students to attend the Stafford Municipal School District tuition free as long as they have met ourstringent criteria. This program brought in well over 500 students each of the past five years.
The District provides employees (of SMSD and the City of Stafford) living outside of Stafford the option toenroll their children in SMSD. For 2012/2013, SMSD had 65 inter-district students enrolled.
The economic disadvantage rate of the District continues to increase annually and finished at 68.23% for the 2012/13 school year.
State FundingThe State of Texas provides funding for public education via a financing formula which weights student attendance levels, property value per student, the District’s tax effort, and regional variations in payroll and othercosts. The District is considered a “property-rich” school district because the assessed value of property perstudent is higher than the target amount established by the Texas Legislature. The target taxable value perstudent enforced for 2012/13 was $476,500, while the comparable value for the District was $508,136.
Statewide, many districts were taxing at $1.50 tax cap for maintenance and operations in 2005/2006. TheLegislature passed House Bill 1 (H.B.1) mandating districts to compress tax rates by 88.67% of the2005/2006 maintenance and operations tax rate ($1.321183 for SMSD) for 2006/2007 and by 66.67% of the2005/2006 maintenance and operations tax rates ($0.993383 for SMSD) for 2007/2008. Districts were then able to assess an additional four cents above the compressed rate for enrichment without a voter election. The Stateholds each district harmless by capping the target revenue as combined state and local revenue per weighted student the district had in 2005/2006, or would have had in 2006/2007 under old law. This adjustment to the target essentially holds the District’s combined state and local revenue at the amount received in 2005/2006 per weighted student level.
Since SMSD is “property-rich” school district, the District paid over $385,000 to the State for redistribution to “property-poor” school districts.
Cash ManagementCash available in excess of cash requirements was invested in the one of three investment pools used by the District and government agency securities. Stafford MSD participates in Texpool, TexStar, and Lone Starinvestment pool. The District’s investment policy is to minimize risk while maintaining a competitive yield on its portfolio. The District’s deposits were entirely covered by Federal Deposit Insurance Corporation (FDIC) insurance and pledged collateral for the year ended August 31, 2013.
To comply with the reporting requirements set forth in House Bill 2459, quarterly investment reports were prepared and submitted to the Board of Trustees. The reports detailed the District’s investment position as of theend of each quarter and reflected the compliance with the District’s investment strategy and the investment policies.
In addition to the quarterly report, the Board of Trustees of Stafford MSD requires that a comprehensive report onthe investment program and investment activity be presented annually. The annual report shall include a reviewof the activities and total yield for the preceding 12 months, suggest policies, strategies, and improvements that might enhance the investment program, and propose an investment plan for the next year. SMSD has complied with this requirement for 2013/2014.
Debt ManagementThe Texas Education Code Section 45.003(e) specifies that a school district is able to issue unlimited tax bonds,provided that the district demonstrates its projected ability to pay such bonds plus the District’s outstandingbonds (excluding bonds authorized by an election held on or before April 1, 1992 and issued before September 1, 1992) at a debt service rate of not more than $0.50 per $100 of assessed valuation. Stafford MSD’s debtservice tax rate in 2012/13 was $0.20995 which is well below the legal limit.

5
Risk ManagementThe District’s risk management program encompasses various means of protecting the District against loss.District instructional facilities range in age from twenty-six to one year. Property and casualty insurance onall facilities, fixtures, and equipment is provided by commercial carriers and liability insurance coverage isprovided by North American Solutions. The District strives to ensure the safety and health of the students andemployees through its accident prevention programs, safety education programs, and safety inspections.
In addition, the District strives to maintain employee benefit programs designed to retain and attract qualifiedpersonnel. To achieve this, the District participates in TRS Active-Care (health insurance program administered through the State) and offers various types of insurance coverage to employees through our Third Party Administrator, TCG. Portions of the coverage available (such as medical, dental and life insurance) are partially paid by the District. The District also participates in a worker’s compensation program through Creative Risk Funding.
MAJOR INITIATIVES AND ACCOMPLISHMENTS
Community SupportIn November 2006, the voters in the Stafford Municipal School District approved a $15.05 million bondreferendum.
In May 2011, the voters in the Stafford Municipal School District approved a $49.9 million bond referendum.
The mission statement of the District is to “Prepare each student to become a critical thinker and an ethical, productive citizen, in the pursuit of excellence through an unwavering commitment to provide multiple life and learning experiences led by dedicated professionals using innovative teaching techniques in an engaging learning environment.” Continuing to aggressively implement the Long-Range Technology Plan not only demonstrates theDistrict’s effort to accomplish this mission but also enables children to experience hands on learning by utilization of leading edge technologies. Computer labs were updated to improve academic success through computer-assisted learning. Secondary Math and Science classrooms were outfitted with ceiling-mounted projectors toutilize promethean board instructional technology. The success of these and many other programs is evident in the continued improvement in student performance on the Texas Assessment of Knowledge and Skills (TAKS) Test.
The 2012/13 financial structure of the Stafford Municipal School District provided support to work toward or accomplish the following goals:
1. Attract and retain a highly-qualified staff. The education of students is a labor-intensive process andpayroll expenditures comprise approximately 78.74% of the General Fund expenditures. The Board voted to approve a 3% salary increase for all personnel. The District is offers competitive salaries with neighboring school districts.
2. Maintain a fiscally responsible tax rate. In 2012/13, the tax rate was compressed to $1.04005 asrequired by H.B. 1 while keeping the general fund balance of approximately $10 million. This fund balance represents approximately 5 months of operating expenditures.
3. Provide educational programs and activities that ensure all students are ready for higher education and/or the workforce. The District has been able to continue financially supporting programs such as math and science pull-out programs, automotive technology, an engineering academy, etc.
A Eleventh Consecutive Schools FIRST Superior RatingThe Stafford Municipal School District received a rating of “Superior Achievement” under the School FinancialIntegrity Rating System of Texas (FIRST), which is the highest rating possible, for the 11
thconsecutive year.
The FIRST rating system is a financial accountability system for Texas school districts developed by the TexasEducation Agency (TEA) in response to Senate Bill 875 of the 76th Texas Legislature in 1999. The primarygoal of Schools FIRST is to achieve quality performance in the management of school districts' financialresources, a goal made more significant due to the complexity of accounting associated with Texas' schoolfinance system.

7
8

9
10
11

12
STAFFORD MUNICIPAL SCHOOL DISTRICTLIST OF PRINCIPAL OFFICIALS AND ADVISORSAUGUST 31, 2013
BOARD OF TRUSTEES
Name OfficeEd Casitllo PresidentVirginia Rosas Vice PresidentGreg Holsapple SecretaryEttienne Zak TrusteeCindy Hoelscher TrusteeRodney Butler TrusteeAuturo Jackson Trustee
CITY COUNCIL
Council Member PositionLeonard Scarcella MayorFred Woolridge Mayor Pro TemCecil Willis CouncilmanWen Guerra CouncilmanKen Mathew CouncilmanFelecia Evans-Smith CouncilmanRobert Sorbet Councilman
ADMINISTRATIVE OFFICIALS
Name of Official PositionDr. Lawrence Hindt SuperintendentKen Gregorski Assistant SuperintendentMarva Rasberry Assistant SuperintendentCarla Merka Chief Financial Officer
CONSULTANTS AND ADVISORS
Name Advisory RoleHereford, Lynch, Sellars & Kirkham, P.C. AuditorsAndrew Kurth LLP Bond CounselFrost National Bank Depository BankRBC Capital Markets Financial AdvisorThompson & Horton LLP General Counsel

13
FINANCIAL SECTION
14
HLSKHereford, Lynch, Sellars & Kirkham
Certified Public Accountants • A Professional Corporation
Conroe Members of the Cleveland1406 Wilson Rd., Suite 100 American Institute of Certified Public Accountants 111 East BootheConroe, Texas 77304 Texas Society of Certified Public Accounts Cleveland, Texas 77327Tel 936-756-8127 Private Companies Practice Section Tel 281-592-6443Metro 936-441-1338 of the AICPA Division for Firms Fax 281-592-7706Fax 936-756-8132
INDEPENDENT AUDITORS’ REPORT
The Board of Trustees of Stafford Municipal School District1625 StaffordshireStafford, Texas 77477
Report on the Financial Statements
We have audited the accompanying financial statements of the governmental activities, each major fund, and the aggregate remaining fund information of Stafford Municipal School District (District), as of and for the year ended August 31, 2013, and the related notes to the financial statements, which collectively comprise the District's basic financial statements as listed in the table of contents.
Management’s Responsibility for the Financial Statements
Management is responsible for the preparation and fair presentation of these financial statements in accordance with accounting principles generally accepted in the United States of America; this includes the design, implementation, and maintenance of internal control relevant to the preparation and fair presentation of financial statements that are free from material misstatement, whether due to fraud or error.
Auditors’ Responsibility
Our responsibility is to express opinions on these financial statements based on our audit. We conducted our audit in accordance with auditing standards generally accepted in the United States of America and the standards applicable to financial audits contained in Government Auditing Standards, issued by the Comptroller General of the United States. Those standards require that we plan and perform the audit to obtain reasonable assurance about whether the financial statements are free from material misstatement.
An audit involves performing procedures to obtain audit evidence about the amounts and disclosures in the financial statements. The procedures selected depend on the auditors’ judgment, including the assessments of the risk of material misstatement of the financial statements, whether due to fraud or error. In making those risk assessments, the auditor considers internal control relevant to the entity’s preparation and fair presentation of the financial statements in order to design audit procedures that are appropriate in the circumstances, but not for the purpose of expressing an opinion on the effectiveness of the entity’s internal control. Accordingly, we express no such opinion. An audit also includes evaluating the appropriateness of accounting policies used and the reasonableness of significant accounting estimates made by management, as well as evaluating the overall presentation of the financial statements.
We believe that the audit evidence we have obtained is sufficient and appropriate to provide a basis for our audit opinions.

15
Opinions
In our opinion, the financial statements referred to above present fairly, in all material respects, the respective financial position of the governmental activities, each major fund, and the aggregate remaining fund information of Stafford Municipal School District, as of August 31, 2013, and the respective changes in financial position, thereoffor the year then ended in accordance with accounting principles generally accepted in the United States of America.
Emphasis of Matter
As described in Note A. 3. Implementation of New Standard in the notes to the financial statements, for August 31, 2013, the District adopted new accounting guidance, GASB Statement No. 65, Items Previously Reported as Assets and Liabilities. Our opinion is not modified with respect to this matter.
Other Matters
Required Supplementary Information
Accounting principles generally accepted in the United States of America require that the management’s discussion and analysis and budgetary comparison information, as listed in the table of contents, be presented to supplement the basic financial statements. Such information, although not a part of the basic financial statements, is required by the Government Accounting Standards Board, who considers it to be an essential part of financial reporting for placing the basic financial statements in an appropriate operational, economic, or historical context. We have applied certain limited procedures to the required supplementary information in accordance with auditing standards generally accepted in the United States of America, which consisted of inquiries of management about the methods of preparing the information and comparing the information for consistency with management’s responses to our inquiries, the basic financial statements, and other knowledge we obtained during our audit of the basic financial statements. We do not express an opinion or provide any assurance on the information because the limited procedures do not provide us with sufficient evidence to express an opinion or provide any assurance.
Other Information
Our audit was conducted for the purpose of forming opinions on the financial statements that collectively comprise Stafford Municipal School District’s basic financial statements. The introductory section, combining and individual fund financial statements, and statistical section, are presented for purposes of additional analysis and are not a required part of the basic financial statements. The schedule of expenditures of federal awards is presented for purposes of additional analysis as required by U.S. Office of Management and Budget Circular A-133, Audits of States, Local Governments, and Non-Profit Organizations, and is also not a required part of the financial statements.
The combining and individual fund financial statements and other supplementary information, including the schedule of expenditures of federal awards, are the responsibility of management and were derived from and relate directly to the underlying accounting and other records used to prepare the basic financial statements. Such information has been subjected to the auditing procedures applied in the audit of the basic financial statements and certain additional procedures, including comparing and reconciling such information directly to the underlying accounting and other records used to prepare the basic financial statements or to the basic financial statements themselves, and other additional procedures in accordance with auditing standards generally accepted in the United States of America. In our opinion, the combining and individual fund financial statements and the schedule of expenditures of federal awards are fairly stated in all material respects in relation to the basic financial statements as a whole.
The introductory and statistical sections have not been subjected to the auditing procedures applied in the audit of the basic financial statements and, accordingly, we do not express an opinion or provide any assurance on them.

16
Other Reporting Required by Government Auditing Standards
In accordance with Government Auditing Standards, we have also issued our report dated January 13, 2014, on our consideration of the Stafford Municipal School District’s internal control over financial reporting and on our tests of its compliance with certain provisions of laws, regulations, contracts, and grant agreements and other matters. The purpose of that report is to describe the scope of our testing of internal control over financial reporting and compliance and the results of that testing, and not to provide an opinion on internal control over financial reporting or on compliance. That report is an integral part of an audit performed in accordance with Government Auditing Standards in considering Stafford Municipal School District’s internal control over financial reporting and compliance.
Respectfully,
Hereford, Lynch, Sellars & Kirkham, P.C.
HEREFORD, LYNCH, SELLARS & KIRKHAM, P.C.Certified Public Accountants
Conroe, TexasJanuary 13, 2014
17
Management's Discussion and Analysis

18
This page is left blank intentionally.
19
MANAGEMENT’S DISCUSSION AND ANALYSIS
This discussion and analysis, as part of the comprehensive annual financial report, of Stafford Municipal School District’s financial performance provides a narrative overview and analysis of the District’s financial activities for the year ended August 31, 2013. It should be read in conjunction with the District’s financial statements, which begin on page 34 of this report.
These statements are management’s report of the District’s financial operations to the Board of Trustees (the Board), taxpayers, grantor agencies, employees, and the Texas Education Agency (TEA). These financial statements must be presented in conformity with generally accepted accounting principles (GAAP) and audited by a firm of licensed certified public accountants in accordance with generally accepted auditing standards.
Responsibility for both the accounting of the presented data and the completeness and accuracy of the data and completeness and fairness of the presentation, including all disclosures, rests with the District. The statements and accompanying notes should enable the reader to gain a comprehensive understanding of the District’s financial affairs.
Financial Highlights
At August 31, 2013, the District’s total combined net position (total assets less total liabilities) were $22,802,811 for all governmental funds combined.
For the year ended August 31, 2013, the District’s total revenues of $32,341,337 were $2,686,404 lessthan the total expenses.
The general fund reported a fund balance of $10,361,422 at August 31, 2013.
The food service funds reported a fund balance of $418,560 at August 31, 2013.
The debt service funds reported a fund balance of $1,521,122 at August 31, 2013.
The District’s long-term bonded indebtedness had a decrease of $1,252,587.
The District did not have any financial statement findings.
Overview of the Financial Statements
The annual report consists of three parts – Management’s Discussion and Analysis (this section), the Basic Financial Statements, and Required Supplemental Information. The basic financial statements include three components and they are as follow:
Government-wide financial statements. These financial statements provide both long-term and short-term information about the District’s overall financial status.
Fund financial statements. The remaining statements are fund financial statements that focus on individual parts of the government, reporting the District’s operations in more detail that the government-wide statements.
The governmental funds statements tell how general government services were financed in the short term as well as what remains for future spending.
20
Notes to the financial statements. The notes provide additional information that is essential to a full understanding of the data provided in the government-wide and fund financial statements. The notes to the financial statements immediately follow the basic financial statements.
In addition to the basic financial statements and the accompanying notes, this report also presents certain required supplementary information that further explains and supports the information in the financial statements. The District did not have any major special revenue funds; therefore, only the general fund is presented as required supplementary information.
The combining and individual statements and other supplementary information are presented immediately following the required supplementary information and are referenced as Exhibits H-1 to K-1 in this report.
Government-Wide Financial Statements
The government-wide statements report information about the District as a whole using accounting methods similar to those used by private-sector companies. The statement of net position includes all of the government’s assets and liabilities. All of the current period’s revenues and expenses are accounted for in the statement of activities regardless of when cash is received or paid.
The statement of net position, page 34, includes all the District's assets and liabilities at the end of the year, with the difference between the two reported as net position. This difference is similar to the total owners’ equity presented by a commercial enterprise. All the District's assets are reported, whether they serve the current year or future years. Liabilities are considered regardless of whether they must be paid in the current or future years. Although the purpose of the District is not to accumulate net position, in general, as the amount increases, it may indicate that the financial position of the District is improving over time. To fully assess the overall health of the District, however, you should consider other factors as well, such as changes in the District's average daily attendance or its property tax base and the condition of the District's facilities.
The purpose of the statement of activities, page 35, is to present the revenues and expenses of the District. Again, the items presented on the statement of activities are measured in a manner similar to the approach used by a commercial enterprise in that revenues are recognized when earned or established criteria are satisfied, and expenses are reported when incurred by the District. Thus, revenues are reported even when they may not be collected for several months or years after the end of the accounting period, and expenses are recorded even though they may not have used cash during the current period.
The District had no business-type activities during 2012/2013.
The two government-wide statements report the District’s net position and how they have changed. Net-assets are the difference between the District’s assets and liabilities and are one way to measure the District’s financial health position.
Over time, increases or decreases to the District’s net position are an indicator of whether its financial health is improving or deteriorating, respectively.
To assess the overall health of the District, one needs to consider additional non-financial factors such as changes in the District’s tax base, staffing patterns, enrollment and attendance.
The government-wide financial statements of the District include only governmental activities. Most of the District’s basic services such as instruction, extracurricular activities, curriculum and staff development, health services, general administration, and plant operation and maintenance are included in government activities. Locally assessed property taxes, together with State Foundation Program entitlements, which are based upon student enrollment and attendance, finance most of the government activities.
The District has no component units for which it is financially accountable.
21
Fund Financial Statements
The fund financial statements (starting on page 36) provide more detailed information about the District’s most significant funds, not the District as a whole. Funds are simply accounting devices that are used to keep track of specific sources of funding and spending for particular purposes.
Some funds are required by State law and other funds are mandated by bond agreements or bond covenants.
The Board of Trustees establishes other funds to control and manage money set aside for particular purposes or to show that the District is properly using certain taxes and grants.
Other funds are used to account for assets held by the District in a custodial capacity; these assets do not belong to the District but the District is responsible to properly account for them.
All of the District’s funds can be divided into the following two categories:
Governmental Funds: Most of the District’s basic services are included in governmental funds, which focus on (1) how cash and other financial assets that can readily be converted to cash flow in and out and (2) the balances left at year-end that are available for spending. Consequently, the governmental fund statements provide a detailed short-term view that helps to determine whether there are more or fewer financial resources that can be spent in the near future to finance the District’s programs. Since this information does not encompass the additional long-term focus of the government-wide statements, we provide additional information at the bottom of the governmental funds statement, or on the subsequent page, that explain the relationship (or differences) between them.
The District maintains several individual governmental funds organized according to their type (special revenue, debt service and capital projects). Information is presented separately in fund financial statements for the general fund, special revenue fund, debt service fund, and capital projects fund, general and capital projects funds are considered major funds. The District adopts an annual appropriated budget for its general fund, food service program within the special revenue fund, and debt service fund. Budgetary comparison schedules have been provided to demonstrate compliance with these budgets.
Fiduciary Funds: The District serves as the trustee, or fiduciary, for certain funds such as scholarship and student activity funds. The District is responsible for ensuring that the assets reported in these funds are used for their intended purposes. All of the District’s fiduciary activities are reported in a separate statement of fiduciary net position and a statement of changes in fiduciary net position. These activities are excluded from the District’s government-wide financial statements because the District cannot use these assets to finance its governmental operations.
The notes to the financial statements (starting on page 45) provide narrative explanations or additional data needed for full disclosure in the government-wide statements or the fund financial statements.
In addition to the basic financial statements and accompanying notes, this report also presents certain required supplementary information that further explains and supports the information in the financial statements. Required supplementary information can be found on pages 62-63 of this report.
Other supplementary information including combining statements and compliance schedules can be found on pages 66-93 of this report.
Financial Reporting Entity
In 1976, Stafford residents voted to create a breakaway school district, on what would offer a small school environment for their children. In 1982, the District was established and opened their doors for the first school year as Stafford Municipal School District. The District is the only municipal school district in the State of Texas. Being a municipal school district allows the District a unique opportunity to partner with the City.
22
During the 78th
Texas Legislative session, HB 2964, now TEC 11.303 was enacted which made changes to the District’s budget and property tax rate adoption process as stated below.
11.303[0]. MUNICIPAL SCHOOL DISTRICTS. (a) Except as otherwise provided by this section, a school district operating under former Chapter 24 may continue to operate under that chapter as it existed on May 1, 1995, and under state law generally applicable to school districts that does not conflict with that chapter.
(b) The governing body of the municipality may participate in annual hearings or work sessions held by the board of trustees of the municipal school district on the budget and ad valorem tax rate for the coming year.
(c) The board of trustees of a municipal school district and the governing body of the municipality shall jointly hold any hearing required by law as a condition for the adoption of an annual budget and imposition of an ad valorem tax.
(d) Neither an annual budget for a municipal school district nor an ad valorem tax to be imposed for the district may be adopted without the affirmative vote of:
(1) a majority of the members of the board of trustees of the municipal school district present and voting; and
(2) at least three-quarters of the total of the voting members of the board of trustees and the governing body of the municipality that are present and voting.
(e) If a quorum of the members of the governing body of the municipality is not present at a meeting required under Subsection (c), the board of trustees may adopt a budget or an ad valorem tax rate without regard to the requirements of Subsection (d).
(f) Notwithstanding former Section 24.06(c), as it existed on May 1, 1995, the governing body of the municipality shall adopt an ordinance providing for the levy and assessment of the tax approved pursuant to Subsection (d) or (e).
(g) After adopting an ordinance levying a tax for the municipal school district, the governing body of the municipality shall provide a certified copy of the ordinance to the district's board of trustees.
(h) This section may not be construed as authorizing the governing body of a municipality to levy a tax for the support of schools of a municipal school district without fully complying with all applicable provisions of the Tax Code.
Added by Acts 2003, 78th Leg., ch. 304, § 1, eff. Sept. 1, 2003.
As required by GAAP, the financial statements of the reporting entity include those of the District (as the primary government) as an independent reporting entity clearly within the criteria established by GASB.
The District encompasses approximately seven square miles and is located in Fort Bend and Harris Counties, Texas, approximately 25 miles southwest of downtown Houston.
The District currently includes a primary school, an elementary school, an intermediate school, a middle school, a high school, and an alternative campus. The District is also a member of the Fort Bend County Juvenile Justice Alternative Educational Placement. The District serves over 3,340 students and provides a full range of educational services appropriate to grade levels Pre-K through 12. These services include regular and enriched academic education, special education for children with special needs, career and technology education, and programs for students with limited English proficiency. These basic programs are supplemented by a wide variety of offerings in fine arts and athletics.
After experiencing several years of fast growth, the District’s student enrollment became relatively static in 1999-2000. The TEA Snapshot reported an enrollment of 2,868, peaking at 2,897 on the 2001-2002 snapshot date, with the District experiencing declining enrollment from 2001-2002 through the end of 2002-2003. The District ended the 2003-2004 school year with an enrollment of 2,838. In the summer of 2003 the District’s Board approved a Limited Open Enrollment (LOE) program that, as of the TEA snapshot date for 2003 added 99 non-resident students, 204 added 106 non-resident students, and 2005 added 235 non-resident students, which increased the District’s total enrollment to 2,810, 2,838, and 3,014 respectively. With the Hurricane Katrina and Hurricane Rita in the 2006 fiscal year, the enrollment jumped to an all-time high of 3,119 including 257 LOE students. During the 2006-2007 fiscal year, about 150 of the hurricane evacuee students left SMSD resulting in a final enrollment of 2,992. In 2007-2008, the strict criteria for the LOE program contributed to an overall decline in enrollment resulting in a final enrollment of 2,902. In 2011-2012 the total enrollment was 3,172 students which included 611 LOE. In 2012-2013 the total enrollment was 3,343 which included 777 LOE students.

23
The mission of SMSD, a diverse and visionary learning community, is to prepare each student to become a critical thinker and an ethical, productive citizen, an unwavering commitment to provide multiple life and learning experiences led by dedicated professionals using innovative teaching techniques in an engaging learning environment.
The formation of the Stafford Municipal School District, the partnership with the City of Stafford, and the involvement of the businesses reinforce the feeling in Stafford, Texas, Where Children Are Important!
The goals for the District improvement include the following:
To improve student achievement as measured by the Academic Excellence Indicators. Optimize student success. Maintain a quality, highly-motivated, and achievement-oriented staff. Address the opportunities and challenges of a changing community. Implement enhanced systems that will improve the school district operation.
Accounting System and Budgetary Controls
The diverse nature of the District’s operations and the necessity of legal compliance preclude recording the financial transactions of the District in a single fund. The District’s accounting system is organized and operated on a ‘fund basis’. Each fund is a distinct, self-balancing accounting entity. The various funds are fully described in Note A. 4. of the Notes to the Financial Statements starting on page 45 of the accompanying financial statements.
In developing, evaluating, and improving the District’s accounting system, consideration is given to the adequacy of the internal control structure. Internal controls are designed to prevent loss from unauthorized use or disposition and assure that transactions are executed in accordance with management’s authorization and recorded properly to permit the preparation of financial statements in accordance with GAAP. The concept of reasonable assurance recognizes that the cost of a control should not exceed the benefits likely to be derived, and the evaluation of costs and benefits requires estimates and judgments by management.
All internal control evaluations occur within the above-mentioned framework. We believe the District’s internal control structure adequately safeguards assets and provides reasonable assurance of the proper recording of financial transactions.
As a recipient of federal and state financial assistance, the District also is responsible for ensuring that an adequate internal control structure is in place to ensure compliance with applicable laws and regulations related to these programs. The internal control structure is subject to periodic evaluation by management of the District.
As a part of the District’s single audit, tests are made to determine the adequacy of the internal control structure, including that portion related to federal financial assistance programs, as well as to determine that the District has complied with applicable laws and regulations. The results of the District’s single audit for the fiscal year ended August 31, 2013, indicated no instances of material weaknesses in the internal control structure and no instances of material noncompliance with applicable laws and regulations.
The District maintains budgetary controls to ensure compliance with legal provisions embodied in the annual appropriated budget approved by the District’s Board. Budgetary control is maintained at the functional level. Principals and directors have primary responsibility for controlling their budgets as necessary and ensuring that no expenditure is made unless funds have been properly authorized. Funds are properly authorized when approved by the Board at the function level.
Activities of the General Fund, Special Revenue Funds, Debt Service Fund, and Capital Projects Fund are included in the annual appropriated budget. The level at which expenditures cannot legally exceed the appropriated amount is established by function within an individual fund. The District also maintains an encumbrance accounting system as one technique of accomplishing budgetary control.
Encumbrances lapse at year end.

24
Factors Affecting Financial Condition
For fiscal year 2013, the District adopted the maximum compressed the maintenance and operating (M&O) ad valorem tax rate of $1.00005 per $100 valuation and the Board approved the four ‘enrichment’ pennies resulting in an adopted M&O tax rate of $1.04005.
During the 2004 fiscal year, the District established a budget process which includes thorough planning, review, and analysis of expenditures at all levels. The District did several initiatives to increase district efficiency andreduce the impact of Chapter 41 expenses. In fiscal years 2005, 2006, 2007, 2008, 2009, 2010, 2011 and 2012the district continued the initiatives started in 2004 to include:
Begin reviewing and discussing the budgets and tax rates in the month of January with the Stafford Municipal School District school board and the Stafford City Council.
There was a continuation of the LOE program whereby non-resident students could attend district schools which kept more resources in the district.
With the implementation of the Chapter 41 strategies, an organizational culture of openness and self-evaluation, the establishment of written procedures, the District is making great strides in building support and targeting resources to achieve the greatest positive impact for all of our students. The financial, cultural, educational, and recreational climate of the area is a testimony to the collective leadership and to the community’s progressive attitude toward responsible growth and their vision of the future.
In November 2006, SMSD taxpayers approved $15.05 million in bonds for district renovations, upgrades, central plant, science labs, technology equipment, and construction of a new cafeteria and playgrounds. In May 2011, SMSD taxpayer approved $49.9 million in bonds for district renovations, tennis courts, security upgrades, new roof, additional classrooms, and buses.
The District received a financial rating of Superior Achievement from the Financial Integrity Rating System of Texas (FIRST).
The Business Services Department earned the following awards for their transparent efforts in regards to the budget and financial statements:
ASBO Meritorious Budget Award for 2012/2013 2012-2013 Distinguished Budget Presentation Certificate of Achievement for Excellence in Financial Reporting Texas Comptroller Leadership Circle Gold Member
Academic Initiatives and Awards
The District has implemented several academic initiative programs to enhance student performance. These programs include district-wide administration of a nationally norm-referenced test, the Iowa Test of Basic Skills (ITBS) test. They also include the PSAT test for all freshmen and sophomores providing an opportunity for these students to participate without any financial hardships placed on the parents. The district has also enhanced academic programs by providing a fully aligned curriculum for teachers through the purchase of the C-SCOPE curriculum. This curriculum is Texas Essential Knowledge and Skills (TEKS) correlated and allows for both vertical and horizontal alignment, prepared model lessons, daily sponge activities, instructional consideration, and assessment lesson pre-requisites.
In addition, the District has an articulation agreement with Houston Community College Systems, which allows high school students an opportunity to earn college credit hours while in high school.
For the first time schools throughout America have a national performance rating as required by the ‘No Child Left Behind’ Act. Starting in the 2004-2005 school year this meant two accountability systems for Texas schools: the existing Academic Excellence Indicator System (AEIS) and the new Adequate Yearly Progress (AYP). For 2011/2012, Primary and Elementary campuses met AYP, while Intermediate, Middle and High School did not meet AYP. All campuses were rated as Academically Acceptable under AEIS. In 2012/2013 the State of Texas requested a waiver regarding ESEA flexibility and the waiver was recently approved in September 2013. Specifically, this waiver of the federal Accountability Performance Targets/Standards Setting Procedures allows TEA to replace the current AYP calculations and performance targets with the state’s robust accountability rating system. The Texas Accountability System meets the intent and purposes of the ESEA statute. Based upon the
25
Texas Accountability System, SMSD campuses were rated with the highest rating of “Met Standard”. As part of the accountability system, System Safeguards were identified for the following campuses: Stafford High School, Stafford Middle School, and Stafford Intermediate. SMSD has implemented target goals and strategies to ensure the students at each campus meet System Safeguards for 2014.
SMSD offered one session of summer school for students, who performed below acceptable levels on their STAAR Math and/or their end-of-course grade was below passing.
Student Athletic Accomplishments
The student-athletes made tremendous strides in the development of an elite program. The seniors provided the leadership that was needed and the entire program committed themselves with their hearts and souls to create a legacy for our future athletes to follow. The most important areas of improvement were within the commitment, pride, and work ethic of our student-athletes.
All sports had a number of accomplishments during the 2012/2013 school year including, but not limited to, football, boys' basketball team, girls' basketball, boys’ soccer and baseball won bi-district championship, and a high number of student-athletes that made Academic All-District teams.
Community Accomplishments
The SMSD is located in Fort Bend County one of the fastest growing counties in the nation. SMSD has greatly benefited from the generosity and support of local non-profits and businesses throughout the Fort Bend County and Houston areas. The George Foundation has funded district programs including instruction, student leadership and assistance. It also has awarded scholarships. The SMSD Education Foundation provided scholarships and teacher grants to supplement the resources needed by our faculty and students. ACHIEVE Fort Bend promotes the value of education and encourages business support of at-risk students. The Fort Bend Chamber and Houston Area Realtors Association create opportunities for SMSD to share information about our schools. The Fort Bend County Fair focuses on youth education annually awards scholarships to high school youth. The Houston Livestock Show and Rodeo Art Program has annually recognized art students and awarded scholarships. Big Brothers Big Sisters has provided our students with professionally supported mentors. Area businesses and church organizations have provided career day speakers, donated services, supplies, technology, and recognition gifts to students and staff.
Government-Wide Financial Analysis
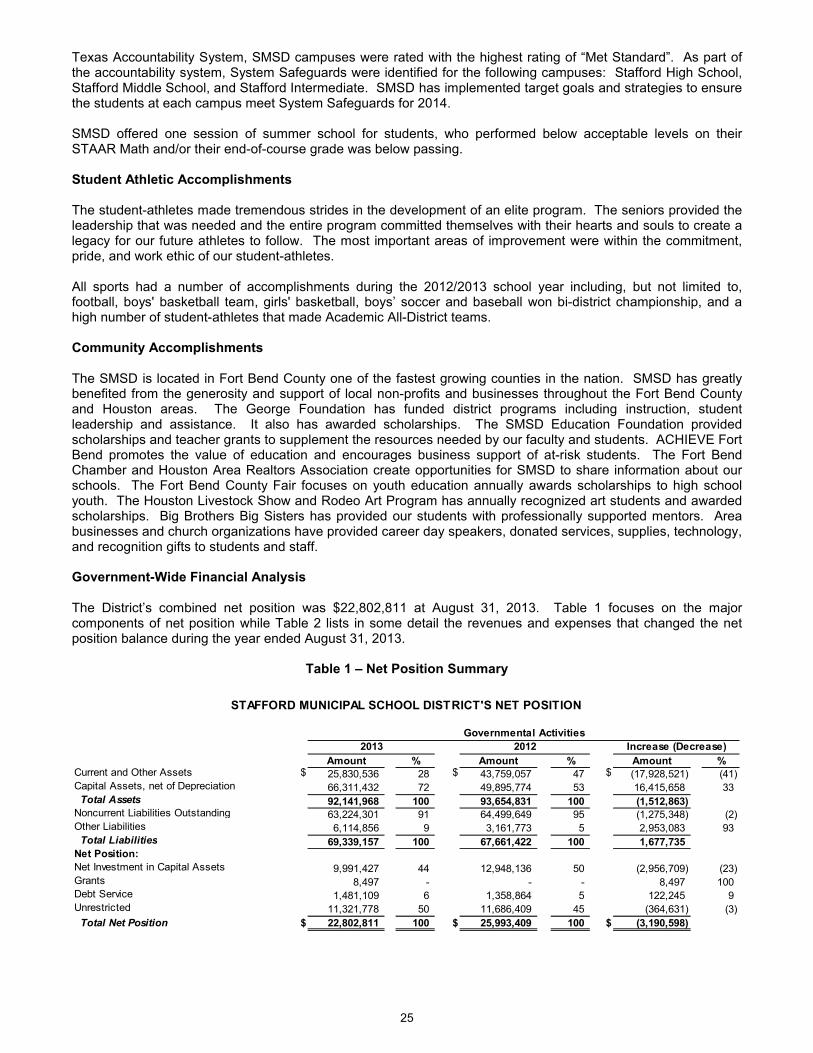
The District’s combined net position was $22,802,811 at August 31, 2013. Table 1 focuses on the major components of net position while Table 2 lists in some detail the revenues and expenses that changed the net position balance during the year ended August 31, 2013.
Table 1 – Net Position Summary
Amount % Amount % Amount %Current and Other Assets $ 25,830,536 28 $ 43,759,057 47 $ (17,928,521) (41) Capital Assets, net of Depreciation 66,311,432 72 49,895,774 53 16,415,658 33 Total Assets 92,141,968 100 93,654,831 100 (1,512,863) Noncurrent Liabilities Outstanding 63,224,301 91 64,499,649 95 (1,275,348) (2) Other Liabilities 6,114,856 9 3,161,773 5 2,953,083 93 Total Liabilities 69,339,157 100 67,661,422 100 1,677,735 Net Position:
Net Investment in Capital Assets 9,991,427 44 12,948,136 50 (2,956,709) (23) Grants 8,497 - - - 8,497 100 Debt Service 1,481,109 6 1,358,864 5 122,245 9 Unrestricted 11,321,778 50 11,686,409 45 (364,631) (3)
Total Net Position $ 22,802,811 100 $ 25,993,409 100 $ (3,190,598)
Governmental Activities
2013 2012 Increase (Decrease)
STAFFORD MUNICIPAL SCHOOL DISTRICT'S NET POSITION

26
Investment in capital assets (e.g., land, buildings, furniture and equipment), less any related debt used to acquire those assets that is still outstanding is $9,991,427. Although the District’s investment in its capital assets is reported net of related debt, it should be noted that the resources needed to repay this debt must be provided from other sources, since the capital assets themselves cannot be used to liquidate these liabilities. An additional portion of the District’s net position (approximately 6%) represents resources that are subject to external restrictions on how they may be used. The remaining balance of unrestricted net position may be used to finance day-to-day operations without constraints established by debt covenants, enabling legislation, or other legal requirements.
Table 2 – Changes in Net Position Summary
2013 2012
Amount % Amount % Amount %
Revenue:
Program Revenues:
Charges for Services $ 679,245 2 $ 646,544 2 $ 32,701 5
Operating Grants and Contributions 4,151,536 13 4,455,959 14 (304,423) (7)
General Revenues:
Property Taxes, Levied for General Purpose 20,629,915 64 20,191,391 62 438,524 2
Property Taxes, Levied for Debt Service 4,157,096 13 3,623,799 11 533,297 15
Grants and Contributions Not Restricted
to Specific Programs 2,083,344 6 3,129,716 9 (1,046,372) (33)
Investment Earnings 37,985 - 60,652 - (22,667) (37)
Miscellaneous 602,216 2 506,205 2 96,011 19
Total Revenues 32,341,337 100 32,614,266 100 (272,929)
Expenses:
Instruction 17,369,464 50 15,976,008 50 1,393,456 9
Instructional Resources and Media Services 213,233 1 169,624 1 43,609 26
Curriculum and Staff Development 467,161 1 132,964 - 334,197 251
Instructional Leadership 489,436 1 456,377 1 33,059 7
School Leadership 1,923,418 5 1,573,235 5 350,183 22
Guidance, Counseling and Evaluation Services 1,112,917 3 945,625 3 167,292 18
Social Work Services - - - - - 100
Health Services 318,685 1 298,060 1 20,625 7
Student Transportation 1,022,021 3 887,353 3 134,668 15
Food Service 2,164,555 6 1,968,994 6 195,561 10
Extracurricular Activities 926,240 3 743,486 2 182,754 25
General Administration 1,480,877 4 1,555,863 5 (74,986) (5)
Plant Maintenance and Operations 3,537,163 10 3,285,241 10 251,922 8
Security and Monitoring Services 91,605 - 40,137 - 51,468 128
Data Processing Services 549,802 2 567,309 2 (17,507) (3)
Community Services 3,496 - 5,762 - (2,266) (39)
Interest on Long-term Debt 2,784,393 9 2,815,543 9 (31,150) (1)
Current Debt Fees 5,050 - 1,500 - 3,550 237
Facilities Repair and Maintenance - - - - - 100
Contracted Instructional Services Between Schools 385,328 1 605,125 2 (219,797) (36)
Payments Related to Shared Services Arrangements 23,078 - 22,938 - 140 1
Payments to Juvenile Justice Alternative Ed. Programs 20,000 - 30,000 - (10,000) (33)
Other Charges 139,819 - - 139,819 100
Total Expenses 35,027,741 100 32,081,144 100 2,946,597
Change in Net Position (2,686,404) 533,122 (3,219,526)
Net Position - Beginning 25,993,409 25,460,287 533,122
Prior Period Adjustment - Implement GASB 65
for Bond Issuance Costs (504,194) - (504,194)
Net Position - Beginning, as restated 25,489,215 25,460,287 28,928
Net Position - Ending $ 22,802,811 $ 25,993,409 $ (3,190,598)
Increase (Decrease)
Governmental Activities
STAFFORD MUNICIPAL SCHOOL DISTRICT'S CHANGES IN NET POSITION
27
$-
$5,000,000
$10,000,000
$15,000,000
$20,000,000
$25,000,000
$30,000,000
2011-2012 2012-2013
Governmental Activity Revenue
Charges for Services
Operating Grants andContributions
General Revenues
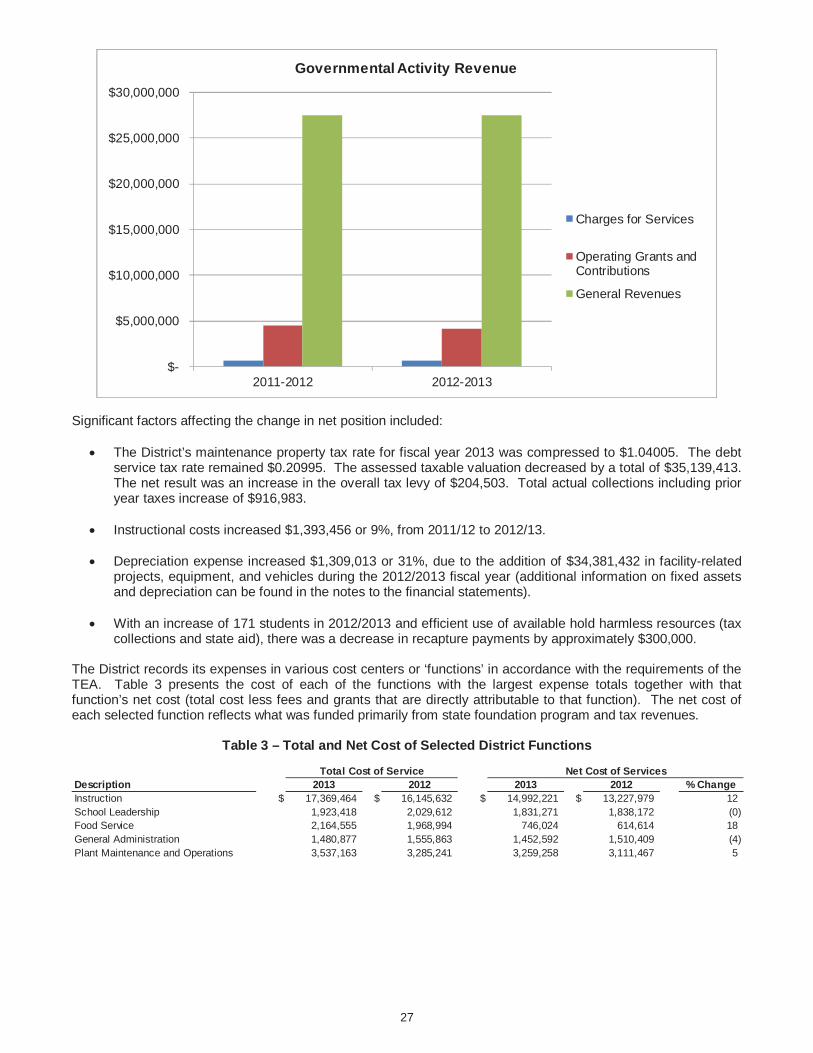
Significant factors affecting the change in net position included:
The District’s maintenance property tax rate for fiscal year 2013 was compressed to $1.04005. The debtservice tax rate remained $0.20995. The assessed taxable valuation decreased by a total of $35,139,413.The net result was an increase in the overall tax levy of $204,503. Total actual collections including prioryear taxes increase of $916,983.
Instructional costs increased $1,393,456 or 9%, from 2011/12 to 2012/13.
Depreciation expense increased $1,309,013 or 31%, due to the addition of $34,381,432 in facility-relatedprojects, equipment, and vehicles during the 2012/2013 fiscal year (additional information on fixed assetsand depreciation can be found in the notes to the financial statements).
With an increase of 171 students in 2012/2013 and efficient use of available hold harmless resources (taxcollections and state aid), there was a decrease in recapture payments by approximately $300,000.
The District records its expenses in various cost centers or ‘functions’ in accordance with the requirements of theTEA. Table 3 presents the cost of each of the functions with the largest expense totals together with thatfunction’s net cost (total cost less fees and grants that are directly attributable to that function). The net cost ofeach selected function reflects what was funded primarily from state foundation program and tax revenues.
Table 3 – Total and Net Cost of Selected District Functions
Description 2013 2012 2013 2012 % ChangeInstruction $ 17,369,464 $ 16,145,632 $ 14,992,221 $ 13,227,979 12School Leadership 1,923,418 2,029,612 1,831,271 1,838,172 (0)Food Service 2,164,555 1,968,994 746,024 614,614 18General Administration 1,480,877 1,555,863 1,452,592 1,510,409 (4)Plant Maintenance and Operations 3,537,163 3,285,241 3,259,258 3,111,467 5
Total Cost of Service Net Cost of Services

28
Financial Analysis of the Individual Funds
As noted earlier, the District uses fund accounting to ensure and demonstrate compliance with finance-related legal requirements.
The District’s individual funds are accounted for on the modified accrual basis of accounting. Under this basis of accounting, revenues are recognized when they are earned and available, and expenditures are recognized when a legal liability occurs, except for earned, accrued interest on debt which is recognized when paid.
As of August 31, 2013, the District’s combined governmental funds (as presented in Exhibit C-1 on page 36 of this report) reported a combined fund balance of $19,278,331. This compared to a combined fund balance of $39,632,702 at August 31, 2012, or a decrease of $20,354,371. Total revenues from governmental fund types decrease of $424,010 and expenditures increased $2,109,878 over prior year (governmental revenues and expenditures are presented in Exhibit C-2 on page 40).
The following chart presents the amounts of undesignated and reserved fund balances for the 2012/2013 fiscal year:
Nonspendable, 0.44%
Unassigned, 46.85%
Committed, 3.92%
Restricted, 43.60%
Assigned, 5.19%
General Fund Budgetary Highlights
In accordance with State law and generally accepted accounting standards, the District prepares an annual budget for the General Fund, the Food Service Special Revenue Fund, and for the Debt Service Fund. TheDistrict budgets the Capital Projects Fund for each project, which routinely may cover several years. Special Revenue Funds have budgets approved by the funding agency and are amended throughout the year as required.
During the year ended August 31, 2013, the District amended its budget as required by State law and to reflect current levels of revenue and anticipated expenses. District officials have adopted a conservative approach to budgeting anticipated revenues and expenditures and utilize strict budgetary controls.
Overall, the expenditures for the general fund were less than the total budget by $1,076,903 or 4.27%.

29
Capital Assets and Debt Administration
Capital Assets
Capital assets are generally defined as those items that have useful lives of two years or more and have an initial cost or value (if donated) of an amount determined by the Board. The District follows the policy of capitalizing all purchases and gifts of capital type assets that have an initial purchase price or value of $5,000 or more. District capital assets (except land) are depreciated on a straight-line basis over the anticipated life of the asset with annual depreciation expense charged to the functional categories based upon the relative use of the asset. Additional information on the District’s capital assets can be found in the notes to the financial statements.At August 31, 2013, the District had a total of $66,311,432 invested in capital assets such as land, buildings, vehicles, and equipment net of depreciation (see Table 4). Of this a total of $20,699,671 was invested in the year ended August 31, 2013.
Table 4 – Capital Assets and Depreciation
2013 2012
Amount % Amount % Amount %
Land $ 657,500 1 $ 657,500 1 $ - -
Construction in Progress 4,517,029 7 18,231,882 37 (13,714,853) (75)
Buildings and Improvements 58,297,124 88 27,872,896 56 30,424,228 109
Vehicles 1,226,756 2 1,521,646 3 (294,890) (19)
Furniture and Equipment 1,613,023 2 1,611,850 3 1,173 -
Totals $ 66,311,432 100 $ 49,895,774 100 $ 16,415,658
STAFFORD MUNICIPAL SCHOOL DISTRICT'S CAPITAL ASSETS
Governmental Activities
Increase (Decrease)
(net of depreciation)
Major capital asset projects/purchases during the current fiscal year included the following:
Bond Projects $33,942,409
Debt Administration
The laws of the State of Texas give the voters of each public school district in the state the right to approve the sale of bonds for the construction, maintenance, and equipping of school buildings and facilities. Principal and interest relating to bonds issued as a result of the successful passage of a bond election are payable from the proceeds of a debt service tax which is assessed on all taxable property within the District. This tax is levied in addition to the maintenance and operation tax and the expenditure of money from this levy is restricted to the payment of expenses, including principal and interest, related to such bonded debt.
SMSD taxpayers approved $49.9 million in bonds for district renovations, upgrades, maintenance facilities, technology equipment, and construction of a new high school wing.
At August 31, 2013, the District had three bond issues outstanding of which the unpaid principal totaled $61,955,000.
Table 5 summarizes the District’s outstanding debt at August 31, 2013. More detailed information regarding the District’s debt obligations is presented in Notes F of the Notes to the Financial Statements.
Table 5 – Summary of Outstanding Debt
2013 2012
Amount % Amount % Amount %
General Obligation Bonds (Net) $ 63,107,589 100 $ 64,360,176 100 $ (1,252,587) (2)
Capital Leases 88,822 - 115,743 - (26,921) (23)
Compensated Absences 27,890 - 23,730 - 4,160 18
Totals $ 63,224,301 100 $ 64,499,649 100 $ (1,275,348)
STAFFORD MUNICIPAL SCHOOL DISTRICT'S OUTSTANDING NONCURRENT LIABILITIES
Governmental Activities
Increase (Decrease)
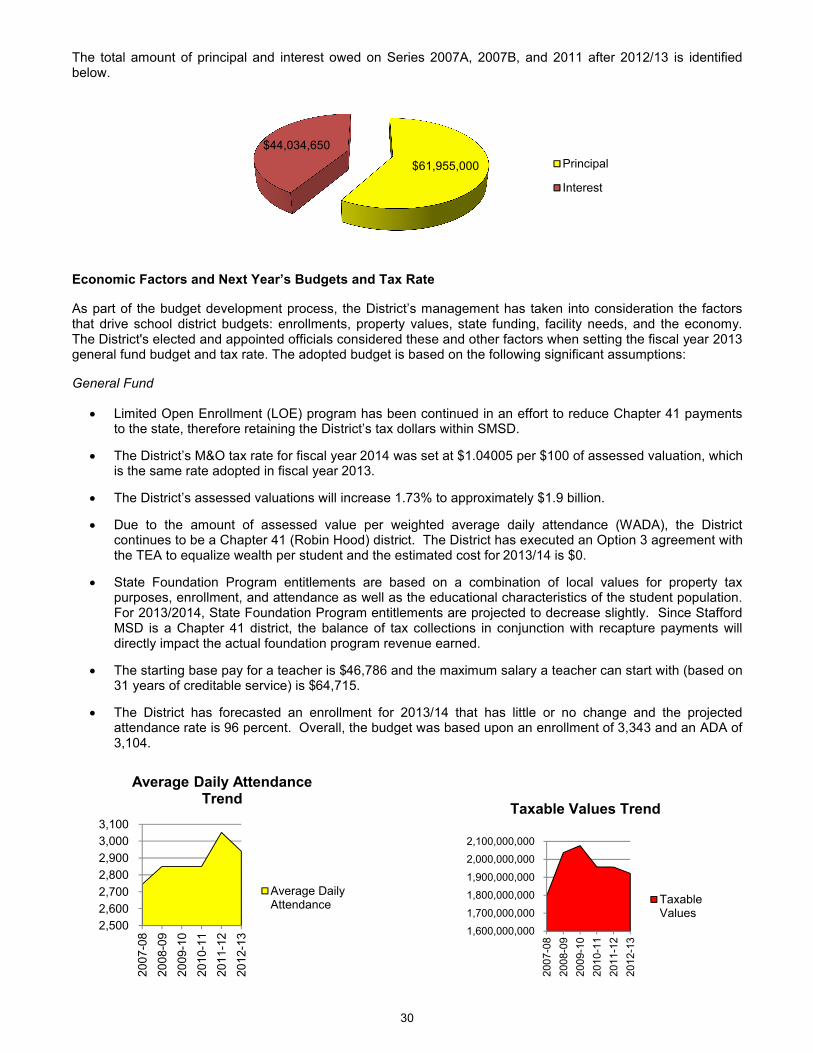
30
The total amount of principal and interest owed on Series 2007A, 2007B, and 2011 after 2012/13 is identified below.
Economic Factors and Next Year’s Budgets and Tax Rate
As part of the budget development process, the District’s management has taken into consideration the factors that drive school district budgets: enrollments, property values, state funding, facility needs, and the economy. The District's elected and appointed officials considered these and other factors when setting the fiscal year 2013general fund budget and tax rate. The adopted budget is based on the following significant assumptions:
General Fund
Limited Open Enrollment (LOE) program has been continued in an effort to reduce Chapter 41 payments to the state, therefore retaining the District’s tax dollars within SMSD.
The District’s M&O tax rate for fiscal year 2014 was set at $1.04005 per $100 of assessed valuation, which is the same rate adopted in fiscal year 2013.
The District’s assessed valuations will increase 1.73% to approximately $1.9 billion.
Due to the amount of assessed value per weighted average daily attendance (WADA), the District continues to be a Chapter 41 (Robin Hood) district. The District has executed an Option 3 agreement with the TEA to equalize wealth per student and the estimated cost for 2013/14 is $0.
State Foundation Program entitlements are based on a combination of local values for property tax purposes, enrollment, and attendance as well as the educational characteristics of the student population. For 2013/2014, State Foundation Program entitlements are projected to decrease slightly. Since Stafford MSD is a Chapter 41 district, the balance of tax collections in conjunction with recapture payments will directly impact the actual foundation program revenue earned.
The starting base pay for a teacher is $46,786 and the maximum salary a teacher can start with (based on 31 years of creditable service) is $64,715.
The District has forecasted an enrollment for 2013/14 that has little or no change and the projected attendance rate is 96 percent. Overall, the budget was based upon an enrollment of 3,343 and an ADA of 3,104.
$61,955,000
$44,034,650
Principal
Interest
2,500
2,600
2,700
2,800
2,900
3,000
3,100
20
07
-08
20
08
-09
20
09
-10
20
10
-11
20
11
-12
20
12
-13
Average Daily Attendance Trend
Average DailyAttendance
1,600,000,000
1,700,000,000
1,800,000,000
1,900,000,000
2,000,000,000
2,100,000,000
20
07
-08
20
08
-09
20
09
-10
20
10
-11
20
11
-12
20
12
-13
Taxable Values Trend
TaxableValues
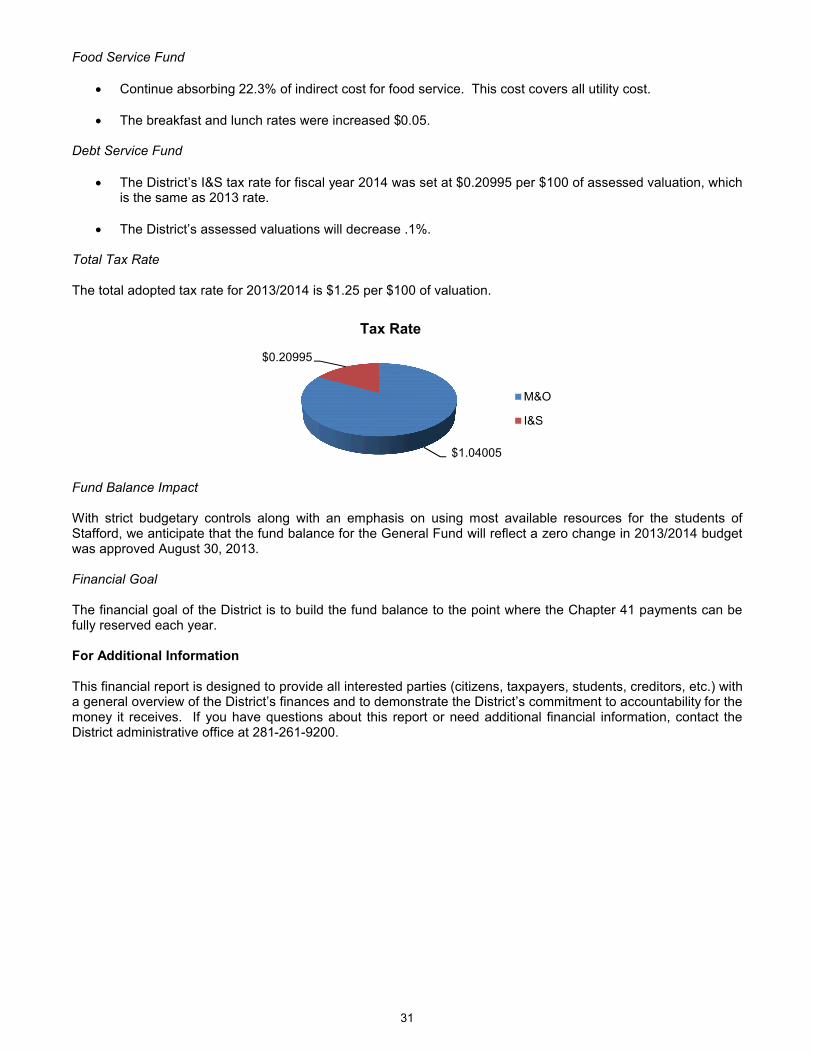
31
Food Service Fund
Continue absorbing 22.3% of indirect cost for food service. This cost covers all utility cost.
The breakfast and lunch rates were increased $0.05.
Debt Service Fund
The District’s I&S tax rate for fiscal year 2014 was set at $0.20995 per $100 of assessed valuation, which is the same as 2013 rate.
The District’s assessed valuations will decrease .1%.
Total Tax Rate
The total adopted tax rate for 2013/2014 is $1.25 per $100 of valuation.
Fund Balance Impact
With strict budgetary controls along with an emphasis on using most available resources for the students of Stafford, we anticipate that the fund balance for the General Fund will reflect a zero change in 2013/2014 budget was approved August 30, 2013.
Financial Goal
The financial goal of the District is to build the fund balance to the point where the Chapter 41 payments can be fully reserved each year.
For Additional Information
This financial report is designed to provide all interested parties (citizens, taxpayers, students, creditors, etc.) with a general overview of the District’s finances and to demonstrate the District’s commitment to accountability for the money it receives. If you have questions about this report or need additional financial information, contact the District administrative office at 281-261-9200.
$1.04005
$0.20995
Tax Rate
M&O
I&S

32
This page is left blank intentionally.
33
BASIC FINANCIAL STATEMENTS
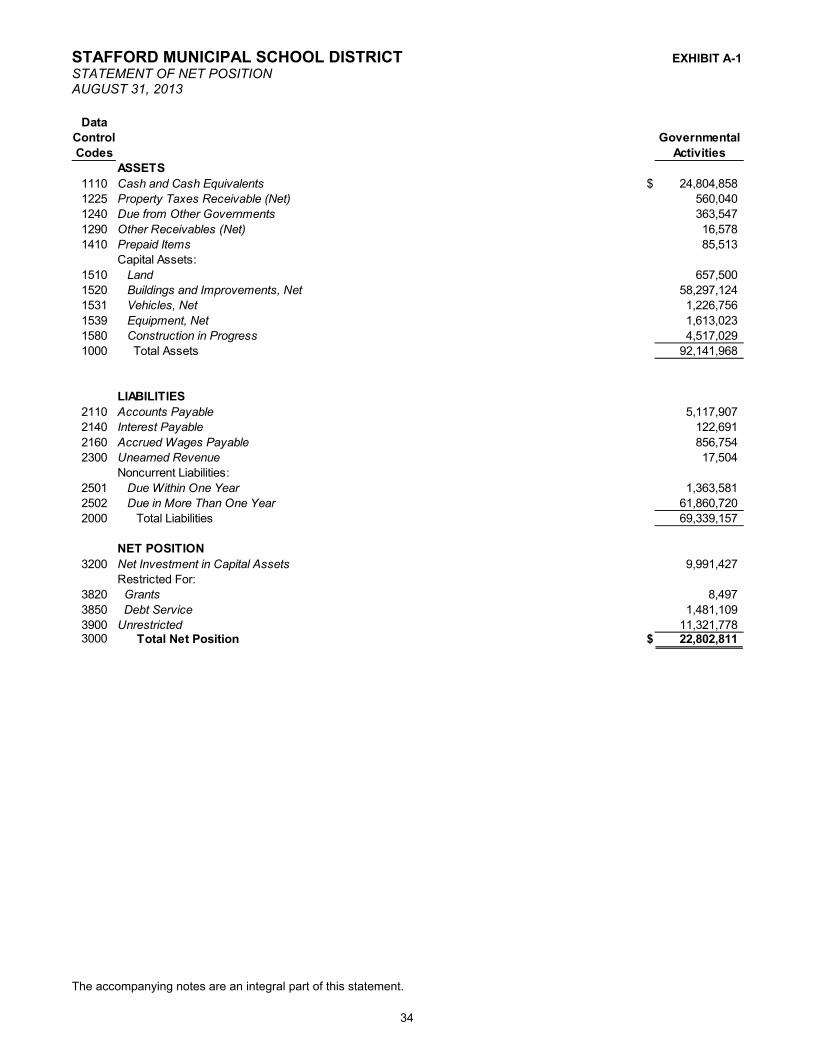
STAFFORD MUNICIPAL SCHOOL DISTRICT EXHIBIT A-1
STATEMENT OF NET POSITIONAUGUST 31, 2013
The accompanying notes are an integral part of this statement.
34
Data
Control Governmental
Codes Activities
ASSETS
1110 Cash and Cash Equivalents $ 24,804,858
1225 Property Taxes Receivable (Net) 560,040
1240 Due from Other Governments 363,547
1290 Other Receivables (Net) 16,578
1410 Prepaid Items 85,513
Capital Assets:
1510 Land 657,500
1520 Buildings and Improvements, Net 58,297,124
1531 Vehicles, Net 1,226,756
1539 Equipment, Net 1,613,023
1580 Construction in Progress 4,517,029
1000 Total Assets 92,141,968
LIABILITIES
2110 Accounts Payable 5,117,907
2140 Interest Payable 122,691
2160 Accrued Wages Payable 856,754
2300 Unearned Revenue 17,504
Noncurrent Liabilities:
2501 Due Within One Year 1,363,581
2502 Due in More Than One Year 61,860,720
2000 Total Liabilities 69,339,157
NET POSITION
3200 Net Investment in Capital Assets 9,991,427
Restricted For:
3820 Grants 8,497
3850 Debt Service 1,481,109
3900 Unrestricted 11,321,778 3000 Total Net Position $ 22,802,811

STAFFORD MUNICIPAL SCHOOL DISTRICT EXHIBIT B-1
STATEMENT OF ACTIVITIESFOR THE YEAR ENDED AUGUST 31, 2013
The accompanying notes are an integral part of this statement.
35
Net (Expense)
Revenue and
Changes in
Net Position
Data Operating
Control Charges for Grants and Governmental
Codes Functions/Programs Expenses Services Contributions Activities
Governmental Activities:
11 Instruction $ 17,369,464 $ 612,008 $ 1,765,235 $ (14,992,221) 12 Instructional Resources and Media Services 213,233 - 17,743 (195,490)
13 Curriculum and Staff Development 467,161 - 45,466 (421,695)
21 Instructional Leadership 489,436 - 160,965 (328,471)
23 School Leadership 1,923,418 - 92,147 (1,831,271)
31 Guidance, Counseling, & Evaluation Services 1,112,917 - 269,878 (843,039)
33 Health Services 318,685 - 40,636 (278,049)
34 Student Transportation 1,022,021 - 20,438 (1,001,583)
35 Food Service 2,164,555 1,230 1,417,301 (746,024)
36 Extracurricular Activities 926,240 42,462 22,260 (861,518)
41 General Administration 1,480,877 - 28,285 (1,452,592)
51 Plant Maintenance and Operations 3,537,163 23,545 254,360 (3,259,258)
52 Security and Monitoring Services 91,605 - - (91,605)
53 Data Processing Services 549,802 - 14,808 (534,994)
61 Community Services 3,496 - 2,014 (1,482)
72 Interest on Long-term Debt 2,784,393 - - (2,784,393)
73 Issuance Costs and Fees 5,050 - - (5,050)
91 Contracted Instructional Services Between Schools 385,328 - - (385,328)
93 Payments Related to Shared Service Arrangements 23,078 - - (23,078)
95 Payments to Juvenile Justice Alternative Ed. Programs 20,000 - - (20,000)
99 Other Intergovernmental Charges 139,819 - - (139,819)
TG Total Governmental Activities 35,027,741 679,245 4,151,536 (30,196,960) TP Total Primary Government $ 35,027,741 $ 679,245 $ 4,151,536 (30,196,960)
General Revenues:
MT Property Taxes, Levied for General Purposes 20,629,915
DT Property Taxes, Levied for Debt Service 4,157,096
IE Investment Earnings 37,985
GC Grants and Contributions Not Restricted to Specific Programs 2,083,344
MI Miscellaneous 602,216
TR Total General Revenues 27,510,556
CN Change in Net Position (2,686,404)
NB Net Position - Beginning 25,993,409
PA Prior Period Adjustment - Implement GASB 65 for Bond Issuance Costs (504,194)
Net Position - Beginning, as restated 25,489,215 NE Net Position - Ending $ 22,802,811
Program Revenues

STAFFORD MUNICIPAL SCHOOL DISTRICTBALANCE SHEET - GOVERNMENTAL FUNDSAUGUST 31, 2013
The accompanying notes are an integral part of this statement.
36
199 599
Data
Control
Codes
ASSETS
1110 Cash and Cash Equivalents $ 11,066,962 $ 1,518,776
1225 Taxes Receivable, Net 477,362 82,678
1240 Due from Other Governments 15,112 -
1260 Due from Other Funds 611,163 -
1290 Other Receivables 14,232 2,346
1410 Prepaid Items 27,449 -
1000 Total Assets $ 12,212,280 $ 1,603,800
LIABILITIES
2110 Accounts Payable $ 202,723 $ -
2160 Accrued Wages Payable 813,551 -
2170 Due to Other Funds 357,222 -
2300 Unearned Revenue - -
2000 Total Liabilities 1,373,496 -
DEFERRED INFLOWS OF RESOURCES
2600 Unavailable Revenue - Property Taxes 477,362 82,678
Total Deferred Inflows of Resources 477,362 82,678
FUND BALANCES
Nonspendable:
3430 Prepaid Items 27,449 -
Restricted for:
3450 Grant Funds - -
3470 Capital Acquisitions and Contractual Obligations - -
3480 Debt Service - 1,521,122
Committed to:
3540 Self-Insurance 303,000 -
3545 Other - -
Assigned to:
3570 Capital Expenditures for Equipment 1,000,000 -
3600 Unassigned 9,030,973 -
3000 Total Fund Balances 10,361,422 1,521,122
4000 Total Liabilities, Deferred Inflows of
Resources, and Fund Balances $ 12,212,280 $ 1,603,800
General Fund
Debt Service
Fund
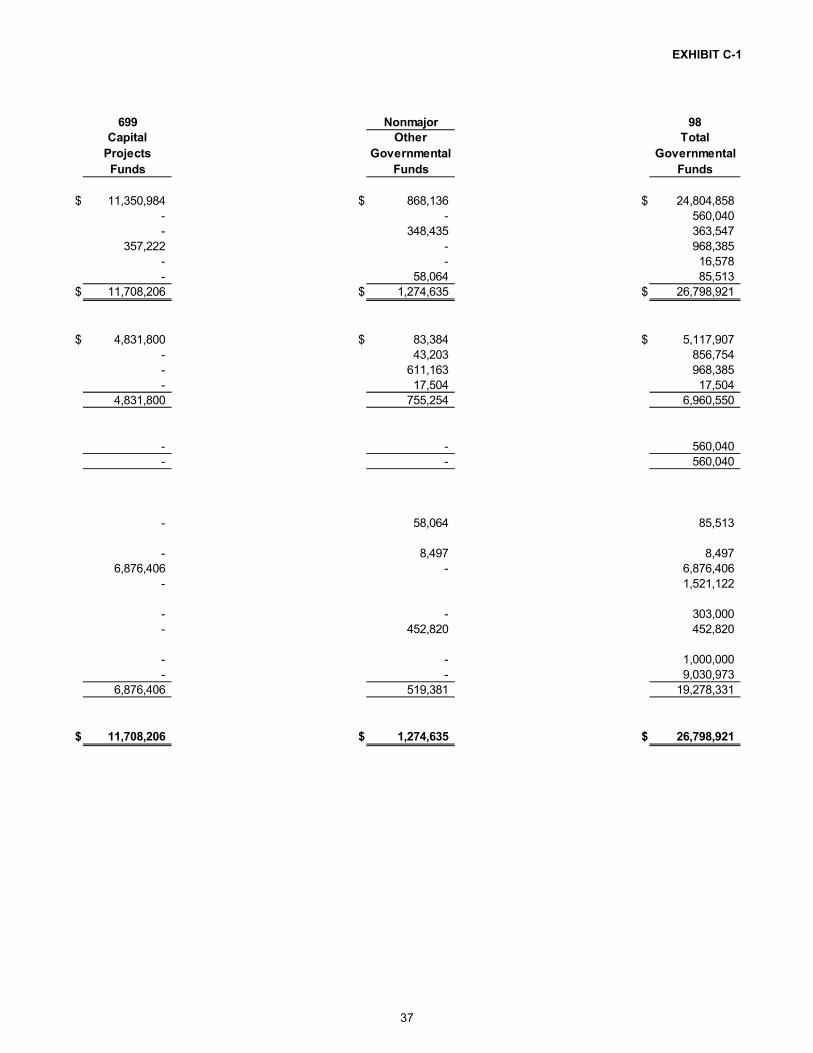
EXHIBIT C-1
37
699 Nonmajor 98
Other Total
Governmental Governmental
Funds Funds
$ 11,350,984 $ 868,136 $ 24,804,858
- - 560,040
- 348,435 363,547
357,222 - 968,385
- - 16,578
- 58,064 85,513
$ 11,708,206 $ 1,274,635 $ 26,798,921
$ 4,831,800 $ 83,384 $ 5,117,907
- 43,203 856,754
- 611,163 968,385
- 17,504 17,504
4,831,800 755,254 6,960,550
- - 560,040
- - 560,040
- 58,064 85,513
- 8,497 8,497
6,876,406 - 6,876,406
- 1,521,122
- - 303,000
- 452,820 452,820
- - 1,000,000
- - 9,030,973
6,876,406 519,381 19,278,331
$ 11,708,206 $ 1,274,635 $ 26,798,921
Capital
Projects
Funds

38
This page is left blank intentionally.
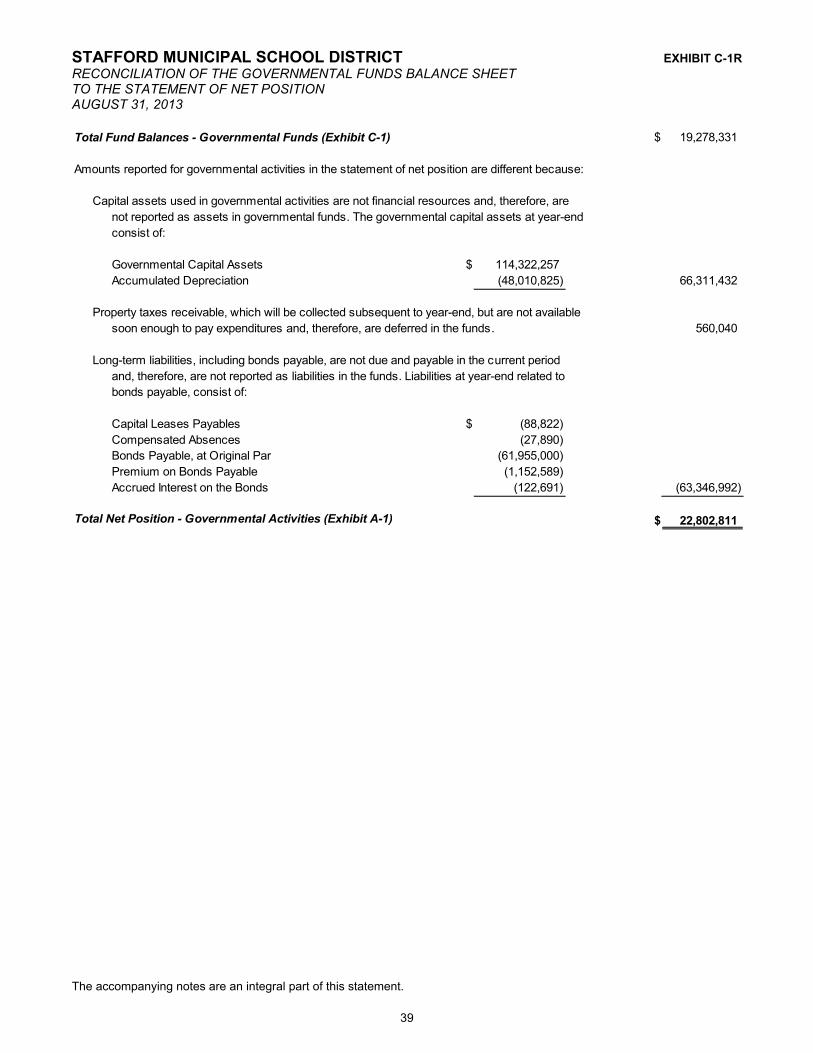
STAFFORD MUNICIPAL SCHOOL DISTRICT EXHIBIT C-1R
RECONCILIATION OF THE GOVERNMENTAL FUNDS BALANCE SHEETTO THE STATEMENT OF NET POSITIONAUGUST 31, 2013
The accompanying notes are an integral part of this statement.
39
Total Fund Balances - Governmental Funds (Exhibit C-1) $ 19,278,331
Amounts reported for governmental activities in the statement of net position are different because:
Capital assets used in governmental activities are not financial resources and, therefore, are
not reported as assets in governmental funds. The governmental capital assets at year-end
consist of:
Governmental Capital Assets $ 114,322,257
Accumulated Depreciation (48,010,825) 66,311,432
Property taxes receivable, which will be collected subsequent to year-end, but are not available
soon enough to pay expenditures and, therefore, are deferred in the funds. 560,040
Long-term liabilities, including bonds payable, are not due and payable in the current period
and, therefore, are not reported as liabilities in the funds. Liabilities at year-end related to
bonds payable, consist of:
Capital Leases Payables $ (88,822)
Compensated Absences (27,890)
Bonds Payable, at Original Par (61,955,000)
Premium on Bonds Payable (1,152,589)
Accrued Interest on the Bonds (122,691) (63,346,992)
Total Net Position - Governmental Activities (Exhibit A-1) $ 22,802,811
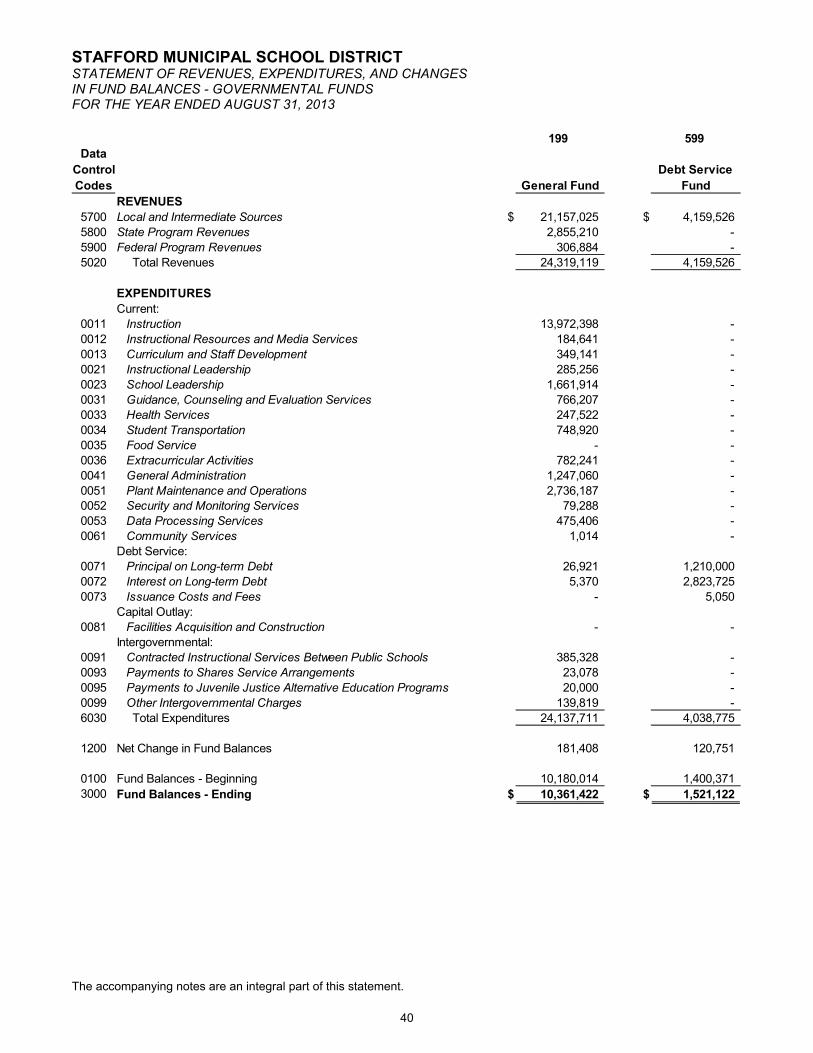
STAFFORD MUNICIPAL SCHOOL DISTRICTSTATEMENT OF REVENUES, EXPENDITURES, AND CHANGESIN FUND BALANCES - GOVERNMENTAL FUNDSFOR THE YEAR ENDED AUGUST 31, 2013
The accompanying notes are an integral part of this statement.
40
199 599
Data
Control
Codes
REVENUES
5700 Local and Intermediate Sources $ 21,157,025 $ 4,159,526
5800 State Program Revenues 2,855,210 -
5900 Federal Program Revenues 306,884 -
5020 Total Revenues 24,319,119 4,159,526
EXPENDITURES
Current:
0011 Instruction 13,972,398 -
0012 Instructional Resources and Media Services 184,641 -
0013 Curriculum and Staff Development 349,141 -
0021 Instructional Leadership 285,256 -
0023 School Leadership 1,661,914 -
0031 Guidance, Counseling and Evaluation Services 766,207 -
0033 Health Services 247,522 -
0034 Student Transportation 748,920 -
0035 Food Service - -
0036 Extracurricular Activities 782,241 -
0041 General Administration 1,247,060 -
0051 Plant Maintenance and Operations 2,736,187 - 0052 Security and Monitoring Services 79,288 -
0053 Data Processing Services 475,406 -
0061 Community Services 1,014 -
Debt Service:
0071 Principal on Long-term Debt 26,921 1,210,000
0072 Interest on Long-term Debt 5,370 2,823,725
0073 Issuance Costs and Fees - 5,050
Capital Outlay:
0081 Facilities Acquisition and Construction - -
Intergovernmental:
0091 Contracted Instructional Services Between Public Schools 385,328 -
0093 Payments to Shares Service Arrangements 23,078 -
0095 Payments to Juvenile Justice Alternative Education Programs 20,000 -
0099 Other Intergovernmental Charges 139,819 -
6030 Total Expenditures 24,137,711 4,038,775
1200 Net Change in Fund Balances 181,408 120,751
0100 Fund Balances - Beginning 10,180,014 1,400,371
3000 Fund Balances - Ending $ 10,361,422 $ 1,521,122
General Fund
Debt Service
Fund
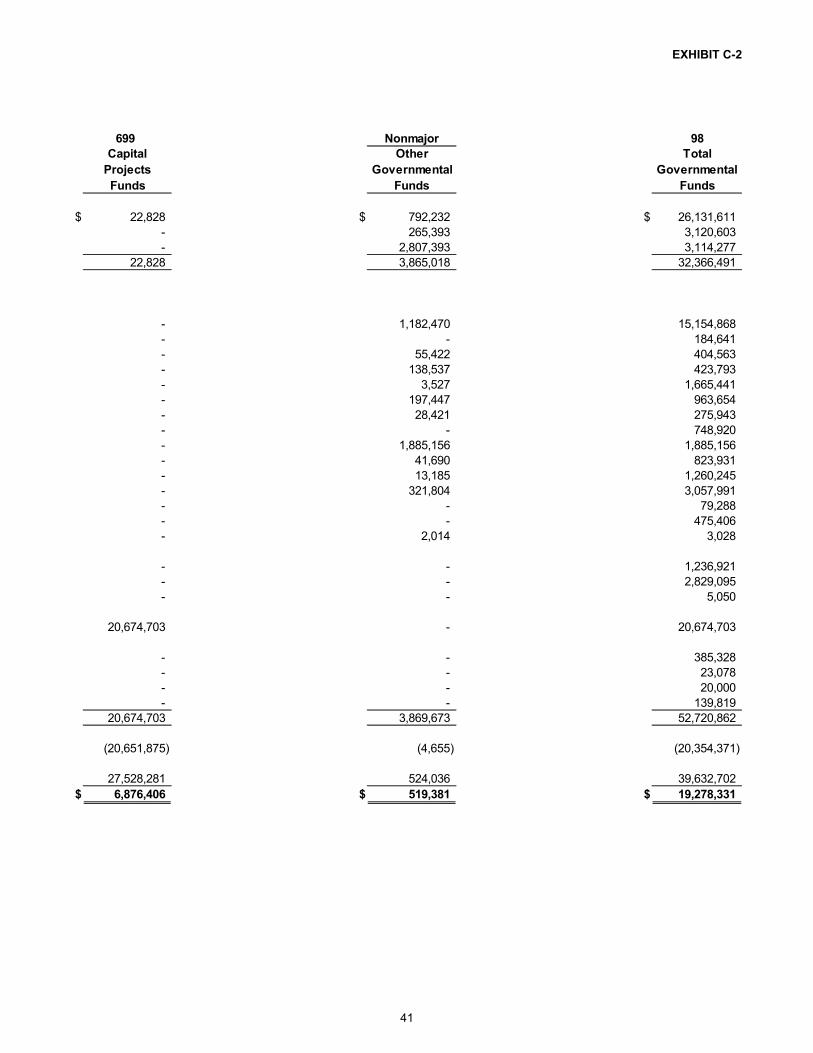
EXHIBIT C-2
41
699 Nonmajor 98
Other Total
Governmental Governmental
Funds Funds
$ 22,828 $ 792,232 $ 26,131,611
- 265,393 3,120,603
- 2,807,393 3,114,277
22,828 3,865,018 32,366,491
- 1,182,470 15,154,868
- - 184,641
- 55,422 404,563
- 138,537 423,793
- 3,527 1,665,441
- 197,447 963,654
- 28,421 275,943
- - 748,920
- 1,885,156 1,885,156
- 41,690 823,931
- 13,185 1,260,245
- 321,804 3,057,991 - - 79,288
- - 475,406
- 2,014 3,028
- - 1,236,921
- - 2,829,095
- - 5,050
20,674,703 - 20,674,703
- - 385,328
- - 23,078
- - 20,000
- - 139,819
20,674,703 3,869,673 52,720,862
(20,651,875) (4,655) (20,354,371)
27,528,281 524,036 39,632,702
$ 6,876,406 $ 519,381 $ 19,278,331
Capital
Projects
Funds

42
This page is left blank intentionally.
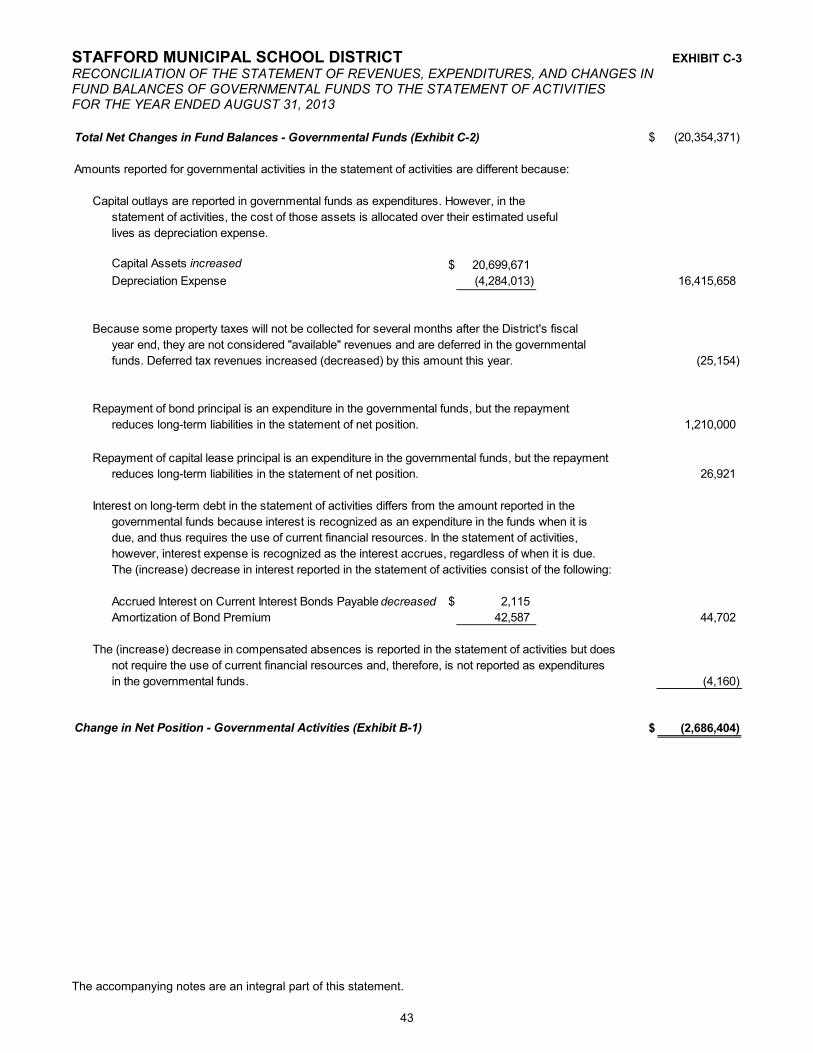
STAFFORD MUNICIPAL SCHOOL DISTRICT EXHIBIT C-3
RECONCILIATION OF THE STATEMENT OF REVENUES, EXPENDITURES, AND CHANGES INFUND BALANCES OF GOVERNMENTAL FUNDS TO THE STATEMENT OF ACTIVITIESFOR THE YEAR ENDED AUGUST 31, 2013
The accompanying notes are an integral part of this statement.
43
Total Net Changes in Fund Balances - Governmental Funds (Exhibit C-2) $ (20,354,371)
Amounts reported for governmental activities in the statement of activities are different because:
Capital outlays are reported in governmental funds as expenditures. However, in the
statement of activities, the cost of those assets is allocated over their estimated useful
lives as depreciation expense.
Capital Assets increased $ 20,699,671
Depreciation Expense (4,284,013) 16,415,658
Because some property taxes will not be collected for several months after the District's fiscal
year end, they are not considered "available" revenues and are deferred in the governmental
funds. Deferred tax revenues increased (decreased) by this amount this year. (25,154)
Repayment of bond principal is an expenditure in the governmental funds, but the repayment
reduces long-term liabilities in the statement of net position. 1,210,000
Repayment of capital lease principal is an expenditure in the governmental funds, but the repayment
reduces long-term liabilities in the statement of net position. 26,921
Interest on long-term debt in the statement of activities differs from the amount reported in the
governmental funds because interest is recognized as an expenditure in the funds when it is
due, and thus requires the use of current financial resources. In the statement of activities,
however, interest expense is recognized as the interest accrues, regardless of when it is due.
The (increase) decrease in interest reported in the statement of activities consist of the following:
Accrued Interest on Current Interest Bonds Payable decreased $ 2,115
Amortization of Bond Premium 42,587 44,702
The (increase) decrease in compensated absences is reported in the statement of activities but does
not require the use of current financial resources and, therefore, is not reported as expenditures
in the governmental funds. (4,160)
Change in Net Position - Governmental Activities (Exhibit B-1) $ (2,686,404)

STAFFORD MUNICIPAL SCHOOL DISTRICT EXHIBIT E-1
STATEMENT OF FIDUCIARY ASSETS AND LIABILITIESFIDUCIARY FUNDAUGUST 31, 2013
The accompanying notes are an integral part of this statement.
44
865
Agency
Fund
Data
Control
Codes
ASSETS
1110 Cash and Cash Equivalents $ 45,976
1000 Total Assets $ 45,976
LIABILITIES
Current Liabilities:
2190 Due to Student Groups $ 45,976
2000 Total Liabilities $ 45,976
Student
Activity
STAFFORD MUNICIPAL SCHOOL DISTRICTNOTES TO THE FINANCIAL STATEMENTSAUGUST 31, 2013
45
A. Summary of Significant Accounting Policies
1. Reporting Entity
The Board of School Trustees ("Board"), a seven-member group, has governance responsibilities over allactivities related to public elementary and secondary education within the jurisdiction of the District. TheBoard is elected by the public and has the exclusive power and duty to govern and oversee the management of the public schools of the District. All powers and duties not specifically delegated by statute to the Texas Education Agency ("TEA") or to the State Board of Education are reserved for the Board, and the TEA may not substitute its judgment for the lawful exercise of those powers and duties by the Board. The District receives funding from local, state and federal government sources and must comply with the requirements of those funding entities. The District is included in any City of Stafford "reporting entity" as defined by the GASB in its Statement No. 14, "The Financial Reporting Entity," as revised by GASB Statement No.39, and there are no component units included within the reporting entity.
Effective September 1, 2003 Texas Education Code 11.303 was put into law and it provided for the CityCouncil to participate jointly with the Board of Trustees for the following actions:
* Hearings and work sessions on the budget and ad valorem tax rate* Adopting of annual budget and ad valorem tax rates* Authorization for bonded debt issuance
2. Government-wide and Fund Financial Statements
Government-wide Financial Statements: The statement of net position and the statement of activitiesinclude the financial activities of the overall government, except for fiduciary activities. Eliminations havebeen made to minimize the double-counting of internal activities. Governmental activities generally arefinanced through taxes, intergovernmental revenues, and other nonexchange transactions.
The statement of activities presents a comparison between direct expenses and program revenues foreach function of the District's governmental activities. Direct expenses are those that are specificallyassociated with a program or function and, therefore, are clearly identifiable to a particular function. Depreciation expense has been allocated to all applicable functions in the statement of activities. Program revenues include (a) fees, fines, and charges paid by the recipients of goods or services offered by the programs and (b) grants and contributions that are restricted to meeting the operational or capital requirements of a particular program. Revenues that are not classified as program revenues, including all taxes, are presented as general revenues.
Fund Financial Statements: The fund financial statements provide information about the District's funds,with separate statements presented for each fund category. The emphasis of fund financial statements ison major governmental funds, each displayed in a separate column. All remaining governmental fundsare aggregated and reported as nonmajor funds.
3. Implementation of New Standard
Change in Accounting Principles – As a result of implementing GASB Statements Nos. 63 and 65, the District has restated the beginning net position in the government-wide statement of activities, effectively decreasing net position as of September 1, 2012 by $504,194. The decrease results from no longer deferring and amortizing bond issuance costs.
4. Measurement Focus, Basis of Accounting, and Financial Statement Presentation
The basic financial statements of Stafford Municipal School District (the "District") have been prepared in conformity with accounting principles generally accepted in the United States of America ("GAAP") applicable to governmental units in conjunction with the Texas Education Agency's Financial Accountability System Resource Guide ("Resource Guide"). The Governmental Accounting Standards Board ("GASB") is the accepted standard setting body for establishing governmental accounting and financial reporting principles.
STAFFORD MUNICIPAL SCHOOL DISTRICTNOTES TO THE FINANCIAL STATEMENTSAUGUST 31, 2013
46
The District’s accounting system is organized and operated on the basis of funds, each of which is a separate accounting entity with a self-balancing set of accounts. The District’s resources are allocated to and accounted for in individual funds based upon the purposed for which they are to be spent and the means by which spending activities are controlled. The District reports the following major governmental funds:
General Fund: This is the District's primary operating fund. It accounts for all financial resources of the District except those required to be accounted for in another fund.
Debt Service Fund: This fund is used to account for the payment of interest and principal on all bonds of the District. Primary sources of revenue for debt service are local property taxes and interest earnings.
Capital Projects Fund: This fund is to account for the expenditures of resources accumulated from sales of bonds and related interest earnings for the acquisition and construction of school facilities and other capital asset acquisitions.
In addition, the District reports the following fund types:
Special Revenue Fund: This fund is used to account for various programs. Specifically, this type of fund is used to account for the District's Food Service Program, including local, state, and federal revenuesources, for federally financed programs (grants) where unused balances are returned to the grantor at the close of specified project periods, and other state and local revenue specific programs. The Food Service Operation is the only required budgeted program. For all other programs in this fund type, project accounting is employed to maintain integrity for the various sources of the funds. Resources accounted for in this fund are awarded to the District for the purpose of accomplishing specific educational tasks as defined by the grantors in contracts or other agreements.
Agency Funds: These funds are used to report student activity funds and other resources held in a purely custodial capacity (assets equal liabilities). Agency funds typically involve only the receipt, temporary investment, and remittance of fiduciary resources to individuals, private organizations, or other governments.
Fiduciary funds are reported in the fiduciary fund financial statements. However, because their assets are held in a trustee or agent capacity and are therefore not available to support District programs, these funds are not included in the government-wide statements.
The fiduciary fund financial statements reflect the District’s agency fund, reporting only assets and liabilities, and do not have a measurement focus.
Government-wide financial statements are reported using the economic resources measurement focus, and the accrual basis of accounting, as are the proprietary fund and fiduciary fund financial statements. Revenues are recorded when earned and expenses are recorded at the time liabilities are incurred, regardless of when the related cash flows take place. Nonexchange transactions, in which the District gives (or receives) value without directly receiving (or giving) equal value in exchange, include property taxes, grants, entitlements, and donations. On an accrual basis, revenue from property taxes isrecognized in the fiscal year for which the taxes are levied. Revenue from grants, entitlements, anddonations is recognized in the fiscal year in which all eligibility requirements have been satisfied.
As a general rule, the effect of interfund activity has been eliminated from the government-wide financial statements. Interfund services that are provided and used are not eliminated in the process of consolidation.
Amounts reported as program revenues include 1) charges to students or users for goods, services, or privileges provided and 2) operating grants and contributions. Internally dedicated resources are reported as general revenues rather than as program revenues. Likewise, general revenues include all taxes and investment income.
STAFFORD MUNICIPAL SCHOOL DISTRICTNOTES TO THE FINANCIAL STATEMENTSAUGUST 31, 2013
47
Governmental fund financial statements are reported using the current financial resources measurement focus and the modified accrual basis of accounting. Under this method, revenues are recognized when measurable and available. The District does not consider revenues collected after its year-end to be available in the current period. Revenues from local sources consist primarily of property taxes. Property tax revenues and revenues received from the State are recognized under the susceptible-to-accrual concept. Miscellaneous revenues are recorded as revenue when received in cash because they are generally not measurable until actually received. Investment earnings are recorded as earned, since they are both measurable and available. Expenditures are recorded when the related fund liability is incurred, except for principal and interest on long-term debt, claims and judgments, and compensated absences, which are recognized as expenditures to the extent they have matured. Capital asset acquisitions are reported as expenditures in governmental funds. Proceeds of long-term debt and acquisitions under capital leases are reported as other financing sources.
5. Financial Statement Amounts
a. Deposit and Investments
The District’s cash and cash equivalents are considered to be cash on hand and demand deposits.
Investments for the District are reported at fair value based on quoted market prices at August 31, 2013. The investment pools operate in accordance with appropriate state laws and regulations.
b. Receivable and Payable Balances
Activity between funds that are representative of lending/borrowing arrangements outstanding at the end of the fiscal year are referred to as either "due to/from other funds" (i.e., the current portion of interfund loans) or "advances to/from other funds" (i.e., the non-current portion of interfund loans). All other outstanding balances between funds are reported as "due to/from other funds."
Property taxes are levied by October 1 on the assessed value listed as of the prior January 1 for all real and business personal property in conformity with Subtitle E, Texas Property Tax Code. Taxes are due on receipt of the tax bill and are delinquent if not paid before February 1 of the year following the year in which imposed. On January 1 of each year, a tax lien attaches to property to secure the payment of all taxes, penalties, and interest ultimately imposed. Property tax revenues are considered available when they become due or past due and receivable within the current period.
Allowances for uncollectible tax receivables within the General and Debt Service Funds are based upon historical experience in collecting property taxes. Uncollectible personal property taxes are periodically reviewed and written off, but the District is prohibited from writing off real property taxes without specific statutory authority from the Texas Legislature.
c. Inventories and Prepaid Items
Inventories consisting of supplies and materials are valued at weighted average cost when an item ispurchased, and are subsequently recognized as expenditures when consumed.
Certain payments to vendors reflect costs applicable to future accounting periods and are recorded as prepaid items.
d. Capital Assets
Purchased or constructed capital assets are reported at cost or estimated historical cost. Donated fixed assets are recorded at their estimated fair value at the date of the donation. The cost of normalmaintenance and repairs that do not add to the value of the asset or materially extend assets' lives are not capitalized. A capitalization threshold of $5,000 is used.

STAFFORD MUNICIPAL SCHOOL DISTRICTNOTES TO THE FINANCIAL STATEMENTSAUGUST 31, 2013
48
Capital assets are being depreciated using the straight-line method over the following estimated useful lives:
EstimatedAsset Class Useful LivesBuildings 30Portable Buildings 20Building Improvements 20Vehicles 8-9Equipment 3-15
Land and construction in progress are not depreciated.
e. Compensated Absences
On retirement or death of certain employees, the District pays any accrued sick leave and vacationleave in a lump case payment to such employee or his/her estate. Effective November 19, 2002, and thereafter, an employee who retires in accordance with Teacher Retirement System (TRS) guidelines after 20 or more years of service in the District shall be paid for up to 90 workdays of unused local leave as follows. A professional employee shall be paid at the rate of $60 per day for each day of unused local leave. A paraprofessional or auxiliary employee shall be paid at the rate of 50% of the daily wage at the time of retirement, not to exceed $40 per day, for each day of unused local leave.
f. Interfund Activity
Transfers In and Transfers Out are netted and presented as a single "Transfers" line on thegovernment-wide statement of activities. Similarly, interfund receivables and payables are netted andpresented as a single "Internal Balances" line of the government-wide statement of net position.
g. Use of Estimates
The preparation of financial statements in conformity with GAAP requires the use of management's estimates. Accordingly actual results may vary.
h. Data Control Codes
Data Control Codes appear in the rows and above the columns of certain financial statements. The TEA requires the display of these codes in the financial statements filed with TEA in order to insure accuracy in building a statewide database for policy development and funding plans.
i. Long-term Obligations
In the government-wide financial statements, long-term debt and other long-term obligations are reported as liabilities in the applicable governmental activities of net position. Bond premiums and discounts are deferred and amortized over the life of the bonds using the effective interest method. Bonds payable are reported net of the applicable bond premium or discount.
In the fund financial statements, governmental fund types recognize bond premiums and discounts during the current period. The face amount of debt issued is reported as other financing sources. Premiums received on debt issuances are reported as other financing sources while discounts on debt issuances are reported as other financing uses.
j. Deferred Outflows/Inflows of Resources
In addition to assets, the statement of financial position will sometimes report a separate section for deferred outflows of resources. The separate financial statement element, deferred outflows of resources, represents a consumption of net position that applies to a future period(s) and so will not
STAFFORD MUNICIPAL SCHOOL DISTRICTNOTES TO THE FINANCIAL STATEMENTSAUGUST 31, 2013
49
be recognized as an outflow of resources (expense/expenditure) until then. The District does not have an item that qualifies for reporting in the category.
In addition to liabilities, the statement of financial position will sometimes report a separate section for deferred inflows of resources. This separate financial statement element, deferred inflows of resources, represents an acquisition of net position that applies to a future period(s) and so will not be recognized as an inflow of resources (revenue) until that time. Accordingly, the District reports unavailable revenue-property taxes in the governmental balance sheet. Unavailable revenue-property taxes is deferred and recognized as an inflow of resources in the period that the amounts become available.
k. Net Position Flow Assumptions
Sometimes the District will fund outlays for a particular purpose from both restricted (e.g., restricted bond or grant proceeds) and unrestricted resources. In order to calculate the amounts to report as restricted-net position and unrestricted-net position in the government-wide and proprietary fund financial statements, a flow assumption must be made about the order in which the resources are considered to be applied. It is the District’s policy to consider restricted-net position to have been depleted before unrestricted-net position is applied.
l. Fund Balance Flow Assumptions
Sometimes the District will fund outlays for a particular purpose from both restricted and unrestricted resources (the total of committed, assigned, and unassigned fund balance). It is the District’s policy to use restricted resources first, then unrestricted resources as they are needed. In order to calculate the amounts to report as restricted, committed, assigned, and unassigned fund balance in the governmental funds financial statements, a flow assumption must be made about the order in whichthe resources are considered to be applied. The District considers that committed amounts would be reduced first, followed by assigned amounts, and then unassigned amounts when expenditures are incurred for purposes for which amounts in any unrestricted fund balance classification could be used.
m. Fund Balance Policies
In the fund financial statements, governmental funds report fund balances based on classifications that comprise a hierarchy that is based primarily on the extent to which the District is bound to honor constraints on the specific purposes for which the amounts in the respective governmental funds can be spent. The District reports the following classifications of fund balances:
Nonspendable Fund Balance - represents amounts that cannot be spent because they are either not in spendable form (such as inventory or prepaid insurance) or legally required to remain intact (such as notes receivable or principal of a permanent fund).
Restricted Fund Balance - represents amounts that are constrained by external parties, constitutional provisions or enabling legislation.
Committed Fund Balance - represents amounts that can only be used for a specific purpose because of a formal action by the District's governing board. Committed amounts cannot be used for any other purpose unless the governing board removes those constraints by taking the same type of formal action. Committed fund balance amounts may be used for other purposes with appropriate due process by the governing board. Commitments are typically done through adoption and amendment of the budget. Committed fund balance amounts differ from restricted balances in that the constraints on their use do not come from outside parties, constitutional provisions, or enabling legislation.
Assigned Fund Balance - represents amounts which the District intends to use for a specific purpose, but that do not meet the criteria to be classified as restricted or committed. Intent may be stipulated by the governing board or by an official or body to which the governing board delegates the authority. Specific amounts that are not restricted or committed in a special revenue, capital projects, debt

STAFFORD MUNICIPAL SCHOOL DISTRICTNOTES TO THE FINANCIAL STATEMENTSAUGUST 31, 2013
50
service or permanent fund are assigned for purposes in accordance with the nature of their fund type or the fund's primary purpose. Assignments within the general fund conveys that the intended use of those amounts is for a specific purpose that is narrower than the general purposes of the District itself.
Unassigned Fund Balance - represents amounts which are unconstrained in that they may be spent for any purpose. Only the general fund reports a positive unassigned fund balance. Other governmental funds might report a negative balance in this classification because of overspending for specific purposes for which amounts had been restricted, committed or assigned.
B. Stewardship, Compliance, and Accountability
1. Budgetary Information
The Board of Trustees and City Council adopts an appropriated budget for general fund, debt service fund, and the National School Breakfast and Lunch Program special revenue fund on a basis consistent with GAAP. Budgetary information for the general fund appears in the required supplementary information subsection where the District compares the final amended budget to actual revenues and expenditures. Per regulatory requirements, the debt service fund and the National School Breakfast and Lunch Program special revenue fund are required to be reported with the original budget, final amended budget and actual revenues and expenditures. These schedules are included in the combining and individual fund statements and schedules subsection. All other governmental funds adopt project-length budgets. All annual appropriations lapse at fiscal year-end.
The following procedures are followed in establishing the budgetary data reflected in the financial schedules:
a. Prior to August 20 of the preceding fiscal year, the District prepares a budget for the next succeeding fiscal year beginning September 1. The operating budget includes proposed expenditures and the means of financing them.
b. A meeting of the Board and Council is then called for the purpose of adopting the proposed budget after ten days’ public notice of the meeting has been given.
c. Prior to September 1, the budget is formally approved and adopted by the Board and Council.
The appropriated budget is prepared by fund and function. The District’s campus/department heads may make transfers of appropriations within a campus/department. Transfers of appropriations between campuses/departments require the approval of the District’s management. Increasing any one of the functional spending categories, or revenues object accounts and other resources required the approval of the Board. The legal level of budgetary control (i.e., the level at which expenditures may not legally exceed appropriations) is the function level within a fund. The District made several supplemental budgetary revisions throughout the year, primarily in the general fund. These revision are further detailed in the notes to the required supplementary information.
2. Encumbrances
Encumbrance accounting is employed in governmental funds. Encumbrances (e.g., purchase orders, contracts) outstanding at year-end are reported as restricted, committed, or assigned, as appropriate.
At August 31, 2013, certain amounts which were previously restricted, committed, or assigned for specific purposes have been encumbered in the governmental funds. The District did not have any encumbrances on August 31, 2013.
C. Deposits and Investments
The District's funds are required to be deposited and invested under the terms of a depository contract. The depository bank deposits for safekeeping and trust with the District's agent bank approved pledged securities in an amount sufficient to protect District funds on a day-to-day basis during the period of the contract. The pledge of approved securities is waived only to the extent of the depository bank's dollar amount of Federal Deposit Insurance Corporation ("FDIC") insurance.
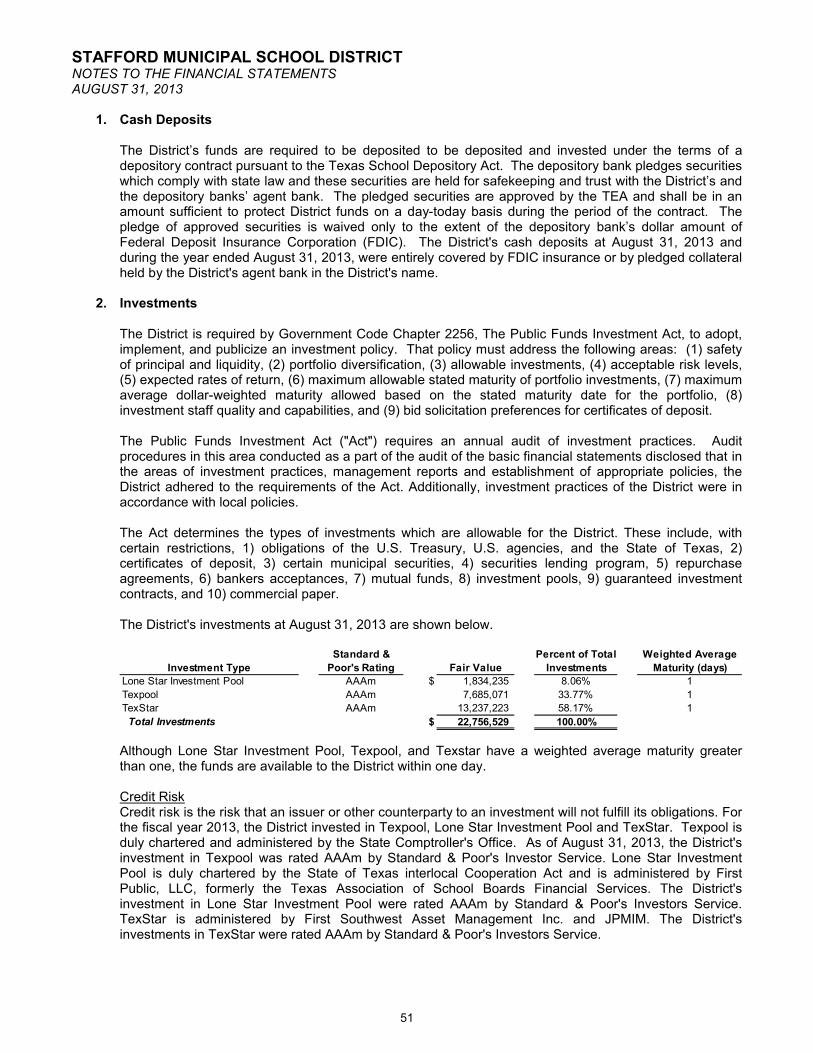
STAFFORD MUNICIPAL SCHOOL DISTRICTNOTES TO THE FINANCIAL STATEMENTSAUGUST 31, 2013
51
1. Cash Deposits
The District’s funds are required to be deposited to be deposited and invested under the terms of a depository contract pursuant to the Texas School Depository Act. The depository bank pledges securities which comply with state law and these securities are held for safekeeping and trust with the District’s and the depository banks’ agent bank. The pledged securities are approved by the TEA and shall be in an amount sufficient to protect District funds on a day-today basis during the period of the contract. The pledge of approved securities is waived only to the extent of the depository bank’s dollar amount of Federal Deposit Insurance Corporation (FDIC). The District's cash deposits at August 31, 2013 and during the year ended August 31, 2013, were entirely covered by FDIC insurance or by pledged collateral held by the District's agent bank in the District's name.
2. Investments
The District is required by Government Code Chapter 2256, The Public Funds Investment Act, to adopt,implement, and publicize an investment policy. That policy must address the following areas: (1) safety of principal and liquidity, (2) portfolio diversification, (3) allowable investments, (4) acceptable risk levels, (5) expected rates of return, (6) maximum allowable stated maturity of portfolio investments, (7) maximum average dollar-weighted maturity allowed based on the stated maturity date for the portfolio, (8) investment staff quality and capabilities, and (9) bid solicitation preferences for certificates of deposit.
The Public Funds Investment Act ("Act") requires an annual audit of investment practices. Audit procedures in this area conducted as a part of the audit of the basic financial statements disclosed that in the areas of investment practices, management reports and establishment of appropriate policies, the District adhered to the requirements of the Act. Additionally, investment practices of the District were in accordance with local policies.
The Act determines the types of investments which are allowable for the District. These include, with certain restrictions, 1) obligations of the U.S. Treasury, U.S. agencies, and the State of Texas, 2) certificates of deposit, 3) certain municipal securities, 4) securities lending program, 5) repurchase agreements, 6) bankers acceptances, 7) mutual funds, 8) investment pools, 9) guaranteed investment contracts, and 10) commercial paper.
The District's investments at August 31, 2013 are shown below.
Standard & Percent of Total Weighted Average
Investment Type Poor's Rating Fair Value Investments Maturity (days)
Lone Star Investment Pool AAAm $ 1,834,235 8.06% 1
Texpool AAAm 7,685,071 33.77% 1
TexStar AAAm 13,237,223 58.17% 1
Total Investments $ 22,756,529 100.00%
Although Lone Star Investment Pool, Texpool, and Texstar have a weighted average maturity greater than one, the funds are available to the District within one day.
Credit RiskCredit risk is the risk that an issuer or other counterparty to an investment will not fulfill its obligations. For the fiscal year 2013, the District invested in Texpool, Lone Star Investment Pool and TexStar. Texpool is duly chartered and administered by the State Comptroller's Office. As of August 31, 2013, the District's investment in Texpool was rated AAAm by Standard & Poor's Investor Service. Lone Star Investment Pool is duly chartered by the State of Texas interlocal Cooperation Act and is administered by First Public, LLC, formerly the Texas Association of School Boards Financial Services. The District's investment in Lone Star Investment Pool were rated AAAm by Standard & Poor's Investors Service.TexStar is administered by First Southwest Asset Management Inc. and JPMIM. The District's investments in TexStar were rated AAAm by Standard & Poor's Investors Service.
STAFFORD MUNICIPAL SCHOOL DISTRICTNOTES TO THE FINANCIAL STATEMENTSAUGUST 31, 2013
52
Custodial Credit RiskDeposits are exposed to custodial credit risk if they are not covered by depository insurance and thedeposits are uncollateralized, collateralized with securities held by the pledging financial institution, orcollateralized with securities held by the pledging financial institution's trust department or agent but not in the District's name.
Investment securities are exposed to custodial credit risk if the securities are uninsured, are not registered in the name of the government, and are held by either the counterparty or the counterparty's trust department or agent but not in the District's name.
At year end, the District was not exposed to custodial credit risk.
Concentration of Credit RiskThis risk is the risk of loss attributed to the magnitude of a government's investment in a single issuer. The District was not exposed to concentration of credit risk, since it was in compliance with its policy that requires the District to diversify its investments.
Interest Rate RiskThis is the risk that changes in interest rates will adversely affect the fair value of an investment. The District was manages this risk by limiting the maximum dollar weighted average maturity to 180 days.
Investment Accounting PolicyThe District's general policy is to report money market investments and short-term participating interest-earning investment contracts at amortized cost and to report nonparticipating interest-earning investment contracts using a cost-based measure. However, if the fair value of an investment is significantly affected by the impairment of the credit standing of the issuer or by other factors, it is reported at fair value. All other investments are reported at fair value unless a legal contract exists which guarantees a higher value. The term "short-term" refers to investments which have a remaining term of one year or less at time of purchase. The term "nonparticipating" means that the investment's value does not vary with market interest rate changes. Nonnegotiable certificates of deposit are examples of nonparticipating interest-earning investment contracts.
Public Funds Investment PoolsPublic funds investment pools in Texas ("Pools") are established under the authority of the Interlocal Cooperation Act, Chapter 79 of the Texas Government Code, and are subject to the provisions of the Public Funds Investment Act (the "Act"), Chapter 2256 of the Texas Government Code. In addition to other provisions of the Act designed to promote liquidity and safety of principal, the Act requires Pools to: 1) have an advisory board composed of participants in the pool and other persons who do not have a business relationship with the pool and are qualified to advise the pool; 2) maintain a continuous rating of no lower than AAA or AAA-m or an equivalent rating by at least one nationally recognized rating service; and 3) maintain the market value of its underlying investment portfolio within one half of one percent of the value of its shares.
The District's investments in Pools are reported at an amount determined by the fair value per share of the pool's underlying portfolio, unless the pool is 2a7-like, in which case they are reported at share value. A 2a7-like pool is one which is not registered with the Securities and Exchange Commission ("SEC") as an investment company, but nevertheless has a policy that it will, and does, operate in a manner consistent with the SEC's Rule 2a7 of the Investment Company Act of 1940.
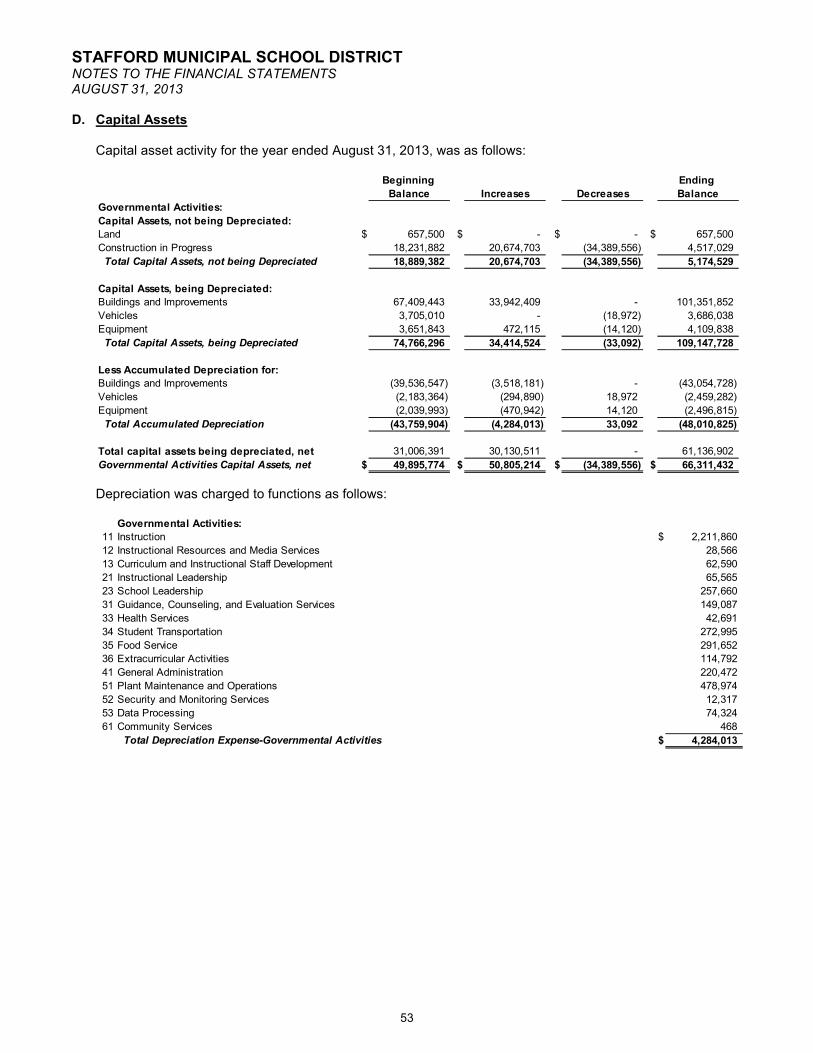
STAFFORD MUNICIPAL SCHOOL DISTRICTNOTES TO THE FINANCIAL STATEMENTSAUGUST 31, 2013
53
D. Capital Assets
Capital asset activity for the year ended August 31, 2013, was as follows:
Beginning Ending
Balance Increases Decreases Balance
Governmental Activities:
Capital Assets, not being Depreciated:
Land $ 657,500 $ - $ - $ 657,500
Construction in Progress 18,231,882 20,674,703 (34,389,556) 4,517,029
Total Capital Assets, not being Depreciated 18,889,382 20,674,703 (34,389,556) 5,174,529
Capital Assets, being Depreciated:
Buildings and Improvements 67,409,443 33,942,409 - 101,351,852
Vehicles 3,705,010 - (18,972) 3,686,038
Equipment 3,651,843 472,115 (14,120) 4,109,838
Total Capital Assets, being Depreciated 74,766,296 34,414,524 (33,092) 109,147,728
Less Accumulated Depreciation for:
Buildings and Improvements (39,536,547) (3,518,181) - (43,054,728)
Vehicles (2,183,364) (294,890) 18,972 (2,459,282)
Equipment (2,039,993) (470,942) 14,120 (2,496,815)
Total Accumulated Depreciation (43,759,904) (4,284,013) 33,092 (48,010,825)
Total capital assets being depreciated, net 31,006,391 30,130,511 - 61,136,902
Governmental Activities Capital Assets, net $ 49,895,774 $ 50,805,214 $ (34,389,556) $ 66,311,432
Depreciation was charged to functions as follows:
Governmental Activities:
11 Instruction $ 2,211,860
12 Instructional Resources and Media Services 28,566
13 Curriculum and Instructional Staff Development 62,590
21 Instructional Leadership 65,565
23 School Leadership 257,660
31 Guidance, Counseling, and Evaluation Services 149,087
33 Health Services 42,691
34 Student Transportation 272,995
35 Food Service 291,652
36 Extracurricular Activities 114,792
41 General Administration 220,472
51 Plant Maintenance and Operations 478,974
52 Security and Monitoring Services 12,317
53 Data Processing 74,324
61 Community Services 468
Total Depreciation Expense-Governmental Activities $ 4,284,013

STAFFORD MUNICIPAL SCHOOL DISTRICTNOTES TO THE FINANCIAL STATEMENTSAUGUST 31, 2013
54
E. Interfund Balances and Activities
Interfund balances consist of short-term lending/borrowing arrangements that result primarily from payroll and other regularly occurring charges that are paid by the general fund and then are charged back to the appropriate other fund. Additionally, some lending/borrowing may occur between two or more nonmajor governmental funds.
The composition of interfund balances as of August 31, 2013 is as follow:
Interfund Interfund
Fund Receivables Payables
Governmental Funds:
General Fund $ 611,163 $ 357,222
Capital Projects Fund 357,222 -
Other Governmental Funds - Nonmajor - 611,163
Total Governmental Funds $ 968,385 $ 968,385
All amounts due are scheduled to be repaid within one year.
F. Long-Term Obligations
Long-term liabilities include general obligation bonds, capital leases and compensated absences. The current and prior requirements for compensated absences are accounted for in the general fund. Changes in long-term obligations for the year ended August 31, 2013, are as follows:
Beginning Ending Due Within
Balance Increases Decreases Balance One Year
Governmental Activities:
Bonds Payable:
General Obligation Bonds $ 63,165,000 $ - $ 1,210,000 $ 61,955,000 $ 1,335,000
Deferred Amounts: - -
Premiums/Discounts 1,195,176 - 42,587 1,152,589 -
Total Bonds Payable 64,360,176 - 1,252,587 63,107,589 1,335,000
Capital Leases 115,743 26,921 88,822 28,581
Compensated Absences 23,730 4,160 - 27,890 -
Total Long-term Liabilities $ 64,499,649 $ 4,160 $ 1,279,508 $ 63,224,301 $ 1,363,581
The following is a summary of the general obligation bonds outstanding at the close of the fiscal year:
Issue Interest Maturity Amount of Bond
Date Rate (%) Date Original Issue Outstanding
2007 6/1/2007 4.1% - 6.0% 8/15/2026 $ 15,050,000 $ 12,555,000
2011 8/1/2011 2.0% - 5.0% 8/15/2041 49,900,000 49,400,000
Totals $ 64,950,000 $ 61,955,000
Bond Series
Debt service requirements on general obligation bonds debt at August 31, 2013, are as follows:
Principal Interest Total
2014 $ 1,335,000 $ 2,775,875 $ 4,110,875
2015 1,470,000 2,724,325 4,194,325
2016 1,610,000 2,664,625 4,274,625
2017 1,760,000 2,599,900 4,359,900
2018-2022 10,110,000 11,694,250 21,804,250
2023-2027 11,540,000 9,126,950 20,666,950
2028-2032 9,915,000 6,716,700 16,631,700
2033-2037 12,280,000 4,359,750 16,639,750
2038-2041 11,935,000 1,372,275 13,307,275
Totals $ 61,955,000 $ 44,034,650 $ 105,989,650
Governmental Activities - Bonds Year Ending
August 31,
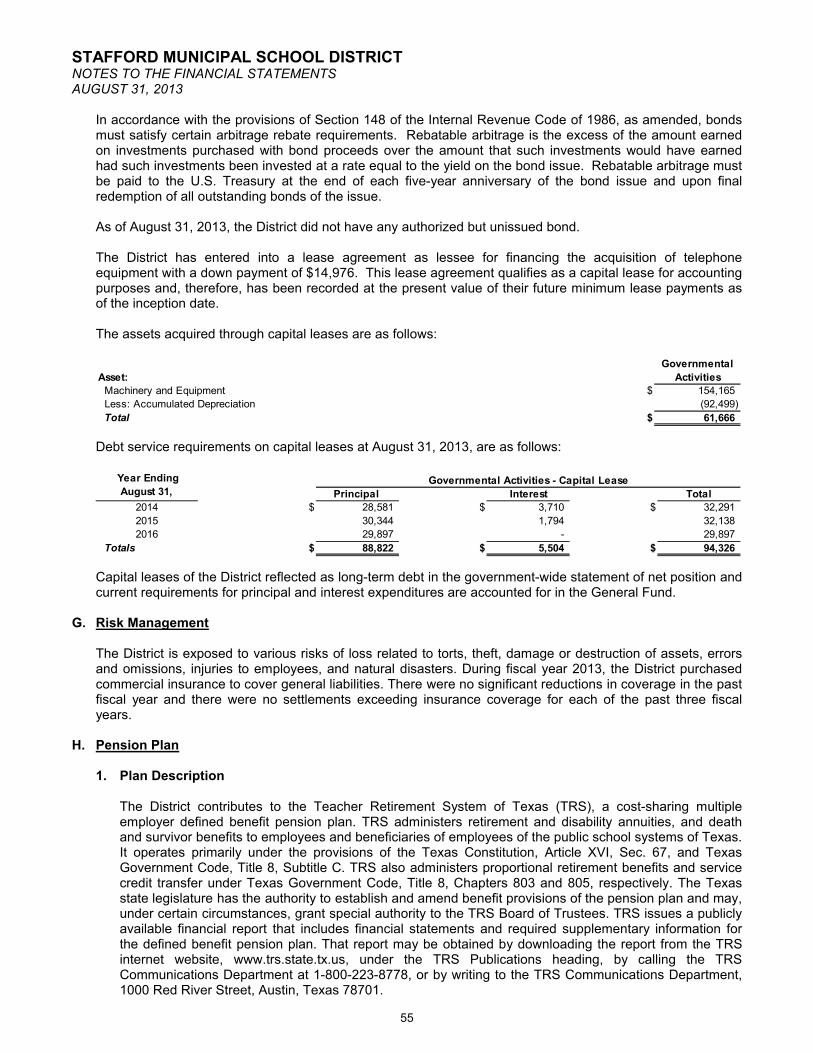
STAFFORD MUNICIPAL SCHOOL DISTRICTNOTES TO THE FINANCIAL STATEMENTSAUGUST 31, 2013
55
In accordance with the provisions of Section 148 of the Internal Revenue Code of 1986, as amended, bonds must satisfy certain arbitrage rebate requirements. Rebatable arbitrage is the excess of the amount earned on investments purchased with bond proceeds over the amount that such investments would have earned had such investments been invested at a rate equal to the yield on the bond issue. Rebatable arbitrage must be paid to the U.S. Treasury at the end of each five-year anniversary of the bond issue and upon final redemption of all outstanding bonds of the issue.
As of August 31, 2013, the District did not have any authorized but unissued bond.
The District has entered into a lease agreement as lessee for financing the acquisition of telephone equipment with a down payment of $14,976. This lease agreement qualifies as a capital lease for accounting purposes and, therefore, has been recorded at the present value of their future minimum lease payments as of the inception date.
The assets acquired through capital leases are as follows:
Governmental
Asset: Activities
Machinery and Equipment $ 154,165
Less: Accumulated Depreciation (92,499)
Total $ 61,666
Debt service requirements on capital leases at August 31, 2013, are as follows:
Principal Interest Total
2014 $ 28,581 $ 3,710 $ 32,291
2015 30,344 1,794 32,138
2016 29,897 - 29,897
Totals $ 88,822 $ 5,504 $ 94,326
Governmental Activities - Capital Lease Year Ending
August 31,
Capital leases of the District reflected as long-term debt in the government-wide statement of net position and current requirements for principal and interest expenditures are accounted for in the General Fund.
G. Risk Management
The District is exposed to various risks of loss related to torts, theft, damage or destruction of assets, errors and omissions, injuries to employees, and natural disasters. During fiscal year 2013, the District purchased commercial insurance to cover general liabilities. There were no significant reductions in coverage in the past fiscal year and there were no settlements exceeding insurance coverage for each of the past three fiscal years.
H. Pension Plan
1. Plan Description
The District contributes to the Teacher Retirement System of Texas (TRS), a cost-sharing multiple employer defined benefit pension plan. TRS administers retirement and disability annuities, and death and survivor benefits to employees and beneficiaries of employees of the public school systems of Texas. It operates primarily under the provisions of the Texas Constitution, Article XVI, Sec. 67, and Texas Government Code, Title 8, Subtitle C. TRS also administers proportional retirement benefits and service credit transfer under Texas Government Code, Title 8, Chapters 803 and 805, respectively. The Texas state legislature has the authority to establish and amend benefit provisions of the pension plan and may, under certain circumstances, grant special authority to the TRS Board of Trustees. TRS issues a publicly available financial report that includes financial statements and required supplementary information for the defined benefit pension plan. That report may be obtained by downloading the report from the TRS internet website, www.trs.state.tx.us, under the TRS Publications heading, by calling the TRS Communications Department at 1-800-223-8778, or by writing to the TRS Communications Department, 1000 Red River Street, Austin, Texas 78701.
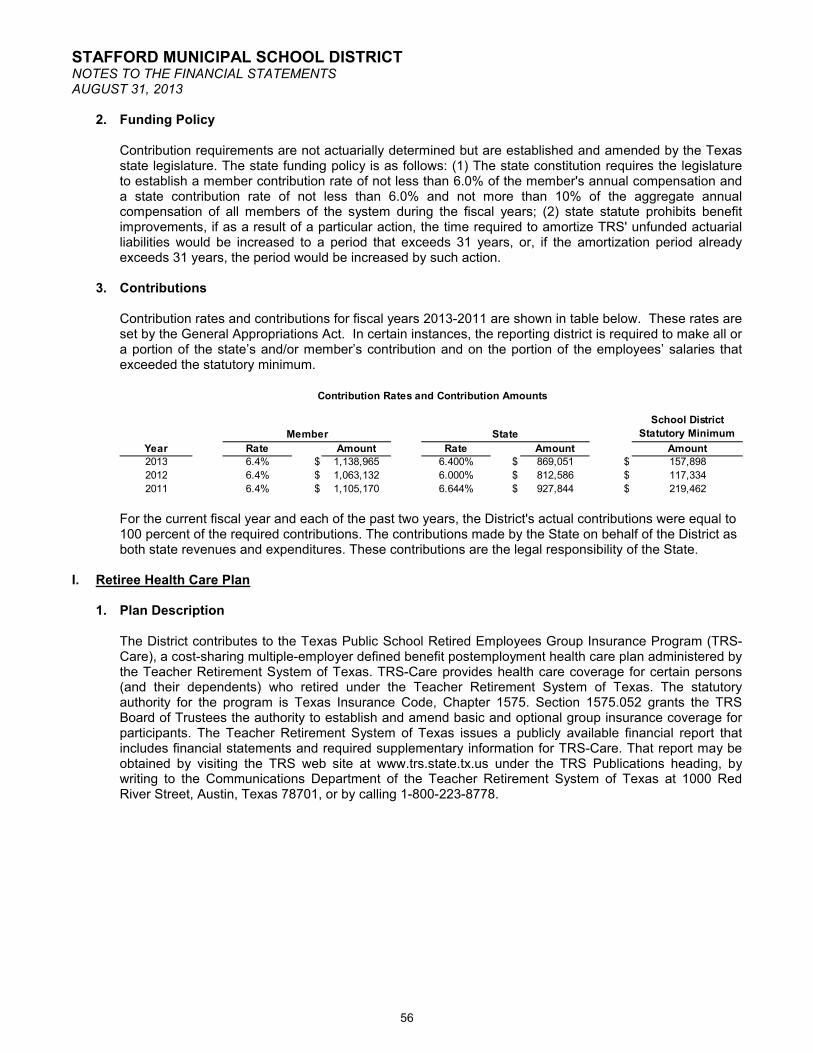
STAFFORD MUNICIPAL SCHOOL DISTRICTNOTES TO THE FINANCIAL STATEMENTSAUGUST 31, 2013
56
2. Funding Policy
Contribution requirements are not actuarially determined but are established and amended by the Texas state legislature. The state funding policy is as follows: (1) The state constitution requires the legislature to establish a member contribution rate of not less than 6.0% of the member's annual compensation and a state contribution rate of not less than 6.0% and not more than 10% of the aggregate annual compensation of all members of the system during the fiscal years; (2) state statute prohibits benefit improvements, if as a result of a particular action, the time required to amortize TRS' unfunded actuarial liabilities would be increased to a period that exceeds 31 years, or, if the amortization period already exceeds 31 years, the period would be increased by such action.
3. Contributions
Contribution rates and contributions for fiscal years 2013-2011 are shown in table below. These rates are set by the General Appropriations Act. In certain instances, the reporting district is required to make all or a portion of the state’s and/or member’s contribution and on the portion of the employees’ salaries that exceeded the statutory minimum.
School District
Statutory Minimum
Year Rate Amount Rate Amount Amount
2013 6.4% $ 1,138,965 6.400% $ 869,051 $ 157,898
2012 6.4% $ 1,063,132 6.000% $ 812,586 $ 117,334
2011 6.4% $ 1,105,170 6.644% $ 927,844 $ 219,462
Contribution Rates and Contribution Amounts
Member State
For the current fiscal year and each of the past two years, the District's actual contributions were equal to 100 percent of the required contributions. The contributions made by the State on behalf of the District as both state revenues and expenditures. These contributions are the legal responsibility of the State.
I. Retiree Health Care Plan
1. Plan Description
The District contributes to the Texas Public School Retired Employees Group Insurance Program (TRS-Care), a cost-sharing multiple-employer defined benefit postemployment health care plan administered by the Teacher Retirement System of Texas. TRS-Care provides health care coverage for certain persons (and their dependents) who retired under the Teacher Retirement System of Texas. The statutory authority for the program is Texas Insurance Code, Chapter 1575. Section 1575.052 grants the TRS Board of Trustees the authority to establish and amend basic and optional group insurance coverage for participants. The Teacher Retirement System of Texas issues a publicly available financial report that includes financial statements and required supplementary information for TRS-Care. That report may be obtained by visiting the TRS web site at www.trs.state.tx.us under the TRS Publications heading, by writing to the Communications Department of the Teacher Retirement System of Texas at 1000 Red River Street, Austin, Texas 78701, or by calling 1-800-223-8778.

STAFFORD MUNICIPAL SCHOOL DISTRICTNOTES TO THE FINANCIAL STATEMENTSAUGUST 31, 2013
57
2. Funding Policy
Contribution requirements are not actuarially determined but are legally established each biennium by theTexas Legislature. Texas Insurance Code, Sections 1575.202, 203, and 204 establish state, active employee and public school contributions, respectively. Funding for free basic coverage is provided by the program based upon public school district payroll. Per Texas Insurance Code, Chapter 1575, the public school contribution may not be less than 0.25% or greater than 0.75% of the salary of each active employee of the public school. Funding for optional coverage is provided by those participants selecting the optional coverage. Contribution rates and amounts are shown in the table below for fiscal years 2013-2011.
Year Rate Amount Rate Amount Rate Amount
2013 0.65% $ 115,676 0.50% $ 82,730 0.55% $ 97,880
2012 0.65% $ 107,974 1.00% $ 155,092 0.55% $ 91,3632011 0.65% $ 112,224 1.00% $ 160,261 0.55% $ 94,976
Contribution Rates
Active Member State School District
For the current fiscal year and each of the past two years, the District's actual contributions were equal to 100 percent of the required contributions. The contributions made by the State on behalf of the District have been recorded in the governmental funds financial statements of the District as both state revenues and expenditures. These contributions are the legal responsibility of the State.
The Medicare Prescription Drug, Improvement, and Modernization Act of 2003, which was effective January 1, 2006, established prescription drug coverage for Medicare beneficiaries known as Medicare Part D. One of the provisions of Medicare Part D allows for the Texas Public School Retired Employee Group Insurance Program (TRS-Care) to receive retiree drug subsidy payments from the federal government to offset certain prescription drug expenditures for eligible TRS-Care participants. For the fiscal years ended August 31, 2013, 2012, and 2011, the subsidy payments received by TRS-Care on behalf of the District were $66,226, $42,312, and $39,317, respectively.
The Early Retiree Reinsurance Program (ERRP) was established by section 1102 of the Affordable Care Act enacted on March 23, 2010. Under ERRP, TRS receives payments for a portion of the cost of providing health benefits to retirees between the ages of 55-64 and their covered dependents. For fiscal year 2012, the ERRP subsidy payments received by TRS-Care on-behalf of the District were $40,013. These payments are recorded as equal revenues and expenditures in the governmental funds’ financial statements of the District.
J. Health Care Coverage
During the year ended August 31, 2013, employees of the District were covered by TRS-Active Care (the Plan) a statewide health coverage program for Texas public education employees, implemented by the Teacher Retirement System of Texas (TRS). The District paid premiums of $225 per month per employee to the Plan. Employees, at their option, authorized payroll withholdings to pay premiums for dependents. All premiums were paid to TRS. The legislature created the Plan for public school employee group health coverage in 2002-03, requiring all Districts with fewer than 500 employees to participate in the Plan.
K. Litigation and Contingencies
The District is a defendant in various lawsuits arising principally in the normal course of operations. In the opinion of the District’s management, the potential losses, after insurance coverage, on all allegations, claims, and lawsuits will not have a material effect on the District’s financial position, results of operations or liquidity.
The District participates in a number of federal and state financial assistance programs. Although the District’s grant programs have been audited in accordance with the provisions of the Single Audit Act through August 31, 2013, these programs are subject to financial and compliance audits by the grantor agencies. The District is also subject to audit by the TEA of the attendance data upon which payments from the agency are based. These audits could result in questioned costs or refunds to be paid back to the granting agencies.
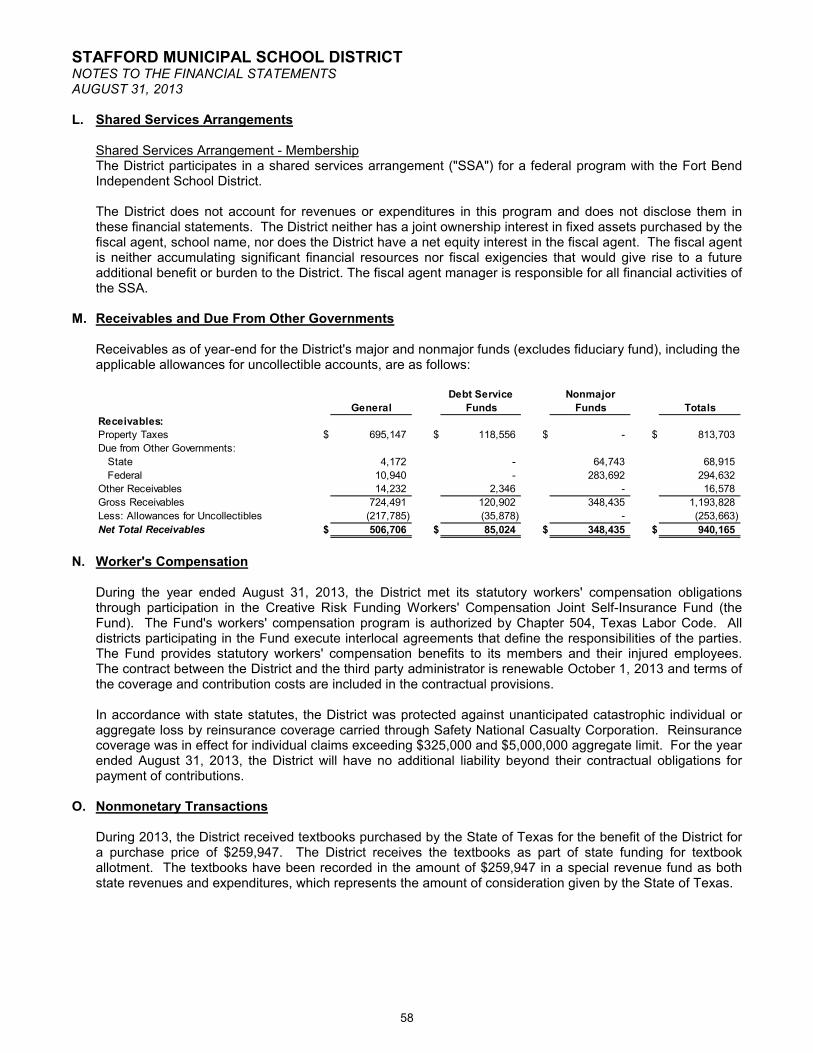
STAFFORD MUNICIPAL SCHOOL DISTRICTNOTES TO THE FINANCIAL STATEMENTSAUGUST 31, 2013
58
L. Shared Services Arrangements
Shared Services Arrangement - MembershipThe District participates in a shared services arrangement ("SSA") for a federal program with the Fort BendIndependent School District.
The District does not account for revenues or expenditures in this program and does not disclose them in these financial statements. The District neither has a joint ownership interest in fixed assets purchased by the fiscal agent, school name, nor does the District have a net equity interest in the fiscal agent. The fiscal agent is neither accumulating significant financial resources nor fiscal exigencies that would give rise to a future additional benefit or burden to the District. The fiscal agent manager is responsible for all financial activities of the SSA.
M. Receivables and Due From Other Governments
Receivables as of year-end for the District's major and nonmajor funds (excludes fiduciary fund), including theapplicable allowances for uncollectible accounts, are as follows:
Debt Service Nonmajor
General Funds Funds Totals
Receivables:
Property Taxes $ 695,147 $ 118,556 $ - $ 813,703
Due from Other Governments:
State 4,172 - 64,743 68,915
Federal 10,940 - 283,692 294,632
Other Receivables 14,232 2,346 - 16,578
Gross Receivables 724,491 120,902 348,435 1,193,828
Less: Allowances for Uncollectibles (217,785) (35,878) - (253,663)
Net Total Receivables $ 506,706 $ 85,024 $ 348,435 $ 940,165
N. Worker's Compensation
During the year ended August 31, 2013, the District met its statutory workers' compensation obligations through participation in the Creative Risk Funding Workers' Compensation Joint Self-Insurance Fund (the Fund). The Fund's workers' compensation program is authorized by Chapter 504, Texas Labor Code. All districts participating in the Fund execute interlocal agreements that define the responsibilities of the parties. The Fund provides statutory workers' compensation benefits to its members and their injured employees. The contract between the District and the third party administrator is renewable October 1, 2013 and terms of the coverage and contribution costs are included in the contractual provisions.
In accordance with state statutes, the District was protected against unanticipated catastrophic individual oraggregate loss by reinsurance coverage carried through Safety National Casualty Corporation. Reinsurancecoverage was in effect for individual claims exceeding $325,000 and $5,000,000 aggregate limit. For the yearended August 31, 2013, the District will have no additional liability beyond their contractual obligations forpayment of contributions.
O. Nonmonetary Transactions
During 2013, the District received textbooks purchased by the State of Texas for the benefit of the District for a purchase price of $259,947. The District receives the textbooks as part of state funding for textbook allotment. The textbooks have been recorded in the amount of $259,947 in a special revenue fund as both state revenues and expenditures, which represents the amount of consideration given by the State of Texas.

STAFFORD MUNICIPAL SCHOOL DISTRICTNOTES TO THE FINANCIAL STATEMENTSAUGUST 31, 2013
59
P. Revenues from Local and Intermediate Sources
During the current year, revenues from local and intermediate sources consisted of the following:
Debt Service Capital Projects Nonmajor
General Funds Funds Funds Totals
Receivables:
Property Taxes $ 20,654,448 $ 4,157,717 $ - $ - $ 24,812,165
Charges for Services 126,710 - - 552,535 679,245
Investment Earnings 13,305 1,809 22,828 43 37,985
Other 362,562 - - 239,654 602,216
Totals $ 21,157,025 $ 4,159,526 $ 22,828 $ 792,232 $ 26,131,611

60
This page is left blank intentionally.

61
REQUIRED SUPPLEMENTARY INFORMATION
Required supplementary information includes financial information and disclosures required by the GovernmentalAccounting Standards Board but not considered a part of the basic financial statements.
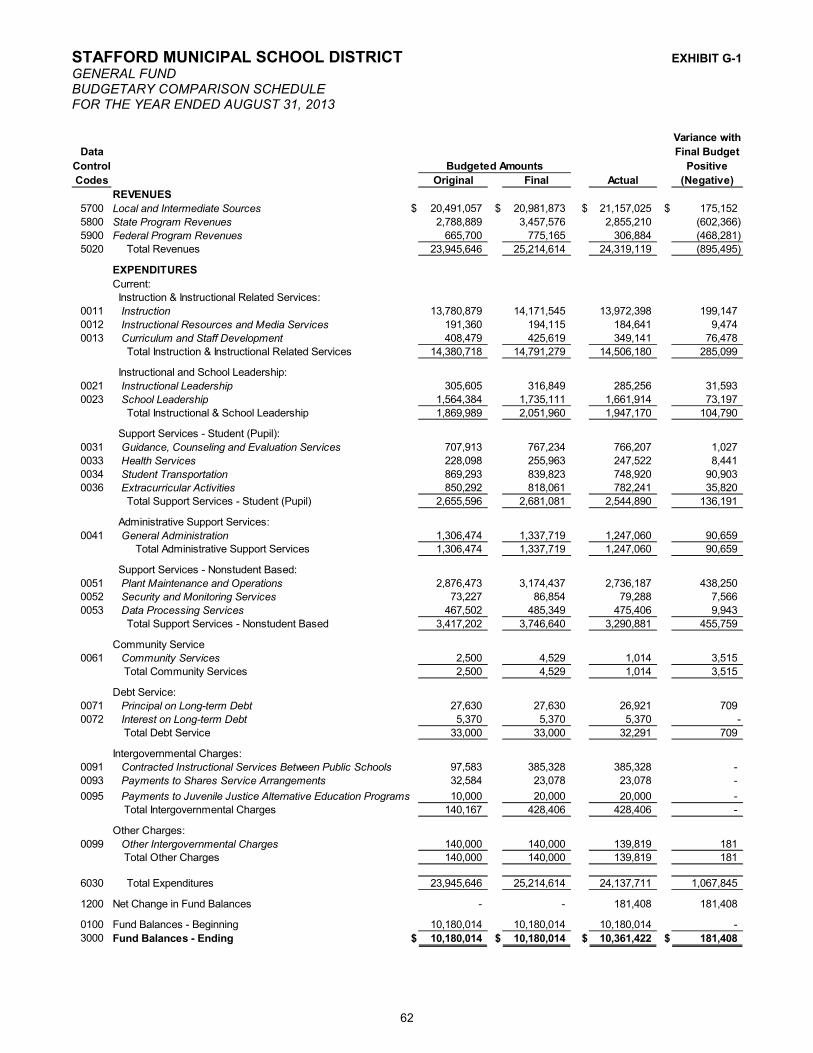
STAFFORD MUNICIPAL SCHOOL DISTRICT EXHIBIT G-1
GENERAL FUNDBUDGETARY COMPARISON SCHEDULEFOR THE YEAR ENDED AUGUST 31, 2013
62
Variance with
Data Final Budget
Control Positive
Codes Original Final Actual (Negative)
REVENUES
5700 Local and Intermediate Sources $ 20,491,057 $ 20,981,873 $ 21,157,025 $ 175,152
5800 State Program Revenues 2,788,889 3,457,576 2,855,210 (602,366)
5900 Federal Program Revenues 665,700 775,165 306,884 (468,281)
5020 Total Revenues 23,945,646 25,214,614 24,319,119 (895,495)
EXPENDITURES
Current:
Instruction & Instructional Related Services:
0011 Instruction 13,780,879 14,171,545 13,972,398 199,147
0012 Instructional Resources and Media Services 191,360 194,115 184,641 9,474
0013 Curriculum and Staff Development 408,479 425,619 349,141 76,478
Total Instruction & Instructional Related Services 14,380,718 14,791,279 14,506,180 285,099
Instructional and School Leadership:
0021 Instructional Leadership 305,605 316,849 285,256 31,593
0023 School Leadership 1,564,384 1,735,111 1,661,914 73,197
Total Instructional & School Leadership 1,869,989 2,051,960 1,947,170 104,790
Support Services - Student (Pupil):
0031 Guidance, Counseling and Evaluation Services 707,913 767,234 766,207 1,027
0033 Health Services 228,098 255,963 247,522 8,441
0034 Student Transportation 869,293 839,823 748,920 90,903
0036 Extracurricular Activities 850,292 818,061 782,241 35,820
Total Support Services - Student (Pupil) 2,655,596 2,681,081 2,544,890 136,191
Administrative Support Services:
0041 General Administration 1,306,474 1,337,719 1,247,060 90,659 Total Administrative Support Services 1,306,474 1,337,719 1,247,060 90,659
Support Services - Nonstudent Based:
0051 Plant Maintenance and Operations 2,876,473 3,174,437 2,736,187 438,250 0052 Security and Monitoring Services 73,227 86,854 79,288 7,566
0053 Data Processing Services 467,502 485,349 475,406 9,943
Total Support Services - Nonstudent Based 3,417,202 3,746,640 3,290,881 455,759
Community Service
0061 Community Services 2,500 4,529 1,014 3,515
Total Community Services 2,500 4,529 1,014 3,515
Debt Service:
0071 Principal on Long-term Debt 27,630 27,630 26,921 709
0072 Interest on Long-term Debt 5,370 5,370 5,370 -
Total Debt Service 33,000 33,000 32,291 709
Intergovernmental Charges:0091 Contracted Instructional Services Between Public Schools 97,583 385,328 385,328 -
0093 Payments to Shares Service Arrangements 32,584 23,078 23,078 -
0095 Payments to Juvenile Justice Alternative Education Programs 10,000 20,000 20,000 -
Total Intergovernmental Charges 140,167 428,406 428,406 -
Other Charges:
0099 Other Intergovernmental Charges 140,000 140,000 139,819 181
Total Other Charges 140,000 140,000 139,819 181
6030 Total Expenditures 23,945,646 25,214,614 24,137,711 1,067,845
1200 Net Change in Fund Balances - - 181,408 181,408
0100 Fund Balances - Beginning 10,180,014 10,180,014 10,180,014 -
3000 Fund Balances - Ending $ 10,180,014 $ 10,180,014 $ 10,361,422 $ 181,408
Budgeted Amounts

STAFFORD MUNICIPAL SCHOOL DISTRICTNOTES TO REQUIRED SUPPLEMENTARY INFORMATIONFOR THE YEAR ENDED AUGUST 31, 2013
63
Note 1 - Summary of Significant Accounting Policies
A. Stewardship, Compliance, and Accountability
Each school district in Texas is required by law to annually prepare a budget of anticipated revenues and expenditures for certain governmental fund types for the fiscal year beginning September 1. The District adopts an "appropriated budget" on a basis consistent with GAAP for the general fund, food service program (which is included in the special revenue fund), and the debt service fund. The District is required to present original adopted and final amended budgeted revenues and expenditures for each of these funds. The District compares the final amended budget to actual revenues and expenditures.
The general fund budget report and the food service fund budget report appear in Exhibit G-1 and J-3,respectively, and the debt service fund budget report is in Exhibit J-4.
The official school budget was prepared for adoption by August 20, 2012 as required by TexasEducation Code 44.002(a). The official school budget was presented before the Board and Council for adoption on August 25, 2012. The budget was formally adopted by the Stafford MSD Board of Trustees and Stafford City Council at a duly advertised public meeting prior to the expenditure of funds. Final priorities and funding of projects are determined by the Board and Council, which subsequently established a local property tax rate sufficient to support the approved budget.
The administration performs budget reviews by which budget requirements are re-evaluated andrevisions are recommended to the Board.
The Board is required to approve amendments to the budget that change any fund or functionalexpenditure category (the legal level of compliance), revenue object accounts, or other financingsources/uses as defined by the agency for each individual fund type. Unexpended appropriations lapse at year-end. Deficit fund balances are prohibited by state law.
Encumbrance accounting, under which purchase orders, contracts, and other commitments are recorded in order to reserve that portion of the applicable appropriation, is used in all governmental funds. Encumbrances outstanding at year-end are commitments that do not constitute expenditures orliabilities, but are reported as reservation of fund balances. Since appropriations lapse at the end ofeach year, outstanding encumbrances are appropriately provided for in the subsequent fiscal year'sbudget to provide for the liquidation of the prior commitments.
The District did not have any outstanding encumbrances as of August 31, 2013.
B. Budget Variances
No significant budget variance.

64
This page is left blank intentionally.

65
COMBINING AND INDIVIDUAL FUND STATEMENTS
This supplementary information includes financial statements and schedules not required by the Governmental Accounting Standards Board, nor a part of the basic financial statements, but are presented for purposes of additional analysis.

STAFFORD MUNICIPAL SCHOOL DISTRICTCOMBINING BALANCE SHEETNONMAJOR GOVERNMENTAL FUNDSSPECIAL REVENUE FUNDSAUGUST 31, 2013
66
211 224
Data
Control
Codes
ASSETS
1110 Cash and Cash Equivalents $ - $ -
1240 Due from Other Governments 47,024 129,101
1410 Prepaid Items - -
1000 Total Assets $ 47,024 $ 129,101
LIABILITIES
2110 Accounts Payable $ - $ -
2160 Accrued Wages Payable - -
2170 Due to Other Funds 47,024 129,101 2300 Unearned Revenue - -
2000 Total Liabilities 47,024 129,101
FUND BALANCE
Nonspendable:
3430 Prepaid Items - -
Restricted for:
3450 Grant Funds - -
3545 Committed - Other - -
3000 Total Fund Balances - -
4000 Total Liabilities and Fund Balances $ 47,024 $ 129,101
ESEA Title I
Part A
Improving Basic
Programs
IDEA-B
Formula
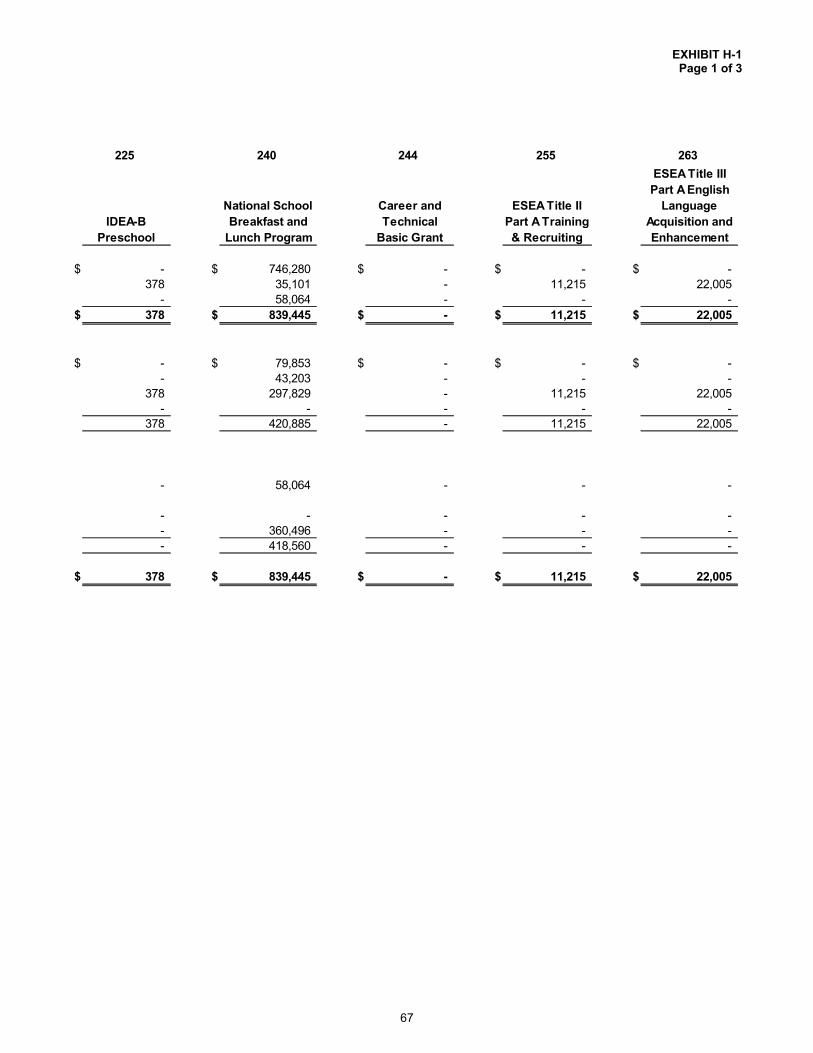
EXHIBIT H-1Page 1 of 3
67
225 240 244 255 263
$ - $ 746,280 $ - $ - $ -
378 35,101 - 11,215 22,005
- 58,064 - - -
$ 378 $ 839,445 $ - $ 11,215 $ 22,005
$ - $ 79,853 $ - $ - $ -
- 43,203 - - -
378 297,829 - 11,215 22,005 - - - - -
378 420,885 - 11,215 22,005
- 58,064 - - -
- - - - -
- 360,496 - - -
- 418,560 - - -
$ 378 $ 839,445 $ - $ 11,215 $ 22,005
ESEA Title III
Part A English
Language
Acquisition and
Enhancement
IDEA-B
Preschool
National School
Breakfast and
Lunch Program
Career and
Technical
Basic Grant
ESEA Title II
Part A Training
& Recruiting
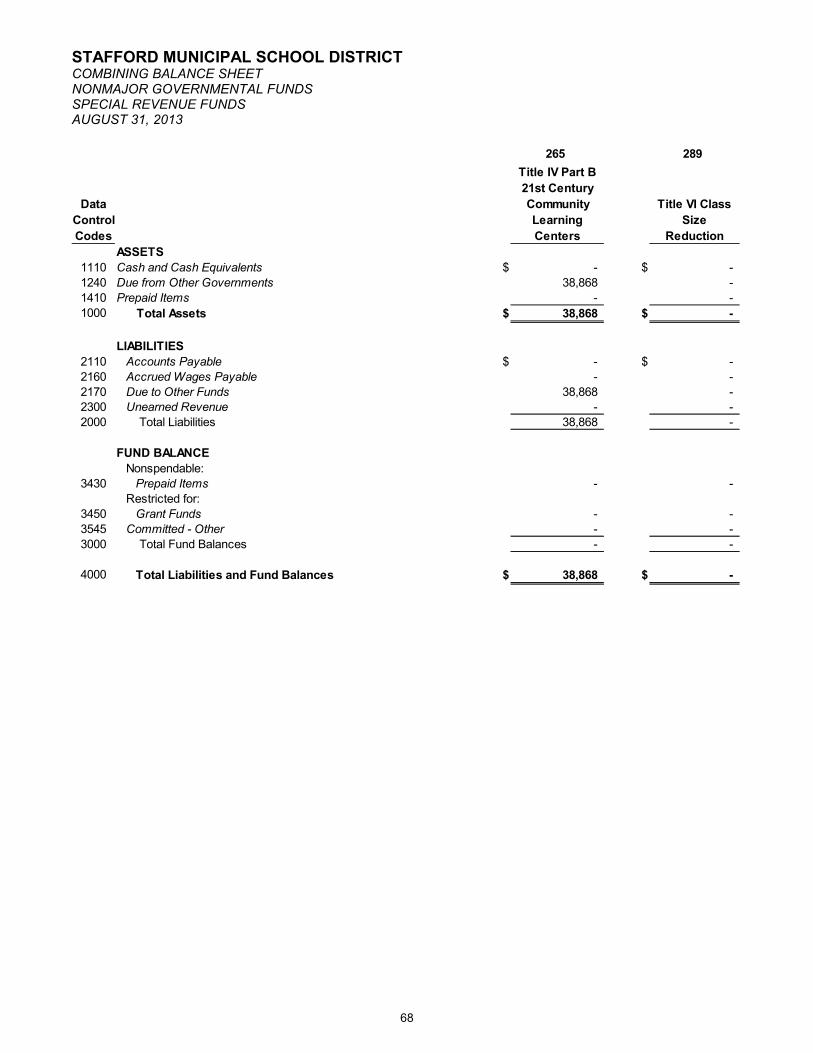
STAFFORD MUNICIPAL SCHOOL DISTRICTCOMBINING BALANCE SHEETNONMAJOR GOVERNMENTAL FUNDSSPECIAL REVENUE FUNDSAUGUST 31, 2013
68
265 289
Data
Control
Codes
ASSETS
1110 Cash and Cash Equivalents $ - $ -
1240 Due from Other Governments 38,868 -
1410 Prepaid Items - -
1000 Total Assets $ 38,868 $ -
LIABILITIES
2110 Accounts Payable $ - $ -
2160 Accrued Wages Payable - -
2170 Due to Other Funds 38,868 - 2300 Unearned Revenue - -
2000 Total Liabilities 38,868 -
FUND BALANCE
Nonspendable:
3430 Prepaid Items - -
Restricted for:
3450 Grant Funds - -
3545 Committed - Other - -
3000 Total Fund Balances - -
4000 Total Liabilities and Fund Balances $ 38,868 $ -
Title IV Part B
21st Century
Community
Learning
Centers
Title VI Class
Size
Reduction
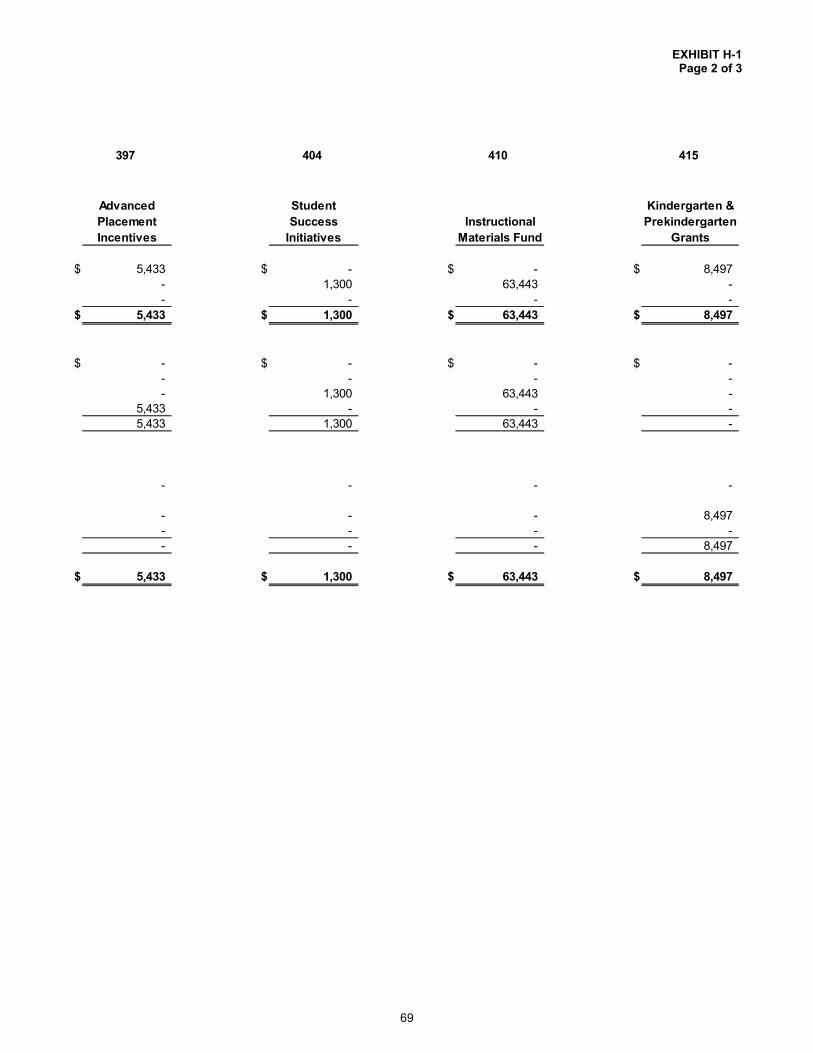
EXHIBIT H-1Page 2 of 3
69
397 404 410 415
$ 5,433 $ - $ - $ 8,497
- 1,300 63,443 -
- - - -
$ 5,433 $ 1,300 $ 63,443 $ 8,497
$ - $ - $ - $ -
- - - -
- 1,300 63,443 - 5,433 - - -
5,433 1,300 63,443 -
- - - -
- - - 8,497
- - - -
- - - 8,497
$ 5,433 $ 1,300 $ 63,443 $ 8,497
Advanced
Placement
Incentives
Student
Success
Initiatives
Instructional
Materials Fund
Kindergarten &
Prekindergarten
Grants
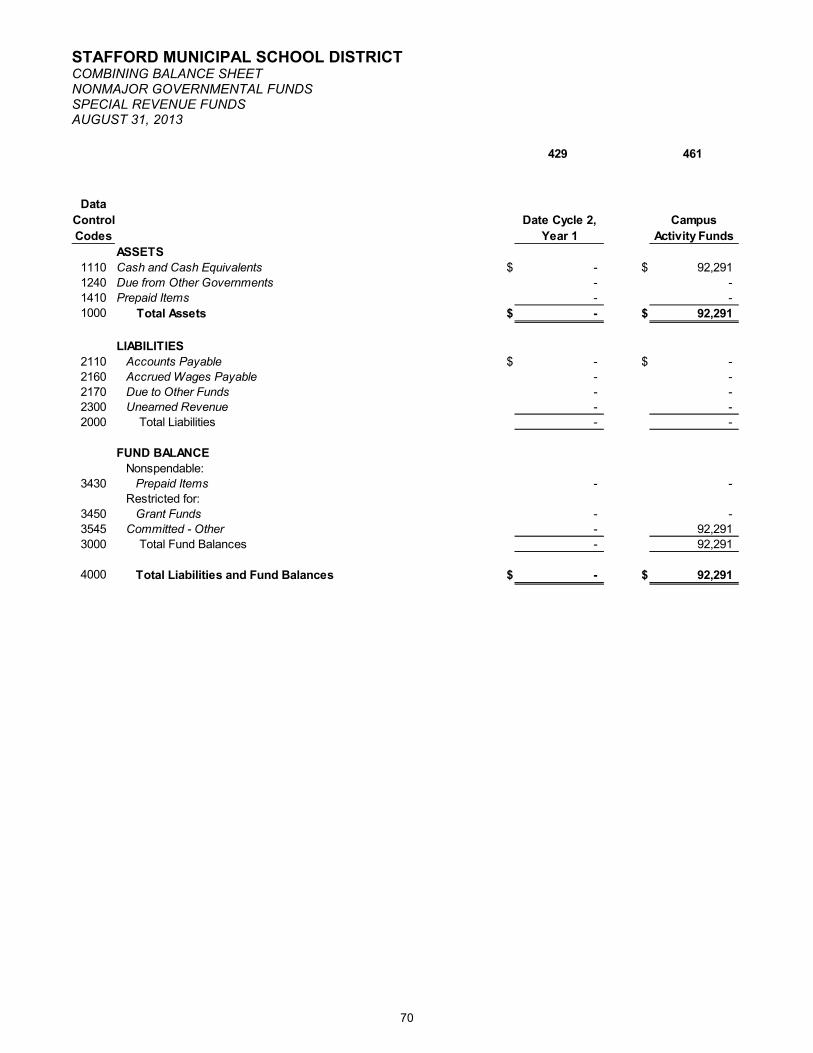
STAFFORD MUNICIPAL SCHOOL DISTRICTCOMBINING BALANCE SHEETNONMAJOR GOVERNMENTAL FUNDSSPECIAL REVENUE FUNDSAUGUST 31, 2013
70
429 461
Data
Control
Codes
ASSETS
1110 Cash and Cash Equivalents $ - $ 92,291
1240 Due from Other Governments - -
1410 Prepaid Items - -
1000 Total Assets $ - $ 92,291
LIABILITIES
2110 Accounts Payable $ - $ -
2160 Accrued Wages Payable - -
2170 Due to Other Funds - - 2300 Unearned Revenue - -
2000 Total Liabilities - -
FUND BALANCE
Nonspendable:
3430 Prepaid Items - -
Restricted for:
3450 Grant Funds - -
3545 Committed - Other - 92,291
3000 Total Fund Balances - 92,291
4000 Total Liabilities and Fund Balances $ - $ 92,291
Date Cycle 2,
Year 1
Campus
Activity Funds

EXHIBIT H-1Page 3 of 3
71
496 497 499
Total
Nonmajor
Governmental
Funds (See
Exhibit H-1)
$ 1,001 $ - $ 14,634 $ 868,136
- - - 348,435
- - - 58,064
$ 1,001 $ - $ 14,634 $ 1,274,635
$ - $ - $ 3,531 $ 83,384
- - - 43,203
- - - 611,163 1,001 - 11,070 17,504
1,001 - 14,601 755,254
- - - 58,064
- - - 8,497
- - 33 452,820
- - 33 519,381
$ 1,001 $ - $ 14,634 $ 1,274,635
Target Grant
Local Funded
Special
Revenue Fund
NRA Rifle
Range
Upgrade Grant

STAFFORD MUNICIPAL SCHOOL DISTRICTCOMBINING STATEMENT OF REVENUES, EXPENDITURES, AND CHANGES IN FUND BALANCESNONMAJOR GOVERNMENTAL FUNDSSPECIAL REVENUE FUNDSFOR THE YEAR ENDED AUGUST 31, 2013
72
211 224
Data
Control
Codes
REVENUES
5700 Local and Intermediate Sources $ - $ -
5800 State Program Revenues - -
5900 Federal Program Revenues 362,642 592,198
5020 Total Revenues 362,642 592,198
EXPENDITURES
Current:
0011 Instruction 312,793 325,077
0013 Curriculum and Staff Development 4,908 5,284
0021 Instructional Leadership 42,927 31,502 0023 School Leadership - -
0031 Guidance, Counseling and Evaluation Services - 195,689
0033 Health Services - 28,421
0035 Food Service - -
0036 Extracurricular Activities - -
0041 General Administration - 6,225
0051 Plant Maintenance and Operations - -
0061 Community Services 2,014 -
6030 Total Expenditures 362,642 592,198
1200 Net Change in Fund Balances - -
0100 Fund Balances - Beginning - -
3000 Fund Balances - Ending $ - $ -
ESEA Title I
Part A
Improving Basic
Programs
IDEA-B
Formula
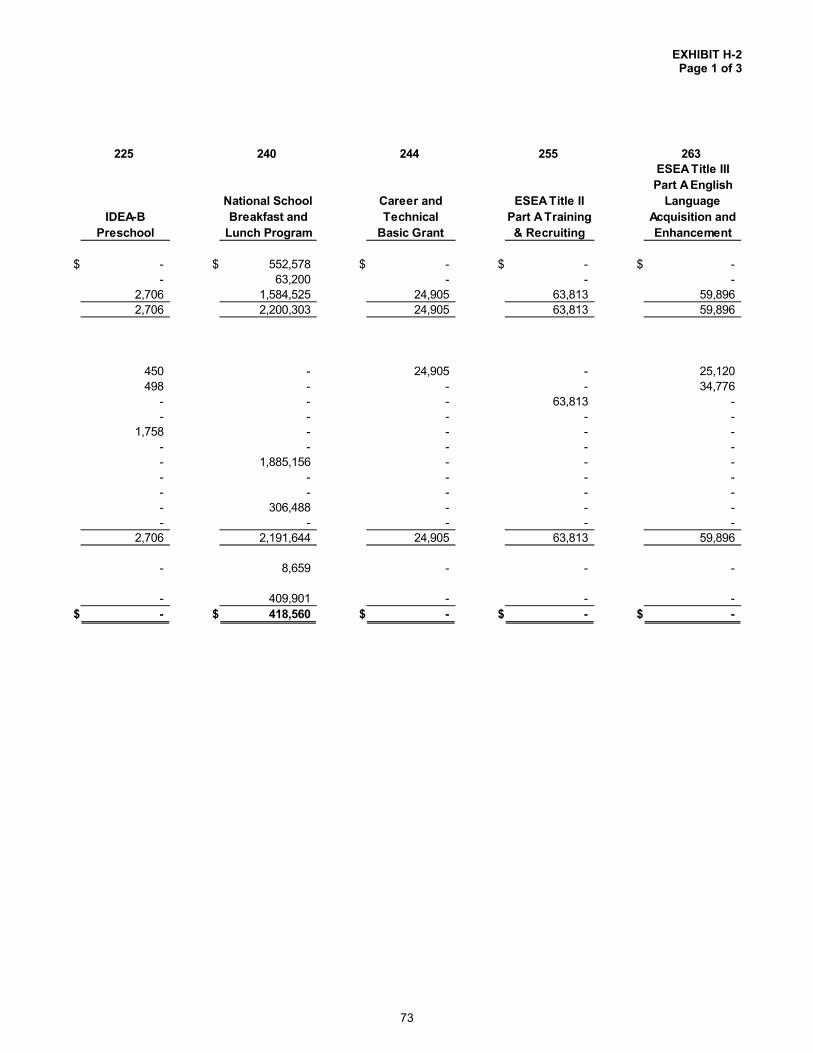
EXHIBIT H-2Page 1 of 3
73
225 240 244 255 263
$ - $ 552,578 $ - $ - $ -
- 63,200 - - -
2,706 1,584,525 24,905 63,813 59,896
2,706 2,200,303 24,905 63,813 59,896
450 - 24,905 - 25,120
498 - - - 34,776
- - - 63,813 - - - - - -
1,758 - - - -
- - - - -
- 1,885,156 - - -
- - - - -
- - - - -
- 306,488 - - -
- - - - -
2,706 2,191,644 24,905 63,813 59,896
- 8,659 - - -
- 409,901 - - -
$ - $ 418,560 $ - $ - $ -
IDEA-B
Preschool
National School
Breakfast and
Lunch Program
Career and
Technical
Basic Grant
ESEA Title II
Part A Training
& Recruiting
ESEA Title III
Part A English
Language
Acquisition and
Enhancement
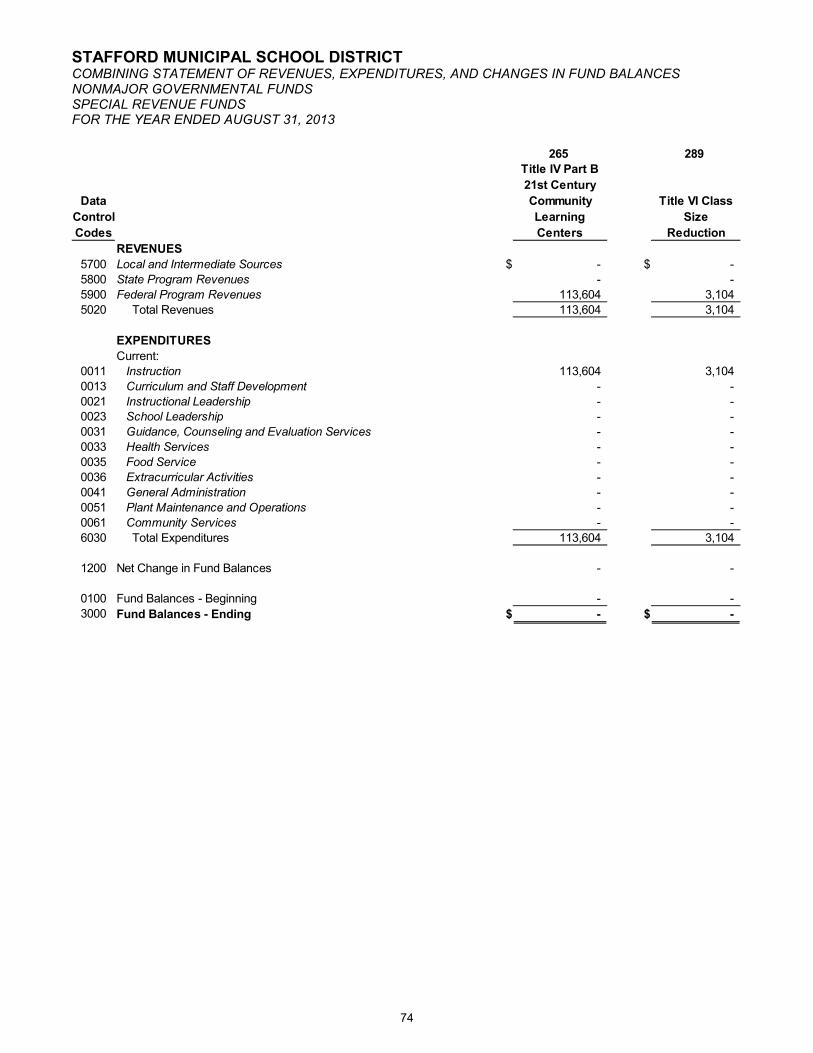
STAFFORD MUNICIPAL SCHOOL DISTRICTCOMBINING STATEMENT OF REVENUES, EXPENDITURES, AND CHANGES IN FUND BALANCESNONMAJOR GOVERNMENTAL FUNDSSPECIAL REVENUE FUNDSFOR THE YEAR ENDED AUGUST 31, 2013
74
265 289
Data
Control
Codes
REVENUES
5700 Local and Intermediate Sources $ - $ -
5800 State Program Revenues - -
5900 Federal Program Revenues 113,604 3,104
5020 Total Revenues 113,604 3,104
EXPENDITURES
Current:
0011 Instruction 113,604 3,104
0013 Curriculum and Staff Development - -
0021 Instructional Leadership - - 0023 School Leadership - -
0031 Guidance, Counseling and Evaluation Services - -
0033 Health Services - -
0035 Food Service - -
0036 Extracurricular Activities - -
0041 General Administration - -
0051 Plant Maintenance and Operations - -
0061 Community Services - -
6030 Total Expenditures 113,604 3,104
1200 Net Change in Fund Balances - -
0100 Fund Balances - Beginning - -
3000 Fund Balances - Ending $ - $ -
Title IV Part B
21st Century
Community
Learning
Centers
Title VI Class
Size
Reduction
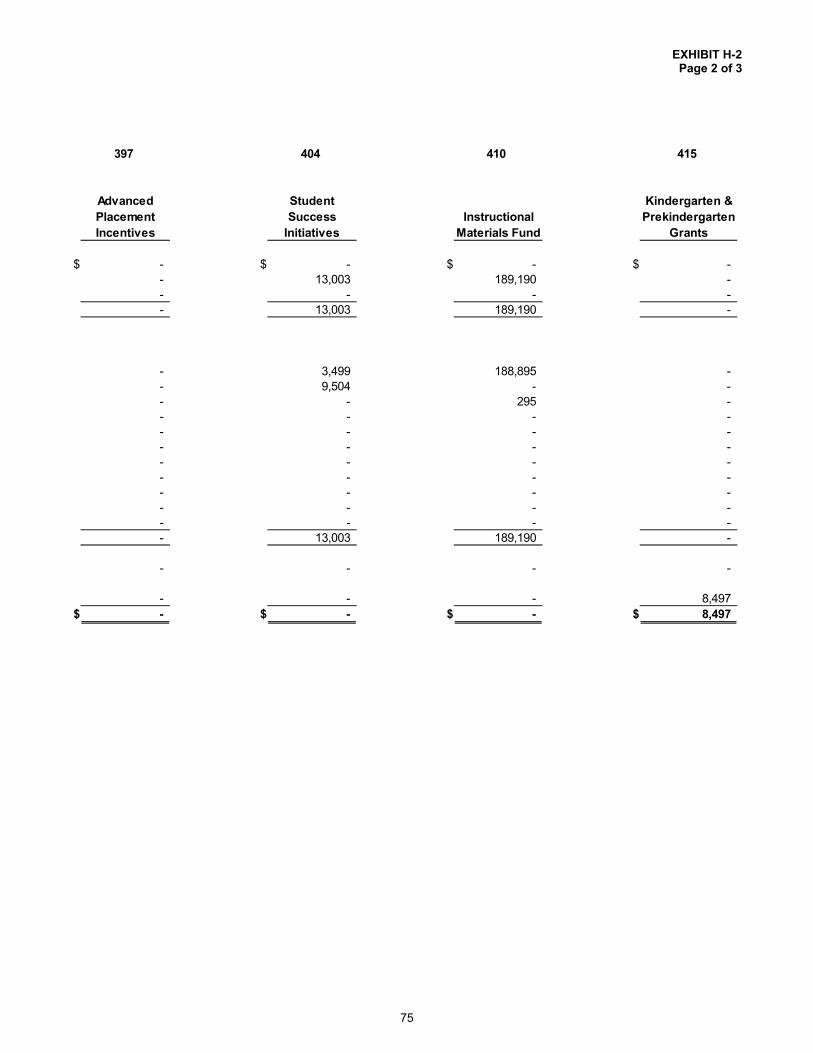
EXHIBIT H-2Page 2 of 3
75
397 404 410 415
$ - $ - $ - $ -
- 13,003 189,190 -
- - - -
- 13,003 189,190 -
- 3,499 188,895 -
- 9,504 - -
- - 295 - - - - -
- - - -
- - - -
- - - -
- - - -
- - - -
- - - -
- - - -
- 13,003 189,190 -
- - - -
- - - 8,497
$ - $ - $ - $ 8,497
Advanced
Placement
Incentives
Student
Success
Initiatives
Instructional
Materials Fund
Kindergarten &
Prekindergarten
Grants

STAFFORD MUNICIPAL SCHOOL DISTRICTCOMBINING STATEMENT OF REVENUES, EXPENDITURES, AND CHANGES IN FUND BALANCESNONMAJOR GOVERNMENTAL FUNDSSPECIAL REVENUE FUNDSFOR THE YEAR ENDED AUGUST 31, 2013
76
429 461
Data
Control
Codes
REVENUES
5700 Local and Intermediate Sources $ - $ 220,253
5800 State Program Revenues - -
5900 Federal Program Revenues - -
5020 Total Revenues - 220,253
EXPENDITURES
Current:
0011 Instruction 4,254 161,367
0013 Curriculum and Staff Development - 452
0021 Instructional Leadership - - 0023 School Leadership - 3,527
0031 Guidance, Counseling and Evaluation Services - -
0033 Health Services - -
0035 Food Service - -
0036 Extracurricular Activities - 41,690
0041 General Administration - 6,960
0051 Plant Maintenance and Operations - 15,316
0061 Community Services - -
6030 Total Expenditures 4,254 229,312
1200 Net Change in Fund Balances (4,254) (9,059)
0100 Fund Balances - Beginning 4,254 101,350
3000 Fund Balances - Ending $ - $ 92,291
Date Cycle 2,
Year 1
Campus
Activity Funds

EXHIBIT H-2Page 3 of 3
77
496 497 499
Total
Nonmajor
Governmental
Funds (See
Exhibit H-2)
$ - $ - $ 19,401 $ 792,232
- - - 265,393
- - - 2,807,393
- - 19,401 3,865,018
- 1 19,401 1,182,470
- - - 55,422
- - - 138,537 - - - 3,527
- - - 197,447
- - - 28,421
- - - 1,885,156
- - - 41,690
- - - 13,185
- - - 321,804
- - - 2,014
- 1 19,401 3,869,673
- (1) - (4,655)
- 1 33 418,398
$ - $ - $ 33 $ 413,743
Local Funded
Special
Revenue Fund
NRA Rifle
Range
Upgrade Grant Target Grant
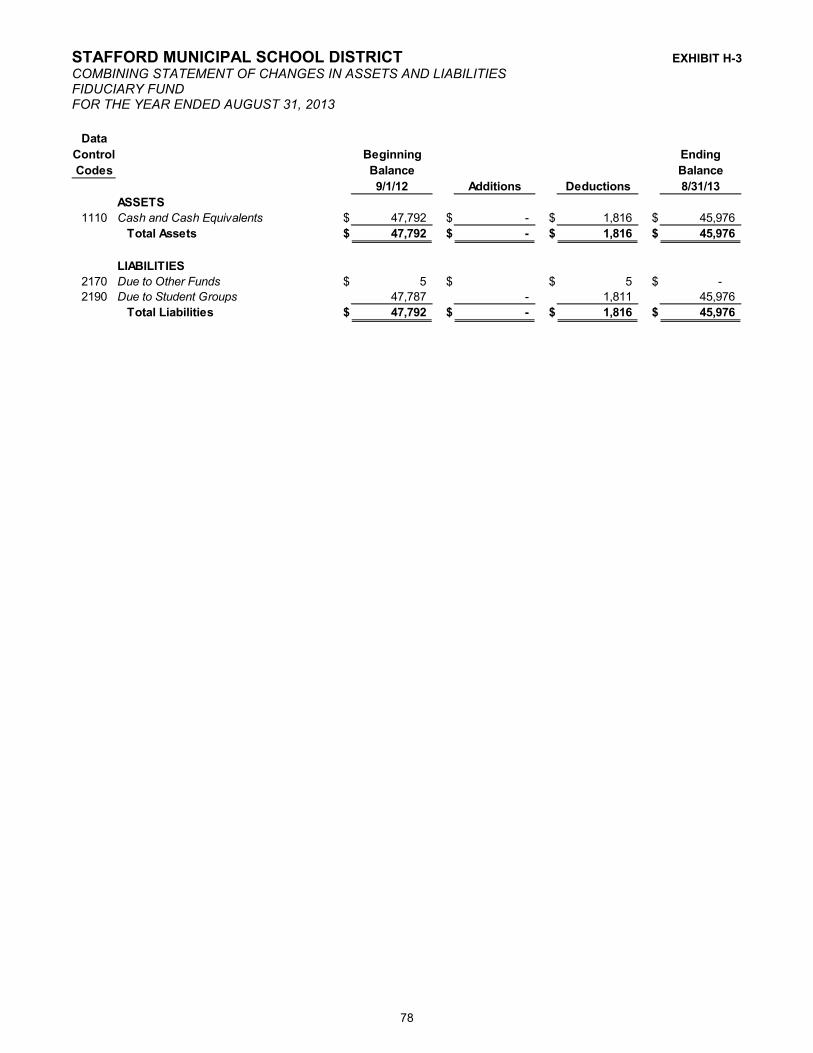
STAFFORD MUNICIPAL SCHOOL DISTRICT EXHIBIT H-3
COMBINING STATEMENT OF CHANGES IN ASSETS AND LIABILITIESFIDUCIARY FUNDFOR THE YEAR ENDED AUGUST 31, 2013
78
Data
Control Beginning Ending
Codes Balance Balance
9/1/12 Additions Deductions 8/31/13
ASSETS
1110 Cash and Cash Equivalents $ 47,792 $ - $ 1,816 $ 45,976
Total Assets $ 47,792 $ - $ 1,816 $ 45,976
LIABILITIES
2170 Due to Other Funds $ 5 $ $ 5 $ -
2190 Due to Student Groups 47,787 - 1,811 45,976
Total Liabilities $ 47,792 $ - $ 1,816 $ 45,976
79
OTHER SUPPLEMENTARY INFORMATION
This section includes financial information and disclosures not required by the Governmental Accounting Standards Board and not considered a part of the basic financial statements. It may, however include information which is required by other entities.
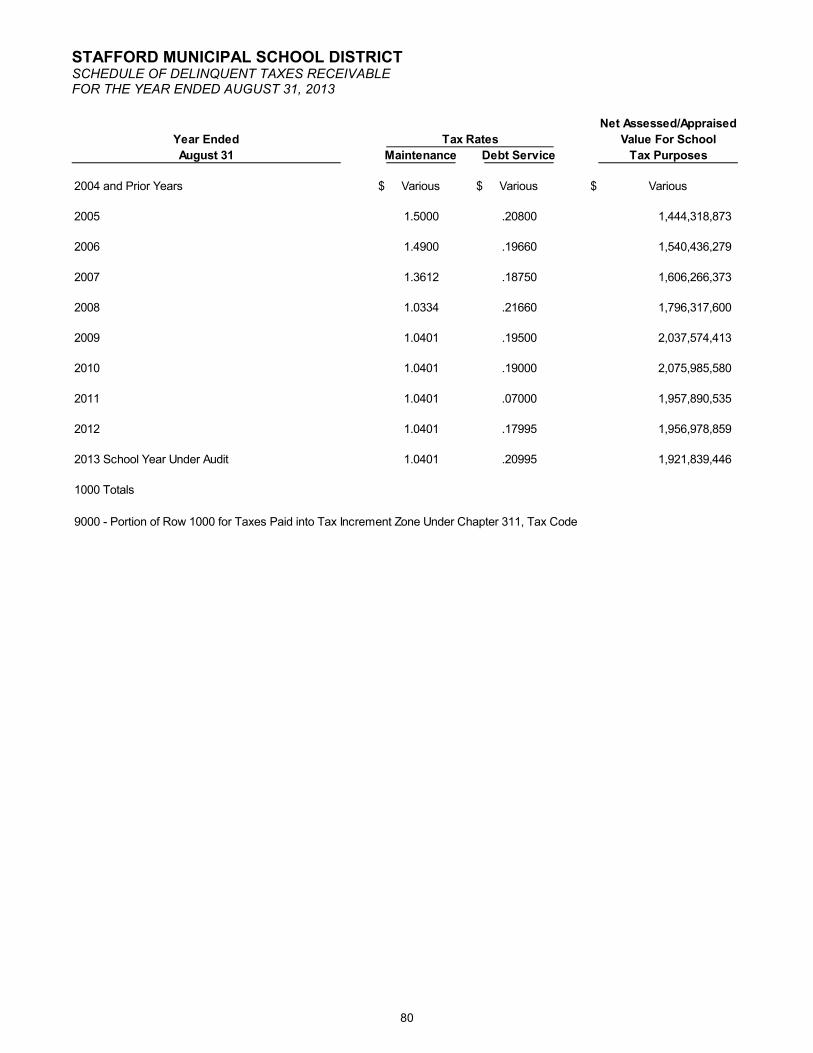
STAFFORD MUNICIPAL SCHOOL DISTRICTSCHEDULE OF DELINQUENT TAXES RECEIVABLEFOR THE YEAR ENDED AUGUST 31, 2013
80
Net Assessed/Appraised
Year Ended Value For School
August 31 Maintenance Debt Service Tax Purposes
2004 and Prior Years $ Various $ Various $ Various
2005 1.5000 .20800 1,444,318,873
2006 1.4900 .19660 1,540,436,279
2007 1.3612 .18750 1,606,266,373
2008 1.0334 .21660 1,796,317,600
2009 1.0401 .19500 2,037,574,413
2010 1.0401 .19000 2,075,985,580
2011 1.0401 .07000 1,957,890,535
2012 1.0401 .17995 1,956,978,859
2013 School Year Under Audit 1.0401 .20995 1,921,839,446
1000 Totals
9000 - Portion of Row 1000 for Taxes Paid into Tax Increment Zone Under Chapter 311, Tax Code
Tax Rates

EXHIBIT J-1
81
Beginning Current Entire Ending
Balance Year's Maintenance Debt Service Year's Balance
9/1/12 Total Levy Collections Collections Adjustments 8/31/13
$ 127,174 $ - $ 1,196 $ 172 $ (109,027) $ 16,779
38,910 - 329 46 (545) 37,990
49,373 - 65 9 (540) 48,759
44,749 - 450 62 (583) 43,654
158,276 - 3,456 724 (1,786) 152,310
75,737 - (2,302) (432) (7,363) 71,108
85,680 - (5,023) (918) (14,639) 76,982
100,811 - (20,198) (1,359) (31,958) 90,410
199,131 - 63,067 10,911 (26,048) 99,105
- 24,023,954 20,381,956 4,114,212 648,820 176,606
$ 879,841 $ 24,023,954 $ 20,422,996 $ 4,123,427 $ 456,331 $ 813,703
$ - $ -

STAFFORD MUNICIPAL SCHOOL DISTRICT EXHIBIT J-2
SCHEDULE OF EXPENDITURES FOR COMPUTATION OF INDIRECT COST FOR 2014-2015GENERAL AND SPECIAL REVENUE FUNDSFOR THE YEAR ENDED AUGUST 31, 2013
82
FUNCTION 41 AND RELATED FUNCTION 53 - GENERAL ADMINISTRATION AND FUNCTION 99 - APPRAISAL DISTRICT COST
(702) (703) (701) (750) (720) (Other)
Account Account School Tax Supt's Indirect DirectNumber Name Board Collection Office Cost Cost Misc. Total
611X-6146 Payroll Costs $ - $ - $ 307,975 $ 622,905 $ - $ - $ 930,880 Fringe Benefits (Unused Leavefor Separating Employees in
6149 Function 41 and Related 53) - - - - - - - Fringe Benefits (Unused Leavefor Separating Employees inall Functions except Function
6149 41 and Related 53) - - - - - - - 6211 Legal Services - - 78,117 - - - 78,117 6212 Audit Services - - - 57,100 - - 57,100 6213 Tax Appraisal and Collection - 139,819 - - - - 139,819 621X Other Prof. Services 1,026 - 760 15,668 - 6,544 23,998 6220 Tuition and Transfer Payments - - - - - - - 6230 Education Service Centers - - 100 19,635 - - 19,735 6240 Contr. Maint. and Repair - - - - - - - 6250 Utilities - - - - - - 6260 Rentals - - - 16,069 - - 16,069 6290 Miscellaneous Contr. 10,105 - 15,651 - - - 25,756 6310 Operational Supplies, Materials - - - - - - - 6320 Textbooks and Reading - - - - - - - 6330 Testing Materials - - - - - - - 63XX Other Supplies, Materials 1,731 - 6,701 26,217 - 8,000 42,649 6410 Travel, Subsistence, Stipends 21,854 - 7,330 16,158 - - 45,342 6420 Ins. and Bonding Costs - - - - - - - 6430 Election Costs 3,771 - - - - - 3,771 6490 Miscellaneous Operating 5,852 - 29,496 121,632 - - 156,980 6500 Debt Service - - - - - - - 6600 Capital Outlay - - - - - - -
Total $ 44,339 $ 139,819 $ 446,130 $ 895,384 $ - $ 14,544 $ 1,540,216
Total Expenditures for General and Special Revenue Funds $ 28,007,384
LESS: Deductions of Unallowable Costs
FISCAL YEARTotal Capital Outlay (6600) $ 24,968 Total Debt & Lease (6500) $ 32,291 Plant Maintenance (Function 51, 6100-6400) $ 3,057,991Food (Function 35, 6341 and 6499) $ 1,047 Column 4 (above) - Total Indirect Cost $ 895,384
Subtotal 4,011,681
Net Allowed Direct Cost $ 23,995,703
CUMULATIVETotal Cost of Buildings Before Depreciation (1520) $ 101,351,852Total Cost of Furniture & Equipment Before Depreciation (1530 & 1540) 7,795,876Historical Cost of Furniture & Equipment over 16 years old 726,303 Amount of Federal Money in Furniture & Equipment (Net of Prior Row) 177,761
(8) Note A - $140,152 in Function 53 expenditures and $139,819 Function 99 expenditures are included in this report on administrative costs.

STAFFORD MUNICIPAL SCHOOL DISTRICT EXHIBIT J-3
NATIONAL SCHOOL BREAKFAST AND LUNCH PROGRAMBUDGETARY COMPARISON SCHEDULEFOR THE YEAR ENDED AUGUST 31, 2013
83
Variance with
Data Final Budget
Control Positive
Codes Original Final Actual (Negative)
REVENUES
5700 Local and Intermediate Sources $ 560,923 $ 528,764 $ 552,578 $ 23,814
5800 State Program Revenues 45,000 63,203 63,200 (3)
5900 Federal Program Revenues 1,495,814 1,599,321 1,584,525 (14,796)
5020 Total Revenues 2,101,737 2,191,288 2,200,303 9,015
EXPENDITURES
Current:
0035 Food Services 1,931,175 1,884,800 1,885,156 (356)
0051 Plant Maintenance and Operations 170,559 306,488 306,488 -
6030 Total Expenditures 2,101,734 2,191,288 2,191,644 (356)
1200 Net Change in Fund Balances 3 - 8,659 8,659
0100 Fund Balances - Beginning 409,901 409,901 409,901 -
3000 Fund Balances - Ending $ 409,904 $ 409,901 $ 418,560 $ 8,659
Budgeted Amounts

STAFFORD MUNICIPAL SCHOOL DISTRICT EXHIBIT J-4
DEBT SERVICE FUNDBUDGETARY COMPARISON SCHEDULEFOR THE YEAR ENDED AUGUST 31, 2013
84
Variance with
Data Final Budget
Control Positive
Codes Original Final Actual (Negative)
REVENUES
5700 Local and Intermediate Sources $ 3,826,473 $ 4,171,620 $ 4,159,526 $ (12,094)
5020 Total Revenues 3,826,473 4,171,620 4,159,526 (12,094)
EXPENDITURES
Debt Service:
0071 Principal on Long-term Debt 1,210,000 1,210,000 1,210,000 -
0072 Interest on Long-term Debt 2,823,725 2,823,725 2,823,725 - 0073 Issuance Costs and Fees 3,550 5,050 5,050 -
6030 Total Expenditures 4,037,275 4,038,775 4,038,775 -
1200 Net Change in Fund Balances (210,802) 132,845 120,751 (12,094)
0100 Fund Balances - Beginning 1,400,371 1,400,371 1,400,371 -
3000 Fund Balances - Ending $ 1,189,569 $ 1,533,216 $ 1,521,122 $ (12,094)
Budgeted Amounts
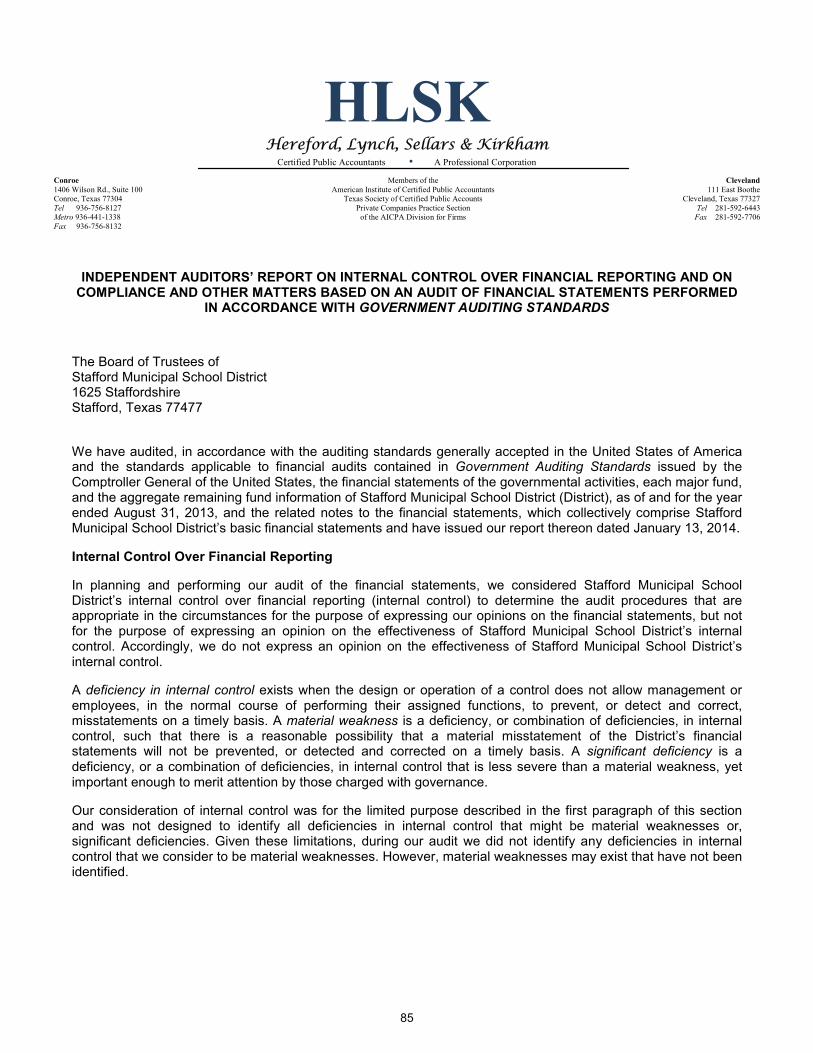
85
HLSKHereford, Lynch, Sellars & Kirkham
Certified Public Accountants • A Professional Corporation
Conroe Members of the Cleveland1406 Wilson Rd., Suite 100 American Institute of Certified Public Accountants 111 East BootheConroe, Texas 77304 Texas Society of Certified Public Accounts Cleveland, Texas 77327Tel 936-756-8127 Private Companies Practice Section Tel 281-592-6443Metro 936-441-1338 of the AICPA Division for Firms Fax 281-592-7706Fax 936-756-8132
INDEPENDENT AUDITORS’ REPORT ON INTERNAL CONTROL OVER FINANCIAL REPORTING AND ON COMPLIANCE AND OTHER MATTERS BASED ON AN AUDIT OF FINANCIAL STATEMENTS PERFORMED
IN ACCORDANCE WITH GOVERNMENT AUDITING STANDARDS
The Board of Trustees ofStafford Municipal School District1625 StaffordshireStafford, Texas 77477
We have audited, in accordance with the auditing standards generally accepted in the United States of America and the standards applicable to financial audits contained in Government Auditing Standards issued by the Comptroller General of the United States, the financial statements of the governmental activities, each major fund, and the aggregate remaining fund information of Stafford Municipal School District (District), as of and for the year ended August 31, 2013, and the related notes to the financial statements, which collectively comprise Stafford Municipal School District’s basic financial statements and have issued our report thereon dated January 13, 2014.
Internal Control Over Financial Reporting
In planning and performing our audit of the financial statements, we considered Stafford Municipal School District’s internal control over financial reporting (internal control) to determine the audit procedures that are appropriate in the circumstances for the purpose of expressing our opinions on the financial statements, but not for the purpose of expressing an opinion on the effectiveness of Stafford Municipal School District’s internal control. Accordingly, we do not express an opinion on the effectiveness of Stafford Municipal School District’sinternal control.
A deficiency in internal control exists when the design or operation of a control does not allow management or employees, in the normal course of performing their assigned functions, to prevent, or detect and correct, misstatements on a timely basis. A material weakness is a deficiency, or combination of deficiencies, in internal control, such that there is a reasonable possibility that a material misstatement of the District’s financial statements will not be prevented, or detected and corrected on a timely basis. A significant deficiency is a deficiency, or a combination of deficiencies, in internal control that is less severe than a material weakness, yet important enough to merit attention by those charged with governance.
Our consideration of internal control was for the limited purpose described in the first paragraph of this section and was not designed to identify all deficiencies in internal control that might be material weaknesses or, significant deficiencies. Given these limitations, during our audit we did not identify any deficiencies in internal control that we consider to be material weaknesses. However, material weaknesses may exist that have not been identified.

86
Compliance and Other Matters
As part of obtaining reasonable assurance about whether Stafford Municipal School District’s financial statements are free from material misstatement, we performed tests of its compliance with certain provisions of laws, regulations, contracts, and grant agreements, noncompliance with which could have a direct and material effect on the determination of financial statement amounts. However, providing an opinion on compliance with those provisions was not an objective of our audit, and accordingly, we do not express such an opinion. The results of our tests disclosed no instances of noncompliance or other matters that are required to be reported under Government Auditing Standards.
Purpose of this Report
The purpose of this report is solely to describe the scope of our testing of internal control and compliance and the results of that testing, and not to provide an opinion on the effectiveness of the District’s internal control or on compliance. This report is an integral part of an audit performed in accordance with Government Auditing Standards in considering the District’s internal control and compliance. Accordingly, this communication is not suitable for any other purpose.
Respectfully,
Hereford, Lynch, Sellars & Kirkham, P.C.
HEREFORD, LYNCH, SELLARS & KIRKHAM, P.C.Certified Public Accountants
Conroe, TexasJanuary 13, 2014

87
HLSKHereford, Lynch, Sellars & Kirkham
Certified Public Accountants • A Professional Corporation
Conroe Members of the Cleveland1406 Wilson Rd., Suite 100 American Institute of Certified Public Accountants 111 East BootheConroe, Texas 77304 Texas Society of Certified Public Accounts Cleveland, Texas 77327Tel 936-756-8127 Private Companies Practice Section Tel 281-592-6443Metro 936-441-1338 of the AICPA Division for Firms Fax 281-592-7706Fax 936-756-8132
INDEPENDENT AUDITORS’ REPORT ON COMPLIANCE FOR EACH MAJOR PROGRAM AND ON INTERNAL CONTROL OVER COMPLIANCE REQUIRED BY OMB CIRCULAR A-133
The Board of Trustees ofStafford Municipal School District1625 StaffordshireStafford, Texas 77477
Report on Compliance for Each Major Federal Program
We have audited Stafford Municipal School District’s (District) compliance with the types of compliance requirements described in the OMB Circular A-133 Compliance Supplement that could have a direct and material effect on each of Stafford Municipal School District’s major federal programs for the year ended August 31, 2013. Stafford Municipal School District’s major federal programs are identified in the summary of auditors’ results section of the accompanying schedule of findings and questioned costs.
Management’s Responsibility
Management is responsible for compliance with the requirements of laws, regulations, contracts, and grants applicable to its federal programs.
Auditors’ Responsibility
Our responsibility is to express an opinion on compliance for each of Stafford Municipal School District’s major federal programs based on our audit of the types of compliance requirements referred to above. We conducted our audit of compliance in accordance with auditing standards generally accepted in the United States of America; the standards applicable to financial audits contained in Government Auditing Standards, issued by the Comptroller General of the United States; and OMB Circular A-133, Audits of States, Local Governments, and Non-Profit Organizations. Those standards and OMB Circular A-133 require that we plan and perform the audit to obtain reasonable assurance about whether noncompliance with the types of compliance requirements referred to above that could have a direct and material effect on a major federal program occurred. An audit includes examining, on a test basis, evidence about Stafford Municipal School District’s compliance with those requirements and performing such other procedures as we considered necessary in the circumstances.
We believe that our audit provides a reasonable basis for our opinion on compliance for each major federal program. However, our audit does not provide a legal determination of Stafford Municipal School District’scompliance.
Opinion on Each Major Federal Program
In our opinion, Stafford Municipal School District, complied, in all material respects, with the types of compliance requirements referred to above that could have a direct and material effect on each of its major federal programs for the year ended August 31, 2013.
88
Report on Internal Control Over Compliance
Management of Stafford Municipal School District is responsible for establishing and maintaining effective internal control over compliance with the types of compliance requirements referred to above. In planning and performing our audit of compliance, we considered Stafford Municipal School District’s internal control over compliance with the requirements that could have a direct and material effect on a major federal program to determine the auditing procedures that are appropriate in the circumstances for the purpose of expressing an opinion on compliance for each major federal program and to test and report on internal control over compliance in accordance with OMB Circular A-133, but not for the purpose of expressing an opinion on the effectiveness of internal control over compliance. Accordingly, we do not express an opinion on the effectiveness of Stafford Municipal School District’sinternal control over compliance.
A deficiency in internal control over compliance exists when the design or operation of a control over compliance does not allow management or employees, in the normal course of performing their assigned functions, to prevent, or detect and correct, noncompliance with a type of compliance requirement of a federal program on a timely basis. A material weakness in internal control over compliance is a deficiency, or combination of deficiencies, in internal control over compliance, such that there is a reasonable possibility that material noncompliance with a type of compliance requirement of a federal program will not be prevented or detected and corrected, on a timely basis. A significant deficiency in internal control over compliance is a deficiency, or a combination of deficiencies, in internal control over compliance with a type of compliance requirement of a federal program that is less severe than a material weakness in internal control over compliance, yet important enough to merit attention by those charged with governance.
Our consideration of internal control over compliance was for the limited purpose described in the first paragraph of this section and was not designed to identify all deficiencies in internal control over compliance that might be, material weaknesses or significant deficiencies. We did not identify any deficiencies in internal control over compliance that we consider to be material weaknesses. However, material weaknesses may exist that have not been identified.
The purpose of this report on internal control over compliance is solely to describe the scope of our testing of internal control over compliance and the results of that testing based on the requirements of OMB Circular A-133. Accordingly, this report is not suitable for any other purpose.
Respectfully,
Hereford, Lynch, Sellars & Kirkham, P.C.
HEREFORD, LYNCH, SELLARS & KIRKHAM, P.C.Certified Public Accountants
Conroe, TexasJanuary 13, 2014
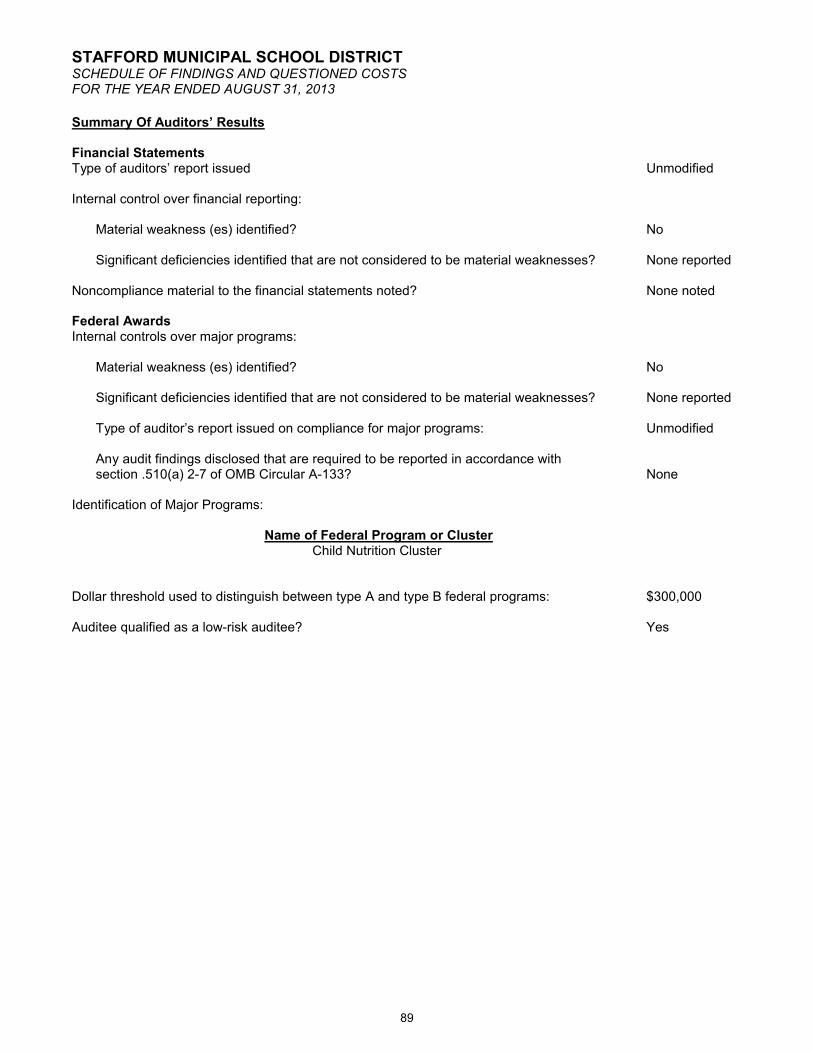
STAFFORD MUNICIPAL SCHOOL DISTRICTSCHEDULE OF FINDINGS AND QUESTIONED COSTSFOR THE YEAR ENDED AUGUST 31, 2013
89
Summary Of Auditors’ Results
Financial StatementsType of auditors’ report issued Unmodified
Internal control over financial reporting:
Material weakness (es) identified? No
Significant deficiencies identified that are not considered to be material weaknesses? None reported
Noncompliance material to the financial statements noted? None noted
Federal AwardsInternal controls over major programs:
Material weakness (es) identified? No
Significant deficiencies identified that are not considered to be material weaknesses? None reported
Type of auditor’s report issued on compliance for major programs: Unmodified
Any audit findings disclosed that are required to be reported in accordance with section .510(a) 2-7 of OMB Circular A-133? None
Identification of Major Programs:
Name of Federal Program or ClusterChild Nutrition Cluster
Dollar threshold used to distinguish between type A and type B federal programs: $300,000
Auditee qualified as a low-risk auditee? Yes

STAFFORD MUNICIPAL SCHOOL DISTRICTSUMMARY SCHEDULE OF PRIOR AUDIT FINDINGSFOR THE YEAR ENDED AUGUST 31, 2013
90
Management’s ExplanationFinding/Recommendation Current Status if Not Implemented
None to report.

STAFFORD MUNICIPAL SCHOOL DISTRICTCORRECTIVE ACTION PLANFOR THE YEAR ENDED AUGUST 31, 2013
91
None to report.

STAFFORD MUNICIPAL SCHOOL DISTRICT EXHIBIT K-1
SCHEDULE EXPENDITURES OF FEDERAL AWARDSFOR THE YEAR ENDED AUGUST 31, 2013
The accompanying notes are an integral part of this schedule.
92
(1) (2) (2A) (3)
Federal Grantor/ Federal Pass-Through
Pass-Through Grantor/ CFDA Entity Identifying Federal
Program Title Number Number Expenditures
U.S. DEPARTMENT OF EDUCATION
Passed Through State Department of Education:
ESEA Title I, Part A - Improving Basic Programs * 84.010A 13610101079910 $ 372,116
Special Education Cluster (IDEA):
IDEA-B Formula 84.027A 136600010799106600 605,537
IDEA-B Preschool 84.173A 136610010799106610 2,774
Total Special Education Cluster (IDEA) 608,311
Career and Technology - Basic Grant 84.048A 13420006079910 25,627
Title III, Part A - English Language Acquisition and Language Enhancement 84.365A 13671001079910 60,679
ESEA Title II, Part A - Teacher & Principal Training & Recruiting 84.367A 13694501079910 65,338
Summer School LEP 84.369A 69551202 3,104
Passed Through Harris County Department of Education:
Title IV Part B 21st Century Community Learning Centers 84.287A S287C090044 113,604
TOTAL U.S. DEPARTMENT OF EDUCATION 1,248,779
U.S. DEPARTMENT OF HEALTH AND HUMAN SERVICES
Passed Through State Department of Health and Human Services:
Medicaid Administrative Claiming Program (MAC) * 93.778 N/A 5,637
U.S. DEPARTMENT OF AGRICULTURE
Child Nutrition Cluster:
Passed Through State Department of Agriculture - Non Cash Assistance:
National School Lunch Program 10.555 00388 100,306
Passed Through State Department of Education - Cash Assistance:
National School Breakfast Program 10.553 71401301 458,872
National School Lunch Program 10.555 71301301 1,025,347
TOTAL U.S. DEPARTMENT OF AGRICULTURE-CHILD NUTRITION CLUSTER 1,584,525
U.S. DEPARTMENT OF DEFENSE
Direct Program:
Reserve Officers' Training Corps 12.000 N/A 76,696
TOTAL EXPENDITURES OF FEDERAL AWARDS $ 2,915,637
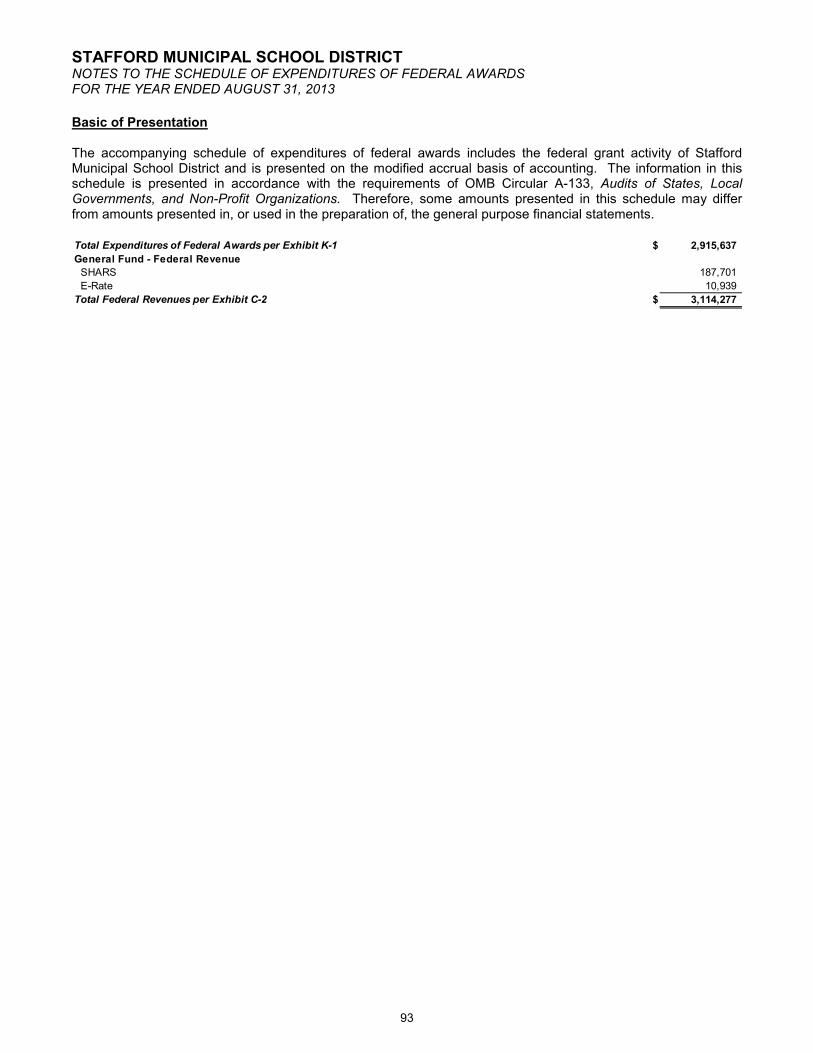
STAFFORD MUNICIPAL SCHOOL DISTRICTNOTES TO THE SCHEDULE OF EXPENDITURES OF FEDERAL AWARDSFOR THE YEAR ENDED AUGUST 31, 2013
93
Basic of Presentation
The accompanying schedule of expenditures of federal awards includes the federal grant activity of Stafford Municipal School District and is presented on the modified accrual basis of accounting. The information in this schedule is presented in accordance with the requirements of OMB Circular A-133, Audits of States, Local Governments, and Non-Profit Organizations. Therefore, some amounts presented in this schedule may differ from amounts presented in, or used in the preparation of, the general purpose financial statements.
Total Expenditures of Federal Awards per Exhibit K-1 $ 2,915,637
General Fund - Federal Revenue
SHARS 187,701
E-Rate 10,939
Total Federal Revenues per Exhibit C-2 $ 3,114,277

94
This page is left blank intentionally.

95
STATISTICAL SECTION
This part of the Stafford Municipal School District's comprehensive annual financial report presents detailed information as a context for understanding what the information in the financial statements, note disclosures, and required supplementary information says about the District's overall financial health.
Contents Page
Financial Trends 96-102
These schedules contain trend information to help the reader understand how the District'sfinancial performance and well-being have changed over time.
Revenue Capacity 104-109
These schedules contain information to help the reader assess the factors affecting the District's ability to generate its property taxes.
Debt Capacity 110-112
These schedules present information to help the reader assess the affordability of the District's current levels of outstanding debt and the District's ability to issue additional debt in the future.
Demographic and Economic Information 113-115
These schedules offer demographic and economic indicators to help the reader understandhow the District's financial activities take place and to help make comparisons over time andwith other governments.
Operating Information 116-120
These schedules contain information about the District's operations and resources to help thereader understand how the District's financial information relates to the services the District provides and the activities it performs.
Sources: Unless otherwise noted, the information in these schedules is derived from the comprehensive annual financial reports for the relevant year.
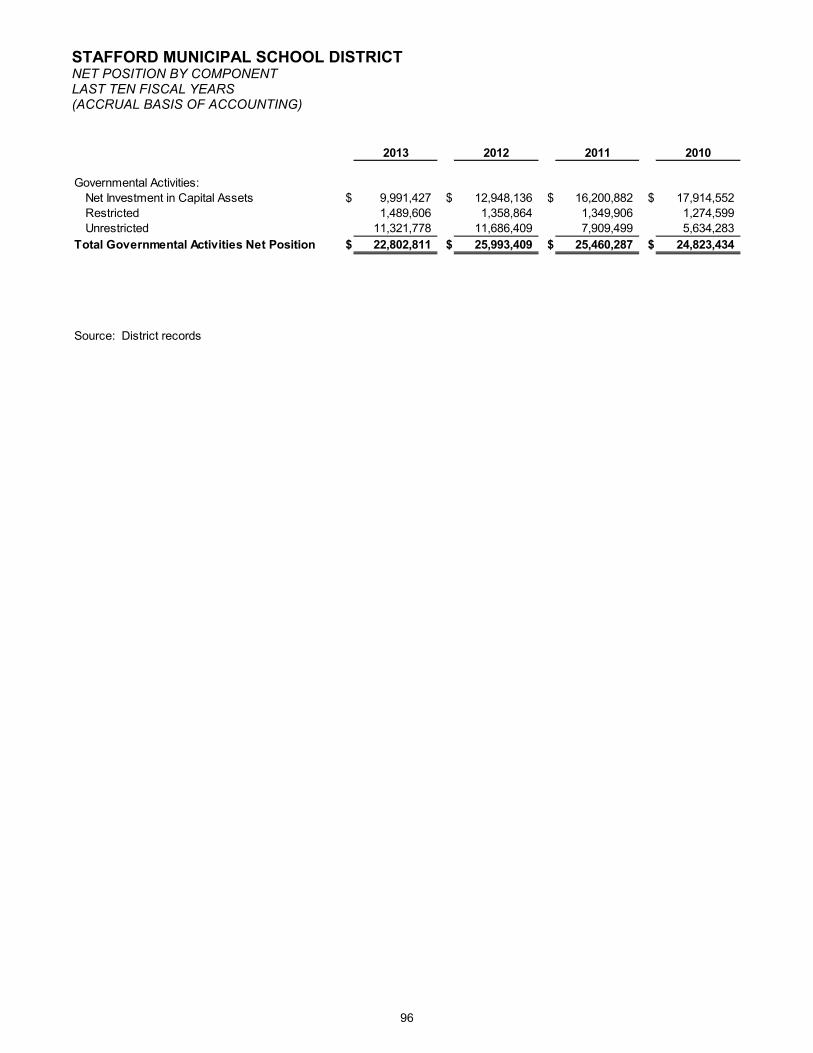
STAFFORD MUNICIPAL SCHOOL DISTRICTNET POSITION BY COMPONENTLAST TEN FISCAL YEARS(ACCRUAL BASIS OF ACCOUNTING)
96
2013 2012 2011 2010
Governmental Activities:
Net Investment in Capital Assets $ 9,991,427 $ 12,948,136 $ 16,200,882 $ 17,914,552
Restricted 1,489,606 1,358,864 1,349,906 1,274,599
Unrestricted 11,321,778 11,686,409 7,909,499 5,634,283
Total Governmental Activities Net Position $ 22,802,811 $ 25,993,409 $ 25,460,287 $ 24,823,434
Source: District records

TABLE L-1
97
2009 2008 2007 2006 2005 2004
$ 17,437,418 $ 18,169,818 $ 6,438,216 $ 16,095,675 $ 15,068,040 $ 13,944,608
1,482,328 975,745 11,456,185 5,537,948 - 894,388
3,164,280 3,142,141 4,220,976 (1,074,245) 3,483,355 2,580,338
$ 22,084,026 $ 22,287,704 $ 22,115,377 $ 20,559,378 $ 18,551,395 $ 17,419,334
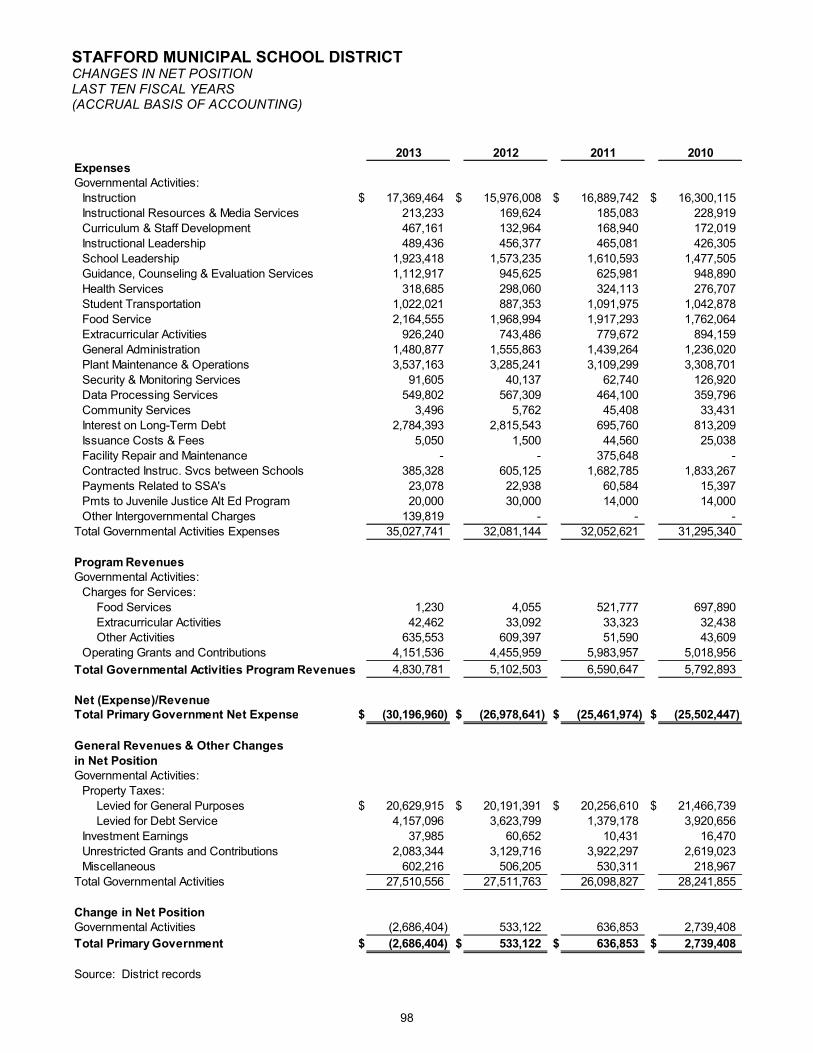
STAFFORD MUNICIPAL SCHOOL DISTRICTCHANGES IN NET POSITIONLAST TEN FISCAL YEARS(ACCRUAL BASIS OF ACCOUNTING)
98
2013 2012 2011 2010
ExpensesGovernmental Activities:
Instruction $ 17,369,464 $ 15,976,008 $ 16,889,742 $ 16,300,115
Instructional Resources & Media Services 213,233 169,624 185,083 228,919
Curriculum & Staff Development 467,161 132,964 168,940 172,019
Instructional Leadership 489,436 456,377 465,081 426,305
School Leadership 1,923,418 1,573,235 1,610,593 1,477,505
Guidance, Counseling & Evaluation Services 1,112,917 945,625 625,981 948,890
Health Services 318,685 298,060 324,113 276,707
Student Transportation 1,022,021 887,353 1,091,975 1,042,878
Food Service 2,164,555 1,968,994 1,917,293 1,762,064
Extracurricular Activities 926,240 743,486 779,672 894,159
General Administration 1,480,877 1,555,863 1,439,264 1,236,020
Plant Maintenance & Operations 3,537,163 3,285,241 3,109,299 3,308,701
Security & Monitoring Services 91,605 40,137 62,740 126,920
Data Processing Services 549,802 567,309 464,100 359,796
Community Services 3,496 5,762 45,408 33,431
Interest on Long-Term Debt 2,784,393 2,815,543 695,760 813,209
Issuance Costs & Fees 5,050 1,500 44,560 25,038
Facility Repair and Maintenance - - 375,648 -
Contracted Instruc. Svcs between Schools 385,328 605,125 1,682,785 1,833,267
Payments Related to SSA's 23,078 22,938 60,584 15,397
Pmts to Juvenile Justice Alt Ed Program 20,000 30,000 14,000 14,000
Other Intergovernmental Charges 139,819 - - -
Total Governmental Activities Expenses 35,027,741 32,081,144 32,052,621 31,295,340
Program RevenuesGovernmental Activities:
Charges for Services:
Food Services 1,230 4,055 521,777 697,890
Extracurricular Activities 42,462 33,092 33,323 32,438 Other Activities 635,553 609,397 51,590 43,609
Operating Grants and Contributions 4,151,536 4,455,959 5,983,957 5,018,956
Total Governmental Activities Program Revenues 4,830,781 5,102,503 6,590,647 5,792,893
Net (Expense)/RevenueTotal Primary Government Net Expense $ (30,196,960) $ (26,978,641) $ (25,461,974) $ (25,502,447)
General Revenues & Other Changes
in Net PositionGovernmental Activities:
Property Taxes:
Levied for General Purposes $ 20,629,915 $ 20,191,391 $ 20,256,610 $ 21,466,739
Levied for Debt Service 4,157,096 3,623,799 1,379,178 3,920,656
Investment Earnings 37,985 60,652 10,431 16,470
Unrestricted Grants and Contributions 2,083,344 3,129,716 3,922,297 2,619,023
Miscellaneous 602,216 506,205 530,311 218,967
Total Governmental Activities 27,510,556 27,511,763 26,098,827 28,241,855
Change in Net PositionGovernmental Activities (2,686,404) 533,122 636,853 2,739,408
Total Primary Government $ (2,686,404) $ 533,122 $ 636,853 $ 2,739,408
Source: District records
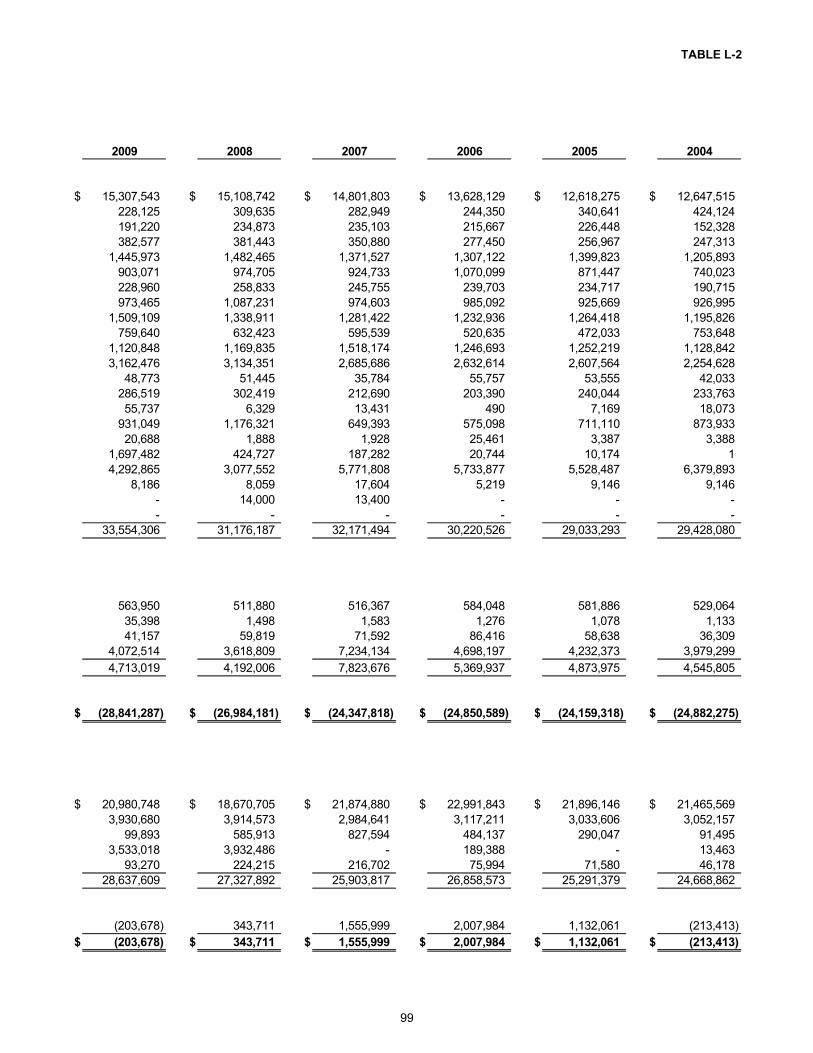
TABLE L-2
99
2009 2008 2007 2006 2005 2004
$ 15,307,543 $ 15,108,742 $ 14,801,803 $ 13,628,129 $ 12,618,275 $ 12,647,515
228,125 309,635 282,949 244,350 340,641 424,124
191,220 234,873 235,103 215,667 226,448 152,328
382,577 381,443 350,880 277,450 256,967 247,313
1,445,973 1,482,465 1,371,527 1,307,122 1,399,823 1,205,893
903,071 974,705 924,733 1,070,099 871,447 740,023
228,960 258,833 245,755 239,703 234,717 190,715
973,465 1,087,231 974,603 985,092 925,669 926,995
1,509,109 1,338,911 1,281,422 1,232,936 1,264,418 1,195,826
759,640 632,423 595,539 520,635 472,033 753,648
1,120,848 1,169,835 1,518,174 1,246,693 1,252,219 1,128,842
3,162,476 3,134,351 2,685,686 2,632,614 2,607,564 2,254,628
48,773 51,445 35,784 55,757 53,555 42,033
286,519 302,419 212,690 203,390 240,044 233,763
55,737 6,329 13,431 490 7,169 18,073
931,049 1,176,321 649,393 575,098 711,110 873,933
20,688 1,888 1,928 25,461 3,387 3,388
1,697,482 424,727 187,282 20,744 10,174 1
4,292,865 3,077,552 5,771,808 5,733,877 5,528,487 6,379,893
8,186 8,059 17,604 5,219 9,146 9,146
- 14,000 13,400 - - -
- - - - - -
33,554,306 31,176,187 32,171,494 30,220,526 29,033,293 29,428,080
563,950 511,880 516,367 584,048 581,886 529,064
35,398 1,498 1,583 1,276 1,078 1,133 41,157 59,819 71,592 86,416 58,638 36,309
4,072,514 3,618,809 7,234,134 4,698,197 4,232,373 3,979,299
4,713,019 4,192,006 7,823,676 5,369,937 4,873,975 4,545,805
$ (28,841,287) $ (26,984,181) $ (24,347,818) $ (24,850,589) $ (24,159,318) $ (24,882,275)
$ 20,980,748 $ 18,670,705 $ 21,874,880 $ 22,991,843 $ 21,896,146 $ 21,465,569
3,930,680 3,914,573 2,984,641 3,117,211 3,033,606 3,052,157
99,893 585,913 827,594 484,137 290,047 91,495
3,533,018 3,932,486 - 189,388 - 13,463
93,270 224,215 216,702 75,994 71,580 46,178
28,637,609 27,327,892 25,903,817 26,858,573 25,291,379 24,668,862
(203,678) 343,711 1,555,999 2,007,984 1,132,061 (213,413)
$ (203,678) $ 343,711 $ 1,555,999 $ 2,007,984 $ 1,132,061 $ (213,413)
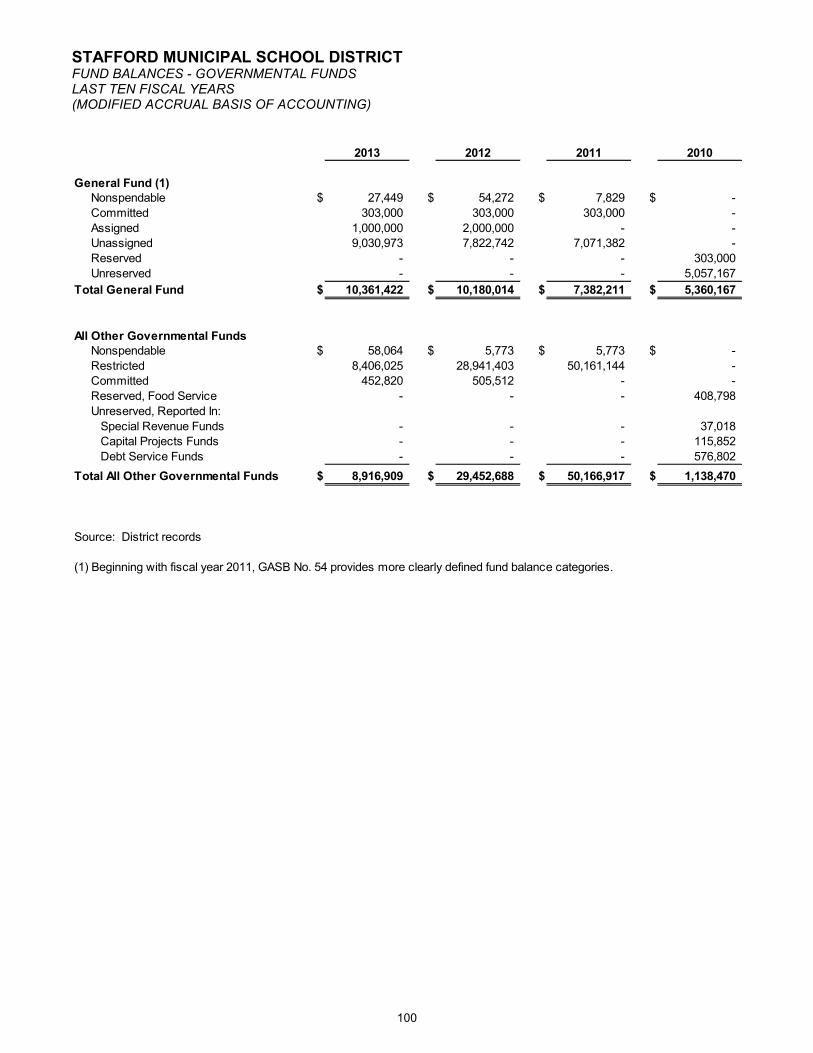
STAFFORD MUNICIPAL SCHOOL DISTRICTFUND BALANCES - GOVERNMENTAL FUNDSLAST TEN FISCAL YEARS(MODIFIED ACCRUAL BASIS OF ACCOUNTING)
100
2013 2012 2011 2010
General Fund (1)Nonspendable $ 27,449 $ 54,272 $ 7,829 $ -
Committed 303,000 303,000 303,000 -
Assigned 1,000,000 2,000,000 - -
Unassigned 9,030,973 7,822,742 7,071,382 -
Reserved - - - 303,000
Unreserved - - - 5,057,167
Total General Fund $ 10,361,422 $ 10,180,014 $ 7,382,211 $ 5,360,167
All Other Governmental FundsNonspendable $ 58,064 $ 5,773 $ 5,773 $ -
Restricted 8,406,025 28,941,403 50,161,144 -
Committed 452,820 505,512 - -
Reserved, Food Service - - - 408,798
Unreserved, Reported In:
Special Revenue Funds - - - 37,018
Capital Projects Funds - - - 115,852
Debt Service Funds - - - 576,802
Total All Other Governmental Funds $ 8,916,909 $ 29,452,688 $ 50,166,917 $ 1,138,470
Source: District records
(1) Beginning with fiscal year 2011, GASB No. 54 provides more clearly defined fund balance categories.
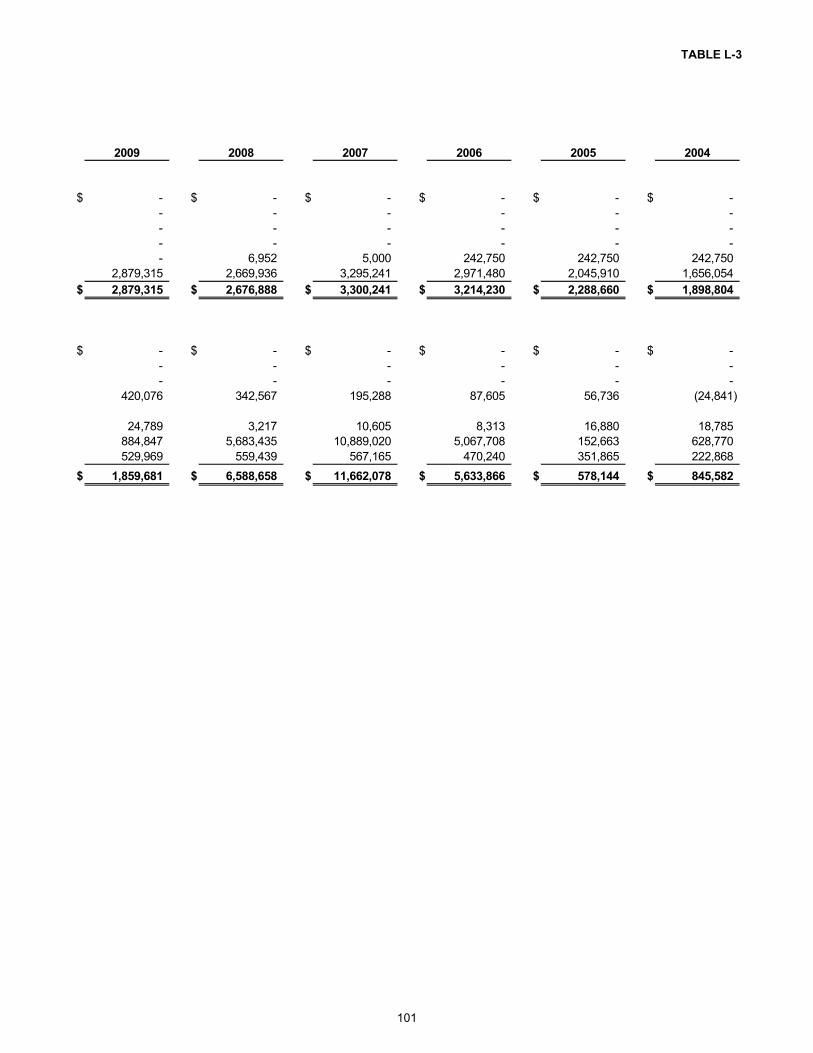
TABLE L-3
101
2009 2008 2007 2006 2005 2004
$ - $ - $ - $ - $ - $ -
- - - - - -
- - - - - -
- - - - - -
- 6,952 5,000 242,750 242,750 242,750
2,879,315 2,669,936 3,295,241 2,971,480 2,045,910 1,656,054
$ 2,879,315 $ 2,676,888 $ 3,300,241 $ 3,214,230 $ 2,288,660 $ 1,898,804
$ - $ - $ - $ - $ - $ -
- - - - - -
- - - - - -
420,076 342,567 195,288 87,605 56,736 (24,841)
24,789 3,217 10,605 8,313 16,880 18,785
884,847 5,683,435 10,889,020 5,067,708 152,663 628,770
529,969 559,439 567,165 470,240 351,865 222,868
$ 1,859,681 $ 6,588,658 $ 11,662,078 $ 5,633,866 $ 578,144 $ 845,582

STAFFORD MUNICIPAL SCHOOL DISTRICTCHANGES IN FUND BALANCES - GOVERNMENTAL FUNDSLAST TEN FISCAL YEARS(MODIFIED ACCRUAL BASIS OF ACCOUNTING)
102
2013 2012 2011 2010
REVENUES
Local & Intermediate Sources $ 26,131,611 $ 25,108,883 $ 22,846,009 $ 26,647,117
State Program Revenues 3,120,603 4,429,356 5,660,245 3,841,700
Federal Program Revenues 3,114,277 3,252,262 4,246,009 3,806,151
Total Revenues 32,366,491 32,790,501 32,752,263 34,294,968
EXPENDITURES
Instruction 15,154,868 14,241,850 15,565,968 14,952,475
Instructional Resources & Media Services 184,641 153,024 169,004 206,422
Curriculum & Staff Development 404,563 119,973 154,224 152,044
Instructional Leadership 423,793 411,694 424,942 400,456
School Leadership 1,665,441 1,419,190 1,470,863 1,355,892
Guidance, Counseling & Evaluation Services 963,654 853,046 914,627 862,170
Health Services 275,943 268,874 295,968 254,540
Student Transportation 748,920 800,542 1,080,288 991,254
Food Service 1,885,156 1,899,701 1,859,807 1,747,106
Extracurricular Activities 823,931 680,567 739,602 981,009
General Administration 1,260,245 1,403,700 1,314,127 1,210,551
Plant Maintenance & Operations 3,057,991 2,991,848 2,860,392 2,966,988
Security & Monitoring Services 79,288 36,218 57,270 122,121
Data Processing Services 475,406 511,805 647,642 340,936
Community Services 3,028 5,199 41,450 33,431
Principal on Long-Term Debt 1,236,921 700,001 658,421 3,095,000
Interest on Long-Term Debt 2,829,095 2,848,612 690,207 818,868
Bond Issuance Costs & Fees 5,050 1,500 509,336 25,038
Facility Repair and Maintenance 20,674,703 20,605,577 1,822,032 156,363
Contracted Instructional Services Between Schools 385,328 605,125 1,682,785 1,833,267
Payments Related to Shared Service Arrangements 23,078 22,938 60,584 15,397
Payments to Juvenile Justice Alternative Ed. Program 20,000 30,000 14,000 14,000
Other Intergovernmental Charges 139,819 - - -
Total Expenditures 52,720,862 50,610,984 33,033,539 32,535,328
Excess (Deficiency) of Revenues Over
(Under) Expenditures (20,354,371) (17,820,483) (281,276) 1,759,640
OVER FINANCING SOURCES (USES)
Refunding Bonds Issued - - - -
Capital-Related Debt Issued (Regular Bonds) - - 49,900,000 -
Sale of Real or Personal Property - - - -
Capital Lease Proceeds - - 154,165 -
Non-Current Loan Proceeds - - - -
Transfers In - - - -
Premium or Discount on Issuance of Bonds - - 1,277,602 -
Prepaid Interest - - - -
Other Resources - - - -
Transfers Out - - - -
Payment to Bond Refunding Escrow Agent - - - -
Other Uses - (95,943) - -
Total Other Financing Sources (Uses) - (95,943) 51,331,767 -
Net Change in Fund Balances $ (20,354,371) $ (17,916,426) $ 51,050,491 $ 1,759,640
Debt Service As A Percentage of
Noncapital Expenditures 12.70% 11.90% 12.30% 11.60%
Source: District records
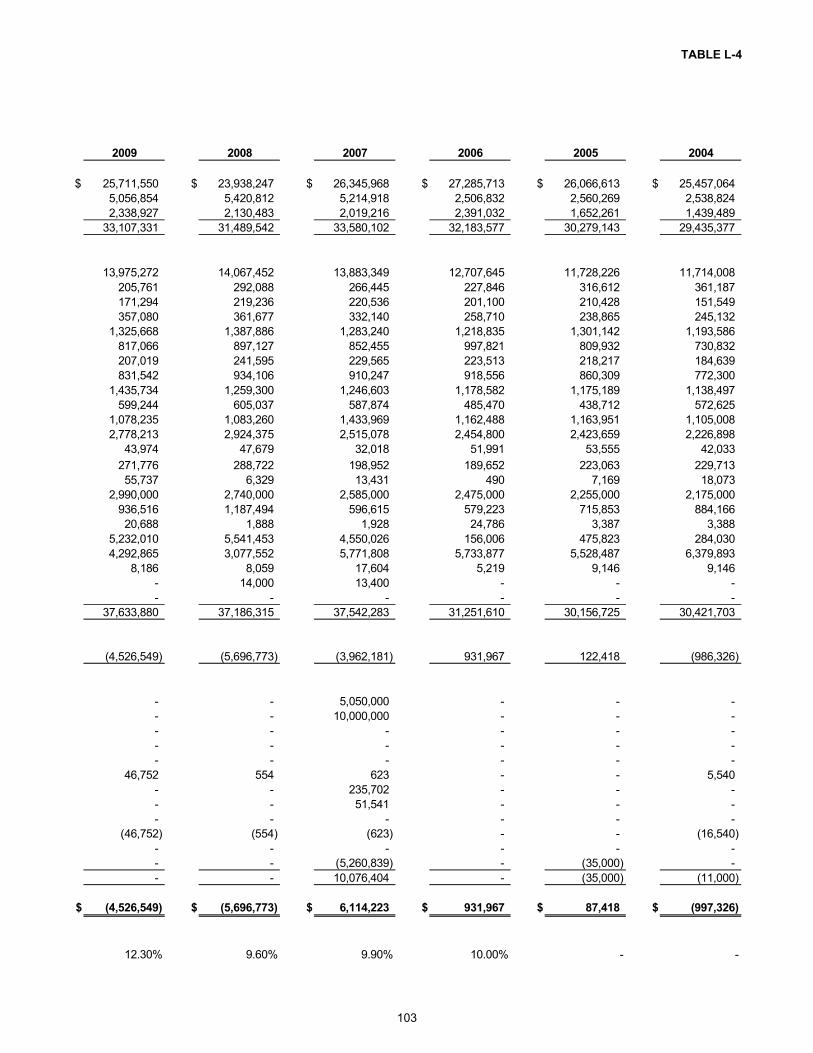
TABLE L-4
103
2009 2008 2007 2006 2005 2004
$ 25,711,550 $ 23,938,247 $ 26,345,968 $ 27,285,713 $ 26,066,613 $ 25,457,064
5,056,854 5,420,812 5,214,918 2,506,832 2,560,269 2,538,824
2,338,927 2,130,483 2,019,216 2,391,032 1,652,261 1,439,489
33,107,331 31,489,542 33,580,102 32,183,577 30,279,143 29,435,377
13,975,272 14,067,452 13,883,349 12,707,645 11,728,226 11,714,008
205,761 292,088 266,445 227,846 316,612 361,187
171,294 219,236 220,536 201,100 210,428 151,549
357,080 361,677 332,140 258,710 238,865 245,132
1,325,668 1,387,886 1,283,240 1,218,835 1,301,142 1,193,586
817,066 897,127 852,455 997,821 809,932 730,832
207,019 241,595 229,565 223,513 218,217 184,639
831,542 934,106 910,247 918,556 860,309 772,300
1,435,734 1,259,300 1,246,603 1,178,582 1,175,189 1,138,497
599,244 605,037 587,874 485,470 438,712 572,625
1,078,235 1,083,260 1,433,969 1,162,488 1,163,951 1,105,008
2,778,213 2,924,375 2,515,078 2,454,800 2,423,659 2,226,898
43,974 47,679 32,018 51,991 53,555 42,033
271,776 288,722 198,952 189,652 223,063 229,713
55,737 6,329 13,431 490 7,169 18,073
2,990,000 2,740,000 2,585,000 2,475,000 2,255,000 2,175,000
936,516 1,187,494 596,615 579,223 715,853 884,166
20,688 1,888 1,928 24,786 3,387 3,388
5,232,010 5,541,453 4,550,026 156,006 475,823 284,030
4,292,865 3,077,552 5,771,808 5,733,877 5,528,487 6,379,893
8,186 8,059 17,604 5,219 9,146 9,146
- 14,000 13,400 - - -
- - - - - -
37,633,880 37,186,315 37,542,283 31,251,610 30,156,725 30,421,703
(4,526,549) (5,696,773) (3,962,181) 931,967 122,418 (986,326)
- - 5,050,000 - - -
- - 10,000,000 - - -
- - - - - -
- - - - - -
- - - - - -
46,752 554 623 - - 5,540
- - 235,702 - - -
- - 51,541 - - -
- - - - - -
(46,752) (554) (623) - - (16,540)
- - - - - -
- - (5,260,839) - (35,000) -
- - 10,076,404 - (35,000) (11,000)
$ (4,526,549) $ (5,696,773) $ 6,114,223 $ 931,967 $ 87,418 $ (997,326)
12.30% 9.60% 9.90% 10.00% - -
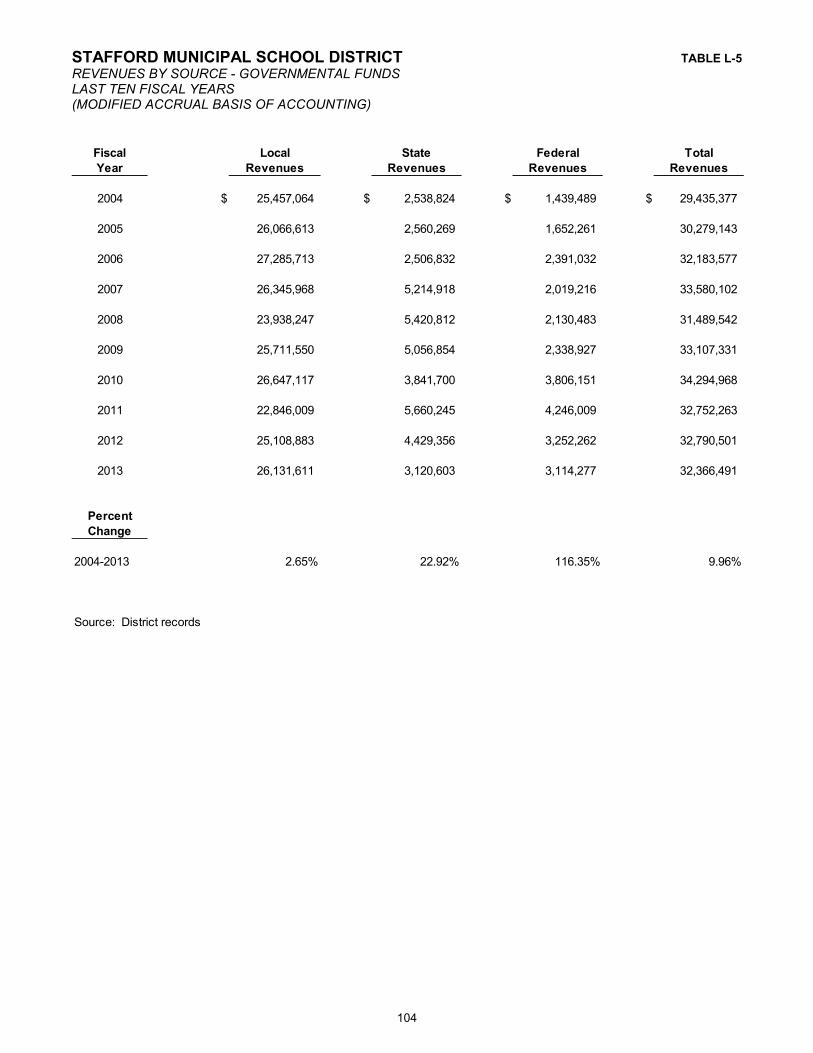
STAFFORD MUNICIPAL SCHOOL DISTRICT TABLE L-5
REVENUES BY SOURCE - GOVERNMENTAL FUNDSLAST TEN FISCAL YEARS(MODIFIED ACCRUAL BASIS OF ACCOUNTING)
104
Fiscal Local State Federal Total
Year Revenues Revenues Revenues Revenues
2004 $ 25,457,064 $ 2,538,824 $ 1,439,489 $ 29,435,377
2005 26,066,613 2,560,269 1,652,261 30,279,143
2006 27,285,713 2,506,832 2,391,032 32,183,577
2007 26,345,968 5,214,918 2,019,216 33,580,102
2008 23,938,247 5,420,812 2,130,483 31,489,542
2009 25,711,550 5,056,854 2,338,927 33,107,331
2010 26,647,117 3,841,700 3,806,151 34,294,968
2011 22,846,009 5,660,245 4,246,009 32,752,263
2012 25,108,883 4,429,356 3,252,262 32,790,501
2013 26,131,611 3,120,603 3,114,277 32,366,491
Percent
Change
2004-2013 2.65% 22.92% 116.35% 9.96%
Source: District records
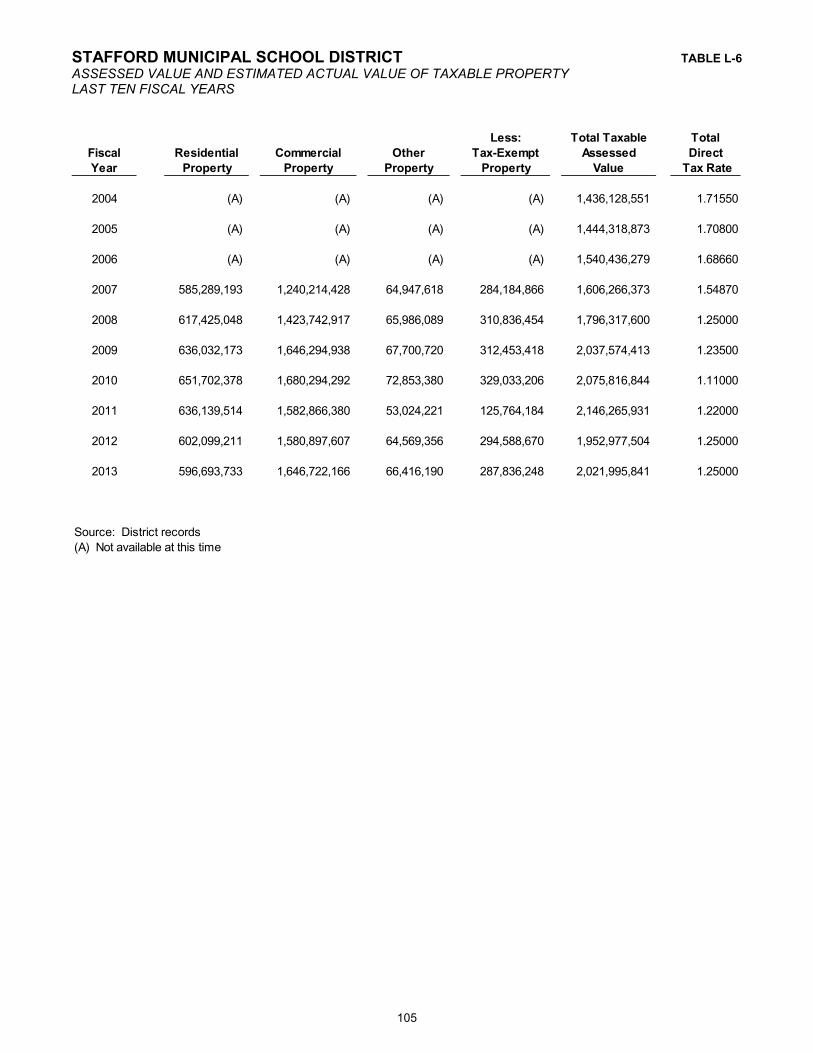
STAFFORD MUNICIPAL SCHOOL DISTRICT TABLE L-6
ASSESSED VALUE AND ESTIMATED ACTUAL VALUE OF TAXABLE PROPERTYLAST TEN FISCAL YEARS
105
Less: Total Taxable Total
Fiscal Residential Commercial Other Tax-Exempt Assessed Direct
Year Property Property Property Property Value Tax Rate
2004 (A) (A) (A) (A) 1,436,128,551 1.71550
2005 (A) (A) (A) (A) 1,444,318,873 1.70800
2006 (A) (A) (A) (A) 1,540,436,279 1.68660
2007 585,289,193 1,240,214,428 64,947,618 284,184,866 1,606,266,373 1.54870
2008 617,425,048 1,423,742,917 65,986,089 310,836,454 1,796,317,600 1.25000
2009 636,032,173 1,646,294,938 67,700,720 312,453,418 2,037,574,413 1.23500
2010 651,702,378 1,680,294,292 72,853,380 329,033,206 2,075,816,844 1.11000
2011 636,139,514 1,582,866,380 53,024,221 125,764,184 2,146,265,931 1.22000
2012 602,099,211 1,580,897,607 64,569,356 294,588,670 1,952,977,504 1.25000
2013 596,693,733 1,646,722,166 66,416,190 287,836,248 2,021,995,841 1.25000
Source: District records
(A) Not available at this time
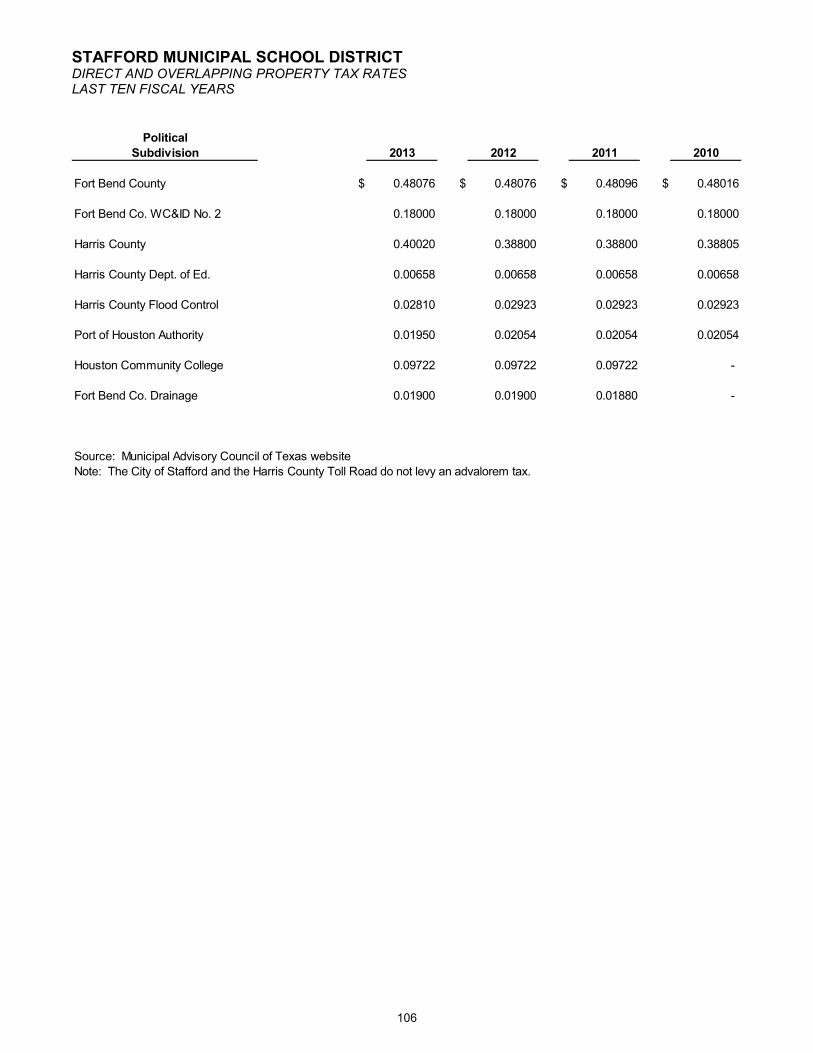
STAFFORD MUNICIPAL SCHOOL DISTRICTDIRECT AND OVERLAPPING PROPERTY TAX RATESLAST TEN FISCAL YEARS
106
Political
Subdivision 2013 2012 2011 2010
Fort Bend County $ 0.48076 $ 0.48076 $ 0.48096 $ 0.48016
Fort Bend Co. WC&ID No. 2 0.18000 0.18000 0.18000 0.18000
Harris County 0.40020 0.38800 0.38800 0.38805
Harris County Dept. of Ed. 0.00658 0.00658 0.00658 0.00658
Harris County Flood Control 0.02810 0.02923 0.02923 0.02923
Port of Houston Authority 0.01950 0.02054 0.02054 0.02054
Houston Community College 0.09722 0.09722 0.09722 -
Fort Bend Co. Drainage 0.01900 0.01900 0.01880 -
Source: Municipal Advisory Council of Texas website
Note: The City of Stafford and the Harris County Toll Road do not levy an advalorem tax.
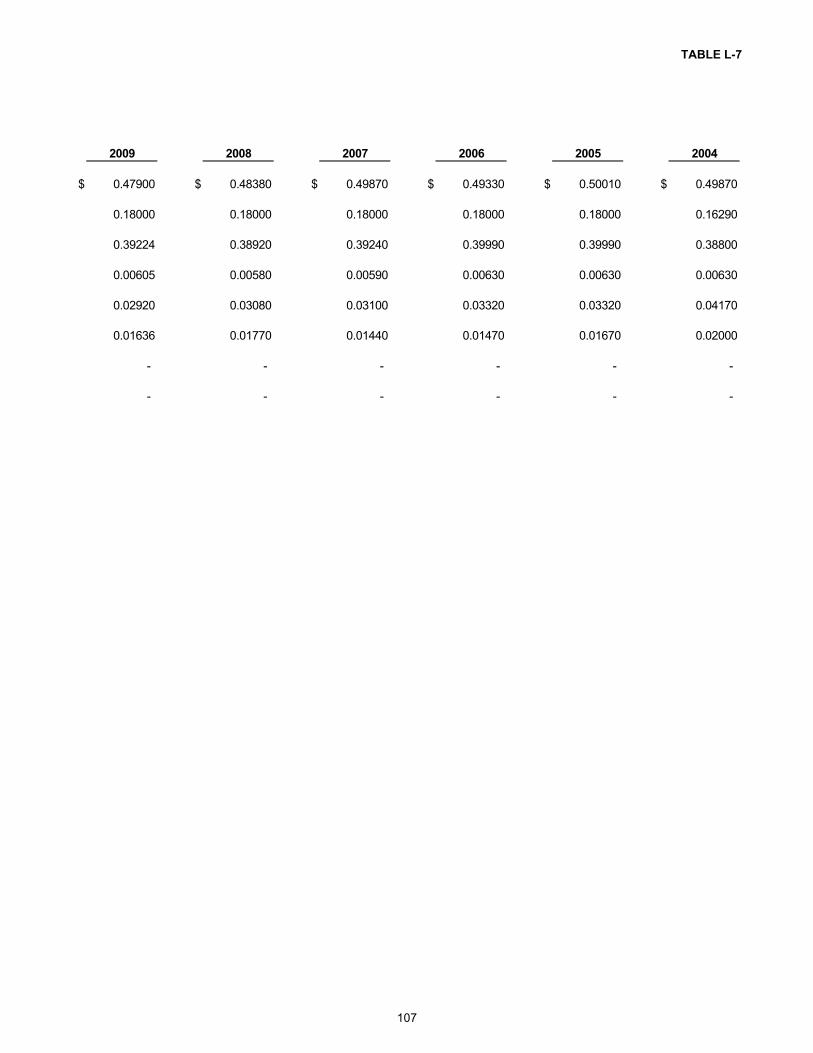
TABLE L-7
107
2009 2008 2007 2006 2005 2004
$ 0.47900 $ 0.48380 $ 0.49870 $ 0.49330 $ 0.50010 $ 0.49870
0.18000 0.18000 0.18000 0.18000 0.18000 0.16290
0.39224 0.38920 0.39240 0.39990 0.39990 0.38800
0.00605 0.00580 0.00590 0.00630 0.00630 0.00630
0.02920 0.03080 0.03100 0.03320 0.03320 0.04170
0.01636 0.01770 0.01440 0.01470 0.01670 0.02000
- - - - - -
- - - - - -
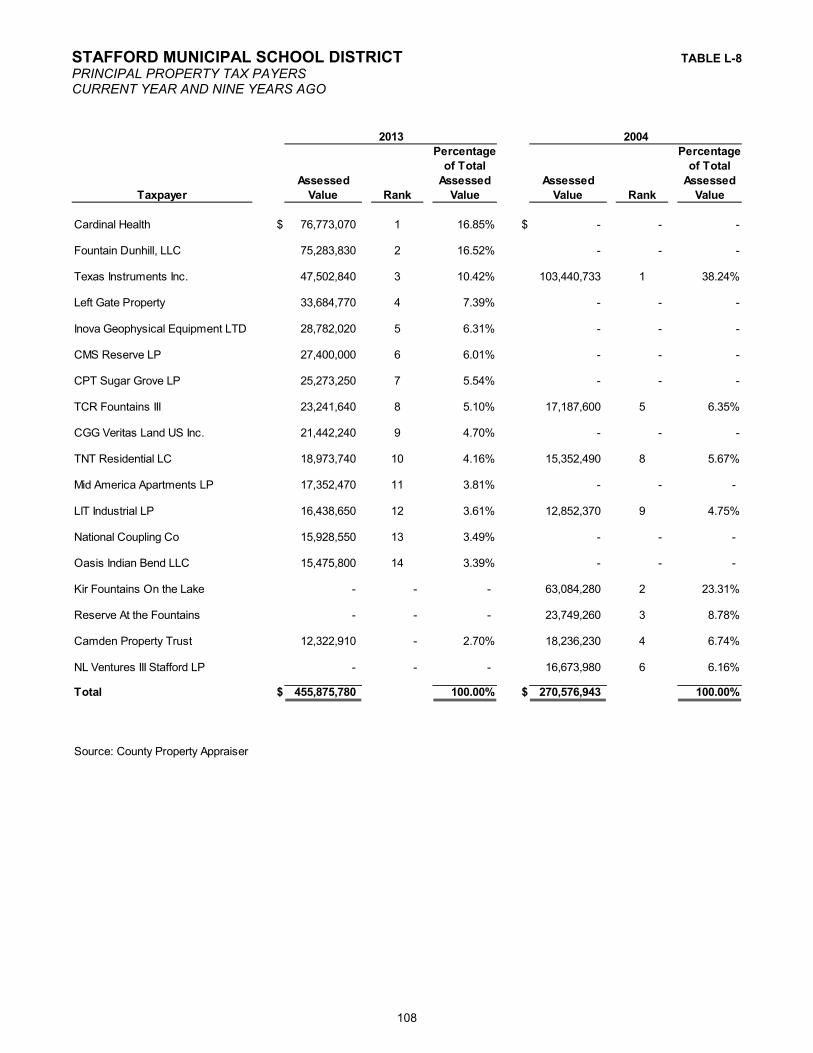
STAFFORD MUNICIPAL SCHOOL DISTRICT TABLE L-8
PRINCIPAL PROPERTY TAX PAYERSCURRENT YEAR AND NINE YEARS AGO
108
Percentage Percentage
of Total of Total
Assessed Assessed Assessed Assessed
Taxpayer Value Rank Value Value Rank Value
Cardinal Health $ 76,773,070 1 16.85% $ - - -
Fountain Dunhill, LLC 75,283,830 2 16.52% - - -
Texas Instruments Inc. 47,502,840 3 10.42% 103,440,733 1 38.24%
Left Gate Property 33,684,770 4 7.39% - - -
Inova Geophysical Equipment LTD 28,782,020 5 6.31% - - -
CMS Reserve LP 27,400,000 6 6.01% - - -
CPT Sugar Grove LP 25,273,250 7 5.54% - - -
TCR Fountains III 23,241,640 8 5.10% 17,187,600 5 6.35%
CGG Veritas Land US Inc. 21,442,240 9 4.70% - - -
TNT Residential LC 18,973,740 10 4.16% 15,352,490 8 5.67%
Mid America Apartments LP 17,352,470 11 3.81% - - -
LIT Industrial LP 16,438,650 12 3.61% 12,852,370 9 4.75%
National Coupling Co 15,928,550 13 3.49% - - -
Oasis Indian Bend LLC 15,475,800 14 3.39% - - -
Kir Fountains On the Lake - - - 63,084,280 2 23.31%
Reserve At the Fountains - - - 23,749,260 3 8.78%
Camden Property Trust 12,322,910 - 2.70% 18,236,230 4 6.74%
NL Ventures III Stafford LP - - - 16,673,980 6 6.16%
Total $ 455,875,780 100.00% $ 270,576,943 100.00%
Source: County Property Appraiser
2013 2004
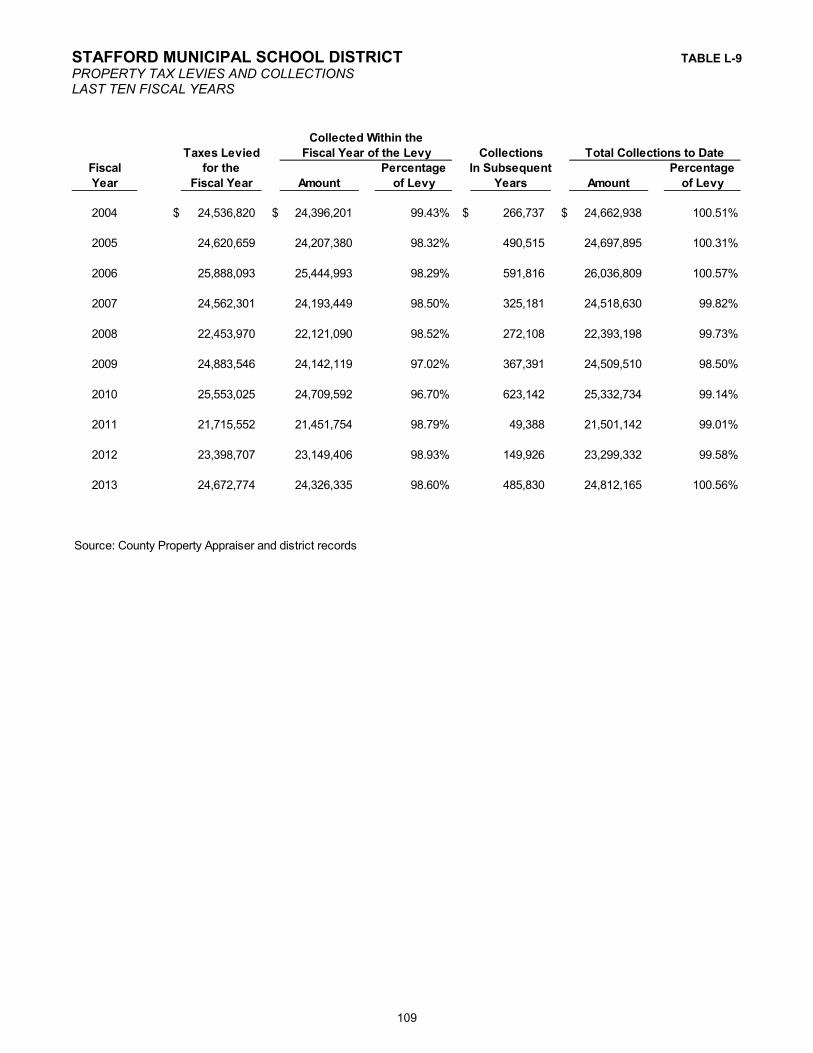
STAFFORD MUNICIPAL SCHOOL DISTRICT TABLE L-9
PROPERTY TAX LEVIES AND COLLECTIONSLAST TEN FISCAL YEARS
109
Taxes Levied Collections
Fiscal for the Percentage In Subsequent Percentage
Year Fiscal Year Amount of Levy Years Amount of Levy
2004 $ 24,536,820 $ 24,396,201 99.43% $ 266,737 $ 24,662,938 100.51%
2005 24,620,659 24,207,380 98.32% 490,515 24,697,895 100.31%
2006 25,888,093 25,444,993 98.29% 591,816 26,036,809 100.57%
2007 24,562,301 24,193,449 98.50% 325,181 24,518,630 99.82%
2008 22,453,970 22,121,090 98.52% 272,108 22,393,198 99.73%
2009 24,883,546 24,142,119 97.02% 367,391 24,509,510 98.50%
2010 25,553,025 24,709,592 96.70% 623,142 25,332,734 99.14%
2011 21,715,552 21,451,754 98.79% 49,388 21,501,142 99.01%
2012 23,398,707 23,149,406 98.93% 149,926 23,299,332 99.58%
2013 24,672,774 24,326,335 98.60% 485,830 24,812,165 100.56%
Source: County Property Appraiser and district records
Fiscal Year of the Levy
Collected Within the
Total Collections to Date
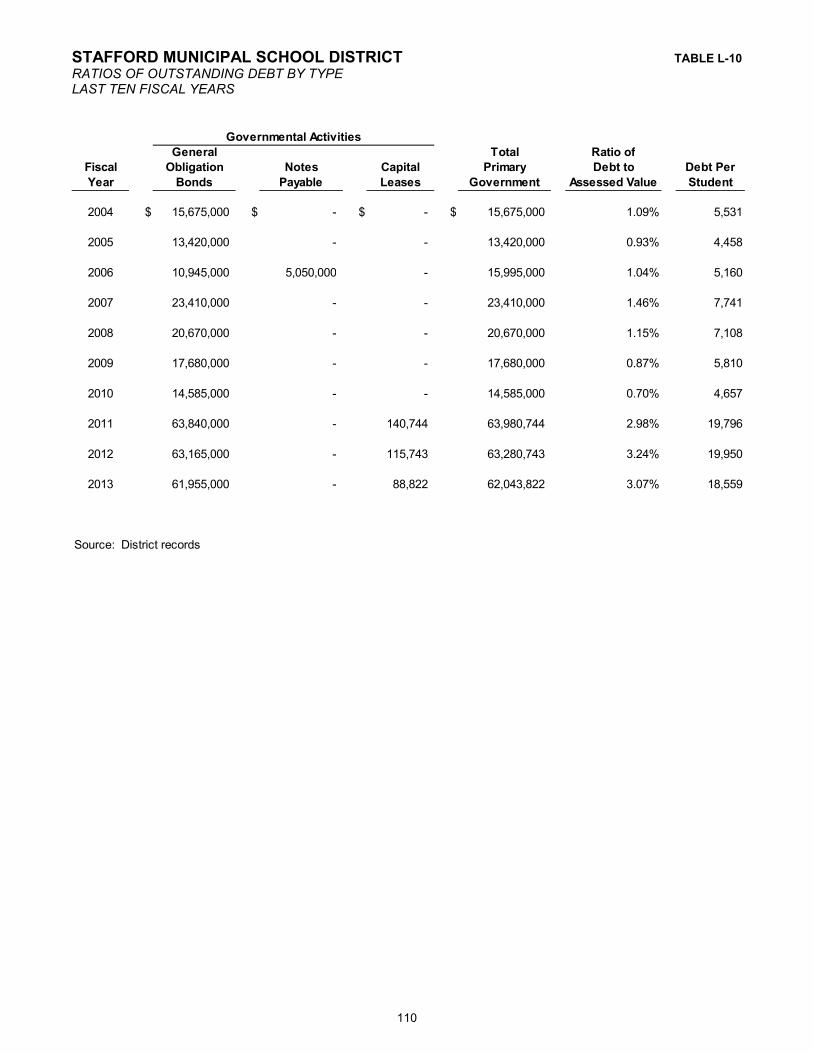
STAFFORD MUNICIPAL SCHOOL DISTRICT TABLE L-10
RATIOS OF OUTSTANDING DEBT BY TYPELAST TEN FISCAL YEARS
110
General Total Ratio of
Fiscal Obligation Notes Capital Primary Debt to Debt Per
Year Bonds Payable Leases Government Assessed Value Student
2004 $ 15,675,000 $ - $ - $ 15,675,000 1.09% 5,531
2005 13,420,000 - - 13,420,000 0.93% 4,458
2006 10,945,000 5,050,000 - 15,995,000 1.04% 5,160
2007 23,410,000 - - 23,410,000 1.46% 7,741
2008 20,670,000 - - 20,670,000 1.15% 7,108
2009 17,680,000 - - 17,680,000 0.87% 5,810
2010 14,585,000 - - 14,585,000 0.70% 4,657
2011 63,840,000 - 140,744 63,980,744 2.98% 19,796
2012 63,165,000 - 115,743 63,280,743 3.24% 19,950
2013 61,955,000 - 88,822 62,043,822 3.07% 18,559
Source: District records
Governmental Activities

STAFFORD MUNICIPAL SCHOOL DISTRICT TABLE L-11
RATIOS OF GENERAL BONDED DEBT OUTSTANDINGLAST TEN FISCAL YEARS
111
General Less: Reserve Ratio of Net Net Bonded
Fiscal Obligation for Retirement Net Bonded Bonded Debt to Debt Per
Year Bonds of Bonded Debt Debt Assessed Value Student
2004 $ 15,675,000 $ 222,868 $ 15,452,132 1.08% 5,452
2005 13,420,000 351,865 13,068,135 0.90% 4,342
2006 10,945,000 470,240 10,474,760 0.68% 3,379
2007 23,410,000 567,165 22,842,835 1.42% 7,554
2008 20,670,000 559,439 20,110,561 1.12% 6,916
2009 17,680,000 529,969 17,150,031 0.84% 5,636
2010 14,585,000 576,802 14,008,198 0.67% 4,473
2011 63,840,000 1,407,546 62,432,454 2.91% 19,317
2012 63,165,000 1,400,371 61,764,629 3.16% 19,472
2013 61,955,000 1,521,122 60,433,878 2.99% 18,078
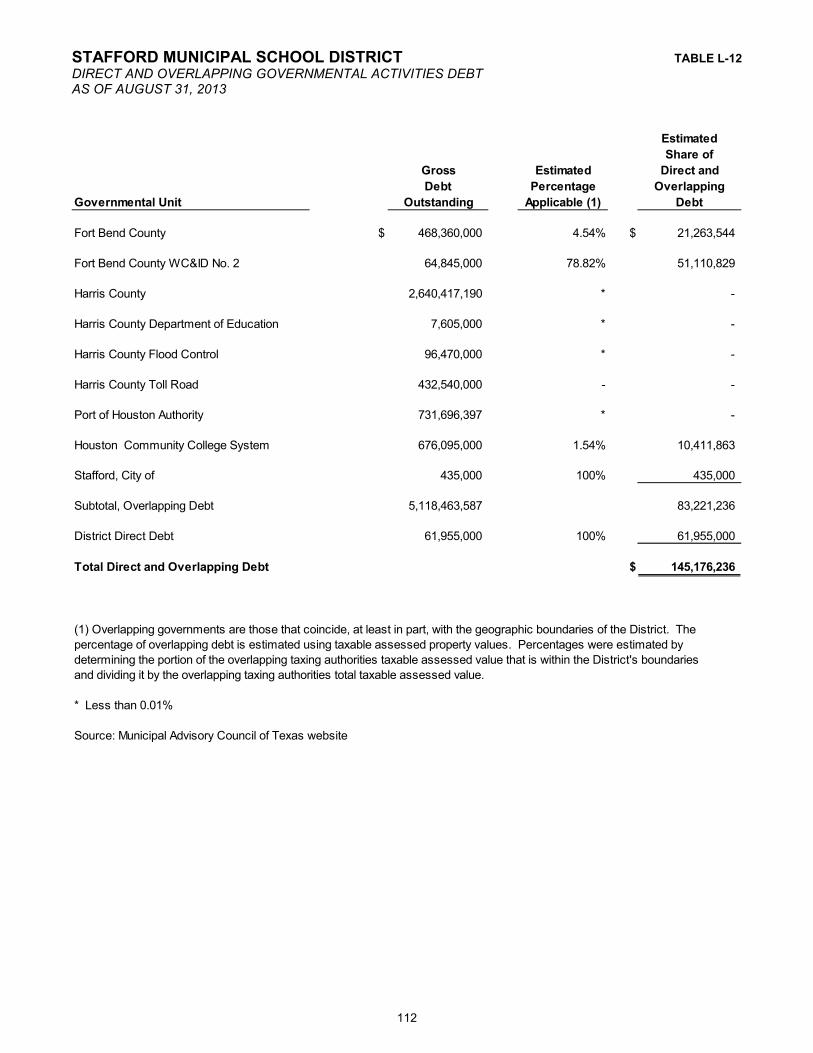
STAFFORD MUNICIPAL SCHOOL DISTRICT TABLE L-12
DIRECT AND OVERLAPPING GOVERNMENTAL ACTIVITIES DEBTAS OF AUGUST 31, 2013
112
Estimated
Share of
Gross Estimated Direct and
Debt Percentage Overlapping
Governmental Unit Outstanding Applicable (1) Debt
Fort Bend County $ 468,360,000 4.54% $ 21,263,544
Fort Bend County WC&ID No. 2 64,845,000 78.82% 51,110,829
Harris County 2,640,417,190 * -
Harris County Department of Education 7,605,000 * -
Harris County Flood Control 96,470,000 * -
Harris County Toll Road 432,540,000 - -
Port of Houston Authority 731,696,397 * -
Houston Community College System 676,095,000 1.54% 10,411,863
Stafford, City of 435,000 100% 435,000
Subtotal, Overlapping Debt 5,118,463,587 83,221,236
District Direct Debt 61,955,000 100% 61,955,000
Total Direct and Overlapping Debt $ 145,176,236
* Less than 0.01%
Source: Municipal Advisory Council of Texas website
(1) Overlapping governments are those that coincide, at least in part, with the geographic boundaries of the District. The
determining the portion of the overlapping taxing authorities taxable assessed value that is within the District's boundaries
percentage of overlapping debt is estimated using taxable assessed property values. Percentages were estimated by
and dividing it by the overlapping taxing authorities total taxable assessed value.
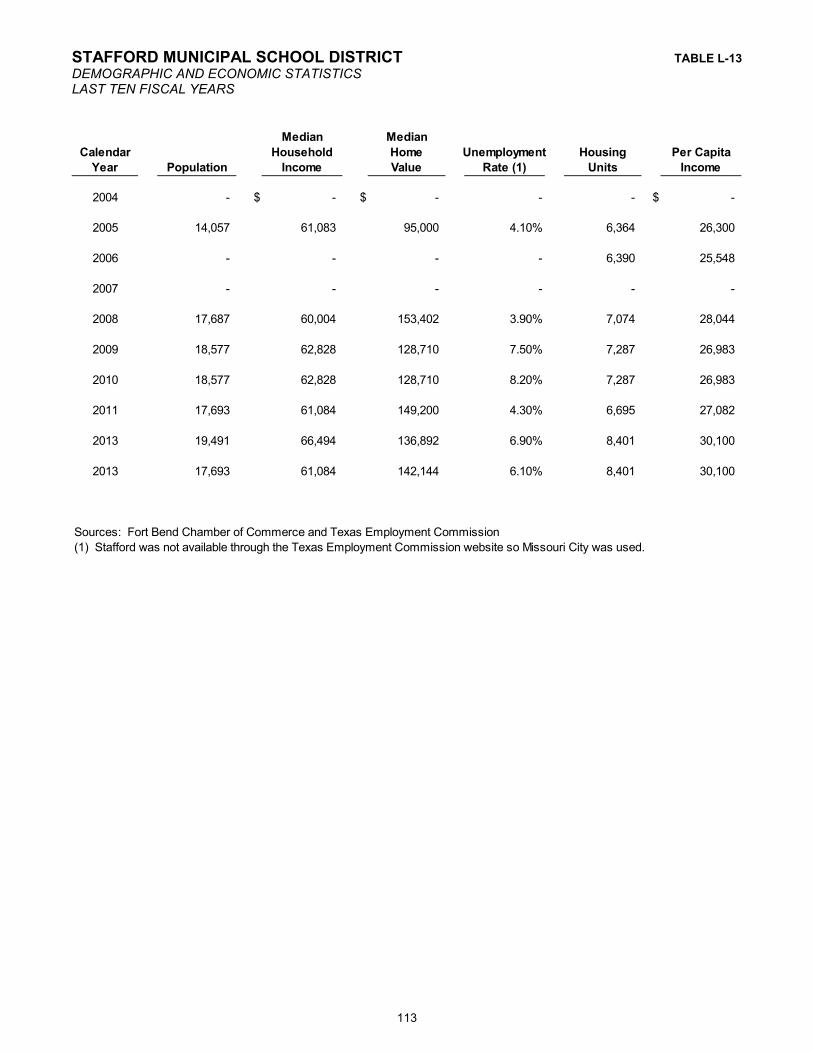
STAFFORD MUNICIPAL SCHOOL DISTRICT TABLE L-13
DEMOGRAPHIC AND ECONOMIC STATISTICSLAST TEN FISCAL YEARS
113
Median Median
Calendar Household Home Unemployment Housing Per Capita
Year Population Income Value Rate (1) Units Income
2004 - $ - $ - - - $ -
2005 14,057 61,083 95,000 4.10% 6,364 26,300
2006 - - - - 6,390 25,548
2007 - - - - - -
2008 17,687 60,004 153,402 3.90% 7,074 28,044
2009 18,577 62,828 128,710 7.50% 7,287 26,983
2010 18,577 62,828 128,710 8.20% 7,287 26,983
2011 17,693 61,084 149,200 4.30% 6,695 27,082
2013 19,491 66,494 136,892 6.90% 8,401 30,100
2013 17,693 61,084 142,144 6.10% 8,401 30,100
Sources: Fort Bend Chamber of Commerce and Texas Employment Commission
(1) Stafford was not available through the Texas Employment Commission website so Missouri City was used.

114
This page is left blank intentionally.

STAFFORD MUNICIPAL SCHOOL DISTRICT TABLE L-14
PRINCIPAL EMPLOYERSCURRENT YEAR AND NINE YEARS AGO
115
Percentage Percentage
of Total of Total
Employer Employees Rank Employment Employees Rank Employment
United Parcel Service 924 1 24.36% 1,092 2 26.43%
Texas Instruments 500 2 13.19% 1,400 1 33.88%
Tyco Valves & Controls 430 3 11.34% - - -
Fiserv Output Solutions 430 4 11.34% - - -
Stafford MSD 425 5 11.21% - - -
Puffer-Sweiven 420 6 11.08% 330 5 7.99%
Flextronics 223 7 5.88% - - -
HCC 178 8 4.69% - - -
Global Flow Technologies 140 9 3.69% - - -
City of Stafford 122 10 3.22% - - -
Tadiran Microwave - - 0.00% 195 7 4.72%
Anderson Greenwood - - 0.00% 450 3 10.89%
Input/Output Corporation - - 0.00% 365 4 8.83%
Personix - - 0.00% 300 6 7.26%
Total 3,792 100.00% 4,132 100.00%
Source: Fort Bend County Chamber of Commerce, Greater Fort Bend Economic Development Council, and SMSD
records. 2004 data is not available, used 2003 numbers.
20042013
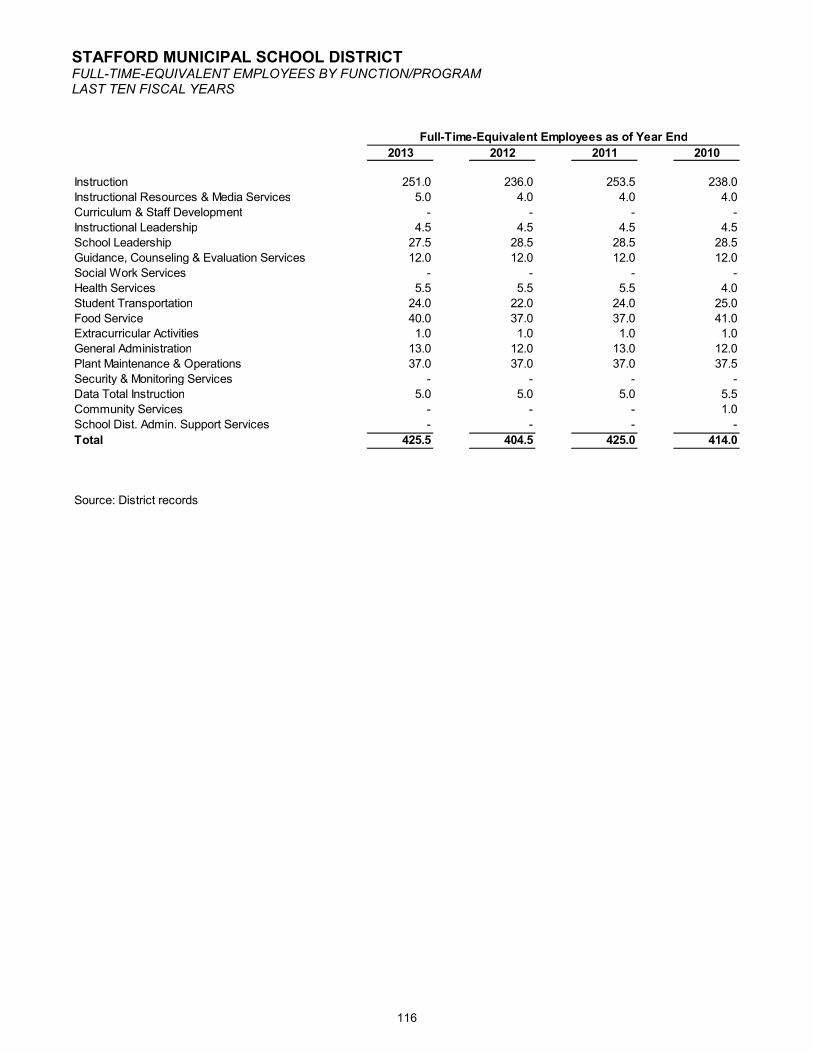
STAFFORD MUNICIPAL SCHOOL DISTRICTFULL-TIME-EQUIVALENT EMPLOYEES BY FUNCTION/PROGRAMLAST TEN FISCAL YEARS
116
2013 2012 2011 2010
Instruction 251.0 236.0 253.5 238.0
Instructional Resources & Media Services 5.0 4.0 4.0 4.0
Curriculum & Staff Development - - - -
Instructional Leadership 4.5 4.5 4.5 4.5
School Leadership 27.5 28.5 28.5 28.5
Guidance, Counseling & Evaluation Services 12.0 12.0 12.0 12.0
Social Work Services - - - -
Health Services 5.5 5.5 5.5 4.0
Student Transportation 24.0 22.0 24.0 25.0
Food Service 40.0 37.0 37.0 41.0Extracurricular Activities 1.0 1.0 1.0 1.0
General Administration 13.0 12.0 13.0 12.0
Plant Maintenance & Operations 37.0 37.0 37.0 37.5
Security & Monitoring Services - - - -
Data Total Instruction 5.0 5.0 5.0 5.5
Community Services - - - 1.0
School Dist. Admin. Support Services - - - -
Total 425.5 404.5 425.0 414.0
Source: District records
Full-Time-Equivalent Employees as of Year End
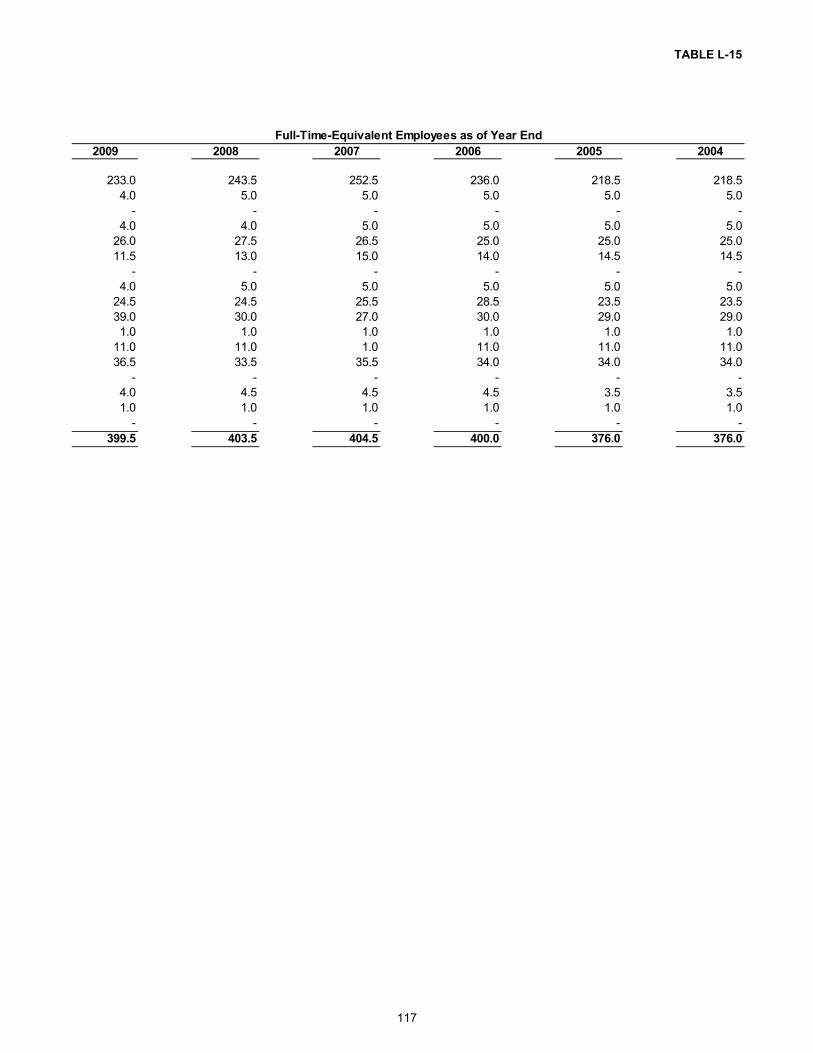
TABLE L-15
117
2009 2008 2007 2006 2005 2004
233.0 243.5 252.5 236.0 218.5 218.5
4.0 5.0 5.0 5.0 5.0 5.0
- - - - - -
4.0 4.0 5.0 5.0 5.0 5.0
26.0 27.5 26.5 25.0 25.0 25.0
11.5 13.0 15.0 14.0 14.5 14.5
- - - - - -
4.0 5.0 5.0 5.0 5.0 5.0
24.5 24.5 25.5 28.5 23.5 23.5
39.0 30.0 27.0 30.0 29.0 29.01.0 1.0 1.0 1.0 1.0 1.0
11.0 11.0 1.0 11.0 11.0 11.0
36.5 33.5 35.5 34.0 34.0 34.0
- - - - - -
4.0 4.5 4.5 4.5 3.5 3.5
1.0 1.0 1.0 1.0 1.0 1.0
- - - - - -
399.5 403.5 404.5 400.0 376.0 376.0
Full-Time-Equivalent Employees as of Year End
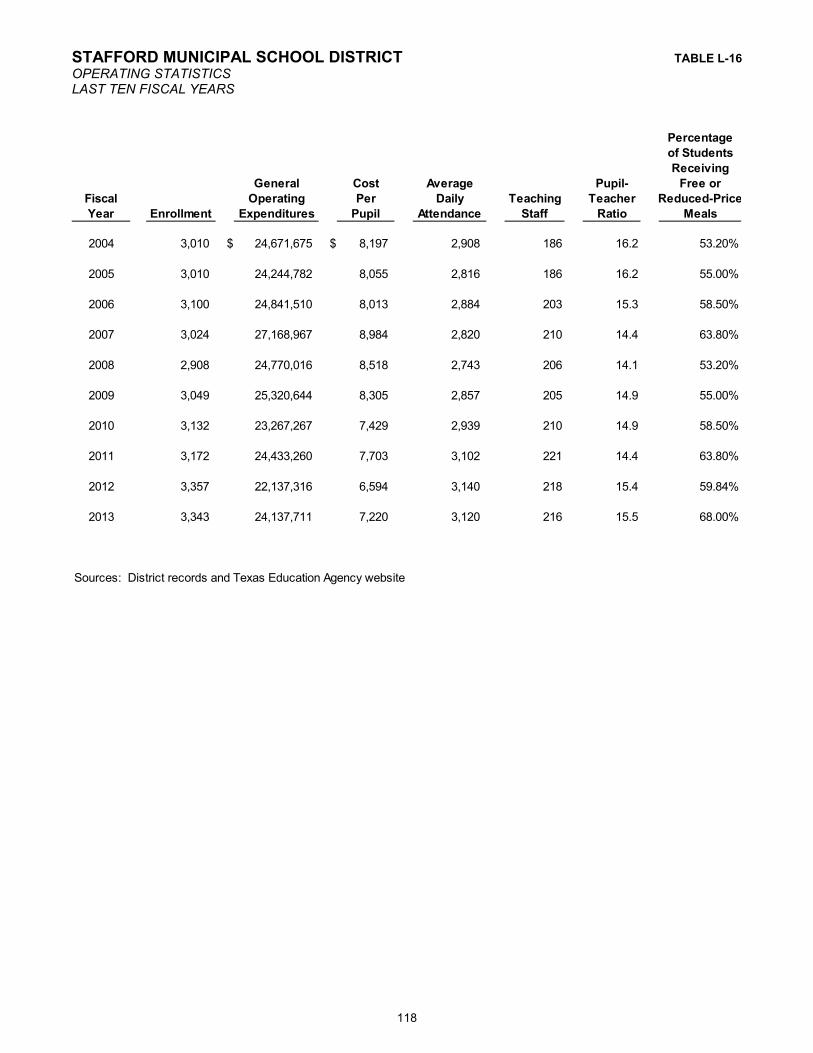
STAFFORD MUNICIPAL SCHOOL DISTRICT TABLE L-16
OPERATING STATISTICSLAST TEN FISCAL YEARS
118
Percentage
of Students
Receiving
General Cost Average Pupil- Free or
Fiscal Operating Per Daily Teaching Teacher Reduced-Price
Year Enrollment Expenditures Pupil Attendance Staff Ratio Meals
2004 3,010 $ 24,671,675 $ 8,197 2,908 186 16.2 53.20%
2005 3,010 24,244,782 8,055 2,816 186 16.2 55.00%
2006 3,100 24,841,510 8,013 2,884 203 15.3 58.50%
2007 3,024 27,168,967 8,984 2,820 210 14.4 63.80%
2008 2,908 24,770,016 8,518 2,743 206 14.1 53.20%
2009 3,049 25,320,644 8,305 2,857 205 14.9 55.00%
2010 3,132 23,267,267 7,429 2,939 210 14.9 58.50%
2011 3,172 24,433,260 7,703 3,102 221 14.4 63.80%
2012 3,357 22,137,316 6,594 3,140 218 15.4 59.84%
2013 3,343 24,137,711 7,220 3,120 216 15.5 68.00%
Sources: District records and Texas Education Agency website

STAFFORD MUNICIPAL SCHOOL DISTRICT TABLE L-17
TEACHER BASE SALARIESLAST TEN FISCAL YEARS
119
District Region IV Statewide
Fiscal Minimum Maximum Average Average Average
Year Salary Salary Salary Salary Salary
2004 $ 36,010 $ 54,009 $ 43,745 $ 43,107 $ 41,011
2005 36,010 54,009 43,745 43,107 41,011
2006 36,500 55,629 42,910 43,852 41,744
2007 40,000 59,242 46,226 46,675 44,897
2008 42,000 59,242 47,148 48,053 46,179
2009 43,000 59,880 47,714 49,186 47,159
2010 44,100 61,000 48,054 50,129 48,263
2011 44,100 61,000 48,054 50,129 48,263
2012 45,423 62,830 50,000 51,632 49,711
2013 45,423 62,830 47,297 50,024 44,630
Sources: District records and Texas Education Agency AEIS reports
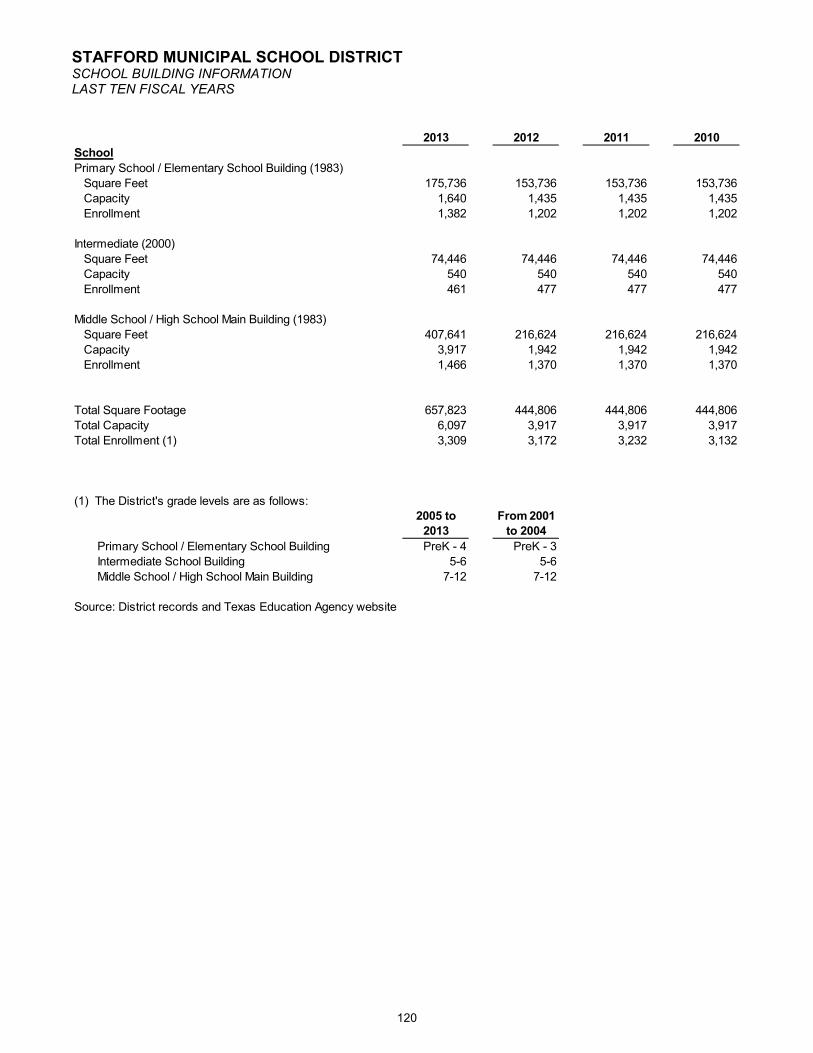
STAFFORD MUNICIPAL SCHOOL DISTRICTSCHOOL BUILDING INFORMATIONLAST TEN FISCAL YEARS
120
2013 2012 2011 2010
School
Primary School / Elementary School Building (1983)
Square Feet 175,736 153,736 153,736 153,736
Capacity 1,640 1,435 1,435 1,435
Enrollment 1,382 1,202 1,202 1,202
Intermediate (2000)
Square Feet 74,446 74,446 74,446 74,446
Capacity 540 540 540 540
Enrollment 461 477 477 477
Middle School / High School Main Building (1983)
Square Feet 407,641 216,624 216,624 216,624
Capacity 3,917 1,942 1,942 1,942
Enrollment 1,466 1,370 1,370 1,370
Total Square Footage 657,823 444,806 444,806 444,806
Total Capacity 6,097 3,917 3,917 3,917
Total Enrollment (1) 3,309 3,172 3,232 3,132
(1) The District's grade levels are as follows:2005 to From 2001
2013 to 2004
Primary School / Elementary School Building PreK - 4 PreK - 3
Intermediate School Building 5-6 5-6
Middle School / High School Main Building 7-12 7-12
Source: District records and Texas Education Agency website

TABLE L-18
121
2009 2008 2007 2006 2005 2004
153,736 153,736 153,736 153,736 153,736 153,736
1,435 1,435 1,435 1,435 1,435 1,435
1,202 1,118 1,151 1,229 1,240 906
74,446 74,446 74,446 74,446 74,446 74,446
540 540 540 540 540 540
477 449 498 507 508 457
216,624 216,624 216,624 216,624 216,624 216,624
1,942 1,942 1,942 1,942 1,942 1,942
1,370 1,341 1,375 1,364 1,262 1,447
444,806 444,806 444,806 444,806 444,806 444,806
3,917 3,917 3,917 3,917 3,917 3,917
3,049 2,908 3,024 3,100 3,010 2,810

122
This page is left blank intentionally.