year ended june , comprehensive annual financial …
TRANSCRIPT

COMPREHENSIVE ANNUAL
FINANCIAL REPORT
CITY OF SUWANEEGEORGIA
YEAR ENDED JUNE ,

i2020 CAFR
COMPREHENSIVE ANNUAL
FINANCIAL REPORT
year ended june 30, 2020
prepared by:Financial Services Department

2020 CAFR ii
CITY COUNCIL
Jimmy BurnetteMayor
Councilmember
Heather HallCouncilmember
Linnea Miller
Councilmember
Larry Pettiford
Mayor ProTem
Beth Hilscher
Councilmember
Vacant

iii2020 CAFR
MANAGEMENT TEAM
Marty AllenCity Manager
Denise BrinsonAssistant City Manager
Elvira RogersAdministrative Services Director
Jessica RothBusiness Services Director
Amie SakmarFinancial Services Director
James MillerParks & Public Works Director
Josh CampbellPlanning Director
Mike JonesChief of Police

2020 CAFR iv
INTRODUCTORY SECTION (unaudited)Letter of Transmittal ............................................................................................................................................................................................................................................................1
Demographics ...............................................................................................................................................................................................................................................................2Government structure................................................................................................................................................................................................................................................2Economic condition and outlook ..........................................................................................................................................................................................................................2Major initiatives .............................................................................................................................................................................................................................................................3For the future ................................................................................................................................................................................................................................................................3Financial information..................................................................................................................................................................................................................................................5Awards .............................................................................................................................................................................................................................................................................6Acknowledgements ....................................................................................................................................................................................................................................................7
Certificate of Achievement for Excellence in Financial Reporting ...................................................................................................................................................................7City of Suwanee administration organizational chart ...........................................................................................................................................................................................8
FINANCIAL SECTIONIndependent Auditor’s Report ........................................................................................................................................................................................................................................9Management Discussion and Analysis ..................................................................................................................................................................................................................... 12
Financial highlights .................................................................................................................................................................................................................................................. 12Overview of the financial statements .............................................................................................................................................................................................................. 12Government-wide financial analysis ................................................................................................................................................................................................................. 13Financial analysis of the government’s funds ............................................................................................................................................................................................... 19General fund budgetary highlights ................................................................................................................................................................................................................... 23Capital assets and debt administration ........................................................................................................................................................................................................... 24Economic factors and next year’s budget and rates ................................................................................................................................................................................. 25Request for information ......................................................................................................................................................................................................................................... 26
BASIC FINANCIAL STATEMENTSStatement of net position ..................................................................................................................................................................................................................................... 28Statement of activities ........................................................................................................................................................................................................................................... 30Governmental funds balance sheet .................................................................................................................................................................................................................. 31Governmental funds statement of revenues, expenditures and changes in fund balances ..................................................................................................... 32Reconciliation of the statement of revenues, expenditures and changes in fund balances of governmental funds to the statement of activities ...........34General fund statement of revenues, expenditures and changes in fund balance budget and actual ................................................................................ 35Proprietary funds statement of net position ................................................................................................................................................................................................. 37Proprietary funds statement of revenues, expenses and changes in fund net position ............................................................................................................ 38Proprietary funds statement of cash flows .................................................................................................................................................................................................... 39Fiduciary fund statement of fiduciary assets and liabilities ................................................................................................................................................................... 40Notes to the financial statements ...................................................................................................................................................................................................................... 41
REQUIRED SUPPLEMENTARY INFORMATIONSchedule of changes in net pension asset and related ratios ................................................................................................................................................................ 65Schedule of City contributions-last ten fiscal years .................................................................................................................................................................................. 68

v2020 CAFR
FINANCIAL SECTION (continued)
SUPPLEMENTARY INFORMATIONNon-Major Governmental Funds
Non-major governmental funds combining balance sheet ............................................................................................................................................................ 70Non-major governmental funds combining statement of revenues, expenditures and changes in fund balances ............................................... 72
Budgetary ComplianceSpecial revenue funds schedule of revenues, expenditures and changes in fund balances budget and actual ..................................................... 74Debt service fund schedule of revenues, expenditures and changes in fund balances budget and actual ............................................................. 77
ComplianceSpecial Purpose Local Option Sales Tax (SPLOST) proceeds schedule of expenditures .................................................................................................. 78Certification of 911 expenditures .............................................................................................................................................................................................................. 79
Agency FundAgency fund statement of changes in fiduciary assets and liabilities ....................................................................................................................................... 81
STATISTICAL SECTION (unaudited)Net position by component - last ten fiscal years (accrual basis of accounting) ........................................................................................................................ S|2Changes in net position - last ten fiscal years (accrual basis of accounting) ................................................................................................................................ S|4Governmental activities tax revenues by source - last ten fiscal years (accrual basis of accounting) ................................................................................ S|8Fund balances of governmental funds - last ten fiscal years (modified accrual basis of accounting) ............................................................................... S|9Changes in fund balances of governmental funds - last ten fiscal years (modified accrual basis of accounting) ......................................................S|10General government tax revenue by source - last ten fiscal years (modified accrual basis of accounting) ...................................................................S|12Assessed value and estimated actual value of taxable property - last ten calendar years ...................................................................................................S|13Property tax rates direct and overlapping governments - last ten fiscal years ..........................................................................................................................S|14Principal property taxpayers - current and ten years ago ...................................................................................................................................................................S|15Property tax levies and collections - last ten fiscal years .....................................................................................................................................................................S|16Ratio of outstanding debt by type - last ten fiscal years .....................................................................................................................................................................S|16Ratio of general bonded debt outstanding - last ten fiscal years .....................................................................................................................................................S|17Direct and overlapping governmental activities debt ............................................................................................................................................................................S|17Legal debt margin information - last ten fiscal years .............................................................................................................................................................................S|18Demographic and economic statistics - last ten fiscal years ..............................................................................................................................................................S|19Principal employers current year and ten years ago ..............................................................................................................................................................................S|20Full-time equivalent City government employees by function - last ten fiscal years ...............................................................................................................S|21Operating indicators by function - last ten years ....................................................................................................................................................................................S|22Capital assets statistics by function - last ten years ...............................................................................................................................................................................S|23
COMPLIANCE SECTIONReport on internal control over financial reporting and on compliance and other matters based on an audit of financial statements
performed in accordance with Government Accounting Standards ........................................................................................................................................C|1

2020 CAFR vi

INTRODUCTORY SECTIONLetter of Transmittal
Organizational Chart
GFOA Certificate of Achievement

I | 1INTRODUCTORY SECTION | 2020 CAFR
December 7, 2020Citizens, Mayor, and Members of the City CouncilSuwanee, Georgia:
“All of us, at some time or other, need help. Whether we’re giving or receiving help, each one of us has something valuable to bring to this world.” — Fred Rogers
The covid-19 pandemic has caused significant disruption and hardships in nearly every aspect of our lives, and it continues to weigh heavily on the national, regional, and local economies. Suwanee began fiscal year 2020 in a strong financial position with a growing local economy. This prosperous and growth outlook changed to an unknown and uncertain outlook during the last three months of fiscal year 2020, with the onset of the covid-19 pandemic. The unknowns and uncertainty have a strong financial impact for fiscal year 2021. In predicting revenues for the fiscal year 2021 budget, forecasts and behavioral trends of the 2009-era recession were used to predict the behavior during the current pandemic crisis. Expenditures were projected to remain flat at fiscal year 2020 levels. A hiring freeze was put into place, salaries were frozen at the current levels, and capital purchases were delayed. These measures were put into place to help Suwanee navigate the unknows and uncertainty that continues with the ongoing covid-19 pandemic.
Suwanee’s Comprehensive Annual Financial Report (CAFR) illustrates how the City receives, spends, and accounts for financial resources and explains the key indicators of its financial strength. Responsibility for the accuracy of the data and the completeness and fairness of the presentation rests with the City. We believe that the data, as presented, is accurate in all material aspects and is presented in a manner designed to enable the reader to understand the City’s financial position and the operational achievements over the last year. Readers are encouraged to consider the presented information in conjunction with information provided in management’s discussion and analysis, the financial statements, and the notes to the financial statements.
This Comprehensive Annual Financial Report (CAFR) is organized into three main sections:
1. The Introductory Section will familiarize the reader with the organizational structure of the City, the nature and scope of the services it provides, and the specifics of its operating environment within the context of the local economy.
2. The Financial Section includes the independent auditor’s report on the basic financial statements, management’s discussion and analysis, the audited basic financial statements, the notes to the basic financial statements, required supplementary information, and combining and individual fund statements and schedules.
3. The Statistical Section provides readers with additional historical perspective, content, and detail to: 1) assist in understanding the information in the financial statements, notes to the financial statements, and required supplementary information, and 2) assess the City’s economic condition.
A Compliance Section is also included in this report in order to satisfy other legal requirements. This section includes the independent auditor’s report on internal controls and compliance with laws and regulations.

2020 CAFR | INTRODUCTORY SECTION2 | I
This report includes government-wide statements and fund financial statements for all funds of the City, including two blended component units. Blended component units are, in substance, part of the primary government. Suwanee’s Urban Redevelopment Authority (URA) and Downtown Development Authority (DDA) are blended component units and are reported as part of the primary government.
OUR STORY Suwanee originated as a Native American village along the banks of Suwanee Creek and Chattahoochee River. The community was named for the Shawnee Indian tribe that settled here in the latter part of the 18th century. The City’s name is thought to derive from the English mispronunciation of Shawnee. Suwanee was incorporated in 1949 and encompasses 11.0 square miles. The City is located in the north central portion of Georgia, approximately 30 miles northeast of downtown Atlanta. Highways serving the City include Interstate 85, U.S. Highway 23 (Buford Highway), Georgia Route 317 (Lawrenceville Suwanee Road), and Georgia Route 141 (Peachtree Industrial Boulevard). Additional demographic information is provided in the statistical section of this report.
CITY HALLThe City operates under a council-manager form of government. The City Council consists of five members elected at large to staggered four-year terms. The Mayor is the sixth voting member of council, who, along with the remaining council members is elected on a non-partisan basis. Council provides responsive, progressive leadership and a vision for the community by setting policies, passing ordinances, adopting the budget, making appointments to citizen boards, and hiring the City Manager. The City Manager carries out the policies and ordinances of the City Council, oversees the day-to-day operations of the City, prepares the budget, and supervises the various department heads.
The City provides a wide range of municipal services to citizens including police protection, parks and recreation, planning and zoning, building inspections, code enforcement, economic and community development, special events, municipal court services, and infrastructure maintenance. The City also provides water services to a small number of citizens in the historic Old Town area of Suwanee. Sanitation services are provided to citizens by private firms.
ECONOMIC CONDITIONBond Rating: Suwanee maintains a AAA bond rating from Standard & Poor’s. Suwanee’s strong bond rating has allowed the City to take advantage of near-historic low interest rates in 2016 and 2017, resulting in significant interest savings for Suwanee residents. Additional information on long term debt can be found in the notes to the financial statements, pages 43-66.
Population: The Planning Department estimates the population of Suwanee at 20,634 residents as of June 30, 2020. Suwanee’s population has grown by 5,155 since 2011, a 33% increase in population over the past ten years. Per capita income, a measure of standard of living, is a useful indicator of the City’s economic well being. In 2011, with the economic recession, citizens’ incomes declined. In 2012, per capita personal income began to improve and to exceed the pre-recession levels. Some fluctuation is noted with fiscal years 2014 to current, but overall improvements have been maintained. For 2020, Suwanee’s per capita personal income is $41,458 compared to 2011 at $31,678, an increase of $9,780 or 31%.
Suwanee Population
0
5,000
10,000
15,000
20,000
25,000
2011 2012 2013 2014 2015 2016 2017 2018 2019 2020

I | 3INTRODUCTORY SECTION | 2020 CAFR
Unemployment. Unemployment rates spiked in April 2020 due to the covid-19 pandemic. At this peak, Suwanee’s unemployment rate was 12.4% when the state-wide stay at home order was in place. Since the spike in April, rates have declined nationally and locally. At June 2020, Gwinnett County’s unemployment rate 8.1%, Georgia’s was 7.6%, and the national rate was 11.2%.
Suwanee’s Development. At the end of fiscal year 2020, there were 381 single family lots in Suwanee. Active neighborhoods have 573 units permitted per rezoning with 186 permits issued and 381 lots remaining.
Home Values. Both the average resale price and number of single family detached homes resold increased slightly from the same time in the prior year. Single family detached resale princes ranged from $195,000 to $585,000 with an average price of $359,000. Single family attached resale prices ranged from $224,000 to $340,000 with an average price of $283,000.
WHAT’S GOING ON NOW!Certainly Uncertain. Regardless of what you were doing at the beginning of 2020, your life has likely changed dramatically since covid-19 arrived. This pandemic has forced leaders around the world to make difficult decisions balancing safety, economic success, and other issues at a pace and with a risk level unprecedented. Suwanee was no exception. City Council took action early to ensure the City focused on mission-critical tasks. Governor Kemp and the State of Georgia issued multiple executive orders, taking control of business-related closures at a statewide level.
Recognizing the challenges being faced by our business community, Suwanee worked to find ways to support local businesses, especially the ones being hit the hardest. Business license renewals were postponed. The City waved certain rules to encourage and facilitate open-air outdoor patios and allowing alcohol to-go sales. A business license tax credit program was enacted that provided up to a $500 business license credit that can be applied to the 2020 or 2021 business license fee.
Fixer Upper. Public Works consolidated the department to a 36,000 square foot facility on Swiftwater Park Drive. This facility now houses office, storage, and warehouse space for 24 full-time and 22 part-time employees.
Happy Little Trees. The City hired a full-time environmental services manager who among other duties has implemented targeted beautification efforts, resulting in the addition of seasonal color and landscaping improvements to a number of locations, including city parks, buildings, and streetscapes.
This Old Courthouse. Renovations to the almost 60-year old courthouse building will significantly improve the court customer experience and create more space for court and police employees. The courthouse lobby will be expanded to accommodate court sessions crowds, court clerk work space will more than double, and new space will be constructed for the police Special Enforcement Unit. Renovations are expected to be completed early 2021.
WHAT’S GOING TO HAPPEN NEXT!Suwanee’s top priorities for the future include reconstruction of Buford Highway as a context-sensitive* multi-model roadway, realignment of Main Street, construction of a new park on Main Street, and continued focus on annual road resurfacing and storm drainage infrastructure with the continuation of the 2017 SPLOST program.
Per-Capita Income
$0
$5,000
$10,000
$15,000
$20,000
$25,000
$30,000
$35,000
$40,000
$45,000
2011 2012 2013 2014 2015 2016 2017 2018 2019 2020

2020 CAFR | INTRODUCTORY SECTION4 | I
Reconstruction of Buford Highway. Suwanee will use a nearly $3.3 million Livable Centers Initiative (LCI) grant funds, received through the Atlanta Regional Commission (ARC), to help fund reconstruction of a portion of Buford Highway as a context-sensitive* roadway that will safely accommodate multiple modes of transportation and help connect residents and visitors to multiple activity centers. Rather than simply widening Buford Highway, Suwanee’s plans call for the thoroughfare to remain a two-lane road. The City plans to add sidewalks, multi-use trails, landscaped medians, streetscaping, operational improvements such as turn lanes, and a roundabout in order to accommodate additional modes of transportation, calm existing traffic, promote Town Center styled development, and provide safer pedestrian access.
Town Center on Main. Located on approximately 25-acres known locally as the DeLay Property, the site is situated behind the Suwanee library and PlayTown Suwanee on Suwanee Dam Road. The park plan features a mixture of urban and rural environments, including:
A roughly 900 foot, elevated signature bridge for pedestrian and bicycle use, spanning the entire park and crossing an approximately one-acre water feature.
An open terrace plaza and lawn area at the peak of the park’s elevation that will include a waterfall feature.
An extension of the existing PlayTown Suwanee geared towards older children, expanding the age range of PlayTown Suwanee without interfering with its existing success.
Sandpit volleyball courts and an iconic public art piece.
Realignment of Main Street will shift the road around the new park, Town Center on Main, and will exit onto Suwanee Dam Road at the existing traffic signal at the library entrance. This shift will allow the median break at the existing Main Street to close, greatly improving the safety and traffic flow on Suwanee Dam.
2017 SPLOST is expected to bring nearly $19 million in transportation improvements to Suwanee. Together, Gwinnett County and the City of Suwanee have allocated approximately $19 million in 2017 SPLOST funding towards transportation, sidewalk improvements and recreational projects. Funding is provided by a restricted one-cent sales tax. Collections of this six year sales tax began April 2017 and will continue until March 2023.
Suwanee is committed to providing effective and responsive delivery of services with an emphasis on safety and planning for the future. The City uses a Capital Improvement Plan (CIP) to develop a framework to advance the goals and objectives of City Council. The CIP is a comprehensive five-year plan that helps identify priorities, provides project cost estimates and identifies financial resources. Longer range planning is accomplished through the City’s Comprehensive Plan which is developed and maintained in accordance with State of Georgia planning requirements.
*Context SensitiveA planning term used to
describe a design that respects the existing scale and character
of the surrounding environment.

I | 5INTRODUCTORY SECTION | 2020 CAFR
FINANCIAL CONTROLSInternal controlsCity management is responsible for establishing and maintaining an internal accounting control system. This system is designed to ensure that City assets are protected from loss, theft, or misuse, and to ensure that adequate accounting data is compiled to allow for the preparation of financial statements in conformity with generally accepted accounting principles. Internal accounting controls are designed to provide reasonable, but not absolute, assurance that these objectives are met. The concept of reasonable assurance recognizes that: 1) the cost of an accounting control should not exceed the benefits likely to be derived, and 2) the evaluation of costs and benefits requires estimates and judgment by management.
Budget controlsBudgetary control is essential for good financial management and legal compliance. The City achieves and maintains budgetary control by operating under the statutes of the State of Georgia, which require the City to adopt an annual balanced budget. Expenditures may not legally exceed appropriations at the department level, within each fund. Operational control of department budgets is accomplished through a purchase order verification process. Additional details regarding budgetary controls may be found in Note 3 of the notes to the financial statements section.
Debt refundingThe City recognizes that the foundation of any well-managed debt program is a comprehensive debt policy. A debt policy sets forth the parameters for issuing debt and managing outstanding debt and provides guidance to decision makers regarding timing and purposes for which debt may be issued, types and amounts of permissible debt, method of sale that may be used and the structural features that may be incorporated. The policy also includes the parameters for refunding opportunities. In general, advance refunding for economic savings will be undertaken when a net present value savings of at least 3% of the refunding principal can be achieved. Additional information regarding outstanding debt can be found in Note 8, page 56.
Fund balanceThe City of Suwanee maintains its financial operations in a manner consistent with sound financial management principles, which require that sufficient funds be retained by the City to provide a stable financial base at all times. An adequate fund balance level is an essential element in both short-term and long-term financial planning. Maintenance of sufficient levels of fund balance enables the City to stabilize funding for operations, stabilize taxes and fees, and realize cost savings in issuing debt. While adequate levels of fund balance are important, the City strives to maintain an appropriate amount that is neither too high nor too low. The City’s policy is to maintain a minimum of four months of general fund budgeted expenditures and transfers. As part of the budget resolution, City Council annually commits this funding level. Additional information on fund balance can be found on Note 1, pages 48-49.
Independent auditThe financial statements included in this report are prepared in compliance with governmental financial reporting standards issued by the Governmental Accounting Standards Board, guidelines issued by the Government Finance Officers Association of the United States and Canada, and generally accepted accounting principles applicable to governmental entities. State of Georgia statutes require an annual audit by an independent Certified Public Accountant.
Mauldin & Jenkins, LLC, issued an unmodified (“clean”) opinion on the City of Suwanee’s financial statements for the year ended June 30, 2020. The independent auditor’s report is located at the front of the financial section of this report.

2020 CAFR | INTRODUCTORY SECTION6 | I
WOOHOO!The City of Suwanee is proud that many of its initiatives and projects have earned regional, state, and national awards and certification over the past several years. Listed below are a few awards received recently. Visit suwanee.com for a complete listing.
• Best Cities to Live in Georgia - #10, Chamber of Commerce
• Top 10 Best Places to Live in Georgia, HomeSnacks
• Certificate of Distinction for Superior Performance Management, International City/County Management Association
• Safest Cities in Georgia- #15, Background Checks
• 100 Most Genius Places in America list, Time magazine
• Distinguished Budget Presentation Award for fiscal year 2020 budget, Government Finance Officers Association
• Bronze Workplace Health Award - American Heart Association
• Designated a PlanFirst Community, Georgia Department of Community Affairs
SUWANEE QUALITYHIGH STANDARDS. OTHERS TAKE NOTICE.NOT DONE TO RECEIVE AWARDS, BUT AWARDS ARE LIKELY TO FOLLOW.
UNIQUEBOLD, RISKY, QUIRKY, ARTSY, COOL, DIFFERENT, INNOVATIVE, EYE-CATCHING. IT HASN’T BEEN DONE BEFORE AND IF IT HAS IT WILL BE DIFFERENT IN SUWANEE. THE NORMAL SOLUTION IS NOT THE SOLUTION IN SUWANEE.
REMARKABLEATTRACTING ATTENTION BY BEING SPECIAL, UNUSUAL OR EXTRAORDINARY. WORTHY OF REMARKS FROM OTHERS, BOTH SUPPORTIVE AND CRITICAL.
VISIONARYLASTING BEYOND THOSE WHO MAKE THE DECISIONS.
SUWANEE’S ANCHOR POINTS

I | 7INTRODUCTORY SECTION | 2020 CAFR
Suwanee Awarded For Excellence In Financial Reporting. GFOA awarded a Certificate of Achievement for Excellence in Financial Reporting to the City for its Comprehensive Annual Financial Report (CAFR) for the fiscal year ended June 30, 2019. This was the 17th consecutive year that the City has received this prestigious award, given for publishing an easily readable, efficiently organized comprehensive annual financial report conforming to program standards. Such reports must satisfy both generally accepted accounting principles and applicable legal requirements. A Certificate of Achievement is valid for a period of one year only. We believe that our current CAFR continues to meet the Certificate of Achievement Program’s requirements, and we are submitting it to GFOA for consideration. The City is committed to this effort and will strive to maintain and surpass these standards on future reports.
THANK YOU!The preparation and production of this document would not be possible without the dedication and cooperation of all City departments. Their willingness to work together has enabled Suwanee to exceed expectations, to boldly go where no financial document has gone, striving to be unique, remarkable, and quirky in providing a quality financial report that is readable, informative, and beneficial to Suwanee citizens. We also extend our appreciation and gratitude to our independent auditors, Mauldin & Jenkins (with a special shout out to Josh Carroll and TJ Holloman) , for the professional guidance, assistance, and encouragement in producing a CAFR. Most importantly, we express our appreciation to Mayor Jimmy Burnette and to each of our Councilmembers for setting the tone and providing the leadership to keep Suwanee moving in the right direction. Their dedication, leadership, vision, and support in planning and conducting the affairs of the City in a responsible and progressive manner ensure that Suwanee is a well-rounded, vibrant community, that residents can be proud to call home today and well into the future.
During these uncertain times, please continue to do your part to help manage the pandemic. Wear a mask in public, social distance, wash your hands, and follow the advice of medical professionals. We can get through this together!
Respectfully submitted,
Amie Sakmar Marty Allen Financial Services Director City Manager
Government Finance Officers Association
Certificate of Achievementfor Excellence
in Financial Reporting
Presented to
City of SuwaneeGeorgia
For its Comprehensive AnnualFinancial Report
For the Fiscal Year Ended
June 30, 2019
Executive Director/CEO

2020 CAFR | INTRODUCTORY SECTION8 | I
Citizens
Mayor and Council
Planning & Zoning Commission
City Attorney
Assistant City Manager
AdministrativeServices Director
Public Works Director
Associate MunicipalCourt Judge
Chief Municipal Court Judge
Lead Municipal Court Prosecuting AttorneyMunicipal Court
Prosecuting Attorney
Business Services Director
PoliceChief
Financial ServicesDirector
Planning Director
Planning & Zoning Appeals Board
City Manager
Vacant
Mauldin & Jenkins, LLC. Chandler, Britt, & Jay, LLC.
City Auditor
ORGANIZATIONALCHART

FINANCIALSECTION Independent Auditor’s ReportManagement’s Discussion And Analysis

II | 9FINANCIAL SECTION | 2020 CAFR
200 GALLERIA PARKWAY S.E., SUITE 1700 • ATLANTA, GA 30339-5946 • 770-955-8600 • 800-277-0080 • FAX 770-980-4489 • www.mjcpa.comMembers of The American Institute of Certified Public Accountants
INDEPENDENT AUDITOR’S REPORT
Honorable Mayor and Members of City CouncilCity of SuwaneeSuwanee, Georgia
Report on the Financial Statements
We have audited the accompanying financial statements of the governmental activities, the business-type activities, each major fund, and the aggregate remaining fund information of the City of Suwanee, Georgia (the “City”), as of and for the year ended June 30, 2020, and the related notes to the financial statements, which collectively comprise the City’s basic financial statements as listed in the table of contents.
Management’s Responsibility for the Financial Statements
Management is responsible for the preparation and fair presentation of these financial statements in accordance with accounting principles generally accepted in the United States of America; this includes the design, implementation, and maintenance of internal control relevant to the preparation and fair presentation of financial statements that are free from material misstatement, whether due to fraud or error.
Auditor’s Responsibility
Our responsibility is to express opinions on these financial statements based on our audit. We conducted our audit in accordance with auditing standards generally accepted in the United States of America and the standards applicable to financial audits contained in Government Auditing Standards issued by the Comptroller General of the United States. Those standards require that we plan and perform the audit to obtain reasonable assurance about whether the financial statements are free from material misstatement.
An audit involves performing procedures to obtain audit evidence about the amounts and disclosures in the financial statements. The procedures selected depend on the auditor's judgment, including the assessment of the risks of material misstatement of the financial statements, whether due

2020 CAFR | FINANCIAL SECTION10 | II
2
to fraud or error. In making those risk assessments, the auditor considers internal control relevant to the entity's preparation and fair presentation of the financial statements in order to design audit procedures that are appropriate in the circumstances, but not for the purpose of expressing an opinion on the effectiveness of the entity's internal control. Accordingly, we express no such opinion. An audit also includes evaluating the appropriateness of accounting policies used and the reasonableness of significant accounting estimates made by management, as well as evaluating the overall presentation of the financial statements.
We believe that the audit evidence we have obtained is sufficient and appropriate to provide a basis for our audit opinions.
Opinions
In our opinion, the financial statements referred to above present fairly, in all material respects, the respective financial position of the governmental activities, the business-type activities, each major fund, and the aggregate remaining fund information of the City of Suwanee,Georgia as of June 30, 2020, and the respective changes in financial position and, where applicable, cash flows thereof, and the budgetary comparison for the General Fund for the year then ended in accordance with accounting principles generally accepted in the United States of America.
Other Matters
Required Supplementary Information
Accounting principles generally accepted in the United States of America require that the Management’s Discussion and Analysis on pages 12-26, the Schedule of Changes in the Net Pension Asset and Related Ratios on page 65, and the Schedule of City Contributions on page 68 be presented to supplement the basic financial statements. Such information, although not a part of the basic financial statements, is required by the Governmental Accounting Standards Board who considers it to be an essential part of financial reporting for placing the basic financial statements in an appropriate operational, economic, or historical context. We have applied certain limited procedures to the required supplementary information in accordance with auditing standards generally accepted in the United States of America, which consisted of inquiriesof management about the methods of preparing the information and comparing the information for consistency with management’s responses to our inquiries, the basic financial statements, and other knowledge we obtained during our audit of the basic financial statements. We do not express an opinion or provide any assurance on the information because the limited procedures do not provide us with sufficient evidence to express an opinion or provide any assurance.

II | 11FINANCIAL SECTION | 2020 CAFR
3
Other Information
Our audit was conducted for the purpose of forming opinions on the financial statements that collectively comprise the City of Suwanee,Georgia’s basic financial statements. The combining and individual fund financial statements and schedules, including the Special Purpose Local Option Sales Tax Proceeds Schedule of Expenditures and the Certification of 911 Expenditures, and the introductory and statistical sections, as listed in the table of contents, are presented for purposes of additional analysis and are not a required part of the basic financial statements, although the Special Purpose Local Option Sales Tax Proceeds Schedule of Expenditures is required by Official Code of Georgia Annotated 48-8-121.
The combining and individual fund financial statements and schedules, including the Special Purpose Local Option Sales Tax Proceeds Schedule of Expenditures and the Certification of 911 Expenditures, (the “supplementary information”) are the responsibility of management and were derived from and relate directly to the underlying accounting and other records used to prepare the basic financial statements. Suchinformation has been subjected to the auditing procedures applied in the audit of the basic financial statements and certain additional procedures, including comparing and reconciling such information directly to the underlying accounting and other records used to prepare the basic financial statements or to the basic financial statements themselves, and other additional procedures in accordance with auditing standards generally accepted in the United States of America. In our opinion, the supplementary information is fairly stated, in all material respects, in relation to the basic financial statements as a whole.
The introductory and statistical sections have not been subjected to the auditing procedures applied in the audit of the basic financial statements, and accordingly, we do not express an opinion or provide any assurance on them.
Other Reporting Required by Governmental Auditing Standards
In accordance with Government Auditing Standards, we have also issued our report dated December 7, 2020 on our consideration of the City of Suwanee, Georgia’s internal control over financial reporting and on our tests of its compliance with certain provisions of laws, regulations,contracts, and grant agreements and other matters. The purpose of that report is solely to describe the scope of our testing of internal control over financial reporting and compliance and the results of that testing, and not to provide an opinion on the effectiveness of the City of Suwanee,Georgia’s internal control over financial reporting or on compliance. That report is an integral part of an audit performed in accordance with Government Auditing Standards in considering the City of Suwanee, Georgia’s internal control over financial reporting and compliance.
Atlanta, GeorgiaDecember 7, 2020

2020 CA20 | FINANCIAL SECTION12 | II
MANAGEMENT DISCUSSION AND
ANALYSIS
FINANCIAL HIGHLIGHTS
OVERVIEW OF THE FINANCIAL
STATEMENTS
The following management discussion and analysis is provided as an introduction to the basic financial statements for the fiscal year ended June 30, 2020. This narrative is intended to assist the reader in understanding significant financial issues, provide an overview of financial activities and identify changes in financial position, material deviations from the original budget, and individual fund issues or concerns. We encourage readers to consider the information presented here in conjunction with the information furnished in the City’s basic financial statements and notes to the financial statements.
Government-wide Assets and deferred outflows of resources of the City’s governmental activities exceeded liabilities and deferred inflows of resources by $89,939,325. This is an increase of $4,262,164 or 5%, as compared to the prior year amount of $85,677,161. The majority of the governmental activities increase is due to capital outlay for building improvements and infrastructure ($3,723,211) and donated infrastructure from developers ($1,730,906). Revenues are recognized as revenue as funds are received but expenses for capitalized assets are amortized over the life of the asset instead of expensed at the time of construction or purchase as in the fund level statements.
Assets of the City’s business-type activities exceeded liabilities by $3,633,756 an increase of $20,811, or less than 1%, as compared to the prior year amount of $3,612,945. The majority of this increase is due to nonoperating revenues of $20,470 for insurance payments due to vandalism and $10,183 from investment earnings.
In total, net position increased by $4,282,975 to $93,573,081. Of this amount, unrestricted net position on June 30, 2020 was $20,499,700 or 22% of the City’s total net position.
Fund levelAs of June 30, 2020, the City’s governmental funds reported a combined ending fund balance $40,830,967, a decrease of ($1,692,525) or (4%) decrease from fiscal year 2019. This majority of this decrease is due to the court renovation project $3,865,069 expended in the period and intergovernmental revenues received from the 2017 SPLOST that were received but not expended during the reporting period $1,646,145. Enterprise fund assets exceeded liabilities by $3,633,756 of which $2,373,083 was invested in capital assets leaving an unrestricted balance of $1,260,673.
Long-term debt In total the City’s bonds payable outstanding decreased by ($1,542,000) or 4% during fiscal year 2020. This decrease is due to scheduled debt service payments. Additional information regarding long-term debt can be found in the notes to the financial statements, Note 8, on pages 56-57.
Suwanee’s financial reporting focuses on the City as a whole and on the major individual funds. Both reporting perspectives provide a comprehensive view of the City’s financial activities and a broad basis for comparison from year to year and from government to government. The financial section of this report presents the City’s financial activities in four parts:
1) Management’s Discussion and Analysis (MD&A), 2) The Basic Financial Statements, 3) Required Supplementary Information, and 4) Other Supplementary Information presenting combining statements. This report also includes statistical and economic data.
The Basic Financial Statements include government-wide financial statements, fund financial statements, and notes to the financial statements. Notes to the financial statements provide additional detailed information to supplement the Basic Financial Statements.

II | 13FINANCIAL SECTION | 2020 CAFR
GOVERNMENT WIDE FINANCIAL
STATEMENTS
The government-wide financial statements are designed to provide the reader with a broad overview of the City’s finances, in a manner similar to a private sector business. The statement of net position and the statement of activities are prepared using the economic resources measurement focus and the accrual basis of accounting. This means that all the current year’s revenues and expenses are included, regardless of when cash is received or paid. In addition, capital expenditures are added to capital assets and depreciated over the life of the asset.
• The statement of net position combines and consolidates the City’s current financial resources with capital assets and long-term obligations. This statement presents information regarding all of the City’s assets and deferred outflows of resources, liabilities and deferred inflows of resources, for all fund types except for fiduciary funds, with the difference between these items reported as net position. Over time, increases or decreases in net position may serve as an indicator of whether the financial position of the City is improving or deteriorating.
• The statement of activities presents information showing how the City’s net position changed during the fiscal year. The focus is on both the gross and net cost of governmental and business-type activities. This statement summarizes the cost or subsidy of providing specific government services and includes all current year revenues and expenses. The format is intended to portray the extent to which governmental activities are funded by taxes and the extent to which business-type activities are supported by the revenue they generate.
The government-wide financial statements distinguish governmental activities (those that are principally supported by taxes and intergovernmental revenues) from business-type activities (other functions that are intended to recover all or a significant portion of their costs through user fees and charges). City governmental activities include general government, judiciary, police service, public works, planning and zoning, inspections, economic and community development, parks, tourism, and code enforcement. Business-type activities include the water and sewer system.
The government-wide financial statements can be found on pages 28-30.
A fund is a grouping of related accounts that is used to maintain control over resources that have been segregated for specific activities or objectives. Fund financial statements focus on the most significant funds, reporting on the City’s operations in greater detail than the government-wide statements. The City’s funds can be divided into three categories: governmental, proprietary, and fiduciary.

2020 CA20 | FINANCIAL SECTION14 | II
FUNDFINANCIAL
STATEMENTS
Governmental funds Most of the basic services provided by the City are financed through governmental funds and are essentially the same functions reported as governmental activities in the government-wide statements. Reporting of these funds focuses on how money flows into and out of the funds and the amounts remaining at year-end for future spending. Governmental funds use the modified accrual basis of accounting, which measures cash and other assets that can be readily converted to cash. These statements provide a detailed short-term view of the City’s finances and assist in determining whether there will be adequate financial resources available to meet the current needs of the City.
Because the focus of governmental funds is short-term and the focus of the government-wide statements is both short-term and long-term, it is useful to compare the information presented for governmental funds with similar information presented for governmental activities in the government-wide financial statements. This comparison is useful in understanding the long-term impact of the City’s near term financing decisions. Both the governmental fund balance sheet and the governmental fund statement of revenues, expenditures, and changes in fund balances provide a reconciliation to facilitate this comparison between governmental funds and governmental activities.
The City maintains sixteen governmental funds. Six of these funds are considered major funds for financial reporting purposes: general, debt service, 2017 SPLOST, other capital projects, Urban Redevelopment Authority (URA), and Downtown Development Authority (DDA). Each major fund is presented in a separate column in the governmental fund balance sheet and in the governmental fund statement of revenues, expenditures, and changes in fund balances. Data for non-major governmental funds are combined into a single, aggregated column. Specific fund data for each of the non-major funds is provided in the form of combining statements beginning on page 70. Suwanee adopts an annual appropriated budget for general, special revenue, and debt service funds. A budgetary comparison statement has been provided for the general fund on pages 35 and 36. Budgetary comparisons for other governmental funds with legally adopted annual budgets start on page 74.
The basic governmental fund financial statements can be found on pages 31-33.
Proprietary funds The City maintains one proprietary fund, the water and sewer fund. This fund operates as an enterprise fund where fees for services are charged to outside customers and to departments of the City. Like the government-wide financial statements, proprietary fund statements use the accrual basis of accounting. No reconciliation is needed between the government-wide financial statements and the proprietary fund financial statements.
The basic proprietary fund financial statements can be found on pages 37-39.
Fiduciary fundsFiduciary funds are used to account for resources held for the benefit of parties outside of the City’s government. These funds are excluded from the government-wide financial statements because the resources of those funds are not owned by or available to support the City’s operations. Fiduciary funds use the accrual basis of accounting, similar to proprietary funds. Suwanee maintains one fiduciary fund, the municipal court agency fund.
The municipal court agency fund information is presented in the statement of fiduciary assets and liabilities on page 40.

II | 15FINANCIAL SECTION | 2020 CAFR
NOTES TO THE FINANCIAL
STATEMENTS
REQUIRED SUPPLEMENTARY
INFORMATION
OTHERINFORMATION
GOVERNMENT WIDE FINANCIAL
ANALYSIS
The notes to the financial statements provide additional information that is essential to a full understanding of the data provided in the government-wide and fund financial statements. The notes to the financial statements can be found on pages 41-64.
Required supplementary information includes the required pension schedules and notes to the schedules. The schedule of changes in net pension assets and related ratios and the schedule of city contributions can be found on pages 65-68.
Other supplemental information includes combining financial statements for non-major governmental funds. Schedules of revenues, expenditures, and changes in fund balance budget to actual are also presented for all governmental funds with annually adopted budgets. These supplemental statements can be found on pages 70-73.
As noted earlier, changes in net position may serve as a useful indicator of a government’s financial position and an important determinant of its ability to finance services in the future. On a government-wide basis, the City’s assets and deferred outflows of resources exceeded its liabilities and deferred inflows by $93,573,081 and $89,290,106 at June 30, 2020 and 2019 respectively. This represents an increase of $4,282,975, or 5% from fiscal year 2019. The following is a condensed version of the government-wide statement of net position.
Net Position on June 30thGovernmental Activities Business-type Activities Total Primary Government
2020 2019 2020 2019 2020 2019Assets
Current and other assets $ 49,450,983 $ 50,336,880 $ 1,271,895 $ 1,194,876 $ 50,722,878 $ 51,531,756Capital assets 79,007,428 75,136,683 2,373,083 2,422,828 81,380,511 77,559,511
Total assets 128,458,411 125,473,563 3,644,978 3,617,704 132,103,389 129,091,267Deferred outflows of resources 880,016 1,064,832 - - 880,016 1,064,832Liabilities
Long-term liabilities outstanding 35,570,226 37,152,705 - - 35,570,226 37,152,705Other liabilities 786,122 859,234 11,222 4,759 797,344 863,993
Total liabilities 36,356,348 38,011,939 11,222 4,759 36,367,570 38,016,698
Deferred inflows of resources 3,042,754 2,849,295 - - 3,042,754 2,849,295Net Position
Net investment in capital assets 62,823,443 61,580,997 2,373,083 2,422,828 65,196,526 64,003,825Restricted 7,876,855 5,959,149 - - 7,876,855 5,959,149Unrestricted 19,239,027 18,137,015 1,260,673 1,190,117 20,499,700 19,327,132
Total net position $ 89,939,325 $ 85,677,161 $ 3,633,756 $ 3,612,945 $ 93,573,081 $ 89,290,106

2020 CAFR | FINANCIAL SECTION16 | II
PRIMARY GOVERNMENT NET POSITION
JUNE 30, 2020
The largest portion of the City’s net position, 70%, reflects its investment in capital assets such as land, buildings, equipment and infrastructure (roads, bridges, and other immovable assets), net of any related debt used to acquire those assets. Net investment in capital assets increased by $1,192,701 or 2%. This increase is due to additions to capital assets, building improvements and infrastructure categories.
The City’s investment in its capital assets is reported net of related debt, the resources needed to repay this debt must be provided from other sources since the capital assets themselves cannot be used to liquidate these liabilities. City has restrictions of $7,876,855 of net position to be used on debt service, capital projects and special programs. The increase in restricted net position is due to 2017 SPLOST revenues that were received but not expended during the fiscal period. The remaining portion of unrestricted net position, 22%, may be used to meet the City’s ongoing obligations to citizens and creditors.
At the end of the current fiscal year, the City was able to report positive balances in all three categories for the governmental activities. Business type activities were also able to report positive balances in two categories. Overall growth in net position is a positive economic indicator of the City’s improved financial position from 2019.
Net investment in capital assets
70%
Restricted8%
Unrestricted22%
II | 17FINANCIAL SECTION | 2020 CAFR
GOVERNMENTALACTIVITIES
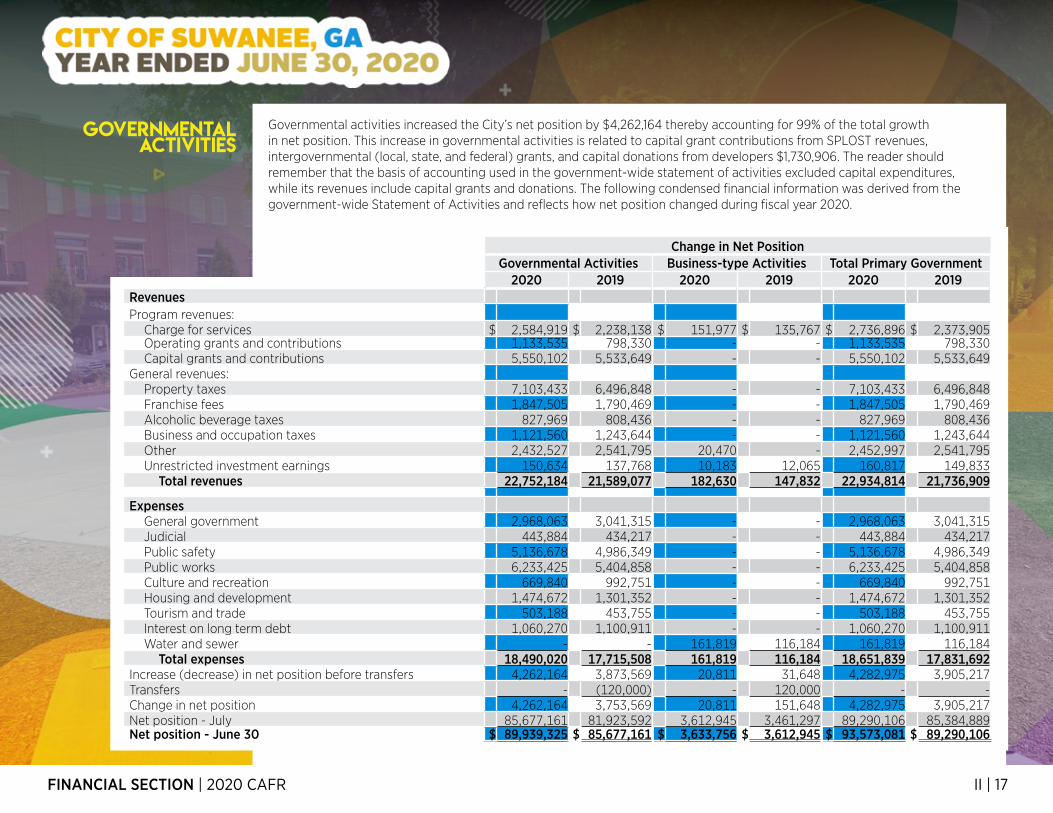
Governmental activities increased the City’s net position by $4,262,164 thereby accounting for 99% of the total growth in net position. This increase in governmental activities is related to capital grant contributions from SPLOST revenues, intergovernmental (local, state, and federal) grants, and capital donations from developers $1,730,906. The reader should remember that the basis of accounting used in the government-wide statement of activities excluded capital expenditures, while its revenues include capital grants and donations. The following condensed financial information was derived from the government-wide Statement of Activities and reflects how net position changed during fiscal year 2020.
Change in Net PositionGovernmental Activities Business-type Activities Total Primary Government
2020 2019 2020 2019 2020 2019RevenuesProgram revenues:
Charge for services $ 2,584,919 $ 2,238,138 $ 151,977 $ 135,767 $ 2,736,896 $ 2,373,905Operating grants and contributions 1,133,535 798,330 - - 1,133,535 798,330Capital grants and contributions 5,550,102 5,533,649 - - 5,550,102 5,533,649
General revenues:Property taxes 7,103,433 6,496,848 - - 7,103,433 6,496,848Franchise fees 1,847,505 1,790,469 - - 1,847,505 1,790,469Alcoholic beverage taxes 827,969 808,436 - - 827,969 808,436Business and occupation taxes 1,121,560 1,243,644 - - 1,121,560 1,243,644Other 2,432,527 2,541,795 20,470 - 2,452,997 2,541,795Unrestricted investment earnings 150,634 137,768 10,183 12,065 160,817 149,833
Total revenues 22,752,184 21,589,077 182,630 147,832 22,934,814 21,736,909
ExpensesGeneral government 2,968,063 3,041,315 - - 2,968,063 3,041,315Judicial 443,884 434,217 - - 443,884 434,217Public safety 5,136,678 4,986,349 - - 5,136,678 4,986,349Public works 6,233,425 5,404,858 - - 6,233,425 5,404,858Culture and recreation 669,840 992,751 - - 669,840 992,751Housing and development 1,474,672 1,301,352 - - 1,474,672 1,301,352Tourism and trade 503,188 453,755 - - 503,188 453,755Interest on long term debt 1,060,270 1,100,911 - - 1,060,270 1,100,911Water and sewer - - 161,819 116,184 161,819 116,184
Total expenses 18,490,020 17,715,508 161,819 116,184 18,651,839 17,831,692Increase (decrease) in net position before transfers 4,262,164 3,873,569 20,811 31,648 4,282,975 3,905,217Transfers - (120,000) - 120,000 - -Change in net position 4,262,164 3,753,569 20,811 151,648 4,282,975 3,905,217Net position - July 85,677,161 81,923,592 3,612,945 3,461,297 89,290,106 85,384,889Net position - June 30 $ 89,939,325 $ 85,677,161 $ 3,633,756 $ 3,612,945 $ 93,573,081 $ 89,290,106

2020 CA20 | FINANCIAL SECTION18 | II
REVENUES BY SOURCE
GOVERNMENTAL ACTIVITIES
EXPENSESBY SOURCE
GOVERNMENTAL ACTIVITIES
GOVERNMENTAL ACTIVITIES
EXPENSES AND PROGRAM REVENUES
Governmental activities revenues totaled $22,752,184 for fiscal year 2020 and $21,589,077 for fiscal year 2019, reporting an increase of $1,163,107. The major difference between the two fiscal years is the increases in 2020 for charge for services $346,781, operating grants $335,205, and property tax revenues $606,585.
Property tax revenue in fiscal year 2020 increased when compared to fiscal year 2019, by $606,585. This growth is due to rising property values. Total taxable assessed values for calendar year 2020 increased by $65,061,091, to an estimated total of $1,419,678,295. Additional information on Suwanee’s taxable assessed property values can be found in the statistical section, page S13.
Property taxes are the largest revenue source for governmental activities accounting for 31% of total revenues. Capital grants and contributions, which include SPLOST funds received from Gwinnett County, intergovermental grants (local, state, and federal), and developer asset donations, account for the second largest at 24%. Charges for services, which include municipal court fines and building permits, are the third largest (single) revenue sources, accounting for 12% of governmental revenues for the year.
Governmental expenses totaled $18,490,020 for the fiscal year. Of the expenses, 34%, or $6,233,425, are related to public works, while public safety accounted for $5,136,678, or 28%. General government activities accounted for the third highest with 16%, General government activities include administration, legal, IT, and facilities. The chart below compares governmental activities with their respective program revenues, if any.
Charge for services
12%Operating grants and
contributions5%
Capital grants and
contributions24%Property
taxes31%
Franchise fees8%
Alcoholic beverage
taxes4%
Business and occupation
taxes5%
Other11%
General government
16%
Judicial2%
Public safety28%Public works
34%
Culture and recreation
3%
Housing and development
8%
Tourism and trade
3%
Interest on long term debt
6%
0 2,000,000 4,000,000 6,000,000 8,000,000
General governmentJudicial
Public safetyPublic works
Culture and recreationHousing and development
Tourism and tradeInterest on long term debt
Program Revenues Expenses

II | 19FINANCIAL SECTION | 2020 CAFR
FINANCIAL ANALYSIS OF THE GOVERNMENT’S
FUNDS
BUSINESS-TYPEACTIVITIES
Business-type activities increased the City’s net position by $20,811 accounting for 1% of the City’s net position increase in fiscal year 2020. This increase is due to unrestricted investment earnings and for insurance payments due to vandalism.
Governmental funds General governmental functions are contained in the general, special revenue, debt service, and capital projects funds. As noted earlier, the focus of the City’s governmental funds is to provide information on near-term inflows, outflows, and balances of spendable resources. Such information is useful in assessing resources available at the end of the year in comparison with upcoming financing requirements.
As of June 30, 2020, the City’s governmental funds reported a combined ending fund balance of $40,830,967, a decrease of ($1,692,525) in comparison with the prior year. The majority of this decrease is due to the URA municipal court building renovations ($3,865,069) combined with 2017 SPLOST revenues received but not expended in the current period $1,845,419. In the governmental fund financial statements, the City’s fund balance is reported in five classifications.
NonspendableFund balances are reported as nonspendable when amounts cannot be spent because they are either 1) not in spendable form (i.e. items that are not expected to be converted to cash) or 2) legally contractually required to be maintained intact.
RestrictedRestricted fund balance encompasses the net fund resources subject to externally enforceable legal restrictions. Such restrictions would include 1) externally imposed by creditors, grantors, contributors, or laws and regulations of other governments, or 2) imposed by law through constitutional provisions or enabling legislation.
CommittedCommitted fund balance represents resources the use of which is constrained by limitations that the government imposes upon itself at the highest level of decision making, City Council, and can only be removed by formal action equivalent to the action taken to impose it.
AssignedAssigned fund balance includes the portion of fund balance that reflects the City’s intended use of resources. Such intent was established by formal action of the City Council or their designee.
UnassignedUnassigned includes fund balance that has not been reported in any other classification.
As of June 30, 2020, Suwanee’s total fund balance for governmental funds was $40,830,967 of which $1,245,335 was nonspendable, $26,307,377 was restricted, $4,479,360 was committed, $3,986,312 was assigned, and $4,812,583 was unassigned. Additional information on fund balance can be found on Note 1 on pages 48-49.
Nonspendable3.0%
Restricted64.4%
Committed11.0%
Assigned9.8%
Unassigned11.8%
0 20,000 40,000 60,000 80,000 100,000 120,000 140,000 160,000 180,000
Expenses
Program Revenues

2020 CA20 | FINANCIAL SECTION20 | II
GOVERNMENTAL FUND
BALANCES
REVENUES CLASSIFIED BY SOURCE
GENERAL FUND
The general fund is the chief operating fund of the City. On June 30, 2020, unassigned fund balance of the general fund was $4,812,583. As a measure of the general fund’s liquidity, it may be useful to compare unassigned fund balance to total fund expenditures. Unassigned fund balance represents 38% of total general fund expenditures and transfers, compared to 26% in the prior year. This increase in unassigned fund balance, $1,392,900, is due to FY 2020 general fund expenditures being lower than projected amounts and revenues performing at predicted levels. Due to the current economic uncertainty, 4th quarter capital transfers for capital improvements prefunding was placed on hold. FY 2019 included $658,000 in capital improvements prefunding.
The following provides an explanation of revenues by source changes from 2019 to 2020:
• Taxes. Real and personal property tax collections increased by $588,159, or 13%, from fiscal year 2019. Suwanee’s property tax digest has shown value growth over the past seven years. Most of this growth is due to new construction. Calendar year 2019 total taxable assessed value increased by $65,061,091 from 2018 values. Please note that property tax values are assessed at January 1 and are based on a calendar year. Taxes billed and collected are based on a fiscal year. Franchise fees increased by $57,036, mainly in electric fees which increased by $59,627 from the prior year. Business taxes showed a decrease of ($53,670) as compared to fiscal year 2019. This decrease is due in part from the covid-19 pandemic. Business license renewals were due on March 30th, due to the pandemic, the renewal date was moved to May 31st.
• License and permits. Alcohol beverage fees remained stable with small difference of $3,775 between the two years. Building permits increased by $672,255, this increase is due to a higher number of building permits being issued in fiscal year 2020. The value of residential and commercial construction in 2020 was $157,479,024 as compared to $77,792,065 in 2019. Due to Suwanee’s size, building permit revenues tend to fluctuate. One or two permits in one period can cause a variance in the next period.
• Intergovernmental. Intergovernmental revenues increased by $117,165 from the prior period. In fiscal year 2020, Suwanee received $744,115 from Gwinnett County for 911 dispatch and police services provided by the City. In fiscal year 2019, Suwanee received $601,625. This annual payment for 911 and police services provided by Gwinnett was part of the Service Delivery Strategy (SDS) settlement agreed upon in March 2012. Payments are based on actual expenditures incurred.
• Fines and forfeitures. Municipal court fees decreased by ($378,548). Due to the pandemic, municipal court operations were shutdown for three months. Court dates from March were moved to July.
FY 2020 FY 2019 Increase/ (Decrease)Amount % of Total Amount % of Total Amount % of Change
Revenues by Source:Taxes $ 10,492,972 76% $ 9,913,075 76% $ 579,897 6%Licenses and permits 1,260,526 9% 591,968 4% 668,558 113%Intergovernmental 744,115 6% 626,950 5% 117,165 19%Charge for services 132,416 1% 205,383 2% (72,967) -35%Fines and forfeitures 1,008,573 7% 1,387,121 11% (378,548) -27%Other 137,964 1% 240,274 2% (102,310) -43%
Total $ 13,776,566 100% $ 12,964,771 100% $ 811,795 6%

II | 21FINANCIAL SECTION | 2020 CAFR
EXPENDITURES BY FUNCTION
GENERAL FUND
CAPITAL PROJECTS
FY 2020 FY 2019 Increase/ (Decrease)Amount % of Total Amount % of Total Amount % of Change
Expenditures by Function:General government $ 2,526,908 20% $ 2,571,428 20% $ (44,520) -2%Judicial 455,352 3% 462,399 3% (7,047) -1%Public safety 5,094,302 41% 5,084,136 41% 10,166 0.1%Public works 2,826,346 23% 2,635,428 21% 190,918 7%Culture and recreation 129,596 1% 267,137 2% (137,541) -51%Housing and development 1,445,057 12% 1,444,405 12% 652 .04%
Total $ 12,477,561 100% $ 12,464,933 100.00% $ 12,628 0.1%
The following provides an explanation of expenditures by function changes from the prior period:
• General government. Expenditures decreased by ($44,520) or -2%. The majority of this decrease is due a reduction in professional services, travel, and education expenditures. Due to the shutdown, municipal staff worked remotely on maintaining basic and essential operations. Travel, education, and projects were limited during this time period.
• Judicial. Expenditures decreased by ($7,047) or -1%. Municipal court cases were placed on hold for three months causing payments for judges, bailiffs, and other court related operating expenditures to be reduced.
• Public works. Expenditures increased by $190,918 or 7%. This increase is due to fewer vacancies as compared to the prior period and one additional position added in FY 2020. Salaries and benefits increased by $150,000. Public works also had additional expenditures related to COVID-19, $51,300. These additional expenditures will be reimbursed by Gwinnett County in fiscal year 2021. See subsequent event note 15 on page 64.
• Culture and recreation. Expenditures decreased by ($137,541) or -51%. Due to the pandemic and the related health issues associated with large group gatherings, Suwanee cancelled all city sponsored events in calendar year 2020. Event expenditures decreased by $110,000 as compared to fiscal year 2019. Also, in fiscal year 2020, the bike share program was moved to Rental Vehicle Excise Tax fund (non-major governmental fund). The annual cost for this program is $20,000.
Capital projects funds account for the financial resources used for the purchase and construction of major facilities and related equipment. During fiscal year 2020, the City had four capital project funds considered major funds: the 2017 SPLOST, Other Capital Projects, the Urban Redevelopment Authority, and the Downtown Development Authority.

2020 CAFR | FINANCIAL SECTION22 | II
CAPITAL PROJECTS
(continued)
The 2017 SPLOST fund consists of eight separate projects focusing on transportation projects 68%, recreation improvements 16%, and administrative facilities 16%. The 2017 SPLOST program was approved by voters on November 8, 2016. This SPLOST program is a six year program with 72 months of revenue collections. Collections began on April 1, 2017 and will continue through March 31, 2023. The fund has a restricted fund balance of $3,335,970, comprised entirely of 2017 SPLOST funds received and unspent. On average, this fund receives $250,000 in SPLOST funds per month. The majority of capital expenditures include street resurfacing $1,242,788 and storm water improvements $184,800.
Other capital projects fund accounts for the local financial resources used for the purchase and construction of capital equipment, facilities, master plan implementation, and community stabilization. As of June 30, 2020, the fund had nonspendable fund balance of $1,245,335 (redevelopment land held for development), restricted balance of $200,184 (intergovernmental funds for paving), and assigned fund balance of $3,957,267. During fiscal year 2020, fund balance decreased by ($495,868). The majority of the capital expenditures were for facility maintenance $341,996, facility enhancements $79,032, paved streets $258,146, storm drainage $23,465, and master plan implementation $245,961.
The Urban Redevelopment Authority fund accounts for the financial resources provided from the 2017 URA bond issue. These funds will finance the costs associated with the cash flow bond repayment (2017 SPLOST) program, construction of a new park (Town Center on Main), administrative facilities renovations, and transportation projects within the URA district. The fund had a restricted fund balance of $19,035,988, comprised entirely of unspent bond proceeds and investment income. The fund had capital expenditures of $3,865,069 during the period for administrative facilities (Court House) renovations.
The Downtown Development Authority is a seven-member board of directors appointed by City Council to serve as advocates and advisors to the City of issues related to downtown Suwanee. The authority is a hybrid agency - neither wholly a public agency nor wholly a private corporation, enacted by municipal government and authorized by state law. It provides centralized leadership, a forum for all stakeholders, and opportunities for public/private partnerships committed to downtown revitalization. The fund had a restricted fund balance of $1,057,453. During the fiscal year 2020, fund balance decreased by ($210,359). The majority of the expenditures were for commission and building improvement payments for leased property. See note 6 on pages 51-53 for additional information.

II | 23FINANCIAL SECTION | 2020 CAFR
GENERAL FUND BUDGETARY HIGHLIGHTS
GENERAL FUND BUDGET COMPARISON
DEBTSERVICES
PROPRIETARYFUNDS
The debt service restricted fund balance was $259,874 as of June 30, 2020, all of which is restricted for future debt service payments.
The proprietary fund statements share the same focus as the government-wide statements, reporting both short-term and long-term financial activity. For the fiscal year end, the water and sewer fund had an operating loss of ($9,842) compared to an operating income of $19,583 in the prior year. Operating revenues increased by $16,210. Operating expenses increased by $45,635. Net position increased by $20,811. The majority of this increase is from nonoperating revenues, investment income $10,183 and other revenues $20,470, insurance payment for repairs made to the water tower from vandalism.
Differences between the original budget, $13,766,780, and the final amended budget, $13,890,580, amounted to an overall increase of $123,800. Operational functions increased by $109,000, or less than 1%. Capital transfers were increased by $14,800. Listed below is a summary of the additional budgetary items:
• $20,000, general building water and sewer expenditures.• $43,000, replacement of police vehicle.• $20,000, additional professional services for planning due to increased development.• $26,000, additional funding economic development, part time employee changed to full time.• $14,800, increase in the tax allocation transfer.
A detail budgetary comparison schedule for the fiscal year ended June 30, 2020 can be found on pages 35-36. The following chart is a summary of that schedule:
The large difference in budgeted fines and forfeitures and actual revenues received is due to the three months that the municipal court building was closed to the public. Scheduled court sessions were moved to future periods.
Budget Variance with Final BudgetOriginal Final Actual
Revenues, transfers, and other financing sources:Taxes $ 10,346,110 $ 10,360,910 $ 10,492,972 $ 132,062Licenses and permits 814,120 880,120 1,260,526 380,406Intergovernmental revenues 716,950 716,950 744,115 27,165Charges for services 166,590 166,590 132,416 (34,174)Fines and forfeitures 1,414,510 1,414,510 1,008,573 (405,937)Investment income 65,000 65,000 105,549 40,549Miscellaneous revenues 57,000 100,000 32,415 (67,585)Other financing sources 186,500 186,500 144,064 (42,436)
Total 13,766,780 13,890,580 13,920,630 30,050
Expenditures and transfers out:Expenditures 13,621,780 13,730,780 12,477,561 1,253,219Transfer out 145,000 159,800 159,736 64
Total 13,766,780 13,890,580 12,637,297 1,253,283
Change in fund balance $ - $ - $ 1,283,333 $ 1,283,333

2020 CA20 | FINANCIAL SECTION24 | II
CAPITAL ASSETS & DEBT
ADMINISTRATION
CAPITAL ASSETS-NET OF ACCUMULATED DEPRECIATION
GENERAL FUND BUDGET COMPARISON
(continued)
General fund expenditures were less ($1,253,219), than budgetary estimates. Listed below are the major areas that expenditures were lower than appropriations.
• Salaries and benefits expenditures were ($480,000) less than appropriations. This was due to staff vacancies, changes in health care enrollment, and reduced overtime for police and public works due to the event season for calendar year 2020 being canceled. Salaries and benefits were 95% of budgetary projections.
• Purchased professional services expenditures were ($188,000) less than appropriations, 74% expended. The major consultant areas include information technology, development reviews, legal services and landscape maintenance.
• Other purchase services expenditures were ($234,000) less than appropriations, 80% expended. This classification includes training, education, travel, printing, and dues and fees.
• Supplies expenditures were ($173,000) less than appropriations, 86% expended. This classification includes supplies and utilities.
• Purchase property services were ($53,000) less than appropriations, 84% expended. This category includes repairs and rental of equipment.
• Capital outlay expenditures were ($123,000) less than appropriations, 75% expended.
Capital assetsOn June 30, 2020, the City’s investments in capital assets in both governmental and business-type activities amounted to $81,380,511 net of accumulated depreciation. This includes land, land improvements, buildings, machinery and equipment, park facilities and infrastructure. The majority of the increase in capital assets is due to the municipal court building renovations, $3,865,069 currently in construction in progress, and donated capital assets, $1,730,906. Additional information on capital assets can be found in Note 7 on pages 54-55 of this report.
Governmental Activities Business-type Activities Total Primary Government2020 2019 2020 2019 2020 2019
Land $ 14,042,281 $ 14,042,281 $ 7,500 $ 7,500 $ 14,049,781 $ 14,049,781Land improvements 1,063,402 1,083,958 - - 1,063,402 1,083,958Buildings 29,731,811 29,604,152 - - 29,731,811 29,604,152Water system - - 2,151,513 2,187,587 2,151,513 2,187,587Machinery and equipment 1,004,719 887,051 - 1,004,719 887,051Vehicles 815,053 931,513 - 815,053 931,513Infrastructure 20,031,568 19,601,140 - 20,031,568 19,601,140Construction in progress 12,318,594 8,986,588 214,070 227,741 12,532,664 9,214,329
Total $ 79,007,428 $ 75,136,683 $ 2,373,083 $ 2,422,828 $ 81,380,511 $ 77,559,511

II | 25FINANCIAL SECTION | 2020 CAFR
LONG-TERMDEBT
ECONOMIC FACTORS AND NEXT YEAR’S
BUDGET & RATES
Long-term debtAt the end of the current fiscal year, the City had total bonded debt outstanding of $35,057,975 comprised of general obligation debt $8,685,000 backed by the full faith and credit of the City, and revenue bonds $26,372,975 obligated through an intergovernmental agreement with the Urban Redevelopment Agency.
The City’s total long-term bonds decreased by ($1,700,079) or 5% during the current fiscal year. This decrease is due to regular scheduled bond payments. The City’s bond rating is AAA from Standard & Poor’s, which was re-affirmed in June 2017. State statutes limit the amount of general obligation debt a government entity may issue up to 10% of its total assessed valuation. The current debt limit for the City is $141,967,829; current general obligation debt is below this limit with 6% of the legal debt limit used. Additional information regarding long-term debt can be found in Note 8 on pages 56-57 of this report.
UnemploymentUnemployment spiked in the second quarter of 2020 due to the covid-19 pandemic. Suwanee’s unemployment rate peaked at 12.4% in April when the state-wide stay at home orders was in place. Rates have declined nationally and locally since the peak in April. At the end of the second quarter of calendar year 2020, Gwinnett County’s unemployment rate was 8.1%, Georgia’s unemployment rate was 7.6%, and the national unemployment rate was 11.2%.
New home startsResidential building permits have been steady overall since 2017 when new lots started being created within the City. At the end of 2016, the City was nearly out of buildable lots as existing neighborhoods built out quickly after the recession. In calendar year 2019, 139 residential building permits were issued, the exact same number as 2018. This is a slight decrease as compared to 169 in 2017.
Active neighborhood developmentsAt the beginning of 2019, there were 353 remaining single family lots. The market absorbed approximately 50% of these lots in 2019, and three neighborhoods were completed: Suwanee Green, Suwanee Walk, and Suwanee Station. Two neighborhoods, Kennedy Township and Reserve at Morningside, were started in 2019 with a total of 25 townhomes lots and 72 single family detached lots. At the end of 2019, there are 364 remaining lots.
Single family resales317 single family homes, 66 single family attached, and 251 single family detached were resold in calendar year 2019. This is 8 more homes resold than in 2018. Resale prices for 2019 single family detached homes ranged from $130,000 to $670,000 with an average price of $354,000. This is a $9,000 increase from 2018. Townhome resale prices ranged from $211,000 to $387,000 with an average resale price of $270,000. This is a $3,000 decrease from 2018.
CommercialThe vacancy rate decreased from 17% to 16% in calendar year 2019 and 32,698 square feet of stand alone commercial was added. This includes Stillfire Brewery, Suwanee Animal Hospital, Circle K, and Regions Bank.

2020 CAFR | FINANCIAL SECTION26 | II
REQUEST FOR INFORMATION
ECONOMIC FACTORS AND NEXT YEAR’S
BUDGET & RATES
(continued)
(continued)
Housing valuesAccording to Zillow, Suwanee home values have gone up 3.6% over the past year and Zillow predicts they will rise 6.4% within the next year. The median list price per square foot in Suwanee at June 2020 is $147 with a median monthly rent of $1,443. The median price of homes currently listed in Suwanee is $273,100.
General fund budgetWhile preparing the FY 2021 budget, the City was faced with many unknown variables. We were in the midst of an unprecedented economic shutdown and a global pandemic. The FY 2021 budget was prepared with the anticipation that as information or facts became clearer, adjustments to the budget plans would be made along the way. The City’s overall budgeting philosophy is to budget and project figures conservatively. In predicting revenues for the FY 2021 budget, forecasts and behavioral trends of the 2009-era recession were used as a baseline. The resulting financial projections, which anticipate a 13.9% decrease in operating revenues, have the City projecting to use approximately $1.5 million of the City’s unassigned fund balance to offset the projected decline in revenues. Budgeted expenditures are projected to remain flat at the FY 2020 levels. In response to the current economic conditions, the FY 2021 budget includes a temporary hiring freeze and current salaries are frozen for all positions. The budget also included delaying capital purchases and other measures to moderate the FY 2021 budget spending. The fiscal year 2021 annual budget for the general fund is $13,438,080; this is a decrease of ($452,500) or -3.3% from the final amended 2020 budget.
This financial report is designed to provide a general overview of Suwanee’s finances to our citizens, taxpayers, customers, investors, creditors, and other interested parties. Questions concerning any of the information contained in this report, or requests for additional financial information, should be addressed to the Financial Services Director, 330 Town Center Avenue, Suwanee, Georgia 30024.

BASIC FINANCIAL STATEMENTS
Government-wideFinancial StatementsFund Financial Statements

III | 27BASIC FINANCIAL STATEMENTS | 2020 CAFR

2020 CAFR | BASIC FINANCIAL STATEMENTS28 | III
Governmental Activities
Business-typeActivities Total
ASSETSCash and cash equivalents $ 19,553,569 $ 944,399 $ 20,497,968Investments 20,171,673 315,765 20,487,438Receivables:
Lease receivable, current 183,150 - 183,150Lease receivable, long term 2,419,856 - 2,419,856Property taxes 260,251 - 260,251Other 251,203 7,861 259,064
Due from other governments 411,533 - 411,533Due from other funds (785) 785 -Inventory land held for development 1,245,335 - 1,245,335Net pension asset 4,955,198 - 4,955,198Restricted cash - 3,085 3,085Capital assets, nondepreciable 26,360,875 221,570 26,582,445Capital assets, depreciable, net of accumulated depreciation 52,646,553 2,151,513 54,798,066
Total assets 128,458,411 3,644,978 132,103,389
DEFERRED OUTFLOW OF RESOURCESPension contribution subsequent to measurement date 257,623 - 257,623Pension assumption changes 45,271 - 45,271Pension demographic changes 291,011 - 291,011Deferred loss on refunding of bonds 286,111 - 286,111
Total deferred outflow of resources 880,016 - 880,016
LIABILITIESCurrent liabilities:
Accounts payable 750,258 8,137 758,395Retainage payable 35,864 - 35,864Liabilities payable from restricted assets - 3,085 3,085
Noncurrent liabilities:General obligation bonds due within one year 1,175,000 - 1,175,000General obligation bonds due in more than one year 7,510,000 - 7,510,000Revenue bonds due within one year 397,000 - 397,000Revenue bonds due in more than one year 25,975,975 - 25,975,975Compensated absences due within one year 163,920 - 163,920Compensated absences due more than one year 348,331 - 348,331
Total liabilities 36,356,348 11,222 36,367,570(continued)
STATEMENT OF NET POSITIONjune 30, 2020

III | 29BASIC FINANCIAL STATEMENTS | 2020 CAFR
Governmental Activities
Business-typeActivities Total
DEFERRED INFLOW OF RESOURCESUnearned revenue, leases 2,524,349 - 2,524,349Pension demographic changes 331,963 - 331,963Pension assumption changes 141,932 - 141,932Pension investment differences 44,510 - 44,510
Total deferred inflow of resources 3,042,754 - 3,042,754
NET POSITIONNet investment in capital assets 62,823,443 2,373,083 65,196,526Restricted for:
Capital projects 6,879,433 - 6,879,433Debt service 328,538 - 328,538Special programs 668,884 - 668,884
Unrestricted 19,239,027 1,260,673 20,499,700Total net position $ 89,939,325 $ 3,633,756 $ 93,573,081
The notes to the financial statements are an integral part of these statements.
STATEMENT OF NET POSITIONjune 30, 2020
(continued)

2020 CAFR | BASIC FINANCIAL STATEMENTS30 | III
Functions/Programs
Expenses
Program Revenues Net (Expense) Revenue and Changes in Net Position
Charges for Services
Operating Grants and
Contributions
Capital Grants and
Contributions
Governmental
Activities
Business Type
Activities Total Governmental activities:
General government $ 2,968,063 $ 283,350 $ 200,000 $ 511,283 $ (1,973,430) $ - $ (1,973,430)Judicial 443,884 - - - (443,884) - (443,884)Public safety 5,136,678 1,159,881 744,115 91 (3,232,591) - (3,232,591)Public works 6,233,425 - - 4,044,202 (2,189,223) - (2,189,223)Culture and recreation 669,840 124,449 189,420 933,707 577,736 - 577,736Housing and development 1,474,672 1,017,239 - 60,819 (396,614) - (396,614)Tourism and trade 503,188 - - - (503,188) - (503,188)Interest on long term debt 1,060,270 - - - (1,060,270) - (1,060,270)
Total governmental activities 18,490,020 2,584,919 1,133,535 5,550,102 (9,221,464) - (9,221,464)
Business-type activities:Water and Sewer 161,819 151,977 - - - (9,842) (9,842)
Total $ 18,651,839 $ 2,736,896 $ 1,133,535 $ 5,550,102 $ (9,221,464) $ (9,842) $ (9,231,306)
General revenues: Taxes:
Property taxes $ 7,103,433 $ - $ 7,103,433Franchise fees 1,847,505 - 1,847,505Alcoholic beverage tax 827,969 - 827,969Business and occupation taxes 1,121,560 - 1,121,560Hotel/motel taxes 508,980 - 508,980Insurance premium taxes 1,168,288 - 1,168,288Other taxes 680,704 - 680,704
Unrestricted investment earnings 150,634 10,183 160,817Miscellaneous 74,555 20,470 95,025 Total general revenues 13,483,628 30,653 13,514,281
Change in net position 4,262,164 20,811 4,282,975 Net position - beginning 85,677,161 3,612,945 89,290,106 Net position - ending $ 89,939,325 $ 3,633,756 $ 93,573,081
The notes to the financial statements are an integral part of these statements.
STATEMENT OF ACTIVITIESyear ended june 30, 2020

III | 31BASIC FINANCIAL STATEMENTS | 2020 CAFR
General Debt
Service 2017
SPLOSTOther Capital
Projects
Urban Redevelopment
Authority
Downtown Development
Authority
Other Governmental
Funds
Total Governmental
Funds ASSETS
Cash and cash equivalents $ 5,479,224 $ 252,574 $ 3,060,669 $ 4,176,321 $ 3,206,545 $ 985,310 $ 2,392,926 $ 19,553,569Investments 3,901,868 - - - 16,218,312 - 51,493 20,171,673Receivables:
Property taxes 184,287 75,964 - - - - - 260,251Leases - - - 48,145 - 2,554,861 - 2,603,006Due from other governments - - 411,533 - - - - 411,533Other 212,458 - - - - - 38,745 251,203
Inventory land held for development - - - 1,245,335 - - - 1,245,335Total assets $ 9,777,837 $ 328,538 $ 3,472,202 $ 5,469,801 $ 19,424,857 $ 3,540,171 $ 2,483,164 $ 44,496,570
LIABILITIESAccounts payable $ 318,983 $ - $ 16,675 $ 18,870 $ 353,005 $ 6,514 $ 36,211 $ 750,258Retainage payable - - - - 35,864 - - 35,864Due to other funds 785 - - - - - - 785
Total liabilities 319,768 - 16,675 18,870 388,869 6,514 36,211 786,907
DEFERRED INFLOWS OF RESOURCESUnavailable revenue 166,126 68,664 119,557 - - - - 354,347Unearned revenue, leases - - - 48,145 - 2,476,204 - 2,524,349
Total deferred inflows of resources 166,126 68,664 119,557 48,145 - 2,476,204 - 2,878,696
FUND BALANCESNonspendable - - - 1,245,335 - - - 1,245,335Restricted - 259,874 3,335,970 200,184 19,035,988 1,057,453 2,417,908 26,307,377Committed 4,479,360 - - - - - - 4,479,360Assigned - - - 3,957,267 - - 29,045 3,986,312Unassigned 4,812,583 - - - - - - 4,812,583
Total fund balances 9,291,943 259,874 3,335,970 5,402,786 19,035,988 1,057,453 2,446,953 40,830,967
Total liabilities, deferred inflows of resources and fund balances $ 9,777,837 $ 328,538 $ 3,472,202 $ 5,469,801 $ 19,424,857 $ 3,540,171 $ 2,483,164
Amounts reported for governmental activities in the statement of net position are different because:Net pension asset is not a current financial resource and is not recorded in the governmental fund statements. 4,955,198Capital assets used in governmental activities are not current financial resources and, therefore, are not reported in the governmental funds. 79,007,428Deferred outflows related to pension contributions, demographic, investment differences, and pension assumption changes, are not current financial resources and, therefore, are not reported in the governmental funds. 593,905Deferred outflows related to losses on bond refunding, are not current financial resources and, therefore, are not reported in the governmental funds. 286,111Deferred inflows in the governmental funds for unavailable revenue, are susceptible to full accrual on the government wide statements. 354,347Deferred inflows related to pensions are not related to current financial resources and, therefore, not reported in the governmental funds. (518,405)Long-term liabilities are not due and payable in the current period and, therefore, are not reported in the governmental funds. (35,570,226)
Net position of governmental activities $ 89,939,325The notes to the financial statements are an integral part of these statements.
GOVERNMENTAL FUNDS BALANCE SHEETjune 30, 2020

2020 CAFR | BASIC FINANCIAL STATEMENTS32 | III
General Debt
Service 2017
SPLOSTOther Capital
Projects
Urban Redevelopment
Authority
Downtown Development
Authority
Other Governmental
Funds
Total Governmental
Funds REVENUES
Property taxes $ 5,116,784 $ 1,959,185 $ - $ - $ - $ - $ - $ 7,075,969Franchise taxes 1,847,505 - - - - - - 1,847,505Alcoholic beverage taxes 827,969 - - - - - - 827,969Business taxes 2,289,848 - - - - - - 2,289,848Hotel/motel taxes - - - - - - 508,980 508,980Other taxes 410,866 - 197,042 - - - 72,796 680,704Licenses and permits 1,260,526 - - - - - - 1,260,526Intergovernmental revenues 744,115 - 3,073,733 400,184 - - - 4,218,032Charges for services 132,416 - - - - - - 132,416Fines and forfeitures 1,008,573 - - - - - 70,095 1,078,668Investment income 105,549 639 2,232 23,190 412,245 19,787 2,714 566,356Rental income - - - 29,258 - 98,846 23,825 151,929Contributions and donations - - - 100 - - 199,420 199,520Miscellaneous revenue 32,415 - - - - - 12,782 45,197
Total revenues $ 13,776,566 $ 1,959,824 $ 3,273,007 $ 452,732 $ 412,245 $ 118,633 $ 890,612 $ 20,883,619EXPENDITURES
Current:General government $ 2,526,908 $ - $ - $ 341,996 $ - $ - $ - $ 2,868,904Judicial 455,352 - - - - - - 455,352Public safety 5,094,302 - - - - - 30,088 5,124,390Public works 2,826,346 - - - - - - 2,826,346Culture and recreation 129,596 - - - - - 242,908 372,504Housing and development 1,445,057 - - - - - 727 1,445,784Tourism and trade - - - - - 111,054 392,134 503,188
Capital outlay - - 1,427,588 606,604 3,865,069 208,576 195,839 6,303,676Debt service:
Principal - 1,542,000 - - - - - 1,542,000Interest and fiscal charges - 1,132,967 - - - - - 1,132,967
Total expenditures $ 12,477,561 $ 2,674,967 $ 1,427,588 $ 948,600 $ 3,865,069 $ 319,630 $ 861,696 $ 22,575,111Excess (deficiency) of revenues over (under) expenditures 1,299,005 (715,143) 1,845,419 (495,868) (3,452,824) (200,997) 28,916 (1,691,492)
The notes to the financial statements are an integral part of these statements. (continued)
GOVERNMENTAL FUNDS STATEMENT OF REVENUES, EXPENDITURES AND CHANGES IN FUND BALANCESyear ended june 30, 2020

III | 33BASIC FINANCIAL STATEMENTS | 2020 CAFR
(continued) General Debt
Service 2017
SPLOST Other Capital
Projects
Urban Redevelopment
Authority
Downtown Development
Authority
Other Governmental
Funds
Total Governmental
Funds OTHER FINANCING SOURCES (USES)
Sale of capital assets $ - $ - $ - $ - $ - $ - $ 8,329 $ 8,329Loss on change in lease terms - - - - - (9,362) - (9,362)Transfers in 144,064 800,000 - - - - 159,736 1,103,800Transfers out (159,736) - - - (800,000) - (144,064) (1,103,800)
Total other financing sources (uses) (15,672) 800,000 - - (800,000) (9,362) 24,001 (1,033)Net change in fund balances 1,283,333 84,857 1,845,419 (495,868) (4,252,824) (210,359) 52,917 (1,692,525)
FUND BALANCES, beginning of year 8,008,610 175,017 1,490,551 5,898,654 23,288,812 1,267,812 2,394,036 42,523,492FUND BALANCES - end of year $ 9,291,943 $ 259,874 $ 3,335,970 $ 5,402,786 $ 19,035,988 $ 1,057,453 $ 2,446,953 $ 40,830,967
The notes to the financial statements are an integral part of these statements.
GOVERNMENTAL FUNDS STATEMENT OF REVENUES, EXPENDITURES AND CHANGES IN FUND BALANCES
year ended june 30, 2020
(continued)

2020 CAFR | BASIC FINANCIAL STATEMENTS34 | III
Amounts reported for governmental activities in the statement of activities are different because:Net change in fund balances-total governmental funds. $ (1,692,525)Revenues in the Statement of Activities that do not provide current financial resources are not reported as revenues in the fund statements. Revenues earned that are deferred in governmental funds due to availability criteria. 147,021Governmental Funds report capital outlay as expenditures. However, in the Government-Wide Statement of Activities, the cost of those assets is allocated over their estimated useful lives as depreciation expense. This is the amount of capital assets recorded in the current period.
Additions $ 4,998,638Donations 1,730,906
Net effect of deletions (35,890)Depreciation expense (2,822,909) 3,870,745
The Governmental Funds report bond proceeds as another financing source, while repayment of bond principal is reported as an expenditure. Principal payment 1,542,000
Government-Wide Statement of Activities, report pension expense using long term financial resources.The following adjustments were made at the governmental wide level:
Deferred outflow assumption changes $ (3,503)Deferred outflow demographic changes (24,040)
Deferred outflow pension investment return (188,533)Deferred inflows assumption changes 10,134
Deferred inflow demographic changes 24,519Deferred inflow pension investment return 216,708
Service costs (347,938)Interest on TPL (505,165)
Employee contributions 107,014Plan administrative expenses (25,073)
Expected rate of return 844,112Deferred outflow for pension payments 331,591 439,826
Governmental Funds report the effect of issuance, premiums, discounts, and similar items when debt is first issued, whereas these amounts are accrued and amortized in the statement of activities. This amount is the net effect of these differences.
Amortization of:Premium/Discount $ 158,079Loss on Refunding (85,382) 72,697
Long-term compensated absences are reported in the Government-Wide Statement of Activities, but they do not require the use of current financial resources. Therefore, long-term compensated absences are not reported as expenditures in Governmental Funds. This is the change in compensated absence payable. (117,600)Change in net position of governmental activities. $ 4,262,164
The notes to the financial statements are an integral part of these statements.
RECONCILIATION OF THE STATEMENT OF REVENUES, EXPENDITURES AND CHANGES IN FUND BALANCES OF GOVERNMENTAL FUNDS TO THE STATEMENT OF ACTIVITIESyear ended june 30, 2020

III | 35BASIC FINANCIAL STATEMENTS | 2020 CAFR
Budgeted Amounts Actual Amounts
Variance with Final Budget -
Positive (Negative) Original Final REVENUES
Taxes: Property taxes $ 4,750,160 $ 4,764,960 $ 5,116,784 $ 351,824 Franchise taxes 1,837,120 1,837,120 1,847,505 10,385 Alcoholic beverage taxes 830,700 830,700 827,969 (2,731) Business taxes 2,466,700 2,466,700 2,289,848 (176,852) Other taxes 461,430 461,430 410,866 (50,564) Total taxes 10,346,110 10,360,910 10,492,972 132,062Licenses and permits: Alcoholic beverage fees 253,500 253,500 248,025 (5,475) Business licenses 36,120 36,120 35,325 (795) Building permits 524,500 590,500 977,176 386,676 Total licenses and permits 814,120 880,120 1,260,526 380,406Intergovernmental revenues: Local grants 716,950 716,950 744,115 27,165 Total intergovernmental revenues 716,950 716,950 744,115 27,165Charges for services: Planning and development fees 30,000 30,000 40,063 10,063 Public safety services 116,590 116,590 81,213 (35,377) Special events 20,000 20,000 11,140 (8,860) Total charges for services 166,590 166,590 132,416 (34,174)
Fines and forfeitures 1,414,510 1,414,510 1,008,573 (405,937)Investment income 65,000 65,000 105,549 40,549Contributions and donations 10,000 10,000 - (10,000)Miscellaneous revenue 47,000 90,000 32,415 (57,585)
Total revenues 13,580,280 13,704,080 13,776,566 72,486EXPENDITURES
Current:General Government: Governing body 152,300 152,300 129,579 22,721 Legislative committees 7,250 6,650 2,742 3,908 Chief executive 499,160 499,160 455,250 43,910 General administration 351,050 351,050 284,973 66,077 Financial administration 630,500 630,500 603,509 26,991 Law 45,000 28,000 20,585 7,415 Data processing 280,150 280,150 213,252 66,898 General government building and plant 256,400 293,400 269,847 23,553 Public information 172,450 191,350 158,435 32,915 Business services 460,280 434,030 388,736 45,294 Total general government $ 2,854,540 $ 2,866,590 $ 2,526,908 $ 339,682
The notes to the financial statements are an integral part of these statements. (continued)
GENERAL FUND - STATEMENT OF REVENUES, EXPENDITURES AND CHANGES IN
FUND BALANCE BUDGET AND ACTUALyear ended june 30, 2020

2020 CAFR | BASIC FINANCIAL STATEMENTS36 | III
Budgeted Amounts Actual Amounts
Variance with Final Budget -
Positive (Negative) Original Final
EXPENDITURES (continued)Judicial $ 482,100 $ 508,350 $ 455,352 $ 52,998Public safety: Police administration 582,800 574,300 528,432 45,868 Criminal investigation 652,590 620,090 567,089 53,001 Patrol 2,840,950 2,949,500 2,742,391 207,109 Records and identification 82,800 84,000 78,501 5,499 Police training 221,310 225,510 202,180 23,330 Special detail services 66,590 61,390 58,312 3,078 Police stations and buildings 189,300 191,300 156,695 34,605 Police substation and training center 38,050 42,700 31,712 10,988 Dispatcher 703,250 668,850 630,005 38,845 Public relations 101,730 104,730 98,985 5,745
Total public safety 5,479,370 5,522,370 5,094,302 428,068Public works: Public works administration 2,486,890 2,553,240 2,400,222 153,018 Environmental 515,020 440,170 378,754 61,416 Storm drainage 49,500 49,500 47,370 2,130
Total public works 3,051,410 3,042,910 2,826,346 216,564Culture and recreation: Special facilities and activities 102,250 74,250 65,998 8,252 Park areas 93,200 101,700 63,598 38,102
Total culture and recreation 195,450 175,950 129,596 46,354Housing and development: Protective inspection administration 336,740 356,940 321,132 35,808 Planning and zoning 498,720 498,370 449,006 49,364 Code enforcement 89,350 90,100 87,410 2,690 Economic development and assistance 513,550 592,100 518,928 73,172 Downtown Suwanee 120,550 77,100 68,581 8,519
Total housing and development 1,558,910 1,614,610 1,445,057 169,553 Total expenditures 13,621,780 13,730,780 12,477,561 1,253,219
Excess of revenues over expenditures (41,500) (26,700) 1,299,005 1,325,705OTHER FINANCING SOURCES (USES):
Transfer in 176,500 176,500 144,064 (32,436)Transfer out (145,000) (159,800) (159,736) 64Sale of capital assets 10,000 10,000 - (10,000)
Total other financing sources (uses) 41,500 26,700 (15,672) (42,372) Net change in fund balances - - 1,283,333 1,283,333
FUND BALANCES - beginning of year 8,008,610 8,008,610 8,008,610 -FUND BALANCES - end of year $ 8,008,610 $ 8,008,610 $ 9,291,943 $ 1,283,333
The notes to the financial statements are an integral part of these statements.
GENERAL FUND - STATEMENT OF REVENUES, EXPENDITURES AND CHANGES IN FUND BALANCE BUDGET AND ACTUALyear ended june 30, 2020 (continued)

III | 37BASIC FINANCIAL STATEMENTS | 2020 CAFR
Major Enterprise Fund Water & Sewer Fund
ASSETSCurrent assets:
Cash and cash equivalents $ 944,399Investments 315,765Accounts receivable 7,861Due from other funds 785
Total current assets 1,268,810
Noncurrent assets:Restricted assets:
Cash and cash equivalents 3,085Capital assets, nondepreciable 221,570Capital assets, depreciable, net of accumulated depreciation 2,151,513
Total noncurrent assets 2,376,168
Total assets $ 3,644,978
LIABILITIESCurrent liabilities:
Accounts payable $ 8,137
Noncurrent liabilities:Payable from restricted assets:
Customer deposits payable 3,085
Total liabilities 11,222
NET POSITIONInvestment in capital assets 2,373,083Unrestricted 1,260,673
Total net position $ 3,633,756
The notes to the financial statements are an integral part of these statements.
PROPRIETARY FUNDS STATEMENT OF NET POSITION
june 30, 2020

2020 CAFR | BASIC FINANCIAL STATEMENTS38 | III
Major Enterprise Fund Water & Sewer Fund
OPERATING REVENUESWater and sewer charges $ 151,977
Total operating revenues 151,977
OPERATING EXPENSESContracted services 53,085Supplies 29,038Depreciation 79,696
Total operating expenses 161,819Operating income (loss) (9,842)
NONOPERATING REVENUES (EXPENSES)Investment income 10,183Other revenue 20,470
Total nonoperating revenues (expenses) 30,653
Change in net position 20,811
Total net position - beginning of year 3,612,945
Total net position - ending $ 3,633,756 The notes to the financial statements are an intergral part of these statements.
PROPRIETARY FUNDS STATEMENT OF REVENUES, EXPENSES AND CHANGES IN FUND NET POSITIONyear ended june 30, 2020

III | 39BASIC FINANCIAL STATEMENTS | 2020 CAFR
Major Enterprise Fund Water & Sewer Fund
CASH FLOWS FROM OPERATING ACTIVITIESReceipts from customers and users $ 151,678Payments to suppliers for goods and services (76,355)
Net cash provided (used) by operating activities 75,323
CASH FLOWS FROM CAPITAL AND RELATED FINANCING ACTIVITIESAcquisition of capital asset (29,951)Insurance recovery 20,471
Net cash used by capital and related financing activities (9,480)
CASH FLOWS FROM INVESTING ACTIVITIESInterest received 4,955
Net cash provided by investing activities 4,955
Net increase in cash and cash equivalents 70,798
Cash and cash equivalents - beginning 876,686Cash and cash equivalents - ending $ 947,484
Reconciliation of operating loss to net cash provided by operating activities:Operating loss $ (9,842)Adjustments to reconcile operating loss to net cash provided (used) by operating activities:Adjustments to reconcile operating loss to net cash provided (used) by operating activities:
Depreciation 79,696
Change in assets and liabilities(Increase) decrease in accounts receivable (209)(Increase) decrease in due from other funds (785)Increase (decrease) in accounts payable not related to a capital asset 6,553Increase (decrease) in customer deposits (90)
Net cash provided (used) by operating activities $ 75,323The notes to the financial statements are an integral part of these statements.
PROPRIETARY FUNDS STATEMENT OF CASH FLOWS
year ended june 30, 2020

2020 CAFR | BASIC FINANCIAL STATEMENTS40 | III
Agency Fund
ASSETSCash and cash equivalents $ 109,070
Total assets 109,070
LIABILITIESDue to others 109,070
Total liabilities $ 109,070
The notes to the financial statements are an integral part of these statements.
FIDUCIARY FUND STATEMENT OF FIDUCIARY ASSETS AND LIABILITIESjune 30, 2020

NOTES TO THE FINANCIALSTATEMENTS

IV | 41NOTES TO THE FINANCIAL STATEMENTS | 2020 CAFR
1. Summary of Significant Accounting Policies...............................................................................42
2. Reconciliation of Government-Wide Financial Statements and Fund Financial Statements.................49
3. Legal Compliance - Budgets...........................................................................................................50
4. Deposits and Investments...............................................................................................................50
5. Receivables........................................................................................................................................50
6. Lease Receivables.............................................................................................................................51
7. Capital Assets....................................................................................................................................54
8. Long Term Debt ...............................................................................................................................56
9. Interfund Transfers and Balances...................................................................................................58
10. Joint Venture.....................................................................................................................................58
11. Pension Plan......................................................................................................................................58
12. Risk Management ............................................................................................................................63
13. Commitments and Contingencies..................................................................................................64
14. Compliance.......................................................................................................................................64
15. Subsequent Event, Intergovernmental Agreement Gwinnett County CARES Act.................64
NOTES TO THE FINANCIAL
STATEMENTS

2020 CAFR | NOTES TO THE FINANCIAL STATEMENTS42 | IV
The financial statements of the City of Suwanee (the “City”), have been prepared in conformity with Generally Accepted Accounting Principles (GAAP) as applied to governmental units. The Governmental Accounting Standards Board (GASB) is the accepted standard-setting body for establishing governmental accounting and financial reporting principles. The more significant accounting policies of the City are described below:
A. Reporting EntityThe City operates under a Council-Manager form of government and provides the following services to its citizens: public safety (police), public works, recreation and parks, planning and zoning, building inspection, code enforcement, community development, municipal court services and general and administrative services. The City also provides water services to a portion of the City’s residents.
As required by accounting principles generally accepted in the United States of America, the financial statements of the reporting entity include those of the City (the primary government) and its component units. The component units discussed below are included in the City’s reporting entity because of the significance of their operational and financial relationships with the City. In conformity with GASB Statement No. 14, “The Financial Reporting Entity”, as amended by GASB Statement No. 39, “Determining Whether Certain Organizations Are Component Units”, and GASB Statement No. 61, “The Financial Reporting Entity”, both of the component unit’s financial statements have been included as blended component units.
Blended component units, although also legally separate entities, are in substance part of the City’s operations; data from these units are combined with the data of the City of Suwanee.
The Downtown Development Authority (DDA) was established as a legally separate entity in 2001. The seven (7) members of the DDA are appointed by the Mayor and City Council and they may also be removed by the Mayor and City Council. Day to day operations are managed by the Downtown Development Manager, a City of Suwanee staff member, and the financial information is maintained by the Financial Services Director, a City of Suwanee staff member. The DDA is charged with financing the revitalization of Suwanee’s downtown district, particularly the historic Old Town area, and in performing this financing, only serves the City. The Urban Redevelopment Agency of the City of Suwanee was established as a legally separate entity on August 22, 2002. The five (5) members of the Urban Redevelopment Agency are appointed by the Mayor and City Council and they may also be removed by the Mayor and City Council. The Urban Redevelopment Agency provides a means to issue revenue bonds for development within the City. Although it is legally separate from the City, the Urban Redevelopment Agency is reported as if it were a part of the primary government because its sole purpose is to finance the City’s acquisition of property within the City’s redevelopment district.
The Downtown Development Authority and the Urban Redevelopment Agency of the City of Suwanee financial information is maintained by the City’s Finance Department. However, separate financial statements will not be prepared.
NOTE 1SUMMARY OFSIGNIFICANTACCOUNTING
POLICIES

IV | 43NOTES TO THE FINANCIAL STATEMENTS | 2020 CAFR
B. Government-wide and Fund Financial StatementsThe government-wide financial statements (i.e., the statement of net position and the statement of activities) report information on all of the non-fiduciary activities of the primary government and its component units. (For the most part, the effect of interfund activity has been removed from these statements). Government-wide financial statements do not provide information by fund, but distinguish between the City’s governmental activities and business-type activities. Governmental activities, which are normally supported by taxes and intergovernmental revenues, are reported separately from business-type activities, which rely to a significant extent on fees and charges for support. Likewise, the primary government is reported separately from discretely presented component units. The statement of net position will include noncurrent assets and noncurrent liabilities. In addition, the government-wide statement of activities reflects depreciation expense on the City’s capital assets.
The statement of activities demonstrates the degree to which the direct expenses of a given function or segment are offset by program revenues. Direct expenses are those that are clearly identifiable with a specific function or segment. Program revenues include 1) charges to customers or applicants who purchase, use, or directly benefit from goods, services, or privileges provided by a given function or segment, and 2) grants and contributions that are restricted to meeting the operational or capital requirements of a particular function or segment. Taxes and other items not considered program revenues are reported instead as general revenues.
Separate financial statements are provided for governmental funds, proprietary funds, and fiduciary funds, even though the latter are excluded from the government-wide financial statements. Major individual governmental funds and major individual enterprise funds are reported as separate columns in the fund financial statements.
The City reports the following major governmental funds:• The General Fund is the City’s primary operating fund. It is used to account for and report all financial resources
traditionally associated with government, which are not accounted for and reported in another fund.
• The Debt Service Fund accounts for and reports financial resources that are restricted to principal and interest expenditures.
• The 2017 Special Purpose Local Option Sales Tax (SPLOST) Fund accounts for and reports financial resources that are restricted or assigned to expenditures for capital outlays. The 2017 SPLOST program focuses on various transportation projects (68%), recreation improvements (16%), and administrative facilities (16%). Funding is provided by a restricted one-cent special purpose local option sales tax approved by voters in 2016.
• The Other Capital Projects Fund accounts for and reports financial resources that are assigned to expenditures primarily for capital outlays, including the acquisition or construction of capital facilities and other capital assets. Funding is provided from local assigned funds.
• The Urban Redevelopment Authority (URA) Fund accounts for the financial resources provided from the 2017 URA bond issue. The URA bonds will finance the costs associated with construction of a new park and quality-of-life amenities (34%), administrative facilities renovations (19%), transportation projects (11%), and cash flow for the 2017 SPLOST program (36%).
• The mission of Suwanee’s Downtown Development Authority (DDA) is to revitalize, create, historically preserve, and maintain downtown Suwanee so that it is a symbol of community pride, making it the heart of the City, and a visible example of why Suwanee is a great place to live, work, play, invest, and do business.

2020 CAFR | NOTES TO THE FINANCIAL STATEMENTS44 | IV
The City aggregates other nonmajor governmental funds in a single column in the fund financial statements.
The City reports the following major enterprise fund:• The Water and Sewer Fund accounts for the operation of the water system including all revenues from sources applicable
to the system’s operations and all expenses of the operation.
Additionally, the City reports the following fund type:
• The Agency Fund is used to account for assets held by the City’s Municipal Court until they can be disbursed to other parties.
C. Measurement Focus and Basis of AccountingThe government-wide financial statements are reported using the economic resources measurement focus and the accrual basis of accounting, as are the proprietary fund financial statements. The fiduciary fund financial statements report on the accrual basis of accounting, yet the agency funds have no measurement focus. Revenues are recorded when earned and expenses are recorded when a liability is incurred, regardless of the timing of the related cash flow. Property taxes are recognized as revenues in the year for which they are levied. Other taxes are recognized predominately when the underlying transaction occurs. Grants and similar items are recognized as revenue as soon as all eligibility requirements imposed by the provider have been met.
Governmental fund financial statements are reported using the current financial resources measurement focus and the modified accrual basis of accounting. Revenues are recognized as soon as they are both measurable and available. Revenues are considered to be available when they are collectible within the current period or soon enough thereafter to pay for current obligations. For this purpose, the government considers revenues to be available if they are collected within 60 days of the end of the current fiscal period. Expenditures generally are recorded when a liability is incurred, as under accrual accounting. However, debt service expenditures, as well as expenditures related to compensated absences and claims and judgments, are recorded only when payment is due.
Property taxes, sales taxes, intergovernmental grants, and investment income associated with the current fiscal period are all considered to be susceptible to accrual and have been recognized as revenues of the current fiscal period. All other revenue items are considered to be measurable and available only when cash is received by the City.
As a general rule, the effect of interfund activity has been eliminated from the government-wide financial statements. Exceptions to this general rule are charges between the City’s water and sewer function and the other functions of the government. Elimination of these charges would distort the direct costs reported for the various functions concerned.
Proprietary funds distinguish operating revenues and expenses from non-operating items. Operating revenues and expenses generally result from providing services and producing and delivering goods in connection with a proprietary fund’s principal ongoing operations. The principal operating revenues of the enterprise fund are charges for goods and services provided. Operating expenses of the enterprise fund include the cost of these goods and services, administrative expenses and depreciation on capital assets. All revenues and expenses not meeting this definition are reported as non-operating revenues and expenses.
(continued)
NOTE 1SUMMARY OFSIGNIFICANTACCOUNTING
POLICIES

IV | 45NOTES TO THE FINANCIAL STATEMENTS | 2020 CAFR
D. Deferred Outflow/Inflow of Resources
Deferred outflows of resources represent a consumption of net position that applies to a future period(s) and so will not be recognized as an outflow of resources (expense/expenditure) until then. The City reports the following deferred charges that are reported on the full accrual in the government-wide statement of net position:
The deferred charge on refunding resulted from the difference in the carrying value of refunded debt and its reacquisition price. This amount is deferred and amortized over the shorter of the life of the refunded or refunding debt.
Deferred inflows of resources represent an acquisition of net position that applies to a future period(s) and so will not be recognized as an inflow of resources (revenue) until that time.
The City has the following types of deferred inflow that are reported on the full accrual in the government-wide statement of net position:
Unavailable revenue, which arise only under a modified accrual basis of accounting, qualifies for reporting in this category on the governmental funds balance sheet. The governmental funds report unavailable revenues from property taxes ($234,790) and SPLOST revenues ($119,557) for a total of $354,347, as these amounts are deferred and will be recognized as an inflow of resources in the period that the amounts become available.
Additional information regarding pension related deferred inflows and outflows is located in note 11, on pages 58-63.
Additional information regarding unearned revenue (leases) is located in note 6, on pages 51-53.
Unearned revenue, leases $ 2,524,349Pension demographic changes 331,963Pension assumption changes 141,932Pension investment differences 44,510
Total deferred inflow of resources, statement of net position $ 3,042,754
Pension contribution made subsequent to the measurement date $ 257,623Pension assumption changes 45,271Pension demographic changes 291,011Deferred loss on refunding bonds 286,111
Total deferred outflow of resources, statement of net position $ 880,016

2020 CAFR | NOTES TO THE FINANCIAL STATEMENTS46 | IV
E. Cash and InvestmentsThe City’s cash and cash equivalents are considered to be cash on hand, demand deposits, and short-term investments with original maturities of three months or less from the date of acquisition.
State statutes authorize the City to invest in: obligations of the United States, the State of Georgia and other political subdivisions of the State of Georgia, and other states; prime banker’s acceptances; repurchase agreements; and the State of Georgia Office of State Treasurer Georgia Fund-1 Liquidity Pool. The City’s investments are all certificates of deposit, which are non-participating interest earning investment contracts, that are reported at cost.
F. Interfund Receivables and PayablesActivity between funds that are representative of lending/borrowing arrangements outstanding at the end of the fiscal year as well as all other outstanding balances between funds are reported as “due to/from other funds.” Any residual balances outstanding between the governmental activities and business-type activities are reported in the government-wide financial statements as “internal balances.”
G. Prepaid ItemsPayments made to vendors for services that will benefit periods beyond the balance sheet date are recorded as prepaid assets and are recognized as expenditures when consumed (consumption method).
H. Inventory Land Held for DevelopmentLand held for development is valued at cost. Additional costs for demolition were expended, since these costs are not anticipated to be recovered and do not add to the service capacity of the asset.
I. Capital AssetsCapital assets, which include property, plant, equipment, and infrastructure assets, are reported in the applicable governmental or business-type activities column in the government wide financial statements. Capital assets are defined by the City as assets with an initial, individual cost of more than $10,000 and an estimated useful life in excess of two years. Such assets are recorded at historical cost or estimated historical cost if purchased or constructed. Donated capital assets are recorded at estimated acquisition value at the date of donation. Additional information can be found in note 7 Capital Assets on pages 54-55.
The cost of normal maintenance and repairs that do not add to the value of the assets or materially extend assets’ lives are not capitalized.
(continued)
NOTE 1SUMMARY OFSIGNIFICANTACCOUNTING
POLICIES

IV | 47NOTES TO THE FINANCIAL STATEMENTS | 2020 CAFR
Capital assets of the City are depreciated using the straight-line method over the following useful lives:
J. Compensated Absences It is the City’s policy to permit employees to accumulate earned but unused vacation and sick pay benefits. There is no liability for unpaid accumulated sick leave since the City does not have a policy to pay any amounts when the employees separate from service with the City. All vacation pay is accrued when incurred in the government-wide, proprietary, and fiduciary fund financial statements. A liability for these amounts is reported in the governmental funds only if they have matured, for example, as a result of employee resignations and retirements.
K. Long-Term ObligationsIn the government-wide financial statements and proprietary fund financial statements, long-term debt and other long-term obligations are reported as liabilities. Bond premiums and discounts are accrued and amortized over the life of the bonds using the effective interest method. Bonds payable are reported net of the applicable bond premium or discount. Bond issuance costs are reported as expenses in the year of issuance.
In the fund financial statements, governmental funds recognize bond premiums and discounts during the current period. The face amount of the debt issued is reported as other financing sources. Premiums received on debt issuances are reported as other financing sources while discounts on debt issuances are reported as other financing uses. Bond issuance costs are reported as debt service expenditures in the year of issuance.
L. PensionsFor purposes of measuring the net pension asset, deferred outflows of resources and deferred inflows of resources related to pensions, and pension expense, information about the fiduciary net position of the Georgia Municipal Association Employee Pension Plan for the City of Suwanee (the GMA plan) and additions to/deductions from the Plan’s fiduciary net position have been determined on the same basis as they are reported by the Plan. For this purpose, benefit payments (including refunds of employee contributions) are recognized when due and payable in accordance with the benefit terms. Investments are reported at fair value.
Assets YearsLand 0*Land Improvements 8-50Buildings/Construction 50Infrastructure 10-75Machinery and equipment 5-20Licensed Vehicles 8Water System Infrastructure 30-65
*Useful Live = 0 years. Land has an inexhaustible life and does not depreciate

2020 CAFR | NOTES TO THE FINANCIAL STATEMENTS48 | IV
M. Net PositionNet position represents the difference between assets and deferred outflows of resources and liabilities and deferred inflows of resources in government-wide financial statements and proprietary fund financial statements, which utilizes the economic resources measurement focus. Net position in the statement of net position is distinguished between amounts invested in capital assets (net of any related debt), amounts that are restricted for use by third parties or outside requirements, and amounts that are unrestricted.
When both restricted and unrestricted resources are available for use, it is the City’s policy to use restricted resources first, then unrestricted resources as they are needed.
N. Use of EstimatesThe preparation of financial statements in conformity with accounting principles generally accepted in the United States of America requires management to make estimates and assumptions that affect the reported amounts of assets, liabilities, deferred outflows of resources, and deferred inflows of resources, the disclosure of contingent assets and liabilities at the date of the financial statements, and the reported amounts of revenues and expenses during the reporting period. Actual results could differ from those estimates.
O. Fund BalanceGASB Statement No. 54, “Fund Balance Reporting and Governmental Fund Type Definitions,” shifts the focus of fund balance reporting from the concept of availability of fund resources to the extent a government is bound to constraints on the specific purposes for which the funds can be spent. In the governmental fund financial statements, fund balance is reported in five classifications.
1. Nonspendable. Fund balances are reported as nonspendable when amounts cannot be spent because they are either (a) not in spendable form (i.e., items that are not expected to be converted to cash) or (b) legally contractually required to be maintained intact. The City has the following nonspendable fund balance: • Other Capital Projects Fund - $1,245,335 in inventory land held for development.
2. Restricted. Restricted fund balance encompasses the net fund resources subject to externally enforceable legal restrictions. Such restrictions would include 1) externally imposed by creditors, grantors, contributors, or laws or regulations of other governments, or 2) imposed by law through constitutional provisions or enabling legislation. The City has the following restricted fund balances:• Debt Service Fund - $259,874 externally imposed by bond covenant for debt.• 2017 SPLOST Fund - $3,335,970 externally imposed by laws or regulations of other governments for capital projects.• Other Capital Projects Fund - $200,184 externally imposed by laws or regulations of other governments for capital paving.• Urban Redevelopment Authority - $19,035,988 externally imposed by bond covenant for capital projects.• Downtown Development Authority - $1,057,453 externally imposed by grantors and laws or regulations of other
governments.• Other Governmental Funds - $2,417,908 externally imposed by grantors and laws or regulations of other governments.
Of this amount, $1,754,024 is for capital projects, $231,645 for public safety, $224,534 for economic development, and $207,705 for cultural and recreation.
(continued)
NOTE 1SUMMARY OFSIGNIFICANTACCOUNTING
POLICIES

IV | 49NOTES TO THE FINANCIAL STATEMENTS | 2020 CAFR
3. Committed. Fund balances are reported as committed when they can be used only for specific purposes pursuant to constraints imposed by formal action of the City Council through the adoption of a resolution. Only the City Council, through a resolution, may modify or rescind the commitment. The City has committed $4,479,360 in the general fund by resolution adopted on June 23, 2020 for stabilization. The stabilization account consists of a minimum of four months of general fund expenditures and transfers.
If it becomes necessary for the City to draw funds from the stabilization account, a new resolution will need to be adopted to authorize any use. The City will develop a plan to replenish the account to the minimum level from net revenue surpluses in subsequent fiscal year(s) until the balance is restored to the minimum level. This plan, which would be a component of the ten year projections, would be submitted and approved along with the resolution authorizing the use of the stabilization account.
4. Assigned. Assigned fund balance includes the portion of fund balance that reflects the City’s intended use of resources. Such intent is established by formal action of the City Council, including an allocation of resources by approved budget adjustment, and City Council has not delegated the ability to assign fund balance to any member of management. Modifications require action by the City Council. These funds are expended last after all other revenue sources have been depleted. The City has the following assigned fund balances: • Other Capital Funds - $3,957,267 assigned by City Council for capital projects appropriation.• Other Governmental Funds - $29,045 assigned by City Council for capital projects appropriation ($24,045) and
cultural and recreation appropriation ($5,000).
5. Unassigned. Unassigned includes fund balance that has not been reported in any other classification. The City has $4,812,583 in unassigned general fund balance.
Suwanee has a revenue spending policy that provides for resources to be used in the following hierarchy: bond proceeds, federal funds, state funds, and local funds. For the purpose of the fund balance classification expenditures are to be spent from restricted fund balance first, followed in order by committed, assigned and unassigned. Suwanee considers restricted amounts to have been spent when an expenditure is incurred for purposes for which both restricted and unrestricted fund balance is available. Committed, assigned, or unassigned amounts are also considered to have been spent when an expenditure has been incurred.
Explanation of certain differences between the governmental fund balance sheet and the government-wide statement of net positionThe governmental fund balance sheet includes a reconciliation between fund balance – total governmental funds and net position – governmental activities as reported in the government-wide statement of net position. One element of that reconciliation explains that “long-term liabilities are not due and payable in the current period and therefore are not reported in the governmental funds.” The details of this $35,570,226 difference are as follows:
Compensated absences payable $ 512,251Bonds payable 35,057,975Net adjustment to reduce fund balance - total governmental funds to arrive at net position - governmental activities $ 35,570,226
NOTE 2RECONCILIATION OF GOVERNMENT-WIDE
FINANCIAL STATEMENTS
AND FUND FINANCIAL
STATEMENTS

2020 CAFR | NOTES TO THE FINANCIAL STATEMENTS50 | IV
Budgets and Budgetary Accounting The City of Suwanee, Georgia follows these procedures in establishing the budgetary data reflected in the financial statements:1. The City’s annual budget is prepared based on anticipated revenues and appropriated expenditures. Revenue anticipation
is designed to help ensure fiscal responsibility and maintain a balanced budget. Budgeting is the responsibility of the Mayor and the City Council members, with assistance provided by the City Manager and his designated staff persons.
2. Public hearings are conducted to obtain taxpayer comments.3. Prior to June 30, the budget is legally enacted by passage of an ordinance.4. The budget was originally adopted on June 25, 2019. The level of legal budgetary control is at the department level. Council
approval is required to increase or decrease the total budget of any department.5. Budgets are adopted on a basis consistent with accounting principles generally accepted in the United States of America.
Annual appropriated budgets are adopted for the General Fund, Special Revenue Funds, and Debt Service Funds. Project length budgets are adopted for all Capital Projects Funds.
No material supplementary budgetary changes were made to the original adopted budget.
Encumbrance accounting is employed in governmental funds. Encumbrances (e.g., purchase orders, contracts) outstanding at year end do not constitute expenditures or liabilities because the commitments will be re-appropriated and honored during the subsequent year. At June 30, 2020, there were no outstanding encumbrances.
Custodial credit risk – deposits Custodial credit risk for deposits is the risk that, in the event of the failure of a depository financial institution, a government will not be able to recover deposits or will not be able to recover collateral securities that are in the possession of an outside party. State statutes require all deposits and investments (other than federal or state government instruments) to be collateralized by depository insurance or pledged securities. Amounts that exceed standard depository insurance limits are required to be collateralized either (1) individually by the financial institutions through pledged obligations of the U.S. Government, obligations backed by the full faith and credit of the U.S. Government, obligations of the State of Georgia or other states, or obligations of counties, municipalities, or public authorities of the State of Georgia, or (2) participation in the State of Georgia Secure Deposit Program, which is administered by the Office of the State Treasurer, requires participating banks holding deposits of public funds to pledge collateral at varying rates depending on tier assigned by the State. As of June 30, 2020, all of the City’s bank balances were insured and/or collateralized as defined by GASB and required by State Statutes.
InvestmentsAt June 30, 2020, the City’s investments consisted solely of certificates of deposit which do not qualify as cash equivalents under the City’s policy. All certificates of deposit are covered under the custodial credit risk – deposit footnote above.
The City receives property tax assessments from Gwinnett County. Tax bills were levied on all real and personal property as of January 1, 2019 and were mailed to taxpayers on October 1, 2019. The due date for these taxes was December 20, 2019, and after that date, both penalty and interest are accrued until the taxes are collected. The lien date was January 1, 2020. Receivables are recorded when taxes are levied and billed (October 1).
NOTE 4DEPOSITS
ANDINVESTMENTS
NOTE 5RECEIVABLES
NOTE 3LEGAL
COMPLIANCE-BUDGETS

IV | 51NOTES TO THE FINANCIAL STATEMENTS | 2020 CAFR
NOTE 6LEASE RECEIVABLES
1. DOWNTOWN DEVELOPMENT AUTHORITY
SOLIS PROJECT:During fiscal year 2019, Suwanee’s Downtown Development Authority acquired 12,000 square feet of retail and restaurant space, in white box condition, on the ground floor of the Solis development. At June 30, 2020 three of the units have been leased.
Lease Execution
DateCommencement
Date TermBase Rent
Renewal Option
Lease Receivable
Present Value
Unit 1 4,400 sf Mar. 20, 2019 Sep. 20, 2019
120 MonthsSep. 2019 to Sep. 2029
$125,160 annually
Base rent escalates by 10% after five years
Two five-year renewal options with base rent for renewal terms 110% of previous year base rental rate
$1,098,129
Unit 2 980 sf Mar. 20, 2019 Jun. 20, 2019
36 MonthsMar. 2019 to Mar. 2022
$13,720 annually
Base rent escalates by 3% annually
N/A $32,403
Unit 3 2,235 sf Apr. 15, 2019 July 1, 2020
66 months July 2020 to Dec. 2025
$51,830 annually
Base rent escalates by 3% annually
One five-year renewal option with the continuation of the 3% annual escalation
$249,774
TOTAL SOLIS $1,380,306
GeneralDebt
Service2017
SPLOST
Other Capital Projects
Downtown Development
Authority
OtherGovernmental
Funds
Waterand
Sewer TotalReceivablesProperty taxes $ 184,287 $ 75,964 $ - $ - $ - $ - $ - $ 260,251 Due from other governments - - 411,533 - - - - 411,533Leases - - - 48,145 2,554,861 - - 2,603,006Other 212,458 - - - - 38,745 7,861 259,064
Net total receivables $ 396,745 $ 75,964 $ 411,533 $ 48,145 $ 2,554,861 $ 38,745 $ 7,861 $ 3,533,854 There is no allowance for uncollectible accounts related to these receivables.
Receivables at June 30, 2020 for the City’s individual major funds and nonmajor funds in the aggregate are as follows:
GASB Statement No. 87, Accounting for Leases, objective is to improve the usefulness of governmental accounting statements by requiring the recognition of lease assets and liabilities for leases and inflows of resources or outflows based on contract terms. Under the standard, a lessor is required to recognize a lease receivable and a deferred inflow of resources.
NOTE 5RECEIVABLES

2020 CAFR | NOTES TO THE FINANCIAL STATEMENTS52 | IV
PIERCE’S CORNERDuring fiscal year 2020, Suwanee’s Downtown Development Authority entered into an agreement to lease the historic Pierce’s Corner building on Main Street.
NOTE 6LEASE RECEIVABLES
(continued)
Lease Execution
DateCommencement
Date TermBase Rent
Purchase Option
Lease Receivable
Present Value
June 1, 2020 June, 1, 2020 130 MonthsApril 2021 to Jan. 2032
6% of the gross revenue paid monthly in arrears. Minimum base rent $5,000
Rent is due 10 months from lease commencement
None $519,599
At June 30, 2020 the Downtown Development Authority reported:Lease Receivable $2,554,861 Interest Revenue from Leasing $12,186Deferred Inflows $2,476,204 Rental Income from Leasing $98,846
Activity on the Downtown Development Authority lease receivable balances for the fiscal year 2020 is shown below.
Beginning Balance Additions Reductions Ending Balance
Due Within One Year
Solis Project $ 1,385,827 $ - $ (5,521) $ 1,380,306 $ 132,735Fire Station 654,956 - - 654,956 9,346Pierce’s Corner - 519,599 - 519,599 9,484 Total $ 2,040,783 $ 519,599 $ (5,521) $ 2,554,861 $ 151,565
FIRE STATION:During fiscal year 2019, Suwanee’s Downtown Development Authority entered into an agreement to lease the old Fire Station for a privately-owned brewery.
Lease Execution
DateCommencement
Date TermBase Rent
Purchase Option
Lease Receivable
Present Value
May 1, 2019 Nov. 1, 2019 132 MonthsNov. 2019 to Oct. 2030
8% of the gross revenue paid monthly in arrears. Minimum base rent $7,000
Rent is due 18 months from lease commencement
After 36 months of the term lease
(Dec. 1, 2022) Floor $1,250,000Ceiling $1,600,000
$654,956

IV | 53NOTES TO THE FINANCIAL STATEMENTS | 2020 CAFR
NOTE 6LEASE RECEIVABLES
2. CITY OF SUWANEE
BILLBOARD:The City of Suwanee obtained a billboard with the purchase of the Police Sub-station property. The property was purchased with the billboard lease in place. The billboard lease term ends December of 2021. The City has no plans to renew this lease and is planning on removing the billboard from the property.
At June 30, 2020 the Billboard Lease balances are as follows:Lease Receivable $48,145Deferred Inflows $48,145Interest Revenue from Leasing $2,569Rental Income from Leasing $29,258
Activity on the Billboard lease receivable balances for the fiscal year 2020 is shown below.
Beginning Balance Additions Reductions Ending Balance
Due Within One Year
Billboard Lease $ 77,403 $ - $ 29,258 $ 48,145 $ 31,585
Schedule of future lease receipts City of Suwanee
Year Ending June 30 Principal Interest2021 $ 31,585 $ 1,3572022 16,560 194
Total $ 48,145 $ 1,551
Schedule of future lease receipts for the Downtown Development Authority:
Year Ending June 30 Principal Interest2021 $ 151,565 $ 60,6372022 238,747 97,4032023 242,034 87,3782024 247,714 77,2542025 267,334 66,611
2026-2030 1,262,907 171,8432031-2032 144,560 3,681
Total $ 2,554,861 $ 564,807

2020 CAFR | NOTES TO THE FINANCIAL STATEMENTS54 | IV
Beginning Balances Increases Decreases Transfer
EndingBalance
Governmental activitiesCapital assets, not being depreciated:Land $ 14,042,281 $ - $ - $ - $ 14,042,281 Construction in progress 8,986,588 3,723,211 - (391,205) 12,318,594
Total 23,028,869 3,723,211 - (391,205) 26,360,875
Capital assets, being depreciatedLand improvements 1,452,333 61,335 - - 1,513,668Buildings and improvements 37,262,086 615,242 - 361,748 38,239,076Machinery and equipment 1,802,053 264,925 (80,814) - 1,986,164Vehicles 2,149,949 115,744 (40,325) - 2,225,368Infrastructure 43,345,886 1,949,087 29,457 45,324,430
Total 86,012,307 3,006,333 (121,139) 391,205 89,288,706
Less accumulated depreciation forLand improvements 368,375 81,891 - 450,266Buildings and improvements 7,657,934 849,331 - 8,507,265Machinery and equipment 915,002 141,611 (75,168) - 981,445Vehicles 1,218,436 201,960 (10,081) - 1,410,315Infrastructure 23,744,746 1,548,116 - 25,292,862
Total 33,904,493 2,822,909 (85,249) - 36,642,153
Total capital assets, being depreciated, net 52,107,814 183,424 (35,890) 391,205 52,646,553
Governmental activities capital assets, net $ 75,136,683 $ 3,906,635 $ (35,890) $ - $ 79,007,428
Capital asset activity for the year ended June 30, 2020 is as follows: NOTE 7CAPITAL
ASSETS

IV | 55NOTES TO THE FINANCIAL STATEMENTS | 2020 CAFR
Business capital assets activity for the year ended June 30, 2020 is as follows:
Depreciation expense was charged to functions/programs of the City as follows:
Governmental activitiesGeneral government $ 209,747Judicial 22,480Public safety 255,576Public works 1,940,691Culture and recreation 291,705Housing and development 102,710
Total depreciation expenses-governmental activities $ 2,822,909
NOTE 7CAPITAL
ASSETSBeginning Balances Increases Decreases Transfers
Ending Balances
Business-type activities/Water and Sewer fundCapital assets, not being depreciated:
Land $ 7,500 $ - $ - $ - $ 7,500 Construction in progress 227,741 19,921 - (33,592) 214,070
Total 235,241 19,921 - (33,592) 221,570
Capital assets, being depreciatedWater system 3,215,345 10,030 - 33,592 3,258,967
Total 3,215,345 10,030 - 33,592 3,258,967
Less accumulated depreciation forWater system 1,027,758 79,696 - - 1,107,454
Total 1,027,758 79,696 - - 1,107,454
Total capital assets, being depreciated, net 2,187,587 (69,666) - 33,592 2,151,513
Business-type activities capital assets, net $ 2,422,828 $ (49,745) $ - $ - $ 2,373,083

2020 CAFR | NOTES TO THE FINANCIAL STATEMENTS56 | IV
The following is a summary of long-term debt activity for the year ended June 30, 2020:
BeginningBalances Additions Reductions
EndingBalances
Due WithinOne Year
GOVERNMENTAL ACTIVITIES Bonds payable
General obligation bonds, direct placement $ 9,835,000 $ - $ (1,150,000) $ 8,685,000 $ 1,175,000 Total general obligation bonds payable 9,835,000 - (1,150,000) 8,685,000 1,175,000
Revenue bonds - Revenue bonds, direct placement 3,348,000 - (392,000) 2,956,000 397,000Revenue bonds, open market 21,470,000 - - 21,470,000 -Add: Issuance premium 2,105,054 - (158,079) 1,946,975 -
Total revenue bonds payable 26,923,054 - (550,079) 26,372,975 397,000
Compensated absences 394,651 380,977 (263,377) 512,251 163,920
Governmental activities long term liabilities $ 37,152,705 $ 380,977 $ (1,963,456) $ 35,570,226 $ 1,735,920
For governmental activities, compensated absences are liquidated by the General Fund.
2016 General Obligation Refunding Series, direct placement. The City issues general obligation bonds to provide funds for the acquisition and construction of major capital facilities. General obligation bonds are direct obligations and pledge the full faith and credit of the City. General obligation bonds have been issued for general government activities, parks and open space, and are reported in the governmental column of the governmentwide statement of net position.
On October 4, 2016, the City entered into a direct placement, bank qualified refunding bond agreement with JP Morgan Chase bank, (2016 General Obligation Refunding series). The City refunded $12,235,000 of the City’s 2006 General Obligation Refunding series, maturing January 2017 through 2032. This refunding is considered a legal defeasement of the 2006 General Obligation Refunding series January 2017 through 2032. The 2016 General Obligation Refunding series were issued with a principal amount of $12,635,000 and a non-callable rate of 1.96%, which has been determined to have a savings in total debt service of $2,968,250, which has a present value savings of $1,939,041.
NOTE 8LONG TERM
DEBT

IV | 57NOTES TO THE FINANCIAL STATEMENTS | 2020 CAFR
Revenue Bonds. Direct PlacementOn November 12, 2015, the City entered into a direct placement, bank qualified refunding bond agreement with JP Morgan Chase Bank, 2015 URA refunding series. The City advanced refunded $3,890,000 of the 2006 URA Bond series, maturing January 2017 through 2027. This advanced refunding is considered a legal defeasement of the 2006 URA bonds series January 2017 through 2027. The 2015 URA refunding series has a non-callable rate of 1.94% and has been determined to create debt service savings of $200,012, which has a present value savings of $180,855.
Open MarketOn July 18, 2017, the URA closed on $21,470,000 of revenue bonds. The bond sale resulted in proceeds totaling $23,494,404 available for Town Center on Main projects, transportation improvements, and administrative facilities in the Urban Redevelopment district. The all-in true interest cost is 3.313% and the average coupon is 4.158%. The 20 year bonds mature on January 1, 2038, and have interest only payments for the first five years.
The amount of revenue bonds outstanding at June 30, 2020 is $24,426,000 in total. There is no required revenue coverage for these bonds. The revenue source of these bonds is pledged by the City of Suwanee through an intergovernmental agreement with the URA. Revenue bonds have been issued for general government activities, financing a new City Hall, and are reported in the governmental column of the governmentwide statement of net position.
The debt service requirements to maturity on the revenue bonds are as follows:
Year ending June 30, Principal Interest2021 $ 1,175,000 $ 158,711 2022 1,195,000 135,485 2023 1,220,000 111,818 2024 1,240,000 87,7102025 1,265,000 63,161
2026 - 2027 2,590,000 50,960 Total $ 8,685,000 $ 607,845
Direct Placement Open Market TotalYear ending June 30, Principal Interest Principal Interest Principal Interest
2021 $ 397,000 $ 53,495 $ - $ 892,750 $ 397,000 $ 946,2452022 407,000 45,697 - 892,750 407,000 938,4472023 416,000 37,714 245,000 887,850 661,000 925,5642024 419,000 29,614 255,000 879,125 674,000 908,7392025 432,000 21,359 260,000 870,100 692,000 891,459
2026-2030 885,000 17,237 4,735,000 3,933,400 5,620,000 3,950,637 2031-2035 - - 9,145,000 2,219,550 9,145,000 2,219,550 2036-2038 - - 6,830,000 420.000 6,830,000 420,000 Total $ 2,956,000 $ 205,116 $ 21,470,000 $ 10,995,525 $ 24,426,000 $ 11,200,641
NOTE 8LONG TERM
DEBT
The debt service requirements to maturity on the general obligation refunding bonds are as follows:

2020 CAFR | NOTES TO THE FINANCIAL STATEMENTS58 | IV
The composition of interfund transfers for the year ended June 30, 2020 is as follows:
Transfers are used to (1) move revenues from the fund that statute or budget requires to collect them to the fund that the statute or budget requires to expend them and (2) use unrestricted revenues collected in the General Fund to finance various programs accounted for in other funds in accordance with budgetary authorizations.
Interfund receivable and payable balance as of June 30, 2020 is as follows:
Under Georgia law, the City, in conjunction with other cities and counties in the ten (10) county Atlanta area, is a member of the Atlanta Regional Commission (the ARC) and is required to pay annual dues thereto. During its fiscal year ended June 30, 2020, the City’s membership dues were paid by Gwinnett County, Georgia. The City did not pay any annual dues. Membership in the ARC is required by the Official Code of Georgia Annotated (OCGA) Section 50-8-34 which provides for the organizational structure of the ARC in Georgia.
The ARC Board membership includes the chief elected official of each county and municipality of the area. OCGA 50-8-39.1 provides that the member governments are liable for any debts or obligations of the ARC. Separate financial statements may be obtained from:
Atlanta Regional CommissionOffice of Financial Services Manager40 Courtland Street NEAtlanta, GA 30303
Effective November 1, 2005, the City changed its retirement program for full time employees from a 401(a) defined contribution plan, the City of Suwanee Money Purchase Pension Plan, to a defined benefit plan, the Georgia Municipal Association Employee Pension Plan for the City of Suwanee. Employees hired or rehired on or after November 1, 2005 automatically participate in the defined benefit plan. Current employees hired before November 1, 2005 had a choice of remaining in the 401(a) plan or electing to participate in the defined benefit plan. Employees that remained in the 401(a) plan will continue to receive contributions under the terms of the 401(a) plan.
Transfer In Transfer Out AmountGeneral fund Non-major governmental funds $ 144,064 Debt Service fund Urban Redevelopment Authority 800,000 Non-major governmental funds General fund 159,736
Total $ 1,103,800
NOTE 9INTERFUND
TRANSFERS AND BALANCES
NOTE 10JOINT
VENTURE
Due to Due From AmountWater and Sewer fund General fund $ 785
NOTE 11PENSION
PLAN
The interfund receivables and payables noted above is due to cash flow related to year end transactions.

IV | 59NOTES TO THE FINANCIAL STATEMENTS | 2020 CAFR
Defined Contribution PlanThe City of Suwanee Money Purchase Pension Plan, a defined contribution plan is administered by ICMA-RC, International City/County Management Association Retirement Center. A participant is covered after ninety (90) days of service. The City is required to contribute 5% of annual covered payroll, with 100% of these funds going into a fixed-rate savings account. The City’s total payroll for the fiscal year was $6,795,459 including $640,837 of payroll covered by this plan. Contributions by the City totaled $32,042 for the fiscal year ended June 30, 2020. Plan provisions and contribution requirements are established by City ordinance and may be amended by the Suwanee City Council.
The employee vesting schedule for the 401 (a) plan is as follows:
Defined Benefit PlanGeneral InformationEmployees electing to participate in the Georgia Municipal Association Employee Pension Plan for the City of Suwanee, (the GMA plan), ceased contributions to the 401(a) plan on November 1, 2005 and all related subsequent contributions were made to the GMA plan. Prior full-time service with the City was counted for eligibility for retirement and death benefits for vesting. The City contributed 20% of full-time service with the City before November 1, 2005 towards the amount of benefits payable under the plan. Employees have the option to use their funds in the 401(a) plan to purchase some or all of the remaining past service to increase the amount of benefits payable under the plan. The GMA plan currently requires an annual employee contribution of 2% and a City contribution of .55%. However, the City has elected to contribute a higher rate of 6% for employer contributions. This rate was determined by a separate actuarial study that was performed in 2017 to provide for an even level of funding year to year and to prevent large fluctuation of pension contributions from year to year. Due to this difference in required contribution and contributions paid by the City, the statement of net position reports a net pension asset of $4,955,198.
The GMA plan board elected to change the valuation schedule from November 1 to January 1 to assist the plan members with their financial forecasting and budgeting process. The annual contribution rate will not change until the commencement of a new fiscal year.
Benefit TermsThe GMA plan provides retirement, disability, and death benefits to plan participates and beneficiaries. The GMA plan is an agent multiple-employer pension plan, administered by The Segal Company. The City Council in its role as the Plan Sponsor, has the sole authority to amend the provisions, including specific benefit provisions and contribution requirements, of the GMA plan, as provided in the Plan document. Benefits are provided by the GMA plan whereby retirees receive 1.5% multiplied by the average of the five highest years of regular earnings multiplied by the total credited years of service. GMA issued a publicly available financial report that includes financial statements and required supplementary information. That report may be obtained by writing to Georgia Municipal Association, Risk Management and Employee Benefit Services, 201 Pryor Street SW, Atlanta, Georgia 30303, or by calling (404) 688-0472.
Less than 2 years 0% 4 years 60%2 years 20% 5 years 80%3 years 40% 6 years 100%
NOTE 11PENSION
PLAN

2020 CAFR | NOTES TO THE FINANCIAL STATEMENTS60 | IV
Employees CoveredAt June 30, 2020, the Plan consisted of the following:
Contribution RequirementsThe City is required to contribute an actuarially determined amount annually to the Plan’s trust. The plan’s contribution amount is determined using actuarial methods and assumptions approved by the GMA Plan of trustees and meets or exceeds the minimum contribution requirement contained in the State of Georgia statutes. However, as noted above, the City, as authorized by the City Council, has chosen to contribute at a higher rate of 6% instead of the plan’s contribution amount of .55%. This excess funding does not represent any additional postemployment benefit obligation to the City. City contributions to the GMA Plan were $331,591 for the year ended June 30, 2020.
Net Pension LiabilityThe City’s net pension asset was measured as of September 30, 2019, and the total pension liability used to calculate the net pension asset was determined by an actuarial valuation conducted in November and December 2019.
Actuarial Assumptions The total pension liability in the January 1, 2020 actuarial valuation was determined using the following actuarial assumptions, applied to all periods included in the measurement:
Inactive employees and beneficiaries currently receiving benefits 9Inactive employees and beneficiaries entitled to benefits, but not yet receiving benefits 27Active employees 100
Inflation 2.25%Cost of living adjustments 0.00%Investment rate of return 7.375%
Years of Service Annual Rate (%)0-1 8.502 5.503 5.254 5.005 4.756 4.50
Years of Service Annual Rate (%)7 4.258 4.009 3.75
10-11 3.5012-14 3.25
15 or more 3.00
Salary increases (including inflation of 2.25%):
NOTE 11PENSION
PLAN(continued)

IV | 61NOTES TO THE FINANCIAL STATEMENTS | 2020 CAFR
The long-term expected rate of return on pension plan investments, 7.375% on-going basis, was determined using a building-block method in which best-estimate ranges of expected future real rates of return (expected returns, net of pension plan investment expense and inflation) are developed for each major asset class. These ranges are combined to produce the long-term expected rate of return by weighting the expected future real rates of return by the target asset allocation percentage and by adding expected inflation. Best estimates of arithmetic real rates of return for each major asset class included in the pension plan’s target asset allocation as of September 30, 2019 are summarized in the following table: *Rates shown here are net of the 2.25% assumed rate of inflation.
Discount RateThe discount rate used to measure the total pension liability was 7.375%, this is a decrease .125% from the previous year rate of 7.5%. The projection of cash flows used to determine the discount rate assumed that employee contributions will be made at the current rate of 2% and the City contributions will be made at rates equal to the difference between actuarially determined contribution rates and the employee rates. Based on those assumptions, the pension plan’s fiduciary net position was projected to be available to make all future benefit payments of current and active and inactive employees. Therefore, the long-term expected rate of return on pension plan investments was applied to all periods of projected benefit payments to determine the total pension asset.
Asset Class Target AllocationLong-term Expected Real Rate of Return*
Long-term Nominal Real Rate of Return
Domestic equity 45% 6.41% 8.66%International equity 20% 6.96% 9.21%Domestic fixed income 20% 1.96% 4.21%Real estate 10% 4.76% 7.01%Global fixed income 5% 3.06% 5.31%
Total 100%
NOTE 11PENSION
PLAN
HealthySex-distinct Pri-2012 head-count weighted Healthy Retiree Mortality Table with rates multiplied by 1.25.
DisabledSex-distinct Pri-2012 head-count weighted Disabled Retiree Mortality Table with rates multiplied by 1.25.
Plan termination basis (all lives) Sex-distinct Pri-2012 head-count weighted Employee Mortality Table.
The demographic and economic actuarial used in the January 1, 2020 valuation were based on the results of an actuarial experience study for the period July 1, 2015 through June 30, 2019.
Mortality rates:

2020 CAFR | NOTES TO THE FINANCIAL STATEMENTS62 | IV
Pension Expense and Deferred Outflows of Resources and Deferred Inflows of Resources Related to PensionsFor the year ended June 30, 2020, the City recognized a negative pension expense of ($108,235). The statement of net position includes a deferred outflows for employer pension contributions of $257,623 subsequent to the measurement date. This amount includes employer payments made to the plan after 9/30/2019, the measurement date, and prior to 6/30/2020, the City’s fiscal year end.
1% decrease (6.375%)
Current discount rate(7.375%)
1% increase (8.375%)
City’s net pension (asset) $ (4,030,651) $ (4,955,198) $ (5,702,800)
Sensitivity of the Net Pension Asset
The following represents the net pension asset of the City, calculated using the discount rate of 7.375%, as well as what the City’s net pension asset would be if it were calculated using a discount rate that is 1% point lower (6.375%) or 1% point higher (8.375%) than the current rate:
NOTE 11PENSION
PLAN(continued)
Change in the Net Pension Asset Increase (Decrease)Total Pension Liability (a) Plan Fiduciary Net Position (b) Net Pension Asset (a) - (b)
Balances at 6/30/2019 $ 6,443,471 $ 11,067,986 $ (4,624,515)
Changes for the year:Service Cost 347,938 - 347,938 Interest 505,165 - 505,165 Difference between expected and actual experience (187,000) - (187,000)Contributions employer - 403,482 (403,482)Contributions employee - 107,014 (107,014)Net investment income - 359,297 (359,297) Benefit payments, including refunds of employee contributions (111,755) (111,755) - Change in assumptions (152,066) (152,066)Administrative expense - (25,073) 25,073
Net change 402,282 732,965 (330,683)
Balances at 6/30/2020 $ 6,845,753 $ 11,800,951 $ (4,955,198)

IV | 63NOTES TO THE FINANCIAL STATEMENTS | 2020 CAFR
NOTE 12RISK
MANAGEMENT
The City is exposed to various risks of losses related to: torts, damage to, theft of, and destruction of assets, errors and omissions, injuries to employees and natural disasters. The goal is to provide resources to reduce loss-related expenses and enhance delivery of public services. The City uses Travelers Property Casualty Insurance Company as the insurance provider and Apex Insurance Agency, LLC as the broker to provide Loss Control and Risk Management Services. The policy covers workers’ compensation, general liability, property liability and automobile liability (including comprehensive and collision coverage). The current coverage agreement period is from March 31, 2020 to March 31, 2021 and covers all buildings, vehicles, mobile equipment and other City owned property which are included on our exposure schedules. Upon knowledge of an occurrence, wrongful act or any other happening or incident which may result in a loss, Apex and Travelers are notified as promptly as possible. Travelers is responsible for payment for covered losses, covered damages and defense costs on behalf of the City of Suwanee in excess of the $1,000 deductible per occurrence and shall not exceed $1,000,000 per each occurrence. A Certificate of Coverage is provided and is used to verify the existence of insurance coverage. It lists the effective dates of the policy, the types of insurance coverage purchased, and the applicable limits of liability. Annually, a renewal package is reviewed for accuracy and updated with any applicable changes for the new year. The renewal package provides the most current information and is prepared in an effort to gather updated exposure information including three exposure schedules for property, mobile equipment and vehicles.
Settled claims in the past three years have not exceeded insurance coverage.
City contributions subsequent to the measurement date of $257,623 are reported as deferred outflows of resources and will be recognized as an increase of the net pension asset in the year ending June 30, 2021. Other amounts reported as deferred outflows of resources and deferred inflows of resources related to pension will be recognized in pension expense as follows:
Year ended June 302021 $ (126,864)2022 (78,771)2023 42,8052024 89,8442025 (7,119)
Thereafter (102,018)
As of June 30, 2020, the City reported deferred outflows and inflows of resources related to pensions, except for employer pension contributions subsequent to the measurement dated noted above, to the following sources:
Deferred Outflows Deferred InflowsAssumption changes $ 45,271 $ 141,932Demographic changes 291,011 331,963Pension contribution subsequent to measurement date 257,623 -Net difference between projected and actual earnings on pension investments - 44,510
Total $ 593,905 $ 518,405

2020 CAFR | NOTES TO THE FINANCIAL STATEMENTS64 | IV
On October 12, 2020 the City of Suwanee entered into a subrecipient agreement with Gwinnett County for the reimbursement of expenditures related to the coronavirus pandemic using the United States Department of Treasury Conronavirus Relief Funds (CFDA number 21.019) directly received by Gwinnett County. The agreement covers allowable grant expenditures, up to $2,222,655, to be reimbursed for funds expended from March 1, 2020 until December 30, 2020. Any funds unspent by the City as of December 1, 2020 will be reallocated.
NOTE 15SUBSEQUENT EVENTS
INTERGOVERNMENTAL AGREEMENT
GWINNETT COUNTY CARES ACT
Hotel/Motel Tax
The City believes it is in compliance with OCGA Section 36-81-7 related to the disbursement of hotel/motel taxes collected. Obligated collections were $511,422 as reported in the City’s Hotel/Motel Tax Fund. Expenditures and transfers totaled $536,198, leaving an ending fund balance of $168,370 to be used for tourism and trade.
Rental Motor Vehicle Excise TaxThe City believes it is in compliance with OCGA 48-13-93 which requires that all motor vehicle excise taxes be expended or obligated contractually for the promotion of tourism or the acquisition, construction, renovating, improving maintenance and equipping of pedestrian walkways, installation of traffic lights, and street lights associated with public safety facilities or public improvements for sports and recreational facilities. During the fiscal year, the City received $72,796 in motor vehicle excise taxes. Expenditures and transfers totaled $64,907, leaving a fund balance of $56,164 to be used in future periods.
Contractual Commitments:In addition to the liabilities enumerated in the balance sheet at June 30, 2020, the City has contractual commitments on uncompleted contracts of approximately $3,580,826 for the following projects: $104,861 Town Center on Main, $346,760 Jackson Street Reconstruction, $71,459 Sidewalk Projects, $111,094 Municipal Court Renovation and Expansion, $2,301,936 Street Resurfacing, and $644,716 Buford Highway Reconstruction and Streetscape. Litigation:The City is involved in several pending lawsuits in the normal course of the City’s business. Liability, if any, which might result from these proceedings, would not, in the opinion of management and legal counsel, have a material adverse effect on the financial position of the City.
Grant Contingencies:The City has received grants for specific purposes that are subject to review and audit by the grantor agencies. Such audits could lead to the disallowance of certain expenditures previously reimbursed by those agencies. Based upon prior experience, management of the City believes such disallowances, if any, will not be significant.
NOTE 14COMPLIANCE
NOTE 13COMMITMENTS
AND CONTINGENCIES

REQUIRED SUPPLEMENTARY INFORMATION

V | 65REQUIRED SUPPLEMENTARY INFORMATION | 2020 CAFR
SCHEDULE OF CHANGES IN NET PENSION ASSET AND RELATED RATIOS
Fiscal Year2020
Fiscal Year2019
Fiscal Year2018
Fiscal Year2017
Fiscal Year2016
Fiscal Year2015
TOTAL PENSION LIABILITYService cost $ 347,938 $ 324,030 $ 326,373 $ 291,552 $ 317,834 $ 313,930 Interest 505,165 452,099 390,116 357,340 284,715 250,350 Difference between expected and actual experience (187,000) 18,243 4,010 (148,787) 385,032 (64,451)Changes of assumptions (152,066) - 53,902 - - 2,284 Benefit payments, including refunds of employee contributions (111,755) (109,725) (98,660) (55,731) (45,240) (72,134)
Net change in pension liability 402,282 684,647 675,741 444,374 942,341 429,979 Total pension liability, beginning 6,443,471 5,758,824 5,083,083 4,638,709 3,696,368 3,266,389
Total pension liability, ending (a) $ 6,845,753 $ 6,443,471 $ 5,758,824 $ 5,083,083 $ 4,638,709 $ 3,696,368
PLAN FIDUCIARY NET POSITIONContributions employer $ 403,482 $ 384,269 $ 404,249 $ 384,200 $ 361,750 $ 341,092 Contributions employee 107,014 91,603 91,837 90,104 80,779 73,029 Net investment income 359,297 979,115 1,252,027 793,135 59,795 638,016 Benefit payments, including refunds of employee contributions (111,755) (109,725) (98,660) (55,731) (45,240) (72,134)Administrative expense (25,073) (26,248) (26,623) (15,071) (16,447) (14,301)
Net change in fiduciary net position 732,965 1,319,014 1,622,830 1,196,637 440,637 965,702 Plan fiduciary net position, beginning 11,067,986 9,748,972 8,126,142 6,929,505 6,488,868 5,523,166
Plan fiduciary net position, ending (b) $ 11,800,951 $ 11,067,986 $ 9,748,972 $ 8,126,142 $ 6,929,505 $ 6,488,868
Net pension asset, ending (a) - (b) $ (4,955,198) $ (4,624,515) $ (3,990,148) $ (3,043,059) $ (2,290,796) $ (2,792,500)
Plan's fiduciary net position as a percent of the total pension liability 172.38% 171.77% 169.29% 159.87% 149.38% 175.55%
Covered payroll $ 5,112,616 $ 4,989,565 $ 4,657,826 $ 4,421,301 $ 3,979,442 $ 3,427,605
Net pension asset as a percentage of covered payroll -96.92% -92.68% -85.67% -68.83% -57.57% -81.47%
The pension schedules in the required supplementary information are intended to show information for ten years. Additional years’ information will be displayed as it becomes available.

2020 CAFR | REQUIRED SUPPLEMENTARY INFORMATION66 | V
SCHEDULE OF CHANGES IN NET PENSION ASSET AND RELATED RATIOS (continued)
Notes to schedule: 1. Changes of assumptions:
a. As a result of the plan change to provide immediate participation for employees and officials, for the fiscal year ending 2015, the eligibility assumption has been changed from three months to immediate. The decrease in the plan’s net pension asset is minimal and has been included in the differences between the expected and actuarial experience. b. As a result of the new administrative fee approved by the Board, the administrative expense assumption was updated for fiscal years beginning in 2016.
FY 2016 Prior to FY 2016Base fee $ 9,000 $ 7,000
Per active and terminated vested participant $ 66 $ 65
Per retiree and beneficiary $ 78 $ 65
Percentage of the market value of assets .06% .05%
Per active participant for the administration of employee contributions $ 18 $ 10
Per inactive participant for the administration of employee contributions $ 9 $ 0
c. Amounts reported for the fiscal year ending in 2016 and later, reflect the following assumption changes based on the results of an actuarial experience study covering the period January 1, 2010 to June 30, 2014:
1. The mortality table for disabled participants was changed to remove the two-year set-forward for females. 2. The inflation assumption was decreased from 3.50% to 3.25%.
d. Amounts reported for the fiscal year ending in 2018 and later, reflect the following assumption changes based on the results of an actuarial experience study conducted in September 2017.
1. The investment return assumption was decreased from 7.75% to 7.50%.
2. The inflation assumption was decreased from 3.25% to 2.75%.
3. The salary increase rate was reduced from 4.25% to 3.75%.
e. Amounts reported for the fiscal year ending in 2020 and later, reflect the following assumption changes based on the results of an actuarial experience study conducted in November and December 2019:
1. The mortality table for healthy retirees and beneficiaries was changed from the 1994 Group Annuity Reserving Unisex Table to the sex distinct Pri-2012 head-count weighted Healthy Retiree Mortality Table with rates multiplied by 1.25.

V | 67REQUIRED SUPPLEMENTARY INFORMATION | 2020 CAFR
SCHEDULE OF CHANGES IN NET PENSION ASSET AND RELATED RATIOS (continued)
Notes to schedule: (continued)
2. The mortality table for disabled participants was changed from the sex-distinct R-2000 Disabled Retiree Mortality Table to the sex distinct Pri-2012 head-count weighted Disabled Retiree Mortality Table with rates multiplied by 1.25.
3. The mortality table for active participants, terminated vested participants, and deferred beneficiaries was changed from the 1994 Group Annuity Reserving Unisex Table to the sex distinct Pri-2012 head-count weighted Employee Mortality Table.
4. Future mortality improvement is based on projecting generationally from 2012 using 60% of the sex distinct Scale SSA2019. Previously future mortality were not explicitly projected.
5. The disability rates were changed to 50% of the rates in the prior age-based table.
6. The inflation assumption was decreased from 2.75% to 2.25%.
7. The salary increase assumption was changed from 3.75% to a service-based scale starting at 8.50% for the first two years of service with an ultimate rate of 3.00% at 15 years of service.
8. The investment return rate assumption was decreased from 7.50% to 7.375%.
2. Benefit changes:
Effective January 1, 2015, the plan was amended to provide for immediate participation for employees and officials. This change has no impact on the service credited under the plan and has no impact on benefits.

2020 CAFR | REQUIRED SUPPLEMENTARY INFORMATION68 | V
2020 2019 2018 2017 2016
Actuarially determined contribution $ 30,396 $ 28,035 $ 26,139 $ 33,225 $ 64,798Contributions in relation to the actuarially determined contribution 331,591 407,779 373,417 415,313 381,166 Contributions deficiency (excess) $ (301,195) $ (379,744) $ (347,278) $ (382,088) $ (316,368)
Covered payroll $ 5,526,497 $ 5,097,235 $ 4,667,712 $ 4,614,591 $ 4,235,178 Contributions as a percent of covered payroll 6.0% 8.0% 8.0% 9.0% 9.0%
Notes to schedule:
1. Valuation date: a. Fiscal years 2020 - 2011: January 1 annually
2. Methods and assumptions used to determine contribution rates: The investment return and inflation assumptions used in the January 1, 2020 valuation were based on the results of an actuarial study for the period July 1, 2015 through June 2019, conducted in November and December of 2019. a. Actuarial cost method: aggregate cost method b. Amortization method: n/a- aggregate method does not identify or separately amortize unfunded actuarial accrued liabilities. c. Remaining amortization method: n/a d. Asset valuation method: Sum of actuarial value at beginning of year and cash flow during the year plus assumed investment return, adjusted by 10% of
the amount that the value exceeds or is less than the market value at the end of year. The actuarial value is adjusted, if necessary, to be within 20% of market value.
e. Investment rate of return: 7.375% - Ongoing basis, based on long-term expected rate of return on pension investments. f. Projected salary increases: A service-based scale starting at 8.50% for the first two years of service with an ultimate rate of 3.00% at 15 years of service. g. Cost of living adjustments: 0.00% h. Expected annual inflation: 2.25% i. Retirement age: 65 with 5 years of service j. Mortality Rates: Healthy: Sex distinct Pri-2012 head-count weighted Healthy Retiree Mortality Table with rates multiplied by 1.25.
Disabled: Sex distinct Pri-2012 head-count weighted Disable Retiree Mortality Table with rates multiplied by 1.25.
Plan termination basis (all lives): Sex distinct Pri-2012 head-count Employee Mortality Table. Other Information:The Georgia Municipal Association Employee Pension Plan for the City of Suwanee (the GMA plan) was established November 1, 2005.
SCHEDULE OF CITY CONTRIBUTIONSLAST TEN FISCAL YEARS
2015 2014 2013 2012 2011Actuarially determined contribution $ 53,343 $ 68,496 $ 117,418 $ 151,635 $ 161,429 Contributions in relation to the actuarially determined contribution 357,671 338,792 398,849 389,788 372,947 Contributions deficiency (excess) $ (304,328) $ (270,296) $ (281,431) $ (238,153) $ (211,518)
Covered payroll $ 3,974,126 $ 3,717,773 $ 3,625,901 $ 3,543,524 $ 3,390,429 Contributions as a percent of covered payroll 9.0% 9.1% 11.0% 11.0% 11.0%

GOVERNMENTAL FUNDS

VI | 69GOVERNMENTAL FUNDS | 2020 CAFR
NON-MAJOR GOVERNMENTAL FUNDS
Suwanee Fest
The purpose of the Suwanee Fest is to provide a high-quality two day family festival for the citizens of Suwanee. The festival is self-funded whereby it generates sponsorship dollars to offset the cost of the festival. These funds are restricted by contribution requirements from sponsors.
CommunityArts
The City Council appointed Public Arts Commission was established to work with and encourage developers to include public art or support public art as a component of new projects and to create programs that bring and promote public art in Suwanee. The Suwanee Public Arts Partnership, a volunteer-based organization, was launched to raise funds for and build community awareness of public art initiatives. These funds are restricted by contribution requirements from sponsors.
Confiscated Assets
Georgia law allows police agencies to file for seizure of property related to illegal substances or activities. These funds must be used, under federal and state law, to purchase police equipment. Suwanee participates in the Federal Drug Task Force and the Joint Gwinnett Municipal Drug Task Force. These task forces provide the participants a percentage of the amount of funds/property seized. Currently, Suwanee has one police officer assigned to each of these task forces.
Community Garden
Suwanee’s Community Garden, Harvest Farm, was established in 2010 to offer residents and members of the community the opportunity to enjoy nature, build community, learn about gardening and grow fresh produce. Contributions to this fund include plot rental fees and donations received from corporations, individuals, and citizen groups. These funds are restricted by plot rental agreements and contribution requirements from sponsors.
Hotel/Motel Tax
This fund accounts for the accommodation taxes collected from the 7% Hotel/Motel tax. These revenues are collected on a monthly basis from each hotel or motel in Suwanee. By state law, the City is required to spend 57% of the collections on programs and initiatives that promote tourism.
Rental Vehicle Excise Tax
State Law permits Georgia municipalities to levy a 3% excise tax on vehicle rentals. In December of 2018, Suwanee adopted the rental vehicle excise tax ordinance that allows for the collection of rental motor vehicle excise tax. By state law, the City is required to spend these funds on the promotion of tourism, public safety, and transportation.
CemeteryThe cemetery fund was created to implement landscaping and other infrastructure improvements to Suwanee’s small cemeteries as outlined in the 2009 Cemetery Preservation Assessment. Cemeteries included in the study were Jackson Street, Shadowbrook and Sims Lake.
Tax Allocation District
Suwanee’s Tax Allocation District (TAD) was created to revitalize Suwanee’s commercial district along I-85, Suwanee’s Gateway, through capital investment. Funds obtained through the creation of a tax allocation district will ignite additional private investment and growth.
2009 SPLOSTThe 2009 Special Purpose Local Option Sales Tax (SPLOST) Fund accounts for and reports financial resources that are restricted or assigned to expenditures for capital outlays, including the acquisition or construction of capital facilities and other capital assets. Funding is provided by a restricted one-cent special purpose local option sales tax approved by voters in 2008, restricted federal, and local resources.
2014 SPLOSTThe 2014 SPLOST accounts for and reports financial resources that are restricted or assigned to expenditures for capital outlays. The 2014 program focuses on various transportation projects, sidewalk improvement projects, and recreational improvements. Funding is provided by a restricted one-cent special purpose local option sales tax approved by voters in 2013, restricted federal, and local resources.
SPECIALREVENUE
CAPITALPROJECTS

2020 CAFR | GOVERNMENTAL FUNDS70 | VI
NON-MAJOR GOVERNMENTAL FUNDSCOMBINING BALANCE SHEETjune 30, 2020
SuwaneeFest
CommunityArts
ConfiscatedAssets
CommunityGarden Hotel/Motel Tax
Rental Vehicle Tax Total
ASSETSCash and cash equivalents $ 22,012 $ 144,359 $ 180,152 $ 46,334 $ 162,664 $ 51,551 $ 607,072Investments - - 51,493 - - - 51,493Receivables:
Other - - - - 34,132 4,613 38,745Total assets $ 22,012 $ 144,359 $ 231,645 $ 46,334 $ 196,796 $ 56,164 $ 697,310
LIABILITIES AND FUND BALANCESLiabilities:
Accounts payable $ - $ - $ - $ - $ 28,426 $ - $ 28,426Total liabilities - - - - 28,426 - 28,426
Fund Balances:Restricted 22,012 144,359 231,645 41,334 168,370 56,164 663,884Assigned - - - 5,000 - - 5,000
Total fund balances 22,012 144,359 231,645 46,334 168,370 56,164 668,884TOTAL LIABILITIES AND FUND BALANCES $ 22,012 $ 144,359 $ 231,645 $ 46,334 $ 196,796 $ 56,164 $ 697,310
S P E C I A L R E V E N U E

VI | 71GOVERNMENTAL FUNDS | 2020 CAFR
NON-MAJOR GOVERNMENTAL FUNDSCOMBINING BALANCE SHEET
june 30, 2020
C A P I T A L P R O J E C T S
Cemetery
TaxAllocation
District2009
SPLOST2014
SPLOST Total
TotalNon-major
Governmental FundsASSETS
Cash and cash equivalents $ 24,045 $ 623,272 $ 500,101 $ 638,436 $ 1,785,854 $ 2,392,926Investments - - - - - 51,493Receivables:
Other - - - - - 38,745Total assets $ 24,045 $ 623,272 $ 500,101 $ 638,436 $ 1,785,854 $ 2,483,164
LIABILITIES AND FUND BALANCESLiabilities:
Accounts payable $ - $ - $ 2,410 $ 5,375 $ 7,785 $ 36,211Total liabilities - - 2,410 5,375 7,785 36,211
Fund Balances:Restricted - 623,272 497,691 633,061 1,754,024 2,417,908Assigned 24,045 - - - 24,045 29,045
Total fund balances 24,045 623,272 497,691 633,061 1,778,069 2,446,953TOTAL LIABILITIES AND FUND BALANCES $ 24,045 $ 623,272 $ 500,101 $ 638,436 $ 1,785,854 $ 2,483,164

2020 CAFR | GOVERNMENTAL FUNDS72 | VI
Suwanee Fest
Community Arts
Confiscated Assets
Community Garden
Hotel/Motel Tax
Rental Vehicle Tax Total
REVENUESHotel/motel taxes $ - $ - $ - $ - $ 508,980 $ - $ 508,980Other taxes - - - - - 72,796 72,796Fines and forfeitures - - 70,095 - - - 70,095Investment income - - 1,174 8 190 97 1,469Rental income - 17,162 - 6,663 - - 23,825Contributions and donations 100,408 80,286 6,474 2,252 10,000 199,420Miscellaneous revenue - - - - - - -
Total revenues 100,408 97,448 71,269 13,145 511,422 82,893 876,585
EXPENDITURESCurrent:
Public safety - - 30,088 - - - 30,088Culture and recreation 134,177 32,725 - 11,099 - 64,907 242,908Housing and development - - - - - - -
Tourism and trade - - - - 392,134 - 392,134Capital Outlay - - - - - - -
Total expenditures 134,177 32,725 30,088 11,099 392,134 64,907 665,130Excess of revenues over (under) expenditures (33,769) 64,723 41,181 2,046 119,288 17,986 211,455
OTHER FINANCING SOURCES (USES)Sale of capital assets - - 8,329 - - - 8,329Transfer in - - - 5,000 - - 5,000 Transfer out - - - - (144,064) - (144,064)
Total other financing sources (uses) - - 8,329 5,000 (144,064) - (130,735)
Net change in fund balances (33,769) 64,723 49,510 7,046 (24,776) 17,986 80,720
FUND BALANCE - beginning 55,781 79,636 182,135 39,288 193,146 38,178 588,164FUND BALANCES - end of year $ 22,012 $ 144,359 $ 231,645 $ 46,334 $ 168,370 $ 56,164 $ 668,884
NON-MAJOR GOVERNMENTAL FUNDSCOMBINING STATEMENT OF REVENUES, EXPENDITURES AND CHANGES IN FUND BALANCESyear ended june 30, 2020
S P E C I A L R E V E N U E

VI | 73GOVERNMENTAL FUNDS | 2020 CAFR
Cemetery
Tax Allocation
District 2009
SPLOST 2014 SPLOST Total
Total Non-major
Governmental Funds
REVENUESHotel/motel taxes $ - $ - $ - $ - $ - $ 508,980 Other taxes - - - - - 72,796Fines and forfeitures - - - - - 70,095Investment income - - 607 638 1,245 2,714Rental income - - - - - 23,825Contributions and donations - - - - - 199,420Miscellaneous revenue - - 12,782 - 12,782 12,782
Total revenues - - 13,389 638 14,027 890,612
EXPENDITURESCurrent:
Public safety - - - - - 30,088Culture and recreation - - - - - 242,908Housing and development - 727 - - 727 727
Tourism and trade - - - - - 392,134Capital outlay - - 166,143 29,696 195,839 195,839
Total expenditures - 727 166,143 29,696 196,566 861,696Excess of revenues over (under) expenditures - (727) (152,754) (29,058) (182,539) 28,916
OTHER FINANCING SOURCES (USES)Sale of capital assets - - - - - 8,329Transfer in - 154,736 - - 154,736 159,736Transfer out - - - - - (144,064)
Total other financing sources (uses) - 154,736 - - 154,736 24,001
Net change in fund balances - 154,009 (152,754) (29,058) (27,803) 52,917
FUND BALANCE - beginning 24,045 469,263 650,445 662,119 1,805,872 2,394,036 FUND BALANCES - end of year $ 24,045 $ 623,272 $ 497,691 $ 633,061 $ 1,778,069 $ 2,446,953
C A P I T A L P R O J E C T S
NON-MAJOR GOVERNMENTAL FUNDSCOMBINING STATEMENT OF REVENUES,
EXPENDITURES AND CHANGES IN FUND BALANCESyear ended june 30, 2020

2020 CAFR | GOVERNMENTAL FUNDS74 | VI
SPECIAL REVENUE FUNDSSCHEDULE OF REVENUES, EXPENDITURES AND CHANGES IN FUND BALANCES budget and actual-year ended june 30, 2020
SUWANEEFEST
COMMUNITYARTS
Budgeted Amounts Actual
Amounts
Variance with Final Budget
- Positive (Negative) Original Final
REVENUESContributions and donations $ 198,000 $ 198,000 $ 100,408 $ (97,592)
Total revenues 198,000 198,000 100,408 (97,592)
EXPENDITURESCurrent:
Culture and recreation 198,000 198,000 134,177 63,823Total expenditures 198,000 198,000 134,177 63,823
Net change in fund balances - - (33,769) (33,769)
FUND BALANCES - beginning of year 55,781 55,781 55,781 - FUND BALANCES - end of year $ 55,781 $ 55,781 $ 22,012 $ (33,769)
Budgeted Amounts Actual
Amounts
Variance with Final Budget
- Positive (Negative) Original Final
REVENUESRental income $ 25,000 $ 25,000 $ 17,162 $ (7,838)Contributions and donations 1,114,000 1,114,000 80,286 (1,033,714)
Total revenues 1,139,000 1,139,000 97,448 (1,041,552)
EXPENDITURESCurrent:
Culture and recreation 1,139,000 1,139,000 32,725 1,106,275Total expenditures 1,139,000 1,139,000 32,725 1,106,275
Net change in fund balances - - 64,723 64,723
FUND BALANCES - beginning of year 79,636 79,636 79,636 - FUND BALANCES - end of year $ 79,636 $ 79,636 $ 144,359 $ 64,723

VI | 75GOVERNMENTAL FUNDS | 2020 CAFR
SPECIAL REVENUE FUNDSSCHEDULE OF REVENUES, EXPENDITURES
AND CHANGES IN FUND BALANCESbudget and actual-year ended june 30, 2020
Budgeted Amounts Actual Amounts
Variance with Final Budget - Positive
(Negative) Original Final REVENUES
Fines and forfeitures $ 129,500 $ 129,500 $ 70,095 $ (59,405)Investment income 500 500 1,174 674
Total revenues 130,000 130,000 71,269 (58,731)
EXPENDITURESCurrent:
Public safety 130,000 130,000 30,088 99,912Total expenditures 130,000 130,000 30,088 99,912
Excess of revenues over expenditures - - 41,181 41,181
OTHER FINANCING SOURCES (USES) Sale of capital assets - - 8,329 8,329 Net change in fund balances - - 49,510 49,510
FUND BALANCES - beginning of year 182,135 182,135 182,135 - FUND BALANCES - end of year $ 182,135 $ 182,135 $ 231,645 $ 49,510
Budgeted Amounts Actual Amounts
Variance with Final Budget - Positive
(Negative) Original Final REVENUES
Investment income $ 100 $ 100 $ 8 $ (92)Rental Income 8,000 8,000 6,663 (1,337)Contributions and donations 2,000 2,000 6,474 4,474
Total revenues 10,100 10,100 13,145 3,045
EXPENDITURESCurrent:
Culture and recreation 15,100 15,100 11,099 4,001Total expenditures 15,100 15,100 11,099 4,001
Excess of revenues over expenditures (5,000) (5,000) 2,046 7,046
OTHER FINANCING SOURCES (USES)Transfer in 5,000 5,000 5,000 -
Net change in fund balances - - 7,046 7,046
FUND BALANCES - beginning of year 39,288 39,288 39,288 - FUND BALANCES - end of year $ 39,288 $ 39,288 $ 46,334 $ 7,046
CONFISCATEDASSETS
COMMUNITYGARDEN

2020 CAFR | GOVERNMENTAL FUNDS76 | VI
Budgeted Amounts Actual Amounts
Variance with Final Budget - Positive
(Negative) Original Final REVENUES
Other taxes $ 72,000 $ 72,000 $ 72,796 $ 796 Investment income - - 97 97Contributions and donations 20,000 20,000 10,000 (10,000)
Total revenues 92,000 92,000 82,893 (9,107)
EXPENDITURESCurrent:
Tourism and trade 92,000 92,000 64,907 27,093 Total expenditures 92,000 92,000 64,907 27,093
Net change in fund balances - - 17,986 17,986
FUND BALANCES - beginning of year 38,178 38,178 38,178 - FUND BALANCES - end of year $ 38,178 $ 38,178 $ 56,164 $ 17,986
SPECIAL REVENUE FUNDSSCHEDULE OF REVENUES, EXPENDITURES AND CHANGES IN FUND BALANCESbudget and actual-year ended june 30, 2020
Budgeted Amounts Actual Amounts
Variance with Final Budget - Positive
(Negative) Original Final REVENUES
Hotel/motel taxes $ 615,260 $ 615,260 $ 508,980 $ (106,280) Investment income 500 500 190 (310)Contributions and donations 2,000 2,000 2,252 252
Total revenues 617,760 617,760 511,422 (106,338)
EXPENDITURESCurrent:
Tourism and trade 441,260 441,260 392,134 49,126 Total expenditures 441,260 441,260 392,134 49,126
Excess of revenues over expenditures 176,500 176,500 119,288 (57,212)
OTHER FINANCING SOURCES (USES)Transfer out (176,500) (176,500) (144,064) 32,436
Net change in fund balances - - (24,776) (24,776)
FUND BALANCES - beginning of year 193,146 193,146 193,146 - FUND BALANCES - end of year $ 193,146 $ 193,146 $ 168,370 $ (24,776)
HOTEL/MOTELTAX
RENTAL VEHICLETAX

VI | 77GOVERNMENTAL FUNDS | 2020 CAFR
DEBT SERVICE FUNDSCHEDULE OF REVENUES, EXPENDITURES
AND CHANGES IN FUND BALANCESbudget and actual-year ended june 30, 2020
Budgeted Amounts Actual Amounts
Variance with Final Budget -
Positive (Negative) Original Final
REVENUESProperty taxes $ 1,829,130 $ 1,829,130 $ 1,959,185 $ 130,055Investment income 1,000 1,000 639 (361)
Total revenues 1,830,130 1,830,130 1,959,824 129,694
EXPENDITURESDebt Service:
Principal retirement 1,542,000 1,542,000 1,542,000 - Interest 1,135,400 1,135,400 1,132,217 3,183 Fiscal agent fees 5,000 5,000 750 4,250
Total expenditures 2,682,400 2,682,400 2,674,967 7,433Excess of revenues over expenditures (852,270) (852,270) (715,143) 137,127
OTHER FINANCING SOURCES (USES)Transfer in 852,270 852,270 800,000 (52,270)
Net change in fund balances - - 84,857 84,857
FUND BALANCES - beginning of year 175,017 175,017 175,017 - FUND BALANCES - end of year $ 175,017 $ 175,017 $ 259,874 $ 84,857
DEBTSERVICE

2020 CAFR | GOVERNMENTAL FUNDS78 | VI
Description
OriginalEstimated
Cost
CurrentEstimated
CostPriorYears
CurrentYear Total
Administrative buildings $ 118,780 $ 80,802 $ 80,802 $ - $ 80,802 Recreational facilities 2,256,827 2,065,169 1,813,700 10,199 1,823,899Parking facilities 2,256,780 2,035,585 2,035,585 - 2,035,585 Public safety facilities and equipment 1,781,710 1,532,302 1,532,302 - 1,532,302 Roads, streets and bridges 5,463,953 4,953,641 4,543,251 155,944 4,699,195
Total $ 11,878,050 $ 10,667,499 $ 10,005,640 $ 166,143 $ 10,171,783
SPLOST PROCEEDSSCHEDULE OF EXPENDITURES year ended june 30, 2020
Description
OriginalEstimated
Cost
CurrentEstimated
CostPriorYears
CurrentYear Total
Administrative facilities $ 2,313,100 $ 2,313,100 $ 2,313,100 $ - $ 2,313,100 Recreational facilities 2,313,053 2,313,053 - - - Roads, streets and bridges 9,680,709 10,148,175 3,009,490 1,427,588 4,437,078
Total $ 14,306,862 $ 14,774,328 $ 5,322,590 $ 1,427,588 $ 6,750,178
Description
OriginalEstimated
Cost
CurrentEstimated
CostPriorYears
CurrentYear Total
Roads, streets and bridges $ 7,239,371 $ 6,720,407 $ 6,216,349 $ 29,696 $ 6,246,045 Recreational facilities 804,375 685,389 527,218 - 527,218
Total $ 8,043,746 $ 7,405,796 $ 6,743,567 $ 29,696 $ 6,773,263
SPLOST2009
SPLOST2014
SPLOST2017

VI | 79GOVERNMENTAL FUNDS | 2020 CAFR
CITY OF SUWANEECERTIFICATION OF 911 EXPENDITURES
for the year ended june 30, 2020
O.C.G.A.Reference:
1
Indicate UCOA Fund Type Used to Account for 9-1-1 Activity (choose one):_____ Special Revenue Fund _____ Enterprise Fund__X__ General Fund
Expenditures (UCOA Activity 3800)
2
Wireless service supplier cost recovery charges (identify each supplier individually on lines below - attach list, if necessary)__________________________________________________________________________________________________________________________________________________________ 46-5-134(e)
$$
________________________
3Emergency telephone equipment, including necessary computer hardware, software, and data base provisioning, addressing, and nonrecurring costs of establishing a 9-1-1 system:
3a Lease costs 46-5-134(f)(1)(A) $3b Purchase costs 46-5-134(f)(1)(A) $3c Maintenance costs 46-5-134(f)(1)(A) $4 Rates associated with the service suppliers 9-1-1 service and other service suppliers recurring charges 46-5-134(f)(1)(B) $
5Employees hired by the local government solely for the operation and maintenance of the emergency 9-1-1 system and employees who work as directors as defined in O.C.G.A. §46-5-138.2
5a Salaries and wages 46-5-134(f)(1)(C) $ 307,382(1)
5b Employee benefit 46-5-134(f)(1)(C) $ 117,1406 Cost of training of employees who work as dispatchers or directors 46-5-134(f)(1)(D) $ 2,576
7Office supplies of the public safety answering points used directly in providing emergency 9-1-1 system services 46-5-134(f)(1)(E) $ 2,272
8 Building used as a public safety answering point:8a Lease costs 46-5-134(f)(1)(F) $8b Purchase costs 46-5-134(f)(1)(F) $ 1,206
9Computer hardware and software used at a public safety answering point, including computer assisted dispatch systems and automatic vehicle location systems:
9a Lease costs 46-5-134(f)(1)(G) $ 165,6229b Purchase costs 46-5-134(f)(1)(G) $9c Maintenance costs 46-5-134(f)(1)(G) $
10Supplies directly related to providing emergency 9-1-1 system services, including the cost of printing emergency 9-1-1 public education materials 46-5-134(f)(1)(H) $
11 Logging recorders used at a public safety answering point to record telephone and radio traffic:11a Lease costs 46-5-134(f)(1)(I) $11b Purchase costs 46-5-134(f)(1)(I) $11c Maintenance costs 46-5-134(f)(1)(I) $
(continued)

2020 CAFR | GOVERNMENTAL FUNDS80 | VI
CITY OF SUWANEECERTIFICATION OF 911 EXPENDITURESfor the year ended june 30, 2020 (continued)
O.C.G.A.Reference:
12Insurance purchased to insure against risks and liability in the operation and maintenance of the 9-1-1 system on behalf of the local government or on behalf of employees hired by the local government solely for the operation and maintenance of the 9-1-1 system and employees who work as directors 46-5-134(f)(2)(B)(i) $
13 Mobile communications vehicle and equipment, if the primary purpose and designation of such vehicle is to function as a backup 9-1-1 system center
13a Lease costs 46-5-134(f)(2)B)(ii) $13b Purchase costs 46-5-134(f)(2)(B)(ii) $13c Maintenance costs 46-5-134(f)(2)(B)(ii) $
14Allocation of indirect costs associated with supporting the 9-1-1 system center and operations as identified and outlined in an indirect cost allocation plan approved by the local governing authority that is consistent with the costs allocated within the local government to both governmental and business-type activities 46-5-134(f)(2)(B)(iii) $
15 Mobile public safety voice and data equipment, geo-targeted test messaging alert systems, or towers necessary to carry out the function of 9-1-1 system operations
15a Lease costs 46-5-134(f)(2)(B)(iv) $ 11,80015b Purchase costs 46-5-134(f)(2)(B)(iv) $15c Maintenance costs 46-5-134(f)(2)(B)(iv) $
16Public safety voice and data communications systems located in the 9-1-1 system facility that further the legislative intent of providing the highest level of emergency response service on a local, regional, and state-wide basis, including equipment and associated hardware and software that supports the use of public safety wireless voice and data communication systems
16a Lease costs 46-5-134(f)(2)(B)(v) $16b Purchase costs 46-5-134(f)(2)(B)(v) $16c Maintenance costs 46-5-134(f)(2)(B)(v) $17 Other expenditures not included in Lines 2 through 16 above. Identify by object and purpose. 18 Total Expenditures (total of all amounts reported on Lines 2 through 17 above) $ 607,998(1)
I have reviewed the information presented in this report and certify that it is accurate and correct. I further certify that the 9-1-1 funds were expended in compliance with the expenditure requirements specified in the Official Code of Georgia Annotated (OCGA), ection 46-5-134. I understand that, in accordance with OCGA Section 46-5-134 (m) (2), any local government which makes expenditures not in compliance with this Code section may be held liable for pro rata reimbursement to telephone and wireless telecommunications subscribers of amounts improperly expended. Further, the noncompliant local government shall be solely financially responsible for the reimbursement and for any costs associated with the reimbursement. Such reimbursement shall be accomplished by the service providers abating the imposition of the 9-1-1 charges and 9-1-1 wireless enhanced charges until such abatement equals the total amount of the rebate.
Signature of Chief Elected Official ______________________________ Date_________________ Print Name of Chief Elected Official _____________________________ Title of Chief Elected Official __________________________________ Signature of Chief Financial Officer______________________________ Date__________________ Print Name of Chief Financial Officer ____________________________
12/01/2020
12/01/2020
(Continued)
(1) Salary & wages as well as the total 911 expenditures are $22,007 less than reported in the general fund-statement of revenues, expenditures and changes in fund balance budget and actual on page 36 as this amount will be reimbursed by Gwinnett County under the CARES Act and therefore not a 911 expenditure.

AGENCYFUND

VII | 81AGENCY FUND | 2020 CAFR
AGENCY FUND-STATEMENT OF CHANGES IN FIDUCIARY ASSETS AND LIABILITIES
year ended june 30, 2020
Municipal Court Fund - Accounts for the collection of various fines and forfeitures (mostly traffic violations) which are disbursed to other parties. The City of Suwanee Municipal Court was established to adjudicate violations of the City Charter, ordinances and the laws of the State of Georgia thereby maintaining the public respect, confidence and satisfaction. The Suwanee Court adjudicates citations written by the Suwanee Police Department and the Suwanee Code Enforcement Officers. The court also receives citations from the Gwinnett County and the Georgia State Patrol that are written in the City limits of Suwanee.
BalanceJune 30, 2019 Increases Decreases
BalanceJune 30, 2020
ASSETSCash and cash equivalents $ 70,375 $ 1,511,299 $ 1,472,604 $ 109,070
Total assets 70,375 1,511,299 1,472,604 109,070
LIABILITIESDue to others 70,375 1,511,299 1,472,604 109,070
Total liabilities $ 70,375 $ 1,511,299 $ 1,472,604 $ 109,070

2020 CAFR | AGENCY FUND82 | VII

STATISTICAL SECTION

S | 1STATISTICAL SECTION | 2020 CAFR
The statistical section provides users with additional historical perspective, content, and detail to assist in understanding the information in the financial statements, notes to financial statements, required supplementary information, and for assessing the City’s overall financial health.
Financial Trends................................................................................. S2 - S11These schedules contain trend information to help the reader understand how the City’s financial performance and well-being have changed over time.
Revenue Capacity............................................................................. S12 - S16These schedules contain information to help the reader assess the City’s most significant local revenue source.
Debt Capacity................................................................................... S16 - S18 These schedules present information to help the reader assess the affordability of the City’s current levels of outstanding debt and the City’s ability to issue additional debt in the future.
Demographic and Economic Information....................................... S19 - S20These schedules offer demographic and economic indicators to help the reader understand the environment within which the City’s financial activities take place.
Operating Information..................................................................... S21 - S23These schedules contain service and infrastructure data to help the reader understand how the information in the City’s financial report relates to the services the government provides and the activities it performs.
Sources: Unless otherwise noted, the information in these schedules is derived from the comprehensive financial reports for the relevant year.

2020 CAFR | STATISTICAL SECTION2 | S
NET POSITION BY COMPONENTLAST TEN FISCAL YEARS accrual basis of accounting
Government Net Position
Fiscal Year2011 2012 2013 2014 2015 2016 2017(1) 2018(2) 2019 2020
GOVERNMENTAL ACTIVITIES Net investment in capital assets $ 44,574,711 $ 46,621,467 $ 46,345,264 $ 46,099,920 $ 45,677,292 $ 46,227,029 $ 50,688,142 $ 59,582,331 $ 61,580,997 $ 62,823,443Restricted 7,106,408 9,258,180 7,751,943 9,014,457 10,619,460 11,805,962 10,395,298 5,167,127 5,959,149 7,876,855Unrestricted 11,402,670 12,074,139 14,650,624 15,397,429 17,885,344 18,289,659 18,381,902 17,174,134 18,137,015 19,239,027
Total governmental activities net position 63,083,789 67,953,786 68,747,831 70,511,806 74,182,096 76,322,650 79,465,342 81,923,592 85,677,161 89,939,325
BUSINESS-TYPE ACTIVITIES Net investment in capital assets 2,493,896 2,462,489 2,417,932 2,435,908 2,419,524 2,365,189 2,388,864 2,467,886 2,422,828 2,373,083Unrestricted (18,533) 171,054 460,124 557,100 596,118 877,387 954,204 993,411 1,190,117 1,260,673
Total business-type activities net position 2,475,363 2,633,543 2,878,056 2,993,008 3,015,642 3,242,576 3,343,068 3,461,297 3,612,945 3,633,756
PRIMARY GOVERNMENTNet investment in capital assets 47,068,607 49,083,956 48,763,196 48,535,828 48,096,816 48,592,218 53,077,006 62,050,217 64,003,825 65,196.526Restricted 7,106,408 9,258,180 7,751,943 9,014,457 10,619,460 11,805,962 10,395,298 5,167,127 5,959,149 7,876,855Unrestricted 11,384,137 12,245,193 15,110,748 15,954,529 18,481,462 19,167,046 19,336,106 18,167,545 19,327,132 20,499,700
Total government net position $ 65,559,152 $ 70,587,329 $ 71,625,887 $ 73,504,814 $ 77,197,738 $ 79,565,226 $ 82,808,410 $ 85,384,889 $ 89,290,106 $ 93,573,081
$0
$20,000,000
$40,000,000
$60,000,000
$80,000,000
$100,000,000
2011 2012 2013 2014 2015 2016 2017 2018 2019 2020
Net investment in capital assets Restricted Unrestricted
NOTES: 1. Fiscal year 2017 balances have been restated to reflect the change in reporting entity and change in accounting principal. See note 6 on page 51 for additional information.
2. The increase in net investment in capital assets and the decrease in restricted net position, in 2018, is due to issuance of $21,470,000 in revenue bonds. See note 8 on page 56 for additional information.

S | 3STATISTICAL SECTION | 2020 CAFR

2020 CAFR | STATISTICAL SECTION4 | S
CHANGES IN NET POSITIONLAST TEN FISCAL YEARS accrual basis of accounting
Fiscal Year 2011 2012 2013 2014 2015
EXPENSESGovernmental activities
General government $ 2,322,019 $ 2,700,781 $ 2,305,973 $ 2,292,068 $ 2,592,707Judicial 292,492 301,056 292,101 330,822 377,590Public safety 3,820,293 3,534,734 3,967,481 4,196,704 4,150,355Public works 3,571,459 3,420,275 4,373,999 4,102,997 4,867,064Culture and recreation 986,196 865,504 903,031 860,294 1,024,032Housing and development 836,946 856,126 1,043,376 1,100,089 1,141,337Tourism and trade 206,151 201,986 223,291 257,322 321,677Interest on long-term debt 882,684 842,818 807,603 777,418 745,439
Total governmental activities expenses 12,918,240 12,723,280 13,916,855 13,917,714 15,220,201Business-type activities
Water and sewer 131,913 110,069 109,558 119,767 114,535 Total business-type activities expenses 131,913 110,069 109,558 119,767 114,535 TOTAL GOVERNMENT EXPENSES $ 13,050,153 $ 12,833,349 $ 14,026,413 $ 14,037,481 $ 15,334,736
PROGRAM REVENUESGovernmental activities
Charge for services:General government $ 187,156 $ 214,742 $ 214,416 $ 225,269 $ 238,239Public safety 1,315,848 1,209,555 1,046,161 1,616,598 2,069,818Culture and recreation 19,363 32,111 33,695 30,941 35,346Housing and development 262,091 420,085 443,094 374,743 386,581
Operating grants and contributions (1) 136,876 2,160,502 1,115,960 982,857 1,003,759Capital grants and contributions 2,572,310 3,156,081 2,553,174 2,482,730 3,576,852
Total governmental activities program revenues 4,493,644 7,193,076 5,406,500 5,713,138 7,310,595Business-type activities
Charge for services:Water and sewer 97,113 118,172 153,714 133,790 135,721
Capital grants and contributions (2) 192,018 - - - - Total business-type activities program revenues 289,131 118,172 153,714 133,790 135,721 TOTAL GOVERNMENT PROGRAM REVENUES $ 4,782,775 $ 7,311,248 $ 5,560,214 $ 5,846,928 $ 7,446,316
NET (EXPENSE)/REVENUEGovernmental activities $ (8,424,596) $ (5,530,204) $ (8,510,355) $ (8,204,576) $ (7,909,606)Business-type activities 157,218 8,103 44,156 14,023 21,186 TOTAL GOVERNMENT NET EXPENSES $ (8,267,378) $ (5,522,101) $ (8,466,199) $ (8,190,553) $ (7,888,420)
(continued)

S | 5STATISTICAL SECTION | 2020 CAFR
CHANGES IN NET POSITIONLAST TEN FISCAL YEARS
accrual basis of accounting
Fiscal Year
2016 2017 2018 2019 2020
EXPENSESGovernmental activities
General government $ 3,112,213 $ 2,893,685 $ 3,202,083 $ 3,041,315 $ 2,968,063Judicial 375,779 396,909 399,218 434,217 443,884Public safety 4,518,605 4,592,531 4,634,147 4,986,349 5,136,678Public works 4,196,203 6,080,986 4,004,108 5,404,858 6,233,425Culture and recreation 982,783 815,305 1,023,763 992,751 669,840Housing and development 1,654,873 1,294,426 1,368,680 1,301,352 1,474,672Tourism and trade 386,987 409,850 460,706 453,755 503,188Interest on long-term debt 637,549 303,200 1,106,628 1,100,911 1,060,270
Total governmental activities expenses 15,864,992 16,786,892 16,199,333 17,715,508 18,490,020Business-type activities
Water and sewer 106,428 136,401 140,699 116,184 161,819 Total business-type activities expenses 106,428 136,401 140,699 116,184 161,819 TOTAL GOVERNMENT EXPENSES $ 15,971,420 $ 16,923,293 $ 16,340,032 $ 17,831,692 $ 18,651,839
PROGRAM REVENUESGovernmental activities
Charge for services:General government $ 251,147 $ 252,363 $ 273,788 $ 278,850 $ 283,350Public safety 1,568,339 1,210,463 1,213,058 1,558,907 1,159,881Culture and recreation 32,279 56,574 52,859 56,373 124,449Housing and development 492,197 462,684 839,673 344,008 1,017,239
Operating grants and contributions (1) 1,321,293 1,103,171 1,011,423 798,330 1,133,535Capital grants and contributions 3,407,960 5,087,607 3,301,807 5,533,649 5,550,102
Total governmental activities program revenues 7,073,215 8,172,862 6,692,608 8,570,117 9,268,556Business-type activities
Charge for services:Water and sewer 131,682 140,759 132,295 135,767 151,977
Capital grants and contributions (2) - - - - - Total business-type activities program revenues 131,682 140,759 132,295 135,767 151,977 TOTAL GOVERNMENT PROGRAM REVENUES $ 7,204,897 $ 8,313,621 $ 6,824,903 $ 8,705,884 $ 9,420,533
NET (EXPENSE)/REVENUEGovernmental activities $ (8,791,777) $ (8,614,030) $ (9,506,725) $ (9,145,391) $ (9,221,464)Business-type activities 25,254 4,358 (8,404) 19,583 (9,842) TOTAL GOVERNMENT NET EXPENSES $ (8,766,523) $ (8,609,672) $ (9,515,129) $ (9,125,808) $ (9,231,306)
(continued)

2020 CAFR | STATISTICAL SECTION6 | S
CHANGES IN NET POSITIONLAST TEN FISCAL YEARS accrual basis of accounting
Fiscal Year 2011 2012 2013 2014 2015
(continued)GENERAL REVENUES AND OTHER CHANGES IN NET POSITIONGovernmental activities
TaxesProperty taxes $ 5,801,792 $ 5,568,706 $ 4,790,195 $ 5,134,943 $ 4,995,599Franchise fees 1,825,464 1,897,907 1,755,375 1,724,565 1,845,517 Alcoholic beverage taxes 836,438 881,679 865,862 835,071 833,056Other taxes 1,812,445 2,083,173 2,190,080 2,252,424 2,868,767
Unrestricted investment earnings 105,368 56,663 31,708 41,835 48,796 Miscellaneous 28,176 62,073 37,579 79,713 62,794 Transfers (150,000) (150,000) (200,000) (100,000) -
Total governmental activities 10,259,683 10,400,201 9,470,799 9,968,551 10,654,529Business-type activities
Unrestricted investment earnings 667 77 357 929 1,448Miscellaneous - - - - - Transfers 150,000 150,000 200,000 100,000 -
Total business-type activities 150,667 150,077 200,357 100,929 1,448 TOTAL GOVERNMENT $ 10,410,350 $ 10,550,278 $ 9,671,156 $ 10,069,480 $ 10,655,977
CHANGE IN NET POSITIONGovernmental activities $ 1,835,087 $ 4,869,997 $ 960,444 $ 1,763,975 $ 2,744,923 Business-type activities 307,885 158,180 244,513 114,952 22,634 TOTAL GOVERNMENT $ 2,142,972 $ 5,028,177 $ 1,204,957 $ 1,878,927 $ 2,767,557
(continued)
NOTES:
1. Operating grants and contributions increase in fiscal year 2012 is due to a negotiated intergovernmental payment for the settlement of service delivery strategy lawsuit with Gwinnett County.2. Business-type capital grants and contributions for fiscal year 2011 is due to the American Recovery and Reinvestment Act of 2009 (ARRA), whereby 40% of the loan principal payments were forgiven.

S | 7STATISTICAL SECTION | 2020 CAFR
CHANGES IN NET POSITION LAST TEN FISCAL YEARS
accrual basis of accounting
(continued)Fiscal Year
2016 2017 2018 2019 2020GENERAL REVENUES AND OTHER CHANGES IN NET POSITIONGovernmental activities
Taxes:Property taxes $ 5,082,644 $ 5,531,567 $ 6,001,465 $ 6,496,848 $ 7,103,433Franchise fees 1,880,182 1,757,052 1,715,558 1,790,469 1,847,505Alcoholic beverage taxes 835,419 831,638 812,385 808,436 827,969Other taxes 3,180,579 3,196,444 3,357,512 3,608,066 3,479,532
Unrestricted investment earnings 50,311 68,941 102,254 137,768 150,634Miscellaneous 103,196 63,661 95,801 177,373 74,555Transfers (200,000) (100,000) (120,000) (120,000) -
Total governmental activities 10,932,331 11,349,303 11,964,975 12,898,960 13,483,628Business-type activities
Unrestricted investment earnings 1,680 3,308 6,633 12,065 10,183Miscellaneous - - - - 20,470Transfers 200,000 100,000 120,000 120,000 -
Total business-type activities 201,680 103,308 126,633 132,065 30,653 TOTAL GOVERNMENT $ 11,134,011 $ 11,452,611 $ 12,091,608 $ 13,031,025 $ 13,514,281
CHANGE IN NET POSITIONGovernmental activities $ 2,140,554 $ 2,735,273 $ 2,458,250 $ 3,753,569 $ 4,262,164Business-type activities 226,934 107,666 118,229 151,648 20,811 TOTAL GOVERNMENT $ 2,367,488 $ 2,842,939 $ 2,576,479 $ 3,905,217 $ 4,282,975

2020 CAFR | STATISTICAL SECTION8 | S
GOVERNMENTAL ACTIVITIES TAX REVENUES BY SOURCELAST TEN FISCAL YEARS accrual basis of accounting
Fiscal Year
PropertyTaxes
FranchiseFees
AlcoholicBeverage
TaxesBusiness
TaxesHotel/Motel
TaxesOtherTaxes Total
2011 $ 5,801,792 $ 1,825,464 $ 836,438 $ 1,347,872 $ 373,400 $ 91,173 $ 10,276,139 2012 5,568,706 1,897,907 881,679 1,648,831 417,319 17,023 10,431,465 2013 4,790,195 1,755,375 865,862 1,693,350 442,293 54,437 9,601,512 2014 5,134,943 1,724,565 835,071 1,757,237 489,208 5,979 9,947,0032015 4,995,599 1,845,517 833,056 1,845,285 558,049 465,433 10,542,9392016 5,082,644 1,880,182 835,419 2,096,080 608,004 476,495 10,978,8242017 5,531,567 1,757,052 831,638 2,159,357 636,226 400,861 11,316,7012018 6,001,465 1,715,558 812,385 2,211,948 651,105 494,459 11,886,9202019 6,496,848 1,790,469 808,436 2,344,213 646,103 617,750 12,703,8192020 7,103,433 1,847,505 827,969 2,289,848 508,980 680,704 13,258,439
Tax Revenues by Year
$0
$1,000,000
$2,000,000
$3,000,000
$4,000,000
$5,000,000
$6,000,000
$7,000,000
$8,000,000
2011 2012 2013 2014 2015 2016 2017 2018 2019 2020
Property taxes Franchise fees Alcoholic beverage taxes
Business taxes Hotel/Motel taxes Other taxes

S | 9STATISTICAL SECTION | 2020 CAFR
FUND BALANCES OF GOVERNMENTAL FUNDSLAST TEN FISCAL YEARS
modified accrual basis of accounting
$0
$1,000,000
$2,000,000
$3,000,000
$4,000,000
$5,000,000
$6,000,000
2011 2012 2013 2014 2015 2016 2017 2018 2019 2020
Fiscal Year2011 2012 2013 2014 2015 (1) 2016 (1) 2017(2) 2018(3) 2019 2020
General fundNonspendable $ - $ 71,057 $ - $ 10,507 $ - $ 4,198 $ - $ - $ - $ -Restricted - 2,276,207 - - - - - - - -
Committed 3,948,073 4,000,813 4,054,997 3,726,627 4,150,930 4,135,107 4,308,697 4,455,637 4,588,927 4,479,360Assigned 222,520 - - - - - - - - -
Unassigned 3,408,881 1,478,613 4,534,625 4,603,911 4,526,649 4,063,891 3,998,170 3,630,675 3,419,683 4,812,583Total general fund 7,579,474 7,826,690 8,589,622 8,341,045 8,677,579 8,203,196 8,306,867 8,086,312 8,008,610 9,291,943
All other governmental fundsNonspendable - - 1,245,335 1,245,335 1,245,335 1,245,335 1,245,335 1,245,335 1,245,335 1,245,335Restricted 7,106,408 6,981,973 7,753,653 8,995,204 10,573,448 11,773,891 10,359,321 28,624,320 28,777,201 26,307,377Assigned reported in:
Special Revenue funds - - - - - - - - 5,000 5,000Capital projects funds 2,857,086 4,912,866 3,477,767 4,314,150 5,189,973 5,834,900 5,370,020 5,107,723 4,487,346 3,981,312
Unassigned - - (1,710) - - - - (1,092,104) - -Total all other governmental funds 9,963,494 11,894,839 12,475,045 14,554,689 17,008,756 18,854,126 16,974,676 33,885,274 34,514,882 31,539,024
TOTAL ALL GOVERNMENTAL FUNDS $ 17,542,968 $ 19,721,529 $ 21,064,667 $ 22,895,734 $ 25,686,335 $ 27,057,322 $ 25,281,543 $ 41,971,586 $ 42,523,492 $ 40,830,967
NOTES: 1. Restricted fund balance increased in fiscal years 2015 and 2016 due to 2014 SPLOST revenues
received for capital projects but not expended.
2.
3.
Fiscal year 2017, balances have been restated to reflect the cumulative effect of implementing the change in reporting entity. See note 6 on page 51 for additional information.
In fiscal year 2018, the negative unassigned balance in all other governmental funds is due to cash flow of SPLOST revenues to SPLOST expenditures. SPLOST revenues are received on a monthly basis. This negative balance will clear itself as additional SPLOST funds are received. The large increase in restricted fund balance is due to the issuance of $21,470,000 in revenue bonds.
General Fund Unassigned Fund Balance

2020 CAFR | STATISTICAL SECTION10 | S
CHANGES IN FUND BALANCES OF GOVERNMENTAL FUNDSLAST TEN FISCAL YEARS modified accrual basis of accounting
Fiscal Year2011 2012 2013 2014 2015 2016(1)
REVENUESTaxes $ 10,431,766 $ 10,446,731 $ 9,999,238 $ 10,025,351 $ 10,481,744 $ 11,071,178 Licenses and permits 441,763 613,838 648,686 588,696 601,618 728,018Intergovernmental revenues 2,042,536 4,186,284 3,423,706 3,212,403 3,433,333 4,486,087 Charges for services 72,455 106,325 106,532 110,438 103,476 141,591Fines and forfeitures 1,257,885 1,147,017 970,895 1,537,086 2,011,298 1,456,064 Investment income 127,186 73,733 49,953 61,057 69,349 78,966Rental Income 32,502 50,982 53,768 54,722 57,889 62,424Contributions and donations 121,672 123,460 132,108 178,261 209,983 214,511Miscellaneous 25,529 37,904 38,047 36,322 18,497 59,061 TOTAL REVENUES 14,553,294 16,786,274 15,422,933 15,804,336 16,987,187 18,297,900
EXPENDITURESGeneral government 2,191,393 2,275,762 2,220,049 2,154,204 2,425,480 2,904,968 Judicial 298,827 310,091 297,447 336,529 379,879 390,015Public safety 3,830,303 3,896,084 4,007,183 4,178,440 4,217,123 4,970,225 Public works 1,464,606 1,621,691 1,680,946 1,763,944 1,913,810 2,037,772Culture and recreation 372,874 375,405 422,315 378,364 499,564 496,507Housing and development 871,702 953,767 1,072,554 1,123,406 1,169,591 1,210,857Tourism and trade 206,151 201,986 223,291 257,322 321,677 386,987Capital outlay 1,370,219 3,217,098 2,374,332 2,102,221 1,687,975 2,798,022Debt service:
Principal 775,959 765,795 780,000 810,000 840,000 933,000Interest and fiscal charges 882,340 842,489 807,290 777,121 745,159 617,934Bond issuance costs - - - - - 122,364
TOTAL EXPENDITURES 12,264,374 14,460,168 13,885,407 13,881,551 14,200,258 16,868,651 Excess of revenues over (under)expenditures 2,288,920 2,326,106 1,537,526 1,922,785 2,786,929 1,429,249 OTHER FINANCING SOURCES (USES)Transfer in 3,365,144 2,783,515 2,898,204 2,025,294 1,933,941 4,059,237Transfer out (3,515,144) (2,933,515) (3,098,204) (2,125,294) (1,933,941) (4,259,237)Sale of capital assets 1,815 2,455 5,612 8,282 3,672 19,374Bonds issued:
Principal - - - - - -Premium - - - - - -
Refunded bonds issued - - - - - 4,210,000Payment to refunded bond escrow agent - - - - - (4,087,636) TOTAL OTHER FINANCING SOURCES (USES) (148,185) (147,545) (194,388) (91,718) 3,672 (58,262)Net change in fund balances $ 2,140,735 $ 2,178,561 $ 1,343,138 $ 1,831,067 $ 2,790,601 $ 1,370,987Total non capital expenditures $ 10,342,579 $ 9,985,369 $ 12,173,503 $ 12,147,575 $ 12,389,558 $ 13,844,972 Debt service as a percentage of non capital expenditures 16.0% 16.1% 13.0% 13.1% 12.8% 11.2%

S | 11STATISTICAL SECTION | 2020 CAFR
CHANGES IN FUND BALANCESOF GOVERNMENTAL FUNDS
LAST TEN FISCAL YEARS modified accrual basis of accounting
NOTES: 1.
2.
3.
In fiscal year 2016, the City refunded a portion of the 2006 URA bonds.
In fiscal year 2017, the City refunded a portion of the 2006 General Obligation refunding series. For additional information see Note 8 page 56.
In fiscal year 2018, the City issued $21,470,000 in revenue bonds . For additional information see Note 8; page 57..
Fiscal Year2017(2) 2018(3) 2019 2020
REVENUESTaxes $ 11,326,266 $ 11,901,059 $ 12,639,628 $ 13,230,975Licenses and permits 674,097 1,084,965 591,968 1,260,526Intergovernmental revenues 4,571,741 3,830,227 3,836,427 4,218,032Charges for services 153,808 148,967 205,383 132,416Fines and forfeitures 1,120,560 1,113,284 1,406,567 1,078,668Investment income 98,119 351,579 554,284 566,356Rental Income 79,825 79,372 87,745 151,929Contributions and donations 302,827 234,257 212,565 199,520Miscellaneous 17,455 48,012 122,988 45,197 TOTAL REVENUES 18,344,698 18,791,722 19,657,555 20,883,619EXPENDITURESGeneral government 2,687,004 2,689,760 2,877,216 2,868,904Judicial 417,033 425,474 462,399 455,352Public safety 4,681,765 4,803,068 5,088,774 5,124,390Public works 2,151,287 2,161,855 2,636,198 2,826,346Culture and recreation 564,815 537,149 590,609 372,504Housing and development 1,341,437 1,419,821 1,510,886 1,445,784Tourism and trade 409,850 460,706 453,755 503,188Capital outlay 6,748,921 10,349,481 2,699,976 6,303,676Debt service:
Principal 1,516,000 1,486,000 1,512,000 1,542,000Interest and fiscal charges 273,125 1,151,045 1,163,104 1,132,967Bond issuance costs 118,000 392,463 - -
TOTAL EXPENDITURES 20,909,237 25,876,822 18,994,917 22,575,111Excess of revenues over (under) expenditures (2,564,539) (7,085,100) 662,638 (1,691,492) OTHER FINANCING SOURCES (USES)Transfer in 760,249 2,221,807 1,433,267 1,103,800Transfer out (860,249) (2,341,807) (1,553,267) (1,103,800)Sale of capital assets 13,358 11,396 9,268 8,329Loss on change in lease terms (9,362)Bonds issued:
Principal - 21,470,000 - -Premium - 2,413,747 - -
Refunded bonds issued 12,635,000 - - -Payment to refunded bond escrow agent (12,482,487) - - -TOTAL OTHER FINANCING SOURCES (USES) 65,871 23,775,143 (110,732) (1,033)Net change in fund balances $ (2,498,668) $ 16,690,043 $ 551,906 $ (1,692,525)Total non capital expenditures $ 13,803,825 $ 15,762,601 $ 15,209,364 $ 17,576,473Debt service as a percentage of non capital expenditures 13.0% 16.7% 17.6% 15.2%

2020 CAFR | STATISTICAL SECTION12 | S
GENERAL GOVERNMENT TAX REVENUE BY SOURCELAST TEN FISCAL YEARS modified accrual basis of accounting
Fiscal Year
Property Taxes
Franchise Fees
AlcoholicBeverage
Taxes Business
Taxes Hotel/Motel
Taxes Other Taxes Total
2011 $ 5,957,419 $ 1,825,464 $ 836,438 $ 1,347,872 $ 373,400 $ 91,173 $ 10,431,766 2012 5,583,972 1,897,907 881,679 1,648,831 417,319 17,023 10,446,731 2013 5,045,704 1,755,375 865,862 1,693,350 442,293 196,654 9,999,238 2014 4,732,419 1,724,565 835,071 1,757,237 489,208 486,851 10,025,3512015 4,934,404 1,845,517 833,056 1,845,285 558,049 465,433 10,481,744 2016 5,174,998 1,880,182 835,419 2,096,080 608,004 476,495 11,071,1782017 5,541,132 1,757,052 831,638 2,159,357 636,226 400,861 11,326,2662018 6,015,604 1,715,558 812,385 2,211,948 651,105 494,459 11,901,0592019 6,432,657 1,790,469 808,436 2,344,213 646,103 617,750 12,639,6282020 7,075,969 1,847,505 827,969 2,289,848 508,980 680,704 13,230,975
Tax Revenue by Year
$0
$2,000,000
$4,000,000
$6,000,000
$8,000,000
$10,000,000
$12,000,000
2011 2012 2013 2014 2015 2016 2017 2018 2019 2020
Property Taxes Franchise Fees Alcoholic Beverage Taxes
Business Taxes Hotel/Motel Taxes Other Taxes
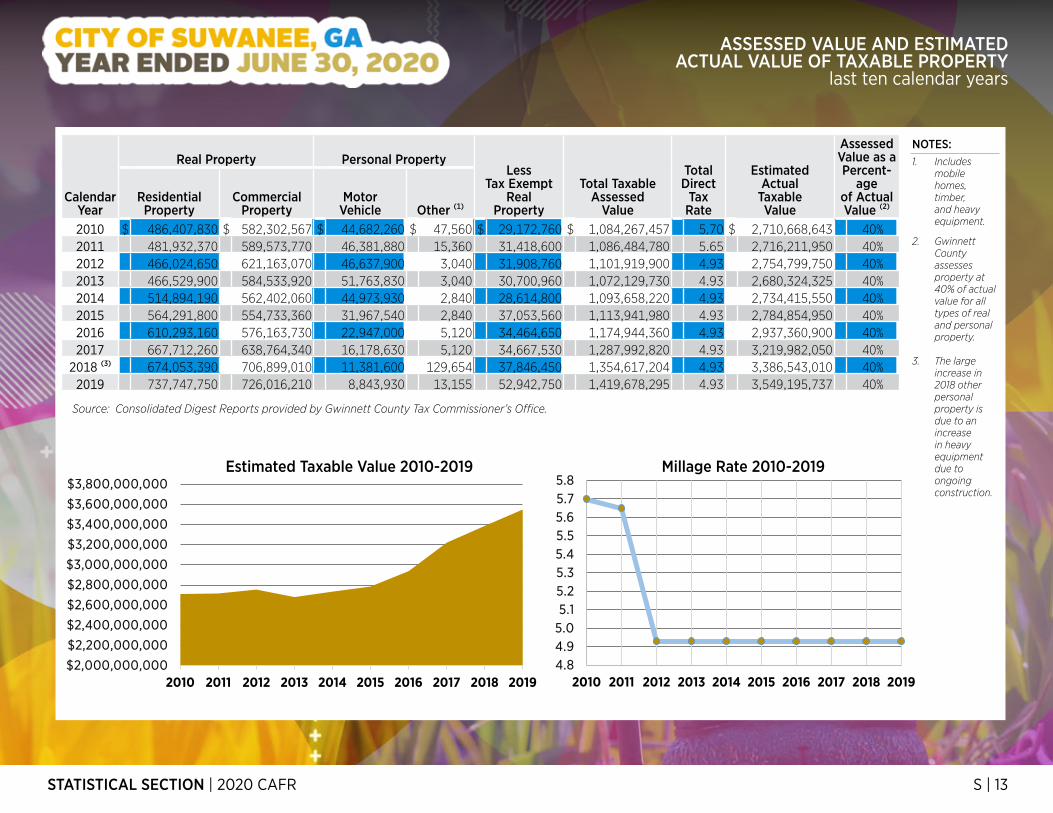
S | 13STATISTICAL SECTION | 2020 CAFR
CalendarYear
Real Property Personal PropertyLess
Tax ExemptReal
Property
Total TaxableAssessed
Value
TotalDirect
TaxRate
EstimatedActual
TaxableValue
AssessedValue as aPercent-
ageof Actual Value (2)
ResidentialProperty
CommercialProperty
MotorVehicle Other (1)
2010 $ 486,407,830 $ 582,302,567 $ 44,682,260 $ 47,560 $ 29,172,760 $ 1,084,267,457 5.70 $ 2,710,668,643 40%2011 481,932,370 589,573,770 46,381,880 15,360 31,418,600 1,086,484,780 5.65 2,716,211,950 40%2012 466,024,650 621,163,070 46,637,900 3,040 31,908,760 1,101,919,900 4.93 2,754,799,750 40%2013 466,529,900 584,533,920 51,763,830 3,040 30,700,960 1,072,129,730 4.93 2,680,324,325 40%2014 514,894,190 562,402,060 44,973,930 2,840 28,614,800 1,093,658,220 4.93 2,734,415,550 40%2015 564,291,800 554,733,360 31,967,540 2,840 37,053,560 1,113,941,980 4.93 2,784,854,950 40%2016 610,293,160 576,163,730 22,947,000 5,120 34,464,650 1,174,944,360 4.93 2,937,360,900 40%2017 667,712,260 638,764,340 16,178,630 5,120 34,667,530 1,287,992,820 4.93 3,219,982,050 40%
2018 (3) 674,053,390 706,899,010 11,381,600 129,654 37,846,450 1,354,617,204 4.93 3,386,543,010 40%2019 737,747,750 726,016,210 8,843,930 13,155 52,942,750 1,419,678,295 4.93 3,549,195,737 40%
ASSESSED VALUE AND ESTIMATED ACTUAL VALUE OF TAXABLE PROPERTY
last ten calendar years
Estimated Taxable Value 2010-2019 Millage Rate 2010-2019
NOTES:1. Includes
mobile homes, timber, and heavy equipment.
2.
3.
Gwinnett County assesses property at 40% of actual value for all types of real and personal property.
The large increase in 2018 other personal property is due to an increase in heavy equipment due to ongoing construction.
Source: Consolidated Digest Reports provided by Gwinnett County Tax Commissioner’s Office.
$2,000,000,000
$2,200,000,000
$2,400,000,000
$2,600,000,000
$2,800,000,000
$3,000,000,000
$3,200,000,000
$3,400,000,000
$3,600,000,000
$3,800,000,000
2010 2011 2012 2013 2014 2015 2016 2017 2018 20194.84.95.05.15.25.35.45.55.65.75.8
2010 2011 2012 2013 2014 2015 2016 2017 2018 2019

2020 CAFR | STATISTICAL SECTION14 | S
PROPERTY TAX RATES DIRECT AND OVERLAPPING GOVERNMENTSlast ten fiscal years
CalendarYear
City of Suwanee Millage
Overlapping Rates
Total Direct &
Overlapping Rates
Gwinnett County Millage
Gwinnett County School Board Millage
State Operating Debt
Service Total Operating Debt
Service Fire
Protection Recreation Total Operationing Debt
Service Total 2010 3.89 1.81 5.77 11.78 0.47 - 1.00 13.25 19.25 1.30 20.55 0.25 39.75 2011 3.89 1.76 5.70 11.78 0.24 - 1.00 13.02 19.25 1.30 20.55 0.25 39.47 2012 3.15 1.78 5.65 11.78 0.24 - 1.00 13.02 19.25 1.30 20.55 0.20 38.70 2013 3.21 1.72 4.93 7.40 0.24 3.20 .95 11.79 19.80 2.05 21.85 0.15 38.72 2014 3.24 1.69 4.93 7.40 0.24 3.20 .95 11.79 19.80 2.05 21.85 0.10 38.67 2015 3.35 1.58 4.93 7.229 0.24 3.20 .95 11.619 19.80 2.05 21.85 0.05 38.449 2016 3.43 1.50 4.93 6.826 0.24 3.20 .95 11.216 19.80 2.05 21.85 - 37.996 2017 3.43 1.50 4.93 7.40 - 3.20 .95 11.55 19.80 2.05 21.85 - 38.332018 3.43 1.50 4.93 7.209 - 3.20 .95 11.359 19.80 1.95 21.75 - 38.0392019 3.52 1.41 4.93 7.209 - 3.20 .95 11.359 19.70 1.90 21.60 - 37.889
Source: Gwinnett County Tax Commissioner website
Direct and Overlapping Property Tax Rates
0
5
10
15
20
25
30
35
40
2010 2011 2012 2013 2014 2015 2016 2017 2018 2019
Suwanee Gwinnett School State

S | 15STATISTICAL SECTION | 2020 CAFR
PRINCIPAL PROPERTY TAXPAYERS
current and ten years ago (calendar year)
Source: 2019 and 2010 Tax Digest.Taxpayer
2019 2010 Taxable
Assessed Value
Rank Percentage of
Total City Taxable Assessed Value
Taxable Assessed
Value Rank
Percentage of Total City Taxable Assessed Value
Star McGinnis Ferry, LLC $ 48,903,800 1 3.4%Landmark at Grand Oasis, LP 28,996,000 2 2.0%Terraces at Suwanee Mtg, LLC 24,846,240 3 1.7%Point at Suwanee Station LLC 22,000,000 4 1.6%DXC Technology Services, LLC 18,923,020 5 1.3%SHLP Artisan Station, LLC 17,844,320 6 1.3%Heartis Suwanee Partners LP 16,629,240 7 1.2%Quality Technology Services 12,375,610 8 0.9%James Campbell Company, LLC 9,612,880 9 0.7% $ 9,261,200 9 0.9%Geifer Automotive Inc 8,410,670 10 0.6%Google, Inc 25,680,870 1 2.4%AMLI Residential Properties 21,165,600 2 2.0%CRLP McGinnis Ferry Road, LLC 13,200,000 3 1.2%Flowers Bakery of Suwanee 13,154,630 4 1.2%Hewlett Packard Company 11,905,614 5 1.1%Wal-Mart 11,018,840 6 1.0%Gwinnett Prado, LP 11,000,000 7 1.0%Caryle Centennial Suwanee Station, LP 10,800,000 8 1.0%Walmart 9,156,200 10 0.8% Totals $ 208,541,780 14.7% $ 136,342,954 12.6%
2018
Star McGinnis Ferry, LLC
Landmark at Grand Oasis, LP
Terraces at Suwanee Mtg, LLC
Point at Suwanee Station LLC
DXC Technology Services, LLC
SHLP Artisan Station, LLC
Heartis Suwanee Partners LP
Quality Technology Services
James Campbell Company, LLC
Geifer Automotoive
All Other Taxpayers
2019 Principal Tax Payers
Google Inc
AMLI Residential Properties LP
CRLP McGinnis Ferry Road, LLC
Flowers Bakery of Suwanee
Hewlett Packard Company
Wal-Mart
Gwinnett Prado, LP
Caryle Centennial Suwanee Station, LP
Walmart
James Campbell Company, LLC
All Other Taxpayers
2010 Principal Tax Payers

2020 CAFR | STATISTICAL SECTION16 | S
PROPERTY TAX LEVIES AND COLLECTIONS last ten fiscal years
Ratio of outstanding debt by type - last ten fiscal years
NOTE: 1. Relates to preceding calendar year digest.
Source:Consolidated Digest Reports provided by Gwinnett County Tax Commissioner.
NOTES: 1. The schedule of Demographic and Economic Statistics
on page S-19 provides information on personal income and population.
Fiscal Year
Ended (1)
Taxes Leviedfor the
Fiscal Year
Collected within the Fiscal Year
of the LevyCollections in Subsequent
Years
Total Collection to Date
AmountPercentage
of Levy AmountPercentage
of Levy2011 $ 5,568,361 $ 5,323,252 95.6% $ 217,057 $ 5,540,309 99.5%2012 5,192,082 5,056,083 97.4% 125,798 5,181,881 99.8%2013 4,498,518 4,422,212 98.3% 65,778 4,487,990 99.8%2014 4,384,928 4,322,848 98.6% 35,188 4,358,036 99.4%2015 4,666,809 4,557,650 97.7% 45,964 4,603,614 98.6%2016 4,947,364 4,905,044 99.1% 24,273 4,929,317 99.6%2017 5,358,951 5,324,391 99.4% 20,932 5,345,323 99.7%2018 5,839,907 5,769,527 98.8% 40,205 5,809,732 99.5%2019 6,309,304 6,225,520 98.7% 22,391 6,247,911 99.0%2020 6,957,467 6,815,712 98.0% - 6,815,712 98.0%
Fiscal Year
Governmental ActivitiesBusiness-type
ActivitiesNote
Payable Total
Government
Percentageof PersonalIncome (1)
PerCapita (1)
GeneralObligation
Bonds
URA RevenueBonds
CapitalLeases
2011 $ 15,455,000 $ 5,640,000 $ 10,795 $ - $ 21,105,795 4.58% $ 1,3642012 14,970,000 5,370,000 - - 20,340,000 4.07% 1,3022013 14,465,000 5,095,000 - - 19,560,000 3.79% 1,2472014 13,940,000 4,810,000 - - 18,750,000 3.14% 1,0982015 13,410,661 4,513,221 - - 17,923,882 3.04% 1,0292016 12,839,051 4,471,111 - - 17,310,162 2.70% 9562017 12,075,000 4,106,000 - - 16,181,000 2.37% 8892018 10,965,000 27,463,133 - - 38,428,133 5.15% 1,9922019 9,835,000 26,923,054 - - 36,758,054 4.68% 1,8692020 8,685,000 26,372,975 - - 35,057,975 4.10% 1,699

S | 17STATISTICAL SECTION | 2020 CAFR
RATIO OF GENERAL BONDED DEBT OUTSTANDING
last ten fiscal years
FiscalYear
General Obligation Bonds (1)
URARevenueBonds (1) Total
Percentage of Estimated Actual Taxable
Value of Property (2)Per
Capita (3)
2011 $ 15,455,000 $ 5,640,000 $ 21,095,000 0.78% $ 1,3632012 14,970,000 5,370,000 20,340,000 0.75% 1,3022013 14,465,000 5,095,000 19,560,000 0.71% 1,2472014 13,940,000 4,810,000 18,750,000 0.70% 1,0982015 13,410,661 4,513,221 17,923,882 0.66% 1,0292016 12,839,051 4,471,111 17,310,162 0.62% 9562017 12,075,000 4,106,000 16,181,000 0.55% 8892018 10,965,000 27,463,133 38,428,133 1.19% 1,9922019 9,835,000 26,923,054 36,758,054 1.08% 1,8692020 8,356,462 26,372,975 34,729,437 0.98% 1,683
JurisdictionGross
Outstanding
EstimatedPercentageApplicable
EstimatedShare of
OverlappingDebt
Direct Debt:City of Suwanee Bonds (General & Revenue) $ 35,057,975 100.0% $ 35,057,975
Overlapping Debt: (1)
Gwinnett County 137,934,000 4.3% 5,931,162Gwinnett County Board of Education 1,356,326,000 4.1% 55,609,366 Total Overlapping Debt 1,494,260,000 61,540,528
Total Direct General Obligation and Overlapping Debt $ 1,529,317,975 $ 96,598,503
Direct and overlapping governmental activities debt as of June 30, 2020
$0
$500
$1,000
$1,500
$2,000
$2,500
NOTES: 12.
Debt information from CAFR financial statements and Note 8 to the financial statements. Externally restricted resources for debt repayment have been used to reduce the bonds reported.Details of estimated actual taxable value of property can be found on page S-13.
3. Details of population data can be found on page S-19.
NOTE: 1. The percentage of overlapping debt
chargeable to property in the City is calculated by dividing the net M&O assessed value of property in the City by the net M&O assessed value of property in the overlapping entity.
Source:Gwinnett County Comprehensive Annual Financial Report for December 31, 2019.
Debt Per Capita 2011-2020

2020 CAFR | STATISTICAL SECTION18 | S
LEGAL DEBT MARGIN INFORMATION last ten fiscal years
Fiscal Year2011 2012 2013 2014 2015
Assessed value of all taxable property $ 1,084,267,457 $ 1,086,484,780 $ 1,101,919,900 $ 1,072,129,730 $ 1,093,658,220
Debt limit: 10% of assessed value 108,426,746 108,648,478 110,191,990 107,212,973 109,365,822
Total net debt applicable to limit 14,125,505 13,631,622 13,117,134 12,674,835 12,118,900
Legal debt margin $ 94,301,241 $ 95,016,856 $ 97,074,856 $ 94,538,138 $ 97,246,922
Total net debt applicable to the limit as a percentage of debt limit 13.03% 12.55% 11.90% 11.82% 11.08%
Fiscal Year2016 2017 2018 2019 2020
Assessed value of all taxable property $ 1,113,941,980 $ 1,174,944,360 $ 1,287,992,820 $ 1,354,617,204 $ 1,419,678,295
Debt limit: 10% of assessed value 111,394,198 117,494,436 128,799,282 135,461,720 141,967,829
Total net debt applicable to limit 11,502,713 10,873,717 10,620,902 9,659,983 8,425,126
Legal debt margin $ 99,891,485 $ 106,620,719 $ 118,178,380 $ 125,801,737 $ 133,542,703
Total net debt applicable to the limit as a percentage of debt limit 10.33% 9.25% 8.25% 7.13% 5.93%
NOTE:Under Georgia financing laws, the City’s outstanding general obligation debt should not exceed 10 percent of the total assessed property value and may be offset by amounts set aside for repaying the general obligation bonds.
Legal Debt Margin Calculationfor Fiscal Year 2019
Assessed value $ 1,419,678,295
Debt limit: 10% of total assessed value 141,967,829Debt applicable to limit:
General obligation bond 8,685,000Less: Amount set aside for repayment of general obligation debt (259,874)
Total net debt applicable to limit 8,425,126
Legal debt margin $ 133,542,703

S | 19STATISTICAL SECTION | 2020 CAFR
DEMOGRAPHIC AND ECONOMIC STATISTICS
last ten fiscal years
Fiscal Year Population (1)PersonalIncome (2)
Per CapitaPersonalIncome
UnemploymentRate (3)
ResidentialConstruction
Value (1)
CommercialConstruction
Value (1)
2011 15,479 $ 490,343,762 $ 31,678 4.0% $ 12,322,129 $ 17,788,046 2012 15,624 499,764,888 31,987 5.6% 15,110,337 12,864,539 2013 15,683 515,359,063 32,861 5.6% 26,684,558 7,725,320 2014 17,081 596,895,545 34,945 4.8% 25,488,011 30,470,078 2015 17,425 589,069,550 33,806 3.9% 36,057,376 29,642,115 2016 18,098 640,198,652 35,374 3.1% 43,762,400 13,773,8082017 18,199 682,662,689 37,511 3.1% 12,361,039 25,431,4172018 19,296 745,558,848 38,638 3.7% 85,726,557 130,509,3282019 19,661 785,397,967 39,947 2.8% 29,940,259 47,851,8062020 20,634 855,444,372 41,458 8.6% 66,425,439 91,053,858
Population Changes 2011-2020 Per Capita Personal Income 2011-2020
$0
$5,000
$10,000
$15,000
$20,000
$25,000
$30,000
$35,000
$40,000
$45,000
2011 2012 2013 2014 2015 2016 2017 2018 2019 20200
5,000
10,000
15,000
20,000
25,000
2011 2012 2013 2014 2015 2016 2017 2018 2019 2020
Sources:1. City of Suwanee Planning Department
2. Bureau of Economic Analysis.
3. Georgia Department of Labor, not seasonally adjusted.

2020 CAFR | STATISTICAL SECTION20 | S
PRINCIPAL EMPLOYERS current year and ten years ago
Source:City of Suwanee Business Services Department
Employer
2020 2011
Employees Rank% of Total
City Employment Employees Rank% of Total
City EmploymentSoutheastern Freight Lines, Inc. 350 1 2.8% 325 1 3.6%Walmart 302 2 2.4% 313 2 3.5%Meggitt Training Systems, Inc. 281 3 2.3% 250 4 2.8%Liberty Mutual Insurance 230 4 1.8%Quality Technology Services 228 5 1.8%Bank of America 203 6 1.6%Kroger 196 7 1.6% 160 6 1.8%Flowers Bakery 164 8 1.3% 190 5 2.1%Annadale Village 164 9 1.3%Main Event Entertainment, Inc. 160 10 1.3%Dish Network/Echosphere Corporation 252 3 2.8%Publix Supermarkets 138 7 1.5%Quality Construction Services, Inc. 135 8 1.5%Lowes 122 9 1.4%Cracker Barrel Old Country Store, Inc. 110 10 1.2%

S | 21STATISTICAL SECTION | 2020 CAFR
FULL-TIME EQUIVALENT CITY GOVERNMENT EMPLOYEES BY FUNCTION
last ten fiscal years
NOTES: 1. In fiscal year 2011, one Police Lieutenant position was moved from Criminal Investigation to Patrol and employees in Targeted Police were also moved to the Patrol Division2.
3.
In fiscal year 2015, Business Services Department was created. Members from Chief Executive, General Administration and Financial Administration were transferred to create this new department.In fiscal year 2017, five part time positions were re-classified from part time to full time.
4. In fiscal year 2018, one Police Officer position was moved was upgradded to corporal and moved to Criminal Investigation.
Function
Full-time Equivalent Employees as of June 30, 2020
2011 (1) 2012 2013 2014 2015 (2) 2016 2017 (3) 2018 (4) 2019 2020 General Government
Chief Executive 3 3 3 3 3 3 3 3 3 3General Administration 2 2 2 2 2 3 2 2 2 2Business Services - - - - 3 3 4 4 4 4Financial Administration 8 8 8 8 4 4 5 5 5 5Public Information 1 1 1 1 1 1 1 1 1 1
Judicial 3 3 3 3 3 3 4 4 4 4Public Safety
Police Administration 3 3 3 3 3 3 3 3 3 3Criminal Investigation 3 3 4 4 5 6 6 7 7 7Patrol 28 28 28 28 27 28 29 28 29 29Records and Identification 1 1 1 1 1 1 1 1 1 1Police Training 1 1 1 1 1 2 2 2 2 2Dispatcher 7 7 7 8 8 7 7 7 8 8Public Relations 1 1 1 1 1 1 1 1 1 1Targeted Police - - - - - - - - - -
Public Works 15 15 15 15 16 17 20 21 24 24Housing and Development
Protective Inspection 1 1 1 1 2 2 2 2 3 3Planning & Zoning 5 5 5 5 5 5 5 5 5 5Economic Development 4 4 4 4 4 4 4 4 5 5
TOTAL 86 86 87 88 89 93 99 100 105 107
Source: Various City departments and corresponding budget documents. City of Suwanee Business Services Department

2020 CAFR | STATISTICAL SECTION22 | S
Function
Calendar Year
2010 2011 2012 2013 2014 2015 2016 2017 2018 2019General government
Business licenses issued 1,720 1,775 1,754 1,719 1,752 1,764 1,638 1,438 1,629 1,586Number of parcels and improvements 11,897 12,004 12,297 12,336 12,737 12,737 12,887 13,352 13,551 13,948
JudicialCases processed 14,883 13,089 7,874 12,300 13,500 14,024 10,656 10,775 11,506 9,700Non-jury trials 319 462 154 200 261 180 165 116 145 109Jury trials 220 370 355 198 256 309 169 135 135 40Warrants issued 236 297 212 240 312 222 204 145 205 110
PoliceCalls for service 41,964 43,926 33,511 47,626 61,770 69,913 82,557 62,171 64,553 61,782 Traffic accidents 1,158 1,086 1,157 1,178 1,306 1,410 1,511 1,446 1,479 1,534 Part I offenses 505 452 443 484 569 651 830 752 651 609 Traffic citations 12,865 11,797 7,678 12,403 16,929 13,373 10,741 8,363 12,358 11,779
Public works Work orders 3,685 (1) 5,294 5,175 5,371 6,135 5,054 5,187 4,948 3,408 4,254 Street overlay (lane miles) - 3.88 6.63 6.8 11.59 4.11 3.54 8.35 5.62 10.4 Hours of litter pick-up service provided 605 985 876 941 920 921 1,128 1,259 911 961
Culture and recreation Number of annual city-sponsored events 21 17 33 22 21 21 19 21 20 22Number of annual non-city sponsored events 16 16 16 14 25 18 22 23 19 23Suwanee Fest attendance 40,000 45,000 50,000 8,500 (2) 55,000 (3) 58,000 56,000 62,000 60,000 70,000
Protective InspectionNumber of residential permits 108 173 200 220 113 208 312 260 288 405Number of total construction permits 224 242 284 301 276 366 405 348 270 492Number of sign permits 268 295 324 227 257 288 245 210 243 176
Planning and ZoningZoning certification letters 6 12 10 16 19 14 29 27 25 18Rezoning cases processed 5 5 5 4 10 5 6 10 9 4Special use permits processed 5 5 2 4 5 5 1 0 0 2Variances processed 6 7 6 9 15 6 4 5 17 27Development review 9 19 28 11 26 16 17 19 19 35Development permits 9 8 14 8 18 30 15 20 16 31
WaterAverage daily consumption in gallons 44,625 46,257 45,863 47,612 47,441 46,034 47,649 45,647 46,419 48,684
OPERATING INDICATORS BY FUNCTION last ten years
1. Overhauled work order system-some work orders combined.2. Low attendance due to inclement weather.3. In 2014, Suwanee Fest went from a one day to a two day event.
Source: Various City departments and corresponding budget documents.
NOTES:

S | 23STATISTICAL SECTION | 2020 CAFR
CAPITAL ASSETS STATISTICS BY FUNCTION
last ten years
FunctionFiscal Year
2011 2012 2013 2014 2015 2016 2017 2018 2019 2020General Administration
Vehicles (1) 1 1 1 1 1 - - - - -
PolicePatrol Units 40 41 30 41 41 39 42 36 38 38Other Police Vehicles 4 4 15 10 13 11 11 14 14 15
Public WorksVehicles 15 16 17 18 16 19 19 20 24 24Street (Miles) (2) 63 62 62 63 63 63 63 64 64 64Streetlights 911 928 968 981 997 1,028 1,114 1,138 1,145 1,169
Culture and RecreationAcreage 372 372 372 372 372 372 372 372 372 372Park Sites 15 15 15 15 15 15 15 15 15 15Public Art 7 11 14 14 14 15 18 19 20 20
WaterWater Mains (Miles) 6.8 6.8 6.8 6.8 6.8 6.8 6.8 6.8 6.8 6.8Storage Capacity 150,000 150,000 150,000 150,000 150,000 150,000 150,000 150,000 150,000 150,000
Housing and DevelopmentVehicles 4 4 4 3 3 3 3 3 4 4
NOTES:1. In fiscal year 2016, the vehicle under the general administration function was moved to the Public Works function. 2. In fiscal year 2012, the newly adopted SDS (Service Delivery Strategy) between the County and City(ies) resulted in a slight adjustment in street mileage
maintained.
Source:Various City departments

2020 CAFR | STATISTICAL SECTION24 | S

COMPLIANCESECTION

C | 1COMPLIANCE SECTION | 2020 CAFR
INDEPENDENT AUDITOR’S REPORT ON INTERNAL CONTROL OVERFINANCIAL REPORTING AND ON COMPLIANCE AND OTHER MATTERS
BASED ON AN AUDIT OF FINANCIAL STATEMENTS PERFORMED INACCORDANCE WITH GOVERMENT AUDITING STANDARDS
Honorable Mayor and MembersOf the City Council
City of SuwaneeSuwanee, Georgia
We have audited, in accordance with the auditing standards generally accepted in the United States of America and the standards applicable to financial audits contained in Government Auditing Standards issued by the Comptroller General of the United States, the financial statements of the governmental activities, the business-type activities, each major fund, and the aggregate remaining fund information of the City of Suwanee, Georgia (the “City”) as of and for the year ended June 30, 2020, and the related notes to the financial statements, which collectively comprise the City’s basic financial statements, and have issued our report thereon dated December 7, 2020.
Internal Control Over Financial Reporting
In planning and performing our audit of the financial statements, we considered the City’s internal control over financial reporting (“internal control”)as a basis for designing audit procedures that are appropriate in the circumstances for the purpose of expressing our opinions on the financial statements, but not for the purpose of expressing an opinion on the effectiveness of the City’s internal control. Accordingly, we do not express an opinion on the effectiveness of the City’s internal control.
A deficiency in internal control exists when the design or operation of a control does not allow management or employees, in the normal course of performing their assigned functions, to prevent, or detect and correct, misstatements on a timely basis. A material weakness is a deficiency, or a combination of deficiencies, in internal control, such that there is a reasonable possibility that a material misstatement of the entity’s financial statements will not be prevented, or detected and corrected on a timely basis. A significant deficiency is a deficiency, or a combination of deficiencies, in internal control that is less severe than a material weakness, yet important enough to merit attention by those charged with governance.
200 GALLERIA PARKWAY S.E., SUITE 1700 • ATLANTA, GA 30339-5946 • 770-955-8600 • 800-277-0080 • FAX 770-980-4489 • www.mjcpa.comMembers of The American Institute of Certified Public Accountants

2020 CAFR | COMPLIANCE SECTION2 | C
2
Our consideration of internal control was for the limited purpose described in the first paragraph of this section and was not designed to identify all deficiencies in internal control that might be material weaknesses or significant deficiencies. Given these limitations, during our audit we did not identify any deficiencies in internal control that we consider to be material weaknesses. However, material weaknesses may exist that have not been identified.
Compliance and Other Matters
As part of obtaining reasonable assurance about whether the City’s financial statements are free from material misstatement, we performed tests of its compliance with certain provisions of laws, regulations, contracts, and grant agreements, noncompliance with which could have a direct and material effect on the financial statements. However, providing an opinion on compliance with those provisions was not an objective of our audit, and accordingly, we do not express such an opinion. The results of our tests disclosed no instances of noncompliance or other matters that are required to be reported under Government Auditing Standards.
Purpose of this Report
The purpose of this report is solely to describe the scope of our testing of internal control and compliance and the results of that testing, and not to provide an opinion on the effectiveness of the entity’s internal control or on compliance. This report is an integral part of an audit performed in accordance with Government Auditing Standards in considering the entity’s internal control and compliance. Accordingly, this communication is not suitable for any other purpose.
Atlanta, GeorgiaDecember 7, 2020

TOWN CENTER AVE. SUWANEE, GA
SUWANEE.COM