collecting and analyzing comprehensive community needs ... · organizational standards standard 3.1...
TRANSCRIPT
Collecting and Analyzing Comprehensive Community Needs Assessment Data
Annual Convention 2017Transforming Communities, Changing Lives
Philadelphia, PA
Courtney Kohler | MPA, CCAP, NCRTSenior Associate, T/TA
Community Action [email protected]

Objectives
• Reinforce the purpose of the CNA
• Learn the aspects of planning a comprehensive CNA
• Discuss important data to collect for the CNA– Quantitative
– Qualitative
• Understand simple analysis techniques for CNA data
• Learn ways to communicate the CNA
COMMUNITY NEEDS ASSESSMENT
Purpose
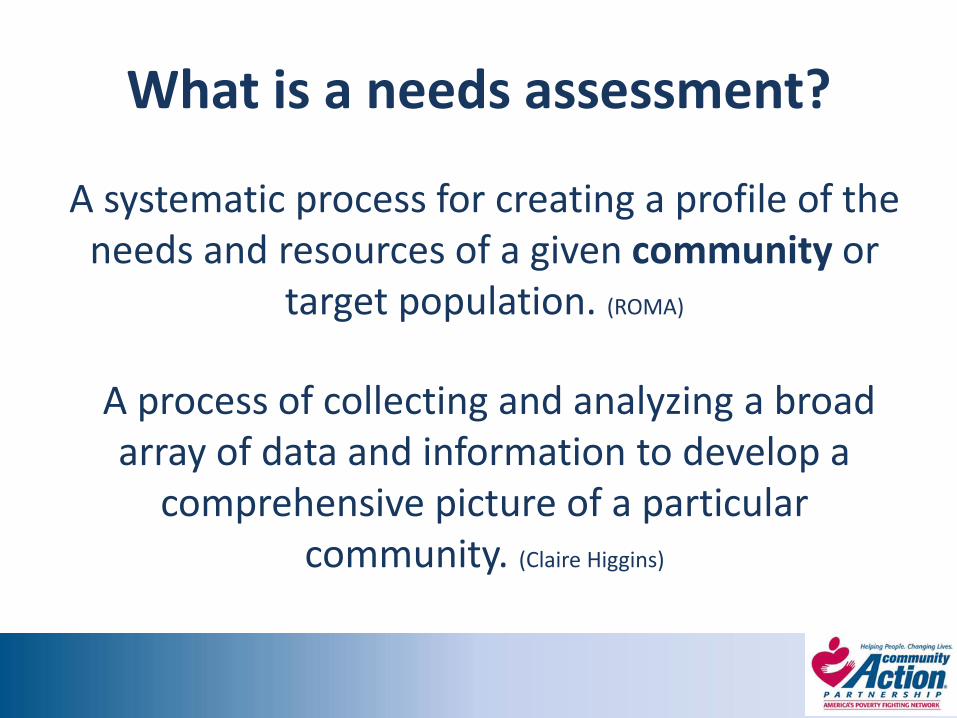
What is a needs assessment?
A systematic process for creating a profile of the needs and resources of a given community or
target population. (ROMA)
A process of collecting and analyzing a broad array of data and information to develop a
comprehensive picture of a particular community. (Claire Higgins)

Purpose
Offers a picture of the community at a point in time relative to its needs – both real and perceived
Creates opportunities for community members to examine their area and region
Provides the “Why?”
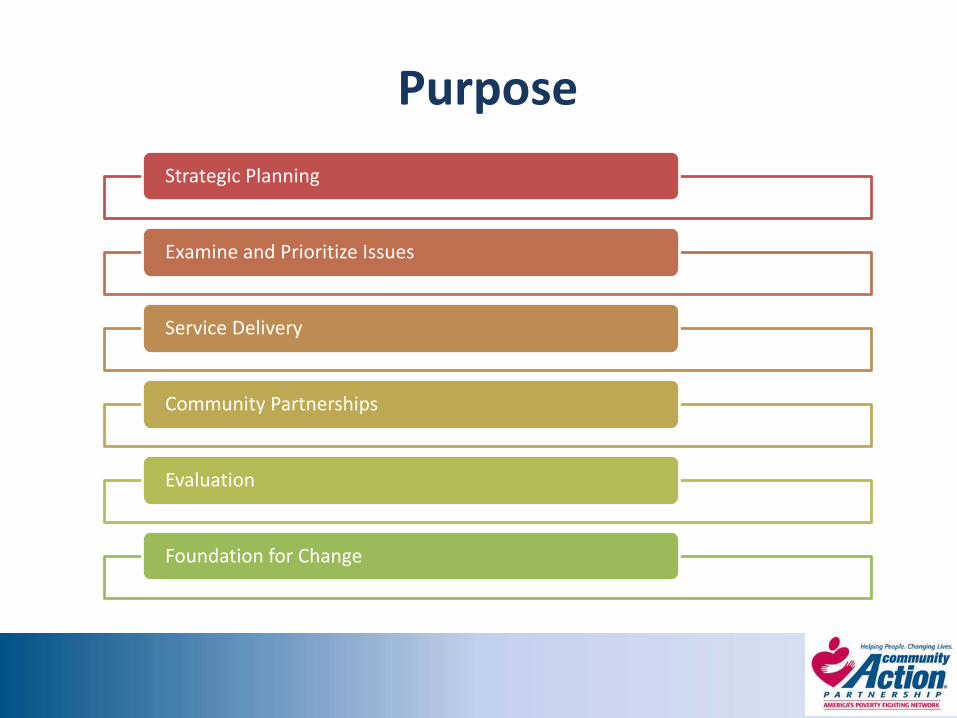
Purpose
Strategic Planning
Examine and Prioritize Issues
Service Delivery
Community Partnerships
Evaluation
Foundation for Change
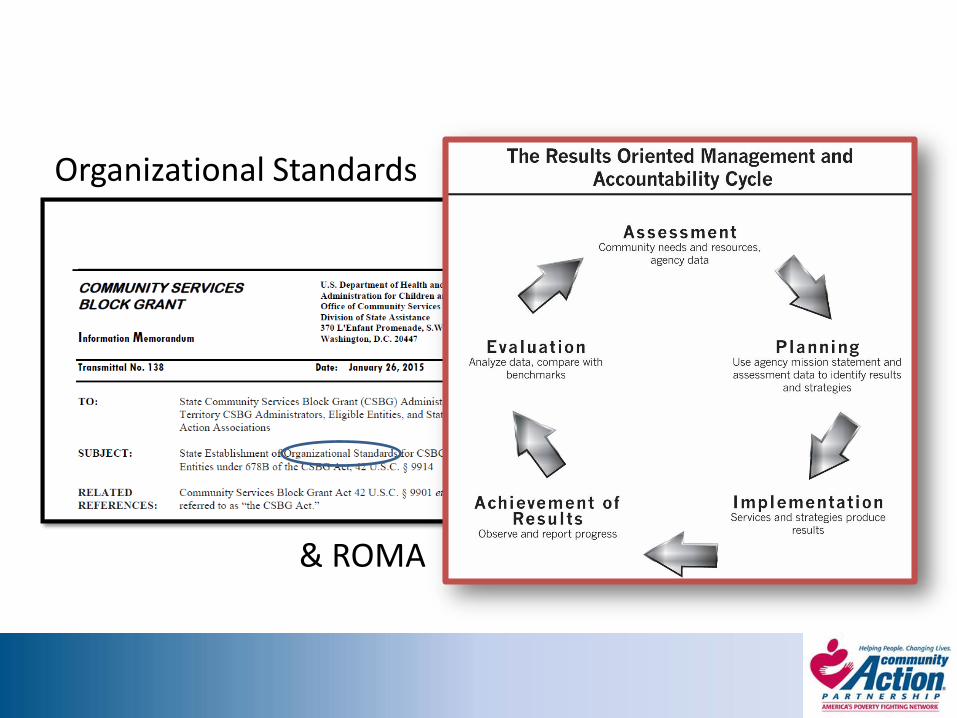
Organizational Standards
& ROMA
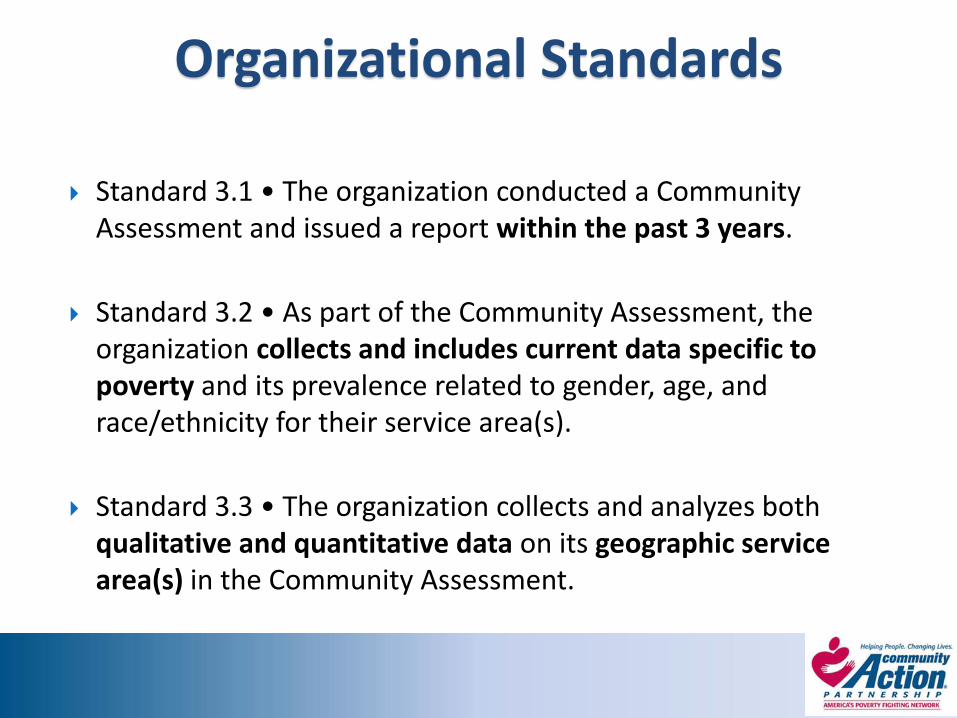
Organizational Standards
Standard 3.1 • The organization conducted a Community Assessment and issued a report within the past 3 years.
Standard 3.2 • As part of the Community Assessment, the organization collects and includes current data specific to poverty and its prevalence related to gender, age, and race/ethnicity for their service area(s).
Standard 3.3 • The organization collects and analyzes both qualitative and quantitative data on its geographic service area(s) in the Community Assessment.
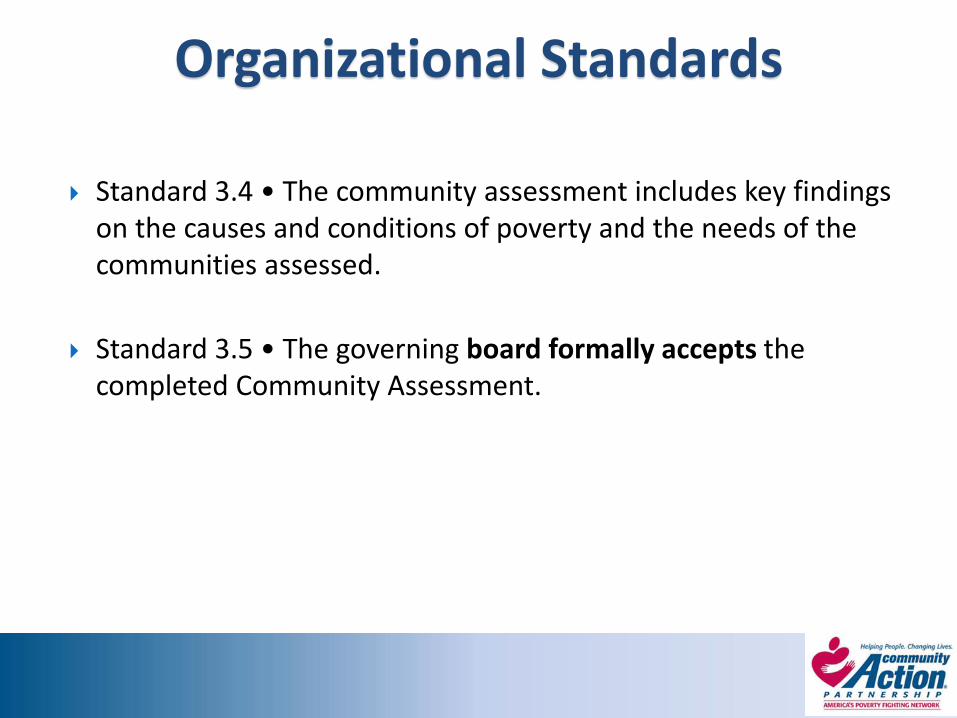
Organizational Standards
Standard 3.4 • The community assessment includes key findings on the causes and conditions of poverty and the needs of the communities assessed.
Standard 3.5 • The governing board formally accepts the completed Community Assessment.

Connecting the CNA with Other Planning Processes
Community Needs Assessment
Community Action Plan
Strategic Plan
COMMUNITY NEEDS ASSESSMENT
Planning
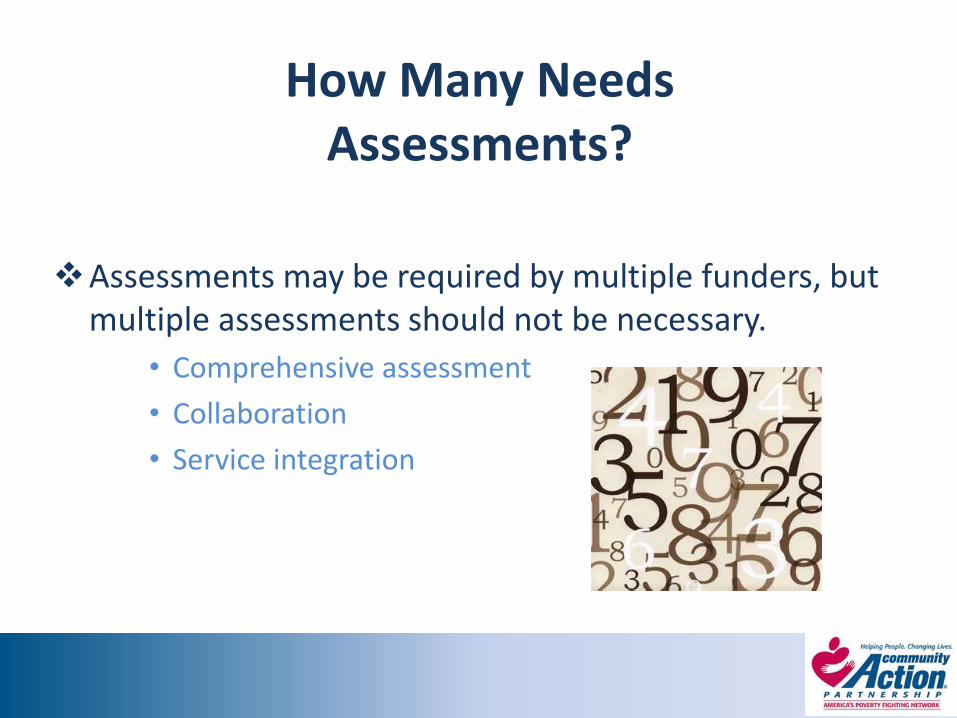
How Many Needs Assessments?
Assessments may be required by multiple funders, but multiple assessments should not be necessary.
• Comprehensive assessment
• Collaboration
• Service integration
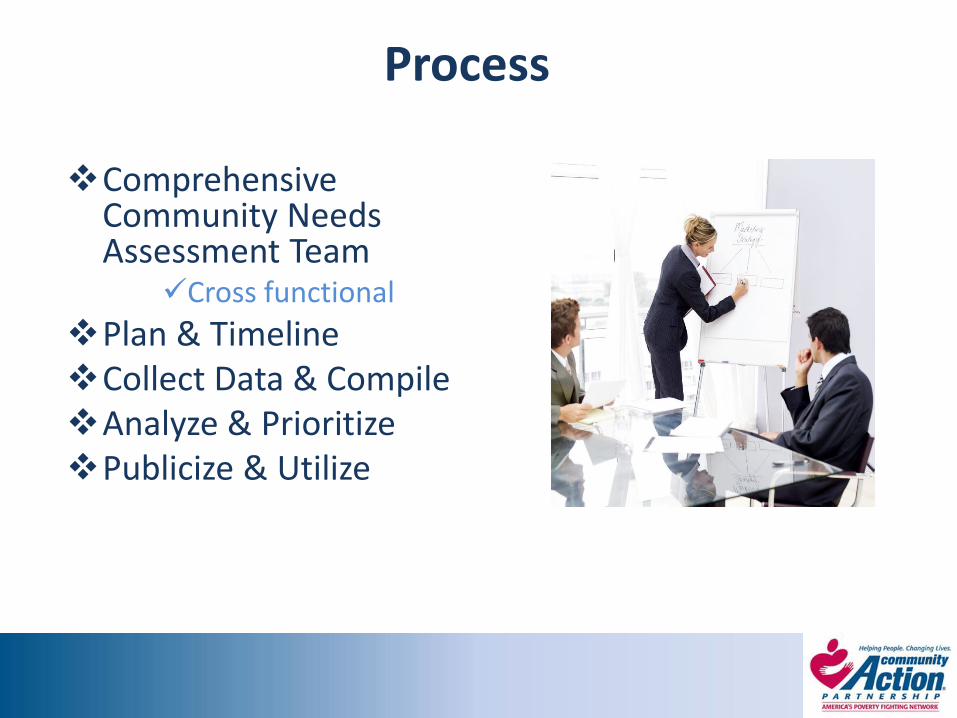
Process
Comprehensive Community Needs Assessment Team
Cross functional
Plan & TimelineCollect Data & CompileAnalyze & PrioritizePublicize & Utilize
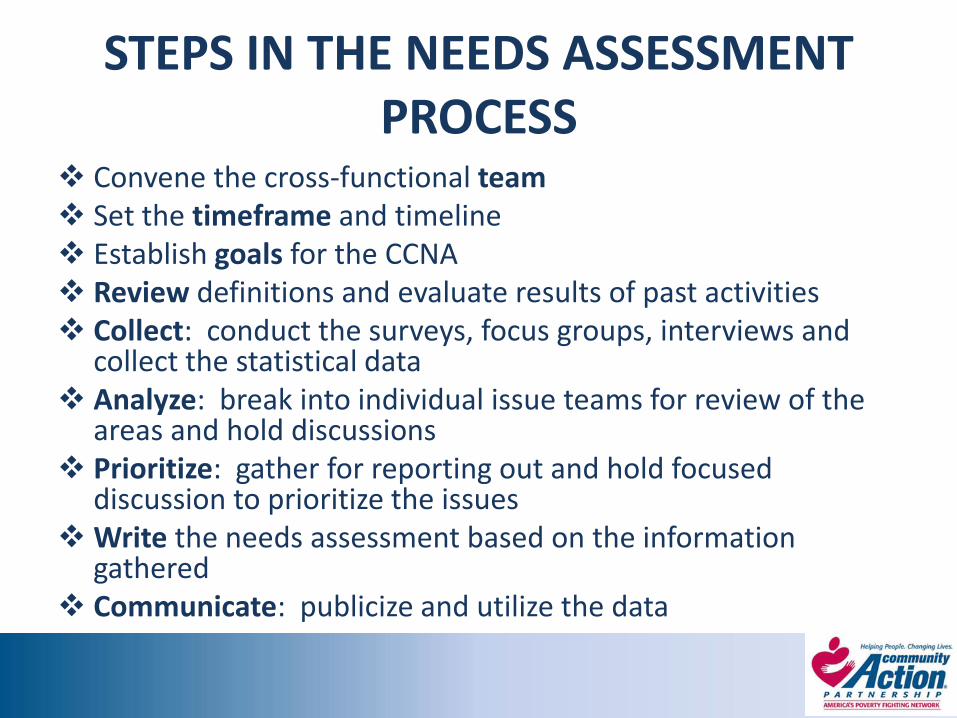
STEPS IN THE NEEDS ASSESSMENT PROCESS
Convene the cross-functional team Set the timeframe and timeline Establish goals for the CCNA Review definitions and evaluate results of past activities Collect: conduct the surveys, focus groups, interviews and
collect the statistical data Analyze: break into individual issue teams for review of the
areas and hold discussions Prioritize: gather for reporting out and hold focused
discussion to prioritize the issues Write the needs assessment based on the information
gathered Communicate: publicize and utilize the data
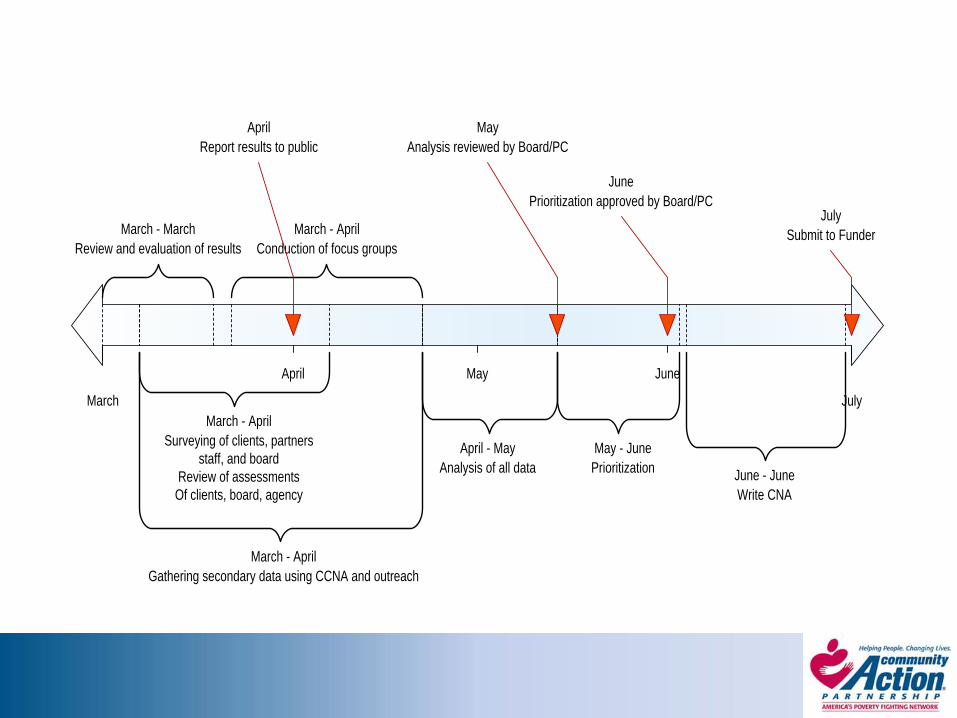
March July
April May June
March - March
Review and evaluation of results
June - June
Write CNA
March - April
Surveying of clients, partners
staff, and board
Review of assessments
Of clients, board, agency
March - April
Conduction of focus groups
March - April
Gathering secondary data using CCNA and outreach
April - May
Analysis of all data
May - June
Prioritization
July
Submit to Funder
May
Analysis reviewed by Board/PC
June
Prioritization approved by Board/PC
April
Report results to public

# Timeline Sample Dates Activity
1 3 weeks March 16th – 31st Planning and developing forms
2 4 weeks April 1st – April 30th Collecting Data
3 3 weeks May 1st - May 22th Analyzing Data
4 2 weeks May 23rd - June 30th Preparing Report
Total 15 Weeks March 16th – June 30th
TDHCA – CSBG Community Needs Assessment – Page 3 – Rev. 04/06/2015

Convening the Cross-Functional Team
Program Managers
CAA planning and development staff/experts
Other agency staff:• Whose work makes them
familiar with key partners, or
• Whose work makes them familiar with participants
Board Members
Other organizations’ leaders and/or community partners
Expert consultants
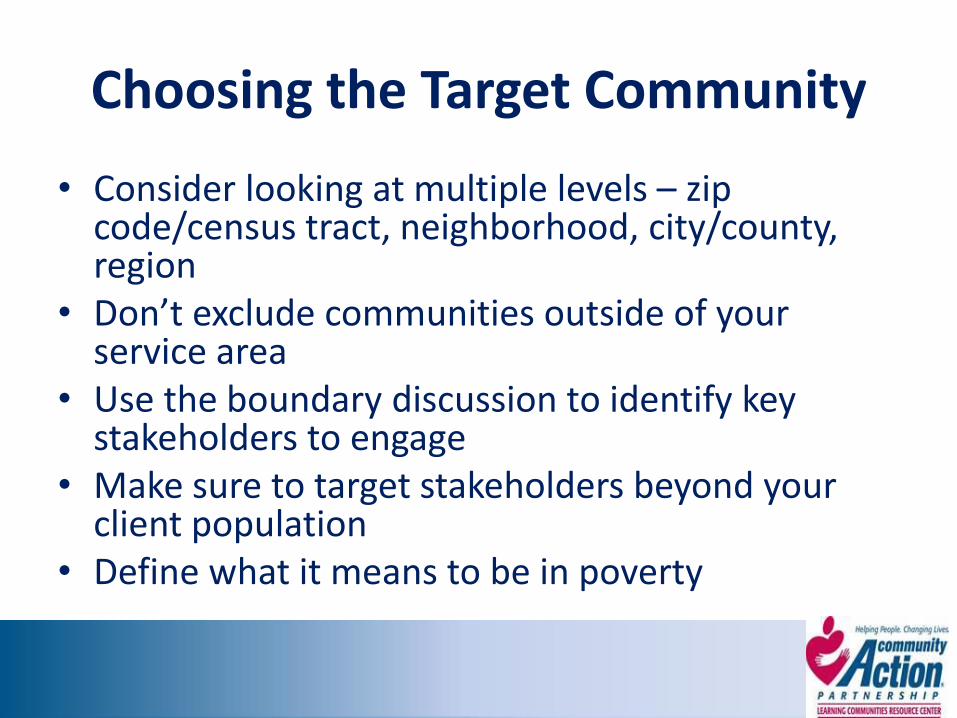
Choosing the Target Community
• Consider looking at multiple levels – zip code/census tract, neighborhood, city/county, region
• Don’t exclude communities outside of your service area
• Use the boundary discussion to identify key stakeholders to engage
• Make sure to target stakeholders beyond your client population
• Define what it means to be in poverty
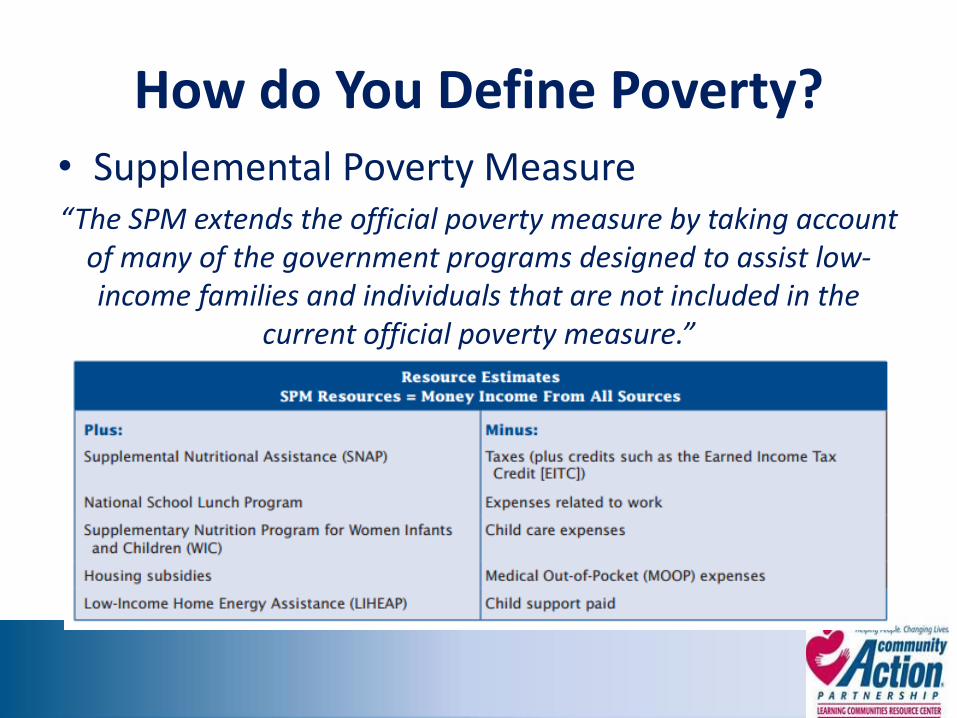
How do You Define Poverty?• Supplemental Poverty Measure“The SPM extends the official poverty measure by taking account
of many of the government programs designed to assist low-income families and individuals that are not included in the
current official poverty measure.”

Choose Your Categories
• Community Commons Online Tool
• Domains of CSBG Act• Employment• Education• Income Management • Housing• Emergency Services
• Nutrition• Self Sufficiency• Health• Services for Youth • Services for Senior
Citizens
• Population Profile• Employment• Education• Housing
• Income• Nutrition• Health Care

Establish Goals
What does the agency want to get out of it?Meet funding requirement
Inform Strategic Plan
Communicate with legislators
Community Partnerships
What else?
What will the agency do with the information?Planning
Share with community partners
Post to website
COMMUNITY NEEDS ASSESSMENT
Collecting Data
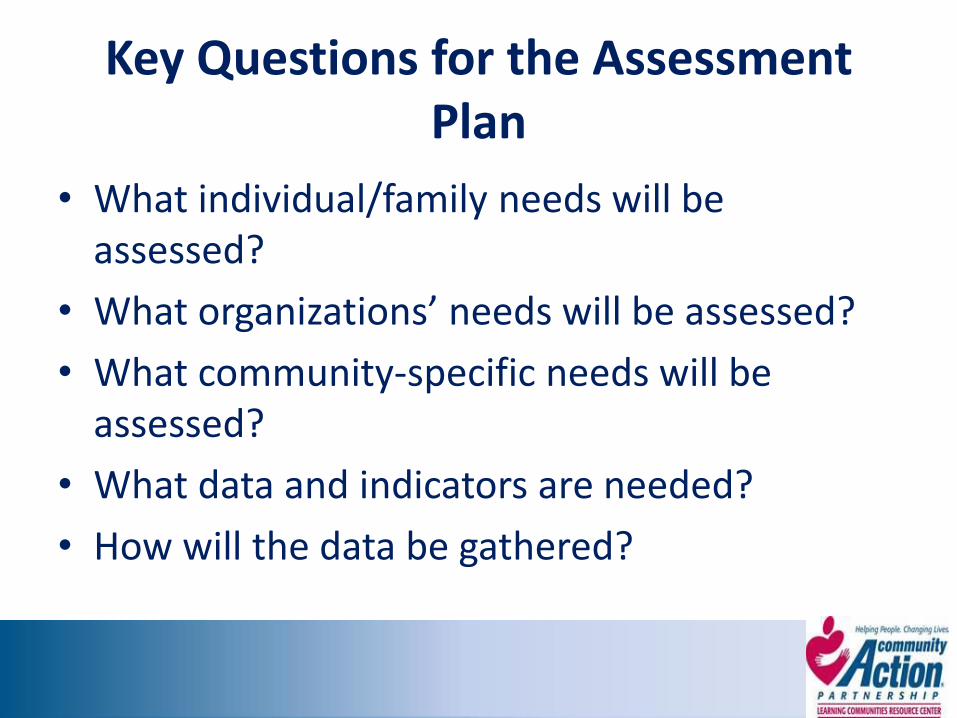
Key Questions for the Assessment Plan
• What individual/family needs will be assessed?
• What organizations’ needs will be assessed?
• What community-specific needs will be assessed?
• What data and indicators are needed?
• How will the data be gathered?
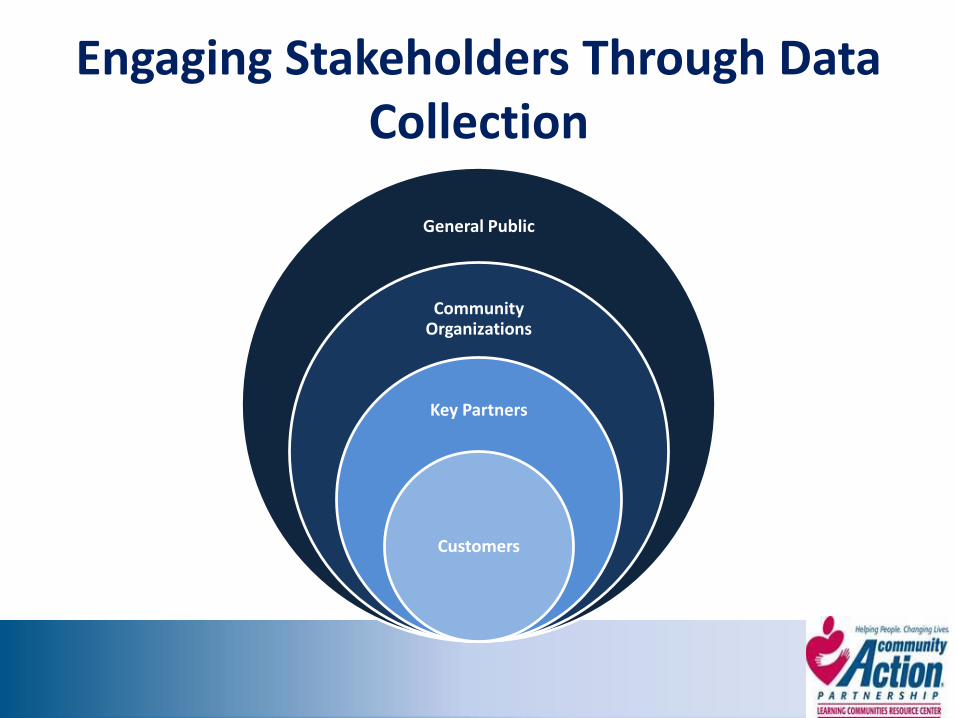
Engaging Stakeholders Through Data Collection
General Public
Community Organizations
Key Partners
Customers
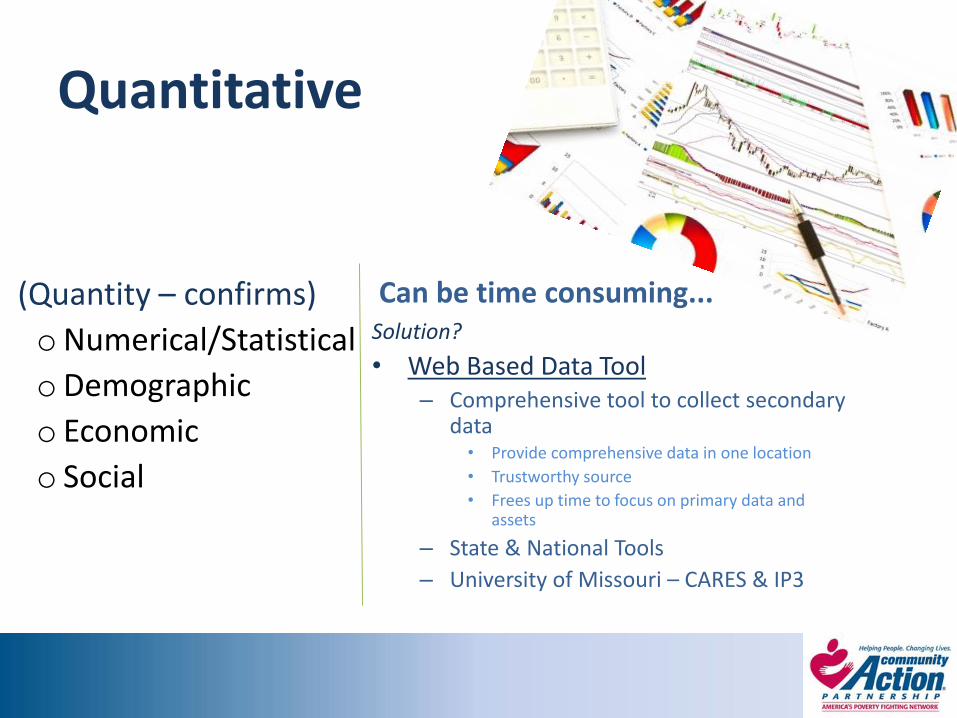
Quantitative
(Quantity – confirms)
oNumerical/Statistical
oDemographic
o Economic
o Social
Can be time consuming... Solution?
• Web Based Data Tool – Comprehensive tool to collect secondary
data • Provide comprehensive data in one location
• Trustworthy source
• Frees up time to focus on primary data and assets
– State & National Tools
– University of Missouri – CARES & IP3

Web-Based Tool
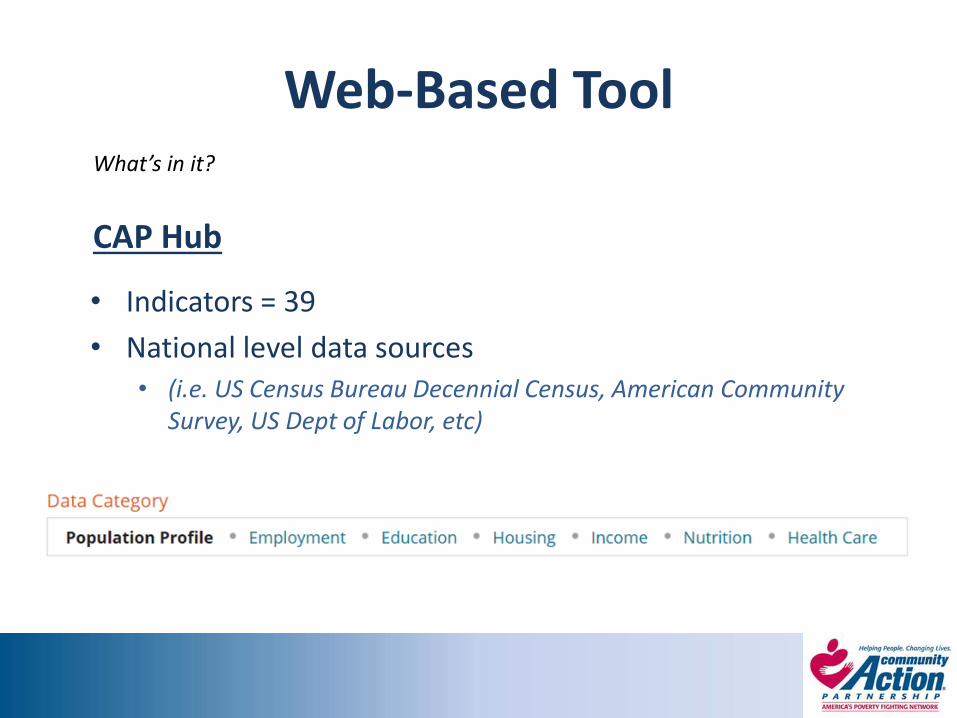
Web-Based Tool
CAP Hub
• Indicators = 39
• National level data sources • (i.e. US Census Bureau Decennial Census, American Community
Survey, US Dept of Labor, etc)
What’s in it?


Qualitative
(Quality – explores)
o Narrative, themes, perceptions
o Available community resources
o At-risk or threatened resources
o Unmet community needs
o Current barriers to accessing services
External
o Key Informant Interviews
o Community Forums
o Focus Groups
o Surveys
Internal
o Agency Capacity
o Surveys

Qualitative - External
Community Forums
SurveysFocus
Groups
Key Informant Interviews
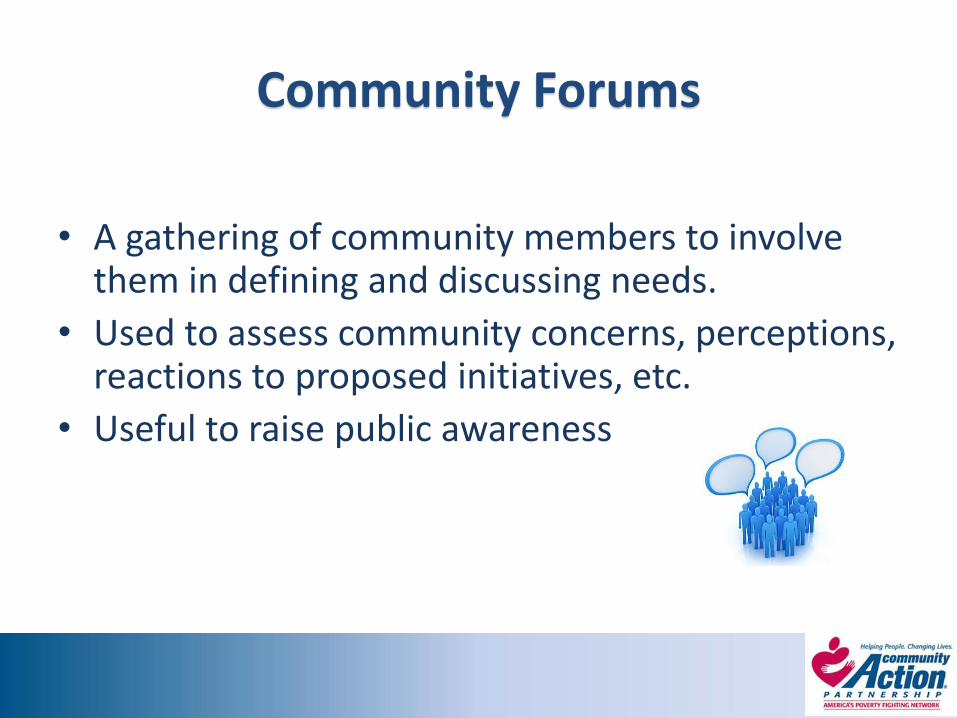
Community Forums
• A gathering of community members to involve them in defining and discussing needs.
• Used to assess community concerns, perceptions, reactions to proposed initiatives, etc.
• Useful to raise public awareness
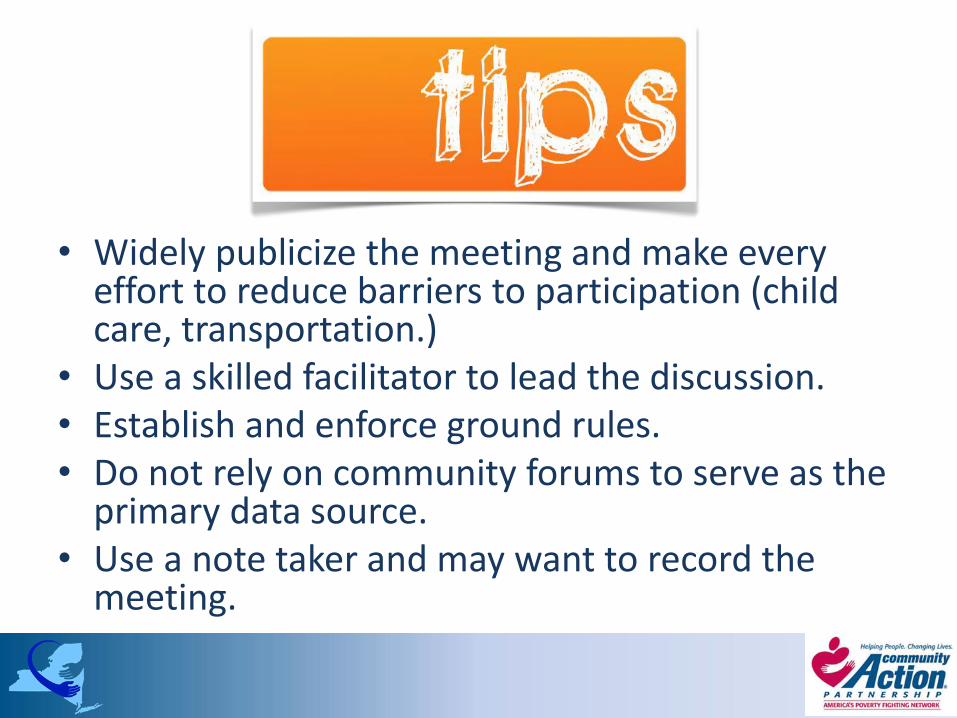
• Widely publicize the meeting and make every effort to reduce barriers to participation (child care, transportation.)
• Use a skilled facilitator to lead the discussion.• Establish and enforce ground rules.• Do not rely on community forums to serve as the
primary data source.• Use a note taker and may want to record the
meeting.

Surveys
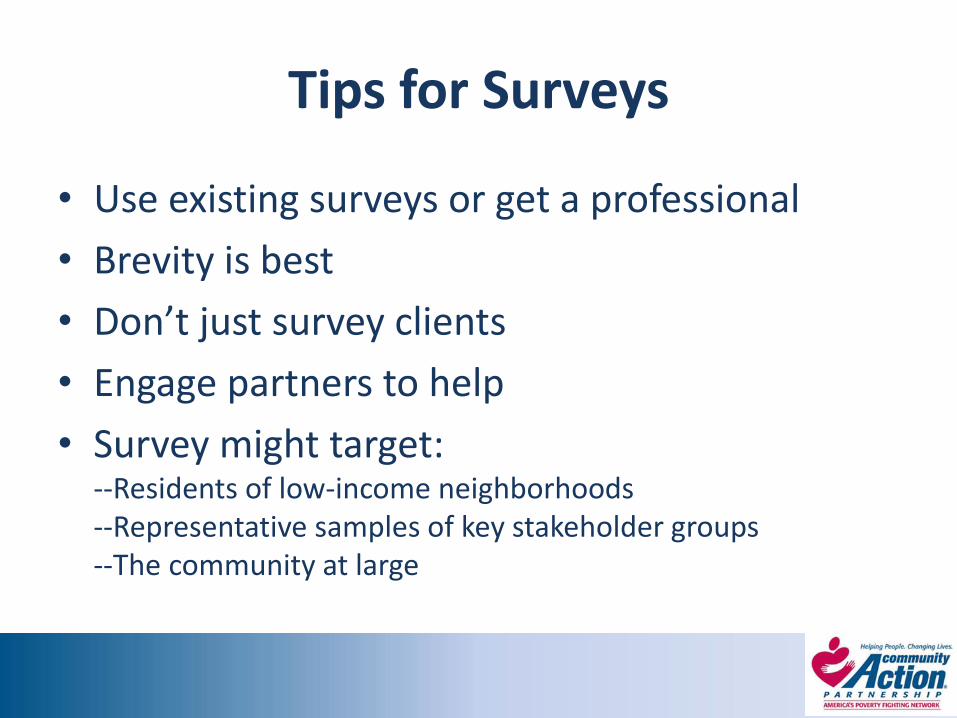
Surveys collect primary data from individuals who collectively constitute a representative sample of the community.
Tips for Surveys
• Use existing surveys or get a professional
• Brevity is best
• Don’t just survey clients
• Engage partners to help
• Survey might target:--Residents of low-income neighborhoods--Representative samples of key stakeholder groups--The community at large
Focus groups
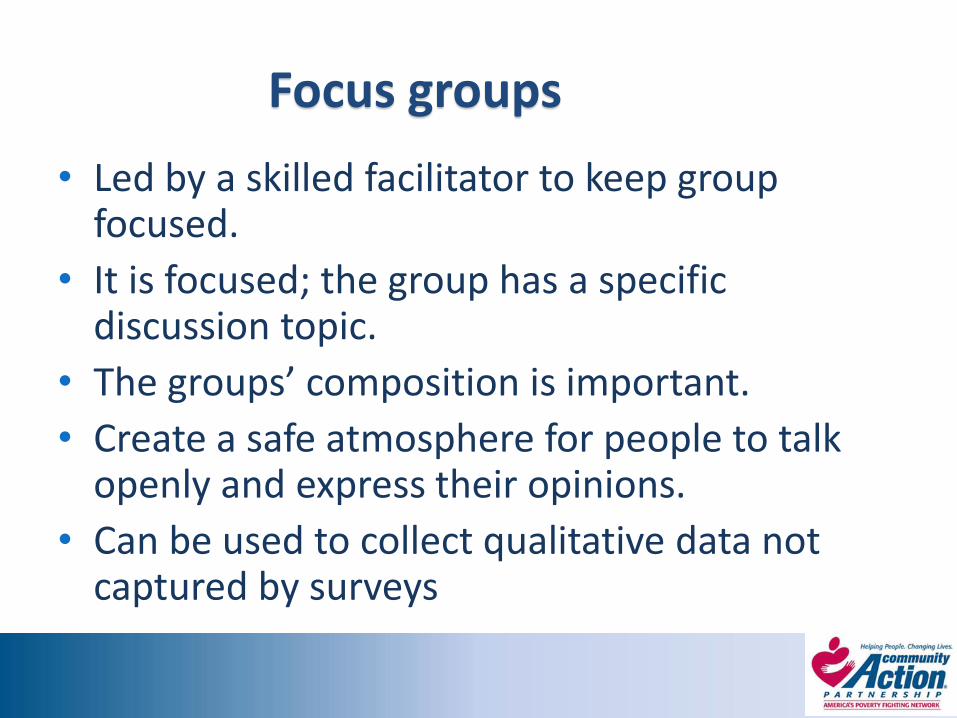
• Led by a skilled facilitator to keep group focused.
• It is focused; the group has a specific discussion topic.
• The groups’ composition is important.
• Create a safe atmosphere for people to talk openly and express their opinions.
• Can be used to collect qualitative data not captured by surveys

Focus group tips
• Limit focus group size to 10-15 participants.
• Use an experienced facilitator as well as a recorder.
• Prepare 5-6 questions to guide the focus group discussion.
• Assure participants that their individual responses will be kept confidential.
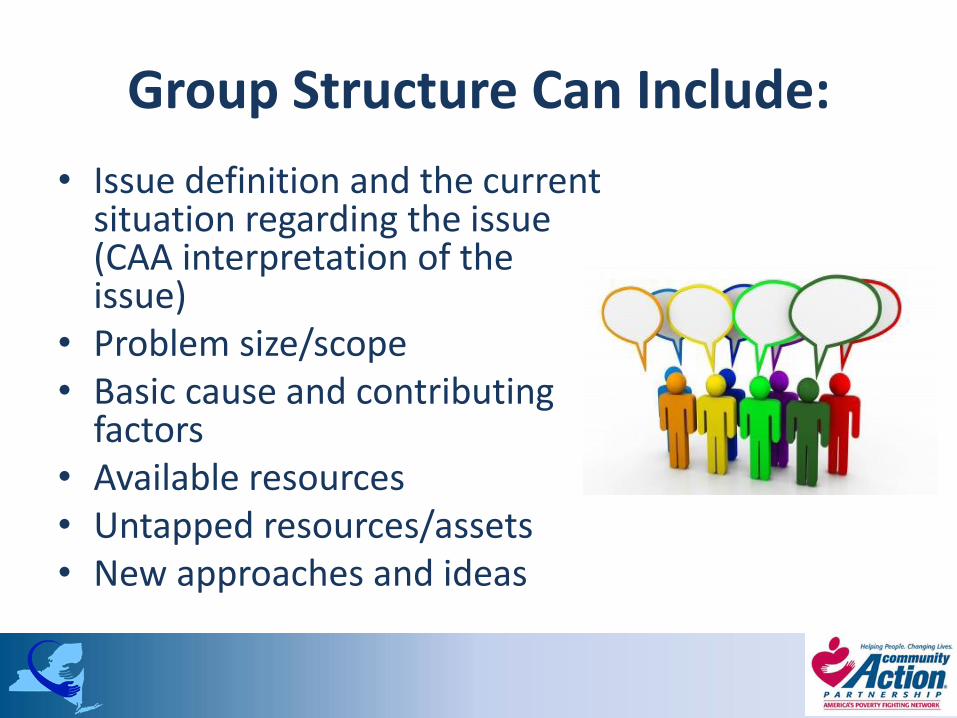
• Issue definition and the current situation regarding the issue (CAA interpretation of the issue)
• Problem size/scope• Basic cause and contributing
factors• Available resources• Untapped resources/assets• New approaches and ideas
Group Structure Can Include:
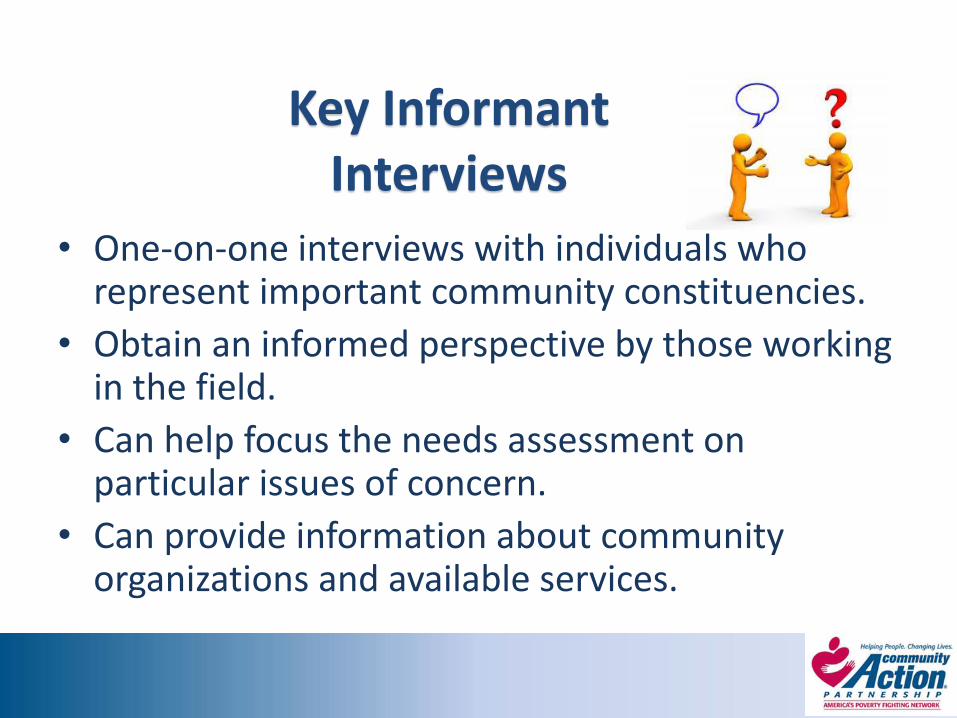
Key Informant Interviews
• One-on-one interviews with individuals who represent important community constituencies.
• Obtain an informed perspective by those working in the field.
• Can help focus the needs assessment on particular issues of concern.
• Can provide information about community organizations and available services.

• Prior to the interviews, prepare a set of open ended questions to guide the discussion. Be prepared to follow-up initial questions with “probes” to elicit more detail.
• Be ready to pursue unexpected “leads” that may emerge through the discussion.
• Two people are better: interviewer and note taker.

Agency Data
Using whatever data system or methods you have to track who is being served and with what programs, consider...
Who is being served?
What are their demographics?
What programs are being utilized?
Then compare agency data with quantitative and qualitative that has been collected.
COMMUNITY NEEDS ASSESSMENT
Analyzing Data
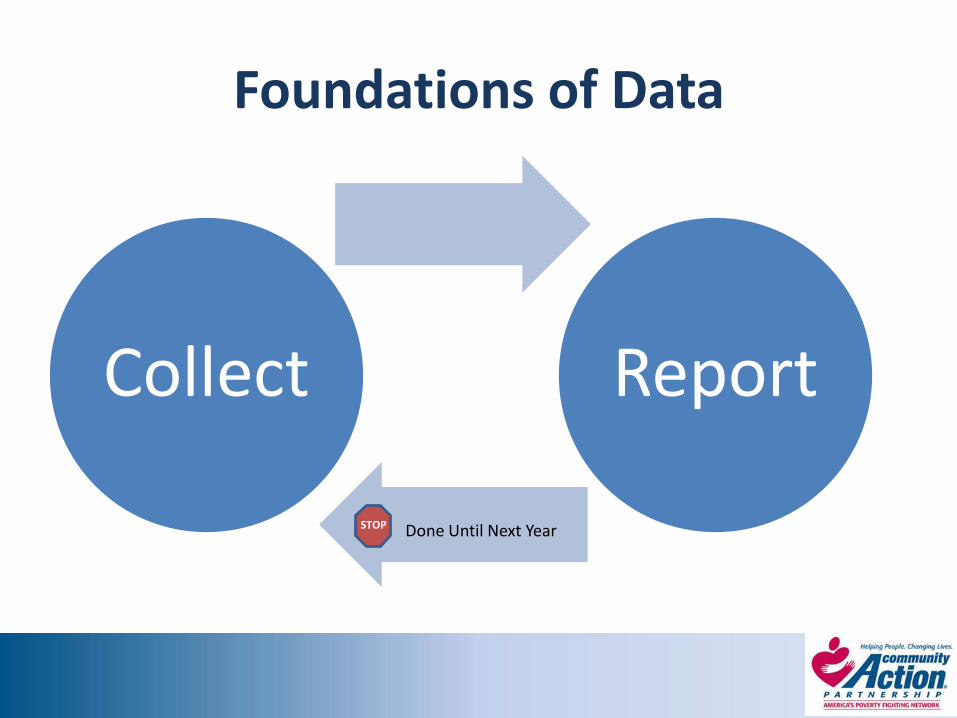
Foundations of Data
Collect Report
Done Until Next YearSTOP

Foundations of Data
Collect Report
Done Until Next YearSTOP

Data, Information, and Knowledge
• Data is facts that are observed, measured, collected and aggregated.
• Data only becomes information for decision making once it has been analyzed in some fashion.
• Knowledge is derived from the interaction of information and experience with a topic.
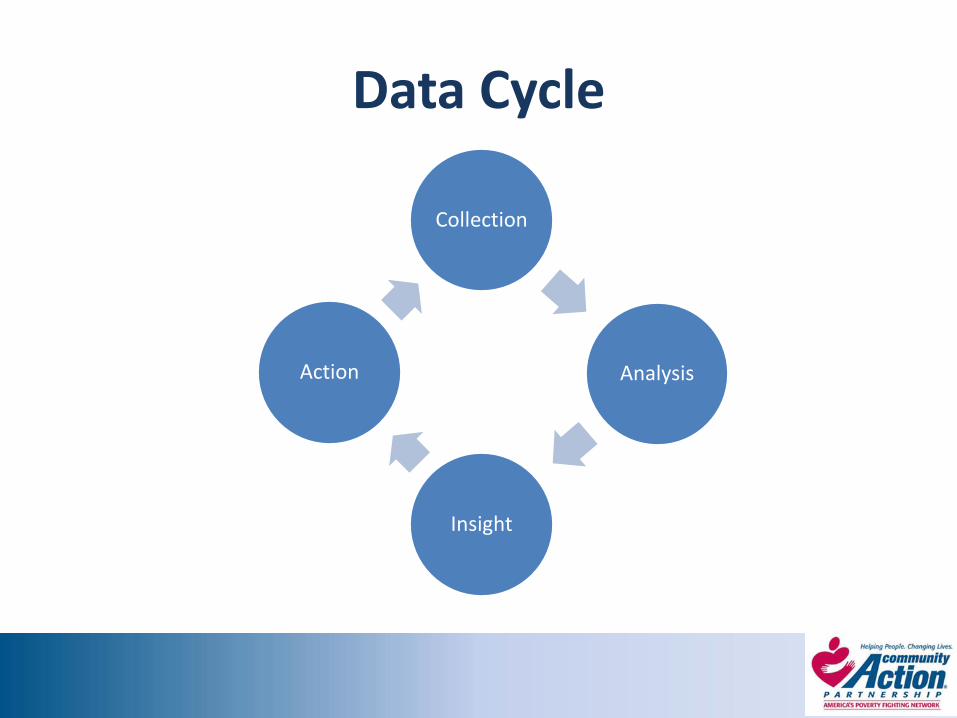
Data Cycle
Collection
Analysis
Insight
Action
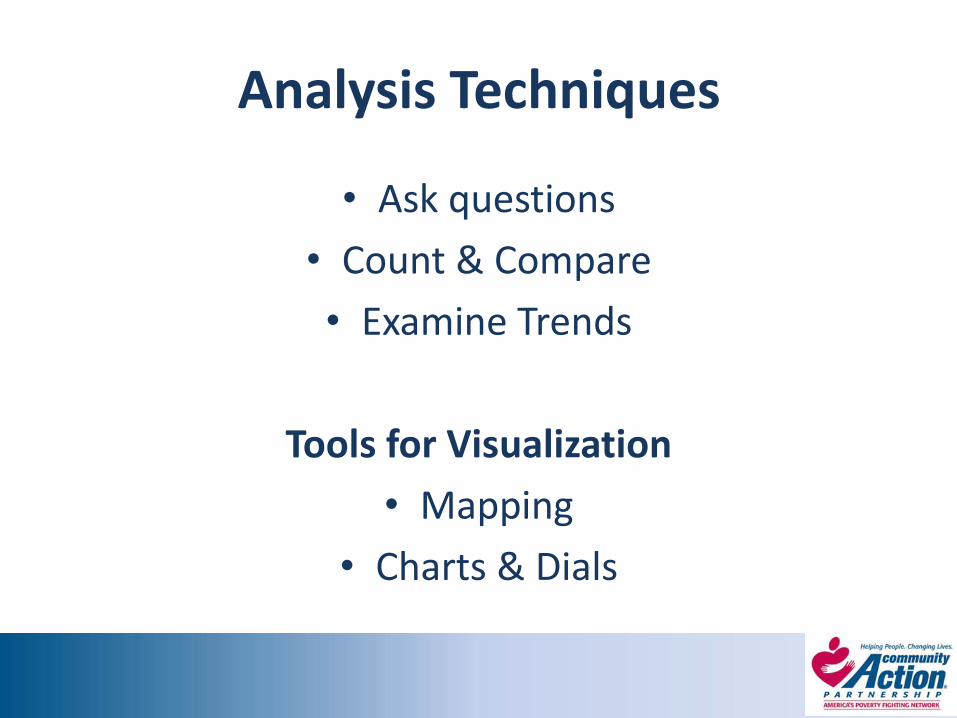
Analysis Techniques
• Ask questions
• Count & Compare
• Examine Trends
Tools for Visualization
• Mapping
• Charts & Dials
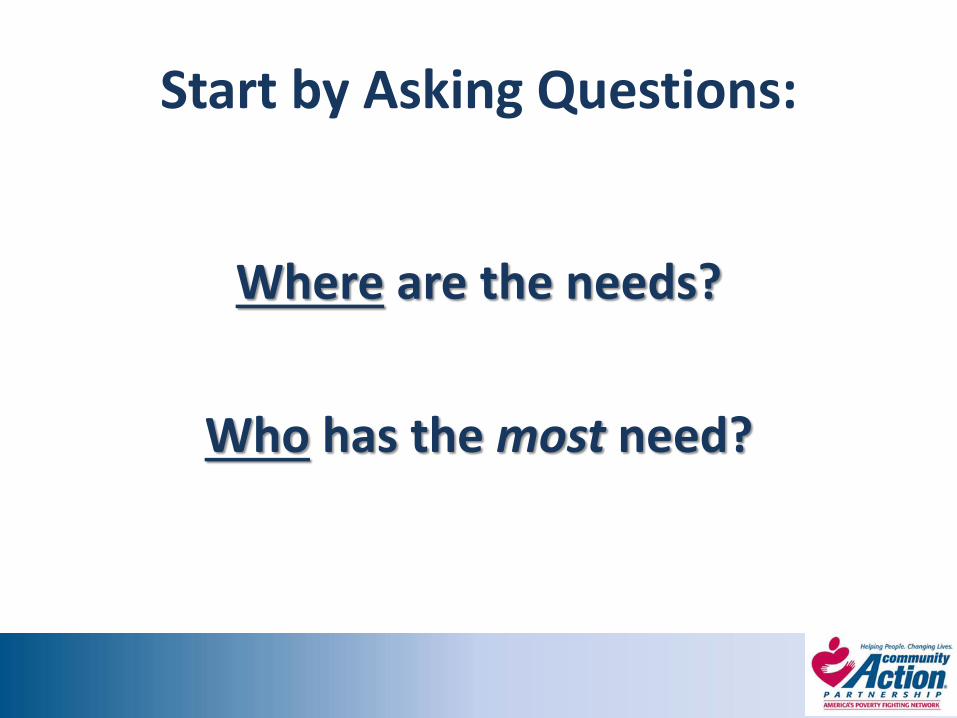
Start by Asking Questions:
Where are the needs?
Who has the most need?
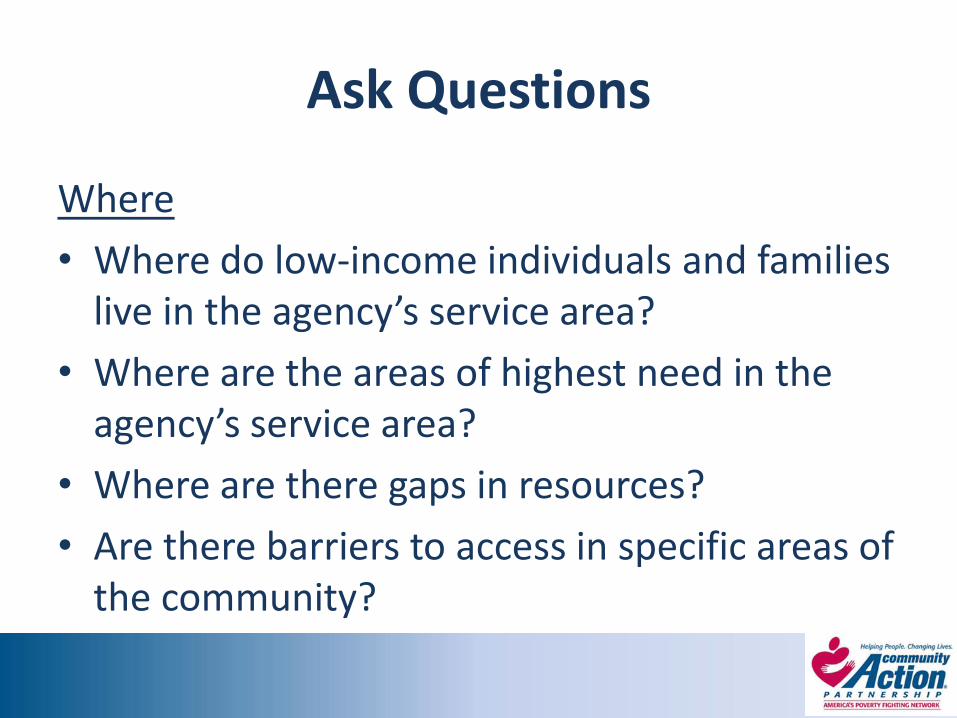
Ask Questions
Where
• Where do low-income individuals and families live in the agency’s service area?
• Where are the areas of highest need in the agency’s service area?
• Where are there gaps in resources?
• Are there barriers to access in specific areas of the community?

Ask Questions
Who
• What is the demographic breakdown of population in poverty by age?
• Are there gaps in services for specific populations (e.g. child care/early education, seniors?)
• Who are we not serving, despite data telling us there is a high need?
• Did you serve the population you thought you’d serve?
Count & Compare
Three Examples
• Compare the Areas of Need with the Location of Services and Resources
• Population profile of age demographics

Compare the Areas of Need with the Location of Services and Resources
Example: The darkest
blue/purple areas are
those with over 56
percent of the Age 0-17
population living at
below 200 percent of
the poverty level. The
location of United
Planning Organization’s
(UPO) Child Care
Center (in red) is
located in the heart of
a community with high
levels of children living
in poverty.

AREA
McDonald Co, MO
CHILDREN
50.5%
SENIORS
14.5%
ALL PERSONS
21.7%
Population profile of age demographics
Data shows that 753 of the 1,492 children in McDonald County are in
poverty.
Further, compare how many children are living in poverty under the
federal poverty guideline to how many they are serving in this county.
Compare age demographics in a certain area:
To target the appropriate population in need, the data can be broken down by
gender, ethnicity, and race in the age category:
6.15% more female children are in poverty (than male children)
12.93% more Hispanic/Latino children are in poverty (than non-
Hispanic/Latino children)
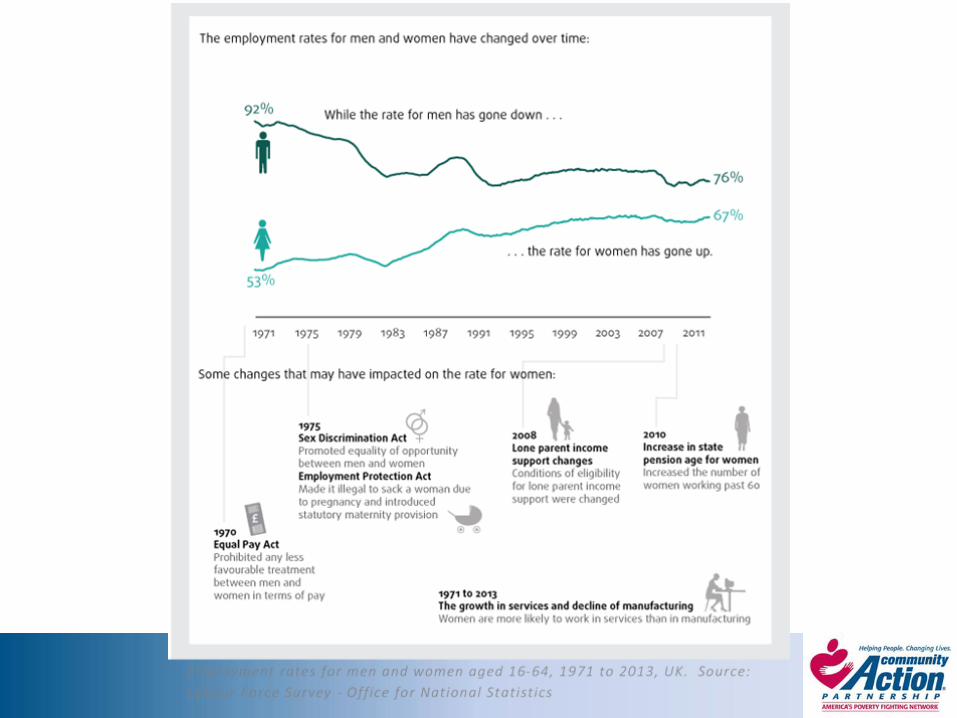
Examine Trends
• 3, 5, 10 year trends
• What has happened over time?
• What events or situations may have impacted these trends?
• What does that mean for us going forward?
Simple, FREE Tools to Visualize and Analyze
• Excel
• Community Commons


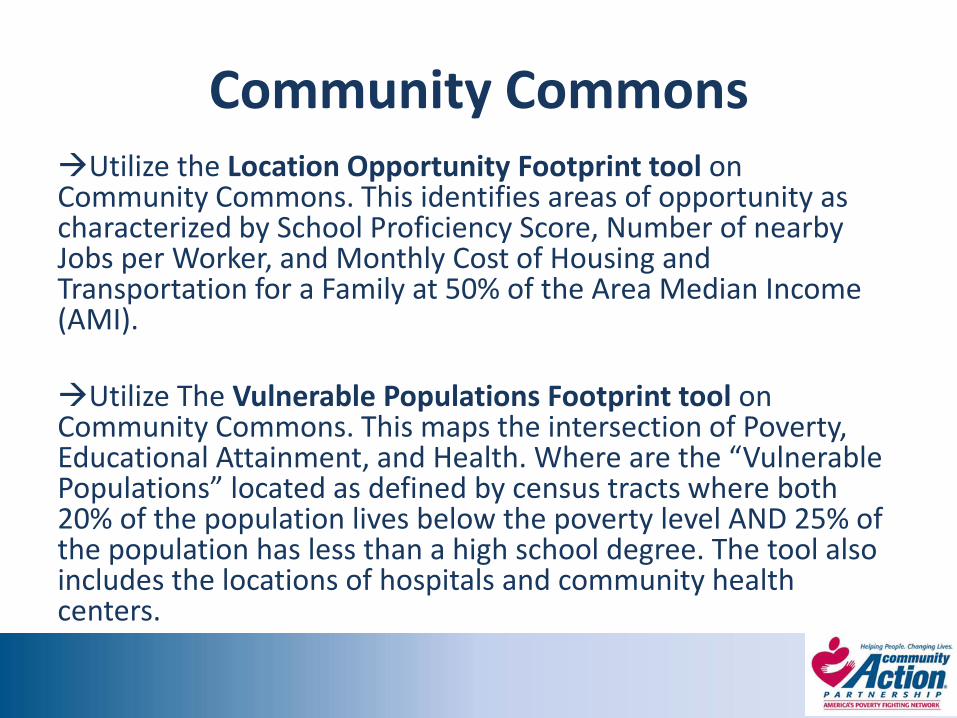
Community CommonsUtilize the Location Opportunity Footprint tool on Community Commons. This identifies areas of opportunity as characterized by School Proficiency Score, Number of nearby Jobs per Worker, and Monthly Cost of Housing and Transportation for a Family at 50% of the Area Median Income (AMI).
Utilize The Vulnerable Populations Footprint tool on Community Commons. This maps the intersection of Poverty, Educational Attainment, and Health. Where are the “Vulnerable Populations” located as defined by census tracts where both 20% of the population lives below the poverty level AND 25% of the population has less than a high school degree. The tool also includes the locations of hospitals and community health centers.
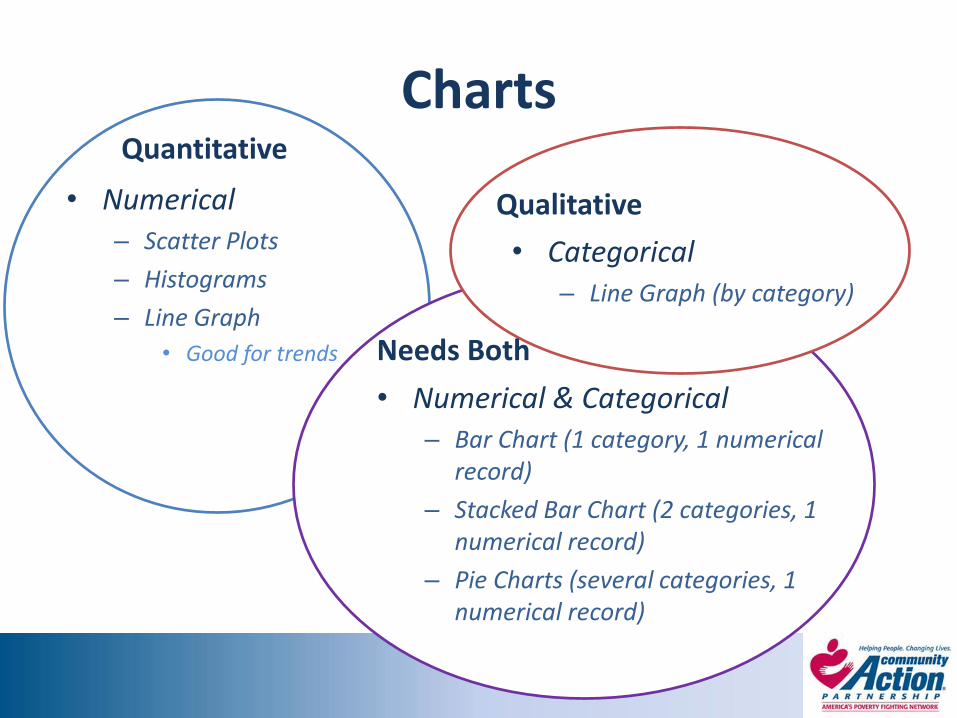
ChartsQuantitative
• Numerical– Scatter Plots
– Histograms
– Line Graph
• Good for trends
Qualitative
• Categorical– Line Graph (by category)
Needs Both
• Numerical & Categorical– Bar Chart (1 category, 1 numerical
record)
– Stacked Bar Chart (2 categories, 1 numerical record)
– Pie Charts (several categories, 1 numerical record)
COMMUNITY NEEDS ASSESSMENT
Communicating Data
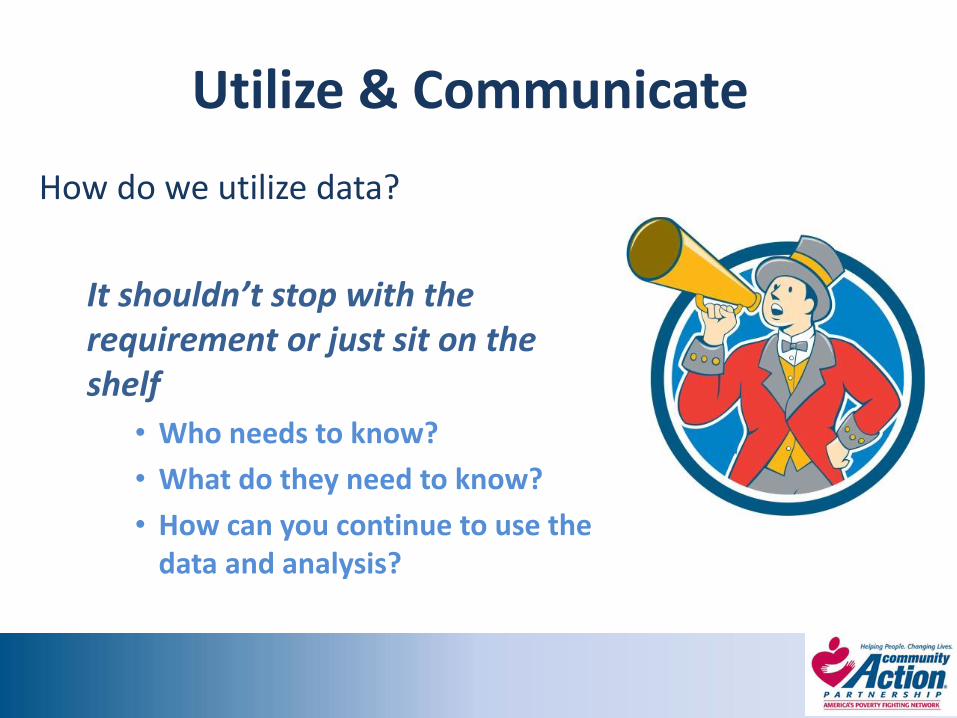
Utilize & Communicate
How do we utilize data?
It shouldn’t stop with the requirement or just sit on the shelf
• Who needs to know?
• What do they need to know?
• How can you continue to use the data and analysis?
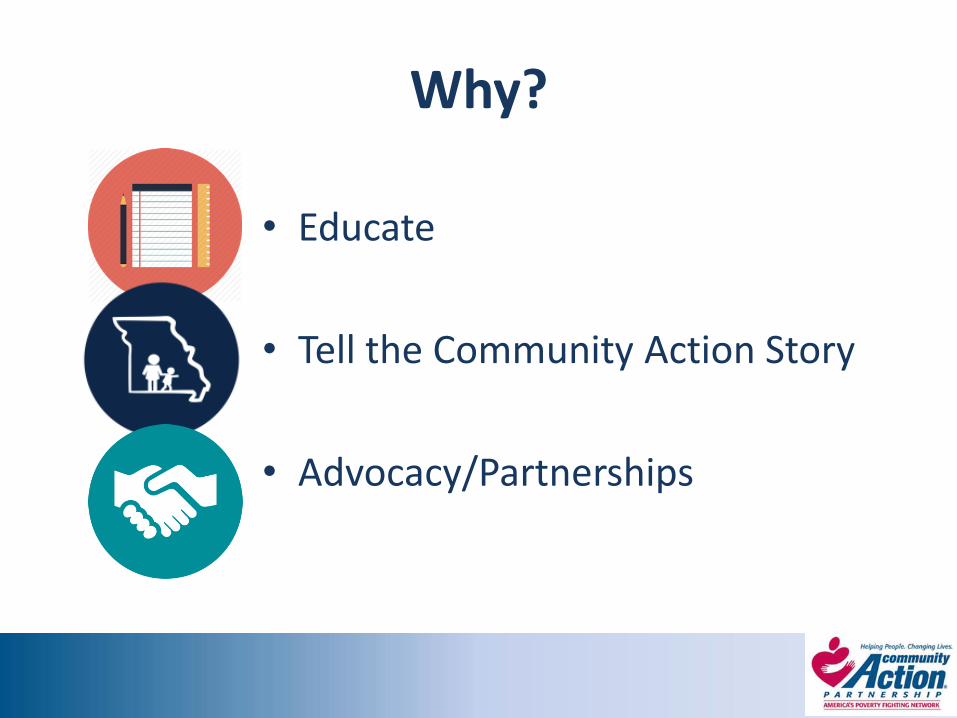
Why?
• Educate
• Tell the Community Action Story
• Advocacy/Partnerships

Who?
• Board of Directors
• Community Members
• Community Action
• Local Funders
• Elected Officials
• News Media

What?Depends on audience & purpose or goal• Board of Directors
• Full report
• Focus discussion on Key Findings
• Community Members
• Key findings
• Emphasize analysis of resources
• Recommendations
• Community Action
• Full report
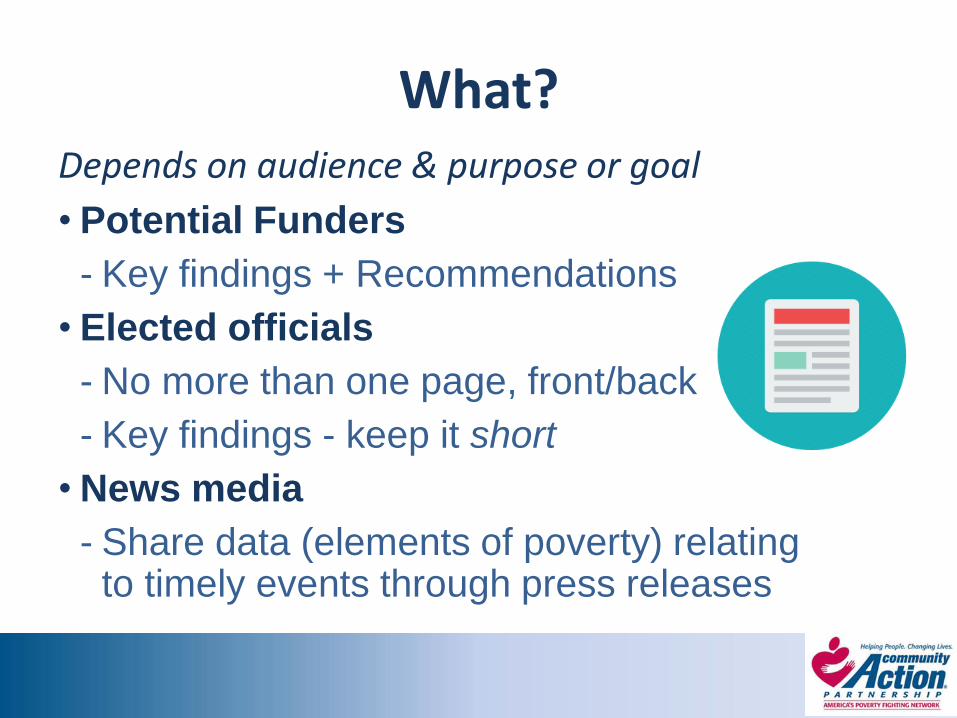
What?Depends on audience & purpose or goal
• Potential Funders
- Key findings + Recommendations
• Elected officials
- No more than one page, front/back
- Key findings - keep it short
• News media
- Share data (elements of poverty) relating to timely events through press releases
What?
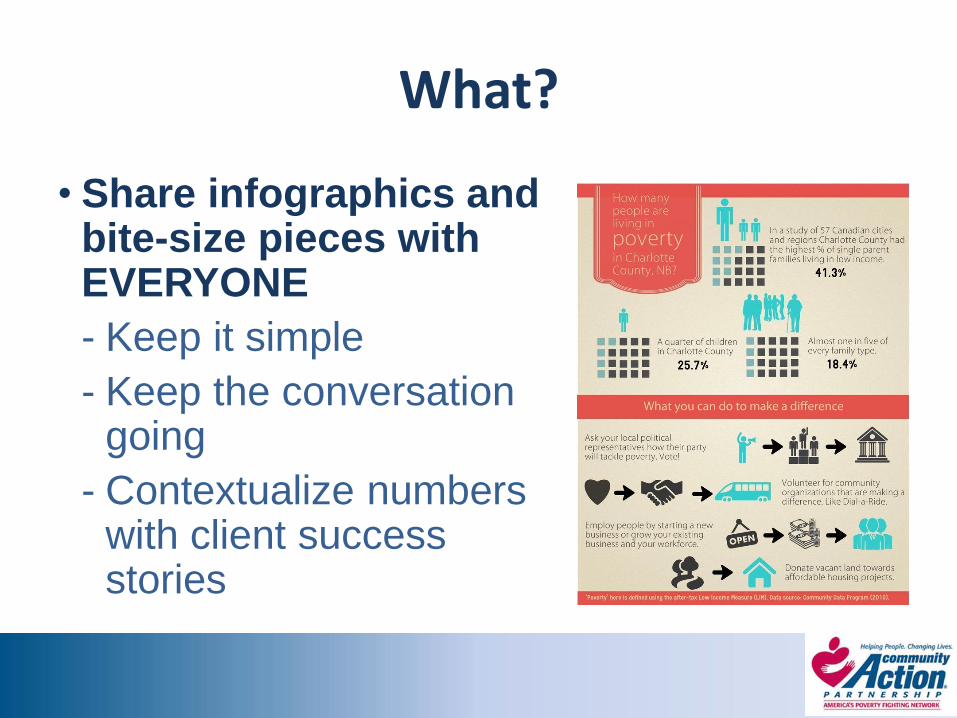
• Share infographics and bite-size pieces with EVERYONE
- Keep it simple
- Keep the conversation going
- Contextualize numbers with client success stories

When?
• Community Action Plan
• Strategic Plan
• Grant Writing
• Building Partnerships
• Advocacy
Where?
• Website
• Social Media
• Community/Advocacy Meetings
Examples & Resources
• How did <agency> address poverty in <county name>? Find out here! <link to website/infographic> #CommunityAction
• CAP/NASCP/CAPLAW Social Media Webinar
• Story Guide and Brochure from NASCP
• Check out Virtual CAP
• Infographics at Piktochart + Canva
• Check out talkpoverty.org