collecting and analyzing oracle database …® trace file analyzer collecting and analyzing oracle...
TRANSCRIPT
Oracle® Trace File AnalyzerCollecting and Analyzing Oracle DatabaseDiagnostic Data
18cE90669-07May 2018
Oracle Trace File Analyzer Collecting and Analyzing Oracle Database Diagnostic Data, 18c
E90669-07
Copyright © 2017, 2018, Oracle and/or its affiliates. All rights reserved.
Primary Author: Nirmal Kumar
Contributing Authors: Mark Bauer, Doug Williams
Contributors: Gareth Chapman, Bill Burton
This software and related documentation are provided under a license agreement containing restrictions onuse and disclosure and are protected by intellectual property laws. Except as expressly permitted in yourlicense agreement or allowed by law, you may not use, copy, reproduce, translate, broadcast, modify,license, transmit, distribute, exhibit, perform, publish, or display any part, in any form, or by any means.Reverse engineering, disassembly, or decompilation of this software, unless required by law forinteroperability, is prohibited.
The information contained herein is subject to change without notice and is not warranted to be error-free. Ifyou find any errors, please report them to us in writing.
If this is software or related documentation that is delivered to the U.S. Government or anyone licensing it onbehalf of the U.S. Government, then the following notice is applicable:
U.S. GOVERNMENT END USERS: Oracle programs, including any operating system, integrated software,any programs installed on the hardware, and/or documentation, delivered to U.S. Government end users are"commercial computer software" pursuant to the applicable Federal Acquisition Regulation and agency-specific supplemental regulations. As such, use, duplication, disclosure, modification, and adaptation of theprograms, including any operating system, integrated software, any programs installed on the hardware,and/or documentation, shall be subject to license terms and license restrictions applicable to the programs.No other rights are granted to the U.S. Government.
This software or hardware is developed for general use in a variety of information management applications.It is not developed or intended for use in any inherently dangerous applications, including applications thatmay create a risk of personal injury. If you use this software or hardware in dangerous applications, then youshall be responsible to take all appropriate fail-safe, backup, redundancy, and other measures to ensure itssafe use. Oracle Corporation and its affiliates disclaim any liability for any damages caused by use of thissoftware or hardware in dangerous applications.
Oracle and Java are registered trademarks of Oracle and/or its affiliates. Other names may be trademarks oftheir respective owners.
Intel and Intel Xeon are trademarks or registered trademarks of Intel Corporation. All SPARC trademarks areused under license and are trademarks or registered trademarks of SPARC International, Inc. AMD, Opteron,the AMD logo, and the AMD Opteron logo are trademarks or registered trademarks of Advanced MicroDevices. UNIX is a registered trademark of The Open Group.
This software or hardware and documentation may provide access to or information about content, products,and services from third parties. Oracle Corporation and its affiliates are not responsible for and expresslydisclaim all warranties of any kind with respect to third-party content, products, and services unless otherwiseset forth in an applicable agreement between you and Oracle. Oracle Corporation and its affiliates will not beresponsible for any loss, costs, or damages incurred due to your access to or use of third-party content,products, or services, except as set forth in an applicable agreement between you and Oracle.

Contents
Preface
Audience xii
Documentation Accessibility xii
Related Documentation xii
Conventions xiii
Third-Party License Information xiii
Changes in this Release for Oracle Trace File Analyzer User’sGuide 18.2.0
REST Service xiv
Oracle Cluster Health Advisor Integration xiv
New SRDCs xv
Metadata Search Capability xv
1 Oracle Trace File Analyzer
2 Getting Started with Oracle Trace File Analyzer
2.1 Supported Environments 2-1
2.2 Installing Oracle Trace File Analyzer on Linux or UNIX as root User inDaemon Mode 2-2
2.3 Installing Oracle Trace File Analyzer on Linux or UNIX as Non-root User inNon-Daemon Mode 2-3
2.4 Installing Oracle Trace File Analyzer on Microsoft Windows 2-3
2.5 Installing Oracle Trace File Analyzer on Microsoft Windows in Non-DaemonMode 2-4
2.6 Oracle Trace File Analyzer Key Directories 2-4
2.7 Oracle Trace File Analyzer Command Interfaces 2-5
2.8 Masking Sensitive Data 2-5
2.9 Securing Access to Oracle Trace File Analyzer 2-6
2.10 Uninstalling Oracle Trace File Analyzer 2-7
iii
3 Automatic Diagnostic Collections
3.1 Collecting Diagnostics Automatically 3-1
3.2 Configuring Email Notification Details 3-2
4 On-demand Analysis and Diagnostic Collection
4.1 Collecting Diagnostics and Analyzing Logs On-Demand 4-1
4.2 Viewing System and Cluster Summary 4-2
4.3 Investigating Logs for Errors 4-2
4.4 Analyzing Logs Using the Included Tools 4-4
4.5 Searching Oracle Trace File Analyzer Metadata 4-6
4.6 Collecting Diagnostic Data and Using One Command Service Request DataCollections 4-6
4.7 Uploading Collections to Oracle Support 4-11
4.8 Changing Oracle Grid Infrastructure Trace Levels 4-13
4.8.1 tfactl dbglevel 4-13
5 Maintaining Oracle Trace File Analyzer to the Latest Version
6 Performing Custom Collections
6.1 Adjusting the Diagnostic Data Collection Period 6-1
6.2 Collecting from Specific Nodes 6-2
6.3 Collecting from Specific Components 6-2
6.4 Collecting from Specific Directories 6-3
6.5 Changing the Collection Name 6-4
6.6 Preventing Copying Zip Files and Trimming Files 6-5
6.7 Performing Silent Collection 6-6
6.8 Preventing Collecting Core Files 6-6
6.9 Collecting Incident Packaging Service (IPS) Packages 6-6
7 Managing and Configuring Oracle Trace File Analyzer
7.1 Querying Oracle Trace File Analyzer Status and Configuration 7-1
7.2 Managing the Oracle Trace File Analyzer Daemon 7-3
7.3 Managing the Repository 7-4
7.3.1 Purging the Repository Automatically 7-4
7.3.2 Purging the Repository Manually 7-5
7.4 Managing Collections 7-5
7.4.1 Including Directories 7-5
iv
7.4.2 Managing the Size of Collections 7-6
7.5 Configuring the Host 7-7
7.6 Configuring the Ports 7-7
7.7 Configuring SSL and SSL Certificates 7-8
7.7.1 Configuring SSL/TLS Protocols 7-8
7.7.2 Configuring Self-Signed Certificates 7-9
7.7.3 Configuring CA-Signed Certificates 7-10
7.7.4 Configuring SSL Cipher Suite 7-11
7.8 Configuring and Using REST 7-11
7.9 REST Authentication 7-17
7.10 Configuring Email Notification Details 7-18
8 Managing Oracle Database and Oracle Grid InfrastructureDiagnostic Data
8.1 Managing Automatic Diagnostic Repository Log and Trace Files 8-1
8.2 Managing Disk Usage Snapshots 8-2
8.3 Purging Oracle Database and Oracle Grid Infrastructure Logs 8-2
9 Troubleshooting Oracle Trace File Analyzer
9.1 Cluster Nodes are Not Showing As One Cluster When Viewed by Running thetfactl status Command 9-1
9.2 Oracle Trace File Analyzer is Not Starting and the init.tfa script is MissingAfter Reboot 9-2
9.3 Error Message Similar to "Can't locate **** in @inc (@inc contains:....)" 9-2
9.4 Non-Release Update Revisions (RURs) Oracle Trace File Analyzer PatchingFails on Remote Nodes 9-3
9.5 Non-Root Access is Not Enabled After Installation 9-3
9.6 TFA_HOME and Repository Locations are Moved After Patching or Upgrade 9-4
9.7 Oracle Trace File Analyzer Fails with TFA-00103 After Applying the July 2015Release Update Revision (RUR) or Later 9-4
9.8 OSWatcher Parameters are Different After a Reboot or OtherwiseUnexpectedly Different 9-10
9.9 Oracle Trace File Analyzer Installation or Oracle Trace File AnalyzerDiscovery (tfactl rediscover) Fails on Linux 7 9-11
9.10 OSWatcher Analyzer Fails When OSWatcher is Not Running from theTFA_HOME 9-12
9.11 Oracle Trace File Analyzer Fails to Start withcom.sleepycat.je.EnvironmentLockedException Java Exception 9-12
9.12 Oracle Trace File Analyzer Startup Fails When Solution-Soft Time MachineSoftware is Installed, but Not Running on the System 9-13
9.13 Non-privileged User is Not Able to Run tfactl Commands? 9-13
v
9.14 Oracle Trace File Analyzer Daemon is Not Starting or Not Running? 9-14
A Oracle Trace File Analyzer Command-Line and Shell Options
A.1 Running Administration Commands A-2
A.1.1 tfactl diagnosetfa A-3
A.1.2 tfactl host A-3
A.1.3 tfactl set A-4
A.1.4 tfactl access A-5
A.2 Running Summary and Analysis Commands A-7
A.2.1 tfactl summary A-7
A.2.2 tfactl changes A-9
A.2.3 tfactl events A-10
A.2.4 tfactl analyze A-11
A.2.5 tfactl run A-14
A.2.6 tfactl toolstatus A-15
A.3 Running Diagnostic Collection Commands A-16
A.3.1 tfactl diagcollect A-17
A.3.2 tfactl directory A-20
A.3.3 tfactl ips A-22
A.3.3.1 tfactl ips ADD A-25
A.3.3.2 tfactl ips ADD FILE A-26
A.3.3.3 tfactl ips COPY IN FILE A-26
A.3.3.4 tfactl ips REMOVE A-27
A.3.3.5 tfactl ips REMOVE FILE A-27
A.3.3.6 tfactl ips ADD NEW INCIDENTS PACKAGE A-27
A.3.3.7 tfactl ips GET REMOTE KEYS FILE A-28
A.3.3.8 tfactl ips USE REMOTE KEYS FILE A-28
A.3.3.9 tfactl ips CREATE PACKAGE A-28
A.3.3.10 tfactl ips FINALIZE PACKAGE A-30
A.3.3.11 tfactl ips GENERATE PACKAGE A-30
A.3.3.12 tfactl ips DELETE PACKAGE A-30
A.3.3.13 tfactl ips GET MANIFEST FROM FILE A-31
A.3.3.14 tfactl ips GET METADATA A-31
A.3.3.15 tfactl ips PACK A-31
A.3.3.16 tfactl ips SET CONFIGURATION A-33
A.3.3.17 tfactl ips SHOW CONFIGURATION A-33
A.3.3.18 tfactl ips SHOW PACKAGE A-33
A.3.3.19 tfactl ips SHOW FILES PACKAGE A-34
A.3.3.20 tfactl ips SHOW INCIDENTS PACKAGE A-34
A.3.3.21 tfactl ips SHOW PROBLEMS A-34
vi
A.3.3.22 tfactl ips UNPACK FILE A-35
A.3.3.23 tfactl ips UNPACK PACKAGE A-35
A.3.4 tfactl collection A-35
A.3.5 tfactl print A-35
A.3.6 tfactl purge A-38
A.3.7 tfactl managelogs A-38
Index
vii
List of Examples
3-1 tfactl set smtp 3-3
4-1 Analyzing logs 4-2
4-2 Diagnostic Collection 4-10
4-3 One command SRDC 4-10
6-1 Show Incidents 6-7
6-2 Show Problems 6-8
6-3 Show Packages 6-9
6-4 IPS Collect 6-9
7-1 Print Configuration 7-2
7-2 tfactl set smtp 7-19
viii
List of Figures
3-1 Automatic Diagnostic Collections 3-1
4-1 On-Demand Collections 4-2
ix

List of Tables
2-1 Key Oracle Trace File Analyzer Directories 2-4
2-2 Oracle Trace File Interfaces 2-5
3-1 Log Entries that Trigger Automatic collection 3-2
3-2 tfactl diagnosetfa Command Parameters 3-3
4-1 Tools included in Linux and UNIX 4-4
4-2 Tools included in Microsoft Windows 4-5
4-3 One Command Service Request Data Collections 4-7
4-4 SRDC collections 4-9
4-5 tfactl dbglevel Command Parameters 4-14
6-1 Ways to Specify the Collection Period 6-1
6-2 Component Options 6-3
6-3 tfactl ips Command Parameters 6-6
7-1 Configuration Listing and Descriptions 7-2
7-2 REST Command Parameters 7-12
7-3 Print API 7-13
7-4 Diagcollect API 7-16
7-5 Download API 7-17
7-6 tfactl diagnosetfa Command Parameters 7-19
A-1 Basic TFACTL commands A-2
A-2 tfactl diagnosetfa Command Parameters A-3
A-3 tfactl set Command Parameters A-4
A-4 tfactl access Command Parameters A-6
A-5 tfactl analyze Command Parameters A-12
A-6 tfactl analyze -type Parameter Arguments A-13
A-7 tfactl run Command Parameters A-14
A-8 tfactl run Analysis Tools Parameters A-14
A-9 tfactl run Profiling Tools Parameters A-15
A-10 tfactl toolstatus Output A-15
A-11 tfactl directory Command Parameters A-21
A-12 tfactl ips Command Parameters A-23
A-13 tfactl ips ADD Command Parameters A-25
A-14 tfactl ips ADD FILE Command Parameters A-26
A-15 tfactl ips COPY IN FILE Command Parameters A-26
A-16 tfactl ips REMOVE Command Parameters A-27
A-17 tfactl ips ADD NEW INCIDENTS PACKAGE Command Parameters A-28
x

A-18 tfactl ips GET REMOTE KEYS FILE Command Parameters A-28
A-19 tfactl ips CREATE PACKAGE Command Parameters A-29
A-20 tfactl ips GENERATE PACKAGE Command Parameters A-30
A-21 tfactl ips DELETE PACKAGE Command Parameters A-31
A-22 tfactl ips GET MANIFEST FROM FILE Command Parameters A-31
A-23 tfactl ips PACK Command Parameters A-32
A-24 tfactl ips SET CONFIGURATION Command Parameters A-33
A-25 tfactl print Command Parameters A-36
A-26 tfactl managelogs Purge Options A-38
A-27 tfactl managelogs Show Options A-39
xi
Preface
Oracle Trace File Analyzer User’s Guide explains how to use the Oracle Trace FileAnalyzer diagnostic utility.
This Preface contains these topics:
• Audience (page xii)
• Documentation Accessibility (page xii)
• Related Documentation (page xii)
• Conventions (page xiii)
• Third-Party License Information (page xiii)
AudienceDatabase administrators can use this guide to understand how to use the OracleTrace File Analyzer. This guide assumes that you are familiar with Oracle Databaseconcepts.
Documentation AccessibilityFor information about Oracle's commitment to accessibility, visit the OracleAccessibility Program website at http://www.oracle.com/pls/topic/lookup?ctx=acc&id=docacc.
Access to Oracle Support
Oracle customers that have purchased support have access to electronic supportthrough My Oracle Support. For information, visit http://www.oracle.com/pls/topic/lookup?ctx=acc&id=info or visit http://www.oracle.com/pls/topic/lookup?ctx=acc&id=trsif you are hearing impaired.
Related DocumentationFor more information, see the following Oracle resources:
Related Topics
• Oracle Automatic Storage Management Administrator's Guide
• Oracle Database 2 Day DBA
• Oracle Database Concepts
• Oracle Database Examples Installation Guide
Preface
xii

• Oracle Database Licensing Information
• Oracle Database Release Notes
• Oracle Database Upgrade Guide
• Oracle Grid Infrastructure Installation and Upgrade Guide
• Oracle Real Application Clusters Installation Guide
ConventionsThe following text conventions are used in this document:
Convention Meaning
boldface Boldface type indicates graphical user interface elements associatedwith an action, or terms defined in text or the glossary.
italic Italic type indicates book titles, emphasis, or placeholder variables forwhich you supply particular values.
monospace Monospace type indicates commands within a paragraph, URLs, codein examples, text that appears on the screen, or text that you enter.
Third-Party License InformationOracle ORAchk and Oracle EXAchk consume third-party code. Oracle is required toprovide the following notices. Note, however, that the Oracle program license thataccompanied this product determines your right to use the Oracle program, includingthe third-party software, and the terms contained in the following notices do notchange those rights.
Python
Python version 3.6.4 license, https://documentation.help/Python-3.6.4/license.html
pexpect
pexpect version 4.4.0 license, http://pexpect.readthedocs.io/en/latest/api/pexpect.html?highlight=license
ptyprocess
ptyprocess version 0.5.1 license, https://github.com/pexpect/ptyprocess/blob/master/LICENSE
Preface
xiii
Changes in this Release for Oracle TraceFile Analyzer User’s Guide 18.2.0
This preface lists changes in Oracle® Trace File Analyzer User’s Guide 18.2.0.
• REST Service (page xiv)Oracle Trace File Analyzer now includes REST support allowing invocation andquery over HTTPS.
• Oracle Cluster Health Advisor Integration (page xiv)Oracle Trace File Analyzer now integrates with Oracle Cluster Health Advisor andconsumes the problem events that Oracle Cluster Health Advisor detects.
• New SRDCs (page xv)This release includes new SRDCs.
• Metadata Search Capability (page xv)All metadata stored in the Oracle Trace File Analyzer index is now searchableusing tfactl search -showdatatypes|-json [json_details].
REST ServiceOracle Trace File Analyzer now includes REST support allowing invocation and queryover HTTPS.
To facilitate REST support Oracle REST Data Services (ORDS) is included within theinstall.
To enable REST, start ORDS: tfactl rest -start.
REST supports printing details, starting a diagcollect, and downloading collections.
Related Topics
• Configuring and Using REST (page 7-11)Oracle Trace File Analyzer includes REST support allowing invocation and queryover HTTPS.
Oracle Cluster Health Advisor IntegrationOracle Trace File Analyzer now integrates with Oracle Cluster Health Advisor andconsumes the problem events that Oracle Cluster Health Advisor detects.
When Oracle Cluster Health Advisor detects a problem event, Oracle Trace FileAnalyzer automatically triggers relevant diagnostic collection and sends an emailnotification.
Email notification is configured through the standard Oracle Trace File Analyzernotification process.
Changes in this Release for Oracle Trace File Analyzer User’s Guide 18.2.0
xiv
New SRDCsThis release includes new SRDCs.
• ORA-01031 for ORA-01031 errors
• ORA-01578 for ORA-01578 errors
• ORA-08102 for ORA-08102 errors
• ORA-08103 for ORA-08103 errors
• dbblockcorruption for problems showing alert log messages of Corrupt blockrelative dba
• dbfs for ASM, DBFS, DNFS, and ACFS problems
• dbpartition for create/maintain partitioned/subpartitioned table/index problems
• dbpartitionperf for slow create/alter/drop commands against partitioned table/index
• dbsqlperf for SQL performance problems
• dbundocorruption for UNDO corruption problems
• esexalogic for Oracle Exalogic full Exalogs data collection information
• listener_services for listener errors: TNS-12516, TNS-12518, TNS-12519, andTNS-12520
• naming_services for naming service errors: ORA-12154, ORA-12514, and ORA-12528
• dbaudit standard information for Oracle Database auditing
Additionally, a number of the existing RMAN related SRDCs have been collapsed intofewer SRDCs:
• dbrman for RMAN related issues, such as backup, maintenance, restore andrecover, RMAN-08137 or RMAN-08120
• dbrman600 for RMAN-00600 error
• dbrmanperf for RMAN performance problems
As with all other SRDCs, use tfactl diagcollect -srdc srdc_name.
Related Topics
• Collecting Diagnostic Data and Using One Command Service Request DataCollections (page 4-6)
Metadata Search CapabilityAll metadata stored in the Oracle Trace File Analyzer index is now searchable usingtfactl search -showdatatypes|-json [json_details].
You can search for all events for a particular Oracle Database between certain dates,for example,
tfactl search -json '{ "data_type":"event",
Changes in this Release for Oracle Trace File Analyzer User’s Guide 18.2.0
xv
"content":"oracle", "database":"rac11g", "from":"01/20/2017 00:00:00", "to":"12/20/2018 00:00:00" }'
To list all index events: tfactl search -json '{"data_type":"event"}'
To list all available datatypes: tfactl search -showdatatypes
Changes in this Release for Oracle Trace File Analyzer User’s Guide 18.2.0
xvi
1Oracle Trace File Analyzer
Oracle Trace File Analyzer helps you collect and analyze diagnostic data.
As a DBA, you are expected to do more work with fewer resources all the time. Youare under pressure to keep the mission-critical applications up and running. Whensomething goes wrong, everyone looks to you to understand what went wrong andhow to fix it.
It is not always easy. You have to run the right tools at the right time. If you're usingOracle Grid Infrastructure, then you also have to collect diagnostic data from all thedatabase nodes. Collecting this data can require you to use tools that you rarely use.Needless to say, each tool has its own syntax.
The amount of data you collect can be huge. Only a fraction of the data that youcollect is useful, but how can you know which part is relevant? You must collect it all,quickly, before the data is overwritten. In the meantime, you have still got a problemthat costs your company time and money.
Oracle Trace File Analyzer enables you to collect diagnostic data. Collectingdiagnostic data is a crucial step to resolving problems that occur with your OracleDatabase.
Oracle Trace File Analyzer monitors your logs for significant problems that potentiallyimpact your service. Oracle Trace File Analyzer also automatically collects relevantdiagnostics when it detects any potential problems.
Oracle Trace File Analyzer can identify the relevant information in log files. It trims logfiles to just the parts that are necessary to resolve an issue. Oracle Trace FileAnalyzer also collects data across cluster nodes and consolidates everything in oneplace.
Using important database diagnostic tools is easy with Oracle Trace File Analyzer.Oracle Trace File Analyzer hides the complexity by providing a single interface andsyntax for them all.
1-1

2Getting Started with Oracle Trace FileAnalyzer
This section explains how to install Oracle Trace File Analyzer on different operatingsystems.
• Supported Environments (page 2-1)You can use Oracle Trace File Analyzer with all supported versions of OracleDatabase and Oracle Grid Infrastructure.
• Installing Oracle Trace File Analyzer on Linux or UNIX as root User in DaemonMode (page 2-2)To obtain the fullest capabilities of Oracle Trace File Analyzer, install it as root.
• Installing Oracle Trace File Analyzer on Linux or UNIX as Non-root User in Non-Daemon Mode (page 2-3)If you are unable to install as root, then install Oracle Trace File Analyzer as theOracle home owner.
• Installing Oracle Trace File Analyzer on Microsoft Windows (page 2-3)
• Installing Oracle Trace File Analyzer on Microsoft Windows in Non-Daemon Mode(page 2-4)
• Oracle Trace File Analyzer Key Directories (page 2-4)Based on your installation type, the ora_home and the bin directories can differ.
• Oracle Trace File Analyzer Command Interfaces (page 2-5)The tfactl tool functions as command-line interface, shell interface, and menuinterface.
• Masking Sensitive Data (page 2-5)Masking sensitive data is an optional feature that you can configure Oracle TraceFile Analyzer to mask sensitive data in log files.
• Securing Access to Oracle Trace File Analyzer (page 2-6)Running tfactl commands is restricted to authorized users.
• Uninstalling Oracle Trace File Analyzer (page 2-7)
2.1 Supported EnvironmentsYou can use Oracle Trace File Analyzer with all supported versions of OracleDatabase and Oracle Grid Infrastructure.
Oracle Trace File Analyzer works on the following operating systems:
• Linux OEL
• Linux RedHat
• Linux SuSE
• Linux Itanium
2-1

• zLinux
• Oracle Solaris SPARC
• Oracle Solaris x86-64
• AIX
• HPUX Itanium
• HPUX PA-RISC
• Microsoft Windows 64-bit
Oracle Trace File Analyzer is supported on the operating system versions supportedby Oracle Database. Use a Java Runtime Edition of version 1.8.
Oracle Trace File Analyzer is shipped with Oracle Gird Infrastructure since versions11.2.0.4 and 12.1.0.2. However, this install does not include many of the OracleDatabase tools. Oracle releases new versions of Oracle Trace File Analyzer severaltimes a year. These new releases include new features and bug fixes.
Ensure that you get the latest Oracle Trace File Analyzer with Oracle Databasesupport tools bundle from My Oracle Support note 1513912.1.
Related Topics
• https://support.oracle.com/rs?type=doc&id=1513912.1
2.2 Installing Oracle Trace File Analyzer on Linux or UNIXas root User in Daemon Mode
To obtain the fullest capabilities of Oracle Trace File Analyzer, install it as root.
Oracle Trace File Analyzer maintains Access Control Lists (ACLs) to determine whichusers are allowed access. By default, the GRID_HOME owner and ORACLE_HOME ownerhave access to their respective diagnostics. No other users can perform diagnosticcollections.
If Oracle Trace File Analyzer is already installed, then reinstalling performs an upgradeto the existing location. If Oracle Trace File Analyzer is not already installed, then therecommended location is /opt/oracle.tfa.
To install as root:
1. Download appropriate Oracle Trace File Analyzer zipped file, copy thedownloaded file to the required machine, and then unzip.
2. Run the installTFA command:
$ ./installTFAplatform
The installation prompts you to do a local or cluster install.
Cluster install requires passwordless SSH user equivalency for root to all clusternodes. If not already configured, then the installation optionally sets up passwordlessSSH user equivalency and then removes at the end.
If you do not wish to use passwordless SSH, then you install on each host using alocal install. Run the tfactl syncnodes command to generate and deploy relevant SSLcertificates.
Chapter 2Installing Oracle Trace File Analyzer on Linux or UNIX as root User in Daemon Mode
2-2

The Cluster Ready Services (CRS) do not manage Oracle Trace File Analyzerbecause Oracle Trace File Analyzer must be available if CRS goes down.
The installation configures Oracle Trace File Analyzer for auto-start. Theimplementation of auto-start is platform-dependent. Linux uses init, or an initreplacement, such as upstart or systemd. Microsoft Windows uses a Windows service.
Related Topics
• Securing Access to Oracle Trace File Analyzer (page 2-6)Running tfactl commands is restricted to authorized users.
2.3 Installing Oracle Trace File Analyzer on Linux or UNIXas Non-root User in Non-Daemon Mode
If you are unable to install as root, then install Oracle Trace File Analyzer as theOracle home owner.
Oracle Trace File Analyzer has reduced capabilities in this installation mode.
You cannot complete the following tasks:
• Automate diagnostic collections
• Collect diagnostics from remote hosts
• Collect files that are not readable by the Oracle home owner, forexample, /var/log/messages, or certain Oracle Grid Infrastructure logs
To install as the Oracle home owner, use the –extractto option. Using the –extracttooption tells Oracle Trace File Analyzer where to install to. Also, use the –javahomeoption to indicate which JRE to use. Use the JRE already available in the Oraclehome, unless you have a later version available.
./installTFAplatform -extractto install_dir -javahome jre_home
2.4 Installing Oracle Trace File Analyzer on MicrosoftWindows
1. Download appropriate Oracle Trace File Analyzer zipped file, copy thedownloaded file to one of the required machines, and then unzip.
2. Open a command prompt as administrator and then run the installation script byspecifying a Perl home.
For example:
install.bat -perlhome D:\oracle\product\12.2.0\dbhome_1\perl
The installer prompts you to do a local or cluster install. If you select cluster install,then the installer installs Oracle Trace File Analyzer on local and remote cluster nodes.
Alternatively, you can perform a local install on each host. Run the tfactl syncnodescommand to generate and deploy relevant SSL certificates.
Chapter 2Installing Oracle Trace File Analyzer on Linux or UNIX as Non-root User in Non-Daemon Mode
2-3
2.5 Installing Oracle Trace File Analyzer on MicrosoftWindows in Non-Daemon Mode
If you do not want Oracle Trace File Analyzer to run automatically as a windowsservice, then install it in non-daemon mode. Oracle Trace File Analyzer has reducedcapabilities in this installation mode.
You cannot complete the following tasks:
• Automate diagnostic collections
• Collect diagnostics from remote hosts
• Collect files that are not readable by the Oracle home owner
1. Download appropriate Oracle Trace File Analyzer zipped file, copy thedownloaded file to one of the required machines, and then unzip.
2. Open a command prompt as administrator and then run the installation script.
tfa_home\bin\tfactl.bat -setupnd
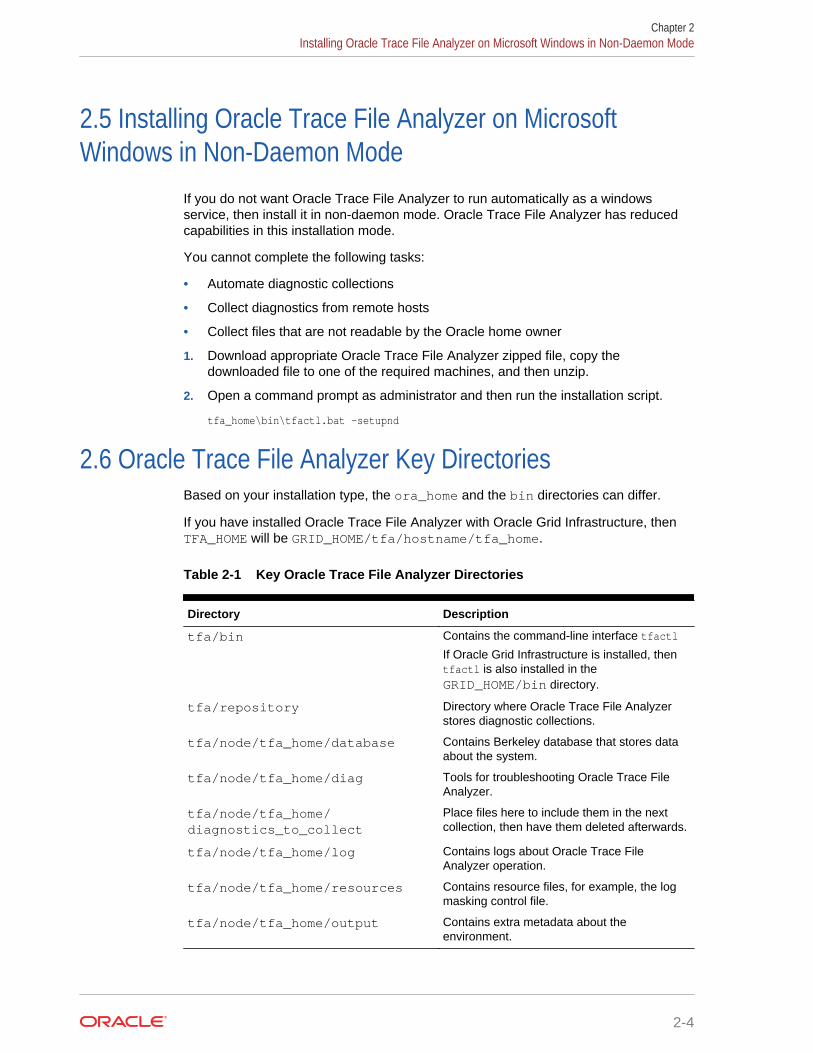
2.6 Oracle Trace File Analyzer Key DirectoriesBased on your installation type, the ora_home and the bin directories can differ.
If you have installed Oracle Trace File Analyzer with Oracle Grid Infrastructure, thenTFA_HOME will be GRID_HOME/tfa/hostname/tfa_home.
Table 2-1 Key Oracle Trace File Analyzer Directories
Directory Description
tfa/bin Contains the command-line interface tfactl
If Oracle Grid Infrastructure is installed, thentfactl is also installed in theGRID_HOME/bin directory.
tfa/repository Directory where Oracle Trace File Analyzerstores diagnostic collections.
tfa/node/tfa_home/database Contains Berkeley database that stores dataabout the system.
tfa/node/tfa_home/diag Tools for troubleshooting Oracle Trace FileAnalyzer.
tfa/node/tfa_home/diagnostics_to_collect
Place files here to include them in the nextcollection, then have them deleted afterwards.
tfa/node/tfa_home/log Contains logs about Oracle Trace FileAnalyzer operation.
tfa/node/tfa_home/resources Contains resource files, for example, the logmasking control file.
tfa/node/tfa_home/output Contains extra metadata about theenvironment.
Chapter 2Installing Oracle Trace File Analyzer on Microsoft Windows in Non-Daemon Mode
2-4

2.7 Oracle Trace File Analyzer Command InterfacesThe tfactl tool functions as command-line interface, shell interface, and menuinterface.
Table 2-2 Oracle Trace File Interfaces
Interface Command How to use
Command-line $ tfactl command Specify all command options at thecommand line.
Shell interface $ tfactl Set and change the context and thenrun commands from within the shell.
Menu Interface $ tfactl menu Select the menu navigation options andthen choose the command that youwant to run.
2.8 Masking Sensitive DataMasking sensitive data is an optional feature that you can configure Oracle Trace FileAnalyzer to mask sensitive data in log files.
Oracle Trace File Analyzer masks information such as host names or IP addressesand replaces sensitive data consistently throughout all files. Replacing consistentlymeans that the information is still relevant and useful for the purposes of diagnosiswithout sharing any sensitive data.
To configure masking:
1. Create a file called mask_strings.xml in the directory tfa_home/resources.
2. Define a mask_strings element then within that a mask_string element, withoriginal and replacement for each string you wish to replace:
For example:
<mask_strings> <mask_string> <original>WidgetNode1</original> <replacement>Node1</replacement> </mask_string> <mask_string> <original>192.168.5.1</original> <replacement>Node1-IP</replacement> </mask_string> <mask_string> <original>WidgetNode2</original> <replacement>Node2</replacement> </mask_string> <mask_string> <original>192.168.5.2</original> <replacement>Node2-IP</replacement> </mask_string></mask_strings>
Chapter 2Oracle Trace File Analyzer Command Interfaces
2-5

Oracle Trace File Analyzer automatically locates the mask_strings.xml files,and starts replacing the sensitive data in the diagnostics it collects.
2.9 Securing Access to Oracle Trace File AnalyzerRunning tfactl commands is restricted to authorized users.
tfactl provides a command-line interface and shell to do the following:
• Run diagnostics and collect all relevant log data from a time of your choosing
• Trim log files around the time, collecting only what is necessary for diagnosis
• Collect and package all trimmed diagnostics from any desired nodes in the clusterand consolidate everything in one package on a single node
Authorized non-root users can run a subset of the tfactl commands. All other tfactlcommands require root access. Users who are not authorized cannot run any tfactlcommand.
By default, the following users are authorized to access a subset of tfactl commands:
• Oracle Grid Infrastructure home owner
• Oracle Database home owners
User access is applicable only if Oracle Trace File Analyzer is installed as root onLinux and UNIX. User access is not applicable if Oracle Trace File Analyzer is installedas non-root, or on Microsoft Windows.
To provision user access to tfactl:
• To list the users who have access to tfactl:
tfactl access lsusers
• To add a user to access tfactl:
tfactl access add –user user [-local]
By default, access commands apply to cluster-wide unless –local is used torestrict to local node.
• To remove a user from accessing tfactl:
tfactl access remove –user user [-local]
• To remove all users from accessing tfactl:
tfactl access removeall [-local]
• To reset user access to default:
tfactl access reset
• To enable user access:
tfactl access enable
• To disable user access:
tfactl access disable
Chapter 2Securing Access to Oracle Trace File Analyzer
2-6
Related Topics
• tfactl access (page A-5)Use the tfactl access command to allow non-root users to have controlled accessto Oracle Trace File Analyzer, and to run diagnostic collections.
2.10 Uninstalling Oracle Trace File Analyzer1. To uninstall Oracle Trace File Analyzer, run the uninstall command as root, or
install user.
$ tfactl uninstall
Chapter 2Uninstalling Oracle Trace File Analyzer
2-7
3Automatic Diagnostic Collections
Oracle Trace File Analyzer monitors your logs for significant problems, such asinternal errors like ORA-00600, or node evictions.
• Collecting Diagnostics Automatically (page 3-1)This section explains automatic diagnostic collection concepts.
• Configuring Email Notification Details (page 3-2)Configure Oracle Trace File Analyzer to send an email to the registered emailaddress after an automatic collection completes.
3.1 Collecting Diagnostics AutomaticallyThis section explains automatic diagnostic collection concepts.
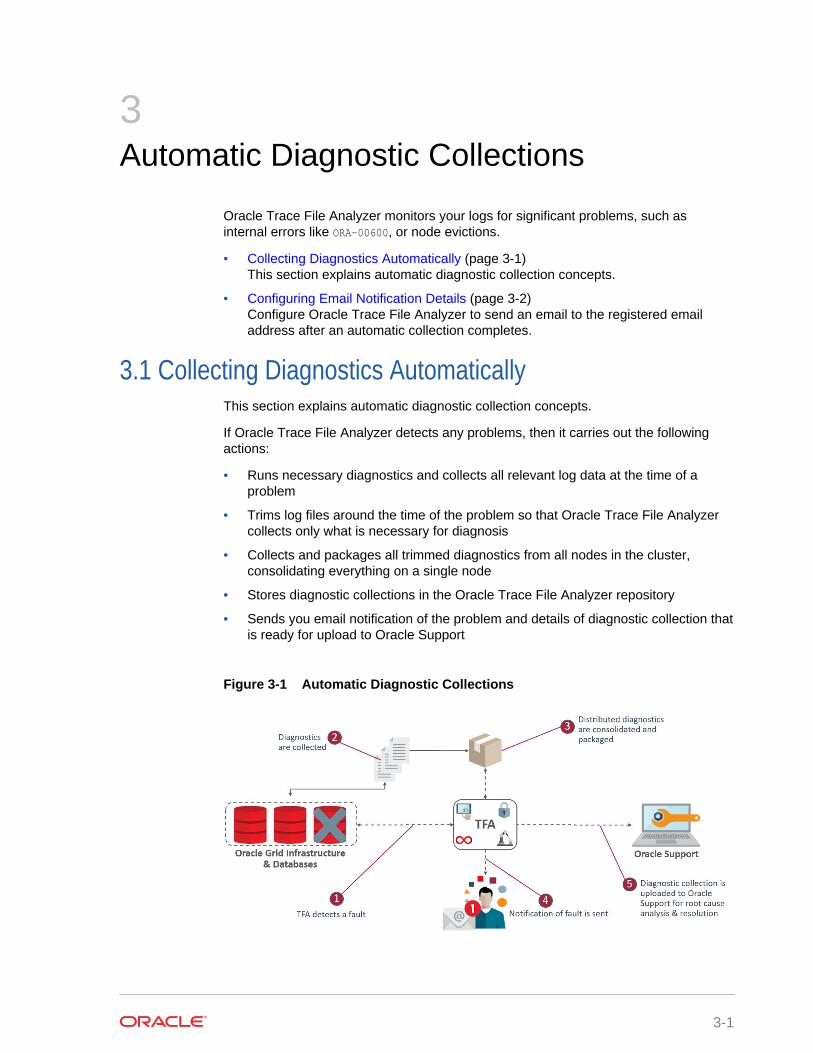
If Oracle Trace File Analyzer detects any problems, then it carries out the followingactions:
• Runs necessary diagnostics and collects all relevant log data at the time of aproblem
• Trims log files around the time of the problem so that Oracle Trace File Analyzercollects only what is necessary for diagnosis
• Collects and packages all trimmed diagnostics from all nodes in the cluster,consolidating everything on a single node
• Stores diagnostic collections in the Oracle Trace File Analyzer repository
• Sends you email notification of the problem and details of diagnostic collection thatis ready for upload to Oracle Support
Figure 3-1 Automatic Diagnostic Collections
3-1

Oracle Trace File Analyzer uses a flood control mechanism. Repeated errors do notflood the system with automatic collections.
Identifying an event triggers the start point for a collection and five minutes later OracleTrace File Analyzer starts collecting diagnostic data. Starting five minutes later is tocapture any other relevant events together. If events are still occurring after fiveminutes, then diagnostic collection continues to wait. Oracle Trace File Analyzer waitsfor 30 seconds with no events occurring, up to a further five minutes.
If events are still occurring after 10 minutes, then a diagnostic collection happens. Anew collection point starts.
After the collection is complete, Oracle Trace File Analyzer sends email notificationthat includes the location of the collection, to the relevant recipients.
If your environment can make a connection to oracle.com, you can then use OracleTrace File Analyzer to upload the collection to a Service Request.
$ tfactl set autodiagcollect=ON|OFF
Automatic collections are ON by default.
Table 3-1 Log Entries that Trigger Automatic collection
String Pattern Log Monitored
ORA-297(01|02|03|08|09|10|40)
ORA-00600
ORA-07445
ORA-04(69|([7-8][0-9]|9([0-3]|[5-8])))
ORA-32701
ORA-00494
System State dumped
Alert Log - Oracle Database
Alert Log - Oracle ASM
Alert Log - Oracle ASM Proxy
Alert Log - Oracle ASM IOServer
CRS-016(07|10|11|12) Alert Log - CRS
Additionally, when Oracle Cluster Health Advisor detects a problem event, OracleTrace File Analyzer automatically triggers the relevant diagnostic collection.
Related Topics
• Uploading Collections to Oracle Support (page 4-11)To enable collection uploads, configure Oracle Trace File Analyzer with your MyOracle Support user name and password.
3.2 Configuring Email Notification DetailsConfigure Oracle Trace File Analyzer to send an email to the registered email addressafter an automatic collection completes.
To send emails, configure the system on which Oracle Trace Analyzer is running. Youmust configure notification with a user email address to enable it to work.
To configure email notification details:
1. To set the notification email to use for a specific ORACLE_HOME, include the operatingsystem owner in the command:
Chapter 3Configuring Email Notification Details
3-2
tfactl set notificationAddress=os_user:email
For example:
tfactl set notificationAddress=oracle:[email protected]
2. To set the notification email to use for any ORACLE_HOME:
tfactl set notificationAddress=email
For example:
tfactl set [email protected]
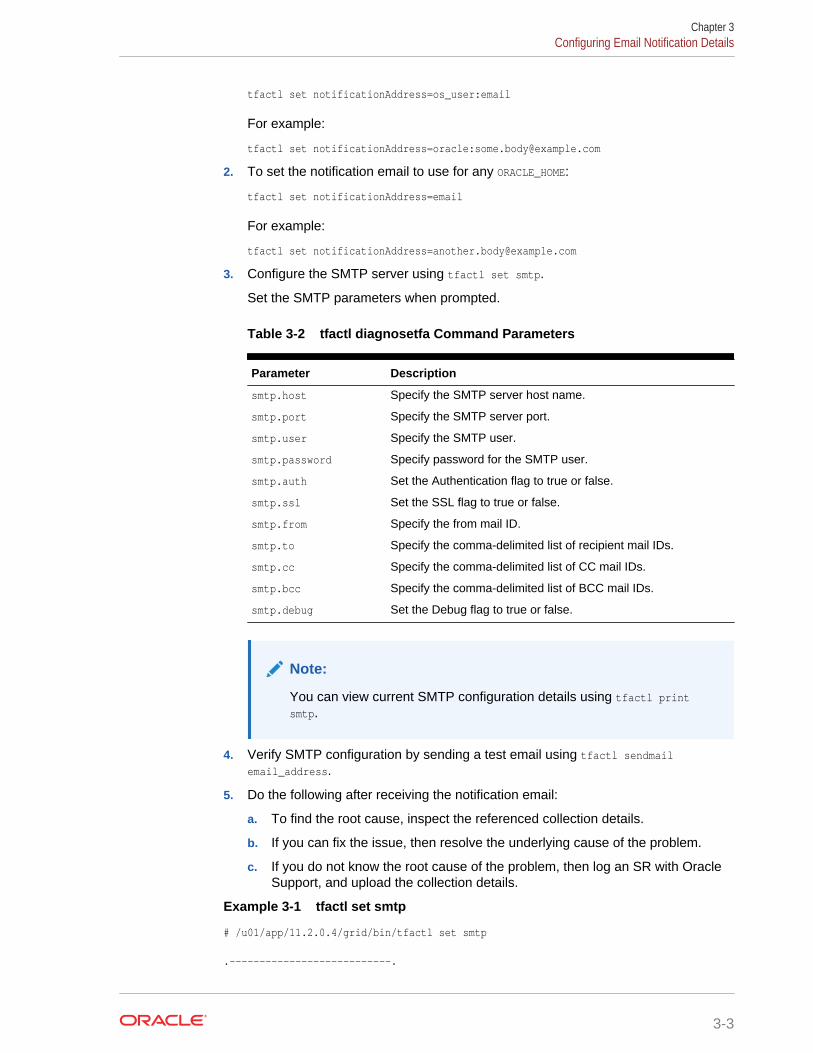
3. Configure the SMTP server using tfactl set smtp.
Set the SMTP parameters when prompted.
Table 3-2 tfactl diagnosetfa Command Parameters
Parameter Description
smtp.host Specify the SMTP server host name.
smtp.port Specify the SMTP server port.
smtp.user Specify the SMTP user.
smtp.password Specify password for the SMTP user.
smtp.auth Set the Authentication flag to true or false.
smtp.ssl Set the SSL flag to true or false.
smtp.from Specify the from mail ID.
smtp.to Specify the comma-delimited list of recipient mail IDs.
smtp.cc Specify the comma-delimited list of CC mail IDs.
smtp.bcc Specify the comma-delimited list of BCC mail IDs.
smtp.debug Set the Debug flag to true or false.
Note:
You can view current SMTP configuration details using tfactl printsmtp.
4. Verify SMTP configuration by sending a test email using tfactl sendmailemail_address.
5. Do the following after receiving the notification email:
a. To find the root cause, inspect the referenced collection details.
b. If you can fix the issue, then resolve the underlying cause of the problem.
c. If you do not know the root cause of the problem, then log an SR with OracleSupport, and upload the collection details.
Example 3-1 tfactl set smtp
# /u01/app/11.2.0.4/grid/bin/tfactl set smtp
.---------------------------.
Chapter 3Configuring Email Notification Details
3-3
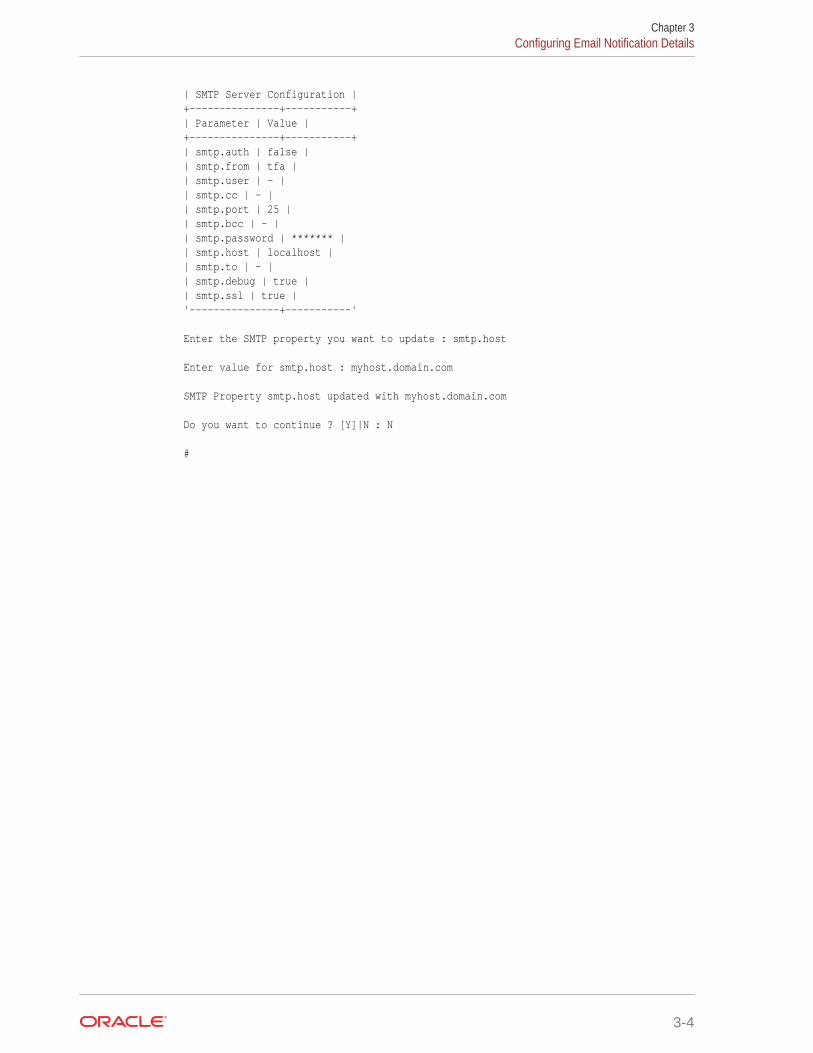
| SMTP Server Configuration |+---------------+-----------+| Parameter | Value |+---------------+-----------+| smtp.auth | false || smtp.from | tfa || smtp.user | - || smtp.cc | - || smtp.port | 25 || smtp.bcc | - || smtp.password | ******* || smtp.host | localhost || smtp.to | - || smtp.debug | true || smtp.ssl | true |'---------------+-----------'
Enter the SMTP property you want to update : smtp.host
Enter value for smtp.host : myhost.domain.com
SMTP Property smtp.host updated with myhost.domain.com
Do you want to continue ? [Y]|N : N
#
Chapter 3Configuring Email Notification Details
3-4

4On-demand Analysis and DiagnosticCollection
Run Oracle Trace File Analyzer on demand using tfactl command-line tool.
• Collecting Diagnostics and Analyzing Logs On-Demand (page 4-1)The tfactl command can use a combination of different database command toolswhen it performs analysis.
• Viewing System and Cluster Summary (page 4-2)The summary command gives you a real-time report of system and cluster status.
• Investigating Logs for Errors (page 4-2)Use Oracle Trace File Analyzer to analyze all your logs across your cluster toidentify recent errors.
• Analyzing Logs Using the Included Tools (page 4-4)Oracle Database support tools bundle is available only when you download OracleTrace File Analyzer from My Oracle Support note 1513912.1.
• Searching Oracle Trace File Analyzer Metadata (page 4-6)You can search all metadata stored in the Oracle Trace File Analyzer index usingtfactl search -showdatatypes|-json [json_details].
• Collecting Diagnostic Data and Using One Command Service Request DataCollections (page 4-6)
• Uploading Collections to Oracle Support (page 4-11)To enable collection uploads, configure Oracle Trace File Analyzer with your MyOracle Support user name and password.
• Changing Oracle Grid Infrastructure Trace Levels (page 4-13)Enabling trace levels enables you to collect enough diagnostics to diagnose thecause of the problem.
4.1 Collecting Diagnostics and Analyzing Logs On-DemandThe tfactl command can use a combination of different database command toolswhen it performs analysis.
The tfactl command enables you to access all tools using common syntax. Usingcommon syntax hides the complexity of the syntax differences between the tools.
Use the Oracle Trace File Analyzer tools to perform analysis and resolve problems. Ifyou need more help, then use the tfactl command to collect diagnostics for OracleSupport.
Oracle Trace File Analyzer does the following:
• Collects all relevant log data from a time of your choosing.
• Trims log files around the time, collecting only what is necessary for diagnosis.
• Packages all diagnostics on the node where tfactl was run from.
4-1

Figure 4-1 On-Demand Collections
4.2 Viewing System and Cluster SummaryThe summary command gives you a real-time report of system and cluster status.
Syntax
tfactl summary [options]
For more help use:
tfactl summary -help
4.3 Investigating Logs for ErrorsUse Oracle Trace File Analyzer to analyze all your logs across your cluster to identifyrecent errors.
1. To find all errors in the last one day:
$ tfactl analyze –last 1d
2. To find all errors over a specified duration:
$ tfactl analyze –last 18h
3. To find all occurrences of a specific error on any node, for example, to reportORA-00600 errors:
$ tfactl analyze -search “ora-00600" -last 8h
Example 4-1 Analyzing logs
tfactl analyze –last 14d
Jun/02/2016 11:44:39 to Jun/16/2016 11:44:39 tfactl> analyze -last 14dINFO: analyzing all (Alert and Unix System Logs) logs for the last 20160 minutes... Please wait...INFO: analyzing host: myserver69
Report title: Analysis of Alert,System Logs
Chapter 4Viewing System and Cluster Summary
4-2
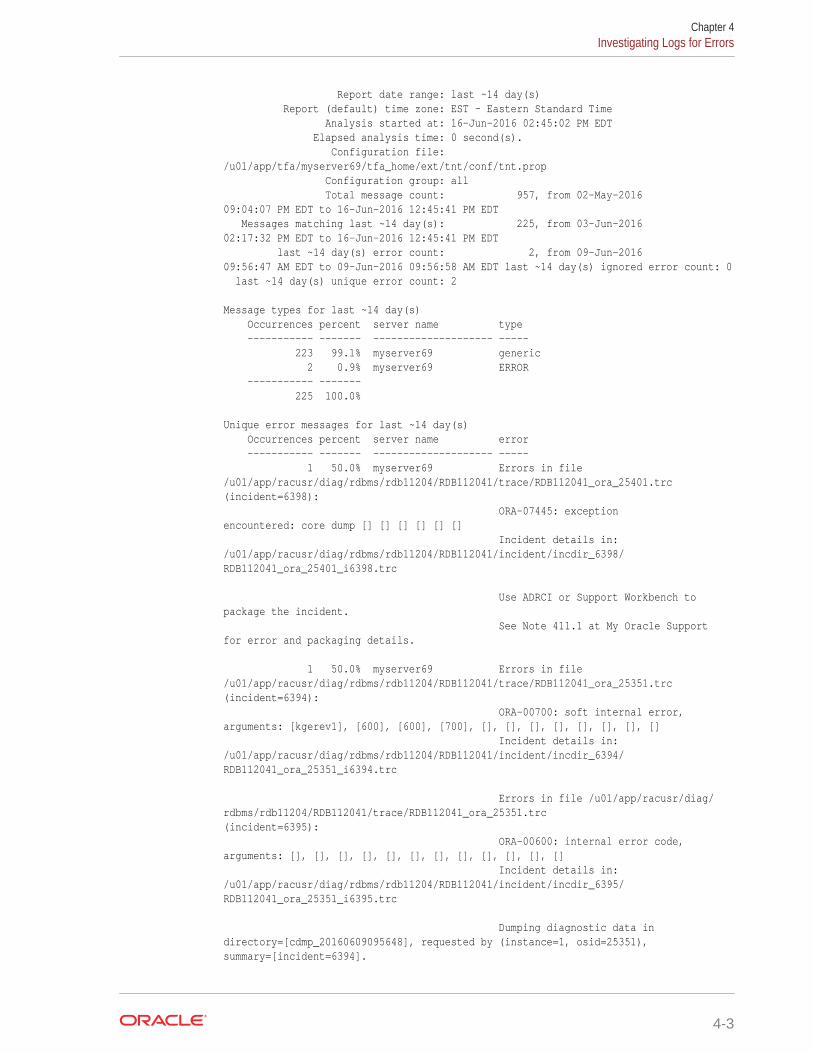
Report date range: last ~14 day(s) Report (default) time zone: EST - Eastern Standard Time Analysis started at: 16-Jun-2016 02:45:02 PM EDT Elapsed analysis time: 0 second(s). Configuration file: /u01/app/tfa/myserver69/tfa_home/ext/tnt/conf/tnt.prop Configuration group: all Total message count: 957, from 02-May-2016 09:04:07 PM EDT to 16-Jun-2016 12:45:41 PM EDT Messages matching last ~14 day(s): 225, from 03-Jun-2016 02:17:32 PM EDT to 16-Jun-2016 12:45:41 PM EDT last ~14 day(s) error count: 2, from 09-Jun-2016 09:56:47 AM EDT to 09-Jun-2016 09:56:58 AM EDT last ~14 day(s) ignored error count: 0 last ~14 day(s) unique error count: 2
Message types for last ~14 day(s) Occurrences percent server name type ----------- ------- -------------------- ----- 223 99.1% myserver69 generic 2 0.9% myserver69 ERROR ----------- ------- 225 100.0%
Unique error messages for last ~14 day(s) Occurrences percent server name error ----------- ------- -------------------- ----- 1 50.0% myserver69 Errors in file /u01/app/racusr/diag/rdbms/rdb11204/RDB112041/trace/RDB112041_ora_25401.trc(incident=6398): ORA-07445: exceptionencountered: core dump [] [] [] [] [] [] Incident details in: /u01/app/racusr/diag/rdbms/rdb11204/RDB112041/incident/incdir_6398/RDB112041_ora_25401_i6398.trc
Use ADRCI or Support Workbench to package the incident. See Note 411.1 at My Oracle Support for error and packaging details.
1 50.0% myserver69 Errors in file /u01/app/racusr/diag/rdbms/rdb11204/RDB112041/trace/RDB112041_ora_25351.trc(incident=6394): ORA-00700: soft internal error, arguments: [kgerev1], [600], [600], [700], [], [], [], [], [], [], [], [] Incident details in: /u01/app/racusr/diag/rdbms/rdb11204/RDB112041/incident/incdir_6394/RDB112041_ora_25351_i6394.trc
Errors in file /u01/app/racusr/diag/rdbms/rdb11204/RDB112041/trace/RDB112041_ora_25351.trc(incident=6395): ORA-00600: internal error code, arguments: [], [], [], [], [], [], [], [], [], [], [], [] Incident details in: /u01/app/racusr/diag/rdbms/rdb11204/RDB112041/incident/incdir_6395/RDB112041_ora_25351_i6395.trc
Dumping diagnostic data in directory=[cdmp_20160609095648], requested by (instance=1, osid=25351), summary=[incident=6394].
Chapter 4Investigating Logs for Errors
4-3
Use ADRCI or Support Workbench to package the incident. See Note 411.1 at My Oracle Support for error and packaging details.
----------- ------- 2 100.0% See Change Which Directories Get Collected for more details.
Related Topics
• tfactl summary (page A-7)Use the tfactl summary command to view the summary of Oracle Trace FileAnalyzer deployment.
• tfactl analyze (page A-11)Use the tfactl analyze command to obtain analysis of your system by parsing thedatabase, Oracle ASM, and Oracle Grid Infrastructure alert logs, system messagelogs, OSWatcher Top, and OSWatcher Slabinfo files.
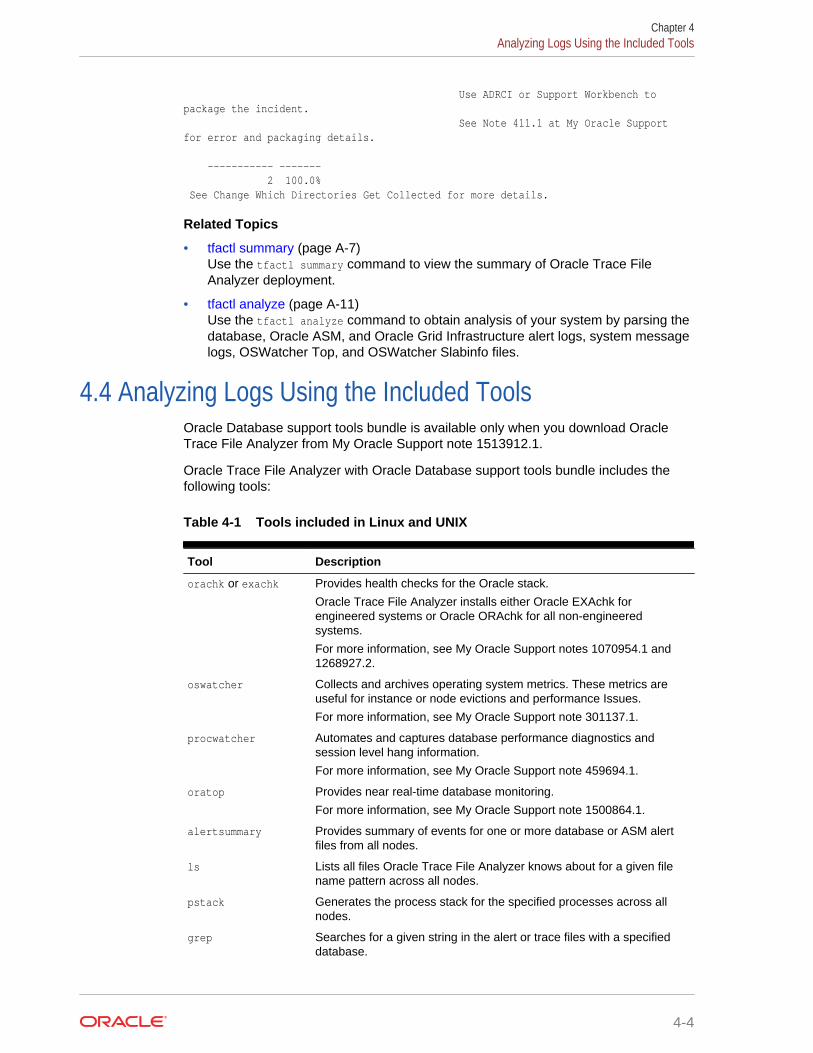
4.4 Analyzing Logs Using the Included ToolsOracle Database support tools bundle is available only when you download OracleTrace File Analyzer from My Oracle Support note 1513912.1.
Oracle Trace File Analyzer with Oracle Database support tools bundle includes thefollowing tools:
Table 4-1 Tools included in Linux and UNIX
Tool Description
orachk or exachk Provides health checks for the Oracle stack.
Oracle Trace File Analyzer installs either Oracle EXAchk forengineered systems or Oracle ORAchk for all non-engineeredsystems.
For more information, see My Oracle Support notes 1070954.1 and1268927.2.
oswatcher Collects and archives operating system metrics. These metrics areuseful for instance or node evictions and performance Issues.
For more information, see My Oracle Support note 301137.1.
procwatcher Automates and captures database performance diagnostics andsession level hang information.
For more information, see My Oracle Support note 459694.1.
oratop Provides near real-time database monitoring.
For more information, see My Oracle Support note 1500864.1.
alertsummary Provides summary of events for one or more database or ASM alertfiles from all nodes.
ls Lists all files Oracle Trace File Analyzer knows about for a given filename pattern across all nodes.
pstack Generates the process stack for the specified processes across allnodes.
grep Searches for a given string in the alert or trace files with a specifieddatabase.
Chapter 4Analyzing Logs Using the Included Tools
4-4
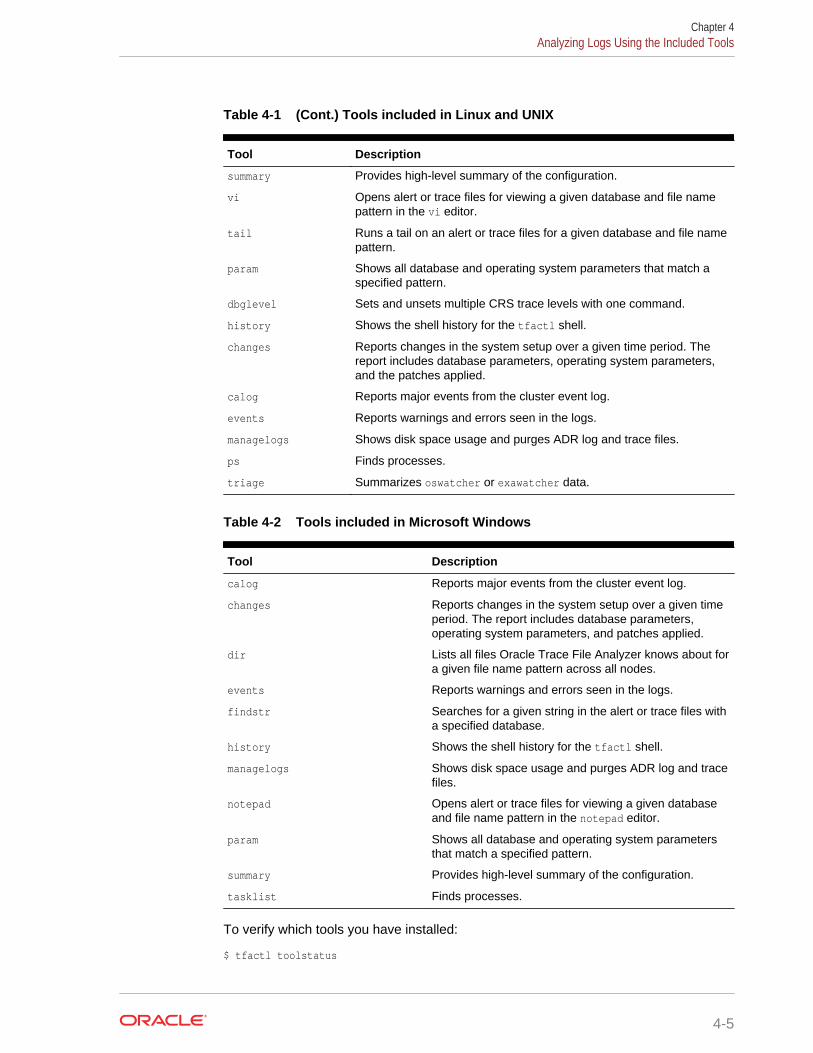
Table 4-1 (Cont.) Tools included in Linux and UNIX
Tool Description
summary Provides high-level summary of the configuration.
vi Opens alert or trace files for viewing a given database and file namepattern in the vi editor.
tail Runs a tail on an alert or trace files for a given database and file namepattern.
param Shows all database and operating system parameters that match aspecified pattern.
dbglevel Sets and unsets multiple CRS trace levels with one command.
history Shows the shell history for the tfactl shell.
changes Reports changes in the system setup over a given time period. Thereport includes database parameters, operating system parameters,and the patches applied.
calog Reports major events from the cluster event log.
events Reports warnings and errors seen in the logs.
managelogs Shows disk space usage and purges ADR log and trace files.
ps Finds processes.
triage Summarizes oswatcher or exawatcher data.
Table 4-2 Tools included in Microsoft Windows
Tool Description
calog Reports major events from the cluster event log.
changes Reports changes in the system setup over a given timeperiod. The report includes database parameters,operating system parameters, and patches applied.
dir Lists all files Oracle Trace File Analyzer knows about fora given file name pattern across all nodes.
events Reports warnings and errors seen in the logs.
findstr Searches for a given string in the alert or trace files witha specified database.
history Shows the shell history for the tfactl shell.
managelogs Shows disk space usage and purges ADR log and tracefiles.
notepad Opens alert or trace files for viewing a given databaseand file name pattern in the notepad editor.
param Shows all database and operating system parametersthat match a specified pattern.
summary Provides high-level summary of the configuration.
tasklist Finds processes.
To verify which tools you have installed:
$ tfactl toolstatus
Chapter 4Analyzing Logs Using the Included Tools
4-5
You can run each tool using tfactl either in command line or shell mode.
To run a tool from the command line:
$ tfactl run tool
The following example shows how to use tfactl in shell mode. Running the commandstarts tfactl, connects to the database MyDB, and then runs oratop:
$ tfactltfactl > database MyDBMyDB tfactl > oratop
Related Topics
• https://support.oracle.com/rs?type=doc&id=1513912.1
• https://support.oracle.com/rs?type=doc&id=1070954.1
• https://support.oracle.com/rs?type=doc&id=1268927.2
• https://support.oracle.com/rs?type=doc&id=301137.1
• https://support.oracle.com/rs?type=doc&id=459694.1
• https://support.oracle.com/rs?type=doc&id=1500864.1
• https://support.oracle.com/rs?type=doc&id=215187.1
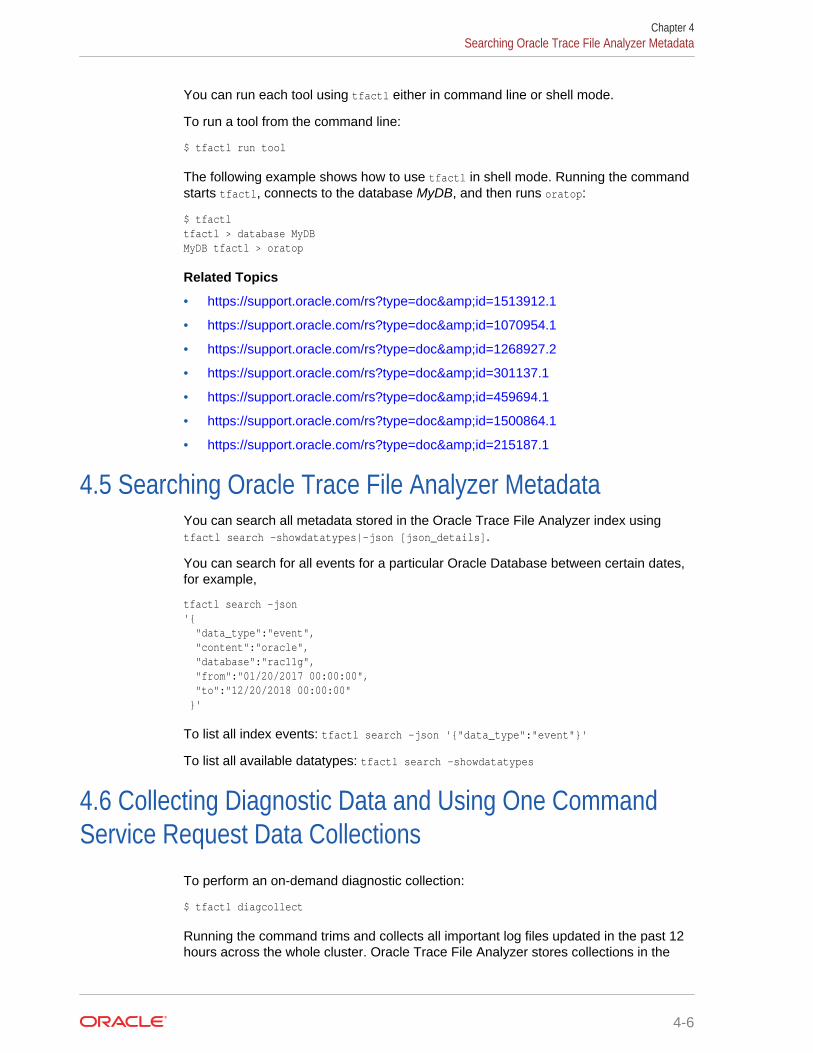
4.5 Searching Oracle Trace File Analyzer MetadataYou can search all metadata stored in the Oracle Trace File Analyzer index usingtfactl search -showdatatypes|-json [json_details].
You can search for all events for a particular Oracle Database between certain dates,for example,
tfactl search -json '{ "data_type":"event", "content":"oracle", "database":"rac11g", "from":"01/20/2017 00:00:00", "to":"12/20/2018 00:00:00" }'
To list all index events: tfactl search -json '{"data_type":"event"}'
To list all available datatypes: tfactl search -showdatatypes
4.6 Collecting Diagnostic Data and Using One CommandService Request Data Collections
To perform an on-demand diagnostic collection:
$ tfactl diagcollect
Running the command trims and collects all important log files updated in the past 12hours across the whole cluster. Oracle Trace File Analyzer stores collections in the
Chapter 4Searching Oracle Trace File Analyzer Metadata
4-6
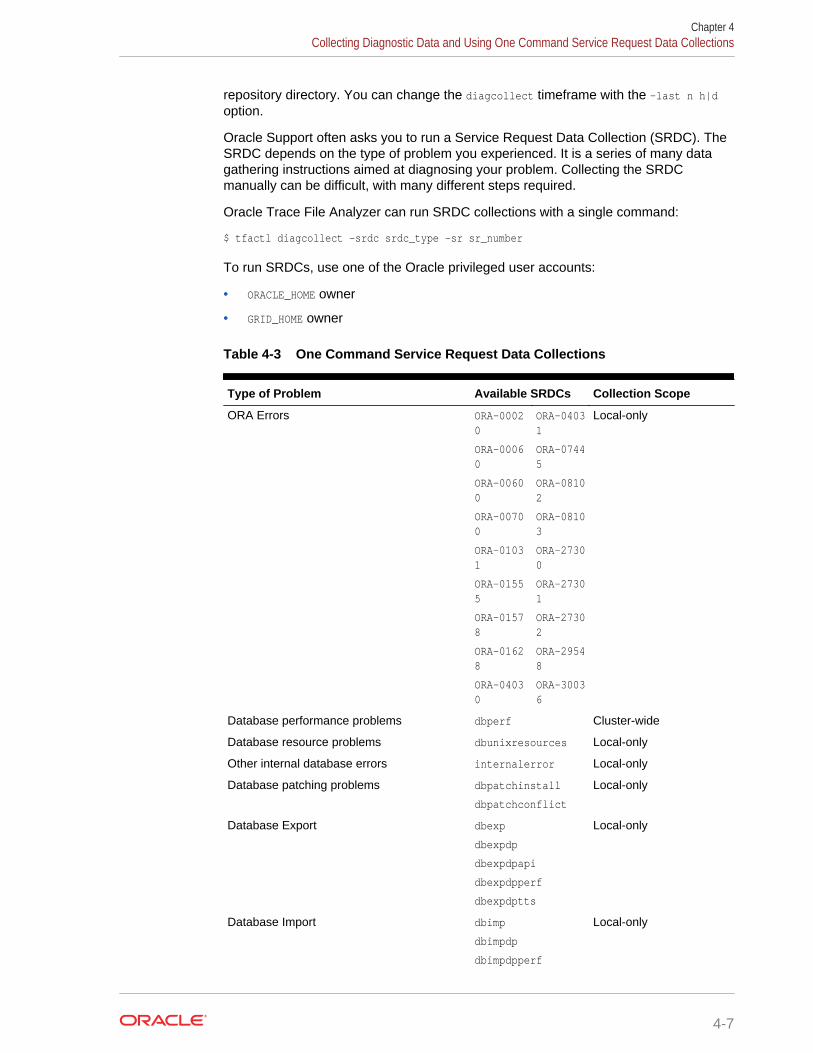
repository directory. You can change the diagcollect timeframe with the –last n h|doption.
Oracle Support often asks you to run a Service Request Data Collection (SRDC). TheSRDC depends on the type of problem you experienced. It is a series of many datagathering instructions aimed at diagnosing your problem. Collecting the SRDCmanually can be difficult, with many different steps required.
Oracle Trace File Analyzer can run SRDC collections with a single command:
$ tfactl diagcollect -srdc srdc_type –sr sr_number
To run SRDCs, use one of the Oracle privileged user accounts:
• ORACLE_HOME owner
• GRID_HOME owner
Table 4-3 One Command Service Request Data Collections
Type of Problem Available SRDCs Collection Scope
ORA Errors ORA-00020
ORA-00060
ORA-00600
ORA-00700
ORA-01031
ORA-01555
ORA-01578
ORA-01628
ORA-04030
ORA-04031
ORA-07445
ORA-08102
ORA-08103
ORA-27300
ORA-27301
ORA-27302
ORA-29548
ORA-30036
Local-only
Database performance problems dbperf Cluster-wide
Database resource problems dbunixresources Local-only
Other internal database errors internalerror Local-only
Database patching problems dbpatchinstall
dbpatchconflict
Local-only
Database Export dbexp
dbexpdp
dbexpdpapi
dbexpdpperf
dbexpdptts
Local-only
Database Import dbimp
dbimpdp
dbimpdpperf
Local-only
Chapter 4Collecting Diagnostic Data and Using One Command Service Request Data Collections
4-7
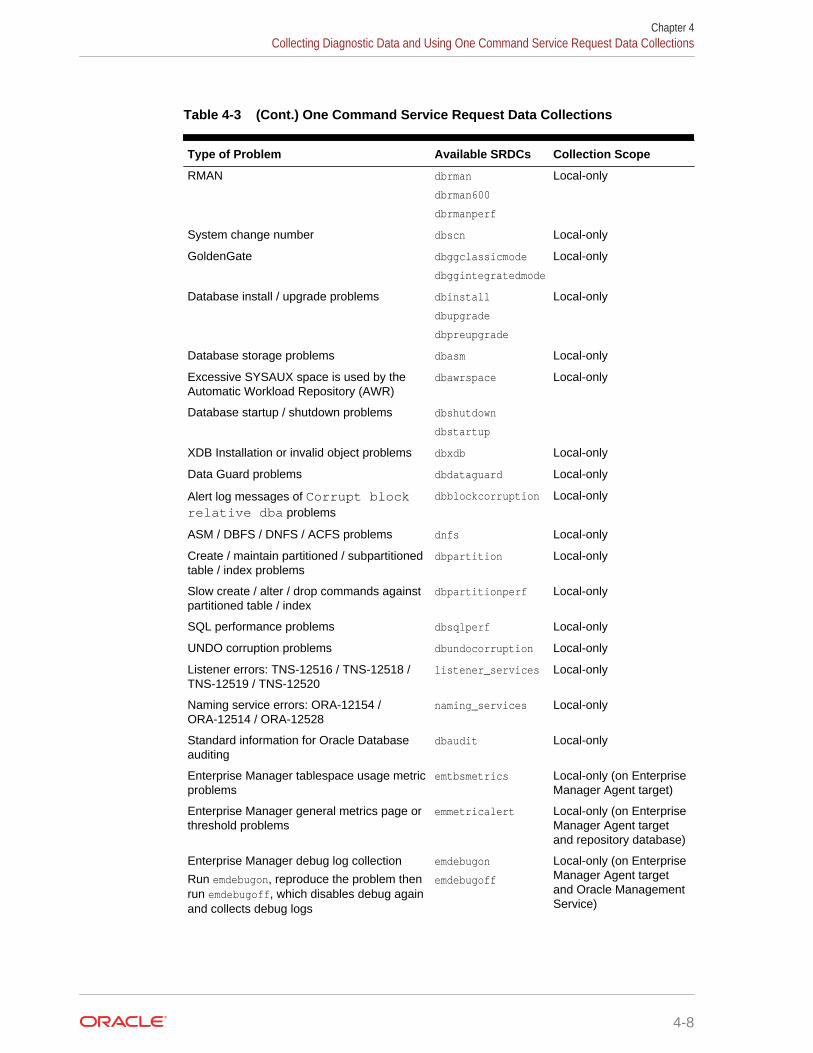
Table 4-3 (Cont.) One Command Service Request Data Collections
Type of Problem Available SRDCs Collection Scope
RMAN dbrman
dbrman600
dbrmanperf
Local-only
System change number dbscn Local-only
GoldenGate dbggclassicmode
dbggintegratedmode
Local-only
Database install / upgrade problems dbinstall
dbupgrade
dbpreupgrade
Local-only
Database storage problems dbasm Local-only
Excessive SYSAUX space is used by theAutomatic Workload Repository (AWR)
dbawrspace Local-only
Database startup / shutdown problems dbshutdown
dbstartup
XDB Installation or invalid object problems dbxdb Local-only
Data Guard problems dbdataguard Local-only
Alert log messages of Corrupt blockrelative dba problems
dbblockcorruption Local-only
ASM / DBFS / DNFS / ACFS problems dnfs Local-only
Create / maintain partitioned / subpartitionedtable / index problems
dbpartition Local-only
Slow create / alter / drop commands againstpartitioned table / index
dbpartitionperf Local-only
SQL performance problems dbsqlperf Local-only
UNDO corruption problems dbundocorruption Local-only
Listener errors: TNS-12516 / TNS-12518 /TNS-12519 / TNS-12520
listener_services Local-only
Naming service errors: ORA-12154 /ORA-12514 / ORA-12528
naming_services Local-only
Standard information for Oracle Databaseauditing
dbaudit Local-only
Enterprise Manager tablespace usage metricproblems
emtbsmetrics Local-only (on EnterpriseManager Agent target)
Enterprise Manager general metrics page orthreshold problems
emmetricalert Local-only (on EnterpriseManager Agent targetand repository database)
Enterprise Manager debug log collection
Run emdebugon, reproduce the problem thenrun emdebugoff, which disables debug againand collects debug logs
emdebugon
emdebugoff
Local-only (on EnterpriseManager Agent targetand Oracle ManagementService)
Chapter 4Collecting Diagnostic Data and Using One Command Service Request Data Collections
4-8
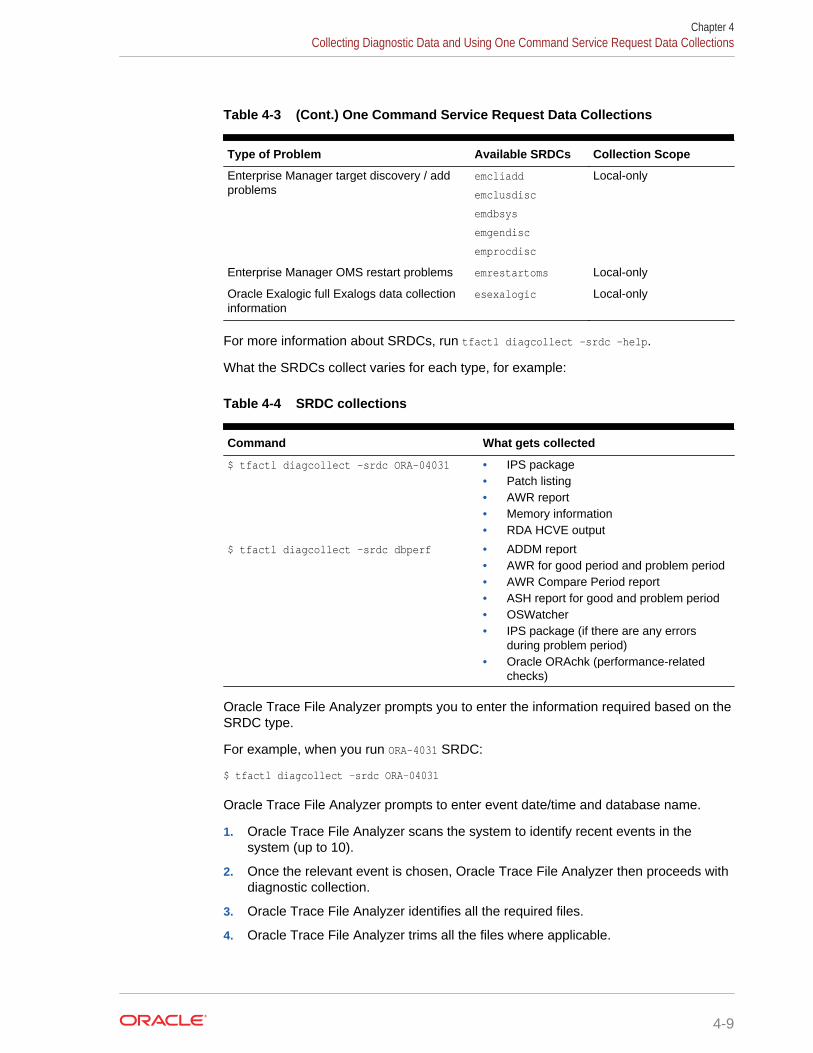
Table 4-3 (Cont.) One Command Service Request Data Collections
Type of Problem Available SRDCs Collection Scope
Enterprise Manager target discovery / addproblems
emcliadd
emclusdisc
emdbsys
emgendisc
emprocdisc
Local-only
Enterprise Manager OMS restart problems emrestartoms Local-only
Oracle Exalogic full Exalogs data collectioninformation
esexalogic Local-only
For more information about SRDCs, run tfactl diagcollect –srdc -help.
What the SRDCs collect varies for each type, for example:
Table 4-4 SRDC collections
Command What gets collected
$ tfactl diagcollect –srdc ORA-04031 • IPS package• Patch listing• AWR report• Memory information• RDA HCVE output
$ tfactl diagcollect –srdc dbperf • ADDM report• AWR for good period and problem period• AWR Compare Period report• ASH report for good and problem period• OSWatcher• IPS package (if there are any errors
during problem period)• Oracle ORAchk (performance-related
checks)
Oracle Trace File Analyzer prompts you to enter the information required based on theSRDC type.
For example, when you run ORA-4031 SRDC:
$ tfactl diagcollect –srdc ORA-04031
Oracle Trace File Analyzer prompts to enter event date/time and database name.
1. Oracle Trace File Analyzer scans the system to identify recent events in thesystem (up to 10).
2. Once the relevant event is chosen, Oracle Trace File Analyzer then proceeds withdiagnostic collection.
3. Oracle Trace File Analyzer identifies all the required files.
4. Oracle Trace File Analyzer trims all the files where applicable.
Chapter 4Collecting Diagnostic Data and Using One Command Service Request Data Collections
4-9
5. Oracle Trace File Analyzer packages all data in a zip file ready to provide tosupport.
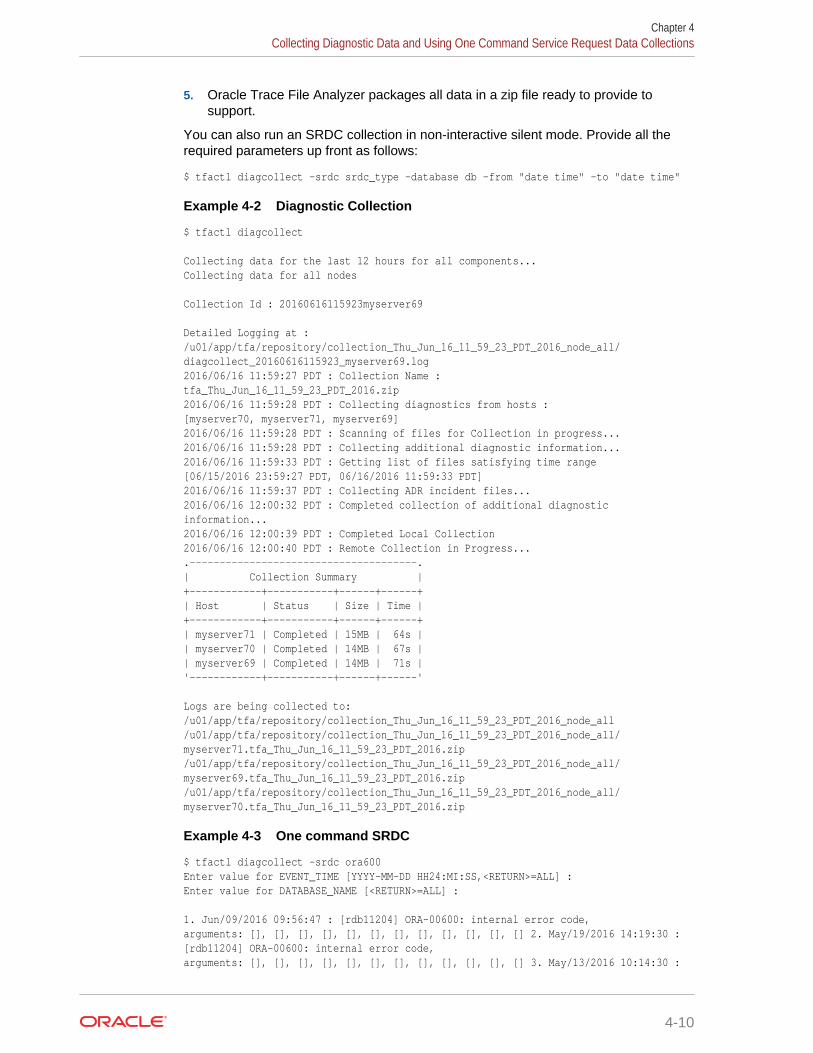
You can also run an SRDC collection in non-interactive silent mode. Provide all therequired parameters up front as follows:
$ tfactl diagcollect –srdc srdc_type -database db -from "date time" -to "date time"
Example 4-2 Diagnostic Collection
$ tfactl diagcollect
Collecting data for the last 12 hours for all components...Collecting data for all nodes
Collection Id : 20160616115923myserver69
Detailed Logging at : /u01/app/tfa/repository/collection_Thu_Jun_16_11_59_23_PDT_2016_node_all/diagcollect_20160616115923_myserver69.log2016/06/16 11:59:27 PDT : Collection Name : tfa_Thu_Jun_16_11_59_23_PDT_2016.zip2016/06/16 11:59:28 PDT : Collecting diagnostics from hosts : [myserver70, myserver71, myserver69]2016/06/16 11:59:28 PDT : Scanning of files for Collection in progress...2016/06/16 11:59:28 PDT : Collecting additional diagnostic information...2016/06/16 11:59:33 PDT : Getting list of files satisfying time range[06/15/2016 23:59:27 PDT, 06/16/2016 11:59:33 PDT]2016/06/16 11:59:37 PDT : Collecting ADR incident files...2016/06/16 12:00:32 PDT : Completed collection of additional diagnostic information...2016/06/16 12:00:39 PDT : Completed Local Collection2016/06/16 12:00:40 PDT : Remote Collection in Progress....--------------------------------------.| Collection Summary |+------------+-----------+------+------+| Host | Status | Size | Time |+------------+-----------+------+------+| myserver71 | Completed | 15MB | 64s || myserver70 | Completed | 14MB | 67s || myserver69 | Completed | 14MB | 71s |'------------+-----------+------+------'
Logs are being collected to: /u01/app/tfa/repository/collection_Thu_Jun_16_11_59_23_PDT_2016_node_all/u01/app/tfa/repository/collection_Thu_Jun_16_11_59_23_PDT_2016_node_all/myserver71.tfa_Thu_Jun_16_11_59_23_PDT_2016.zip/u01/app/tfa/repository/collection_Thu_Jun_16_11_59_23_PDT_2016_node_all/myserver69.tfa_Thu_Jun_16_11_59_23_PDT_2016.zip/u01/app/tfa/repository/collection_Thu_Jun_16_11_59_23_PDT_2016_node_all/myserver70.tfa_Thu_Jun_16_11_59_23_PDT_2016.zip
Example 4-3 One command SRDC
$ tfactl diagcollect –srdc ora600Enter value for EVENT_TIME [YYYY-MM-DD HH24:MI:SS,<RETURN>=ALL] :Enter value for DATABASE_NAME [<RETURN>=ALL] :
1. Jun/09/2016 09:56:47 : [rdb11204] ORA-00600: internal error code,arguments: [], [], [], [], [], [], [], [], [], [], [], [] 2. May/19/2016 14:19:30 : [rdb11204] ORA-00600: internal error code,arguments: [], [], [], [], [], [], [], [], [], [], [], [] 3. May/13/2016 10:14:30 :
Chapter 4Collecting Diagnostic Data and Using One Command Service Request Data Collections
4-10
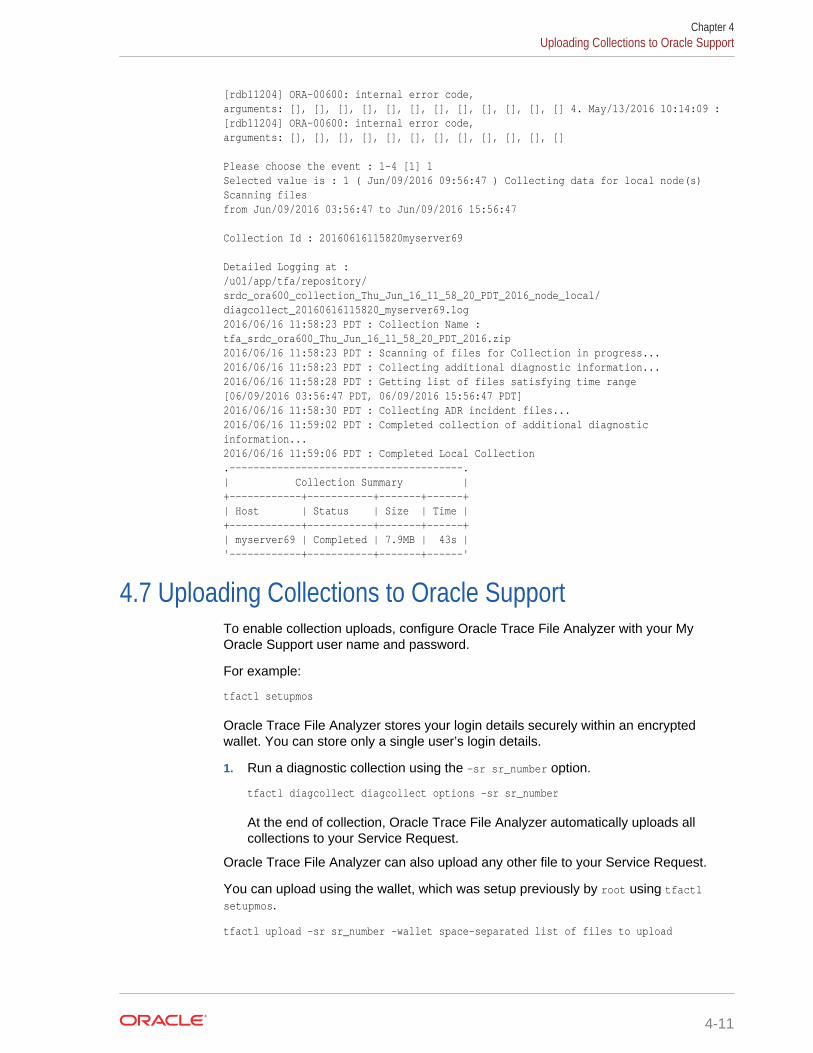
[rdb11204] ORA-00600: internal error code,arguments: [], [], [], [], [], [], [], [], [], [], [], [] 4. May/13/2016 10:14:09 : [rdb11204] ORA-00600: internal error code,arguments: [], [], [], [], [], [], [], [], [], [], [], []
Please choose the event : 1-4 [1] 1Selected value is : 1 ( Jun/09/2016 09:56:47 ) Collecting data for local node(s) Scanning files from Jun/09/2016 03:56:47 to Jun/09/2016 15:56:47
Collection Id : 20160616115820myserver69
Detailed Logging at : /u01/app/tfa/repository/srdc_ora600_collection_Thu_Jun_16_11_58_20_PDT_2016_node_local/diagcollect_20160616115820_myserver69.log2016/06/16 11:58:23 PDT : Collection Name : tfa_srdc_ora600_Thu_Jun_16_11_58_20_PDT_2016.zip2016/06/16 11:58:23 PDT : Scanning of files for Collection in progress...2016/06/16 11:58:23 PDT : Collecting additional diagnostic information...2016/06/16 11:58:28 PDT : Getting list of files satisfying time range[06/09/2016 03:56:47 PDT, 06/09/2016 15:56:47 PDT]2016/06/16 11:58:30 PDT : Collecting ADR incident files...2016/06/16 11:59:02 PDT : Completed collection of additional diagnostic information...2016/06/16 11:59:06 PDT : Completed Local Collection .---------------------------------------.| Collection Summary |+------------+-----------+-------+------+| Host | Status | Size | Time |+------------+-----------+-------+------+| myserver69 | Completed | 7.9MB | 43s |'------------+-----------+-------+------'
4.7 Uploading Collections to Oracle SupportTo enable collection uploads, configure Oracle Trace File Analyzer with your MyOracle Support user name and password.
For example:
tfactl setupmos
Oracle Trace File Analyzer stores your login details securely within an encryptedwallet. You can store only a single user’s login details.
1. Run a diagnostic collection using the –sr sr_number option.
tfactl diagcollect diagcollect options -sr sr_number
At the end of collection, Oracle Trace File Analyzer automatically uploads allcollections to your Service Request.
Oracle Trace File Analyzer can also upload any other file to your Service Request.
You can upload using the wallet, which was setup previously by root using tfactlsetupmos.
tfactl upload -sr sr_number -wallet space-separated list of files to upload
Chapter 4Uploading Collections to Oracle Support
4-11
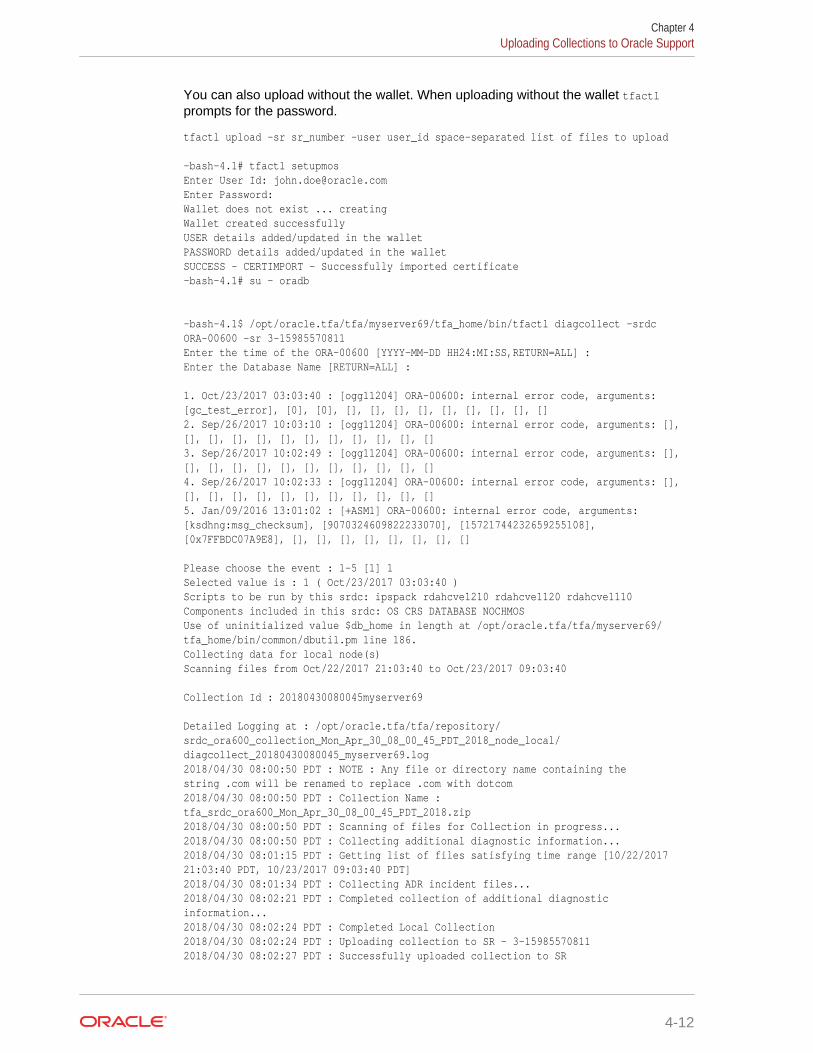
You can also upload without the wallet. When uploading without the wallet tfactlprompts for the password.
tfactl upload -sr sr_number -user user_id space-separated list of files to upload
-bash-4.1# tfactl setupmosEnter User Id: [email protected] Password: Wallet does not exist ... creatingWallet created successfullyUSER details added/updated in the walletPASSWORD details added/updated in the walletSUCCESS - CERTIMPORT - Successfully imported certificate-bash-4.1# su - oradb
-bash-4.1$ /opt/oracle.tfa/tfa/myserver69/tfa_home/bin/tfactl diagcollect -srdc ORA-00600 -sr 3-15985570811Enter the time of the ORA-00600 [YYYY-MM-DD HH24:MI:SS,RETURN=ALL] : Enter the Database Name [RETURN=ALL] :
1. Oct/23/2017 03:03:40 : [ogg11204] ORA-00600: internal error code, arguments: [gc_test_error], [0], [0], [], [], [], [], [], [], [], [], []2. Sep/26/2017 10:03:10 : [ogg11204] ORA-00600: internal error code, arguments: [], [], [], [], [], [], [], [], [], [], [], []3. Sep/26/2017 10:02:49 : [ogg11204] ORA-00600: internal error code, arguments: [], [], [], [], [], [], [], [], [], [], [], []4. Sep/26/2017 10:02:33 : [ogg11204] ORA-00600: internal error code, arguments: [], [], [], [], [], [], [], [], [], [], [], []5. Jan/09/2016 13:01:02 : [+ASM1] ORA-00600: internal error code, arguments: [ksdhng:msg_checksum], [9070324609822233070], [15721744232659255108], [0x7FFBDC07A9E8], [], [], [], [], [], [], [], []
Please choose the event : 1-5 [1] 1Selected value is : 1 ( Oct/23/2017 03:03:40 )Scripts to be run by this srdc: ipspack rdahcve1210 rdahcve1120 rdahcve1110 Components included in this srdc: OS CRS DATABASE NOCHMOSUse of uninitialized value $db_home in length at /opt/oracle.tfa/tfa/myserver69/tfa_home/bin/common/dbutil.pm line 186.Collecting data for local node(s)Scanning files from Oct/22/2017 21:03:40 to Oct/23/2017 09:03:40
Collection Id : 20180430080045myserver69
Detailed Logging at : /opt/oracle.tfa/tfa/repository/srdc_ora600_collection_Mon_Apr_30_08_00_45_PDT_2018_node_local/diagcollect_20180430080045_myserver69.log2018/04/30 08:00:50 PDT : NOTE : Any file or directory name containing the string .com will be renamed to replace .com with dotcom2018/04/30 08:00:50 PDT : Collection Name : tfa_srdc_ora600_Mon_Apr_30_08_00_45_PDT_2018.zip2018/04/30 08:00:50 PDT : Scanning of files for Collection in progress...2018/04/30 08:00:50 PDT : Collecting additional diagnostic information...2018/04/30 08:01:15 PDT : Getting list of files satisfying time range [10/22/2017 21:03:40 PDT, 10/23/2017 09:03:40 PDT]2018/04/30 08:01:34 PDT : Collecting ADR incident files...2018/04/30 08:02:21 PDT : Completed collection of additional diagnostic information...2018/04/30 08:02:24 PDT : Completed Local Collection2018/04/30 08:02:24 PDT : Uploading collection to SR - 3-159855708112018/04/30 08:02:27 PDT : Successfully uploaded collection to SR
Chapter 4Uploading Collections to Oracle Support
4-12
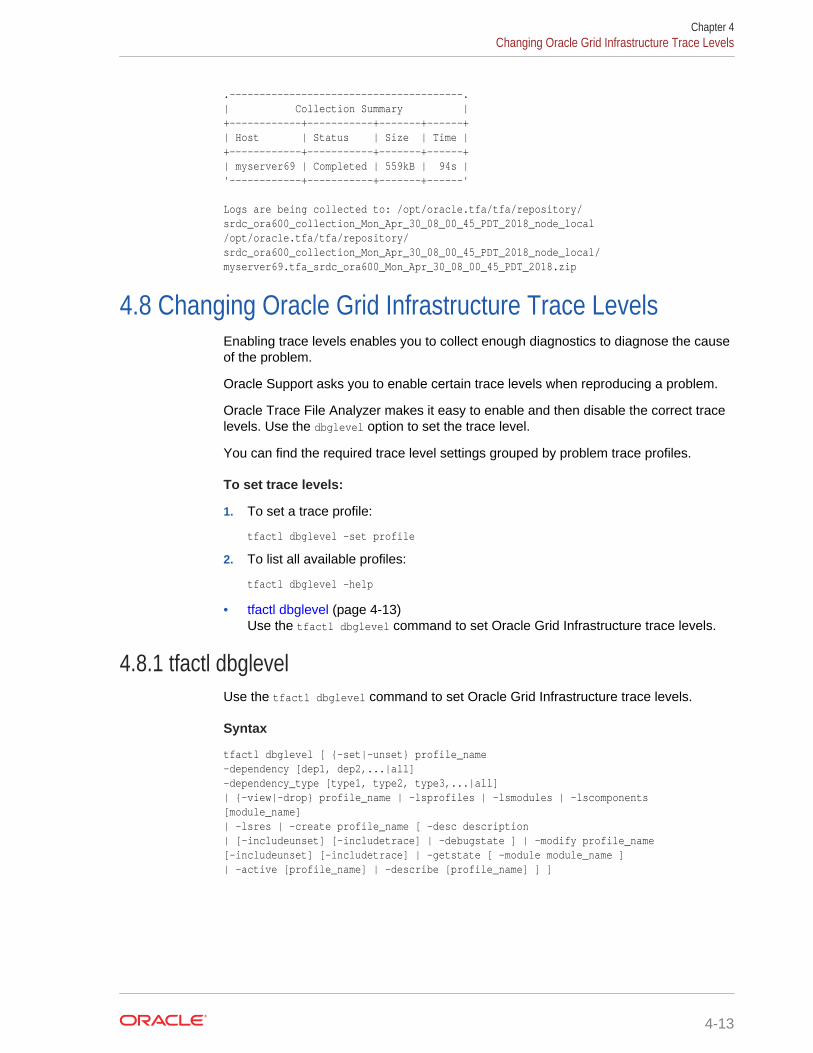
.---------------------------------------.| Collection Summary |+------------+-----------+-------+------+| Host | Status | Size | Time |+------------+-----------+-------+------+| myserver69 | Completed | 559kB | 94s |'------------+-----------+-------+------'
Logs are being collected to: /opt/oracle.tfa/tfa/repository/srdc_ora600_collection_Mon_Apr_30_08_00_45_PDT_2018_node_local/opt/oracle.tfa/tfa/repository/srdc_ora600_collection_Mon_Apr_30_08_00_45_PDT_2018_node_local/myserver69.tfa_srdc_ora600_Mon_Apr_30_08_00_45_PDT_2018.zip
4.8 Changing Oracle Grid Infrastructure Trace LevelsEnabling trace levels enables you to collect enough diagnostics to diagnose the causeof the problem.
Oracle Support asks you to enable certain trace levels when reproducing a problem.
Oracle Trace File Analyzer makes it easy to enable and then disable the correct tracelevels. Use the dbglevel option to set the trace level.
You can find the required trace level settings grouped by problem trace profiles.
To set trace levels:
1. To set a trace profile:
tfactl dbglevel –set profile
2. To list all available profiles:
tfactl dbglevel –help
• tfactl dbglevel (page 4-13)Use the tfactl dbglevel command to set Oracle Grid Infrastructure trace levels.
4.8.1 tfactl dbglevelUse the tfactl dbglevel command to set Oracle Grid Infrastructure trace levels.
Syntax
tfactl dbglevel [ {-set|-unset} profile_name -dependency [dep1, dep2,...|all] -dependency_type [type1, type2, type3,...|all] | {-view|-drop} profile_name | -lsprofiles | -lsmodules | -lscomponents [module_name] | -lsres | -create profile_name [ -desc description | [-includeunset] [-includetrace] | -debugstate ] | -modify profile_name [-includeunset] [-includetrace] | -getstate [ -module module_name ] | -active [profile_name] | -describe [profile_name] ] ]
Chapter 4Changing Oracle Grid Infrastructure Trace Levels
4-13

Parameters
Table 4-5 tfactl dbglevel Command Parameters
Parameter Description
profile_name Specify the name of the profile.
active Displays the list of active profiles.
set Sets the trace or log levels for the profile specified.
unset Unsets the trace or log levels for the profile specified.
view Displays the trace or log entries for the profile specified.
create Creates a profile.
drop Drops the profile specified.
modify Modifies the profile specified.
describe Describes the profiles specified.
lsprofiles Lists all the available profiles.
lsmodules Lists all the discovered CRS modules.
lscomponents Lists all the components associated with the CRSmodule.
lsres Lists all the discovered CRS resources.
getstate Displays the current trace or log levels for the CRScomponents or resources.
module Specify the CRS module.
dependency Specify the dependencies to consider, start, or stopdependencies, or both.
dependency_type Specify the type of dependencies to be consider.
debugstate Generates a System State Dump for all the availablelevels.
includeunset Adds or modifies an unset value for the CRScomponents or resources.
includetrace Adds or modifies a trace value for the CRS components.
WARNING:
Set the profiles only at the direction of Oracle Support.
Chapter 4Changing Oracle Grid Infrastructure Trace Levels
4-14

5Maintaining Oracle Trace File Analyzer tothe Latest Version
Oracle releases a new version of Oracle Trace File Analyzer approximately everythree months.
Applying standard Release Update Revisions (RURs) automatically updates OracleTrace File Analyzer. However, the Release Update Revisions (RURs) do not containthe rest of the Oracle Database support tools bundle updates. Download the latestversion of Oracle Trace File Analyzer with Oracle Database support tools bundle fromMy Oracle Support note 1513912.1.
Upgrading is similar to first-time install. As root, use the installTFAplatform script. IfOracle Trace File Analyzer is already installed, then the installer updates the existinginstallation. When already installed, a cluster upgrade does not need SSH. The clusterupgrade uses the existing daemon secure socket communication between hosts.
$ ./installTFAplatform
If you are not able to install as root, then install Oracle Trace File Analyzer as Oraclehome owner. Use the -extractto and –javahome options:
$ ./installTFAplatform -extractto dir -javahome jre_home
Related Topics
• Installing Oracle Trace File Analyzer on Microsoft Windows (page 2-3)
• https://support.oracle.com/rs?type=doc&id=1513912.1
5-1
6Performing Custom Collections
Use the custom collection options to change the diagnostic collections from thedefault.
• Adjusting the Diagnostic Data Collection Period (page 6-1)Oracle Trace File Analyzer trims and collects any important logs updated in thepast 12 hours.
• Collecting from Specific Nodes (page 6-2)
• Collecting from Specific Components (page 6-2)
• Collecting from Specific Directories (page 6-3)
• Changing the Collection Name (page 6-4)
• Preventing Copying Zip Files and Trimming Files (page 6-5)
• Performing Silent Collection (page 6-6)
• Preventing Collecting Core Files (page 6-6)
• Collecting Incident Packaging Service (IPS) Packages (page 6-6)Incident Packaging Service packages details of problems stored by OracleDatabase in ADR for later diagnosis.
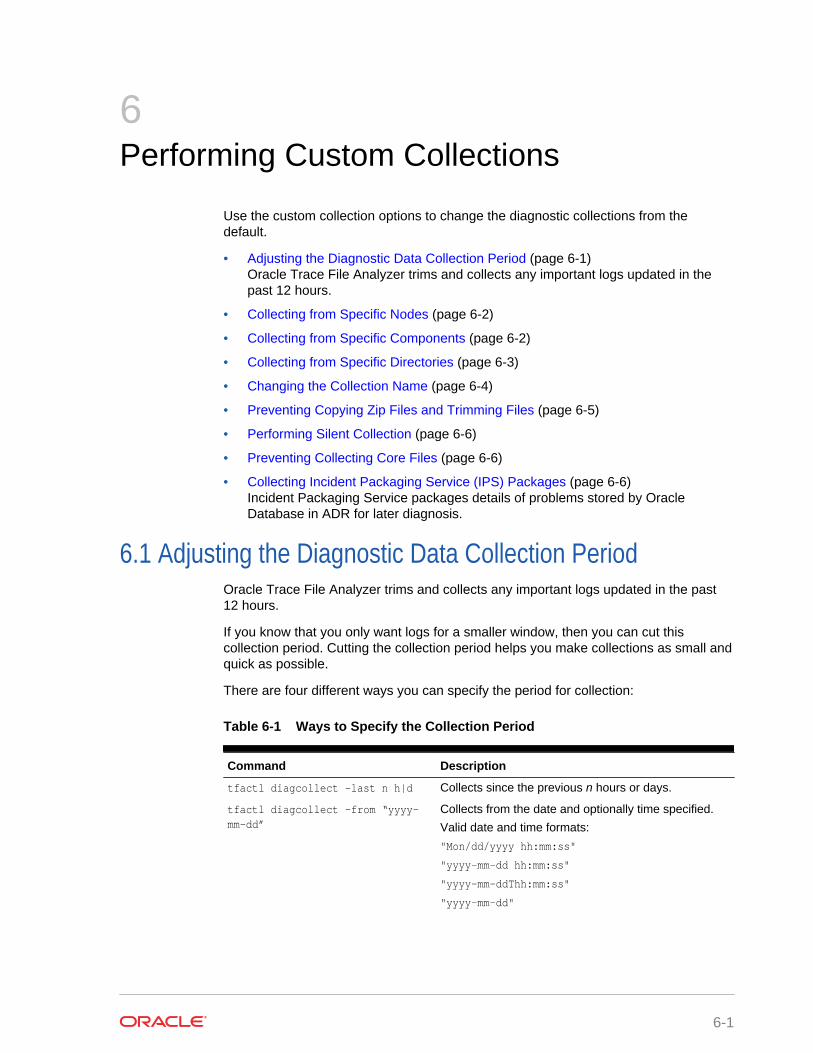
6.1 Adjusting the Diagnostic Data Collection PeriodOracle Trace File Analyzer trims and collects any important logs updated in the past12 hours.
If you know that you only want logs for a smaller window, then you can cut thiscollection period. Cutting the collection period helps you make collections as small andquick as possible.
There are four different ways you can specify the period for collection:
Table 6-1 Ways to Specify the Collection Period
Command Description
tfactl diagcollect -last n h|d Collects since the previous n hours or days.
tfactl diagcollect -from “yyyy-mm-dd”
Collects from the date and optionally time specified.
Valid date and time formats:
"Mon/dd/yyyy hh:mm:ss"
"yyyy-mm-dd hh:mm:ss"
"yyyy-mm-ddThh:mm:ss"
"yyyy-mm-dd"
6-1
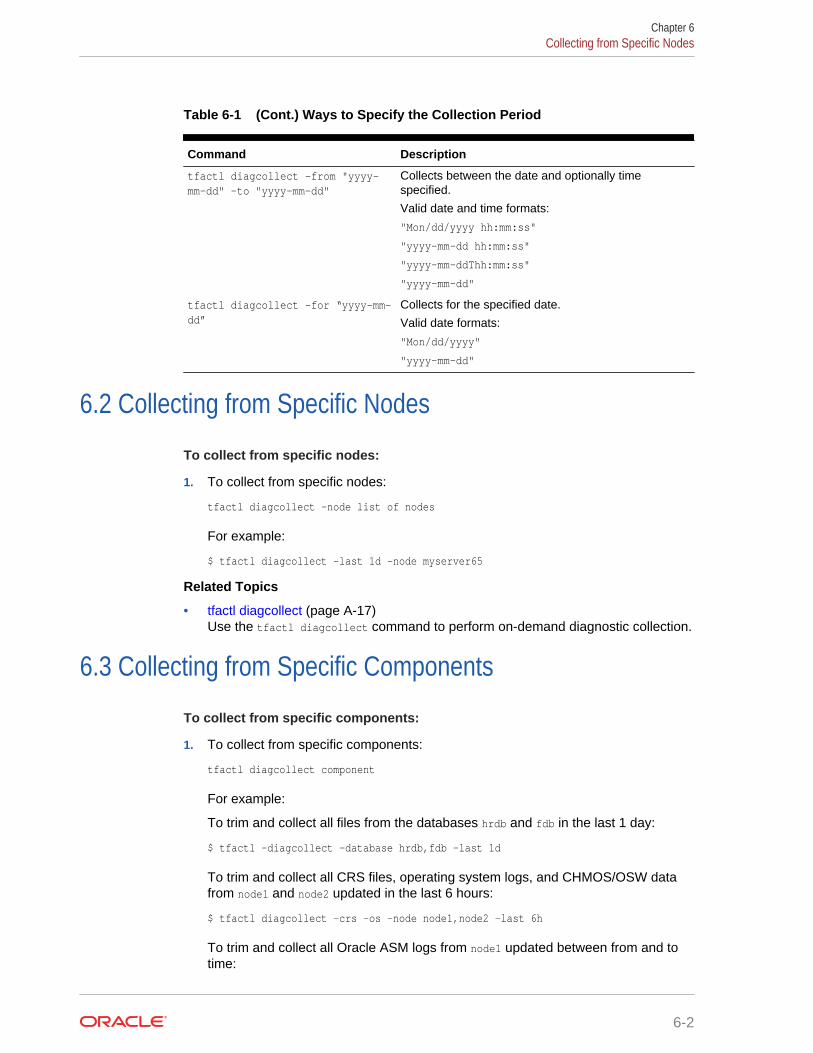
Table 6-1 (Cont.) Ways to Specify the Collection Period
Command Description
tfactl diagcollect –from "yyyy-mm-dd" -to "yyyy-mm-dd"
Collects between the date and optionally timespecified.
Valid date and time formats:
"Mon/dd/yyyy hh:mm:ss"
"yyyy-mm-dd hh:mm:ss"
"yyyy-mm-ddThh:mm:ss"
"yyyy-mm-dd"
tfactl diagcollect -for “yyyy-mm-dd”
Collects for the specified date.
Valid date formats:
"Mon/dd/yyyy"
"yyyy-mm-dd"
6.2 Collecting from Specific Nodes
To collect from specific nodes:
1. To collect from specific nodes:
tfactl diagcollect –node list of nodes
For example:
$ tfactl diagcollect -last 1d -node myserver65
Related Topics
• tfactl diagcollect (page A-17)Use the tfactl diagcollect command to perform on-demand diagnostic collection.
6.3 Collecting from Specific Components
To collect from specific components:
1. To collect from specific components:
tfactl diagcollect component
For example:
To trim and collect all files from the databases hrdb and fdb in the last 1 day:
$ tfactl –diagcollect –database hrdb,fdb –last 1d
To trim and collect all CRS files, operating system logs, and CHMOS/OSW datafrom node1 and node2 updated in the last 6 hours:
$ tfactl diagcollect -crs -os -node node1,node2 -last 6h
To trim and collect all Oracle ASM logs from node1 updated between from and totime:
Chapter 6Collecting from Specific Nodes
6-2
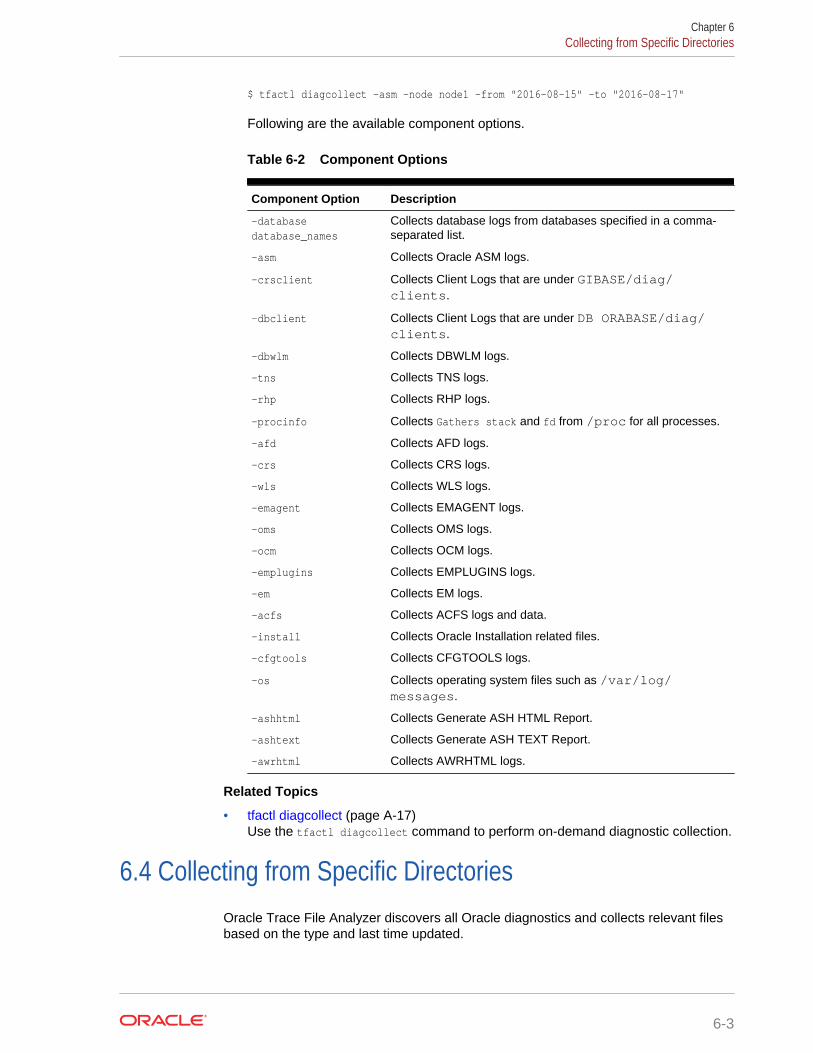
$ tfactl diagcollect -asm -node node1 -from "2016-08-15" -to "2016-08-17"
Following are the available component options.
Table 6-2 Component Options
Component Option Description
-databasedatabase_names
Collects database logs from databases specified in a comma-separated list.
-asm Collects Oracle ASM logs.
-crsclient Collects Client Logs that are under GIBASE/diag/clients.
-dbclient Collects Client Logs that are under DB ORABASE/diag/clients.
-dbwlm Collects DBWLM logs.
-tns Collects TNS logs.
-rhp Collects RHP logs.
-procinfo Collects Gathers stack and fd from /proc for all processes.
-afd Collects AFD logs.
-crs Collects CRS logs.
-wls Collects WLS logs.
-emagent Collects EMAGENT logs.
-oms Collects OMS logs.
-ocm Collects OCM logs.
-emplugins Collects EMPLUGINS logs.
-em Collects EM logs.
-acfs Collects ACFS logs and data.
-install Collects Oracle Installation related files.
-cfgtools Collects CFGTOOLS logs.
-os Collects operating system files such as /var/log/messages.
-ashhtml Collects Generate ASH HTML Report.
-ashtext Collects Generate ASH TEXT Report.
-awrhtml Collects AWRHTML logs.
Related Topics
• tfactl diagcollect (page A-17)Use the tfactl diagcollect command to perform on-demand diagnostic collection.
6.4 Collecting from Specific DirectoriesOracle Trace File Analyzer discovers all Oracle diagnostics and collects relevant filesbased on the type and last time updated.
Chapter 6Collecting from Specific Directories
6-3

If you want to collect other files, then you can specify extra directories. Oracle TraceFile Analyzer collects only the files updated in the relevant time range (12 hours bydefault).
You can configure collection of all files irrespective of the time last updated. Configureon a directory by directory basis using the -collectall option.
To collect from specific directories:
1. To include all files updated in the last 12 hours:
tfactl diagcollect –collectdir dir1,dir2,...dirn
For example:
To trim and collect all CRS files updated in the last 12 hours as well as all filesfrom /tmp_dir1 and /tmp_dir2 at the initiating node:
$ tfactl diagcollect –crs –collectdir /tmp_dir1,/tmpdir_2
2. To configure Oracle Trace File Analyzer to collect all files from a directory, firstconfigure it with the -collectall option:
$ tfactl add dir -collectall
or
tfactl modify dir -collectall
Start a diagnostic collection using the -collectalldirs option:
$ tfactl diagcollect -collectalldirs
Note:
If the -collectalldirs option is not used normal, then the file type, name,and time range restrictions are applied.
Related Topics
• tfactl diagcollect (page A-17)Use the tfactl diagcollect command to perform on-demand diagnostic collection.
6.5 Changing the Collection NameOracle Trace File Analyzer zips collections and puts the zip files in the repositorydirectory, using the following naming format:
repository/collection_date_time/node_all/node.tfa_date_time.zip
You must only change the name of the zipped files using the following options.Manually changing the file name prevents you from using collections with variousOracle Support self-service tools.
To change the collection name:
1. To use your own naming to organize collections:
Chapter 6Changing the Collection Name
6-4
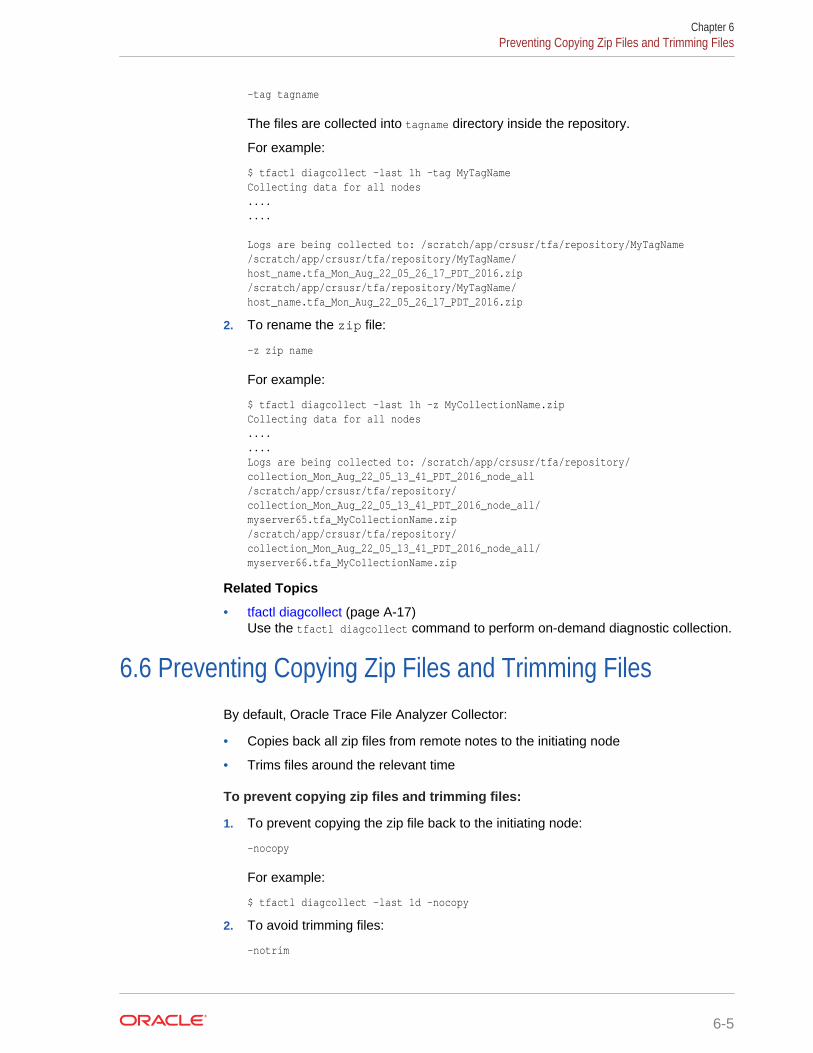
–tag tagname
The files are collected into tagname directory inside the repository.
For example:
$ tfactl diagcollect -last 1h -tag MyTagNameCollecting data for all nodes........
Logs are being collected to: /scratch/app/crsusr/tfa/repository/MyTagName/scratch/app/crsusr/tfa/repository/MyTagName/host_name.tfa_Mon_Aug_22_05_26_17_PDT_2016.zip/scratch/app/crsusr/tfa/repository/MyTagName/host_name.tfa_Mon_Aug_22_05_26_17_PDT_2016.zip
2. To rename the zip file:
–z zip name
For example:
$ tfactl diagcollect -last 1h -z MyCollectionName.zipCollecting data for all nodes........Logs are being collected to: /scratch/app/crsusr/tfa/repository/collection_Mon_Aug_22_05_13_41_PDT_2016_node_all/scratch/app/crsusr/tfa/repository/collection_Mon_Aug_22_05_13_41_PDT_2016_node_all/myserver65.tfa_MyCollectionName.zip/scratch/app/crsusr/tfa/repository/collection_Mon_Aug_22_05_13_41_PDT_2016_node_all/myserver66.tfa_MyCollectionName.zip
Related Topics
• tfactl diagcollect (page A-17)Use the tfactl diagcollect command to perform on-demand diagnostic collection.
6.6 Preventing Copying Zip Files and Trimming FilesBy default, Oracle Trace File Analyzer Collector:
• Copies back all zip files from remote notes to the initiating node
• Trims files around the relevant time
To prevent copying zip files and trimming files:
1. To prevent copying the zip file back to the initiating node:
–nocopy
For example:
$ tfactl diagcollect -last 1d -nocopy
2. To avoid trimming files:
–notrim
Chapter 6Preventing Copying Zip Files and Trimming Files
6-5
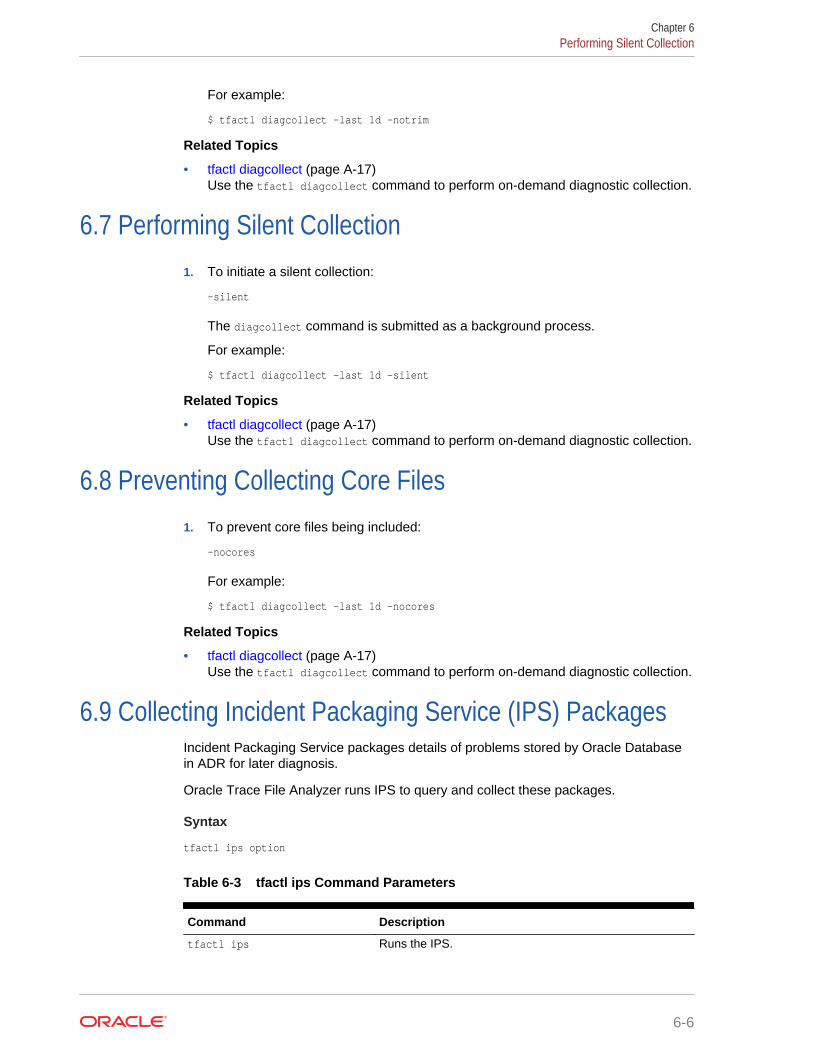
For example:
$ tfactl diagcollect -last 1d -notrim
Related Topics
• tfactl diagcollect (page A-17)Use the tfactl diagcollect command to perform on-demand diagnostic collection.
6.7 Performing Silent Collection1. To initiate a silent collection:
–silent
The diagcollect command is submitted as a background process.
For example:
$ tfactl diagcollect -last 1d -silent
Related Topics
• tfactl diagcollect (page A-17)Use the tfactl diagcollect command to perform on-demand diagnostic collection.
6.8 Preventing Collecting Core Files1. To prevent core files being included:
–nocores
For example:
$ tfactl diagcollect -last 1d -nocores
Related Topics
• tfactl diagcollect (page A-17)Use the tfactl diagcollect command to perform on-demand diagnostic collection.
6.9 Collecting Incident Packaging Service (IPS) PackagesIncident Packaging Service packages details of problems stored by Oracle Databasein ADR for later diagnosis.
Oracle Trace File Analyzer runs IPS to query and collect these packages.
Syntax
tfactl ips option
Table 6-3 tfactl ips Command Parameters
Command Description
tfactl ips Runs the IPS.
Chapter 6Performing Silent Collection
6-6

Table 6-3 (Cont.) tfactl ips Command Parameters
Command Description
tfactl ips show incidents Shows all IPS incidents.
tfactl ips show problems Shows all IPS problems.
tfactl ips show package Shows all IPS Packages.
tfactl diagcollect -ips -h Shows all available diagcollect IPS options.
tfactl diagcollect -ips Performs an IPS collection following prompts. You can useall the standard diagcollect options to limit the scope ofIPS collection.
tfactl diagcollect -ips -adrbasepath adr_base -adrhomepath adr_home
Performs an IPS collection in silent mode.
tfactl diagcollect -ips -incident incident_id
Collects ADR details about a specific incident id.
tfactl diagcollect -ips -problem problem_id
Collect ADR details about a specific problem id.
You can change the contents of the IPS package. Use the following options:
1. Start the collection.
2. Suspend the collection using the -manageips option.
For example:
$ tfactl diagcollect -ips -incident incident_id -manageips -node local
3. Find the suspended collection using the print suspendedips option.
For example:
$ tfactl print suspendedips
4. Manipulate the package.
5. Resume the collection using the -resumeips option.
For example:
$ tfactl diagcollect -resumeips collection_id
Example 6-1 Show Incidents
$ tfactl ips show incidents
ADR Home = /scratch/app/crsusr/diag/clients/user_crsusr/host_622665046_106:
*************************************************************************0 rows fetched
ADR Home = /scratch/app/crsusr/diag/afdboot/user_root/host_622665046_106:
*************************************************************************0 rows fetched
ADR Home = /scratch/app/crsusr/diag/rdbms/_mgmtdb/-MGMTDB:
*************************************************************************
Chapter 6Collecting Incident Packaging Service (IPS) Packages
6-7
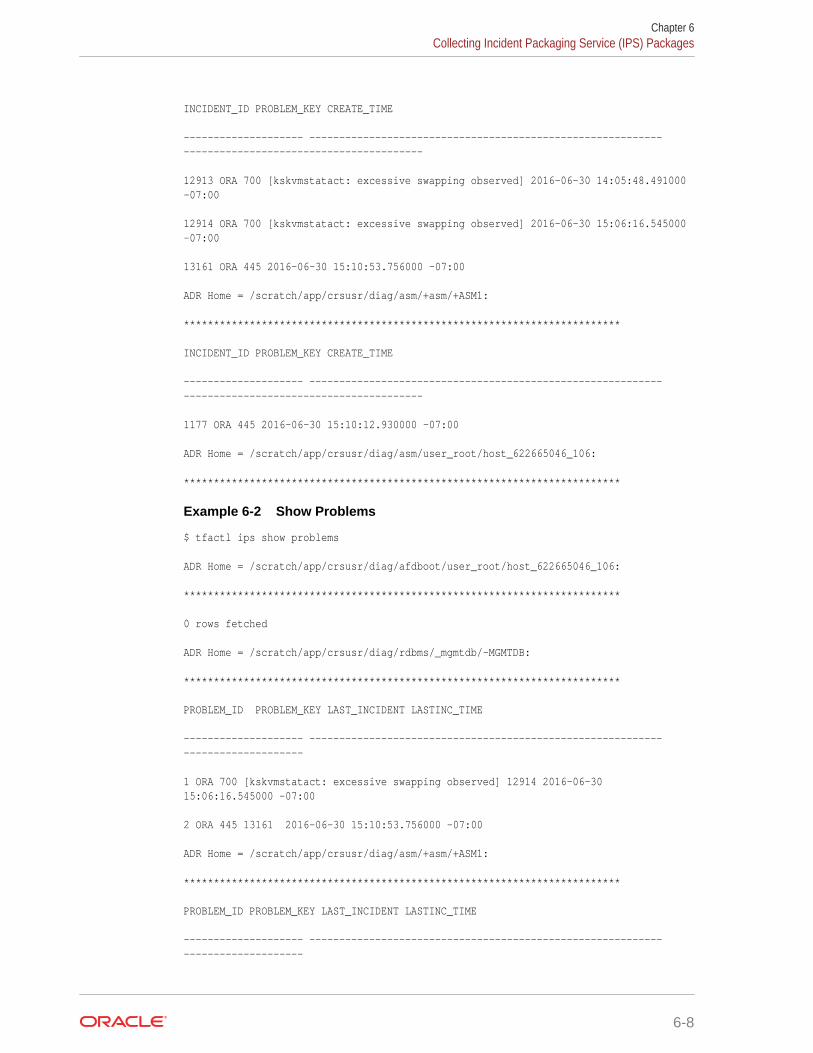
INCIDENT_ID PROBLEM_KEY CREATE_TIME
-------------------- ----------------------------------------------------------- ----------------------------------------
12913 ORA 700 [kskvmstatact: excessive swapping observed] 2016-06-30 14:05:48.491000 -07:00
12914 ORA 700 [kskvmstatact: excessive swapping observed] 2016-06-30 15:06:16.545000 -07:00
13161 ORA 445 2016-06-30 15:10:53.756000 -07:00
ADR Home = /scratch/app/crsusr/diag/asm/+asm/+ASM1:
*************************************************************************
INCIDENT_ID PROBLEM_KEY CREATE_TIME
-------------------- ----------------------------------------------------------- ----------------------------------------
1177 ORA 445 2016-06-30 15:10:12.930000 -07:00
ADR Home = /scratch/app/crsusr/diag/asm/user_root/host_622665046_106:
*************************************************************************
Example 6-2 Show Problems
$ tfactl ips show problems
ADR Home = /scratch/app/crsusr/diag/afdboot/user_root/host_622665046_106:
*************************************************************************
0 rows fetched
ADR Home = /scratch/app/crsusr/diag/rdbms/_mgmtdb/-MGMTDB:
*************************************************************************
PROBLEM_ID PROBLEM_KEY LAST_INCIDENT LASTINC_TIME
-------------------- ----------------------------------------------------------- --------------------
1 ORA 700 [kskvmstatact: excessive swapping observed] 12914 2016-06-30 15:06:16.545000 -07:00
2 ORA 445 13161 2016-06-30 15:10:53.756000 -07:00
ADR Home = /scratch/app/crsusr/diag/asm/+asm/+ASM1:
*************************************************************************
PROBLEM_ID PROBLEM_KEY LAST_INCIDENT LASTINC_TIME
-------------------- ----------------------------------------------------------- --------------------
Chapter 6Collecting Incident Packaging Service (IPS) Packages
6-8

1 ORA 445 1177 2016-06-30 15:10:12.930000 -07:00
Example 6-3 Show Packages
$ tfactl ips show package
Multiple ADR homepaths were found for /scratch/app/crsusr, please select one ...
( ) option[0] diag/asmtool/user_root/host_622665046_106 ( ) option[1] diag/asmtool/user_crsusr/host_622665046_106 ( ) option[2] diag/clients/user_root/host_622665046_106 ( ) option[3] diag/clients/user_crsusr/host_622665046_106 ( ) option[4] diag/afdboot/user_root/host_622665046_106 ( ) option[5] diag/rdbms/_mgmtdb/-MGMTDB option[6] Done
Pls select a homepath [6] ?5 diag/rdbms/_mgmtdb/-MGMTDB was selected
PACKAGE_ID 1 PACKAGE_NAME ORA700kge_20160731211334 PACKAGE_DESCRIPTION DRIVING_PROBLEM 2 DRIVING_PROBLEM_KEY ORA 700 [kgerev1] DRIVING_INCIDENT 42605 DRIVING_INCIDENT_TIME 2016-07-05 07:53:28.578000 -07:00 STATUS Generated (4) CORRELATION_LEVEL Typical (2) PROBLEMS 2 main problems, 0 correlated problems INCIDENTS 2 main incidents, 0 correlated incidents INCLUDED_FILES 84
PACKAGE_ID 2 PACKAGE_NAME IPSPKG_20160801203518 PACKAGE_DESCRIPTION DRIVING_PROBLEM N/A DRIVING_PROBLEM_KEY N/A DRIVING_INCIDENT N/A DRIVING_INCIDENT_TIME N/A STATUS Generated (4) CORRELATION_LEVEL Typical (2) PROBLEMS 0 main problems, 0 correlated problems INCIDENTS 0 main incidents, 0 correlated incidents INCLUDED_FILES 27
Example 6-4 IPS Collect
$ tfactl diagcollect -ips
Collecting data for the last 12 hours for this component ...Collecting data for all nodesCreating ips package in master node ...
Multiple ADR homepaths were found for /scratch/app/crsusr, please select one or more...
( ) option[0] diag/asmtool/user_root/host_622665046_106 ( ) option[1] diag/asmtool/user_crsusr/host_622665046_106 ( ) option[2] diag/clients/user_root/host_622665046_106
Chapter 6Collecting Incident Packaging Service (IPS) Packages
6-9
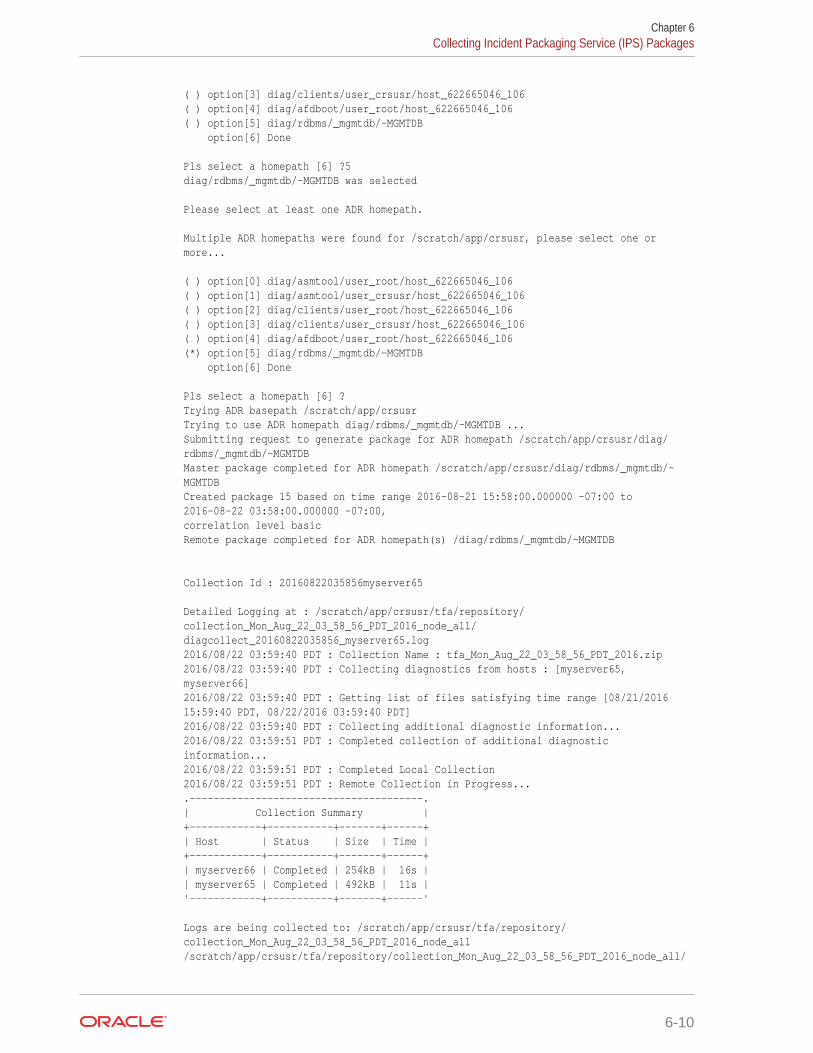
( ) option[3] diag/clients/user_crsusr/host_622665046_106 ( ) option[4] diag/afdboot/user_root/host_622665046_106 ( ) option[5] diag/rdbms/_mgmtdb/-MGMTDB option[6] Done
Pls select a homepath [6] ?5diag/rdbms/_mgmtdb/-MGMTDB was selected
Please select at least one ADR homepath.
Multiple ADR homepaths were found for /scratch/app/crsusr, please select one or more...
( ) option[0] diag/asmtool/user_root/host_622665046_106 ( ) option[1] diag/asmtool/user_crsusr/host_622665046_106 ( ) option[2] diag/clients/user_root/host_622665046_106 ( ) option[3] diag/clients/user_crsusr/host_622665046_106 ( ) option[4] diag/afdboot/user_root/host_622665046_106 (*) option[5] diag/rdbms/_mgmtdb/-MGMTDB option[6] Done
Pls select a homepath [6] ?Trying ADR basepath /scratch/app/crsusrTrying to use ADR homepath diag/rdbms/_mgmtdb/-MGMTDB ...Submitting request to generate package for ADR homepath /scratch/app/crsusr/diag/rdbms/_mgmtdb/-MGMTDBMaster package completed for ADR homepath /scratch/app/crsusr/diag/rdbms/_mgmtdb/-MGMTDBCreated package 15 based on time range 2016-08-21 15:58:00.000000 -07:00 to 2016-08-22 03:58:00.000000 -07:00, correlation level basicRemote package completed for ADR homepath(s) /diag/rdbms/_mgmtdb/-MGMTDB
Collection Id : 20160822035856myserver65
Detailed Logging at : /scratch/app/crsusr/tfa/repository/collection_Mon_Aug_22_03_58_56_PDT_2016_node_all/diagcollect_20160822035856_myserver65.log2016/08/22 03:59:40 PDT : Collection Name : tfa_Mon_Aug_22_03_58_56_PDT_2016.zip2016/08/22 03:59:40 PDT : Collecting diagnostics from hosts : [myserver65, myserver66]2016/08/22 03:59:40 PDT : Getting list of files satisfying time range [08/21/2016 15:59:40 PDT, 08/22/2016 03:59:40 PDT]2016/08/22 03:59:40 PDT : Collecting additional diagnostic information...2016/08/22 03:59:51 PDT : Completed collection of additional diagnostic information...2016/08/22 03:59:51 PDT : Completed Local Collection2016/08/22 03:59:51 PDT : Remote Collection in Progress....---------------------------------------.| Collection Summary |+------------+-----------+-------+------+| Host | Status | Size | Time |+------------+-----------+-------+------+| myserver66 | Completed | 254kB | 16s || myserver65 | Completed | 492kB | 11s |'------------+-----------+-------+------'
Logs are being collected to: /scratch/app/crsusr/tfa/repository/collection_Mon_Aug_22_03_58_56_PDT_2016_node_all/scratch/app/crsusr/tfa/repository/collection_Mon_Aug_22_03_58_56_PDT_2016_node_all/
Chapter 6Collecting Incident Packaging Service (IPS) Packages
6-10

myserver66.tfa_Mon_Aug_22_03_58_56_PDT_2016.zip/scratch/app/crsusr/tfa/repository/collection_Mon_Aug_22_03_58_56_PDT_2016_node_all/myserver65.tfa_Mon_Aug_22_03_58_56_PDT_2016.zip
Related Topics
• tfactl ips (page A-22)Use the tfactl ips command to collect Automatic Diagnostic Repositorydiagnostic data.
Chapter 6Collecting Incident Packaging Service (IPS) Packages
6-11
7Managing and Configuring Oracle TraceFile Analyzer
This section helps you manage Oracle Trace File Analyzer daemon, diagnosticcollections, and the collection repository.
• Querying Oracle Trace File Analyzer Status and Configuration (page 7-1)Use the print command to query the status or configuration.
• Managing the Oracle Trace File Analyzer Daemon (page 7-3)Oracle Trace File Analyzer runs from init on UNIX systems or init/upstart/systemd on Linux, or Microsoft Windows uses a Windows Service so that OracleTrace File Analyzer starts automatically whenever a node starts.
• Managing the Repository (page 7-4)Oracle Trace File Analyzer stores all diagnostic collections in the repository.
• Managing Collections (page 7-5)Manage directories configured in Oracle Trace File Analyzer and diagnosticcollections.
• Configuring the Host (page 7-7)You must have root or sudo access to tfactl to add hosts to Oracle Trace FileAnalyzer configuration.
• Configuring the Ports (page 7-7)The Oracle Trace File Analyzer daemons in a cluster communicate securely overports 5000 to 5005.
• Configuring SSL and SSL Certificates (page 7-8)View and restrict SSL/TLS protocols. Configure Oracle Trace File Analyzer to useself-signed or CA-signed certificates.
• Configuring and Using REST (page 7-11)Oracle Trace File Analyzer includes REST support allowing invocation and queryover HTTPS.
• REST Authentication (page 7-17)Oracle Trace File Analyzer REST uses first-party cookie-based authentication(basic authentication).
• Configuring Email Notification Details (page 7-18)Configure Oracle Trace File Analyzer to send an email to the registered emailaddress after an automatic collection completes.
7.1 Querying Oracle Trace File Analyzer Status andConfiguration
Use the print command to query the status or configuration.
7-1
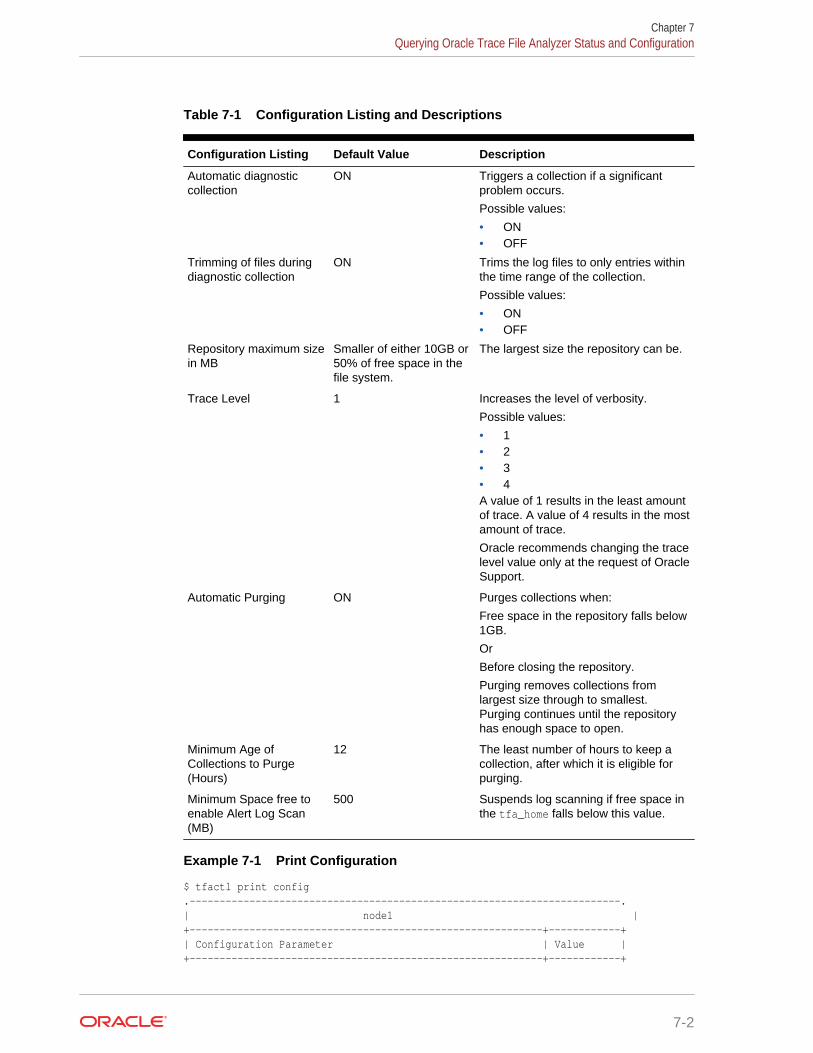
Table 7-1 Configuration Listing and Descriptions
Configuration Listing Default Value Description
Automatic diagnosticcollection
ON Triggers a collection if a significantproblem occurs.
Possible values:
• ON• OFF
Trimming of files duringdiagnostic collection
ON Trims the log files to only entries withinthe time range of the collection.
Possible values:
• ON• OFF
Repository maximum sizein MB
Smaller of either 10GB or50% of free space in thefile system.
The largest size the repository can be.
Trace Level 1 Increases the level of verbosity.
Possible values:
• 1• 2• 3• 4A value of 1 results in the least amountof trace. A value of 4 results in the mostamount of trace.
Oracle recommends changing the tracelevel value only at the request of OracleSupport.
Automatic Purging ON Purges collections when:
Free space in the repository falls below1GB.
Or
Before closing the repository.
Purging removes collections fromlargest size through to smallest.Purging continues until the repositoryhas enough space to open.
Minimum Age ofCollections to Purge(Hours)
12 The least number of hours to keep acollection, after which it is eligible forpurging.
Minimum Space free toenable Alert Log Scan(MB)
500 Suspends log scanning if free space inthe tfa_home falls below this value.
Example 7-1 Print Configuration
$ tfactl print config.------------------------------------------------------------------------.| node1 |+-----------------------------------------------------------+------------+| Configuration Parameter | Value |+-----------------------------------------------------------+------------+
Chapter 7Querying Oracle Trace File Analyzer Status and Configuration
7-2
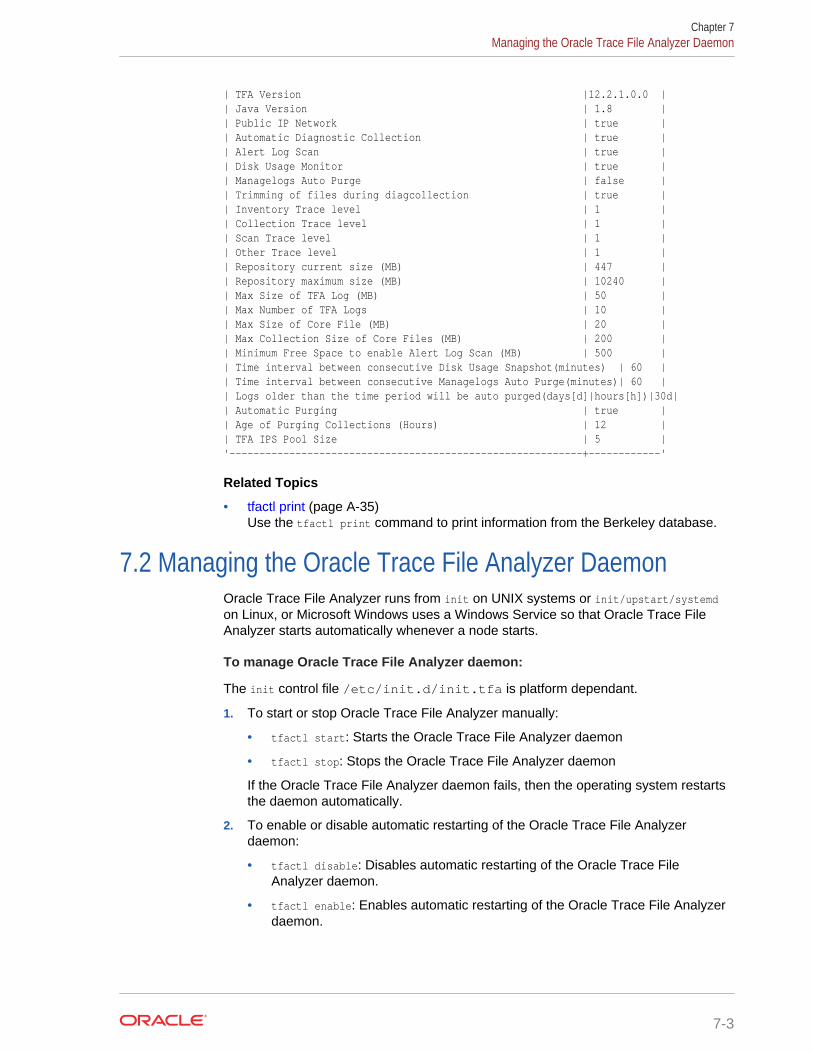
| TFA Version |12.2.1.0.0 || Java Version | 1.8 || Public IP Network | true || Automatic Diagnostic Collection | true || Alert Log Scan | true || Disk Usage Monitor | true || Managelogs Auto Purge | false || Trimming of files during diagcollection | true || Inventory Trace level | 1 || Collection Trace level | 1 || Scan Trace level | 1 || Other Trace level | 1 || Repository current size (MB) | 447 || Repository maximum size (MB) | 10240 || Max Size of TFA Log (MB) | 50 || Max Number of TFA Logs | 10 || Max Size of Core File (MB) | 20 || Max Collection Size of Core Files (MB) | 200 || Minimum Free Space to enable Alert Log Scan (MB) | 500 || Time interval between consecutive Disk Usage Snapshot(minutes) | 60 || Time interval between consecutive Managelogs Auto Purge(minutes)| 60 || Logs older than the time period will be auto purged(days[d]|hours[h])|30d|| Automatic Purging | true || Age of Purging Collections (Hours) | 12 || TFA IPS Pool Size | 5 |'-----------------------------------------------------------+------------'
Related Topics
• tfactl print (page A-35)Use the tfactl print command to print information from the Berkeley database.
7.2 Managing the Oracle Trace File Analyzer DaemonOracle Trace File Analyzer runs from init on UNIX systems or init/upstart/systemdon Linux, or Microsoft Windows uses a Windows Service so that Oracle Trace FileAnalyzer starts automatically whenever a node starts.
To manage Oracle Trace File Analyzer daemon:
The init control file /etc/init.d/init.tfa is platform dependant.
1. To start or stop Oracle Trace File Analyzer manually:
• tfactl start: Starts the Oracle Trace File Analyzer daemon
• tfactl stop: Stops the Oracle Trace File Analyzer daemon
If the Oracle Trace File Analyzer daemon fails, then the operating system restartsthe daemon automatically.
2. To enable or disable automatic restarting of the Oracle Trace File Analyzerdaemon:
• tfactl disable: Disables automatic restarting of the Oracle Trace FileAnalyzer daemon.
• tfactl enable: Enables automatic restarting of the Oracle Trace File Analyzerdaemon.
Chapter 7Managing the Oracle Trace File Analyzer Daemon
7-3
7.3 Managing the RepositoryOracle Trace File Analyzer stores all diagnostic collections in the repository.
The repository size is the maximum space Oracle Trace File Analyzer is able to use ondisk to store collections.
• Purging the Repository Automatically (page 7-4)
• Purging the Repository Manually (page 7-5)
7.3.1 Purging the Repository Automatically
Oracle Trace File Analyzer closes the repository, if:
• Free space in TFA_HOME is less than 100 MB, also stops indexing
• Free space in ORACLE_BASE is less than 100 MB, also stops indexing
• Free space in the repository is less than 1 GB
• Current size of the repository is greater than the repository max size (reposizeMB)
The Oracle Trace File Analyzer daemon monitors and automatically purges therepository when the free space falls below 1 GB or before closing the repository.Purging removes collections from largest size through to smallest until the repositoryhas enough space to open.
Oracle Trace File Analyzer automatically purges only the collections that are olderthan minagetopurge. By default, minagetopurge is 12 hours.
To purge the repository automatically
1. To change the minimum age to purge:
set minagetopurge=number of hours
For example:
$ tfactl set minagetopurge=48
Purging the repository automatically is enabled by default.
2. To disable or enable automatic purging:
set autopurge=ON|OFF
For example:
$ tfactl set autopurge=ON
3. To change the location of the repository:
set repositorydir=dir
For example:
$ tfactl set repositorydir=/opt/mypath
4. To change the size of the repository:
set reposizeMB
Chapter 7Managing the Repository
7-4
For example:
$ tfactl set reposizeMB=20480
Related Topics
• tfactl set (page A-4)Use the tfactl set command to enable or disable, or modify various Oracle TraceFile Analyzer functions.
7.3.2 Purging the Repository Manually
To purge the repository manually:
1. To view the status of the Oracle Trace File Analyzer repository:
tfactl print repository
2. To view statistics about collections:
tfactl print collections
3. To manually purge collections that are older than a specific time:
tfactl purge -older number[h|d] [-force]
Related Topics
• tfactl purge (page A-38)Use the tfactl purge command to delete diagnostic collections from the OracleTrace File Analyzer repository that are older than a specific time.
• tfactl print (page A-35)Use the tfactl print command to print information from the Berkeley database.
7.4 Managing CollectionsManage directories configured in Oracle Trace File Analyzer and diagnosticcollections.
• Including Directories (page 7-5)Add directories to the Oracle Trace File Analyzer configuration to include thedirectories in diagnostic collections.
• Managing the Size of Collections (page 7-6)Use the Oracle Trace File Analyzer configuration options trimfiles,maxcorefilesize, maxcorecollectionsize, and diagcollect -nocores to reduce thesize of collections.
7.4.1 Including DirectoriesAdd directories to the Oracle Trace File Analyzer configuration to include thedirectories in diagnostic collections.
Oracle Trace File Analyzer then stores diagnostic collection metadata about the:
• Directory
• Subdirectories
Chapter 7Managing Collections
7-5

• Files in the directory and all sub directories
All Oracle Trace File Analyzer users can add directories they have read access to.
To manage directories:
1. To view the current directories configured in Oracle Trace File Analyzer
tfactl print directories [ -node all | local | n1,n2,... ] [ -comp component_name1,component_name2,.. ] [ -policy exclusions | noexclusions ] [ -permission public | private ]
2. To add directories:
tfactl directory add dir [ -public ] [ -exclusions | -noexclusions | -collectall ] [ -node all | n1,n2,... ]
3. To remove a directory from being collected:
tfactl directory remove dir [ -node all | n1,n2,... ]
Related Topics
• tfactl directory (page A-20)Use the tfactl directory command to add a directory to, or remove a directoryfrom the list of directories to analyze their trace or log files.
• tfactl print (page A-35)Use the tfactl print command to print information from the Berkeley database.
7.4.2 Managing the Size of CollectionsUse the Oracle Trace File Analyzer configuration options trimfiles, maxcorefilesize,maxcorecollectionsize, and diagcollect -nocores to reduce the size of collections.
To manage the size of collections:
1. To trim files during diagnostic collection:
tfactl set trimfiles=ON|OFF
• When set to ON (default), Oracle Trace File Analyzer trims files to include dataaround the time of the event
• When set to OFF, any file that was written to at the time of the event iscollected in its entirety
2. To set the maximum size of core file to n MB (default 20 MB):
tfactl set maxcorefilesize=n
Oracle Trace File Analyzer skips core files that are greater than maxcorefilesize.
3. To set the maximum collection size of core files to n MB (default 200 MB):
tfactl set maxcorecollectionsize=n
Oracle Trace File Analyzer skips collecting core files after maxcorecollectionsize isreached.
4. To prevent the collection of core files with diagnostic collections:
Chapter 7Managing Collections
7-6
tfactl diagcollect -nocores
Related Topics
• tfactl diagcollect (page A-17)Use the tfactl diagcollect command to perform on-demand diagnostic collection.
• tfactl set (page A-4)Use the tfactl set command to enable or disable, or modify various Oracle TraceFile Analyzer functions.
7.5 Configuring the HostYou must have root or sudo access to tfactl to add hosts to Oracle Trace FileAnalyzer configuration.
To add, remove, and replace SSL certificates:
1. To view the list of current hosts in the Oracle Trace File Analyzer configuration:
tfactl print hosts
2. To add a host to the Oracle Trace File Analyzer configuration for the first time:
a. If necessary, install and start Oracle Trace File Analyzer on the new host.
b. From the existing host, synchronize authentication certificates for all hosts byrunning:
tfactl syncnodes
If needed, then Oracle Trace File Analyzer displays the current node list it isaware of and prompts you to update this node list.
c. Select Y, and then enter the name of the new host.
Oracle Trace File Analyzer contacts Oracle Trace File Analyzer on the newhost to synchronize certificates and add each other to their respective hostslists.
3. To remove a host:
tfactl host remove host
4. To add a host and the certificates that are already synchronized:
tfactl host add host
Oracle Trace File Analyzer generates self-signed SSL certificates during install.Replace those certificates with one of the following:
• Personal self-signed certificate
• CA-signed certificate
7.6 Configuring the PortsThe Oracle Trace File Analyzer daemons in a cluster communicate securely over ports5000 to 5005.
If the port range is not available on your system, then replace it with the ports availableon your system.
Chapter 7Configuring the Host
7-7
To change the ports:
1. To set the primary port use the tfactl set port command:
tfactl set port=port_1
Or, specify a comma-delimited list of sequentially numbered ports to use. You canspecify a maximum of five ports.
tfactl set port=port_1,port_2,port_3,port_4,port_5
2. Restart Oracle Trace File Analyzer on all nodes:
tfactl stop
tfactl start
7.7 Configuring SSL and SSL CertificatesView and restrict SSL/TLS protocols. Configure Oracle Trace File Analyzer to use self-signed or CA-signed certificates.
• Configuring SSL/TLS Protocols (page 7-8)The Oracle Trace File Analyzer daemons in a cluster communicate securely usingthe SSL/TLS protocols.
• Configuring Self-Signed Certificates (page 7-9)Use Java keytool to replace self-signed SSL certificates with personal self-signedcertificates.
• Configuring CA-Signed Certificates (page 7-10)Use Java keytool and openssl to replace self-signed SSL certificates with theCertificate Authority (CA) signed certificates.
• Configuring SSL Cipher Suite (page 7-11)The cipher suite is a set of cryptographic algorithms used by the TLS/SSLprotocols to create keys and encrypt data.
7.7.1 Configuring SSL/TLS ProtocolsThe Oracle Trace File Analyzer daemons in a cluster communicate securely using theSSL/TLS protocols.
The SSL protocols available for use by Oracle Trace File Analyzer are:
• TLSv1.2
• TLCv1.1
• TLSv1
Oracle Trace File Analyzer always restricts use of older the protocols SSLv3 andSSLv2Hello.
To view and restrict protocols:
1. To view the available and restricted protocols:
tfactl print protocols
Chapter 7Configuring SSL and SSL Certificates
7-8
For example:
$ tfactl print protocols.---------------------------------------.| node1 |+---------------------------------------+| Protocols |+---------------------------------------+| Available : [TLSv1, TLSv1.2, TLSv1.1] || Restricted : [SSLv3, SSLv2Hello] |'---------------------------------------'
2. To restrict the use of certain protocols:
tfactl restrictprotocol [-force] protocol
For example:
$ tfactl restrictprotocol TLSv1
7.7.2 Configuring Self-Signed CertificatesUse Java keytool to replace self-signed SSL certificates with personal self-signedcertificates.
To configure Oracle Trace File Analyzer to use self-signed certificates:
1. Create a private key and keystore file containing the self-signed certificate for theserver:
$ keytool -genkey -alias server_full -keyalg RSA -keysize 2048 -validity 18263 -keystore myserver.jks
2. Create a private key and keystore file containing the private key and self signed-certificate for the client:
$ keytool -genkey -alias client_full -keyalg RSA -keysize 2048 -validity 18263 -keystore myclient.jks
3. Export the server public key certificate from the server keystore:
$ keytool -export -alias server_full -file myserver_pub.crt -keystore myserver.jks -storepass password
4. Export the client public key certificate from the server keystore:
$ keytool -export -alias client_full -file myclient_pub.crt -keystore myclient.jks -storepass password
5. Import the server public key certificate into the client keystore:
$ keytool -import -alias server_pub -file myserver_pub.crt -keystore myclient.jks -storepass password
6. Import the client public key certificate into the server keystore:
$ keytool -import -alias client_pub -file myclient_pub.crt -keystore myserver.jks -storepass password
7. Restrict the permissions on the keystores to root read-only.
$ chmod 400 myclient.jks myserver.jks
8. Copy the keystores (jks files) to each node.
9. Configure Oracle Trace File Analyzer to use the new certificates:
Chapter 7Configuring SSL and SSL Certificates
7-9
$ tfactl set sslconfig
10. Restart the Oracle Trace File Analyzer process to start using new certificates:
$ tfactl stop $ tfactl start
7.7.3 Configuring CA-Signed CertificatesUse Java keytool and openssl to replace self-signed SSL certificates with theCertificate Authority (CA) signed certificates.
To configure Oracle Trace File Analyzer to use CA-signed certificates:
1. Create a private key for the server request:
$ openssl genrsa -aes256 -out myserver.key 2048
2. Create a private key for the client request:
$ openssl genrsa -aes256 -out myclient.key 2048
3. Create a Certificate Signing Request (CSR) for the server:
$ openssl req -key myserver.key -new -sha256 -out myserver.csr
4. Create a Certificate Signing Request (CSR) for the client:
$ openssl req -key myclient.key -new -sha256 -out myclient.csr
5. Send the resulting CSR for the client and the server to the relevant signingauthority.
The signing authority sends back the signed certificates:
• myserver.cert
• myclient.cert
• CA root certificate
6. Convert the certificates to JKS format for the server and the client:
$ openssl pkcs12 -export -out serverCert.pkcs12 -in myserver.cert -inkey myserver.key
$ keytool -v -importkeystore -srckeystore serverCert.pkcs12 -srcstoretype PKCS12 -destkeystore myserver.jks -deststoretype JKS
$ openssl pkcs12 -export -out clientCert.pkcs12 -in myclient.cert -inkey myclient.key
$ keytool -v -importkeystore -srckeystore clientCert.pkcs12 -srcstoretype PKCS12 -destkeystore myclient.jks -deststoretype JKS
7. Import the server public key into to the client jks file:
$ keytool -import -v -alias server-ca -file myserver.cert -keystore myclient.jks
8. Import the client public key to the server jks file:
$ keytool -import -v -alias client-ca -file myclient.cert -keystore myserver.jks
9. Import the CA root certificate from the signing authority into the Oracle Trace FileAnalyzer server certificate:
Chapter 7Configuring SSL and SSL Certificates
7-10
$ keytool -importcert -trustcacerts -alias inter -file caroot.cert -keystore myserver.jks
10. Restrict the permissions on the keystores to root read-only:
$ chmod 400 myclient.jks myserver.jks
11. Copy the keystores (jks files) to each node.
12. Configure Oracle Trace File Analyzer to use the new certificates:
$ tfactl set sslconfig
13. Restart the Oracle Trace File Analyzer process to start using the new certificates.
$ tfactl stop $ tfactl start
7.7.4 Configuring SSL Cipher SuiteThe cipher suite is a set of cryptographic algorithms used by the TLS/SSL protocols tocreate keys and encrypt data.
Oracle Trace File Analyzer supports any of the cipher suites used by JRE 1.8.
The default cipher suite used is TLS_RSA_WITH_AES_128_CBC_SHA256.
1. You can change the cipher suite with the command:
tfactl set ciphersuite=cipher_suite
For example:
tfactl set ciphersuite=TLS_RSA_WITH_AES_128_GCM_SHA256
For a list of JRE cipher suites, see:https://docs.oracle.com/javase/8/docs/technotes/guides/security/SunProviders.html#SunJSSEProvider
7.8 Configuring and Using RESTOracle Trace File Analyzer includes REST support allowing invocation and query overHTTPS.
Syntax
To facilitate this REST support Oracle REST Data Services (ORDS) is included withinthe install.
tfactl rest [-status|-start|-stop|-uninstall] [-dir] [-port] [-user] [-debug [-level]]
Note:
You can run the REST command only as root user.
Chapter 7Configuring and Using REST
7-11
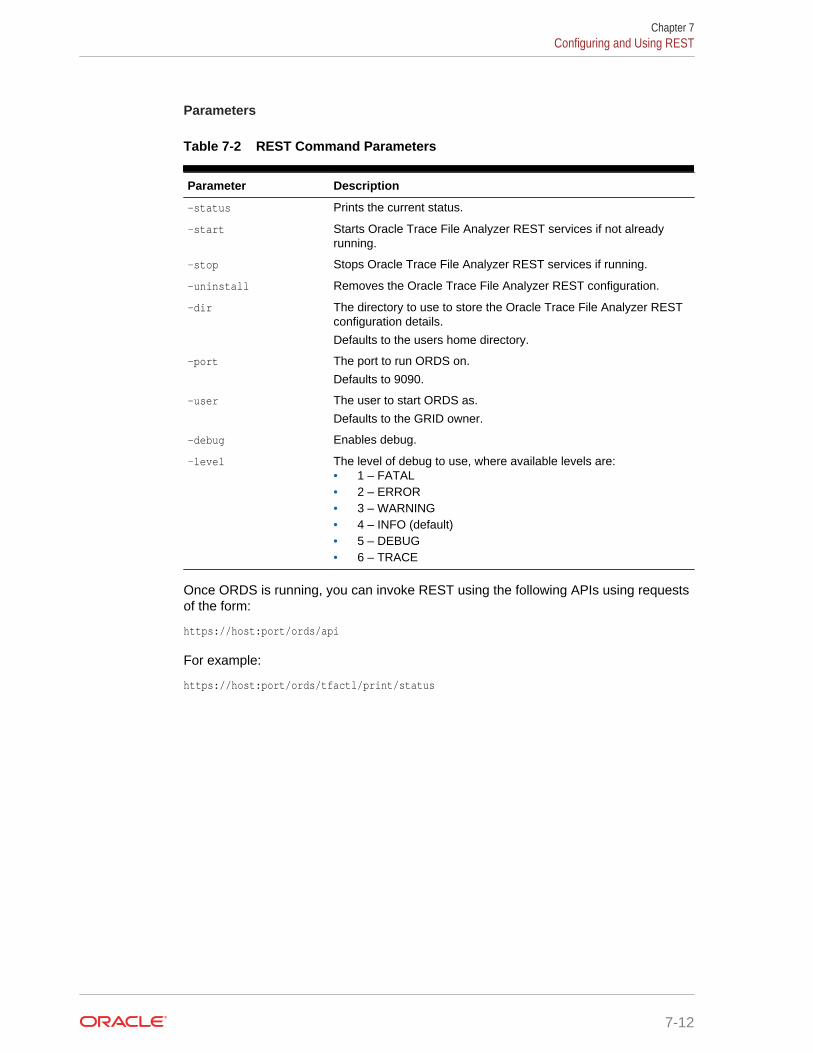
Parameters
Table 7-2 REST Command Parameters
Parameter Description
-status Prints the current status.
-start Starts Oracle Trace File Analyzer REST services if not alreadyrunning.
-stop Stops Oracle Trace File Analyzer REST services if running.
-uninstall Removes the Oracle Trace File Analyzer REST configuration.
–dir The directory to use to store the Oracle Trace File Analyzer RESTconfiguration details.
Defaults to the users home directory.
–port The port to run ORDS on.
Defaults to 9090.
-user The user to start ORDS as.
Defaults to the GRID owner.
–debug Enables debug.
–level The level of debug to use, where available levels are:• 1 – FATAL• 2 – ERROR• 3 – WARNING• 4 – INFO (default)• 5 – DEBUG• 6 – TRACE
Once ORDS is running, you can invoke REST using the following APIs using requestsof the form:
https://host:port/ords/api
For example:
https://host:port/ords/tfactl/print/status
Chapter 7Configuring and Using REST
7-12
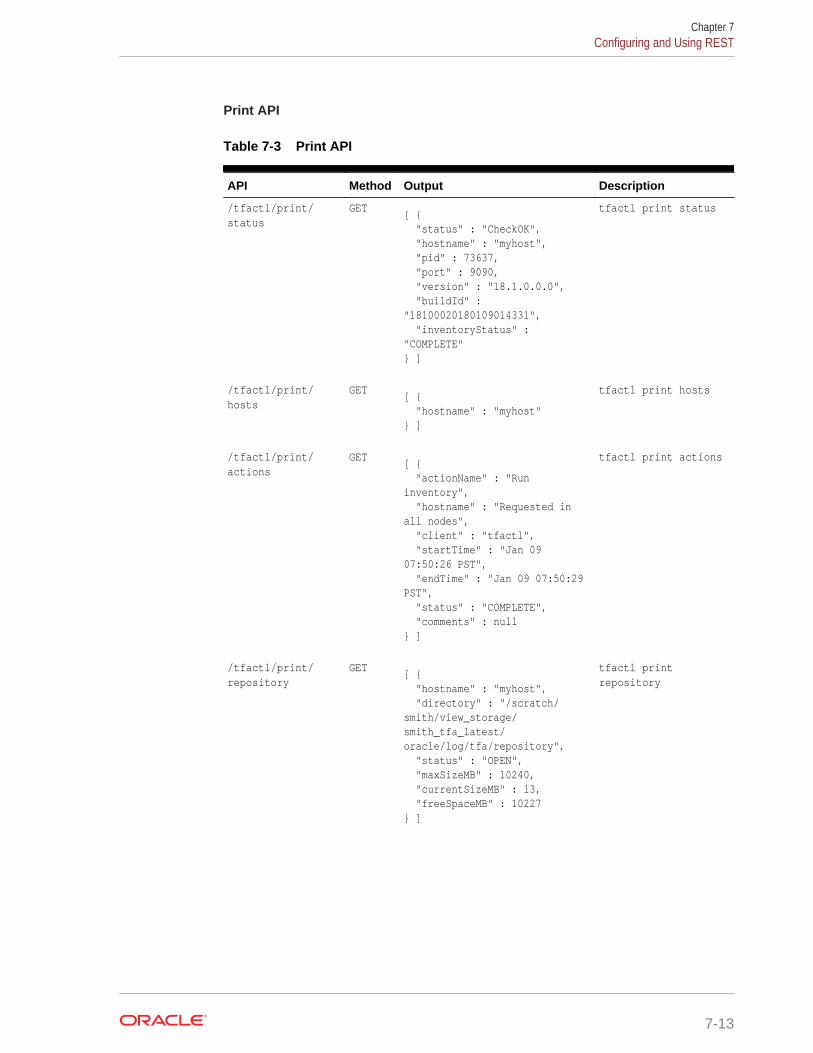
Print API
Table 7-3 Print API
API Method Output Description
/tfactl/print/status
GET[ { "status" : "CheckOK", "hostname" : "myhost", "pid" : 73637, "port" : 9090, "version" : "18.1.0.0.0", "buildId" : "18100020180109014331", "inventoryStatus" : "COMPLETE"} ]
tfactl print status
/tfactl/print/hosts
GET[ { "hostname" : "myhost"} ]
tfactl print hosts
/tfactl/print/actions
GET[ { "actionName" : "Run inventory", "hostname" : "Requested in all nodes", "client" : "tfactl", "startTime" : "Jan 09 07:50:26 PST", "endTime" : "Jan 09 07:50:29 PST", "status" : "COMPLETE", "comments" : null} ]
tfactl print actions
/tfactl/print/repository
GET[ { "hostname" : "myhost", "directory" : "/scratch/smith/view_storage/smith_tfa_latest/oracle/log/tfa/repository", "status" : "OPEN", "maxSizeMB" : 10240, "currentSizeMB" : 13, "freeSpaceMB" : 10227} ]
tfactl printrepository
Chapter 7Configuring and Using REST
7-13

Table 7-3 (Cont.) Print API
API Method Output Description
/tfactl/print/collections
GET[ { "id" : "20171010115528myhost", "type" : "Manual Collection", "requestUser" : "smith", "nodeList" : "[]", "masterHost" : "myhost", "startTime" : "Mon Oct 09 23:55:32 PDT 2017", "endTime" : "Tue Oct 10 11:55:32 PDT 2017", "tag" : "/scratch/smith/view_storage/smith_tfa_latest/oracle/log/tfa/repository/tfa_11", "zipFileName" : "myhost.tfa_Tue_Oct_10_11_55_28_PDT_2017.zip", "componentList" : "[emagent, crsclient, oms, dbwlm,emplugins, cfgtools, afd, wls]", "zipFileSize" : 3055, "collectionTime" : 16, "events" : null}]
tfactl printcollections
/tfactl/print/collections/{collectionid}
GET{ "id" : "20171011044112myhost", "type" : "Manual Collection", "requestUser" : "smith", "nodeList" : "[]", "masterHost" : "myhost", "startTime" : "null", "endTime" : "Wed Oct 11 04:41:14 PDT 2017", "tag" : "/scratch/smith/view_storage/smith_tfa_latest/oracle/log/tfa/repository/TFA_T1", "zipFileName" : "myhost.TFA_T1.zip", "componentList" : "[]", "zipFileSize" : 0, "collectionTime" : 0, "events" : null}
tfactl printcollections
Chapter 7Configuring and Using REST
7-14
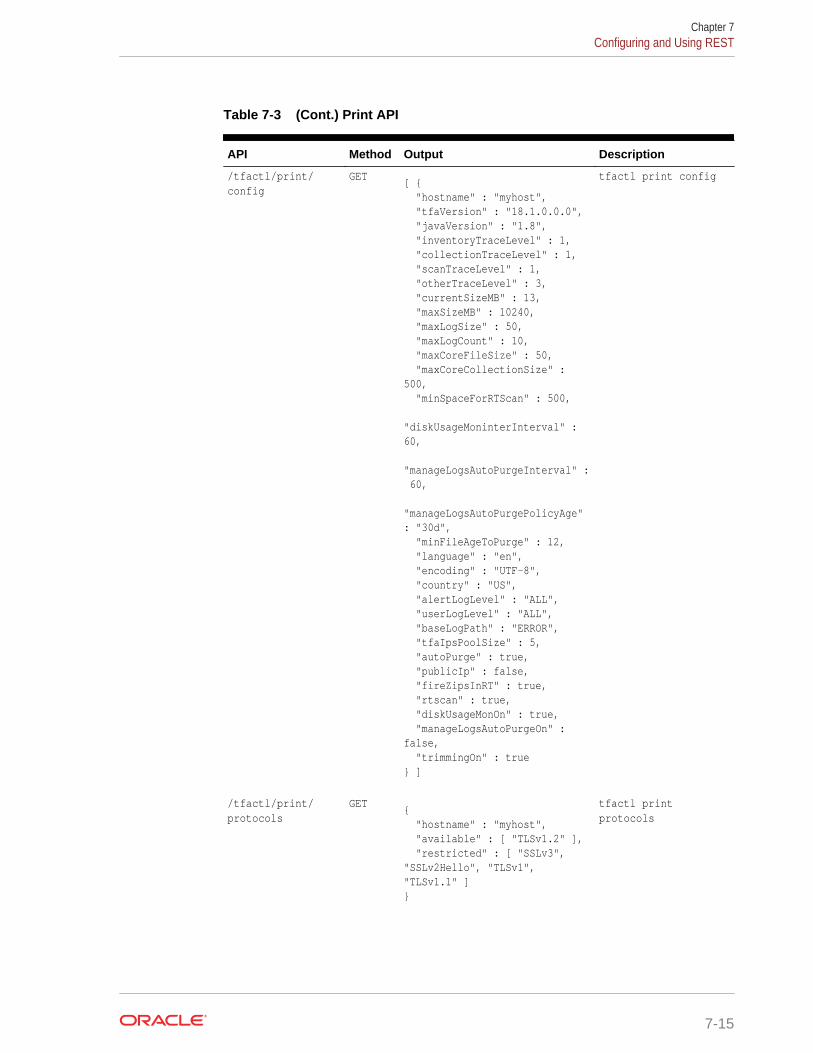
Table 7-3 (Cont.) Print API
API Method Output Description
/tfactl/print/config
GET[ { "hostname" : "myhost", "tfaVersion" : "18.1.0.0.0", "javaVersion" : "1.8", "inventoryTraceLevel" : 1, "collectionTraceLevel" : 1, "scanTraceLevel" : 1, "otherTraceLevel" : 3, "currentSizeMB" : 13, "maxSizeMB" : 10240, "maxLogSize" : 50, "maxLogCount" : 10, "maxCoreFileSize" : 50, "maxCoreCollectionSize" : 500, "minSpaceForRTScan" : 500, "diskUsageMoninterInterval" : 60, "manageLogsAutoPurgeInterval" : 60, "manageLogsAutoPurgePolicyAge" : "30d", "minFileAgeToPurge" : 12, "language" : "en", "encoding" : "UTF-8", "country" : "US", "alertLogLevel" : "ALL", "userLogLevel" : "ALL", "baseLogPath" : "ERROR", "tfaIpsPoolSize" : 5, "autoPurge" : true, "publicIp" : false, "fireZipsInRT" : true, "rtscan" : true, "diskUsageMonOn" : true, "manageLogsAutoPurgeOn" : false, "trimmingOn" : true} ]
tfactl print config
/tfactl/print/protocols
GET{ "hostname" : "myhost", "available" : [ "TLSv1.2" ], "restricted" : [ "SSLv3", "SSLv2Hello", "TLSv1", "TLSv1.1" ]}
tfactl printprotocols
Chapter 7Configuring and Using REST
7-15
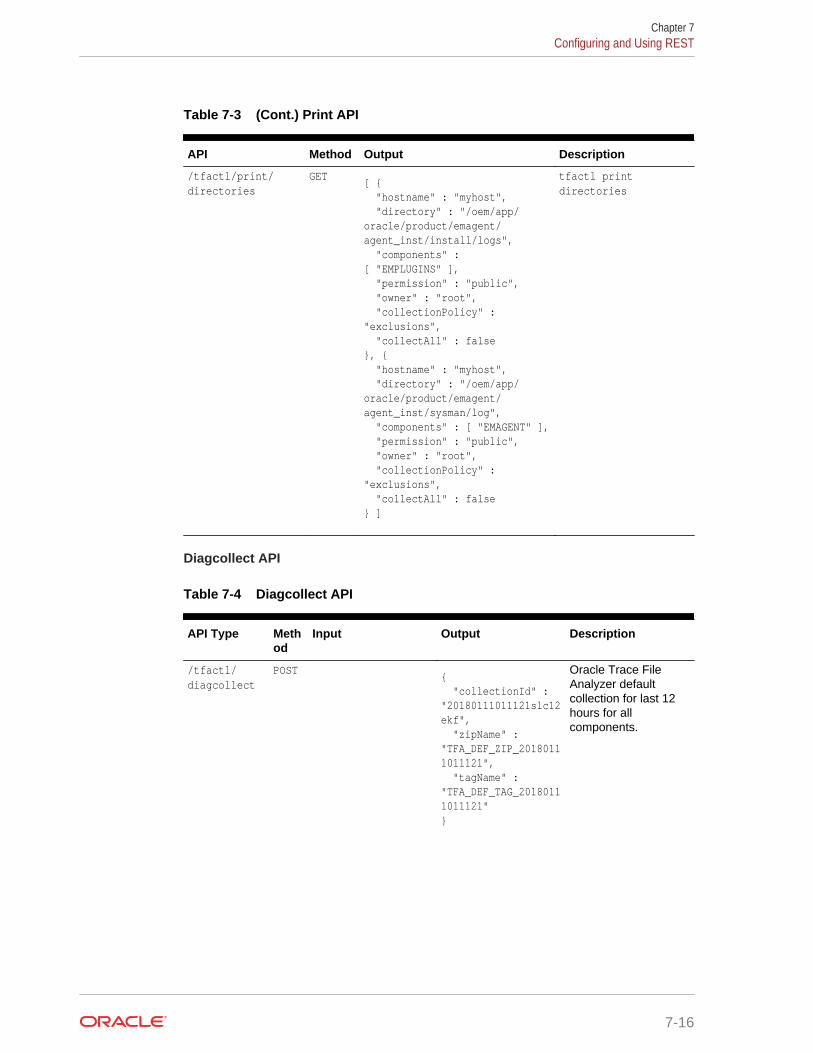
Table 7-3 (Cont.) Print API
API Method Output Description
/tfactl/print/directories
GET[ { "hostname" : "myhost", "directory" : "/oem/app/oracle/product/emagent/agent_inst/install/logs", "components" : [ "EMPLUGINS" ], "permission" : "public", "owner" : "root", "collectionPolicy" : "exclusions", "collectAll" : false}, { "hostname" : "myhost", "directory" : "/oem/app/oracle/product/emagent/agent_inst/sysman/log", "components" : [ "EMAGENT" ], "permission" : "public", "owner" : "root", "collectionPolicy" : "exclusions", "collectAll" : false} ]
tfactl printdirectories
Diagcollect API
Table 7-4 Diagcollect API
API Type Method
Input Output Description
/tfactl/diagcollect
POST{ "collectionId" : "20180111011121slc12ekf", "zipName" : "TFA_DEF_ZIP_20180111011121", "tagName" : "TFA_DEF_TAG_20180111011121"}
Oracle Trace FileAnalyzer defaultcollection for last 12hours for allcomponents.
Chapter 7Configuring and Using REST
7-16
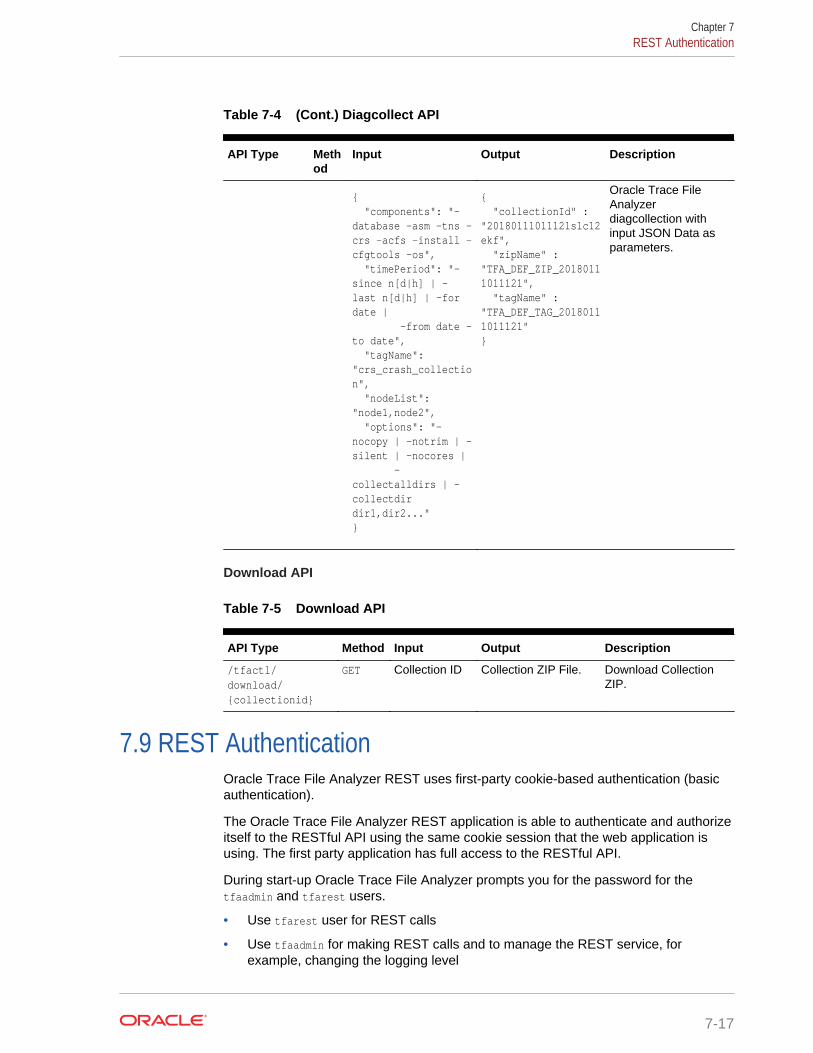
Table 7-4 (Cont.) Diagcollect API
API Type Method
Input Output Description
{ "components": "-database -asm -tns -crs -acfs -install -cfgtools -os", "timePeriod": "-since n[d|h] | -last n[d|h] | -for date | -from date -to date", "tagName": "crs_crash_collection", "nodeList": "node1,node2", "options": "-nocopy | -notrim | -silent | -nocores | -collectalldirs | -collectdir dir1,dir2..."}
{ "collectionId" : "20180111011121slc12ekf", "zipName" : "TFA_DEF_ZIP_20180111011121", "tagName" : "TFA_DEF_TAG_20180111011121"}
Oracle Trace FileAnalyzerdiagcollection withinput JSON Data asparameters.
Download API
Table 7-5 Download API
API Type Method Input Output Description
/tfactl/download/{collectionid}
GET Collection ID Collection ZIP File. Download CollectionZIP.
7.9 REST AuthenticationOracle Trace File Analyzer REST uses first-party cookie-based authentication (basicauthentication).
The Oracle Trace File Analyzer REST application is able to authenticate and authorizeitself to the RESTful API using the same cookie session that the web application isusing. The first party application has full access to the RESTful API.
During start-up Oracle Trace File Analyzer prompts you for the password for thetfaadmin and tfarest users.
• Use tfarest user for REST calls
• Use tfaadmin for making REST calls and to manage the REST service, forexample, changing the logging level
Chapter 7REST Authentication
7-17

# ./tfactl rest -start
Configuring TFA REST Services using ORDS :
This might take couple of minutes. Please be patient.
Adding Dependency Jars to ORDS
Adding users to ORDS :
Enter a password for user tfaadmin: Confirm password for user tfaadmin:
Enter a password for user tfarest: Confirm password for user tfarest:
Starting TFA REST Services
Successfully started TFA REST Services [PID : 32650]
URL : https://myserver:9090/ords/tfactl/print/status
Access the web service from a browser using the following URL:
https://host_name:9090/ords/tfactl/print/status
You are presented with a 401 message, which includes a sign in link. Click the link,sign in with tfarest credentials you just created, and you will be directed to RESToutput.
Alternatively, you can also specify the credentials in a curl command.
# curl -k --user tfarest:mypassword https://myserver:9090/ords/tfactl/print/status[ { "status" : "CheckOK", "hostname" : "myserver", "pid" : 2430, "port" : 5000, "version" : "18.2.0.0.0", "buildId" : "18200020180501035221", "inventoryStatus" : "COMPLETE"} ]
7.10 Configuring Email Notification DetailsConfigure Oracle Trace File Analyzer to send an email to the registered email addressafter an automatic collection completes.
To send emails, configure the system on which Oracle Trace Analyzer is running. Youmust configure notification with a user email address to enable it to work.
To configure email notification details:
1. To set the notification email to use for a specific ORACLE_HOME, include the operatingsystem owner in the command:
tfactl set notificationAddress=os_user:email
For example:
Chapter 7Configuring Email Notification Details
7-18
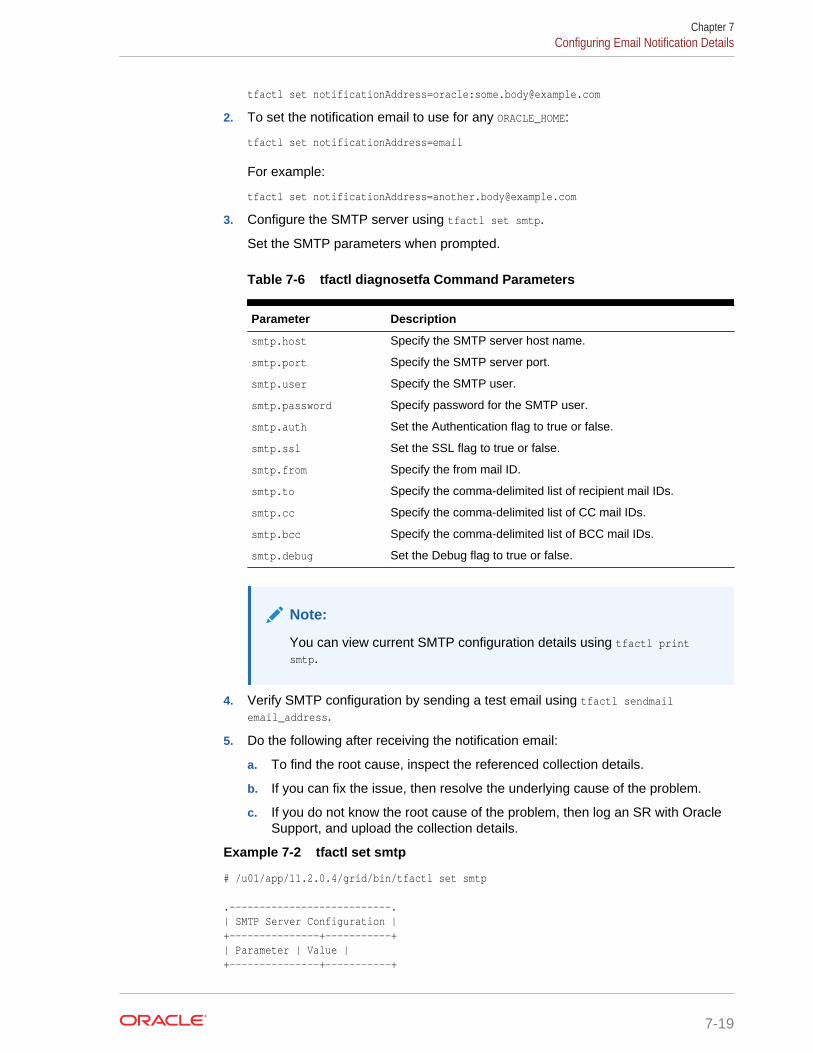
tfactl set notificationAddress=oracle:[email protected]
2. To set the notification email to use for any ORACLE_HOME:
tfactl set notificationAddress=email
For example:
tfactl set [email protected]
3. Configure the SMTP server using tfactl set smtp.
Set the SMTP parameters when prompted.
Table 7-6 tfactl diagnosetfa Command Parameters
Parameter Description
smtp.host Specify the SMTP server host name.
smtp.port Specify the SMTP server port.
smtp.user Specify the SMTP user.
smtp.password Specify password for the SMTP user.
smtp.auth Set the Authentication flag to true or false.
smtp.ssl Set the SSL flag to true or false.
smtp.from Specify the from mail ID.
smtp.to Specify the comma-delimited list of recipient mail IDs.
smtp.cc Specify the comma-delimited list of CC mail IDs.
smtp.bcc Specify the comma-delimited list of BCC mail IDs.
smtp.debug Set the Debug flag to true or false.
Note:
You can view current SMTP configuration details using tfactl printsmtp.
4. Verify SMTP configuration by sending a test email using tfactl sendmailemail_address.
5. Do the following after receiving the notification email:
a. To find the root cause, inspect the referenced collection details.
b. If you can fix the issue, then resolve the underlying cause of the problem.
c. If you do not know the root cause of the problem, then log an SR with OracleSupport, and upload the collection details.
Example 7-2 tfactl set smtp
# /u01/app/11.2.0.4/grid/bin/tfactl set smtp
.---------------------------.| SMTP Server Configuration |+---------------+-----------+| Parameter | Value |+---------------+-----------+
Chapter 7Configuring Email Notification Details
7-19
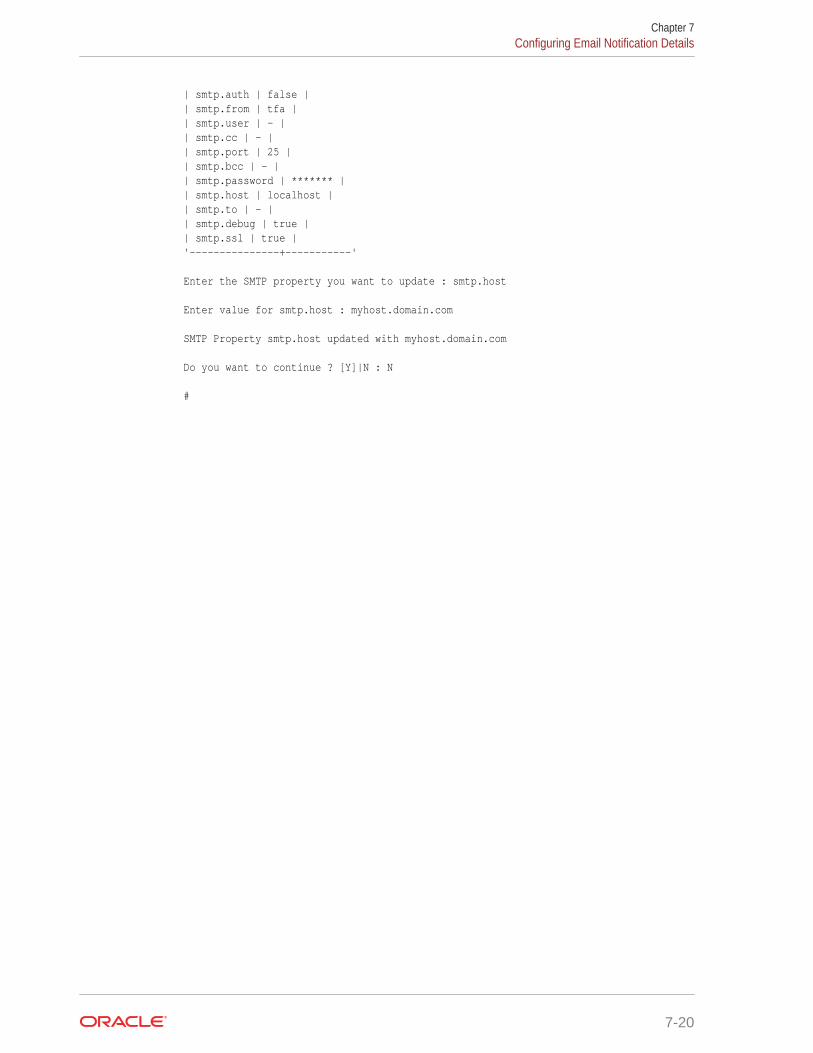
| smtp.auth | false || smtp.from | tfa || smtp.user | - || smtp.cc | - || smtp.port | 25 || smtp.bcc | - || smtp.password | ******* || smtp.host | localhost || smtp.to | - || smtp.debug | true || smtp.ssl | true |'---------------+-----------'
Enter the SMTP property you want to update : smtp.host
Enter value for smtp.host : myhost.domain.com
SMTP Property smtp.host updated with myhost.domain.com
Do you want to continue ? [Y]|N : N
#
Chapter 7Configuring Email Notification Details
7-20

8Managing Oracle Database and OracleGrid Infrastructure Diagnostic Data
This section enables you to manage Oracle Database and Oracle Grid Infrastructurediagnostic data and disk usage snapshots.
• Managing Automatic Diagnostic Repository Log and Trace Files (page 8-1)Use the managelogs command to manage Automatic Diagnostic Repository log andtrace files.
• Managing Disk Usage Snapshots (page 8-2)Use tfactl commands to manage Oracle Trace File Analyzer disk usagesnapshots.
• Purging Oracle Database and Oracle Grid Infrastructure Logs (page 8-2)Use these tfactl commands to manage log file purge policy for Oracle Databaseand Oracle Grid Infrastructure logs.
8.1 Managing Automatic Diagnostic Repository Log andTrace Files
Use the managelogs command to manage Automatic Diagnostic Repository log andtrace files.
The -purge command option removes files managed by Automatic DiagnosticRepository. This command clears files from “ALERT”, "INCIDENT", "TRACE", "CDUMP", "HM","UTSCDMP", "LOG" under diagnostic destinations. The -purge command also providesdetails about the change in the file system space.
If the diagnostic destinations contain large numbers of files, then the command runsfor a while. Check the removal of files in progress from the corresponding directories.
To remove files, you must have operating system privileges over the correspondingdiagnostic destinations.
To manage Automatic Diagnostic Repository log and trace files:
1. To limit purge, or show operations to only files older than a specific time:
$ tfactl managelogs -older nm|h|d Files from past 'n' [d]ays or 'n' [h]ours or 'n' [m]inutes
For example:
$ tfactl managelogs -purge -older 30d -dryrun
$ tfactl managelogs -purge -older 30d
2. To get an estimate of how many files are removed and how much space is freed,use the –dryrun option:
For example:
8-1
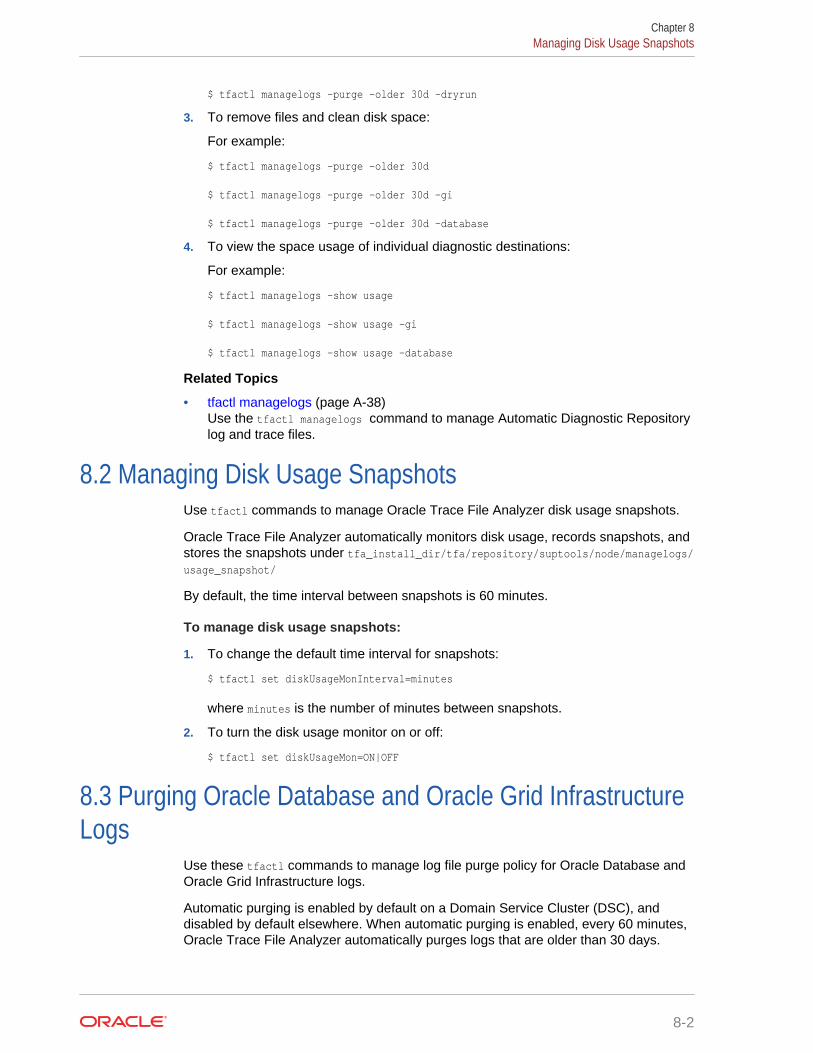
$ tfactl managelogs -purge -older 30d -dryrun
3. To remove files and clean disk space:
For example:
$ tfactl managelogs -purge -older 30d
$ tfactl managelogs -purge -older 30d –gi
$ tfactl managelogs -purge -older 30d -database
4. To view the space usage of individual diagnostic destinations:
For example:
$ tfactl managelogs -show usage
$ tfactl managelogs -show usage –gi
$ tfactl managelogs -show usage -database
Related Topics
• tfactl managelogs (page A-38)Use the tfactl managelogs command to manage Automatic Diagnostic Repositorylog and trace files.
8.2 Managing Disk Usage SnapshotsUse tfactl commands to manage Oracle Trace File Analyzer disk usage snapshots.
Oracle Trace File Analyzer automatically monitors disk usage, records snapshots, andstores the snapshots under tfa_install_dir/tfa/repository/suptools/node/managelogs/usage_snapshot/
By default, the time interval between snapshots is 60 minutes.
To manage disk usage snapshots:
1. To change the default time interval for snapshots:
$ tfactl set diskUsageMonInterval=minutes
where minutes is the number of minutes between snapshots.
2. To turn the disk usage monitor on or off:
$ tfactl set diskUsageMon=ON|OFF
8.3 Purging Oracle Database and Oracle Grid InfrastructureLogs
Use these tfactl commands to manage log file purge policy for Oracle Database andOracle Grid Infrastructure logs.
Automatic purging is enabled by default on a Domain Service Cluster (DSC), anddisabled by default elsewhere. When automatic purging is enabled, every 60 minutes,Oracle Trace File Analyzer automatically purges logs that are older than 30 days.
Chapter 8Managing Disk Usage Snapshots
8-2
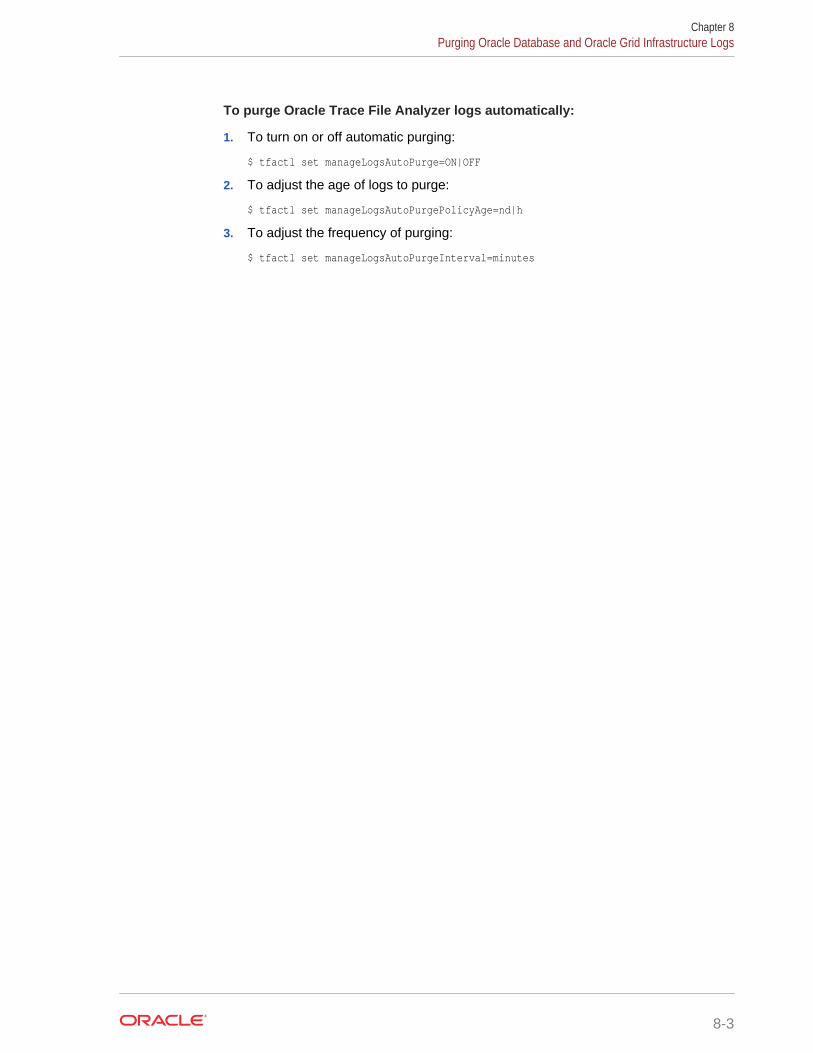
To purge Oracle Trace File Analyzer logs automatically:
1. To turn on or off automatic purging:
$ tfactl set manageLogsAutoPurge=ON|OFF
2. To adjust the age of logs to purge:
$ tfactl set manageLogsAutoPurgePolicyAge=nd|h
3. To adjust the frequency of purging:
$ tfactl set manageLogsAutoPurgeInterval=minutes
Chapter 8Purging Oracle Database and Oracle Grid Infrastructure Logs
8-3
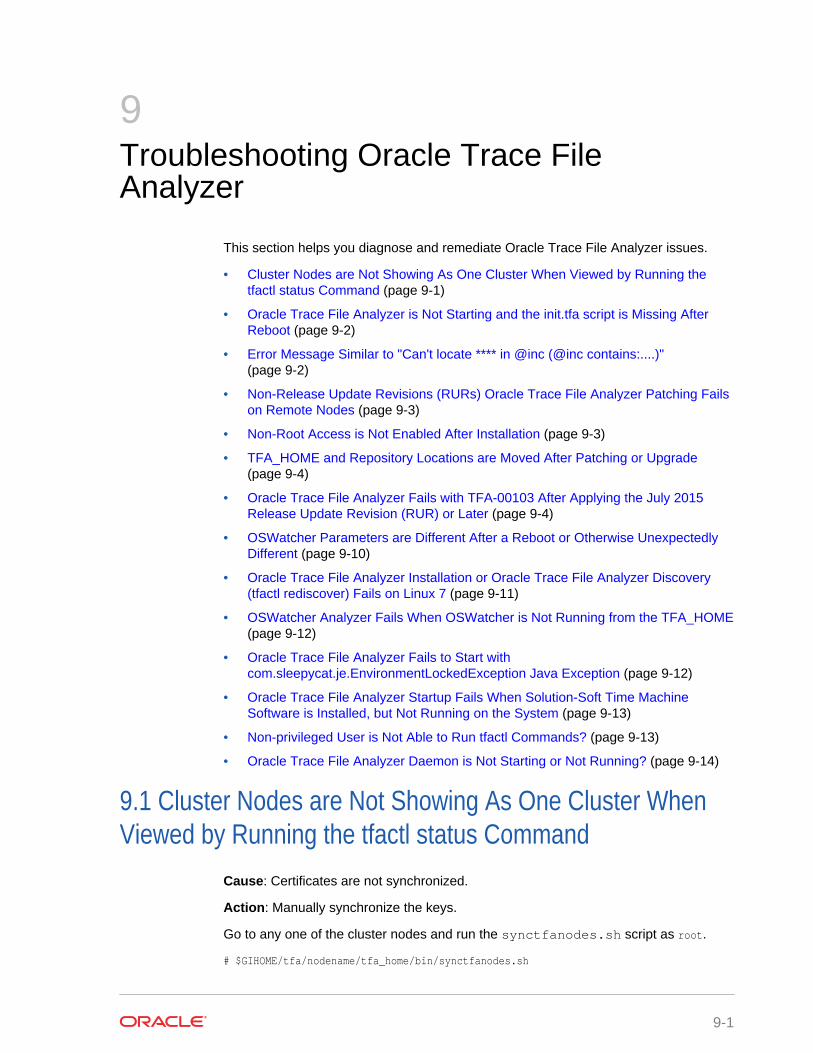
9Troubleshooting Oracle Trace FileAnalyzer
This section helps you diagnose and remediate Oracle Trace File Analyzer issues.
• Cluster Nodes are Not Showing As One Cluster When Viewed by Running thetfactl status Command (page 9-1)
• Oracle Trace File Analyzer is Not Starting and the init.tfa script is Missing AfterReboot (page 9-2)
• Error Message Similar to "Can't locate **** in @inc (@inc contains:....)"(page 9-2)
• Non-Release Update Revisions (RURs) Oracle Trace File Analyzer Patching Failson Remote Nodes (page 9-3)
• Non-Root Access is Not Enabled After Installation (page 9-3)
• TFA_HOME and Repository Locations are Moved After Patching or Upgrade(page 9-4)
• Oracle Trace File Analyzer Fails with TFA-00103 After Applying the July 2015Release Update Revision (RUR) or Later (page 9-4)
• OSWatcher Parameters are Different After a Reboot or Otherwise UnexpectedlyDifferent (page 9-10)
• Oracle Trace File Analyzer Installation or Oracle Trace File Analyzer Discovery(tfactl rediscover) Fails on Linux 7 (page 9-11)
• OSWatcher Analyzer Fails When OSWatcher is Not Running from the TFA_HOME(page 9-12)
• Oracle Trace File Analyzer Fails to Start withcom.sleepycat.je.EnvironmentLockedException Java Exception (page 9-12)
• Oracle Trace File Analyzer Startup Fails When Solution-Soft Time MachineSoftware is Installed, but Not Running on the System (page 9-13)
• Non-privileged User is Not Able to Run tfactl Commands? (page 9-13)
• Oracle Trace File Analyzer Daemon is Not Starting or Not Running? (page 9-14)
9.1 Cluster Nodes are Not Showing As One Cluster WhenViewed by Running the tfactl status Command
Cause: Certificates are not synchronized.
Action: Manually synchronize the keys.
Go to any one of the cluster nodes and run the synctfanodes.sh script as root.
# $GIHOME/tfa/nodename/tfa_home/bin/synctfanodes.sh
9-1
Note:
The script uses SSH and SCP. If passwordless SSH is not set for root, thenOracle Trace File Analyzer prompts you 3 times per node for password eachtime a command is run.
If the Expect utility is available on the node, then Oracle Trace File Analyzeruses Expect thus reducing the number of prompts for password.
9.2 Oracle Trace File Analyzer is Not Starting and the init.tfascript is Missing After Reboot
Description: The file system housing TFA_HOME with Oracle Trace File Analyzerbinaries was not mounted when init.tfa was run from init or System D on Linux 6and above.
Cause: There are many reasons and not restricted to the following:
• Mounting the file system was disabled for maintenance or patching
• Problems or errors related to the file system
• NFS inaccessible network
• File system with TFA_HOME is mounting slowly
Action: Refer to My Oracle Support note 2224163.1 to fix this issue.
Related Topics
• https://support.oracle.com/rs?type=doc&id=2224163.1
9.3 Error Message Similar to "Can't locate **** in @inc(@inc contains:....)"
Cause: Using an old version of Perl causes this error.
Action: Oracle Trace File Analyzer requires Perl version 5.10 or above. If youencounter similar errors, then upgrade Perl to version 5.10 or above.
After installing, update the location of Perl in the tfa_home/tfa_setup.txt file topoint to the new location:
PERL=/u01/perl/bin/perl
If the problem occurs during install, then use the -perlhome dir install option.
The directory you specify must contain /bin/perl. If you install Perl as root, thenroot must own the Perl executable.
# which perl/usr/bin/perl
Chapter 9Oracle Trace File Analyzer is Not Starting and the init.tfa script is Missing After Reboot
9-2
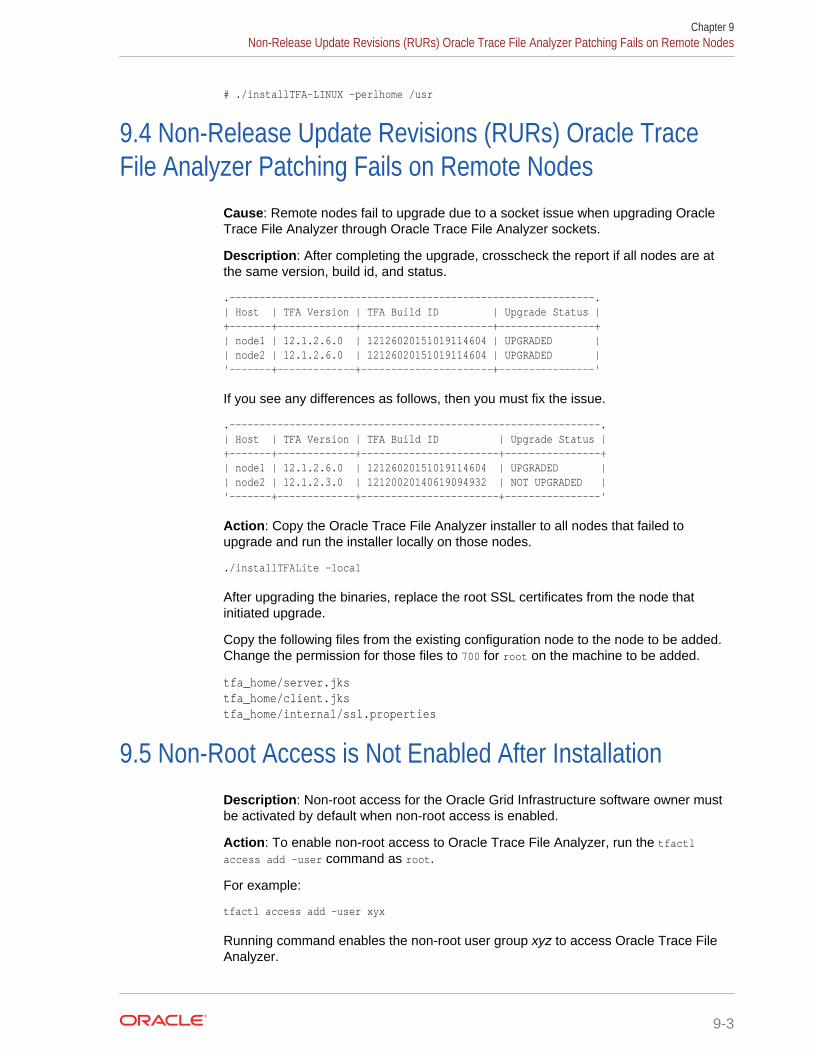
# ./installTFA-LINUX -perlhome /usr
9.4 Non-Release Update Revisions (RURs) Oracle TraceFile Analyzer Patching Fails on Remote Nodes
Cause: Remote nodes fail to upgrade due to a socket issue when upgrading OracleTrace File Analyzer through Oracle Trace File Analyzer sockets.
Description: After completing the upgrade, crosscheck the report if all nodes are atthe same version, build id, and status.
.-------------------------------------------------------------.| Host | TFA Version | TFA Build ID | Upgrade Status |+-------+-------------+----------------------+----------------+| node1 | 12.1.2.6.0 | 12126020151019114604 | UPGRADED || node2 | 12.1.2.6.0 | 12126020151019114604 | UPGRADED |'-------+-------------+----------------------+----------------'
If you see any differences as follows, then you must fix the issue.
.--------------------------------------------------------------.| Host | TFA Version | TFA Build ID | Upgrade Status |+-------+-------------+-----------------------+----------------+| node1 | 12.1.2.6.0 | 12126020151019114604 | UPGRADED || node2 | 12.1.2.3.0 | 12120020140619094932 | NOT UPGRADED |'-------+-------------+-----------------------+----------------'
Action: Copy the Oracle Trace File Analyzer installer to all nodes that failed toupgrade and run the installer locally on those nodes.
./installTFALite –local
After upgrading the binaries, replace the root SSL certificates from the node thatinitiated upgrade.
Copy the following files from the existing configuration node to the node to be added.Change the permission for those files to 700 for root on the machine to be added.
tfa_home/server.jkstfa_home/client.jkstfa_home/internal/ssl.properties
9.5 Non-Root Access is Not Enabled After InstallationDescription: Non-root access for the Oracle Grid Infrastructure software owner mustbe activated by default when non-root access is enabled.
Action: To enable non-root access to Oracle Trace File Analyzer, run the tfactlaccess add -user command as root.
For example:
tfactl access add -user xyx
Running command enables the non-root user group xyz to access Oracle Trace FileAnalyzer.
Chapter 9Non-Release Update Revisions (RURs) Oracle Trace File Analyzer Patching Fails on Remote Nodes
9-3
9.6 TFA_HOME and Repository Locations are Moved AfterPatching or Upgrade
Description: Before Oracle Trace File Analyzer version 12.1.2.6.0, when an existingfree standing Oracle Trace File Analyzer was installed (MOS version installed outsidethe GRID_HOME) and Oracle Trace File Analyzer is then patched with Oracle GridInfrastructure as part of Oracle 12.1.0.2, then TFA_HOME is moved into the GRID_HOME andthe repository directory is moved to the Oracle Grid Infrastructure owners ORACLE_BASEdirectory.
If the repository directory is changed to a non-default location, then the change is lost.
• To set the Oracle Trace File Analyzer zip file repository location to the requiredbase directory, run the tfactl set repositorydir command.
• To change the maximum size of the Oracle Trace File Analyzer repository, run thetfactl set reposizeMB command.
Starting with Oracle Trace File Analyzer version 12.1.2.6.0 and above, if TFA_HOMEexists outside the GRID_HOME, then Oracle Trace File Analyzer installation is moved aspart of Release Update Revision (RUR) installation. However, if the Release UpdateRevision (RUR) has a newer version of Oracle Trace File Analyzer, then Oracle TraceFile Analyzer is upgraded in its current location.
If Oracle Trace File Analyzer is installed in the GRID_HOME and the GRID_HOME is movedas part of any patching, then the existing TFA_HOME is migrated to the new GRID_HOMEand upgraded as required.
9.7 Oracle Trace File Analyzer Fails with TFA-00103 AfterApplying the July 2015 Release Update Revision (RUR) orLater
• Phase 1 of Oracle Trace File Analyzer upgrade (page 9-4)
• Phase 2 of Oracle Trace File Analyzer upgrade (page 9-5)
• How can I verify that both phases have been completed and that Oracle Trace FileAnalyzer communication among all the nodes has been established? (page 9-5)
• What if I do not upgrade all my nodes at the same time by choice or if some aredown for maintenance? (page 9-6)
• I know that not all nodes are upgraded at the same time. I do not want to wait 24hours for Oracle Trace File Analyzer to sync the key files. What do I do?(page 9-9)
Phase 1 of Oracle Trace File Analyzer upgrade
Oracle Trace File Analyzer communication model has been changed in versionsgreater than 12.1.2.4.1. To avoid communication problems, Oracle Trace File Analyzercommunication change must be complete across all nodes of the Oracle Trace FileAnalyzer configuration. Oracle Trace File Analyzer is upgraded on each node locally
Chapter 9TFA_HOME and Repository Locations are Moved After Patching or Upgrade
9-4
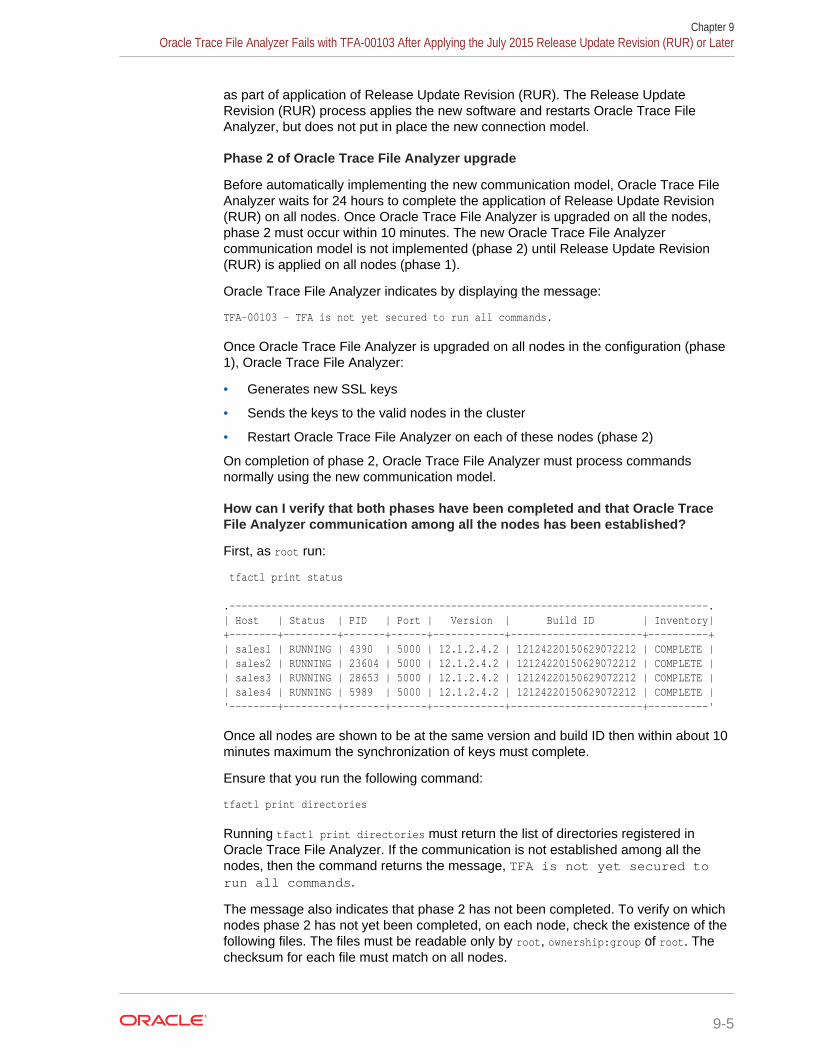
as part of application of Release Update Revision (RUR). The Release UpdateRevision (RUR) process applies the new software and restarts Oracle Trace FileAnalyzer, but does not put in place the new connection model.
Phase 2 of Oracle Trace File Analyzer upgrade
Before automatically implementing the new communication model, Oracle Trace FileAnalyzer waits for 24 hours to complete the application of Release Update Revision(RUR) on all nodes. Once Oracle Trace File Analyzer is upgraded on all the nodes,phase 2 must occur within 10 minutes. The new Oracle Trace File Analyzercommunication model is not implemented (phase 2) until Release Update Revision(RUR) is applied on all nodes (phase 1).
Oracle Trace File Analyzer indicates by displaying the message:
TFA-00103 - TFA is not yet secured to run all commands.
Once Oracle Trace File Analyzer is upgraded on all nodes in the configuration (phase1), Oracle Trace File Analyzer:
• Generates new SSL keys
• Sends the keys to the valid nodes in the cluster
• Restart Oracle Trace File Analyzer on each of these nodes (phase 2)
On completion of phase 2, Oracle Trace File Analyzer must process commandsnormally using the new communication model.
How can I verify that both phases have been completed and that Oracle TraceFile Analyzer communication among all the nodes has been established?
First, as root run:
tfactl print status
.--------------------------------------------------------------------------------.| Host | Status | PID | Port | Version | Build ID | Inventory|+--------+---------+-------+------+------------+----------------------+----------+| sales1 | RUNNING | 4390 | 5000 | 12.1.2.4.2 | 12124220150629072212 | COMPLETE || sales2 | RUNNING | 23604 | 5000 | 12.1.2.4.2 | 12124220150629072212 | COMPLETE || sales3 | RUNNING | 28653 | 5000 | 12.1.2.4.2 | 12124220150629072212 | COMPLETE || sales4 | RUNNING | 5989 | 5000 | 12.1.2.4.2 | 12124220150629072212 | COMPLETE |'--------+---------+-------+------+------------+----------------------+----------'
Once all nodes are shown to be at the same version and build ID then within about 10minutes maximum the synchronization of keys must complete.
Ensure that you run the following command:
tfactl print directories
Running tfactl print directories must return the list of directories registered inOracle Trace File Analyzer. If the communication is not established among all thenodes, then the command returns the message, TFA is not yet secured torun all commands.
The message also indicates that phase 2 has not been completed. To verify on whichnodes phase 2 has not yet been completed, on each node, check the existence of thefollowing files. The files must be readable only by root, ownership:group of root. Thechecksum for each file must match on all nodes.
Chapter 9Oracle Trace File Analyzer Fails with TFA-00103 After Applying the July 2015 Release Update Revision (RUR) or Later
9-5
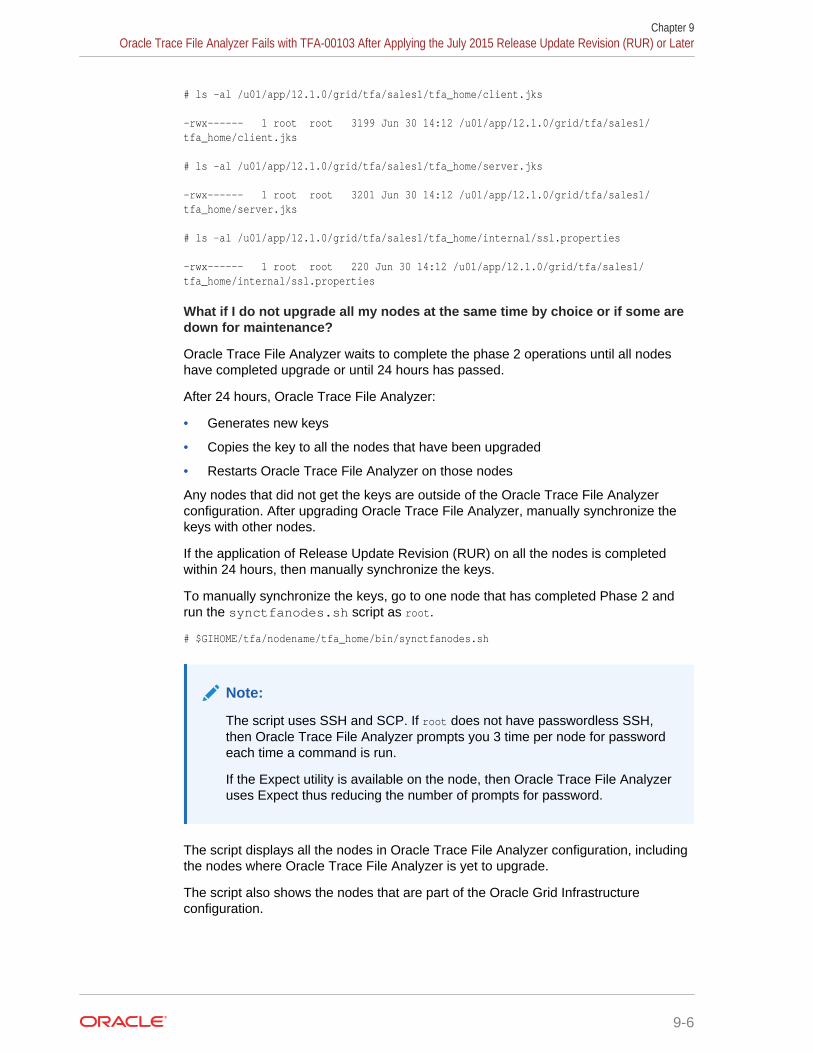
# ls -al /u01/app/12.1.0/grid/tfa/sales1/tfa_home/client.jks
-rwx------ 1 root root 3199 Jun 30 14:12 /u01/app/12.1.0/grid/tfa/sales1/tfa_home/client.jks
# ls -al /u01/app/12.1.0/grid/tfa/sales1/tfa_home/server.jks
-rwx------ 1 root root 3201 Jun 30 14:12 /u01/app/12.1.0/grid/tfa/sales1/tfa_home/server.jks
# ls -al /u01/app/12.1.0/grid/tfa/sales1/tfa_home/internal/ssl.properties
-rwx------ 1 root root 220 Jun 30 14:12 /u01/app/12.1.0/grid/tfa/sales1/tfa_home/internal/ssl.properties
What if I do not upgrade all my nodes at the same time by choice or if some aredown for maintenance?
Oracle Trace File Analyzer waits to complete the phase 2 operations until all nodeshave completed upgrade or until 24 hours has passed.
After 24 hours, Oracle Trace File Analyzer:
• Generates new keys
• Copies the key to all the nodes that have been upgraded
• Restarts Oracle Trace File Analyzer on those nodes
Any nodes that did not get the keys are outside of the Oracle Trace File Analyzerconfiguration. After upgrading Oracle Trace File Analyzer, manually synchronize thekeys with other nodes.
If the application of Release Update Revision (RUR) on all the nodes is completedwithin 24 hours, then manually synchronize the keys.
To manually synchronize the keys, go to one node that has completed Phase 2 andrun the synctfanodes.sh script as root.
# $GIHOME/tfa/nodename/tfa_home/bin/synctfanodes.sh
Note:
The script uses SSH and SCP. If root does not have passwordless SSH,then Oracle Trace File Analyzer prompts you 3 time per node for passwordeach time a command is run.
If the Expect utility is available on the node, then Oracle Trace File Analyzeruses Expect thus reducing the number of prompts for password.
The script displays all the nodes in Oracle Trace File Analyzer configuration, includingthe nodes where Oracle Trace File Analyzer is yet to upgrade.
The script also shows the nodes that are part of the Oracle Grid Infrastructureconfiguration.
Chapter 9Oracle Trace File Analyzer Fails with TFA-00103 After Applying the July 2015 Release Update Revision (RUR) or Later
9-6

Verify the node list provided and supply a space-separated list of nodes tosynchronize. It doesn't hurt to include the nodes that were previously upgraded as theprocess is idempotent.
For example:
Nodes sales1, sales2, sales3, and sales4 are all part of Oracle Grid Infrastructure. Thenodes were running Oracle Trace File Analyzer 12.1.2.0.0 until the July 2015 ReleaseUpdate Revision (RUR) was applied.
The Release Update Revision (RUR) was applied initially only to sales1 and sales3due to outage restrictions.
After completion of phase 1 of the Oracle Trace File Analyzer upgrade, run printstatus. Running the command lists all nodes even though different versions of OracleTrace File Analyzer are running on some of the nodes.
-bash-3.2# /u01/app/12.1.0/grid/bin/tfactl print status.--------------------------------------------------------------------------------.| Host | Status | PID | Port | Version | Build ID |Inventory |+--------+---------+------ +------+------------+----------------------+----------+| sales1 | RUNNING | 27270 | 5000 | 12.1.2.4.2 | 12124220150629072212 | COMPLETE || sales3 | RUNNING | 19222 | 5000 | 12.1.2.4.2 | 12124220150629072212 | COMPLETE || sales2 | RUNNING | 10141 | 5000 | 12.1.2.0.0 | 12120020140619094932 | COMPLETE || sales4 | RUNNING | 17725 | 5000 | 12.1.2.0.0 | 12120020140619094932 | COMPLETE |'--------+---------+-------+------+------------+----------------------+----------'
Since the new Oracle Trace File Analyzer communication model is not set up amongall the nodes, many commands when run as root fail with the message:
TFA is not yet secured to run all commands.
Failed attempts to run tfactl commands as a non-root indicates that there is nosufficient permission to use Oracle Trace File Analyzer.
After 24 hours, Oracle Trace File Analyzer completes phase 2 for sales1 and sales3.Oracle Trace File Analyzer communication model is established for sales1 and sales3.You can perform normal Oracle Trace File Analyzer operations on sales1 and sales3.Communication with sales2 and sales4 has not yet been established and so runningremote commands to them fail.
When running print status on sales1 and sales3, we no longer see sales2 andsales4. Only Oracle Trace File Analyzer using the new Oracle Trace File Analyzercommunication model communicates.
-bash-3.2# /u01/app/12.1.0/grid/bin/tfactl print status
.--------------------------------------------------------------------------------.| Host | Status | PID | Port | Version | Build ID |Inventory |+--------+---------+-------+------+------------+----------------------+----------+| sales1 | RUNNING | 4390 | 5000 | 12.1.2.4.2 | 12124220150629072212 | COMPLETE || sales3 | RUNNING | 23604 | 5000 | 12.1.2.4.2 | 12124220150629072212 | COMPLETE |'--------+---------+-------+------+------------+----------------------+----------'
Running the command tfactl diagcollect collects from sales1 and sales3 but notfrom the other nodes.
-bash-3.2$ /u01/app/12.1.0/grid/bin/tfactl diagcollectCollecting data for the last 4 hours for this component...Collecting data for all nodes
Chapter 9Oracle Trace File Analyzer Fails with TFA-00103 After Applying the July 2015 Release Update Revision (RUR) or Later
9-7
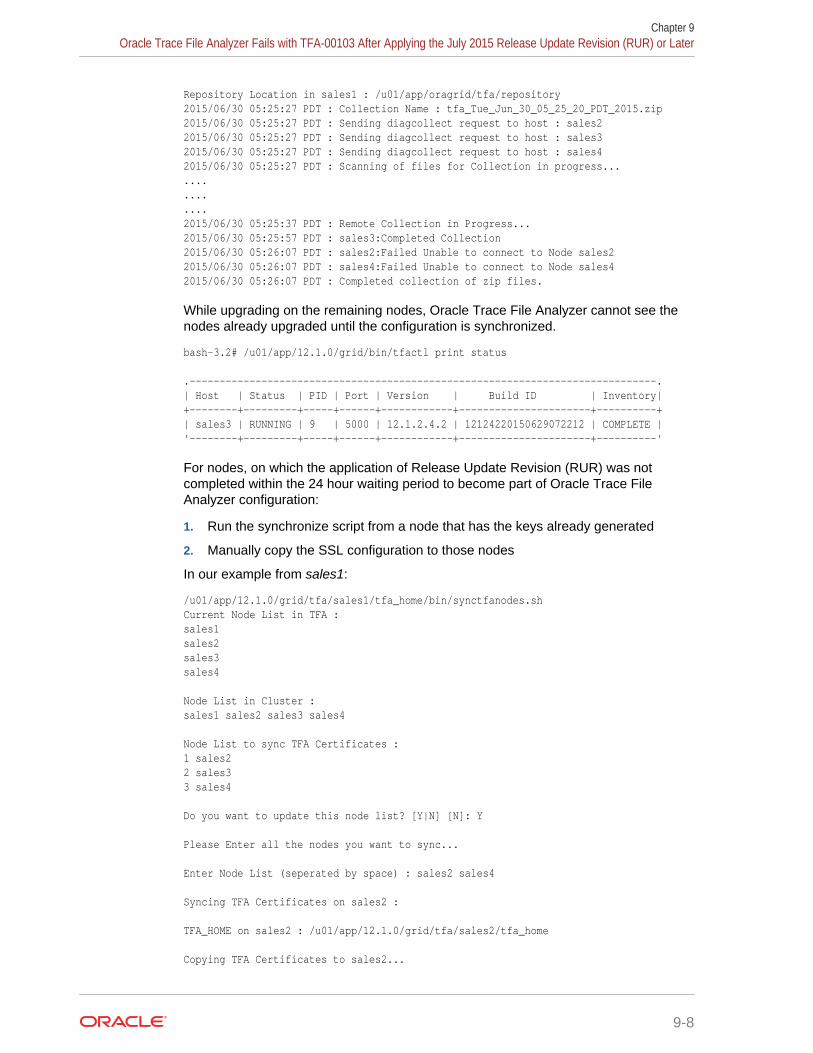
Repository Location in sales1 : /u01/app/oragrid/tfa/repository2015/06/30 05:25:27 PDT : Collection Name : tfa_Tue_Jun_30_05_25_20_PDT_2015.zip2015/06/30 05:25:27 PDT : Sending diagcollect request to host : sales22015/06/30 05:25:27 PDT : Sending diagcollect request to host : sales32015/06/30 05:25:27 PDT : Sending diagcollect request to host : sales42015/06/30 05:25:27 PDT : Scanning of files for Collection in progress...............2015/06/30 05:25:37 PDT : Remote Collection in Progress...2015/06/30 05:25:57 PDT : sales3:Completed Collection2015/06/30 05:26:07 PDT : sales2:Failed Unable to connect to Node sales22015/06/30 05:26:07 PDT : sales4:Failed Unable to connect to Node sales42015/06/30 05:26:07 PDT : Completed collection of zip files.
While upgrading on the remaining nodes, Oracle Trace File Analyzer cannot see thenodes already upgraded until the configuration is synchronized.
bash-3.2# /u01/app/12.1.0/grid/bin/tfactl print status
.------------------------------------------------------------------------------.| Host | Status | PID | Port | Version | Build ID | Inventory|+--------+---------+-----+------+------------+----------------------+----------+| sales3 | RUNNING | 9 | 5000 | 12.1.2.4.2 | 12124220150629072212 | COMPLETE |'--------+---------+-----+------+------------+----------------------+----------'
For nodes, on which the application of Release Update Revision (RUR) was notcompleted within the 24 hour waiting period to become part of Oracle Trace FileAnalyzer configuration:
1. Run the synchronize script from a node that has the keys already generated
2. Manually copy the SSL configuration to those nodes
In our example from sales1:
/u01/app/12.1.0/grid/tfa/sales1/tfa_home/bin/synctfanodes.shCurrent Node List in TFA :sales1sales2sales3sales4
Node List in Cluster :sales1 sales2 sales3 sales4
Node List to sync TFA Certificates :1 sales22 sales33 sales4
Do you want to update this node list? [Y|N] [N]: Y
Please Enter all the nodes you want to sync...
Enter Node List (seperated by space) : sales2 sales4
Syncing TFA Certificates on sales2 :
TFA_HOME on sales2 : /u01/app/12.1.0/grid/tfa/sales2/tfa_home
Copying TFA Certificates to sales2...
Chapter 9Oracle Trace File Analyzer Fails with TFA-00103 After Applying the July 2015 Release Update Revision (RUR) or Later
9-8
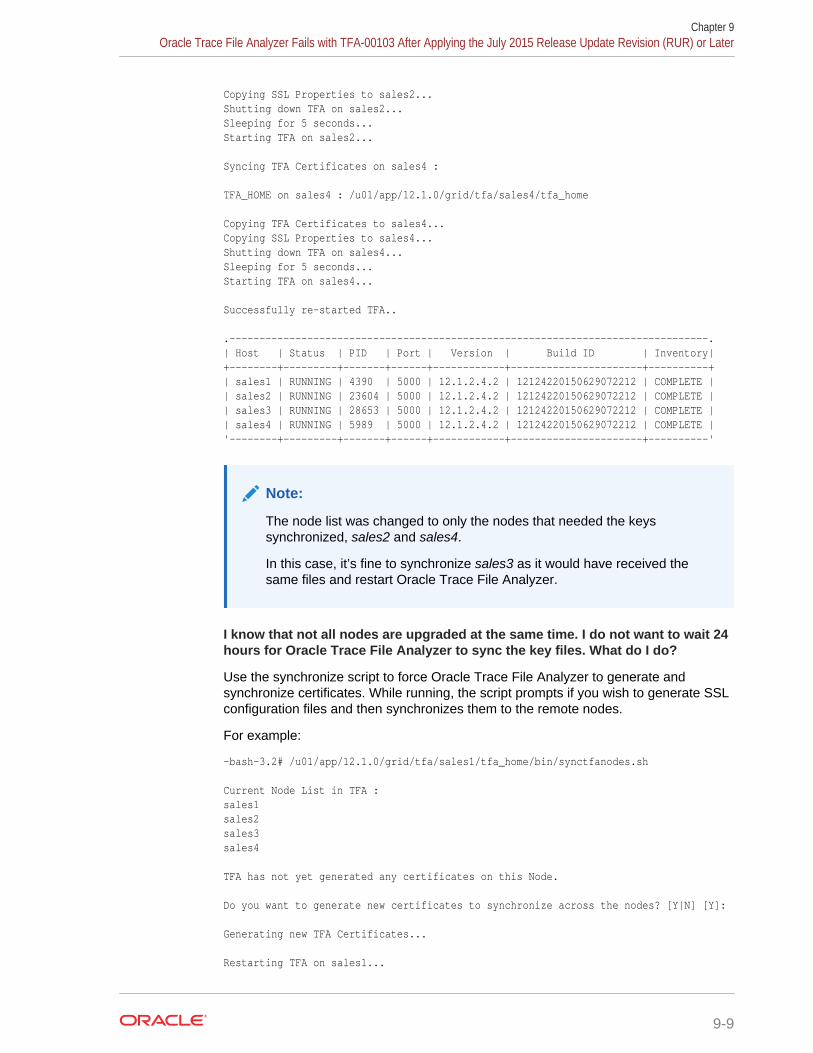
Copying SSL Properties to sales2...Shutting down TFA on sales2...Sleeping for 5 seconds...Starting TFA on sales2...
Syncing TFA Certificates on sales4 :
TFA_HOME on sales4 : /u01/app/12.1.0/grid/tfa/sales4/tfa_home
Copying TFA Certificates to sales4...Copying SSL Properties to sales4...Shutting down TFA on sales4...Sleeping for 5 seconds...Starting TFA on sales4...
Successfully re-started TFA..
.--------------------------------------------------------------------------------.| Host | Status | PID | Port | Version | Build ID | Inventory|+--------+---------+-------+------+------------+----------------------+----------+| sales1 | RUNNING | 4390 | 5000 | 12.1.2.4.2 | 12124220150629072212 | COMPLETE || sales2 | RUNNING | 23604 | 5000 | 12.1.2.4.2 | 12124220150629072212 | COMPLETE || sales3 | RUNNING | 28653 | 5000 | 12.1.2.4.2 | 12124220150629072212 | COMPLETE || sales4 | RUNNING | 5989 | 5000 | 12.1.2.4.2 | 12124220150629072212 | COMPLETE |'--------+---------+-------+------+------------+----------------------+----------'
Note:
The node list was changed to only the nodes that needed the keyssynchronized, sales2 and sales4.
In this case, it’s fine to synchronize sales3 as it would have received thesame files and restart Oracle Trace File Analyzer.
I know that not all nodes are upgraded at the same time. I do not want to wait 24hours for Oracle Trace File Analyzer to sync the key files. What do I do?
Use the synchronize script to force Oracle Trace File Analyzer to generate andsynchronize certificates. While running, the script prompts if you wish to generate SSLconfiguration files and then synchronizes them to the remote nodes.
For example:
-bash-3.2# /u01/app/12.1.0/grid/tfa/sales1/tfa_home/bin/synctfanodes.sh
Current Node List in TFA : sales1 sales2 sales3 sales4
TFA has not yet generated any certificates on this Node.
Do you want to generate new certificates to synchronize across the nodes? [Y|N] [Y]:
Generating new TFA Certificates...
Restarting TFA on sales1...
Chapter 9Oracle Trace File Analyzer Fails with TFA-00103 After Applying the July 2015 Release Update Revision (RUR) or Later
9-9
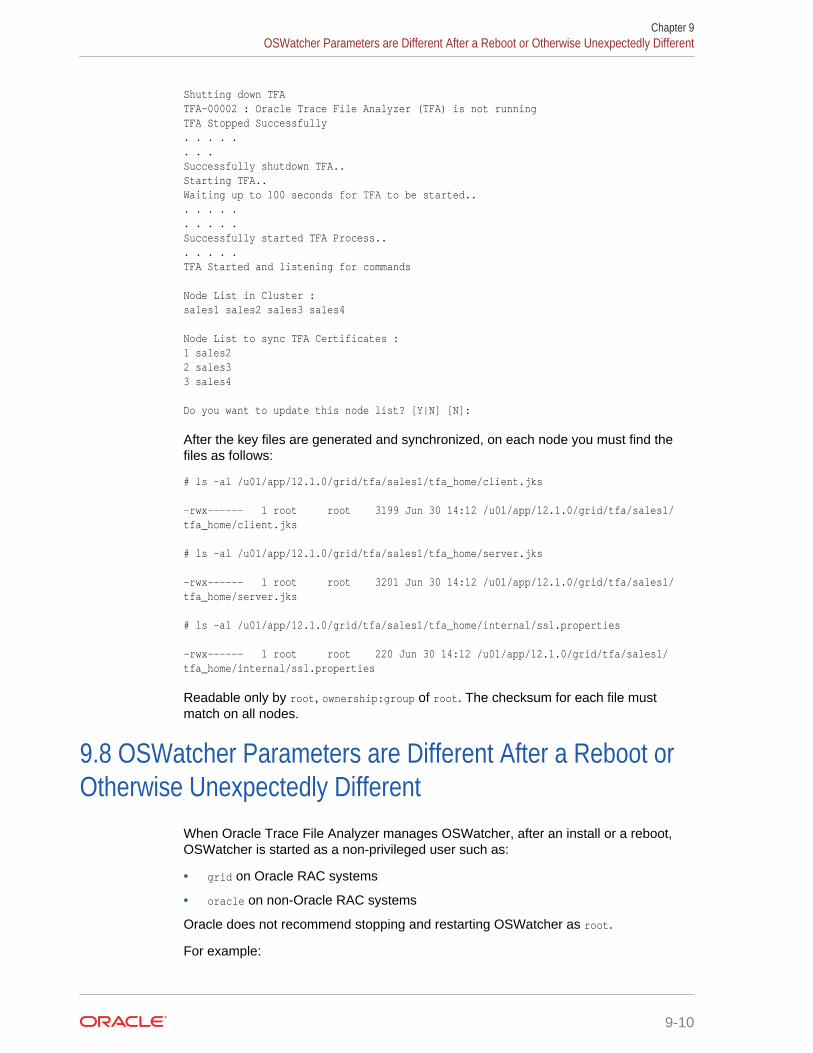
Shutting down TFA TFA-00002 : Oracle Trace File Analyzer (TFA) is not runningTFA Stopped Successfully . . . . . . . . Successfully shutdown TFA.. Starting TFA.. Waiting up to 100 seconds for TFA to be started.. . . . . . . . . . . Successfully started TFA Process.. . . . . . TFA Started and listening for commands
Node List in Cluster :sales1 sales2 sales3 sales4
Node List to sync TFA Certificates : 1 sales2 2 sales3 3 sales4
Do you want to update this node list? [Y|N] [N]:
After the key files are generated and synchronized, on each node you must find thefiles as follows:
# ls -al /u01/app/12.1.0/grid/tfa/sales1/tfa_home/client.jks
-rwx------ 1 root root 3199 Jun 30 14:12 /u01/app/12.1.0/grid/tfa/sales1/tfa_home/client.jks
# ls -al /u01/app/12.1.0/grid/tfa/sales1/tfa_home/server.jks
-rwx------ 1 root root 3201 Jun 30 14:12 /u01/app/12.1.0/grid/tfa/sales1/tfa_home/server.jks
# ls -al /u01/app/12.1.0/grid/tfa/sales1/tfa_home/internal/ssl.properties
-rwx------ 1 root root 220 Jun 30 14:12 /u01/app/12.1.0/grid/tfa/sales1/tfa_home/internal/ssl.properties
Readable only by root, ownership:group of root. The checksum for each file mustmatch on all nodes.
9.8 OSWatcher Parameters are Different After a Reboot orOtherwise Unexpectedly Different
When Oracle Trace File Analyzer manages OSWatcher, after an install or a reboot,OSWatcher is started as a non-privileged user such as:
• grid on Oracle RAC systems
• oracle on non-Oracle RAC systems
Oracle does not recommend stopping and restarting OSWatcher as root.
For example:
Chapter 9OSWatcher Parameters are Different After a Reboot or Otherwise Unexpectedly Different
9-10
tfactl oswbb stop
tfactl start oswbb 20 72 (interval of 20 seconds and retention of 72 hours)
OSWatcher is then run as root until it is stopped and re-started as oracle or grid, orthere is a reboot. In either case, the parameters are persisted in a property file.OSWatcher defaults (30,48) are used unless other parameters are specified forinterval and retention period. Beginning with Oracle Trace File Analyzer version12.1.2.5.2, an OSWatcher property file is maintained for each user. Each timeOSWatcher is started, the parameters for interval or retention hours are madepersistent for that user. In earlier versions, if the OSWatcher startup parameters aredifferent than expected, then it is because OSWatcher was stopped and started asroot with different parameters. These settings would have persisted across rebootsbecause there was only one properties file.
In 12.1.2.5.2 and above, if there is a reboot, then OSWatcher must always be broughtup using the parameters from the properties of oracle or grid. The OSWatcher startupparameters are different if OSWatcher is stopped and re-started as root with differentparameters before a reboot. The parameters fetched from the root properties must nottake effect after a reboot. The parameters must revert to the parameters of oracleproperties.
The parameters are different and the persistent settings are changed because OracleSupport would have recommended different settings to investigate an issue. In thatcase, stop, and re-start OSWatcher with the normal parameters as a non-privilegeduser.
tfactl oswbb stop
tfactl start oswbb (in this case the default interval of 30 seconds and retention of 48 hours would be persisted)
Note:
If OSWatcher is installed and running, and not managed by Oracle Trace FileAnalyzer, then Oracle Trace File Analyzer defers to that installation andparameters. When listing the oswbb tool status, the status must be NOTRUNNING, that is, not managed by Oracle Trace File Analyzer.
9.9 Oracle Trace File Analyzer Installation or Oracle TraceFile Analyzer Discovery (tfactl rediscover) Fails on Linux 7
Description: Reported errors are similar to:
Can't locate Data/Dumper.pm in @INC (@INC contains: /usr/local/lib64/perl5 /usr/local/share/perl5 /usr/lib64/perl5/vendor_perl /usr/share/perl5/vendor_perl /usr/lib64/perl5 /usr/share/perl5 . /u01/app/12.1.0/grid/tfa/dc75orarac02/tfa_home/bin /u01/app/12.1.0/grid/tfa/dc75orarac02/tfa_home/bin/common /u01/app/12.1.0/grid/tfa/dc75orarac02/tfa_home/bin/modules /u01/app/12.1.0/grid/tfa/dc75orarac02/tfa_home/bin/common/exceptions) at /u01/app/12.1.0/grid/tfa/dc75orarac02/tfa_home/bin/common/tfactlshare.pm line 545.
Chapter 9Oracle Trace File Analyzer Installation or Oracle Trace File Analyzer Discovery (tfactl rediscover) Fails on Linux 7
9-11
Cause: This error occurs due to Bug 21790910 and Bug 22393355, which are fixed inOracle Trace File Analyzer version 12.1.2.6.4.
Action: Link the operating system Perl to the version of Perl in the GRID_HOME.
9.10 OSWatcher Analyzer Fails When OSWatcher is NotRunning from the TFA_HOME
Description: Reported errors are similar to:
tfactl> oswbbError: Cannot find OSWatcher files under/u01/app/grid/tfa/repository/suptools//oswbb//archiveOSWatcher analyzer commands are supported only when it is running from TFA_HOME
Cause: Expected behavior when OSWatcher is not running from TFA_HOME.
Action:
1. Stop and disable the OSWatcher version running outside of Oracle Trace FileAnalyzer.
2. Start OSWatcher from within Oracle Trace File Analyzer.
9.11 Oracle Trace File Analyzer Fails to Start withcom.sleepycat.je.EnvironmentLockedException JavaException
Description: Reported errors found in the Oracle Trace File Analyzer syserroroutlog located in $TFA_BASE//log are:
/u01/app/oracle/tfa//log$ cat syserrorout.08.06.2015-16.19.54
Exception in thread "TFAMain" com.sleepycat.je.EnvironmentLockedException: (JE 5.0.84) /u01/app/oracle/tfa//database/BERKELEY_JE_DB The environment cannot be locked for single writer access. ENV_LOCKED: The je.lck file could not be locked. Environment is invalid and must be closed.at com.sleepycat.je.log.FileManager.(FileManager.java:368)at com.sleepycat.je.dbi.EnvironmentImpl.(EnvironmentImpl.java:483)at com.sleepycat.je.dbi.EnvironmentImpl.(EnvironmentImpl.java:409
Cause: The root cause is unknown.
Action:
1. Check if there are any processes accessing the BDB.
# fuser $GI_BASE/tfa//database/BERKELEY_JE_DB/je.lck
2. If a process is returned, then kill it.
# kill -9
Chapter 9OSWatcher Analyzer Fails When OSWatcher is Not Running from the TFA_HOME
9-12
3. Remove the $GI_BASE/tfa//database/BERKELEY_JE_DB/je.lck file.
# rm -rf $GI_BASE/tfa//database/BERKELEY_JE_DB/je.lck
4. Start Oracle Trace File Analyzer.
# $TFA_HOME/bin/tfactl start
9.12 Oracle Trace File Analyzer Startup Fails WhenSolution-Soft Time Machine Software is Installed, but NotRunning on the System
Action: Uninstall the Time Machine software.
9.13 Non-privileged User is Not Able to Run tfactlCommands?
Description:
As root verify that the non-privileged user has Oracle Trace File Analyzer privilege torun the tfactl commands.
tfactl access lsuser/u01/app/12.1.0/grid/bin/tfactl access lsusers.---------------------------------.| TFA Users in myNode1 |+-----------+-----------+---------+| User Name | User Type | Status |+-----------+-----------+---------+| oracle | USER | Allowed |'-----------+-----------+---------'
If the user is listed and the status is displayed as Disabled, then that indicates all non-privileged user access has been disabled.
Action:
To enable non-privileged user access:
tfactl access enable
If the user, for example, oracle is not listed, then add oracle.
tfactl access add -user oracle
If none of the above techniques resolve the problem, then run tfactl diagnosetfa -local. Upload the resultant file to Oracle Support.
Chapter 9Oracle Trace File Analyzer Startup Fails When Solution-Soft Time Machine Software is Installed, but Not Running on the
System
9-13
9.14 Oracle Trace File Analyzer Daemon is Not Starting orNot Running?
Description:
TFA-00001: Failed to start Oracle Trace File Analyzer (TFA) daemon
TFA-00002: Oracle Trace File Analyzer (TFA) is not running
The errors indicate that Java does not start.
Action:
1. Verify that Oracle Trace File Analyzer is not running.
ps -ef|grep -i tfa
Note:
On some operating systems, the ps command truncates the output at 80characters. The ps command does not display the process even if it isrunning.
2. To confirm that the Oracle Trace File Analyzer daemon is not running, run thefollowing command run as root.
# tfactl print status
3. Try starting the Oracle Trace File Analyzer daemon as root.
# tfactl start
If Oracle Trace File Analyzer still fails to start, then run tfactl diagnosetfa -local.Upload the resultant file to Oracle Support.
Chapter 9Oracle Trace File Analyzer Daemon is Not Starting or Not Running?
9-14
AOracle Trace File Analyzer Command-Lineand Shell Options
The Trace File Analyzer control utility, TFACTL, is the command-line interface forOracle Trace File Analyzer.
TFACTL provides a command-line and shell interface to Oracle Trace File Analyzercommands for:
• Administration
• Summary and analysis
• Diagnostic collection
The tfactl commands that you can run depends on your access level.
• You need root access or sudo access to tfactl to run administration commands.
• Run a subset of commands as:
– An Oracle Database home owner or Oracle Grid Infrastructure home owner
– A member of OS DBA or ASM groups
You gain access to summary, analysis, and diagnostic collection functionality byrunning the commands as an Oracle Database home owner or Oracle GridInfrastructure home owner.
To grant other users access to tfactl:
tfactl access
To use tfactl as a command-line tool:
tfactl command [options]
To use tfactl as a shell interface:
tfactl
Once the shell starts enter commands as needed.
$ tfactl
tfactl>
Append the -help option to any of the tfactl commands to obtain command-specifichelp.
$ tfactl command -help
• Running Administration Commands (page A-2)You need root access to tfactl, or sudo access to run all administrationcommands.
A-1
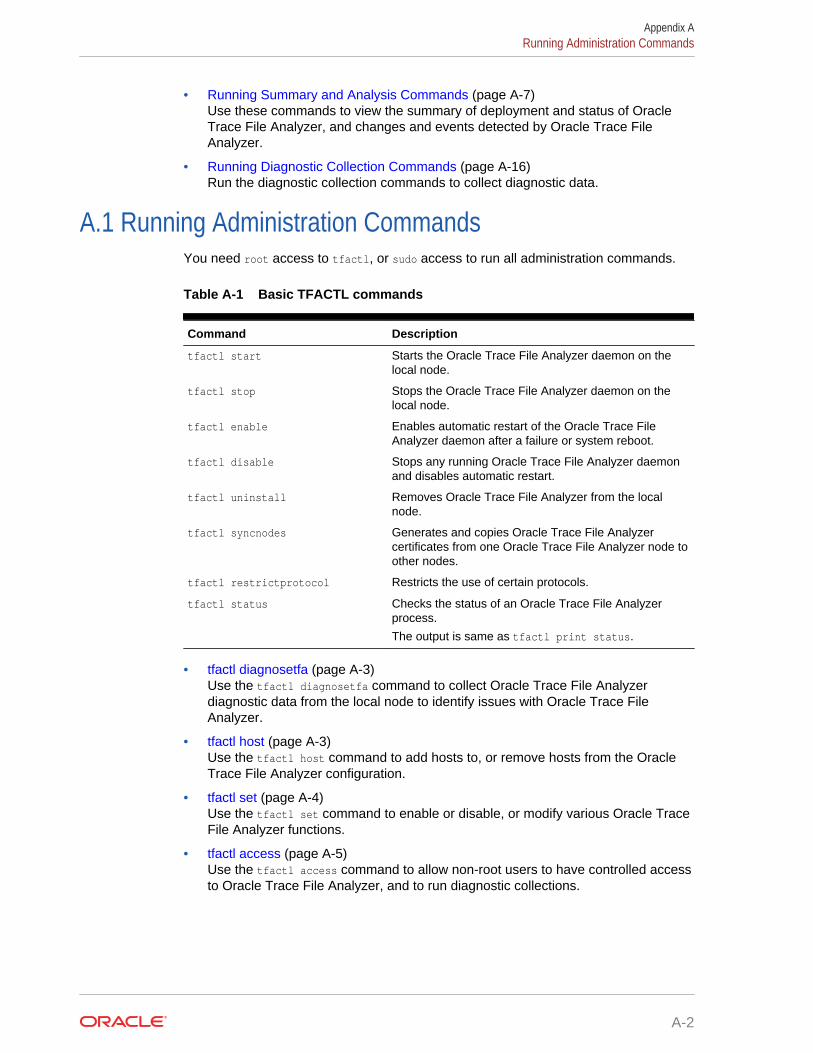
• Running Summary and Analysis Commands (page A-7)Use these commands to view the summary of deployment and status of OracleTrace File Analyzer, and changes and events detected by Oracle Trace FileAnalyzer.
• Running Diagnostic Collection Commands (page A-16)Run the diagnostic collection commands to collect diagnostic data.
A.1 Running Administration CommandsYou need root access to tfactl, or sudo access to run all administration commands.
Table A-1 Basic TFACTL commands
Command Description
tfactl start Starts the Oracle Trace File Analyzer daemon on thelocal node.
tfactl stop Stops the Oracle Trace File Analyzer daemon on thelocal node.
tfactl enable Enables automatic restart of the Oracle Trace FileAnalyzer daemon after a failure or system reboot.
tfactl disable Stops any running Oracle Trace File Analyzer daemonand disables automatic restart.
tfactl uninstall Removes Oracle Trace File Analyzer from the localnode.
tfactl syncnodes Generates and copies Oracle Trace File Analyzercertificates from one Oracle Trace File Analyzer node toother nodes.
tfactl restrictprotocol Restricts the use of certain protocols.
tfactl status Checks the status of an Oracle Trace File Analyzerprocess.
The output is same as tfactl print status.
• tfactl diagnosetfa (page A-3)Use the tfactl diagnosetfa command to collect Oracle Trace File Analyzerdiagnostic data from the local node to identify issues with Oracle Trace FileAnalyzer.
• tfactl host (page A-3)Use the tfactl host command to add hosts to, or remove hosts from the OracleTrace File Analyzer configuration.
• tfactl set (page A-4)Use the tfactl set command to enable or disable, or modify various Oracle TraceFile Analyzer functions.
• tfactl access (page A-5)Use the tfactl access command to allow non-root users to have controlled accessto Oracle Trace File Analyzer, and to run diagnostic collections.
Appendix ARunning Administration Commands
A-2
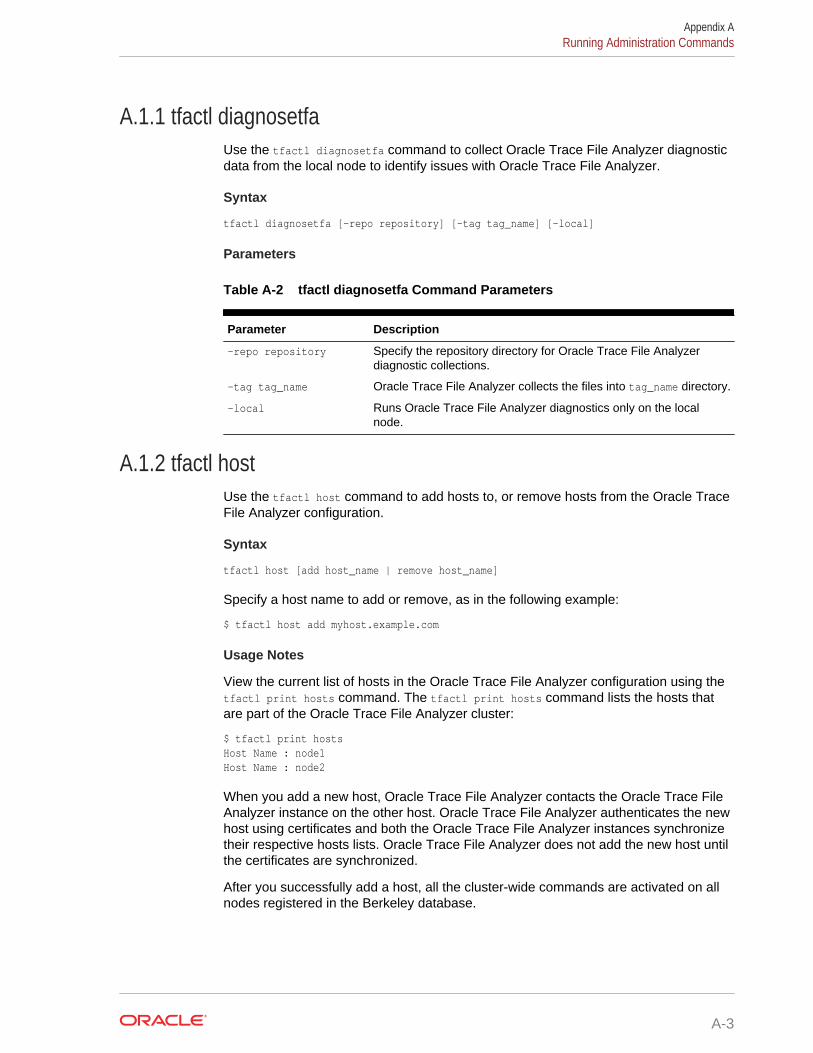
A.1.1 tfactl diagnosetfaUse the tfactl diagnosetfa command to collect Oracle Trace File Analyzer diagnosticdata from the local node to identify issues with Oracle Trace File Analyzer.
Syntax
tfactl diagnosetfa [-repo repository] [-tag tag_name] [-local]
Parameters
Table A-2 tfactl diagnosetfa Command Parameters
Parameter Description
-repo repository Specify the repository directory for Oracle Trace File Analyzerdiagnostic collections.
-tag tag_name Oracle Trace File Analyzer collects the files into tag_name directory.
-local Runs Oracle Trace File Analyzer diagnostics only on the localnode.
A.1.2 tfactl hostUse the tfactl host command to add hosts to, or remove hosts from the Oracle TraceFile Analyzer configuration.
Syntax
tfactl host [add host_name | remove host_name]
Specify a host name to add or remove, as in the following example:
$ tfactl host add myhost.example.com
Usage Notes
View the current list of hosts in the Oracle Trace File Analyzer configuration using thetfactl print hosts command. The tfactl print hosts command lists the hosts thatare part of the Oracle Trace File Analyzer cluster:
$ tfactl print hostsHost Name : node1Host Name : node2
When you add a new host, Oracle Trace File Analyzer contacts the Oracle Trace FileAnalyzer instance on the other host. Oracle Trace File Analyzer authenticates the newhost using certificates and both the Oracle Trace File Analyzer instances synchronizetheir respective hosts lists. Oracle Trace File Analyzer does not add the new host untilthe certificates are synchronized.
After you successfully add a host, all the cluster-wide commands are activated on allnodes registered in the Berkeley database.
Appendix ARunning Administration Commands
A-3
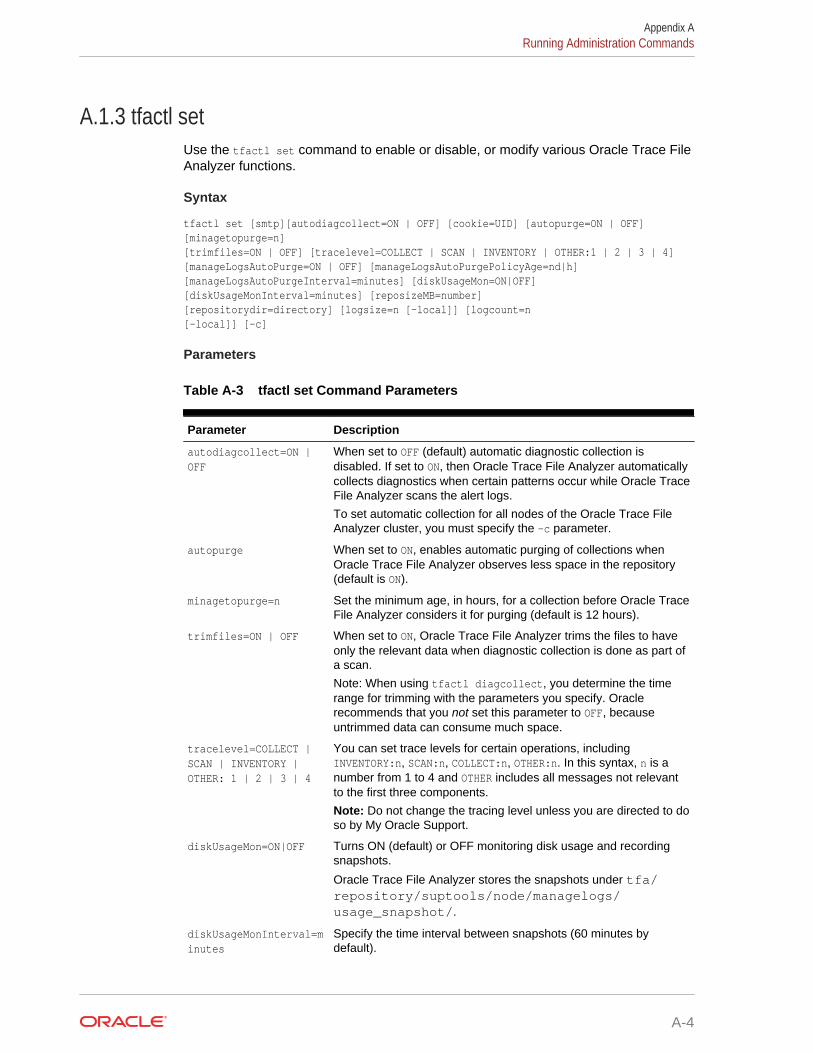
A.1.3 tfactl setUse the tfactl set command to enable or disable, or modify various Oracle Trace FileAnalyzer functions.
Syntax
tfactl set [smtp][autodiagcollect=ON | OFF] [cookie=UID] [autopurge=ON | OFF] [minagetopurge=n] [trimfiles=ON | OFF] [tracelevel=COLLECT | SCAN | INVENTORY | OTHER:1 | 2 | 3 | 4] [manageLogsAutoPurge=ON | OFF] [manageLogsAutoPurgePolicyAge=nd|h] [manageLogsAutoPurgeInterval=minutes] [diskUsageMon=ON|OFF] [diskUsageMonInterval=minutes] [reposizeMB=number] [repositorydir=directory] [logsize=n [-local]] [logcount=n [-local]] [-c]
Parameters
Table A-3 tfactl set Command Parameters
Parameter Description
autodiagcollect=ON |OFF
When set to OFF (default) automatic diagnostic collection isdisabled. If set to ON, then Oracle Trace File Analyzer automaticallycollects diagnostics when certain patterns occur while Oracle TraceFile Analyzer scans the alert logs.
To set automatic collection for all nodes of the Oracle Trace FileAnalyzer cluster, you must specify the -c parameter.
autopurge When set to ON, enables automatic purging of collections whenOracle Trace File Analyzer observes less space in the repository(default is ON).
minagetopurge=n Set the minimum age, in hours, for a collection before Oracle TraceFile Analyzer considers it for purging (default is 12 hours).
trimfiles=ON | OFF When set to ON, Oracle Trace File Analyzer trims the files to haveonly the relevant data when diagnostic collection is done as part ofa scan.
Note: When using tfactl diagcollect, you determine the timerange for trimming with the parameters you specify. Oraclerecommends that you not set this parameter to OFF, becauseuntrimmed data can consume much space.
tracelevel=COLLECT |SCAN | INVENTORY |OTHER: 1 | 2 | 3 | 4
You can set trace levels for certain operations, includingINVENTORY:n, SCAN:n, COLLECT:n, OTHER:n. In this syntax, n is anumber from 1 to 4 and OTHER includes all messages not relevantto the first three components.
Note: Do not change the tracing level unless you are directed to doso by My Oracle Support.
diskUsageMon=ON|OFF Turns ON (default) or OFF monitoring disk usage and recordingsnapshots.
Oracle Trace File Analyzer stores the snapshots under tfa/repository/suptools/node/managelogs/usage_snapshot/.
diskUsageMonInterval=minutes
Specify the time interval between snapshots (60 minutes bydefault).
Appendix ARunning Administration Commands
A-4
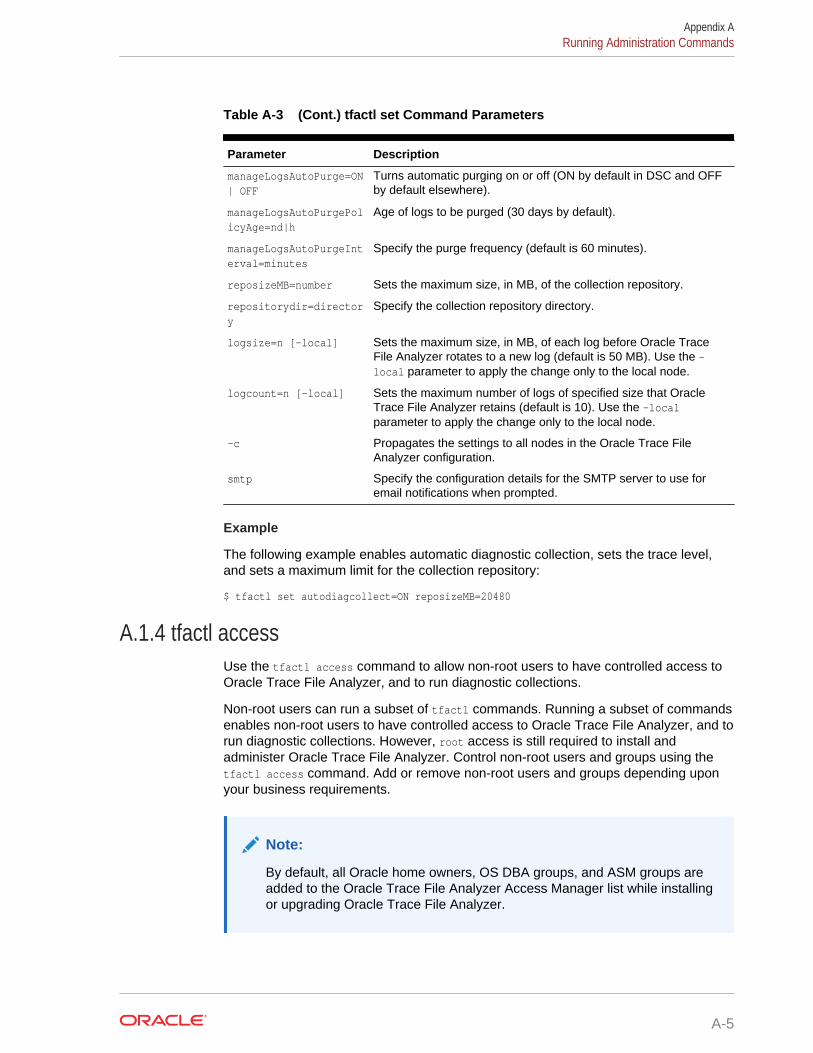
Table A-3 (Cont.) tfactl set Command Parameters
Parameter Description
manageLogsAutoPurge=ON| OFF
Turns automatic purging on or off (ON by default in DSC and OFFby default elsewhere).
manageLogsAutoPurgePolicyAge=nd|h
Age of logs to be purged (30 days by default).
manageLogsAutoPurgeInterval=minutes
Specify the purge frequency (default is 60 minutes).
reposizeMB=number Sets the maximum size, in MB, of the collection repository.
repositorydir=directory
Specify the collection repository directory.
logsize=n [-local] Sets the maximum size, in MB, of each log before Oracle TraceFile Analyzer rotates to a new log (default is 50 MB). Use the -local parameter to apply the change only to the local node.
logcount=n [-local] Sets the maximum number of logs of specified size that OracleTrace File Analyzer retains (default is 10). Use the -localparameter to apply the change only to the local node.
-c Propagates the settings to all nodes in the Oracle Trace FileAnalyzer configuration.
smtp Specify the configuration details for the SMTP server to use foremail notifications when prompted.
Example
The following example enables automatic diagnostic collection, sets the trace level,and sets a maximum limit for the collection repository:
$ tfactl set autodiagcollect=ON reposizeMB=20480
A.1.4 tfactl accessUse the tfactl access command to allow non-root users to have controlled access toOracle Trace File Analyzer, and to run diagnostic collections.
Non-root users can run a subset of tfactl commands. Running a subset of commandsenables non-root users to have controlled access to Oracle Trace File Analyzer, and torun diagnostic collections. However, root access is still required to install andadminister Oracle Trace File Analyzer. Control non-root users and groups using thetfactl access command. Add or remove non-root users and groups depending uponyour business requirements.
Note:
By default, all Oracle home owners, OS DBA groups, and ASM groups areadded to the Oracle Trace File Analyzer Access Manager list while installingor upgrading Oracle Trace File Analyzer.
Appendix ARunning Administration Commands
A-5

Syntax
tfactl access [ lsusers | add -user user_name [ -group group_name ] [ -local ] | remove -user user_name [ -group group_name ] [ -all ] [ -local ] | block -user user_name [ -local ] | unblock -user user_name [-local] | enable [ -local ] | disable [ -local ] | reset [ -local ] | removeall [ -local ]
Parameters
Table A-4 tfactl access Command Parameters
Parameter Description
lsusers Lists all the Oracle Trace File Analyzer users and groups.
enable Enables Oracle Trace File Analyzer access for non-root users.
Use the –local flag to change settings only on the local node.
disable Disables Oracle Trace File Analyzer access for non-root users.
However, the list of users who were granted access to OracleTrace File Analyzer is stored, if the access to non-root users isenabled later.
Use the –local flag to change settings only on the local node.
add Adds a user or a group to the Oracle Trace File Analyzer accesslist.
remove Removes a user or a group from the Oracle Trace File Analyzeraccess list.
block Blocks Oracle Trace File Analyzer access for non-root user.
Use this command to block a specific user even though the user isa member of a group that is granted access to Oracle Trace FileAnalyzer.
unblock Enables Oracle Trace File Analyzer access for non-root users whowere blocked earlier.
Use this command to unblock a user that was blocked earlier byrunning the command tfactl access block.
reset Resets to the default access list that includes all Oracle Homeowners and DBA groups.
removeall Removes all Oracle Trace File Analyzer users and groups.
Remove all users from the Oracle Trace File Analyzer access listincluding the default users and groups.
Examples
To add a user, for example, abc to the Oracle Trace File Analyzer access list andenable access to Oracle Trace File Analyzer across cluster.
/u01/app/tfa/bin/tfactl access add -user abc
To add all members of a group, for example, xyz to the Oracle Trace File Analyzeraccess list and enable access to Oracle Trace File Analyzer on the localhost.
/u01/app/tfa/bin/tfactl access add -group xyz -local
To remove a user, for example, abc from the Oracle Trace File Analyzer access list.
Appendix ARunning Administration Commands
A-6
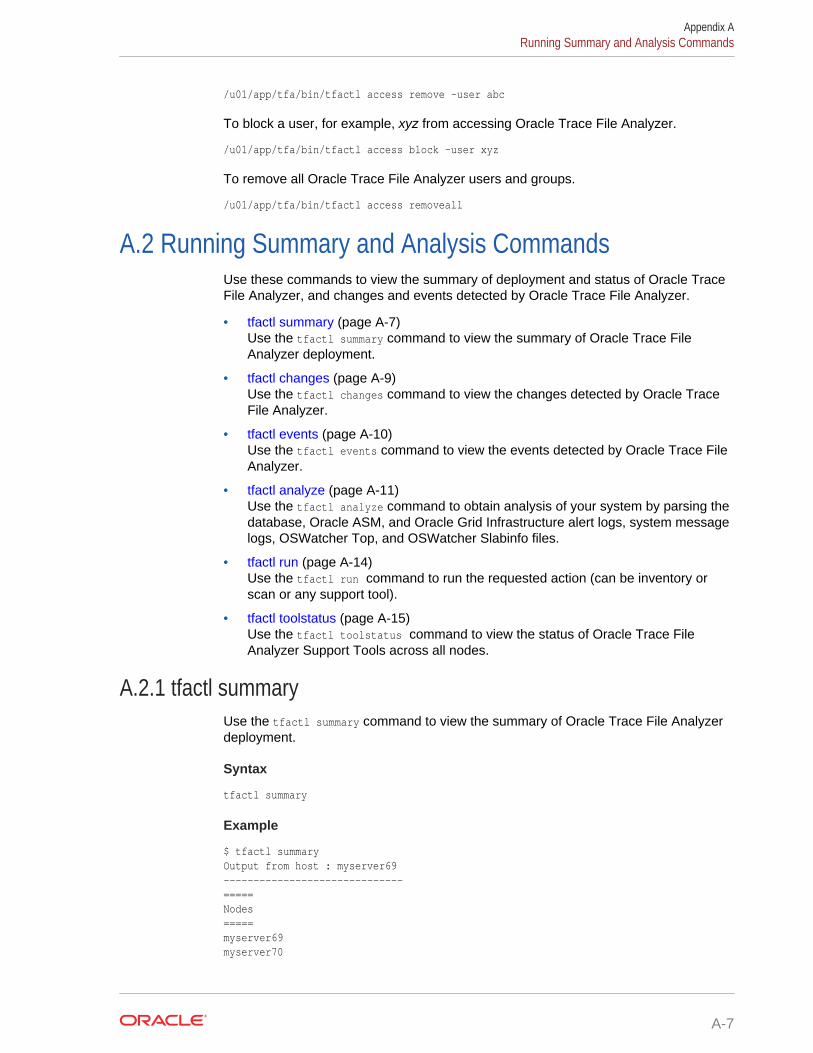
/u01/app/tfa/bin/tfactl access remove -user abc
To block a user, for example, xyz from accessing Oracle Trace File Analyzer.
/u01/app/tfa/bin/tfactl access block -user xyz
To remove all Oracle Trace File Analyzer users and groups.
/u01/app/tfa/bin/tfactl access removeall
A.2 Running Summary and Analysis CommandsUse these commands to view the summary of deployment and status of Oracle TraceFile Analyzer, and changes and events detected by Oracle Trace File Analyzer.
• tfactl summary (page A-7)Use the tfactl summary command to view the summary of Oracle Trace FileAnalyzer deployment.
• tfactl changes (page A-9)Use the tfactl changes command to view the changes detected by Oracle TraceFile Analyzer.
• tfactl events (page A-10)Use the tfactl events command to view the events detected by Oracle Trace FileAnalyzer.
• tfactl analyze (page A-11)Use the tfactl analyze command to obtain analysis of your system by parsing thedatabase, Oracle ASM, and Oracle Grid Infrastructure alert logs, system messagelogs, OSWatcher Top, and OSWatcher Slabinfo files.
• tfactl run (page A-14)Use the tfactl run command to run the requested action (can be inventory orscan or any support tool).
• tfactl toolstatus (page A-15)Use the tfactl toolstatus command to view the status of Oracle Trace FileAnalyzer Support Tools across all nodes.
A.2.1 tfactl summaryUse the tfactl summary command to view the summary of Oracle Trace File Analyzerdeployment.
Syntax
tfactl summary
Example
$ tfactl summaryOutput from host : myserver69------------------------------=====Nodes=====myserver69myserver70
Appendix ARunning Summary and Analysis Commands
A-7
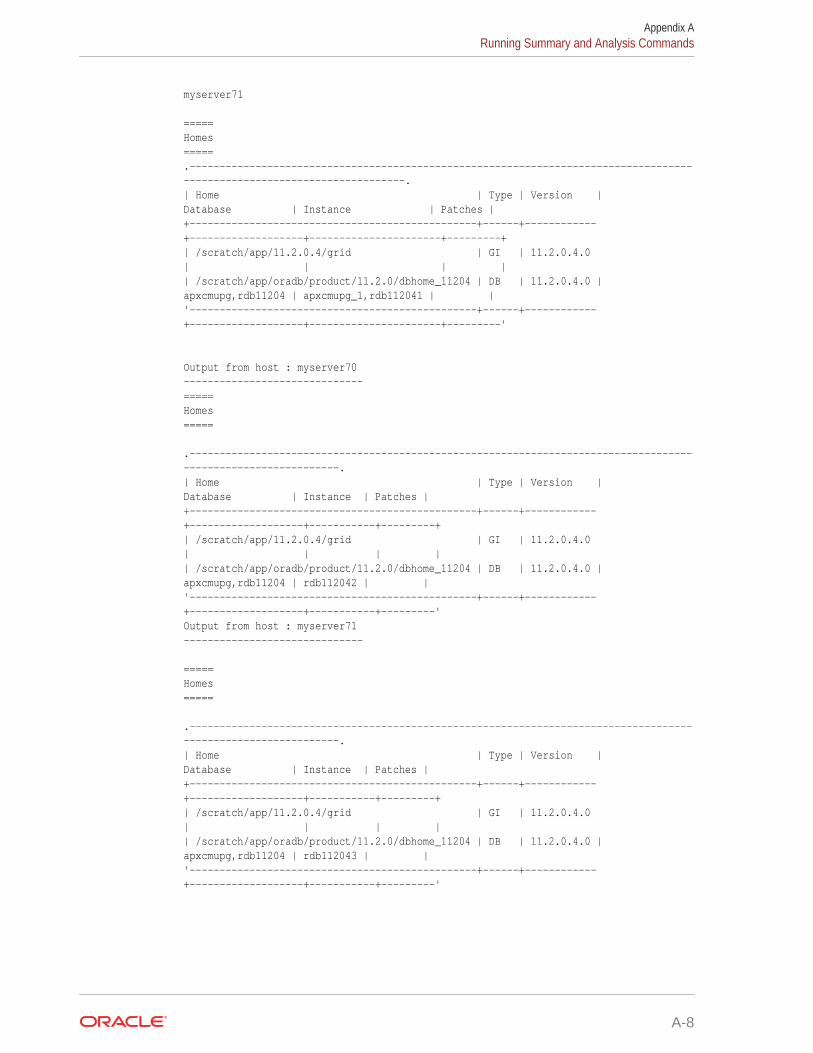
myserver71
=====Homes=====.-------------------------------------------------------------------------------------------------------------------------.| Home | Type | Version | Database | Instance | Patches |+------------------------------------------------+------+------------+-------------------+----------------------+---------+| /scratch/app/11.2.0.4/grid | GI | 11.2.0.4.0 | | | || /scratch/app/oradb/product/11.2.0/dbhome_11204 | DB | 11.2.0.4.0 | apxcmupg,rdb11204 | apxcmupg_1,rdb112041 | |'------------------------------------------------+------+------------+-------------------+----------------------+---------'
Output from host : myserver70------------------------------=====Homes=====
.--------------------------------------------------------------------------------------------------------------.| Home | Type | Version | Database | Instance | Patches |+------------------------------------------------+------+------------+-------------------+-----------+---------+| /scratch/app/11.2.0.4/grid | GI | 11.2.0.4.0 | | | || /scratch/app/oradb/product/11.2.0/dbhome_11204 | DB | 11.2.0.4.0 | apxcmupg,rdb11204 | rdb112042 | |'------------------------------------------------+------+------------+-------------------+-----------+---------'Output from host : myserver71------------------------------
=====Homes=====
.--------------------------------------------------------------------------------------------------------------.| Home | Type | Version | Database | Instance | Patches |+------------------------------------------------+------+------------+-------------------+-----------+---------+| /scratch/app/11.2.0.4/grid | GI | 11.2.0.4.0 | | | || /scratch/app/oradb/product/11.2.0/dbhome_11204 | DB | 11.2.0.4.0 | apxcmupg,rdb11204 | rdb112043 | |'------------------------------------------------+------+------------+-------------------+-----------+---------'
Appendix ARunning Summary and Analysis Commands
A-8
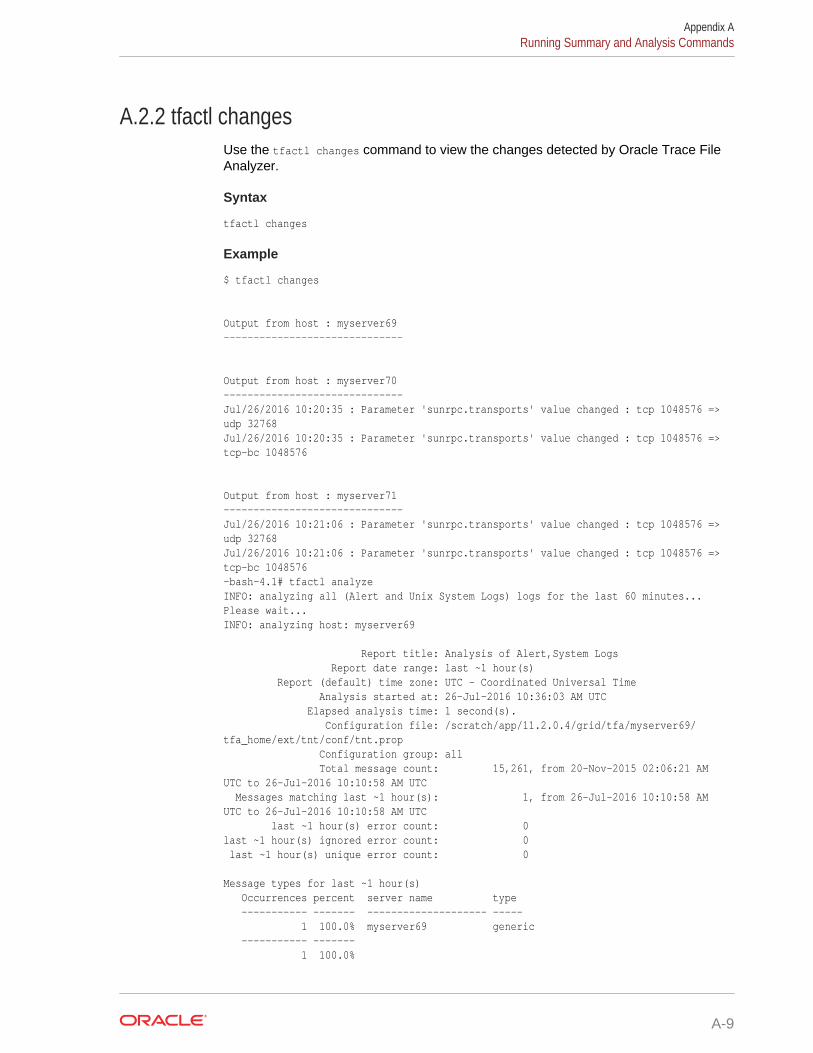
A.2.2 tfactl changesUse the tfactl changes command to view the changes detected by Oracle Trace FileAnalyzer.
Syntax
tfactl changes
Example
$ tfactl changes
Output from host : myserver69------------------------------
Output from host : myserver70------------------------------Jul/26/2016 10:20:35 : Parameter 'sunrpc.transports' value changed : tcp 1048576 => udp 32768Jul/26/2016 10:20:35 : Parameter 'sunrpc.transports' value changed : tcp 1048576 => tcp-bc 1048576
Output from host : myserver71------------------------------Jul/26/2016 10:21:06 : Parameter 'sunrpc.transports' value changed : tcp 1048576 => udp 32768Jul/26/2016 10:21:06 : Parameter 'sunrpc.transports' value changed : tcp 1048576 => tcp-bc 1048576-bash-4.1# tfactl analyzeINFO: analyzing all (Alert and Unix System Logs) logs for the last 60 minutes... Please wait...INFO: analyzing host: myserver69
Report title: Analysis of Alert,System Logs Report date range: last ~1 hour(s) Report (default) time zone: UTC - Coordinated Universal Time Analysis started at: 26-Jul-2016 10:36:03 AM UTC Elapsed analysis time: 1 second(s). Configuration file: /scratch/app/11.2.0.4/grid/tfa/myserver69/tfa_home/ext/tnt/conf/tnt.prop Configuration group: all Total message count: 15,261, from 20-Nov-2015 02:06:21 AM UTC to 26-Jul-2016 10:10:58 AM UTC Messages matching last ~1 hour(s): 1, from 26-Jul-2016 10:10:58 AM UTC to 26-Jul-2016 10:10:58 AM UTC last ~1 hour(s) error count: 0last ~1 hour(s) ignored error count: 0 last ~1 hour(s) unique error count: 0
Message types for last ~1 hour(s) Occurrences percent server name type ----------- ------- -------------------- ----- 1 100.0% myserver69 generic ----------- ------- 1 100.0%
Appendix ARunning Summary and Analysis Commands
A-9

Unique error messages for last ~1 hour(s) Occurrences percent server name error ----------- ------- -------------------- ----- ----------- ------- 0 100.0%
A.2.3 tfactl eventsUse the tfactl events command to view the events detected by Oracle Trace FileAnalyzer.
Syntax
tfactl events
Example
$ tfactl eventsOutput from host : myserver69------------------------------Jul/25/2016 06:25:33 : [crs.myserver69] : [cssd(7513)]CRS-1603:CSSD on node myserver69 shutdown by user.Jul/25/2016 06:32:41 : [crs.myserver69] : [cssd(5794)]CRS-1601:CSSD Reconfiguration complete. Active nodes are myserver69 myserver70 myserver71 .Jul/25/2016 06:47:37 : [crs.myserver69] : [/scratch/app/11.2.0.4/grid/bin/scriptagent.bin(16233)]CRS-5818:Aborted command 'start' for resource 'ora.oc4j'. Details at (:CRSAGF00113:) {1:32892:193} in /scratch/app/11.2.0.4/grid/log/myserver69/agent/crsd/scriptagent_oragrid/scriptagent_oragrid.log.Jul/25/2016 06:24:43 : [db.apxcmupg.apxcmupg_1] : Instance terminated by USER, pid = 21581Jul/25/2016 06:24:43 : [db.rdb11204.rdb112041] : Instance terminated by USER, pid = 18683Jul/25/2016 06:24:44 : [db.+ASM1] : ORA-15032: not all alterations performed [db.+ASM1] : ORA-15001: diskgroup "FRA" does not exist or is not mounted [db.+ASM1] : ORA-15032: not all alterations performed [db.+ASM1] : ORA-15001: diskgroup "FRA" does not exist or is not mounted [db.+ASM1] : ORA-15032: not all alterations performed [db.+ASM1] : ORA-15001: diskgroup "FRA" does not exist or is not mounted [db.+ASM1] : ORA-15032: not all alterations performed [db.+ASM1] : ORA-15001: diskgroup "FRA" does not exist or is not mounted [db.+ASM1] : ORA-15032: not all alterations performed [db.+ASM1] : ORA-15001: diskgroup "FRA" does not exist or is not mounted [db.+ASM1] : ORA-15032: not all alterations performed [db.+ASM1] : ORA-15001: diskgroup "DATA" does not exist or is not mounted [db.+ASM1] : ORA-15032: not all alterations performed [db.+ASM1] : ORA-15001: diskgroup "DATA" does not exist or is not mounted [db.+ASM1] : ORA-15032: not all alterations performed [db.+ASM1] : ORA-15001: diskgroup "DATA" does not exist or is not mounted [db.+ASM1] : ORA-15032: not all alterations performed [db.+ASM1] : ORA-15001: diskgroup "DATA" does not exist or is not mounted [db.+ASM1] : ORA-15032: not all alterations performed [db.+ASM1] : ORA-15001: diskgroup "DATA" does not exist or is not mountedJul/25/2016 06:24:53 : [db.+ASM1] : ORA-15032: not all alterations performed [db.+ASM1] : ORA-15027: active use of diskgroup "VDATA" precludes its
Appendix ARunning Summary and Analysis Commands
A-10
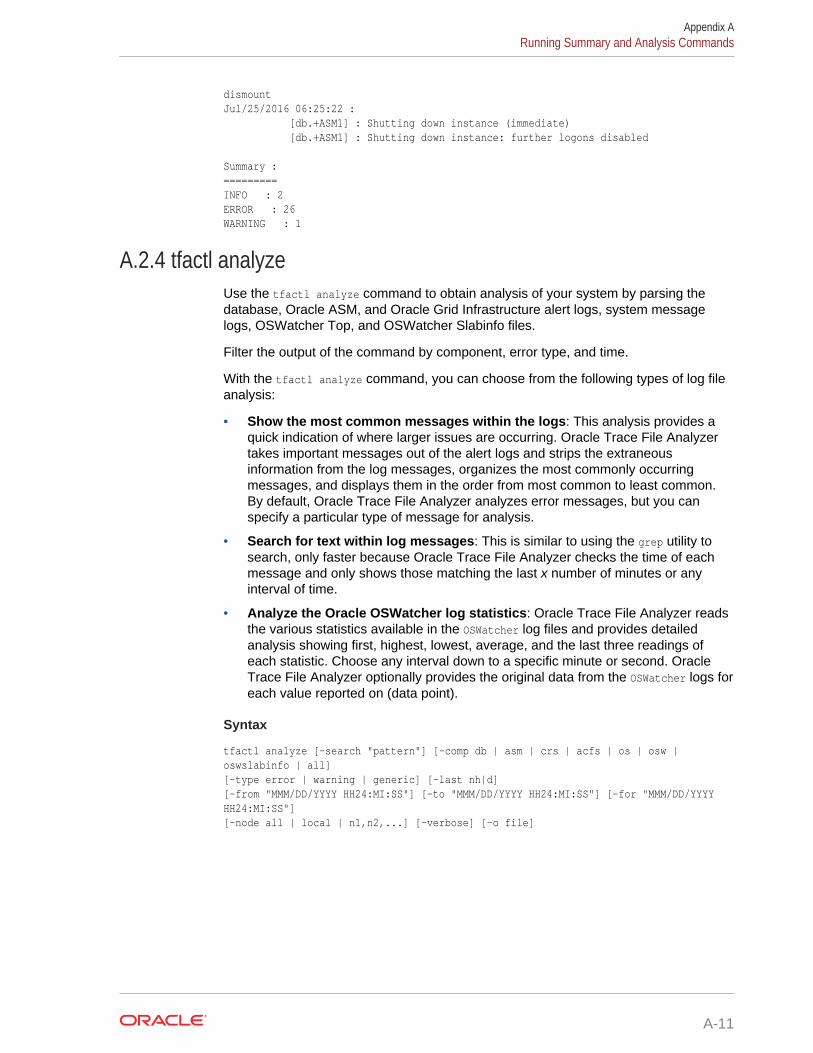
dismountJul/25/2016 06:25:22 : [db.+ASM1] : Shutting down instance (immediate) [db.+ASM1] : Shutting down instance: further logons disabled
Summary :=========INFO : 2ERROR : 26WARNING : 1
A.2.4 tfactl analyzeUse the tfactl analyze command to obtain analysis of your system by parsing thedatabase, Oracle ASM, and Oracle Grid Infrastructure alert logs, system messagelogs, OSWatcher Top, and OSWatcher Slabinfo files.
Filter the output of the command by component, error type, and time.
With the tfactl analyze command, you can choose from the following types of log fileanalysis:
• Show the most common messages within the logs: This analysis provides aquick indication of where larger issues are occurring. Oracle Trace File Analyzertakes important messages out of the alert logs and strips the extraneousinformation from the log messages, organizes the most commonly occurringmessages, and displays them in the order from most common to least common.By default, Oracle Trace File Analyzer analyzes error messages, but you canspecify a particular type of message for analysis.
• Search for text within log messages: This is similar to using the grep utility tosearch, only faster because Oracle Trace File Analyzer checks the time of eachmessage and only shows those matching the last x number of minutes or anyinterval of time.
• Analyze the Oracle OSWatcher log statistics: Oracle Trace File Analyzer readsthe various statistics available in the OSWatcher log files and provides detailedanalysis showing first, highest, lowest, average, and the last three readings ofeach statistic. Choose any interval down to a specific minute or second. OracleTrace File Analyzer optionally provides the original data from the OSWatcher logs foreach value reported on (data point).
Syntax
tfactl analyze [-search "pattern"] [-comp db | asm | crs | acfs | os | osw | oswslabinfo | all] [-type error | warning | generic] [-last nh|d] [-from "MMM/DD/YYYY HH24:MI:SS"] [-to "MMM/DD/YYYY HH24:MI:SS"] [-for "MMM/DD/YYYY HH24:MI:SS"] [-node all | local | n1,n2,...] [-verbose] [-o file]
Appendix ARunning Summary and Analysis Commands
A-11

Parameters
Table A-5 tfactl analyze Command Parameters
Parameter Description
-search "pattern" Searches for a pattern enclosed in double quotation marks ("") insystem and alert logs within a specified time range. This parametersupports both case-sensitive and case-insensitive search in alertand system message files across the cluster within the specifiedfilters. Default is case insensitive.
If you do not specify the -search parameter, then Oracle Trace FileAnalyzer provides a summary of messages within specified filtersfrom alert and system log messages across the cluster.
Oracle Trace File Analyzer displays message counts grouped bytype (error, warning, and generic) and shows unique messagesin a table organized by message type selected for analysis. Thegeneric message type is assigned to all messages which are noteither an error or warning message type.
-comp db | asm | crs |acfs | os | osw |oswslabinfo | all
Select which components you want Oracle Trace File Analyzer toanalyze. Default is all.
• db: Database alert logs• asm: Oracle ASM alert logs• crs: Oracle Grid Infrastructure alert logs• acfs: Oracle ACFS alert logs• os: System message files• osw: OSW Top output• oswlabinfo: OSW Slabinfo outputWhen OSWatcher data is available, OSW and OSWSLABINFOcomponents provide summary views of OSWatcher data.
-type error | warning| generic
Select what type of messages Oracle Trace File Analyzer analyzes.Default is error.
-last n[h|d] Specify an amount of time, in hours or days, before current timethat you want Oracle Trace File Analyzer to analyze.
-from | -to | -for"MMM/DD/YYYYHH24:MI:SS"
Specify a time interval, using the -from and -to parameterstogether, or a specific time using the -for parameter, that you wantOracle Trace File Analyzer to analyze.
-node all | local |n1,n2,...
Specify a comma-separated list of host names. Use -local toanalyze files on the local node. Default is all.
–verbose Displays verbose output.
–o file Specify a file where Oracle Trace File Analyzer writes the outputinstead of displaying on the screen.
-type Parameter Arguments
The tfactl analyze command classifies all the messages into different categorieswhen you specify the -type parameter. The analysis component provides count ofmessages by the message type you configure and lists all unique messages groupedby count within specified filters. The message type patterns for each argument arelisted in the following table.
Appendix ARunning Summary and Analysis Commands
A-12
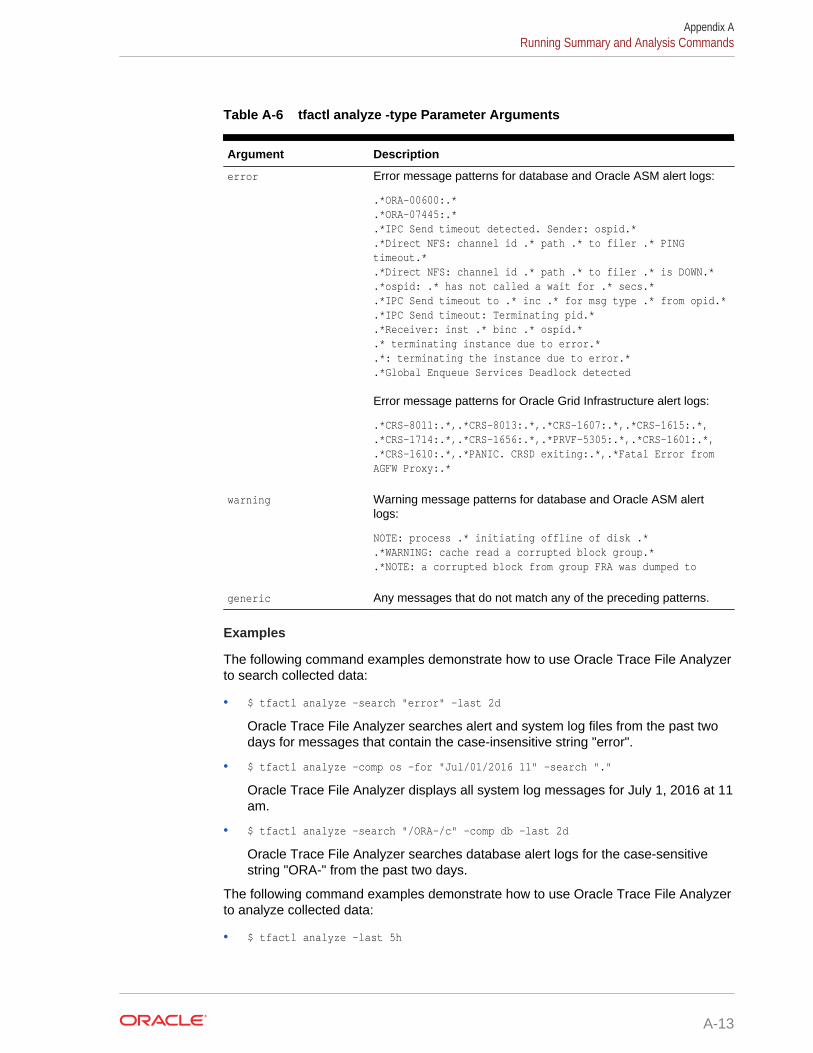
Table A-6 tfactl analyze -type Parameter Arguments
Argument Description
error Error message patterns for database and Oracle ASM alert logs:
.*ORA-00600:.*
.*ORA-07445:.*
.*IPC Send timeout detected. Sender: ospid.*
.*Direct NFS: channel id .* path .* to filer .* PING timeout.*.*Direct NFS: channel id .* path .* to filer .* is DOWN.*.*ospid: .* has not called a wait for .* secs.*.*IPC Send timeout to .* inc .* for msg type .* from opid.*.*IPC Send timeout: Terminating pid.*.*Receiver: inst .* binc .* ospid.*.* terminating instance due to error.*.*: terminating the instance due to error.*.*Global Enqueue Services Deadlock detected
Error message patterns for Oracle Grid Infrastructure alert logs:
.*CRS-8011:.*,.*CRS-8013:.*,.*CRS-1607:.*,.*CRS-1615:.*,
.*CRS-1714:.*,.*CRS-1656:.*,.*PRVF-5305:.*,.*CRS-1601:.*,
.*CRS-1610:.*,.*PANIC. CRSD exiting:.*,.*Fatal Error from AGFW Proxy:.*
warning Warning message patterns for database and Oracle ASM alertlogs:
NOTE: process .* initiating offline of disk .*.*WARNING: cache read a corrupted block group.*.*NOTE: a corrupted block from group FRA was dumped to
generic Any messages that do not match any of the preceding patterns.
Examples
The following command examples demonstrate how to use Oracle Trace File Analyzerto search collected data:
• $ tfactl analyze -search "error" -last 2d
Oracle Trace File Analyzer searches alert and system log files from the past twodays for messages that contain the case-insensitive string "error".
• $ tfactl analyze -comp os -for "Jul/01/2016 11" -search "."
Oracle Trace File Analyzer displays all system log messages for July 1, 2016 at 11am.
• $ tfactl analyze -search "/ORA-/c" -comp db -last 2d
Oracle Trace File Analyzer searches database alert logs for the case-sensitivestring "ORA-" from the past two days.
The following command examples demonstrate how to use Oracle Trace File Analyzerto analyze collected data:
• $ tfactl analyze -last 5h
Appendix ARunning Summary and Analysis Commands
A-13
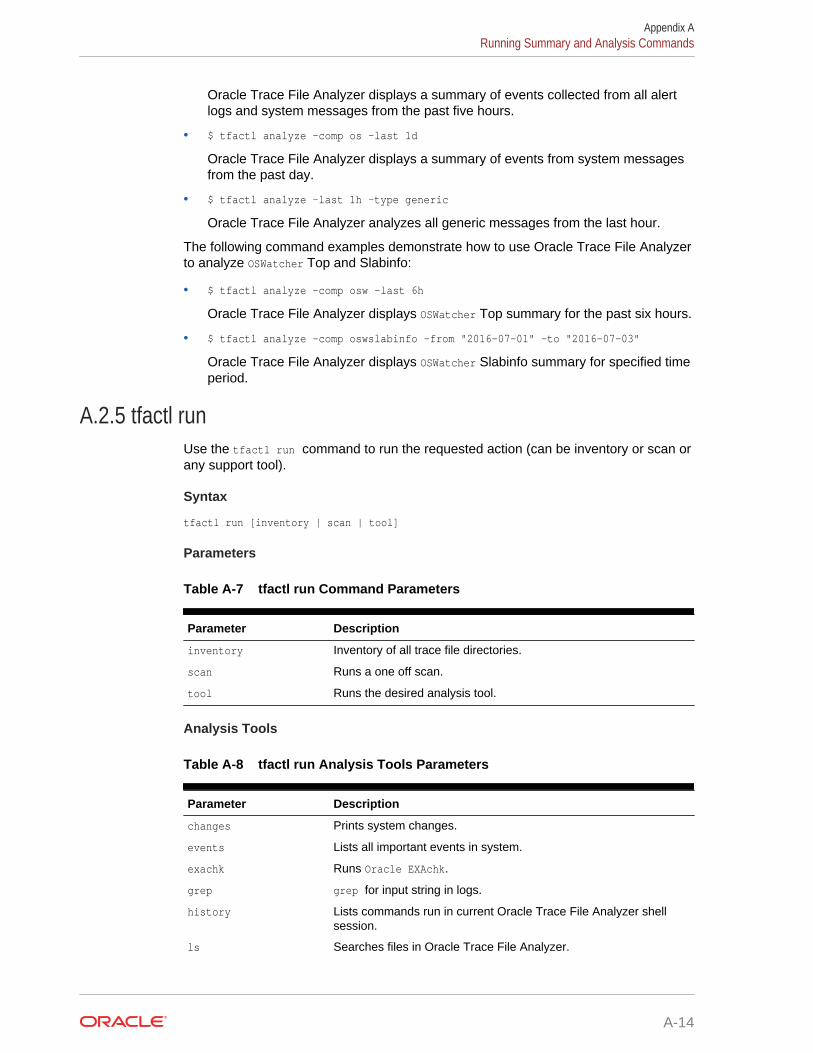
Oracle Trace File Analyzer displays a summary of events collected from all alertlogs and system messages from the past five hours.
• $ tfactl analyze -comp os -last 1d
Oracle Trace File Analyzer displays a summary of events from system messagesfrom the past day.
• $ tfactl analyze -last 1h -type generic
Oracle Trace File Analyzer analyzes all generic messages from the last hour.
The following command examples demonstrate how to use Oracle Trace File Analyzerto analyze OSWatcher Top and Slabinfo:
• $ tfactl analyze -comp osw -last 6h
Oracle Trace File Analyzer displays OSWatcher Top summary for the past six hours.
• $ tfactl analyze -comp oswslabinfo -from "2016-07-01" -to "2016-07-03"
Oracle Trace File Analyzer displays OSWatcher Slabinfo summary for specified timeperiod.
A.2.5 tfactl runUse the tfactl run command to run the requested action (can be inventory or scan orany support tool).
Syntax
tfactl run [inventory | scan | tool]
Parameters
Table A-7 tfactl run Command Parameters
Parameter Description
inventory Inventory of all trace file directories.
scan Runs a one off scan.
tool Runs the desired analysis tool.
Analysis Tools
Table A-8 tfactl run Analysis Tools Parameters
Parameter Description
changes Prints system changes.
events Lists all important events in system.
exachk Runs Oracle EXAchk.
grep grep for input string in logs.
history Lists commands run in current Oracle Trace File Analyzer shellsession.
ls Searches files in Oracle Trace File Analyzer.
Appendix ARunning Summary and Analysis Commands
A-14
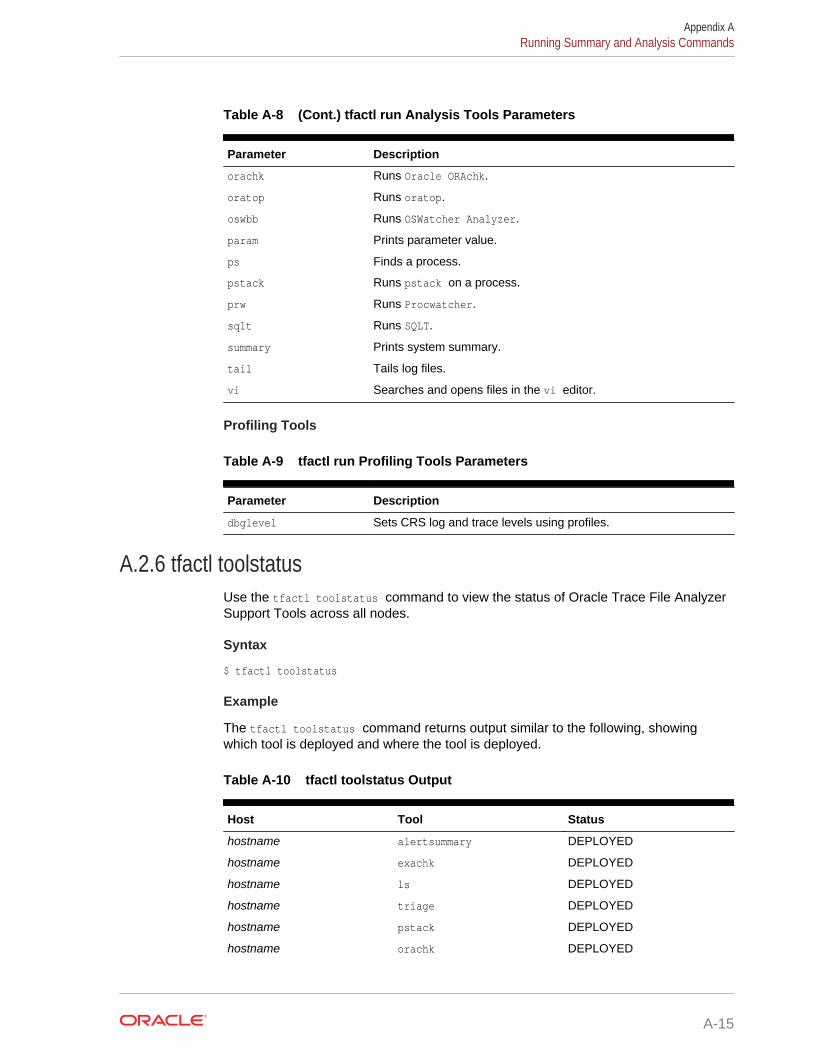
Table A-8 (Cont.) tfactl run Analysis Tools Parameters
Parameter Description
orachk Runs Oracle ORAchk.
oratop Runs oratop.
oswbb Runs OSWatcher Analyzer.
param Prints parameter value.
ps Finds a process.
pstack Runs pstack on a process.
prw Runs Procwatcher.
sqlt Runs SQLT.
summary Prints system summary.
tail Tails log files.
vi Searches and opens files in the vi editor.
Profiling Tools
Table A-9 tfactl run Profiling Tools Parameters
Parameter Description
dbglevel Sets CRS log and trace levels using profiles.
A.2.6 tfactl toolstatusUse the tfactl toolstatus command to view the status of Oracle Trace File AnalyzerSupport Tools across all nodes.
Syntax
$ tfactl toolstatus
Example
The tfactl toolstatus command returns output similar to the following, showingwhich tool is deployed and where the tool is deployed.
Table A-10 tfactl toolstatus Output
Host Tool Status
hostname alertsummary DEPLOYED
hostname exachk DEPLOYED
hostname ls DEPLOYED
hostname triage DEPLOYED
hostname pstack DEPLOYED
hostname orachk DEPLOYED
Appendix ARunning Summary and Analysis Commands
A-15
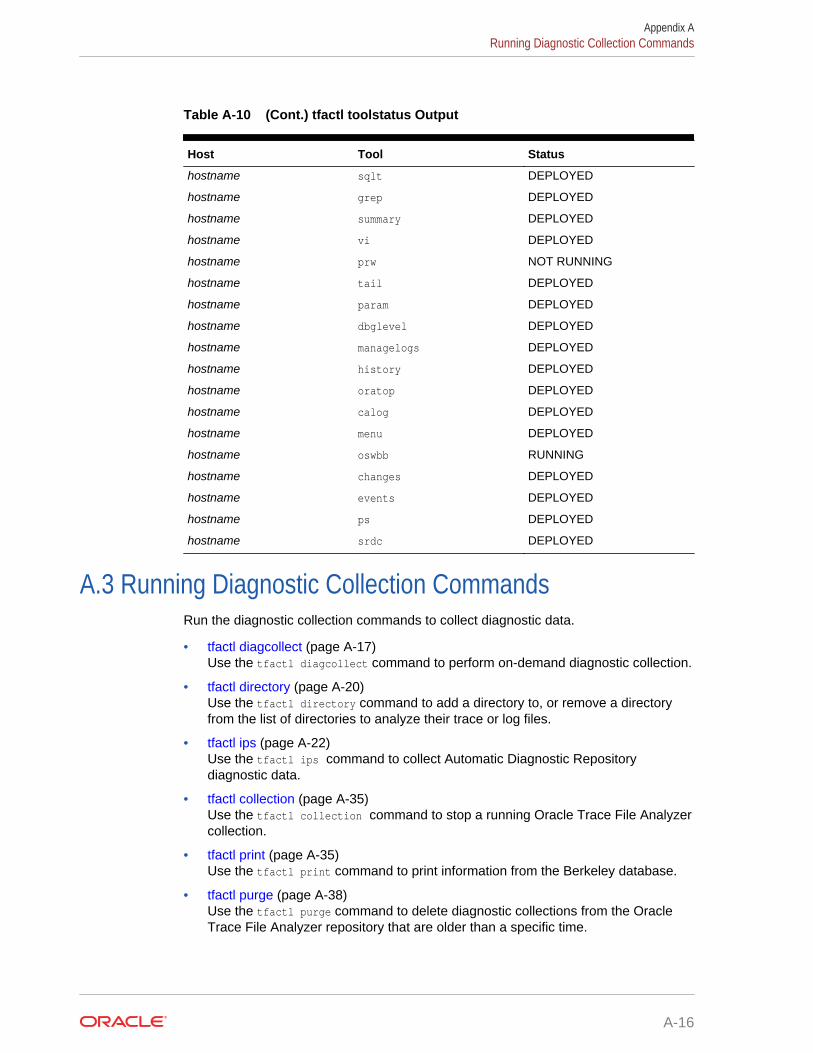
Table A-10 (Cont.) tfactl toolstatus Output
Host Tool Status
hostname sqlt DEPLOYED
hostname grep DEPLOYED
hostname summary DEPLOYED
hostname vi DEPLOYED
hostname prw NOT RUNNING
hostname tail DEPLOYED
hostname param DEPLOYED
hostname dbglevel DEPLOYED
hostname managelogs DEPLOYED
hostname history DEPLOYED
hostname oratop DEPLOYED
hostname calog DEPLOYED
hostname menu DEPLOYED
hostname oswbb RUNNING
hostname changes DEPLOYED
hostname events DEPLOYED
hostname ps DEPLOYED
hostname srdc DEPLOYED
A.3 Running Diagnostic Collection CommandsRun the diagnostic collection commands to collect diagnostic data.
• tfactl diagcollect (page A-17)Use the tfactl diagcollect command to perform on-demand diagnostic collection.
• tfactl directory (page A-20)Use the tfactl directory command to add a directory to, or remove a directoryfrom the list of directories to analyze their trace or log files.
• tfactl ips (page A-22)Use the tfactl ips command to collect Automatic Diagnostic Repositorydiagnostic data.
• tfactl collection (page A-35)Use the tfactl collection command to stop a running Oracle Trace File Analyzercollection.
• tfactl print (page A-35)Use the tfactl print command to print information from the Berkeley database.
• tfactl purge (page A-38)Use the tfactl purge command to delete diagnostic collections from the OracleTrace File Analyzer repository that are older than a specific time.
Appendix ARunning Diagnostic Collection Commands
A-16
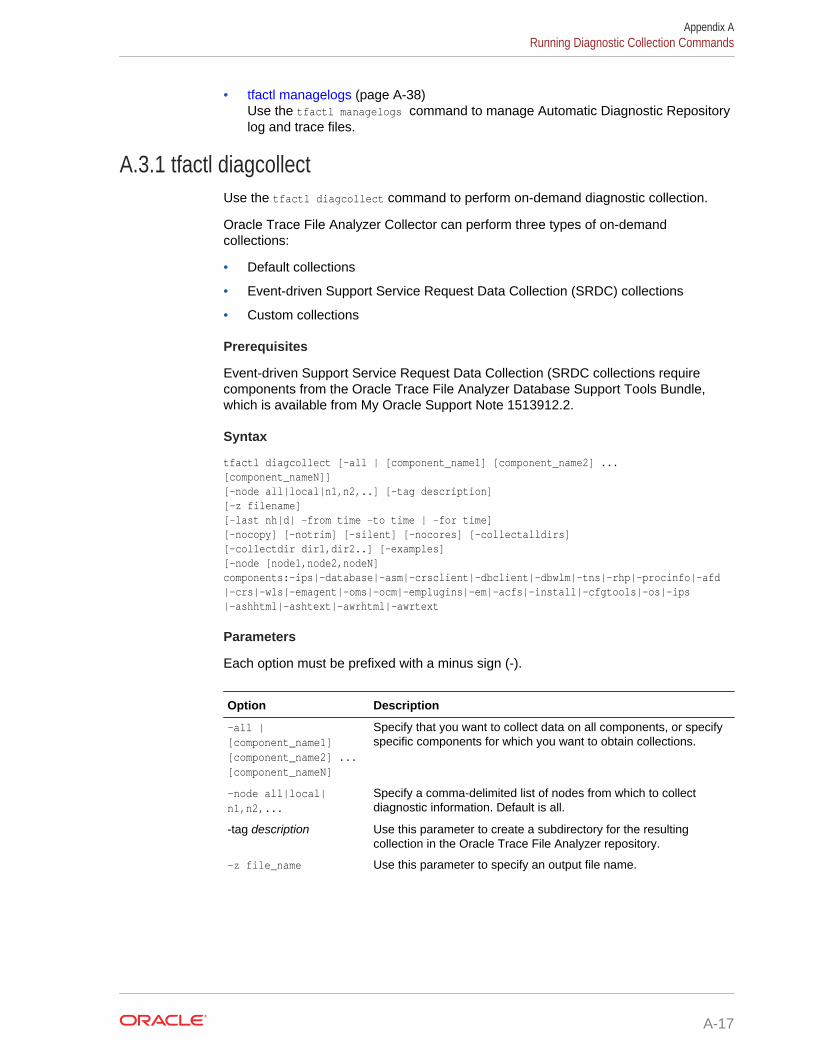
• tfactl managelogs (page A-38)Use the tfactl managelogs command to manage Automatic Diagnostic Repositorylog and trace files.
A.3.1 tfactl diagcollectUse the tfactl diagcollect command to perform on-demand diagnostic collection.
Oracle Trace File Analyzer Collector can perform three types of on-demandcollections:
• Default collections
• Event-driven Support Service Request Data Collection (SRDC) collections
• Custom collections
Prerequisites
Event-driven Support Service Request Data Collection (SRDC collections requirecomponents from the Oracle Trace File Analyzer Database Support Tools Bundle,which is available from My Oracle Support Note 1513912.2.
Syntax
tfactl diagcollect [-all | [component_name1] [component_name2] ... [component_nameN]] [-node all|local|n1,n2,..] [-tag description] [-z filename] [-last nh|d| -from time -to time | -for time] [-nocopy] [-notrim] [-silent] [-nocores] [-collectalldirs] [-collectdir dir1,dir2..] [-examples] [-node [node1,node2,nodeN] components:-ips|-database|-asm|-crsclient|-dbclient|-dbwlm|-tns|-rhp|-procinfo|-afd|-crs|-wls|-emagent|-oms|-ocm|-emplugins|-em|-acfs|-install|-cfgtools|-os|-ips|-ashhtml|-ashtext|-awrhtml|-awrtext
Parameters
Each option must be prefixed with a minus sign (-).
Option Description
-all |[component_name1][component_name2] ...[component_nameN]
Specify that you want to collect data on all components, or specifyspecific components for which you want to obtain collections.
-node all|local|n1,n2,...
Specify a comma-delimited list of nodes from which to collectdiagnostic information. Default is all.
-tag description Use this parameter to create a subdirectory for the resultingcollection in the Oracle Trace File Analyzer repository.
-z file_name Use this parameter to specify an output file name.
Appendix ARunning Diagnostic Collection Commands
A-17
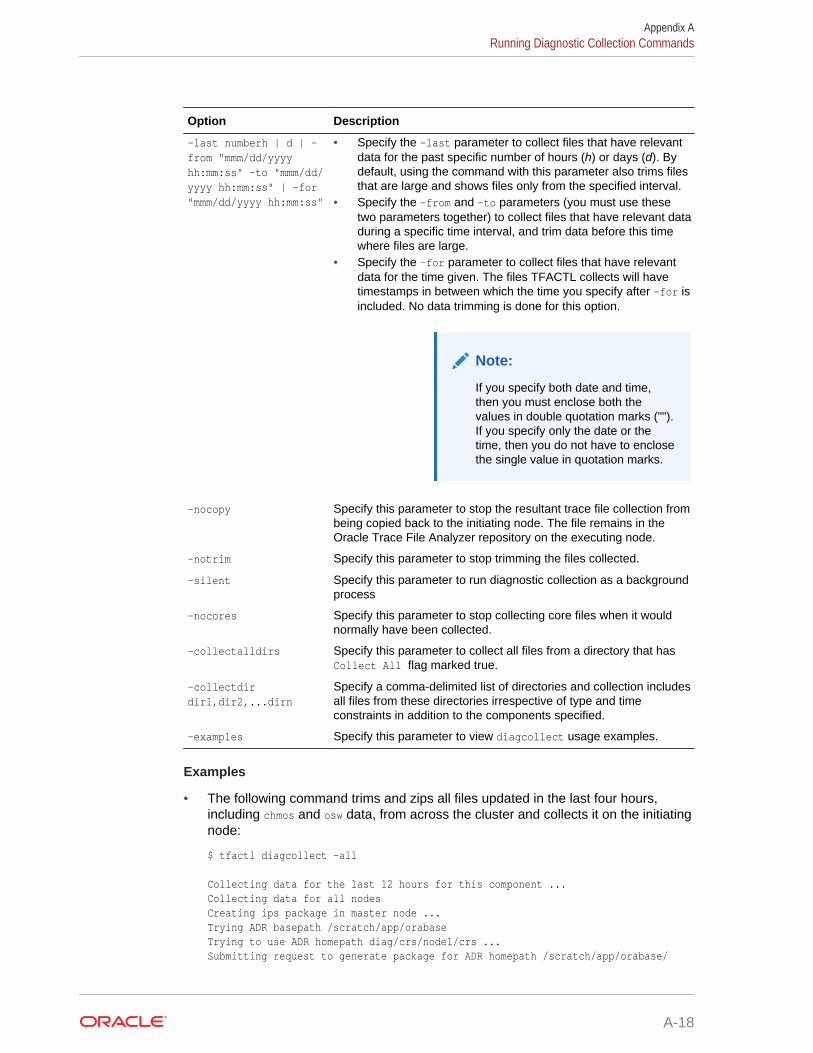
Option Description
-last numberh | d | -from "mmm/dd/yyyyhh:mm:ss" -to "mmm/dd/yyyy hh:mm:ss" | -for"mmm/dd/yyyy hh:mm:ss"
• Specify the -last parameter to collect files that have relevantdata for the past specific number of hours (h) or days (d). Bydefault, using the command with this parameter also trims filesthat are large and shows files only from the specified interval.
• Specify the -from and -to parameters (you must use thesetwo parameters together) to collect files that have relevant dataduring a specific time interval, and trim data before this timewhere files are large.
• Specify the -for parameter to collect files that have relevantdata for the time given. The files TFACTL collects will havetimestamps in between which the time you specify after -for isincluded. No data trimming is done for this option.
Note:
If you specify both date and time,then you must enclose both thevalues in double quotation marks ("").If you specify only the date or thetime, then you do not have to enclosethe single value in quotation marks.
-nocopy Specify this parameter to stop the resultant trace file collection frombeing copied back to the initiating node. The file remains in theOracle Trace File Analyzer repository on the executing node.
-notrim Specify this parameter to stop trimming the files collected.
-silent Specify this parameter to run diagnostic collection as a backgroundprocess
-nocores Specify this parameter to stop collecting core files when it wouldnormally have been collected.
-collectalldirs Specify this parameter to collect all files from a directory that hasCollect All flag marked true.
-collectdirdir1,dir2,...dirn
Specify a comma-delimited list of directories and collection includesall files from these directories irrespective of type and timeconstraints in addition to the components specified.
-examples Specify this parameter to view diagcollect usage examples.
Examples
• The following command trims and zips all files updated in the last four hours,including chmos and osw data, from across the cluster and collects it on the initiatingnode:
$ tfactl diagcollect –all
Collecting data for the last 12 hours for this component ...Collecting data for all nodesCreating ips package in master node ...Trying ADR basepath /scratch/app/orabaseTrying to use ADR homepath diag/crs/node1/crs ...Submitting request to generate package for ADR homepath /scratch/app/orabase/
Appendix ARunning Diagnostic Collection Commands
A-18
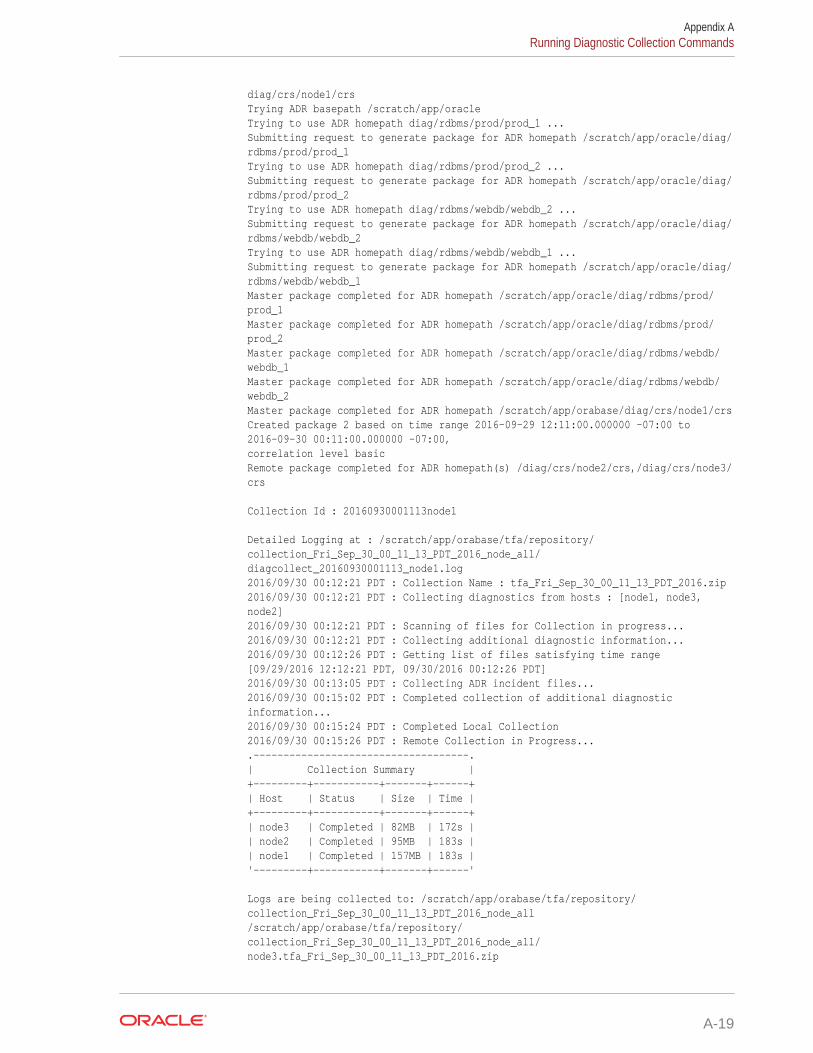
diag/crs/node1/crsTrying ADR basepath /scratch/app/oracleTrying to use ADR homepath diag/rdbms/prod/prod_1 ...Submitting request to generate package for ADR homepath /scratch/app/oracle/diag/rdbms/prod/prod_1Trying to use ADR homepath diag/rdbms/prod/prod_2 ...Submitting request to generate package for ADR homepath /scratch/app/oracle/diag/rdbms/prod/prod_2Trying to use ADR homepath diag/rdbms/webdb/webdb_2 ...Submitting request to generate package for ADR homepath /scratch/app/oracle/diag/rdbms/webdb/webdb_2Trying to use ADR homepath diag/rdbms/webdb/webdb_1 ...Submitting request to generate package for ADR homepath /scratch/app/oracle/diag/rdbms/webdb/webdb_1Master package completed for ADR homepath /scratch/app/oracle/diag/rdbms/prod/prod_1Master package completed for ADR homepath /scratch/app/oracle/diag/rdbms/prod/prod_2Master package completed for ADR homepath /scratch/app/oracle/diag/rdbms/webdb/webdb_1Master package completed for ADR homepath /scratch/app/oracle/diag/rdbms/webdb/webdb_2Master package completed for ADR homepath /scratch/app/orabase/diag/crs/node1/crsCreated package 2 based on time range 2016-09-29 12:11:00.000000 -07:00 to 2016-09-30 00:11:00.000000 -07:00, correlation level basicRemote package completed for ADR homepath(s) /diag/crs/node2/crs,/diag/crs/node3/crs
Collection Id : 20160930001113node1
Detailed Logging at : /scratch/app/orabase/tfa/repository/collection_Fri_Sep_30_00_11_13_PDT_2016_node_all/diagcollect_20160930001113_node1.log2016/09/30 00:12:21 PDT : Collection Name : tfa_Fri_Sep_30_00_11_13_PDT_2016.zip2016/09/30 00:12:21 PDT : Collecting diagnostics from hosts : [node1, node3, node2]2016/09/30 00:12:21 PDT : Scanning of files for Collection in progress...2016/09/30 00:12:21 PDT : Collecting additional diagnostic information...2016/09/30 00:12:26 PDT : Getting list of files satisfying time range [09/29/2016 12:12:21 PDT, 09/30/2016 00:12:26 PDT]2016/09/30 00:13:05 PDT : Collecting ADR incident files...2016/09/30 00:15:02 PDT : Completed collection of additional diagnostic information...2016/09/30 00:15:24 PDT : Completed Local Collection2016/09/30 00:15:26 PDT : Remote Collection in Progress....------------------------------------.| Collection Summary |+---------+-----------+-------+------+| Host | Status | Size | Time |+---------+-----------+-------+------+| node3 | Completed | 82MB | 172s || node2 | Completed | 95MB | 183s || node1 | Completed | 157MB | 183s |'---------+-----------+-------+------'
Logs are being collected to: /scratch/app/orabase/tfa/repository/collection_Fri_Sep_30_00_11_13_PDT_2016_node_all/scratch/app/orabase/tfa/repository/collection_Fri_Sep_30_00_11_13_PDT_2016_node_all/node3.tfa_Fri_Sep_30_00_11_13_PDT_2016.zip
Appendix ARunning Diagnostic Collection Commands
A-19
/scratch/app/orabase/tfa/repository/collection_Fri_Sep_30_00_11_13_PDT_2016_node_all/node2.tfa_Fri_Sep_30_00_11_13_PDT_2016.zip/scratch/app/orabase/tfa/repository/collection_Fri_Sep_30_00_11_13_PDT_2016_node_all/node1.tfa_Fri_Sep_30_00_11_13_PDT_2016.zip
• The following command trims and zips all files updated in the last eight hours,including chmos and osw data, from across the cluster and collects it on the initiatingnode:
$ tfactl diagcollect –all –last 8h
• The following command trims and zips all files from databases hrdb and fdbupdated in the last one day and collects it on the initiating node:
$ tfactl diagcollect -database hrdb,fdb -last 1d -z foo
• The following command trims and zips all Oracle Grid Infrastructure files,operating system logs, and chmos and osw data from node1 and node2 updated in thelast six hours, and collects it on the initiating node:
$ tfactl diagcollect –crs -os -node node1,node2 -last 6h
• The following command trims and zips all Oracle ASM logs from node1 updatedbetween September 22, 2016 and September 23, 2016 at 21:00, and collects it onthe initiating node:
$ tfactl diagcollect -asm -node node1 -from Sep/22/2016 -to "Sep/23/2016 21:00:00"
• The following command trims and zips all log files updated on September 23, 2016and collect at the initiating node:
$ tfactl diagcollect -for Sep/23/2016
• The following command trims and zips all log files updated from 09:00 onSeptember 22, 2016, to 09:00 on September 23, 2016, which is 12 hours beforeand after the time specified in the command, and collects it on the initiating node:
$ tfactl diagcollect -for "September/22/2016 21:00:00"
Related Topics
• https://support.oracle.com/rs?type=doc&id=1513912.2
A.3.2 tfactl directoryUse the tfactl directory command to add a directory to, or remove a directory fromthe list of directories to analyze their trace or log files.
Also, use the tfactl directory command to change the directory permissions. Whenautomatic discovery adds a directory, the directory is added as public. Any user whohas sufficient permissions to run the tfactl diagcollect command collects any file inthat directory. This is only important when non-root or sudo users run TFACTLcommands.
If a directory is marked as private, then Oracle Trace File Analyzer, before allowingany files to be collected:
• Determines which user is running TFACTL commands
• Verifies if the user has permissions to see the files in the directory
Appendix ARunning Diagnostic Collection Commands
A-20
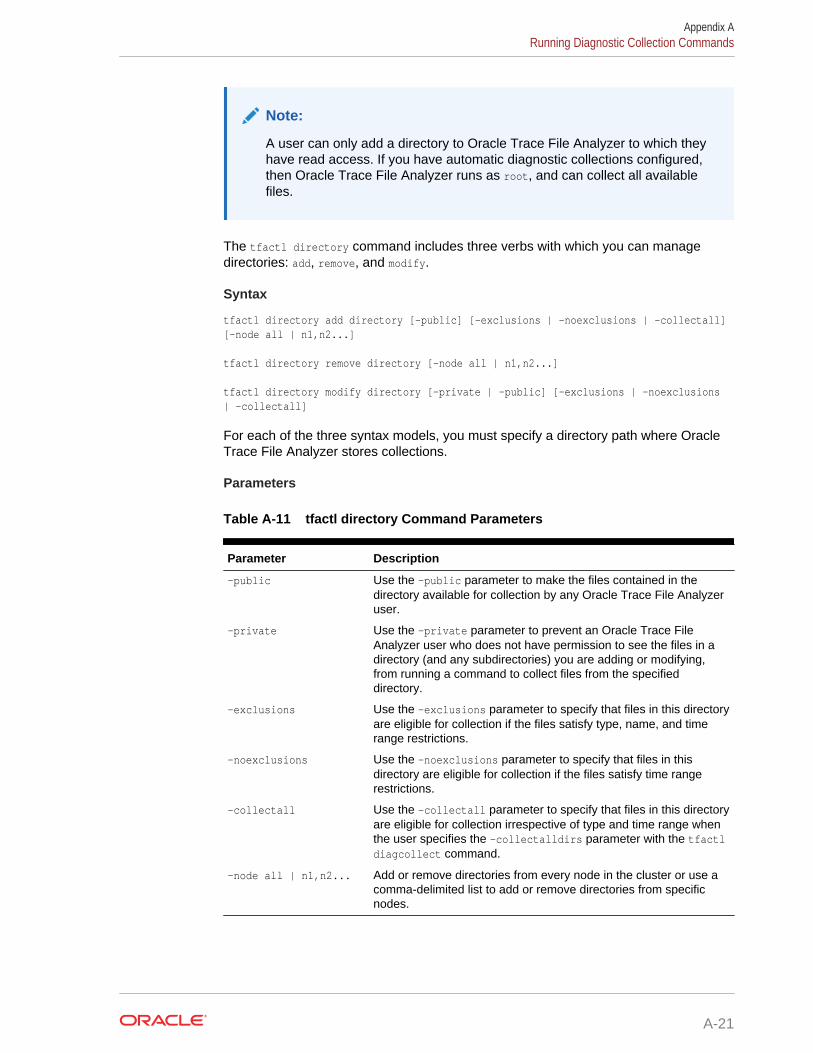
Note:
A user can only add a directory to Oracle Trace File Analyzer to which theyhave read access. If you have automatic diagnostic collections configured,then Oracle Trace File Analyzer runs as root, and can collect all availablefiles.
The tfactl directory command includes three verbs with which you can managedirectories: add, remove, and modify.
Syntax
tfactl directory add directory [-public] [-exclusions | -noexclusions | -collectall] [-node all | n1,n2...]
tfactl directory remove directory [-node all | n1,n2...]
tfactl directory modify directory [-private | -public] [-exclusions | -noexclusions | -collectall]
For each of the three syntax models, you must specify a directory path where OracleTrace File Analyzer stores collections.
Parameters
Table A-11 tfactl directory Command Parameters
Parameter Description
-public Use the -public parameter to make the files contained in thedirectory available for collection by any Oracle Trace File Analyzeruser.
-private Use the -private parameter to prevent an Oracle Trace FileAnalyzer user who does not have permission to see the files in adirectory (and any subdirectories) you are adding or modifying,from running a command to collect files from the specifieddirectory.
-exclusions Use the -exclusions parameter to specify that files in this directoryare eligible for collection if the files satisfy type, name, and timerange restrictions.
-noexclusions Use the -noexclusions parameter to specify that files in thisdirectory are eligible for collection if the files satisfy time rangerestrictions.
-collectall Use the -collectall parameter to specify that files in this directoryare eligible for collection irrespective of type and time range whenthe user specifies the -collectalldirs parameter with the tfactldiagcollect command.
-node all | n1,n2... Add or remove directories from every node in the cluster or use acomma-delimited list to add or remove directories from specificnodes.
Appendix ARunning Diagnostic Collection Commands
A-21

Usage Notes
You must add all trace directory names to the Berkeley database so that Oracle TraceFile Analyzer can collect file metadata in that directory. The discovery process findsmost directories, but if new or undiscovered directories are required, then you can addthese manually using the tfactl directory command.
When you add a directory using TFACTL, then Oracle Trace File Analyzer attempts todetermine whether the directory is for
• Oracle Database
• Oracle Grid Infrastructure
• Operating system logs
• Some other component
• Which database or instance
If Oracle Trace File Analyzer cannot determine this information, then Oracle Trace FileAnalyzer returns an error and requests that you enter the information, similar to thefollowing:
# tfactl directory add /tmp
Failed to add directory to TFA. Unable to determine parameters for directory: /tmpPlease enter component for this Directory [RDBMS|CRS|ASM|INSTALL|OS|CFGTOOLS|TNS|DBWLM|ACFS|ALL] : RDBMSPlease enter database name for this Directory :MYDBPlease enter instance name for this Directory :MYDB1
Note:
For OS, CRS, CFGTOOLS, ACFS, ALL, or INSTALL files, only thecomponent is requested and for Oracle ASM only the instance is created. Noverification is done for these entries so use caution when entering this data.
Examples
The following command adds a directory:
# tfactl directory add /u01/app/grid/diag/asm/+ASM1/trace
The following command modifies a directory and makes the contents available forcollection only to Oracle Trace File Analyzer users with sufficient permissions:
# tfactl directory modify /u01/app/grid/diag/asm/+ASM1/trace -private
The following command removes a directory from all nodes in the cluster:
# tfactl directory remove /u01/app/grid/diag/asm/+ASM1/trace -node all
A.3.3 tfactl ipsUse the tfactl ips command to collect Automatic Diagnostic Repository diagnosticdata.
Appendix ARunning Diagnostic Collection Commands
A-22
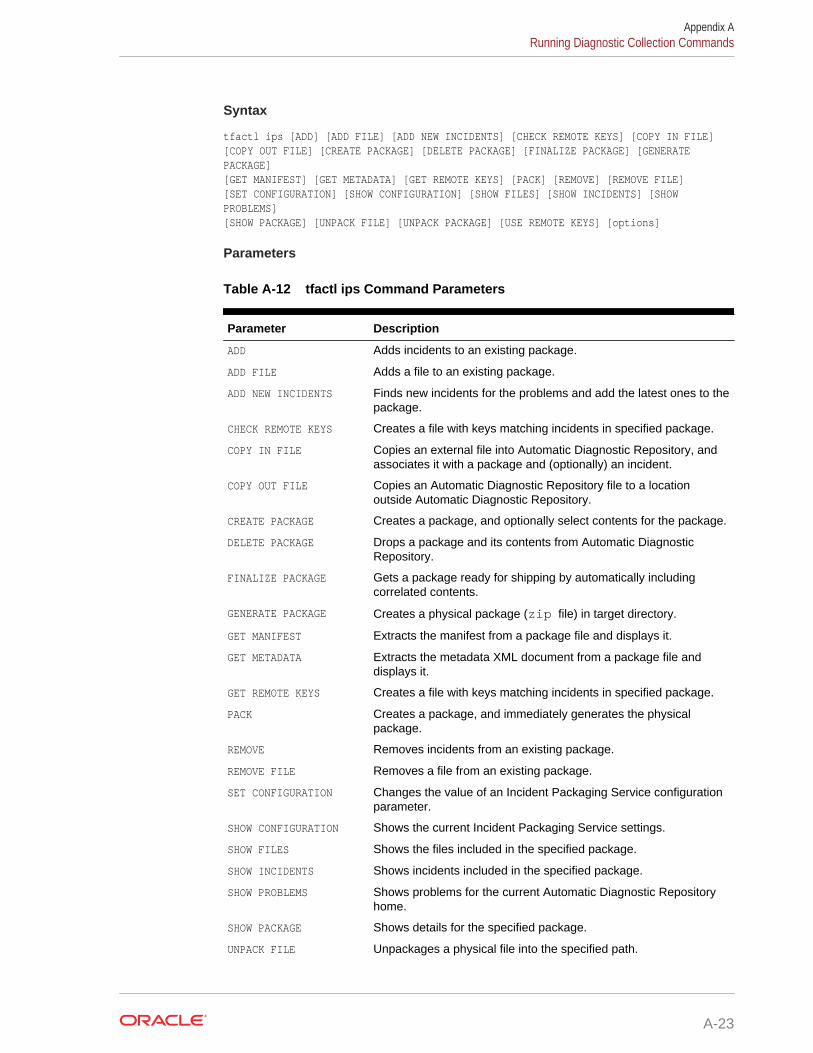
Syntax
tfactl ips [ADD] [ADD FILE] [ADD NEW INCIDENTS] [CHECK REMOTE KEYS] [COPY IN FILE] [COPY OUT FILE] [CREATE PACKAGE] [DELETE PACKAGE] [FINALIZE PACKAGE] [GENERATE PACKAGE] [GET MANIFEST] [GET METADATA] [GET REMOTE KEYS] [PACK] [REMOVE] [REMOVE FILE] [SET CONFIGURATION] [SHOW CONFIGURATION] [SHOW FILES] [SHOW INCIDENTS] [SHOW PROBLEMS] [SHOW PACKAGE] [UNPACK FILE] [UNPACK PACKAGE] [USE REMOTE KEYS] [options]
Parameters
Table A-12 tfactl ips Command Parameters
Parameter Description
ADD Adds incidents to an existing package.
ADD FILE Adds a file to an existing package.
ADD NEW INCIDENTS Finds new incidents for the problems and add the latest ones to thepackage.
CHECK REMOTE KEYS Creates a file with keys matching incidents in specified package.
COPY IN FILE Copies an external file into Automatic Diagnostic Repository, andassociates it with a package and (optionally) an incident.
COPY OUT FILE Copies an Automatic Diagnostic Repository file to a locationoutside Automatic Diagnostic Repository.
CREATE PACKAGE Creates a package, and optionally select contents for the package.
DELETE PACKAGE Drops a package and its contents from Automatic DiagnosticRepository.
FINALIZE PACKAGE Gets a package ready for shipping by automatically includingcorrelated contents.
GENERATE PACKAGE Creates a physical package (zip file) in target directory.
GET MANIFEST Extracts the manifest from a package file and displays it.
GET METADATA Extracts the metadata XML document from a package file anddisplays it.
GET REMOTE KEYS Creates a file with keys matching incidents in specified package.
PACK Creates a package, and immediately generates the physicalpackage.
REMOVE Removes incidents from an existing package.
REMOVE FILE Removes a file from an existing package.
SET CONFIGURATION Changes the value of an Incident Packaging Service configurationparameter.
SHOW CONFIGURATION Shows the current Incident Packaging Service settings.
SHOW FILES Shows the files included in the specified package.
SHOW INCIDENTS Shows incidents included in the specified package.
SHOW PROBLEMS Shows problems for the current Automatic Diagnostic Repositoryhome.
SHOW PACKAGE Shows details for the specified package.
UNPACK FILE Unpackages a physical file into the specified path.
Appendix ARunning Diagnostic Collection Commands
A-23

Table A-12 (Cont.) tfactl ips Command Parameters
Parameter Description
UNPACK PACKAGE Unpackages physical files in the current directory into the specifiedpath, if they match the package name.
USE REMOTE KEYS Adds incidents matching the keys in the specified file to thespecified package.
• tfactl ips ADD (page A-25)Use the tfactl ips ADD command to add incidents to an existing package.
• tfactl ips ADD FILE (page A-26)Use the tfactl ADD FILE command to add a file to an existing package.
• tfactl ips COPY IN FILE (page A-26)Use the tfactl ips COPY IN FILE command to copy an external file into AutomaticDiagnostic Repository, and associate the file with a package and (optionally) anincident.
• tfactl ips REMOVE (page A-27)Use the tfactl ips REMOVE command to remove incidents from an existingpackage.
• tfactl ips REMOVE FILE (page A-27)Use the tfactl ips REMOVE FILE command to remove a file from an existingpackage.
• tfactl ips ADD NEW INCIDENTS PACKAGE (page A-27)Use the tfactl ips ADD NEW INCIDENTS PACKAGE command to find new incidents forthe problems in a specific package, and add the latest ones to the package.
• tfactl ips GET REMOTE KEYS FILE (page A-28)Use the tfactl ips GET REMOTE KEYS FILE command to create a file with keysmatching incidents in a specific package.
• tfactl ips USE REMOTE KEYS FILE (page A-28)Use the tfactl ips USE REMOTE KEYS FILE command to add incidents matching thekeys in a specific file to a specific package.
• tfactl ips CREATE PACKAGE (page A-28)Use the tfactl ips CREATE PACKAGE command to create a package, and optionallyselect the contents for the package.
• tfactl ips FINALIZE PACKAGE (page A-30)Use the tfactl ips FINALIZE PACKAGE command to get a package ready forshipping by automatically including correlated contents.
• tfactl ips GENERATE PACKAGE (page A-30)Use the tfactl ips GENERATE PACKAGE command to create a physical package (zipfile) in the target directory.
• tfactl ips DELETE PACKAGE (page A-30)Use the tfactl ips DELETE PACKAGE command to drop a package and its contentsfrom the Automatic Diagnostic Repository.
• tfactl ips GET MANIFEST FROM FILE (page A-31)Use the tfactl ips GET MANIFEST FROM FILE command to extract the manifest froma package file and view it.
Appendix ARunning Diagnostic Collection Commands
A-24
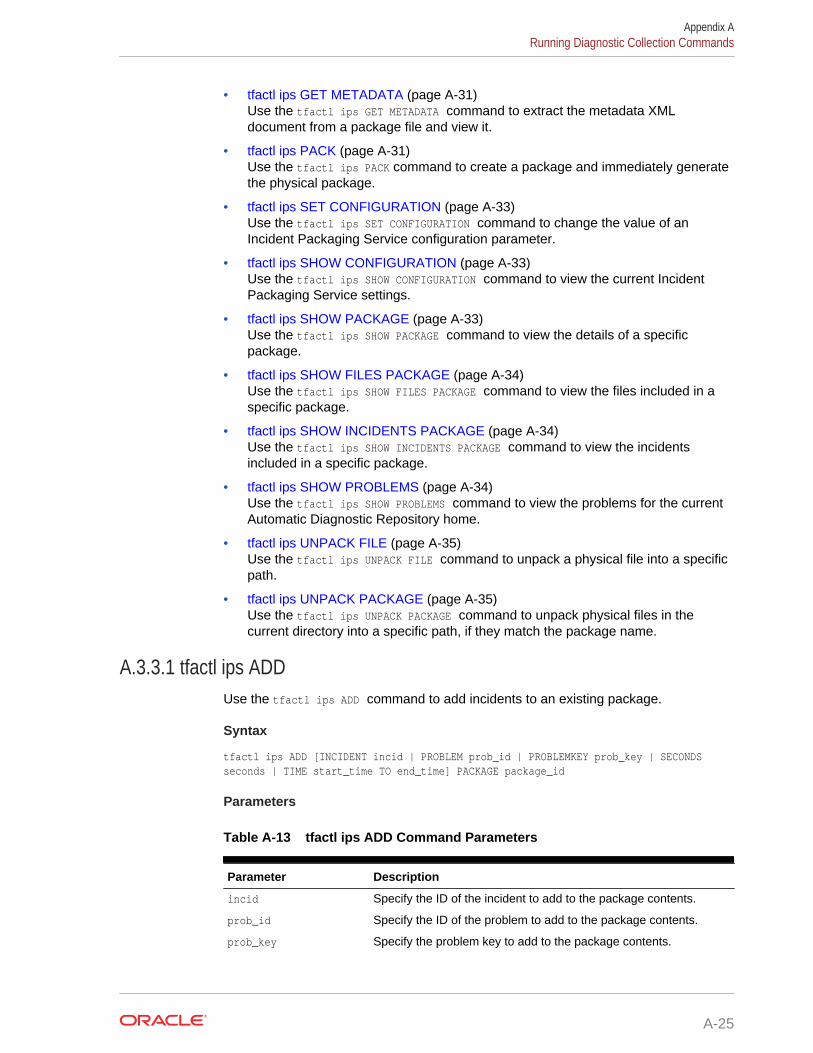
• tfactl ips GET METADATA (page A-31)Use the tfactl ips GET METADATA command to extract the metadata XMLdocument from a package file and view it.
• tfactl ips PACK (page A-31)Use the tfactl ips PACK command to create a package and immediately generatethe physical package.
• tfactl ips SET CONFIGURATION (page A-33)Use the tfactl ips SET CONFIGURATION command to change the value of anIncident Packaging Service configuration parameter.
• tfactl ips SHOW CONFIGURATION (page A-33)Use the tfactl ips SHOW CONFIGURATION command to view the current IncidentPackaging Service settings.
• tfactl ips SHOW PACKAGE (page A-33)Use the tfactl ips SHOW PACKAGE command to view the details of a specificpackage.
• tfactl ips SHOW FILES PACKAGE (page A-34)Use the tfactl ips SHOW FILES PACKAGE command to view the files included in aspecific package.
• tfactl ips SHOW INCIDENTS PACKAGE (page A-34)Use the tfactl ips SHOW INCIDENTS PACKAGE command to view the incidentsincluded in a specific package.
• tfactl ips SHOW PROBLEMS (page A-34)Use the tfactl ips SHOW PROBLEMS command to view the problems for the currentAutomatic Diagnostic Repository home.
• tfactl ips UNPACK FILE (page A-35)Use the tfactl ips UNPACK FILE command to unpack a physical file into a specificpath.
• tfactl ips UNPACK PACKAGE (page A-35)Use the tfactl ips UNPACK PACKAGE command to unpack physical files in thecurrent directory into a specific path, if they match the package name.
A.3.3.1 tfactl ips ADDUse the tfactl ips ADD command to add incidents to an existing package.
Syntax
tfactl ips ADD [INCIDENT incid | PROBLEM prob_id | PROBLEMKEY prob_key | SECONDS seconds | TIME start_time TO end_time] PACKAGE package_id
Parameters
Table A-13 tfactl ips ADD Command Parameters
Parameter Description
incid Specify the ID of the incident to add to the package contents.
prob_id Specify the ID of the problem to add to the package contents.
prob_key Specify the problem key to add to the package contents.
Appendix ARunning Diagnostic Collection Commands
A-25

Table A-13 (Cont.) tfactl ips ADD Command Parameters
Parameter Description
seconds Specify the number of seconds before now for adding packagecontents.
start_time Specify the start of time range to look for incidents in.
end_time Specify the end of time range to look for incidents in.
A.3.3.2 tfactl ips ADD FILEUse the tfactl ADD FILE command to add a file to an existing package.
Syntax
The file must be in the same ADR_BASE as the package.
tfactl ips ADD FILE file_spec PACKAGE pkgid
Parameters
Table A-14 tfactl ips ADD FILE Command Parameters
Parameter Description
file_spec Specify the file with file and path (full or relative).
package_id Specify the ID of the package to add the file to.
A.3.3.3 tfactl ips COPY IN FILEUse the tfactl ips COPY IN FILE command to copy an external file into AutomaticDiagnostic Repository, and associate the file with a package and (optionally) anincident.
Syntax
tfactl ips COPY IN FILE file [TO new_name] [OVERWRITE] PACKAGE pkgid [INCIDENT incid]
Parameters
Table A-15 tfactl ips COPY IN FILE Command Parameters
Parameter Description
file Specify the file with file name and full path (full or relative).
new_name Specify a name for the copy of the file.
pkgid Specify the ID of the package to associate the file with.
incid Specify the ID of the incident to associate the file with.
Options
OVERWRITE: If the file exists, then use the OVERWRITE option to overwrite the file.
Appendix ARunning Diagnostic Collection Commands
A-26
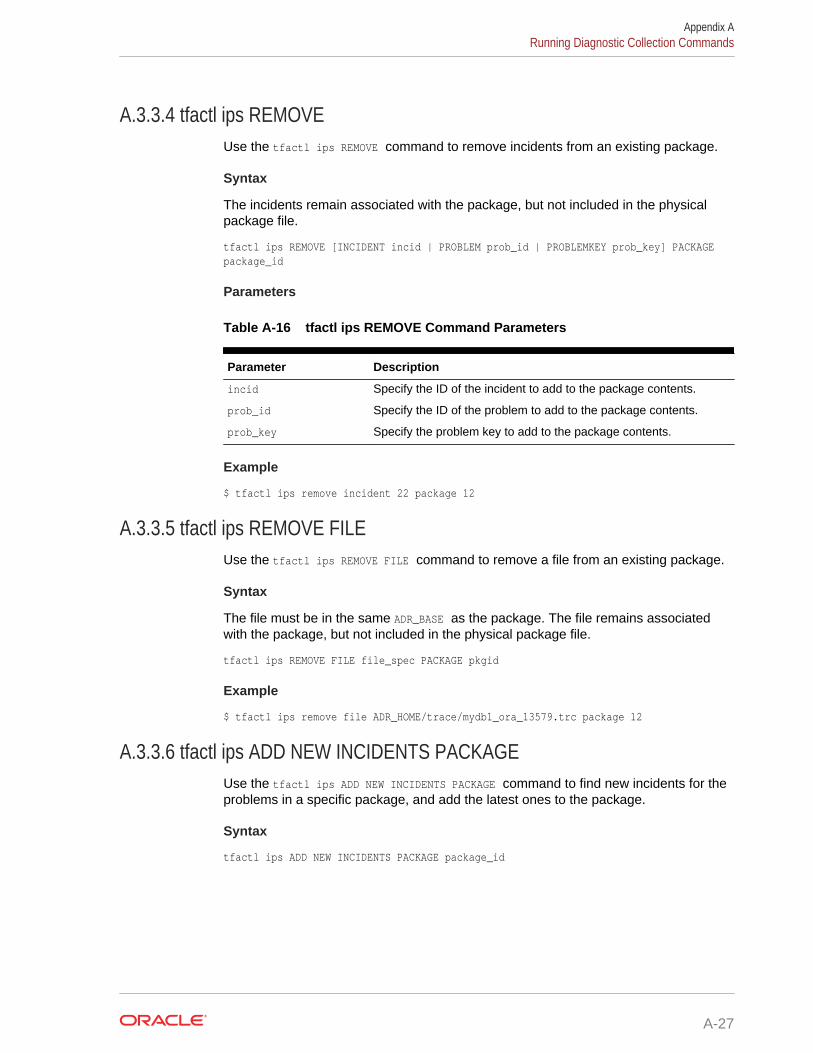
A.3.3.4 tfactl ips REMOVEUse the tfactl ips REMOVE command to remove incidents from an existing package.
Syntax
The incidents remain associated with the package, but not included in the physicalpackage file.
tfactl ips REMOVE [INCIDENT incid | PROBLEM prob_id | PROBLEMKEY prob_key] PACKAGE package_id
Parameters
Table A-16 tfactl ips REMOVE Command Parameters
Parameter Description
incid Specify the ID of the incident to add to the package contents.
prob_id Specify the ID of the problem to add to the package contents.
prob_key Specify the problem key to add to the package contents.
Example
$ tfactl ips remove incident 22 package 12
A.3.3.5 tfactl ips REMOVE FILEUse the tfactl ips REMOVE FILE command to remove a file from an existing package.
Syntax
The file must be in the same ADR_BASE as the package. The file remains associatedwith the package, but not included in the physical package file.
tfactl ips REMOVE FILE file_spec PACKAGE pkgid
Example
$ tfactl ips remove file ADR_HOME/trace/mydb1_ora_13579.trc package 12
A.3.3.6 tfactl ips ADD NEW INCIDENTS PACKAGEUse the tfactl ips ADD NEW INCIDENTS PACKAGE command to find new incidents for theproblems in a specific package, and add the latest ones to the package.
Syntax
tfactl ips ADD NEW INCIDENTS PACKAGE package_id
Appendix ARunning Diagnostic Collection Commands
A-27
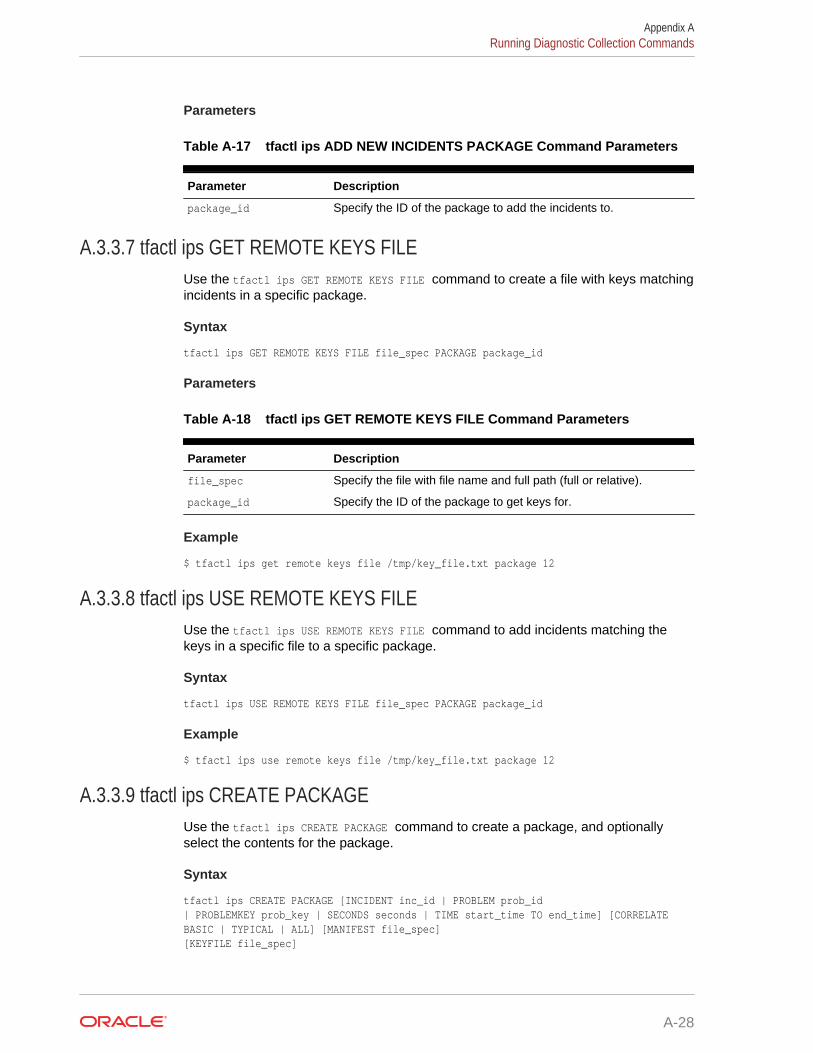
Parameters
Table A-17 tfactl ips ADD NEW INCIDENTS PACKAGE Command Parameters
Parameter Description
package_id Specify the ID of the package to add the incidents to.
A.3.3.7 tfactl ips GET REMOTE KEYS FILEUse the tfactl ips GET REMOTE KEYS FILE command to create a file with keys matchingincidents in a specific package.
Syntax
tfactl ips GET REMOTE KEYS FILE file_spec PACKAGE package_id
Parameters
Table A-18 tfactl ips GET REMOTE KEYS FILE Command Parameters
Parameter Description
file_spec Specify the file with file name and full path (full or relative).
package_id Specify the ID of the package to get keys for.
Example
$ tfactl ips get remote keys file /tmp/key_file.txt package 12
A.3.3.8 tfactl ips USE REMOTE KEYS FILEUse the tfactl ips USE REMOTE KEYS FILE command to add incidents matching thekeys in a specific file to a specific package.
Syntax
tfactl ips USE REMOTE KEYS FILE file_spec PACKAGE package_id
Example
$ tfactl ips use remote keys file /tmp/key_file.txt package 12
A.3.3.9 tfactl ips CREATE PACKAGEUse the tfactl ips CREATE PACKAGE command to create a package, and optionallyselect the contents for the package.
Syntax
tfactl ips CREATE PACKAGE [INCIDENT inc_id | PROBLEM prob_id | PROBLEMKEY prob_key | SECONDS seconds | TIME start_time TO end_time] [CORRELATE BASIC | TYPICAL | ALL] [MANIFEST file_spec] [KEYFILE file_spec]
Appendix ARunning Diagnostic Collection Commands
A-28

Parameters
Table A-19 tfactl ips CREATE PACKAGE Command Parameters
Parameter Description
incid Specify the ID of the incident to use for selecting the packagecontents.
prob_id Specify the ID of the problem to use for selecting the packagecontents.
prob_key Specify the problem key to use for selecting the package contents.
seconds Specify the number of seconds before now for selecting thepackage contents.
start_time Specify the start of time range to look for the incidents in.
end_time Specify the end of time range to look for the incidents in.
Options
• CORRELATE BASIC: The package includes the incident dumps and the incidentprocess trace files. If the incidents share relevant correlation keys, then moreincidents are included automatically.
• CORRELATE TYPICAL: The package includes the incident dumps and all trace files thatwere modified in a time window around each incident. If the incidents sharerelevant correlation keys, or occurred in a time window around the main incidents,then more incidents are included automatically.
• CORRELATE ALL: The package includes the incident dumps and all trace files thatwere modified between the first selected incident and the last selected incident. Ifthe incidents occurred in the same time range, then more incidents are includedautomatically.
• MANIFEST file_spec: Generates the XML format package manifest file.
• KEYFILE file_spec: Generates the remote key file.
Note:
• If you do not specify package contents, such as incident, problem, andso on, then Oracle Trace File Analyzer creates an empty package.
You can add files and incidents later.
• If you do not specify the correlation level, then Oracle Trace FileAnalyzer uses the default level.
• The default is normally TYPICAL, but you can change using the IPS SETCONFIGURATION command.
Example
$tfactl ips create package incident 861
Appendix ARunning Diagnostic Collection Commands
A-29

$ tfactl ips create package time '2006-12-31 23:59:59.00 -07:00' to '2007-01-01 01:01:01.00 -07:00'
A.3.3.10 tfactl ips FINALIZE PACKAGEUse the tfactl ips FINALIZE PACKAGE command to get a package ready for shippingby automatically including correlated contents.
Syntax
tfactl ips FINALIZE PACKAGE package_id
A.3.3.11 tfactl ips GENERATE PACKAGEUse the tfactl ips GENERATE PACKAGE command to create a physical package (zip file)in the target directory.
Syntax
tfactl ips GENERATE PACKAGE package_id [IN path][COMPLETE | INCREMENTAL]
Parameters
Table A-20 tfactl ips GENERATE PACKAGE Command Parameters
Parameter Description
package_id Specify the ID of the package to create physical package file for.
path Specify the path where the physical package file must begenerated.
Options
• COMPLETE: (Default) The package includes all package files even if a previouspackage sequence was generated.
• INCREMENTAL: The package includes only the files that have been added or changedsince the last package was generated.
Note:
If no target path is specified, then Oracle Trace File Analyzer generates thephysical package file in the current working directory.
Example
$ tfactl ips generate package 12 in /tmp
A.3.3.12 tfactl ips DELETE PACKAGEUse the tfactl ips DELETE PACKAGE command to drop a package and its contents fromthe Automatic Diagnostic Repository.
Appendix ARunning Diagnostic Collection Commands
A-30
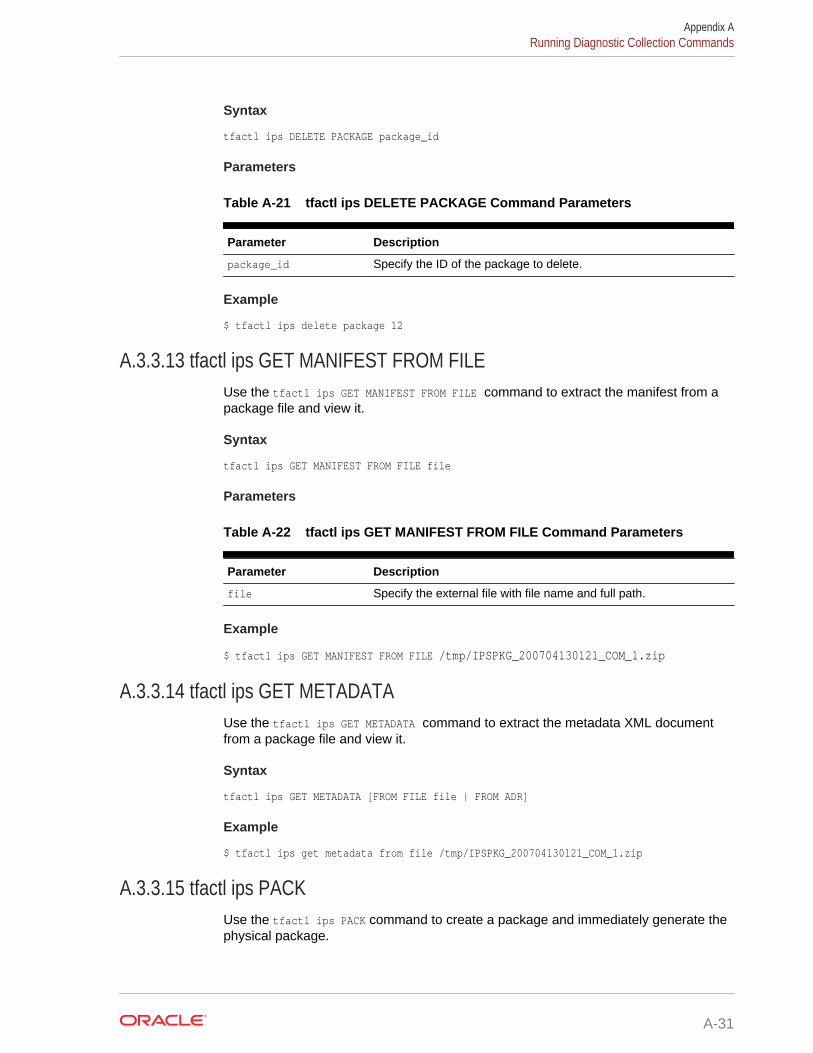
Syntax
tfactl ips DELETE PACKAGE package_id
Parameters
Table A-21 tfactl ips DELETE PACKAGE Command Parameters
Parameter Description
package_id Specify the ID of the package to delete.
Example
$ tfactl ips delete package 12
A.3.3.13 tfactl ips GET MANIFEST FROM FILEUse the tfactl ips GET MANIFEST FROM FILE command to extract the manifest from apackage file and view it.
Syntax
tfactl ips GET MANIFEST FROM FILE file
Parameters
Table A-22 tfactl ips GET MANIFEST FROM FILE Command Parameters
Parameter Description
file Specify the external file with file name and full path.
Example
$ tfactl ips GET MANIFEST FROM FILE /tmp/IPSPKG_200704130121_COM_1.zip
A.3.3.14 tfactl ips GET METADATAUse the tfactl ips GET METADATA command to extract the metadata XML documentfrom a package file and view it.
Syntax
tfactl ips GET METADATA [FROM FILE file | FROM ADR]
Example
$ tfactl ips get metadata from file /tmp/IPSPKG_200704130121_COM_1.zip
A.3.3.15 tfactl ips PACKUse the tfactl ips PACK command to create a package and immediately generate thephysical package.
Appendix ARunning Diagnostic Collection Commands
A-31
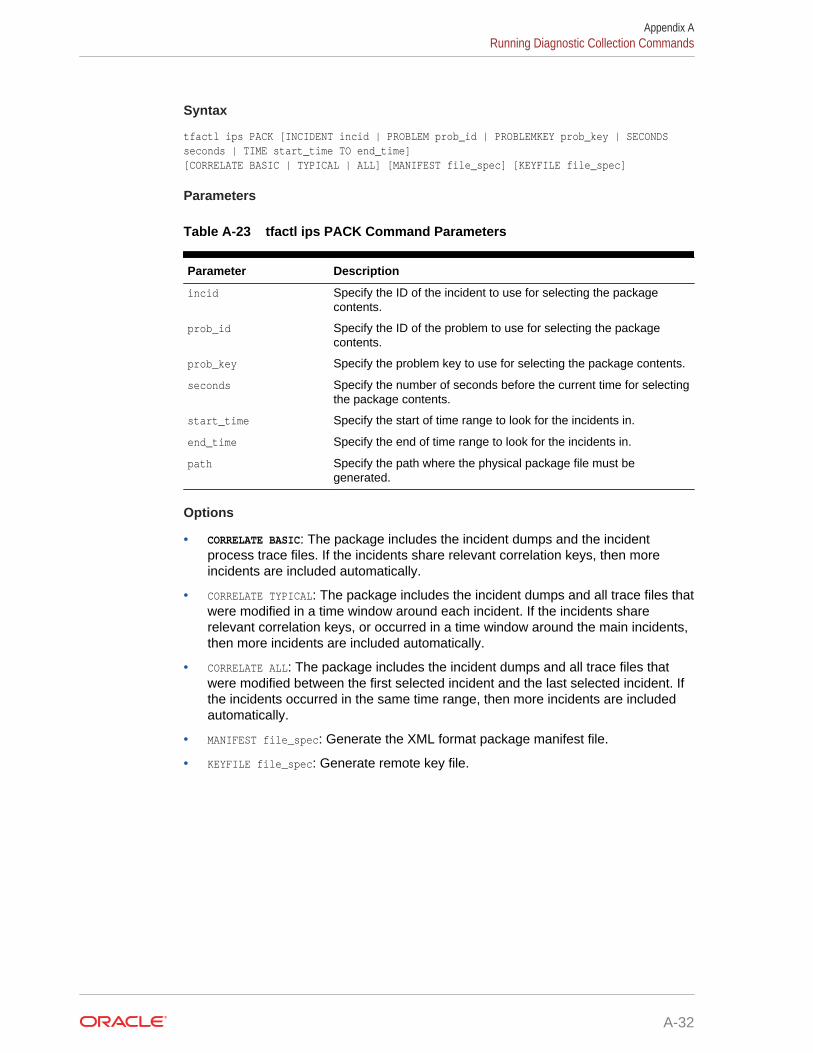
Syntax
tfactl ips PACK [INCIDENT incid | PROBLEM prob_id | PROBLEMKEY prob_key | SECONDS seconds | TIME start_time TO end_time] [CORRELATE BASIC | TYPICAL | ALL] [MANIFEST file_spec] [KEYFILE file_spec]
Parameters
Table A-23 tfactl ips PACK Command Parameters
Parameter Description
incid Specify the ID of the incident to use for selecting the packagecontents.
prob_id Specify the ID of the problem to use for selecting the packagecontents.
prob_key Specify the problem key to use for selecting the package contents.
seconds Specify the number of seconds before the current time for selectingthe package contents.
start_time Specify the start of time range to look for the incidents in.
end_time Specify the end of time range to look for the incidents in.
path Specify the path where the physical package file must begenerated.
Options
• CORRELATE BASIC: The package includes the incident dumps and the incidentprocess trace files. If the incidents share relevant correlation keys, then moreincidents are included automatically.
• CORRELATE TYPICAL: The package includes the incident dumps and all trace files thatwere modified in a time window around each incident. If the incidents sharerelevant correlation keys, or occurred in a time window around the main incidents,then more incidents are included automatically.
• CORRELATE ALL: The package includes the incident dumps and all trace files thatwere modified between the first selected incident and the last selected incident. Ifthe incidents occurred in the same time range, then more incidents are includedautomatically.
• MANIFEST file_spec: Generate the XML format package manifest file.
• KEYFILE file_spec: Generate remote key file.
Appendix ARunning Diagnostic Collection Commands
A-32
Note:
If you do not specify package contents, such as incident, problem, and so on,then Oracle Trace File Analyzer creates an empty package.
You can add files and incidents later.
If you do not specify the correlation level, then Oracle Trace File Analyzeruses the default level.
The default is normally TYPICAL, but you can change using the IPS SETCONFIGURATION command.
Example
$ tfactl ips pack incident 861
$ tfactl ips pack time '2006-12-31 23:59:59.00 -07:00' to '2007-01-01 01:01:01.00 -07:00'
A.3.3.16 tfactl ips SET CONFIGURATIONUse the tfactl ips SET CONFIGURATION command to change the value of an IncidentPackaging Service configuration parameter.
Syntax
tfactl ips SET CONFIGURATION parameter_id value
Parameters
Table A-24 tfactl ips SET CONFIGURATION Command Parameters
Parameter Description
parameter_id Specify the ID of the parameter to change.
value Specify the new value for the parameter.
Example
$ tfactl ips set configuration 6 2
A.3.3.17 tfactl ips SHOW CONFIGURATIONUse the tfactl ips SHOW CONFIGURATION command to view the current IncidentPackaging Service settings.
Syntax
tfactl ips SHOW CONFIGURATION parameter_id
A.3.3.18 tfactl ips SHOW PACKAGEUse the tfactl ips SHOW PACKAGE command to view the details of a specific package.
Appendix ARunning Diagnostic Collection Commands
A-33
Syntax
tfactl ips SHOW PACKAGE package_id [BASIC | BRIEF | DETAIL]
Note:
It is possible to specify the level of detail to use with this command.
BASIC : Shows a minimal amount of information. It is the default when no package ID isspecified.
BRIEF : Shows a more extensive amount of information. It is the default when apackage ID is specified.
DETAIL : Shows the same information as BRIEF, and also some package history andinformation on included incidents and files.
Example
$ tfactl ips show package$ tfactl ips show package 12 detail
A.3.3.19 tfactl ips SHOW FILES PACKAGEUse the tfactl ips SHOW FILES PACKAGE command to view the files included in aspecific package.
Syntax
tfactl ips SHOW FILES PACKAGE package_id
Example
$ tfactl ips show files package 12
A.3.3.20 tfactl ips SHOW INCIDENTS PACKAGEUse the tfactl ips SHOW INCIDENTS PACKAGE command to view the incidents included ina specific package.
Syntax
tfactl ips SHOW INCIDENTS PACKAGE package_id
Example
$ tfactl ips show incidents package 12
A.3.3.21 tfactl ips SHOW PROBLEMSUse the tfactl ips SHOW PROBLEMS command to view the problems for the currentAutomatic Diagnostic Repository home.
Appendix ARunning Diagnostic Collection Commands
A-34
Syntax
tfactl ips SHOW PROBLEMS
A.3.3.22 tfactl ips UNPACK FILEUse the tfactl ips UNPACK FILE command to unpack a physical file into a specificpath.
Syntax
Running the following command automatically creates a valid ADR_HOME structure. Thepath must exist and be writable.
tfactl ips UNPACK FILE file_spec [INTO path]
Example
$ tfactl ips unpack file /tmp/IPSPKG_20061026010203_COM_1.zip into /tmp/newadr
A.3.3.23 tfactl ips UNPACK PACKAGEUse the tfactl ips UNPACK PACKAGE command to unpack physical files in the currentdirectory into a specific path, if they match the package name.
Syntax
Running the following command automatically creates a valid ADR_HOME structure. Thepath must exist and be writable.
tfactl ips UNPACK PACKAGE pkg_name [INTO path]
Example
$ tfactl ips unpack package IPSPKG_20061026010203 into /tmp/newadr
A.3.4 tfactl collectionUse the tfactl collection command to stop a running Oracle Trace File Analyzercollection.
Syntax
tfactl collection [stop collection_id]
You can only stop a collection using the tfactl collection command. You mustprovide a collection ID, which you can obtain by running the tfactl print command.
A.3.5 tfactl printUse the tfactl print command to print information from the Berkeley database.
Syntax
tfactl print [status | config | directories | hosts | actions | repository | cookie]
Appendix ARunning Diagnostic Collection Commands
A-35
Parameters
Table A-25 tfactl print Command Parameters
Parameter Description
status Displays the status of Oracle Trace File Analyzer across all nodesin the cluster. Also, displays the Oracle Trace File Analyzer versionand the port on which it is running.
config Displays the current Oracle Trace File Analyzer configurationsettings.
directories Lists all the directories that Oracle Trace File Analyzer scans fortrace or log file data. Also, displays the location of the tracedirectories allocated for the database, Oracle ASM, and instance.
hosts Lists the hosts that are part of the Oracle Trace File Analyzercluster, and that can receive cluster-wide commands.
actions Lists all the actions submitted to Oracle Trace File Analyzer, suchas diagnostic collection. By default, tfactl print commands onlydisplay actions that are running or that have completed in the lasthour.
repository Displays the current location and amount of used space of therepository directory. Initially, the maximum size of the repositorydirectory is the smaller of either 10 GB or 50% of available filesystem space. If the maximum size is exceeded or the file systemspace gets to 1 GB or less, then Oracle Trace File Analyzersuspends operations and closes the repository. Use the tfactlpurge command to clear collections from the repository.
cookie Generates and displays an identification code for use by the tfactlset command.
Example
The tfactl print config command returns output similar to the following:
$ tfactl print config
.------------------------------------------------------------------------------------
.| node1 |+-----------------------------------------------------------------------+------------+| Configuration Parameter | Value |+-----------------------------------------------------------------------+------------+| TFA Version | 12.2.1.0.0 || Java Version | 1.8 || Public IP Network | true || Automatic Diagnostic Collection | true || Alert Log Scan | true |
Appendix ARunning Diagnostic Collection Commands
A-36
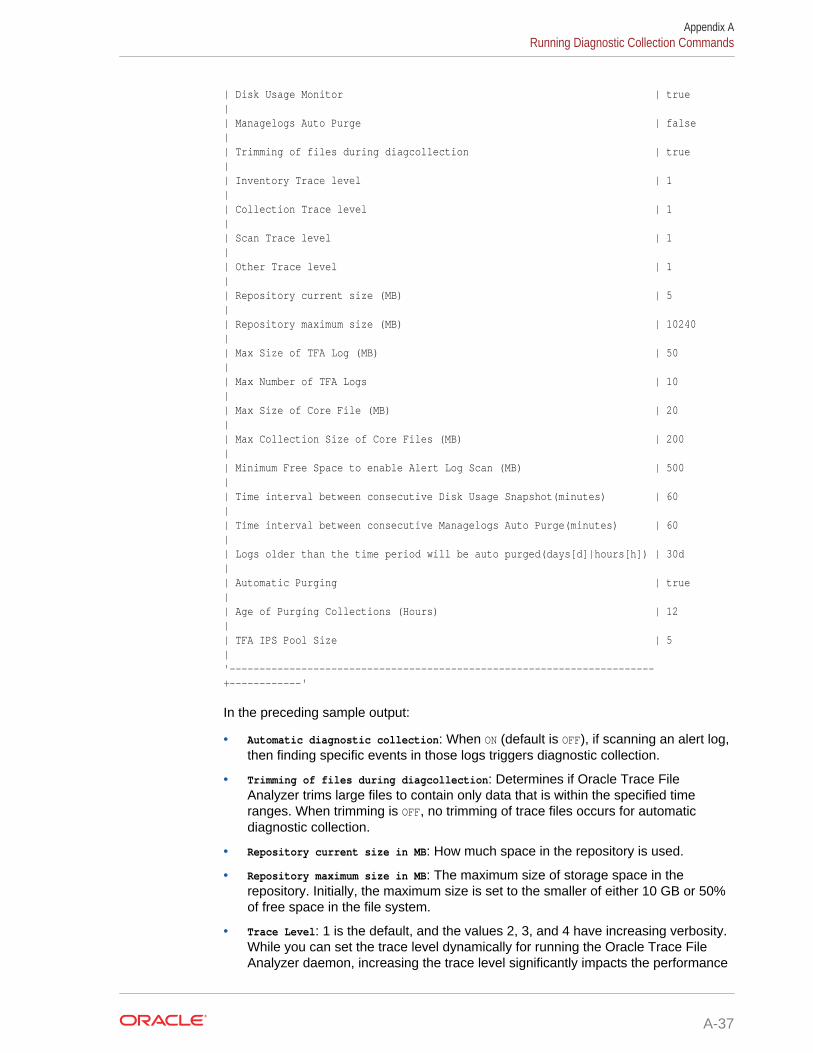
| Disk Usage Monitor | true || Managelogs Auto Purge | false || Trimming of files during diagcollection | true || Inventory Trace level | 1 || Collection Trace level | 1 || Scan Trace level | 1 || Other Trace level | 1 || Repository current size (MB) | 5 || Repository maximum size (MB) | 10240 || Max Size of TFA Log (MB) | 50 || Max Number of TFA Logs | 10 || Max Size of Core File (MB) | 20 || Max Collection Size of Core Files (MB) | 200 || Minimum Free Space to enable Alert Log Scan (MB) | 500 || Time interval between consecutive Disk Usage Snapshot(minutes) | 60 || Time interval between consecutive Managelogs Auto Purge(minutes) | 60 || Logs older than the time period will be auto purged(days[d]|hours[h]) | 30d || Automatic Purging | true || Age of Purging Collections (Hours) | 12 || TFA IPS Pool Size | 5 |'-----------------------------------------------------------------------+------------'
In the preceding sample output:
• Automatic diagnostic collection: When ON (default is OFF), if scanning an alert log,then finding specific events in those logs triggers diagnostic collection.
• Trimming of files during diagcollection: Determines if Oracle Trace FileAnalyzer trims large files to contain only data that is within the specified timeranges. When trimming is OFF, no trimming of trace files occurs for automaticdiagnostic collection.
• Repository current size in MB: How much space in the repository is used.
• Repository maximum size in MB: The maximum size of storage space in therepository. Initially, the maximum size is set to the smaller of either 10 GB or 50%of free space in the file system.
• Trace Level: 1 is the default, and the values 2, 3, and 4 have increasing verbosity.While you can set the trace level dynamically for running the Oracle Trace FileAnalyzer daemon, increasing the trace level significantly impacts the performance
Appendix ARunning Diagnostic Collection Commands
A-37
of Oracle Trace File Analyzer. Increase the trace level only at the request of MyOracle Support.
• Automatic Purging: Automatic purging of Oracle Trace File Analyzer collections isenabled by default. Oracle Trace File Analyzer collections are purged if their ageexceeds the value of Minimum Age of Collections to Purge, and the repositoryspace is exhausted.
• Minimum Age of Collections to Purge (Hours): The minimum number of hours thatOracle Trace File Analyzer keeps a collection, after which Oracle Trace FileAnalyzer purges the collection. You can set the number of hours using the tfactlset minagetopurge=hours command.
• Minimum Space free to enable Alert Log Scan (MB): The space limit, in MB, atwhich Oracle Trace File Analyzer temporarily suspends alert log scanning untilspace becomes free. Oracle Trace File Analyzer does not store alert log events ifspace on the file system used for the metadata database falls below the limit.
A.3.6 tfactl purgeUse the tfactl purge command to delete diagnostic collections from the Oracle TraceFile Analyzer repository that are older than a specific time.
Syntax
tfactl purge -older number[h | d]
Example
The following command removes files older than 30 days:
$ tfactl purge -older 30d
A.3.7 tfactl managelogsUse the tfactl managelogs command to manage Automatic Diagnostic Repository logand trace files.
Syntax
tfactl managelogs [-purge [[-older nm|h|d] | [-gi] | [-database all|d1,d2,...]]] [-show [usage|variation] [[-older nd] | [-gi] | [-database all|d1,d2,...]]]
Parameters
Table A-26 tfactl managelogs Purge Options
Purge Option Description
-older Time period for purging logs.
-gi Purges Oracle Grid Infrastructure logs (all Automatic DiagnosticRepository homes under GIBASE/diag and crsdata (cvu dirs)).
-database Purges Oracle database logs (Default is all, else provide a list).
-dryrun Estimates logs cleared by purge command.
Appendix ARunning Diagnostic Collection Commands
A-38

Table A-27 tfactl managelogs Show Options
Show Option Description
-older Time period for change in log volume.
-gi Space utilization under GIBASE.
-database Space utilization for Oracle database logs (Default is all, elseprovide a list).
Example
$ tfactl managelogs -show usage -gi
Output from host : node3------------------------------
.----------------------------------------------------------------------------------------.| Grid Infrastructure Usage |+----------------------------------------------------------------------------+-----------+| Location | Size |+----------------------------------------------------------------------------+-----------+| /scratch/app/orabase/diag/clients/user_grid/host_1389480572_107/alert | 8.00 KB || /scratch/app/orabase/diag/clients/user_grid/host_1389480572_107/incident | 4.00 KB || /scratch/app/orabase/diag/clients/user_grid/host_1389480572_107/trace | 1.55 MB || /scratch/app/orabase/diag/clients/user_grid/host_1389480572_107/cdump | 4.00 KB || /scratch/app/orabase/diag/clients/user_oracle/host_1389480572_107/alert | 8.00 KB || /scratch/app/orabase/diag/clients/user_oracle/host_1389480572_107/incident | 4.00 KB || /scratch/app/orabase/diag/clients/user_oracle/host_1389480572_107/trace | 712.00 KB || /scratch/app/orabase/diag/clients/user_oracle/host_1389480572_107/cdump | 4.00 KB || /scratch/app/orabase/diag/tnslsnr/node3/listener/alert | 921.39 MB || /scratch/app/orabase/diag/tnslsnr/node3/listener/incident | 4.00 KB || /scratch/app/orabase/diag/tnslsnr/node3/listener/trace | 519.20 MB || /scratch/app/orabase/diag/tnslsnr/node3/listener/cdump | 4.00 KB || /scratch/app/orabase/diag/tnslsnr/node3/listener_scan2/alert | 726.55 MB || /scratch/app/orabase/diag/tnslsnr/node3/listener_scan2/incident | 4.00 KB || /scratch/app/orabase/diag/tnslsnr/node3/listener_scan2/trace | 339.90 MB || /scratch/app/orabase/diag/tnslsnr/node3/listener_scan2/cdump | 4.00 KB |
Appendix ARunning Diagnostic Collection Commands
A-39
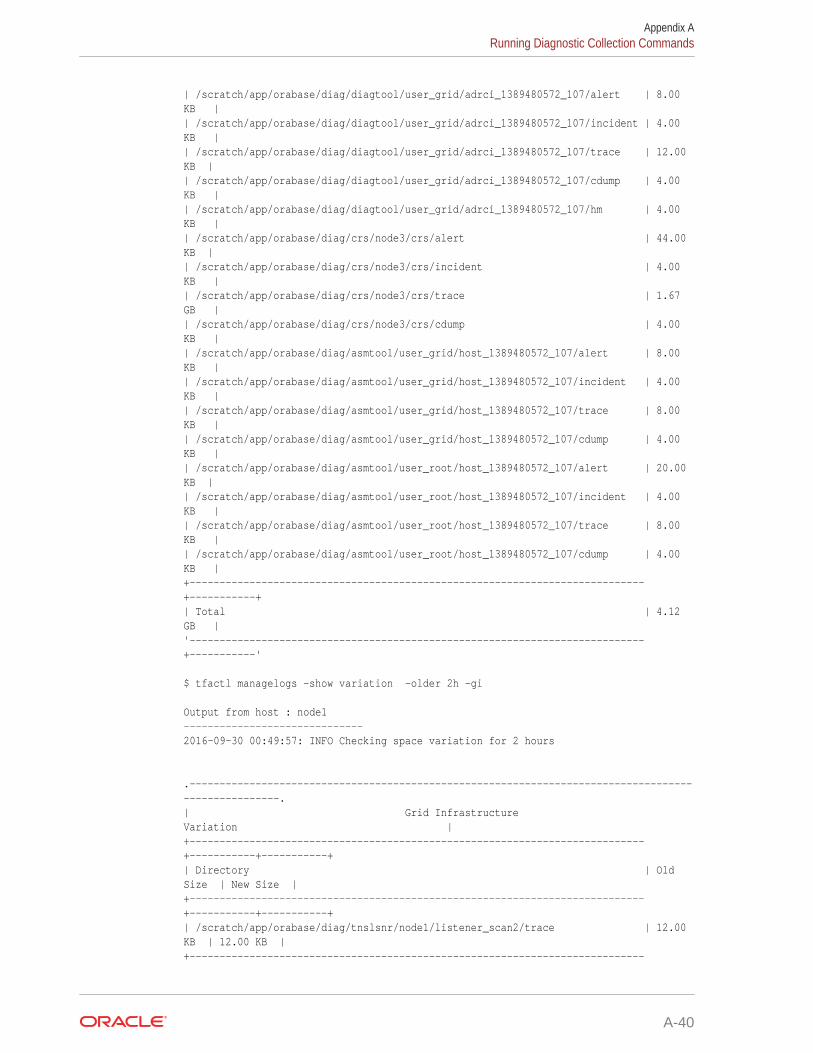
| /scratch/app/orabase/diag/diagtool/user_grid/adrci_1389480572_107/alert | 8.00 KB || /scratch/app/orabase/diag/diagtool/user_grid/adrci_1389480572_107/incident | 4.00 KB || /scratch/app/orabase/diag/diagtool/user_grid/adrci_1389480572_107/trace | 12.00 KB || /scratch/app/orabase/diag/diagtool/user_grid/adrci_1389480572_107/cdump | 4.00 KB || /scratch/app/orabase/diag/diagtool/user_grid/adrci_1389480572_107/hm | 4.00 KB || /scratch/app/orabase/diag/crs/node3/crs/alert | 44.00 KB || /scratch/app/orabase/diag/crs/node3/crs/incident | 4.00 KB || /scratch/app/orabase/diag/crs/node3/crs/trace | 1.67 GB || /scratch/app/orabase/diag/crs/node3/crs/cdump | 4.00 KB || /scratch/app/orabase/diag/asmtool/user_grid/host_1389480572_107/alert | 8.00 KB || /scratch/app/orabase/diag/asmtool/user_grid/host_1389480572_107/incident | 4.00 KB || /scratch/app/orabase/diag/asmtool/user_grid/host_1389480572_107/trace | 8.00 KB || /scratch/app/orabase/diag/asmtool/user_grid/host_1389480572_107/cdump | 4.00 KB || /scratch/app/orabase/diag/asmtool/user_root/host_1389480572_107/alert | 20.00 KB || /scratch/app/orabase/diag/asmtool/user_root/host_1389480572_107/incident | 4.00 KB || /scratch/app/orabase/diag/asmtool/user_root/host_1389480572_107/trace | 8.00 KB || /scratch/app/orabase/diag/asmtool/user_root/host_1389480572_107/cdump | 4.00 KB |+----------------------------------------------------------------------------+-----------+| Total | 4.12 GB |'----------------------------------------------------------------------------+-----------'
$ tfactl managelogs -show variation -older 2h -gi
Output from host : node1------------------------------2016-09-30 00:49:57: INFO Checking space variation for 2 hours
.----------------------------------------------------------------------------------------------------.| Grid Infrastructure Variation |+----------------------------------------------------------------------------+-----------+-----------+| Directory | Old Size | New Size |+----------------------------------------------------------------------------+-----------+-----------+| /scratch/app/orabase/diag/tnslsnr/node1/listener_scan2/trace | 12.00 KB | 12.00 KB |+----------------------------------------------------------------------------
Appendix ARunning Diagnostic Collection Commands
A-40
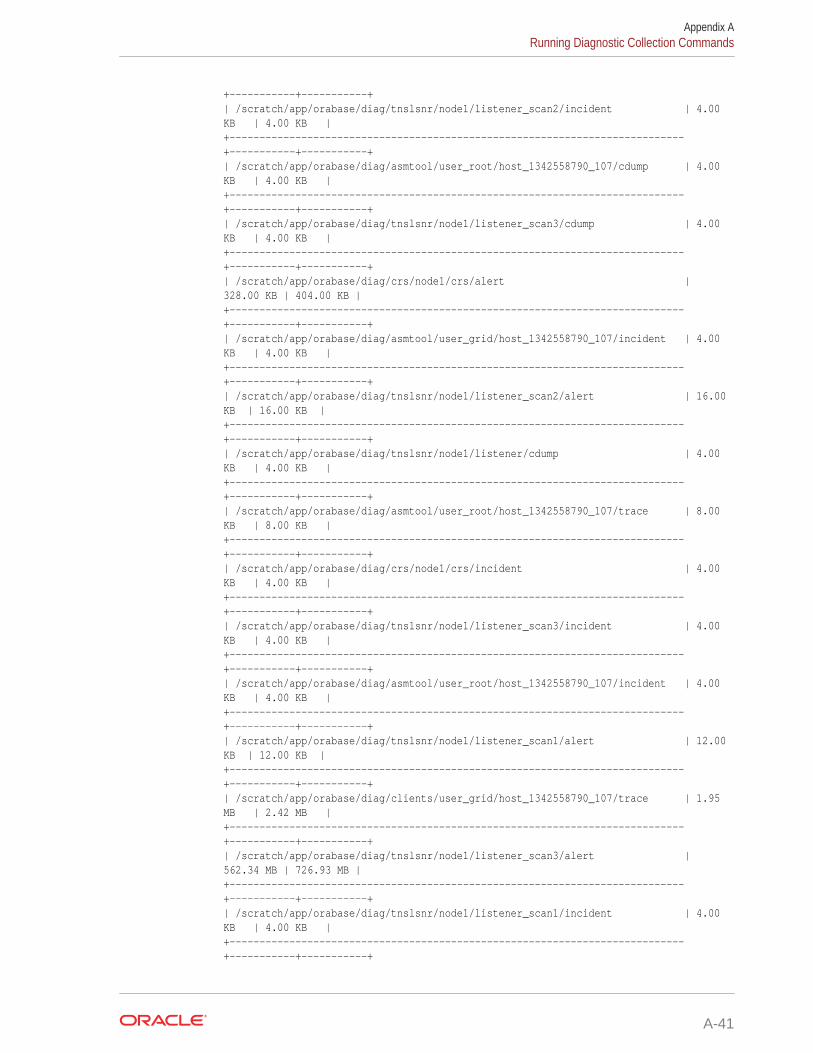
+-----------+-----------+| /scratch/app/orabase/diag/tnslsnr/node1/listener_scan2/incident | 4.00 KB | 4.00 KB |+----------------------------------------------------------------------------+-----------+-----------+| /scratch/app/orabase/diag/asmtool/user_root/host_1342558790_107/cdump | 4.00 KB | 4.00 KB |+----------------------------------------------------------------------------+-----------+-----------+| /scratch/app/orabase/diag/tnslsnr/node1/listener_scan3/cdump | 4.00 KB | 4.00 KB |+----------------------------------------------------------------------------+-----------+-----------+| /scratch/app/orabase/diag/crs/node1/crs/alert | 328.00 KB | 404.00 KB |+----------------------------------------------------------------------------+-----------+-----------+| /scratch/app/orabase/diag/asmtool/user_grid/host_1342558790_107/incident | 4.00 KB | 4.00 KB |+----------------------------------------------------------------------------+-----------+-----------+| /scratch/app/orabase/diag/tnslsnr/node1/listener_scan2/alert | 16.00 KB | 16.00 KB |+----------------------------------------------------------------------------+-----------+-----------+| /scratch/app/orabase/diag/tnslsnr/node1/listener/cdump | 4.00 KB | 4.00 KB |+----------------------------------------------------------------------------+-----------+-----------+| /scratch/app/orabase/diag/asmtool/user_root/host_1342558790_107/trace | 8.00 KB | 8.00 KB |+----------------------------------------------------------------------------+-----------+-----------+| /scratch/app/orabase/diag/crs/node1/crs/incident | 4.00 KB | 4.00 KB |+----------------------------------------------------------------------------+-----------+-----------+| /scratch/app/orabase/diag/tnslsnr/node1/listener_scan3/incident | 4.00 KB | 4.00 KB |+----------------------------------------------------------------------------+-----------+-----------+| /scratch/app/orabase/diag/asmtool/user_root/host_1342558790_107/incident | 4.00 KB | 4.00 KB |+----------------------------------------------------------------------------+-----------+-----------+| /scratch/app/orabase/diag/tnslsnr/node1/listener_scan1/alert | 12.00 KB | 12.00 KB |+----------------------------------------------------------------------------+-----------+-----------+| /scratch/app/orabase/diag/clients/user_grid/host_1342558790_107/trace | 1.95 MB | 2.42 MB |+----------------------------------------------------------------------------+-----------+-----------+| /scratch/app/orabase/diag/tnslsnr/node1/listener_scan3/alert | 562.34 MB | 726.93 MB |+----------------------------------------------------------------------------+-----------+-----------+| /scratch/app/orabase/diag/tnslsnr/node1/listener_scan1/incident | 4.00 KB | 4.00 KB |+----------------------------------------------------------------------------+-----------+-----------+
Appendix ARunning Diagnostic Collection Commands
A-41
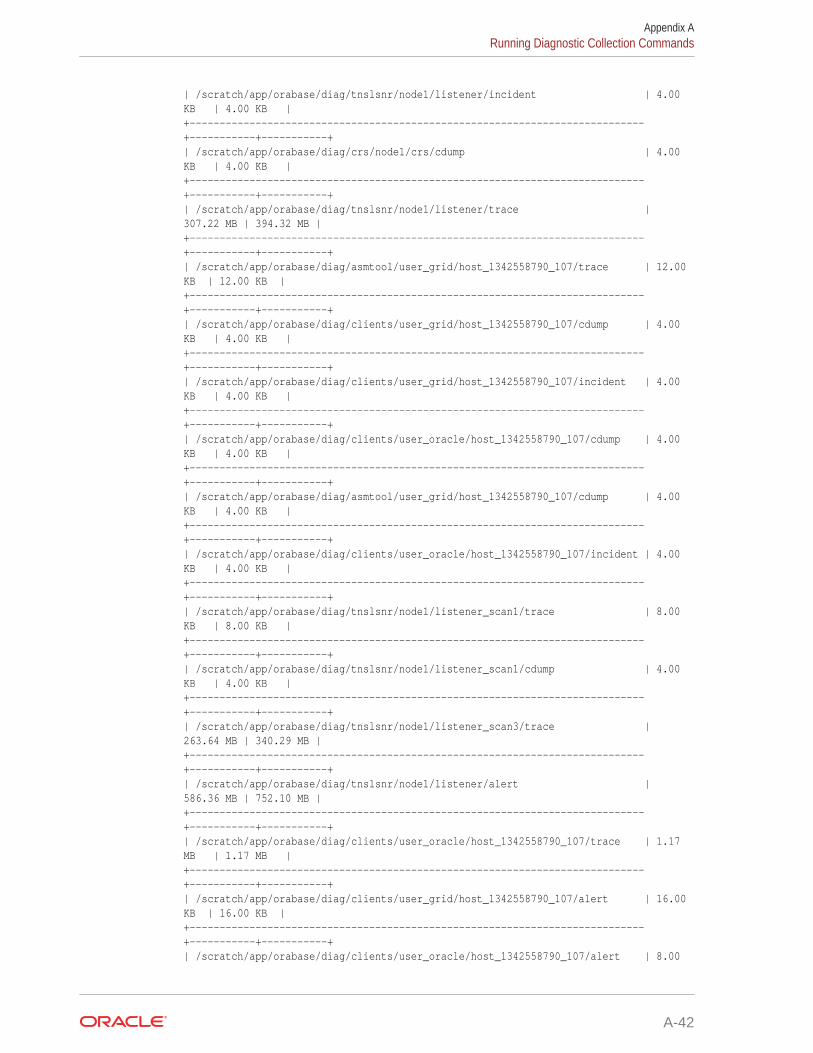
| /scratch/app/orabase/diag/tnslsnr/node1/listener/incident | 4.00 KB | 4.00 KB |+----------------------------------------------------------------------------+-----------+-----------+| /scratch/app/orabase/diag/crs/node1/crs/cdump | 4.00 KB | 4.00 KB |+----------------------------------------------------------------------------+-----------+-----------+| /scratch/app/orabase/diag/tnslsnr/node1/listener/trace | 307.22 MB | 394.32 MB |+----------------------------------------------------------------------------+-----------+-----------+| /scratch/app/orabase/diag/asmtool/user_grid/host_1342558790_107/trace | 12.00 KB | 12.00 KB |+----------------------------------------------------------------------------+-----------+-----------+| /scratch/app/orabase/diag/clients/user_grid/host_1342558790_107/cdump | 4.00 KB | 4.00 KB |+----------------------------------------------------------------------------+-----------+-----------+| /scratch/app/orabase/diag/clients/user_grid/host_1342558790_107/incident | 4.00 KB | 4.00 KB |+----------------------------------------------------------------------------+-----------+-----------+| /scratch/app/orabase/diag/clients/user_oracle/host_1342558790_107/cdump | 4.00 KB | 4.00 KB |+----------------------------------------------------------------------------+-----------+-----------+| /scratch/app/orabase/diag/asmtool/user_grid/host_1342558790_107/cdump | 4.00 KB | 4.00 KB |+----------------------------------------------------------------------------+-----------+-----------+| /scratch/app/orabase/diag/clients/user_oracle/host_1342558790_107/incident | 4.00 KB | 4.00 KB |+----------------------------------------------------------------------------+-----------+-----------+| /scratch/app/orabase/diag/tnslsnr/node1/listener_scan1/trace | 8.00 KB | 8.00 KB |+----------------------------------------------------------------------------+-----------+-----------+| /scratch/app/orabase/diag/tnslsnr/node1/listener_scan1/cdump | 4.00 KB | 4.00 KB |+----------------------------------------------------------------------------+-----------+-----------+| /scratch/app/orabase/diag/tnslsnr/node1/listener_scan3/trace | 263.64 MB | 340.29 MB |+----------------------------------------------------------------------------+-----------+-----------+| /scratch/app/orabase/diag/tnslsnr/node1/listener/alert | 586.36 MB | 752.10 MB |+----------------------------------------------------------------------------+-----------+-----------+| /scratch/app/orabase/diag/clients/user_oracle/host_1342558790_107/trace | 1.17 MB | 1.17 MB |+----------------------------------------------------------------------------+-----------+-----------+| /scratch/app/orabase/diag/clients/user_grid/host_1342558790_107/alert | 16.00 KB | 16.00 KB |+----------------------------------------------------------------------------+-----------+-----------+| /scratch/app/orabase/diag/clients/user_oracle/host_1342558790_107/alert | 8.00
Appendix ARunning Diagnostic Collection Commands
A-42
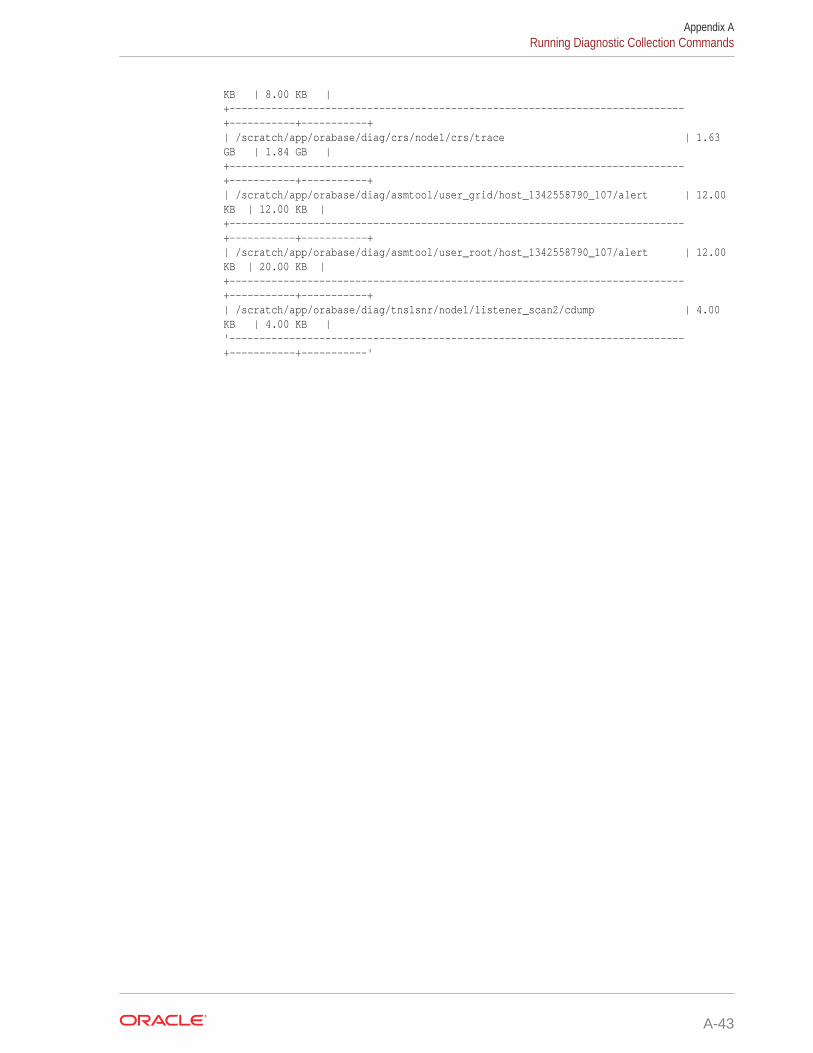
KB | 8.00 KB |+----------------------------------------------------------------------------+-----------+-----------+| /scratch/app/orabase/diag/crs/node1/crs/trace | 1.63 GB | 1.84 GB |+----------------------------------------------------------------------------+-----------+-----------+| /scratch/app/orabase/diag/asmtool/user_grid/host_1342558790_107/alert | 12.00 KB | 12.00 KB |+----------------------------------------------------------------------------+-----------+-----------+| /scratch/app/orabase/diag/asmtool/user_root/host_1342558790_107/alert | 12.00 KB | 20.00 KB |+----------------------------------------------------------------------------+-----------+-----------+| /scratch/app/orabase/diag/tnslsnr/node1/listener_scan2/cdump | 4.00 KB | 4.00 KB |'----------------------------------------------------------------------------+-----------+-----------'
Appendix ARunning Diagnostic Collection Commands
A-43
Index
Aautomatic diagnostic collections, 3-1Automatic Diagnostic Repository
log file, 8-1trace file, 8-1
automatic purging, 7-4
CCA-signed certificate, 7-10certificates, 9-1collection period, 6-1command interfaces, 2-5
Ddata redaction, 2-5
Eemail notification, 3-2, 7-18Expect utility, 9-1
Iinit.tfa, 9-2install
Linux, 2-2, 2-3Microsoft Windows, 2-3UNIX, 2-2, 2-3
investigate logs, 4-2IPS packages, 6-6
JJava exception, 9-12Java keytool, 7-9, 7-10
Kkey directories, 2-4
Mmanage diagnostic collections, 7-6manage directories, 7-5manual purging, 7-5metadata, xv
Nnew SRDCs, xvnon-root access, 9-3non-root users, 9-13
Oon-demand diagnostic collection, 4-1openssl, 7-10Oracle Cluster Health Advisor, xivOracle Trace File Analyzer, 1-1
configuration, 7-1configure hosts, 7-7configure ports, 7-7daemon, 9-14discovery, 9-11managing Oracle Trace File Analyzer, 7-3on-demand diagnostic collections
custom collectionschanging the collection
name, 6-4copying zip files, 6-5preventing collecting core
files, 6-6silent collection, 6-6specific components, 6-2specific directories, 6-3specific nodes, 6-2trimming files, 6-5
purge logs automatically, 8-2restarting, 7-3shutting down, 7-3starting, 7-3status, 7-1stopping, 7-3TFACTL
command-line utility, A-1
Index-1
Oracle Trace File Analyzer log analyzer utility,A-11
OSWatcher, 9-10oswbb, 9-12
PPerl, 9-2
Rrepository, 9-4REST, xiv, 7-11
authentication, 7-17
Sself-signed certificate, 7-9sockets, 9-3SSL certificates, 9-3SSL cipher suite, 7-11SSL protocols, 7-8supported environments, 2-1system and cluster summary, 4-2
TTFACTL
commandstfactl access, A-5tfactl analyze, A-11tfactl changes, A-9tfactl collection, A-35tfactl dbglevel, 4-13tfactl diagcollect, A-17tfactl diagnosetfa, A-3tfactl directory, A-20tfactl events, A-10tfactl host, A-3tfactl ips, A-22tfactl ips ADD, A-25tfactl ips ADD FILE, A-26tfactl ips ADD NEW INCIDENTS
PACKAGE, A-27tfactl ips COPY IN FILE, A-26tfactl ips CREATE PACKAGE, A-28tfactl ips DELETE PACKAGE, A-30tfactl ips FINALIZE PACKAGE, A-30
TFACTL (continued)commands (continued)tfactl ips GENERATE PACKAGE, A-30tfactl ips GET MANIFEST FROM FILE,
A-31tfactl ips GET METADATA, A-31tfactl ips GET REMOTE KEYS FILE,
A-28tfactl ips PACK, A-31tfactl ips REMOVE, A-27tfactl ips REMOVE FILE, A-27tfactl ips SET CONFIGURATION, A-33tfactl ips SHOW CONFIGURATION,
A-33tfactl ips SHOW FILES PACKAGE, A-34tfactl ips SHOW INCIDENTS PACKAGE,
A-34tfactl ips SHOW PACKAGE, A-33tfactl ips SHOW PROBLEMS, A-34tfactl ips UNPACK FILE, A-35tfactl ips UNPACK PACKAGE, A-35tfactl ips USE REMOTE KEYS FILE,
A-28tfactl managelogs, A-38tfactl print, A-35tfactl purge, A-38tfactl run, A-14tfactl set, A-4tfactl summary, A-7tfactl toolstatus, A-15
Oracle Trace File Analyzer command-lineutility, A-1
Time Machine software, 9-13TLS protocols, 7-8tools bundle, 4-4Trace File Analyzer
disk usage snapshots, 8-2
UUninstall, 2-7update
Oracle Trace File Analyzer, 5-1tools bundle, 5-1
upgrade phases, 9-4upload collections, 4-11user
add, 2-6remove, 2-6reset, 2-6
Index
Index-2