china - peoples republic of oilseeds and products update … gain publications... · ·...
TRANSCRIPT

THIS REPORT CONTAINS ASSESSMENTS OF COMMODITY AND TRADE ISSUES MADE BY
USDA STAFF AND NOT NECESSARILY STATEMENTS OF OFFICIAL U.S. GOVERNMENT
POLICY
Date:
GAIN Report Number:
Approved By:
Prepared By:
Report Highlights:
In anticipation of higher demand for industry feed and protein meal, based on a recovery in swine
production and steady growth in the poultry sector, China’s soybean imports are forecast to hit a record
of 86 million metric tons (MMT) in MY16/17, up from the estimated 83 MMT in MY15/16. Post’s
forecast for MY16/17 soybean imports is slightly lower than the official USDA data forecast of 87
MMT. China’s recent sale of stored oilseed and oilseed product reserves (soybeans and rapeseed oil) is
expected to absorb market share for food soybeans and vegetable oils. However, forecast lower imports
of DDGS as a result of China’s anti-dumping investigation may increase demand for soybean meal and
thus support growth in soybean imports.
Jennifer Clever and WU Xinping
Jennifer Clever
MY16/17 China's Soybean Imports to Hit 86 Million Metric
Tons
Oilseeds and Products Update
China - Peoples Republic of
CH16045
8/30/2016
Required Report - public distribution

Executive Summary:
In anticipation of higher demand for industry feed and protein meal, based on a recovery in swine
production and steady growth in the poultry sector, China’s soybean imports are forecast to hit a record
of 86 million metric tons (MMT) in MY16/17, up from the estimated 83 MMT in MY15/16. Post’s
forecast for MY16/17 soybean imports is slightly lower than the official USDA data forecast of 87
MMT. China’s recent sale of stored oilseed and oilseed product reserves (soybeans and rapeseed oil) is
expected to absorb market share for food soybeans and vegetable oils. However, forecast lower imports
of DDGS as a result of China’s anti-dumping investigation may increase demand for soybean meal and
thus support growth in soybean imports.
MY16/17 Chinese soybean production is forecast to recover to 13 MMT
Due to recent change in the Chinese government’s corn policy (see related GAIN Report CH16035
Oilseeds and Products Update), domestic soybean production is forecast to recover in MY16/17 to13
MMT from the estimated 11.6 MMT in MY15/16. Post’s MY16/17 production is higher than the
USDA July 2016 official data of 12.2 MMT. This is based on a larger forecast planted area of 7.11
MHa (up 10.4 percent from the previous year) and a slightly higher yield.
In late July, China’s Ministry of Agriculture (MOA) announced that newly added soybean area
reached 8 million Mu (or 533,000 Ha) in MY16/17 as a result of government’s efforts and policy
support to restructure the crop mix. In mid-August, The China Agricultural Outlook Committee
(affiliated to MOA) raised MY16/17 soybean production to 12.86 MMT from its previous forecast of
12.76 MMT. The increase reflects expected higher yields due to favorable weather conditions. The
China National Grain and Oilseed Information Center (CNGOIC) forecast MY16/17 soybean
production at 12.6 MMT, up by 8.6 percent from last year. This is based on a larger planted area of
6.95 MHa, up 7.8 percent compared to the previous year.
An independent oilseed information source based in Heilongjiang province reported that the total
soybean acreage in the four northeast provinces reached 3.61 MHa in MY16/17. This is a net
increase of 1.25 MHa from the previous year. Similarly, the combined soybean planted area for all
other provinces is forecast at 3.41 MHa, up by 327,000 Ha compared to last year. Thus, this source
forecasts MY16/17 total soybean production will reach 14.1 MMT, up by 3.67 MMT from its
estimated 10.43 MMT in MY15/16.
As previously reported, the Heilongjiang province’s soybean industry leader estimated that the
MY16/17 corn acreage in the province is down by 1 million hectares (MHa), part of which was
substituted with soybeans. One of the major branches of the Heilongjiang State Farm Bureau also
reported that the branch’s 2016 soybean acreage increased by 40 percent to 152,000 Ha from the
108,666 Ha last year. This is in response to the government’s call for less corn planting and also to
keep good crop rotation practices.

According to an MOA survey results released during the first week of July, the growth of MY16/17
soybean crop in the Northeast soybean-producing region is rated as “good” due to favorable weather
conditions.
MY16/17 soybean imports forecast at 86 MMT
Based on a forecast steady growth in protein meal consumption to meet the growing animal
production sector, Post’s forecast for MY16/17 soybean imports is 86 MMT. This is a net increase
of 3 MMT from MY15/16 but lower than the USDA July 2016 official forecast of 87 MMT. Post’s
estimate for MY15/16 soybean imports coincides with USDA’s official July estimate of 83 MMT, up
by 4.65 MMT from MY14/15. According to the Global Trade Atlas, total soybean imports in the
first ten months of MY15/16 stands at 68.4 MMT, up 8 percent over the previous year. CNGOIC
estimates combined soybean arrivals in August and September could reach 14.6 MMT supporting
MY15/16 soybean imports to 83 MMT.
China’s leading industry sources generally agree that MY16/17 soybean imports continue to grow to
about 85 MMT. CNGOIC’s current forecast is 85 MMT while China JCI’s forecast stands at 84.6
MMT. It is worth mentioning that the MOA’s China Agricultural Outlook Committee lowered its
forecast MY16/17 soybean imports by 1.5 MMT to 83.5 MMT from its July report. This is based on
higher domestic soybean yield/production coupled with sales of state soybean reserve.
According to China’s industry statistics, the profit margins for swine farmers in the first half of
August remained high. Margins exceeded RMB500 ($76)/head but were much lower than the
RMB1,000 ($151) to 1,500 ($227)/head in May. However, China’s industry association estimated a
slight fall in the 2016 pork production based on a slow recovery of the swine and sow inventory.
Poultry production remained generally stable during July to August. Industry leaders estimate
moderate growth for both poultry meat and eggs in 2016. Feed use during the month of August
continues to grow as swine farmers continue to fatten pigs for the upcoming mid-autumn and
national day festivals. In the second half of 2016, soybean meal use is expected to continue growing
moderately.
MOA forecast feed production growth is expected to level off during the 13th Five-Year Plan Period
(2016-2020), with a yearly growth rate ranging from 1.5 to 2 percent or annual net growth of 4 to 6
MMT. The growth is mainly driven by swine (of which currently 75 percent are raised with industry
feed) and ruminant farming. MOA estimates soybean meal use increased rapidly to 55 MMT in
2015, a net growth of 5.5 MMT from 2014. This is based on a small domestic supply of other
protein meals and relatively low price for soybean meal (which is also supported by industry
insiders).
Factors impacting China’s soybean imports
The Chinese government’s decision to sell part of its 6 MMT of stored soybean reserves is likely to
impact soybean import growth in MY15/16 and MY16/17. As of August 23, six weekly auctions
were held with sales totaling 1.04 MMT at relatively cheap price. See the following table.

Jul 15 Jul 22 Jul 29 Aug 5 Aug 12 Aug 19 Aug 26 ….. Sep 30
Volume offered
(1,000 tons) 300 579 603 602 603 602
Volume purchased
(1,000 tons) 300 332 84 102 97 128
Purchase rate (%) 100 57 14 17 16 21 Average price
(RMB/ton) 3,360 3,262 3,300 3,300 3,189 3,310
The declining purchase rate is reportedly due to weak prices for soybean meal and oil since August.
Weak prices coupled with soy food processors’ concerns with quality impacted crusher’s
participation in the auctions. Currently, the auction price remains lower than the RMB3,500 (or $
530)/ton for imported soybeans at ports in mid-August. The government continues to restrict the use
of imported biotech soybeans for food processing. These factors might encourage food processors to
continue purchasing from the upcoming auctions. Similarly, crushers may return to auctions if
crushing margins improve. Otherwise, the total purchased volume by the end of September may not
reach more than 2 MMT, much lower than expected 3 MMT.
A favorable factor supporting soybean import growth is China’s anti-dumping investigation against
U.S. DDGS imports. This may result in 2 to 3 MMT less of DDGS imports in 2016. China’s DDGS
imports declined significantly to about 1.5 MMT during the first 6 months of 2016 compared to the
2.4 MMT in the previous year. As the anti-dumping investigation is pending, many industry insiders
estimate total DDGS imports could fall to 3 MMT from the record 6.3 MMT in 2015 (or average
yearly imports of 5 MMT in recent years). Lower DDGS imports in 2017 may continue and may
boost China’s use of soybean meal.
Forecast lower rapeseed and cottonseed production in MY16/17 is also expected to be compensated
by soybean imports for protein meal.
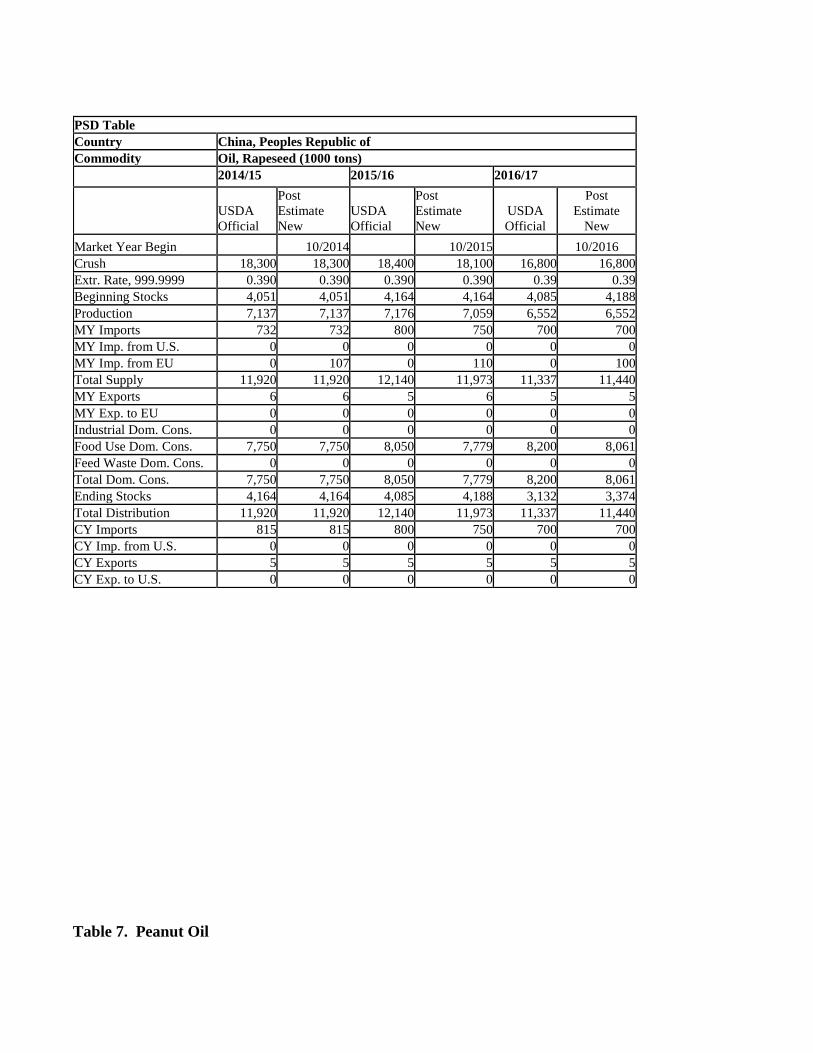
Forecast MY16/17 rapeseed production is 13.5 MMT
Based on a forecast planted area of 7 MHa, down 4.1 percent from the previous year, MY16/17
rapeseed production is forecast to fall by 5.6 percent to 13.5 MMT. CNGOIC’s August estimate of
MY16/17 rapeseed production stands at 14 MMT based on a relatively high acreage at 7.1 MHa.
MY16/17 rapeseed imports forecast at 3.9 MMT
Post’s forecast for MY16/17 rapeseed imports is 3.9 MMT. This forecast is unchanged from the
estimated imports for MY15/16, but is higher than the USDA official forecast of 3.8 MMT.
Rapeseed imports face uncertainty as the Chinese regulatory authorities are likely to enforce stricter
inspection rules in September 2016. Based on a new inspection requirement, rapeseed suppliers will
be requested to reduce foreign matter content in rapeseed exports to China to 1 percent from the
current 2.5 percent. Industry source reported that technical discussions between China and the major

rapeseed exporting country to address China’s quarantine concern on foreign matter were held in
mid-August. However, there was reportedly no immediate breakthrough on the issue. This could
impact China’s import contracts as rapeseed harvest in major exporting country approaches.
Notwithstanding, industry sources indicate that in August Chinese buyers signed import contracts for
4 shipments of rapeseed from Canada implying that the industry remains confident on a consensus on
the issue.
Additionally, China’s cumulative sales of state rapeseed oil reserves of 2.28 MMT (ending in June)
are expected to satisfy part of the rapeseed product market for the rest of 2016. Positive news is the
world rapeseed production in MY16/17 appears to be higher than the previous forecast. That said, a
significant fall in rapeseed imports is not expected given China’s large crushing capacity and lower-
than-officially reported domestic production.
MY16/17 Chinese peanut production is up
MY16/17 peanut production is expected to grow to 17 MMT given its comparatively stable profits
and also in response to lower government support for corn planting. Based on reported acreage
expansion, CNGOIC’s late July report raised MY16/17 peanut production to 17.7 MMT, up 7.7
percent over the previous year.
Forecast MY16/17 peanut imports remain strong
Post raised its MY15/16 peanut imports to 550,000 tons primarily due to price advantages for
imported peanuts both in shell and shelled. Comparatively, Post forecast MY16/17 imports are down
to 400,000 tons mainly based on expected high domestic production.
Chinese imports of both shelled and in-shell peanuts surged during the first three quarters of
MY15/16 (see more in GAIN CH16041). Peanut import shipments usually decline during July to
September as the crushers try to avoid the hot season to guarantee oil quality and domestic crop
partly will enter market in late August. Currently, Post forecast MY16/17 imports are 400,000 tons
given the MY16/17 domestic peanut acreage seems to be expanded greatly coupled with a continuing
depreciation of Chinese currency, both adding pressure on import profit margins.
MY16/17 cotton seed production is expected to fall to 8.3 MMT
Post’s forecast MY16/17 cotton seed production is 8.3 MMT, significantly lower from the 11 MMT
in MY14/15, and lower than the estimated 8.9 MMT in MY15/16. In response to low profit
expectations due to the government’s low support for cotton production, Post’s forecast for MY16/17
cotton acreage is more than 9 percent lower than the previous year. According to a survey done in
May by the China Cotton Association, MY16/17 cotton acreage is expected to fall by 10 percent
from MY15/16.
Forecast MY16/17 vegetable oil imports level off
Based on the high crushing volume of oilseeds and the sales of state oilseed product reserves,

China’s vegetable oil imports in MY15/16 declined and continue to be flat in MY16/17. MY16/17
soybean oil imports are forecast at 650,000 tons, unchanged from MY15/16 estimate. MY16/17
rapeseed oil imports are forecast at 700,000 tons, down from the estimate 750,000 tons for
MY15/16. Peanut oil imports are forecast at 130,000 tons in MY16/17 from the estimate of 120,000
tons in MY15/16. Due to the relatively cheaper prices for Ukraine and Russia supplies, and Chinese
consumer’s diversified preferences for vegetable oil, sunflower seed oil imports are up to 0.8 MMT
in MY15/16 and expected to remain similar level in MY16/17.
Post’s estimate for MY15/16 palm oil imports are lowered to 5 MMT based on lower than expected
imports in recent months. Weaker palm oil imports are due to a combination of factors: resumption
of export duty in exporting countries; weak demand for palm oil; an adequate supply of other
vegetable oils; and depreciation of the Chinese currency. Palm oil imports were 3.8 MMT in the first
ten months of MY15/16, significantly down from the 4.6 MMT in the previous year. Palm oil
imports may recover moderately during August through September given low domestic palm oil
stocks. Domestic palm oil stocks are estimated at less than half of the average level in the past five
years. Post’s preliminary forecast for MY16/17 palm oil imports are up to 5.2 MMT. However, this
is significantly lower than the average 5.95 MMT during MY12/13 to MY14/15.
As previously reported, since late 2015, China began to sell its aged rapeseed oil reserves, estimated
at 6.41 MMT. Based on CNGOIC, as of June 1, 2016, a total of 2.28 MMT of rapeseed oil reserves
were sold. The 2.28 MMT of rapeseed oil sold is expected to reach end-users impacting vegetable
oil market in the second half of 2016. The government suspended the auction of rapeseed oil in June
without an official public notice. Based on CNGOIC’s estimate, as of this report, China’s state
rapeseed oil reserve stands at about 4.1 MMT.
Oilseeds PSD Tables

Table 1. Soybeans
PSD Table Country China, Peoples Republic of Commodity Oilseed, Soybean (1000 tons; 1000 Ha)
2014/15 2015/16 2016/17
USDA
Official
Post
Estimate
New USDA
Official
Post
Estimate
New USDA
Official
Post
Estimate
New
Market Year Begin 10/2014 10/2015 10/2016 Area Planted 7,700 6,800 6,600 6,440 6,200 7,110 Area Harvested 6,800 6,800 6,440 6,440 6,800 7,110 Beginning Stocks 13,877 13,877 17,034 16,234 15,984 14,984 Production 12,150 12,150 11,600 11,600 12,200 13,000 MY Imports 78,350 78,350 83,000 83,000 87,000 86,000 MY Imp. from U.S. 29,697 29,697 28,500 28,000 30,000 29,500 MY Imp. from EU 0 0 0 0 0 0 Total Supply 104,377 104,377 111,634 110,834 115,184 113,984 MY Exports 143 143 150 150 150 150 MY Exp. to EU 10 0 10 10 10 10 Crush 74,500 74,500 81,800 81,500 87,000 86,000 Food Use Dom. Cons. 10,200 11,000 10,800 11,400 11,200 11,700 Feed Waste Dom. Cons. 2,500 2,500 2,900 2,800 3,000 3,000 Total Dom. Cons. 87,200 88,000 95,500 95,700 101,200 100,700 Ending Stocks 17,034 16,234 15,984 14,984 13,834 13,134 Total Distribution 104,377 104,377 111,634 110,834 115,184 113,984 CY Imports 81,740 81,740 83,500 83,500 89,000 86,000 CY Imp. from U.S. 28,000 28,413 29,000 29,000 30,000 30,000 CY Exports 133 133 150 150 150 150 CY Exp. to U.S. 70 70 70 50 70 50
Table 2. Rapeseed

PSD Table Country China, Peoples Republic of Commodity Oilseed, Rapeseed (1000 tons;1000 Ha)
2014/15 2015/16 2016/17
USDA
Official
Post
Estimate
New USDA
Official
Post
Estimate
New USDA
Official
Post
Estimate
New
Market Year Begin 10/2014 10/2015 10/2016 Area Planted 0 7,588 0 7,300 0 7,000 Area Harvested 7,588 7,588 7,300 7,300 7,000 7,000 Beginning Stocks 1,036 1,036 1,499 1,499 1,048 998 Production 14,772 14,772 14,300 14,300 13,300 13,500 MY Imports 4,591 4,591 4,250 3,900 3,800 3,900 MY Imp. from U.S. 0 0 0 0 0 0 MY Imp. from EU 0 0 0 0 0 0 Total Supply 20,399 20,399 20,049 19,699 18,148 18,398 MY Exports 0 0 1 1 0 0 MY Exp. to EU 0 0 0 0 0 0 Crush 18,300 18,300 18,400 18,100 16,800 16,800 Food Use Dom. Cons. 0 0 0 0 0 0 Feed Waste Dom. Cons. 600 600 600 600 600 600 Total Dom. Cons. 18,900 18,900 19,000 18,700 17,400 17,400 Ending Stocks 1,499 1,499 1,048 998 748 998 Total Distribution 20,399 20,399 20,049 19,699 18,148 18,398 CY Imports 4,470 4,470 4,200 3,900 3,800 4,000 CY Imp. from U.S. 0 0 0 0 0 0 CY Exports 0 0 0 0 0 0 CY Exp. to U.S. 0 0 0 0 0 0
Table 3. Peanuts

PSD Table Country China, Peoples Republic of Commodity Oilseed, Peanut (1000 tons; 1000 Ha)
2014/15 2015/16 2016/17
USDA
Official
Post
Estimate
New USDA
Official
Post
Estimate
New USDA
Official
Post
Estimate
New
Market Year Begin 10/2014 10/2015 10/2016 Area Planted 4,604 4,604 4,600 4,600 4,700 4,750 Area Harvested 4,604 4,604 4,600 4,600 4,700 4,750 Beginning Stocks 0 0 0 0 0 0 Production 16,482 16,482 16,500 16,500 16,900 17,000 MY Imports 161 161 580 550 600 400 MY Imp. from U.S. 0 21 0 5 0 10 MY Imp. from EU 0 0 0 0 0 0 Total Supply 16,643 16,643 17,080 17,050 17,500 17,400 MY Exports 502 502 500 500 500 500 MY Exp. to EU 37 37 50 50 50 50 Crush 8,394 8,394 8,750 8,850 9,050 9,130 Food Use Dom. Cons. 6,650 6,650 6,830 6,700 6,950 6,750 Feed Waste Dom. Cons. 1,097 1,097 1,000 1,000 1,000 1,020 Total Dom. Cons. 16,141 16,141 16,580 16,550 17,000 16,900 Ending Stocks 0 0 0 0 0 0 Total Distribution 16,643 16,643 17,080 17,050 17,500 17,400 CY Imports 165 175 550 500 600 450 CY Imp. from U.S. 0 12 0 8 0 10 CY Exports 511 509 500 500 500 500 CY Exp. to U.S. 0 0 0 0 0 0
Meal PSD Tables

Table 4. Soybean Meal
PSD Table Country China, Peoples Republic of Commodity Meal, Soybean (1000 tons)
2014/15 2015/16 2016/17
USDA
Official
Post
Estimate
New USDA
Official
Post
Estimate
New USDA
Official
Post
Estimate
New
Market Year Begin 10/2014 10/2015 10/2016 Crush 74,500 74,500 81,800 81,500 87,000 86,000 Extr. Rate, 999.9999 0.7921 0.7921 0.792 0.792 0.792 0.792 Beginning Stocks 0 0 0 0 0 0 Production 59,008 59,008 64,782 64,548 68,900 68,110 MY Imports 58 58 30 27 30 20 MY Imp. from U.S. 0 0 0 0 0 0 MY Imp. from EU 0 0 0 0 0 0 Total Supply 59,066 59,066 64,812 64,575 68,930 68,130 MY Exports 1,595 1,577 1,850 1,800 1,850 1,850 MY Exp. to EU 60 60 30 100 30 100 Industrial Dom. Cons. 980 980 1,000 1,000 1,020 1,050 Food Use Dom. Cons. 0 0 0 0 0 0 Feed Waste Dom. Cons. 56,491 56,509 61,962 61,775 66,060 65,230 Total Dom. Cons. 57,471 57,489 62,962 62,775 67,080 66,280 Ending Stocks 0 0 0 0 0 0 Total Distribution 59,066 59,066 64,812 64,575 68,930 68,130 CY Imports 60 60 30 25 30 25 CY Imp. from U.S. 0 0 0 0 0 0 CY Exports 1,714 1,696 1,850 1,800 1,850 1,900 CY Exp. to U.S. 20 20 20 20 0 30
Oils PSD Tables

Table 5. Soybean Oil
PSD Table Country China, Peoples Republic of Commodity Oil, Soybean (1000 tons)
2014/15 2015/16 2016/17
USDA
Official
Post
Estimate
New USDA
Official
Post
Estimate
New USDA
Official
Post
Estimate
New
Market Year Begin 10/2014 10/2015 10/2016 Crush 74,500 74,500 81,800 81,500 87,000 86,000 Extr. Rate, 999.9999 0.179 0.179 0.179 0.179 0.179 0.179 Beginning Stocks 965 965 778 778 693 750 Production 13,347 13,347 14,655 14,590 15,587 15,390 MY Imports 773 773 820 650 820 650 MY Imp. from U.S. 150 0 100 30 100 30 MY Imp. from EU 0 0 0 0 0 0 Total Supply 15,085 15,085 16,253 16,018 17,100 16,790 MY Exports 107 107 110 100 110 100 MY Exp. to EU 0 0 0 0 0 0 Industrial Dom. Cons. 0 0 0 0 0 0 Food Use Dom. Cons. 14,200 14,200 15,450 15,168 16,200 15,800 Feed Waste Dom. Cons. 0 0 0 0 0 0 Total Dom. Cons. 14,200 14,200 15,450 15,168 16,200 15,800 Ending Stocks 778 778 693 750 790 890 Total Distribution 15,085 15,085 16,253 16,018 17,100 16,790 CY Imports 818 818 820 650 820 700 CY Imp. from U.S. 150 0 100 30 100 30 CY Exports 104 104 110 100 110 100 CY Exp. to U.S. 0 0 0 0 0 0
Table 6. Rapeseed Oil
PSD Table Country China, Peoples Republic of Commodity Oil, Rapeseed (1000 tons)
2014/15 2015/16 2016/17
USDA
Official
Post
Estimate
New USDA
Official
Post
Estimate
New USDA
Official
Post
Estimate
New
Market Year Begin 10/2014 10/2015 10/2016 Crush 18,300 18,300 18,400 18,100 16,800 16,800 Extr. Rate, 999.9999 0.390 0.390 0.390 0.390 0.39 0.39 Beginning Stocks 4,051 4,051 4,164 4,164 4,085 4,188 Production 7,137 7,137 7,176 7,059 6,552 6,552 MY Imports 732 732 800 750 700 700 MY Imp. from U.S. 0 0 0 0 0 0 MY Imp. from EU 0 107 0 110 0 100 Total Supply 11,920 11,920 12,140 11,973 11,337 11,440 MY Exports 6 6 5 6 5 5 MY Exp. to EU 0 0 0 0 0 0 Industrial Dom. Cons. 0 0 0 0 0 0 Food Use Dom. Cons. 7,750 7,750 8,050 7,779 8,200 8,061 Feed Waste Dom. Cons. 0 0 0 0 0 0 Total Dom. Cons. 7,750 7,750 8,050 7,779 8,200 8,061 Ending Stocks 4,164 4,164 4,085 4,188 3,132 3,374 Total Distribution 11,920 11,920 12,140 11,973 11,337 11,440 CY Imports 815 815 800 750 700 700 CY Imp. from U.S. 0 0 0 0 0 0 CY Exports 5 5 5 5 5 5 CY Exp. to U.S. 0 0 0 0 0 0
Table 7. Peanut Oil

PSD Table Country China, Peoples Republic of Commodity Oil, Peanut (1000 tons)
2014/15 2015/16 2016/17
USDA
Official
Post
Estimate
New USDA
Official
Post
Estimate
New USDA
Official
Post
Estimate
New
Market Year Begin 10/2014 10/2015 10/2016 Crush 8,394 8,394 8,750 8,850 9,050 9,130 Extr. Rate, 999.9999 0.320 0.320 0.320 0.32 0.32 0.32 Beginning Stocks 0 0 0 0 0 0 Production 2,686 2,686 2,800 2,832 2,896 2,922 MY Imports 141 141 150 120 150 130 MY Imp. from U.S. 0 0 0 0 0 0 MY Imp. from EU 0 0 0 0 0 0 Total Supply 2,827 2,827 2,950 2,952 3,046 3,052 MY Exports 8 8 10 7 6 6 MY Exp. to EU 0 0 0 0 0 0 Industrial Dom. Cons. 0 0 0 0 0 0 Food Use Dom. Cons. 2,819 2,819 2,940 2,945 3,040 3,046 Feed Waste Dom. Cons. 0 0 0 0 0 0 Total Dom. Cons. 2,819 2,819 2,940 2,945 3,040 3,046 Ending Stocks 0 0 0 0 0 0 Total Distribution 2,827 2,827 2,950 2,952 3,046 3,052 CY Imports 128 128 150 130 150 130 CY Imp. from U.S. 0 0 0 0 0 0 CY Exports 8 8 7 7 6 6 CY Exp. to U.S. 0 0 0 0 0 0
Table 8. Palm Oil

PSD Table Country China, Peoples Republic of Commodity Oil, Palm (1000 tons)
2014/15 2014/16 2016/17
USDA
Official
Post
Estimate
New USDA
Official
Post
Estimate
New USDA
Official
Post
Estimate
New
Market Year Begin 10/2014 10/2015 10/2016 Area Planted 0 0 0 0 0 0 Area Harvested 0 0 0 0 0 0 Trees 0 0 0 0 0 0 Beginning Stocks 310 310 255 255 205 100 Production 0 0 0 0 0 0 MY Imports 5,696 5,696 5,000 5,000 5,150 5,200 MY Imp. from U.S. 0 0 0 0 0 0 MY Imp. from EU 0 0 0 0 0 0 Total Supply 6,006 6,006 5,255 5,255 5,355 5,300 MY Exports 1 1 0 0 0 2 MY Exp. to EU 0 0 0 0 0 0 Industrial Dom. Cons. 1,950 1,950 2,000 2,050 2,050 2,100 Food Use Dom. Cons. 3,800 3,800 3,050 3,105 3,100 3,050 Feed Waste Dom. Cons. 0 0 0 0 0 0 Total Dom. Cons. 5,750 5,750 5,050 5,155 5,150 5,150 Ending Stocks 255 255 205 100 205 148 Total Distribution 6,006 6,006 5,255 5,255 5,355 5,300 CY Imports 5,910 5,910 5,000 5,100 5,150 5,250 CY Imp. from U.S. 0 0 0 0 0 0 CY Exports 2 2 0 1 0 2 CY Exp. to U.S. 0 0 0 0 0 0
Table 9. Sunflower Seed Oil

PSD Table Country China, Peoples Republic of Commodity Oil, Sunflower Seed (1000 tons)
2014/15 2015/16 2016/17
USDA
Official
Post
Estimate
New USDA
Official
Post
Estimate
New USDA
Official
Post
Estimate
New
Market Year Begin 10/2014 10/2015 10/2016 Crush 1,300 1,300 1,300 1,294 1320 1322 Extr. Rate, 999.9999 0.359 0.359 0.359 0.359 0.360 0.359 Beginning Stocks 0 0 0 0 0 0 Production 466 466 466 465 475 475 MY Imports 534 534 750 800 750 800 MY Imp. from U.S. 0 0 0 0 0 0 MY Imp. from EU 0 0 0 0 0 0 Total Supply 1,000 1,000 1,216 1,265 1,225 1,275 MY Exports 0 2 0 2 0 2 MY Exp. to EU 0 0 0 0 0 0 Industrial Dom. Cons. 0 0 0 0 0 0 Food Use Dom. Cons. 1,000 998 1,216 1,263 1,225 1,273 Feed Waste Dom. Cons. 0 0 0 0 0 0 Total Dom. Cons. 1,000 998 1,216 1,263 1,225 1,273 Ending Stocks 0 0 0 0 0 0 Total Distribution 1,000 1,000 1,216 1,265 1,225 1,275 CY Imports 450 651 700 800 700 800 CY Imp. from U.S. 0 0 0 0 0 0 CY Exports 0 1 0 2 0 2 CY Exp. to U.S. 0 0 0 0 0 0