china - peoples republic of oilseeds and products … gain publications/oilseeds and... · total...
TRANSCRIPT

THIS REPORT CONTAINS ASSESSMENTS OF COMMODITY AND TRADE ISSUES MADE BY USDA
STAFF AND NOT NECESSARILY STATEMENTS OF OFFICIAL U.S. GOVERNMENT POLICY
Date: GAIN Report Number:
Approved By:
Prepared By:
Report Highlights:
China continues to be the largest oilseed importer in the world. In MY15/16, China’s total oilseed imports
reached 87.93 million tons (MMT). Chinese total soybean imports hit another record at 83.23 MMT, absorbing
61 percent of total world exports, and 59 percent of total U.S. soybean exports. Post estimates this growing trend
in soybean imports will continue and reach 86 MMT in MY16/17, and 89 MMT in MY17/18. Favorable import
prices led to record peanuts imports in MY15/16 but are expected to level off. Rising incomes, urbanization and
the modernization of the domestic feed and livestock sectors will continue fostering Chinese oilseed consumption.
A recent change in government policy has encouraged farmers to plant more oilseeds instead of corn. However,
growth in China’s oilseed production remains constrained by limited arable land and stagnant yields. Thus,
China’s oilseed production is forecast to rise modestly to 56.25 MMT in MY17/18. In addition, during MY15/16,
China imposed registration requirements for grain and oilseed exporters (known as AQSIQ Decree 177). Major
exporters continue their efforts to comply with new requirements.
Jennifer Clever
Lisa Anderson
China’s Robust Demand for Oilseeds Continues to Outpace
Growth in Domestic Production
Oilseeds and Products Annual
China - Peoples Republic of
CH17012
3/15/2017
Required Report - public distribution
2
Executive Summary:
China’s limited arable land and stagnant yields continue to hinder growth in domestic oilseed production. Prior to
MY15/16, oilseed production was also tempered by government support policies favoring major crops, such as
corn. However, as a result of the government’s recent policy change to reduce support to corn producers, China’s
total planted area for all oilseed crops is forecast to rise by 1.4 percent to 23.3 million hectares (MHa). Total
oilseed production is forecast to rise to 56.25 MMT in MY17/18, up from the estimated 55.3 MMT in MY16/17.
The higher production forecast reflects an expected rise in China’s production of soybeans, peanuts, and
cottonseed. This combined increase of about 1.3 MMT will likely be offset by a forecast drop of 0.3 MMT in
rapeseed production.
Driven by an increasing domestic demand for meats, eggs, milk, seafood, and vegetable oils, China’s oilseed
consumption is forecast to rise to 149.7 MMT in MY17/18 from the estimated 147.1 MMT in MY16/17.
Additionally, a modest expansion of the oilseed crushing sector, continued growth in the feed industry, and
progress in farm consolidation in the livestock and aquatic sectors are collectively spurring demand and the need
for oilseed imports as protein ingredients.
As a result of China’s limited domestic production, soybean and rapeseed imports are expected to stay robust.
Soybean imports could reach 89 MMT in MY17/18, up significantly from the estimated 86 MMT in MY16/17,
and in line with USDA’s official February 2017 estimate. Correspondingly, China’s total oilseed imports are
forecast at 93.84 MMT for MY17/18. In MY15/16, Chinese imports of U.S. soybeans reached 28.9 MMT, down
from the 29.7 MMT compared to the previous year, and accounted for 35 percent of China’s total soybean
imports. Annual imports from the United States are expected to stay strong at about 30 MMT in MY16/17 and
MY17/18. However, U.S. soybeans still face fierce competition from South American suppliers.
It is important to note that forecasting China’s meal and oil use, and total oilseed demand remains a challenge as
data differs greatly depending on the source. This is particularly true with data pertaining to rapeseed and peanut
area and production; soybean use as food or feed; feed and livestock production; and the unknown volume of
soybean and vegetable oils reserves.
Oilseeds Situation and Outlook
Growth in Domestic Demand for Oilseeds Exceeds Growth in Domestic Oilseed Production
Overall, the growth in China’s domestic oilseed production continues to lag behind the growth in domestic
demand. As a result of the MY14/15 direct subsidy payment to soybean farmers based on a stable target price,
and the MY15/16 change in government policy to reduce the level of support to corn producers, China’s total
planted area for all oilseed crops is forecast to rise by 1.4 percent to 23.3 million hectares (MHa). Total oilseed
production is forecast to rise to 56.25 MMT in MY17/18, up from the estimated 55.3 MMT in MY16/17 but still
lower than the total in MY14/15. The higher production forecast reflects an expected rise in soybeans, peanuts,
and cottonseed production. This combined increase of about 1.3 MMT will likely be offset by a forecast 0.3 MMT
drop in rapeseed production. Inadequate production conditions – from economies of scale, agronomic practices,
technology resources and input quality – continue to limit the potential gains in oilseed yields. Meanwhile,
Chinese consumption of meat, seafood, vegetable oils, and soybeans for food-processing continues its unrelenting
growth, fueled by rising affluence, urbanization, and expanding consumer preferences. In response to these
dietary demands, China must complement its domestic oilseed resources with imports, primarily from Brazil, the
United States, Argentina and Canada.
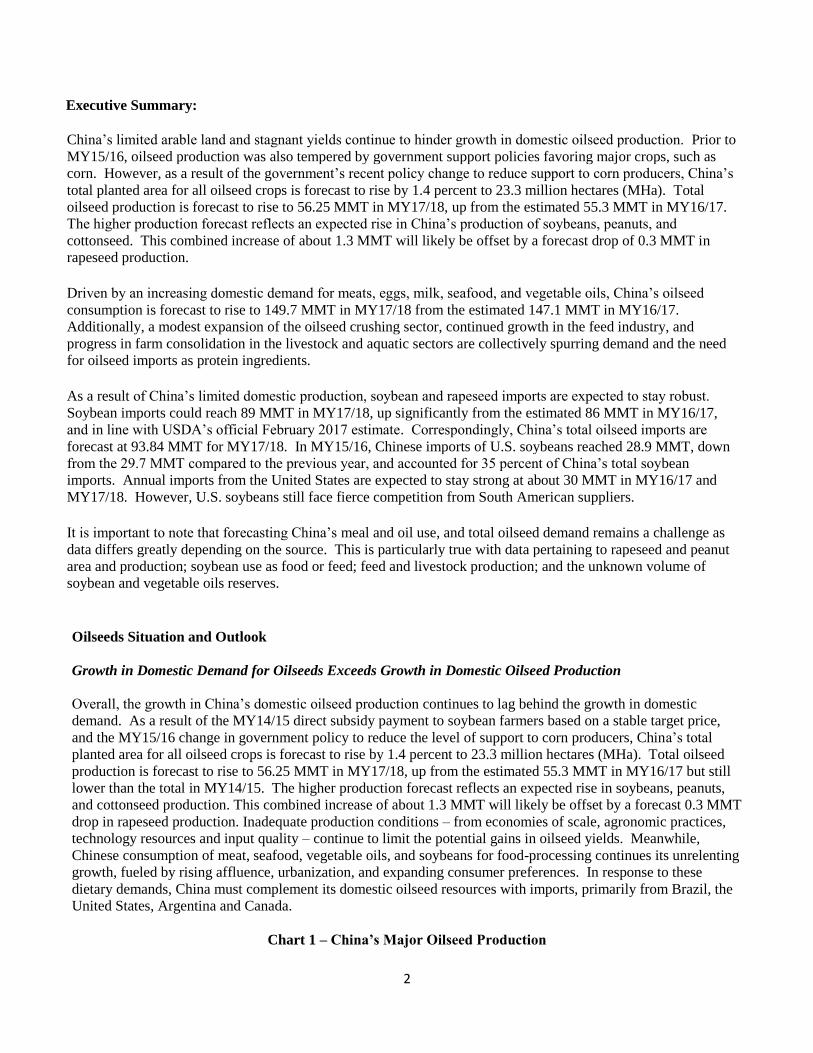
Chart 1 – China’s Major Oilseed Production
3
(MY14/15 to MY17/18; in 10,000 tons)
Source: NSB; MY16/17 estimate and MY17/18 forecast by FAS/Beijing
China’s soybean area is expected to increase moderately in MY17/18 in response to the government’s policy
change to limit grain crops. Lower corn earnings in major soybean-producing provinces are likely to encourage
some farmers to plant soybeans in MY17/18.
Driven by steady positive earnings received in recent years, the forecast for China’s peanut production is slightly
up for MY17/18. Cottonseed production is forecast to recover in MY17/18 in response to higher cotton prices
and higher profits in MY16/17. Post forecast for MY17/18 cotton acreage is 3.3 percent higher than the previous
year. Conversely, the MY16/17 rapeseed planting area and production are both forecast to fall 3 percent. This is
in response to lower farm earnings since the government ended its price support policy for rapeseed in MY15/16.
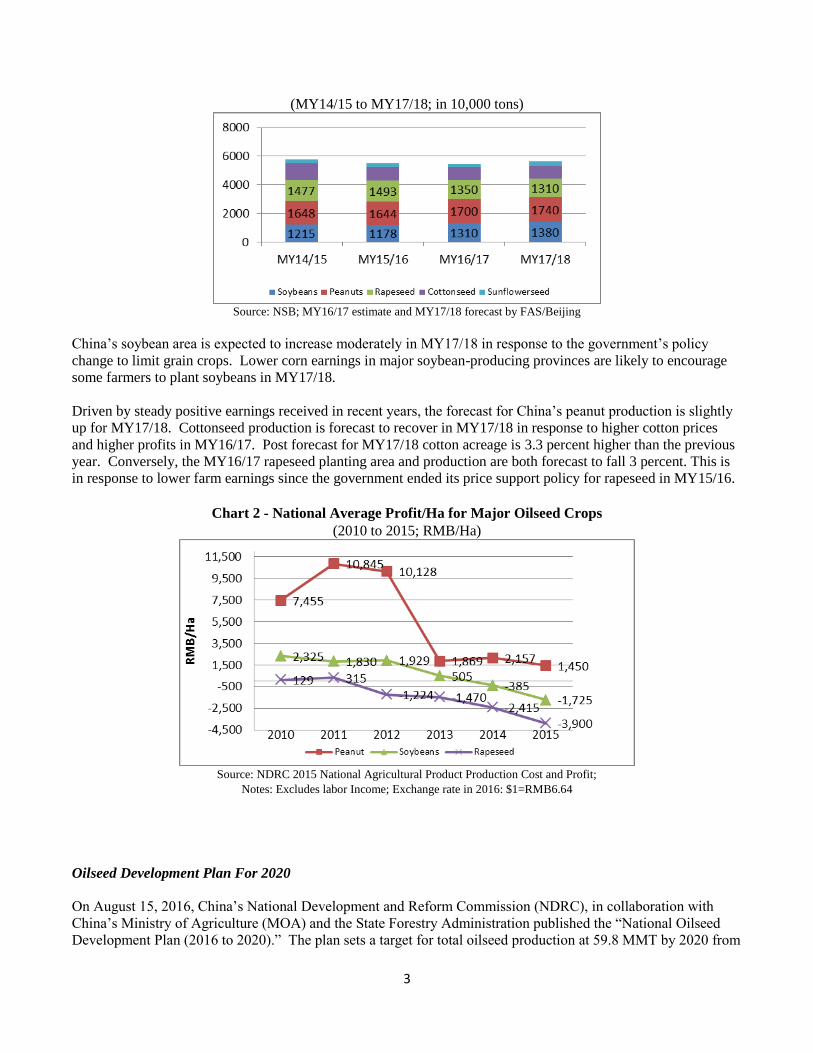
Chart 2 - National Average Profit/Ha for Major Oilseed Crops
(2010 to 2015; RMB/Ha)
Source: NDRC 2015 National Agricultural Product Production Cost and Profit;
Notes: Excludes labor Income; Exchange rate in 2016: $1=RMB6.64
Oilseed Development Plan For 2020
On August 15, 2016, China’s National Development and Reform Commission (NDRC), in collaboration with
China’s Ministry of Agriculture (MOA) and the State Forestry Administration published the “National Oilseed
Development Plan (2016 to 2020).” The plan sets a target for total oilseed production at 59.8 MMT by 2020 from
4
the 45.4 MMT in 2014 (note: oilseeds include rapeseed, peanuts, soybean and camellia). This target is to be
achieved through a planted area expansion with an additional area of 4.16 MHa and yield gains through
technological advancement.
China’s National Oilseed Development Plan (2016-2020)
Soybeans Rapeseed Peanuts Camellia
MMT/MHa Prod Area Prod Area Prod Area Prod Area
2020 18.9 9.33 16.2 8 18.7 4.8 4 4.67
2014 12.15 6.8 14.77 7.59 16.48 4.6 2 3.65 Source: NDRC
The plan also highlights that the government will provide support for oilseed production, processing, technical
extension and innovation. However, as of this report, China has not announced any specific national-level
support measures. Soybean acreage recovered moderately in MY16/17 and is expected to increase further in
MY17/18 in response to the government’s reduced support to corn. Rapeseed planting continues to fall as profits
remain thin and the government has not issued any new support measures. Camellia planting is reportedly being
supported by the government and production is expected to grow in the coming years. While steady growth in the
domestic oilseed supply is likely to moderately flatten the growth rate of oilseed imports, domestic supplies will
not satisfy the rise in demand.
China’s General Agriculture Support Program
In addition to the ongoing commodity-specific price support schemes, China maintains a general agriculture
support program. This includes direct payment to grain farmers, and subsidies for seed, fuel/fertilizer, and
machinery. Since 2012, this basic support has reportedly stayed stable at about $26 billion a year and is expected
to continue at similar levels in the coming years.
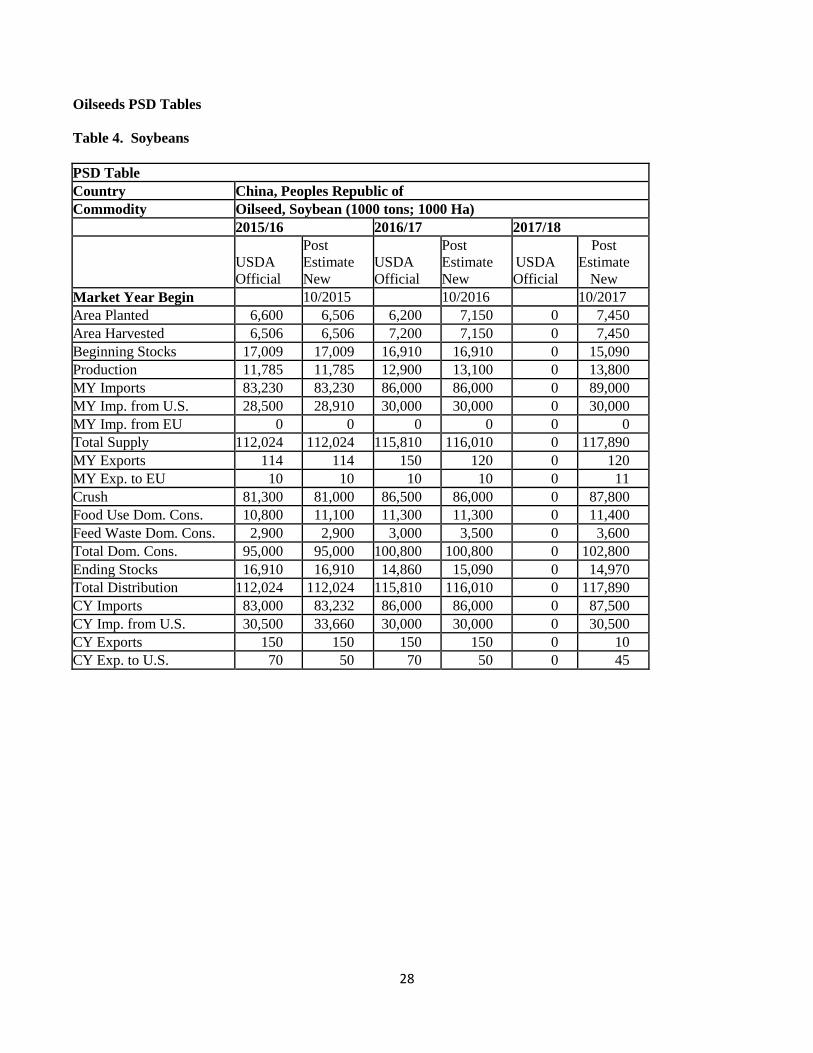
Soybeans
Production
Consistent with a forecast 4 percent rise in the soybean planted area and an average yield, Post’s forecast for
MY17/18 soybean production is 13.8 MMT, up from the estimated 13.1 MMT in MY16/17. This estimate is
slightly higher than the USDA February 2017 official estimate. The expected slight recovery in soybean
production is supported by changes in the government’s grain support policy, which lowered corn profits for
MY16/17 and encouraged some farmers to plant soybeans.
Over the past seven years, the government’s policy supporting grain prices resulted in smaller soybean planted
area in China’s leading-soybean producing regions, the four Northeastern provinces. However, since MY15/16,
the government prescribed a lower purchase price for corn which cut corn earnings by an estimated RMB1,500
($242)/Ha. This is about half of the MY14/15 national average income of RMB3,045 ($495)/Ha. Moreover, in
MY16/17, soybeans earnings are estimated to be the same or even higher than corn in the Northeastern provinces.
For instance, in MY16/17, the local Hailun City government in Heilongjiang province estimated soybean profits
are 7.5 percent higher than corn.
Additionally, the government’s “target price-based direct subsidy” for soybeans that has been in force over the
last three years is unlikely to change. At minimum, the target price will most likely remain unchanged at
RMB4,800 ($722)/ton, or raised in MY17/18. Soybean farmers in the four Northeastern provinces will continue
to be compensated based on the difference between the market price and the target price.
5
The government is also calling for more forage area including silage corn in the Northeast and Northwest regions
to ease the pressure of the government’s still high corn stocks. The central government’s plan is to cut corn
planting acreage by 50 million mu (or 3.67 MHa) in the “reaphook” shaped regions by year 2020. According to
MOA, the 2017 target is to reduce 10 million mu (or 667,000 Ha) of corn area. The “reaphook” shaped regions
refer mostly to the bordering regions between crop farming and ranchers in the Northeastern provinces, and the
dry and windy regions in the Northwestern provinces. The program covers 13 provinces, with the major
adjustment areas located in the four Northeastern provinces.
In some regions in Heilongjiang and Inner Mongolian provinces, crop alternatives to soybeans are limited due to
the shorter growing days. Additionally, soybeans are more resilient to stand the cold weather than other more
lucrative crops.
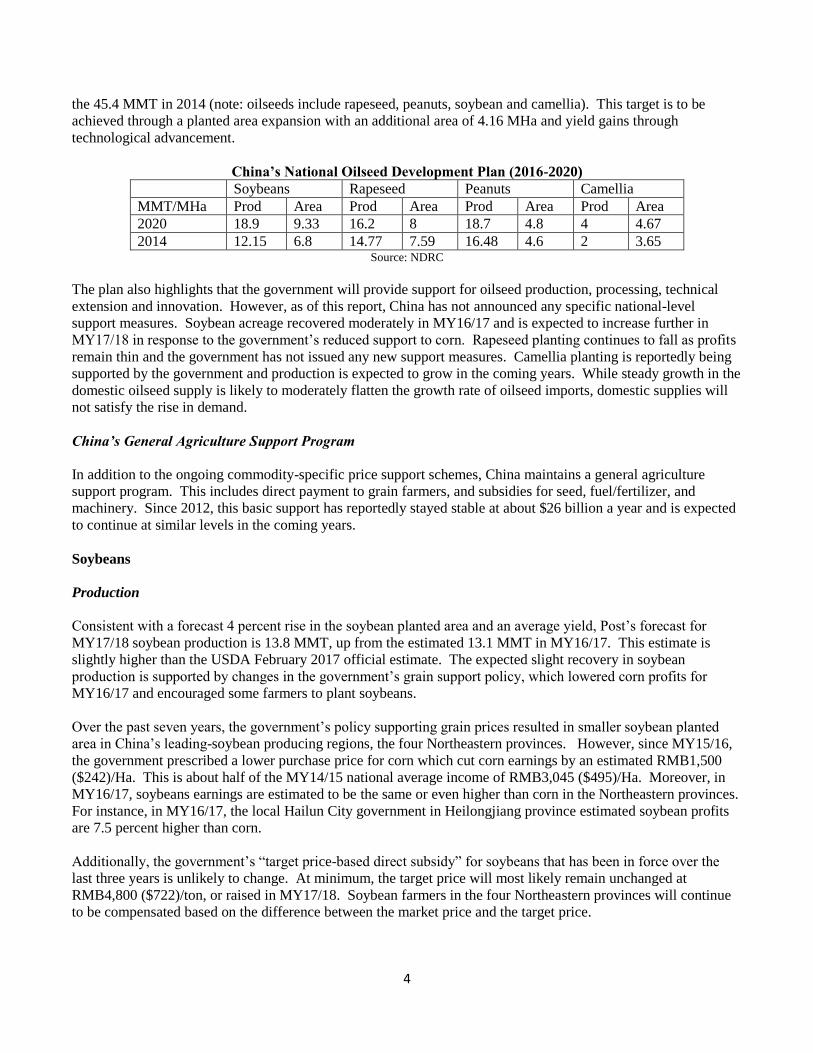
Chart 3 - State Purchase Floor Price for Soybeans and Rapeseed
VS Average Wholesale Soybean Price (2011 to 2016; RMB/ton)
Source: State Grain Administration (soybean target price for four Northeastern provinces) and China JCI (average wholesale soy price).
From 2014, the soybean price is the “target price.” The state purchase of rapeseed at high floor prices ended in 2015.
Unlike soybean farmers in the four Northeastern provinces, farmers in other provinces are not entitled to the
government target price support. However, in general, soybean profits in these provinces are relatively higher
than the four Northeastern provinces. In those provinces, soybeans enjoy a premium as a result of convenient
delivery and can satisfy the local demand for soybean food use. From MY12/13 to MY16/17, soybean production
in these provinces remained stable ranging around 6 to 6.5 MMT per year. In Anhui province, the local official
survey showed an increase in planting intentions in MY17/18. This increase is mainly due to soybean’s
comparative advantage in terms of lower inputs over competing crops in MY16/17. Also in MY16/17, local
farmers in Shandong province reported higher soybean profits compared to corn. With respect to other provinces,
Post expects MY17/18 soybean planting intentions to be stable or go up slightly.
Chart 4 - China’s Soybean Production by Region (2012-2016)
(1,000 tons)

6
Source: 2012-2015 data based on NSB; 2016 data based on CNGOIC estimate
Soybean farmers also continue to struggle to boost yields and productivity which have remained constant for
several years. Without access to the latest seed technology, Chinese soybean farmers face major impediments to
improve productivity. Impediments also include small scale farming and inadequate agronomic practices (such as
the lack of proper crop rotation). These conditions are unlikely to change significantly in the near future. Over
the last four years, soybean yield in China averaged 1.79 ton/Ha, compared to 2.9 ton/Ha in the United States.
Stocks
Chinese official statistics for stocks are not publicly available. Based on industry sources, China sold about 1.7
MMT of soybean reserves in the middle of 2016. By the end of the year, the sale reduced the government’s
soybean reserves to about 4.4 MMT. Post estimates that China’s rise in soybean imports during MY15/16 also
contributed to the estimated high carry-out stocks at 16.9 MMT. Depending on the domestic oilseed product
market situation, the government may auction the left over older stocks as a means to stabilize any significant
changes in the domestic soybean supply and price. MY16/17 ending stocks are expected to adjust down to 15.1
MMT. Given the government’s suspension of direct purchases of domestic oilseeds, and maintenance of a
moderate vegetable oil reserve as a market regulating tool, MY17/18 soybean ending stocks are forecast at 15
MMT.
Trade
--Imports
China’s domestic production remains insufficient and unable to meet growing consumption of oilseed products
(protein meal and oil). In MY15/16, China continued to dominate the global soybean market and remains the
largest importer of soybeans in the world. China’s total soybean imports of 83.23 MMT in MY15/16 were
equivalent to 61 percent of total world exports, and 59 percent of total U.S. soybean exports. In the first four
months of MY16/17, China’s soybean imports reached 29.7 MMT, up 7.2 percent over the same period last year.
Post estimates this growing trend will continue with soybean imports reaching 86 MMT in MY16/17, and 89
MMT in MY17/18.
Chart 5 – Chinese Soybean Imports over the Last Decade
(MY04/05-MY15/16; 1,000 tons)

7
Source: Global Trade Atlas
The Chinese crushing industry’s demand for soybeans continues to be strong. In addition, economic incentives
are reportedly driving greater use of imported soybeans for food in the coastal provinces. However, figures
capturing this trend are not readily available. As a result, MY17/18 soybean imports are forecast at 89 MMT, up
3 percent from an estimated 86 MMT in MY16/17. Adequate global soybean supplies at lower prices stimulated
imports contributing to annual net import growth of 8 MMT in MY14/15, and 4.88 MMT in MY15/16. This also
contributed to relatively high ending stocks. It is worth noting that the forecast growing soybean imports are
partly supported by the expected drop in DDGS imports in 2017 as China imposed high antidumping duties on
U.S. DDGS imports in January 2017.
Brazil continued to be China’s largest soybean supplier in MY15/16 with total exports reaching 42.6 MMT and
holding 51 percent share of the market. After hitting a record in MY14/15, China’s imports of U.S. soybeans
slowed somewhat to 28.9 MMT in MY15/16 and accounted for 35 percent China’s total imports. Brazil’s
weakening currency and Argentina’s lower export taxes are expected to boost more South American soybean
exports to China in MY16/17. Post estimates imports of U.S. soybeans to recover slightly to 30 MMT in
MY16/17.
China’s Soybean Imports by Country of Origin from MY13/14 to MY15/16
Country
MY13/14 MY14/15 MY15/16
MMT Share MMT Share MMT Share
United States 27.04 38% 29.7 38% 28.9 35%
Brazil 32.92 47% 36.4 47% 42.6 51%
Argentina 7.14 10% 8.3 11% 8.4 10%
Others 3.26 4% 3.9 5% 3.4 4%
Total 70.36
78.35 83.32 Source: World Trade Atlas
Chinese crushers have expressed interest in using sustainable soybeans with the prospect to differentiate their
finished products. Starting in mid MY14/15, the United States began exporting sustainable soybeans certified
under the U.S. Soy Sustainability Certification Protocol (SSAP). . U.S. industry sources report that as of late
February 2017, out of China’s total contracted 30.6 MMT of U.S. soybeans in MY16/17, certified U.S.
sustainable soy exports to China reached 2.53 MMT, slightly lower than the 3 MMT in MY15/16. That said, as
most U.S. soybean producers already participate in certified and audited conservation and nutrient management
programs, China stands to become the largest importer of U.S. sustainable soy. Increased interest for sustainable
soybeans could create opportunities for U.S. soybean growers to gain market share.
Changes in China’s consumption trends created new challenges in forecasting China’s soybean use/imports as
these are generally calculated on a meal and oil based analysis. Industry observers highlight that as a result of
8
price advantage and purchasing convenience, many food processors in the coastal provinces are progressively
using more imported soybeans to produce tofu, soy milk and other foods. The direct use of whole soybean as a
feed ingredient is also increasing. However, specific consumption data on broader utilization of imported
soybeans is not readily available.
--Exports
China’s soybean exports, mostly destined for traditional food use, are forecast at 120,000 tons for MY17/18,
unchanged from the estimate in MY16/17. China's soybean export volume remains small and stable. This
volume is not expected to change significantly as traditional markets, like Korea and Japan, source food soybeans
(both biotech and conventional) from several suppliers, including the United States. Industry sources report that
in recent years some domestic soybeans have been increasingly processed into protein for exports to EU and Asia.
However, specific figures on this trend are currently not available.
Soybean Crushing Sector Continues to Restructure
As of late 2015, industry sources estimated China’s total soybean crush capacity reached 449,000 tons per day
with an estimated annual crushing capacity of about 148 MMT; this is based on 11 operational months. China’s
total crushing capacity does not appear to have changed significantly in 2016. Based on Post’s estimated crushing
volume for MY15/16 of 81 MMT, the utilization rate stood at about 55 percent. This rate is slightly higher than
the previous year. Despite the low utilization rate, demand for crushed volume endures. The crushing sector will
continue restructuring with new construction and expanded renovations to existing facilities. This will likely
contribute to a moderate expansion of the crushing capacity in MY17/18 but not to the extent seen in MY14/15.
Post’s estimates crushing volume will increase to 86 MMT in MY16/17, and forecasts it will continue to grow to
87.8 MMT in MY17/18.
Policy
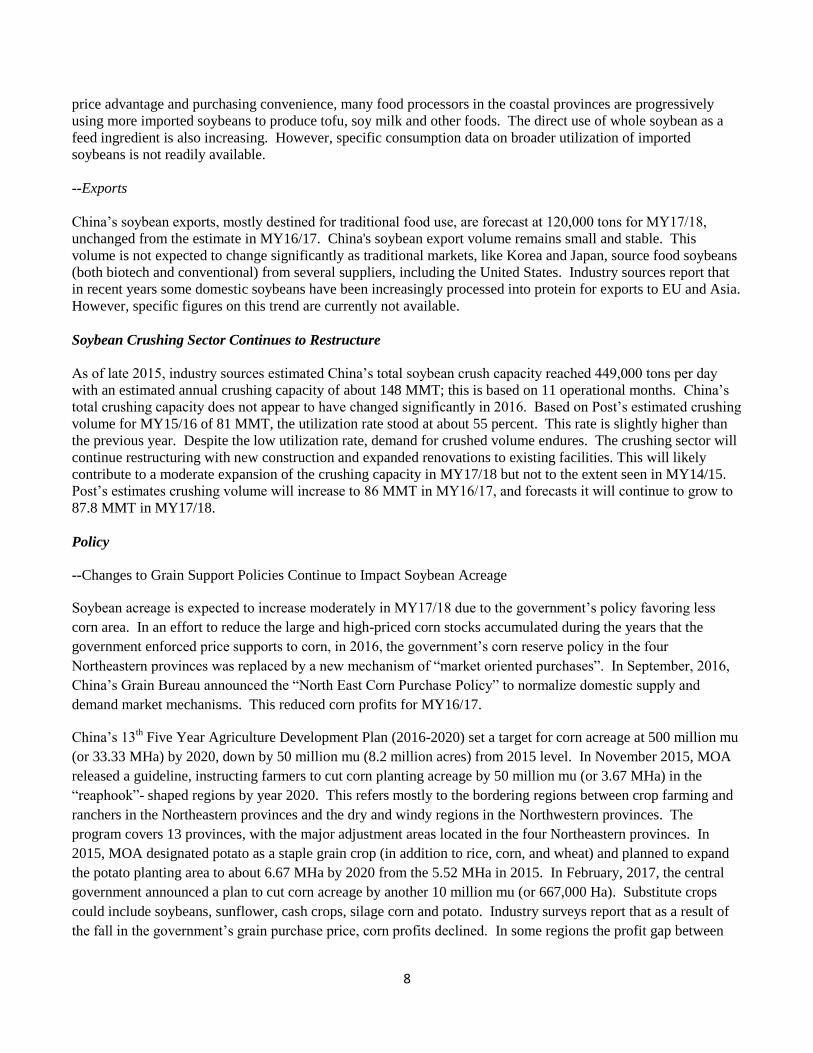
--Changes to Grain Support Policies Continue to Impact Soybean Acreage
Soybean acreage is expected to increase moderately in MY17/18 due to the government’s policy favoring less
corn area. In an effort to reduce the large and high-priced corn stocks accumulated during the years that the
government enforced price supports to corn, in 2016, the government’s corn reserve policy in the four
Northeastern provinces was replaced by a new mechanism of “market oriented purchases”. In September, 2016,
China’s Grain Bureau announced the “North East Corn Purchase Policy” to normalize domestic supply and
demand market mechanisms. This reduced corn profits for MY16/17.
China’s 13th Five Year Agriculture Development Plan (2016-2020) set a target for corn acreage at 500 million mu
(or 33.33 MHa) by 2020, down by 50 million mu (8.2 million acres) from 2015 level. In November 2015, MOA
released a guideline, instructing farmers to cut corn planting acreage by 50 million mu (or 3.67 MHa) in the
“reaphook”- shaped regions by year 2020. This refers mostly to the bordering regions between crop farming and
ranchers in the Northeastern provinces and the dry and windy regions in the Northwestern provinces. The
program covers 13 provinces, with the major adjustment areas located in the four Northeastern provinces. In
2015, MOA designated potato as a staple grain crop (in addition to rice, corn, and wheat) and planned to expand
the potato planting area to about 6.67 MHa by 2020 from the 5.52 MHa in 2015. In February, 2017, the central
government announced a plan to cut corn acreage by another 10 million mu (or 667,000 Ha). Substitute crops
could include soybeans, sunflower, cash crops, silage corn and potato. Industry surveys report that as a result of
the fall in the government’s grain purchase price, corn profits declined. In some regions the profit gap between
9
corn and soybeans narrowed while in others soybean profits even exceed those for corn. This is likely to
encourage a modest increase in soybean acreage in the Northeastern provinces.
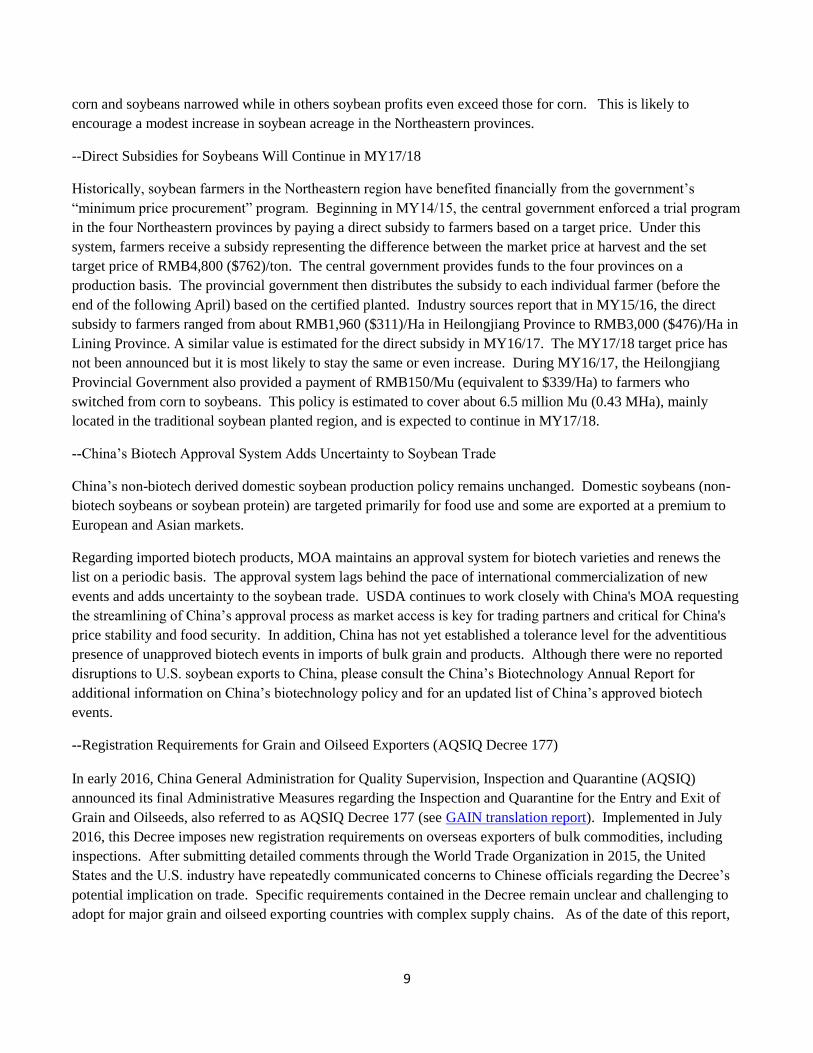
--Direct Subsidies for Soybeans Will Continue in MY17/18
Historically, soybean farmers in the Northeastern region have benefited financially from the government’s
“minimum price procurement” program. Beginning in MY14/15, the central government enforced a trial program
in the four Northeastern provinces by paying a direct subsidy to farmers based on a target price. Under this
system, farmers receive a subsidy representing the difference between the market price at harvest and the set
target price of RMB4,800 ($762)/ton. The central government provides funds to the four provinces on a
production basis. The provincial government then distributes the subsidy to each individual farmer (before the
end of the following April) based on the certified planted. Industry sources report that in MY15/16, the direct
subsidy to farmers ranged from about RMB1,960 ($311)/Ha in Heilongjiang Province to RMB3,000 ($476)/Ha in
Lining Province. A similar value is estimated for the direct subsidy in MY16/17. The MY17/18 target price has
not been announced but it is most likely to stay the same or even increase. During MY16/17, the Heilongjiang
Provincial Government also provided a payment of RMB150/Mu (equivalent to $339/Ha) to farmers who
switched from corn to soybeans. This policy is estimated to cover about 6.5 million Mu (0.43 MHa), mainly
located in the traditional soybean planted region, and is expected to continue in MY17/18.
--China’s Biotech Approval System Adds Uncertainty to Soybean Trade
China’s non-biotech derived domestic soybean production policy remains unchanged. Domestic soybeans (non-
biotech soybeans or soybean protein) are targeted primarily for food use and some are exported at a premium to
European and Asian markets.
Regarding imported biotech products, MOA maintains an approval system for biotech varieties and renews the
list on a periodic basis. The approval system lags behind the pace of international commercialization of new
events and adds uncertainty to the soybean trade. USDA continues to work closely with China's MOA requesting
the streamlining of China’s approval process as market access is key for trading partners and critical for China's
price stability and food security. In addition, China has not yet established a tolerance level for the adventitious
presence of unapproved biotech events in imports of bulk grain and products. Although there were no reported
disruptions to U.S. soybean exports to China, please consult the China’s Biotechnology Annual Report for
additional information on China’s biotechnology policy and for an updated list of China’s approved biotech
events.
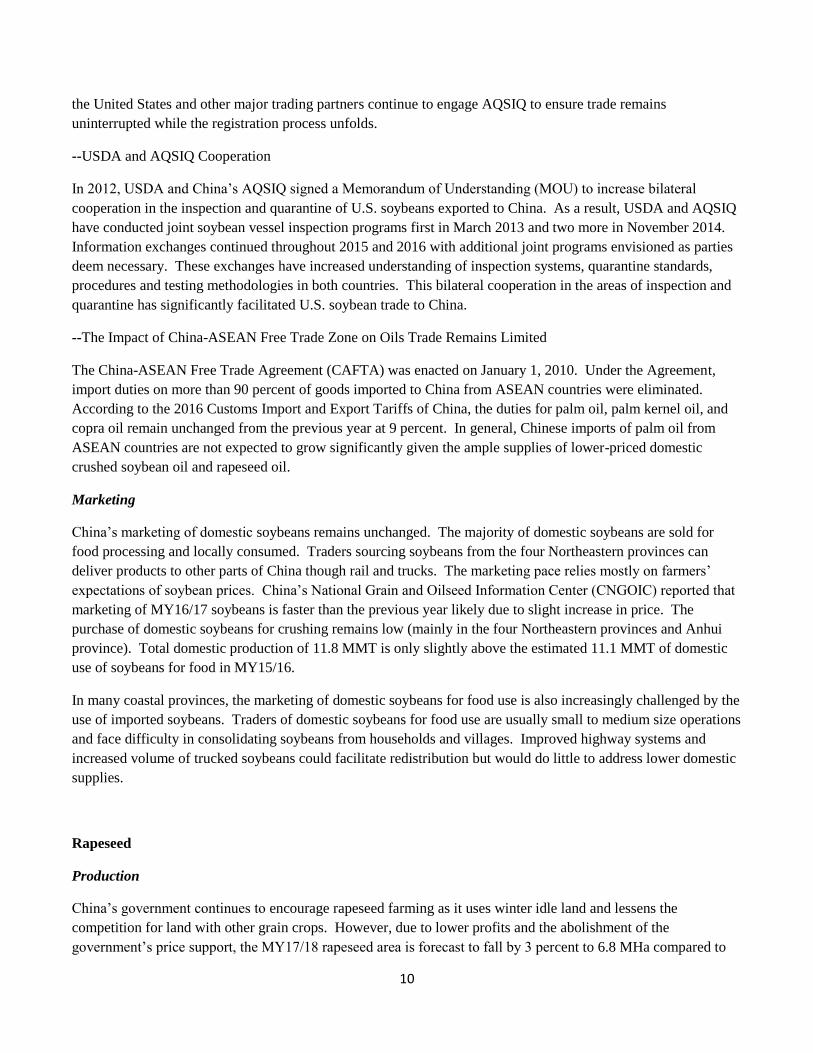
--Registration Requirements for Grain and Oilseed Exporters (AQSIQ Decree 177)
In early 2016, China General Administration for Quality Supervision, Inspection and Quarantine (AQSIQ)
announced its final Administrative Measures regarding the Inspection and Quarantine for the Entry and Exit of
Grain and Oilseeds, also referred to as AQSIQ Decree 177 (see GAIN translation report). Implemented in July
2016, this Decree imposes new registration requirements on overseas exporters of bulk commodities, including
inspections. After submitting detailed comments through the World Trade Organization in 2015, the United
States and the U.S. industry have repeatedly communicated concerns to Chinese officials regarding the Decree’s
potential implication on trade. Specific requirements contained in the Decree remain unclear and challenging to
adopt for major grain and oilseed exporting countries with complex supply chains. As of the date of this report,
10
the United States and other major trading partners continue to engage AQSIQ to ensure trade remains
uninterrupted while the registration process unfolds.
--USDA and AQSIQ Cooperation
In 2012, USDA and China’s AQSIQ signed a Memorandum of Understanding (MOU) to increase bilateral
cooperation in the inspection and quarantine of U.S. soybeans exported to China. As a result, USDA and AQSIQ
have conducted joint soybean vessel inspection programs first in March 2013 and two more in November 2014.
Information exchanges continued throughout 2015 and 2016 with additional joint programs envisioned as parties
deem necessary. These exchanges have increased understanding of inspection systems, quarantine standards,
procedures and testing methodologies in both countries. This bilateral cooperation in the areas of inspection and
quarantine has significantly facilitated U.S. soybean trade to China.
--The Impact of China-ASEAN Free Trade Zone on Oils Trade Remains Limited
The China-ASEAN Free Trade Agreement (CAFTA) was enacted on January 1, 2010. Under the Agreement,
import duties on more than 90 percent of goods imported to China from ASEAN countries were eliminated.
According to the 2016 Customs Import and Export Tariffs of China, the duties for palm oil, palm kernel oil, and
copra oil remain unchanged from the previous year at 9 percent. In general, Chinese imports of palm oil from
ASEAN countries are not expected to grow significantly given the ample supplies of lower-priced domestic
crushed soybean oil and rapeseed oil.
Marketing
China’s marketing of domestic soybeans remains unchanged. The majority of domestic soybeans are sold for
food processing and locally consumed. Traders sourcing soybeans from the four Northeastern provinces can
deliver products to other parts of China though rail and trucks. The marketing pace relies mostly on farmers’
expectations of soybean prices. China’s National Grain and Oilseed Information Center (CNGOIC) reported that
marketing of MY16/17 soybeans is faster than the previous year likely due to slight increase in price. The
purchase of domestic soybeans for crushing remains low (mainly in the four Northeastern provinces and Anhui
province). Total domestic production of 11.8 MMT is only slightly above the estimated 11.1 MMT of domestic
use of soybeans for food in MY15/16.
In many coastal provinces, the marketing of domestic soybeans for food use is also increasingly challenged by the
use of imported soybeans. Traders of domestic soybeans for food use are usually small to medium size operations
and face difficulty in consolidating soybeans from households and villages. Improved highway systems and
increased volume of trucked soybeans could facilitate redistribution but would do little to address lower domestic
supplies.
Rapeseed
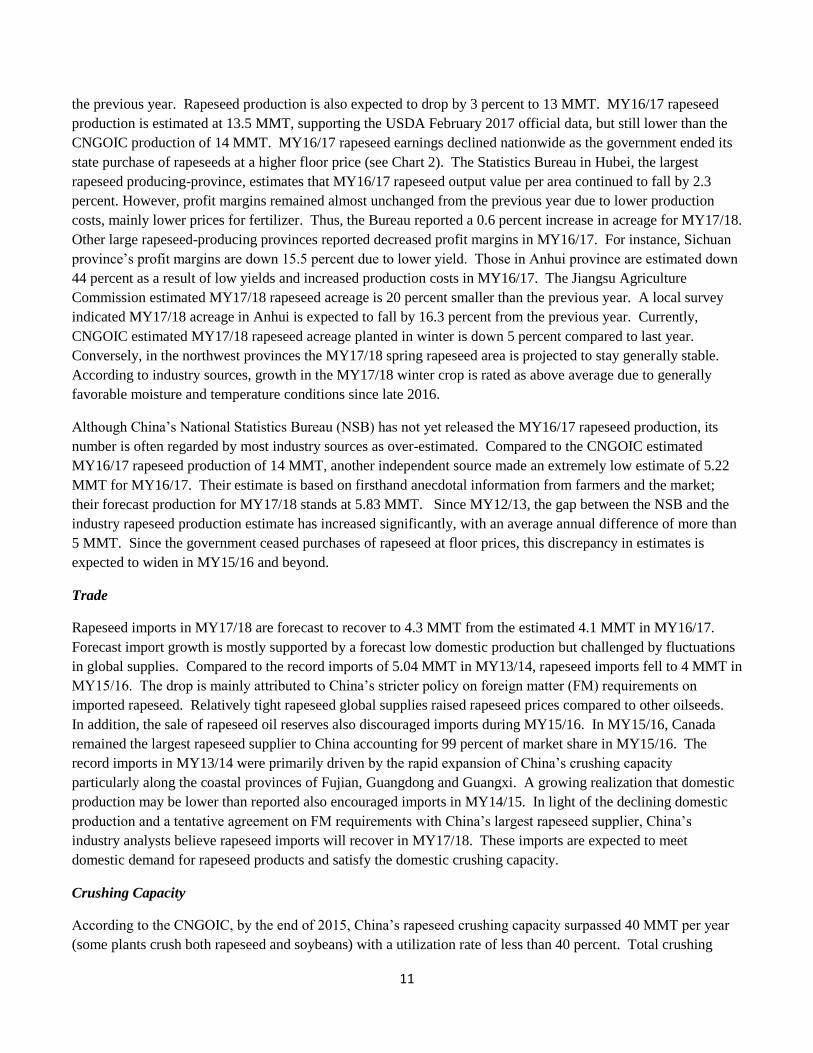
Production
China’s government continues to encourage rapeseed farming as it uses winter idle land and lessens the
competition for land with other grain crops. However, due to lower profits and the abolishment of the
government’s price support, the MY17/18 rapeseed area is forecast to fall by 3 percent to 6.8 MHa compared to
11
the previous year. Rapeseed production is also expected to drop by 3 percent to 13 MMT. MY16/17 rapeseed
production is estimated at 13.5 MMT, supporting the USDA February 2017 official data, but still lower than the
CNGOIC production of 14 MMT. MY16/17 rapeseed earnings declined nationwide as the government ended its
state purchase of rapeseeds at a higher floor price (see Chart 2). The Statistics Bureau in Hubei, the largest
rapeseed producing-province, estimates that MY16/17 rapeseed output value per area continued to fall by 2.3
percent. However, profit margins remained almost unchanged from the previous year due to lower production
costs, mainly lower prices for fertilizer. Thus, the Bureau reported a 0.6 percent increase in acreage for MY17/18.
Other large rapeseed-producing provinces reported decreased profit margins in MY16/17. For instance, Sichuan
province’s profit margins are down 15.5 percent due to lower yield. Those in Anhui province are estimated down
44 percent as a result of low yields and increased production costs in MY16/17. The Jiangsu Agriculture
Commission estimated MY17/18 rapeseed acreage is 20 percent smaller than the previous year. A local survey
indicated MY17/18 acreage in Anhui is expected to fall by 16.3 percent from the previous year. Currently,
CNGOIC estimated MY17/18 rapeseed acreage planted in winter is down 5 percent compared to last year.
Conversely, in the northwest provinces the MY17/18 spring rapeseed area is projected to stay generally stable.
According to industry sources, growth in the MY17/18 winter crop is rated as above average due to generally
favorable moisture and temperature conditions since late 2016.
Although China’s National Statistics Bureau (NSB) has not yet released the MY16/17 rapeseed production, its
number is often regarded by most industry sources as over-estimated. Compared to the CNGOIC estimated
MY16/17 rapeseed production of 14 MMT, another independent source made an extremely low estimate of 5.22
MMT for MY16/17. Their estimate is based on firsthand anecdotal information from farmers and the market;
their forecast production for MY17/18 stands at 5.83 MMT. Since MY12/13, the gap between the NSB and the
industry rapeseed production estimate has increased significantly, with an average annual difference of more than
5 MMT. Since the government ceased purchases of rapeseed at floor prices, this discrepancy in estimates is
expected to widen in MY15/16 and beyond.
Trade
Rapeseed imports in MY17/18 are forecast to recover to 4.3 MMT from the estimated 4.1 MMT in MY16/17.
Forecast import growth is mostly supported by a forecast low domestic production but challenged by fluctuations
in global supplies. Compared to the record imports of 5.04 MMT in MY13/14, rapeseed imports fell to 4 MMT in
MY15/16. The drop is mainly attributed to China’s stricter policy on foreign matter (FM) requirements on
imported rapeseed. Relatively tight rapeseed global supplies raised rapeseed prices compared to other oilseeds.
In addition, the sale of rapeseed oil reserves also discouraged imports during MY15/16. In MY15/16, Canada
remained the largest rapeseed supplier to China accounting for 99 percent of market share in MY15/16. The
record imports in MY13/14 were primarily driven by the rapid expansion of China’s crushing capacity
particularly along the coastal provinces of Fujian, Guangdong and Guangxi. A growing realization that domestic
production may be lower than reported also encouraged imports in MY14/15. In light of the declining domestic
production and a tentative agreement on FM requirements with China’s largest rapeseed supplier, China’s
industry analysts believe rapeseed imports will recover in MY17/18. These imports are expected to meet
domestic demand for rapeseed products and satisfy the domestic crushing capacity.
Crushing Capacity
According to the CNGOIC, by the end of 2015, China’s rapeseed crushing capacity surpassed 40 MMT per year
(some plants crush both rapeseed and soybeans) with a utilization rate of less than 40 percent. Total crushing

12
capacity remained generally stable in 2016. Given a declining domestic rapeseed supply, investors will have less
incentive to expand the crushing capacity further in MY16/17 and MY17/18.
Policy
Although some provinces still provide some limited subsidies to their rapeseed farmers, the government stopped
its price support for rapeseed production in MY15/16. Since then, rapeseed prices decreased dramatically. Prior
to MY15/16, government policies encouraged rapeseed production through a “minimum price purchase program”
and a direct seed subsidy. In MY14/15, the government maintained the rapeseed purchase floor price at
RMB5,100 ($822)/ton (see Chart 3). This price was significantly higher about RMB800 to 1,000/ton (or $130 to
$163/ton) than the price for imported rapeseed. Currently, the government maintains a planting seed subsidy of
RBM150 ($24)/Ha.
Citing phytosanitary concerns, China’s rapeseed import policy of restricting entry of imports to only non-rapeseed
producing regions remains unchanged. However, the establishment of rapeseed crushing plants in non-rapeseed
producing areas has minimized this policy’s impact on imports. Additionally, AQSIQ has reached agreements
with Russia and Mongolia on rapeseed imports for crushing.
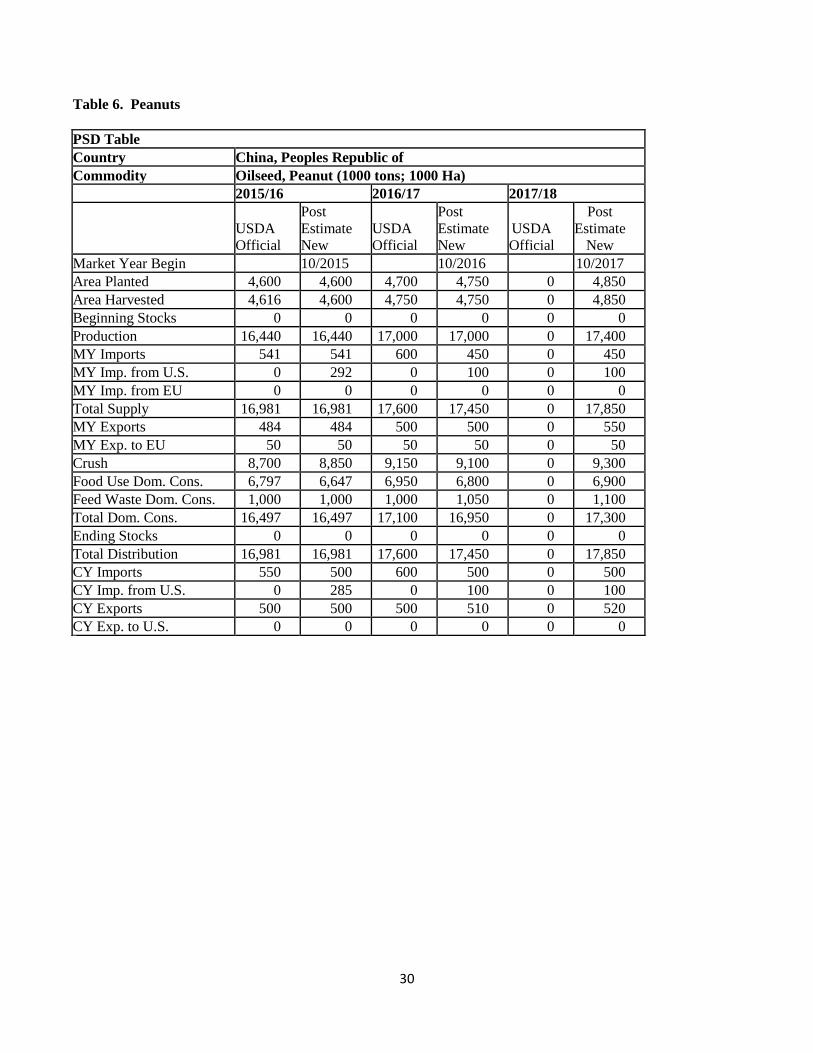
Peanuts
Production
MY17/18 peanut production is forecast at 17.4 MMT, slightly up from the estimated 17 MMT in MY16/17.
Similarly, CNGOIC estimated a higher production at 17.7 MMT for MY16/17. Driven by strong domestic
demand for peanut products, peanut farming has been the most profitable crop in many peanut-producing
provinces (namely Henan, Shandong and Hebei; see Chart 2). NSB’s released MY15/16 production stood at 16.4
MMT, similar to the previous year. In 2016, peanut production appeared to lag behind demand, driving the
domestic peanut price high and triggering more than half million tons of imports in 2016. A steady growing
demand for peanut products both as food (various snacks and milk etc.) and for cooking (oil) will encourage the
expansion of peanut acreage. However, additional gains are constrained by limited land resources.
Top Five Peanut Producing Provinces (Area: 1,000 Ha & Prod: 1,000 tons)
MY MY14/15 MY15/16 MY16/17
Area Production Area Production Area Production
Henan 1,058 4,713 1,075 4,853 1,120 5,020
Shandong 755 3,313 740 3,194 800 3,520
Hebei 353 1,292 343 1,274 375 1,380
Guangdong 357 1,030 366 1,090 370 1,065
Anhui 190 944 191 944 200 960
Nation 4,603 16,482 4,616 16,440 4,850 17,700
Nation Yield 3,581 3,562 3,649
13
Kg/Ha
Note: Data based on CNGOIC
Trade
--Imports
In MY15/16, China’s peanut imports (primarily for crushing) skyrocketed to a record 541,000 tons compared to
161,000 tons in MY14/15 and 74,000 tons in MY13/14. The surge is primarily due to more advantageous prices
for imported peanuts. Imports of peanuts for food use remain low due to sufficient domestic supplies.
Senegal is China’s main peanut supplier as it is exempted from Chinese import duties. Senegal peanut prices also
remain very competitive compared to other suppliers such as Argentina, India and the United States. In
MY15/16, Chinese imports of shelled peanuts were 202,000 tons. Senegal supplied 59.5 percent of all shelled
peanuts followed by Argentina supplying 22.5 percent. Chinese imports of in-shell peanuts were 272,000 tons,
primarily from the United States. Industry sources report that the import boom is mainly driven by price. Senegal
shelled peanuts stood at about $840/ton while U.S. in-shell peanuts from the United States averaged at about
$550/ton. By comparison, China’s price for peanuts/shelled for oil crushing ranging from RMB8,400
($1,270/ton) to 8,700 ($1,320)/ton. These imports remain competitive compared to domestic supplies even after a
combined 15 percent import duty and 13 percent VAT. Imports of U.S. in-shell peanuts slowed from October to
December 2016 but rebounded to 16,800 tons in January 2017 (with the unit price increased only slightly). The
rebound was likely as a result of a Chinese trader’s trip to the United States in October 2016. China’s total
imports of shelled peanuts stood at 16,000 tons during the first 4 months of MY16/17 down from the 23,000 tons
in the previous year.
The majority of imported peanuts are crushed for oil. A small percentage may be used for food/snacks provided
the product meets quality requirements. Peanut import shipments usually decline during July through September
as the crushers try to avoid crushing during the hot season to guarantee the quality of the oil. Industry traders
speculate that during the past two marketing years, higher domestic peanut prices may be indicative of a slightly
lower peanut production than what is officially reported. It is too early to tell whether the recent upward pressure
on domestic prices is in fact a result of tighter supplies or an increase in domestic demand.
China’s imports of peanut oil continued high at 113,400 tons in MY 15/16 from the average 70,000 tons prior to
MY14/15. Peanut oil imports are forecast at 100,000 tons for MY16/17, and forecast to stay unchanged in
MY17/18 (equivalent to 315,000 tons of in-shell peanuts). Notwithstanding, peanut imports could potentially
increase as Chinese crushers prefer to import seeds to crush rather than import peanut oil.
In general, the share of imported peanuts remains small compared to China’s overall consumption. China’s
overall demand for peanut products supports relatively higher imports. However, peanut imports could fall
significantly if the price gap between domestic and global prices fails to offset the duty and VAT. Given the
forecast increase in domestic peanut production, it is unlikely that imports of peanuts will sustain the record levels
seen in MY15/16. Correspondingly, Post estimates peanut imports will level off at 450,000 in MY16/17 tons and
forecast to stay unchanged for MY17/18.
--Exports
14
Chinese peanut exports are expected to grow to 550,000 tons in MY 17/18 from the estimated 500,000 tons in
MY16/17. Exports totaled at 484,000 tons in MY15/16. A slight growth in production may strengthen exports in
search for better profits. However, strong domestic demand together with strict import conditions in some major
export markets will impede any significant growth in exports.
Policy
Beginning in MY 10/11, in an effort to stimulate production and improve the domestic self-sufficiency rate for
vegetable oil, the Chinese government implemented a planting seed purchase subsidy program for peanuts of
about RMB150 ($24)/Ha. This policy is expected to continue in MY17/18. As mentioned above, the
government’s reduced price support for grain and cotton appear to have encouraged additional peanut acreage in
MY17/18 in some regions.
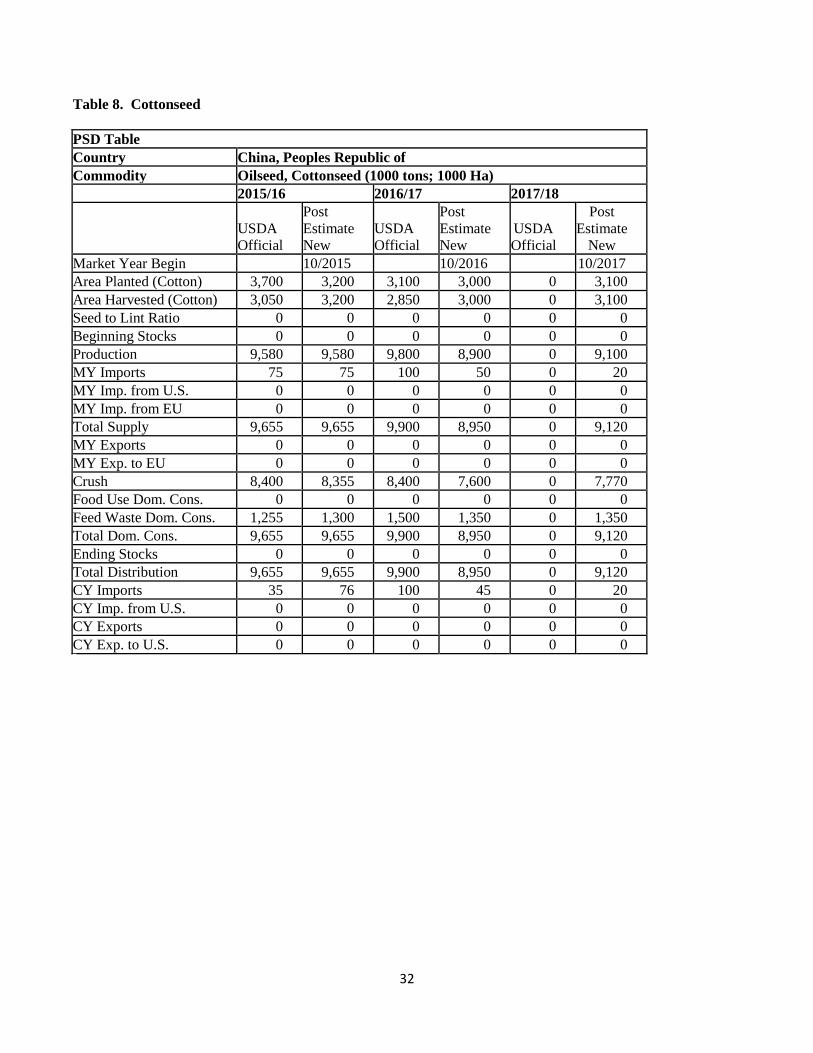
Cottonseed
Production
Cottonseed production in MY17/18 is forecast to increase to 9.1 MMT, up from the estimated 8.9 MMT in the
previous year. MY17/18 cotton planting area is expected to increase by 3.3 percent from the previous year in
response to an increase in domestic cotton prices resulting from moderately recovered profits in MY16/17. Since
MY14/15, the government replaced a four-year-old “minimum price cotton purchase program” with a “target
price-based direct subsidy.” The new policy, however, favors farmers in Xinjiang over farmers in the Yangtze
River and Yellow River regions. Hence, the cotton planted area declined sharply MY15/16 and MY16/17,
particularly in the Yangtze River and Yellow River regions.
Post forecast MY17/18 cotton acreage is 3.3 percent higher than the previous year. A Chinese leading industry
survey showed that in MY16/17 there was a slight decrease in production costs both in Xinjiang and other cotton
–producing provinces despite a slight increase in land rental prices. Most industry insiders believe that in
MY16/17, cotton profits improved nationwide compared to the previous year, and were even higher in the Yellow
River Region compared to other competing crops such as corn and soybeans. This improvement in cotton profits
is attributed to the fact that the majority of cotton planting is done in self-owned land and that cotton seed prices
increased. In addition, cotton remains the most reliable and safe cash crop in Xinjiang while in all other provinces
cotton is only planted in those regions where cotton has been traditionally planted and profits from alternative
crops tend to be low. A preliminary planting intention survey conducted by an industry source indicated that
MY17/18 cotton acreage is up 2.2 percent from the previous year. Another source’s survey results showed cotton
planting intentions recovered in all three cotton-producing regions in MY17/18, specifically Xinjiang up 4
percent, the Yangtze River region up 3.5 percent, and the Yellow River region up 1.4 percent, respectively.
Trade
China’s domestic cotton seed production continues to fall but total volume remains comparatively high.
Nonetheless, increased uses for cottonseed, such as in mushroom farming, have supported cottonseed imports
since MY13/14. Given the adequate supply of other oilseed products at competitive prices, sporadic imports of
cottonseed may continue in MY16/17 and MY17/18. Imports of U.S. cottonseed must complete a Pest Risk
Assessment before gaining access to the Chinese market. Currently, USDA continues to engage China’s import
authority on this process.

15
Other oilseeds
Camellia planting in southern provinces is booming. In the 13th Five Year Development Plan for Oilseeds,
China’s government set a target to increase the camellia planting area to 4.67 MHa by 2020 from the estimated
3.65 MHa in 2014, and increase the camellia oil supply to 1 MMT by 2020 from the estimated 500,000 tons in
2014. The plan also proposes to develop woody oilseed plants in 800 counties and increase planted area to 13.3
MHa from the current 8 MHa. Woody oilseed plants include camellia, walnut, and oil peony. Grown mainly on
hilly lands in southern provinces of Hunan, Jiangxi and Guangxi, these woody plants pose no competition for
arable land. Industry sources estimate total camellia oil production continued on a growing trend during 2015 and
2016. However, no official data is available. The annual target increase of 100,000 tons for camellia oil supply,
together with oil from other woody plants, satisfies high-end consumers’ demand and could reduce the growth of
China’s imports of oilseed products.
Oilseed Meal Situation and Outlook
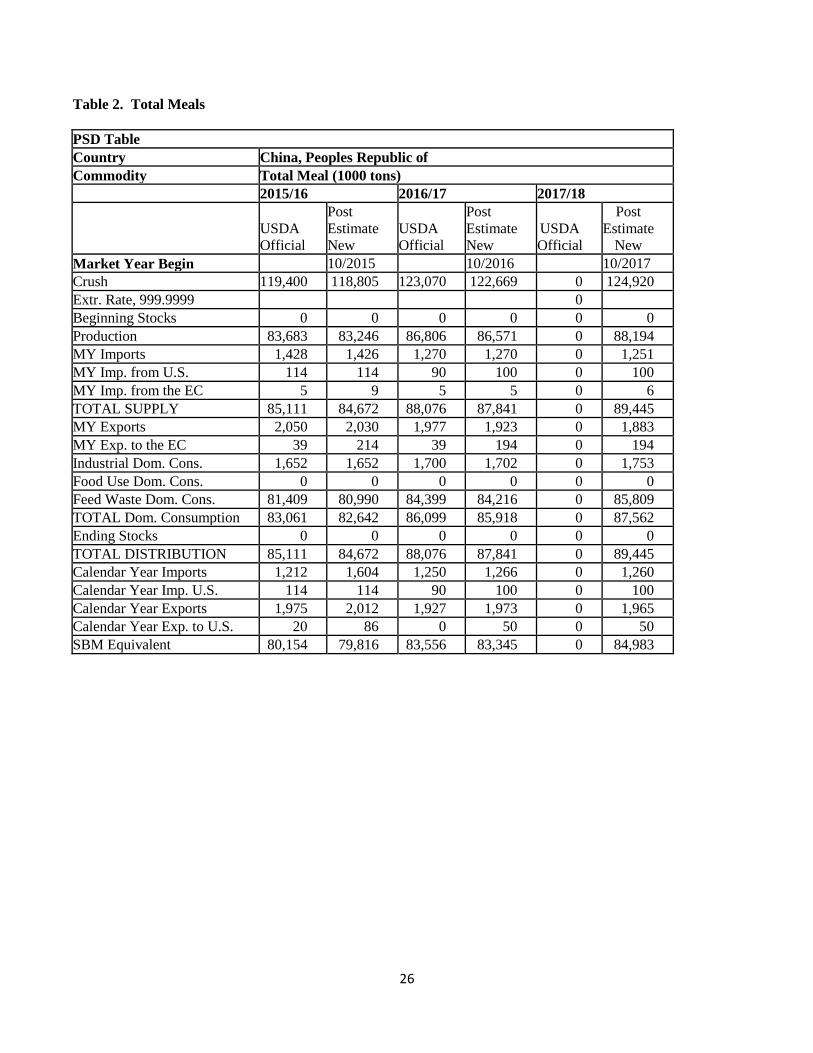
Total Meals
MY17/18 protein meal (including fish meal) production is forecast at 88.2 MMT, up 1.9 percent over the 86.6
MMT during the previous year. This rise is attributable to the increased crushing of imported soybeans.
MY17/18 total protein meal supply is forecast to reach 89.4 MMT. This forecast includes 1 MMT of meal
imports, primarily fish meal.
Total protein meal consumption in MY17/18 is forecast at 87.6 MMT, up 1.64 MMT or 1.9 percent over
MY16/17 due to steady demand for industrialized feed from the livestock and aquaculture sectors. (MY17/18 all
protein meal use converted into soybean meal/SBM equivalent is 85 MMT, up 2 percent over the 83.3 MMT in
MY16/17). The estimated 66.3 MMT soybean meal (SBM) use for MY16/17, which is 4 MMT or 6.4 percent
up from the previous year, is partly to substitute a forecast large supply gap of DDGS as a result of China’s high
anti-dumping duty on U.S. imports imposed since January 2017. China’s DDGS imports averaged over 5 MMT
per year in recent 3 years. SBM will continue to dominate the protein meal use in MY17/18, accounting for 77.4
percent of total meal consumption followed by rapeseed meal at 11.9 percent and peanut meal at 4.3 percent.
Consumption Outlook
In general, China’s high GDP growth (up 6.7 percent in 2016) continues to increase per capita disposal income
and boosting demand for more and better quality animal products. The NSB reports that in 2015, China’s urban
per capita consumption of animal products stood slightly higher at 63.5 Kg and milk consumption at 17.1 Kg. On
the other hand, in rural areas per capita consumption of animal products was significantly lower at 45.7 Kg and
milk consumption at 6.3 Kg. Nevertheless, Chinese meat consumption is still less than nearby markets such as
Taiwan, whose combined per capita consumption of pork and poultry reached 71.2 Kg in 2011 (Taiwan Grain and
Feed Annual 2013). Additionally, potential increases in protein consumption among the 589.73 million people
living in rural areas (out of the total population of 1.3 billion by 2016) open opportunities for higher demand for
protein meal.
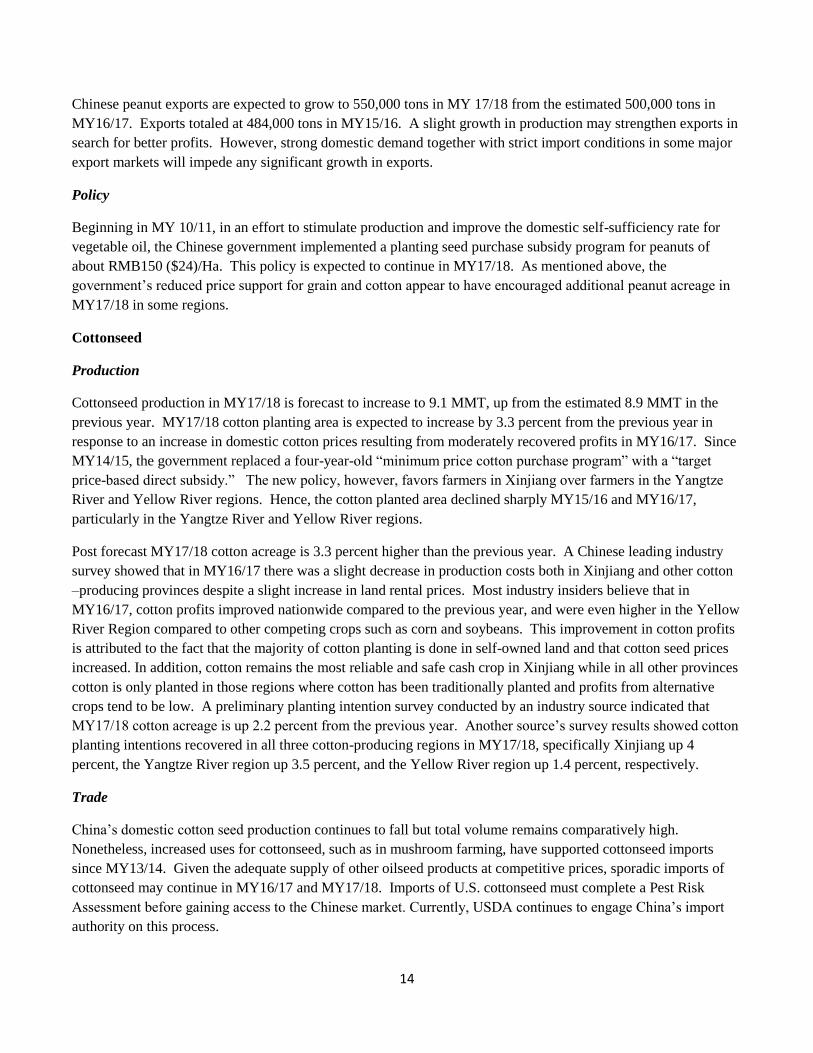
Chart 6 - Comparison of Urban and Rural per Capita Consumption
of Animal Products and Milk (in Kg)
16
Source: Table 6-9 and 6-14 2016 China Statistical Yearbook; Note: AP refers animal products which include pork, beef and mutton,
poultry, fresh eggs, aquatic products for Urban, and pork, beef, mutton, poultry, egg and processed products and aquatic products
The overall increase in demand for meat and seafood is also fueled by population growth and urbanization.
According to the NSB, from 2011 to 2015, China’s average annual net population growth was 6.8 million. The
government’s amendment to the “one child policy” in 2016 pushed net population growth to 8.09 million in 2016
and this trend is expected to continue in 2017 and beyond. Additionally, rapid urbanization continues with annual
urban population growth averaging 20.1 million from 2011 to 2015 and 21.82 million new urban residents added
in 2016. Greater demand for meats and seafood will continue to fuel animal production and the need for feed.
Potential growth along the value chain signals encouraging prospects for oilseed meals in the coming years.
MOA estimates China’s animal production growth will continue but at a lower rate during the coming years along
with a slower GDP growth rate (compared to before 2015) and an increasingly aging population. Given a
significant increase in production cost and environmental concerns, the priority for MOA and the industry is to
upgrade productivity, efficiency, and quality. The following table shows China’s rapid expansion of animal scale
farming in recent years and MOA’s target by 2020. MOA estimated the overall animal scale farming rate
averaged about only 40 percent in 2015 and plans to raise it to 50 percent by 2020.
China’s Animal Scale Farming Share and Development Target (2005 -2020)
Percentage out of total farms Scale swine farms Scale poultry farms Scale dairy/cattle farms
2020 52%
2015 50% (est) 92% 45.2%/27.5%
2010 34% 82% 28%
2005 16% 66% 11% Source: MOA; Note: Swine scale farming refers to farm with yearly slaughtered 500 pigs or more; dairy farm with inventory of 100 or
above; cattle farm with yearly slaughtered 50 or above
Steady growth and advancement of the animal production sector continues to drive industrialized feed production.
The table above shows MOA’s 13th Five Year (2016-2020) Agriculture Development Target for animal product
by 2020. Specifically, by 2020 all meat, milk and cultured aquatic production is targeted to reach 90 MMT, 41
MMT and 52.4 MMT, respectively. This requires an average annual growth rate at 4.3, 5.9 and 6 percent from
the 2015 production level. While MOA’s egg production is targeted at about 30 MMT by 2020, the NSB data for
2016 has already hitting 30.95 MMT. MOA’s 13th Five Year Feed Industry Development Plan (2016-2020) set a
target feed production of 220 MMT by 2020 with annual growth of 4 MMT from 2016 through 2020. Given the
poultry sector’s industrialized feed utilization rate exceeding 90 percent, major feed demand growth will be driven

17
by increasing scale farming for swine and ruminant animals. To achieve the target for animal products, MOA’s
forecast for newly added demand for protein meal is 1 to 1.25 MMT per year during 2016 to 2020.
Chart 7 - Production Data of Major Animal Products and Feed
(2011 to 2016; in MMT)
Source: NSB and MOA; 2016 feed and aquatic production estimated by Post
CNGOIC’s estimate for 2016 compound feed production is down 0.5 percent to 173.1 MMT compared to the
previous year, while concentrate feed is up 1.5 percent to 19.9 MMT. Based on CNGOIC estimates and
converting the concentrate into its compound feed equivalent, total feed production is 272.6 MMT, slightly higher
than 2015. Over the last two years, feed production has been affected by weak feed consumption. Since 2013,
an outbreak of animal diseases and negative swine profits lowered the inventory of sows and swine through 2016.
The government’s strict environmental regulations further contributed to the significant fall in swine/sow
inventory in eastern provinces. Media reported more than 20 provinces/municipalities (including Guangdong,
Zhejiang, Shanghai, Fujian, Hubei and Anhui etc.) have implemented measures by establishing “non-animal
farming zones” or intensified waste treatment supervision. This forced the closure or relocation of animal farms in
these regions in 2016. As result, swine inventory fell by 8 percent or 36 million heads last year. Most of the new
swine farming capacity is expected to be added in the four Northeastern provinces. It is also reported that the
“Environmental Protection Taxation Law” passed at the end of 2016 will require animal farms of a certain scale
(yearly slaughtered pigs of 500 or above for a scale swine farm) to pay an environmental protection tax starting in
2018. If enforced, this tax will further increase costs in swine farming. Despite sustained high swine profits since
October 2015, swine inventory recovered slower than expected. This is also reflected in the NSB pork data
highlighting a continuous fall in pork production from the 56.71 MMT in 2014 to the 54.87 MMT in 2015, and
the 52.99 MMT in 2016. Conversely, NSB data for 2014 to 2016, showed steady growth in egg, poultry meat,
and cultured aquatic production.
However, driven by high swine profits, the swine sector is expected to add sow and inventory, and pork
production is also expected to recover in 2017. Industry insiders believe that by the end of 2016, sow restocking
was almost completed adding a supply of piglets for 2017. Positive swine profits will continue but likely to fall to
RMB300 ($45)/head. Investment in large-scale swine production is popular leading to more demand of
industrialized feed. In addition, traditional small-scale operations are phasing out the use of self-mix feed for
alternative feeds to improve productivity and efficiency. Total SBM inclusion in feed is expected to strengthen
along with the growth of industrialized feed production.
18
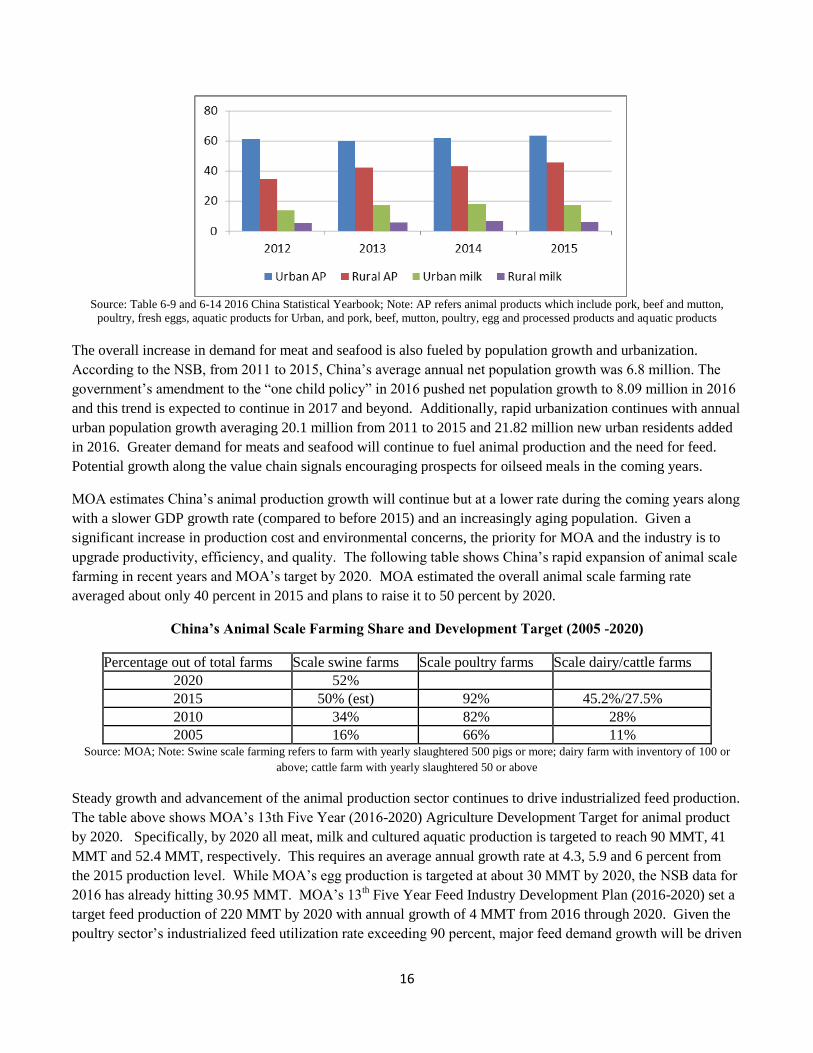
Chart 8 - Swine Profit Margins (Oct 2015 to Feb 2017; RMB/Head)
Source: ChinaJCI Daily Report; Daily Average of the 20th of Every Month;
Exchange rate: $1= RMB6.6
Despite the ups and downs in China’s animal production sectors in recent years, total yearly feed production
trended upward which might partly be explained by the restructuring and advancing of the animal and feed
production sectors. Post expects the feed production growing trend to sustain in 2017.
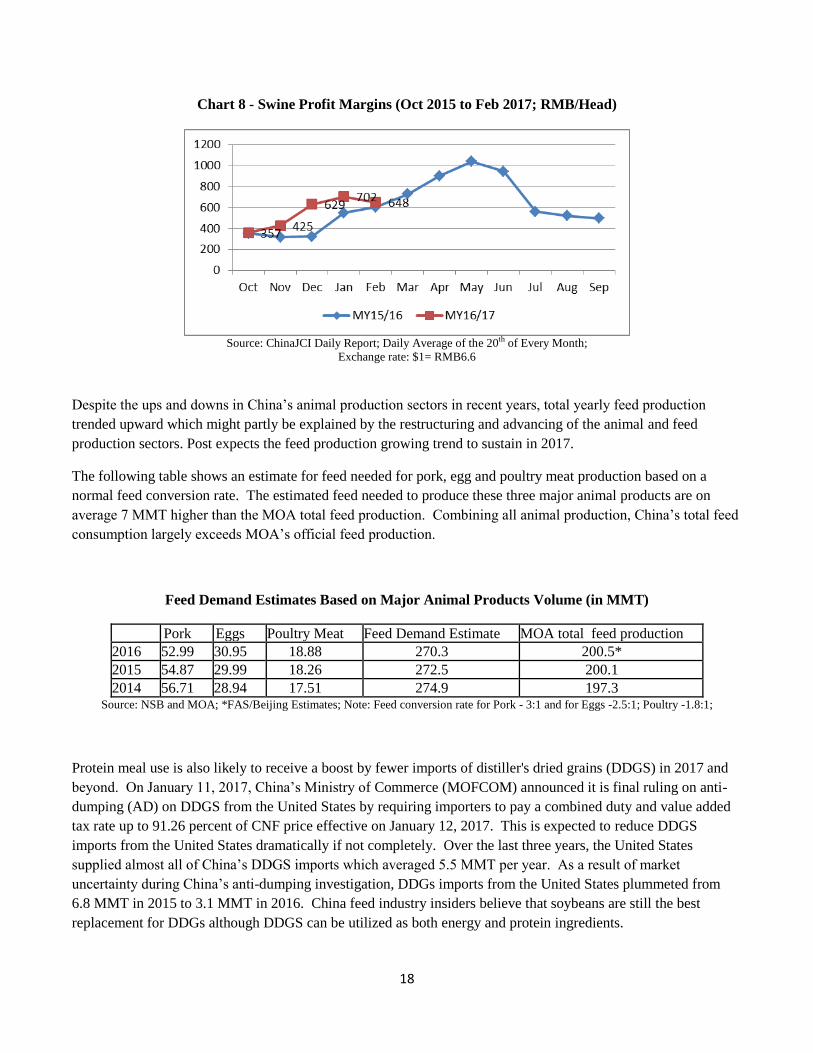
The following table shows an estimate for feed needed for pork, egg and poultry meat production based on a
normal feed conversion rate. The estimated feed needed to produce these three major animal products are on
average 7 MMT higher than the MOA total feed production. Combining all animal production, China’s total feed
consumption largely exceeds MOA’s official feed production.
Feed Demand Estimates Based on Major Animal Products Volume (in MMT)
Pork Eggs Poultry Meat Feed Demand Estimate MOA total feed production
2016 52.99 30.95 18.88 270.3 200.5*
2015 54.87 29.99 18.26 272.5 200.1
2014 56.71 28.94 17.51 274.9 197.3 Source: NSB and MOA; *FAS/Beijing Estimates; Note: Feed conversion rate for Pork - 3:1 and for Eggs -2.5:1; Poultry -1.8:1;
Protein meal use is also likely to receive a boost by fewer imports of distiller's dried grains (DDGS) in 2017 and
beyond. On January 11, 2017, China’s Ministry of Commerce (MOFCOM) announced it is final ruling on anti-
dumping (AD) on DDGS from the United States by requiring importers to pay a combined duty and value added
tax rate up to 91.26 percent of CNF price effective on January 12, 2017. This is expected to reduce DDGS
imports from the United States dramatically if not completely. Over the last three years, the United States
supplied almost all of China’s DDGS imports which averaged 5.5 MMT per year. As a result of market
uncertainty during China’s anti-dumping investigation, DDGs imports from the United States plummeted from
6.8 MMT in 2015 to 3.1 MMT in 2016. China feed industry insiders believe that soybeans are still the best
replacement for DDGs although DDGS can be utilized as both energy and protein ingredients.

19
Except for fish meal, protein meal trade has been unstable in recent years. Sporadic imports/exports of some
protein meals will continue in the foreseeable future. Both feed mills and crushing plants may choose to trade
between nearby countries rather than domestic provinces to regulate the regional supply/demand. The difference
in market prices, cost effectiveness, and more importantly ease of transport are factors impacting trade decisions.
With the exceptions of SBM exports, total trade volume of other oilseed meals are expected to be insignificant in
China’s huge protein meal matrix.
Soybean Meal
Production
Soybean Meal (SBM) continues to dominate the protein meal complex with MY17/18 production forecast at 69.5
MMT, up 2.1 percent over the estimated 68.1 MMT in MY16/17. MY17/18 SBM consumption is forecast at 67.8
MMT from the 66.3 MMT in the previous year. It is worth noting that the high net growth of 4 MMT in SMB
consumption in MY16/17 compared to the previous year is primarily prompted by the expected shortage of
DDGS supplies. Other protein meal production remains stagnant. Imports of fish meal are constrained by limited
supplies and relatively high prices. Imports of other meals are not attractive due to their relatively low price to
nutrition value coupled with adequate domestic SBM supplies. SBM price trended upward in 2016 with
December prices up 25 percent from January despite the record soybean imports and crushing volume. This
signals that SBM demand continues to be strong.
Chart 9 – 2016 China’s Monthly Average Wholesale Price for Major Protein Meals (RMB/ton)
Source: China JCI; Exchange Rate: $1=RMB6.6
Trade
In MY17/18, China’s SBM exports are expected to stay relatively stable but down slightly from last year at 1.8
MMT from the estimated 1.85 MMT in MY16/17. SBM exports recovered in MY13/14 driven by China’s large
crushing capacity and excessive production. This increased the feasibility for exports to nearby markets such as
Japan, Vietnam and Korea. Chinese SBM exports will continue in limited volume as crushing plants/traders take
advantages of the differences in price and delivery distance with foreign markets. Chinese SBM imports have
been minimal in recent years because of its large domestic SBM production. In general, SBM trade remains
insignificant in proportion to China’s large domestic consumption.
20
Rapeseed Meal
Post’s forecast for MY17/18 rapeseed meal imports is 200,000 tons, unchanged from the MY16/17 estimate but
lower than the 359,000 tons in MY15/16 (likely due to a fall in rapeseed imports). Domestic rapeseed meal
consumption continues to be driven primarily by the growing aquaculture sector. Rapeseed meal imports will
continue but at a lower level as China’s large rapeseed crushing industry favors rapeseed imports instead of
rapeseed meal. Rapeseed meal exports remain small and in general rapeseed meal trade insignificant.
Fishmeal
Production
Post’s MY17/18 forecast for China’s domestic fishmeal production stands at about 0.44 MMT. Industry sources
differ regarding the data on domestic fish meal production as the statistics can be based on different raw materials
used and quality.
Imports
Fishmeal imports are projected at 1 MMT for MY17/18, unchanged from the MY16/17 estimate. This reflects
China’s average consumption level for fish meal by the large and expanding aquaculture sector and small
domestic fishmeal production. China’s fish meal import growth is increasingly constrained by a stagnant global
fish meal supply and strengthening price. During 2016, Peru remained China’s largest fishmeal supplier at
436,000 tons and accounted for 41.8 percent of China’s total fish meal imports. Imports from the United States in
2016 rose from the 91,900 tons in 2015 to 114,000 tons, most likely due to tight supplies in other countries.
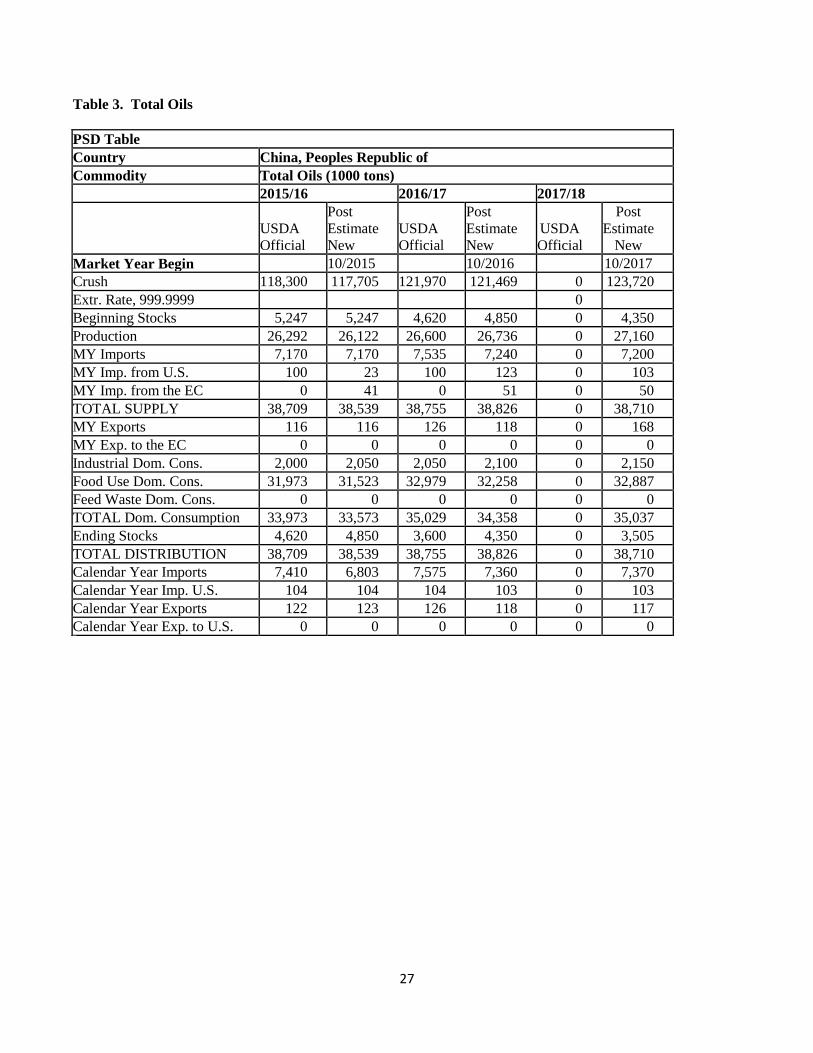
Oil Situation and Outlook
Post’s MY17/18 forecast for total vegetable oil consumption is up 2 percent (a net growth of 679,000 tons) to 35
MMT compared to the previous year. As mentioned above, China’s 6.7 percent GDP growth in 2016 and forecast
6.5 percent growth in 2017 continues is expected to increase consumers’ disposable income. Fast urbanization
and population growth will also fuel demand for more vegetable oil. NSB statistics show that in the recent three
years, vegetable oil consumption for urban consumers grew slightly. However, annual per capita vegetable oil
consumption in rural areas is still 1.4 Kg lower than in urban areas. Despite the government’s restrictions on
hosting banquets/meals, in 2016 China’s catering industry revenue grew 6.7 percent over the previous year.
Growth in consumption of vegetable oils among rural residents and more consumers dining out are expected to
encourage demand for more vegetable oils in 2017 and beyond.
MY17/18 total oil supply is forecast at 38.7 MMT, similar to the estimated level in MY16/17. Given the
increased use of imported soybeans and rapeseeds for crushing, total vegetable oil production for MY17/18 is
forecast at 27.2 MMT, up 1.6 percent from the MY16/17 estimate. In MY17/18, soybean oil will continue to be
the primary vegetable oil in China, accounting for 57.8 percent of total oil production, followed by rapeseed oil
(24.8 percent) and peanut oil (10.9 percent). It is worth noting that China’s combined production of specialty oils,
including camellia oil and sesame oil and other small oil such as corn oil and rice oil, is increasing along with
diversified consumer demand. As a result, specialty oils are gaining market share from other vegetable oils.
21
In MY17/18, domestic consumption of oil for food-use is forecast to grow 1.9 percent to 32.9 MMT from
MY16/17. Similarly, domestic consumption of oil for industrial use (e.g. cosmetics, feed, etc.) is forecast to
increase by a steady 2.4 percent to 2.15 MMT in MY17/18.
MY17/18 total oil imports are forecast at 7.2 MMT, slightly down from the previous year. In general, adequate
availability of domestic vegetable oil will hinder import growth of vegetable oils. However, this is not the case
for specialty oils such as palm oil (not produced domestically), sunflower seed oil (domestic supply limited) and
olive oil. Palm oil continues to dominate vegetable oil imports and is forecast to be stable at 5 MMT in MY16/17
and MY17/18. Growth in palm oil imports is increasingly impacted by stagnant demand from the instant noodle
industry, and adequate supplies of other vegetable oils at more competitive prices.
Taking into account the strong forecast for imports of soybeans and rapeseed, in MY17/18 imports of both
soybean oil and rapeseed oil are forecast at 500,000 tons and 610,000 tons, respectively. Imports of soybean oil
and rapeseed oil are not expected to lead imports but only to make up supply differences when prices for imported
oil are competitive.
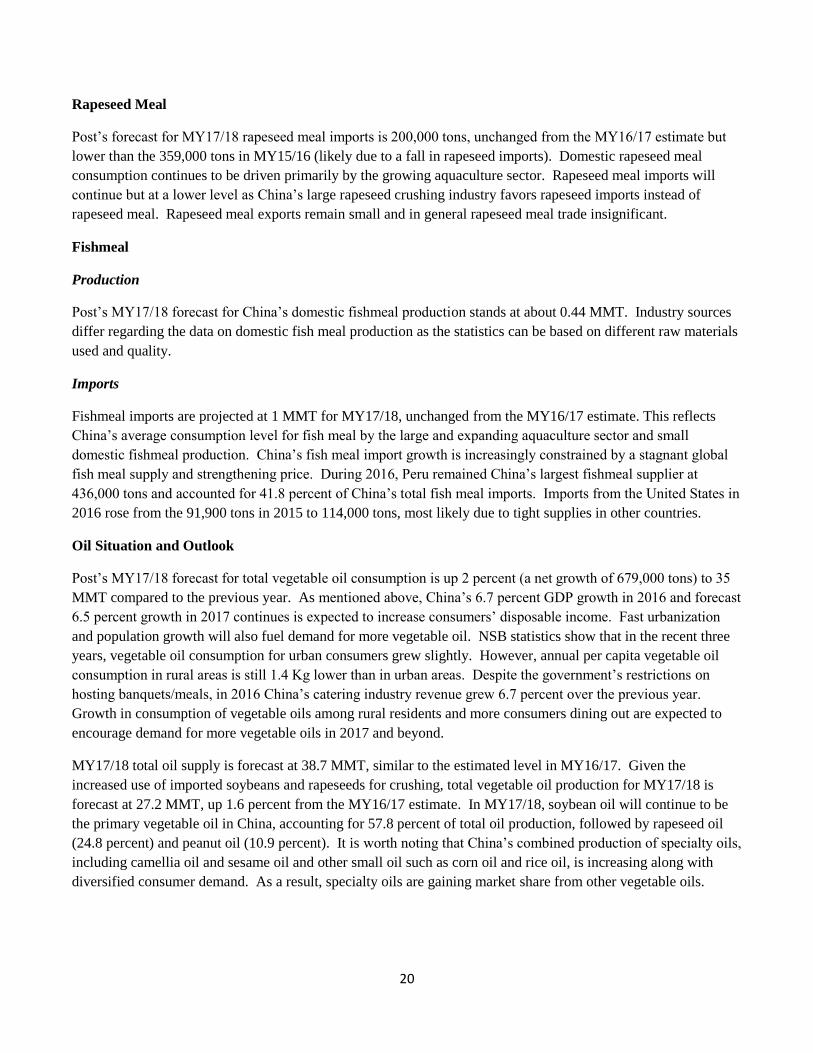
The wholesale price for major vegetable oils increased rapidly towards the end of 2016. The price difference
between palm oil and soy oil (Grade1) narrowed to 8 percent in December 2016 compared to 23 percent in
January 2016. Palm oil consumption could be constrained as there is less incentive for blending palm oil with
other oils as “salad oil.”
Chart 10 – 2016 Wholesale Price for Major Vegetable Oils (RMB/ton)
Source: China JCI
It is should be mentioned that forecasting trends in China’s vegetable oil market remains a challenge given the
differing data on domestic rapeseed production and the unknown volume of vegetable oil reserves. In recent
years, some industry sources estimate the actual yearly production of rapeseed to be several million tons lower
than the official number in recent years. Based on currently available data, the forecast for China’s per capita
vegetable oil consumption in MY16/17 appears to have reached the level of more industrialized economies such
as Taiwan. This appears to be an overestimation and not necessarily an accurate representation of the actual
market situation. If the volume of domestic rapeseed continues to be overestimated, forecasting China’s
vegetable oils trends will present an even greater challenge in the coming years. Based on a CNGOIC report, the
government sold 1.88 MMT out of the estimated 6.4 MMT of rapeseed oil reserves from October 2016 to the end
of February 2017. From time to time, the government rotates (purchases or sells) oil reserves to regulate the
22
domestic vegetable oil supply and price. As a result of government’s sale of vegetable oil reserves, total
vegetable oil stocks are expected to fall to 3.5 MMT by the end of MY17/18. As the reserves continue to age,
there will be more pressure for the government to hold auctions more frequently. This may create further
uncertainty in the Chinese vegetable oil market in 2017.
Soybean Oil
As a result of increased crushing of imported soybeans, MY17/18 soybean oil production is forecast at 15.7
MMT, up 2 percent from last year’s estimate. Soybean oil remains the dominant vegetable oil, and will account
for 45.7 percent of domestic vegetable oil consumption in MY17/18. However, soybean oil consumption growth
is affected by consumer’s sensitivity regarding biotechnology despite government assurances on the safety of all
approved biotech products.
In MY17/18, soybean oil imports are forecast to be weak at 500,000 tons due to adequate domestic production.
Imports of U.S. soybean oil are expected to be 100,000 tons in MY17/18.
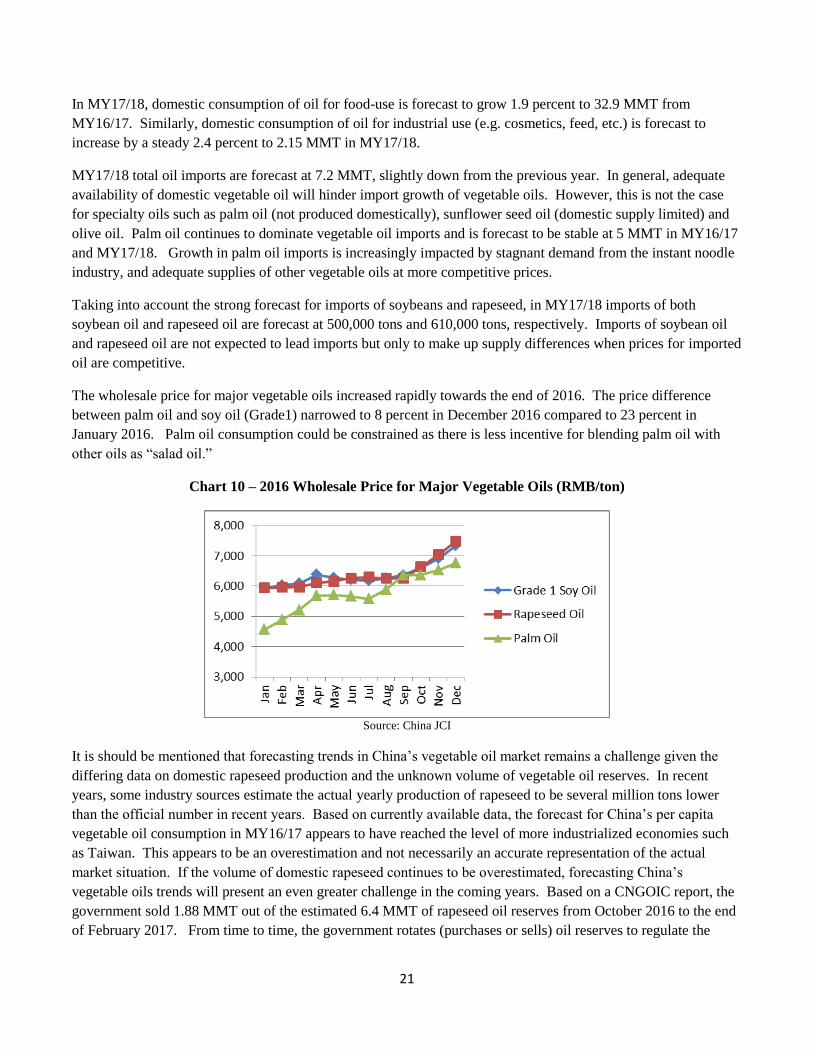
Palm Oil
MY17/18 palm oil imports are forecast at 5 MMT, unchanged from the previous year estimate. This level is
higher than MY15/16 as a result of increased global supplies which may lead to more favorable prices. China’s
palm oil imports peaked in MY12/13 at 6.59 MMT in response to lower prices. Palm oil imports fell in MY15/16
given relatively tight supplies and an increasing supply of competing vegetable oils at competitive price in China
market.
Chart 11 - China’s Palm Oil Imports by Country of Origins (2011-2016; MMT)
Source: Global Trade Atlas
With increases in palm oil prices, the blending of palm oil with other vegetable oils for cooking also decreases.
As mentioned above, the food processing industry in China uses large amounts of palm oil in processed foods,
especially instant noodles. However, due to more choices for consumers, China’s rapid growth of instant noodle
production has leveled off since 2014 and the 2015 production was down by 8.54 percent compared to the
previous year. Instant noodle production for 2016 is not available but unlikely to grow. Taking into account the
saturated instant noodle market, further expansion of palm oil use by the instant noodle industry is unlikely in the
near term.
23
Changes in Vegetable Oil Import Policy
On January 1, 2013, AQSIQ implemented additional import inspection requirements for edible and crude
vegetable oils. AQSIQ’s clarification on specific items to be certified and the laboratories qualified for providing
such test reports and certificates remains vague (see more in CH13005). However, as of this report, there are no
alerts of trade disruptions related to this issue.
AQSIQ Notice Soliciting Comments on the “Administrative Measures for Foreign Food Importer’s Review and
Inspection of Overseas Enterprises”
Under China’s 2015 Food Safety Law, there are new requirements instructing importers to review relevant
documents provided by their foreign suppliers (exporters and producers). Correspondingly, in 2015, AQSIQ
issued a draft measure suggesting that the imported food products that fall in seven designated categories must
have on-site inspection. Hence importers are required to conduct on-site inspection of the exporters as well as
producers. The draft also recommends punishment in the case of importers’ failure to comply with the outlined
requirements. The “Catalogue of Products that Must Have On-site Inspection” includes bulk vegetable oil among
other products. Details on the draft remain vague but Chinese authorities have indicated that this will likely affect
all vegetable oils imports including crude and consumer-ready oils. As of this report, AQSIQ has not finalized
the draft and has not notified the World Trade Organization of this measure. Post continues to monitor this
development.

24
Statistics Tables
Total Oilseeds, Total Meal, and Total Oil PSD Tables
Table 1. Total Oilseeds
PSD Table
Country China, Peoples Republic of
Commodity Total Oilseeds (1000 tons; 1000Ha)
2015/16 2016/17 2017/18
USDA
Official
Post
Estimate
New
USDA
Official
Post
Estimate
New
USDA
Official
Post
Estimate
New
Market Year Begin 10/2015 10/2016 10/2017
Area Planted 15,830 22,642 14,940 22,980 0 23,300
Area Harvested 22,742 22,642 22,740 22,980 0 23,300
Beginning Stocks 18,601 18,601 18,424 18,193 0 16,179
Production 55,434 54,803 55,710 55,300 0 56,250
MY Imports 87,931 87,931 90,370 90,670 0 93,845
MY Imp. from U.S. 28,500 29,202 30,000 30,100 0 30,100
MY Imp. from the EC 0 0 0 0 0 0
TOTAL SUPPLY 161,966 161,335 164,504 164,163 0 166,274
MY Exports 885 885 900 900 0 960
MY Exp. to the EC 78 78 60 80 0 81
Crush Dom. Cons. 118,300 117,705 121,970 121,469 0 123,720
Food Use Dom. Cons. 18,502 18,652 19,160 19,010 0 19,215
Feed,Seed,Waste Dom.Cons. 5,855 5,900 6,200 6,605 0 6,758
TOTAL Dom. Consumption 142,657 142,257 147,330 147,084 0 149,693
Ending Stocks 18,424 18,193 16,274 16,179 0 15,621
TOTAL DISTRIBUTION 161,966 161,335 164,504 164,163 0 166,274
Calendar Year Imports 87,835 87,450 90,350 90,925 0 92,490
Calendar Year Imp. U.S. 30,501 33,945 30,001 30,101 0 30,601

25
Calendar Year Exports 900 947 900 940 0 815
Calendar Year Exp. to U.S. 74 55 74 54 0 49
26
Table 2. Total Meals
PSD Table
Country China, Peoples Republic of
Commodity Total Meal (1000 tons)
2015/16 2016/17 2017/18
USDA
Official
Post
Estimate
New
USDA
Official
Post
Estimate
New
USDA
Official
Post
Estimate
New
Market Year Begin 10/2015 10/2016 10/2017
Crush 119,400 118,805 123,070 122,669 0 124,920
Extr. Rate, 999.9999
0
Beginning Stocks 0 0 0 0 0 0
Production 83,683 83,246 86,806 86,571 0 88,194
MY Imports 1,428 1,426 1,270 1,270 0 1,251
MY Imp. from U.S. 114 114 90 100 0 100
MY Imp. from the EC 5 9 5 5 0 6
TOTAL SUPPLY 85,111 84,672 88,076 87,841 0 89,445
MY Exports 2,050 2,030 1,977 1,923 0 1,883
MY Exp. to the EC 39 214 39 194 0 194
Industrial Dom. Cons. 1,652 1,652 1,700 1,702 0 1,753
Food Use Dom. Cons. 0 0 0 0 0 0
Feed Waste Dom. Cons. 81,409 80,990 84,399 84,216 0 85,809
TOTAL Dom. Consumption 83,061 82,642 86,099 85,918 0 87,562
Ending Stocks 0 0 0 0 0 0
TOTAL DISTRIBUTION 85,111 84,672 88,076 87,841 0 89,445
Calendar Year Imports 1,212 1,604 1,250 1,266 0 1,260
Calendar Year Imp. U.S. 114 114 90 100 0 100
Calendar Year Exports 1,975 2,012 1,927 1,973 0 1,965
Calendar Year Exp. to U.S. 20 86 0 50 0 50
SBM Equivalent 80,154 79,816 83,556 83,345 0 84,983
27
Table 3. Total Oils
PSD Table
Country China, Peoples Republic of
Commodity Total Oils (1000 tons)
2015/16 2016/17 2017/18
USDA
Official
Post
Estimate
New
USDA
Official
Post
Estimate
New
USDA
Official
Post
Estimate
New
Market Year Begin 10/2015 10/2016 10/2017
Crush 118,300 117,705 121,970 121,469 0 123,720
Extr. Rate, 999.9999
0
Beginning Stocks 5,247 5,247 4,620 4,850 0 4,350
Production 26,292 26,122 26,600 26,736 0 27,160
MY Imports 7,170 7,170 7,535 7,240 0 7,200
MY Imp. from U.S. 100 23 100 123 0 103
MY Imp. from the EC 0 41 0 51 0 50
TOTAL SUPPLY 38,709 38,539 38,755 38,826 0 38,710
MY Exports 116 116 126 118 0 168
MY Exp. to the EC 0 0 0 0 0 0
Industrial Dom. Cons. 2,000 2,050 2,050 2,100 0 2,150
Food Use Dom. Cons. 31,973 31,523 32,979 32,258 0 32,887
Feed Waste Dom. Cons. 0 0 0 0 0 0
TOTAL Dom. Consumption 33,973 33,573 35,029 34,358 0 35,037
Ending Stocks 4,620 4,850 3,600 4,350 0 3,505
TOTAL DISTRIBUTION 38,709 38,539 38,755 38,826 0 38,710
Calendar Year Imports 7,410 6,803 7,575 7,360 0 7,370
Calendar Year Imp. U.S. 104 104 104 103 0 103
Calendar Year Exports 122 123 126 118 0 117
Calendar Year Exp. to U.S. 0 0 0 0 0 0
28
Oilseeds PSD Tables
Table 4. Soybeans
PSD Table
Country China, Peoples Republic of
Commodity Oilseed, Soybean (1000 tons; 1000 Ha)
2015/16 2016/17 2017/18
USDA
Official
Post
Estimate
New
USDA
Official
Post
Estimate
New
USDA
Official
Post
Estimate
New
Market Year Begin 10/2015 10/2016 10/2017
Area Planted 6,600 6,506 6,200 7,150 0 7,450
Area Harvested 6,506 6,506 7,200 7,150 0 7,450
Beginning Stocks 17,009 17,009 16,910 16,910 0 15,090
Production 11,785 11,785 12,900 13,100 0 13,800
MY Imports 83,230 83,230 86,000 86,000 0 89,000
MY Imp. from U.S. 28,500 28,910 30,000 30,000 0 30,000
MY Imp. from EU 0 0 0 0 0 0
Total Supply 112,024 112,024 115,810 116,010 0 117,890
MY Exports 114 114 150 120 0 120
MY Exp. to EU 10 10 10 10 0 11
Crush 81,300 81,000 86,500 86,000 0 87,800
Food Use Dom. Cons. 10,800 11,100 11,300 11,300 0 11,400
Feed Waste Dom. Cons. 2,900 2,900 3,000 3,500 0 3,600
Total Dom. Cons. 95,000 95,000 100,800 100,800 0 102,800
Ending Stocks 16,910 16,910 14,860 15,090 0 14,970
Total Distribution 112,024 112,024 115,810 116,010 0 117,890
CY Imports 83,000 83,232 86,000 86,000 0 87,500
CY Imp. from U.S. 30,500 33,660 30,000 30,000 0 30,500
CY Exports 150 150 150 150 0 10
CY Exp. to U.S. 70 50 70 50 0 45

29
Table 5. Rapeseed
PSD Table
Country China, Peoples Republic of
Commodity Oilseed, Rapeseed (1000 tons;1000 Ha)
2015/16 2016/17 2017/18
USDA
Official
Post
Estimate
New
USDA
Official
Post
Estimate
New
USDA
Official
Post
Estimate
New
Market Year Begin 10/2015 10/2016 10/2017
Area Planted 0 7,300 0 7,000 0 6,800
Area Harvested 7,534 7,300 7,000 7,000 0 6,800
Beginning Stocks 1,499 1,499 1,340 1,109 0 909
Production 14,931 14,300 13,500 13,500 0 13,100
MY Imports 4,011 4,011 3,600 4,100 0 4,300
MY Imp. from U.S. 0 0 0 0 0 0
MY Imp. from EU 0 0 0 0 0 0
Total Supply 20,441 19,810 18,440 18,709 0 18,309
MY Exports 1 1 0 0 0 0
MY Exp. to EU 0 0 0 0 0 0
Crush 18,500 18,100 16,600 17,200 0 17,200
Food Use Dom. Cons. 0 0 0 0 0 0
Feed Waste Dom. Cons. 600 600 600 600 0 600
Total Dom. Cons. 19,100 18,700 17,200 17,800 0 17,800
Ending Stocks 1,340 1,109 1,240 909 0 509
Total Distribution 20,441 19,810 18,440 18,709 0 18,309
CY Imports 4,200 3,565 3,600 4,300 0 4,400
CY Imp. from U.S. 0 0 0 0 0 0
CY Exports 0 1 0 0 0 0
CY Exp. to U.S. 0 1 0 0 0 0
30
Table 6. Peanuts
PSD Table
Country China, Peoples Republic of
Commodity Oilseed, Peanut (1000 tons; 1000 Ha)
2015/16 2016/17 2017/18
USDA
Official
Post
Estimate
New
USDA
Official
Post
Estimate
New
USDA
Official
Post
Estimate
New
Market Year Begin 10/2015 10/2016 10/2017
Area Planted 4,600 4,600 4,700 4,750 0 4,850
Area Harvested 4,616 4,600 4,750 4,750 0 4,850
Beginning Stocks 0 0 0 0 0 0
Production 16,440 16,440 17,000 17,000 0 17,400
MY Imports 541 541 600 450 0 450
MY Imp. from U.S. 0 292 0 100 0 100
MY Imp. from EU 0 0 0 0 0 0
Total Supply 16,981 16,981 17,600 17,450 0 17,850
MY Exports 484 484 500 500 0 550
MY Exp. to EU 50 50 50 50 0 50
Crush 8,700 8,850 9,150 9,100 0 9,300
Food Use Dom. Cons. 6,797 6,647 6,950 6,800 0 6,900
Feed Waste Dom. Cons. 1,000 1,000 1,000 1,050 0 1,100
Total Dom. Cons. 16,497 16,497 17,100 16,950 0 17,300
Ending Stocks 0 0 0 0 0 0
Total Distribution 16,981 16,981 17,600 17,450 0 17,850
CY Imports 550 500 600 500 0 500
CY Imp. from U.S. 0 285 0 100 0 100
CY Exports 500 500 500 510 0 520
CY Exp. to U.S. 0 0 0 0 0 0

31
Table 7. Sunflower Seed
PSD Table
Country China, Peoples Republic of
Commodity Oilseed, Sunflower seed (1000 tons; 1000 Ha)
201/16 2016/17 2017/18
USDA
Official
Post
Estimate
New
USDA
Official
Post
Estimate
New
USDA
Official
Post
Estimate
New
Market Year Begin 10/2015 10/2016 10/2017
Area Planted 930 1,036 940 1,080 0 1,100
Area Harvested 1,036 1,036 940 1,080 0 1,100
Beginning Stocks 93 93 174 174 0 180
Production 2,698 2,698 2,510 2,800 0 2,850
MY Imports 74 74 70 70 0 75
MY Imp. from U.S. 0 0 0 0 0 0
MY Imp. from EU 0 0 0 0 0 0
Total Supply 2,865 2,865 2,754 3,044 0 3,105
MY Exports 286 286 250 280 0 290
MY Exp. to EU 18 18 0 20 0 20
Crush 1,400 1,400 1,320 1,569 0 1,650
Food Use Dom. Cons. 905 905 910 910 0 915
Feed Waste Dom. Cons. 100 100 100 105 0 108
Total Dom. Cons. 2,405 2,405 2,330 2,584 0 2,673
Ending Stocks 174 174 174 180
142
Total Distribution 2,865 2,865 2,754 3,044 0 3,105
CY Imports 50 77 50 80 0 70
CY Imp. from U.S. 1 0 1 1 0 1
CY Exports 250 296 250 280 0 285
CY Exp. to U.S. 4 4 4 4 0 4
32
Table 8. Cottonseed
PSD Table
Country China, Peoples Republic of
Commodity Oilseed, Cottonseed (1000 tons; 1000 Ha)
2015/16 2016/17 2017/18
USDA
Official
Post
Estimate
New
USDA
Official
Post
Estimate
New
USDA
Official
Post
Estimate
New
Market Year Begin 10/2015 10/2016 10/2017
Area Planted (Cotton) 3,700 3,200 3,100 3,000 0 3,100
Area Harvested (Cotton) 3,050 3,200 2,850 3,000 0 3,100
Seed to Lint Ratio 0 0 0 0 0 0
Beginning Stocks 0 0 0 0 0 0
Production 9,580 9,580 9,800 8,900 0 9,100
MY Imports 75 75 100 50 0 20
MY Imp. from U.S. 0 0 0 0 0 0
MY Imp. from EU 0 0 0 0 0 0
Total Supply 9,655 9,655 9,900 8,950 0 9,120
MY Exports 0 0 0 0 0 0
MY Exp. to EU 0 0 0 0 0 0
Crush 8,400 8,355 8,400 7,600 0 7,770
Food Use Dom. Cons. 0 0 0 0 0 0
Feed Waste Dom. Cons. 1,255 1,300 1,500 1,350 0 1,350
Total Dom. Cons. 9,655 9,655 9,900 8,950 0 9,120
Ending Stocks 0 0 0 0 0 0
Total Distribution 9,655 9,655 9,900 8,950 0 9,120
CY Imports 35 76 100 45 0 20
CY Imp. from U.S. 0 0 0 0 0 0
CY Exports 0 0 0 0 0 0
CY Exp. to U.S. 0 0 0 0 0 0
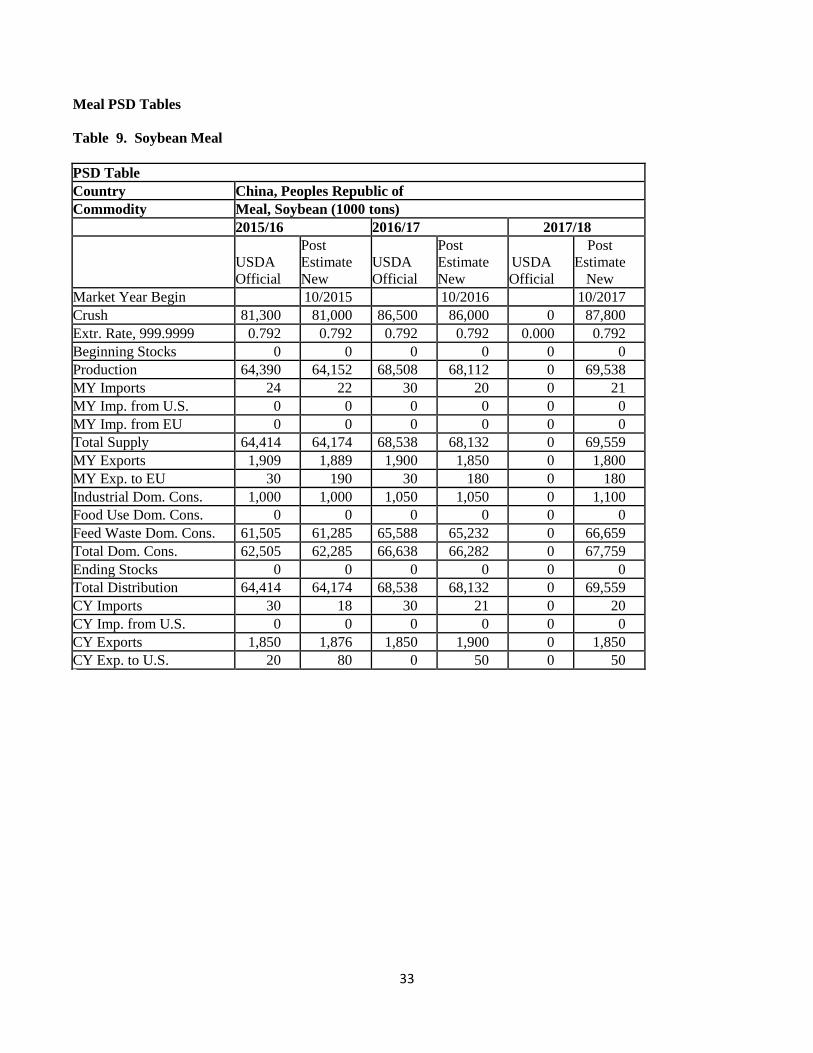
33
Meal PSD Tables
Table 9. Soybean Meal
PSD Table
Country China, Peoples Republic of
Commodity Meal, Soybean (1000 tons)
2015/16 2016/17 2017/18
USDA
Official
Post
Estimate
New
USDA
Official
Post
Estimate
New
USDA
Official
Post
Estimate
New
Market Year Begin 10/2015 10/2016 10/2017
Crush 81,300 81,000 86,500 86,000 0 87,800
Extr. Rate, 999.9999 0.792 0.792 0.792 0.792 0.000 0.792
Beginning Stocks 0 0 0 0 0 0
Production 64,390 64,152 68,508 68,112 0 69,538
MY Imports 24 22 30 20 0 21
MY Imp. from U.S. 0 0 0 0 0 0
MY Imp. from EU 0 0 0 0 0 0
Total Supply 64,414 64,174 68,538 68,132 0 69,559
MY Exports 1,909 1,889 1,900 1,850 0 1,800
MY Exp. to EU 30 190 30 180 0 180
Industrial Dom. Cons. 1,000 1,000 1,050 1,050 0 1,100
Food Use Dom. Cons. 0 0 0 0 0 0
Feed Waste Dom. Cons. 61,505 61,285 65,588 65,232 0 66,659
Total Dom. Cons. 62,505 62,285 66,638 66,282 0 67,759
Ending Stocks 0 0 0 0 0 0
Total Distribution 64,414 64,174 68,538 68,132 0 69,559
CY Imports 30 18 30 21 0 20
CY Imp. from U.S. 0 0 0 0 0 0
CY Exports 1,850 1,876 1,850 1,900 0 1,850
CY Exp. to U.S. 20 80 0 50 0 50

34
Table 10. Rapeseed Meal
PSD Table
Country China, Peoples Republic of
Commodity Meal, Rapeseed (1000 tons)
2015/16 2016/17 2017/18
USDA
Official
Post
Estimate
USDA
Official
Post
Estimate
New
USDA
Official
Post
Estimate
New
Market Year Begin 10/2015 10/2016 10/2017
Crush 18,500 18,100 16,600 17,200 0 17,200
Extr. Rate, 999.9999 0.595 0.595 0.595 0.595 0 0.595
Beginning Stocks 0 0 0 0 0 0
Production 11,009 10,770 9,879 10,234 0 10,234
MY Imports 359 359 200 200 0 200
MY Imp. from U.S. 0 0 0 0 0 0
MY Imp. from EU 0 0 0 0 0 0
Total Supply 11,368 11,129 10,079 10,434 0 10,434
MY Exports 114 114 50 50 0 60
MY Exp. to EU 0 4 0 0 0 0
Industrial Dom. Cons. 450 450 450 450 0 450
Food Use Dom. Cons. 0 0 0 0 0 0
Feed Waste Dom. Cons. 10,804 10,565 9,579 9,934 0 9,924
Total Dom. Cons. 11,254 11,015 10,029 10,384 0 10,374
Ending Stocks 0 0 0 0 0 0
Total Distribution 11,368 11,129 10,079 10,434 0 10,434
CY Imports 100 504 200 200 0 210
CY Imp. from U.S. 0 0 0 0 0 0
CY Exports 100 107 50 50 0 55
CY Exp. to U.S. 0 4 0 0 0 0

35
Table 11. Peanut Meal
PSD Table
Country China, Peoples Republic of
Commodity Meal, Peanut (1000 tons)
2015/16 2016/17 2017/18
USDA
Official
Post
Estimate
New
USDA
Official
Post
Estimate
New
USDA
Official
Post
Estimate
New
Market Year Begin 10/2015 10/2016 10/2017
Crush 8,700 8,850 9,150 9,100 0 9,300
Extr. Rate, 999.9999 0.400 0.400 0.400 0.400 0.000 0.400
Beginning Stocks 0 0 0 0 0 0
Production 3,480 3,540 3,660 3,640 0 3,720
MY Imports 3 3 40 50 0 30
MY Imp. from U.S. 0 0 0 0 0 0
MY Imp. from EU 0 0 0 0 0 0
Total Supply 3,483 3,543 3,700 3,690 0 3,750
MY Exports 1 1 2 3 0 0
MY Exp. to EU 0 0 0 0 0 0
Industrial Dom. Cons. 0 0 0 0 0 0
Food Use Dom. Cons. 0 0 0 0 0 0
Feed Waste Dom. Cons. 3,482 3,542 3,698 3,687 0 3,750
Total Dom. Cons. 3,482 3,542 3,698 3,687 0 3,750
Ending Stocks 0 0 0 0 0 0
Total Distribution 3,483 3,543 3,700 3,690 0 3,750
CY Imports 40 40 20 45 0 30
CY Imp. from U.S. 0 0 0 0 0 0
CY Exports 2 2 2 3 0 2
CY Exp. to U.S. 0 0 0 0 0 0

36
Table 12. Sunflower Seed Meal
PSD Table
Country China, Peoples Republic of
Commodity Meal, Sunflowerseed (1000 tons)
2015/16 2016/17 2017/18
USDA
Official
Post
Estimate
New
USDA
Official
Post
Estimate
New
USDA
Official
Post
Estimate
New
Market Year Begin 10/2015 10/2016 10/2017
Crush 1,400 1,400 1,320 1,569 0 1,650
Extr. Rate, 999.9999 0.546 0.546 0.546 0.546 0.000 0.546
Beginning Stocks 0 0 0 0 0 0
Production 764 764 720 856 0 900
MY Imports 0 0 0 0 0 0
MY Imp. from U.S. 0 0 0 0 0 0
MY Imp. from EU 0 0 0 0 0 0
Total Supply 764 764 720 856 0 900
MY Exports 23 23 15 15 0 18
MY Exp. to EU 9 20 9 14 0 14
Industrial Dom. Cons. 62 62 60 62 0 63
Food Use Dom. Cons. 0 0 0 0 0 0
Feed Waste Dom. Cons. 679 679 645 779 0 819
Total Dom. Cons. 741 741 705 841 0 882
Ending Stocks 0 0 0 0 0 0
Total Distribution 764 764 720 856 0 900
CY Imports 0 0 0 0 0 0
CY Imp. from U.S. 0 0 0 0 0 0
CY Exports 15 24 15 15 0 17
CY Exp. to U.S. 0 2 0 0 0 0

37
Table 13. Cotton Seed Meal
PSD Table
Country China, Peoples Republic of
Commodity Meal, Cottonseed (1000 tons)
2015/16 2016/17 2017/18
USDA
Official
Post
Estimate
New
USDA
Official
Post
Estimate
New
USDA
Official
Post
Estimate
New
Market Year Begin 10/2015 10/2016 10/2017
Crush 8,400 8,355 8,400 7,600 0 7,770
Extr. Rate, 999.9999 0.433 0.433 0.433 0.433 0.000 0.433
Beginning Stocks 0 0 0 0 0 0
Production 3,640 3,620 3,639 3,293 0 3,366
MY Imports 0 0 0 0 0 0
MY Imp. from U.S. 0 0 0 0 0 0
MY Imp. from EU 0 0 0 0 0 0
Total Supply 3,640 3,620 3,639 3,293 0 3,366
MY Exports 0 0 5 0 0 0
MY Exp. to EU 0 0 0 0 0 0
Industrial Dom. Cons. 140 140 140 140 0 140
Food Use Dom. Cons. 0 0 0 0 0 0
Feed Waste Dom. Cons. 3,500 3,480 3,494 3,153 0 3,226
Total Dom. Cons. 3,640 3,620 3,634 3,293 0 3,366
Ending Stocks 0 0 0 0 0 0
Total Distribution 3,640 3,620 3,639 3,293 0 3,366
CY Imports 0 0 0 0 0 0
CY Imp. from U.S. 0 0 0 0 0 0
CY Exports 5 0 5 0 0 35
CY Exp. to U.S. 0 0 0 0 0 0
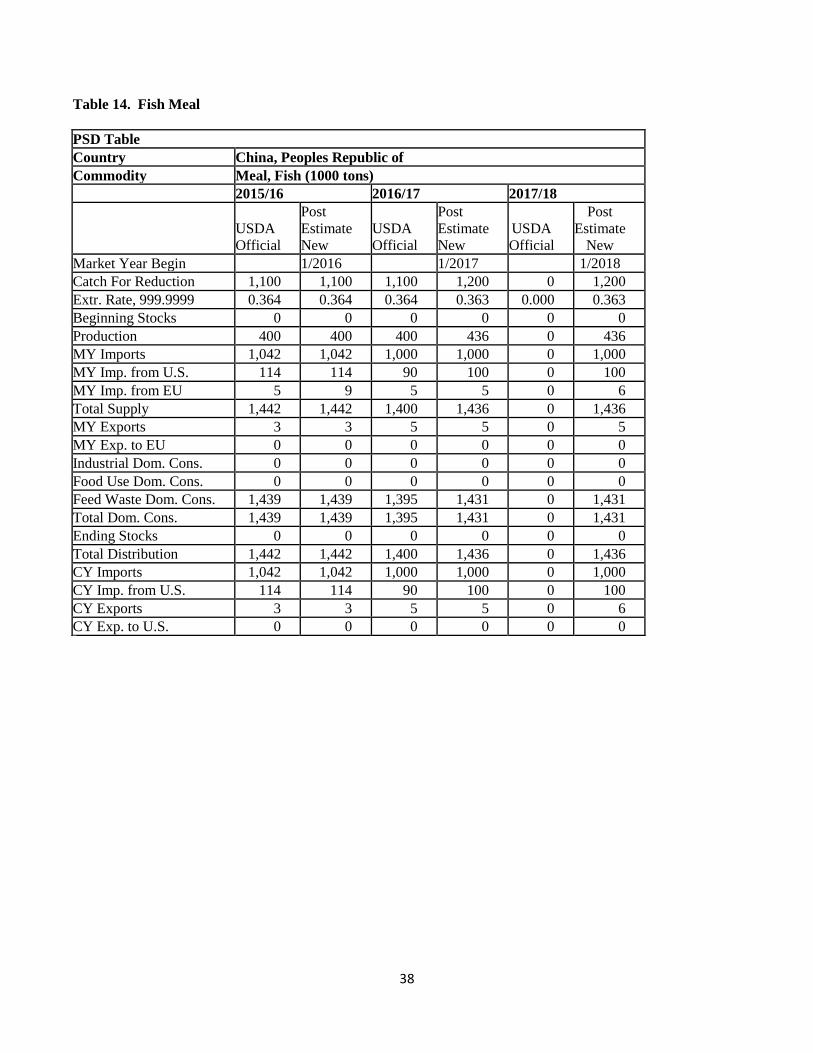
38
Table 14. Fish Meal
PSD Table
Country China, Peoples Republic of
Commodity Meal, Fish (1000 tons)
2015/16 2016/17 2017/18
USDA
Official
Post
Estimate
New
USDA
Official
Post
Estimate
New
USDA
Official
Post
Estimate
New
Market Year Begin 1/2016 1/2017 1/2018
Catch For Reduction 1,100 1,100 1,100 1,200 0 1,200
Extr. Rate, 999.9999 0.364 0.364 0.364 0.363 0.000 0.363
Beginning Stocks 0 0 0 0 0 0
Production 400 400 400 436 0 436
MY Imports 1,042 1,042 1,000 1,000 0 1,000
MY Imp. from U.S. 114 114 90 100 0 100
MY Imp. from EU 5 9 5 5 0 6
Total Supply 1,442 1,442 1,400 1,436 0 1,436
MY Exports 3 3 5 5 0 5
MY Exp. to EU 0 0 0 0 0 0
Industrial Dom. Cons. 0 0 0 0 0 0
Food Use Dom. Cons. 0 0 0 0 0 0
Feed Waste Dom. Cons. 1,439 1,439 1,395 1,431 0 1,431
Total Dom. Cons. 1,439 1,439 1,395 1,431 0 1,431
Ending Stocks 0 0 0 0 0 0
Total Distribution 1,442 1,442 1,400 1,436 0 1,436
CY Imports 1,042 1,042 1,000 1,000 0 1,000
CY Imp. from U.S. 114 114 90 100 0 100
CY Exports 3 3 5 5 0 6
CY Exp. to U.S. 0 0 0 0 0 0

39
Oils PSD Tables
Table 15. Soybean Oil
PSD Table
Country China, Peoples Republic of
Commodity Oil, Soybean (1000 tons)
2015/16 2016/17 2017/18
USDA
Official
Post
Estimate
New
USDA
Official
Post
Estimate
New
USDA
Official
Post
Estimate
New
Market Year Begin 10/2015 10/2016 10/2017
Crush 81,300 81,000 86,500 86,000 0 87,800
Extr. Rate, 999.9999 0.179 0.179 0.179 0.179 0.000 0.179
Beginning Stocks 778 778 587 533 0 743
Production 14,569 14,515 15,501 15,410 0 15,716
MY Imports 586 586 620 550 0 500
MY Imp. from U.S. 100 20 100 120 0 100
MY Imp. from EU 0 0 0 0 0 0
Total Supply 15,933 15,879 16,708 16,493 0 16,959
MY Exports 96 96 110 100 0 150
MY Exp. to EU 0 0 0 0 0 0
Industrial Dom. Cons. 0 0 0 0 0 0
Food Use Dom. Cons. 15,250 15,250 16,000 15,650 0 16,000
Feed Waste Dom. Cons. 0 0 0 0 0 0
Total Dom. Cons. 15,250 15,250 16,000 15,650 0 16,000
Ending Stocks 587 533 598 743 0 809
Total Distribution 15,933 15,879 16,708 16,493 0 16,959
CY Imports 700 560 600 600 0 600
CY Imp. from U.S. 100 100 100 100 0 100
CY Exports 110 100 110 100 0 100
CY Exp. to U.S. 0 0 0 0 0 0

40
Table 16. Rapeseed Oil
PSD Table
Country China, Peoples Republic of
Commodity Oil, Rapeseed (1000 tons)
2015/16 2016/17 2017/18
USDA
Official
Post
Estimate
New
USDA
Official
Post
Estimate
New
USDA
Official
Post
Estimate
New
Market Year Begin 10/2015 10/2016 10/2017
Crush 18,500 18,100 16,600 17,200 0 17,200
Extr. Rate, 999.9999 0.390 0.392 0.392 0.392 0.000 0.392
Beginning Stocks 4,164 4,164 3,844 4,178 0 3,370
Production 7,215 7,059 6,474 6,747 0 6,747
MY Imports 768 768 700 600 0 610
MY Imp. from U.S. 0 0 0 0 0 0
MY Imp. from EU 0 40 0 50 0 50
Total Supply 12,147 11,991 11,018 11,525 0 10,727
MY Exports 3 3 5 5 0 5
MY Exp. to EU 0 0 0 0 0 0
Industrial Dom. Cons. 0 0 0 0 0 0
Food Use Dom. Cons. 8,300 7,810 8,250 8,150 0 8,260
Feed Waste Dom. Cons. 0 0 0 0 0 0
Total Dom. Cons. 8,300 7,810 8,250 8,150 0 8,260
Ending Stocks 3,844 4,178 2,763 3,370 0 2,462
Total Distribution 12,147 11,991 11,018 11,525 0 10,727
CY Imports 800 700 700 700 0 700
CY Imp. from U.S. 0 0 0 0 0 0
CY Exports 5 5 5 5 0 4
CY Exp. to U.S. 0 0 0 0 0 0

41
Table 17. Peanut Oil
PSD Table
Country China, Peoples Republic of
Commodity Oil, Peanut (1000 tons)
2015/16 2016/17 2017/18
USDA
Official
Post
Estimate
New
USDA
Official
Post
Estimate
New
USDA
Official
Post
Estimate
New
Market Year Begin 10/2015 10/2016 10/2017
Crush 8,700 8,850 9,150 9,100 0 9,300
Extr. Rate, 999.9999 0.320 0.320 0.320 0.320 0.000 0.320
Beginning Stocks 0 0 0 0 0 0
Production 2,784 2,832 2,928 2,912 0 2,976
MY Imports 113 113 130 100 0 100
MY Imp. from U.S. 0 0 0 0 0 0
MY Imp. from EU 0 0 0 0 0 0
Total Supply 2,897 2,945 3,058 3,012 0 3,076
MY Exports 10 10 6 8 0 9
MY Exp. to EU 0 0 0 0 0 0
Industrial Dom. Cons. 0 0 0 0 0 0
Food Use Dom. Cons. 2,887 2,935 3,052 3,004 0 3,067
Feed Waste Dom. Cons. 0 0 0 0 0 0
Total Dom. Cons. 2,887 2,935 3,052 3,004 0 3,067
Ending Stocks 0 0 0 0 0 0
Total Distribution 2,897 2,945 3,058 3,012 0 3,076
CY Imports 120 107 130 110 0 110
CY Imp. from U.S. 0 0 0 0 0 0
CY Exports 7 9 6 8 0 9
CY Exp. to U.S. 0 0 0 0 0 0

42
Table 18. Cotton Seed Oil
PSD Table
Country China, Peoples Republic of
Commodity Oil, Cottonseed (1000 tons)
2015/16 2016/17 2017/18
USDA
Official
Post
Estimate
New
USDA
Official
Post
Estimate
New
USDA
Official
Post
Estimate
New
Market Year Begin 10/2015 10/2016 10/2017
Crush 8,400 8,355 8,400 7,600 0 7,770
Extr. Rate, 999.9999 0.146 0.145 0.146 0.145 0.000 0.145
Beginning Stocks 0 0 0 0 0 0
Production 1,222 1,215 1,222 1,105 0 1,130
MY Imports 0 0 0 0 0 0
MY Imp. from U.S. 0 0 0 0 0 0
MY Imp. from EU 0 0 0 0 0 0
Total Supply 1,222 1,215 1,222 1,105 0 1,130
MY Exports 1 1 5 1 0 1
MY Exp. to EU 0 0 0 0 0 0
Industrial Dom. Cons. 0 0 0 0 0 0
Food Use Dom. Cons. 1,221 1,214 1,217 1,104 0 1,129
Feed Waste Dom. Cons. 0 0 0 0 0 0
Total Dom. Cons. 1,221 1,214 1,217 1,104 0 1,129
Ending Stocks 0 0 0 0 0 0
Total Distribution 1,222 1,215 1,222 1,105 0 1,130
CY Imports 0 0 0 0 0 0
CY Imp. from U.S. 0 0 0 0 0 0
CY Exports 0 1 5 1 0 1
CY Exp. to U.S. 0 0 0 0 0 0

43
Table 19. Sunflower Seed Oil
PSD Table
Country China, Peoples Republic of
Commodity Oil, Sunflower Seed (1000 tons)
2015/16 2016/17 2017/18
USDA
Official
Post
Estimate
New
USDA
Official
Post
Estimate
New
USDA
Official
Post
Estimate
New
Market Year Begin 10/2015 10/2016 10/2017
Crush 1,400 1,400 1,320 1,569 0 1,650
Extr. Rate, 999.9999 0.359 0.358 0.360 0.358 0 0.358
Beginning Stocks 0 0 0 0 0 0
Production 502 501 475 562 0 591
MY Imports 878 878 850 850 0 850
MY Imp. from U.S. 0 0 0 0 0 0
MY Imp. from EU 0 1 0 1 0 0
Total Supply 1,380 1,379 1,325 1,412 0 1,441
MY Exports 1 1 0 2 0 0
MY Exp. to EU 0 0 0 0 0 0
Industrial Dom. Cons. 0 0 0 0 0 0
Food Use Dom. Cons. 1,379 1,378 1,325 1,410 0 1,441
Feed Waste Dom. Cons. 0 0 0 0 0 0
Total Dom. Cons. 1,379 1,378 1,325 1,410 0 1,441
Ending Stocks 0 0 0 0 0 0
Total Distribution 1,380 1,379 1,325 1,412 0 1,441
CY Imports 850 957 850 850 0 860
CY Imp. from U.S. 0 0 0 0 0 0
CY Exports 0 1 0 2 0 0
CY Exp. to U.S. 0 0 0 0 0 0
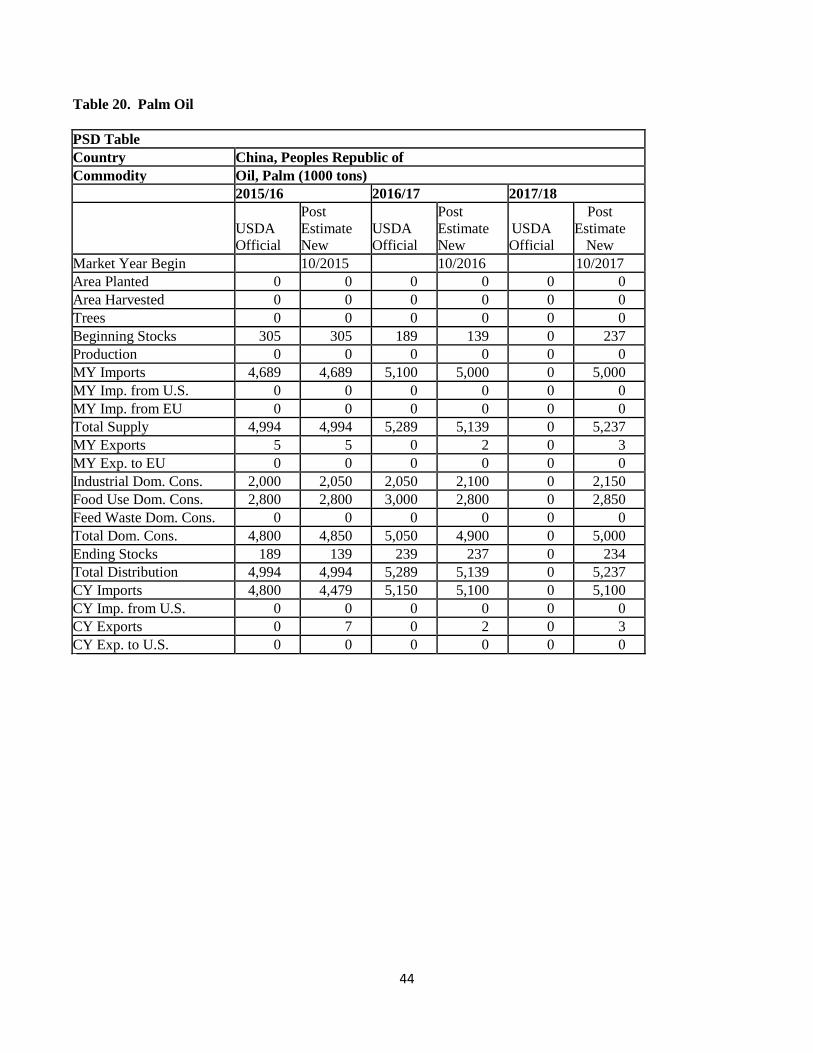
44
Table 20. Palm Oil
PSD Table
Country China, Peoples Republic of
Commodity Oil, Palm (1000 tons)
2015/16 2016/17 2017/18
USDA
Official
Post
Estimate
New
USDA
Official
Post
Estimate
New
USDA
Official
Post
Estimate
New
Market Year Begin 10/2015 10/2016 10/2017
Area Planted 0 0 0 0 0 0
Area Harvested 0 0 0 0 0 0
Trees 0 0 0 0 0 0
Beginning Stocks 305 305 189 139 0 237
Production 0 0 0 0 0 0
MY Imports 4,689 4,689 5,100 5,000 0 5,000
MY Imp. from U.S. 0 0 0 0 0 0
MY Imp. from EU 0 0 0 0 0 0
Total Supply 4,994 4,994 5,289 5,139 0 5,237
MY Exports 5 5 0 2 0 3
MY Exp. to EU 0 0 0 0 0 0
Industrial Dom. Cons. 2,000 2,050 2,050 2,100 0 2,150
Food Use Dom. Cons. 2,800 2,800 3,000 2,800 0 2,850
Feed Waste Dom. Cons. 0 0 0 0 0 0
Total Dom. Cons. 4,800 4,850 5,050 4,900 0 5,000
Ending Stocks 189 139 239 237 0 234
Total Distribution 4,994 4,994 5,289 5,139 0 5,237
CY Imports 4,800 4,479 5,150 5,100 0 5,100
CY Imp. from U.S. 0 0 0 0 0 0
CY Exports 0 7 0 2 0 3
CY Exp. to U.S. 0 0 0 0 0 0

45
Table 21. Coconut Oil
PSD Table
Country China, Peoples Republic of
Commodity Oil, Coconut (1000 tons)
2015/16 2016/17 2017/18
USDA
Official
Post
Estimate
New
USDA
Official
Post
Estimate
New
USDA
Official
Post
Estimate
New
Market Year Begin 10/2015 10/2016 10/2017
Crush 0 0 0 0 0 0
Extr. Rate, 999.9999 0 0 0 0 0.000 0.000
Beginning Stocks 0 0 0 0 0 0
Production 0 0 0 0 0 0
MY Imports 136 136 135 140 0 140
MY Imp. from U.S. 0 3 0 3 0 3
MY Imp. from EU 0 0 0 0 0 0
Total Supply 136 136 135 140 0 140
MY Exports 0 0 0 0 0 0
MY Exp. to EU 0 0 0 0 0 0
Industrial Dom. Cons. 0 0 0 0 0 0
Food Use Dom. Cons. 136 136 135 140 0 140
Feed Waste Dom. Cons. 0 0 0 0 0 0
Total Dom. Cons. 136 136 135 140 0 140
Ending Stocks 0 0 0 0 0 0
Total Distribution 136 136 135 140 0 140
CY Imports 140 0 145 0 0 0
CY Imp. from U.S. 4 4 4 3 0 3
CY Exports 0 0 0 0 0 0
CY Exp. to U.S. 0 0 0 0 0 0
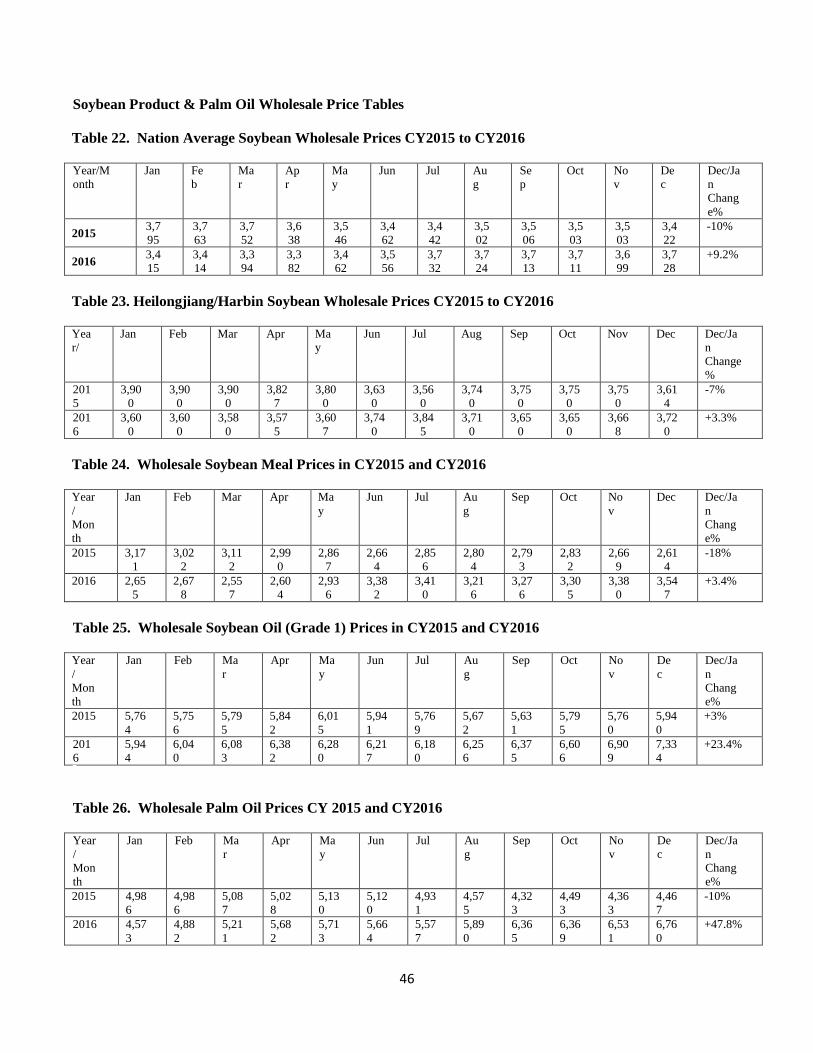
46
Soybean Product & Palm Oil Wholesale Price Tables
Table 22. Nation Average Soybean Wholesale Prices CY2015 to CY2016
Year/M
onth
Jan Fe
b
Ma
r
Ap
r
Ma
y
Jun Jul Au
g
Se
p
Oct No
v
De
c
Dec/Ja
n
Chang
e%
2015 3,7
95
3,7
63
3,7
52
3,6
38
3,5
46
3,4
62
3,4
42
3,5
02
3,5
06
3,5
03
3,5
03
3,4
22
-10%
2016 3,4
15
3,4
14
3,3
94
3,3
82
3,4
62
3,5
56
3,7
32
3,7
24
3,7
13
3,7
11
3,6
99
3,7
28
+9.2%
Table 23. Heilongjiang/Harbin Soybean Wholesale Prices CY2015 to CY2016
Yea
r/
Jan Feb Mar Apr Ma
y
Jun Jul Aug Sep Oct Nov Dec Dec/Ja
n
Change
%
201
5
3,90
0
3,90
0
3,90
0
3,82
7
3,80
0
3,63
0
3,56
0
3,74
0
3,75
0
3,75
0
3,75
0
3,61
4
-7%
201
6
3,60
0
3,60
0
3,58
0
3,57
5
3,60
7
3,74
0
3,84
5
3,71
0
3,65
0
3,65
0
3,66
8
3,72
0
+3.3%
Table 24. Wholesale Soybean Meal Prices in CY2015 and CY2016
Year
/
Mon
th
Jan Feb Mar Apr Ma
y
Jun Jul Au
g
Sep Oct No
v
Dec Dec/Ja
n
Chang
e%
2015 3,17
1
3,02
2
3,11
2
2,99
0
2,86
7
2,66
4
2,85
6
2,80
4
2,79
3
2,83
2
2,66
9
2,61
4
-18%
2016 2,65
5
2,67
8
2,55
7
2,60
4
2,93
6
3,38
2
3,41
0
3,21
6
3,27
6
3,30
5
3,38
0
3,54
7
+3.4%
Table 25. Wholesale Soybean Oil (Grade 1) Prices in CY2015 and CY2016
Year
/
Mon
th
Jan Feb Ma
r
Apr Ma
y
Jun Jul Au
g
Sep Oct No
v
De
c
Dec/Ja
n
Chang
e%
2015 5,76
4
5,75
6
5,79
5
5,84
2
6,01
5
5,94
1
5,76
9
5,67
2
5,63
1
5,79
5
5,76
0
5,94
0
+3%
201
6
5,94
4
6,04
0
6,08
3
6,38
2
6,28
0
6,21
7
6,18
0
6,25
6
6,37
5
6,60
6
6,90
9
7,33
4
+23.4%
Table 26. Wholesale Palm Oil Prices CY 2015 and CY2016
Year
/
Mon
th
Jan Feb Ma
r
Apr Ma
y
Jun Jul Au
g
Sep Oct No
v
De
c
Dec/Ja
n
Chang
e%
2015 4,98
6
4,98
6
5,08
7
5,02
8
5,13
0
5,12
0
4,93
1
4,57
5
4,32
3
4,49
3
4,36
3
4,46
7
-10%
2016 4,57
3
4,88
2
5,21
1
5,68
2
5,71
3
5,66
4
5,57
7
5,89
0
6,36
5
6,36
9
6,53
1
6,76
0
+47.8%

47

48
Table 27. Comparison of Wholesale Prices for Grade 1-Soy Oil and Palm Oil in CY2016
Unit: RMB Yuan/MT; 2016 Exchange Rate: RMB6.64 =US$1.0
CY201
6
Jan Feb Mar Apr May Jun Jul Aug Sep Oct Nov Dec
Soybea
n Oil
5,94
4
6,04
0
6,08
3
6,38
2
6,28
0
6,21
7
6,18
0
6,25
6
6,37
5
6,60
6
6,90
9
7,33
4
Palm
Oil
4,57
3
4,88
2
5,21
1
5,68
2
5,71
3
5,66
4
5,57
7
5,89
0
6,36
5
6,36
9
6,53
1
6,76
0
Diff %
Palm vs
Soy Oil
-23% -19% -14% -11% -9% -9% -10% -6% 0% -4% -5% -8%
Average palm oil price is 10% lower than G1 soy oil in CY2016 compared to the 17.5% lower in CY2015 and the
11% lower in CY2014.
Source: All wholesale prices are based on China JCI Consulting Co.
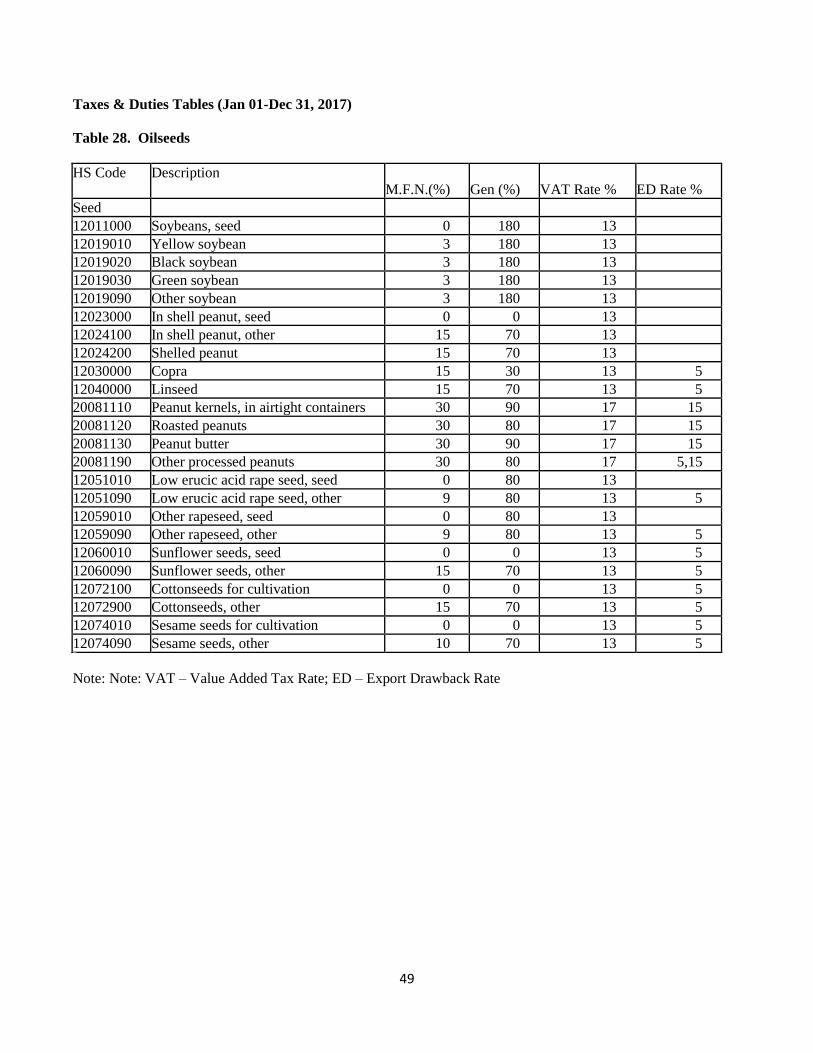
49
Taxes & Duties Tables (Jan 01-Dec 31, 2017)
Table 28. Oilseeds
HS Code
Description
M.F.N.(%)
Gen (%)
VAT Rate % ED Rate %
Seed
12011000 Soybeans, seed 0 180 13
12019010 Yellow soybean 3 180 13
12019020 Black soybean 3 180 13
12019030 Green soybean 3 180 13
12019090 Other soybean 3 180 13
12023000 In shell peanut, seed 0 0 13
12024100 In shell peanut, other 15 70 13
12024200 Shelled peanut 15 70 13
12030000 Copra 15 30 13 5
12040000 Linseed 15 70 13 5
20081110 Peanut kernels, in airtight containers 30 90 17 15
20081120 Roasted peanuts 30 80 17 15
20081130 Peanut butter 30 90 17 15
20081190 Other processed peanuts 30 80 17 5,15
12051010 Low erucic acid rape seed, seed 0 80 13
12051090 Low erucic acid rape seed, other 9 80 13 5
12059010 Other rapeseed, seed 0 80 13
12059090 Other rapeseed, other 9 80 13 5
12060010 Sunflower seeds, seed 0 0 13 5
12060090 Sunflower seeds, other 15 70 13 5
12072100 Cottonseeds for cultivation 0 0 13 5
12072900 Cottonseeds, other 15 70 13 5
12074010 Sesame seeds for cultivation 0 0 13 5
12074090 Sesame seeds, other 10 70 13 5
Note: Note: VAT – Value Added Tax Rate; ED – Export Drawback Rate
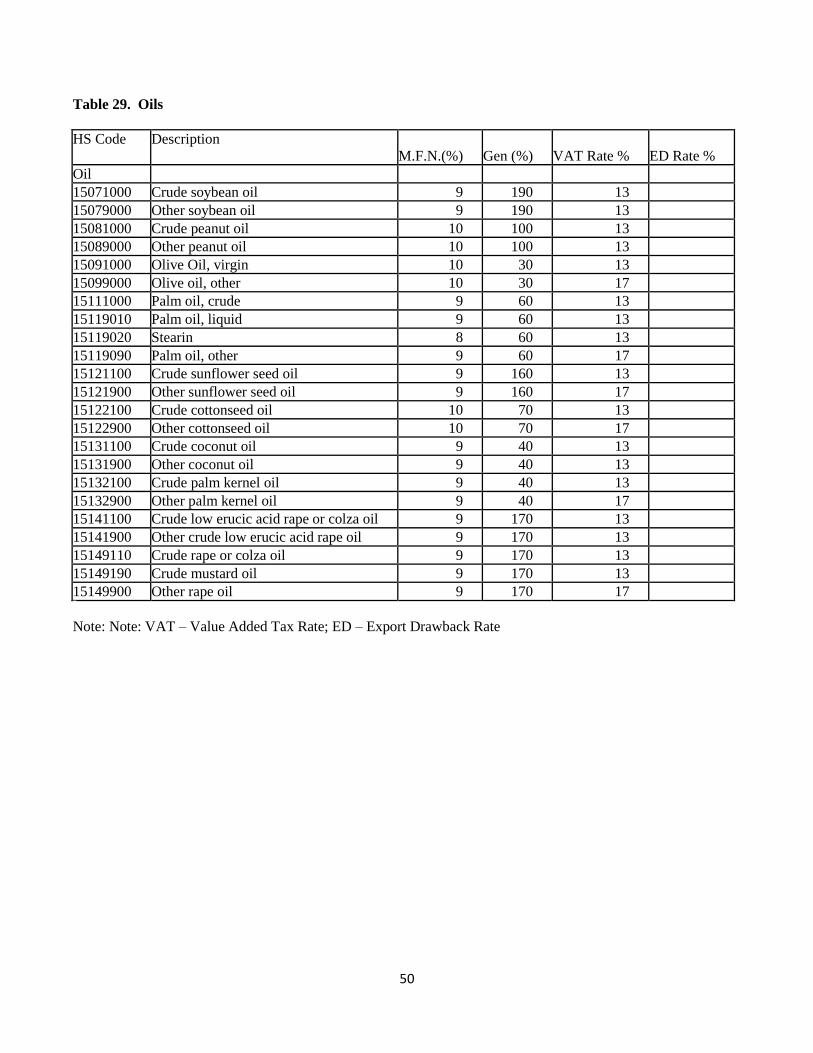
50
Table 29. Oils
HS Code
Description
M.F.N.(%)
Gen (%)
VAT Rate % ED Rate %
Oil
15071000 Crude soybean oil 9 190 13
15079000 Other soybean oil 9 190 13
15081000 Crude peanut oil 10 100 13
15089000 Other peanut oil 10 100 13
15091000 Olive Oil, virgin 10 30 13
15099000 Olive oil, other 10 30 17
15111000 Palm oil, crude 9 60 13
15119010 Palm oil, liquid 9 60 13
15119020 Stearin 8 60 13
15119090 Palm oil, other 9 60 17
15121100 Crude sunflower seed oil 9 160 13
15121900 Other sunflower seed oil 9 160 17
15122100 Crude cottonseed oil 10 70 13
15122900 Other cottonseed oil 10 70 17
15131100 Crude coconut oil 9 40 13
15131900 Other coconut oil 9 40 13
15132100 Crude palm kernel oil 9 40 13
15132900 Other palm kernel oil 9 40 17
15141100 Crude low erucic acid rape or colza oil 9 170 13
15141900 Other crude low erucic acid rape oil 9 170 13
15149110 Crude rape or colza oil 9 170 13
15149190 Crude mustard oil 9 170 13
15149900 Other rape oil 9 170 17
Note: Note: VAT – Value Added Tax Rate; ED – Export Drawback Rate
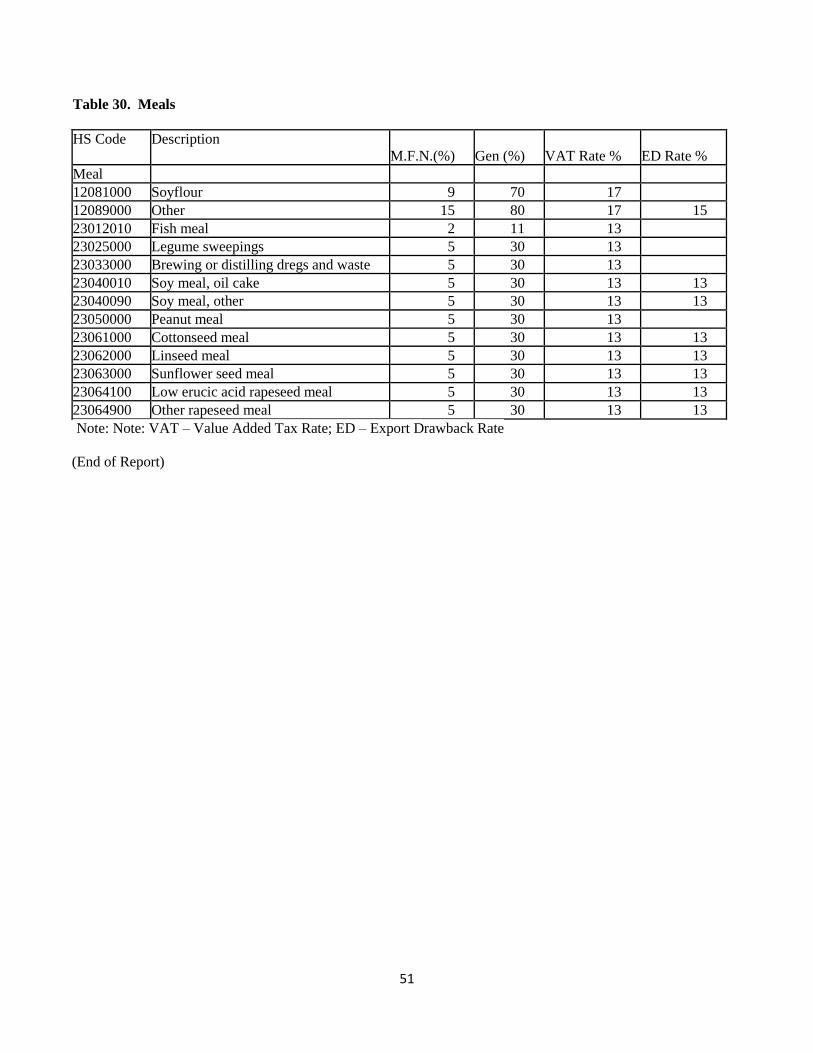
51
Table 30. Meals
HS Code
Description
M.F.N.(%)
Gen (%)
VAT Rate % ED Rate %
Meal
12081000 Soyflour 9 70 17
12089000 Other 15 80 17 15
23012010 Fish meal 2 11 13
23025000 Legume sweepings 5 30 13
23033000 Brewing or distilling dregs and waste 5 30 13
23040010 Soy meal, oil cake 5 30 13 13
23040090 Soy meal, other 5 30 13 13
23050000 Peanut meal 5 30 13
23061000 Cottonseed meal 5 30 13 13
23062000 Linseed meal 5 30 13 13
23063000 Sunflower seed meal 5 30 13 13
23064100 Low erucic acid rapeseed meal 5 30 13 13
23064900 Other rapeseed meal 5 30 13 13
Note: Note: VAT – Value Added Tax Rate; ED – Export Drawback Rate
(End of Report)