chapter 4: discrete random variable - cabrillo college 12 new/ch 4... · chapter 4: discrete random...
TRANSCRIPT
CHAPTER 4: DISCRETE RANDOM VARIABLE
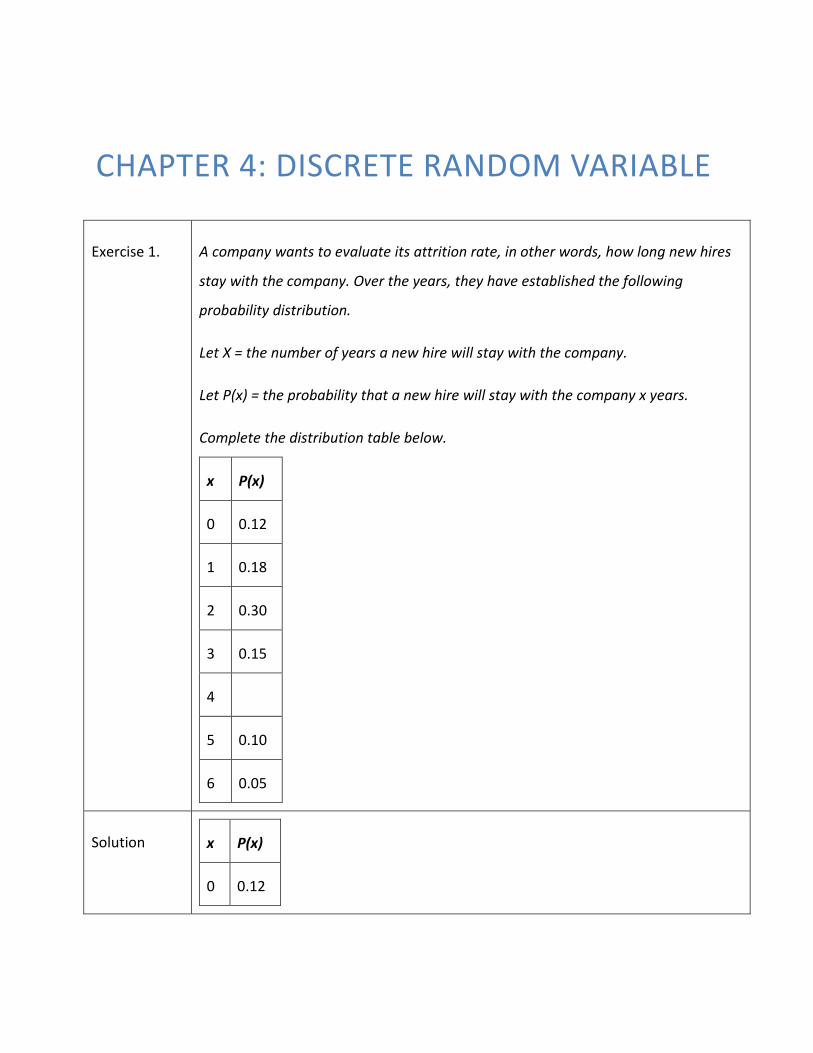
Exercise 1. A company wants to evaluate its attrition rate, in other words, how long new hires
stay with the company. Over the years, they have established the following
probability distribution.
Let X = the number of years a new hire will stay with the company.
Let P(x) = the probability that a new hire will stay with the company x years.
Complete the distribution table below.
x P(x)
0 0.12
1 0.18
2 0.30
3 0.15
4
5 0.10
6 0.05
Solution x P(x)
0 0.12
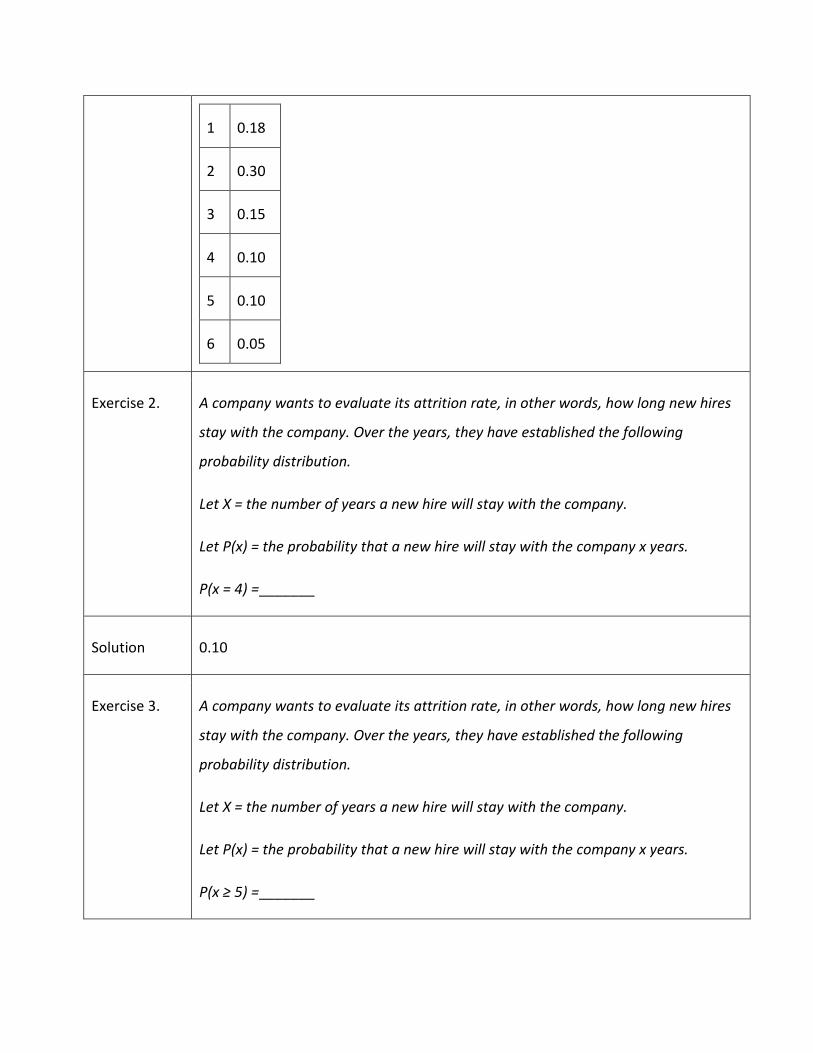
1 0.18
2 0.30
3 0.15
4 0.10
5 0.10
6 0.05
Exercise 2. A company wants to evaluate its attrition rate, in other words, how long new hires
stay with the company. Over the years, they have established the following
probability distribution.
Let X = the number of years a new hire will stay with the company.
Let P(x) = the probability that a new hire will stay with the company x years.
P(x = 4) =_______
Solution 0.10
Exercise 3. A company wants to evaluate its attrition rate, in other words, how long new hires
stay with the company. Over the years, they have established the following
probability distribution.
Let X = the number of years a new hire will stay with the company.
Let P(x) = the probability that a new hire will stay with the company x years.
P(x ≥ 5) =_______
Solution 0.10 + 0.05 = 0.15
Exercise 4. A company wants to evaluate its attrition rate, in other words, how long new hires
stay with the company. Over the years, they have established the following
probability distribution.
Let X = the number of years a new hire will stay with the company.
Let P(x) = the probability that a new hire will stay with the company x years.
On average, how long would you expect a new hire to stay with the company?
Solution 0 + 0.18 + 0.60 + 0.45 + 0.40 + 0.50 + 0.30 = 2.43 years
Exercise 5. A company wants to evaluate its attrition rate, in other words, how long new hires
stay with the company. Over the years, they have established the following
probability distribution.
Let X = the number of years a new hire will stay with the company.
Let P(x) = the probability that a new hire will stay with the company x years.
What does the column “P(x)” sum to?
Solution 1
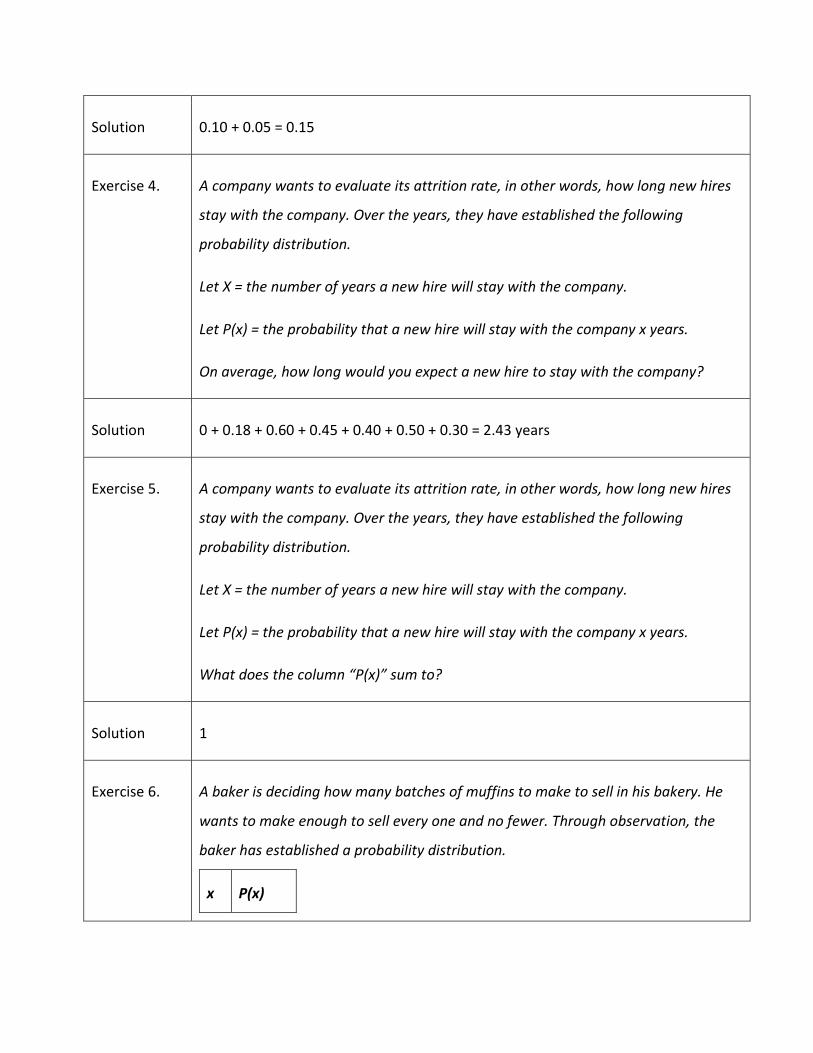
Exercise 6. A baker is deciding how many batches of muffins to make to sell in his bakery. He
wants to make enough to sell every one and no fewer. Through observation, the
baker has established a probability distribution.
x P(x)
1 0.15
2 0.35
3 0.40
4 0.10
Define the random variable X.
Solution Let X = the number of batches that the baker will sell.
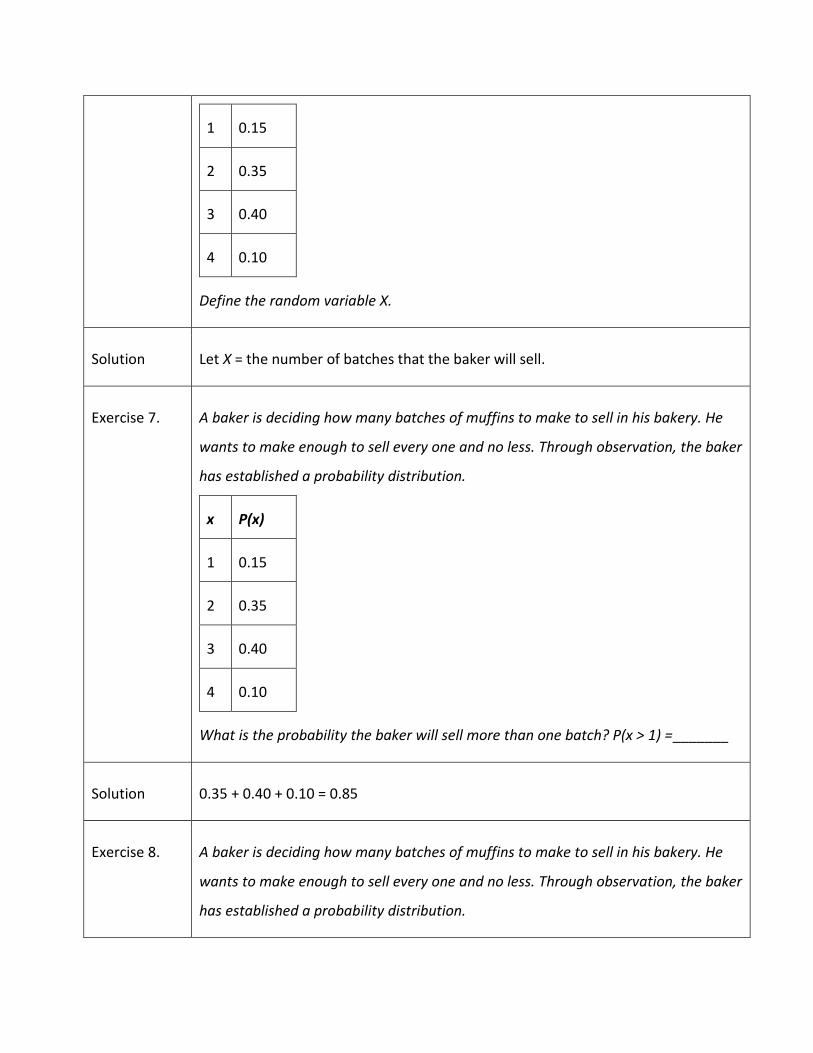
Exercise 7. A baker is deciding how many batches of muffins to make to sell in his bakery. He
wants to make enough to sell every one and no less. Through observation, the baker
has established a probability distribution.
x P(x)
1 0.15
2 0.35
3 0.40
4 0.10
What is the probability the baker will sell more than one batch? P(x > 1) =_______
Solution 0.35 + 0.40 + 0.10 = 0.85
Exercise 8. A baker is deciding how many batches of muffins to make to sell in his bakery. He
wants to make enough to sell every one and no less. Through observation, the baker
has established a probability distribution.
x P(x)
1 0.15
2 0.35
3 0.40
4 0.10
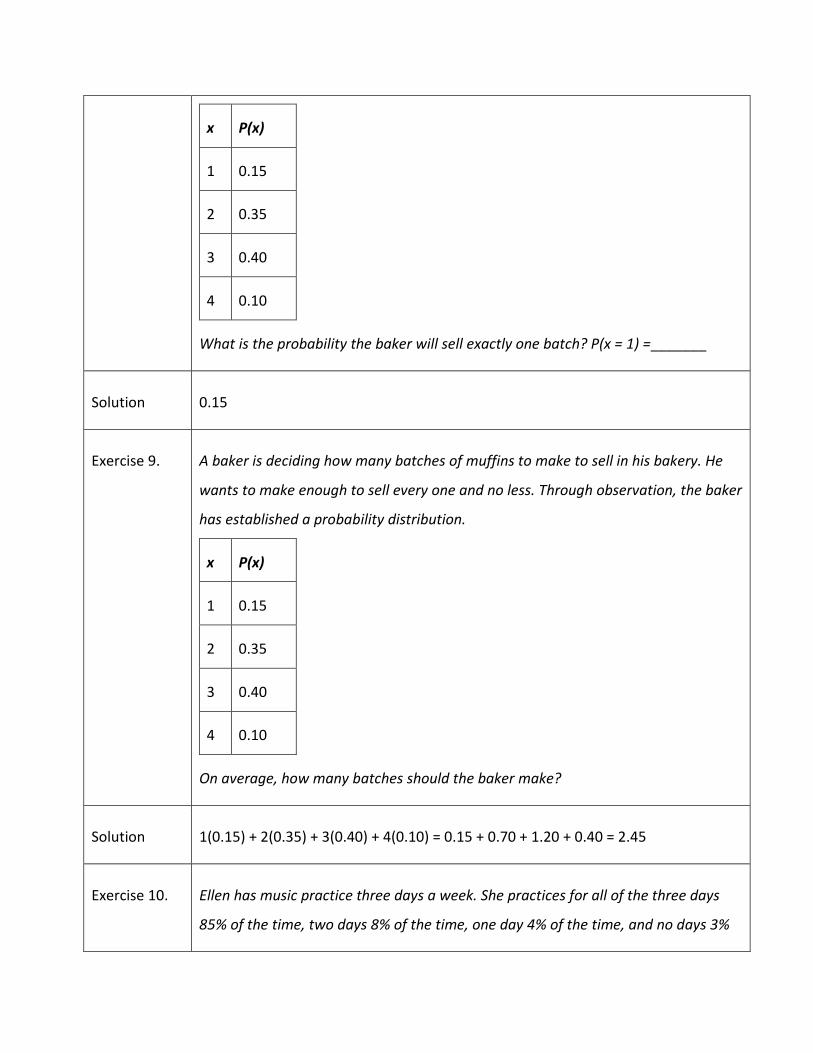
What is the probability the baker will sell exactly one batch? P(x = 1) =_______
Solution 0.15
Exercise 9. A baker is deciding how many batches of muffins to make to sell in his bakery. He
wants to make enough to sell every one and no less. Through observation, the baker
has established a probability distribution.
x P(x)
1 0.15
2 0.35
3 0.40
4 0.10
On average, how many batches should the baker make?
Solution 1(0.15) + 2(0.35) + 3(0.40) + 4(0.10) = 0.15 + 0.70 + 1.20 + 0.40 = 2.45
Exercise 10. Ellen has music practice three days a week. She practices for all of the three days
85% of the time, two days 8% of the time, one day 4% of the time, and no days 3%
of the time. One week is selected at random.
Define the random variable X.
Solution Let X = the number of days Ellen attends practice per week.
Exercise 11. Ellen has music practice three days a week. She practices for all of the three days
85% of the time, two days 8% of the time, one day 4% of the time, and no days 3%
of the time. One week is selected at random.
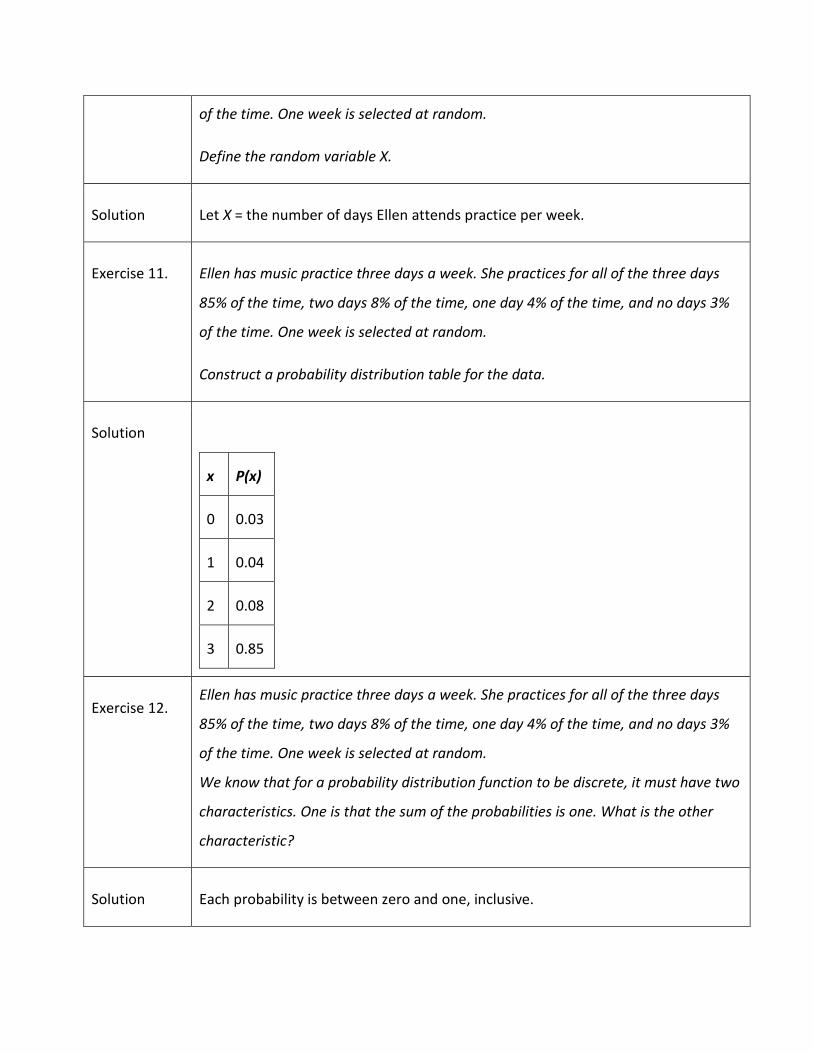
Construct a probability distribution table for the data.
Solution
x P(x)
0 0.03
1 0.04
2 0.08
3 0.85
Exercise 12. Ellen has music practice three days a week. She practices for all of the three days
85% of the time, two days 8% of the time, one day 4% of the time, and no days 3%
of the time. One week is selected at random.
We know that for a probability distribution function to be discrete, it must have two
characteristics. One is that the sum of the probabilities is one. What is the other
characteristic?
Solution Each probability is between zero and one, inclusive.
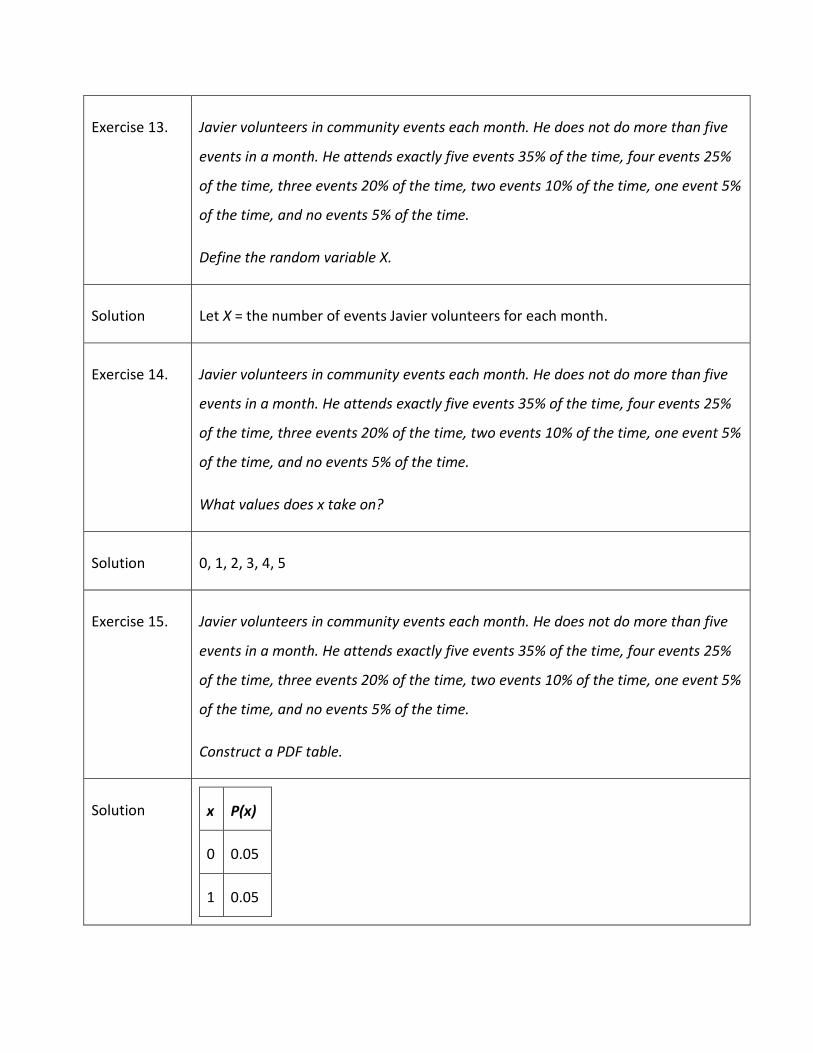
Exercise 13. Javier volunteers in community events each month. He does not do more than five
events in a month. He attends exactly five events 35% of the time, four events 25%
of the time, three events 20% of the time, two events 10% of the time, one event 5%
of the time, and no events 5% of the time.
Define the random variable X.
Solution Let X = the number of events Javier volunteers for each month.
Exercise 14. Javier volunteers in community events each month. He does not do more than five
events in a month. He attends exactly five events 35% of the time, four events 25%
of the time, three events 20% of the time, two events 10% of the time, one event 5%
of the time, and no events 5% of the time.
What values does x take on?
Solution 0, 1, 2, 3, 4, 5
Exercise 15. Javier volunteers in community events each month. He does not do more than five
events in a month. He attends exactly five events 35% of the time, four events 25%
of the time, three events 20% of the time, two events 10% of the time, one event 5%
of the time, and no events 5% of the time.
Construct a PDF table.
Solution x P(x)
0 0.05
1 0.05
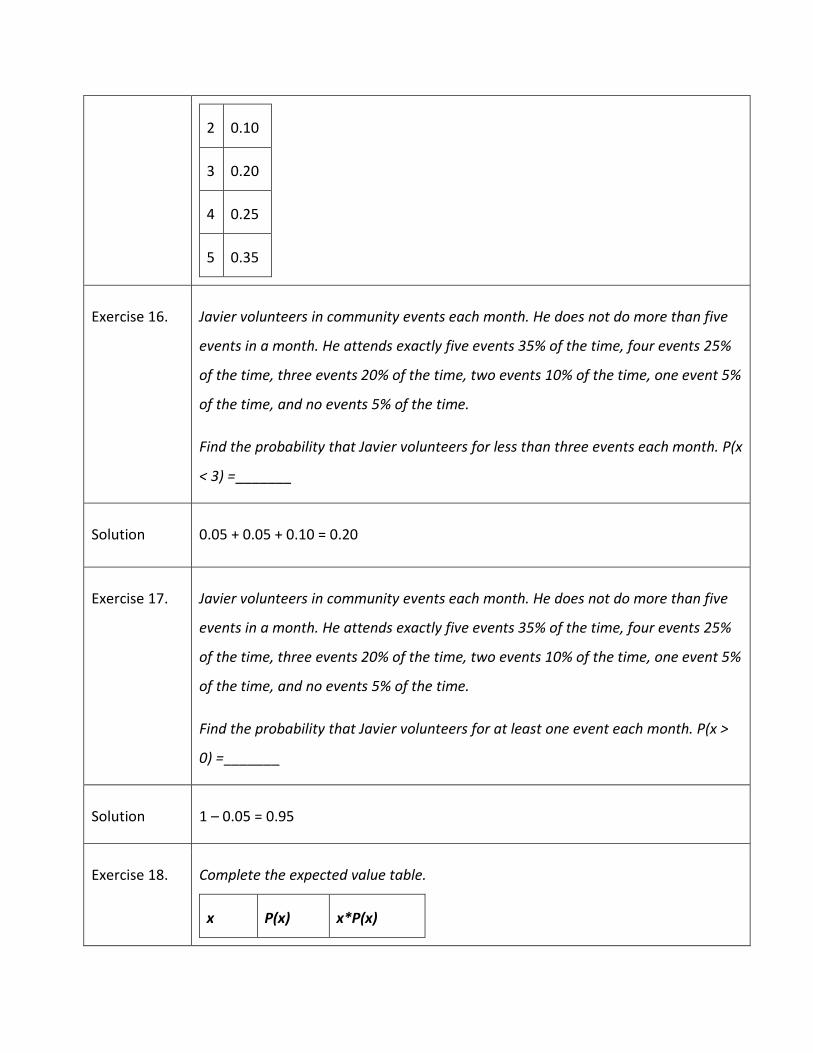
2 0.10
3 0.20
4 0.25
5 0.35
Exercise 16. Javier volunteers in community events each month. He does not do more than five
events in a month. He attends exactly five events 35% of the time, four events 25%
of the time, three events 20% of the time, two events 10% of the time, one event 5%
of the time, and no events 5% of the time.
Find the probability that Javier volunteers for less than three events each month. P(x
< 3) =_______
Solution 0.05 + 0.05 + 0.10 = 0.20
Exercise 17. Javier volunteers in community events each month. He does not do more than five
events in a month. He attends exactly five events 35% of the time, four events 25%
of the time, three events 20% of the time, two events 10% of the time, one event 5%
of the time, and no events 5% of the time.
Find the probability that Javier volunteers for at least one event each month. P(x >
0) =_______
Solution 1 – 0.05 = 0.95
Exercise 18. Complete the expected value table.
x P(x) x*P(x)
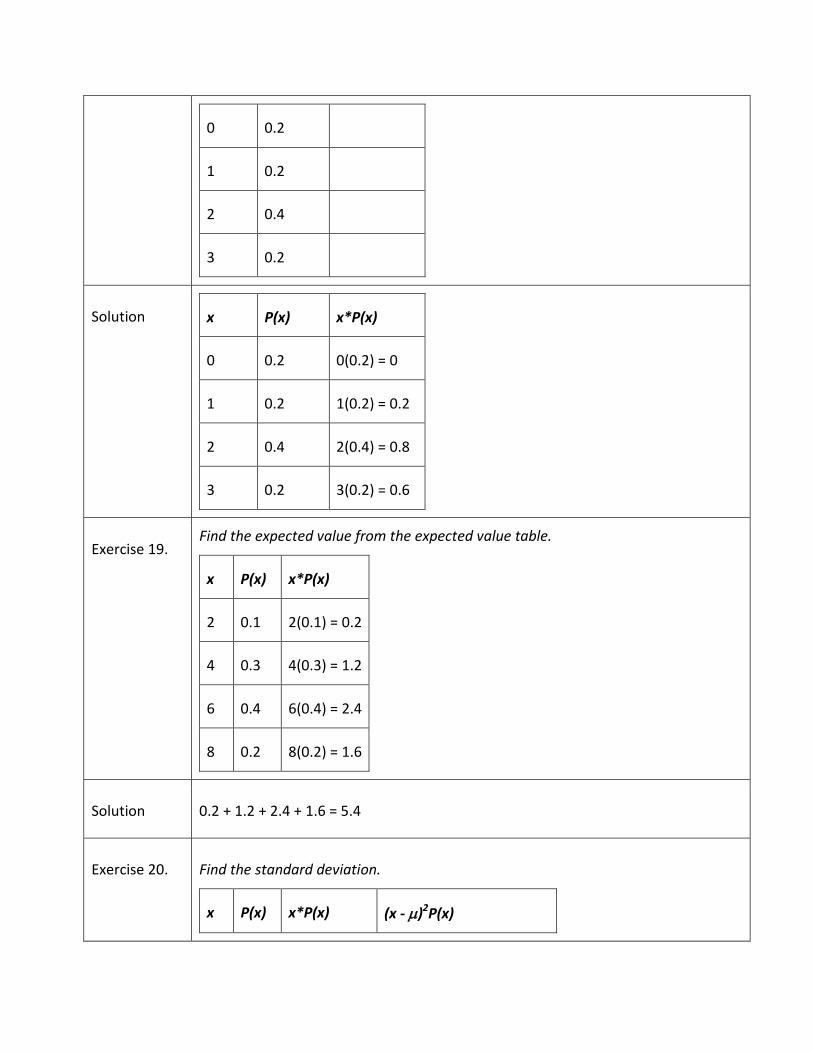
0 0.2
1 0.2
2 0.4
3 0.2
Solution x P(x) x*P(x)
0 0.2 0(0.2) = 0
1 0.2 1(0.2) = 0.2
2 0.4 2(0.4) = 0.8
3 0.2 3(0.2) = 0.6
Exercise 19. Find the expected value from the expected value table.
x P(x) x*P(x)
2 0.1 2(0.1) = 0.2
4 0.3 4(0.3) = 1.2
6 0.4 6(0.4) = 2.4
8 0.2 8(0.2) = 1.6
Solution 0.2 + 1.2 + 2.4 + 1.6 = 5.4
Exercise 20. Find the standard deviation.
x P(x) x*P(x) (x - µ)2P(x)

2 0.1 2(0.1) = 0.2 (2 – 5.4)2(0.1) = 1.156
4 0.3 4(0.3) = 1.2 (4 – 5.4)2(0.3) = 0.588
6 0.4 6(0.4) = 2.4 (6 – 5.4)2(0.4) = 0.144
8 0.2 8(0.2) = 1.6 (8 – 5.4)2(0.2) = 1.352
Solution 𝜎 = √1.156 + 0.588 + 0.144 + 1.352 = √3.24 = 1.8
Exercise 21. Identify the mistake in the probability distribution table.
x P(x) x*P(x)
1 0.15 0.15
2 0.25 0.50
3 0.30 0.90
4 0.20 0.80
5 0.15 0.75
Solution The values of P(x) do not sum to one.
Exercise 22. Identify the mistake in the probability distribution table.
x P(x) x*P(x)
1 0.15 0.15
2 0.25 0.40
3 0.25 0.65
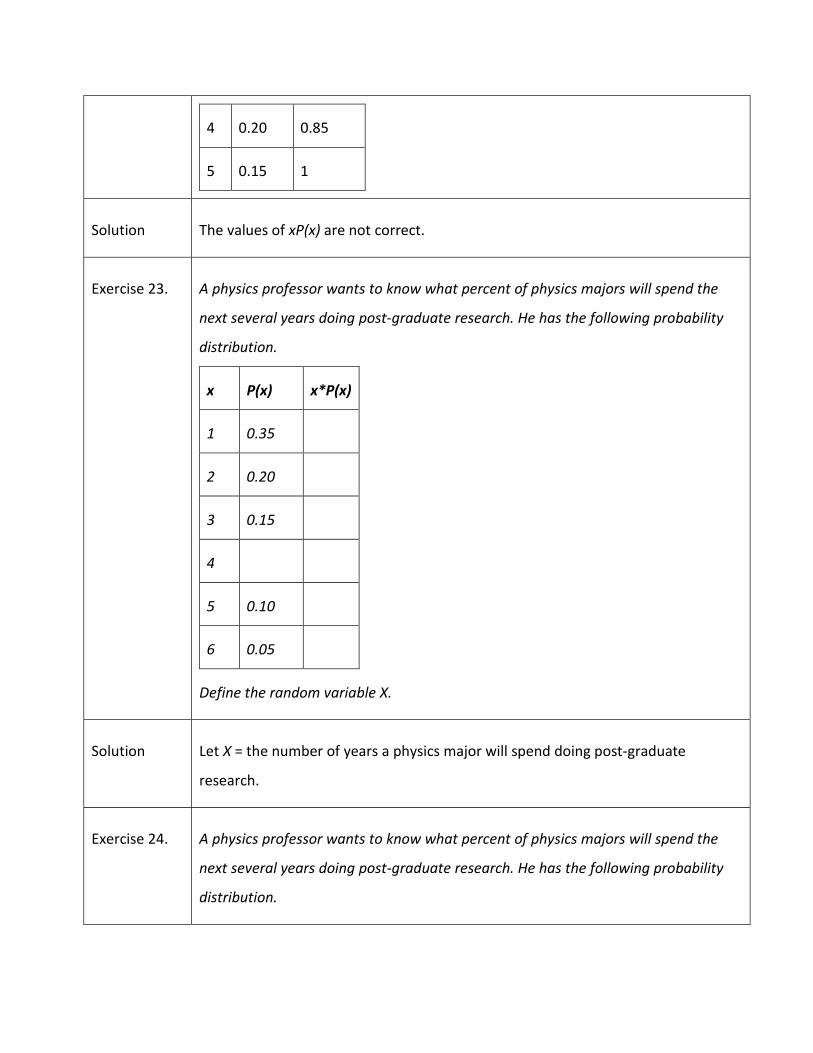
4 0.20 0.85
5 0.15 1
Solution The values of xP(x) are not correct.
Exercise 23. A physics professor wants to know what percent of physics majors will spend the
next several years doing post-graduate research. He has the following probability
distribution.
x P(x) x*P(x)
1 0.35
2 0.20
3 0.15
4
5 0.10
6 0.05
Define the random variable X.
Solution Let X = the number of years a physics major will spend doing post-graduate
research.
Exercise 24. A physics professor wants to know what percent of physics majors will spend the
next several years doing post-graduate research. He has the following probability
distribution.

x P(x) x*P(x)
1 0.35
2 0.20
3 0.15
4
5 0.10
6 0.05
Define P(x), or the probablity of x.
Solution Let P(x) = the probability that a physics major will do post-graduate research for x
years.
Exercise 25. A physics professor wants to know what percent of physics majors will spend the
next several years doing post-graduate research. He has the following probability
distribution.
x P(x) x*P(x)
1 0.35
2 0.20
3 0.15
4
5 0.10

6 0.05
Find the probability that a physics major will do post-graduate research for four
years. P(x = 4) =_______
Solution 1 – 0.35 – 0.20 – 0.15 – 0.10 – 0.05 = 0.15
Exercise 26. A physics professor wants to know what percent of physics majors will spend the
next several years doing post-graduate research. He has the following probability
distribution.
x P(x) x*P(x)
1 0.35
2 0.20
3 0.15
4
5 0.10
6 0.05
Find the probability that a physics major will do post-graduate research for at most
three years. P(x ≤ 3) =_______
Solution 0.35 + 0.20 + 0.15 = 0.70
Exercise 27. A physics professor wants to know what percent of physics majors will spend the
next several years doing post-graduate research. He has the following probability
distribution.
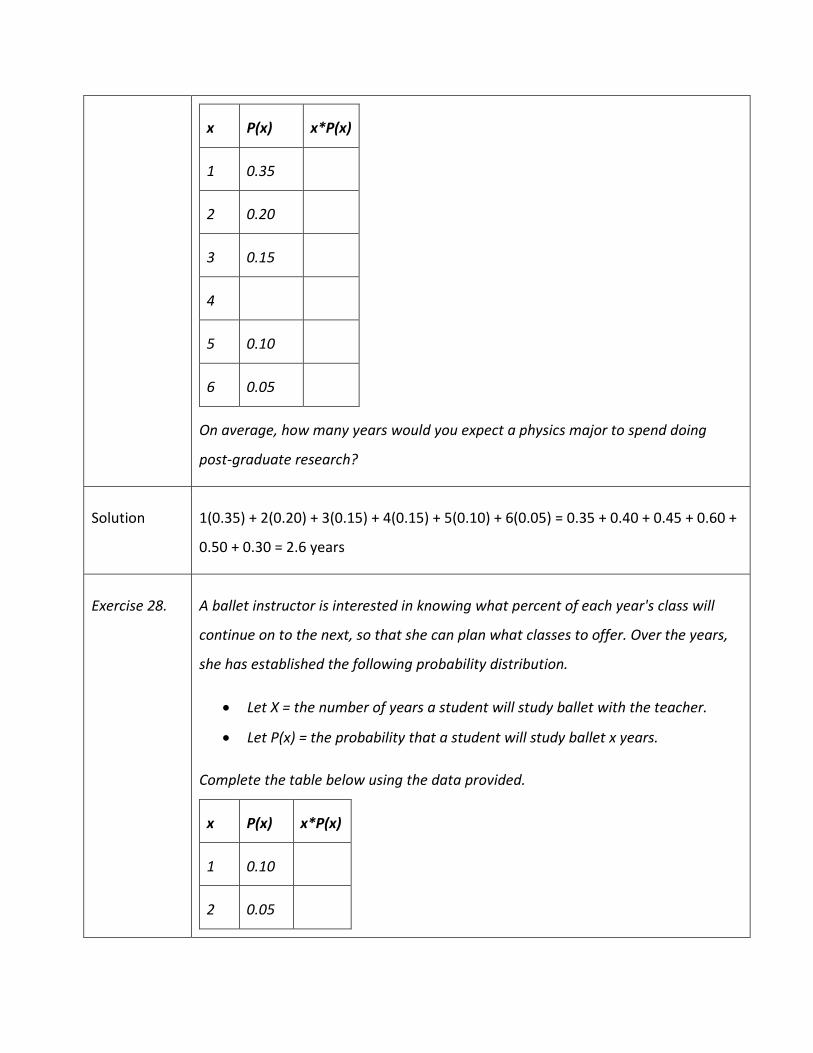
x P(x) x*P(x)
1 0.35
2 0.20
3 0.15
4
5 0.10
6 0.05
On average, how many years would you expect a physics major to spend doing
post-graduate research?
Solution 1(0.35) + 2(0.20) + 3(0.15) + 4(0.15) + 5(0.10) + 6(0.05) = 0.35 + 0.40 + 0.45 + 0.60 +
0.50 + 0.30 = 2.6 years
Exercise 28. A ballet instructor is interested in knowing what percent of each year's class will
continue on to the next, so that she can plan what classes to offer. Over the years,
she has established the following probability distribution.
• Let X = the number of years a student will study ballet with the teacher.
• Let P(x) = the probability that a student will study ballet x years.
Complete the table below using the data provided.
x P(x) x*P(x)
1 0.10
2 0.05
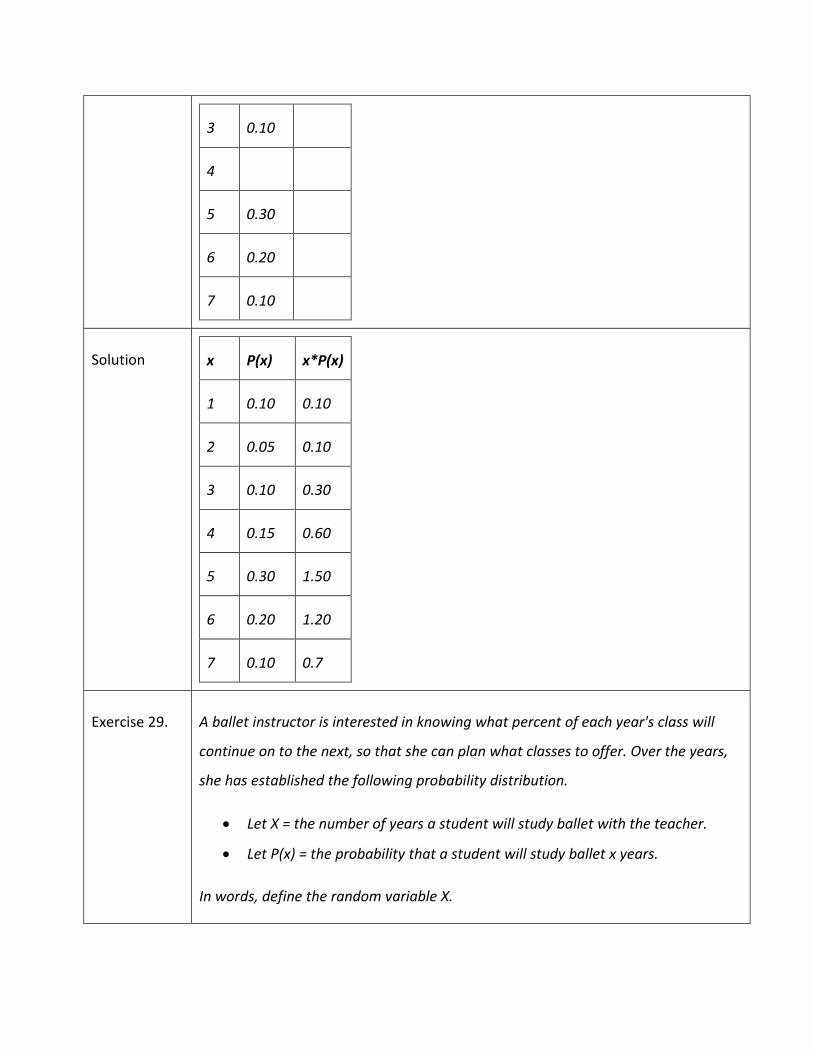
3 0.10
4
5 0.30
6 0.20
7 0.10
Solution x P(x) x*P(x)
1 0.10 0.10
2 0.05 0.10
3 0.10 0.30
4 0.15 0.60
5 0.30 1.50
6 0.20 1.20
7 0.10 0.7
Exercise 29. A ballet instructor is interested in knowing what percent of each year's class will
continue on to the next, so that she can plan what classes to offer. Over the years,
she has established the following probability distribution.
• Let X = the number of years a student will study ballet with the teacher.
• Let P(x) = the probability that a student will study ballet x years.
In words, define the random variable X.

Solution X is the number of years a student studies ballet with the teacher.
Exercise 30. A ballet instructor is interested in knowing what percent of each year's class will
continue on to the next, so that she can plan what classes to offer. Over the years,
she has established the following probability distribution.
• Let X = the number of years a student will study ballet with the teacher.
• Let P(x) = the probability that a student will study ballet x years.
P(x = 4) = _______
Solution 1 – 0.10 – 0.05 – 0.10 – 0.30 – 0.20 – 0.10 = 0.15
Exercise 31. A ballet instructor is interested in knowing what percent of each year's class will
continue on to the next, so that she can plan what classes to offer. Over the years,
she has established the following probability distribution.
• Let X = the number of years a student will study ballet with the teacher.
• Let P(x) = the probability that a student will study ballet x years.
P(x < 4) =_______
Solution 0.10 + 0.05 + 0.10 = 0.25
Exercise 32. A ballet instructor is interested in knowing what percent of each year's class will
continue on to the next, so that she can plan what classes to offer. Over the years,
she has established the following probability distribution.
• Let X = the number of years a student will study ballet with the teacher.
• Let P(x) = the probability that a student will study ballet x years.
On average, how many years would you expect a child to study ballet with this
teacher?
Solution 1(0.10) + 2(0.05) + 3(0.10) +4(0.15) + 5(0.30) + 6(0.20) + 7(0.10) = 4.5 years
Exercise 33. A ballet instructor is interested in knowing what percent of each year's class will
continue on to the next, so that she can plan what classes to offer. Over the years,
she has established the following probability distribution.
• Let X = the number of years a student will study ballet with the teacher.
• Let P(x) = the probability that a student will study ballet x years.
What does the column “P(x)” sum to and why?
Solution The sum of the probabilities sum to one because it is a probability distribution.
Exercise 34. A ballet instructor is interested in knowing what percent of each year's class will
continue on to the next, so that she can plan what classes to offer. Over the years,
she has established the following probability distribution.
• Let X = the number of years a student will study ballet with the teacher.
• Let P(x) = the probability that a student will study ballet x years.
What does the column “x*P(x)” sum to and why?
Solution The sum of x*P(x) = 4.5; it is the mean of the distribution.
Exercise 35. You are playing a game by drawing a card from a standard deck and replacing it. If
the card is a face card, you win $30. If it is not a face card, you pay $2. There are 12
face cards in a deck of 52 cards. What is the expected value of playing the game?
Solution −2 �4052� + 30 �12
52� = –1.54 + 6.92 = 5.38
Exercise 36. You are playing a game by drawing a card from a standard deck and replacing it. If
the card is a face card, you win $30. If it is not a face card, you pay $2. There are 12
face cards in a deck of 52 cards. Should you play the game?
Solution Yes, because there is a positive expected value, and the more you play , the more
likely you are to get closer to the expected value.
Exercise 37. The Higher Education Research Institute at UCLA collected data from 203,967
incoming first-time, full-time freshmen from 270 four-year colleges and universities
in the U.S. 71.3% of those students replied that, yes, they believe that same-sex
couples should have the right to legal marital status.
Suppose that you randomly pick eight first-time, full-time freshmen from the survey.
You are interested in the number that believes that same sex-couples should have
the right to legal marital status.
In words, define the random variable X.
Solution X = the number that reply “yes”
Exercise 38 The Higher Education Research Institute at UCLA collected data from 203,967
incoming first-time, full-time freshmen from 270 four-year colleges and universities
in the U.S. 71.3% of those students replied that, yes, they believe that same-sex
couples should have the right to legal marital status.
Suppose that you randomly pick eight first-time, full-time freshmen from the survey.
You are interested in the number that believes that same sex-couples should have
the right to legal marital status.
X ~ _____(_____,_____)
Solution B(8,0.713)
Exercise 39. The Higher Education Research Institute at UCLA collected data from 203,967
incoming first-time, full-time freshmen from 270 four-year colleges and universities
in the U.S. 71.3% of those students replied that, yes, they believe that same-sex
couples should have the right to legal marital status.
Suppose that you randomly pick eight first-time, full-time freshmen from the survey.
You are interested in the number that believes that same sex-couples should have
the right to legal marital status.
What values does the random variable X take on?
Solution 0, 1, 2, 3, 4, 5, 6, 7, 8
Exercise 40. The Higher Education Research Institute at UCLA collected data from 203,967
incoming first-time, full-time freshmen from 270 four-year colleges and universities
in the U.S. 71.3% of those students replied that, yes, they believe that same-sex
couples should have the right to legal marital status.
Suppose that you randomly pick eight first-time, full-time freshmen from the survey.
You are interested in the number that believes that same sex-couples should have
the right to legal marital status.
Construct the probability distribution function (PDF).
x P(x)
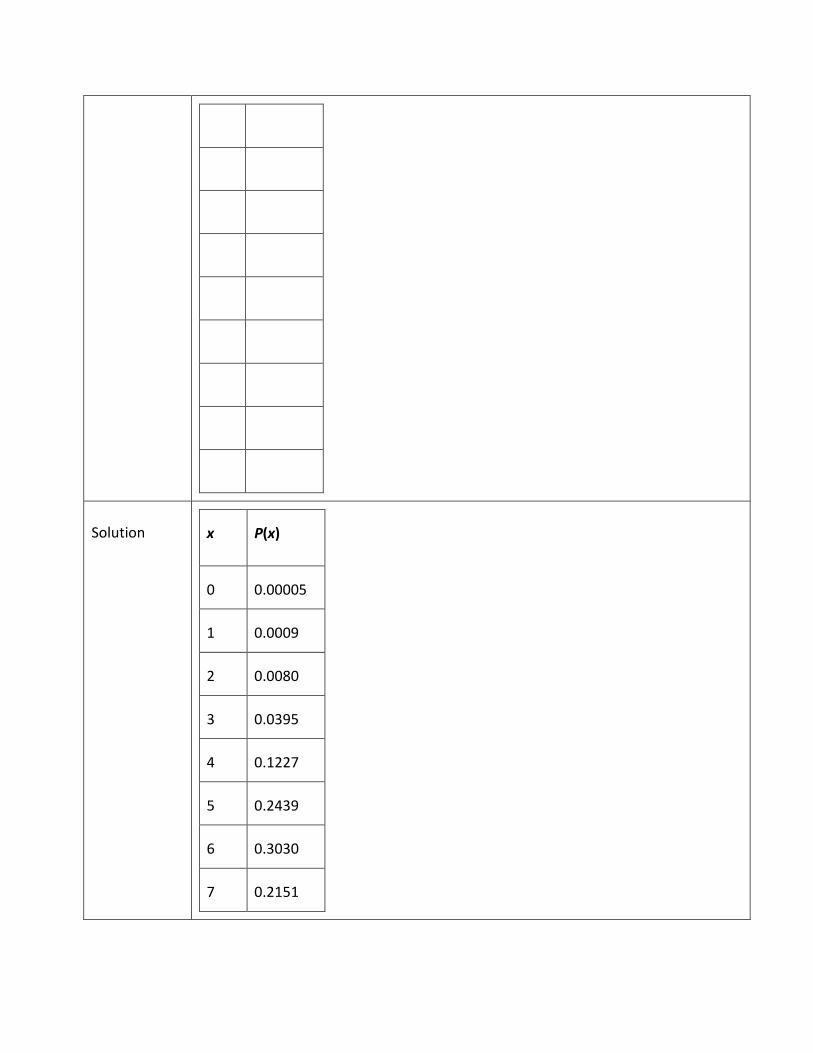
Solution x P(x)
0 0.00005
1 0.0009
2 0.0080
3 0.0395
4 0.1227
5 0.2439
6 0.3030
7 0.2151
8 0.0668
Exercise 41. The Higher Education Research Institute at UCLA collected data from 203,967
incoming first-time, full-time freshmen from 270 four-year colleges and universities
in the U.S. 71.3% of those students replied that, yes, they believe that same-sex
couples should have the right to legal marital status.
Suppose that you randomly pick eight first-time, full-time freshmen from the survey.
You are interested in the number that believes that same sex-couples should have
the right to legal marital status.
On average (μ), how many would you expect to answer yes?
Solution 5.7
Exercise 42. The Higher Education Research Institute at UCLA collected data from 203,967
incoming first-time, full-time freshmen from 270 four-year colleges and universities
in the U.S. 71.3% of those students replied that, yes, they believe that same-sex
couples should have the right to legal marital status.
Suppose that you randomly pick eight first-time, full-time freshmen from the survey.
You are interested in the number that believes that same sex-couples should have
the right to legal marital status.
What is the standard deviation (σ)?
Solution 1.2795
Exercise 43. The Higher Education Research Institute at UCLA collected data from 203,967
incoming first-time, full-time freshmen from 270 four-year colleges and universities
in the U.S. 71.3% of those students replied that, yes, they believe that same-sex
couples should have the right to legal marital status.
Suppose that you randomly pick eight first-time, full-time freshmen from the survey.
You are interested in the number that believes that same sex-couples should have
the right to legal marital status.
What is the probability that at most five of the freshmen reply “yes”?
Solution 0.4151
Exercise 44. The Higher Education Research Institute at UCLA collected data from 203,967
incoming first-time, full-time freshmen from 270 four-year colleges and universities
in the U.S. 71.3% of those students replied that, yes, they believe that same-sex
couples should have the right to legal marital status.
Suppose that you randomly pick eight first-time, full-time freshmen from the survey.
You are interested in the number that believes that same sex-couples should have
the right to legal marital status.
What is the probability that at least two of the freshmen reply “yes”?
Solution 0.9990
Exercise 45. The Higher Education Research Institute at UCLA collected data from 203,967 incoming first-time, full-time freshmen from 270 four-year colleges and universities in the U.S. 71.3% of those students replied that, yes, they believe that same-sex couples should have the right to legal marital status.
Suppose that you randomly select freshman from the study until you find one who
replies “yes.” You are interested in the number of freshmen you must ask.
In words, define the random variable X.
Solution X = the number of freshmen selected from the study until one replied "yes" that
same-sex couples should have the right to legal marital status.
Exercise 46. The Higher Education Research Institute at UCLA collected data from 203,967 incoming first-time, full-time freshmen from 270 four-year colleges and universities in the U.S. 71.3% of those students replied that, yes, they believe that same-sex couples should have the right to legal marital status.
Suppose that you randomly select freshman from the study until you find one who
replies “yes.” You are interested in the number of freshmen you must ask.
X~_____(_____,_____)
Solution G(0.713)
Exercise 47. The Higher Education Research Institute at UCLA collected data from 203,967 incoming first-time, full-time freshmen from 270 four-year colleges and universities in the U.S. 71.3% of those students replied that, yes, they believe that same-sex couples should have the right to legal marital status.
Suppose that you randomly select freshman from the study until you find one who
replies “yes.” You are interested in the number of freshmen you must ask.
What values does the random variable X take on?
Solution 1, 2, …
Exercise 48. The Higher Education Research Institute at UCLA collected data from 203,967 incoming first-time, full-time freshmen from 270 four-year colleges and universities in the U.S. 71.3% of those students replied that, yes, they believe that same-sex couples should have the right to legal marital status.
Suppose that you randomly select freshman from the study until you find one who
replies “yes.” You are interested in the number of freshmen you must ask.
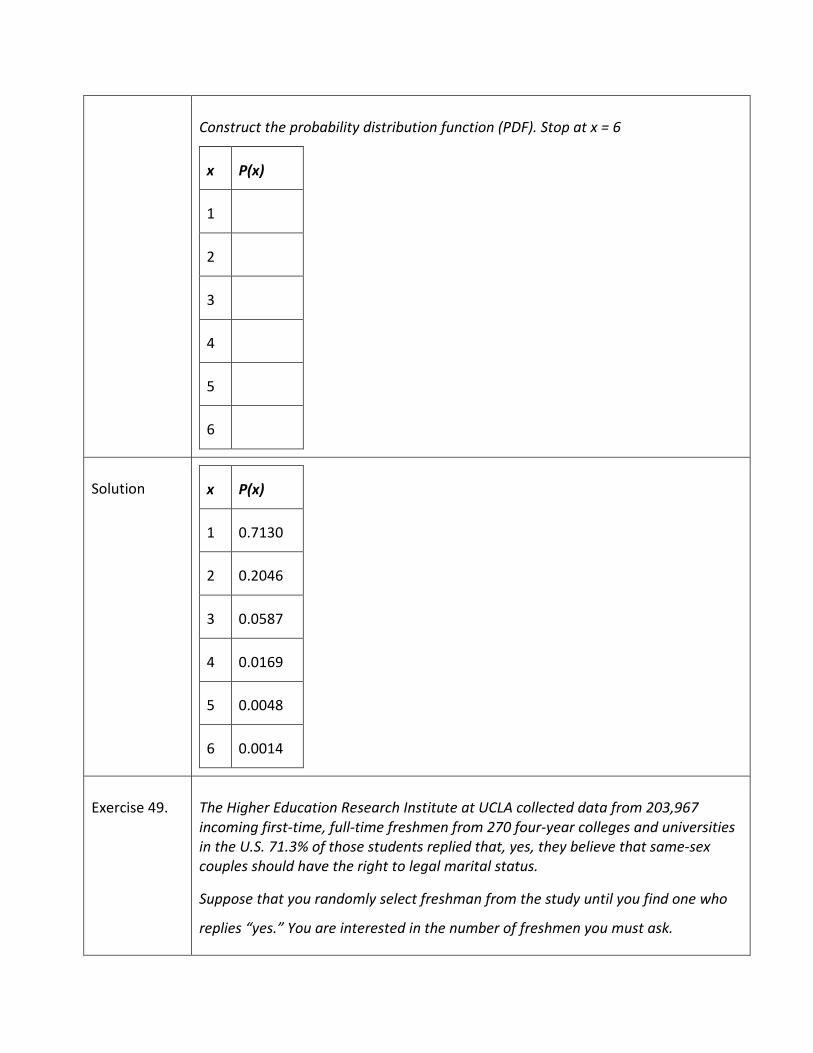
Construct the probability distribution function (PDF). Stop at x = 6
x P(x)
1
2
3
4
5
6
Solution x P(x)
1 0.7130
2 0.2046
3 0.0587
4 0.0169
5 0.0048
6 0.0014
Exercise 49. The Higher Education Research Institute at UCLA collected data from 203,967 incoming first-time, full-time freshmen from 270 four-year colleges and universities in the U.S. 71.3% of those students replied that, yes, they believe that same-sex couples should have the right to legal marital status.
Suppose that you randomly select freshman from the study until you find one who
replies “yes.” You are interested in the number of freshmen you must ask.
On average (µ), how many freshmen would you expect to have to ask until you
found one who replies "yes?."
Solution 1.4
Exercise 50. The Higher Education Research Institute at UCLA collected data from 203,967 incoming first-time, full-time freshmen from 270 four-year colleges and universities in the U.S. 71.3% of those students replied that, yes, they believe that same-sex couples should have the right to legal marital status.
Suppose that you randomly select freshman from the study until you find one who
replies “yes.” You are interested in the number of freshmen you must ask.
What is the probability that you will need to ask fewer than three freshmen?
Solution 0.9176
Exercise 51. Suppose that a group of statistics students is divided into two groups: business
majors and non-business majors. There are 16 business majors in the group and
seven non-business majors in the group. A random sample of nine students is taken.
We are interested in the number of business majors in the sample.
In words, define the random variable X.
Solution X = the number of business majors in the sample.
Exercise 52. Suppose that a group of statistics students is divided into two groups: business
majors and non-business majors. There are 16 business majors in the group and
seven non-business majors in the group. A random sample of nine students is taken.
We are interested in the number of business majors in the sample.
X ~_____(_____,_____)
Solution H(16,7,9)
Exercise 53. Suppose that a group of statistics students is divided into two groups: business
majors and non-business majors. There are 16 business majors in the group and
seven non-business majors in the group. A random sample of nine students is taken.
We are interested in the number of business majors in the sample.
What values does X take on?
Solution 2, 3, 4, 5, 6, 7, 8, 9
Exercise 54. Suppose that a group of statistics students is divided into two groups: business
majors and non-business majors. There are 16 business majors in the group and
seven non-business majors in the group. A random sample of nine students is taken.
We are interested in the number of business majors in the sample.
Construct the probability distribution function (PDF) for X.
Solution x P(X)
Exercise 55. Suppose that a group of statistics students is divided into two groups: business
majors and non-business majors. There are 16 business majors in the group and
seven non-business majors in the group. A random sample of nine students is taken.
We are interested in the number of business majors in the sample.
On average (µ), how many would you expect to be business majors?
Solution 6.26
Exercise 56. On average, a clothing store gets 120 customers per day.
Assume the event occurs independently on any given day. Define the random
variable X.
Solution X ~ P(120)
Exercise 57. On average, a clothing store gets 120 customers per day.
What values does X take on?
Solution 0, 1, 2, 3, 4, …
Exercise 58. On average, a clothing store gets 120 customers per day.
What is the probability of getting 150 customers in one day?
Solution 0.0010
Exercise 59. On average, a clothing store gets 120 customers per day.
What is the probability of getting 35 customers in the first four hours? Assume the
store is open 12 hours each day.
Solution 0.0485
Exercise 60. On average, a clothing store gets 120 customers per day.
What is the probability that the store will have more than 12 customers in the first
hour?
Solution 0.2084
Exercise 61. On average, a clothing store gets 120 customers per day.
What is the probability that the store will have fewer than 12 customers in the first
two hours?
Solution 0.0214
Exercise 62. Which type of distribution can the Poisson model be used to approximate? When
would you do this?
Solution The Poisson distribution can approximate a binomial distribution, which you would
do if the probability of success is small and the number of trials is large.
Exercise 63. On average, eight teens in the U.S. die from motor vehicle injuries per day. As a
result, states across the country are debating raising the driving age.
Assume the event occurs independently on any given day. In words, define the
random variable X.
Solution X = the number of U.S. teens who die from motor vehicle injuries per day.
Exercise 64. On average, eight teens in the U.S. die from motor vehicle injuries per day. As a
result, states across the country are debating raising the driving age.
X ~ _____(_____,_____)
Solution P(8)
Exercise 65. On average, eight teens in the U.S. die from motor vehicle injuries per day. As a
result, states across the country are debating raising the driving age.
What values does X take on?
Solution 0, 1, 2, 3, 4, …
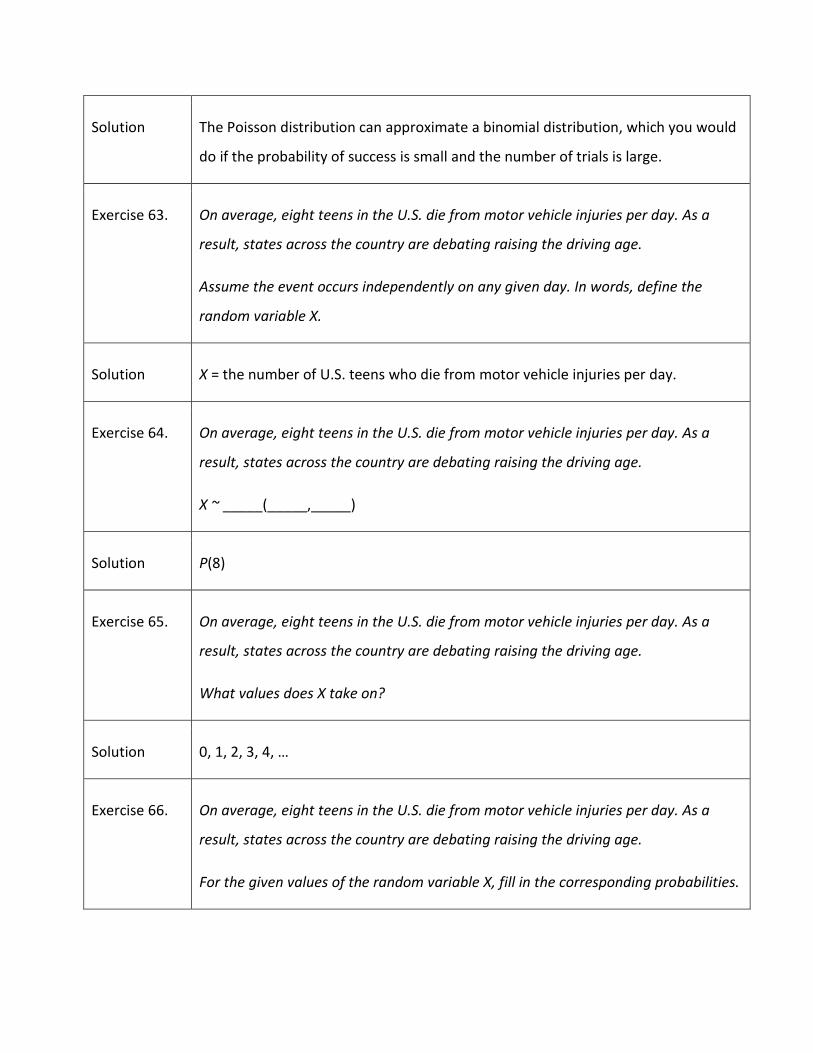
Exercise 66. On average, eight teens in the U.S. die from motor vehicle injuries per day. As a
result, states across the country are debating raising the driving age.
For the given values of the random variable X, fill in the corresponding probabilities.
Solution x P(x)
0 0.0003
4 0.0573
8 0.1396
10 0.993
11 0.0722
15 0.0090
Exercise 67. On average, eight teens in the U.S. die from motor vehicle injuries per day . As a
result, states across the country are debating raising the driving age.
Is it likely that there will be no teens killed from motor vehicle injuries on any given
day in the U.S? Justify your answer numerically.
Solution No
Exercise 68. On average, eight teens in the U.S. die from motor vehicle injuries per day . As a
result, states across the country are debating raising the driving age.
Is it likely that there will be more than 20 teens killed from motor vehicle injuries on
any given day in the U.S.? Justify your answer numerically.
Solution No
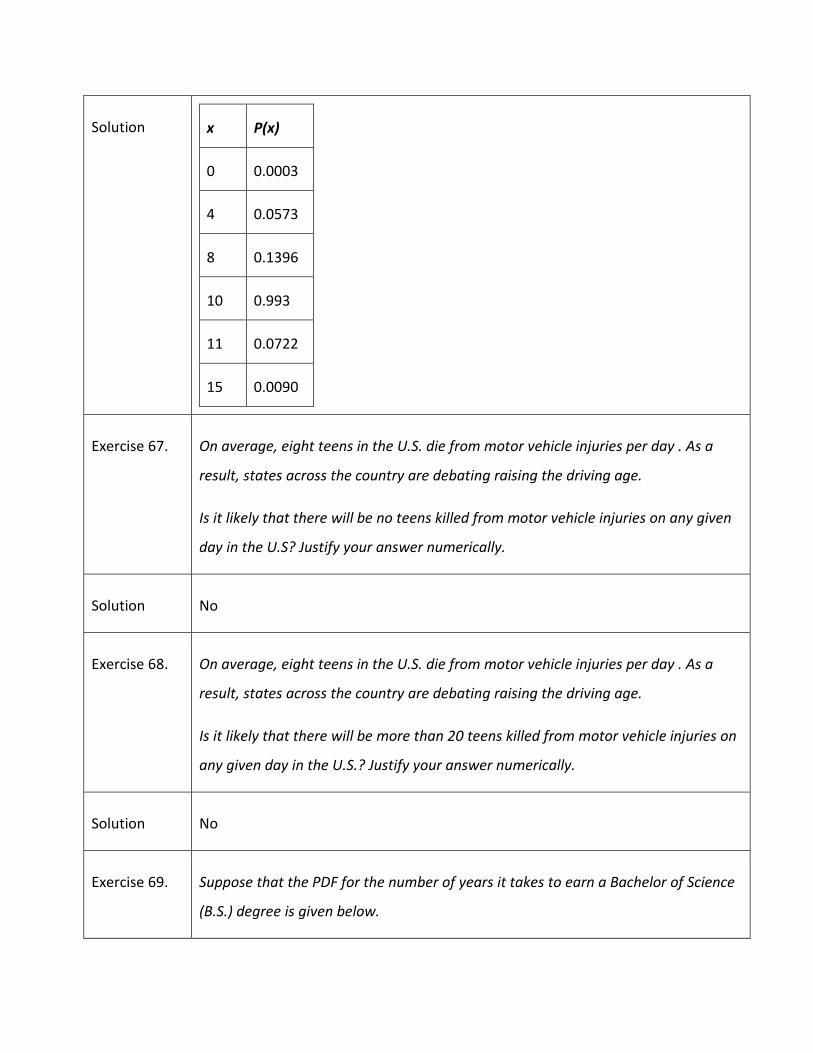
Exercise 69. Suppose that the PDF for the number of years it takes to earn a Bachelor of Science
(B.S.) degree is given below.
x P(x)
3 0.05
4 0.40
5 0.30
6 0.15
7 0.10
a. In words, define the random variable X.
b. What does it mean that the values zero, one, and two are not included for x in
the PDF?
Solution a. X = the number of years it takes to earn a Bachelor of Science degree
b. It takes a minimum of three years to earn a Bachelor of Science degree.
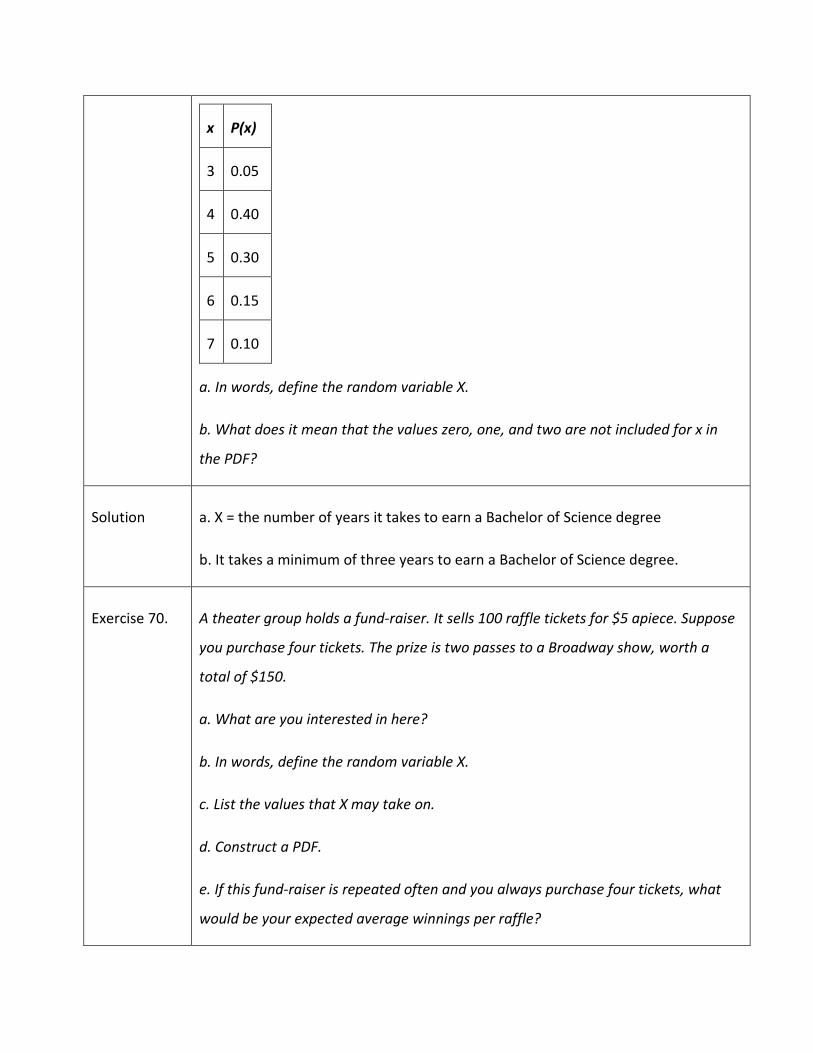
Exercise 70. A theater group holds a fund-raiser. It sells 100 raffle tickets for $5 apiece. Suppose
you purchase four tickets. The prize is two passes to a Broadway show, worth a
total of $150.
a. What are you interested in here?
b. In words, define the random variable X.
c. List the values that X may take on.
d. Construct a PDF.
e. If this fund-raiser is repeated often and you always purchase four tickets, what
would be your expected average winnings per raffle?
Solution a. I am interested in the average profit or loss.
b. Let X = the return from the raffle
c. Win ($150) or Lose ($0)
d.
X P(x)
150 1100
0 99100
e. 150� 1100� + 0 � 99
100� − 20 = −$14.00
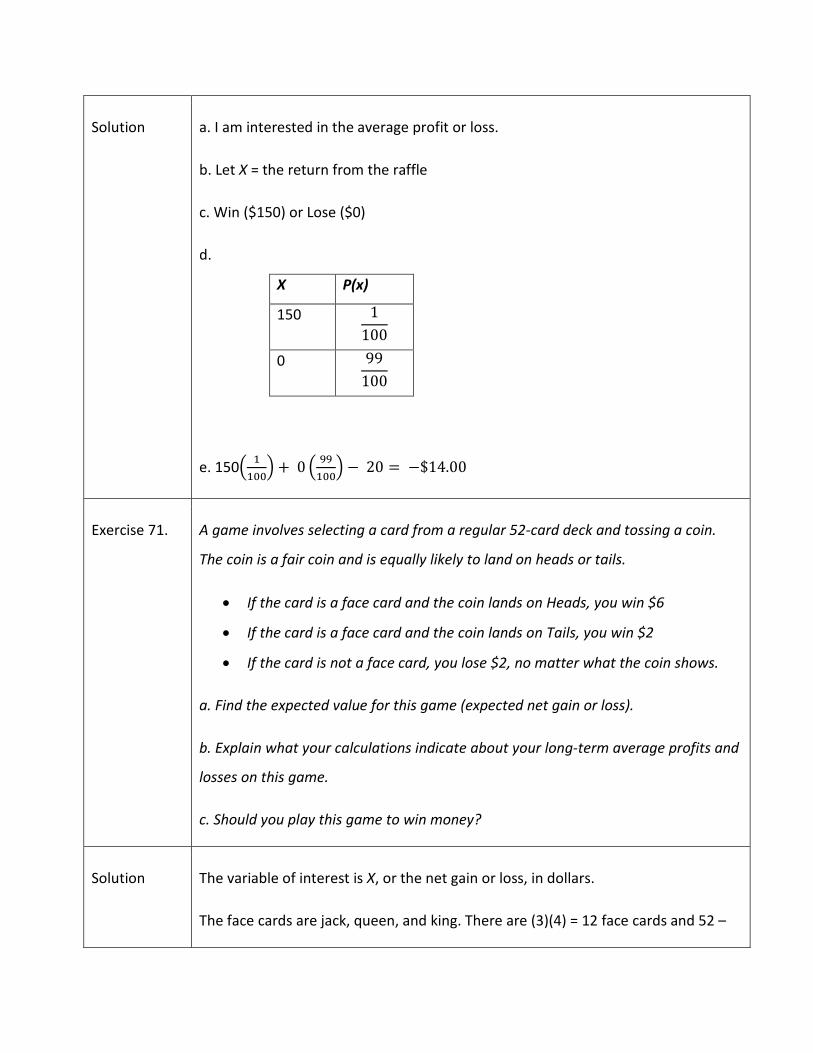
Exercise 71. A game involves selecting a card from a regular 52-card deck and tossing a coin.
The coin is a fair coin and is equally likely to land on heads or tails.
• If the card is a face card and the coin lands on Heads, you win $6
• If the card is a face card and the coin lands on Tails, you win $2
• If the card is not a face card, you lose $2, no matter what the coin shows.
a. Find the expected value for this game (expected net gain or loss).
b. Explain what your calculations indicate about your long-term average profits and
losses on this game.
c. Should you play this game to win money?
Solution The variable of interest is X, or the net gain or loss, in dollars.
The face cards are jack, queen, and king. There are (3)(4) = 12 face cards and 52 –
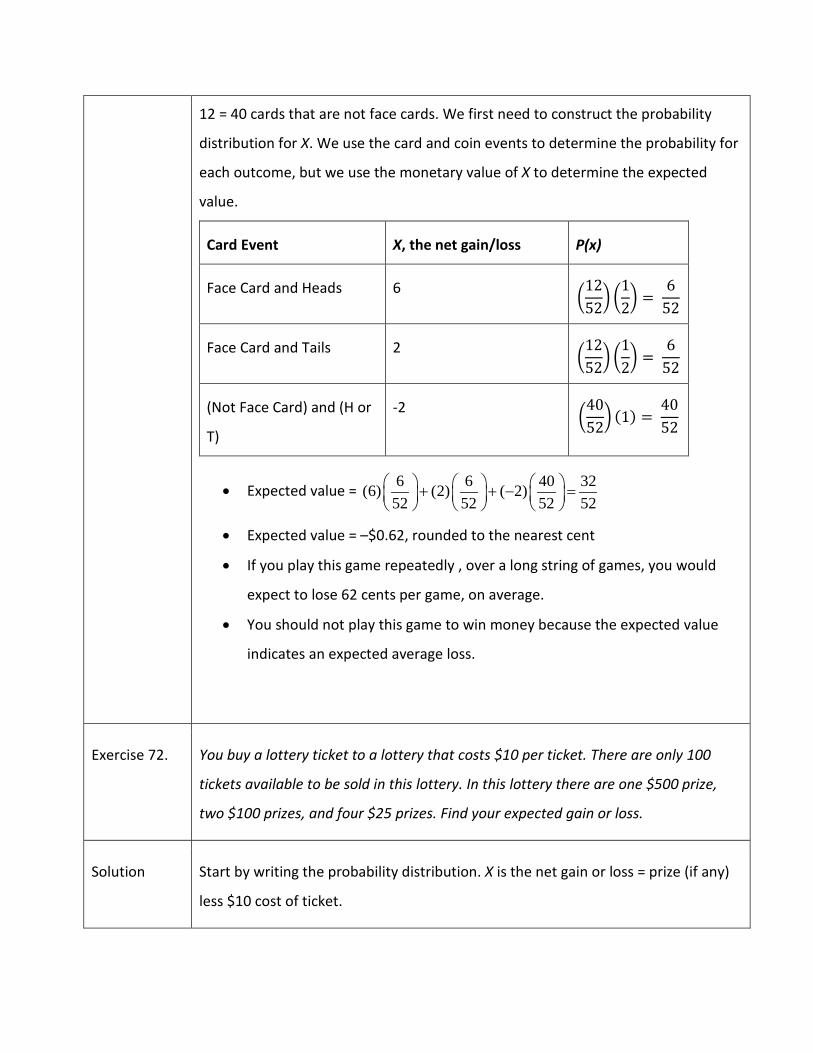
12 = 40 cards that are not face cards. We first need to construct the probability
distribution for X. We use the card and coin events to determine the probability for
each outcome, but we use the monetary value of X to determine the expected
value.
Card Event X, the net gain/loss P(x)
Face Card and Heads 6 �1252� �
12� =
652
Face Card and Tails 2 �1252� �
12� =
652
(Not Face Card) and (H or
T)
-2 �4052� (1) =
4052
• Expected value = 6 6 40 32(6) (2) ( 2)52 52 52 52
+ + − =
• Expected value = –$0.62, rounded to the nearest cent
• If you play this game repeatedly , over a long string of games, you would
expect to lose 62 cents per game, on average.
• You should not play this game to win money because the expected value
indicates an expected average loss.
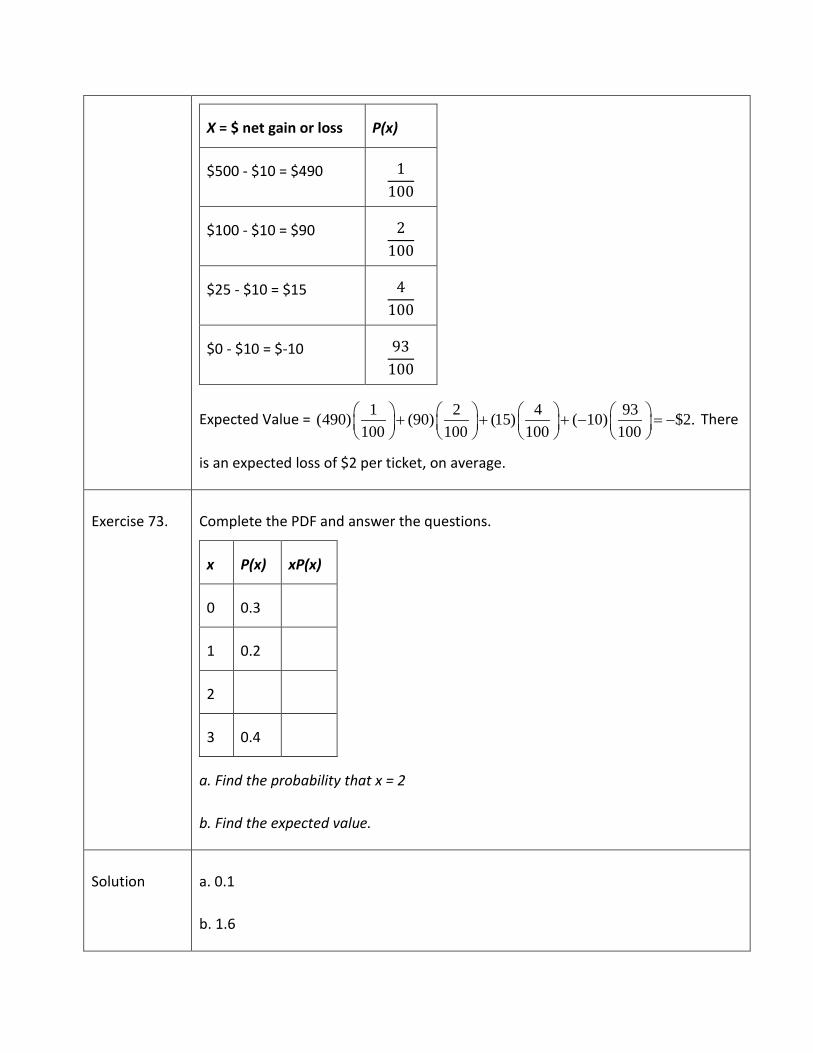
Exercise 72. You buy a lottery ticket to a lottery that costs $10 per ticket. There are only 100
tickets available to be sold in this lottery. In this lottery there are one $500 prize,
two $100 prizes, and four $25 prizes. Find your expected gain or loss.
Solution Start by writing the probability distribution. X is the net gain or loss = prize (if any)
less $10 cost of ticket.
X = $ net gain or loss P(x)
$500 - $10 = $490 1100
$100 - $10 = $90 2100
$25 - $10 = $15 4100
$0 - $10 = $-10 93100
Expected Value = 1 2 4 93(490) (90) (15) ( 10) $2.100 100 100 100 + + + − = −
There
is an expected loss of $2 per ticket, on average.
Exercise 73. Complete the PDF and answer the questions.
x P(x) xP(x)
0 0.3
1 0.2
2
3 0.4
a. Find the probability that x = 2
b. Find the expected value.
Solution a. 0.1
b. 1.6

Exercise 74. Suppose that you are offered the following “deal.” You roll a die. If you roll a six, you
win $10. If you roll a four or five, you win $5. If you roll a one, two, or three, you pay
$6.
a. What are you ultimately interested in here (the value of the roll or the money you
win)?
b. In words, define the Random Variable X.
c. List the values that X may take on.
d. Construct a PDF.
e. Over the long run of playing this game, what are your expected average winnings
per game?
f. Based on numerical values, should you take the deal? Explain your decision in
complete sentences.
Solution a. the money won
b. X = the amount of money won or lost
c. $5, -$6, $10
d.
Roll x p(x)
6 10 16
4 or 5 5 26
1, 2, or 3 -6 36
e. Expected Value = 1 2 3(10) (5) (6) 0.336 6 6+ − =
f. Yes, the expected value is 33 cents.
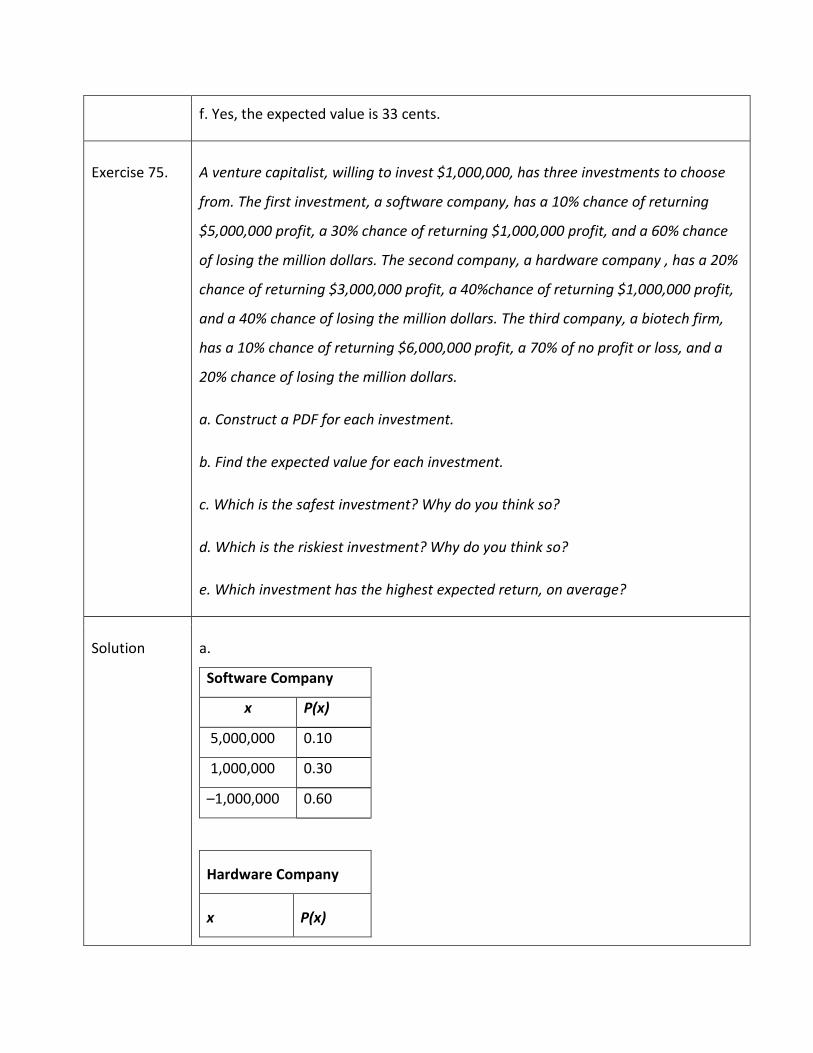
Exercise 75. A venture capitalist, willing to invest $1,000,000, has three investments to choose
from. The first investment, a software company, has a 10% chance of returning
$5,000,000 profit, a 30% chance of returning $1,000,000 profit, and a 60% chance
of losing the million dollars. The second company, a hardware company , has a 20%
chance of returning $3,000,000 profit, a 40%chance of returning $1,000,000 profit,
and a 40% chance of losing the million dollars. The third company, a biotech firm,
has a 10% chance of returning $6,000,000 profit, a 70% of no profit or loss, and a
20% chance of losing the million dollars.
a. Construct a PDF for each investment.
b. Find the expected value for each investment.
c. Which is the safest investment? Why do you think so?
d. Which is the riskiest investment? Why do you think so?
e. Which investment has the highest expected return, on average?
Solution a.
Software Company
x P(x)
5,000,000 0.10
1,000,000 0.30
–1,000,000 0.60
Hardware Company
x P(x)

3,000,000 0.20
1,000,000 0.40
-1,000,00 0.40
Biotech Firm
x P(x)
6,00,000 0.10
0 0.70
–1,000,000 0.20
b. $200,000; $600,000; $400,000
c. third investment because it has the lowest probability of loss
d. first investment because it has the highest probability of loss
e. second investment
Exercise 76. Suppose that 20,000 married adults in the United States were randomly surveyed as
to the number of children they have. The results are compiled and are used as
theoretical probabilities. Let X = the number of children
x P(x) xP(x)
0 0.10
1 0.20

2 0.30
3
4 0.10
5 0.05
6 (or more) 0.05
a. Find the probability that a married adult has three children.
b. In words, what does the expected value in this example represent?
c. Find the expected value.
d. Is it more likely that a married adult will have two to three children or four to six
children? How do you know?
Solution a. 0.2
b. The average number of children married adults have.
c. 2.35
d. two to three children
Exercise 77 Suppose that the PDF for the number of years it takes to earn a Bachelor of Science
(B.S.) degree is given below.
x P(x)
3 0.05
4 0.40

5 0.30
6 0.15
7 0.10
On average, how many years do you expect it to take for an individual to earn a
B.S.?
Solution 4.85 years
Exercise 78. People visiting video rental stores often rent more than one DVD at a time. The
probability distribution for DVD rentals per customer at Video To Go is given in the
following table. There is a five-video limit per customer at this store, so nobody ever
rents more than five DVDs.
x P(x)
0 0.03
1 0.50
2 0.24
3
4 0.70
5 0.04
a. Describe the random variable X in words.
b. Find the probability that a customer rents three DVDs.
c. Find the probability that a customer rents at least four DVDs.
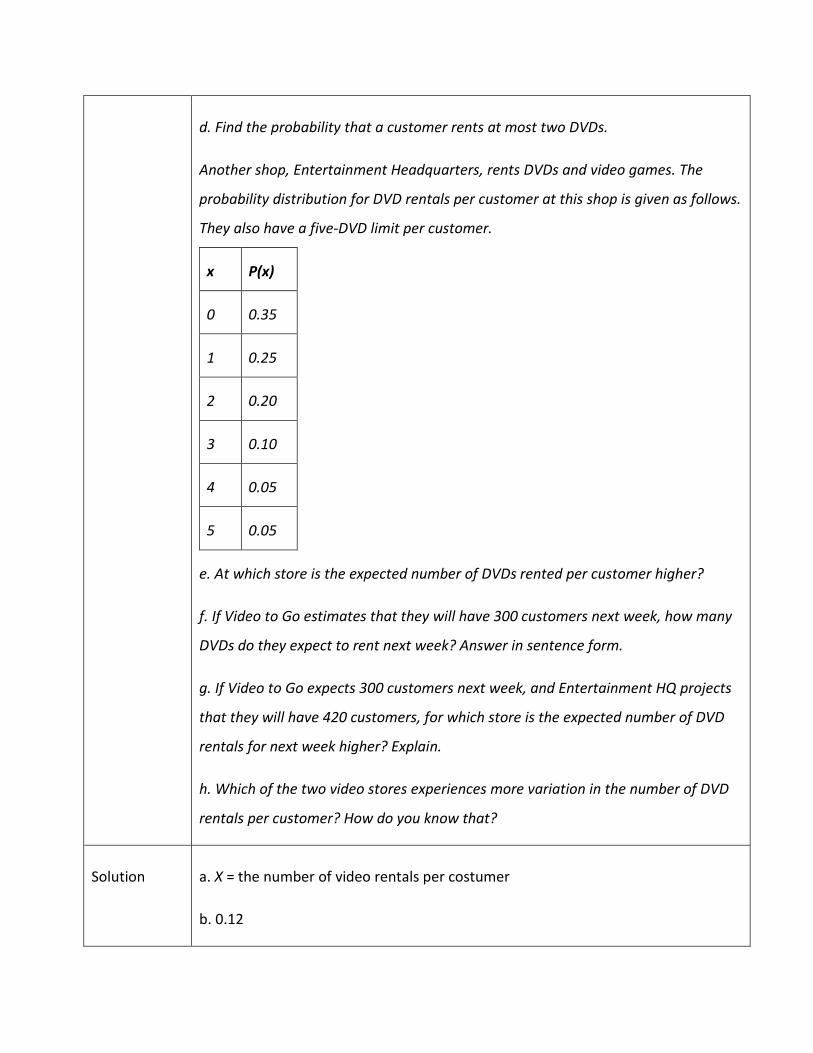
d. Find the probability that a customer rents at most two DVDs.
Another shop, Entertainment Headquarters, rents DVDs and video games. The
probability distribution for DVD rentals per customer at this shop is given as follows.
They also have a five-DVD limit per customer.
x P(x)
0 0.35
1 0.25
2 0.20
3 0.10
4 0.05
5 0.05
e. At which store is the expected number of DVDs rented per customer higher?
f. If Video to Go estimates that they will have 300 customers next week, how many
DVDs do they expect to rent next week? Answer in sentence form.
g. If Video to Go expects 300 customers next week, and Entertainment HQ projects
that they will have 420 customers, for which store is the expected number of DVD
rentals for next week higher? Explain.
h. Which of the two video stores experiences more variation in the number of DVD
rentals per customer? How do you know that?
Solution a. X = the number of video rentals per costumer
b. 0.12

c. 0.11
d. 0.77
e. Video To Go (1.82 expected value vs. 1.4 for Entertainment Headquarters)
f. The expected number of videos rented to 300 Video To Go customers is 546.
g. The expected number of videos rented to 420 Entertainment Headquarters
customers is 588. Entertainment Headquarters will rent more videos.
h. The standard deviation for the number of videos rented at Video To Go is 1.1609.
The standard deviation for the number of videos rented at Entertainment
Headquarters is 1.4293. Entertainment Headquarters has more variation.
Exercise 79. A “friend” offers you the following “deal.” For a $10 fee, you may pick an envelope
from a box containing 100 seemingly identical envelopes. However, each envelope
contains a coupon for a free gift.
• Ten of the coupons are for a free gift worth $6.
• Eighty of the coupons are for a free gift worth $8.
• Six of the coupons are for a free gift worth $12.
• Four of the coupons are for a free gift worth $40.
Based upon the financial gain or loss over the long run, should you play the game?
a. Yes, I expect to come out ahead in money.
b. No, I expect to come out behind in money.
c. It doesn’t matter. I expect to break even.
Solution b
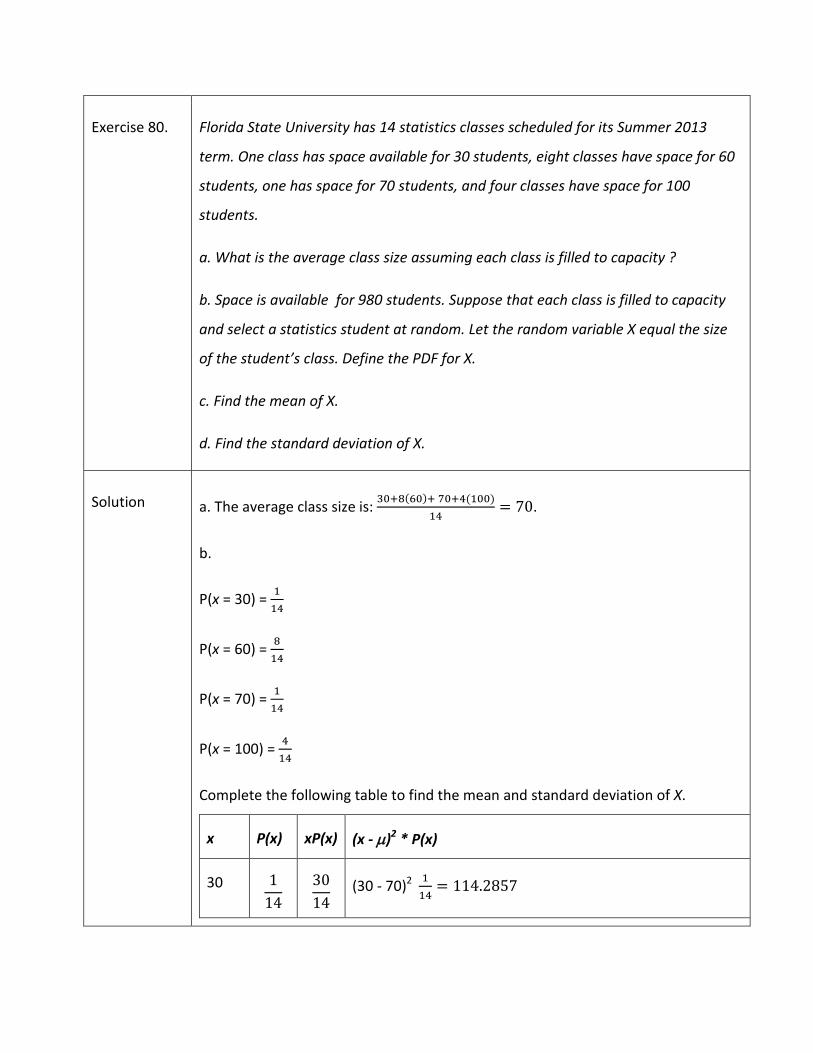
Exercise 80. Florida State University has 14 statistics classes scheduled for its Summer 2013
term. One class has space available for 30 students, eight classes have space for 60
students, one has space for 70 students, and four classes have space for 100
students.
a. What is the average class size assuming each class is filled to capacity ?
b. Space is available for 980 students. Suppose that each class is filled to capacity
and select a statistics student at random. Let the random variable X equal the size
of the student’s class. Define the PDF for X.
c. Find the mean of X.
d. Find the standard deviation of X.
Solution a. The average class size is: 30+8(60)+ 70+4(100)14
= 70.
b.
P(x = 30) = 114
P(x = 60) = 814
P(x = 70) = 114
P(x = 100) = 414
Complete the following table to find the mean and standard deviation of X.
x P(x) xP(x) (x - µ)2 * P(x)
30 114
3014
(30 - 70)2 114
= 114.2857
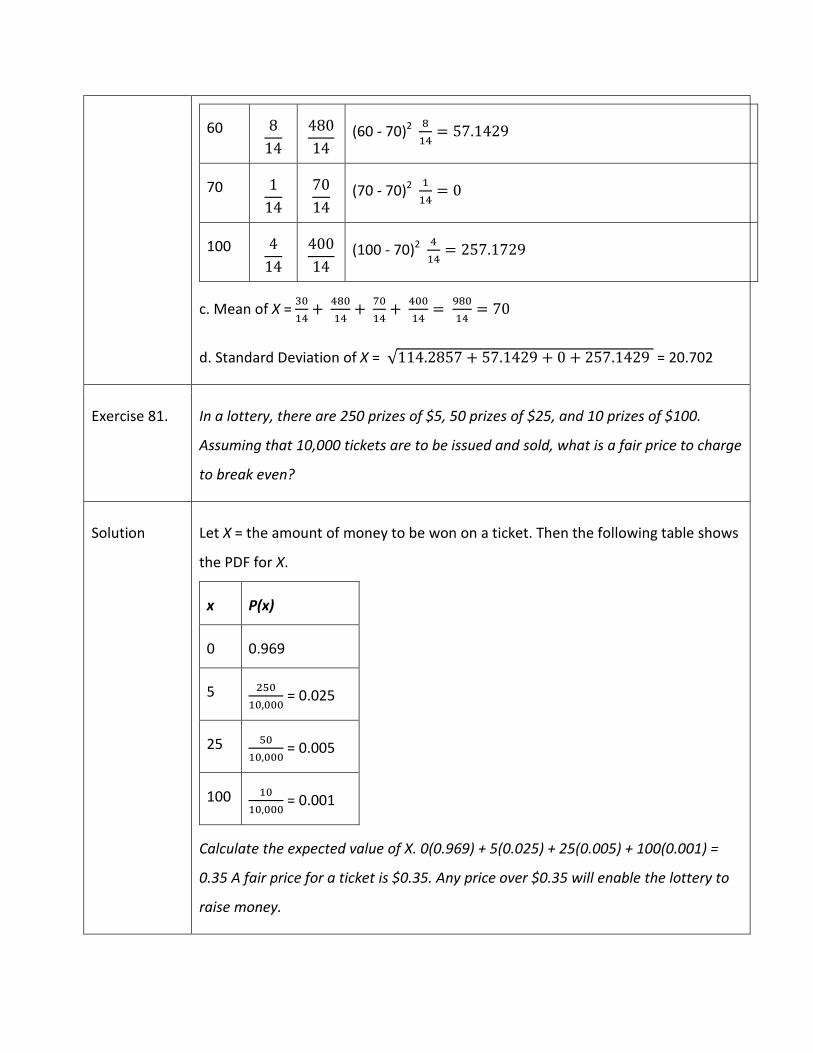
60 814
48014
(60 - 70)2 814
= 57.1429
70 114
7014
(70 - 70)2 114
= 0
100 414
40014
(100 - 70)2 414
= 257.1729
c. Mean of X = 3014
+ 48014
+ 7014
+ 40014
= 98014
= 70
d. Standard Deviation of X = √114.2857 + 57.1429 + 0 + 257.1429 = 20.702
Exercise 81. In a lottery, there are 250 prizes of $5, 50 prizes of $25, and 10 prizes of $100.
Assuming that 10,000 tickets are to be issued and sold, what is a fair price to charge
to break even?
Solution Let X = the amount of money to be won on a ticket. Then the following table shows
the PDF for X.
x P(x)
0 0.969
5 25010,000
= 0.025
25 5010,000
= 0.005
100 1010,000
= 0.001
Calculate the expected value of X. 0(0.969) + 5(0.025) + 25(0.005) + 100(0.001) =
0.35 A fair price for a ticket is $0.35. Any price over $0.35 will enable the lottery to
raise money.
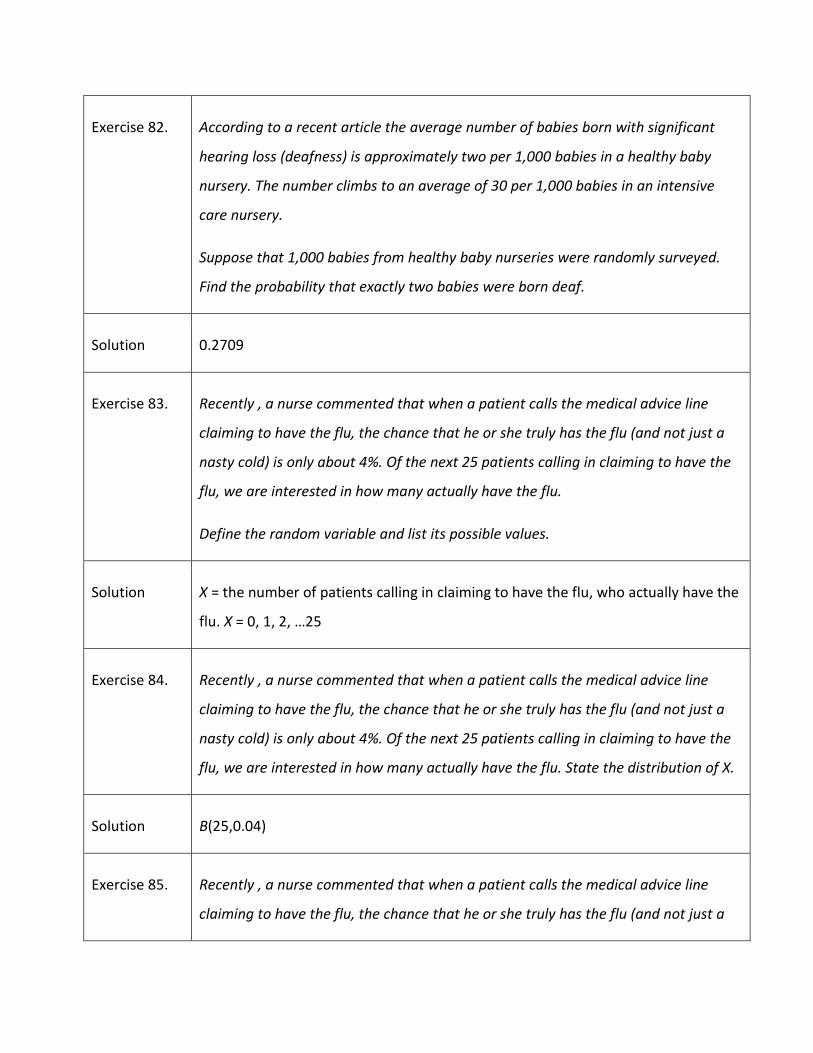
Exercise 82. According to a recent article the average number of babies born with significant
hearing loss (deafness) is approximately two per 1,000 babies in a healthy baby
nursery. The number climbs to an average of 30 per 1,000 babies in an intensive
care nursery.
Suppose that 1,000 babies from healthy baby nurseries were randomly surveyed.
Find the probability that exactly two babies were born deaf.
Solution 0.2709
Exercise 83. Recently , a nurse commented that when a patient calls the medical advice line
claiming to have the flu, the chance that he or she truly has the flu (and not just a
nasty cold) is only about 4%. Of the next 25 patients calling in claiming to have the
flu, we are interested in how many actually have the flu.
Define the random variable and list its possible values.
Solution X = the number of patients calling in claiming to have the flu, who actually have the
flu. X = 0, 1, 2, …25
Exercise 84. Recently , a nurse commented that when a patient calls the medical advice line
claiming to have the flu, the chance that he or she truly has the flu (and not just a
nasty cold) is only about 4%. Of the next 25 patients calling in claiming to have the
flu, we are interested in how many actually have the flu. State the distribution of X.
Solution B(25,0.04)
Exercise 85. Recently , a nurse commented that when a patient calls the medical advice line
claiming to have the flu, the chance that he or she truly has the flu (and not just a
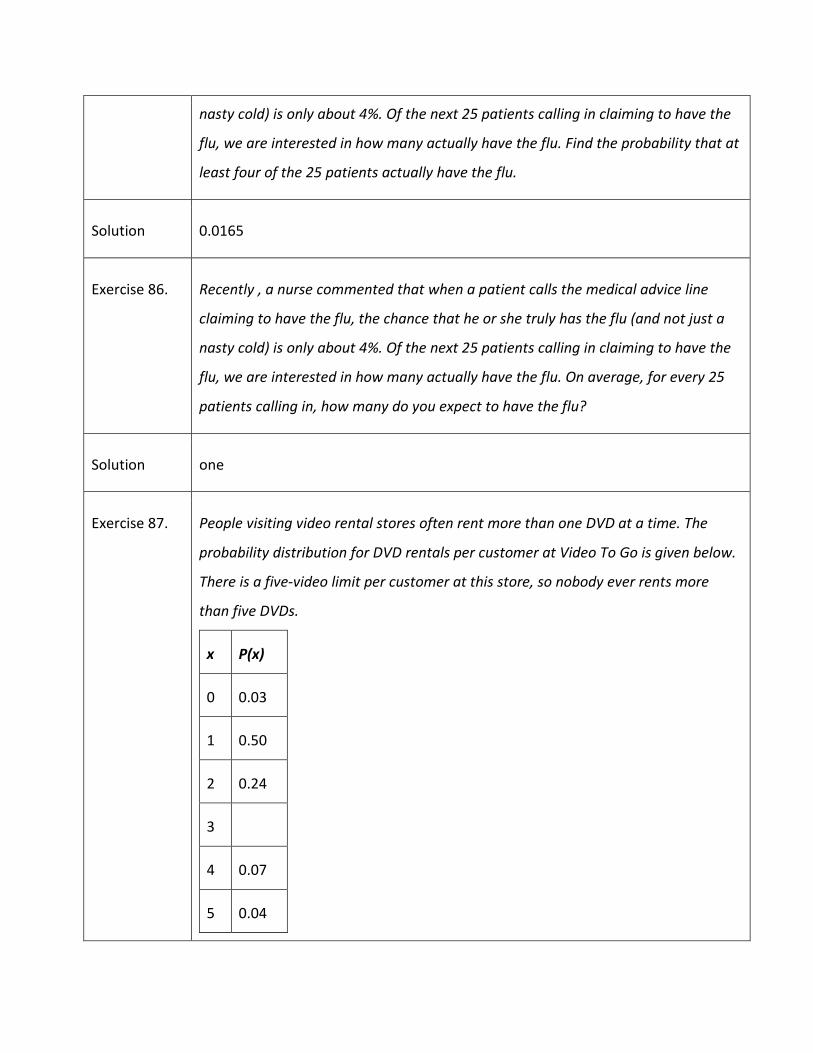
nasty cold) is only about 4%. Of the next 25 patients calling in claiming to have the
flu, we are interested in how many actually have the flu. Find the probability that at
least four of the 25 patients actually have the flu.
Solution 0.0165
Exercise 86. Recently , a nurse commented that when a patient calls the medical advice line
claiming to have the flu, the chance that he or she truly has the flu (and not just a
nasty cold) is only about 4%. Of the next 25 patients calling in claiming to have the
flu, we are interested in how many actually have the flu. On average, for every 25
patients calling in, how many do you expect to have the flu?
Solution one
Exercise 87. People visiting video rental stores often rent more than one DVD at a time. The
probability distribution for DVD rentals per customer at Video To Go is given below.
There is a five-video limit per customer at this store, so nobody ever rents more
than five DVDs.
x P(x)
0 0.03
1 0.50
2 0.24
3
4 0.07
5 0.04
a. Describe the random variable X in words.
b. Find the probability that a customer rents three DVDs.
c. Find the probability that a customer rents at least four DVDs.
d. Find the probability that a customer rents at most two DVDs.
Solution a. X = the number of DVDs a Video to Go customer rents
b. 0.12
c. 0.11
d. 0.77
Exercise 88. A school newspaper reporter decides to randomly survey 12 students to see if they
will attend Tet (Vietnamese New Year) festivities this year. Based on past years, she
knows that 18% of students attend Tet festivities. We are interested in the number
of students who will attend the festivities.
a. In words, define the Random Variable X.
b. List the values that X may take on.
c. Give the distribution of X. X ~_____(_____,_____)
d. How many of the 12 students do we expect to attend the festivities?
e. Find the probability that at most four students will attend.
f. Find the probability that more than two students will attend.
Solution a. X = the number of students that will attend Tet.
b. 0, 1, 2, 3, 4, 5, 6, 7 , 8, 9, 10, 11, 12
c. X ~ B(12,0.18)
d. 2.16
e. 0.9511
f. 0.3702
Exercise 89. The probability that the San Jose Sharks will win any given game is 0.3694 based on
a 13 year win history of 382 wins out of 1,034 games played (as of a certain date).
An upcoming monthly schedule contains 12 games.
The expected number of wins for that upcoming month is:
a. 1.67
b. 12
c. 3821,043
d. 4.43
Let X = the number of games won in that upcoming month.
Solution d. 4.43
Exercise 90. The probability that the San Jose Sharks will win any given game is 0.3694 based on
a 13 year win history of 382 wins out of 1,034 games played (as of a certain date).
An upcoming monthly schedule contains 12 games.
What is the probability that the San Jose Sharks win six games in that upcoming
month?

a. 0.1476
b. 0.2336
c. 0.7664
d. 0.8903
Solution a
Exercise 91. What is the probability that the San Jose Sharks win at least five games in that
upcoming month?
a. 0.3694
b. 0.5266
c. 0.4734
d. 0.2305
Solution c
Exercise 92. A student takes a ten-question, true-false quiz, but did not study and randomly
guesses each answer. Find the probability that the student passes the quiz with a
grade of at least 70% of the questions correct.
Solution • X = number of questions answered correctly
• X~B(10, 0.5)
• We are interested in AT LEAST 70% of ten questions correct. 70% of ten is 7.
We want to find the probability that X is greater than or equal to 7. The
event "at least 7" is the complement of "less than or equal to six."
• Using your calculator's distribution menu: 1 – binomcdf(10, .5, 6) gives
0.171875
• The probability of getting at least 70% of the ten questions correct when
randomly guessing is approximately 0.172.
Exercise 93. A student takes a 32 question multiple-choice exam, but did not study and randomly
guesses each answer. Each question has three possible choices for the answer. Find
the probability that the student guesses more than 75% of the questions correctly.
Solution • X = number of questions answered correctly
• X~B 132,3
• We are interested in MORE THAN 75% of 32 questions correct. 75% of 32 is
24. We want to find P(x>24). The event "more than 24" is the complement
of "less than or equal to 24."
• Using your calculator's distribution menu: 1 – binomcdf 132, , 243
• P(x > 24) = 0
• The probability of getting more than 75% of the 32 questions correct when
randomly guessing is very small and practically zero.
Exercise 94. Six different colored dice are rolled. Of interest is the number of dice that show a
one.
a. In words, define the Random Variable X.
b. List the values that X may take on.
c. Give the distribution of X. X~_____(_____,_____)
d. On average, how many dice would you expect to show a one?

e. Find the probability that all six dice show a one.
f. Is it more likely that three or that four dice will show a one? Use numbers to
justify your answer numerically.
Solution a. X = the number of dice that show a one
b. 0, 1, 2, 3, 4, 5, 6
c. 𝑋 ~ 𝐵 �6, 16�
d. 1
e. 0.00002
f. three dice
Exercise 95. More than 96 percent of the very largest colleges and universities (more than
15,000 total enrollments) have some online offerings. Suppose you randomly pick
13 such institutions. We are interested in the number that offer distance learning
courses.
a. In words, define the Random Variable X.
b. List the values that X may take on.
c. Give the distributions of X. X~_____(_____,_____)
d. On average, how many schools would you expect to offer such courses?
e. Find the probability that at most ten offer such courses.
f. Is it more likely that 12 or that 13 will offer such courses? Use numbers to justify
your answer numerically and answer in a complete sentence.

Solution a. X = the number of college and universities that offer online offerings.
b. 0, 1, 2, …, 13
c. X~B(13, 0.96)
d. 12.48
e. 0.0135
f. P(x = 12) = 0.3186 P(x = 13) = 0.5882 More likely to get 13.
Exercise 96. Suppose that about 85% of graduating students attend their graduation. A group of
22 graduating students is randomly chosen.
a. In words, define the Random Variable X.
b. List the values that X may take on.
c. Give the distribution of X. X~_____(_____,_____)
d. How many are expected to attend their graduation?
e. Find the probability that 17 or 18 attend.
f. Based on numerical values, would you be surprised if all 22 attended graduation?
Justify your answer numerically.
Solution a. X = the number of students who attend their graduation
b. 0, 1, 2, …, 22
c. X~B(22, 0.85)
d. 18.7
e. 0.3249
f. P(x = 22) = 0.0280 (less than 3%) which is unusual
Exercise 97. At The Fencing Center, 60% of the fencers use the foil as their main weapon. We
randomly survey 25 fencers at The Fencing Center. We are interested in the number
of fencers who do not use the foil as their main weapon.
a. In words, define the random variable X.
b. List the values that X may take on.
c. Give the distribution of X. X ~_____(_____,_____)
d. How many are expected to not to use the foil as their main weapon?
e. Find the probability that six do not use the foil as their main weapon.
f. Based on numerical values, would you be surprised if all 25 did not use foil as their
main weapon? Justify your answer numerically.
Solution a. X = the number of fencers that do not use foil as their main weapon
b. 0, 1, 2, 3,... 25
c. X ~ B(25,0.40)
d. 10
e. 0.0442
f. The probability that all 25 do not use the foil is almost zero. Therefore, it would
be very surprising.
Exercise 98. Approximately 8% of students at a local high school participate in after-school
sports all four years of high school. A group of 60 seniors is randomly chosen. Of
interest is the number that participated in after-school sports all four years of high
school.
a. In words, define the random variable X.
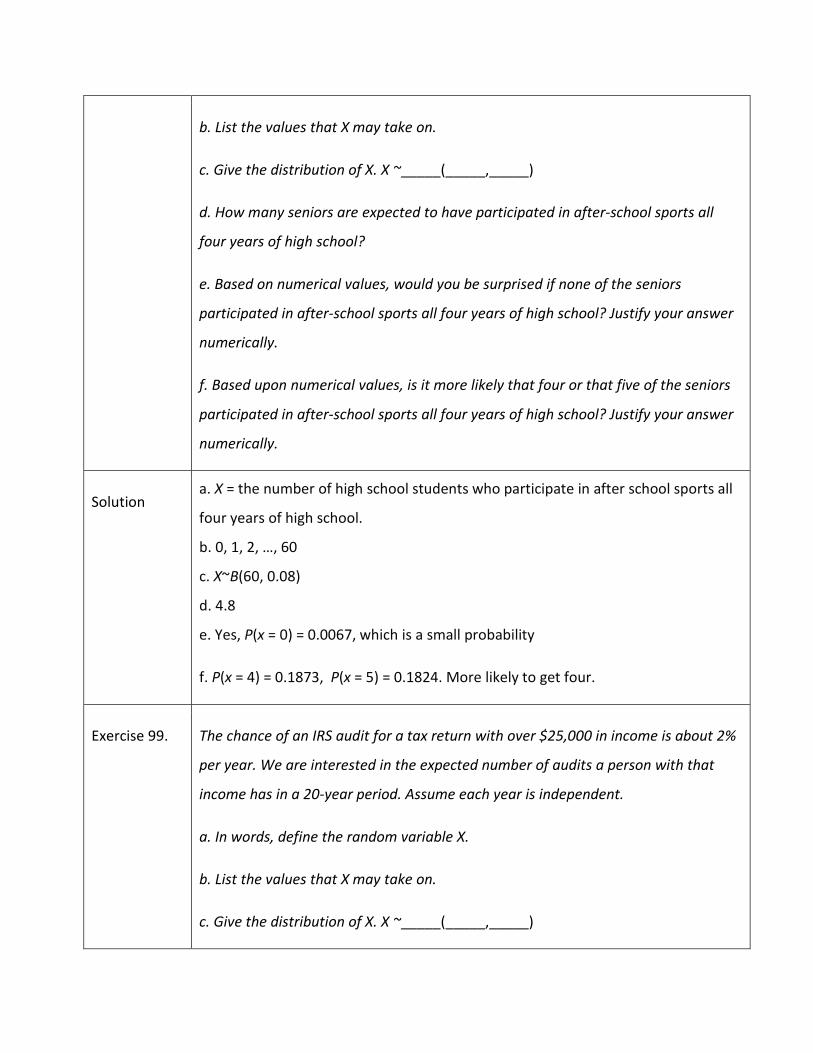
b. List the values that X may take on.
c. Give the distribution of X. X ~_____(_____,_____)
d. How many seniors are expected to have participated in after-school sports all
four years of high school?
e. Based on numerical values, would you be surprised if none of the seniors
participated in after-school sports all four years of high school? Justify your answer
numerically.
f. Based upon numerical values, is it more likely that four or that five of the seniors
participated in after-school sports all four years of high school? Justify your answer
numerically.
Solution a. X = the number of high school students who participate in after school sports all
four years of high school.
b. 0, 1, 2, …, 60
c. X~B(60, 0.08)
d. 4.8
e. Yes, P(x = 0) = 0.0067, which is a small probability
f. P(x = 4) = 0.1873, P(x = 5) = 0.1824. More likely to get four.
Exercise 99. The chance of an IRS audit for a tax return with over $25,000 in income is about 2%
per year. We are interested in the expected number of audits a person with that
income has in a 20-year period. Assume each year is independent.
a. In words, define the random variable X.
b. List the values that X may take on.
c. Give the distribution of X. X ~_____(_____,_____)
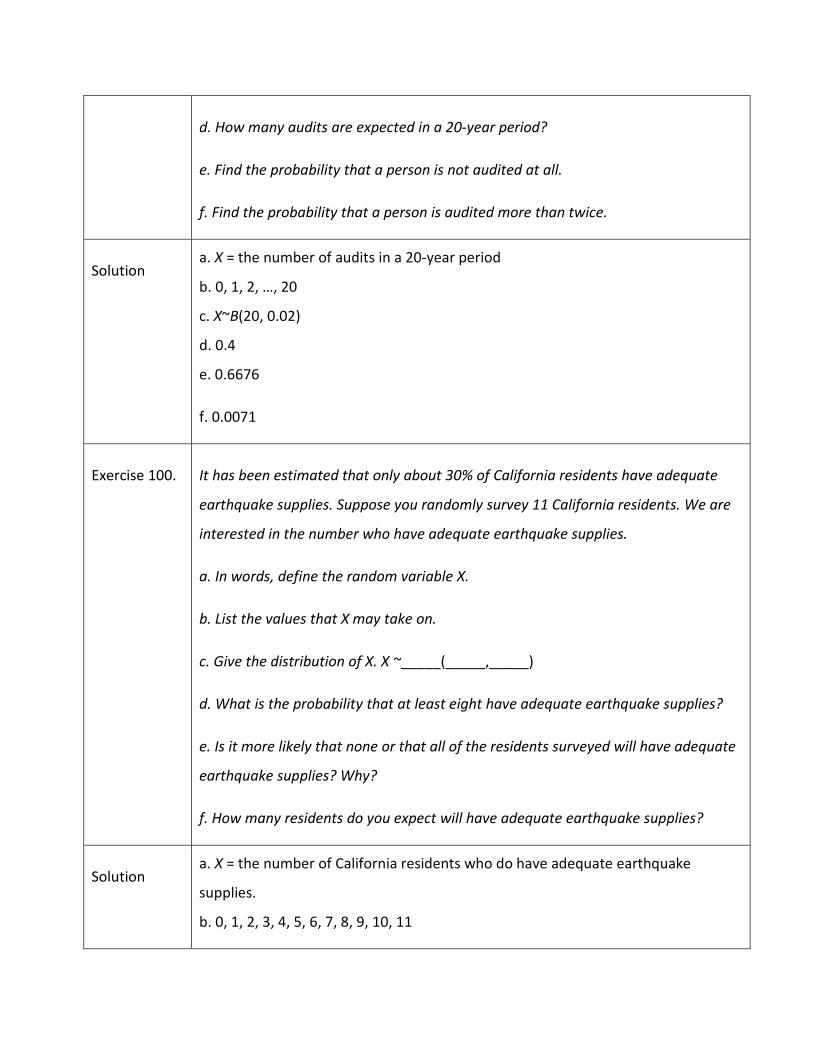
d. How many audits are expected in a 20-year period?
e. Find the probability that a person is not audited at all.
f. Find the probability that a person is audited more than twice.
Solution a. X = the number of audits in a 20-year period
b. 0, 1, 2, …, 20
c. X~B(20, 0.02)
d. 0.4
e. 0.6676
f. 0.0071
Exercise 100. It has been estimated that only about 30% of California residents have adequate
earthquake supplies. Suppose you randomly survey 11 California residents. We are
interested in the number who have adequate earthquake supplies.
a. In words, define the random variable X.
b. List the values that X may take on.
c. Give the distribution of X. X ~_____(_____,_____)
d. What is the probability that at least eight have adequate earthquake supplies?
e. Is it more likely that none or that all of the residents surveyed will have adequate
earthquake supplies? Why?
f. How many residents do you expect will have adequate earthquake supplies?
Solution a. X = the number of California residents who do have adequate earthquake
supplies.
b. 0, 1, 2, 3, 4, 5, 6, 7, 8, 9, 10, 11
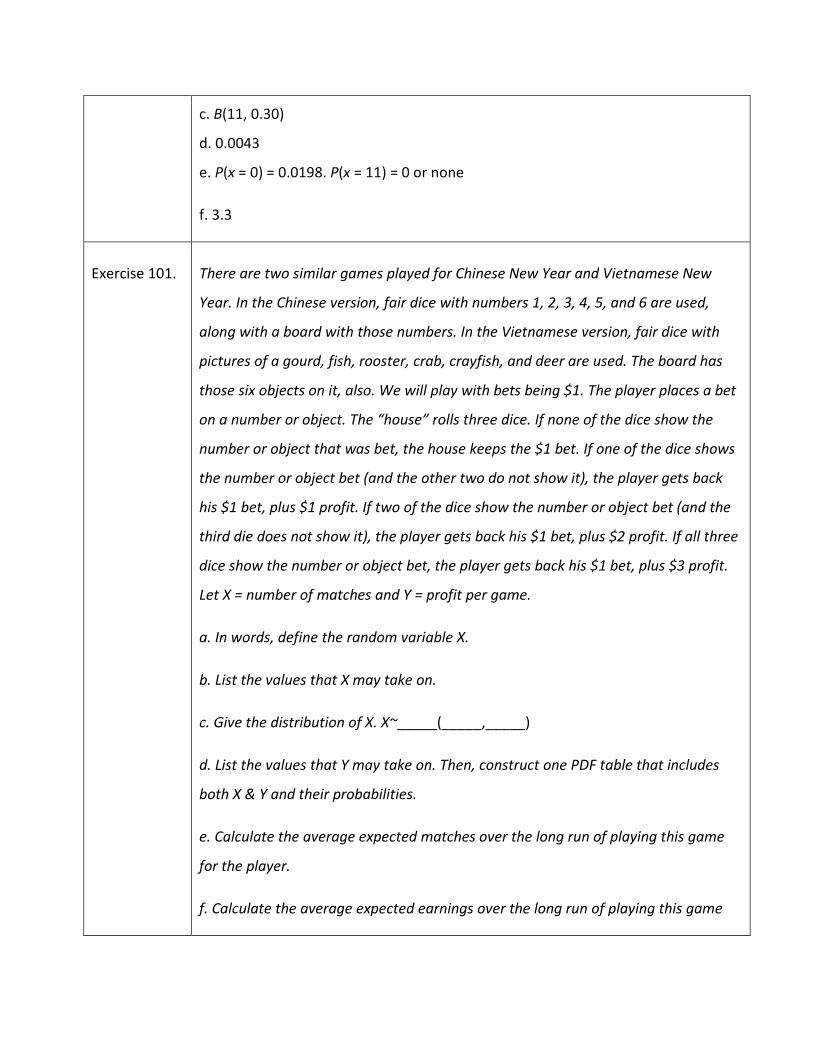
c. B(11, 0.30)
d. 0.0043
e. P(x = 0) = 0.0198. P(x = 11) = 0 or none
f. 3.3
Exercise 101. There are two similar games played for Chinese New Year and Vietnamese New
Year. In the Chinese version, fair dice with numbers 1, 2, 3, 4, 5, and 6 are used,
along with a board with those numbers. In the Vietnamese version, fair dice with
pictures of a gourd, fish, rooster, crab, crayfish, and deer are used. The board has
those six objects on it, also. We will play with bets being $1. The player places a bet
on a number or object. The “house” rolls three dice. If none of the dice show the
number or object that was bet, the house keeps the $1 bet. If one of the dice shows
the number or object bet (and the other two do not show it), the player gets back
his $1 bet, plus $1 profit. If two of the dice show the number or object bet (and the
third die does not show it), the player gets back his $1 bet, plus $2 profit. If all three
dice show the number or object bet, the player gets back his $1 bet, plus $3 profit.
Let X = number of matches and Y = profit per game.
a. In words, define the random variable X.
b. List the values that X may take on.
c. Give the distribution of X. X~_____(_____,_____)
d. List the values that Y may take on. Then, construct one PDF table that includes
both X & Y and their probabilities.
e. Calculate the average expected matches over the long run of playing this game
for the player.
f. Calculate the average expected earnings over the long run of playing this game
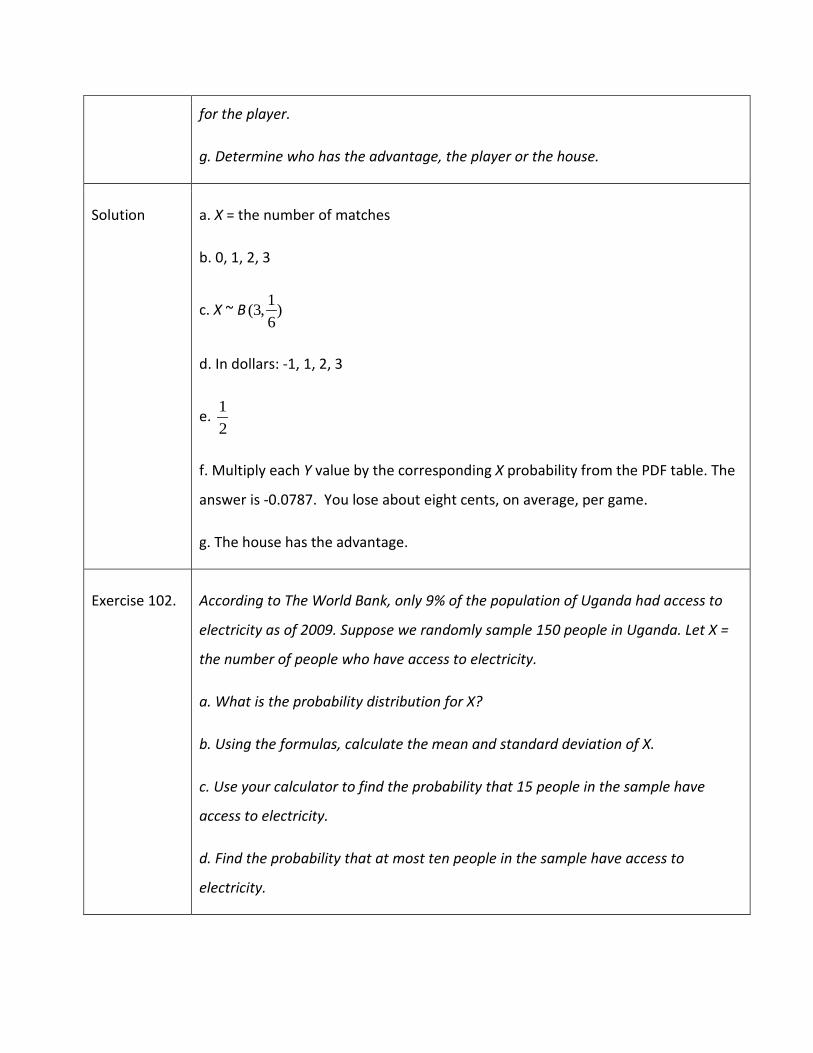
for the player.
g. Determine who has the advantage, the player or the house.
Solution a. X = the number of matches
b. 0, 1, 2, 3
c. X ~ B 1(3, )6
d. In dollars: -1, 1, 2, 3
e. 12
f. Multiply each Y value by the corresponding X probability from the PDF table. The
answer is -0.0787. You lose about eight cents, on average, per game.
g. The house has the advantage.
Exercise 102. According to The World Bank, only 9% of the population of Uganda had access to
electricity as of 2009. Suppose we randomly sample 150 people in Uganda. Let X =
the number of people who have access to electricity.
a. What is the probability distribution for X?
b. Using the formulas, calculate the mean and standard deviation of X.
c. Use your calculator to find the probability that 15 people in the sample have
access to electricity.
d. Find the probability that at most ten people in the sample have access to
electricity.
e. Find the probability that more than 25 people in the sample have access to
electricity.
Solution a. X ~ B(150,0.09)
b.
i. Mean = np = 150(0.09) = 13.5
ii. Standard Deviation = �𝑛𝑛𝑛 = �150(0.09)(0.91) ≈ 3.5050
c. P(x = 15) = binompdf(150, 0.09, 15) = 0.0988
d. P(x ≤ 10) = binomcdf(150, 0.09, 10) = 0.1987
e. P(x > 25) = 1 – P(x ≤ 25) = 1 – binomcdf(150, 0.09, 25) = 1 – 0.9991 = 0.0009
Exercise 103. The literacy rate for a nation measures the proportion of people age 15 and over
that can read and write. The literacy rate in Afghanistan is 28.1%. Suppose you
choose 15 people in Afghanistan at random. Let X = the number of people who are
literate.
a. Sketch a graph of the probability distribution of X.
b. Using the formulas, calculate the (i) mean and (ii) standard deviation of X.
c. Find the probability that more than five people in the sample are literate. Is it is
more likely that three people or four people are literate.
Solution X ~ B(15, 0.281)

b.
i. Mean = µ = np = 15(0.281) = 4.215
ii. Standard Deviation = 𝜎 = �𝑛𝑛𝑛 = �15(0.281)(0.719) = 1.7409
c.
P(x > 5) = 1 – P(x ≤ 5) = 1 – binomcdf(15, 0.281, 5) = 1 – 0.7754 = 0.2246
P(x = 3) = binompdf(15, 0.281, 3) = 0.1927
P(x = 4) = binompdf(15, 0.281, 4) = 0.2259
It is more likely that four people are literate than three people are.
Exercise 104. A consumer looking to buy a used red Miata car will call dealerships until she finds a
dealership that carries the car. She estimates that the probability that any
independent dealership will have the car will be 28%. We are interested in the
number of dealerships she must call.
a. In words, define the random variable X.
b. List the values that X may take on.
c. Give the distribution of X. X ~_____(_____,_____)
d. On average, how many dealerships would we expect her to have to call until she
finds one that has the car?
e. Find the probability that she must call at most four dealerships.
f. Find the probability that she must call three or four dealerships.
Solution a. X = the number of dealers she calls until she finds one with a used red Miata
b. 1, 2, 3, …
c. X ~ G(0.28)
d. 3.57
e. 0.7313
f. 0.2497
Exercise 105. Suppose that the probability that an adult in America will watch the Super Bowl is
40%. Each person is considered independent. We are interested in the number of
adults in America we must survey until we find one who will watch the Super Bowl.
a. In words, define the random variable X.
b. List the values that X may take on.
c. Give the distribution of X. X ~_____(_____,_____)
d. How many adults in America do you expect to survey until you find one who will
watch the Super Bowl?
e. Find the probability that you must ask seven people.
f. Find the probability that you must ask three or four people.
Solution a. X = the number of adults in America who are surveyed until one says he or she
will watch the Super Bowl.
c. X ~ G(0.40)
d. 2.5
e. 0.0187
f. 0.2304
Exercise 106. It has been estimated that only about 30% of California residents have adequate
earthquake supplies. Suppose we are interested in the number of California
residents we must survey until we find a resident who does not have adequate
earthquake supplies.
a. In words, define the random variable X.
b. List the values that X may take on.
c. Give the distribution of X. X ~_____(_____,_____)
d. What is the probability that we must survey just one or two residents until we
find a California resident who does not have adequate earthquake supplies?
e. What is the probability that we must survey at least three California residents
until we find a California resident who does not have adequate earthquake
supplies?
f. How many California residents do you expect to need to survey until you find a
California resident who does not have adequate earthquake supplies?
Solution a. X = number of California residents that have adequate earthquake insurance
b. 1, 2, 3, ...
c. X~ G(0.30)
d. 0.5100
e. 0.4900
f. 1.4286
Exercise 107. In one of its Spring catalogs, L.L. Bean® advertised footwear on 29 of its 192 catalog
pages. Suppose we randomly survey 20 pages. We are interested in the number of
pages that advertise footwear. Each page may be picked more than once.
a. In words, define the random variable X.
b. List the values that X may take on.
c. Give the distribution of X. X ~_____(_____,_____)
d. How many pages do you expect to advertise footwear on them?
e. Is it probable that all twenty will advertise footwear on them? Why or why not?
f. What is the probability that fewer than ten will advertise footwear on them?
g. Reminder: A page may be picked more than once. We are interested in the
number of pages that we must randomly survey until we find one that has footwear
advertised on it. Define the random variable X and give its distribution.
h. What is the probability that you only need to survey at most three pages in order
to find one that advertises footwear on it?
i. How many pages do you expect to need to survey in order to find one that
advertises footwear?
Solution a. X = the number of pages that advertise footwear
b. X takes on the values 0, 1, 2, ..., 20
c. X ~ B�20, 29192�
d. 3.02
e. No
f. 0.9997
g. X = the number of pages we must survey until we find one that advertises
footwear.
X ~ G� 29192�
h. 0.3881
i. 6.6207 pages
Exercise 108. Suppose that you are performing the probability experiment of rolling one fair six-
sided die. Let F be the event of rolling a four or a five. You are interested in how
many times you need to roll the die in order to obtain the first four or five as the
outcome.
• p = probability of success (event F occurs)
• q = probability of failure (event F does not occur)
a. Write the description of the random variable X.
b. What are the values that X can take on?
c. Find the values p and q.
d. Find the probability that the first occurrence of event F(rolling a four or five) is on
the second trial.
Solution a. X = the number of times you need to roll the die in order to get the face four or
five.
b. X can take on the values 1, 2, 3, and so on.
c. p = 26 and q = 4
6
d. 0.2222
Exercise 109. Ellen has music practice three days a week. She practices for all of the three days
85% of the time, two day s 8% of the time, one day 4% of the time, and no days 3%
of the time. One week is selected at random. What values does X take on?
Solution 0, 1, 2, and 3
Exercise 110. The World Bank records the prevalence of HIV in countries around the world.
According to their data, “Prevalence of HIV refers to the percentage of people ages
15 to 49 who are infected with HIV.”[1]
In South Africa, the prevalence of HIV is 17.3%. Let X = the number of people you
test until you find a person infected with HIV.
a. Sketch a graph of the distribution of the discrete random variable X.

b. What is the probability that you must test 30 people to find one with HIV?
c. What is the probability that you must ask ten people?
d. Find the (i) mean and the (ii) standard deviation of the distribution of X.
Solution a. X ~ G(0.173)
b. P(x = 30) = geometpdf(0.173, 30) = 0.0007
c. P(x = 10) = geometpdf(0.173, 10) = 0.0313
d.
i. Mean = 𝜇 =𝑝1= 1
0.173 ~ 5.7804
ii. Standard Deviation = 𝜎 = �1−𝑝𝑝2
= �1−0.173(0.173)2 = 5.2566
Exercise 111. According to a recent Pew Research poll, 75% of millenials (people born between
1981 and 1995) have a profile on a social networking site. Let X = the number of
millenials you ask until you find a person without a profile on a social networking
site.
a. Describe the distribution of X.
b. Find the (i) mean and (ii) standard deviation of X.
c. What is the probability that you must ask ten people to find one person without a
social networking site?
d. What is the probability that you must ask 20 people to find one person without a
social networking site?
e. What is the probability that you must ask at most five people?
Solution a. X ~ G(0.25)
b.
i. Mean = µ = 1𝑝
= 10.25
= 4
ii. Standard Deviation = σ = �1−𝑝𝑝2
= �1−0.250.252
~ 3.4641
c. P(x = 10) = geometpdf(0.25, 10) = 0.0188
d. P(x = 20) = geometpdf(0.25, 20) = 0.0011
e. P(x ≤ 5) = geometcdf(0.25, 5) = 0.7627
Exercise 112. A group of Martial Arts students is planning on participating in an upcoming
demonstration. Six are students of Tae Kwon Do; seven are students of Shotokan
Karate. Suppose that eight students are randomly picked to be in the first
demonstration. We are interested in the number of Shotokan Karate students in
that first demonstration.

a. In words, define the random variable X.
b. List the values that X may take on.
c. Give the distribution of X. X ~_____(_____,_____)
d. How many Shotokan Karate students do we expect to be in that first
demonstration?
Solution a. X = the number of Shotokan Karate students in the first demonstration
b. 0, 1, 2, 3, 4, 5, 6, 7
c. X ~ H(7, 6, 8)
d. 4.31
Exercise 113. In one of its Spring catalogs, L.L. Bean® advertised footwear on 29 of its 192 catalog
pages. Suppose we randomly survey 20 pages. We are interested in the number of
pages that advertise footwear. Each page may be picked at most once.
a. In words, define the random variable X.
b. List the values that X may take on.
c. Give the distribution of X. X ~_____(_____,_____)
d. How many pages do you expect to advertise footwear on them?
e. Calculate the standard deviation.
Solution a. X = the number of pages that advertise footwear
b. 0, 1, 2, 3, ..., 20
c. X ~ H(29, 163, 20); r = 29, b = 163, n = 20
d. 3.03
e. 1.5197
Exercise 114. Suppose that a technology task force is being formed to study technology
awareness among instructors. Assume that ten people will be randomly chosen to
be on the committee from a group of 28 volunteers, 20 who are technically
proficient and eight who are not. We are interested in the number on the
committee who are not technically proficient.
a. In words, define the random variable X.
b. List the values that X may take on.
c. Give the distribution of X. X ~_____(_____,_____)
d. How many instructors do you expect on the committee who are not technically
proficient?
e. Find the probability that at least five on the committee are not technically
proficient.
f. Find the probability that at most three on the committee are not technically
proficient.
Solution a. X = the number of people on the committee who are not technically proficient
b. 0, 1, 2, 3, 4, 5, 6, 7, 8, 9, 10
c. X ~ B 81028
d. 2.8571
e. 0.1269

f. 0.6873
Exercise 115. Suppose that nine Massachusetts athletes are scheduled to appear at a charity
benefit. The nine are randomly chosen from eight volunteers from the Boston Celtics
and four volunteers from the New England Patriots. We are interested in the
number of Patriots picked.
a. In words, define the random variable X.
b. List the values that X may take on.
c. Give the distribution of X. X~_____(_____,_____)
d. Are you choosing the nine athletes with or without replacement?
e. What is the probability that all of the volunteers will be from the Celtics?
f. Is it more likely that more of the volunteers will be from the Patriots or from the
Celtics? How do you know?
Solution a. X = the number of Patriots picked
b. 0, 1, 2, 3, 4
c. X ~ H(4, 8, 9)
d. Without replacement
Exercise 116. A bridge hand is defined as 13 cards selected at random and without replacement
from a deck of 52 cards. In a standard deck of cards, there are 13 cards from each
suit: hearts, spades, clubs, and diamonds. What is the probability of being dealt a
hand that does not contain a heart?
a. What is the group of interest?
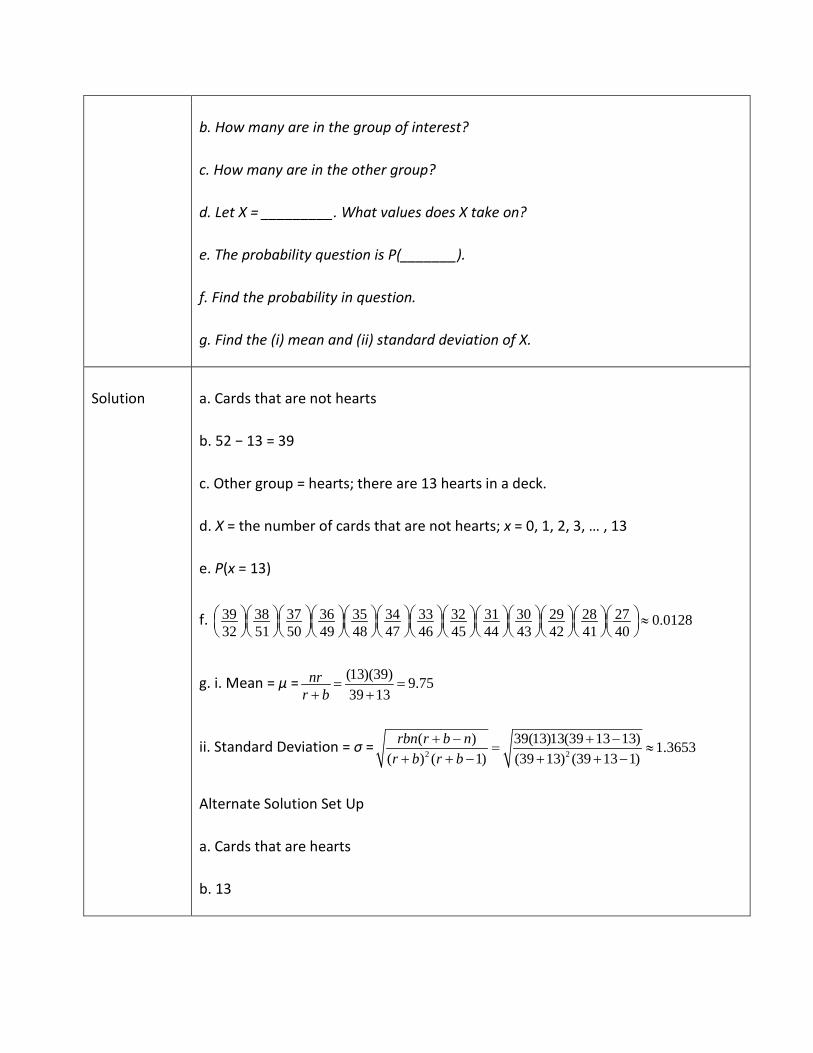
b. How many are in the group of interest?
c. How many are in the other group?
d. Let X = _________. What values does X take on?
e. The probability question is P(_______).
f. Find the probability in question.
g. Find the (i) mean and (ii) standard deviation of X.
Solution a. Cards that are not hearts
b. 52 − 13 = 39
c. Other group = hearts; there are 13 hearts in a deck.
d. X = the number of cards that are not hearts; x = 0, 1, 2, 3, … , 13
e. P(x = 13)
f. 39 38 37 36 35 34 33 32 31 30 29 28 27 0.012832 51 50 49 48 47 46 45 44 43 42 41 40
≈
g. i. Mean = μ = (13)(39) 9.7539 13
nrr b
= =+ +
ii. Standard Deviation = σ = 2 2( ) 39(13)13(39 13 13) 1.3653
( ) ( 1) (39 13) (39 13 1)rbn r b n
r b r b+ − + −= ≈
+ + − + + −
Alternate Solution Set Up
a. Cards that are hearts
b. 13
c. Other group = non-hearts; b = 39
d. X = the number of cards that are hearts; x = 0, 1, 2, 3, … , 13
e. P(x = 0)
Exercise 117. The switchboard in a Minneapolis law office gets an average of 5.5 incoming phone
calls during the noon hour on Mondays. Experience shows that the existing staff can
handle up to six calls in an hour. Let X = the number of calls received at noon.
a. Find the mean and standard deviation of X.
b. What is the probability that the office receives at most six calls at noon on
Monday ?
c. Find the probability that the law office receives six calls at noon. What does this
mean to the law office staff who get, on average, 5.5 incoming phone calls at noon?
d. What is the probability that the office receives more than eight calls at noon?
Solution a. X ~ P(5.5); µ = 5.5; σ = √5.5 ≈ 2.3452
b. P(x ≤ 6) = poissoncdf(5.5, 6) ≈ 0.6860
c. There is a 15.7% probability that the law office staff will receive more calls than
they can handle.
d. X ~ P(x > 8) = 1 – P(x ≤ 8) = 1 – poissoncdf(5.5,8) ≈ 1 – 0.8944 = 0.1056
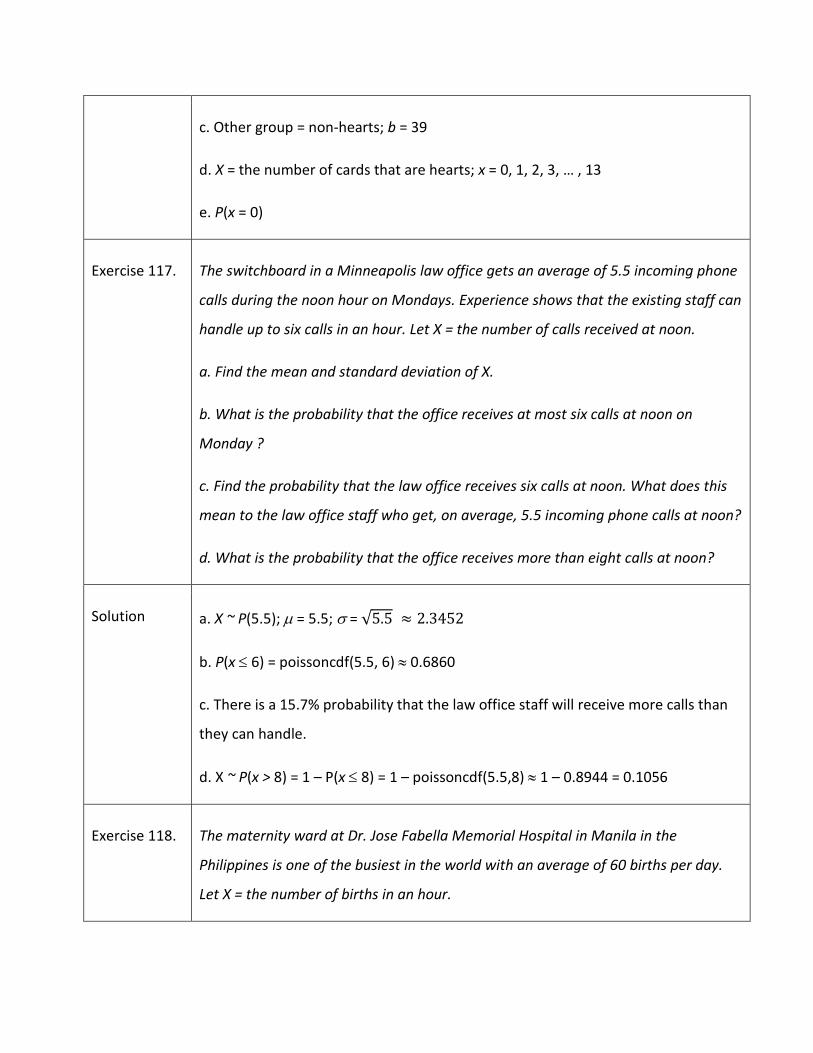
Exercise 118. The maternity ward at Dr. Jose Fabella Memorial Hospital in Manila in the
Philippines is one of the busiest in the world with an average of 60 births per day.
Let X = the number of births in an hour.
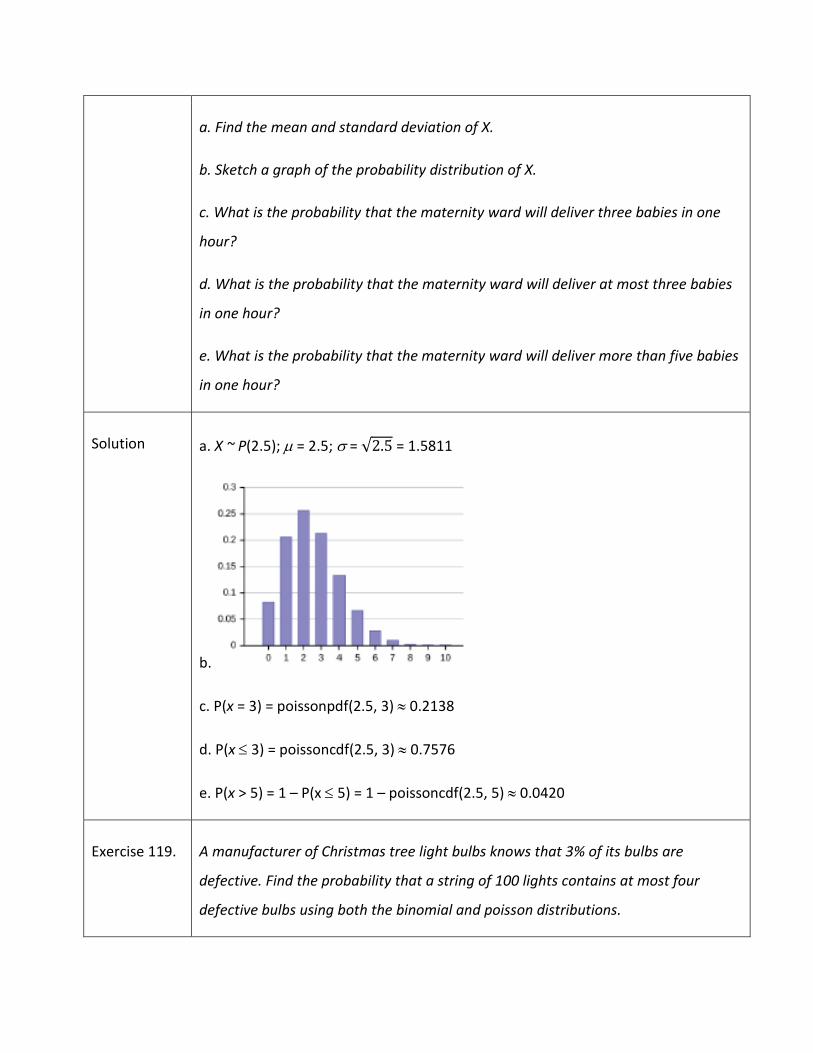
a. Find the mean and standard deviation of X.
b. Sketch a graph of the probability distribution of X.
c. What is the probability that the maternity ward will deliver three babies in one
hour?
d. What is the probability that the maternity ward will deliver at most three babies
in one hour?
e. What is the probability that the maternity ward will deliver more than five babies
in one hour?
Solution a. X ~ P(2.5); µ = 2.5; σ = √2.5 = 1.5811
b.
c. P(x = 3) = poissonpdf(2.5, 3) ≈ 0.2138
d. P(x ≤ 3) = poissoncdf(2.5, 3) ≈ 0.7576
e. P(x > 5) = 1 – P(x ≤ 5) = 1 – poissoncdf(2.5, 5) ≈ 0.0420
Exercise 119. A manufacturer of Christmas tree light bulbs knows that 3% of its bulbs are
defective. Find the probability that a string of 100 lights contains at most four
defective bulbs using both the binomial and poisson distributions.
Solution Let X = the number of defective bulbs in a string. Using the Poisson distribution:
• µ = np = 100(0.03) = 3
• X ~ P(3)
• P(x ≤ 4) = poissoncdf(3, 4) ≈ 0.8153
Using the Binomial distribution:
• X ~ B(100,0.03)
• P(x ≤ 4) = binomcdf(100, 0.03, 4) ≈ 0.8179
The Poisson approximation is very good—the difference between the probabilities
is only 0.0026.
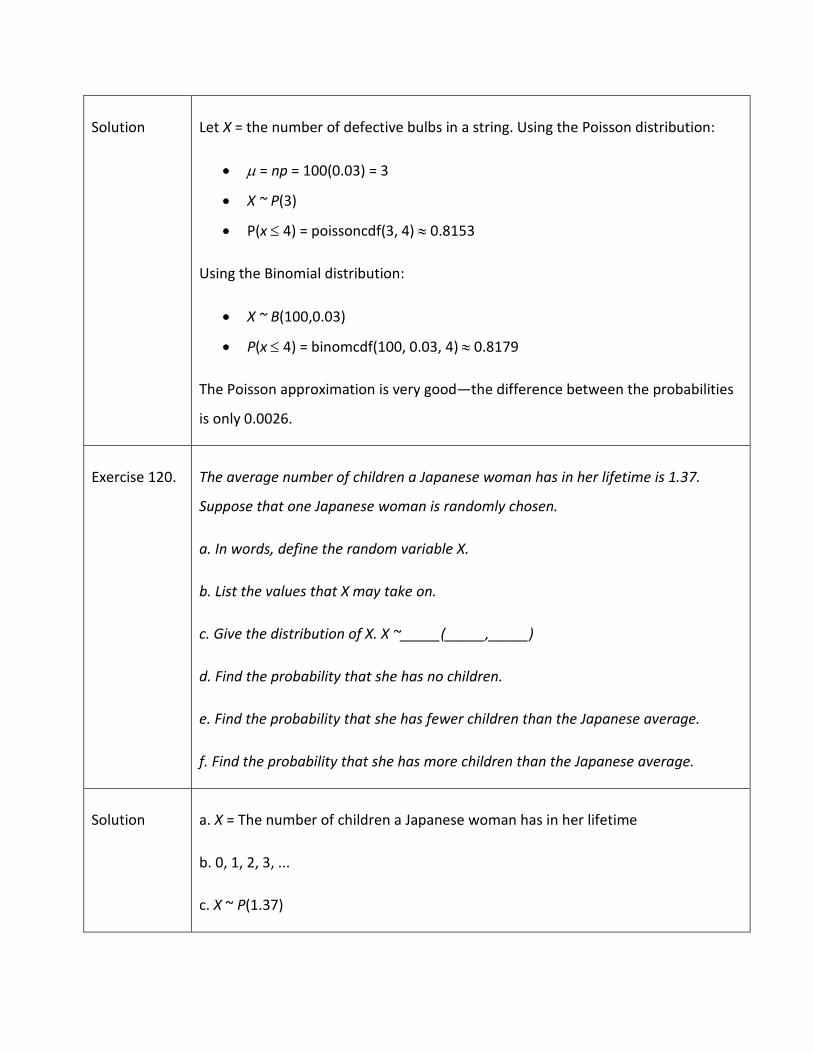
Exercise 120. The average number of children a Japanese woman has in her lifetime is 1.37.
Suppose that one Japanese woman is randomly chosen.
a. In words, define the random variable X.
b. List the values that X may take on.
c. Give the distribution of X. X ~_____(_____,_____)
d. Find the probability that she has no children.
e. Find the probability that she has fewer children than the Japanese average.
f. Find the probability that she has more children than the Japanese average.
Solution a. X = The number of children a Japanese woman has in her lifetime
b. 0, 1, 2, 3, ...
c. X ~ P(1.37)
d. 0.2541
e. 0.6022
f. 0.1593
Exercise 121. The average number of children a Spanish woman has in her lifetime is 1.47.
Suppose that one Spanish woman is randomly chosen.
a. In words, define the Random Variable X.
b. List the values that X may take on.
c. Give the distribution of X. X ~_____(_____,_____)
d. Find the probability that she has no children.
e. Find the probability that she has fewer children than the Spanish average.
f. Find the probability that she has more children than the Spanish average.
Solution a. X = the number of children for a Spanish women
b. 0, 1, 2, 3, …
c. X ~ P(1.47)
d. 0.2299
e. 0.5679
f. 0.4321
Exercise 122. Fertile (female) cats produce an average of three litters per year. Suppose that one
fertile, female cat is randomly chosen. In on year, find the probability she produces:
a. In words, define the random variable X.
b. List the values that X may take on.
c. Give the distribution of X. X ~_____(_____,_____)
d. Find the probability that she has no litters in one year
e. Find the probability that she has at least two litters in one year
f. Find the probability that she has exactly three litters in one year
Solution a. X = the number of litters a fertile, female cat produces per year
b. 0, 1, 2, 3, ...
c. X ~ P(3)
d. 0.0498
e. 0.8009
f. 0.2240
Exercise 123. The chance of having an extra fortune in a fortune cookie is about 3%. Given a bag
of 144 fortune cookies, we are interested in the number of cookies with an extra
fortune. Two distributions may be used to solve this problem. Use one distribution
to solve the problem.
a. In words, define the random variable X.
b. List the values that X may take on.
c. Give the distribution X. X~_____(_____,_____)
d. How many cookies do we expect to have an extra fortune?
e. Find the probability that none of the cookies have an extra fortune.
f. Find the probability that more than three have an extra fortune.
g. As n increases, what happens involving the probabilities using the two
distributions? Explain in complete sentences.
Solution a. X = the number of fortune cookies that have an extra fortune
b. 0, 1, 2, 3,… 144
c. X ~ B(144,0.03) or P(4.32)
d. 4.32
e. 0.0124 or 0.0133
f. 0.6300 or 0.6264
g. As n get larger, the probabilities get closer together.
Exercise 124. According to the South Carolina Department of Mental Health web site, for every
200 U.S. women, the average number who suffer from anorexia is one. Out of a
randomly chosen group of 600 U.S. women determine the following.
a. In words, define the random variable X.
b. List the values that X may take on.
c. Give the distribution of X. X~_____(_____,_____)
d. How many are expected to suffer from anorexia?
e. Find the probability that no one suffers from anorexia.
f. Find the probability that more than four suffer from anorexia.
Solution a. X = the number of women that suffer from anorexia
b. 0, 1, 2, 3, …600
c. X ~ P(3)
d. 3
e. 0.0498
f. 0.1847
Exercise 125. The chance of an IRS audit for a tax return with over $25,000 in income is about 2%
per year. Suppose that 100 people with tax returns over $25,000 are randomly
picked. We are interested in the number of people audited in one year. Use a
Poisson distribution to answer the following questions.
a. In words, define the random variable X.
b. List the values that X may take on.
c. Give the distribution of X. X ~_____(_____,_____)
d. How many are expected to be audited?
e. Find the probability that no one was audited.
f. Find the probability that at least three were audited.
Solution a. X = the number of people audited in one year
b. 0, 1, 2, ..., 100
c. X ~ P(2)
d. 2
e. 0.1353
f. 0.3233
Exercise 126. Approximately 8% of students at a local high school participate in after-school
sports all four years of high school. A group of 60 seniors is randomly chosen. Of
interest is the number that participated in after-school sports all four years of high
school.
a. In words, define the random variable X.
b. List the values that X may take on.
c. Give the distribution of X. X ~_____(_____,_____)
d. How many seniors are expected to have participated in after-school sports all
four years of high school?
e. Based on numerical values, would you be surprised if none of the seniors
participated in after-school sports all four years of high school? Justify your answer
numerically.
f. Based upon numerical values, is it more likely that four or that five of the seniors
participated in after-school sports all four years of high school? Justify your answer
numerically.
Solution a. X = the number of seniors who participated in after-school sports all four years of
high school
b. 0, 1, 2, 3, ... 60
c. X ~ P(4.8)

d. 4.8
e. Yes
f. 4
Exercise 127. On average, Pierre, an amateur chef, drops three pieces of egg shell into every two
cake batters he makes. Suppose that you buy one of his cakes.
a. In words, define the random variable X.
b. List the values that X may take on.
c. Give the distribution of X. X ~_____(_____,_____)
d. On average, how many pieces of egg shell do you expect to be in the cake?
e. What is the probability that there will not be any pieces of egg shell in the cake?
f. Let’s say that you buy one of Pierre’s cakes each week for 6 weeks. What is the
probability that there will not be any egg shell in any of the cakes?
g. Based upon the average given for Pierre, is it possible for there to be seven pieces
of shell in the cake? Why?
Solution a. X = the number of shell pieces in one cake
b. 0, 1, 2, 3…
c. X ~ P(1.5)
d. 1.5
e. 0.2231
f. 0.0001
g. Yes
Exercise 128. The average number of times per week that Mrs. Plum’s cats wake her up at night
because they want to play is ten. We are interested in the number of times her cats
wake her up each week.
In words, the random variable X = _____________________
a. the number of times Mrs. Plum’s cats wake her up each week
b. the number of times Mrs. Plum’s cats wake her up each hour
c. the number of times Mrs. Plum’s cats wake her up each night
d. the number of times Mrs. Plum’s cats wake her up
Solution a
Exercise 129. The average number of times per week that Mrs. Plum’s cats wake her up at night
because they want to play is ten. We are interested in the number of times her cats
wake her up each week.
Find the probability that her cats will wake her up no more than five times next
week.
a. 0.5000
b. 0.9329
c. 0.0378
d. 0.0671

Solution d
This file is copyright 2011-2015, Rice University. All Rights Reserved.