discrete probability distributions. random variable random variable is a variable whose value is...
TRANSCRIPT

Discrete Probability Distributions
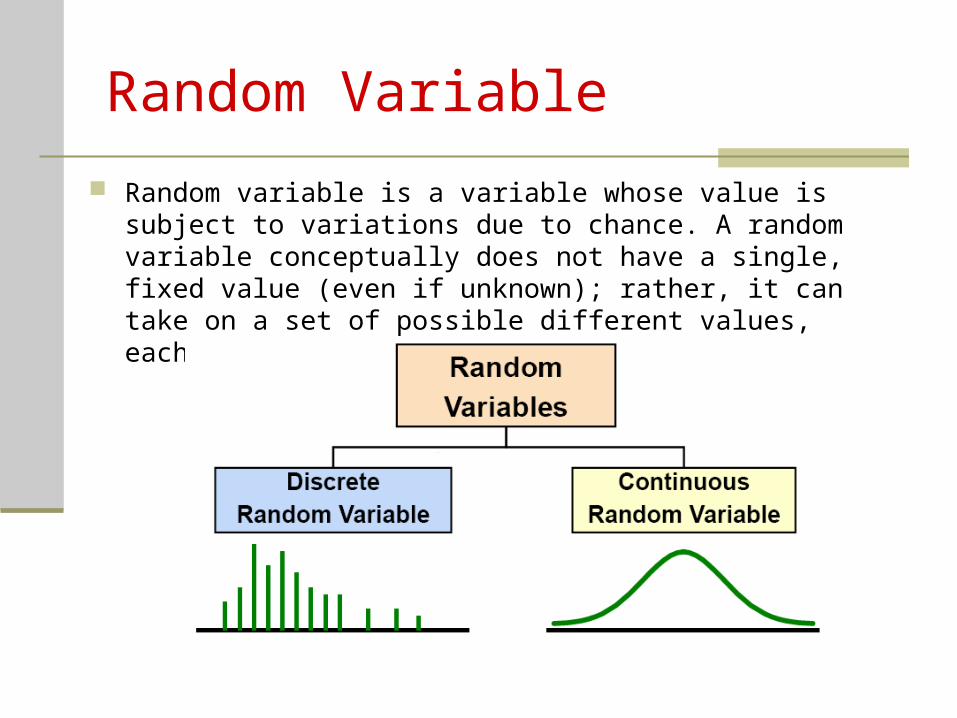
Random Variable
Random variable is a variable whose value is subject to variations due to chance. A random variable conceptually does not have a single, fixed value (even if unknown); rather, it can take on a set of possible different values, each with an associated probability.
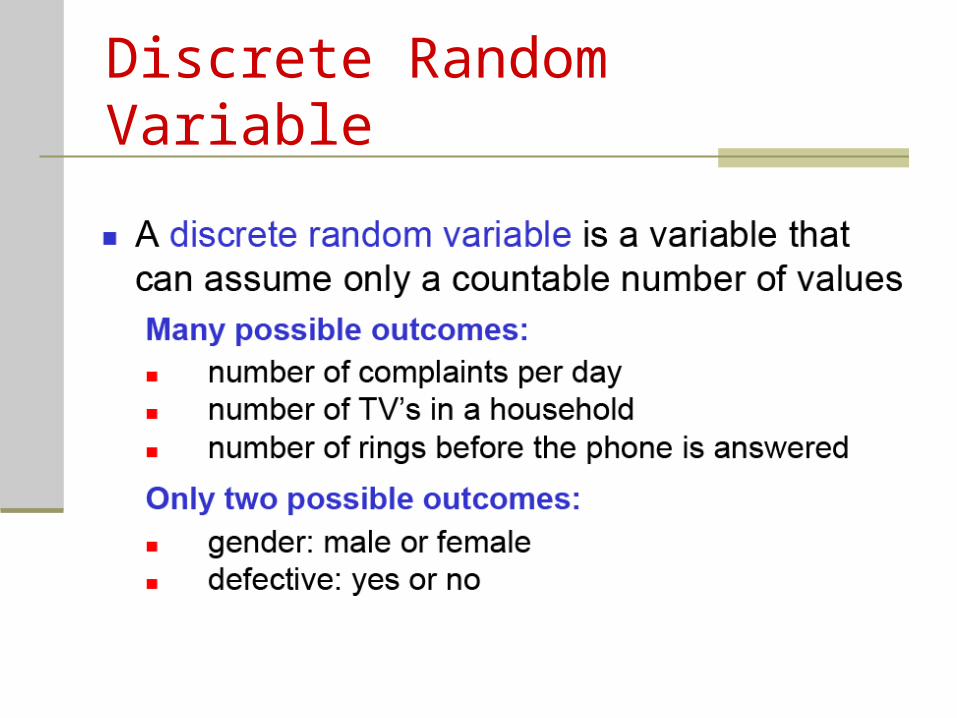
Discrete Random Variable
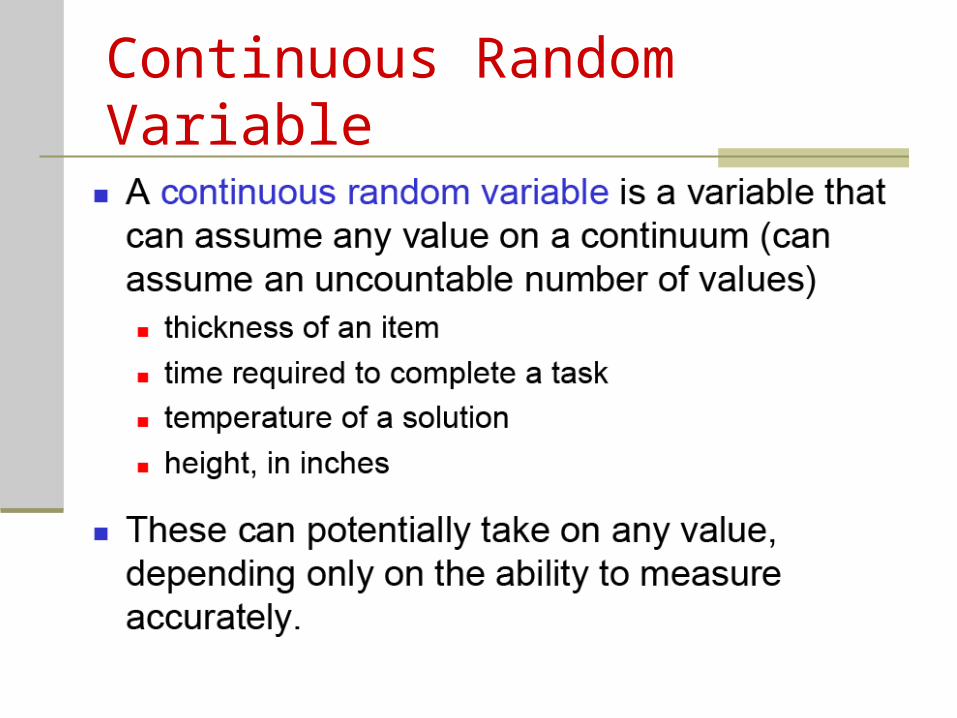
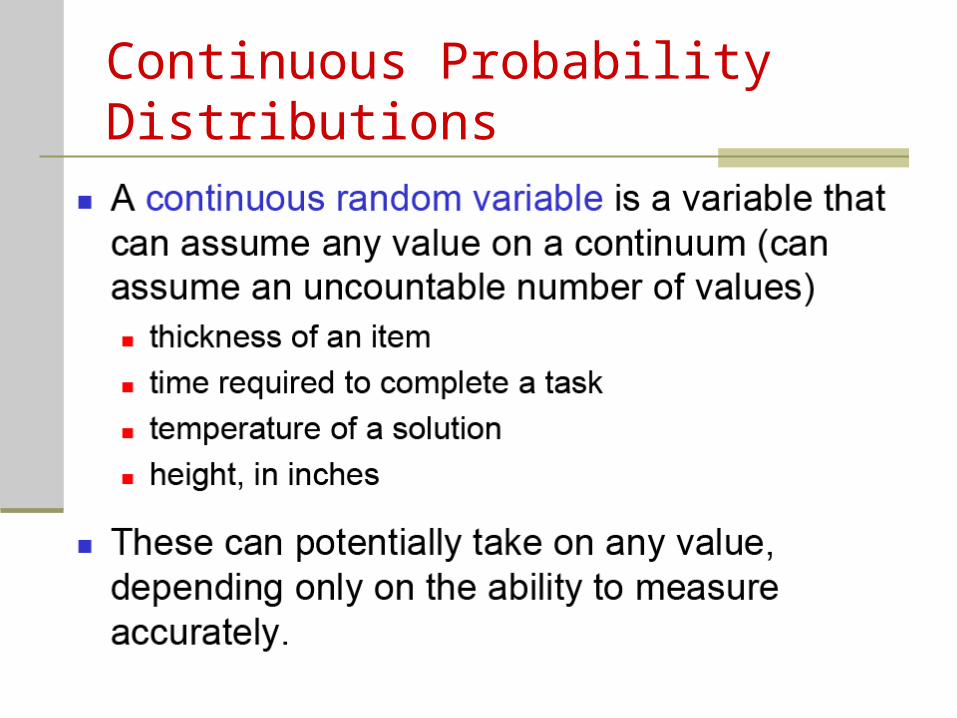
Continuous Random Variable
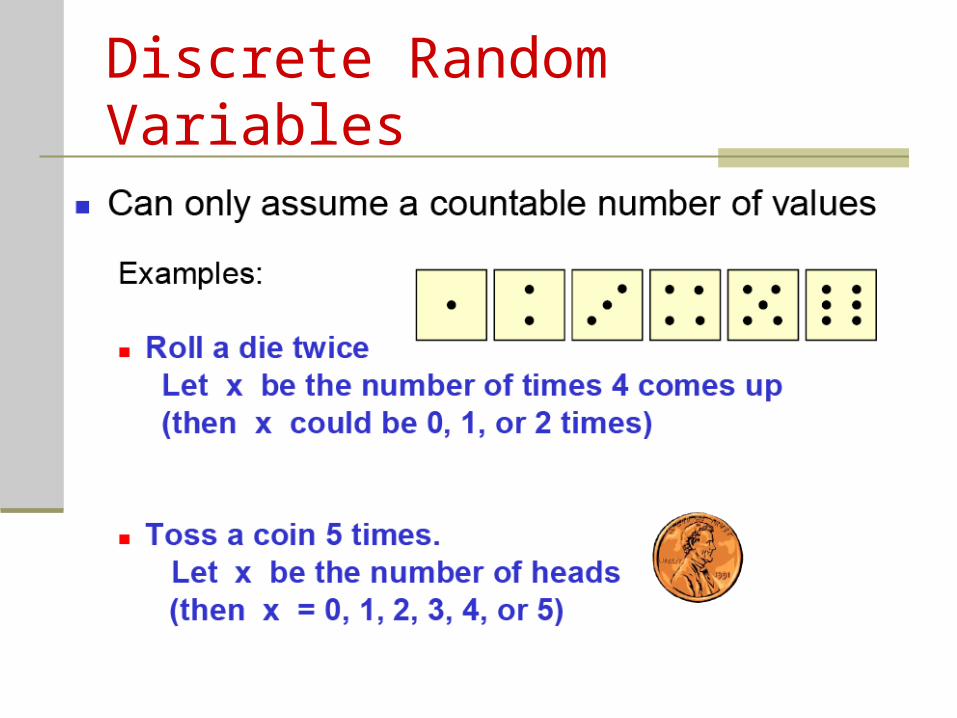
Discrete Random Variables
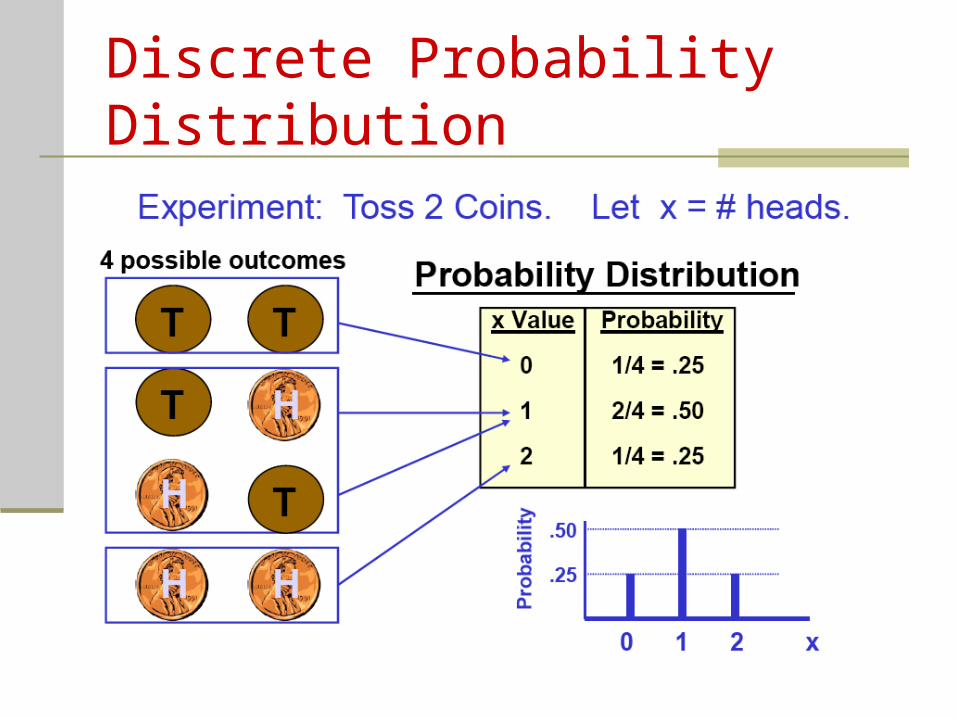
Discrete Probability Distribution

Discrete Probability Distribution

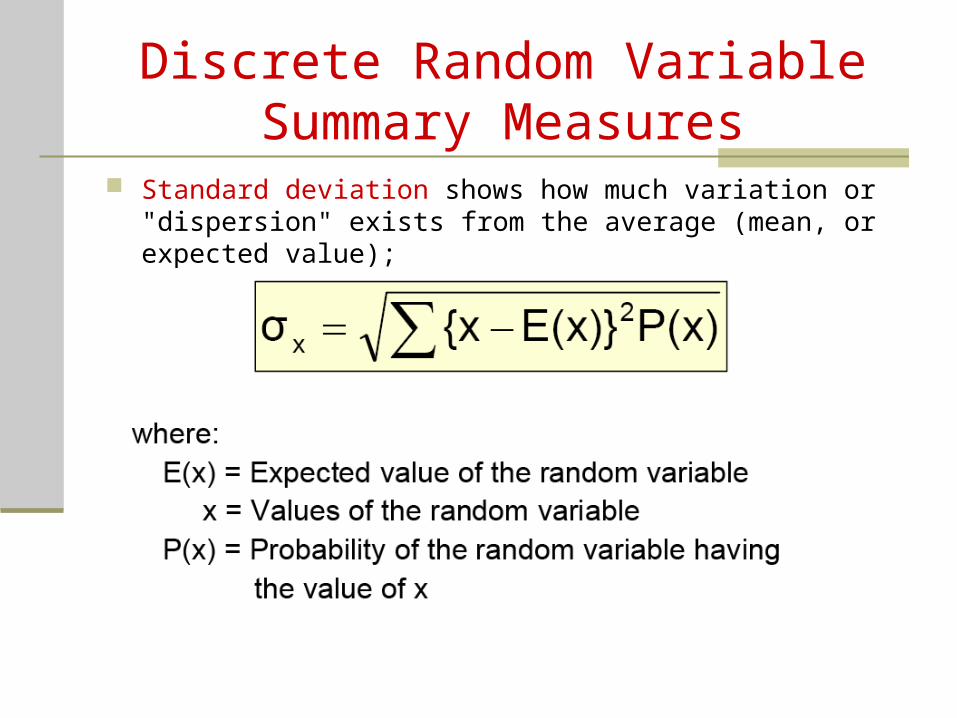
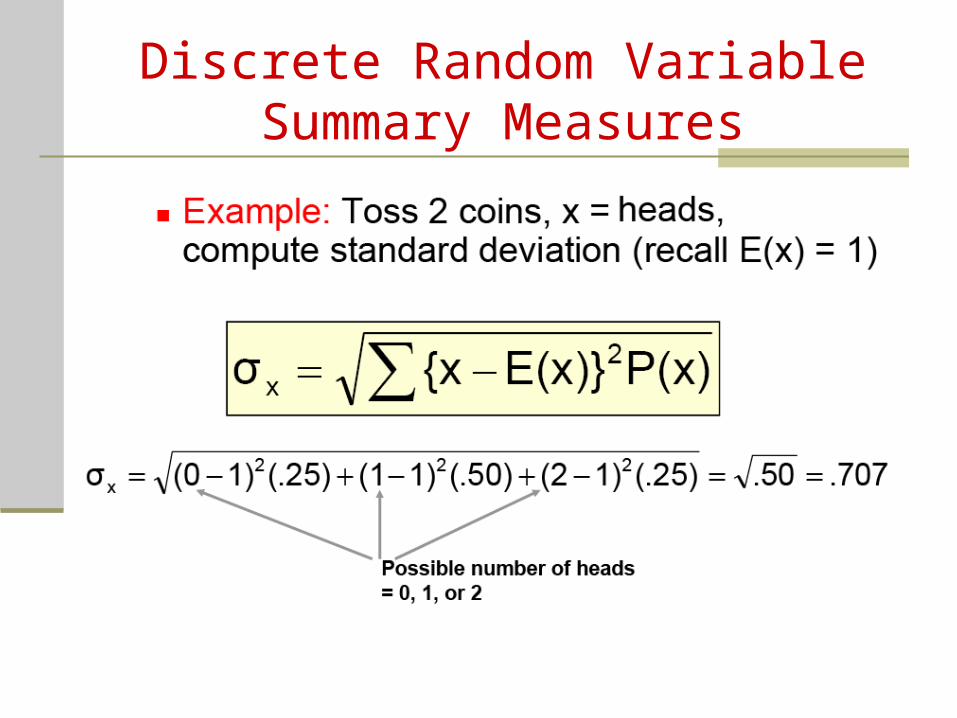
Discrete Random Variable Summary Measures
Expected Value : the expected value of a random variable is the weighted average of all possible values that this random variable can take on. The weights used in computing this average correspond to the probabilities in case of a discrete random variable, or densities in case of a continuous random variable ;
Discrete Random Variable Summary Measures
Standard deviation shows how much variation or "dispersion" exists from the average (mean, or expected value);
Discrete Random Variable Summary Measures
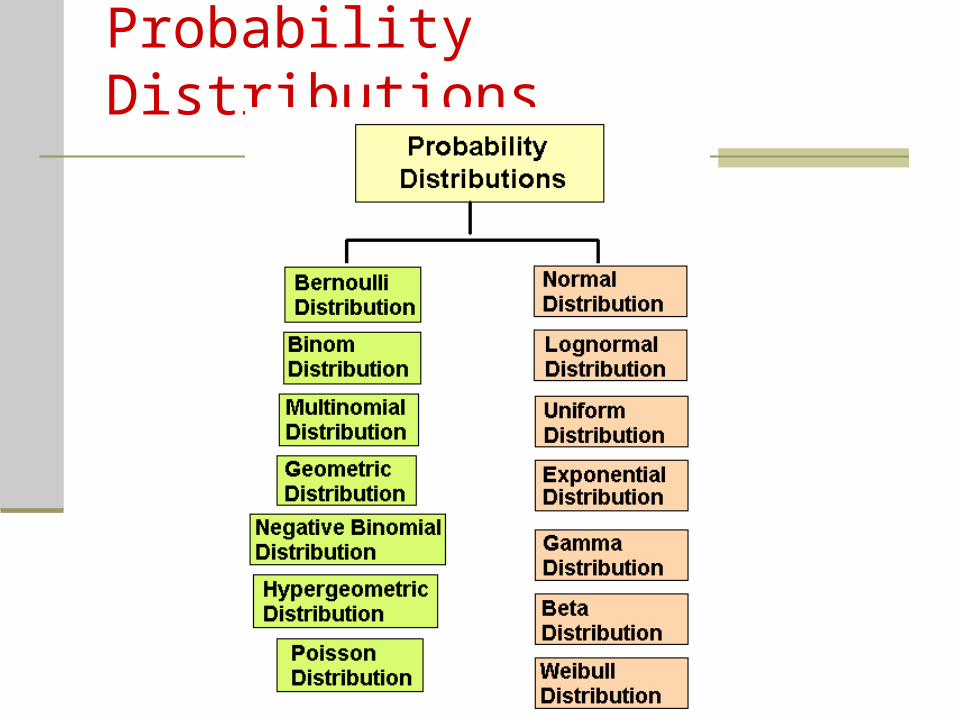
Probability Distributions
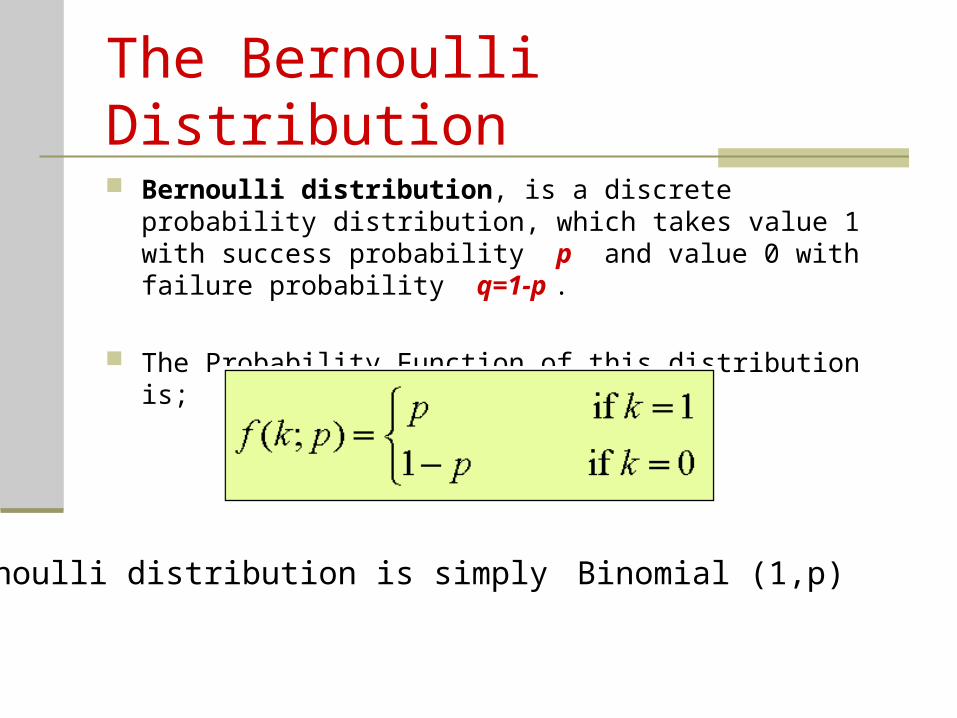
The Bernoulli Distribution
Bernoulli distribution, is a discrete probability distribution, which takes value 1 with success probability p and value 0 with failure probability q=1-p .
The Probability Function of this distribution is;
The Bernoulli distribution is simply Binomial (1,p) .
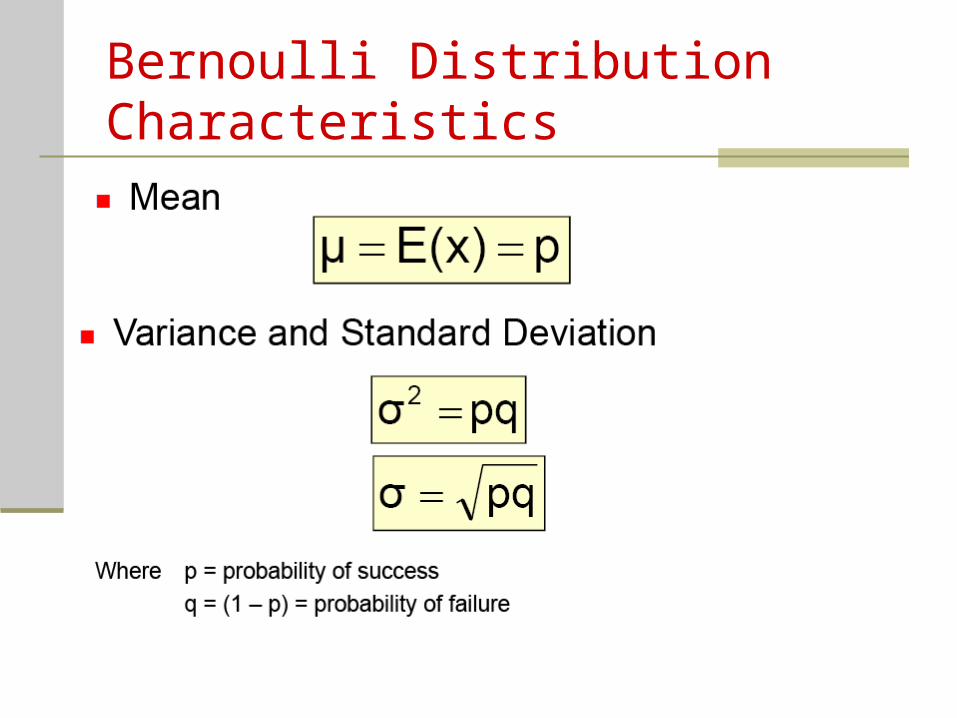
Bernoulli Distribution Characteristics
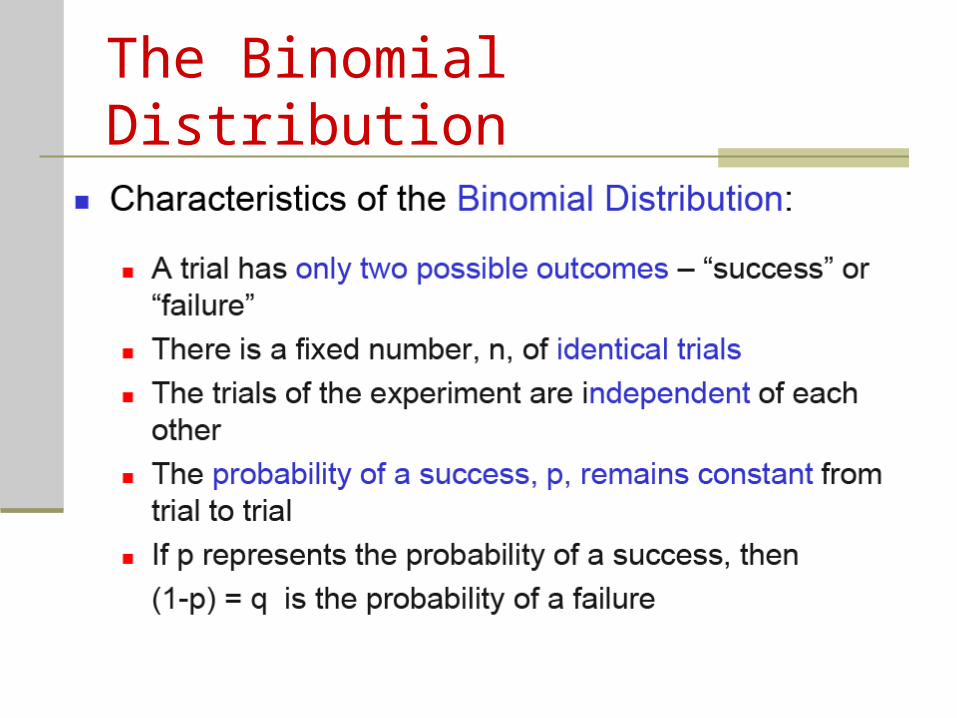
The Binomial Distribution
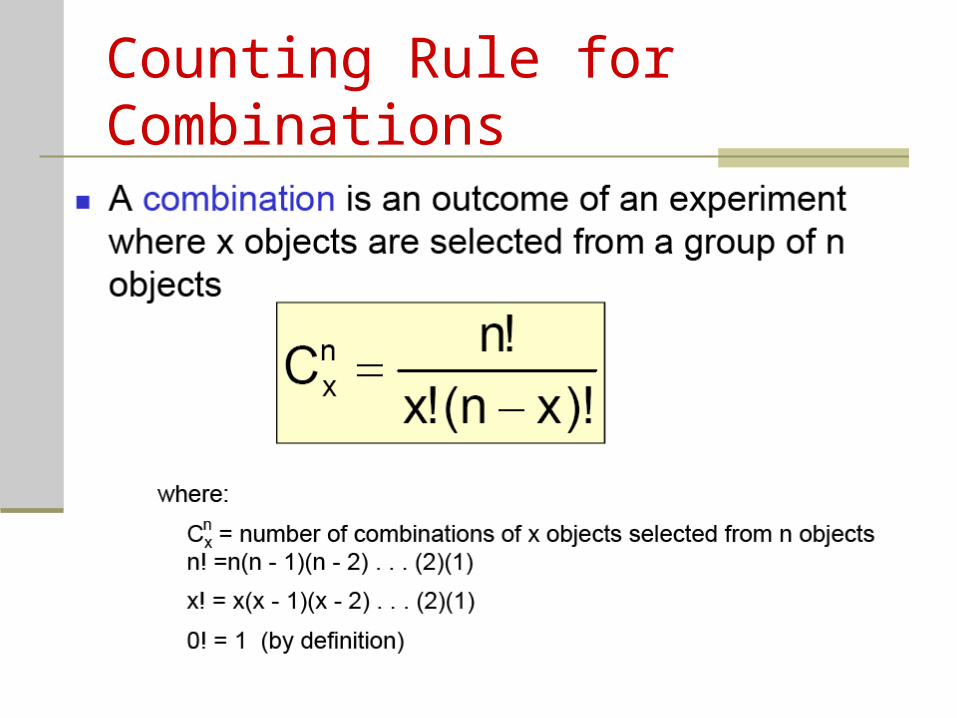
Counting Rule for Combinations
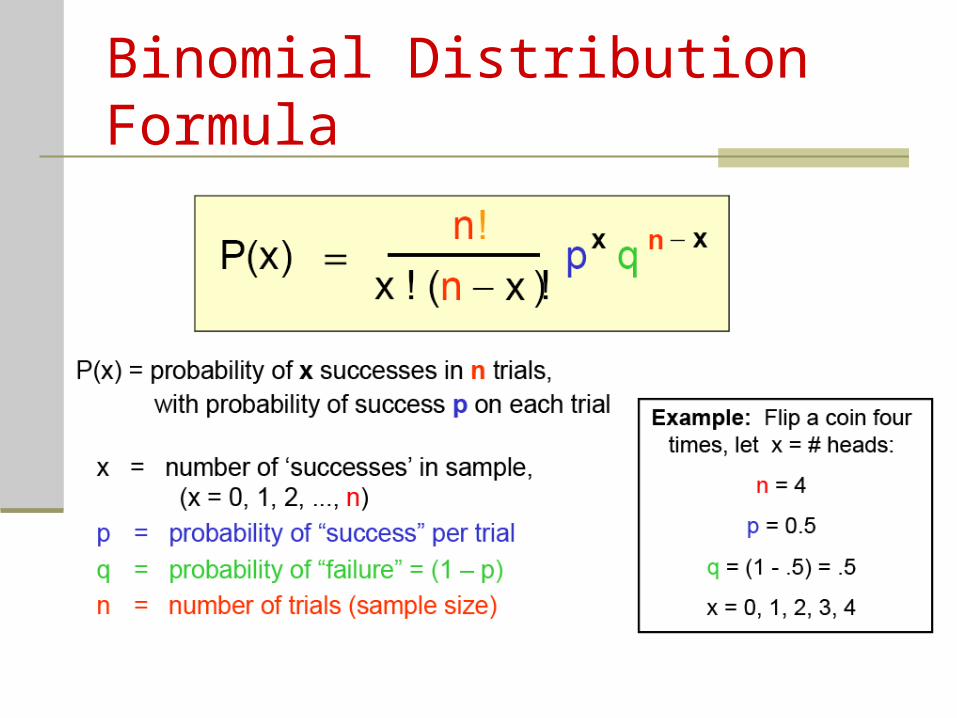
Binomial Distribution Formula

Binomial Distribution
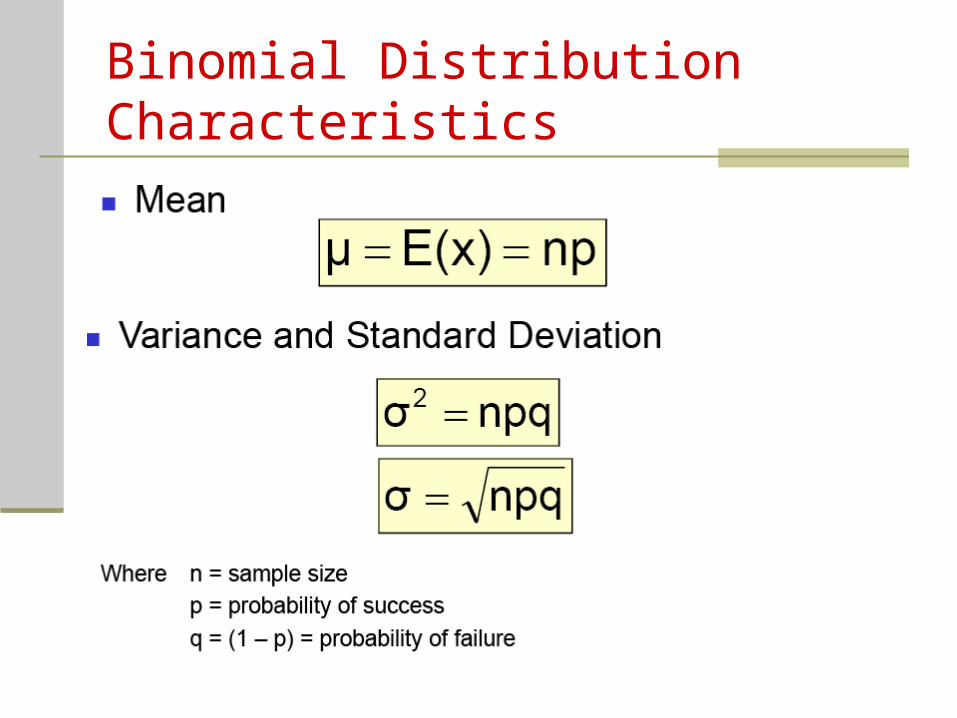
Binomial Distribution Characteristics
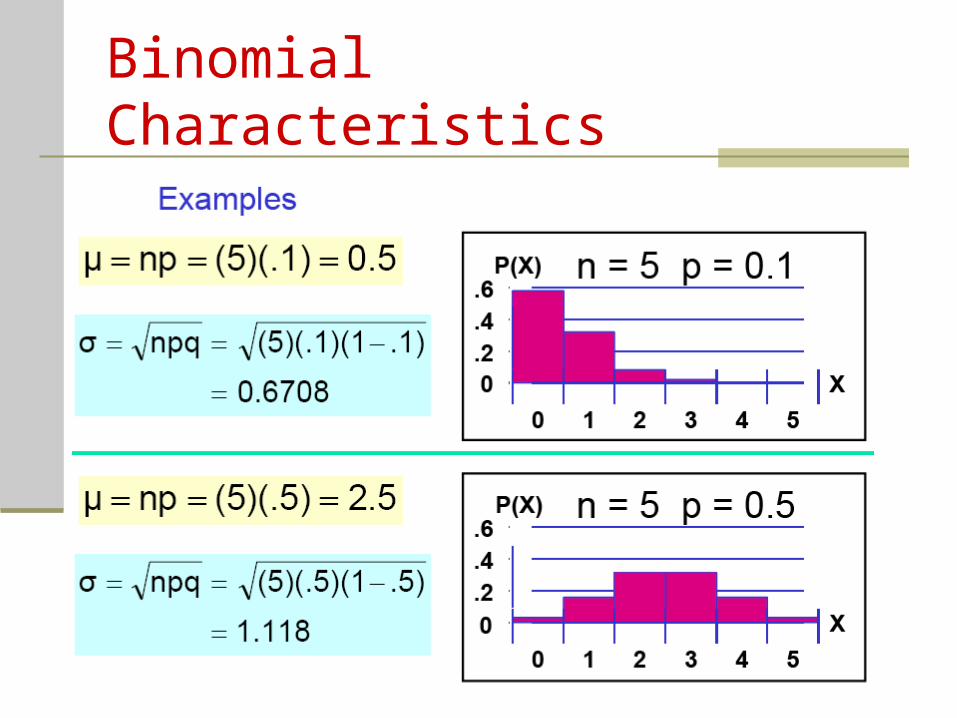
Binomial Characteristics
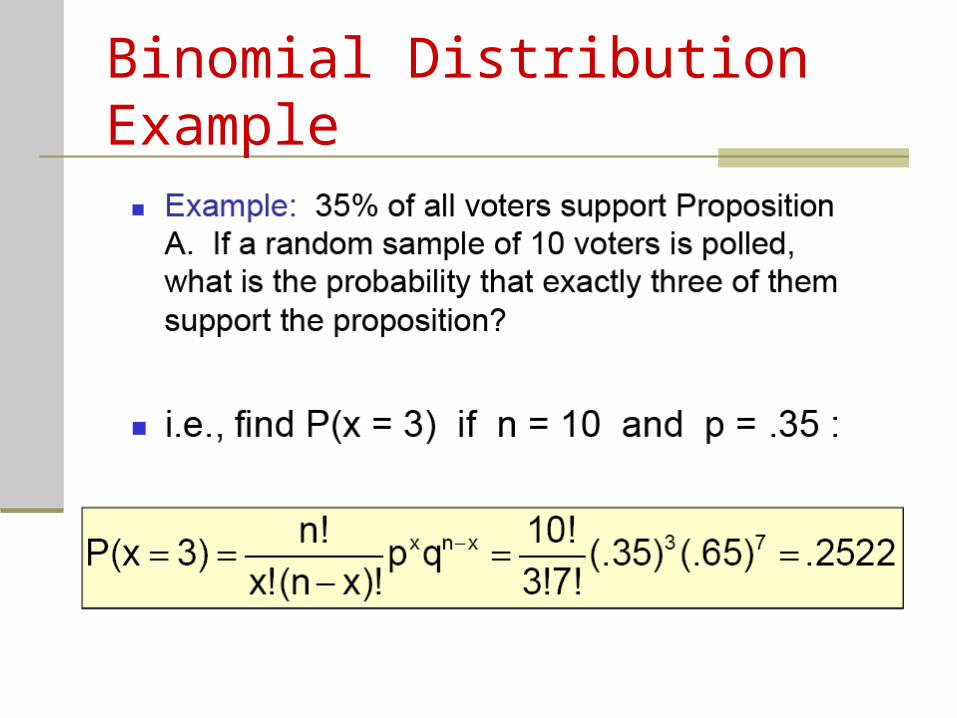
Binomial Distribution Example
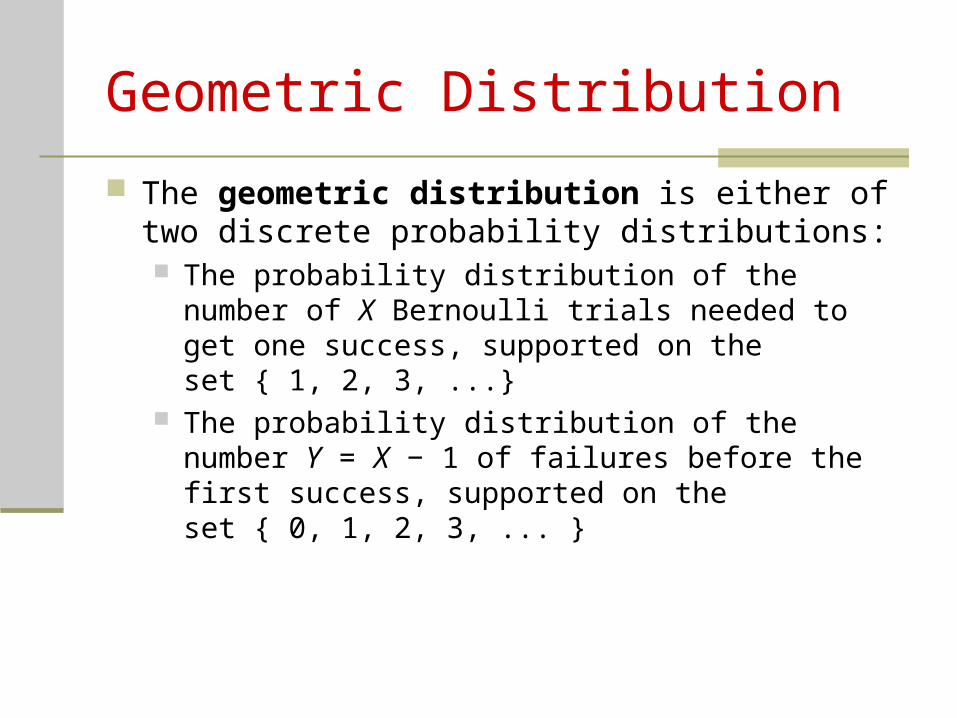
Geometric Distribution
The geometric distribution is either of two discrete probability distributions: The probability distribution of the number of X Bernoulli
trials needed to get one success, supported on the set { 1, 2, 3, ...}
The probability distribution of the number Y = X − 1 of failures before the first success, supported on the set { 0, 1, 2, 3, ... }
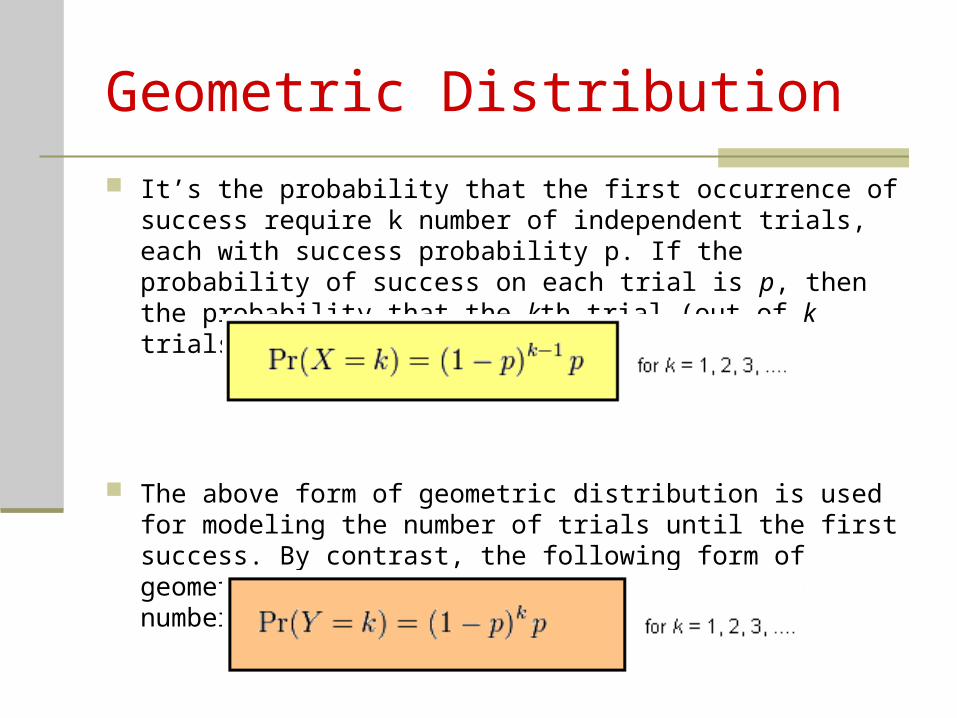
It’s the probability that the first occurrence of success require k number of independent trials, each with success probability p. If the probability of success on each trial is p, then the probability that the kth trial (out of k trials) is the first success is
The above form of geometric distribution is used for modeling the number of trials until the first success. By contrast, the following form of geometric distribution is used for modeling number of failures until the first success:
Geometric Distribution
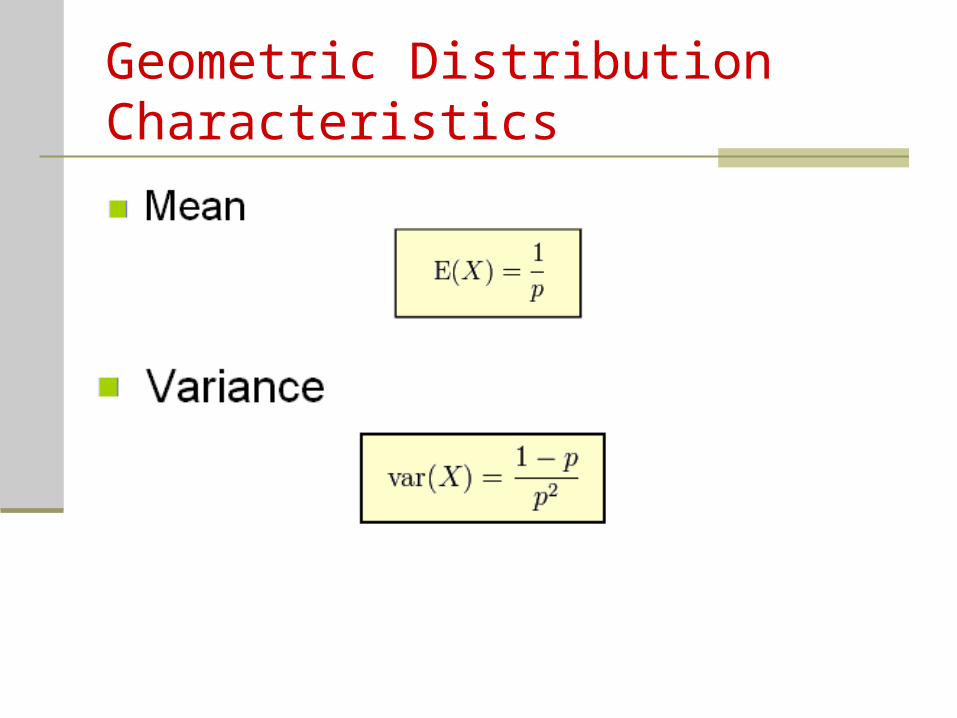
Geometric Distribution Characteristics
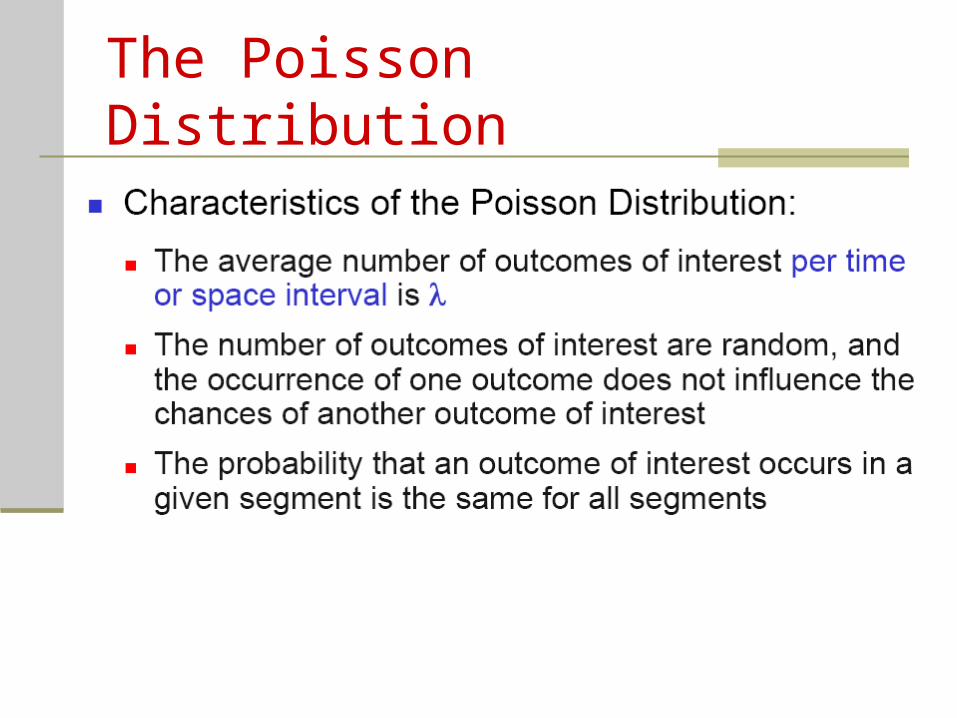
The Poisson Distribution
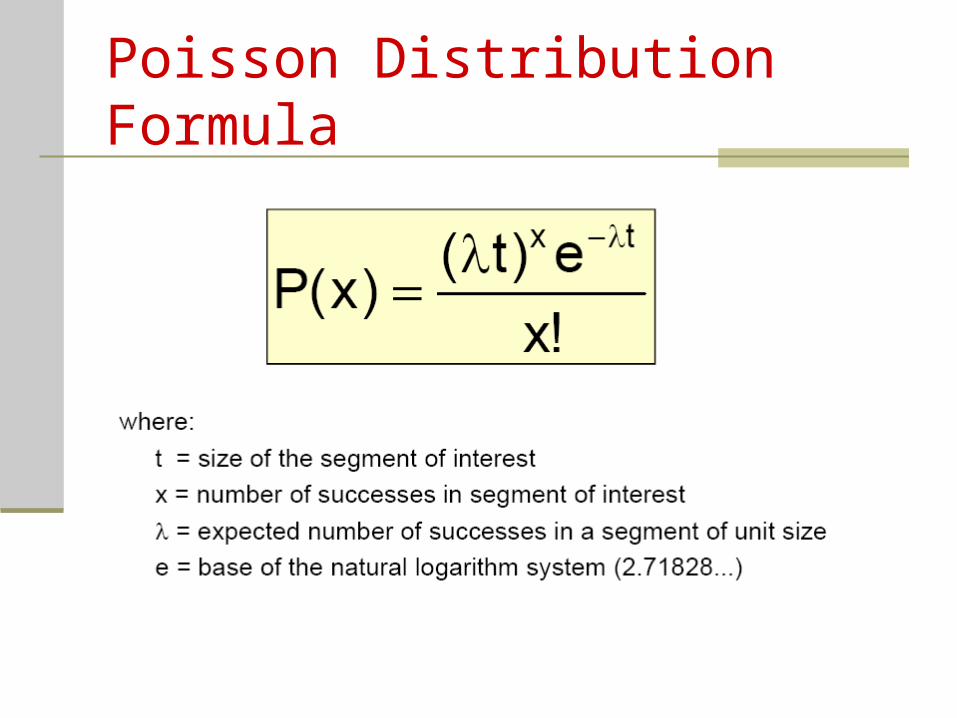
Poisson Distribution Formula
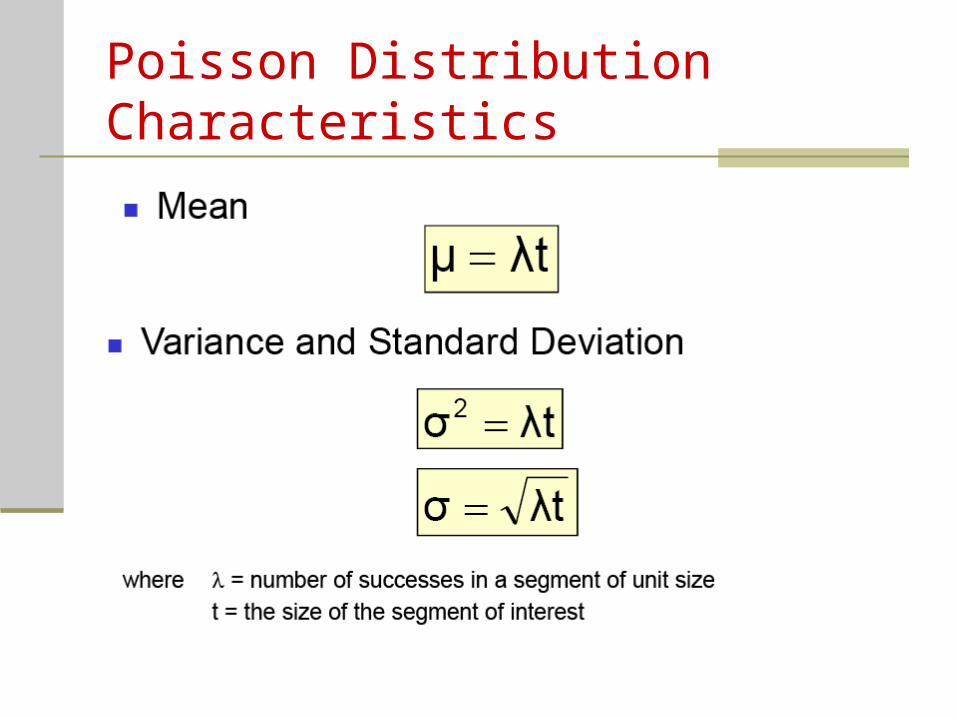
Poisson Distribution Characteristics
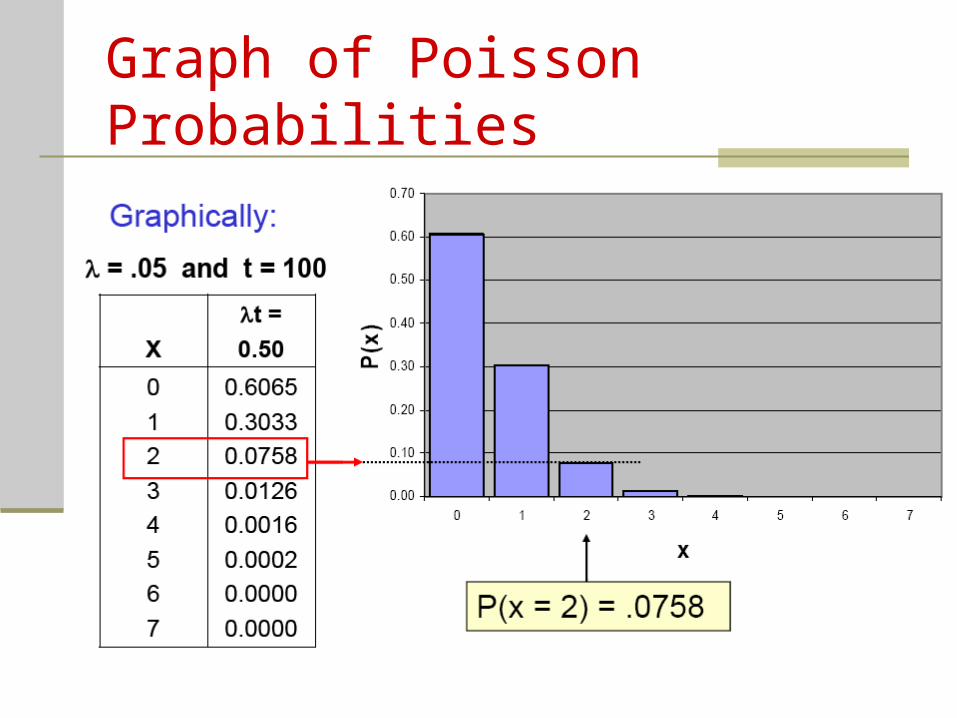
Graph of Poisson Probabilities
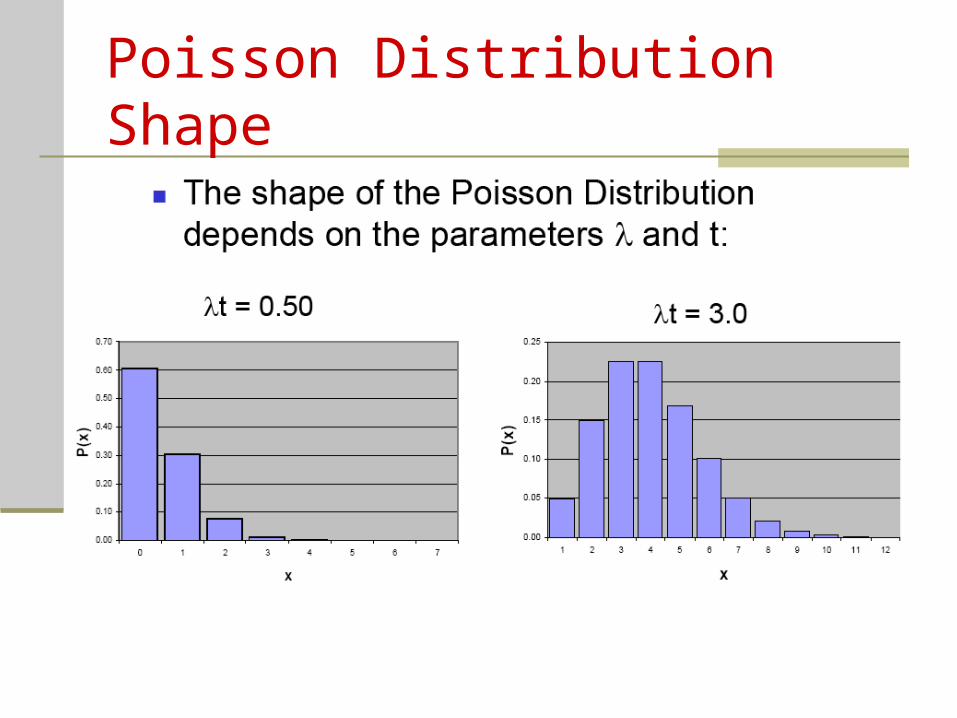
Poisson Distribution Shape
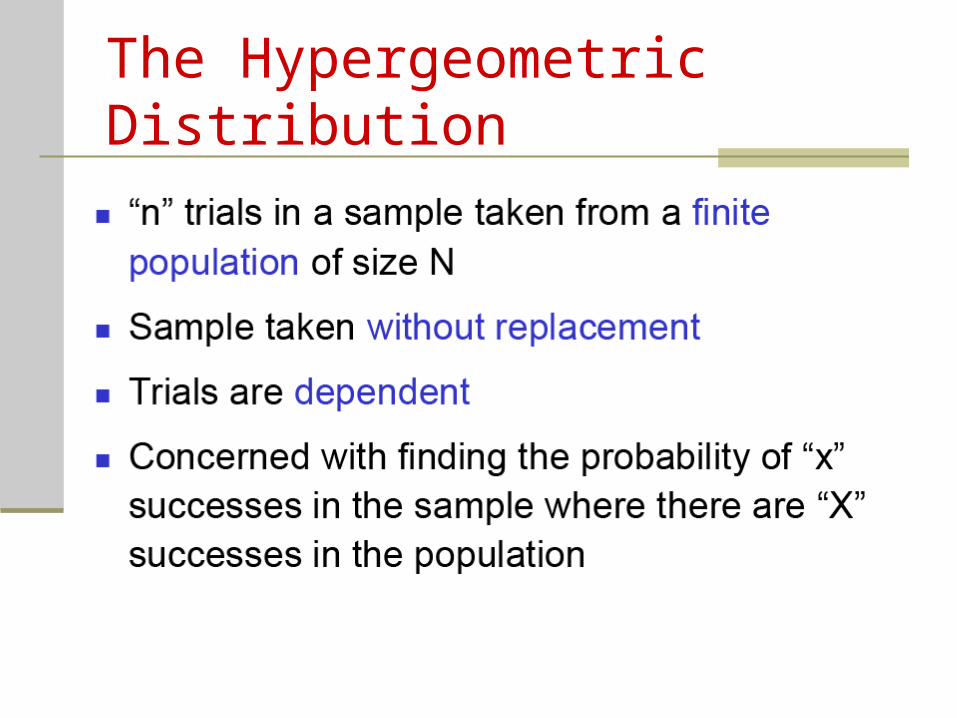
The Hypergeometric Distribution
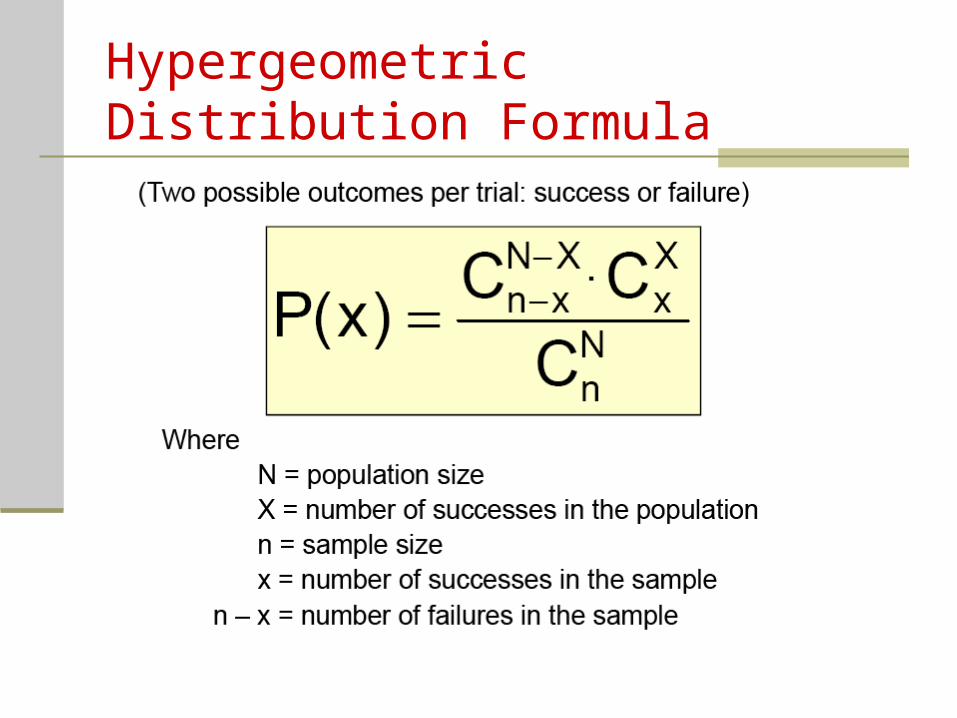
Hypergeometric Distribution Formula
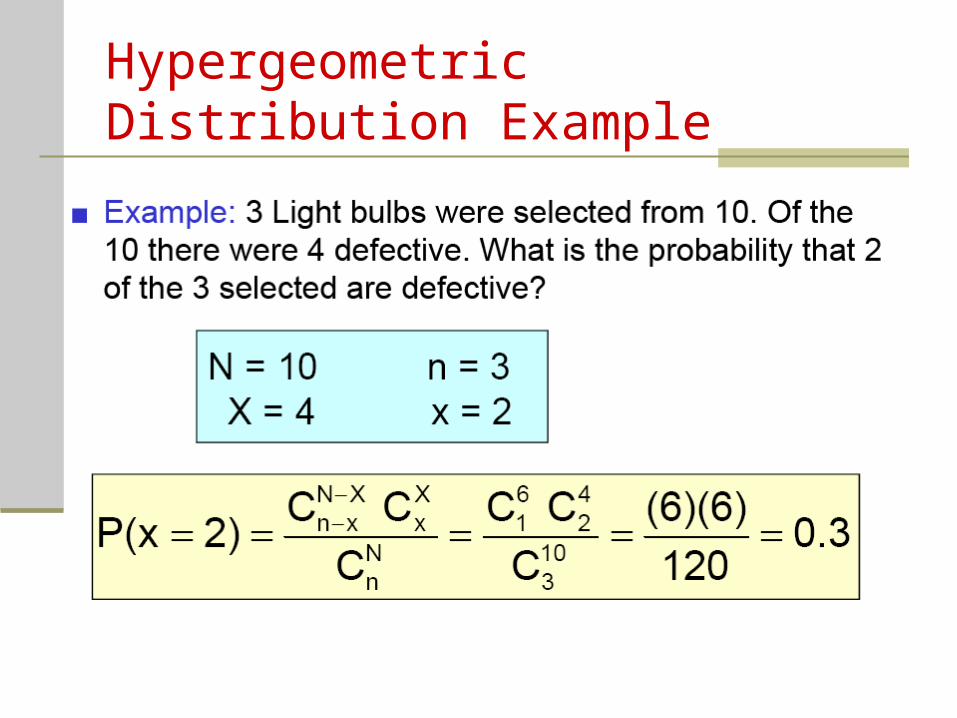
Hypergeometric Distribution Example
Continuous Probability Distributions
Continuous Probability Distributions
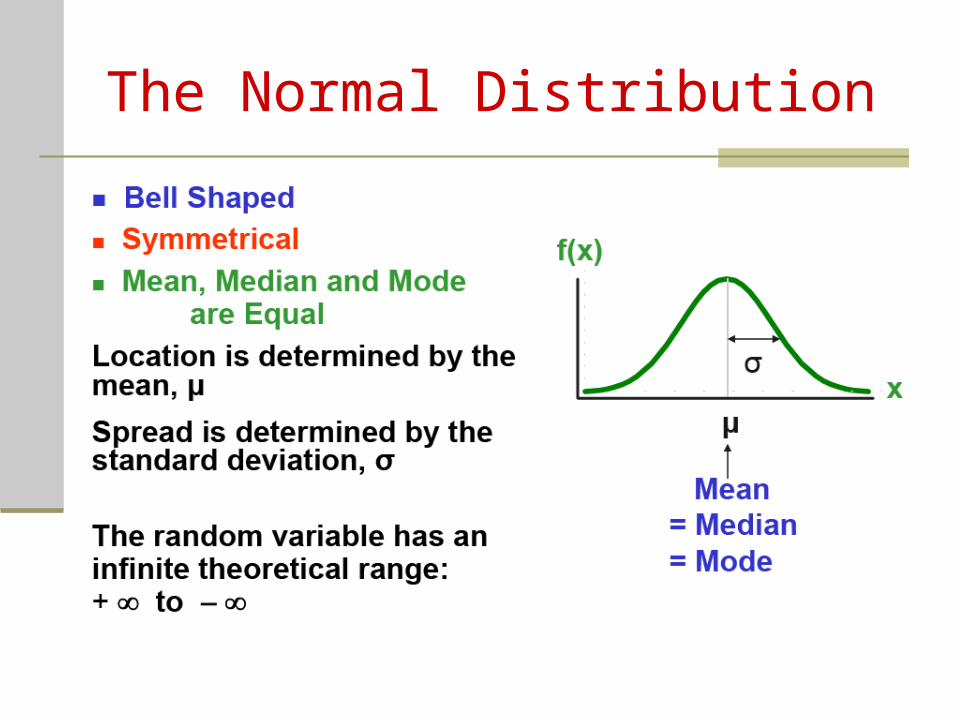
The Normal Distribution
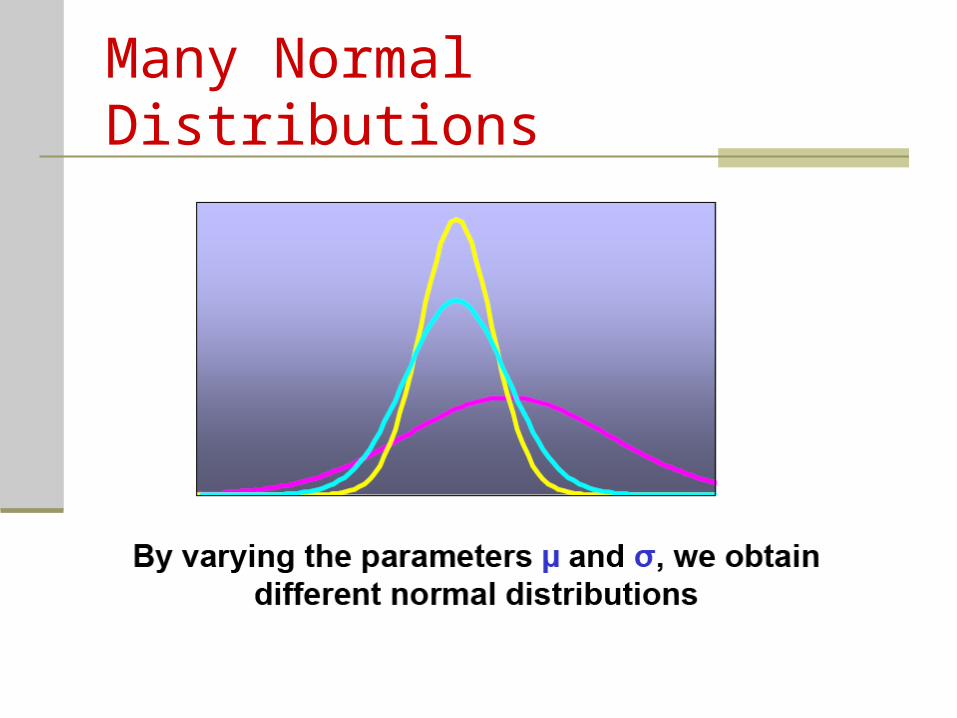
Many Normal Distributions
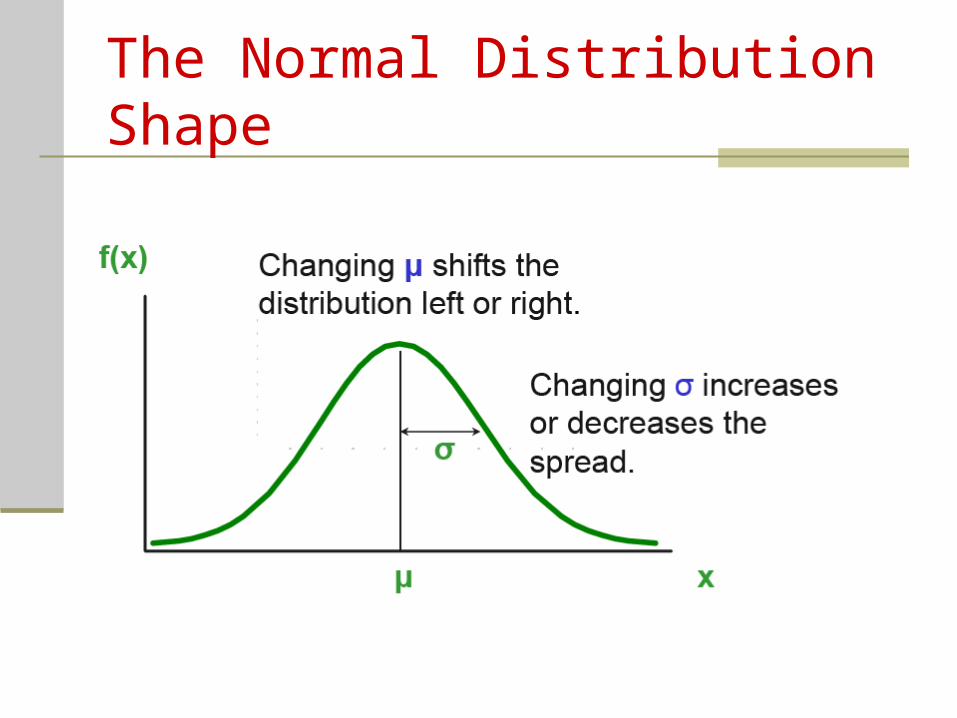
The Normal Distribution Shape
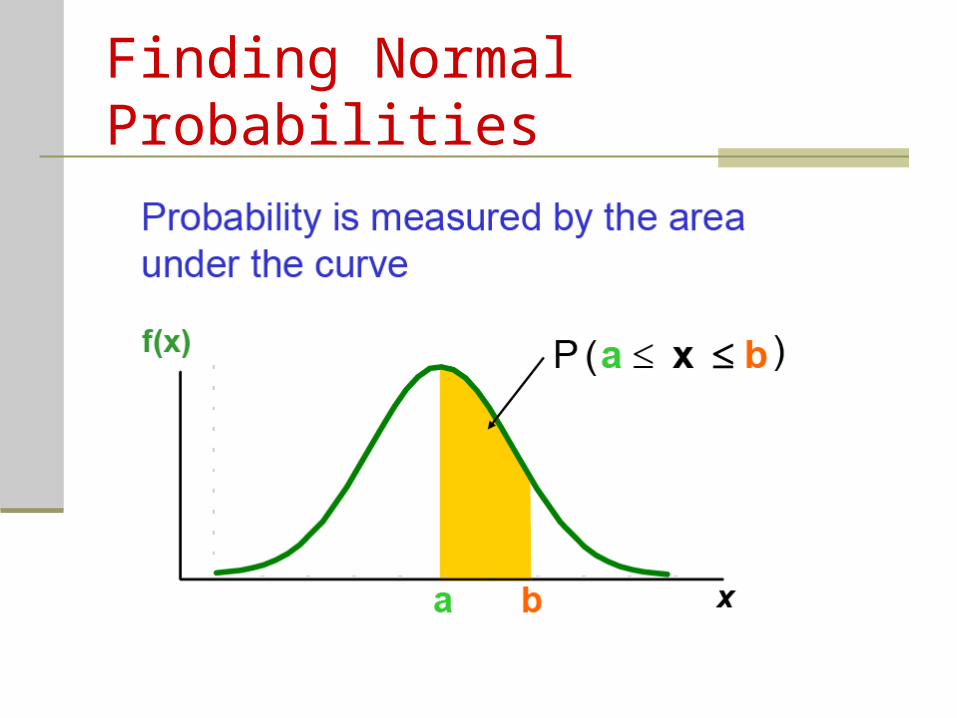
Finding Normal Probabilities
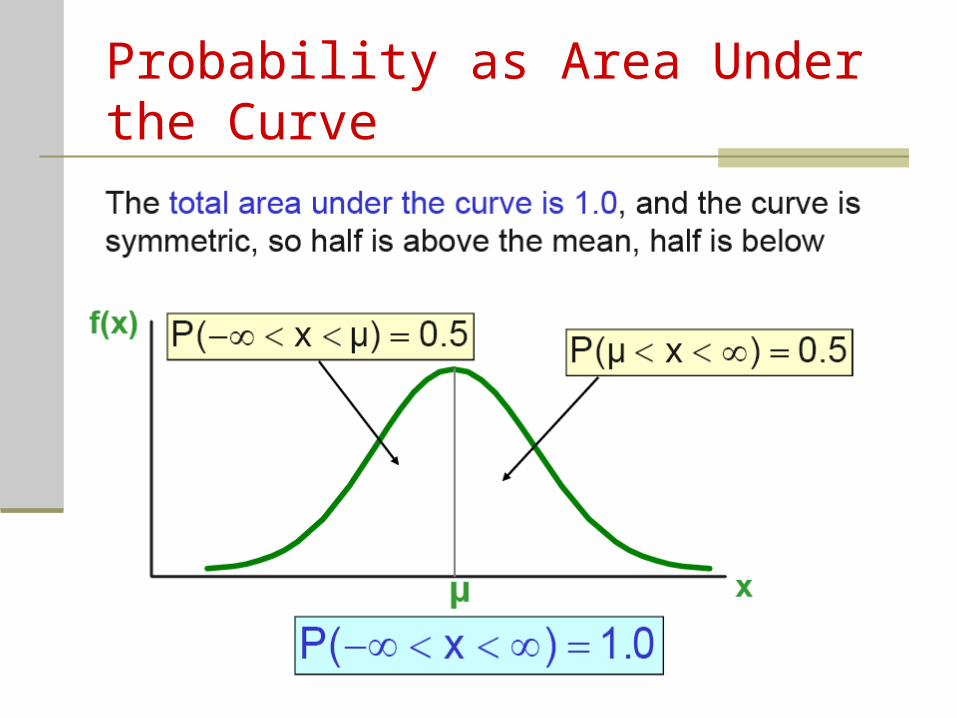
Probability as Area Under the Curve
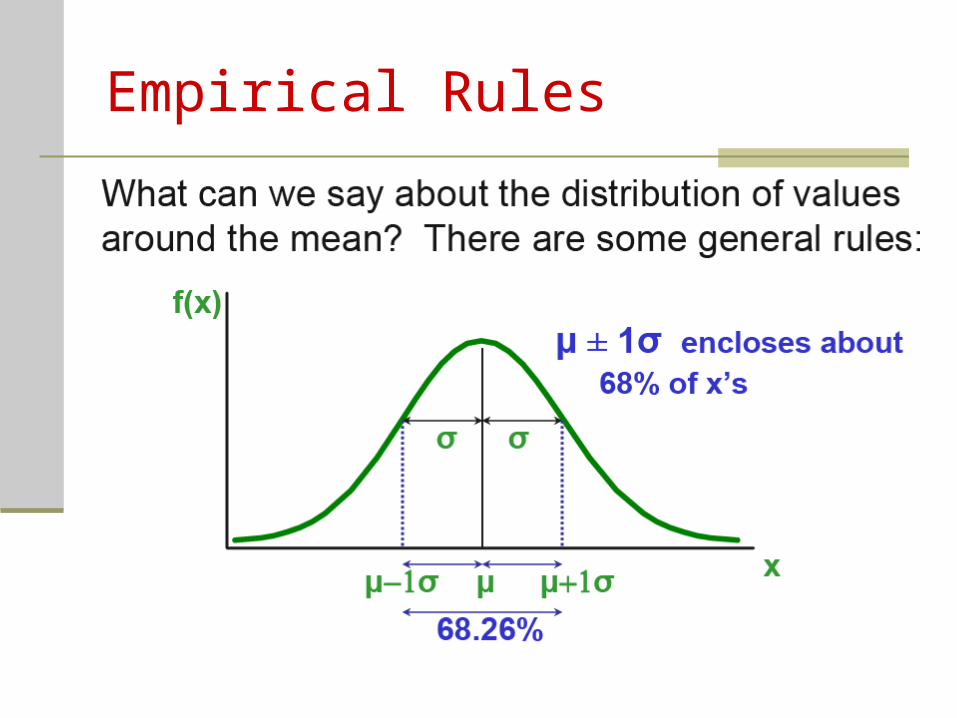
Empirical Rules
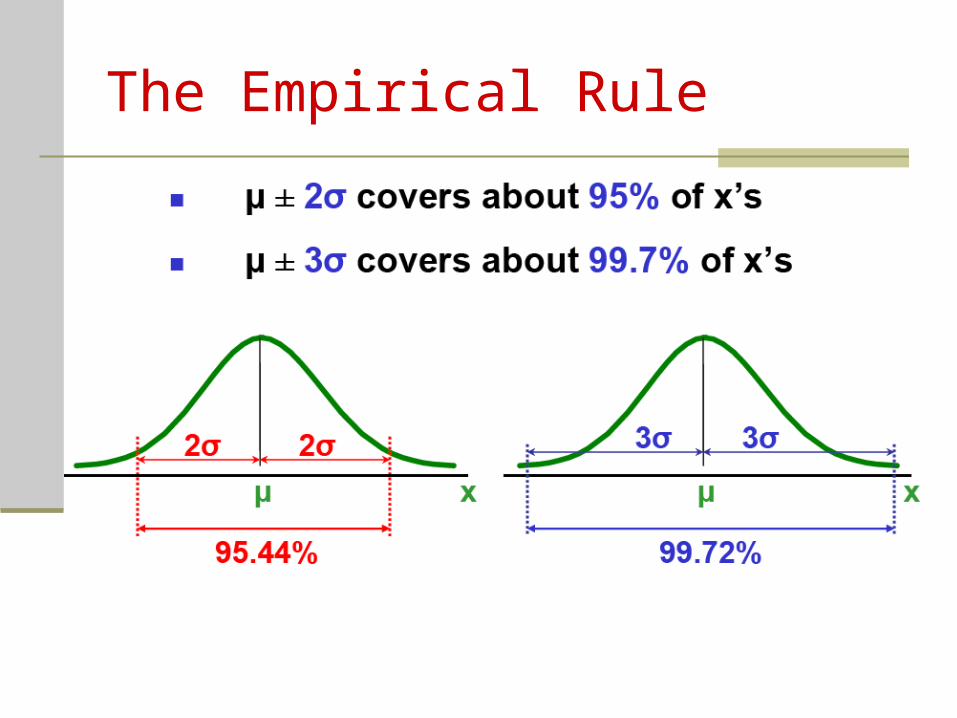
The Empirical Rule
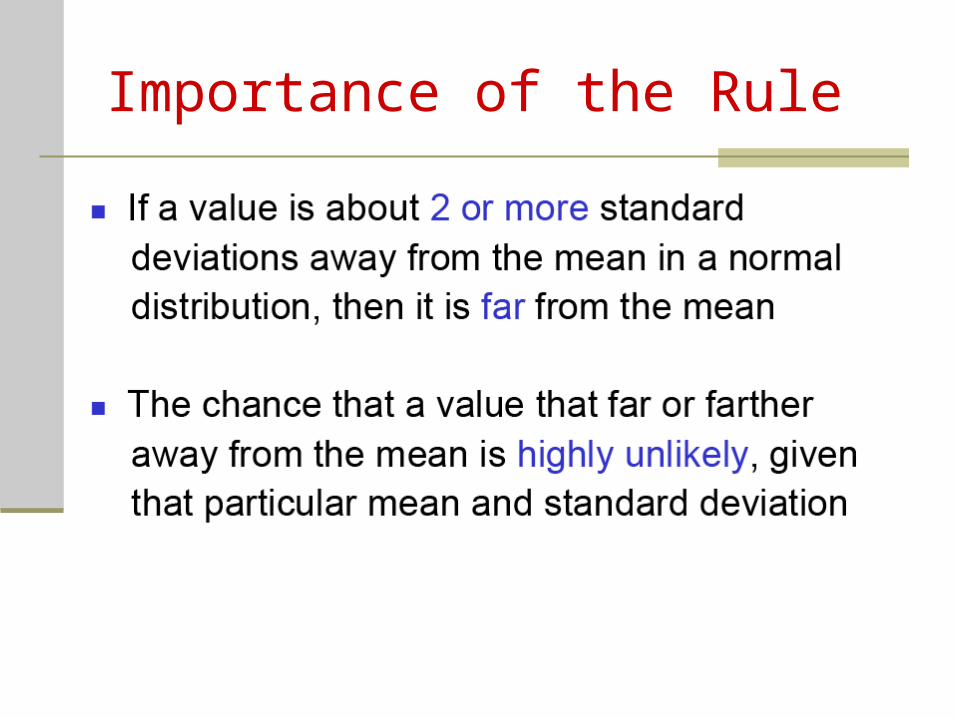
Importance of the Rule
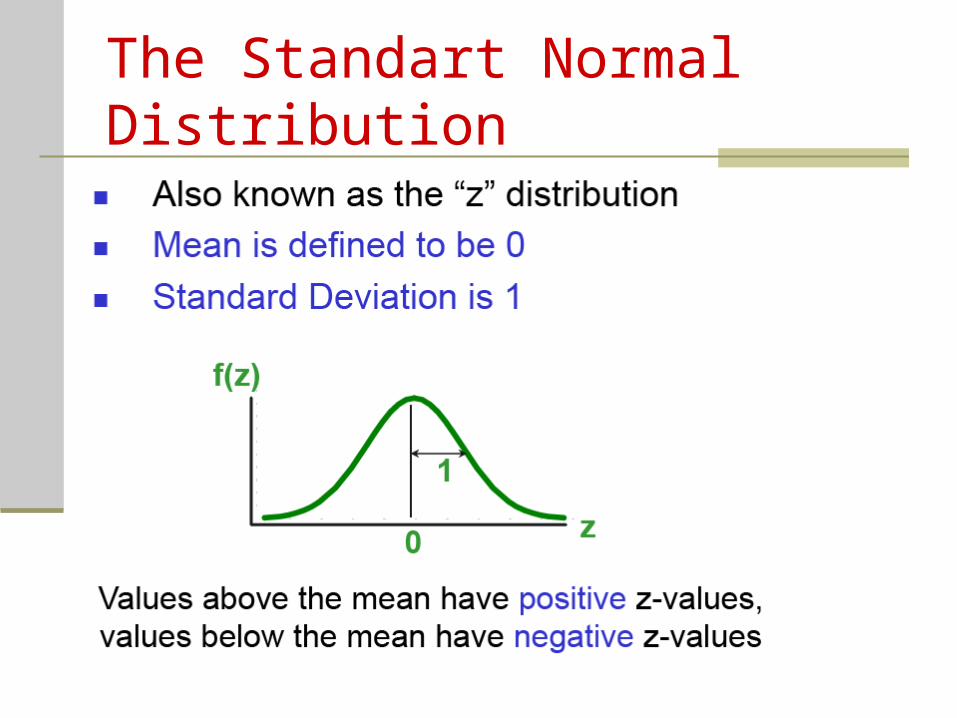
The Standart Normal Distribution
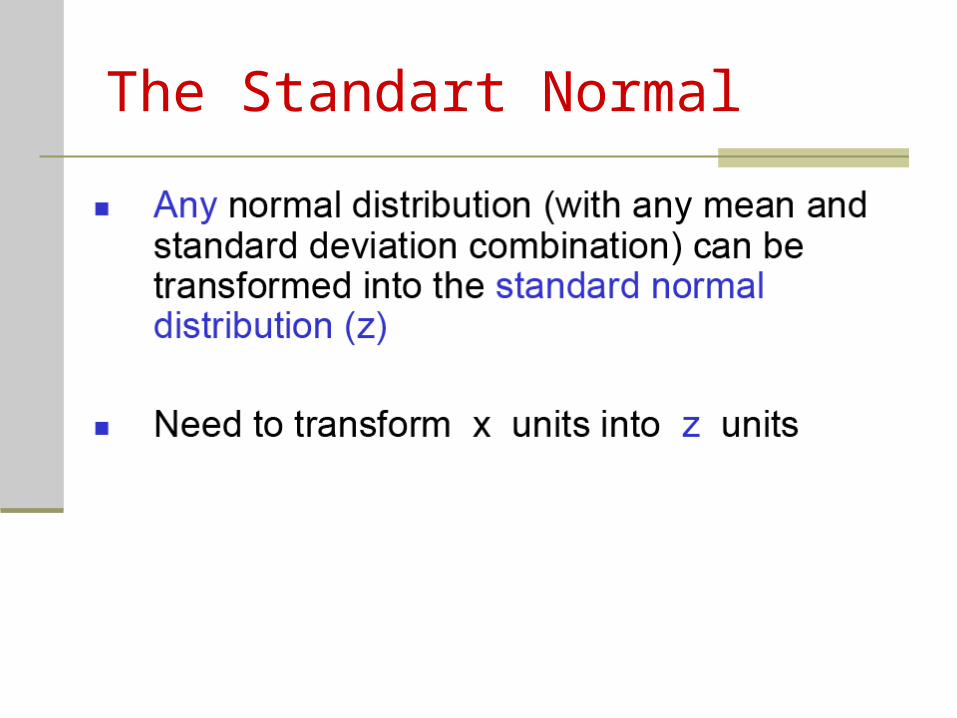
The Standart Normal
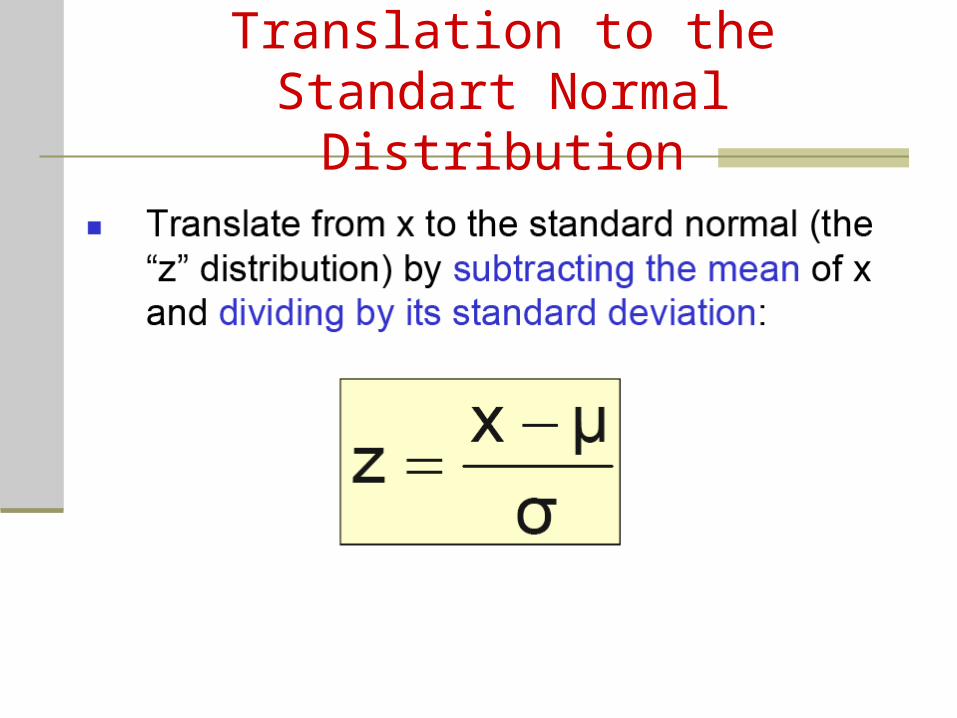
Translation to the Standart Normal Distribution
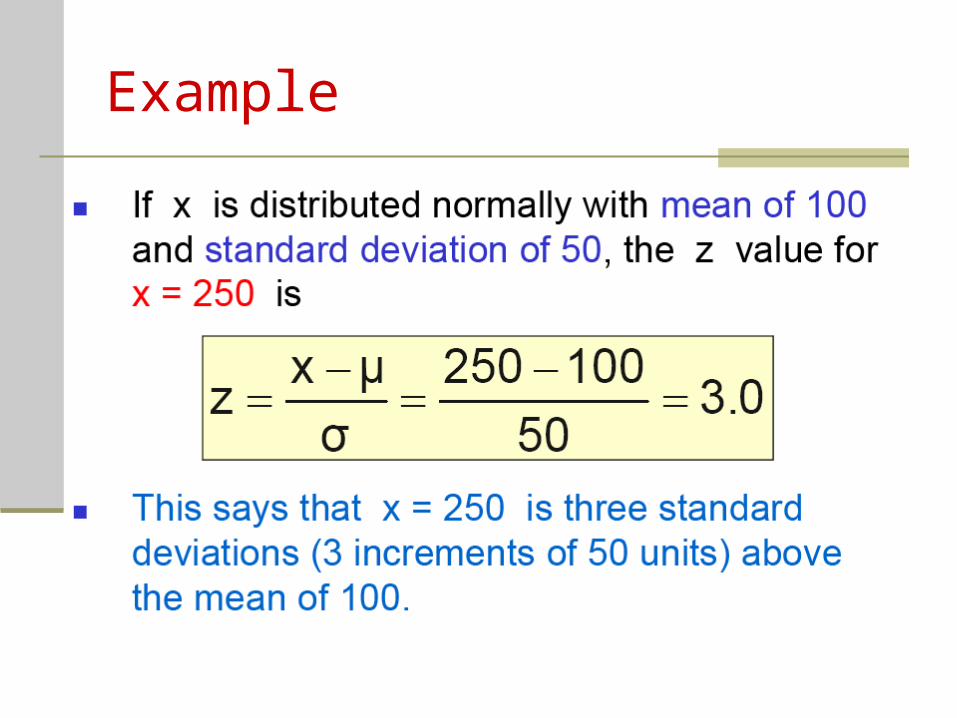
Example
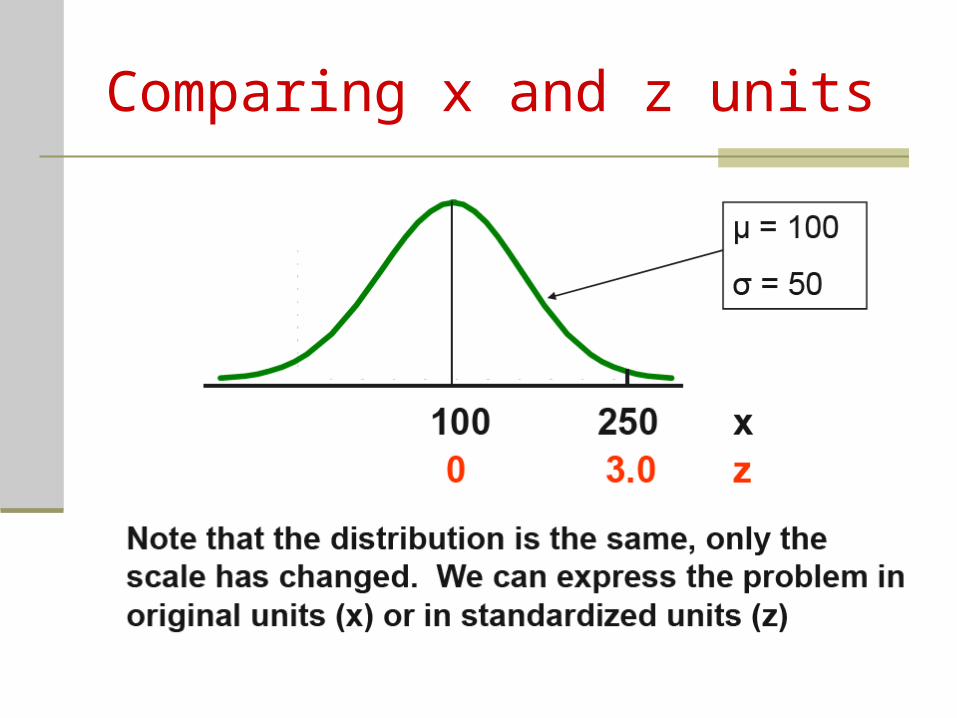
Comparing x and z units
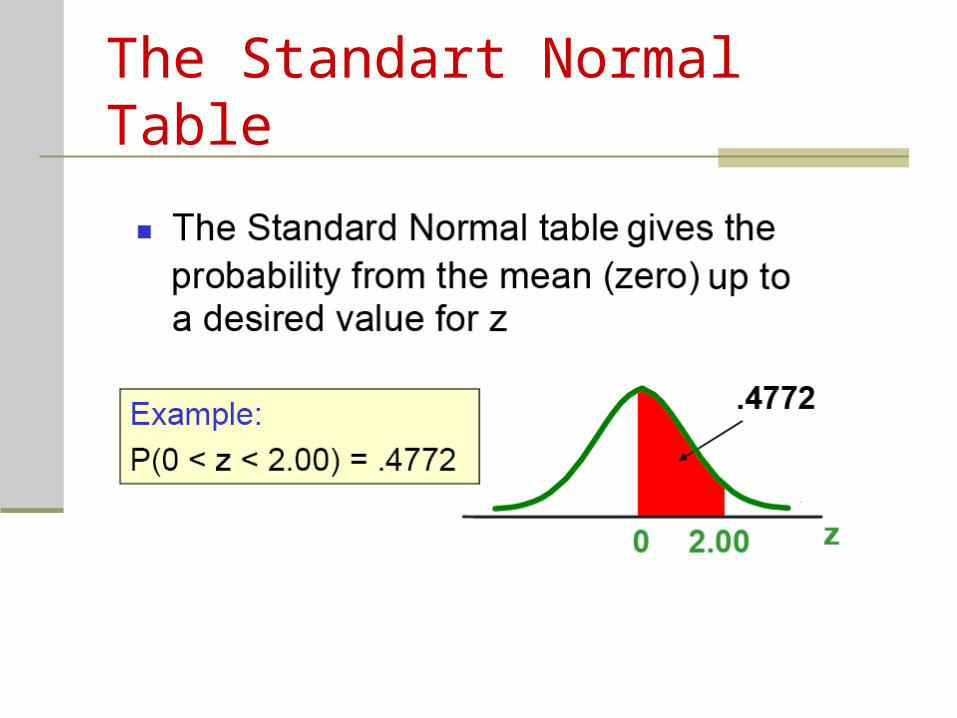
The Standart Normal Table
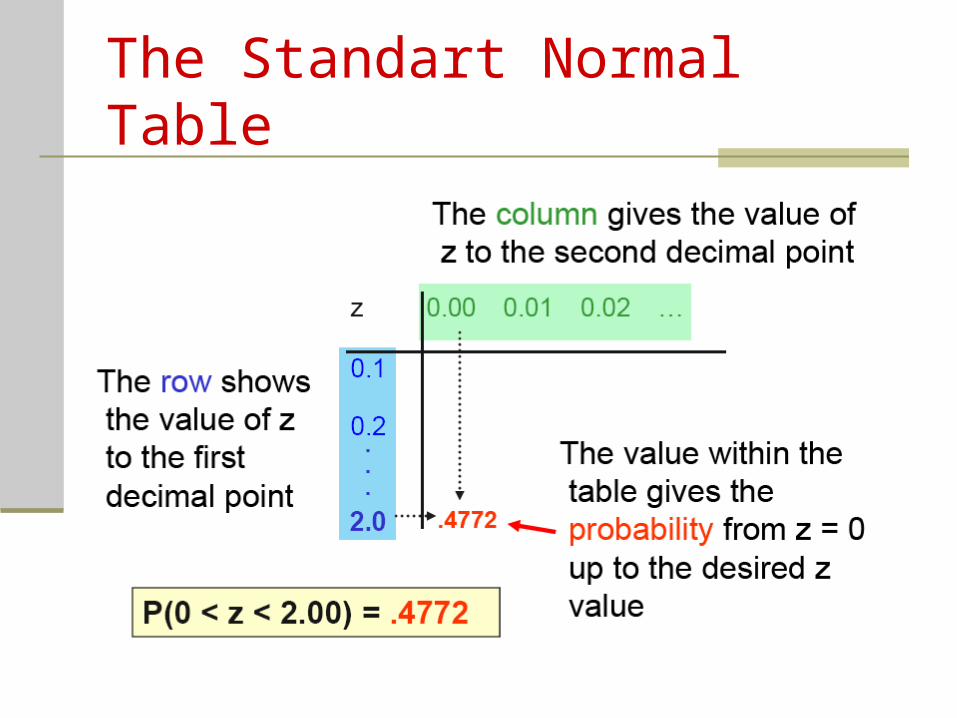
The Standart Normal Table
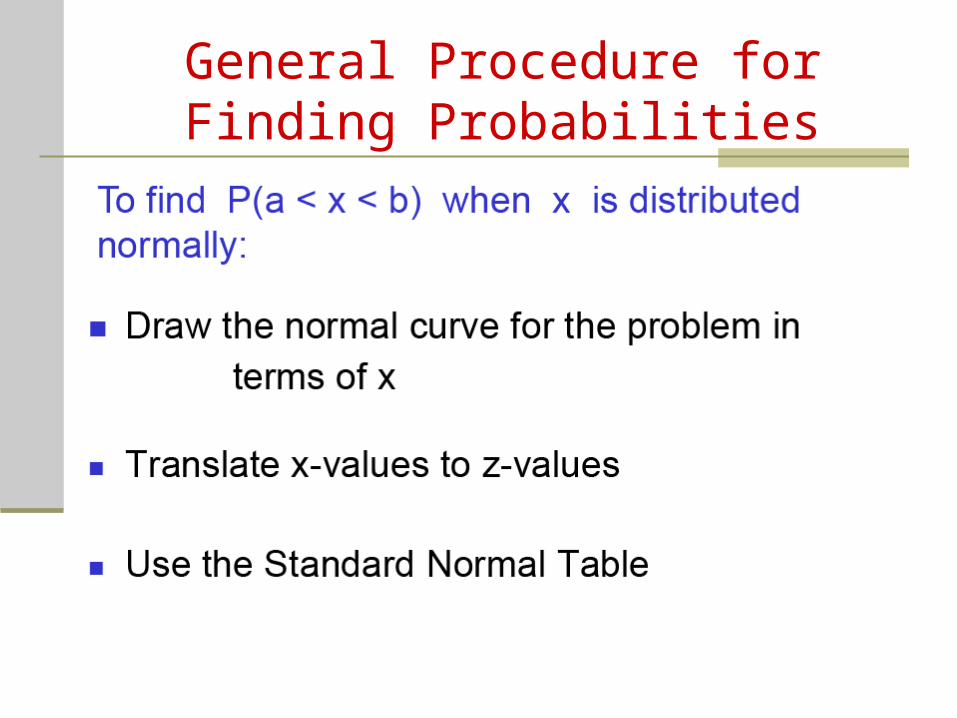
General Procedure for Finding Probabilities
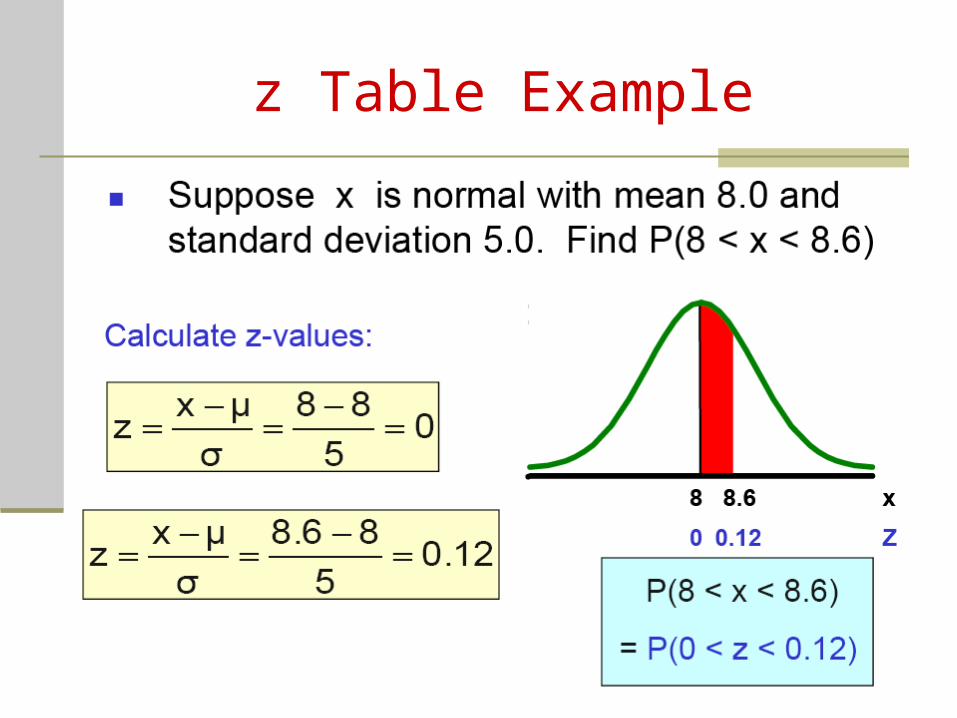
z Table Example
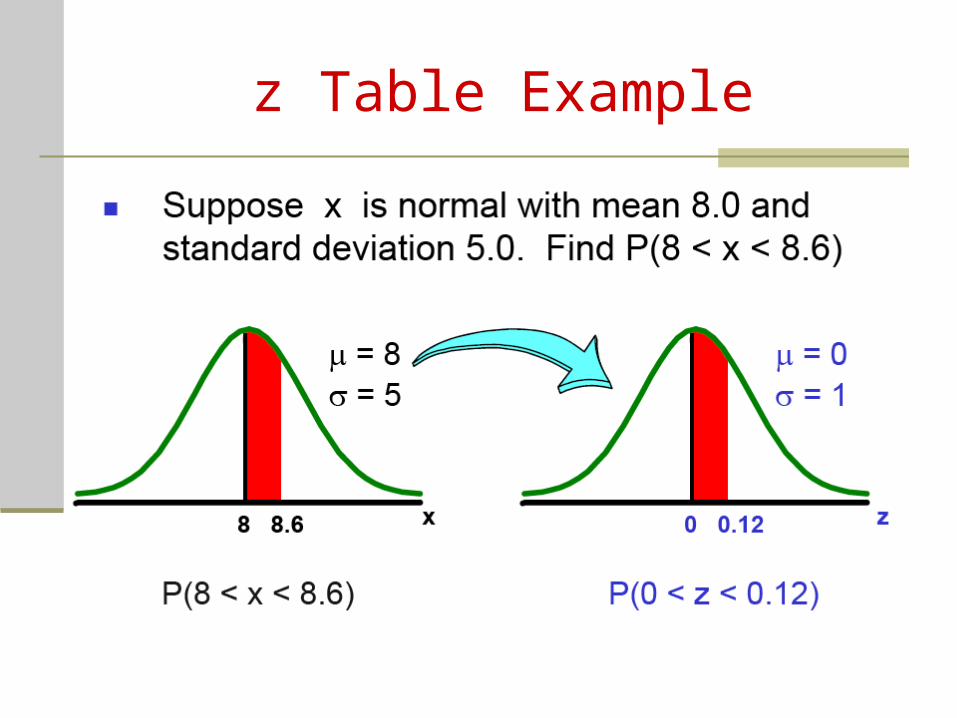
z Table Example
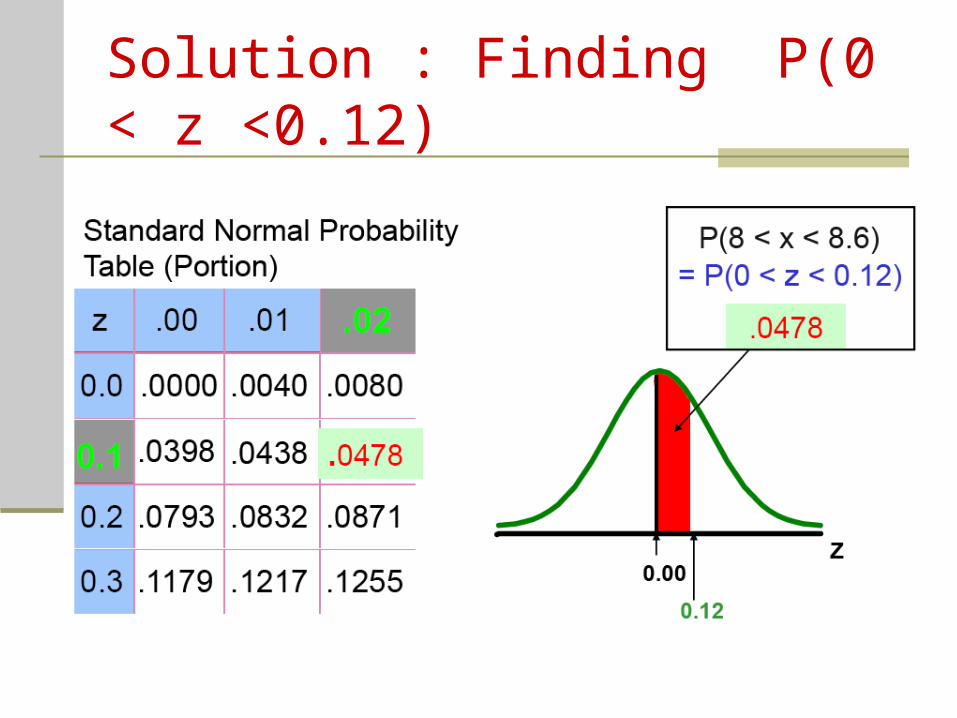
Solution : Finding P(0 < z <0.12)

Finding Normal Probabilities
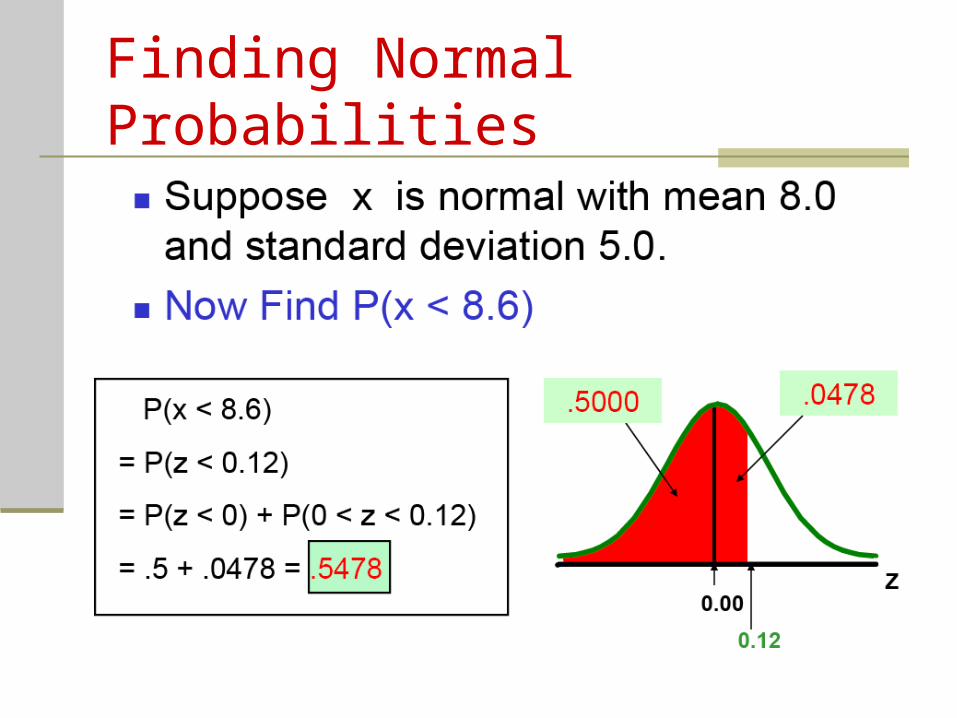
Finding Normal Probabilities
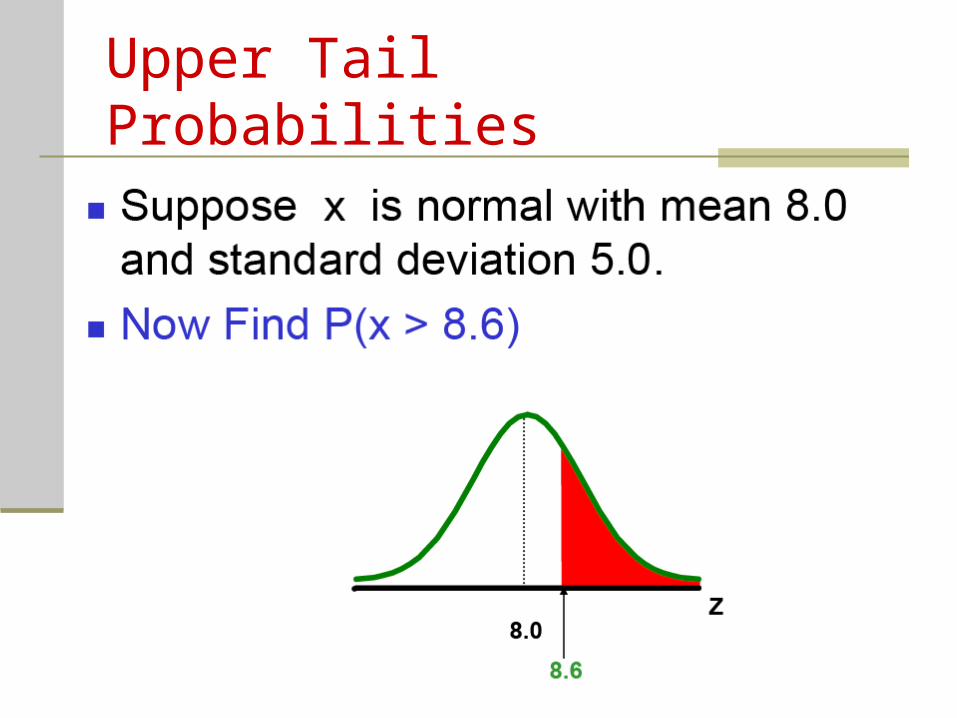
Upper Tail Probabilities
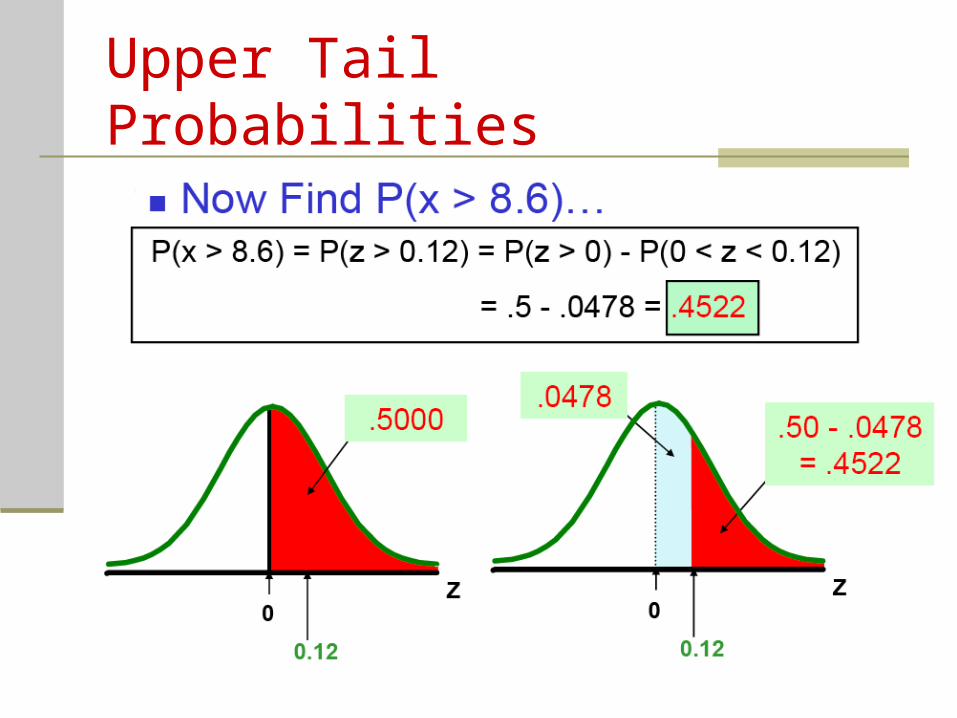
Upper Tail Probabilities
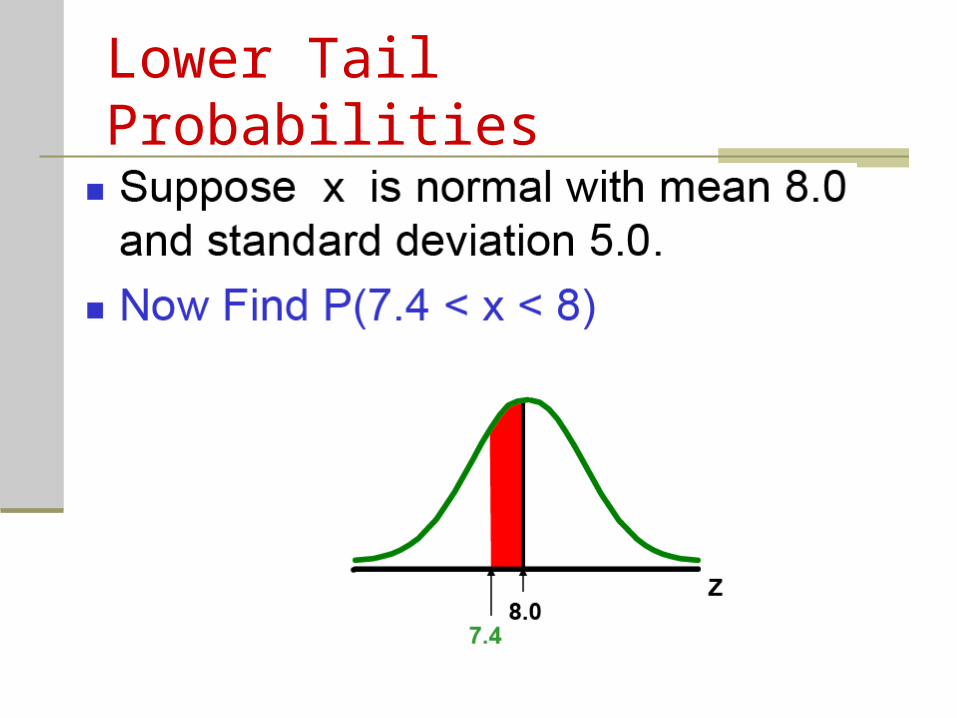
Lower Tail Probabilities
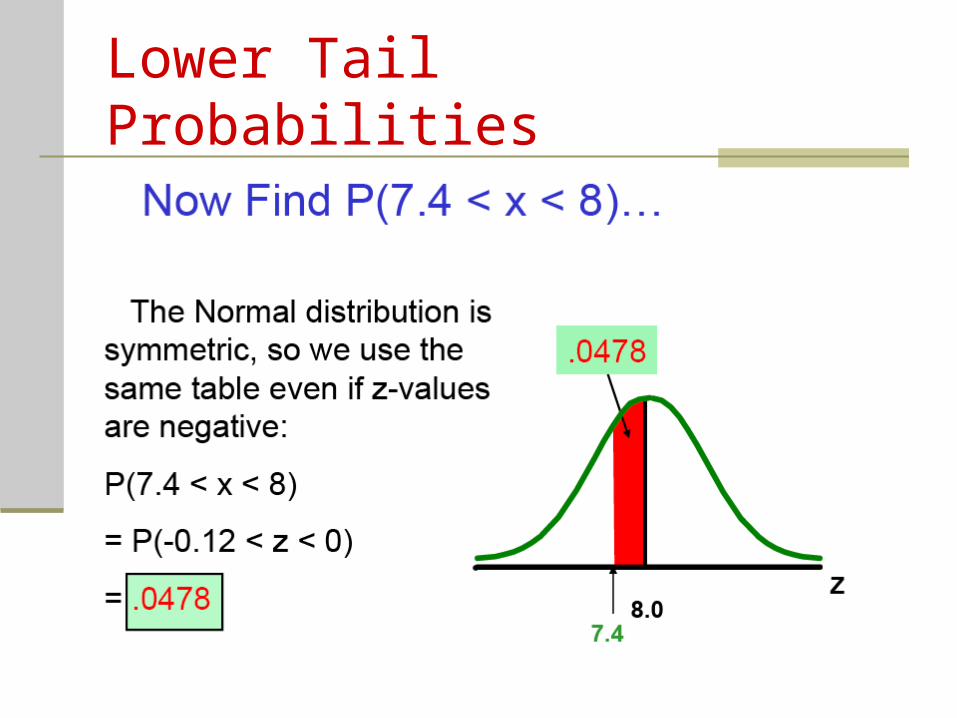
Lower Tail Probabilities
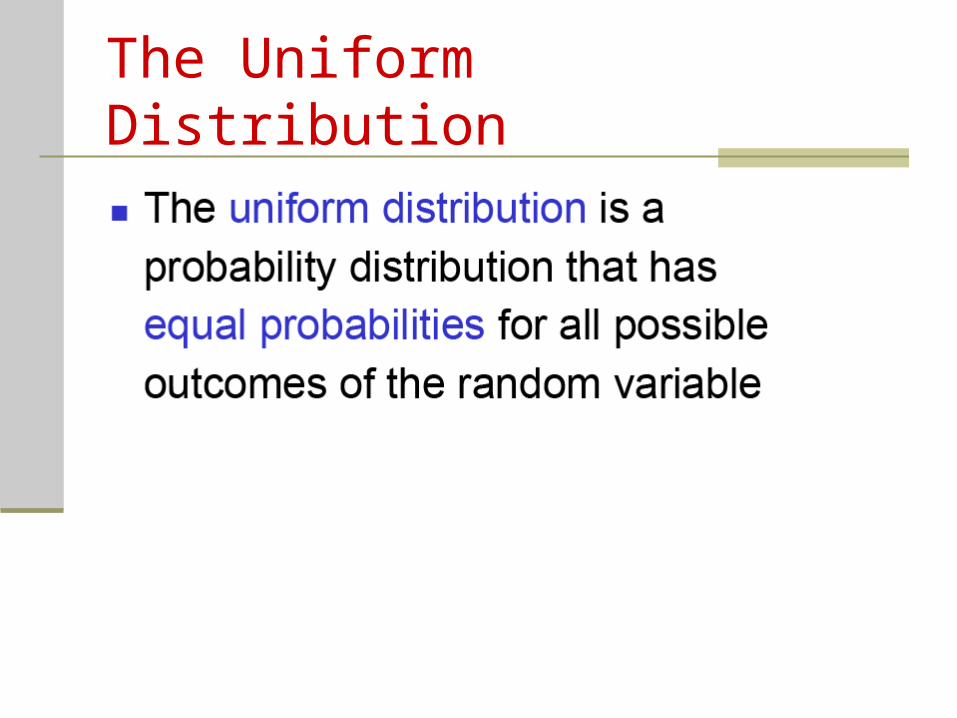
The Uniform Distribution
The Uniform Distribution
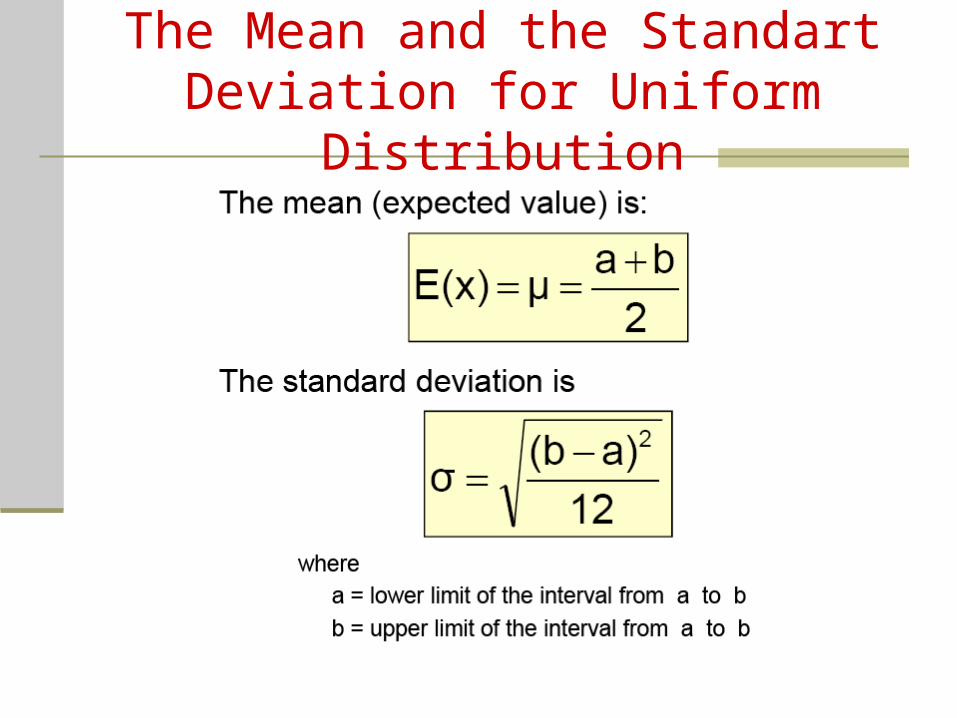
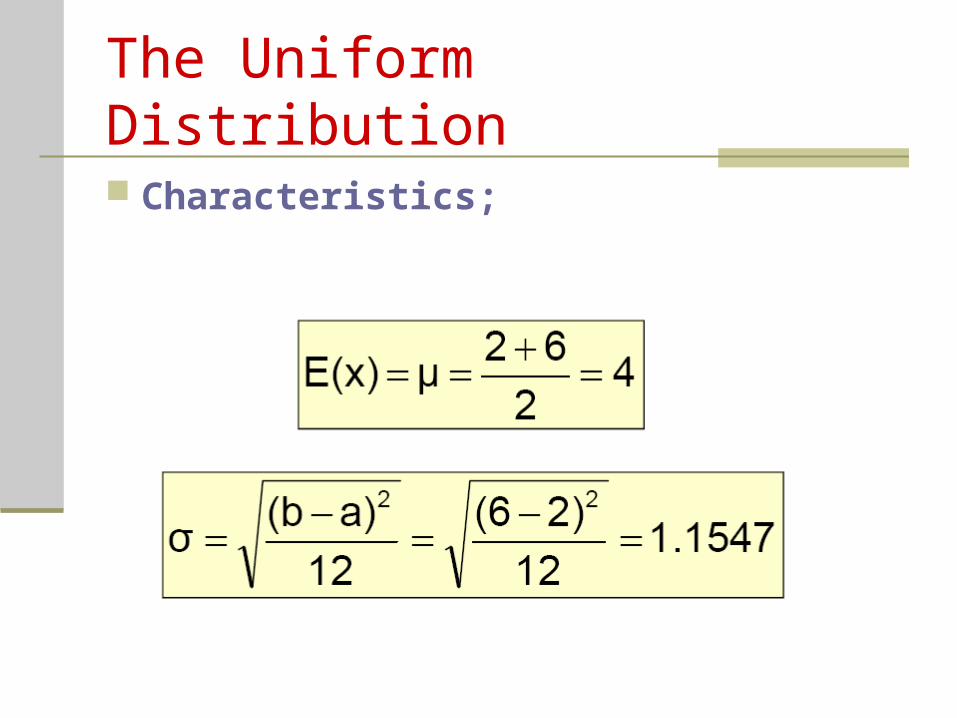
The Mean and the Standart Deviation for Uniform Distribution
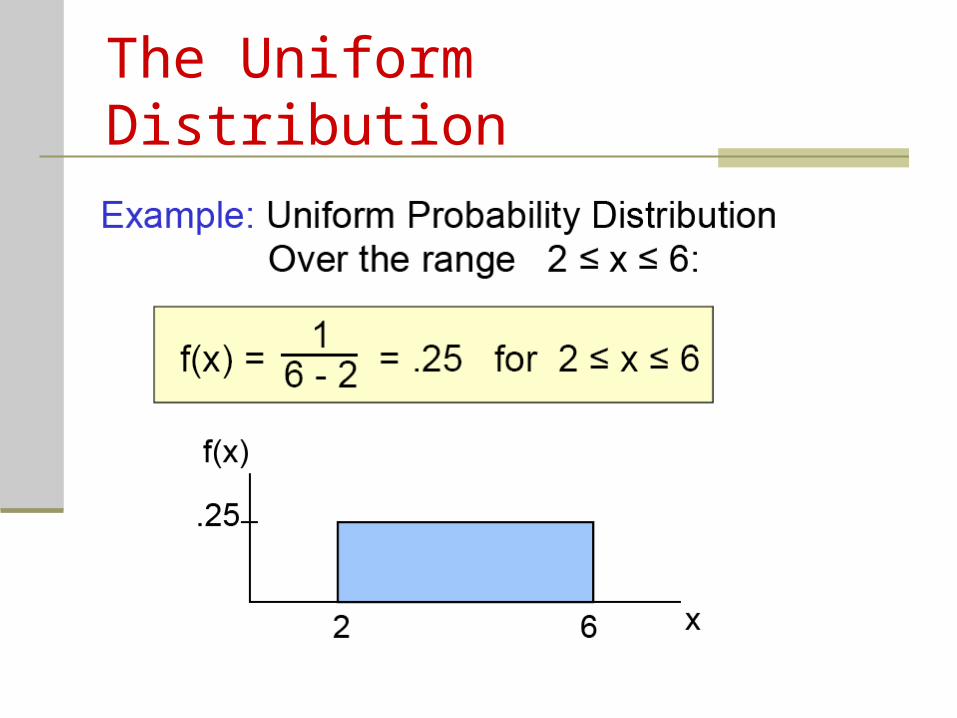
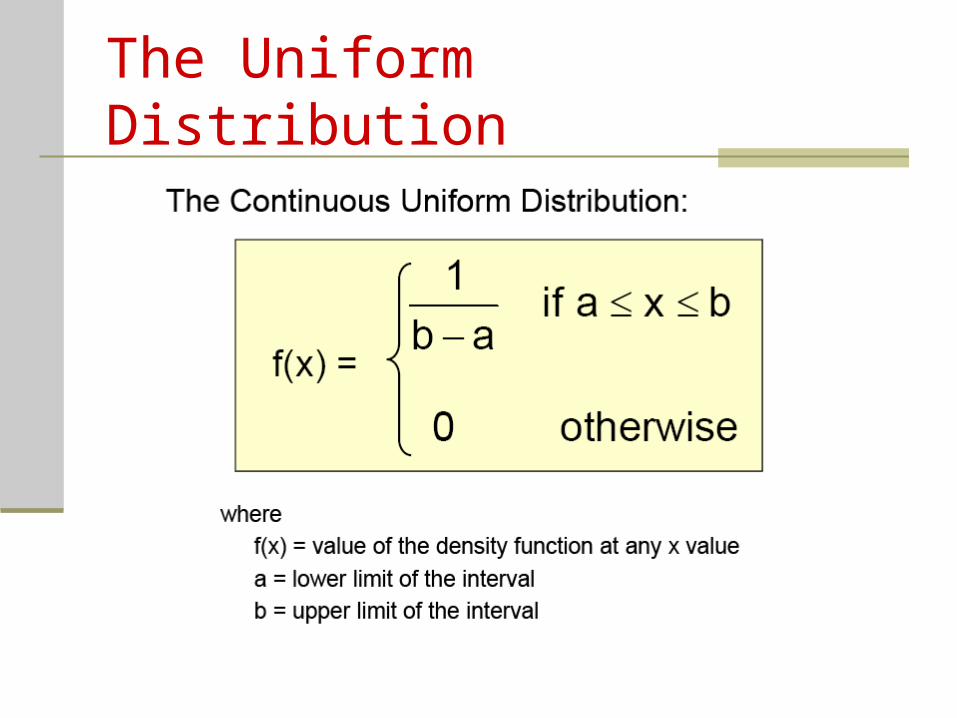
The Uniform Distribution
The Uniform Distribution
Characteristics;
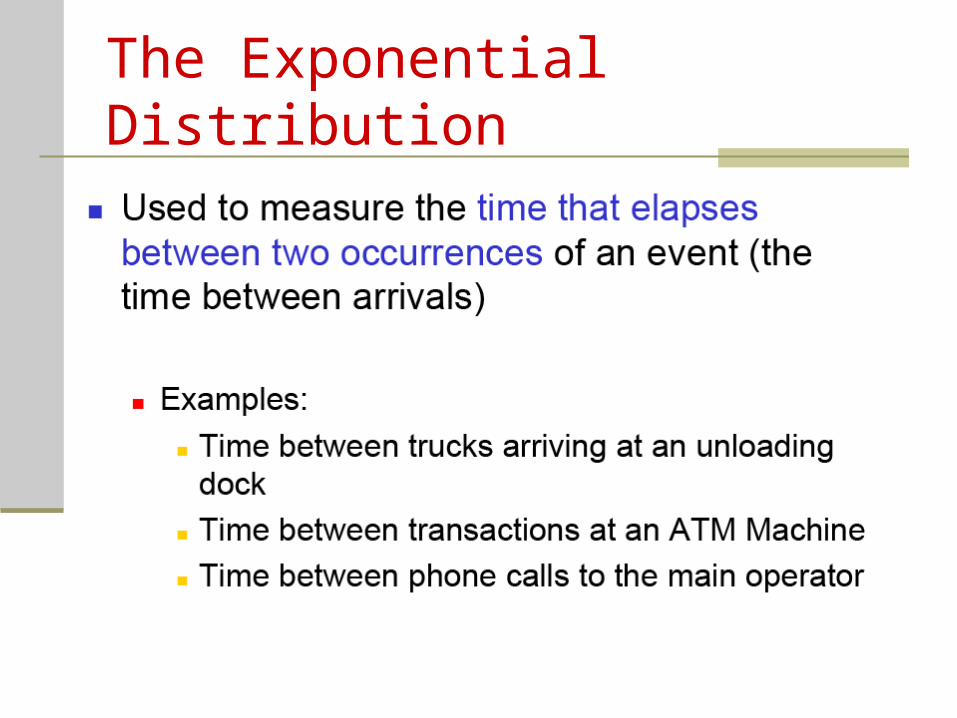
The Exponential Distribution
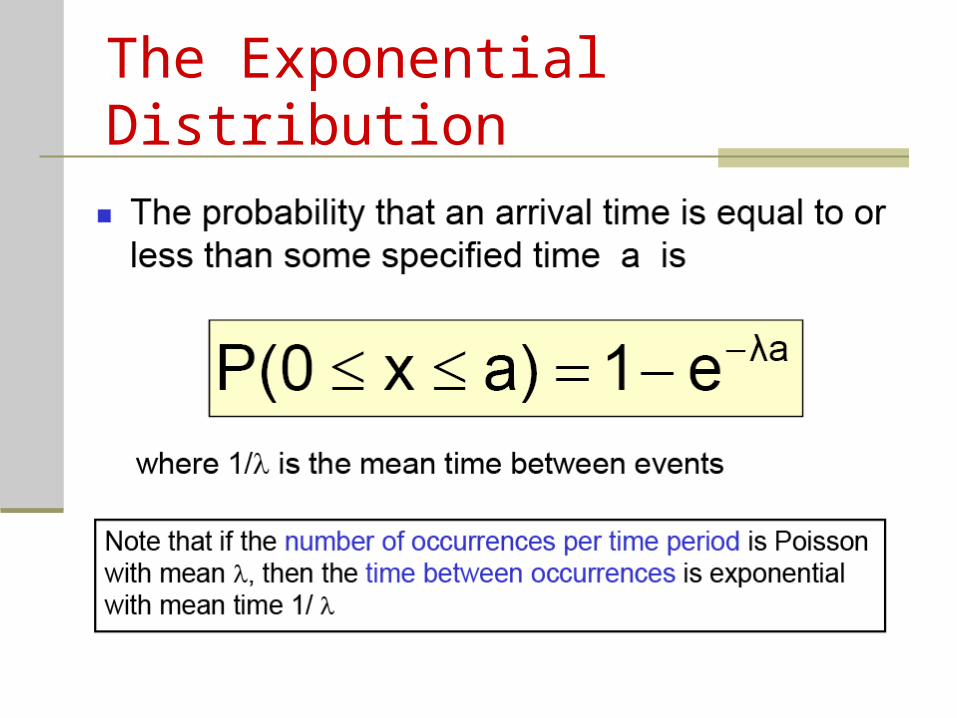
The Exponential Distribution
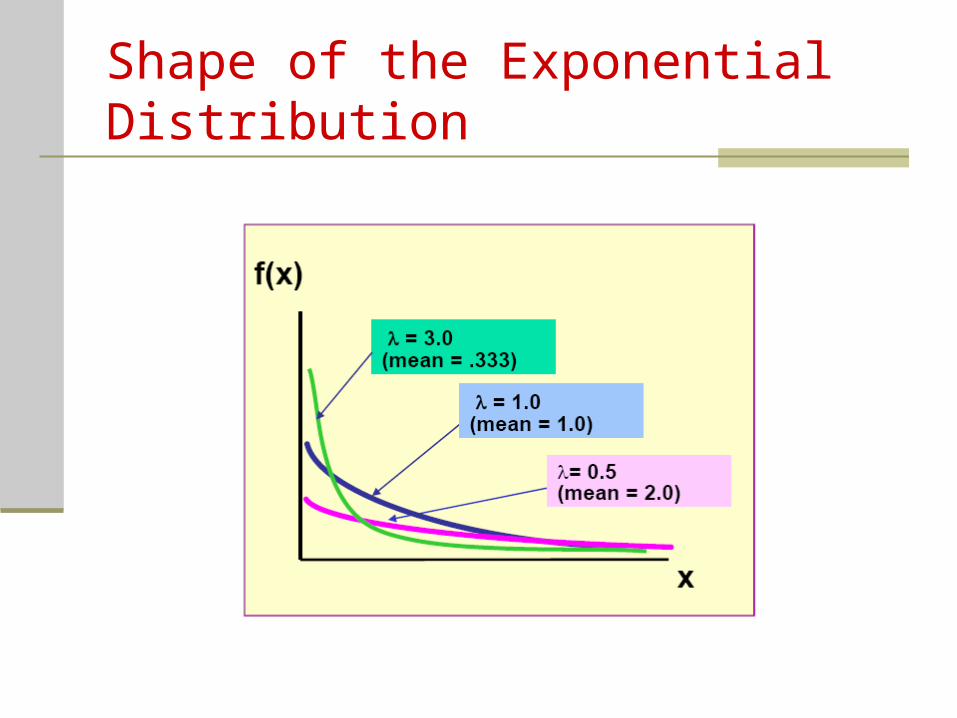
Shape of the Exponential Distribution
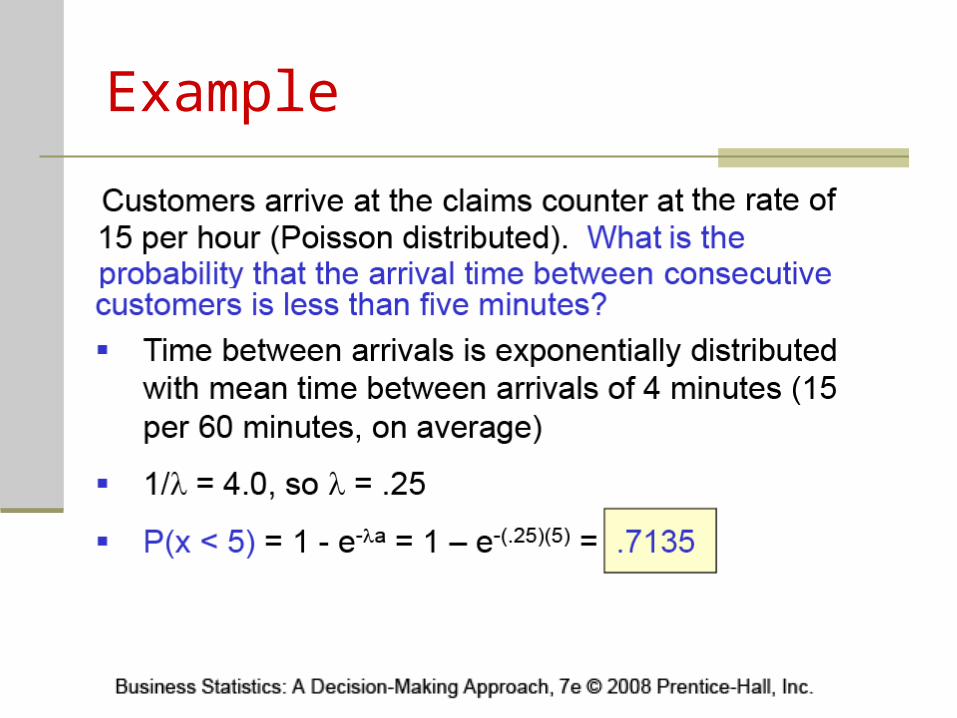
Example