cep discussion paper no 1008 october 2010 industrial ... · marco manacorda is a research associate...
TRANSCRIPT

ISSN 2042-2695
CEP Discussion Paper No 1008
October 2010
Industrial Structure and Child Labor: Evidence from the Brazilian Population Census
Marco Manacorda and Furio Camillo Rosati

Abstract This paper uses micro data from the 1980, 1991 and 2000 population censuses to investigate the role of changes in the industry mix in accounting for the differential trends in the incidence of child work (ages 10-15) across Brazilian states. We find that exogenous compositional changes account for around 20% of the observed fall in child employment in rural areas. Keywords: Child labour, shift-share analysis, Brazil JEL Classifications: J21, J24, O15, O18 This paper was produced as part of the Centre’s Labour Markets Programme. The Centre for Economic Performance is financed by the Economic and Social Research Council. Acknowledgements This research was partly funded by UCW (Understanding Children's Work), a joint ILO, World Bank and UNICEF project. The views expressed here are those of the authors' and should not be attributed to the ILO, the World Bank, UNICEF or any of these agencies’ member countries. We are grateful to Cristina Valdivia for excellent research assistance and to Eric Edmonds, Diane Krueger, John Van Reenen, two anonymous referees and seminar participants to the third IZA-World Bank Conference on Employment and Development for several comments and suggestions. All errors remain our own. Marco Manacorda is a Research Associate of the Centre for Economic Performance, London School of Economics and Professor of Economics at University of London - Queen Mary. He is currently a Visiting Associate Professor & Scholar at Princeton University. Furio Camillo Rosati is Professor of Public Finance at the University of Tor Vergata, Rome in the Faculty of Economics. In addition, he is Project Manager for “Understanding Children's Work” (UCW) an inter-agency research initiative on child labour involving the International Labor Organization, UNICEF and the World Bank. Published by Centre for Economic Performance London School of Economics and Political Science Houghton Street London WC2A 2AE All rights reserved. No part of this publication may be reproduced, stored in a retrieval system or transmitted in any form or by any means without the prior permission in writing of the publisher nor be issued to the public or circulated in any form other than that in which it is published. Requests for permission to reproduce any article or part of the Working Paper should be sent to the editor at the above address. © M. Manacorda and F. C. Rosati, submitted 2010

1
INTRODUCTION
A large amount of literature has been produced on the phenomenon of child labor. We have solid
evidence that improvements in living standards are responsible for the secular fall in children’s
employment typically associated with economic development (for all, see Edmonds 2008, and
references therein). Economic progress, with the associated secular increase in the demand for
skills, is also likely to reduce the incentives to engage in work at an early age, as the opportunity
cost of dropping out of school increases. The same variables are also potentially able to explain
cross-sectional differences in the incidence of child labor across countries at different stages of
development.
Much of the emphasis in the literature is on the labor supply determinants of child labor.
The increasing availability of micro data from household surveys for many developing countries
has allowed researchers to investigate decisions regarding children’s work in the context of their
household labor supply, link work and schooling decisions, investigate the role of credit
constraints and poverty (for all see Edmonds 2005, 2008; Baland and Robinson 2000, and Cigno
and Rosati 2005 for a discussion of the theory underpinning child labor decisions).
Less attention has been paid to the demand side. Some studies analyze temporary changes
in aggregate local labor demand or local economic conditions. There is evidence for both Brazil
(Duryea and Arends-Kuenning 2003; Neri and Thomas 2000; Parikh and Sadoulet 2005;
Manacorda and Rosati 2007) and other countries (see for example Guarcello et al. 2005 for
Ethiopia) that on average child labor tends to increase when local labor demand is stronger. In a
similar vein, Kruger (2007) shows that increases in the value of coffee production induce a rise
in child labor in coffee producing regions of Brazil, especially among children of less educated

2
parents, implying that a temporary increase in labor demand tends to increase child labor, despite
a potentially counteracting income effect.
Much less is known about how different patterns of industrial specialization affect child
labor. To the extent that children enjoy a comparative advantage in specific industries, different
industry mixes will lead to different incidence of child labor in the population. This is a
potentially relevant - but to our knowledge largely neglected - mechanism behind the secular fall
in child labor. If children are concentrated in low productivity industries with obsolete
production technologies - because of the unskilled nature of their work or because child labor
legislation creates an incentive for them to specialize into informal occupations - changes in the
industry mix driven by technological change or shifts in consumers’ preferences can potentially
be a major force behind the fall in child labor that typically accompanies economic growth.
Obviously, children’s occupational choices might readjust, as their opportunities for
employment change. This is particularly true if child labor is driven by dire poverty, and children
are sent to work (only) to guarantee a subsistence level of consumption to their household (as in
Basu and Van 1998), in which case one would not expect changes in the industry mix to lead to
changes in child labor.
The only paper we are aware of that attempts to identify the role of industrial
specialization on child labor is Edmonds (2003). Using data for Vietnam, this author finds little
evidence of an association between children’s involvement in economic activity and variation in
the (one-digit) industrial mix across communities.
A complementary body of work investigates whether children effectively enjoy an
advantage in specific productions. The evidence again is quite mixed. Koutstaal and Schacter
(1997) and Sloutsky and Fisher (2004) seem to imply that children have an advantage at work

3
that requires patterns memorization, although direct evidence in support of the “nimble fingers”
hypothesis is weak (Levison et al. 1998, Edmonds 2008).
In this paper we examine more closely the question of whether sector specific labor
demand is responsible for the differential variation in the fraction of working children across
Brazilian states.
Since the mid 1990s the incidence of child labor in Brazil has been declining rapidly (for
all, World Bank 2001a). Despite this clear evidence, there is still no consensus on the
determinants of this decline. Improvements in living standards, increasing urbanization, rising
public pressure, educational policies and the adoption of local and federal policies aimed
specifically at promoting school attendance and curbing child labor have all likely played a role.
A certain number of papers focus specifically on school promotion and child labor
eradication policies. Following the success of conditional cash transfer programs (Bolsa Escola)
in two urban municipalities (the Distrito Federal and Campinas), since 1995 other municipalities
have adopted similar programs: by 1999, there were 60 (rather heterogeneous) programs in
operation in various urban municipalities (out of a total of 5,564 municipalities in the whole of
Brazil). Simultaneously a Federal program for the eradication of the worst forms of child labor in
rural areas (PETI) was launched. This program targeted children in the worst forms of child labor
by providing a combination of conditional cash transfers and after-school activities (jornada
ampliada). By 1999 the program had managed to reach 166 municipalities (World Bank 2001b).
There is some disagreement as to whether these earlier programs were effective in
reducing child labor and there is no study that we are aware of attempting to quantify their
contribution to the observed fall in child labor. Pianto and Soares (2004) using household survey
data and a diff-in-diff estimator across municipalities find that PETI was successful in reducing

4
child labor in Brazil. A similar conclusion is reached by Yap et al. (2009) and World Bank
(2001b). Cardoso and Portela (2004), though, using data from the 2000 census and propensity
score matching find little evidence of an effect of these income transfer programs on child labor,
although their data do not allow to separately indentify the effects of Bolsa Escola and PETI.
Differently from existing work on Brazil that focuses on short term or cyclical changes in
child labor (Duryea and Arends-Kuenning 2003; Duryea et al 2007; Krueger 2007, Manacorda
and Rosati 2007), our paper investigates long term trends in child labor using data from the 1980,
1991 and 2000 population censuses. There are two major advantages associated to using micro
data from the Census compared to the more widely used data from the Brazilian Pesquisa
Nacional por Amostra de Domicílios (PNAD). First, starting in 1980, the census provides a
detailed 3-digit level breakdown for the sectors of economic activity. This allows us to
investigate in great detail the contribution of changes in the industrial structure to changes in the
incidence of child labor. Second, the very large sample sizes (between 0.8 and 1.3 million
children per year) allow us to obtain very precise estimates of child employment by industry and
state that could not obtained using typical household survey data.
The structure of the paper is as follows. In section 1 we show that Brazilian children
appear to enjoy a comparative advantage in specific productions, implying that differences in the
industrial mix have the potential to explain part of the differential variation in the incidence of
child labor across States. Section 2 lays out the methodology that is then used in section 3 to
ascertain the role of compositional changes in explaining the incidence of child labor based on
Census data. Section 4 finally concludes.

5
1. DATA AND DESCRIPTIVE ANALYSIS
For the purpose of this analysis we use micro data from the IPUMS version of the Brazilian
Population census (Minnesota Population Center 2007) for the years 1980, 1991 and 2000.1 The
data provide information on labor market participation for all individuals aged 10 or above.
Sample sizes are very large and increase from around 5.8 million observations in 1980 to more
than 10 million observations in 2000, with children - defined as those aged 10 to 15 - accounting
for around 12% of the sample.2 Work activity refers to the week before the census week and
includes both paid and unpaid economic work but excludes non-economic activities such as
household chores. In the following we refer to children’s engagement in economic activities
indifferently as “child labor”, “work” or “labor force participation”. This includes activities
inside or outside the child’s home.
For those in work, the census ascertains the sector of activity at the three digit level.
Because the classification of activities changes over time, we have proceeded to standardize it,
resulting into 105 three-digit industrial categories that are consistently defined throughout the
period of observation. Details are contained in the Appendix to the paper.
An analysis of census data shows that, between 1980 and 2000, the incidence of child
labor nationwide halves, falling from 23% to 11% for boys and from 10% to 6% for girls. This
fall is particularly pronounced for rural boys, with larger falls in high-child labor states, implying
regional convergence. One cannot observe instead any appreciable change over time in rural
girls’ propensity to work. This is likely to be the reflection of rural girls’ lower propensity to
1 IPUMS Census data for Brazil are available since 1970. The problem with the 1970 data, though, is that the classification of industries is too coarse in that year. Around 40% of children would be in fact classified in the “undefined crops” category. To avoid this problem, we restrict our analysis to the period 1980-2000. 2 We use the upper limit of 15 years of age (as opposed to 14 years, as it is standard in the literature) since, according to Brazilian national legislation, the minimum age for general employment is 16 years. This minimum age was raised from 14 to 16 years in 1998. The Consolidated Labour Act establishes however that younger children can work in family enterprises under the supervision of parents or guardians (except for working at night, in hazardous work and overtime), without specifying a minimum age.

6
work compared to boys. In urban areas, where child labor is less widespread than in rural areas,
we also observe a rapid convergence in child labor across states for both boys and girls.3
1.a Child intensive industries
Table 1 lists the top-ten child labor intensive industries, as measured by the ratio of child (ages
10-15) to adult (ages 16-60) workers. The figures are nationwide averages across the three
periods and are computed separately for males and females in rural and urban areas. Perhaps
unsurprisingly, the most child intensive productions in rural areas are related to agriculture.
Cultivation of cotton, followed by tobacco, corn, coffee, manioc root, sugar cane, and rice plus a
number of undefined agricultural activities employ disproportionately more children than other
sectors of the economy. While the average ratio of male children to male adult workers in rural
areas is on the order of 0.11, in the cotton industry this number is 0.16, i.e. 50% higher.
Broadly speaking, the industries in Table 1 are all labor intensive cultivations, where
harvesting is done by hand, which explains why children might be disproportionately
represented. An analysis of the data (results not reported) shows a positive correlation between
child labor intensity and the fraction of adult workers in each industry who are unskilled,4
suggesting, perhaps unsurprisingly, that children display a comparative advantage in productions
with low skills requirements.
The right-hand side panel of Table 1 reports results for girls. If anything, employment of
rural girls relative to adult females is higher than what found for boys relative to their adult
counterparts (0.14 versus 0.11). This is due to adult women being on average less likely to
3 Because Brazil becomes increasingly urbanized over the period of observation (the share of children in urban areas grows from approximately 68% to 80% between 1980 and 2000), this also contributes to a fall in the incidence of child labor. 4 These are defined as adults with at most completed 4 years of education, accounting for 33% and 10% of total adult employment respectively in rural and urban areas.

7
participate in the labor market relative to adult men. However, the majority of boys’ intensive
productions are also intensive in girls’ employment, implying that rural boys and girls are highly
substitutable in production. One exception is represented by domestic services that constitute a
major sector of employment for girls but not for boys. Social norms together with girls’
comparative advantage in household chores relative to market activities - and the ensuing
accumulation of skills that are valuable for domestic activities - are likely to explain girls’
preponderant employment in the paid domestic service sector.
When we turn to urban children in the bottom panel of Table 1, we find that, even in
urban areas, the sectors where these children are employed in high proportions relative to adults
are linked to agricultural (cotton, tobacco, sugar cane), horticultural, and floricultural production.
An analysis of the data reveals that - even if most (80%) child workers in urban areas work for
pay - more than 50% of those in agriculture are unpaid, suggesting potentially that these children
work on the household’s plot of land. Outside of agriculture, the sectors that are particularly
child labor intensive in urban Brazil are domestic services, paper trade and footwear. These are
highly informal sectors, where child employment is unlikely to be sanctioned. Production in
footwear in particular, one of Brazil’s major export industries, is often subcontracted and takes
places in sweatshops and hazardous conditions (USDOL 1998).
1.b Changes in the industrial mix
We conclude this section by investigating the (nationwide) correlation between changes in child
labor intensity and changes in the industry mix. Figure 1 depicts the average change in the
fraction of employed adults in each industry between 1980 and 2000 over the 20-year average
child labor intensity, defined as the ratio of children to adults in each of the 105 industries. We

8
present separate graphs for boys and girls in rural and urban areas. Note that the scales of the
graphs differ between urban and rural areas. The solid line is the best fit regression line: for rural
boys this is clearly negatively sloped (with a negative and statistically significant coefficient of -
0.089), implying that over the twenty years of observation the most child labor intensive
industries tend to decline.
For legibility, in the picture, we attach labels to those industries whose employment share
changes in absolute value by at least 1%. The share of rural men employed in cotton cultivation,
for example, declines by around 5 percentage points between 1980 and 2000. This is one of the
industries with higher child labor intensity: for every 100 adult men employed in this sector in
rural areas, there are 16 male child laborers. The same is true for corn. Expanding sectors, such
as construction and food production - where either physical strength is required or capital is
intensively used - are instead typically adult intensive. A similar negative relationship, although
admittedly less pronounced, can be observed for rural girls: again, for example, we see a large
fall in adult female employment in the cultivation of cotton, one of the most child intensive
industries.
We see no clear correlation between child labor intensity and changes in the industry mix
in urban areas. The reason for this is that, differently from rural areas, children in urban areas are
employed in relatively marginal industries, i.e. industries that account for a small and essentially
fixed share of adult employment. For example, while the top 10 most intensive child industries in
rural areas account for more than 50% of adult employment, the corresponding figure in urban
areas is around 14%. That children happen to more segregated than adults in urban areas
compared to rural areas should not be surprising given the higher degree of labor specialization
in urban areas.

9
2. DECOMPOSING CHANGES IN CHILD LABOR: METHODOLOGY
The evidence in Figure 1 is suggestive of some role for changes in the industry mix in explaining
the fall in child labor in Brazil between 1980 and 2000. In this section we ascertain precisely this
contribution using a simple modified version of the traditional shift-share decomposition that is
borrowed from Lewis (2004).5
Let pSt denote the fraction of children working in state S at time t. This by definition
equals the ratio of child employment in state S (NCSt) to child population (PCSt). If the economy is
composed of K different industries, total child employment will be the sum of child employment
in these different industries denoted by NkCSt (k=1,…, K). In formulas:
pSt = ΣkNkCSt/PCSt = ΣkpkSt = Σk(NkCSt/NkUSt) (NkUSt/NkASt)(NkASt/NASt)(NASt/PASt)(PASt/PCSt) (1)
where the subscript A refers to adults (irrespective of their skills) and the subscript U refers to
unskilled adult workers. (1) says that the incidence of child labor is the sum across industries of
the product of different terms. The first term (NkC/NkU) is the ratio of children to unskilled
workers by industry. The second term (NkU/NkA) is the share of adult workers in industry k who
are unskilled. The product between these two terms is the measure of child labor intensity in
industry k (NkC/NkA) that is presented in Table 1. The third term (NkA/NA) is the industrial
distribution of adult employment. The product of the three first components - once summed over
the different industries - is the ratio of child to adult employment (NC/NA). To obtain the fraction
5 Shift share (or variance) decomposition is often used to understand the determinants of changes in the employment (or wage) of specific groups (see for example Bound and Freeman 1992 for an analysis of the employment of blacks in the USA; Card and Lewis 2007 for an analysis of the fortunes of immigrants to the US; and Katz and Autor 1999, for an analysis of changes in the returns to skills in the USA).
10
of children working we multiply this term by the adult employment to population ratio (NA/PA)
and the ratio of adult to child population (PA/PC).
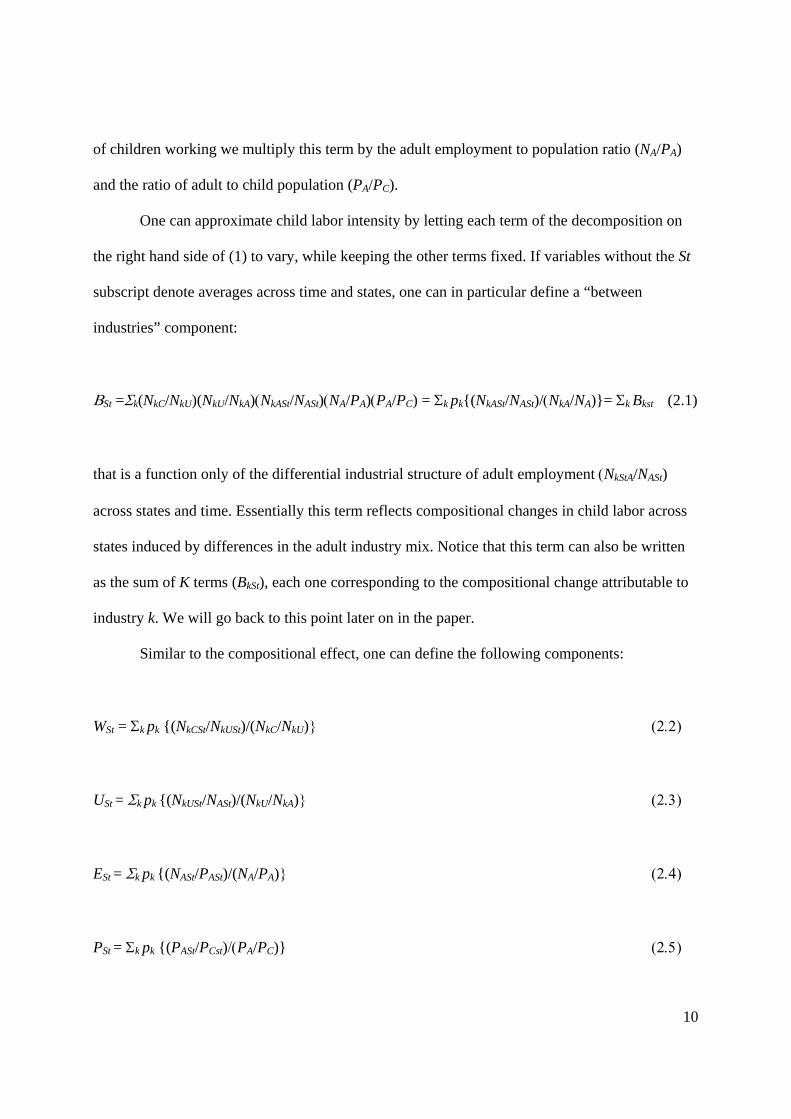
One can approximate child labor intensity by letting each term of the decomposition on
the right hand side of (1) to vary, while keeping the other terms fixed. If variables without the St
subscript denote averages across time and states, one can in particular define a “between
industries” component:
ΒSt =Σk(NkC/NkU)(NkU/NkA)(NkASt/NASt)(NA/PA)(PA/PC) = Σk pk{(NkASt/NASt)/(NkA/NA)}= Σk Bkst (2.1)
that is a function only of the differential industrial structure of adult employment (NkStA/NASt)
across states and time. Essentially this term reflects compositional changes in child labor across
states induced by differences in the adult industry mix. Notice that this term can also be written
as the sum of K terms (BkSt), each one corresponding to the compositional change attributable to
industry k. We will go back to this point later on in the paper.
Similar to the compositional effect, one can define the following components:
WSt = Σk pk {(NkCSt/NkUSt)/(NkC/NkU)} (2.2)
USt = Σk pk {(NkUSt/NASt)/(NkU/NkA)} (2.3)
ESt = Σk pk {(NASt/PASt)/(NA/PA)} (2.4)
PSt = Σk pk {(PASt/PCst)/(PA/PC)} (2.5)
11
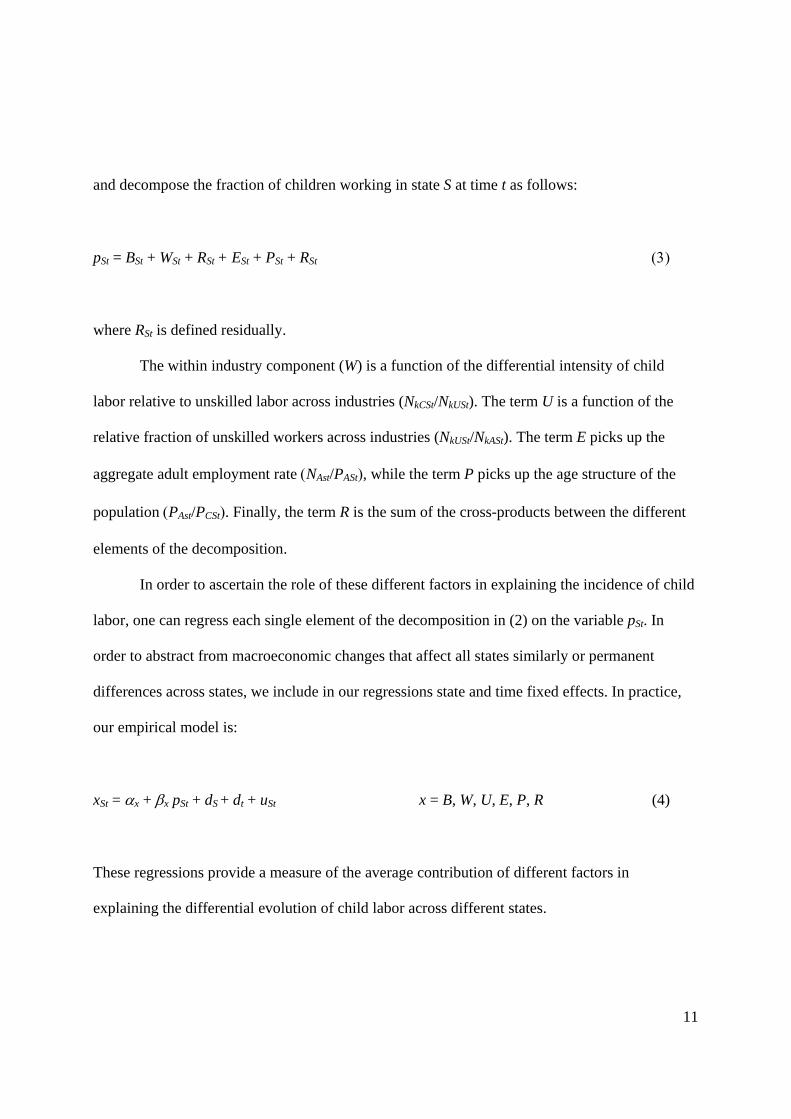
and decompose the fraction of children working in state S at time t as follows:
pSt = BSt + WSt + RSt + ESt + PSt + RSt (3)
where RSt is defined residually.
The within industry component (W) is a function of the differential intensity of child
labor relative to unskilled labor across industries (NkCSt/NkUSt). The term U is a function of the
relative fraction of unskilled workers across industries (NkUSt/NkASt). The term E picks up the
aggregate adult employment rate (NAst/PASt), while the term P picks up the age structure of the
population (PAst/PCSt). Finally, the term R is the sum of the cross-products between the different
elements of the decomposition.
In order to ascertain the role of these different factors in explaining the incidence of child
labor, one can regress each single element of the decomposition in (2) on the variable pSt. In
order to abstract from macroeconomic changes that affect all states similarly or permanent
differences across states, we include in our regressions state and time fixed effects. In practice,
our empirical model is:
xSt = αx + βx pSt + dS + dt + uSt x = B, W, U, E, P, R (4)
These regressions provide a measure of the average contribution of different factors in
explaining the differential evolution of child labor across different states.

12
Although, by construction, the coefficients from these regressions add up to one, there is
no a priori restriction on their sign or magnitude. For example, the coefficient βB - that is the
coefficient of primary interest in this paper - will be positive (negative) if industries that are
typically child labor intensive (high NkC/NkA) happen to absorb increasing less (more) workers
(NkASt/NASt) in states that experience larger falls in the incidence of child labor.
Because, as said, the term ΒSt is the sum of K different terms, one can run a separate
regression for each industry and ascertain the contribution of this industry to changes in child
labor.
(5) BkSt = αk + βBk pSt + dS + dt + eSt k = 1,…K
The coefficient βBk will be positive (negative) if industry k declines (grows) more in states
that experience the largest fall in child labor. The magnitude of this coefficient will be directly
proportional to child intensity in each industry (NkC/NkA), so that more child intensive industries
will also be expected to display larger coefficients.
As for the other terms, higher labor demand will imply - everything else being equal -
higher child labor. For this reason, one would expect βE to be positive. However, to the extent
that higher adult employment is associated with higher living standards and hence lower child
labor, one will expect the reverse to be true.
Similarly, while a higher proportion of children in the population, i.e. higher aggregate
child labor supply, will - at given demand - decrease the fraction of children in work, the
opposite might be true if - for example - a higher fraction of children in the population is

13
associated to larger household size, and the latter leads to higher child labor supply; hence βP
might be either positive or negative.
Even at fixed industrial composition, the evolution in the fraction of children in work will
depend on the evolution of child labor intensity across industries (i.e. within states). If the ratio
of children to unskilled adult laborers falls across all industries in a state - say because of an
overall fall in child labor supply due to school promotion policies - the fraction of working
children will also fall, and hence the coefficient βW will be positive.
The coefficient βU will typically be positive if the relative employment of unskilled
workers falls across all industries in states that experience a larger fall in child labor. This will be
the case, for example, if changes in child labor are driven by skill biased technological change.
By the opposite token, an exogenous increase in the supply of unskilled workers might displace
child labor, leading to a negative correlation between the fraction of working children and the
fraction of unskilled workers in the economy.
Finally a positive βR coefficient implies that the different elements of the decomposition
covary positively and reinforce each other. This might happen for example if child labor
intensity falls more in industries that decline more rapidly in states that experience a larger fall in
child labor. To the extent that the cross correlation between the different elements on the right
hand side of (1) is small, changes in child labor can be approximated by the sum of the between,
within, population, relative and total employment components, so that the coefficient on the
residual term (βR) will be close to zero.
Before presenting the empirical results, it is useful to emphasize that some caution must
be exerted in interpreting the OLS estimates of equation (4) as causal. Not different from any
other variance decomposition, these estimates only provide a descriptive measure of the average

14
contribution of different components to changes in child labor across states and time and they do
not necessarily carry a causal interpretation. We return to this issue in the last section of the
paper.
3. EMPIRICAL RESULTS
3.1. Main results
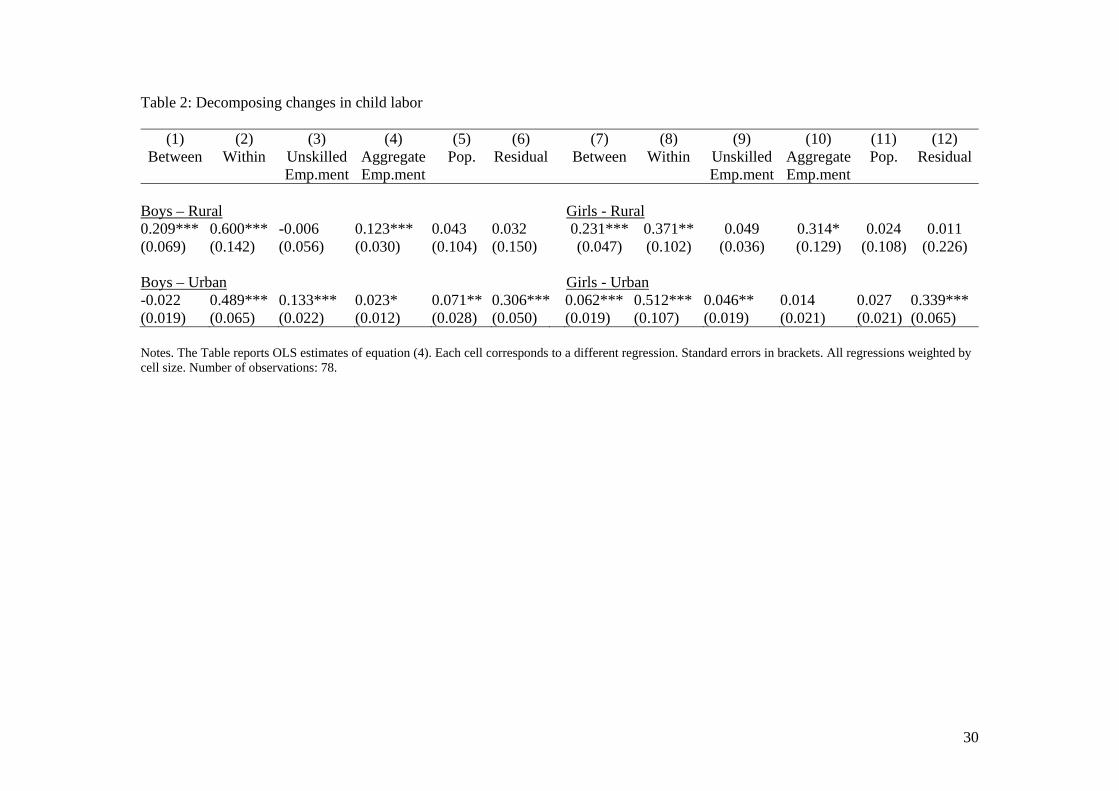
We start by presenting OLS estimates of equation (4) in Table 2, where each column refers to a
different dependent variable. Regressions are performed on grouped data (by state and year).
Overall we have 78 observations (26 states x 3 years).6 For the estimation we use GLS with
weights given by the number of observations by cell.
We start by assessing the role played by between changes, the component of primary
interest in this paper. This term accounts for 21% of the variations in rural boys’ employment
(row 1, column 1). This says that around one fifth of the differential trends in the fraction of
working boys across states is accommodated by differential shifts in their industry mix. In other
terms, child intensive industries happen to decline more in states that experienced larger declines
in the intensity of child labor.
In order to shed some light on this correlation, we investigate the contribution of changes
in the relative employment weight of the top ten child-intensive industries in Table 3. In practice
for the first, second, third, etc. top child-intensive industry we run a regression like (5). For rural
boys, the associated coefficients are reported in column 1. We also report the cumulative
contribution of the top one, two, three etc. child intensive industries in column 2. For example,
row 1, column 1 of Table 3 illustrates that the differential trends in the share of adult
6 The state of Tocantins was created in 1985 out of a spilt of the state of Goias. For consistency we consider Tocantins and Goias as single state throughout the period.
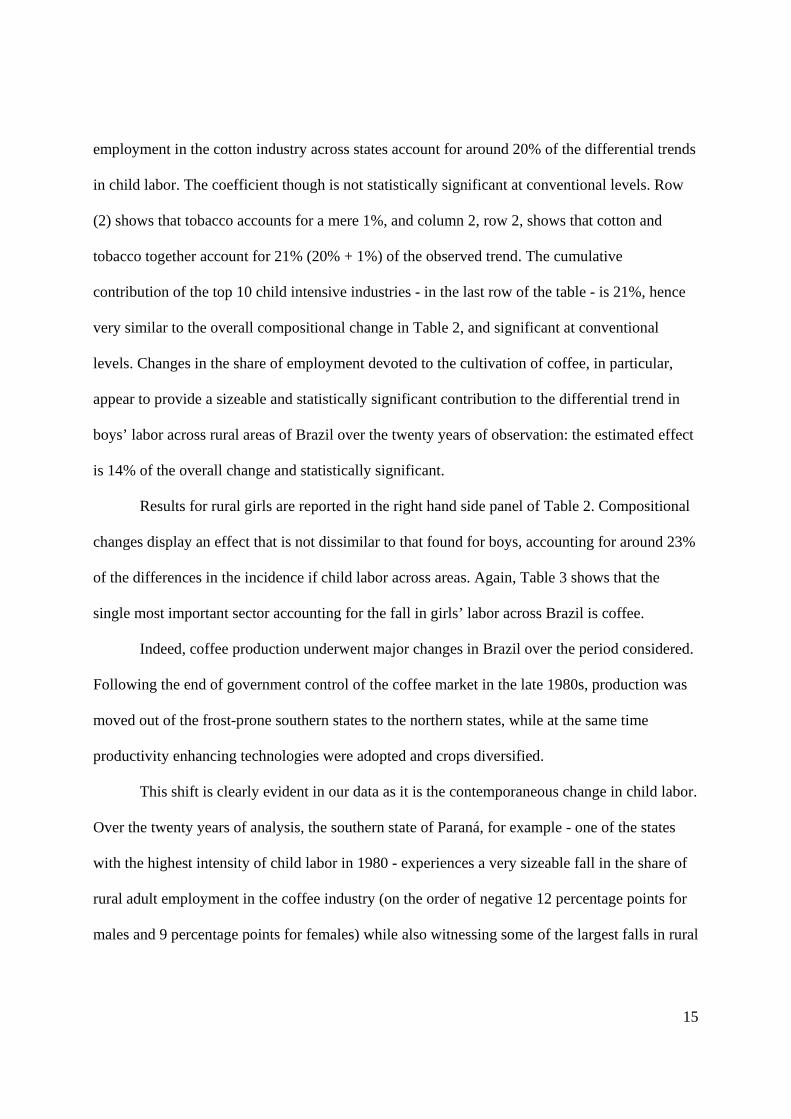
15
employment in the cotton industry across states account for around 20% of the differential trends
in child labor. The coefficient though is not statistically significant at conventional levels. Row
(2) shows that tobacco accounts for a mere 1%, and column 2, row 2, shows that cotton and
tobacco together account for 21% (20% + 1%) of the observed trend. The cumulative
contribution of the top 10 child intensive industries - in the last row of the table - is 21%, hence
very similar to the overall compositional change in Table 2, and significant at conventional
levels. Changes in the share of employment devoted to the cultivation of coffee, in particular,
appear to provide a sizeable and statistically significant contribution to the differential trend in
boys’ labor across rural areas of Brazil over the twenty years of observation: the estimated effect
is 14% of the overall change and statistically significant.
Results for rural girls are reported in the right hand side panel of Table 2. Compositional
changes display an effect that is not dissimilar to that found for boys, accounting for around 23%
of the differences in the incidence if child labor across areas. Again, Table 3 shows that the
single most important sector accounting for the fall in girls’ labor across Brazil is coffee.
Indeed, coffee production underwent major changes in Brazil over the period considered.
Following the end of government control of the coffee market in the late 1980s, production was
moved out of the frost-prone southern states to the northern states, while at the same time
productivity enhancing technologies were adopted and crops diversified.
This shift is clearly evident in our data as it is the contemporaneous change in child labor.
Over the twenty years of analysis, the southern state of Paraná, for example - one of the states
with the highest intensity of child labor in 1980 - experiences a very sizeable fall in the share of
rural adult employment in the coffee industry (on the order of negative 12 percentage points for
males and 9 percentage points for females) while also witnessing some of the largest falls in rural

16
child labor (on the order of negative 19 percentage points for boys and negative 5 percentage
points for girls). By the opposite token, Espirito Santo in the north experiences a fast rise in the
share of adult employment in coffee (of around 7 percentage points for males and 20 percentage
points for girls) and no change or even a rise in rural child labor (of negative 1 percentage points
for boys and positive 7 percentage points for girls).
Table 3 also shows that domestic services appear to have the opposite effect on child
labor: in states where adult employment in domestic services grows relative to the national trend,
girls’ labor declines by more. For example, San Paulo, one of the states with the largest fall in
rural child labor (of negative 25 percentage points for boys and negative 13 percentage points for
girls), sees the share of adult employment in domestic services grow well above the national
average (by around positive 4 percentage points for males and 10 percentage points for women,
in the face of substantial stability in the share of adult domestic workers nationwide). One
possible explanation for this correlation is that in places where the overall demand for or supply
of child labor falls more, because of technical progress or increases in living standards, the
demand for domestic services increases by more.
Similar to what found for rural boys, the top 10 girls-intensive-industries account in
practice for the entire change in child labor attributable to compositional changes (29% versus
23%).
Consistent with the findings in Figure 1, results in the bottom part of Table 2 show that
urban child labor - whether of boys or girls - is essentially unaffected by between industry
changes, the effect being between 6% for girls and -2% (but statistically insignificant) for boys.
Table 3 also reveals that in urban areas there is no single industry that contributes individually to
variations in the incidence of child labor in any appreciable way.
17
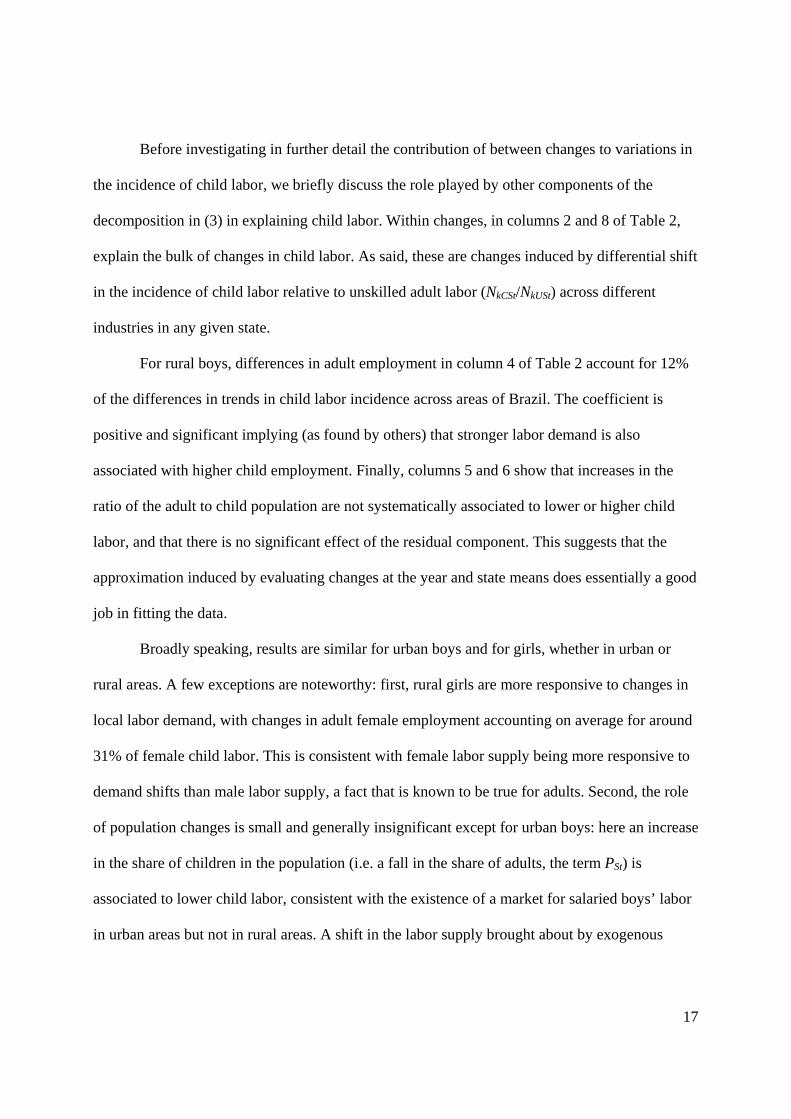
Before investigating in further detail the contribution of between changes to variations in
the incidence of child labor, we briefly discuss the role played by other components of the
decomposition in (3) in explaining child labor. Within changes, in columns 2 and 8 of Table 2,
explain the bulk of changes in child labor. As said, these are changes induced by differential shift
in the incidence of child labor relative to unskilled adult labor (NkCSt/NkUSt) across different
industries in any given state.
For rural boys, differences in adult employment in column 4 of Table 2 account for 12%
of the differences in trends in child labor incidence across areas of Brazil. The coefficient is
positive and significant implying (as found by others) that stronger labor demand is also
associated with higher child employment. Finally, columns 5 and 6 show that increases in the
ratio of the adult to child population are not systematically associated to lower or higher child
labor, and that there is no significant effect of the residual component. This suggests that the
approximation induced by evaluating changes at the year and state means does essentially a good
job in fitting the data.
Broadly speaking, results are similar for urban boys and for girls, whether in urban or
rural areas. A few exceptions are noteworthy: first, rural girls are more responsive to changes in
local labor demand, with changes in adult female employment accounting on average for around
31% of female child labor. This is consistent with female labor supply being more responsive to
demand shifts than male labor supply, a fact that is known to be true for adults. Second, the role
of population changes is small and generally insignificant except for urban boys: here an increase
in the share of children in the population (i.e. a fall in the share of adults, the term PSt) is
associated to lower child labor, consistent with the existence of a market for salaried boys’ labor
in urban areas but not in rural areas. A shift in the labor supply brought about by exogenous

18
changes in the population depresses wages and reduces the incentives for children to work.
Finally, demand for skills, as proxied by the employment of low education adult workers only
affects children’s employment in urban areas but not in rural areas.
We have performed a few robustness checks on our data (not reported). These show that
results in Table 2 are not sensitive to weighting or a more detailed industrial classification.
3.2 Endogeneity concerns
A concern with the estimates in Tables 2 and 3 is reverse causality, i.e. that changes in industry
composition are a result of - rather than a driving force behind - the fall in child labor. Simple
economic reasoning suggests that child intensive industries might flourish where there is excess
supply of child labor. Precisely in this vein, Goldin and Sokoloff (1982) attribute the
industrialization of the American North-East, among other things, to the abundance of child
labor.
A related concern is given by omitted variables: if a state becomes more educated, its
industry mix might change as will the propensity of children to work. In this case, one would
erroneously conclude that changes in child labor are caused by changes in the industry mix,
although in fact it is changes in the demand for education to drive this correlation.
As a way to check for the potential endogeneity of compositional changes, in Table 4 we
regress the between component on the other - arguably exogenous - determinants of child labor.
First, we investigate whether changes in the industry mix are correlated with changes in the ratio
of adults to children in the population, the term PSt. If a higher share of children creates an
incentive for child intensive industries to flourish, one would expect the OLS coefficient from
this regression to be negative. In column 1 of Table 4 we report OLS coefficients from a

19
regression similar to equation (4) where the dependent variable is BSt and the independent
variable is PSt. Again regressions include state and year fixed effects and are weighted by cell
size. The estimated coefficient can never told apart from zero, lending little support to the notion
that the industry mix is endogenous to the population structure.
In column 2 we regress the between term on the term USt, that measures changes in the
employment of unskilled workers. This term arguably proxies for changes in the demand of
unskilled labor in a given state, so one would expect the regression coefficient to be positive if
omitted demand shifts explain different trends in the industry mix across states. Column 2 again
finds little support in favor of this hypothesis. In three cases out of four the regression
coefficients are statistically insignificant. It is only for girls in rural areas that the coefficient is
significant. Although we have no obvious explanation as to why results for rural girls appear
different, we find little evidence that changes in the industry mix do not vary endogenously in
response to other underlying forces behind the changes in child labor.
As a final check, we have re-estimated the model in first-differences (as opposed to levels
with the inclusion of state fixed effects) and we have allowed the coefficient of interest to vary
across decades (1980-1991 and 1991-2000).7 In this way we test whether the effect of changes in
the industry mix manifest predominantly in one decade. This is particularly relevant in the
context of Brazil since - as said - the second half of the 1990s saw a vigorous policy effort in the
fight against child labor. The concern here is that changes in both child labor and the between
term might be driven by policy changes that happened to affect some states but not others.8
Indeed, the regressions show no evidence of the correlation being stronger in any single decade:
7 First differences estimates are almost undistinguishable from estimates in levels with the inclusion of state fixed effects. 8 A potentially better strategy would be to control explicitly for the spread of Bolsa Escola and PETI across different states. However, as said, most of these programs were implemented at the municipality level and we have no information on the spread of these programs across areas and time.

20
the interaction term between changes in child labor and a dummy for the decade of the 1980s (in
column 4) is insignificant in all cases. This suggests that the policy efforts of the 1990s - and in
particular the rapid expansion of PETI and Bolsa Escola schemes - are unlikely to be driving our
results. This is perhaps not surprising since by 1999 municipal Bolsa Escola and PETI programs
extended to a small minority of Brazilian municipalities. It is only in the early 2000s, so after our
period of analysis, that these programs were scalded up to the federal level and when one might
expect a sizeable effect.
4. CONCLUSIONS
Brazil has experienced one of the largest declines in child labor and increases in schooling
observed in any country over a 25 year period. Within industry differences in employment are
the single most important factor in explaining this fall. These differences subsume changes in the
supply of child labor induced by improvements in living standards and policy interventions. The
sustained effort of the Brazilian government to increase school attendance and curb child labor
through school promotion programs might have played some role in explaining the observed fall
in child labor.
Despite this evidence, we find that changes in the industry mix are able to account for a
sizeable and significant share of the differential trends in child employment across Brazilian
states. As child intensive industries decline, child labor falls, suggesting that households do not
fully readjust their children’s labor supply through endogenous occupational choices.
We show that around 20% of the differential evolution of rural child labor across states is
explained by the spread of different industries. In particular, differential trends across states in
coffee production - a sector that sees Brazil as the top world producer and that is characterized

21
by high child labor intensity - can explain around 16-17% of the differential trends in child labor
across Brazilian states. Indeed, the shift in coffee production from the frost-prone southern states
to the northern states that took place in the 1990s was accompanied by a modest fall in child
labor in the rural north and a much rapid fall in the south.
Results for urban areas show a smaller role of compositional changes in explaining
differences in the incidence of child labor across states. This is consistent with our finding that
urban children happen to be much more segregated in specific industries than rural children, and
that child intensive industries amount for a small and essentially fixed share of adult employment
in urban areas.
One potential concern with our analysis is that changes in the industry mix are the
response to - rather than the cause of - changes in child labor induced by increased availability of
child labor or skill-biased changes in labor demand. In this spirit, Goldin and Sokoloff (1982) for
example trace the early industrialization of the American North-East, among other things, to the
availability of cheap child (and female) labor that was complementary to capital intensive
technologies employed in manufacturing. Our empirical analysis however shows evidence that
changes in child labor induced by changes in the industry mix are largely exogenous to changes
in the supply of child labor or skilled-biased technological change. Similarly, we find no
evidence that the estimated coefficient is explained primarily by changes in child labor over the
1990s, when a number of policy interventions were implemented with the precise scope of
combating child labor. This appears to rule out that exogenous economic and policy changes are
behind our estimated effect, although, admittedly, we cannot rule out that other unobserved
factors (e.g. changes in living standards) might explain the correlation between changes in the
adult industry mix and the incidence of child labor.

22
Changes in the pattern of coffee production across Brazilian states provide additional
corroborating evidence in favor of our conclusion, as, by all accounts, these were driven by the
liberalization of the coffee market and the contemporaneous replacement of traditional shade
grown farming with sun cultivation, rather than local abundance of child labor or demand for
education.
Our analysis suggests that sectoral interventions aimed at boosting product demand or
expanding production by lowering costs, for example by affecting import or export tariffs or
through targeted aid, might have unwanted effects on child labor. We find evidence that the
incidence of child work increases as child intensive sectors expand. In this vein, sectoral policies
aimed at limiting the spread of child intensive industries or policies that promote the adoption of
technologies that are substitutes for children in child intensive industries could have the potential
to reduce the incidence of child labor, although admittedly potentially making households worse-
off at the same time.

23
References
Baland, Jean-Marie, and James A. Robinson. 2000. “Is Child Labor Inefficient.” Journal of
Political Economy 108 (4): 663-679.
Basu Kaushik, and Pham Hoang Van. 1998. “The Economics of Child Labor.” American
Economic Review, 88, ( (3): 412-427.
Bound, John, and Richard Freeman. 1992. “What Went Wrong? The Erosion of the Relative
Earnings and Employment among Young Black Men in the 1980s.” Quarterly Journal of
Economics, 107: 201-232.
Card, David, and Ethan G. Lewis. 2007. “The Diffusion of Mexican Immigrants during the
1990s: Explanations and Impacts.” In Mexican Immigration, ed. George Borjas, Chicago:
University of Chicago Press.
Cardoso, Eliana, and Andre Portela Souza. 2004. “The Impact of Cash Transfers on Child Labor
and School Attendance in Brazil.” Working Paper 0407, Department of Economics,
Vanderbilt University, 2004.
Cigno, Alessandro, and Furio Camillo Rosati, (2005) The Economics of Child Labour, New
York and Oxford: Oxford University Press, 2005.
Duryea, Suzanne, and Mary P. Arends-Kuenning. 2003. “School Attendance, Child Labor and
Local Labor Market Fluctuations in Urban Brazil.” World Development, 31 (7): 1165-
1178.
Duryea, Suzanne, David Lam, and Deborah Levison. 2007. “Effects of Economic Shocks on
Children's Employment and Schooling in Brazil.” Journal of Development Economics, 84
(1): 188-214.

24
Edmonds, Eric V.. 2003. “Child Labor in South Asia.” OECD Social, Employment and
Migration Working Papers, no. 5.
Edmonds, Eric V.. 2005. “Does child labor decline with improving economic status?.” The
Journal of Human Resources, 40: 77-99.
Edmonds, Eric V. 2008. “Child Labor”, in Handbook of Development Economics, Volume 4, ed.
1, eds. T. Paul Schultz and John A. Strauss, Elsevier.
Goldin, Claudia and Kenneth Sokoloff. 1982. “Women, Children, and Industrialization in the
Early Republic: Evidence from the Manufacturing Censuses.” The Journal of Economic
History, 42 (4): 741-774.
Guarcello, Lyon, and Furio Camillo Rosati. 2005. “The twin challenges of child labour and
youth employment in Ethiopia”, UCW working paper, 2005.
Katz, Lawrence F., and David H. Autor. 1999. “Changes in the Wage Structure and Earnings
Inequality”. In Handbook of Labor Economics, eds. O. Ashenfelter and D. Card, vol. 3A,
North-Holland.
Koutstaal, Wilma, and Daniel Schacter. 1997. “Gist-based false recognition of pictures in older
and younger adults.” Journal of Memory and Language, 37: 555-583.
Kruger, Diane. 2007, “Coffee Production Effects on Child Labour and Schooling in Rural
Brazil.” Journal of Development Economics, 82 (2): 448-463.
Levison, Deborah, Richard Anker, Shahid Ashraf and Sandhya Barge. 1998. “Is child labor
really necessary in India‘s carpet industry.” In Economics of Child Labor in Hazardous
Industries of India, eds. R. Anker, S. Barge, S. Rajagopal, and M.P. Joseph. New Delhi:
Hindustan Publishing.

25
Lewis, Ethan. 2004. “How Do Local Labor Markets in the U.S. Adapt to Immigration?”,
unpublished manuscript, Dartmouth College, 2004.
Manacorda, Marco, and Furio Camillo Rosati. 2007. “Local Labor Demand and Child Labor”,
UCW working paper.
Minnesota Population Center. 2007. Integrated Public Use Microdata Series - International:
Version 3.0. Minneapolis: University of Minnesota.
Neri, Marcelo and Mark R. Thomas. 2000. “Household educational responses to labor-market
shocks in Brazil: 1982-99”, unpublished manuscript, The World Bank.
Parikh, Anokhim, and Elisabeth Sadoulet. 2005. “The Effect of Parents‘ Occupation on Child
Labor and School Attendance in Brazil”, unpublished manuscript, University of
California at Berkeley.
Pianto, Donald M, Sergei S.D. Soares. 2004. “Use of Survey Design for the Evaluation of Social
Programs: the PNAD and PETI.” In Anais do XXXII Encontro Nacional de Economia,
133, Associação Nacional dos Centros de Pósgraduação em Economia.
Sloutsky, Vladimir M. and Anna Fisher. 2004. “When development and learning decrease
memory: Evidence against category-based induction in children.” Psychological Science,
15: 553–558.
USDOL. 1998. By the Sweat & Toil of Children, Efforts to Eliminate Child Labor, Washington
DC. (available at http://www.dol.gov/ilab/media/reports/iclp/main.htm)
World Bank, 2001a. “Eradicating Child Labor in Brazil.” World Bank Report, No.21858-BR
World Bank. 2001b. “Brazil: an Assessment of the Bolsa Escola Programs.” World Bank Report,
No.20208-BR.

26
Yap, Yoon Tine, Guilherme Sedlacek, and Perter F. Orazem. 2009. “Limiting Child Labor
Trough Behavior-based Income Transfer: an Experimental Evaluation of the PETI
program in Rural Brazil.” In Child Labor and Education in Latin America, An Economic
Perspective, eds. Peter F. Orazem, Zafiris Tzannatos and Guilherme Sedlacek, Palgrave
Macmillan.

27
Data Appendix
The industrial classification changes over time in the Brazilian census. In particular, recent
censuses (especially the 2000 census) include more industry items than older ones,
corresponding to a lower level of aggregation. In each year, an “undefined” category for each
one-digit industry collects workers who are not classified elsewhere. This residual group
encompasses different industries at different times. An additional problem is that certain
activities which were relevant in the past, such as for example home-based textile production,
have lost significance with time and are not included in recent surveys. Such activities are
potentially relevant among child laborers. On the other hand, the emergence of “new” activities
associated with technological development implies that several sectors are not present in past
surveys (for example several services in financial intermediation, communications and several
services rendered to companies).
To face these problems and to produce a harmonized industrial classification, the
following approach was adopted:
1. The harmonized classification scheme preserved the items that were present in all survey
years, while those which were not were assigned to broader categories common to all
years were imputed to the existing categories. As a consequence, such categories
aggregated a different number of items by year.
2. In several cases, the nomenclature of items was not uniform over time, although the
underlying industry activity was presumably the same. The assignment of items to
broader categories was carried out referring to the UN ISIC (Revision 3) classification of
economic activities.

28
3. All items which could not be assigned with a reasonable level of confidence to broader
categories were grouped under “Other activities”.
4. New activities were assigned to “Other activities” unless they could be assigned
unequivocally to existing categories.
5. “Obsolete” activities were treated the same way.
The result of the reclassification exercise was a harmonized taxonomy at a higher level of
aggregation relative to all survey years that includes 105 industries.

29
Table 1: Child intensive industries
Boys – Rural Girls- Rural Herbaceous cotton 0.157 Herbaceous cotton 0.235 Tobacco 0.142 Coffee 0.204 Corn 0.135 Tobacco 0.179 Other activities 0.133 Corn 0.167 Manioc root 0.132 Transf. Non-metallic miner. 0.165 Undefined crops 0.127 Lumber 0.162 Coffee 0.120 Domestic services 0.157 Sugar cane 0.119 Undefined crops 0.148 Rice 0.116 Cocoa beans 0.141 Paper commerce 0.110 Horti/floriculture 0.140 Average 0.110 Average 0.137 Boys – Urban Girls - Urban Herbaceous cotton 0.099 Herbaceous cotton 0.134 Horticulture 0.098 Tobacco 0.114 Domestic services 0.094 Domestic services 0.111 Personal services 0.093 Coffee 0.102 Footwear 0.090 Undefined crops 0.089 Tobacco 0.090 Footwear 0.088 Sugar cane 0.089 Soybeans 0.087 Supermarkets 0.086 Horti/floriculture 0.079 Coffee 0.085 Sugar cane 0.074 Paper commerce 0.085 Manioc root 0.068 Average 0.033 Average 0.041
Notes. The table reports the ratio of children to adults employed in the top ten child intensive industries separately by sex and area. For example, row 1, column 1, shows that in rural areas there are 15.7 male children employed in cotton for every 100 adult males employed in that industry. The bottom row reports the ratio of employed children to adults in the economy as a whole.
30
Table 2: Decomposing changes in child labor
(1) (2) (3) (4) (5) (6) (7) (8) (9) (10) (11) (12) Between Within Unskilled
Emp.mentAggregateEmp.ment
Pop. Residual Between Within Unskilled Emp.ment
AggregateEmp.ment
Pop. Residual
Boys – Rural Girls - Rural 0.209*** 0.600*** -0.006 0.123*** 0.043 0.032 0.231*** 0.371** 0.049 0.314* 0.024 0.011 (0.069) (0.142) (0.056) (0.030) (0.104) (0.150) (0.047) (0.102) (0.036) (0.129) (0.108) (0.226) Boys – Urban Girls - Urban -0.022 0.489*** 0.133*** 0.023* 0.071** 0.306*** 0.062*** 0.512*** 0.046** 0.014 0.027 0.339*** (0.019) (0.065) (0.022) (0.012) (0.028) (0.050) (0.019) (0.107) (0.019) (0.021) (0.021) (0.065) Notes. The Table reports OLS estimates of equation (4). Each cell corresponds to a different regression. Standard errors in brackets. All regressions weighted by cell size. Number of observations: 78.

31
Table 3: Contribution to changes in child labor of most child intensive industries
(1) (2) (3) (4)
Marginal Effect Cumulative effect Marginal
effect Cumulative effect
Boys- Rural Girls- Rural Herbaceous cotton 0.201 (0.172) 0.201 (0.172) Herbaceous cotton 0.031 (0.045) 0.031 (0.045) Tobacco 0.014 (0.017) 0.215 (0.174) Coffee 0.157*** (0.028) 0.188*** (0.050) Corn -0.021 (0.075) 0.195 (0.145) Tobacco -0.001 (0.009) 0.187*** (0.050) Other activities 0.011 (0.011) 0.206 (0.147) Corn 0.105*** (0.036) 0.292*** (0.056) Manioc root -0.067* (0.039) 0.139 (0.157) Transf. Non-metallic miner. 0.011*** (0.003) 0.303*** (0.056) Undefined crops -0.069 (0.080) 0.070 (0.127) Lumber -0.001 (0.023) 0.302*** (0.064) Coffee 0.174*** (0.044) 0.244* (0.122) Domestic services -0.058*** (0.012) 0.244*** (0.062) Sugar cane -0.001*** (0.000) 0.244** (0.122) Undefined crops 0.045 (0.059) 0.289*** (0.057) Rice -0.036 (0.072) 0.208* (0.105) Cocoa beans -0.006 (0.009) 0.283*** (0.056) Paper commerce -0.000* (0.000) 0.207* (0.105) Horti/floriculture 0.004 (0.005) 0.287*** (0.055) Boys- Urban Girls- Urban Herbaceous cotton -0.006 (0.023) -0.006 (0.023) Herbaceous cotton -0.004 (0.004) -0.004 (0.004) Horticulture 0.004* (0.002) -0.002 (0.023) Tobacco -0.001 (0.001) -0.005 (0.004) Domestic services 0.004*** (0.001) 0.002 (0.023) Domestic services 0.025 (0.020) 0.021 (0.020) Personal services -0.004** (0.002) -0.001 (0.023) Coffee 0.006 (0.004) 0.027 (0.019) Footwear 0.004 (0.004) 0.002 (0.023) Undefined crops 0.003 (0.005) 0.030 (0.019) Tobacco -0.001 (0.001) 0.001 (0.022) Footwear 0.007** (0.003) 0.037* (0.019) Sugar cane -0.008 (0.009) -0.007 (0.025) Soybeans 0.001 (0.001) 0.038* (0.019) Supermarkets -0.002 (0.003) -0.010 (0.026) Horti/floriculture 0.001 (0.001) 0.038* (0.019) Coffee 0.018** (0.008) 0.008 (0.027) Sugar cane 0.007** (0.003) 0.045** (0.020) Paper commerce -0.000 (0.001) 0.008 (0.027) Manioc root -0.001 (0.001) 0.044** (0.020) Notes. Columns 1 and 3 report OLS estimates of equation (5) for the top-ten most child intensive industries (in Table 1). Regression coefficients provide an estimate of the marginal contribution of changes in the employment share of the first, second, third, etc. top child-intensive industry to changes in child labor. Columns 2 and 4 report the cumulative contribution of the first one, first two, first three, etc. top child-intensive industries. See also notes to Table 2.

32
Table 4: Endogeneity checks
Endogeneity checks (1) (2) (3) (4) Independent variable Heterogeneous effects by decade Population Unskilled relative
employment Changes in
child labor Changes in child
labor X (1980-91)
Boys – Rural -0.025 0.280 0.250*** -0.109 (0.0103) (0.188) (0.047) (0.047)
Girls – Rural 0.224 -0.094 0.304*** -0.003 (0.134) (0.238) (0.078) (0.003)
Boys – Urban -0.126 -0.224** -0.031 0.045 (0.091) (0.090) (0.022) (0.052)
Girls – Urban 0.155 0.209 0.120*** -0.079 (0.139) (0.142) (0.026) (0.067)
Notes. Columns 1 and 2 report regressions of the between component on the population and unskilled relative employment components respectively. Columns 3 and 4 report results from the estimation of equation (4) in first differences, where the child labor variable is interacted with a dummy for the decade of the 1980s.

33
Figure 1 - Changes in adult distribution of employment and average child labor intensity by industry Boys – Rural Girls- Rural
Boys – Urban Girls- Urban
Notes. The figure reports the change in the share of adult employment between 1980 and 2000 on the vertical axis over the average (between 1980 and 2000) ratio of child to adult employment in each of the 105 industries separately for urban and rural areas and by gender.
CENTRE FOR ECONOMIC PERFORMANCE Recent Discussion Papers
1007 Peter Dolton Chiara Rosazza-Bondibene Jonathan Wadsworth
Employment, Inequality and the UK Naitonal Minimum Wage over the Medium-Term
1006 David Marsden Individual Voice in Employment Relationships: A Comparison Under Different Collective Voice Regimes
1005 Sharon Belenzon Mark Schankerman
Spreading the Word: Geography, Policy and University Knowledge Diffusion
1004 Florence Kondylis Marco Manacords
School Proximity and Child Labor Evidence from Rural Tanzania
1003 Alex Bryson John Forth
Trade Union Membership and Influence 1999-2009
1002 Christian Helmers The Effect of Market Entry on Innovation: Evidence from UK University Incubators
1001 Alex Bryson Richard Freeman
To Join or Not to Join? Factors Influencing Employee Share Plan Membership in a Multinational Corporation
1000 John Van Reenen Title TBC
999 Leonardo Iacovone Ferdinand Rauch L. Alan Winters
Trade as an Engine of Creative Destruction: Mexican Experience with Chinese Competition
998 David Marsden The End of National Models in Employment Relations?
997 Ralf Martin Productivity Spreads, Market Power Spreads and Trade
996 Rachel Smithies A Map of Mental Health
995 Kristian Behrens Gregory Corcos Giordano Miron
Trade Crisis? What Trade Crisis?
994 Stephen Redding Theories of Heterogeneous Firms and Trade
993 Jordi Blanes I Vidal Mirko Draca Christian Fons Rosen
Revolving Door Lobbyists

992 Susan Scott John Van Reenen Markos Zachariadis
The Impact of the Diffusion of a Financial Innovation on Company Performance: An Analysis of SWIFT Adoption
991 Sergey Lychagin Joris Pinkse Margaret E. Slade John Van Reenen
Spillovers in Space: Does Geography Matter?
990 Luis Garicano Rosa Lastra
Towards a New Architecture for Financial Stability: Seven Principles
989 David Marsden The Growth of Extended ‘Entry Tournaments’ and the Decline of Institutionalised Occupational Labour Markets in Britain
988 Zack Cooper Stephen Gibbons Simon Jones Alistair McGuire
Does Hospital Competition Improve Efficiency? An Analysis of the Recent Market-Based Reforms to the English NHS
987 Guy Michaels Ashwini Natraj John Van Reenen
Has ICT Polarized Skill Demand? Evidence from Eleven Countries Over 25 Years
986 J. M. C. Santos Silva Silvana Tenreyro
Currency Unions in Prospect and Retrospect
985 Fabian Waldinger Quality Matters – The Expulsion of Professors and Ph.D. Student Outcomes in Nazi Germany
984 Brian Bell Stephen Machin Francesco Fasani
Crime and Immigration: Evidence from Large Immigrant Waves
983 Nicholas Bloom Carol Propper Stephan Seiler John Van Reenen
The Impact of Competition on Management Quality: Evidence from Public Hospitals
982 Nicholas Bloom John Van Reenen
Human Resource Management and Productivity
981 Alan Manning Imperfect Competition in the Labour Market
980 Ana Fernandes Heiwai Tang
The Determinants of Vertical Integration in Export Processing: Theory and Evidence from China
The Centre for Economic Performance Publications Unit Tel 020 7955 7284 Fax 020 7955 7595
Email [email protected] Web site http://cep.lse.ac.uk