do cash transfers to the poor affect birth...
TRANSCRIPT

Veronica AmaranteUniversidad de la República, Uruguay
Marco ManacordaQueen Mary University of London,
CEP (LSE), CEPR and IZA
Edward MiguelUniversity of California, Berkeley and NBER
Andrea VigoritoUniversidad de la República, Uruguay
Do Cash Transfers to the Poor Affect Birth Outcomes?
Evidence from Matched Vital Statistics, Social Security and Program Administrative Data

Motivation
Can (temporary) cash transfers to the poor break the cycle of inter-generational poverty?
Little evidence on cash in-hand, unrestricted cashsocial assistance during pregnancy on birth outcomes
What is the right timing (targeting)?
2
Marco Manacorda - QMUL and CEP (LSE) Cash Transfers and Birth Outcomes
INTRODUCTION DETERMINANTS OF LBW PROGRAM DATA MODEL RESULTS CONCLUSIONS

Data and Findings Plan de Atención Nacional a la Emergencia Social (PANES) De facto unconditional cash program
Matched Administrative program micro data Vital statistics Social security data
Channels
Considerable decline in incidence of LBW We can rule out most “behavioral” channels
3
Marco Manacorda - QMUL and CEP (LSE) Cash Transfers and Birth Outcomes
INTRODUCTION DETERMINANTS OF LBW PROGRAM DATA MODEL RESULTS CONCLUSIONS
Structure1. Effects and determinants of LBW (Social Assistance )2. Program description3. Data and summary statistics4. Empirical model5. Estimates 6. Conclusions
4
Marco Manacorda - QMUL and CEP (LSE) Cash Transfers and Birth Outcomes
INTRODUCTION DETERMINANTS OF LBW PROGRAM DATA MODEL RESULTS CONCLUSIONS

Effects of LBW Significant negative effect of LBW on health and economic
and non-economic outcomes (Behrman and Rosenzweig 2004, Almond et al., 2005, Almond, 2006, Black et al., 2007, Currie and Moretti, 2007, Royer, 2010)
5
Marco Manacorda - QMUL and CEP (LSE) Cash Transfers and Birth Outcomes
INTRODUCTION DETERMINANTS OF LBW PROGRAM DATA MODEL RESULTS CONCLUSIONS

Determinants of LBWIUGR/Pre-term delivery - Almond and Currie (2010)
Mother’s health, nutrition (Kramer, 1987) Smoking, risky behavior, pollution (Currie and
Schmieder, 2009, Currie et al., 2009, Currie, 2010) Stress, conflict and violence (Camacho, 2008, Aizer,
2010) Mother’s work involvement (Del Bono et al., 2008) Ante-natal care utilization, quality of care (Kramer, 1987,
Alexander and Korenbrot, 1995)
6
Marco Manacorda - QMUL and CEP (LSE) Cash Transfers and Birth Outcomes
INTRODUCTION DETERMINANTS OF LBW PROGRAM DATA MODEL RESULTS CONCLUSIONS

Socio economic determinants of LBWChallenges• Exogenous variation in income• Data limitations(survey or aggregate)• Behavioral effects • Substitution/complementarities with other social programs• Conditionalities
Income during pregnancy (Conley and Bennett, 2000) Maternal education (Currie and Moretti, 2003, McCrary
and Royer, 2010) Unemployment and economic crises (Dehejia and Lleras-
Muney, 2003, Bozzoli and Quintana, 2010)
7
Marco Manacorda - QMUL and CEP (LSE) Cash Transfers and Birth Outcomes
INTRODUCTION DETERMINANTS OF LBW PROGRAM DATA MODEL RESULTS CONCLUSIONS

Social assistance and LBW
US evidence on social assistance (Bitler and Currie, 2004,Currie and Cole, 1993, Currie and Moretti, 2008, Almond et al., 2009)
In-kind/restricted Passport role of SA
Large effects from Oportunidades (Barber and Gertler, 2008)
8
Marco Manacorda - QMUL and CEP (LSE) Cash Transfers and Birth Outcomes
INTRODUCTION DETERMINANTS OF LBW PROGRAM DATA MODEL RESULTS CONCLUSIONS

Effects of LBW Significant negative effect of LBW on health and economic
and non-economic outcomes (Behrman and Rosenzweig 2004, Almond et al., 2005, Almond, 2006, Black et al., 2007, Currie and Moretti, 2007, Royer, 2010)
9
Marco Manacorda - QMUL and CEP (LSE) Cash Transfers and Birth Outcomes
INTRODUCTION DETERMINANTS OF LBW PROGRAM DATA MODEL RESULTS CONCLUSIONS

Do cash transfers (to poor mothers) matter?• Nutrition• Ante-natal care• Credit constrains (investment)• Labor supply• Psychological effects/empowerment
10
Marco Manacorda - QMUL and CEP (LSE) Cash Transfers and Birth Outcomes
INTRODUCTION DETERMINANTS OF LBW PROGRAM DATA MODEL RESULTS CONCLUSIONS

Do cash transfers (to poor mothers) matter?• Selective fertility, abortion and foetus survival• Consumption of “bads”• Work disincentives and health insurance• IG commitment /altruism (paternalism and CCTs)• Substitution between ante-natal and post-natal care• Reversion to the mean• Migration/household structure• (Domestic violence)
11
Marco Manacorda - QMUL and CEP (LSE) Cash Transfers and Birth Outcomes
INTRODUCTION DETERMINANTS OF LBW PROGRAM DATA MODEL RESULTS CONCLUSIONS

Background: Uruguay
12
Marco Manacorda - QMUL and CEP (LSE) Cash Transfers and Birth Outcomes
INTRODUCTION DETERMINANTS OF LBW PROGRAM DATA MODEL RESULTS CONCLUSIONS

Background: Uruguay
13
Human development
index
GDP per capita (PPP)
Uruguay 0.852 9,962 USA 0.951 41,890 Argentina 0.869 14,280 Brazil 0.800 8,402 Chile 0.867 12,027 Colombia 0.791 7,304 Mexico 0.829 10,751 Venezuela 0.792 6,632
Marco Manacorda - QMUL and CEP (LSE) Cash Transfers and Birth Outcomes
INTRODUCTION DETERMINANTS OF LBW PROGRAM DATA MODEL RESULTS CONCLUSIONS

Background: Uruguayan PANES2001/02 economic crisis
Plan de Atención Nacional a la Emergencia Social
Temporary antipoverty program, April 2005 -December 2007
Target population: bottom quintile below poverty line
14
Marco Manacorda - QMUL and CEP (LSE) Cash Transfers and Birth Outcomes
INTRODUCTION DETERMINANTS OF LBW PROGRAM DATA MODEL RESULTS CONCLUSIONS
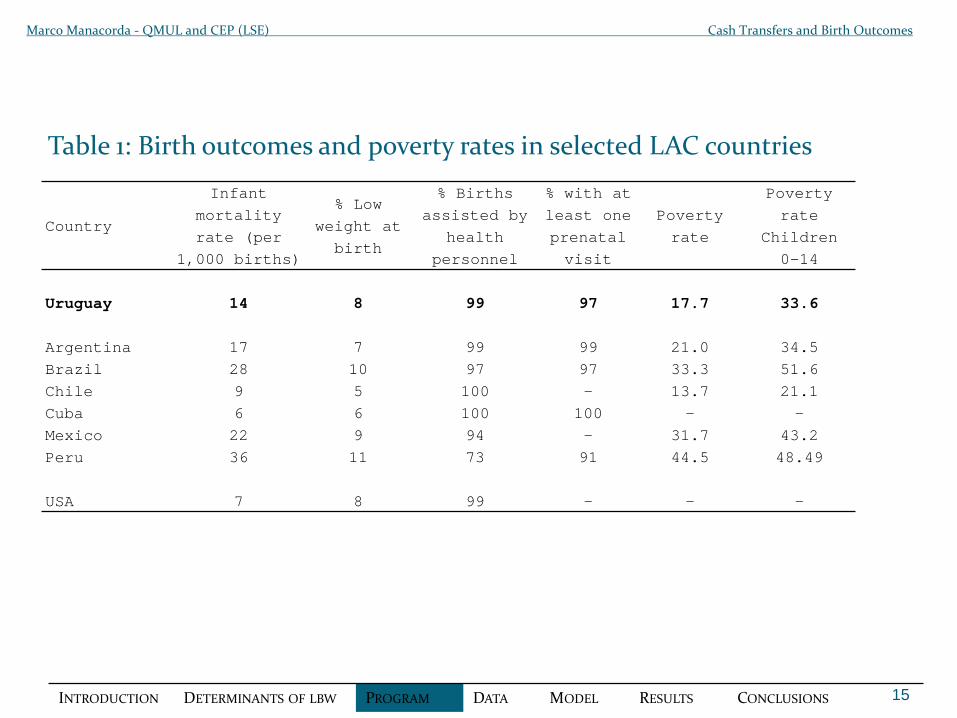
Table 1: Birth outcomes and poverty rates in selected LAC countries
15
Marco Manacorda - QMUL and CEP (LSE) Cash Transfers and Birth Outcomes
INTRODUCTION DETERMINANTS OF LBW PROGRAM DATA MODEL RESULTS CONCLUSIONS
Country
Infant mortality rate (per
1,000 births)
% Low weight at
birth
% Births assisted by
health personnel
% with at least one prenatal visit
Poverty rate
Poverty rate
Children 0-14
Uruguay 14 8 99 97 17.7 33.6
Argentina 17 7 99 99 21.0 34.5Brazil 28 10 97 97 33.3 51.6Chile 9 5 100 - 13.7 21.1Cuba 6 6 100 100 - -Mexico 22 9 94 - 31.7 43.2Peru 36 11 73 91 44.5 48.49
USA 7 8 99 - - -

PANES :enrollment, eligibility and components
190k applicant - 100k beneficiary HH (14% population)
Monthly cash transfer US$56 (=PPP US$102) – (IC)
Food Card -US$13 -US$30 (delayed until mid 2006)
+other smaller ingredients (TxU, RdS..)
Assignment based on poverty score: RDD Does not depend on child bearing status No manipulation Means-tested
Conditionalities (school attendance and health checks) not enforced
16
Marco Manacorda - QMUL and CEP (LSE) Cash Transfers and Birth Outcomes
INTRODUCTION DETERMINANTS OF LBW PROGRAM DATA MODEL RESULTS CONCLUSIONS

Data1. Baseline socio-demographics at time of enrollment – (700k
individuals) (05→)
2. Vital statistics: registered births 2003-2007
3. Social security data 2004-2007
4. Administrative program data (2005→)
All linked by cedula and across individuals in same HH
Restrict to applicants: 68,174 births 2003-2007
17
Marco Manacorda - QMUL and CEP (LSE) Cash Transfers and Birth Outcomes
INTRODUCTION DETERMINANTS OF LBW PROGRAM DATA MODEL RESULTS CONCLUSIONS

Figure A1: Timing of PANES, program, vital statistics and social security data
18
Marco Manacorda - QMUL and CEP (LSE) Cash Transfers and Birth Outcomes
INTRODUCTION DETERMINANTS OF LBW PROGRAM DATA MODEL RESULTS CONCLUSIONS
Application
Apr. 2005 →
Assessment visit
Apr 2005 →
Program ends
Dec 2007
Administrative decision: eligibility
Payment of IC to successful applicants (+ arrears to application time)
May 2005 →
Vital statistics
Jan 2003 - Dec 2007
Baseline survey
Apr 2005 →
Social security data Mar 2004 -Dec 2007
Administrative program data
May 2005 -Dec 2007

19
Marco Manacorda - QMUL and CEP (LSE) Cash Transfers and Birth Outcomes
INTRODUCTION DETERMINANTS OF LBW PROGRAM DATA MODEL RESULTS CONCLUSIONS

20
Panel A: Time of application Panel B: Time of baseline survey Panel C: Time of first payment of income transfer
0.1
.2.3
.4F
rac
tio
n
01 jan2 005 01jan2006 01jan2007 01 jan2008
0.0
5.1
.15
.2F
rac
tio
n01 jan2 005 01jan2006 01jan2007 01 jan2008
date_visi ta
0.0
5.1
.15
.2.2
5F
rac
tio
n
01 jan2 005 01jan2006 01jan2007 01 jan2008
Panel D: Time of first payment of food card Panel E: Time of baseline survey – timeapplication
Panel F: Time of first payment of incometransfer – baseline survey
0.2
.4.6
Fra
cti
on
01 jan2 005 01jan2006 01jan2007 01 jan2008
0.0
5.1
.15
.2F
rac
tio
n
0 .5 1 1.5 2
0.1
.2.3
.4.5
Fra
cti
on
0 .5 1 1.5 2
Figure A2: Distribution of PANES program dates
Marco Manacorda - QMUL and CEP (LSE) Cash Transfers and Birth Outcomes
INTRODUCTION DETERMINANTS OF LBW PROGRAM DATA MODEL RESULTS CONCLUSIONS
21
Marco Manacorda - QMUL and CEP (LSE) Cash Transfers and Birth Outcomes
INTRODUCTION DETERMINANTS OF LBW PROGRAM DATA MODEL RESULTS CONCLUSIONS
PANES Applicants Non-PANES Applicants
All
Vital statistics
Eligible Non-Eligible
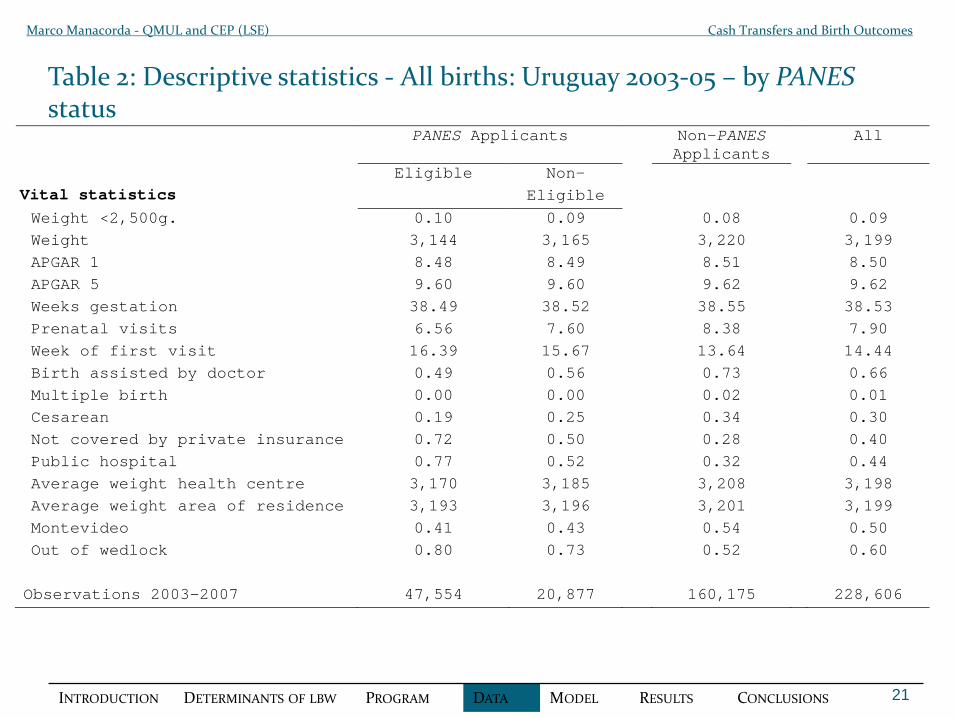
Weight <2,500g. 0.10 0.09 0.08 0.09 Weight 3,144 3,165 3,220 3,199 APGAR 1 8.48 8.49 8.51 8.50 APGAR 5 9.60 9.60 9.62 9.62 Weeks gestation 38.49 38.52 38.55 38.53 Prenatal visits 6.56 7.60 8.38 7.90 Week of first visit 16.39 15.67 13.64 14.44 Birth assisted by doctor 0.49 0.56 0.73 0.66 Multiple birth 0.00 0.00 0.02 0.01 Cesarean 0.19 0.25 0.34 0.30 Not covered by private insurance 0.72 0.50 0.28 0.40 Public hospital 0.77 0.52 0.32 0.44 Average weight health centre 3,170 3,185 3,208 3,198 Average weight area of residence 3,193 3,196 3,201 3,199 Montevideo 0.41 0.43 0.54 0.50 Out of wedlock 0.80 0.73 0.52 0.60 Observations 2003-2007 47,554 20,877 160,175 228,606
Table 2: Descriptive statistics - All births: Uruguay 2003-05 – by PANESstatus

22
Marco Manacorda - QMUL and CEP (LSE) Cash Transfers and Birth Outcomes
INTRODUCTION DETERMINANTS OF LBW PROGRAM DATA MODEL RESULTS CONCLUSIONS
PANES Applicants Non-PANES Applicants
All
Eligible Non-Eligible
Vital statistics Mother characteristics
Age 25.39 24.74 27.54 26.81 Incomplete primary 0.12 0.05 0.03 0.05 Not employed 0.88 0.82 0.56 0.65 Single mother 0.31 0.32 0.20 0.24 # previous births 2.37 1.43 1.23 1.50 # alive children 2.14 1.24 1.03 1.30
Father characteristics Missing 0.62 0.52 0.31 0.40 Incomplete primary 0.12 0.06 0.03 0.05 Not employed 0.11 0.09 0.05 0.06
Program data
Ever treated (05-07) 0.97 0.14 Social Security data Mother positive earnings 0.08 0.15
Mother earnings 43 133 Maternity leave 0.03 0.05 Household total income 1,359 2,700 Observations 2003-2007 47,554 20,877 160,175 228,606
Table 2: Descriptive statistics - All births: Uruguay 2003-05 – by PANES status (cont.d)

23
Table 3: Correlation between LBW and observable characteristics., 2003-04Marco Manacorda - QMUL and CEP (LSE) Cash Transfers and Birth Outcomes
INTRODUCTION DETERMINANTS OF LBW PROGRAM DATA MODEL RESULTS CONCLUSIONS
Mother’s education – completed primary -0.019***(0.003)
- completed secondary -0.024***(0.004)
- completed college -0.034***(0.004)
Out of wedlock 0.009***(0.002)
Visits first week -0.006***(0.001)
Visits second week 0.002***(0.001)
Visits third week -0.007***(0.001)
Week first visit -0.0002(0.0001)
Number of previous births -0.002***(0.001)
Weeks gestation -0.068***(0.001)
Birth attended by medical personnel 0.012***(0.002)
Public health center 0.007**(0.003)
Not covered by private insurance -0.005*(0.003)
Mean weight center (in kg) -0.140***(0.011)
Cesarean 0.041***(0.001)
Multiple birth 0.026***(0.007)

Model specification and identificationTwo identification strategies
•Birth after entry into program (eligible) – Diff-in-diff
•Discontinuity in income (poverty) score - RD
24
Marco Manacorda - QMUL and CEP (LSE) Cash Transfers and Birth Outcomes
INTRODUCTION DETERMINANTS OF LBW PROGRAM DATA MODEL RESULTS CONCLUSIONS
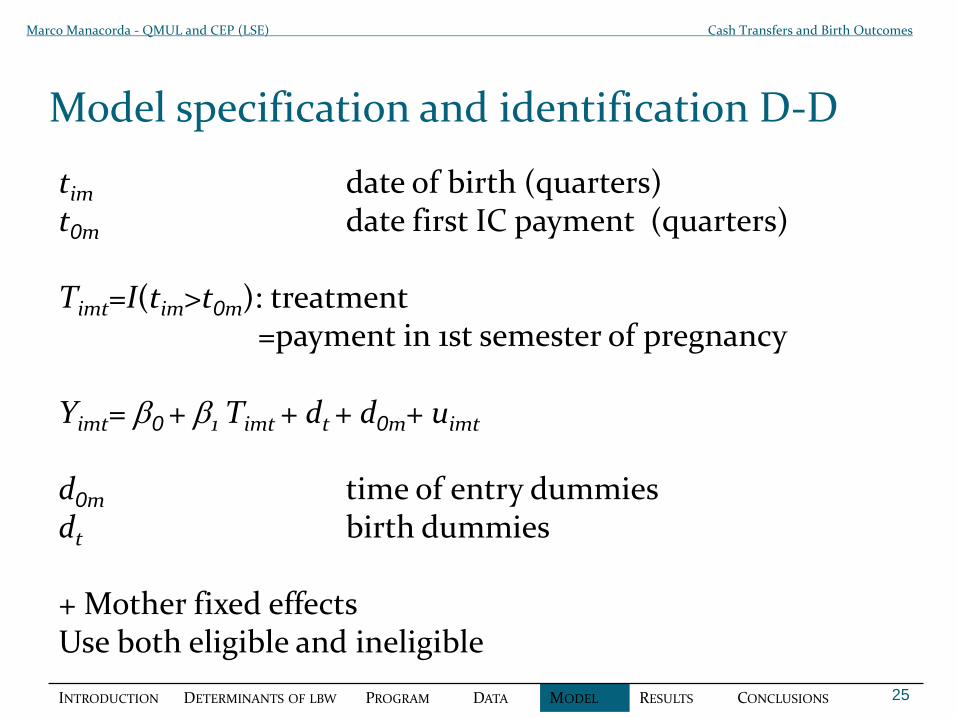
Model specification and identification D-D
tim date of birth (quarters)t0m date first IC payment (quarters)
Timt=I(tim>t0m): treatment=payment in 1st semester of pregnancy
Yimt= β0 + β1 Timt + dt + d0m+ uimt
d0m time of entry dummiesdt birth dummies
+ Mother fixed effectsUse both eligible and ineligible
25
Marco Manacorda - QMUL and CEP (LSE) Cash Transfers and Birth Outcomes
INTRODUCTION DETERMINANTS OF LBW PROGRAM DATA MODEL RESULTS CONCLUSIONS

Model specification and identification D-D
Imperfect enforcement: IV
Sm income scoreS* eligibility threshold
Em=I(Sm<S*) PANES eligibility dummy
Eimt=Pimt Em treatment =0 for ineligible
First stage:
Timt= γ0 + γ1 Eimt + dt + d0m+ eimt
26
Marco Manacorda - QMUL and CEP (LSE) Cash Transfers and Birth Outcomes
INTRODUCTION DETERMINANTS OF LBW PROGRAM DATA MODEL RESULTS CONCLUSIONS

Model specification and identification - RD Yimt= β0 + β1 Timt + f(Sm) + dt + d0m + vimt
Timt= δ0 + δ1Em + g(Sm) + ft+ f0m + ωimt
Estimated on post-program data
Use pre-program data to enhance precision
Yimt= β0 + β1 Timt + ft(Sm) + dt + d0m + vimt
Timt= δ0 + δ1t Em + gt(Sm) + ft + f0m + ωimt
+ Mother fixed effects27
Marco Manacorda - QMUL and CEP (LSE) Cash Transfers and Birth Outcomes
INTRODUCTION DETERMINANTS OF LBW PROGRAM DATA MODEL RESULTS CONCLUSIONS

Potential endogeneity concerns
Endogenous fertility (selective survival rates, abortion) (Endogenous time of entry)
28
Marco Manacorda - QMUL and CEP (LSE) Cash Transfers and Birth Outcomes
INTRODUCTION DETERMINANTS OF LBW PROGRAM DATA MODEL RESULTS CONCLUSIONS

Figure 1: Low Birth weight as a function of time to/from first payment
-.04
-.02
0.0
2.0
4
-3 -2 -1 0 1 2date birth - date first payment
29
Marco Manacorda - QMUL and CEP (LSE) Cash Transfers and Birth Outcomes
INTRODUCTION DETERMINANTS OF LBW PROGRAM DATA MODEL RESULTS CONCLUSIONS

Channels Length of gestation Ante-natal care Household resources - Cash/in-kind Mother’s / household LS Residential mobility/household structure Fertility
30
Marco Manacorda - QMUL and CEP (LSE) Cash Transfers and Birth Outcomes
INTRODUCTION DETERMINANTS OF LBW PROGRAM DATA MODEL RESULTS CONCLUSIONS

Table 4: Program effects on birth outcomes 2003-2007 - D-D IV estimates1. Low birthweight (<2,500 g.) -0.017*** -0.017*** -0.021**
(0.005) (0.005) (0.009)
2. Birthweight 29.510*** 27.238*** 25.992*(10.236) (9.725) (15.162)
3. Weeks gestation 0.048 0.036 0.035(0.036) (0.035) (0.064)
4. Visits first week -0.027** -0.029** 0.011(0.013) (0.013) (0.023)
5. Visits second week 0.055** 0.052** 0.008(0.024) (0.023) (0.042)
6. Visits third week 0.148*** 0.151*** 0.096(0.045) (0.044) (0.078)
7. Total visits 0.179*** 0.178*** 0.122(0.060) (0.058) (0.099)
8. Week first visit 0.118 0.142 -0.365(0.143) (0.142) (0.296)
9. Birth assisted by doctor 0.017** 0.014 0.014(0.009) (0.009) (0.015)
10. Not privately insured -0.022*** -0.019** 0.030**(0.008) (0.008) (0.013)
11. Public health center -0.006 -0.003 0.036***(0.008) (0.008) (0.012)
12. Average weight health center -4.872*** -3.954*** -3.557**(1.308) (1.261) (1.564)
13. Average weight area of residence -1.579** -1.342* -0.361(0.735) (0.720) (0.814)
14. Out of wedlock -0.019*** -0.016** -0.001(0.007) (0.007) (0.008)
15. Mother in work -0.010* -0.012** -0.025**(0.006) (0.006) (0.010)
16. Treated (First stage) 0.833*** 0.834*** 0.848***(0.004) (0.004) (0.006)
Additional controls No Yes Yes
Mother fixed effects No No Yes

32
Table 4A: Program effects on the incidence of low birthweight: by length of exposure – reduced form estimates
(1) (2)
1. By quarter3rd trimester of pregnancy -0.011 0.002
(0.007) (0.015)2nd trimester of pregnancy -0.018** -0.019
(0.007) (0.014)1st trimester of pregnancy -0.022*** -0.009
(0.007) (0.014)1 trimester before conception -0.014* -0.013
(0.008) (0.015)2 trimesters before conception -0.008 -0.022
(0.008) (0.014)3 trimesters before conception -0.018** -0.038**
(0.008) (0.015)4 trimesters before conception -0.016* -0.009
(0.009) (0.016)5 or more trimesters before conception -0.013 -0.014
(0.008) (0.015)2. Before/after conception
During pregnancy -0.018*** -0.015(0.006) (0.010)
Before pregnancy -0.012** -0.019**(0.005) (0.009)
Additional controls Yes YesMother fixed effects No Yes
INTRODUCTION DETERMINANTS OF LBW PROGRAM DATA MODEL RESULTS CONCLUSIONS

Figure 2: Estimated proportional program effects by birth weight
33INTRODUCTION DETERMINANTS OF LBW PROGRAM DATA MODEL RESULTS CONCLUSIONS
Marco Manacorda - QMUL and CEP (LSE) Cash Transfers and Birth Outcomes
-.4
-.3
-.2
-.1
0.1
1500 20 00 2500 3000 3500 4000 4500 5000we ight

Figure 3: RD estimates: March 2006-December 2007Treatment (ever treated) Low Birthweight
0.2
.4.6
.81
-.1 -.05 0 .05 .1poverty score
0.1
.2.3
-.1 -.05 0 .05 .1poverty score
34INTRODUCTION DETERMINANTS OF LBW PROGRAM DATA MODEL RESULTS CONCLUSIONS
Marco Manacorda - QMUL and CEP (LSE) Cash Transfers and Birth Outcomes

Figure A4: Distribution of the standardized PANES income score
35
McCrary test: -0.1/+0.1
05
1015
-.1 -.05 0 .05 .1
INTRODUCTION DETERMINANTS OF LBW PROGRAM DATA MODEL RESULTS CONCLUSIONS
Marco Manacorda - QMUL and CEP (LSE) Cash Transfers and Birth Outcomes
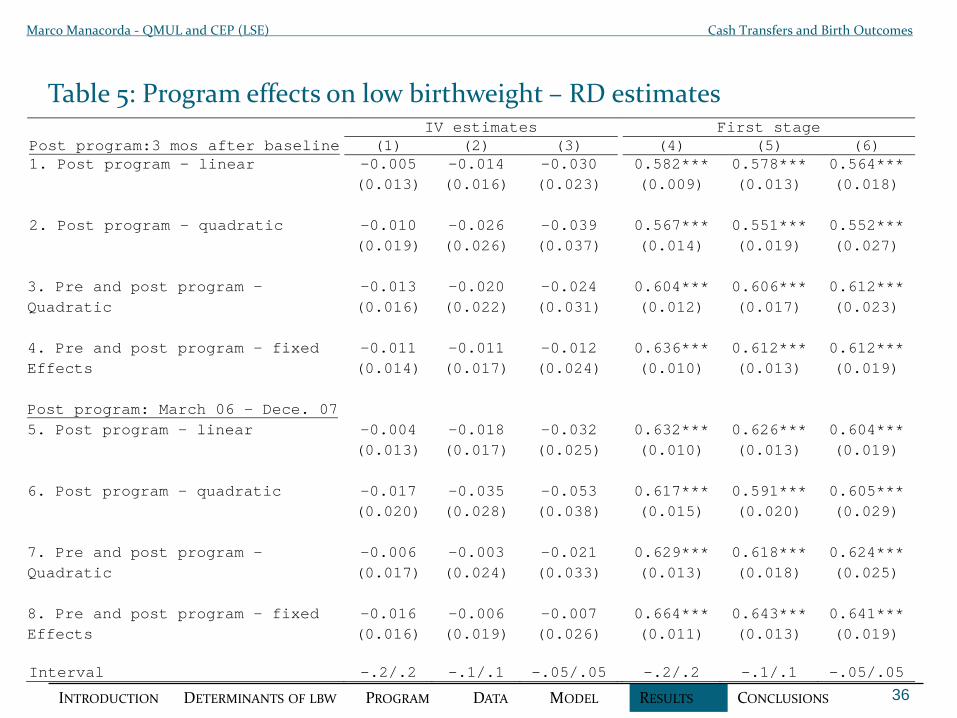
Table 5: Program effects on low birthweight – RD estimates
36
Marco Manacorda - QMUL and CEP (LSE) Cash Transfers and Birth Outcomes
INTRODUCTION DETERMINANTS OF LBW PROGRAM DATA MODEL RESULTS CONCLUSIONS
IV estimates First stage Post program:3 mos after baseline (1) (2) (3) (4) (5) (6) 1. Post program - linear -0.005 -0.014 -0.030 0.582*** 0.578*** 0.564*** (0.013) (0.016) (0.023) (0.009) (0.013) (0.018) 2. Post program – quadratic -0.010 -0.026 -0.039 0.567*** 0.551*** 0.552*** (0.019) (0.026) (0.037) (0.014) (0.019) (0.027) 3. Pre and post program – -0.013 -0.020 -0.024 0.604*** 0.606*** 0.612*** Quadratic (0.016) (0.022) (0.031) (0.012) (0.017) (0.023) 4. Pre and post program - fixed -0.011 -0.011 -0.012 0.636*** 0.612*** 0.612*** Effects (0.014) (0.017) (0.024) (0.010) (0.013) (0.019) Post program: March 06 - Dece. 07 5. Post program - linear -0.004 -0.018 -0.032 0.632*** 0.626*** 0.604*** (0.013) (0.017) (0.025) (0.010) (0.013) (0.019) 6. Post program – quadratic -0.017 -0.035 -0.053 0.617*** 0.591*** 0.605*** (0.020) (0.028) (0.038) (0.015) (0.020) (0.029) 7. Pre and post program – -0.006 -0.003 -0.021 0.629*** 0.618*** 0.624*** Quadratic (0.017) (0.024) (0.033) (0.013) (0.018) (0.025) 8. Pre and post program - fixed -0.016 -0.006 -0.007 0.664*** 0.643*** 0.641*** Effects (0.016) (0.019) (0.026) (0.011) (0.013) (0.019) Interval -.2/.2 -.1/.1 -.05/.05 -.2/.2 -.1/.1 -.05/.05

37
Marco Manacorda - QMUL and CEP (LSE) Cash Transfers and Birth Outcomes
Table 6: Program effects on income and labor supply - IV estimates
INTRODUCTION DETERMINANTS OF LBW PROGRAM DATA MODEL RESULTS CONCLUSIONS
(1) (2 )
1. Income transfer 873.510*** 902.688***
(5.534) (9.549)
2. Food card 161.510*** 161.231***
(2.165) (3.954)
3. Mother’s earnings -55.007*** -77.619***
(12.075) (22.786)
4. Mother positive earnings -0.003 -0.003
(0.004) (0.009)
5. Household total income (inc. transfers) 753.206*** 837.297***
(44.845) (71.034)
6. Maternity leave – last trimester -9.504*** -3.635
(3.320) (6.014)
Additional controls Yes Yes
Mother fixed effects No No

Figure A5: RD estimates of program eligibility on formal earnings, by gender and month: March 2004–December 2009
38
Marco Manacorda - QMUL and CEP (LSE) Cash Transfers and Birth Outcomes
INTRODUCTION DETERMINANTS OF LBW PROGRAM DATA MODEL RESULTS CONCLUSIONS
Males Females
-50
0-3
00
-10
01
00
2004m 1 2005m 1 2006m 1 2007m 1 2008m1 2009m1 2010m1tim e
-50
0-3
00
-10
01
00
2004m 1 2005m 1 2006m 1 2007m 1 2008m1 2009m1 2010m1tim e

39
Marco Manacorda - QMUL and CEP (LSE) Cash Transfers and Birth Outcomes
Table 7: Additional specifications – IV estimates
INTRODUCTION DETERMINANTS OF LBW PROGRAM DATA MODEL RESULTS CONCLUSIONS
(1) (2)1. Controls for week of gestation, week of first visit and -0.013*** -0.023***total visits (0.004) (0.008)
2. Up to May 2006 (no food card) -0.009 -0.019(0.011) (0.022)
3. Controls for food card
Income transfer >0 -0.021*** -0.009(0.006) (0.011)
Food card >0 0.007 -0.025**(0.007) (0.012)
4. Saturated specification -0.017*** -0.020**(0.005) (0.009)
Additional controls Yes Yes
Mother fixed effects No Yes

Selective fertility
• Direct income effect (temporary vs. permanent transfer)• Selective survival• Informal/uninsured• (Built-in incentives)
• Effects unlikely to manifest immediately and probably not for women who have already conceived
40
Marco Manacorda - QMUL and CEP (LSE) Cash Transfers and Birth Outcomes
INTRODUCTION DETERMINANTS OF LBW PROGRAM DATA MODEL RESULTS CONCLUSIONS

41
Marco Manacorda - QMUL and CEP (LSE) Cash Transfers and Birth Outcomes
.006
.007
.008
.009
ferti
lity
rate
-3 -2 -1 0 1 2time - time first payment
Figure 4: Fertility rates by as a function of time to/since first payment -PANES eligible women only
INTRODUCTION DETERMINANTS OF LBW PROGRAM DATA MODEL RESULTS CONCLUSIONS

Figure 5: Fertility rates by PANES eligibility status as a function of time to/since baseline survey
42
Marco Manacorda - QMUL and CEP (LSE) Cash Transfers and Birth Outcomes
Eligible women Ineligible women Eligible/ineligible women
.004
.006
.008
.01
ferti
lity
rate
-3 -2 -1 0 1 2time - time baseline survey
11.
21.
41.
61.
8fe
rtilit
y ra
te
-3 -2 -1 0 1 2time - time baseline survey
.004
.006
.008
.01
ferti
lity
rate
-3 -2 -1 0 1 2time - time baseline survey
INTRODUCTION DETERMINANTS OF LBW PROGRAM DATA MODEL RESULTS CONCLUSIONS

Figure 6: Fertility rates by number of children born by baseline survey date and PANES eligibility status as a function of time to/since baseline survey
0 children 1 child 2 or more children
0.0
02.0
04.0
06
-3 -2 -1 0 1 2time - time baseline survey
ineligible eligible
0.0
1.0
2.0
3.0
4
-3 -2 -1 0 1 2time - time baseline survey
ineligible eligible
0.0
2.0
4.0
6.0
8
-3 -2 -1 0 1 2time - time baseline survey
ineligible eligible
43
Marco Manacorda - QMUL and CEP (LSE) Cash Transfers and Birth Outcomes
INTRODUCTION DETERMINANTS OF LBW PROGRAM DATA MODEL RESULTS CONCLUSIONS

Table 8: Program effect on fertility
44
Marco Manacorda - QMUL and CEP (LSE) Cash Transfers and Birth Outcomes
INTRODUCTION DETERMINANTS OF LBW PROGRAM DATA MODEL RESULTS CONCLUSIONS
(1) (2) (3) -.0013*** -.0016*** -0.0002 (0.0001) (0.0002) (0.0001)
Additional controls No Yes Yes Number of previous pregnancies x controls
No Yes Yes

Summary of main findings• Reduction in incidence of LBW (-10% to -20%)
• No evidence that effects driven by:• - increased ante-natal care utilization• - increased gestational length• - selective fertility• - improvements in quality of ante-natal care• - reduced mother labor supply• - in-kind transfers
• Cash transfers in last trimester matter • Little evidence of accumulated effects• Rules out selective fertility
45
Marco Manacorda - QMUL and CEP (LSE) Cash Transfers and Birth Outcomes
INTRODUCTION DETERMINANTS OF LBW PROGRAM DATA MODEL RESULTS CONCLUSIONS

46
1. Income transfer 96.7 2. Food card 70.9 3. Public works employment 17.6 4. Education and training 16.0 5. Other components 12.7
Marco Manacorda - QMUL and CEP (LSE) Cash Transfers and Birth Outcomes
Program components take up rates

47
02
46
8P
erce
nt
0 1000 2000 3000 4000 5000Birth weight
Figure A3: Distribution of birthweight
Marco Manacorda - QMUL and CEP (LSE) Cash Transfers and Birth Outcomes

Figure B1: PANES eligibility and government political support
48