by vikas gautam - inflibnetshodhganga.inflibnet.ac.in/bitstream/10603/12326/8/08_research.........
TRANSCRIPT

PhD Thesis
Tentative Proposal
An Empirical Analysis to Study the Impact of Service Quality
Attributes on Customer Value, Satisfaction and Loyalty in
Mobile Telecommunication Services in Dehradun
By
Vikas Gautam
Submitted to:
Doctoral Advisory Committee: Dr. Abhay Kumar Tiwari Dr. Tarak Nath Shaw
Dr. Pinaki Ranjan Bhattacharyya
ICFAI University, Dehradun
2
TABLE OF CONTENTS
1. Motivation for proposed research
2. Literature survey and identification of research gaps
3. The objectives of the study and proposed research hypotheses
4. Methodology and sources of data
5. Expected Contribution to the literature
6. List of references
7. The plan of research

3
1. THE MOTIVATION FOR THE PROPOSED RESEARCH
The present Indian economy has seen a vast change in the business operations
as an aftermath of globalization and liberalization in the 21s t
century. Quality
has become a strategic tool in obtaining efficiency in operations and
improving performance in business, which holds good for both the goods and
services sectors. However, the problem with management of service quality
in service firms is that quality is not easily identifiable and measurable due
to inherent characteristics of services which make them differe nt from goods.
In today’s market environment customers look for technology and support for
remaining loyal to the goods and services offered by marketers. This calls for
skilled and technically competent employees, proper maintenance of
equipments, and supportive operative systems.
The mobile telecommunication services sector being a part of services
industry has also shown sufficient maturity to accept these changes as
required by the market, and as geared up itself with competent technology,
human resources and operations to serve their customers and satisfy them.
In the context of customers, the need for excellent services always keeps on
changing. With the passage of time, the level of service quality also varies.
There is no guarantee that what is exc ellent service quality today is also
applicable for tomorrow or day after tomorrow. Besides this, in the last two
decades the use of technology in the delivery of services has also changed
significantly. The use of latest world class innovative technology in terms of
various value added services has also increased the war among service
providers. To win the battle of global competition in the service industries

4
and to be able to exist, these service providers will need to bring into play
new contemporary st rategies in providing service that will satisfy the
continuous demanding customers. Because of this reason services marketing
and telecommunication marketing gaining prominence in marketing literature
(Kotler, 2001).
The interest in services marketing rese arch on service quality and customer
satisfaction has gained prominence due to a good number of researches which
have been conducted by applying related theories and methods in the services
industry like; banking, telecommunication, hospitality, travel and tourism
etc. Researches are still divided into two schools of thought -i) Is it that
service quality in terms of tangibility, reliability, responsiveness, assurance,
empathy (Parasuraman et al. , 1988) or ii) Is it that service performance is
more important than service quality (Cronin and Taylor, 1992). Gronroos,
(1990); Bitran and Lojo, (1993), Parasuraman et al., (1993); Zeithaml and
Bitner, (1996) prescribed definitions for services and concluded that for most
of the services, there are four basic charac teristics that differentiate them
from the goods are:
1. Services are of intangible nature; however degree of intangibility
varies from service to service.
2. Services are produced and consumed simultaneously to some extent.
3. Services are activities or series of activities as compared to goods.
As a stepping stone to this notion of refining the theories, Cronin, Brady, and
Hult (2000) conducted an empirical study to assess the effects of service
quality, value, and customer satisfaction on behavioural intentions in the

5
context of different service industries. They suggested in their findings that
there is need to include additional decision -making variables like tangibility
aspect of service quality, customers’ expectations and quality of service
environment. Also, suggested replication of similar study in another service
setting. Caruana (2002) attempted to examine the model in which service
quality is linked to service loyalty via customer satisfaction. After examining
this model, he suggested the need to conside r the role of customer value and
reputation of the company in predicting loyalty. The present study will try to
address the doubts raised by the researchers like Cronin, Brady, and Hult
(2000), Caruana (2002) etc.
The telecommunications sector in India was liberalized in the early 1990s.
Attack of private as well as foreign direct investment in the sector started
afterwards. With taut margins and ephemeral customer loyalty, the mobile
phone service providers are now operating in a highly competitive
environment. Profitability of the service providers is being curbed by factors
like; revenue leakage, customer churn and ineffective customer service. The
Indian mobile phone operators are facing a number of significant challenges,
because of changing dynamics.
o First, retaining existing customers mainly in a pre -paid and high churn
market has become more difficult and costly.
o Second, new customer acquisition is becoming more elusive than ever
as potential customers have more options to choose from and mobile
phone operators offer attractive deals to lure prospect customers.
o Third, as mobile phone operators have had to incur additional cost in
keeping existing customers and acquiring new ones, their average
6
revenue per user (ARPU) has declined, leading to worsenin g of their
financial performance.
Source: http://www.trai.gov.in/trai/upload/PressRel
In light of above mentioned challenges, mobile telecommunication service
providers need to make customer satisfaction a strategic priority. Past
researches in service literature provide evidences that customer satisfaction
has a direct effect on the financial performance of a company (Smith and
Wright 2004; Ittner and Larcker, 1998). Moreover, satisfied customers have a
higher propensity to stay with their existing service provider than the less
satisfied ones (Cronin et al . , 2000) and are more likely to recommend the
service provider to others, leading to improved bottom line for the company
(Reichheld 2003, 2006). Thus, it is very important that Indian mobile phone
operators gain a better understanding of the relationship between the
performance of service quality attributes, customer value, satisfaction, and
loyalty.
Definition of the terms
Customer satisfaction: An emotional response, that result from a cognitive
process of evaluating the service received against the costs of obtaining
service (Woodruff et al . 1991; Rust and Oliver 1994).
Customer loyalty: Customer loyalty means that the customer may come
under environmental effect or marketing technique, which induce their
possibly latent transformation behaviour, but they wouldn’t change their
repeat purchase intention with preference commodity or service Oliver, Rust
and Varki (1997). The concept of customer loyalty can be understood as a

7
combination of favourable attitude of customers and their repurchase
behaviour (Kim et al. 2004).
Customer value: Customer value means that overall assessment of customer
about the uti lity of service based upon what is received and what if given in
exchange to service provider (Cronin, Brady and Hult, 2000).
Service quality: Service quality means the consumer’s perception of the way
the service has been performed (Cronin and Taylor, 199 2).
Service quality attributes: means the attributes of the service offered
perceived by consumer.
Mobile telecommunication services: are the services offered for the public
by the service providers. These services consist of both types of services
namely; Code division Multiple Access (CDMA), and Global System for
Mobile Communications (GSM).
2. LITERATURE SURVEY AND IDENTIFICATION OF RESEARCH
GAPS
In order to understand and identify the research gap, review of literature has
been conducted extensively with respect to service quality, service
performance, customer satisfaction, customer loyalty, and customer value.
This was done with the intention to determine the definitions pertaining to
this research in creating the research gap emanating out of the s tudy.
According to Quinn, Baruch, and Paquette (1987) services can be defined as
“Most authorities consider the services sector to include all economic
8
activities whose output is not a physical product or construction, is generally
consumed at the time it is produced, and provides added value in forms (such
as convenience, amusement, timeliness, comfort, or health) that are
essentially intangible concerns of its first purchaser”. Gronroos (1990)
defined services as “An activity or series of activities of mo re or less
intangible nature that normally, but not necessarily, take place in interactions
between the customer and service employees and or system of the service
provider which are provided as solutions to customer problems (p.27).
Service quality is more difficult to measure as compared to measurement of
quality of goods (Parasuraman, Berry, and Zeithaml, 1985). At the time of
purchase in the case of goods, various tangible attributes like shape, size,
colour, package etc. can be checked properly and quality can be assessed. But
in the case of services, because of intangible nature, it is difficult to make
assessment about their quality before their purchase. Therefore in case of
services purchasing procedure various other tangible attributes like per sonnel
of service providers, their equipments, and physical facilities etc. can be
taken as measures of quality assessment.
Parasuraman, Berry, and Zeithaml (1985) identified five potential gaps within
the service organizations that may lead to a final and major gap: the
difference between expectations before delivery and perceptions of customers
after delivery of services. Therefore they discovered five service quality gaps
based on interviews with executives of service organizations. As per their
proposed gap model, five gaps in service quality were as follows:
Gap1---- customers’ expectations and management perceptions gap

9
Gap2---- management perceptions about customers’ expectations and
specifications of service quality gap
Gap3---- specifications of service quality and service delivery gap
Gap4---- service delivery and communication to external customers’ gap
Gap5---- customers’ expected service and customers’ perceived service
performance gap
According to Lovelock (1994), in addition to the five gaps, t wo more gaps
have been identified, which exists during design and delivery of service
offering. The modified gaps as mentioned by Lovelock can be described as
follows:
1. The Knowledge gap
2. The standards gap
3. The delivery gap
4. The internal communications gap
5. The perceptions gap
6. The interpretation gap
7. The service gap
Parasuraman, Berry, and Zeithaml (1988) developed instrument to measure
customers’ perception of service quality in service organizations by taking
all the above mentioned ten dimensions and was nam ed as SERVQUAL.
Further this instrument was purified and scaled down into five dimensions
consisting of 22 items. With this 22 item scale of SERVQUAL researchers
can measure the expectations and perceptions of customers about service
quality in service set ups.

10
Perceived service quality was measured by the authors by taking the
difference between expectations and perceptions scores in research and
categories were made.
i) Expectations are not met, when the difference between expectation
and perception scores is negative.
ii) Expectations are met, when the difference between expectation and
perception scores is zero.
ii i) Expectations are highly met, when the difference between
expectation and perception scores is positive.
Reliability of SERVQUAL
Study
(Author &
Year)
Research
Instrument
Reliability
(Cronbach’s
alpha values)
Factor Structure
Carman, 1990 Four modified
SERVQUALs
using 12-21 of
original items
Mean of 0.75 Five to Nine factors
Brensinger
and Lambert,
1990
Original 22
items
0.64 to 0.88 Four factors
Parasuraman,
Zeithaml, and
Berry, 1991
Original 22
items
0.80 to 0.93 Five factors, but different
from a priori model.
Tangible dimension splits
into two factors, while

11
responsiveness and
assurance dimensions
loaded on a single factor
Finn and
Lamb, 1991
Original 22
items
0.59 to 0.83 Poor fit for Five factor
model
Babakus and
Boller, 1992
Original 22
items
0.67 to 0.83 Five factor model not
supported two factors
Cronin and
Taylor, 1992
Original 22
items
0.85 to 0.90 Unidimensional structure
Kettinger and
Lee, 1994
Original 22
items
Mean of 0.87 Four factor model,
tangibles dimension
dropped
Pitt, Watson,
and Kavan,
1995
Original 22
items
0.62 to 0.87 Financial institution
seven factor model with
tangibles and empathy
split into two; Consulting
firm five factors, not
matching the original;
information systems
service firm three factor
model
Source: Van Dyke, T.P., L.A. Kappelman, and V.R. Prybutok. 1997.
Measuring information systems service quality: Concern on the use of the
SERVQUAL questionnaire. MIS Quarterly , 21, p202.

12
Van Dyke, T.P., L.A. Kappelman, and V.R. Prybutok, (1999) summarised all
the empirical and theoretical findings related to the critique of SEVQUAL
instrument, and presented them in a tabled form by referencing various
studies based on gap scores.
Problems identified in the literature
Issue Problem Literature
Use of gap
score
Poor choice as a measure of a complex
psychological construct.
Lord, 1958; Wall
and Payne, 1973;
Johns, 1981;
Peter, Churchill,
and Brown, 1993
Reliability Cronbach’s alpha overestimates the
reliability of different scores.
Lord, 1958; Wall
and Payne, 1973;
Johns, 1981;
Prakash and
Lounsbury, 1983;
Peter, Churchill,
and Brown, 1993
Discriminant
validity
Given the high correlation between the
difference score and the perception score,
it is difficult to demonstrate that the
difference score is measuring something
unique from the perception components.
Cronin and
Taylor, 1992;
Peter, Churchill,
and Brown, 1993

13
Spurious
correlation
Correlations between the gap scores and
other variable are artifacts of correlations
with the components.
Peter, Churchill,
and Brown, 1993
Variance
restriction
Expectation scores are consistently higher
than Perception scores. This leads to a
systematic variance restriction, which is
problematic for many types of statistical
analysis.
Peter, Churchill,
and Brown, 1993
Validity The perception component of the
perception minus expectation scores
performs better as a predictor of perceived
overall quality than the difference score
itself.
Parasuraman et.
al. , 1988;
Brensinger and
Lambert, 1990;
Cronin and
Taylor, 1992,
1994; Babakus
and Boller, 1992;
Boulding et. al. ,
1993
Ambiguity of
‘expectation’
construct
Multiple definitions of expectations result
in a concept that is loose ly defined and
open to multiple interpretations. These
various interpretations can result in
serious measurement validity problems.
Teas, 1993, 1994

14
Unstable
dimensionality
A theoretical construction combined with
the use of gap scores raise questions about
the true factor structure of the service
quality construct.
Carman, 1990;
Brensinger and
Lambert, 1990;
Finn and Lamb,
1991;
Parasuraman et.
al. , 1991;
Babakus and
Boller, 1992;
Cronin and
Taylor, 1992
Source: Van Dyke, T.P., L.A. Kappleman, and V.R . Prybutok. 1999. Cautions
on the use of the SERVQUAL measure to assess the quality of information
system services. Decision Sciences , 30(3), p879.
In a more recent study, Sanjay K. Jain, and Garima Gupta (2004) supported
the argument that overall serv ice quality is determined by perception only
rather than the difference between expectation and perception. They
empirically tested superiority of perception based SERVPERF scale and
Expectation and Perception difference score based SERVQUAL scale in
Indian context with reference to fast food restaurants. They came out with the
conclusion that SERVPERF scale is more convergent and discriminant valid
explanation of the service construct possesses greater power to explain
variations in the overall service qua lity scores, and are also more
parsimonious data collection instrument.

15
The concept of service quality could not be well explained and understood
without elaborating each attribute that make up the service quality.
2.1 Service Quality Attributes of Services
Gronroos (1983, 1984) defined service quality in terms of functional and
technical quality. Later in 1988, Parasuraman, Zeithaml, and Berry proposed
five dimensions (tangibles, reliability, responsiveness, assurance, empathy)
of service quality ‘SERVQUAL’ based on their empirical research conducted
in different service industries. In view of the fact that perception of service
quality is based on multiple dimensions, but there is no general concurrence
over nature or content of dimensions. Various r esearchers across the world
proposed different numbers of dimensions in service quality construct based
on their empirical studies in different service environments. Gronroos in
1983, proposed two (2) dimensions; Parasuraman, Zeithaml, and Berry in
1985, proposed ten (10) dimensions; Parasuraman, Zeithaml, and Berry in
1988, proposed five (5) dimensions Rust and Oliver in 1994 proposed three
(3) dimensions; Kettinger and Lee in 1994 proposed four (4) dimensions;
Avkiran in 1994 proposed six (6) dimensions; Stafford in 1996 proposed
seven (7) dimensions; Bahia and Nantel in 2000 proposed six (6) dimensions;
Sureshchandar, Chandrasekharan, and Anantharaman in 2002 proposed five
(5) dimensions of service quality.
A review of past literature has shown conceptual and measurement problems
with SERVQUAL scale. The issues of concern are use of gap score
(difference between expectation and perception score); applicability of
SERVQUAL measure to different service industries and countries; ambiguous
16
constructs; low validity and reliability; non-uniform dimensionality. Because
of above mentioned issues SERVQUAL measure, applied in different service
settings, produced sundry results.
After the description of perceived service quality, service quality attributes,
and service quality attributes of mobile telecommunication services, then
customer value as one of the constructs, which is closely related to service
quality requires to be elaborated.
2.2 Customer Value
According to means-end model (Attribute → Consequences → Values) by
Gutman, (1982) there was a hierarchical organization of consumer perception
and product knowledge. The hierarchical organization starts with product
attributes, which have consumption consequences, and then these
consequences support one or more than one values in the life of persons. This
model tried to explain how customers categorize the product knowledge in
memory. Woodruff and Gardial, (1996) showed that means -end model can be
adapted to capture the essence of customer value , and derived a conceptual
framework for customer value. Based on this conceptual framework, later in
1997, Woodruff defined customer value as customer’s perceived performance
for and evaluation of those attributes of goods and services, attribute
performances, and consequences arising out from use that assist or block
achieving the customer’s goals and purposes in use situations. Zeithaml,
(1988) also defined value as customer’s overall assessment of utility of a
product based on perceptions of what is rec eived and what is given away.
Perceived value is a trade-off between perceived quality and perceived
psychological or monetary sacrifice (Dodds et al. , 1991). Parasuraman,

17
(1997) suggested that conceptual definition by Woodruff, (1997) is broader
than existing definitions that focus on give versus get type evaluations that
occur during or after the use of good or service.
2.3 Customer Satisfaction
Oliver, (1981) introduced the expectancy -disconfirmation model to study
customer satisfaction in retail and ser vice industry. The discrepancies
between prior expectations and actual product performance give birth to
disconfirmation or confirmation. This concept has been reflected in the
definition of satisfaction propounded by Tse and Wilton, (1988). They
defined the satisfaction as the response of customers to the evaluation of the
perceived discrepancy between prior expectations and actual product
performance after consumption. While, Churchill and Suprenant, (1982)
argued that customer satisfaction resulted from buying and consuming a
particular good or service, which was made by a consumer to compare the
expected return and the actual cost of purchase. In their study, they found
that gap between prior expectations and actual product performance was not
the main factor for customer satisfaction, but production performance was the
deciding factor in determining customer satisfaction. A consumer compares
the actual benefit and the cost level in the buying behaviour with the
expected level of benefit. Feelings (positi ve or negative), and emotions occur
after this process.
Satisfaction is one of the most elementary ideas of marketing, until now there
is a lit tle agreement regarding its core nature. The traditional concept of
satisfaction considers it as rational, compa ring expectations to actual product
performance (Oliver, 1980). Later Anderson and Fornell , (1994) supported

18
this traditional concept of satisfaction with their empirical study. In recent
time, satisfaction experience is considered as mixture of cognition and
emotion in the consumption context (Fournier and Mick, 1999; Carroll ,
2004). A review of existing literature indicates a broad discrepancy in
defining satisfaction. In addition to variation in satisfaction definition, some
common elements are also found by Giese and Cote, (2000). First , customer
satisfaction has been characteristically conceptualized as either completely
emotional or completely rational. Second, the response pertains to a
particular focus (choice of good or service; purchase or consumpt ion). Third,
the response occurs at a particular time, which is generally limited in
duration, and it varies from situation to situation.
2.3 Service Quality and Customer Satisfaction Relationship
Research on relationship between perceived service qual ity and customer
satisfaction produced mix results. In some studies, customer satisfaction is
found antecedent of service quality and in some other studied, perceived
service quality is found antecedent of customer satisfaction. Based upon the
argument propounded by Lee et al. , (2000), in which consumers can evaluate
an object only after they interpret the object, it can be concluded that service
quality serves as antecedent of customer satisfaction.
2.4 Customer Loyalty
Dawes and Swailes, (1999) propounded that high customer loyalty is central
to successful customer retention, and firms who compete on the basis of
loyalty will win over the battle of competition. The conceptualization of
customer loyalty construct has been developed steadily over the years. In the

19
earlier years, the focus of loyalty was brand loyalty with respect to tangible
goods (Tucker, 1964; Day, 1969). Cunningham, (1956) defined brand loyalty
as the proportion of purchases of a household dedicated to the brand it
purchases most often. Brand loyalty in marketing consists of a consumer’s
commitment to repurchase or otherwise continue using the brand and can be
demonstrated by repeated buying of a good or service or other positive
behaviours such as word of mouth advocacy (Dick, and Basu, 1994).
Tucker, (1964) stated that neither consideration should be given to what the
subject thinks nor what goes on in his/her central nervous system , his/her
behaviour represents the full statement of what brand loyalty is. Based on the
past l iterature, it was found that initial research emphasized only on the
behavioural dimension of loyalty. Jacoby, (1971) confirmed through
extensive li terature that past studies focused only on the behavioural
outcomes and ignored the consideration that what went into the minds of
consumers. He concluded that brand loyalty was simply measured in terms of
outcome characteristics.
There is more to brand loyalty than just regular purchasing of same brand
(Day, 1964). Based on findings of earlier studies, Jacoby, (1971) pr oposed a
conceptualization of brand loyalty that incorporates both a behavioural and
an attitudinal constituent. Later Jacoby and Chesnut, (1978) proposed
definition for brand loyalty by incorporating both behavioural and attitudinal
constituents. Bran loyalty is the extent of the faithfulness of consumers
towards a particular brand, expressed through their repeat purchases,
irrespective of the marketing pressure generated by the competitors. Brand
loyalty is non random behavioural response expressed over t ime by some

20
decision making unit with regard to one or more brands out of a set of brands
and is a function of psychological processes (Jacoby and Chesnut, 1978).
Engel et al . , (1982) defined brand loyalty as the preferential, attitudinal, and
behavioural response toward one or more brands in a product category
expressed over a period of time by a consumer. Loyalty may be defined as a
favourable attitude towards a particular brand resulting in a consistent
purchase of that brand over time, suggesting that l oyalty is present when
favourable attitudes are manifested in repeat purchase behaviour (Keller,
1993).
Gremler and Brown, (1996) found that past studies on customer loyalty
focused largely good related brand loyalty, whereas research on customer
loyalty to service firms has remained limited. The findings in the field of
good related loyalty can not be generalized to service related loyalty because
of following reasons:
o Service loyalty depends more on interpersonal relationships between
firms and consumers as compared to loyalty of goods (Berry, 1983).
o Person to person interactions form an essential element in marketing of
services (Suprenant and Solomon, 1987).
o The influence of perceived risk is larger in case of services, as
customer loyalty may act as a barricade to customer switching
behaviour (Zeithaml, 1981).
o Intangible attributes like reliability, and confidence may play a vital
role in building or maintaining loyalty in the context of services (Dick
and Basu, 1994).
21
Later Gremler and Brown, (1996) extended the concept of loyalty to services
(intangible goods) and defined the service loyalty as the degree to which a
customer exhibits repeat buying behaviour from a service organization,
possesses a positive atti tudinal temperament towards the organizatio n, and
considers only this organization when a need for this service exist.
The Effect of Service Quality Attributes on Customer Value, Satisfaction,
Loyalty
Based on the past research in the context of customer satisfaction, positive
relationship between service quality and customer satisfaction was found. In
the literature, some researchers argued indirect effect of service quality,
while others argued for direct effect. Based upon the customer value
li terature, it is suggested to lead directly to custom er loyalty. In addition, the
investigation of the model which is derived from the previous literature that
examines the linkages among service quality attributes, value, satisfaction,
and customer loyalty, shows that service quality attributes influence cu stomer
loyalty through customer value and satisfaction.
However, most the past researches on service quality attributes and customer
loyalty relationship investigated whether there is direct or indirect impact of
service quality attributes on customer loy alty, there is very lit tle researches
have investigated the effect of service quality attributes on perceived
customer value, satisfaction, and loyalty especially in Indian mobile
telecommunication service sector.
22
2.5 RESEARCH GAPS
Till date the research on service quality, customer value, customer
satisfaction, and customer loyalty issues have dominated the services
marketing literature, but a very few studies on mobile telecommunication
services sector have been conducted to investigate the impact of t he
performance of service quality attributes on customer value, satisfaction, and
loyalty into an integrated model.
The partial examination of simple bivariate relationships between any of the
service constructs and behavioural intentions may not show th eir true
relationship because of omitted variable bias, so integrated model needs to be
developed (Cronin, Brady, and Hult, 2000). Besides this, attributes like
tangible quality of service product and quality of service environment play s a
vital role in serving as symbols of quality and value to the customers
(Cronin, Brady, and Hult, 2000).
Caruana (2002) suggested that the role of customer value and reputation of an
organization can be considered as new constructs to relate customer
satisfaction with customer loyalty. Moreover, the findings need to be
confirmed by further evidence from other regions given the difference in
values and cultures among different regions (Wang, Lo, and Yang, 2004).
An investigation should be conducted on how the network quality (core
service product quality) interacts with service quality to influence customer
satisfaction (Lai et al . , 2007).

23
Based on the literature review, it can be concluded that there is a need to
investigate the impact of performance of service quality attributes on
customer value, satisfaction, and loyalty. In addition, managing the
performance of service quality attributes is very important in order to
influence customer value, satisfaction, and loyalty.
3. THE OBJECTIVES OF THE STUDY AND PROPOSED RESEARCH
HYPOTHESES
Although research on the service quality of telecommunication services based
on customer perceptions has been conducted widely, no recent studies have
been conducted which examine the effect of the se rvice quality dimensions
on customer value, satisfaction, and loyalty in an integrated model in Indian
context. The current study attempts to examine the effect of service quality
dimensions on customer value, satisfaction, and loyalty based on the research
objectives which are presented as follows:
Broad Objective
Broad objective of the study is to examine the effect of s ervice quality
dimensions on customer value, customer satisfaction, and customer loyalty.
Specific Objectives
• To identify the service quality dimensions in the mob ile
telecommunications services sector.

24
• To analyse the specific dimensions of service quality that influence
customer value, vis-à-vis, customer satisfaction.
• To analyse the specific predictors (service quality attributes, customer
value, customer satis faction) which influence customer loyalty.
• To analyse whether the attributes can correlate relationships among
service quality attributes, customer value, customer satisfaction, and
customer loyalty.
• To examine whether customer value plays mediating role in the
relationships between service quality attributes and customer
satisfaction.
• To examine whether customer satisfaction plays mediating role in the
relationships between customer value and customer loyalty.
• To examine whether customer value / customer satisfaction play
mediating role in the relationships between service quality attributes
and customer loyalty.
3.1 Proposed Hypotheses of the Study
The following hypotheses are proposed to be developed with reference to
li terature review to test the r elationships among the following:
Relationship between service quality attributes and customer value

25
Relationship between service quality attributes and customer
satisfaction.
Relationships among service quality attributes, customer value, and
customer sat isfaction.
Relationship between customer value and customer satisfaction.
Relationships among attributes of service quality, customer value,
customer satisfaction, and customer loyalty.
4. METHODOLOGY AND THE SOURCES OF DATA
4.1 Research Design
To create a research design for the study appropriate measures and model s
are considered as per requirement of the research work. The focus of present
research work is investigation of relationships among attributes of service
quality, customer value, customer satis faction, and customer loyalty in Indian
mobile telecommunication services sector. Since present research work will
be based on primary data, which is to be collected from mobile
telecommunication services users with the help of structured questionnaire, a
field based survey design will be used as data collection method.

26
4.2 Research Framework
Conceptual Research Framework of service quality attributes, customer
value, customer satisfaction, and customer loyalty
Research framework for the present study is adopted from Heskett et al . ,
(1997), Cronin, Brady, and Hult (2000), and Caruana, (2002) based on the
constructs namely service quality attributes; customer value; customer
satisfaction; and customer loyalty. It will include hypothesized relationships
among above mentioned constructs, and statistically this model will be
tested.
Service
Quality
Attributes
Customer
Value
Customer
Satisfaction
Customer
Loyalty

27
4.3 Sources of Data
Primary data will be collected with the help of structured questionnaire by
employing field survey method.
4.4 Target Population for the Study
The population for this research consists of subjects, who have experience
with mobile telecommunication services in the city of Dehradun.
4.5 Sample Size
In case of exploratory factor analysis, more acceptable sample size
would have a 10:1 ratio (Hair et al. , 2008, P. 136).
In Structural Equation Modeling as a rule of thumb, any number above
200 (critical sample size) is understood to provide sufficient statistical
power for data analysis (Hoelter, 1983; Hoe, 2008).
4.6 Sampling Plan
Multistage sampling technique will be employed to collect the primary data
from the respondents. Out of these circulated questionnaires, incomplete
questionnaires will be kept out of study. Only completely filled
questionnaires will be considered for t he analysis.
4.7 Research Instrument
In the context of current study, structured questionnaire with closed -ended
questions will be used and responses will be measured on 5 – point Likert’s
scale. The survey instrument is a revised version of that originall y developed
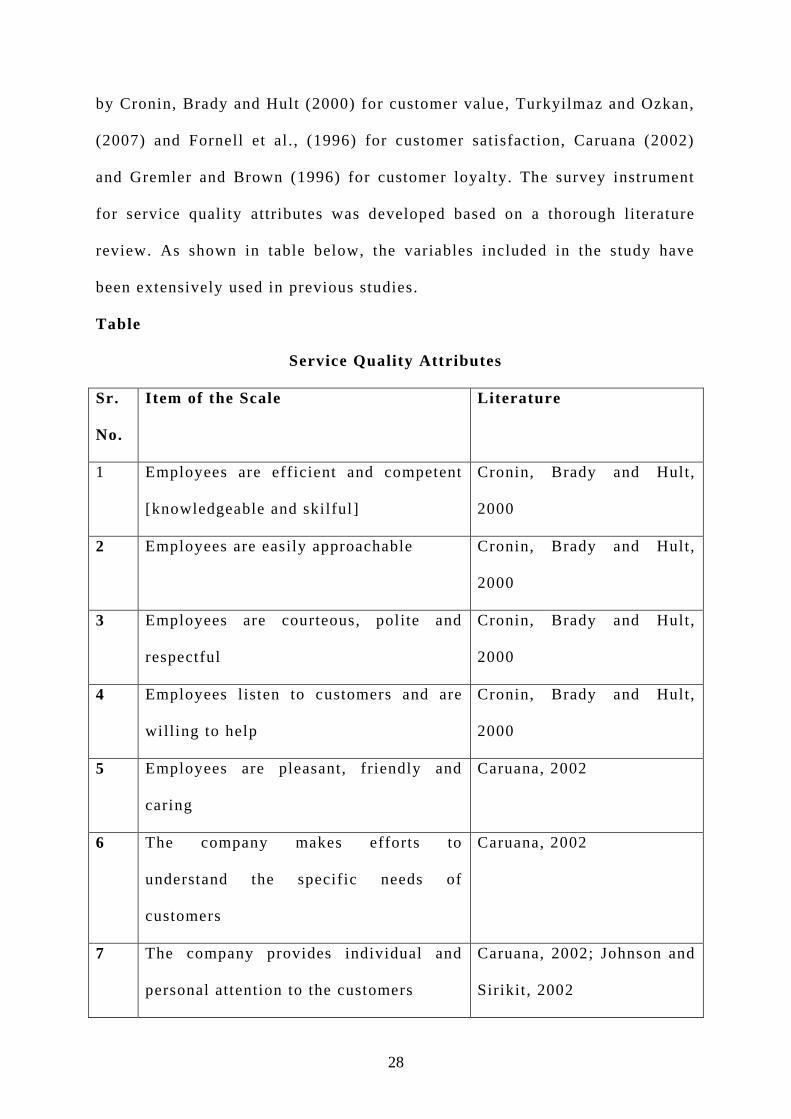
28
by Cronin, Brady and Hult (2000) for customer value, Turkyilmaz and Ozkan,
(2007) and Fornell et al . , (1996) for customer satisfaction, Caruana (2002)
and Gremler and Brown (1996) for customer loyalty. The survey instrument
for service quality attributes was developed based on a thorough literature
review. As shown in table below, the variables included in the study have
been extensively used in previous studies.
Table
Service Quality Attributes
Sr.
No.
Item of the Scale Literature
1 Employees are efficient and competent
[knowledgeable and skilful]
Cronin, Brady and Hult,
2000
2 Employees are easily approachable Cronin, Brady and Hult,
2000
3 Employees are courteous, polite and
respectful
Cronin, Brady and Hult,
2000
4 Employees listen to customers and are
willing to help
Cronin, Brady and Hult,
2000
5 Employees are pleasant, friendly and
caring
Caruana, 2002
6 The company makes efforts to
understand the specific needs of
customers
Caruana, 2002
7 The company provides individual and
personal attention to the customers
Caruana, 2002; Johnson and
Sirikit, 2002

29
8 The company performs any service right
first t ime
Caruana, 2002
9 All the records are maintained accurately
by the cellular company
Wang and Lo 2002; Lai et
al. 2007; Johnson and
Sirikit, 2002
10 The company provides accurate and
timely information
Ndubisi and Wah, 2005
11 The services provided the company is
prompt [low waiting time and quick
response]
Olorunniwo and Hsu, 2006
12 When there are problems, the service
provider is sympathetic and reassuring
Lai et al . 2007
13 Complaint resolution or fault repair is
fast
Athanassopoulos and
Iliakopoulos, 2003
14 Employees in the offices are neat and
clean
Caruana, 2002
15 Physical facilities of offices are visually
appealing
Caruana, 2002
16 The operating hours are convenient for
the customers
Wang and Lo, 2002
17 The advertisements and promotional
campaigns of the company are effective
Aydin and Ozer, 2005
18 The network is up-to-date and low
congestion problem [even in peak t raffic
hours]
Olorunniwo and Hsu, 2006

30
19 The cellular company provides service
reliably, consistently and dependably
Caruana, 2002
20 The cellular company is trustworthy and
its employees are believable and honest
Caruana, 2002
21 The company fulfils i ts promises Caruana, 2002
22 The services provided by the company
are competitive
Athanassopoulos and
Iliakopoulos, 2003
23 The pricing of the services are
reasonable and competitive
Host and Andersen, 2004
24 There is enough variety of pricing plans
available
Kim et al. 2004
25 The range and variety of Value Added
Services (SMS, Ring tones etc.)
provided is comprehensive and
competitive
Aydin and Ozer, 2005
26 The call quality (voice clarity) is good
and call drops are minimal
Kim et al. 2004
27 The coverage area of the company is
wide
Aydin and Ozer, 2005
28 The company has sufficient presence in
different geographical areas through own
offices or dealers, franchises
Aydin and Ozer, 2005
29 It is easy and convenient to take up a
new cellular connection as well as get
recharges and top-ups
Lai et al . 2007

31
30 The billing is accurate and easy to
understand
Levesque and McDougall,
1996
31 The cellular company has reputation and
good image
Aydin and Ozer, 2005
32 The company is innovative and forward
looking
Aydin and Ozer, 2005
4.8 Statistical Tools and Techniques
Descriptive Statistics
Frequency; Mean; Standard deviation; Percentages for demographical and
psycho graphical variables.
Inferential Statistics
Correlation Analysis , Exploratory Factor Analysis, Structural equation
modelling.
Exploratory Factor Analysis
To organize the variables into factors.
Structural Equation Modelling
To test the structural model of study, and test the hypotheses of the study.
5. EXPECTED CONTRIBUTION TO THE LITERATURE
This research is designed to help both academicians and practitioners
understand the extent to which service quality, customer value, and customer
satisfaction relate to customer loyalty in a mobile telecommunication
services sector . The assessment of the most important attributes in mobile
telecommunication services set up can provide important cues, which may be
used to review characteristics of the sector as experienced by customers.

32
These cues can be used to improve customer value and customer satisfa ction,
which will lead to improved customer loyalty. Finally, this study contributes
to the service marketing literature by applying concept of service quality,
customer value, customer satisfaction, and loyalty in a mobile
telecommunication services setti ng in India, as one of developing country in
Asia.
6. LIST OF REFERENCES
Anantharaman R. N., Chandrasekharan Rajendran, and G.S. Sureshchandar.
2003. Customer perceptions of service quality in the banking sector of
a developing economy: A critical analysis . International Journal of
Bank Marketing , 21(3), 233-242.
Babakus, E., and G.W. Boller. 1992. An empirical assessment of the
SERVQUAL scale. Journal of Business Research , 24, 253-268.
Boulding, W., A. Kalra, R. Staelin, and V.A. Zeithaml. 1993. A dynamic
process model of service quality: From expectations to behavioural
intentions. Journal of Marketing Research , 30, 7-27.
Buzzell , R.D., L. Phillips, R. Dae, and W. Chang. 1983. Product quality, cost
position, and business performance: A test of some hypothe sis. Journal
of marketing , 47(2), 26-44.
Cadotte, Ernest R., Robert B. Woodruff, and Roger L. Jenkins. 1987.
Expectations and norms in models of consumer satisfaction. Journal of
Market Research , 24, 305-314.
Churchill , G.A., and C. Suprenant. 1982. An inv estigation into the
determinants of customer satisfaction. Journal of Marketing Research ,
19(4), 491-504.
33
Cowles, D., K.R. Evans, and L.A. Crosby. 1990. Relationship quality in
services selling: An interpersonal influence perspective. Journal of
Marketing , 54(1), 68-81.
Dick, Alan S. and Kunal Basu. 1994. Customer loyalty: Toward an integrated
conceptual framework," Journal of the Academy of Marketing Science , 22
(2), 99-113.
Eshghi, Abdolreza, Sanjit Kumar Roy, and Shirshendu Ganguly. 2008.
Service quality and customer satisfaction: An empirical investigation
in Indian mobile telecommunication services. Marketing Management
Journal, 18(2),119-144.
Gronroos, Christian. 1984. A service q uality model and its marketing
implications. European Journal of Marketing , 18(4), 36-44.
James Brian Quinn, Jordan J. Baruch, and Penny Cushman Paquette. 1987.
Technology in services. Scientific American, 257(2), 50.
Johnson, William, C, and Anuchit Sirik it . 2002. Service quality in the thai
telecommunication industry: A tool for achieving a sustainable
competitive advantage. Management Decision, 40(7/8), 693-701.
Najjar, Lotfollah, and Ram R. Bishu. 2006. Service quality: A case study of a
bank. The Quality Management Journal , 5(3), 35-44.
Ndubisi, Nelson Oly, and Chan Kok Wah. 2005. Factorial and discriminant
analyses of the underpinnings of relationship marketing and customer
satisfaction. International Journal of Bank Marketing, 23(7), 542-557.
Nerurkar, O. 2000. A preliminary investigation of SERVQUAL dimensions in
India. Proceedings of the International Conference on Delivering
Service Quality – Managerial Challenges for the 21st Century , New
Delhi, 571-80.

34
Oliver, R.L., and R.T. Rust. 1994. Service qu ality: Insights and managerial
implications from the frontier, service quality: New directions in
theory and practice, Sage publications, Thousand Oaks, CA, 1 -19.
Parasuraman, A., Leonard L. Berry, and Valarie A. Zeithaml. 1985. A
conceptual model of service quality and its implications for future
research. Journal of Marketing , 49, 41-50.
_______________1988. SERVQUAL: A multiple -item scale for measuring
consumer perceptions of service quality. Journal of Retailing, 64 (1),
12-40.

35
7. THE PLAN OF RESEARCH
Second Stage Literature Review-----30-45 Days (Approx.)
Structural Designing of Research Instrument (Questionnaire) ----------
15-20 Days (Approx.)
Pilot Test of Questionnaire-------10-15 Days (Approx.)
Modifications in the Questionnaire (if any)-----5-10 Days (Approx.)
Primary Data Collection with the Help of Field Survey Method---------
40-45 Days (Approx.)
Data Cleaning----------15 Days
Statistical Analysis to Achieve the Stated Objectives of the Study-------
------------------------------20-25 Days (Approx.)
Interpretation of Findings and Discussion of Results-------15-20 Days
(Approx.)
Thesis Writing in a Prescribed Format------2 Months (Approx.)